UNITED STATES
SECURITIES AND EXCHANGE COMMISSION
WASHINGTON, D.C. 20549
FORM N-CSR
CERTIFIED SHAREHOLDER REPORT OF REGISTERED MANAGEMENT
INVESTMENT COMPANIES
Investment Company Act file number 811-5225
Oppenheimer Quest for Value Funds
(Exact name of registrant as specified in charter)
6803 South Tucson Way, Centennial, Colorado 80112-3924
(Address of principal executive offices) (Zip code)
Cynthia Lo Bessette
OFI Global Asset Management, Inc.
225 Liberty Street, New York, New York 10281-1008
(Name and address of agent for service)
Registrant’s telephone number, including area code: (303) 768-3200
Date of fiscal year end: October 31
Date of reporting period: 4/29/2016
Item 1. Reports to Stockholders.
Table of Contents
Class A Shares
AVERAGE ANNUAL TOTAL RETURNS AT 4/29/16*
| | | | | | | | | | | | | | | | |
| | | 6-Month | | | 1-Year | | | 5-Year | | | 10-Year | |
Class A Shares of the Fund without Sales Charge | | | -0.93% | | | | -2.75% | | | | 2.79% | | | | 2.57% | |
Class A Shares of the Fund with Sales Charge | | | -6.62 | | | | -8.35 | | | | 1.58 | | | | 1.96 | |
S&P 500 Index | | | 0.43 | | | | 1.21 | | | | 11.02 | | | | 6.91 | |
Reference Index11 | | | 0.84 | | | | -1.93 | | | | 4.86 | | | | 4.70 | |
MSCI All Country World Index | | | -0.94 | | | | -5.66 | | | | 4.69 | | | | 3.89 | |
Barclays Global Aggregate Bond Index, Hedged | | | 3.22 | | | | 3.19 | | | | 4.44 | | | | 4.82 | |
Reference Index21 | | | 2.05 | | | | -1.13 | | | | 4.26 | | | | 5.09 | |
Russell 1000 Index | | | 0.22 | | | | 0.34 | | | | 10.81 | | | | 6.99 | |
MSCI All County World Index (ex-U.S.) | | | -1.75 | | | | -11.28 | | | | -0.13 | | | | 1.70 | |
Barclays U.S. Aggregate Bond Index | | | 2.82 | | | | 2.72 | | | | 3.60 | | | | 4.95 | |
Barclays Multiverse Index (ex-U.S.) | | | 8.66 | | | | 6.49 | | | | -0.01 | | | | 3.82 | |
Performance data quoted represents past performance, which does not guarantee future results. The investment return and principal value of an investment in the Fund will fluctuate so that an investor’s shares, when redeemed, may be worth more or less than their original cost. Fund returns include changes in share price, reinvested distributions, and a 5.75% maximum applicable sales charge except where “without sales charge” is indicated. Current
2 OPPENHEIMER GLOBAL ALLOCATION FUND
performance may be lower or higher than the performance quoted. Returns do not consider capital gains or income taxes on an individual’s investment. Returns for periods of less than one year are cumulative and not annualized. For performance data current to the most recent month-end, visit oppenheimerfunds.com or call 1.800.CALL OPP (225.5677).
*April 29, 2016, was the last business day of the Fund’s semiannual period. See Note 2 of the accompanying Notes to Consolidated Financial Statements. Index returns are calculated through April 30, 2016.
1. The Fund has changed its benchmark from Reference Index 2 (30% Russell 1000 Index / 30% MSCI All Country World Index (ex-U.S.) / 20% Barclays U.S. Aggregate Bond Index / 20% Barclays Multiverse Index (ex-U.S.) to Reference Index 1 (60% MSCI All Country World Index / 40% Barclays Global Aggregate Bond Index, Hedged), which it believes is a more appropriate measure of the Fund’s performance. The Fund will not show performance for the Reference Index 2 (or for the indices comprising the Reference Index 2) in its next semiannual report.
3 OPPENHEIMER GLOBAL ALLOCATION FUND
Fund Performance Discussion
The Fund’s Class A shares (without sales charge) produced a return of -0.93% during the reporting period. The Fund outperformed its Reference Index (the “Reference Index”), a customized weighted index currently comprised of 60% of the MSCI All Country World Index (ex-U.S.) and 40% of the Barclays Global Aggregate Bond Index, Hedged, which returned 0.84%.
MARKET OVERVIEW
Over the first half of the reporting period, continued volatility in oil, weak economic data in some emerging markets, and mixed data in much of the developed world helped contribute to a volatile close to 2015. Ironically, the strong November U.S. payrolls report and subsequent high expectations of a Federal Reserve (“Fed”) hike brought out sellers as equity markets approached their early summer highs. The Fed finally hiked interest rates 0.25% in December, which followed a somewhat underwhelming easing program by the European Central Bank (“ECB”) earlier in the month.
2016 began with declines in the price of almost every risk asset globally. Much of this volatility was driven by the twin fears of slowing global growth and the aggressive interest rate hike path indicated by the Fed in its December 2015 communication. March saw a relief rally, however, as communication from the Fed turned more accommodative in light of this weak start to the year. Oil prices also began to stabilize and commodities started to pick up.
Financial market fears during this reporting period did not translate into a recession globally, however, and economic growth remained slow and steady. We believe continued accommodative monetary policy globally coupled with modest economic growth may likely set the tempo for the rest of 2016 despite the weak start to the year.
FUND REVIEW
During the reporting period, the equity security selection component of the Fund’s investment process was the largest detractor from relative performance, driven mostly by international and domestic strategies. Our global developed equity strategy had underperformance relative to the MSCI All Country World Index during the period driven by poor stock selection within the Financials and Technology sectors. Our domestic large-cap growth strategy underperformed the Russell 1000 Growth Index, with poor stock selection within the Technology and Health Care sectors.
4 OPPENHEIMER GLOBAL ALLOCATION FUND
Our overweight duration posture versus the Reference Index was a big contributor during the period. Last year, we anticipated that U.S. Treasuries would be an attractive hedge against renewed market volatility, given their positive yield (relative to option based hedging strategies, where we would typically pay a premium for protection). Given our general concerns about global growth and a lack of discernible inflation, we believed developed market government bonds, particularly long-dated U.S. Treasuries, offered an attractive hedge in an uncertain environment. This duration hedge worked extremely well as volatility picked up in the first part of 2016 and yields on Treasuries fell substantially. With the significant move in yields, we reduced this exposure but still remain long duration versus the Reference Index.
We expect the Fed to take a more accommodative stance that will help to calm markets over the near term. With this improvement in the risk backdrop and in conjunction with most developed markets in a slowdown regime, we think the most compelling opportunities are in credit. This is an area of the market that we had reduced last fall at a time when we believed credit
would underperform as volatility picked up. We did see this play out, and spreads widened to near recession levels across the high yield market. In mid-March, with attractive valuations and a belief that volatility will stabilize with a more dovish Fed, we added high yield credit to the portfolio. In our view, credit offers an attractive opportunity to capture returns versus equities while incurring less risk in the aggregate portfolio.
Our active currency overlay, in particular our overweight position to the Japanese Yen versus the Reference Index, was a positive contributor to relative performance. In our view, the Yen was an attractive currency based on cheaper valuations, growing account surplus, and safe-haven characteristics. For the period, the Yen was the best performing currency globally, with a 7% appreciation. While financial markets witnessed meaningful volatility, the overall performance of riskier assets was basically flat for the period and the economic backdrop has also been stable. In other words, in our view, the resilience in the Yen seems more driven by fundamental tailwinds and to a lesser extent by safe haven flows. With such strong appreciation in the period, we reduced our positon to neutral versus the Reference Index.
5 OPPENHEIMER GLOBAL ALLOCATION FUND
The Fund’s return shaping strategies, which are designed to improve the overall risk profile of the Fund, were a neutral contributor to performance during the period. Under normal circumstances, we expect return shaping strategies to cost money, like any insurance premium, and commensurately enhance returns or partially protect principal in environments of extreme market volatility. These strategies are often used as an efficient way to access upside market participation, especially when we are running lower levels of risk. With implied volatility higher than realized volatility across a number of assets (implying a relatively high cost of portfolio protection), we preferred to reduce risk through our asset allocation overlays, and had limited exposure to hedging strategies through options.
STRATEGY & OUTLOOK
Overall, we are underweight equities relative to the Reference Index and prefer to own credit, an attractive alternative to equities, in these less certain times. With most developed equity market valuations relatively full in comparison to history, we have a preference for emerging market equities, where we see cheaper valuations and improving fundamentals. We continue to have a modest
overweight to duration versus the Reference Index to help offset potential market volatility, as we view this as an attractive downside hedge that collects premium. In terms of the macro environment, we are seeing a relatively weaker economic picture as our macro regime framework continues to indicate that most of the global economy remains in the “slowdown” regime, which typically foretells mediocre asset returns and significant uncertainty. Most central banks, excluding the U.S., are trying to counterbalance the “slowdown” by supportive monetary policy. It is worth noting that the more experimental stimulus measures, like negative deposit rates, are starting to have unintended and adverse effects on asset prices and currencies.
As we look ahead, we expect a continuation in this reporting period’s seesaw behavior, in which global markets alternate between risk-on and risk-off. Our view is informed by the divergence in policy across the world’s major economies, as the U.S. looks to continue to normalize interest rates, while Europe, Japan, and China maintain and may even expand stimulative policy measures. This muted growth outlook coupled with lack of consistent direction is causing a high degree of financial market uncertainty that may
6 OPPENHEIMER GLOBAL ALLOCATION FUND
persist for some time. With this type of backdrop, we believe in being somewhat cautious with our risk posture and instead focusing on higher risk-adjusted return assets. Finally, with a choppy market backdrop, we think a dynamic asset allocation approach is well suited to navigate the short-term
market risks. Diverging policy and unintended stimulus effects are leading to some very interesting trends that we believe can persist over time. We believe a flexible mandate is well equipped to capitalize on such an environment.
7 OPPENHEIMER GLOBAL ALLOCATION FUND
Top Holdings and Allocations*
TOP TEN COMMON STOCK HOLDINGS
| | | | |
Alphabet, Inc., Cl. C | | | 0.9% | |
Apple, Inc. | | | 0.7 | |
Citigroup, Inc. | | | 0.7 | |
Alphabet, Inc., Cl. A | | | 0.7 | |
SAP SE | | | 0.7 | |
Airbus Group SE | | | 0.6 | |
PayPal Holdings, Inc. | | | 0.6 | |
Facebook, Inc., Cl. A | | | 0.5 | |
S&P Global, Inc. | | | 0.5 | |
General Electric Co. | | | 0.5 | |
Portfolio holdings and allocations are subject to change. Percentages are as of April 29, 2016, and are based on net assets. For more current Fund holdings, please visit oppenheimerfunds. com.
TOP TEN COMMON STOCK INDUSTRIES
| | | | |
Internet Software & Services | | | 3.9% | |
Commercial Banks | | | 2.5 | |
Pharmaceuticals | | | 2.5 | |
Food Products | | | 2.4 | |
Oil, Gas & Consumable Fuels | | | 2.2 | |
Software | | | 2.2 | |
Textiles, Apparel & Luxury Goods | | | 2.1 | |
Hotels, Restaurants & Leisure | | | 1.9 | |
Media | | | 1.8 | |
IT Services | | | 1.7 | |
Portfolio holdings and allocations are subject to change. Percentages are as of April 29, 2016, and are based on net assets.
PORTFOLIO ALLOCATION
| | | | |
Common Stocks | | | 63.1% | |
Investment Companies | | | | |
iShares iBoxx $ High Yield Corporate Bond Exchange Traded Fund | | | 8.5 | |
Oppenheimer Institutional Money Market Fund | | | 1.6 | |
Oppenheimer Master Event- Linked Bond Fund, LLC | | | 6.0 | |
Oppenheimer Master Loan Fund, LLC | | | 5.7 | |
U.S. Government Obligations | | | 14.7 | |
Preferred Stocks | | | 0.4 | |
Corporate Loans | | | —** | |
Rights, Warrants and Certificates | | | —** | |
Non-Convertible Corporate Bonds and Notes | | | —** | |
** Represents a value of less than 0.05%.
Portfolio holdings and allocations are subject to change. Percentages are as of April 29, 2016, and are based on the total market value of investments.
8 OPPENHEIMER GLOBAL ALLOCATION FUND
TOP TEN GEOGRAPHICAL HOLDINGS
| | | | |
United States | | | 63.5% | |
United Kingdom | | | 5.5 | |
Japan | | | 4.3 | |
France | | | 3.9 | |
Germany | | | 3.6 | |
Switzerland | | | 2.8 | |
China | | | 2.3 | |
Netherlands | | | 2.0 | |
Canada | | | 1.9 | |
India | | | 1.7 | |
Portfolio holdings and allocation are subject to change. Percentages are as of April 29, 2016, and are based on total market value of investments.
REGIONAL ALLOCATION
| | | | |
U.S./Canada | | | 65.4% | |
Europe | | | 21.2 | |
Asia | | | 11.2 | |
Latin America | | | 1.2 | |
Emerging Europe | | | 0.5 | |
Middle East/Africa | | | 0.5 | |
Portfolio holdings and allocation are subject to change. Percentages are as of April 29, 2016, and are based on total market value of investments.
*April 29, 2016, was the last business day of the Fund’s semiannual period. See Note 2 of the accompanying Notes to Consolidated Financial Statements.
9 OPPENHEIMER GLOBAL ALLOCATION FUND
Share Class Performance
AVERAGE ANNUAL TOTAL RETURNS WITHOUT SALES CHARGE AS OF 4/29/2016
| | | | | | | | | | | | | | | | | | |
| | | Inception
Date | | | 6-Month | | | 1-Year | | | 5-Year | | 10-Year | |
Class A (QVGIX) | | | 11/1/91 | | | | -0.93% | | | | -2.75% | | | 2.79% | | | 2.57% | |
| |
Class B (QGRBX) | | | 9/1/93 | | | | -1.25 | | | | -3.51 | | | 1.96 | | | 2.08 | |
| |
Class C (QGRCX) | | | 9/1/93 | | | | -1.28 | | | | -3.46 | | | 2.04 | | | 1.83 | |
| |
Class I (QGRIX) | | | 2/28/12 | | | | -0.65 | | | | -2.26 | | | 5.40* | | | N/A | |
| |
Class R (QGRNX) | | | 3/1/01 | | | | -1.01 | | | | -3.00 | | | 2.54 | | | 2.31 | |
| |
Class Y (QGRYX) | | | 5/1/00 | | | | -0.80 | | | | -2.50 | | | 3.11 | | | 2.91 | |
| |
|
AVERAGE ANNUAL TOTAL RETURNS WITH SALES CHARGE AS OF 4/29/2016 | |
| | | Inception
Date | | | 6-Month | | | 1-Year | | | 5-Year | | 10-Year | |
Class A (QVGIX) | | | 11/1/91 | | | | -6.62% | | | | -8.35% | | | 1.58% | | | 1.96% | |
| |
Class B (QGRBX) | | | 9/1/93 | | | | -6.14 | | | | -8.28 | | | 1.59 | | | 2.08 | |
| |
Class C (QGRCX) | | | 9/1/93 | | | | -2.26 | | | | -4.42 | | | 2.04 | | | 1.83 | |
| |
Class I (QGRIX) | | | 2/28/12 | | | | -0.65 | | | | -2.26 | | | 5.40* | | | N/A | |
| |
Class R (QGRNX) | | | 3/1/01 | | | | -1.01 | | | | -3.00 | | | 2.54 | | | 2.31 | |
| |
Class Y (QGRYX) | | | 5/1/00 | | | | -0.80 | | | | -2.50 | | | 3.11 | | | 2.91 | |
| |
| * | Shows performance since inception. |
Performance data quoted represents past performance, which does not guarantee future results. The investment return and principal value of an investment in the Fund will fluctuate so that an investor’s shares, when redeemed, may be worth more or less than their original cost. Current performance may be lower or higher than the performance quoted. For performance data current to the most recent month-end, visit oppenheimerfunds.com or call 1.800. CALL OPP (225.5677). Fund returns include changes in share price, reinvested distributions, and the applicable sales charge: for Class A shares, the current maximum initial sales charge of 5.75%; for Class B shares, the contingent deferred sales charge of 5% (1-year) and 2% (5-year); and for Class C shares, the contingent deferred sales charge (“CDSC”) of 1% for the 1-year period. Prior to 7/1/14, Class R shares were named Class N shares. Beginning 7/1/14, new purchases of Class R shares will no longer be subject to a CDSC upon redemption (any CDSC will remain in effect for purchases prior to 7/1/14). There is no sales charge for Class I and Class Y shares. Because Class B shares convert to Class A shares 72 months after purchase, the 10-year return for Class B shares uses Class A performance for the period after conversion. Returns for periods of less than one year are cumulative and not annualized.
The Fund’s performance is compared to the performance of the S&P 500 Index, Reference Index 1 (60% MSCI All Country World Index / 40% Barclays Global Aggregate Bond Index, Hedged), the MSCI All Country World Index, the Barclays Global Aggregate Bond Index, Hedged, Reference Index 2 (30% Russell 1000 Index / 30% MSCI All Country World Index (ex-U.S.) / 20% Barclays U.S. Aggregate Bond Index / 20% Barclays Multiverse Index (ex-U.S.) the Russell 1000 Index, the MSCI All Country World Index (ex-U.S.), the Barclays U.S. Aggregate Bond Index, and the Barclays Multiverse Index (ex-U.S.). The Fund has changed its benchmark
10 OPPENHEIMER GLOBAL ALLOCATION FUND
from Reference Index 2 (30% Russell 1000 Index / 30% MSCI All Country World Index (ex-U.S.) / 20% Barclays U.S. Aggregate Bond Index / 20% Barclays Multiverse Index (ex-U.S.) to Reference Index 1 (60% MSCI All Country World Index / 40% Barclays Global Aggregate Bond Index, Hedged), which it believes is a more appropriate measure of the Fund’s performance. The Fund will not show performance for Reference Index 2 (or for the indices Reference Index 2) in its next semiannual report. The S&P 500 Index is a broad-based measure of domestic stock performance. The MSCI All Country World Index is a free float-adjusted market capitalization weighted index that is designed to measure the equity market performance of developed and emerging markets. The Barclays Global Aggregate Bond Index provides a broad-based measure of global investment grade fixed-rate debt markets. The index is comprised of several other Barclays indexes that measure fixed income performance of regions around the world while hedging the currency back to the U.S. dollar. The Russell 1000 Index measures the performance of the large-cap segment of the U.S. equity universe. The MSCI All Country World Index (ex U.S.) is designed to measure global developed and emerging equity market performance excluding the United States. The Barclays U.S. Aggregate Bond Index is an index of U.S dollar-denominated, investment-grade U.S. corporate government and mortgage-backed securities. The Barclays Multiverse Index (ex-U.S.) provides a broad-based measure of the global fixed-income bond market. The indices are unmanaged and cannot be purchased directly by investors. While index comparisons may be useful to provide a benchmark for the Fund’s performance, it must be noted that the Fund’s investments are not limited to the investments comprising the indices. Index performance includes reinvestment of income, but does not reflect transaction costs, fees, expenses or taxes. Index performance is shown for illustrative purposes only as a benchmark for the Fund’s performance, and does not predict or depict performance of the Fund. The Fund’s performance reflects the effects of the Fund’s business and operating expenses.
The Fund’s investment strategy and focus can change over time. The mention of specific fund holdings does not constitute a recommendation by OppenheimerFunds, Inc. or its affiliates.
Before investing in any of the Oppenheimer funds, investors should carefully consider a fund’s investment objectives, risks, charges and expenses. Fund prospectuses and summary prospectuses contain this and other information about the funds, and may be obtained by asking your financial advisor, visiting oppenheimerfunds.com, or calling 1.800.CALL OPP (225.5677). Read prospectuses and summary prospectuses carefully before investing.
Shares of Oppenheimer funds are not deposits or obligations of any bank, are not guaranteed by any bank, are not insured by the FDIC or any other agency, and involve investment risks, including the possible loss of the principal amount invested.
11 OPPENHEIMER GLOBAL ALLOCATION FUND
Fund Expenses
Fund Expenses. As a shareholder of the Fund, you incur two types of costs: (1) transaction costs, which may include sales charges (loads) on purchase payments and/or contingent deferred sales charges on redemptions; and (2) ongoing costs, including management fees; distribution and service fees; and other Fund expenses. These examples are intended to help you understand your ongoing costs (in dollars) of investing in the Fund and to compare these costs with the ongoing costs of investing in other mutual funds.
The examples are based on an investment of $1,000.00 invested at the beginning of the period and held for the entire 6-month period ended April 29, 2016.
Actual Expenses. The first section of the table provides information about actual account values and actual expenses. You may use the information in this section for the class of shares you hold, together with the amount you invested, to estimate the expense that you paid over the period. Simply divide your account value by $1,000.00 (for example, an $8,600.00 account value divided by $1,000.00 = 8.60), then multiply the result by the number in the first section under the heading entitled “Expenses Paid During 6 Months Ended April 29, 2016” to estimate the expenses you paid on your account during this period.
Hypothetical Example for Comparison Purposes. The second section of the table provides information about hypothetical account values and hypothetical expenses based on the Fund’s actual expense ratio for each class of shares, and an assumed rate of return of 5% per year for each class before expenses, which is not the Fund’s actual return. The hypothetical account values and expenses may not be used to estimate the actual ending account balance or expenses you paid for the period. You may use this information to compare the ongoing costs of investing in the Fund and other funds. To do so, compare this 5% hypothetical example for the class of shares you hold with the 5% hypothetical examples that appear in the shareholder reports of the other funds.
Please note that the expenses shown in the table are meant to highlight your ongoing costs only and do not reflect any transactional costs, such as front-end or contingent deferred sales charges (loads). Therefore, the “hypothetical” section of the table is useful in comparing ongoing costs only, and will not help you determine the relative total costs of owning different funds. In addition, if these transactional costs were included, your costs would have been higher.
12 OPPENHEIMER GLOBAL ALLOCATION FUND
| | | | | | | | | | | | |
| Actual | | Beginning
Account Value
November 1, 2015 | | | Ending
Account
Value
April 29, 2016 | | | Expenses
Paid During 6
Months Ended
April 29, 2016 | |
| |
Class A | | $ | 1,000.00 | | | $ | 990.70 | | | $ | 6.37 | |
| |
Class B | | | 1,000.00 | | | | 987.50 | | | | 10.23 | |
| |
Class C | | | 1,000.00 | | | | 987.20 | | | | 10.07 | |
| |
Class I | | | 1,000.00 | | | | 993.50 | | | | 3.95 | |
| |
Class R | | | 1,000.00 | | | | 989.90 | | | | 7.61 | |
| |
Class Y | | | 1,000.00 | | | | 992.00 | | | | 5.09 | |
| | | |
Hypothetical (5% return before expenses) | | | | | | | | | |
| |
Class A | | | 1,000.00 | | | | 1,018.35 | | | | 6.46 | |
| |
Class B | | | 1,000.00 | | | | 1,014.49 | | | | 10.36 | |
| |
Class C | | | 1,000.00 | | | | 1,014.64 | | | | 10.21 | |
| |
Class I | | | 1,000.00 | | | | 1,020.77 | | | | 4.01 | |
| |
Class R | | | 1,000.00 | | | | 1,017.11 | | | | 7.71 | |
| |
Class Y | | | 1,000.00 | | | | 1,019.63 | | | | 5.16 | |
Expenses are equal to the Fund’s annualized expense ratio for that class, multiplied by the average account value over the period, multiplied by 181/366 (to reflect the one-half year period). Those annualized expense ratios, excluding indirect expenses from affiliated funds, based on the 6-month period ended April 29, 2016 are as follows:
| | | | |
| Class | | Expense Ratios | |
| |
Class A | | | 1.29% | |
| |
Class B | | | 2.07 | |
| |
Class C | | | 2.04 | |
| |
Class I | | | 0.80 | |
| |
Class R | | | 1.54 | |
| |
Class Y | | | 1.03 | |
The expense ratios reflect voluntary and/or contractual waivers and/or reimbursements of expenses by the Fund’s Manager. Some of these undertakings may be modified or terminated at any time, as indicated in the Fund’s prospectus. The “Consolidated Financial Highlights” tables in the Fund’s financial statements, included in this report, also show the gross expense ratios, without such waivers or reimbursements and reduction to custodian expenses, if applicable.
13 OPPENHEIMER GLOBAL ALLOCATION FUND
CONSOLIDATED STATEMENT OF INVESTMENTS April 29, 2016* Unaudited
| | | | | | | | |
| | | Shares | | | Value | |
| Common Stocks—61.6% | | | | | | | | |
| Consumer Discretionary—10.7% | | | | | | | | |
| Auto Components—1.0% | | | | | | | | |
| Bridgestone Corp. | | | 77,300 | | | $ | 2,857,132 | |
| Continental AG | | | 15,092 | | | | 3,314,918 | |
| Delphi Automotive plc | | | 12,930 | | | | 952,036 | |
| Denso Corp. | | | 36,600 | | | | 1,371,300 | |
| Johnson Controls, Inc. | | | 34,370 | | | | 1,422,918 | |
| Lear Corp. | | | 4,320 | | | | 497,362 | |
| Valeo SA | | | 26,719 | | | | 4,227,908 | |
| | | | | | | 14,643,574 | |
| | |
| Automobiles—0.5% | | | | | | | | |
| Astra International Tbk PT | | | 1,671,000 | | | | 849,850 | |
| Bayerische Motoren Werke AG | | | 15,174 | | | | 1,397,541 | |
| Ford Motor Co. | | | 48,930 | | | | 663,491 | |
| Hero MotoCorp Ltd. | | | 50,090 | | | | 2,183,334 | |
| Suzuki Motor Corp. | | | 31,300 | | | | 844,530 | |
| Tata Motors Ltd., ADR1 | | | 78,800 | | | | 2,393,944 | |
| | | | | | | 8,332,690 | |
| | |
| Diversified Consumer Services—0.3% | | | | | | | | |
| Dignity plc | | | 44,341 | | | | 1,582,321 | |
| Estacio Participacoes SA | | | 132,700 | | | | 457,992 | |
| Kroton Educacional SA | | | 160,454 | | | | 597,169 | |
| New Oriental Education & Technology Group, Inc., Sponsored ADR | | | 39,330 | | | | 1,540,163 | |
| | | | | | | 4,177,645 | |
| | |
| Hotels, Restaurants & Leisure—1.9% | | | | | | | | |
| Accor SA | | | 43,130 | | | | 1,912,045 | |
| Carnival Corp. | | | 119,830 | | | | 5,877,662 | |
| China Lodging Group Ltd., ADR | | | 13,746 | | | | 495,681 | |
| Crown Resorts Ltd. | | | 103,100 | | | | 924,573 | |
| Domino’s Pizza Group plc | | | 153,220 | | | | 2,059,530 | |
| Genting Bhd | | | 761,000 | | | | 1,720,894 | |
| Genting Malaysia Bhd | | | 453,100 | | | | 518,120 | |
| International Game Technology plc | | | 55,914 | | | | 969,549 | |
| Jollibee Foods Corp. | | | 135,080 | | | | 661,026 | |
| Las Vegas Sands Corp. | | | 18,380 | | | | 829,857 | |
| McDonald’s Corp. | | | 40,670 | | | | 5,144,348 | |
| Melco Crown Entertainment Ltd., ADR | | | 62,880 | | | | 930,624 | |
| Revel Entertainment, Inc.1 | | | 5,092 | | | | — | |
| Sands China Ltd. | | | 345,200 | | | | 1,230,214 | |
| Starbucks Corp. | | | 14,800 | | | | 832,204 | |
| Whitbread plc | | | 31,270 | | | | 1,773,374 | |
| William Hill plc | | | 417,579 | | | | 1,910,380 | |
| Yum! Brands, Inc. | | | 9,450 | | | | 751,842 | |
| | | | | | | 28,541,923 | |
| |
| Household Durables—0.5% | | | | | | | | |
| Lennar Corp., Cl. A | | | 15,540 | | | | 704,118 | |
| SEB SA | | | 21,300 | | | | 2,385,677 | |
14 OPPENHEIMER GLOBAL ALLOCATION FUND
| | | | | | | | |
| | | Shares | | | Value | |
| |
| Household Durables (Continued) | | | | | | | | |
| |
| Sony Corp. | | | 132,800 | | | $ | 3,228,407 | |
| |
| Whirlpool Corp. | | | 6,860 | | | | 1,194,600 | |
| | | | | | | | |
| | | | | | | 7,512,802 | |
|
| |
| Internet & Catalog Retail—0.8% | | | | | | | | |
| |
| Amazon.com, Inc.1 | | | 5,156 | | | | 3,400,846 | |
| |
| Ctrip.com International Ltd., ADR1 | | | 47,680 | | | | 2,079,325 | |
| |
| JD.com, Inc., ADR1 | | | 172,070 | | | | 4,398,109 | |
| |
| Netflix, Inc.1 | | | 1,810 | | | | 162,954 | |
| |
| Rakuten, Inc. | | | 224,600 | | | | 2,436,795 | |
| | | | | | | | |
| | | | | | | 12,478,029 | |
|
| |
| Leisure Products—0.1% | | | | | | | | |
| |
| Hasbro, Inc. | | | 11,640 | | | | 985,210 | |
| |
| Nintendo Co. Ltd. | | | 8,700 | | | | 1,170,298 | |
| | | | | | | | |
| | | | | | | 2,155,508 | |
|
| |
| Media—1.8% | | | | | | | | |
| |
| CBS Corp., Cl. B | | | 20,720 | | | | 1,158,455 | |
| |
| Comcast Corp., Cl. A | | | 104,180 | | | | 6,329,977 | |
| |
| DISH Network Corp., Cl. A1 | | | 13,100 | | | | 645,699 | |
| |
| Grupo Televisa SAB, Sponsored ADR | | | 89,890 | | | | 2,627,485 | |
| |
| ProSiebenSat.1 Media SE | | | 44,846 | | | | 2,286,972 | |
| |
| SES SA, FDR | | | 52,710 | | | | 1,438,674 | |
| |
| SKY Perfect JSAT Holdings, Inc. | | | 225,900 | | | | 1,194,380 | |
| |
| Sky plc | | | 207,270 | | | | 2,848,643 | |
| |
| Walt Disney Co. (The) | | | 53,746 | | | | 5,549,812 | |
| |
| Zee Entertainment Enterprises Ltd. | | | 490,298 | | | | 3,058,909 | |
| | | | | | | | |
| | | | | | | 27,139,006 | |
|
| |
| Multiline Retail—0.4% | | | | | | | | |
| |
| Dollarama, Inc. | | | 55,182 | | | | 3,978,452 | |
| |
| Hudson’s Bay Co. | | | 128,382 | | | | 1,706,712 | |
| |
| Kohl’s Corp. | | | 3,950 | | | | 174,985 | |
| |
| Macy’s, Inc. | | | 7,390 | | | | 292,570 | |
| |
| Nordstrom, Inc. | | | 3,500 | | | | 178,955 | |
| | | | | | | | |
| | | | | | | 6,331,674 | |
|
| |
| Specialty Retail—1.3% | | | | | | | | |
| |
| AutoZone, Inc.1 | | | 2,720 | | | | 2,081,426 | |
| |
| Bed Bath & Beyond, Inc.1 | | | 3,360 | | | | 158,659 | |
| |
| CarMax, Inc.1 | | | 11,650 | | | | 616,868 | |
| |
| Dufry AG1 | | | 12,520 | | | | 1,647,059 | |
| |
| Fast Retailing Co. Ltd. | | | 2,000 | | | | 515,976 | |
| |
| Foot Locker, Inc. | | | 8,250 | | | | 506,880 | |
| |
| Home Depot, Inc. (The) | | | 34,300 | | | | 4,592,427 | |
| |
| Industria de Diseno Textil SA | | | 151,302 | | | | 4,863,035 | |
| |
| O’Reilly Automotive, Inc.1 | | | 2,790 | | | | 732,877 | |
| |
| Tiffany & Co. | | | 28,020 | | | | 1,999,227 | |
| |
| TJX Cos., Inc. (The) | | | 17,406 | | | | 1,319,723 | |
15 OPPENHEIMER GLOBAL ALLOCATION FUND
CONSOLIDATED STATEMENT OF INVESTMENTS Unaudited / Continued
| | | | | | | | |
| | | Shares | | | Value | |
| |
| Specialty Retail (Continued) | | | | | | | | |
| |
| Williams-Sonoma, Inc. | | | 4,190 | | | $ | 246,288 | |
| | | | | | | | |
| | | | | | | 19,280,445 | |
|
| |
| Textiles, Apparel & Luxury Goods—2.1% | | | | | | | | |
| |
| adidas AG | | | 34,041 | | | | 4,389,571 | |
| |
| Brunello Cucinelli SpA | | | 31,293 | | | | 614,758 | |
| |
| Burberry Group plc | | | 208,558 | | | | 3,618,706 | |
| |
| Christian Dior SE | | | 8,160 | | | | 1,430,482 | |
| |
| Cie Financiere Richemont SA | | | 26,203 | | | | 1,744,799 | |
| |
| Coach, Inc. | | | 11,230 | | | | 452,232 | |
| |
| Hermes International | | | 5,041 | | | | 1,792,531 | |
| |
| HUGO BOSS AG | | | 17,138 | | | | 1,092,150 | |
| |
| Kering | | | 28,668 | | | | 4,918,664 | |
| |
| LVMH Moet Hennessy Louis Vuitton SE | | | 40,500 | | | | 6,716,064 | |
| |
| NIKE, Inc., Cl. B | | | 25,386 | | | | 1,496,251 | |
| |
| Prada SpA | | | 444,500 | | | | 1,498,738 | |
| |
| Swatch Group AG (The) | | | 4,263 | | | | 1,457,725 | |
| |
| Tod’s SpA | | | 8,063 | | | | 556,126 | |
| | | | | | | | |
| | | | | | | 31,778,797 | |
|
| |
| Consumer Staples—6.6% | | | | | | | | |
| |
| Beverages—1.5% | | | | | | | | |
| |
| Ambev SA, ADR | | | 16,990 | | | | 94,974 | |
| |
| Anadolu Efes Biracilik Ve Malt Sanayii AS | | | 77,625 | | | | 610,378 | |
| |
| Coca-Cola Co. (The) | | | 25,050 | | | | 1,122,240 | |
| |
| Coca-Cola Enterprises, Inc. | | | 35,320 | | | | 1,853,594 | |
| |
| Constellation Brands, Inc., Cl. A | | | 7,430 | | | | 1,159,526 | |
| |
| Diageo plc | | | 83,535 | | | | 2,257,019 | |
| |
| Dr Pepper Snapple Group, Inc. | | | 5,520 | | | | 501,823 | |
| |
| Fomento Economico Mexicano SAB de CV | | | 96,053 | | | | 895,397 | |
| |
| Heineken NV | | | 31,763 | | | | 2,977,992 | |
| |
| Molson Coors Brewing Co., Cl. B | | | 4,800 | | | | 459,024 | |
| |
| Nigerian Breweries plc | | | 712,630 | | | | 416,203 | |
| |
| PepsiCo, Inc. | | | 53,570 | | | | 5,515,567 | |
| |
| Pernod Ricard SA | | | 38,520 | | | | 4,160,817 | |
| |
| SABMiller plc | | | 16,030 | | | | 980,878 | |
| |
| Tsingtao Brewery Co. Ltd., Cl. H | | | 72,000 | | | | 272,176 | |
| | | | | | | | |
| | | | | | | 23,277,608 | |
|
| |
| Food & Staples Retailing—0.9% | | | | | | | | |
| |
| Alimentation Couche-Tard, Inc., Cl. B | | | 8,145 | | | | 357,037 | |
| |
| Almacenes Exito SA | | | 54,215 | | | | 304,885 | |
| |
| Almacenes Exito SA, GDR2 | | | 38,900 | | | | 218,474 | |
| |
| BIM Birlesik Magazalar AS | | | 32,845 | | | | 723,591 | |
| |
| Costco Wholesale Corp. | | | 4,775 | | | | 707,321 | |
| |
| CP ALL PCL | | | 1,979,000 | | | | 2,584,446 | |
| |
| CVS Health Corp. | | | 9,950 | | | | 999,975 | |
| |
| Kroger Co. (The) | | | 9,870 | | | | 349,299 | |
| |
| Magnit PJSC | | | 20,356 | | | | 2,840,710 | |
| |
| Spar Group Ltd. (The) | | | 120,887 | | | | 1,806,703 | |
| |
| Walgreens Boots Alliance, Inc. | | | 19,070 | | | | 1,511,870 | |
16 OPPENHEIMER GLOBAL ALLOCATION FUND
| | | | | | | | |
| | | Shares | | | Value | |
| |
| Food & Staples Retailing (Continued) | | | | | | | | |
| |
| Wal-Mart de Mexico SAB de CV | | | 153,481 | | | $ | 379,317 | |
| |
| Wal-Mart Stores, Inc. | | | 16,670 | | | | 1,114,723 | |
| | | | | | | | |
| | | | | | | 13,898,351 | |
|
| |
| Food Products—2.4% | | | | | | | | |
| |
| Aryzta AG1 | | | 41,397 | | | | 1,608,719 | |
| |
| Barry Callebaut AG1 | | | 1,540 | | | | 1,805,984 | |
| |
| Danone SA | | | 75,385 | | | | 5,282,398 | |
| |
| Hormel Foods Corp. | | | 10,130 | | | | 390,511 | |
| |
| Kraft Heinz Co. (The) | | | 63,780 | | | | 4,979,304 | |
| |
| Mondelez International, Inc., Cl. A | | | 121,910 | | | | 5,237,254 | |
| |
| Nestle SA | | | 89,562 | | | | 6,668,315 | |
| |
| Saputo, Inc. | | | 80,058 | | | | 2,517,166 | |
| |
| Tingyi Cayman Islands Holding Corp. | | | 492,000 | | | | 575,411 | |
| |
| Unilever plc | | | 123,043 | | | | 5,517,672 | |
| |
| Want Want China Holdings Ltd. | | | 1,066,000 | | | | 817,331 | |
| | | | | | | | |
| | | | | | | 35,400,065 | |
|
| |
| Household Products—0.6% | | | | | | | | |
| |
| Colgate-Palmolive Co. | | | 64,110 | | | | 4,546,681 | |
| |
| Procter & Gamble Co. (The) | | | 21,230 | | | | 1,700,948 | |
| |
| Reckitt Benckiser Group plc | | | 25,176 | | | | 2,444,017 | |
| | | | | | | | |
| | | | | | | 8,691,646 | |
|
| |
| Personal Products—0.1% | | | | | | | | |
| |
| LG Household & Health Care Ltd. | | | 162 | | | | 142,725 | |
| |
| Shiseido Co. Ltd. | | | 79,500 | | | | 1,775,505 | |
| | | | | | | | |
| | | | | | | 1,918,230 | |
|
| |
| Tobacco—1.1% | | | | | | | | |
| |
| Japan Tobacco, Inc. | | | 109,000 | | | | 4,464,799 | |
| |
| KT&G Corp. | | | 27,981 | | | | 3,019,239 | |
| |
| Philip Morris International, Inc. | | | 62,340 | | | | 6,116,801 | |
| |
| Reynolds American, Inc. | | | 2,958 | | | | 146,717 | |
| |
| Swedish Match AB | | | 103,272 | | | | 3,274,492 | |
| | | | | | | | |
| | | | | | | 17,022,048 | |
|
| |
| Energy—2.6% | | | | | | | | |
| |
| Energy Equipment & Services—0.4% | | | | | | | | |
| |
| Halliburton Co. | | | 12,504 | | | | 516,540 | |
| |
| Schlumberger Ltd. | | | 12,117 | | | | 973,480 | |
| |
| Technip SA1 | | | 69,140 | | | | 4,070,447 | |
| | | | | | | | |
| | | | | | | 5,560,467 | |
|
| |
| Oil, Gas & Consumable Fuels—2.2% | | | | | | | | |
| |
| Anadarko Petroleum Corp. | | | 30,078 | | | | 1,586,915 | |
| |
| Apache Corp. | | | 28,430 | | | | 1,546,592 | |
| |
| BP plc, Sponsored ADR | | | 35,794 | | | | 1,201,962 | |
| |
| Chevron Corp. | | | 53,744 | | | | 5,491,562 | |
| |
| CNOOC Ltd. | | | 1,030,000 | | | | 1,276,827 | |
| |
| ConocoPhillips | | | 29,382 | | | | 1,404,166 | |
| |
| Continental Resources, Inc.1 | | | 14,492 | | | | 539,972 | |
17 OPPENHEIMER GLOBAL ALLOCATION FUND
CONSOLIDATED STATEMENT OF INVESTMENTS Unaudited / Continued
| | | | | | | | |
| | | Shares | | | Value | |
| |
| Oil, Gas & Consumable Fuels (Continued) | | | | | | | | |
| |
| Enbridge, Inc. | | | 28,156 | | | $ | 1,169,600 | |
| |
| EOG Resources, Inc. | | | 17,082 | | | | 1,411,315 | |
| |
| HollyFrontier Corp. | | | 28,033 | | | | 997,975 | |
| |
| Koninklijke Vopak NV | | | 41,789 | | | | 2,271,849 | |
| |
| Magellan Midstream Partners LP3 | | | 27,180 | | | | 1,958,863 | |
| |
| Newfield Exploration Co.1 | | | 19,660 | | | | 712,675 | |
| |
| Noble Energy, Inc. | | | 45,996 | | | | 1,660,916 | |
| |
| Novatek OAO, Sponsored GDR | | | 20,900 | | | | 2,021,023 | |
| |
| Phillips 66 | | | 9,793 | | | | 804,103 | |
| |
| Pioneer Natural Resources Co. | | | 2,803 | | | | 465,578 | |
| |
| Repsol SA | | | 83,524 | | | | 1,102,409 | |
| |
| Suncor Energy, Inc. | | | 171,730 | | | | 5,043,710 | |
| |
| Total SA | | | 29,670 | | | | 1,500,361 | |
| | | | | | | | |
| | | | | | | 34,168,373 | |
|
| |
| Financials—9.0% | | | | | | | | |
| |
| Capital Markets—1.4% | | | | | | | | |
| |
| Bank of New York Mellon Corp. (The) | | | 84,910 | | | | 3,416,779 | |
| |
| BlackRock, Inc., Cl. A | | | 3,180 | | | | 1,133,129 | |
| |
| Charles Schwab Corp. (The) | | | 23,320 | | | | 662,521 | |
| |
| Credit Suisse Group AG1 | | | 102,145 | | | | 1,547,617 | |
| |
| Deutsche Bank AG | | | 67,245 | | | | 1,267,810 | |
| |
| Goldman Sachs Group, Inc. (The) | | | 18,730 | | | | 3,073,780 | |
| |
| ICAP plc | | | 347,025 | | | | 2,380,905 | |
| |
| Morgan Stanley | | | 5,070 | | | | 137,194 | |
| |
| Nomura Holdings, Inc. | | | 153,700 | | | | 645,596 | |
| |
| T. Rowe Price Group, Inc. | | | 7,440 | | | | 560,158 | |
| |
| Tullett Prebon plc | | | 113,340 | | | | 561,161 | |
| |
| UBS Group AG | | | 351,563 | | | | 6,070,521 | |
| | | | | | | | |
| | | | | | | 21,457,171 | |
|
| |
| Commercial Banks—2.5% | | | | | | | | |
| |
| Banca Monte dei Paschi di Siena SpA1 | | | 761,297 | | | | 618,536 | |
| |
| Banco Bilbao Vizcaya Argentaria SA | | | 206,396 | | | | 1,421,234 | |
| |
| Bank of America Corp. | | | 199,070 | | | | 2,898,459 | |
| |
| Bank Pekao SA | | | 11,463 | | | | 465,109 | |
| |
| BOC Hong Kong Holdings Ltd. | | | 348,000 | | | | 1,037,126 | |
| |
| Citigroup, Inc. | | | 239,260 | | | | 11,072,953 | |
| |
| Commercial International Bank Egypt SAE | | | 123,370 | | | | 639,081 | |
| |
| Grupo Aval Acciones y Valores SA, ADR | | | 119,110 | | | | 963,600 | |
| |
| Grupo Financiero Banorte SAB de CV | | | 198,884 | | | | 1,130,789 | |
| |
| Grupo Financiero Inbursa SAB de CV | | | 503,803 | | | | 987,421 | |
| |
| ICICI Bank Ltd., Sponsored ADR | | | 461,220 | | | | 3,251,601 | |
| |
| JPMorgan Chase & Co. | | | 60,720 | | | | 3,837,504 | |
| |
| Kotak Mahindra Bank Ltd. | | | 32,676 | | | | 351,669 | |
| |
| Kotak Mahindra Bank Ltd.1 | | | 28,693 | | | | 308,803 | |
| |
| Lloyds Banking Group plc | | | 1,884,840 | | | | 1,854,341 | |
| |
| M&T Bank Corp. | | | 13,950 | | | | 1,650,564 | |
| |
| Sberbank of Russia PJSC, ADR | | | 185,500 | | | | 1,489,249 | |
| |
| Societe Generale SA | | | 37,360 | | | | 1,466,953 | |
18 OPPENHEIMER GLOBAL ALLOCATION FUND
| | | | | | | | |
| | | Shares | | | Value | |
| |
| Commercial Banks (Continued) | | | | | | | | |
| |
| Sumitomo Mitsui Financial Group, Inc. | | | 52,700 | | | $ | 1,584,170 | |
| |
| SunTrust Banks, Inc. | | | 29,770 | | | | 1,242,600 | |
| |
| Zenith Bank plc | | | 4,422,114 | | | | 282,435 | |
| | | | | | | | |
| | | | | | | 38,554,197 | |
|
| |
| Consumer Finance—0.5% | | | | | | | | |
| |
| Ally Financial, Inc.1 | | | 168,740 | | | | 3,005,260 | |
| |
| Discover Financial Services | | | 42,890 | | | | 2,413,420 | |
| |
| Synchrony Financial1 | | | 61,660 | | | | 1,884,946 | |
| | | | | | | | |
| | | | | | | 7,303,626 | |
|
| |
| Diversified Financial Services—1.6% | | | | | | | | |
| |
| Berkshire Hathaway, Inc., Cl. B1 | | | 35,210 | | | | 5,122,351 | |
| |
| BM&FBovespa SA-Bolsa de Valores Mercadorias e Futuros | | | 293,100 | | | | 1,464,115 | |
| |
| CME Group, Inc., Cl. A | | | 58,980 | | | | 5,420,852 | |
| |
| Grupo de Inversiones Suramericana SA | | | 61,197 | | | | 827,076 | |
| |
| Hong Kong Exchanges & Clearing Ltd. | | | 49,487 | | | | 1,247,915 | |
| |
| ING Groep NV | | | 142,008 | | | | 1,741,516 | |
| |
| Intercontinental Exchange, Inc. | | | 1,140 | | | | 273,634 | |
| |
| Investment AB Kinnevik, Cl. B | | | 26,229 | | | | 753,206 | |
| |
| S&P Global, Inc. | | | 72,130 | | | | 7,707,090 | |
| | | | | | | | |
| | | | | | | 24,557,755 | |
|
| |
| Insurance—1.7% | | | | | | | | |
| |
| AIA Group Ltd. | | | 388,400 | | | | 2,318,739 | |
| |
| Allianz SE | | �� | 19,017 | | | | 3,225,358 | |
| |
| American International Group, Inc. | | | 45,410 | | | | 2,534,786 | |
| |
| Aon plc | | | 11,970 | | | | 1,258,287 | |
| |
| China Pacific Insurance Group Co. Ltd., Cl. H | | | 251,600 | | | | 882,861 | |
| |
| Dai-ichi Life Insurance Co. Ltd. (The) | | | 155,800 | | | | 1,855,787 | |
| |
| FNF Group | | | 40,880 | | | | 1,304,072 | |
| |
| Marsh & McLennan Cos., Inc. | | | 29,020 | | | | 1,832,613 | |
| |
| Old Mutual plc | | | 486,874 | | | | 1,324,967 | |
| |
| PICC Property & Casualty Co. Ltd., Cl. H | | | 146,000 | | | | 262,915 | |
| |
| Ping An Insurance Group Co. of China Ltd., Cl. H | | | 338,500 | | | | 1,575,802 | |
| |
| Progressive Corp. (The) | | | 61,430 | | | | 2,002,618 | |
| |
| Prudential plc | | | 230,459 | | | | 4,559,050 | |
| |
| Sul America SA | | | 94,960 | | | | 462,479 | |
| | | | | | | | |
| | | | | | | 25,400,334 | |
|
| |
| Real Estate Investment Trusts (REITs)—0.4% | | | | | | | | |
| |
| Crown Castle International Corp. | | | 4,790 | | | | 416,155 | |
| |
| Digital Realty Trust, Inc. | | | 5,710 | | | | 502,366 | |
| |
| Equity Residential | | | 10,740 | | | | 731,072 | |
| |
| Public Storage | | | 3,520 | | | | 861,731 | |
| |
| Simon Property Group, Inc. | | | 15,000 | | | | 3,017,550 | |
| | | | | | | | |
| | | | | | | 5,528,874 | |
|
| |
| Real Estate Management & Development—0.6% | | | | | | | | |
| |
| Deutsche Wohnen AG | | | 28,040 | | | | 858,365 | |
| |
| DLF Ltd. | | | 1,311,407 | | | | 2,554,141 | |
| |
| Global Logistic Properties Ltd. | | | 386,000 | | | | 548,276 | |
19 OPPENHEIMER GLOBAL ALLOCATION FUND
CONSOLIDATED STATEMENT OF INVESTMENTS Unaudited / Continued
| | | | | | | | |
| | | Shares | | | Value | |
| |
| Real Estate Management & Development (Continued) | | | | | | | | |
| |
| Hang Lung Group Ltd. | | | 136,500 | | | $ | 419,288 | |
| |
| Hang Lung Properties Ltd. | | | 114,600 | | | | 227,229 | |
| |
| SM Prime Holdings, Inc. | | | 2,091,103 | | | | 1,006,546 | |
| |
| SOHO China Ltd. | | | 671,000 | | | | 338,030 | |
| |
| Vonovia SE | | | 86,854 | | | | 2,923,632 | |
| |
| Wallace Theater Holdings, Inc.1,2 | | | 430 | | | | 4 | |
| | | | | | | | |
| | | | | | | 8,875,511 | |
|
| |
| Thrifts & Mortgage Finance—0.3% | | | | | | | | |
| |
| Housing Development Finance Corp. Ltd. | | | 239,224 | | | | 3,918,746 | |
|
| |
| Health Care—6.8% | | | | | | | | |
| |
| Biotechnology—1.4% | | | | | | | | |
| |
| ACADIA Pharmaceuticals, Inc.1 | | | 42,380 | | | | 1,368,874 | |
| |
| Amgen, Inc. | | | 4,150 | | | | 656,945 | |
| |
| Biogen, Inc.1 | | | 16,480 | | | | 4,531,835 | |
| |
| BioMarin Pharmaceutical, Inc.1 | | | 14,440 | | | | 1,222,779 | |
| |
| Bluebird Bio, Inc.1 | | | 13,100 | | | | 580,985 | |
| |
| Celgene Corp.1 | | | 7,776 | | | | 804,116 | |
| |
| Celldex Therapeutics, Inc.1 | | | 89,290 | | | | 357,160 | |
| |
| Circassia Pharmaceuticals plc1 | | | 314,724 | | | | 1,241,833 | |
| |
| CSL Ltd. | | | 30,900 | | | | 2,465,508 | |
| |
| Gilead Sciences, Inc. | | | 34,800 | | | | 3,069,708 | |
| |
| Grifols SA | | | 103,752 | | | | 2,260,134 | |
| |
| Ionis Pharmaceuticals, Inc.1 | | | 14,260 | | | | 584,232 | |
| |
| MacroGenics, Inc.1 | | | 28,810 | | | | 592,334 | |
| |
| Regeneron Pharmaceuticals, Inc.1 | | | 1,090 | | | | 410,614 | |
| |
| Sage Therapeutics, Inc.1 | | | 6,020 | | | | 226,894 | |
| |
| Vertex Pharmaceuticals, Inc.1 | | | 13,485 | | | | 1,137,325 | |
| | | | | | | | |
| | | | | | | 21,511,276 | |
|
| |
| Health Care Equipment & Supplies—1.0% | | | | | | | | |
| |
| Boston Scientific Corp.1 | | | 113,020 | | | | 2,477,398 | |
| |
| Coloplast AS, Cl. B | | | 25,293 | | | | 1,897,825 | |
| |
| Essilor International SA | | | 14,220 | | | | 1,841,754 | |
| |
| Medtronic plc | | | 5,000 | | | | 395,750 | |
| |
| Sonova Holding AG | | | 13,622 | | | | 1,821,491 | |
| |
| St. Jude Medical, Inc. | | | 18,990 | | | | 1,447,038 | |
| |
| William Demant Holding AS1 | | | 15,104 | | | | 1,553,222 | |
| |
| Zimmer Biomet Holdings, Inc. | | | 28,170 | | | | 3,261,241 | |
| | | | | | | | |
| | | | | | | 14,695,719 | |
|
| |
| Health Care Providers & Services—1.6% | | | | | | | | |
| |
| Aetna, Inc. | | | 41,830 | | | | 4,696,254 | |
| |
| Anthem, Inc. | | | 21,960 | | | | 3,091,309 | |
| |
| Apollo Hospitals Enterprise Ltd. | | | 38,464 | | | | 756,373 | |
| |
| Cardinal Health, Inc. | | | 9,320 | | | | 731,247 | |
| |
| Cigna Corp. | | | 3,320 | | | | 459,953 | |
| |
| Express Scripts Holding Co.1 | | | 53,300 | | | | 3,929,809 | |
| |
| HCA Holdings, Inc.1 | | | 3,610 | | | | 291,038 | |
| |
| Humana, Inc. | | | 950 | | | | 168,217 | |
20 OPPENHEIMER GLOBAL ALLOCATION FUND
| | | | | | | | |
| | | Shares | | | Value | |
| |
| Health Care Providers & Services (Continued) | | | | | | | | |
| |
| McKesson Corp. | | | 9,520 | | | $ | 1,597,646 | |
| |
| Sinopharm Group Co. Ltd., Cl. H | | | 386,600 | | | | 1,640,754 | |
| |
| Sonic Healthcare Ltd. | | | 80,122 | | | | 1,174,959 | |
| |
| UnitedHealth Group, Inc. | | | 48,540 | | | | 6,391,747 | |
| | | | | | | | |
| | | | | | | 24,929,306 | |
|
| |
| Health Care Technology—0.1% | | | | | | | | |
| |
| Cerner Corp.1 | | | 14,130 | | | | 793,258 | |
|
| |
| Life Sciences Tools & Services—0.2% | | | | | | | | |
| |
| Agilent Technologies, Inc. | | | 19,020 | | | | 778,299 | |
| |
| Lonza Group AG1 | | | 11,196 | | | | 1,863,958 | |
| |
| Thermo Fisher Scientific, Inc. | | | 4,600 | | | | 663,550 | |
| | | | | | | | |
| | | | | | | 3,305,807 | |
|
| |
| Pharmaceuticals—2.5% | | | | | | | | |
| |
| Allergan plc1 | | | 14,710 | | | | 3,185,598 | |
| |
| Bayer AG | | | 21,647 | | | | 2,497,957 | |
| |
| Bristol-Myers Squibb Co. | | | 72,891 | | | | 5,261,272 | |
| |
| Dr. Reddy’s Laboratories Ltd. | | | 25,099 | | | | 1,158,383 | |
| |
| Eli Lilly & Co. | | | 12,470 | | | | 941,859 | |
| |
| Galenica AG | | | 1,323 | | | | 1,935,016 | |
| |
| Glenmark Pharmaceuticals Ltd. | | | 26,011 | | | | 323,949 | |
| |
| Johnson & Johnson | | | 42,980 | | | | 4,817,198 | |
| |
| Merck & Co., Inc. | | | 53,770 | | | | 2,948,747 | |
| |
| Mylan NV1 | | | 29,110 | | | | 1,214,178 | |
| |
| Novo Nordisk AS, Cl. B | | | 42,434 | | | | 2,371,277 | |
| |
| Pfizer, Inc. | | | 81,670 | | | | 2,671,426 | |
| |
| Roche Holding AG | | | 16,065 | | | | 4,063,537 | |
| |
| Shire plc | | | 17,300 | | | | 1,080,063 | |
| |
| Sun Pharmaceutical Industries Ltd. | | | 53,207 | | | | 649,638 | |
| |
| Teva Pharmaceutical Industries Ltd., Sponsored ADR | | | 37,040 | | | | 2,016,828 | |
| |
| Theravance Biopharma, Inc.1 | | | 10,912 | | | | 226,424 | |
| | | | | | | | |
| | | | | | | 37,363,350 | |
|
| |
| Industrials—8.6% | | | | | | | | |
| |
| Aerospace & Defense—1.4% | | | | | | | | |
| |
| Airbus Group SE | | | 152,930 | | | | 9,569,989 | |
| |
| Embraer SA | | | 136,000 | | | | 813,410 | |
| |
| Embraer SA, Sponsored ADR | | | 81,130 | | | | 1,874,103 | |
| |
| Lockheed Martin Corp. | | | 13,620 | | | | 3,165,016 | |
| |
| Rolls-Royce Holdings plc1 | | | 276,532 | | | | 2,715,442 | |
| |
| United Technologies Corp. | | | 22,720 | | | | 2,371,286 | |
| | | | | | | | |
| | | | | | | 20,509,246 | |
|
| |
| Air Freight & Couriers—0.5% | | | | | | | | |
| |
| FedEx Corp. | | | 3,620 | | | | 597,698 | |
| |
| Royal Mail plc | | | 638,170 | | | | 4,551,985 | |
| |
| United Parcel Service, Inc., Cl. B | | | 24,570 | | | | 2,581,570 | |
| |
| XPO Logistics, Inc.1 | | | 10,340 | | | | 311,648 | |
| | | | | | | | |
| | | | | | | 8,042,901 | |
21 OPPENHEIMER GLOBAL ALLOCATION FUND
CONSOLIDATED STATEMENT OF INVESTMENTS Unaudited / Continued
| | | | | | | | |
| | | Shares | | | Value | |
| |
| Airlines—0.2% | | | | | | | | |
| |
| Delta Air Lines, Inc. | | | 12,640 | | | $ | 526,709 | |
| |
| Japan Airlines Co. Ltd. | | | 77,000 | | | | 2,785,707 | |
| | | | | | | | |
| | | | | | | 3,312,416 | |
|
| |
| Building Products—0.3% | | | | | | | | |
| |
| A.O. Smith Corp. | | | 4,720 | | | | 364,478 | |
| |
| Allegion plc | | | 6,390 | | | | 418,226 | |
| |
| Assa Abloy AB, Cl. B | | | 146,434 | | | | 3,068,586 | |
| | | | | | | | |
| | | | | | | 3,851,290 | |
|
| |
| Commercial Services & Supplies—0.7% | | | | | | | | |
| |
| Aggreko plc | | | 70,669 | | | | 1,125,991 | |
| |
| Cintas Corp. | | | 800 | | | | 71,824 | |
| |
| Edenred | | | 83,084 | | | | 1,635,773 | |
| |
| Prosegur Cia de Seguridad SA | | | 362,147 | | | | 2,098,677 | |
| |
| Republic Services, Inc., Cl. A | | | 15,600 | | | | 734,292 | |
| |
| Tyco International plc | | | 64,250 | | | | 2,474,910 | |
| |
| Waste Connections, Inc. | | | 25,682 | | | | 1,727,885 | |
| |
| Waste Management, Inc. | | | 8,570 | | | | 503,830 | |
| | | | | | | | |
| | | | | | | 10,373,182 | |
|
| |
| Construction & Engineering—0.5% | | | | | | | | |
| |
| Boskalis Westminster | | | 56,641 | | | | 2,362,277 | |
| |
| CIMIC Group Ltd. | | | 58,100 | | | | 1,574,440 | |
| |
| FLSmidth & Co. AS | | | 14,499 | | | | 563,591 | |
| |
| Vinci SA | | | 38,380 | | | | 2,870,888 | |
| | | | | | | | |
| | | | | | | 7,371,196 | |
|
| |
| Electrical Equipment—1.0% | | | | | | | | |
| |
| ABB Ltd.1 | | | 42,855 | | | | 906,660 | |
| |
| Acuity Brands, Inc. | | | 2,240 | | | | 546,314 | |
| |
| Eaton Corp. plc | | | 29,030 | | | | 1,836,728 | |
| |
| Emerson Electric Co. | | | 26,010 | | | | 1,420,926 | |
| |
| Legrand SA | | | 32,600 | | | | 1,857,855 | |
| |
| Nidec Corp. | | | 72,900 | | | | 5,272,017 | |
| |
| Prysmian SpA | | | 35,255 | | | | 832,683 | |
| |
| Rockwell Automation, Inc. | | | 3,940 | | | | 447,072 | |
| |
| Schneider Electric SE1 | | | 24,620 | | | | 1,603,792 | |
| | | | | | | | |
| | | | | | | 14,724,047 | |
|
| |
| Industrial Conglomerates—1.1% | | | | | | | | |
| |
| 3M Co. | | | 17,200 | | | | 2,878,936 | |
| |
| Danaher Corp. | | | 28,994 | | | | 2,805,169 | |
| |
| General Electric Co. | | | 233,210 | | | | 7,171,208 | |
| |
| Jardine Strategic Holdings Ltd. | | | 41,072 | | | | 1,187,682 | |
| |
| Siemens AG | | | 9,343 | | | | 975,115 | |
| |
| SM Investments Corp. | | | 59,663 | | | | 1,198,096 | |
| | | | | | | | |
| | | | | | | 16,216,206 | |
|
| |
| Machinery—0.9% | | | | | | | | |
| |
| Aalberts Industries NV | | | 75,645 | | | | 2,592,860 | |
| |
| Atlas Copco AB, Cl. A | | | 78,827 | | | | 2,038,015 | |
22 OPPENHEIMER GLOBAL ALLOCATION FUND
| | | | | | | | |
| | | Shares | | | Value | |
| |
| Machinery (Continued) | | | | | | | | |
| |
| Caterpillar, Inc. | | | 7,370 | | | $ | 572,796 | |
| |
| Colfax Corp.1 | | | 4,760 | | | | 154,367 | |
| |
| Cummins, Inc. | | | 3,920 | | | | 458,758 | |
| |
| Deere & Co. | | | 22,080 | | | | 1,857,149 | |
| |
| FANUC Corp. | | | 7,400 | | | | 1,085,618 | |
| |
| Ingersoll-Rand plc | | | 10,300 | | | | 675,062 | |
| |
| NGK Insulators Ltd. | | | 46,000 | | | | 937,775 | |
| |
| Parker-Hannifin Corp. | | | 9,260 | | | | 1,074,345 | |
| |
| Stanley Black & Decker, Inc. | | | 3,800 | | | | 425,296 | |
| |
| WABCO Holdings, Inc.1 | | | 4,800 | | | | 538,368 | |
| |
| Wabtec Corp. | | | 7,150 | | | | 592,949 | |
| |
| Weir Group plc (The) | | | 35,491 | | | | 625,238 | |
| | | | | | | | |
| | | | | | | 13,628,596 | |
|
| |
| Professional Services—0.9% | | | | | | | | |
| |
| Experian plc | | | 160,156 | | | | 2,935,320 | |
| |
| Intertek Group plc | | | 52,990 | | | | 2,526,915 | |
| |
| Nielsen Holdings plc | | | 82,530 | | | | 4,303,114 | |
| |
| Recruit Holdings Co. Ltd. | | | 69,400 | | | | 2,147,586 | |
| |
| SGS SA | | | 666 | | | | 1,466,536 | |
| | | | | | | | |
| | | | | | | 13,379,471 | |
|
| |
| Road & Rail—0.3% | | | | | | | | |
| |
| Canadian National Railway Co. | | | 24,840 | | | | 1,529,150 | |
| |
| Canadian Pacific Railway Ltd. | | | 17,990 | | | | 2,595,058 | |
| |
| CSX Corp. | | | 18,120 | | | | 494,132 | |
| |
| J.B. Hunt Transport Services, Inc. | | | 5,740 | | | | 475,731 | |
| | | | | | | | |
| | | | | | | 5,094,071 | |
|
| |
| Trading Companies & Distributors—0.7% | | | | | | | | |
| |
| Brenntag AG | | | 72,507 | | | | 4,257,159 | |
| |
| Bunzl plc | | | 94,730 | | | | 2,827,828 | |
| |
| Travis Perkins plc | | | 76,449 | | | | 2,069,024 | |
| |
| Wolseley plc | | | 37,487 | | | | 2,098,970 | |
| | | | | | | | |
| | | | | | | 11,252,981 | |
|
| |
| Transportation Infrastructure—0.1% | | | | | | | | |
| |
| Airports of Thailand PCL | | | 23,700 | | | | 265,267 | |
| |
| DP World Ltd. | | | 74,172 | | | | 1,395,526 | |
| |
| Grupo Aeroportuario del Sureste SAB de CV, Cl. B1 | | | 29,512 | | | | 454,499 | |
| | | | | | | | |
| | | | | | | 2,115,292 | |
|
| |
| Information Technology—11.9% | | | | | | | | |
| |
| Communications Equipment—0.5% | | | | | | | | |
| |
| Nokia OYJ | | | 345,970 | | | | 2,037,248 | |
| |
| Nokia OYJ, Sponsored ADR | | | 211,037 | | | | 1,238,787 | |
| |
| Telefonaktiebolaget LM Ericsson, Cl. B | | | 541,948 | | | | 4,383,586 | |
| | | | | | | | |
| | | | | | | 7,659,621 | |
|
| |
| Electronic Equipment, Instruments, & Components—1.2% | | | | | | | | |
| |
| Hoya Corp. | | | 55,000 | | | | 2,093,991 | |
| |
| Keyence Corp. | | | 9,350 | | | | 5,568,494 | |
23 OPPENHEIMER GLOBAL ALLOCATION FUND
CONSOLIDATED STATEMENT OF INVESTMENTS Unaudited / Continued
| | | | | | | | |
| | | Shares | | | Value | |
| |
| Electronic Equipment, Instruments, & Components (Continued) | | | | | | | | |
| |
| Kyocera Corp. | | | 44,200 | | | $ | 2,165,839 | |
| |
| Murata Manufacturing Co. Ltd. | | | 39,400 | | | | 5,094,999 | |
| |
| Spectris plc | | | 40,746 | | | | 1,087,972 | |
| |
| TDK Corp. | | | 11,600 | | | | 673,118 | |
| |
| TE Connectivity Ltd. | | | 19,620 | | | | 1,166,998 | |
| | | | | | | | |
| | | | | | | 17,851,411 | |
|
| |
| Internet Software & Services—3.9% | | | | | | | | |
| |
| Alibaba Group Holding Ltd., Sponsored ADR1 | | | 61,529 | | | | 4,734,041 | |
| |
| Alphabet, Inc., Cl. A1 | | | 15,039 | | | | 10,645,807 | |
| |
| Alphabet, Inc., Cl. C1 | | | 18,832 | | | | 13,050,764 | |
| |
| Baidu, Inc., Sponsored ADR1 | | | 36,630 | | | | 7,117,209 | |
| |
| eBay, Inc.1 | | | 125,390 | | | | 3,063,278 | |
| |
| Facebook, Inc., Cl. A1 | | | 70,070 | | | | 8,238,831 | |
| |
| LinkedIn Corp., Cl. A1 | | | 12,750 | | | | 1,597,702 | |
| |
| NAVER Corp. | | | 1,946 | | | | 1,153,531 | |
| |
| Tencent Holdings Ltd. | | | 217,285 | | | | 4,409,218 | |
| |
| Twitter, Inc.1 | | | 70,030 | | | | 1,023,839 | |
| |
| United Internet AG | | | 33,522 | | | | 1,635,061 | |
| |
| Yahoo Japan Corp. | | | 428,400 | | | | 1,914,321 | |
| | | | | | | | |
| | | | | | | 58,583,602 | |
|
| |
| IT Services—1.7% | | | | | | | | |
| |
| Amadeus IT Holding SA, Cl. A | | | 59,508 | | | | 2,713,534 | |
| |
| Amdocs Ltd. | | | 60,080 | | | | 3,396,923 | |
| |
| Cognizant Technology Solutions Corp., Cl. A1 | | | 4,220 | | | | 246,321 | |
| |
| Earthport plc1 | | | 814,414 | | | | 203,452 | |
| |
| First Data Corp., Cl. A1 | | | 97,140 | | | | 1,106,425 | |
| |
| Infosys Ltd. | | | 157,757 | | | | 2,861,573 | |
| |
| MasterCard, Inc., Cl. A | | | 23,710 | | | | 2,299,633 | |
| |
| NTT Data Corp. | | | 16,400 | | | | 852,491 | |
| |
| PayPal Holdings, Inc.1 | | | 226,860 | | | | 8,888,375 | |
| |
| Tata Consultancy Services Ltd. | | | 28,745 | | | | 1,097,491 | |
| |
| Visa, Inc., Cl. A | | | 12,122 | | | | 936,303 | |
| |
| Xerox Corp. | | | 164,380 | | | | 1,578,048 | |
| | | | | | | | |
| | | | | | | 26,180,569 | |
|
| |
| Semiconductors & Semiconductor Equipment—1.5% | | | | | | | | |
| |
| Applied Materials, Inc. | | | 55,170 | | | | 1,129,330 | |
| |
| ARM Holdings plc | | | 106,700 | | | | 1,465,306 | |
| |
| ASML Holding NV1 | | | 18,324 | | | | 1,771,706 | |
| |
| Broadcom Ltd. | | | 22,547 | | | | 3,286,225 | |
| |
| Infineon Technologies AG | | | 347,241 | | | | 4,937,176 | |
| |
| Maxim Integrated Products, Inc. | | | 96,340 | | | | 3,441,265 | |
| |
| Microchip Technology, Inc. | | | 13,750 | | | | 668,113 | |
| |
| Micron Technology, Inc.1 | | | 39,476 | | | | 424,367 | |
| |
| NVIDIA Corp. | | | 29,040 | | | | 1,031,791 | |
| |
| NXP Semiconductors NV1 | | | 5,580 | | | | 475,862 | |
| |
| Taiwan Semiconductor Manufacturing Co. Ltd. | | | 645,000 | | | | 2,955,385 | |
24 OPPENHEIMER GLOBAL ALLOCATION FUND
| | | | | | | | |
| | | Shares | | | Value | |
| |
| Semiconductors & Semiconductor Equipment (Continued) | | | | | | | | |
| |
| Texas Instruments, Inc. | | | 26,820 | | | $ | 1,529,813 | |
| | | | | | | | |
| | | | | | | 23,116,339 | |
|
| |
| Software—2.2% | | | | | | | | |
| |
| Activision Blizzard, Inc. | | | 63,700 | | | | 2,195,739 | |
| |
| Adobe Systems, Inc.1 | | | 28,640 | | | | 2,698,461 | |
| |
| AVEVA Group plc | | | 28,130 | | | | 663,589 | |
| |
| Check Point Software Technologies Ltd.1 | | | 5,700 | | | | 472,359 | |
| |
| Dassault Systemes | | | 27,815 | | | | 2,176,478 | |
| |
| Electronic Arts, Inc.1 | | | 29,620 | | | | 1,831,997 | |
| |
| Gemalto NV | | | 24,807 | | | | 1,614,243 | |
| |
| Intuit, Inc. | | | 35,480 | | | | 3,579,577 | |
| |
| Microsoft Corp. | | | 37,480 | | | | 1,869,128 | |
| |
| Oracle Corp. | | | 60,980 | | | | 2,430,663 | |
| |
| SAP SE | | | 127,207 | | | | 9,950,375 | |
| |
| Synopsys, Inc.1 | | | 21,660 | | | | 1,029,283 | |
| |
| Temenos Group AG1 | | | 45,481 | | | | 2,355,878 | |
| | | | | | | | |
| | | | | | | 32,867,770 | |
|
| |
| Technology Hardware, Storage & Peripherals—0.9% | | | | | | | | |
| |
| Apple, Inc. | | | 122,171 | | | | 11,452,310 | |
| |
| Lenovo Group Ltd. | | | 1,692,000 | | | | 1,327,821 | |
| |
| Western Digital Corp. | | | 41,990 | | | | 1,715,921 | |
| | | | | | | | |
| | | | | | | 14,496,052 | |
|
| |
| Materials—2.4% | | | | | | | | |
| |
| Chemicals—1.3% | | | | | | | | |
| |
| Akzo Nobel NV | | | 32,644 | | | | 2,316,531 | |
| |
| Albemarle Corp. | | | 12,880 | | | | 852,141 | |
| |
| Asian Paints Ltd. | | | 15,950 | | | | 208,310 | |
| |
| Eastman Chemical Co. | | | 16,070 | | | | 1,227,426 | |
| |
| Essentra plc | | | 177,222 | | | | 2,109,203 | |
| |
| Linde AG | | | 26,346 | | | | 4,026,017 | |
| |
| Mosaic Co. (The) | | | 5,320 | | | | 148,907 | |
| |
| Novozymes AS, Cl. B | | | 44,850 | | | | 2,150,728 | |
| |
| PPG Industries, Inc. | | | 12,500 | | | | 1,379,875 | |
| |
| Sherwin-Williams Co. (The) | | | 2,100 | | | | 603,351 | |
| |
| Sika AG | | | 483 | | | | 2,056,842 | |
| |
| Syngenta AG | | | 7,503 | | | | 3,024,441 | |
| | | | | | | | |
| | | | | | | 20,103,772 | |
|
| |
| Construction Materials—0.4% | | | | | | | | |
| |
| Indocement Tunggal Prakarsa Tbk PT | | | 360,500 | | | | 537,406 | |
| |
| James Hardie Industries plc | | | 161,400 | | | | 2,271,057 | |
| |
| Semen Indonesia Persero Tbk PT1 | | | 462,500 | | | | 346,378 | |
| |
| UltraTech Cement Ltd. | | | 13,428 | | | | 637,200 | |
| |
| Vulcan Materials Co. | | | 24,840 | | | | 2,673,529 | |
| | | | | | | | |
| | | | | | | 6,465,570 | |
|
| |
| Containers & Packaging—0.1% | | | | | | | | |
| |
| CCL Industries, Inc., Cl. B | | | 6,109 | | | | 1,118,628 | |
25 OPPENHEIMER GLOBAL ALLOCATION FUND
CONSOLIDATED STATEMENT OF INVESTMENTS Unaudited / Continued
| | | | | | | | |
| | | Shares | | | Value | |
| Metals & Mining—0.5% | | | | | | | | |
| |
| Agnico Eagle Mines Ltd. | | | 30,450 | | | $ | 1,437,544 | |
| |
| Alrosa PAO | | | 742,015 | | | | 850,158 | |
| |
| Glencore plc1 | | | 255,570 | | | | 614,853 | |
| |
| Goldcorp, Inc. | | | 94,430 | | | | 1,902,764 | |
| |
| Newcrest Mining Ltd.1 | | | 87,300 | | | | 1,279,773 | |
| |
| Newmont Mining Corp. | | | 4,480 | | | | 156,666 | |
| |
| Real Gold Mining Ltd.1 | | | 273,000 | | | | 352 | |
| |
| Silver Wheaton Corp. | | | 84,600 | | | | 1,772,370 | |
| | | | | | | | |
| | | | | | | 8,014,480 | |
|
| |
| Paper & Forest Products—0.1% | | | | | | | | |
| |
| Louisiana-Pacific Corp.1 | | | 49,920 | | | | 848,640 | |
|
| |
| Telecommunication Services—2.5% | | | | | | | | |
| |
| Diversified Telecommunication Services—1.5% | | | | | | | | |
| |
| BT Group plc | | | 376,361 | | | | 2,445,402 | |
| |
| Iliad SA | | | 8,520 | | | | 1,858,976 | |
| |
| Inmarsat plc | | | 101,710 | | | | 1,379,994 | |
| |
| Koninklijke KPN NV | | | 273,234 | | | | 1,075,154 | |
| |
| Nippon Telegraph & Telephone Corp. | | | 113,100 | | | | 5,006,713 | |
| |
| Spark New Zealand Ltd. | | | 665,878 | | | | 1,722,754 | |
| |
| Telesites SAB de CV1 | | | 55,202 | | | | 34,011 | |
| |
| Telstra Corp. Ltd. | | | 230,335 | | | | 938,032 | |
| |
| Verizon Communications, Inc. | | | 96,840 | | | | 4,933,030 | |
| |
| Vivendi SA | | | 166,930 | | | | 3,198,652 | |
| | | | | | | | |
| | | | | | | 22,592,718 | |
|
| |
| Wireless Telecommunication Services—1.0% | | | | | | | | |
| |
| America Movil SAB de CV, ADR | | | 34,510 | | | | 488,662 | |
| |
| China Mobile Ltd. | | | 113,500 | | | | 1,290,993 | |
| |
| KDDI Corp. | | | 139,500 | | | | 3,967,993 | |
| |
| Rogers Communications, Inc., Cl. B | | | 61,755 | | | | 2,401,884 | |
| |
| SK Telecom Co. Ltd. | | | 3,665 | | | | 664,263 | |
| |
| T-Mobile US, Inc.1 | | | 16,160 | | | | 634,765 | |
| |
| Vodafone Group plc | | | 1,643,030 | | | | 5,313,388 | |
| | | | | | | | |
| | | | | | | 14,761,948 | |
|
| |
| Utilities—0.5% | | | | | | | | |
| |
| Electric Utilities—0.4% | | | | | | | | |
| |
| Edison International | | | 31,720 | | | | 2,242,921 | |
| |
| NextEra Energy, Inc. | | | 2,101 | | | | 247,035 | |
| |
| OGE Energy Corp. | | | 21,940 | | | | 649,205 | |
| |
| PG&E Corp. | | | 58,540 | | | | 3,407,028 | |
| | | | | | | | |
| | | | | | | 6,546,189 | |
|
| |
| Gas Utilities—0.1% | | | | | | | | |
| |
| AmeriGas Partners LP3 | | | 25,210 | | | | 1,092,854 | |
| | | | | | | | |
| Total Common Stocks (Cost $900,390,590) | | | | | | | 932,674,869 | |
|
| |
| Preferred Stocks—0.4% | | | | | | | | |
| |
| Banco Davivienda SA, Preference | | | 44,678 | | | | 420,951 | |
| |
| Bayerische Motoren Werke (BMW) AG, Preference | | | 40,659 | | | | 3,230,304 | |
26 OPPENHEIMER GLOBAL ALLOCATION FUND
| | | | | | | | |
| | | Shares | | | Value | |
| Preferred Stocks (Continued) | | | | | | | | |
| |
| Lojas Americanas SA, Preference | | | 405,614 | | | $ | 1,890,526 | |
| |
| Zee Entertainment Enterprises Ltd., 6% Cum. | | | 1,175,581 | | | | 154,724 | |
| | | | | | | | |
| Total Preferred Stocks (Cost $4,920,199) | | | | | | | 5,696,505 | |
| | |
| | | Units | | | | |
| |
| Rights, Warrants and Certificates—0.0% | | | | | | | | |
| |
| Genting Bhd Wts., Strike Price 7.96MYR, Exp. 12/18/181 (Cost $77,776) | | | 123,800 | | | | 52,290 | |
| | |
| | | Principal Amount | | | | |
| |
| U.S. Government Obligations—14.4% | | | | | | | | |
| |
| United States Treasury Bonds, 2.875%, 8/15/454 | | $ | 74,680,000 | | | | 77,891,837 | |
| |
| United States Treasury Nts.: | | | | | | | | |
| 1.125%, 2/28/214,5 | | | 23,375,000 | | | | 23,222,525 | |
| 1.625%, 2/15/26 | | | 118,600,000 | | | | 116,473,502 | |
| | | | | | | | |
| Total U.S. Government Obligations (Cost $215,120,388) | | | | | | | 217,587,864 | |
|
| |
| Non-Convertible Corporate Bonds and Notes—0.0% | | | | | | | | |
| |
| FGI Operating Co. LLC/FGI Finance, Inc., 7.875% Sec. Nts., 5/1/20 | | | 440,000 | | | | 261,800 | |
| |
| Omnicare, Inc., 4.75% Sr. Unsec. Nts., 12/1/22 | | | 210,000 | | | | 235,813 | |
| | | | | | | | |
| Total Non-Convertible Corporate Bonds and Notes (Cost $656,015) | | | | | | | 497,613 | |
|
| |
| Corporate Loan—0.0% | | | | | | | | |
| |
| Revel Entertainment, Inc., Sr. Sec. Credit Facilities 2nd Lien Exit Term | | | | | | | | |
| Loan, 14.50%, 5/20/186,7 (Cost $315,292) | | | 326,143 | | | | 1,631 | |
| | |
| | | Shares | | | | |
| |
| Investment Companies—21.2% | | | | | | | | |
| |
| iShares iBoxx $ High Yield Corporate Bond Exchange Traded Fund | | | 1,497,249 | | | | 125,544,327 | |
| |
| Oppenheimer Institutional Money Market Fund, Cl. E, 0.48%8,9 | | | 24,110,883 | | | | 24,110,883 | |
| |
| Oppenheimer Master Event-Linked Bond Fund, LLC8 | | | 5,734,430 | | | | 87,772,136 | |
| |
| Oppenheimer Master Loan Fund, LLC8 | | | 5,674,937 | | | | 83,962,231 | |
| | | | | | | | |
| Total Investment Companies (Cost $324,186,404) | | | | | | | 321,389,577 | |
|
| |
| Total Investments, at Value (Cost $1,445,666,664) | | | 97.6% | | | | 1,477,900,349 | |
| |
| Net Other Assets (Liabilities) | | | 2.4 | | | | 35,691,825 | |
| | | | |
| Net Assets | | | 100.0% | | | $ | 1,513,592,174 | |
| | | | |
Footnotes to Consolidated Statement of Investments
* April 29, 2016 represents the last business day of the Fund’s reporting period. See Note 2 of the accompanying Consolidated Notes.
1. Non-income producing security.
2. Represents securities sold under Rule 144A, which are exempt from registration under the Securities Act of 1933, as amended. These securities have been determined to be liquid under guidelines established by the Board of Trustees. These securities amount to $218,478 or 0.01% of the Fund’s net assets at period end.
3. Security is a Master Limited Partnership.
4. All or a portion of the security position is held in accounts at a futures clearing merchant and pledged to cover margin requirements on open futures contracts and written options on futures, if applicable. The aggregate market value of such securities is $7,357,890. See Note 6 of the accompanying Consolidated Notes.
5. All or a portion of the security position is held in segregated accounts and pledged to cover margin requirements under certain derivative contracts. The aggregate market value of such securities is $882,208. See Note 6 of the accompanying Consolidated Notes.
27 OPPENHEIMER GLOBAL ALLOCATION FUND
CONSOLIDATED STATEMENT OF INVESTMENTS Unaudited / Continued
Footnotes to Consolidated Statement of Investments (Continued)
6. Represents the current interest rate for a variable or increasing rate security.
7. This security is not accruing income because the issuer has missed an interest payment on it and/or is not anticipated to make future interest and/or principal payments. The rate shown is the contractual interest rate. See Note 4 of the accompanying Consolidated Notes.
8. Is or was an affiliate, as defined in the Investment Company Act of 1940, as amended, at or during the reporting period, by virtue of the Fund owning at least 5% of the voting securities of the issuer or as a result of the Fund and the issuer having the same investment adviser. Transactions during the reporting period in which the issuer was an affiliate are as follows:
| | | | | | | | | | | | | | | | |
| | | Shares October 30, 2015a | | | Gross Additions | | | Gross Reductions | | | Shares April 29, 2016 a | |
| Oppenheimer Institutional Money | | | | | | | | | | | | | | | | |
| Market Fund, Cl. E | | | 26,662,924 | | | | 467,943,804 | | | | 470,495,845 | | | | 24,110,883 | |
| Oppenheimer Master Event-Linked | | | | | | | | | | | | | | | | |
| Bond Fund, LLC | | | 5,734,430 | | | | — | | | | — | | | | 5,734,430 | |
| Oppenheimer Master Loan Fund, | | | | | | | | | | | | | | | | |
| LLC | | | 5,674,937 | | | | — | | | | — | | | | 5,674,937 | |
| | | | |
| | | | | | Value | | | Income | | | Realized Loss | |
| Oppenheimer Institutional Money Market Fund, Cl. E | | | | | | $ | 24,110,883 | | | $ | 114,134 | | | $ | — | |
| Oppenheimer Master Event-Linked Bond Fund, LLC | | | | | | | 87,772,136 | | | | 2,323,205b | | | | 819,095 b | |
| Oppenheimer Master Loan Fund, LLC | | | | | | | 83,962,231 | | | | 2,374,276c | | | | 1,267,870 c | |
| | | | | | | | |
| Total | | | | | | $ | 195,845,250 | | | $ | 4,811,615 | | | $ | 2,086,965 | |
| | | | | | | | |
a. Represents the last business day of the Fund’s reporting period. See Note 2 of the accompanying Consolidated Notes.
b. Represents the amount allocated to the Fund from Oppenheimer Master Event-linked Bond Fund, LLC.
c. Represents the amount allocated to the Fund from Oppenheimer Master Loan Fund, LLC.
9. Rate shown is the 7-day yield at period end.
Distribution of investments representing geographic holdings, as a percentage of total investments at value, is as follows:
| | | | | | | | | | | | |
| Geographic Holdings | | Value | | | | | Percent | | | |
| United States | | $ | 945,468,688 | | | | | | 63.5 | % | | |
| United Kingdom | | | 76,183,366 | | | | | | 5.5 | | | |
| Japan | | | 63,511,337 | | | | | | 4.3 | | | |
| France | | | 58,347,191 | | | | | | 3.9 | | | |
| Germany | | | 52,265,481 | | | | | | 3.6 | | | |
| Switzerland | | | 43,826,949 | | | | | | 2.8 | | | |
| China | | | 35,035,017 | | | | | | 2.3 | | | |
| Netherlands | | | 28,769,980 | | | | | | 2.0 | | | |
| Canada | | | 27,530,077 | | | | | | 1.9 | | | |
| India | | | 25,868,790 | | | | | | 1.7 | | | |
| Spain | | | 14,459,023 | | | | | | 1.1 | | | |
| Sweden | | | 13,517,886 | | | | | | 1.0 | | | |
| Hong Kong | | | 8,598,817 | | | | | | 0.7 | | | |
| Denmark | | | 8,536,642 | | | | | | 0.6 | | | |
| Australia | | | 8,357,285 | | | | | | 0.6 | | | |
| Brazil | | | 7,654,767 | | | | | | 0.5 | | | |
| Russia | | | 7,201,140 | | | | | | 0.5 | | | |
| Mexico | | | 6,997,580 | | | | | | 0.5 | | | |
28 OPPENHEIMER GLOBAL ALLOCATION FUND
| | | | | | | | | | |
| Geographic Holdings (Continued) | | Value | | | | | Percent | | |
| South Korea | | $ | 4,979,758 | | | | | 0.3% | | |
| Italy | | | 4,120,842 | | | | | 0.3 | | |
| Singapore | | | 3,834,501 | | | | | 0.3 | | |
| Ireland | | | 3,351,119 | | | | | 0.2 | | |
| Finland | | | 3,276,035 | | | | | 0.2 | | |
| Taiwan | | | 2,955,385 | | | | | 0.2 | | |
| Philippines | | | 2,865,668 | | | | | 0.2 | | |
| Thailand | | | 2,849,713 | | | | | 0.2 | | |
| Colombia | | | 2,734,986 | | | | | 0.2 | | |
| Israel | | | 2,489,187 | | | | | 0.2 | | |
| Malaysia | | | 2,291,303 | | | | | 0.2 | | |
| South Africa | | | 1,806,703 | | | | | 0.1 | | |
| Indonesia | | | 1,733,634 | | | | | 0.1 | | |
| New Zealand | | | 1,722,754 | | | | | 0.1 | | |
| United Arab Emirates | | | 1,395,526 | | | | | 0.1 | | |
| Turkey | | | 1,333,969 | | | | | 0.1 | | |
| Nigeria | | | 698,638 | | | | | 0.0 | | |
| Egypt | | | 639,080 | | | | | 0.0 | | |
| Poland | | | 465,108 | | | | | 0.0 | | |
| Cayman Islands | | | 226,424 | | | | | 0.0 | | |
| | | |
| Total | | $ | 1,477,900,349 | | | | | 100.0% | | |
| | | |
| | | | | | | | | | | | | | | | | | | | | | | | |
| |
| Forward Currency Exchange Contracts as of April 29, 2016 | |
| Counter-party | | Settlement
Month(s) | | | | | Currency
Purchased
(000’s) | | | | | Currency Sold (000’s) | | | Unrealized
Appreciation | | | Unrealized Depreciation | |
| |
| BNP | | | 06/2016 | | | MXN | | | 147,800 | | | USD | | | 8,441 | | | $ | 105,965 | | | $ | — | |
| BOA | | | 06/2016 | | | CLP | | | 10,163,200 | | | USD | | | 15,136 | | | | 176,629 | | | | — | |
| BOA | | | 06/2016 | | | JPY | | | 3,898,000 | | | USD | | | 35,032 | | | | 1,656,115 | | | | — | |
| BOA | | | 06/2016 | | | SEK | | | 312,040 | | | USD | | | 38,266 | | | | 664,360 | | | | — | |
| BOA | | | 06/2016 | | | USD | | | 10,296 | | | CAD | | | 13,370 | | | | — | | | | 359,751 | |
| BOA | | | 06/2016 | | | USD | | | 14,679 | | | HKD | | | 113,790 | | | | 2,414 | | | | — | |
| BOA | | | 06/2016 | | | USD | | | 49,644 | | | INR | | | 3,339,000 | | | | — | | | | 162,172 | |
| CITNA-B | | | 06/2016 | | | USD | | | 118,381 | | | EUR | | | 104,365 | | | | — | | | | 1,313,057 | |
| CITNA-B | | | 06/2016 | | | USD | | | 72,699 | | | GBP | | | 50,171 | | | | — | | | | 619,334 | |
| CITNA-B | | | 06/2016 | | | USD | | | 15,414 | | | PLN | | | 60,020 | | | | — | | | | 294,453 | |
| DEU | | | 05/2016 | | | JPY | | | 1,124,000 | | | USD | | | 10,104 | | | | 465,401 | | | | — | |
| DEU | | | 06/2016 | | | ZAR | | | 333,740 | | | USD | | | 22,920 | | | | 279,400 | | | | — | |
| GSCO-OT | | | 05/2016 - 06/2016 | | | BRL | | | 234,200 | | | USD | | | 66,864 | | | | 887,826 | | | | — | |
| GSCO-OT | | | 06/2016 | | | COP | | | 62,524,000 | | | USD | | | 21,109 | | | | 669,383 | | | | — | |
| GSCO-OT | | | 06/2016 | | | IDR | | | 277,201,000 | | | USD | | | 20,881 | | | | — | | | | 68,462 | |
| GSCO-OT | | | 05/2016 | | | USD | | | 33,220 | | | BRL | | | 117,100 | | | | — | | | | 828,263 | |
| HSBC | | | 06/2016 | | | PLN | | | 58,270 | | | USD | | | 15,387 | | | | — | | | | 136,338 | |
| HSBC | | | 06/2016 | | | USD | | | 8,730 | | | HKD | | | 67,680 | | | | 973 | | | | — | |
| HSBC | | | 05/2016 | | | USD | | | 9,927 | | | JPY | | | 1,124,000 | | | | — | | | | 642,582 | |
| HSBC | | | 06/2016 | | | ZAR | | | 57,700 | | | USD | | | 3,732 | | | | 279,206 | | | | — | |
| JPM | | | 06/2016 | | | AUD | | | 37,120 | | | USD | | | 28,250 | | | | — | | | | 86,128 | |
| JPM | | | 05/2016 | | | BRL | | | 117,100 | | | USD | | | 32,555 | | | | 1,493,214 | | | | — | |
| JPM | | | 06/2016 | | | INR | | | 2,010,000 | | | USD | | | 29,795 | | | | 187,549 | | | | — | |
| JPM | | | 06/2016 | | | USD | | | 17,378 | | | AUD | | | 22,593 | | | | 236,586 | | | | — | |
29 OPPENHEIMER GLOBAL ALLOCATION FUND
CONSOLIDATED STATEMENT OF INVESTMENTS Unaudited / Continued
| | | | | | | | | | | | | | | | | | | | | | | | |
| |
| Forward Currency Exchange Contracts (Continued) | |
| Counter-party | | Settlement
Month(s) | | | | | Currency
Purchased
(000’s) | | | Currency Sold (000’s) | | | Unrealized
Appreciation | | | Unrealized
Depreciation | |
| |
| JPM | | | 05/2016 | | | USD | | | 33,934 | | | BRL | | | 117,100 | | | $ | — | | | $ | 113,961 | |
| JPM | | | 06/2016 | | | USD | | | 36,070 | | | JPY | | | 3,898,000 | | | | — | | | | 618,418 | |
| JPM | | | 06/2016 | | | USD | | | 2,938 | | | KRW | | | 3,401,000 | | | | — | | | | 26,381 | |
| JPM | | | 06/2016 | | | USD | | | 1,243 | | | TWD | | | 40,000 | | | | 5,079 | | | | — | |
| MSCO | | | 06/2016 | | | NOK | | | 126,780 | | | USD | | | 15,230 | | | | 512,009 | | | | — | |
| MSCO | | | 06/2016 | | | USD | | | 44,894 | | | CHF | | | 43,280 | | | | — | | | | 324,073 | |
| MSCO | | | 06/2016 | | | USD | | | 20,554 | | | JPY | | | 2,288,000 | | | | — | | | | 980,713 | |
| | | | | | | | | | | | | | | | | | | | |
| Total Unrealized Appreciation and Depreciation | | | | | | | | | | | | $ | 7,622,109 | | | $ | 6,574,086 | |
| | | | | | | | | | | | | | | | | | | | |
| | | | | | | | | | | | | | | | | | | | | | | | |
| |
| Futures Contracts as of April 29, 2016 | | | | | | | | | | | | | | | | | | |
| Description | | Exchange | | | Buy/Sell | | | Expiration
Date | | | Number of
Contracts | | | Value | | | Unrealized
Appreciation
(Depreciation) | |
| |
| Mini MSCI Emerging Markets | | | | | | | | | | | | | | | | | | | | | | | | |
| Index | | | NYF | | | | Buy | | | | 6/17/16 | | | | 210 | | | $ | 8,803,200 | | | $ | 374,289 | |
| S&P 500 E-Mini Index | | | CME | | | | Sell | | | | 6/17/16 | | | | 250 | | | | 25,738,750 | | | | 218,052 | |
| STOXX Europe 600 Index | | | EUX | | | | Sell | | | | 6/17/16 | | | | 6,285 | | | | 121,623,201 | | | | (1,587,135) | |
| United States Treasury Long Bonds | | | CBT | | | | Buy | | | | 6/21/16 | | | | 80 | | | | 13,065,000 | | | | 70,074 | |
| United States Treasury Nts., 10 yr. | | | CBT | | | | Buy | | | | 6/21/16 | | | | 276 | | | | 35,897,250 | | | | 267,158 | |
| United States Treasury Nts., 5 yr. | | | CBT | | | | Buy | | | | 6/30/16 | | | | 1,838 | | | | 222,240,048 | | | | 1,254,654 | |
| United States Ultra Bonds | | | CBT | | | | Buy | | | | 6/21/16 | | | | 53 | | | | 9,081,219 | | | | 58,990 | |
| | | | | | | | | | | | | | | | | | | | | | | | |
| | | | | | | | | | | | | | | | | | | | | | $ | 656,082 | |
| | | | | | | | | | | | | | | | | | | | | | | | |
| | | | | | | | | | | | | | | | | | | | | | | | | | | | | | | | |
| |
| Centrally Cleared Interest Rate Swaps at April 29, 2016 | |
| Counterparty | | Pay/Receive Floating
Rate | | | Floating Rate | | | | | Fixed
Rate | | | | | Maturity Date | | | | | Notional Amount
(000’s) | | | | | Value | |
| |
| | | | | | | Three-Month USD | | | | | | | | | | | | | | | | | | | | | | | | | |
| JPM | | | Pay | | | | BBA LIBOR | | | | | | 2.080 | % | | | | | 3/11/36 USD | | | | | | 10,040 | | | | | $ | (20,432) | |
| | |
| Glossary: | | |
| Counterparty Abbreviations |
| BNP | | BNP Paribas |
| BOA | | Bank of America NA |
| CITNA-B | | Citibank NA |
| DEU | | Deutsche Bank AG |
| GSCO-OT | | Goldman Sachs Bank USA |
| HSBC | | HSBC Bank USA NA |
| JPM | | JPMorgan Chase Bank NA |
| MSCO | | Morgan Stanley Capital Services, Inc. |
|
| Currency abbreviations indicate amounts reporting in currencies |
| AUD | | Australian Dollar |
| BRL | | Brazilian Real |
| CAD | | Canadian Dollar |
| CHF | | Swiss Franc |
30 OPPENHEIMER GLOBAL ALLOCATION FUND
| | |
| Currency abbreviations indicate amounts reporting in currencies (Continued) |
| CLP | | Chilean Peso |
| COP | | Colombian Peso |
| EUR | | Euro |
| GBP | | British Pound Sterling |
| HKD | | Hong Kong Dollar |
| IDR | | Indonesian Rupiah |
| INR | | Indian Rupee |
| JPY | | Japanese Yen |
| KRW | | South Korean Won |
| MXN | | Mexican Nuevo Peso |
| NOK | | Norwegian Krone |
| PLN | | Polish Zloty |
| SEK | | Swedish Krona |
| TWD | | New Taiwan Dollar |
| ZAR | | South African Rand |
|
| Definitions |
| BBA LIBOR | | British Bankers’ Association London - Interbank Offered Rate |
| MSCI | | Morgan Stanley Capital International |
| S&P | | Standard & Poor’s |
|
| Exchange Abbreviations |
| CBT | | Chicago Board of Trade |
| CME | | Chicago Mercantile Exchanges |
| EUX | | European Stock Exchange |
| NYF | | New York Futures Exchange |
See accompanying Notes to Consolidated Financial Statements.
31 OPPENHEIMER GLOBAL ALLOCATION FUND
CONSOLIDATED STATEMENT OF
ASSETS AND LIABILITIES April 29, 20161 Unaudited
| | | | |
| Assets | | | | |
| Investments, at value—see accompanying statement of investments: | | | | |
| Unaffiliated companies (cost $1,244,477,169) | | $ | 1,282,055,099 | |
| Affiliated companies (cost $201,189,495) | | | 195,845,250 | |
| | | | 1,477,900,349 | |
| Cash | | | 15,478,915 | |
| Cash—foreign currencies (cost $341,481) | | | 344,913 | |
| Cash used for collateral on futures | | | 10,059,000 | |
| Cash used for collateral on centrally cleared swaps | | | 718,175 | |
| Unrealized appreciation on forward currency exchange contracts | | | 7,622,109 | |
| Receivables and other assets: | | | | |
| Investments sold (including $210,325 sold on a when-issued or delayed delivery basis) | | | 4,858,460 | |
| Interest and dividends | | | 3,882,093 | |
| Variation margin receivable | | | 2,799,566 | |
| Shares of beneficial interest sold | | | 854,193 | |
| Other | | | 270,451 | |
Total assets | | | 1,524,788,224 | |
| Liabilities | | | | |
| Unrealized depreciation on forward currency exchange contracts | | | 6,574,086 | |
| Centrally cleared swaps, at value | | | 20,432 | |
| Payables and other liabilities: | | | | |
| Investments purchased | | | 2,476,962 | |
| Shares of beneficial interest redeemed | | | 1,007,857 | |
| Trustees’ compensation | | | 598,983 | |
| Distribution and service plan fees | | | 298,512 | |
| Foreign capital gains tax | | | 59,577 | |
| Variation margin payable | | | 30,450 | |
| Shareholder communications | | | 17,419 | |
| Other | | | 111,772 | |
| Total liabilities | | | 11,196,050 | |
| |
| | | | |
| Net Assets | | $ | 1,513,592,174 | |
| | | | |
| | | | |
| Composition of Net Assets | | | | |
| Par value of shares of beneficial interest | | $ | 884,328 | |
| Additional paid-in capital | | | 2,033,678,130 | |
| Accumulated net investment loss | | | (169,518) | |
| Accumulated net realized loss on investments and foreign currency transactions | | | (555,191,814) | |
| Net unrealized appreciation on investments and translation of assets and liabilities denominated in foreign currencies | | | 34,391,048 | |
| Net Assets | | $ | 1,513,592,174 | |
| | | | |
32 OPPENHEIMER GLOBAL ALLOCATION FUND
| | | | | | |
| Net Asset Value Per Share | | | | | | |
Class A Shares: | | | | | | |
| Net asset value and redemption price per share (based on net assets of $1,148,703,075 and 66,655,103 shares of beneficial interest outstanding) | | | | $ | 17.23 | |
| | |
Maximum offering price per share (net asset value plus sales charge of 5.75% of offering price) | | | | $ | 18.28 | |
Class B Shares: | | | | | | |
| Net asset value, redemption price (excludes applicable contingent deferred sales charge) and offering price per share (based on net assets of $24,649,068 and 1,483,138 shares of beneficial interest outstanding) | | | | $ | 16.62 | |
Class C Shares: | | | | | | |
| Net asset value, redemption price (excludes applicable contingent deferred sales charge) and offering price per share (based on net assets of $242,950,843 and 14,608,180 shares of beneficial interest outstanding) | | | | $ | 16.63 | |
Class I Shares: | | | | | | |
| Net asset value, redemption price and offering price per share (based on net assets of $2,904,167 and 168,700 shares of beneficial interest outstanding) | | | | $ | 17.21 | |
Class R Shares: | | | | | | |
| Net asset value, redemption price (excludes applicable contingent deferred sales charge) and offering price per share (based on net assets of $36,732,926 and 2,168,325 shares of beneficial interest outstanding) | | | | $ | 16.94 | |
Class Y Shares: | | | | | | |
| Net asset value, redemption price and offering price per share (based on net assets of $57,652,095 and 3,349,373 shares of beneficial interest outstanding) | | | | $ | 17.21 | |
1. April 29, 2016 represents the last business day of the Fund’s reporting period. See Note 2 of the accompanying Consolidated Notes.
See accompanying Notes to Consolidated Financial Statements.
33 OPPENHEIMER GLOBAL ALLOCATION FUND
CONSOLIDATED STATEMENT OF
OPERATIONS For the Six Months Ended April 29, 20161 Unaudited
| | | | |
| |
| Allocation of Income and Expenses from Master Funds2 | | | | |
| Net investment income allocated from Oppenheimer Master Event-Linked Bond Fund, LLC: | | | | |
| Interest | | $ | 2,320,928 | |
| Dividends | | | 2,277 | |
| Net expenses | | | (186,694) | |
| | | | |
| Net investment income allocated from Oppenheimer Master Event-Linked Bond Fund, LLC | | | 2,136,511 | |
| |
| Net investment income allocated from Oppenheimer Master Loan Fund, LLC: | | | | |
| Interest | | | 2,369,879 | |
| Dividends | | | 4,397 | |
| Net expenses | | | (147,768) | |
| | | | |
| Net investment income allocated from Oppenheimer Master Loan Fund, LLC | | | 2,226,508 | |
| |
Total allocation of net investment income from master funds | | | 4,363,019 | |
| |
| Investment Income | | | | |
| Dividends: | | | | |
| Unaffiliated companies (net of foreign withholding taxes of $341,894) | | | 9,608,982 | |
| Affiliated companies | | | 114,134 | |
| |
| Interest (net of foreign withholding taxes of $32,938) | | | 4,383,171 | |
| | | | |
| Total investment income | | | 14,106,287 | |
| |
| Expenses | | | | |
| Management fees | | | 5,923,643 | |
| |
| Distribution and service plan fees: | | | | |
| Class A | | | 1,384,662 | |
| Class B | | | 138,493 | |
| Class C | | | 1,181,922 | |
| Class R | | | 87,233 | |
| |
| Transfer and shareholder servicing agent fees: | | | | |
| Class A | | | 1,254,365 | |
| Class B | | | 30,601 | |
| Class C | | | 261,024 | |
| Class I | | | 217 | |
| Class R | | | 38,740 | |
| Class Y | | | 54,132 | |
| |
| Shareholder communications: | | | | |
| Class A | | | 28,409 | |
| Class B | | | 2,779 | |
| Class C | | | 5,353 | |
| Class I | | | 20 | |
| Class R | | | 584 | |
| Class Y | | | 229 | |
| |
| Custodian fees and expenses | | | 56,186 | |
| |
| Trustees’ compensation | | | 21,370 | |
| |
| Dividends on short sales | | | 15,856 | |
| |
| Borrowing fees | | | 13,249 | |
| |
| Other | | | 137,294 | |
| | | | |
| Total expenses | | | 10,636,361 | |
34 OPPENHEIMER GLOBAL ALLOCATION FUND
| | | | |
| |
| Expenses Continued | | | | |
| Less waivers and reimbursements of expenses | | $ | (381,532) | |
| | | | |
Net expenses | | | 10,254,829 | |
| |
Net Investment Income | | | 8,214,477 | |
| |
| Realized and Unrealized Gain (Loss) | | | | |
| Net realized gain (loss) on: | | | | |
| Investments from unaffiliated companies (includes premiums on options exercised)(net of foreign capital gains tax of $2,721) | | | (25,360,206) | |
| Closing and expiration of futures contracts | | | (4,860,050) | |
| Foreign currency transactions | | | 1,578,835 | |
| Short positions | | | (65,356) | |
Swap contracts | | | 1,554,754 | |
| |
| Net realized loss allocated from: | | | | |
| Oppenheimer Master Event-Linked Bond Fund, LLC | | | (819,095) | |
| Oppenheimer Master Loan Fund, LLC | | | (1,267,870) | |
| | | | |
Net realized loss | | | (29,238,988) | |
| |
| Net change in unrealized appreciation/depreciation on: | | | | |
| Investments | | | (19,998,119) | |
| Translation of assets and liabilities denominated in foreign currencies | | | 16,932,705 | |
| Futures contracts | | | 7,342,689 | |
Swap contracts | | | (222,737) | |
| |
| Net change in unrealized appreciation/depreciation allocated from: | | | | |
| Oppenheimer Master Event-Linked Bond Fund, LLC | | | 796,152 | |
| Oppenheimer Master Loan Fund, LLC | | | (30,235) | |
| | | | |
Net change in unrealized appreciation/depreciation | | | 4,820,455 | |
| |
| Net Decrease in Net Assets Resulting from Operations | | | $ (16,204,056) | |
| | | | |
1. April 29, 2016 represents the last business day of the Fund’s reporting period. See Note 2 of the accompanying Consolidated Notes.
2. The Fund invests in certain affiliated mutual funds that expect to be treated as partnerships for tax purposes. See Note 4 of the accompanying Consolidated Notes.
See accompanying Notes to Consolidated Financial Statements.
35 OPPENHEIMER GLOBAL ALLOCATION FUND
CONSOLIDATED STATEMENTS OF CHANGES IN NET ASSETS
| | | | | | | | |
| | | Six Months Ended
April 29, 20161
(Unaudited) | | | Year Ended
October 30, 20151 | |
| |
| Operations | | | | | | | | |
| Net investment income | | $ | 8,214,477 | | | $ | 20,355,322 | |
| |
| Net realized gain (loss) | | | (29,238,988) | | | | 192,105,870 | |
| |
| Net change in unrealized appreciation/depreciation | | | 4,820,455 | | | | (178,509,355) | |
| | | | |
| Net increase (decrease) in net assets resulting from operations | | | (16,204,056 | ) | | | 33,951,837 | |
|
| |
| Dividends and/or Distributions to Shareholders | | | | | | | | |
| Dividends from net investment income: | | | | | | | | |
| Class A | | | (12,424,540) | | | | (17,023,110) | |
| Class B | | | (264,356) | | | | (341,539) | |
| Class C | | | (2,157,968) | | | | (1,985,156) | |
| Class I | | | (11,979) | | | | (13,008) | |
| Class R | | | (360,329) | | | | (438,972) | |
| Class Y | | | (552,078) | | | | (679,618) | |
| | | | |
| | | (15,771,250) | | | | (20,481,403) | |
| |
| Beneficial Interest Transactions | | | | | | | | |
| Net increase (decrease) in net assets resulting from beneficial interest transactions: | | | | | | | | |
| Class A | | | (30,044,079) | | | | (86,862,338) | |
| Class B | | | (8,025,612) | | | | (23,313,213) | |
| Class C | | | 875,175 | | | | (16,762,893) | |
| Class I | | | 2,108,472 | | | | (2,296,278) | |
| Class R | | | 914,485 | | | | (3,186,570) | |
| Class Y | | | 12,652,815 | | | | 4,773,129 | |
| | | | |
| | | (21,518,744) | | | | (127,648,163) | |
| |
| Net Assets | | | | | | | | |
| Total decrease | | | (53,494,050) | | | | (114,177,729) | |
| |
| Beginning of period | | | 1,567,086,224 | | | | 1,681,263,953 | |
| | | | |
| End of period (including accumulated net investment income (loss) of $(169,518) and $7,387,255, respectively) | | $ | 1,513,592,174 | | | $ | 1,567,086,224 | |
| | | | |
1. April 29, 2016 and October 30, 2015 represents the last business day of the Fund’s respective reporting periods. See Note 2 of the accompanying Consolidated Notes.
See accompanying Notes to Consolidated Financial Statements.
36 OPPENHEIMER GLOBAL ALLOCATION FUND
CONSOLIDATED FINANCIAL HIGHLIGHTS
| | | | | | | | | | | | |
| Class A | | Six Months
Ended
April 29, 2016
(Unaudited)1 | | Year Ended
October 30,
20151 | | Year Ended
October 31,
2014 | | Year Ended
October 31,
2013 | | Year Ended
October 31,
2012 | | Year Ended
October 31,
2011 |
|
| Per Share Operating Data | | | | | | | | | | | | |
| Net asset value, beginning of period | | $17.58 | | $17.43 | | $17.27 | | $14.70 | | $14.81 | | $15.08 |
|
| Income (loss) from investment operations: | | | | | | | | | | | | |
| Net investment income2 | | 0.10 | | 0.24 | | 0.27 | | 0.34 | | 0.33 | | 0.36 |
| Net realized and unrealized gain (loss) | | (0.27) | | 0.15 | | 0.21 | | 2.41 | | (0.04) | | (0.41) |
| | |
| Total from investment operations | | (0.17) | | 0.39 | | 0.48 | | 2.75 | | 0.29 | | (0.05) |
|
| Dividends and/or distributions to shareholders: | | | | | | | | | | | | |
| Dividends from net investment income | | (0.18) | | (0.24) | | (0.32) | | (0.18) | | (0.40) | | (0.22) |
|
| Net asset value, end of period | | $17.23 | | $17.58 | | $17.43 | | $17.27 | | $14.70 | | $14.81 |
| | |
|
|
| Total Return, at Net Asset Value3 | | (0.93)% | | 2.26% | | 2.85% | | 18.81% | | 2.14% | | (0.37)% |
| | | | |
|
| Ratios/Supplemental Data | | | | | | | | | | | | |
| Net assets, end of period (in thousands) | | $1,148,703 | | $1,203,181 | | $1,279,187 | | $1,369,331 | | $1,294,433 | | $1,473,322 |
|
| Average net assets (in thousands) | | $1,145,958 | | $1,247,197 | | $1,336,323 | | $1,327,442 | | $1,358,002 | | $1,589,726 |
|
| Ratios to average net assets:4,5 | | | | | | | | | | | | |
| Net investment income | | 1.23% | | 1.39% | | 1.58% | | 2.11% | | 2.29% | | 2.35% |
| Expenses excluding specific expenses listed below | | 1.34% | | 1.33% | | 1.37% | | 1.43% | | 1.46% | | 1.44% |
| Interest and fees from borrowings | | 0.00%6 | | 0.00%6 | | 0.00% | | 0.00% | | 0.00% | | 0.00% |
| | |
| Total expenses7 | | 1.34% | | 1.33% | | 1.37% | | 1.43% | | 1.46% | | 1.44% |
| Expenses after payments, waivers and/or reimbursements and reduction to custodian expenses | | 1.29% | | 1.28% | | 1.30% | | 1.35% | | 1.38% | | 1.36% |
|
| Portfolio turnover rate | | 55% | | 83% | | 43% | | 37% | | 59% | | 82% |
37 OPPENHEIMER GLOBAL ALLOCATION FUND
CONSOLIDATED FINANCIAL HIGHLIGHTS Continued
1. April 29, 2016 and October 30, 2015 represent the last business days of the Fund’s respective reporting periods.
See Note 2 of the accompanying Consolidated Notes.
2. Per share amounts calculated based on the average shares outstanding during the period.
3. Assumes an initial investment on the business day before the first day of the fiscal period, with all dividends and distributions reinvested in additional shares on the reinvestment date, and redemption at the net asset value calculated on the last business day of the fiscal period. Sales charges are not reflected in the total returns. Total returns are not annualized for periods less than one full year. Returns do not reflect the deduction of taxes that a shareholder would pay on fund distributions or the redemption of fund shares.
4. Annualized for periods less than one full year.
5. Includes the Fund’s share of the allocated expenses and/or net investment income from the master funds.
6. Less than 0.005%.
7. Total expenses including indirect expenses from affiliated fund fees and expenses were as follows:
| | | | | | | | |
| | | | | | | | |
| | Six Months Ended April 29, 2016 | | | 1.34 | % | |
| | Year Ended October 30, 2015 | | | 1.33 | % | |
| | Year Ended October 31, 2014 | | | 1.38 | % | |
| | Year Ended October 31, 2013 | | | 1.44 | % | |
| | Year Ended October 31, 2012 | | | 1.46 | % | |
| | Year Ended October 31, 2011 | | | 1.44 | % | |
See accompanying Notes to Consolidated Financial Statements.
38 OPPENHEIMER GLOBAL ALLOCATION FUND
| | | | | | | | | | | | |
| Class B | | Six Months
Ended
April 29, 2016
(Unaudited)1 | | Year Ended
October 30,
20151 | | Year Ended
October 31,
2014 | | Year Ended
October 31,
2013 | | Year Ended
October 31,
2012 | | Year Ended
October 31,
2011 |
|
| Per Share Operating Data | | | | | | | | | | | | |
| Net asset value, beginning of period | | $16.99 | | $16.86 | | $16.76 | | $14.30 | | $14.43 | | $14.73 |
|
| Income (loss) from investment operations: | | | | | | | | | | | | |
| Net investment income2 | | 0.04 | | 0.11 | | 0.13 | | 0.19 | | 0.20 | | 0.23 |
| Net realized and unrealized gain (loss) | | (0.26) | | 0.14 | | 0.21 | | 2.34 | | (0.02) | | (0.41) |
| | |
| Total from investment operations | | (0.22) | | 0.25 | | 0.34 | | 2.53 | | 0.18 | | (0.18) |
|
| Dividends and/or distributions to shareholders: | | | | | | | | | | | | |
| Dividends from net investment income | | (0.15) | | (0.12) | | (0.24) | | (0.07) | | (0.31) | | (0.12) |
|
| Net asset value, end of period | | $16.62 | | $16.99 | | $16.86 | | $16.76 | | $14.30 | | $14.43 |
| | |
|
|
| Total Return, at Net Asset Value3 | | (1.25)% | | 1.45% | | 2.05% | | 17.72% | | 1.36% | | (1.25)% |
| | | | |
|
| Ratios/Supplemental Data | | | | | | | | | | | | |
| Net assets, end of period (in thousands) | | $24,649 | | $33,478 | | $56,317 | | $84,161 | | $102,131 | | $145,291 |
|
| Average net assets (in thousands) | | $27,915 | | $42,919 | | $69,381 | | $91,497 | | $119,580 | | $224,604 |
|
| Ratios to average net assets:4,5 | | | | | | | | | | | | |
| Net investment income | | 0.44% | | 0.63% | | 0.79% | | 1.24% | | 1.46% | | 1.52% |
| Expenses excluding specific expenses listed below | | 2.12% | | 2.08% | | 2.21% | | 2.42% | | 2.41% | | 2.43% |
| Interest and fees from borrowings | | 0.00%6 | | 0.00%6 | | 0.00% | | 0.00% | | 0.00% | | 0.00% |
| | |
| Total expenses7 | | 2.12% | | 2.08% | | 2.21% | | 2.42% | | 2.41% | | 2.43% |
| Expenses after payments, waivers and/or reimbursements and reduction to custodian expenses | | 2.07% | | 2.03% | | 2.09% | | 2.22% | | 2.20% | | 2.21% |
|
| Portfolio turnover rate | | 55% | | 83% | | 43% | | 37% | | 59% | | 82% |
39 OPPENHEIMER GLOBAL ALLOCATION FUND
CONSOLIDATED FINANCIAL HIGHLIGHTS Continued
1. April 29, 2016 and October 30, 2015 represent the last business days of the Fund’s respective reporting periods.
See Note 2 of the accompanying Consolidated Notes.
2. Per share amounts calculated based on the average shares outstanding during the period.
3. Assumes an initial investment on the business day before the first day of the fiscal period, with all dividends and distributions reinvested in additional shares on the reinvestment date, and redemption at the net asset value calculated on the last business day of the fiscal period. Sales charges are not reflected in the total returns. Total returns are not annualized for periods less than one full year. Returns do not reflect the deduction of taxes that a shareholder would pay on fund distributions or the redemption of fund shares.
4. Annualized for periods less than one full year.
5. Includes the Fund’s share of the allocated expenses and/or net investment income from the master funds.
6. Less than 0.005%.
7. Total expenses including indirect expenses from affiliated fund fees and expenses were as follows:
| | | | | | | | |
| | | | | | | | |
| | Six Months Ended April 29, 2016 | | | 2.12 | % | |
| | Year Ended October 30, 2015 | | | 2.08 | % | |
| | Year Ended October 31, 2014 | | | 2.22 | % | |
| | Year Ended October 31, 2013 | | | 2.43 | % | |
| | Year Ended October 31, 2012 | | | 2.41 | % | |
| | Year Ended October 31, 2011 | | | 2.43 | % | |
See accompanying Notes to Consolidated Financial Statements.
40 OPPENHEIMER GLOBAL ALLOCATION FUND
| | | | | | | | | | | | | | |
| Class C | | Six Months
Ended
April 29, 2016
(Unaudited)1 | | Year Ended
October 30,
20151 | | Year Ended
October 31,
2014 | | Year Ended
October 31,
2013 | | Year Ended
October 31,
2012 | | Year Ended
October 31,
2011 |
|
Per Share Operating Data | | | | | | | | | | | | | | |
| Net asset value, beginning of period | | $17.00 | | $16.88 | | $16.78 | | $14.31 | | $14.44 | | $14.73 | | |
|
Income (loss) from investment operations: | | | | | | | | | | | | | | |
Net investment income2 | | 0.04 | | 0.11 | | 0.14 | | 0.22 | | 0.22 | | 0.25 | | |
Net realized and unrealized gain (loss) | | (0.26) | | 0.14 | | 0.21 | | 2.33 | | (0.03) | | (0.40) | | |
| | |
Total from investment operations | | (0.22) | | 0.25 | | 0.35 | | 2.55 | | 0.19 | | (0.15) | | |
|
Dividends and/or distributions to shareholders: | | | | | | | | | | | | | | |
Dividends from net investment income | | (0.15) | | (0.13) | | (0.25) | | (0.08) | | (0.32) | | (0.14) | | |
|
Net asset value, end of period | | $16.63 | | $17.00 | | $16.88 | | $16.78 | | $14.31 | | $14.44 | | |
| | |
| | | | | | | | | | | | | | |
|
Total Return, at Net Asset Value3 | | (1.28)% | | 1.50% | | 2.10% | | 17.90% | | 1.45% | | (1.08)% | | |
| | |
|
Ratios/Supplemental Data | | | | | | | | | | | | | | |
Net assets, end of period (in thousands) | | $242,951 | | $247,445 | | $262,594 | | $281,444 | | $267,392 | | $313,963 | | |
|
Average net assets (in thousands) | | $238,520 | | $256,637 | | $275,145 | | $273,813 | | $284,820 | | $350,372 | | |
|
Ratios to average net assets:4,5 | | | | | | | | | | | | | | |
Net investment income | | 0.48% | | 0.64% | | 0.83% | | 1.39% | | 1.58% | | 1.64% | | |
Expenses excluding specific expenses listed below | | 2.09% | | 2.08% | | 2.12% | | 2.14% | | 2.17% | | 2.15% | | |
Interest and fees from borrowings | | 0.00%6 | | 0.00%6 | | 0.00% | | 0.00% | | 0.00% | | 0.00% | | |
| | |
Total expenses7 | | 2.09% | | 2.08% | | 2.12% | | 2.14% | | 2.17% | | 2.15% | | |
| Expenses after payments, waivers and/or reimbursements and reduction to custodian expenses | | 2.04% | | 2.03% | | 2.05% | | 2.06% | | 2.09% | | 2.07% | | |
|
Portfolio turnover rate | | 55% | | 83% | | 43% | | 37% | | 59% | | 82% | | |
41 OPPENHEIMER GLOBAL ALLOCATION FUND
CONSOLIDATED FINANCIAL HIGHLIGHTS Continued
1. April 29, 2016 and October 30, 2015 represent the last business days of the Fund’s respective reporting periods.
See Note 2 of the accompanying Consolidated Notes.
2. Per share amounts calculated based on the average shares outstanding during the period.
3. Assumes an initial investment on the business day before the first day of the fiscal period, with all dividends and distributions reinvested in additional shares on the reinvestment date, and redemption at the net asset value calculated on the last business day of the fiscal period. Sales charges are not reflected in the total returns. Total returns are not annualized for periods less than one full year. Returns do not reflect the deduction of taxes that a shareholder would pay on fund distributions or the redemption of fund shares.
4. Annualized for periods less than one full year.
5. Includes the Fund’s share of the allocated expenses and/or net investment income from the master funds.
6. Less than 0.005%.
7. Total expenses including indirect expenses from affiliated fund fees and expenses were as follows:
| | | | | | | | |
| | | | | | | | |
| | Six Months Ended April 29, 2016 | | | 2.09 | % | |
| | Year Ended October 30, 2015 | | | 2.08 | % | |
| | Year Ended October 31, 2014 | | | 2.13 | % | |
| | Year Ended October 31, 2013 | | | 2.15 | % | |
| | Year Ended October 31, 2012 | | | 2.17 | % | |
| | Year Ended October 31, 2011 | | | 2.15 | % | |
See accompanying Notes to Consolidated Financial Statements.
42 OPPENHEIMER GLOBAL ALLOCATION FUND
| | | | | | | | | | | | |
| Class I | | Six Months
Ended
April 29, 2016
(Unaudited)1 | | Year Ended
October 30,
20151 | | Year Ended
October 31,
2014 | | Year Ended
October 31,
2013 | | Period
Ended
October 31,
20122 |
|
Per Share Operating Data | | | | | | | | | | | | |
| Net asset value, beginning of period | | $17.56 | | $17.41 | | $17.25 | | $14.69 | | $14.98 | | |
|
Income (loss) from investment operations: | | | | | | | | | | | | |
Net investment income3 | | 0.16 | | 0.31 | | 0.32 | | 0.34 | | 0.37 | | |
Net realized and unrealized gain (loss) | | (0.29) | | 0.16 | | 0.24 | | 2.48 | | (0.53) | | |
| | |
Total from investment operations | | (0.13) | | 0.47 | | 0.56 | | 2.82 | | (0.16) | | |
|
Dividends and/or distributions to shareholders: | | | | | | | | | | | | |
Dividends from net investment income | | (0.22) | | (0.32) | | (0.40) | | (0.26) | | (0.13) | | |
|
Net asset value, end of period | | $17.21 | | $17.56 | | $17.41 | | $17.25 | | $14.69 | | |
| | |
| | | | | | | | | | | | |
|
Total Return, at Net Asset Value4 | | (0.65)% | | 2.71% | | 3.32% | | 19.35% | | (1.04)% | | |
| | |
|
Ratios/Supplemental Data | | | | | | | | | | | | |
Net assets, end of period (in thousands) | | $2,904 | | $747 | | $3,031 | | $775 | | $10 | | |
|
Average net assets (in thousands) | | $1,462 | | $877 | | $1,075 | | $147 | | $10 | | |
|
Ratios to average net assets:5,6 | | | | | | | | | | | | |
Net investment income | | 1.94% | | 1.74% | | 1.90% | | 2.01% | | 3.78% | | |
Expenses excluding specific expenses listed below | | 0.85% | | 0.88% | | 0.94% | | 0.92% | | 0.94% | | |
Interest and fees from borrowings | | 0.00%7 | | 0.00%7 | | 0.00% | | 0.00% | | 0.00% | | |
| | |
Total expenses8 | | 0.85% | | 0.88% | | 0.94% | | 0.92% | | 0.94% | | |
| Expenses after payments, waivers and/or reimbursements and reduction to custodian expenses | | 0.80% | | 0.83% | | 0.87% | | 0.84% | | 0.89% | | |
|
Portfolio turnover rate | | 55% | | 83% | | 43% | | 37% | | 59% | | |
1. April 29, 2016 and October 30, 2015 represent the last business days of the Fund’s respective reporting periods.
See Note 2 of the accompanying Consolidated Notes.
2. For the period from February 28, 2012 (inception of offering) to October 31, 2012.
3. Per share amounts calculated based on the average shares outstanding during the period.
4. Assumes an initial investment on the business day before the first day of the fiscal period, with all dividends and distributions reinvested in additional shares on the reinvestment date, and redemption at the net asset value calculated on the last business day of the fiscal period. Sales charges are not reflected in the total returns. Total returns are not annualized for periods less than one full year. Returns do not reflect the deduction of taxes that a shareholder would pay on fund distributions or the redemption of fund shares.
5. Annualized for periods less than one full year.
6. Includes the Fund’s share of the allocated expenses and/or net investment income from the master funds.
7. Less than 0.005%.
8. Total expenses including indirect expenses from affiliated fund fees and expenses were as follows:
| | | | | | | | |
| | | | | | | | |
| | Six Months Ended April 29, 2016 | | | 0.85 | % | |
| | Year Ended October 30, 2015 | | | 0.88 | % | |
| | Year Ended October 31, 2014 | | | 0.95 | % | |
| | Year Ended October 31, 2013 | | | 0.93 | % | |
| | Period Ended October 31, 2012 | | | 0.94 | % | |
See accompanying Notes to Consolidated Financial Statements.
43 OPPENHEIMER GLOBAL ALLOCATION FUND
CONSOLIDATED FINANCIAL HIGHLIGHTS Continued
| | | | | | | | | | | | | | |
| Class R | | Six Months
Ended
April 29, 2016
(Unaudited)1 | | Year Ended
October 30,
20151 | | Year Ended
October 31,
2014 | | Year Ended
October 31,
2013 | | Year Ended
October 31,
2012 | | Year Ended
October 31,
2011 |
|
Per Share Operating Data | | | | | | | | | | | | | | |
| Net asset value, beginning of period | | $17.29 | | $17.15 | | $17.01 | | $14.48 | | $14.60 | | $14.86 | | |
|
Income (loss) from investment operations: | | | | | | | | | | | | | | |
Net investment income2 | | 0.08 | | 0.20 | | 0.23 | | 0.29 | | 0.29 | | 0.32 | | |
Net realized and unrealized gain (loss) | | (0.26) | | 0.14 | | 0.20 | | 2.38 | | (0.04) | | (0.39) | | |
| | |
Total from investment operations | | (0.18) | | 0.34 | | 0.43 | | 2.67 | | 0.25 | | (0.07) | | |
|
Dividends and/or distributions to shareholders: | | | | | | | | | | | | | | |
Dividends from net investment income | | (0.17) | | (0.20) | | (0.29) | | (0.14) | | (0.37) | | (0.19) | | |
|
Net asset value, end of period | | $16.94 | | $17.29 | | $17.15 | | $17.01 | | $14.48 | | $14.60 | | |
| | |
| | | | | | | | | | | | | | |
|
Total Return, at Net Asset Value3 | | (1.01)% | | 1.98% | | 2.56% | | 18.52% | | 1.86% | | (0.55)% | | |
| | |
|
Ratios/Supplemental Data | | | | | | | | | | | | | | |
Net assets, end of period (in thousands) | | $36,733 | | $36,537 | | $39,483 | | $43,683 | | $44,700 | | $56,284 | | |
|
Average net assets (in thousands) | | $35,400 | | $38,398 | | $42,159 | | $44,174 | | $50,331 | | $63,592 | | |
|
Ratios to average net assets:4,5 | | | | | | | | | | | | | | |
Net investment income | | 0.99% | | 1.14% | | 1.33% | | 1.86% | | 2.05% | | 2.12% | | |
Expenses excluding specific expenses listed below | | 1.59% | | 1.58% | | 1.63% | | 1.68% | | 1.70% | | 1.67% | | |
Interest and fees from borrowings | | 0.00%6 | | 0.00%6 | | 0.00% | | 0.00% | | 0.00% | | 0.00% | | |
| | |
Total expenses7 | | 1.59% | | 1.58% | | 1.63% | | 1.68% | | 1.70% | | 1.67% | | |
| Expenses after payments, waivers and/or reimbursements and reduction to custodian expenses | | 1.54% | | 1.53% | | 1.56% | | 1.60% | | 1.62% | | 1.59% | | |
|
Portfolio turnover rate | | 55% | | 83% | | 43% | | 37% | | 59% | | 82% | | |
44 OPPENHEIMER GLOBAL ALLOCATION FUND
1. April 29, 2016 and October 30, 2015 represent the last business days of the Fund’s respective reporting periods.
See Note 2 of the accompanying Consolidated Notes.
2. Per share amounts calculated based on the average shares outstanding during the period.
3. Assumes an initial investment on the business day before the first day of the fiscal period, with all dividends and distributions reinvested in additional shares on the reinvestment date, and redemption at the net asset value calculated on the last business day of the fiscal period. Sales charges are not reflected in the total returns. Total returns are not annualized for periods less than one full year. Returns do not reflect the deduction of taxes that a shareholder would pay on fund distributions or the redemption of fund shares.
4. Annualized for periods less than one full year.
5. Includes the Fund’s share of the allocated expenses and/or net investment income from the master funds.
6. Less than 0.005%.
7. Total expenses including indirect expenses from affiliated fund fees and expenses were as follows:
| | | | | | | | |
| | | | | | | | |
| | Six Months Ended April 29, 2016 | | | 1.59 | % | |
| | Year Ended October 30, 2015 | | | 1.58 | % | |
| | Year Ended October 31, 2014 | | | 1.64 | % | |
| | Year Ended October 31, 2013 | | | 1.69 | % | |
| | Year Ended October 31, 2012 | | | 1.70 | % | |
| | Year Ended October 31, 2011 | | | 1.67 | % | |
See accompanying Notes to Consolidated Financial Statements.
45 OPPENHEIMER GLOBAL ALLOCATION FUND
CONSOLIDATED FINANCIAL HIGHLIGHTS Continued
| | | | | | | | | | | | |
| Class Y | | Six Months
Ended
April 29, 2016
(Unaudited)1 | | Year Ended
October 30,
20151 | | Year Ended
October 31,
2014 | | Year Ended
October 31,
2013 | | Year Ended
October 31,
2012 | | Year Ended
October 31,
2011 |
|
| Per Share Operating Data | | | | | | | | | | | | |
| Net asset value, beginning of period | | $17.56 | | $17.42 | | $17.26 | | $14.69 | | $14.80 | | $15.07 |
|
| Income (loss) from investment operations: | | | | | | | | | | | | |
| Net investment income2 | | 0.13 | | 0.29 | | 0.32 | | 0.40 | | 0.38 | | 0.42 |
| Net realized and unrealized gain (loss) | | (0.28) | | 0.14 | | 0.22 | | 2.41 | | (0.03) | | (0.42) |
| | |
| Total from investment operations | | (0.15) | | 0.43 | | 0.54 | | 2.81 | | 0.35 | | 0.00 |
|
| Dividends and/or distributions to shareholders: | | | | | | | | | | | | |
| Dividends from net investment income | | (0.20) | | (0.29) | | (0.38) | | (0.24) | | (0.46) | | (0.27) |
|
| Net asset value, end of period | | $17.21 | | $17.56 | | $17.42 | | $17.26 | | $14.69 | | $14.80 |
| | |
| | |
|
| Total Return, at Net Asset Value3 | | (0.80)% | | 2.47% | | 3.17% | | 19.26% | | 2.53% | | (0.04)% |
| | |
|
| Ratios/Supplemental Data | | | | | | | | | | | | |
| Net assets, end of period (in thousands) | | $57,652 | | $45,698 | | $40,652 | | $37,264 | | $31,958 | | $36,291 |
|
| Average net assets (in thousands) | | $49,571 | | $42,596 | | $39,075 | | $33,958 | | $33,356 | | $38,475 |
|
| Ratios to average net assets:4,5 | | | | | | | | | | | | |
| Net investment income | | 1.51% | | 1.63% | | 1.86% | | 2.47% | | 2.65% | | 2.70% |
| Expenses excluding specific expenses listed below | | 1.08% | | 1.08% | | 1.09% | | 1.06% | | 1.09% | | 1.11% |
| Interest and fees from borrowings | | 0.00%6 | | 0.00%6 | | 0.00% | | 0.00% | | 0.00% | | 0.00% |
| | |
| Total expenses7 | | 1.08% | | 1.08% | | 1.09% | | 1.06% | | 1.09% | | 1.11% |
| Expenses after payments, waivers and/or reimbursements and reduction to custodian expenses | | 1.03% | | 1.03% | | 1.02% | | 0.98% | | 1.01% | | 1.03% |
|
| Portfolio turnover rate | | 55% | | 83% | | 43% | | 37% | | 59% | | 82% |
46 OPPENHEIMER GLOBAL ALLOCATION FUND
1. April 29, 2016 and October 30, 2015 represent the last business days of the Fund’s respective reporting periods. See Note 2 of the accompanying Consolidated Notes.
2. Per share amounts calculated based on the average shares outstanding during the period.
3. Assumes an initial investment on the business day before the first day of the fiscal period, with all dividends and distributions reinvested in additional shares on the reinvestment date, and redemption at the net asset value calculated on the last business day of the fiscal period. Sales charges are not reflected in the total returns. Total returns are not annualized for periods less than one full year. Returns do not reflect the deduction of taxes that a shareholder would pay on fund distributions or the redemption of fund shares.
4. Annualized for periods less than one full year.
5. Includes the Fund’s share of the allocated expenses and/or net investment income from the master funds.
6. Less than 0.005%.
7. Total expenses including indirect expenses from affiliated fund fees and expenses were as follows:
| | | | | | | | |
| | Six Months Ended April 29, 2016 | | | 1.08 | % | | |
| | Year Ended October 30, 2015 | | | 1.08 | % | | |
| | Year Ended October 31, 2014 | | | 1.10 | % | | |
| | Year Ended October 31, 2013 | | | 1.07 | % | | |
| | Year Ended October 31, 2012 | | | 1.09 | % | | |
| | Year Ended October 31, 2011 | | | 1.11 | % | | |
See accompanying Notes to Consolidated Financial Statements.
47 OPPENHEIMER GLOBAL ALLOCATION FUND
NOTES TO CONSOLIDATED
FINANCIAL STATEMENTS April 29, 2016 Unaudited
1. Organization
Oppenheimer Global Allocation Fund (the “Fund”) is a diversified open-end management investment company registered under the Investment Company Act of 1940 (“1940 Act”), as amended. The Fund’s investment objective is to seek total return. The Fund’s investment adviser is OFI Global Asset Management, Inc. (“OFI Global” or the “Manager”), a wholly-owned subsidiary of OppenheimerFunds, Inc. (“OFI” or the “Sub-Adviser”). The Manager has entered into a sub-advisory agreement with OFI.
The Fund offers Class A, Class C, Class I, Class R and Class Y shares, and previously offered Class B shares for new purchase through June 29, 2012. Subsequent to that date, no new purchases of Class B shares are permitted, however reinvestment of dividend and/or capital gain distributions and exchanges of Class B shares into and from other Oppenheimer funds are allowed. Class A shares are sold at their offering price, which is normally net asset value plus a front-end sales charge. Class C and Class R shares are sold, and Class B shares were sold, without a front-end sales charge but may be subject to a contingent deferred sales charge (“CDSC”). Class R shares are sold only through retirement plans. Retirement plans that offer Class R shares may impose charges on those accounts. Class I and Class Y shares are sold to certain institutional investors or intermediaries without either a front-end sales charge or a CDSC, however, the intermediaries may impose charges on their accountholders who beneficially own Class I and Class Y shares. All classes of shares have identical rights and voting privileges with respect to the Fund in general and exclusive voting rights on matters that affect that class alone. Earnings, net assets and net asset value per share may differ due to each class having its own expenses, such as transfer and shareholder servicing agent fees and shareholder communications, directly attributable to that class. Class A, B, C and R shares have separate distribution and/or service plans under which they pay fees. Class I and Class Y shares do not pay such fees. Class B shares will automatically convert to Class A shares 72 months after the date of purchase.
The following is a summary of significant accounting policies followed in the Fund’s preparation of financial statements in accordance with accounting principles generally accepted in the United States (“U.S. GAAP”).
2. Significant Accounting Policies
Security Valuation. All investments in securities are recorded at their estimated fair value, as described in Note 3.
Reporting Period End Date. The last day of the Fund’s reporting period is the last day the New York Stock Exchange was open for trading during the period. The Fund’s financial statements have been presented through that date to maintain consistency with the Fund’s net asset value calculations used for shareholder transactions.
Basis for Consolidation. The Fund has established a Cayman Islands exempted company, Oppenheimer Global Allocation Fund (Cayman) Ltd., which is wholly-owned and controlled by the Fund (the “Subsidiary”). The Fund and Subsidiary are both managed by the Manager.
48 OPPENHEIMER GLOBAL ALLOCATION FUND
2. Significant Accounting Policies (Continued)
The Fund may invest up to 25% of its total assets in the Subsidiary. The Subsidiary invests primarily in commodity-linked derivatives (including commodity futures, financial futures, options and swap contracts) and certain fixed-income securities and other investments that may serve as margin or collateral for its derivatives positions. The Subsidiary is subject to the same investment restrictions and guidelines, and follows the same compliance policies and procedures, as the Fund.
The financial statements have been consolidated and include accounts of the Fund and the Subsidiary. Accordingly, all inter-company transactions and balances have been eliminated. At period end, the Fund owned 2,920 shares with net assets of $14,474,473 in the Subsidiary.
Other financial information at period end:
| | | | |
Total market value of investments* | | $ | — | |
Net assets | | $ | 14,474,473 | |
Net income (loss) | | $ | (76,099) | |
Net realized gain (loss) | | $ | — | |
Net change in unrealized appreciation/depreciation | | $ | — | |
* At period end, the Subsidiary only held cash.
Foreign Currency Translation. The Fund’s accounting records are maintained in U.S. dollars. The values of securities denominated in foreign currencies and amounts related to the purchase and sale of foreign securities and foreign investment income are translated into U.S. dollars as of the close of the New York Stock Exchange (the “Exchange”), normally 4:00 P.M. Eastern time, on each day the Exchange is open for trading. Foreign exchange rates may be valued primarily using a reliable bank, dealer or service authorized by the Board of Trustees.
Reported net realized gains and losses from foreign currency transactions arise from sales of portfolio securities, sales and maturities of short-term securities, sales of foreign currencies, exchange rate fluctuations between the trade and settlement dates on securities transactions, and the difference between the amounts of dividends, interest, and foreign withholding taxes recorded on the Fund’s books and the U.S. dollar equivalent of the amounts actually received or paid. Net unrealized appreciation and depreciation on the translation of assets and liabilities denominated in foreign currencies arise from changes in the values of assets and liabilities, including investments in securities at fiscal period end, resulting from changes in exchange rates.
The effect of changes in foreign currency exchange rates on investments is separately identified from the fluctuations arising from changes in market values of securities held and reported with all other foreign currency gains and losses in the Fund’s Consolidated Statement of Operations.
Allocation of Income, Expenses, Gains and Losses. Income, expenses (other than those attributable to a specific class), gains and losses are allocated on a daily basis to each class of shares based upon the relative proportion of net assets represented by such class. Operating expenses directly attributable to a specific class are charged against the operations of that class.
49 OPPENHEIMER GLOBAL ALLOCATION FUND
NOTES TO CONSOLIDATED
FINANCIAL STATEMENTS Unaudited / Continued
2. Significant Accounting Policies (Continued)
Dividends and Distributions to Shareholders. Dividends and distributions to shareholders, which are determined in accordance with income tax regulations and may differ from U.S. GAAP, are recorded on the ex-dividend date. Income distributions, if any, are declared and paid quarterly. Capital gain distributions, if any, are declared and paid annually.
The tax character of distributions is determined as of the Fund’s fiscal year end. Therefore, a portion of the Fund’s distributions made to shareholders prior to the Fund’s fiscal year end may ultimately be categorized as a tax return of capital.
Investment Income. Dividend income is recorded on the ex-dividend date or upon ex-dividend notification in the case of certain foreign dividends where the ex-dividend date may have passed. Non-cash dividends included in dividend income, if any, are recorded at the fair market value of the securities received. Interest income is recognized on an accrual basis. Discount and premium, which are included in interest income on the Consolidated Statement of Operations, are amortized or accreted daily.
Return of Capital Estimates. Distributions received from the Fund’s investments in Master Limited Partnerships (MLPs) and Real Estate Investments Trusts (REITs), generally are comprised of income and return of capital. The Fund records investment income and return of capital based on estimates. Such estimates are based on historical information available from each MLP, REIT and other industry sources. These estimates may subsequently be revised based on information received from MLPs and REITs after their tax reporting periods are concluded.
Custodian Fees. “Custodian fees and expenses” in the Consolidated Statement of Operations may include interest expense incurred by the Fund on any cash overdrafts of its custodian account during the period. Such cash overdrafts may result from the effects of failed trades in portfolio securities and from cash outflows resulting from unanticipated shareholder redemption activity. The Fund pays interest to its custodian on such cash overdrafts, to the extent they are not offset by positive cash balances maintained by the Fund, based on the negative rolling average balance at an average Federal Funds Rate plus 0.50%. The “Reduction to custodian expenses” line item, if applicable, represents earnings on cash balances maintained by the Fund during the period. Such interest expense and other custodian fees may be paid with these earnings.
Security Transactions. Security transactions are recorded on the trade date. Realized gains and losses on securities sold (except for the investments in the Subsidiary) are determined on the basis of identified cost.
Indemnifications. The Fund’s organizational documents provide current and former Trustees and officers with a limited indemnification against liabilities arising in connection with the performance of their duties to the Fund. In the normal course of business, the Fund may also enter into contracts that provide general indemnifications. The Fund’s maximum exposure
50 OPPENHEIMER GLOBAL ALLOCATION FUND
2. Significant Accounting Policies (Continued)
under these arrangements is unknown as this would be dependent on future claims that may be made against the Fund. The risk of material loss from such claims is considered remote.
Federal Taxes. The Fund intends to comply with provisions of the Internal Revenue Code applicable to regulated investment companies and to distribute substantially all of its investment company taxable income to shareholders. Therefore, no federal income or excise tax provision is required. The Fund files income tax returns in U.S. federal and applicable state jurisdictions. The statute of limitations on the Fund’s tax return filings generally remains open for the three preceding fiscal reporting period ends. The Fund has analyzed its tax positions for the fiscal year ended October 30, 2015, including open tax years, and does not believe there are any uncertain tax positions requiring recognition in the Fund’s financial statements.
Subchapter M requires, among other things, that at least 90% of the Fund’s gross income be derived from securities or derived with respect to its business of investing in securities (typically referred to as “qualifying income”). Income from commodity-linked derivatives may not be treated as “qualifying income” for purposes of the 90% gross income requirement. The Internal Revenue Service (IRS) has previously issued a number of private letter rulings which conclude that income derived from commodity index-linked notes and investments in a wholly-owned subsidiary will be “qualifying income.” As a result, the Fund will gain exposure to commodities through commodity-linked notes and its wholly-owned subsidiary.
The IRS has suspended the granting of private letter rulings pending further review. As a result, there can be no assurance that the IRS will not change its position with respect to commodity-linked notes and wholly-owned subsidiaries. In addition, future legislation and guidance from the Treasury and the IRS may adversely affect the fund’s ability to gain exposure to commodities through commodity-linked notes and its wholly-owned subsidiary.
The Fund is required to include in income for federal income tax purposes all of the subsidiary’s net income and gains whether or not such income is distributed by the subsidiary. Net income and gains from the subsidiary are generally treated as ordinary income by the Fund, regardless of the character of the subsidiary’s underlying income. Net losses from the subsidiary do not pass through to the Fund for federal income tax purposes.
During the fiscal year ended October 30, 2015, the Fund utilized $204,227,463 of capital loss carryforward to offset capital gains realized in that fiscal year. Details of the fiscal year ended October 30, 2015 capital loss carryforwards are included in the table below. Capital loss carryforwards with no expiration, if any, must be utilized prior to those with expiration dates. Capital losses with no expiration will be carried forward to future years if not offset by gains.
| | | | |
| Expiring | | | |
| |
2016 | | $ | 124,512,473 | |
2017 | | | 410,473,446 | |
| | | | |
Total | | $ | 534,985,919 | |
| | | | |
At period end, it is estimated that the capital loss carryforwards would be $534,985,919 expiring by 2017 and $29,238,988, which will not expire. The estimated capital loss
51 OPPENHEIMER GLOBAL ALLOCATION FUND
NOTES TO CONSOLIDATED
FINANCIAL STATEMENTS Unaudited / Continued
2. Significant Accounting Policies (Continued)
carryforward represents the carryforward as of the end of the last fiscal year, increased or decreased by capital losses or gains realized in the first six months of the current fiscal year. During the reporting period, it is estimated that the Fund will not utilize any capital loss carryforward to offset realized capital gains.
Net investment income (loss) and net realized gain (loss) may differ for financial statement and tax purposes. The character of dividends and distributions made during the fiscal year from net investment income or net realized gains are determined in accordance with federal income tax requirements, which may differ from the character of net investment income or net realized gains presented in those financial statements in accordance with U.S. GAAP. Also, due to timing of dividends and distributions, the fiscal year in which amounts are distributed may differ from the fiscal year in which the income or net realized gain was recorded by the Fund.
The aggregate cost of securities and other investments and the composition of unrealized appreciation and depreciation of securities and other investments for federal income tax purposes at period end are noted in the following table. The primary difference between book and tax appreciation or depreciation of securities and other investments, if applicable, is attributable to the tax deferral of losses or tax realization of financial statement unrealized gain or loss.
| | | | |
Federal tax cost of securities | | $ | 1,449,568,460 | |
Federal tax cost of other investments | | | 141,410,165 | |
| | | | |
Total federal tax cost | | $ | 1,590,978,625 | |
| | | | |
Gross unrealized appreciation | | $ | 127,026,072 | |
Gross unrealized depreciation | | | (96,536,824) | |
| | | | |
Net unrealized appreciation | | $ | 30,489,248 | |
| | | | |
Certain foreign countries impose a tax on capital gains which is accrued by the Fund based on unrealized appreciation, if any, on affected securities. The tax is paid when the gain is realized.
Recent Accounting Pronouncement. In May 2015, Financial Accounting Standards Board (“FASB”) issued Accounting Standards Update (“ASU”), ASU 2015-07. This is an update to Fair Value Measurement Topic 820. Under the amendments in this ASU, investments for which fair value is measured at net asset value per share (or its equivalent) using the practical expedient should not be categorized in the fair value hierarchy. ASU 2015-07 is effective for financial statements issued for fiscal years beginning after December 31, 2015, and interim periods within those fiscal years, with early adoption permitted. This has been adopted as reflected in Note 3.
Use of Estimates. The preparation of financial statements in conformity with U.S. GAAP requires management to make estimates and assumptions that affect the reported amounts of assets and liabilities and disclosure of contingent assets and liabilities at the date of the financial statements and the reported amounts of increases and decreases in net assets from operations during the reporting period. Actual results could differ from those estimates.
52 OPPENHEIMER GLOBAL ALLOCATION FUND
3. Securities Valuation
The Fund calculates the net asset value of its shares as of 4:00 P.M. Eastern time, on each day the New York Stock Exchange (the “Exchange”) is open for trading, except in the case of a scheduled early closing of the Exchange, in which case the Fund will calculate net asset value of the shares as of the scheduled early closing time of the Exchange.
The Fund’s Board has adopted procedures for the valuation of the Fund’s securities and has delegated the day-to-day responsibility for valuation determinations under those procedures to the Manager. The Manager has established a Valuation Committee which is responsible for determining a “fair valuation” for any security for which market quotations are not “readily available.” The Valuation Committee’s fair valuation determinations are subject to review, approval and ratification by the Fund’s Board at its next regularly scheduled meeting covering the calendar quarter in which the fair valuation was determined.
Valuation Methods and Inputs
Securities are valued using unadjusted quoted market prices, when available, as supplied primarily by third party pricing services or dealers.
The following methodologies are used to determine the market value or the fair value of the types of securities described below:
Securities traded on a registered U.S. securities exchange (including exchange-traded derivatives other than futures and futures options) are valued based on the last sale price of the security reported on the principal exchange on which it is traded, prior to the time when the Fund’s assets are valued. In the absence of a sale, the security is valued at the mean between the bid and asked price on the principal exchange or, if not available from the principal exchange, obtained from two dealers. If bid and asked prices are not available from either the exchange or two dealers, the security is valued by using one of the following methodologies (listed in order of priority): (1) a bid from the principal exchange, (2) the mean between the bid and asked price as provided by a single dealer, or (3) a bid from a single dealer. A security of a foreign issuer traded on a foreign exchange, but not listed on a registered U.S. securities exchange, is valued based on the last sale price on the principal exchange on which the security is traded, as identified by the third party pricing service used by the Manager, prior to the time when the Fund’s assets are valued. If the last sale price is unavailable, the security is valued at the most recent official closing price on the principal exchange on which it is traded. If the last sales price or official closing price for a foreign security is not available, the security is valued at the mean between the bid and asked price per the exchange or, if not available from the exchange, obtained from two dealers. If bid and asked prices are not available from either the exchange or two dealers, the security is valued by using one of the following methodologies (listed in order of priority): (1) a bid from the exchange, (2) the mean between the bid and asked price as provided by a single dealer, or (3) a bid from a single dealer.
Shares of a registered investment company that are not traded on an exchange are valued at that investment company’s net asset value per share.
Corporate and government debt securities (of U.S. or foreign issuers) and municipal debt
53 OPPENHEIMER GLOBAL ALLOCATION FUND
NOTES TO CONSOLIDATED
FINANCIAL STATEMENTS Unaudited / Continued
3. Securities Valuation (Continued)
securities, event-linked bonds, loans, mortgage-backed securities, collateralized mortgage obligations, and asset-backed securities are valued at the mean between the “bid” and “asked” prices utilizing evaluated prices obtained from third party pricing services or broker-dealers who may use matrix pricing methods to determine the evaluated prices.
Short-term money market type debt securities with a remaining maturity of sixty days or less are valued at cost adjusted by the amortization of discount or premium to maturity (amortized cost), which approximates market value. Short-term debt securities with a remaining maturity in excess of sixty days are valued at the mean between the “bid” and “asked” prices utilizing evaluated prices obtained from third party pricing services or broker-dealers.
Structured securities, swaps, swaptions, and other over-the-counter derivatives are valued utilizing evaluated prices obtained from third party pricing services or broker-dealers.
Forward foreign currency exchange contracts are valued utilizing current and forward currency rates obtained from third party pricing services. When the settlement date of a contract is an interim date for which a quotation is not available, interpolated values are derived using the nearest dated forward currency rate.
Futures contracts and futures options traded on a commodities or futures exchange will be valued at the final settlement price or official closing price on the principal exchange as reported by such principal exchange at its trading session ending at, or most recently prior to, the time when the Fund’s assets are valued.
A description of the standard inputs that may generally be considered by the third party pricing vendors in determining their evaluated prices is provided below.
| | |
| Security Type | | Standard inputs generally considered by third-party pricing vendors |
|
| Corporate debt, government debt, municipal, mortgage- backed and asset-backed securities | | Reported trade data, broker-dealer price quotations, benchmark yields, issuer spreads on comparable securities, the credit quality, yield, maturity, and other appropriate factors. |
|
| Loans | | Information obtained from market participants regarding reported trade data and broker-dealer price quotations. |
|
| Event-linked bonds | | Information obtained from market participants regarding reported trade data and broker-dealer price quotations. |
|
| Structured securities | | Relevant market information such as the price of underlying financial instruments, stock market indices, foreign currencies, interest rate spreads, commodities, or the occurrence of other specific events. |
|
| Swaps | | Relevant market information, including underlying reference assets such as credit spreads, credit event probabilities, index values, individual security values, forward interest rates, variable interest rates, volatility measures, and forward currency rates. |
If a market value or price cannot be determined for a security using the methodologies described above, or if, in the “good faith” opinion of the Manager, the market value or price obtained does not constitute a “readily available market quotation,” or a significant event has occurred that would materially affect the value of the security, the security is fair valued either (i) by a standardized fair valuation methodology applicable to the security type or the significant event as previously approved by the Valuation Committee and the
54 OPPENHEIMER GLOBAL ALLOCATION FUND
3. Securities Valuation (Continued)
Fund’s Board or (ii) as determined in good faith by the Manager’s Valuation Committee. The Valuation Committee considers all relevant facts that are reasonably available, through either public information or information available to the Manager, when determining the fair value of a security. Fair value determinations by the Manager are subject to review, approval and ratification by the Fund’s Board at its next regularly scheduled meeting covering the calendar quarter in which the fair valuation was determined. Those fair valuation standardized methodologies include, but are not limited to, valuing securities at the last sale price or initially at cost and subsequently adjusting the value based on: changes in company specific fundamentals, changes in an appropriate securities index, or changes in the value of similar securities which may be further adjusted for any discounts related to security-specific resale restrictions. When possible, such methodologies use observable market inputs such as unadjusted quoted prices of similar securities, observable interest rates, currency rates and yield curves. The methodologies used for valuing securities are not necessarily an indication of the risks associated with investing in those securities nor can it be assured that the Fund can obtain the fair value assigned to a security if it were to sell the security.
To assess the continuing appropriateness of security valuations, the Manager, or its third party service provider who is subject to oversight by the Manager, regularly compares prior day prices, prices on comparable securities, and sale prices to the current day prices and challenges those prices exceeding certain tolerance levels with the third party pricing service or broker source. For those securities valued by fair valuations, whether through a standardized fair valuation methodology or a fair valuation determination, the Valuation Committee reviews and affirms the reasonableness of the valuations based on such methodologies and fair valuation determinations on a regular basis after considering all relevant information that is reasonably available.
Classifications
Each investment asset or liability of the Fund is assigned a level at measurement date based on the significance and source of the inputs to its valuation. Various data inputs are used in determining the value of each of the Fund’s investments as of the reporting period end. These data inputs are categorized in the following hierarchy under applicable financial accounting standards:
1) Level 1-unadjusted quoted prices in active markets for identical assets or liabilities (including securities actively traded on a securities exchange)
2) Level 2-inputs other than unadjusted quoted prices that are observable for the asset or liability (such as unadjusted quoted prices for similar assets and market corroborated inputs such as interest rates, prepayment speeds, credit risks, etc.)
3) Level 3-significant unobservable inputs (including the Manager’s own judgments about assumptions that market participants would use in pricing the asset or liability).
The inputs used for valuing securities are not necessarily an indication of the risks associated with investing in those securities.
The Fund classifies each of its investments in those investment companies which are
55 OPPENHEIMER GLOBAL ALLOCATION FUND
NOTES TO CONSOLIDATED
FINANCIAL STATEMENTS Unaudited / Continued
3. Securities Valuation (Continued)
publicly offered and reported on an exchange as Level 1, and those investment companies which are not publicly offered as Level 2, without consideration as to the classification level of the specific investments held by those investment companies.
The table below categorizes amounts that are included in the Fund’s Consolidated Statement of Assets and Liabilities at period end based on valuation input level:
| | | | | | | | | | | | | | | | |
| | | Level 1—
Unadjusted
Quoted Prices | | | Level 2— Other Significant
Observable Inputs | | | Level 3—
Significant
Unobservable
Inputs | | | Value | |
Assets Table | | | | | | | | | | | | | | | | |
Investments, at Value: | | | | | | | | | | | | | | | | |
Common Stocks | | | | | | | | | | | | | | | | |
Consumer Discretionary | | $ | 73,072,803 | | | $ | 89,299,290 | | | $ | — | | | $ | 162,372,093 | |
Consumer Staples | | | 41,761,672 | | | | 58,446,276 | | | | — | | | | 100,207,948 | |
Energy | | | 27,485,924 | | | | 12,242,916 | | | | — | | | | 39,728,840 | |
Financials | | | 74,189,645 | | | | 61,406,565 | | | | 4 | | | | 135,596,214 | |
Health Care | | | 70,001,085 | | | | 32,597,631 | | | | — | | | | 102,598,716 | |
Industrials | | | 50,576,103 | | | | 79,294,792 | | | | — | | | | 129,870,895 | |
Information Technology | | | 111,591,488 | | | | 69,163,876 | | | | — | | | | 180,755,364 | |
Materials | | | 14,121,841 | | | | 22,428,897 | | | | 352 | | | | 36,551,090 | |
Telecommunication Services | | | 8,458,341 | | | | 28,896,325 | | | | — | | | | 37,354,666 | |
Utilities | | | 7,639,043 | | | | — | | | | — | | | | 7,639,043 | |
Preferred Stocks | | | 154,724 | | | | 5,541,781 | | | | — | | | | 5,696,505 | |
Rights, Warrants and Certificates | | | 52,290 | | | | — | | | | — | | | | 52,290 | |
U.S. Government Obligations | | | — | | | | 217,587,864 | | | | — | | | | 217,587,864 | |
Non-Convertible Corporate Bonds and Notes | | | — | | | | 497,613 | | | | — | | | | 497,613 | |
Corporate Loan | | | — | | | | — | | | | 1,631 | | | | 1,631 | |
Investment Companies | | | 149,655,210 | | | | �� | | | | — | | | | 149,655,210 | |
| | | | |
Total Investments, at Value | | | 628,760,169 | | | | 677,403,826 | | | | 1,987 | | | | 1,306,165,982 | |
Other Financial Instruments: | | | | | | | | | | | | | | | | |
Futures contracts | | | 2,243,217 | | | | — | | | | — | | | | 2,243,217 | |
Forward currency exchange contracts | | | — | | | | 7,622,109 | | | | — | | | | 7,622,109 | |
| | | | |
| Total Assets excluding investment companies valued using practical expedient | | $ | 631,003,386 | | | $ | 685,025,935 | | | $ | 1,987 | | | | 1,316,031,308 | |
| | | | |
Investment companies valued using practical expedient | | | | | | | | | | | | | | | 171,734,367 | |
| | | | | | | | | | | | | | | | |
Total Assets | | | | | | | | | | | | | | $ | 1,487,765,675 | |
| | | | | | | | | | | | | | | | |
| | | | |
Liabilities Table | | | | | | | | | | | | | | | | |
Other Financial Instruments: | | | | | | | | | | | | | | | | |
Futures contracts | | $ | (1,587,135) | | | $ | — | | | $ | — | | | $ | (1,587,135) | |
Forward currency exchange contracts | | | — | | | | (6,574,086) | | | | — | | | | (6,574,086) | |
Centrally cleared swaps, at value | | | — | | | | (20,432) | | | | — | | | | (20,432) | |
| | | | |
Total Liabilities | | $ | (1,587,135) | | | $ | (6,594,518 | ) | | $ | — | | | $ | (8,181,653) | |
| | | | |
Forward currency exchange contracts and futures contracts, if any, are reported at their
56 OPPENHEIMER GLOBAL ALLOCATION FUND
3. Securities Valuation (Continued)
unrealized appreciation/depreciation at measurement date, which represents the change in the contract’s value from trade date. All additional assets and liabilities included in the above table are reported at their market value at measurement date.
The table below shows the transfers between Level 1 and Level 2. The Fund’s policy is to recognize transfers in and transfers out as of the beginning of the reporting period.
| | | | | | | | |
| | | Transfers out of Level 1* | | | Transfers into Level 2* | |
| |
Assets Table | | | | | | | | |
Investments, at Value: | | | | | | | | |
Common Stocks | | | | | | | | |
Consumer Discretionary | | $ | (956,803) | | | $ | 956,803 | |
Consumer Staples | | | (919,664) | | | | 919,664 | |
Financials | | | (3,020,755) | | | | 3,020,755 | |
Industrials | | | (1,260,351) | | | | 1,260,351 | |
Preferred Stocks | | | (1,059,563) | | | | 1,059,563 | |
| | | | |
Total Assets | | $ | (7,217,136) | | | $ | 7,217,136 | |
| | | | |
* Transfers from Level 1 to Level 2 are a result of a change from the use of an exchange traded price to a valuation received from a third-party pricing service or a fair valuation determined based on observable market information other than quoted prices from an active market.
4. Investments and Risks
Risks of Foreign Investing. The Fund may invest in foreign securities which are subject to special risks. Securities traded in foreign markets may be less liquid and more volatile than those traded in U.S. markets. Foreign issuers are usually not subject to the same accounting and disclosure requirements that U.S. companies are subject to, which may make it difficult for the Fund to evaluate a foreign company’s operations or financial condition. A change in the value of a foreign currency against the U.S. dollar will result in a change in the U.S. dollar value of investments denominated in that foreign currency and in the value of any income or distributions the Fund may receive on those investments. The value of foreign investments may be affected by exchange control regulations, foreign taxes, higher transaction and other costs, delays in the settlement of transactions, changes in economic or monetary policy in the United States or abroad, expropriation or nationalization of a company’s assets, or other political and economic factors. In addition, due to the inter-relationship of global economies and financial markets, changes in political and economic factors in one country or region could adversely affect conditions in another country or region. Investments in foreign securities may also expose the Fund to time-zone arbitrage risk. Foreign securities may trade on weekends or other days when the Fund does not price its shares. At times, the Fund may emphasize investments in a particular country or region and may be subject to greater risks from adverse events that occur in that country or region. Foreign securities and foreign currencies held in foreign banks and securities depositories may be subject to limited or no regulatory oversight.
Investments in Affiliated Funds. The Fund is permitted to invest in other mutual funds
57 OPPENHEIMER GLOBAL ALLOCATION FUND
NOTES TO CONSOLIDATED
FINANCIAL STATEMENTS Unaudited / Continued
4. Investments and Risks (Continued)
advised by the Manager (“Affiliated Funds”). Affiliated Funds are open-end management investment companies registered under the 1940 Act, as amended. The Manager is the investment adviser of, and the Sub-Adviser provides investment and related advisory services to, the Affiliated Funds. When applicable, the Fund’s investments in Affiliated Funds are included in the Consolidated Statement of Investments. Shares of Affiliated Funds are valued at their net asset value per share. As a shareholder, the Fund is subject to its proportional share of the Affiliated Funds’ expenses, including their management fee. The Manager will waive fees and/or reimburse Fund expenses in an amount equal to the indirect management fees incurred through the Fund’s investment in the Affiliated Funds.
Each of the Affiliated Funds in which the Fund invests has its own investment risks, and those risks can affect the value of the Fund’s investments and therefore the value of the Fund’s shares. To the extent that the Fund invests more of its assets in one Affiliated Fund than in another, the Fund will have greater exposure to the risks of that Affiliated Fund.
Investment in Oppenheimer Institutional Money Market Fund. The Fund is permitted to invest daily available cash balances in a money market Affiliated Fund. The Fund may invest the available cash in Class E shares of Oppenheimer Institutional Money Market Fund (“IMMF”) to seek current income while preserving liquidity or for defensive purposes. IMMF is regulated as a money market fund under the Investment Company Act of 1940, as amended.
Investment in Oppenheimer Master Funds. The Fund is permitted to invest in entities sponsored and/or advised by the Manager or an affiliate. Certain of these entities in which the Fund invests are mutual funds registered under the Investment Company Act of 1940 that expect to be treated as partnerships for tax purposes, specifically Oppenheimer Master Loan Fund, LLC (“Master Loan”) and Oppenheimer Master Event-Linked Bond Fund, LLC (“Master Event-Linked Bond”) (the “Master Funds”). Each Master Fund has its own investment risks, and those risks can affect the value of the Fund’s investments and therefore the value of the Fund’s shares. To the extent that the Fund invests more of its assets in one Master Fund than in another, the Fund will have greater exposure to the risks of that Master Fund.
The investment objective of Master Loan is to seek income. The investment objective of Master Event-Linked Bond is to seek total return. The Fund’s investments in the Master Funds are included in the Consolidated Statement of Investments. The Fund recognizes income and gain/(loss) on its investments in each Master Fund according to its allocated pro-rata share, based on its relative proportion of total outstanding Master Fund shares held, of the total net income earned and the net gain/(loss) realized on investments sold by the Master Funds. As a shareholder, the Fund is subject to its proportional share of the Master Funds’ expenses, including their management fee. The Manager will waive fees and/or reimburse Fund expenses in an amount equal to the indirect management fees incurred through the Fund’s investment in the Master Funds. The Fund owns 7.5% of Master Loan and 28.0% of Master Event-Linked Bond at period end.
Master Limited Partnerships (“MLPs”). MLPs issue common units that represent an
58 OPPENHEIMER GLOBAL ALLOCATION FUND
4. Investments and Risks (Continued)
equity ownership interest in a partnership and provide limited voting rights. MLP common units are registered with the Securities and Exchange Commission (“SEC”), and are freely tradable on securities exchanges such as the NYSE and the NASDAQ Stock Market (“NASDAQ”), or in the over-the-counter (“OTC”) market. An MLP consists of one or more general partners, who conduct the business, and one or more limited partners, who contribute capital. MLP common unit holders have a limited role in the partnership’s operations and management. The Fund, as a limited partner, normally would not be liable for the debts of the MLP beyond the amounts the Fund has contributed, but would not be shielded to the same extent that a shareholder of a corporation would be. In certain circumstances creditors of an MLP would have the right to seek return of capital distributed to a limited partner. This right of an MLP’s creditors would continue after the Fund sold its investment in the MLP.
Loans. The Fund invests in loans made to U.S. and foreign borrowers that are corporations, partnerships or other business entities. The Fund will do so directly as an original lender or by assignment or indirectly through participation agreements or certain derivative instruments. While many of these loans will be collateralized, the Fund can also invest in uncollateralized loans. Loans are often issued in connection with recapitalizations, acquisitions, leveraged buyouts, and refinancing of borrowers. The loans often pay interest at rates that float above (or are adjusted periodically based on) a benchmark that reflects current interest rates although the Fund can also invest in loans with fixed interest rates.
Securities on a When-Issued or Delayed Delivery Basis. The Fund may purchase securities on a “when-issued” basis, and may purchase or sell securities on a “delayed delivery” basis. “When-issued” or “delayed delivery” refers to securities whose terms and indenture are available and for which a market exists, but which are not available for immediate delivery. Delivery and payment for securities that have been purchased by the Fund on a when-issued basis normally takes place within six months and possibly as long as two years or more after the trade date. During this period, such securities do not earn interest, are subject to market fluctuation and may increase or decrease in value prior to their delivery. The purchase of securities on a when-issued basis may increase the volatility of the Fund’s net asset value to the extent the Fund executes such transactions while remaining substantially fully invested. When the Fund engages in when-issued or delayed delivery transactions, it relies on the buyer or seller, as the case may be, to complete the transaction. Their failure to do so may cause the Fund to lose the opportunity to obtain or dispose of the security at a price and yield it considers advantageous. The Fund may also sell securities that it purchased on a when-issued basis or forward commitment prior to settlement of the original purchase.
At period end, the Fund had purchased securities issued on a when-issued or delayed delivery basis and sold securities issued on a delayed delivery basis as follows:
59 OPPENHEIMER GLOBAL ALLOCATION FUND
NOTES TO CONSOLIDATED
FINANCIAL STATEMENTS Unaudited / Continued
4. Investments and Risks (Continued)
| | | | |
| | | When-Issued or
Delayed Delivery
Basis Transactions | |
| |
Sold securities | | | $210,325 | |
Equity Security Risk. Stocks and other equity securities fluctuate in price. The value of the Fund’s portfolio may be affected by changes in the equity markets generally. Equity markets may experience significant short-term volatility and may fall sharply at times. Different markets may behave differently from each other and U.S. equity markets may move in the opposite direction from one or more foreign stock markets. Adverse events in any part of the equity or fixed-income markets may have unexpected negative effects on other market segments.
The prices of individual equity securities generally do not all move in the same direction at the same time and a variety of factors can affect the price of a particular company’s securities. These factors may include, but are not limited to, poor earnings reports, a loss of customers, litigation against the company, general unfavorable performance of the company’s sector or industry, or changes in government regulations affecting the company or its industry.
Credit Risk. The Fund invests in high-yield, non-investment-grade bonds, which may be subject to a greater degree of credit risk. Credit risk relates to the ability of the issuer to meet interest or principal payments or both as they become due. The Fund may acquire securities that have missed an interest payment, and is not obligated to dispose of securities whose issuers or underlying obligors subsequently miss an interest payment.
Information concerning securities not accruing interest at period end is as follows:
| | | | |
Cost | | | $315,292 | |
Market Value | | | $1,631 | |
Market Value as % of Net Assets | | | Less than 0.005% | |
5. Market Risk Factors
The Fund’s investments in securities and/or financial derivatives may expose the Fund to various market risk factors:
Commodity Risk. Commodity risk relates to the change in value of commodities or commodity indexes as they relate to increases or decreases in the commodities market.
Commodities are physical assets that have tangible properties. Examples of these types of assets are crude oil, heating oil, metals, livestock, and agricultural products.
Credit Risk. Credit risk relates to the ability of the issuer of debt to meet interest and principal payments, or both, as they come due. In general, lower-grade, higher-yield debt securities are subject to credit risk to a greater extent than lower-yield, higher-quality securities.
Equity Risk. Equity risk relates to the change in value of equity securities as they relate to increases or decreases in the general market.
Foreign Exchange Rate Risk. Foreign exchange rate risk relates to the change in the U.S. dollar value of a security held that is denominated in a foreign currency. The U.S. dollar
60 OPPENHEIMER GLOBAL ALLOCATION FUND
5. Market Risk Factors (Continued)
value of a foreign currency denominated security will decrease as the dollar appreciates against the currency, while the U.S. dollar value will increase as the dollar depreciates against the currency.
Interest Rate Risk. Interest rate risk refers to the fluctuations in value of fixed-income securities resulting from the inverse relationship between price and yield. For example, an increase in general interest rates will tend to reduce the market value of already issued fixed-income investments, and a decline in general interest rates will tend to increase their value. In addition, debt securities with longer maturities, which tend to have higher yields, are subject to potentially greater fluctuations in value from changes in interest rates than obligations with shorter maturities.
Volatility Risk. Volatility risk refers to the magnitude of the movement, but not the direction of the movement, in a financial instrument’s price over a defined time period. Large increases or decreases in a financial instrument’s price over a relative time period typically indicate greater volatility risk, while small increases or decreases in its price typically indicate lower volatility risk.
6. Use of Derivatives
The Fund’s investment objective not only permits the Fund to purchase investment securities, it also allows the Fund to enter into various types of derivatives contracts, including, but not limited to, futures contracts, forward currency exchange contracts, credit default swaps, interest rate swaps, total return swaps, variance swaps and purchased and written options. In doing so, the Fund will employ strategies in differing combinations to permit it to increase, decrease, or change the level or types of exposure to market risk factors. These instruments may allow the Fund to pursue its objectives more quickly and efficiently than if it were to make direct purchases or sales of securities capable of effecting a similar response to market factors. Such contracts may be entered into through a bilateral over-the-counter (“OTC”) transaction, or through a securities or futures exchange and cleared through a clearinghouse.
Derivatives may have little or no initial cash investment relative to their market value exposure and therefore can produce significant gains or losses in excess of their cost due to unanticipated changes in the market risk factors and the overall market. This use of embedded leverage allows the Fund to increase its market value exposure relative to its net assets and can substantially increase the volatility of the Fund’s performance. In instances where the Fund is using derivatives to decrease, or hedge, exposures to market risk factors for securities held by the Fund, there are also risks that those derivatives may not perform as expected resulting in losses for the combined or hedged positions. Some derivatives have the potential for unlimited loss, regardless of the size of the Fund’s initial investment.
Additional associated risks from investing in derivatives also exist and potentially could have significant effects on the valuation of the derivative and the Fund. Typically, the associated risks are not the risks that the Fund is attempting to increase or decrease exposure to, per its investment objectives, but are the additional risks from investing in derivatives. Examples of these associated risks are liquidity risk, which is the risk that the Fund will not be
61 OPPENHEIMER GLOBAL ALLOCATION FUND
NOTES TO CONSOLIDATED
FINANCIAL STATEMENTS Unaudited / Continued
6. Use of Derivatives (Continued)
able to sell the derivative in the open market in a timely manner, and counterparty credit risk, which is the risk that the counterparty will not fulfill its obligation to the Fund.
The Fund’s actual exposures to these market risk factors and associated risks during the period are discussed in further detail, by derivative type, below.
Forward Currency Exchange Contracts
The Fund may enter into forward currency exchange contracts (“forward contracts”) for the purchase or sale of a foreign currency at a negotiated rate at a future date. Such contracts are traded in the OTC inter-bank currency dealer market.
Forward contracts are reported on a schedule following the Consolidated Statement of Investments. The unrealized appreciation (depreciation) is reported in the Consolidated Statement of Assets and Liabilities as a receivable (or payable) and in the Consolidated Statement of Operations within the change in unrealized appreciation (depreciation). At contract close, the difference between the original cost of the contract and the value at the close date is recorded as a realized gain (loss) in the Consolidated Statement of Operations.
The Fund has entered into forward contracts with the obligation to purchase specified foreign currencies in the future at a currently negotiated forward rate in order to take a positive investment perspective on the related currency. These forward contracts seek to increase exposure to foreign exchange rate risk.
The Fund has entered into forward contracts with the obligation to purchase specified foreign currencies in the future at a currently negotiated forward rate in order to decrease exposure to foreign exchange rate risk associated with foreign currency denominated securities held by the Fund.
The Fund has entered into forward contracts with the obligation to sell specified foreign currencies in the future at a currently negotiated forward rate in order to take a negative investment perspective on the related currency. These forward contracts seek to increase exposure to foreign exchange rate risk.
The Fund has entered into forward contracts with the obligation to sell specified foreign currencies in the future at a currently negotiated forward rate in order to decrease exposure to foreign exchange rate risk associated with foreign currency denominated securities held by the Fund.
During the reporting period, the Fund had daily average contract amounts on forward contracts to buy and sell of $209,499,434 and $326,881,474, respectively.
Additional associated risk to the Fund includes counterparty credit risk. Counterparty credit risk arises from the possibility that the counterparty to a forward contract will default and fail to perform its obligations to the Fund.
Futures Contracts
A futures contract is a commitment to buy or sell a specific amount of a commodity, financial instrument or currency at a negotiated price on a stipulated future date. The Fund may buy and sell futures contracts and may also buy or write put or call options on these futures contracts. Futures contracts and options thereon are generally entered into on a regulated
62 OPPENHEIMER GLOBAL ALLOCATION FUND
6. Use of Derivatives (Continued)
futures exchange and cleared through a clearinghouse associated with the exchange.
Upon entering into a futures contract, the Fund is required to deposit either cash or securities (initial margin) in an amount equal to a certain percentage of the contract value in an account registered in the futures commission merchant’s name. Subsequent payments (variation margin) are paid to or from the futures commission merchant each day equal to the daily changes in the contract value. Such payments are recorded as unrealized gains and losses. Should the Fund fail to make requested variation margin payments, the futures commission merchant can gain access to the initial margin to satisfy the Fund’s payment obligations.
Futures contracts are reported on a schedule following the Consolidated Statement of Investments. Securities held by a futures commission merchant to cover initial margin requirements on open futures contracts are noted in the Consolidated Statement of Investments. Cash held by a futures commission merchant to cover initial margin requirements on open futures contracts and the receivable and/or payable for the daily mark to market for the variation margin are noted in the Consolidated Statement of Assets and Liabilities. The net change in unrealized appreciation and depreciation is reported in the Consolidated Statement of Operations. Realized gains (losses) are reported in the Consolidated Statement of Operations at the closing or expiration of futures contracts.
The Fund has purchased futures contracts on various bonds and notes to increase exposure to interest rate risk.
The Fund has purchased futures contracts on various equity indexes to increase exposure to equity risk.
The Fund has sold futures contracts on various equity indexes to decrease exposure to equity risk.
During the reporting period, the Fund had an ending monthly average market value of $95,294,113 and $113,908,786 on futures contracts purchased and sold, respectively.
Additional associated risks of entering into futures contracts (and related options) include the possibility that there may be an illiquid market where the Fund is unable to liquidate the contract or enter into an offsetting position and, if used for hedging purposes, the risk that the price of the contract will correlate imperfectly with the prices of the Fund’s securities.
Option Activity
The Fund may buy and sell put and call options, or write put and call options. When an option is written, the Fund receives a premium and becomes obligated to sell or purchase the underlying security, currency or other underlying financial instrument at a fixed price, upon exercise of the option.
Options can be traded through an exchange or through a privately negotiated arrangement with a dealer in an OTC transaction. Options traded through an exchange are generally cleared through a clearinghouse (such as The Options Clearing Corporation). The difference between the premium received or paid, and market value of the option, is recorded as unrealized appreciation or depreciation. The net change in unrealized appreciation or depreciation is reported in the Consolidated Statement of Operations. When an option is
63 OPPENHEIMER GLOBAL ALLOCATION FUND
NOTES TO CONSOLIDATED
FINANCIAL STATEMENTS Unaudited / Continued
6. Use of Derivatives (Continued)
exercised, the cost of the security purchased or the proceeds of the security sale are adjusted by the amount of premium received or paid. Upon the expiration or closing of the option transaction, a gain or loss is reported in the Consolidated Statement of Operations.
The Fund has purchased put options on treasury and/or euro futures to decrease exposure to interest rate risk. A purchased put option becomes more valuable as the price of the underlying financial instrument depreciates relative to the strike price.
The Fund has purchased call options on individual equity securities and/or equity indexes to increase exposure to equity risk. A purchased call option becomes more valuable as the price of the underlying financial instrument appreciates relative to the strike price.
During the reporting period, the Fund had an ending monthly average market value of $1,514,670 and $22,760 on purchased call options and purchased put options, respectively.
Options written, if any, are reported in a schedule following the Consolidated Statement of Investments and as a liability in the Consolidated Statement of Assets and Liabilities. Securities held in collateral accounts to cover potential obligations with respect to outstanding written options are noted in the Consolidated Statement of Investments.
The risk in writing a call option is that the market price of the security increases and if the option is exercised, the Fund must either purchase the security at a higher price for delivery or, if the Fund owns the underlying security, give up the opportunity for profit. The risk in writing a put option is that the Fund may incur a loss if the market price of the security decreases and the option is exercised. The risk in buying an option is that the Fund pays a premium whether or not the option is exercised. The Fund also has the additional risk that there may be an illiquid market where the Fund is unable to close the contract.
The Fund has written call options on treasury and/or euro futures to decrease exposure to interest rate risk. A written call option becomes more valuable as the price of the underlying financial instrument depreciates relative to the strike price.
During the reporting period, the Fund had an ending monthly average market value of $140,822 written call options.
Additional associated risks to the Fund include counterparty credit risk and liquidity risk.
Written option activity for the reporting period was as follows:
| | | | | | | | | | |
| | | Number of
Contracts | | | | | Amount of
Premiums | |
| |
| Options outstanding as of October 30, 2015 | | | – | | | | | $ | – | |
| Options written | | | 2,681 | | | | | | 888,145 | |
| Options exercised | | | (2,681) | | | | | | (888,145) | |
| | | | |
Options outstanding as of April 29, 2016 | | | – | | | | | $ | – | |
| | | | |
Swap Contracts
The Fund may enter into swap contract agreements with a counterparty to exchange a series of cash flows based on either specified reference rates, the price or volatility of asset or non-asset references, or the occurrence of a credit event, over a specified period. Swaps can be
64 OPPENHEIMER GLOBAL ALLOCATION FUND
6. Use of Derivatives (Continued)
executed in a bi-lateral privately negotiated arrangement with a dealer in an OTC transaction (“OTC swaps”) or executed on a regulated market. Certain swaps, regardless of the venue of their execution, are required to be cleared through a clearinghouse (“centrally cleared swaps”). Swap contracts may include interest rate, equity, debt, index, total return, credit default, currency, and volatility swaps.
Swap contracts are reported on a schedule following the Consolidated Statement of Investments. The values of centrally cleared swap and OTC swap contracts are aggregated by positive and negative values and disclosed separately on the Consolidated Statement of Assets and Liabilities. The unrealized appreciation (depreciation) related to the change in the valuation of the notional amount of the swap is combined with the accrued interest due to (owed by) the Fund, if any, at termination or settlement. The net change in this amount during the period is included on the Consolidated Statement of Operations. The Fund also records any periodic payments received from (paid to) the counterparty, including at termination, under such contracts as realized gain (loss) on the Consolidated Statement of Operations.
Swap contract agreements are exposed to the market risk factor of the specific underlying reference rate or asset. Swap contracts are typically more attractively priced compared to similar investments in related cash securities because they isolate the risk to one market risk factor and eliminate the other market risk factors. Investments in cash securities (for instance bonds) have exposure to multiple risk factors (credit and interest rate risk). Because swaps have embedded leverage, they can expose the Fund to substantial risk in the isolated market risk factor.
Interest Rate Swap Contracts. An interest rate swap is an agreement between counterparties to exchange periodic payments based on interest rates. One cash flow stream will typically be a floating rate payment based upon a specified floating interest rate while the other is typically a fixed interest rate.
The Fund has entered into interest rate swaps in which it pays a floating interest rate and receives a fixed interest rate in order to increase exposure to interest rate risk. Typically, if relative interest rates rise, payments made by the Fund under a swap agreement will be greater than the payments received by the Fund.
For the reporting period, the Fund had ending monthly average notional amounts of $7,371,429 on interest rate swaps which receive a fixed rate.
Additional associated risks to the Fund include counterparty credit risk and liquidity risk.
Total Return Swap Contracts. A total return swap is an agreement between counterparties to exchange periodic payments based on the value of asset or non-asset references. One cash flow is typically based on a non-asset reference (such as an interest rate) and the other on the total return of a reference asset (such as a security or a basket of securities or securities index). The total return of the reference asset typically includes appreciation or depreciation on the reference asset, plus any interest or dividend payments.
Total return swap contracts are exposed to the market risk factor of the specific underlying financial instrument or index. Total return swaps are less standard in structure than other types of swaps and can isolate and/or include multiple types of market risk factors including equity risk, credit risk, and interest rate risk.
65 OPPENHEIMER GLOBAL ALLOCATION FUND
NOTES TO CONSOLIDATED
FINANCIAL STATEMENTS Unaudited / Continued
6. Use of Derivatives (Continued)
The Fund has entered into total return swaps to decrease exposure to the credit risk of various indexes or basket of securities. These credit risk related total return swaps require the fund to pay to, or receive payments from, the counterparty based on the movement of credit spreads of the related indexes or securities.
For the reporting period, the Fund had ending monthly average notional amounts of $21,420,763 on total return swaps which are short the reference asset.
At period end, the Fund has no such total return swap agreements outstanding.
Additional associated risks to the Fund include counterparty credit risk and liquidity risk.
Counterparty Credit Risk. Derivative positions are subject to the risk that the counterparty will not fulfill its obligation to the Fund. The Fund intends to enter into derivative transactions with counterparties that the Manager believes to be creditworthy at the time of the transaction.
The Fund’s risk of loss from counterparty credit risk on OTC derivatives is generally limited to the aggregate unrealized gain netted against any collateral held by the Fund. For OTC options purchased, the Fund bears the risk of loss of the amount of the premiums paid plus the positive change in market values net of any collateral held by the Fund should the counterparty fail to perform under the contracts. Options written by the Fund do not typically give rise to counterparty credit risk, as options written generally obligate the Fund and not the counterparty to perform.
To reduce counterparty risk with respect to OTC transactions, the Fund has entered into master netting arrangements, established within the Fund’s International Swap and Derivatives Association, Inc. (“ISDA”) master agreements, which allow the Fund to make (or to have an entitlement to receive) a single net payment in the event of default (close-out netting) for outstanding payables and receivables with respect to certain OTC positions in swaps, options, swaptions, and forward currency exchange contracts for each individual counterparty. In addition, the Fund may require that certain counterparties post cash and/or securities in collateral accounts to cover their net payment obligations for those derivative contracts subject to ISDA master agreements. If the counterparty fails to perform under these contracts and agreements, the cash and/or securities will be made available to the Fund.
At period end, the Fund has required certain counterparties to post collateral of $2,880,138.
ISDA master agreements include credit related contingent features which allow counterparties to OTC derivatives to terminate derivative contracts prior to maturity in the event that, for example, the Fund’s net assets decline by a stated percentage or the Fund fails to meet the terms of its ISDA master agreements, which would cause the Fund to accelerate payment of any net liability owed to the counterparty.
For financial reporting purposes, the Fund does not offset derivative assets and derivative liabilities that are subject to netting arrangements in the Consolidated Statement of Assets and Liabilities. Bankruptcy or insolvency laws of a particular jurisdiction may impose restrictions on or prohibitions against the right of offset in bankruptcy, insolvency or other events.
66 OPPENHEIMER GLOBAL ALLOCATION FUND
6. Use of Derivatives (Continued)
The Fund’s risk of loss from counterparty credit risk on exchange-traded derivatives cleared through a clearinghouse and for centrally cleared swaps is generally considered lower than as compared to OTC derivatives. However, counterparty credit risk exists with respect to initial and variation margin deposited/paid by the Fund that is held in futures commission merchant, broker and/or clearinghouse accounts for such exchange-traded derivatives and for centrally cleared swaps.
With respect to centrally cleared swaps, such transactions will be submitted for clearing, and if cleared, will be held in accounts at futures commission merchants or brokers that are members of clearinghouses. While brokers, futures commission merchants and clearinghouses are required to segregate customer margin from their own assets, in the event that a broker, futures commission merchant or clearinghouse becomes insolvent or goes into bankruptcy and at that time there is a shortfall in the aggregate amount of margin held by the broker, futures commission merchant or clearinghouse for all its customers, U.S. bankruptcy laws will typically allocate that shortfall on a pro-rata basis across all the broker’s, futures commission merchant’s or clearinghouse’s customers, potentially resulting in losses to the Fund.
There is the risk that a broker, futures commission merchant or clearinghouse will decline to clear a transaction on the Fund’s behalf, and the Fund may be required to pay a termination fee to the executing broker with whom the Fund initially enters into the transaction.
Clearinghouses may also be permitted to terminate centrally cleared swaps at any time. The Fund is also subject to the risk that the broker or futures commission merchant will improperly use the Fund’s assets deposited/paid as initial or variation margin to satisfy payment obligations of another customer. In the event of a default by another customer of the broker or futures commission merchant, the Fund might not receive its variation margin payments from the clearinghouse, due to the manner in which variation margin payments are aggregated for all customers of the broker/futures commission merchant.
Collateral and margin requirements differ by type of derivative. Margin requirements are established by the broker, futures commission merchant or clearinghouse for exchange-traded and cleared derivatives, including centrally cleared swaps. Brokers, futures commission merchants and clearinghouses can ask for margin in excess of the regulatory minimum, or increase the margin amount, in certain circumstances.
Collateral terms are contract specific for OTC derivatives. For derivatives traded under an ISDA master agreement, the collateral requirements are typically calculated by netting the mark to market amount for each transaction under such agreement and comparing that amount to the value of any collateral currently pledged by the Fund or the counterparty.
For financial reporting purposes, cash collateral that has been pledged to cover obligations of the Fund, if any, is reported separately on the Consolidated Statement of Assets and Liabilities as cash pledged as collateral. Non-cash collateral pledged by the Fund, if any, is noted in the Consolidated Statement of Investments. Generally, the amount of collateral due from or to a party must exceed a minimum transfer amount threshold (e.g. $250,000) before a transfer has to be made. To the extent amounts due to the Fund from its counterparties are not fully collateralized, contractually or otherwise, the Fund bears the risk of loss from counterparty nonperformance.
67 OPPENHEIMER GLOBAL ALLOCATION FUND
NOTES TO CONSOLIDATED
FINANCIAL STATEMENTS Unaudited / Continued
6. Use of Derivatives (Continued)
The following table presents by counterparty the Fund’s OTC derivative assets net of the related collateral pledged by the Fund at period end.
| | | | | | | | | | | | | | | | | | | | |
| | | | | | Gross Amounts Not Offset in the Consolidated
Statement of Assets & Liabilities | | | | |
| Counterparty | | Gross Amounts
Not Offset in the
Consolidated
Statement of
Assets &
Liabilities* | | | Financial
Instruments
Available for
Offset | | | Financial
Instruments
Collateral
Received** | | | Cash Collateral
Received** | | | Net Amount | |
| |
| Bank of America NA | | $ | 2,499,518 | | | $ | (521,923) | | | $ | — | | | $ | — | | | $ | 1,977,595 | |
| BNP Paribas | | | 105,965 | | | | — | | | | — | | | | — | | | | 105,965 | |
| Deutsche Bank AG | | | 744,801 | | | | — | | | | — | | | | (49,000) | | | | 695,801 | |
| Goldman Sachs Bank USA | | | 1,557,209 | | | | (896,725) | | | | — | | | | — | | | | 660,484 | |
| HSBC Bank USA NA | | | 280,179 | | | | (280,179) | | | | — | | | | — | | | | — | |
| JPMorgan Chase Bank NA | | | 1,922,428 | | | | (844,888) | | | | (1,077,540) | | | | — | | | | — | |
| Morgan Stanley Capital Services, Inc. | | | 512,009 | | | | (512,009) | | | | — | | | | — | | | | — | |
| | | | |
| | $ | 7,622,109 | | | $ | (3,055,724) | | | $ | (1,077,540) | | | $ | (49,000) | | | $ | 3,439,845 | |
| | | | |
*OTC derivatives are reported gross on the Consolidated Statement of Assets and Liabilities. Exchange traded options and margin related to centrally cleared swaps and futures are excluded from these reported amounts.
**Reported collateral posted for the benefit of the Fund within this table is limited to the net outstanding amount due from an individual counterparty. The collateral posted for the benefit of the Fund may exceed these amounts.
The following table presents by counterparty the Fund’s OTC derivative liabilities net of the related collateral pledged by the Fund at period end.
| | | | | | | | | | | | | | | | | | | | |
| | | | | | Gross Amounts Not Offset in the Consolidated
Statement of Assets & Liabilities | | | | |
| Counterparty | | Gross Amounts Not Offset in the Consolidated
Statement of
Assets &
Liabilities* | | | Financial
Instruments
Available for
Offset | | | Financial
Instruments
Collateral
Pledged** | | | Cash Collateral
Pledged** | | | Net Amount | |
| |
| Bank of America NA | | $ | (521,923) | | | $ | 521,923 | | | $ | — | | | $ | — | | | $ | — | |
| Citibank NA | | | (2,226,844) | | | | — | | | | 81,465 | | | | — | | | | (2,145,379) | |
| Goldman Sachs Bank USA | | | (896,725) | | | | 896,725 | | | | — | | | | — | | | | — | |
| HSBC Bank USA NA | | | (778,920) | | | | 280,179 | | | | 498,741 | | | | — | | | | — | |
| JPMorgan Chase Bank NA | | | (844,888) | | | | 844,888 | | | | — | | | | — | | | | — | |
| Morgan Stanley Capital Services, Inc. | | | (1,304,786) | | | | 512,009 | | | | — | | | | — | | | | (792,777) | |
| | | | |
| | $ | (6,574,086) | | | $ | 3,055,724 | | | $ | 580,206 | | | $ | — | | | $ | (2,938,156) | |
| | | | |
68 OPPENHEIMER GLOBAL ALLOCATION FUND
6. Use of Derivatives (Continued)
*OTC derivatives are reported gross on the Consolidated Statement of Assets and Liabilities. Exchange traded options and margin related to centrally cleared swaps and futures are excluded from these reported amounts.
**Reported collateral pledged within this table is limited to the net outstanding amount due from the Fund. The securities pledged as collateral by the Fund as reported on the Consolidated Statements of Investments may exceed these amounts.
The following table presents the valuations of derivative instruments by risk exposure as reported within the Consolidated Statement of Assets and Liabilities at period end:
| | | | | | | | | | | | |
| | | Asset Derivatives | | | Liability Derivatives | |
| | | | | | |
Derivatives Not Accounted for as Hedging
Instruments | | Consolidated Statement
of Assets and Liabilities Location | | Value | | | Consolidated Statement of Assets and Liabilities Location | | Value | |
| |
| Interest rate contracts | | | | | | | | Centrally cleared swaps,
at value | | $ | 20,432 | |
| Equity contracts | | Variation margin receivable | | $ | 2,504,035* | | | Variation margin payable | | | 30,450* | |
| Interest rate contracts | | Variation margin receivable | | | 295,531* | | | | | | | |
| Forward currency exchange contracts | | Unrealized appreciation on
foreign currency exchange
contracts | | | 7,622,109 | | | Unrealized depreciation on
foreign currency exchange
contracts | | | 6,574,086 | |
| | | | | | | | | | | | |
| Total | | | | $ | 10,421,675 | | | | | $ | 6,624,968 | |
| | | | | | | | | | | | |
*Includes only the current day’s variation margin. Prior variation margin movements have been reflected in cash on the Consolidated Statement of Assets and Liabilities upon receipt or payment.
The effect of derivative instruments on the Consolidated Statement of Operations is as follows:
| | | | | | | | | | | | | | | | | | | | |
| Amount of Realized Gain or (Loss) Recognized on Derivatives | |
| |
Derivatives Not Accounted for as Hedging Instruments | | Investment from unaffiliated companies (including premiums on options exercised)* | | | Closing and expiration of futures contracts | | | Foreign currency transactions | | | Swap contracts | | | Total | |
| |
| Credit contracts | | $ | — | | | $ | — | | | $ | — | | | $ | 1,654,552 | | | $ | 1,654,552 | |
| Equity contracts | | | (3,681,938 | ) | | | (2,796,938 | ) | | | — | | | | — | | | | (6,478,876) | |
Forward currency exchange contracts | | | — | | | | — | | | | (4,039,581 | ) | | | — | | | | (4,039,581) | |
| Interest rate contracts | | | 133,044 | | | | (2,063,112 | ) | | | — | | | | (99,798 | ) | | | (2,029,866) | |
| | | | |
| Total | | | $ (3,548,894) | | | | $ (4,860,050) | | | | $ (4,039,581) | | | | $ 1,554,754 | | | | $ (10,893,771) | |
| | | | |
*Includes purchased options contracts, purchased swaption contracts, written options contracts exercised and written swaption contracts exercised, if any.
69 OPPENHEIMER GLOBAL ALLOCATION FUND
NOTES TO CONSOLIDATED
FINANCIAL STATEMENTS Unaudited / Continued
6. Use of Derivatives (Continued)
| | | | | | | | | | | | | | | | | | | | |
| Amount of Change in Unrealized Gain or (Loss) Recognized on Derivatives | |
| |
Derivatives Not Accounted for as Hedging Instruments | | Investments* | | | Futures
contracts | | | Translation
of assets and liabilities denominated in foreign currencies | | | Swap contracts | | | Total | |
| |
| Equity contracts | | $ | (1,341,640) | | | $ | 5,691,813 | | | $ | — | | | $ | — | | | $ | 4,350,173 | |
Forward currency exchange contracts | | | — | | | | — | | | | 1,231,903 | | | | — | | | | 1,231,903 | |
| Interest rate contracts | | | — | | | | 1,650,876 | | | | — | | | | (222,737) | | | | 1,428,139 | |
| | | | |
| Total | | $ | (1,341,640) | | | $ | 7,342,689 | | | $ | 1,231,903 | | | $ | (222,737) | | | $ | 7,010,215 | |
| | | | |
*Includes purchased option contracts and purchased swaption contracts, if any.
7. Shares of Beneficial Interest
The Fund has authorized an unlimited number of $0.01 par value shares of beneficial interest of each class. Transactions in shares of beneficial interest were as follows:
| | | | | | | | | | | | | | | | |
| | | Six Months Ended April 29, 20161 | | | Year Ended October 30, 20151 | |
| | | Shares | | | Amount | | | Shares | | | Amount | |
| |
Class A | | | | | | | | | | | | | | | | |
| Sold | | | 2,333,066 | | | $ | 39,584,602 | | | | 4,170,278 | | | $ | 73,756,543 | |
Dividends and/or distributions reinvested | | | 683,755 | | | | 11,521,433 | | | | 907,671 | | | | 15,732,481 | |
| Redeemed | | | (4,806,015) | | | | (81,150,114) | | | | (10,011,504) | | | | (176,351,362) | |
| | | | |
| Net decrease | | | (1,789,194) | | | $ | (30,044,079) | | | | (4,933,555) | | | $ | (86,862,338) | |
| | | | |
| | | | | | | | | | | | | | | | |
| |
Class B | | | | | | | | | | | | | | | | |
| Sold | | | 20,091 | | | $ | 333,408 | | | | 30,331 | | | $ | 518,762 | |
Dividends and/or distributions reinvested | | | 15,810 | | | | 257,695 | | | | 20,063 | | | | 334,153 | |
| Redeemed | | | (523,751) | | | | (8,616,715) | | | | (1,418,934) | | | | (24,166,128) | |
| | | | |
| Net decrease | | | (487,850) | | | $ | (8,025,612) | | | | (1,368,540) | | | $ | (23,313,213) | |
| | | | |
| | | | | | | | | | | | | | | | |
| |
Class C | | | | | | | | | | | | | | | | |
| Sold | | | 1,052,374 | | | $ | 17,186,259 | | | | 1,462,062 | | | $ | 25,116,258 | |
Dividends and/or distributions reinvested | | | 118,106 | | | | 1,926,306 | | | | 106,042 | | | | 1,774,699 | |
| Redeemed | | | (1,118,897) | | | | (18,237,390) | | | | (2,565,044) | | | | (43,653,850) | |
| | | | |
| Net increase (decrease) | | | 51,583 | | | $ | 875,175 | | | | (996,940) | | | $ | (16,762,893) | |
| | | | |
| | | | | | | | | | | | | | | | |
| |
Class I | | | | | | | | | | | | | | | | |
| Sold | | | 143,521 | | | $ | 2,397,659 | | | | 11,137 | | | $ | 194,426 | |
Dividends and/or distributions reinvested | | | 702 | | | | 11,832 | | | | 741 | | | | 12,797 | |
| Redeemed | | | (18,083) | | | | (301,019) | | | | (143,372) | | | | (2,503,501) | |
| | | | |
| Net increase (decrease) | | | 126,140 | | | $ | 2,108,472 | | | | (131,494) | | | $ | (2,296,278) | |
| | | | |
70 OPPENHEIMER GLOBAL ALLOCATION FUND
7. Shares of Beneficial Interest (Continued)
| | | | | | | | | | | | | | | | |
| | | Six Months Ended April 29, 20161 | | | Year Ended October 30, 20151 | |
| | | Shares | | | Amount | | | Shares | | | Amount | |
| |
Class R | | | | | | | | | | | | | | | | |
| Sold | | | 227,385 | | | $ | 3,777,212 | | | | 302,088 | | | $ | 5,268,180 | |
Dividends and/or distributions reinvested | | | 20,792 | | | | 344,723 | | | | 24,645 | | | | 420,071 | |
| Redeemed | | | (192,709) | | | | (3,207,450) | | | | (515,784) | | | | (8,874,821) | |
| | | | |
| Net increase (decrease) | | | 55,468 | | | $ | 914,485 | | | | (189,051) | | | $ | (3,186,570) | |
| | | | |
| | | | | | | | | | | | | | | | |
| |
Class Y | | | | | | | | | | | | | | | | |
| Sold | | | 1,116,772 | | | $ | 18,898,498 | | | | 745,110 | | | $ | 13,146,361 | |
Dividends and/or distributions reinvested | | | 28,376 | | | | 477,797 | | | | 36,217 | | | | 627,593 | |
| Redeemed | | | (398,333) | | | | (6,723,480) | | | | (512,820) | | | | (9,000,825) | |
| | | | |
| Net increase | | | 746,815 | | | $ | 12,652,815 | | | | 268,507 | | | $ | 4,773,129 | |
| | | | |
1. April 29, 2016 and October 30, 2015 represent the last business days of the Fund’s respective reporting periods. See Note 2.
8. Purchases and Sales of Securities
The aggregate cost of purchases and proceeds from sales of securities, other than short-term obligations and investments in IMMF, for the reporting period were as follows:
| | | | | | | | | | |
| | | Purchases | | | | | Sales | |
| |
| Investment securities | | $ | 483,288,160 | | | | | $ | 530,686,319 | |
| U.S. government and government agency obligations | | | 301,867,609 | | | | | | 265,378,721 | |
9. Fees and Other Transactions with Affiliates
Management Fees. Under the investment advisory agreement, the Fund pays the Manager a management fee based on the daily net assets of the Fund at an annual rate as shown in the following table:
| | | | | | |
Fee Schedule | | | | | |
|
Up to $1.0 billion | | | 0.80 | % | | |
Next $2.0 billion | | | 0.76 | | | |
Next $1.0 billion | | | 0.71 | | | |
Next $1.0 billion | | | 0.66 | | | |
Next $1.0 billion | | | 0.60 | | | |
Next $1.0 billion | | | 0.55 | | | |
Next $2.0 billion | | | 0.50 | | | |
Over $9.0 billion | | | 0.48 | | | |
The Manager also provides investment management related services to the Subsidiary. The Subsidiary pays the Manager a monthly management fee at an annual rate according to the above schedule. The Subsidiary also pays certain other expenses including custody and directors’ fees.
The Fund’s effective management fee for the reporting period was 0.79% of average annual net assets before any Subsidiary management fees or any applicable waivers.
71 OPPENHEIMER GLOBAL ALLOCATION FUND
NOTES TO CONSOLIDATED
FINANCIAL STATEMENTS Unaudited / Continued
9. Fees and Other Transactions with Affiliates (Continued)
Sub-Adviser Fees. The Manager has retained the Sub-Adviser to provide the day-to-day portfolio management of the Fund and the Subsidiary. Under the Sub-Advisory Agreement, the Manager pays the Sub-Adviser an annual fee in monthly installments, equal to a percentage of the investment management fee collected by the Manager from the Fund and the Subsidiary, which shall be calculated after any investment management fee waivers. The fee paid to the Sub-Adviser is paid by the Manager, not by the Fund.
Transfer Agent Fees. OFI Global (the “Transfer Agent”) serves as the transfer and shareholder servicing agent for the Fund. The Fund pays the Transfer Agent a fee based on annual net assets. Fees incurred and average net assets for each class with respect to these services are detailed in the Consolidated Statement of Operations and Consolidated Financial Highlights, respectively.
Sub-Transfer Agent Fees. The Transfer Agent has retained Shareholder Services, Inc., a wholly-owned subsidiary of OFI (the “Sub-Transfer Agent”), to provide the day-to-day transfer agent and shareholder servicing of the Fund. Under the Sub-Transfer Agency Agreement, the Transfer Agent pays the Sub-Transfer Agent an annual fee in monthly installments, equal to a percentage of the transfer agent fee collected by the Transfer Agent from the Fund, which shall be calculated after any applicable fee waivers. The fee paid to the Sub-Transfer Agent is paid by the Transfer Agent, not by the Fund.
Trustees’ Compensation. The Fund has adopted an unfunded retirement plan (the “Plan”) for the Fund’s Independent Trustees. Benefits are based on years of service and fees paid to each Trustee during their period of service. The Plan was frozen with respect to adding new participants effective December 31, 2006 (the “Freeze Date”) and existing Plan Participants as of the Freeze Date will continue to receive accrued benefits under the Plan. Active Independent Trustees as of the Freeze Date have each elected a distribution method with respect to their benefits under the Plan. During the reporting period, the Fund’s projected benefit obligations, payments to retired Trustees and accumulated liability were as follows:
| | | | |
Projected Benefit Obligations Increased | | $ | 2,555 | |
Payments Made to Retired Trustees | | | 101,588 | |
Accumulated Liability as of April 29, 2016 | | | 395,114 | |
The Fund’s Board of Trustees (“Board”) has adopted a compensation deferral plan for Independent Trustees that enables Trustees to elect to defer receipt of all or a portion of the annual compensation they are entitled to receive from the Fund. For purposes of determining the amount owed to the Trustee under the plan, deferred amounts are treated as though equal dollar amounts had been invested in shares of the Fund or in other Oppenheimer funds selected by the Trustee. The Fund purchases shares of the funds selected for deferral by the Trustee in amounts equal to his or her deemed investment, resulting in a Fund asset equal to the deferred compensation liability. Such assets are included as a component of “Other” within the asset section of the Consolidated Statement of Assets and Liabilities. Deferral of
72 OPPENHEIMER GLOBAL ALLOCATION FUND
9. Fees and Other Transactions with Affiliates (Continued)
Trustees’ fees under the plan will not affect the net assets of the Fund and will not materially affect the Fund’s assets, liabilities or net investment income per share. Amounts will be deferred until distributed in accordance with the compensation deferral plan.
Distribution and Service Plan (12b-1) Fees. Under its General Distributor’s Agreement with the Fund, OppenheimerFunds Distributor, Inc. (the “Distributor”) acts as the Fund’s principal underwriter in the continuous public offering of the Fund’s classes of shares.
Distribution and Service Plan for Class A Shares. The Fund has adopted a Distribution and Service Plan (the “Plan”) for Class A shares pursuant to Rule 12b-1 under the 1940 Act. Under the Plan, the Fund pays a service fee to the Distributor at an annual rate of 0.25% of the daily net assets of Class A shares. The Distributor currently uses all of those fees to pay dealers, brokers, banks and other financial institutions periodically for providing personal services and maintenance of accounts of their customers that hold Class A shares. Under the Plan, the Fund may also pay an asset-based sales charge to the Distributor. However, the Fund’s Board has currently set the rate at zero. Fees incurred by the Fund under the Plan are detailed in the Consolidated Statement of Operations.
Distribution and Service Plans for Class B, Class C and Class R Shares. The Fund has adopted Distribution and Service Plans (the “Plans”) for Class B, Class C and Class R shares pursuant to Rule 12b-1 under the 1940 Act to compensate the Distributor for distributing those share classes, maintaining accounts and providing shareholder services. Under the Plans, the Fund pays the Distributor an annual asset-based sales charge of 0.75% on Class B and Class C shares’ daily net assets and 0.25% on Class R shares’ daily net assets. The Fund also pays a service fee under the Plans at an annual rate of 0.25% of daily net assets. The Plans continue in effect from year to year only if the Fund’s Board of Trustees votes annually to approve their continuance at an in person meeting called for that purpose. Fees incurred by the Fund under the Plans are detailed in the Consolidated Statement of Operations.
Sales Charges. Front-end sales charges and CDSC do not represent expenses of the Fund. They are deducted from the proceeds of sales of Fund shares prior to investment or from redemption proceeds prior to remittance, as applicable. The sales charges retained by the Distributor from the sale of shares and the CDSC retained by the Distributor on the redemption of shares is shown in the following table for the period indicated.
| | | | | | | | | | | | | | | | | | | | |
| Six Months Ended | | Class A Front-End Sales Charges Retained by Distributor | | | Class A Contingent Deferred Sales Charges Retained by Distributor | | | Class B Contingent Deferred Sales Charges Retained by Distributor | | | Class C Contingent Deferred Sales Charges Retained by Distributor | | | Class R Contingent Deferred Sales Charges Retained by Distributor | |
| |
April 29, 2016 | | | $137,909 | | | | $— | | | | $15,735 | | | | $6,881 | | | | $— | |
Waivers and Reimbursements of Expenses. The Manager has contractually agreed to
73 OPPENHEIMER GLOBAL ALLOCATION FUND
NOTES TO CONSOLIDATED
FINANCIAL STATEMENTS Unaudited / Continued
9. Fees and Other Transactions with Affiliates (Continued)
waive the management fee it receives from the Fund in an amount equal to the management fee it receives from the Subsidiary. During the reporting period, the Manager waived $57,627.
The Manager will waive fees and/or reimburse Fund expenses in an amount equal to the indirect management fees incurred through the Fund’s investments in underlying funds managed by the Manager or its affiliates. During the reporting period, the Manager waived fees and/or reimbursed the Fund $323,905 for management fees.
Waivers and/or reimbursements may be modified or terminated as set forth according to the terms in the prospectus.
10. Borrowings and Other Financing
Securities Sold Short. The Fund sells securities that it does not own, and it will therefore be obligated to purchase such securities at a future date. Upon entering into a short position, the Fund is required to segregate cash or securities at its custodian which are pledged for the benefit of the lending broker and/or to deposit and pledge cash directly at the lending broker, with a value equal to a certain percentage, exceeding 100%, of the value of the securities that it sold short. Cash that has been segregated and pledged for this purpose will be disclosed on the Consolidated Statement of Assets and Liabilities; securities that have been segregated and pledged for this purpose are disclosed as such in the Consolidated Statement of Investments. The value of the open short position is recorded as a liability, and the Fund records an unrealized gain or loss to the extent of the difference between the proceeds received and the change in value of the open short position. The Fund records a realized gain or loss when the short position is closed out. By entering into short sales, the Fund bears the market risk of increases in value of the security sold short in excess of the proceeds received. Until the security is replaced, the Fund is required to pay the lender any dividend or interest earned. Dividend expense on short sales is treated as an expense in the Consolidated Statement of Operations.
At period end, the Fund had no outstanding securities sold short.
Joint Credit Facility. A number of mutual funds managed by the Manager participate in a $1.28 billion revolving credit facility (the “Facility”) intended to provide short-term financing, if necessary, subject to certain restrictions in connection with atypical redemption activity. Expenses and fees related to the Facility are paid by the participating funds and are disclosed separately or as other expenses on the Consolidated Statement of Operations. The Fund did not utilize the Facility during the reporting period.
11. Pending Litigation
In 2009, several putative class action lawsuits were filed and later consolidated before the U.S. District Court for the District of Colorado against OppenheimerFunds, Inc. (“OFI”), OppenheimerFunds Distributor, Inc. (“OFDI”), and Oppenheimer Rochester California Municipal Fund, a fund advised by OFI Global Asset Management, Inc. and distributed by the Distributor (the “California Fund”), in connection with the California Fund’s investment
74 OPPENHEIMER GLOBAL ALLOCATION FUND
11. Pending Litigation (Continued)
performance. The plaintiffs asserted claims against OFI, OFDI and certain present and former trustees and officers of the California Fund under the federal securities laws, alleging, among other things, that the disclosure documents of the California Fund contained misrepresentations and omissions and the investment policies of the California Fund were not followed. Plaintiffs in the suit filed an amended complaint and defendants filed a motion to dismiss. In 2011, the court issued an order which granted in part and denied in part the defendants’ motion to dismiss. In 2012, plaintiffs filed a motion, which defendants opposed, to certify a class and appoint class representatives and class counsel. In March 2015, the court granted plaintiffs’ motion for class certification. In May 2015, the U.S. Court of Appeals for the Tenth Circuit vacated the class certification order and remanded the matter to the district court for further proceedings. In October 2015, the district court reaffirmed its order and determined that the suit will proceed as a class action. In December 2015, the Tenth Circuit denied defendants’ petition to appeal the district court’s reaffirmed class certification order.
OFI and OFDI believe the suit is without merit; that it is premature to render any opinion as to the likelihood of an outcome unfavorable to them in the suit; and that no estimate can yet be made as to the amount or range of any potential loss. Furthermore, OFI believes that the suit should not impair the ability of OFI or OFDI to perform their respective duties to the Fund and that the outcome of the suit should not have any material effect on the operations of any of the Oppenheimer funds.
75 OPPENHEIMER GLOBAL ALLOCATION FUND
PORTFOLIO PROXY VOTING POLICIES AND GUIDELINES;
UPDATES TO CONSOLIDATED STATEMENTS OF INVESTMENTS Unaudited
The Fund has adopted Portfolio Proxy Voting Policies and Guidelines under which the Fund votes proxies relating to securities (“portfolio proxies”) held by the Fund. A description of the Fund’s Portfolio Proxy Voting Policies and Guidelines is available (i) without charge, upon request, by calling the Fund toll-free at 1.800.CALL OPP (225.5677), (ii) on the Fund’s website at www.oppenheimerfunds.com, and (iii) on the SEC’s website at www.sec.gov. In addition, the Fund is required to file Form N-PX, with its complete proxy voting record for the 12 months ended June 30th, no later than August 31st of each year. The Fund’s voting record is available (i) without charge, upon request, by calling the Fund toll-free at 1.800.CALL OPP (225.5677), and (ii) in the Form N-PX filing on the SEC’s website at www.sec.gov.
The Fund files its complete schedule of portfolio holdings with the SEC for the first quarter and the third quarter of each fiscal year on Form N-Q. The Fund’s Form N-Q filings are available on the SEC’s website at www.sec.gov. Those forms may be reviewed and copied at the SEC’s Public Reference Room in Washington, D.C. Information on the operation of the Public Reference Room may be obtained by calling 1-800-SEC-0330.
Householding—Delivery of Shareholder Documents
This is to inform you about OppenheimerFunds’ “householding” policy. If more than one member of your household maintains an account in a particular fund, OppenheimerFunds will mail only one copy of the fund’s prospectus (or, if available, the fund’s summary prospectus), annual and semiannual report and privacy policy. The consolidation of these mailings, called householding, benefits your fund through reduced mailing expense, and benefits you by reducing the volume of mail you receive from OppenheimerFunds. Householding does not affect the delivery of your account statements.
Please note that we will continue to household these mailings for as long as you remain an OppenheimerFunds shareholder, unless you request otherwise. If you prefer to receive multiple copies of these materials, please call us at 1.800.CALL-OPP (225-5677). You may also notify us in writing or via email. We will begin sending you individual copies of the prospectus (or, if available, the summary prospectus), reports and privacy policy within 30 days of receiving your request to stop householding.
76 OPPENHEIMER GLOBAL ALLOCATION FUND
DISTRIBUTION SOURCES Unaudited
For any distribution that took place over the Fund’s reporting period, the table below details on a per-share basis the percentage of the Fund’s total distribution payment amount that was derived from the following sources: net income, net profit from the sale of securities, and other capital sources. This information is based upon income and capital gains using generally accepted accounting principles as of the date of each distribution. Because the Fund is actively managed, the relative amount of the Fund’s total distributions derived from various sources over the calendar year may change. Please note that this information should not be used for tax reporting purposes as the tax character of distributable income may differ from the amounts used for this notification. You will receive IRS tax forms in the first quarter of each calendar year detailing the actual amount of the taxable and non-taxable portion of distributions paid to you during the tax year.
For the most current information, please go to oppenheimerfunds.com. Select your Fund, then the ’Detailed’ tab; where ‘Dividends’ are shown, the Fund’s latest pay date will be followed by the sources of any distribution, updated daily.
| | | | | | | | | | | | | | | | |
| Fund Name | | Pay Date | | | Net Income | | | Net Profit
from Sale | | | Other
Capital
Sources | |
Oppenheimer Global Allocation Fund | | | 12/14/15 | | | | 21.9% | | | | 0.0% | | | | 78.1% | |
77 OPPENHEIMER GLOBAL ALLOCATION FUND
OPPENHEIMER GLOBAL ALLOCATION FUND
| | |
| Trustees and Officers | | Brian F. Wruble, Chairman of the Board of Trustees and Trustee |
| | Beth Ann Brown, Trustee |
| | Matthew P. Fink, Trustee |
| | Edmund P. Giambastiani, Jr., Trustee |
| | Elizabeth Krentzman, Trustee |
| | Mary F. Miller, Trustee |
| | Joel W. Motley, Trustee |
| | Joanne Pace, Trustee |
| | Daniel Vandivort, Trustee |
| | Arthur P. Steinmetz, Trustee, President and Principal Executive Officer |
| | Mark Hamilton, Vice President |
| | Benjamin Rockmuller, Vice President |
| | Alessio de Longis, Vice President |
| | Dokyoung Lee, Vice President |
| | Cynthia Lo Bessette, Secretary and Chief Legal Officer |
| | Jennifer Sexton, Vice President and Chief Business Officer |
| | Mary Ann Picciotto, Chief Compliance Officer and Chief Anti-Money |
| | Laundering Officer |
| | Brian S. Petersen, Treasurer and Principal Financial & Accounting Officer |
| |
| Manager | | OFI Global Asset Management, Inc. |
| |
| Sub-Adviser | | OppenheimerFunds, Inc. |
| |
| Distributor | | OppenheimerFunds Distributor, Inc. |
| |
| Transfer and Shareholder | | OFI Global Asset Management, Inc. |
| Servicing Agent | | |
| |
| Sub-Transfer Agent | | Shareholder Services, Inc. |
| | DBA OppenheimerFunds Services |
| |
| Independent Registered | | KPMG LLP |
| Public Accounting Firm | | |
| |
| Legal Counsel | | Kramer Levin Naftalis & Frankel LLP |
| |
| | The financial statements included herein have been taken from the records of the Fund without examination of those records by the independent registered public accounting firm. |
© 2016 OppenheimerFunds, Inc. All Rights reserved.
78 OPPENHEIMER GLOBAL ALLOCATION FUND
PRIVACY POLICY NOTICE
As an Oppenheimer fund shareholder, you are entitled to know how we protect your personal information and how we limit its disclosure.
Information Sources
We obtain nonpublic personal information about our shareholders from the following sources:
| ● | | Applications or other forms |
| ● | | When you create a user ID and password for online account access |
| ● | | When you enroll in eDocs Direct, our electronic document delivery service |
| ● | | Your transactions with us, our affiliates or others |
| ● | | A software program on our website, often referred to as a “cookie,” which indicates which parts of our site you’ve visited |
| ● | | When you set up challenge questions to reset your password online |
If you visit oppenheimerfunds.com and do not log on to the secure account information areas, we do not obtain any personal information about you. When you do log on to a secure area, we do obtain your user ID and password to identify you. We also use this information to provide you with products and services you have requested, to inform you about products and services that you may be interested in and assist you in other ways.
We do not collect personal information through our website unless you willingly provide it to us, either directly by email or in those areas of the website that request information. In order to update your personal information (including your mailing address, email address and phone number) you must first log on and visit your user profile.
If you have set your browser to warn you before accepting cookies, you will receive the warning message with each cookie. You can refuse cookies by turning them off in your browser. However, doing so may limit your access to certain sections of our website.
We use cookies to help us improve and manage our website. For example, cookies help us recognize new versus repeat visitors to the site, track the pages visited, and enable some special features on the website. This data helps us provide a better service for our website visitors.
Protection of Information
We do not disclose any non-public personal information (such as names on a customer list) about current or former customers to anyone, except as permitted by law.
Disclosure of Information
Copies of confirmations, account statements and other documents reporting activity in your fund accounts are made available to your financial advisor (as designated by you). We may also use details about you and your investments to help us, our financial service affiliates, or firms that jointly market their financial products and services with ours, to better serve your investment needs or suggest financial services or educational material that may be of interest to you. If this requires us to provide you with an opportunity to “opt in” or “opt out” of such information sharing with a firm not affiliated with us, you will receive notification on how to do so, before any such sharing takes place.
Right of Refusal
We will not disclose your personal information to unaffiliated third parties (except as permitted by law), unless we first offer you a reasonable opportunity to refuse or “opt out” of such disclosure.
79 OPPENHEIMER GLOBAL ALLOCATION FUND
PRIVACY POLICY NOTICE Continued
Internet Security and Encryption
In general, the email services provided by our website are encrypted and provide a secure and private means of communication with us. To protect your own privacy, confidential and/or personal information should only be communicated via email when you are advised that you are using a secure website. As a security measure, we do not include personal or account information in non-secure emails, and we advise you not to send such information to us in non-secure emails. Instead, you may take advantage of the secure features of our website to encrypt your email correspondence. To do this, you will need to use a browser that supports Secure Sockets Layer (SSL) protocol.
We do not guarantee or warrant that any part of our website, including files available for download, are free of viruses or other harmful code. It is your responsibility to take appropriate precautions, such as use of an anti-virus software package, to protect your computer hardware and software.
| ● | | All transactions, including redemptions, exchanges and purchases, are secured by SSL and 256-bit encryption. SSL is used to establish a secure connection between your PC and OppenheimerFunds’ server. It transmits information in an encrypted and scrambled format. |
| ● | | Encryption is achieved through an electronic scrambling technology that uses a “key” to code and then decode the data. Encryption acts like the cable converter box you may have on your television set. It scrambles data with a secret code so that no one can make sense of it while it is being transmitted. When the data reaches its destination, the same software unscrambles the data. |
| ● | | You can exit the secure area by either closing your browser, or for added security, you can use the Log Out button before you close your browser. |
Other Security Measures
We maintain physical, electronic and procedural safeguards to protect your personal account information. Our employees and agents have access to that information only so that they may offer you products or provide services, for example, when responding to your account questions.
How You Can Help
You can also do your part to keep your account information private and to prevent unauthorized transactions. If you obtain a user ID and password for your account, do not allow it to be used by anyone else. Also, take special precautions when accessing your account on a computer used by others.
Who We Are
This joint notice describes the privacy policies of the Oppenheimer funds, OppenheimerFunds, Inc., each of its investment adviser subsidiaries, OppenheimerFunds Distributor, Inc. and OFI Global Trust Co. It applies to all Oppenheimer fund accounts you presently have, or may open in the future, using your Social Security number—whether or not you remain a shareholder of our funds. This notice was last updated March 2015. In the event it is updated or changed, we will post an updated notice on our website at oppenheimerfunds.com. If you have any questions about this privacy policy, write to us at P.O. Box 5270, Denver, CO 80217-5270, email us by clicking on the Contact Us section of our website at oppenheimerfunds.com or call us at 1.800.CALL OPP (225.5677).
80 OPPENHEIMER GLOBAL ALLOCATION FUND
THIS PAGE INTENTIONALLY LEFT BLANK.
81 OPPENHEIMER GLOBAL ALLOCATION FUND
THIS PAGE INTENTIONALLY LEFT BLANK.
82 OPPENHEIMER GLOBAL ALLOCATION FUND
THIS PAGE INTENTIONALLY LEFT BLANK.
83 OPPENHEIMER GLOBAL ALLOCATION FUND
THIS PAGE INTENTIONALLY LEFT BLANK.
84 OPPENHEIMER GLOBAL ALLOCATION FUND
THIS PAGE INTENTIONALLY LEFT BLANK.
85 OPPENHEIMER GLOBAL ALLOCATION FUND
THIS PAGE INTENTIONALLY LEFT BLANK.
86 OPPENHEIMER GLOBAL ALLOCATION FUND
THIS PAGE INTENTIONALLY LEFT BLANK.
87 OPPENHEIMER GLOBAL ALLOCATION FUND

Class A Shares
AVERAGE ANNUAL TOTAL RETURNS AT 4/29/16*
| | | | | | | | | | | | | | | | | | | | |
| | | Class A Shares of the Fund | | | | | | | | | | |
| | | Without Sales
Charge | | | With Sales
Charge | | | HFRX Global
Hedge Fund
Index | | | S&P 500 Index | | | HFRI Fund
Weighted
Composite
Index | |
6-Month | | | -2.30% | | | | -7.92% | | | | -3.49% | | | | 0.43% | | | | -0.66% | |
1-Year | | | -0.76 | | | | -6.46 | | | | -7.18 | | | | 1.21 | | | | -3.84 | |
5-Year | | | 1.11 | | | | -0.08 | | | | -1.18 | | | | 11.02 | | | | 1.73 | |
10-Year | | | 3.09 | | | | 2.48 | | | | -0.58 | | | | 6.91 | | | | 3.31 | |
Performance data quoted represents past performance, which does not guarantee future results. The investment return and principal value of an investment in the Fund will fluctuate so that an investor’s shares, when redeemed, may be worth more or less than their original cost. Fund returns include changes in share price, reinvested distributions, and a 5.75% maximum applicable sales charge except where “without sales charge” is indicated. Current performance may be lower or higher than the performance quoted. Returns do not consider capital gains or income taxes on an individual’s investment. For performance data current to the most recent month-end, visit oppenheimerfunds.com or call 1.800.CALL OPP (225.5677).
*April 29, 2016, was the last business day of the Fund’s semiannual period end. See Note 2 of the accompanying Notes to Financial Statements. Index returns are calculated through April 30, 2016.
2 OPPENHEIMER FUNDAMENTAL ALTERNATIVES FUND
Fund Performance Discussion
The Fund’s Class A shares (without sales charge) produced a total return of -2.30% for the 6-month reporting period ending 4/30/16. The Fund outperformed its benchmark, the HFRX Global Hedge Fund Index, which returned -3.49% during the same period, by 119 basis points (“bps”). However, the Fund underperformed the peer average in the Morningstar Multialternative Category, which produced an average return of -1.49%, by 81 bps. The Fund’s Class A shares (without sales charge) ranked in the 68th percentile (341 out of 499 funds) of the Morningstar Multialternative Funds Category for total return during the six-month reporting period. Over the one-year, three-year, five-year and ten-year periods ended 4/30/16, the Fund ranked in the 16th percentile (75 out of 474 funds), 5th (14 out of 260 funds), 55th (80 out of 145 funds) and the 14th (6 out of 39 funds), respectively. (Michelle Borré’s performance record began on 4/1/12, and she was not involved in the management of the Fund for the full five- and ten-year periods.)
As discussed below, in the wake of the Federal Reserve’s (“Fed”) rate hike in December 2015 and its commentary about the expected path toward interest rate normalization, risk assets sold off sharply around the world. For example, the S&P 500 Index declined 10.3% from 1/1/16 to 2/11/16 as WTI crude oil collapsed 29.2%, the Nikkei 225 Index fell 17.4%, the MSCI Emerging Markets Index dropped 10.2%, the 10-year Treasury yield declined to 1.66%, the HFRX Global Hedge Fund Index fell 4.8% and the Morningstar Multialternative peer group average fell 3.2%. During that same six-week period, the Fund delivered on its goal of mitigating risk on the downside by limiting its drawdown to -1.0%. However, as the Fed started to rein in expectations surrounding the proposed path toward rate normalization, the dollar began to weaken, commodity prices began to rise and risk assets began to rally.
During the final 10 weeks of the reporting period (from 2/12/16 to 4/30/16), risk assets rebounded sharply, including the S&P 500 (up 13.4%), WTI crude oil (up 75.2%), the Nikkei 225 Index (up 7.0%), the MSCI Emerging Markets Index (up 18.3%), the HFRX Global Hedge Fund Index (up 3.5%) and the Morningstar Multialternative peer group average (up 2.5%). During that same period, the Fund declined a modest 46 bps to end the first four months of 2016 down 1.46%. Our long equity positions lagged as the market rebounded sharply, which we attribute to the fact that we did not have enough beta to catch much of the rally, and our security selection also detracted from performance. In addition, our Long/Short Macro strategy started to lag in part due to the reversal in the U.S. dollar, which began declining in February as the market started to discount the likelihood that the Fed would not raise rates
3 OPPENHEIMER FUNDAMENTAL ALTERNATIVES FUND
as quickly or steeply as originally indicated in December. As the dollar declined, so did our short currency (long dollar) positions, which had done well for us in 2015. While we were not pleased with our underperformance in the final 10 weeks of the reporting period, we did control the magnitude of the drawdown, limiting our maximum drawdown to 98 bps during the market turmoil in the first six weeks of 2016 versus 308 bps and 196 bps for the HFRX Global Hedge Fund Index and Morningstar Multialternative peer group, respectively.
Our key strategies generated negative returns during the reporting period. Our Long/Short Equity strategy (called Equity Hedge in the Fund’s prospectus dated 2/26/16) was the largest detractor followed by our Long/Short Macro strategy (called Global Macro in the Fund’s prospectus dated 2/26/16). Our Long/Short Credit strategy was a marginal detractor. The Long/Short Equity strategy, which consists of long and short positions in equities, generated a total return of -0.97%, outperforming the HFRX Equity Hedge Index (which represents the long/short equity portion of the Index), by 297 bps during an extremely difficult period for long and short equity in the industry. (These long and short equity returns are reported gross of fees and before any cash allocation. We report these numbers separately to provide some insight into how this part of the Fund performed as compared to the equity portion of the Index. All other performance numbers are reported net of fees.)
The Fund offers the flexibility often associated with alternatives while providing the daily liquidity and transparency benefits of a mutual fund. It seeks to provide investors with strong risk-adjusted returns that have low sensitivity to traditional market factors over the long term. The investment team’s process has an underlying value philosophy that combines bottom-up and top-down fundamental analysis for security selection and portfolio construction. The Fund is able to invest both long and short across distinct alternative investment strategies including Long/Short Equity, Long/Short Credit and Long/Short Macro (including currencies, interest rates, sovereign debt and commodities), making the Fund truly flexible. Although many investors focus on the short-term outlook when considering potential investments, the Fund utilizes a longer-term approach. We look at changing dynamics on both a macroeconomic and microeconomic basis over a multi-year time horizon to uncover investment opportunities which emerge from change.
MARKET OVERVIEW
The global capital markets underwent significant challenges during the reporting period. Certain of these challenges stemmed from the Fed’s decision to raise interest rates in December, the first such hike in nine years. Since the European Central Bank (“ECB”) and the Bank of Japan (“BoJ”) were still executing quantitative easing (“QE”) programs, the Fed’s decision led to a divergence of monetary policy that investors had not faced before.
4 OPPENHEIMER FUNDAMENTAL ALTERNATIVES FUND
Although the rate hike in December was only 25 bps, the Fed made clear that it intended to raise rates four times in 2016 and another four times in 2017. The steepness of this proposed path toward rate normalization unnerved investors and contributed to a sharp global selloff in risk assets over the next two months. However, as the Fed started to rein in expectations surrounding the proposed path toward normalization, the dollar began to weaken, commodity prices began to rise and risk assets began to recover much of their losses from earlier in the year. In our view, we are in a period where if the economy and markets are too strong, the Fed will step in to normalize rates, potentially leading to another selloff and providing a ceiling to how far this rally can go.
In addition, we believe that equity and other markets are exhibiting increased volatility but are no longer rising consistently, and traditional fixed income investments are not providing as much ballast to diversified portfolios during a challenging market environment. Under these circumstances, we believe investors could benefit from a broader toolkit than was needed during the risk-on markets of 2009-2014, and in some respects a different toolkit than has been effective in the past because of the unfavorable risk/reward in conservative fixed income. Part of this broader toolkit could include the ability to take positions with short exposure, which can actually profit from market declines. This kind of short exposure is available through the Long/Short Equity, Long/Short Credit and Long/Short Macro strategies of the Fund.
FUND REVIEW
Long and Short Equity Strategy. The top contributors to performance during the reporting period in the long equity component of the strategy were AT&T and Honeywell. The top contributors in the short equity component of the strategy were ClubCorp Holdings and Ensco. In contrast, the biggest detractors in the long equity component of the strategy were Juniper Networks and Allergan, while the biggest detractors in the short equity component were Subsea 7 and Caterpillar. More broadly, our total long equity positions in the Fund detracted -0.23% from the performance of Fund during the reporting period, while our total short equity positions detracted -0.90% from performance over the same period.
Top Contributors in Long and Short Equity Strategy
AT&T (T), a communications provider, contributed to performance during the period as the company benefited from a shift in investor interest toward domestic-oriented companies with stable business models in a global market that is being whipped around by macro headwinds and currency volatility. In addition, the company continues to generate financial and strategic synergies from its acquisition of DirecTV. These include lower per-subscriber content costs as customers transition to the satellite platform as well as the ability to bundle video with wireless service. Moreover, investors are anticipating positive results from the
5 OPPENHEIMER FUNDAMENTAL ALTERNATIVES FUND
company’s new OTT video offering that is expected to launch before the end of 2016.
Honeywell (HON), a leading diversified multi-industrials company, also contributed to performance. The stock benefited from in-line fourth quarter 2015 financial results combined with management’s earnings outlook for 2016 that was better than expected given the global macro environment. This was followed by an upside surprise in first quarter financial results (driven by better organic sales growth), and management raised future earnings guidance as well. In addition, investors cheered the company’s decision to terminate its attempted acquisition of United Technologies which they feared could result in greater regulatory scrutiny that might challenge the value creation from any potential deal. Finally, Honeywell hosted an upbeat analyst day where management introduced an organic growth outlook of 4-5% for 2017, a level that was well above that of its industrials peers.
Our short position in ClubCorp Holdings (MYCC) contributed to performance as well. The company operates more than 200 country clubs, business clubs and alumni clubs across the U.S., and its stock price suffered as concerns arose about the energy-dependent markets where it has large exposure. Furthermore, investors are becoming concerned about a possible secular decline in the sport of golf as millennials pursue leisure activities outside of the traditional country club. In this regard, during January of 2016 the number of golf rounds played in the
U.S. declined by approximately 13% year on year. We covered our short position during the first quarter after it had performed well and the risk/reward profile had become less compelling.
Similarly, our short position in Ensco (ESV), a U.K.-based shallow water offshore driller, also contributed to performance. The stock was hurt by another surprise cut in the quarterly dividend (from $0.15/share to $0.01/share) as the company maneuvered to improve its capital management flexibility. Ensco continues to struggle in an oversupplied offshore rig market. Investors are now concerned that the offshore drilling market could continue to see anemic rig demand into 2018 versus prior expectations of weakness into 2017. Investors also became concerned when Petrobras terminated a contract for one of Ensco’s deep-water rigs. As a result, the stock declined 27.4% during the reporting period.
Largest Detractors in Long and Short Equity Strategy
In contrast, our long position in Juniper Networks (JNPR) detracted from performance during the period. The company’s underperformance was primarily driven by two factors. First, in early 2016 the volatility in the financial markets caused customers to rein in enterprise IT spending, which negatively impacted results. Second, Juniper is in the midst of launching a robust portfolio of new products. While we are quite optimistic about the potential for these new
6 OPPENHEIMER FUNDAMENTAL ALTERNATIVES FUND
products, the launch is causing some near-term pressure on operational performance. In particular, some customers have not yet finished vetting the new products, yet at the same time they are hesitant to purchase the older products. Once these customers have completed their due diligence process, we would expect this headwind to dissipate.
Our long position in Allergan (AGN) also detracted from performance. The company, formerly known as Actavis, is a specialty pharmaceuticals manufacturer that markets branded drugs for patients suffering from diseases principally in the eye care, neuroscience, medical aesthetics/dermatology, women’s health and gastroenterology categories. Last July, Allergan announced the sale of its generic business, which sells approximately 1,000 generic and branded generic products globally, to Teva Pharmaceuticals for approximately $40 billion. The transaction is expected to close in the first half of 2016 and should allow the company to pursue additional opportunities in its expanding branded pharmaceuticals business. In November 2015, the company announced that it was merging with Pfizer to create a global pharmaceuticals company, and expected the deal to close in the second half of 2016. Allergan declined in the first quarter as concerns increased during March about the likelihood of the transaction closing. Subsequently, the merger was called off in early April after unprecedented actions by the U.S. Treasury department made the economics of the transaction unattractive. We continue to like Allergan as a stand-alone company,
particularly considering its organic and non-organic growth opportunities, and have added to our position following the break-up of the Pfizer acquisition.
Our short position in Subsea 7 (SUB NO), a U.K.-based offshore engineering and construction company, was also a detractor during the period. The stock rebounded off its January low based upon two key factors. First, the price of Brent crude oil climbed 72.6% from $27.88 to $48.13 per barrel. Second, the company posted upside surprises in its adjusted EBITDA (Earnings Before Interest, Taxes, Depreciation and Amortization) for the fourth quarter of 2015 and first quarter of 2016 after the completion of several large projects in Africa and strong operational execution that provided a short term boost to margins. This offset investor concerns that the company could see 20% of its vessel contracts cancelled by Brazil this year with no recourse, which would hurt Subsea 7’s vessel backlog by 15%.
Our short position in Caterpillar (CAT) detracted from performance as well. The company manufactures construction and mining equipment as well as diesel and natural gas engines. The stock bounced off its January low due to a combination of factors. For example, investor sentiment on China, a significant end market for CAT, improved as short term industrial indicators recovered on a pickup in fixed asset investment. In addition, demand was relatively stable in non-resource dependent industries, led by U.S. construction. Moreover, order trends for new equipment
7 OPPENHEIMER FUNDAMENTAL ALTERNATIVES FUND
improved, and while they are still negative, they are less negative than in prior quarters as inventory levels have moved closer to dealer targets. This spurred investor debate about whether Caterpillar’s earnings for 2016 have already troughed, and the stock climbed 8.9% during the reporting period.
Long and Short Credit & Long and Short Macro Strategies. The Fund’s non-equity strategies include Long/Short Credit and Long/Short Macro. In terms of individual holdings, the top performers in the period were our long positions in gold, the corporate debt of Lukoil and Wachovia Capital Trust III. The biggest detractors were our short positions in the Japanese yen and Australian dollar as well as our long position in an asset-backed security (“ABS”) backed by aircraft engines.
Top Contributors in Long and Short Credit & Long and Short Macro Strategies
Our long position in gold (GLD) contributed to performance as the yellow metal climbed by 13.3% (or $151) to $1,293 per troy ounce during the period. The first quarter of 2016 witnessed the largest percentage quarterly gain in the price of gold (up 16.2%) since 1986. As investors became concerned by sharply falling markets in early 2016 and worried about the efficacy of central bank monetary policy, they bid up the price of gold as a safe haven play. The yellow metal also benefited from a decline in real interest rates and extreme volatility in the equity markets,
both of which tend to be supportive for the price of gold.
Our long position in the unsecured corporate debt of Lukoil also contributed to performance. Lukoil, a Russian integrated oil company, is one of five firms targeted with sanctions as a result of Russia’s invasion of Ukraine. Increasing oil prices in the last 10 weeks of the reporting period were the primary driver of an improving credit profile for the company. This improvement was partially offset by an appreciating Russian ruble, which increases the company’s cost structure. However, the rebound in oil prices coincided with a rally in emerging market debt, which further supported our position in this security.
Our long position in Wachovia Capital Trust III contributed to performance as well. This is a trust preferred security of Wells Fargo that was issued as a fixed-to-floating-rate instrument. Because the security was not called (i.e., redeemed) in 2011, it became a floating rate instrument. Since the security’s floor rate of 5.57% exceeds its contractual floating rate of 3-month Libor plus 93 bps, we are receiving the higher floor rate. A rally in longer-duration Treasury securities combined with a tightening in corporate credit spreads caused Wachovia Capital Trust III to perform well during the reporting period.
Finally, low levels of issuance in the bank preferred market created a technical tailwind for $1000 preferreds like this one.
8 OPPENHEIMER FUNDAMENTAL ALTERNATIVES FUND
Largest Detractors in Long and Short Credit & Long and Short Macro Strategies
Long U.S. Dollar/Short JPY and AUD. We are short several different currencies relative to the U.S. dollar, including the Japanese yen (JPY) and Australian dollar (AUD). Both of these positions contributed to performance in 2015 but detracted from performance in the first four months of 2016. The U.S. dollar reversed course and declined during that four month period as the Fed signaled that it was less likely to increase rates going forward, and that it was considering two rate hikes in 2016 rather than its initial expectation of four hikes this year and four more hikes in 2017. In changing its view, the Fed cited concerns about international economic developments and the slowly improving U.S. economy. Lower U.S. interest rates make the dollar less attractive relative to other currencies.
During the first quarter of 2016, the BoJ increased its use of unconventional monetary policy in an attempt to stimulate the Japanese economy. In particular, the BoJ implemented negative interest rates for the first time with the expectation that the yen would weaken and risk assets would rise. In fact, precisely the opposite happened, in part because investors have become skeptical of the ability of central banks to stimulate economic growth and inflation by weakening their currency. This made the yen more attractive relative to the U.S. dollar, which negatively impacted our short position in the JPY.
In addition, Australia is a natural resource-driven economy and a large exporter of commodities to China. Commodity prices rallied in the last 10 weeks of the reporting period as Chinese economic data showed signs of stabilization. Credit growth in China has been particularly strong so far in 2016, which coincided with an increase in state sponsored infrastructure projects and improvements in the property market. (However, we do not believe the acceleration in credit growth is sustainable.) Infrastructure projects and property construction drive demand for Australia’s commodities. Higher demand for Australian exports and rising commodity prices, in turn, increase demand for the Australian dollar. The combination of these factors has helped bolster the Australian economy and with it the AUD, which negatively impacted our short position in the currency.
Similarly, our holdings in an ABS (BLADE 2006-1AW A1) detracted from performance during the reporting period. This bond is backed by a portfolio of aircraft engines, and during the first quarter of 2016, the servicer sold three of those engines below appraisal value. Although the sales were of older engines for which there is lower demand, and they did not represent a large portion of the portfolio, the sale prices raised questions about the value of the remaining engines. In addition, during January Standard & Poor’s downgraded the uninsured version of this bond from BBB- to BB. Although our position is primarily in the investment grade
9 OPPENHEIMER FUNDAMENTAL ALTERNATIVES FUND
and insured bond, the downgrade negatively impacted the performance of this security.
STRATEGY AND OUTLOOK
The macro environment remains complex and we continue to see numerous cross currents. While equities look interesting versus bonds in the mid to longer term, we saw a shorter term disconnect between the strong performance in equities (prior to the selloff last August), softness in earnings growth, and negative earnings revisions for the S&P 500 in 2015. Importantly, those negative earnings revisions have continued into 2016. (Consensus estimates at the start of last year called for S&P 500 earnings growth of 7-8% in 2015, but actual growth was just 0.4% on a pro forma basis, and -12.7% on a GAAP (Generally Accepted Accounting Principles) basis; consensus estimates at the end of 2015 called for 7-8% earnings growth in 2016, but those estimates have since been reduced to 3%, which still may prove too high.) Simply put, the U.S. equity market moved meaningfully ahead of earnings growth in 2012-2014, and valuations climbed to the point where U.S. equities were no longer inexpensive. As a result, security selection has become even more important. In our view, volatility was likely to increase, which it did with a vengeance in August of 2015, and that heightened volatility continued throughout late 2015 and the first two months of 2016. Extremely accommodative monetary policy around the world has impacted all asset classes, including equities, and has been an important driver of rising
asset prices during the last several years. This exceptional accommodation was evident in 2015 with at least 35 central banks cutting rates collectively more than 55 times (as discussed below). It has continued into 2016 with additional rate cuts so far this year by the ECB, the BoJ and central banks in India, Australia, Indonesia, Singapore and Norway, among others.
Under these circumstances, we believed that any normalization of rates and/or the withdrawal of central bank stimulus could pressure risk asset prices significantly, and that is precisely what happened as the Fed raised rates in December. We continue to believe that there is more risk lurking beneath the surface of the market than many investors recognize, but it has been masked by unusually accommodative monetary policy, unusually low interest rates, unusually low volatility and adequate market liquidity. Some of that risk became evident in 2015 with the flare-up of the Greek debt crisis in April, the extraordinary backup in yields on German bunds during May/June, the 30-40% drop in Chinese equities in June, the Chinese yuan devaluation in August, the double digit drop in the S&P 500 during August, sovereign debt downgrades in Brazil (to junk status) and Japan, and the global equity selloffs in December as well as the first six weeks of 2016. In our view, the market is caught between two unattractive outcomes—if growth really resumes, it will lead to sustained tightening. If growth tapers off, the tightening will be avoided but challenging underlying fundamentals will remain.
10 OPPENHEIMER FUNDAMENTAL ALTERNATIVES FUND
More broadly, Treasury rates seem range bound in the near term absent some exogenous shock, with yields oscillating between 1.5% to 3.0%, although a significant negative development in the emerging markets could push rates below the lower end of this range. The market came close to this outcome when 10-year Treasury yields dipped to 1.66% on 2/11/16. In the longer run, however, we do not believe rates this low are sustainable. Over the past several quarters, economic growth has slowed and central banks around the world have resorted to increasingly aggressive and distorting monetary policy. This included large scale purchases of government bonds and other debt, which pushed the price of those securities up and the yield down. In addition, investors increasingly sought the safety of these securities, partly as a result of the macro risks they saw. Zero interest rate policies morphed into negative interest rate policies. In fact, approximately 23% of global GDP (“Gross Domestic Product”) today comes from countries with negative interest rates, including the Eurozone (19 countries), Japan, Switzerland, Denmark and Sweden.
In 2015, central banks around the world resorted to more aggressive monetary policy, including a constant parade of surprise interest rate cuts. In fact, central banks cut interest rates over 55 times collectively last year, and over 700 times since 2008. China and Russia were the most aggressive, cutting rates five times each in 2015, followed by India (four times) and Australia/Canada (twice each). Significantly, this means that three
of the four BRICs (Brazil, Russia, India and China) slashed rates a total of 14 times in 2015. In our view, these central banks have been cutting rates because they are worried that growth may be slowing too much—and a low inflation environment gives them leeway to do so. China’s growth continues to slow and this has put pressure on commodity prices due to demand weakness. The supply that has come on (and in some cases is still coming on) was planned for a higher growth environment, but that supply will likely still come on due to its low cost nature and other impediments to curtailing supply.
In contrast, the Fed ended its latest QE program in October 2014, which helped to send the dollar higher against many major currencies. Partly as a result of this, combined with slowing economies in China and numerous emerging markets as well as issues specific to the various regions in question, we hold positions that are long the U.S. dollar and short other currencies including the Australian dollar, euro and Japanese yen. We also added several new positions in 2015 that are designed to protect against the risk of further slowing in the emerging markets. These include a short position in the Chinese yuan (added before the devaluation of the yuan last August), a short position in the Thai baht and a credit default swap on the sovereign debt of Malaysia. In our view, the markets face a new paradigm of slower economic growth in China, and investors need to adjust to it. We also believe this relative divergence in monetary policy could ultimately feed through to interest rates.
11 OPPENHEIMER FUNDAMENTAL ALTERNATIVES FUND
Currently, the moves that historically could have occurred in the rates markets are being pushed to the currency markets due to the central banks’ aggressive monetary policies holding rates low.
Moreover, while some market commentators are calling for further deprecation (or perhaps another devaluation) of the yuan, we believe such a move would negatively impact Asian trading partners and commodity producers. Private credit growth and bank loans in China have continued to grow at a much higher rate than Gross Domestic Product (“GDP”). This level of credit growth is unsustainable, and at some point it will need to slow, which will act as a new drag on GDP in China. In our view, the longer term trend in China is still toward slower growth. The data we analyze indicate that there has been no meaningful shift in that economy, and so far the efforts to stimulate domestic consumption have not been able to overcome the negative impact of the industrial slowdown.
Although the U.S. economy remains stuck in first gear with average annual real GDP growth of 1.4% over the last seven years (dipping to 0.8% in 1Q 2016), that growth rate has been relatively attractive compared to certain other developed markets. We are mindful that economies around the world likely will not decouple so long as the engines of global growth are slowing. The yield on the 10-year Treasury at 1.83% (as of
4/30/16) is an order of magnitude higher than those in other parts of the developed world, with yields on 10-year German Bunds and 10-year Japanese Government Bonds at 0.27% and -0.08%, respectively, on that date. Japan is becoming more desperate as consumption falls and evidence mounts that Abenomics is not working as planned. That policy was designed to revive the Japanese economy with “three arrows.” The third arrow in the quiver—meaningful structural reform—is proving to be a significant challenge. The Japanese economy narrowly avoided its sixth recession in nine years during the first quarter of 2016. In addition, the economy has not bounced back as expected from an increase in the consumption tax, and inflation has remained stubbornly below the BoJ’s target of 2%. (The government had hoped to implement a 10% consumption tax by 2015, but persistently slow economic growth means that goal has now been pushed out to 2019.) In our view, early evidence that the market is becoming disillusioned with Abenomics has centered on a weakening yen. The BoJ’s implementation of negative interest rates in the first quarter of 2016 had the opposite effect than what the central bank intended, with the yen strengthening dramatically and the equity market falling by double digits. Additional evidence could involve investors’ loss of faith in the supposed omnipotence of the BoJ and the efficacy of its continuing QE and negative interest rate efforts. This is beginning to cause investors to be less
12 OPPENHEIMER FUNDAMENTAL ALTERNATIVES FUND
responsive to central bank talk and require more actions.
We now see a potential inflection point in investors’ faith in stimulus spending regarding China. There is a growing realization that boosting spending on infrastructure is only adding to the excess capacity problem in China, which is exacerbating deflation. More stimulus spending can make the problem worse instead of better. Fixing the oversupply by shutting it down is contractionary for GDP. This is in contrast to past government actions of increasing spending which were additive to GDP. This could mark the beginning of a new phase where the markets no longer have the same faith in the ability of central banks to boost growth. The massive credit growth in China in over the last 18 months may not result in the GDP growth that is hoped for, and even if it does, that GDP growth is unsustainable absent further boosts in credit growth in the future.
Against this backdrop, growth in parts of Europe is stagnating with numerous countries facing an increasing risk of deflation. Precisely because growth is so slow in the Eurozone, the ECB has now implemented its own form of QE six years after the U.S. first went down that path. However, the results so far have been underwhelming, which has led the ECB to extend the end date of the program, increase the amount of monthly debt purchases by 33%, expand
the scope of the bonds it buys and further lower interest rates. By accelerating QE and expanding its balance sheet aggressively, the ECB seeks to inflate asset prices, just as it did in early 2015. Unfortunately, the real impediment to Eurozone growth is the lack of meaningful structural reform over the past seven years. Furthermore, the investor playbook of overweighting equities in countries where there is aggressive QE is not working this year, even after the snapback in risk assets over the last several months. The equity markets in Japan and Europe are lagging the U.S. equity market this year, even though the BoJ and ECB are executing QE and have adopted negative interest rates, while the Fed has ended QE and is hiking rates, not implementing negative rates. In short, negative interest rates appear to have backfired as a form of monetary stimulus, with the banks selling off and equities underperforming, and with the yen and euro actually strengthening versus the U.S. dollar. This is not what the ECB or the BoJ predicted or intended.
Moreover, geopolitical risk remains elevated as evidenced by the flare-up of the debt crisis in Greece in April 2015 combined with election results favoring populist/separatist parties in Greece, Spain and Portugal. (In our view, Greece is still at risk of becoming the first member to exit the Eurozone, despite having received its third bailout in the last six years. The International Monetary Fund
13 OPPENHEIMER FUNDAMENTAL ALTERNATIVES FUND
(“IMF”) is now proposing a much delayed payback schedule on that debt over the years 2040-2080, essentially making the bailouts perpetual debt.) Simply put, political instability in the Eurozone appears to be contained for now but it is by no means resolved. We believe continued immigration from the Middle East will only exacerbate tensions. Unfortunately, the focal point for a lot of those tensions will be in Greece. More broadly, while some economic green shoots are visible in the Eurozone, and that region likely has the ability to demonstrate increasing momentum in the near term, we do not believe that positive developments in the Eurozone will be enough to offset slowing momentum in China, Japan and many of the emerging markets. A vote by U.K. citizens to exit to Eurozone could also spark a resurgence in concern about Eurozone fragmentation.
We believe the U.S. economy still has attractive growth potential in certain areas. A variety of changes in technology could create a host of winners and losers, and could drive growth for companies that are able to successfully implement and harness the power of new technologies. There are pockets of innovation in different industries including pharmaceuticals, consumer discretionary and technology. Nonetheless, we are mindful that U.S. equity valuations were pushing up against the edge of bubble territory after
several years when S&P 500 Index performance ran well ahead of earnings growth, leading to significant multiple expansion. In fact, the only time in the last four decades when the S&P 500 Index has traded at a higher price-earnings (P/E) multiple on next 12 months’ consensus earnings was during the Tech Bubble in 1997-2000. While valuations came down somewhat following the equity selloffs in the third quarter of 2015 and again in early 2016, they climbed back up each time as earnings estimates were reduced and the market moved toward all-time highs. Furthermore, volatility has been artificially restrained over the last several years by highly accommodative monetary policy, but this started to change in August of 2015 with sharp spikes in the Chicago Board Options Exchange SPX Volatility Index (“VIX Index”), and could remain elevated on a more sustained basis now that the Fed has started raising rates and monetary policy is diverging significantly. In the past few years, whenever equities sold off, buyers typically stepped in quickly because valuations were still relatively attractive. Since valuations are less attractive today, we could reach a point where it takes longer for buyers to appear after selloffs. Moreover, banking regulations are significantly stricter, the fixed income markets are a lot less liquid, and banks are taking on much less risk. Under these circumstances, we believe that any softness in the markets
14 OPPENHEIMER FUNDAMENTAL ALTERNATIVES FUND
could lead to more volatility on the fixed income side than we have seen in recent years. That was certainly evident in the fourth quarter of 2015 and in early 2016, and we expect it to continue. Accordingly, we continue to pick our spots, selecting securities that we believe offer attractive risk-adjusted returns. We remain focused, as always, on controlling volatility and mitigating downside risk.
We expect to be in a low return world for a while. We believe that the ability to generate attractive returns efficiently and without taking on undue risk, controlling volatility and limiting drawdowns will be of greater value to investors in a low return world, and that is where our investment team’s efforts are focused.
| | |

| | 
Michelle Borré, CFA Portfolio Manager |
15 OPPENHEIMER FUNDAMENTAL ALTERNATIVES FUND
Portfolio Positioning*
LONG/SHORT CREDIT ALLOCATIONS
| | | | | | | | | | | | |
| | | Long | | Short | | Net |
Bank Loans | | | | 8.7% | | | | | 0.0% | | | 8.7% |
Asset Backed Securities | | | | 12.8 | | | | | 0.0 | | | 12.8 |
Non-convertible Bonds | | | | 7.7 | | | | | 0.0 | | | 7.7 |
Non-convertible Preferred Stocks | | | | 1.0 | | | | | 0.0 | | | 1.0 |
Bond Futures | | | | 0.0 | | | | | -1.2 | | | -1.2 |
Credit Default Swaps | | | | 4.1 | | | | | -7.0 | | | -2.9 |
LONG/SHORT EQUITY ALLOCATIONS |
| | | Long | | Short | | Net |
Common Stocks | | | | 51.0% | | | | | -28.6% | | | 22.4% |
Equity Total Return Swaps | | | | 0.8 | | | | | -0.6 | | | 0.2 |
Convertible Bonds | | | | 0.3 | | | | | 0.0 | | | 0.3 |
Private Securities | | | | 0.1 | | | | | 0.0 | | | 0.1 |
LONG/SHORT MACRO ALLOCATIONS |
| | | Long | | Short | | Net |
Commodities | | | | 2.8% | | | | | 0.0% | | | 2.8% |
Interest Rate Swaps | | | | 2.1 | | | | | 0.0 | | | 2.1 |
Bond Futures | | | | 0.0 | | | | | -1.0 | | | -1.0 |
Currency Derivatives | | | | 1.1 | | | | | -11.4 | | | -10.3 |
Swaptions | | | | 0.0 | | | | | -5.0 | | | -5.0 |
Credit Default Swaps | | | | 0.0 | | | | | -12.7 | | | -12.7 |
CASH |
| | | Long | | Short | | Net |
Collateral Cash | | | | 24.3% | | | | | 0.0% | | | 24.3% |
Cash Net of Collateral Cash | | | | 15.9 | | | | | 0.0 | | | 15.9 |
*April 29, 2016, was the last business day of the Fund’s semiannual period. See Note 2 of the accompanying Notes to Financial Statements.
16 OPPENHEIMER FUNDAMENTAL ALTERNATIVES FUND
TOTAL PORTFOLIO ALLOCATIONS
| | | | | | | | | | | | |
| | | Long | | | Short | | | Net | |
Long/Short Credit | | | 34.3 | % | | | -8.2 | % | | | 26.1 | % |
Long/Short Equity | | | 52.2 | | | | -29.2 | | | | 23.0 | |
Long/Short Macro | | | 6.0 | | | | -30.1 | | | | -24.1 | |
Portfolio holdings are subject to change, and are dollar weighted based on total net assets. Percentages are as of April 29, 2016. Negative weightings may result from the use of leverage. Leverage involves the use of various financial instruments or borrowed capital in an attempt to increase investment return. Leverage risks include potential for higher volatility, greater decline of the Fund’s net asset value and fluctuations of dividends and distributions paid by the Fund.
17 OPPENHEIMER FUNDAMENTAL ALTERNATIVES FUND
Share Class Performance
AVERAGE ANNUAL TOTAL RETURNS WITHOUT SALES CHARGE AS OF 4/29/16
| | | | | | | | | | | | | | | | | | | | |
| | | Inception Date | | | 6-Month | | | 1-Year | | | 5-Year | | | 10-Year | |
Class A (QVOPX) | | | 1/3/89 | | | | -2.30 | % | | | -0.76 | % | | | 1.11 | % | | | 3.09% | |
Class B (QOPBX) | | | 9/1/93 | | | | -2.66 | | | | -1.52 | | | | 0.28 | | | | 2.58 | |
Class C (QOPCX) | | | 9/1/93 | | | | -2.66 | | | | -1.51 | | | | 0.34 | | | | 2.31 | |
Class I (QOPIX) | | | 2/28/13 | | | | -2.07 | | | | -0.31 | | | | 4.32 | * | | | N/A | |
Class R (QOPNX) | | | 3/1/01 | | | | -2.41 | | | | -1.00 | | | | 0.82 | | | | 2.77 | |
Class Y (QOPYX) | | | 12/16/96 | | | | -2.18 | | | | -0.49 | | | | 1.36 | | | | 3.35 | |
| |
| AVERAGE ANNUAL TOTAL RETURNS WITH SALES CHARGE AS OF 4/29/16 | | | | | |
| | | Inception Date | | | 6-Month | | | 1-Year | | | 5-Year | | | 10-Year | |
Class A (QVOPX) | | | 1/3/89 | | | | -7.92 | % | | | -6.46 | % | | | -0.08 | % | | | 2.48% | |
Class B (QOPBX) | | | 9/1/93 | | | | -7.51 | | | | -6.43 | | | | -0.08 | | | | 2.58 | |
Class C (QOPCX) | | | 9/1/93 | | | | -3.63 | | | | -2.50 | | | | 0.34 | | | | 2.31 | |
Class I (QOPIX) | | | 2/28/13 | | | | -2.07 | | | | -0.31 | | | | 4.32 | * | | | N/A | |
Class R (QOPNX) | | | 3/1/01 | | | | -2.41 | | | | -1.00 | | | | 0.82 | | | | 2.77 | |
Class Y (QOPYX) | | | 12/16/96 | | | | -2.18 | | | | -0.49 | | | | 1.36 | | | | 3.35 | |
| * | Shows performance since inception. |
Performance data quoted represents past performance, which does not guarantee future results. The investment return and principal value of an investment in the Fund will fluctuate so that an investor’s shares, when redeemed, may be worth more or less than their original cost. Current performance may be lower or higher than the performance quoted. Returns do not consider capital gains or income taxes on an individual’s investment. For performance data current to the most recent month-end, visit oppenheimerfunds.com or call 1.800. CALL OPP (225.5677). Fund returns include changes in share price, reinvested distributions, and the applicable sales charge: for Class A shares, the current maximum initial sales charge of 5.75%; for Class B shares, the contingent deferred sales charge of 5% (1-year) and 2% (5-year); and for Class C shares, the contingent deferred sales charge (“CDSC”) of 1% for the 1-year period. Prior to 7/1/14, Class R shares were named Class N shares. Beginning 7/1/14, new purchases of Class R shares will no longer be subject to a CDSC upon redemption (any CDSC will remain in effect for purchases prior to 7/1/14). There is no sales charge for Class I and Class Y shares. Because Class B shares convert to Class A shares 72 months after purchase, the 10-year return for Class B shares uses Class A performance for the period after conversion.
The Fund’s performance is compared to the performance of the HFRX Global Hedge Fund Index, the S&P 500 Index and the HFRI Fund Weighted Composite Index. The HFRX Global Hedge Fund Index is designed to be representative of the overall composition of the hedge fund universe. It is comprised of all eligible hedge fund strategies; including but not limited to convertible arbitrage, distressed securities, equity hedge, equity market neutral, event driven, macro, merger arbitrage, and relative value arbitrage. The strategies are asset weighted based on the distribution of assets in the hedge fund industry. The S&P 500 Index is a
18 OPPENHEIMER FUNDAMENTAL ALTERNATIVES FUND
capitalization-weighted index of 500 stocks intended to be a representative sample of leading companies in leading industries within the U.S. economy. The HFRI Fund Weighted Composite Index is a global, equal-weighted index of over 2,000 single-manager funds that report to the HFR Database. Constituent funds report monthly net of all fees performance in U.S. Dollars and have a minimum of $50 million under management or a twelve (12) month track record of active performance. The HFRI Fund Weighted Composite Index’s returns are calculated three times each month and are subject to periodic recalculation by Hedge Fund Research, Inc. As a result, the HFRI Fund Weighted Composite Index returns shown may differ from the same Index’s returns for the same period published elsewhere. If subsequent recalculations cause the Index’s returns to change, the Fund does not expect to update the Index returns. The Fund has changed its benchmarks from the S&P 500 Index and the HFRI Fund Weighted Composite Index to the HFRX Global Hedge Fund Index, which it believes is a more appropriate measure of the Fund’s performance. The indices are unmanaged and cannot be purchased directly by investors. While index comparisons may be useful to provide a benchmark for the Fund’s performance, it must be noted that the Fund’s investments are not limited to the investments comprising the indices. Index performance includes reinvestment of income, but does not reflect transaction costs, fees, expenses or taxes. Index performance is shown for illustrative purposes only as a benchmark for the Fund’s performance, and does not predict or depict performance of the Fund. The Fund’s performance reflects the effects of the Fund’s business and operating expenses.
The Morningstar Multialternative Funds Category Average is the average return of the mutual funds within the investment category as defined by Morningstar. Returns include the reinvestment of distributions but do not consider sales charges. The Morningstar Multialternative Category Average performance is shown for illustrative purposes only and does not predict or depict the performance of the Fund.
Morningstar ranking is for Class A shares and ranking may include more than one share class of funds in the category, including other share classes of this Fund. Ranking is based on total return as of 4/30/16, without considering sales charges. Different share classes may have different expenses and performance characteristics. Fund rankings are subject to change monthly. The Fund’s total-return percentile rank is relative to all funds that are in the Multialternative Funds Category. The highest (or most favorable) percentile rank is 1 and the lowest (or least favorable) percentile rank is 100. The top-performing fund in a category will always receive a rank of 1.
The Fund’s investment strategy and focus can change over time. The mention of specific fund holdings does not constitute a recommendation by OppenheimerFunds, Inc. or its affiliates.
Before investing in any of the Oppenheimer funds, investors should carefully consider a fund’s investment objectives, risks, charges and expenses. Fund prospectuses and summary prospectuses contain this and other information about the funds, and may be obtained by asking your financial advisor, visiting oppenheimerfunds.com, or calling 1.800.CALL OPP (225.5677). Read prospectuses and summary prospectuses carefully before investing.
Shares of Oppenheimer funds are not deposits or obligations of any bank, are not guaranteed by any bank, are not insured by the FDIC or any other agency, and involve investment risks, including the possible loss of the principal amount invested.
19 OPPENHEIMER FUNDAMENTAL ALTERNATIVES FUND
Fund Expenses
Fund Expenses. As a shareholder of the Fund, you incur two types of costs: (1) transaction costs, which may include sales charges (loads) on purchase payments and/or contingent deferred sales charges on redemptions; and (2) ongoing costs, including management fees; distribution and service fees; and other Fund expenses. These examples are intended to help you understand your ongoing costs (in dollars) of investing in the Fund and to compare these costs with the ongoing costs of investing in other mutual funds.
The examples are based on an investment of $1,000.00 invested at the beginning of the period and held for the entire 6-month period ended April 29, 2016.
Actual Expenses. The first section of the table provides information about actual account values and actual expenses. You may use the information in this section for the class of shares you hold, together with the amount you invested, to estimate the expense that you paid over the period. Simply divide your account value by $1,000.00 (for example, an $8,600.00 account value divided by $1,000.00 = 8.60), then multiply the result by the number in the first section under the heading entitled “Expenses Paid During 6 Months Ended April 29, 2016” to estimate the expenses you paid on your account during this period.
Hypothetical Example for Comparison Purposes. The second section of the table provides information about hypothetical account values and hypothetical expenses based on the Fund’s actual expense ratio for each class of shares, and an assumed rate of return of 5% per year for each class before expenses, which is not the Fund’s actual return. The hypothetical account values and expenses may not be used to estimate the actual ending account balance or expenses you paid for the period. You may use this information to compare the ongoing costs of investing in the Fund and other funds. To do so, compare this 5% hypothetical example for the class of shares you hold with the 5% hypothetical examples that appear in the shareholder reports of the other funds.
Please note that the expenses shown in the table are meant to highlight your ongoing costs only and do not reflect any transactional costs, such as front-end or contingent deferred sales charges (loads). Therefore, the “hypothetical” section of the table is useful in comparing ongoing costs only, and will not help you determine the relative total costs of owning different funds. In addition, if these transactional costs were included, your costs would have been higher.
20 OPPENHEIMER FUNDAMENTAL ALTERNATIVES FUND
| | | | | | | | | | | | | | | | |
| Actual | | Beginning
Account
Value
November 1, 2015 | | | | | Ending Account
Value
April 29, 2016 | | | | | Expenses
Paid During
6 Months Ended
April 29, 2016 | |
Class A | | $ | 1,000.00 | | | | | $ | 977.00 | | | | | $ | 9.48 | |
Class B | | | 1,000.00 | | | | | | 973.40 | | | | | | 13.31 | |
Class C | | | 1,000.00 | | | | | | 973.40 | | | | | | 13.21 | |
Class I | | | 1,000.00 | | | | | | 979.30 | | | | | | 7.42 | |
Class R | | | 1,000.00 | | | | | | 975.90 | | | | | | 10.76 | |
Class Y | | | 1,000.00 | | | | | | 978.20 | | | | | | 8.45 | |
| | | | | |
Hypothetical
(5% return before expenses) | | | | | | | | | | | | | | | | |
Class A | | | 1,000.00 | | | | | | 1,015.18 | | | | | | 9.66 | |
Class B | | | 1,000.00 | | | | | | 1,011.32 | | | | | | 13.57 | |
Class C | | | 1,000.00 | | | | | | 1,011.42 | | | | | | 13.47 | |
Class I | | | 1,000.00 | | | | | | 1,017.26 | | | | | | 7.56 | |
Class R | | | 1,000.00 | | | | | | 1,013.90 | | | | | | 10.96 | |
Class Y | | | 1,000.00 | | | | | | 1,016.22 | | | | | | 8.61 | |
Expenses are equal to the Fund’s annualized expense ratio for that class, multiplied by the average account value over the period, multiplied by 181/366 (to reflect the one-half year period). Those annualized expense ratios, excluding indirect expenses from affiliated funds, based on the 6-month period ended April 29, 2016 are as follows:
| | | | |
| Class | | Expense Ratios | |
Class A | | | 1.93% | |
Class B | | | 2.71 | |
Class C | | | 2.69 | |
Class I | | | 1.51 | |
Class R | | | 2.19 | |
Class Y | | | 1.72 | |
The expense ratios reflect voluntary and/or contractual waivers and/or reimbursements of expenses by the Fund’s Manager. Some of these undertakings may be modified or terminated at any time, as indicated in the Fund’s prospectus. The “Consolidated Financial Highlights” tables in the Fund’s financial statements, included in this report, also show the gross expense ratios, without such waivers or reimbursements and reduction to custodian expenses, if applicable.
21 OPPENHEIMER FUNDAMENTAL ALTERNATIVES FUND
CONSOLIDATED STATEMENT OF INVESTMENTS April 29, 2016* Unaudited
| | | | | | | | |
| | | Shares | | | Value | |
| Common Stocks—50.9% | | | | | | | | |
| Consumer Discretionary—2.3% | | | | | | | | |
| Hotels, Restaurants & Leisure—0.5% | | | | | | | | |
| Brinker International, Inc. | | | 145,506 | | | $ | 6,740,903 | |
| | | | | | | | | |
| Household Durables—0.0% | | | | | | | | |
| Everyware Global, Inc.1 | | | 8,735 | | | | 65,512 | |
| | | | | | | | | |
| Media—0.6% | | | | | | | | |
| DISH Network Corp., Cl. A1,2 | | | 158,155 | | | | 7,795,460 | |
| | | | | | | | | |
| Multiline Retail—1.2% | | | | | | | | |
| Target Corp. | | | 181,180 | | | | 14,403,810 | |
| | | | | | | | | |
| Consumer Staples—3.1% | | | | | | | | |
| Beverages—0.8% | | | | | | | | |
| Coca-Cola Co. (The) | | | 221,760 | | | | 9,934,848 | |
| | | | | | | | | |
| Tobacco—2.3% | | | | | | | | |
| Altria Group, Inc.2 | | | 259,161 | | | | 16,251,986 | |
| Philip Morris International, Inc. | | | 131,370 | | | | 12,890,025 | |
| | | | | | | | |
| | | | | | | 29,142,011 | |
| | | | | | | | | |
| Energy—4.5% | | | | | | | | |
| Energy Equipment & Services—0.5% | | | | | | | | |
| Schlumberger Ltd. | | | 80,884 | | | | 6,498,220 | |
| Vantage Drilling International1 | | | 492 | | | | 49,200 | |
| | | | | | | | |
| | | | | | | 6,547,420 | |
| | | | | | | | | |
| Oil, Gas & Consumable Fuels—4.0% | | | | | | | | |
| Canadian Natural Resources Ltd. | | | 118,904 | | | | 3,570,816 | |
| Chevron Corp. | | | 69,430 | | | | 7,094,357 | |
| ConocoPhillips | | | 228,433 | | | | 10,916,813 | |
| EOG Resources, Inc. | | | 80,281 | | | | 6,632,816 | |
| Noble Energy, Inc.2 | | | 291,575 | | | | 10,528,773 | |
| Occidental Petroleum Corp. | | | 98,304 | | | | 7,535,002 | |
| Valero Energy Corp. | | | 57,250 | | | | 3,370,308 | |
| | | | | | | | |
| | | | | | | 49,648,885 | |
| | | | | | | | | |
| Financials—7.8% | | | | | | | | |
| Capital Markets—0.4% | | | | | | | | |
| Goldman Sachs Group, Inc. (The) | | | 32,130 | | | | 5,272,854 | |
| | | | | | | | | |
| Commercial Banks—2.9% | | | | | | | | |
| Citigroup, Inc. | | | 162,070 | | | | 7,500,600 | |
| JPMorgan Chase & Co.2 | | | 168,030 | | | | 10,619,496 | |
| M&T Bank Corp. | | | 129,730 | | | | 15,349,654 | |
| Wells Fargo & Co. | | | 60,540 | | | | 3,025,789 | |
| | | | | | | | |
| | | | | | | 36,495,539 | |
| | | | | | | | | |
| Insurance—2.3% | | | | | | | | |
| Allstate Corp. (The) | | | 106,060 | | | | 6,899,203 | |
| Chubb Ltd. | | | 177,350 | | | | 20,902,471 | |
| | | | | | | | |
| | | | | | | 27,801,674 | |
22 OPPENHEIMER FUNDAMENTAL ALTERNATIVES FUND
| | | | | | | | |
| | | Shares | | | Value | |
| Real Estate Investment Trusts (REITs)—2.2% | | | | | | | | |
| American Assets Trust, Inc. | | | 111,648 | | | $ | 4,429,076 | |
| Blackstone Mortgage Trust, Inc., Cl. A2 | | | 356,330 | | | | 9,791,948 | |
| Macerich Co. (The) | | | 86,410 | | | | 6,574,073 | |
| Starwood Property Trust, Inc.2 | | | 338,280 | | | | 6,549,101 | |
| | | | | | | | |
| | | | | | | 27,344,198 | |
| | | | | | | | | |
| Health Care—8.5% | | | | | | | | |
| Biotechnology—0.7% | | | | | | | | |
| Baxalta, Inc. | | | 200,170 | | | | 8,397,131 | |
| | | | | | | | | |
| Health Care Equipment & Supplies—0.4% | | | | | | | | |
| Medtronic plc | | | 66,738 | | | | 5,282,313 | |
| New Millennium Holdco, Inc.1 | | | 7,733 | | | | 59,285 | |
| | | | | | | | |
| | | | | | | 5,341,598 | |
| | | | | | | | | |
| Health Care Providers & Services—3.2% | | | | | | | | |
| Express Scripts Holding Co.1 | | | 107,440 | | | | 7,921,551 | |
| HCA Holdings, Inc.1 | | | 36,720 | | | | 2,960,367 | |
| Millennium Corporate Claim Litigation Trust1 | | | 441 | | | | 4 | |
| Millennium Lender Claim Litigation Trust1 | | | 882 | | | | 9 | |
| UnitedHealth Group, Inc. | | | 160,670 | | | | 21,157,026 | |
| Universal Health Services, Inc., Cl. B | | | 58,090 | | | | 7,765,471 | |
| | | | | | | | |
| | | | | | | 39,804,428 | |
| | | | | | | | | |
| Pharmaceuticals—4.2% | | | | | | | | |
| Allergan plc1 | | | 56,560 | | | | 12,248,634 | |
| Merck & Co., Inc. | | | 245,150 | | | | 13,444,026 | |
| Novartis AG, ADR | | | 160,590 | | | | 12,200,022 | |
| Roche Holding AG | | | 55,807 | | | | 14,116,015 | |
| | | | | | | | |
| | | | | | | 52,008,697 | |
| | | | | | | | | |
| Industrials—9.5% | | | | | | | | |
| Aerospace & Defense—5.6% | | | | | | | | |
| Honeywell International, Inc.2 | | | 244,800 | | | | 27,973,296 | |
| L-3 Communications Holdings, Inc. | | | 53,140 | | | | 6,989,504 | |
| Lockheed Martin Corp.2 | | | 81,260 | | | | 18,883,199 | |
| Northrop Grumman Corp. | | | 46,150 | | | | 9,518,899 | |
| Raytheon Co. | | | 52,680 | | | | 6,656,118 | |
| | | | | | | | |
| | | | | | | 70,021,016 | |
| | | | | | | | | |
| Airlines—0.3% | | | | | | | | |
| United Continental Holdings, Inc.1 | | | 88,026 | | | | 4,032,471 | |
| | | | | | | | | |
| Commercial Services & Supplies—2.0% | | | | | | | | |
| Republic Services, Inc., Cl. A2 | | | 374,870 | | | | 17,645,131 | |
| Tyco International plc | | | 194,000 | | | | 7,472,880 | |
| | | | | | | | |
| | | | | | | 25,118,011 | |
| | | | | | | | | |
| Industrial Conglomerates—1.0% | | | | | | | | |
| General Electric Co. | | | 382,960 | | | | 11,776,020 | |
| | | | | | | | | |
| Road & Rail—0.6% | | | | | | | | |
| Union Pacific Corp. | | | 85,940 | | | | 7,496,546 | |
23 OPPENHEIMER FUNDAMENTAL ALTERNATIVES FUND
CONSOLIDATED STATEMENT OF INVESTMENTS Unaudited / Continued
| | | | | | | | |
| | | Shares | | | Value | |
| Information Technology—6.5% | | | | | | | | |
| Communications Equipment—0.9% | | | | | | | | |
| Juniper Networks, Inc.2 | | | 347,340 | | | $ | 8,127,756 | |
| Telefonaktiebolaget LM Ericsson, Cl. B | | | 425,279 | | | | 3,439,901 | |
| | | | | | | | |
| | | | | | | 11,567,657 | |
| | | | | | | | | |
| Internet Software & Services—2.1% | | | | | | | | |
| Alphabet, Inc., Cl. A1,2 | | | 36,550 | | | | 25,873,014 | |
| | | | | | | | | |
| Semiconductors & Semiconductor Equipment—2.2% | | | | | | | | |
| QUALCOMM, Inc.2 | | | 279,700 | | | | 14,130,444 | |
| Xilinx, Inc.2 | | | 319,910 | | | | 13,781,723 | |
| | | | | | | | |
| | | | | | | 27,912,167 | |
| | | | | | | | | |
| Technology Hardware, Storage & Peripherals—1.3% | | | | | | | | |
| Apple, Inc.2 | | | 170,526 | | | | 15,985,107 | |
| | | | | | | | | |
| Materials—3.5% | | | | | | | | |
| Chemicals—1.9% | | | | | | | | |
| Celanese Corp., Cl. A | | | 148,190 | | | | 10,477,033 | |
| LyondellBasell Industries NV, Cl. A | | | 46,342 | | | | 3,831,093 | |
| Methanex Corp. | | | 272,191 | | | | 9,515,797 | |
| | | | | | | | |
| | | | | | | 23,823,923 | |
| | | | | | | | | |
| Containers & Packaging—1.6% | | | | | | | | |
| Packaging Corp. of America | | | 116,020 | | | | 7,527,378 | |
| Sonoco Products Co. | | | 267,590 | | | | 12,547,295 | |
| | | | | | | | |
| | | | | | | 20,074,673 | |
| | | | | | | | | |
| Telecommunication Services—2.6% | | | | | | | | |
| Diversified Telecommunication Services—2.6% | | | | | | | | |
| AT&T, Inc.2 | | | 531,450 | | | | 20,630,889 | |
| BCE, Inc. | | | 237,530 | | | | 11,142,532 | |
| | | | | | | | |
| | | | | | | 31,773,421 | |
| | | | | | | | | |
| Utilities—2.6% | | | | | | | | |
| Electric Utilities—2.3% | | | | | | | | |
| Edison International | | | 223,740 | | | | 15,820,655 | |
| PPL Corp.2 | | | 334,984 | | | | 12,608,798 | |
| | | | | | | | |
| | | | | | | 28,429,453 | |
| | | | | | | | | |
| Multi-Utilities—0.3% | | | | | | | | |
| CMS Energy Corp. | | | 107,170 | | | | 4,359,676 | |
| | | | | | | | |
| Total Common Stocks (Cost $586,712,412) | | | | | | | 634,988,123 | |
| | | | | | | | | |
| Preferred Stocks—1.0% | | | | | | | | |
| M&T Bank Corp., 6.375% Cum., Series A, Non-Vtg. | | | 5,167 | | | | 5,296,175 | |
| M&T Bank Corp., 6.375% Cum., Series C, Non-Vtg. | | | 7,500 | | | | 7,687,500 | |
| | | | | | | | |
| Total Preferred Stocks (Cost $12,684,599) | | | | | | | 12,983,675 | |
| | | | | | | | |
| | | Principal Amount | | | | |
| Asset-Backed Securities—7.9% | | | | | | | | |
| Airspeed Ltd.: | | | | | | | | |
| Series 2007-1A, Cl. G1, 0.703%, 6/15/323,4 | | $ | 22,824,837 | | | | 17,706,938 | |
| Series 2007-1A, Cl. G2, 0.713%, 6/15/323,4 | | | 6,562,141 | | | | 5,388,259 | |
24 OPPENHEIMER FUNDAMENTAL ALTERNATIVES FUND
| | | | | | | | |
| | | Principal Amount | | | Value | |
| Asset-Backed Securities (Continued) | | | | | | | | |
| Blade Engine Securitization Ltd., Series 2006-1AW, Cl. A1, 0.733%, 9/15/413,4 | | $ | 27,646,383 | | | $ | 18,564,519 | |
| Citigroup Mortgage Loan Trust Series Asset Backed Pass-Through Certificate, Series 2004-OPT1, Cl. M3, 1.384%, 10/25/344 | | | 1,250,000 | | | | 1,062,349 | |
| GSAMP Trust: | | | | | | | | |
| Series 2005-HE4, Cl. M3, 0.959%, 7/25/454 | | | 3,300,000 | | | | 2,731,238 | |
| Series 2005-HE5, Cl. M3, 0.899%, 11/25/354 | | | 8,121,777 | | | | 6,304,884 | |
| New Century Home Equity Loan Trust, Series 2005-2, Cl. M3, 0.929%, 6/25/354 | | | 5,500,000 | | | | 4,566,487 | |
| Park Place Securities, Inc., Series 2005-WCW3, Cl. M1, 0.919%, 8/25/354 | | | 5,000,000 | | | | 4,713,064 | |
| RASC Series Trust: | | | | | | | | |
| Series 2005-KS8, Cl. M5, 1.079%, 8/25/354 | | | 2,993,634 | | | | 2,425,657 | |
| Series 2006-KS2, Cl. M2, 0.829%, 3/25/364 | | | 14,625,000 | | | | 11,361,449 | |
| Raspro Trust, Series 2005-1A, Cl. G, 1.023%, 3/23/244,5 | | | 20,001,864 | | | | 19,179,607 | |
| Saxon Asset Securities Trust, Series 2007-3, Cl. 2A4, 0.929%, 9/25/474 | | | 7,595,000 | | | | 4,406,125 | |
| | | | | | | | |
| Total Asset-Backed Securities (Cost $99,945,496) | | | | | | | 98,410,576 | |
| | | | | | | | | |
| Mortgage-Backed Obligations—4.9% | | | | | | | | |
| Ameriquest Mortgage Securities, Inc., Series 2004-R2, Cl. M1, 1.084%, 4/25/344 | | | 3,558,338 | | | | 3,020,722 | |
| Asset-Backed Funding Certificates Trust, Series 2005-HE2, Cl. M3, 1.219%, 6/25/354 | | | 4,000,000 | | | | 3,721,616 | |
| Bear Stearns Asset Backed Securities I Trust, Series 2004-HE9, Cl. M2, 2.239%, 11/25/344 | | | 4,601,892 | | | | 4,204,615 | |
| First NLC Trust, Series 2005-4, Cl. A4, 0.829%, 2/25/364 | | | 11,003,000 | | | | 9,585,577 | |
| Home Equity Asset Trust, Series 2005-5, Cl. M2, 1.204%, 11/25/354 | | | 1,888,088 | | | | 1,820,200 | |
| Home Equity Mortgage Loan Asset-Backed Trust, Series 2005-B, Cl. M3, 0.929%, 8/25/354 | | | 1,298,061 | | | | 1,196,548 | |
| MASTR Adjustable Rate Mortgages Trust, Series 2004-13, Cl. 2A2, 2.852%, 4/21/344 | | | 466,452 | | | | 474,272 | |
| RAMP Trust: | | | | | | | | |
| Series 2005-RS2, Cl. M4, 1.159%, 2/25/354 | | | 4,469,000 | | | | 4,038,731 | |
| Series 2005-RS6, Cl. M2, 1.204%, 6/25/354 | | | 944,044 | | | | 929,613 | |
| Series 2006-EFC1, Cl. M2, 0.839%, 2/25/364 | | | 5,490,000 | | | | 4,560,450 | |
| Series 2006-NC3, Cl. A3, 0.709%, 3/25/364 | | | 16,698,000 | | | | 14,183,039 | |
| Structured Asset Securities Corp. Mortgage Loan Trust: | | | | | | | | |
| Series 2007-GEL2, Cl. A2, 0.759%, 5/25/374,5 | | | 10,373,899 | | | | 9,545,139 | |
| Series 2007-GEL2, Cl. A3, 0.889%, 5/25/374,5 | | | 4,486,000 | | | | 3,583,930 | |
| | | | | | | | |
| Total Mortgage-Backed Obligations (Cost $47,667,919) | | | | | | | 60,864,452 | |
| | | | | | | | | |
| Non-Convertible Corporate Bonds and Notes—7.5% | | | | | | | | |
| Altice US Finance I Corp., 5.50% Sr. Sec. Nts., 5/15/265 | | | 460,000 | | | | 465,750 | |
| Bank of America Corp., 8% Jr. Sub. Perpetual Bonds, Series K4,6 | | | 12,480,000 | | | | 12,183,600 | |
| Citigroup, Inc., 5.875% Jr. Sub. Perpetual Bonds4,6 | | | 12,647,000 | | | | 12,249,252 | |
| Goldman Sachs Capital II, 4% Jr. Sub. Perpetual Bonds4,6 | | | 639,000 | | | | 462,061 | |
| JPMorgan Chase & Co., 7.90% Jr. Sub. Perpetual Bonds, Series 14,6 | | | 13,630,000 | | | | 13,723,706 | |
| Lukoil International Finance BV, 6.125% Sr. Unsec. Nts., 11/9/205 | | | 22,530,000 | | | | 24,168,269 | |
| Wachovia Capital Trust III, 5.57% Jr. Sub. Perpetual Bonds4,6 | | | 17,462,000 | | | | 17,440,173 | |
25 OPPENHEIMER FUNDAMENTAL ALTERNATIVES FUND
CONSOLIDATED STATEMENT OF INVESTMENTS Unaudited / Continued
| | | | | | | | |
| | | Principal Amount | | | Value | |
| Non-Convertible Corporate Bonds and Notes (Continued) | | | | | | | | |
| Wells Fargo & Co., 7.98% Jr. Sub. Perpetual Bonds, Series K4,6 | | $ | 13,165,000 | | | $ | 13,708,056 | |
| | | | | | | | |
| Total Non-Convertible Corporate Bonds and Notes (Cost $91,981,553) | | | | | | | 94,400,867 | |
| | | | | | | | | |
| Convertible Corporate Bond and Note—0.3% | | | | | | | | |
| SEACOR Holdings, Inc., 2.50% Cv. Sr. Unsec. Nts., 12/15/27 (Cost $3,668,469) | | | 3,694,000 | | | | 3,622,429 | |
| | | | | | | | | |
| Corporate Loans—8.6% | | | | | | | | |
| 21st Century Oncology, Inc., Sr. Sec. Credit Facilities 1st Lien Term Loan, Tranche B, 6.50%, 4/30/224 | | | 265,844 | | | | 237,265 | |
| 4L Technologies, Inc., Sr. Sec. Credit Facilities 1st Lien Term Loan, Tranche B, 5.50%-7.00%, 5/8/204 | | | 148,932 | | | | 134,039 | |
| ABC Supply Co., Inc., Sr. Sec. Credit Facilities 1st Lien Term Loan, Tranche B, 3.50%, 4/16/204 | | | 125,000 | | | | 125,391 | |
| Access CIG LLC, Sr. Sec. Credit Facilities 1st Lien Term Loan, Tranche B, 6.00%, 10/18/214 | | | 123,690 | | | | 122,969 | |
| Acrisure LLC, Sr. Sec. Credit Facilities 1st Lien Term Loan, Tranche B, 6.50%, 5/13/224 | | | 285,128 | | | | 283,160 | |
| Active Network, Inc. (The), Sr. Sec. Credit Facilities 1st Lien Term Loan, 5.50%, 11/13/204 | | | 275,514 | | | | 263,116 | |
| AdvancePierre Foods, Inc., Sr. Sec. Credit Facilities 1st Lien Term Loan, Tranche B, 5.75%, 7/10/174 | | | 359,967 | | | | 360,770 | |
| Affinion Group, Inc., Sr. Sec. Credit Facilities 1st Lien Term Loan, Tranche B, 6.75%, 4/30/184 | | | 472,587 | | | | 417,501 | |
| Air Canda, Sr. Sec. Credit Facilities 1st Lien Term Loan, Tranche B, 4.00%, 9/26/194,7 | | | 408,959 | | | | 411,388 | |
| Air Medical Group Holdings, Inc., Sr. Sec. Credit Facilities 1st Lien Term Loan, Tranche B, 4.25%, 4/28/224 | | | 444,370 | | | | 440,037 | |
| Akorn, Inc., Sr. Sec. Credit Facilities 1st Lien Term Loan, Tranche B, 6.00%, 4/16/214 | | | 287,206 | | | | 288,284 | |
| Albertsons Holdings LLC, Sr. Sec. Credit Facilities 1st Lien Term Loan: | | | | | | | | |
| Tranche B2, 5.50%, 3/21/194 | | | 442,430 | | | | 443,654 | |
| Tranche B4, 5.50%, 8/25/214 | | | 367,517 | | | | 369,278 | |
| Alinta Energy Finance Pty Ltd., Sr. Sec. Credit Facilities 1st Lien Term Loan, Tranche B, 6.375%, 8/13/194 | | | 629,910 | | | | 615,737 | |
| Alinta Energy Finance Pty Ltd., Sr. Sec. Credit Facilities 1st Lien Term Loan, Delayed Draw, Tranche B, 6.375%, 8/13/184 | | | 41,867 | | | | 40,925 | |
| Alliance Healthcare Services, Inc., Sr. Sec. Credit Facilities 1st Lien Term Loan, Tranche B, 4.25%, 6/3/194 | | | 248,711 | | | | 238,141 | |
| Alliant Holdings I LLC, Sr. Sec. Credit Facilities 1st Lien Term Loan, Tranche B, 4.50%, 8/12/224 | | | 287,825 | | | | 285,846 | |
| Allied Security Holdings LLC, Sr. Sec. Credit Facilities 1st Lien Term Loan, Tranche B, 4.25%, 2/12/214 | | | 673,561 | | | | 670,754 | |
| Allied Security Holdings LLC, Sr. Sec. Credit Facilities 2nd Lien Term Loan, Tranche B, 8.00%, 8/12/214 | | | 16,911 | | | | 16,562 | |
| Allnex Luxembourg & CY SCA, Sr. Sec. Credit Facilities 1st Lien Term Loan: | | | | | | | | |
| Tranche B1, 4.50%, 10/4/194 | | | 78,315 | | | | 78,217 | |
| Tranche B2, 4.50%, 10/4/194 | | | 40,634 | | | | 40,583 | |
26 OPPENHEIMER FUNDAMENTAL ALTERNATIVES FUND
| | | | | | | | |
| | | Principal Amount | | | Value | |
| Corporate Loans (Continued) | | | | | | | | |
| Alpha Media Group, Inc., Sr. Sec. Credit Facilities Term Loan, Tranche B, 3.05%, 7/15/164,8,12 | | $ | 236,418 | | | $ | 24 | |
| Altice Financing SA, Sr. Sec. Credit Facilities 1st Lien Term Loan, 5.50%, 7/2/194 | | | 462,916 | | | | 465,202 | |
| Alvogen Pharma US, Inc., Sr. Sec. Credit Facilities 1st Lien Term Loan, 6.00%, 4/1/224 | | | 249,323 | | | | 249,946 | |
| AM General LLC, Sr. Sec. Credit Facilities 1st Lien Term Loan, Tranche B, 10.25%, 3/22/184 | | | 166,393 | | | | 131,450 | |
| Amaya Gaming, Sr. Sec. Credit Facilities 1st Lien Term Loan, 5.00%, 7/29/214 | | | 455,014 | | | | 437,145 | |
| American Casino & Entertainment Properties, Sr. Sec. Credit Facilities 1st Lien Term Loan, 4.75%, 7/7/224 | | | 87,386 | | | | 88,259 | |
| American Energy-Marcellus LLC, Sr. Sec. Credit Facilities 1st Lien Term Loan, 5.25%, 8/4/204 | | | 288,584 | | | | 80,804 | |
| American Renal Holdings, Inc., Sr. Sec. Credit Facilities 1st Lien Term Loan, Delayed Draw, Tranche B, 4.50%, 8/20/194 | | | 154,703 | | | | 154,993 | |
| Apex Tool Group LLC, Sr. Sec. Credit Facilities 1st Lien Term Loan, Tranche B, 4.50%, 1/31/204 | | | 188,536 | | | | 185,119 | |
| Applied Systems, Inc., Sr. Sec. Credit Facilities 1st Lien Term Loan, Tranche B, 4.25%, 1/25/214 | | | 130,520 | | | | 130,330 | |
| Aptean, Inc., Sr. Sec. Credit Facilities 1st Lien Term Loan, Tranche B, 5.25%, 2/21/204 | | | 110,339 | | | | 108,960 | |
| Aqgen Liberty Management I, Inc., Sr. Sec. Credit Facilities 1st Lien Term Loan, 6.50%, 7/1/194 | | | 314,557 | | | | 313,377 | |
| Ardagh Holdings USA, Inc., Sr. Sec. Credit Facilities 1st Lien Term Loan, Delayed Draw, Tranche B, 4.00%, 12/17/194 | | | 236,282 | | | | 236,430 | |
| Ardent Legacy Acquisitions, Inc., Sr. Sec. Credit Facilities 1st Lien Term Loan, Tranche B, 6.50%, 8/4/214 | | | 114,425 | | | | 114,997 | |
| Aricent Technologies, Sr. Sec. Credit Facilities 1st Lien Term Loan, 5.50%, 4/14/214 | | | 200,489 | | | | 183,448 | |
| Ascena Retail Group, Inc., Sr. Sec. Credit Facilities 1st Lien Term Loan, Tranche B, 5.25%, 7/29/224 | | | 546,500 | | | | 538,576 | |
| Ascend Learning LLC, Sr. Sec. Credit Facilities 1st Lien Term Loan, Tranche B, 5.50%, 7/26/194 | | | 440,698 | | | | 441,616 | |
| Asurion LLC, Sr. Sec. Credit Facilities 1st Lien Term Loan: | | | | | | | | |
| Tranche B, 5.00%, 8/4/224 | | | 737,695 | | | | 733,637 | |
| Tranche B1, 5.00%, 5/24/194 | | | 433,054 | | | | 432,729 | |
| Asurion LLC, Sr. Sec. Credit Facilities 2nd Lien Term Loan, 8.50%, 3/3/214 | | | 15,000 | | | | 14,489 | |
| Audio Visual Services Corp., Sr. Sec. Credit Facilities 1st Lien Term Loan, 4.50%, 1/22/214 | | | 458,043 | | | | 449,455 | |
| Avago Technologies Cayman Finance Ltd., Sr. Sec. Credit Facilities 1st Lien Term Loan, Tranche B, 4.25%, 2/1/234,7 | | | 20,000 | | | | 20,048 | |
| Avaya, Inc., Sr. Sec. Credit Facilities 1st Lien Term Loan, Tranche B7, 6.25%, 4/30/204,7 | | | 1,424,147 | | | | 906,707 | |
| Bass Pro Group LLC, Sr. Sec. Credit Facilities 1st Lien Term Loan, Tranche B, 4.00%, 6/5/204 | | | 410,857 | | | | 406,491 | |
| Birch Communications, Inc., Sr. Sec. Credit Facilities 1st Lien Term Loan, Tranche B, 7.75%, 7/17/204 | | | 239,796 | | | | 209,822 | |
27 OPPENHEIMER FUNDAMENTAL ALTERNATIVES FUND
CONSOLIDATED STATEMENT OF INVESTMENTS Unaudited / Continued
| | | | | | | | |
| | | Principal Amount | | | Value | |
| Corporate Loans (Continued) | | | | | | | | |
| BJ’s Wholesale Club, Inc., Sr. Sec. Credit Facilities 1st Lien Term Loan, Tranche B, 4.50%, 9/26/194,7 | | $ | 160,779 | | | $ | 159,523 | |
| Blackboard, Inc., Sr. Sec. Credit Facilities 1st Lien Term Loan, Tranche B3, 4.75%, 10/4/184 | | | 324,895 | | | | 305,807 | |
| Blue Coat Systems, Inc., Sr. Sec. Credit Facilities 1st Lien Term Loan, Tranche B, 4.50%, 5/20/224,7 | | | 317,951 | | | | 316,461 | |
| BMC Foreign Holding Co., Sr. Sec. Credit Facilities 1st Lien Term Loan, Tranche B, 5.00%, 9/10/204 | | | 39,905 | | | | 34,443 | |
| BMC Software, Inc., Sr. Sec. Credit Facilities 1st Lien Term Loan, Tranche B, 5.00%, 9/10/204 | | | 332,696 | | | | 288,198 | |
| Bowlmor AMF, Sr. Sec. Credit Facilities 1st Lien Term Loan, Tranche B, 7.25%, 9/20/214 | | | 221,909 | | | | 221,909 | |
| Boyd Corp., Sr. Sec. Credit Facilities 1st Lien Term Loan, 5.25%, 4/15/224 | | | 144,124 | | | | 137,638 | |
| Boyd Gaming Corp., Sr. Sec. Credit Facilities 1st Lien Term Loan, Tranche B, 4.00%, 8/14/204 | | | 141,350 | | | | 141,741 | |
| Burger King, Sr. Sec. Credit Facilities 1st Lien Term Loan, Tranche B, 3.75%, 12/10/214 | | | 230,594 | | | | 231,243 | |
| Burlington Coat Factory Warehouse Corp., Sr. Sec. Credit Facilities 1st Lien Term Loan, Tranche B3, 4.25%, 8/13/214 | | | 498,208 | | | | 500,077 | |
| BWAY Holdings Co., Sr. Sec. Credit Facilities 1st Lien Term Loan, Tranche B, 5.50%-7.00%, 8/14/204 | | | 525,912 | | | | 524,991 | |
| Caesars Entertainment Operating Co., Inc., Extended Sr. Sec. Credit Facilities 1st Lien Term Loan, Tranche B5, 1.50%, 3/1/174,9 | | | 146,278 | | | | 134,088 | |
| Caesars Entertainment Operating Co., Inc., Sr. Sec. Credit Facilities 1st Lien Term Loan: | | | | | | | | |
| Tranche B4, 1.50%, 10/31/164,9 | | | 65,614 | | | | 62,333 | |
| Tranche B6, 1.50%, 3/1/174,9 | | | 306,497 | | | | 289,639 | |
| Tranche B7, 1.50%, 1/28/184,9 | | | 372,725 | | | | 348,731 | |
| Caesars Entertainment Resort Properties LLC, Sr. Sec. Credit Facilities 1st Lien Term Loan, Tranche B, 7.00%, 10/11/204 | | | 893,469 | | | | 846,842 | |
| Caesars Growth Properties Holdings LLC, Sr. Sec. Credit Facilities 1st Lien Term Loan, 6.25%, 5/10/214 | | | 412,312 | | | | 370,050 | |
| Calpine Corp., Sr. Sec. Credit Facilities 1st Lien Term Loan: | | | | | | | | |
| Tranche B, 3.50%, 5/27/224 | | | 153,838 | | | | 152,888 | |
| Tranche B3, 4.00%, 10/9/194 | | | 249,354 | | | | 249,536 | |
| Camping World, Sr. Sec. Credit Facilities 1st Lien Term Loan, Tranche B, 5.75%, 2/20/204 | | | 294,986 | | | | 294,617 | |
| Capital Automotive LP, Sr. Sec. Credit Facilities 1st Lien Term Loan, Tranche B, 4.00%, 4/10/194 | | | 54,693 | | | | 54,878 | |
| Capital Automotive LP, Sr. Sec. Credit Facilities 2nd Lien Term Loan, 6.00%, 4/30/204 | | | 596,672 | | | | 598,910 | |
| CareCore National LLC, Sr. Sec. Credit Facilities 1st Lien Term Loan, Tranche B, 5.50%, 3/5/214 | | | 155,798 | | | | 146,061 | |
| Carestream Health, Inc., Sr. Sec. Credit Facilities 1st Lien Term Loan, Tranche B, 5.00%, 6/7/194 | | | 536,473 | | | | 517,697 | |
| CCO Safari III LLC, Sr. Sec. Credit Facilities 1st Lien Term Loan, Tranche I, 3.50%, 1/23/234 | | | 575,000 | | | | 578,131 | |
| CEC Entertainment, Inc., Sr. Sec. Credit Facilities Term Loan, Tranche B, 4.00%, 2/14/214 | | | 362,134 | | | | 354,552 | |
28 OPPENHEIMER FUNDAMENTAL ALTERNATIVES FUND
| | | | | | | | |
| | | Principal Amount | | | Value | |
| Corporate Loans (Continued) | | | | | | | | |
| CeramTec Acquisition Corp., Sr. Sec. Credit Facilities 1st Lien Term Loan, Tranche B2, 4.25%, 8/28/204 | | $ | 31,542 | | | $ | 31,562 | |
| CeramTec Service GmbH, Sr. Sec. Credit Facilities 1st Lien Term Loan: | | | | | | | | |
| Tranche B1, 4.25%, 8/28/204 | | | 296,728 | | | | 296,914 | |
| Tranche B3, 4.25%, 8/28/204 | | | 90,423 | | | | 90,479 | |
| Ceridian HCM Holdings, Inc., Sr. Sec. Credit Facilities 1st Lien Exit Term Loan, Tranche B, 4.50%, 9/15/204 | | | 418,267 | | | | 401,798 | |
| CEVA Group plc, Sr. Sec. Credit Facilities 1st Lien Term Loan, 6.50%, 3/14/214 | | | 80,730 | | | | 70,908 | |
| CEVA Group plc, Sr. Sec. Credit Facilities 1st Lien Term Loan, 6.50%, 3/19/214 | | | 68,621 | | | | 60,272 | |
| CEVA Group plc, Sr. Sec. Credit Facilities Letter of Credit 1st Lien Term Loan, 6.50%, 3/14/214 | | | 56,635 | | | | 49,744 | |
| Checkout Holdings, Inc., Sr. Sec. Credit Facilities 1st Lien Term Loan, Tranche B, 4.50%, 4/1/214 | | | 370,400 | | | | 316,229 | |
| CHS/Community Health Systems, Inc., Sr. Sec. Credit Facilities 1st Lien Term Loan: | | | | | | | | |
| Tranche G, 3.75%, 12/31/194 | | | 63,143 | | | | 62,288 | |
| Tranche H, 4.00%, 1/27/214 | | | 300,490 | | | | 296,471 | |
| Cincinnati Bell, Inc., Sr. Sec. Credit Facilities 1st Lien Term Loan, Tranche B, 4.00%, 9/10/204 | | | 435,968 | | | | 434,660 | |
| Cinram International, Inc., Sr. Sec. Credit Facilities 2nd Lien Term Loan, 0.432%, 8/3/494,8,12 | | | 39,438 | | | | 100 | |
| Clear Channel Communications, Inc., Extended Sr. Sec. Credit Facilities 1st Lien Exit Term Loan, Tranche D, 7.185%, 1/30/194 | | | 1,616,691 | | | | 1,210,245 | |
| Clear Channel Communications, Inc., Sr. Sec. Credit Facilities 1st Lien Term Loan, Tranche E, 7.935%, 7/30/194 | | | 57,055 | | | | 42,560 | |
| Commercial Barge Line Co., Sr. Sec. Credit Facilities 1st Lien Term Loan, Tranche B, 9.75%, 11/12/204 | | | 375,000 | | | | 328,125 | |
| CommScope, Inc., Sr. Sec. Credit Facilities 1st Lien Term Loan, Tranche B, 3.75%, 12/29/224 | | | 104,475 | | | | 104,780 | |
| Communications Sales & Leasing, Inc., Sr. Sec. Credit Facilities 1st Lien Term Loan, Tranche B, 5.00%, 10/14/224 | | | 538,262 | | | | 529,291 | |
| Compuware Corp., Sr. Sec. Credit Facilities 1st Lien Term Loan, Tranche B2, 6.25%, 12/15/214 | | | 449,570 | | | | 435,071 | |
| Connolly Corp., Sr. Sec. Credit Facilities 1st Lien Term Loan, Tranche B, 4.50%, 5/14/214 | | | 436,068 | | | | 435,341 | |
| Consolidated Container Holdings LLC, Sr. Sec. Credit Facilities 1st Lien Term Loan, Tranche B, 5.00%, 7/3/194 | | | 326,132 | | | | 317,163 | |
| Continental Building Products LLC, Sr. Sec. Credit Facilities 1st Lien Term Loan, Tranche B, 4.00%, 8/28/204 | | | 311,590 | | | | 306,254 | |
| ConvaTec, Inc., Sr. Sec. Credit Facilities 1st Lien Term Loan, Tranche B, 4.25%, 6/15/204 | | | 378,005 | | | | 379,658 | |
| Cooper Standard, Sr. Sec. Credit Facilities 1st Lien Term Loan, Tranche B, 4.00%, 3/26/214 | | | 227,524 | | | | 227,524 | |
| Corner Investment Propco LLC, Sr. Sec. Credit Facilities 1st Lien Term Loan, 11.00%, 11/2/194 | | | 284,845 | | | | 279,148 | |
| CPG International, Inc., Sr. Sec. Credit Facilities 1st Lien Term Loan, Tranche B, 4.75%, 9/30/204 | | | 168,148 | | | | 167,517 | |
| CPI Acquisition, Inc., Sr. Sec. Credit Facilities 1st Lien Term Loan, Tranche B, 5.50%, 8/17/224 | | | 233,939 | | | | 235,109 | |
29 OPPENHEIMER FUNDAMENTAL ALTERNATIVES FUND
CONSOLIDATED STATEMENT OF INVESTMENTS Unaudited / Continued
| | | | | | | | |
| | | Principal Amount | | | Value | |
| Corporate Loans (Continued) | | | | | | | | |
| CSM Bakery Supplies, Sr. Sec. Credit Facilities 1st Lien Term Loan, Tranche B, 5.00%, 7/3/204,7 | | $ | 406,385 | | | $ | 402,956 | |
| CSM Bakery Supplies, Sr. Sec. Credit Facilities 2nd Lien Term Loan, 8.75%, 7/5/214 | | | 49,896 | | | | 46,902 | |
| CT Technologies Intermediate Holdings, Inc., Sr. Sec. Credit Facilities 1st Lien Term Loan, Tranche B, 5.25%, 11/18/214 | | | 233,859 | | | | 233,275 | |
| Cyanco Intermediate Corp., Sr. Sec. Credit Facilities 1st Lien Term Loan, Tranche B, 5.50%, 5/1/204 | | | 322,588 | | | | 316,540 | |
| Dayco Products LLC, Sr. Sec. Credit Facilities 1st Lien Term Loan, Tranche B, 5.25%, 12/12/194 | | | 243,694 | | | | 239,125 | |
| Del Monte Foods Co., Inc., Sr. Sec. Credit Facilities 1st Lien Term Loan, Tranche B, 4.25%, 2/18/214,7 | | | 215,243 | | | | 209,324 | |
| Dell International LLC, Sr. Sec. Credit Facilities 1st Lien Term Loan, Tranche B2, 4.00%, 4/29/204 | | | 441,744 | | | | 441,938 | |
| Delos Finance Sarl, Sr. Sec. Credit Facilities 1st Lien Term Loan, Tranche B, 3.50%, 2/26/214 | | | 4,200,000 | | | | 4,221,655 | |
| Deltek, Inc., Sr. Sec. Credit Facilities 1st Lien Term Loan, 5.00%, 6/25/224,7 | | | 404,490 | | | | 404,490 | |
| Deluxe Entertainment Services, Sr. Sec. Credit Facilities 1st Lien Term Loan, Tranche B, 6.50%, 2/26/204 | | | 884,660 | | | | 866,967 | |
| DJO Finance LLC, Sr. Sec. Credit Facilities 1st Lien Term Loan, Tranche B, 4.25%, 6/8/204,7 | | | 390,248 | | | | 380,004 | |
| Dole Food Co., Inc., Sr. Sec. Credit Facilities 1st Lien Term Loan, Tranche B, 4.50%-6.00%, 11/1/184,7 | | | 312,972 | | | | 312,972 | |
| Doncasters US Finance LLC, Sr. Sec. Credit Facilities 1st Lien Term Loan, Tranche B, 4.50%, 4/9/204 | | | 152,545 | | | | 144,346 | |
| Doosan Bobcat, Sr. Sec. Credit Facilities 1st Lien Term Loan, Tranche B, 4.50%, 5/28/214 | | | 198,748 | | | | 196,388 | |
| DPx Holdings BV, Sr. Sec. Credit Facilities 1st Lien Term Loan, Tranche B, 4.25%, 3/11/214 | | | 390,451 | | | | 387,766 | |
| Drillships Financing Holding, Inc., Sr. Sec. Credit Facilities 1st Lien Term Loan, Tranche B1, 6.00%, 3/31/214,7 | | | 20,000 | | | | 9,800 | |
| Drumm Investors LLC, Sr. Sec. Credit Facilities 1st Lien Term Loan, 9.50%, 5/4/184 | | | 316,109 | | | | 308,207 | |
| DTZ US Borrower LLC, Sr. Sec. Credit Facilities 1st Lien Term Loan, Tranche B, 4.25%, 11/4/214 | | | 249,372 | | | | 249,580 | |
| Dynegy, Inc., Sr. Sec. Credit Facilities 1st Lien Term Loan, Tranche B2, 4.00%, 4/23/204 | | | 3,657,021 | | | | 3,633,250 | |
| Eldorado Resorts, Inc., Sr. Sec. Credit Facilities 1st Lien Term Loan, Tranche B, 4.25%, 7/25/224 | | | 222,412 | | | | 223,154 | |
| Emerald Performance Materials LLC, Sr. Sec. Credit Facilities 1st Lien Term Loan, 4.50%, 7/23/214 | | | 190,038 | | | | 188,850 | |
| Endemol, Sr. Sec. Credit Facilities 1st Lien Term Loan, 6.75%, 8/11/214 | | | 329,888 | | | | 283,154 | |
| Energy Future Intermediate Holding Co. LLC, Sr. Sec. Credit Facilities 1st Lien Term Loan, Debtor in Possession, 4.25%, 12/19/164 | | | 5,250,000 | | | | 5,252,189 | |
| Energy Transfer Equity LP, Sr. Sec. Credit Facilities 1st Lien Term Loan, 3.25%-4.00%, 12/2/194 | | | 140,000 | | | | 132,935 | |
| Envision Healthcare Corp., Sr. Sec. Credit Facilities 1st Lien Term Loan, Tranche B2, 4.50%, 10/28/224 | | | 324,188 | | | | 325,538 | |
30 OPPENHEIMER FUNDAMENTAL ALTERNATIVES FUND
| | | | | | | | |
| | | Principal Amount | | | Value | |
| Corporate Loans (Continued) | | | | | | | | |
| Epicor Software Corp., Sr. Sec. Credit Facilities 1st Lien Term Loan, 4.75%, 6/1/224 | | $ | 232,762 | | | $ | 224,325 | |
| Equinox Holdings, Inc., Sr. Sec. Credit Facilities 1st Lien Term Loan, Tranche B, 5.00%, 1/31/204 | | | 324,452 | | | | 323,996 | |
| EWT Holdings III Corp., Sr. Sec. Credit Facilities 1st Lien Term Loan, 4.75%, 1/15/214 | | | 174,966 | | | | 172,998 | |
| Excelitas Technologies Corp., Sr. Sec. Credit Facilities 1st Lien Term Loan, 6.00%, 11/2/204 | | | 142,082 | | | | 132,491 | |
| ExGen Texas Power LLC, Sr. Sec. Credit Facilities 1st Lien Term Loan, Tranche B, 5.75%, 9/20/214 | | | 314,530 | | | | 229,607 | |
| Exopack/Coveris, Sr. Sec. Credit Facilities 1st Lien Term Loan, Tranche B, 4.50%, 5/8/194 | | | 219,545 | | | | 217,899 | |
| FairPoint Communications, Inc., Sr. Sec. Credit Facilities 1st Lien Term Loan, Tranche B, 7.50%, 2/14/194 | | | 632,529 | | | | 631,738 | |
| Federal-Mogul Holdings Corp., Sr. Sec. Credit Facilities 1st Lien Term Loan: | | | | | | | | |
| Tranche B, 4.00%, 4/3/184 | | | 124,367 | | | | 120,740 | |
| Tranche C, 4.75%, 4/15/214 | | | 1,075,017 | | | | 1,029,329 | |
| Filtration Group, Inc., Sr. Sec. Credit Facilities 1st Lien Term Loan, Tranche B, 4.25%, 11/20/204 | | | 146,297 | | | | 146,114 | |
| First Advantage, Sr. Sec. Credit Facilities 1st Lien Term Loan, Tranche B, 6.25%, 6/30/224 | | | 202,904 | | | | 198,973 | |
| First Data Corp., Sr. Sec. Credit Facilities 1st Lien Term Loan: | | | | | | | | |
| Tranche B, 4.439%, 3/24/214 | | | 886,715 | | | | 889,929 | |
| Tranche B, 4.189%, 7/8/224 | | | 100,000 | | | | 100,089 | |
| Formula One, Sr. Sec. Credit Facilities 1st Lien Term Loan, Tranche B, 4.75%, 7/30/214 | | | 512,240 | | | | 503,980 | |
| FPC Holdings, Inc., Sr. Sec. Credit Facilities 1st Lien Term Loan, 5.25%, 11/19/194 | | | 403,193 | | | | 354,810 | |
| Garda World Security Corp., Sr. Sec. Credit Facilities 1st Lien Term Loan, Tranche B, 4.00%-5.50%, 11/6/204 | | | 610,526 | | | | 601,113 | |
Garda World Security Corp., Sr. Sec. Credit Facilities 1st Lien Term Loan, Delayed Draw, Tranche B,
4.00%-5.50%, 11/6/204 | | | 93,369 | | | | 91,929 | |
| Gates Global LLC, Sr. Sec. Credit Facilities 1st Lien Term Loan, 4.25%, 7/5/214 | | | 355,650 | | | | 341,868 | |
| Genesis Healthcare Corp., Sr. Sec. Credit Facilities 1st Lien Term Loan, Tranche B, 10.00%, 12/4/174 | | | 213,568 | | | | 212,501 | |
| Getty Images, Inc., Sr. Sec. Credit Facilities 1st Lien Term Loan, Tranche B, 4.75%, 10/18/194 | | | 178,558 | | | | 134,960 | |
| Global Tel*Link Corp., Sr. Sec. Credit Facilities 1st Lien Term Loan, 5.00%, 5/22/204 | | | 477,474 | | | | 445,543 | |
| Golden Nugget, Inc., Sr. Sec. Credit Facilities 1st Lien Term Loan, Tranche B, 5.50%, 11/21/194 | | | 539,300 | | | | 540,817 | |
| Goodyear Tire & Rubber Co. (The), Sr. Sec. Credit Facilities 2nd Lien Term Loan, 3.75%, 4/30/194 | | | 161,337 | | | | 161,892 | |
| Guggenheim Partners Investment Management, Sr. Sec. Credit Facilities 1st Lien Term Loan, Tranche B, 4.25%, 7/22/204 | | | 183,145 | | | | 183,565 | |
| Gymboree Corp. (The), Sr. Sec. Credit Facilities 1st Lien Term Loan, 5.00%, 2/23/184 | | | 190,512 | | | | 148,004 | |
| GYP Holdings, Sr. Sec. Credit Facilities 1st Lien Term Loan, 4.75%, 3/27/214 | | | 200,038 | | | | 192,870 | |
31 OPPENHEIMER FUNDAMENTAL ALTERNATIVES FUND
CONSOLIDATED STATEMENT OF INVESTMENTS Unaudited / Continued
| | | | | | | | |
| | | Principal Amount | | | Value | |
| Corporate Loans (Continued) | | | | | | | | |
| Harbor Freight Tools USA, Inc., Sr. Sec. Credit Facilities 1st Lien Term Loan, Tranche B, 4.75%, 7/26/194 | | $ | 446,550 | | | $ | 449,676 | |
| Harland Clarke Holdings Corp., Sr. Sec. Credit Facilities 1st Lien Term Loan: | | | | | | | | |
| Tranche B3, 7.00%, 5/22/184 | | | 34,216 | | | | 33,845 | |
| Tranche B4, 6.00%, 8/4/194 | | | 270,387 | | | | 265,430 | |
| HCR Healthcare, Inc., Sr. Sec. Credit Facilities 1st Lien Term Loan, 5.00%, 4/6/184 | | | 190,471 | | | | 159,101 | |
| HD Supply, Inc., Sr. Sec. Credit Facilities 1st Lien Term Loan, 3.75%, 8/13/214 | | | 378,100 | | | | 378,431 | |
| Hillman Group, Inc. (The), Sr. Sec. Credit Facilities 1st Lien Term Loan, Tranche B, 4.50%, 6/30/214 | | | 149,948 | | | | 147,605 | |
| Hilton Worldwide Finance LLC, Sr. Sec. Credit Facilities 1st Lien Term Loan, Tranche B, 3.50%, 10/26/204 | | | 125,452 | | | | 125,954 | |
| Hostess Brands LLC, Sr. Sec. Credit Facilities 1st Lien Term Loan, 4.50%, 8/3/224 | | | 466,840 | | | | 468,590 | |
| HUB International Ltd., Sr. Sec. Credit Facilities 1st Lien Term Loan, Tranche B, 4.25%, 10/2/204 | | | 564,577 | | | | 560,343 | |
| Hyperion Insurance Group Ltd., Sr. Sec. Credit Facilities 1st Lien Term Loan, Tranche B, 5.50%, 4/9/224 | | | 213,305 | | | | 212,061 | |
| IASIS Healthcare LLC, Sr. Sec. Credit Facilities 1st Lien Term Loan, Tranche B2, 4.50%, 5/3/184 | | | 377,565 | | | | 376,975 | |
| IG Investments Holdings LLC, Sr. Sec. Credit Facilities 1st Lien Term Loan, Tranche B, 6.00%, 10/31/214 | | | 464,480 | | | | 463,028 | |
| IMG Worldwide, Inc., Sr. Sec. Credit Facilities 1st Lien Term Loan, Tranche B, 5.25%, 5/6/214 | | | 640,977 | | | | 641,639 | |
| Ineos US Finance LLC, Sr. Sec. Credit Facilities 1st Lien Term Loan: | | | | | | | | |
| Tranche B, 3.75%, 5/4/184 | | | 313,201 | | | | 313,453 | |
| Tranche B, 4.25%, 3/31/224 | | | 77,090 | | | | 76,396 | |
| Infor US, Inc., Sr. Sec. Credit Facilities 1st Lien Term Loan, Tranche B5, 3.75%, 6/3/204 | | | 383,973 | | | | 375,950 | |
| Informatica Corp., Sr. Sec. Credit Facilities 1st Lien Term Loan, Tranche B, 4.25%, 8/5/224 | | | 382,578 | | | | 378,075 | |
| Information Resources, Inc., Sr. Sec. Credit Facilities 1st Lien Term Loan, Tranche B, 4.75%, 9/30/204 | | | 41,987 | | | | 42,078 | |
| Inmar, Inc., Sr. Sec. Credit Facilities 1st Lien Term Loan, Tranche B, 4.25%, 1/27/214 | | | 155,982 | | | | 153,057 | |
| Intelsat Jackson Holdings SA, Sr. Sec. Credit Facilities 1st Lien Term Loan, Tranche B2, 3.75%, 6/30/194,7 | | | 185,000 | | | | 173,946 | |
| InterGen NV, Sr. Sec. Credit Facilities 1st Lien Term Loan, Tranche B, 5.50%, 6/15/204 | | | 298,562 | | | | 266,218 | |
| Internap Network Services Corp., Sr. Sec. Credit Facilities 1st Lien Term Loan, 7.00%, 11/22/194 | | | 111,587 | | | | 103,218 | |
| International Equipment Solutions LLC, Sr. Sec. Credit Facilities 1st Lien Term Loan, Tranche B, 7.25%-8.50%, 8/16/194 | | | 131,773 | | | | 113,325 | |
| International Lease Finance Corp., Sr. Sec. Credit Facilities 1st Lien Term Loan, Tranche B, 3.50%, 2/26/214,7 | | | 3,320,000 | | | | 3,337,118 | |
| Internet Brands, Sr. Sec. Credit Facilities 1st Lien Term Loan, Tranche B, 4.75%, 6/30/214,7 | | | 388,927 | | | | 388,927 | |
| Intrawest Operations Group LLC, Sr. Sec. Credit Facilities 1st Lien Term Loan, Tranche B, 5.00%, 12/9/204 | | | 219,071 | | | | 219,482 | |
32 OPPENHEIMER FUNDAMENTAL ALTERNATIVES FUND
| | | | | | | | |
| | | Principal Amount | | | Value | |
| Corporate Loans (Continued) | | | | | | | | |
| inVentiv Health, Inc., Sr. Sec. Credit Facilities 1st Lien Term Loan, Tranche B4, 7.75%, 5/15/184 | | $ | 213,985 | | | $ | 213,852 | |
| ION Media Networks, Inc., Sr. Sec. Credit Facilities 1st Lien Term Loan, 4.75%, 12/18/204 | | | 712,109 | | | | 713,889 | |
| IPC Corp., Sr. Sec. Credit Facilities 1st Lien Term Loan, Tranche B, 5.50%, 8/6/214 | | | 521,650 | | | | 483,830 | |
| IPC Corp., Sr. Sec. Credit Facilities 2nd Lien Term Loan, 10.50%, 2/4/224 | | | 161,028 | | | | 132,043 | |
| IQOR US, Inc., Sr. Sec. Credit Facilities 1st Lien Term Loan, Tranche B, 6.00%, 4/1/214 | | | 317,970 | | | | 263,915 | |
| IQOR US, Inc., Sr. Sec. Credit Facilities 2nd Lien Term Loan, 9.75%, 4/1/224 | | | 89,964 | | | | 65,674 | |
| iStar Financial, Inc., Sr. Sec. Credit Facilities 1st Lien Term Loan, Tranche A2, 7.00%, 3/19/174 | | | 125,024 | | | | 125,337 | |
| J.C. Penney Corp., Inc., Sr. Sec. Credit Facilities 1st Lien Term Loan, 6.00%, 5/22/184 | | | 487,251 | | | | 488,287 | |
| Jacobs Entertainment, Inc., Sr. Sec. Credit Facilities 1st Lien Term Loan, 5.25%, 10/29/184 | | | 251,150 | | | | 248,638 | |
| Kenan Advantage Group, Inc. (The), Sr. Sec. Credit Facilities 1st Lien Term Loan: | | | | | | | | |
| Tranche B1, 4.00%, 7/29/224 | | | 583,972 | | | | 583,485 | |
| Tranche B2, 4.00%, 7/29/224 | | | 190,091 | | | | 189,933 | |
| Kenan Advantage Group, Inc. (The), Sr. Sec. Credit Facilities 1st Lien Term Loan, Delayed Draw, 4.00%, 1/24/174,7 | | | 56,925 | | | | 56,878 | |
| Kenan Advantage Group, Inc. (The), Sr. Sec. Credit Facilities 1st Lien Term Loan, Delayed Draw, 1.50%, 1/31/174,7 | | | 21,214 | | | | 21,197 | |
| Key Safety Systems, Inc., Sr. Sec. Credit Facilities 1st Lien Term Loan, 4.75%, 8/30/214,7 | | | 328,248 | | | | 328,863 | |
| KIK Custom Products, Inc., Sr. Sec. Credit Facilities 1st Lien Term Loan, Tranche B, 6.00%, 8/26/224 | | | 486,927 | | | | 473,232 | |
| Kindred Healthcare, Inc., Sr. Sec. Credit Facilities 1st Lien Term Loan, Tranche B, 4.25%, 4/9/214 | | | 542,241 | | | | 540,885 | |
| Kinetic Concepts, Inc., Sr. Sec. Credit Facilities 1st Lien Term Loan, Tranche E1, 4.50%, 5/4/184 | | | 367,787 | | | | 368,286 | |
| Kloeckner Pentaplast of America, Inc., Sr. Sec. Credit Facilities 1st Lien Term Loan, 5.00%, 4/22/204 | | | 110,692 | | | | 110,969 | |
| Kloeckner Pentaplast of America, Inc., Sr. Sec. Credit Facilities 1st Lien Term Loan, 5.00%, 4/28/204 | | | 260,471 | | | | 261,122 | |
| Koosharem LLC, Sr. Sec. Credit Facilities 1st Lien Exit Term Loan, 7.50%, 5/15/204 | | | 1,030,769 | | | | 901,923 | |
| Kraton Polymers LLC, Sr. Sec. Credit Facilities 1st Lien Term Loan, Tranche B, 6.00%, 1/6/224 | | | 500,000 | | | | 481,979 | |
| Kronos, Inc., Sr. Sec. Credit Facilities 1st Lien Term Loan, 4.50%, 10/30/194 | | | 226,707 | | | | 226,962 | |
| La Quinta Intermediate Holdings LLC, Sr. Sec. Credit Facilities 1st Lien Term Loan, Tranche B, 3.75%, 4/14/214 | | | 224,655 | | | | 222,072 | |
| Landry’s, Inc., Sr. Sec. Credit Facilities 1st Lien Term Loan, Tranche B, 4.00%, 4/24/184 | | | 206,116 | | | | 206,567 | |
| Laureate Education, Inc., Sr. Sec. Credit Facilities 1st Lien Term Loan, Tranche B, 5.00%, 6/15/184 | | | 378,575 | | | | 352,075 | |
33 OPPENHEIMER FUNDAMENTAL ALTERNATIVES FUND
CONSOLIDATED STATEMENT OF INVESTMENTS Unaudited / Continued
| | | | | | | | |
| | | Principal Amount | | | Value | |
| Corporate Loans (Continued) | | | | | | | | |
| Leighton Services, Sr. Sec. Credit Facilities 1st Lien Term Loan, Tranche B, 5.50%, 5/23/224 | | $ | 182,188 | | | $ | 182,643 | |
| Leslie’s Poolmart, Inc., Sr. Sec. Credit Facilities 1st Lien Term Loan, Tranche B, 4.25%, 10/16/194,7 | | | 210,994 | | | | 210,379 | |
| LHP Operations Co. LLC, Sr. Sec. Credit Facilities 1st Lien Term Loan, Tranche B, 9.00%, 7/3/184 | | | 75,731 | | | | 75,352 | |
| LifeCare Holdings LLC, Sr. Sec. Credit Facilities 1st Lien Exit Term Loan, Tranche A, 6.50%, 11/30/184 | | | 155,232 | | | | 139,709 | |
| Linxens France SA, Sr. Sec. Credit Facilities 1st Lien Term Loan, 5.00%, 10/14/224 | | | 314,213 | | | | 314,213 | |
| Livingston International, Inc., Sr. Sec. Credit Facilities 1st Lien Term Loan, Tranche B1, 5.00%, 4/18/194 | | | 102,929 | | | | 95,982 | |
| Livingston International, Inc., Sr. Sec. Credit Facilities 2nd Lien Term Loan, 9.00%, 4/17/204 | | | 45,073 | | | | 41,130 | |
| LTS Buyer LLC, Sr. Sec. Credit Facilities 1st Lien Term Loan, Tranche B, 4.00%, 4/13/204 | | | 778,483 | | | | 779,619 | |
| Media General, Inc., Sr. Sec. Credit Facilities 1st Lien Term Loan, Delayed Draw, Tranche B, 4.00%, 7/30/204 | | | 414,592 | | | | 415,006 | |
| MEG Energy Corp., Sr. Sec. Credit Facilities 1st Lien Term Loan, Tranche B, 3.75%, 3/31/204,7 | | | 214,533 | | | | 191,292 | |
| Mergermarket USA, Inc., Sr. Sec. Credit Facilities 1st Lien Term Loan, 4.50%, 2/4/214 | | | 252,538 | | | | 250,012 | |
| Micro Focus US, Inc., Sr. Sec. Credit Facilities 1st Lien Term Loan, Tranche B, 5.25%, 11/19/214 | | | 435,506 | | | | 435,615 | |
| Milacron LLC, Sr. Sec. Credit Facilities 1st Lien Term Loan, Tranche B, 4.50%, 9/28/204 | | | 178,627 | | | | 179,073 | |
| Mitchell International, Inc., Sr. Sec. Credit Facilities 1st Lien Term Loan, Tranche B, 4.50%, 10/12/204 | | | 142,255 | | | | 141,031 | |
| Moxie Patriot LLC, Sr. Sec. Credit Facilities 1st Lien Term Loan, Tranche B1, 6.75%, 12/19/204 | | | 518,994 | | | | 511,209 | |
| MPG Holdco I, Inc., Sr. Sec. Credit Facilities 1st Lien Term Loan, 3.75%, 10/21/214 | | | 145,122 | | | | 144,500 | |
| National Financial Partners Corp., Sr. Sec. Credit Facilities 1st Lien Term Loan, Tranche B, 4.50%, 7/1/204 | | | 373,835 | | | | 370,213 | |
| National Mentor, Sr. Sec. Credit Facilities 1st Lien Term Loan, Tranche B, 4.25%, 1/31/214 | | | 235,998 | | | | 235,777 | |
| National Surgical Hospitals, Inc., Sr. Sec. Credit Facilities 1st Lien Term Loan, Tranche B, 4.50%, 6/1/224 | | | 59,550 | | | | 58,693 | |
| National Vision, Sr. Sec. Credit Facilities 1st Lien Term Loan, Tranche B, 4.00%, 3/5/214 | | | 143,353 | | | | 140,307 | |
| Navistar, Inc., Sr. Sec. Credit Facilities 1st Lien Term Loan, Tranche B, 6.50%, 8/7/204 | | | 608,475 | | | | 578,558 | |
| Neiman Marcus, Sr. Sec. Credit Facilities 1st Lien Term Loan, 4.25%, 10/25/204,7 | | | 496,269 | | | | 473,760 | |
| NEP/NCP Holdco, Inc., Sr. Sec. Credit Facilities 1st Lien Term Loan, Tranche B, 4.25%, 1/22/204,7 | | | 524,256 | | | | 500,009 | |
| New Millennium Holdco, Inc., Sr. Sec. Credit Facilities 1st Lien Term Loan, 7.50%, 12/21/204 | | | 264,030 | | | | 205,943 | |
| New Trident Holdcorp, Inc., Sr. Sec. Credit Facilities 1st Lien Term Loan, Tranche B, 6.50%, 7/31/194 | | | 111,285 | | | | 105,165 | |
34 OPPENHEIMER FUNDAMENTAL ALTERNATIVES FUND
| | | | | | | | |
| | | Principal Amount | | | Value | |
| Corporate Loans (Continued) | | | | | | | | |
| Nord Anglia Education Finance, Sr. Sec. Credit Facilities 1st Lien Term Loan, Tranche B, 5.00%, 3/31/214 | | $ | 440,611 | | | $ | 432,900 | |
| Novelis, Inc., Sr. Sec. Credit Facilities 1st Lien Term Loan, Tranche B, 4.00%, 6/2/224 | | | 225,892 | | | | 225,073 | |
| Novitex Acquisition LLC, Sr. Sec. Credit Facilities 1st Lien Term Loan, 7.50%, 7/1/204 | | | 164,531 | | | | 154,659 | |
| NRG Energy, Inc., Sr. Sec. Credit Facilities 1st Lien Term Loan, Tranche B, 2.75%, 7/1/184 | | | 546,543 | | | | 545,120 | |
| NTELOS, Inc., Sr. Sec. Credit Facilities 1st Lien Term Loan, Tranche B, 5.75%, 11/9/194 | | | 42,955 | | | | 43,115 | |
| Numericable US LLC, Sr. Sec. Credit Facilities 1st Lien Term Loan, Tranche B, 4.563%, 7/29/224 | | | 188,501 | | | | 188,649 | |
| Nusil Technology LLC, Sr. Sec. Credit Facilities 1st Lien Term Loan, Tranche B, 5.25%, 4/7/174,7 | | | 73,775 | | | | 73,529 | |
| OCI Beaumont LLC, Sr. Sec. Credit Facilities 1st Lien Term Loan, Tranche B, 6.50%, 8/20/194 | | | 167,691 | | | | 169,368 | |
| Opal Acquisition, Inc., Sr. Sec. Credit Facilities 1st Lien Term Loan, Tranche B, 5.00%, 11/27/204 | | | 465,342 | | | | 407,174 | |
| Orchard Acquisition Co. LLC, Sr. Sec. Credit Facilities 1st Lien Term Loan, Tranche B, 7.00%, 2/8/194 | | | 361,682 | | | | 168,182 | |
| Ortho-Clinical Diagnostics, Inc., Sr. Sec Credit Facilities 1st Lien Term Loan, Tranche B, 4.75%, 6/30/214,7 | | | 275,493 | | | | 261,977 | |
| Packers Holdings LLC, Sr. Sec. Credit Facilities 1st Lien Term Loan, Tranche B, 5.00%, 12/2/214 | | | 54,125 | | | | 54,396 | |
| Pelican Products, Inc., Sr. Sec. Credit Facilities 1st Lien Term Loan, Tranche B, 5.25%, 4/8/204,7 | | | 74,052 | | | | 69,609 | |
| Peninsula Gaming LLC, Sr. Sec. Credit Facilities 1st Lien Term Loan, Tranche B, 4.25%, 11/20/174 | | | 234,578 | | | | 234,944 | |
| Penton Business Media, Inc., Sr. Sec. Credit Facilities 1st Lien Term Loan, 4.75%, 10/3/194 | | | 236,933 | | | | 236,044 | |
| Performance Food Group, Inc., Sr. Sec. Credit Facilities 2nd Lien Term Loan, 6.00%, 11/14/194 | | | 120,997 | | | | 121,602 | |
| PetSmart, Inc., Sr. Sec. Credit Facilities 1st Lien Term Loan, Tranche B, 4.25%, 3/11/224 | | | 443,481 | | | | 442,599 | |
| PGX Holdings, Inc., Sr. Sec. Credit Facilities 1st Lien Term Loan, 5.75%, 9/29/204 | | | 141,805 | | | | 141,096 | |
| PGX Holdings, Inc., Sr. Sec. Credit Facilities 2nd Lien Term Loan, 10.00%, 9/29/214 | | | 79,734 | | | | 78,538 | |
| Pharmaceutical Product Development LLC, Sr. Sec. Credit Facilities 1st Lien Term Loan, Tranche D, 4.25%, 8/18/224 | | | 326,877 | | | | 326,877 | |
| Pinnacle Operating Corp., Sr. Sec. Credit Facilities 1st Lien Term Loan, Tranche B, 4.75%, 11/15/184 | | | 406,192 | | | | 365,573 | |
| Playa Resorts Holding BV, Sr. Sec. Credit Facilities 1st Lien Term Loan, Tranche B, 4.00%, 8/9/194 | | | 184,275 | | | | 181,511 | |
| PQ Corp., Sr. Sec. Credit Facilities 1st Lien Term Loan, Tranche B, 4.00%, 8/7/174 | | | 186,710 | | | | 186,846 | |
| PRA Holdings, Inc., Sr. Sec. Credit Facilities 1st Lien Term Loan, 4.50%, 9/24/204 | | | 361,605 | | | | 363,639 | |
| Prime Security Services Borrower LLC, Sr. Sec. Credit Facilities 1st Lien Term Loan, 5.50%, 4/7/224,7 | | | 260,000 | | | | 261,259 | |
35 OPPENHEIMER FUNDAMENTAL ALTERNATIVES FUND
CONSOLIDATED STATEMENT OF INVESTMENTS Unaudited / Continued
| | | | | | | | |
| | | Principal Amount | | | Value | |
| Corporate Loans (Continued) | | | | | | | | |
| ProPetro Services, Inc., Sr. Sec. Credit Facilities 1st Lien Term Loan, Tranche B, 7.25%, 9/30/194 | | $ | 265,923 | | | $ | 164,872 | |
| Protection One, Inc., Sr. Sec. Credit Facilities 1st Lien Term Loan, 5.00%, 7/1/214 | | | 577,100 | | | | 578,783 | |
| PTL Acquisition, Inc., Sr. Sec. Credit Facilities 1st Lien Term Loan, Tranche B, 4.00%, 4/12/234,7 | | | 60,000 | | | | 60,563 | |
| Quikrete Holdings, Inc., Sr. Sec. Credit Facilities 1st Lien Term Loan, Tranche B, 4.00%, 9/28/204 | | | 229,964 | | | | 229,940 | |
| Quorum Health Corp., Sr. Sec. Credit Facilities 1st Lien Term Loan, 6.75%, 3/29/224,7 | | | 220,000 | | | | 219,966 | |
| RBS Global, Inc., Sr. Sec. Credit Facilities 1st Lien Term Loan, Tranche B, 4.00%, 8/21/204,7 | | | 128,355 | | | | 127,713 | |
| RCS Capital Corp., Sr. Sec. Credit Facilities 1st Lien Term Loan, 7.50%, 4/29/194,8 | | | 358,032 | | | | 244,357 | |
| RCS Capital Corp., Sr. Sec. Credit Facilities 1st Lien Term Loan, Delayed Draw, 8.00%, 8/4/164 | | | 56,797 | | | | 56,975 | |
| Realogy Group LLC, Sr. Sec. Credit Facilities 1st Lien Term Loan, Tranche B, 3.75%, 3/5/204 | | | 374,043 | | | | 374,686 | |
| Regal Cinemas Corp., Sr. Sec. Credit Facilities 1st Lien Term Loan, Tranche B, 3.75%, 4/1/224 | | | 54,774 | | | | 55,069 | |
| Revel Entertainment, Inc., Sr. Sec. Credit Facilities 2nd Lien Exit Term Loan, 14.50%, 5/20/184,8,12 | | | 280,573 | | | | 1,403 | |
| Reynolds Group Holdings, Inc., Sr. Sec. Credit Facilities 1st Lien Term Loan, Tranche BI, 4.50%, 12/1/184 | | | 185,000 | | | | 185,809 | |
| Rite Aid Corp., Sr. Sec. Credit Facilities 2nd Lien Term Loan, Tranche 1, 5.75%, 8/21/204 | | | 63,202 | | | | 63,518 | |
| Riverbed Technology, Inc., Sr. Sec. Credit Facilities 1st Lien Term Loan, Tranche B, 6.00%, 4/25/224 | | | 381,006 | | | | 384,068 | |
| Road Infrastructure Investment, Sr. Sec. Credit Facilities 1st Lien Term Loan, 4.25%, 3/31/214 | | | 277,698 | | | | 271,450 | |
| Royal Holdings, Inc., Sr. Sec. Credit Facilities 1st Lien Term Loan, 4.50%, 6/20/224 | | | 198,500 | | | | 197,663 | |
| RP Crown Parent LLC, Sr. Sec. Credit Facilities 1st Lien Term Loan, Tranche B, 6.00%, 12/21/184 | | | 250,072 | | | | 237,256 | |
| Sabine Oil & Gas Corp., Sr. Sec. Credit Facilities 2nd Lien Term Loan, Tranche B, 8.75%, 12/31/184,8 | | | 205,632 | | | | 5,912 | |
| Sabre GLBL, Inc., Sr. Sec. Credit Facilities 1st Lien Term Loan, Tranche B, 4.00%, 2/19/194,7 | | | 399,133 | | | | 400,672 | |
| Sabre, Inc., Sr. Sec. Credit Facilities Incremental 1st Lien Term Loan, Tranche B2, 4.00%, 2/19/194 | | | 114,251 | | | | 114,703 | |
| Salem Communications Corp., Sr. Sec. Credit Facilities 1st Lien Term Loan, Tranche B, 4.50%, 3/13/204,7 | | | 234,908 | | | | 227,860 | |
| Sandy Creek Energy Associates LP, Sr. Sec. Credit Facilities 1st Lien Term Loan, Tranche B, 5.00%, 11/9/204 | | | 66,838 | | | | 39,100 | |
| Scientific Games International, Inc., Sr. Sec. Credit Facilities 1st Lien Term Loan: | | | | | | | | |
| Tranche B1, 6.00%, 10/18/204 | | | 111,222 | | | | 109,832 | |
| Tranche B2, 6.00%, 10/1/214 | | | 294,142 | | | | 290,557 | |
| Seadrill Operating LP, Sr. Sec. Credit Facilities 1st Lien Term Loan, Tranche B, 4.00%, 2/12/214,7 | | | 470,000 | | | | 231,181 | |
36 OPPENHEIMER FUNDAMENTAL ALTERNATIVES FUND
| | | | | | | | |
| | | Principal Amount | | | Value | |
| Corporate Loans (Continued) | | | | | | | | |
| SeaWorld Parks & Entertainment, Inc., Sr. Sec. Credit Facilities 1st Lien Term Loan, Tranche B3, 4.00%, 5/14/204 | | $ | 97,446 | | | $ | 97,568 | |
| Securus Technologies Holdings, Inc., Sr. Sec. Credit Facilities 1st Lien Term Loan, Tranche B, 4.75%, 4/30/204 | | | 307,372 | | | | 293,604 | |
| Securus Technologies Holdings, Inc., Sr. Sec. Credit Facilities 2nd Lien Term Loan, 9.00%, 4/30/214 | | | 87,678 | | | | 79,495 | |
| Sequa Corp., Sr. Sec. Credit Facilities 1st Lien Term Loan, Tranche B, 5.25%, 6/19/174 | | | 82,500 | | | | 63,594 | |
| Signode Industrial Group US, Inc., Sr. Sec. Credit Facilities 1st Lien Term Loan, Tranche B, 3.75%-4.00%, 4/30/214 | | | 210,360 | | | | 209,045 | |
| Solenis International LP, Sr. Sec. Credit Facilities 1st Lien Term Loan, 4.25%, 8/2/214 | | | 142,313 | | | | 141,174 | |
| SourceHOV LLC, Sr. Sec. Credit Facilities 1st Lien Term Loan, Tranche B, 7.75%, 10/31/194,7 | | | 160,449 | | | | 108,704 | |
| Southcross Energy Partners LP, Sr. Sec. Credit Facilities 1st Lien Term Loan, Tranche B, 5.25%, 7/29/214 | | | 203,441 | | | | 167,669 | |
| SRAM LLC, Sr. Sec. Credit Facilities 1st Lien Term Loan, Tranche B, 2.544%-4.00%, 4/10/204 | | | 346,154 | | | | 304,615 | |
| Staples Escrow LLC, Sr. Sec. Credit Facilities 1st Lien Term Loan, Tranche B, 4.75%, 2/2/224 | | | 397,500 | | | | 398,576 | |
| Station Casinos LLC, Sr. Sec. Credit Facilities 1st Lien Term Loan, Tranche B, 4.25%, 3/2/204,7 | | | 311,252 | | | | 312,273 | |
| Sterigenics-Nordion Holdings LLC, Sr. Sec. Credit Facilities 1st Lien Term Loan, Tranche B, 4.25%, 5/15/224 | | | 423,498 | | | | 423,498 | |
| Steward Health Care System LLC, Sr. Sec. Credit Facilities 1st Lien Term Loan, 6.75%, 4/10/204 | | | 123,281 | | | | 121,432 | |
| Styrolution Group GmbH, Sr. Sec. Credit Facilities 1st Lien Term Loan, Tranche B, 6.50%, 11/7/194 | | | 452,552 | | | | 453,401 | |
| Sun Products Corp. (The), Sr. Sec. Credit Facilities 1st Lien Term Loan, Tranche B, 5.50%, 3/23/204 | | | 530,117 | | | | 519,673 | |
| SUPERVALU, Inc., Sr. Sec. Credit Facilities 1st Lien Term Loan, 4.50%, 3/21/194,7 | | | 498,232 | | | | 493,784 | |
| Surgery Center Holdings LLC, Sr. Sec. Credit Facilities 1st Lien Term Loan, 5.25%, 11/3/204 | | | 488,449 | | | | 487,228 | |
| Technicolor, Sr. Sec. Credit Facilities 1st Lien Term Loan, Tranche B, 5.00%, 7/11/204,7 | | | 460,757 | | | | 459,605 | |
| Tekni-Plex, Inc., Sr. Sec. Credit Facilities 1st Lien Term Loan, 4.50%, 6/1/224 | | | 187,902 | | | | 186,337 | |
| Templar Energy LLC, Sr. Sec. Credit Facilities 2nd Lien Term Loan, Tranche B, 8.50%, 11/25/204 | | | 396,494 | | | | 44,110 | |
| TI Group Automotive Systems LLC, Sr. Sec. Credit Facilities 1st Lien Term Loan, Tranche B, 4.50%, 6/30/224 | | | 646,750 | | | | 646,750 | |
| TIBCO Software, Inc., Sr. Sec. Credit Facilities 1st Lien Term Loan, Tranche B, 6.50%, 12/4/204 | | | 463,752 | | | | 420,855 | |
| Tower Automotive Holdings USA LLC, Sr. Sec. Credit Facilities 1st Lien Term Loan, Tranche B, 4.00%, 4/23/204 | | | 329,487 | | | | 329,487 | |
| TPF II Power LLC, Sr. Sec. Credit Facilities 1st Lien Term Loan, Tranche B, 5.50%, 10/4/214 | | | 522,572 | | | | 521,265 | |
| TransDigm, Sr. Sec. Credit Facilities 1st Lien Term Loan, Tranche E, 3.50%, 5/14/224 | | | 197,740 | | | | 196,133 | |
37 OPPENHEIMER FUNDAMENTAL ALTERNATIVES FUND
CONSOLIDATED STATEMENT OF INVESTMENTS Unaudited / Continued
| | | | | | | | |
| | | Principal Amount | | | Value | |
| Corporate Loans (Continued) | | | | | | | | |
| Transtar Holding Co., Sr. Sec. Credit Facilities 1st Lien Term Loan, 5.75%, 10/9/184 | | $ | 233,458 | | | $ | 161,086 | |
| Travelport Finance Luxembourg Sarl, Sr. Sec. Credit Facilities 1st Lien Term Loan, Tranche B, 5.75%, 9/2/214 | | | 250,000 | | | | 250,860 | |
| Tribune Co., Sr. Sec. Credit Facilities 1st Lien Term Loan, Tranche B, 3.75%, 12/27/204 | | | 467,883 | | | | 466,786 | |
| Tronox Pigments BV, Sr. Sec. Credit Facilities 1st Lien Term Loan, Tranche B, 4.50%, 3/19/204 | | | 158,426 | | | | 153,797 | |
| TTM Technologies, Inc., Sr. Sec. Credit Facilities 1st Lien Term Loan, Tranche B, 6.00%, 5/31/214,7 | | | 198,641 | | | | 194,916 | |
| TurboCombustor Technology, Inc., Sr. Sec. Credit Facilities 1st Lien Term Loan, Tranche B, 5.50%, 12/2/204 | | | 214,980 | | | | 192,944 | |
| Univar, Inc., Sr. Sec. Credit Facilities 1st Lien Term Loan, Tranche B, 4.25%, 7/1/224,7 | | | 356,902 | | | | 353,035 | |
| Univision Communications, Inc., Sr. Sec. Credit Facilities 1st Lien Term Loan: | | | | | | | | |
| Tranche C3, 4.00%, 3/1/204 | | | 248,383 | | | | 248,516 | |
| Tranche C4, 4.00%, 3/1/204 | | | 366,587 | | | | 366,979 | |
| US Farathane LLC, Sr. Sec. Credit Facilities 1st Lien Term Loan, Tranche B, 6.75%, 12/23/214 | | | 90,405 | | | | 90,744 | |
| US Foods, Inc., Sr. Sec. Credit Facilities 1st Lien Term Loan, Tranche B, 4.50%, 3/31/194 | | | 333,058 | | | | 333,058 | |
| US Renal Care, Inc., Sr. Sec. Credit Facilities 1st Lien Term Loan, 5.25%, 12/30/224 | | | 399,000 | | | | 400,621 | |
| US TelePacific Corp., Sr. Sec. Credit Facilities 1st Lien Term Loan, 6.00%, 11/25/204 | | | 215,057 | | | | 206,097 | |
| USAGM HoldCo LLC, Sr. Sec. Credit Facilities 1st Lien Term Loan, 4.75%, 7/28/224 | | | 573,563 | | | | 563,286 | |
| Vertafore, Inc., Sr. Sec. Credit Facilities 1st Lien Term Loan, 4.25%, 10/3/194 | | | 237,324 | | | | 238,090 | |
| Vitera Healthcare Solutions LLC, Sr. Sec. Credit Facilities 1st Lien Term Loan, 6.00%, 11/4/204 | | | 169,559 | | | | 156,842 | |
| Wabash National Corp., Sr. Sec. Credit Facilities 1st Lien Term Loan, Tranche B, 4.25%, 3/18/224 | | | 104,407 | | | | 104,668 | |
| WaveDivision Holdings LLC, Sr. Sec. Credit Facilities 1st Lien Term Loan, 4.00%, 10/12/194,7 | | | 329,686 | | | | 328,862 | |
| Weight Watchers International, Inc., Sr. Sec. Credit Facilities 1st Lien Term Loan, Tranche B2, 4.00%, 4/2/204 | | | 931,280 | | | | 688,759 | |
| Wencor Group, Sr. Sec. Credit Facilities 1st Lien Term Loan, 4.50%, 6/25/214 | | | 251,135 | | | | 225,865 | |
| Western Digital Corp., Sr. Sec. Credit Facilities 1st Lien Term Loan, Tranche B, 6.25%, 3/31/234,7 | | | 15,000 | | | | 14,784 | |
| Western Express, Inc., Sr. Sec. Credit Facilities 2nd Lien Term Loan, 8.652%, 2/23/224 | | | 982,800 | | | | 958,525 | |
| Wheelabrator, Sr. Sec. Credit Facilities 1st Lien Term Loan: | | | | | | | | |
| Tranche B, 5.00%, 12/17/214 | | | 188,803 | | | | 183,021 | |
| Tranche C, 5.00%, 12/17/214 | | | 8,412 | | | | 8,155 | |
| Wilton Brands LLC, Sr. Sec. Credit Facilities 1st Lien Term Loan, Tranche B, 8.50%, 8/30/184 | | | 154,147 | | | | 139,503 | |
| WP CPP Holdings LLC, Sr. Sec. Credit Facilities 1st Lien Term Loan, 4.50%, 12/28/194 | | | 155,759 | | | | 149,918 | |
38 OPPENHEIMER FUNDAMENTAL ALTERNATIVES FUND
| | | | | | | | |
| | | Principal Amount | | | Value | |
| Corporate Loans (Continued) | | | | | | | | |
| Yankee Cable Acquisition LLC, Sr. Sec. Credit Facilities 1st Lien Term Loan, Tranche B, 4.25%, 3/1/204,7 | | $ | 428,283 | | | $ | 429,487 | |
| YP LLC, Sr. Sec. Credit Facilities 1st Lien Term Loan, Tranche B, 8.00%, 6/4/184 | | | 89,828 | | | | 83,989 | |
| YRC Worldwide, Inc. Sr. Sec. Credit Facilities 1st Lien Term Loan, 8.00%, 2/13/194 | | | 600,452 | | | | 540,407 | |
| Zayo Group LLC, Sr. Sec. Credit Facilities 1st Lien Term Loan, Tranche B, 3.75%, 5/6/214 | | | 268,984 | | | | 269,224 | |
| | | | | | | | |
| Total Corporate Loans (Cost $111,241,214) | | | | | | | 107,283,141 | |
| | |
| | | Shares | | | | |
| Structured Security—0.1% | | | | | | | | |
| Africa Telecommunications Media & Technology Fund 1 LLC3 (Cost $10,000,000) | | | 9,542,930 | | | | 849,321 | |
| | | | | | | | | | | | | | | | | | | | | | | | |
Counter- party | | | Exercise
Price | | | Expiration
Date | | | | | | Contracts | | | | |
| Over-the-Counter Options Purchased—0.2% | | | | | | | | | | | | | | | | | | | | | |
| CNH Currency Put1 | | | RBS | | | | CNH6.677 | | | | 3/15/17 | | | | CNH | | | | 27,000,000 | | | | 100,980 | |
| CNH Currency Put1 | | | GSG | | | | CNH6.800 | | | | 4/5/17 | | | | CNH | | | | 578,000,000 | | | | 1,825,902 | |
| CNH Currency Put1 | | | BOA | | | | CNH6.693 | | | | 3/6/17 | | | | CNH | | | | 27,000,000 | | | | 94,446 | |
| CNH Currency Put1 | | | BOA | | | | CNH6.906 | | | | 1/24/17 | | | | CNH | | | | 28,000,000 | | | | 54,040 | |
| CNH Currency Put1 | | | BOA | | | | CNH6.757 | | | | 2/14/17 | | | | CNH | | | | 33,000,000 | | | | 93,324 | |
| | | | | | | | | | | | | | | | | | | | | | | | |
| Total Over-the-Counter Options Purchased (Cost $2,699,884) | | | | | | | | 2,168,692 | |
| | | | | | | | | | | | | | | | | | | | | | | | | | | | |
Counter- party | | | Pay/Receive
Floating
Rate | | | Floating Rate | | | Fixed
Rate | | | | | | Notional Amount (000’s) | | | | |
| Over-the-Counter Interest Rate Swaptions Purchased—0.3% | | | | | |
| Interest Rate Swap maturing 1/24/29 Call1 | | | GSG | | | | Receive | | |
| Six-Month
JPY BBA
LIBOR |
| | | 0.708% | | | | 1/22/19 JPY | | | | 795,000 | | | | 139,105 | |
| Interest Rate Swap maturing 1/9/29 Call1 | | | GSG | | | | Receive | | |
| Three-
Month USD
BBA LIBOR |
| | | 2.595 | | | | 1/7/19 USD | | | | 9,500 | | | | 328,434 | |
39 OPPENHEIMER FUNDAMENTAL ALTERNATIVES FUND
CONSOLIDATED STATEMENT OF INVESTMENTS Unaudited / Continued
| | | | | | | | | | | | | | | | | | | | | | | | | | | | |
| | | | Pay/Receive
Floating
Rate | | | Floating
Rate | | | Fixed
Rate | | | Expiration
Date | | | Notional Amount
(000’s) | | | Value | |
| Over-the-Counter Interest Rate Swaptions Purchased (Continued) | | | | | |
| Interest Rate Swap maturing 11/21/28 Call1 | | | GSG | | | | Receive | | |
| Six-Month
JPY BBA
LIBOR |
| | | 0.850% | | | | 11/19/18 JPY | | | | 749,000 | | | $ | 108,958 | |
| Interest Rate Swap maturing 11/22/27 Call1 | | | GSG | | | | Receive | | |
| Six-Month
JPY BBA
LIBOR |
| | | 1.070 | | | | 11/20/17 JPY | | | | 8,024,000 | | | | 597,585 | |
| Interest Rate Swap maturing 11/7/28 Call1 | | | GSG | | | | Receive | | |
| Three-
Month USD
BBA LIBOR |
| | | 2.680 | | | | 11/5/18 USD | | | | 9,500 | | | | 286,926 | |
| Interest Rate Swap maturing 2/13/29 Call1 | | | BAC | | | | Receive | | |
| Three-
Month USD
BBA LIBOR |
| | | 1.905 | | | | 2/11/19 USD | | | | 5,000 | | | | 284,721 | |
| Interest Rate Swap maturing 3/12/29 Call1 | | | GSG | | | | Receive | | |
| Three-
Month USD
BBA LIBOR |
| | | 2.073 | | | | 3/8/19 USD | | | | 6,000 | | | | 311,478 | |
| Interest Rate Swap maturing 3/20/29 Call1 | | | GSG | | | | Receive | | |
| Three-
Month USD
BBA LIBOR |
| | | 2.200 | | | | 3/18/19 USD | | | | 5,000 | | | | 240,497 | |
| Interest Rate Swap maturing 3/21/28 Call1 | | | GSG | | | | Receive | | |
| Three-
Month USD
BBA LIBOR |
| | | 2.580 | | | | 3/19/18 USD | | | | 14,400 | | | | 359,442 | |
| Interest Rate Swap maturing 3/26/29 Put1 | | | GSG | | | | Receive | | |
| Three-
Month USD
BBA LIBOR |
| | | 2.185 | | | | 3/22/19 USD | | | | 9,500 | | | | 463,260 | |
40 OPPENHEIMER FUNDAMENTAL ALTERNATIVES FUND
| | | | | | | | | | | | | | | | | | | | | | | | | | | | |
| | | | Pay/Receive
Floating
Rate | | | Floating
Rate | | | Fixed
Rate | | | Expiration Date | | | Notional Amount
(000’s) | | | Value | |
| Over-the-Counter Interest Rate Swaptions Purchased (Continued) | | | | | |
| Interest Rate Swap maturing 4/18/28 Call1 | | | GSG | | | | Receive | | |
| Three-
Month USD
BBA LIBOR |
| | | 2.505% | | | | 4/16/18 USD | | | | 36,000 | | | $ | 1,002,352 | |
| Interest Rate Swap maturing 7/25/28 Call1 | | | GSG | | | | Receive | | |
| Six-Month
JPY BBA
LIBOR |
| | | 1.050 | | | | 11/15/18 JPY | | | | 2,000,000 | | | | 286,591 | |
| | | | | | | | | | | | | | | | | | | | | | | | | | | | |
Total Over-the-Counter Interest Rate Swaptions Purchased
(Cost $7,658,428) | | | | | | | | 4,409,349 | |
| | | | | | | | |
| | | Shares | | | | |
| Investment Companies—18.7% | | | | | | | | |
| Oppenheimer Institutional Money Market Fund, Cl. E, 0.48%10,11 | | | 197,937,022 | | | | 197,937,022 | |
| SPDR Gold Trust Exchange Traded Fund1,13 | | | 284,260 | | | | 35,148,749 | |
| | | | | | | | |
| Total Investment Companies (Cost $231,769,880) | | | | | | | 233,085,771 | |
| | | | | | | | | |
| Total Investments, at Value (Cost $1,206,029,854) | | | 100.4% | | | | 1,253,066,396 | |
| Net Other Assets (Liabilities) | | | (0.4 | ) | | | (5,592,549) | |
| | | | |
| Net Assets | | | 100.0% | | | $ | 1,247,473,847 | |
| | | | |
Footnotes to Consolidated Statement of Investments
*April 29, 2016 represents the last business day of the Fund’s reporting period. See Note 2 of the accompanying Consolidated Notes.
1. Non-income producing security.
2. All or portion of the security position is held in segregated accounts and pledged to cover margin requirements with respect to securities sold short. The aggregate market value of such securities is $112,845,410. See Note 10 of accompanying Consolidated Notes.
3. Restricted security. The aggregate value of restricted securities at period end was $42,509,037, which represents 3.41% of the Fund’s net assets. See Note 4 of the accompanying Consolidated Notes. Information concerning restricted securities is as follows:
| | | | | | | | | | | | | | | | |
| Security | | Acquisition Dates | | | Cost | | | Value | | | Unrealized
Depreciation | |
| Africa Telecommunications Media & Technology Fund 1 LLC | | | 4/20/11 | | | $ | 10,000,000 | | | $ | 849,321 | | | $ | 9,150,679 | |
| Airspeed Ltd., Series 2007-1A, Cl. G1, 0.703%, 6/15/32 | | | 1/9/13-7/10/13 | | | | 18,742,997 | | | | 17,706,938 | | | | 1,036,059 | |
| Airspeed Ltd., Series 2007-1A, Cl. G2, 0.713%, 6/15/32 | | | 1/9/13-1/25/13 | | | | 5,574,307 | | | | 5,388,259 | | | | 186,048 | |
| Blade Engine Securitization Ltd., Series 2006-1AW, Cl. A1, 0.733%, 9/15/41 | | | 4/19/13-5/29/13 | | | | 21,630,310 | | | | 18,564,519 | | | | 3,065,791 | |
| | | | | | | | | | | | | | | | |
| | | | | | $ | 55,947,614 | | | $ | 42,509,037 | | | $ | 13,438,577 | |
| | | | | | | | | | | | | | | | |
4. Represents the current interest rate for a variable or increasing rate security.
41 OPPENHEIMER FUNDAMENTAL ALTERNATIVES FUND
CONSOLIDATED STATEMENT OF INVESTMENTS Unaudited / Continued
Footnotes to Consolidated Statement of Investments (Continued)
5. Represents securities sold under Rule 144A, which are exempt from registration under the Securities Act of 1933, as amended. These securities have been determined to be liquid under guidelines established by the Board of Trustees. These securities amount to $56,942,695 or 4.56% of the Fund’s net assets at period end.
6. This bond has no contractual maturity date, is not redeemable and contractually pays an indefinite stream of interest.
7. All or a portion of the security position is when-issued or delayed delivery to be delivered and settled after period end. See Note 4 of the accompanying Consolidated Notes.
8. This security is not accruing income because the issuer has missed an interest payment on it and/or is not anticipated to make future interest and/or principal payments. The rate shown is the contractual interest rate. See Note 4 of the accompanying Consolidated Notes.
9. Subject to a forbearance agreement. Rate shown is the contractual interest rate. See Note 4 of the accompanying Consolidated Notes.
10. Is or was an affiliate, as defined in the Investment Company Act of 1940, as amended, at or during the reporting period, by virtue of the Fund owning at least 5% of the voting securities of the issuer or as a result of the Fund and the issuer having the same investment adviser. Transactions during the reporting period in which the issuer was an affiliate are as follows:
| | | | | | | | | | | | | | | | |
| | | Shares
October 30,
2015a | | | Gross
Additions | | | Gross
Reductions | | | Shares
April 29, 2016a | |
| Oppenheimer Institutional Money Market Fund, Cl. E | | | 138,198,466 | | | | 377,274,524 | | | | 317,535,968 | | | | 197,937,022 | |
| Oppenheimer Master Loan Fund, LLC | | | 1,370,520 | | | | — | | | | 1,370,520 | | | | — | |
| | | | |
| | | | | | Value | | | Income | | | Realized Loss | |
| Oppenheimer Institutional Money Market Fund, Cl. E | | | | | | $ | 197,937,022 | | | $ | 335,435 | | | $ | — | |
| Oppenheimer Master Loan Fund, LLC | | | | | | | — | | | | 162,705b | | | | 5,332,452b | |
| | | | | | | | |
| Total | | | | | | $ | 197,937,022 | | | $ | 498,140 | | | $ | 5,332,452 | |
| | | | | | | | |
a. Represents the last business day of the Fund’s reporting period. See Note 2 of the accompanying
Consolidated Notes.
b. Represents the amount allocated to the Fund from Oppenheimer Master Loan Fund, LLC.
11. Rate shown is the 7-day yield at period end.
12. Interest or dividend is paid-in-kind, when applicable.
| 13. | All or a portion of this security is owned by the subsidiary. See Note 2 of the accompanying Consolidated Notes. |
| | | | | | | | |
| | | Shares Sold
Short | | | Value | |
| Securities Sold Short—(28.5)% | | | | | | | | |
| Common Stock Securities Sold Short—(28.5)% | | | | | | | | |
| AGCO Corp. | | | (235,290) | | | $ | (12,580,956) | |
| Air Lease Corp., Cl. A | | | (441,900) | | | | (13,469,112) | |
| Aircastle Ltd. | | | (226,930) | | | | (4,924,381) | |
| Aker Solutions ASA1 | | | (1,968,856) | | | | (7,512,948) | |
| Assurant, Inc. | | | (64,970) | | | | (5,494,513) | |
| athenahealth, Inc.1 | | | (40,080) | | | | (5,342,664) | |
| Boeing Co. (The) | | | (112,694) | | | | (15,191,151) | |
| Camden Property Trust | | | (143,700) | | | | (11,600,901) | |
| Caterpillar, Inc. | | | (162,230) | | | | (12,608,516) | |
| CBL & Associates Properties, Inc. | | | (534,380) | | | | (6,241,559) | |
| Charter Communications, Inc., Cl. A1 | | | (48,210) | | | | (10,232,090) | |
42 OPPENHEIMER FUNDAMENTAL ALTERNATIVES FUND
| | | | | | | | |
| | | Shares Sold
Short | | | Value | |
| Common Stock Securities Sold Short (Continued) | | | | | | | | |
| Cheniere Energy, Inc.1 | | | (230,870) | | | $ | (8,976,226) | |
| Cie Financiere Richemont SA | | | (179,416) | | | | (11,946,911) | |
| CNH Industrial NV | | | (1,281,780) | | | | (9,920,977) | |
| Colgate-Palmolive Co. | | | (198,220) | | | | (14,057,762) | |
| Comcast Corp., Cl. A | | | (215,740) | | | | (13,108,363) | |
| Comerica, Inc. | | | (92,900) | | | | (4,124,760) | |
| Commerce Bancshares, Inc. | | | (183,104) | | | | (8,572,929) | |
| Deere & Co. | | | (190,300) | | | | (16,006,133) | |
| Ensco plc, Cl. A | | | (629,550) | | | | (7,529,418) | |
| Fastenal Co. | | | (109,940) | | | | (5,144,093) | |
| Franklin Resources, Inc. | | | (272,160) | | | | (10,162,454) | |
| Gulfmark Offshore, Inc., Cl. A1 | | | (506,940) | | | | (3,437,053) | |
| Intel Corp. | | | (314,110) | | | | (9,511,251) | |
| Oracle Corp. | | | (270,220) | | | | (10,770,969) | |
| Pennsylvania Real Estate Investment Trust | | | (637,640) | | | | (14,627,462) | |
| Procter & Gamble Co. (The) | | | (152,260) | | | | (12,199,071) | |
| Rio Tinto plc, Sponsored ADR | | | (161,327) | | | | (5,430,267) | |
| RLJ Lodging Trust | | | (367,660) | | | | (7,746,596) | |
| Southern Copper Corp. | | | (468,915) | | | | (13,912,708) | |
| Subsea 7 SA1 | | | (1,679,269) | | | | (15,383,597) | |
| Tidewater, Inc. | | | (688,120) | | | | (6,027,931) | |
| Tiffany & Co. | | | (151,955) | | | | (10,841,989) | |
| Transocean Ltd. | | | (80,252) | | | | (889,192) | |
| W.W. Grainger, Inc. | | | (21,670) | | | | (5,082,048) | |
| Walt Disney Co. (The) | | | (50,520) | | | | (5,216,695) | |
| Weingarten Realty Investors | | | (391,883) | | | | (14,468,320) | |
| Zions Bancorporation | | | (190,890) | | | | (5,253,293) | |
| | | | | | | | |
| Total Securities Sold Short (Proceeds $335,684,824) | | | | | | $ | (355,547,259) | |
| | | | | | | | |
| | | | | | | | | | | | | | | | | | | | | | | | |
| Forward Currency Exchange Contracts as of April 29, 2016 | |
| Counter-party | | Settlement
Month(s) | | | | | Currency
Purchased
(000’s) | | | | | Currency Sold (000’s) | | | Unrealized
Appreciation | | | Unrealized
Depreciation | |
| BOA | | | 06/2016 | | | NOK | | | 13,770 | | | USD | | | 1,681 | | | $ | 29,115 | | | $ | — | |
| BOA | | | 06/2016 | | | USD | | | 11,956 | | | CAD | | | 15,525 | | | | — | | | | 417,737 | |
| BOA | | | 06/2016 | | | USD | | | 3,829 | | | SEK | | | 31,200 | | | | — | | | | 63,956 | |
| BOA | | | 06/2016 | | | USD | | | 1,273 | | | THB | | | 45,000 | | | | — | | | | 13,360 | |
| CITNA-B | | | 06/2016 | | | CHF | | | 750 | | | USD | | | 771 | | | | 12,149 | | | | — | |
| CITNA-B | | | 06/2016 | | | USD | | | 16,927 | | | AUD | | | 22,240 | | | | 53,081 | | | | — | |
| CITNA-B | | | 06/2016 | | | USD | | | 1,047 | | | CAD | | | 1,350 | | | | — | | | | 28,983 | |
| CITNA-B | | | 06/2016 | | | USD | | | 27,909 | | | EUR | | | 24,605 | | | | — | | | | 309,565 | |
| CITNA-B | | | 06/2016 | | | USD | | | 1,285 | | | THB | | | 45,000 | | | | — | | | | 1,956 | |
| DEU | | | 06/2016 | | | USD | | | 307 | | | SEK | | | 2,540 | | | | — | | | | 10,075 | |
| GSCO-OT | | | 06/2016 | | | USD | | | 786 | | | CAD | | | 1,045 | | | | — | | | | 46,557 | |
| GSCO-OT | | | 04/2017 | | | USD | | | 9,183 | | | CNH | | | 61,000 | | | | — | | | | 20,805 | |
| JPM | | | 06/2016 | | | USD | | | 1,974 | | | AUD | | | 2,610 | | | | 23 | | | | 6,055 | |
| JPM | | | 06/2016 | | | USD | | | 1,650 | | | EUR | | | 1,445 | | | | — | | | | 7,345 | |
| JPM | | | 06/2016 | | | USD | | | 937 | | | JPY | | | 105,000 | | | | — | | | | 51,486 | |
43 OPPENHEIMER FUNDAMENTAL ALTERNATIVES FUND
CONSOLIDATED STATEMENT OF INVESTMENTS Unaudited / Continued
| | | | | | | | | | | | | | | | | | | | | | | | | | | | |
| Forward Currency Exchange Contracts (Continued) | |
| Counter-party | | Settlement
Month(s) | | | | | | Currency
Purchased
(000’s) | | | | | | Currency Sold (000’s) | | | Unrealized Appreciation | | | Unrealized Depreciation | |
JPM | | | 06/2016 | | | | USD | | | | 22,162 | | | | THB | | | | 771,000 | | | $ | 115,883 | | | $ | — | |
MSCO | | | 06/2016 | | | | NOK | | | | 142,740 | | | | USD | | | | 17,128 | | | | 595,432 | | | | — | |
MSCO | | | 06/2016 | | | | USD | | | | 13,641 | | | | CHF | | | | 13,150 | | | | — | | | | 98,465 | |
MSCO | | | 06/2016 | | | | USD | | | | 16,026 | | | | JPY | | | | 1,783,000 | | | | — | | | | 755,780 | |
NOM | | | 06/2016 | | | | USD | | | | 1,193 | | | | CHF | | | | 1,135 | | | | 7,078 | | | | — | |
NOM | | | 06/2016 | | | | USD | | | | 1,625 | | | | EUR | | | | 1,445 | | | | — | | | | 31,966 | |
| TDB | | | 06/2016 | | | | USD | | | | 956 | | | | JPY | | | | 105,000 | | | | — | | | | 31,933 | |
| | | | | | | | | | | | | | | | | | | | | | | | |
| Total Unrealized Appreciation and Depreciation | | | | | | | | | | | $ | 812,761 | | | $ | 1,896,024 | |
| | | | | | | | | | | | | | | | | | | | | | | | |
| | | | | | | | | | | | | | | | | |
| | | | | | | | | | | | | | | | | | | | | | | | |
| Futures Contracts as of April 29, 2016 | | | | | | | | | | | | | | | | | | |
| Description | | Exchange | | | Buy/Sell | | | Expiration
Date | | | Number of Contracts | | | Value | | | Unrealized
Appreciation | |
Euro-BTP | | | EUX | | | | Sell | | | | 6/8/16 | | | | 75 | | | $ | 11,846,973 | | | $ | 35,266 | |
United States Treasury Nts., 10 yr. | | | CBT | | | | Sell | | | | 6/21/16 | | | | 114 | | | | 14,827,125 | | | | 33,529 | |
| | | | | | | | | | | | | | | | | | | | | | | | |
| | | | | | | | | | | | | | | | | | | | | | $ | 68,795 | |
| | | | | | | | | | | | | | | | | | | | | | | | |
| | | | | | | | | | | | | | | | | | | | | | | | | | | | | | | | |
| Over-the-Counter Options Written at April 29, 2016 | |
| Description | | Counterparty | | | Exercise
Price | | | Expiration
Date | | | Number of Contracts | | | Premiums
Received | | | Value | |
CNH Currency Put | | | GSG | | | | CNH | | | | 7.500 | | | | 4/5/17 | | | | CNH | | | | (637,500,000) | | | $ | 792,200 | | | $ | (628,575) | |
| | | | | | | | | | | | | | | | | | | | | | | | | | | | |
| Centrally Cleared Credit Default Swaps at April 29, 2016 | |
| Reference Asset | | Buy/Sell
Protection | | | Fixed
Rate | | | Maturity
Date | | | | | | Notional
Amount
(000’s) | | | Premiums
Received/(Paid) | | | Value | |
CDX.HY.24 | | | Buy | | | | 5.000% | | | | 6/20/20 | | | | USD | | | | 19,206 | | | $ | 1,485,497 | | | $ | (1,012,811) | |
CDX.IG.25 | | | Sell | | | | 1.000 | | | | 12/20/20 | | | | USD | | | | 46,105 | | | | (488,724 | ) | | | 398,535 | |
CDX.IG.25 | | | Sell | | | | 1.000 | | | | 12/20/20 | | | | USD | | | | 1,400 | | | | (7,242 | ) | | | 12,102 | |
iTraxx.Main.24 | | | Buy | | | | 1.000 | | | | 12/20/20 | | | | EUR | | | | 2,750 | | | | 35,224 | | | | (40,641) | |
iTraxx.Main.24 | | | Buy | | | | 1.000 | | | | 12/20/20 | | | | EUR | | | | 40,044 | | | | 642,532 | | | | (591,795) | |
| | | | | | | | | | | | | | | | | | | | | | | | |
Total Centrally Cleared Credit Default Swaps | | | | | | | | | | | | | | | $ | 1,667,287 | | | $ | (1,234,610) | |
| | | | | | | | | | | | | | | | | | | | | | | | |
| | | | | | | | | | | | | | | | | | | | | | | | | | | | | | |
| Over-the-Counter Credit Default Swaps at April 29, 2016 | |
| Reference Asset | | Counterparty | | | Buy/Sell
Protection | | | Fixed
Rate | | | Maturity
Date | | | | | Notional
Amount
(000’s) | | | Premiums Received/(Paid) | | | Value | |
CDX.HY.21 | | | CITNA-B | | | | Buy | | | | 5.000 | | | | 12/20/18 | | | USD | | | 1,407 | | | $ | 74,649 | | | $ | (71,327) | |
CDX.HY.25 | | | CITNA-B | | | | Buy | | | | 5.000 | | | | 12/20/20 | | | USD | | | 471 | | | | (48,278 | ) | | | 41,916 | |
CDX.HY.25 | | | CITNA-B | | | | Buy | | | | 5.000 | | | | 12/20/20 | | | USD | | | 936 | | | | (109,330 | ) | | | 83,299 | |
CDX.HY.25 | | | CITNA-B | | | | Sell | | | | 5.000 | | | | 12/20/18 | | | USD | | | 470 | | | | 178,894 | | | | (176,661 | ) |
CDX.HY.25 | | | CITNA-B | | | | Sell | | | | 5.000 | | | | 12/20/20 | | | USD | | | 157 | | | | 97,340 | | | | (97,133 | ) |
CDX.HY.25 | | | CITNA-B | | | | Sell | | | | 5.000 | | | | 12/20/20 | | | USD | | | 312 | | | | 202,583 | | | | (193,030 | ) |
CDX.NA.HY.21 | | | CITNA-B | | | | Buy | | | | 5.000 | | | | 12/20/18 | | | USD | | | 7,500 | | | | (230,208 | ) | | | (380,208 | ) |
CDX.NA.HY.21 | | | CITNA-B | | | | Sell | | | | 5.000 | | | | 12/20/18 | | | USD | | | 1,920 | | | | 1,071,501 | | | | (721,653 | ) |
CDX.NA.HY.21 | | | GSG | | | | Sell | | | | 5.000 | | | | 12/20/18 | | | USD | | | 583 | | | | 318,928 | | | | (219,383 | ) |
44 OPPENHEIMER FUNDAMENTAL ALTERNATIVES FUND
| | | | | | | | | | | | | | | | | | | | | | | | | | | | | | |
| Over-the-Counter Credit Default Swaps (Continued) | |
| Reference Asset | | Counterparty | | | Buy/Sell
Protection | | | Fixed
Rate | | | Maturity
Date | | | | | Notional
Amount
(000’s) | | | Premiums Received/(Paid) | | | Value | |
CDX.NA.HY.25 | | | GSG | | | | Buy | | | | 5.000% | | | | 12/20/20 | | | USD | | | 7,500 | | | $ | (1,297,917) | | | $ | 667,458 | |
CDX.NA.HY.25 | | | GSG | | | | Sell | | | | 5.000 | | | | 12/20/20 | | | USD | | | 2,500 | | | | 1,659,201 | | | | (1,546,711 | ) |
Kingdom of Spain | | | BAC | | | | Buy | | | | 1.000 | | | | 6/20/21 | | | USD | | | 4,330 | | | | (11,109 | ) | | | (17,426 | ) |
Kingdom of Spain | | | BAC | | | | Buy | | | | 1.000 | | | | 12/20/20 | | | USD | | | 1,070 | | | | 2,874 | | | | (6,887 | ) |
Kingdom of Spain | | | BAC | | | | Buy | | | | 1.000 | | | | 12/20/20 | | | USD | | | 1,897 | | | | (7,819 | ) | | | (12,211 | ) |
Kingdom of Spain | | | BAC | | | | Buy | | | | 1.000 | | | | 12/20/20 | | | USD | | | 953 | | | | 6,706 | | | | (6,134 | ) |
Kingdom of Spain | | | BAC | | | | Buy | | | | 1.000 | | | | 12/20/20 | | | USD | | | 2,050 | | | | 4,518 | | | | (13,195 | ) |
Kingdom of Spain | | | BOA | | | | Buy | | | | 1.000 | | | | 12/20/20 | | | USD | | | 28,700 | | | | 151,476 | | | | (184,738 | ) |
Malaysia | | | BAC | | | | Buy | | | | 1.000 | | | | 12/20/20 | | | USD | | | 2,900 | | | | (136,197 | ) | | | 62,580 | |
Malaysia | | | BAC | | | | Buy | | | | 1.000 | | | | 12/20/20 | | | USD | | | 854 | | | | (35,262 | ) | | | 18,429 | |
Malaysia | | | BNP | | | | Buy | | | | 1.000 | | | | 6/20/21 | | | USD | | | 3,820 | | | | (112,656 | ) | | | 116,615 | |
Malaysia | | | BNP | | | | Buy | | | | 1.000 | | | | 12/20/20 | | | USD | | | 1,811 | | | | (51,082 | ) | | | 39,080 | |
Malaysia | | | BNP | | | | Buy | | | | 1.000 | | | | 12/20/20 | | | USD | | | 761 | | | | (26,351 | ) | | | 16,422 | |
Malaysia | | | BNP | | | | Buy | | | | 1.000 | | | | 12/20/20 | | | USD | | | 10,000 | | | | (651,135 | ) | | | 215,792 | |
Malaysia | | | CITNA-B | | | | Buy | | | | 1.000 | | | | 12/20/20 | | | USD | | | 4,295 | | | | (209,624 | ) | | | 92,683 | |
Malaysia | | | MOS-A | | | | Buy | | | | 1.000 | | | | 12/20/20 | | | USD | | | 10,000 | | | | (502,319 | ) | | | 215,792 | |
Portuguese Republic | | | BAC | | | | Buy | | | | 1.000 | | | | 12/20/20 | | | USD | | | 1,360 | | | | (97,694 | ) | | | 86,513 | |
Portuguese Republic | | | BAC | | | | Buy | | | | 1.000 | | | | 12/20/20 | | | USD | | | 3,226 | | | | (386,319 | ) | | | 205,215 | |
Portuguese Republic | | | BAC | | | | Buy | | | | 1.000 | | | | 12/20/20 | | | USD | | | 641 | | | | (24,558 | ) | | | 40,776 | |
Portuguese Republic | | | BAC | | | | Buy | | | | 1.000 | | | | 12/20/20 | | | USD | | | 570 | | | | (21,466 | ) | | | 36,259 | |
Portuguese Republic | | | GSG | | | | Buy | | | | 1.000 | | | | 12/20/20 | | | USD | | | 17,200 | | | | (596,516 | ) | | | 1,094,141 | |
Portuguese Republic | | | GSG | | | | Buy | | | | 1.000 | | | | 6/20/21 | | | USD | | | 2,870 | | | | (236,484 | ) | | | 215,206 | |
Republic of Austria | | | BAC | | | | Buy | | | | 1.000 | | | | 12/20/20 | | | USD | | | 1,819 | | | | 56,734 | | | | (60,747 | ) |
Republic of Austria | | | BAC | | | | Buy | | | | 1.000 | | | | 12/20/20 | | | USD | | | 362 | | | | 13,517 | | | | (12,089 | ) |
Republic of Austria | | | BAC | | | | Buy | | | | 1.000 | | | | 12/20/20 | | | USD | | | 322 | | | | 12,251 | | | | (10,753) | |
Republic of Austria | | | BAC | | | | Buy | | | | 1.000 | | | | 12/20/20 | | | USD | | | 767 | | | | 24,849 | | | | (25,614 | ) |
Republic of Austria | | | GSG | | | | Buy | | | | 1.000 | | | | 6/20/21 | | | USD | | | 1,620 | | | | 57,372 | | | | (56,711 | ) |
Republic of Austria | | | GSG | | | | Buy | | | | 1.000 | | | | 12/20/20 | | | USD | | | 9,700 | | | | 356,896 | | | | (323,938 | ) |
Republic of Italy | | | BAC | | | | Buy | | | | 1.000 | | | | 12/20/20 | | | USD | | | 2,457 | | | | (24,305 | ) | | | 20,429 | |
Republic of Italy | | | BAC | | | | Buy | | | | 1.000 | | | | 6/20/21 | | | USD | | | 5,190 | | | | (105,907 | ) | | | 63,173 | |
Republic of Italy | | | BAC | | | | Buy | | | | 1.000 | | | | 12/20/20 | | | USD | | | 1,140 | | | | 1,225 | | | | 9,479 | |
Republic of Italy | | | BAC | | | | Buy | | | | 1.000 | | | | 12/20/20 | | | USD | | | 2,273 | | | | (39,705 | ) | | | 18,899 | |
Republic of Italy | | | BAC | | | | Buy | | | | 1.000 | | | | 12/20/20 | | | USD | | | 1,282 | | | | (738 | ) | | | 10,660 | |
Republic of Italy | | | GSG | | | | Buy | | | | 1.000 | | | | 12/20/20 | | | USD | | | 34,400 | | | | (68,209 | ) | | | 286,028 | |
| | | | | | | | | | | | | | | | | | | | | | | | | | |
Total Over-the-Counter Credit Default Swaps | | | | | | | | | | | | | | | | | | | | | $ | (739,674) | | | $ | (479,705) | |
| | | | | | | | | | | | | | | | | | | | | | | | | | |
The table that follows shows the undiscounted maximum potential payment by the Fund related to selling credit protection in credit default swaps:
| | | | | | | | | | |
Type of Reference Asset on which the Fund Sold Protection | | Total Maximum Potential Payments for Selling Credit Protection (Undiscounted) | | | Amount Recoverable* | | | Reference Asset Rating
Range** |
Investment Grade Corporate Debt | | | $47,505,000 | | | | $— | | | BBB+ |
Indexes | | | | | | | | | | |
Non-Investment Grade Corporate Debt | | | $5,942,049 | | | | $17,814,000 | | | B to CCC |
Indexes | | | | | | | | | | |
| | | |
Total | | | $53,447,049 | | | | $17,814,000 | | | |
| | | |
45 OPPENHEIMER FUNDAMENTAL ALTERNATIVES FUND
CONSOLIDATED STATEMENT OF INVESTMENTS Unaudited / Continued
*The Fund has no amounts recoverable from related purchased protection. In addition, the Fund has no recourse provisions under the credit derivatives and holds no collateral which can offset or reduce potential payments under a triggering event.
**The period end reference asset security ratings, as rated by any rating organization, are included in the equivalent Standard & Poor’s rating category. The reference asset rating represents the likelihood of a potential credit event on the reference asset which would result in a related payment by the Fund.
| | | | | | | | | | | | | | | | | | | | | | | | | | | | |
| Over-the-Counter Interest Rate Swaps at April 29, 2016 | |
| Counterparty | | Pay/Receive Floating Rate | | Floating
Rate | | | | Fixed
Rate | | | Maturity
Date | | | Notional Amount (000’s) | | | | | Value | |
| | | | Three-Month CNY | | | | | | | | | | | | | | | | | | | | | | | | |
BOA | | Pay | | CNREPOFIX=CFXS | | | | | 2.660% | | | | 3/12/21 | | | | CNY | | | | 8,500 | | | | | $ | (17,077 | ) |
| | | | Three-Month CNY | | | | | | | | | | | | | | | | | | | | | | | | |
BOA | | Pay | | CNREPOFIX=CFXS | | | | | 2.565 | | | | 2/22/21 | | | | CNY | | | | 11,000 | | | | | | (26,097 | ) |
| | | | Three-Month CNY | | | | | | | | | | | | | | | | | | | | | | | | |
BOA | | Pay | | CNREPOFIX=CFXS | | | | | 2.605 | | | | 3/26/21 | | | | CNY | | | | 19,340 | | | | | | (43,764 | ) |
| | | | Three-Month CNY | | | | | | | | | | | | | | | | | | | | | | | | |
BOA | | Pay | | CNREPOFIX=CFXS | | | | | 2.595 | | | | 3/19/21 | | | | CNY | | | | 9,200 | | | | | | (21,150 | ) |
| | | | Three-Month CNY | | | | | | | | | | | | | | | | | | | | | | | | |
BOA | | Pay | | CNREPOFIX=CFXS | | | | | 2.900 | | | | 7/24/20 | | | | CNY | | | | 84,000 | | | | | | (31,520 | ) |
| | | | Three-Month CNY | | | | | | | | | | | | | | | | | | | | | | | | |
BOA | | Pay | | CNREPOFIX=CFXS | | | | | 2.730 | | | | 11/6/20 | | | | CNY | | | | 15,000 | | | | | | (21,067 | ) |
| | | | Three-Month CNY | | | | | | | | | | | | | | | | | | | | | | | | |
BOA | | Pay | | CNREPOFIX=CFXS | | | | | 2.450 | | | | 1/25/21 | | | | CNY | | | | 8,250 | | | | | | (22,692 | ) |
| | | | Three-Month CNY | | | | | | | | | | | | | | | | | | | | | | | | |
GSG | | Pay | | CNREPOFIX=CFXS | | | | | 2.830 | | | | 8/14/20 | | | | CNY | | | | 19,000 | | | | | | (13,936 | ) |
| | | | | | | | | | | | | | | | | | | | | | | | | | | | |
Total Over-the-Counter Interest Rate Swaps | | | | | | | | | | | | | | | | | | | | | | | | $ | (197,303) | |
| | | | | | | | | | | | | | | | | | | | | | | | | | | | |
| | | | | | | | | | | | | | | | | | | | | | | | | | | | |
| Over-the-Counter Total Return Swaps at April 29, 2016 | |
| Reference Asset | | Counterparty | | | Pay/Receive Total Return* | | | Floating Rate | | | Maturity Date | | | | | | | Notional Amount (000’s) | | | Value | |
Blackstone Group LP (The) | | | GSG | | | | Receive | | |
| Twelve-Month
USD BBA LIBOR plus 70 basis points |
| | | 1/13/17 | | | USD | | | | | 10,422 | | | $ | (715,791 | ) |
GSEHOPCN Custom Basket | | | GSG | | | | Pay | | |
| One-Month HKD
HIBOR HKAB minus 25 basis points |
| | | 5/27/16 | | | HKD | | | | | 58,514 | | | | (216,911 | ) |
| | | | | | | | | | | | | | | | | | | | | | | | | | | | |
Total Over-the-Counter Total Return Swaps | | | | | | | | | | | | | | | $ | (932,702) | |
| | | | | | | | | | | | | | | | | | | | | | | | | | | | |
* Fund will pay or receive the total return of the reference asset depending on whether the return is positive or negative. For contracts where the Fund has elected to receive the total return of the reference asset if positive, it will be responsible for paying the floating rate and the total return of the reference asset if negative. If the Fund has elected to pay the total return of the reference asset if positive, it will receive the floating rate and the total return of the reference asset if negative.
| | |
Glossary: |
| Counterparty Abbreviations |
| BAC | | Barclays Bank plc |
| BNP | | BNP Paribas |
| BOA | | Bank of America NA |
46 OPPENHEIMER FUNDAMENTAL ALTERNATIVES FUND
| | |
| Counterparty Abbreviations (Continued) |
| CITNA-B | | Citibank NA |
| DEU | | Deutsche Bank AG |
| GSCO-OT | | Goldman Sachs Bank USA |
| GSG | | Goldman Sachs Group, Inc. (The) |
| JPM | | JPMorgan Chase Bank NA |
| MOS-A | | Morgan Stanley |
| MSCO | | Morgan Stanley Capital Services, Inc. |
| NOM | | Nomura Global Financial Products, Inc. |
| RBS | | Royal Bank of Scotland plc (The) |
| TDB | | Toronto Dominion Bank |
|
| Currency abbreviations indicate amounts reporting in currencies |
| AUD | | Australian Dollar |
| CAD | | Canadian Dollar |
| CHF | | Swiss Franc |
| CNH | | Offshore Chinese Renminbi |
| CNY | | Chinese Renminbi |
| EUR | | Euro |
| HKD | | Hong Kong Dollar |
| JPY | | Japanese Yen |
| NOK | | Norwegian Krone |
| SEK | | Swedish Krona |
| THB | | Thailand Baht |
| |
| Definitions | | |
| BBA LIBOR | | British Bankers’ Association London - Interbank Offered Rate |
| BTP | | Italian Treasury Bonds |
| CDX.HY.21 | | Markit CDX High Yield Index |
| CDX.HY.24 | | Markit CDX High Yield Index |
| CDX.HY.25 | | Markit CDX High Yield Index |
| CDX.IG.25 | | Markit CDX Investment Grade Index |
| CDX.NA.HY.21 | | Markit CDX North American High Yield |
| CDX.NA.HY.25 | | Markit CDX North American High Yield |
| CNREPOFIX=CFXS | | Repurchase Fixing Rates |
| GSEHOPCN | | Custom Basket of Securities |
| HIBOR | | Hong Kong Interbank Offered Rate |
| HKAB | | Hong Kong Association of Banks |
| iTraxx.Main.24 | | Credit Default Swap Trading Index for a Specific Basket of Securities |
|
| Exchange Abbreviations |
| CBT | | Chicago Board of Trade |
| EUX | | European Stock Exchange |
See accompanying Notes to Consolidated Financial Statements.
47 OPPENHEIMER FUNDAMENTAL ALTERNATIVES FUND
CONSOLIDATED STATEMENT OF
ASSETS AND LIABILITIES April 29, 20161 Unaudited
| | | | |
| Assets | | | | |
Investments, at value—see accompanying statement of investments: | | | | |
Unaffiliated companies (cost $1,008,092,832) | | $ | 1,055,129,374 | |
Affiliated companies (cost $197,937,022) | | | 197,937,022 | |
| | | | |
| | | 1,253,066,396 | |
| |
Cash | | | 335,938 | |
| |
Cash—foreign currencies (cost $34,690,425) | | | 35,825,618 | |
| |
Cash used for collateral on futures | | | 526,000 | |
| |
Cash used for collateral on OTC derivatives | | | 2,270,000 | |
| |
Cash used for collateral on centrally cleared swaps | | | 2,741,668 | |
| |
Deposits with broker for securities sold short | | | 303,907,132 | |
| |
Unrealized appreciation on forward currency exchange contracts | | | 812,761 | |
| |
Swaps, at value (premiums paid $4,780,827) | | | 3,656,844 | |
| |
Centrally cleared swaps, at value (premiums paid $495,966) | | | 410,637 | |
| |
Receivables and other assets: | | | | |
Investments sold (including $7,967,217 sold on a when-issued or delayed delivery basis) | | | 14,754,431 | |
Shares of beneficial interest sold | | | 5,659,059 | |
Interest and dividends | | | 3,441,876 | |
Variation margin receivable | | | 30,043 | |
Other | | | 181,132 | |
| | | | |
Total assets | | | 1,627,619,535 | |
| |
| | | | |
| Liabilities | | | | |
Securities sold short, at value (proceeds $335,684,824) - see accompanying statement of investments | | | 355,547,259 | |
| |
Unrealized depreciation on forward currency exchange contracts | | | 1,896,024 | |
| |
Options written, at value (premiums received $792,200) | | | 628,575 | |
| |
Swaps, at value (premiums received $4,041,153) | | | 5,266,554 | |
| |
Centrally cleared swaps, at value (premiums received $2,163,253 ) | | | 1,645,247 | |
| |
Payables and other liabilities: | | | | |
Investments purchased (including $3,337,343 purchased on a when-issued or delayed delivery basis) | | | 12,867,035 | |
Shares of beneficial interest redeemed | | | 1,147,875 | |
Dividends | | | 665,721 | |
Trustees’ compensation | | | 204,776 | |
Distribution and service plan fees | | | 175,692 | |
Variation margin payable | | | 12,469 | |
Shareholder communications | | | 10,058 | |
Other | | | 78,403 | |
| | | | |
Total liabilities | | | 380,145,688 | |
|
| |
| Net Assets | �� | $ | 1,247,473,847 | |
| | | | |
48 OPPENHEIMER FUNDAMENTAL ALTERNATIVES FUND
| | | | |
| Composition of Net Assets | | | | |
Par value of shares of beneficial interest | | $ | 478,941 | |
| |
Additional paid-in capital | | | 1,225,874,843 | |
| |
Accumulated net investment income | | | 4,933,233 | |
| |
Accumulated net realized loss on investments and foreign currency transactions | | | (9,333,130) | |
| |
Net unrealized appreciation on investments and translation of assets and liabilities denominated in foreign currencies | | | 25,519,960 | |
| | | | |
Net Assets | | $ | 1,247,473,847 | |
| | | | |
| | | | |
| Net Asset Value Per Share | | | | |
Class A Shares: | | | | |
| |
| Net asset value and redemption price per share (based on net assets of $683,542,479 and 26,048,688 shares of beneficial interest outstanding) | | | $26.24 | |
| Maximum offering price per share (net asset value plus sales charge of 5.75% of offering price) | | | $27.84 | |
| |
| |
| Class B Shares: | | | | |
| |
| Net asset value, redemption price (excludes applicable contingent deferred sales charge) and offering price per share (based on net assets of $10,045,876 and 428,812 shares of beneficial interest outstanding) | | | $23.43 | |
| |
| |
| Class C Shares: | | | | |
| |
| Net asset value, redemption price (excludes applicable contingent deferred sales charge) and offering price per share (based on net assets of $138,177,104 and 5,897,688 shares of beneficial interest outstanding) | | | $23.43 | |
| |
| |
| Class I Shares: | | | | |
| |
| Net asset value, redemption price and offering price per share (based on net assets of $82,522,798 and 3,062,495 shares of beneficial interest outstanding) | | | $26.95 | |
| |
| |
| Class R Shares: | | | | |
| |
| Net asset value, redemption price (excludes applicable contingent deferred sales charge) and offering price per share (based on net assets of $18,369,011 and 729,592 shares of beneficial interest outstanding) | | | $25.18 | |
| |
| |
| Class Y Shares: | | | | |
| |
| Net asset value, redemption price and offering price per share (based on net assets of $314,816,579 and 11,726,816 shares of beneficial interest outstanding) | | | $26.85 | |
1. April 29, 2016 represents the last business day of the Fund’s reporting period. See Note 2 of the accompanying Consolidated Notes.
See accompanying Notes to Consolidated Financial Statements.
49 OPPENHEIMER FUNDAMENTAL ALTERNATIVES FUND
CONSOLIDATED STATEMENT OF
OPERATIONS For the Six Months Ended April 29, 20161 Unaudited
| | | | |
| Allocation of Income and Expenses from Master Funds2 | | | | |
Net investment income allocated from Oppenheimer Master Loan Fund, LLC: | | | | |
Interest | | $ | 162,456 | |
Dividends | | | 249 | |
Net expenses | | | (10,367) | |
| | | | |
Net investment income allocated from Oppenheimer Master Loan Fund, LLC | | | 152,338 | |
| | | | |
| Investment Income | | | | |
Interest | | | 8,620,893 | |
| |
Dividends: | | | | |
Unaffiliated companies (net of foreign withholding taxes of $162,018) | | | 8,097,288 | |
Affiliated companies | | | 335,435 | |
| | | | |
Total investment income | | | 17,053,616 | |
| | | | |
| Expenses | | | | |
Management fees | | | 4,693,690 | |
| |
Distribution and service plan fees: | | | | |
Class A | | | 804,387 | |
Class B | | | 58,361 | |
Class C | | | 647,187 | |
Class R | | | 43,174 | |
| |
Transfer and shareholder servicing agent fees: | | | | |
Class A | | | 732,193 | |
Class B | | | 12,919 | |
Class C | | | 143,033 | |
Class I | | | 10,089 | |
Class R | | | 19,158 | |
Class Y | | | 209,811 | |
| |
Shareholder communications: | | | | |
Class A | | | 18,333 | |
Class B | | | 1,738 | |
Class C | | | 3,593 | |
Class I | | | 212 | |
Class R | | | 462 | |
Class Y | | | 1,776 | |
| |
Dividends on short sales | | | 2,802,920 | |
| |
Financing expense from short sales | | | 530,791 | |
| |
Trustees’ compensation | | | 17,203 | |
| |
Borrowing fees | | | 7,940 | |
| |
Custodian fees and expenses | | | 3,589 | |
| |
Other | | | 151,365 | |
| | | | |
Total expenses | | | 10,913,924 | |
Less reduction to custodian expenses | | | (45) | |
Less waivers and reimbursements of expenses | | | (212,663) | |
| | | | |
Net expenses | | | 10,701,216 | |
| | | | |
Net Investment Income | | | 6,504,738 | |
50 OPPENHEIMER FUNDAMENTAL ALTERNATIVES FUND
| | | | |
Realized and Unrealized Gain (Loss) | | | | |
Net realized gain (loss) on: | | | | |
Investments from unaffiliated companies | | $ | 5,483,965 | |
Closing and expiration of futures contracts | | | (698,812) | |
Foreign currency transactions | | | (3,674,068) | |
Short positions | | | 1,552,263 | |
Swap contracts | | | (4,812,731) | |
| |
Net realized loss allocated from Oppenheimer Master Loan Fund, LLC | | | (5,332,452) | |
| | | | |
Net realized loss | | | (7,481,835) | |
| |
Net change in unrealized appreciation/depreciation on: | | | | |
Investments | | | (12,105,226) | |
Translation of assets and liabilities denominated in foreign currencies | | | 622,184 | |
Futures contracts | | | 334,229 | |
Option contracts written | | | 163,625 | |
Short positions | | | (17,859,529) | |
Swap contracts | | | 229,323 | |
| |
Net change in unrealized appreciation/depreciation allocated from Oppenheimer Master Loan | | | | |
Fund, LLC | | | 4,690,587 | |
| | | | |
Net change in unrealized appreciation/depreciation | | | (23,924,807) | |
Net Decrease in Net Assets Resulting from Operations | | $ | (24,901,904) | |
| | | | |
1. April 29, 2016 represents the last business day of the Fund’s reporting period. See Note 2 of the accompanying Consolidated Notes.
2. The Fund invests in a certain affiliated mutual fund that expects to be treated as a partnership for tax purposes. See Note 4 of the accompanying Consolidated Notes.
See accompanying Notes to Consolidated Financial Statements.
51 OPPENHEIMER FUNDAMENTAL ALTERNATIVES FUND
CONSOLIDATED STATEMENTS OF CHANGES IN NET ASSETS
| | | | | | | | |
| | | Six Months Ended
April 29, 20161
(Unaudited) | | | Year Ended
October 30, 20151 | |
Operations | | | | | | | | |
Net investment income | | $ | 6,504,738 | | | $ | 8,416,093 | |
| |
Net realized gain (loss) | | | (7,481,835) | | | | 37,862,034 | |
| |
Net change in unrealized appreciation/depreciation | | | (23,924,807) | | | | (21,447,350) | |
| | | | |
Net increase (decrease) in net assets resulting from operations | | | (24,901,904) | | | | 24,830,777 | |
| | |
| | | | | | | | |
Dividends and/or Distributions to Shareholders | | | | | | | | |
Dividends from net investment income: | | | | | | | | |
Class A | | | (3,490,406) | | | | (11,377,733) | |
Class B | | | (41,676) | | | | (264,034) | |
Class C | | | (422,888) | | | | (1,406,772) | |
Class I | | | (587,576) | | | | (245) | |
Class R | | | (58,448) | | | | (264,122) | |
Class Y | | | (1,050,986) | | | | (395,622) | |
| | | | |
| | | (5,651,980) | | | | (13,708,528) | |
| | |
| | | | | | | | |
Beneficial Interest Transactions | | | | | | | | |
Net increase (decrease) in net assets resulting from beneficial interest transactions: | | | | | | | | |
Class A | | | 59,782,897 | | | | (8,609,111) | |
Class B | | | (3,802,044) | | | | (11,336,193) | |
Class C | | | 24,921,258 | | | | 5,538,324 | |
Class I | | | 25,267,821 | | | | 58,913,333 | |
Class R | | | 1,710,242 | | | | (381,009) | |
Class Y | | | 232,520,231 | | | | 67,220,726 | |
| | | | |
| | | 340,400,405 | | | | 111,346,070 | |
| | |
| | | | | | | | |
Net Assets | | | | | | | | |
Total increase | | | 309,846,521 | | | | 122,468,319 | |
| |
Beginning of period | | | 937,627,326 | | | | 815,159,007 | |
| | | | |
| End of period (including accumulated net investment income (loss) of $4,933,233 and $4,080,475, respectively) | | $ | 1,247,473,847 | | | $ | 937,627,326 | |
| | | | |
1. April 29, 2016 and October 30, 2015 represent the last business days of the Fund’s respective reporting periods.
See Note 2 of the accompanying Consolidated Notes.
See accompanying Notes to Consolidated Financial Statements.
52 OPPENHEIMER FUNDAMENTAL ALTERNATIVES FUND
CONSOLIDATED FINANCIAL HIGHLIGHTS
| | | | | | | | | | | | |
| Class A | | Six Months
Ended
April 29, 2016
(Unaudited)1 | | Year Ended
October 30,
20151 | | Year Ended
October 31,
2014 | | Year Ended
October 31,
2013 | | Year Ended
October 31,
2012 | | Year Ended
October 31,
2011 |
Per Share Operating Data
| | | | | | | | | | | | |
Net asset value, beginning of period | | $27.00 | | $26.64 | | $24.48 | | $23.35 | | $25.55 | | $26.01 |
|
Income (loss) from investment operations: | | | | | | | | | | | | |
Net investment income (loss)2 | | 0.16 | | 0.30 | | 0.29 | | 0.30 | | 0.04 | | (0.17) |
Net realized and unrealized gain (loss) | | (0.78) | | 0.53 | | 1.87 | | 0.83 | | (0.10) | | 0.22 |
| | |
Total from investment operations | | (0.62) | | 0.83 | | 2.16 | | 1.13 | | (0.06) | | 0.05 |
|
Dividends and/or distributions to shareholders: | | | | | | | | | | | | |
Dividends from net investment income | | (0.14) | | (0.47) | | 0.00 | | 0.00 | | 0.00 | | 0.00 |
Distributions from net realized gain | | 0.00 | | 0.00 | | 0.00 | | 0.00 | | (2.13) | | (0.51) |
Tax return of capital distribution | | 0.00 | | 0.00 | | 0.00 | | 0.00 | | (0.01) | | 0.00 |
| | |
Total dividends and/or distributions to shareholders | | (0.14) | | (0.47) | | 0.00 | | 0.00 | | (2.14) | | (0.51) |
|
Net asset value, end of period | | $26.24 | | $27.00 | | $26.64 | | $24.48 | | $23.35 | | $25.55 |
| | |
| | | | | | | | | | | | |
Total Return, at Net Asset Value3 | | (2.30)% | | 3.18% | | 8.82% | | 4.84% | | 0.03% | | 0.14% |
| | | | | | | | | | | | |
Ratios/Supplemental Data | | | | | | | | | | | | |
Net assets, end of period (in thousands) | | $683,542 | | $642,670 | | $642,789 | | $668,235 | | $774,007 | | $1,024,109 |
|
Average net assets (in thousands) | | $669,656 | | $636,510 | | $662,351 | | $721,521 | | $870,856 | | $1,165,257 |
|
Ratios to average net assets:4 | | | | | | | | | | | | |
Net investment income (loss) | | 1.23%5 | | 1.14%5 | | 1.12%5 | | 1.25%5 | | 0.19%5 | | (0.65)% |
Expenses excluding specific expenses listed below | | 1.35%5 | | 1.39%5 | | 1.42%5 | | 1.44%5 | | 1.40%5 | | 1.33%5 |
Dividends and/or interest expense on securities sold short | | 0.52% | | 0.60% | | 0.55% | | 0.58% | | 0.31% | | 0.11% |
Borrowing expenses on securities sold short | | 0.10% | | 0.18% | | 0.42% | | 0.02% | | 0.14% | | 0.13% |
Interest and fees from borrowings | | 0.00%6 | | 0.00%6 | | 0.00% | | 0.00% | | 0.00% | | 0.00% |
| | |
Total expenses7 | | 1.97%5 | | 2.17%5 | | 2.39%5 | | 2.04%5 | | 1.85%5 | | 1.57% |
| Expenses after payments, waivers and/or reimbursements and reduction to custodian expenses | | 1.93%5 | | 2.12%5 | | 2.25%5 | | 1.97%5 | | 1.78%5 | | 1.52% |
|
Portfolio turnover rate | | 80% | | 62% | | 44% | | 76% | | 212% | | 181% |
53 OPPENHEIMER FUNDAMENTAL ALTERNATIVES FUND
CONSOLIDATED FINANCIAL HIGHLIGHTS Continued
1. April 29, 2016 and October 30, 2015 represent the last business days of the Fund’s reporting periods. See Note 2 of the accompanying Consolidated Notes.
2. Per share amounts calculated based on the average shares outstanding during the period.
3. Assumes an initial investment on the business day before the first day of the fiscal period, with all dividends and distributions reinvested in additional shares on the reinvestment date, and redemption at the net asset value calculated on the last business day of the fiscal period. Sales charges are not reflected in the total returns. Total returns are not annualized for periods less than one full year. Returns do not reflect the deduction of taxes that a shareholder would pay on fund distributions or the redemption of fund shares.
4. Annualized for periods less than one full year.
5. Includes the Fund’s share of the allocated expenses and/or net investment income from the master funds.
6. Less than 0.005%.
7. Total expenses including indirect expenses from affiliated fund fees and expenses were as follows:
| | | | | | | | |
| | Six Months Ended April 29, 2016 | | | 2.01 | % | | |
| | Year Ended October 30, 2015 | | | 2.18 | % | | |
| | Year Ended October 31, 2014 | | | 2.40 | % | | |
| | Year Ended October 31, 2013 | | | 2.06 | % | | |
| | Year Ended October 31, 2012 | | | 1.90 | % | | |
| | Year Ended October 31, 2011 | | | 1.62 | % | | |
See accompanying Notes to Consolidated Financial Statements.
54 OPPENHEIMER FUNDAMENTAL ALTERNATIVES FUND
| | | | | | | | | | | | |
| Class B | | Six Months
Ended
April 29, 2016
(Unaudited)1 | | Year Ended
October 30,
20151 | | Year Ended
October 31,
2014 | | Year Ended
October 31,
2013 | | Year Ended
October 31,
2012 | | Year Ended
October 31,
2011 |
Per Share Operating Data | | | | | | | | | | | | |
Net asset value, beginning of period | | $24.15 | | $23.84 | | $22.08 | | $21.25 | | $23.63 | | $24.32 |
|
Income (loss) from investment operations: | | | | | | | | | | | | |
Net investment income (loss)2 | | 0.06 | | 0.15 | | 0.08 | | 0.08 | | (0.15) | | (0.38) |
Net realized and unrealized gain (loss) | | (0.70) | | 0.42 | | 1.68 | | 0.75 | | (0.09) | | 0.20 |
| | |
Total from investment operations | | (0.64) | | 0.57 | | 1.76 | | 0.83 | | (0.24) | | (0.18) |
|
Dividends and/or distributions to shareholders: | | | | | | | | | | | | |
Dividends from net investment income | | (0.08) | | (0.26) | | 0.00 | | 0.00 | | 0.00 | | 0.00 |
Distributions from net realized gain | | 0.00 | | 0.00 | | 0.00 | | 0.00 | | (2.13) | | (0.51) |
Tax return of capital distribution | | 0.00 | | 0.00 | | 0.00 | | 0.00 | | (0.01) | | 0.00 |
| | |
| Total dividends and/or distributions to shareholders | | (0.08) | | (0.26) | | 0.00 | | 0.00 | | (2.14) | | (0.51) |
|
Net asset value, end of period | | $23.43 | | $24.15 | | $23.84 | | $22.08 | | $21.25 | | $23.63 |
| | |
| | | | | | | | | | | | |
Total Return, at Net Asset Value3 | | (2.66)% | | 2.40% | | 7.97% | | 3.91% | | (0.79)% | | (0.81)% |
| | | | | | | | | | | | |
Ratios/Supplemental Data | | | | | | | | | | | | |
Net assets, end of period (in thousands) | | $10,046 | | $14,201 | | $25,296 | | $34,346 | | $46,780 | | $68,426 |
|
Average net assets (in thousands) | | $11,783 | | $19,249 | | $30,329 | | $40,057 | | $56,004 | | $82,022 |
|
Ratios to average net assets:4 | | | | | | | | | | | | |
Net investment income (loss) | | 0.47%5 | | 0.61%5 | | 0.34%5 | | 0.35%5 | | (0.70)%5 | | (1.55)% |
| Expenses excluding specific expenses listed below | | 2.13%5 | | 2.16%5 | | 2.29%5 | | 2.46%5 | | 2.40%5 | | 2.33% |
| Dividends and/or interest expense on securities sold short | | 0.52% | | 0.60% | | 0.55% | | 0.58% | | 0.31% | | 0.11% |
| Borrowing expenses on securities sold short | | 0.10% | | 0.18% | | 0.42% | | 0.02% | | 0.14% | | 0.13% |
Interest and fees from borrowings | | 0.00%6 | | 0.00%6 | | 0.00% | | 0.00% | | 0.00% | | 0.00% |
| | |
Total expenses7 | | 2.75%5 | | 2.94%5 | | 3.26%5 | | 3.06%5 | | 2.85%5 | | 2.57% |
| Expenses after payments, waivers and/or reimbursements and reduction to custodian expenses | | 2.71%5 | | 2.89%5 | | 3.06%5 | | 2.86%5 | | 2.67%5 | | 2.43% |
|
Portfolio turnover rate | | 80% | | 62% | | 44% | | 76% | | 212% | | 181% |
55 OPPENHEIMER FUNDAMENTAL ALTERNATIVES FUND
CONSOLIDATED FINANCIAL HIGHLIGHTS Continued
1. April 29, 2016 and October 30, 2015 represent the last business days of the Fund’s reporting periods. See Note 2 of the accompanying Consolidated Notes.
2. Per share amounts calculated based on the average shares outstanding during the period.
3. Assumes an initial investment on the business day before the first day of the fiscal period, with all dividends and distributions reinvested in additional shares on the reinvestment date, and redemption at the net asset value calculated on the last business day of the fiscal period. Sales charges are not reflected in the total returns. Total returns are not annualized for periods less than one full year. Returns do not reflect the deduction of taxes that a shareholder would pay on fund distributions or the redemption of fund shares.
4. Annualized for periods less than one full year.
5. Includes the Fund’s share of the allocated expenses and/or net investment income from the master funds.
6. Less than 0.005%.
7. Total expenses including indirect expenses from affiliated fund fees and expenses were as follows:
| | | | | | | | |
| | Six Months Ended April 29, 2016 | | | 2.79 | % | | |
| | Year Ended October 30, 2015 | | | 2.95 | % | | |
| | Year Ended October 31, 2014 | | | 3.27 | % | | |
| | Year Ended October 31, 2013 | | | 3.08 | % | | |
| | Year Ended October 31, 2012 | | | 2.90 | % | | |
| | Year Ended October 31, 2011 | | | 2.62 | % | | |
See accompanying Notes to Consolidated Financial Statements.
56 OPPENHEIMER FUNDAMENTAL ALTERNATIVES FUND
| | | | | | | | | | | | |
| Class C | | Six Months
Ended
April 29, 2016
(Unaudited)1 | | Year Ended
October 30,
20151 | | Year Ended
October 31,
2014 | | Year Ended
October 31,
2013 | | Year Ended
October 31,
2012 | | Year Ended
October 31,
2011 |
Per Share Operating Data | | | | | | | | | | | | |
Net asset value, beginning of period | | $24.15 | | $23.89 | | $22.12 | | $21.26 | | $23.62 | | $24.27 |
|
| Income (loss) from investment operations: | | | | | | | | | | | | |
Net investment income (loss)2 | | 0.06 | | 0.09 | | 0.08 | | 0.10 | | (0.12) | | (0.35) |
| Net realized and unrealized gain (loss) | | (0.70) | | 0.47 | | 1.69 | | 0.76 | | (0.10) | | 0.21 |
| | |
Total from investment operations | | (0.64) | | 0.56 | | 1.77 | | 0.86 | | (0.22) | | (0.14) |
|
| Dividends and/or distributions to shareholders: | | | | | | | | | | | | |
Dividends from net investment income | | (0.08) | | (0.30) | | 0.00 | | 0.00 | | 0.00 | | 0.00 |
Distributions from net realized gain | | 0.00 | | 0.00 | | 0.00 | | 0.00 | | (2.13) | | (0.51) |
Tax return of capital distribution | | 0.00 | | 0.00 | | 0.00 | | 0.00 | | (0.01) | | 0.00 |
| | |
| Total dividends and/or distributions to shareholders | | (0.08) | | (0.30) | | 0.00 | | 0.00 | | (2.14) | | (0.51) |
|
Net asset value, end of period | | $23.43 | | $24.15 | | $23.89 | | $22.12 | | $21.26 | | $23.62 |
| | |
| | | | | | | | | | | | |
Total Return, at Net Asset Value3 | | (2.66)% | | 2.39% | | 8.00% | | 4.05% | | (0.71)% | | (0.64)% |
| | | | | | | | | | | | |
Ratios/Supplemental Data | | | | | | | | | | | | |
| Net assets, end of period (in thousands) | | $138,177 | | $117,152 | | $110,383 | | $112,993 | | $135,750 | | $199,765 |
|
Average net assets (in thousands) | | $130,907 | | $111,050 | | $112,984 | | $122,514 | | $160,258 | | $233,997 |
|
Ratios to average net assets:4 | | | | | | | | | | | | |
Net investment income (loss) | | 0.48%5 | | 0.38%5 | | 0.36%5 | | 0.48%5 | | (0.59)%5 | | (1.40)% |
| Expenses excluding specific expenses listed below | | 2.11%5 | | 2.14%5 | | 2.19%5 | | 2.21%5 | | 2.17%5 | | 2.08% |
| Dividends and/or interest expense on securities sold short | | 0.52% | | 0.60% | | 0.55% | | 0.58% | | 0.31% | | 0.11% |
Borrowing expenses on securities sold short | | 0.10% | | 0.18% | | 0.42% | | 0.02% | | 0.14% | | 0.13% |
Interest and fees from borrowings | | 0.00%6 | | 0.00%6 | | 0.00% | | 0.00% | | 0.00% | | 0.00% |
| | |
Total expenses7 | | 2.73%5 | | 2.92%5 | | 3.16%5 | | 2.81%5 | | 2.62%5 | | 2.32% |
| Expenses after payments, waivers and/or reimbursements and reduction to custodian expenses | | 2.69%5 | | 2.87%5 | | 3.02%5 | | 2.74%5 | | 2.55%5 | | 2.27% |
|
Portfolio turnover rate | | 80% | | 62% | | 44% | | 76% | | 212% | | 181% |
57 OPPENHEIMER FUNDAMENTAL ALTERNATIVES FUND
CONSOLIDATED FINANCIAL HIGHLIGHTS Continued
1. April 29, 2016 and October 30, 2015 represent the last business days of the Fund’s reporting periods. See Note 2 of the accompanying Consolidated Notes.
2. Per share amounts calculated based on the average shares outstanding during the period.
3. Assumes an initial investment on the business day before the first day of the fiscal period, with all dividends and distributions reinvested in additional shares on the reinvestment date, and redemption at the net asset value calculated on the last business day of the fiscal period. Sales charges are not reflected in the total returns. Total returns are not annualized for periods less than one full year. Returns do not reflect the deduction of taxes that a shareholder would pay on fund distributions or the redemption of fund shares.
4. Annualized for periods less than one full year.
5. Includes the Fund’s share of the allocated expenses and/or net investment income from the master funds.
6. Less than 0.005%.
7. Total expenses including indirect expenses from affiliated fund fees and expenses were as follows:
| | | | | | | | |
| | Six Months Ended April 29, 2016 | | | 2.77 | % | | |
| | Year Ended October 30, 2015 | | | 2.93 | % | | |
| | Year Ended October 31, 2014 | | | 3.17 | % | | |
| | Year Ended October 31, 2013 | | | 2.83 | % | | |
| | Year Ended October 31, 2012 | | | 2.67 | % | | |
| | Year Ended October 31, 2011 | | | 2.37 | % | | |
See accompanying Notes to Consolidated Financial Statements.
58 OPPENHEIMER FUNDAMENTAL ALTERNATIVES FUND
| | | | | | | | |
| Class I | | Six Months
Ended
April 29, 2016
(Unaudited)1 | | Year Ended
October 30,
20151 | | Year Ended
October 31,
2014 | | Period
Ended
October 31,
20132 |
| Per Share Operating Data | | | | | | | | |
| Net asset value, beginning of period | | $27.79 | | $27.41 | | $25.09 | | $24.32 |
| Income (loss) from investment operations: | | | | | | | | |
| Net investment income3 | | 0.22 | | 0.28 | | 0.42 | | 0.34 |
| Net realized and unrealized gain (loss) | | (0.79) | | 0.69 | | 1.90 | | 0.43 |
| Total from investment operations | | (0.57) | | 0.97 | | 2.32 | | 0.77 |
Dividends and/or distributions to shareholders: | | | | | | | | |
| Dividends from net investment income | | (0.27) | | (0.59) | | 0.00 | | 0.00 |
| Distributions from net realized gain | | 0.00 | | 0.00 | | 0.00 | | 0.00 |
| Tax return of capital distribution | | 0.00 | | 0.00 | | 0.00 | | 0.00 |
| Total dividends and/or distributions to shareholders | | (0.27) | | (0.59) | | 0.00 | | 0.00 |
| Net asset value, end of period | | $26.95 | | $27.79 | | $27.41 | | $25.09 |
| | | | | | | | |
| | | | | | | | |
| Total Return, at Net Asset Value4 | | (2.07)% | | 3.62% | | 9.25% | | 3.17% |
| | | | | | | | |
| Ratios/Supplemental Data | | | | | | | | |
| Net assets, end of period (in thousands) | | $82,523 | | $59,214 | | $11 | | $10 |
| Average net assets (in thousands) | | $67,763 | | $8,550 | | $11 | | $10 |
| Ratios to average net assets:5,6 | | | | | | | | |
| Net investment income | | 1.65% | | 1.06% | | 1.57% | | 2.07% |
| Expenses excluding specific expenses listed below | | 0.93% | | 0.82% | | 0.95% | | 1.26% |
| Dividends and/or interest expense on securities sold short | | 0.52% | | 0.60% | | 0.55% | | 0.58% |
| Borrowing expenses on securities sold short | | 0.10% | | 0.18% | | 0.42% | | 0.02% |
| Interest and fees from borrowings | | 0.00%7 | | 0.00%7 | | 0.00% | | 0.00% |
| Total expenses8 | | 1.55% | | 1.60% | | 1.92% | | 1.86% |
| Expenses after payments, waivers and/or reimbursements and reduction to custodian expenses | | 1.51% | | 1.55% | | 1.79% | | 1.79% |
| Portfolio turnover rate | | 80% | | 62% | | 44% | | 76% |
1. April 29, 2016 and October 30, 2015 represent the last business days of the Fund’s reporting periods. See Note 2 of the accompanying Consolidated Notes.
2. For the period from February 28, 2013 (inception of offering) to October 31, 2013.
3. Per share amounts calculated based on the average shares outstanding during the period.
4. Assumes an initial investment on the business day before the first day of the fiscal period, with all dividends and distributions reinvested in additional shares on the reinvestment date, and redemption at the net asset value calculated on the last business day of the fiscal period. Sales charges are not reflected in the total returns. Total returns are not annualized for periods less than one full year. Returns do not reflect the deduction of taxes that a shareholder would pay on fund distributions or the redemption of fund shares.
5. Annualized for periods less than one full year.
6. Includes the Fund’s share of the allocated expenses and/or net investment income from the master funds.
7. Less than 0.005%.
8. Total expenses including indirect expenses from affiliated fund fees and expenses were as follows:
| | | | | | | | |
| | Six Months Ended April 29, 2016 | | | 1.59 | % | | |
| | Year Ended October 30, 2015 | | | 1.61 | % | | |
| | Year Ended October 31, 2014 | | | 1.93 | % | | |
| | Period Ended October 31, 2013 | | | 1.88 | % | | |
See accompanying Notes to Consolidated Financial Statements.
59 OPPENHEIMER FUNDAMENTAL ALTERNATIVES FUND
CONSOLIDATED FINANCIAL HIGHLIGHTS Continued
| | | | | | | | | | | | |
| Class R | | Six Months
Ended
April 29, 2016
(Unaudited)1 | | Year Ended
October 30,
20151 | | Year Ended
October 31,
2014 | | Year Ended
October 31,
2013 | | Year Ended
October 31,
2012 | | Year Ended
October 31,
2011 |
| Per Share Operating Data | | | | | | | | | | | | |
| Net asset value, beginning of period | | $25.89 | | $25.55 | | $23.54 | | $22.53 | | $24.80 | | $25.34 |
| Income (loss) from investment operations: | | | | | | | | | | | | |
| Net investment income (loss)2 | | 0.12 | | 0.22 | | 0.21 | | 0.21 | | (0.03) | | (0.24) |
| Net realized and unrealized gain (loss) | | (0.74) | | 0.52 | | 1.80 | | 0.80 | | (0.10) | | 0.21 |
| Total from investment operations | | (0.62) | | 0.74 | | 2.01 | | 1.01 | | (0.13) | | (0.03) |
| Dividends and/or distributions to shareholders: | | | | | | | | | | | | |
| Dividends from net investment income | | (0.09) | | (0.40) | | 0.00 | | 0.00 | | 0.00 | | 0.00 |
| Distributions from net realized gain | | 0.00 | | 0.00 | | 0.00 | | 0.00 | | (2.13) | | (0.51) |
| Tax return of capital distribution | | 0.00 | | 0.00 | | 0.00 | | 0.00 | | (0.01) | | 0.00 |
| Total dividends and/or distributions to shareholders | | (0.09) | | (0.40) | | 0.00 | | 0.00 | | (2.14) | | (0.51) |
| Net asset value, end of period | | $25.18 | | $25.89 | | $25.55 | | $23.54 | | $22.53 | | $24.80 |
| | | | | | | | | | | | |
| | | | | | | | | | | | |
| Total Return, at Net Asset Value3 | | (2.41)% | | 2.92% | | 8.54% | | 4.48% | | (0.27)% | | (0.18)% |
| | | | | | | | | | | | |
| Ratios/Supplemental Data | | | | | | | | | | | | |
| Net assets, end of period (in thousands) | | $18,369 | | $17,141 | | $17,302 | | $20,410 | | $27,181 | | $39,916 |
| Average net assets (in thousands) | | $17,521 | | $16,942 | | $19,224 | | $23,822 | | $33,095 | | $45,004 |
| Ratios to average net assets:4 | | | | | | | | | | | | |
| Net investment income (loss) | | 0.98%5 | | 0.85%5 | | 0.85%5 | | 0.92%5 | | (0.14)%5 | | (0.95)% |
| Expenses excluding specific expenses listed below | | 1.61%5 | | 1.64%5 | | 1.72%5 | | 1.76%5 | | 1.73%5 | | 1.63% |
| Dividends and/or interest expense on securities sold short | | 0.52% | | 0.60% | | 0.55% | | 0.58% | | 0.31% | | 0.11% |
| Borrowing expenses on securities sold short | | 0.10% | | 0.18% | | 0.42% | | 0.02% | | 0.14% | | 0.13% |
| Interest and fees from borrowings | | 0.00%6 | | 0.00%6 | | 0.00% | | 0.00% | | 0.00% | | 0.00% |
| Total expenses7 | | 2.23%5 | | 2.42%5 | | 2.69%5 | | 2.36%5 | | 2.18%5 | | 1.87% |
| Expenses after payments, waivers and/or reimbursements and reduction to custodian expenses | | 2.19%5 | | 2.37%5 | | 2.54%5 | | 2.29%5 | | 2.11%5 | | 1.82% |
| Portfolio turnover rate | | 80% | | 62% | | 44% | | 76% | | 212% | | 181% |
60 OPPENHEIMER FUNDAMENTAL ALTERNATIVES FUND
1. April 29, 2016 and October 30, 2015 represent the last business days of the Fund’s reporting periods. See Note 2 of the accompanying Consolidated Notes.
2. Per share amounts calculated based on the average shares outstanding during the period.
3. Assumes an initial investment on the business day before the first day of the fiscal period, with all dividends and distributions reinvested in additional shares on the reinvestment date, and redemption at the net asset value calculated on the last business day of the fiscal period. Sales charges are not reflected in the total returns. Total returns are not annualized for periods less than one full year. Returns do not reflect the deduction of taxes that a shareholder would pay on fund distributions or the redemption of fund shares
4. Annualized for periods less than one full year.
5. Includes the Fund’s share of the allocated expenses and/or net investment income from the master funds.
6. Less than 0.005%.
7. Total expenses including indirect expenses from affiliated fund fees and expenses were as follows:
| | | | | | | | |
| | Six Months Ended April 29, 2016 | | | 2.27 | % | | |
| | Year Ended October 30, 2015 | | | 2.43 | % | | |
| | Year Ended October 31, 2014 | | | 2.70 | % | | |
| | Year Ended October 31, 2013 | | | 2.38 | % | | |
| | Year Ended October 31, 2012 | | | 2.23 | % | | |
| | Year Ended October 31, 2011 | | | 1.92 | % | | |
See accompanying Notes to Consolidated Financial Statements.
61 OPPENHEIMER FUNDAMENTAL ALTERNATIVES FUND
CONSOLIDATED FINANCIAL HIGHLIGHTS Continued
| | | | | | | | | | | | |
| Class Y | | Six Months
Ended
April 29, 2016
(Unaudited)1 | | Year Ended October 30,
20151 | | Year Ended
October 31,
2014 | | Year Ended
October 31,
2013 | | Year Ended
October 31,
2012 | | Year Ended
October 31,
2011 |
| Per Share Operating Data | | | | | | | | | | | | |
| Net asset value, beginning of period | | $27.68 | | $27.32 | | $25.05 | | $23.84 | | $25.97 | | $26.35 |
| Income (loss) from investment operations: | | | | | | | | | | | | |
| Net investment income (loss)2 | | 0.20 | | 0.31 | | 0.34 | | 0.38 | | 0.10 | | (0.09) |
| Net realized and unrealized gain (loss) | | (0.79) | | 0.60 | | 1.93 | | 0.83 | | (0.09) | | 0.22 |
| Total from investment operations | | (0.59) | | 0.91 | | 2.27 | | 1.21 | | 0.01 | | 0.13 |
| Dividends and/or distributions to shareholders: | | | | | | | | | | | | |
| Dividends from net investment income | | (0.24) | | (0.55) | | 0.00 | | 0.00 | | 0.00 | | 0.00 |
| Distributions from net realized gain | | 0.00 | | 0.00 | | 0.00 | | 0.00 | | (2.13) | | (0.51) |
| Tax return of capital distribution | | 0.00 | | 0.00 | | 0.00 | | 0.00 | | (0.01) | | 0.00 |
| Total dividends and/or distributions to shareholders | | (0.24) | | (0.55) | | 0.00 | | 0.00 | | (2.14) | | (0.51) |
| Net asset value, end of period | | $26.85 | | $27.68 | | $27.32 | | $25.05 | | $23.84 | | $25.97 |
| | | | | | | | | | | | |
| | | | | | | | | | | | |
| Total Return, at Net Asset Value3 | | (2.18)% | | 3.43% | | 9.06% | | 5.08% | | 0.32% | | 0.45% |
| | | | | | | | | | | | |
| Ratios/Supplemental Data | | | | | | | | | | | | |
| Net assets, end of period (in thousands) | | $314,817 | | $87,249 | | $19,378 | | $11,237 | | $16,234 | | $53,803 |
| Average net assets (in thousands) | | $193,669 | | $34,589 | | $14,096 | | $12,213 | | $28,561 | | $58,196 |
| Ratios to average net assets:4 | | | | | | | | | | | | |
| Net investment income (loss) | | 1.47%5 | | 1.13%5 | | 1.27%5 | | 1.52%5 | | 0.41%5 | | (0.34)% |
| Expenses excluding specific expenses listed below | | 1.14%5 | | 1.10%5 | | 1.78%5 | | 1.19%5 | | 1.15%5 | | 1.01% |
| Dividends and/or interest expense on securities sold short | | 0.52% | | 0.60% | | 0.55% | | 0.58% | | 0.31% | | 0.11% |
| Borrowing expenses on securities sold short | | 0.10% | | 0.18% | | 0.42% | | 0.02% | | 0.14% | | 0.13% |
| Interest and fees from borrowings | | 0.00%6 | | 0.00%6 | | 0.00% | | 0.00% | | 0.00% | | 0.00% |
| Total expenses7 | | 1.76%5 | | 1.88%5 | | 2.75%5 | | 1.79%5 | | 1.60%5 | | 1.25% |
| Expenses after payments, waivers and/or reimbursements and reduction to custodian expenses | | 1.72%5 | | 1.83%5 | | 2.04%5 | | 1.72%5 | | 1.53%5 | | 1.20% |
| Portfolio turnover rate | | 80% | | 62% | | 44% | | 76% | | 212% | | 181% |
62 OPPENHEIMER FUNDAMENTAL ALTERNATIVES FUND
1. April 29, 2016 and October 30, 2015 represent the last business days of the Fund’s reporting periods. See Note 2 of the accompanying Consolidated Notes.
2. Per share amounts calculated based on the average shares outstanding during the period.
3. Assumes an initial investment on the business day before the first day of the fiscal period, with all dividends and distributions reinvested in additional shares on the reinvestment date, and redemption at the net asset value calculated on the last business day of the fiscal period. Sales charges are not reflected in the total returns. Total returns are not annualized for periods less than one full year. Returns do not reflect the deduction of taxes that a shareholder would pay on fund distributions or the redemption of fund shares.
4. Annualized for periods less than one full year.
5. Includes the Fund’s share of the allocated expenses and/or net investment income from the master funds.
6. Less than 0.005%.
7. Total expenses including indirect expenses from affiliated fund fees and expenses were as follows:
| | | | | | | | |
| | Six Months Ended April 29, 2016 | | | 1.80 | % | | |
| | Year Ended October 30, 2015 | | | 1.89 | % | | |
| | Year Ended October 31, 2014 | | | 2.76 | % | | |
| | Year Ended October 31, 2013 | | | 1.81 | % | | |
| | Year Ended October 31, 2012 | | | 1.65 | % | | |
| | Year Ended October 31, 2011 | | | 1.30 | % | | |
See accompanying Notes to Consolidated Financial Statements.
63 OPPENHEIMER FUNDAMENTAL ALTERNATIVES FUND
NOTES TO CONSOLIDATED FINANCIAL STATEMENTS April 29, 2016 Unaudited
1. Organization
Oppenheimer Fundamental Alternatives Fund (the “Fund”), formerly known as Oppenheimer Flexible Strategies Fund, a series of Oppenheimer Quest for Value Funds, is registered under the Investment Company Act of 1940 (“1940 Act”), as amended, as a diversified open-end management investment company. The Fund’s investment objective is to seek total return. The Fund’s investment adviser is OFI Global Asset Management, Inc. (“OFI Global” or the “Manager”), a wholly-owned subsidiary of OppenheimerFunds, Inc. (“OFI” or the “Sub-Adviser”). The Manager has entered into a sub-advisory agreement with OFI.
The Fund offers Class A, Class C, Class I, Class R and Class Y shares, and previously offered Class B shares for new purchase through June 29, 2012. Subsequent to that date, no new purchases of Class B shares are permitted, however reinvestment of dividend and/or capital gain distributions and exchanges of Class B shares into and from other Oppenheimer funds are allowed. Class A shares are sold at their offering price, which is normally net asset value plus a front-end sales charge. Class C and Class R shares are sold, and Class B shares were sold, without a front-end sales charge but may be subject to a contingent deferred sales charge (“CDSC”). Class R shares are sold only through retirement plans. Retirement plans that offer Class R shares may impose charges on those accounts. Class I and Class Y shares are sold to certain institutional investors or intermediaries without either a front-end sales charge or a CDSC, however, the intermediaries may impose charges on their accountholders who beneficially own Class I and Class Y shares. All classes of shares have identical rights and voting privileges with respect to the Fund in general and exclusive voting rights on matters that affect that class alone. Earnings, net assets and net asset value per share may differ due to each class having its own expenses, such as transfer and shareholder servicing agent fees and shareholder communications, directly attributable to that class. Class A, B, C and R shares have separate distribution and/or service plans under which they pay fees. Class I and Class Y shares do not pay such fees. Class B shares will automatically convert to Class A shares 72 months after the date of purchase.
The following is a summary of significant accounting policies followed in the Fund’s preparation of financial statements in accordance with accounting principles generally accepted in the United States (“U.S. GAAP”).
2. Significant Accounting Policies
Security Valuation. All investments in securities are recorded at their estimated fair value, as described in Note 3.
Reporting Period End Date. The last day of the Fund’s reporting period is the last day the New York Stock Exchange was open for trading during the period. The Fund’s financial statements have been presented through that date to maintain consistency with the Fund’s net asset value calculations used for shareholder transactions.
Basis for Consolidation. The Fund has established a Cayman Islands exempted company, Oppenheimer Fundamental Alternatives Fund (Cayman) Ltd., which is wholly-owned and
64 OPPENHEIMER FUNDAMENTAL ALTERNATIVES FUND
2. Significant Accounting Policies (Continued)
controlled by the Fund (the “Subsidiary”). The Fund and Subsidiary are both managed by the Manager. The Fund may invest up to 25% of its total assets in the Subsidiary. The Subsidiary invests primarily in commodity-linked derivatives (including commodity futures, financial futures, options and swap contracts) and certain fixed-income securities and other investments that may serve as margin or collateral for its derivatives positions. Investments in the Subsidiary are intended to provide the Fund with exposure to commodities market returns within the limitations of the federal tax requirements that apply to the Fund. The Subsidiary is subject to the same investment restrictions and guidelines, and follows the same compliance policies and procedures, as the Fund.
The financial statements have been consolidated and include accounts of the Fund and the Subsidiary. Accordingly, all inter-company transactions and balances have been eliminated. At period end, the Fund owned 11,463 shares with net assets of $35,111,891 in the Subsidiary.
Other financial information at period end:
| | | | |
Total market value of investments | | $ | 35,148,749 | |
Net assets | | $ | 35,111,891 | |
Net income (loss) | | $ | (134,941) | |
Net realized gain (loss) | | $ | — | |
Net change in unrealized appreciation/depreciation | | $ | 3,457,165 | |
Foreign Currency Translation. The Fund’s accounting records are maintained in U.S. dollars. The values of securities denominated in foreign currencies and amounts related to the purchase and sale of foreign securities and foreign investment income are translated into U.S. dollars as of the close of the New York Stock Exchange (the “Exchange”), normally 4:00 P.M. Eastern time, on each day the Exchange is open for trading. Foreign exchange rates may be valued primarily using a reliable bank, dealer or service authorized by the Board of Trustees.
Reported net realized gains and losses from foreign currency transactions arise from sales of portfolio securities, sales and maturities of short-term securities, sales of foreign currencies, exchange rate fluctuations between the trade and settlement dates on securities transactions, and the difference between the amounts of dividends, interest, and foreign withholding taxes recorded on the Fund’s books and the U.S. dollar equivalent of the amounts actually received or paid. Net unrealized appreciation and depreciation on the translation of assets and liabilities denominated in foreign currencies arise from changes in the values of assets and liabilities, including investments in securities at fiscal period end, resulting from changes in exchange rates.
The effect of changes in foreign currency exchange rates on investments is separately identified from the fluctuations arising from changes in market values of securities held and reported with all other foreign currency gains and losses in the Fund’s Consolidated Statement of Operations.
Allocation of Income, Expenses, Gains and Losses. Income, expenses (other than those attributable to a specific class), gains and losses are allocated on a daily basis to each class of
65 OPPENHEIMER FUNDAMENTAL ALTERNATIVES FUND
NOTES TO CONSOLIDATED FINANCIAL STATEMENTS Unaudited / Continued
2. Significant Accounting Policies (Continued)
shares based upon the relative proportion of net assets represented by such class. Operating expenses directly attributable to a specific class are charged against the operations of that class.
Dividends and Distributions to Shareholders. Dividends and distributions to shareholders, which are determined in accordance with income tax regulations and may differ from U.S. GAAP, are recorded on the ex-dividend date. Income and capital gain distributions, if any, are declared and paid annually or at other times as deemed necessary by the Manager.
The tax character of distributions is determined as of the Fund’s fiscal year end. Therefore, a portion of the Fund’s distributions made to shareholders prior to the Fund’s fiscal year end may ultimately be categorized as a tax return of capital.
Investment Income. Dividend income is recorded on the ex-dividend date or upon ex-dividend notification in the case of certain foreign dividends where the ex-dividend date may have passed. Non-cash dividends included in dividend income, if any, are recorded at the fair market value of the securities received. Interest income is recognized on an accrual basis. Discount and premium, which are included in interest income on the Consolidated Statement of Operations, are amortized or accreted daily.
Return of Capital Estimates. Distributions received from the Fund’s investments in Real Estate Investments Trusts (REITs), generally are comprised of income and return of capital. The Fund records investment income and return of capital based on estimates. Such estimates are based on historical information available from each REIT and other industry sources. These estimates may subsequently be revised based on information received from REITs after their tax reporting periods are concluded.
Custodian Fees. “Custodian fees and expenses” in the Consolidated Statement of Operations may include interest expense incurred by the Fund on any cash overdrafts of its custodian account during the period. Such cash overdrafts may result from the effects of failed trades in portfolio securities and from cash outflows resulting from unanticipated shareholder redemption activity. The Fund pays interest to its custodian on such cash overdrafts, to the extent they are not offset by positive cash balances maintained by the Fund, based on the negative rolling average balance at an average Federal Funds Rate plus 0.50%. The “Reduction to custodian expenses” line item, if applicable, represents earnings on cash balances maintained by the Fund during the period. Such interest expense and other custodian fees may be paid with these earnings.
Security Transactions. Security transactions are recorded on the trade date. Realized gains and losses on securities sold (except for the investments in the Subsidiary) are determined on the basis of identified cost.
Indemnifications. The Fund’s organizational documents provide current and former Trustees
66 OPPENHEIMER FUNDAMENTAL ALTERNATIVES FUND
2. Significant Accounting Policies (Continued)
and officers with a limited indemnification against liabilities arising in connection with the performance of their duties to the Fund. In the normal course of business, the Fund may also enter into contracts that provide general indemnifications. The Fund’s maximum exposure under these arrangements is unknown as this would be dependent on future claims that may be made against the Fund. The risk of material loss from such claims is considered remote.
Federal Taxes. The Fund intends to comply with provisions of the Internal Revenue Code applicable to regulated investment companies and to distribute substantially all of its investment company taxable income to shareholders. Therefore, no federal income or excise tax provision is required. The Fund files income tax returns in U.S. federal and applicable state jurisdictions. The statute of limitations on the Fund’s tax return filings generally remains open for the three preceding fiscal reporting period ends. The Fund has analyzed its tax positions for the fiscal year ended October 30, 2015, including open tax years, and does not believe there are any uncertain tax positions requiring recognition in the Fund’s financial statements.
Subchapter M requires, among other things, that at least 90% of the Fund’s gross income be derived from securities or derived with respect to its business of investing in securities (typically referred to as “qualifying income”). Income from commodity-linked derivatives may not be treated as “qualifying income” for purposes of the 90% gross income requirement. The Internal Revenue Service (IRS) has previously issued a number of private letter rulings which conclude that income derived from commodity index-linked notes and investments in a wholly-owned subsidiary will be “qualifying income.” As a result, the Fund will gain exposure to commodities through commodity-linked notes and its wholly-owned subsidiary.
The IRS has suspended the granting of private letter rulings pending further review. As a result, there can be no assurance that the IRS will not change its position with respect to commodity-linked notes and wholly-owned subsidiaries. In addition, future legislation and guidance from the Treasury and the IRS may adversely affect the fund’s ability to gain exposure to commodities through commodity-linked notes and its wholly-owned subsidiary.
The Fund is required to include in income for federal income tax purposes all of the subsidiary’s net income and gains whether or not such income is distributed by the subsidiary. Net income and gains from the subsidiary are generally treated as ordinary income by the Fund, regardless of the character of the subsidiary’s underlying income. Net losses from the subsidiary do not pass through to the Fund for federal income tax purposes.
During the fiscal year ended October 30, 2015, the Fund utilized $38,791,182 of capital loss carryforward to offset capital gains realized in that fiscal year. Details of the fiscal year ended October 30, 2015 capital loss carryforwards are included in the table below. Capital loss carryforwards with no expiration, if any, must be utilized prior to those with expiration dates. Capital losses with no expiration will be carried forward to future years if not offset by gains.
| | | | |
Expiring | | | | |
No expiration | | $ | 2,012,388 | |
At period end, it is estimated that the capital loss carryforwards would be $9,494,223, which
67 OPPENHEIMER FUNDAMENTAL ALTERNATIVES FUND
NOTES TO CONSOLIDATED FINANCIAL STATEMENTS Unaudited / Continued
2. Significant Accounting Policies (Continued)
will not expire. The estimated capital loss carryforward represents the carryforward as of the end of the last fiscal year, increased or decreased by capital losses or gains realized in the first six months of the current fiscal year. During the reporting period, it is estimated that the Fund will not utilize any capital loss carryforward to offset realized capital gains.
Net investment income (loss) and net realized gain (loss) may differ for financial statement and tax purposes. The character of dividends and distributions made during the fiscal year from net investment income or net realized gains are determined in accordance with federal income tax requirements, which may differ from the character of net investment income or net realized gains presented in those financial statements in accordance with U.S. GAAP. Also, due to timing of dividends and distributions, the fiscal year in which amounts are distributed may differ from the fiscal year in which the income or net realized gain was recorded by the Fund.
The aggregate cost of securities and other investments and the composition of unrealized appreciation and depreciation of securities and other investments for federal income tax purposes at period end are noted in the following table. The primary difference between book and tax appreciation or depreciation of securities and other investments, if applicable, is attributable to the tax deferral of losses or tax realization of financial statement unrealized gain or loss.
| | | | |
Federal tax cost of securities | | $ | 1,210,675,734 | |
Federal tax cost of other investments | | | (329,447,761) | |
| | | | |
Total federal tax cost | | $ | 881,227,973 | |
| | | | |
Gross unrealized appreciation | | $ | 97,212,587 | |
Gross unrealized depreciation | | | (76,347,626) | |
| | | | |
Net unrealized appreciation | | $ | 20,864,961 | |
| | | | |
Recent Accounting Pronouncement. In May 2015, Financial Accounting Standards Board (“FASB”) issued Accounting Standards Update (“ASU”), ASU 2015-07. This is an update to Fair Value Measurement Topic 820. Under the amendments in this ASU, investments for which fair value is measured at net asset value per share (or its equivalent) using the practical expedient should not be categorized in the fair value hierarchy. ASU 2015-07 is effective for financial statements issued for fiscal years beginning after December 31, 2015, and interim periods within those fiscal years, with early adoption permitted.
Use of Estimates. The preparation of financial statements in conformity with U.S. GAAP requires management to make estimates and assumptions that affect the reported amounts of assets and liabilities and disclosure of contingent assets and liabilities at the date of the financial statements and the reported amounts of increases and decreases in net assets from operations during the reporting period. Actual results could differ from those estimates.
3. Securities Valuation
The Fund calculates the net asset value of its shares as of 4:00 P.M. Eastern time, on each day the New York Stock Exchange (the “Exchange”) is open for trading, except in the case of a
68 OPPENHEIMER FUNDAMENTAL ALTERNATIVES FUND
3. Securities Valuation (Continued)
scheduled early closing of the Exchange, in which case the Fund will calculate net asset value of the shares as of the scheduled early closing time of the Exchange.
The Fund’s Board has adopted procedures for the valuation of the Fund’s securities and has delegated the day-to-day responsibility for valuation determinations under those procedures to the Manager. The Manager has established a Valuation Committee which is responsible for determining a “fair valuation” for any security for which market quotations are not “readily available.” The Valuation Committee’s fair valuation determinations are subject to review, approval and ratification by the Fund’s Board at its next regularly scheduled meeting covering the calendar quarter in which the fair valuation was determined.
Valuation Methods and Inputs
Securities are valued using unadjusted quoted market prices, when available, as supplied primarily by third party pricing services or dealers.
The following methodologies are used to determine the market value or the fair value of the types of securities described below:
Securities traded on a registered U.S. securities exchange (including exchange-traded derivatives other than futures and futures options) are valued based on the last sale price of the security reported on the principal exchange on which it is traded, prior to the time when the Fund’s assets are valued. In the absence of a sale, the security is valued at the mean between the bid and asked price on the principal exchange or, if not available from the principal exchange, obtained from two dealers. If bid and asked prices are not available from either the exchange or two dealers, the security is valued by using one of the following methodologies (listed in order of priority): (1) a bid from the principal exchange, (2) the mean between the bid and asked price as provided by a single dealer, or (3) a bid from a single dealer. A security of a foreign issuer traded on a foreign exchange, but not listed on a registered U.S. securities exchange, is valued based on the last sale price on the principal exchange on which the security is traded, as identified by the third party pricing service used by the Manager, prior to the time when the Fund’s assets are valued. If the last sale price is unavailable, the security is valued at the most recent official closing price on the principal exchange on which it is traded. If the last sales price or official closing price for a foreign security is not available, the security is valued at the mean between the bid and asked price per the exchange or, if not available from the exchange, obtained from two dealers. If bid and asked prices are not available from either the exchange or two dealers, the security is valued by using one of the following methodologies (listed in order of priority): (1) a bid from the exchange, (2) the mean between the bid and asked price as provided by a single dealer, or (3) a bid from a single dealer.
Shares of a registered investment company that are not traded on an exchange are valued at that investment company’s net asset value per share.
Corporate and government debt securities (of U.S. or foreign issuers) and municipal debt securities, event-linked bonds, loans, mortgage-backed securities, collateralized mortgage obligations, and asset-backed securities are valued at the mean between the “bid” and “asked” prices utilizing evaluated prices obtained from third party pricing services or
69 OPPENHEIMER FUNDAMENTAL ALTERNATIVES FUND
NOTES TO CONSOLIDATED FINANCIAL STATEMENTS Unaudited / Continued
3. Securities Valuation (Continued)
broker-dealers who may use matrix pricing methods to determine the evaluated prices.
Short-term money market type debt securities with a remaining maturity of sixty days or less are valued at cost adjusted by the amortization of discount or premium to maturity (amortized cost), which approximates market value. Short-term debt securities with a remaining maturity in excess of sixty days are valued at the mean between the “bid” and “asked” prices utilizing evaluated prices obtained from third party pricing services or broker-dealers.
Structured securities, swaps, swaptions, and other over-the-counter derivatives are valued utilizing evaluated prices obtained from third party pricing services or broker-dealers.
Forward foreign currency exchange contracts are valued utilizing current and forward currency rates obtained from third party pricing services. When the settlement date of a contract is an interim date for which a quotation is not available, interpolated values are derived using the nearest dated forward currency rate.
Futures contracts and futures options traded on a commodities or futures exchange will be valued at the final settlement price or official closing price on the principal exchange as reported by such principal exchange at its trading session ending at, or most recently prior to, the time when the Fund’s assets are valued.
A description of the standard inputs that may generally be considered by the third party pricing vendors in determining their evaluated prices is provided below.
| | |
| Security Type | | Standard inputs generally considered by third-party pricing vendors |
|
| Corporate debt, government debt, municipal, mortgage-backed and asset-backed securities | | Reported trade data, broker-dealer price quotations, benchmark yields, issuer spreads on comparable securities, the credit quality, yield, maturity, and other appropriate factors. |
|
| Loans | | Information obtained from market participants regarding reported trade data and broker-dealer price quotations. |
|
| Event-linked bonds | | Information obtained from market participants regarding reported trade data and broker-dealer price quotations. |
| Structured securities | | Relevant market information such as the price of underlying financial instruments, stock market indices, foreign currencies, interest rate spreads, commodities, or the occurrence of other specific events. |
|
| Swaps | | Relevant market information, including underlying reference assets such as credit spreads, credit event probabilities, index values, individual security values, forward interest rates, variable interest rates, volatility measures, and forward currency rates. |
If a market value or price cannot be determined for a security using the methodologies described above, or if, in the “good faith” opinion of the Manager, the market value or price obtained does not constitute a “readily available market quotation,” or a significant event has occurred that would materially affect the value of the security, the security is fair valued either (i) by a standardized fair valuation methodology applicable to the security type or the significant event as previously approved by the Valuation Committee and the Fund’s Board or (ii) as determined in good faith by the Manager’s Valuation Committee. The Valuation Committee considers all relevant facts that are reasonably available, through either public information or information available to the Manager, when determining the fair
70 OPPENHEIMER FUNDAMENTAL ALTERNATIVES FUND
3. Securities Valuation (Continued)
value of a security. Fair value determinations by the Manager are subject to review, approval and ratification by the Fund’s Board at its next regularly scheduled meeting covering the calendar quarter in which the fair valuation was determined. Those fair valuation standardized methodologies include, but are not limited to, valuing securities at the last sale price or initially at cost and subsequently adjusting the value based on: changes in company specific fundamentals, changes in an appropriate securities index, or changes in the value of similar securities which may be further adjusted for any discounts related to security-specific resale restrictions. When possible, such methodologies use observable market inputs such as unadjusted quoted prices of similar securities, observable interest rates, currency rates and yield curves. The methodologies used for valuing securities are not necessarily an indication of the risks associated with investing in those securities nor can it be assured that the Fund can obtain the fair value assigned to a security if it were to sell the security.
To assess the continuing appropriateness of security valuations, the Manager, or its third party service provider who is subject to oversight by the Manager, regularly compares prior day prices, prices on comparable securities, and sale prices to the current day prices and challenges those prices exceeding certain tolerance levels with the third party pricing service or broker source. For those securities valued by fair valuations, whether through a standardized fair valuation methodology or a fair valuation determination, the Valuation Committee reviews and affirms the reasonableness of the valuations based on such methodologies and fair valuation determinations on a regular basis after considering all relevant information that is reasonably available.
Classifications
Each investment asset or liability of the Fund is assigned a level at measurement date based on the significance and source of the inputs to its valuation. Various data inputs are used in determining the value of each of the Fund’s investments as of the reporting period end. These data inputs are categorized in the following hierarchy under applicable financial accounting standards:
1) Level 1-unadjusted quoted prices in active markets for identical assets or liabilities (including securities actively traded on a securities exchange)
2) Level 2-inputs other than unadjusted quoted prices that are observable for the asset or liability (such as unadjusted quoted prices for similar assets and market corroborated inputs such as interest rates, prepayment speeds, credit risks, etc.)
3) Level 3-significant unobservable inputs (including the Manager’s own judgments about assumptions that market participants would use in pricing the asset or liability).
The inputs used for valuing securities are not necessarily an indication of the risks associated with investing in those securities.
The Fund classifies each of its investments in those investment companies which are publicly offered and reported on an exchange as Level 1, and those investment companies which are not publicly offered are not assigned a level, without consideration as to the classification level of the specific investments held by those investment companies.
71 OPPENHEIMER FUNDAMENTAL ALTERNATIVES FUND
NOTES TO CONSOLIDATED FINANCIAL STATEMENTS Unaudited / Continued
3. Securities Valuation (Continued)
The table below categorizes amounts that are included in the Fund’s Consolidated Statement of Assets and Liabilities at period end based on valuation input level:
| | | | | | | | | | | | | | | | |
| | | Level 1—
Unadjusted
Quoted Prices | | | Level 2— Other Significant Observable Inputs | | | Level 3—
Significant
Unobservable
Inputs | | | Value | |
| |
Assets Table | | | | | | | | | | | | | | | | |
Investments, at Value: | | | | | | | | | | | | | | | | |
Common Stocks | | | | | | | | | | | | | | | | |
Consumer Discretionary | | $ | 28,940,173 | | | $ | 65,512 | | | $ | — | | | $ | 29,005,685 | |
Consumer Staples | | | 39,076,859 | | | | — | | | | — | | | | 39,076,859 | |
Energy | | | 56,196,305 | | | | — | | | | — | | | | 56,196,305 | |
Financials | | | 96,914,265 | | | | — | | | | — | | | | 96,914,265 | |
Health Care | | | 91,376,541 | | | | 14,175,313 | | | | — | | | | 105,551,854 | |
Industrials | | | 118,444,064 | | | | — | | | | — | | | | 118,444,064 | |
Information Technology | | | 77,898,044 | | | | 3,439,901 | | | | — | | | | 81,337,945 | |
Materials | | | 43,898,596 | | | | — | | | | — | | | | 43,898,596 | |
Telecommunication Services | | | 31,773,421 | | | | — | | | | — | | | | 31,773,421 | |
Utilities | | | 32,789,129 | | | | — | | | | — | | | | 32,789,129 | |
Preferred Stocks | | | — | | | | 12,983,675 | | | | — | | | | 12,983,675 | |
Asset-Backed Securities | | | — | | | | 79,846,057 | | | | 18,564,519 | | | | 98,410,576 | |
Mortgage-Backed Obligations | | | — | | | | 60,864,452 | | | | — | | | | 60,864,452 | |
Non-Convertible Corporate Bonds and Notes | | | — | | | | 94,400,867 | | | | — | | | | 94,400,867 | |
Convertible Corporate Bond and | | | | | | | | | | | | | | | | |
Note | | | — | | | | 3,622,429 | | | | — | | | | 3,622,429 | |
Corporate Loans | | | — | | | | 107,041,490 | | | | 241,651 | | | | 107,283,141 | |
Structured Security | | | — | | | | — | | | | 849,321 | | | | 849,321 | |
Over-the-Counter Options Purchased | | | — | | | | 2,168,692 | | | | — | | | | 2,168,692 | |
Over-the-Counter Interest Rate | | | | | | | | | | | | | | | | |
Swaptions Purchased | | | — | | | | 4,409,349 | | | | — | | | | 4,409,349 | |
Investment Companies | | | 233,085,771 | | | | — | | | | — | | | | 233,085,771 | |
| | | | |
Total Investments, at Value | | | 850,393,168 | | | | 383,017,737 | | | | 19,655,491 | | | | 1,253,066,396 | |
Other Financial Instruments: | | | | | | | | | | | | | | | | |
Swaps, at value | | | — | | | | 3,656,844 | | | | — | | | | 3,656,844 | |
Centrally cleared swaps, at value | | | — | | | | 410,637 | | | | — | | | | 410,637 | |
Futures contracts | | | 68,795 | | | | — | | | | — | | | | 68,795 | |
Forward currency exchange contracts | | | — | | | | 812,761 | | | | — | | | | 812,761 | |
| | | | |
Total Assets | | $ | 850,461,963 | | | $ | 387,897,979 | | | $ | 19,655,491 | | | $ | 1,258,015,433 | |
| | | | |
| | | | |
Liabilities Table | | | | | | | | | | | | | | | | |
Other Financial Instruments: | | | | | | | | | | | | | | | | |
Common Stock Securities Sold Short | | $ | (320,703,803) | | | $ | (34,843,456 | ) | | $ | — | | | $ | (355,547,259) | |
Swaps, at value | | | — | | | | (5,266,554 | ) | | | — | | | | (5,266,554) | |
Centrally cleared swaps, at value | | | — | | | | (1,645,247 | ) | | | — | | | | (1,645,247) | |
Options written, at value | | | — | | | | (628,575 | ) | | | — | | | | (628,575) | |
Forward currency exchange contracts | | | — | | | | (1,896,024 | ) | | | — | | | | (1,896,024) | |
| | | | |
Total Liabilities | | $ | (320,703,803) | | | $ | (44,279,856 | ) | | $ | — | | | $ | (364,983,659) | |
| | | | |
Forward currency exchange contracts and futures contracts, if any, are reported at their
72 OPPENHEIMER FUNDAMENTAL ALTERNATIVES FUND
3. Securities Valuation (Continued)
unrealized appreciation/depreciation at measurement date, which represents the change in the contract’s value from trade date. All additional assets and liabilities included in the above table are reported at their market value at measurement date.
The following is a reconciliation of assets in which significant unobservable inputs (level 3) were used in determining fair value:
| | | | | | | | | | | | | | | | |
| | | Value as of
October 30,
2015 | | | Realized gain
(loss) | | | Change in
unrealized
appreciation/
depreciation | | | Accretion/
(amortization)
of premium/
discounta | |
| |
Assets Table | | | | | | | | | | | | | | | | |
Investments, at Value: | | | | | | | | | | | | | | | | |
Asset-Backed Securities | | $ | 20,581,739 | | | $ | 185,509 | | | $ | (1,568,016 | ) | | $ | 205,739 | |
Corporate Loans | | | 252,794 | | | | 115 | | | | (413 | ) | | | 169 | |
Structured Security | | | 895,986 | | | | — | | | | (46,665 | ) | | | — | |
| | | | |
Total Assets | | $ | 21,730,519 | | | $ | 185,624 | | | $ | (1,615,094 | ) | | $ | 205,908 | |
| | | | |
| | | | |
a. Included in net investment income.
| | | | | | | | | | | | |
| | | Purchases | | | Sales | | | Value as of
April 29, 2016 | |
| |
Assets Table | | | | | | | | | | | | |
Investments, at Value: | | | | | | | | | | | | |
Asset-Backed Securities | | $ | — | | | | $(840,452) | | | $ | 18,564,519 | |
Corporate Loans | | | 2 | | | | (11,016 | ) | | | 241,651 | |
Structured Security | | | — | | | | — | | | | 849,321 | |
| | | | |
Total Assets | | $ | 2 | | | | $ (851,468 | ) | | $ | 19,655,491 | |
| | | | |
| | | | |
The total change in unrealized appreciation/depreciation included in the Consolidated Statement of Operations attributable to Level 3 investments still held at period end:
| | | | |
| | | Change in
unrealized
appreciation/
depreciation | |
| |
Assets Table | | | | |
Investments, at Value | | | | |
Asset-Backed Securities | | $ | (1,568,016) | |
Corporate Bonds and Notes | | | (413) | |
Structured Security | | | (46,665) | |
| | | | |
Total | | $ | (1,615,094) | |
| | | | |
The following table summarizes the valuation techniques and significant unobservable inputs used in determining fair value measurements for those investments classified as Level 3 at period end:
73 OPPENHEIMER FUNDAMENTAL ALTERNATIVES FUND
NOTES TO CONSOLIDATED FINANCIAL STATEMENTS Unaudited / Continued
3. Securities Valuation (Continued)
| | | | | | | | | | | | | | | | | | | | |
| | | Value as of
April 29, 2016 | | | Valuation
Technique | | | Unobservable
Input | | | Range of Unobservable
Inputs | | | Unobservable Input Used | |
| |
Assets Table | | | | | | | | | | | | | | | | | | | | |
Investments, at Value: | | | | | | | | | | | | | | | | | | | | |
Asset-Backed Securities | | $ | 18,564,519 | | | | Pricing service | | | | N/A | | | | N/A | | | | N/A (a) | |
Corporate Loans | | | 241,627 | | | | Pricing service | | | | N/A | | | | N/A | | | | N/A (a) | |
| | | | | | | Estimated re- | | | | | | | | | | | | 0.01% of par | |
Corporate Loans | | | 24 | | | | covery proceeds | | | | Nominal Value | | | | N/A | | | | (b) | |
| | | | | | | Discount to | | | | | | | | | | | | | |
| | | | | | | Capital Account | | | | | | | | | | | | | |
Structured Security | | | 849,321 | | | | Balance | | | | Discount rate | | | | N/A | | | | 84% (c) | |
| | | | | | | | | | | Capital Account | | | | | | | | | |
| | | | | | | | | | | Balance | | | | N/A | | | $ | 5,343,050 (c) | |
| | | | | | | | | | | | | | | | | | | | |
Total | | $ | 19,655,491 | | | | | | | | | | | | | | | | | |
| | | | | | | | | | | | | | | | | | | | |
(a) Securities classified as Level 3 whose unadjusted values were provided by a pricing service or broker-dealer for which such inputs are unobservable. The Manager periodically reviews pricing vendor methodologies and inputs to confirm they are determined using unobservable inputs and have been appropriately classified. Such securities’ fair valuations could change significantly based on changes in unobservable inputs used by the pricing service.
(b) The Fund fair values certain corporate loans using a nominal value to reflect the low probability of future recovery. The Manager monitors such investments for additional market information or the occurrence of a significant event which would warrant a re-evaluation of the security’s fair valuation. A significant increase (decrease) in the future distribution amount, or a significant increase (decrease) to the probability of payment rate, will result in a significant increase (decrease) to the fair value of the investment.
(c) The Fund fair values the structured security at a discount to the selected capital account balance to reflect uncertainty and illiquidity. A significant decrease (increase) to the discount rate, or a significant increase (decrease) to the capital account balance, will result in a significant increase (decrease) to the fair vale of the investment.
4. Investments and Risks
Investments in Affiliated Funds. The Fund is permitted to invest in other mutual funds advised by the Manager (“Affiliated Funds”). Affiliated Funds are open-end management investment companies registered under the 1940 Act, as amended. The Manager is the investment adviser of, and the Sub-Adviser provides investment and related advisory services to, the Affiliated Funds. When applicable, the Fund’s investments in Affiliated Funds are included in the Consolidated Statement of Investments. Shares of Affiliated Funds are valued at their net asset value per share. As a shareholder, the Fund is subject to its proportional share of the Affiliated Funds’ expenses, including their management fee. The Manager will waive fees and/or reimburse Fund expenses in an amount equal to the indirect management fees incurred through the Fund’s investment in the Affiliated Funds.
Each of the Affiliated Funds in which the Fund invests has its own investment risks, and those risks can affect the value of the Fund’s investments and therefore the value of the Fund’s shares. To the extent that the Fund invests more of its assets in one Affiliated Fund than in another, the Fund will have greater exposure to the risks of that Affiliated Fund.
Investment in Oppenheimer Institutional Money Market Fund. The Fund is permitted to invest daily available cash balances in a money market Affiliated Fund. The Fund may
74 OPPENHEIMER FUNDAMENTAL ALTERNATIVES FUND
4. Investments and Risks (Continued)
invest the available cash in Class E shares of Oppenheimer Institutional Money Market Fund (“IMMF”) to seek current income while preserving liquidity or for defensive purposes. IMMF is regulated as a money market fund under the Investment Company Act of 1940, as amended.
Investment in Oppenheimer Master Fund. The Fund is permitted to invest in entities sponsored and/or advised by the Manager or an affiliate. Certain of these entities in which the Fund invests are mutual funds registered under the Investment Company Act of 1940 that expect to be treated as partnerships for tax purposes, specifically Oppenheimer Master Loan Fund, LLC (the “Master Fund”). The Master Fund has its own investment risks, and those risks can affect the value of the Fund’s investments and therefore the value of the Fund’s shares. To the extent that the Fund invests more of its assets in the Master Fund, the Fund will have greater exposure to the risks of the Master Fund.
The investment objective of the Master Fund is to seek income. The Fund’s investment in the Master Fund is included in the Consolidated Statement of Investments. The Fund recognizes income and gain/(loss) on its investment in the master fund according to its allocated pro-rata share, based on its relative proportion of total outstanding Master Fund shares held, of the total net income earned and the net gain/(loss) realized on investments sold by the Master Fund. As a shareholder, the Fund is subject to its proportional share of the Master Fund’s expenses, including its management fee. The Manager will waive fees and/ or reimburse Fund expenses in an amount equal to the indirect management fees incurred through the Fund’s investment in the Master Fund. At period end, the Fund no longer held the Master Fund.
Structured Securities. The Fund invests in structured securities whose market values, interest rates and/or redemption prices are linked to the performance of underlying foreign currencies, interest rate spreads, stock market indices, prices of individual securities, commodities or other financial instruments or the occurrence of other specific events. The structured securities are often leveraged, increasing the volatility of each note’s market value relative to the change in the underlying linked financial element or event. Fluctuations in value of these securities are recorded as unrealized gains and losses in the accompanying Statement of Operations in the annual and semiannual reports. The Fund records a realized gain or loss when a structured security is sold or matures.
Loans. The Fund invests in loans made to U.S. and foreign borrowers that are corporations, partnerships or other business entities. The Fund will do so directly as an original lender or by assignment or indirectly through participation agreements or certain derivative instruments. While many of these loans will be collateralized, the Fund can also invest in uncollateralized loans. Loans are often issued in connection with recapitalizations, acquisitions, leveraged buyouts, and refinancing of borrowers. The loans often pay interest at rates that float above (or are adjusted periodically based on) a benchmark that reflects current interest rates although the Fund can also invest in loans with fixed interest rates.
75 OPPENHEIMER FUNDAMENTAL ALTERNATIVES FUND
NOTES TO CONSOLIDATED FINANCIAL STATEMENTS Unaudited / Continued
4. Investments and Risks (Continued)
Securities on a When-Issued or Delayed Delivery Basis. The Fund may purchase securities on a “when-issued” basis, and may purchase or sell securities on a “delayed delivery” basis. “When-issued” or “delayed delivery” refers to securities whose terms and indenture are available and for which a market exists, but which are not available for immediate delivery. Delivery and payment for securities that have been purchased by the Fund on a when-issued basis normally takes place within six months and possibly as long as two years or more after the trade date. During this period, such securities do not earn interest, are subject to market fluctuation and may increase or decrease in value prior to their delivery. The purchase of securities on a when-issued basis may increase the volatility of the Fund’s net asset value to the extent the Fund executes such transactions while remaining substantially fully invested. When the Fund engages in when-issued or delayed delivery transactions, it relies on the buyer or seller, as the case may be, to complete the transaction. Their failure to do so may cause the Fund to lose the opportunity to obtain or dispose of the security at a price and yield it considers advantageous. The Fund may also sell securities that it purchased on a when-issued basis or forward commitment prior to settlement of the original purchase.
At period end, the Fund had purchased securities issued on a when-issued or delayed delivery basis and sold securities issued on a delayed delivery basis as follows:
| | | | |
| | | When-Issued or
Delayed Delivery Basis Transactions | |
| |
Purchased securities | | $ | 3,337,343 | |
Sold securities | | | 7,967,217 | |
Restricted Securities. At period end, investments in securities included issues that are restricted. A restricted security may have a contractual restriction on its resale and is valued under methods approved by the Board of Trustees as reflecting fair value. Securities that are restricted are marked with an applicable footnote on the Consolidated Statement of Investments. Restricted securities are reported on a schedule following the Consolidated Statement of Investments.
Equity Security Risk. Stocks and other equity securities fluctuate in price. The value of the Fund’s portfolio may be affected by changes in the equity markets generally. Equity markets may experience significant short-term volatility and may fall sharply at times. Different markets may behave differently from each other and U.S. equity markets may move in the opposite direction from one or more foreign stock markets. Adverse events in any part of the equity or fixed-income markets may have unexpected negative effects on other market segments.
The prices of individual equity securities generally do not all move in the same direction at the same time and a variety of factors can affect the price of a particular company’s securities. These factors may include, but are not limited to, poor earnings reports, a loss of customers, litigation against the company, general unfavorable performance of the company’s sector or industry, or changes in government regulations affecting the company or its industry.
76 OPPENHEIMER FUNDAMENTAL ALTERNATIVES FUND
4. Investments and Risks (Continued)
Credit Risk. Loans and debt securities are subject to credit risk. Credit risk relates to the ability of the borrower under a loan or issuer of a debt to meet interest or principal payments or both as they become due. The Fund may acquire securities that have missed an interest payment, and is not obligated to dispose of securities whose issuers subsequently miss an interest payment. Information concerning securities not accruing income at period end is as follows:
| | | | |
Cost | | | $926,772 | |
Market Value | | | $251,796 | |
Market Value as % of Net Assets | | | 0.02% | |
The Fund has entered into forbearance agreements with certain obligors under which the Fund has agreed to temporarily forego receipt of the original principal or coupon interest rates. At period end, securities with an aggregate market value of $834,791, representing 0.07% of the Fund’s net assets, were subject to these forbearance agreements.
5. Market Risk Factors
The Fund’s investments in securities and/or financial derivatives may expose the Fund to various market risk factors:
Commodity Risk. Commodity risk relates to the change in value of commodities or commodity indexes as they relate to increases or decreases in the commodities market. Commodities are physical assets that have tangible properties. Examples of these types of assets are crude oil, heating oil, metals, livestock, and agricultural products.
Credit Risk. Credit risk relates to the ability of the issuer of debt to meet interest and principal payments, or both, as they come due. In general, lower-grade, higher-yield debt securities are subject to credit risk to a greater extent than lower-yield, higher-quality securities.
Equity Risk. Equity risk relates to the change in value of equity securities as they relate to increases or decreases in the general market.
Foreign Exchange Rate Risk. Foreign exchange rate risk relates to the change in the U.S. dollar value of a security held that is denominated in a foreign currency. The U.S. dollar value of a foreign currency denominated security will decrease as the dollar appreciates against the currency, while the U.S. dollar value will increase as the dollar depreciates against the currency.
Interest Rate Risk. Interest rate risk refers to the fluctuations in value of fixed-income securities resulting from the inverse relationship between price and yield. For example, an increase in general interest rates will tend to reduce the market value of already issued fixed-income investments, and a decline in general interest rates will tend to increase their value. In addition, debt securities with longer maturities, which tend to have higher yields, are subject to potentially greater fluctuations in value from changes in interest rates than obligations with shorter maturities.
77 OPPENHEIMER FUNDAMENTAL ALTERNATIVES FUND
NOTES TO CONSOLIDATED FINANCIAL STATEMENTS Unaudited / Continued
5. Market Risk Factors (Continued)
Volatility Risk. Volatility risk refers to the magnitude of the movement, but not the direction of the movement, in a financial instrument’s price over a defined time period. Large increases or decreases in a financial instrument’s price over a relative time period typically indicate greater volatility risk, while small increases or decreases in its price typically indicate lower volatility risk.
6. Use of Derivatives
The Fund’s investment objective not only permits the Fund to purchase investment securities, it also allows the Fund to enter into various types of derivatives contracts, including, but not limited to, futures contracts, forward currency exchange contracts, credit default swaps, interest rate swaps, total return swaps, variance swaps and purchased and written options. In doing so, the Fund will employ strategies in differing combinations to permit it to increase, decrease, or change the level or types of exposure to market risk factors. These instruments may allow the Fund to pursue its objectives more quickly and efficiently than if it were to make direct purchases or sales of securities capable of effecting a similar response to market factors. Such contracts may be entered into through a bilateral over-the-counter (“OTC”) transaction, or through a securities or futures exchange and cleared through a clearinghouse.
Derivatives may have little or no initial cash investment relative to their market value exposure and therefore can produce significant gains or losses in excess of their cost due to unanticipated changes in the market risk factors and the overall market. This use of embedded leverage allows the Fund to increase its market value exposure relative to its net assets and can substantially increase the volatility of the Fund’s performance. In instances where the Fund is using derivatives to decrease, or hedge, exposures to market risk factors for securities held by the Fund, there are also risks that those derivatives may not perform as expected resulting in losses for the combined or hedged positions. Some derivatives have the potential for unlimited loss, regardless of the size of the Fund’s initial investment.
Additional associated risks from investing in derivatives also exist and potentially could have significant effects on the valuation of the derivative and the Fund. Typically, the associated risks are not the risks that the Fund is attempting to increase or decrease exposure to, per its investment objectives, but are the additional risks from investing in derivatives. Examples of these associated risks are liquidity risk, which is the risk that the Fund will not be able to sell the derivative in the open market in a timely manner, and counterparty credit risk, which is the risk that the counterparty will not fulfill its obligation to the Fund.
The Fund’s actual exposures to these market risk factors and associated risks during the period are discussed in further detail, by derivative type, below.
Forward Currency Exchange Contracts
The Fund may enter into forward currency exchange contracts (“forward contracts”) for the purchase or sale of a foreign currency at a negotiated rate at a future date. Such contracts are traded in the OTC inter-bank currency dealer market.
Forward contracts are reported on a schedule following the Consolidated Statement of
78 OPPENHEIMER FUNDAMENTAL ALTERNATIVES FUND
6. Use of Derivatives (Continued)
Investments. The unrealized appreciation (depreciation) is reported in the Consolidated Statement of Assets and Liabilities as a receivable (or payable) and in the Consolidated Statement of Operations within the change in unrealized appreciation (depreciation). At contract close, the difference between the original cost of the contract and the value at the close date is recorded as a realized gain (loss) in the Consolidated Statement of Operations.
The Fund has entered into forward contracts with the obligation to purchase specified foreign currencies in the future at a currently negotiated forward rate in order to take a positive investment perspective on the related currency. These forward contracts seek to increase exposure to foreign exchange rate risk.
The Fund has entered into forward contracts with the obligation to purchase specified foreign currencies in the future at a currently negotiated forward rate in order to decrease exposure to foreign exchange rate risk associated with foreign currency denominated securities held by the Fund.
The Fund has entered into forward contracts with the obligation to sell specified foreign currencies in the future at a currently negotiated forward rate in order to take a negative investment perspective on the related currency. These forward contracts seek to increase exposure to foreign exchange rate risk.
The Fund has entered into forward contracts with the obligation to sell specified foreign currencies in the future at a currently negotiated forward rate in order to decrease exposure to foreign exchange rate risk associated with foreign currency denominated securities held by the Fund.
During the reporting period, the Fund had daily average contract amounts on forward contracts to buy and sell of $18,335,371 and $105,796,603, respectively.
Additional associated risk to the Fund includes counterparty credit risk. Counterparty credit risk arises from the possibility that the counterparty to a forward contract will default and fail to perform its obligations to the Fund.
Futures Contracts
A futures contract is a commitment to buy or sell a specific amount of a commodity, financial instrument or currency at a negotiated price on a stipulated future date. The Fund may buy and sell futures contracts and may also buy or write put or call options on these futures contracts. Futures contracts and options thereon are generally entered into on a regulated futures exchange and cleared through a clearinghouse associated with the exchange.
Upon entering into a futures contract, the Fund is required to deposit either cash or securities (initial margin) in an amount equal to a certain percentage of the contract value in an account registered in the futures commission merchant’s name. Subsequent payments (variation margin) are paid to or from the futures commission merchant each day equal to the daily changes in the contract value. Such payments are recorded as unrealized gains and losses. Should the Fund fail to make requested variation margin payments, the futures commission merchant can gain access to the initial margin to satisfy the Fund’s payment obligations.
Futures contracts are reported on a schedule following the Consolidated Statement
79 OPPENHEIMER FUNDAMENTAL ALTERNATIVES FUND
NOTES TO CONSOLIDATED FINANCIAL STATEMENTS Unaudited / Continued
6. Use of Derivatives (Continued)
of Investments. Securities held by a futures commission merchant to cover initial margin requirements on open futures contracts are noted in the Consolidated Statement of Investments. Cash held by a futures commission merchant to cover initial margin requirements on open futures contracts and the receivable and/or payable for the daily mark to market for the variation margin are noted in the Consolidated Statement of Assets and Liabilities. The net change in unrealized appreciation and depreciation is reported in the Consolidated Statement of Operations. Realized gains (losses) are reported in the Consolidated Statement of Operations at the closing or expiration of futures contracts.
The Fund has sold futures contracts on various bonds and notes to decrease exposure to interest rate risk.
During the reporting period, the Fund had an ending monthly average market value of $20,466,006 on futures contracts sold.
Additional associated risks of entering into futures contracts (and related options) include the possibility that there may be an illiquid market where the Fund is unable to liquidate the contract or enter into an offsetting position and, if used for hedging purposes, the risk that the price of the contract will correlate imperfectly with the prices of the Fund’s securities.
Option Activity
The Fund may buy and sell put and call options, or write put and call options. When an option is written, the Fund receives a premium and becomes obligated to sell or purchase the underlying security, currency or other underlying financial instrument at a fixed price, upon exercise of the option.
Options can be traded through an exchange or through a privately negotiated arrangement with a dealer in an OTC transaction. Options traded through an exchange are generally cleared through a clearinghouse (such as The Options Clearing Corporation). The difference between the premium received or paid, and market value of the option, is recorded as unrealized appreciation or depreciation. The net change in unrealized appreciation or depreciation is reported in the Consolidated Statement of Operations. When an option is exercised, the cost of the security purchased or the proceeds of the security sale are adjusted by the amount of premium received or paid. Upon the expiration or closing of the option transaction, a gain or loss is reported in the Consolidated Statement of Operations.
The Fund has purchased put options on currencies to decrease exposure to foreign exchange rate risk. A purchased put option becomes more valuable as the price of the underlying financial instrument depreciates relative to the strike price.
During the reporting period, the Fund had an ending monthly average market value of $1,563,191 on purchased put options.
Options written, if any, are reported in a schedule following the Consolidated Statement of Investments and as a liability in the Consolidated Statement of Assets and Liabilities. Securities held in collateral accounts to cover potential obligations with respect to outstanding written options are noted in the Consolidated Statement of Investments.
The risk in writing a call option is that the market price of the security increases and if the option is exercised, the Fund must either purchase the security at a higher price for delivery or,
80 OPPENHEIMER FUNDAMENTAL ALTERNATIVES FUND
6. Use of Derivatives (Continued)
if the Fund owns the underlying security, give up the opportunity for profit. The risk in writing a put option is that the Fund may incur a loss if the market price of the security decreases and the option is exercised. The risk in buying an option is that the Fund pays a premium whether or not the option is exercised. The Fund also has the additional risk that there may be an illiquid market where the Fund is unable to close the contract.
The Fund has written put options on currencies to increase exposure to foreign exchange rate risk. A written put option becomes more valuable as the price of the underlying financial instrument appreciates relative to the strike price.
During the reporting period, the Fund had an ending monthly average market value of $89,796 on written put options.
Additional associated risks to the Fund include counterparty credit risk and liquidity risk.
Written option activity for the reporting period was as follows:
| | | | | | | | | | |
| | | Number of
Contracts | | | | | Amount of
Premiums | |
| |
| Options outstanding as of October 30, 2015 | | | — | | | | | $ | — | |
| Options written | | | 637,500,000 | | | | | | 792,200 | |
| Options closed or expired | | | — | | | | | | — | |
| Options exercised | | | — | | | | | | — | |
| | | | |
| Options outstanding as of April 29, 2016 | | | 637,500,000 | | | | | $ | 792,200 | |
| | | | |
Swap Contracts
The Fund may enter into swap contract agreements with a counterparty to exchange a series of cash flows based on either specified reference rates, the price or volatility of asset or non-asset references, or the occurrence of a credit event, over a specified period. Swaps can be executed in a bi-lateral privately negotiated arrangement with a dealer in an OTC transaction (“OTC swaps”) or executed on a regulated market. Certain swaps, regardless of the venue of their execution, are required to be cleared through a clearinghouse (“centrally cleared swaps”). Swap contracts may include interest rate, equity, debt, index, total return, credit default, currency, and volatility swaps.
Swap contracts are reported on a schedule following the Consolidated Statement of Investments. The values of centrally cleared swap and OTC swap contracts are aggregated by positive and negative values and disclosed separately on the Consolidated Statement of Assets and Liabilities. The unrealized appreciation (depreciation) related to the change in the valuation of the notional amount of the swap is combined with the accrued interest due to (owed by) the Fund, if any, at termination or settlement. The net change in this amount during the period is included on the Consolidated Statement of Operations. The Fund also records any periodic payments received from (paid to) the counterparty, including at termination, under such contracts as realized gain (loss) on the Consolidated Statement of Operations.
Swap contract agreements are exposed to the market risk factor of the specific underlying reference rate or asset. Swap contracts are typically more attractively priced compared to
81 OPPENHEIMER FUNDAMENTAL ALTERNATIVES FUND
NOTES TO CONSOLIDATED FINANCIAL STATEMENTS Unaudited / Continued
6. Use of Derivatives (Continued)
similar investments in related cash securities because they isolate the risk to one market risk factor and eliminate the other market risk factors. Investments in cash securities (for instance bonds) have exposure to multiple risk factors (credit and interest rate risk). Because swaps have embedded leverage, they can expose the Fund to substantial risk in the isolated market risk factor.
Credit Default Swap Contracts. A credit default swap is a contract that enables an investor to buy or sell protection against a defined-issuer credit event, such as the issuer’s failure to make timely payments of interest or principal on a debt security, bankruptcy or restructuring. The Fund may enter into credit default swaps either by buying or selling protection on a corporate issuer, sovereign issuer, or a basket or index of issuers (the “reference asset”).
The buyer of protection pays a periodic fee to the seller of protection based on the notional amount of the swap contract. The seller of protection agrees to compensate the buyer of protection for future potential losses as a result of a credit event on the reference asset. The contract effectively transfers the credit event risk of the reference asset from the buyer of protection to the seller of protection.
The ongoing value of the contract will fluctuate throughout the term of the contract based primarily on the credit risk of the reference asset. If the credit quality of the reference asset improves relative to the credit quality at contract initiation, the buyer of protection may have an unrealized loss greater than the anticipated periodic fee owed. This unrealized loss would be the result of current credit protection being cheaper than the cost of credit protection at contract initiation. If the buyer elects to terminate the contract prior to its maturity, and there has been no credit event, this unrealized loss will become realized. If the contract is held to maturity, and there has been no credit event, the realized loss will be equal to the periodic fee paid over the life of the contract.
If there is a credit event, the buyer of protection can exercise its rights under the contract and receive a payment from the seller of protection equal to the notional amount of the swap less the market value of specified debt securities issued by the reference asset.
Upon exercise of the contract the difference between such value and the notional amount is recorded as realized gain (loss) and is included on the Consolidated Statement of Operations.
The Fund has sold credit protection through credit default swaps to increase exposure to the credit risk of individual issuers and/or indexes of issuers that are either unavailable or considered to be less attractive in the bond market.
The Fund has purchased credit protection through credit default swaps to decrease exposure to the credit risk of individual issuers and/or indexes of issuers.
The Fund has purchased credit protection through credit default swaps to take an outright negative investment perspective on the credit risk of an individual issuer or basket or index of issuers as opposed to decreasing its credit risk exposure related to debt securities of such issuer(s) held by the Fund.
For the reporting period, the Fund had ending monthly average notional amounts of $208,175,542 and $57,749,176 on credit default swaps to buy protection and credit
82 OPPENHEIMER FUNDAMENTAL ALTERNATIVES FUND
6. Use of Derivatives (Continued)
default swaps to sell protection, respectively.
Additional associated risks to the Fund include counterparty credit risk and liquidity risk.
Interest Rate Swap Contracts. An interest rate swap is an agreement between counterparties to exchange periodic payments based on interest rates. One cash flow stream will typically be a floating rate payment based upon a specified floating interest rate while the other is typically a fixed interest rate.
The Fund has entered into interest rate swaps in which it pays a floating interest rate and receives a fixed interest rate in order to increase exposure to interest rate risk. Typically, if relative interest rates rise, payments made by the Fund under a swap agreement will be greater than the payments received by the Fund.
The Fund has entered into interest rate swaps in which it pays a fixed interest rate and receives a floating interest rate in order to decrease exposure to interest rate risk. Typically, if relative interest rates rise, payments received by the Fund under the swap agreement will be greater than the payments made by the Fund.
For the reporting period, the Fund had ending monthly average notional amounts of $2,507,641 and $18,477,881 on interest rate swaps which pay a fixed rate and interest rate swaps which receive a fixed rate, respectively.
Additional associated risks to the Fund include counterparty credit risk and liquidity risk.
Total Return Swap Contracts. A total return swap is an agreement between counterparties to exchange periodic payments based on the value of asset or non-asset references. One cash flow is typically based on a non-asset reference (such as an interest rate) and the other on the total return of a reference asset (such as a security or a basket of securities or securities index). The total return of the reference asset typically includes appreciation or depreciation on the reference asset, plus any interest or dividend payments.
Total return swap contracts are exposed to the market risk factor of the specific underlying financial instrument or index. Total return swaps are less standard in structure than other types of swaps and can isolate and/or include multiple types of market risk factors including equity risk, credit risk, and interest rate risk.
The Fund has entered into total return swaps on various equity securities or indexes to increase exposure to equity risk. These equity risk related total return swaps require the Fund to pay a floating reference interest rate, and an amount equal to the negative price movement of securities or an index (expressed as a percentage) multiplied by the notional amount of the contract. The Fund will receive payments equal to the positive price movement of the same securities or index (expressed as a percentage) multiplied by the notional amount of the contract and, in some cases, dividends paid on the securities.
The Fund has entered into total return swaps on various equity securities or indexes to decrease exposure to equity risk. These equity risk related total return swaps require the Fund to pay an amount equal to the positive price movement of securities or an index (expressed as a percentage) multiplied by the notional amount of the contract and, in some cases, dividends paid on the securities. The Fund will receive payments of a floating reference interest rate and an amount equal to the negative price movement of the same securities or index (expressed as a percentage) multiplied by the notional amount of the
83 OPPENHEIMER FUNDAMENTAL ALTERNATIVES FUND
NOTES TO CONSOLIDATED FINANCIAL STATEMENTS Unaudited / Continued
6. Use of Derivatives (Continued)
contract.
The Fund has entered into total return swaps to decrease exposure to the credit risk of various indexes or basket of securities. These credit risk related total return swaps require the fund to pay to, or receive payments from, the counterparty based on the movement of credit spreads of the related indexes or securities.
For the reporting period, the Fund had ending monthly average notional amounts of $10,706,085 and $18,179,284 on total return swaps which are long the reference asset and total return swaps which are short the reference asset, respectively.
Additional associated risks to the Fund include counterparty credit risk and liquidity risk.
Swaption Transactions
The Fund may enter into a swaption contract which grants the purchaser the right, but not the obligation, to enter into a swap transaction at preset terms detailed in the underlying agreement within a specified period of time. The purchaser pays a premium to the swaption writer who bears the risk of unfavorable changes in the preset terms on the underlying swap.
Purchased swaptions are reported as a component of investments in the Consolidated Statement of Investments and the Consolidated Statement of Assets and Liabilities. Written swaptions are reported on a schedule following the Consolidated Statement of Investments and their value is reported as a separate asset or liability line item in the Consolidated Statement of Assets and Liabilities. The net change in unrealized appreciation or depreciation on written swaptions is separately reported in the Consolidated Statement of Operations. When a swaption is exercised, the cost of the swap is adjusted by the amount of premium paid or received. Upon the expiration or closing of an unexercised swaption contract, a gain or loss is reported in the Consolidated Statement of Operations for the amount of the premium paid or received.
The Fund generally will incur a greater risk when it writes a swaption than when it purchases a swaption. When the Fund writes a swaption it will become obligated, upon exercise of the swaption, according to the terms of the underlying agreement. Swaption contracts written by the Fund do not give rise to counterparty credit risk prior to exercise as they obligate the Fund, not its counterparty, to perform. When the Fund purchases a swaption it only risks losing the amount of the premium it paid if the swaption expires unexercised. However, when the Fund exercises a purchased swaption there is a risk that the counterparty will fail to perform or otherwise default on its obligations under the swaption contract.
The Fund has purchased swaptions which gives it the option to enter into an interest rate swap in which it pays a fixed interest rate and receives a floating interest rate in order to decrease exposure to interest rate risk. A purchased swaption of this type becomes more valuable as the reference interest rate increases relative to the preset interest rate.
During the reporting period, the Fund had an ending monthly average market value of $3,413,544 on purchased swaptions.
Counterparty Credit Risk. Derivative positions are subject to the risk that the counterparty will not fulfill its obligation to the Fund. The Fund intends to enter into derivative transactions
84 OPPENHEIMER FUNDAMENTAL ALTERNATIVES FUND
6. Use of Derivatives (Continued)
with counterparties that the Manager believes to be creditworthy at the time of the transaction.
The Fund’s risk of loss from counterparty credit risk on OTC derivatives is generally limited to the aggregate unrealized gain netted against any collateral held by the Fund. For OTC options purchased, the Fund bears the risk of loss of the amount of the premiums paid plus the positive change in market values net of any collateral held by the Fund should the counterparty fail to perform under the contracts. Options written by the Fund do not typically give rise to counterparty credit risk, as options written generally obligate the Fund and not the counterparty to perform.
To reduce counterparty risk with respect to OTC transactions, the Fund has entered into master netting arrangements, established within the Fund’s International Swap and Derivatives Association, Inc. (“ISDA”) master agreements, which allow the Fund to make (or to have an entitlement to receive) a single net payment in the event of default (close-out netting) for outstanding payables and receivables with respect to certain OTC positions in swaps, options, swaptions, and forward currency exchange contracts for each individual counterparty. In addition, the Fund may require that certain counterparties post cash and/or securities in collateral accounts to cover their net payment obligations for those derivative contracts subject to ISDA master agreements. If the counterparty fails to perform under these contracts and agreements, the cash and/or securities will be made available to the Fund.
At period end, the Fund has required certain counterparties to post collateral of $6,188,700.
ISDA master agreements include credit related contingent features which allow counterparties to OTC derivatives to terminate derivative contracts prior to maturity in the event that, for example, the Fund’s net assets decline by a stated percentage or the Fund fails to meet the terms of its ISDA master agreements, which would cause the Fund to accelerate payment of any net liability owed to the counterparty.
For financial reporting purposes, the Fund does not offset derivative assets and derivative liabilities that are subject to netting arrangements in the Consolidated Statement of Assets and Liabilities. Bankruptcy or insolvency laws of a particular jurisdiction may impose restrictions on or prohibitions against the right of offset in bankruptcy, insolvency or other events.
The Fund’s risk of loss from counterparty credit risk on exchange-traded derivatives cleared through a clearinghouse and for centrally cleared swaps is generally considered lower than as compared to OTC derivatives. However, counterparty credit risk exists with respect to initial and variation margin deposited/paid by the Fund that is held in futures commission merchant, broker and/or clearinghouse accounts for such exchange-traded derivatives and for centrally cleared swaps.
With respect to centrally cleared swaps, such transactions will be submitted for clearing, and if cleared, will be held in accounts at futures commission merchants or brokers that are members of clearinghouses. While brokers, futures commission merchants and clearinghouses are required to segregate customer margin from their own assets, in the event that a broker, futures commission merchant or clearinghouse becomes insolvent or goes into bankruptcy
85 OPPENHEIMER FUNDAMENTAL ALTERNATIVES FUND
NOTES TO CONSOLIDATED FINANCIAL STATEMENTS Unaudited / Continued
6. Use of Derivatives (Continued)
and at that time there is a shortfall in the aggregate amount of margin held by the broker, futures commission merchant or clearinghouse for all its customers, U.S. bankruptcy laws will typically allocate that shortfall on a pro-rata basis across all the broker’s, futures commission merchant’s or clearinghouse’s customers, potentially resulting in losses to the Fund.
There is the risk that a broker, futures commission merchant or clearinghouse will decline to clear a transaction on the Fund’s behalf, and the Fund may be required to pay a termination fee to the executing broker with whom the Fund initially enters into the transaction. Clearinghouses may also be permitted to terminate centrally cleared swaps at any time. The Fund is also subject to the risk that the broker or futures commission merchant will improperly use the Fund’s assets deposited/paid as initial or variation margin to satisfy payment obligations of another customer. In the event of a default by another customer of the broker or futures commission merchant, the Fund might not receive its variation margin payments from the clearinghouse, due to the manner in which variation margin payments are aggregated for all customers of the broker/futures commission merchant.
Collateral and margin requirements differ by type of derivative. Margin requirements are established by the broker, futures commission merchant or clearinghouse for exchange-traded and cleared derivatives, including centrally cleared swaps. Brokers, futures commission merchants and clearinghouses can ask for margin in excess of the regulatory minimum, or increase the margin amount, in certain circumstances.
Collateral terms are contract specific for OTC derivatives. For derivatives traded under an ISDA master agreement, the collateral requirements are typically calculated by netting the mark to market amount for each transaction under such agreement and comparing that amount to the value of any collateral currently pledged by the Fund or the counterparty.
For financial reporting purposes, cash collateral that has been pledged to cover obligations of the Fund, if any, is reported separately on the Consolidated Statement of Assets and Liabilities as cash pledged as collateral. Non-cash collateral pledged by the Fund, if any, is noted in the Consolidated Statement of Investments. Generally, the amount of collateral due from or to a party must exceed a minimum transfer amount threshold (e.g. $250,000) before a transfer has to be made. To the extent amounts due to the Fund from its counterparties are not fully collateralized, contractually or otherwise, the Fund bears the risk of loss from counterparty nonperformance.
The following table presents by counterparty the Fund’s OTC derivative assets net of the related collateral pledged by the Fund at period end.
| | | | | | | | | | | | | | | | | | | | |
| | | | | | Gross Amounts Not Offset in the Consolidated
Statement of Assets & Liabilities | | | | |
| Counterparty | | Gross Amounts Not Offset in the
Consolidated
Statement of Assets &
Liabilities* | | | Financial
Instruments
Available for
Offset | | | Financial
Instruments
Collateral
Received** | | | Cash Collateral
Received** | | | Net Amount | |
| |
| Bank of America NA | | $ | 270,925 | | | $ | (270,925) | | | $ | – | | | $ | – | | | $ | – | |
86 OPPENHEIMER FUNDAMENTAL ALTERNATIVES FUND
6. Use of Derivatives (Continued)
| | | | | | | | | | | | | | | | | | | | |
| | | | | | Gross Amounts Not Offset in the Consolidated
Statement of Assets & Liabilities | | | | |
| Counterparty | | Gross Amounts Not Offset in the
Consolidated
Statement of Assets &
Liabilities* | | | Financial
Instruments
Available for
Offset | | | Financial
Instruments
Collateral
Received** | | | Cash Collateral
Received** | | | Net Amount | |
| |
| Barclays Bank plc | | $ | 572,412 | | | $ | (165,056) | | | $ | – | | | $ | (407,356) | | | $ | – | |
| BNP Paribas | | | 387,909 | | | | – | | | | (387,909) | | | | – | | | | – | |
| Citibank NA | | | 283,128 | | | | (283,128) | | | | – | | | | – | | | | – | |
| Goldman Sachs Group, Inc. (The) | | | 8,498,084 | | | | (3,721,956) | | | | (3,713,283) | | | | – | | | | 1,062,845 | |
| JPMorgan Chase Bank NA | | | 115,906 | | | | (64,886) | | | | (51,020) | | | | – | | | | – | |
| Morgan Stanley | | | 215,792 | | | | – | | | | – | | | | – | | | | 215,792 | |
| Morgan Stanley Capital Services, Inc. | | | 595,432 | | | | (595,432) | | | | – | | | | – | | | | – | |
| Nomura Global Financial Products, Inc. | | | 7,078 | | | | (7,078) | | | | – | | | | – | | | | – | |
| Royal Bank of Scotland plc (The) | | | 100,980 | | | | – | | | | – | | | | – | | | | 100,980 | |
| | | | |
| | $ | 11,047,646 | | | $ | (5,108,461) | | | $ | (4,152,212) | | | $ | (407,356) | | | $ | 1,379,617 | |
| | | | |
*OTC derivatives are reported gross on the Statement of Assets and Liabilities. Exchange traded options and margin related to centrally cleared swaps and futures are excluded from these reported amounts.
**Reported collateral posted for the benefit of the Fund within this table is limited to the net outstanding amount due from an individual counterparty. The collateral posted for the benefit of the Fund may exceed these amounts.
The following table presents by counterparty the Fund’s OTC derivative liabilities net of the related collateral pledged by the Fund at period end.
| | | | | | | | | | | | | | | | | | | | |
| | | | | | Gross Amounts Not Offset in the Consolidated
Statement of Assets & Liabilities | | | | |
| Counterparty | | Gross Amounts Not Offset in the
Consolidated
Statement
of Assets &
Liabilities* | | | Financial
Instruments
Available for
Offset | | | Financial
Instruments
Collateral
Pledged** | | | Cash Collateral
Pledged** | | | Net Amount | |
| |
| Bank of America NA | | $ | (863,158) | | | $ | 270,925 | | | $ | – | | | $ | 330,000 | | | $ | (262,233) | |
| Barclays Bank plc | | | (165,056) | | | | 165,056 | | | | – | | | | – | | | | – | |
| Citibank NA | | | (1,980,516) | | | | 283,128 | | | | – | | | | 1,697,388 | | | | – | |
| Deutsche Bank Securities, Inc. | | | (10,075) | | | | – | | | | – | | | | 10,000 | | | | (75) | |
| Goldman Sachs Bank USA | | | (67,362) | | | | – | | | | – | | | | – | | | | (67,362) | |
| Goldman Sachs Group, Inc. (The) | | | (3,721,956) | | | | 3,721,956 | | | | – | | | | – | | | | – | |
| JPMorgan Chase Bank NA | | | (64,886) | | | | 64,886 | | | | – | | | | – | | | | – | |
87 OPPENHEIMER FUNDAMENTAL ALTERNATIVES FUND
NOTES TO CONSOLIDATED FINANCIAL STATEMENTS Unaudited / Continued
6. Use of Derivatives (Continued)
| | | | | | | | | | | | | | | | | | | | |
| | | | | | Gross Amounts Not Offset in the Consolidated
Statement of Assets & Liabilities | | | | |
| Counterparty | | Gross Amounts Not Offset in the
Consolidated
Statement
of Assets &
Liabilities* | | | Financial
Instruments
Available for
Offset | | | Financial
Instruments
Collateral
Pledged** | | | Cash Collateral
Pledged** | | | Net Amount | |
| |
| Morgan Stanley Capital Services, Inc. | | $ | (854,245) | | | $ | 595,432 | | | $ | – | | | $ | – | | | $ | (258,813) | |
| Nomura Global Financial Products, Inc. | | | (31,966) | | | | 7,078 | | | | – | | | | – | | | | (24,888) | |
| Toronto Dominion Bank | | | (31,933) | | | | – | | | | – | | | | – | | | | (31,933) | |
| | | | |
| | $ | (7,791,153) | | | $ | 5,108,461 | | | $ | – | | | $ | 2,037,388 | | | $ | (645,304) | |
| | | | |
*OTC derivatives are reported gross on the Consolidated Statement of Assets and Liabilities. Exchange traded options and margin related to centrally cleared swaps and futures are excluded from these reported amounts.
**Reported collateral pledged within this table is limited to the net outstanding amount due from the Fund. The securities pledged as collateral by the Fund as reported on the Consolidated Statements of Investments may exceed these amounts.
The following table presents the valuations of derivative instruments by risk exposure as reported within the Consolidated Statement of Assets and Liabilities at period end:
| | | | | | | | | | | | |
| | | Asset Derivatives | | | Liability Derivatives | |
| | | | | | |
Derivatives Not Accounted for as Hedging Instruments | | Consolidated
Statement of Assets
and Liabilities Location | | Value | | | Consolidated
Statement of Assets
and Liabilities Location | | Value | |
| |
| Credit contracts | | Swaps, at value | | $ | 3,656,844 | | | Swaps, at value | | $ | 4,136,549 | |
| Equity contracts | | | | | | | | Swaps, at value | | | 932,702 | |
| Interest rate contracts | | | | | | | | Swaps, at value | | | 197,303 | |
| Credit contracts | | Centrally cleared swaps, at
value | | | 410,637 | | | Centrally cleared swaps, at
value | | | 1,645,247 | |
| Interest rate contracts | | Variation margin receivable | | | 30,043* | | | Variation margin payable | | | 12,469* | |
| Forward currency exchange contracts | | Unrealized appreciation on
forward currency exchange
contracts | | | 812,761 | | | Unrealized depreciation on
forward currency exchange
contracts | | | 1,896,024 | |
| Forward currency exchange contracts | | Investments, at value | | | 2,168,692** | | | | | | | |
| Interest rate contracts | | Investments, at value | | | 4,409,349** | | | | | | | |
| Forward currency exchange contracts | | | | | | | | Options written, at value | | | 628,575 | |
| | | | | | | | | | | | |
| Total | | | | $ | 11,488,326 | | | | | $ | 9,448,869 | |
| | | | | | | | | | | | |
*Includes only the current day’s variation margin. Prior variation margin movements have been reflected in cash on the Consolidated Statement of Assets and Liabilities upon receipt or payment.
**Amounts relate to purchased option contracts and purchased swaption contracts.
The effect of derivative instruments on the Consolidated Statement of Operations is as follows:
88 OPPENHEIMER FUNDAMENTAL ALTERNATIVES FUND
6. Use of Derivatives (Continued)
| | | | | | | | | | | | | | | | | | | | |
| Amount of Realized Gain or (Loss) Recognized on Derivatives | |
| |
Derivatives Not Accounted for as Hedging Instruments | | Investment
from
unaffiliated
companies
(including
premiums on
options and
swaptions
exercised)* | | | Closing and
expiration of futures
contracts | | | Foreign
currency
transactions | | | Swap contracts | | | Total | |
| |
| Credit contracts | | $ | — | | | $ | — | | | $ | — | | | $ | (2,099,584) | | | $ | (2,099,584) | |
| Equity contracts | | | — | | | | — | | | | — | | | | (2,713,147) | | | | (2,713,147) | |
| Forward currency exchange contracts | | | 261,347 | | | | — | | | | (3,812,368) | | | | — | | | | (3,551,021) | |
| Interest rate contracts | | | (1,338,743) | | | | (698,812) | | | | — | | | | — | | | | (2,037,555) | |
| | | | |
| Total | | $ | (1,077,396) | | | $ | (698,812) | | | $ | (3,812,368) | | | $ | (4,812,731) | | | $ | (10,401,307) | |
| | | | |
*Includes purchased option contracts and purchased swaption contracts, if any.
| | | | | | | | | | | | |
| Amount of Change in Unrealized Gain or (Loss) Recognized on Derivatives | |
| |
Derivatives Not Accounted for as Hedging Instruments | | Investments* | | | Option
contracts
written | | | Futures
contracts | |
| |
| Credit contracts | | $ | — | | | $ | — | | | $ | — | |
| Equity contracts | | | — | | | | — | | | | — | |
| Forward currency exchange contracts | | | (793,236 | ) | | | 163,625 | | | | — | |
| Interest rate contracts | | | (328,655 | ) | | | — | | | | 334,229 | |
| | | | |
| Total | | $ | (1,121,891 | ) | | $ | 163,625 | | | $ | 334,229 | |
| | | | |
|
| Amount of Change in Unrealized Gain or (Loss) Recognized on Derivatives (Continued) | |
| |
Derivatives Not Accounted for as Hedging Instruments | | Translation
of assets and
liabilities
denominated
in foreign
currencies | | | Swap contracts | | | Total | |
| |
| Credit contracts | | $ | — | | | $ | (782,480 | ) | | $ | (782,480) | |
| Equity contracts | | | — | | | | 1,270,375 | | | | 1,270,375 | |
| Forward currency exchange contracts | | | (345,618 | ) | | | — | | | | (975,229) | |
| Interest rate contracts | | | — | | | | (258,572 | ) | | | (252,998) | |
| | | | |
| Total | | $ | (345,618 | ) | | $ | 229,323 | | | $ | (740,332) | |
| | | | |
*Includes purchased option contracts and purchased swaption contracts, if any.
7. Shares of Beneficial Interest
The Fund has authorized an unlimited number of $0.01 par value shares of beneficial interest
89 OPPENHEIMER FUNDAMENTAL ALTERNATIVES FUND
NOTES TO CONSOLIDATED FINANCIAL STATEMENTS Unaudited / Continued
7. Shares of Beneficial Interest (Continued)
of each class. Transactions in shares of beneficial interest were as follows:
| | | | | | | | | | | | | | | | |
| | | Six Months Ended April 29, 20161 | | | Year Ended October 30, 20151 | |
| | | Shares | | | Amount | | | Shares | | | Amount | |
| |
Class A | | | | | | | | | | | | | | | | |
| Sold | | | 4,182,747 | | | $ | 111,222,444 | | | | 2,747,796 | | | $ | 73,610,677 | |
| Dividends and/or distributions reinvested | | | 126,226 | | | | 3,386,153 | | | | 419,970 | | | | 11,036,800 | |
| Redeemed | | | (2,066,463) | | | | (54,825,700) | | | | (3,488,073) | | | | (93,256,588) | |
| | | | |
| Net increase (decrease) | | | 2,242,510 | | | $ | 59,782,897 | | | | (320,307) | | | $ | (8,609,111) | |
| | | | |
| | | | | | | | | | | | | | | | |
| |
Class B | | | | | | | | | | | | | | | | |
| Sold | | | 19,388 | | | $ | 459,845 | | | | 15,739 | | | $ | 377,454 | |
| Dividends and/or distributions reinvested | | | 1,728 | | | | 41,404 | | | | 10,988 | | | | 260,095 | |
| Redeemed | | | (180,428) | | | | (4,303,293) | | | | (499,532) | | | | (11,973,742) | |
| | | | |
| Net decrease | | | (159,312) | | | $ | (3,802,044) | | | | (472,805) | | | $ | (11,336,193) | |
| | | | |
| | | | | | | | | | | | | | | | |
| |
Class C | | | | | | | | | | | | | | | | |
| Sold | | | 1,606,503 | | | $ | 38,204,412 | | | | 947,430 | | | $ | 22,745,866 | |
| Dividends and/or distributions reinvested | | | 16,779 | | | | 402,017 | | | | 56,544 | | | | 1,338,398 | |
| Redeemed | | | (577,288) | | | | (13,685,171) | | | | (773,115) | | | | (18,545,940) | |
| | | | |
| Net increase | | | 1,045,994 | | | $ | 24,921,258 | | | | 230,859 | | | $ | 5,538,324 | |
| | | | |
| | | | | | | | | | | | | | | | |
| |
Class I | | | | | | | | | | | | | | | | |
| Sold | | | 1,135,694 | | | $ | 30,810,246 | | | | 2,344,685 | | | $ | 64,807,277 | |
| Dividends and/or distributions reinvested | | | 18,652 | | | | 513,881 | | | | — | | | | — | |
| Redeemed | | | (222,871) | | | | (6,056,306) | | | | (214,076) | | | | (5,893,944) | |
| | | | |
| Net increase | | | 931,475 | | | $ | 25,267,821 | | | | 2,130,609 | | | $ | 58,913,333 | |
| | | | |
| | | | | | | | | | | | | | | | |
| |
Class R | | | | | | | | | | | | | | | | |
| Sold | | | 145,881 | | | $ | 3,709,664 | | | | 126,438 | | | $ | 3,251,422 | |
| Dividends and/or distributions reinvested | | | 2,175 | | | | 55,891 | | | | 10,202 | | | | 257,596 | |
| Redeemed | | | (80,655) | | | | (2,055,313) | | | | (151,535) | | | | (3,890,027) | |
| | | | |
| Net increase (decrease) | | | 67,401 | | | $ | 1,710,242 | | | | (14,895) | | | $ | (381,009) | |
| | | | |
| | | | | | | | | | | | | | | | |
| |
Class Y | | | | | | | | | | | | | | | | |
| Sold | | | 10,515,468 | | | $ | 285,038,110 | | | | 3,035,636 | | | $ | 83,471,376 | |
| Dividends and/or distributions reinvested | | | 29,335 | | | | 805,201 | | | | 13,913 | | | | 374,117 | |
| Redeemed | | | (1,969,919) | | | | (53,323,080) | | | | (606,971) | | | | (16,624,767) | |
| | | | |
| Net increase | | | 8,574,884 | | | $ | 232,520,231 | | | | 2,442,578 | | | $ | 67,220,726 | |
| | | | |
1. April 29, 2016 and October 30, 2015 represent the last business days of the Fund’s respective reporting periods.
See Note 2.
8. Purchases and Sales of Securities
The aggregate cost of purchases and proceeds from sales of securities, other than short-term
90 OPPENHEIMER FUNDAMENTAL ALTERNATIVES FUND
8. Purchases and Sales of Securities (Continued)
obligations and investments in IMMF, for the reporting period were as follows:
| | | | | | | | | | |
| | | Purchases | | | | | Sales | |
| Investment securities | | $ | 619,979,505 | | | | | $ | 504,829,615 | |
9. Fees and Other Transactions with Affiliates
Management Fees. Under the investment advisory agreement, the Fund pays the Manager a management fee based on the daily net assets of the Fund at an annual rate as shown in the following table:
| | | | |
| Fee Schedule | | | |
Up to $1.0 billion | | | 0.85 | % |
Next $500 million | | | 0.80 | |
Next $500 million | | | 0.75 | |
Next $500 million | | | 0.70 | |
Next $500 million | | | 0.65 | |
Next $500 million | | | 0.60 | |
Next $500 billion | | | 0.55 | |
Over $4.0 billion | | | 0.50 | |
The Manager also provides investment management related services to the Subsidiary. The Subsidiary pays the Manager a monthly management fee at an annual rate according to the above schedule. The Subsidiary also pays certain other expenses including custody and directors’ fees.
The Fund’s effective management fee for the reporting period was 0.86% of average annual net assets before any Subsidiary management fees or any applicable waivers.
Sub-Adviser Fees. The Manager has retained the Sub-Adviser to provide the day-to-day portfolio management of the Fund and the Subsidiary. Under the Sub-Advisory Agreement, the Manager pays the Sub-Adviser an annual fee in monthly installments, equal to a percentage of the investment management fee collected by the Manager from the Fund and the Subsidiary, which shall be calculated after any investment management fee waivers. The fee paid to the Sub-Adviser is paid by the Manager, not by the Fund.
Transfer Agent Fees. OFI Global (the “Transfer Agent”) serves as the transfer and shareholder servicing agent for the Fund. The Fund pays the Transfer Agent a fee based on annual net assets. Fees incurred and average net assets for each class with respect to these services are detailed in the Consolidated Statement of Operations and Consolidated Financial Highlights, respectively.
Sub-Transfer Agent Fees. The Transfer Agent has retained Shareholder Services, Inc., a wholly-owned subsidiary of OFI (the “Sub-Transfer Agent”), to provide the day-to-day transfer agent and shareholder servicing of the Fund. Under the Sub-Transfer Agency Agreement, the Transfer Agent pays the Sub-Transfer Agent an annual fee in monthly installments, equal to a percentage of the transfer agent fee collected by the Transfer Agent from the Fund, which shall be calculated after any applicable fee waivers. The fee paid to the Sub-Transfer Agent is paid
91 OPPENHEIMER FUNDAMENTAL ALTERNATIVES FUND
NOTES TO CONSOLIDATED FINANCIAL STATEMENTS Unaudited / Continued
9. Fees and Other Transactions with Affiliates (Continued)
by the Transfer Agent, not by the Fund.
Trustees’ Compensation. The Fund has adopted an unfunded retirement plan (the “Plan”) for the Fund’s Independent Trustees. Benefits are based on years of service and fees paid to each Trustee during their period of service. The Plan was frozen with respect to adding new participants effective December 31, 2006 (the “Freeze Date”) and existing Plan Participants as of the Freeze Date will continue to receive accrued benefits under the Plan. Active Independent Trustees as of the Freeze Date have each elected a distribution method with respect to their benefits under the Plan. During the reporting period, the Fund’s projected benefit obligations, payments to retired Trustees and accumulated liability were as follows:
| | | | |
Projected Benefit Obligations Increased | | $ | 1,328 | |
Payments Made to Retired Trustees | | | 29,914 | |
Accumulated Liability as of April 29, 2016 | | | 116,578 | |
The Fund’s Board of Trustees (“Board”) has adopted a compensation deferral plan for Independent Trustees that enables Trustees to elect to defer receipt of all or a portion of the annual compensation they are entitled to receive from the Fund. For purposes of determining the amount owed to the Trustee under the plan, deferred amounts are treated as though equal dollar amounts had been invested in shares of the Fund or in other Oppenheimer funds selected by the Trustee. The Fund purchases shares of the funds selected for deferral by the Trustee in amounts equal to his or her deemed investment, resulting in a Fund asset equal to the deferred compensation liability. Such assets are included as a component of “Other” within the asset section of the Consolidated Statement of Assets and Liabilities. Deferral of Trustees’ fees under the plan will not affect the net assets of the Fund and will not materially affect the Fund’s assets, liabilities or net investment income per share. Amounts will be deferred until distributed in accordance with the compensation deferral plan.
Distribution and Service Plan (12b-1) Fees. Under its General Distributor’s Agreement with the Fund, OppenheimerFunds Distributor, Inc. (the “Distributor”) acts as the Fund’s principal underwriter in the continuous public offering of the Fund’s classes of shares.
Distribution and Service Plan for Class A Shares. The Fund has adopted a Distribution and Service Plan (the “Plan”) for Class A shares pursuant to Rule 12b-1 under the 1940 Act. Under the Plan, the Fund pays a service fee to the Distributor at an annual rate of 0.25% of the daily net assets of Class A shares. The Distributor currently uses all of those fees to pay dealers, brokers, banks and other financial institutions periodically for providing personal services and maintenance of accounts of their customers that hold Class A shares. Under the Plan, the Fund may also pay an asset-based sales charge to the Distributor. However, the Fund’s Board has currently set the rate at zero. Fees incurred by the Fund under the Plan are detailed in the Consolidated Statement of Operations.
Distribution and Service Plans for Class B, Class C and Class R Shares. The Fund has
92 OPPENHEIMER FUNDAMENTAL ALTERNATIVES FUND
9. Fees and Other Transactions with Affiliates (Continued)
adopted Distribution and Service Plans (the “Plans”) for Class B, Class C and Class R shares pursuant to Rule 12b-1 under the 1940 Act to compensate the Distributor for distributing those share classes, maintaining accounts and providing shareholder services. Under the Plans, the Fund pays the Distributor an annual asset-based sales charge of 0.75% on Class B and Class C shares’ daily net assets and 0.25% on Class R shares’ daily net assets. The Fund also pays a service fee under the Plans at an annual rate of 0.25% of daily net assets. The Plans continue in effect from year to year only if the Fund’s Board of Trustees votes annually to approve their continuance at an in person meeting called for that purpose. Fees incurred by the Fund under the Plans are detailed in the Consolidated Statement of Operations.
Sales Charges. Front-end sales charges and CDSC do not represent expenses of the Fund. They are deducted from the proceeds of sales of Fund shares prior to investment or from redemption proceeds prior to remittance, as applicable. The sales charges retained by the Distributor from the sale of shares and the CDSC retained by the Distributor on the redemption of shares is shown in the following table for the period indicated.
| | | | | | | | | | | | | | | | |
| Six Months Ended | | Class A
Front-End
Sales Charges
Retained by
Distributor | | | Class B
Contingent
Deferred
Sales Charges
Retained by
Distributor | | | Class C
Contingent
Deferred
Sales Charges
Retained by
Distributor | | | Class R
Contingent
Deferred
Sales Charges
Retained by
Distributor | |
April 29, 2016 | | | $92,488 | | | | $8,267 | | | | $8,917 | | | | $— | |
Waivers and Reimbursements of Expenses. The Manager has contractually agreed to waive the management fee it receives from the Fund in an amount equal to the management fee it receives from the Subsidiary. During the reporting period, the Manager waived $115,775.
The Manager will waive fees and/or reimburse Fund expenses in an amount equal to the indirect management fees incurred through the Fund’s investments in underlying funds managed by the Manager or its affiliates. During the reporting period, the Manager waived fees and/or reimbursed the Fund $96,888 for management fees.
Waivers and/or reimbursements may be modified or terminated as set forth according to the terms in the prospectus.
10. Borrowings and Other Financing
Securities Sold Short. The Fund sells securities that it does not own, and it will therefore be obligated to purchase such securities at a future date. Upon entering into a short position, the Fund is required to segregate cash or securities at its custodian which are pledged for the benefit of the lending broker and/or to deposit and pledge cash directly at the lending broker, with a value equal to a certain percentage, exceeding 100%, of the value of the securities that it sold short. Cash that has been segregated and pledged for this purpose will be disclosed on the Consolidated Statement of Assets and Liabilities; securities that have been segregated and
93 OPPENHEIMER FUNDAMENTAL ALTERNATIVES FUND
NOTES TO CONSOLIDATED FINANCIAL STATEMENTS Unaudited / Continued
10. Borrowings and Other Financing (Continued)
pledged for this purpose are disclosed as such in the Consolidated Statement of Investments. The aggregate market value of such cash and securities at period end is $452,543,358. The value of the open short position is recorded as a liability, and the Fund records an unrealized gain or loss to the extent of the difference between the proceeds received and the change in value of the open short position. The Fund records a realized gain or loss when the short position is closed out. By entering into short sales, the Fund bears the market risk of increases in value of the security sold short in excess of the proceeds received. Until the security is replaced, the Fund is required to pay the lender any dividend or interest earned. Dividend expense on short sales is treated as an expense in the Consolidated Statement of Operations.
Joint Credit Facility. A number of mutual funds managed by the Manager participate in a $1.28 billion revolving credit facility (the “Facility”) intended to provide short-term financing, if necessary, subject to certain restrictions in connection with atypical redemption activity. Expenses and fees related to the Facility are paid by the participating funds and are disclosed separately or as other expenses on the Consolidated Statement of Operations. The Fund did not utilize the Facility during the reporting period.
Loan Commitments. Pursuant to the terms of certain credit agreements, the Fund has unfunded loan commitments of $21,214 at period end. The Fund generally will maintain with its custodian, liquid investments having an aggregate value at least equal to the par value of unfunded loan commitments. At period end, these commitments have a market value of $21,214 and have been included as Corporate Loans in the Statement of Investments. The following commitments are subject to funding based on the borrower’s discretion. The Fund is obligated to fund these commitments at the time of the request by the borrower. These commitments have been excluded from the Statement of Investments. The unrealized appreciation/depreciation on these commitments is recorded as an asset/liability on the Statement of Assets and Liabilities.
11. Pending Litigation
In 2009, several putative class action lawsuits were filed and later consolidated before the U.S. District Court for the District of Colorado against OppenheimerFunds, Inc. (“OFI”), OppenheimerFunds Distributor, Inc. (“OFDI”), and Oppenheimer Rochester California Municipal Fund, a fund advised by OFI Global Asset Management, Inc. and distributed by the Distributor (the “California Fund”), in connection with the California Fund’s investment performance. The plaintiffs asserted claims against OFI, OFDI and certain present and former trustees and officers of the California Fund under the federal securities laws, alleging, among other things, that the disclosure documents of the California Fund contained misrepresentations and omissions and the investment policies of the California Fund were not followed. Plaintiffs in the suit filed an amended complaint and defendants filed a motion to dismiss. In 2011, the court issued an order which granted in part and denied in part the defendants’ motion to dismiss. In 2012, plaintiffs filed a motion, which defendants opposed,
94 OPPENHEIMER FUNDAMENTAL ALTERNATIVES FUND
11. Pending Litigation (Continued)
to certify a class and appoint class representatives and class counsel. In March 2015, the court granted plaintiffs’ motion for class certification. In May 2015, the U.S. Court of Appeals for the Tenth Circuit vacated the class certification order and remanded the matter to the district court for further proceedings. In October 2015, the district court reaffirmed its order and determined that the suit will proceed as a class action. In December 2015, the Tenth Circuit denied defendants’ petition to appeal the district court’s reaffirmed class certification order.
OFI and OFDI believe the suit is without merit; that it is premature to render any opinion as to the likelihood of an outcome unfavorable to them in the suit; and that no estimate can yet be made as to the amount or range of any potential loss. Furthermore, OFI believes that the suit should not impair the ability of OFI or OFDI to perform their respective duties to the Fund and that the outcome of the suit should not have any material effect on the operations of any of the Oppenheimer funds.
95 OPPENHEIMER FUNDAMENTAL ALTERNATIVES FUND
PORTFOLIO PROXY VOTING POLICES AND GUIDELINES;
UPDATES TO STATEMENTS OF INVESTMENTS Unaudited
The Fund has adopted Portfolio Proxy Voting Policies and Guidelines under which the Fund votes proxies relating to securities (“portfolio proxies”) held by the Fund. A description of the Fund’s Portfolio Proxy Voting Policies and Guidelines is available (i) without charge, upon request, by calling the Fund toll-free at 1.800.CALL OPP (225.5677), (ii) on the Fund’s website at www.oppenheimerfunds.com, and (iii) on the SEC’s website at www.sec.gov. In addition, the Fund is required to file Form N-PX, with its complete proxy voting record for the 12 months ended June 30th, no later than August 31st of each year. The Fund’s voting record is available (i) without charge, upon request, by calling the Fund toll-free at 1.800.CALL OPP (225.5677), and (ii) in the Form N-PX filing on the SEC’s website at www.sec.gov.
The Fund files its complete schedule of portfolio holdings with the SEC for the first quarter and the third quarter of each fiscal year on Form N-Q. The Fund’s Form N-Q filings are available on the SEC’s website at www.sec.gov. Those forms may be reviewed and copied at the SEC’s Public Reference Room in Washington, D.C. Information on the operation of the Public Reference Room may be obtained by calling 1-800-SEC-0330.
Householding—Delivery of Shareholder Documents
This is to inform you about OppenheimerFunds’ “householding” policy. If more than one member of your household maintains an account in a particular fund, OppenheimerFunds will mail only one copy of the fund’s prospectus (or, if available, the fund’s summary prospectus), annual and semiannual report and privacy policy. The consolidation of these mailings, called householding, benefits your fund through reduced mailing expense, and benefits you by reducing the volume of mail you receive from OppenheimerFunds. Householding does not affect the delivery of your account statements.
Please note that we will continue to household these mailings for as long as you remain an OppenheimerFunds shareholder, unless you request otherwise. If you prefer to receive multiple copies of these materials, please call us at 1.800.CALL-OPP (225-5677). You may also notify us in writing or via email. We will begin sending you individual copies of the prospectus (or, if available, the summary prospectus), reports and privacy policy within 30 days of receiving your request to stop householding.
96 OPPENHEIMER FUNDAMENTAL ALTERNATIVES FUND
DISTRIBUTION SOURCES Unaudited
For any distribution that took place over the Fund’s reporting period, the table below details on a per-share basis the percentage of the Fund’s total distribution payment amount that was derived from the following sources: net income, net profit from the sale of securities, and other capital sources. This information is based upon income and capital gains using generally accepted accounting principles as of the date of each distribution. Because the Fund is actively managed, the relative amount of the Fund’s total distributions derived from various sources over the calendar year may change. Please note that this information should not be used for tax reporting purposes as the tax character of distributable income may differ from the amounts used for this notification. You will receive IRS tax forms in the first quarter of each calendar year detailing the actual amount of the taxable and non-taxable portion of distributions paid to you during the tax year.
For the most current information, please go to oppenheimerfunds.com. Select your Fund, then the ’Detailed’ tab; where ‘Dividends’ are shown, the Fund’s latest pay date will be followed by the sources of any distribution, updated daily.
| | | | | | | | | | | | | | | | |
| Fund Name | | Pay
Date | | | Net Income | | | Net Profit
from Sale | | | Other
Capital
Sources | |
Oppenheimer Fundamental Alternatives Fund | | | 12/4/15 | | | | 41.6% | | | | 32.9% | | | | 25.5% | |
Oppenheimer Fundamental Alternatives Fund | | | 12/29/15 | | | | 33.3% | | | | 41.2% | | | | 25.5% | |
97 OPPENHEIMER FUNDAMENTAL ALTERNATIVES FUND
OPPENHEIMER FUNDAMENTAL ALTERNATIVES FUND
| | |
| Trustees and Officers | | Brian F. Wruble, Chairman of the Board of Trustees and Trustee |
| | Beth Ann Brown, Trustee |
| | Matthew P. Fink, Trustee |
| | Edmund P. Giambastiani, Jr., Trustee |
| | Elizabeth Krentzman, Trustee |
| | Mary F. Miller, Trustee |
| | Joel W. Motley, Trustee |
| | Joanne Pace, Trustee |
| | Daniel Vandivort, Trustee |
| | Arthur P. Steinmetz, Trustee, President and Principal Executive Officer |
| | Michelle Borré, Vice President |
| | Cynthia Lo Bessette, Secretary and Chief Legal Officer |
| | Jennifer Sexton, Vice President and Chief Business Officer |
| | Mary Ann Picciotto, Chief Compliance Officer and Chief Anti-Money |
| | Laundering Officer |
| | Brian S. Petersen, Treasurer and Principal Financial & Accounting Officer |
| |
| Manager | | OFI Global Asset Management, Inc. |
| |
| Sub-Adviser | | OppenheimerFunds, Inc. |
| |
| Distributor | | OppenheimerFunds Distributor, Inc. |
| |
| Transfer and Shareholder Servicing Agent | | OFI Global Asset Management, Inc. |
| |
| Sub-Transfer Agent | | Shareholder Services, Inc. |
| | DBA OppenheimerFunds Services |
| |
| Independent Registered | | KPMG LLP |
| Public Accounting Firm | | |
| |
| Legal Counsel | | Kramer Levin Naftalis & Frankel LLP |
| |
| | The financial statements included herein have been taken from the records of the Fund without examination of those records by the independent registered public accounting firm. |
© 2016 OppenheimerFunds, Inc. All Rights reserved.
98 OPPENHEIMER FUNDAMENTAL ALTERNATIVES FUND
PRIVACY POLICY NOTICE
As an Oppenheimer fund shareholder, you are entitled to know how we protect your personal information and how we limit its disclosure.
Information Sources
We obtain nonpublic personal information about our shareholders from the following sources:
| ● | | Applications or other forms |
| ● | | When you create a user ID and password for online account access |
| ● | | When you enroll in eDocs Direct, our electronic document delivery service |
| ● | | Your transactions with us, our affiliates or others |
| ● | | A software program on our website, often referred to as a “cookie,” which indicates which parts of our site you’ve visited |
| ● | | When you set up challenge questions to reset your password online |
If you visit oppenheimerfunds.com and do not log on to the secure account information areas, we do not obtain any personal information about you. When you do log on to a secure area, we do obtain your user ID and password to identify you. We also use this information to provide you with products and services you have requested, to inform you about products and services that you may be interested in and assist you in other ways.
We do not collect personal information through our website unless you willingly provide it to us, either directly by email or in those areas of the website that request information. In order to update your personal information (including your mailing address, email address and phone number) you must first log on and visit your user profile.
If you have set your browser to warn you before accepting cookies, you will receive the warning message with each cookie. You can refuse cookies by turning them off in your browser. However, doing so may limit your access to certain sections of our website.
We use cookies to help us improve and manage our website. For example, cookies help us recognize new versus repeat visitors to the site, track the pages visited, and enable some special features on the website. This data helps us provide a better service for our website visitors.
Protection of Information
We do not disclose any non-public personal information (such as names on a customer list) about current or former customers to anyone, except as permitted by law.
Disclosure of Information
Copies of confirmations, account statements and other documents reporting activity in your fund accounts are made available to your financial advisor (as designated by you). We may also use details about you and your investments to help us, our financial service affiliates, or firms that jointly market their financial products and services with ours, to better serve your investment needs or suggest financial services or educational material that may be of interest to you. If this requires us to provide you with an opportunity to “opt in” or “opt out” of such information sharing with a firm not affiliated with us, you will receive notification on how to do so, before any such sharing takes place.
Right of Refusal
We will not disclose your personal information to unaffiliated third parties (except as permitted by law), unless we first offer you a reasonable opportunity to refuse or “opt out” of such disclosure.
99 OPPENHEIMER FUNDAMENTAL ALTERNATIVES FUND
PRIVACY POLICY NOTICE Continued
Internet Security and Encryption
In general, the email services provided by our website are encrypted and provide a secure and private means of communication with us. To protect your own privacy, confidential and/or personal information should only be communicated via email when you are advised that you are using a secure website. As a security measure, we do not include personal or account information in non-secure emails, and we advise you not to send such information to us in non-secure emails. Instead, you may take advantage of the secure features of our website to encrypt your email correspondence. To do this, you will need to use a browser that supports Secure Sockets Layer (SSL) protocol.
We do not guarantee or warrant that any part of our website, including files available for download, are free of viruses or other harmful code. It is your responsibility to take appropriate precautions, such as use of an anti-virus software package, to protect your computer hardware and software.
| ● | | All transactions, including redemptions, exchanges and purchases, are secured by SSL and 256-bit encryption. SSL is used to establish a secure connection between your PC and OppenheimerFunds’ server. It transmits information in an encrypted and scrambled format. |
| ● | | Encryption is achieved through an electronic scrambling technology that uses a “key” to code and then decode the data. Encryption acts like the cable converter box you may have on your television set. It scrambles data with a secret code so that no one can make sense of it while it is being transmitted. When the data reaches its destination, the same software unscrambles the data. |
| ● | | You can exit the secure area by either closing your browser, or for added security, you can use the Log Out button before you close your browser. |
Other Security Measures
We maintain physical, electronic and procedural safeguards to protect your personal account information. Our employees and agents have access to that information only so that they may offer you products or provide services, for example, when responding to your account questions.
How You Can Help
You can also do your part to keep your account information private and to prevent unauthorized transactions. If you obtain a user ID and password for your account, do not allow it to be used by anyone else. Also, take special precautions when accessing your account on a computer used by others.
Who We Are
This joint notice describes the privacy policies of the Oppenheimer funds, OppenheimerFunds, Inc., each of its investment adviser subsidiaries, OppenheimerFunds Distributor, Inc. and OFI Global Trust Co. It applies to all Oppenheimer fund accounts you presently have, or may open in the future, using your Social Security number—whether or not you remain a shareholder of our funds. This notice was last updated March 2015. In the event it is updated or changed, we will post an updated notice on our website at oppenheimerfunds.com. If you have any questions about this privacy policy, write to us at P.O. Box 5270, Denver, CO 80217-5270, email us by clicking on the Contact Us section of our website at oppenheimerfunds.com or call us at 1.800.CALL OPP (225.5677).
100 OPPENHEIMER FUNDAMENTAL ALTERNATIVES FUND
THIS PAGE INTENTIONALLY LEFT BLANK.
101 OPPENHEIMER FUNDAMENTAL ALTERNATIVES FUND
THIS PAGE INTENTIONALLY LEFT BLANK.
102 OPPENHEIMER FUNDAMENTAL ALTERNATIVES FUND
THIS PAGE INTENTIONALLY LEFT BLANK.
103 OPPENHEIMER FUNDAMENTAL ALTERNATIVES FUND

Table of Contents
Class A Shares
AVERAGE ANNUAL TOTAL RETURNS AT 4/29/16*
| | | | | | | | |
| | | Class A Shares of the Fund | | | | |
| | | Without Sales Charge | | With Sales Charge | | Russell MidCap Value
Index | | Russell 2500 Value Index |
6-Month | | 0.97% | | -4.83% | | 3.16% | | 2.20% |
1-Year | | -5.43 | | -10.88 | | -0.18 | | -1.95 |
5-Year | | 6.19 | | 4.95 | | 10.45 | | 8.25 |
10-Year | | 4.38 | | 3.76 | | 7.35 | | 5.96 |
Prior to September 1, 2015, the Fund was named Oppenheimer Small- & Mid-Cap Value Fund.
Performance data quoted represents past performance, which does not guarantee future results. The investment return and principal value of an investment in the Fund will fluctuate so that an investor’s shares, when redeemed, may be worth more or less than their original cost. Fund returns include changes in share price, reinvested distributions, and a 5.75% maximum applicable sales charge except where “without sales charge” is indicated. Current performance may be lower or higher than the performance quoted. Returns do not consider capital gains or income taxes on an individual’s investment. Returns for periods of less than one year are cumulative and not annualized. For performance data current to the most recent month-end, visit oppenheimerfunds.com or call 1.800.CALL OPP (225.5677).
*April 29, 2016, was the last business day of the Fund’s semiannual period. See Note 2 of the accompanying Notes to Financial Statements. Index returns are calculated through April 30, 2016.
2 OPPENHEIMER MID CAP VALUE FUND
Fund Performance Discussion
The Fund’s Class A shares (without sales charge) returned 0.97% during the reporting period. On a relative basis, the Fund underperformed the Russell MidCap Value Index (the “Index”), which returned 3.16%. The Fund’s underperformance was driven primarily by weaker relative stock selection in the materials and financials sectors. The Fund outperformed the Index within health care and energy, due largely to stronger relative stock selection.
MARKET OVERVIEW
The six-month reporting period ended was a tumultuous time for global equity markets. The closing months of 2015 were marked by uncertainty over when, or if, the Federal Reserve (the “Fed”) would raise interest rates, which it eventually did in mid-December. In addition, plummeting energy prices, decelerating emerging market growth and sluggish developed market growth all contributed to an environment where investor sentiment swung back and forth like a pendulum. Volatility continued in the first four months of 2016. Adding to concerns over China’s slowing economy and falling crude oil prices were concerns of slowing global and domestic economic growth. However, sentiment improved in March as the Fed began to hint at lowering the trajectory of rate rises. Oil prices stabilized. Commodities, which have been declining from their super cycle peak for some time, rallied.
FUND REVIEW
Top contributors to performance this reporting period included WPX Energy, Inc., Tyson Foods, Inc. and MedAssets, Inc. We have been increasing our exposure to the energy
sector, moving from a significant underweight position in the summer of 2015 to a modest overweight at the end of the reporting period. Weakness in energy stocks during the second half of 2015 and early 2016 allowed us to add to positions in a number of exploration and production companies, including top performer WPX Energy, Inc. Energy companies have been aggressively cutting capital expenditure plans, which may lead to higher returns on invested capital as oil prices stabilize. Tyson Foods is a food production company that reported strong profit growth, driven by its efforts to boost sales of its “Core 9” packaged food brands. Our position in MedAssets benefited performance as it was acquired by private equity in January.
Detractors from performance included First NBC Bank Holding Co., Western Digital Corp. and Indivior plc. Early in 2016, financials experienced a selloff, which impacted our investment First NBC Bank Holding. This weakness led to opportunity, however. For example, we were able to add to positions at more favorable prices in Synchrony Financial. Synchrony, formerly a subsidiary of
3 OPPENHEIMER MID CAP VALUE FUND
General Electric, provides private label credit products, and January weakness provided an attractive buying opportunity. Western Digital continued to be weighed down by the weak PC market and issues relating to its pending acquisition of SanDisk. With respect to financing for the SanDisk acquisition, the stock has been hurt by additional equity issuance necessary to make up for the U.S. Government’s “blocking” of a Chinese equity infusion into Western Digital, as well as stress in the high yield credit markets raising the financing costs for the required debt. Western Digital completed the acquisition of SanDisk in May 2016, shortly after this reporting period ended. Indivior is a U.K.-based pharmaceutical firm focused on the treatment of opioid dependence. Shares were weak as questions emerged regarding ongoing litigation with generic companies over its Suboxone film products, as well as delays in its R&D (research and development) pipeline. We believe the upside potential of positive outcomes of the litigation and pipeline outweigh the downside risks.
STRATEGY & OUTLOOK
Our research process is centered around finding companies with improving return on invested capital, where that improvement has yet to be reflected in today’s price. This process uncovered ideas during the reporting period that are more likely to be thought of as deep value (e.g. energy and materials).
We believe this focus on value is timely. Since early 2009, the growth style has significantly
outperformed value. As value investors, this period has been a difficult one. But data is beginning to emerge that may suggest that value as a style may come back into favor:
| • | | Value dispersion—since 2009, the dispersion of valuations had been narrowing. In other words, the multiples investors pay for stocks has been converging. In such markets, growth tends to outperform as growth rates become the differentiating factor between businesses. Over the past year, those valuations have diverged significantly, which tends to reward a focus on valuation. |
| • | | Absolute valuations—the relative valuations of growth versus value, in aggregate, has approached peak levels, suggesting that the value portion of the market has become more attractive. This valuation data has tended to foreshadow value outperformance. |
| • | | Capital allocation trends—market volatility and economic uncertainty have led a number of companies to re-evaluate capital plans, most notably in the energy sector. The focus on prudently managing capital investments may generate higher long-term returns on capital, which tends to drive valuations higher. |
While many investors focus on a short-term view when considering potential investments, the Fund utilizes in-depth fundamental research to identify companies that we believe are poised for an unanticipated acceleration in return on invested capital over a multi-year time horizon. We believe this longer term
4 OPPENHEIMER MID CAP VALUE FUND
approach provides a more comprehensive outlook of potential investments by focusing on all three financial statements—income statement, balance sheet and statement of
| | | | |
 | | 
Laton Spahr, CFA Portfolio Manager | | |
cash flows—and helps us uncover companies whose generation and use of free cash flow we deem as yet to be fully reflected in the current stock price.
| | | | |
 | | 
Eric Hewitt Portfolio Manager | | |
5 OPPENHEIMER MID CAP VALUE FUND
Top Holdings and Allocations*
TOP TEN COMMON STOCK HOLDINGS
| | | | |
Reinsurance Group of America, Inc., Cl. A | | | 2.6 | % |
Lennar Corp., Cl. A | | | 2.6 | |
Ally Financial, Inc. | | | 2.1 | |
Validus Holdings Ltd. | | | 1.9 | |
Synopsys, Inc. | | | 1.9 | |
WPX Energy, Inc. | | | 1.8 | |
Associated Banc-Corp. | | | 1.8 | |
SunTrust Banks, Inc. | | | 1.6 | |
Zimmer Biomet Holdings, Inc. | | | 1.6 | |
Eaton Corp. plc | | | 1.6 | |
Portfolio holdings and allocations are subject to change. Percentages are as of April 29, 2016, and are based on net assets. For more current Fund holdings, please visit oppenheimerfunds.com.
TOP TEN COMMON STOCK INDUSTRIES
| | | | |
Insurance | | | 8.5 | % |
Oil, Gas & Consumable Fuels | | | 7.8 | |
Commercial Banks | | | 6.9 | |
Real Estate Investment Trusts (REITs) | | | 6.4 | |
Health Care Equipment & Supplies | | | 4.2 | |
Semiconductors & Semiconductor Equipment | | | 3.7 | |
Consumer Finance | | | 3.6 | |
Chemicals | | | 3.6 | |
Software | | | 3.5 | |
Household Durables | | | 3.4 | |
Portfolio holdings and allocations are subject to change. Percentages are as of April 29, 2016, and are based on net assets.
SECTOR ALLOCATION
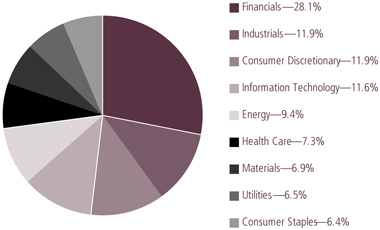
Portfolio holdings and allocations are subject to change. Percentages are as of April 29, 2016, and are based on the total market value of common stocks.
*April 29, 2016, was the last business day of the Fund’s semiannual period. See Note 2 of the accompanying Notes to Financial Statements.
6 OPPENHEIMER MID CAP VALUE FUND
Share Class Performance
AVERAGE ANNUAL TOTAL RETURNS WITHOUT SALES CHARGE AS OF 4/29/16
| | | | | | | | | | | | | | | | | | |
| | | Inception Date | | 6-Month | | | 1-Year | | | 5-Year | | | 10-Year | |
Class A (QVSCX) | | 1/3/89 | | | 0.97 | % | | | -5.43 | % | | | 6.19 | % | | | 4.38 | % |
Class B (QSCBX) | | 9/1/93 | | | 0.62 | | | | -6.16 | | | | 5.34 | | | | 3.88 | |
Class C (QSCCX) | | 9/1/93 | | | 0.62 | | | | -6.15 | | | | 5.38 | | | | 3.58 | |
Class I (QSCIX) | | 2/28/12 | | | 1.20 | | | | -5.01 | | | | 10.20 | * | | | N/A | |
Class R (QSCNX) | | 3/1/01 | | | 0.88 | | | | -5.68 | | | | 5.91 | | | | 4.08 | |
Class Y (QSCYX) | | 10/24/05 | | | 1.11 | | | | -5.19 | | | | 6.50 | | | | 4.73 | |
AVERAGE ANNUAL TOTAL RETURNS WITH SALES CHARGE AS OF 4/29/16
| | | | | | | | | | | | | | | | | | |
| | | Inception Date | | 6-Month | | | 1-Year | | | 5-Year | | | 10-Year | |
Class A (QVSCX) | | 1/3/89 | | | -4.83 | % | | | -10.88 | % | | | 4.95 | % | | | 3.76 | % |
Class B (QSCBX) | | 9/1/93 | | | -4.38 | | | | -10.85 | | | | 5.02 | | | | 3.88 | |
Class C (QSCCX) | | 9/1/93 | | | -0.39 | | | | -7.09 | | | | 5.38 | | | | 3.58 | |
Class I (QSCIX) | | 2/28/12 | | | 1.20 | | | | -5.01 | | | | 10.20 | * | | | N/A | |
Class R (QSCNX) | | 3/1/01 | | | 0.88 | | | | -5.68 | | | | 5.91 | | | | 4.08 | |
Class Y (QSCYX) | | 10/24/05 | | | 1.11 | | | | -5.19 | | | | 6.50 | | | | 4.73 | |
*Shows performance since inception.
Performance data quoted represents past performance, which does not guarantee future results. The investment return and principal value of an investment in the Fund will fluctuate so that an investor’s shares, when redeemed, may be worth more or less than their original cost. Current performance may be lower or higher than the performance quoted. Returns do not consider capital gains or income taxes on an individual’s investment. For performance data current to the most recent month-end, visit oppenheimerfunds.com or call 1.800.CALL OPP (225.5677). Fund returns include changes in share price, reinvested distributions, and the applicable sales charge: for Class A shares, the current maximum initial sales charge of 5.75%; for Class B shares, the contingent deferred sales charge of 5% (1-year) and 2% (5-year); and for Class C shares, the contingent deferred sales charge (“CDSC”) of 1% for the 1-year period. Prior to 7/1/14, Class R shares were named Class N shares. Beginning 7/1/14, new purchases of Class R shares will no longer be subject to a CDSC upon redemption (any CDSC will remain in effect for purchases prior to 7/1/14). There is no sales charge for Class I and Class Y shares. Because Class B shares convert to Class A shares 72 months after purchase, the 10-year return for Class B shares uses Class A performance for the period after conversion. Returns for periods of less than one year are cumulative and not annualized.
The Fund’s performance is compared to that of the Russell MidCap Value Index and the Russell 2500 Value Index. The Fund has changed its benchmark from the Russell 2500 Value Index to the Russell MidCap Value Index, which it believes is a more appropriate measure of the Fund’s performance. The Russell MidCap Value Index measures the performance of the mid-cap value segment of the U.S. equity universe. It includes those Russell MidCap Index companies with lower price-to-book ratios and lower forecasted growth values. The Russell
7 OPPENHEIMER MID CAP VALUE FUND
2500 Value Index measures the performance of the small to mid-cap value segment of the U.S. equity universe. It includes those Russell 2500 Index companies with lower price-to-book ratios and lower forecasted growth values. Indices are unmanaged and cannot be purchased directly by investors. While index comparisons may be useful to provide a benchmark for the Fund’s performance, it must be noted that the Fund’s investments are not limited to the investments comprising the indices. Index performance includes reinvestment of income, but does not reflect transaction costs, fees, expenses or taxes. Index performance is shown for illustrative purposes only as a benchmark for the Fund’s performance, and does not predict or depict performance of the Fund. The Fund’s performance reflects the effects of the Fund’s business and operating expenses.
The Fund’s investment strategy and focus can change over time. The mention of specific fund holdings does not constitute a recommendation by OppenheimerFunds, Inc. or its affiliates.
Before investing in any of the Oppenheimer funds, investors should carefully consider a fund’s investment objectives, risks, charges and expenses. Fund prospectuses and summary prospectuses contain this and other information about the funds, and may be obtained by asking your financial advisor, visiting oppenheimerfunds.com, or calling 1.800.CALL OPP (225.5677). Read prospectuses and summary prospectuses carefully before investing.
Shares of Oppenheimer funds are not deposits or obligations of any bank, are not guaranteed by any bank, are not insured by the FDIC or any other agency, and involve investment risks, including the possible loss of the principal amount invested.
8 OPPENHEIMER MID CAP VALUE FUND
Fund Expenses
Fund Expenses. As a shareholder of the Fund, you incur two types of costs: (1) transaction costs, which may include sales charges (loads) on purchase payments and/or contingent deferred sales charges on redemptions; and (2) ongoing costs, including management fees; distribution and service fees; and other Fund expenses. These examples are intended to help you understand your ongoing costs (in dollars) of investing in the Fund and to compare these costs with the ongoing costs of investing in other mutual funds.
The examples are based on an investment of $1,000.00 invested at the beginning of the period and held for the entire 6-month period ended April 29, 2016.
Actual Expenses. The first section of the table provides information about actual account values and actual expenses. You may use the information in this section for the class of shares you hold, together with the amount you invested, to estimate the expense that you paid over the period. Simply divide your account value by $1,000.00 (for example, an $8,600.00 account value divided by $1,000.00 = 8.60), then multiply the result by the number in the first section under the heading entitled “Expenses Paid During 6 Months Ended April 29, 2016” to estimate the expenses you paid on your account during this period.
Hypothetical Example for Comparison Purposes. The second section of the table provides information about hypothetical account values and hypothetical expenses based on the Fund’s actual expense ratio for each class of shares, and an assumed rate of return of 5% per year for each class before expenses, which is not the Fund’s actual return. The hypothetical account values and expenses may not be used to estimate the actual ending account balance or expenses you paid for the period. You may use this information to compare the ongoing costs of investing in the Fund and other funds. To do so, compare this 5% hypothetical example for the class of shares you hold with the 5% hypothetical examples that appear in the shareholder reports of the other funds.
Please note that the expenses shown in the table are meant to highlight your ongoing costs only and do not reflect any transactional costs, such as front-end or contingent deferred sales charges (loads). Therefore, the “hypothetical” section of the table is useful in comparing ongoing costs only, and will not help you determine the relative total costs of owning different funds. In addition, if these transactional costs were included, your costs would have been higher.
9 OPPENHEIMER MID CAP VALUE FUND
| | | | | | | | | | | | | | | | | | |
| Actual | | Beginning Account Value November 1, 2015 | | Ending Account Value April 29, 2016 | | Expenses Paid During 6 Months Ended April 29, 2016 |
Class A | | $ | 1,000.00 | | | | | $ | 1,009.70 | | | | | $ | 5.93 | | | |
Class B | | | 1,000.00 | | | | | | 1,006.20 | | | | | | 9.72 | | | |
Class C | | | 1,000.00 | | | | | | 1,006.20 | | | | | | 9.72 | | | |
Class I | | | 1,000.00 | | | | | | 1,012.00 | | | | | | 3.79 | | | |
Class R | | | 1,000.00 | | | | | | 1,008.80 | | | | | | 7.18 | | | |
Class Y | | | 1,000.00 | | | | | | 1,011.10 | | | | | | 4.74 | | | |
| | | | | | |
| Hypothetical | | | | | | | | | | | | | | | | | | |
(5% return before expenses) | | | | | | | | | | | | | | | | | | |
Class A | | | 1,000.00 | | | | | | 1,018.84 | | | | | | 5.96 | | | |
Class B | | | 1,000.00 | | | | | | 1,015.08 | | | | | | 9.76 | | | |
Class C | | | 1,000.00 | | | | | | 1,015.08 | | | | | | 9.76 | | | |
Class I | | | 1,000.00 | | | | | | 1,020.97 | | | | | | 3.80 | | | |
Class R | | | 1,000.00 | | | | | | 1,017.61 | | | | | | 7.21 | | | |
Class Y | | | 1,000.00 | | | | | | 1,020.03 | | | | | | 4.76 | | | |
Expenses are equal to the Fund’s annualized expense ratio for that class, multiplied by the average account value over the period, multiplied by 181/366 (to reflect the one-half year period). Those annualized expense ratios, excluding indirect expenses from affiliated funds, based on the 6-month period ended April 29, 2016 are as follows:
| | | | | | |
| Class | | Expense Ratios | | | |
Class A | | | 1.19 | % | | |
Class B | | | 1.95 | | | |
Class C | | | 1.95 | | | |
Class I | | | 0.76 | | | |
Class R | | | 1.44 | | | |
Class Y | | | 0.95 | | | |
The expense ratios reflect voluntary and/or contractual waivers and/or reimbursements of expenses by the Fund’s Manager. Some of these undertakings may be modified or terminated at any time, as indicated in the Fund’s prospectus. The “Financial Highlights” tables in the Fund’s financial statements, included in this report, also show the gross expense ratios, without such waivers or reimbursements and reduction to custodian expenses, if applicable.
10 OPPENHEIMER MID CAP VALUE FUND
STATEMENT OF INVESTMENTS April 29, 2016* Unaudited
| | | | | | | | |
| | | Shares | | | Value | |
Common Stocks—99.3% | |
Consumer Discretionary—11.8% | |
Auto Components—1.3% | |
BorgWarner, Inc. | | | 464,050 | | | | $ 16,668,676 | |
Automobiles—1.0% | | | | | | | | |
Thor Industries, Inc. | | | 211,010 | | | | 13,508,860 | |
Hotels, Restaurants & Leisure—1.3% | |
Norwegian Cruise Line Holdings Ltd.1 | | | 169,320 | | | | 8,278,055 | |
Royal Caribbean Cruises Ltd. | | | 109,420 | | | | 8,469,108 | |
| | | | | | | 16,747,163 | |
| | | | | | | | | |
Household Durables—3.4% | | | | | | | | |
Lennar Corp., Cl. A | | | 733,600 | | | | 33,239,416 | |
Whirlpool Corp. | | | 62,040 | | | | 10,803,646 | |
| | | | | | | 44,043,062 | |
| | | | | | | | | |
Leisure Products—1.1% | | | | | | | | |
Arctic Cat, Inc. | | | 79,260 | | | | 1,318,094 | |
Mattel, Inc. | | | 442,100 | | | | 13,744,889 | |
| | | | | | | 15,062,983 | |
| | | | | | | | | |
Media—1.6% | | | | | | | | |
Cinemark Holdings, Inc. | | | 289,610 | | | | 10,034,986 | |
Regal Entertainment Group, Cl. A | | | 221,700 | | | | 4,622,445 | |
TEGNA, Inc. | | | 260,110 | | | | 6,076,170 | |
| | | | | | | 20,733,601 | |
| | | | | | | | | |
Multiline Retail—0.9% | | | | | | | | |
Dillard’s, Inc., Cl. A | | | 48,300 | | | | 3,402,735 | |
Kohl’s Corp. | | | 109,770 | | | | 4,862,811 | |
Nordstrom, Inc. | | | 66,510 | | | | 3,400,656 | |
| | | | | | | 11,666,202 | |
| | | | | | | | | |
Specialty Retail—1.2% | | | | | | | | |
Advance Auto Parts, Inc. | | | 27,780 | | | | 4,336,458 | |
Bed Bath & Beyond, Inc.1 | | | 54,320 | | | | 2,564,990 | |
Best Buy Co., Inc. | | | 150,910 | | | | 4,841,193 | |
Williams-Sonoma, Inc. | | | 69,750 | | | | 4,099,905 | |
| | | | | | | 15,842,546 | |
| | | | | | | | | |
Consumer Staples—6.4% | |
Beverages—1.3% | | | | | | | | |
Molson Coors Brewing Co., Cl. B | | | 180,090 | | | | 17,222,007 | |
| | | | | | | | |
| | | Shares | | | Value | |
Food & Staples Retailing—1.3% | |
Rite Aid Corp.1 | | | 2,030,668 | | | $ | 16,346,877 | |
Food Products—1.9% | | | | | | | | |
B&G Foods, Inc. | | | 254,084 | | | | 10,470,802 | |
Hain Celestial Group, Inc. (The)1 | | | 117,820 | | | | 4,931,945 | |
Tyson Foods, Inc., Cl. A | | | 142,730 | | | | 9,394,488 | |
| | | | | | | 24,797,235 | |
| | | | | | | | | |
Household Products—1.3% | | | | | | | | |
Energizer Holdings, Inc. | | | 176,081 | | | | 7,657,763 | |
Spectrum Brands Holdings, Inc. | | | 82,290 | | | | 9,348,144 | |
| | | | | | | 17,005,907 | |
| | | | | | | | | |
Personal Products—0.6% | | | | | | | | |
Edgewell Personal Care Co. | | | 93,941 | | | | 7,709,738 | |
| | | | | | | | | |
Energy—9.4% | |
Energy Equipment & Services—1.6% | |
FMC Technologies, Inc.1 | | | 167,266 | | | | 5,099,940 | |
Helmerich & Payne, Inc. | | | 81,515 | | | | 5,389,772 | |
Oceaneering International, Inc. | | | 91,705 | | | | 3,360,988 | |
Patterson-UTI Energy, Inc. | | | 323,735 | | | | 6,393,766 | |
| | | | | | | 20,244,466 | |
| | | | | | | | | |
Oil, Gas & Consumable Fuels—7.8% | |
Chesapeake Energy Corp.1 | | | 400,380 | | | | 2,750,610 | |
Cimarex Energy Co. | | | 185,826 | | | | 20,232,735 | |
Denbury Resources, Inc. | | | 1,339,460 | | | | 5,170,316 | |
Hess Corp. | | | 258,970 | | | | 15,439,791 | |
HollyFrontier Corp. | | | 88,637 | | | | 3,155,477 | |
Newfield Exploration Co.1 | | | 348,059 | | | | 12,617,139 | |
PDC Energy, Inc.1 | | | 90,030 | | | | 5,652,984 | |
SM Energy Co. | | | 241,460 | | | | 7,523,894 | |
Tesoro Corp. | | | 71,220 | | | | 5,675,522 | |
WPX Energy, Inc.1 | | | 2,460,470 | | | | 23,768,140 | |
| | | | | | | 101,986,608 | |
| | | | | | | | | |
Financials—27.9% | |
Capital Markets—2.1% | | | | | | | | |
Ares Management LP2 | | | 801,442 | | | | 11,628,923 | |
11 OPPENHEIMER MID CAP VALUE FUND
| | |
| |
| STATEMENT OF INVESTMENTS Unaudited / Continued | | |
| | | | | | | | |
| | | Shares | | | Value | |
Capital Markets (Continued) | |
Raymond James Financial, Inc. | | | 293,350 | | | $ | 15,304,070 | |
| | | | | | | 26,932,993 | |
| | | | | | | | | |
Commercial Banks—6.9% | |
Associated Banc-Corp. | | | 1,282,400 | | | | 23,390,976 | |
First NBC Bank Holding Co.1 | | | 313,680 | | | | 6,819,403 | |
Glacier Bancorp, Inc. | | | 89,310 | | | | 2,312,236 | |
Huntington Bancshares, Inc. | | | 1,981,940 | | | | 19,938,316 | |
KeyCorp | | | 264,830 | | | | 3,254,761 | |
SunTrust Banks, Inc. | | | 499,570 | | | | 20,852,052 | |
TCF Financial Corp. | | | 528,190 | | | | 7,204,512 | |
Zions Bancorporation | | | 208,337 | | | | 5,733,434 | |
| | | | | | | 89,505,690 | |
| | | | | | | | | |
Consumer Finance—3.6% | |
Ally Financial, Inc.1 | | | 1,558,790 | | | | 27,762,050 | |
Synchrony Financial1 | | | 643,550 | | | | 19,673,324 | |
| | | | | | | 47,435,374 | |
| | | | | | | | | |
Diversified Financial Services—0.4% | |
Nasdaq, Inc. | | | 50,950 | | | | 3,144,124 | |
Voya Financial, Inc. | | | 79,770 | | | | 2,590,132 | |
| | | | | | | 5,734,256 | |
| | | | | | | | | |
Insurance—8.5% | | | | | | | | |
Arthur J. Gallagher & Co. | | | 52,370 | | | | 2,411,115 | |
CNO Financial Group, Inc. | | | 305,270 | | | | 5,607,810 | |
Everest Re Group Ltd. | | | 52,940 | | | | 9,788,606 | |
Genworth Financial, Inc., Cl. A1 | | | 1,801,940 | | | | 6,180,654 | |
Reinsurance Group of America, Inc., Cl. A | | | 355,820 | | | | 33,881,180 | |
Unum Group | | | 544,780 | | | | 18,636,924 | |
Validus Holdings Ltd. | | | 549,470 | | | | 25,325,072 | |
XL Group plc, Cl. A | | | 268,760 | | | | 8,796,515 | |
| | | | | | | 110,627,876 | |
| | | | | | | | | |
Real Estate Investment Trusts (REITs)—6.4% | |
Alexandria Real Estate Equities, Inc. | | | 74,690 | | | | 6,942,436 | |
American Capital Agency Corp. | | | 412,640 | | | | 7,580,197 | |
| | | | | | | | |
| | | Shares | | | Value | |
Real Estate Investment Trusts (REITs) (Continued) | |
Apartment Investment & Management Co., Cl. A | | | 145,770 | | | $ | 5,839,546 | |
Care Capital Properties, Inc. | | | 118,620 | | | | 3,163,595 | |
CubeSmart | | | 459,120 | | | | 13,594,543 | |
Digital Realty Trust, Inc. | | | 66,890 | | | | 5,884,982 | |
Equity LifeStyle Properties, Inc. | | | 233,080 | | | | 15,963,649 | |
Highwoods Properties, Inc. | | | 137,590 | | | | 6,429,581 | |
LaSalle Hotel Properties | | | 379,694 | | | | 9,074,687 | |
Omega Healthcare Investors, Inc. | | | 278,437 | | | | 9,402,817 | |
| | | | | | | 83,876,033 | |
| | | | | | | | | |
Health Care—7.2% | | | | | | | | |
Health Care Equipment & Supplies—4.2% | |
Boston Scientific Corp.1 | | | 421,637 | | | | 9,242,283 | |
Cooper Cos., Inc. (The) | | | 42,810 | | | | 6,553,355 | |
Teleflex, Inc. | | | 122,737 | | | | 19,119,970 | |
Zimmer Biomet Holdings, Inc. | | | 177,670 | | | | 20,568,856 | |
| | | | | | | 55,484,464 | |
| | | | | | | | | |
Life Sciences Tools & Services—1.0% | |
Quintiles Transnational Holdings, Inc.1 | | | 185,911 | | | | 12,840,873 | |
| | | | | | | | | |
Pharmaceuticals—2.0% | | | | | | | | |
Indivior plc, Sponsored ADR | | | 1,375,554 | | | | 16,348,459 | |
Jazz Pharmaceuticals plc1 | | | 62,880 | | | | 9,476,016 | |
| | | | | | | 25,824,475 | |
| | | | | | | | | |
Industrials—11.8% | | | | | | | | |
Aerospace & Defense—2.4% | |
Esterline Technologies Corp.1 | | | 170,170 | | | | 11,683,872 | |
Huntington Ingalls Industries, Inc. | | | 60,750 | | | | 8,794,778 | |
Orbital ATK, Inc. | | | 124,850 | | | | 10,861,950 | |
| | | | | | | 31,340,600 | |
12 OPPENHEIMER MID CAP VALUE FUND
| | | | | | | | |
| | | Shares | | | Value | |
Air Freight & Couriers—0.4% | |
XPO Logistics, Inc.1 | | | 152,440 | | | $ | 4,594,542 | |
| | | | | | | | | |
Airlines—0.8% | | | | | | | | |
Air Canada1 | | | 1,472,443 | | | | 10,896,078 | |
| | | | | | | | | |
Commercial Services & Supplies—1.3% | |
Deluxe Corp. | | | 264,770 | | | | 16,622,260 | |
| | | | | | | | | |
Electrical Equipment—2.5% | | | | | | | | |
Eaton Corp. plc | | | 322,710 | | | | 20,417,861 | |
Hubbell, Inc., Cl. B | | | 119,080 | | | | 12,593,901 | |
| | | | | | | 33,011,762 | |
| | | | | | | | | |
Machinery—1.8% | | | | | | | | |
Parker-Hannifin Corp. | | | 126,350 | | | | 14,659,127 | |
WABCO Holdings, Inc.1 | | | 40,510 | | | | 4,543,602 | |
Xylem, Inc. | | | 105,600 | | | | 4,411,968 | |
| | | | | | | 23,614,697 | |
| | | | | | | | | |
Professional Services—1.6% | |
Nielsen Holdings plc | | | 158,220 | | | | 8,249,591 | |
On Assignment, Inc.1 | | | 355,000 | | | | 12,801,300 | |
| | | | | | | 21,050,891 | |
| | | | | | | | | |
Road & Rail—0.2% | |
Swift Transportation Co., Cl. A1 | | | 172,690 | | | | 2,870,108 | |
| | | | | | | | | |
Trading Companies & Distributors—0.8% | |
HD Supply Holdings, Inc.1 | | | 282,210 | | | | 9,674,159 | |
| | | | | | | | | |
Information Technology—11.5% | |
Electronic Equipment, Instruments, & Components—3.0% | |
Avnet, Inc. | | | 396,410 | | | | 16,300,379 | |
Dolby Laboratories, Inc., Cl. A | | | 263,200 | | | | 12,530,952 | |
Flextronics International Ltd.1 | | | 877,050 | | | | 10,656,158 | |
| | | | | | | 39,487,489 | |
| | | | | | | | | |
IT Services—0.5% | |
First Data Corp., Cl. A1 | | | 593,870 | | | | 6,764,179 | |
| | | | | | | | | |
Semiconductors & Semiconductor Equipment—3.7% | |
Applied Materials, Inc. | | | 664,070 | | | | 13,593,513 | |
Lam Research Corp. | | | 198,990 | | | | 15,202,836 | |
Micron Technology, Inc.1 | | | 328,120 | | | | 3,527,290 | |
| | | | | | | | |
| | | Shares | | | Value | |
Semiconductors & Semiconductor Equipment (Continued) | |
Semtech Corp.1 | | | 634,610 | | | $ | 13,732,961 | |
Skyworks Solutions, Inc. | | | 36,320 | | | | 2,426,902 | |
| | | | | | | 48,483,502 | |
| | | | | | | | | |
Software—3.5% | | | | | | | | |
Check Point Software Technologies Ltd.1 | | | 139,560 | | | | 11,565,337 | |
Synopsys, Inc.1 | | | 504,070 | | | | 23,953,406 | |
Verint Systems, Inc.1 | | | 282,190 | | | | 9,549,310 | |
| | | | | | | 45,068,053 | |
| | | | | | | | | |
Technology Hardware, Storage & Peripherals—0.8% | |
Western Digital Corp. | | | 249,990 | | | | 10,215,841 | |
| | | | | | | | | |
Materials—6.8% | |
Chemicals—3.6% | | | | | | | | |
Eastman Chemical Co. | | | 136,580 | | | | 10,431,980 | |
International Flavors & Fragrances, Inc. | | | 93,340 | | | | 11,151,330 | |
Mosaic Co. (The) | | | 79,500 | | | | 2,225,205 | |
PPG Industries, Inc. | | | 129,370 | | | | 14,281,154 | |
RPM International, Inc. | | | 183,950 | | | | 9,294,994 | |
| | | | | | | 47,384,663 | |
| | | | | | | | | |
Containers & Packaging—2.2% | | | | | | | | |
Ball Corp. | | | 123,980 | | | | 8,849,692 | |
Owens-Illinois, Inc.1 | | | 503,170 | | | | 9,288,518 | |
WestRock Co. | | | 241,730 | | | | 10,116,401 | |
| | | | | | | 28,254,611 | |
| | | | | | | | | |
Paper & Forest Products—1.0% | | | | | | | | |
Louisiana-Pacific Corp.1 | | | 789,220 | | | | 13,416,740 | |
| | | | | | | | | |
Utilities—6.5% | |
Electric Utilities—2.0% | | | | | | | | |
Avangrid, Inc. | | | 108,690 | | | | 4,358,469 | |
Emera, Inc. | | | 179,174 | | | | 6,493,219 | |
Portland General Electric Co. | | | 165,100 | | | | 6,557,772 | |
PPL Corp. | | | 135,670 | | | | 5,106,619 | |
Xcel Energy, Inc. | | | 90,200 | | | | 3,610,706 | |
| | | | | | | 26,126,785 | |
13 OPPENHEIMER MID CAP VALUE FUND
STATEMENT OF INVESTMENTS Unaudited / Continued
| | | | | | | | |
| | | Shares | | | Value | |
Independent Power and Renewable Electricity Producers—0.4% | |
AES Corp. | | | 468,570 | | | $ | 5,229,241 | |
| | |
| | | | | | | | | |
Multi-Utilities—3.0% | | | | | | | | |
Alliant Energy Corp. | | | 121,710 | | | | 8,582,989 | |
Ameren Corp. | | | 281,880 | | | | 13,530,240 | |
Avista Corp. | | | 175,390 | | | | 7,027,877 | |
DTE Energy Co. | | | 72,840 | | | | 6,494,415 | |
MDU Resources Group, Inc. | | | 177,070 | | | | 3,552,024 | |
| | | | | | | 39,187,545 | |
| | |
| | | | | | | | | |
Water Utilities—1.1% | | | | | | | | |
American Water Works Co., Inc. | | | 186,780 | | | | 13,590,113 | |
Total Common Stocks (Cost $1,159,481,276) | | | | | | | 1,294,731,824 | |
| | | | | | | | |
| | | Shares | | | Value | |
Investment Company—0.7% | |
| Oppenheimer Institutional Money Market Fund, Cl. E, 0.48%3,4 (Cost $8,678,176) | | | 8,678,176 | | | $ | 8,678,176 | |
| |
Total Investments, at Value
(Cost $1,168,159,452) | | | 100.0% | | | | 1,303,410,000 | |
| |
Net Other Assets (Liabilities) | | | 0.0 | | | | 168,555 | |
| | | | |
Net Assets | | | 100.0% | | | $ | 1,303,578,555 | |
| | | | |
Footnotes to Statement of Investments
| * | April 29, 2016 represents the last business day of the Fund’s reporting period. See Note 2 of the accompanying notes. |
1. Non-income producing security.
2. Security is a Master Limited Partnership.
3. Rate shown is the 7-day yield at period end.
4. Is or was an affiliate, as defined in the Investment Company Act of 1940, as amended, at or during the reporting period, by virtue of the Fund owning at least 5% of the voting securities of the issuer or as a result of the Fund and the issuer having the same investment adviser. Transactions during the reporting period in which the issuer was an affiliate are as follows:
| | | | | | | | | | | | | | | | |
| | | Shares
October 30,
2015a | | | Gross
Additions | | | Gross
Reductions | | | Shares
April 29, 2016a | |
Oppenheimer Institutional Money Market Fund, Cl. E | | | 18,716,295 | | | | 137,365,241 | | | | 147,403,360 | | | | 8,678,176 | |
| | | | |
| | | | | | | | | Value | | | Income | |
Oppenheimer Institutional Money Market Fund, Cl. E | | | | | | | | | | $ | 8,678,176 | | | $ | 25,311 | |
a. Represents the last business day of the Fund’s reporting period. See Note 2 of the accompanying notes.
See accompanying Notes to Financial Statements.
14 OPPENHEIMER MID CAP VALUE FUND
STATEMENT OF ASSETS AND LIABILITIES April 29, 20161 Unaudited
| | | | |
Assets | | | | |
Investments, at value—see accompanying statement of investments: | | | | |
Unaffiliated companies (cost $1,159,481,276) | | $ | 1,294,731,824 | |
Affiliated companies (cost $8,678,176) | | | 8,678,176 | |
| | | | |
| | | 1,303,410,000 | |
| |
Cash | | | 1,000,073 | |
| |
Receivables and other assets: | | | | |
Dividends | | | 706,181 | |
Investments sold | | | 353,133 | |
Shares of beneficial interest sold | | | 291,359 | |
Other | | | 209,722 | |
| | | | |
Total assets | | | 1,305,970,468 | |
|
| |
Liabilities | | | | |
Payables and other liabilities: | | | | |
Shares of beneficial interest redeemed | | | 1,366,033 | |
Trustees’ compensation | | | 399,636 | |
Investments purchased | | | 334,584 | |
Distribution and service plan fees | | | 255,809 | |
Shareholder communications | | | 11,548 | |
Other | | | 24,303 | |
| | | | |
Total liabilities | | | 2,391,913 | |
|
| |
Net Assets | | $ | 1,303,578,555 | |
| | | | |
|
| |
Composition of Net Assets | | | | |
Par value of shares of beneficial interest | | $ | 289,309 | |
| |
Additional paid-in capital | | | 1,249,388,128 | |
| |
Accumulated net investment income | | | 883,315 | |
| |
Accumulated net realized loss on investments and foreign currency transactions | | | (82,232,720 | ) |
| |
Net unrealized appreciation on investments and translation of assets and liabilities denominated in foreign currencies | | | 135,250,523 | |
| | | | |
Net Assets | | $ | 1,303,578,555 | |
| | | | |
15 OPPENHEIMER MID CAP VALUE FUND
| | |
| |
| STATEMENT OF ASSETS AND LIABILITIES Unaudited / Continued | | |
| | | | |
| |
Net Asset Value Per Share | | | | |
Class A Shares: | | | | |
| |
| Net asset value and redemption price per share (based on net assets of $919,604,785 and 19,646,129 shares of beneficial interest outstanding) | | | $46.81 | |
| |
| Maximum offering price per share (net asset value plus sales charge of 5.75% of offering price) | | | $49.67 | |
| |
| |
Class B Shares: | | | | |
| |
| Net asset value, redemption price (excludes applicable contingent deferred sales charge) and offering price per share (based on net assets of $15,050,756 and 384,155 shares of beneficial interest outstanding) | | | $39.18 | |
| |
| |
Class C Shares: | | | | |
| |
| Net asset value, redemption price (excludes applicable contingent deferred sales charge) and offering price per share (based on net assets of $234,760,880 and 5,983,438 shares of beneficial interest outstanding) | | | $39.24 | |
| |
| |
Class I Shares: | | | | |
| |
| Net asset value, redemption price and offering price per share (based on net assets of $811,130 and 17,049 shares of beneficial interest outstanding) | | | $47.58 | |
| |
| |
Class R Shares: | | | | |
| |
| Net asset value, redemption price (excludes applicable contingent deferred sales charge) and offering price per share (based on net assets of $85,809,936 and 1,909,218 shares of beneficial interest outstanding) | | | $44.95 | |
| |
| |
Class Y Shares: | | | | |
| |
| Net asset value, redemption price and offering price per share (based on net assets of $47,541,068 and 990,905 shares of beneficial interest outstanding) | | | $47.98 | |
1. April 29, 2016 represents the last day of the Fund’s reporting period. See Note 2 of the accompanying notes.
See accompanying Notes to Financial Statements.
16 OPPENHEIMER MID CAP VALUE FUND
STATEMENT OF OPERATIONS For the Six Months Ended April 29, 20161 Unaudited
| | | | |
| | |
Investment Income | | | | |
| |
Dividends: | | | | |
Unaffiliated companies (net of foreign withholding taxes of $22,549) | | $ | 10,753,437 | |
Affiliated companies | | | 25,311 | |
| |
Interest | | | 731 | |
| | | | |
Total investment income | | | 10,779,479 | |
| | | | |
Expenses | | | | |
Management fees | | | 4,515,482 | |
| |
Distribution and service plan fees: | | | | |
Class A | | | 1,093,211 | |
Class B | | | 83,512 | |
Class C | | | 1,150,770 | |
Class R | | | 210,615 | |
| |
Transfer and shareholder servicing agent fees: | | | | |
Class A | | | 983,868 | |
Class B | | | 18,454 | |
Class C | | | 253,917 | |
Class I | | | 112 | |
Class R | | | 93,148 | |
Class Y | | | 50,207 | |
| |
Shareholder communications: | | | | |
Class A | | | 13,507 | |
Class B | | | 904 | |
Class C | | | 3,608 | |
Class I | | | 3 | |
Class Y | | | 541 | |
| |
Trustees’ compensation | | | 13,065 | |
| |
Borrowing fees | | | 11,924 | |
| |
Custodian fees and expenses | | | 4,429 | |
| |
Other | | | 74,288 | |
| | | | |
Total expenses | | | 8,575,565 | |
Less waivers and reimbursements of expenses | | | (6,100) | |
| | | | |
Net expenses | | | 8,569,465 | |
| |
Net Investment Income | | | 2,210,014 | |
17 OPPENHEIMER MID CAP VALUE FUND
| | |
| |
| STATEMENT OF OPERATIONS Unaudited / Continued | | |
| | | | |
| |
Realized and Unrealized Gain | | | | |
Net realized gain on: | | | | |
Investments from unaffiliated companies | | $ | 765,080 | |
Foreign currency transactions | | | 2,670 | |
| | | | |
Net realized gain | | | 767,750 | |
| |
Net change in unrealized appreciation/depreciation on: | | | | |
Investments | | | 3,695,112 | |
Translation of assets and liabilities denominated in foreign currencies | | | 272,573 | |
| | | | |
Net change in unrealized appreciation/depreciation | | | 3,967,685 | |
| |
Net Increase in Net Assets Resulting from Operations | | $ | 6,945,449 | |
| | | | |
1. April 29, 2016 represents the last day of the Fund’s reporting period. See Note 2 of the accompanying notes.
See accompanying Notes to Financial Statements.
18 OPPENHEIMER MID CAP VALUE FUND
STATEMENTS OF CHANGES IN NET ASSETS
| | | | | | | | |
| | | Six Months Ended
April 29, 2016
(Unaudited)1 | | | Year Ended
October 30, 20151 | |
Operations | | | | | | | | |
Net investment income | | $ | 2,210,014 | | | $ | 5,197,297 | |
Net realized gain | | | 767,750 | | | | 150,686,311 | |
Net change in unrealized appreciation/depreciation | | | 3,967,685 | | | | (151,613,923) | |
| | | | |
Net increase in net assets resulting from operations | | | 6,945,449 | | | | 4,269,685 | |
Dividends and/or Distributions to Shareholders | | | | | | | | |
Dividends from net investment income: | | | | | | | | |
Class A | | | (1,652,638 | ) | | | (5,142,601) | |
Class B | | | — | | | | — | |
Class C | | | — | | | | — | |
Class I | | | (2,927 | ) | | | (5,660) | |
Class R | | | (56,762 | ) | | | (288,773) | |
Class Y | | | (136,078 | ) | | | (368,204) | |
| | | | |
| | | (1,848,405 | ) | | | (5,805,238) | |
Beneficial Interest Transactions | | | | | | | | |
Net increase (decrease) in net assets resulting from beneficial interest transactions: | | | | | | | | |
Class A | | | (51,188,466 | ) | | | (136,822,185) | |
Class B | | | (5,599,047 | ) | | | (16,687,522) | |
Class C | | | (19,031,499 | ) | | | (24,861,505) | |
Class I | | | 12,775 | | | | 370,030 | |
Class R | | | (12,752,024 | ) | | | (28,135,380) | |
Class Y | | | (2,034,271 | ) | | | (975,486) | |
| | | | |
| | | (90,592,532 | ) | | | (207,112,048) | |
| | | | | | | | |
Net Assets | | | | | | | | |
Total decrease | | | (85,495,488 | ) | | | (208,647,601) | |
| |
Beginning of period | | | 1,389,074,043 | | | | 1,597,721,644 | |
| | | | |
End of period (including accumulated net investment income of $883,315 and $521,706, respectively) | | $ | 1,303,578,555 | | | $ | 1,389,074,043 | |
| | | | |
1. April 29, 2016 and October 30, 2015 represent the last days of the Fund’s reporting periods. See Note 2 of the accompanying notes.
See accompanying Notes to Financial Statements.
19 OPPENHEIMER MID CAP VALUE FUND
FINANCIAL HIGHLIGHTS
| | | | | | | | | | | | |
| Class A | | Six Months
Ended
April 29, 2016
(Unaudited)1 | | Year Ended
October 30,
20151 | | Year Ended
October 31,
2014 | | Year Ended
October 31,
2013 | | Year Ended
October 31,
2012 | | Year Ended
October 31,
2011 |
|
Per Share Operating Data | | | | | | | | | | | | |
Net asset value, beginning of period | | $46.44 | | $46.72 | | $42.63 | | $31.33 | | $30.05 | | $29.44 |
|
Income (loss) from investment operations: | | | | | | | | | | | | |
Net investment income2 | | 0.11 | | 0.24 | | 0.36 | | 0.24 | | 0.07 | | 0.03 |
Net realized and unrealized gain (loss) | | 0.34 | | (0.29) | | 4.25 | | 11.09 | | 1.21 | | 0.58 |
| | |
Total from investment operations | | 0.45 | | (0.05) | | 4.61 | | 11.33 | | 1.28 | | 0.61 |
|
Dividends and/or distributions to shareholders: | | | | | | | | | | | | |
Dividends from net investment income | | (0.08) | | (0.23) | | (0.52) | | (0.03) | | 0.00 | | 0.00 |
|
Net asset value, end of period | | $46.81 | | $46.44 | | $46.72 | | $42.63 | | $31.33 | | $30.05 |
| | |
|
| | | | | | |
Total Return, at Net Asset Value3 | | 0.97% | | (0.13)% | | 10.91% | | 36.16% | | 4.26% | | 2.07% |
|
Ratios/Supplemental Data | | | | | | | | | | | | |
Net assets, end of period (in thousands) | | $919,605 | | $966,842 | | $1,104,252 | | $1,162,455 | | $938,427 | | $1,250,055 |
|
Average net assets (in thousands) | | $899,184 | | $1,085,463 | | $1,151,106 | | $1,013,781 | | $1,099,549 | | $1,527,052 |
|
Ratios to average net assets:4 | | | | | | | | | | | | |
Net investment income | | 0.50% | | 0.49% | | 0.80% | | 0.65% | | 0.24% | | 0.11% |
| Expenses excluding specific expenses listed below | | 1.19% | | 1.17% | | 1.18% | | 1.27% | | 1.31% | | 1.26% |
Interest and fees from borrowings | | 0.00%5 | | 0.00%5 | | 0.00% | | 0.00% | | 0.00% | | 0.00% |
| | |
Total expenses6 | | 1.19% | | 1.17% | | 1.18% | | 1.27% | | 1.31% | | 1.26% |
| Expenses after payments, waivers and/or reimbursements and reduction to custodian expenses | | 1.19% | | 1.17% | | 1.18% | | 1.27% | | 1.26% | | 1.25% |
|
Portfolio turnover rate | | 16% | | 47% | | 51% | | 128% | | 54% | | 89% |
20 OPPENHEIMER MID CAP VALUE FUND
1. April 29, 2016 and October 30, 2015 represent the last business days of the Fund’s respective reporting periods.
See Note 2 of the accompanying Notes.
2. Per share amounts calculated based on the average shares outstanding during the period.
3. Assumes an initial investment on the business day before the first day of the fiscal period, with all dividends and distributions reinvested in additional shares on the reinvestment date, and redemption at the net asset value calculated on the last business day of the fiscal period. Sales charges are not reflected in the total returns. Total returns are not annualized for periods less than one full year. Returns do not reflect the deduction of taxes that a shareholder would pay on fund distributions or the redemption of fund shares.
4. Annualized for periods less than one full year.
5. Less than 0.005%.
6. Total expenses including indirect expenses from affiliated fund fees and expenses were as follows:
| | | | | | | | |
| | Six Months Ended April 29, 2016 | | | 1.19 | % | | |
| | Year Ended October 30, 2015 | | | 1.17 | % | | |
| | Year Ended October 31, 2014 | | | 1.18 | % | | |
| | Year Ended October 31, 2013 | | | 1.27 | % | | |
| | Year Ended October 31, 2012 | | | 1.31 | % | | |
| | Year Ended October 31, 2011 | | | 1.27 | % | | |
See accompanying Notes to Financial Statements.
21 OPPENHEIMER MID CAP VALUE FUND
| | |
| |
| FINANCIAL HIGHLIGHTS Continued | | |
| | | | | | | | | | | | |
| Class B | | Six Months
Ended
April 29, 2016
(Unaudited)1 | | Year Ended
October 30,
20151 | | Year Ended
October 31,
2014 | | Year Ended
October 31,
2013 | | Year Ended
October 31,
2012 | | Year Ended
October 31,
2011 |
Per Share Operating Data | | | | | | | | | | | | |
Net asset value, beginning of period | | $38.94 | | $39.29 | | $35.74 | | $26.48 | | $25.60 | | $25.29 |
|
Income (loss) from investment operations: | | | | | | | | | | | | |
Net investment income (loss)2 | | (0.04) | | (0.10) | | 0.01 | | (0.08) | | (0.15) | | (0.20) |
Net realized and unrealized gain (loss) | | 0.28 | | (0.25) | | 3.57 | | 9.34 | | 1.03 | | 0.51 |
| | |
Total from investment operations | | 0.24 | | (0.35) | | 3.58 | | 9.26 | | 0.88 | | 0.31 |
|
Dividends and/or distributions to shareholders: | | | | | | | | | | | | |
Dividends from net investment income | | 0.00 | | 0.00 | | (0.03) | | 0.00 | | 0.00 | | 0.00 |
|
Net asset value, end of period | | $39.18 | | $38.94 | | $39.29 | | $35.74 | | $26.48 | | $25.60 |
| | |
| | | | | | | | | | | | |
Total Return, at Net Asset Value3 | | 0.62% | | (0.89)% | | 10.03% | | 34.97% | | 3.44% | | 1.23% |
| | | | | | | | | | | | |
|
Ratios/Supplemental Data | | | | | | | | | | | | |
Net assets, end of period (in thousands) | | $15,051 | | $20,774 | | $37,092 | | $48,927 | | $53,204 | | $85,100 |
|
Average net assets (in thousands) | | $16,840 | | $29,531 | | $43,889 | | $48,518 | | $67,022 | | $113,687 |
|
Ratios to average net assets:4 | | | | | | | | | | | | |
Net investment income (loss) | | (0.19)% | | (0.23)% | | 0.04% | | (0.25)% | | (0.57)% | | (0.71)% |
Expenses excluding specific expenses listed below | | 1.95% | | 1.92% | | 2.01% | | 2.35% | | 2.37% | | 2.30% |
Interest and fees from borrowings | | 0.00%5 | | 0.00%5 | | 0.00% | | 0.00% | | 0.00% | | 0.00% |
| | |
Total expenses6 | | 1.95% | | 1.92% | | 2.01% | | 2.35% | | 2.37% | | 2.30% |
| Expenses after payments, waivers and/or reimbursements and reduction to custodian expenses | | 1.95% | | 1.92% | | 1.96% | | 2.15% | | 2.09% | | 2.08% |
|
Portfolio turnover rate | | 16% | | 47% | | 51% | | 128% | | 54% | | 89% |
22 OPPENHEIMER MID CAP VALUE FUND
1. April 29, 2016 and October 30, 2015 represent the last business days of the Fund’s respective reporting periods.
See Note 2 of the accompanying Notes.
2. Per share amounts calculated based on the average shares outstanding during the period.
3. Assumes an initial investment on the business day before the first day of the fiscal period, with all dividends and distributions reinvested in additional shares on the reinvestment date, and redemption at the net asset value calculated on the last business day of the fiscal period. Sales charges are not reflected in the total returns. Total returns are not annualized for periods less than one full year. Returns do not reflect the deduction of taxes that a shareholder would pay on fund distributions or the redemption of fund shares.
4. Annualized for periods less than one full year.
5. Less than 0.005%.
6. Total expenses including indirect expenses from affiliated fund fees and expenses were as follows:
| | | | | | | | |
| | Six Months Ended April 29, 2016 | | | 1.95 | % | | |
| | Year Ended October 30, 2015 | | | 1.92 | % | | |
| | Year Ended October 31, 2014 | | | 2.01 | % | | |
| | Year Ended October 31, 2013 | | | 2.35 | % | | |
| | Year Ended October 31, 2012 | | | 2.37 | % | | |
| | Year Ended October 31, 2011 | | | 2.31 | % | | |
See accompanying Notes to Financial Statements.
23 OPPENHEIMER MID CAP VALUE FUND
| | |
| |
| FINANCIAL HIGHLIGHTS Continued | | |
| | | | | | | | | | | | |
| Class C | | Six Months
Ended
April 29, 2016
(Unaudited)1 | | Year Ended
October 30,
20151 | | Year Ended
October 31,
2014 | | Year Ended
October 31,
2013 | | Year Ended
October 31,
2012 | | Year Ended
October 31,
2011 |
Per Share Operating Data | | | | | | | | | | | | |
Net asset value, beginning of period | | $39.00 | | $39.35 | | $35.83 | | $26.52 | | $25.64 | | $25.32 |
|
Income (loss) from investment operations: | | | | | | | | | | | | |
Net investment income (loss)2 | | (0.05) | | (0.11) | | 0.02 | | (0.04) | | (0.14) | | (0.18) |
Net realized and unrealized gain (loss) | | 0.29 | | (0.24) | | 3.59 | | 9.35 | | 1.02 | | 0.50 |
| | |
Total from investment operations | | 0.24 | | (0.35) | | 3.61 | | 9.31 | | 0.88 | | 0.32 |
|
Dividends and/or distributions to shareholders: | | | | | | | | | | | | |
Dividends from net investment income | | 0.00 | | 0.00 | | (0.09) | | 0.00 | | 0.00 | | 0.00 |
|
Net asset value, end of period | | $39.24 | | $39.00 | | $39.35 | | $35.83 | | $26.52 | | $25.64 |
| | |
| | | | | | | | | | | | |
Total Return, at Net Asset Value3 | | 0.62% | | (0.87)% | | 10.05% | | 35.10% | | 3.43% | | 1.26% |
| | | | | | | | | | | | |
|
Ratios/Supplemental Data | | | | | | | | | | | | |
Net assets, end of period (in thousands) | | $234,761 | | $253,446 | | $279,925 | | $276,676 | | $234,237 | | $285,735 |
|
Average net assets (in thousands) | | $232,033 | | $278,916 | | $283,792 | | $252,028 | | $258,974 | | $336,244 |
|
Ratios to average net assets:4 | | | | | | | | | | | | |
Net investment income (loss) | | (0.25)% | | (0.26)% | | 0.05% | | (0.13)% | | (0.56)% | | (0.67)% |
Expenses excluding specific expenses listed below | | 1.95% | | 1.92% | | 1.93% | | 2.05% | | 2.08% | | 2.03% |
Interest and fees from borrowings | | 0.00%5 | | 0.00%5 | | 0.00% | | 0.00% | | 0.00% | | 0.00% |
| | |
Total expenses6 | | 1.95% | | 1.92% | | 1.93% | | 2.05% | | 2.08% | | 2.03% |
| Expenses after payments, waivers and/or reimbursements and reduction to custodian expenses | | 1.95% | | 1.92% | | 1.93% | | 2.05% | | 2.06% | | 2.02% |
|
Portfolio turnover rate | | 16% | | 47% | | 51% | | 128% | | 54% | | 89% |
24 OPPENHEIMER MID CAP VALUE FUND
1. April 29, 2016 and October 30, 2015 represent the last business days of the Fund’s respective reporting periods.
See Note 2 of the accompanying Notes.
2. Per share amounts calculated based on the average shares outstanding during the period.
3. Assumes an initial investment on the business day before the first day of the fiscal period, with all dividends and distributions reinvested in additional shares on the reinvestment date, and redemption at the net asset value calculated on the last business day of the fiscal period. Sales charges are not reflected in the total returns. Total returns are not annualized for periods less than one full year. Returns do not reflect the deduction of taxes that a shareholder would pay on fund distributions or the redemption of fund shares.
4. Annualized for periods less than one full year.
5. Less than 0.005%.
6. Total expenses including indirect expenses from affiliated fund fees and expenses were as follows:
| | | | | | | | |
| | Six Months Ended April 29, 2016 | | | 1.95 | % | | |
| | Year Ended October 30, 2015 | | | 1.92 | % | | |
| | Year Ended October 31, 2014 | | | 1.93 | % | | |
| | Year Ended October 31, 2013 | | | 2.05 | % | | |
| | Year Ended October 31, 2012 | | | 2.08 | % | | |
| | Year Ended October 31, 2011 | | | 2.04 | % | | |
See accompanying Notes to Financial Statements.
25 OPPENHEIMER MID CAP VALUE FUND
| | |
| |
| FINANCIAL HIGHLIGHTS Continued | | |
| | | | | | | | | | |
| Class I | | Six Months
Ended
April 29, 2016
(Unaudited)1 | | Year Ended
October 30,
20151 | | Year Ended October 31,
2014 | | Year Ended October 31,
2013 | | Period
Ended
October 31,
20122 |
|
Per Share Operating Data | | | | | | | | | | |
Net asset value, beginning of period | | $47.20 | | $47.49 | | $43.64 | | $31.88 | | $32.90 |
|
Income (loss) from investment operations: | | | | | | | | | | |
Net investment income3 | | 0.20 | | 0.43 | | 0.47 | | 0.49 | | 0.21 |
Net realized and unrealized gain (loss) | | 0.36 | | (0.27) | | 4.42 | | 11.27 | | (1.23) |
| | |
Total from investment operations | | 0.56 | | 0.16 | | 4.89 | | 11.76 | | (1.02) |
|
Dividends and/or distributions to shareholders: | | | | | | | | | | |
Dividends from net investment income | | (0.18) | | (0.45) | | (1.04) | | 0.00 | | 0.00 |
|
Net asset value, end of period | | $47.58 | | $47.20 | | $47.49 | | $43.64 | | $31.88 |
| | |
| | | | | | | | | | |
Total Return, at Net Asset Value4 | | 1.20% | | 0.31% | | 11.36% | | 36.85% | | (3.07)% |
| | | | | | | | | | |
Ratios/Supplemental Data | | | | | | | | | | |
Net assets, end of period (in thousands) | | $811 | | $788 | | $427 | | $95 | | $10 |
|
Average net assets (in thousands) | | $749 | | $621 | | $178 | | $35 | | $422 |
|
Ratios to average net assets:5 | | | | | | | | | | |
Net investment income | | 0.90% | | 0.88% | | 1.02% | | 1.23% | | 0.99% |
Expenses excluding specific expenses listed below | | 0.76% | | 0.73% | | 0.76% | | 0.77% | | 0.74% |
Interest and fees from borrowings | | 0.00%6 | | 0.00%6 | | 0.00% | | 0.00% | | 0.00% |
| | |
Total expenses7 | | 0.76% | | 0.73% | | 0.76% | | 0.77% | | 0.74% |
| Expenses after payments, waivers and/or reimbursements and reduction to custodian expenses | | 0.76% | | 0.73% | | 0.76% | | 0.77% | | 0.74% |
|
Portfolio turnover rate | | 16% | | 47% | | 51% | | 128% | | 54% |
1. April 29, 2016 and October 30, 2015 represent the last business days of the Fund’s respective reporting periods.
See Note 2 of the accompanying Notes.
2. For the period from February 28, 2012 (inception of offering) to October 31, 2012.
3. Per share amounts calculated based on the average shares outstanding during the period.
4. Assumes an initial investment on the business day before the first day of the fiscal period, with all dividends and distributions reinvested in additional shares on the reinvestment date, and redemption at the net asset value calculated on the last business day of the fiscal period. Sales charges are not reflected in the total returns. Total returns are not annualized for periods less than one full year. Returns do not reflect the deduction of taxes that a shareholder would pay on fund distributions or the redemption of fund shares.
5. Annualized for periods less than one full year.
6. Less than 0.005%.
7. Total expenses including indirect expenses from affiliated fund fees and expenses were as follows:
| | | | | | | | |
| | Six Months Ended April 29, 2016 | | | 0.76 | % | | |
| | Year Ended October 30, 2015 | | | 0.73 | % | | |
| | Year Ended October 31, 2014 | | | 0.76 | % | | |
| | Year Ended October 31, 2013 | | | 0.77 | % | | |
| | Period Ended October 31, 2012 | | | 0.74 | % | | |
See accompanying Notes to Financial Statements.
26 OPPENHEIMER MID CAP VALUE FUND
| | | | | | | | | | | | |
| Class R | | Six Months
Ended
April 29, 2016
(Unaudited)1 | | Year Ended
October 30,
20151 | | Year Ended
October 31,
2014 | | Year Ended
October 31,
2013 | | Year Ended
October 31,
2012 | | Year Ended
October 31,
2011 |
Per Share Operating Data | | | | | | | | | | | | |
Net asset value, beginning of period | | $44.59 | | $44.88 | | $40.87 | | $30.09 | | $28.94 | | $28.44 |
|
Income (loss) from investment operations: | | | | | | | | | | | | |
Net investment income (loss)2 | | 0.06 | | 0.12 | | 0.23 | | 0.14 | | (0.02) | | (0.05) |
Net realized and unrealized gain (loss) | | 0.33 | | (0.30) | | 4.09 | | 10.64 | | 1.17 | | 0.55 |
| | |
Total from investment operations | | 0.39 | | (0.18) | | 4.32 | | 10.78 | | 1.15 | | 0.50 |
|
Dividends and/or distributions to shareholders: | | | | | | | | | | | | |
Dividends from net investment income | | (0.03) | | (0.11) | | (0.31) | | 0.00 | | 0.00 | | 0.00 |
|
Net asset value, end of period | | $44.95 | | $44.59 | | $44.88 | | $40.87 | | $30.09 | | $28.94 |
| | |
| | | | | | | | | | | | |
Total Return, at Net Asset Value3 | | 0.88% | | (0.38)% | | 10.61% | | 35.79% | | 3.97% | | 1.76% |
| | | | | | | | | | | | |
Ratios/Supplemental Data | | | | | | | | | | | | |
Net assets, end of period (in thousands) | | $85,810 | | $97,983 | | $125,703 | | $130,267 | | $132,365 | | $176,002 |
|
Average net assets (in thousands) | | $85,084 | | $114,811 | | $129,580 | | $129,674 | | $154,101 | | $213,872 |
|
Ratios to average net assets:4 | | | | | | | | | | | | |
Net investment income (loss) | | 0.26% | | 0.25% | | 0.53% | | 0.39% | | (0.05)% | | (0.17)% |
Expenses excluding specific expenses listed below | | 1.44% | | 1.42% | | 1.45% | | 1.53% | | 1.59% | | 1.54% |
Interest and fees from borrowings | | 0.00%5 | | 0.00%5 | | 0.00% | | 0.00% | | 0.00% | | 0.00% |
| | |
Total expenses6 | | 1.44% | | 1.42% | | 1.45% | | 1.53% | | 1.59% | | 1.54% |
| Expenses after payments, waivers and/or reimbursements and reduction to custodian expenses | | 1.44% | | 1.42% | | 1.45% | | 1.53% | | 1.55% | | 1.53% |
|
Portfolio turnover rate | | 16% | | 47% | | 51% | | 128% | | 54% | | 89% |
27 OPPENHEIMER MID CAP VALUE FUND
| | |
| |
| FINANCIAL HIGHLIGHTS Continued | | |
1. April 29, 2016 and October 30, 2015 represent the last business days of the Fund’s respective reporting periods.
See Note 2 of the accompanying Notes.
2. Per share amounts calculated based on the average shares outstanding during the period.
3. Assumes an initial investment on the business day before the first day of the fiscal period, with all dividends and distributions reinvested in additional shares on the reinvestment date, and redemption at the net asset value calculated on the last business day of the fiscal period. Sales charges are not reflected in the total returns. Total returns are not annualized for periods less than one full year. Returns do not reflect the deduction of taxes that a shareholder would pay on fund distributions or the redemption of fund shares.
4. Annualized for periods less than one full year.
5. Less than 0.005%.
6. Total expenses including indirect expenses from affiliated fund fees and expenses were as follows:
| | | | | | | | |
| | Six Months Ended April 29, 2016 | | | 1.44 | % | | |
| | Year Ended October 30, 2015 | | | 1.42 | % | | |
| | Year Ended October 31, 2014 | | | 1.45 | % | | |
| | Year Ended October 31, 2013 | | | 1.53 | % | | |
| | Year Ended October 31, 2012 | | | 1.59 | % | | |
| | Year Ended October 31, 2011 | | | 1.55 | % | | |
See accompanying Notes to Financial Statements.
28 OPPENHEIMER MID CAP VALUE FUND
| | | | | | | | | | | | |
| Class Y | | Six Months
Ended
April 29, 2016
(Unaudited)1 | | Year Ended
October 30,
20151 | | Year Ended
October 31,
2014 | | Year Ended
October 31,
2013 | | Year Ended
October 31,
2012 | | Year Ended
October 31,
2011 |
Per Share Operating Data | | | | | | | | | | | | |
Net asset value, beginning of period | | $47.59 | | $47.88 | | $43.81 | | $32.20 | | $30.78 | | $30.08 |
�� |
Income (loss) from investment operations: | | | | | | | | | | | | |
Net investment income2 | | 0.17 | | 0.36 | | 0.52 | | 0.34 | | 0.19 | | 0.12 |
Net realized and unrealized gain (loss) | | 0.35 | | (0.30) | | 4.37 | | 11.40 | | 1.23 | | 0.58 |
| | |
Total from investment operations | | 0.52 | | 0.06 | | 4.89 | | 11.74 | | 1.42 | | 0.70 |
|
Dividends and/or distributions to shareholders: | | | | | | | | | | | | |
Dividends from net investment income | | (0.13) | | (0.35) | | (0.82) | | (0.13) | | 0.00 | | 0.00 |
|
Net asset value, end of period | | $47.98 | | $47.59 | | $47.88 | | $43.81 | | $32.20 | | $30.78 |
| | |
| | | | | | | | | | | | |
Total Return, at Net Asset Value3 | | 1.11% | | 0.12% | | 11.30% | | 36.55% | | 4.62% | | 2.33% |
| | | | | | | | | | | | |
Ratios/Supplemental Data | | | | | | | | | | | | |
Net assets, end of period (in thousands) | | $47,541 | | $49,241 | | $50,323 | | $49,589 | | $63,259 | | $100,231 |
|
Average net assets (in thousands) | | $45,903 | | $51,876 | | $50,290 | | $50,572 | | $85,178 | | $102,025 |
|
Ratios to average net assets:4 | | | | | | | | | | | | |
Net investment income | | 0.74% | | 0.73% | | 1.13% | | 0.91% | | 0.60% | | 0.35% |
Expenses excluding specific expenses listed below | | 0.95% | | 0.92% | | 0.84% | | 0.98% | | 0.92% | | 1.00% |
Interest and fees from borrowings | | 0.00%5 | | 0.00%5 | | 0.00% | | 0.00% | | 0.00% | | 0.00% |
| | |
Total expenses6 | | 0.95% | | 0.92% | | 0.84% | | 0.98% | | 0.92% | | 1.00% |
| Expenses after payments, waivers and/or reimbursements and reduction to custodian expenses | | 0.95% | | 0.92% | | 0.83% | | 0.98% | | 0.92% | | 0.99% |
|
Portfolio turnover rate | | 16% | | 47% | | 51% | | 128% | | 54% | | 89% |
29 OPPENHEIMER MID CAP VALUE FUND
| | |
| |
| FINANCIAL HIGHLIGHTS Continued | | |
1. April 29, 2016 and October 30, 2015 represent the last business days of the Fund’s respective reporting periods.
See Note 2 of the accompanying Notes.
2. Per share amounts calculated based on the average shares outstanding during the period.
3. Assumes an initial investment on the business day before the first day of the fiscal period, with all dividends and distributions reinvested in additional shares on the reinvestment date, and redemption at the net asset value calculated on the last business day of the fiscal period. Sales charges are not reflected in the total returns. Total returns are not annualized for periods less than one full year. Returns do not reflect the deduction of taxes that a shareholder would pay on fund distributions or the redemption of fund shares.
4. Annualized for periods less than one full year.
5. Less than 0.005%.
6. Total expenses including indirect expenses from affiliated fund fees and expenses were as follows:
| | | | | | | | |
| | Six Months Ended April 29, 2016 | | | 0.95 | % | | |
| | Year Ended October 30, 2015 | | | 0.92 | % | | |
| | Year Ended October 31, 2014 | | | 0.84 | % | | |
| | Year Ended October 31, 2013 | | | 0.98 | % | | |
| | Year Ended October 31, 2012 | | | 0.92 | % | | |
| | Year Ended October 31, 2011 | | | 1.01 | % | | |
See accompanying Notes to Financial Statements.
30 OPPENHEIMER MID CAP VALUE FUND
NOTES TO FINANCIAL STATEMENTS April 29, 2016 Unaudited
1. Organization
Oppenheimer Mid Cap Value Fund (the “Fund”), a series of Oppenheimer Quest for Value Funds, is registered under the Investment Company Act of 1940 (“1940 Act”), as amended, as a diversified open-end management investment company. The Fund’s investment objective is to seek capital appreciation. The Fund’s investment adviser is OFI Global Asset Management, Inc. (“OFI Global” or the “Manager”), a wholly-owned subsidiary of OppenheimerFunds, Inc. (“OFI” or the “Sub-Adviser”). The Manager has entered into a sub-advisory agreement with OFI.
The Fund offers Class A, Class C, Class I, Class R and Class Y shares, and previously offered Class B shares for new purchase through June 29, 2012. Subsequent to that date, no new purchases of Class B shares are permitted, however reinvestment of dividend and/or capital gain distributions and exchanges of Class B shares into and from other Oppenheimer funds are allowed. Class A shares are sold at their offering price, which is normally net asset value plus a front-end sales charge. Class C and Class R shares are sold, and Class B shares were sold, without a front-end sales charge but may be subject to a contingent deferred sales charge (“CDSC”). Class R shares are sold only through retirement plans. Retirement plans that offer Class R shares may impose charges on those accounts. Class I and Class Y shares are sold to certain institutional investors or intermediaries without either a front-end sales charge or a CDSC, however, the intermediaries may impose charges on their accountholders who beneficially own Class I and Class Y shares. All classes of shares have identical rights and voting privileges with respect to the Fund in general and exclusive voting rights on matters that affect that class alone. Earnings, net assets and net asset value per share may differ due to each class having its own expenses, such as transfer and shareholder servicing agent fees and shareholder communications, directly attributable to that class. Class A, B, C and R shares have separate distribution and/or service plans under which they pay fees. Class I and Class Y shares do not pay such fees. Class B shares will automatically convert to Class A shares 72 months after the date of purchase.
The following is a summary of significant accounting policies followed in the Fund’s preparation of financial statements in accordance with accounting principles generally accepted in the United States (“U.S. GAAP”).
2. Significant Accounting Policies
Security Valuation. All investments in securities are recorded at their estimated fair value, as described in Note 3.
Reporting Period End Date. The last day of the Fund’s reporting period is the last day the New York Stock Exchange was open for trading during the period. The Fund’s financial statements have been presented through that date to maintain consistency with the Fund’s net asset value calculations used for shareholder transactions.
Foreign Currency Translation. The Fund’s accounting records are maintained in U.S. dollars. The values of securities denominated in foreign currencies and amounts related to the
31 OPPENHEIMER MID CAP VALUE FUND
| | |
| NOTES TO FINANCIAL STATEMENTS Unaudited / Continued | | |
2. Significant Accounting Policies (Continued)
purchase and sale of foreign securities and foreign investment income are translated into U.S. dollars as of the close of the New York Stock Exchange (the “Exchange”), normally 4:00 P.M. Eastern time, on each day the Exchange is open for trading. Foreign exchange rates may be valued primarily using a reliable bank, dealer or service authorized by the Board of Trustees.
Reported net realized gains and losses from foreign currency transactions arise from sales of portfolio securities, sales and maturities of short-term securities, sales of foreign currencies, exchange rate fluctuations between the trade and settlement dates on securities transactions, and the difference between the amounts of dividends, interest, and foreign withholding taxes recorded on the Fund’s books and the U.S. dollar equivalent of the amounts actually received or paid. Net unrealized appreciation and depreciation on the translation of assets and liabilities denominated in foreign currencies arise from changes in the values of assets and liabilities, including investments in securities at fiscal period end, resulting from changes in exchange rates.
The effect of changes in foreign currency exchange rates on investments is separately identified from the fluctuations arising from changes in market values of securities held and reported with all other foreign currency gains and losses in the Fund’s Statement of Operations.
Allocation of Income, Expenses, Gains and Losses. Income, expenses (other than those attributable to a specific class), gains and losses are allocated on a daily basis to each class of shares based upon the relative proportion of net assets represented by such class. Operating expenses directly attributable to a specific class are charged against the operations of that class.
Dividends and Distributions to Shareholders. Dividends and distributions to shareholders, which are determined in accordance with income tax regulations and may differ from U.S. GAAP, are recorded on the ex-dividend date. Income distributions, if any, are declared and paid quarterly. Capital gain distributions, if any, are declared and paid annually.
The tax character of distributions is determined as of the Fund’s fiscal year end. Therefore, a portion of the Fund’s distributions made to shareholders prior to the Fund’s fiscal year end may ultimately be categorized as a tax return of capital.
Investment Income. Dividend income is recorded on the ex-dividend date or upon ex-dividend notification in the case of certain foreign dividends where the ex-dividend date may have passed. Non-cash dividends included in dividend income, if any, are recorded at the fair market value of the securities received. Interest income is recognized on an accrual basis. Discount and premium, which are included in interest income on the Statement of Operations, are amortized or accreted daily.
Return of Capital Estimates. Distributions received from the Fund’s investments in Master Limited Partnerships (MLPs) and Real Estate Investments Trusts (REITs), generally are comprised of income and return of capital. The Fund records investment income and return
32 OPPENHEIMER MID CAP VALUE FUND
2. Significant Accounting Policies (Continued)
of capital based on estimates. Such estimates are based on historical information available from each MLP, REIT and other industry sources. These estimates may subsequently be revised based on information received from MLPs and REITs after their tax reporting periods are concluded.
Custodian Fees. “Custodian fees and expenses” in the Statement of Operations may include interest expense incurred by the Fund on any cash overdrafts of its custodian account during the period. Such cash overdrafts may result from the effects of failed trades in portfolio securities and from cash outflows resulting from unanticipated shareholder redemption activity. The Fund pays interest to its custodian on such cash overdrafts, to the extent they are not offset by positive cash balances maintained by the Fund, based on the negative rolling average balance at an average Federal Funds Rate plus 0.50%. The “Reduction to custodian expenses” line item, if applicable, represents earnings on cash balances maintained by the Fund during the period. Such interest expense and other custodian fees may be paid with these earnings.
Security Transactions. Security transactions are recorded on the trade date. Realized gains and losses on securities sold are determined on the basis of identified cost.
Indemnifications. The Fund’s organizational documents provide current and former Trustees and officers with a limited indemnification against liabilities arising in connection with the performance of their duties to the Fund. In the normal course of business, the Fund may also enter into contracts that provide general indemnifications. The Fund’s maximum exposure under these arrangements is unknown as this would be dependent on future claims that may be made against the Fund. The risk of material loss from such claims is considered remote.
Federal Taxes. The Fund intends to comply with provisions of the Internal Revenue Code applicable to regulated investment companies and to distribute substantially all of its investment company taxable income to shareholders. Therefore, no federal income or excise tax provision is required. The Fund files income tax returns in U.S. federal and applicable state jurisdictions. The statute of limitations on the Fund’s tax return filings generally remains open for the three preceding fiscal reporting period ends. The Fund has analyzed its tax positions for the fiscal year ended October 30, 2015, including open tax years, and does not believe there are any uncertain tax positions requiring recognition in the Fund’s financial statements.
During the fiscal year ended October 30, 2015, the Fund utilized $151,218,079 of capital loss carryforward to offset capital gains realized in that fiscal year. Details of the fiscal year ended October 30, 2015 capital loss carryforwards are included in the table below. Capital loss carryforwards with no expiration, if any, must be utilized prior to those with expiration dates. Capital losses with no expiration will be carried forward to future years if not offset by gains.
| | | | |
| Expiring | |
2017 | | $ | 80,242,236 | |
33 OPPENHEIMER MID CAP VALUE FUND
| | |
| NOTES TO FINANCIAL STATEMENTS Unaudited / Continued | | |
| | |
2. Significant Accounting Policies (Continued)
At period end, it is estimated that the capital loss carryforwards would be $79,474,486 expiring by 2017. The estimated capital loss carryforward represents the carryforward as of the end of the last fiscal year, increased or decreased by capital losses or gains realized in the first six months of the current fiscal year. During the reporting period, it is estimated that the Fund will utilize $767,750 of capital loss carryforward to offset realized capital gains.
Net investment income (loss) and net realized gain (loss) may differ for financial statement and tax purposes. The character of dividends and distributions made during the fiscal year from net investment income or net realized gains are determined in accordance with federal income tax requirements, which may differ from the character of net investment income or net realized gains presented in those financial statements in accordance with U.S. GAAP. Also, due to timing of dividends and distributions, the fiscal year in which amounts are distributed may differ from the fiscal year in which the income or net realized gain was recorded by the Fund.
The aggregate cost of securities and other investments and the composition of unrealized appreciation and depreciation of securities and other investments for federal income tax purposes at period end are noted in the following table. The primary difference between book and tax appreciation or depreciation of securities and other investments, if applicable, is attributable to the tax deferral of losses or tax realization of financial statement unrealized gain or loss.
| | | | |
Federal tax cost of securities | | $ | 1,170,930,737 | |
| | | | |
Gross unrealized appreciation | | $ | 198,929,612 | |
Gross unrealized depreciation | | | (66,450,374) | |
| | | | |
Net unrealized appreciation | | $ | 132,479,238 | |
| | | | |
Use of Estimates. The preparation of financial statements in conformity with U.S. GAAP requires management to make estimates and assumptions that affect the reported amounts of assets and liabilities and disclosure of contingent assets and liabilities at the date of the financial statements and the reported amounts of increases and decreases in net assets from operations during the reporting period. Actual results could differ from those estimates.
3. Securities Valuation
The Fund calculates the net asset value of its shares as of 4:00 P.M. Eastern time, on each day the New York Stock Exchange (the “Exchange”) is open for trading, except in the case of a scheduled early closing of the Exchange, in which case the Fund will calculate net asset value of the shares as of the scheduled early closing time of the Exchange.
The Fund’s Board has adopted procedures for the valuation of the Fund’s securities and has delegated the day-to-day responsibility for valuation determinations under those procedures to the Manager. The Manager has established a Valuation Committee which is responsible for determining a “fair valuation” for any security for which market quotations are not “readily available.” The Valuation Committee’s fair valuation determinations are subject to review, approval and ratification by the Fund’s Board at its next regularly scheduled meeting covering the calendar quarter in which the fair valuation was determined.
34 OPPENHEIMER MID CAP VALUE FUND
3. Securities Valuation (Continued)
Valuation Methods and Inputs
Securities are valued using unadjusted quoted market prices, when available, as supplied primarily by third party pricing services or dealers.
The following methodologies are used to determine the market value or the fair value of the types of securities described below:
Securities traded on a registered U.S. securities exchange (including exchange-traded derivatives other than futures and futures options) are valued based on the last sale price of the security reported on the principal exchange on which it is traded, prior to the time when the Fund’s assets are valued. In the absence of a sale, the security is valued at the mean between the bid and asked price on the principal exchange or, if not available from the principal exchange, obtained from two dealers. If bid and asked prices are not available from either the exchange or two dealers, the security is valued by using one of the following methodologies (listed in order of priority): (1) a bid from the principal exchange, (2) the mean between the bid and asked price as provided by a single dealer, or (3) a bid from a single dealer. A security of a foreign issuer traded on a foreign exchange, but not listed on a registered U.S. securities exchange, is valued based on the last sale price on the principal exchange on which the security is traded, as identified by the third party pricing service used by the Manager, prior to the time when the Fund’s assets are valued. If the last sale price is unavailable, the security is valued at the most recent official closing price on the principal exchange on which it is traded. If the last sales price or official closing price for a foreign security is not available, the security is valued at the mean between the bid and asked price per the exchange or, if not available from the exchange, obtained from two dealers. If bid and asked prices are not available from either the exchange or two dealers, the security is valued by using one of the following methodologies (listed in order of priority): (1) a bid from the exchange, (2) the mean between the bid and asked price as provided by a single dealer, or (3) a bid from a single dealer.
Shares of a registered investment company that are not traded on an exchange are valued at that investment company’s net asset value per share.
Corporate and government debt securities (of U.S. or foreign issuers) and municipal debt securities, event-linked bonds, loans, mortgage-backed securities, collateralized mortgage obligations, and asset-backed securities are valued at the mean between the “bid” and “asked” prices utilizing evaluated prices obtained from third party pricing services or broker-dealers who may use matrix pricing methods to determine the evaluated prices.
Short-term money market type debt securities with a remaining maturity of sixty days or less are valued at cost adjusted by the amortization of discount or premium to maturity (amortized cost), which approximates market value. Short-term debt securities with a remaining maturity in excess of sixty days are valued at the mean between the “bid” and “asked” prices utilizing evaluated prices obtained from third party pricing services or broker-dealers.
A description of the standard inputs that may generally be considered by the third party pricing vendors in determining their evaluated prices is provided below.
35 OPPENHEIMER MID CAP VALUE FUND
| | |
| NOTES TO FINANCIAL STATEMENTS Unaudited / Continued | | |
| | |
3. Securities Valuation (Continued)
| | |
| Security Type | | Standard inputs generally considered by third-party pricing vendors |
|
| Corporate debt, government debt, municipal, mortgage-backed and asset-backed securities | | Reported trade data, broker-dealer price quotations, benchmark yields, issuer spreads on comparable securities, the credit quality, yield, maturity, and other appropriate factors. |
|
Loans | | Information obtained from market participants regarding reported trade data and broker-dealer price quotations. |
|
Event-linked bonds | | Information obtained from market participants regarding reported trade data and broker-dealer price quotations. |
If a market value or price cannot be determined for a security using the methodologies described above, or if, in the “good faith” opinion of the Manager, the market value or price obtained does not constitute a “readily available market quotation,” or a significant event has occurred that would materially affect the value of the security, the security is fair valued either (i) by a standardized fair valuation methodology applicable to the security type or the significant event as previously approved by the Valuation Committee and the Fund’s Board or (ii) as determined in good faith by the Manager’s Valuation Committee. The Valuation Committee considers all relevant facts that are reasonably available, through either public information or information available to the Manager, when determining the fair value of a security. Fair value determinations by the Manager are subject to review, approval and ratification by the Fund’s Board at its next regularly scheduled meeting covering the calendar quarter in which the fair valuation was determined. Those fair valuation standardized methodologies include, but are not limited to, valuing securities at the last sale price or initially at cost and subsequently adjusting the value based on: changes in company specific fundamentals, changes in an appropriate securities index, or changes in the value of similar securities which may be further adjusted for any discounts related to security-specific resale restrictions. When possible, such methodologies use observable market inputs such as unadjusted quoted prices of similar securities, observable interest rates, currency rates and yield curves. The methodologies used for valuing securities are not necessarily an indication of the risks associated with investing in those securities nor can it be assured that the Fund can obtain the fair value assigned to a security if it were to sell the security.
To assess the continuing appropriateness of security valuations, the Manager, or its third party service provider who is subject to oversight by the Manager, regularly compares prior day prices, prices on comparable securities, and sale prices to the current day prices and challenges those prices exceeding certain tolerance levels with the third party pricing service or broker source. For those securities valued by fair valuations, whether through a standardized fair valuation methodology or a fair valuation determination, the Valuation Committee reviews and affirms the reasonableness of the valuations based on such methodologies and fair valuation determinations on a regular basis after considering all relevant information that is reasonably available.
Classifications
Each investment asset or liability of the Fund is assigned a level at measurement date based
36 OPPENHEIMER MID CAP VALUE FUND
3. Securities Valuation (Continued)
on the significance and source of the inputs to its valuation. Various data inputs are used in determining the value of each of the Fund’s investments as of the reporting period end. These data inputs are categorized in the following hierarchy under applicable financial accounting standards:
1) Level 1-unadjusted quoted prices in active markets for identical assets or liabilities (including securities actively traded on a securities exchange)
2) Level 2-inputs other than unadjusted quoted prices that are observable for the asset or liability (such as unadjusted quoted prices for similar assets and market corroborated inputs such as interest rates, prepayment speeds, credit risks, etc.)
3) Level 3-significant unobservable inputs (including the Manager’s own judgments about assumptions that market participants would use in pricing the asset or liability).
The inputs used for valuing securities are not necessarily an indication of the risks associated with investing in those securities.
The Fund classifies each of its investments in those investment companies which are publicly offered and reported on an exchange as Level 1, and those investment companies which are not publicly offered are not assigned a level, without consideration as to the classification level of the specific investments held by those investment companies.
The table below categorizes amounts that are included in the Fund’s Statement of Assets and Liabilities at period end based on valuation input level:
| | | | | | | | | | | | | | | | |
| | | Level 1—
Unadjusted
Quoted Prices | | | Level 2—
Other Significant
Observable Inputs | | | Level 3—
Significant
Unobservable
Inputs | | | Value | |
| |
Assets Table | | | | | | | | | | | | | | | | |
Investments, at Value: | | | | | | | | | | | | | | | | |
Common Stocks | | | | | | | | | | | | | | | | |
Consumer Discretionary | | $ | 154,273,093 | | | $ | — | | | $ | — | | | $ | 154,273,093 | |
Consumer Staples | | | 83,081,764 | | | | — | | | | — | | | | 83,081,764 | |
Energy | | | 122,231,074 | | | | — | | | | — | | | | 122,231,074 | |
Financials | | | 364,112,222 | | | | — | | | | — | | | | 364,112,222 | |
Health Care | | | 94,149,812 | | | | — | | | | — | | | | 94,149,812 | |
Industrials | | | 153,675,097 | | | | — | | | | — | | | | 153,675,097 | |
Information Technology | | | 150,019,064 | | | | — | | | | — | | | | 150,019,064 | |
Materials | | | 89,056,014 | | | | — | | | | — | | | | 89,056,014 | |
Utilities | | | 84,133,684 | | | | — | | | | — | | | | 84,133,684 | |
Investment Company | | | 8,678,176 | | | | — | | | | — | | | | 8,678,176 | |
| | | | |
Total Assets | | $ | 1,303,410,000 | | | $ | — | | | $ | — | | | $ | 1,303,410,000 | |
| | | | |
Forward currency exchange contracts and futures contracts, if any, are reported at their unrealized appreciation/depreciation at measurement date, which represents the change in the contract’s value from trade date. All additional assets and liabilities included in the above table are reported at their market value at measurement date.
37 OPPENHEIMER MID CAP VALUE FUND
| | |
| NOTES TO FINANCIAL STATEMENTS Unaudited / Continued | | |
| | |
4. Investments and Risks
Investments in Affiliated Funds. The Fund is permitted to invest in other mutual funds advised by the Manager (“Affiliated Funds”). Affiliated Funds are open-end management investment companies registered under the 1940 Act, as amended. The Manager is the investment adviser of, and the Sub-Adviser provides investment and related advisory services to, the Affiliated Funds. When applicable, the Fund’s investments in Affiliated Funds are included in the Statement of Investments. Shares of Affiliated Funds are valued at their net asset value per share. As a shareholder, the Fund is subject to its proportional share of the Affiliated Funds’ expenses, including their management fee. The Manager will waive fees and/ or reimburse Fund expenses in an amount equal to the indirect management fees incurred through the Fund’s investment in the Affiliated Funds.
Each of the Affiliated Funds in which the Fund invests has its own investment risks, and those risks can affect the value of the Fund’s investments and therefore the value of the Fund’s shares. To the extent that the Fund invests more of its assets in one Affiliated Fund than in another, the Fund will have greater exposure to the risks of that Affiliated Fund.
Investment in Oppenheimer Institutional Money Market Fund. The Fund is permitted to invest daily available cash balances in a money market Affiliated Fund. The Fund may invest the available cash in Class E shares of Oppenheimer Institutional Money Market Fund (“IMMF”) to seek current income while preserving liquidity or for defensive purposes. IMMF is regulated as a money market fund under the Investment Company Act of 1940, as amended.
Master Limited Partnerships (“MLPs”). MLPs issue common units that represent an equity ownership interest in a partnership and provide limited voting rights. MLP common units are registered with the Securities and Exchange Commission (“SEC”), and are freely tradable on securities exchanges such as the NYSE and the NASDAQ Stock Market (“NASDAQ”), or in the over-the-counter (“OTC”) market. An MLP consists of one or more general partners, who conduct the business, and one or more limited partners, who contribute capital. MLP common unit holders have a limited role in the partnership’s operations and management. The Fund, as a limited partner, normally would not be liable for the debts of the MLP beyond the amounts the Fund has contributed, but would not be shielded to the same extent that a shareholder of a corporation would be. In certain circumstances creditors of an MLP would have the right to seek return of capital distributed to a limited partner. This right of an MLP’s creditors would continue after the Fund sold its investment in the MLP.
Equity Security Risk. Stocks and other equity securities fluctuate in price. The value of the Fund’s portfolio may be affected by changes in the equity markets generally. Equity markets may experience significant short-term volatility and may fall sharply at times. Different markets may behave differently from each other and U.S. equity markets may move in the opposite direction from one or more foreign stock markets. Adverse events in any part of the equity or fixed-income markets may have unexpected negative effects on other market segments.
The prices of individual equity securities generally do not all move in the same direction at the same time and a variety of factors can affect the price of a particular company’s securities.
38 OPPENHEIMER MID CAP VALUE FUND
4. Investments and Risks (Continued)
These factors may include, but are not limited to, poor earnings reports, a loss of customers, litigation against the company, general unfavorable performance of the company’s sector or industry, or changes in government regulations affecting the company or its industry.
5. Market Risk Factors
The Fund’s investments in securities and/or financial derivatives may expose the Fund to various market risk factors:
Commodity Risk. Commodity risk relates to the change in value of commodities or commodity indexes as they relate to increases or decreases in the commodities market. Commodities are physical assets that have tangible properties. Examples of these types of assets are crude oil, heating oil, metals, livestock, and agricultural products.
Credit Risk. Credit risk relates to the ability of the issuer of debt to meet interest and principal payments, or both, as they come due. In general, lower-grade, higher-yield debt securities are subject to credit risk to a greater extent than lower-yield, higher-quality securities.
Equity Risk. Equity risk relates to the change in value of equity securities as they relate to increases or decreases in the general market.
Foreign Exchange Rate Risk. Foreign exchange rate risk relates to the change in the U.S. dollar value of a security held that is denominated in a foreign currency. The U.S. dollar value of a foreign currency denominated security will decrease as the dollar appreciates against the currency, while the U.S. dollar value will increase as the dollar depreciates against the currency.
Interest Rate Risk. Interest rate risk refers to the fluctuations in value of fixed-income securities resulting from the inverse relationship between price and yield. For example, an increase in general interest rates will tend to reduce the market value of already issued fixed-income investments, and a decline in general interest rates will tend to increase their value. In addition, debt securities with longer maturities, which tend to have higher yields, are subject to potentially greater fluctuations in value from changes in interest rates than obligations with shorter maturities.
Volatility Risk. Volatility risk refers to the magnitude of the movement, but not the direction of the movement, in a financial instrument’s price over a defined time period. Large increases or decreases in a financial instrument’s price over a relative time period typically indicate greater volatility risk, while small increases or decreases in its price typically indicate lower volatility risk.
6. Shares of Beneficial Interest
The Fund has authorized an unlimited number of $0.01 par value shares of beneficial interest of each class. Transactions in shares of beneficial interest were as follows:
39 OPPENHEIMER MID CAP VALUE FUND
| | |
| NOTES TO FINANCIAL STATEMENTS Unaudited / Continued | | |
| | |
6. Shares of Beneficial Interest (Continued)
| | | | | | | | | | | | | | | | |
| | | Six Months Ended April 29, 20161 | | | Year Ended October 30, 20151 | |
| | | Shares | | | Amount | | | Shares | | | Amount | |
| |
Class A | | | | | | | | | | | | | | | | |
Sold | | | 973,775 | | | $ | 43,738,499 | | | | 2,255,940 | | | $ | 109,086,400 | |
Dividends and/or distributions reinvested | | | 34,782 | | | | 1,563,800 | | | | 101,546 | | | | 4,867,198 | |
Redeemed | | | (2,183,032) | | | | (96,490,765) | | | | (5,170,323) | | | | (250,775,783) | |
| | | | |
Net decrease | | | (1,174,475) | | | $ | (51,188,466) | | | | (2,812,837) | | | $ | (136,822,185) | |
| | | | |
| | | | | | | | | | | | | | | | |
| |
Class B | | | | | | | | | | | | | | | | |
Sold | | | 4,103 | | | $ | 154,464 | | | | 17,119 | | | $ | 701,094 | |
Dividends and/or distributions reinvested | | | — | | | | — | | | | — | | | | — | |
Redeemed | | | (153,375) | | | | (5,753,511) | | | | (427,628) | | | | (17,388,616) | |
| | | | |
Net decrease | | | (149,272) | | | $ | (5,599,047) | | | | (410,509) | | | $ | (16,687,522) | |
| | | | |
| | | | | | | | | | | | | | | | |
| |
Class C | | | | | | | | | | | | | | | | |
Sold | | | 275,637 | | | $ | 10,271,600 | | | | 739,635 | | | $ | 30,223,895 | |
Dividends and/or distributions reinvested | | | — | | | | — | | | | — | | | | — | |
Redeemed | | | (790,935) | | | | (29,303,099) | | | | (1,355,102) | | | | (55,085,400) | |
| | | | |
Net decrease | | | (515,298) | | | $ | (19,031,499) | | | | (615,467) | | | $ | (24,861,505) | |
| | | | |
| | | | | | | | | | | | | | | | |
| |
Class I | | | | | | | | | | | | | | | | |
Sold | | | 2,328 | | | $ | 104,415 | | | | 9,008 | | | $ | 434,194 | |
Dividends and/or distributions reinvested | | | 63 | | | | 2,873 | | | | 114 | | | | 5,524 | |
Redeemed | | | (2,040) | | | | (94,513) | | | | (1,407) | | | | (69,688) | |
| | | | |
Net increase | | | 351 | | | $ | 12,775 | | | | 7,715 | | | $ | 370,030 | |
| | | | |
| | | | | | | | | | | | | | | | |
| |
Class R | | | | | | | | | | | | | | | | |
Sold | | | 156,053 | | | $ | 6,621,684 | | | | 377,495 | | | $ | 17,567,746 | |
Dividends and/or distributions reinvested | | | 1,188 | | | | 51,175 | | | | 5,671 | | | | 262,387 | |
Redeemed | | | (445,300) | | | | (19,424,883) | | | | (986,856) | | | | (45,965,513) | |
| | | | |
Net decrease | | | (288,059) | | | $ | (12,752,024) | | | | (603,690) | | | $ | (28,135,380) | |
| | | | |
| | | | | | | | | | | | | | | | |
| |
Class Y | | | | | | | | | | | | | | | | |
Sold | | | 146,054 | | | $ | 6,606,084 | | | | 282,520 | | | $ | 13,973,036 | |
Dividends and/or distributions reinvested | | | 2,522 | | | | 116,339 | | | | 6,385 | | | | 312,843 | |
Redeemed | | | (192,329) | | | | (8,756,694) | | | | (305,180) | | | | (15,261,365) | |
| | | | |
Net decrease | | | (43,753) | | | $ | (2,034,271) | | | | (16,275) | | | $ | (975,486) | |
| | | | |
1. April 29, 2016 and October 30, 2015 represent the last business days of the Fund’s respective reporting periods. See Note 2.
7. Purchases and Sales of Securities
The aggregate cost of purchases and proceeds from sales of securities, other than short-term obligations and investments in IMMF, for the reporting period were as follows:
40 OPPENHEIMER MID CAP VALUE FUND
7. Purchases and Sales of Securities (Continued)
| | | | | | | | | | |
| | | Purchases | | | | | Sales | |
| |
Investment securities | | $ | 207,722,170 | | | | | $ | 294,336,546 | |
8. Fees and Other Transactions with Affiliates
Management Fees. Under the investment advisory agreement, the Fund pays the Manager a management fee based on the daily net assets of the Fund at an annual rate as shown in the following table:
| | | | |
| Fee Schedule | |
| |
Up to $400 million | | | 0.80% | |
Next $400 million | | | 0.75 | |
Next $1.2 billion | | | 0.60 | |
Next $4 billion | | | 0.58 | |
Over $6 billion | | | 0.56 | |
The Fund’s effective management fee for the reporting period was 0.71% of average annual net assets before any applicable waivers.
Sub-Adviser Fees. The Manager has retained the Sub-Adviser to provide the day-to-day portfolio management of the Fund. Under the Sub-Advisory Agreement, the Manager pays the Sub-Adviser an annual fee in monthly installments, equal to a percentage of the investment management fee collected by the Manager from the Fund, which shall be calculated after any investment management fee waivers. The fee paid to the Sub-Adviser is paid by the Manager, not by the Fund.
Transfer Agent Fees. OFI Global (the “Transfer Agent”) serves as the transfer and shareholder servicing agent for the Fund. The Fund pays the Transfer Agent a fee based on annual net assets. Fees incurred and average net assets for each class with respect to these services are detailed in the Statement of Operations and Financial Highlights, respectively.
Sub-Transfer Agent Fees. The Transfer Agent has retained Shareholder Services, Inc., a wholly-owned subsidiary of OFI (the “Sub-Transfer Agent”), to provide the day-to-day transfer agent and shareholder servicing of the Fund. Under the Sub-Transfer Agency Agreement, the Transfer Agent pays the Sub-Transfer Agent an annual fee in monthly installments, equal to a percentage of the transfer agent fee collected by the Transfer Agent from the Fund, which shall be calculated after any applicable fee waivers. The fee paid to the Sub-Transfer Agent is paid by the Transfer Agent, not by the Fund.
Trustees’ Compensation. The Fund has adopted an unfunded retirement plan (the “Plan”) for the Fund’s Independent Trustees. Benefits are based on years of service and fees paid to each Trustee during their period of service. The Plan was frozen with respect to adding new participants effective December 31, 2006 (the “Freeze Date”) and existing Plan Participants as of the Freeze Date will continue to receive accrued benefits under the Plan. Active Independent Trustees as of the Freeze Date have each elected a distribution method with
41 OPPENHEIMER MID CAP VALUE FUND
| | |
| NOTES TO FINANCIAL STATEMENTS Unaudited / Continued | | |
| | |
8. Fees and Other Transactions with Affiliates (Continued)
respect to their benefits under the Plan. During the reporting period, the Fund’s projected benefit obligations, payments to retired Trustees and accumulated liability were as follows:
| | | | | | |
Projected Benefit Obligations Increased | | $ | 2,380 | | | |
Payments Made to Retired Trustees | | | 63,860 | | | |
Accumulated Liability as of April 29, 2016 | | | 248,683 | | | |
The Fund’s Board of Trustees (“Board”) has adopted a compensation deferral plan for Independent Trustees that enables Trustees to elect to defer receipt of all or a portion of the annual compensation they are entitled to receive from the Fund. For purposes of determining the amount owed to the Trustee under the plan, deferred amounts are treated as though equal dollar amounts had been invested in shares of the Fund or in other Oppenheimer funds selected by the Trustee. The Fund purchases shares of the funds selected for deferral by the Trustee in amounts equal to his or her deemed investment, resulting in a Fund asset equal to the deferred compensation liability. Such assets are included as a component of “Other” within the asset section of the Statement of Assets and Liabilities. Deferral of Trustees’ fees under the plan will not affect the net assets of the Fund and will not materially affect the Fund’s assets, liabilities or net investment income per share. Amounts will be deferred until distributed in accordance with the compensation deferral plan.
Distribution and Service Plan (12b-1) Fees. Under its General Distributor’s Agreement with the Fund, OppenheimerFunds Distributor, Inc. (the “Distributor”) acts as the Fund’s principal underwriter in the continuous public offering of the Fund’s classes of shares.
Distribution and Service Plan for Class A Shares. The Fund has adopted a Distribution and Service Plan (the “Plan”) for Class A shares pursuant to Rule 12b-1 under the 1940 Act. Under the Plan, the Fund pays a service fee to the Distributor at an annual rate of 0.25% of the daily net assets of Class A shares. The Distributor currently uses all of those fees to pay dealers, brokers, banks and other financial institutions periodically for providing personal services and maintenance of accounts of their customers that hold Class A shares. Under the Plan, the Fund may also pay an asset-based sales charge to the Distributor. However, the Fund’s Board has currently set the rate at zero. Fees incurred by the Fund under the Plan are detailed in the Statement of Operations.
Distribution and Service Plans for Class B, Class C and Class R Shares. The Fund has adopted Distribution and Service Plans (the “Plans”) for Class B, Class C and Class R shares pursuant to Rule 12b-1 under the 1940 Act to compensate the Distributor for distributing those share classes, maintaining accounts and providing shareholder services. Under the Plans, the Fund pays the Distributor an annual asset-based sales charge of 0.75% on Class B and Class C shares’ daily net assets and 0.25% on Class R shares’ daily net assets. The Fund also pays a service fee under the Plans at an annual rate of 0.25% of daily net assets. The Plans continue in effect from year to year only if the Fund’s Board of Trustees votes annually to approve their continuance at an in person meeting called for that purpose. Fees incurred by
42 OPPENHEIMER MID CAP VALUE FUND
8. Fees and Other Transactions with Affiliates (Continued)
the Fund under the Plans are detailed in the Statement of Operations.
Sales Charges. Front-end sales charges and CDSC do not represent expenses of the Fund. They are deducted from the proceeds of sales of Fund shares prior to investment or from redemption proceeds prior to remittance, as applicable. The sales charges retained by the Distributor from the sale of shares and the CDSC retained by the Distributor on the redemption of shares is shown in the following table for the period indicated.
| | | | | | | | | | | | | | | | | | | | |
| Six Months Ended | | Class A
Front-End
Sales Charges
Retained by
Distributor | | | Class A
Contingent
Deferred
Sales Charges
Retained by
Distributor | | | Class B
Contingent
Deferred
Sales Charges
Retained by
Distributor | | | Class C
Contingent
Deferred
Sales Charges
Retained by
Distributor | | | Class R
Contingent
Deferred
Sales Charges
Retained by
Distributor | |
April 29, 2016 | | | $120,437 | | | | $541 | | | | $8,221 | | | | $5,291 | | | | $3 | |
Waivers and Reimbursements of Expenses. The Manager will waive fees and/or reimburse Fund expenses in an amount equal to the indirect management fees incurred through the Fund’s investment in IMMF. During the reporting period, the Manager waived fees and/or reimbursed the Fund $6,100 for IMMF management fees.
Waivers and/or reimbursements may be modified or terminated as set forth according to the terms in the prospectus.
9. Borrowings and Other Financing
Joint Credit Facility. A number of mutual funds managed by the Manager participate in a $1.28 billion revolving credit facility (the “Facility”) intended to provide short-term financing, if necessary, subject to certain restrictions in connection with atypical redemption activity. Expenses and fees related to the Facility are paid by the participating funds and are disclosed separately or as other expenses on the Statement of Operations. The Fund did not utilize the Facility during the reporting period.
10. Pending Litigation
In 2009, several putative class action lawsuits were filed and later consolidated before the U.S. District Court for the District of Colorado against OppenheimerFunds, Inc. (“OFI”), OppenheimerFunds Distributor, Inc. (“OFDI”), and Oppenheimer Rochester California Municipal Fund, a fund advised by OFI Global Asset Management, Inc. and distributed by the Distributor (the “California Fund”), in connection with the California Fund’s investment performance. The plaintiffs asserted claims against OFI, OFDI and certain present and former trustees and officers of the California Fund under the federal securities laws, alleging, among other things, that the disclosure documents of the California Fund contained misrepresentations and omissions and the investment policies of the California Fund were not followed. Plaintiffs in the suit filed an amended complaint and defendants filed a motion to dismiss. In 2011, the court issued an order which granted in part and denied in part the
43 OPPENHEIMER MID CAP VALUE FUND
| | |
| NOTES TO FINANCIAL STATEMENTS Unaudited / Continued | | |
| | |
10. Pending Litigation (Continued)
defendants’ motion to dismiss. In 2012, plaintiffs filed a motion, which defendants opposed, to certify a class and appoint class representatives and class counsel. In March 2015, the court granted plaintiffs’ motion for class certification. In May 2015, the U.S. Court of Appeals for the Tenth Circuit vacated the class certification order and remanded the matter to the district court for further proceedings. In October 2015, the district court reaffirmed its order and determined that the suit will proceed as a class action. In December 2015, the Tenth Circuit denied defendants’ petition to appeal the district court’s reaffirmed class certification order.
OFI and OFDI believe the suit is without merit; that it is premature to render any opinion as to the likelihood of an outcome unfavorable to them in the suit; and that no estimate can yet be made as to the amount or range of any potential loss. Furthermore, OFI believes that the suit should not impair the ability of OFI or OFDI to perform their respective duties to the Fund and that the outcome of the suit should not have any material effect on the operations of any of the Oppenheimer funds.
44 OPPENHEIMER MID CAP VALUE FUND
PORTFOLIO PROXY VOTING POLICIES AND GUIDELINES;
UPDATES TO STATEMENTS OF INVESTMENTS Unaudited
The Fund has adopted Portfolio Proxy Voting Policies and Guidelines under which the Fund votes proxies relating to securities (“portfolio proxies”) held by the Fund. A description of the Fund’s Portfolio Proxy Voting Policies and Guidelines is available (i) without charge, upon request, by calling the Fund toll-free at 1.800.CALL OPP (225.5677), (ii) on the Fund’s website at www.oppenheimerfunds.com, and (iii) on the SEC’s website at www.sec.gov. In addition, the Fund is required to file Form N-PX, with its complete proxy voting record for the 12 months ended June 30th, no later than August 31st of each year. The Fund’s voting record is available (i) without charge, upon request, by calling the Fund toll-free at 1.800.CALL OPP (225.5677), and (ii) in the Form N-PX filing on the SEC’s website at www.sec.gov.
The Fund files its complete schedule of portfolio holdings with the SEC for the first quarter and the third quarter of each fiscal year on Form N-Q. The Fund’s Form N-Q filings are available on the SEC’s website at www.sec.gov. Those forms may be reviewed and copied at the SEC’s Public Reference Room in Washington, D.C. Information on the operation of the Public Reference Room may be obtained by calling 1-800-SEC-0330.
Householding—Delivery of Shareholder Documents
This is to inform you about OppenheimerFunds’ “householding” policy. If more than one member of your household maintains an account in a particular fund, OppenheimerFunds will mail only one copy of the fund’s prospectus (or, if available, the fund’s summary prospectus), annual and semiannual report and privacy policy. The consolidation of these mailings, called householding, benefits your fund through reduced mailing expense, and benefits you by reducing the volume of mail you receive from OppenheimerFunds. Householding does not affect the delivery of your account statements.
Please note that we will continue to household these mailings for as long as you remain an OppenheimerFunds shareholder, unless you request otherwise. If you prefer to receive multiple copies of these materials, please call us at 1.800.CALL-OPP (225-5677). You may also notify us in writing or via email. We will begin sending you individual copies of the prospectus (or, if available, the summary prospectus), reports and privacy policy within 30 days of receiving your request to stop householding.
45 OPPENHEIMER MID CAP VALUE FUND
DISTRIBUTION SOURCES Unaudited
For any distribution that took place over the Fund’s reporting period, the table below details on a per-share basis the percentage of the Fund’s total distribution payment amount that was derived from the following sources: net income, net profit from the sale of securities, and other capital sources. This information is based upon income and capital gains using generally accepted accounting principles as of the date of each distribution. For certain securities, such as Real Estate Investment Trusts and Master Limited Partnerships (“MLPs”), the percentages attributed to each category are estimated using historical information because the character of the amounts received from the REITs and MLPs in which the Fund invests is unknown until after the end of the calendar year. Because the Fund is actively managed, the relative amount of the Fund’s total distributions derived from various sources over the calendar year may change. Please note that this information should not be used for tax reporting purposes as the tax character of distributable income may differ from the amounts used for this notification. You will receive IRS tax forms in the first quarter of each calendar year detailing the actual amount of the taxable and non-taxable portion of distributions paid to you during the tax year.
For the most current information, please go to oppenheimerfunds.com. Select your Fund, then the ‘Detailed’ tab; where ‘Dividends’ are shown, the Fund’s latest pay date will be followed by the sources of any distribution, updated daily.
| | | | | | | | | | | | | | | | |
| Fund Name | | Pay Date | | | Net Income | | | Net Profit
from Sale | | | Other
Capital
Sources | |
Oppenheimer Mid Cap Value Fund | | | 12/11/15 | | | | 66.6% | | | | 33.4% | | | | 0.0% | |
Oppenheimer Mid Cap Value Fund | | | 3/22/16 | | | | 63.6% | | | | 0.0% | | | | 36.4% | |
46 OPPENHEIMER MID CAP VALUE FUND
OPPENHEIMER MID CAP VALUE FUND
| | |
Trustees and Officers | | Brian F. Wruble, Chairman of the Board of Trustees and Trustee |
| | Beth Ann Brown, Trustee |
| | Matthew P. Fink, Trustee |
| | Edmund P. Giambastiani, Jr., Trustee |
| | Elizabeth Krentzman, Trustee |
| | Mary F. Miller, Trustee |
| | Joel W. Motley, Trustee |
| | Joanne Pace, Trustee |
| | Daniel Vandivort, Trustee |
| | Arthur P. Steinmetz, Trustee, President and Principal Executive Officer |
| | Laton Spahr, Vice President |
| | Eric Hewitt, Vice President |
| | Cynthia Lo Bessette, Secretary and Chief Legal Officer |
| | Jennifer Sexton, Vice President and Chief Business Officer |
| | Mary Ann Picciotto, Chief Compliance Officer and Chief Anti-Money |
| | Laundering Officer |
| | Brian S. Petersen, Treasurer and Principal Financial & Accounting Officer |
| |
Manager | | OFI Global Asset Management, Inc. |
| |
Sub-Adviser | | OppenheimerFunds, Inc. |
| |
Distributor | | OppenheimerFunds Distributor, Inc. |
| |
Transfer and Shareholder | | OFI Global Asset Management, Inc. |
Servicing Agent | | |
| |
Sub-Transfer Agent | | Shareholder Services, Inc. |
| | DBA OppenheimerFunds Services |
| |
Independent Registered | | KPMG LLP |
Public Accounting Firm | | |
| |
Legal Counsel | | Kramer Levin Naftalis & Frankel LLP |
| |
| | The financial statements included herein have been taken from the records of the Fund without examination of those records by the independent registered public accounting firm. |
© 2016 OppenheimerFunds, Inc. All Rights reserved.
47 OPPENHEIMER MID CAP VALUE FUND
PRIVACY POLICY NOTICE
As an Oppenheimer fund shareholder, you are entitled to know how we protect your personal information and how we limit its disclosure.
Information Sources
We obtain nonpublic personal information about our shareholders from the following sources:
| ● | | Applications or other forms |
| ● | | When you create a user ID and password for online account access |
| ● | | When you enroll in eDocs Direct, our electronic document delivery service |
| ● | | Your transactions with us, our affiliates or others |
| ● | | A software program on our website, often referred to as a “cookie,” which indicates which parts of our site you’ve visited |
| ● | | When you set up challenge questions to reset your password online |
If you visit oppenheimerfunds.com and do not log on to the secure account information areas, we do not obtain any personal information about you. When you do log on to a secure area, we do obtain your user ID and password to identify you. We also use this information to provide you with products and services you have requested, to inform you about products and services that you may be interested in and assist you in other ways.
We do not collect personal information through our website unless you willingly provide it to us, either directly by email or in those areas of the website that request information. In order to update your personal information (including your mailing address, email address and phone number) you must first log on and visit your user profile.
If you have set your browser to warn you before accepting cookies, you will receive the warning message with each cookie. You can refuse cookies by turning them off in your browser. However, doing so may limit your access to certain sections of our website.
We use cookies to help us improve and manage our website. For example, cookies help us recognize new versus repeat visitors to the site, track the pages visited, and enable some special features on the website. This data helps us provide a better service for our website visitors.
Protection of Information
We do not disclose any non-public personal information (such as names on a customer list) about current or former customers to anyone, except as permitted by law.
Disclosure of Information
Copies of confirmations, account statements and other documents reporting activity in your fund accounts are made available to your financial advisor (as designated by you). We may also use details about you and your investments to help us, our financial service affiliates, or firms that jointly market their financial products and services with ours, to better serve your investment needs or suggest financial services or educational material that may be of interest to you. If this requires us to provide you with an opportunity to “opt in” or “opt out” of such information sharing with a firm not affiliated with us, you will receive notification on how to do so, before any such sharing takes place.
Right of Refusal
We will not disclose your personal information to unaffiliated third parties (except as permitted by law), unless we first offer you a reasonable opportunity to refuse or “opt out” of such disclosure.
48 OPPENHEIMER MID CAP VALUE FUND
Internet Security and Encryption
In general, the email services provided by our website are encrypted and provide a secure and private means of communication with us. To protect your own privacy, confidential and/or personal information should only be communicated via email when you are advised that you are using a secure website. As a security measure, we do not include personal or account information in non-secure emails, and we advise you not to send such information to us in non-secure emails. Instead, you may take advantage of the secure features of our website to encrypt your email correspondence. To do this, you will need to use a browser that supports Secure Sockets Layer (SSL) protocol.
We do not guarantee or warrant that any part of our website, including files available for download, are free of viruses or other harmful code. It is your responsibility to take appropriate precautions, such as use of an anti-virus software package, to protect your computer hardware and software.
| ● | | All transactions, including redemptions, exchanges and purchases, are secured by SSL and 256-bit encryption. SSL is used to establish a secure connection between your PC and OppenheimerFunds’ server. It transmits information in an encrypted and scrambled format. |
| ● | | Encryption is achieved through an electronic scrambling technology that uses a “key” to code and then decode the data. Encryption acts like the cable converter box you may have on your television set. It scrambles data with a secret code so that no one can make sense of it while it is being transmitted. When the data reaches its destination, the same software unscrambles the data. |
| ● | | You can exit the secure area by either closing your browser, or for added security, you can use the Log Out button before you close your browser. |
Other Security Measures
We maintain physical, electronic and procedural safeguards to protect your personal account information. Our employees and agents have access to that information only so that they may offer you products or provide services, for example, when responding to your account questions.
How You Can Help
You can also do your part to keep your account information private and to prevent unauthorized transactions. If you obtain a user ID and password for your account, do not allow it to be used by anyone else. Also, take special precautions when accessing your account on a computer used by others.
Who We Are
This joint notice describes the privacy policies of the Oppenheimer funds, OppenheimerFunds, Inc., each of its investment adviser subsidiaries, OppenheimerFunds Distributor, Inc. and OFI Global Trust Co. It applies to all Oppenheimer fund accounts you presently have, or may open in the future, using your Social Security number—whether or not you remain a shareholder of our funds. This notice was last updated March 2015. In the event it is updated or changed, we will post an updated notice on our website at oppenheimerfunds.com. If you have any questions about this privacy policy, write to us at P.O. Box 5270, Denver, CO 80217-5270, email us by clicking on the Contact Us section of our website at oppenheimerfunds.com or call us at 1.800.CALL OPP (225.5677).
49 OPPENHEIMER MID CAP VALUE FUND
THIS PAGE INTENTIONALLY LEFT BLANK.
50 OPPENHEIMER MID CAP VALUE FUND
THIS PAGE INTENTIONALLY LEFT BLANK.
51 OPPENHEIMER MID CAP VALUE FUND
THIS PAGE INTENTIONALLY LEFT BLANK.
52 OPPENHEIMER MID CAP VALUE FUND
THIS PAGE INTENTIONALLY LEFT BLANK.
53 OPPENHEIMER MID CAP VALUE FUND
THIS PAGE INTENTIONALLY LEFT BLANK.
54 OPPENHEIMER MID CAP VALUE FUND
THIS PAGE INTENTIONALLY LEFT BLANK.
55 OPPENHEIMER MID CAP VALUE FUND

Item 2. Code of Ethics.
Not applicable to semiannual reports.
Item 3. Audit Committee Financial Expert.
Not applicable to semiannual reports.
Item 4. Principal Accountant Fees and Services.
Not applicable to semiannual reports.
Item 5. Audit Committee of Listed Registrants
Not applicable.
Item 6. Schedule of Investments.
a) Not applicable. The complete schedule of investments is included in Item 1 of this Form N-CSR.
b) Not applicable.
Item 7. Disclosure of Proxy Voting Policies and Procedures for Closed-End Management Investment Companies.
Not applicable.
Item 8. Portfolio Managers of Closed-End Management Investment Companies.
Not applicable.
Item 9. Purchases of Equity Securities by Closed-End Management Investment Company and Affiliated Purchasers.
Not applicable.
Item 10. Submission of Matters to a Vote of Security Holders.
The Fund’s Governance Committee Provisions with Respect to Nominations of Directors/Trustees to the Respective Boards
None
Item 11. Controls and Procedures.
Based on their evaluation of the registrant’s disclosure controls and procedures (as defined in rule 30a-3(c) under the Investment Company Act of 1940 (17 CFR 270.30a-3(c)) as of 4/29/2016, the registrant’s principal executive officer and principal financial officer found the registrant’s disclosure controls and procedures to provide reasonable assurances that information required to be disclosed by the registrant in the reports that it files under the Securities Exchange Act of 1934 (a) is accumulated and communicated to registrant’s management, including its principal executive officer and principal financial officer, to allow timely decisions regarding required disclosure, and (b) is recorded, processed, summarized and reported, within the time
periods specified in the rules and forms adopted by the U.S. Securities and Exchange Commission.
There have been no changes in the registrant’s internal controls over financial reporting that occurred during the registrant’s second fiscal quarter of the period covered by this report that have materially affected, or are reasonably likely to materially affect, the registrant’s internal control over financial reporting.
Item 12. Exhibits.
| (a) | (1) Not applicable to semiannual reports. |
| | (2) Exhibits attached hereto. |
| (b) | Exhibit attached hereto. |
SIGNATURES
Pursuant to the requirements of the Securities Exchange Act of 1934 and the Investment Company Act of 1940, the registrant has duly caused this report to be signed on its behalf by the undersigned, thereunto duly authorized.
Oppenheimer Quest for Value Funds
| | |
| By: | | /s/ Arthur P. Steinmetz |
| | |
| | Arthur P. Steinmetz |
| | Principal Executive Officer |
| Date: | | 6/15/2016 |
Pursuant to the requirements of the Securities Exchange Act of 1934 and the Investment Company Act of 1940, this report has been signed below by the following persons on behalf of the registrant and in the capacities and on the dates indicated.
| | |
| By: | | /s/ Arthur P. Steinmetz |
| | |
| | Arthur P. Steinmetz |
| | Principal Executive Officer |
| Date: | | 6/15/2016 |
| | |
| By: | | /s/ Brian S. Petersen |
| | |
| | Brian S. Petersen |
| | Principal Financial Officer |
| Date: | | 6/15/2016 |