UNITED STATES
SECURITIES AND EXCHANGE COMMISSION
Washington, D.C. 20549
FORM N-CSR
CERTIFIED SHAREHOLDER REPORT OF REGISTERED
MANAGEMENT INVESTMENT COMPANIES
Investment Company Act file number 811-05251
Fidelity Concord Street Trust
(Exact name of registrant as specified in charter)
245 Summer St., Boston, MA 02210
(Address of principal executive offices) (Zip code)
Cynthia Lo Bessette, Secretary
245 Summer St.
Boston, Massachusetts 02210
(Name and address of agent for service)
Registrant's telephone number, including area code:
617-563-7000
| |
Date of fiscal year end: | February 28 |
|
|
Date of reporting period: | August 31, 2022 |
Item 1.
Reports to Stockholders
Fidelity® Series Total Market Index Fund
Semi-Annual Report
August 31, 2022
Contents
To view a fund's proxy voting guidelines and proxy voting record for the 12-month period ended June 30, visit http://www.fidelity.com/proxyvotingresults or visit the Securities and Exchange Commission's (SEC) web site at http://www.sec.gov.
You may also call 1-800-544-8544 to request a free copy of the proxy voting guidelines.
Standard & Poor's ® ; and S&P ® ; are registered trademarks of Standard & Poor's Financial Services LLC ("S&P") and Dow Jones ® ; is a registered trademark of Dow Jones Trademark Holdings LLC ("Dow Jones"). The fund is not sponsored, endorsed, sold or promoted by SPDJI, Dow Jones, S&P, or their respective affiliates and none of such parties make any representation regarding the advisability of investing in such product(s) nor do they have any liability for any errors, omissions, or interruptions of the index or indices.
Standard & Poor's, S&P and S&P 500 are registered service marks of The McGraw-Hill Companies, Inc. and have been licensed for use by Fidelity Distributors Corporation.
Other third-party marks appearing herein are the property of their respective owners.
All other marks appearing herein are registered or unregistered trademarks or service marks of FMR LLC or an affiliated company. © 2022 FMR LLC. All rights reserved.
This report and the financial statements contained herein are submitted for the general information of the shareholders of the Fund. This report is not authorized for distribution to prospective investors in the Fund unless preceded or accompanied by an effective prospectus.
A fund files its complete schedule of portfolio holdings with the SEC for the first and third quarters of each fiscal year on Form N-PORT. Forms N-PORT are available on the SEC's web site at http://www.sec.gov. A fund's Forms N-PORT may be reviewed and copied at the SEC's Public Reference Room in Washington, DC. Information regarding the operation of the SEC's Public Reference Room may be obtained by calling 1-800-SEC-0330.
For a complete list of a fund's portfolio holdings, view the most recent holdings listing, semiannual report, or annual report on Fidelity's web site at http://www.fidelity.com, http://www.institutional.fidelity.com, or http://www.401k.com, as applicable.
NOT FDIC INSURED •MAY LOSE VALUE •NO BANK GUARANTEE
Neither the Fund nor Fidelity Distributors Corporation is a bank.
Top Holdings (% of Fund's net assets) |
| |
| Apple, Inc. | 6.1 | |
| Microsoft Corp. | 5.0 | |
| Amazon.com, Inc. | 2.8 | |
| Tesla, Inc. | 1.8 | |
| Alphabet, Inc. Class A | 1.7 | |
| Alphabet, Inc. Class C | 1.5 | |
| Berkshire Hathaway, Inc. Class B | 1.3 | |
| UnitedHealth Group, Inc. | 1.2 | |
| Johnson & Johnson | 1.1 | |
| Exxon Mobil Corp. | 1.0 | |
| | 23.5 | |
| |
| Market Sectors (% of Fund's net assets) |
| |
| Information Technology | 26.1 | |
| Health Care | 13.9 | |
| Financials | 11.6 | |
| Consumer Discretionary | 11.5 | |
| Industrials | 8.8 | |
| Communication Services | 7.6 | |
| Consumer Staples | 6.2 | |
| Energy | 4.7 | |
| Real Estate | 3.5 | |
| Utilities | 3.0 | |
| Materials | 2.8 | |
| |
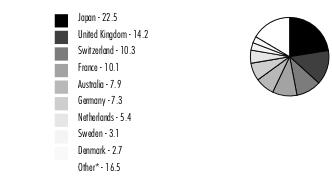
Asset Allocation (% of Fund's net assets) |
|
Foreign investments - 3.1% |
|
Showing Percentage of Net Assets
| Common Stocks - 99.7% |
| | | Shares | Value ($) |
| COMMUNICATION SERVICES - 7.6% | | | |
| Diversified Telecommunication Services - 0.9% | | | |
| Anterix, Inc. (a) | | 21,970 | 932,627 |
| AST SpaceMobile, Inc. (a)(b) | | 48,351 | 581,179 |
| AT&T, Inc. | | 8,288,438 | 145,379,203 |
| ATN International, Inc. | | 13,677 | 640,767 |
| Bandwidth, Inc. (a) | | 28,446 | 440,913 |
| Charge Enterprises, Inc. (a)(b) | | 168,781 | 410,138 |
| Cogent Communications Group, Inc. | | 49,140 | 2,616,705 |
| Consolidated Communications Holdings, Inc. (a) | | 81,800 | 469,532 |
| Cuentas, Inc. (a)(b) | | 11,438 | 9,908 |
| EchoStar Holding Corp. Class A (a)(b) | | 43,092 | 793,324 |
| Frontier Communications Parent, Inc. (a) | | 240,499 | 6,195,254 |
| Globalstar, Inc. (a)(b) | | 764,652 | 1,529,304 |
| IDT Corp. Class B (a) | | 20,477 | 523,597 |
| Iridium Communications, Inc. (a) | | 147,059 | 6,527,949 |
| Liberty Global PLC: | | | |
| Class A (a) | | 64,484 | 1,302,577 |
| Class C (a) | | 478,044 | 10,187,118 |
| Liberty Latin America Ltd.: | | | |
| Class A (a) | | 37,031 | 259,217 |
| Class C (a) | | 189,775 | 1,322,732 |
| Lumen Technologies, Inc. (b) | | 1,079,689 | 10,753,702 |
| Nextplat Corp. (a) | | 4,554 | 14,755 |
| Ooma, Inc. (a) | | 24,618 | 297,878 |
| Radius Global Infrastructure, Inc. (a) | | 80,868 | 1,113,552 |
| Starry Group Holdings, Inc. Class A (a)(b) | | 155,365 | 349,571 |
| Verizon Communications, Inc. | | 4,865,901 | 203,443,321 |
| | | | 396,094,823 |
| Entertainment - 1.2% | | | |
| Activision Blizzard, Inc. | | 904,080 | 70,961,239 |
| AMC Entertainment Holdings, Inc. Class A (a)(b) | | 597,827 | 5,452,182 |
| Ballantyne of Omaha, Inc. (a) | | 17,326 | 41,409 |
| Chicken Soup For The Soul Entertainment, Inc. (a)(b) | | 9,276 | 79,866 |
| Cinedigm Corp. (a)(b) | | 156,892 | 84,737 |
| Cinemark Holdings, Inc. (a) | | 122,931 | 1,730,868 |
| CuriosityStream, Inc. Class A (a)(b) | | 29,764 | 50,599 |
| Dolphin Entertainment, Inc. (a)(b) | | 5,671 | 23,818 |
| Electronic Arts, Inc. | | 325,291 | 41,269,669 |
| Gaia, Inc. Class A (a) | | 14,601 | 48,183 |
| Genius Brands International, Inc. (a)(b) | | 341,061 | 245,564 |
| Golden Matrix Group, Inc. (a)(b) | | 11,373 | 42,649 |
| Grom Social Enterprises, Inc. (a) | | 12,514 | 4,893 |
| Lions Gate Entertainment Corp.: | | | |
| Class A (a) | | 109,195 | 1,075,571 |
| Class B (a) | | 101,018 | 942,498 |
| Live Nation Entertainment, Inc. (a) | | 159,373 | 14,400,944 |
| LiveOne, Inc. (a)(b) | | 71,440 | 71,433 |
| Madison Square Garden Entertainment Corp. (a)(b) | | 29,311 | 1,628,519 |
| Madison Square Garden Sports Corp. (a) | | 19,613 | 3,143,376 |
| Marcus Corp. (b) | | 24,598 | 395,782 |
| Motorsport Games, Inc. Class A (a)(b) | | 2,692 | 1,719 |
| Netflix, Inc. (a) | | 514,332 | 114,984,062 |
| Playstudios, Inc. Class A (a)(b) | | 90,262 | 326,748 |
| Playtika Holding Corp. (a) | | 118,323 | 1,245,941 |
| Reading International, Inc. Class A (a) | | 15,573 | 62,915 |
| Reservoir Media, Inc. (a)(b) | | 38,449 | 251,841 |
| Roku, Inc. Class A (a) | | 139,378 | 9,477,704 |
| Sciplay Corp. (A Shares) (a) | | 29,954 | 365,139 |
| Skillz, Inc. (a)(b) | | 323,755 | 430,594 |
| Take-Two Interactive Software, Inc. (a) | | 182,675 | 22,388,648 |
| The Walt Disney Co. (a) | | 2,109,549 | 236,438,252 |
| Warner Bros Discovery, Inc. (a) | | 2,556,183 | 33,843,863 |
| Warner Music Group Corp. Class A | | 132,383 | 3,543,893 |
| World Wrestling Entertainment, Inc. Class A (b) | | 49,470 | 3,364,455 |
| | | | 568,419,573 |
| Interactive Media & Services - 4.4% | | | |
| Alphabet, Inc.: | | | |
| Class A (a) | | 6,981,586 | 755,547,237 |
| Class C (a) | | 6,370,091 | 695,295,433 |
| Angi, Inc. (a)(b) | | 85,809 | 348,385 |
| Autoweb, Inc. (a) | | 6,160 | 2,390 |
| Bumble, Inc. (a) | | 83,314 | 2,087,016 |
| BuzzFeed, Inc. (a)(b) | | 30,163 | 46,753 |
| CarGurus, Inc. Class A (a) | | 101,340 | 1,895,058 |
| Cars.com, Inc. (a) | | 75,615 | 964,091 |
| Creatd, Inc. (a)(b) | | 17,561 | 9,170 |
| DHI Group, Inc. (a) | | 48,272 | 246,187 |
| Eventbrite, Inc. (a)(b) | | 93,347 | 663,697 |
| EverQuote, Inc. Class A (a) | | 24,751 | 214,096 |
| fuboTV, Inc. (a)(b) | | 211,146 | 764,349 |
| IAC (a) | | 99,657 | 6,404,955 |
| Izea Worldwide, Inc. (a)(b) | | 64,396 | 55,014 |
| Kubient, Inc. (a)(b) | | 9,055 | 11,590 |
| Liberty TripAdvisor Holdings, Inc. (a) | | 74,921 | 89,905 |
| Match Group, Inc. (a) | | 332,998 | 18,824,377 |
| MediaAlpha, Inc. Class A (a) | | 25,835 | 215,722 |
| Meta Platforms, Inc. Class A (a) | | 2,656,020 | 432,745,339 |
| Nextdoor Holdings, Inc. (a)(b) | | 111,845 | 355,667 |
| Outbrain, Inc. (a)(b) | | 9,538 | 42,063 |
| Paltalk, Inc. (b) | | 4,883 | 8,692 |
| Pinterest, Inc. Class A (a) | | 669,571 | 15,426,916 |
| QuinStreet, Inc. (a) | | 59,201 | 711,004 |
| Shutterstock, Inc. | | 26,790 | 1,484,434 |
| Snap, Inc. Class A (a) | | 1,269,015 | 13,806,883 |
| Society Pass, Inc. (b) | | 6,665 | 12,597 |
| Super League Gaming, Inc. (a)(b) | | 51,901 | 46,197 |
| System1, Inc. (a)(b) | | 21,980 | 242,879 |
| The Arena Group Holdings, Inc. (b) | | 13,854 | 145,744 |
| Travelzoo, Inc. (a) | | 8,037 | 46,856 |
| TripAdvisor, Inc. (a) | | 115,144 | 2,740,427 |
| TrueCar, Inc. (a) | | 102,878 | 224,274 |
| Twitter, Inc. (a) | | 884,208 | 34,263,060 |
| Vimeo, Inc. (a) | | 180,899 | 1,070,922 |
| Vinco Ventures, Inc. (a)(b) | | 190,410 | 184,698 |
| Wejo Group Ltd. (a)(b) | | 49,036 | 55,411 |
| Yelp, Inc. (a) | | 76,737 | 2,622,103 |
| Zedge, Inc. (a) | | 13,083 | 37,025 |
| Ziff Davis, Inc. (a) | | 54,403 | 4,204,264 |
| ZipRecruiter, Inc. (a) | | 13,997 | 233,470 |
| Zoominfo Technologies, Inc. (a) | | 349,115 | 15,856,803 |
| | | | 2,010,253,153 |
| Media - 0.9% | | | |
| AdTheorent Holding Co., Inc. Class A (a) | | 56,738 | 149,788 |
| Advantage Solutions, Inc. Class A (a)(b) | | 114,364 | 416,285 |
| Altice U.S.A., Inc. Class A (a) | | 260,925 | 2,609,250 |
| AMC Networks, Inc. Class A (a) | | 35,192 | 942,794 |
| Audacy, Inc. Class A (a) | | 133,357 | 73,560 |
| Beasley Broadcast Group, Inc. Class A (a) | | 5,666 | 6,913 |
| Boston Omaha Corp. (a)(b) | | 20,476 | 549,371 |
| Cable One, Inc. (b) | | 5,791 | 6,572,785 |
| Cardlytics, Inc. (a) | | 39,095 | 517,618 |
| Cbdmd, Inc. (a)(b) | | 48,506 | 19,359 |
| Charter Communications, Inc. Class A (a) | | 134,202 | 55,375,771 |
| Clear Channel Outdoor Holdings, Inc. (a) | | 544,859 | 871,774 |
| Comcast Corp. Class A | | 5,177,750 | 187,382,773 |
| comScore, Inc. (a)(b) | | 85,291 | 185,934 |
| Cumulus Media, Inc. (a) | | 18,958 | 176,689 |
| Daily Journal Corp. (a) | | 911 | 237,953 |
| DallasNews Corp. | | 1,634 | 13,072 |
| Digital Media Solutions, Inc. Class A (a)(b) | | 10,331 | 13,327 |
| DISH Network Corp. Class A (a) | | 293,883 | 5,098,870 |
| E.W. Scripps Co. Class A (a) | | 67,553 | 1,009,917 |
| Emerald Holding, Inc. (a) | | 25,809 | 98,848 |
| Entravision Communication Corp. Class A | | 69,720 | 354,178 |
| Fluent, Inc. (a) | | 49,180 | 78,688 |
| Fox Corp.: | | | |
| Class A | | 406,218 | 13,884,531 |
| Class B | | 122,554 | 3,875,157 |
| Gannett Co., Inc. (a)(b) | | 173,936 | 403,532 |
| Gray Television, Inc. | | 102,645 | 1,960,520 |
| Harte-Hanks, Inc. (a) | | 4,290 | 65,637 |
| Hemisphere Media Group, Inc. (a) | | 22,142 | 161,858 |
| iHeartMedia, Inc. (a) | | 126,107 | 1,116,047 |
| Innovid Corp. (a)(b) | | 75,400 | 276,718 |
| Insignia Systems, Inc. (a)(b) | | 895 | 6,444 |
| Integral Ad Science Holding Corp. (a) | | 17,695 | 143,860 |
| Interpublic Group of Companies, Inc. | | 454,334 | 12,557,792 |
| John Wiley & Sons, Inc. Class A | | 50,939 | 2,344,722 |
| Lee Enterprises, Inc. (a) | | 5,616 | 111,758 |
| Liberty Broadband Corp.: | | | |
| Class A (a) | | 31,164 | 3,141,954 |
| Class C (a) | | 145,470 | 14,794,299 |
| Liberty Media Corp.: | | | |
| Liberty Braves Class A (a)(b) | | 15,624 | 439,034 |
| Liberty Braves Class C (a) | | 39,934 | 1,091,796 |
| Liberty Formula One Group Series C (a) | | 232,719 | 14,819,546 |
| Liberty Media Class A (a) | | 29,993 | 1,743,493 |
| Liberty SiriusXM Series A (a)(b) | | 80,840 | 3,358,094 |
| Liberty SiriusXM Series C (a) | | 192,929 | 7,979,543 |
| Loyalty Ventures, Inc. (a) | | 22,436 | 47,340 |
| Magnite, Inc. (a) | | 131,903 | 993,230 |
| Marchex, Inc. Class B (a) | | 22,844 | 47,287 |
| Mediaco Holding, Inc. (a) | | 1,561 | 4,543 |
| National CineMedia, Inc. (b) | | 65,009 | 80,611 |
| News Corp.: | | | |
| Class A | | 352,482 | 5,963,995 |
| Class B | | 240,206 | 4,141,151 |
| Nexstar Broadcasting Group, Inc. Class A | | 46,600 | 8,915,512 |
| Nextplay Technologies, Inc. (a)(b) | | 73,271 | 19,534 |
| Omnicom Group, Inc. | | 239,158 | 15,999,670 |
| Paramount Global: | | | |
| Class A (b) | | 61,182 | 1,616,428 |
| Class B | | 645,807 | 15,105,426 |
| PubMatic, Inc. (a)(b) | | 48,919 | 957,345 |
| Saga Communications, Inc. Class A | | 4,627 | 128,769 |
| Salem Communications Corp. Class A (a) | | 11,612 | 27,869 |
| Scholastic Corp. | | 35,299 | 1,620,577 |
| Sinclair Broadcast Group, Inc. Class A (b) | | 50,820 | 1,122,614 |
| Sirius XM Holdings, Inc. (b) | | 1,046,435 | 6,372,789 |
| SPAR Group, Inc. (a)(b) | | 5,651 | 7,290 |
| Stagwell, Inc. (a)(b) | | 88,789 | 601,989 |
| Stran & Co., Inc. (a)(b) | | 13,640 | 25,098 |
| TechTarget, Inc. (a) | | 30,692 | 1,991,911 |
| TEGNA, Inc. | | 256,173 | 5,482,102 |
| The New York Times Co. Class A | | 191,422 | 5,836,457 |
| Thryv Holdings, Inc. (a) | | 19,237 | 492,082 |
| Townsquare Media, Inc. (a) | | 11,232 | 97,718 |
| Troika Media Group, Inc. (a)(b) | | 24,495 | 17,259 |
| Urban One, Inc.: | | | |
| Class A (a) | | 7,985 | 43,598 |
| Class D (non-vtg.) (a) | | 23,198 | 97,200 |
| WideOpenWest, Inc. (a) | | 60,594 | 1,078,573 |
| Xcel Brands, Inc. (a)(b) | | 4,185 | 4,687 |
| | | | 425,972,506 |
| Wireless Telecommunication Services - 0.2% | | | |
| Gogo, Inc. (a) | | 78,478 | 1,166,183 |
| KORE Group Holdings, Inc. (a) | | 37,958 | 113,494 |
| NII Holdings, Inc. (a)(c) | | 62,298 | 16,197 |
| Shenandoah Telecommunications Co. | | 57,957 | 1,291,862 |
| Spok Holdings, Inc. | | 23,090 | 166,248 |
| SurgePays, Inc. (a)(b) | | 9,534 | 40,138 |
| T-Mobile U.S., Inc. (a) | | 681,798 | 98,151,640 |
| Telephone & Data Systems, Inc. | | 114,025 | 1,855,187 |
| U.S. Cellular Corp. (a) | | 17,714 | 506,443 |
| | | | 103,307,392 |
TOTAL COMMUNICATION SERVICES | | | 3,504,047,447 |
| CONSUMER DISCRETIONARY - 11.5% | | | |
| Auto Components - 0.3% | | | |
| Adient PLC (a) | | 108,699 | 3,608,807 |
| American Axle & Manufacturing Holdings, Inc. (a) | | 130,693 | 1,352,673 |
| Aptiv PLC (a) | | 313,731 | 29,311,887 |
| Autoliv, Inc. | | 92,595 | 7,202,965 |
| BorgWarner, Inc. | | 280,714 | 10,582,918 |
| Cooper-Standard Holding, Inc. (a)(b) | | 19,304 | 151,150 |
| Dana, Inc. | | 164,989 | 2,552,380 |
| Dorman Products, Inc. (a) | | 32,502 | 2,946,306 |
| Fox Factory Holding Corp. (a) | | 48,475 | 4,518,355 |
| Garrett Motion, Inc. (a)(b) | | 66,074 | 455,250 |
| Gentex Corp. | | 272,463 | 7,435,515 |
| Gentherm, Inc. (a) | | 38,092 | 2,281,711 |
| Holley, Inc. (a)(b) | | 43,507 | 246,685 |
| Horizon Global Corp. (a)(b) | | 20,130 | 29,994 |
| LCI Industries | | 29,214 | 3,385,026 |
| Lear Corp. | | 69,501 | 9,635,619 |
| Luminar Technologies, Inc. (a)(b) | | 253,174 | 2,182,360 |
| Modine Manufacturing Co. (a) | | 59,806 | 895,894 |
| Motorcar Parts of America, Inc. (a) | | 22,334 | 331,883 |
| Patrick Industries, Inc. | | 25,239 | 1,336,910 |
| QuantumScape Corp. Class A (a)(b) | | 295,485 | 3,259,200 |
| Solid Power, Inc. (a) | | 128,530 | 845,727 |
| Standard Motor Products, Inc. | | 21,859 | 802,225 |
| Stoneridge, Inc. (a) | | 31,429 | 597,151 |
| Strattec Security Corp. (a) | | 4,336 | 118,373 |
| Superior Industries International, Inc. (a)(b) | | 28,808 | 143,464 |
| Sypris Solutions, Inc. (a) | | 11,199 | 21,502 |
| Tenneco, Inc. (a) | | 86,211 | 1,625,939 |
| The Goodyear Tire & Rubber Co. (a) | | 326,153 | 4,575,927 |
| Unique Fabricating, Inc. (a) | | 2,233 | 1,675 |
| Visteon Corp. (a) | | 32,253 | 3,864,877 |
| Worksport Ltd. (a)(b) | | 10,407 | 22,167 |
| XL Fleet Corp. (Class A) (a)(b) | | 111,499 | 124,879 |
| XPEL, Inc. (a)(b) | | 19,162 | 1,313,172 |
| | | | 107,760,566 |
| Automobiles - 2.1% | | | |
| Arcimoto, Inc. (a)(b) | | 32,018 | 70,119 |
| AYRO, Inc. (a)(b) | | 31,853 | 28,368 |
| Canoo, Inc. (a)(b) | | 162,949 | 519,807 |
| Faraday Future Intelligent Electric, Inc. (a)(b) | | 182,080 | 203,930 |
| Fisker, Inc. (a)(b) | | 164,616 | 1,486,482 |
| Ford Motor Co. | | 4,573,434 | 69,699,134 |
| General Motors Co. | | 1,690,832 | 64,606,691 |
| Harley-Davidson, Inc. | | 172,315 | 6,646,190 |
| Lordstown Motors Corp. Class A (a)(b) | | 139,440 | 298,402 |
| Lucid Group, Inc. Class A (a)(b) | | 660,694 | 10,135,046 |
| Mullen Automotive, Inc. (a)(b) | | 281,323 | 187,642 |
| Rivian Automotive, Inc. | | 188,032 | 6,150,527 |
| Tesla, Inc. (a) | | 2,915,251 | 803,472,328 |
| Thor Industries, Inc. (b) | | 63,242 | 5,123,234 |
| Volcon, Inc. (b) | | 21,850 | 66,424 |
| Winnebago Industries, Inc. (b) | | 37,759 | 2,174,163 |
| Workhorse Group, Inc. (a)(b) | | 186,107 | 582,515 |
| | | | 971,451,002 |
| Distributors - 0.1% | | | |
| Amcon Distributing Co. (b) | | 193 | 37,633 |
| Educational Development Corp. | | 7,003 | 22,200 |
| Funko, Inc. (a) | | 31,367 | 698,543 |
| Genuine Parts Co. | | 163,828 | 25,558,806 |
| Kaival Brands Innovations Group, Inc. (a)(b) | | 17,015 | 22,120 |
| LKQ Corp. | | 302,241 | 16,085,266 |
| Pool Corp. | | 46,584 | 15,800,827 |
| Weyco Group, Inc. | | 7,906 | 202,394 |
| | | | 58,427,789 |
| Diversified Consumer Services - 0.1% | | | |
| 2U, Inc. (a) | | 91,548 | 651,822 |
| ADT, Inc. | | 267,749 | 1,951,890 |
| Adtalem Global Education, Inc. (a) | | 52,075 | 1,962,707 |
| American Public Education, Inc. (a) | | 21,703 | 224,192 |
| Aspen Group, Inc. (a) | | 20,278 | 16,263 |
| Bright Horizons Family Solutions, Inc. (a) | | 68,215 | 4,652,263 |
| Carriage Services, Inc. | | 15,738 | 557,283 |
| Chegg, Inc. (a) | | 145,118 | 2,855,922 |
| Coursera, Inc. (a) | | 98,933 | 1,137,730 |
| Duolingo, Inc. (a)(b) | | 23,475 | 2,207,120 |
| European Wax Center, Inc. (b) | | 22,181 | 479,775 |
| Frontdoor, Inc. (a) | | 94,420 | 2,216,982 |
| Graham Holdings Co. | | 4,503 | 2,546,131 |
| Grand Canyon Education, Inc. (a) | | 37,098 | 3,019,035 |
| H&R Block, Inc. | | 184,444 | 8,299,980 |
| Laureate Education, Inc. Class A | | 161,256 | 1,777,041 |
| Lincoln Educational Services Corp. (a) | | 28,204 | 183,326 |
| Mister Car Wash, Inc. (a)(b) | | 43,977 | 435,812 |
| Nerdy, Inc. Class A (a)(b) | | 68,278 | 208,931 |
| OneSpaWorld Holdings Ltd. (a)(b) | | 82,358 | 725,574 |
| Perdoceo Education Corp. (a) | | 77,292 | 895,041 |
| PowerSchool Holdings, Inc. (a)(b) | | 48,779 | 878,022 |
| Regis Corp. (a)(b) | | 37,935 | 53,109 |
| Rover Group, Inc. Class A (a)(b) | | 87,252 | 332,430 |
| Service Corp. International | | 183,782 | 11,341,187 |
| StoneMor, Inc. (a) | | 44,124 | 151,787 |
| Strategic Education, Inc. (b) | | 26,672 | 1,725,678 |
| Stride, Inc. (a) | | 49,145 | 1,874,390 |
| Terminix Global Holdings, Inc. (a) | | 139,293 | 5,940,846 |
| The Beachbody Co., Inc. (a)(b) | | 106,680 | 123,749 |
| Udemy, Inc. | | 18,784 | 279,130 |
| Universal Technical Institute, Inc. (a) | | 37,512 | 257,332 |
| Vivint Smart Home, Inc. Class A (a)(b) | | 48,761 | 305,244 |
| WW International, Inc. (a) | | 59,887 | 312,610 |
| Xpresspa Group, Inc. (a)(b) | | 115,040 | 119,642 |
| Zovio, Inc. (a)(b) | | 25,669 | 6,725 |
| | | | 60,706,701 |
| Hotels, Restaurants & Leisure - 2.0% | | | |
| Accel Entertainment, Inc. (a) | | 64,149 | 603,642 |
| Airbnb, Inc. Class A (a) | | 442,907 | 50,101,640 |
| Allied Esports Entertainment, Inc. (a)(b) | | 18,221 | 27,332 |
| ARAMARK Holdings Corp. | | 297,332 | 10,617,726 |
| Ark Restaurants Corp. (b) | | 2,540 | 50,063 |
| Bally's Corp. (a) | | 33,233 | 787,290 |
| BBQ Holdings, Inc. (a) | | 12,395 | 213,070 |
| Biglari Holdings, Inc.: | | | |
| Class A (a) | | 82 | 54,120 |
| Class B (a) | | 947 | 127,712 |
| BJ's Restaurants, Inc. (a) | | 27,638 | 693,161 |
| Bloomin' Brands, Inc. | | 92,397 | 1,868,267 |
| Bluegreen Vacations Holding Corp. Class A | | 16,027 | 334,003 |
| Booking Holdings, Inc. (a) | | 47,050 | 88,256,861 |
| Bowlero Corp. Class A (a)(b) | | 47,058 | 556,226 |
| Boyd Gaming Corp. | | 91,620 | 4,986,877 |
| Brinker International, Inc. (a) | | 50,530 | 1,238,490 |
| BurgerFi International, Inc. (a)(b) | | 15,389 | 46,321 |
| Caesars Entertainment, Inc. (a) | | 250,422 | 10,798,197 |
| Canterbury Park Holding Co. | | 2,366 | 52,052 |
| Carnival Corp. (a)(b) | | 1,141,064 | 10,794,465 |
| Carrols Restaurant Group, Inc. | | 38,623 | 84,971 |
| Century Casinos, Inc. (a) | | 32,935 | 242,731 |
| Chipotle Mexican Grill, Inc. (a) | | 32,364 | 51,678,835 |
| Choice Hotels International, Inc. | | 37,664 | 4,320,437 |
| Churchill Downs, Inc. | | 40,151 | 7,913,361 |
| Chuy's Holdings, Inc. (a) | | 22,879 | 510,888 |
| Cracker Barrel Old Country Store, Inc. (b) | | 26,765 | 2,889,014 |
| Darden Restaurants, Inc. | | 144,129 | 17,830,199 |
| Dave & Buster's Entertainment, Inc. (a) | | 44,560 | 1,842,110 |
| Denny's Corp. (a) | | 71,116 | 672,046 |
| Dine Brands Global, Inc. (b) | | 19,311 | 1,286,113 |
| Domino's Pizza, Inc. | | 41,609 | 15,472,723 |
| Draftkings Holdings, Inc. (a)(b) | | 419,128 | 6,731,196 |
| Drive Shack, Inc. (a)(b) | | 94,875 | 102,465 |
| Dutch Bros, Inc. (b) | | 31,332 | 1,143,618 |
| Ebet, Inc. (a)(b) | | 2,137 | 3,975 |
| El Pollo Loco Holdings, Inc. (a) | | 22,844 | 206,738 |
| Elys Game Technology Corp. (a) | | 16,022 | 8,927 |
| Esports Entertainment Group, Inc. (a)(b) | | 34,598 | 16,590 |
| Everi Holdings, Inc. (a) | | 111,963 | 2,071,316 |
| Expedia, Inc. (a) | | 176,212 | 18,088,162 |
| F45 Training Holdings, Inc. (a) | | 24,849 | 62,123 |
| FAT Brands, Inc.: | | | |
| Class A (b) | | 166 | 1,406 |
| Class B | | 6,852 | 56,392 |
| Fiesta Restaurant Group, Inc. (a) | | 18,933 | 126,283 |
| First Watch Restaurant Group, Inc. | | 11,185 | 187,572 |
| Flanigans Enterprises, Inc. | | 648 | 16,654 |
| Full House Resorts, Inc. (a) | | 39,366 | 265,327 |
| GAN Ltd. (a) | | 44,881 | 115,793 |
| Golden Entertainment, Inc. (a) | | 23,365 | 893,945 |
| Good Times Restaurants, Inc. (a) | | 10,762 | 31,640 |
| Hall of Fame Resort & Entertainment Co. (a)(b) | | 75,282 | 59,977 |
| Hilton Grand Vacations, Inc. (a) | | 106,246 | 4,332,712 |
| Hilton Worldwide Holdings, Inc. | | 323,578 | 41,210,894 |
| Hyatt Hotels Corp. Class A (a) | | 58,758 | 5,265,892 |
| Inspirato, Inc. (a) | | 25,787 | 71,946 |
| Inspired Entertainment, Inc. (a) | | 30,618 | 320,570 |
| Jack in the Box, Inc. (b) | | 24,108 | 1,925,265 |
| Krispy Kreme, Inc. | | 35,171 | 413,259 |
| Kura Sushi U.S.A., Inc. Class A (a) | | 4,862 | 363,483 |
| Las Vegas Sands Corp. (a) | | 399,770 | 15,043,345 |
| Life Time Group Holdings, Inc. (b) | | 44,950 | 532,658 |
| Light & Wonder, Inc. Class A (a) | | 114,278 | 5,625,906 |
| Lindblad Expeditions Holdings (a) | | 35,320 | 273,024 |
| Lottery.Com, Inc. (a)(b) | | 36,408 | 12,965 |
| Marriott International, Inc. Class A | | 318,333 | 48,940,515 |
| Marriott Vacations Worldwide Corp. | | 47,738 | 6,798,846 |
| McDonald's Corp. | | 855,760 | 215,891,133 |
| Membership Collective Group, Inc. Class A (a)(b) | | 34,907 | 197,923 |
| MGM Resorts International | | 408,691 | 13,339,674 |
| Monarch Casino & Resort, Inc. (a) | | 15,243 | 920,525 |
| Nathan's Famous, Inc. (b) | | 4,351 | 282,815 |
| Noodles & Co. (a) | | 41,511 | 197,177 |
| Norwegian Cruise Line Holdings Ltd. (a)(b) | | 481,278 | 6,295,116 |
| Papa John's International, Inc. (b) | | 36,525 | 2,952,316 |
| Penn Entertainment, Inc. (a) | | 187,496 | 5,855,500 |
| Planet Fitness, Inc. (a) | | 98,838 | 6,696,275 |
| Playa Hotels & Resorts NV (a) | | 154,175 | 1,011,388 |
| PlayAGS, Inc. (a) | | 31,282 | 230,236 |
| Portillo's, Inc. (b) | | 33,810 | 744,496 |
| Potbelly Corp. (a) | | 24,448 | 132,997 |
| Rave Restaurant Group, Inc. (a)(b) | | 14,724 | 17,522 |
| RCI Hospitality Holdings, Inc. | | 9,130 | 595,367 |
| Red Robin Gourmet Burgers, Inc. (a)(b) | | 17,510 | 130,099 |
| Red Rock Resorts, Inc. | | 60,667 | 2,318,693 |
| Royal Caribbean Cruises Ltd. (a) | | 262,225 | 10,711,891 |
| Rush Street Interactive, Inc. (a) | | 63,364 | 306,682 |
| Ruth's Hospitality Group, Inc. | | 36,077 | 657,323 |
| SeaWorld Entertainment, Inc. (a) | | 54,113 | 2,719,178 |
| Shake Shack, Inc. Class A (a) | | 45,115 | 2,150,181 |
| Six Flags Entertainment Corp. (a)(b) | | 88,864 | 1,968,338 |
| Sonder Holdings, Inc. (a)(b) | | 136,699 | 254,260 |
| Starbucks Corp. | | 1,327,607 | 111,611,920 |
| Sweetgreen, Inc. Class A | | 15,325 | 259,146 |
| Target Hospitality Corp. (a)(b) | | 28,885 | 383,882 |
| Texas Roadhouse, Inc. Class A | | 78,249 | 6,945,381 |
| The Cheesecake Factory, Inc. (b) | | 56,668 | 1,735,174 |
| The ONE Group Hospitality, Inc. (a) | | 30,050 | 214,557 |
| Travel+Leisure Co. | | 102,412 | 4,342,269 |
| Vacasa, Inc. Class A (a) | | 106,326 | 425,304 |
| Vail Resorts, Inc. | | 46,577 | 10,464,920 |
| Wendy's Co. | | 195,863 | 3,756,652 |
| Wingstop, Inc. (b) | | 34,299 | 3,905,284 |
| Wyndham Hotels & Resorts, Inc. | | 105,444 | 6,889,711 |
| Wynn Resorts Ltd. (a) | | 120,923 | 7,326,725 |
| Xponential Fitness, Inc. (a)(b) | | 15,371 | 281,750 |
| Yum! Brands, Inc. | | 329,384 | 36,640,676 |
| | | | 920,032,778 |
| Household Durables - 0.4% | | | |
| Aterian, Inc. (a)(b) | | 56,142 | 128,004 |
| Bassett Furniture Industries, Inc. (b) | | 10,142 | 193,307 |
| Beazer Homes U.S.A., Inc. (a) | | 35,293 | 502,572 |
| Cavco Industries, Inc. (a) | | 9,839 | 2,302,424 |
| Century Communities, Inc. | | 34,877 | 1,628,407 |
| Cricut, Inc. (a)(b) | | 49,760 | 310,502 |
| D.R. Horton, Inc. | | 370,895 | 26,389,179 |
| Dixie Group, Inc. (a) | | 13,394 | 15,135 |
| Dream Finders Homes, Inc. (a)(b) | | 20,864 | 257,670 |
| Emerson Radio Corp. (a) | | 6,994 | 4,553 |
| Ethan Allen Interiors, Inc. | | 25,549 | 607,300 |
| Flexsteel Industries, Inc. | | 6,418 | 112,251 |
| Garmin Ltd. | | 177,354 | 15,694,055 |
| GoPro, Inc. Class A (a) | | 151,021 | 919,718 |
| Green Brick Partners, Inc. (a)(b) | | 52,777 | 1,285,648 |
| Hamilton Beach Brands Holding Co. Class A (b) | | 8,711 | 107,581 |
| Harbor Custom Development, Inc. (a)(b) | | 15,633 | 17,665 |
| Helen of Troy Ltd. (a) | | 27,373 | 3,384,124 |
| Hooker Furnishings Corp. | | 13,935 | 221,148 |
| Hovnanian Enterprises, Inc. Class A (a) | | 5,654 | 226,669 |
| Installed Building Products, Inc. | | 26,684 | 2,416,503 |
| iRobot Corp. (a)(b) | | 31,336 | 1,845,064 |
| KB Home | | 99,266 | 2,843,971 |
| Koss Corp. (a)(b) | | 7,625 | 59,704 |
| La-Z-Boy, Inc. | | 49,473 | 1,305,592 |
| Landsea Homes Corp. (a) | | 15,255 | 102,209 |
| Legacy Housing Corp. (a) | | 13,278 | 226,921 |
| Leggett & Platt, Inc. (b) | | 153,171 | 5,854,196 |
| Lennar Corp.: | | | |
| Class A | | 311,637 | 24,136,286 |
| Class B | | 1,838 | 113,368 |
| LGI Homes, Inc. (a) | | 23,993 | 2,277,176 |
| Lifetime Brands, Inc. | | 14,087 | 125,656 |
| Live Ventures, Inc. (a) | | 1,305 | 32,860 |
| Lovesac (a)(b) | | 15,389 | 474,751 |
| M.D.C. Holdings, Inc. | | 65,727 | 2,042,795 |
| M/I Homes, Inc. (a) | | 32,398 | 1,400,890 |
| Meritage Homes Corp. (a) | | 43,017 | 3,370,382 |
| Mohawk Industries, Inc. (a) | | 60,015 | 6,623,255 |
| Nephros, Inc. (a)(b) | | 3,430 | 4,871 |
| Newell Brands, Inc. | | 427,982 | 7,639,479 |
| Nova LifeStyle, Inc. (a) | | 1,541 | 1,171 |
| NVR, Inc. (a) | | 3,576 | 14,804,855 |
| PulteGroup, Inc. | | 273,860 | 11,135,148 |
| Purple Innovation, Inc. (a)(b) | | 81,801 | 233,951 |
| Skyline Champion Corp. (a) | | 60,803 | 3,445,706 |
| Snap One Holdings Corp. (a) | | 16,069 | 179,812 |
| Sonos, Inc. (a) | | 146,914 | 2,209,587 |
| Taylor Morrison Home Corp. (a) | | 137,260 | 3,446,599 |
| Tempur Sealy International, Inc. | | 201,368 | 5,036,214 |
| Toll Brothers, Inc. | | 126,087 | 5,521,350 |
| TopBuild Corp. (a) | | 38,255 | 7,029,739 |
| Traeger, Inc. (a)(b) | | 26,778 | 70,694 |
| TRI Pointe Homes, Inc. (a) | | 118,069 | 2,046,136 |
| Tupperware Brands Corp. (a)(b) | | 52,756 | 592,977 |
| Universal Electronics, Inc. (a) | | 15,604 | 346,877 |
| Vizio Holding Corp. (a) | | 43,573 | 467,103 |
| VOXX International Corp. (a)(b) | | 17,324 | 167,003 |
| Vuzix Corp. (a)(b) | | 67,703 | 508,450 |
| Weber, Inc. (b) | | 22,172 | 159,195 |
| Whirlpool Corp. (b) | | 65,913 | 10,321,976 |
| ZAGG, Inc. rights (a)(c) | | 23,001 | 2,070 |
| | | | 184,930,454 |
| Internet & Direct Marketing Retail - 3.1% | | | |
| 1-800-FLOWERS.com, Inc. Class A (a) | | 33,402 | 289,929 |
| 1stDibs.com, Inc. (a) | | 6,796 | 46,009 |
| Amazon.com, Inc. (a) | | 10,131,867 | 1,284,416,780 |
| BARK, Inc. (a) | | 93,452 | 216,809 |
| Boxed, Inc. Class A (a) | | 58,883 | 62,416 |
| CarParts.com, Inc. (a)(b) | | 55,617 | 360,398 |
| Chewy, Inc. (a)(b) | | 104,262 | 3,579,314 |
| ContextLogic, Inc. (a)(b) | | 394,841 | 513,293 |
| Digital Brands Group, Inc. (a)(b) | | 37,142 | 5,062 |
| Doordash, Inc. (a) | | 194,525 | 11,652,048 |
| Duluth Holdings, Inc. (a) | | 14,419 | 127,897 |
| eBay, Inc. | | 648,459 | 28,616,496 |
| Etsy, Inc. (a) | | 147,696 | 15,598,175 |
| Groupon, Inc. (a)(b) | | 24,339 | 241,199 |
| iMedia Brands, Inc. (a)(b) | | 25,039 | 25,164 |
| iPower, Inc. (a)(b) | | 2,046 | 2,128 |
| Lands' End, Inc. (a) | | 16,347 | 225,916 |
| Liquidity Services, Inc. (a) | | 31,099 | 543,922 |
| Lulu's Fashion Lounge Holdings, Inc. (b) | | 7,277 | 46,427 |
| Lyft, Inc. (a) | | 347,297 | 5,115,685 |
| Overstock.com, Inc. (a)(b) | | 49,225 | 1,284,773 |
| PARTS iD, Inc. (a)(b) | | 3,233 | 4,238 |
| PetMed Express, Inc. (b) | | 24,525 | 504,479 |
| Polished.Com, Inc. (a)(b) | | 119,292 | 83,755 |
| Porch Group, Inc. Class A (a)(b) | | 86,259 | 185,457 |
| Poshmark, Inc. (a) | | 47,331 | 512,121 |
| Quotient Technology, Inc. (a)(b) | | 99,818 | 185,661 |
| Qurate Retail, Inc. Series A | | 401,270 | 1,243,937 |
| Remark Holdings, Inc. (a)(b) | | 95,953 | 38,199 |
| Rent the Runway, Inc. Class A (b) | | 19,968 | 88,858 |
| Revolve Group, Inc. (a)(b) | | 46,934 | 1,102,480 |
| RumbleON, Inc. Class B (a) | | 11,604 | 253,547 |
| Stitch Fix, Inc. (a)(b) | | 93,676 | 470,254 |
| The RealReal, Inc. (a) | | 101,834 | 217,925 |
| thredUP, Inc. (a) | | 64,900 | 156,409 |
| Trxade Health, Inc. (a)(b) | | 1,931 | 2,201 |
| Uber Technologies, Inc. (a) | | 1,956,400 | 56,266,064 |
| Vivid Seats, Inc. Class A (b) | | 25,869 | 209,280 |
| Waitr Holdings, Inc. (a)(b) | | 132,508 | 34,147 |
| Wayfair LLC Class A (a)(b) | | 91,397 | 4,817,536 |
| Xometry, Inc. (a)(b) | | 11,087 | 543,374 |
| | | | 1,419,889,762 |
| Leisure Products - 0.1% | | | |
| Acushnet Holdings Corp. | | 38,862 | 1,851,774 |
| American Outdoor Brands, Inc. (a)(b) | | 15,252 | 131,015 |
| AMMO, Inc. (a)(b) | | 105,001 | 400,054 |
| Brunswick Corp. | | 88,300 | 6,596,893 |
| Callaway Golf Co. (a) | | 133,503 | 2,954,421 |
| Clarus Corp. (b) | | 30,778 | 466,902 |
| Escalade, Inc. (b) | | 14,000 | 163,940 |
| Hasbro, Inc. | | 151,215 | 11,918,766 |
| JAKKS Pacific, Inc. (a) | | 8,859 | 198,442 |
| Johnson Outdoors, Inc. Class A | | 8,387 | 512,781 |
| Latham Group, Inc. (a) | | 36,924 | 210,836 |
| Malibu Boats, Inc. Class A (a) | | 23,500 | 1,410,705 |
| Marine Products Corp. | | 22,603 | 224,448 |
| MasterCraft Boat Holdings, Inc. (a) | | 20,785 | 500,711 |
| Mattel, Inc. (a) | | 407,598 | 9,016,068 |
| Nautilus, Inc. (a) | | 32,238 | 65,121 |
| Peloton Interactive, Inc. Class A (a)(b) | | 359,304 | 3,661,308 |
| Polaris, Inc. (b) | | 65,253 | 7,391,207 |
| Smith & Wesson Brands, Inc. (b) | | 51,715 | 687,810 |
| Solo Brands, Inc. Class A | | 14,731 | 61,134 |
| Sturm, Ruger & Co., Inc. (b) | | 20,213 | 1,056,129 |
| Vista Outdoor, Inc. (a) | | 65,622 | 1,845,291 |
| YETI Holdings, Inc. (a) | | 98,793 | 3,644,474 |
| | | | 54,970,230 |
| Multiline Retail - 0.5% | | | |
| Big Lots, Inc. (b) | | 33,419 | 687,429 |
| Dillard's, Inc. Class A (b) | | 4,238 | 1,255,465 |
| Dollar General Corp. | | 265,151 | 62,952,150 |
| Dollar Tree, Inc. (a) | | 260,537 | 35,349,660 |
| Franchise Group, Inc. | | 31,346 | 1,062,316 |
| Kohl's Corp. | | 150,902 | 4,288,635 |
| Macy's, Inc. | | 329,903 | 5,713,920 |
| Nordstrom, Inc. | | 127,910 | 2,188,540 |
| Ollie's Bargain Outlet Holdings, Inc. (a) | | 67,132 | 3,713,071 |
| Target Corp. | | 535,447 | 85,853,572 |
| Tuesday Morning Corp. (a)(b) | | 56,575 | 20,452 |
| | | | 203,085,210 |
| Specialty Retail - 2.2% | | | |
| Abercrombie & Fitch Co. Class A (a) | | 58,070 | 835,627 |
| Academy Sports & Outdoors, Inc. (b) | | 97,890 | 4,217,101 |
| Advance Auto Parts, Inc. | | 70,915 | 11,959,106 |
| America's Car Mart, Inc. (a) | | 7,026 | 566,366 |
| American Eagle Outfitters, Inc. (b) | | 177,398 | 1,997,501 |
| Arhaus, Inc. | | 14,695 | 125,789 |
| Arko Corp. (b) | | 74,930 | 714,083 |
| Asbury Automotive Group, Inc. (a) | | 26,108 | 4,555,324 |
| AutoNation, Inc. (a) | | 40,807 | 5,084,552 |
| AutoZone, Inc. (a) | | 22,965 | 48,667,658 |
| Barnes & Noble Education, Inc. (a)(b) | | 39,887 | 102,111 |
| Bath & Body Works, Inc. | | 276,649 | 10,327,307 |
| Bed Bath & Beyond, Inc. (a)(b) | | 92,921 | 885,537 |
| Best Buy Co., Inc. | | 235,364 | 16,637,881 |
| Big 5 Sporting Goods Corp. (b) | | 25,578 | 313,075 |
| Boot Barn Holdings, Inc. (a) | | 34,145 | 2,274,740 |
| Brilliant Earth Group, Inc. Class A | | 11,899 | 88,053 |
| Build-A-Bear Workshop, Inc. | | 17,019 | 260,731 |
| Burlington Stores, Inc. (a) | | 76,707 | 10,753,554 |
| Caleres, Inc. (b) | | 43,626 | 1,113,336 |
| Camping World Holdings, Inc. (b) | | 44,339 | 1,335,491 |
| CarLotz, Inc. Class A (a)(b) | | 78,816 | 31,526 |
| CarMax, Inc. (a)(b) | | 186,726 | 16,514,047 |
| Carvana Co. Class A (a)(b) | | 114,153 | 3,765,907 |
| Chico's FAS, Inc. (a) | | 147,414 | 837,312 |
| Citi Trends, Inc. (a)(b) | | 10,784 | 217,837 |
| Conn's, Inc. (a)(b) | | 18,630 | 179,034 |
| Designer Brands, Inc. Class A (b) | | 71,271 | 1,215,883 |
| Destination XL Group, Inc. (a) | | 45,394 | 250,121 |
| Dick's Sporting Goods, Inc. (b) | | 66,509 | 7,074,562 |
| Envela Corp. (a) | | 11,687 | 84,848 |
| EVgo, Inc. Class A (a)(b) | | 78,226 | 742,365 |
| Express, Inc. (a)(b) | | 84,247 | 128,055 |
| Five Below, Inc. (a) | | 63,683 | 8,143,782 |
| Floor & Decor Holdings, Inc. Class A (a)(b) | | 123,376 | 10,037,871 |
| Foot Locker, Inc. | | 96,165 | 3,542,719 |
| GameStop Corp. Class A (b) | | 287,365 | 8,230,134 |
| Gap, Inc. (b) | | 241,306 | 2,205,537 |
| Genesco, Inc. (a) | | 14,872 | 841,458 |
| Group 1 Automotive, Inc. (b) | | 19,520 | 3,486,077 |
| GrowGeneration Corp. (a)(b) | | 64,344 | 305,634 |
| Guess?, Inc. (b) | | 41,237 | 720,410 |
| Haverty Furniture Companies, Inc. (b) | | 17,974 | 482,063 |
| Hibbett, Inc. (b) | | 14,112 | 826,963 |
| J.Jill, Inc. (a) | | 4,471 | 72,430 |
| JOANN, Inc. (b) | | 15,055 | 106,891 |
| Kirkland's, Inc. (a)(b) | | 13,524 | 55,178 |
| Lazydays Holdings, Inc. (a)(b) | | 11,200 | 184,352 |
| Leslie's, Inc. (a)(b) | | 157,679 | 2,235,888 |
| Lithia Motors, Inc. Class A (sub. vtg.) | | 33,587 | 8,915,333 |
| LL Flooring Holdings, Inc. (a) | | 36,012 | 293,138 |
| Lowe's Companies, Inc. | | 765,357 | 148,586,408 |
| MarineMax, Inc. (a) | | 24,781 | 900,542 |
| Monro, Inc. (b) | | 38,669 | 1,790,761 |
| Murphy U.S.A., Inc. | | 25,596 | 7,427,191 |
| National Vision Holdings, Inc. (a)(b) | | 93,487 | 3,106,573 |
| O'Reilly Automotive, Inc. (a) | | 76,048 | 53,014,582 |
| OneWater Marine, Inc. Class A (a) | | 13,666 | 544,590 |
| Party City Holdco, Inc. (a)(b) | | 141,433 | 278,623 |
| Penske Automotive Group, Inc. (b) | | 33,930 | 4,000,686 |
| Petco Health & Wellness Co., Inc. (a)(b) | | 93,402 | 1,393,558 |
| Rent-A-Center, Inc. | | 62,406 | 1,612,571 |
| RH (a) | | 20,180 | 5,164,264 |
| Ross Stores, Inc. | | 408,327 | 35,226,370 |
| Sally Beauty Holdings, Inc. (a) | | 122,834 | 1,827,770 |
| Shift Technologies, Inc. Class A (a)(b) | | 72,042 | 61,236 |
| Shoe Carnival, Inc. (b) | | 21,370 | 508,392 |
| Signet Jewelers Ltd. (b) | | 54,447 | 3,559,200 |
| Sleep Number Corp. (a)(b) | | 25,416 | 1,052,985 |
| Sonic Automotive, Inc. Class A (sub. vtg.) | | 22,673 | 1,205,977 |
| Sportsman's Warehouse Holdings, Inc. (a) | | 51,427 | 409,359 |
| The Aaron's Co., Inc. | | 36,353 | 432,601 |
| The Buckle, Inc. | | 34,212 | 1,104,363 |
| The Cato Corp. Class A (sub. vtg.) (b) | | 20,968 | 226,664 |
| The Children's Place, Inc. (a) | | 15,504 | 653,959 |
| The Container Store Group, Inc. (a) | | 39,823 | 270,000 |
| The Home Depot, Inc. | | 1,196,283 | 345,031,943 |
| The ODP Corp. (a) | | 50,398 | 1,801,729 |
| Tile Shop Holdings, Inc. | | 45,938 | 180,077 |
| Tilly's, Inc. | | 28,099 | 210,743 |
| TJX Companies, Inc. | | 1,359,400 | 84,758,590 |
| Torrid Holdings, Inc. (a)(b) | | 11,517 | 64,610 |
| Tractor Supply Co. | | 129,863 | 24,044,134 |
| TravelCenters of America LLC (a) | | 14,343 | 775,669 |
| Ulta Beauty, Inc. (a) | | 60,512 | 25,407,173 |
| Urban Outfitters, Inc. (a)(b) | | 72,744 | 1,464,337 |
| Victoria's Secret & Co. (a) | | 77,974 | 2,607,451 |
| Volta, Inc. (a)(b) | | 162,964 | 348,743 |
| Vroom, Inc. (a)(b) | | 159,288 | 259,639 |
| Warby Parker, Inc. (a)(b) | | 14,547 | 182,856 |
| Williams-Sonoma, Inc. (b) | | 80,679 | 12,001,001 |
| Winmark Corp. | | 3,361 | 693,610 |
| Zumiez, Inc. (a)(b) | | 19,218 | 498,899 |
| | | | 979,232,707 |
| Textiles, Apparel & Luxury Goods - 0.6% | | | |
| Allbirds, Inc. Class A (b) | | 109,022 | 448,080 |
| Capri Holdings Ltd. (a) | | 169,992 | 8,020,223 |
| Carter's, Inc. (b) | | 46,201 | 3,411,944 |
| Charles & Colvard Ltd. (a) | | 24,455 | 31,058 |
| Columbia Sportswear Co. | | 38,205 | 2,721,724 |
| Crocs, Inc. (a) | | 71,733 | 5,286,722 |
| Crown Crafts, Inc. | | 4,375 | 26,688 |
| Culp, Inc. (b) | | 11,695 | 53,797 |
| Deckers Outdoor Corp. (a) | | 31,700 | 10,193,769 |
| Delta Apparel, Inc. (a) | | 6,624 | 124,399 |
| Forward Industries, Inc. (NY Shares) (a)(b) | | 3,817 | 5,993 |
| Fossil Group, Inc. (a) | | 60,572 | 256,220 |
| G-III Apparel Group Ltd. (a) | | 49,730 | 1,047,811 |
| Hanesbrands, Inc. (b) | | 400,266 | 3,486,317 |
| Jerash Holdings U.S., Inc. | | 2,992 | 16,067 |
| Kontoor Brands, Inc. (b) | | 53,665 | 1,997,948 |
| Lakeland Industries, Inc. (a)(b) | | 8,580 | 115,830 |
| Levi Strauss & Co. Class A (b) | | 111,642 | 1,885,633 |
| lululemon athletica, Inc. (a) | | 135,028 | 40,502,999 |
| Movado Group, Inc. (b) | | 19,877 | 633,878 |
| NIKE, Inc. Class B | | 1,469,488 | 156,426,998 |
| Oxford Industries, Inc. (b) | | 18,183 | 1,940,672 |
| PLBY Group, Inc. (a)(b) | | 26,557 | 119,507 |
| PVH Corp. | | 77,353 | 4,351,106 |
| Ralph Lauren Corp. | | 53,004 | 4,840,855 |
| Rocky Brands, Inc. | | 8,992 | 234,961 |
| Skechers U.S.A., Inc. Class A (sub. vtg.) (a) | | 154,833 | 5,852,687 |
| Steven Madden Ltd. | | 86,555 | 2,519,616 |
| Superior Group of Companies, Inc. | | 12,016 | 133,498 |
| Tapestry, Inc. | | 289,897 | 10,068,123 |
| Toughbuilt Industries, Inc. (a) | | 357 | 1,050 |
| Under Armour, Inc.: | | | |
| Class A (sub. vtg.) (a) | | 228,888 | 1,927,237 |
| Class C (non-vtg.) (a) | | 237,540 | 1,802,929 |
| Unifi, Inc. (a) | | 15,719 | 178,568 |
| Vera Bradley, Inc. (a) | | 27,694 | 109,668 |
| VF Corp. | | 373,225 | 15,470,176 |
| Vince Holding Corp. (a) | | 1,696 | 12,126 |
| Wolverine World Wide, Inc. (b) | | 93,467 | 1,826,345 |
| | | | 288,083,222 |
TOTAL CONSUMER DISCRETIONARY | | | 5,248,570,421 |
| CONSUMER STAPLES - 6.2% | | | |
| Beverages - 1.6% | | | |
| Alkaline Water Co., Inc. (a)(b) | | 119,158 | 65,823 |
| Boston Beer Co., Inc. Class A (a) | | 10,822 | 3,647,880 |
| Brown-Forman Corp.: | | | |
| Class A | | 43,538 | 3,072,477 |
| Class B (non-vtg.) | | 234,351 | 17,037,318 |
| Celsius Holdings, Inc. (a) | | 44,168 | 4,570,946 |
| Coca-Cola Bottling Co. Consolidated | | 5,299 | 2,513,475 |
| Constellation Brands, Inc. Class A (sub. vtg.) | | 188,681 | 46,424,960 |
| Duckhorn Portfolio, Inc. (a) | | 36,053 | 657,607 |
| Eastside Distilling, Inc. (a)(b) | | 11,228 | 5,277 |
| Keurig Dr. Pepper, Inc. | | 852,867 | 32,511,290 |
| MGP Ingredients, Inc. (b) | | 14,442 | 1,580,821 |
| Molson Coors Beverage Co. Class B | | 217,261 | 11,225,876 |
| Monster Beverage Corp. (a) | | 435,857 | 38,717,177 |
| National Beverage Corp. (b) | | 27,126 | 1,504,408 |
| PepsiCo, Inc. | | 1,599,701 | 275,580,491 |
| REED'S, Inc. (a)(b) | | 79,714 | 16,740 |
| Splash Beverage Group, Inc. (a)(b) | | 26,777 | 49,537 |
| The Coca-Cola Co. | | 4,514,179 | 278,569,986 |
| The Vita Coco Co., Inc. | | 13,131 | 196,834 |
| Vintage Wine Estates, Inc. (a)(b) | | 34,327 | 202,873 |
| Willamette Valley Vineyards, Inc. (a) | | 4,326 | 27,903 |
| Winc, Inc. (b) | | 2,034 | 2,176 |
| Zevia PBC (a)(b) | | 15,612 | 69,161 |
| | | | 718,251,036 |
| Food & Staples Retailing - 1.5% | | | |
| Albertsons Companies, Inc. | | 122,373 | 3,366,481 |
| Andersons, Inc. | | 37,422 | 1,385,737 |
| BJ's Wholesale Club Holdings, Inc. (a) | | 155,363 | 11,572,990 |
| Blue Apron Holdings, Inc.: | | | |
| warrants 11/4/28 (a) | | 17,555 | 4,097 |
| warrants 11/4/28 (a) | | 17,555 | 1,740 |
| warrants 11/4/28 (a) | | 17,555 | 787 |
| Class A (a)(b) | | 33,666 | 195,599 |
| Casey's General Stores, Inc. | | 42,902 | 9,171,161 |
| Chefs' Warehouse Holdings (a) | | 37,788 | 1,259,852 |
| Costco Wholesale Corp. | | 513,176 | 267,929,190 |
| Grocery Outlet Holding Corp. (a) | | 100,703 | 4,040,204 |
| HF Foods Group, Inc. (a) | | 39,825 | 202,709 |
| Ingles Markets, Inc. Class A | | 16,497 | 1,443,982 |
| Kroger Co. | | 759,808 | 36,425,196 |
| MedAvail Holdings, Inc. (a)(b) | | 23,081 | 26,774 |
| Natural Grocers by Vitamin Cottage, Inc. | | 11,428 | 164,106 |
| Performance Food Group Co. (a) | | 180,398 | 9,016,292 |
| PriceSmart, Inc. | | 27,742 | 1,755,236 |
| Rite Aid Corp. (a)(b) | | 64,973 | 466,506 |
| SpartanNash Co. | | 41,584 | 1,265,401 |
| Sprouts Farmers Market LLC (a) | | 126,134 | 3,645,273 |
| Sysco Corp. | | 590,550 | 48,555,021 |
| U.S. Foods Holding Corp. (a) | | 259,245 | 7,938,082 |
| United Natural Foods, Inc. (a) | | 67,018 | 2,954,153 |
| Village Super Market, Inc. Class A (b) | | 10,045 | 220,789 |
| Walgreens Boots Alliance, Inc. | | 832,811 | 29,198,354 |
| Walmart, Inc. | | 1,625,798 | 215,499,525 |
| Weis Markets, Inc. | | 19,154 | 1,488,457 |
| | | | 659,193,694 |
| Food Products - 1.1% | | | |
| Alico, Inc. | | 4,781 | 162,315 |
| AppHarvest, Inc. (a)(b) | | 70,851 | 204,051 |
| Arcadia Biosciences, Inc. (a)(b) | | 27,868 | 24,315 |
| Archer Daniels Midland Co. | | 651,897 | 57,295,227 |
| B&G Foods, Inc. Class A (b) | | 79,649 | 1,725,197 |
| Barfresh Food Group, Inc. (a)(b) | | 3,086 | 10,739 |
| Benson Hill, Inc. (a)(b) | | 155,771 | 552,987 |
| Better Choice Co., Inc. (a)(b) | | 24,615 | 44,799 |
| Beyond Meat, Inc. (a)(b) | | 69,357 | 1,692,311 |
| Blue Star Foods Corp. (b) | | 10,512 | 12,089 |
| BRC, Inc. Class A (a)(b) | | 35,524 | 346,359 |
| Bridgford Foods Corp. (a)(b) | | 1,670 | 24,048 |
| Bunge Ltd. | | 175,682 | 17,422,384 |
| Cal-Maine Foods, Inc. | | 43,077 | 2,309,358 |
| Calavo Growers, Inc. | | 20,461 | 860,180 |
| Campbell Soup Co. | | 232,793 | 11,728,111 |
| Coffee Holding Co., Inc. | | 4,336 | 11,751 |
| Conagra Brands, Inc. | | 553,206 | 19,019,222 |
| Darling Ingredients, Inc. (a) | | 187,444 | 14,256,991 |
| Farmer Brothers Co. (a) | | 19,791 | 111,028 |
| Flowers Foods, Inc. | | 233,402 | 6,371,875 |
| Fresh Del Monte Produce, Inc. | | 38,934 | 1,064,456 |
| Freshpet, Inc. (a) | | 54,982 | 2,393,366 |
| General Mills, Inc. | | 696,663 | 53,503,718 |
| Hormel Foods Corp. | | 330,661 | 16,625,635 |
| Hostess Brands, Inc. Class A (a) | | 166,746 | 3,865,172 |
| Ingredion, Inc. | | 76,240 | 6,638,217 |
| J&J Snack Foods Corp. | | 17,341 | 2,584,329 |
| John B. Sanfilippo & Son, Inc. | | 10,394 | 839,108 |
| Kellogg Co. | | 294,300 | 21,407,382 |
| Laird Superfood, Inc. (a) | | 7,014 | 17,675 |
| Lamb Weston Holdings, Inc. | | 167,464 | 13,318,412 |
| Lancaster Colony Corp. | | 22,985 | 3,874,122 |
| Landec Corp. (a) | | 30,882 | 324,261 |
| Lifeway Foods, Inc. (a) | | 4,358 | 27,238 |
| Limoneira Co. | | 16,736 | 205,183 |
| Local Bounti Corp. (a)(b) | | 37,317 | 138,819 |
| MamaMancini's Holdings, Inc. (a) | | 14,930 | 22,843 |
| McCormick & Co., Inc. (non-vtg.) | | 291,036 | 24,467,397 |
| Mission Produce, Inc. (a) | | 42,713 | 687,679 |
| Mondelez International, Inc. | | 1,599,859 | 98,967,278 |
| Nuzee, Inc. (a) | | 8,894 | 6,518 |
| Pilgrim's Pride Corp. (a) | | 55,245 | 1,572,825 |
| Post Holdings, Inc. (a) | | 64,342 | 5,710,996 |
| RiceBran Technologies (a)(b) | | 4,706 | 10,871 |
| Rocky Mountain Chocolate Factory, Inc. (a) | | 4,008 | 26,693 |
| S&W Seed Co. (a)(b) | | 20,820 | 26,650 |
| Seaboard Corp. | | 299 | 1,154,840 |
| Seneca Foods Corp. Class A (a) | | 8,004 | 422,851 |
| Sovos Brands, Inc. | | 28,431 | 434,141 |
| Stryve Foods, Inc. (a)(b) | | 10,731 | 6,978 |
| Tattooed Chef, Inc. (a)(b) | | 53,038 | 353,233 |
| The Hain Celestial Group, Inc. (a) | | 103,304 | 2,092,939 |
| The Hershey Co. | | 168,742 | 37,911,265 |
| The J.M. Smucker Co. | | 126,067 | 17,648,119 |
| The Kraft Heinz Co. | | 822,206 | 30,750,504 |
| The Real Good Food Co., Inc. (b) | | 7,165 | 51,086 |
| The Simply Good Foods Co. (a) | | 109,748 | 3,352,801 |
| Tootsie Roll Industries, Inc. (b) | | 20,922 | 749,635 |
| TreeHouse Foods, Inc. (a) | | 64,610 | 3,010,826 |
| Tyson Foods, Inc. Class A | | 337,124 | 25,412,407 |
| Utz Brands, Inc. Class A (b) | | 76,164 | 1,268,892 |
| Vital Farms, Inc. (a)(b) | | 27,180 | 351,981 |
| Whole Earth Brands, Inc. Class A (a) | | 46,016 | 235,142 |
| | | | 517,719,820 |
| Household Products - 1.2% | | | |
| Central Garden & Pet Co. (a) | | 62,448 | 2,492,924 |
| Central Garden & Pet Co. Class A (non-vtg.) (a) | | 5,986 | 226,031 |
| Church & Dwight Co., Inc. | | 283,897 | 23,765,018 |
| Colgate-Palmolive Co. | | 967,472 | 75,665,985 |
| Energizer Holdings, Inc. | | 75,379 | 2,118,150 |
| Kimberly-Clark Corp. | | 390,481 | 49,794,137 |
| Oil-Dri Corp. of America | | 5,783 | 159,553 |
| Procter & Gamble Co. | | 2,776,846 | 383,038,137 |
| Reynolds Consumer Products, Inc. (b) | | 61,560 | 1,719,371 |
| Spectrum Brands Holdings, Inc. | | 46,752 | 2,944,908 |
| The Clorox Co. | | 143,316 | 20,686,231 |
| WD-40 Co. (b) | | 15,703 | 2,970,379 |
| | | | 565,580,824 |
| Personal Products - 0.2% | | | |
| BellRing Brands, Inc. (a) | | 141,802 | 3,359,289 |
| Coty, Inc. Class A (a) | | 394,134 | 2,959,946 |
| Cyanotech Corp. (a) | | 678 | 1,607 |
| Edgewell Personal Care Co. (b) | | 60,687 | 2,364,366 |
| elf Beauty, Inc. (a) | | 55,038 | 2,098,599 |
| Estee Lauder Companies, Inc. Class A | | 268,655 | 68,340,459 |
| Guardion Health Sciences, Inc. (a)(b) | | 18,722 | 2,823 |
| Herbalife Nutrition Ltd. (a) | | 109,684 | 2,861,656 |
| Inter Parfums, Inc. | | 20,515 | 1,610,838 |
| Jupiter Wellness, Inc. (a)(b) | | 27,726 | 23,298 |
| Lifemd, Inc. (a) | | 24,227 | 62,263 |
| LifeVantage Corp. | | 12,763 | 50,797 |
| Mannatech, Inc. | | 902 | 21,080 |
| MediFast, Inc. | | 13,262 | 1,664,116 |
| Natural Alternatives International, Inc. (a) | | 5,280 | 61,301 |
| Natural Health Trends Corp. (b) | | 6,482 | 34,160 |
| Nature's Sunshine Products, Inc. (a) | | 13,733 | 133,210 |
| Newage, Inc. (a)(b) | | 160,793 | 36,982 |
| Nu Skin Enterprises, Inc. Class A | | 57,829 | 2,367,519 |
| Olaplex Holdings, Inc. (b) | | 82,487 | 1,098,727 |
| The Beauty Health Co. (a)(b) | | 110,914 | 1,286,602 |
| The Honest Co., Inc. (a) | | 27,978 | 101,001 |
| Thorne HealthTech, Inc. (b) | | 10,663 | 49,903 |
| United-Guardian, Inc. | | 2,834 | 44,777 |
| Upexi, Inc. (a)(b) | | 3,852 | 15,793 |
| USANA Health Sciences, Inc. (a) | | 13,290 | 857,471 |
| Veru, Inc. (a)(b) | | 68,791 | 1,052,502 |
| | | | 92,561,085 |
| Tobacco - 0.6% | | | |
| 22nd Century Group, Inc. (a)(b) | | 190,501 | 255,271 |
| Altria Group, Inc. | | 2,099,257 | 94,718,476 |
| Philip Morris International, Inc. | | 1,794,473 | 171,354,227 |
| Turning Point Brands, Inc. | | 15,304 | 356,889 |
| Universal Corp. (b) | | 28,206 | 1,439,634 |
| Vector Group Ltd. (b) | | 151,200 | 1,481,760 |
| | | | 269,606,257 |
TOTAL CONSUMER STAPLES | | | 2,822,912,716 |
| ENERGY - 4.7% | | | |
| Energy Equipment & Services - 0.4% | | | |
| Archrock, Inc. | | 157,195 | 1,161,671 |
| Baker Hughes Co. Class A | | 1,085,652 | 27,423,570 |
| Bristow Group, Inc. (a) | | 26,959 | 782,081 |
| Cactus, Inc. | | 69,692 | 2,784,195 |
| Championx Corp. | | 233,614 | 5,095,121 |
| Core Laboratories NV (b) | | 53,142 | 858,243 |
| Diamond Offshore Drilling, Inc. (a) | | 101,804 | 723,826 |
| DMC Global, Inc. (a) | | 22,824 | 509,432 |
| Dril-Quip, Inc. (a) | | 40,915 | 905,449 |
| Energy Services of America Corp. (a) | | 6,702 | 20,977 |
| ENGlobal Corp. (a)(b) | | 22,259 | 36,505 |
| Enservco Corp. (a)(b) | | 13,463 | 22,079 |
| Expro Group Holdings NV (a)(b) | | 34,146 | 461,654 |
| Exterran Corp. (a) | | 27,013 | 132,634 |
| Forum Energy Technologies, Inc. (a)(b) | | 5,455 | 146,630 |
| Geospace Technologies Corp. (a) | | 14,438 | 71,757 |
| Gulf Island Fabrication, Inc. (a) | | 10,051 | 40,908 |
| Halliburton Co. | | 1,053,663 | 31,746,866 |
| Helix Energy Solutions Group, Inc. (a) | | 163,534 | 706,467 |
| Helmerich & Payne, Inc. | | 120,600 | 5,155,650 |
| Independence Contract Drilling, Inc. (a)(b) | | 12,653 | 40,490 |
| KLX Energy Services Holdings, Inc. (a)(b) | | 7,801 | 59,288 |
| Liberty Oilfield Services, Inc. Class A (a) | | 126,555 | 1,898,325 |
| Mammoth Energy Services, Inc. (a) | | 15,463 | 64,017 |
| MIND Technology, Inc. (a) | | 11,948 | 9,092 |
| Nabors Industries Ltd. (a) | | 10,163 | 1,346,699 |
| Natural Gas Services Group, Inc. (a) | | 12,820 | 142,687 |
| NCS Multistage Holdings, Inc. (a) | | 611 | 17,108 |
| Newpark Resources, Inc. (a) | | 104,173 | 300,018 |
| Nextier Oilfield Solutions, Inc. (a) | | 184,532 | 1,729,065 |
| Nine Energy Service, Inc. (a) | | 13,017 | 43,347 |
| Noble Corp. (a) | | 74,710 | 2,267,449 |
| NOV, Inc. | | 460,826 | 8,142,795 |
| Oceaneering International, Inc. (a) | | 115,739 | 1,024,290 |
| Oil States International, Inc. (a) | | 69,583 | 340,957 |
| Patterson-UTI Energy, Inc. | | 248,195 | 3,698,106 |
| Profire Energy, Inc. (a) | | 20,459 | 22,505 |
| ProFrac Holding Corp. | | 18,150 | 357,374 |
| ProPetro Holding Corp. (a) | | 99,100 | 907,756 |
| Ranger Energy Services, Inc. Class A (a)(b) | | 15,035 | 148,696 |
| RPC, Inc. (b) | | 88,315 | 702,104 |
| Schlumberger Ltd. | | 1,635,105 | 62,379,256 |
| SEACOR Marine Holdings, Inc. (a)(b) | | 27,696 | 180,024 |
| Select Energy Services, Inc. Class A (a) | | 77,520 | 551,167 |
| Smart Sand, Inc. (a) | | 28,197 | 50,755 |
| Solaris Oilfield Infrastructure, Inc. Class A | | 33,022 | 353,335 |
| Superior Drilling Products, Inc. (a)(b) | | 12,552 | 11,441 |
| TechnipFMC PLC (a) | | 487,760 | 3,989,877 |
| TETRA Technologies, Inc. (a) | | 145,457 | 578,919 |
| Tidewater, Inc. (a) | | 48,051 | 1,064,810 |
| Transocean Ltd. (United States) (a)(b) | | 724,883 | 2,624,076 |
| U.S. Silica Holdings, Inc. (a) | | 86,452 | 1,212,922 |
| U.S. Well Services, Inc. (a)(b) | | 10,076 | 64,789 |
| Valaris Ltd. (a)(b) | | 75,056 | 3,826,355 |
| Weatherford International PLC (a) | | 75,625 | 2,128,088 |
| | | | 181,063,697 |
| Oil, Gas & Consumable Fuels - 4.3% | | | |
| Adams Resources & Energy, Inc. | | 2,792 | 83,397 |
| Aemetis, Inc. (a)(b) | | 36,713 | 334,823 |
| Alto Ingredients, Inc. (a)(b) | | 91,001 | 393,124 |
| American Resources Corp. (a)(b) | | 66,786 | 221,730 |
| Amplify Energy Corp. (a) | | 48,345 | 360,170 |
| Antero Midstream GP LP (b) | | 374,575 | 3,771,970 |
| Antero Resources Corp. (a) | | 328,561 | 13,168,725 |
| APA Corp. | | 389,760 | 15,243,514 |
| Arch Resources, Inc. (b) | | 17,733 | 2,581,570 |
| Archaea Energy, Inc. (a) | | 63,043 | 1,245,730 |
| Barnwell Industries, Inc. | | 4,636 | 14,233 |
| Battalion Oil Corp. (a)(b) | | 3,577 | 47,359 |
| Berry Corp. | | 81,550 | 746,183 |
| Brigham Minerals, Inc. Class A | | 70,349 | 2,092,883 |
| California Resources Corp. | | 91,820 | 4,587,327 |
| Callon Petroleum Co. (a) | | 54,471 | 2,318,286 |
| Camber Energy, Inc. (a)(b) | | 410,892 | 142,990 |
| Centennial Resource Development, Inc. Class A (a) | | 211,925 | 1,744,143 |
| Centrus Energy Corp. Class A (a) | | 12,490 | 622,127 |
| Cheniere Energy, Inc. | | 274,096 | 43,904,697 |
| Chesapeake Energy Corp. (b) | | 131,576 | 13,222,072 |
| Chevron Corp. | | 2,274,854 | 359,563,423 |
| Chord Energy Corp. | | 47,093 | 6,666,014 |
| Civitas Resources, Inc. | | 85,806 | 5,765,305 |
| Clean Energy Fuels Corp. (a)(b) | | 194,091 | 1,304,292 |
| CNX Resources Corp. (a) | | 224,077 | 3,959,441 |
| Comstock Resources, Inc. (a) | | 104,488 | 2,047,965 |
| ConocoPhillips Co. | | 1,498,115 | 163,968,687 |
| CONSOL Energy, Inc. | | 36,745 | 2,637,556 |
| Continental Resources, Inc. | | 66,633 | 4,652,982 |
| Coterra Energy, Inc. | | 932,856 | 28,834,579 |
| Crescent Energy, Inc. Class A (b) | | 31,646 | 542,096 |
| CVR Energy, Inc. | | 33,405 | 1,091,007 |
| Delek U.S. Holdings, Inc. | | 81,392 | 2,299,324 |
| Denbury, Inc. (a) | | 57,812 | 5,141,221 |
| Devon Energy Corp. | | 710,693 | 50,189,140 |
| Diamondback Energy, Inc. | | 198,678 | 26,479,804 |
| Dorian LPG Ltd. (b) | | 32,174 | 468,132 |
| DT Midstream, Inc. | | 111,924 | 6,179,324 |
| Earthstone Energy, Inc. (a)(b) | | 57,858 | 879,442 |
| Ecoark Holdings, Inc. (a)(b) | | 22,302 | 41,705 |
| Empire Petroleum Corp. (a)(b) | | 10,102 | 149,106 |
| Enviva, Inc. (b) | | 32,867 | 2,284,914 |
| EOG Resources, Inc. | | 678,594 | 82,313,452 |
| Epsilon Energy Ltd. | | 30,501 | 219,607 |
| EQT Corp. | | 343,411 | 16,415,046 |
| Equitrans Midstream Corp. | | 469,075 | 4,348,325 |
| Evolution Petroleum Corp. | | 37,977 | 263,560 |
| Excelerate Energy, Inc. | | 20,077 | 515,577 |
| Exxon Mobil Corp. | | 4,876,806 | 466,173,886 |
| Gevo, Inc. (a)(b) | | 228,896 | 716,444 |
| Green Plains, Inc. (a) | | 62,059 | 2,273,221 |
| Gulfport Energy Corp. (a) | | 15,799 | 1,544,510 |
| Hallador Energy Co. (a)(b) | | 27,076 | 176,536 |
| Hess Corp. | | 320,395 | 38,697,308 |
| HF Sinclair Corp. | | 172,567 | 9,082,201 |
| Houston American Energy Corp. (a)(b) | | 9,688 | 42,143 |
| International Seaways, Inc. | | 47,608 | 1,405,864 |
| Kinder Morgan, Inc. | | 2,256,678 | 41,342,341 |
| Kinetik Holdings, Inc. (b) | | 21,974 | 810,181 |
| Kosmos Energy Ltd. (a) | | 522,049 | 3,690,886 |
| Laredo Petroleum, Inc. (a) | | 16,640 | 1,291,430 |
| Lightbridge Corp. (a)(b) | | 11,182 | 66,309 |
| Magnolia Oil & Gas Corp. Class A | | 181,598 | 4,334,744 |
| Marathon Oil Corp. | | 820,066 | 20,985,489 |
| Marathon Petroleum Corp. | | 626,195 | 63,089,146 |
| Matador Resources Co. (b) | | 129,240 | 7,702,704 |
| Mexco Energy Corp. (a)(b) | | 1,824 | 35,504 |
| Murphy Oil Corp. | | 167,673 | 6,534,217 |
| NACCO Industries, Inc. Class A (b) | | 4,904 | 220,533 |
| New Fortress Energy, Inc. | | 47,714 | 2,736,398 |
| Nextdecade Corp. (a)(b) | | 29,971 | 220,886 |
| Northern Oil & Gas, Inc. | | 75,755 | 2,396,888 |
| Occidental Petroleum Corp. | | 1,030,189 | 73,143,419 |
| ONEOK, Inc. | | 518,069 | 31,721,365 |
| Overseas Shipholding Group, Inc. (a) | | 81,324 | 252,918 |
| Ovintiv, Inc. | | 298,245 | 15,848,739 |
| Par Pacific Holdings, Inc. (a) | | 52,372 | 984,594 |
| PBF Energy, Inc. Class A (a) | | 109,466 | 3,739,359 |
| PDC Energy, Inc. | | 110,955 | 7,534,954 |
| Peabody Energy Corp. (a)(b) | | 122,173 | 3,012,786 |
| Pedevco Corp. (a) | | 21,244 | 23,793 |
| Phillips 66 Co. | | 557,140 | 49,841,744 |
| Phx Minerals, Inc. Class A (b) | | 39,245 | 129,509 |
| Pioneer Natural Resources Co. | | 260,240 | 65,897,973 |
| PrimeEnergy Corp. (a) | | 493 | 46,322 |
| Range Resources Corp. | | 298,683 | 9,814,723 |
| Ranger Oil Corp. | | 24,415 | 951,941 |
| Rex American Resources Corp. (a) | | 18,267 | 553,490 |
| Riley Exploration Permian, Inc. | | 4,521 | 113,658 |
| Ring Energy, Inc. (a)(b) | | 109,268 | 354,028 |
| SandRidge Energy, Inc. (a) | | 35,276 | 740,090 |
| SilverBow Resources, Inc. (a) | | 11,873 | 472,070 |
| Sitio Royalties Corp. (b) | | 11,657 | 296,554 |
| SM Energy Co. | | 142,075 | 6,261,245 |
| Southwestern Energy Co. (a) | | 1,293,224 | 9,686,248 |
| Talos Energy, Inc. (a) | | 47,056 | 975,471 |
| Targa Resources Corp. | | 262,560 | 17,914,469 |
| Tellurian, Inc. (a)(b) | | 536,470 | 2,145,880 |
| Texas Pacific Land Corp. (b) | | 7,167 | 13,190,577 |
| The Williams Companies, Inc. | | 1,409,658 | 47,970,662 |
| U.S. Energy Corp. | | 12,195 | 42,317 |
| Uranium Energy Corp. (a)(b) | | 379,385 | 1,714,820 |
| VAALCO Energy, Inc. (b) | | 62,727 | 314,262 |
| Valero Energy Corp. | | 472,449 | 55,333,227 |
| Vertex Energy, Inc. (a)(b) | | 54,021 | 459,179 |
| W&T Offshore, Inc. (a) | | 107,959 | 701,734 |
| World Fuel Services Corp. | | 72,892 | 1,880,614 |
| | | | 1,985,702,582 |
TOTAL ENERGY | | | 2,166,766,279 |
| FINANCIALS - 11.6% | | | |
| Banks - 4.0% | | | |
| 1st Source Corp. | | 19,757 | 932,333 |
| ACNB Corp. | | 9,938 | 353,395 |
| Affinity Bancshares, Inc. (a) | | 500 | 7,375 |
| Allegiance Bancshares, Inc. | | 21,848 | 925,481 |
| Amalgamated Financial Corp. | | 17,016 | 382,860 |
| Amerant Bancorp, Inc. Class A | | 27,275 | 714,332 |
| American National Bankshares, Inc. | | 12,767 | 420,417 |
| Ameris Bancorp | | 76,169 | 3,555,569 |
| AmeriServ Financial, Inc. | | 16,210 | 61,598 |
| Ames National Corp. | | 10,699 | 233,880 |
| Arrow Financial Corp. | | 19,264 | 618,567 |
| Associated Banc-Corp. | | 171,775 | 3,442,371 |
| Atlantic Union Bankshares Corp. | | 86,868 | 2,818,867 |
| Auburn National Bancorp., Inc. | | 2,294 | 62,695 |
| Banc of California, Inc. | | 59,882 | 1,010,808 |
| BancFirst Corp. (b) | | 21,626 | 2,332,580 |
| Bancorp, Inc., Delaware (a) | | 64,747 | 1,535,799 |
| Bank First National Corp. | | 7,013 | 569,947 |
| Bank of America Corp. | | 8,211,944 | 276,003,438 |
| Bank of Hawaii Corp. (b) | | 46,096 | 3,596,410 |
| Bank of Marin Bancorp | | 18,532 | 572,639 |
| Bank of South Carolina Corp. | | 1,655 | 27,125 |
| Bank of the James Financial Group, Inc. (b) | | 6,254 | 77,362 |
| Bank OZK | | 129,174 | 5,235,422 |
| Bank7 Corp. | | 2,954 | 70,335 |
| BankFinancial Corp. | | 15,633 | 155,548 |
| BankUnited, Inc. | | 93,286 | 3,456,246 |
| Bankwell Financial Group, Inc. | | 6,471 | 203,966 |
| Banner Corp. | | 39,696 | 2,411,929 |
| Bar Harbor Bankshares | | 17,710 | 501,724 |
| BayCom Corp. (b) | | 14,004 | 260,614 |
| BayFirst Financial Corp. (b) | | 2,480 | 46,624 |
| BCB Bancorp, Inc. | | 16,909 | 304,362 |
| Berkshire Hills Bancorp, Inc. | | 53,620 | 1,512,620 |
| Blue Ridge Bankshares, Inc. | | 18,384 | 269,693 |
| BOK Financial Corp. | | 34,452 | 3,061,749 |
| Brookline Bancorp, Inc., Delaware | | 88,882 | 1,108,359 |
| Business First Bancshares, Inc. | | 24,858 | 586,400 |
| Byline Bancorp, Inc. | | 27,018 | 589,263 |
| C & F Financial Corp. | | 3,325 | 162,094 |
| Cadence Bank | | 210,820 | 5,371,694 |
| California Bancorp, Inc. (a) | | 8,230 | 165,423 |
| Cambridge Bancorp | | 8,311 | 683,414 |
| Camden National Corp. | | 17,181 | 777,097 |
| Capital Bancorp, Inc. | | 10,082 | 249,731 |
| Capital City Bank Group, Inc. | | 15,888 | 507,304 |
| Capstar Financial Holdings, Inc. | | 22,198 | 447,290 |
| Carter Bankshares, Inc. (a) | | 29,141 | 479,952 |
| Cathay General Bancorp | | 86,187 | 3,614,683 |
| CB Financial Services, Inc. | | 4,962 | 108,172 |
| CBTX, Inc. | | 21,113 | 629,167 |
| Central Pacific Financial Corp. | | 30,254 | 659,235 |
| Central Valley Community Bancorp | | 10,966 | 195,195 |
| Chemung Financial Corp. | | 3,911 | 176,269 |
| ChoiceOne Financial Services, Inc. | | 7,191 | 155,937 |
| Citigroup, Inc. | | 2,248,152 | 109,732,299 |
| Citizens & Northern Corp. | | 18,823 | 451,752 |
| Citizens Community Bancorp, Inc. | | 8,162 | 103,657 |
| Citizens Financial Group, Inc. | | 566,553 | 20,781,164 |
| Citizens Holding Co. | | 5,474 | 95,795 |
| City Holding Co. | | 17,005 | 1,445,595 |
| Civista Bancshares, Inc. | | 15,934 | 337,004 |
| CNB Financial Corp., Pennsylvania | | 20,025 | 527,058 |
| Coastal Financial Corp. of Washington (a) | | 11,939 | 479,948 |
| Codorus Valley Bancorp, Inc. | | 8,563 | 171,346 |
| Colony Bankcorp, Inc. | | 17,488 | 246,931 |
| Columbia Banking Systems, Inc. | | 89,997 | 2,695,410 |
| Comerica, Inc. | | 150,845 | 12,112,854 |
| Commerce Bancshares, Inc. | | 128,114 | 8,810,400 |
| Community Bank System, Inc. | | 62,146 | 4,063,105 |
| Community Financial Corp. | | 6,053 | 228,864 |
| Community Trust Bancorp, Inc. | | 17,828 | 753,233 |
| Community West Bancshares | | 8,703 | 122,712 |
| ConnectOne Bancorp, Inc. | | 40,466 | 1,012,864 |
| CrossFirst Bankshares, Inc. (a) | | 50,935 | 671,323 |
| Cullen/Frost Bankers, Inc. | | 67,513 | 8,773,989 |
| Customers Bancorp, Inc. (a) | | 35,985 | 1,248,320 |
| CVB Financial Corp. | | 151,167 | 3,966,622 |
| Dime Community Bancshares, Inc. | | 37,098 | 1,159,683 |
| Eagle Bancorp Montana, Inc. | | 6,463 | 124,736 |
| Eagle Bancorp, Inc. | | 36,966 | 1,793,960 |
| East West Bancorp, Inc. | | 164,514 | 11,872,975 |
| Eastern Bankshares, Inc. | | 190,659 | 3,698,785 |
| Emclaire Financial Corp. | | 2,863 | 91,731 |
| Enterprise Bancorp, Inc. | | 10,759 | 346,225 |
| Enterprise Financial Services Corp. | | 42,960 | 1,964,131 |
| Equity Bancshares, Inc. | | 17,139 | 535,251 |
| Esquire Financial Holdings, Inc. | | 7,947 | 297,059 |
| Evans Bancorp, Inc. | | 6,487 | 247,998 |
| Farmers & Merchants Bancorp, Inc. (b) | | 13,809 | 394,385 |
| Farmers National Banc Corp. | | 35,881 | 512,739 |
| FB Financial Corp. (b) | | 40,769 | 1,615,268 |
| Fidelity D & D Bancorp, Inc. | | 5,204 | 208,160 |
| Fifth Third Bancorp | | 792,302 | 27,057,113 |
| Financial Institutions, Inc. | | 17,519 | 456,020 |
| Finward Bancorp (b) | | 3,428 | 126,253 |
| FinWise BanCorp | | 3,407 | 36,659 |
| First Bancorp, North Carolina | | 39,438 | 1,435,938 |
| First Bancorp, Puerto Rico | | 226,706 | 3,241,896 |
| First Bancshares, Inc. | | 23,632 | 706,597 |
| First Bank Hamilton New Jersey | | 18,153 | 272,113 |
| First Busey Corp. | | 58,071 | 1,335,633 |
| First Business Finance Services, Inc. | | 8,004 | 266,373 |
| First Capital, Inc. | | 3,573 | 95,042 |
| First Citizens Bancshares, Inc. | | 15,429 | 12,527,731 |
| First Commonwealth Financial Corp. | | 106,871 | 1,440,621 |
| First Community Bankshares, Inc. | | 17,368 | 547,613 |
| First Community Corp. | | 7,124 | 128,232 |
| First Financial Bancorp, Ohio | | 108,808 | 2,348,077 |
| First Financial Bankshares, Inc. (b) | | 147,262 | 6,260,108 |
| First Financial Corp., Indiana | | 12,344 | 573,996 |
| First Financial Northwest, Inc. | | 8,821 | 132,844 |
| First Foundation, Inc. | | 57,019 | 1,081,080 |
| First Guaranty Bancshares, Inc. (b) | | 6,744 | 150,256 |
| First Hawaiian, Inc. | | 147,290 | 3,786,826 |
| First Horizon National Corp. | | 616,936 | 13,955,092 |
| First Internet Bancorp | | 10,758 | 394,496 |
| First Interstate Bancsystem, Inc. | | 94,460 | 3,802,960 |
| First Merchants Corp. | | 66,052 | 2,630,191 |
| First Mid-Illinois Bancshares, Inc. | | 21,831 | 771,726 |
| First National Corp. (b) | | 3,023 | 52,298 |
| First Northwest Bancorp | | 10,734 | 171,744 |
| First of Long Island Corp. | | 25,142 | 462,864 |
| First Republic Bank | | 208,670 | 31,682,366 |
| First Savings Financial Group, Inc. | | 5,868 | 133,908 |
| First U.S. Bancshares, Inc. | | 8,570 | 80,987 |
| First United Corp. | | 6,673 | 116,778 |
| First Western Financial, Inc. (a) | | 7,698 | 204,228 |
| Five Star Bancorp | | 7,105 | 180,680 |
| Flushing Financial Corp. | | 35,043 | 723,638 |
| FNB Corp., Pennsylvania | | 386,286 | 4,604,529 |
| FNCB Bancorp, Inc. | | 13,381 | 105,844 |
| Franklin Financial Services Corp. | | 5,128 | 163,993 |
| Fulton Financial Corp. | | 191,855 | 3,113,807 |
| FVCBankcorp, Inc. (a)(b) | | 12,858 | 247,645 |
| German American Bancorp, Inc. (b) | | 32,257 | 1,211,573 |
| Glacier Bancorp, Inc. | | 124,874 | 6,328,614 |
| Great Southern Bancorp, Inc. | | 11,187 | 657,572 |
| Guaranty Bancshares, Inc. Texas | | 9,891 | 342,723 |
| Hancock Whitney Corp. | | 99,136 | 4,781,329 |
| Hanmi Financial Corp. | | 34,825 | 860,874 |
| Hanover Bancorp, Inc. (b) | | 310 | 6,079 |
| HarborOne Bancorp, Inc. | | 54,104 | 737,979 |
| Hawthorn Bancshares, Inc. | | 6,779 | 162,086 |
| HBT Financial, Inc. | | 12,199 | 220,558 |
| Heartland Financial U.S.A., Inc. | | 47,126 | 2,105,118 |
| Heritage Commerce Corp. | | 70,321 | 793,924 |
| Heritage Financial Corp., Washington | | 40,073 | 1,041,497 |
| Hilltop Holdings, Inc. | | 57,005 | 1,504,932 |
| Home Bancshares, Inc. (b) | | 216,765 | 5,100,480 |
| HomeStreet, Inc. | | 21,684 | 754,820 |
| HomeTrust Bancshares, Inc. | | 18,266 | 424,137 |
| Hope Bancorp, Inc. | | 138,442 | 2,003,256 |
| Horizon Bancorp, Inc. Indiana | | 44,255 | 837,305 |
| Huntington Bancshares, Inc. | | 1,662,400 | 22,276,160 |
| Independent Bank Corp. | | 53,747 | 4,204,628 |
| Independent Bank Corp. | | 23,535 | 482,938 |
| Independent Bank Group, Inc. | | 41,886 | 2,821,441 |
| International Bancshares Corp. | | 61,367 | 2,560,845 |
| Investar Holding Corp. | | 10,083 | 217,793 |
| John Marshall Bankcorp, Inc. | | 13,284 | 334,890 |
| JPMorgan Chase & Co. | | 3,401,328 | 386,833,033 |
| KeyCorp | | 1,076,919 | 19,050,697 |
| Lakeland Bancorp, Inc. | | 72,350 | 1,178,582 |
| Lakeland Financial Corp. | | 29,225 | 2,201,812 |
| Landmark Bancorp, Inc. | | 2,994 | 76,437 |
| LCNB Corp. | | 15,550 | 248,178 |
| Limestone Bancorp, Inc. (b) | | 2,642 | 51,149 |
| Live Oak Bancshares, Inc. | | 37,143 | 1,346,062 |
| M&T Bank Corp. | | 208,175 | 37,842,052 |
| Macatawa Bank Corp. | | 31,806 | 302,793 |
| Mainstreet Bancshares, Inc. | | 6,871 | 166,416 |
| Malvern Bancorp, Inc. (a) | | 4,770 | 74,555 |
| Mercantile Bank Corp. | | 16,988 | 561,963 |
| Meridian Bank/Malvern, PA | | 5,527 | 167,579 |
| Metrocity Bankshares, Inc. | | 21,812 | 436,022 |
| Metropolitan Bank Holding Corp. (a) | | 12,010 | 859,796 |
| Mid Penn Bancorp, Inc. | | 15,287 | 444,699 |
| Middlefield Banc Corp. | | 6,301 | 170,190 |
| Midland States Bancorp, Inc. | | 24,099 | 604,644 |
| MidWestOne Financial Group, Inc. | | 16,876 | 514,718 |
| MVB Financial Corp. (b) | | 12,412 | 396,936 |
| National Bank Holdings Corp. (b) | | 34,206 | 1,372,687 |
| National Bankshares, Inc. | | 6,247 | 210,212 |
| NBT Bancorp, Inc. | | 49,339 | 1,913,366 |
| Nicolet Bankshares, Inc. (a) | | 13,239 | 1,013,843 |
| Northeast Bank | | 8,173 | 316,867 |
| Northrim Bancorp, Inc. | | 6,316 | 256,114 |
| Northwest Bancshares, Inc. (b) | | 145,568 | 2,048,142 |
| Norwood Financial Corp. | | 8,384 | 213,792 |
| Oak Valley Bancorp Oakdale California | | 6,445 | 116,590 |
| OceanFirst Financial Corp. | | 68,432 | 1,330,318 |
| OFG Bancorp | | 62,557 | 1,701,550 |
| Ohio Valley Banc Corp. (b) | | 3,631 | 106,243 |
| Old National Bancorp, Indiana | | 336,102 | 5,609,542 |
| Old Point Financial Corp. | | 6,643 | 156,310 |
| Old Second Bancorp, Inc. | | 47,590 | 652,935 |
| Orange County Bancorp, Inc. (b) | | 1,384 | 46,239 |
| Origin Bancorp, Inc. | | 25,693 | 1,049,559 |
| Orrstown Financial Services, Inc. | | 12,719 | 327,260 |
| Pacific Premier Bancorp, Inc. (b) | | 110,264 | 3,612,249 |
| PacWest Bancorp | | 134,902 | 3,551,970 |
| Park National Corp. (b) | | 16,899 | 2,227,795 |
| Parke Bancorp, Inc. (b) | | 11,281 | 250,213 |
| Partners Bancorp | | 9,598 | 86,958 |
| Pathfinder Bancorp, Inc. | | 393 | 7,719 |
| Pathward Financial, Inc. | | 33,406 | 1,101,062 |
| Patriot National Bancorp, Inc. (a) | | 1,783 | 20,986 |
| PCB Bancorp | | 14,270 | 267,991 |
| PCSB Financial Corp. | | 16,279 | 301,324 |
| Peapack-Gladstone Financial Corp. | | 18,975 | 638,888 |
| Penns Woods Bancorp, Inc. | | 7,073 | 167,630 |
| Peoples Bancorp of North Carolina | | 4,669 | 121,394 |
| Peoples Bancorp, Inc. | | 28,712 | 858,202 |
| Peoples Financial Services Corp. | | 7,906 | 384,864 |
| Pinnacle Financial Partners, Inc. | | 87,577 | 7,068,340 |
| Plumas Bancorp | | 5,387 | 160,425 |
| PNC Financial Services Group, Inc. | | 479,419 | 75,748,202 |
| Popular, Inc. | | 88,500 | 6,833,970 |
| Preferred Bank, Los Angeles | | 15,329 | 1,039,919 |
| Premier Financial Corp. | | 41,047 | 1,109,090 |
| Primis Financial Corp. (b) | | 23,468 | 307,665 |
| Professional Holdings Corp. (A Shares) (a) | | 15,798 | 441,712 |
| Prosperity Bancshares, Inc. | | 107,626 | 7,628,531 |
| QCR Holdings, Inc. | | 18,443 | 1,030,042 |
| RBB Bancorp | | 16,097 | 355,744 |
| Red River Bancshares, Inc. | | 5,733 | 293,014 |
| Regions Financial Corp. | | 1,079,453 | 23,391,747 |
| Renasant Corp. | | 64,834 | 2,161,566 |
| Republic Bancorp, Inc., Kentucky Class A | | 10,932 | 464,610 |
| Republic First Bancorp, Inc. (a)(b) | | 54,258 | 172,540 |
| Richmond Mutual Bancorp., Inc. | | 12,822 | 179,764 |
| Riverview Bancorp, Inc. | | 21,670 | 152,774 |
| S&T Bancorp, Inc. | | 44,958 | 1,332,555 |
| Salisbury Bancorp, Inc. | | 5,088 | 120,280 |
| Sandy Spring Bancorp, Inc. | | 52,380 | 2,017,678 |
| SB Financial Group, Inc. | | 7,227 | 125,605 |
| Seacoast Banking Corp., Florida | | 70,935 | 2,292,619 |
| ServisFirst Bancshares, Inc. | | 56,070 | 4,730,065 |
| Shore Bancshares, Inc. | | 20,407 | 388,753 |
| Sierra Bancorp | | 16,465 | 341,155 |
| Signature Bank | | 73,404 | 12,798,721 |
| Silvergate Capital Corp. (a) | | 36,296 | 3,307,292 |
| Simmons First National Corp. Class A | | 145,921 | 3,442,276 |
| SmartFinancial, Inc. | | 18,517 | 464,592 |
| Sound Financial Bancorp, Inc. | | 3,078 | 132,723 |
| South Plains Financial, Inc. | | 15,643 | 424,395 |
| Southern First Bancshares, Inc. (a) | | 8,071 | 347,941 |
| Southern States Bancshares, Inc. (b) | | 2,397 | 57,792 |
| Southside Bancshares, Inc. (b) | | 37,126 | 1,398,908 |
| Southstate Corp. | | 86,546 | 6,754,050 |
| Stock Yards Bancorp, Inc. | | 31,053 | 2,057,572 |
| Summit Financial Group, Inc. | | 11,772 | 335,737 |
| Summit State Bank | | 4,162 | 62,430 |
| SVB Financial Group (a) | | 68,485 | 27,840,522 |
| Synovus Financial Corp. | | 176,823 | 7,101,212 |
| Texas Capital Bancshares, Inc. (a) | | 58,185 | 3,434,661 |
| The Bank of Princeton | | 6,141 | 175,203 |
| The First Bancorp, Inc. | | 10,307 | 298,903 |
| Third Coast Bancshares, Inc. | | 3,994 | 72,691 |
| Tompkins Financial Corp. (b) | | 15,251 | 1,092,582 |
| TowneBank | | 77,153 | 2,198,089 |
| Trico Bancshares (b) | | 35,367 | 1,668,969 |
| Triumph Bancorp, Inc. (a) | | 27,315 | 1,691,072 |
| Truist Financial Corp. | | 1,545,151 | 72,374,873 |
| Trustmark Corp. | | 70,271 | 2,216,347 |
| U.S. Bancorp | | 1,566,710 | 71,457,643 |
| UMB Financial Corp. | | 49,214 | 4,403,177 |
| Umpqua Holdings Corp. | | 250,602 | 4,445,679 |
| Union Bankshares, Inc. | | 4,955 | 126,353 |
| United Bancorp, Inc. | | 8,035 | 124,623 |
| United Bankshares, Inc., West Virginia (b) | | 155,603 | 5,772,871 |
| United Community Bank, Inc. | | 120,926 | 4,054,649 |
| United Security Bancshares, California | | 12,691 | 90,106 |
| Unity Bancorp, Inc. | | 6,454 | 180,906 |
| Univest Corp. of Pennsylvania | | 34,279 | 850,119 |
| USCB Financial Holdings, Inc. (a) | | 7,126 | 92,638 |
| Valley National Bancorp | | 482,557 | 5,607,312 |
| Veritex Holdings, Inc. | | 72,479 | 2,182,343 |
| Virginia National Bankshares C (b) | | 5,501 | 181,533 |
| Washington Federal, Inc. | | 74,876 | 2,396,781 |
| Washington Trust Bancorp, Inc. | | 20,150 | 1,020,195 |
| Webster Financial Corp. | | 211,474 | 9,949,852 |
| Wells Fargo & Co. | | 4,391,932 | 191,971,348 |
| WesBanco, Inc. | | 69,937 | 2,392,545 |
| West Bancorp., Inc. | | 18,128 | 446,130 |
| Westamerica Bancorp. | | 31,020 | 1,735,569 |
| Western Alliance Bancorp. | | 127,376 | 9,772,287 |
| Wintrust Financial Corp. | | 73,203 | 6,173,941 |
| Zions Bancorp NA | | 175,103 | 9,635,918 |
| | | | 1,840,760,599 |
| Capital Markets - 3.1% | | | |
| Affiliated Managers Group, Inc. | | 44,225 | 5,632,496 |
| Ameriprise Financial, Inc. | | 127,439 | 34,154,926 |
| Ares Management Corp. | | 198,607 | 14,724,723 |
| Artisan Partners Asset Management, Inc. | | 82,590 | 2,788,238 |
| Ashford, Inc. (a) | | 1,740 | 31,233 |
| Assetmark Financial Holdings, Inc. (a) | | 23,898 | 462,187 |
| Associated Capital Group, Inc. | | 3,311 | 131,082 |
| B. Riley Financial, Inc. (b) | | 18,686 | 930,002 |
| Bakkt Holdings, Inc. Class A (a)(b) | | 58,706 | 152,049 |
| Bank of New York Mellon Corp. | | 859,802 | 35,707,577 |
| BGC Partners, Inc. Class A | | 383,187 | 1,540,412 |
| BlackRock, Inc. Class A | | 164,899 | 109,887,045 |
| Blackstone, Inc. | | 810,992 | 76,184,588 |
| Blucora, Inc. (a) | | 53,705 | 1,078,396 |
| Blue Owl Capital, Inc. Class A (b) | | 398,391 | 4,422,140 |
| Bridge Investment Group Holdings, Inc. | | 28,757 | 469,027 |
| BrightSphere Investment Group, Inc. | | 38,775 | 662,665 |
| Carlyle Group LP | | 161,694 | 5,259,906 |
| Cboe Global Markets, Inc. | | 123,386 | 14,555,846 |
| Charles Schwab Corp. | | 1,746,759 | 123,932,551 |
| CME Group, Inc. | | 416,109 | 81,395,081 |
| Cohen & Co., Inc. (b) | | 202 | 2,363 |
| Cohen & Steers, Inc. | | 29,365 | 2,096,074 |
| Coinbase Global, Inc. (a)(b) | | 37,857 | 2,528,848 |
| Cowen Group, Inc. Class A | | 31,733 | 1,220,134 |
| Diamond Hill Investment Group, Inc. | | 3,654 | 625,017 |
| Donnelley Financial Solutions, Inc. (a) | | 32,191 | 1,366,508 |
| Evercore, Inc. Class A | | 47,371 | 4,438,189 |
| FactSet Research Systems, Inc. | | 43,779 | 18,971,192 |
| Federated Hermes, Inc. | | 105,139 | 3,581,034 |
| Focus Financial Partners, Inc. Class A (a) | | 65,693 | 2,571,881 |
| Forge Global Holdings, Inc. Class A (a)(b) | | 116,624 | 445,504 |
| Franklin Resources, Inc. (b) | | 322,338 | 8,403,352 |
| GAMCO Investors, Inc. Class A | | 4,488 | 90,792 |
| GCM Grosvenor, Inc. Class A (b) | | 42,162 | 330,972 |
| Goldman Sachs Group, Inc. | | 397,180 | 132,129,871 |
| Greenhill & Co., Inc. (b) | | 19,582 | 153,131 |
| Hamilton Lane, Inc. Class A | | 40,304 | 2,804,352 |
| Hennessy Advisors, Inc. (b) | | 2,447 | 24,323 |
| Heritage Global, Inc. (a) | | 30,061 | 49,601 |
| Houlihan Lokey | | 57,608 | 4,522,228 |
| Interactive Brokers Group, Inc. | | 100,289 | 6,176,800 |
| Intercontinental Exchange, Inc. | | 646,283 | 65,177,641 |
| Invesco Ltd. | | 385,945 | 6,356,514 |
| Janus Henderson Group PLC (b) | | 192,977 | 4,515,662 |
| Jefferies Financial Group, Inc. | | 224,101 | 7,191,401 |
| KKR & Co. LP | | 686,429 | 34,705,850 |
| Lazard Ltd. Class A | | 136,585 | 4,964,865 |
| LPL Financial | | 92,304 | 20,429,644 |
| Manning & Napier, Inc. Class A | | 16,920 | 215,392 |
| MarketAxess Holdings, Inc. | | 43,509 | 10,815,902 |
| MarketWise, Inc. Class A (a)(b) | | 31,232 | 87,137 |
| Moelis & Co. Class A | | 76,500 | 3,186,990 |
| Moody's Corp. | | 185,827 | 52,871,498 |
| Morgan Stanley | | 1,619,654 | 138,026,914 |
| Morningstar, Inc. | | 27,750 | 6,326,723 |
| MSCI, Inc. | | 93,926 | 42,195,316 |
| NASDAQ, Inc. | | 399,165 | 23,762,292 |
| Northern Trust Corp. | | 242,446 | 23,054,190 |
| Open Lending Corp. (a) | | 118,211 | 1,147,829 |
| Oppenheimer Holdings, Inc. Class A (non-vtg.) (b) | | 11,427 | 414,800 |
| P10, Inc. | | 41,883 | 522,700 |
| Perella Weinberg Partners Class A | | 45,898 | 330,007 |
| Piper Jaffray Companies (b) | | 16,282 | 1,865,429 |
| PJT Partners, Inc. | | 28,398 | 1,965,710 |
| Pzena Investment Management, Inc. | | 21,803 | 207,565 |
| Raymond James Financial, Inc. | | 225,787 | 23,565,389 |
| S&P Global, Inc. | | 401,728 | 141,480,567 |
| Safeguard Scientifics, Inc. (a) | | 19,693 | 81,332 |
| Sculptor Capital Management, Inc. Class A (b) | | 26,511 | 249,999 |
| SEI Investments Co. | | 120,194 | 6,574,612 |
| Siebert Financial Corp. (a)(b) | | 7,387 | 12,780 |
| Silvercrest Asset Management Group Class A | | 12,405 | 221,677 |
| State Street Corp. | | 425,793 | 29,102,952 |
| StepStone Group, Inc. Class A | | 55,981 | 1,527,721 |
| Stifel Financial Corp. | | 124,221 | 7,367,548 |
| StoneX Group, Inc. (a) | | 19,668 | 1,825,977 |
| T. Rowe Price Group, Inc. | | 263,371 | 31,604,520 |
| TPG, Inc. (b) | | 39,634 | 1,163,654 |
| Tradeweb Markets, Inc. Class A | | 125,415 | 8,727,630 |
| U.S. Global Investors, Inc. Class A | | 14,361 | 54,285 |
| Value Line, Inc. | | 1,208 | 99,068 |
| Victory Capital Holdings, Inc. | | 28,744 | 769,764 |
| Virtu Financial, Inc. Class A | | 91,844 | 2,108,738 |
| Virtus Investment Partners, Inc. | | 8,138 | 1,556,393 |
| Westwood Holdings Group, Inc. | | 8,928 | 120,528 |
| WisdomTree Investments, Inc. (b) | | 128,897 | 645,774 |
| | | | 1,415,833,215 |
| Consumer Finance - 0.6% | | | |
| Ally Financial, Inc. | | 371,810 | 12,344,092 |
| American Express Co. | | 706,383 | 107,370,216 |
| Atlanticus Holdings Corp. (a)(b) | | 6,412 | 182,550 |
| Bread Financial Holdings, Inc. | | 57,005 | 2,190,702 |
| Capital One Financial Corp. | | 455,966 | 48,250,322 |
| Consumer Portfolio Services, Inc. (a)(b) | | 13,562 | 157,862 |
| Credit Acceptance Corp. (a)(b) | | 8,764 | 4,663,149 |
| CURO Group Holdings Corp. (b) | | 25,064 | 165,422 |
| Discover Financial Services | | 324,759 | 32,635,032 |
| Elevate Credit, Inc. (a)(b) | | 24,596 | 36,402 |
| Encore Capital Group, Inc. (a) | | 27,692 | 1,514,199 |
| Enova International, Inc. (a) | | 37,613 | 1,314,198 |
| EZCORP, Inc. (non-vtg.) Class A (a) | | 61,916 | 541,765 |
| FirstCash Holdings, Inc. | | 45,416 | 3,540,631 |
| Green Dot Corp. Class A (a) | | 62,882 | 1,275,876 |
| Katapult Holdings, Inc. (a)(b) | | 61,862 | 70,523 |
| LendingClub Corp. (a) | | 117,479 | 1,535,451 |
| LendingTree, Inc. (a) | | 12,841 | 391,522 |
| Medallion Financial Corp. | | 23,897 | 190,220 |
| MoneyLion, Inc. (a) | | 107,179 | 153,266 |
| Navient Corp. | | 176,726 | 2,719,813 |
| Nelnet, Inc. Class A | | 23,202 | 1,954,536 |
| NerdWallet, Inc. (b) | | 8,417 | 87,453 |
| Nicholas Financial, Inc. (a) | | 2,497 | 22,173 |
| OneMain Holdings, Inc. | | 122,102 | 4,265,023 |
| Oportun Financial Corp. (a) | | 33,264 | 169,979 |
| OppFi, Inc. Class A (a)(b) | | 16,122 | 43,691 |
| PRA Group, Inc. (a) | | 46,961 | 1,734,739 |
| PROG Holdings, Inc. (a) | | 62,259 | 1,154,282 |
| Regional Management Corp. | | 10,817 | 364,425 |
| SLM Corp. | | 308,594 | 4,715,316 |
| SoFi Technologies, Inc. (a)(b) | | 854,616 | 5,059,327 |
| Sunlight Financial Holdings, Inc. Class A (a)(b) | | 40,790 | 124,817 |
| Synchrony Financial | | 581,417 | 19,041,407 |
| Upstart Holdings, Inc. (a)(b) | | 58,431 | 1,513,363 |
| World Acceptance Corp. (a)(b) | | 4,274 | 496,810 |
| | | | 261,990,554 |
| Diversified Financial Services - 1.4% | | | |
| A-Mark Precious Metals, Inc. | | 19,526 | 603,549 |
| Acacia Research Corp. (a) | | 52,384 | 235,204 |
| Alerus Financial Corp. | | 16,841 | 400,142 |
| Apollo Global Management, Inc. | | 434,276 | 24,137,060 |
| Berkshire Hathaway, Inc. Class B (a) | | 2,093,428 | 587,834,582 |
| Cannae Holdings, Inc. (a) | | 92,826 | 2,005,970 |
| Equitable Holdings, Inc. | | 407,859 | 12,133,805 |
| FlexShopper, Inc. (a)(b) | | 13,495 | 35,492 |
| Jackson Financial, Inc. | | 99,784 | 3,119,248 |
| LM Funding America, Inc. (a) | | 13,321 | 17,317 |
| SWK Holdings Corp. (a)(b) | | 10,175 | 177,859 |
| Voya Financial, Inc. (b) | | 118,235 | 7,275,000 |
| | | | 637,975,228 |
| Insurance - 2.2% | | | |
| AFLAC, Inc. | | 686,845 | 40,812,330 |
| Alleghany Corp. (a) | | 15,392 | 12,947,443 |
| Allstate Corp. | | 318,381 | 38,364,911 |
| AMBAC Financial Group, Inc. (a) | | 52,680 | 794,941 |
| American Equity Investment Life Holding Co. | | 90,586 | 3,442,268 |
| American Financial Group, Inc. | | 77,419 | 9,884,858 |
| American International Group, Inc. | | 916,766 | 47,442,641 |
| Amerisafe, Inc. | | 22,874 | 1,093,835 |
| Aon PLC | | 246,028 | 68,705,779 |
| Arch Capital Group Ltd. (a) | | 437,135 | 19,985,812 |
| Argo Group International Holdings, Ltd. | | 40,322 | 791,521 |
| Arthur J. Gallagher & Co. | | 242,814 | 44,087,738 |
| Assurant, Inc. | | 62,805 | 9,953,964 |
| Assured Guaranty Ltd. | | 73,543 | 3,755,841 |
| Atlantic American Corp. (b) | | 6,710 | 20,063 |
| Axis Capital Holdings Ltd. | | 89,155 | 4,738,588 |
| Brighthouse Financial, Inc. (a) | | 86,654 | 4,120,398 |
| Brown & Brown, Inc. | | 269,572 | 16,993,819 |
| BRP Group, Inc. (a) | | 64,235 | 2,016,979 |
| Chubb Ltd. | | 490,812 | 92,788,009 |
| Cincinnati Financial Corp. | | 172,253 | 16,701,651 |
| Citizens, Inc. Class A (a)(b) | | 51,576 | 195,473 |
| CNA Financial Corp. | | 38,276 | 1,472,095 |
| CNO Financial Group, Inc. | | 133,953 | 2,466,075 |
| Crawford & Co.: | | | |
| Class A | | 18,589 | 113,021 |
| Class B | | 9,523 | 56,186 |
| Donegal Group, Inc. Class A | | 21,284 | 309,044 |
| eHealth, Inc. (a) | | 27,435 | 175,584 |
| Employers Holdings, Inc. | | 31,765 | 1,243,917 |
| Enstar Group Ltd. (a) | | 14,129 | 2,673,913 |
| Erie Indemnity Co. Class A | | 28,703 | 6,169,136 |
| Everest Re Group Ltd. | | 45,492 | 12,239,623 |
| Fednat Holding Co. (a) | | 14,110 | 4,545 |
| FG Financial Group, Inc. (a)(b) | | 3,476 | 4,901 |
| Fidelity National Financial, Inc. | | 323,126 | 12,634,227 |
| First American Financial Corp. | | 125,240 | 6,700,340 |
| Genworth Financial, Inc. Class A (a) | | 585,662 | 2,471,494 |
| Globe Life, Inc. | | 103,885 | 10,096,583 |
| GoHealth, Inc. (a)(b) | | 69,785 | 31,536 |
| Goosehead Insurance (b) | | 23,475 | 1,220,700 |
| Greenlight Capital Re, Ltd. (a) | | 29,289 | 231,090 |
| Hagerty, Inc. Class A (a)(b) | | 30,960 | 347,681 |
| Hallmark Financial Services, Inc. (a) | | 19,831 | 25,185 |
| Hanover Insurance Group, Inc. | | 40,847 | 5,285,193 |
| Hartford Financial Services Group, Inc. | | 381,803 | 24,553,751 |
| HCI Group, Inc. (b) | | 9,206 | 439,955 |
| Heritage Insurance Holdings, Inc. | | 27,593 | 72,846 |
| Hippo Holdings, Inc. (a)(b) | | 431,806 | 418,852 |
| Horace Mann Educators Corp. | | 48,009 | 1,717,282 |
| Investors Title Co. | | 1,719 | 253,295 |
| James River Group Holdings Ltd. | | 43,041 | 1,022,654 |
| Kemper Corp. | | 69,377 | 3,191,342 |
| Kingstone Companies, Inc. (b) | | 6,183 | 24,299 |
| Kingsway Financial Services, Inc. (a) | | 20,658 | 144,606 |
| Kinsale Capital Group, Inc. | | 25,101 | 6,365,112 |
| Lemonade, Inc. (a)(b) | | 49,670 | 1,098,700 |
| Lincoln National Corp. | | 185,990 | 8,566,699 |
| Loews Corp. | | 224,232 | 12,402,272 |
| Maiden Holdings Ltd. (a)(b) | | 76,044 | 173,380 |
| Markel Corp. (a) | | 15,683 | 18,727,227 |
| Marpai, Inc. (b) | | 14,531 | 13,640 |
| Marsh & McLennan Companies, Inc. | | 581,227 | 93,792,601 |
| MBIA, Inc. (a) | | 54,847 | 646,646 |
| Mercury General Corp. (b) | | 30,985 | 988,422 |
| MetLife, Inc. | | 801,313 | 51,548,465 |
| Midwest Holding, Inc. (a)(b) | | 3,043 | 44,732 |
| National Western Life Group, Inc. | | 2,630 | 500,515 |
| NI Holdings, Inc. (a) | | 7,473 | 98,120 |
| Old Republic International Corp. | | 331,670 | 7,243,673 |
| Oscar Health, Inc. (a) | | 44,065 | 292,151 |
| Oxbridge Re Holdings Ltd. (a) | | 4,100 | 10,947 |
| Palomar Holdings, Inc. (a) | | 27,786 | 2,203,152 |
| Primerica, Inc. | | 44,241 | 5,607,547 |
| Principal Financial Group, Inc. (b) | | 272,477 | 20,370,381 |
| ProAssurance Corp. | | 62,871 | 1,344,811 |
| Progressive Corp. | | 677,796 | 83,131,679 |
| Prudential Financial, Inc. | | 434,398 | 41,593,609 |
| Reinsurance Group of America, Inc. | | 78,092 | 9,789,613 |
| Reliance Global Group, Inc. (a) | | 7,434 | 5,877 |
| RenaissanceRe Holdings Ltd. | | 50,768 | 6,866,880 |
| RLI Corp. | | 45,887 | 5,036,557 |
| Root, Inc. (a)(b) | | 7,031 | 87,114 |
| Ryan Specialty Group Holdings, Inc. (a)(b) | | 67,329 | 2,852,056 |
| Safety Insurance Group, Inc. (b) | | 16,266 | 1,464,753 |
| Selective Insurance Group, Inc. | | 69,291 | 5,503,091 |
| Selectquote, Inc. (a) | | 143,138 | 158,883 |
| Siriuspoint Ltd. (a) | | 105,819 | 473,011 |
| Stewart Information Services Corp. | | 31,315 | 1,585,792 |
| The Travelers Companies, Inc. | | 278,447 | 45,008,173 |
| Tiptree, Inc. | | 26,527 | 316,998 |
| Trean Insurance Group, Inc. (a) | | 20,091 | 89,405 |
| Trupanion, Inc. (a)(b) | | 39,805 | 2,809,437 |
| United Fire Group, Inc. | | 25,493 | 750,259 |
| United Insurance Holdings Corp. (b) | | 24,133 | 24,374 |
| Universal Insurance Holdings, Inc. (b) | | 31,386 | 374,749 |
| Unum Group | | 232,112 | 8,785,439 |
| W.R. Berkley Corp. | | 242,748 | 15,730,070 |
| White Mountains Insurance Group Ltd. | | 3,435 | 4,705,950 |
| Willis Towers Watson PLC | | 129,079 | 26,697,410 |
| | | | 1,033,330,185 |
| Mortgage Real Estate Investment Trusts - 0.2% | | | |
| Acres Commercial Realty Corp. (a) | | 9,778 | 94,944 |
| AG Mortgage Investment Trust, Inc. | | 30,113 | 193,024 |
| AGNC Investment Corp. | | 602,104 | 7,195,143 |
| Angel Oak Mortgage, Inc. (b) | | 10,445 | 144,872 |
| Annaly Capital Management, Inc. | | 1,925,254 | 12,417,888 |
| Apollo Commercial Real Estate Finance, Inc. | | 162,810 | 1,896,737 |
| Arbor Realty Trust, Inc. | | 184,228 | 2,759,735 |
| Ares Commercial Real Estate Corp. | | 67,312 | 887,845 |
| Arlington Asset Investment Corp. (a) | | 31,881 | 102,019 |
| Armour Residential REIT, Inc. (b) | | 118,053 | 838,176 |
| Blackstone Mortgage Trust, Inc. | | 194,829 | 5,646,144 |
| BrightSpire Capital, Inc. | | 106,120 | 891,408 |
| Broadmark Realty Capital, Inc. | | 150,042 | 967,771 |
| Cherry Hill Mortgage Investment Corp. (b) | | 25,168 | 162,837 |
| Chimera Investment Corp. | | 276,498 | 2,350,233 |
| Dynex Capital, Inc. | | 41,919 | 650,164 |
| Ellington Financial LLC (b) | | 66,401 | 974,767 |
| Ellington Residential Mortgage REIT (b) | | 15,394 | 124,384 |
| Franklin BSP Realty Trust, Inc. (b) | | 102,839 | 1,326,623 |
| Granite Point Mortgage Trust, Inc. | | 63,974 | 602,635 |
| Great Ajax Corp. | | 26,135 | 236,522 |
| Hannon Armstrong Sustainable Infrastructure Capital, Inc. | | 99,838 | 3,945,598 |
| Invesco Mortgage Capital, Inc. (b) | | 39,301 | 624,493 |
| KKR Real Estate Finance Trust, Inc. | | 62,126 | 1,196,547 |
| Ladder Capital Corp. Class A | | 127,556 | 1,410,769 |
| Lument Finance Trust, Inc. (b) | | 43,199 | 108,429 |
| Manhattan Bridge Capital, Inc. | | 9,140 | 51,275 |
| MFA Financial, Inc. | | 108,122 | 1,181,773 |
| New York Mortgage Trust, Inc. | | 426,429 | 1,194,001 |
| Nexpoint Real Estate Finance, Inc. (b) | | 11,473 | 235,426 |
| Orchid Island Capital, Inc. | | 43,967 | 594,434 |
| PennyMac Mortgage Investment Trust | | 108,342 | 1,608,879 |
| Ready Capital Corp. | | 78,406 | 1,027,119 |
| Redwood Trust, Inc. | | 152,397 | 1,181,077 |
| Rithm Capital Corp. | | 534,488 | 5,040,222 |
| Sachem Capital Corp. | | 41,020 | 181,308 |
| Seven Hills Realty Trust (b) | | 14,449 | 150,125 |
| Starwood Property Trust, Inc. | | 352,582 | 8,084,705 |
| TPG RE Finance Trust, Inc. | | 67,663 | 626,559 |
| Two Harbors Investment Corp. | | 416,006 | 2,017,629 |
| Western Asset Mortgage Capital Corp. | | 6,965 | 94,306 |
| | | | 71,018,545 |
| Thrifts & Mortgage Finance - 0.1% | | | |
| 1895 Bancorp of Wisconsin, Inc. (a) | | 2,017 | 19,888 |
| Axos Financial, Inc. (a) | | 62,359 | 2,605,359 |
| Blue Foundry Bancorp (a) | | 36,016 | 409,502 |
| Bogota Financial Corp. (a) | | 3,655 | 40,351 |
| Bridgewater Bancshares, Inc. (a) | | 24,991 | 429,345 |
| Broadway Financial Corp. (a) | | 35,836 | 39,061 |
| Capitol Federal Financial, Inc. | | 150,016 | 1,359,145 |
| Carver Bancorp, Inc. (a) | | 721 | 3,439 |
| Catalyst Bancorp, Inc. | | 413 | 5,481 |
| Cf Bankshares, Inc. | | 1,307 | 27,578 |
| Columbia Financial, Inc. (a) | | 47,729 | 1,018,060 |
| Cullman Bancorp, Inc. | | 455 | 5,105 |
| ESSA Bancorp, Inc. | | 8,257 | 166,791 |
| Essent Group Ltd. | | 124,102 | 4,962,839 |
| Federal Agricultural Mortgage Corp. Class C (non-vtg.) | | 11,588 | 1,265,873 |
| FFBW, Inc. (a)(b) | | 6,012 | 73,948 |
| Finance of America Companies, Inc. (a)(b) | | 24,497 | 29,886 |
| Flagstar Bancorp, Inc. | | 61,670 | 2,376,145 |
| FS Bancorp, Inc. | | 8,438 | 250,693 |
| Greene County Bancorp, Inc. | | 3,658 | 194,606 |
| Guild Holdings Co. Class A (b) | | 7,894 | 78,387 |
| Hingham Institution for Savings | | 1,790 | 531,451 |
| HMN Financial, Inc. | | 7,447 | 168,675 |
| Home Bancorp, Inc. | | 8,912 | 347,924 |
| Home Federal Bancorp, Inc. | | 750 | 14,483 |
| Impac Mortgage Holdings, Inc. (a) | | 6,758 | 3,374 |
| Kearny Financial Corp. | | 83,012 | 943,016 |
| Kentucky First Federal Bancorp | | 1,347 | 9,833 |
| loanDepot, Inc. (b) | | 40,381 | 66,629 |
| Luther Burbank Corp. | | 15,778 | 206,850 |
| Magyar Bancorp, Inc. | | 2,799 | 34,176 |
| Merchants Bancorp | | 29,276 | 789,574 |
| MGIC Investment Corp. | | 356,304 | 5,091,584 |
| Mr. Cooper Group, Inc. (a) | | 85,594 | 3,620,626 |
| New York Community Bancorp, Inc. (b) | | 537,561 | 5,262,722 |
| NMI Holdings, Inc. (a) | | 105,130 | 2,158,319 |
| Northeast Community Bancorp, Inc. (b) | | 19,724 | 250,100 |
| Northfield Bancorp, Inc. | | 52,779 | 777,962 |
| NSTS Bancorp, Inc. (b) | | 2,012 | 22,132 |
| Ocwen Financial Corp. (a) | | 9,318 | 243,945 |
| OP Bancorp | | 13,529 | 163,566 |
| PennyMac Financial Services, Inc. (b) | | 37,326 | 1,982,757 |
| Pioneer Bancorp, Inc. (a) | | 9,928 | 92,827 |
| Ponce Financial Group, Inc. (a)(b) | | 29,919 | 281,538 |
| Provident Bancorp, Inc. | | 18,659 | 270,369 |
| Provident Financial Holdings, Inc. (b) | | 6,264 | 88,949 |
| Provident Financial Services, Inc. | | 88,664 | 2,059,665 |
| Radian Group, Inc. | | 202,858 | 4,282,332 |
| Randolph Bancorp, Inc. | | 5,178 | 137,787 |
| Rocket Companies, Inc. (b) | | 136,629 | 1,079,369 |
| Security National Financial Corp. Class A | | 15,440 | 117,344 |
| Southern Missouri Bancorp, Inc. | | 9,231 | 486,751 |
| Sterling Bancorp, Inc. (a) | | 26,190 | 154,259 |
| Territorial Bancorp, Inc. | | 10,885 | 226,517 |
| TFS Financial Corp. | | 60,133 | 859,902 |
| Timberland Bancorp, Inc./Washington | | 8,251 | 218,817 |
| Trustco Bank Corp., New York | | 22,637 | 754,718 |
| UWM Holdings Corp. Class A (b) | | 97,310 | 352,262 |
| Velocity Financial, Inc. (a) | | 18,154 | 207,319 |
| Walker & Dunlop, Inc. | | 36,910 | 3,707,979 |
| Waterstone Financial, Inc. | | 26,585 | 459,655 |
| Western New England Bancorp, Inc. | | 24,781 | 206,426 |
| William Penn Bancorp, Inc. (b) | | 14,583 | 167,705 |
| WSFS Financial Corp. | | 75,086 | 3,630,408 |
| | | | 57,894,078 |
TOTAL FINANCIALS | | | 5,318,802,404 |
| HEALTH CARE - 13.9% | | | |
| Biotechnology - 2.6% | | | |
| 180 Life Sciences Corp. (a)(b) | | 28,480 | 24,248 |
| 2seventy bio, Inc. (a) | | 43,254 | 637,131 |
| 4D Molecular Therapeutics, Inc. (a)(b) | | 28,211 | 221,738 |
| 89Bio, Inc. (a)(b) | | 8,522 | 38,008 |
| Aadi Bioscience, Inc. (a)(b) | | 24,205 | 327,978 |
| Aadi Bioscience, Inc. rights (a)(c) | | 36,950 | 0 |
| AbbVie, Inc. | | 2,046,321 | 275,148,322 |
| Abeona Therapeutics, Inc. (a) | | 5,690 | 20,712 |
| ACADIA Pharmaceuticals, Inc. (a) | | 135,978 | 2,234,119 |
| Achieve Life Sciences, Inc. (a)(b) | | 10,848 | 49,467 |
| Acorda Therapeutics, Inc. (a) | | 7,506 | 3,035 |
| Actinium Pharmaceuticals, Inc. (a)(b) | | 31,053 | 218,303 |
| Acumen Pharmaceuticals, Inc. (a) | | 11,625 | 66,146 |
| Acurx Pharmaceuticals, Inc. (a)(b) | | 2,258 | 7,835 |
| Adagio Therapeutics, Inc. (b) | | 21,363 | 97,415 |
| Adicet Bio, Inc. (a) | | 21,090 | 298,634 |
| Adicet Bio, Inc. rights (a)(c) | | 1,929 | 0 |
| Aditxt, Inc. (a)(b) | | 35,618 | 5,435 |
| ADMA Biologics, Inc. (a)(b) | | 205,029 | 553,578 |
| Adverum Biotechnologies, Inc. (a) | | 88,508 | 102,669 |
| Aeglea BioTherapeutics, Inc. (a)(b) | | 51,579 | 26,976 |
| Aerovate Therapeutics, Inc. (a)(b) | | 10,682 | 211,824 |
| Aevi Genomic Medicine, Inc. rights (a)(c) | | 12,284 | 413 |
| Agenus, Inc. (a) | | 286,168 | 772,654 |
| AgeX Therapeutics, Inc. (a)(b) | | 10,213 | 5,821 |
| Agios Pharmaceuticals, Inc. (a) | | 62,975 | 1,605,863 |
| Aikido Pharma, Inc. (a)(b) | | 4,839 | 28,550 |
| Aileron Therapeutics, Inc. (a) | | 69,639 | 12,890 |
| AIM ImmunoTech, Inc. (a)(b) | | 48,657 | 32,357 |
| Akebia Therapeutics, Inc. (a) | | 200,210 | 72,937 |
| Akero Therapeutics, Inc. (a)(b) | | 27,739 | 325,933 |
| Akouos, Inc. (a)(b) | | 27,153 | 90,963 |
| Alaunos Therapeutics, Inc. (a)(b) | | 247,809 | 609,610 |
| Albireo Pharma, Inc. (a)(b) | | 22,354 | 391,195 |
| Aldeyra Therapeutics, Inc. (a) | | 58,232 | 409,953 |
| Alector, Inc. (a) | | 68,505 | 709,027 |
| Aligos Therapeutics, Inc. (a) | | 19,513 | 24,391 |
| Alkermes PLC (a) | | 187,549 | 4,439,285 |
| Allakos, Inc. (a) | | 38,476 | 186,609 |
| Allarity Therapeutics, Inc. (a)(b) | | 14,501 | 16,966 |
| Allena Pharmaceuticals, Inc. (a)(b) | | 76,391 | 8,029 |
| Allogene Therapeutics, Inc. (a)(b) | | 85,936 | 1,178,183 |
| Allovir, Inc. (a)(b) | | 37,747 | 283,480 |
| Alnylam Pharmaceuticals, Inc. (a) | | 140,006 | 28,935,040 |
| Alpine Immune Sciences, Inc. (a) | | 15,627 | 117,359 |
| Altimmune, Inc. (a) | | 44,638 | 985,607 |
| ALX Oncology Holdings, Inc. (a) | | 23,638 | 307,294 |
| Amgen, Inc. | | 618,239 | 148,562,832 |
| Amicus Therapeutics, Inc. (a) | | 289,934 | 3,255,959 |
| AnaptysBio, Inc. (a)(b) | | 22,853 | 530,647 |
| Anavex Life Sciences Corp. (a)(b) | | 89,723 | 860,444 |
| Anika Therapeutics, Inc. (a) | | 16,997 | 384,132 |
| Anixa Biosciences, Inc. (a) | | 33,806 | 140,971 |
| Annexon, Inc. (a)(b) | | 29,052 | 170,826 |
| Annovis Bio, Inc. (a)(b) | | 5,659 | 65,644 |
| Apellis Pharmaceuticals, Inc. (a) | | 106,301 | 6,432,274 |
| Applied Genetic Technologies Corp. (a) | | 53,156 | 21,358 |
| Applied Molecular Transport, Inc. (a)(b) | | 16,796 | 24,858 |
| Applied Therapeutics, Inc. (a) | | 19,438 | 26,630 |
| Aprea Therapeutics, Inc. (a)(b) | | 22,004 | 17,473 |
| Aptevo Therapeutics, Inc. (a)(b) | | 4,235 | 14,992 |
| Aptinyx, Inc. (a) | | 44,239 | 18,359 |
| AquaBounty Technologies, Inc. (a)(b) | | 52,652 | 63,182 |
| Aravive, Inc. (a) | | 20,027 | 13,464 |
| Arbutus Biopharma Corp. (a) | | 115,015 | 255,333 |
| ARCA Biopharma, Inc. (a) | | 14,897 | 34,859 |
| Arcellx, Inc. | | 10,338 | 185,774 |
| Arcturus Therapeutics Holdings, Inc. (a)(b) | | 25,441 | 357,192 |
| Arcus Biosciences, Inc. (a) | | 53,704 | 1,293,192 |
| Arcutis Biotherapeutics, Inc. (a) | | 44,450 | 1,197,928 |
| Ardelyx, Inc. (a)(b) | | 124,140 | 117,672 |
| Aridis Pharmaceuticals, Inc. (a)(b) | | 18,161 | 26,515 |
| Armata Pharmaceuticals, Inc. (a)(b) | | 4,981 | 20,073 |
| Arrowhead Pharmaceuticals, Inc. (a) | | 131,311 | 5,214,360 |
| Assembly Biosciences, Inc. (a)(b) | | 53,532 | 100,105 |
| Astria Therapeutics, Inc. (a) | | 10,868 | 93,356 |
| Atara Biotherapeutics, Inc. (a)(b) | | 107,955 | 432,900 |
| Athenex, Inc. (a) | | 70,744 | 33,922 |
| Athersys, Inc. (a)(b) | | 10,642 | 29,266 |
| Atossa Therapeutics, Inc. (a)(b) | | 142,167 | 130,936 |
| Atreca, Inc. (a)(b) | | 31,977 | 59,477 |
| aTyr Pharma, Inc. (a) | | 30,063 | 102,815 |
| Aura Biosciences, Inc. | | 6,401 | 85,517 |
| Avalo Therapeutics, Inc. (a) | | 6,301 | 29,930 |
| AVEO Pharmaceuticals, Inc. (a) | | 36,146 | 292,421 |
| Avid Bioservices, Inc. (a) | | 71,131 | 1,224,876 |
| Avidity Biosciences, Inc. (a)(b) | | 52,777 | 1,035,485 |
| Avita Medical, Inc. (a)(b) | | 32,191 | 198,940 |
| AVROBIO, Inc. (a)(b) | | 42,141 | 40,034 |
| Axcella Health, Inc. (a) | | 18,697 | 45,995 |
| Beam Therapeutics, Inc. (a)(b) | | 53,428 | 2,917,169 |
| Bellerophon Therapeutics, Inc. (a)(b) | | 9,250 | 11,748 |
| Bellicum Pharmaceuticals, Inc. (a)(b) | | 5,837 | 7,355 |
| Benitec Biopharma, Inc. (a)(b) | | 5,555 | 4,166 |
| Bio Path Holdings, Inc. (a)(b) | | 9,683 | 35,440 |
| BioAtla, Inc. (a)(b) | | 18,824 | 163,957 |
| BioCardia, Inc. (a)(b) | | 10,166 | 20,129 |
| Biocept, Inc. (a)(b) | | 19,355 | 19,936 |
| BioCryst Pharmaceuticals, Inc. (a)(b) | | 213,621 | 2,969,332 |
| Biogen, Inc. (a) | | 170,677 | 33,346,872 |
| Biohaven Pharmaceutical Holding Co. Ltd. (a) | | 72,945 | 10,894,336 |
| BioMarin Pharmaceutical, Inc. (a) | | 213,964 | 19,085,589 |
| Biomea Fusion, Inc. (a)(b) | | 10,887 | 125,201 |
| Biora Therapeutics, Inc. (a)(b) | | 149,499 | 107,983 |
| BioVie, Inc. (a) | | 5,898 | 21,292 |
| BioXcel Therapeutics, Inc. (a)(b) | | 21,279 | 291,097 |
| Black Diamond Therapeutics, Inc. (a)(b) | | 25,040 | 79,878 |
| Blue Water Vaccines, Inc. (b) | | 2,289 | 7,210 |
| bluebird bio, Inc. (a)(b) | | 81,081 | 473,513 |
| Blueprint Medicines Corp. (a) | | 68,578 | 5,021,281 |
| Bolt Biotherapeutics, Inc. (a)(b) | | 13,947 | 25,105 |
| BrainStorm Cell Therpeutic, Inc. (a)(b) | | 35,086 | 127,011 |
| Brickell Biotech, Inc. (a)(b) | | 2,328 | 5,867 |
| BridgeBio Pharma, Inc. (a)(b) | | 125,069 | 1,313,225 |
| Brooklyn ImmunoTherapeutics, Inc. (a)(b) | | 26,099 | 10,740 |
| C4 Therapeutics, Inc. (a)(b) | | 42,280 | 426,182 |
| Cabaletta Bio, Inc. (a)(b) | | 20,497 | 19,573 |
| Calithera Biosciences, Inc. (a)(b) | | 5,180 | 20,150 |
| Calyxt, Inc. (a) | | 14,195 | 3,086 |
| Candel Therapeutics, Inc. (a) | | 9,179 | 31,851 |
| Capricor Therapeutics, Inc. (a)(b) | | 27,549 | 160,335 |
| Cardiff Oncology, Inc. (a)(b) | | 48,440 | 130,304 |
| CareDx, Inc. (a) | | 61,449 | 1,203,786 |
| Caribou Biosciences, Inc. (a) | | 23,148 | 228,471 |
| CASI Pharmaceuticals, Inc. (a)(b) | | 13,295 | 49,856 |
| Catalyst Biosciences, Inc. (a)(b) | | 34,507 | 67,979 |
| Catalyst Pharmaceutical Partners, Inc. (a) | | 110,388 | 1,494,654 |
| Cel-Sci Corp. (a)(b) | | 48,709 | 191,913 |
| Celcuity, Inc. (a) | | 11,880 | 111,078 |
| Celldex Therapeutics, Inc. (a) | | 53,912 | 1,638,925 |
| Cellectar Biosciences, Inc. (a) | | 4,798 | 26,629 |
| Celsion Corp. (a)(b) | | 5,191 | 11,057 |
| Century Therapeutics, Inc. (a) | | 14,237 | 149,773 |
| Cerevel Therapeutics Holdings (a)(b) | | 64,963 | 1,890,423 |
| Checkpoint Therapeutics, Inc. (a)(b) | | 73,239 | 94,478 |
| ChemoCentryx, Inc. (a) | | 57,412 | 2,926,864 |
| Chimerix, Inc. (a) | | 79,586 | 175,089 |
| Chinook Therapeutics, Inc. (a) | | 54,901 | 1,141,941 |
| Chinook Therapeutics, Inc. rights (a)(c) | | 8,006 | 0 |
| Cidara Therapeutics, Inc. (a) | | 66,517 | 45,232 |
| Clene, Inc. (a)(b) | | 24,130 | 71,425 |
| Clovis Oncology, Inc. (a)(b) | | 166,909 | 186,938 |
| Codiak Biosciences, Inc. (a) | | 18,333 | 39,416 |
| Cogent Biosciences, Inc. (a) | | 43,522 | 717,678 |
| Cogent Biosciences, Inc. rights (a)(c) | | 4,804 | 0 |
| CohBar, Inc. (a) | | 36,799 | 5,616 |
| Coherus BioSciences, Inc. (a) | | 74,371 | 831,468 |
| Concert Pharmaceuticals, Inc. (a) | | 30,133 | 198,275 |
| ContraFect Corp. (a)(b) | | 46,332 | 12,324 |
| Corbus Pharmaceuticals Holdings, Inc. (a) | | 134,436 | 27,102 |
| Corvus Pharmaceuticals, Inc. (a) | | 36,174 | 34,673 |
| Creative Medical Technology Holdings, Inc. | | 7,244 | 5,007 |
| Crinetics Pharmaceuticals, Inc. (a) | | 50,460 | 952,685 |
| CRISPR Therapeutics AG (a)(b) | | 83,924 | 5,462,613 |
| CTI BioPharma Corp. (a)(b) | | 97,447 | 611,967 |
| Cue Biopharma, Inc. (a) | | 35,846 | 105,387 |
| Cullinan Oncology, Inc. (a) | | 29,198 | 393,589 |
| Curis, Inc. (a)(b) | | 85,857 | 83,281 |
| Cyclacel Pharmaceuticals, Inc. (a)(b) | | 8,512 | 14,300 |
| Cyclerion Therapeutics, Inc. (a) | | 46,517 | 39,074 |
| Cyclo Therapeutics, Inc. (a) | | 4,492 | 9,343 |
| Cyteir Therapeutics, Inc. (a) | | 7,522 | 16,248 |
| Cytokinetics, Inc. (a)(b) | | 100,894 | 5,343,346 |
| CytomX Therapeutics, Inc. (a) | | 67,527 | 101,291 |
| Day One Biopharmaceuticals, Inc. (a) | | 23,982 | 563,337 |
| Decibel Therapeutics, Inc. (a) | | 8,027 | 39,653 |
| Deciphera Pharmaceuticals, Inc. (a) | | 53,755 | 872,444 |
| Denali Therapeutics, Inc. (a) | | 107,702 | 2,980,114 |
| DermTech, Inc. (a)(b) | | 27,983 | 155,585 |
| Design Therapeutics, Inc. (a)(b) | | 13,935 | 282,323 |
| DiaMedica Therapeutics, Inc. (a) | | 22,138 | 39,184 |
| Diffusion Pharmaceuticals, Inc. (a)(b) | | 1,658 | 10,827 |
| Dyadic International, Inc. (a)(b) | | 15,307 | 41,099 |
| Dynavax Technologies Corp. (a)(b) | | 134,874 | 1,547,005 |
| Dyne Therapeutics, Inc. (a) | | 30,035 | 294,343 |
| Eagle Pharmaceuticals, Inc. (a) | | 12,977 | 425,256 |
| Edesa Biotech, Inc. (a) | | 10,140 | 18,658 |
| Editas Medicine, Inc. (a)(b) | | 79,625 | 1,170,488 |
| Effector Therapeutics, Inc. Class A (a) | | 10,545 | 6,427 |
| Eiger Biopharmaceuticals, Inc. (a) | | 46,448 | 383,660 |
| Eledon Pharmaceuticals, Inc. (a)(b) | | 16,812 | 63,045 |
| Elevation Oncology, Inc. (a)(b) | | 6,688 | 7,691 |
| Eliem Therapeutics, Inc. | | 7,219 | 21,729 |
| Emergent BioSolutions, Inc. (a) | | 51,579 | 1,238,928 |
| Enanta Pharmaceuticals, Inc. (a) | | 21,159 | 1,288,160 |
| Enochian Biosciences, Inc. (a) | | 17,236 | 42,573 |
| Ensysce Biosciences, Inc. (a)(b) | | 22,103 | 9,336 |
| Entrada Therapeutics, Inc. (b) | | 10,756 | 135,848 |
| EQRx, Inc. (a) | | 258,446 | 1,263,801 |
| Equillium, Inc. (a)(b) | | 16,678 | 45,364 |
| Erasca, Inc. (a) | | 21,973 | 198,196 |
| Evelo Biosciences, Inc. (a)(b) | | 29,921 | 65,527 |
| Exact Sciences Corp. (a) | | 207,199 | 7,365,924 |
| Exagen, Inc. (a) | | 10,962 | 49,658 |
| Exelixis, Inc. (a) | | 376,217 | 6,674,090 |
| Exicure, Inc. (a)(b) | | 2,072 | 3,709 |
| F-star Therapeutics, Inc. (a) | | 23,723 | 159,181 |
| F-star Therapeutics, Inc.: | | | |
| rights (a)(c) | | 1,555 | 0 |
| rights (a)(c) | | 1,555 | 0 |
| Fate Therapeutics, Inc. (a)(b) | | 94,698 | 2,475,406 |
| FibroGen, Inc. (a) | | 100,152 | 1,245,891 |
| Finch Therapeutics Group, Inc. (a) | | 7,011 | 15,144 |
| First Wave BioPharma, Inc. (a)(b) | | 223 | 685 |
| Foghorn Therapeutics, Inc. (a) | | 22,963 | 228,252 |
| Forma Therapeutics Holdings, Inc. (a) | | 39,041 | 523,149 |
| Forte Biosciences, Inc. (a) | | 10,770 | 14,001 |
| Fortress Biotech, Inc. (a) | | 88,530 | 90,301 |
| Frequency Therapeutics, Inc. (a) | | 34,117 | 70,281 |
| G1 Therapeutics, Inc. (a)(b) | | 44,504 | 645,753 |
| Gain Therapeutics, Inc. (a)(b) | | 6,653 | 22,953 |
| Galectin Therapeutics, Inc. (a)(b) | | 49,282 | 93,636 |
| Galecto, Inc. (a) | | 18,314 | 39,375 |
| Galera Therapeutics, Inc. (a) | | 7,383 | 9,893 |
| Gelesis Holdings, Inc. Class A (a)(b) | | 27,460 | 33,227 |
| Gemini Therapeutics, Inc. (a)(b) | | 29,602 | 45,883 |
| Generation Bio Co. (a) | | 51,716 | 264,786 |
| Genprex, Inc. (a)(b) | | 42,686 | 68,298 |
| GeoVax Labs, Inc. (a) | | 5,820 | 6,926 |
| Geron Corp. (a)(b) | | 432,123 | 1,140,805 |
| Gilead Sciences, Inc. | | 1,453,689 | 92,265,641 |
| Global Blood Therapeutics, Inc. (a) | | 68,163 | 4,628,268 |
| GlycoMimetics, Inc. (a) | | 45,384 | 34,492 |
| Gossamer Bio, Inc. (a)(b) | | 60,165 | 839,302 |
| Graphite Bio, Inc. (a) | | 16,050 | 53,126 |
| GreenLight Biosciences Holdings PBC Class A (a)(b) | | 69,516 | 197,425 |
| Greenwich Lifesciences, Inc. (a)(b) | | 4,204 | 39,854 |
| Gritstone Bio, Inc. (a)(b) | | 67,616 | 222,457 |
| Gt Biopharma, Inc. (a) | | 34,566 | 89,180 |
| Halozyme Therapeutics, Inc. (a) | | 161,368 | 6,572,519 |
| Harpoon Therapeutics, Inc. (a)(b) | | 24,861 | 41,269 |
| HCW Biologics, Inc. (a)(b) | | 7,752 | 19,768 |
| Heron Therapeutics, Inc. (a)(b) | | 123,332 | 504,428 |
| HilleVax, Inc. | | 13,805 | 164,418 |
| Histogen, Inc. (a)(b) | | 612 | 1,224 |
| Homology Medicines, Inc. (a) | | 47,190 | 110,425 |
| Hookipa Pharma, Inc. (a) | | 47,681 | 71,045 |
| Horizon Therapeutics PLC (a) | | 267,731 | 15,852,353 |
| Humacyte, Inc. Class A (a)(b) | | 69,276 | 252,857 |
| Humanigen, Inc. (a) | | 60,412 | 13,484 |
| iBio, Inc. (a)(b) | | 237,200 | 65,776 |
| Icosavax, Inc. (a)(b) | | 14,580 | 68,818 |
| Ideaya Biosciences, Inc. (a)(b) | | 37,838 | 371,948 |
| Idera Pharmaceuticals, Inc. (a)(b) | | 54,014 | 27,007 |
| IGM Biosciences, Inc. (a)(b) | | 11,248 | 218,324 |
| Imago BioSciences, Inc. (a)(b) | | 9,898 | 143,818 |
| Immix Biopharma, Inc. (b) | | 11,417 | 20,779 |
| Immucell Corp. (a) | | 7,193 | 52,149 |
| Immuneering Corp. (a)(b) | | 8,768 | 48,925 |
| Immunic, Inc. (a) | | 24,171 | 107,561 |
| ImmunityBio, Inc. (a)(b) | | 77,637 | 310,548 |
| ImmunoGen, Inc. (a) | | 230,735 | 1,340,570 |
| Immunome, Inc. (a)(b) | | 10,708 | 61,464 |
| Immunovant, Inc. (a) | | 52,808 | 271,961 |
| Impel Pharmaceuticals, Inc. (a)(b) | | 7,767 | 60,738 |
| Incyte Corp. (a) | | 217,639 | 15,328,315 |
| Indaptus Therapeutics, Inc. (a) | | 9,314 | 22,726 |
| Infinity Pharmaceuticals, Inc. (a) | | 96,613 | 155,547 |
| Inhibikase Therapeutics, Inc. (a) | | 19,418 | 18,634 |
| Inhibrx, Inc. (a)(b) | | 23,746 | 421,254 |
| Inmune Bio, Inc. (a)(b) | | 13,664 | 110,268 |
| Inovio Pharmaceuticals, Inc. (a)(b) | | 258,342 | 591,603 |
| Inozyme Pharma, Inc. (a) | | 29,791 | 89,373 |
| Insmed, Inc. (a) | | 137,678 | 3,389,632 |
| Instil Bio, Inc. (a)(b) | | 19,060 | 99,112 |
| Intellia Therapeutics, Inc. (a) | | 81,076 | 4,869,425 |
| Intercept Pharmaceuticals, Inc. (a)(b) | | 28,344 | 492,335 |
| Ionis Pharmaceuticals, Inc. (a) | | 167,175 | 7,108,281 |
| Iovance Biotherapeutics, Inc. (a) | | 157,813 | 1,691,755 |
| Ironwood Pharmaceuticals, Inc. Class A (a) | | 175,322 | 1,886,465 |
| IsoRay, Inc. (a)(b) | | 145,306 | 53,763 |
| iTeos Therapeutics, Inc. (a) | | 23,306 | 516,927 |
| Iveric Bio, Inc. (a) | | 125,708 | 1,236,967 |
| Janux Therapeutics, Inc. (a) | | 13,747 | 148,743 |
| Jasper Therapeutics, Inc. (a)(b) | | 16,061 | 30,516 |
| Jounce Therapeutics, Inc. (a) | | 36,582 | 133,890 |
| Kalvista Pharmaceuticals, Inc. (a) | | 25,264 | 416,098 |
| Karuna Therapeutics, Inc. (a) | | 30,281 | 7,723,472 |
| Karyopharm Therapeutics, Inc. (a)(b) | | 84,421 | 427,170 |
| Keros Therapeutics, Inc. (a) | | 15,280 | 540,454 |
| Kezar Life Sciences, Inc. (a)(b) | | 48,950 | 503,206 |
| Kiniksa Pharmaceuticals Ltd. (a) | | 34,350 | 402,582 |
| Kinnate Biopharma, Inc. (a)(b) | | 19,544 | 282,997 |
| Kintara Therapeutics, Inc. (a)(b) | | 51,820 | 8,037 |
| Kodiak Sciences, Inc. (a) | | 39,544 | 395,835 |
| Kronos Bio, Inc. (a)(b) | | 46,508 | 186,032 |
| Krystal Biotech, Inc. (a)(b) | | 24,158 | 1,693,717 |
| Kura Oncology, Inc. (a) | | 76,789 | 1,064,296 |
| Kymera Therapeutics, Inc. (a)(b) | | 41,061 | 1,160,794 |
| Lantern Pharma, Inc. (a)(b) | | 7,922 | 40,957 |
| Larimar Therapeutics, Inc. (a) | | 12,755 | 34,694 |
| Leap Therapeutics, Inc. (a)(b) | | 75,519 | 107,237 |
| Lexicon Pharmaceuticals, Inc. (a) | | 84,526 | 232,447 |
| Ligand Pharmaceuticals, Inc. Class B (a) | | 19,423 | 1,794,491 |
| Lineage Cell Therapeutics, Inc. (a)(b) | | 144,998 | 204,447 |
| LogicBio Therapeutics, Inc. (a)(b) | | 14,173 | 5,080 |
| Longeveron, Inc. (a)(b) | | 4,864 | 23,274 |
| Lumos Pharma, Inc. (a) | | 3,560 | 29,156 |
| Lyell Immunopharma, Inc. (a)(b) | | 28,334 | 189,838 |
| Macrogenics, Inc. (a) | | 62,078 | 246,450 |
| Madrigal Pharmaceuticals, Inc. (a) | | 14,127 | 1,018,839 |
| Magenta Therapeutics, Inc. (a) | | 39,775 | 70,004 |
| MannKind Corp. (a)(b) | | 290,855 | 1,061,621 |
| Marker Therapeutics, Inc. (a) | | 56,046 | 17,374 |
| Matinas BioPharma Holdings, Inc. (a)(b) | | 223,450 | 158,650 |
| MediciNova, Inc. (a)(b) | | 53,558 | 114,079 |
| MEI Pharma, Inc. (a)(b) | | 131,326 | 66,530 |
| Merrimack Pharmaceuticals, Inc. (a) | | 14,294 | 59,320 |
| Mersana Therapeutics, Inc. (a) | | 105,210 | 789,075 |
| Metacrine, Inc. (a)(b) | | 22,410 | 10,578 |
| MiMedx Group, Inc. (a) | | 95,431 | 336,871 |
| Minerva Neurosciences, Inc. (a)(b) | | 5,215 | 58,825 |
| MiNK Therapeutics, Inc. (b) | | 3,901 | 10,260 |
| Mirati Therapeutics, Inc. (a) | | 57,507 | 4,659,792 |
| Mirum Pharmaceuticals, Inc. (a)(b) | | 18,734 | 467,975 |
| Moderna, Inc. (a) | | 400,605 | 52,988,023 |
| Molecular Templates, Inc. (a)(b) | | 47,342 | 34,735 |
| Moleculin Biotech, Inc. (a)(b) | | 33,890 | 50,157 |
| Monopar Therapeutics, Inc. (a) | | 1,919 | 3,454 |
| Monte Rosa Therapeutics, Inc. (a)(b) | | 13,812 | 109,391 |
| Morphic Holding, Inc. (a)(b) | | 30,970 | 852,294 |
| Mustang Bio, Inc. (a) | | 83,538 | 50,749 |
| Myovant Sciences Ltd. (a)(b) | | 52,339 | 894,474 |
| Myriad Genetics, Inc. (a) | | 92,417 | 2,064,596 |
| NanoViricides, Inc. (a)(b) | | 15,314 | 36,600 |
| Natera, Inc. (a) | | 103,048 | 5,076,144 |
| Navidea Biopharmaceuticals, Inc. (a) | | 17,813 | 5,932 |
| Neoleukin Therapeutics, Inc. (a) | | 36,968 | 38,077 |
| Neubase Therapeutics, Inc. (a)(b) | | 28,508 | 17,264 |
| Neurobo Pharmaceuticals, Inc. (a) | | 3,685 | 1,142 |
| Neurobo Pharmaceuticals, Inc. rights (a)(c) | | 159 | 0 |
| Neurocrine Biosciences, Inc. (a) | | 110,422 | 11,553,454 |
| Neximmune, Inc. (a) | | 6,586 | 7,574 |
| NextCure, Inc. (a)(b) | | 24,411 | 100,085 |
| Nighthawk Biosciences, Inc. (a)(b) | | 29,127 | 62,914 |
| Nkarta, Inc. (a)(b) | | 32,148 | 462,610 |
| Novavax, Inc. (a)(b) | | 89,700 | 2,963,688 |
| Nurix Therapeutics, Inc. (a) | | 47,291 | 743,887 |
| Nuvalent, Inc. Class A (a)(b) | | 10,737 | 181,241 |
| Nuvectis Pharma, Inc. (b) | | 4,618 | 37,406 |
| Ocugen, Inc. (a)(b) | | 246,808 | 636,765 |
| Olema Pharmaceuticals, Inc. (a) | | 33,859 | 133,743 |
| Omega Therapeutics, Inc. (a) | | 8,399 | 37,544 |
| OncoCyte Corp. (a)(b) | | 126,582 | 100,000 |
| Oncorus, Inc. (a)(b) | | 19,076 | 24,799 |
| OncoSec Medical, Inc. (a) | | 22,064 | 14,853 |
| Oncternal Therapeutics, Inc. (a) | | 53,480 | 59,898 |
| Oncternal Therapeutics, Inc. rights (a)(c) | | 780 | 0 |
| OpGen, Inc. (a) | | 54,653 | 25,463 |
| Oragenics, Inc. (a)(b) | | 120,635 | 37,674 |
| Organogenesis Holdings, Inc. Class A (a) | | 72,797 | 261,341 |
| Organovo Holdings, Inc. (a)(b) | | 6,277 | 14,688 |
| Orgenesis, Inc. (a)(b) | | 20,758 | 40,271 |
| ORIC Pharmaceuticals, Inc. (a)(b) | | 36,045 | 124,716 |
| Outlook Therapeutics, Inc. (a)(b) | | 131,165 | 146,905 |
| Ovid Therapeutics, Inc. (a) | | 64,792 | 130,232 |
| Oyster Point Pharma, Inc. (a)(b) | | 13,471 | 84,194 |
| Palatin Technologies, Inc. (a) | | 9,400 | 47,188 |
| Pardes Biosciences, Inc. (a)(b) | | 30,820 | 108,178 |
| Pasithea Therapeutics Corp. (b) | | 7,664 | 8,814 |
| Passage Bio, Inc. (a) | | 38,362 | 77,491 |
| PDL BioPharma, Inc. (a)(c) | | 91,243 | 134,127 |
| PDS Biotechnology Corp. (a)(b) | | 30,493 | 127,766 |
| PepGen, Inc. | | 10,828 | 102,866 |
| PharmaCyte Biotech, Inc. (a)(b) | | 23,200 | 61,016 |
| PhaseBio Pharmaceuticals, Inc. (a)(b) | | 38,086 | 40,371 |
| Phio Pharmaceuticals Corp. (a) | | 5,556 | 3,891 |
| Pieris Pharmaceuticals, Inc. (a)(b) | | 75,568 | 110,329 |
| Plus Therapeutics, Inc. (a) | | 18,668 | 15,670 |
| PMV Pharmaceuticals, Inc. (a)(b) | | 31,233 | 434,763 |
| Point Biopharma Global, Inc. (a)(b) | | 84,352 | 822,432 |
| Polarityte, Inc. (a)(b) | | 2,586 | 2,638 |
| Poseida Therapeutics, Inc. (a) | | 34,181 | 113,139 |
| Praxis Precision Medicines, Inc. (a)(b) | | 40,329 | 125,826 |
| Precigen, Inc. (a)(b) | | 109,144 | 241,208 |
| Precision BioSciences, Inc. (a) | | 55,204 | 88,878 |
| Prelude Therapeutics, Inc. (a) | | 14,590 | 105,048 |
| Prometheus Biosciences, Inc. (a) | | 12,045 | 630,074 |
| Protagenic Therapeutics, Inc. (a)(b) | | 13,156 | 9,803 |
| Protagonist Therapeutics, Inc. (a) | | 52,076 | 454,103 |
| Protara Therapeutics, Inc. (a) | | 13,148 | 45,361 |
| Prothena Corp. PLC (a) | | 41,603 | 1,146,995 |
| PTC Therapeutics, Inc. (a) | | 82,035 | 4,096,828 |
| Puma Biotechnology, Inc. (a) | | 44,310 | 118,751 |
| Pyxis Oncology, Inc. (b) | | 12,422 | 32,173 |
| Qualigen Therapeutics, Inc. (a)(b) | | 29,257 | 11,135 |
| Quince Therapeutics, Inc. (a)(b) | | 18,841 | 33,160 |
| Rallybio Corp. (a) | | 6,990 | 77,240 |
| RAPT Therapeutics, Inc. (a) | | 23,068 | 616,146 |
| Recursion Pharmaceuticals, Inc. (a)(b) | | 30,522 | 320,786 |
| Regeneron Pharmaceuticals, Inc. (a) | | 125,175 | 72,734,186 |
| REGENXBIO, Inc. (a) | | 43,676 | 1,288,442 |
| Regulus Therapeutics, Inc. (a)(b) | | 12,302 | 17,469 |
| Relay Therapeutics, Inc. (a)(b) | | 88,969 | 2,043,618 |
| Reneo Pharmaceuticals, Inc. (a) | | 7,193 | 22,658 |
| Renovacor, Inc. (a)(b) | | 1,473 | 2,592 |
| Repligen Corp. (a)(b) | | 59,929 | 13,146,625 |
| Replimune Group, Inc. (a) | | 34,704 | 661,458 |
| Revolution Medicines, Inc. (a) | | 85,105 | 1,772,737 |
| Rezolute, Inc. (a)(b) | | 33,215 | 79,052 |
| Rhythm Pharmaceuticals, Inc. (a) | | 44,886 | 1,014,424 |
| Rigel Pharmaceuticals, Inc. (a) | | 193,090 | 274,188 |
| Rocket Pharmaceuticals, Inc. (a)(b) | | 53,638 | 826,562 |
| Rubius Therapeutics, Inc. (a) | | 44,204 | 30,943 |
| S.A.B. Biotherapeutics, Inc. (a)(b) | | 35,086 | 24,564 |
| Sage Therapeutics, Inc. (a) | | 60,024 | 2,260,504 |
| Salarius Pharmaceuticals, Inc. (a) | | 61,707 | 12,403 |
| Salarius Pharmaceuticals, Inc. warrants 1/20/25 (a) | | 2,725 | 2 |
| Sana Biotechnology, Inc. (a)(b) | | 95,958 | 653,474 |
| Sangamo Therapeutics, Inc. (a) | | 143,004 | 772,222 |
| Sarepta Therapeutics, Inc. (a) | | 102,227 | 11,181,589 |
| Savara, Inc. (a) | | 99,203 | 141,860 |
| Scholar Rock Holding Corp. (a) | | 30,183 | 251,726 |
| Scopus Biopharma, Inc. (a) | | 13,273 | 4,608 |
| Seagen, Inc. (a) | | 156,424 | 24,134,659 |
| Selecta Biosciences, Inc. (a) | | 145,588 | 273,705 |
| Sellas Life Sciences Group, Inc. (a)(b) | | 22,272 | 68,152 |
| Sensei Biotherapeutics, Inc. (a) | | 11,174 | 21,342 |
| Sera Prognostics, Inc. (a) | | 5,451 | 11,447 |
| Seres Therapeutics, Inc. (a) | | 73,795 | 379,306 |
| Sesen Bio, Inc. (a) | | 228,813 | 157,881 |
| Shattuck Labs, Inc. (a) | | 32,403 | 105,310 |
| Sigilon Therapeutics, Inc. (a) | | 18,577 | 11,547 |
| Silverback Therapeutics, Inc. (a) | | 25,091 | 136,495 |
| Sio Gene Therapies, Inc. (a) | | 72,102 | 24,154 |
| Societal Cdmo, Inc. (a) | | 54,472 | 64,822 |
| Soleno Therapeutics, Inc. (a)(b) | | 6,196 | 13,631 |
| Solid Biosciences, Inc. (a) | | 74,471 | 47,661 |
| Soligenix, Inc. (a)(b) | | 39,915 | 31,054 |
| Sonnet Biotherapeutics Holding (a) | | 48,093 | 10,157 |
| Sorrento Therapeutics, Inc. (a)(b) | | 447,718 | 917,822 |
| Spectrum Pharmaceuticals, Inc. (a) | | 210,764 | 238,163 |
| Spero Therapeutics, Inc. (a) | | 30,553 | 24,653 |
| Springworks Therapeutics, Inc. (a)(b) | | 30,357 | 843,014 |
| Spruce Biosciences, Inc. (a)(b) | | 9,911 | 20,813 |
| SQZ Biotechnologies Co. (a)(b) | | 20,524 | 61,572 |
| Statera Biopharma, Inc. (a)(b) | | 26,219 | 4,735 |
| Stoke Therapeutics, Inc. (a) | | 26,201 | 394,587 |
| Surface Oncology, Inc. (a) | | 44,039 | 59,893 |
| Surrozen, Inc. (a)(b) | | 21,025 | 54,034 |
| Sutro Biopharma, Inc. (a) | | 52,244 | 295,701 |
| Synaptogenix, Inc. (a)(b) | | 7,226 | 60,771 |
| Syndax Pharmaceuticals, Inc. (a) | | 56,470 | 1,333,257 |
| Synlogic, Inc. (a) | | 45,816 | 45,816 |
| Synthetic Biologics, Inc. (a)(b) | | 14,856 | 21,838 |
| Syros Pharmaceuticals, Inc. (a) | | 60,099 | 48,115 |
| T2 Biosystems, Inc. (a)(b) | | 171,064 | 20,955 |
| Talaris Therapeutics, Inc. (a) | | 10,723 | 35,493 |
| Tango Therapeutics, Inc. (a) | | 74,226 | 304,327 |
| Taysha Gene Therapies, Inc. (a) | | 27,039 | 85,443 |
| TCR2 Therapeutics, Inc. (a) | | 37,941 | 103,200 |
| Tempest Therapeutics, Inc. (a)(b) | | 2,967 | 6,527 |
| Tenax Therapeutics, Inc. (a)(b) | | 19,302 | 4,613 |
| Tenaya Therapeutics, Inc. (a)(b) | | 14,476 | 63,550 |
| TG Therapeutics, Inc. (a) | | 155,668 | 1,109,913 |
| TONIX Pharmaceuticals Holding (a)(b) | | 19,144 | 19,527 |
| TRACON Pharmaceuticals, Inc. (a) | | 21,595 | 42,758 |
| TransCode Therapeutics, Inc. (a) | | 3,968 | 4,801 |
| Travere Therapeutics, Inc. (a) | | 61,510 | 1,646,008 |
| Trevena, Inc. (a) | | 183,963 | 39,718 |
| TScan Therapeutics, Inc. (a) | | 5,643 | 15,518 |
| Twist Bioscience Corp. (a) | | 64,778 | 2,598,893 |
| Tyme Technologies, Inc. (a)(b) | | 121,670 | 34,992 |
| Tyra Biosciences, Inc. (b) | | 12,460 | 82,361 |
| Ultragenyx Pharmaceutical, Inc. (a) | | 80,414 | 3,834,944 |
| uniQure B.V. (a) | | 41,978 | 820,250 |
| United Therapeutics Corp. (a) | | 52,296 | 11,851,320 |
| UNITY Biotechnology, Inc. (a) | | 60,685 | 28,206 |
| Vaccinex, Inc. (a)(b) | | 26,583 | 23,053 |
| Vanda Pharmaceuticals, Inc. (a) | | 65,107 | 688,832 |
| Vaxart, Inc. (a)(b) | | 142,573 | 441,976 |
| Vaxcyte, Inc. (a) | | 40,204 | 1,051,737 |
| VBI Vaccines, Inc. (a) | | 273,164 | 244,646 |
| Vera Therapeutics, Inc. (a)(b) | | 11,029 | 239,660 |
| Veracyte, Inc. (a)(b) | | 82,350 | 1,679,940 |
| Verastem, Inc. (a) | | 210,658 | 244,363 |
| Vericel Corp. (a) | | 54,248 | 1,353,488 |
| Vertex Pharmaceuticals, Inc. (a) | | 296,306 | 83,487,179 |
| Verve Therapeutics, Inc. (a) | | 26,386 | 1,012,167 |
| Vigil Neuroscience, Inc. | | 8,225 | 69,995 |
| Viking Therapeutics, Inc. (a)(b) | | 85,518 | 271,947 |
| Vincerx Pharma, Inc. (a)(b) | | 16,229 | 24,668 |
| Vir Biotechnology, Inc. (a) | | 85,298 | 2,025,828 |
| Viracta Therapeutics, Inc. (a)(b) | | 21,477 | 86,982 |
| Viridian Therapeutics, Inc. (a) | | 40,231 | 893,531 |
| Viridian Therapeutics, Inc. rights (a)(c) | | 33,262 | 0 |
| Virios Therapeutics, Inc. (a) | | 3,308 | 22,891 |
| VistaGen Therapeutics, Inc. (a)(b) | | 213,363 | 39,259 |
| Vor Biopharma, Inc. (a)(b) | | 12,010 | 61,611 |
| Voyager Therapeutics, Inc. (a)(b) | | 30,215 | 180,384 |
| vTv Therapeutics, Inc. Class A (a)(b) | | 31,879 | 33,792 |
| Vyant Bio, Inc. (a)(b) | | 30,818 | 21,973 |
| Werewolf Therapeutics, Inc. (a) | | 8,395 | 42,479 |
| Windtree Therapeutics, Inc. (a)(b) | | 8,372 | 3,299 |
| X4 Pharmaceuticals, Inc. (a) | | 23,718 | 23,483 |
| Xbiotech, Inc. (a) | | 18,066 | 72,445 |
| Xencor, Inc. (a) | | 68,882 | 1,817,796 |
| Xenetic Biosciences, Inc. (a) | | 7,136 | 5,245 |
| Xilio Therapeutics, Inc. | | 8,232 | 18,440 |
| XOMA Corp. (a)(b) | | 13,129 | 261,005 |
| Y-mAbs Therapeutics, Inc. (a)(b) | | 40,281 | 647,718 |
| Yield10 Bioscience, Inc. (a)(b) | | 5,106 | 15,880 |
| Yumanity Therapeutics, Inc. (a) | | 5,441 | 9,304 |
| Yumanity Therapeutics, Inc. rights (a)(c) | | 24,450 | 0 |
| Zentalis Pharmaceuticals, Inc. (a) | | 55,721 | 1,493,880 |
| | | | 1,175,396,198 |
| Health Care Equipment & Supplies - 2.6% | | | |
| Abbott Laboratories | | 2,027,018 | 208,073,398 |
| Abiomed, Inc. (a) | | 52,524 | 13,618,423 |
| Accelerate Diagnostics, Inc. (a)(b) | | 46,990 | 76,594 |
| Accuray, Inc. (a)(b) | | 104,268 | 248,158 |
| Acutus Medical, Inc. (a) | | 19,182 | 22,827 |
| Aethlon Medical, Inc. (a) | | 15,750 | 15,278 |
| Align Technology, Inc. (a) | | 85,200 | 20,763,240 |
| Allied Healthcare Products, Inc. (a)(b) | | 2,823 | 5,166 |
| Alphatec Holdings, Inc. (a) | | 79,159 | 600,817 |
| Angiodynamics, Inc. (a) | | 44,652 | 988,595 |
| Apollo Endosurgery, Inc. (a) | | 35,443 | 195,645 |
| Apyx Medical Corp. (a) | | 34,383 | 197,015 |
| Artivion, Inc. (a) | | 46,221 | 1,024,257 |
| Asensus Surgical, Inc. (a)(b) | | 263,568 | 142,327 |
| Aspira Women's Health, Inc. (a)(b) | | 69,647 | 35,520 |
| Atricure, Inc. (a) | | 53,360 | 2,434,283 |
| Atrion Corp. | | 1,610 | 972,360 |
| Avanos Medical, Inc. (a) | | 54,850 | 1,350,956 |
| Avinger, Inc. (a)(b) | | 4,588 | 6,515 |
| AxoGen, Inc. (a) | | 48,241 | 452,018 |
| Axonics Modulation Technologies, Inc. (a) | | 54,103 | 3,908,942 |
| Baxter International, Inc. | | 582,158 | 33,450,799 |
| Becton, Dickinson & Co. | | 330,336 | 83,383,413 |
| Beyond Air, Inc. (a)(b) | | 28,070 | 263,297 |
| BioLase Technology, Inc. (a)(b) | | 6,828 | 26,185 |
| BioLife Solutions, Inc. (a) | | 35,080 | 828,239 |
| Biomerica, Inc. (a)(b) | | 11,649 | 41,237 |
| BioSig Technologies, Inc. (a)(b) | | 38,669 | 42,536 |
| Bioventus, Inc. (a)(b) | | 24,780 | 181,142 |
| Bluejay Diagnostics, Inc. (a)(b) | | 8,427 | 8,511 |
| Boston Scientific Corp. (a) | | 1,654,299 | 66,684,793 |
| Butterfly Network, Inc. Class A (a)(b) | | 154,234 | 960,878 |
| Cardiovascular Systems, Inc. (a) | | 46,825 | 618,558 |
| Cerus Corp. (a) | | 202,712 | 833,146 |
| Chembio Diagnostics, Inc. (a)(b) | | 18,346 | 11,112 |
| ClearPoint Neuro, Inc. (a)(b) | | 20,249 | 260,605 |
| Co.-Diagnostics, Inc. (a)(b) | | 36,580 | 123,640 |
| ConforMis, Inc. (a) | | 212,854 | 55,342 |
| CONMED Corp. (b) | | 33,835 | 2,996,766 |
| CryoPort, Inc. (a)(b) | | 57,030 | 1,862,600 |
| Cutera, Inc. (a)(b) | | 18,907 | 902,809 |
| CVRx, Inc. (a) | | 8,706 | 63,119 |
| CytoSorbents Corp. (a) | | 45,604 | 86,648 |
| DarioHealth Corp. (a)(b) | | 23,009 | 109,753 |
| Delcath Systems, Inc. (a)(b) | | 7,838 | 32,606 |
| Dentsply Sirona, Inc. | | 248,711 | 8,150,259 |
| DexCom, Inc. (a) | | 454,416 | 37,357,539 |
| Eargo, Inc. (a)(b) | | 21,506 | 39,141 |
| Edwards Lifesciences Corp. (a) | | 720,106 | 64,881,551 |
| Ekso Bionics Holdings, Inc. (a) | | 11,780 | 27,683 |
| electroCore, Inc. (a)(b) | | 71,219 | 37,725 |
| Electromed, Inc. (a) | | 7,866 | 76,300 |
| Embecta Corp. | | 66,581 | 2,125,266 |
| ENDRA Life Sciences, Inc. (a)(b) | | 53,240 | 15,530 |
| Enovis Corp. (a) | | 58,632 | 2,969,711 |
| Envista Holdings Corp. (a) | | 187,540 | 6,955,859 |
| Envveno Medical Corp. (a) | | 7,560 | 55,868 |
| Femasys, Inc. (a)(b) | | 2,323 | 3,949 |
| Figs, Inc. Class A (a) | | 43,590 | 503,900 |
| Fonar Corp. (a) | | 7,149 | 100,801 |
| Glaukos Corp. (a) | | 54,347 | 2,638,547 |
| Globus Medical, Inc. (a) | | 94,125 | 5,571,259 |
| Haemonetics Corp. (a) | | 60,460 | 4,536,314 |
| Helius Medical Technologies, Inc. (U.S.) (a)(b) | | 3,762 | 2,065 |
| Heska Corp. (a) | | 12,446 | 1,133,457 |
| Hologic, Inc. (a) | | 288,615 | 19,498,829 |
| Hyperfine, Inc. (a)(b) | | 58,309 | 78,134 |
| ICU Medical, Inc. (a) | | 23,017 | 3,659,703 |
| IDEXX Laboratories, Inc. (a) | | 97,104 | 33,755,292 |
| Inari Medical, Inc. (a)(b) | | 39,067 | 2,709,296 |
| Inogen, Inc. (a) | | 23,571 | 674,838 |
| Inspire Medical Systems, Inc. (a) | | 31,672 | 6,064,871 |
| Insulet Corp. (a) | | 80,502 | 20,565,846 |
| Integer Holdings Corp. (a) | | 38,230 | 2,411,166 |
| Integra LifeSciences Holdings Corp. (a) | | 85,173 | 4,063,604 |
| Intuitive Surgical, Inc. (a) | | 415,840 | 85,554,922 |
| Invacare Corp. (a)(b) | | 40,177 | 34,753 |
| InVivo Therapeutics Holdings Corp. (a)(b) | | 2,425 | 15,156 |
| INVO Bioscience, Inc. (a) | | 10,569 | 10,231 |
| IRadimed Corp. | | 7,631 | 256,020 |
| iRhythm Technologies, Inc. (a) | | 34,732 | 5,121,233 |
| Iridex Corp. (a) | | 14,170 | 36,842 |
| Kewaunee Scientific Corp. (a) | | 406 | 8,096 |
| KORU Medical Systems, Inc. (a)(b) | | 42,213 | 104,266 |
| Lantheus Holdings, Inc. (a) | | 79,713 | 6,281,384 |
| LeMaitre Vascular, Inc. (b) | | 22,618 | 1,116,877 |
| LENSAR, Inc. (a) | | 8,148 | 43,918 |
| LivaNova PLC (a) | | 64,941 | 3,652,931 |
| LogicMark, Inc. (a)(b) | | 9,769 | 11,137 |
| Lucid Diagnostics, Inc. (b) | | 6,236 | 13,532 |
| Lucira Health, Inc. (a) | | 12,002 | 21,244 |
| Masimo Corp. (a) | | 59,529 | 8,744,215 |
| Medtronic PLC | | 1,553,526 | 136,586,006 |
| Meridian Bioscience, Inc. (a) | | 49,960 | 1,628,196 |
| Merit Medical Systems, Inc. (a) | | 58,740 | 3,479,170 |
| Mesa Laboratories, Inc. (b) | | 6,122 | 1,046,005 |
| Microbot Medical, Inc. (a)(b) | | 4,719 | 23,784 |
| Milestone Scientific, Inc. (a)(b) | | 39,546 | 37,964 |
| Minerva Surgical, Inc. (b) | | 7,681 | 13,058 |
| Motus GI Holdings, Inc. (a)(b) | | 2,749 | 9,017 |
| Myomo, Inc. (a) | | 8,164 | 15,185 |
| NanoVibronix, Inc. (a)(b) | | 18,999 | 9,836 |
| Nemaura Medical, Inc. (a)(b) | | 7,006 | 13,311 |
| Neogen Corp. (a)(b) | | 124,071 | 2,593,084 |
| NeuroMetrix, Inc. (a)(b) | | 7,672 | 25,855 |
| Neuronetics, Inc. (a) | | 32,377 | 115,586 |
| NeuroOne Medical Technologies Corp. (a)(b) | | 18,788 | 47,909 |
| NeuroPace, Inc. (a)(b) | | 7,118 | 29,255 |
| Nevro Corp. (a) | | 40,635 | 1,841,578 |
| Novocure Ltd. (a) | | 103,817 | 8,526,490 |
| NuVasive, Inc. (a) | | 59,888 | 2,545,839 |
| Nuwellis, Inc. (a)(b) | | 4,077 | 5,952 |
| Omnicell, Inc. (a) | | 50,719 | 5,188,047 |
| OraSure Technologies, Inc. (a) | | 82,355 | 336,832 |
| Orthofix International NV (a) | | 23,277 | 463,212 |
| OrthoPediatrics Corp. (a)(b) | | 16,514 | 810,672 |
| Outset Medical, Inc. (a) | | 47,901 | 876,109 |
| Owlet, Inc. (a) | | 82,343 | 133,396 |
| Paragon 28, Inc. (b) | | 8,716 | 152,966 |
| PAVmed, Inc. (a)(b) | | 86,307 | 102,705 |
| Penumbra, Inc. (a) | | 40,693 | 6,680,570 |
| PetVivo Holdings, Inc. (b) | | 3,291 | 8,162 |
| Predictive Oncology, Inc. (a) | | 73,029 | 29,445 |
| Pro-Dex, Inc. (a) | | 3,251 | 62,419 |
| PROCEPT BioRobotics Corp. | | 8,047 | 325,743 |
| Pulmonx Corp. (a)(b) | | 40,277 | 739,888 |
| Pulse Biosciences, Inc. (a)(b) | | 12,872 | 16,347 |
| QuidelOrtho Corp. (a) | | 58,352 | 4,624,980 |
| Quotient Ltd. (a) | | 91,791 | 17,835 |
| Ra Medical Systems, Inc. (a) | | 24,020 | 3,728 |
| Reshape Lifesciences, Inc. (a) | | 22,368 | 9,332 |
| ResMed, Inc. | | 169,424 | 37,259,726 |
| Retractable Technologies, Inc. (a)(b) | | 19,058 | 44,405 |
| Rockwell Medical Technologies, Inc. (a)(b) | | 8,225 | 14,887 |
| RxSight, Inc. (a) | | 8,803 | 110,126 |
| Sanara Medtech, Inc. (a)(b) | | 3,163 | 108,333 |
| Seaspine Holdings Corp. (a) | | 42,016 | 268,902 |
| Semler Scientific, Inc. (a) | | 5,581 | 255,108 |
| Senseonics Holdings, Inc. (a)(b) | | 488,727 | 869,934 |
| Sensus Healthcare, Inc. (a)(b) | | 15,169 | 188,854 |
| Shockwave Medical, Inc. (a) | | 41,533 | 12,329,486 |
| SI-BONE, Inc. (a) | | 32,747 | 540,326 |
| Sientra, Inc. (a)(b) | | 67,987 | 43,879 |
| Sight Sciences, Inc. (a)(b) | | 11,796 | 82,218 |
| Silk Road Medical, Inc. (a)(b) | | 40,519 | 1,613,872 |
| Sintx Technologies, Inc. (a)(b) | | 16,443 | 7,564 |
| Sintx Technologies, Inc. rights 12/31/99 (a)(c) | | 16,443 | 0 |
| SmileDirectClub, Inc. (a)(b) | | 119,854 | 136,634 |
| Sonendo, Inc. (b) | | 11,247 | 13,384 |
| Staar Surgical Co. (a) | | 54,966 | 5,199,234 |
| Stereotaxis, Inc. (a) | | 49,910 | 102,815 |
| STERIS PLC | | 116,526 | 23,466,006 |
| STRATA Skin Sciences, Inc. (a) | | 2,761 | 2,734 |
| Stryker Corp. | | 389,571 | 79,939,969 |
| Surgalign Holdings, Inc. (a)(b) | | 6,071 | 25,073 |
| SurModics, Inc. (a) | | 16,495 | 555,717 |
| Tactile Systems Technology, Inc. (a) | | 21,799 | 179,842 |
| Talis Biomedical Corp. (a)(b) | | 14,676 | 13,208 |
| Tandem Diabetes Care, Inc. (a) | | 73,491 | 3,361,478 |
| Tela Bio, Inc. (a)(b) | | 10,430 | 88,134 |
| Teleflex, Inc. | | 54,623 | 12,359,000 |
| Tenon Medical, Inc. (b) | | 3,148 | 6,327 |
| The Cooper Companies, Inc. | | 56,799 | 16,326,305 |
| Thermogenesis Holdings, Inc. (a) | | 4,357 | 1,070 |
| Tivic Health Systems, Inc. (b) | | 2,667 | 4,961 |
| TransMedics Group, Inc. (a) | | 32,283 | 1,679,684 |
| Treace Medical Concepts, Inc. (a) | | 14,079 | 282,002 |
| UFP Technologies, Inc. (a) | | 7,967 | 740,851 |
| Utah Medical Products, Inc. | | 3,997 | 367,324 |
| Vapotherm, Inc. (a) | | 26,159 | 51,010 |
| Varex Imaging Corp. (a)(b) | | 46,009 | 970,330 |
| Venus Concept, Inc. (a)(b) | | 28,654 | 8,845 |
| Vicarious Surgical, Inc. (a)(b) | | 41,554 | 154,996 |
| ViewRay, Inc. (a) | | 177,731 | 607,840 |
| Vivani Medical, Inc. (a)(b) | | 10,669 | 43,743 |
| Viveve Medical, Inc. (a)(b) | | 5,483 | 4,721 |
| VolitionRx Ltd. (a)(b) | | 44,319 | 74,899 |
| Zimmer Biomet Holdings, Inc. | | 242,660 | 25,799,611 |
| Zimvie, Inc. (a) | | 23,938 | 364,336 |
| Zomedica Corp. (a)(b) | | 1,117,891 | 272,989 |
| Zynex, Inc. (b) | | 25,268 | 225,896 |
| | | | 1,196,995,184 |
| Health Care Providers & Services - 3.2% | | | |
| 1Life Healthcare, Inc. (a) | | 198,520 | 3,416,529 |
| 23andMe Holding Co. Class A (a)(b) | | 242,539 | 817,356 |
| Acadia Healthcare Co., Inc. (a) | | 106,212 | 8,701,949 |
| Accolade, Inc. (a) | | 68,469 | 697,014 |
| AdaptHealth Corp. (a) | | 113,053 | 2,031,562 |
| Addus HomeCare Corp. (a) | | 18,589 | 1,658,511 |
| Agiliti, Inc. (a)(b) | | 32,517 | 522,223 |
| agilon health, Inc. (a)(b) | | 56,212 | 1,168,085 |
| AirSculpt Technologies, Inc. | | 8,162 | 71,173 |
| Alerislife, Inc. (a) | | 18,341 | 20,359 |
| Alignment Healthcare, Inc. (a) | | 33,055 | 502,767 |
| Amedisys, Inc. (a) | | 37,429 | 4,433,465 |
| AmerisourceBergen Corp. | | 174,507 | 25,575,746 |
| AMN Healthcare Services, Inc. (a) | | 52,402 | 5,378,541 |
| Apollo Medical Holdings, Inc. (a)(b) | | 43,941 | 1,895,175 |
| ATI Physical Therapy, Inc. (a)(b) | | 65,041 | 58,537 |
| Aveanna Healthcare Holdings, Inc. (a)(b) | | 44,180 | 80,408 |
| Biodesix, Inc. (a)(b) | | 18,660 | 35,267 |
| Brookdale Senior Living, Inc. (a) | | 214,637 | 944,403 |
| Caladrius Biosciences, Inc. (a)(b) | | 51,793 | 25,430 |
| Cano Health, Inc. (a) | | 220,337 | 1,359,479 |
| Cardinal Health, Inc. | | 315,056 | 22,280,760 |
| CareMax, Inc. Class A (a)(b) | | 75,972 | 519,648 |
| Castle Biosciences, Inc. (a) | | 28,006 | 812,174 |
| Centene Corp. (a) | | 677,909 | 60,835,554 |
| Chemed Corp. | | 17,591 | 8,376,658 |
| Cigna Corp. | | 367,382 | 104,134,428 |
| Clover Health Investments Corp. (a)(b) | | 356,024 | 929,223 |
| Community Health Systems, Inc. (a) | | 144,374 | 384,035 |
| Corvel Corp. (a) | | 10,833 | 1,683,232 |
| Covetrus, Inc. (a) | | 120,019 | 2,504,797 |
| Cross Country Healthcare, Inc. (a) | | 40,789 | 1,035,225 |
| CVS Health Corp. | | 1,519,077 | 149,097,408 |
| CynergisTek, Inc. (a) | | 10,026 | 12,533 |
| DaVita HealthCare Partners, Inc. (a) | | 69,401 | 5,919,211 |
| DocGo, Inc. Class A (a)(b) | | 88,668 | 904,414 |
| Elevance Health, Inc. | | 279,099 | 135,393,716 |
| Encompass Health Corp. | | 114,444 | 5,558,545 |
| Enhabit Home Health & Hospice (a) | | 57,357 | 952,126 |
| Enzo Biochem, Inc. (a)(b) | | 52,369 | 126,733 |
| Fulgent Genetics, Inc. (a) | | 22,758 | 989,290 |
| Great Elm Group, Inc. (a) | | 30,049 | 63,103 |
| Guardant Health, Inc. (a) | | 119,471 | 5,980,718 |
| Hanger, Inc. (a) | | 42,890 | 799,041 |
| HCA Holdings, Inc. | | 263,583 | 52,155,168 |
| HealthEquity, Inc. (a) | | 100,028 | 6,609,850 |
| Henry Schein, Inc. (a) | | 159,849 | 11,734,515 |
| Hims & Hers Health, Inc. (a)(b) | | 145,036 | 922,429 |
| Humana, Inc. | | 146,434 | 70,548,973 |
| IMAC Holdings, Inc. (a)(b) | | 24,559 | 11,641 |
| InfuSystems Holdings, Inc. (a) | | 20,760 | 160,060 |
| Innovage Holding Corp. (a) | | 20,016 | 73,459 |
| Invitae Corp. (a)(b) | | 241,170 | 733,157 |
| Laboratory Corp. of America Holdings | | 107,393 | 24,192,421 |
| LHC Group, Inc. (a) | | 35,744 | 5,771,584 |
| LifeStance Health Group, Inc. (a) | | 47,902 | 301,304 |
| McKesson Corp. | | 168,361 | 61,788,487 |
| Modivcare, Inc. (a) | | 14,243 | 1,542,802 |
| Molina Healthcare, Inc. (a) | | 68,144 | 22,989,741 |
| National Healthcare Corp. | | 15,910 | 1,104,950 |
| National Research Corp. Class A | | 15,840 | 540,302 |
| Novo Integrated Sciences, Inc. (a) | | 4,809 | 7,935 |
| Oak Street Health, Inc. (a)(b) | | 160,663 | 4,209,371 |
| Ontrak, Inc. (a)(b) | | 7,794 | 5,069 |
| Opko Health, Inc. (a)(b) | | 472,152 | 1,029,291 |
| Option Care Health, Inc. (a) | | 172,272 | 5,333,541 |
| Owens & Minor, Inc. | | 87,447 | 2,580,561 |
| P3 Health Partners, Inc. Class A (a)(b) | | 13,901 | 68,393 |
| Patterson Companies, Inc. | | 100,134 | 2,792,737 |
| Pediatrix Medical Group, Inc. (a) | | 99,170 | 1,767,209 |
| Pennant Group, Inc. (a) | | 31,056 | 486,648 |
| PetIQ, Inc. Class A (a) | | 30,834 | 287,990 |
| Precipio, Inc. (a)(b) | | 20,654 | 24,372 |
| Premier, Inc. | | 135,492 | 4,774,738 |
| Privia Health Group, Inc. (a)(b) | | 31,444 | 1,251,157 |
| Progyny, Inc. (a) | | 81,656 | 3,283,388 |
| Psychemedics Corp. | | 2,812 | 18,615 |
| Quest Diagnostics, Inc. | | 135,443 | 16,972,362 |
| R1 Rcm, Inc. (a) | | 154,463 | 3,375,017 |
| RadNet, Inc. (a) | | 54,042 | 1,085,704 |
| Regional Health Properties, Inc. (a) | | 1,040 | 3,817 |
| Select Medical Holdings Corp. | | 118,776 | 3,045,417 |
| Sema4 Holdings Corp. Class A (a)(b) | | 307,214 | 313,358 |
| Signify Health, Inc. (a) | | 28,200 | 786,780 |
| Sonida Senior Living, Inc. (a) | | 3,889 | 78,752 |
| Star Equity Holdings, Inc. (a)(b) | | 11,072 | 11,847 |
| SunLink Health Systems, Inc. (a) | | 3,788 | 5,417 |
| Surgery Partners, Inc. (a) | | 41,435 | 1,140,706 |
| Talkspace, Inc. Class A (a)(b) | | 108,262 | 143,988 |
| Tenet Healthcare Corp. (a) | | 125,228 | 7,075,382 |
| The Ensign Group, Inc. | | 60,660 | 5,174,298 |
| The Joint Corp. (a) | | 16,239 | 296,199 |
| The Oncology Institute, Inc. (a)(b) | | 12,388 | 78,664 |
| U.S. Physical Therapy, Inc. | | 15,029 | 1,241,546 |
| UnitedHealth Group, Inc. | | 1,086,241 | 564,117,539 |
| Universal Health Services, Inc. Class B | | 78,787 | 7,708,520 |
| Vivos Therapeutics, Inc. (a)(b) | | 21,264 | 26,155 |
| | | | 1,470,469,877 |
| Health Care Technology - 0.1% | | | |
| Allscripts Healthcare Solutions, Inc. (a) | | 133,355 | 2,267,035 |
| American Well Corp. (a) | | 235,559 | 1,071,793 |
| Better Therapeutics, Inc. (a) | | 13,172 | 22,524 |
| Biotricity, Inc. (a)(b) | | 48,003 | 53,763 |
| CareCloud, Inc. (a)(b) | | 10,494 | 33,896 |
| Certara, Inc. (a) | | 119,938 | 1,879,428 |
| Change Healthcare, Inc. (a) | | 293,576 | 7,213,162 |
| Computer Programs & Systems, Inc. (a) | | 17,429 | 531,759 |
| Convey Health Solutions Holdin (a) | | 15,285 | 160,340 |
| Definitive Healthcare Corp. (b) | | 30,434 | 611,115 |
| Doximity, Inc. (a)(b) | | 106,436 | 3,532,611 |
| Evolent Health, Inc. (a) | | 95,753 | 3,518,923 |
| Forian, Inc. (a) | | 18,212 | 75,398 |
| GoodRx Holdings, Inc. (a)(b) | | 79,648 | 485,853 |
| Health Catalyst, Inc. (a) | | 61,413 | 736,956 |
| HealthStream, Inc. (a) | | 28,899 | 639,535 |
| HTG Molecular Diagnostics (a) | | 3,764 | 3,248 |
| iCAD, Inc. (a) | | 24,553 | 73,905 |
| iSpecimen, Inc. (a)(b) | | 3,041 | 6,660 |
| MultiPlan Corp. Class A (a)(b) | | 280,715 | 988,117 |
| NantHealth, Inc. (a) | | 41,724 | 20,086 |
| Nextgen Healthcare, Inc. (a) | | 65,002 | 1,114,134 |
| OptimizeRx Corp. (a) | | 21,345 | 338,745 |
| Pear Therapeutics, Inc. Class A (a)(b) | | 44,091 | 77,600 |
| Phreesia, Inc. (a) | | 60,180 | 1,544,219 |
| Schrodinger, Inc. (a) | | 54,528 | 1,496,248 |
| SCWorx, Corp. (a) | | 5,597 | 3,722 |
| Sharecare, Inc. Class A (a)(b) | | 342,248 | 626,314 |
| Simulations Plus, Inc. (b) | | 18,003 | 1,081,080 |
| Streamline Health Solutions, Inc. (a)(b) | | 27,068 | 44,392 |
| Tabula Rasa HealthCare, Inc. (a)(b) | | 27,476 | 133,259 |
| Teladoc Health, Inc. (a)(b) | | 185,513 | 5,762,034 |
| UpHealth, Inc. (a)(b) | | 77,814 | 47,529 |
| Veeva Systems, Inc. Class A (a) | | 162,662 | 32,421,790 |
| | | | 68,617,173 |
| Life Sciences Tools & Services - 1.7% | | | |
| 10X Genomics, Inc. (a) | | 107,935 | 3,560,776 |
| Absci Corp. (a) | | 14,340 | 48,326 |
| Adaptive Biotechnologies Corp. (a) | | 127,256 | 1,135,124 |
| Agilent Technologies, Inc. | | 348,206 | 44,657,420 |
| Akoya Biosciences, Inc. (a) | | 7,641 | 87,107 |
| Alpha Teknova, Inc. (a) | | 6,742 | 30,406 |
| Applied DNA Sciences, Inc. (a)(b) | | 13,479 | 42,054 |
| Avantor, Inc. (a) | | 706,691 | 17,603,673 |
| Azenta, Inc. | | 88,894 | 4,685,603 |
| Berkeley Lights, Inc. (a) | | 47,572 | 174,589 |
| Bio-Rad Laboratories, Inc. Class A (a) | | 25,017 | 12,134,246 |
| Bio-Techne Corp. | | 45,269 | 15,020,707 |
| BioNano Genomics, Inc. (a)(b) | | 344,503 | 854,367 |
| Bruker Corp. | | 117,674 | 6,589,744 |
| Champions Oncology, Inc. (a) | | 3,881 | 30,970 |
| Charles River Laboratories International, Inc. (a) | | 59,071 | 12,124,323 |
| ChromaDex, Inc. (a)(b) | | 61,369 | 88,371 |
| Codex DNA, Inc. (a)(b) | | 7,877 | 15,124 |
| Codexis, Inc. (a) | | 67,940 | 476,259 |
| Cytek Biosciences, Inc. (a) | | 16,980 | 197,817 |
| Danaher Corp. | | 749,066 | 202,180,404 |
| Harvard Bioscience, Inc. (a) | | 41,614 | 137,326 |
| Illumina, Inc. (a) | | 182,106 | 36,719,854 |
| Inotiv, Inc. (a)(b) | | 17,608 | 344,589 |
| IQVIA Holdings, Inc. (a) | | 218,986 | 46,569,563 |
| IsoPlexis Corp. | | 10,417 | 20,209 |
| Maravai LifeSciences Holdings, Inc. (a) | | 125,620 | 2,621,689 |
| Medpace Holdings, Inc. (a) | | 30,920 | 4,564,101 |
| Mettler-Toledo International, Inc. (a) | | 26,220 | 31,790,701 |
| Miromatrix Medical, Inc. (a) | | 11,051 | 37,131 |
| Nanostring Technologies, Inc. (a) | | 52,728 | 714,992 |
| Nautilus Biotechnology, Inc. (a)(b) | | 59,292 | 131,035 |
| NeoGenomics, Inc. (a) | | 144,118 | 1,448,386 |
| Pacific Biosciences of California, Inc. (a)(b) | | 257,047 | 1,506,295 |
| PerkinElmer, Inc. | | 145,763 | 19,686,751 |
| Personalis, Inc. (a) | | 40,310 | 133,426 |
| Quanterix Corp. (a) | | 38,945 | 364,136 |
| Quantum-Si, Inc. (a) | | 94,393 | 294,506 |
| Rapid Micro Biosystems, Inc. (a)(b) | | 9,702 | 32,308 |
| Science 37 Holdings, Inc. (a) | | 59,540 | 94,073 |
| Seer, Inc. (a)(b) | | 41,360 | 417,736 |
| Singular Genomics Systems, Inc. (a)(b) | | 12,304 | 32,852 |
| SomaLogic, Inc. Class A (a)(b) | | 163,362 | 601,172 |
| Sotera Health Co. (a) | | 113,836 | 1,924,967 |
| Standard BioTools, Inc. (a)(b) | | 79,944 | 112,721 |
| Syneos Health, Inc. (a) | | 119,522 | 7,184,467 |
| Thermo Fisher Scientific, Inc. | | 453,164 | 247,119,392 |
| Waters Corp. (a) | | 69,624 | 20,789,726 |
| West Pharmaceutical Services, Inc. | | 85,829 | 25,464,606 |
| | | | 772,596,120 |
| Pharmaceuticals - 3.7% | | | |
| 9 Meters Biopharma, Inc. (a) | | 295,999 | 78,469 |
| AcelRx Pharmaceuticals, Inc. (a)(b) | | 157,426 | 46,441 |
| Acer Therapeutics, Inc. (a)(b) | | 8,778 | 11,675 |
| Aclaris Therapeutics, Inc. (a) | | 59,021 | 939,024 |
| Adamis Pharmaceuticals Corp. (a)(b) | | 167,252 | 55,695 |
| Adial Pharmaceuticals, Inc. (a)(b) | | 23,937 | 12,849 |
| Aerie Pharmaceuticals, Inc. (a)(b) | | 56,000 | 845,600 |
| Agile Therapeutics, Inc. (a)(b) | | 2,095 | 843 |
| Alimera Sciences, Inc. (a)(b) | | 3,266 | 22,209 |
| Amneal Pharmaceuticals, Inc. (a) | | 116,774 | 253,400 |
| Amphastar Pharmaceuticals, Inc. (a) | | 43,457 | 1,286,327 |
| Ampio Pharmaceuticals, Inc. (a)(b) | | 228,075 | 23,036 |
| Amylyx Pharmaceuticals, Inc. (b) | | 12,123 | 305,985 |
| AN2 Therapeutics, Inc. (b) | | 5,615 | 96,241 |
| Angion Biomedica Corp. (a) | | 4,530 | 4,621 |
| ANI Pharmaceuticals, Inc. (a) | | 15,135 | 558,330 |
| Aquestive Therapeutics, Inc. (a)(b) | | 31,058 | 44,879 |
| Artelo Biosciences, Inc. (a)(b) | | 1,814 | 6,984 |
| Arvinas Holding Co. LLC (a) | | 50,435 | 2,135,418 |
| Assertio Holdings, Inc. (a)(b) | | 51,001 | 130,053 |
| Atea Pharmaceuticals, Inc. (a) | | 61,561 | 461,708 |
| Athira Pharma, Inc. (a)(b) | | 38,518 | 130,191 |
| Avenue Therapeutics, Inc. (a) | | 4,408 | 1,061 |
| Axsome Therapeutics, Inc. (a)(b) | | 35,322 | 2,253,544 |
| Aytu BioScience, Inc. (a)(b) | | 31,869 | 7,091 |
| Baudax Bio, Inc. (a)(b) | | 7,583 | 2,472 |
| Biofrontera, Inc. (b) | | 10,434 | 12,103 |
| Bristol-Myers Squibb Co. | | 2,464,822 | 166,153,651 |
| Cara Therapeutics, Inc. (a)(b) | | 48,511 | 500,634 |
| Cassava Sciences, Inc. (a)(b) | | 43,565 | 1,120,927 |
| Catalent, Inc. (a) | | 208,954 | 18,387,952 |
| CinCor Pharma, Inc. | | 20,584 | 695,122 |
| Citius Pharmaceuticals, Inc. (a)(b) | | 149,014 | 183,287 |
| Clarus Therapeutics Holdings, Inc. (a)(b) | | 34,341 | 2,576 |
| Clearside Biomedical, Inc. (a) | | 57,526 | 78,811 |
| Clever Leaves Holdings, Inc. (a)(b) | | 30,908 | 25,314 |
| CNS Pharmaceuticals, Inc. (a) | | 22,678 | 5,543 |
| Cocrystal Pharma, Inc. (a)(b) | | 76,792 | 30,786 |
| Cognition Therapeutics, Inc. (b) | | 4,791 | 9,726 |
| Collegium Pharmaceutical, Inc. (a) | | 39,234 | 689,734 |
| Context Therapeutics, Inc. (b) | | 10,930 | 20,767 |
| Corcept Therapeutics, Inc. (a) | | 109,978 | 2,839,632 |
| CorMedix, Inc. (a)(b) | | 44,027 | 155,415 |
| Cumberland Pharmaceuticals, Inc. (a) | | 22,081 | 51,890 |
| CymaBay Therapeutics, Inc. (a) | | 92,813 | 328,558 |
| Dare Bioscience, Inc. (a)(b) | | 97,011 | 104,772 |
| DICE Therapeutics, Inc. | | 14,243 | 223,615 |
| Durect Corp. (a) | | 259,885 | 189,066 |
| Edgewise Therapeutics, Inc. (a) | | 12,981 | 130,848 |
| Elanco Animal Health, Inc. (a) | | 555,410 | 8,403,353 |
| Elanco Animal Health, Inc. rights (a)(c) | | 26,032 | 0 |
| Eli Lilly & Co. | | 913,338 | 275,124,806 |
| Eloxx Pharmaceuticals, Inc. (a) | | 64,312 | 23,152 |
| Enveric Biosciences, Inc. (a)(b) | | 880 | 4,910 |
| Esperion Therapeutics, Inc. (a)(b) | | 72,392 | 540,044 |
| Eton Pharmaceuticals, Inc. (a)(b) | | 27,239 | 61,560 |
| Evoke Pharma, Inc. (a) | | 2,958 | 7,987 |
| Evolus, Inc. (a)(b) | | 39,896 | 383,401 |
| Eyenovia, Inc. (a) | | 26,714 | 43,544 |
| Eyepoint Pharmaceuticals, Inc. (a)(b) | | 29,071 | 290,710 |
| Fulcrum Therapeutics, Inc. (a) | | 33,271 | 246,205 |
| Graybug Vision, Inc. (a)(b) | | 13,171 | 13,168 |
| Harmony Biosciences Holdings, Inc. (a) | | 26,542 | 1,165,459 |
| Harrow Health, Inc. (a)(b) | | 27,976 | 251,504 |
| Hepion Pharmaceuticals, Inc. (a)(b) | | 68,049 | 46,457 |
| Hoth Therapeutics, Inc. (a) | | 17,537 | 7,541 |
| Ikena Oncology, Inc. (a) | | 10,422 | 49,505 |
| IMARA, Inc. (a) | | 4,202 | 4,958 |
| Innoviva, Inc. (a) | | 72,180 | 949,889 |
| Intra-Cellular Therapies, Inc. (a) | | 101,955 | 5,124,258 |
| Jaguar Health, Inc. (a)(b) | | 66,892 | 15,720 |
| Jazz Pharmaceuticals PLC (a) | | 72,636 | 11,274,560 |
| Johnson & Johnson | | 3,046,752 | 491,562,968 |
| Kala Pharmaceuticals, Inc. (a)(b) | | 51,567 | 15,676 |
| KemPharm, Inc. (a)(b) | | 34,340 | 187,496 |
| Kiora Pharmaceuticals, Inc. (a)(b) | | 12,052 | 2,343 |
| Landos Biopharma, Inc. (a) | | 5,994 | 5,395 |
| Lannett Co., Inc. (a)(b) | | 37,950 | 19,123 |
| Lexaria Bioscience Corp. (a)(b) | | 5,481 | 16,224 |
| Lipocine, Inc. (a) | | 101,741 | 59,010 |
| Liquidia Technologies, Inc. (a) | | 59,491 | 343,263 |
| Longboard Pharmaceuticals, Inc. (a) | | 5,791 | 19,400 |
| Lyra Therapeutics, Inc. (a)(b) | | 18,305 | 105,986 |
| Marinus Pharmaceuticals, Inc. (a) | | 37,544 | 261,306 |
| Merck & Co., Inc. | | 2,928,198 | 249,950,981 |
| MyMD Pharmaceuticals, Inc. (a)(b) | | 33,015 | 123,476 |
| Nektar Therapeutics (a)(b) | | 214,034 | 843,294 |
| NGM Biopharmaceuticals, Inc. (a) | | 43,566 | 614,716 |
| NovaBay Pharmaceuticals, Inc. (a)(b) | | 41,986 | 9,867 |
| Novan, Inc. (a) | | 21,781 | 55,324 |
| NRX Pharmaceuticals, Inc. (a)(b) | | 37,162 | 24,155 |
| Nutriband, Inc. (b) | | 7,433 | 28,617 |
| Nuvation Bio, Inc. (a)(b) | | 133,263 | 373,136 |
| Ocular Therapeutix, Inc. (a) | | 88,320 | 448,666 |
| Ocuphire Pharma, Inc. (a)(b) | | 20,408 | 46,326 |
| Ocuphire Pharma, Inc. rights (a)(c) | | 259 | 215 |
| Omeros Corp. (a)(b) | | 70,557 | 284,345 |
| Onconova Therapeutics, Inc. (a) | | 21,108 | 25,224 |
| Opiant Pharmaceuticals, Inc. (a) | | 5,641 | 67,636 |
| OptiNose, Inc. (a)(b) | | 75,100 | 274,115 |
| Organon & Co. | | 292,642 | 8,349,076 |
| Otonomy, Inc. (a)(b) | | 60,819 | 22,260 |
| Pacira Biosciences, Inc. (a) | | 52,389 | 2,749,375 |
| Palisade Bio, Inc. rights (a)(c) | | 122 | 0 |
| Paratek Pharmaceuticals, Inc. (a)(b) | | 52,304 | 131,283 |
| Perrigo Co. PLC | | 158,655 | 5,936,870 |
| Petros Pharmaceuticals, Inc. (a) | | 11,591 | 7,598 |
| Pfizer, Inc. | | 6,498,558 | 293,929,778 |
| Phathom Pharmaceuticals, Inc. (a)(b) | | 17,673 | 150,927 |
| Phibro Animal Health Corp. Class A | | 25,144 | 372,383 |
| Pliant Therapeutics, Inc. (a)(b) | | 38,357 | 739,523 |
| PLx Pharma PLC (a)(b) | | 27,237 | 22,637 |
| Prestige Brands Holdings, Inc. (a) | | 57,903 | 2,928,734 |
| Processa Pharmaceuticals, Inc. (a) | | 8,545 | 23,499 |
| ProPhase Labs, Inc. (b) | | 14,587 | 176,649 |
| Provention Bio, Inc. (a) | | 59,898 | 258,759 |
| Pulmatrix, Inc. (a)(b) | | 4,155 | 18,365 |
| Rain Therapeutics, Inc. (a) | | 8,355 | 49,545 |
| Rani Therapeutics Holdings, Inc. (a)(b) | | 9,957 | 88,617 |
| Reata Pharmaceuticals, Inc. (a) | | 31,588 | 755,269 |
| Relmada Therapeutics, Inc. (a) | | 32,791 | 955,530 |
| Revance Therapeutics, Inc. (a) | | 77,313 | 1,538,529 |
| Reviva Pharmaceuticals Holdings, Inc. (a)(b) | | 6,698 | 14,669 |
| Roivant Sciences Ltd. (a)(b) | | 113,825 | 405,217 |
| Royalty Pharma PLC | | 417,951 | 17,474,531 |
| RVL Pharmaceuticals PLC (a) | | 35,186 | 79,169 |
| Satsuma Pharmaceuticals, Inc. (a) | | 20,285 | 130,635 |
| scPharmaceuticals, Inc. (a) | | 11,211 | 65,584 |
| SCYNEXIS, Inc. (a)(b) | | 34,927 | 88,365 |
| Seelos Therapeutics, Inc. (a)(b) | | 116,576 | 131,731 |
| SenesTech, Inc. (a) | | 6,556 | 3,475 |
| SIGA Technologies, Inc. (b) | | 42,404 | 639,452 |
| Sonoma Pharmaceuticals, Inc. (a) | | 1,722 | 4,787 |
| Supernus Pharmaceuticals, Inc. (a) | | 61,661 | 2,110,656 |
| Tarsus Pharmaceuticals, Inc. (a)(b) | | 13,898 | 213,751 |
| Terns Pharmaceuticals, Inc. (a) | | 9,414 | 36,715 |
| TFF Pharmaceuticals, Inc. (a)(b) | | 24,329 | 112,157 |
| TherapeuticsMD, Inc. (a)(b) | | 620 | 6,144 |
| Theravance Biopharma, Inc. (a) | | 61,990 | 558,530 |
| Theseus Pharmaceuticals, Inc. (b) | | 12,198 | 83,190 |
| Timber Pharmaceuticals, Inc. (a)(b) | | 56,919 | 6,648 |
| Titan Pharmaceuticals, Inc. (a)(b) | | 10,454 | 13,799 |
| Trevi Therapeutics, Inc. (a) | | 27,452 | 87,297 |
| Tricida, Inc. (a)(b) | | 38,011 | 475,898 |
| Vallon Pharamceuticals, Inc. (a)(b) | | 3,451 | 1,415 |
| Ventyx Biosciences, Inc. (b) | | 10,933 | 223,033 |
| Verrica Pharmaceuticals, Inc. (a) | | 10,933 | 42,857 |
| Viatris, Inc. | | 1,402,102 | 13,390,074 |
| Virpax Pharmaceuticals, Inc. (a)(b) | | 10,445 | 13,265 |
| Vyne Therapeutics, Inc. (a)(b) | | 47,713 | 14,948 |
| WAVE Life Sciences (a) | | 57,040 | 169,409 |
| Xeris Biopharma Holdings, Inc. (a)(b) | | 144,523 | 241,353 |
| Xeris Biopharma Holdings, Inc. rights (a)(c) | | 47,594 | 8,620 |
| Zoetis, Inc. Class A | | 545,763 | 85,428,282 |
| Zynerba Pharmaceuticals, Inc. (a)(b) | | 44,979 | 52,625 |
| | | | 1,692,989,336 |
TOTAL HEALTH CARE | | | 6,377,063,888 |
| INDUSTRIALS - 8.8% | | | |
| Aerospace & Defense - 1.6% | | | |
| AAR Corp. (a) | | 37,994 | 1,629,183 |
| Aerojet Rocketdyne Holdings, Inc. (a) | | 86,037 | 3,705,614 |
| AeroVironment, Inc. (a) | | 26,750 | 2,371,388 |
| AerSale Corp. (a)(b) | | 18,367 | 354,116 |
| Air Industries Group, Inc. (a)(b) | | 20,123 | 14,022 |
| Archer Aviation, Inc. Class A (a) | | 143,926 | 509,498 |
| Astra Space, Inc. Class A (a)(b) | | 145,698 | 124,266 |
| Astronics Corp. (a) | | 31,954 | 294,296 |
| Astrotech Corp. (a) | | 34,846 | 16,029 |
| Axon Enterprise, Inc. (a) | | 82,844 | 9,666,238 |
| BWX Technologies, Inc. | | 104,702 | 5,458,115 |
| Byrna Technologies, Inc. (a)(b) | | 17,867 | 159,552 |
| Cadre Holdings, Inc. | | 8,163 | 208,157 |
| Curtiss-Wright Corp. | | 44,065 | 6,485,927 |
| Ducommun, Inc. (a) | | 13,106 | 576,664 |
| General Dynamics Corp. | | 267,491 | 61,236,715 |
| HEICO Corp. (b) | | 51,423 | 7,831,723 |
| HEICO Corp. Class A | | 83,681 | 10,257,617 |
| Hexcel Corp. | | 96,276 | 5,648,513 |
| Howmet Aerospace, Inc. | | 437,470 | 15,499,562 |
| Huntington Ingalls Industries, Inc. | | 46,558 | 10,720,445 |
| Innovative Solutions & Support, Inc. (a) | | 12,886 | 92,135 |
| Kaman Corp. (b) | | 32,063 | 1,017,038 |
| Kratos Defense & Security Solutions, Inc. (a) | | 145,113 | 1,819,717 |
| L3Harris Technologies, Inc. | | 223,332 | 50,962,129 |
| Lockheed Martin Corp. | | 274,181 | 115,186,180 |
| Maxar Technologies, Inc. | | 84,834 | 2,021,594 |
| Mercury Systems, Inc. (a) | | 66,310 | 3,191,500 |
| Momentus, Inc. Class A (a)(b) | | 56,927 | 100,761 |
| Moog, Inc. Class A | | 33,240 | 2,492,335 |
| National Presto Industries, Inc. | | 6,946 | 473,856 |
| Northrop Grumman Corp. | | 169,424 | 80,982,978 |
| Park Aerospace Corp. | | 22,525 | 259,263 |
| Parsons Corp. (a) | | 31,108 | 1,287,249 |
| Raytheon Technologies Corp. | | 1,721,726 | 154,524,909 |
| Redwire Corp. (a)(b) | | 18,775 | 51,819 |
| Rocket Lab U.S.A., Inc. Class A (a)(b) | | 170,343 | 936,887 |
| Sidus Space, Inc. Class A (b) | | 3,133 | 8,553 |
| SIFCO Industries, Inc. (a) | | 5,271 | 17,447 |
| Sigma Additive Solutions, Inc. (a)(b) | | 8,545 | 8,545 |
| Spirit AeroSystems Holdings, Inc. Class A | | 120,523 | 3,627,742 |
| Terran Orbital Corp. Class A (a)(b) | | 63,478 | 266,608 |
| Textron, Inc. | | 249,188 | 15,544,347 |
| The Boeing Co. (a) | | 643,871 | 103,180,328 |
| TransDigm Group, Inc. | | 59,959 | 35,998,784 |
| Triumph Group, Inc. (a) | | 74,136 | 963,027 |
| V2X, Inc. (a) | | 14,928 | 517,404 |
| Virgin Galactic Holdings, Inc. (a)(b) | | 203,921 | 1,205,173 |
| VirTra, Inc. (a) | | 12,401 | 65,973 |
| Woodward, Inc. | | 71,695 | 6,672,654 |
| | | | 726,244,575 |
| Air Freight & Logistics - 0.6% | | | |
| Air T, Inc. (a) | | 2,895 | 48,752 |
| Air Transport Services Group, Inc. (a) | | 67,117 | 2,022,235 |
| Atlas Air Worldwide Holdings, Inc. (a) | | 30,012 | 2,998,799 |
| C.H. Robinson Worldwide, Inc. (b) | | 147,264 | 16,810,186 |
| Expeditors International of Washington, Inc. | | 194,508 | 20,012,928 |
| FedEx Corp. | | 276,421 | 58,272,311 |
| Forward Air Corp. | | 30,949 | 3,003,291 |
| GXO Logistics, Inc. (a) | | 116,897 | 5,187,889 |
| Hub Group, Inc. Class A (a) | | 39,211 | 3,129,430 |
| Radiant Logistics, Inc. (a) | | 51,815 | 362,705 |
| United Parcel Service, Inc. Class B | | 850,071 | 165,347,310 |
| | | | 277,195,836 |
| Airlines - 0.2% | | | |
| Alaska Air Group, Inc. (a) | | 147,141 | 6,409,462 |
| Allegiant Travel Co. (a) | | 17,501 | 1,688,847 |
| American Airlines Group, Inc. (a) | | 744,634 | 9,672,796 |
| Blade Air Mobility, Inc. (a) | | 53,997 | 278,625 |
| Delta Air Lines, Inc. (a) | | 738,494 | 22,945,009 |
| Frontier Group Holdings, Inc. (a)(b) | | 34,885 | 450,017 |
| Hawaiian Holdings, Inc. (a) | | 59,272 | 888,487 |
| JetBlue Airways Corp. (a) | | 369,601 | 2,879,192 |
| Joby Aviation, Inc. (a)(b) | | 307,484 | 1,629,665 |
| Mesa Air Group, Inc. (a) | | 45,342 | 110,181 |
| SkyWest, Inc. (a) | | 58,642 | 1,248,488 |
| Southwest Airlines Co. (a) | | 692,733 | 25,423,301 |
| Spirit Airlines, Inc. (a) | | 124,766 | 2,829,693 |
| Sun Country Airlines Holdings, Inc. (a) | | 36,480 | 726,682 |
| United Airlines Holdings, Inc. (a) | | 381,064 | 13,341,051 |
| Wheels Up Experience, Inc. Class A (a) | | 205,134 | 383,601 |
| | | | 90,905,097 |
| Building Products - 0.6% | | | |
| A.O. Smith Corp. | | 153,411 | 8,660,051 |
| AAON, Inc. (b) | | 48,501 | 2,787,837 |
| Advanced Drain Systems, Inc. (b) | | 65,731 | 8,919,697 |
| AeroClean Technologies, Inc. (b) | | 3,541 | 11,508 |
| Allegion PLC | | 102,614 | 9,758,591 |
| Alpha PRO Tech Ltd. (a)(b) | | 13,086 | 54,045 |
| American Woodmark Corp. (a) | | 18,957 | 982,541 |
| Apogee Enterprises, Inc. | | 25,439 | 1,038,929 |
| Applied UV, Inc. (a)(b) | | 6,121 | 10,283 |
| Armstrong World Industries, Inc. | | 53,837 | 4,521,770 |
| Builders FirstSource, Inc. (a) | | 199,204 | 11,675,346 |
| Carlisle Companies, Inc. | | 59,679 | 17,644,693 |
| Carrier Global Corp. | | 982,943 | 38,452,730 |
| CEA Industrie, Inc. (a)(b) | | 5,985 | 7,661 |
| CSW Industrials, Inc. | | 18,283 | 2,314,628 |
| Fortune Brands Home & Security, Inc. | | 154,488 | 9,490,198 |
| Gibraltar Industries, Inc. (a) | | 37,949 | 1,588,166 |
| Griffon Corp. | | 55,057 | 1,726,037 |
| Hayward Holdings, Inc. (a)(b) | | 67,596 | 710,434 |
| Insteel Industries, Inc. | | 22,538 | 651,348 |
| Janus International Group, Inc. (a) | | 63,860 | 659,674 |
| Jeld-Wen Holding, Inc. (a) | | 100,077 | 1,115,859 |
| Johnson Controls International PLC | | 806,552 | 43,666,725 |
| Lennox International, Inc. | | 38,102 | 9,149,052 |
| Masco Corp. | | 274,047 | 13,940,771 |
| Masonite International Corp. (a) | | 25,962 | 2,124,211 |
| Owens Corning | | 112,099 | 9,161,851 |
| PGT Innovations, Inc. (a) | | 69,327 | 1,450,321 |
| Quanex Building Products Corp. | | 38,454 | 857,524 |
| Resideo Technologies, Inc. (a) | | 167,523 | 3,487,829 |
| Simpson Manufacturing Co. Ltd. | | 49,553 | 4,590,590 |
| Tecnoglass, Inc. | | 24,481 | 533,196 |
| The AZEK Co., Inc. (a) | | 128,824 | 2,351,038 |
| Trane Technologies PLC | | 271,106 | 41,769,301 |
| Trex Co., Inc. (a) | | 132,171 | 6,184,281 |
| UFP Industries, Inc. | | 72,683 | 5,770,303 |
| View, Inc. Class A (a)(b) | | 69,538 | 123,778 |
| Zurn Elkay Water Solutions Cor | | 144,529 | 3,986,110 |
| | | | 271,928,907 |
| Commercial Services & Supplies - 0.6% | | | |
| ABM Industries, Inc. | | 76,853 | 3,565,979 |
| ACCO Brands Corp. | | 110,451 | 654,974 |
| Acme United Corp. (b) | | 3,494 | 100,453 |
| ACV Auctions, Inc. Class A (a) | | 129,686 | 1,103,628 |
| Aqua Metals, Inc. (a)(b) | | 79,353 | 72,624 |
| ARC Document Solutions, Inc. | | 39,917 | 117,755 |
| Aris Water Solution, Inc. Class A (b) | | 23,259 | 395,403 |
| Aurora Innovation, Inc. (a)(b) | | 324,614 | 694,674 |
| Brady Corp. Class A | | 55,408 | 2,578,688 |
| BrightView Holdings, Inc. (a) | | 53,032 | 536,684 |
| Casella Waste Systems, Inc. Class A (a) | | 58,201 | 4,768,408 |
| CECO Environmental Corp. (a) | | 34,232 | 340,951 |
| Charah Solutions, Inc. (a) | | 18,709 | 47,895 |
| Cimpress PLC (a) | | 22,776 | 764,818 |
| Cintas Corp. | | 100,847 | 41,028,593 |
| Clean Harbors, Inc. (a) | | 57,700 | 6,775,134 |
| CompX International, Inc. Class A | | 1,643 | 39,383 |
| Copart, Inc. (a) | | 248,093 | 29,684,327 |
| CoreCivic, Inc. (a) | | 140,067 | 1,334,839 |
| Deluxe Corp. | | 49,501 | 952,399 |
| Driven Brands Holdings, Inc. (a) | | 64,107 | 2,014,883 |
| DSS, Inc. (a)(b) | | 80,044 | 28,135 |
| Ennis, Inc. | | 30,468 | 646,836 |
| Fuel Tech, Inc. (a) | | 23,169 | 32,668 |
| Harsco Corp. (a) | | 90,828 | 514,995 |
| Healthcare Services Group, Inc. (b) | | 85,137 | 1,197,878 |
| Heritage-Crystal Clean, Inc. (a) | | 18,487 | 602,122 |
| HNI Corp. | | 48,948 | 1,566,336 |
| IAA, Inc. (a) | | 157,239 | 5,858,725 |
| Interface, Inc. | | 68,289 | 762,788 |
| JanOne, Inc. (a)(b) | | 1,372 | 4,075 |
| KAR Auction Services, Inc. (a) | | 139,527 | 2,037,094 |
| Kimball International, Inc. Class B | | 41,355 | 316,366 |
| Knightscope, Inc. Class A (b) | | 9,856 | 25,823 |
| Matthews International Corp. Class A | | 36,215 | 905,737 |
| Millerknoll, Inc. | | 87,583 | 2,424,297 |
| Montrose Environmental Group, Inc. (a)(b) | | 30,726 | 1,235,492 |
| MSA Safety, Inc. | | 41,999 | 4,992,001 |
| NL Industries, Inc. | | 9,673 | 85,219 |
| Odyssey Marine Exploration, Inc. (a)(b) | | 13,394 | 41,789 |
| Performant Financial Corp. (a) | | 63,681 | 133,093 |
| Perma-Fix Environmental Services, Inc. (a) | | 7,911 | 40,504 |
| Pitney Bowes, Inc. (b) | | 185,867 | 537,156 |
| Quad/Graphics, Inc. (a)(b) | | 37,574 | 118,734 |
| Quest Resource Holding Corp. (a) | | 14,944 | 93,998 |
| Recycling Asset Holdings, Inc. (a)(c) | | 478 | 17 |
| Republic Services, Inc. | | 241,154 | 34,417,499 |
| Rollins, Inc. | | 265,077 | 8,949,000 |
| Shapeways Holdings, Inc. (a)(b) | | 15,768 | 13,472 |
| SP Plus Corp. (a) | | 26,906 | 891,665 |
| Steelcase, Inc. Class A (b) | | 101,222 | 1,131,662 |
| Stericycle, Inc. (a) | | 105,900 | 5,304,531 |
| Team, Inc. (a) | | 45,373 | 58,531 |
| Tetra Tech, Inc. | | 61,838 | 8,398,219 |
| The Brink's Co. | | 53,975 | 2,983,738 |
| The GEO Group, Inc. (a) | | 142,143 | 1,162,730 |
| TOMI Environmental Solutions, Inc. (a)(b) | | 10,144 | 8,214 |
| UniFirst Corp. | | 17,519 | 3,157,975 |
| Viad Corp. (a) | | 23,453 | 895,436 |
| Virco Manufacturing Co. (a) | | 791 | 3,433 |
| VSE Corp. | | 11,990 | 501,782 |
| Waste Management, Inc. | | 442,344 | 74,769,406 |
| Wilhelmina International, Inc. (a)(b) | | 3,864 | 17,620 |
| | | | 264,439,283 |
| Construction & Engineering - 0.2% | | | |
| AECOM | | 164,347 | 12,021,983 |
| Ameresco, Inc. Class A (a)(b) | | 35,806 | 2,465,243 |
| API Group Corp. (a) | | 236,161 | 3,672,304 |
| Arcosa, Inc. | | 55,672 | 3,254,028 |
| Argan, Inc. | | 17,346 | 599,998 |
| Bowman Consulting Group Ltd. (a) | | 6,956 | 106,079 |
| Comfort Systems U.S.A., Inc. | | 41,318 | 4,145,848 |
| Concrete Pumping Holdings, Inc. (a) | | 33,466 | 224,222 |
| Construction Partners, Inc. Class A (a) | | 47,359 | 1,385,724 |
| Dycom Industries, Inc. (a) | | 33,964 | 3,808,044 |
| EMCOR Group, Inc. | | 59,710 | 7,100,713 |
| Fluor Corp. (a)(b) | | 163,178 | 4,314,426 |
| Granite Construction, Inc. | | 52,169 | 1,564,027 |
| Great Lakes Dredge & Dock Corp. (a) | | 77,455 | 741,244 |
| IES Holdings, Inc. (a) | | 10,141 | 308,185 |
| Infrastructure and Energy Alternatives, Inc. (a) | | 34,434 | 489,307 |
| INNOVATE Corp. (a)(b) | | 51,944 | 79,474 |
| iSun, Inc. (a)(b) | | 10,652 | 31,530 |
| Limbach Holdings, Inc. (a) | | 10,116 | 81,231 |
| MasTec, Inc. (a)(b) | | 65,593 | 5,280,237 |
| Matrix Service Co. (a) | | 30,280 | 171,990 |
| MDU Resources Group, Inc. | | 239,672 | 7,226,111 |
| MYR Group, Inc. (a) | | 19,602 | 1,821,810 |
| Northwest Pipe Co. (a) | | 11,971 | 379,002 |
| NV5 Global, Inc. (a) | | 13,730 | 1,932,635 |
| Orbital Infrastructure Group I (a)(b) | | 94,651 | 75,721 |
| Orion Group Holdings, Inc. (a) | | 29,657 | 94,606 |
| Primoris Services Corp. | | 61,402 | 1,244,619 |
| QualTek Services, Inc. Class A (a)(b) | | 4,178 | 8,231 |
| Quanta Services, Inc. | | 166,553 | 23,533,939 |
| SG Blocks, Inc. (a) | | 12,110 | 27,611 |
| Sterling Construction Co., Inc. (a) | | 34,727 | 878,246 |
| Tutor Perini Corp. (a) | | 47,763 | 323,833 |
| Valmont Industries, Inc. | | 25,219 | 6,981,124 |
| Williams Industrial Services G (a) | | 25,226 | 41,623 |
| Willscot Mobile Mini Holdings (a) | | 256,091 | 10,279,493 |
| | | | 106,694,441 |
| Electrical Equipment - 0.7% | | | |
| Acuity Brands, Inc. | | 39,669 | 6,502,939 |
| Advent Technologies Holdings, Inc. Class A (a)(b) | | 37,320 | 117,185 |
| Allied Motion Technologies, Inc. | | 14,542 | 509,261 |
| American Superconductor Corp. (a) | | 35,772 | 191,022 |
| AMETEK, Inc. | | 267,735 | 32,171,038 |
| Array Technologies, Inc. (a) | | 153,669 | 3,211,682 |
| Atkore, Inc. (a) | | 50,625 | 4,273,256 |
| AZZ, Inc. | | 28,123 | 1,198,321 |
| Babcock & Wilcox Enterprises, Inc. (a) | | 64,573 | 515,293 |
| Beam Global (a)(b) | | 11,928 | 174,984 |
| Bitnile Holdings, Inc. (a)(b) | | 293,837 | 88,122 |
| Blink Charging Co. (a)(b) | | 42,701 | 912,520 |
| Bloom Energy Corp. Class A (a)(b) | | 202,158 | 5,136,835 |
| Broadwind, Inc. (a) | | 17,263 | 52,134 |
| Capstone Turbine Corp. (a) | | 16,211 | 39,069 |
| ChargePoint Holdings, Inc. Class A (a)(b) | | 204,873 | 3,333,284 |
| Eaton Corp. PLC | | 462,338 | 63,173,864 |
| Emerson Electric Co. | | 687,021 | 56,157,097 |
| Encore Wire Corp. | | 22,666 | 2,948,847 |
| Energous Corp. (a)(b) | | 79,323 | 108,673 |
| Energy Focus, Inc. (a)(b) | | 7,456 | 5,591 |
| Energy Vault Holdings, Inc. Class A (a)(b) | | 68,167 | 375,600 |
| EnerSys | | 47,682 | 2,973,926 |
| Enovix Corp. (a)(b) | | 120,402 | 2,663,292 |
| Eos Energy Enterprises, Inc. (a)(b) | | 41,997 | 86,514 |
| Espey Manufacturing & Electronics Corp. (a) | | 594 | 8,839 |
| ESS Tech, Inc. Class A (a)(b) | | 67,906 | 301,503 |
| Fluence Energy, Inc. (b) | | 41,239 | 822,718 |
| Flux Power Holdings, Inc. (a)(b) | | 11,033 | 27,472 |
| FTC Solar, Inc. (a)(b) | | 24,637 | 101,997 |
| FuelCell Energy, Inc. (a)(b) | | 422,582 | 1,770,619 |
| Generac Holdings, Inc. (a) | | 74,187 | 16,351,557 |
| GrafTech International Ltd. | | 227,085 | 1,335,260 |
| Heliogen, Inc. (a)(b) | | 106,821 | 256,370 |
| Hubbell, Inc. Class B | | 62,546 | 12,903,240 |
| Ideal Power, Inc. (a)(b) | | 5,838 | 84,651 |
| KULR Technology Group, Inc. (a)(b) | �� | 64,756 | 93,896 |
| LSI Industries, Inc. | | 30,647 | 237,208 |
| NuScale Power Corp. (a)(b) | | 22,078 | 302,910 |
| Nuvve Holding Corp. (a)(b) | | 14,013 | 40,217 |
| nVent Electric PLC | | 191,114 | 6,299,117 |
| Ocean Power Technologies, Inc. (a)(b) | | 59,627 | 64,993 |
| Orion Energy Systems, Inc. (a) | | 29,892 | 50,219 |
| Pineapple Energy, Inc. (a)(b) | | 3,501 | 8,122 |
| Pineapple Energy, Inc. rights (a)(c) | | 1,326 | 0 |
| Pioneer Power Solutions, Inc. (a)(b) | | 4,181 | 14,508 |
| Plug Power, Inc. (a)(b) | | 604,648 | 16,954,330 |
| Polar Power, Inc. (a)(b) | | 4,369 | 14,549 |
| Powell Industries, Inc. | | 10,238 | 252,469 |
| Preformed Line Products Co. | | 3,348 | 260,474 |
| Regal Rexnord Corp. | | 78,060 | 10,740,275 |
| Rockwell Automation, Inc. | | 134,668 | 31,908,236 |
| Romeo Power, Inc. (a)(b) | | 109,862 | 67,565 |
| Sensata Technologies, Inc. PLC | | 180,139 | 7,255,999 |
| SES AI Corp. Class A (a)(b) | | 112,001 | 530,885 |
| Shoals Technologies Group, Inc. (a) | | 129,123 | 3,404,974 |
| Stem, Inc. (a)(b) | | 154,652 | 2,431,129 |
| Sunrun, Inc. (a) | | 244,186 | 8,065,464 |
| Sunworks, Inc. (a)(b) | | 43,532 | 149,315 |
| Thermon Group Holdings, Inc. (a) | | 38,564 | 676,798 |
| TPI Composites, Inc. (a) | | 43,965 | 817,309 |
| Ultralife Corp. (a) | | 13,215 | 66,075 |
| Vertiv Holdings Co. | | 351,346 | 4,051,019 |
| Vicor Corp. (a) | | 25,001 | 1,778,571 |
| Westwater Resources, Inc. (a)(b) | | 41,173 | 57,642 |
| | | | 317,478,843 |
| Industrial Conglomerates - 0.7% | | | |
| 3M Co. (b) | | 658,411 | 81,873,408 |
| Gaucho Group Holdings, Inc. (a)(b) | | 2,994 | 860 |
| General Electric Co. | | 1,274,428 | 93,593,992 |
| Honeywell International, Inc. | | 788,449 | 149,292,818 |
| | | | 324,761,078 |
| Machinery - 1.8% | | | |
| AGCO Corp. | | 71,088 | 7,727,976 |
| AgEagle Aerial Systems, Inc. (a)(b) | | 85,493 | 49,107 |
| Agrify Corp. (a)(b) | | 25,981 | 18,449 |
| Alamo Group, Inc. | | 11,461 | 1,498,640 |
| Albany International Corp. Class A | | 36,177 | 3,190,450 |
| Allison Transmission Holdings, Inc. | | 111,197 | 4,032,003 |
| Altra Industrial Motion Corp. | | 75,175 | 2,852,891 |
| Astec Industries, Inc. | | 26,277 | 1,003,256 |
| Barnes Group, Inc. | | 53,820 | 1,671,111 |
| Berkshire Grey, Inc. Class A (a)(b) | | 43,979 | 88,838 |
| Blue Bird Corp. (a) | | 22,956 | 272,488 |
| Caterpillar, Inc. | | 617,775 | 114,109,220 |
| Chart Industries, Inc. (a)(b) | | 41,736 | 8,090,941 |
| Chicago Rivet & Machine Co. | | 343 | 9,522 |
| CIRCOR International, Inc. (a) | | 23,227 | 378,600 |
| Columbus McKinnon Corp. (NY Shares) | | 33,315 | 1,020,438 |
| Commercial Vehicle Group, Inc. (a) | | 32,462 | 211,977 |
| Crane Holdings Co. | | 55,462 | 5,233,394 |
| Cummins, Inc. | | 163,218 | 35,152,261 |
| Deere & Co. | | 323,373 | 118,111,988 |
| Desktop Metal, Inc. (a)(b) | | 215,188 | 684,298 |
| Donaldson Co., Inc. | | 143,087 | 7,347,517 |
| Douglas Dynamics, Inc. | | 26,318 | 765,854 |
| Dover Corp. | | 167,677 | 20,952,918 |
| Eastern Co. (b) | | 6,106 | 122,303 |
| Energy Recovery, Inc. (a) | | 43,223 | 991,536 |
| Enerpac Tool Group Corp. Class A | | 69,782 | 1,353,771 |
| EnPro Industries, Inc. | | 23,960 | 2,169,818 |
| ESAB Corp. | | 52,467 | 2,155,869 |
| ESCO Technologies, Inc. | | 29,974 | 2,440,783 |
| Evoqua Water Technologies Corp. (a) | | 142,795 | 5,009,249 |
| Fast Radius, Inc. Class A (a)(b) | | 21,419 | 15,638 |
| Fathom Digital Manufacturing Corp. (a) | | 11,051 | 41,994 |
| Federal Signal Corp. | | 69,893 | 2,786,634 |
| Flowserve Corp. | | 150,177 | 4,575,893 |
| Fortive Corp. | | 414,654 | 26,260,038 |
| Franklin Electric Co., Inc. | | 44,724 | 3,884,279 |
| FreightCar America, Inc. (a)(b) | | 13,824 | 57,508 |
| Gates Industrial Corp. PLC (a) | | 109,939 | 1,178,546 |
| Gencor Industries, Inc. (a)(b) | | 9,373 | 93,449 |
| Gorman-Rupp Co. | | 26,339 | 695,613 |
| Graco, Inc. | | 195,405 | 12,474,655 |
| Graham Corp. (b) | | 10,821 | 103,124 |
| Helios Technologies, Inc. | | 37,408 | 2,043,225 |
| Hillenbrand, Inc. | | 82,609 | 3,442,317 |
| Hillman Solutions Corp. Class A (a)(b) | | 118,009 | 990,096 |
| Hurco Companies, Inc. | | 7,409 | 179,816 |
| Hydrofarm Holdings Group, Inc. (a)(b) | | 39,858 | 135,517 |
| Hyliion Holdings Corp. Class A (a)(b) | | 141,543 | 496,816 |
| Hyster-Yale Materials Handling Class A | | 11,943 | 347,900 |
| Hyzon Motors, Inc. Class A (a)(b) | | 104,297 | 222,153 |
| IDEX Corp. | | 88,192 | 17,745,112 |
| Illinois Tool Works, Inc. | | 328,354 | 63,973,210 |
| Ingersoll Rand, Inc. | | 470,448 | 22,285,122 |
| ITT, Inc. | | 98,890 | 7,172,492 |
| John Bean Technologies Corp. | | 36,549 | 3,774,050 |
| Kadant, Inc. | | 13,469 | 2,416,743 |
| Kennametal, Inc. | | 95,237 | 2,232,355 |
| L.B. Foster Co. Class A (a) | | 11,485 | 150,454 |
| Lightning eMotors, Inc. (a)(b) | | 29,863 | 84,811 |
| Lincoln Electric Holdings, Inc. | | 66,928 | 9,148,388 |
| Lindsay Corp. | | 12,680 | 2,033,365 |
| LiqTech International, Inc. (a)(b) | | 16,458 | 7,735 |
| Luxfer Holdings PLC sponsored | | 37,306 | 613,684 |
| Manitex International, Inc. (a) | | 18,263 | 98,803 |
| Manitowoc Co., Inc. (a) | | 42,009 | 401,186 |
| Markforged Holding Corp. (a)(b) | | 78,105 | 189,795 |
| Mayville Engineering Co., Inc. (a) | | 10,043 | 69,899 |
| Microvast Holdings, Inc. (a)(b) | | 273,568 | 672,977 |
| Middleby Corp. (a) | | 63,181 | 9,086,691 |
| Miller Industries, Inc. | | 13,013 | 305,936 |
| Mueller Industries, Inc. | | 65,920 | 4,164,166 |
| Mueller Water Products, Inc. Class A | | 180,916 | 2,040,732 |
| Nikola Corp. (a)(b) | | 248,259 | 1,330,668 |
| NN, Inc. (a)(b) | | 49,000 | 104,860 |
| Nordson Corp. | | 62,215 | 14,133,382 |
| Omega Flex, Inc. (b) | | 3,649 | 368,622 |
| Oshkosh Corp. | | 75,350 | 6,009,916 |
| Otis Worldwide Corp. | | 489,257 | 35,334,141 |
| PACCAR, Inc. | | 403,184 | 35,282,632 |
| Park-Ohio Holdings Corp. | | 9,398 | 155,913 |
| Parker Hannifin Corp. | | 148,826 | 39,438,890 |
| Pentair PLC | | 192,410 | 8,562,245 |
| Perma-Pipe International Holdings, Inc. (a) | | 4,669 | 43,889 |
| Proterra, Inc. Class A (a)(b) | | 215,348 | 1,300,702 |
| Proto Labs, Inc. (a) | | 31,949 | 1,226,842 |
| RBC Bearings, Inc. (a) | | 33,646 | 8,097,919 |
| REV Group, Inc. (b) | | 37,535 | 432,403 |
| Sarcos Technology and Robotics Corp. Class A (a)(b) | | 75,618 | 248,027 |
| Shyft Group, Inc. (The) | | 37,225 | 891,539 |
| Snap-On, Inc. | | 61,648 | 13,430,633 |
| SPX Corp. (a) | | 52,654 | 3,004,437 |
| Standex International Corp. | | 14,059 | 1,271,074 |
| Stanley Black & Decker, Inc. | | 175,667 | 15,476,263 |
| Tennant Co. (b) | | 21,473 | 1,295,896 |
| Terex Corp. | | 79,471 | 2,640,027 |
| The Greenbrier Companies, Inc. (b) | | 37,288 | 1,063,081 |
| The L.S. Starrett Co. Class A (a) | | 5,778 | 51,713 |
| Timken Co. | | 77,598 | 4,887,898 |
| Titan International, Inc. (a) | | 59,124 | 829,510 |
| Toro Co. | | 120,756 | 10,014,295 |
| Trinity Industries, Inc. (b) | | 80,343 | 1,958,762 |
| Twin Disc, Inc. (a) | | 10,436 | 97,055 |
| Urban-Gro, Inc. (a)(b) | | 7,927 | 29,885 |
| Velo3D, Inc. (a)(b) | | 72,759 | 313,591 |
| Wabash National Corp. | | 59,209 | 973,988 |
| Watts Water Technologies, Inc. Class A | | 31,509 | 4,364,627 |
| Westinghouse Air Brake Tech Co. | | 211,022 | 18,496,078 |
| Xos, Inc. Class A (a)(b) | | 59,323 | 90,171 |
| Xylem, Inc. | | 207,795 | 18,930,125 |
| | | | 809,592,082 |
| Marine - 0.0% | | | |
| Eagle Bulk Shipping, Inc. | | 18,588 | 807,463 |
| Genco Shipping & Trading Ltd. | | 41,258 | 565,647 |
| Kirby Corp. (a) | | 69,152 | 4,637,333 |
| Matson, Inc. | | 46,858 | 3,451,560 |
| Pangaea Logistics Solutions Ltd. | | 30,042 | 150,510 |
| | | | 9,612,513 |
| Professional Services - 0.6% | | | |
| Alight, Inc. Class A (a)(b) | | 295,117 | 2,325,522 |
| ASGN, Inc. (a) | | 60,613 | 5,861,277 |
| Atlas Technical Consultants, Inc. (a) | | 22,323 | 190,192 |
| Barrett Business Services, Inc. | | 8,312 | 670,280 |
| BGSF, Inc. (b) | | 11,003 | 133,118 |
| BlackSky Technology, Inc. Class A (a)(b) | | 64,400 | 130,732 |
| Booz Allen Hamilton Holding Corp. Class A | | 154,742 | 14,808,809 |
| CACI International, Inc. Class A (a) | | 27,206 | 7,641,349 |
| CBIZ, Inc. (a) | | 59,751 | 2,608,729 |
| Clarivate Analytics PLC (a)(b) | | 455,816 | 5,319,373 |
| CoStar Group, Inc. (a) | | 459,040 | 31,967,546 |
| CRA International, Inc. | | 8,496 | 776,619 |
| DLH Holdings Corp. (a) | | 12,500 | 204,625 |
| Dun & Bradstreet Holdings, Inc. | | 174,969 | 2,493,308 |
| Equifax, Inc. | | 141,756 | 26,756,445 |
| Exponent, Inc. | | 59,503 | 5,584,952 |
| First Advantage Corp. (a) | | 48,086 | 665,510 |
| Forrester Research, Inc. (a) | | 12,828 | 533,517 |
| Franklin Covey Co. (a) | | 14,560 | 692,619 |
| FTI Consulting, Inc. (a) | | 40,024 | 6,427,854 |
| Gee Group, Inc. (a)(b) | | 112,243 | 80,815 |
| Heidrick & Struggles International, Inc. | | 22,758 | 647,693 |
| Hill International, Inc. (a) | | 52,332 | 176,359 |
| Hirequest, Inc. (b) | | 5,581 | 78,469 |
| HireRight Holdings Corp. | | 25,343 | 412,077 |
| Hudson Global, Inc. (a) | | 2,753 | 97,126 |
| Huron Consulting Group, Inc. (a) | | 24,519 | 1,640,321 |
| ICF International, Inc. | | 19,436 | 1,973,920 |
| Insperity, Inc. | | 40,881 | 4,456,847 |
| Jacobs Solutions, Inc. | | 148,711 | 18,526,416 |
| KBR, Inc. | | 161,723 | 7,811,221 |
| Kelly Services, Inc. Class A (non-vtg.) | | 39,825 | 641,581 |
| Kforce, Inc. | | 23,165 | 1,267,589 |
| Korn Ferry | | 61,846 | 3,767,658 |
| LegalZoom.com, Inc. (a)(b) | | 22,391 | 230,627 |
| Leidos Holdings, Inc. | | 158,299 | 15,046,320 |
| Manpower, Inc. | | 60,622 | 4,444,805 |
| ManTech International Corp. Class A | | 31,549 | 3,025,865 |
| Mastech Digital, Inc. (a) | | 3,276 | 50,319 |
| MISTRAS Group, Inc. (a)(b) | | 22,538 | 124,635 |
| Nielsen Holdings PLC | | 417,152 | 11,613,512 |
| Planet Labs PBC Class A (a)(b) | | 212,989 | 1,167,180 |
| RCM Technologies, Inc. (a) | | 8,830 | 154,172 |
| Red Violet, Inc. (a)(b) | | 12,340 | 234,337 |
| Resources Connection, Inc. | | 35,629 | 696,191 |
| Robert Half International, Inc. | | 127,245 | 9,794,048 |
| Science Applications International Corp. | | 64,005 | 5,828,935 |
| ShiftPixy, Inc. (a) | | 18,028 | 2,526 |
| Skillsoft Corp. (a)(b) | | 91,790 | 295,564 |
| Spire Global, Inc. (a) | | 116,458 | 157,218 |
| Staffing 360 Solutions, Inc. (a)(b) | | 848 | 3,121 |
| Sterling Check Corp. (b) | | 16,602 | 353,291 |
| TransUnion Holding Co., Inc. | | 223,939 | 16,542,374 |
| TriNet Group, Inc. (a) | | 44,652 | 3,679,325 |
| TrueBlue, Inc. (a) | | 38,595 | 792,741 |
| Upwork, Inc. (a) | | 140,344 | 2,441,986 |
| Verisk Analytics, Inc. | | 182,589 | 34,173,357 |
| Willdan Group, Inc. (a) | | 13,887 | 316,068 |
| | | | 268,538,985 |
| Road & Rail - 0.9% | | | |
| AMERCO | | 11,426 | 6,006,305 |
| ArcBest Corp. | | 28,157 | 2,267,483 |
| Avis Budget Group, Inc. (a) | | 39,611 | 6,630,089 |
| Bird Global, Inc. Class A (a) | | 165,230 | 70,206 |
| Covenant Transport Group, Inc. Class A (b) | | 11,445 | 321,833 |
| CSX Corp. | | 2,516,408 | 79,644,313 |
| Daseke, Inc. (a) | | 70,997 | 430,242 |
| Heartland Express, Inc. | | 54,545 | 826,357 |
| Helbiz, Inc. (a)(b) | | 8,295 | 5,558 |
| Hertz Global Holdings, Inc. | | 56,703 | 1,046,737 |
| HyreCar, Inc. (a)(b) | | 17,022 | 13,532 |
| J.B. Hunt Transport Services, Inc. | | 96,778 | 16,841,308 |
| Knight-Swift Transportation Holdings, Inc. Class A | | 191,080 | 9,651,451 |
| Landstar System, Inc. | | 43,250 | 6,341,748 |
| Marten Transport Ltd. | | 68,736 | 1,361,660 |
| Norfolk Southern Corp. | | 275,935 | 67,088,077 |
| Old Dominion Freight Lines, Inc. | | 106,542 | 28,916,564 |
| P.A.M. Transportation Services, Inc. | | 7,898 | 234,650 |
| Patriot Transportation Holding, Inc. (a) | | 2,215 | 17,011 |
| Ryder System, Inc. | | 59,237 | 4,528,076 |
| Saia, Inc. (a) | | 30,876 | 6,386,083 |
| Schneider National, Inc. Class B | | 40,178 | 918,469 |
| TuSimple Holdings, Inc. (a)(b) | | 40,974 | 294,603 |
| U.S. Xpress Enterprises, Inc. (a)(b) | | 26,318 | 64,742 |
| U.S.A. Truck, Inc. (a) | | 7,831 | 245,580 |
| Union Pacific Corp. | | 726,955 | 163,208,667 |
| Universal Logistics Holdings, Inc. | | 9,048 | 330,342 |
| Werner Enterprises, Inc. | | 67,935 | 2,703,134 |
| XPO Logistics, Inc. (a) | | 113,458 | 5,947,468 |
| Yellow Corp. (a)(b) | | 40,956 | 257,204 |
| | | | 412,599,492 |
| Trading Companies & Distributors - 0.3% | | | |
| Air Lease Corp. Class A | | 123,834 | 4,502,604 |
| Alta Equipment Group, Inc. | | 30,505 | 359,044 |
| Applied Industrial Technologies, Inc. | | 44,568 | 4,725,099 |
| Beacon Roofing Supply, Inc. (a) | | 62,660 | 3,440,661 |
| BlueLinx Corp. (a) | | 11,251 | 788,695 |
| Boise Cascade Co. | | 45,792 | 2,854,215 |
| Core & Main, Inc. (a)(b) | | 65,843 | 1,551,920 |
| Custom Truck One Source, Inc. Class A (a) | | 57,564 | 378,771 |
| Distribution Solutions Group I (a) | | 24,628 | 978,717 |
| DXP Enterprises, Inc. (a) | | 20,013 | 531,946 |
| EVI Industries, Inc. (a)(b) | | 5,270 | 65,875 |
| Fastenal Co. | | 666,479 | 33,543,888 |
| GATX Corp. | | 42,824 | 4,137,227 |
| Global Industrial Co. | | 18,645 | 560,842 |
| GMS, Inc. (a) | | 51,106 | 2,463,309 |
| H&E Equipment Services, Inc. | | 36,475 | 1,154,799 |
| Herc Holdings, Inc. | | 29,977 | 3,373,312 |
| Hudson Technologies, Inc. (a) | | 36,565 | 303,490 |
| India Globalization Capital, Inc. (a) | | 42,330 | 23,705 |
| Karat Packaging, Inc. (a) | | 4,976 | 89,021 |
| McGrath RentCorp. | | 28,033 | 2,369,349 |
| Mega Matrix Corp. | | 8,950 | 13,962 |
| MRC Global, Inc. (a) | | 70,741 | 688,310 |
| MSC Industrial Direct Co., Inc. Class A | | 53,872 | 4,267,201 |
| NOW, Inc. (a) | | 127,432 | 1,544,476 |
| Rush Enterprises, Inc.: | | | |
| Class A | | 59,426 | 2,796,588 |
| Class B | | 44 | 2,228 |
| SiteOne Landscape Supply, Inc. (a) | | 53,032 | 6,637,485 |
| Titan Machinery, Inc. (a) | | 22,989 | 707,601 |
| Transcat, Inc. (a) | | 8,227 | 609,538 |
| Triton International Ltd. | | 74,219 | 4,422,710 |
| United Rentals, Inc. (a) | | 82,856 | 24,197,266 |
| Univar Solutions, Inc. (a) | | 195,560 | 4,932,023 |
| Veritiv Corp. (a) | | 15,994 | 1,906,325 |
| W.W. Grainger, Inc. | | 49,679 | 27,568,864 |
| Watsco, Inc. | | 38,275 | 10,411,948 |
| WESCO International, Inc. (a) | | 51,348 | 6,761,505 |
| Willis Lease Finance Corp. (a) | | 3,309 | 121,109 |
| | | | 165,785,628 |
| Transportation Infrastructure - 0.0% | | | |
| Sky Harbour Group Corp. Class A (a)(b) | | 2,437 | 11,137 |
TOTAL INDUSTRIALS | | | 4,045,787,897 |
| INFORMATION TECHNOLOGY - 26.1% | | | |
| Communications Equipment - 0.8% | | | |
| Actelis Networks, Inc. (a) | | 2,989 | 3,886 |
| ADTRAN Holdings, Inc. | | 88,843 | 2,064,711 |
| Airspan Networks Holdings, Inc. (a)(b) | | 29,364 | 62,252 |
| Applied Optoelectronics, Inc. (a)(b) | | 28,297 | 68,196 |
| Arista Networks, Inc. (a) | | 261,682 | 31,370,438 |
| Aviat Networks, Inc. (a) | | 12,229 | 382,768 |
| BK Technologies Corp. | | 2,781 | 6,646 |
| CalAmp Corp. (a) | | 39,927 | 246,749 |
| Calix, Inc. (a) | | 63,852 | 3,757,690 |
| Cambium Networks Corp. (a) | | 12,756 | 248,232 |
| Casa Systems, Inc. (a)(b) | | 47,285 | 183,466 |
| Ciena Corp. (a) | | 176,664 | 8,963,931 |
| Cisco Systems, Inc. | | 4,811,385 | 215,165,137 |
| Clearfield, Inc. (a)(b) | | 13,130 | 1,524,524 |
| ClearOne, Inc. (a) | | 9,941 | 6,462 |
| CommScope Holding Co., Inc. (a) | | 239,009 | 2,700,802 |
| COMSovereign Holding Corp. (a)(b) | | 55,681 | 7,233 |
| Comtech Telecommunications Corp. (b) | | 30,869 | 348,511 |
| Digi International, Inc. (a) | | 40,489 | 1,340,591 |
| DZS, Inc. (a) | | 19,593 | 260,783 |
| EMCORE Corp. (a) | | 36,766 | 87,503 |
| Extreme Networks, Inc. (a) | | 150,565 | 2,157,596 |
| F5, Inc. (a) | | 70,540 | 11,079,012 |
| Franklin Wireless Corp. (a) | | 6,625 | 19,014 |
| Genasys, Inc. (a) | | 42,030 | 122,728 |
| Harmonic, Inc. (a) | | 121,728 | 1,370,657 |
| Infinera Corp. (a)(b) | | 247,335 | 1,355,396 |
| Inseego Corp. (a)(b) | | 104,309 | 281,634 |
| Juniper Networks, Inc. | | 376,146 | 10,690,069 |
| KVH Industries, Inc. (a) | | 17,948 | 175,890 |
| Lantronix, Inc. (a) | | 29,651 | 179,685 |
| Lumentum Holdings, Inc. (a) | | 79,197 | 6,616,909 |
| Motorola Solutions, Inc. | | 193,910 | 47,199,633 |
| NETGEAR, Inc. (a) | | 32,929 | 776,795 |
| NetScout Systems, Inc. (a) | | 84,837 | 2,692,726 |
| Network-1 Security Solutions, Inc. | | 6,331 | 14,498 |
| Ondas Holdings, Inc. (a)(b) | | 35,442 | 167,286 |
| Optical Cable Corp. (a) | | 2,399 | 8,948 |
| PC-Tel, Inc. | | 15,232 | 83,776 |
| Ribbon Communications, Inc. (a) | | 145,212 | 509,694 |
| Tessco Technologies, Inc. (a) | | 8,063 | 39,992 |
| Ubiquiti, Inc. (b) | | 7,084 | 2,198,803 |
| ViaSat, Inc. (a)(b) | | 85,851 | 3,260,621 |
| Viavi Solutions, Inc. (a) | | 261,742 | 3,685,327 |
| Vislink Technologies, Inc. (a)(b) | | 42,158 | 22,850 |
| | | | 363,510,050 |
| Electronic Equipment & Components - 0.8% | | | |
| 908 Devices, Inc. (a)(b) | | 19,390 | 390,709 |
| Advanced Energy Industries, Inc. | | 43,377 | 3,894,821 |
| Aeva Technologies, Inc. (a)(b) | | 104,728 | 322,562 |
| AEye, Inc. Class A (a)(b) | | 122,561 | 188,744 |
| Airgain, Inc. (a) | | 11,534 | 89,389 |
| Akoustis Technologies, Inc. (a)(b) | | 66,863 | 292,860 |
| Alpine 4 Holdings, Inc. (a) | | 182,523 | 135,980 |
| Amphenol Corp. Class A | | 691,391 | 50,837,980 |
| AmpliTech Group, Inc. (a)(b) | | 3,837 | 8,365 |
| Arlo Technologies, Inc. (a) | | 99,261 | 604,499 |
| Arrow Electronics, Inc. (a) | | 75,997 | 7,965,246 |
| Autoscope Technologies Corp. | | 2,186 | 11,083 |
| Avnet, Inc. | | 112,024 | 4,916,733 |
| Badger Meter, Inc. (b) | | 33,696 | 3,190,674 |
| Bel Fuse, Inc. Class B (non-vtg.) | | 14,563 | 413,880 |
| Belden, Inc. | | 50,888 | 3,332,146 |
| Benchmark Electronics, Inc. | | 41,203 | 1,131,022 |
| CDW Corp. | | 156,243 | 26,670,680 |
| Cemtrex, Inc. (a) | | 25,205 | 7,466 |
| Cepton, Inc. (a)(b) | | 30,626 | 53,902 |
| ClearSign Combustion Corp. (a)(b) | | 30,692 | 30,385 |
| Coda Octopus Group, Inc. (a)(b) | | 3,569 | 17,559 |
| Cognex Corp. | | 202,446 | 8,525,001 |
| Corning, Inc. | | 881,239 | 30,244,122 |
| CPS Technologies Corp. (a) | | 13,073 | 42,226 |
| CTS Corp. | | 37,170 | 1,573,034 |
| Daktronics, Inc. (a) | | 43,386 | 138,835 |
| Data I/O Corp. (a) | | 4,118 | 14,372 |
| Digital Ally, Inc. (a)(b) | | 49,546 | 27,458 |
| Electro-Sensors, Inc. (a) | | 1,518 | 8,820 |
| eMagin Corp. (a)(b) | | 75,478 | 55,122 |
| ePlus, Inc. (a) | | 30,972 | 1,459,401 |
| Evolv Technologies Holdings, Inc. (a)(b) | | 62,292 | 141,403 |
| Fabrinet (a) | | 42,376 | 4,357,948 |
| FARO Technologies, Inc. (a) | | 21,154 | 709,717 |
| Focus Universal, Inc. (a)(b) | | 20,177 | 216,903 |
| Frequency Electronics, Inc. (a) | | 2,027 | 13,155 |
| Identiv, Inc. (a) | | 25,667 | 382,952 |
| II-VI, Inc. (a) | | 150,414 | 7,104,053 |
| Insight Enterprises, Inc. (a) | | 40,066 | 3,650,814 |
| Interlink Electronics, Inc. (a)(b) | | 936 | 7,816 |
| IPG Photonics Corp. (a) | | 39,953 | 3,619,342 |
| Iteris, Inc. (a) | | 47,511 | 155,361 |
| Itron, Inc. (a) | | 52,059 | 2,476,967 |
| Jabil, Inc. | | 162,894 | 9,822,508 |
| KEY Tronic Corp. (a) | | 5,878 | 27,979 |
| Keysight Technologies, Inc. (a) | | 211,772 | 34,707,313 |
| Kimball Electronics, Inc. (a) | | 29,034 | 625,392 |
| Knowles Corp. (a) | | 105,553 | 1,599,128 |
| LGL Group, Inc. (a) | | 3,314 | 45,816 |
| LGL Group, Inc. warrants 11/16/25 (a) | | 2,530 | 1,189 |
| LightPath Technologies, Inc. Class A (a) | | 20,018 | 28,826 |
| Lightwave Logic, Inc. (a)(b) | | 119,448 | 952,001 |
| Littelfuse, Inc. | | 28,897 | 6,854,946 |
| Luna Innovations, Inc. (a)(b) | | 36,726 | 211,175 |
| Methode Electronics, Inc. Class A | | 42,877 | 1,734,803 |
| MicroVision, Inc. (a)(b) | | 191,409 | 926,420 |
| MICT, Inc. (a)(b) | | 132,901 | 110,108 |
| Mirion Technologies, Inc. Class A (a) | | 119,248 | 902,707 |
| Napco Security Technologies, Inc. | | 33,835 | 1,003,546 |
| National Instruments Corp. | | 150,687 | 5,991,315 |
| Neonode, Inc. (a)(b) | | 10,083 | 33,879 |
| nLIGHT, Inc. (a) | | 50,988 | 636,840 |
| Nortech Systems, Inc. (a) | | 833 | 10,271 |
| Novanta, Inc. (a) | | 40,967 | 5,476,878 |
| OSI Systems, Inc. (a) | | 18,325 | 1,526,839 |
| Ouster, Inc. (a)(b) | | 83,733 | 125,600 |
| Par Technology Corp. (a)(b) | | 29,908 | 1,052,762 |
| PC Connection, Inc. | | 13,100 | 650,808 |
| Plexus Corp. (a) | | 31,968 | 2,996,361 |
| Powerfleet, Inc. (a) | | 39,533 | 126,110 |
| Quanergy Systems, Inc. Class A (a)(b) | | 42,268 | 12,308 |
| Red Cat Holdings, Inc. (a)(b) | | 34,077 | 81,274 |
| Research Frontiers, Inc. (a)(b) | | 20,807 | 48,064 |
| RF Industries Ltd. (a) | | 8,437 | 58,806 |
| Richardson Electronics Ltd. | | 11,082 | 179,861 |
| Rogers Corp. (a) | | 21,602 | 5,411,733 |
| Sanmina Corp. (a) | | 71,489 | 3,468,646 |
| ScanSource, Inc. (a) | | 29,120 | 843,606 |
| Sigmatron International, Inc. (a)(b) | | 5,507 | 42,349 |
| Smartrent, Inc. (a)(b) | | 103,722 | 335,022 |
| Sono-Tek Corp. (a) | | 4,720 | 25,488 |
| TD SYNNEX Corp. | | 47,647 | 4,587,453 |
| TE Connectivity Ltd. | | 372,767 | 47,046,923 |
| Teledyne Technologies, Inc. (a) | | 54,635 | 20,125,349 |
| Trimble, Inc. (a) | | 289,478 | 18,309,484 |
| TTM Technologies, Inc. (a) | | 117,083 | 1,841,716 |
| Universal Security Instruments, Inc. (a)(b) | | 1,618 | 6,278 |
| Velodyne Lidar, Inc. (a)(b) | | 112,503 | 140,629 |
| Vishay Intertechnology, Inc. | | 152,130 | 2,992,397 |
| Vishay Precision Group, Inc. (a) | | 14,885 | 510,704 |
| Vontier Corp. | | 184,511 | 4,044,481 |
| Wayside Technology Group, Inc. | | 4,375 | 127,706 |
| Wireless Telecom Group, Inc. (a) | | 21,142 | 30,656 |
| Wrap Technologies, Inc. (a)(b) | | 30,325 | 60,650 |
| Zebra Technologies Corp. Class A (a) | | 61,171 | 18,451,620 |
| | | | 376,396,230 |
| IT Services - 4.4% | | | |
| Accenture PLC Class A | | 733,050 | 211,455,603 |
| Affirm Holdings, Inc. (a)(b) | | 191,565 | 4,488,368 |
| AgileThought, Inc. Class A (a)(b) | | 31,199 | 130,412 |
| Akamai Technologies, Inc. (a) | | 184,627 | 16,668,126 |
| ALJ Regional Holdings, Inc. (a) | | 25,239 | 37,606 |
| American Virtual Cloud Technologies, Inc. (a)(b) | | 63,695 | 29,300 |
| AppTech Payments Corp. (a) | | 10,018 | 6,581 |
| Automatic Data Processing, Inc. | | 483,608 | 118,198,631 |
| AvidXchange Holdings, Inc. | | 28,742 | 223,900 |
| Backblaze, Inc. Class A (b) | | 9,269 | 60,341 |
| BigCommerce Holdings, Inc. (a) | | 69,585 | 1,159,982 |
| Block, Inc. Class A (a) | | 583,561 | 40,213,189 |
| BM Technologies, Inc. (a)(b) | | 10,050 | 63,516 |
| Brightcove, Inc. (a) | | 47,052 | 312,425 |
| Broadridge Financial Solutions, Inc. | | 136,191 | 23,311,813 |
| Cantaloupe, Inc. (a) | | 66,227 | 421,866 |
| Cass Information Systems, Inc. | | 12,866 | 471,925 |
| Cerberus Cyber Sentinel Corp. (b) | | 45,196 | 122,933 |
| Cloudflare, Inc. (a) | | 325,271 | 20,352,206 |
| Cognizant Technology Solutions Corp. Class A | | 603,029 | 38,093,342 |
| Computer Task Group, Inc. (a) | | 14,710 | 115,915 |
| Concentrix Corp. | | 50,331 | 6,330,633 |
| Conduent, Inc. (a) | | 187,584 | 767,219 |
| Core Scientific, Inc. (a)(b) | | 267,552 | 588,614 |
| Crexendo, Inc. (b) | | 7,301 | 20,516 |
| CSG Systems International, Inc. | | 35,678 | 2,063,972 |
| CSP, Inc. | | 1,089 | 8,451 |
| Cyxtera Technologies, Inc. Class A (a) | | 42,056 | 266,635 |
| Data Storage Corp. (a) | | 4,633 | 10,841 |
| DecisionPoint Systems, Inc. (a)(b) | | 5,255 | 32,371 |
| Digitalocean Holdings, Inc. (a)(b) | | 19,389 | 816,083 |
| DXC Technology Co. (a) | | 284,118 | 7,040,444 |
| Edgio, Inc. (a) | | 156,368 | 575,434 |
| EPAM Systems, Inc. (a) | | 66,242 | 28,252,213 |
| Euronet Worldwide, Inc. (a) | | 59,275 | 5,255,322 |
| EVERTEC, Inc. | | 74,882 | 2,516,035 |
| EVO Payments, Inc. Class A (a) | | 55,460 | 1,847,927 |
| Exela Technologies, Inc. (a)(b) | | 525,796 | 495,037 |
| ExlService Holdings, Inc. (a) | | 38,739 | 6,496,918 |
| Fastly, Inc. Class A (a) | | 125,845 | 1,176,651 |
| Fidelity National Information Services, Inc. | | 707,208 | 64,617,595 |
| Fiserv, Inc. (a) | | 673,431 | 68,144,483 |
| FleetCor Technologies, Inc. (a) | | 89,691 | 19,062,028 |
| Flywire Corp. (a) | | 13,245 | 329,271 |
| Gartner, Inc. (a) | | 93,064 | 26,553,020 |
| Genpact Ltd. | | 197,874 | 9,296,121 |
| Global Payments, Inc. | | 326,509 | 40,562,213 |
| GoDaddy, Inc. (a) | | 186,427 | 14,134,895 |
| GreenBox POS (a)(b) | | 18,089 | 20,983 |
| Grid Dynamics Holdings, Inc. (a) | | 54,241 | 1,096,211 |
| Hackett Group, Inc. | | 33,304 | 683,731 |
| i3 Verticals, Inc. Class A (a) | | 26,203 | 612,102 |
| IBM Corp. | | 1,041,266 | 133,750,618 |
| Information Services Group, Inc. | | 38,811 | 223,939 |
| Innodata, Inc. (a) | | 24,736 | 83,360 |
| Inpixon (a)(b) | | 147,035 | 20,306 |
| International Money Express, Inc. (a) | | 38,331 | 858,614 |
| Jack Henry & Associates, Inc. | | 84,139 | 16,171,516 |
| Kyndryl Holdings, Inc. (a) | | 207,199 | 2,159,014 |
| Marqeta, Inc. Class A (a) | | 417,526 | 3,252,528 |
| MasterCard, Inc. Class A | | 994,065 | 322,444,864 |
| Maximus, Inc. | | 70,594 | 4,277,290 |
| MoneyGram International, Inc. (a) | | 110,385 | 1,136,966 |
| MongoDB, Inc. Class A (a) | | 78,159 | 25,234,415 |
| Okta, Inc. (a) | | 175,722 | 16,060,991 |
| OMNIQ Corp. (a)(b) | | 3,021 | 19,697 |
| Paya Holdings, Inc. (a) | | 99,239 | 622,229 |
| Paychex, Inc. | | 371,619 | 45,835,487 |
| Paymentus Holdings, Inc. (a)(b) | | 17,184 | 204,661 |
| Payoneer Global, Inc. (a) | | 227,017 | 1,502,853 |
| PayPal Holdings, Inc. (a) | | 1,340,753 | 125,279,960 |
| Paysign, Inc. (a)(b) | | 33,968 | 104,621 |
| Perficient, Inc. (a) | | 39,877 | 3,114,394 |
| PFSweb, Inc. (a) | | 18,529 | 175,284 |
| Priority Technology Holdings, Inc. (a) | | 17,410 | 69,640 |
| Rackspace Technology, Inc. (a)(b) | | 72,543 | 323,542 |
| Repay Holdings Corp. (a) | | 89,315 | 829,736 |
| Research Solutions, Inc. (a) | | 20,127 | 37,839 |
| Sabre Corp. (a) | | 375,545 | 2,700,169 |
| Shift4 Payments, Inc. (a)(b) | | 61,752 | 2,796,748 |
| Snowflake, Inc. (a) | | 280,823 | 50,814,922 |
| SolarWinds, Inc. | | 53,808 | 488,039 |
| Squarespace, Inc. Class A (a) | | 32,590 | 684,390 |
| SS&C Technologies Holdings, Inc. | | 255,376 | 14,239,766 |
| StarTek, Inc. (a) | | 14,129 | 59,907 |
| Steel Connect, Inc. (a) | | 39,611 | 53,871 |
| Switch, Inc. Class A | | 158,170 | 5,369,872 |
| TaskUs, Inc. (a) | | 31,796 | 473,124 |
| The Glimpse Group, Inc. (a)(b) | | 3,933 | 21,749 |
| The OLB Group, Inc. (a)(b) | | 17,950 | 28,361 |
| The Western Union Co. | | 442,851 | 6,563,052 |
| Thoughtworks Holding, Inc. | | 42,774 | 562,906 |
| Toast, Inc. | | 284,007 | 5,376,253 |
| Ttec Holdings, Inc. | | 21,391 | 1,119,819 |
| Tucows, Inc. (a)(b) | | 10,587 | 497,483 |
| Twilio, Inc. Class A (a) | | 200,147 | 13,926,228 |
| Unisys Corp. (a) | | 77,788 | 724,206 |
| Usio, Inc. (a) | | 19,620 | 33,943 |
| VeriSign, Inc. (a) | | 110,108 | 20,063,880 |
| Verra Mobility Corp. (a) | | 147,735 | 2,354,896 |
| Visa, Inc. Class A | | 1,905,224 | 378,587,061 |
| WaveDancer, Inc. (a) | | 11,457 | 12,603 |
| WEX, Inc. (a) | | 52,679 | 8,125,736 |
| WidePoint Corp. (a)(b) | | 8,205 | 19,323 |
| | | | 2,005,104,620 |
| Semiconductors & Semiconductor Equipment - 4.8% | | | |
| ACM Research, Inc. (b) | | 42,998 | 726,236 |
| Advanced Micro Devices, Inc. (a) | | 1,876,278 | 159,239,714 |
| AEHR Test Systems (a) | | 26,332 | 382,867 |
| Allegro MicroSystems LLC (a) | | 63,497 | 1,480,750 |
| Alpha & Omega Semiconductor Ltd. (a) | | 25,649 | 991,590 |
| Ambarella, Inc. (a) | | 43,708 | 2,966,899 |
| Amkor Technology, Inc. | | 115,781 | 2,330,672 |
| Amtech Systems, Inc. (a) | | 13,876 | 154,024 |
| Analog Devices, Inc. | | 605,615 | 91,768,841 |
| Applied Materials, Inc. | | 1,022,436 | 96,180,555 |
| Atomera, Inc. (a)(b) | | 26,242 | 339,309 |
| Axcelis Technologies, Inc. (a) | | 37,951 | 2,540,440 |
| AXT, Inc. (a) | | 46,897 | 402,845 |
| Broadcom, Inc. | | 472,739 | 235,948,762 |
| CEVA, Inc. (a) | | 26,822 | 785,080 |
| Cirrus Logic, Inc. (a) | | 65,879 | 5,052,261 |
| Cohu, Inc. (a) | | 56,349 | 1,511,844 |
| Credo Technology Group Holding Ltd. | | 23,556 | 324,837 |
| CVD Equipment Corp. (a) | | 7,163 | 38,609 |
| CyberOptics Corp. (a) | | 8,374 | 445,832 |
| Diodes, Inc. (a) | | 56,286 | 4,005,875 |
| Enphase Energy, Inc. (a) | | 156,315 | 44,774,869 |
| Entegris, Inc. | | 171,703 | 16,291,181 |
| Everspin Technologies, Inc. (a) | | 17,769 | 129,714 |
| First Solar, Inc. (a) | | 115,056 | 14,675,393 |
| FormFactor, Inc. (a) | | 89,871 | 2,631,423 |
| GSI Technology, Inc. (a) | | 13,332 | 44,396 |
| Ichor Holdings Ltd. (a) | | 32,928 | 1,011,548 |
| Impinj, Inc. (a)(b) | | 22,439 | 2,003,354 |
| indie Semiconductor, Inc. (a)(b) | | 70,551 | 600,389 |
| Intel Corp. | | 4,735,765 | 151,165,619 |
| Intest Corp. (a) | | 11,904 | 105,708 |
| KLA Corp. | | 172,762 | 59,452,587 |
| Kopin Corp. (a) | | 85,538 | 117,187 |
| Kulicke & Soffa Industries, Inc. (b) | | 70,086 | 2,946,415 |
| Lam Research Corp. | | 160,650 | 70,350,242 |
| Lattice Semiconductor Corp. (a) | | 158,057 | 8,519,272 |
| MACOM Technology Solutions Holdings, Inc. (a) | | 56,248 | 3,102,077 |
| Marvell Technology, Inc. | | 983,845 | 46,063,623 |
| MaxLinear, Inc. Class A (a) | | 85,838 | 3,084,159 |
| Meta Materials, Inc. (a)(b) | | 282,426 | 244,298 |
| Microchip Technology, Inc. | | 646,106 | 42,158,417 |
| Micron Technology, Inc. | | 1,292,315 | 73,054,567 |
| MKS Instruments, Inc. | | 65,827 | 6,557,027 |
| Monolithic Power Systems, Inc. | | 50,984 | 23,104,929 |
| Navitas Semiconductor Corp. (a)(b) | | 89,648 | 529,820 |
| NVE Corp. | | 5,737 | 290,981 |
| NVIDIA Corp. | | 2,899,403 | 437,635,889 |
| NXP Semiconductors NV | | 304,109 | 50,050,259 |
| onsemi (a) | | 502,528 | 34,558,851 |
| Onto Innovation, Inc. (a) | | 59,428 | 4,218,794 |
| PDF Solutions, Inc. (a) | | 34,167 | 901,325 |
| Peraso, Inc. (a) | | 5,952 | 12,559 |
| Photronics, Inc. (a) | | 70,868 | 1,190,582 |
| Pixelworks, Inc. (a) | | 57,340 | 107,226 |
| Power Integrations, Inc. | | 67,096 | 4,799,377 |
| Qorvo, Inc. (a) | | 124,958 | 11,218,729 |
| Qualcomm, Inc. | | 1,297,017 | 171,556,439 |
| QuickLogic Corp. (a)(b) | | 14,097 | 95,437 |
| Rambus, Inc. (a) | | 133,937 | 3,454,235 |
| Rigetti Computing, Inc. Class A (a)(b) | | 90,516 | 360,254 |
| Rockley Photonics Holdings Ltd. (a)(b) | | 108,406 | 153,937 |
| Rubicon Technology, Inc. (a)(b) | | 2,032 | 6,685 |
| Semtech Corp. (a) | | 72,929 | 3,368,591 |
| Silicon Laboratories, Inc. (a) | | 41,983 | 5,261,729 |
| SiTime Corp. (a) | | 17,892 | 1,903,888 |
| SkyWater Technology, Inc. (a)(b) | | 8,020 | 104,260 |
| Skyworks Solutions, Inc. | | 185,886 | 18,319,065 |
| SMART Global Holdings, Inc. (a)(b) | | 54,078 | 992,331 |
| SolarEdge Technologies, Inc. (a) | | 64,036 | 17,672,015 |
| SunPower Corp. (a)(b) | | 95,945 | 2,302,680 |
| Synaptics, Inc. (a) | | 45,565 | 5,267,770 |
| Teradyne, Inc. | | 184,924 | 15,651,967 |
| Texas Instruments, Inc. | | 1,067,496 | 176,361,014 |
| Transphorm, Inc. (a) | | 21,348 | 118,481 |
| Trio-Tech International (a)(b) | | 2,367 | 10,865 |
| Ultra Clean Holdings, Inc. (a) | | 52,001 | 1,522,069 |
| Universal Display Corp. | | 49,910 | 5,576,444 |
| Veeco Instruments, Inc. (a)(b) | | 62,490 | 1,321,039 |
| WiSA Technologies, Inc. (a) | | 14,292 | 8,918 |
| Wolfspeed, Inc. (a)(b) | | 143,676 | 16,302,916 |
| | | | 2,173,013,657 |
| Software - 8.9% | | | |
| 8x8, Inc. (a)(b) | | 134,432 | 700,391 |
| A10 Networks, Inc. | | 67,625 | 939,988 |
| ACI Worldwide, Inc. (a) | | 136,986 | 3,246,568 |
| Adobe, Inc. (a) | | 547,058 | 204,293,340 |
| Agilysys, Inc. (a) | | 22,660 | 1,173,108 |
| Alarm.com Holdings, Inc. (a) | | 53,085 | 3,535,461 |
| Alfi, Inc. (a) | | 3,888 | 4,627 |
| Altair Engineering, Inc. Class A (a)(b) | | 60,083 | 3,124,917 |
| Alteryx, Inc. Class A (a) | | 69,542 | 4,333,857 |
| American Software, Inc. Class A | | 38,886 | 658,340 |
| Amplitude, Inc. (a)(b) | | 29,984 | 454,258 |
| ANSYS, Inc. (a) | | 101,094 | 25,101,640 |
| AppFolio, Inc. (a) | | 23,152 | 2,347,150 |
| Appian Corp. Class A (a)(b) | | 47,190 | 2,213,211 |
| AppLovin Corp. (a) | | 41,351 | 1,018,475 |
| Arteris, Inc. | | 5,692 | 40,527 |
| Asana, Inc. (a)(b) | | 96,473 | 1,847,458 |
| Aspen Technology, Inc. (a) | | 32,372 | 6,817,543 |
| Asure Software, Inc. (a)(b) | | 20,572 | 111,912 |
| Auddia, Inc. (a)(b) | | 3,096 | 3,406 |
| AudioEye, Inc. (a)(b) | | 7,611 | 47,721 |
| Authid, Inc. (a)(b) | | 21,089 | 52,723 |
| Autodesk, Inc. (a) | | 251,835 | 50,805,193 |
| Avalara, Inc. (a) | | 102,732 | 9,409,224 |
| Avaya Holdings Corp. (a)(b) | | 101,295 | 161,059 |
| AvePoint, Inc. (a)(b) | | 103,844 | 485,990 |
| Aware, Inc. (a) | | 5,680 | 11,758 |
| Benefitfocus, Inc. (a) | | 34,027 | 252,140 |
| Bentley Systems, Inc. Class B (b) | | 222,165 | 8,169,007 |
| Bill.Com Holdings, Inc. (a) | | 107,707 | 17,435,609 |
| Bio-Key International, Inc. (a)(b) | | 11,210 | 18,945 |
| Black Knight, Inc. (a) | | 181,173 | 11,986,406 |
| Blackbaud, Inc. (a) | | 52,299 | 2,735,238 |
| Blackboxstocks, Inc. (a)(b) | | 11,138 | 13,254 |
| BlackLine, Inc. (a) | | 62,018 | 4,213,503 |
| Blend Labs, Inc. (a)(b) | | 35,347 | 111,343 |
| Box, Inc. Class A (a) | | 164,721 | 4,241,566 |
| Braze, Inc. | | 11,930 | 491,277 |
| Bridgeline Digital, Inc. (a) | | 6,040 | 8,939 |
| BSQUARE Corp. (a) | | 21,884 | 26,917 |
| BTCS, Inc. (b) | | 7,098 | 11,712 |
| BTRS Holdings, Inc. (a) | | 92,166 | 623,042 |
| C3.Ai, Inc. (a)(b) | | 83,264 | 1,498,752 |
| Cadence Design Systems, Inc. (a) | | 319,144 | 55,457,653 |
| CCC Intelligent Solutions Holdings, Inc. Class A (a) | | 70,132 | 670,462 |
| Cerence, Inc. (a) | | 46,082 | 922,101 |
| Ceridian HCM Holding, Inc. (a) | | 157,862 | 9,414,890 |
| ChannelAdvisor Corp. (a) | | 36,294 | 547,676 |
| Cipher Mining, Inc. (a) | | 44,591 | 89,628 |
| Citrix Systems, Inc. | | 143,434 | 14,740,712 |
| Cleanspark, Inc. (a)(b) | | 47,399 | 202,868 |
| Clear Secure, Inc. (a)(b) | | 16,889 | 387,434 |
| Clearwater Analytics Holdings, Inc. (b) | | 46,971 | 723,353 |
| CommVault Systems, Inc. (a) | | 51,319 | 2,786,109 |
| Confluent, Inc. (a)(b) | | 134,486 | 3,679,537 |
| Consensus Cloud Solutions, Inc. (a) | | 18,751 | 944,113 |
| CoreCard Corp. (a)(b) | | 8,214 | 199,190 |
| Couchbase, Inc. (a)(b) | | 11,490 | 190,619 |
| Coupa Software, Inc. (a) | | 86,292 | 5,039,453 |
| Crowdstrike Holdings, Inc. (a) | | 247,147 | 45,131,514 |
| CS Disco, Inc. (a)(b) | | 15,763 | 217,529 |
| Cvent Holding Corp. (a)(b) | | 79,612 | 402,837 |
| Cyngn, Inc. | | 7,262 | 9,150 |
| Datadog, Inc. Class A (a) | | 297,994 | 31,274,470 |
| DatChat, Inc. (a)(b) | | 7,676 | 7,676 |
| Dave, Inc. (a)(b) | | 188,362 | 97,006 |
| Digimarc Corp. (a)(b) | | 18,904 | 336,869 |
| Digital Turbine, Inc. (a) | | 101,190 | 1,868,979 |
| DocuSign, Inc. (a) | | 230,350 | 13,410,977 |
| Dolby Laboratories, Inc. Class A | | 74,318 | 5,443,050 |
| Domo, Inc. Class B (a) | | 36,259 | 698,348 |
| Dropbox, Inc. Class A (a) | | 309,809 | 6,626,815 |
| Duck Creek Technologies, Inc. (a) | | 89,636 | 1,066,668 |
| Dynatrace, Inc. (a) | | 229,909 | 8,777,926 |
| E2open Parent Holdings, Inc. (a)(b) | | 206,376 | 1,417,803 |
| Ebix, Inc. (b) | | 28,033 | 729,419 |
| eGain Communications Corp. (a) | | 23,871 | 219,852 |
| Elastic NV (a) | | 83,772 | 7,029,309 |
| Embark Technology, Inc. (a)(b) | | 11,186 | 101,793 |
| Enfusion, Inc. Class A (b) | | 22,986 | 284,797 |
| Envestnet, Inc. (a) | | 65,721 | 3,441,809 |
| Everbridge, Inc. (a) | | 46,283 | 1,841,138 |
| EverCommerce, Inc. (a) | | 23,521 | 273,784 |
| Expensify, Inc. | | 11,758 | 213,173 |
| Fair Isaac Corp. (a) | | 30,020 | 13,490,988 |
| Five9, Inc. (a) | | 81,238 | 7,970,260 |
| ForgeRock, Inc. | | 36,850 | 628,661 |
| Fortinet, Inc. (a) | | 771,143 | 37,546,953 |
| Freshworks, Inc. (b) | | 122,526 | 1,667,579 |
| GitLab, Inc. | | 42,073 | 2,518,911 |
| Greenidge Generation Holdings, Inc. (a)(b) | | 11,557 | 28,084 |
| GSE Systems, Inc. (a) | | 29,471 | 33,302 |
| Guidewire Software, Inc. (a) | | 95,917 | 6,878,208 |
| HashiCorp, Inc. | | 36,720 | 1,298,052 |
| HubSpot, Inc. (a) | | 52,783 | 17,789,982 |
| Informatica, Inc. (b) | | 35,760 | 789,223 |
| Intapp, Inc. (a) | | 13,097 | 189,776 |
| Intellicheck, Inc. (a)(b) | | 16,349 | 51,009 |
| InterDigital, Inc. | | 35,950 | 1,803,252 |
| Intrusion, Inc. (a)(b) | | 13,138 | 53,472 |
| Intuit, Inc. | | 327,548 | 141,428,675 |
| Inuvo, Inc. (a)(b) | | 93,057 | 48,083 |
| IronNet, Inc. Class A (a) | | 52,029 | 105,099 |
| Issuer Direct Corp. (a) | | 3,190 | 73,960 |
| Jamf Holding Corp. (a)(b) | | 63,177 | 1,513,089 |
| Kaltura, Inc. (a) | | 17,654 | 42,899 |
| Kaspien Holdings, Inc. (a) | | 43 | 112 |
| KnowBe4, Inc. (a) | | 87,110 | 1,674,254 |
| Latch, Inc. (a)(b) | | 97,155 | 103,956 |
| LivePerson, Inc. (a)(b) | | 82,160 | 953,056 |
| Liveramp Holdings, Inc. (a) | | 78,654 | 1,561,282 |
| Livevox Holdings, Inc. (a) | | 24,687 | 52,830 |
| Mandiant, Inc. (a) | | 275,135 | 6,289,586 |
| Manhattan Associates, Inc. (a) | | 73,739 | 10,416,371 |
| Marathon Digital Holdings, Inc. (a)(b) | | 121,250 | 1,436,813 |
| Marin Software, Inc. (a)(b) | | 15,416 | 27,903 |
| Matterport, Inc. (a)(b) | | 245,695 | 1,132,654 |
| MeridianLink, Inc. (a)(b) | | 17,426 | 302,690 |
| Microsoft Corp. | | 8,659,786 | 2,264,274,245 |
| MicroStrategy, Inc. Class A (a)(b) | | 10,715 | 2,481,165 |
| Mitek Systems, Inc. (a) | | 52,802 | 539,636 |
| Model N, Inc. (a) | | 39,147 | 1,170,495 |
| Momentive Global, Inc. (a) | | 149,366 | 1,059,005 |
| N-able, Inc. (a) | | 81,303 | 809,778 |
| nCino, Inc. (a)(b) | | 66,202 | 2,088,011 |
| NCR Corp. (a) | | 156,688 | 4,865,162 |
| NetSol Technologies, Inc. (a) | | 4,917 | 17,554 |
| New Relic, Inc. (a) | | 68,457 | 4,156,024 |
| Nextnav, Inc. (a) | | 23,303 | 78,997 |
| NortonLifeLock, Inc. | | 671,366 | 15,166,158 |
| Nutanix, Inc. Class A (a) | | 254,345 | 4,400,169 |
| Oblong, Inc. (a) | | 14,552 | 3,711 |
| Olo, Inc. (a)(b) | | 105,888 | 826,985 |
| ON24, Inc. (a) | | 10,105 | 90,541 |
| Onespan, Inc. (a) | | 40,130 | 461,896 |
| Oracle Corp. | | 1,822,580 | 135,144,307 |
| Pagerduty, Inc. (a) | | 90,242 | 2,349,902 |
| Palantir Technologies, Inc. (a)(b) | | 1,899,385 | 14,663,252 |
| Palo Alto Networks, Inc. (a) | | 113,994 | 63,472,999 |
| Park City Group, Inc. (a)(b) | | 12,790 | 77,252 |
| Paycom Software, Inc. (a) | | 56,039 | 19,680,897 |
| Paycor HCM, Inc. (a)(b) | | 36,174 | 1,071,836 |
| Paylocity Holding Corp. (a) | | 46,307 | 11,159,987 |
| Pegasystems, Inc. | | 47,250 | 1,729,823 |
| Phunware, Inc. (a)(b) | | 92,405 | 122,899 |
| Ping Identity Holding Corp. (a) | | 69,737 | 1,962,399 |
| Progress Software Corp. (b) | | 53,126 | 2,556,954 |
| PROS Holdings, Inc. (a) | | 47,320 | 986,622 |
| PTC, Inc. (a) | | 121,414 | 13,949,254 |
| Q2 Holdings, Inc. (a) | | 65,973 | 2,620,448 |
| Qualtrics International, Inc. (a) | | 118,614 | 1,453,022 |
| Qualys, Inc. (a) | | 38,307 | 5,818,833 |
| Quantum Computing, Inc. (a)(b) | | 23,293 | 68,947 |
| Qumu Corp. (a) | | 12,633 | 8,265 |
| Rapid7, Inc. (a) | | 66,933 | 3,848,648 |
| RealNetworks, Inc. (a) | | 36,372 | 25,133 |
| Rekor Systems, Inc. (a) | | 38,679 | 54,924 |
| Rimini Street, Inc. (a) | | 39,839 | 200,789 |
| RingCentral, Inc. (a) | | 97,694 | 4,204,750 |
| Riot Blockchain, Inc. (a)(b) | | 124,061 | 889,517 |
| Roper Technologies, Inc. | | 122,556 | 49,338,594 |
| Salesforce.com, Inc. (a) | | 1,150,527 | 179,620,275 |
| Samsara, Inc. (b) | | 79,129 | 1,176,648 |
| SeaChange International, Inc. (a) | | 31,744 | 16,228 |
| SecureWorks Corp. (a) | | 11,559 | 120,214 |
| Semrush Holdings, Inc. (a)(b) | | 32,397 | 397,511 |
| SentinelOne, Inc. (a)(b) | | 213,303 | 5,825,305 |
| ServiceNow, Inc. (a) | | 231,953 | 100,811,413 |
| ShotSpotter, Inc. (a) | | 10,798 | 352,339 |
| SilverSun Technologies, Inc. (A Shares) (a) | | 1,276 | 4,657 |
| Smartsheet, Inc. (a) | | 148,173 | 4,929,716 |
| Smith Micro Software, Inc. (a)(b) | | 57,930 | 140,770 |
| Soluna Holdings, Inc. (a)(b) | | 9,112 | 27,063 |
| SoundHound AI, Inc. (a)(b) | | 129,043 | 367,773 |
| Splunk, Inc. (a) | | 187,421 | 16,873,513 |
| Sprinklr, Inc. (a)(b) | | 66,137 | 784,385 |
| Sprout Social, Inc. (a) | | 53,434 | 3,208,177 |
| SPS Commerce, Inc. (a) | | 43,206 | 5,276,317 |
| SRAX, Inc. (a)(b) | | 24,582 | 58,259 |
| Stronghold Digital Mining, Inc. Class A (b) | | 7,392 | 10,275 |
| Sumo Logic, Inc. (a) | | 108,274 | 950,646 |
| Synchronoss Technologies, Inc. (a) | | 93,028 | 150,705 |
| Synopsys, Inc. (a) | | 177,213 | 61,319,242 |
| Telos Corp. (a) | | 64,471 | 638,263 |
| Tenable Holdings, Inc. (a) | | 107,868 | 4,272,651 |
| Teradata Corp. (a) | | 123,895 | 4,076,146 |
| TeraWulf, Inc. (a)(b) | | 34,683 | 51,678 |
| TeraWulf, Inc. rights (a)(c) | | 734 | 0 |
| The Trade Desk, Inc. (a) | | 512,595 | 32,139,707 |
| Tyler Technologies, Inc. (a) | | 47,902 | 17,796,072 |
| UiPath, Inc. Class A (a)(b) | | 319,039 | 5,248,192 |
| Unity Software, Inc. (a)(b) | | 192,477 | 8,222,617 |
| Upland Software, Inc. (a) | | 34,052 | 356,524 |
| Varonis Systems, Inc. (a) | | 126,191 | 3,451,324 |
| Verb Technology Co., Inc. (a)(b) | | 80,585 | 39,632 |
| Verint Systems, Inc. (a) | | 75,501 | 3,661,043 |
| Veritone, Inc. (a)(b) | | 38,810 | 285,254 |
| Vertex, Inc. Class A (a) | | 35,227 | 481,905 |
| Viant Technology, Inc. (a) | | 15,094 | 68,225 |
| VirnetX Holding Corp. (a)(b) | | 65,333 | 133,279 |
| VMware, Inc. Class A | | 233,691 | 27,115,167 |
| Workday, Inc. Class A (a) | | 230,401 | 37,914,789 |
| Workiva, Inc. (a) | | 55,470 | 3,765,858 |
| Xperi Holding Corp. | | 119,606 | 1,902,931 |
| Yext, Inc. (a) | | 139,075 | 618,884 |
| Zendesk, Inc. (a) | | 142,070 | 10,906,714 |
| Zeta Global Holdings Corp. (a)(b) | | 30,406 | 212,842 |
| Zoom Video Communications, Inc. Class A (a) | | 263,786 | 21,208,394 |
| Zscaler, Inc. (a) | | 93,458 | 14,882,252 |
| Zuora, Inc. (a) | | 146,517 | 1,125,251 |
| | | | 4,084,543,818 |
| Technology Hardware, Storage & Peripherals - 6.4% | | | |
| 3D Systems Corp. (a) | | 150,386 | 1,523,410 |
| Apple, Inc. | | 17,803,917 | 2,799,131,753 |
| Astro-Med, Inc. (a) | | 5,791 | 74,993 |
| Avid Technology, Inc. (a) | | 40,952 | 1,120,037 |
| Boxlight Corp. (a)(b) | | 63,010 | 41,171 |
| CompoSecure, Inc. (a)(b) | | 10,605 | 61,297 |
| Corsair Gaming, Inc. (a)(b) | | 39,554 | 608,736 |
| CPI Card Group (a)(b) | | 4,457 | 85,441 |
| Dell Technologies, Inc. | | 316,635 | 12,123,954 |
| Diebold Nixdorf, Inc. (a) | | 83,376 | 290,148 |
| Eastman Kodak Co. (a)(b) | | 80,885 | 437,588 |
| Hewlett Packard Enterprise Co. | | 1,505,065 | 20,468,884 |
| HP, Inc. | | 1,220,719 | 35,046,842 |
| Immersion Corp. (a)(b) | | 33,991 | 202,586 |
| Intevac, Inc. (a) | | 29,216 | 145,788 |
| IonQ, Inc. (a)(b) | | 134,285 | 797,653 |
| Movano, Inc. (a) | | 2,476 | 6,933 |
| NetApp, Inc. | | 259,102 | 18,689,027 |
| One Stop Systems, Inc. (a) | | 16,800 | 65,856 |
| Pure Storage, Inc. Class A (a) | | 329,946 | 9,558,536 |
| Quantum Corp. (a) | | 81,500 | 127,955 |
| Seagate Technology Holdings PLC | | 229,710 | 15,381,382 |
| Socket Mobile, Inc. (a)(b) | | 6,713 | 19,535 |
| Sonim Technologies, Inc. (a) | | 12,500 | 9,566 |
| Super Micro Computer, Inc. (a) | | 51,319 | 3,339,841 |
| Transact Technologies, Inc. (a) | | 10,404 | 47,962 |
| Turtle Beach Corp. (a) | | 18,542 | 174,109 |
| Western Digital Corp. (a) | | 364,776 | 15,415,434 |
| Xerox Holdings Corp. | | 138,447 | 2,300,989 |
| | | | 2,937,297,406 |
TOTAL INFORMATION TECHNOLOGY | | | 11,939,865,781 |
| MATERIALS - 2.8% | | | |
| Chemicals - 1.8% | | | |
| Advanced Emissions Solutions, Inc. (a) | | 19,897 | 74,415 |
| AdvanSix, Inc. | | 32,467 | 1,177,253 |
| AgroFresh Solutions, Inc. (a) | | 16,647 | 26,718 |
| Air Products & Chemicals, Inc. | | 256,767 | 64,820,829 |
| Albemarle Corp. | | 135,700 | 36,362,172 |
| American Vanguard Corp. | | 30,437 | 606,609 |
| Amyris, Inc. (a)(b) | | 229,485 | 674,686 |
| Ashland, Inc. | | 59,123 | 6,016,356 |
| Aspen Aerogels, Inc. (a) | | 30,485 | 396,610 |
| Avient Corp. | | 109,732 | 4,809,554 |
| Axalta Coating Systems Ltd. (a) | | 238,421 | 6,139,341 |
| Balchem Corp. | | 36,887 | 4,862,444 |
| Cabot Corp. | | 65,187 | 4,691,508 |
| Celanese Corp. Class A | | 124,796 | 13,834,885 |
| CF Industries Holdings, Inc. | | 242,015 | 25,038,872 |
| Chase Corp. | | 8,760 | 772,282 |
| Core Molding Technologies, Inc. (a) | | 6,425 | 79,670 |
| Corteva, Inc. | | 838,474 | 51,507,458 |
| Crown ElectroKinetics Corp. (a) | | 10,703 | 4,363 |
| Danimer Scientific, Inc. (a)(b) | | 98,365 | 437,724 |
| Diversey Holdings Ltd. (a) | | 55,411 | 339,669 |
| Dow, Inc. | | 842,143 | 42,949,293 |
| DuPont de Nemours, Inc. | | 588,916 | 32,767,286 |
| Eastman Chemical Co. | | 149,957 | 13,646,087 |
| Ecolab, Inc. | | 288,369 | 47,243,493 |
| Ecovyst, Inc. | | 61,790 | 570,940 |
| Element Solutions, Inc. | | 257,785 | 4,812,846 |
| Flotek Industries, Inc. (a)(b) | | 67,360 | 66,686 |
| FMC Corp. | | 145,406 | 15,715,480 |
| FutureFuel Corp. | | 28,447 | 207,379 |
| GCP Applied Technologies, Inc. (a) | | 61,859 | 1,943,610 |
| Ginkgo Bioworks Holdings, Inc. Class A (a)(b) | | 1,105,942 | 2,974,984 |
| H.B. Fuller Co. | | 60,850 | 3,946,731 |
| Hawkins, Inc. | | 21,670 | 830,394 |
| Huntsman Corp. | | 230,558 | 6,460,235 |
| Ingevity Corp. (a) | | 44,541 | 3,124,106 |
| Innospec, Inc. | | 28,618 | 2,674,638 |
| International Flavors & Fragrances, Inc. | | 294,944 | 32,585,413 |
| Intrepid Potash, Inc. (a) | | 11,165 | 521,740 |
| Koppers Holdings, Inc. | | 25,150 | 574,175 |
| Kronos Worldwide, Inc. (b) | | 26,199 | 337,443 |
| Linde PLC | | 582,572 | 164,786,316 |
| Livent Corp. (a)(b) | | 188,554 | 6,067,668 |
| Loop Industries, Inc. (a)(b) | | 25,519 | 136,782 |
| LSB Industries, Inc. | | 48,738 | 769,086 |
| LyondellBasell Industries NV Class A | | 299,932 | 24,894,356 |
| Mativ, Inc. | | 63,705 | 1,504,712 |
| Minerals Technologies, Inc. | | 38,042 | 2,216,327 |
| NewMarket Corp. | | 7,805 | 2,241,674 |
| Northern Technologies International Corp. | | 7,022 | 81,806 |
| Olin Corp. | | 159,878 | 8,738,931 |
| Origin Materials, Inc. Class A (a)(b) | | 133,924 | 837,025 |
| Orion Engineered Carbons SA | | 69,445 | 1,170,843 |
| PPG Industries, Inc. | | 273,203 | 34,691,317 |
| PureCycle Technologies, Inc. (a)(b) | | 118,310 | 1,080,170 |
| Quaker Houghton (b) | | 15,559 | 2,712,245 |
| Rayonier Advanced Materials, Inc. (a) | | 71,838 | 324,708 |
| RPM International, Inc. | | 149,430 | 13,920,899 |
| Sensient Technologies Corp. | | 48,229 | 3,842,404 |
| Sherwin-Williams Co. | | 277,180 | 64,333,478 |
| Stepan Co. | | 24,516 | 2,555,303 |
| The Chemours Co. LLC | | 179,379 | 6,050,454 |
| The Mosaic Co. | | 419,911 | 22,620,606 |
| The Scotts Miracle-Gro Co. Class A (b) | | 46,472 | 3,111,300 |
| Tredegar Corp. | | 31,189 | 318,440 |
| Trinseo PLC | | 41,485 | 1,100,597 |
| Tronox Holdings PLC | | 132,759 | 1,942,264 |
| Valhi, Inc. | | 2,503 | 87,455 |
| Valvoline, Inc. | | 204,882 | 5,955,920 |
| Westlake Corp. | | 38,672 | 3,814,219 |
| Zymergen, Inc. (a) | | 16,194 | 38,380 |
| | | | 818,572,062 |
| Construction Materials - 0.1% | | | |
| Eagle Materials, Inc. | | 46,177 | 5,523,693 |
| Martin Marietta Materials, Inc. | | 71,987 | 25,030,600 |
| Smith-Midland Corp. (a) | | 4,497 | 103,476 |
| Summit Materials, Inc. (a) | | 136,126 | 3,868,701 |
| United States Lime & Minerals, Inc. | | 2,596 | 266,843 |
| Vulcan Materials Co. | | 153,994 | 25,638,461 |
| | | | 60,431,774 |
| Containers & Packaging - 0.4% | | | |
| Amcor PLC | | 1,745,486 | 20,963,287 |
| Aptargroup, Inc. | | 77,236 | 7,940,633 |
| Avery Dennison Corp. | | 94,461 | 17,344,929 |
| Ball Corp. | | 370,178 | 20,659,634 |
| Berry Global Group, Inc. (a) | | 151,015 | 8,204,645 |
| Crown Holdings, Inc. | | 142,377 | 12,897,932 |
| Cryptyde, Inc. (a)(b) | | 18,497 | 14,557 |
| Graphic Packaging Holding Co. | | 328,315 | 7,311,575 |
| Greif, Inc.: | | | |
| Class A (b) | | 30,613 | 2,052,602 |
| Class B | | 6,879 | 448,992 |
| International Paper Co. | | 429,473 | 17,874,666 |
| Myers Industries, Inc. | | 42,809 | 827,070 |
| O-I Glass, Inc. (a) | | 179,613 | 2,336,765 |
| Packaging Corp. of America | | 108,535 | 14,860,612 |
| Pactiv Evergreen, Inc. | | 50,528 | 560,861 |
| Ranpak Holdings Corp. (A Shares) (a) | | 45,487 | 240,626 |
| Sealed Air Corp. | | 168,128 | 9,046,968 |
| Silgan Holdings, Inc. | | 96,650 | 4,402,408 |
| Sonoco Products Co. | | 112,149 | 7,067,630 |
| TriMas Corp. | | 49,305 | 1,356,874 |
| WestRock Co. | | 294,151 | 11,939,589 |
| | | | 168,352,855 |
| Metals & Mining - 0.5% | | | |
| 5E Advanced Materials, Inc. (a) | | 32,343 | 485,145 |
| Alcoa Corp. | | 214,340 | 10,605,543 |
| Alpha Metallurgical Resources | | 20,152 | 3,166,887 |
| Ampco-Pittsburgh Corp. (a)(b) | | 13,319 | 56,872 |
| Arconic Corp. (a) | | 121,636 | 3,066,444 |
| Ascent Industries Co. (a) | | 10,179 | 170,396 |
| ATI, Inc. (a) | | 142,456 | 4,263,708 |
| Carpenter Technology Corp. | | 55,877 | 1,898,142 |
| Century Aluminum Co. (a) | | 60,936 | 470,426 |
| Cleveland-Cliffs, Inc. (a) | | 552,081 | 9,534,439 |
| Coeur d'Alene Mines Corp. (a) | | 321,880 | 888,389 |
| Commercial Metals Co. | | 140,494 | 5,691,412 |
| Compass Minerals International, Inc. | | 39,329 | 1,592,431 |
| Comstock Mining, Inc. (a)(b) | | 77,218 | 44,393 |
| Freeport-McMoRan, Inc. | | 1,680,088 | 49,730,605 |
| Friedman Industries | | 7,755 | 81,195 |
| Gatos Silver, Inc. (a) | | 51,795 | 157,457 |
| Gold Resource Corp. | | 100,269 | 170,457 |
| Golden Minerals Co. (a)(b) | | 129,922 | 33,910 |
| Haynes International, Inc. (b) | | 14,912 | 591,857 |
| Hecla Mining Co. | | 621,613 | 2,449,155 |
| Hycroft Mining Holding Corp. (a) | | 142,957 | 114,380 |
| Idaho Strategic Resources, Inc. (a)(b) | | 9,169 | 49,329 |
| Kaiser Aluminum Corp. | | 18,376 | 1,318,662 |
| Materion Corp. | | 23,585 | 2,035,621 |
| McEwen Mining, Inc. (a)(b) | | 44,042 | 135,209 |
| MP Materials Corp. (a)(b) | | 85,574 | 2,994,234 |
| Newmont Corp. | | 921,458 | 38,111,503 |
| Nucor Corp. | | 308,158 | 40,966,525 |
| Olympic Steel, Inc. | | 10,998 | 289,467 |
| Paramount Gold Nevada Corp. (a)(b) | | 2,346 | 814 |
| Piedmont Lithium, Inc. (a)(b) | | 21,131 | 1,292,161 |
| Ramaco Resources, Inc. | | 11,322 | 119,334 |
| Reliance Steel & Aluminum Co. | | 71,748 | 13,487,189 |
| Royal Gold, Inc. | | 77,276 | 7,101,664 |
| Ryerson Holding Corp. | | 19,430 | 553,755 |
| Schnitzer Steel Industries, Inc. Class A | | 29,848 | 986,178 |
| Solitario Exploration & Royalty Corp. (a)(b) | | 76,068 | 43,739 |
| Steel Dynamics, Inc. | | 206,677 | 16,682,967 |
| SunCoke Energy, Inc. | | 98,314 | 647,889 |
| TimkenSteel Corp. (a) | | 48,900 | 750,126 |
| U.S. Antimony Corp. (a)(b) | | 84,637 | 37,291 |
| U.S. Gold Corp. (a) | | 7,183 | 25,931 |
| United States Steel Corp. | | 299,591 | 6,851,646 |
| Universal Stainless & Alloy Products, Inc. (a) | | 8,491 | 67,843 |
| Warrior Metropolitan Coal, Inc. | | 59,210 | 1,927,286 |
| Worthington Industries, Inc. (b) | | 36,999 | 1,886,579 |
| | | | 233,626,585 |
| Paper & Forest Products - 0.0% | | | |
| Clearwater Paper Corp. (a) | | 19,807 | 842,590 |
| Glatfelter Corp. | | 53,142 | 258,802 |
| Louisiana-Pacific Corp. | | 94,671 | 5,134,008 |
| Mercer International, Inc. (SBI) | | 46,657 | 756,777 |
| Resolute Forest Products, Inc. (a) | | 52,803 | 1,069,789 |
| Sylvamo Corp. | | 40,563 | 1,802,620 |
| | | | 9,864,586 |
TOTAL MATERIALS | | | 1,290,847,862 |
| REAL ESTATE - 3.5% | | | |
| Equity Real Estate Investment Trusts (REITs) - 3.3% | | | |
| Acadia Realty Trust (SBI) | | 109,943 | 1,751,392 |
| Agree Realty Corp. | | 86,491 | 6,514,502 |
| Alexander & Baldwin, Inc. | | 85,420 | 1,599,917 |
| Alexanders, Inc. | | 2,616 | 619,730 |
| Alexandria Real Estate Equities, Inc. | | 172,372 | 26,441,865 |
| Alpine Income Property Trust, Inc. | | 13,880 | 251,922 |
| American Assets Trust, Inc. | | 62,669 | 1,739,691 |
| American Homes 4 Rent Class A | | 344,133 | 12,237,369 |
| American Tower Corp. | | 537,905 | 136,654,765 |
| Americold Realty Trust | | 315,242 | 9,274,420 |
| Apartment Income (REIT) Corp. | | 181,843 | 7,428,287 |
| Apartment Investment & Management Co. Class A | | 179,777 | 1,589,229 |
| Apple Hospitality (REIT), Inc. | | 245,224 | 3,901,514 |
| Armada Hoffler Properties, Inc. | | 78,742 | 1,033,882 |
| Ashford Hospitality Trust, Inc. (a) | | 39,129 | 359,204 |
| AvalonBay Communities, Inc. | | 161,879 | 32,523,110 |
| Bluerock Residential Growth (REIT), Inc. | | 31,367 | 835,931 |
| Boston Properties, Inc. | | 164,597 | 13,073,940 |
| Braemar Hotels & Resorts, Inc. | | 70,484 | 362,993 |
| Brandywine Realty Trust (SBI) | | 197,674 | 1,587,322 |
| Brixmor Property Group, Inc. | | 344,172 | 7,392,815 |
| Broadstone Net Lease, Inc. | | 197,030 | 3,771,154 |
| BRT Apartments Corp. | | 13,425 | 320,455 |
| Camden Property Trust (SBI) | | 122,687 | 15,766,506 |
| CareTrust (REIT), Inc. | | 113,206 | 2,438,457 |
| CatchMark Timber Trust, Inc. | | 58,152 | 619,319 |
| Centerspace | | 18,200 | 1,371,916 |
| Chatham Lodging Trust (a) | | 56,793 | 690,603 |
| City Office REIT, Inc. | | 51,225 | 591,649 |
| Clipper Realty, Inc. | | 15,205 | 127,874 |
| Community Healthcare Trust, Inc. | | 27,945 | 1,030,891 |
| CorEnergy Infrastructure Trust, Inc. | | 12,714 | 29,751 |
| Corporate Office Properties Trust (SBI) | | 130,226 | 3,365,040 |
| Cousins Properties, Inc. | | 172,388 | 4,628,618 |
| Creative Media & Community Trust Corp. | | 21,532 | 151,155 |
| Crown Castle International Corp. | | 501,243 | 85,627,342 |
| CTO Realty Growth, Inc. (b) | | 22,231 | 469,296 |
| CubeSmart | | 261,904 | 12,060,679 |
| DiamondRock Hospitality Co. | | 243,464 | 2,125,441 |
| Digital Realty Trust, Inc. | | 330,018 | 40,800,125 |
| Diversified Healthcare Trust (SBI) | | 270,376 | 394,749 |
| Douglas Emmett, Inc. | | 202,938 | 3,961,350 |
| Duke Realty Corp. | | 444,561 | 26,162,415 |
| Easterly Government Properties, Inc. | | 107,229 | 1,924,761 |
| EastGroup Properties, Inc. | | 49,342 | 8,142,910 |
| Empire State Realty Trust, Inc. | | 155,930 | 1,086,832 |
| EPR Properties | | 86,457 | 3,760,015 |
| Equinix, Inc. | | 105,552 | 69,386,718 |
| Equity Commonwealth | | 138,590 | 3,646,303 |
| Equity Lifestyle Properties, Inc. | | 199,786 | 14,004,999 |
| Equity Residential (SBI) | | 400,340 | 29,296,881 |
| Essential Properties Realty Trust, Inc. | | 165,869 | 3,755,274 |
| Essex Property Trust, Inc. | | 76,252 | 20,211,355 |
| Extra Space Storage, Inc. | | 156,086 | 31,018,971 |
| Farmland Partners, Inc. | | 35,854 | 520,242 |
| Federal Realty Investment Trust (SBI) | | 82,127 | 8,317,001 |
| First Industrial Realty Trust, Inc. | | 151,453 | 7,675,638 |
| Four Corners Property Trust, Inc. | | 93,275 | 2,508,165 |
| Franklin Street Properties Corp. | | 107,956 | 303,356 |
| Gaming & Leisure Properties | | 271,230 | 13,092,272 |
| Generation Income Properties, Inc. (b) | | 1,312 | 8,935 |
| Getty Realty Corp. | | 47,820 | 1,438,426 |
| Gladstone Commercial Corp. | | 46,613 | 888,910 |
| Gladstone Land Corp. | | 35,582 | 836,533 |
| Global Medical REIT, Inc. | | 72,683 | 787,884 |
| Global Net Lease, Inc. | | 122,916 | 1,692,553 |
| Global Self Storage, Inc. | | 12,441 | 72,407 |
| Healthcare Trust of America, Inc. | | 441,736 | 10,743,020 |
| Healthpeak Properties, Inc. | | 622,469 | 16,339,811 |
| Hersha Hospitality Trust (a) | | 39,699 | 385,080 |
| Highwoods Properties, Inc. (SBI) | | 121,887 | 3,706,584 |
| Host Hotels & Resorts, Inc. | | 829,744 | 14,744,551 |
| Hudson Pacific Properties, Inc. | | 167,882 | 2,217,721 |
| Independence Realty Trust, Inc. | | 254,097 | 4,942,187 |
| Indus Realty Trust, Inc. (b) | | 7,847 | 481,963 |
| Industrial Logistics Properties Trust | | 75,812 | 567,832 |
| InnSuites Hospitality Trust (b) | | 2,044 | 5,008 |
| InvenTrust Properties Corp. | | 77,828 | 2,043,763 |
| Invitation Homes, Inc. | | 706,268 | 25,623,403 |
| Iron Mountain, Inc. | | 337,218 | 17,741,039 |
| iStar Financial, Inc. | | 95,989 | 1,321,769 |
| JBG SMITH Properties | | 126,300 | 2,774,811 |
| Kilroy Realty Corp. | | 120,850 | 5,893,855 |
| Kimco Realty Corp. | | 716,397 | 15,101,649 |
| Kite Realty Group Trust | | 252,748 | 4,893,201 |
| Lamar Advertising Co. Class A | | 100,469 | 9,433,034 |
| Life Storage, Inc. | | 98,555 | 12,541,124 |
| LTC Properties, Inc. (b) | | 45,975 | 2,063,818 |
| LXP Industrial Trust (REIT) | | 331,280 | 3,332,677 |
| Medalist Diversified (REIT), Inc. | | 8,334 | 6,844 |
| Medical Properties Trust, Inc. | | 693,168 | 10,127,184 |
| Mid-America Apartment Communities, Inc. | | 135,095 | 22,381,189 |
| National Health Investors, Inc. | | 53,186 | 3,484,215 |
| National Retail Properties, Inc. | | 202,351 | 9,085,560 |
| National Storage Affiliates Trust | | 96,886 | 4,894,681 |
| Necessity Retail (REIT), Inc./The | | 156,782 | 1,169,594 |
| NETSTREIT Corp. (b) | | 56,950 | 1,119,637 |
| New York City REIT, Inc. | | 15,278 | 47,362 |
| NexPoint Residential Trust, Inc. | | 26,985 | 1,425,348 |
| Office Properties Income Trust | | 67,602 | 1,187,767 |
| Omega Healthcare Investors, Inc. | | 277,910 | 9,076,541 |
| One Liberty Properties, Inc. | | 19,665 | 474,910 |
| Orion Office (REIT), Inc. | | 65,353 | 645,034 |
| Outfront Media, Inc. | | 168,558 | 2,983,477 |
| Paramount Group, Inc. | | 226,446 | 1,569,271 |
| Park Hotels & Resorts, Inc. | | 268,444 | 3,758,216 |
| Pebblebrook Hotel Trust | | 151,504 | 2,669,500 |
| Pennsylvania Real Estate Investment Trust (SBI) (a)(b) | | 4,088 | 19,214 |
| Phillips Edison & Co., Inc. (b) | | 135,455 | 4,425,315 |
| Physicians Realty Trust | | 260,583 | 4,341,313 |
| Piedmont Office Realty Trust, Inc. Class A | | 177,644 | 2,092,646 |
| Plymouth Industrial REIT, Inc. | | 46,331 | 939,129 |
| Postal Realty Trust, Inc. | | 23,051 | 342,307 |
| Potlatch Corp. | | 82,636 | 3,835,963 |
| Presidio Property Trust, Inc.: | | | |
| Class A (b) | | 13,120 | 40,672 |
| Class A warrants 1/24/27 (a) | | 5,422 | 813 |
| Prologis (REIT), Inc. | | 856,944 | 106,698,097 |
| Public Storage | | 176,746 | 58,472,879 |
| Rayonier, Inc. | | 171,908 | 6,106,172 |
| Realty Income Corp. | | 697,186 | 47,603,860 |
| Regency Centers Corp. | | 182,308 | 11,091,619 |
| Retail Opportunity Investments Corp. | | 144,071 | 2,413,189 |
| Rexford Industrial Realty, Inc. | | 191,406 | 11,907,367 |
| RLJ Lodging Trust | | 193,042 | 2,328,087 |
| RPT Realty | | 97,613 | 940,013 |
| Ryman Hospitality Properties, Inc. | | 63,322 | 5,206,335 |
| Sabra Health Care REIT, Inc. | | 267,096 | 3,998,427 |
| Safehold, Inc. | | 18,111 | 688,761 |
| Saul Centers, Inc. | | 15,521 | 687,425 |
| SBA Communications Corp. Class A | | 124,781 | 40,585,020 |
| Service Properties Trust | | 190,175 | 1,300,797 |
| Simon Property Group, Inc. | | 381,067 | 38,861,213 |
| SITE Centers Corp. | | 210,183 | 2,723,972 |
| SL Green Realty Corp. (b) | | 74,111 | 3,273,483 |
| Sotherly Hotels, Inc. (a) | | 18,032 | 43,096 |
| Spirit Realty Capital, Inc. | | 155,055 | 6,333,997 |
| Stag Industrial, Inc. | | 206,697 | 6,366,268 |
| Store Capital Corp. | | 297,339 | 8,022,206 |
| Summit Hotel Properties, Inc. | | 122,147 | 960,075 |
| Sun Communities, Inc. | | 141,786 | 21,793,926 |
| Sunstone Hotel Investors, Inc. | | 247,309 | 2,693,195 |
| Tanger Factory Outlet Centers, Inc. | | 120,652 | 1,860,454 |
| Terreno Realty Corp. | | 87,260 | 5,321,987 |
| The Macerich Co. (b) | | 248,039 | 2,373,733 |
| UDR, Inc. | | 345,825 | 15,517,168 |
| UMH Properties, Inc. | | 60,258 | 1,087,054 |
| Uniti Group, Inc. | | 273,314 | 2,566,418 |
| Universal Health Realty Income Trust (SBI) | | 15,866 | 807,421 |
| Urban Edge Properties | | 128,294 | 2,018,065 |
| Urstadt Biddle Properties, Inc. Class A | | 43,203 | 722,354 |
| Ventas, Inc. | | 465,492 | 22,278,447 |
| Veris Residential, Inc. (a) | | 91,880 | 1,234,867 |
| VICI Properties, Inc. | | 1,114,964 | 36,782,662 |
| Vornado Realty Trust | | 183,524 | 4,811,999 |
| Washington REIT (SBI) | | 100,987 | 1,980,355 |
| Welltower Op | | 525,774 | 40,300,577 |
| Weyerhaeuser Co. | | 862,288 | 29,455,758 |
| Wheeler REIT, Inc. (a) | | 7,954 | 15,510 |
| Whitestone REIT Class B | | 56,515 | 556,108 |
| WP Carey, Inc. | | 223,688 | 18,796,503 |
| Xenia Hotels & Resorts, Inc. (a) | | 132,522 | 2,101,799 |
| | | | 1,528,786,246 |
| Real Estate Management & Development - 0.2% | | | |
| Alset Ehome International, Inc. (a) | | 69,623 | 18,798 |
| Altisource Asset Management Corp. (a)(b) | | 665 | 13,500 |
| Altisource Portfolio Solutions SA (a)(b) | | 9,264 | 108,481 |
| American Realty Investments, Inc. (a) | | 3,152 | 43,781 |
| Amrep Corp. (a) | | 3,605 | 50,218 |
| Anywhere Real Estate, Inc. (a) | | 136,779 | 1,336,331 |
| Avalon GloboCare Corp. (a)(b) | | 12,514 | 8,021 |
| CBRE Group, Inc. (a) | | 378,235 | 29,865,436 |
| Comstock Holding Companies, Inc. (a) | | 441 | 1,861 |
| Cushman & Wakefield PLC (a) | | 174,293 | 2,607,423 |
| Digitalbridge Group, Inc. (a) | | 172,047 | 3,062,437 |
| Doma Holdings, Inc. Class A (a) | | 194,481 | 117,291 |
| Douglas Elliman, Inc. (b) | | 82,503 | 380,339 |
| eXp World Holdings, Inc. (b) | | 78,622 | 1,016,582 |
| Fathom Holdings, Inc. (a)(b) | | 6,724 | 46,194 |
| Forestar Group, Inc. (a) | | 21,757 | 270,657 |
| FRP Holdings, Inc. (a) | | 7,087 | 407,644 |
| Howard Hughes Corp. (a) | | 44,313 | 2,819,636 |
| InterGroup Corp. (a) | | 287 | 14,522 |
| Jones Lang LaSalle, Inc. (a) | | 56,069 | 9,699,937 |
| Kennedy-Wilson Holdings, Inc. (b) | | 138,866 | 2,438,487 |
| Marcus & Millichap, Inc. | | 28,611 | 1,069,479 |
| Maui Land & Pineapple, Inc. (a) | | 5,834 | 56,006 |
| Newmark Group, Inc. | | 176,975 | 1,813,994 |
| Offerpad Solutions, Inc. (a)(b) | | 81,243 | 123,489 |
| Opendoor Technologies, Inc. (a)(b) | | 453,263 | 1,962,629 |
| Rafael Holdings, Inc. (a) | | 10,947 | 23,755 |
| RE/MAX Holdings, Inc. | | 26,936 | 613,063 |
| Redfin Corp. (a)(b) | | 128,176 | 1,049,761 |
| Seritage Growth Properties (a)(b) | | 42,300 | 530,442 |
| Stratus Properties, Inc. | | 7,686 | 273,698 |
| Tejon Ranch Co. (a) | | 28,302 | 446,040 |
| The RMR Group, Inc. | | 17,508 | 455,908 |
| The St. Joe Co. (b) | | 37,664 | 1,438,765 |
| Transcontinental Realty Investors, Inc. (a) | | 3,085 | 132,655 |
| Trinity Place Holdings, Inc. (a)(b) | | 24,361 | 23,440 |
| WeWork, Inc. (a) | | 242,850 | 995,685 |
| Zillow Group, Inc.: | | | |
| Class A (a) | | 59,559 | 1,989,271 |
| Class C (a)(b) | | 176,367 | 5,901,240 |
| | | | 73,226,896 |
TOTAL REAL ESTATE | | | 1,602,013,142 |
| UTILITIES - 3.0% | | | |
| Electric Utilities - 1.8% | | | |
| Allete, Inc. | | 65,796 | 3,893,807 |
| Alliant Energy Corp. | | 289,585 | 17,676,268 |
| American Electric Power Co., Inc. | | 592,923 | 59,410,885 |
| Avangrid, Inc. (b) | | 85,426 | 4,220,044 |
| Constellation Energy Corp. | | 377,867 | 30,830,169 |
| Duke Energy Corp. | | 889,779 | 95,126,273 |
| Edison International | | 444,544 | 30,126,747 |
| Entergy Corp. | | 236,789 | 27,301,772 |
| Evergy, Inc. | | 265,800 | 18,215,274 |
| Eversource Energy | | 400,371 | 35,909,275 |
| Exelon Corp. | | 1,135,702 | 49,868,675 |
| FirstEnergy Corp. | | 660,724 | 26,131,634 |
| Genie Energy Ltd. Class B | | 26,202 | 273,549 |
| Hawaiian Electric Industries, Inc. | | 126,145 | 4,934,792 |
| IDACORP, Inc. | | 58,151 | 6,352,415 |
| MGE Energy, Inc. | | 41,824 | 3,221,284 |
| NextEra Energy, Inc. | | 2,274,015 | 193,427,716 |
| NRG Energy, Inc. | | 273,598 | 11,294,125 |
| OGE Energy Corp. | | 232,846 | 9,439,577 |
| Otter Tail Corp. | | 48,122 | 3,635,136 |
| PG&E Corp. (a) | | 1,757,220 | 21,666,523 |
| Pinnacle West Capital Corp. | | 129,851 | 9,784,273 |
| PNM Resources, Inc. | | 99,743 | 4,730,810 |
| Portland General Electric Co. (b) | | 102,271 | 5,284,343 |
| PPL Corp. | | 853,881 | 24,830,859 |
| Southern Co. | | 1,228,014 | 94,643,039 |
| Via Renewables, Inc. Class A, (b) | | 14,270 | 121,723 |
| Xcel Energy, Inc. | | 630,168 | 46,789,974 |
| | | | 839,140,961 |
| Gas Utilities - 0.2% | | | |
| Atmos Energy Corp. | | 159,906 | 18,130,142 |
| Chesapeake Utilities Corp. | | 20,588 | 2,600,264 |
| National Fuel Gas Co. | | 105,139 | 7,493,257 |
| New Jersey Resources Corp. | | 111,179 | 4,907,441 |
| Northwest Natural Holding Co. | | 39,566 | 1,883,737 |
| ONE Gas, Inc. | | 62,354 | 4,880,448 |
| RGC Resources, Inc. (b) | | 8,491 | 181,453 |
| South Jersey Industries, Inc. | | 139,319 | 4,715,948 |
| Southwest Gas Corp. | | 78,668 | 6,124,304 |
| Spire, Inc. (b) | | 64,693 | 4,521,394 |
| UGI Corp. | | 243,544 | 9,619,988 |
| | | | 65,058,376 |
| Independent Power and Renewable Electricity Producers - 0.1% | | | |
| Altus Power, Inc. Class A (a) | | 48,369 | 506,907 |
| Clearway Energy, Inc.: | | | |
| Class A | | 43,313 | 1,493,432 |
| Class C | | 94,498 | 3,505,876 |
| Montauk Renewables, Inc. (a) | | 73,110 | 1,297,703 |
| Ormat Technologies, Inc. (b) | | 51,437 | 4,808,331 |
| Sunnova Energy International, Inc. (a)(b) | | 109,518 | 2,762,044 |
| The AES Corp. | | 775,466 | 19,735,610 |
| Vistra Corp. | | 499,519 | 12,363,095 |
| | | | 46,472,998 |
| Multi-Utilities - 0.8% | | | |
| Ameren Corp. | | 297,973 | 27,598,259 |
| Avista Corp. (b) | | 83,938 | 3,410,401 |
| Black Hills Corp. | | 74,757 | 5,642,658 |
| CenterPoint Energy, Inc. | | 723,017 | 22,796,726 |
| CMS Energy Corp. | | 337,417 | 22,789,144 |
| Consolidated Edison, Inc. | | 410,296 | 40,102,331 |
| Dominion Energy, Inc. | | 936,168 | 76,578,542 |
| DTE Energy Co. | | 224,158 | 29,216,754 |
| NiSource, Inc. | | 465,959 | 13,750,450 |
| NorthWestern Energy Corp. (b) | | 62,973 | 3,336,310 |
| Public Service Enterprise Group, Inc. | | 576,996 | 37,135,463 |
| Sempra Energy | | 363,610 | 59,984,742 |
| Unitil Corp. | | 18,600 | 968,874 |
| WEC Energy Group, Inc. | | 366,767 | 37,828,348 |
| | | | 381,139,002 |
| Water Utilities - 0.1% | | | |
| American States Water Co. | | 48,864 | 4,054,246 |
| American Water Works Co., Inc. | | 209,525 | 31,103,986 |
| Artesian Resources Corp. Class A | | 10,496 | 573,396 |
| Cadiz, Inc. (a)(b) | | 30,946 | 118,523 |
| California Water Service Group | | 66,360 | 3,884,051 |
| Consolidated Water Co., Inc. | | 18,442 | 298,760 |
| Essential Utilities, Inc. | | 264,133 | 12,982,137 |
| Global Water Resources, Inc. | | 12,866 | 175,235 |
| Middlesex Water Co. | | 20,856 | 1,851,387 |
| Pure Cycle Corp. (a)(b) | | 21,296 | 219,775 |
| SJW Corp. | | 32,886 | 2,114,570 |
| York Water Co. | | 16,181 | 711,479 |
| | | | 58,087,545 |
TOTAL UTILITIES | | | 1,389,898,882 |
| TOTAL COMMON STOCKS (Cost $38,620,125,969) | | | 45,706,576,719 |
| | | | |
| Nonconvertible Preferred Stocks - 0.0% |
| | | Shares | Value ($) |
| INFORMATION TECHNOLOGY - 0.0% | | | |
| Software - 0.0% | | | |
SRAX, Inc. (c) (Cost $872) | | 18,304 | 915 |
| | | | |
| U.S. Treasury Obligations - 0.0% |
| | | Principal Amount (d) | Value ($) |
U.S. Treasury Bills, yield at date of purchase 1.15% 1/26/23 (e) (Cost $4,976,735) | | 5,000,000 | 4,937,910 |
| | | | |
| Money Market Funds - 2.3% |
| | | Shares | Value ($) |
| Fidelity Cash Central Fund 2.33% (f) | | 93,111,859 | 93,130,481 |
| Fidelity Securities Lending Cash Central Fund 2.34% (f)(g) | | 936,226,546 | 936,320,169 |
| TOTAL MONEY MARKET FUNDS (Cost $1,029,450,650) | | | 1,029,450,650 |
| | | | |
| TOTAL INVESTMENT IN SECURITIES - 102.0% (Cost $39,654,554,226) | 46,740,966,194 |
NET OTHER ASSETS (LIABILITIES) - (2.0)% | (914,474,699) |
| NET ASSETS - 100.0% | 45,826,491,495 |
| | |
| Futures Contracts |
| | Number of contracts | Expiration Date | Notional Amount ($) | Value ($) | Unrealized Appreciation/ (Depreciation) ($) |
| Purchased | | | | | |
| | | | | | |
| Equity Index Contracts | | | | | |
| CME E-mini Russell 2000 Index Contracts (United States) | 173 | Sep 2022 | 15,955,790 | 873,194 | 873,194 |
| CME E-mini S&P 500 Index Contracts (United States) | 552 | Sep 2022 | 109,199,400 | 3,963,142 | 3,963,142 |
| CME E-mini S&P MidCap 400 Index Contracts (United States) | 33 | Sep 2022 | 8,019,990 | 417,540 | 417,540 |
| | | | | | |
| TOTAL FUTURES CONTRACTS | | | | | 5,253,876 |
| The notional amount of futures purchased as a percentage of Net Assets is 0.2% |
Legend
| (b) | Security or a portion of the security is on loan at period end. |
| (d) | Amount is stated in United States dollars unless otherwise noted. |
| (e) | Security or a portion of the security was pledged to cover margin requirements for futures contracts. At period end, the value of securities pledged amounted to $4,937,910. |
| (f) | Affiliated fund that is generally available only to investment companies and other accounts managed by Fidelity Investments. The rate quoted is the annualized seven-day yield of the fund at period end. A complete unaudited listing of the fund's holdings as of its most recent quarter end is available upon request. In addition, each Fidelity Central Fund's financial statements are available on the SEC's website or upon request. |
| (g) | Investment made with cash collateral received from securities on loan. |
Affiliated Central Funds
Fiscal year to date information regarding the Fund's investments in Fidelity Central Funds, including the ownership percentage, is presented below.
| Affiliate | Value, beginning of period ($) | Purchases ($) | Sales Proceeds ($) | Dividend Income ($) | Realized Gain (loss) ($) | Change in Unrealized appreciation (depreciation) ($) | Value, end of period ($) | %ownership, end of period |
| Fidelity Cash Central Fund 2.33% | 161,087,653 | 4,058,528,203 | 4,126,485,375 | 751,422 | - | - | 93,130,481 | 0.2% |
| Fidelity Securities Lending Cash Central Fund 2.34% | 911,009,120 | 1,674,444,928 | 1,649,133,879 | 7,126,091 | - | - | 936,320,169 | 2.7% |
| Total | 1,072,096,773 | 5,732,973,131 | 5,775,619,254 | 7,877,513 | - | - | 1,029,450,650 | |
| | | | | | | | | |
Amounts in the income column in the above table include any capital gain distributions from underlying funds, which are presented in the corresponding line item in the Statement of Operations, if applicable.
Amount for Fidelity Securities Lending Cash Central Fund represents the income earned on investing cash collateral, less rebates paid to borrowers and any lending agent fees associated with the loan, plus any premium payments received for lending certain types of securities.
Investment Valuation
The following is a summary of the inputs used, as of August 31, 2022, involving the Fund's assets and liabilities carried at fair value. The inputs or methodology used for valuing securities may not be an indication of the risk associated with investing in those securities. For more information on valuation inputs, and their aggregation into the levels used below, please refer to the Investment Valuation section in the accompanying Notes to Financial Statements.
| Valuation Inputs at Reporting Date: |
| Description | Total ($) | Level 1 ($) | Level 2 ($) | Level 3 ($) |
Investments in Securities: | | | | |
|
| Equities: | | | | |
Communication Services | 3,504,047,447 | 3,504,031,250 | - | 16,197 |
Consumer Discretionary | 5,248,570,421 | 5,248,568,351 | - | 2,070 |
Consumer Staples | 2,822,912,716 | 2,822,906,092 | 6,624 | - |
Energy | 2,166,766,279 | 2,166,766,279 | - | - |
Financials | 5,318,802,404 | 5,318,802,404 | - | - |
Health Care | 6,377,063,888 | 6,376,920,511 | 2 | 143,375 |
Industrials | 4,045,787,897 | 4,045,787,880 | - | 17 |
Information Technology | 11,939,866,696 | 11,939,865,781 | - | 915 |
Materials | 1,290,847,862 | 1,290,847,862 | - | - |
Real Estate | 1,602,013,142 | 1,602,013,142 | - | - |
Utilities | 1,389,898,882 | 1,389,898,882 | - | - |
|
| U.S. Government and Government Agency Obligations | 4,937,910 | - | 4,937,910 | - |
|
| Money Market Funds | 1,029,450,650 | 1,029,450,650 | - | - |
| Total Investments in Securities: | 46,740,966,194 | 46,735,859,084 | 4,944,536 | 162,574 |
Derivative Instruments: | | | | |
|
| Assets | | | | |
Futures Contracts | 5,253,876 | 5,253,876 | - | - |
| Total Assets | 5,253,876 | 5,253,876 | - | - |
| Total Derivative Instruments: | 5,253,876 | 5,253,876 | - | - |
Value of Derivative Instruments
The following table is a summary of the Fund's value of derivative instruments by primary risk exposure as of August 31, 2022. For additional information on derivative instruments, please refer to the Derivative Instruments section in the accompanying Notes to Financial Statements.
Primary Risk Exposure / Derivative Type | Value |
| Asset ($) | Liability ($) |
| Equity Risk | | |
Futures Contracts (a) | 5,253,876 | 0 |
| Total Equity Risk | 5,253,876 | 0 |
| Total Value of Derivatives | 5,253,876 | 0 |
(a)Reflects gross cumulative appreciation (depreciation) on futures contracts as presented in the Schedule of Investments. In the Statement of Assets and Liabilities, the period end daily variation margin is included in receivable or payable for daily variation margin on futures contracts, and the net cumulative appreciation (depreciation) is included in Total accumulated earnings (loss).
| Statement of Assets and Liabilities |
| | | | August 31, 2022 (Unaudited) |
| | | | | |
| Assets | | | | |
| Investment in securities, at value (including securities loaned of $903,255,812) - See accompanying schedule: | | $45,711,515,544 | | |
Unaffiliated issuers (cost $38,625,103,576) | | | |
Fidelity Central Funds (cost $1,029,450,650) | | 1,029,450,650 | | |
| | | | | |
| Total Investment in Securities (cost $39,654,554,226) | | | $ | 46,740,966,194 |
| Segregated cash with brokers for derivative instruments | | | | 4,202,182 |
| Receivable for investments sold | | | | 2,362,087 |
| Receivable for fund shares sold | | | | 12,722,654 |
| Dividends receivable | | | | 68,184,665 |
| Distributions receivable from Fidelity Central Funds | | | | 1,525,634 |
Total assets | | | | 46,829,963,416 |
| Liabilities | | | | |
| Payable to custodian bank | | $2,344,095 | | |
| Payable for fund shares redeemed | | 63,509,138 | | |
| Payable for daily variation margin on futures contracts | | 1,232,404 | | |
| Other payables and accrued expenses | | 78,589 | | |
| Collateral on securities loaned | | 936,307,695 | | |
| Total Liabilities | | | | 1,003,471,921 |
| Net Assets | | | $ | 45,826,491,495 |
| Net Assets consist of: | | | | |
| Paid in capital | | | $ | 39,182,847,440 |
| Total accumulated earnings (loss) | | | | 6,643,644,055 |
| Net Assets | | | $ | 45,826,491,495 |
Net Asset Value , offering price and redemption price per share ($45,826,491,495 ÷ 3,479,749,284 shares) | | | $ | 13.17 |
| | | | | |
| Statement of Operations |
| | | | Six months ended August 31, 2022 (Unaudited) |
| Investment Income | | | | |
| Dividends | | | $ | 371,267,318 |
| Interest | | | | 29,273 |
| Income from Fidelity Central Funds (including $7,126,091 from security lending) | | | | 7,877,513 |
| Total Income | | | | 379,174,104 |
| Expenses | | | | |
| Custodian fees and expenses | | 155,160 | | |
| Independent trustees' fees and expenses | | 74,349 | | |
| Interest | | 1,916 | | |
| Total expenses before reductions | | 231,425 | | |
| Expense reductions | | (1,081) | | |
| Total expenses after reductions | | | | 230,344 |
| Net Investment income (loss) | | | | 378,943,760 |
| Realized and Unrealized Gain (Loss) | | | | |
| Net realized gain (loss) on: | | | | |
| Investment Securities: | | | | |
| Unaffiliated issuers | | (360,751,036) | | |
| Futures contracts | | (13,834,192) | | |
| Total net realized gain (loss) | | | | (374,585,228) |
| Change in net unrealized appreciation (depreciation) on: | | | | |
| Investment Securities: | | | | |
| Unaffiliated issuers | | (4,536,341,302) | | |
| Futures contracts | | 2,481,726 | | |
| Total change in net unrealized appreciation (depreciation) | | | | (4,533,859,576) |
| Net gain (loss) | | | | (4,908,444,804) |
| Net increase (decrease) in net assets resulting from operations | | | $ | (4,529,501,044) |
| Statement of Changes in Net Assets |
| |
| | Six months ended August 31, 2022 (Unaudited) | | Year ended February 28, 2022 |
| Increase (Decrease) in Net Assets | | | | |
| Operations | | | | |
| Net investment income (loss) | $ | 378,943,760 | $ | 583,081,338 |
| Net realized gain (loss) | | (374,585,228) | | 111,891,611 |
| Change in net unrealized appreciation (depreciation) | | (4,533,859,576) | | 3,544,857,384 |
| Net increase (decrease) in net assets resulting from operations | | (4,529,501,044) | | 4,239,830,333 |
| Distributions to shareholders | | (172,065,726) | | (746,713,332) |
| Share transactions | | | | |
| Proceeds from sales of shares | | 6,153,858,337 | | 15,421,514,648 |
| Reinvestment of distributions | | 172,065,726 | | 746,713,332 |
| Cost of shares redeemed | | (3,532,852,642) | | (7,147,150,801) |
Net increase (decrease) in net assets resulting from share transactions | | 2,793,071,421 | | 9,021,077,179 |
| Total increase (decrease) in net assets | | (1,908,495,349) | | 12,514,194,180 |
| | | | | |
| Net Assets | | | | |
| Beginning of period | | 47,734,986,844 | | 35,220,792,664 |
| End of period | $ | 45,826,491,495 | $ | 47,734,986,844 |
| | | | | |
| Other Information | | | | |
| Shares | | | | |
| Sold | | 453,011,399 | | 1,036,151,268 |
| Issued in reinvestment of distributions | | 11,594,726 | | 48,340,282 |
| Redeemed | | (249,150,575) | | (473,190,529) |
| Net increase (decrease) | | 215,455,550 | | 611,301,021 |
| | | | | |
| Fidelity® Series Total Market Index Fund |
| |
| | Six months ended (Unaudited) August 31, 2022 | | Years ended February 28, 2022 | | 2021 | | 2020 A,B |
Selected Per-Share Data | | | | | | | | |
| Net asset value, beginning of period | $ | 14.62 | $ | 13.28 | $ | 10.00 | $ | 10.00 |
| Income from Investment Operations | | | | | | | | |
Net investment income (loss) C,D | | .11 | | .20 | | .18 | | .17 |
| Net realized and unrealized gain (loss) | | (1.51) | | 1.39 | | 3.34 | | (.02) |
| Total from investment operations | | (1.40) | | 1.59 | | 3.52 | | .15 |
| Distributions from net investment income | | (.03) | | (.19) | | (.18) | | (.12) |
| Distributions from net realized gain | | (.02) | | (.06) | | (.06) | | (.02) |
| Total distributions | | (.05) | | (.25) | | (.24) | | (.15) E |
| Net asset value, end of period | $ | 13.17 | $ | 14.62 | $ | 13.28 | $ | 10.00 |
Total Return F,G | | (9.60)% | | 11.87% | | 35.56% | | 1.38% |
Ratios to Average Net Assets D,H,I | | | | | | | | |
Expenses before reductions J | | -% K | | -% | | -% | | -% K |
Expenses net of fee waivers, if any J | | -% K | | -% | | -% | | -% K |
Expenses net of all reductions J | | -% K | | -% | | -% | | -% K |
| Net investment income (loss) | | 1.63% K | | 1.33% | | 1.61% | | 1.96% K |
| Supplemental Data | | | | | | | | |
| Net assets, end of period (000 omitted) | $ | 45,826,491 | $ | 47,734,987 | $ | 35,220,793 | $ | 21,966,720 |
Portfolio turnover rate L | | 14% K | | 14% | | 18% M | | 27% K,M |
A For the period April 26, 2019 (commencement of operations) through February 29, 2020.
B For the year ended February 29.
C Calculated based on average shares outstanding during the period.
D Net investment income (loss) is affected by the timing of the declaration of dividends by any underlying mutual funds or exchange-traded funds (ETFs). Net investment income (loss) of any such underlying funds is not included in the Fund's net investment income (loss) ratio.
E Total distributions per share do not sum due to rounding.
F Total returns for periods of less than one year are not annualized.
G Total returns would have been lower if certain expenses had not been reduced during the applicable periods shown.
H Fees and expenses of any underlying mutual funds or exchange-traded funds (ETFs) are not included in the Fund's expense ratio. The Fund indirectly bears its proportionate share of these expenses. For additional expense information related to investments in Fidelity Central Funds, please refer to the "Investments in Fidelity Central Funds" note found in the Notes to Financial Statements section of the most recent Annual or Semi-Annual report.
I Expense ratios reflect operating expenses of the class. Expenses before reductions do not reflect amounts reimbursed, waived, or reduced through arrangements with the investment adviser, brokerage services, or other offset arrangements, if applicable, and do not represent the amount paid by the class during periods when reimbursements, waivers or reductions occur.
J Amount represents less than .005%.
K Annualized
L Amount does not include the portfolio activity of any underlying mutual funds or exchange-traded funds (ETFs).
M Portfolio turnover rate excludes securities received or delivered in-kind.
For the period ended August 31, 2022
1. Organization.
Fidelity Series Total Market Index Fund (the Fund) is a fund of Fidelity Concord Street Trust (the Trust) and is authorized to issue an unlimited number of shares. Shares are offered only to certain other Fidelity funds, Fidelity managed 529 plans, and Fidelity managed collective investment trusts. The Trust is registered under the Investment Company Act of 1940, as amended (the 1940 Act), as an open-end management investment company organized as a Massachusetts business trust.
2. Investments in Fidelity Central Funds.
Funds may invest in Fidelity Central Funds, which are open-end investment companies generally available only to other investment companies and accounts managed by the investment adviser and its affiliates. The Schedule of Investments lists any Fidelity Central Funds held as an investment as of period end, but does not include the underlying holdings of each Fidelity Central Fund. An investing fund indirectly bears its proportionate share of the expenses of the underlying Fidelity Central Funds.
Based on its investment objective, each Fidelity Central Fund may invest or participate in various investment vehicles or strategies that are similar to those of the investing fund. These strategies are consistent with the investment objectives of the investing fund and may involve certain economic risks which may cause a decline in value of each of the Fidelity Central Funds and thus a decline in the value of the investing fund.
| Fidelity Central Fund | Investment Manager | Investment Objective | Investment Practices | Expense Ratio A |
| Fidelity Money Market Central Funds | Fidelity Management & Research Company LLC (FMR) | Each fund seeks to obtain a high level of current income consistent with the preservation of capital and liquidity. | Short-term Investments | Less than .005% |
A Expenses expressed as a percentage of average net assets and are as of each underlying Central Fund's most recent annual or semi-annual shareholder report.
A complete unaudited list of holdings for each Fidelity Central Fund is available upon request or at the Securities and Exchange Commission website at www.sec.gov. In addition, the financial statements of the Fidelity Central Funds which contain the significant accounting policies (including investment valuation policies) of those funds, and are not covered by the Report of Independent Registered Public Accounting Firm, are available on the Securities and Exchange Commission website or upon request.
3. Significant Accounting Policies.
The Fund is an investment company and applies the accounting and reporting guidance of the Financial Accounting Standards Board (FASB) Accounting Standards Codification Topic 946 Financial Services - Investment Companies . The financial statements have been prepared in conformity with accounting principles generally accepted in the United States of America (GAAP), which require management to make certain estimates and assumptions at the date of the financial statements. Actual results could differ from those estimates. Subsequent events, if any, through the date that the financial statements were issued have been evaluated in the preparation of the financial statements. The Fund's Schedule of Investments lists any underlying mutual funds or exchange-traded funds (ETFs) but does not include the underlying holdings of these funds. The following summarizes the significant accounting policies of the Fund:
Investment Valuation. Investments are valued as of 4:00 p.m. Eastern time on the last calendar day of the period. The Board of Trustees (the Board) has delegated the day to day responsibility for the valuation of the Fund's investments to the Fair Value Committee (the Committee) established by the Fund's investment adviser. In accordance with valuation policies and procedures approved by the Board, the Fund attempts to obtain prices from one or more third party pricing vendors or brokers to value its investments. When current market prices, quotations or currency exchange rates are not readily available or reliable, investments will be fair valued in good faith by the Committee, in accordance with procedures adopted by the Board. Factors used in determining fair value vary by investment type and may include market or investment specific events, changes in interest rates and credit quality. The frequency with which these procedures are used cannot be predicted and they may be utilized to a significant extent. The Committee oversees the Fund's valuation policies and procedures and reports to the Board on the Committee's activities and fair value determinations. The Board monitors the appropriateness of the procedures used in valuing the Fund's investments and ratifies the fair value determinations of the Committee.
The Fund categorizes the inputs to valuation techniques used to value its investments into a disclosure hierarchy consisting of three levels as shown below:
Level 1 - unadjusted quoted prices in active markets for identical investments
Level 2 - other significant observable inputs (including quoted prices for similar investments, interest rates, prepayment speeds, etc.)
Level 3 - unobservable inputs (including the Fund's own assumptions based on the best information available)
Valuation techniques used to value the Fund's investments by major category are as follows:
Equity securities, including restricted securities, for which market quotations are readily available, are valued at the last reported sale price or official closing price as reported by a third party pricing vendor on the primary market or exchange on which they are traded and are categorized as Level 1 in the hierarchy. In the event there were no sales during the day or closing prices are not available, securities are valued at the last quoted bid price or may be valued using the last available price and are generally categorized as Level 2 in the hierarchy. For foreign equity securities, when market or security specific events arise, comparisons to the valuation of American Depositary Receipts (ADRs), futures contracts, ETFs and certain indexes as well as quoted prices for similar securities may be used and would be categorized as Level 2 in the hierarchy. For equity securities, including restricted securities, where observable inputs are limited, assumptions about market activity and risk are used and these securities may be categorized as Level 3 in the hierarchy.
Debt securities, including restricted securities, are valued based on evaluated prices received from third party pricing vendors or from brokers who make markets in such securities. U.S. government and government agency obligations are valued by pricing vendors who utilize matrix pricing which considers yield or price of bonds of comparable quality, coupon, maturity and type or by broker-supplied prices. When independent prices are unavailable or unreliable, debt securities may be valued utilizing pricing methodologies which consider similar factors that would be used by third party pricing vendors. Debt securities are generally categorized as Level 2 in the hierarchy but may be Level 3 depending on the circumstances.
Futures contracts are valued at the settlement price established each day by the board of trade or exchange on which they are traded and are categorized as Level 1 in the hierarchy. Investments in open-end mutual funds, including the Fidelity Central Funds, are valued at their closing net asset value (NAV) each business day and are categorized as Level 1 in the hierarchy.
Changes in valuation techniques may result in transfers in or out of an assigned level within the disclosure hierarchy. The aggregate value of investments by input level as of August 31, 2022 is included at the end of the Fund's Schedule of Investments.
Investment Transactions and Income. For financial reporting purposes, the Fund's investment holdings and NAV include trades executed through the end of the last business day of the period. The NAV per share for processing shareholder transactions is calculated as of the close of business of the New York Stock Exchange (NYSE), normally 4:00 p.m. Eastern time and includes trades executed through the end of the prior business day. Gains and losses on securities sold are determined on the basis of identified cost and include proceeds received from litigation. Commissions paid to certain brokers with whom the investment adviser, or its affiliates, places trades on behalf of a fund include an amount in addition to trade execution, which may be rebated back to a fund. Any such rebates are included in net realized gain (loss) on investments in the Statement of Operations. Dividend income is recorded on the ex-dividend date, except for certain dividends from foreign securities where the ex-dividend date may have passed, which are recorded as soon as the Fund is informed of the ex-dividend date. Non-cash dividends included in dividend income, if any, are recorded at the fair market value of the securities received. Income and capital gain distributions from Fidelity Central Funds, if any, are recorded on the ex-dividend date. Certain distributions received by the Fund represent a return of capital or capital gain. The Fund determines the components of these distributions subsequent to the ex-dividend date, based upon receipt of tax filings or other correspondence relating to the underlying investment. These distributions are recorded as a reduction of cost of investments and/or as a realized gain. Interest income is accrued as earned and includes coupon interest and amortization of premium and accretion of discount on debt securities as applicable. Investment income is recorded net of foreign taxes withheld where recovery of such taxes is uncertain.
Expenses. Expenses directly attributable to a fund are charged to that fund. Expenses attributable to more than one fund are allocated among the respective funds on the basis of relative net assets or other appropriate methods. Expenses included in the accompanying financial statements reflect the expenses of that fund and do not include any expenses associated with any underlying mutual funds or exchange-traded funds. Although not included in a fund's expenses, a fund indirectly bears its proportionate share of these expenses through the net asset value of each underlying mutual fund or exchange-traded fund. Expense estimates are accrued in the period to which they relate and adjustments are made when actual amounts are known.
Income Tax Information and Distributions to Shareholders. Each year, the Fund intends to qualify as a regulated investment company under Subchapter M of the Internal Revenue Code, including distributing substantially all of its taxable income and realized gains. As a result, no provision for U.S. Federal income taxes is required. The Fund files a U.S. federal tax return, in addition to state and local tax returns as required. The Fund's federal income tax returns are subject to examination by the Internal Revenue Service (IRS) for a period of three fiscal years after they are filed. State and local tax returns may be subject to examination for an additional fiscal year depending on the jurisdiction.
Distributions are declared and recorded on the ex-dividend date. Income and capital gain distributions are determined in accordance with income tax regulations, which may differ from GAAP.
Capital accounts within the financial statements are adjusted for permanent book-tax differences. These adjustments have no impact on net assets or the results of operations. Capital accounts are not adjusted for temporary book-tax differences which will reverse in a subsequent period.
Book-tax differences are primarily due to futures contracts, foreign currency transactions, passive foreign investment companies (PFIC), partnerships, certain deemed distributions and losses deferred due to wash sales.
As of period end, the cost and unrealized appreciation (depreciation) in securities, and derivatives if applicable, for federal income tax purposes were as follows:
| Gross unrealized appreciation | $ 10,386,371,883 |
| Gross unrealized depreciation | (4,134,886,602) |
| Net unrealized appreciation (depreciation) | $ 6,251,485,281 |
| Tax cost | $40,494,734,789 |
4. Derivative Instruments.
Risk Exposures and the Use of Derivative Instruments. Investment objectives allow a fund to enter into various types of derivative contracts, including futures contracts. Derivatives are investments whose value is primarily derived from underlying assets, indices or reference rates and may be transacted on an exchange or over-the-counter (OTC). Derivatives may involve a future commitment to buy or sell a specified asset based on specified terms, to exchange future cash flows at periodic intervals based on a notional principal amount, or for one party to make one or more payments upon the occurrence of specified events in exchange for periodic payments from the other party.
Derivatives were used to increase returns and to manage exposure to certain risks as defined below. The success of any strategy involving derivatives depends on analysis of numerous economic factors, and if the strategies for investment do not work as intended, the objectives may not be achieved.
Derivatives were used to increase or decrease exposure to the following risk(s):
| Equity Risk | Equity risk relates to the fluctuations in the value of financial instruments as a result of changes in market prices (other than those arising from interest rate risk or foreign exchange risk), whether caused by factors specific to an individual investment, its issuer, or all factors affecting all instruments traded in a market or market segment. |
Funds are also exposed to additional risks from investing in derivatives, such as liquidity risk and counterparty credit risk. Liquidity risk is the risk that a fund will be unable to close out the derivative in the open market in a timely manner. Counterparty credit risk is the risk that the counterparty will not be able to fulfill its obligation to a fund. Counterparty credit risk related to exchange-traded contracts may be mitigated by the protection provided by the exchange on which they trade.
Investing in derivatives may involve greater risks than investing in the underlying assets directly and, to varying degrees, may involve risk of loss in excess of any initial investment and collateral received and amounts recognized in the Statement of Assets and Liabilities. In addition, there may be the risk that the change in value of the derivative contract does not correspond to the change in value of the underlying instrument.
Futures Contracts. A futures contract is an agreement between two parties to buy or sell a specified underlying instrument for a fixed price at a specified future date. Futures contracts were used to manage exposure to the stock market.
Upon entering into a futures contract, a fund is required to deposit either cash or securities (initial margin) with a clearing broker in an amount equal to a certain percentage of the face value of the contract. Futures contracts are marked-to-market daily and subsequent daily payments are made or received by a fund depending on the daily fluctuations in the value of the futures contracts and are recorded as unrealized appreciation or (depreciation). This receivable and/or payable, if any, is included in daily variation margin on futures contracts in the Statement of Assets and Liabilities. Realized gain or (loss) is recorded upon the expiration or closing of a futures contract. The net realized gain (loss) and change in net unrealized appreciation (depreciation) on futures contracts during the period is presented in the Statement of Operations.
Any open futures contracts at period end are presented in the Schedule of Investments under the caption "Futures Contracts". The notional amount at value reflects each contract's exposure to the underlying instrument or index at period end, and is representative of volume of activity during the period unless an average notional amount is presented. Any securities deposited to meet initial margin requirements are identified in the Schedule of Investments. Any cash deposited to meet initial margin requirements is presented as segregated cash with brokers for derivative instruments in the Statement of Assets and Liabilities.
5. Purchases and Sales of Investments.
Purchases and sales of securities, other than short-term securities, U.S. government securities and in-kind transactions, as applicable, are noted in the table below.
| | Purchases ($) | Sales ($) |
| Fidelity Series Total Market Index Fund | 6,502,577,293 | 3,263,839,929 |
6. Fees and Other Transactions with Affiliates.
Management Fee. Fidelity Management & Research Company LLC (the investment adviser) and its affiliates provide the Fund with investment management related services for which the Fund does not pay a management fee. Under the management contract, the investment adviser or an affiliate pays all ordinary operating expenses of the Fund, except custody fees, fees and expenses of the independent Trustees, and certain miscellaneous expenses such as proxy and shareholder meeting expenses.
Sub-Adviser. Geode Capital Management, LLC (Geode), serves as sub-adviser for the Fund. Geode provides discretionary investment advisory services to the Fund and is paid by the investment adviser for providing these services.
Interfund Lending Program. Pursuant to an Exemptive Order issued by the Securities and Exchange Commission (the SEC), the Fund, along with other registered investment companies having management contracts with Fidelity Management & Research Company LLC (FMR), or other affiliated entities of FMR, may participate in an interfund lending program. This program provides an alternative credit facility allowing the Fund to borrow from, or lend money to, other participating affiliated funds. At period end, there were no interfund loans outstanding. Activity in this program during the period for which loans were outstanding was as follows:
| | Borrower or Lender | Average Loan Balance | Weighted Average Interest Rate | Interest Expense |
| Fidelity Series Total Market Index Fund | Borrower | $ 66,648,000 | 1.03% | $ 1,916 |
Interfund Trades. Funds may purchase from or sell securities to other Fidelity Funds under procedures adopted by the Board. The procedures have been designed to ensure these interfund trades are executed in accordance with Rule 17a-7 of the 1940 Act. Any interfund trades are included within the respective purchases and sales amounts shown in the Purchases and Sales of Investments note. During the period, there were no interfund trades.
7. Committed Line of Credit.
Certain Funds participate with other funds managed by the investment adviser or an affiliate in a $4.25 billion credit facility (the "line of credit") to be utilized for temporary or emergency purposes to fund shareholder redemptions or for other short-term liquidity purposes. The commitment fees on the pro-rata portion of the line of credit are borne by the investment adviser. During the period, there were no borrowings on this line of credit.
8. Security Lending.
Funds lend portfolio securities from time to time in order to earn additional income. Lending agents are used, including National Financial Services (NFS), an affiliate of the investment adviser. Pursuant to a securities lending agreement, NFS will receive a fee, which is capped at 9.9% of a fund's daily lending revenue, for its services as lending agent. A fund may lend securities to certain qualified borrowers, including NFS. On the settlement date of the loan, a fund receives collateral (in the form of U.S. Treasury obligations, letters of credit and/or cash) against the loaned securities and maintains collateral in an amount not less than 100% of the market value of the loaned securities during the period of the loan. The market value of the loaned securities is determined at the close of business of a fund and any additional required collateral is delivered to a fund on the next business day. A fund or borrower may terminate the loan at any time, and if the borrower defaults on its obligation to return the securities loaned because of insolvency or other reasons, a fund may apply collateral received from the borrower against the obligation. A fund may experience delays and costs in recovering the securities loaned. Any cash collateral received is invested in the Fidelity Securities Lending Cash Central Fund. Any loaned securities are identified as such in the Schedule of Investments, and the value of loaned securities and cash collateral at period end, as applicable, are presented in the Statement of Assets and Liabilities. Security lending income represents the income earned on investing cash collateral, less rebates paid to borrowers and any lending agent fees associated with the loan, plus any premium payments received for lending certain types of securities. Security lending income is presented in the Statement of Operations as a component of income from Fidelity Central Funds. Affiliated security lending activity, if any, was as follows:
| | Total Security Lending Fees Paid to NFS | Security Lending Income From Securities Loaned to NFS | Value of Securities Loaned to NFS at Period End |
| Fidelity Series Total Market Index Fund | $ 736,063 | $ 256,269 | $5,734,159 |
9. Expense Reductions.
Through arrangements with the Fund's custodian, credits realized as a result of certain uninvested cash balances were used to reduce the Fund's expenses by $1,081.
10. Other.
A fund's organizational documents provide former and current trustees and officers with a limited indemnification against liabilities arising in connection with the performance of their duties to the fund. In the normal course of business, a fund may also enter into contracts that provide general indemnifications. A fund's maximum exposure under these arrangements is unknown as this would be dependent on future claims that may be made against a fund. The risk of material loss from such claims is considered remote.
At the end of the period, mutual funds and accounts managed by the investment adviser or its affiliates were the owners of record of all of the outstanding shares of the Fund.
11. Risk and Uncertainties.
Many factors affect a fund's performance. Developments that disrupt global economies and financial markets, such as pandemics, epidemics, outbreaks of infectious diseases, war, terrorism, and environmental disasters, may significantly affect a fund's investment performance. The effects of these developments to a fund will be impacted by the types of securities in which a fund invests, the financial condition, industry, economic sector, and geographic location of an issuer, and a fund's level of investment in the securities of that issuer.
As a shareholder, you incur two types of costs: (1) transaction costs, which may include sales charges (loads) on purchase payments or redemption proceeds, as applicable and (2) ongoing costs, which generally include management fees, distribution and/or service (12b-1) fees and other Fund expenses. This Example is intended to help you understand your ongoing costs (in dollars) of investing in a fund and to compare these costs with the ongoing costs of investing in other mutual funds.
| The Example is based on an investment of $1,000 invested at the beginning of the period and held for the entire period (March 1, 2022 to August 31, 2022). |
Actual Expenses
The first line of the accompanying table provides information about actual account values and actual expenses. You may use the information in this line, together with the amount you invested, to estimate the expenses that you paid over the period. Simply divide your account value by $1,000.00 (for example, an $8,600 account value divided by $1,000.00 = 8.6), then multiply the result by the number in the first line for a class/Fund under the heading entitled "Expenses Paid During Period" to estimate the expenses you paid on your account during this period. If any fund is a shareholder of any underlying mutual funds or exchange-traded funds (ETFs) (the Underlying Funds), such fund indirectly bears its proportional share of the expenses of the Underlying Funds in addition to the direct expenses incurred presented in the table. These fees and expenses are not included in the annualized expense ratio used to calculate the expense estimate in the table below.
Hypothetical Example for Comparison Purposes
The second line of the accompanying table provides information about hypothetical account values and hypothetical expenses based on the actual expense ratio and an assumed rate of return of 5% per year before expenses, which is not the actual return. The hypothetical account values and expenses may not be used to estimate the actual ending account balance or expenses you paid for the period. You may use this information to compare the ongoing costs of investing in the Fund and other funds. To do so, compare this 5% hypothetical example with the 5% hypothetical examples that appear in the shareholder reports of the other funds. If any fund is a shareholder of any Underlying Funds, such fund indirectly bears its proportional share of the expenses of the Underlying Funds in addition to the direct expenses as presented in the table. These fees and expenses are not included in the annualized expense ratio used to calculate the expense estimate in the table below.
Please note that the expenses shown in the table are meant to highlight your ongoing costs only and do not reflect any transaction costs. Therefore, the second line of the table is useful in comparing ongoing costs only, and will not help you determine the relative total costs of owning different funds. In addition, if these transactional costs were included, your costs would have been higher.
| | | | | Annualized Expense Ratio- A | | Beginning Account Value March 1, 2022 | | Ending Account Value August 31, 2022 | | Expenses Paid During Period- C March 1, 2022 to August 31, 2022 |
| | | | | | | | | | |
| Fidelity® Series Total Market Index Fund | | | | -%- D | | | | | | |
| Actual | | | | | | $ 1,000 | | $ 904.00 | | $- E |
Hypothetical- B | | | | | | $ 1,000 | | $ 1,025.21 | | $- E |
| |
A Annualized expense ratio reflects expenses net of applicable fee waivers.
B 5% return per year before expenses
C Expenses are equal to the annualized expense ratio, multiplied by the average account value over the period, multiplied by 184/ 365 (to reflect the one-half year period). The fees and expenses of any Underlying Funds are not included in each annualized expense ratio.
D Amount represents less than .005%.
E Amount represents less than $.005.
Fidelity Series Total Market Index Fund
Each year, the Board of Trustees, including the Independent Trustees (together, the Board), votes on the renewal of the management contract with Fidelity Management & Research Company LLC (FMR) and the sub-advisory agreement (Sub-Advisory Agreement) for the fund with Geode Capital Management, LLC (Geode) (together, the Advisory Contracts). FMR and Geode are referred to herein as the Investment Advisers. The Board, assisted by the advice of fund counsel and Independent Trustees' counsel, requests and considers a broad range of information relevant to the renewal of the Advisory Contracts throughout the year.
The Board meets regularly and, at each of its meetings, covers an extensive agenda of topics and materials and considers factors that are relevant to its annual consideration of the renewal of the fund's Advisory Contracts, including the services and support provided to the fund and its shareholders. The Board has established various standing committees (Committees), each composed of and chaired by Independent Trustees with varying backgrounds, to which the Board has assigned specific subject matter responsibilities in order to enhance effective decision-making by the Board. The Board, acting directly and through its Committees, requests and receives information concerning the annual consideration of the renewal of the fund's Advisory Contracts. The Board also meets as needed to review matters specifically related to the Board's annual consideration of the renewal of the Advisory Contracts. Members of the Board may also meet with trustees of other Fidelity funds through joint ad hoc committees to discuss certain matters relevant to all of the Fidelity funds.
At its May 2022 meeting, the Board unanimously determined to renew the fund's Advisory Contracts. In considering whether to renew the Advisory Contracts for the fund, the Board considered all factors it believed relevant and reached a determination, with the assistance of fund counsel and Independent Trustees' counsel and through the exercise of its business judgment, that the renewal of the Advisory Contracts was in the best interests of the fund and its shareholders and the fact that no fee is payable under the management contract was fair and reasonable.
Nature, Extent, and Quality of Services Provided. The Board considered staffing as it relates to the fund, including the backgrounds of investment personnel of Fidelity and Geode, and also considered the fund's investment objective, strategies, and related investment philosophy. The Independent Trustees also had discussions with senior management of Fidelity's investment operations and investment groups and with senior management of Geode. The Board considered the structure of the investment personnel compensation programs and whether the structures provide appropriate incentives to act in the best interests of the fund. The Board also considered the steps Fidelity had taken to ensure the continued provision of high quality services to the Fidelity funds during the COVID-19 pandemic, including the expansion of staff in client facing positions to maintain service levels in periods of high volumes and volatility.
The Trustees also discussed with representatives of Fidelity, at meetings throughout the year, Fidelity's role in, among other things, overseeing compliance with federal securities laws and other applicable requirements by Geode with respect to the fund and monitoring and overseeing the performance and investment capabilities of Geode. The Trustees considered that the Board had received from Fidelity periodic reports about its oversight and due diligence processes, as well as periodic reports regarding the performance of Geode.
The Board also considered the nature, extent and quality of services provided by Geode. The Trustees noted that under the Sub-Advisory Agreement, subject to oversight by Fidelity, Geode is responsible for, among other things, identifying investments and arranging for execution of portfolio transactions to implement the fund's investment strategy. In addition, the Trustees noted that Geode is responsible for providing such reporting as may be requested by Fidelity to fulfill its oversight responsibilities discussed above.
Resources Dedicated to Investment Management and Support Services . The Board and the Fund Oversight and Research Committees reviewed the general qualifications and capabilities of Fidelity's and Geode's investment staffs, including their size, education, experience, and resources, as well as Fidelity's and Geode's approach to recruiting, training, managing, and compensating investment personnel. The Board noted the resources devoted to expansion of Fidelity's global investment organization, and that Fidelity's analysts have extensive resources, tools, and capabilities that allow them to conduct sophisticated quantitative and fundamental analysis, as well as credit analysis of issuers, counterparties, and guarantors. The Board considered that Fidelity's and Geode's investment professionals have extensive resources, tools and capabilities so as to provide competitive investment results over time, and that those professionals also have access to sophisticated tools that permit them to assess portfolio construction and risk and performance attribution characteristics continuously. Additionally, in its deliberations, the Board considered Fidelity's and Geode's trading, risk management, compliance, and technology and operations capabilities and resources, which are integral parts of the investment management process.
Administrative Services . The Board considered (i) the nature, extent, quality, and cost of advisory and administrative services performed by the Investment Advisers and their affiliates under the Advisory Contracts and under separate agreements covering transfer agency, pricing and bookkeeping, and securities lending services for the fund; (ii) the nature and extent of the supervision of third party service providers, principally custodians, subcustodians, and pricing vendors; and (iii) the resources devoted to, and the record of compliance with, the fund's compliance policies and procedures. The Board also reviewed the allocation of fund brokerage, including allocations to brokers affiliated with the Investment Advisers, the use of brokerage commissions to pay fund expenses, and the use of "soft" commission dollars to pay for research services.
Investment Performance . The Board considered whether the fund has operated in accordance with its investment objective, as well as its record of compliance with its investment restrictions. The Board reviewed the fund's absolute investment performance, as well as the fund's relative investment performance, but did not consider performance to be a material factor in its decision to renew the fund's Advisory Contracts, as the fund is not publicly offered as a stand-alone investment product. In this regard, the Board noted that the fund is designed to offer an investment option for other investment companies, 529 plans, and collective investment trusts managed by Fidelity and ultimately to enhance the performance of those investment companies, 529 plans, and collective investment trusts.
Based on its review, the Board concluded that the nature, extent, and quality of services provided to the fund under the Advisory Contracts should continue to benefit the shareholders of the fund.
Competitiveness of Management Fee and Total Expense Ratio. The Board considered that the fund does not pay FMR a management fee for investment advisory services, but that FMR receives fees for providing services to funds that invest in the fund. The Board noted that FMR or an affiliate undertakes to pay all operating expenses of the fund, except transfer agent fees, 12b-1 fees, Independent Trustee fees and expenses, custodian fees and expenses, proxy and shareholder meeting expenses, interest, taxes, and extraordinary expenses (such as litigation expenses). The Board further noted that the fund pays its non-operating expenses, including brokerage commissions and fees and expenses associated with the fund's securities lending program, if applicable.
The Board further considered that FMR has contractually agreed to reimburse the fund to the extent that total operating expenses, with certain exceptions, as a percentage of its average net assets, exceed 0.003% through June 30, 2025.
Based on its review, the Board considered that the fund does not pay a management fee and concluded that the total expense ratio of the fund was reasonable in light of the services that the fund and its shareholders receive and the other factors considered.
Costs of the Services and Profitability . The Board considered the level of Fidelity's profits in respect of all the Fidelity funds.
A public accounting firm has been engaged annually by the Board as part of the Board's assessment of Fidelity's profitability analysis. The engagement includes the review and assessment of the methodologies used by Fidelity in determining the revenues and expenses attributable to Fidelity's mutual fund business, and completion of agreed-upon procedures in respect of the mathematical accuracy of certain fund profitability information and its conformity to established allocation methodologies. After considering the reports issued under the engagement and information provided by Fidelity, the Board concluded that while other allocation methods may also be reasonable, Fidelity's profitability methodologies are reasonable in all material respects.
The Board also reviewed Fidelity's and Geode's non-fund businesses and potential indirect benefits such businesses may have received as a result of their association with Fidelity's mutual fund business (i.e., fall-out benefits) as well as cases where Fidelity's and Geode's affiliates may benefit from the funds' business. The Board considered areas where potential indirect benefits to the Fidelity funds from their relationships with Fidelity may exist. The Board's consideration of these matters was informed by the findings of a joint ad hoc committee created by it and the boards of other Fidelity funds to evaluate potential fall-out benefits.
The Board concluded that the costs of the services provided by and the profits realized by Fidelity and Geode in connection with the operation of the fund were not relevant to the renewal of the Advisory Contracts because the fund pays no advisory fees and FMR bears all expenses of the fund with certain exceptions.
The Board also considered information regarding the profitability of Geode's relationship with the fund.
Economies of Scale. The Board concluded that because the fund pays no advisory fees and FMR bears all expenses of the fund with certain exceptions, the realization of economies of scale was not a material factor in the Board's decision to renew the fund's Advisory Contracts.
Additional Information Requested by the Board. In order to develop fully the factual basis for consideration of the Fidelity funds' advisory contracts, the Board requested and received additional information on certain topics, including: (i) fund flow and performance trends, in particular the underperformance of certain funds and strategies, and Fidelity's long-term strategies for certain funds, including any consideration of fund liquidations or mergers; (ii) the operation of performance fees, competitor use of performance fees, and consideration of the expansion of performance fees to additional funds; (iii) Fidelity's pricing philosophy compared to competitors; (iv) fund profitability methodology and data; (v) evaluation of competitive fund data and peer group classifications and fee and expense comparisons; (vi) the management fee and expense structures for different funds and classes and information about the differences between various fee and expense structures; (vii) group fee breakpoints and related voluntary fee waivers; and (viii) information regarding other accounts managed by Fidelity and the funds' sub-advisory arrangements.
Based on its evaluation of all of the conclusions noted above, and after considering all factors it believed relevant, the Board concluded that the advisory and sub-advisory fee arrangements are fair and reasonable and that the fund's Advisory Contracts should be renewed.
1.9892982.103
STX-SANN-1022
Fidelity Flex® Funds
Fidelity Flex® 500 Index Fund
Semi-Annual Report
August 31, 2022
Contents
To view a fund's proxy voting guidelines and proxy voting record for the 12-month period ended June 30, visit http://www.fidelity.com/proxyvotingresults or visit the Securities and Exchange Commission's (SEC) web site at http://www.sec.gov.
You may also call 1-800-544-3455 (for managed account clients) or 1-800-835-5092 (for retirement plan participants) to request a free copy of the proxy voting guidelines.
Standard & Poor's ® ; and S&P ® ; are registered trademarks of Standard & Poor's Financial Services LLC ("S&P") and Dow Jones ® ; is a registered trademark of Dow Jones Trademark Holdings LLC ("Dow Jones"). The fund is not sponsored, endorsed, sold or promoted by SPDJI, Dow Jones, S&P, or their respective affiliates and none of such parties make any representation regarding the advisability of investing in such product(s) nor do they have any liability for any errors, omissions, or interruptions of the index or indices.
Standard & Poor's, S&P and S&P 500 are registered service marks of The McGraw-Hill Companies, Inc. and have been licensed for use by Fidelity Distributors Corporation.
Other third-party marks appearing herein are the property of their respective owners.
All other marks appearing herein are registered or unregistered trademarks or service marks of FMR LLC or an affiliated company. © 2022 FMR LLC. All rights reserved.
This report and the financial statements contained herein are submitted for the general information of the shareholders of the Fund. This report is not authorized for distribution to prospective investors in the Fund unless preceded or accompanied by an effective prospectus.
A fund files its complete schedule of portfolio holdings with the SEC for the first and third quarters of each fiscal year on Form N-PORT. Forms N-PORT are available on the SEC's web site at http://www.sec.gov. A fund's Forms N-PORT may be reviewed and copied at the SEC's Public Reference Room in Washington, DC. Information regarding the operation of the SEC's Public Reference Room may be obtained by calling 1-800-SEC-0330.
For a complete list of a fund's portfolio holdings, view the most recent holdings listing, semiannual report, or annual report on Fidelity's web site at http://www.fidelity.com, http://www.institutional.fidelity.com, or http://www.401k.com, as applicable.
NOT FDIC INSURED •MAY LOSE VALUE •NO BANK GUARANTEE
Neither the Fund nor Fidelity Distributors Corporation is a bank.
Top Holdings (% of Fund's net assets) |
| |
| Apple, Inc. | 7.2 | |
| Microsoft Corp. | 5.8 | |
| Amazon.com, Inc. | 3.3 | |
| Tesla, Inc. | 2.1 | |
| Alphabet, Inc. Class A | 1.9 | |
| Alphabet, Inc. Class C | 1.8 | |
| Berkshire Hathaway, Inc. Class B | 1.5 | |
| UnitedHealth Group, Inc. | 1.4 | |
| Johnson & Johnson | 1.3 | |
| Exxon Mobil Corp. | 1.2 | |
| | 27.5 | |
| |
| Market Sectors (% of Fund's net assets) |
| |
| Information Technology | 27.2 | |
| Health Care | 14.0 | |
| Consumer Discretionary | 11.4 | |
| Financials | 10.8 | |
| Communication Services | 8.4 | |
| Industrials | 7.9 | |
| Consumer Staples | 6.7 | |
| Energy | 4.6 | |
| Utilities | 3.1 | |
| Real Estate | 2.8 | |
| Materials | 2.5 | |
| |
Asset Allocation (% of Fund's net assets) |
|
Foreign investments - 2.9% |
|
Showing Percentage of Net Assets
| Common Stocks - 99.4% |
| | | Shares | Value ($) |
| COMMUNICATION SERVICES - 8.4% | | | |
| Diversified Telecommunication Services - 0.9% | | | |
| AT&T, Inc. | | 561,380 | 9,846,605 |
| Lumen Technologies, Inc. (a) | | 73,592 | 732,976 |
| Verizon Communications, Inc. | | 329,295 | 13,767,824 |
| | | | 24,347,405 |
| Entertainment - 1.4% | | | |
| Activision Blizzard, Inc. | | 61,303 | 4,811,672 |
| Electronic Arts, Inc. | | 22,004 | 2,791,647 |
| Live Nation Entertainment, Inc. (b) | | 10,718 | 968,478 |
| Netflix, Inc. (b) | | 34,845 | 7,789,948 |
| Take-Two Interactive Software, Inc. (b) | | 12,336 | 1,511,900 |
| The Walt Disney Co. (b) | | 142,845 | 16,010,068 |
| Warner Bros Discovery, Inc. (b) | | 172,553 | 2,284,602 |
| | | | 36,168,315 |
| Interactive Media & Services - 5.0% | | | |
| Alphabet, Inc.: | | | |
| Class A (b) | | 470,275 | 50,893,161 |
| Class C (b) | | 433,915 | 47,361,822 |
| Match Group, Inc. (b) | | 22,291 | 1,260,110 |
| Meta Platforms, Inc. Class A (b) | | 179,860 | 29,304,590 |
| Twitter, Inc. (b) | | 59,648 | 2,311,360 |
| | | | 131,131,043 |
| Media - 0.8% | | | |
| Charter Communications, Inc. Class A (b) | | 9,085 | 3,748,744 |
| Comcast Corp. Class A | | 350,558 | 12,686,694 |
| DISH Network Corp. Class A (a)(b) | | 20,052 | 347,902 |
| Fox Corp.: | | | |
| Class A | | 24,736 | 845,476 |
| Class B | | 11,105 | 351,140 |
| Interpublic Group of Companies, Inc. | | 30,811 | 851,616 |
| News Corp.: | | | |
| Class A | | 30,349 | 513,505 |
| Class B | | 9,008 | 155,298 |
| Omnicom Group, Inc. | | 16,266 | 1,088,195 |
| Paramount Global Class B (a) | | 47,938 | 1,121,270 |
| | | | 21,709,840 |
| Wireless Telecommunication Services - 0.3% | | | |
| T-Mobile U.S., Inc. (b) | | 46,220 | 6,653,831 |
TOTAL COMMUNICATION SERVICES | | | 220,010,434 |
| CONSUMER DISCRETIONARY - 11.4% | | | |
| Auto Components - 0.1% | | | |
| Aptiv PLC (b) | | 21,184 | 1,979,221 |
| BorgWarner, Inc. (a) | | 18,829 | 709,853 |
| | | | 2,689,074 |
| Automobiles - 2.4% | | | |
| Ford Motor Co. | | 309,702 | 4,719,858 |
| General Motors Co. | | 114,354 | 4,369,466 |
| Tesla, Inc. (b) | | 197,409 | 54,407,894 |
| | | | 63,497,218 |
| Distributors - 0.2% | | | |
| Genuine Parts Co. | | 11,167 | 1,742,164 |
| LKQ Corp. | | 20,244 | 1,077,386 |
| Pool Corp. | | 3,162 | 1,072,519 |
| | | | 3,892,069 |
| Hotels, Restaurants & Leisure - 1.9% | | | |
| Booking Holdings, Inc. (b) | | 3,189 | 5,981,958 |
| Caesars Entertainment, Inc. (b) | | 16,806 | 724,675 |
| Carnival Corp. (a)(b) | | 76,326 | 722,044 |
| Chipotle Mexican Grill, Inc. (b) | | 2,191 | 3,498,589 |
| Darden Restaurants, Inc. | | 9,853 | 1,218,915 |
| Domino's Pizza, Inc. | | 2,840 | 1,056,082 |
| Expedia, Inc. (b) | | 11,833 | 1,214,657 |
| Hilton Worldwide Holdings, Inc. | | 21,776 | 2,773,391 |
| Las Vegas Sands Corp. (b) | | 26,765 | 1,007,167 |
| Marriott International, Inc. Class A | | 21,541 | 3,311,713 |
| McDonald's Corp. | | 58,007 | 14,634,006 |
| MGM Resorts International | | 27,696 | 903,997 |
| Norwegian Cruise Line Holdings Ltd. (b) | | 32,216 | 421,385 |
| Penn Entertainment, Inc. (b) | | 12,708 | 396,871 |
| Royal Caribbean Cruises Ltd. (b) | | 17,729 | 724,230 |
| Starbucks Corp. | | 89,990 | 7,565,459 |
| Wynn Resorts Ltd. (a)(b) | | 8,362 | 506,654 |
| Yum! Brands, Inc. | | 22,302 | 2,480,874 |
| | | | 49,142,667 |
| Household Durables - 0.3% | | | |
| D.R. Horton, Inc. | | 25,028 | 1,780,742 |
| Garmin Ltd. | | 11,986 | 1,060,641 |
| Lennar Corp. Class A | | 20,298 | 1,572,080 |
| Mohawk Industries, Inc. (b) | | 4,076 | 449,827 |
| Newell Brands, Inc. | | 29,273 | 522,523 |
| NVR, Inc. (b) | | 242 | 1,001,895 |
| PulteGroup, Inc. | | 18,681 | 759,569 |
| Whirlpool Corp. | | 4,424 | 692,798 |
| | | | 7,840,075 |
| Internet & Direct Marketing Retail - 3.4% | | | |
| Amazon.com, Inc. (b) | | 686,129 | 86,980,573 |
| eBay, Inc. | | 43,719 | 1,929,319 |
| Etsy, Inc. (b) | | 9,971 | 1,053,037 |
| | | | 89,962,929 |
| Leisure Products - 0.0% | | | |
| Hasbro, Inc. | | 10,319 | 813,344 |
| Multiline Retail - 0.5% | | | |
| Dollar General Corp. | | 17,948 | 4,261,214 |
| Dollar Tree, Inc. (b) | | 17,620 | 2,390,682 |
| Target Corp. | | 36,268 | 5,815,211 |
| | | | 12,467,107 |
| Specialty Retail - 2.1% | | | |
| Advance Auto Parts, Inc. | | 4,781 | 806,268 |
| AutoZone, Inc. (b) | | 1,555 | 3,295,372 |
| Bath & Body Works, Inc. | | 18,883 | 704,902 |
| Best Buy Co., Inc. | | 15,755 | 1,113,721 |
| CarMax, Inc. (a)(b) | | 12,676 | 1,121,065 |
| Lowe's Companies, Inc. | | 51,829 | 10,062,082 |
| O'Reilly Automotive, Inc. (b) | | 5,151 | 3,590,865 |
| Ross Stores, Inc. | | 27,670 | 2,387,091 |
| The Home Depot, Inc. | | 81,018 | 23,367,212 |
| TJX Companies, Inc. | | 92,094 | 5,742,061 |
| Tractor Supply Co. | | 8,736 | 1,617,470 |
| Ulta Beauty, Inc. (b) | | 4,081 | 1,713,489 |
| | | | 55,521,598 |
| Textiles, Apparel & Luxury Goods - 0.5% | | | |
| NIKE, Inc. Class B | | 99,515 | 10,593,372 |
| PVH Corp. | | 5,156 | 290,025 |
| Ralph Lauren Corp. | | 3,599 | 328,697 |
| Tapestry, Inc. | | 19,843 | 689,147 |
| VF Corp. | | 25,423 | 1,053,783 |
| | | | 12,955,024 |
TOTAL CONSUMER DISCRETIONARY | | | 298,781,105 |
| CONSUMER STAPLES - 6.7% | | | |
| Beverages - 1.8% | | | |
| Brown-Forman Corp. Class B (non-vtg.) | | 14,456 | 1,050,951 |
| Constellation Brands, Inc. Class A (sub. vtg.) | | 12,742 | 3,135,169 |
| Keurig Dr. Pepper, Inc. | | 58,081 | 2,214,048 |
| Molson Coors Beverage Co. Class B | | 14,826 | 766,059 |
| Monster Beverage Corp. (b) | | 29,403 | 2,611,868 |
| PepsiCo, Inc. | | 108,386 | 18,671,656 |
| The Coca-Cola Co. | | 305,858 | 18,874,497 |
| | | | 47,324,248 |
| Food & Staples Retailing - 1.5% | | | |
| Costco Wholesale Corp. | | 34,758 | 18,147,152 |
| Kroger Co. | | 51,266 | 2,457,692 |
| Sysco Corp. | | 39,914 | 3,281,729 |
| Walgreens Boots Alliance, Inc. | | 56,483 | 1,980,294 |
| Walmart, Inc. | | 110,086 | 14,591,899 |
| | | | 40,458,766 |
| Food Products - 1.1% | | | |
| Archer Daniels Midland Co. | | 44,115 | 3,877,267 |
| Campbell Soup Co. (a) | | 15,934 | 802,755 |
| Conagra Brands, Inc. | | 37,691 | 1,295,817 |
| General Mills, Inc. | | 47,193 | 3,624,422 |
| Hormel Foods Corp. | | 22,321 | 1,122,300 |
| Kellogg Co. | | 19,804 | 1,440,543 |
| Lamb Weston Holdings, Inc. | | 11,421 | 908,312 |
| McCormick & Co., Inc. (non-vtg.) | | 19,556 | 1,644,073 |
| Mondelez International, Inc. | | 108,589 | 6,717,316 |
| The Hershey Co. | | 11,413 | 2,564,159 |
| The J.M. Smucker Co. | | 8,548 | 1,196,635 |
| The Kraft Heinz Co. | | 55,430 | 2,073,082 |
| Tyson Foods, Inc. Class A | | 22,769 | 1,716,327 |
| | | | 28,983,008 |
| Household Products - 1.4% | | | |
| Church & Dwight Co., Inc. | | 18,955 | 1,586,723 |
| Colgate-Palmolive Co. | | 65,685 | 5,137,224 |
| Kimberly-Clark Corp. | | 26,398 | 3,366,273 |
| Procter & Gamble Co. | | 188,159 | 25,954,652 |
| The Clorox Co. | | 9,686 | 1,398,077 |
| | | | 37,442,949 |
| Personal Products - 0.2% | | | |
| Estee Lauder Companies, Inc. Class A | | 18,187 | 4,626,409 |
| Tobacco - 0.7% | | | |
| Altria Group, Inc. | | 142,033 | 6,408,529 |
| Philip Morris International, Inc. | | 121,574 | 11,609,101 |
| | | | 18,017,630 |
TOTAL CONSUMER STAPLES | | | 176,853,010 |
| ENERGY - 4.6% | | | |
| Energy Equipment & Services - 0.3% | | | |
| Baker Hughes Co. Class A | | 72,967 | 1,843,146 |
| Halliburton Co. | | 71,082 | 2,141,701 |
| Schlumberger Ltd. | | 110,860 | 4,229,309 |
| | | | 8,214,156 |
| Oil, Gas & Consumable Fuels - 4.3% | | | |
| APA Corp. | | 26,217 | 1,025,347 |
| Chevron Corp. | | 154,074 | 24,352,936 |
| ConocoPhillips Co. | | 101,482 | 11,107,205 |
| Coterra Energy, Inc. | | 62,897 | 1,944,146 |
| Devon Energy Corp. | | 48,066 | 3,394,421 |
| Diamondback Energy, Inc. | | 13,400 | 1,785,952 |
| EOG Resources, Inc. | | 45,976 | 5,576,889 |
| Exxon Mobil Corp. | | 330,333 | 31,576,531 |
| Hess Corp. | | 21,819 | 2,635,299 |
| Kinder Morgan, Inc. | | 152,549 | 2,794,698 |
| Marathon Oil Corp. | | 55,660 | 1,424,339 |
| Marathon Petroleum Corp. | | 42,421 | 4,273,916 |
| Occidental Petroleum Corp. | | 69,856 | 4,959,776 |
| ONEOK, Inc. | | 35,198 | 2,155,174 |
| Phillips 66 Co. | | 37,684 | 3,371,211 |
| Pioneer Natural Resources Co. | | 17,644 | 4,467,814 |
| The Williams Companies, Inc. | | 95,379 | 3,245,747 |
| Valero Energy Corp. | | 31,984 | 3,745,966 |
| | | | 113,837,367 |
TOTAL ENERGY | | | 122,051,523 |
| FINANCIALS - 10.8% | | | |
| Banks - 3.7% | | | |
| Bank of America Corp. | | 555,959 | 18,685,782 |
| Citigroup, Inc. | | 152,275 | 7,432,543 |
| Citizens Financial Group, Inc. | | 38,349 | 1,406,641 |
| Comerica, Inc. | | 10,318 | 828,535 |
| Fifth Third Bancorp | | 53,572 | 1,829,484 |
| First Republic Bank | | 14,131 | 2,145,510 |
| Huntington Bancshares, Inc. | | 112,973 | 1,513,838 |
| JPMorgan Chase & Co. | | 230,291 | 26,190,995 |
| KeyCorp | | 73,093 | 1,293,015 |
| M&T Bank Corp. | | 14,029 | 2,550,192 |
| PNC Financial Services Group, Inc. | | 32,439 | 5,125,362 |
| Regions Financial Corp. | | 73,109 | 1,584,272 |
| Signature Bank | | 4,896 | 853,667 |
| SVB Financial Group (b) | | 4,600 | 1,869,992 |
| Truist Financial Corp. | | 104,452 | 4,892,532 |
| U.S. Bancorp | | 106,025 | 4,835,800 |
| Wells Fargo & Co. | | 297,267 | 12,993,541 |
| Zions Bancorp NA | | 12,023 | 661,626 |
| | | | 96,693,327 |
| Capital Markets - 3.0% | | | |
| Ameriprise Financial, Inc. | | 8,593 | 2,303,010 |
| Bank of New York Mellon Corp. | | 58,148 | 2,414,886 |
| BlackRock, Inc. Class A | | 11,171 | 7,444,243 |
| Cboe Global Markets, Inc. | | 8,317 | 981,156 |
| Charles Schwab Corp. | | 118,283 | 8,392,179 |
| CME Group, Inc. | | 28,191 | 5,514,442 |
| FactSet Research Systems, Inc. | | 2,986 | 1,293,953 |
| Franklin Resources, Inc. (a) | | 21,819 | 568,821 |
| Goldman Sachs Group, Inc. | | 26,924 | 8,956,807 |
| Intercontinental Exchange, Inc. | | 43,784 | 4,415,616 |
| Invesco Ltd. | | 26,441 | 435,483 |
| MarketAxess Holdings, Inc. | | 2,920 | 725,883 |
| Moody's Corp. | | 12,586 | 3,580,969 |
| Morgan Stanley | | 109,731 | 9,351,276 |
| MSCI, Inc. | | 6,354 | 2,854,471 |
| NASDAQ, Inc. | | 27,255 | 1,622,490 |
| Northern Trust Corp. | | 16,350 | 1,554,722 |
| Raymond James Financial, Inc. | | 15,346 | 1,601,662 |
| S&P Global, Inc. | | 27,217 | 9,585,283 |
| State Street Corp. | | 28,681 | 1,960,346 |
| T. Rowe Price Group, Inc. | | 17,912 | 2,149,440 |
| | | | 77,707,138 |
| Consumer Finance - 0.5% | | | |
| American Express Co. | | 47,843 | 7,272,136 |
| Capital One Financial Corp. | | 30,803 | 3,259,573 |
| Discover Financial Services | | 21,957 | 2,206,459 |
| Synchrony Financial | | 39,554 | 1,295,394 |
| | | | 14,033,562 |
| Diversified Financial Services - 1.5% | | | |
| Berkshire Hathaway, Inc. Class B (b) | | 141,857 | 39,833,446 |
| Insurance - 2.1% | | | |
| AFLAC, Inc. | | 46,398 | 2,756,969 |
| Allstate Corp. | | 21,511 | 2,592,076 |
| American International Group, Inc. | | 62,080 | 3,212,640 |
| Aon PLC | | 16,654 | 4,650,796 |
| Arthur J. Gallagher & Co. | | 16,445 | 2,985,919 |
| Assurant, Inc. | | 4,247 | 673,107 |
| Brown & Brown, Inc. | | 18,539 | 1,168,699 |
| Chubb Ltd. | | 33,213 | 6,278,918 |
| Cincinnati Financial Corp. | | 11,788 | 1,142,964 |
| Everest Re Group Ltd. | | 3,078 | 828,136 |
| Globe Life, Inc. | | 7,120 | 691,993 |
| Hartford Financial Services Group, Inc. | | 25,709 | 1,653,346 |
| Lincoln National Corp. | | 12,599 | 580,310 |
| Loews Corp. | | 15,324 | 847,570 |
| Marsh & McLennan Companies, Inc. | | 39,356 | 6,350,878 |
| MetLife, Inc. | | 54,193 | 3,486,236 |
| Principal Financial Group, Inc. (a) | | 18,549 | 1,386,723 |
| Progressive Corp. | | 45,899 | 5,629,512 |
| Prudential Financial, Inc. | | 29,369 | 2,812,082 |
| The Travelers Companies, Inc. | | 18,793 | 3,037,701 |
| W.R. Berkley Corp. | | 16,558 | 1,072,958 |
| Willis Towers Watson PLC | | 8,715 | 1,802,523 |
| | | | 55,642,056 |
TOTAL FINANCIALS | | | 283,909,529 |
| HEALTH CARE - 14.0% | | | |
| Biotechnology - 2.0% | | | |
| AbbVie, Inc. | | 138,564 | 18,631,315 |
| Amgen, Inc. | | 41,878 | 10,063,283 |
| Biogen, Inc. (b) | | 11,445 | 2,236,124 |
| Gilead Sciences, Inc. | | 98,340 | 6,241,640 |
| Incyte Corp. (b) | | 14,870 | 1,047,294 |
| Moderna, Inc. (b) | | 27,138 | 3,589,543 |
| Regeneron Pharmaceuticals, Inc. (b) | | 8,472 | 4,922,740 |
| Vertex Pharmaceuticals, Inc. (b) | | 20,061 | 5,652,387 |
| | | | 52,384,326 |
| Health Care Equipment & Supplies - 2.6% | | | |
| Abbott Laboratories | | 137,307 | 14,094,564 |
| Abiomed, Inc. (b) | | 3,565 | 924,333 |
| Align Technology, Inc. (b) | | 5,772 | 1,406,636 |
| Baxter International, Inc. | | 39,344 | 2,260,706 |
| Becton, Dickinson & Co. | | 22,360 | 5,644,111 |
| Boston Scientific Corp. (b) | | 112,153 | 4,520,887 |
| Dentsply Sirona, Inc. | | 16,924 | 554,599 |
| DexCom, Inc. (b) | | 30,701 | 2,523,929 |
| Edwards Lifesciences Corp. (b) | | 48,790 | 4,395,979 |
| Hologic, Inc. (b) | | 19,654 | 1,327,824 |
| IDEXX Laboratories, Inc. (b) | | 6,569 | 2,283,516 |
| Intuitive Surgical, Inc. (b) | | 28,164 | 5,794,461 |
| Medtronic PLC | | 105,199 | 9,249,096 |
| ResMed, Inc. | | 11,444 | 2,516,764 |
| STERIS PLC | | 7,822 | 1,575,194 |
| Stryker Corp. | | 26,402 | 5,417,690 |
| Teleflex, Inc. | | 3,715 | 840,556 |
| The Cooper Companies, Inc. | | 3,873 | 1,113,255 |
| Zimmer Biomet Holdings, Inc. | | 16,378 | 1,741,309 |
| | | | 68,185,409 |
| Health Care Providers & Services - 3.4% | | | |
| AmerisourceBergen Corp. | | 11,768 | 1,724,718 |
| Cardinal Health, Inc. | | 21,257 | 1,503,295 |
| Centene Corp. (b) | | 45,885 | 4,117,720 |
| Cigna Corp. | | 24,886 | 7,053,937 |
| CVS Health Corp. | | 102,823 | 10,092,077 |
| DaVita HealthCare Partners, Inc. (b) | | 4,748 | 404,957 |
| Elevance Health, Inc. | | 18,908 | 9,172,460 |
| HCA Holdings, Inc. | | 17,836 | 3,529,209 |
| Henry Schein, Inc. (b) | | 10,844 | 796,058 |
| Humana, Inc. | | 9,920 | 4,779,258 |
| Laboratory Corp. of America Holdings | | 7,235 | 1,629,828 |
| McKesson Corp. | | 11,401 | 4,184,167 |
| Molina Healthcare, Inc. (b) | | 4,605 | 1,553,589 |
| Quest Diagnostics, Inc. | | 9,259 | 1,160,245 |
| UnitedHealth Group, Inc. | | 73,565 | 38,204,511 |
| Universal Health Services, Inc. Class B | | 5,320 | 520,509 |
| | | | 90,426,538 |
| Life Sciences Tools & Services - 1.9% | | | |
| Agilent Technologies, Inc. | | 23,489 | 3,012,464 |
| Bio-Rad Laboratories, Inc. Class A (b) | | 1,699 | 824,083 |
| Bio-Techne Corp. | | 3,053 | 1,013,016 |
| Charles River Laboratories International, Inc. (b) | | 4,016 | 824,284 |
| Danaher Corp. | | 50,772 | 13,703,871 |
| Illumina, Inc. (b) | | 12,282 | 2,476,542 |
| IQVIA Holdings, Inc. (b) | | 14,832 | 3,154,173 |
| Mettler-Toledo International, Inc. (b) | | 1,772 | 2,148,479 |
| PerkinElmer, Inc. | | 9,910 | 1,338,445 |
| Thermo Fisher Scientific, Inc. | | 30,709 | 16,746,232 |
| Waters Corp. (b) | | 4,706 | 1,405,212 |
| West Pharmaceutical Services, Inc. | | 5,787 | 1,716,945 |
| | | | 48,363,746 |
| Pharmaceuticals - 4.1% | | | |
| Bristol-Myers Squibb Co. | | 166,910 | 11,251,403 |
| Catalent, Inc. (b) | | 13,996 | 1,231,648 |
| Eli Lilly & Co. | | 61,843 | 18,628,967 |
| Johnson & Johnson | | 206,318 | 33,287,346 |
| Merck & Co., Inc. | | 198,277 | 16,924,925 |
| Organon & Co. | | 19,941 | 568,917 |
| Pfizer, Inc. | | 439,980 | 19,900,295 |
| Viatris, Inc. | | 95,926 | 916,093 |
| Zoetis, Inc. Class A | | 36,914 | 5,778,148 |
| | | | 108,487,742 |
TOTAL HEALTH CARE | | | 367,847,761 |
| INDUSTRIALS - 7.9% | | | |
| Aerospace & Defense - 1.7% | | | |
| General Dynamics Corp. | | 18,073 | 4,137,452 |
| Howmet Aerospace, Inc. | | 29,640 | 1,050,145 |
| Huntington Ingalls Industries, Inc. | | 3,158 | 727,161 |
| L3Harris Technologies, Inc. | | 15,109 | 3,447,723 |
| Lockheed Martin Corp. | | 18,582 | 7,806,484 |
| Northrop Grumman Corp. | | 11,468 | 5,481,589 |
| Raytheon Technologies Corp. | | 116,651 | 10,469,427 |
| Textron, Inc. | | 16,744 | 1,044,491 |
| The Boeing Co. (b) | | 43,627 | 6,991,227 |
| TransDigm Group, Inc. | | 4,054 | 2,433,981 |
| | | | 43,589,680 |
| Air Freight & Logistics - 0.7% | | | |
| C.H. Robinson Worldwide, Inc. (a) | | 9,914 | 1,131,683 |
| Expeditors International of Washington, Inc. | | 13,179 | 1,355,987 |
| FedEx Corp. | | 18,700 | 3,942,147 |
| United Parcel Service, Inc. Class B | | 57,591 | 11,202,025 |
| | | | 17,631,842 |
| Airlines - 0.2% | | | |
| Alaska Air Group, Inc. (b) | | 9,631 | 419,526 |
| American Airlines Group, Inc. (a)(b) | | 51,023 | 662,789 |
| Delta Air Lines, Inc. (b) | | 50,013 | 1,553,904 |
| Southwest Airlines Co. (b) | | 46,563 | 1,708,862 |
| United Airlines Holdings, Inc. (b) | | 25,730 | 900,807 |
| | | | 5,245,888 |
| Building Products - 0.4% | | | |
| A.O. Smith Corp. | | 10,167 | 573,927 |
| Allegion PLC | | 6,945 | 660,470 |
| Carrier Global Corp. | | 66,406 | 2,597,803 |
| Fortune Brands Home & Security, Inc. | | 10,320 | 633,958 |
| Johnson Controls International PLC | | 54,489 | 2,950,034 |
| Masco Corp. | | 18,353 | 933,617 |
| Trane Technologies PLC | | 18,311 | 2,821,176 |
| | | | 11,170,985 |
| Commercial Services & Supplies - 0.5% | | | |
| Cintas Corp. | | 6,805 | 2,768,546 |
| Copart, Inc. (b) | | 16,853 | 2,016,461 |
| Republic Services, Inc. | | 16,284 | 2,324,052 |
| Rollins, Inc. | | 17,797 | 600,827 |
| Waste Management, Inc. | | 29,950 | 5,062,449 |
| | | | 12,772,335 |
| Construction & Engineering - 0.1% | | | |
| Quanta Services, Inc. | | 11,323 | 1,599,940 |
| Electrical Equipment - 0.5% | | | |
| AMETEK, Inc. | | 18,193 | 2,186,071 |
| Eaton Corp. PLC | | 31,299 | 4,276,695 |
| Emerson Electric Co. | | 46,574 | 3,806,959 |
| Generac Holdings, Inc. (b) | | 4,968 | 1,094,997 |
| Rockwell Automation, Inc. | | 9,082 | 2,151,889 |
| | | | 13,516,611 |
| Industrial Conglomerates - 0.8% | | | |
| 3M Co. (a) | | 44,621 | 5,548,621 |
| General Electric Co. | | 86,347 | 6,341,324 |
| Honeywell International, Inc. | | 53,382 | 10,107,882 |
| | | | 21,997,827 |
| Machinery - 1.6% | | | |
| Caterpillar, Inc. | | 41,828 | 7,726,050 |
| Cummins, Inc. | | 11,037 | 2,377,039 |
| Deere & Co. | | 21,894 | 7,996,784 |
| Dover Corp. | | 11,316 | 1,414,047 |
| Fortive Corp. | | 28,124 | 1,781,093 |
| IDEX Corp. | | 6,003 | 1,207,864 |
| Illinois Tool Works, Inc. | | 22,214 | 4,327,954 |
| Ingersoll Rand, Inc. | | 32,043 | 1,517,877 |
| Nordson Corp. | | 4,230 | 960,929 |
| Otis Worldwide Corp. | | 33,083 | 2,389,254 |
| PACCAR, Inc. | | 27,205 | 2,380,710 |
| Parker Hannifin Corp. | | 10,056 | 2,664,840 |
| Pentair PLC | | 13,025 | 579,613 |
| Snap-On, Inc. | | 4,179 | 910,437 |
| Stanley Black & Decker, Inc. | | 11,895 | 1,047,950 |
| Westinghouse Air Brake Tech Co. | | 14,392 | 1,261,459 |
| Xylem, Inc. | | 14,042 | 1,279,226 |
| | | | 41,823,126 |
| Professional Services - 0.3% | | | |
| Equifax, Inc. | | 9,562 | 1,804,828 |
| Jacobs Solutions, Inc. | | 10,030 | 1,249,537 |
| Leidos Holdings, Inc. | | 10,807 | 1,027,205 |
| Nielsen Holdings PLC | | 28,526 | 794,164 |
| Robert Half International, Inc. | | 8,553 | 658,324 |
| Verisk Analytics, Inc. | | 12,431 | 2,326,586 |
| | | | 7,860,644 |
| Road & Rail - 0.9% | | | |
| CSX Corp. | | 170,488 | 5,395,945 |
| J.B. Hunt Transport Services, Inc. | | 6,537 | 1,137,569 |
| Norfolk Southern Corp. | | 18,691 | 4,544,343 |
| Old Dominion Freight Lines, Inc. | | 7,232 | 1,962,837 |
| Union Pacific Corp. | | 49,241 | 11,055,097 |
| | | | 24,095,791 |
| Trading Companies & Distributors - 0.2% | | | |
| Fastenal Co. | | 45,003 | 2,265,001 |
| United Rentals, Inc. (b) | | 5,640 | 1,647,106 |
| W.W. Grainger, Inc. | | 3,359 | 1,864,043 |
| | | | 5,776,150 |
TOTAL INDUSTRIALS | | | 207,080,819 |
| INFORMATION TECHNOLOGY - 27.2% | | | |
| Communications Equipment - 0.8% | | | |
| Arista Networks, Inc. (b) | | 17,624 | 2,112,765 |
| Cisco Systems, Inc. | | 325,825 | 14,570,894 |
| F5, Inc. (b) | | 4,796 | 753,260 |
| Juniper Networks, Inc. | | 25,223 | 716,838 |
| Motorola Solutions, Inc. | | 13,102 | 3,189,158 |
| | | | 21,342,915 |
| Electronic Equipment & Components - 0.6% | | | |
| Amphenol Corp. Class A | | 46,821 | 3,442,748 |
| CDW Corp. | | 10,650 | 1,817,955 |
| Corning, Inc. | | 59,375 | 2,037,750 |
| Keysight Technologies, Inc. (b) | | 14,223 | 2,331,007 |
| TE Connectivity Ltd. | | 25,249 | 3,186,676 |
| Teledyne Technologies, Inc. (b) | | 3,672 | 1,352,618 |
| Trimble, Inc. (b) | | 19,521 | 1,234,703 |
| Zebra Technologies Corp. Class A (b) | | 4,122 | 1,243,360 |
| | | | 16,646,817 |
| IT Services - 4.4% | | | |
| Accenture PLC Class A | | 49,668 | 14,327,231 |
| Akamai Technologies, Inc. (b) | | 12,657 | 1,142,674 |
| Automatic Data Processing, Inc. | | 32,764 | 8,007,849 |
| Broadridge Financial Solutions, Inc. | | 9,171 | 1,569,800 |
| Cognizant Technology Solutions Corp. Class A | | 40,773 | 2,575,630 |
| DXC Technology Co. (b) | | 19,308 | 478,452 |
| EPAM Systems, Inc. (b) | | 4,470 | 1,906,455 |
| Fidelity National Information Services, Inc. | | 47,900 | 4,376,623 |
| Fiserv, Inc. (b) | | 45,625 | 4,616,794 |
| FleetCor Technologies, Inc. (b) | | 6,089 | 1,294,095 |
| Gartner, Inc. (b) | | 6,324 | 1,804,364 |
| Global Payments, Inc. | | 22,034 | 2,737,284 |
| IBM Corp. | | 70,525 | 9,058,936 |
| Jack Henry & Associates, Inc. | | 5,756 | 1,106,303 |
| MasterCard, Inc. Class A | | 67,338 | 21,842,427 |
| Paychex, Inc. | | 25,168 | 3,104,221 |
| PayPal Holdings, Inc. (b) | | 90,831 | 8,487,249 |
| VeriSign, Inc. (b) | | 7,514 | 1,369,201 |
| Visa, Inc. Class A | | 129,046 | 25,642,731 |
| | | | 115,448,319 |
| Semiconductors & Semiconductor Equipment - 5.1% | | | |
| Advanced Micro Devices, Inc. (b) | | 127,100 | 10,786,977 |
| Analog Devices, Inc. | | 41,058 | 6,221,519 |
| Applied Materials, Inc. | | 69,304 | 6,519,427 |
| Broadcom, Inc. | | 32,017 | 15,980,005 |
| Enphase Energy, Inc. (b) | | 10,574 | 3,028,817 |
| Intel Corp. | | 320,650 | 10,235,148 |
| KLA Corp. | | 11,709 | 4,029,418 |
| Lam Research Corp. | | 10,885 | 4,766,650 |
| Microchip Technology, Inc. | | 43,536 | 2,840,724 |
| Micron Technology, Inc. | | 87,589 | 4,951,406 |
| Monolithic Power Systems, Inc. | | 3,454 | 1,565,284 |
| NVIDIA Corp. | | 196,365 | 29,639,333 |
| NXP Semiconductors NV | | 20,584 | 3,387,715 |
| onsemi (b) | | 33,959 | 2,335,360 |
| Qorvo, Inc. (b) | | 8,525 | 765,375 |
| Qualcomm, Inc. | | 87,833 | 11,617,671 |
| Skyworks Solutions, Inc. | | 12,530 | 1,234,832 |
| SolarEdge Technologies, Inc. (b) | | 4,365 | 1,204,609 |
| Teradyne, Inc. | | 12,468 | 1,055,292 |
| Texas Instruments, Inc. | | 72,305 | 11,945,509 |
| | | | 134,111,071 |
| Software - 8.8% | | | |
| Adobe, Inc. (b) | | 37,058 | 13,838,940 |
| ANSYS, Inc. (b) | | 6,842 | 1,698,869 |
| Autodesk, Inc. (b) | | 17,049 | 3,439,465 |
| Cadence Design Systems, Inc. (b) | | 21,618 | 3,756,560 |
| Ceridian HCM Holding, Inc. (b) | | 10,865 | 647,989 |
| Citrix Systems, Inc. | | 9,702 | 997,075 |
| Fortinet, Inc. (b) | | 52,118 | 2,537,625 |
| Intuit, Inc. | | 22,188 | 9,580,335 |
| Microsoft Corp. | | 586,457 | 153,340,912 |
| NortonLifeLock, Inc. | | 45,206 | 1,021,204 |
| Oracle Corp. | | 123,466 | 9,155,004 |
| Paycom Software, Inc. (b) | | 3,757 | 1,319,458 |
| PTC, Inc. (b) | | 8,260 | 948,991 |
| Roper Technologies, Inc. | | 8,296 | 3,339,804 |
| Salesforce.com, Inc. (b) | | 77,929 | 12,166,275 |
| ServiceNow, Inc. (b) | | 15,728 | 6,835,703 |
| Synopsys, Inc. (b) | | 12,010 | 4,155,700 |
| Tyler Technologies, Inc. (b) | | 3,236 | 1,202,206 |
| | | | 229,982,115 |
| Technology Hardware, Storage & Peripherals - 7.5% | | | |
| Apple, Inc. | | 1,205,645 | 189,551,511 |
| Hewlett Packard Enterprise Co. | | 101,390 | 1,378,904 |
| HP, Inc. | | 82,415 | 2,366,135 |
| NetApp, Inc. | | 17,489 | 1,261,482 |
| Seagate Technology Holdings PLC | | 15,612 | 1,045,380 |
| Western Digital Corp. (b) | | 24,715 | 1,044,456 |
| | | | 196,647,868 |
TOTAL INFORMATION TECHNOLOGY | | | 714,179,105 |
| MATERIALS - 2.5% | | | |
| Chemicals - 1.8% | | | |
| Air Products & Chemicals, Inc. | | 17,401 | 4,392,882 |
| Albemarle Corp. | | 9,159 | 2,454,246 |
| Celanese Corp. Class A | | 8,555 | 948,407 |
| CF Industries Holdings, Inc. | | 16,380 | 1,694,675 |
| Corteva, Inc. | | 56,739 | 3,485,477 |
| Dow, Inc. | | 57,053 | 2,909,703 |
| DuPont de Nemours, Inc. | | 39,789 | 2,213,860 |
| Eastman Chemical Co. | | 10,083 | 917,553 |
| Ecolab, Inc. | | 19,479 | 3,191,245 |
| FMC Corp. | | 9,894 | 1,069,344 |
| International Flavors & Fragrances, Inc. | | 19,929 | 2,201,756 |
| Linde PLC | | 39,478 | 11,166,747 |
| LyondellBasell Industries NV Class A | | 20,205 | 1,677,015 |
| PPG Industries, Inc. | | 18,472 | 2,345,575 |
| Sherwin-Williams Co. | | 18,774 | 4,357,445 |
| The Mosaic Co. | | 28,458 | 1,533,032 |
| | | | 46,558,962 |
| Construction Materials - 0.1% | | | |
| Martin Marietta Materials, Inc. | | 4,895 | 1,702,040 |
| Vulcan Materials Co. | | 10,394 | 1,730,497 |
| | | | 3,432,537 |
| Containers & Packaging - 0.3% | | | |
| Amcor PLC | | 117,967 | 1,416,784 |
| Avery Dennison Corp. | | 6,445 | 1,183,431 |
| Ball Corp. | | 25,221 | 1,407,584 |
| International Paper Co. | | 29,266 | 1,218,051 |
| Packaging Corp. of America | | 7,401 | 1,013,345 |
| Sealed Air Corp. | | 11,464 | 616,878 |
| WestRock Co. | | 19,989 | 811,354 |
| | | | 7,667,427 |
| Metals & Mining - 0.3% | | | |
| Freeport-McMoRan, Inc. | | 113,580 | 3,361,968 |
| Newmont Corp. | | 62,123 | 2,569,407 |
| Nucor Corp. | | 20,830 | 2,769,140 |
| | | | 8,700,515 |
TOTAL MATERIALS | | | 66,359,441 |
| REAL ESTATE - 2.8% | | | |
| Equity Real Estate Investment Trusts (REITs) - 2.7% | | | |
| Alexandria Real Estate Equities, Inc. | | 11,623 | 1,782,968 |
| American Tower Corp. | | 36,436 | 9,256,566 |
| AvalonBay Communities, Inc. | | 10,920 | 2,193,937 |
| Boston Properties, Inc. | | 11,282 | 896,129 |
| Camden Property Trust (SBI) | | 8,417 | 1,081,669 |
| Crown Castle International Corp. | | 33,950 | 5,799,679 |
| Digital Realty Trust, Inc. (a) | | 22,276 | 2,753,982 |
| Duke Realty Corp. | | 30,060 | 1,769,031 |
| Equinix, Inc. | | 7,140 | 4,693,622 |
| Equity Residential (SBI) | | 26,965 | 1,973,299 |
| Essex Property Trust, Inc. | | 5,132 | 1,360,288 |
| Extra Space Storage, Inc. | | 10,498 | 2,086,268 |
| Federal Realty Investment Trust (SBI) | | 5,564 | 563,466 |
| Healthpeak Properties, Inc. | | 42,665 | 1,119,956 |
| Host Hotels & Resorts, Inc. | | 55,701 | 989,807 |
| Iron Mountain, Inc. (a) | | 22,897 | 1,204,611 |
| Kimco Realty Corp. | | 48,931 | 1,031,465 |
| Mid-America Apartment Communities, Inc. | | 9,082 | 1,504,615 |
| Prologis (REIT), Inc. | | 58,055 | 7,228,428 |
| Public Storage | | 11,974 | 3,961,358 |
| Realty Income Corp. | | 47,130 | 3,218,036 |
| Regency Centers Corp. | | 12,209 | 742,796 |
| SBA Communications Corp. Class A | | 8,439 | 2,744,785 |
| Simon Property Group, Inc. | | 25,697 | 2,620,580 |
| UDR, Inc. | | 23,656 | 1,061,445 |
| Ventas, Inc. | | 31,349 | 1,500,363 |
| VICI Properties, Inc. | | 75,846 | 2,502,160 |
| Vornado Realty Trust | | 12,305 | 322,637 |
| Welltower Op | | 35,527 | 2,723,145 |
| Weyerhaeuser Co. | | 58,206 | 1,988,317 |
| | | | 72,675,408 |
| Real Estate Management & Development - 0.1% | | | |
| CBRE Group, Inc. (b) | | 25,527 | 2,015,612 |
TOTAL REAL ESTATE | | | 74,691,020 |
| UTILITIES - 3.1% | | | |
| Electric Utilities - 2.0% | | | |
| Alliant Energy Corp. | | 19,641 | 1,198,887 |
| American Electric Power Co., Inc. | | 40,481 | 4,056,196 |
| Constellation Energy Corp. | | 25,617 | 2,090,091 |
| Duke Energy Corp. | | 60,379 | 6,455,119 |
| Edison International | | 29,775 | 2,017,852 |
| Entergy Corp. | | 15,892 | 1,832,348 |
| Evergy, Inc. | | 18,069 | 1,238,269 |
| Eversource Energy | | 26,956 | 2,417,684 |
| Exelon Corp. | | 76,846 | 3,374,308 |
| FirstEnergy Corp. | | 44,577 | 1,763,020 |
| NextEra Energy, Inc. | | 154,070 | 13,105,194 |
| NRG Energy, Inc. | | 18,664 | 770,450 |
| Pinnacle West Capital Corp. | | 8,953 | 674,609 |
| PPL Corp. | | 57,771 | 1,679,981 |
| Southern Co. | | 83,403 | 6,427,869 |
| Xcel Energy, Inc. | | 42,652 | 3,166,911 |
| | | | 52,268,788 |
| Gas Utilities - 0.0% | | | |
| Atmos Energy Corp. | | 10,843 | 1,229,379 |
| Independent Power and Renewable Electricity Producers - 0.1% | | | |
| The AES Corp. | | 52,791 | 1,343,531 |
| Multi-Utilities - 0.9% | | | |
| Ameren Corp. | | 20,166 | 1,867,775 |
| CenterPoint Energy, Inc. | | 49,388 | 1,557,204 |
| CMS Energy Corp. | | 22,668 | 1,530,997 |
| Consolidated Edison, Inc. | | 27,742 | 2,711,503 |
| Dominion Energy, Inc. | | 63,713 | 5,211,723 |
| DTE Energy Co. | | 15,128 | 1,971,784 |
| NiSource, Inc. | | 31,803 | 938,507 |
| Public Service Enterprise Group, Inc. | | 39,051 | 2,513,322 |
| Sempra Energy | | 24,657 | 4,067,665 |
| WEC Energy Group, Inc. | | 24,675 | 2,544,980 |
| | | | 24,915,460 |
| Water Utilities - 0.1% | | | |
| American Water Works Co., Inc. | | 14,198 | 2,107,693 |
TOTAL UTILITIES | | | 81,864,851 |
| TOTAL COMMON STOCKS (Cost $2,234,357,730) | | | 2,613,628,598 |
| | | | |
| U.S. Treasury Obligations - 0.0% |
| | | Principal Amount (c) | Value ($) |
U.S. Treasury Bills, yield at date of purchase 1.23% 1/26/23 (d) (Cost $497,520) | | 500,000 | 493,791 |
| | | | |
| Money Market Funds - 0.8% |
| | | Shares | Value ($) |
| Fidelity Cash Central Fund 2.33% (e) | | 8,606,365 | 8,608,086 |
| Fidelity Securities Lending Cash Central Fund 2.34% (e)(f) | | 11,850,406 | 11,851,592 |
| TOTAL MONEY MARKET FUNDS (Cost $20,459,678) | | | 20,459,678 |
| | | | |
| TOTAL INVESTMENT IN SECURITIES - 100.2% (Cost $2,255,314,928) | 2,634,582,067 |
NET OTHER ASSETS (LIABILITIES) - (0.2)% | (5,143,859) |
| NET ASSETS - 100.0% | 2,629,438,208 |
| | |
| Futures Contracts |
| | Number of contracts | Expiration Date | Notional Amount ($) | Value ($) | Unrealized Appreciation/ (Depreciation) ($) |
| Purchased | | | | | |
| | | | | | |
| Equity Index Contracts | | | | | |
| CME E-mini S&P 500 Index Contracts (United States) | 79 | Sep 2022 | 15,628,175 | (203,840) | (203,840) |
| | | | | | |
| The notional amount of futures purchased as a percentage of Net Assets is 0.6% |
Legend
| (a) | Security or a portion of the security is on loan at period end. |
| (c) | Amount is stated in United States dollars unless otherwise noted. |
| (d) | Security or a portion of the security was pledged to cover margin requirements for futures contracts. At period end, the value of securities pledged amounted to $493,791. |
| (e) | Affiliated fund that is generally available only to investment companies and other accounts managed by Fidelity Investments. The rate quoted is the annualized seven-day yield of the fund at period end. A complete unaudited listing of the fund's holdings as of its most recent quarter end is available upon request. In addition, each Fidelity Central Fund's financial statements are available on the SEC's website or upon request. |
| (f) | Investment made with cash collateral received from securities on loan. |
Affiliated Central Funds
Fiscal year to date information regarding the Fund's investments in Fidelity Central Funds, including the ownership percentage, is presented below.
| Affiliate | Value, beginning of period ($) | Purchases ($) | Sales Proceeds ($) | Dividend Income ($) | Realized Gain (loss) ($) | Change in Unrealized appreciation (depreciation) ($) | Value, end of period ($) | %ownership, end of period |
| Fidelity Cash Central Fund 2.33% | 2,182,978 | 245,089,410 | 238,664,301 | 58,148 | - | (1) | 8,608,086 | 0.0% |
| Fidelity Securities Lending Cash Central Fund 2.34% | 970,387 | 41,978,530 | 31,097,325 | 3,794 | - | - | 11,851,592 | 0.0% |
| Total | 3,153,365 | 287,067,940 | 269,761,626 | 61,942 | - | (1) | 20,459,678 | |
| | | | | | | | | |
Amounts in the income column in the above table include any capital gain distributions from underlying funds, which are presented in the corresponding line item in the Statement of Operations, if applicable.
Amount for Fidelity Securities Lending Cash Central Fund represents the income earned on investing cash collateral, less rebates paid to borrowers and any lending agent fees associated with the loan, plus any premium payments received for lending certain types of securities.
Investment Valuation
The following is a summary of the inputs used, as of August 31, 2022, involving the Fund's assets and liabilities carried at fair value. The inputs or methodology used for valuing securities may not be an indication of the risk associated with investing in those securities. For more information on valuation inputs, and their aggregation into the levels used below, please refer to the Investment Valuation section in the accompanying Notes to Financial Statements.
| Valuation Inputs at Reporting Date: |
| Description | Total ($) | Level 1 ($) | Level 2 ($) | Level 3 ($) |
Investments in Securities: | | | | |
|
| Equities: | | | | |
Communication Services | 220,010,434 | 220,010,434 | - | - |
Consumer Discretionary | 298,781,105 | 298,781,105 | - | - |
Consumer Staples | 176,853,010 | 176,853,010 | - | - |
Energy | 122,051,523 | 122,051,523 | - | - |
Financials | 283,909,529 | 283,909,529 | - | - |
Health Care | 367,847,761 | 367,847,761 | - | - |
Industrials | 207,080,819 | 207,080,819 | - | - |
Information Technology | 714,179,105 | 714,179,105 | - | - |
Materials | 66,359,441 | 66,359,441 | - | - |
Real Estate | 74,691,020 | 74,691,020 | - | - |
Utilities | 81,864,851 | 81,864,851 | - | - |
|
| U.S. Government and Government Agency Obligations | 493,791 | - | 493,791 | - |
|
| Money Market Funds | 20,459,678 | 20,459,678 | - | - |
| Total Investments in Securities: | 2,634,582,067 | 2,634,088,276 | 493,791 | - |
Derivative Instruments: | | | | |
|
| Liabilities | | | | |
Futures Contracts | (203,840) | (203,840) | - | - |
| Total Liabilities | (203,840) | (203,840) | - | - |
| Total Derivative Instruments: | (203,840) | (203,840) | - | - |
Value of Derivative Instruments
The following table is a summary of the Fund's value of derivative instruments by primary risk exposure as of August 31, 2022. For additional information on derivative instruments, please refer to the Derivative Instruments section in the accompanying Notes to Financial Statements.
Primary Risk Exposure / Derivative Type | Value |
| Asset ($) | Liability ($) |
| Equity Risk | | |
Futures Contracts (a) | 0 | (203,840) |
| Total Equity Risk | 0 | (203,840) |
| Total Value of Derivatives | 0 | (203,840) |
(a)Reflects gross cumulative appreciation (depreciation) on futures contracts as presented in the Schedule of Investments. In the Statement of Assets and Liabilities, the period end daily variation margin is included in receivable or payable for daily variation margin on futures contracts, and the net cumulative appreciation (depreciation) is included in Total accumulated earnings (loss).
| Statement of Assets and Liabilities |
| | | | August 31, 2022 (Unaudited) |
| | | | | |
| Assets | | | | |
| Investment in securities, at value (including securities loaned of $11,511,917) - See accompanying schedule: | | $2,614,122,389 | | |
Unaffiliated issuers (cost $2,234,855,250) | | | |
Fidelity Central Funds (cost $20,459,678) | | 20,459,678 | | |
| | | | | |
| Total Investment in Securities (cost $2,255,314,928) | | | $ | 2,634,582,067 |
| Segregated cash with brokers for derivative instruments | | | | 161,139 |
| Receivable for fund shares sold | | | | 3,862,069 |
| Dividends receivable | | | | 4,294,317 |
| Distributions receivable from Fidelity Central Funds | | | | 12,719 |
Total assets | | | | 2,642,912,311 |
| Liabilities | | | | |
| Payable for fund shares redeemed | | $1,522,121 | | |
| Payable for daily variation margin on futures contracts | | 100,297 | | |
| Collateral on securities loaned | | 11,851,685 | | |
| Total Liabilities | | | | 13,474,103 |
| Net Assets | | | $ | 2,629,438,208 |
| Net Assets consist of: | | | | |
| Paid in capital | | | $ | 2,270,107,391 |
| Total accumulated earnings (loss) | | | | 359,330,817 |
| Net Assets | | | $ | 2,629,438,208 |
Net Asset Value , offering price and redemption price per share ($2,629,438,208 ÷ 155,494,154 shares) | | | $ | 16.91 |
| | | | | |
| Statement of Operations |
| | | | Six months ended August 31, 2022 (Unaudited) |
| Investment Income | | | | |
| Dividends | | | $ | 21,996,153 |
| Interest | | | | 3,886 |
| Income from Fidelity Central Funds (including $3,794 from security lending) | | | | 61,942 |
| Total Income | | | | 22,061,981 |
| Expenses | | | | |
| Independent trustees' fees and expenses | | 4,328 | | |
| Interest | | 3,823 | | |
| Total expenses before reductions | | 8,151 | | |
| Expense reductions | | (14) | | |
| Total expenses after reductions | | | | 8,137 |
| Net Investment income (loss) | | | | 22,053,844 |
| Realized and Unrealized Gain (Loss) | | | | |
| Net realized gain (loss) on: | | | | |
| Investment Securities: | | | | |
| Unaffiliated issuers | | (16,456,847) | | |
| Futures contracts | | 221,125 | | |
| Total net realized gain (loss) | | | | (16,235,722) |
| Change in net unrealized appreciation (depreciation) on: | | | | |
| Investment Securities: | | | | |
| Unaffiliated issuers | | (251,863,441) | | |
| Fidelity Central Funds | | (1) | | |
| Futures contracts | | (342,021) | | |
| Total change in net unrealized appreciation (depreciation) | | | | (252,205,463) |
| Net gain (loss) | | | | (268,441,185) |
| Net increase (decrease) in net assets resulting from operations | | | $ | (246,387,341) |
| Statement of Changes in Net Assets |
| |
| | Six months ended August 31, 2022 (Unaudited) | | Year ended February 28, 2022 |
| Increase (Decrease) in Net Assets | | | | |
| Operations | | | | |
| Net investment income (loss) | $ | 22,053,844 | $ | 33,067,650 |
| Net realized gain (loss) | | (16,235,722) | | 817,533 |
| Change in net unrealized appreciation (depreciation) | | (252,205,463) | | 257,089,594 |
| Net increase (decrease) in net assets resulting from operations | | (246,387,341) | | 290,974,777 |
| Distributions to shareholders | | (19,422,509) | | (32,960,793) |
| Share transactions | | | | |
| Proceeds from sales of shares | | 631,522,428 | | 1,535,656,043 |
| Reinvestment of distributions | | 13,353,131 | | 22,749,290 |
| Cost of shares redeemed | | (510,158,614) | | (744,296,057) |
Net increase (decrease) in net assets resulting from share transactions | | 134,716,945 | | 814,109,276 |
| Total increase (decrease) in net assets | | (131,092,905) | | 1,072,123,260 |
| | | | | |
| Net Assets | | | | |
| Beginning of period | | 2,760,531,113 | | 1,688,407,853 |
| End of period | $ | 2,629,438,208 | $ | 2,760,531,113 |
| | | | | |
| Other Information | | | | |
| Shares | | | | |
| Sold | | 35,795,263 | | 82,535,630 |
| Issued in reinvestment of distributions | | 765,402 | | 1,209,622 |
| Redeemed | | (28,800,283) | | (39,738,052) |
| Net increase (decrease) | | 7,760,382 | | 44,007,200 |
| | | | | |
| Fidelity Flex® 500 Index Fund |
| |
| | Six months ended (Unaudited) August 31, 2022 | | Years ended February 28, 2022 | | 2021 | | 2020 A | | 2019 | | 2018 B |
Selected Per-Share Data | | | | | | | | | | | | |
| Net asset value, beginning of period | $ | 18.69 | $ | 16.28 | $ | 12.62 | $ | 11.88 | $ | 11.58 | $ | 10.00 |
| Income from Investment Operations | | | | | | | | | | | | |
Net investment income (loss) C,D | | .14 | | .26 | | .24 | | .26 | | .24 | | .22 |
| Net realized and unrealized gain (loss) | | (1.79) | | 2.41 | | 3.66 | | .73 | | .29 | | 1.47 |
| Total from investment operations | | (1.65) | | 2.67 | | 3.90 | | .99 | | .53 | | 1.69 |
| Distributions from net investment income | | (.13) | | (.24) | | (.24) | | (.25) | | (.19) | | (.10) |
| Distributions from net realized gain | | - | | (.02) | | - | | - | | (.04) | | (.01) |
| Total distributions | | (.13) | | (.26) | | (.24) | | (.25) | | (.23) | | (.11) |
| Net asset value, end of period | $ | 16.91 | $ | 18.69 | $ | 16.28 | $ | 12.62 | $ | 11.88 | $ | 11.58 |
Total Return E,F | | (8.86)% | | 16.38% | | 31.31% | | 8.26% | | 4.67% | | 16.91% |
Ratios to Average Net Assets D,G,H | | | | | | | | | | | | |
Expenses before reductions I | | -% J | | -% | | -% | | -% | | -% | | -% J |
Expenses net of fee waivers, if any I | | -% J | | -% | | -% | | -% | | -% | | -% J |
Expenses net of all reductions I | | -% J | | -% | | -% | | -% | | -% | | -% J |
| Net investment income (loss) | | 1.63% J | | 1.38% | | 1.69% | | 1.98% | | 2.05% | | 2.04% J |
| Supplemental Data | | | | | | | | | | | | |
| Net assets, end of period (000 omitted) | $ | 2,629,438 | $ | 2,760,531 | $ | 1,688,408 | $ | 846,477 | $ | 553,837 | $ | 26,382 |
Portfolio turnover rate K | | 8% J | | 2% | | 6% | | 3% | | 8% L | | 10% J |
A For the year ended February 29.
B For the period March 9, 2017 (commencement of operations) through February 28, 2018.
C Calculated based on average shares outstanding during the period.
D Net investment income (loss) is affected by the timing of the declaration of dividends by any underlying mutual funds or exchange-traded funds (ETFs). Net investment income (loss) of any such underlying funds is not included in the Fund's net investment income (loss) ratio.
E Total returns for periods of less than one year are not annualized.
F Total returns would have been lower if certain expenses had not been reduced during the applicable periods shown.
G Fees and expenses of any underlying mutual funds or exchange-traded funds (ETFs) are not included in the Fund's expense ratio. The Fund indirectly bears its proportionate share of these expenses. For additional expense information related to investments in Fidelity Central Funds, please refer to the "Investments in Fidelity Central Funds" note found in the Notes to Financial Statements section of the most recent Annual or Semi-Annual report.
H Expense ratios reflect operating expenses of the class. Expenses before reductions do not reflect amounts reimbursed, waived, or reduced through arrangements with the investment adviser, brokerage services, or other offset arrangements, if applicable, and do not represent the amount paid by the class during periods when reimbursements, waivers or reductions occur.
I Amount represents less than .005%.
J Annualized
K Amount does not include the portfolio activity of any underlying mutual funds or exchange-traded funds (ETFs).
L Portfolio turnover rate excludes securities received or delivered in-kind.
For the period ended August 31, 2022
1. Organization.
Fidelity Flex 500 Index Fund (the Fund) is a fund of Fidelity Concord Street Trust (the Trust) and is authorized to issue an unlimited number of shares. Share transactions on the Statement of Changes in Net Assets may contain exchanges between affiliated funds. The Trust is registered under the Investment Company Act of 1940, as amended (the 1940 Act), as an open-end management investment company organized as a Massachusetts business trust. The Fund is available only to certain fee-based accounts and advisory programs offered by Fidelity.
2. Investments in Fidelity Central Funds.
Funds may invest in Fidelity Central Funds, which are open-end investment companies generally available only to other investment companies and accounts managed by the investment adviser and its affiliates. The Schedule of Investments lists any Fidelity Central Funds held as an investment as of period end, but does not include the underlying holdings of each Fidelity Central Fund. An investing fund indirectly bears its proportionate share of the expenses of the underlying Fidelity Central Funds.
Based on its investment objective, each Fidelity Central Fund may invest or participate in various investment vehicles or strategies that are similar to those of the investing fund. These strategies are consistent with the investment objectives of the investing fund and may involve certain economic risks which may cause a decline in value of each of the Fidelity Central Funds and thus a decline in the value of the investing fund.
| Fidelity Central Fund | Investment Manager | Investment Objective | Investment Practices | Expense Ratio A |
| Fidelity Money Market Central Funds | Fidelity Management & Research Company LLC (FMR) | Each fund seeks to obtain a high level of current income consistent with the preservation of capital and liquidity. | Short-term Investments | Less than .005% |
A Expenses expressed as a percentage of average net assets and are as of each underlying Central Fund's most recent annual or semi-annual shareholder report.
A complete unaudited list of holdings for each Fidelity Central Fund is available upon request or at the Securities and Exchange Commission website at www.sec.gov. In addition, the financial statements of the Fidelity Central Funds which contain the significant accounting policies (including investment valuation policies) of those funds, and are not covered by the Report of Independent Registered Public Accounting Firm, are available on the Securities and Exchange Commission website or upon request.
3. Significant Accounting Policies.
The Fund is an investment company and applies the accounting and reporting guidance of the Financial Accounting Standards Board (FASB) Accounting Standards Codification Topic 946 Financial Services - Investment Companies . The financial statements have been prepared in conformity with accounting principles generally accepted in the United States of America (GAAP), which require management to make certain estimates and assumptions at the date of the financial statements. Actual results could differ from those estimates. Subsequent events, if any, through the date that the financial statements were issued have been evaluated in the preparation of the financial statements. The Fund's Schedule of Investments lists any underlying mutual funds or exchange-traded funds (ETFs) but does not include the underlying holdings of these funds. The following summarizes the significant accounting policies of the Fund:
Investment Valuation. Investments are valued as of 4:00 p.m. Eastern time on the last calendar day of the period. The Board of Trustees (the Board) has delegated the day to day responsibility for the valuation of the Fund's investments to the Fair Value Committee (the Committee) established by the Fund's investment adviser. In accordance with valuation policies and procedures approved by the Board, the Fund attempts to obtain prices from one or more third party pricing vendors or brokers to value its investments. When current market prices, quotations or currency exchange rates are not readily available or reliable, investments will be fair valued in good faith by the Committee, in accordance with procedures adopted by the Board. Factors used in determining fair value vary by investment type and may include market or investment specific events, changes in interest rates and credit quality. The frequency with which these procedures are used cannot be predicted and they may be utilized to a significant extent. The Committee oversees the Fund's valuation policies and procedures and reports to the Board on the Committee's activities and fair value determinations. The Board monitors the appropriateness of the procedures used in valuing the Fund's investments and ratifies the fair value determinations of the Committee.
The Fund categorizes the inputs to valuation techniques used to value its investments into a disclosure hierarchy consisting of three levels as shown below:
Level 1 - unadjusted quoted prices in active markets for identical investments
Level 2 - other significant observable inputs (including quoted prices for similar investments, interest rates, prepayment speeds, etc.)
Level 3 - unobservable inputs (including the Fund's own assumptions based on the best information available)
Valuation techniques used to value the Fund's investments by major category are as follows:
Equity securities, including restricted securities, for which market quotations are readily available, are valued at the last reported sale price or official closing price as reported by a third party pricing vendor on the primary market or exchange on which they are traded and are categorized as Level 1 in the hierarchy. In the event there were no sales during the day or closing prices are not available, securities are valued at the last quoted bid price or may be valued using the last available price and are generally categorized as Level 2 in the hierarchy. For foreign equity securities, when market or security specific events arise, comparisons to the valuation of American Depositary Receipts (ADRs), futures contracts, ETFs and certain indexes as well as quoted prices for similar securities may be used and would be categorized as Level 2 in the hierarchy. For equity securities, including restricted securities, where observable inputs are limited, assumptions about market activity and risk are used and these securities may be categorized as Level 3 in the hierarchy.
Debt securities, including restricted securities, are valued based on evaluated prices received from third party pricing vendors or from brokers who make markets in such securities. U.S. government and government agency obligations are valued by pricing vendors who utilize matrix pricing which considers yield or price of bonds of comparable quality, coupon, maturity and type or by broker-supplied prices. When independent prices are unavailable or unreliable, debt securities may be valued utilizing pricing methodologies which consider similar factors that would be used by third party pricing vendors. Debt securities are generally categorized as Level 2 in the hierarchy but may be Level 3 depending on the circumstances.
Futures contracts are valued at the settlement price established each day by the board of trade or exchange on which they are traded and are categorized as Level 1 in the hierarchy. Investments in open-end mutual funds, including the Fidelity Central Funds, are valued at their closing net asset value (NAV) each business day and are categorized as Level 1 in the hierarchy.
Changes in valuation techniques may result in transfers in or out of an assigned level within the disclosure hierarchy. The aggregate value of investments by input level as of August 31, 2022 is included at the end of the Fund's Schedule of Investments.
Investment Transactions and Income. For financial reporting purposes, the Fund's investment holdings and NAV include trades executed through the end of the last business day of the period. The NAV per share for processing shareholder transactions is calculated as of the close of business of the New York Stock Exchange (NYSE), normally 4:00 p.m. Eastern time and includes trades executed through the end of the prior business day. Gains and losses on securities sold are determined on the basis of identified cost and include proceeds received from litigation. Commissions paid to certain brokers with whom the investment adviser, or its affiliates, places trades on behalf of a fund include an amount in addition to trade execution, which may be rebated back to a fund. Any such rebates are included in net realized gain (loss) on investments in the Statement of Operations. Dividend income is recorded on the ex-dividend date, except for certain dividends from foreign securities where the ex-dividend date may have passed, which are recorded as soon as the Fund is informed of the ex-dividend date. Non-cash dividends included in dividend income, if any, are recorded at the fair market value of the securities received. Income and capital gain distributions from Fidelity Central Funds, if any, are recorded on the ex-dividend date. Certain distributions received by the Fund represent a return of capital or capital gain. The Fund determines the components of these distributions subsequent to the ex-dividend date, based upon receipt of tax filings or other correspondence relating to the underlying investment. These distributions are recorded as a reduction of cost of investments and/or as a realized gain. Interest income is accrued as earned and includes coupon interest and amortization of premium and accretion of discount on debt securities as applicable.
Expenses. Expenses directly attributable to a fund are charged to that fund. Expenses attributable to more than one fund are allocated among the respective funds on the basis of relative net assets or other appropriate methods. Expenses included in the accompanying financial statements reflect the expenses of that fund and do not include any expenses associated with any underlying mutual funds or exchange-traded funds. Although not included in a fund's expenses, a fund indirectly bears its proportionate share of these expenses through the net asset value of each underlying mutual fund or exchange-traded fund. Expense estimates are accrued in the period to which they relate and adjustments are made when actual amounts are known.
Income Tax Information and Distributions to Shareholders. Each year, the Fund intends to qualify as a regulated investment company under Subchapter M of the Internal Revenue Code, including distributing substantially all of its taxable income and realized gains. As a result, no provision for U.S. Federal income taxes is required. The Fund files a U.S. federal tax return, in addition to state and local tax returns as required. The Fund's federal income tax returns are subject to examination by the Internal Revenue Service (IRS) for a period of three fiscal years after they are filed. State and local tax returns may be subject to examination for an additional fiscal year depending on the jurisdiction.
Distributions are declared and recorded on the ex-dividend date. Income and capital gain distributions are determined in accordance with income tax regulations, which may differ from GAAP.
Capital accounts within the financial statements are adjusted for permanent book-tax differences. These adjustments have no impact on net assets or the results of operations. Capital accounts are not adjusted for temporary book-tax differences which will reverse in a subsequent period.
Book-tax differences are primarily due to futures contracts, short-term gain distributions from the Underlying Funds, capital loss carryforwards and losses deferred due to wash sales and excise tax regulations.
As of period end, the cost and unrealized appreciation (depreciation) in securities, and derivatives if applicable, for federal income tax purposes were as follows:
| Gross unrealized appreciation | $ 555,780,781 |
| Gross unrealized depreciation | (203,983,381) |
| Net unrealized appreciation (depreciation) | $351,797,400 |
| Tax cost | $2,282,580,827 |
The Fund elected to defer to its next fiscal year approximately $352,305 of capital losses recognized during the period November 1, 2021 to February 28, 2022.
4. Derivative Instruments.
Risk Exposures and the Use of Derivative Instruments. Investment objectives allow a fund to enter into various types of derivative contracts, including futures contracts. Derivatives are investments whose value is primarily derived from underlying assets, indices or reference rates and may be transacted on an exchange or over-the-counter (OTC). Derivatives may involve a future commitment to buy or sell a specified asset based on specified terms, to exchange future cash flows at periodic intervals based on a notional principal amount, or for one party to make one or more payments upon the occurrence of specified events in exchange for periodic payments from the other party.
Derivatives were used to increase returns and to manage exposure to certain risks as defined below. The success of any strategy involving derivatives depends on analysis of numerous economic factors, and if the strategies for investment do not work as intended, the objectives may not be achieved.
Derivatives were used to increase or decrease exposure to the following risk(s):
| | |
| Equity Risk | Equity risk relates to the fluctuations in the value of financial instruments as a result of changes in market prices (other than those arising from interest rate risk or foreign exchange risk), whether caused by factors specific to an individual investment, its issuer, or all factors affecting all instruments traded in a market or market segment. |
Funds are also exposed to additional risks from investing in derivatives, such as liquidity risk and counterparty credit risk. Liquidity risk is the risk that a fund will be unable to close out the derivative in the open market in a timely manner. Counterparty credit risk is the risk that the counterparty will not be able to fulfill its obligation to a fund. Counterparty credit risk related to exchange-traded contracts may be mitigated by the protection provided by the exchange on which they trade.
Investing in derivatives may involve greater risks than investing in the underlying assets directly and, to varying degrees, may involve risk of loss in excess of any initial investment and collateral received and amounts recognized in the Statement of Assets and Liabilities. In addition, there may be the risk that the change in value of the derivative contract does not correspond to the change in value of the underlying instrument.
Futures Contracts. A futures contract is an agreement between two parties to buy or sell a specified underlying instrument for a fixed price at a specified future date. Futures contracts were used to manage exposure to the stock market.
Upon entering into a futures contract, a fund is required to deposit either cash or securities (initial margin) with a clearing broker in an amount equal to a certain percentage of the face value of the contract. Futures contracts are marked-to-market daily and subsequent daily payments are made or received by a fund depending on the daily fluctuations in the value of the futures contracts and are recorded as unrealized appreciation or (depreciation). This receivable and/or payable, if any, is included in daily variation margin on futures contracts in the Statement of Assets and Liabilities. Realized gain or (loss) is recorded upon the expiration or closing of a futures contract. The net realized gain (loss) and change in net unrealized appreciation (depreciation) on futures contracts during the period is presented in the Statement of Operations.
Any open futures contracts at period end are presented in the Schedule of Investments under the caption "Futures Contracts". The notional amount at value reflects each contract's exposure to the underlying instrument or index at period end, and is representative of volume of activity during the period unless an average notional amount is presented. Any securities deposited to meet initial margin requirements are identified in the Schedule of Investments. Any cash deposited to meet initial margin requirements is presented as segregated cash with brokers for derivative instruments in the Statement of Assets and Liabilities.
5. Purchases and Sales of Investments.
Purchases and sales of securities, other than short-term securities and in-kind transactions, as applicable, are noted in the table below.
| | Purchases ($) | Sales ($) |
| Fidelity Flex 500 Index Fund | 242,140,888 | 108,680,649 |
6.Fees and Other Transactions with Affiliates.
Management Fee. Fidelity Management & Research Company LLC (the investment adviser) and its affiliates provide the Fund with investment management related services and the Fund does not pay any fees for these services. Under the management contract, the investment adviser or an affiliate pays all other expenses of the Fund, excluding fees and expenses of the independent Trustees, and certain miscellaneous expenses such as proxy and shareholder meeting expenses.
Sub-Adviser. Geode Capital Management, LLC (Geode), serves as sub-adviser for the Fund. Geode provides discretionary investment advisory services to the Fund and is paid by the investment adviser for providing these services.
Interfund Lending Program. Pursuant to an Exemptive Order issued by the Securities and Exchange Commission (the SEC), the Fund, along with other registered investment companies having management contracts with Fidelity Management & Research Company LLC (FMR), or other affiliated entities of FMR, may participate in an interfund lending program. This program provides an alternative credit facility allowing the Fund to borrow from, or lend money to, other participating affiliated funds. At period end, there were no interfund loans outstanding. Activity in this program during the period for which loans were outstanding was as follows:
| | Borrower or Lender | Average Loan Balance | Weighted Average Interest Rate | Interest Expense |
| Fidelity Flex 500 Index Fund | Borrower | $ 16,294,286 | 1.21% | $ 3,823 |
Interfund Trades. Funds may purchase from or sell securities to other Fidelity Funds under procedures adopted by the Board. The procedures have been designed to ensure these interfund trades are executed in accordance with Rule 17a-7 of the 1940 Act. Any interfund trades are included within the respective purchases and sales amounts shown in the Purchases and Sales of Investments note. During the period, there were no interfund trades.
7. Committed Line of Credit.
Certain Funds participate with other funds managed by the investment adviser or an affiliate in a $4.25 billion credit facility (the "line of credit") to be utilized for temporary or emergency purposes to fund shareholder redemptions or for other short-term liquidity purposes. The commitment fees on the pro-rata portion of the line of credit are borne by the investment adviser. During the period, there were no borrowings on this line of credit.
8. Security Lending.
Funds lend portfolio securities through a lending agent from time to time in order to earn additional income. A fund may lend securities to certain qualified borrowers, including NFS. On the settlement date of the loan, a fund receives collateral (in the form of U.S. Treasury obligations, letters of credit and/or cash) against the loaned securities and maintains collateral in an amount not less than 100% of the market value of the loaned securities during the period of the loan. The market value of the loaned securities is determined at the close of business of a fund and any additional required collateral is delivered to a fund on the next business day. The Fund or borrower may terminate the loan at any time, and if the borrower defaults on its obligation to return the securities loaned because of insolvency or other reasons, a fund may apply collateral received from the borrower against the obligation. A fund may experience delays and costs in recovering the securities loaned. Any cash collateral received is invested in the Fidelity Securities Lending Cash Central Fund. Any loaned securities are identified as such in the Schedule of Investments, and the value of loaned securities and cash collateral at period end, as applicable, are presented in the Statement of Assets and Liabilities. Security lending income represents the income earned on investing cash collateral, less rebates paid to borrowers and any lending agent fees associated with the loan, plus any premium payments received for lending certain types of securities. Security lending income is presented in the Statement of Operations as a component of income from Fidelity Central Funds.
| | Security Lending Income From Securities Loaned to NFS | Value of Securities Loaned to NFS at Period End |
| Fidelity Flex 500 Index Fund | $ - | $ - |
9. Expense Reductions.
Through arrangements with the Fund's custodian, credits realized as a result of certain uninvested cash balances were used to reduce the Fund's expenses by $14.
10. Other.
A fund's organizational documents provide former and current trustees and officers with a limited indemnification against liabilities arising in connection with the performance of their duties to the fund. In the normal course of business, a fund may also enter into contracts that provide general indemnifications. A fund's maximum exposure under these arrangements is unknown as this would be dependent on future claims that may be made against a fund. The risk of material loss from such claims is considered remote.
11. Risk and Uncertainties.
Many factors affect a fund's performance. Developments that disrupt global economies and financial markets, such as pandemics, epidemics, outbreaks of infectious diseases, war, terrorism, and environmental disasters, may significantly affect a fund's investment performance. The effects of these developments to a fund will be impacted by the types of securities in which a fund invests, the financial condition, industry, economic sector, and geographic location of an issuer, and a fund's level of investment in the securities of that issuer.
As a shareholder, you incur two types of costs: (1) transaction costs, which may include sales charges (loads) on purchase payments or redemption proceeds, as applicable and (2) ongoing costs, which generally include management fees, distribution and/or service (12b-1) fees and other Fund expenses. This Example is intended to help you understand your ongoing costs (in dollars) of investing in a fund and to compare these costs with the ongoing costs of investing in other mutual funds.
| The Example is based on an investment of $1,000 invested at the beginning of the period and held for the entire period (March 1, 2022 to August 31, 2022). |
Actual Expenses
The first line of the accompanying table provides information about actual account values and actual expenses. You may use the information in this line, together with the amount you invested, to estimate the expenses that you paid over the period. Simply divide your account value by $1,000.00 (for example, an $8,600 account value divided by $1,000.00 = 8.6), then multiply the result by the number in the first line for a class/Fund under the heading entitled "Expenses Paid During Period" to estimate the expenses you paid on your account during this period. If any fund is a shareholder of any underlying mutual funds or exchange-traded funds (ETFs) (the Underlying Funds), such fund indirectly bears its proportional share of the expenses of the Underlying Funds in addition to the direct expenses incurred presented in the table. These fees and expenses are not included in the annualized expense ratio used to calculate the expense estimate in the table below.
Hypothetical Example for Comparison Purposes
The second line of the accompanying table provides information about hypothetical account values and hypothetical expenses based on the actual expense ratio and an assumed rate of return of 5% per year before expenses, which is not the actual return. The hypothetical account values and expenses may not be used to estimate the actual ending account balance or expenses you paid for the period. You may use this information to compare the ongoing costs of investing in the Fund and other funds. To do so, compare this 5% hypothetical example with the 5% hypothetical examples that appear in the shareholder reports of the other funds. If any fund is a shareholder of any Underlying Funds, such fund indirectly bears its proportional share of the expenses of the Underlying Funds in addition to the direct expenses as presented in the table. These fees and expenses are not included in the annualized expense ratio used to calculate the expense estimate in the table below.
Please note that the expenses shown in the table are meant to highlight your ongoing costs only and do not reflect any transaction costs. Therefore, the second line of the table is useful in comparing ongoing costs only, and will not help you determine the relative total costs of owning different funds. In addition, if these transactional costs were included, your costs would have been higher.
| | | | | Annualized Expense Ratio- A | | Beginning Account Value March 1, 2022 | | Ending Account Value August 31, 2022 | | Expenses Paid During Period- C March 1, 2022 to August 31, 2022 |
| | | | | | | | | | |
| Fidelity Flex® 500 Index Fund | | | | -%- D | | | | | | |
| Actual | | | | | | $ 1,000 | | $ 911.40 | | $- E |
Hypothetical- B | | | | | | $ 1,000 | | $ 1,025.21 | | $- E |
| |
A Annualized expense ratio reflects expenses net of applicable fee waivers.
B 5% return per year before expenses
C Expenses are equal to the annualized expense ratio, multiplied by the average account value over the period, multiplied by 184/ 365 (to reflect the one-half year period). The fees and expenses of any Underlying Funds are not included in each annualized expense ratio.
D Amount represents less than .005%.
E Amount represents less than $.005.
Fidelity Flex 500 Index Fund
Each year, the Board of Trustees, including the Independent Trustees (together, the Board), votes on the renewal of the management contract with Fidelity Management & Research Company LLC (FMR) and the sub-advisory agreement (Sub-Advisory Agreement) for the fund with Geode Capital Management, LLC (Geode) (together, the Advisory Contracts). FMR and Geode are referred to herein as the Investment Advisers. The Board, assisted by the advice of fund counsel and Independent Trustees' counsel, requests and considers a broad range of information relevant to the renewal of the Advisory Contracts throughout the year.
The Board meets regularly and, at each of its meetings, covers an extensive agenda of topics and materials and considers factors that are relevant to its annual consideration of the renewal of the fund's Advisory Contracts, including the services and support provided to the fund and its shareholders. The Board has established various standing committees (Committees), each composed of and chaired by Independent Trustees with varying backgrounds, to which the Board has assigned specific subject matter responsibilities in order to enhance effective decision-making by the Board. The Board, acting directly and through its Committees, requests and receives information concerning the annual consideration of the renewal of the fund's Advisory Contracts. The Board also meets as needed to review matters specifically related to the Board's annual consideration of the renewal of the Advisory Contracts. Members of the Board may also meet with trustees of other Fidelity funds through joint ad hoc committees to discuss certain matters relevant to all of the Fidelity funds.
At its May 2022 meeting, the Board unanimously determined to renew the fund's Advisory Contracts. In considering whether to renew the Advisory Contracts for the fund, the Board considered all factors it believed relevant and reached a determination, with the assistance of fund counsel and Independent Trustees' counsel and through the exercise of its business judgment, that the renewal of the Advisory Contracts was in the best interests of the fund and its shareholders and the fact that no fee is payable under the management contract was fair and reasonable.
Nature, Extent, and Quality of Services Provided. The Board considered staffing as it relates to the fund, including the backgrounds of investment personnel of Fidelity and Geode, and also considered the fund's investment objective, strategies, and related investment philosophy. The Independent Trustees also had discussions with senior management of Fidelity's investment operations and investment groups and with senior management of Geode. The Board considered the structure of the investment personnel compensation programs and whether the structures provide appropriate incentives to act in the best interests of the fund. Additionally, the Board considered the portfolio managers' investments, if any, in the funds that they manage. The Board also considered the steps Fidelity and Geode have taken to ensure the continued provision of high quality services to the Fidelity funds during the COVID-19 pandemic, including the expansion of staff in client facing positions to maintain service levels in periods of high volumes and volatility.
The Trustees also discussed with representatives of Fidelity, at meetings throughout the year, Fidelity's role in, among other things, overseeing compliance with federal securities laws and other applicable requirements by Geode with respect to the fund and monitoring and overseeing the performance and investment capabilities of Geode. The Trustees considered that the Board had received from Fidelity periodic reports about its oversight and due diligence processes, as well as periodic reports regarding the performance of Geode.
The Board also considered the nature, extent and quality of services provided by Geode. The Trustees noted that under the Sub-Advisory Agreement, subject to oversight by Fidelity, Geode is responsible for, among other things, identifying investments and arranging for execution of portfolio transactions to implement the fund's investment strategy. In addition, the Trustees noted that Geode is responsible for providing such reporting as may be requested by Fidelity to fulfill its oversight responsibilities discussed above.
Resources Dedicated to Investment Management and Support Services. The Board and the Fund Oversight and Research Committees reviewed the general qualifications and capabilities of Fidelity's and Geode's investment staffs, including their size, education, experience, and resources, as well as Fidelity's and Geode's approach to recruiting, training, managing, and compensating investment personnel. The Board considered that Fidelity's and Geode's investment professionals have extensive resources, tools and capabilities so as to provide competitive investment results over time, and that those professionals also have access to sophisticated tools that permit them to assess portfolio construction and risk and performance attribution characteristics continuously. Additionally, in its deliberations, the Board considered Fidelity's and Geode's trading, risk management, compliance, and technology and operations capabilities and resources, which are integral parts of the investment management process.
Shareholder and Administrative Services. The Board considered (i) the nature, extent, quality, and cost of advisory, administrative, and shareholder services performed by the Investment Advisers and their affiliates under the Advisory Contracts and by FMR's affiliates under separate agreements covering transfer agency, pricing and bookkeeping, and securities lending services for the fund; (ii) the nature and extent of the supervision of third party service providers, principally custodians, subcustodians, and pricing vendors; and (iii) the resources devoted to, and the record of compliance with, the fund's compliance policies and procedures. The Board also reviewed the allocation of fund brokerage, including allocations to brokers affiliated with the Investment Advisers.
The Board noted that the growth of fund assets over time across the complex allows Fidelity to reinvest in the development of services designed to enhance the value and convenience of the Fidelity funds as investment vehicles. These services include 24-hour access to account information and market information over the Internet and through telephone representatives, investor education materials, and asset allocation tools. The Board also considered that it reviews customer service metrics such as telephone response times, continuity of services on the website and metrics addressing services at Fidelity Investor Centers.
Investment in a Large Fund Family. The Board considered the benefits to shareholders of investing in a Fidelity fund, including the benefits of investing in a fund that is part of a large family of funds offering a variety of investment disciplines and providing a large variety of mutual fund investor services. The Board noted that Fidelity had taken, or had made recommendations that resulted in the Fidelity funds taking, a number of actions over the previous year that benefited particular funds, including: (i) continuing to dedicate additional resources to Fidelity's investment research process, which includes meetings with management of issuers of securities in which the funds invest; (ii) continuing efforts to enhance Fidelity's global research capabilities; (iii) launching new funds and ETFs with innovative structures, strategies and pricing and making other enhancements to meet client needs; (iv) launching new share classes of existing funds; (v) eliminating purchase minimums and broadening eligibility requirements for certain funds and share classes; (vi) reducing management fees and total expenses for certain target date funds and classes and index funds; (vii) lowering expenses for certain existing funds and classes by implementing or lowering expense caps; (viii) rationalizing product lines and gaining increased efficiencies from fund mergers and liquidations; (ix) continuing to develop, acquire and implement systems and technology to improve services to the funds and shareholders, strengthen information security, and increase efficiency; and (x) continuing to implement enhancements to further strengthen Fidelity's product line to increase investors' probability of success in achieving their investment goals, including retirement income goals.
Investment Performance. The Board considered whether the fund has operated in accordance with its investment objective, as well as its record of compliance with its investment restrictions. The Board reviewed the fund's absolute investment performance, as well as the fund's relative investment performance. The Board did not consider performance to be a material factor in its decision to renew the fund's Advisory Contracts, as the fund is not publicly offered as a stand-alone investment product. In this regard, the Board noted that the fund is available exclusively to certain fee-based accounts and advisor programs offered by Fidelity, including certain employer-sponsored plans and discretionary investment programs.
Based on its review, the Board concluded that the nature, extent, and quality of services provided to the fund under the Advisory Contracts should continue to benefit the shareholders of the fund.
Competitiveness of Management Fee and Total Expense Ratio. The Board noted that the fund is available exclusively through certain Fidelity fee-based accounts and advisory programs. The Board considered that the fund does not pay FMR a management fee for investment advisory services, but that FMR is indirectly compensated for its services out of Fidelity fee-based account and advisory program fees. The Board also noted that FMR or an affiliate undertakes to pay all operating expenses of the fund, except Independent Trustee fees and expenses, proxy and shareholder meeting expenses, interest, taxes, and extraordinary expenses (such as litigation expenses). The Board further noted that the fund pays its non-operating expenses, including brokerage commissions and fees and expenses associated with the fund's securities lending program, if applicable.
Based on its review, the Board considered that the fund does not pay a management fee and concluded that the total expense ratio of the fund was reasonable in light of the services that the fund and its shareholders receive and the other factors considered.
Costs of the Services and Profitability. The Board considered the level of Fidelity's profits in respect of all the Fidelity funds.
A public accounting firm has been engaged annually by the Board as part of the Board's assessment of Fidelity's profitability analysis. The engagement includes the review and assessment of the methodologies used by Fidelity in determining the revenues and expenses attributable to Fidelity's mutual fund business, and completion of agreed-upon procedures in respect of the mathematical accuracy of certain fund profitability information and its conformity to established allocation methodologies. After considering the reports issued under the engagement and information provided by Fidelity, the Board concluded that while other allocation methods may also be reasonable, Fidelity's profitability methodologies are reasonable in all material respects.
The Board also reviewed Fidelity's and Geode's non-fund businesses and potential indirect benefits such businesses may have received as a result of their association with Fidelity's mutual fund business (i.e., fall-out benefits) as well as cases where Fidelity's and Geode's affiliates may benefit from the funds' business. The Board considered areas where potential indirect benefits to the Fidelity funds from their relationships with Fidelity may exist. The Board's consideration of these matters was informed by the findings of a joint ad hoc committee created by it and the boards of other Fidelity funds to evaluate potential fall-out benefits.
The Board concluded that the costs of the services provided by and the profits realized by Fidelity and Geode in connection with the operation of the fund were not relevant to the renewal of the Advisory Contracts because the fund pays no advisory fees and FMR or an affiliate bears all expenses of the fund with limited exceptions.
The Board also considered information regarding the profitability of Geode's relationship with the fund.
Economies of Scale. The Board concluded that because the fund pays no advisory fees and FMR or an affiliate bears all expenses of the fund with limited exceptions, the realization of economies of scale was not a material factor in the Board's decision to renew the fund's Advisory Contracts.
Additional Information Requested by the Board. In order to develop fully the factual basis for consideration of the Fidelity funds' advisory contracts, the Board requested and received additional information on certain topics, including: (i) fund flow and performance trends, in particular the underperformance of certain funds and strategies, and Fidelity's long-term strategies for certain funds, including any consideration of fund liquidations or mergers; (ii) the operation of performance fees, competitor use of performance fees, and consideration of the expansion of performance fees to additional funds; (iii) Fidelity's pricing philosophy compared to competitors; (iv) fund profitability methodology and data; (v) evaluation of competitive fund data and peer group classifications and fee and expense comparisons; (vi) the management fee and expense structures for different funds and classes and information about the differences between various fee and expense structures; (vii) group fee breakpoints and related voluntary fee waivers; and (viii) information regarding other accounts managed by Fidelity and the funds' sub-advisory arrangements.
Based on its evaluation of all of the conclusions noted above, and after considering all factors it believed relevant, the Board concluded that the advisory and sub-advisory fee arrangements are fair and reasonable, and that the fund's Advisory Contracts should be renewed.
1.9881570.105
Z5I-SANN-1022
Fidelity® Total Market Index Fund
Fidelity® Extended Market Index Fund
Fidelity® International Index Fund
Semi-Annual Report
August 31, 2022
Contents
To view a fund's proxy voting guidelines and proxy voting record for the 12-month period ended June 30, visit http://www.fidelity.com/proxyvotingresults or visit the Securities and Exchange Commission's (SEC) web site at http://www.sec.gov.
You may also call 1-800-544-8544 to request a free copy of the proxy voting guidelines.
The funds or securities referred to herein are not sponsored, endorsed, or promoted by MSCI, and MSCI bears no liability with respect to any such funds or securities or any index on which such funds or securities are based. The prospectus contains a more detailed description of the limited relationship MSCI has with Fidelity and any related funds.
Standard & Poor's ® ; and S&P ® ; are registered trademarks of Standard & Poor's Financial Services LLC ("S&P") and Dow Jones ® ; is a registered trademark of Dow Jones Trademark Holdings LLC ("Dow Jones"). The fund is not sponsored, endorsed, sold or promoted by SPDJI, Dow Jones, S&P, or their respective affiliates and none of such parties make any representation regarding the advisability of investing in such product(s) nor do they have any liability for any errors, omissions, or interruptions of the index or indices.
Standard & Poor's, S&P and S&P 500 are registered service marks of The McGraw-Hill Companies, Inc. and have been licensed for use by Fidelity Distributors Corporation.
Other third-party marks appearing herein are the property of their respective owners.
All other marks appearing herein are registered or unregistered trademarks or service marks of FMR LLC or an affiliated company. © 2022 FMR LLC. All rights reserved.
This report and the financial statements contained herein are submitted for the general information of the shareholders of the Fund. This report is not authorized for distribution to prospective investors in the Fund unless preceded or accompanied by an effective prospectus.
A fund files its complete schedule of portfolio holdings with the SEC for the first and third quarters of each fiscal year on Form N-PORT. Forms N-PORT are available on the SEC's web site at http://www.sec.gov. A fund's Forms N-PORT may be reviewed and copied at the SEC's Public Reference Room in Washington, DC. Information regarding the operation of the SEC's Public Reference Room may be obtained by calling 1-800-SEC-0330.
For a complete list of a fund's portfolio holdings, view the most recent holdings listing, semiannual report, or annual report on Fidelity's web site at http://www.fidelity.com, http://www.institutional.fidelity.com, or http://www.401k.com, as applicable.
NOT FDIC INSURED •MAY LOSE VALUE •NO BANK GUARANTEE
Neither the Fund nor Fidelity Distributors Corporation is a bank.
Top Holdings (% of Fund's net assets) |
| |
| Apple, Inc. | 6.1 | |
| Microsoft Corp. | 5.0 | |
| Amazon.com, Inc. | 2.8 | |
| Tesla, Inc. | 1.8 | |
| Alphabet, Inc. Class A | 1.7 | |
| Alphabet, Inc. Class C | 1.5 | |
| Berkshire Hathaway, Inc. Class B | 1.3 | |
| UnitedHealth Group, Inc. | 1.2 | |
| Johnson & Johnson | 1.1 | |
| Exxon Mobil Corp. | 1.0 | |
| | 23.5 | |
| |
| Market Sectors (% of Fund's net assets) |
| |
| Information Technology | 26.1 | |
| Health Care | 13.9 | |
| Financials | 11.6 | |
| Consumer Discretionary | 11.5 | |
| Industrials | 8.8 | |
| Communication Services | 7.7 | |
| Consumer Staples | 6.2 | |
| Energy | 4.7 | |
| Real Estate | 3.5 | |
| Utilities | 3.0 | |
| Materials | 2.8 | |
| |
Asset Allocation (% of Fund's net assets) |
|
Foreign investments - 3.1% |
|
Fidelity® Total Market Index Fund
| Common Stocks - 99.8% |
| | | Shares | Value ($) |
| COMMUNICATION SERVICES - 7.7% | | | |
| Diversified Telecommunication Services - 0.9% | | | |
| Anterix, Inc. (a) | | 30,350 | 1,288,358 |
| AST SpaceMobile, Inc. (a)(b) | | 79,690 | 957,874 |
| AT&T, Inc. | | 11,736,730 | 205,862,244 |
| ATN International, Inc. | | 17,036 | 798,137 |
| Bandwidth, Inc. (a) | | 37,243 | 577,267 |
| Charge Enterprises, Inc. (a)(b) | | 255,781 | 621,548 |
| Cogent Communications Group, Inc. | | 67,315 | 3,584,524 |
| Consolidated Communications Holdings, Inc. (a) | | 110,609 | 634,896 |
| EchoStar Holding Corp. Class A (a)(b) | | 69,893 | 1,286,730 |
| Frontier Communications Parent, Inc. (a) | | 337,490 | 8,693,742 |
| Globalstar, Inc. (a)(b) | | 1,067,098 | 2,134,196 |
| IDT Corp. Class B (a) | | 31,682 | 810,109 |
| Iridium Communications, Inc. (a) | | 214,179 | 9,507,406 |
| Liberty Global PLC: | | | |
| Class A (a) | | 197,552 | 3,990,550 |
| Class C (a) | | 569,367 | 12,133,211 |
| Liberty Latin America Ltd.: | | | |
| Class A (a) | | 54,858 | 384,006 |
| Class C (a) | | 264,040 | 1,840,359 |
| Lumen Technologies, Inc. | | 1,520,995 | 15,149,110 |
| Ooma, Inc. (a) | | 34,826 | 421,395 |
| Radius Global Infrastructure, Inc. (a) | | 119,650 | 1,647,581 |
| Starry Group Holdings, Inc. Class A (a)(b) | | 280,078 | 630,176 |
| Verizon Communications, Inc. | | 6,884,235 | 287,829,865 |
| | | | 560,783,284 |
| Entertainment - 1.3% | | | |
| Activision Blizzard, Inc. | | 1,276,946 | 100,227,492 |
| AMC Entertainment Holdings, Inc. Class A (a)(b) | | 843,665 | 7,694,225 |
| Ballantyne of Omaha, Inc. (a) | | 23,510 | 56,189 |
| Chicken Soup For The Soul Entertainment, Inc. (a)(b) | | 16,217 | 139,628 |
| Cinedigm Corp. (a)(b) | | 172,863 | 93,363 |
| Cinemark Holdings, Inc. (a) | | 166,755 | 2,347,910 |
| CuriosityStream, Inc. Class A (a)(b) | | 37,463 | 63,687 |
| Dolphin Entertainment, Inc. (a)(b) | | 7,242 | 30,416 |
| Electronic Arts, Inc. | | 459,992 | 58,359,185 |
| Gaia, Inc. Class A (a) | | 15,337 | 50,612 |
| Genius Brands International, Inc. (a)(b) | | 425,203 | 306,146 |
| Golden Matrix Group, Inc. (a) | | 4,379 | 16,421 |
| Lions Gate Entertainment Corp.: | | | |
| Class A (a) | | 179,930 | 1,772,311 |
| Class B (a) | | 119,348 | 1,113,517 |
| Live Nation Entertainment, Inc. (a) | | 223,911 | 20,232,598 |
| LiveOne, Inc. (a)(b) | | 76,855 | 76,847 |
| Madison Square Garden Entertainment Corp. (a)(b) | | 41,498 | 2,305,629 |
| Madison Square Garden Sports Corp. (a) | | 28,500 | 4,567,695 |
| Marcus Corp. | | 41,151 | 662,120 |
| Motorsport Games, Inc. Class A (a) | | 3,147 | 2,010 |
| Netflix, Inc. (a) | | 728,129 | 162,780,519 |
| Playstudios, Inc. Class A (a)(b) | | 122,479 | 443,374 |
| Playtika Holding Corp. (a) | | 164,283 | 1,729,900 |
| Reading International, Inc. Class A (a) | | 27,398 | 110,688 |
| Reservoir Media, Inc. (a)(b) | | 52,019 | 340,724 |
| Roku, Inc. Class A (a) | | 196,292 | 13,347,856 |
| Sciplay Corp. (A Shares) (a) | | 39,902 | 486,405 |
| Skillz, Inc. (a)(b) | | 406,553 | 540,715 |
| Take-Two Interactive Software, Inc. (a) | | 258,372 | 31,666,072 |
| The Walt Disney Co. (a) | | 2,987,871 | 334,880,582 |
| Warner Bros Discovery, Inc. (a) | | 3,623,092 | 47,969,738 |
| Warner Music Group Corp. Class A | | 185,537 | 4,966,825 |
| World Wrestling Entertainment, Inc. Class A (b) | | 74,183 | 5,045,186 |
| | | | 804,426,585 |
| Interactive Media & Services - 4.4% | | | |
| Alphabet, Inc.: | | | |
| Class A (a) | | 9,900,250 | 1,071,405,055 |
| Class C (a) | | 9,004,886 | 982,883,307 |
| Angi, Inc. (a)(b) | | 120,975 | 491,159 |
| Autoweb, Inc. (a) | | 6,653 | 2,581 |
| Bumble, Inc. (a) | | 116,568 | 2,920,028 |
| BuzzFeed, Inc. (a)(b) | | 21,874 | 33,905 |
| CarGurus, Inc. Class A (a) | | 140,803 | 2,633,016 |
| Cars.com, Inc. (a) | | 110,752 | 1,412,088 |
| Creatd, Inc. (a)(b) | | 3,582 | 1,871 |
| DHI Group, Inc. (a) | | 99,689 | 508,414 |
| Eventbrite, Inc. (a)(b) | | 126,087 | 896,479 |
| EverQuote, Inc. Class A (a) | | 31,519 | 272,639 |
| fuboTV, Inc. (a)(b) | | 302,238 | 1,094,102 |
| IAC (a) | | 135,749 | 8,724,588 |
| Izea Worldwide, Inc. (a)(b) | | 76,210 | 65,106 |
| Kubient, Inc. (a)(b) | | 10,430 | 13,350 |
| Liberty TripAdvisor Holdings, Inc. (a) | | 107,591 | 129,109 |
| Match Group, Inc. (a) | | 467,409 | 26,422,631 |
| MediaAlpha, Inc. Class A (a) | | 32,872 | 274,481 |
| Meta Platforms, Inc. Class A (a) | | 3,761,388 | 612,842,947 |
| Nextdoor Holdings, Inc. (a)(b) | | 139,333 | 443,079 |
| Outbrain, Inc. (a)(b) | | 11,828 | 52,161 |
| Pinterest, Inc. Class A (a) | | 940,398 | 21,666,770 |
| QuinStreet, Inc. (a) | | 77,397 | 929,538 |
| Shutterstock, Inc. | | 39,252 | 2,174,953 |
| Snap, Inc. Class A (a) | | 1,785,044 | 19,421,279 |
| Society Pass, Inc. (b) | | 4,312 | 8,150 |
| Super League Gaming, Inc. (a)(b) | | 63,028 | 56,101 |
| System1, Inc. (a)(b) | | 182,644 | 2,018,216 |
| The Arena Group Holdings, Inc. (b) | | 16,866 | 177,430 |
| Travelzoo, Inc. (a) | | 7,598 | 44,296 |
| TripAdvisor, Inc. (a) | | 160,194 | 3,812,617 |
| TrueCar, Inc. (a) | | 153,372 | 334,351 |
| Twitter, Inc. (a) | | 1,250,679 | 48,463,811 |
| Vimeo, Inc. (a) | | 248,101 | 1,468,758 |
| Vinco Ventures, Inc. (a)(b) | | 251,397 | 243,855 |
| Wejo Group Ltd. (a)(b) | | 49,984 | 56,482 |
| Yelp, Inc. (a) | | 108,283 | 3,700,030 |
| Zedge, Inc. (a) | | 20,075 | 56,812 |
| Ziff Davis, Inc. (a) | | 78,337 | 6,053,883 |
| ZipRecruiter, Inc. (a) | | 18,444 | 307,646 |
| Zoominfo Technologies, Inc. (a) | | 492,759 | 22,381,114 |
| | | | 2,846,898,188 |
| Media - 0.9% | | | |
| AdTheorent Holding Co., Inc. Class A (a) | | 104,712 | 276,440 |
| Advantage Solutions, Inc. Class A (a)(b) | | 170,835 | 621,839 |
| Altice U.S.A., Inc. Class A (a) | | 371,068 | 3,710,680 |
| AMC Networks, Inc. Class A (a) | | 47,913 | 1,283,589 |
| Audacy, Inc. Class A (a) | | 191,452 | 105,605 |
| Boston Omaha Corp. (a)(b) | | 27,653 | 741,930 |
| Cable One, Inc. | | 7,997 | 9,076,595 |
| Cardlytics, Inc. (a) | | 53,560 | 709,134 |
| Cbdmd, Inc. (a)(b) | | 50,529 | 20,166 |
| Charter Communications, Inc. Class A (a) | | 189,733 | 78,289,528 |
| Clear Channel Outdoor Holdings, Inc. (a) | | 740,980 | 1,185,568 |
| Comcast Corp. Class A | | 7,332,412 | 265,359,990 |
| comScore, Inc. (a)(b) | | 92,260 | 201,127 |
| Cumulus Media, Inc. (a) | | 27,829 | 259,366 |
| Daily Journal Corp. (a)(b) | | 1,984 | 518,221 |
| DallasNews Corp. | | 3,909 | 31,272 |
| Digital Media Solutions, Inc. Class A (a)(b) | | 25,067 | 32,336 |
| DISH Network Corp. Class A (a) | | 405,172 | 7,029,734 |
| E.W. Scripps Co. Class A (a) | | 95,768 | 1,431,732 |
| Emerald Holding, Inc. (a) | | 42,037 | 161,002 |
| Entravision Communication Corp. Class A | | 94,991 | 482,554 |
| Fluent, Inc. (a) | | 74,191 | 118,706 |
| Fox Corp.: | | | |
| Class A | | 627,602 | 21,451,436 |
| Class B | | 109,235 | 3,454,011 |
| Gannett Co., Inc. (a)(b) | | 219,560 | 509,379 |
| Gray Television, Inc. | | 143,029 | 2,731,854 |
| Hemisphere Media Group, Inc. (a) | | 34,654 | 253,321 |
| iHeartMedia, Inc. (a) | | 179,686 | 1,590,221 |
| Innovid Corp. (a)(b) | | 106,610 | 391,259 |
| Insignia Systems, Inc. (a)(b) | | 507 | 3,650 |
| Integral Ad Science Holding Corp. (a) | | 23,383 | 190,104 |
| Interpublic Group of Companies, Inc. | | 640,723 | 17,709,584 |
| John Wiley & Sons, Inc. Class A | | 71,807 | 3,305,276 |
| Lee Enterprises, Inc. (a) | | 8,452 | 168,195 |
| Liberty Broadband Corp.: | | | |
| Class A (a) | | 25,365 | 2,557,299 |
| Class C (a) | | 227,287 | 23,115,088 |
| Liberty Media Corp.: | | | |
| Liberty Braves Class A (a)(b) | | 24,095 | 677,070 |
| Liberty Braves Class C (a) | | 62,805 | 1,717,089 |
| Liberty Formula One Group Series C (a) | | 337,657 | 21,501,998 |
| Liberty Media Class A (a) | | 32,992 | 1,917,825 |
| Liberty SiriusXM Series A (a)(b) | | 34,066 | 1,415,102 |
| Liberty SiriusXM Series C (a) | | 356,345 | 14,738,429 |
| Loyalty Ventures, Inc. (a) | | 31,511 | 66,488 |
| Magnite, Inc. (a) | | 192,035 | 1,446,024 |
| Marchex, Inc. Class B (a) | | 35,256 | 72,980 |
| Mediaco Holding, Inc. (a) | | 178 | 518 |
| National CineMedia, Inc. (b) | | 107,997 | 133,916 |
| News Corp.: | | | |
| Class A | | 682,104 | 11,541,200 |
| Class B | | 191,837 | 3,307,270 |
| Nexstar Broadcasting Group, Inc. Class A | | 66,178 | 12,661,175 |
| Nextplay Technologies, Inc. (a) | | 100,008 | 26,662 |
| Omnicom Group, Inc. | | 339,720 | 22,727,268 |
| Paramount Global: | | | |
| Class A (b) | | 69,669 | 1,840,655 |
| Class B | | 929,418 | 21,739,087 |
| PubMatic, Inc. (a)(b) | | 65,245 | 1,276,845 |
| Saga Communications, Inc. Class A | | 7,361 | 204,857 |
| Salem Communications Corp. Class A (a) | | 7,646 | 18,350 |
| Scholastic Corp. | | 50,277 | 2,308,217 |
| Sinclair Broadcast Group, Inc. Class A | | 77,434 | 1,710,517 |
| Sirius XM Holdings, Inc. (b) | | 1,475,030 | 8,982,933 |
| Stagwell, Inc. (a) | | 119,050 | 807,159 |
| TechTarget, Inc. (a) | | 42,643 | 2,767,531 |
| TEGNA, Inc. | | 359,293 | 7,688,870 |
| The New York Times Co. Class A | | 274,513 | 8,369,901 |
| Thryv Holdings, Inc. (a) | | 25,563 | 653,902 |
| Townsquare Media, Inc. (a) | | 9,598 | 83,503 |
| Urban One, Inc.: | | | |
| Class A (a) | | 10,957 | 59,825 |
| Class D (non-vtg.) (a) | | 38,819 | 162,652 |
| WideOpenWest, Inc. (a) | | 83,183 | 1,480,657 |
| | | | 603,184,266 |
| Wireless Telecommunication Services - 0.2% | | | |
| Gogo, Inc. (a) | | 106,885 | 1,588,311 |
| KORE Group Holdings, Inc. (a) | | 79,518 | 237,759 |
| NII Holdings, Inc. (a)(c) | | 149,032 | 38,748 |
| Shenandoah Telecommunications Co. | | 78,495 | 1,749,654 |
| Spok Holdings, Inc. | | 30,552 | 219,974 |
| SurgePays, Inc. (a)(b) | | 1,668 | 7,022 |
| T-Mobile U.S., Inc. (a) | | 967,881 | 139,336,149 |
| Telephone & Data Systems, Inc. | | 161,500 | 2,627,605 |
| U.S. Cellular Corp. (a) | | 28,689 | 820,219 |
| | | | 146,625,441 |
TOTAL COMMUNICATION SERVICES | | | 4,961,917,764 |
| CONSUMER DISCRETIONARY - 11.5% | | | |
| Auto Components - 0.2% | | | |
| Adient PLC (a) | | 154,678 | 5,135,310 |
| American Axle & Manufacturing Holdings, Inc. (a) | | 183,058 | 1,894,650 |
| Aptiv PLC (a) | | 444,467 | 41,526,552 |
| Autoliv, Inc. | | 128,986 | 10,033,821 |
| BorgWarner, Inc. | | 391,628 | 14,764,376 |
| Cooper-Standard Holding, Inc. (a) | | 28,839 | 225,809 |
| Dana, Inc. | | 229,930 | 3,557,017 |
| Dorman Products, Inc. (a) | | 46,380 | 4,204,347 |
| Fox Factory Holding Corp. (a) | | 68,695 | 6,403,061 |
| Garrett Motion, Inc. (a)(b) | | 92,281 | 635,816 |
| Gentex Corp. | | 384,749 | 10,499,800 |
| Gentherm, Inc. (a) | | 54,198 | 3,246,460 |
| Holley, Inc. (a)(b) | | 64,299 | 364,575 |
| Horizon Global Corp. (a)(b) | | 37,011 | 55,146 |
| LCI Industries | | 40,937 | 4,743,370 |
| Lear Corp. | | 97,640 | 13,536,810 |
| Luminar Technologies, Inc. (a)(b) | | 365,408 | 3,149,817 |
| Modine Manufacturing Co. (a) | | 81,089 | 1,214,713 |
| Motorcar Parts of America, Inc. (a)(b) | | 29,851 | 443,586 |
| Patrick Industries, Inc. | | 36,284 | 1,921,963 |
| QuantumScape Corp. Class A (a)(b) | | 413,818 | 4,564,413 |
| Solid Power, Inc. (a) | | 218,786 | 1,439,612 |
| Standard Motor Products, Inc. | | 32,227 | 1,182,731 |
| Stoneridge, Inc. (a) | | 43,731 | 830,889 |
| Strattec Security Corp. (a) | | 4,907 | 133,961 |
| Superior Industries International, Inc. (a) | | 42,371 | 211,008 |
| Sypris Solutions, Inc. (a) | | 11,882 | 22,813 |
| Tenneco, Inc. (a) | | 122,380 | 2,308,087 |
| The Goodyear Tire & Rubber Co. (a) | | 453,337 | 6,360,318 |
| Visteon Corp. (a) | | 45,106 | 5,405,052 |
| XL Fleet Corp. (Class A) (a)(b) | | 173,152 | 193,930 |
| XPEL, Inc. (a)(b) | | 26,707 | 1,830,231 |
| | | | 152,040,044 |
| Automobiles - 2.1% | | | |
| Arcimoto, Inc. (a)(b) | | 43,176 | 94,555 |
| AYRO, Inc. (a)(b) | | 34,158 | 30,421 |
| Canoo, Inc. (a)(b) | | 232,462 | 741,554 |
| Faraday Future Intelligent Electric, Inc. (a)(b) | | 288,721 | 323,368 |
| Fisker, Inc. (a)(b) | | 229,875 | 2,075,771 |
| Ford Motor Co. | | 6,477,329 | 98,714,494 |
| General Motors Co. | | 2,389,195 | 91,291,141 |
| Harley-Davidson, Inc. | | 248,783 | 9,595,560 |
| Lordstown Motors Corp. Class A (a)(b) | | 197,612 | 422,890 |
| Lucid Group, Inc. Class A (a)(b) | | 924,927 | 14,188,380 |
| Mullen Automotive, Inc. (a)(b) | | 374,606 | 249,862 |
| Rivian Automotive, Inc. | | 262,108 | 8,573,553 |
| Tesla, Inc. (a) | | 4,128,698 | 1,137,910,456 |
| Thor Industries, Inc. (b) | | 89,486 | 7,249,261 |
| Volcon, Inc. (b) | | 15,265 | 46,406 |
| Winnebago Industries, Inc. | | 53,934 | 3,105,520 |
| Workhorse Group, Inc. (a)(b) | | 231,756 | 725,396 |
| | | | 1,375,338,588 |
| Distributors - 0.1% | | | |
| Amcon Distributing Co. | | 152 | 29,638 |
| Educational Development Corp. | | 5,163 | 16,367 |
| Funko, Inc. (a) | | 41,454 | 923,181 |
| Genuine Parts Co. | | 230,651 | 35,983,863 |
| LKQ Corp. | | 426,478 | 22,697,159 |
| Pool Corp. | | 65,055 | 22,066,005 |
| Weyco Group, Inc. | | 9,583 | 245,325 |
| | | | 81,961,538 |
| Diversified Consumer Services - 0.2% | | | |
| 2U, Inc. (a) | | 116,907 | 832,378 |
| ADT, Inc. | | 455,717 | 3,322,177 |
| Adtalem Global Education, Inc. (a) | | 77,585 | 2,924,179 |
| American Public Education, Inc. (a) | | 28,012 | 289,364 |
| Aspen Group, Inc. (a) | | 21,363 | 17,133 |
| Bright Horizons Family Solutions, Inc. (a) | | 97,199 | 6,628,972 |
| Carriage Services, Inc. | | 23,992 | 849,557 |
| Chegg, Inc. (a) | | 228,511 | 4,497,096 |
| Coursera, Inc. (a) | | 135,627 | 1,559,711 |
| Duolingo, Inc. (a)(b) | | 36,831 | 3,462,851 |
| European Wax Center, Inc. (b) | | 20,926 | 452,629 |
| Frontdoor, Inc. (a) | | 135,535 | 3,182,362 |
| Graham Holdings Co. | | 6,298 | 3,561,078 |
| Grand Canyon Education, Inc. (a) | | 54,253 | 4,415,109 |
| H&R Block, Inc. | | 255,103 | 11,479,635 |
| Laureate Education, Inc. Class A | | 256,655 | 2,828,338 |
| Lincoln Educational Services Corp. (a) | | 31,176 | 202,644 |
| Mister Car Wash, Inc. (a)(b) | | 66,192 | 655,963 |
| Nerdy, Inc. Class A (a)(b) | | 129,511 | 396,304 |
| OneSpaWorld Holdings Ltd. (a) | | 94,442 | 832,034 |
| Perdoceo Education Corp. (a) | | 108,375 | 1,254,983 |
| PowerSchool Holdings, Inc. (a)(b) | | 63,397 | 1,141,146 |
| Regis Corp. (a)(b) | | 39,837 | 55,772 |
| Rover Group, Inc. Class A (a)(b) | | 131,248 | 500,055 |
| Service Corp. International | | 263,306 | 16,248,613 |
| StoneMor, Inc. (a) | | 110,712 | 380,849 |
| Strategic Education, Inc. | | 37,303 | 2,413,504 |
| Stride, Inc. (a) | | 69,044 | 2,633,338 |
| Terminix Global Holdings, Inc. (a) | | 197,468 | 8,422,010 |
| The Beachbody Co., Inc. (a)(b) | | 175,511 | 203,593 |
| Udemy, Inc. | | 27,151 | 403,464 |
| Universal Technical Institute, Inc. (a) | | 46,086 | 316,150 |
| Vivint Smart Home, Inc. Class A (a) | | 79,191 | 495,736 |
| WW International, Inc. (a) | | 79,747 | 416,279 |
| Xpresspa Group, Inc. (a)(b) | | 140,249 | 145,859 |
| Zovio, Inc. (a)(b) | | 36,795 | 9,640 |
| | | | 87,430,505 |
| Hotels, Restaurants & Leisure - 2.0% | | | |
| Accel Entertainment, Inc. (a) | | 93,729 | 881,990 |
| Airbnb, Inc. Class A (a) | | 629,486 | 71,207,456 |
| Allied Esports Entertainment, Inc. (a)(b) | | 25,037 | 37,556 |
| ARAMARK Holdings Corp. | | 414,155 | 14,789,475 |
| Bally's Corp. (a)(b) | | 46,457 | 1,100,566 |
| BBQ Holdings, Inc. (a) | | 12,714 | 218,554 |
| Biglari Holdings, Inc.: | | | |
| Class A (a) | | 174 | 114,840 |
| Class B (a) | | 1,581 | 213,214 |
| BJ's Restaurants, Inc. (a) | | 37,258 | 934,431 |
| Bloomin' Brands, Inc. | | 130,439 | 2,637,477 |
| Bluegreen Vacations Holding Corp. Class A | | 29,111 | 606,673 |
| Booking Holdings, Inc. (a) | | 66,566 | 124,865,168 |
| Bowlero Corp. Class A (a)(b) | | 92,010 | 1,087,558 |
| Boyd Gaming Corp. | | 130,412 | 7,098,325 |
| Brinker International, Inc. (a) | | 71,650 | 1,756,142 |
| BurgerFi International, Inc. (a) | | 21,228 | 63,896 |
| Caesars Entertainment, Inc. (a) | | 351,335 | 15,149,565 |
| Carnival Corp. (a)(b) | | 1,594,843 | 15,087,215 |
| Carrols Restaurant Group, Inc. | | 60,237 | 132,521 |
| Century Casinos, Inc. (a) | | 39,038 | 287,710 |
| Chipotle Mexican Grill, Inc. (a) | | 45,761 | 73,071,165 |
| Choice Hotels International, Inc. | | 52,456 | 6,017,228 |
| Churchill Downs, Inc. | | 55,800 | 10,997,622 |
| Chuy's Holdings, Inc. (a)(b) | | 33,724 | 753,057 |
| Cracker Barrel Old Country Store, Inc. (b) | | 37,077 | 4,002,091 |
| Darden Restaurants, Inc. | | 205,560 | 25,429,828 |
| Dave & Buster's Entertainment, Inc. (a) | | 66,331 | 2,742,124 |
| Denny's Corp. (a) | | 103,084 | 974,144 |
| Dine Brands Global, Inc. | | 28,616 | 1,905,826 |
| Domino's Pizza, Inc. | | 58,907 | 21,905,157 |
| Draftkings Holdings, Inc. (a)(b) | | 588,519 | 9,451,615 |
| Drive Shack, Inc. (a) | | 119,769 | 129,351 |
| Dutch Bros, Inc. (b) | | 43,286 | 1,579,939 |
| Ebet, Inc. (a)(b) | | 3,383 | 6,292 |
| El Pollo Loco Holdings, Inc. (a) | | 26,883 | 243,291 |
| Esports Entertainment Group, Inc. (a)(b) | | 23,795 | 11,410 |
| Everi Holdings, Inc. (a) | | 142,882 | 2,643,317 |
| Expedia, Inc. (a) | | 247,205 | 25,375,593 |
| F45 Training Holdings, Inc. (a) | | 37,234 | 93,085 |
| FAT Brands, Inc. Class B | | 2,371 | 19,513 |
| Fiesta Restaurant Group, Inc. (a) | | 35,860 | 239,186 |
| First Watch Restaurant Group, Inc. | | 15,692 | 263,155 |
| Full House Resorts, Inc. (a) | | 53,281 | 359,114 |
| GAN Ltd. (a) | | 71,082 | 183,392 |
| Golden Entertainment, Inc. (a) | | 31,438 | 1,202,818 |
| Good Times Restaurants, Inc. (a) | | 5,599 | 16,461 |
| Hall of Fame Resort & Entertainment Co. (a)(b) | | 89,097 | 70,984 |
| Hilton Grand Vacations, Inc. (a) | | 142,465 | 5,809,723 |
| Hilton Worldwide Holdings, Inc. | | 453,418 | 57,747,316 |
| Hyatt Hotels Corp. Class A (a) | | 88,561 | 7,936,837 |
| Inspired Entertainment, Inc. (a) | | 44,757 | 468,606 |
| Jack in the Box, Inc. | | 35,134 | 2,805,801 |
| Krispy Kreme, Inc. | | 53,506 | 628,696 |
| Kura Sushi U.S.A., Inc. Class A (a) | | 6,490 | 485,192 |
| Las Vegas Sands Corp. (a) | | 558,878 | 21,030,579 |
| Life Time Group Holdings, Inc. (b) | | 68,768 | 814,901 |
| Light & Wonder, Inc. Class A (a) | | 156,889 | 7,723,645 |
| Lindblad Expeditions Holdings (a) | | 44,975 | 347,657 |
| Lottery.Com, Inc. (a)(b) | | 82,135 | 29,248 |
| Marriott International, Inc. Class A | | 449,481 | 69,103,209 |
| Marriott Vacations Worldwide Corp. | | 68,223 | 9,716,320 |
| McDonald's Corp. | | 1,211,394 | 305,610,478 |
| Membership Collective Group, Inc. Class A (a)(b) | | 56,459 | 320,123 |
| MGM Resorts International | | 599,487 | 19,567,256 |
| Monarch Casino & Resort, Inc. (a) | | 20,944 | 1,264,808 |
| Nathan's Famous, Inc. | | 6,187 | 402,155 |
| Noodles & Co. (a) | | 63,938 | 303,706 |
| Norwegian Cruise Line Holdings Ltd. (a)(b) | | 720,130 | 9,419,300 |
| Papa John's International, Inc. | | 52,065 | 4,208,414 |
| Penn Entertainment, Inc. (a) | | 269,254 | 8,408,802 |
| Planet Fitness, Inc. (a) | | 137,154 | 9,292,184 |
| Playa Hotels & Resorts NV (a) | | 219,671 | 1,441,042 |
| PlayAGS, Inc. (a) | | 60,755 | 447,157 |
| Portillo's, Inc. (b) | | 48,106 | 1,059,294 |
| Potbelly Corp. (a) | | 36,935 | 200,926 |
| Rave Restaurant Group, Inc. (a) | | 6,403 | 7,620 |
| RCI Hospitality Holdings, Inc. | | 12,368 | 806,517 |
| Red Robin Gourmet Burgers, Inc. (a)(b) | | 25,958 | 192,868 |
| Red Rock Resorts, Inc. | | 93,175 | 3,561,149 |
| Royal Caribbean Cruises Ltd. (a) | | 368,594 | 15,057,065 |
| Rush Street Interactive, Inc. (a) | | 87,753 | 424,725 |
| Ruth's Hospitality Group, Inc. | | 49,781 | 907,010 |
| SeaWorld Entertainment, Inc. (a) | | 83,455 | 4,193,614 |
| Shake Shack, Inc. Class A (a) | | 62,792 | 2,992,667 |
| Six Flags Entertainment Corp. (a) | | 121,554 | 2,692,421 |
| Sonder Holdings, Inc. (a)(b) | | 179,697 | 334,236 |
| Starbucks Corp. | | 1,880,385 | 158,083,967 |
| Sweetgreen, Inc. Class A | | 25,762 | 435,635 |
| Target Hospitality Corp. (a)(b) | | 48,383 | 643,010 |
| Texas Roadhouse, Inc. Class A | | 112,853 | 10,016,832 |
| The Cheesecake Factory, Inc. (b) | | 76,873 | 2,353,851 |
| The ONE Group Hospitality, Inc. (a) | | 36,136 | 258,011 |
| Travel+Leisure Co. | | 139,005 | 5,893,812 |
| Vacasa, Inc. Class A (a) | | 193,798 | 775,192 |
| Vail Resorts, Inc. | | 65,663 | 14,753,163 |
| Wendy's Co. | | 283,943 | 5,446,027 |
| Wingstop, Inc. | | 47,979 | 5,462,889 |
| Wyndham Hotels & Resorts, Inc. | | 150,464 | 9,831,318 |
| Wynn Resorts Ltd. (a) | | 169,641 | 10,278,548 |
| Xponential Fitness, Inc. (a)(b) | | 18,001 | 329,958 |
| Yum! Brands, Inc. | | 468,362 | 52,100,589 |
| | | | 1,302,383,159 |
| Household Durables - 0.4% | | | |
| Aterian, Inc. (a)(b) | | 69,892 | 159,354 |
| Bassett Furniture Industries, Inc. | | 12,880 | 245,493 |
| Beazer Homes U.S.A., Inc. (a) | | 48,298 | 687,764 |
| Cavco Industries, Inc. (a) | | 13,634 | 3,190,492 |
| Century Communities, Inc. | | 47,715 | 2,227,813 |
| Cricut, Inc. (a)(b) | | 65,540 | 408,970 |
| D.R. Horton, Inc. | | 525,565 | 37,393,950 |
| Dixie Group, Inc. (a) | | 7,832 | 8,850 |
| Dream Finders Homes, Inc. (a)(b) | | 29,284 | 361,657 |
| Emerson Radio Corp. (a) | | 16,730 | 10,891 |
| Ethan Allen Interiors, Inc. | | 37,945 | 901,953 |
| Flexsteel Industries, Inc. | | 17,223 | 301,230 |
| Garmin Ltd. | | 250,746 | 22,188,514 |
| GoPro, Inc. Class A (a) | | 212,794 | 1,295,915 |
| Green Brick Partners, Inc. (a)(b) | | 80,012 | 1,949,092 |
| Hamilton Beach Brands Holding Co. Class A | | 10,452 | 129,082 |
| Helen of Troy Ltd. (a) | | 38,952 | 4,815,636 |
| Hooker Furnishings Corp. | | 18,614 | 295,404 |
| Hovnanian Enterprises, Inc. Class A (a) | | 8,315 | 333,348 |
| Installed Building Products, Inc. | | 38,994 | 3,531,297 |
| iRobot Corp. (a)(b) | | 44,313 | 2,609,149 |
| KB Home | | 137,845 | 3,949,259 |
| Koss Corp. (a)(b) | | 11,662 | 91,313 |
| La-Z-Boy, Inc. | | 74,632 | 1,969,538 |
| Landsea Homes Corp. (a) | | 19,593 | 131,273 |
| Legacy Housing Corp. (a) | | 15,990 | 273,269 |
| Leggett & Platt, Inc. | | 215,518 | 8,237,098 |
| Lennar Corp.: | | | |
| Class A | | 415,337 | 32,167,851 |
| Class B | | 35,557 | 2,193,156 |
| LGI Homes, Inc. (a) | | 34,423 | 3,267,087 |
| Lifetime Brands, Inc. | | 17,450 | 155,654 |
| Live Ventures, Inc. (a) | | 1,880 | 47,338 |
| Lovesac (a)(b) | | 21,120 | 651,552 |
| M.D.C. Holdings, Inc. | | 91,120 | 2,832,010 |
| M/I Homes, Inc. (a) | | 46,618 | 2,015,762 |
| Meritage Homes Corp. (a) | | 59,899 | 4,693,087 |
| Mohawk Industries, Inc. (a) | | 83,330 | 9,196,299 |
| Nephros, Inc. (a) | | 3,446 | 4,893 |
| Newell Brands, Inc. | | 615,839 | 10,992,726 |
| Nova LifeStyle, Inc. (a) | | 3,687 | 2,802 |
| NVR, Inc. (a) | | 5,052 | 20,915,583 |
| PulteGroup, Inc. | | 380,004 | 15,450,963 |
| Purple Innovation, Inc. (a)(b) | | 105,570 | 301,930 |
| Skyline Champion Corp. (a) | | 87,064 | 4,933,917 |
| Snap One Holdings Corp. (a) | | 21,487 | 240,440 |
| Sonos, Inc. (a)(b) | | 205,071 | 3,084,268 |
| Taylor Morrison Home Corp. (a) | | 195,148 | 4,900,166 |
| Tempur Sealy International, Inc. | | 285,316 | 7,135,753 |
| Toll Brothers, Inc. | | 180,989 | 7,925,508 |
| TopBuild Corp. (a) | | 53,710 | 9,869,750 |
| Traeger, Inc. (a)(b) | | 39,712 | 104,840 |
| TRI Pointe Homes, Inc. (a) | | 180,087 | 3,120,908 |
| Tupperware Brands Corp. (a)(b) | | 76,977 | 865,221 |
| Universal Electronics, Inc. (a) | | 23,102 | 513,557 |
| Vizio Holding Corp. (a) | | 64,186 | 688,074 |
| VOXX International Corp. (a) | | 27,867 | 268,638 |
| Vuzix Corp. (a)(b) | | 97,307 | 730,776 |
| Weber, Inc. (b) | | 30,501 | 218,997 |
| Whirlpool Corp. | | 90,874 | 14,230,868 |
| ZAGG, Inc. rights (a)(c) | | 43,858 | 3,947 |
| | | | 261,421,925 |
| Internet & Direct Marketing Retail - 3.1% | | | |
| 1-800-FLOWERS.com, Inc. Class A (a) | | 43,802 | 380,201 |
| 1stDibs.com, Inc. (a) | | 6,388 | 43,247 |
| Amazon.com, Inc. (a) | | 14,347,666 | 1,818,853,619 |
| BARK, Inc. (a) | | 149,946 | 347,875 |
| Boxed, Inc. Class A (a) | | 112,044 | 118,767 |
| CarParts.com, Inc. (a)(b) | | 76,847 | 497,969 |
| Chewy, Inc. (a)(b) | | 146,299 | 5,022,445 |
| ContextLogic, Inc. (a)(b) | | 526,320 | 684,216 |
| Doordash, Inc. (a) | | 282,956 | 16,949,064 |
| Duluth Holdings, Inc. (a) | | 15,571 | 138,115 |
| eBay, Inc. | | 922,686 | 40,718,133 |
| Etsy, Inc. (a) | | 207,365 | 21,899,818 |
| Groupon, Inc. (a)(b) | | 35,364 | 350,457 |
| iMedia Brands, Inc. (a)(b) | | 24,675 | 24,798 |
| Lands' End, Inc. (a) | | 23,736 | 328,032 |
| Liquidity Services, Inc. (a) | | 47,418 | 829,341 |
| Lulu's Fashion Lounge Holdings, Inc. (b) | | 7,636 | 48,718 |
| Lyft, Inc. (a) | | 487,668 | 7,183,350 |
| Overstock.com, Inc. (a)(b) | | 68,032 | 1,775,635 |
| PetMed Express, Inc. | | 33,067 | 680,188 |
| Polished.Com, Inc. (a)(b) | | 168,222 | 118,109 |
| Porch Group, Inc. Class A (a)(b) | | 118,909 | 255,654 |
| Poshmark, Inc. (a) | | 69,938 | 756,729 |
| Quotient Technology, Inc. (a)(b) | | 146,280 | 272,081 |
| Qurate Retail, Inc. Series A | | 576,339 | 1,786,651 |
| Remark Holdings, Inc. (a)(b) | | 139,324 | 55,465 |
| Rent the Runway, Inc. Class A (b) | | 27,527 | 122,495 |
| Revolve Group, Inc. (a)(b) | | 62,648 | 1,471,602 |
| RumbleON, Inc. Class B (a) | | 19,100 | 417,335 |
| Stitch Fix, Inc. (a)(b) | | 139,978 | 702,690 |
| The RealReal, Inc. (a) | | 125,506 | 268,583 |
| thredUP, Inc. (a) | | 93,019 | 224,176 |
| Uber Technologies, Inc. (a) | | 2,782,756 | 80,032,063 |
| Vivid Seats, Inc. Class A (b) | | 51,628 | 417,671 |
| Waitr Holdings, Inc. (a)(b) | | 137,727 | 35,492 |
| Wayfair LLC Class A (a)(b) | | 128,223 | 6,758,634 |
| Xometry, Inc. (a)(b) | | 14,241 | 697,951 |
| | | | 2,011,267,369 |
| Leisure Products - 0.1% | | | |
| Acushnet Holdings Corp. | | 57,513 | 2,740,494 |
| American Outdoor Brands, Inc. (a)(b) | | 21,630 | 185,802 |
| AMMO, Inc. (a)(b) | | 141,631 | 539,614 |
| Brunswick Corp. | | 124,216 | 9,280,177 |
| Callaway Golf Co. (a)(b) | | 191,253 | 4,232,429 |
| Clarus Corp. | | 45,444 | 689,385 |
| Escalade, Inc. | | 10,982 | 128,599 |
| Hasbro, Inc. | | 213,336 | 16,815,144 |
| JAKKS Pacific, Inc. (a) | | 11,881 | 266,134 |
| Johnson Outdoors, Inc. Class A | | 12,012 | 734,414 |
| Latham Group, Inc. (a) | | 51,727 | 295,361 |
| Malibu Boats, Inc. Class A (a) | | 34,585 | 2,076,138 |
| Marine Products Corp. | | 38,035 | 377,688 |
| MasterCraft Boat Holdings, Inc. (a) | | 30,461 | 733,805 |
| Mattel, Inc. (a) | | 567,868 | 12,561,240 |
| Nautilus, Inc. (a) | | 53,757 | 108,589 |
| Peloton Interactive, Inc. Class A (a)(b) | | 498,139 | 5,076,036 |
| Polaris, Inc. | | 91,999 | 10,420,727 |
| Smith & Wesson Brands, Inc. | | 77,606 | 1,032,160 |
| Solo Brands, Inc. Class A | | 25,537 | 105,979 |
| Sturm, Ruger & Co., Inc. | | 28,496 | 1,488,916 |
| Vista Outdoor, Inc. (a) | | 90,430 | 2,542,892 |
| YETI Holdings, Inc. (a) | | 142,036 | 5,239,708 |
| | | | 77,671,431 |
| Multiline Retail - 0.5% | | | |
| Big Lots, Inc. | | 54,004 | 1,110,862 |
| Dillard's, Inc. Class A (b) | | 6,696 | 1,983,623 |
| Dollar General Corp. | | 373,830 | 88,754,719 |
| Dollar Tree, Inc. (a) | | 367,729 | 49,893,471 |
| Franchise Group, Inc. | | 47,283 | 1,602,421 |
| Kohl's Corp. | | 210,881 | 5,993,238 |
| Macy's, Inc. | | 464,436 | 8,044,032 |
| Nordstrom, Inc. | | 181,079 | 3,098,262 |
| Ollie's Bargain Outlet Holdings, Inc. (a) | | 95,759 | 5,296,430 |
| Target Corp. | | 757,378 | 121,437,989 |
| Tuesday Morning Corp. (a)(b) | | 59,058 | 21,349 |
| | | | 287,236,396 |
| Specialty Retail - 2.2% | | | |
| Abercrombie & Fitch Co. Class A (a) | | 99,607 | 1,433,345 |
| Academy Sports & Outdoors, Inc. | | 140,117 | 6,036,240 |
| Advance Auto Parts, Inc. | | 101,076 | 17,045,457 |
| America's Car Mart, Inc. (a) | | 10,463 | 843,422 |
| American Eagle Outfitters, Inc. | | 242,556 | 2,731,181 |
| Arhaus, Inc. | | 19,542 | 167,280 |
| Arko Corp. | | 126,616 | 1,206,650 |
| Asbury Automotive Group, Inc. (a) | | 37,220 | 6,494,146 |
| AutoNation, Inc. (a) | | 55,708 | 6,941,217 |
| AutoZone, Inc. (a) | | 32,392 | 68,645,450 |
| Barnes & Noble Education, Inc. (a) | | 70,687 | 180,959 |
| Bath & Body Works, Inc. | | 391,797 | 14,625,782 |
| Bed Bath & Beyond, Inc. (a)(b) | | 139,002 | 1,324,689 |
| Best Buy Co., Inc. | | 328,072 | 23,191,410 |
| Big 5 Sporting Goods Corp. (b) | | 32,469 | 397,421 |
| Boot Barn Holdings, Inc. (a) | | 47,052 | 3,134,604 |
| Brilliant Earth Group, Inc. Class A | | 14,638 | 108,321 |
| Build-A-Bear Workshop, Inc. | | 23,020 | 352,666 |
| Burlington Stores, Inc. (a) | | 108,168 | 15,164,072 |
| Caleres, Inc. | | 68,876 | 1,757,716 |
| Camping World Holdings, Inc. (b) | | 65,207 | 1,964,035 |
| CarLotz, Inc. Class A (a)(b) | | 137,648 | 55,059 |
| CarMax, Inc. (a)(b) | | 261,826 | 23,155,891 |
| Carvana Co. Class A (a)(b) | | 160,865 | 5,306,936 |
| Chico's FAS, Inc. (a) | | 202,946 | 1,152,733 |
| Citi Trends, Inc. (a) | | 15,082 | 304,656 |
| Conn's, Inc. (a)(b) | | 29,861 | 286,964 |
| Designer Brands, Inc. Class A | | 95,997 | 1,637,709 |
| Destination XL Group, Inc. (a) | | 64,100 | 353,191 |
| Dick's Sporting Goods, Inc. | | 93,787 | 9,976,123 |
| Envela Corp. (a) | | 402 | 2,919 |
| EVgo, Inc. Class A (a)(b) | | 118,741 | 1,126,852 |
| Express, Inc. (a)(b) | | 96,752 | 147,063 |
| Five Below, Inc. (a) | | 90,565 | 11,581,452 |
| Floor & Decor Holdings, Inc. Class A (a) | | 172,713 | 14,051,930 |
| Foot Locker, Inc. | | 143,132 | 5,272,983 |
| GameStop Corp. Class A (b) | | 403,090 | 11,544,498 |
| Gap, Inc. (b) | | 342,614 | 3,131,492 |
| Genesco, Inc. (a) | | 26,115 | 1,477,587 |
| Group 1 Automotive, Inc. | | 28,477 | 5,085,707 |
| GrowGeneration Corp. (a)(b) | | 88,212 | 419,007 |
| Guess?, Inc. | | 66,366 | 1,159,414 |
| Haverty Furniture Companies, Inc. | | 27,351 | 733,554 |
| Hibbett, Inc. | | 25,777 | 1,510,532 |
| J.Jill, Inc. (a) | | 3,463 | 56,101 |
| JOANN, Inc. | | 13,717 | 97,391 |
| Kirkland's, Inc. (a)(b) | | 25,171 | 102,698 |
| Lazydays Holdings, Inc. (a)(b) | | 12,717 | 209,322 |
| Leslie's, Inc. (a)(b) | | 217,189 | 3,079,740 |
| Lithia Motors, Inc. Class A (sub. vtg.) | | 48,521 | 12,879,414 |
| LL Flooring Holdings, Inc. (a) | | 50,665 | 412,413 |
| Lowe's Companies, Inc. | | 1,081,807 | 210,022,011 |
| MarineMax, Inc. (a) | | 35,375 | 1,285,528 |
| Monro, Inc. | | 53,112 | 2,459,617 |
| Murphy U.S.A., Inc. | | 36,730 | 10,657,944 |
| National Vision Holdings, Inc. (a)(b) | | 133,195 | 4,426,070 |
| O'Reilly Automotive, Inc. (a) | | 107,294 | 74,796,793 |
| OneWater Marine, Inc. Class A (a) | | 18,903 | 753,285 |
| Party City Holdco, Inc. (a)(b) | | 171,416 | 337,690 |
| Penske Automotive Group, Inc. | | 49,522 | 5,839,139 |
| Petco Health & Wellness Co., Inc. (a)(b) | | 133,327 | 1,989,239 |
| Rent-A-Center, Inc. | | 98,678 | 2,549,840 |
| RH (a) | | 28,148 | 7,203,355 |
| Ross Stores, Inc. | | 572,086 | 49,353,859 |
| Sally Beauty Holdings, Inc. (a) | | 183,067 | 2,724,037 |
| Shift Technologies, Inc. Class A (a)(b) | | 132,997 | 113,047 |
| Shoe Carnival, Inc. (b) | | 30,232 | 719,219 |
| Signet Jewelers Ltd. | | 84,270 | 5,508,730 |
| Sleep Number Corp. (a)(b) | | 38,662 | 1,601,767 |
| Sonic Automotive, Inc. Class A (sub. vtg.) | | 34,017 | 1,809,364 |
| Sportsman's Warehouse Holdings, Inc. (a) | | 71,936 | 572,611 |
| The Aaron's Co., Inc. | | 54,327 | 646,491 |
| The Buckle, Inc. | | 46,567 | 1,503,183 |
| The Cato Corp. Class A (sub. vtg.) | | 41,620 | 449,912 |
| The Children's Place, Inc. (a) | | 24,987 | 1,053,952 |
| The Container Store Group, Inc. (a) | | 52,697 | 357,286 |
| The Home Depot, Inc. | | 1,693,296 | 488,380,432 |
| The ODP Corp. (a) | | 76,422 | 2,732,087 |
| Tile Shop Holdings, Inc. | | 51,012 | 199,967 |
| Tilly's, Inc. | | 36,368 | 272,760 |
| TJX Companies, Inc. | | 1,921,332 | 119,795,050 |
| Torrid Holdings, Inc. (a)(b) | | 13,880 | 77,867 |
| Tractor Supply Co. | | 184,580 | 34,174,987 |
| TravelCenters of America LLC (a) | | 19,777 | 1,069,540 |
| Ulta Beauty, Inc. (a) | | 84,854 | 35,627,649 |
| Urban Outfitters, Inc. (a)(b) | | 108,681 | 2,187,749 |
| Victoria's Secret & Co. (a) | | 117,292 | 3,922,244 |
| Volta, Inc. (a)(b) | | 210,537 | 450,549 |
| Vroom, Inc. (a)(b) | | 203,379 | 331,508 |
| Warby Parker, Inc. (a)(b) | | 21,924 | 275,585 |
| Williams-Sonoma, Inc. (b) | | 114,374 | 17,013,133 |
| Winmark Corp. | | 4,695 | 968,907 |
| Zumiez, Inc. (a)(b) | | 35,654 | 925,578 |
| | | | 1,387,196,955 |
| Textiles, Apparel & Luxury Goods - 0.6% | | | |
| Allbirds, Inc. Class A (b) | | 226,179 | 929,596 |
| Capri Holdings Ltd. (a) | | 241,328 | 11,385,855 |
| Carter's, Inc. | | 69,283 | 5,116,550 |
| Charles & Colvard Ltd. (a) | | 34,272 | 43,525 |
| Columbia Sportswear Co. | | 56,649 | 4,035,675 |
| Crocs, Inc. (a) | | 100,101 | 7,377,444 |
| Crown Crafts, Inc. | | 2,254 | 13,749 |
| Culp, Inc. | | 17,685 | 81,351 |
| Deckers Outdoor Corp. (a) | | 44,127 | 14,189,919 |
| Delta Apparel, Inc. (a) | | 10,797 | 202,768 |
| Fossil Group, Inc. (a) | | 73,749 | 311,958 |
| G-III Apparel Group Ltd. (a) | | 70,446 | 1,484,297 |
| Hanesbrands, Inc. (b) | | 558,849 | 4,867,575 |
| Kontoor Brands, Inc. | | 77,916 | 2,900,813 |
| Lakeland Industries, Inc. (a)(b) | | 10,472 | 141,372 |
| Levi Strauss & Co. Class A (b) | | 159,242 | 2,689,597 |
| lululemon athletica, Inc. (a) | | 190,751 | 57,217,670 |
| Movado Group, Inc. | | 27,839 | 887,786 |
| NIKE, Inc. Class B | | 2,079,929 | 221,408,442 |
| Oxford Industries, Inc. | | 26,813 | 2,861,751 |
| PLBY Group, Inc. (a)(b) | | 34,177 | 153,797 |
| PVH Corp. | | 112,950 | 6,353,438 |
| Ralph Lauren Corp. | | 78,953 | 7,210,777 |
| Rocky Brands, Inc. | | 10,160 | 265,481 |
| Skechers U.S.A., Inc. Class A (sub. vtg.) (a) | | 217,891 | 8,236,280 |
| Steven Madden Ltd. | | 120,378 | 3,504,204 |
| Superior Group of Companies, Inc. | | 16,600 | 184,426 |
| Tapestry, Inc. | | 406,471 | 14,116,738 |
| Under Armour, Inc.: | | | |
| Class A (sub. vtg.) (a)(b) | | 341,429 | 2,874,832 |
| Class C (non-vtg.) (a) | | 313,083 | 2,376,300 |
| Unifi, Inc. (a) | | 23,352 | 265,279 |
| Vera Bradley, Inc. (a) | | 33,550 | 132,858 |
| VF Corp. | | 527,178 | 21,851,528 |
| Vince Holding Corp. (a) | | 3,162 | 22,608 |
| Wolverine World Wide, Inc. | | 134,660 | 2,631,256 |
| | | | 408,327,495 |
TOTAL CONSUMER DISCRETIONARY | | | 7,432,275,405 |
| CONSUMER STAPLES - 6.2% | | | |
| Beverages - 1.6% | | | |
| Alkaline Water Co., Inc. (a)(b) | | 127,625 | 70,500 |
| Boston Beer Co., Inc. Class A (a) | | 15,253 | 5,141,481 |
| Brown-Forman Corp.: | | | |
| Class A | | 74,968 | 5,290,492 |
| Class B (non-vtg.) | | 315,600 | 22,944,120 |
| Celsius Holdings, Inc. (a) | | 61,796 | 6,395,268 |
| Coca-Cola Bottling Co. Consolidated | | 7,622 | 3,615,343 |
| Constellation Brands, Inc. Class A (sub. vtg.) | | 267,179 | 65,739,393 |
| Duckhorn Portfolio, Inc. (a) | | 48,352 | 881,940 |
| Keurig Dr. Pepper, Inc. | | 1,206,825 | 46,004,169 |
| MGP Ingredients, Inc. | | 20,436 | 2,236,925 |
| Molson Coors Beverage Co. Class B | | 305,926 | 15,807,196 |
| Monster Beverage Corp. (a) | | 616,479 | 54,761,830 |
| National Beverage Corp. (b) | | 37,630 | 2,086,960 |
| PepsiCo, Inc. | | 2,264,404 | 390,088,877 |
| REED'S, Inc. (a)(b) | | 103,117 | 21,655 |
| Splash Beverage Group, Inc. (a)(b) | | 41,300 | 76,405 |
| The Coca-Cola Co. | | 6,391,085 | 394,393,855 |
| The Vita Coco Co., Inc. (b) | | 19,029 | 285,245 |
| Vintage Wine Estates, Inc. (a)(b) | | 46,164 | 272,829 |
| Willamette Valley Vineyards, Inc. (a) | | 6,462 | 41,680 |
| Zevia PBC (a)(b) | | 19,324 | 85,605 |
| | | | 1,016,241,768 |
| Food & Staples Retailing - 1.5% | | | |
| Albertsons Companies, Inc. | | 171,969 | 4,730,867 |
| Andersons, Inc. | | 49,516 | 1,833,577 |
| BJ's Wholesale Club Holdings, Inc. (a) | | 218,454 | 16,272,638 |
| Blue Apron Holdings, Inc.: | | | |
| warrants 11/4/28 (a) | | 20,436 | 4,769 |
| warrants 11/4/28 (a) | | 20,436 | 2,026 |
| warrants 11/4/28 (a) | | 20,436 | 916 |
| Class A (a)(b) | | 37,276 | 216,574 |
| Casey's General Stores, Inc. | | 60,357 | 12,902,516 |
| Chefs' Warehouse Holdings (a) | | 53,535 | 1,784,857 |
| Costco Wholesale Corp. | | 727,172 | 379,656,501 |
| Grocery Outlet Holding Corp. (a) | | 142,854 | 5,731,302 |
| HF Foods Group, Inc. (a) | | 55,310 | 281,528 |
| Ingles Markets, Inc. Class A | | 22,175 | 1,940,978 |
| Kroger Co. | | 1,081,429 | 51,843,706 |
| MedAvail Holdings, Inc. (a) | | 18,315 | 21,245 |
| Natural Grocers by Vitamin Cottage, Inc. | | 14,534 | 208,708 |
| Performance Food Group Co. (a) | | 251,237 | 12,556,825 |
| PriceSmart, Inc. | | 39,082 | 2,472,718 |
| Rite Aid Corp. (a)(b) | | 92,312 | 662,800 |
| SpartanNash Co. | | 56,475 | 1,718,534 |
| Sprouts Farmers Market LLC (a) | | 185,834 | 5,370,603 |
| Sysco Corp. | | 835,280 | 68,676,722 |
| U.S. Foods Holding Corp. (a) | | 362,723 | 11,106,578 |
| United Natural Foods, Inc. (a) | | 95,629 | 4,215,326 |
| Village Super Market, Inc. Class A | | 15,048 | 330,755 |
| Walgreens Boots Alliance, Inc. | | 1,175,597 | 41,216,431 |
| Walmart, Inc. | | 2,304,028 | 305,398,911 |
| Weis Markets, Inc. | | 28,274 | 2,197,173 |
| | | | 933,356,084 |
| Food Products - 1.1% | | | |
| Alico, Inc. | | 7,630 | 259,039 |
| AppHarvest, Inc. (a)(b) | | 112,964 | 325,336 |
| Arcadia Biosciences, Inc. (a)(b) | | 10,882 | 9,495 |
| Archer Daniels Midland Co. | | 922,521 | 81,080,371 |
| B&G Foods, Inc. Class A (b) | | 108,674 | 2,353,879 |
| Barfresh Food Group, Inc. (a) | | 3,165 | 11,014 |
| Benson Hill, Inc. (a)(b) | | 238,952 | 848,280 |
| Better Choice Co., Inc. (a) | | 17,919 | 32,613 |
| Beyond Meat, Inc. (a)(b) | | 95,900 | 2,339,960 |
| BRC, Inc. Class A (a) | | 47,684 | 464,919 |
| Bunge Ltd. | | 249,679 | 24,760,666 |
| Cal-Maine Foods, Inc. | | 61,762 | 3,311,061 |
| Calavo Growers, Inc. | | 29,166 | 1,226,139 |
| Campbell Soup Co. | | 329,713 | 16,610,941 |
| Coffee Holding Co., Inc. | | 10,373 | 28,111 |
| Conagra Brands, Inc. | | 787,282 | 27,066,755 |
| Darling Ingredients, Inc. (a) | | 263,159 | 20,015,874 |
| Farmer Brothers Co. (a) | | 23,211 | 130,214 |
| Flowers Foods, Inc. | | 324,301 | 8,853,417 |
| Fresh Del Monte Produce, Inc. | | 59,504 | 1,626,839 |
| Freshpet, Inc. (a)(b) | | 77,204 | 3,360,690 |
| General Mills, Inc. | | 986,375 | 75,753,600 |
| Hormel Foods Corp. | | 468,970 | 23,579,812 |
| Hostess Brands, Inc. Class A (a) | | 221,633 | 5,137,453 |
| Ingredion, Inc. | | 108,439 | 9,441,784 |
| J&J Snack Foods Corp. | | 24,991 | 3,724,409 |
| John B. Sanfilippo & Son, Inc. | | 16,536 | 1,334,951 |
| Kellogg Co. | | 415,566 | 30,228,271 |
| Laird Superfood, Inc. (a) | | 5,131 | 12,930 |
| Lamb Weston Holdings, Inc. | | 235,428 | 18,723,589 |
| Lancaster Colony Corp. | | 33,281 | 5,609,513 |
| Landec Corp. (a) | | 46,512 | 488,376 |
| Lifeway Foods, Inc. (a) | | 4,739 | 29,619 |
| Limoneira Co. | | 21,703 | 266,079 |
| Local Bounti Corp. (a)(b) | | 46,024 | 171,209 |
| McCormick & Co., Inc. (non-vtg.) | | 409,916 | 34,461,638 |
| Mission Produce, Inc. (a) | | 70,289 | 1,131,653 |
| Mondelez International, Inc. | | 2,269,506 | 140,391,641 |
| Nuzee, Inc. (a) | | 21,533 | 15,779 |
| Pilgrim's Pride Corp. (a) | | 80,215 | 2,283,721 |
| Post Holdings, Inc. (a) | | 94,126 | 8,354,624 |
| RiceBran Technologies (a)(b) | | 6,131 | 14,163 |
| S&W Seed Co. (a)(b) | | 9,599 | 12,287 |
| Seaboard Corp. | | 457 | 1,765,089 |
| Seneca Foods Corp. Class A (a) | | 11,293 | 596,609 |
| Sovos Brands, Inc. | | 45,167 | 689,700 |
| Tattooed Chef, Inc. (a)(b) | | 69,948 | 465,854 |
| The Hain Celestial Group, Inc. (a) | | 147,656 | 2,991,511 |
| The Hershey Co. | | 239,068 | 53,711,408 |
| The J.M. Smucker Co. | | 177,729 | 24,880,283 |
| The Kraft Heinz Co. | | 1,165,268 | 43,581,023 |
| The Real Good Food Co., Inc. | | 8,530 | 60,819 |
| The Simply Good Foods Co. (a) | | 142,405 | 4,350,473 |
| Tootsie Roll Industries, Inc. | | 30,759 | 1,102,095 |
| TreeHouse Foods, Inc. (a) | | 92,293 | 4,300,854 |
| Tyson Foods, Inc. Class A | | 477,641 | 36,004,579 |
| Utz Brands, Inc. Class A (b) | | 108,985 | 1,815,690 |
| Vital Farms, Inc. (a)(b) | | 41,138 | 532,737 |
| Whole Earth Brands, Inc. Class A (a) | | 69,040 | 352,794 |
| | | | 733,084,232 |
| Household Products - 1.2% | | | |
| Central Garden & Pet Co. (a) | | 68,586 | 2,737,953 |
| Central Garden & Pet Co. Class A (non-vtg.) (a) | | 10,924 | 412,490 |
| Church & Dwight Co., Inc. | | 399,689 | 33,457,966 |
| Colgate-Palmolive Co. | | 1,370,271 | 107,168,895 |
| Energizer Holdings, Inc. | | 106,598 | 2,995,404 |
| Kimberly-Clark Corp. | | 554,214 | 70,673,369 |
| Oil-Dri Corp. of America | | 9,041 | 249,441 |
| Procter & Gamble Co. | | 3,937,119 | 543,086,195 |
| Reynolds Consumer Products, Inc. | | 102,560 | 2,864,501 |
| Spectrum Brands Holdings, Inc. | | 68,622 | 4,322,500 |
| The Clorox Co. | | 200,834 | 28,988,380 |
| WD-40 Co. | | 22,322 | 4,222,430 |
| | | | 801,179,524 |
| Personal Products - 0.2% | | | |
| BellRing Brands, Inc. (a) | | 201,858 | 4,782,016 |
| Coty, Inc. Class A (a) | | 548,291 | 4,117,665 |
| Cyanotech Corp. (a) | | 1,622 | 3,844 |
| Edgewell Personal Care Co. | | 89,507 | 3,487,193 |
| elf Beauty, Inc. (a) | | 78,381 | 2,988,668 |
| Estee Lauder Companies, Inc. Class A | | 379,689 | 96,585,288 |
| Guardion Health Sciences, Inc. (a)(b) | | 21,495 | 3,241 |
| Herbalife Nutrition Ltd. (a) | | 158,116 | 4,125,246 |
| Inter Parfums, Inc. | | 30,625 | 2,404,675 |
| Lifemd, Inc. (a) | | 30,706 | 78,914 |
| LifeVantage Corp. | | 21,148 | 84,169 |
| Mannatech, Inc. | | 422 | 9,862 |
| MediFast, Inc. | | 19,094 | 2,395,915 |
| Natural Alternatives International, Inc. (a) | | 1,931 | 22,419 |
| Natural Health Trends Corp. | | 15,505 | 81,711 |
| Nature's Sunshine Products, Inc. (a) | | 22,697 | 220,161 |
| Newage, Inc. (a)(b) | | 192,160 | 44,197 |
| Nu Skin Enterprises, Inc. Class A | | 80,123 | 3,280,236 |
| Olaplex Holdings, Inc. (b) | | 115,644 | 1,540,378 |
| The Beauty Health Co. (a)(b) | | 154,904 | 1,796,886 |
| The Honest Co., Inc. (a) | | 44,122 | 159,280 |
| Thorne HealthTech, Inc. | | 11,940 | 55,879 |
| USANA Health Sciences, Inc. (a) | | 20,194 | 1,302,917 |
| Veru, Inc. (a)(b) | | 97,862 | 1,497,289 |
| | | | 131,068,049 |
| Tobacco - 0.6% | | | |
| 22nd Century Group, Inc. (a)(b) | | 260,654 | 349,276 |
| Altria Group, Inc. | | 2,969,643 | 133,990,292 |
| Philip Morris International, Inc. | | 2,542,697 | 242,802,137 |
| Turning Point Brands, Inc. | | 21,840 | 509,309 |
| Universal Corp. | | 39,521 | 2,017,152 |
| Vector Group Ltd. | | 206,245 | 2,021,201 |
| | | | 381,689,367 |
TOTAL CONSUMER STAPLES | | | 3,996,619,024 |
| ENERGY - 4.7% | | | |
| Energy Equipment & Services - 0.4% | | | |
| Archrock, Inc. | | 221,194 | 1,634,624 |
| Baker Hughes Co. Class A | | 1,535,464 | 38,785,821 |
| Bristow Group, Inc. (a) | | 37,240 | 1,080,332 |
| Cactus, Inc. | | 103,451 | 4,132,867 |
| Championx Corp. | | 331,051 | 7,220,222 |
| Core Laboratories NV (b) | | 72,272 | 1,167,193 |
| Diamond Offshore Drilling, Inc. (a) | | 182,080 | 1,294,589 |
| DMC Global, Inc. (a) | | 37,007 | 825,996 |
| Dril-Quip, Inc. (a) | | 58,780 | 1,300,801 |
| ENGlobal Corp. (a)(b) | | 22,963 | 37,659 |
| Enservco Corp. (a)(b) | | 19,986 | 32,777 |
| Expro Group Holdings NV (a)(b) | | 45,127 | 610,117 |
| Exterran Corp. (a) | | 49,663 | 243,845 |
| Forum Energy Technologies, Inc. (a)(b) | | 6,537 | 175,715 |
| Geospace Technologies Corp. (a) | | 18,281 | 90,857 |
| Gulf Island Fabrication, Inc. (a) | | 16,117 | 65,596 |
| Halliburton Co. | | 1,479,342 | 44,572,574 |
| Helix Energy Solutions Group, Inc. (a) | | 222,819 | 962,578 |
| Helmerich & Payne, Inc. | | 171,933 | 7,350,136 |
| Independence Contract Drilling, Inc. (a)(b) | | 17,283 | 55,306 |
| KLX Energy Services Holdings, Inc. (a)(b) | | 7,463 | 56,719 |
| Liberty Oilfield Services, Inc. Class A (a) | | 172,780 | 2,591,700 |
| Mammoth Energy Services, Inc. (a) | | 46,773 | 193,640 |
| MIND Technology, Inc. (a) | | 16,422 | 12,497 |
| Nabors Industries Ltd. (a) | | 13,259 | 1,756,950 |
| Natural Gas Services Group, Inc. (a) | | 16,673 | 185,570 |
| NCS Multistage Holdings, Inc. (a) | | 1,463 | 40,964 |
| Newpark Resources, Inc. (a) | | 154,268 | 444,292 |
| Nextier Oilfield Solutions, Inc. (a) | | 267,599 | 2,507,403 |
| Nine Energy Service, Inc. (a) | | 20,239 | 67,396 |
| Noble Corp. (a) | | 102,321 | 3,105,442 |
| NOV, Inc. | | 637,956 | 11,272,683 |
| Oceaneering International, Inc. (a) | | 167,706 | 1,484,198 |
| Oil States International, Inc. (a) | | 97,333 | 476,932 |
| Patterson-UTI Energy, Inc. | | 346,093 | 5,156,786 |
| Profire Energy, Inc. (a) | | 29,334 | 32,267 |
| ProFrac Holding Corp. | | 32,046 | 630,986 |
| ProPetro Holding Corp. (a) | | 136,781 | 1,252,914 |
| Ranger Energy Services, Inc. Class A (a) | | 12,493 | 123,556 |
| RPC, Inc. | | 116,598 | 926,954 |
| Schlumberger Ltd. | | 2,316,594 | 88,378,061 |
| SEACOR Marine Holdings, Inc. (a)(b) | | 36,271 | 235,762 |
| Select Energy Services, Inc. Class A (a) | | 103,572 | 736,397 |
| Smart Sand, Inc. (a) | | 29,122 | 52,420 |
| Solaris Oilfield Infrastructure, Inc. Class A | | 51,951 | 555,876 |
| Superior Drilling Products, Inc. (a) | | 18,281 | 16,663 |
| TechnipFMC PLC (a) | | 675,830 | 5,528,289 |
| TETRA Technologies, Inc. (a) | | 210,342 | 837,161 |
| Tidewater, Inc. (a) | | 63,015 | 1,396,412 |
| Transocean Ltd. (United States) (a)(b) | | 991,250 | 3,588,325 |
| U.S. Silica Holdings, Inc. (a) | | 118,181 | 1,658,079 |
| U.S. Well Services, Inc. (a)(b) | | 10,317 | 66,338 |
| Valaris Ltd. (a)(b) | | 121,385 | 6,188,207 |
| Weatherford International PLC (a) | | 109,589 | 3,083,834 |
| | | | 256,281,278 |
| Oil, Gas & Consumable Fuels - 4.3% | | | |
| Adams Resources & Energy, Inc. | | 5,219 | 155,892 |
| Aemetis, Inc. (a)(b) | | 46,560 | 424,627 |
| Alto Ingredients, Inc. (a)(b) | | 114,502 | 494,649 |
| American Resources Corp. (a)(b) | | 93,679 | 311,014 |
| Amplify Energy Corp. (a) | | 57,284 | 426,766 |
| Antero Midstream GP LP | | 531,216 | 5,349,345 |
| Antero Resources Corp. (a) | | 461,868 | 18,511,669 |
| APA Corp. | | 547,686 | 21,419,999 |
| Arch Resources, Inc. | | 24,768 | 3,605,725 |
| Archaea Energy, Inc. (a) | | 85,825 | 1,695,902 |
| Barnwell Industries, Inc. | | 2,008 | 6,165 |
| Battalion Oil Corp. (a)(b) | | 3,202 | 42,394 |
| Berry Corp. | | 103,193 | 944,216 |
| Brigham Minerals, Inc. Class A | | 79,228 | 2,357,033 |
| California Resources Corp. | | 130,751 | 6,532,320 |
| Callon Petroleum Co. (a) | | 76,601 | 3,260,139 |
| Camber Energy, Inc. (a)(b) | | 511,308 | 177,935 |
| Centennial Resource Development, Inc. Class A (a) | | 298,555 | 2,457,108 |
| Centrus Energy Corp. Class A (a) | | 16,660 | 829,835 |
| Cheniere Energy, Inc. | | 390,690 | 62,580,724 |
| Chesapeake Energy Corp. | | 187,910 | 18,883,076 |
| Chevron Corp. | | 3,222,289 | 509,314,999 |
| Chord Energy Corp. | | 66,031 | 9,346,688 |
| Civitas Resources, Inc. | | 117,411 | 7,888,845 |
| Clean Energy Fuels Corp. (a)(b) | | 279,379 | 1,877,427 |
| CNX Resources Corp. (a) | | 368,981 | 6,519,894 |
| Comstock Resources, Inc. (a) | | 142,590 | 2,794,764 |
| ConocoPhillips Co. | | 2,117,826 | 231,796,056 |
| CONSOL Energy, Inc. | | 51,003 | 3,660,995 |
| Continental Resources, Inc. | | 94,904 | 6,627,146 |
| Coterra Energy, Inc. | | 1,316,766 | 40,701,237 |
| Crescent Energy, Inc. Class A | | 44,324 | 759,270 |
| CVR Energy, Inc. | | 47,964 | 1,566,504 |
| Delek U.S. Holdings, Inc. | | 122,085 | 3,448,901 |
| Denbury, Inc. (a) | | 81,360 | 7,235,345 |
| Devon Energy Corp. | | 1,002,285 | 70,781,367 |
| Diamondback Energy, Inc. | | 280,338 | 37,363,449 |
| Dorian LPG Ltd. | | 50,344 | 732,505 |
| DT Midstream, Inc. | | 158,066 | 8,726,824 |
| Earthstone Energy, Inc. (a)(b) | | 101,539 | 1,543,393 |
| Ecoark Holdings, Inc. (a) | | 38,632 | 72,242 |
| Empire Petroleum Corp. (a) | | 12,672 | 187,039 |
| Enviva, Inc. (b) | | 49,391 | 3,433,662 |
| EOG Resources, Inc. | | 960,354 | 116,490,940 |
| Epsilon Energy Ltd. | | 30,870 | 222,264 |
| EQT Corp. | | 485,540 | 23,208,812 |
| Equitrans Midstream Corp. | | 664,952 | 6,164,105 |
| Evolution Petroleum Corp. | | 44,969 | 312,085 |
| Excelerate Energy, Inc. | | 37,104 | 952,831 |
| Exxon Mobil Corp. | | 6,905,101 | 660,058,605 |
| Gevo, Inc. (a)(b) | | 314,898 | 985,631 |
| Green Plains, Inc. (a) | | 88,397 | 3,237,982 |
| Gulfport Energy Corp. (a) | | 22,157 | 2,166,068 |
| Hallador Energy Co. (a)(b) | | 41,674 | 271,714 |
| Hess Corp. | | 456,349 | 55,117,832 |
| HF Sinclair Corp. | | 242,441 | 12,759,670 |
| Houston American Energy Corp. (a)(b) | | 17,123 | 74,485 |
| International Seaways, Inc. | | 66,704 | 1,969,769 |
| Kinder Morgan, Inc. | | 3,204,984 | 58,715,307 |
| Kinetik Holdings, Inc. | | 30,132 | 1,110,967 |
| Kosmos Energy Ltd. (a) | | 793,265 | 5,608,384 |
| Laredo Petroleum, Inc. (a) | | 22,655 | 1,758,255 |
| Lightbridge Corp. (a)(b) | | 11,250 | 66,713 |
| Magnolia Oil & Gas Corp. Class A | | 248,719 | 5,936,923 |
| Marathon Oil Corp. | | 1,153,474 | 29,517,400 |
| Marathon Petroleum Corp. | | 884,968 | 89,160,526 |
| Matador Resources Co. | | 178,400 | 10,632,640 |
| Murphy Oil Corp. | | 235,311 | 9,170,070 |
| NACCO Industries, Inc. Class A | | 5,538 | 249,044 |
| New Fortress Energy, Inc. | | 72,352 | 4,149,387 |
| Nextdecade Corp. (a)(b) | | 80,795 | 595,459 |
| Northern Oil & Gas, Inc. | | 105,036 | 3,323,339 |
| Occidental Petroleum Corp. | | 1,457,683 | 103,495,493 |
| ONEOK, Inc. | | 735,329 | 45,024,195 |
| Overseas Shipholding Group, Inc. (a) | | 117,734 | 366,153 |
| Ovintiv, Inc. | | 422,297 | 22,440,863 |
| Par Pacific Holdings, Inc. (a) | | 70,672 | 1,328,634 |
| PBF Energy, Inc. Class A (a) | | 151,941 | 5,190,305 |
| PDC Energy, Inc. | | 160,269 | 10,883,868 |
| Peabody Energy Corp. (a)(b) | | 179,929 | 4,437,049 |
| Pedevco Corp. (a) | | 45,076 | 50,485 |
| Phillips 66 Co. | | 789,440 | 70,623,302 |
| Phx Minerals, Inc. Class A | | 35,580 | 117,414 |
| Pioneer Natural Resources Co. | | 368,609 | 93,339,171 |
| PrimeEnergy Corp. (a) | | 218 | 20,483 |
| Range Resources Corp. | | 419,102 | 13,771,692 |
| Ranger Oil Corp. | | 41,239 | 1,607,909 |
| Rex American Resources Corp. (a) | | 26,922 | 815,737 |
| Riley Exploration Permian, Inc. | | 6,788 | 170,650 |
| Ring Energy, Inc. (a)(b) | | 124,626 | 403,788 |
| SandRidge Energy, Inc. (a) | | 51,200 | 1,074,176 |
| SilverBow Resources, Inc. (a) | | 17,135 | 681,288 |
| Sitio Royalties Corp. (b) | | 17,360 | 441,638 |
| SM Energy Co. | | 196,725 | 8,669,671 |
| Southwestern Energy Co. (a) | | 1,871,543 | 14,017,857 |
| Stabilis Solutions, Inc. (a) | | 1,783 | 8,576 |
| Talos Energy, Inc. (a) | | 73,390 | 1,521,375 |
| Targa Resources Corp. | | 372,068 | 25,386,200 |
| Tellurian, Inc. (a)(b) | | 741,586 | 2,966,344 |
| Texas Pacific Land Corp. | | 10,123 | 18,630,977 |
| The Williams Companies, Inc. | | 1,998,717 | 68,016,340 |
| U.S. Energy Corp. | | 20,023 | 69,480 |
| Uranium Energy Corp. (a)(b) | | 539,271 | 2,437,505 |
| VAALCO Energy, Inc. | | 86,598 | 433,856 |
| Valero Energy Corp. | | 667,531 | 78,181,231 |
| Vertex Energy, Inc. (a) | | 75,724 | 643,654 |
| W&T Offshore, Inc. (a) | | 146,133 | 949,865 |
| World Fuel Services Corp. | | 103,028 | 2,658,122 |
| | | | 2,811,707,638 |
TOTAL ENERGY | | | 3,067,988,916 |
| FINANCIALS - 11.6% | | | |
| Banks - 4.0% | | | |
| 1st Source Corp. | | 26,739 | 1,261,813 |
| ACNB Corp. | | 13,867 | 493,111 |
| Affinity Bancshares, Inc. (a) | | 1,202 | 17,730 |
| Allegiance Bancshares, Inc. | | 31,930 | 1,352,555 |
| Amalgamated Financial Corp. | | 38,284 | 861,390 |
| Amerant Bancorp, Inc. Class A | | 38,591 | 1,010,698 |
| American National Bankshares, Inc. | | 20,045 | 660,082 |
| Ameris Bancorp | | 109,905 | 5,130,365 |
| Ames National Corp. | | 15,118 | 330,479 |
| Arrow Financial Corp. | | 26,521 | 851,589 |
| Associated Banc-Corp. | | 245,797 | 4,925,772 |
| Atlantic Union Bankshares Corp. | | 120,733 | 3,917,786 |
| Auburn National Bancorp., Inc. | | 4,890 | 133,644 |
| Banc of California, Inc. | | 81,180 | 1,370,318 |
| BancFirst Corp. (b) | | 30,870 | 3,329,638 |
| Bancorp, Inc., Delaware (a) | | 89,358 | 2,119,572 |
| Bank First National Corp. | | 10,409 | 845,939 |
| Bank of America Corp. | | 11,621,073 | 390,584,264 |
| Bank of Hawaii Corp. | | 63,305 | 4,939,056 |
| Bank of Marin Bancorp | | 24,756 | 764,960 |
| Bank of South Carolina Corp. | | 1,474 | 24,159 |
| Bank OZK | | 194,678 | 7,890,299 |
| Bank7 Corp. | | 2,447 | 58,263 |
| BankFinancial Corp. | | 26,395 | 262,630 |
| BankUnited, Inc. | | 144,087 | 5,338,423 |
| Bankwell Financial Group, Inc. | | 14,320 | 451,366 |
| Banner Corp. | | 57,055 | 3,466,662 |
| Bar Harbor Bankshares | | 23,926 | 677,824 |
| BayCom Corp. | | 21,291 | 396,226 |
| BayFirst Financial Corp. | | 928 | 17,446 |
| BCB Bancorp, Inc. | | 24,133 | 434,394 |
| Berkshire Hills Bancorp, Inc. | | 82,194 | 2,318,693 |
| Blue Ridge Bankshares, Inc. | | 48,596 | 712,903 |
| BOK Financial Corp. | | 47,474 | 4,219,014 |
| Brookline Bancorp, Inc., Delaware | | 128,696 | 1,604,839 |
| Business First Bancshares, Inc. | | 31,539 | 744,005 |
| Byline Bancorp, Inc. | | 39,282 | 856,740 |
| C & F Financial Corp. | | 4,598 | 224,153 |
| Cadence Bank | | 318,269 | 8,109,494 |
| California Bancorp, Inc. (a) | | 5,512 | 110,791 |
| Cambridge Bancorp | | 11,522 | 947,454 |
| Camden National Corp. | | 24,222 | 1,095,561 |
| Capital Bancorp, Inc. | | 18,695 | 463,075 |
| Capital City Bank Group, Inc. | | 21,876 | 698,501 |
| Capstar Financial Holdings, Inc. | | 31,481 | 634,342 |
| Carter Bankshares, Inc. (a) | | 39,560 | 651,553 |
| Cathay General Bancorp | | 118,685 | 4,977,649 |
| CB Financial Services, Inc. | | 5,665 | 123,497 |
| CBTX, Inc. | | 31,753 | 946,239 |
| Central Pacific Financial Corp. | | 48,171 | 1,049,646 |
| Central Valley Community Bancorp | | 22,607 | 402,405 |
| Chemung Financial Corp. | | 6,174 | 278,262 |
| ChoiceOne Financial Services, Inc. | | 8,388 | 181,894 |
| Citigroup, Inc. | | 3,180,989 | 155,264,073 |
| Citizens & Northern Corp. | | 28,579 | 685,896 |
| Citizens Community Bancorp, Inc. | | 4,317 | 54,826 |
| Citizens Financial Group, Inc. | | 799,435 | 29,323,276 |
| Citizens Holding Co. | | 306 | 5,355 |
| City Holding Co. | | 27,257 | 2,317,118 |
| Civista Bancshares, Inc. | | 27,243 | 576,189 |
| CNB Financial Corp., Pennsylvania | | 27,942 | 735,433 |
| Coastal Financial Corp. of Washington (a) | | 15,353 | 617,191 |
| Codorus Valley Bancorp, Inc. | | 18,082 | 361,821 |
| Colony Bankcorp, Inc. | | 20,092 | 283,699 |
| Columbia Banking Systems, Inc. | | 125,409 | 3,756,000 |
| Comerica, Inc. | | 210,180 | 16,877,454 |
| Commerce Bancshares, Inc. | | 184,285 | 12,673,279 |
| Community Bank System, Inc. | | 88,923 | 5,813,786 |
| Community Financial Corp. | | 7,161 | 270,757 |
| Community Trust Bancorp, Inc. | | 27,110 | 1,145,398 |
| Community West Bancshares | | 2,179 | 30,724 |
| ConnectOne Bancorp, Inc. | | 55,514 | 1,389,515 |
| CrossFirst Bankshares, Inc. (a) | | 90,504 | 1,192,843 |
| Cullen/Frost Bankers, Inc. | | 91,327 | 11,868,857 |
| Customers Bancorp, Inc. (a) | | 49,497 | 1,717,051 |
| CVB Financial Corp. | | 215,808 | 5,662,802 |
| Dime Community Bancshares, Inc. | | 65,255 | 2,039,871 |
| Eagle Bancorp Montana, Inc. | | 6,459 | 124,659 |
| Eagle Bancorp, Inc. | | 48,232 | 2,340,699 |
| East West Bancorp, Inc. | | 231,448 | 16,703,602 |
| Eastern Bankshares, Inc. | | 282,397 | 5,478,502 |
| Emclaire Financial Corp. | | 1,019 | 32,649 |
| Enterprise Bancorp, Inc. | | 12,979 | 417,664 |
| Enterprise Financial Services Corp. | | 62,635 | 2,863,672 |
| Equity Bancshares, Inc. | | 23,831 | 744,242 |
| Esquire Financial Holdings, Inc. | | 9,982 | 373,127 |
| Evans Bancorp, Inc. | | 8,480 | 324,190 |
| Farmers & Merchants Bancorp, Inc. | | 16,526 | 471,983 |
| Farmers National Banc Corp. | | 48,117 | 687,592 |
| FB Financial Corp. | | 58,458 | 2,316,106 |
| Fidelity D & D Bancorp, Inc. | | 6,708 | 268,320 |
| Fifth Third Bancorp | | 1,115,768 | 38,103,477 |
| Financial Institutions, Inc. | | 21,673 | 564,148 |
| Finward Bancorp | | 768 | 28,285 |
| FinWise BanCorp | | 2,661 | 28,632 |
| First Bancorp, North Carolina | | 65,148 | 2,372,039 |
| First Bancorp, Puerto Rico | | 346,471 | 4,954,535 |
| First Bancshares, Inc. | | 33,525 | 1,002,398 |
| First Bank Hamilton New Jersey | | 22,930 | 343,721 |
| First Busey Corp. | | 80,065 | 1,841,495 |
| First Business Finance Services, Inc. | | 8,841 | 294,228 |
| First Capital, Inc. | | 5,994 | 159,440 |
| First Citizens Bancshares, Inc. | | 21,564 | 17,509,105 |
| First Commonwealth Financial Corp. | | 159,996 | 2,156,746 |
| First Community Bankshares, Inc. | | 24,687 | 778,381 |
| First Community Corp. | | 13,413 | 241,434 |
| First Financial Bancorp, Ohio | | 157,860 | 3,406,619 |
| First Financial Bankshares, Inc. | | 206,994 | 8,799,315 |
| First Financial Corp., Indiana | | 19,546 | 908,889 |
| First Financial Northwest, Inc. | | 3,993 | 60,135 |
| First Foundation, Inc. | | 81,698 | 1,548,994 |
| First Guaranty Bancshares, Inc. (b) | | 7,645 | 170,331 |
| First Hawaiian, Inc. | | 204,496 | 5,257,592 |
| First Horizon National Corp. | | 866,733 | 19,605,500 |
| First Internet Bancorp | | 13,430 | 492,478 |
| First Interstate Bancsystem, Inc. | | 131,732 | 5,303,530 |
| First Merchants Corp. | | 95,699 | 3,810,734 |
| First Mid-Illinois Bancshares, Inc. | | 31,128 | 1,100,375 |
| First National Corp. | | 284 | 4,913 |
| First Northwest Bancorp | | 20,578 | 329,248 |
| First of Long Island Corp. | | 34,934 | 643,135 |
| First Republic Bank | | 293,242 | 44,522,933 |
| First Savings Financial Group, Inc. | | 7,302 | 166,632 |
| First United Corp. | | 6,102 | 106,785 |
| First Western Financial, Inc. (a) | | 10,890 | 288,912 |
| Five Star Bancorp | | 9,306 | 236,652 |
| Flushing Financial Corp. | | 46,712 | 964,603 |
| FNB Corp., Pennsylvania | | 546,675 | 6,516,366 |
| FNCB Bancorp, Inc. | | 19,280 | 152,505 |
| Franklin Financial Services Corp. | | 8,527 | 272,693 |
| Fulton Financial Corp. | | 266,429 | 4,324,143 |
| FVCBankcorp, Inc. (a)(b) | | 20,878 | 402,110 |
| German American Bancorp, Inc. | | 44,979 | 1,689,411 |
| Glacier Bancorp, Inc. | | 176,930 | 8,966,812 |
| Great Southern Bancorp, Inc. | | 19,976 | 1,174,189 |
| Guaranty Bancshares, Inc. Texas | | 16,206 | 561,538 |
| Hancock Whitney Corp. | | 140,718 | 6,786,829 |
| Hanmi Financial Corp. | | 52,122 | 1,288,456 |
| HarborOne Bancorp, Inc. | | 87,577 | 1,194,550 |
| Hawthorn Bancshares, Inc. | | 7,911 | 189,152 |
| HBT Financial, Inc. | | 20,193 | 365,089 |
| Heartland Financial U.S.A., Inc. | | 96,421 | 4,307,126 |
| Heritage Commerce Corp. | | 94,602 | 1,068,057 |
| Heritage Financial Corp., Washington | | 58,219 | 1,513,112 |
| Hilltop Holdings, Inc. | | 80,036 | 2,112,950 |
| Home Bancshares, Inc. | | 367,750 | 8,653,158 |
| HomeStreet, Inc. | | 36,867 | 1,283,340 |
| HomeTrust Bancshares, Inc. | | 25,888 | 601,119 |
| Hope Bancorp, Inc. | | 271,099 | 3,922,803 |
| Horizon Bancorp, Inc. Indiana | | 69,865 | 1,321,846 |
| Huntington Bancshares, Inc. | | 2,323,488 | 31,134,739 |
| Independent Bank Corp. | | 77,967 | 6,099,358 |
| Independent Bank Corp. | | 39,714 | 814,931 |
| Independent Bank Group, Inc. | | 57,936 | 3,902,569 |
| International Bancshares Corp. | | 117,784 | 4,915,126 |
| Investar Holding Corp. | | 17,521 | 378,454 |
| John Marshall Bankcorp, Inc. (b) | | 22,510 | 567,477 |
| JPMorgan Chase & Co. | | 4,812,752 | 547,354,285 |
| KeyCorp | | 1,495,502 | 26,455,430 |
| Lakeland Bancorp, Inc. | | 99,820 | 1,626,068 |
| Lakeland Financial Corp. | | 42,143 | 3,175,054 |
| Landmark Bancorp, Inc. | | 1,999 | 51,034 |
| LCNB Corp. | | 17,540 | 279,938 |
| Limestone Bancorp, Inc. | | 841 | 16,282 |
| Live Oak Bancshares, Inc. | | 50,883 | 1,844,000 |
| M&T Bank Corp. | | 293,331 | 53,321,709 |
| Macatawa Bank Corp. | | 40,525 | 385,798 |
| Mainstreet Bancshares, Inc. | | 12,877 | 311,881 |
| Malvern Bancorp, Inc. (a) | | 4,574 | 71,492 |
| Mercantile Bank Corp. | | 23,539 | 778,670 |
| Meridian Bank/Malvern, PA | | 4,950 | 150,084 |
| Metrocity Bankshares, Inc. | | 29,056 | 580,829 |
| Metropolitan Bank Holding Corp. (a) | | 15,435 | 1,104,992 |
| Mid Penn Bancorp, Inc. | | 20,755 | 603,763 |
| Middlefield Banc Corp. | | 10,954 | 295,868 |
| Midland States Bancorp, Inc. | | 31,243 | 783,887 |
| MidWestOne Financial Group, Inc. | | 23,660 | 721,630 |
| MVB Financial Corp. | | 16,558 | 529,525 |
| National Bank Holdings Corp. | | 45,648 | 1,831,854 |
| National Bankshares, Inc. | | 11,039 | 371,462 |
| NBT Bancorp, Inc. | | 71,469 | 2,771,568 |
| Nicolet Bankshares, Inc. (a) | | 19,145 | 1,466,124 |
| Northeast Bank | | 10,980 | 425,695 |
| Northrim Bancorp, Inc. | | 11,189 | 453,714 |
| Northwest Bancshares, Inc. | | 197,345 | 2,776,644 |
| Norwood Financial Corp. | | 9,528 | 242,964 |
| Oak Valley Bancorp Oakdale California | | 6,546 | 118,417 |
| OceanFirst Financial Corp. | | 94,375 | 1,834,650 |
| OFG Bancorp | | 85,671 | 2,330,251 |
| Ohio Valley Banc Corp. | | 2,970 | 86,902 |
| Old National Bancorp, Indiana | | 480,769 | 8,024,035 |
| Old Point Financial Corp. | | 1,571 | 36,966 |
| Old Second Bancorp, Inc. | | 56,847 | 779,941 |
| Origin Bancorp, Inc. | | 34,908 | 1,425,992 |
| Orrstown Financial Services, Inc. | | 17,921 | 461,107 |
| Pacific Premier Bancorp, Inc. | | 152,779 | 5,005,040 |
| PacWest Bancorp | | 197,218 | 5,192,750 |
| Park National Corp. | | 23,477 | 3,094,973 |
| Parke Bancorp, Inc. | | 13,231 | 293,464 |
| Partners Bancorp | | 3,887 | 35,216 |
| Pathward Financial, Inc. | | 54,671 | 1,801,956 |
| PCB Bancorp | | 21,803 | 409,460 |
| PCSB Financial Corp. | | 32,661 | 604,555 |
| Peapack-Gladstone Financial Corp. | | 27,332 | 920,268 |
| Penns Woods Bancorp, Inc. | | 11,259 | 266,838 |
| Peoples Bancorp of North Carolina | | 5,200 | 135,200 |
| Peoples Bancorp, Inc. | | 38,650 | 1,155,249 |
| Peoples Financial Services Corp. | | 10,516 | 511,919 |
| Pinnacle Financial Partners, Inc. | | 123,201 | 9,943,553 |
| Plumas Bancorp | | 5,258 | 156,583 |
| PNC Financial Services Group, Inc. | | 677,699 | 107,076,442 |
| Popular, Inc. | | 129,381 | 9,990,801 |
| Preferred Bank, Los Angeles | | 21,696 | 1,471,857 |
| Premier Financial Corp. | | 64,269 | 1,736,548 |
| Primis Financial Corp. | | 33,221 | 435,527 |
| Professional Holdings Corp. (A Shares) (a) | | 18,961 | 530,150 |
| Prosperity Bancshares, Inc. | | 147,776 | 10,474,363 |
| QCR Holdings, Inc. | | 24,595 | 1,373,631 |
| RBB Bancorp | | 20,535 | 453,824 |
| Red River Bancshares, Inc. | | 6,351 | 324,600 |
| Regions Financial Corp. | | 1,526,822 | 33,086,233 |
| Renasant Corp. | | 93,780 | 3,126,625 |
| Republic Bancorp, Inc., Kentucky Class A | | 17,004 | 722,670 |
| Republic First Bancorp, Inc. (a)(b) | | 81,890 | 260,410 |
| Richmond Mutual Bancorp., Inc. | | 20,641 | 289,387 |
| Riverview Bancorp, Inc. | | 36,754 | 259,116 |
| S&T Bancorp, Inc. | | 63,512 | 1,882,496 |
| Salisbury Bancorp, Inc. | | 4,010 | 94,796 |
| Sandy Spring Bancorp, Inc. | | 74,560 | 2,872,051 |
| SB Financial Group, Inc. | | 5,379 | 93,487 |
| Seacoast Banking Corp., Florida | | 96,824 | 3,129,352 |
| ServisFirst Bancshares, Inc. | | 80,872 | 6,822,362 |
| Shore Bancshares, Inc. | | 28,409 | 541,191 |
| Sierra Bancorp | | 23,953 | 496,306 |
| Signature Bank | | 102,427 | 17,859,172 |
| Silvergate Capital Corp. (a) | | 50,969 | 4,644,295 |
| Simmons First National Corp. Class A | | 208,950 | 4,929,131 |
| SmartFinancial, Inc. | | 25,926 | 650,483 |
| Sound Financial Bancorp, Inc. | | 404 | 17,420 |
| South Plains Financial, Inc. | | 22,555 | 611,917 |
| Southern First Bancshares, Inc. (a) | | 13,815 | 595,565 |
| Southern States Bancshares, Inc. | | 2,558 | 61,673 |
| Southside Bancshares, Inc. | | 52,721 | 1,986,527 |
| Southstate Corp. | | 126,941 | 9,906,476 |
| Stock Yards Bancorp, Inc. | | 42,675 | 2,827,646 |
| Summit Financial Group, Inc. | | 17,114 | 488,091 |
| Summit State Bank | | 1,403 | 21,045 |
| SVB Financial Group (a) | | 96,164 | 39,092,589 |
| Synovus Financial Corp. | | 234,093 | 9,401,175 |
| Texas Capital Bancshares, Inc. (a) | | 82,307 | 4,858,582 |
| The Bank of Princeton | | 13,350 | 380,876 |
| The First Bancorp, Inc. | | 14,713 | 426,677 |
| Third Coast Bancshares, Inc. | | 4,483 | 81,591 |
| Tompkins Financial Corp. | | 19,976 | 1,431,081 |
| TowneBank | | 107,103 | 3,051,364 |
| Trico Bancshares | | 43,839 | 2,068,762 |
| Triumph Bancorp, Inc. (a) | | 38,327 | 2,372,825 |
| Truist Financial Corp. | | 2,176,629 | 101,953,302 |
| Trustmark Corp. | | 102,660 | 3,237,896 |
| U.S. Bancorp | | 2,216,000 | 101,071,760 |
| UMB Financial Corp. | | 69,590 | 6,226,217 |
| Umpqua Holdings Corp. | | 355,861 | 6,312,974 |
| Union Bankshares, Inc. | | 1,567 | 39,959 |
| United Bancorp, Inc. | | 496 | 7,693 |
| United Bankshares, Inc., West Virginia | | 221,239 | 8,207,967 |
| United Community Bank, Inc. | | 170,806 | 5,727,125 |
| United Security Bancshares, California | | 17,486 | 124,151 |
| Unity Bancorp, Inc. | | 8,532 | 239,152 |
| Univest Corp. of Pennsylvania | | 49,540 | 1,228,592 |
| USCB Financial Holdings, Inc. (a) | | 3,249 | 42,237 |
| Valley National Bancorp | | 676,526 | 7,861,232 |
| Veritex Holdings, Inc. | | 77,139 | 2,322,655 |
| Virginia National Bankshares C | | 4,966 | 163,878 |
| Washington Federal, Inc. | | 119,876 | 3,837,231 |
| Washington Trust Bancorp, Inc. | | 28,510 | 1,443,461 |
| Webster Financial Corp. | | 296,194 | 13,935,928 |
| Wells Fargo & Co. | | 6,212,534 | 271,549,861 |
| WesBanco, Inc. | | 103,697 | 3,547,474 |
| West Bancorp., Inc. | | 30,143 | 741,819 |
| Westamerica Bancorp. | | 42,832 | 2,396,450 |
| Western Alliance Bancorp. | | 175,074 | 13,431,677 |
| Wintrust Financial Corp. | | 98,349 | 8,294,755 |
| Zions Bancorp NA | | 251,094 | 13,817,703 |
| | | | 2,606,145,627 |
| Capital Markets - 3.1% | | | |
| Affiliated Managers Group, Inc. | | 65,663 | 8,362,840 |
| Ameriprise Financial, Inc. | | 179,716 | 48,165,685 |
| Ares Management Corp. | | 278,544 | 20,651,252 |
| Artisan Partners Asset Management, Inc. | | 110,409 | 3,727,408 |
| Ashford, Inc. (a) | | 2,235 | 40,118 |
| Assetmark Financial Holdings, Inc. (a) | | 41,945 | 811,216 |
| Associated Capital Group, Inc. | | 5,126 | 202,938 |
| B. Riley Financial, Inc. | | 27,652 | 1,376,240 |
| Bakkt Holdings, Inc. Class A (a)(b) | | 74,344 | 192,551 |
| Bank of New York Mellon Corp. | | 1,217,564 | 50,565,433 |
| BGC Partners, Inc. Class A | | 525,250 | 2,111,505 |
| BlackRock, Inc. Class A | | 233,502 | 155,603,398 |
| Blackstone, Inc. | | 1,148,454 | 107,885,769 |
| Blucora, Inc. (a) | | 80,680 | 1,620,054 |
| Blue Owl Capital, Inc. Class A (b) | | 562,538 | 6,244,172 |
| Bridge Investment Group Holdings, Inc. | | 37,122 | 605,460 |
| BrightSphere Investment Group, Inc. | | 74,845 | 1,279,101 |
| Carlyle Group LP | | 227,401 | 7,397,355 |
| Cboe Global Markets, Inc. | | 172,859 | 20,392,176 |
| Charles Schwab Corp. | | 2,473,121 | 175,467,935 |
| CME Group, Inc. | | 589,234 | 115,260,063 |
| Cohen & Co., Inc. (b) | | 486 | 5,686 |
| Cohen & Steers, Inc. | | 43,360 | 3,095,037 |
| Coinbase Global, Inc. (a)(b) | | 53,107 | 3,547,548 |
| Cowen Group, Inc. Class A | | 44,103 | 1,695,760 |
| Diamond Hill Investment Group, Inc. | | 5,542 | 947,959 |
| Donnelley Financial Solutions, Inc. (a) | | 48,467 | 2,057,424 |
| Evercore, Inc. Class A | | 64,702 | 6,061,930 |
| FactSet Research Systems, Inc. | | 61,678 | 26,727,545 |
| Federated Hermes, Inc. | | 157,636 | 5,369,082 |
| Focus Financial Partners, Inc. Class A (a) | | 91,539 | 3,583,752 |
| Forge Global Holdings, Inc. Class A (a)(b) | | 168,454 | 643,494 |
| Franklin Resources, Inc. | | 453,409 | 11,820,373 |
| GAMCO Investors, Inc. Class A | | 5,653 | 114,360 |
| GCM Grosvenor, Inc. Class A | | 75,903 | 595,839 |
| Goldman Sachs Group, Inc. | | 562,322 | 187,067,660 |
| Greenhill & Co., Inc. (b) | | 26,471 | 207,003 |
| Hamilton Lane, Inc. Class A | | 55,722 | 3,877,137 |
| Heritage Global, Inc. (a) | | 17,766 | 29,314 |
| Houlihan Lokey | | 82,201 | 6,452,779 |
| Interactive Brokers Group, Inc. | | 141,470 | 8,713,137 |
| Intercontinental Exchange, Inc. | | 914,409 | 92,218,148 |
| Invesco Ltd. | | 555,004 | 9,140,916 |
| Janus Henderson Group PLC | | 271,270 | 6,347,718 |
| Jefferies Financial Group, Inc. | | 316,645 | 10,161,138 |
| KKR & Co. LP | | 988,217 | 49,964,252 |
| Lazard Ltd. Class A | | 180,823 | 6,572,916 |
| LPL Financial | | 130,572 | 28,899,501 |
| Manning & Napier, Inc. Class A | | 19,285 | 245,498 |
| MarketAxess Holdings, Inc. | | 61,932 | 15,395,676 |
| MarketWise, Inc. Class A (a)(b) | | 32,026 | 89,353 |
| Moelis & Co. Class A | | 107,924 | 4,496,114 |
| Moody's Corp. | | 263,174 | 74,878,266 |
| Morgan Stanley | | 2,294,073 | 195,500,901 |
| Morningstar, Inc. | | 38,090 | 8,684,139 |
| MSCI, Inc. | | 132,849 | 59,681,085 |
| NASDAQ, Inc. | | 570,675 | 33,972,283 |
| Northern Trust Corp. | | 342,092 | 32,529,528 |
| Open Lending Corp. (a) | | 168,184 | 1,633,067 |
| Oppenheimer Holdings, Inc. Class A (non-vtg.) | | 13,722 | 498,109 |
| P10, Inc. | | 56,207 | 701,463 |
| Perella Weinberg Partners Class A | | 80,733 | 580,470 |
| Piper Jaffray Companies | | 23,798 | 2,726,537 |
| PJT Partners, Inc. | | 39,183 | 2,712,247 |
| Pzena Investment Management, Inc. | | 31,037 | 295,472 |
| Raymond James Financial, Inc. | | 316,854 | 33,070,052 |
| S&P Global, Inc. | | 568,972 | 200,380,559 |
| Safeguard Scientifics, Inc. (a)(b) | | 30,517 | 126,035 |
| Sculptor Capital Management, Inc. Class A | | 34,842 | 328,560 |
| SEI Investments Co. | | 169,092 | 9,249,332 |
| Siebert Financial Corp. (a)(b) | | 8,951 | 15,485 |
| Silvercrest Asset Management Group Class A | | 12,013 | 214,672 |
| State Street Corp. | | 600,383 | 41,036,178 |
| StepStone Group, Inc. Class A | | 76,578 | 2,089,814 |
| Stifel Financial Corp. | | 172,040 | 10,203,692 |
| StoneX Group, Inc. (a) | | 27,471 | 2,550,408 |
| T. Rowe Price Group, Inc. | | 374,515 | 44,941,800 |
| TPG, Inc. (b) | | 62,136 | 1,824,313 |
| Tradeweb Markets, Inc. Class A | | 175,424 | 12,207,756 |
| U.S. Global Investors, Inc. Class A | | 16,788 | 63,459 |
| Value Line, Inc. | | 1,293 | 106,039 |
| Victory Capital Holdings, Inc. | | 38,833 | 1,039,948 |
| Virtu Financial, Inc. Class A | | 137,842 | 3,164,852 |
| Virtus Investment Partners, Inc. | | 11,542 | 2,207,408 |
| Westwood Holdings Group, Inc. | | 13,508 | 182,358 |
| WisdomTree Investments, Inc. | | 197,978 | 991,870 |
| | | | 2,004,494,875 |
| Consumer Finance - 0.6% | | | |
| Ally Financial, Inc. | | 522,531 | 17,348,029 |
| American Express Co. | | 999,076 | 151,859,552 |
| Atlanticus Holdings Corp. (a)(b) | | 8,957 | 255,006 |
| Bread Financial Holdings, Inc. | | 78,778 | 3,027,439 |
| Capital One Financial Corp. | | 640,176 | 67,743,424 |
| Consumer Portfolio Services, Inc. (a)(b) | | 16,212 | 188,708 |
| Credit Acceptance Corp. (a)(b) | | 12,273 | 6,530,218 |
| CURO Group Holdings Corp. | | 29,847 | 196,990 |
| Discover Financial Services | | 457,857 | 46,010,050 |
| Elevate Credit, Inc. (a) | | 23,656 | 35,011 |
| Encore Capital Group, Inc. (a)(b) | | 39,165 | 2,141,542 |
| Enova International, Inc. (a) | | 58,336 | 2,038,260 |
| EZCORP, Inc. (non-vtg.) Class A (a) | | 87,514 | 765,748 |
| FirstCash Holdings, Inc. | | 64,527 | 5,030,525 |
| Green Dot Corp. Class A (a) | | 87,731 | 1,780,062 |
| Katapult Holdings, Inc. (a)(b) | | 75,838 | 86,455 |
| LendingClub Corp. (a) | | 166,265 | 2,173,084 |
| LendingTree, Inc. (a) | | 18,680 | 569,553 |
| Medallion Financial Corp. | | 35,405 | 281,824 |
| MoneyLion, Inc. (a)(b) | | 201,081 | 287,546 |
| Navient Corp. | | 267,361 | 4,114,686 |
| Nelnet, Inc. Class A | | 34,550 | 2,910,492 |
| NerdWallet, Inc. (b) | | 11,622 | 120,753 |
| Nicholas Financial, Inc. (a) | | 4,023 | 35,724 |
| OneMain Holdings, Inc. | | 179,631 | 6,274,511 |
| Oportun Financial Corp. (a) | | 29,210 | 149,263 |
| OppFi, Inc. Class A (a)(b) | | 8,549 | 23,168 |
| PRA Group, Inc. (a) | | 72,410 | 2,674,825 |
| PROG Holdings, Inc. (a) | | 92,447 | 1,713,967 |
| Regional Management Corp. | | 15,004 | 505,485 |
| SLM Corp. | | 457,539 | 6,991,196 |
| SoFi Technologies, Inc. (a)(b) | | 1,265,472 | 7,491,594 |
| Sunlight Financial Holdings, Inc. Class A (a)(b) | | 67,319 | 205,996 |
| Synchrony Financial | | 816,739 | 26,748,202 |
| Upstart Holdings, Inc. (a)(b) | | 80,776 | 2,092,098 |
| World Acceptance Corp. (a)(b) | | 6,665 | 774,740 |
| | | | 371,175,726 |
| Diversified Financial Services - 1.4% | | | |
| A-Mark Precious Metals, Inc. | | 26,412 | 816,395 |
| Acacia Research Corp. (a) | | 84,790 | 380,707 |
| Alerus Financial Corp. | | 66,600 | 1,582,416 |
| Apollo Global Management, Inc. | | 608,725 | 33,832,936 |
| Berkshire Hathaway, Inc. Class B (a) | | 2,961,362 | 831,550,450 |
| Cannae Holdings, Inc. (a) | | 134,293 | 2,902,072 |
| Equitable Holdings, Inc. | | 601,426 | 17,892,424 |
| Jackson Financial, Inc. | | 144,094 | 4,504,378 |
| LM Funding America, Inc. (a) | | 11,991 | 15,588 |
| SWK Holdings Corp. (a)(b) | | 21,988 | 384,350 |
| Voya Financial, Inc. | | 176,326 | 10,849,339 |
| | | | 904,711,055 |
| Insurance - 2.3% | | | |
| AFLAC, Inc. | | 972,484 | 57,784,999 |
| Alleghany Corp. (a) | | 21,462 | 18,053,405 |
| Allstate Corp. | | 450,677 | 54,306,579 |
| AMBAC Financial Group, Inc. (a) | | 75,325 | 1,136,654 |
| American Equity Investment Life Holding Co. | | 132,674 | 5,041,612 |
| American Financial Group, Inc. | | 106,932 | 13,653,078 |
| American International Group, Inc. | | 1,292,967 | 66,911,042 |
| Amerisafe, Inc. | | 31,043 | 1,484,476 |
| Aon PLC | | 348,119 | 97,215,712 |
| Arch Capital Group Ltd. (a) | | 609,837 | 27,881,748 |
| Argo Group International Holdings, Ltd. | | 57,951 | 1,137,578 |
| Arthur J. Gallagher & Co. | | 343,747 | 62,414,143 |
| Assurant, Inc. | | 87,290 | 13,834,592 |
| Assured Guaranty Ltd. | | 118,373 | 6,045,309 |
| Axis Capital Holdings Ltd. | | 125,906 | 6,691,904 |
| Brighthouse Financial, Inc. (a) | | 128,500 | 6,110,175 |
| Brown & Brown, Inc. | | 381,914 | 24,075,859 |
| BRP Group, Inc. (a) | | 87,666 | 2,752,712 |
| Chubb Ltd. | | 693,930 | 131,187,467 |
| Cincinnati Financial Corp. | | 245,297 | 23,783,997 |
| Citizens, Inc. Class A (a)(b) | | 89,803 | 340,353 |
| CNA Financial Corp. | | 59,725 | 2,297,024 |
| CNO Financial Group, Inc. | | 200,159 | 3,684,927 |
| Crawford & Co.: | | | |
| Class A | | 27,890 | 169,571 |
| Class B | | 22,240 | 131,216 |
| Donegal Group, Inc. Class A | | 23,026 | 334,338 |
| eHealth, Inc. (a) | | 40,297 | 257,901 |
| Employers Holdings, Inc. | | 42,255 | 1,654,706 |
| Enstar Group Ltd. (a) | | 20,448 | 3,869,784 |
| Erie Indemnity Co. Class A | | 41,450 | 8,908,849 |
| Everest Re Group Ltd. | | 64,006 | 17,220,814 |
| Fednat Holding Co. (a) | | 13,703 | 4,414 |
| Fidelity National Financial, Inc. | | 460,388 | 18,001,171 |
| First American Financial Corp. | | 178,700 | 9,560,450 |
| Genworth Financial, Inc. Class A (a) | | 809,566 | 3,416,369 |
| Globe Life, Inc. | | 148,857 | 14,467,412 |
| GoHealth, Inc. (a)(b) | | 90,284 | 40,799 |
| Goosehead Insurance (b) | | 32,268 | 1,677,936 |
| Greenlight Capital Re, Ltd. (a) | | 42,996 | 339,238 |
| Hagerty, Inc. Class A (a)(b) | | 54,191 | 608,565 |
| Hallmark Financial Services, Inc. (a) | | 25,240 | 32,055 |
| Hanover Insurance Group, Inc. | | 57,030 | 7,379,112 |
| Hartford Financial Services Group, Inc. | | 534,842 | 34,395,689 |
| HCI Group, Inc. (b) | | 12,326 | 589,060 |
| Heritage Insurance Holdings, Inc. | | 42,724 | 112,791 |
| Hippo Holdings, Inc. (a)(b) | | 598,333 | 580,383 |
| Horace Mann Educators Corp. | | 69,703 | 2,493,276 |
| Investors Title Co. | | 2,479 | 365,281 |
| James River Group Holdings Ltd. | | 61,647 | 1,464,733 |
| Kemper Corp. | | 97,742 | 4,496,132 |
| Kingstone Companies, Inc. | | 8,338 | 32,768 |
| Kinsale Capital Group, Inc. | | 35,098 | 8,900,151 |
| Lemonade, Inc. (a)(b) | | 68,132 | 1,507,080 |
| Lincoln National Corp. | | 272,791 | 12,564,753 |
| Loews Corp. | | 318,625 | 17,623,149 |
| Maiden Holdings Ltd. (a)(b) | | 88,227 | 201,158 |
| Markel Corp. (a) | | 22,141 | 26,438,790 |
| Marsh & McLennan Companies, Inc. | | 823,212 | 132,841,720 |
| MBIA, Inc. (a)(b) | | 87,611 | 1,032,934 |
| Mercury General Corp. | | 42,951 | 1,370,137 |
| MetLife, Inc. | | 1,130,804 | 72,744,621 |
| Midwest Holding, Inc. (a) | | 909 | 13,362 |
| National Western Life Group, Inc. | | 3,737 | 711,188 |
| NI Holdings, Inc. (a) | | 9,696 | 127,308 |
| Old Republic International Corp. | | 463,914 | 10,131,882 |
| Oscar Health, Inc. (a) | | 66,615 | 441,657 |
| Palomar Holdings, Inc. (a) | | 39,153 | 3,104,441 |
| Primerica, Inc. | | 63,534 | 8,052,935 |
| Principal Financial Group, Inc. | | 389,196 | 29,096,293 |
| ProAssurance Corp. | | 85,575 | 1,830,449 |
| Progressive Corp. | | 957,499 | 117,437,252 |
| Prudential Financial, Inc. | | 613,694 | 58,761,201 |
| Reinsurance Group of America, Inc. | | 108,847 | 13,645,060 |
| Reliance Global Group, Inc. (a) | | 14,320 | 11,320 |
| RenaissanceRe Holdings Ltd. | | 74,238 | 10,041,432 |
| RLI Corp. | | 65,118 | 7,147,352 |
| Root, Inc. (a)(b) | | 9,002 | 111,535 |
| Ryan Specialty Group Holdings, Inc. (a)(b) | | 94,896 | 4,019,795 |
| Safety Insurance Group, Inc. | | 23,962 | 2,157,778 |
| Selective Insurance Group, Inc. | | 96,987 | 7,702,708 |
| Selectquote, Inc. (a) | | 199,454 | 221,394 |
| Siriuspoint Ltd. (a) | | 151,223 | 675,967 |
| Stewart Information Services Corp. | | 44,177 | 2,237,123 |
| The Travelers Companies, Inc. | | 392,403 | 63,428,021 |
| Tiptree, Inc. | | 34,571 | 413,123 |
| Trean Insurance Group, Inc. (a) | | 23,898 | 106,346 |
| Trupanion, Inc. (a)(b) | | 56,593 | 3,994,334 |
| United Fire Group, Inc. | | 35,716 | 1,051,122 |
| United Insurance Holdings Corp. | | 35,027 | 35,377 |
| Universal Insurance Holdings, Inc. | | 51,387 | 613,561 |
| Unum Group | | 328,466 | 12,432,438 |
| W.R. Berkley Corp. | | 340,701 | 22,077,425 |
| White Mountains Insurance Group Ltd. | | 4,999 | 6,848,630 |
| Willis Towers Watson PLC | | 184,372 | 38,133,661 |
| | | | 1,462,468,121 |
| Mortgage Real Estate Investment Trusts - 0.1% | | | |
| Acres Commercial Realty Corp. (a) | | 14,835 | 144,048 |
| AG Mortgage Investment Trust, Inc. | | 27,853 | 178,538 |
| AGNC Investment Corp. | | 832,486 | 9,948,208 |
| Angel Oak Mortgage, Inc. | | 9,825 | 136,273 |
| Annaly Capital Management, Inc. | | 2,713,973 | 17,505,126 |
| Apollo Commercial Real Estate Finance, Inc. | | 205,384 | 2,392,724 |
| Arbor Realty Trust, Inc. | | 262,373 | 3,930,348 |
| Ares Commercial Real Estate Corp. | | 77,869 | 1,027,092 |
| Arlington Asset Investment Corp. (a) | | 71,308 | 228,186 |
| Armour Residential REIT, Inc. | | 183,254 | 1,301,103 |
| Blackstone Mortgage Trust, Inc. | | 274,313 | 7,949,591 |
| BrightSpire Capital, Inc. | | 140,374 | 1,179,142 |
| Broadmark Realty Capital, Inc. | | 216,880 | 1,398,876 |
| Cherry Hill Mortgage Investment Corp. (b) | | 22,382 | 144,812 |
| Chimera Investment Corp. | | 375,131 | 3,188,614 |
| Dynex Capital, Inc. | | 47,445 | 735,872 |
| Ellington Financial LLC | | 94,998 | 1,394,571 |
| Ellington Residential Mortgage REIT | | 11,126 | 89,898 |
| Franklin BSP Realty Trust, Inc. | | 212,271 | 2,738,296 |
| Granite Point Mortgage Trust, Inc. | | 87,209 | 821,509 |
| Great Ajax Corp. | | 33,856 | 306,397 |
| Hannon Armstrong Sustainable Infrastructure Capital, Inc. | | 145,141 | 5,735,972 |
| Invesco Mortgage Capital, Inc. | | 53,971 | 857,599 |
| KKR Real Estate Finance Trust, Inc. | | 94,406 | 1,818,260 |
| Ladder Capital Corp. Class A | | 291,742 | 3,226,667 |
| Lument Finance Trust, Inc. | | 10,765 | 27,020 |
| MFA Financial, Inc. | | 172,445 | 1,884,824 |
| New York Mortgage Trust, Inc. | | 576,914 | 1,615,359 |
| Nexpoint Real Estate Finance, Inc. | | 15,867 | 325,591 |
| Orchid Island Capital, Inc. | | 51,783 | 700,106 |
| PennyMac Mortgage Investment Trust | | 163,219 | 2,423,802 |
| Ready Capital Corp. | | 94,290 | 1,235,199 |
| Redwood Trust, Inc. | | 178,481 | 1,383,228 |
| Rithm Capital Corp. | | 744,442 | 7,020,088 |
| Sachem Capital Corp. | | 24,185 | 106,898 |
| Seven Hills Realty Trust | | 9,264 | 96,253 |
| Starwood Property Trust, Inc. | | 483,911 | 11,096,079 |
| TPG RE Finance Trust, Inc. | | 89,006 | 824,196 |
| Two Harbors Investment Corp. | | 539,138 | 2,614,819 |
| Western Asset Mortgage Capital Corp. | | 7,504 | 101,604 |
| | | | 99,832,788 |
| Thrifts & Mortgage Finance - 0.1% | | | |
| Axos Financial, Inc. (a) | | 89,575 | 3,742,444 |
| Blue Foundry Bancorp (a) | | 44,743 | 508,728 |
| Bridgewater Bancshares, Inc. (a) | | 40,020 | 687,544 |
| Capitol Federal Financial, Inc. | | 348,928 | 3,161,288 |
| Cf Bankshares, Inc. | | 105 | 2,216 |
| Columbia Financial, Inc. (a) | | 83,772 | 1,786,857 |
| ESSA Bancorp, Inc. | | 14,301 | 288,880 |
| Essent Group Ltd. | | 178,452 | 7,136,295 |
| Federal Agricultural Mortgage Corp. Class C (non-vtg.) | | 16,148 | 1,764,008 |
| FFBW, Inc. (a) | | 2,161 | 26,580 |
| Finance of America Companies, Inc. (a)(b) | | 23,514 | 28,687 |
| Flagstar Bancorp, Inc. | | 82,405 | 3,175,065 |
| FS Bancorp, Inc. | | 13,648 | 405,482 |
| Greene County Bancorp, Inc. | | 3,607 | 191,892 |
| Guild Holdings Co. Class A (b) | | 3,409 | 33,851 |
| Hingham Institution for Savings | | 2,412 | 716,123 |
| HMN Financial, Inc. | | 429 | 9,717 |
| Home Bancorp, Inc. | | 11,351 | 443,143 |
| Home Federal Bancorp, Inc. | | 709 | 13,691 |
| Impac Mortgage Holdings, Inc. (a) | | 16,166 | 8,072 |
| Kearny Financial Corp. | | 133,106 | 1,512,084 |
| loanDepot, Inc. (b) | | 34,309 | 56,610 |
| Luther Burbank Corp. | | 25,110 | 329,192 |
| Merchants Bancorp | | 38,584 | 1,040,610 |
| MGIC Investment Corp. | | 535,832 | 7,657,039 |
| Mr. Cooper Group, Inc. (a) | | 119,318 | 5,047,151 |
| New York Community Bancorp, Inc. | | 746,015 | 7,303,487 |
| NMI Holdings, Inc. (a) | | 135,399 | 2,779,741 |
| Northeast Community Bancorp, Inc. (b) | | 23,171 | 293,808 |
| Northfield Bancorp, Inc. | | 70,790 | 1,043,445 |
| Ocwen Financial Corp. (a) | | 12,933 | 338,586 |
| OP Bancorp | | 28,065 | 339,306 |
| PennyMac Financial Services, Inc. | | 50,702 | 2,693,290 |
| Pioneer Bancorp, Inc. (a) | | 18,130 | 169,516 |
| Ponce Financial Group, Inc. (a) | | 31,055 | 292,228 |
| Provident Bancorp, Inc. | | 19,950 | 289,076 |
| Provident Financial Holdings, Inc. | | 2,162 | 30,700 |
| Provident Financial Services, Inc. | | 131,514 | 3,055,070 |
| Radian Group, Inc. | | 298,509 | 6,301,525 |
| Randolph Bancorp, Inc. | | 3,929 | 104,551 |
| Rocket Companies, Inc. (b) | | 219,146 | 1,731,253 |
| Security National Financial Corp. Class A | | 26,758 | 203,361 |
| Southern Missouri Bancorp, Inc. | | 10,935 | 576,603 |
| Sterling Bancorp, Inc. (a) | | 31,816 | 187,396 |
| Territorial Bancorp, Inc. | | 10,478 | 218,047 |
| TFS Financial Corp. | | 98,914 | 1,414,470 |
| Timberland Bancorp, Inc./Washington | | 10,535 | 279,388 |
| Trustco Bank Corp., New York | | 31,580 | 1,052,877 |
| UWM Holdings Corp. Class A (b) | | 130,421 | 472,124 |
| Velocity Financial, Inc. (a) | | 41,453 | 473,393 |
| Walker & Dunlop, Inc. | | 48,037 | 4,825,797 |
| Waterstone Financial, Inc. | | 41,989 | 725,990 |
| Western New England Bancorp, Inc. | | 31,628 | 263,461 |
| William Penn Bancorp, Inc. | | 17,081 | 196,432 |
| WSFS Financial Corp. | | 106,879 | 5,167,600 |
| | | | 82,595,770 |
TOTAL FINANCIALS | | | 7,531,423,962 |
| HEALTH CARE - 13.9% | | | |
| Biotechnology - 2.6% | | | |
| 180 Life Sciences Corp. (a)(b) | | 38,298 | 32,607 |
| 2seventy bio, Inc. (a) | | 58,465 | 861,189 |
| 4D Molecular Therapeutics, Inc. (a) | | 40,072 | 314,966 |
| 89Bio, Inc. (a)(b) | | 12,416 | 55,375 |
| Aadi Bioscience, Inc. (a)(b) | | 40,680 | 551,214 |
| Aadi Bioscience, Inc. rights (a)(c) | | 85,026 | 1 |
| AbbVie, Inc. | | 2,898,987 | 389,797,792 |
| Abeona Therapeutics, Inc. (a) | | 3,965 | 14,433 |
| ACADIA Pharmaceuticals, Inc. (a)(b) | | 192,151 | 3,157,041 |
| Achieve Life Sciences, Inc. (a)(b) | | 12,876 | 58,715 |
| Acorda Therapeutics, Inc. (a) | | 10,397 | 4,204 |
| Actinium Pharmaceuticals, Inc. (a) | | 26,708 | 187,757 |
| Acumen Pharmaceuticals, Inc. (a) | | 11,407 | 64,906 |
| Adagio Therapeutics, Inc. (b) | | 31,869 | 145,323 |
| Adicet Bio, Inc. (a) | | 28,726 | 406,760 |
| Adicet Bio, Inc. rights (a)(c) | | 3,198 | 0 |
| ADMA Biologics, Inc. (a)(b) | | 265,336 | 716,407 |
| Adverum Biotechnologies, Inc. (a) | | 128,644 | 149,227 |
| Aeglea BioTherapeutics, Inc. (a) | | 48,938 | 25,595 |
| Aerovate Therapeutics, Inc. (a)(b) | | 13,806 | 273,773 |
| Aevi Genomic Medicine, Inc. rights (a)(c) | | 29,385 | 989 |
| Agenus, Inc. (a) | | 378,754 | 1,022,636 |
| AgeX Therapeutics, Inc. (a)(b) | | 24,431 | 13,926 |
| Agios Pharmaceuticals, Inc. (a) | | 196,300 | 5,005,650 |
| Aikido Pharma, Inc. (a)(b) | | 7,418 | 43,766 |
| Aileron Therapeutics, Inc. (a) | | 48,109 | 8,905 |
| AIM ImmunoTech, Inc. (a)(b) | | 36,509 | 24,278 |
| Akebia Therapeutics, Inc. (a) | | 290,002 | 105,648 |
| Akero Therapeutics, Inc. (a) | | 38,922 | 457,334 |
| Akouos, Inc. (a)(b) | | 39,152 | 131,159 |
| Alaunos Therapeutics, Inc. (a)(b) | | 334,879 | 823,802 |
| Albireo Pharma, Inc. (a)(b) | | 35,809 | 626,658 |
| Aldeyra Therapeutics, Inc. (a) | | 83,344 | 586,742 |
| Alector, Inc. (a) | | 93,231 | 964,941 |
| Aligos Therapeutics, Inc. (a) | | 24,753 | 30,941 |
| Alkermes PLC (a) | | 264,660 | 6,264,502 |
| Allakos, Inc. (a) | | 54,416 | 263,918 |
| Allena Pharmaceuticals, Inc. (a)(b) | | 13,108 | 1,378 |
| Allogene Therapeutics, Inc. (a)(b) | | 125,225 | 1,716,835 |
| Allovir, Inc. (a)(b) | | 42,456 | 318,845 |
| Alnylam Pharmaceuticals, Inc. (a) | | 198,389 | 41,001,055 |
| Alpine Immune Sciences, Inc. (a) | | 16,715 | 125,530 |
| Altimmune, Inc. (a) | | 58,747 | 1,297,134 |
| ALX Oncology Holdings, Inc. (a) | | 35,269 | 458,497 |
| Amgen, Inc. | | 876,401 | 210,599,160 |
| Amicus Therapeutics, Inc. (a) | | 416,584 | 4,678,238 |
| AnaptysBio, Inc. (a)(b) | | 40,835 | 948,189 |
| Anavex Life Sciences Corp. (a)(b) | | 122,008 | 1,170,057 |
| Anika Therapeutics, Inc. (a) | | 21,739 | 491,301 |
| Anixa Biosciences, Inc. (a) | | 52,257 | 217,912 |
| Annexon, Inc. (a)(b) | | 39,153 | 230,220 |
| Annovis Bio, Inc. (a)(b) | | 7,008 | 81,293 |
| Apellis Pharmaceuticals, Inc. (a) | | 146,360 | 8,856,244 |
| Applied Genetic Technologies Corp. (a) | | 45,693 | 18,359 |
| Applied Molecular Transport, Inc. (a) | | 28,241 | 41,797 |
| Applied Therapeutics, Inc. (a) | | 23,151 | 31,717 |
| Aprea Therapeutics, Inc. (a)(b) | | 16,675 | 13,242 |
| Aptevo Therapeutics, Inc. (a) | | 5,943 | 21,038 |
| Aptinyx, Inc. (a) | | 41,124 | 17,066 |
| AquaBounty Technologies, Inc. (a)(b) | | 111,133 | 133,360 |
| Aravive, Inc. (a) | | 19,699 | 13,244 |
| Arbutus Biopharma Corp. (a) | | 137,997 | 306,353 |
| Arcellx, Inc. | | 13,574 | 243,925 |
| Arcturus Therapeutics Holdings, Inc. (a)(b) | | 32,952 | 462,646 |
| Arcus Biosciences, Inc. (a) | | 73,414 | 1,767,809 |
| Arcutis Biotherapeutics, Inc. (a) | | 54,459 | 1,467,670 |
| Ardelyx, Inc. (a)(b) | | 110,261 | 104,516 |
| Aridis Pharmaceuticals, Inc. (a)(b) | | 11,612 | 16,954 |
| Arrowhead Pharmaceuticals, Inc. (a) | | 169,403 | 6,726,993 |
| Assembly Biosciences, Inc. (a) | | 45,323 | 84,754 |
| Astria Therapeutics, Inc. (a) | | 7,457 | 64,056 |
| Atara Biotherapeutics, Inc. (a) | | 143,180 | 574,152 |
| Athenex, Inc. (a) | | 104,505 | 50,110 |
| Athersys, Inc. (a) | | 12,554 | 34,524 |
| Atossa Therapeutics, Inc. (a)(b) | | 182,911 | 168,461 |
| Atreca, Inc. (a)(b) | | 36,913 | 68,658 |
| aTyr Pharma, Inc. (a) | | 34,154 | 116,807 |
| Aura Biosciences, Inc. | | 8,030 | 107,281 |
| Avalo Therapeutics, Inc. (a) | | 14,996 | 71,231 |
| AVEO Pharmaceuticals, Inc. (a) | | 37,534 | 303,650 |
| Avid Bioservices, Inc. (a) | | 97,789 | 1,683,927 |
| Avidity Biosciences, Inc. (a)(b) | | 77,699 | 1,524,454 |
| Avita Medical, Inc. (a)(b) | | 40,787 | 252,064 |
| AVROBIO, Inc. (a) | | 47,959 | 45,561 |
| Axcella Health, Inc. (a) | | 9,842 | 24,211 |
| Beam Therapeutics, Inc. (a)(b) | | 73,420 | 4,008,732 |
| Bellerophon Therapeutics, Inc. (a)(b) | | 7,640 | 9,703 |
| Bellicum Pharmaceuticals, Inc. (a)(b) | | 5,352 | 6,744 |
| Bio Path Holdings, Inc. (a)(b) | | 3,392 | 12,415 |
| BioAtla, Inc. (a)(b) | | 28,920 | 251,893 |
| Biocept, Inc. (a)(b) | | 14,680 | 15,120 |
| BioCryst Pharmaceuticals, Inc. (a)(b) | | 295,818 | 4,111,870 |
| Biogen, Inc. (a) | | 240,268 | 46,943,562 |
| Biohaven Pharmaceutical Holding Co. Ltd. (a) | | 103,908 | 15,518,660 |
| BioMarin Pharmaceutical, Inc. (a) | | 303,062 | 27,033,130 |
| Biomea Fusion, Inc. (a)(b) | | 12,921 | 148,592 |
| Biora Therapeutics, Inc. (a)(b) | | 210,765 | 152,236 |
| BioVie, Inc. (a) | | 1,121 | 4,047 |
| BioXcel Therapeutics, Inc. (a)(b) | | 26,766 | 366,159 |
| Black Diamond Therapeutics, Inc. (a)(b) | | 27,214 | 86,813 |
| bluebird bio, Inc. (a)(b) | | 103,400 | 603,856 |
| Blueprint Medicines Corp. (a) | | 95,437 | 6,987,897 |
| Bolt Biotherapeutics, Inc. (a)(b) | | 21,951 | 39,512 |
| BrainStorm Cell Therpeutic, Inc. (a)(b) | | 47,807 | 173,061 |
| Brickell Biotech, Inc. (a)(b) | | 2,082 | 5,247 |
| BridgeBio Pharma, Inc. (a)(b) | | 190,334 | 1,998,507 |
| Brooklyn ImmunoTherapeutics, Inc. (a)(b) | | 40,942 | 16,848 |
| C4 Therapeutics, Inc. (a)(b) | | 63,241 | 637,469 |
| Cabaletta Bio, Inc. (a)(b) | | 14,463 | 13,811 |
| Calithera Biosciences, Inc. (a)(b) | | 4,238 | 16,486 |
| Calyxt, Inc. (a) | | 14,780 | 3,213 |
| Candel Therapeutics, Inc. (a) | | 8,840 | 30,675 |
| Capricor Therapeutics, Inc. (a) | | 29,656 | 172,598 |
| Cardiff Oncology, Inc. (a)(b) | | 75,260 | 202,449 |
| CareDx, Inc. (a) | | 84,337 | 1,652,162 |
| Caribou Biosciences, Inc. (a) | | 37,522 | 370,342 |
| CASI Pharmaceuticals, Inc. (a)(b) | | 14,678 | 55,043 |
| Catalyst Biosciences, Inc. (a) | | 35,667 | 70,264 |
| Catalyst Pharmaceutical Partners, Inc. (a) | | 146,497 | 1,983,569 |
| Cel-Sci Corp. (a)(b) | | 62,124 | 244,769 |
| Celcuity, Inc. (a) | | 12,131 | 113,425 |
| Celldex Therapeutics, Inc. (a) | | 73,883 | 2,246,043 |
| Cellectar Biosciences, Inc. (a) | | 5,651 | 31,363 |
| Celsion Corp. (a)(b) | | 8,015 | 17,072 |
| Century Therapeutics, Inc. (a) | | 17,785 | 187,098 |
| Cerevel Therapeutics Holdings (a)(b) | | 94,288 | 2,743,781 |
| Checkpoint Therapeutics, Inc. (a)(b) | | 111,216 | 143,469 |
| ChemoCentryx, Inc. (a) | | 81,917 | 4,176,129 |
| Chimerix, Inc. (a) | | 127,558 | 280,628 |
| Chinook Therapeutics, Inc. (a) | | 74,531 | 1,550,245 |
| Chinook Therapeutics, Inc. rights (a)(c) | | 14,580 | 0 |
| Cidara Therapeutics, Inc. (a) | | 43,932 | 29,874 |
| Clene, Inc. (a)(b) | | 54,704 | 161,924 |
| Clovis Oncology, Inc. (a)(b) | | 218,833 | 245,093 |
| Codiak Biosciences, Inc. (a) | | 20,613 | 44,318 |
| Cogent Biosciences, Inc. (a) | | 57,368 | 945,998 |
| Cogent Biosciences, Inc. rights (a)(c) | | 11,491 | 0 |
| CohBar, Inc. (a) | | 61,277 | 9,351 |
| Coherus BioSciences, Inc. (a) | | 98,564 | 1,101,946 |
| Concert Pharmaceuticals, Inc. (a) | | 34,715 | 228,425 |
| ContraFect Corp. (a)(b) | | 52,173 | 13,878 |
| Corbus Pharmaceuticals Holdings, Inc. (a) | | 157,355 | 31,723 |
| Corvus Pharmaceuticals, Inc. (a) | | 58,129 | 55,717 |
| Crinetics Pharmaceuticals, Inc. (a) | | 67,928 | 1,282,481 |
| CRISPR Therapeutics AG (a)(b) | | 129,510 | 8,429,806 |
| CTI BioPharma Corp. (a)(b) | | 132,240 | 830,467 |
| Cue Biopharma, Inc. (a) | | 47,568 | 139,850 |
| Cullinan Oncology, Inc. (a) | | 44,855 | 604,645 |
| Curis, Inc. (a)(b) | | 130,100 | 126,197 |
| Cyclerion Therapeutics, Inc. (a) | | 45,211 | 37,977 |
| Cyclo Therapeutics, Inc. (a) | | 5,309 | 11,043 |
| Cyteir Therapeutics, Inc. (a) | | 6,729 | 14,535 |
| Cytokinetics, Inc. (a) | | 137,726 | 7,293,969 |
| CytomX Therapeutics, Inc. (a) | | 90,799 | 136,199 |
| Day One Biopharmaceuticals, Inc. (a) | | 34,031 | 799,388 |
| Decibel Therapeutics, Inc. (a) | | 9,257 | 45,730 |
| Deciphera Pharmaceuticals, Inc. (a) | | 70,506 | 1,144,312 |
| Denali Therapeutics, Inc. (a) | | 149,179 | 4,127,783 |
| DermTech, Inc. (a)(b) | | 39,764 | 221,088 |
| Design Therapeutics, Inc. (a)(b) | | 32,403 | 656,485 |
| DiaMedica Therapeutics, Inc. (a) | | 22,097 | 39,112 |
| Diffusion Pharmaceuticals, Inc. (a)(b) | | 1,688 | 11,023 |
| Dyadic International, Inc. (a)(b) | | 37,918 | 101,810 |
| Dynavax Technologies Corp. (a)(b) | | 188,284 | 2,159,617 |
| Dyne Therapeutics, Inc. (a) | | 38,912 | 381,338 |
| Eagle Pharmaceuticals, Inc. (a) | | 18,690 | 612,471 |
| Edesa Biotech, Inc. (a) | | 8,424 | 15,500 |
| Editas Medicine, Inc. (a)(b) | | 107,475 | 1,579,883 |
| Effector Therapeutics, Inc. Class A (a) | | 9,490 | 5,784 |
| Eiger Biopharmaceuticals, Inc. (a)(b) | | 59,685 | 492,998 |
| Eledon Pharmaceuticals, Inc. (a) | | 18,468 | 69,255 |
| Eliem Therapeutics, Inc. | | 7,452 | 22,431 |
| Emergent BioSolutions, Inc. (a) | | 78,444 | 1,884,225 |
| Enanta Pharmaceuticals, Inc. (a) | | 29,715 | 1,809,049 |
| Enochian Biosciences, Inc. (a) | | 23,157 | 57,198 |
| Ensysce Biosciences, Inc. (a)(b) | | 15,267 | 6,449 |
| Entrada Therapeutics, Inc. (b) | | 14,082 | 177,856 |
| EQRx, Inc. (a) | | 409,898 | 2,004,401 |
| Equillium, Inc. (a) | | 21,675 | 58,956 |
| Erasca, Inc. (a) | | 30,268 | 273,017 |
| Evelo Biosciences, Inc. (a)(b) | | 43,475 | 95,210 |
| Exact Sciences Corp. (a) | | 284,829 | 10,125,671 |
| Exagen, Inc. (a)(b) | | 10,039 | 45,477 |
| Exelixis, Inc. (a) | | 518,224 | 9,193,294 |
| Exicure, Inc. (a)(b) | | 4,479 | 8,017 |
| F-star Therapeutics, Inc. (a) | | 27,582 | 185,075 |
| F-star Therapeutics, Inc.: | | | |
| rights (a)(c) | | 1,612 | 0 |
| rights (a)(c) | | 1,612 | 0 |
| Fate Therapeutics, Inc. (a)(b) | | 129,184 | 3,376,870 |
| FibroGen, Inc. (a) | | 136,057 | 1,692,549 |
| Finch Therapeutics Group, Inc. (a) | | 10,837 | 23,408 |
| First Wave BioPharma, Inc. (a)(b) | | 197 | 605 |
| Foghorn Therapeutics, Inc. (a) | | 31,617 | 314,273 |
| Forma Therapeutics Holdings, Inc. (a) | | 47,722 | 639,475 |
| Forte Biosciences, Inc. (a) | | 16,638 | 21,629 |
| Fortress Biotech, Inc. (a) | | 118,327 | 120,694 |
| Frequency Therapeutics, Inc. (a) | | 54,830 | 112,950 |
| G1 Therapeutics, Inc. (a)(b) | | 56,782 | 823,907 |
| Galectin Therapeutics, Inc. (a)(b) | | 63,339 | 120,344 |
| Galecto, Inc. (a) | | 11,675 | 25,101 |
| Galera Therapeutics, Inc. (a) | | 4,354 | 5,834 |
| Gelesis Holdings, Inc. Class A (a)(b) | | 21,776 | 26,349 |
| Gemini Therapeutics, Inc. (a)(b) | | 62,884 | 97,470 |
| Generation Bio Co. (a) | | 76,796 | 393,196 |
| Genprex, Inc. (a)(b) | | 68,088 | 108,941 |
| GeoVax Labs, Inc. (a) | | 8,310 | 9,889 |
| Geron Corp. (a) | | 572,827 | 1,512,263 |
| Gilead Sciences, Inc. | | 2,057,460 | 130,586,986 |
| Global Blood Therapeutics, Inc. (a) | | 98,478 | 6,686,656 |
| GlycoMimetics, Inc. (a) | | 51,855 | 39,410 |
| Gossamer Bio, Inc. (a)(b) | | 78,933 | 1,101,115 |
| Graphite Bio, Inc. (a) | | 25,883 | 85,673 |
| GreenLight Biosciences Holdings PBC Class A (a)(b) | | 106,111 | 301,355 |
| Greenwich Lifesciences, Inc. (a)(b) | | 4,975 | 47,163 |
| Gritstone Bio, Inc. (a)(b) | | 105,793 | 348,059 |
| Gt Biopharma, Inc. (a) | | 29,786 | 76,848 |
| Halozyme Therapeutics, Inc. (a) | | 229,622 | 9,352,504 |
| Harpoon Therapeutics, Inc. (a)(b) | | 34,224 | 56,812 |
| Heron Therapeutics, Inc. (a)(b) | | 170,063 | 695,558 |
| HilleVax, Inc. | | 18,321 | 218,203 |
| Histogen, Inc. (a)(b) | | 128 | 256 |
| Homology Medicines, Inc. (a) | | 61,627 | 144,207 |
| Hookipa Pharma, Inc. (a) | | 77,302 | 115,180 |
| Horizon Therapeutics PLC (a) | | 390,127 | 23,099,420 |
| Humacyte, Inc. Class A (a)(b) | | 126,345 | 461,159 |
| Humanigen, Inc. (a)(b) | | 75,276 | 16,802 |
| iBio, Inc. (a)(b) | | 343,356 | 95,213 |
| Icosavax, Inc. (a)(b) | | 22,828 | 107,748 |
| Ideaya Biosciences, Inc. (a)(b) | | 52,287 | 513,981 |
| Idera Pharmaceuticals, Inc. (a)(b) | | 91,027 | 45,514 |
| IGM Biosciences, Inc. (a)(b) | | 26,875 | 521,644 |
| Imago BioSciences, Inc. (a)(b) | | 13,642 | 198,218 |
| Immix Biopharma, Inc. | | 4,692 | 8,539 |
| Immuneering Corp. (a)(b) | | 9,384 | 52,363 |
| Immunic, Inc. (a) | | 36,420 | 162,069 |
| ImmunityBio, Inc. (a)(b) | | 116,914 | 467,656 |
| ImmunoGen, Inc. (a) | | 354,829 | 2,061,556 |
| Immunome, Inc. (a)(b) | | 11,659 | 66,923 |
| Immunovant, Inc. (a) | | 88,169 | 454,070 |
| Impel Pharmaceuticals, Inc. (a)(b) | | 5,825 | 45,552 |
| Incyte Corp. (a) | | 309,782 | 21,817,946 |
| Infinity Pharmaceuticals, Inc. (a) | | 116,752 | 187,971 |
| Inhibrx, Inc. (a)(b) | | 36,754 | 652,016 |
| Inmune Bio, Inc. (a)(b) | | 15,186 | 122,551 |
| Inovio Pharmaceuticals, Inc. (a)(b) | | 329,782 | 755,201 |
| Inozyme Pharma, Inc. (a) | | 37,524 | 112,572 |
| Insmed, Inc. (a) | | 190,481 | 4,689,642 |
| Instil Bio, Inc. (a)(b) | | 35,978 | 187,086 |
| Intellia Therapeutics, Inc. (a) | | 113,379 | 6,809,543 |
| Intercept Pharmaceuticals, Inc. (a)(b) | | 41,103 | 713,959 |
| Ionis Pharmaceuticals, Inc. (a) | | 229,087 | 9,740,779 |
| Iovance Biotherapeutics, Inc. (a) | | 225,570 | 2,418,110 |
| Ironwood Pharmaceuticals, Inc. Class A (a) | | 258,371 | 2,780,072 |
| IsoRay, Inc. (a)(b) | | 190,229 | 70,385 |
| iTeos Therapeutics, Inc. (a) | | 32,752 | 726,439 |
| Iveric Bio, Inc. (a) | | 167,112 | 1,644,382 |
| Janux Therapeutics, Inc. (a) | | 19,512 | 211,120 |
| Jasper Therapeutics, Inc. (a)(b) | | 15,107 | 28,703 |
| Jounce Therapeutics, Inc. (a) | | 42,840 | 156,794 |
| Kalvista Pharmaceuticals, Inc. (a) | | 34,538 | 568,841 |
| Karuna Therapeutics, Inc. (a) | | 42,046 | 10,724,253 |
| Karyopharm Therapeutics, Inc. (a)(b) | | 117,204 | 593,052 |
| Keros Therapeutics, Inc. (a) | | 21,091 | 745,989 |
| Kezar Life Sciences, Inc. (a)(b) | | 60,129 | 618,126 |
| Kiniksa Pharmaceuticals Ltd. (a) | | 42,836 | 502,038 |
| Kinnate Biopharma, Inc. (a)(b) | | 27,233 | 394,334 |
| Kintara Therapeutics, Inc. (a)(b) | | 69,028 | 10,706 |
| Kodiak Sciences, Inc. (a) | | 53,766 | 538,198 |
| Kronos Bio, Inc. (a)(b) | | 77,287 | 309,148 |
| Krystal Biotech, Inc. (a)(b) | | 33,112 | 2,321,482 |
| Kura Oncology, Inc. (a) | | 110,209 | 1,527,497 |
| Kymera Therapeutics, Inc. (a) | | 57,835 | 1,634,995 |
| Lantern Pharma, Inc. (a)(b) | | 6,165 | 31,873 |
| Larimar Therapeutics, Inc. (a) | | 18,481 | 50,268 |
| Leap Therapeutics, Inc. (a)(b) | | 105,092 | 149,231 |
| Lexicon Pharmaceuticals, Inc. (a) | | 117,528 | 323,202 |
| Ligand Pharmaceuticals, Inc. Class B (a) | | 27,397 | 2,531,209 |
| Lineage Cell Therapeutics, Inc. (a)(b) | | 256,547 | 361,731 |
| LogicBio Therapeutics, Inc. (a) | | 12,282 | 4,402 |
| Longeveron, Inc. (a)(b) | | 4,231 | 20,245 |
| Lumos Pharma, Inc. (a) | | 3,251 | 26,626 |
| Lyell Immunopharma, Inc. (a)(b) | | 33,410 | 223,847 |
| Macrogenics, Inc. (a) | | 92,923 | 368,904 |
| Madrigal Pharmaceuticals, Inc. (a)(b) | | 20,245 | 1,460,069 |
| Magenta Therapeutics, Inc. (a) | | 49,503 | 87,125 |
| MannKind Corp. (a)(b) | | 393,051 | 1,434,636 |
| Marker Therapeutics, Inc. (a) | | 89,516 | 27,750 |
| Matinas BioPharma Holdings, Inc. (a) | | 264,925 | 188,097 |
| MediciNova, Inc. (a)(b) | | 61,340 | 130,654 |
| MEI Pharma, Inc. (a)(b) | | 134,168 | 67,970 |
| Merrimack Pharmaceuticals, Inc. (a) | | 15,717 | 65,226 |
| Mersana Therapeutics, Inc. (a) | | 139,980 | 1,049,850 |
| MiMedx Group, Inc. (a) | | 151,572 | 535,049 |
| Minerva Neurosciences, Inc. (a)(b) | | 5,733 | 64,668 |
| Mirati Therapeutics, Inc. (a) | | 80,378 | 6,513,029 |
| Mirum Pharmaceuticals, Inc. (a)(b) | | 25,087 | 626,673 |
| Moderna, Inc. (a) | | 567,188 | 75,021,957 |
| Molecular Templates, Inc. (a)(b) | | 59,475 | 43,637 |
| Moleculin Biotech, Inc. (a)(b) | | 30,817 | 45,609 |
| Monte Rosa Therapeutics, Inc. (a)(b) | | 20,292 | 160,713 |
| Morphic Holding, Inc. (a) | | 52,732 | 1,451,185 |
| Mustang Bio, Inc. (a) | | 96,783 | 58,796 |
| Myovant Sciences Ltd. (a)(b) | | 74,672 | 1,276,144 |
| Myriad Genetics, Inc. (a) | | 128,467 | 2,869,953 |
| NanoViricides, Inc. (a)(b) | | 8,252 | 19,722 |
| Natera, Inc. (a) | | 144,381 | 7,112,208 |
| Navidea Biopharmaceuticals, Inc. (a) | | 7,141 | 2,378 |
| Neoleukin Therapeutics, Inc. (a) | | 48,248 | 49,695 |
| Neubase Therapeutics, Inc. (a)(b) | | 27,182 | 16,461 |
| Neurobo Pharmaceuticals, Inc. (a) | | 380 | 118 |
| Neurobo Pharmaceuticals, Inc. rights (a)(c) | | 380 | 0 |
| Neurocrine Biosciences, Inc. (a) | | 155,135 | 16,231,775 |
| Neximmune, Inc. (a)(b) | | 6,510 | 7,487 |
| NextCure, Inc. (a)(b) | | 28,995 | 118,880 |
| Nighthawk Biosciences, Inc. (a)(b) | | 35,946 | 77,643 |
| Nkarta, Inc. (a)(b) | | 44,187 | 635,851 |
| Novavax, Inc. (a)(b) | | 126,533 | 4,180,650 |
| Nurix Therapeutics, Inc. (a)(b) | | 67,925 | 1,068,460 |
| Nuvalent, Inc. Class A (a)(b) | | 16,142 | 272,477 |
| Nuvectis Pharma, Inc. (b) | | 4,368 | 35,381 |
| Ocugen, Inc. (a)(b) | | 327,028 | 843,732 |
| Olema Pharmaceuticals, Inc. (a) | | 43,005 | 169,870 |
| Omega Therapeutics, Inc. (a) | | 7,699 | 34,415 |
| OncoCyte Corp. (a)(b) | | 131,228 | 103,670 |
| Oncorus, Inc. (a)(b) | | 15,974 | 20,766 |
| OncoSec Medical, Inc. (a) | | 19,670 | 13,242 |
| Oncternal Therapeutics, Inc. (a) | | 80,553 | 90,219 |
| Oncternal Therapeutics, Inc. rights (a)(c) | | 2,146 | 0 |
| OpGen, Inc. (a) | | 60,641 | 28,253 |
| Oragenics, Inc. (a)(b) | | 83,373 | 26,037 |
| Organogenesis Holdings, Inc. Class A (a) | | 103,797 | 372,631 |
| Organovo Holdings, Inc. (a)(b) | | 11,895 | 27,834 |
| Orgenesis, Inc. (a)(b) | | 40,821 | 79,193 |
| ORIC Pharmaceuticals, Inc. (a)(b) | | 62,904 | 217,648 |
| Outlook Therapeutics, Inc. (a)(b) | | 155,532 | 174,196 |
| Ovid Therapeutics, Inc. (a) | | 80,268 | 161,339 |
| Oyster Point Pharma, Inc. (a)(b) | | 16,744 | 104,650 |
| Palatin Technologies, Inc. (a)(b) | | 10,930 | 54,869 |
| Pardes Biosciences, Inc. (a)(b) | | 44,132 | 154,903 |
| Passage Bio, Inc. (a) | | 44,674 | 90,241 |
| PDL BioPharma, Inc. (a)(c) | | 218,274 | 320,863 |
| PDS Biotechnology Corp. (a)(b) | | 32,700 | 137,013 |
| PepGen, Inc. | | 13,944 | 132,468 |
| PharmaCyte Biotech, Inc. (a)(b) | | 21,430 | 56,361 |
| PhaseBio Pharmaceuticals, Inc. (a)(b) | | 26,632 | 28,230 |
| Pieris Pharmaceuticals, Inc. (a)(b) | | 100,668 | 146,975 |
| PMV Pharmaceuticals, Inc. (a)(b) | | 43,513 | 605,701 |
| Point Biopharma Global, Inc. (a)(b) | | 160,062 | 1,560,605 |
| Polarityte, Inc. (a)(b) | | 3,639 | 3,712 |
| Poseida Therapeutics, Inc. (a) | | 39,484 | 130,692 |
| Praxis Precision Medicines, Inc. (a)(b) | | 56,623 | 176,664 |
| Precigen, Inc. (a)(b) | | 140,644 | 310,823 |
| Precision BioSciences, Inc. (a) | | 69,476 | 111,856 |
| Prelude Therapeutics, Inc. (a) | | 24,019 | 172,937 |
| Prometheus Biosciences, Inc. (a) | | 23,004 | 1,203,339 |
| Protagonist Therapeutics, Inc. (a) | | 71,859 | 626,610 |
| Protara Therapeutics, Inc. (a) | | 11,701 | 40,368 |
| Prothena Corp. PLC (a) | | 57,010 | 1,571,766 |
| PTC Therapeutics, Inc. (a) | | 160,943 | 8,037,493 |
| Puma Biotechnology, Inc. (a) | | 56,688 | 151,924 |
| Pyxis Oncology, Inc. (b) | | 13,063 | 33,833 |
| Qualigen Therapeutics, Inc. (a)(b) | | 15,124 | 5,756 |
| Quince Therapeutics, Inc. (a)(b) | | 25,276 | 44,486 |
| Rallybio Corp. (a) | | 8,481 | 93,715 |
| RAPT Therapeutics, Inc. (a) | | 32,027 | 855,441 |
| Recursion Pharmaceuticals, Inc. (a) | | 47,396 | 498,132 |
| Regeneron Pharmaceuticals, Inc. (a) | | 177,096 | 102,903,402 |
| REGENXBIO, Inc. (a) | | 61,477 | 1,813,572 |
| Regulus Therapeutics, Inc. (a)(b) | | 5,076 | 7,208 |
| Relay Therapeutics, Inc. (a)(b) | | 121,592 | 2,792,968 |
| Reneo Pharmaceuticals, Inc. (a) | | 5,709 | 17,983 |
| Repligen Corp. (a) | | 84,267 | 18,485,652 |
| Replimune Group, Inc. (a) | | 44,877 | 855,356 |
| Revolution Medicines, Inc. (a) | | 124,562 | 2,594,626 |
| Rezolute, Inc. (a)(b) | | 19,905 | 47,374 |
| Rhythm Pharmaceuticals, Inc. (a) | | 69,148 | 1,562,745 |
| Rigel Pharmaceuticals, Inc. (a) | | 265,322 | 376,757 |
| Rocket Pharmaceuticals, Inc. (a)(b) | | 68,184 | 1,050,715 |
| Rubius Therapeutics, Inc. (a) | | 69,675 | 48,773 |
| S.A.B. Biotherapeutics, Inc. (a)(b) | | 85,867 | 60,115 |
| Sage Therapeutics, Inc. (a) | | 84,853 | 3,195,564 |
| Salarius Pharmaceuticals, Inc. (a) | | 64,297 | 12,924 |
| Salarius Pharmaceuticals, Inc. warrants 1/20/25 (a) | | 7,499 | 6 |
| Sana Biotechnology, Inc. (a)(b) | | 137,536 | 936,620 |
| Sangamo Therapeutics, Inc. (a) | | 180,337 | 973,820 |
| Sarepta Therapeutics, Inc. (a) | | 141,878 | 15,518,616 |
| Savara, Inc. (a) | | 99,425 | 142,178 |
| Scholar Rock Holding Corp. (a) | | 40,482 | 337,620 |
| Seagen, Inc. (a) | | 220,729 | 34,056,277 |
| Selecta Biosciences, Inc. (a)(b) | | 188,029 | 353,495 |
| Sellas Life Sciences Group, Inc. (a)(b) | | 20,426 | 62,504 |
| Sensei Biotherapeutics, Inc. (a) | | 11,330 | 21,640 |
| Seres Therapeutics, Inc. (a) | | 104,209 | 535,634 |
| Sesen Bio, Inc. (a) | | 266,888 | 184,153 |
| Shattuck Labs, Inc. (a) | | 38,622 | 125,522 |
| Sigilon Therapeutics, Inc. (a) | | 12,132 | 7,541 |
| Silverback Therapeutics, Inc. (a) | | 38,363 | 208,695 |
| Sio Gene Therapies, Inc. (a) | | 38,531 | 12,908 |
| Societal Cdmo, Inc. (a) | | 57,578 | 68,518 |
| Soleno Therapeutics, Inc. (a)(b) | | 2,452 | 5,394 |
| Solid Biosciences, Inc. (a) | | 89,818 | 57,484 |
| Soligenix, Inc. (a)(b) | | 23,654 | 18,403 |
| Sorrento Therapeutics, Inc. (a)(b) | | 591,024 | 1,211,599 |
| Spectrum Pharmaceuticals, Inc. (a) | | 243,368 | 275,006 |
| Spero Therapeutics, Inc. (a) | | 39,004 | 31,472 |
| Springworks Therapeutics, Inc. (a)(b) | | 43,652 | 1,212,216 |
| Spruce Biosciences, Inc. (a)(b) | | 5,509 | 11,569 |
| SQZ Biotechnologies Co. (a)(b) | | 20,477 | 61,431 |
| Statera Biopharma, Inc. (a)(b) | | 22,064 | 3,985 |
| Stoke Therapeutics, Inc. (a) | | 34,516 | 519,811 |
| Surface Oncology, Inc. (a) | | 51,934 | 70,630 |
| Surrozen, Inc. (a)(b) | | 11,713 | 30,102 |
| Sutro Biopharma, Inc. (a) | | 65,091 | 368,415 |
| Synaptogenix, Inc. (a)(b) | | 7,462 | 62,755 |
| Syndax Pharmaceuticals, Inc. (a) | | 79,875 | 1,885,849 |
| Synlogic, Inc. (a) | | 57,398 | 57,398 |
| Synthetic Biologics, Inc. (a)(b) | | 9,757 | 14,343 |
| Syros Pharmaceuticals, Inc. (a)(b) | | 80,524 | 64,468 |
| T2 Biosystems, Inc. (a)(b) | | 242,249 | 29,676 |
| Talaris Therapeutics, Inc. (a) | | 13,340 | 44,155 |
| Tango Therapeutics, Inc. (a) | | 115,083 | 471,840 |
| Taysha Gene Therapies, Inc. (a) | | 35,232 | 111,333 |
| TCR2 Therapeutics, Inc. (a) | | 40,487 | 110,125 |
| Tempest Therapeutics, Inc. (a)(b) | | 2,810 | 6,182 |
| Tenaya Therapeutics, Inc. (a)(b) | | 17,221 | 75,600 |
| TG Therapeutics, Inc. (a) | | 217,897 | 1,553,606 |
| TONIX Pharmaceuticals Holding (a)(b) | | 19,853 | 20,250 |
| TRACON Pharmaceuticals, Inc. (a) | | 24,147 | 47,811 |
| Travere Therapeutics, Inc. (a) | | 95,192 | 2,547,338 |
| Trevena, Inc. (a) | | 223,656 | 48,287 |
| Twist Bioscience Corp. (a) | | 89,742 | 3,600,449 |
| Tyme Technologies, Inc. (a) | | 123,850 | 35,619 |
| Tyra Biosciences, Inc. (b) | | 15,618 | 103,235 |
| Ultragenyx Pharmaceutical, Inc. (a) | | 112,316 | 5,356,350 |
| uniQure B.V. (a) | | 63,200 | 1,234,928 |
| United Therapeutics Corp. (a) | | 73,461 | 16,647,732 |
| UNITY Biotechnology, Inc. (a) | | 46,076 | 21,416 |
| Vanda Pharmaceuticals, Inc. (a) | | 89,284 | 944,625 |
| Vaxart, Inc. (a)(b) | | 200,059 | 620,183 |
| Vaxcyte, Inc. (a) | | 54,213 | 1,418,212 |
| VBI Vaccines, Inc. (a) | | 359,977 | 322,395 |
| Vera Therapeutics, Inc. (a)(b) | | 14,733 | 320,148 |
| Veracyte, Inc. (a)(b) | | 113,731 | 2,320,112 |
| Verastem, Inc. (a) | | 271,742 | 315,221 |
| Vericel Corp. (a) | | 76,907 | 1,918,830 |
| Vertex Pharmaceuticals, Inc. (a) | | 419,711 | 118,257,771 |
| Verve Therapeutics, Inc. (a) | | 37,248 | 1,428,833 |
| Vigil Neuroscience, Inc. | | 8,965 | 76,292 |
| Viking Therapeutics, Inc. (a)(b) | | 104,003 | 330,730 |
| Vincerx Pharma, Inc. (a)(b) | | 27,455 | 41,732 |
| Vir Biotechnology, Inc. (a) | | 120,241 | 2,855,724 |
| Viracta Therapeutics, Inc. (a) | | 26,919 | 109,022 |
| Viridian Therapeutics, Inc. (a) | | 57,214 | 1,270,723 |
| Viridian Therapeutics, Inc. rights (a)(c) | | 27,850 | 0 |
| VistaGen Therapeutics, Inc. (a) | | 268,335 | 49,374 |
| Vor Biopharma, Inc. (a)(b) | | 18,724 | 96,054 |
| Voyager Therapeutics, Inc. (a) | | 41,094 | 245,331 |
| vTv Therapeutics, Inc. Class A (a)(b) | | 39,197 | 41,549 |
| Vyant Bio, Inc. (a) | | 18,007 | 12,839 |
| Werewolf Therapeutics, Inc. (a) | | 11,166 | 56,500 |
| X4 Pharmaceuticals, Inc. (a) | | 23,776 | 23,541 |
| Xbiotech, Inc. (a) | | 22,712 | 91,075 |
| Xencor, Inc. (a) | | 92,030 | 2,428,672 |
| Xilio Therapeutics, Inc. | | 11,070 | 24,797 |
| XOMA Corp. (a)(b) | | 16,955 | 337,065 |
| Y-mAbs Therapeutics, Inc. (a)(b) | | 57,506 | 924,696 |
| Yumanity Therapeutics, Inc. (a) | | 2,924 | 5,000 |
| Yumanity Therapeutics, Inc. rights (a)(c) | | 58,487 | 1 |
| Zentalis Pharmaceuticals, Inc. (a) | | 76,523 | 2,051,582 |
| | | | 1,662,805,030 |
| Health Care Equipment & Supplies - 2.6% | | | |
| Abbott Laboratories | | 2,871,981 | 294,808,850 |
| Abiomed, Inc. (a) | | 74,726 | 19,374,957 |
| Accelerate Diagnostics, Inc. (a)(b) | | 57,249 | 93,316 |
| Accuray, Inc. (a)(b) | | 143,156 | 340,711 |
| Acutus Medical, Inc. (a) | | 22,522 | 26,801 |
| Aethlon Medical, Inc. (a)(b) | | 25,344 | 24,584 |
| Align Technology, Inc. (a) | | 120,149 | 29,280,311 |
| Alphatec Holdings, Inc. (a) | | 115,279 | 874,968 |
| Angiodynamics, Inc. (a) | | 60,440 | 1,338,142 |
| Apollo Endosurgery, Inc. (a) | | 43,174 | 238,320 |
| Apyx Medical Corp. (a) | | 57,479 | 329,355 |
| Artivion, Inc. (a) | | 63,237 | 1,401,332 |
| Asensus Surgical, Inc. (a)(b) | | 410,079 | 221,443 |
| Aspira Women's Health, Inc. (a)(b) | | 97,584 | 49,768 |
| Atricure, Inc. (a) | | 74,191 | 3,384,593 |
| Atrion Corp. | | 2,373 | 1,433,173 |
| Avanos Medical, Inc. (a) | | 78,830 | 1,941,583 |
| Avinger, Inc. (a)(b) | | 7,694 | 10,925 |
| AxoGen, Inc. (a) | | 73,587 | 689,510 |
| Axonics Modulation Technologies, Inc. (a) | | 77,608 | 5,607,178 |
| Baxter International, Inc. | | 826,531 | 47,492,471 |
| Becton, Dickinson & Co. | | 467,962 | 118,122,968 |
| Beyond Air, Inc. (a)(b) | | 36,491 | 342,286 |
| BioLase Technology, Inc. (a)(b) | | 10,705 | 41,054 |
| BioLife Solutions, Inc. (a) | | 48,948 | 1,155,662 |
| Biomerica, Inc. (a)(b) | | 3,201 | 11,332 |
| BioSig Technologies, Inc. (a)(b) | | 30,625 | 33,688 |
| Bioventus, Inc. (a)(b) | | 37,543 | 274,439 |
| Boston Scientific Corp. (a) | | 2,345,441 | 94,544,727 |
| Butterfly Network, Inc. Class A (a)(b) | | 218,205 | 1,359,417 |
| Cardiovascular Systems, Inc. (a) | | 64,374 | 850,381 |
| Cerus Corp. (a) | | 263,959 | 1,084,871 |
| Chembio Diagnostics, Inc. (a)(b) | | 13,955 | 8,453 |
| ClearPoint Neuro, Inc. (a)(b) | | 24,679 | 317,619 |
| Co.-Diagnostics, Inc. (a)(b) | | 43,909 | 148,412 |
| ConforMis, Inc. (a) | | 293,619 | 76,341 |
| CONMED Corp. | | 47,340 | 4,192,904 |
| CryoPort, Inc. (a)(b) | | 83,452 | 2,725,542 |
| Cutera, Inc. (a)(b) | | 27,141 | 1,295,983 |
| CVRx, Inc. (a) | | 9,373 | 67,954 |
| CytoSorbents Corp. (a) | | 62,586 | 118,913 |
| DarioHealth Corp. (a)(b) | | 29,090 | 138,759 |
| Delcath Systems, Inc. (a)(b) | | 4,791 | 19,931 |
| Dentsply Sirona, Inc. | | 353,299 | 11,577,608 |
| DexCom, Inc. (a) | | 652,094 | 53,608,648 |
| Eargo, Inc. (a)(b) | | 30,166 | 54,902 |
| Edwards Lifesciences Corp. (a) | | 1,019,699 | 91,874,880 |
| Ekso Bionics Holdings, Inc. (a) | | 14,838 | 34,869 |
| electroCore, Inc. (a)(b) | | 58,573 | 31,026 |
| Electromed, Inc. (a) | | 6,101 | 59,180 |
| Embecta Corp. | | 92,214 | 2,943,471 |
| ENDRA Life Sciences, Inc. (a)(b) | | 38,471 | 11,222 |
| Enovis Corp. (a)(b) | | 75,422 | 3,820,124 |
| Envista Holdings Corp. (a) | | 263,192 | 9,761,791 |
| Envveno Medical Corp. (a)(b) | | 10,208 | 75,437 |
| Figs, Inc. Class A (a) | | 58,336 | 674,364 |
| Fonar Corp. (a) | | 12,634 | 178,139 |
| Glaukos Corp. (a) | | 75,954 | 3,687,567 |
| Globus Medical, Inc. (a) | | 130,103 | 7,700,797 |
| Haemonetics Corp. (a) | | 83,034 | 6,230,041 |
| Helius Medical Technologies, Inc. (U.S.) (a)(b) | | 534 | 293 |
| Heska Corp. (a) | | 18,209 | 1,658,294 |
| Hologic, Inc. (a) | | 408,350 | 27,588,126 |
| Hyperfine, Inc. (a)(b) | | 66,299 | 88,841 |
| ICU Medical, Inc. (a) | | 32,418 | 5,154,462 |
| IDEXX Laboratories, Inc. (a) | | 137,806 | 47,904,122 |
| Inari Medical, Inc. (a)(b) | | 54,375 | 3,770,906 |
| Inogen, Inc. (a) | | 32,816 | 939,522 |
| Inspire Medical Systems, Inc. (a) | | 44,530 | 8,527,050 |
| Insulet Corp. (a) | | 113,596 | 29,020,370 |
| Integer Holdings Corp. (a) | | 53,179 | 3,354,000 |
| Integra LifeSciences Holdings Corp. (a) | | 119,716 | 5,711,650 |
| Intuitive Surgical, Inc. (a) | | 591,150 | 121,623,201 |
| Invacare Corp. (a)(b) | | 53,785 | 46,524 |
| INVO Bioscience, Inc. (a) | | 23,986 | 23,218 |
| IRadimed Corp. | | 10,923 | 366,467 |
| iRhythm Technologies, Inc. (a) | | 48,163 | 7,101,634 |
| Iridex Corp. (a) | | 14,475 | 37,635 |
| Kewaunee Scientific Corp. (a) | | 970 | 19,342 |
| KORU Medical Systems, Inc. (a)(b) | | 36,405 | 89,920 |
| Lantheus Holdings, Inc. (a) | | 110,629 | 8,717,565 |
| LeMaitre Vascular, Inc. | | 32,885 | 1,623,861 |
| LENSAR, Inc. (a) | | 16,562 | 89,269 |
| LivaNova PLC (a) | | 86,269 | 4,852,631 |
| LogicMark, Inc. (a)(b) | | 2,348 | 2,677 |
| Lucid Diagnostics, Inc. (b) | | 3,903 | 8,470 |
| Lucira Health, Inc. (a) | | 12,311 | 21,790 |
| Masimo Corp. (a) | | 83,888 | 12,322,308 |
| Medtronic PLC | | 2,202,145 | 193,612,588 |
| Meridian Bioscience, Inc. (a) | | 72,255 | 2,354,790 |
| Merit Medical Systems, Inc. (a) | | 83,343 | 4,936,406 |
| Mesa Laboratories, Inc. | | 8,973 | 1,533,127 |
| Microbot Medical, Inc. (a)(b) | | 10,061 | 50,707 |
| Milestone Scientific, Inc. (a)(b) | | 55,851 | 53,617 |
| Minerva Surgical, Inc. (b) | | 7,017 | 11,929 |
| Motus GI Holdings, Inc. (a)(b) | | 2,318 | 7,603 |
| Myomo, Inc. (a) | | 6,750 | 12,555 |
| NanoVibronix, Inc. (a)(b) | | 39,040 | 20,211 |
| Nemaura Medical, Inc. (a) | | 15,517 | 29,482 |
| Neogen Corp. (a)(b) | | 178,417 | 3,728,915 |
| NeuroMetrix, Inc. (a)(b) | | 14,942 | 50,355 |
| Neuronetics, Inc. (a) | | 31,678 | 113,090 |
| NeuroOne Medical Technologies Corp. (a) | | 11,708 | 29,855 |
| NeuroPace, Inc. (a)(b) | | 9,942 | 40,862 |
| Nevro Corp. (a) | | 55,911 | 2,533,887 |
| NEXGEL, Inc. (a) | | 12 | 21 |
| Novocure Ltd. (a) | | 146,317 | 12,017,015 |
| NuVasive, Inc. (a) | | 83,296 | 3,540,913 |
| Nuwellis, Inc. (a) | | 9,397 | 13,720 |
| Omnicell, Inc. (a) | | 71,739 | 7,338,182 |
| OraSure Technologies, Inc. (a) | | 114,677 | 469,029 |
| Orthofix International NV (a) | | 31,860 | 634,014 |
| OrthoPediatrics Corp. (a) | | 22,370 | 1,098,143 |
| Outset Medical, Inc. (a) | | 67,302 | 1,230,954 |
| Owlet, Inc. (a) | | 110,618 | 179,201 |
| Paragon 28, Inc. (b) | | 13,480 | 236,574 |
| PAVmed, Inc. (a)(b) | | 117,738 | 140,108 |
| Penumbra, Inc. (a) | | 57,242 | 9,397,419 |
| Predictive Oncology, Inc. (a) | | 75,628 | 30,493 |
| Pro-Dex, Inc. (a) | | 4,562 | 87,590 |
| PROCEPT BioRobotics Corp. | | 19,181 | 776,447 |
| Pulmonx Corp. (a)(b) | | 58,442 | 1,073,580 |
| Pulse Biosciences, Inc. (a)(b) | | 22,939 | 29,133 |
| QuidelOrtho Corp. (a) | | 81,395 | 6,451,368 |
| Quotient Ltd. (a) | | 147,507 | 28,661 |
| Reshape Lifesciences, Inc. (a) | | 178 | 74 |
| ResMed, Inc. | | 240,522 | 52,895,598 |
| Retractable Technologies, Inc. (a)(b) | | 32,187 | 74,996 |
| Rockwell Medical Technologies, Inc. (a)(b) | | 7,463 | 13,508 |
| RxSight, Inc. (a) | | 13,636 | 170,586 |
| Sanara Medtech, Inc. (a)(b) | | 3,697 | 126,622 |
| Seaspine Holdings Corp. (a) | | 50,376 | 322,406 |
| Semler Scientific, Inc. (a) | | 9,790 | 447,501 |
| Senseonics Holdings, Inc. (a)(b) | | 678,541 | 1,207,803 |
| Sensus Healthcare, Inc. (a) | | 23,984 | 298,601 |
| Shockwave Medical, Inc. (a) | | 58,336 | 17,317,625 |
| SI-BONE, Inc. (a)(b) | | 41,873 | 690,905 |
| Sientra, Inc. (a)(b) | | 77,158 | 49,798 |
| Sight Sciences, Inc. (a)(b) | | 18,672 | 130,144 |
| Silk Road Medical, Inc. (a)(b) | | 58,045 | 2,311,932 |
| Sintx Technologies, Inc. (a)(b) | | 35,965 | 16,544 |
| Sintx Technologies, Inc. rights 12/31/99 (a)(c) | | 35,965 | 0 |
| SmileDirectClub, Inc. (a)(b) | | 154,431 | 176,051 |
| Sonendo, Inc. (b) | | 11,072 | 13,176 |
| Staar Surgical Co. (a) | | 77,607 | 7,340,846 |
| Stereotaxis, Inc. (a) | | 91,596 | 188,688 |
| STERIS PLC | | 164,180 | 33,062,568 |
| STRATA Skin Sciences, Inc. (a) | | 566 | 561 |
| Stryker Corp. | | 552,233 | 113,318,212 |
| Surgalign Holdings, Inc. (a)(b) | | 4,658 | 19,238 |
| SurModics, Inc. (a) | | 24,724 | 832,952 |
| Tactile Systems Technology, Inc. (a) | | 29,608 | 244,266 |
| Talis Biomedical Corp. (a)(b) | | 29,289 | 26,360 |
| Tandem Diabetes Care, Inc. (a) | | 102,883 | 4,705,868 |
| Tela Bio, Inc. (a)(b) | | 6,272 | 52,998 |
| Teleflex, Inc. | | 77,045 | 17,432,202 |
| The Cooper Companies, Inc. | | 80,743 | 23,208,768 |
| TransMedics Group, Inc. (a) | | 45,270 | 2,355,398 |
| Treace Medical Concepts, Inc. (a) | | 24,916 | 499,067 |
| UFP Technologies, Inc. (a) | | 10,975 | 1,020,565 |
| Utah Medical Products, Inc. | | 6,131 | 563,439 |
| Vapotherm, Inc. (a) | | 38,832 | 75,722 |
| Varex Imaging Corp. (a)(b) | | 66,514 | 1,402,780 |
| Venus Concept, Inc. (a)(b) | | 16,173 | 4,993 |
| Vicarious Surgical, Inc. (a)(b) | | 130,910 | 488,294 |
| ViewRay, Inc. (a) | | 235,446 | 805,225 |
| Vivani Medical, Inc. (a)(b) | | 14,822 | 60,770 |
| VolitionRx Ltd. (a)(b) | | 47,456 | 80,201 |
| Zimmer Biomet Holdings, Inc. | | 345,094 | 36,690,394 |
| Zimvie, Inc. (a) | | 33,340 | 507,435 |
| Zomedica Corp. (a)(b) | | 1,469,468 | 358,844 |
| Zynex, Inc. (b) | | 44,671 | 399,359 |
| | | | 1,694,784,568 |
| Health Care Providers & Services - 3.2% | | | |
| 1Life Healthcare, Inc. (a) | | 289,064 | 4,974,791 |
| 23andMe Holding Co. Class A (a)(b) | | 469,993 | 1,583,876 |
| Acadia Healthcare Co., Inc. (a) | | 146,079 | 11,968,252 |
| Accolade, Inc. (a) | | 93,458 | 951,402 |
| AdaptHealth Corp. (a) | | 155,505 | 2,794,425 |
| Addus HomeCare Corp. (a) | | 26,118 | 2,330,248 |
| Agiliti, Inc. (a)(b) | | 53,180 | 854,071 |
| agilon health, Inc. (a)(b) | | 81,408 | 1,691,658 |
| AirSculpt Technologies, Inc. | | 11,103 | 96,818 |
| Alerislife, Inc. (a) | | 29,657 | 32,919 |
| Alignment Healthcare, Inc. (a) | | 53,495 | 813,659 |
| Amedisys, Inc. (a) | | 52,246 | 6,188,539 |
| AmerisourceBergen Corp. | | 244,980 | 35,904,269 |
| AMN Healthcare Services, Inc. (a) | | 75,845 | 7,784,731 |
| Apollo Medical Holdings, Inc. (a)(b) | | 61,407 | 2,648,484 |
| ATI Physical Therapy, Inc. (a)(b) | | 89,658 | 80,692 |
| Aveanna Healthcare Holdings, Inc. (a)(b) | | 88,069 | 160,286 |
| Biodesix, Inc. (a) | | 19,025 | 35,957 |
| Brookdale Senior Living, Inc. (a) | | 290,814 | 1,279,582 |
| Caladrius Biosciences, Inc. (a)(b) | | 48,949 | 24,034 |
| Cano Health, Inc. (a) | | 301,442 | 1,859,897 |
| Cardinal Health, Inc. | | 453,344 | 32,060,488 |
| CareMax, Inc. Class A (a)(b) | | 115,874 | 792,578 |
| Castle Biosciences, Inc. (a) | | 38,514 | 1,116,906 |
| Centene Corp. (a) | | 957,149 | 85,894,551 |
| Chemed Corp. | | 25,028 | 11,918,083 |
| Cigna Corp. | | 520,071 | 147,414,125 |
| Clover Health Investments Corp. (a)(b) | | 482,532 | 1,259,409 |
| Community Health Systems, Inc. (a) | | 197,459 | 525,241 |
| Corvel Corp. (a) | | 15,216 | 2,364,262 |
| Covetrus, Inc. (a) | | 166,485 | 3,474,542 |
| Cross Country Healthcare, Inc. (a) | | 58,202 | 1,477,167 |
| CVS Health Corp. | | 2,151,127 | 211,133,115 |
| DaVita HealthCare Partners, Inc. (a) | | 102,564 | 8,747,684 |
| DocGo, Inc. Class A (a)(b) | | 146,761 | 1,496,962 |
| Elevance Health, Inc. | | 395,368 | 191,796,970 |
| Encompass Health Corp. | | 160,554 | 7,798,108 |
| Enhabit Home Health & Hospice (a) | | 80,169 | 1,330,805 |
| Enzo Biochem, Inc. (a)(b) | | 55,775 | 134,976 |
| Fulgent Genetics, Inc. (a) | | 31,039 | 1,349,265 |
| Great Elm Group, Inc. (a) | | 40,893 | 85,875 |
| Guardant Health, Inc. (a) | | 165,564 | 8,288,134 |
| Hanger, Inc. (a) | | 61,041 | 1,137,194 |
| HCA Holdings, Inc. | | 372,626 | 73,731,507 |
| HealthEquity, Inc. (a) | | 136,280 | 9,005,382 |
| Henry Schein, Inc. (a) | | 225,020 | 16,518,718 |
| Hims & Hers Health, Inc. (a)(b) | | 197,563 | 1,256,501 |
| Humana, Inc. | | 207,444 | 99,942,370 |
| InfuSystems Holdings, Inc. (a) | | 28,044 | 216,219 |
| Innovage Holding Corp. (a) | | 38,861 | 142,620 |
| Invitae Corp. (a)(b) | | 334,312 | 1,016,308 |
| Laboratory Corp. of America Holdings | | 151,743 | 34,183,146 |
| LHC Group, Inc. (a) | | 51,768 | 8,358,979 |
| LifeStance Health Group, Inc. (a) | | 72,912 | 458,616 |
| McKesson Corp. | | 238,070 | 87,371,690 |
| Modivcare, Inc. (a) | | 19,757 | 2,140,078 |
| Molina Healthcare, Inc. (a) | | 95,903 | 32,354,795 |
| National Healthcare Corp. | | 23,234 | 1,613,601 |
| National Research Corp. Class A | | 24,295 | 828,702 |
| Oak Street Health, Inc. (a)(b) | | 226,438 | 5,932,676 |
| Ontrak, Inc. (a)(b) | | 11,611 | 7,552 |
| Opko Health, Inc. (a) | | 684,094 | 1,491,325 |
| Option Care Health, Inc. (a) | | 244,994 | 7,585,014 |
| Owens & Minor, Inc. | | 121,790 | 3,594,023 |
| P3 Health Partners, Inc. Class A (a)(b) | | 12,186 | 59,955 |
| Patterson Companies, Inc. | | 140,502 | 3,918,601 |
| Pediatrix Medical Group, Inc. (a) | | 139,334 | 2,482,932 |
| Pennant Group, Inc. (a) | | 44,512 | 697,503 |
| PetIQ, Inc. Class A (a)(b) | | 46,814 | 437,243 |
| Precipio, Inc. (a)(b) | | 37,582 | 44,347 |
| Premier, Inc. | | 198,749 | 7,003,915 |
| Privia Health Group, Inc. (a)(b) | | 42,202 | 1,679,218 |
| Progyny, Inc. (a) | | 114,181 | 4,591,218 |
| Psychemedics Corp. | | 1,921 | 12,717 |
| Quest Diagnostics, Inc. | | 193,020 | 24,187,336 |
| R1 Rcm, Inc. (a) | | 215,594 | 4,710,729 |
| RadNet, Inc. (a) | | 78,041 | 1,567,844 |
| Select Medical Holdings Corp. | | 171,824 | 4,405,567 |
| Sema4 Holdings Corp. Class A (a)(b) | | 408,887 | 417,065 |
| Signify Health, Inc. (a) | | 39,888 | 1,112,875 |
| Sonida Senior Living, Inc. (a) | | 5,304 | 107,406 |
| Surgery Partners, Inc. (a) | | 58,273 | 1,604,256 |
| Talkspace, Inc. Class A (a)(b) | | 193,412 | 257,238 |
| Tenet Healthcare Corp. (a) | | 174,619 | 9,865,974 |
| The Ensign Group, Inc. | | 85,637 | 7,304,836 |
| The Joint Corp. (a) | | 22,958 | 418,754 |
| The Oncology Institute, Inc. (a)(b) | | 13,451 | 85,414 |
| U.S. Physical Therapy, Inc. | | 21,681 | 1,791,067 |
| UnitedHealth Group, Inc. | | 1,538,080 | 798,771,086 |
| Universal Health Services, Inc. Class B | | 112,870 | 11,043,201 |
| Vivos Therapeutics, Inc. (a)(b) | | 22,495 | 27,669 |
| | | | 2,082,010,818 |
| Health Care Technology - 0.1% | | | |
| Allscripts Healthcare Solutions, Inc. (a) | | 230,245 | 3,914,165 |
| American Well Corp. (a) | | 296,298 | 1,348,156 |
| Biotricity, Inc. (a)(b) | | 59,907 | 67,096 |
| CareCloud, Inc. (a)(b) | | 4,478 | 14,464 |
| Certara, Inc. (a) | | 165,988 | 2,601,032 |
| Change Healthcare, Inc. (a) | | 407,519 | 10,012,742 |
| Computer Programs & Systems, Inc. (a) | | 23,788 | 725,772 |
| Convey Health Solutions Holdin (a) | | 16,696 | 175,141 |
| Definitive Healthcare Corp. (b) | | 48,999 | 983,900 |
| Doximity, Inc. (a)(b) | | 154,534 | 5,128,983 |
| Evolent Health, Inc. (a) | | 131,266 | 4,824,026 |
| Forian, Inc. (a) | | 20,350 | 84,249 |
| GoodRx Holdings, Inc. (a)(b) | | 106,811 | 651,547 |
| Health Catalyst, Inc. (a) | | 151,822 | 1,821,864 |
| HealthStream, Inc. (a) | | 43,232 | 956,724 |
| HTG Molecular Diagnostics (a) | | 3,005 | 2,593 |
| iCAD, Inc. (a) | | 34,731 | 104,540 |
| MultiPlan Corp. Class A (a)(b) | | 415,543 | 1,462,711 |
| NantHealth, Inc. (a) | | 57,911 | 27,878 |
| Nextgen Healthcare, Inc. (a) | | 95,142 | 1,630,734 |
| OptimizeRx Corp. (a) | | 28,785 | 456,818 |
| Pear Therapeutics, Inc. Class A (a)(b) | | 44,666 | 78,612 |
| Phreesia, Inc. (a) | | 83,949 | 2,154,131 |
| Schrodinger, Inc. (a) | | 75,144 | 2,061,951 |
| Sharecare, Inc. Class A (a)(b) | | 459,324 | 840,563 |
| Simulations Plus, Inc. | | 23,644 | 1,419,822 |
| Streamline Health Solutions, Inc. (a)(b) | | 94,959 | 155,733 |
| Tabula Rasa HealthCare, Inc. (a)(b) | | 34,118 | 165,472 |
| Teladoc Health, Inc. (a)(b) | | 258,042 | 8,014,785 |
| UpHealth, Inc. (a) | | 105,581 | 64,489 |
| Veeva Systems, Inc. Class A (a) | | 233,823 | 46,605,600 |
| | | | 98,556,293 |
| Life Sciences Tools & Services - 1.7% | | | |
| 10X Genomics, Inc. (a) | | 152,112 | 5,018,175 |
| Absci Corp. (a)(b) | | 17,170 | 57,863 |
| Adaptive Biotechnologies Corp. (a) | | 176,030 | 1,570,188 |
| Agilent Technologies, Inc. | | 491,819 | 63,075,787 |
| Akoya Biosciences, Inc. (a) | | 10,639 | 121,285 |
| Alpha Teknova, Inc. (a) | | 7,482 | 33,744 |
| Applied DNA Sciences, Inc. (a)(b) | | 4,922 | 15,357 |
| Avantor, Inc. (a) | | 998,136 | 24,863,568 |
| Azenta, Inc. | | 121,957 | 6,428,353 |
| Berkeley Lights, Inc. (a) | | 69,952 | 256,724 |
| Bio-Rad Laboratories, Inc. Class A (a) | | 35,227 | 17,086,504 |
| Bio-Techne Corp. | | 64,256 | 21,320,783 |
| BioNano Genomics, Inc. (a)(b) | | 457,006 | 1,133,375 |
| Bruker Corp. | | 166,218 | 9,308,208 |
| Champions Oncology, Inc. (a) | | 6,812 | 54,360 |
| Charles River Laboratories International, Inc. (a) | | 82,995 | 17,034,724 |
| ChromaDex, Inc. (a)(b) | | 81,329 | 117,114 |
| Codex DNA, Inc. (a)(b) | | 11,274 | 21,646 |
| Codexis, Inc. (a) | | 93,591 | 656,073 |
| Cytek Biosciences, Inc. (a) | | 26,180 | 304,997 |
| Danaher Corp. | | 1,061,804 | 286,591,518 |
| Harvard Bioscience, Inc. (a) | | 56,746 | 187,262 |
| Illumina, Inc. (a) | | 257,470 | 51,916,251 |
| Inotiv, Inc. (a)(b) | | 24,145 | 472,518 |
| IQVIA Holdings, Inc. (a) | | 310,083 | 65,942,251 |
| IsoPlexis Corp. | | 12,886 | 24,999 |
| Maravai LifeSciences Holdings, Inc. (a) | | 176,936 | 3,692,654 |
| Medpace Holdings, Inc. (a) | | 47,178 | 6,963,945 |
| Mettler-Toledo International, Inc. (a) | | 37,353 | 45,289,018 |
| Miromatrix Medical, Inc. (a)(b) | | 6,754 | 22,693 |
| Nanostring Technologies, Inc. (a) | | 76,221 | 1,033,557 |
| Nautilus Biotechnology, Inc. (a)(b) | | 76,085 | 168,148 |
| NeoGenomics, Inc. (a) | | 199,965 | 2,009,648 |
| Pacific Biosciences of California, Inc. (a)(b) | | 363,537 | 2,130,327 |
| PerkinElmer, Inc. | | 206,433 | 27,880,841 |
| Personalis, Inc. (a) | | 51,986 | 172,074 |
| Quanterix Corp. (a) | | 54,798 | 512,361 |
| Quantum-Si, Inc. (a) | | 146,687 | 457,663 |
| Rapid Micro Biosystems, Inc. (a)(b) | | 8,506 | 28,325 |
| Science 37 Holdings, Inc. (a) | | 109,685 | 173,302 |
| Seer, Inc. (a)(b) | | 58,297 | 588,800 |
| Singular Genomics Systems, Inc. (a)(b) | | 12,930 | 34,523 |
| SomaLogic, Inc. Class A (a) | | 259,192 | 953,827 |
| Sotera Health Co. (a) | | 163,887 | 2,771,329 |
| Standard BioTools, Inc. (a)(b) | | 112,984 | 159,307 |
| Syneos Health, Inc. (a) | | 167,624 | 10,075,879 |
| Thermo Fisher Scientific, Inc. | | 642,134 | 350,168,513 |
| Waters Corp. (a) | | 99,218 | 29,626,495 |
| West Pharmaceutical Services, Inc. | | 121,486 | 36,043,681 |
| | | | 1,094,570,537 |
| Pharmaceuticals - 3.7% | | | |
| 9 Meters Biopharma, Inc. (a) | | 348,519 | 92,392 |
| AcelRx Pharmaceuticals, Inc. (a)(b) | | 161,025 | 47,502 |
| Acer Therapeutics, Inc. (a)(b) | | 6,588 | 8,762 |
| Aclaris Therapeutics, Inc. (a) | | 79,553 | 1,265,688 |
| Adamis Pharmaceuticals Corp. (a)(b) | | 200,206 | 66,669 |
| Adial Pharmaceuticals, Inc. (a) | | 12,772 | 6,856 |
| Aerie Pharmaceuticals, Inc. (a) | | 77,126 | 1,164,603 |
| Agile Therapeutics, Inc. (a)(b) | | 2,144 | 863 |
| Alimera Sciences, Inc. (a)(b) | | 1,036 | 7,045 |
| Amneal Pharmaceuticals, Inc. (a) | | 186,979 | 405,744 |
| Amphastar Pharmaceuticals, Inc. (a) | | 63,471 | 1,878,742 |
| Ampio Pharmaceuticals, Inc. (a)(b) | | 268,882 | 27,157 |
| Amylyx Pharmaceuticals, Inc. (b) | | 16,211 | 409,166 |
| AN2 Therapeutics, Inc. (b) | | 8,413 | 144,199 |
| Angion Biomedica Corp. (a) | | 6,656 | 6,789 |
| ANI Pharmaceuticals, Inc. (a)(b) | | 21,042 | 776,239 |
| Aquestive Therapeutics, Inc. (a)(b) | | 29,801 | 43,062 |
| Arvinas Holding Co. LLC (a) | | 71,562 | 3,029,935 |
| Assertio Holdings, Inc. (a)(b) | | 79,725 | 203,299 |
| Atea Pharmaceuticals, Inc. (a) | | 85,304 | 639,780 |
| Athira Pharma, Inc. (a)(b) | | 48,208 | 162,943 |
| Avenue Therapeutics, Inc. (a) | | 6,166 | 1,485 |
| Axsome Therapeutics, Inc. (a)(b) | | 48,663 | 3,104,699 |
| Aytu BioScience, Inc. (a)(b) | | 31,782 | 7,072 |
| Baudax Bio, Inc. (a)(b) | | 2,199 | 717 |
| Biofrontera, Inc. (b) | | 8,427 | 9,775 |
| Bristol-Myers Squibb Co. | | 3,494,496 | 235,563,975 |
| Cara Therapeutics, Inc. (a)(b) | | 70,847 | 731,141 |
| Cassava Sciences, Inc. (a)(b) | | 60,675 | 1,561,168 |
| Catalent, Inc. (a) | | 296,183 | 26,064,104 |
| CinCor Pharma, Inc. | | 29,659 | 1,001,584 |
| Citius Pharmaceuticals, Inc. (a)(b) | | 224,231 | 275,804 |
| Clearside Biomedical, Inc. (a) | | 75,812 | 103,862 |
| Clever Leaves Holdings, Inc. (a)(b) | | 37,601 | 30,795 |
| Cocrystal Pharma, Inc. (a)(b) | | 102,307 | 41,015 |
| Collegium Pharmaceutical, Inc. (a) | | 55,936 | 983,355 |
| Corcept Therapeutics, Inc. (a)(b) | | 164,952 | 4,259,061 |
| CorMedix, Inc. (a)(b) | | 59,573 | 210,293 |
| Cumberland Pharmaceuticals, Inc. (a) | | 5,048 | 11,863 |
| CymaBay Therapeutics, Inc. (a) | | 114,604 | 405,698 |
| Dare Bioscience, Inc. (a)(b) | | 83,204 | 89,860 |
| DICE Therapeutics, Inc. | | 26,843 | 421,435 |
| Durect Corp. (a) | | 315,588 | 229,590 |
| Edgewise Therapeutics, Inc. (a) | | 31,396 | 316,472 |
| Elanco Animal Health, Inc. (a) | | 772,390 | 11,686,261 |
| Elanco Animal Health, Inc. rights (a)(c) | | 71,624 | 1 |
| Eli Lilly & Co. | | 1,294,114 | 389,825,960 |
| Eloxx Pharmaceuticals, Inc. (a) | | 111,164 | 40,019 |
| Enveric Biosciences, Inc. (a)(b) | | 463 | 2,584 |
| Esperion Therapeutics, Inc. (a)(b) | | 107,452 | 801,592 |
| Eton Pharmaceuticals, Inc. (a)(b) | | 30,410 | 68,727 |
| Evoke Pharma, Inc. (a) | | 494 | 1,334 |
| Evolus, Inc. (a)(b) | | 58,378 | 561,013 |
| Eyenovia, Inc. (a) | | 22,772 | 37,118 |
| Eyepoint Pharmaceuticals, Inc. (a) | | 42,504 | 425,040 |
| Fulcrum Therapeutics, Inc. (a) | | 47,442 | 351,071 |
| Graybug Vision, Inc. (a)(b) | | 6,561 | 6,560 |
| Harmony Biosciences Holdings, Inc. (a) | | 39,934 | 1,753,502 |
| Harrow Health, Inc. (a)(b) | | 36,339 | 326,688 |
| Hepion Pharmaceuticals, Inc. (a)(b) | | 105,370 | 71,936 |
| Ikena Oncology, Inc. (a) | | 13,683 | 64,994 |
| IMARA, Inc. (a) | | 8,877 | 10,475 |
| Innoviva, Inc. (a) | | 104,480 | 1,374,957 |
| Intra-Cellular Therapies, Inc. (a) | | 140,892 | 7,081,232 |
| Jaguar Health, Inc. (a)(b) | | 64,081 | 15,059 |
| Jazz Pharmaceuticals PLC (a) | | 101,391 | 15,737,911 |
| Johnson & Johnson | | 4,317,119 | 696,523,979 |
| Kala Pharmaceuticals, Inc. (a)(b) | | 77,128 | 23,447 |
| KemPharm, Inc. (a)(b) | | 51,355 | 280,398 |
| Landos Biopharma, Inc. (a) | | 9,145 | 8,231 |
| Lannett Co., Inc. (a)(b) | | 54,109 | 27,266 |
| Lipocine, Inc. (a) | | 129,114 | 74,886 |
| Liquidia Technologies, Inc. (a) | | 77,898 | 449,471 |
| Lyra Therapeutics, Inc. (a) | | 16,033 | 92,831 |
| Marinus Pharmaceuticals, Inc. (a) | | 48,200 | 335,472 |
| Merck & Co., Inc. | | 4,149,500 | 354,201,320 |
| MyMD Pharmaceuticals, Inc. (a)(b) | | 46,364 | 173,401 |
| Nektar Therapeutics (a)(b) | | 294,483 | 1,160,263 |
| NGM Biopharmaceuticals, Inc. (a) | | 58,005 | 818,451 |
| NovaBay Pharmaceuticals, Inc. (a)(b) | | 4,499 | 1,057 |
| Novan, Inc. (a)(b) | | 20,460 | 51,968 |
| NRX Pharmaceuticals, Inc. (a)(b) | | 44,573 | 28,972 |
| Nutriband, Inc. | | 6,343 | 24,421 |
| Nuvation Bio, Inc. (a) | | 182,873 | 512,044 |
| Ocular Therapeutix, Inc. (a) | | 116,440 | 591,515 |
| Ocuphire Pharma, Inc. (a)(b) | | 23,026 | 52,269 |
| Ocuphire Pharma, Inc. rights (a)(c) | | 621 | 515 |
| Omeros Corp. (a)(b) | | 102,323 | 412,362 |
| Onconova Therapeutics, Inc. (a) | | 23,169 | 27,687 |
| Opiant Pharmaceuticals, Inc. (a) | | 7,158 | 85,824 |
| OptiNose, Inc. (a)(b) | | 99,846 | 364,438 |
| Organon & Co. | | 413,039 | 11,784,003 |
| Otonomy, Inc. (a) | | 64,513 | 23,612 |
| Pacira Biosciences, Inc. (a) | | 72,340 | 3,796,403 |
| Palisade Bio, Inc. rights (a)(c) | | 289 | 0 |
| Paratek Pharmaceuticals, Inc. (a)(b) | | 56,395 | 141,551 |
| Perrigo Co. PLC | | 218,944 | 8,192,884 |
| Petros Pharmaceuticals, Inc. (a) | | 1,091 | 715 |
| Pfizer, Inc. | | 9,205,796 | 416,378,153 |
| Phathom Pharmaceuticals, Inc. (a)(b) | | 25,460 | 217,428 |
| Phibro Animal Health Corp. Class A | | 34,319 | 508,264 |
| Pliant Therapeutics, Inc. (a)(b) | | 53,730 | 1,035,914 |
| PLx Pharma PLC (a)(b) | | 35,408 | 29,428 |
| Prestige Brands Holdings, Inc. (a) | | 81,607 | 4,127,682 |
| Processa Pharmaceuticals, Inc. (a) | | 8,812 | 24,233 |
| ProPhase Labs, Inc. (b) | | 16,656 | 201,704 |
| Provention Bio, Inc. (a)(b) | | 78,461 | 338,952 |
| Pulmatrix, Inc. (a)(b) | | 4,453 | 19,682 |
| Rain Therapeutics, Inc. (a) | | 10,662 | 63,226 |
| Rani Therapeutics Holdings, Inc. (a)(b) | | 13,242 | 117,854 |
| Reata Pharmaceuticals, Inc. (a) | | 43,548 | 1,041,233 |
| Relmada Therapeutics, Inc. (a) | | 43,769 | 1,275,429 |
| Revance Therapeutics, Inc. (a) | | 106,604 | 2,121,420 |
| Roivant Sciences Ltd. (a)(b) | | 161,554 | 575,132 |
| Royalty Pharma PLC | | 591,837 | 24,744,705 |
| RVL Pharmaceuticals PLC (a) | | 23,005 | 51,761 |
| Satsuma Pharmaceuticals, Inc. (a) | | 10,782 | 69,436 |
| scPharmaceuticals, Inc. (a) | | 12,249 | 71,657 |
| SCYNEXIS, Inc. (a)(b) | | 42,296 | 107,009 |
| Seelos Therapeutics, Inc. (a)(b) | | 135,701 | 153,342 |
| Seelos Therapeutics, Inc. rights (a)(b)(c) | | 1,387 | 0 |
| SIGA Technologies, Inc. (b) | | 70,199 | 1,058,601 |
| Supernus Pharmaceuticals, Inc. (a) | | 84,923 | 2,906,914 |
| Tarsus Pharmaceuticals, Inc. (a) | | 19,417 | 298,633 |
| Terns Pharmaceuticals, Inc. (a) | | 10,067 | 39,261 |
| TFF Pharmaceuticals, Inc. (a)(b) | | 28,255 | 130,256 |
| TherapeuticsMD, Inc. (a)(b) | | 11,150 | 110,497 |
| Theravance Biopharma, Inc. (a) | | 83,308 | 750,605 |
| Theseus Pharmaceuticals, Inc. (b) | | 15,814 | 107,851 |
| Trevi Therapeutics, Inc. (a) | | 33,825 | 107,564 |
| Tricida, Inc. (a)(b) | | 50,336 | 630,207 |
| Ventyx Biosciences, Inc. (b) | | 13,802 | 281,561 |
| Verrica Pharmaceuticals, Inc. (a)(b) | | 20,129 | 78,906 |
| Viatris, Inc. | | 1,994,515 | 19,047,618 |
| Vyne Therapeutics, Inc. (a)(b) | | 75,926 | 23,788 |
| WAVE Life Sciences (a) | | 77,452 | 230,032 |
| Xeris Biopharma Holdings, Inc. (a)(b) | | 172,855 | 288,668 |
| Xeris Biopharma Holdings, Inc. rights (a)(c) | | 72,002 | 13,041 |
| Zoetis, Inc. Class A | | 772,801 | 120,966,541 |
| Zynerba Pharmaceuticals, Inc. (a)(b) | | 56,274 | 65,841 |
| | | | 2,396,727,977 |
TOTAL HEALTH CARE | | | 9,029,455,223 |
| INDUSTRIALS - 8.8% | | | |
| Aerospace & Defense - 1.6% | | | |
| AAR Corp. (a) | | 52,938 | 2,269,981 |
| Aerojet Rocketdyne Holdings, Inc. (a) | | 120,883 | 5,206,431 |
| AeroVironment, Inc. (a) | | 37,770 | 3,348,311 |
| AerSale Corp. (a)(b) | | 25,215 | 486,145 |
| Air Industries Group, Inc. (a) | | 17,165 | 11,961 |
| Archer Aviation, Inc. Class A (a)(b) | | 224,092 | 793,286 |
| Astra Space, Inc. Class A (a)(b) | | 205,493 | 175,265 |
| Astronics Corp. (a) | | 36,467 | 335,861 |
| Astrotech Corp. (a) | | 1,228 | 565 |
| Axon Enterprise, Inc. (a) | | 116,414 | 13,583,186 |
| BWX Technologies, Inc. | | 151,790 | 7,912,813 |
| Byrna Technologies, Inc. (a)(b) | | 36,119 | 322,543 |
| Cadre Holdings, Inc. | | 9,401 | 239,726 |
| Curtiss-Wright Corp. | | 65,035 | 9,572,502 |
| Ducommun, Inc. (a) | | 17,391 | 765,204 |
| General Dynamics Corp. | | 376,765 | 86,252,811 |
| HEICO Corp. | | 84,816 | 12,917,477 |
| HEICO Corp. Class A | | 107,425 | 13,168,157 |
| Hexcel Corp. | | 134,376 | 7,883,840 |
| Howmet Aerospace, Inc. | | 616,494 | 21,842,382 |
| Huntington Ingalls Industries, Inc. | | 65,426 | 15,064,991 |
| Innovative Solutions & Support, Inc. (a) | | 15,429 | 110,317 |
| Kaman Corp. | | 44,496 | 1,411,413 |
| Kratos Defense & Security Solutions, Inc. (a) | | 206,943 | 2,595,065 |
| L3Harris Technologies, Inc. | | 317,475 | 72,444,620 |
| Lockheed Martin Corp. | | 388,255 | 163,109,808 |
| Maxar Technologies, Inc. | | 120,199 | 2,864,342 |
| Mercury Systems, Inc. (a) | | 91,529 | 4,405,291 |
| Momentus, Inc. Class A (a)(b) | | 98,824 | 174,918 |
| Moog, Inc. Class A | | 49,726 | 3,728,455 |
| National Presto Industries, Inc. | | 8,226 | 561,178 |
| Northrop Grumman Corp. | | 239,023 | 114,250,604 |
| Park Aerospace Corp. | | 27,998 | 322,257 |
| Parsons Corp. (a) | | 42,021 | 1,738,829 |
| Raytheon Technologies Corp. | | 2,437,722 | 218,785,550 |
| Redwire Corp. (a)(b) | | 24,954 | 68,873 |
| Rocket Lab U.S.A., Inc. Class A (a) | | 235,277 | 1,294,024 |
| SIFCO Industries, Inc. (a) | | 3,677 | 12,171 |
| Sigma Additive Solutions, Inc. (a)(b) | | 24,802 | 24,802 |
| Spirit AeroSystems Holdings, Inc. Class A | | 168,960 | 5,085,696 |
| Terran Orbital Corp. Class A (a)(b) | | 80,962 | 340,040 |
| Textron, Inc. | | 356,550 | 22,241,589 |
| The Boeing Co. (a) | | 911,791 | 146,114,508 |
| TransDigm Group, Inc. | | 85,371 | 51,255,895 |
| Triumph Group, Inc. (a) | | 105,938 | 1,376,135 |
| V2X, Inc. (a) | | 17,920 | 621,107 |
| Virgin Galactic Holdings, Inc. (a)(b) | | 281,388 | 1,663,003 |
| VirTra, Inc. (a) | | 10,373 | 55,184 |
| Woodward, Inc. | | 103,028 | 9,588,816 |
| | | | 1,028,397,928 |
| Air Freight & Logistics - 0.6% | | | |
| Air T, Inc. (a) | | 2,344 | 39,473 |
| Air Transport Services Group, Inc. (a) | | 93,480 | 2,816,552 |
| Atlas Air Worldwide Holdings, Inc. (a) | | 43,035 | 4,300,057 |
| C.H. Robinson Worldwide, Inc. | | 209,882 | 23,958,030 |
| Expeditors International of Washington, Inc. | | 274,879 | 28,282,300 |
| FedEx Corp. | | 390,161 | 82,249,840 |
| Forward Air Corp. | | 45,062 | 4,372,816 |
| GXO Logistics, Inc. (a) | | 164,788 | 7,313,291 |
| Hub Group, Inc. Class A (a) | | 55,569 | 4,434,962 |
| Radiant Logistics, Inc. (a) | | 65,808 | 460,656 |
| United Parcel Service, Inc. Class B | | 1,201,404 | 233,685,092 |
| | | | 391,913,069 |
| Airlines - 0.2% | | | |
| Alaska Air Group, Inc. (a) | | 207,442 | 9,036,174 |
| Allegiant Travel Co. (a) | | 25,574 | 2,467,891 |
| American Airlines Group, Inc. (a) | | 1,047,192 | 13,603,024 |
| Blade Air Mobility, Inc. (a)(b) | | 82,254 | 424,431 |
| Delta Air Lines, Inc. (a) | | 1,043,903 | 32,434,066 |
| Frontier Group Holdings, Inc. (a)(b) | | 48,856 | 630,242 |
| Hawaiian Holdings, Inc. (a) | | 88,296 | 1,323,557 |
| JetBlue Airways Corp. (a) | | 518,274 | 4,037,354 |
| Joby Aviation, Inc. (a)(b) | | 437,847 | 2,320,589 |
| Mesa Air Group, Inc. (a) | | 68,627 | 166,764 |
| SkyWest, Inc. (a) | | 87,662 | 1,866,324 |
| Southwest Airlines Co. (a) | | 975,008 | 35,782,794 |
| Spirit Airlines, Inc. (a) | | 176,591 | 4,005,084 |
| Sun Country Airlines Holdings, Inc. (a) | | 51,241 | 1,020,721 |
| United Airlines Holdings, Inc. (a) | | 532,368 | 18,638,204 |
| Wheels Up Experience, Inc. Class A (a) | | 304,396 | 569,221 |
| | | | 128,326,440 |
| Building Products - 0.6% | | | |
| A.O. Smith Corp. | | 214,980 | 12,135,621 |
| AAON, Inc. | | 66,952 | 3,848,401 |
| Advanced Drain Systems, Inc. | | 92,158 | 12,505,841 |
| AeroClean Technologies, Inc. (b) | | 3,247 | 10,553 |
| Allegion PLC | | 144,802 | 13,770,670 |
| Alpha PRO Tech Ltd. (a)(b) | | 16,469 | 68,017 |
| American Woodmark Corp. (a) | | 25,743 | 1,334,260 |
| Apogee Enterprises, Inc. | | 41,015 | 1,675,053 |
| Armstrong World Industries, Inc. | | 76,370 | 6,414,316 |
| Builders FirstSource, Inc. (a) | | 279,138 | 16,360,278 |
| Carlisle Companies, Inc. | | 85,029 | 25,139,674 |
| Carrier Global Corp. | | 1,391,251 | 54,425,739 |
| CSW Industrials, Inc. | | 25,569 | 3,237,035 |
| Fortune Brands Home & Security, Inc. | | 214,851 | 13,198,297 |
| Gibraltar Industries, Inc. (a) | | 54,389 | 2,276,180 |
| Griffon Corp. | | 77,041 | 2,415,235 |
| Hayward Holdings, Inc. (a)(b) | | 94,274 | 990,820 |
| Insteel Industries, Inc. | | 31,347 | 905,928 |
| Janus International Group, Inc. (a) | | 107,423 | 1,109,680 |
| Jeld-Wen Holding, Inc. (a) | | 151,616 | 1,690,518 |
| Johnson Controls International PLC | | 1,141,705 | 61,811,909 |
| Lennox International, Inc. | | 54,369 | 13,055,084 |
| Masco Corp. | | 393,227 | 20,003,457 |
| Masonite International Corp. (a) | | 38,895 | 3,182,389 |
| Owens Corning | | 162,019 | 13,241,813 |
| PGT Innovations, Inc. (a) | | 97,850 | 2,047,022 |
| Quanex Building Products Corp. | | 54,142 | 1,207,367 |
| Resideo Technologies, Inc. (a) | | 237,658 | 4,948,040 |
| Simpson Manufacturing Co. Ltd. | | 70,827 | 6,561,413 |
| Tecnoglass, Inc. | | 34,853 | 759,098 |
| The AZEK Co., Inc. (a) | | 178,044 | 3,249,303 |
| Trane Technologies PLC | | 382,656 | 58,955,810 |
| Trex Co., Inc. (a) | | 187,633 | 8,779,348 |
| UFP Industries, Inc. | | 100,796 | 8,002,194 |
| View, Inc. Class A (a)(b) | | 119,339 | 212,423 |
| Zurn Elkay Water Solutions Cor | | 201,636 | 5,561,121 |
| | | | 385,089,907 |
| Commercial Services & Supplies - 0.6% | | | |
| ABM Industries, Inc. | | 109,996 | 5,103,814 |
| ACCO Brands Corp. | | 163,699 | 970,735 |
| Acme United Corp. | | 9,376 | 269,560 |
| ACV Auctions, Inc. Class A (a) | | 178,097 | 1,515,605 |
| Aqua Metals, Inc. (a)(b) | | 89,321 | 81,747 |
| ARC Document Solutions, Inc. | | 47,602 | 140,426 |
| Aris Water Solution, Inc. Class A (b) | | 36,870 | 626,790 |
| Aurora Innovation, Inc. (a)(b) | | 450,669 | 964,432 |
| Brady Corp. Class A | | 79,599 | 3,704,537 |
| BrightView Holdings, Inc. (a) | | 83,005 | 840,011 |
| Casella Waste Systems, Inc. Class A (a) | | 82,403 | 6,751,278 |
| CECO Environmental Corp. (a) | | 48,247 | 480,540 |
| Charah Solutions, Inc. (a)(b) | | 8,915 | 22,822 |
| Cimpress PLC (a) | | 31,479 | 1,057,065 |
| Cintas Corp. | | 142,612 | 58,020,266 |
| Clean Harbors, Inc. (a) | | 81,172 | 9,531,216 |
| Copart, Inc. (a) | | 350,709 | 41,962,332 |
| CoreCivic, Inc. (a) | | 195,332 | 1,861,514 |
| Deluxe Corp. | | 71,451 | 1,374,717 |
| Driven Brands Holdings, Inc. (a) | | 93,610 | 2,942,162 |
| DSS, Inc. (a) | | 33,676 | 11,837 |
| Ennis, Inc. | | 45,280 | 961,294 |
| Fuel Tech, Inc. (a) | | 36,624 | 51,640 |
| Harsco Corp. (a) | | 123,643 | 701,056 |
| Healthcare Services Group, Inc. | | 118,454 | 1,666,648 |
| Heritage-Crystal Clean, Inc. (a) | | 27,312 | 889,552 |
| HNI Corp. | | 72,559 | 2,321,888 |
| IAA, Inc. (a) | | 216,948 | 8,083,482 |
| Interface, Inc. | | 99,933 | 1,116,252 |
| KAR Auction Services, Inc. (a) | | 197,871 | 2,888,917 |
| Kimball International, Inc. Class B | | 60,393 | 462,006 |
| Knightscope, Inc. Class A | | 6,780 | 17,764 |
| Matthews International Corp. Class A | | 51,046 | 1,276,660 |
| Millerknoll, Inc. | | 124,810 | 3,454,741 |
| Montrose Environmental Group, Inc. (a)(b) | | 43,921 | 1,766,063 |
| MSA Safety, Inc. | | 59,937 | 7,124,112 |
| NL Industries, Inc. | | 10,778 | 94,954 |
| Odyssey Marine Exploration, Inc. (a)(b) | | 13,660 | 42,619 |
| Performant Financial Corp. (a) | | 86,393 | 180,561 |
| Perma-Fix Environmental Services, Inc. (a) | | 4,892 | 25,047 |
| Pitney Bowes, Inc. | | 271,890 | 785,762 |
| Quad/Graphics, Inc. (a)(b) | | 51,262 | 161,988 |
| Quest Resource Holding Corp. (a) | | 13,551 | 85,236 |
| Recycling Asset Holdings, Inc. (a)(c) | | 1,142 | 40 |
| Republic Services, Inc. | | 343,347 | 49,002,484 |
| Rollins, Inc. | | 371,795 | 12,551,799 |
| Shapeways Holdings, Inc. (a)(b) | | 16,765 | 14,324 |
| SP Plus Corp. (a) | | 36,498 | 1,209,544 |
| Steelcase, Inc. Class A | | 137,111 | 1,532,901 |
| Stericycle, Inc. (a) | | 149,953 | 7,511,146 |
| Team, Inc. (a) | | 50,049 | 64,563 |
| Tetra Tech, Inc. | | 87,190 | 11,841,274 |
| The Brink's Co. | | 79,510 | 4,395,313 |
| The GEO Group, Inc. (a) | | 199,379 | 1,630,920 |
| UniFirst Corp. | | 24,834 | 4,476,577 |
| Viad Corp. (a) | | 32,024 | 1,222,676 |
| Virco Manufacturing Co. (a) | | 1,891 | 8,207 |
| VSE Corp. | | 17,116 | 716,305 |
| Waste Management, Inc. | | 626,753 | 105,940,060 |
| | | | 374,509,781 |
| Construction & Engineering - 0.2% | | | |
| AECOM | | 229,711 | 16,803,360 |
| Ameresco, Inc. Class A (a)(b) | | 51,224 | 3,526,772 |
| API Group Corp. (a) | | 334,499 | 5,201,459 |
| Arcosa, Inc. | | 79,267 | 4,633,156 |
| Argan, Inc. | | 24,446 | 845,587 |
| Bowman Consulting Group Ltd. (a) | | 4,071 | 62,083 |
| Comfort Systems U.S.A., Inc. | | 58,899 | 5,909,926 |
| Concrete Pumping Holdings, Inc. (a) | | 49,943 | 334,618 |
| Construction Partners, Inc. Class A (a) | | 68,815 | 2,013,527 |
| Dycom Industries, Inc. (a) | | 48,747 | 5,465,514 |
| EMCOR Group, Inc. | | 85,917 | 10,217,250 |
| Fluor Corp. (a)(b) | | 226,331 | 5,984,192 |
| Granite Construction, Inc. | | 72,759 | 2,181,315 |
| Great Lakes Dredge & Dock Corp. (a) | | 111,001 | 1,062,280 |
| IES Holdings, Inc. (a) | | 18,535 | 563,279 |
| Infrastructure and Energy Alternatives, Inc. (a) | | 56,324 | 800,364 |
| INNOVATE Corp. (a)(b) | | 108,565 | 166,104 |
| iSun, Inc. (a)(b) | | 5,821 | 17,230 |
| Limbach Holdings, Inc. (a) | | 9,347 | 75,056 |
| MasTec, Inc. (a)(b) | | 96,427 | 7,762,374 |
| Matrix Service Co. (a) | | 45,828 | 260,303 |
| MDU Resources Group, Inc. | | 331,767 | 10,002,775 |
| MYR Group, Inc. (a) | | 28,918 | 2,687,639 |
| Northwest Pipe Co. (a) | | 14,039 | 444,475 |
| NV5 Global, Inc. (a) | | 19,896 | 2,800,561 |
| Orbital Infrastructure Group I (a) | | 98,610 | 78,888 |
| Orion Group Holdings, Inc. (a) | | 65,396 | 208,613 |
| Primoris Services Corp. | | 84,607 | 1,714,984 |
| Quanta Services, Inc. | | 234,855 | 33,185,012 |
| SG Blocks, Inc. (a) | | 5,593 | 12,752 |
| Sterling Construction Co., Inc. (a) | | 45,427 | 1,148,849 |
| Tutor Perini Corp. (a) | | 63,623 | 431,364 |
| Valmont Industries, Inc. | | 34,622 | 9,584,062 |
| Williams Industrial Services G (a) | | 15,203 | 25,085 |
| Willscot Mobile Mini Holdings (a) | | 360,968 | 14,489,256 |
| | | | 150,700,064 |
| Electrical Equipment - 0.7% | | | |
| Acuity Brands, Inc. | | 56,619 | 9,281,553 |
| Advent Technologies Holdings, Inc. Class A (a)(b) | | 74,346 | 233,446 |
| Allied Motion Technologies, Inc. | | 19,415 | 679,913 |
| American Superconductor Corp. (a) | | 34,421 | 183,808 |
| AMETEK, Inc. | | 377,509 | 45,361,481 |
| Array Technologies, Inc. (a) | | 214,942 | 4,492,288 |
| Atkore, Inc. (a) | | 74,285 | 6,270,397 |
| AZZ, Inc. | | 41,474 | 1,767,207 |
| Babcock & Wilcox Enterprises, Inc. (a) | | 110,748 | 883,769 |
| Beam Global (a)(b) | | 12,935 | 189,756 |
| Bitnile Holdings, Inc. (a)(b) | | 274,681 | 82,377 |
| Blink Charging Co. (a)(b) | | 64,929 | 1,387,533 |
| Bloom Energy Corp. Class A (a)(b) | | 307,105 | 7,803,538 |
| Broadwind, Inc. (a) | | 11,239 | 33,942 |
| Capstone Turbine Corp. (a)(b) | | 19,527 | 47,060 |
| ChargePoint Holdings, Inc. Class A (a)(b) | | 280,921 | 4,570,585 |
| Eaton Corp. PLC | | 653,186 | 89,251,335 |
| Emerson Electric Co. | | 974,618 | 79,665,275 |
| Encore Wire Corp. | | 33,727 | 4,387,883 |
| Energous Corp. (a)(b) | | 69,319 | 94,967 |
| Energy Focus, Inc. (a) | | 1,128 | 846 |
| Energy Vault Holdings, Inc. Class A (a)(b) | | 124,507 | 686,034 |
| EnerSys | | 69,146 | 4,312,636 |
| Enovix Corp. (a)(b) | | 167,950 | 3,715,054 |
| Eos Energy Enterprises, Inc. (a)(b) | | 61,950 | 127,617 |
| Espey Manufacturing & Electronics Corp. (a) | | 1,421 | 21,144 |
| ESS Tech, Inc. Class A (a)(b) | | 108,020 | 479,609 |
| Fluence Energy, Inc. (b) | | 57,867 | 1,154,447 |
| Flux Power Holdings, Inc. (a) | | 13,273 | 33,050 |
| FTC Solar, Inc. (a)(b) | | 26,011 | 107,686 |
| FuelCell Energy, Inc. (a)(b) | | 612,700 | 2,567,213 |
| Generac Holdings, Inc. (a) | | 104,296 | 22,987,881 |
| GrafTech International Ltd. | | 331,218 | 1,947,562 |
| Heliogen, Inc. (a) | | 185,139 | 444,334 |
| Hubbell, Inc. Class B | | 88,177 | 18,190,915 |
| Ideal Power, Inc. (a) | | 8,368 | 121,336 |
| KULR Technology Group, Inc. (a)(b) | | 73,685 | 106,843 |
| LSI Industries, Inc. | | 39,736 | 307,557 |
| NuScale Power Corp. (a)(b) | | 18,626 | 255,549 |
| Nuvve Holding Corp. (a)(b) | | 20,830 | 59,782 |
| nVent Electric PLC | | 274,204 | 9,037,764 |
| Ocean Power Technologies, Inc. (a)(b) | | 72,330 | 78,840 |
| Orion Energy Systems, Inc. (a) | | 45,571 | 76,559 |
| Pineapple Energy, Inc. (a)(b) | | 760 | 1,763 |
| Pineapple Energy, Inc. rights (a)(c) | | 760 | 0 |
| Plug Power, Inc. (a)(b) | | 850,222 | 23,840,225 |
| Polar Power, Inc. (a)(b) | | 7,081 | 23,580 |
| Powell Industries, Inc. | | 13,125 | 323,663 |
| Preformed Line Products Co. | | 4,117 | 320,303 |
| Regal Rexnord Corp. | | 109,450 | 15,059,226 |
| Rockwell Automation, Inc. | | 190,098 | 45,041,820 |
| Romeo Power, Inc. (a) | | 176,207 | 108,367 |
| Sensata Technologies, Inc. PLC | | 254,807 | 10,263,626 |
| SES AI Corp. Class A (a)(b) | | 205,451 | 973,838 |
| Shoals Technologies Group, Inc. (a) | | 180,352 | 4,755,882 |
| Stem, Inc. (a)(b) | | 213,679 | 3,359,034 |
| Sunrun, Inc. (a) | | 340,627 | 11,250,910 |
| Sunworks, Inc. (a)(b) | | 40,952 | 140,465 |
| Thermon Group Holdings, Inc. (a) | | 50,679 | 889,416 |
| TPI Composites, Inc. (a)(b) | | 63,452 | 1,179,573 |
| Ultralife Corp. (a) | | 35,865 | 179,325 |
| Vertiv Holdings Co. | | 489,181 | 5,640,257 |
| Vicor Corp. (a) | | 34,753 | 2,472,328 |
| Westwater Resources, Inc. (a)(b) | | 45,895 | 64,253 |
| | | | 449,376,225 |
| Industrial Conglomerates - 0.7% | | | |
| 3M Co. (b) | | 934,193 | 116,166,900 |
| General Electric Co. | | 1,806,124 | 132,641,747 |
| Honeywell International, Inc. | | 1,117,390 | 211,577,797 |
| | | | 460,386,444 |
| Machinery - 1.8% | | | |
| AGCO Corp. | | 99,592 | 10,826,646 |
| AgEagle Aerial Systems, Inc. (a) | | 92,813 | 53,312 |
| Agrify Corp. (a)(b) | | 29,004 | 20,596 |
| Alamo Group, Inc. | | 16,212 | 2,119,881 |
| Albany International Corp. Class A | | 52,609 | 4,639,588 |
| Allison Transmission Holdings, Inc. | | 167,536 | 6,074,855 |
| Altra Industrial Motion Corp. | | 107,093 | 4,064,179 |
| Astec Industries, Inc. | | 36,430 | 1,390,897 |
| Barnes Group, Inc. | | 78,082 | 2,424,446 |
| Berkshire Grey, Inc. Class A (a)(b) | | 63,119 | 127,500 |
| Blue Bird Corp. (a) | | 30,138 | 357,738 |
| Caterpillar, Inc. | | 874,552 | 161,538,500 |
| Chart Industries, Inc. (a)(b) | | 58,136 | 11,270,245 |
| CIRCOR International, Inc. (a) | | 31,076 | 506,539 |
| Columbus McKinnon Corp. (NY Shares) | | 46,628 | 1,428,216 |
| Commercial Vehicle Group, Inc. (a) | | 49,365 | 322,353 |
| Crane Holdings Co. | | 81,031 | 7,646,085 |
| Cummins, Inc. | | 231,014 | 49,753,485 |
| Deere & Co. | | 457,834 | 167,223,869 |
| Desktop Metal, Inc. (a)(b) | | 303,529 | 965,222 |
| Donaldson Co., Inc. | | 203,188 | 10,433,704 |
| Douglas Dynamics, Inc. | | 37,087 | 1,079,232 |
| Dover Corp. | | 235,753 | 29,459,695 |
| Eastern Co. (b) | | 9,630 | 192,889 |
| Energy Recovery, Inc. (a) | | 64,072 | 1,469,812 |
| Enerpac Tool Group Corp. Class A | | 94,784 | 1,838,810 |
| EnPro Industries, Inc. | | 32,910 | 2,980,330 |
| ESAB Corp. | | 72,760 | 2,989,708 |
| ESCO Technologies, Inc. | | 41,927 | 3,414,116 |
| Evoqua Water Technologies Corp. (a) | | 197,366 | 6,923,599 |
| Fast Radius, Inc. Class A (a)(b) | | 23,247 | 16,973 |
| Fathom Digital Manufacturing Corp. (a)(b) | | 11,044 | 41,967 |
| Federal Signal Corp. | | 101,454 | 4,044,971 |
| Flowserve Corp. | | 212,985 | 6,489,653 |
| Fortive Corp. | | 586,776 | 37,160,524 |
| Franklin Electric Co., Inc. | | 62,979 | 5,469,726 |
| FreightCar America, Inc. (a)(b) | | 13,689 | 56,946 |
| Gates Industrial Corp. PLC (a) | | 151,690 | 1,626,117 |
| Gencor Industries, Inc. (a) | | 10,152 | 101,215 |
| Gorman-Rupp Co. | | 38,288 | 1,011,186 |
| Graco, Inc. | | 278,194 | 17,759,905 |
| Graham Corp. (b) | | 19,661 | 187,369 |
| Helios Technologies, Inc. | | 52,550 | 2,870,281 |
| Hillenbrand, Inc. | | 120,256 | 5,011,068 |
| Hillman Solutions Corp. Class A (a)(b) | | 179,578 | 1,506,659 |
| Hurco Companies, Inc. | | 9,916 | 240,661 |
| Hydrofarm Holdings Group, Inc. (a)(b) | | 58,803 | 199,930 |
| Hyliion Holdings Corp. Class A (a)(b) | | 167,994 | 589,659 |
| Hyster-Yale Materials Handling Class A | | 15,771 | 459,409 |
| Hyzon Motors, Inc. Class A (a)(b) | | 152,523 | 324,874 |
| IDEX Corp. | | 125,145 | 25,180,425 |
| Illinois Tool Works, Inc. | | 463,388 | 90,281,884 |
| Ingersoll Rand, Inc. | | 661,899 | 31,354,156 |
| ITT, Inc. | | 139,656 | 10,129,250 |
| John Bean Technologies Corp. | | 51,936 | 5,362,911 |
| Kadant, Inc. | | 18,689 | 3,353,367 |
| Kennametal, Inc. | | 134,824 | 3,160,275 |
| L.B. Foster Co. Class A (a) | | 14,144 | 185,286 |
| Lightning eMotors, Inc. (a)(b) | | 43,434 | 123,353 |
| Lincoln Electric Holdings, Inc. | | 95,741 | 13,086,837 |
| Lindsay Corp. | | 17,700 | 2,838,372 |
| LiqTech International, Inc. (a)(b) | | 36,587 | 17,196 |
| Luxfer Holdings PLC sponsored | | 93,203 | 1,533,189 |
| Manitex International, Inc. (a) | | 15,946 | 86,268 |
| Manitowoc Co., Inc. (a) | | 54,859 | 523,903 |
| Markforged Holding Corp. (a)(b) | | 126,902 | 308,372 |
| Mayville Engineering Co., Inc. (a) | | 21,728 | 151,227 |
| Microvast Holdings, Inc. (a)(b) | | 382,808 | 941,708 |
| Middleby Corp. (a) | | 90,318 | 12,989,535 |
| Miller Industries, Inc. | | 19,020 | 447,160 |
| Mueller Industries, Inc. | | 93,697 | 5,918,839 |
| Mueller Water Products, Inc. Class A | | 257,600 | 2,905,728 |
| Nikola Corp. (a)(b) | | 335,080 | 1,796,029 |
| NN, Inc. (a)(b) | | 70,310 | 150,463 |
| Nordson Corp. | | 89,086 | 20,237,667 |
| Omega Flex, Inc. (b) | | 5,326 | 538,033 |
| Oshkosh Corp. | | 110,529 | 8,815,793 |
| Otis Worldwide Corp. | | 691,957 | 49,973,135 |
| PACCAR, Inc. | | 567,745 | 49,683,365 |
| Park-Ohio Holdings Corp. | | 15,706 | 260,563 |
| Parker Hannifin Corp. | | 209,838 | 55,607,070 |
| Pentair PLC | | 269,685 | 12,000,983 |
| Perma-Pipe International Holdings, Inc. (a) | | 248 | 2,331 |
| Proterra, Inc. Class A (a)(b) | | 296,310 | 1,789,712 |
| Proto Labs, Inc. (a) | | 43,763 | 1,680,499 |
| RBC Bearings, Inc. (a) | | 46,806 | 11,265,268 |
| REV Group, Inc. | | 54,109 | 623,336 |
| Sarcos Technology and Robotics Corp. Class A (a)(b) | | 166,437 | 545,913 |
| Shyft Group, Inc. (The) | | 50,736 | 1,215,127 |
| Snap-On, Inc. | | 86,784 | 18,906,762 |
| SPX Corp. (a) | | 74,336 | 4,241,612 |
| Standex International Corp. | | 19,575 | 1,769,776 |
| Stanley Black & Decker, Inc. | | 248,134 | 21,860,605 |
| Tennant Co. | | 30,061 | 1,814,181 |
| Terex Corp. | | 114,478 | 3,802,959 |
| The Greenbrier Companies, Inc. | | 52,955 | 1,509,747 |
| The L.S. Starrett Co. Class A (a) | | 3,411 | 30,528 |
| Timken Co. | | 112,276 | 7,072,265 |
| Titan International, Inc. (a) | | 85,722 | 1,202,680 |
| Toro Co. | | 170,795 | 14,164,029 |
| Trinity Industries, Inc. | | 131,721 | 3,211,358 |
| Twin Disc, Inc. (a) | | 13,536 | 125,885 |
| Urban-Gro, Inc. (a)(b) | | 10,932 | 41,214 |
| Velo3D, Inc. (a)(b) | | 107,482 | 463,247 |
| Wabash National Corp. | | 88,082 | 1,448,949 |
| Watts Water Technologies, Inc. Class A | | 44,588 | 6,176,330 |
| Westinghouse Air Brake Tech Co. | | 298,010 | 26,120,577 |
| Xos, Inc. Class A (a)(b) | | 75,804 | 115,222 |
| Xylem, Inc. | | 295,080 | 26,881,788 |
| | | | 1,146,729,382 |
| Marine - 0.0% | | | |
| Eagle Bulk Shipping, Inc. (b) | | 22,365 | 971,536 |
| Genco Shipping & Trading Ltd. | | 59,921 | 821,517 |
| Kirby Corp. (a) | | 95,789 | 6,423,610 |
| Matson, Inc. | | 66,766 | 4,917,984 |
| Pangaea Logistics Solutions Ltd. | | 36,429 | 182,509 |
| | | | 13,317,156 |
| Professional Services - 0.6% | | | |
| Alight, Inc. Class A (a)(b) | | 402,836 | 3,174,348 |
| ASGN, Inc. (a) | | 84,072 | 8,129,762 |
| Atlas Technical Consultants, Inc. (a) | | 26,005 | 221,563 |
| Barrett Business Services, Inc. | | 11,823 | 953,407 |
| BGSF, Inc. | | 14,883 | 180,059 |
| BlackSky Technology, Inc. Class A (a)(b) | | 120,376 | 244,363 |
| Booz Allen Hamilton Holding Corp. Class A | | 216,689 | 20,737,137 |
| CACI International, Inc. Class A (a) | | 37,852 | 10,631,491 |
| CBIZ, Inc. (a) | | 86,061 | 3,757,423 |
| Clarivate Analytics PLC (a) | | 662,004 | 7,725,587 |
| CoStar Group, Inc. (a) | | 649,037 | 45,198,937 |
| CRA International, Inc. | | 12,291 | 1,123,520 |
| DLH Holdings Corp. (a) | | 18,283 | 299,293 |
| Dun & Bradstreet Holdings, Inc. | | 240,695 | 3,429,904 |
| Equifax, Inc. | | 200,147 | 37,777,746 |
| Exponent, Inc. | | 84,271 | 7,909,676 |
| First Advantage Corp. (a) | | 64,760 | 896,278 |
| Forrester Research, Inc. (a) | | 18,246 | 758,851 |
| Franklin Covey Co. (a) | | 19,917 | 947,452 |
| FTI Consulting, Inc. (a) | | 55,451 | 8,905,431 |
| Gee Group, Inc. (a) | | 144,333 | 103,920 |
| Heidrick & Struggles International, Inc. | | 31,293 | 890,599 |
| Hill International, Inc. (a) | | 66,466 | 223,990 |
| Hirequest, Inc. | | 5,687 | 79,959 |
| HireRight Holdings Corp. | | 40,234 | 654,205 |
| Hudson Global, Inc. (a) | | 3,194 | 112,684 |
| Huron Consulting Group, Inc. (a) | | 38,344 | 2,565,214 |
| ICF International, Inc. | | 28,953 | 2,940,467 |
| Insperity, Inc. | | 57,815 | 6,302,991 |
| Jacobs Solutions, Inc. | | 211,205 | 26,311,919 |
| KBR, Inc. | | 226,051 | 10,918,263 |
| Kelly Services, Inc. Class A (non-vtg.) | | 59,921 | 965,327 |
| Kforce, Inc. | | 32,992 | 1,805,322 |
| Korn Ferry | | 87,561 | 5,334,216 |
| LegalZoom.com, Inc. (a)(b) | | 31,735 | 326,871 |
| Leidos Holdings, Inc. | | 224,306 | 21,320,285 |
| Manpower, Inc. | | 87,187 | 6,392,551 |
| ManTech International Corp. Class A | | 45,315 | 4,346,162 |
| Mastech Digital, Inc. (a) | | 3,834 | 58,890 |
| MISTRAS Group, Inc. (a) | | 27,338 | 151,179 |
| Nielsen Holdings PLC | | 582,705 | 16,222,507 |
| Planet Labs PBC Class A (a)(b) | | 361,681 | 1,982,012 |
| RCM Technologies, Inc. (a) | | 11,207 | 195,674 |
| Red Violet, Inc. (a)(b) | | 15,889 | 301,732 |
| Resources Connection, Inc. | | 45,089 | 881,039 |
| Robert Half International, Inc. | | 179,555 | 13,820,348 |
| Science Applications International Corp. | | 91,395 | 8,323,343 |
| ShiftPixy, Inc. (a) | | 35,098 | 4,917 |
| Skillsoft Corp. (a)(b) | | 126,123 | 406,116 |
| Spire Global, Inc. (a) | | 194,667 | 262,800 |
| Sterling Check Corp. (b) | | 27,386 | 582,774 |
| TransUnion Holding Co., Inc. | | 313,940 | 23,190,748 |
| TriNet Group, Inc. (a) | | 64,498 | 5,314,635 |
| TrueBlue, Inc. (a) | | 57,204 | 1,174,970 |
| Upwork, Inc. (a) | | 194,393 | 3,382,438 |
| Verisk Analytics, Inc. | | 258,250 | 48,334,070 |
| Willdan Group, Inc. (a) | | 19,268 | 438,540 |
| | | | 379,625,905 |
| Road & Rail - 0.9% | | | |
| AMERCO | | 15,985 | 8,402,835 |
| ArcBest Corp. | | 40,546 | 3,265,169 |
| Avis Budget Group, Inc. (a) | | 55,910 | 9,358,216 |
| Bird Global, Inc. Class A (a) | | 273,684 | 116,288 |
| Covenant Transport Group, Inc. Class A | | 18,761 | 527,559 |
| CSX Corp. | | 3,561,880 | 112,733,502 |
| Daseke, Inc. (a) | | 96,300 | 583,578 |
| Heartland Express, Inc. | | 81,030 | 1,227,605 |
| Hertz Global Holdings, Inc. | | 86,347 | 1,593,966 |
| HyreCar, Inc. (a)(b) | | 25,347 | 20,151 |
| J.B. Hunt Transport Services, Inc. | | 136,570 | 23,765,911 |
| Knight-Swift Transportation Holdings, Inc. Class A | | 270,015 | 13,638,458 |
| Landstar System, Inc. | | 61,815 | 9,063,933 |
| Marten Transport Ltd. | | 102,571 | 2,031,932 |
| Norfolk Southern Corp. | | 390,789 | 95,012,530 |
| Old Dominion Freight Lines, Inc. | | 151,172 | 41,029,593 |
| P.A.M. Transportation Services, Inc. | | 10,708 | 318,135 |
| Patriot Transportation Holding, Inc. (a) | | 903 | 6,935 |
| Ryder System, Inc. | | 85,534 | 6,538,219 |
| Saia, Inc. (a) | | 42,488 | 8,787,793 |
| Schneider National, Inc. Class B | | 56,943 | 1,301,717 |
| TuSimple Holdings, Inc. (a)(b) | | 53,889 | 387,462 |
| U.S. Xpress Enterprises, Inc. (a)(b) | | 38,464 | 94,621 |
| U.S.A. Truck, Inc. (a) | | 12,296 | 385,603 |
| Union Pacific Corp. | | 1,028,331 | 230,870,593 |
| Universal Logistics Holdings, Inc. | | 13,605 | 496,719 |
| Werner Enterprises, Inc. | | 97,977 | 3,898,505 |
| XPO Logistics, Inc. (a) | | 158,984 | 8,333,941 |
| Yellow Corp. (a)(b) | | 71,428 | 448,568 |
| | | | 584,240,037 |
| Trading Companies & Distributors - 0.3% | | | |
| Air Lease Corp. Class A | | 173,614 | 6,312,605 |
| Alta Equipment Group, Inc. | | 41,687 | 490,656 |
| Applied Industrial Technologies, Inc. | | 62,284 | 6,603,350 |
| Beacon Roofing Supply, Inc. (a) | | 90,446 | 4,966,390 |
| BlueLinx Corp. (a) | | 15,563 | 1,090,966 |
| Boise Cascade Co. | | 63,237 | 3,941,562 |
| Core & Main, Inc. (a)(b) | | 94,621 | 2,230,217 |
| Custom Truck One Source, Inc. Class A (a) | | 79,192 | 521,083 |
| Distribution Solutions Group I (a) | | 39,279 | 1,560,947 |
| DXP Enterprises, Inc. (a) | | 30,426 | 808,723 |
| EVI Industries, Inc. (a)(b) | | 6,377 | 79,713 |
| Fastenal Co. | | 944,771 | 47,550,324 |
| GATX Corp. | | 57,945 | 5,598,066 |
| Global Industrial Co. | | 28,032 | 843,203 |
| GMS, Inc. (a) | | 71,061 | 3,425,140 |
| H&E Equipment Services, Inc. | | 50,677 | 1,604,434 |
| Herc Holdings, Inc. | | 40,448 | 4,551,613 |
| Hudson Technologies, Inc. (a) | | 53,713 | 445,818 |
| India Globalization Capital, Inc. (a) | | 57,861 | 32,402 |
| Karat Packaging, Inc. (a) | | 5,763 | 103,100 |
| McGrath RentCorp. | | 39,796 | 3,363,558 |
| Mega Matrix Corp. | | 12,120 | 18,907 |
| MRC Global, Inc. (a) | | 113,270 | 1,102,117 |
| MSC Industrial Direct Co., Inc. Class A | | 76,002 | 6,020,118 |
| NOW, Inc. (a) | | 179,120 | 2,170,934 |
| Rush Enterprises, Inc.: | | | |
| Class A | | 81,699 | 3,844,755 |
| Class B | | 40 | 2,026 |
| SiteOne Landscape Supply, Inc. (a) | | 73,661 | 9,219,411 |
| Titan Machinery, Inc. (a) | | 32,741 | 1,007,768 |
| Transcat, Inc. (a) | | 13,138 | 973,394 |
| Triton International Ltd. | | 108,126 | 6,443,228 |
| United Rentals, Inc. (a) | | 117,273 | 34,248,407 |
| Univar Solutions, Inc. (a) | | 278,173 | 7,015,523 |
| Veritiv Corp. (a) | | 22,482 | 2,679,630 |
| W.W. Grainger, Inc. | | 70,363 | 39,047,243 |
| Watsco, Inc. | | 54,200 | 14,744,026 |
| WESCO International, Inc. (a) | | 72,103 | 9,494,523 |
| Willis Lease Finance Corp. (a) | | 5,069 | 185,525 |
| | | | 234,341,405 |
TOTAL INDUSTRIALS | | | 5,726,953,743 |
| INFORMATION TECHNOLOGY - 26.1% | | | |
| Communications Equipment - 0.8% | | | |
| ADTRAN Holdings, Inc. | | 125,993 | 2,928,077 |
| Airspan Networks Holdings, Inc. (a)(b) | | 38,468 | 81,552 |
| Applied Optoelectronics, Inc. (a)(b) | | 32,418 | 78,127 |
| Arista Networks, Inc. (a) | | 368,663 | 44,195,320 |
| Aviat Networks, Inc. (a) | | 15,157 | 474,414 |
| BK Technologies Corp. | | 6,655 | 15,905 |
| CalAmp Corp. (a) | | 55,099 | 340,512 |
| Calix, Inc. (a) | | 89,605 | 5,273,254 |
| Cambium Networks Corp. (a) | | 19,057 | 370,849 |
| Casa Systems, Inc. (a)(b) | | 51,702 | 200,604 |
| Ciena Corp. (a) | | 249,972 | 12,683,579 |
| Cisco Systems, Inc. | | 6,816,884 | 304,851,052 |
| Clearfield, Inc. (a)(b) | | 19,689 | 2,286,090 |
| ClearOne, Inc. (a) | | 23,778 | 15,456 |
| CommScope Holding Co., Inc. (a) | | 336,748 | 3,805,252 |
| COMSovereign Holding Corp. (a)(b) | | 74,803 | 9,717 |
| Comtech Telecommunications Corp. | | 41,993 | 474,101 |
| Digi International, Inc. (a) | | 55,594 | 1,840,717 |
| DZS, Inc. (a) | | 29,592 | 393,870 |
| EMCORE Corp. (a) | | 52,233 | 124,315 |
| Extreme Networks, Inc. (a) | | 212,544 | 3,045,756 |
| F5, Inc. (a) | | 98,996 | 15,548,312 |
| Franklin Wireless Corp. (a) | | 2,616 | 7,508 |
| Genasys, Inc. (a) | | 40,213 | 117,422 |
| Harmonic, Inc. (a) | | 164,395 | 1,851,088 |
| Infinera Corp. (a)(b) | | 351,575 | 1,926,631 |
| Inseego Corp. (a) | | 125,101 | 337,773 |
| Juniper Networks, Inc. | | 527,910 | 15,003,202 |
| KVH Industries, Inc. (a) | | 21,024 | 206,035 |
| Lantronix, Inc. (a) | | 37,900 | 229,674 |
| Lumentum Holdings, Inc. (a) | | 117,435 | 9,811,694 |
| Motorola Solutions, Inc. | | 275,167 | 66,978,399 |
| NETGEAR, Inc. (a) | | 49,273 | 1,162,350 |
| NetScout Systems, Inc. (a) | | 120,500 | 3,824,670 |
| Network-1 Security Solutions, Inc. | | 15,146 | 34,684 |
| Ondas Holdings, Inc. (a)(b) | | 57,259 | 270,262 |
| Optical Cable Corp. (a) | | 398 | 1,485 |
| PC-Tel, Inc. | | 20,765 | 114,208 |
| Ribbon Communications, Inc. (a) | | 213,935 | 750,912 |
| Tessco Technologies, Inc. (a) | | 10,550 | 52,328 |
| Ubiquiti, Inc. | | 10,419 | 3,233,953 |
| ViaSat, Inc. (a) | | 122,000 | 4,633,560 |
| Viavi Solutions, Inc. (a) | | 388,379 | 5,468,376 |
| Vislink Technologies, Inc. (a)(b) | | 65,360 | 35,425 |
| | | | 515,088,470 |
| Electronic Equipment & Components - 0.8% | | | |
| 908 Devices, Inc. (a) | | 30,980 | 624,247 |
| Advanced Energy Industries, Inc. | | 62,075 | 5,573,714 |
| Aeva Technologies, Inc. (a)(b) | | 163,649 | 504,039 |
| AEye, Inc. Class A (a)(b) | | 192,732 | 296,807 |
| Airgain, Inc. (a) | | 15,261 | 118,273 |
| Akoustis Technologies, Inc. (a)(b) | | 72,240 | 316,411 |
| Alpine 4 Holdings, Inc. (a)(b) | | 281,186 | 209,484 |
| Amphenol Corp. Class A | | 980,198 | 72,073,959 |
| Arlo Technologies, Inc. (a) | | 135,629 | 825,981 |
| Arrow Electronics, Inc. (a) | | 106,042 | 11,114,262 |
| Avnet, Inc. | | 160,790 | 7,057,073 |
| Badger Meter, Inc. | | 47,845 | 4,530,443 |
| Bel Fuse, Inc. Class B (non-vtg.) | | 24,186 | 687,366 |
| Belden, Inc. | | 73,245 | 4,796,083 |
| Benchmark Electronics, Inc. | | 58,759 | 1,612,935 |
| CDW Corp. | | 221,315 | 37,778,471 |
| ClearSign Combustion Corp. (a)(b) | | 41,576 | 41,160 |
| Coda Octopus Group, Inc. (a)(b) | | 5,872 | 28,890 |
| Cognex Corp. | | 286,943 | 12,083,170 |
| Corning, Inc. | | 1,248,910 | 42,862,591 |
| CPS Technologies Corp. (a) | | 12,397 | 40,042 |
| CTS Corp. | | 54,664 | 2,313,380 |
| Daktronics, Inc. (a) | | 56,072 | 179,430 |
| Digital Ally, Inc. (a)(b) | | 73,531 | 40,751 |
| eMagin Corp. (a)(b) | | 90,283 | 65,934 |
| ePlus, Inc. (a) | | 44,608 | 2,101,929 |
| Evolv Technologies Holdings, Inc. (a)(b) | | 94,990 | 215,627 |
| Fabrinet (a) | | 60,557 | 6,227,682 |
| FARO Technologies, Inc. (a) | | 29,116 | 976,842 |
| Focus Universal, Inc. (a)(b) | | 43,222 | 464,637 |
| Frequency Electronics, Inc. (a) | | 1,929 | 12,519 |
| Identiv, Inc. (a)(b) | | 35,097 | 523,647 |
| II-VI, Inc. (a) | | 208,024 | 9,824,974 |
| Insight Enterprises, Inc. (a) | | 56,228 | 5,123,495 |
| IPG Photonics Corp. (a) | | 57,141 | 5,176,403 |
| Iteris, Inc. (a) | | 71,414 | 233,524 |
| Itron, Inc. (a) | | 74,005 | 3,521,158 |
| Jabil, Inc. | | 233,875 | 14,102,663 |
| KEY Tronic Corp. (a) | | 6,355 | 30,250 |
| Keysight Technologies, Inc. (a) | | 298,338 | 48,894,615 |
| Kimball Electronics, Inc. (a) | | 38,858 | 837,001 |
| Knowles Corp. (a) | | 151,215 | 2,290,907 |
| LGL Group, Inc. (a) | | 914 | 12,636 |
| LightPath Technologies, Inc. Class A (a) | | 29,403 | 42,340 |
| Lightwave Logic, Inc. (a)(b) | | 164,892 | 1,314,189 |
| Littelfuse, Inc. | | 40,142 | 9,522,485 |
| Luna Innovations, Inc. (a)(b) | | 47,621 | 273,821 |
| Methode Electronics, Inc. Class A | | 62,108 | 2,512,890 |
| MicroVision, Inc. (a)(b) | | 255,796 | 1,238,053 |
| MICT, Inc. (a)(b) | | 144,803 | 119,969 |
| Mirion Technologies, Inc. Class A (a) | | 181,659 | 1,375,159 |
| Napco Security Technologies, Inc. | | 49,107 | 1,456,514 |
| National Instruments Corp. | | 213,078 | 8,471,981 |
| Neonode, Inc. (a)(b) | | 7,545 | 25,351 |
| nLIGHT, Inc. (a) | | 71,401 | 891,798 |
| Novanta, Inc. (a) | | 57,539 | 7,692,389 |
| OSI Systems, Inc. (a) | | 26,014 | 2,167,486 |
| Ouster, Inc. (a)(b) | | 129,594 | 194,391 |
| Par Technology Corp. (a)(b) | | 40,645 | 1,430,704 |
| PC Connection, Inc. | | 19,804 | 983,863 |
| Plexus Corp. (a) | | 44,896 | 4,208,102 |
| Powerfleet, Inc. (a) | | 51,313 | 163,688 |
| Quanergy Systems, Inc. Class A (a)(b) | | 38,554 | 11,227 |
| Red Cat Holdings, Inc. (a)(b) | | 36,475 | 86,993 |
| Research Frontiers, Inc. (a)(b) | | 31,238 | 72,160 |
| RF Industries Ltd. (a) | | 7,617 | 53,090 |
| Richardson Electronics Ltd. | | 16,718 | 271,333 |
| Rogers Corp. (a) | | 29,781 | 7,460,736 |
| Sanmina Corp. (a) | | 101,555 | 4,927,449 |
| ScanSource, Inc. (a) | | 40,643 | 1,177,428 |
| Sigmatron International, Inc. (a)(b) | | 7,949 | 61,128 |
| Smartrent, Inc. (a)(b) | | 160,366 | 517,982 |
| Sono-Tek Corp. (a) | | 2,407 | 12,998 |
| TD SYNNEX Corp. | | 68,159 | 6,562,349 |
| TE Connectivity Ltd. | | 529,085 | 66,775,818 |
| Teledyne Technologies, Inc. (a) | | 77,150 | 28,418,974 |
| Trimble, Inc. (a) | | 409,200 | 25,881,900 |
| TTM Technologies, Inc. (a) | | 174,433 | 2,743,831 |
| Velodyne Lidar, Inc. (a)(b) | | 148,508 | 185,635 |
| Vishay Intertechnology, Inc. | | 218,305 | 4,294,059 |
| Vishay Precision Group, Inc. (a) | | 20,987 | 720,064 |
| Vontier Corp. | | 273,386 | 5,992,621 |
| Wayside Technology Group, Inc. | | 4,316 | 125,984 |
| Wireless Telecom Group, Inc. (a) | | 7,898 | 11,452 |
| Wrap Technologies, Inc. (a)(b) | | 42,925 | 85,850 |
| Zebra Technologies Corp. Class A (a) | | 86,208 | 26,003,781 |
| | | | 532,885,420 |
| IT Services - 4.4% | | | |
| Accenture PLC Class A | | 1,037,661 | 299,323,692 |
| Affirm Holdings, Inc. (a)(b) | | 268,191 | 6,283,715 |
| AgileThought, Inc. Class A (a)(b) | | 52,890 | 221,080 |
| Akamai Technologies, Inc. (a) | | 262,708 | 23,717,278 |
| ALJ Regional Holdings, Inc. (a) | | 34,476 | 51,369 |
| American Virtual Cloud Technologies, Inc. (a)(b) | | 86,788 | 39,922 |
| Automatic Data Processing, Inc. | | 684,546 | 167,309,888 |
| AvidXchange Holdings, Inc. | | 47,727 | 371,793 |
| Backblaze, Inc. Class A (b) | | 9,950 | 64,775 |
| BigCommerce Holdings, Inc. (a) | | 94,371 | 1,573,165 |
| Block, Inc. Class A (a) | | 834,434 | 57,500,847 |
| BM Technologies, Inc. (a)(b) | | 21,878 | 138,269 |
| Brightcove, Inc. (a) | | 67,314 | 446,965 |
| Broadridge Financial Solutions, Inc. | | 191,261 | 32,738,145 |
| Cantaloupe, Inc. (a) | | 103,731 | 660,766 |
| Cass Information Systems, Inc. | | 20,495 | 751,757 |
| Cerberus Cyber Sentinel Corp. (b) | | 67,013 | 182,275 |
| Cloudflare, Inc. (a) | | 460,503 | 28,813,673 |
| Cognizant Technology Solutions Corp. Class A | | 853,636 | 53,924,186 |
| Computer Task Group, Inc. (a) | | 14,035 | 110,596 |
| Concentrix Corp. | | 69,448 | 8,735,169 |
| Conduent, Inc. (a) | | 264,970 | 1,083,727 |
| Core Scientific, Inc. (a)(b) | | 396,392 | 872,062 |
| Crexendo, Inc. | | 4,063 | 11,417 |
| CSG Systems International, Inc. | | 51,383 | 2,972,507 |
| CSP, Inc. | | 2,607 | 20,230 |
| Cyxtera Technologies, Inc. Class A (a) | | 53,994 | 342,322 |
| Digitalocean Holdings, Inc. (a)(b) | | 28,464 | 1,198,050 |
| DXC Technology Co. (a) | | 404,426 | 10,021,676 |
| Edgio, Inc. (a) | | 224,073 | 824,589 |
| EPAM Systems, Inc. (a) | | 93,730 | 39,975,845 |
| Euronet Worldwide, Inc. (a) | | 86,131 | 7,636,374 |
| EVERTEC, Inc. | | 106,530 | 3,579,408 |
| EVO Payments, Inc. Class A (a) | | 78,020 | 2,599,626 |
| Exela Technologies, Inc. (a)(b) | | 22,191 | 20,893 |
| ExlService Holdings, Inc. (a) | | 53,996 | 9,055,669 |
| Fastly, Inc. Class A (a) | | 168,754 | 1,577,850 |
| Fidelity National Information Services, Inc. | | 1,001,062 | 91,467,035 |
| Fiserv, Inc. (a) | | 952,928 | 96,426,784 |
| FleetCor Technologies, Inc. (a) | | 126,401 | 26,864,005 |
| Flywire Corp. (a) | | 21,123 | 525,118 |
| Gartner, Inc. (a) | | 132,631 | 37,842,277 |
| Genpact Ltd. | | 279,779 | 13,144,017 |
| Global Payments, Inc. | | 463,077 | 57,528,056 |
| GoDaddy, Inc. (a) | | 270,604 | 20,517,195 |
| GreenBox POS (a)(b) | | 53,497 | 62,057 |
| Grid Dynamics Holdings, Inc. (a) | | 77,575 | 1,567,791 |
| Hackett Group, Inc. | | 43,271 | 888,354 |
| i3 Verticals, Inc. Class A (a) | | 33,701 | 787,255 |
| IBM Corp. | | 1,473,293 | 189,244,486 |
| Information Services Group, Inc. | | 51,969 | 299,861 |
| Innodata, Inc. (a) | | 31,372 | 105,724 |
| Inpixon (a)(b) | | 89,480 | 12,357 |
| International Money Express, Inc. (a) | | 53,014 | 1,187,514 |
| Jack Henry & Associates, Inc. | | 119,419 | 22,952,332 |
| Kyndryl Holdings, Inc. (a) | | 292,537 | 3,048,236 |
| Marqeta, Inc. Class A (a) | | 639,267 | 4,979,890 |
| MasterCard, Inc. Class A | | 1,407,063 | 456,409,025 |
| Maximus, Inc. | | 101,005 | 6,119,893 |
| MoneyGram International, Inc. (a) | | 152,861 | 1,574,468 |
| MongoDB, Inc. Class A (a) | | 112,095 | 36,190,992 |
| Okta, Inc. (a) | | 247,033 | 22,578,816 |
| OMNIQ Corp. (a)(b) | | 2,813 | 18,341 |
| Paya Holdings, Inc. (a) | | 140,998 | 884,057 |
| Paychex, Inc. | | 525,948 | 64,870,426 |
| Paymentus Holdings, Inc. (a)(b) | | 22,563 | 268,725 |
| Payoneer Global, Inc. (a) | | 327,808 | 2,170,089 |
| PayPal Holdings, Inc. (a) | | 1,898,997 | 177,442,280 |
| Paysign, Inc. (a)(b) | | 43,478 | 133,912 |
| Perficient, Inc. (a) | | 54,843 | 4,283,238 |
| PFSweb, Inc. (a) | | 26,610 | 251,731 |
| Priority Technology Holdings, Inc. (a) | | 16,070 | 64,280 |
| Rackspace Technology, Inc. (a)(b) | | 101,318 | 451,878 |
| Repay Holdings Corp. (a) | | 122,143 | 1,134,708 |
| Sabre Corp. (a) | | 522,212 | 3,754,704 |
| Shift4 Payments, Inc. (a)(b) | | 85,083 | 3,853,409 |
| Snowflake, Inc. (a) | | 399,223 | 72,239,402 |
| SolarWinds, Inc. | | 72,102 | 653,965 |
| Squarespace, Inc. Class A (a) | | 49,523 | 1,039,983 |
| SS&C Technologies Holdings, Inc. | | 359,972 | 20,072,039 |
| StarTek, Inc. (a) | | 19,120 | 81,069 |
| Steel Connect, Inc. (a) | | 24,325 | 33,082 |
| Switch, Inc. Class A | | 216,593 | 7,353,332 |
| TaskUs, Inc. (a) | | 45,878 | 682,665 |
| The Western Union Co. | | 641,380 | 9,505,252 |
| Thoughtworks Holding, Inc. | | 61,853 | 813,985 |
| Toast, Inc. | | 418,929 | 7,930,326 |
| Ttec Holdings, Inc. | | 29,519 | 1,545,320 |
| Tucows, Inc. (a)(b) | | 17,083 | 802,730 |
| Twilio, Inc. Class A (a) | | 292,960 | 20,384,157 |
| Unisys Corp. (a) | | 110,846 | 1,031,976 |
| Usio, Inc. (a) | | 20,216 | 34,974 |
| VeriSign, Inc. (a) | | 156,697 | 28,553,327 |
| Verra Mobility Corp. (a) | | 217,741 | 3,470,792 |
| Visa, Inc. Class A | | 2,697,412 | 536,002,739 |
| WaveDancer, Inc. (a) | | 11,443 | 12,587 |
| WEX, Inc. (a) | | 73,155 | 11,284,159 |
| WidePoint Corp. (a) | | 10,560 | 24,869 |
| | | | 2,840,209,616 |
| Semiconductors & Semiconductor Equipment - 4.8% | | | |
| ACM Research, Inc. | | 60,060 | 1,014,413 |
| Advanced Micro Devices, Inc. (a) | | 2,656,449 | 225,452,827 |
| AEHR Test Systems (a) | | 35,381 | 514,440 |
| Allegro MicroSystems LLC (a) | | 93,584 | 2,182,379 |
| Alpha & Omega Semiconductor Ltd. (a) | | 34,696 | 1,341,347 |
| Ambarella, Inc. (a) | | 61,126 | 4,149,233 |
| Amkor Technology, Inc. | | 164,515 | 3,311,687 |
| Amtech Systems, Inc. (a) | | 21,399 | 237,529 |
| Analog Devices, Inc. | | 858,852 | 130,141,844 |
| Applied Materials, Inc. | | 1,449,350 | 136,340,355 |
| Atomera, Inc. (a)(b) | | 34,654 | 448,076 |
| Axcelis Technologies, Inc. (a) | | 53,944 | 3,611,011 |
| AXT, Inc. (a) | | 69,951 | 600,879 |
| Broadcom, Inc. | | 669,095 | 333,952,005 |
| CEVA, Inc. (a) | | 39,602 | 1,159,151 |
| Cirrus Logic, Inc. (a) | | 92,464 | 7,091,064 |
| Cohu, Inc. (a) | | 78,600 | 2,108,838 |
| Credo Technology Group Holding Ltd. | | 32,745 | 451,554 |
| CVD Equipment Corp. (a) | | 17,135 | 92,358 |
| CyberOptics Corp. (a) | | 11,708 | 623,334 |
| Diodes, Inc. (a) | | 72,032 | 5,126,517 |
| Enphase Energy, Inc. (a) | | 221,428 | 63,425,836 |
| Entegris, Inc. | | 243,020 | 23,057,738 |
| Everspin Technologies, Inc. (a) | | 20,884 | 152,453 |
| First Solar, Inc. (a) | | 161,821 | 20,640,269 |
| FormFactor, Inc. (a) | | 127,141 | 3,722,688 |
| GSI Technology, Inc. (a) | | 19,727 | 65,691 |
| Ichor Holdings Ltd. (a) | | 47,923 | 1,472,195 |
| Impinj, Inc. (a)(b) | | 33,495 | 2,990,434 |
| indie Semiconductor, Inc. (a)(b) | | 95,019 | 808,612 |
| Intel Corp. | | 6,700,746 | 213,887,812 |
| Intest Corp. (a) | | 15,245 | 135,376 |
| KLA Corp. | | 244,501 | 84,140,129 |
| Kopin Corp. (a) | | 114,030 | 156,221 |
| Kulicke & Soffa Industries, Inc. (b) | | 101,487 | 4,266,513 |
| Lam Research Corp. | | 227,205 | 99,495,342 |
| Lattice Semiconductor Corp. (a) | | 223,888 | 12,067,563 |
| MACOM Technology Solutions Holdings, Inc. (a) | | 80,552 | 4,442,443 |
| Marvell Technology, Inc. | | 1,407,231 | 65,886,555 |
| MaxLinear, Inc. Class A (a) | | 115,202 | 4,139,208 |
| Meta Materials, Inc. (a)(b) | | 381,482 | 329,982 |
| Microchip Technology, Inc. | | 910,226 | 59,392,247 |
| Micron Technology, Inc. | | 1,830,440 | 103,474,773 |
| MKS Instruments, Inc. | | 93,517 | 9,315,228 |
| Monolithic Power Systems, Inc. | | 71,986 | 32,622,615 |
| Navitas Semiconductor Corp. (a)(b) | | 131,697 | 778,329 |
| NVE Corp. | | 8,223 | 417,071 |
| NVIDIA Corp. | | 4,106,948 | 619,902,731 |
| NXP Semiconductors NV | | 429,851 | 70,744,878 |
| onsemi (a) | | 711,817 | 48,951,655 |
| Onto Innovation, Inc. (a) | | 80,026 | 5,681,046 |
| PDF Solutions, Inc. (a) | | 48,536 | 1,280,380 |
| Peraso, Inc. (a) | | 10,535 | 22,229 |
| Photronics, Inc. (a) | | 110,942 | 1,863,826 |
| Pixelworks, Inc. (a) | | 76,064 | 142,240 |
| Power Integrations, Inc. | | 96,155 | 6,877,967 |
| Qorvo, Inc. (a) | | 176,851 | 15,877,683 |
| Qualcomm, Inc. | | 1,836,921 | 242,969,541 |
| QuickLogic Corp. (a)(b) | | 18,425 | 124,737 |
| Rambus, Inc. (a) | | 179,693 | 4,634,282 |
| Rigetti Computing, Inc. Class A (a)(b) | | 164,810 | 655,944 |
| Rockley Photonics Holdings Ltd. (a)(b) | | 200,868 | 285,233 |
| Rubicon Technology, Inc. (a)(b) | | 1,323 | 4,353 |
| Semtech Corp. (a) | | 104,394 | 4,821,959 |
| Silicon Laboratories, Inc. (a) | | 64,031 | 8,025,005 |
| SiTime Corp. (a) | | 25,204 | 2,681,958 |
| SkyWater Technology, Inc. (a)(b) | | 10,876 | 141,388 |
| Skyworks Solutions, Inc. | | 265,299 | 26,145,216 |
| SMART Global Holdings, Inc. (a)(b) | | 75,722 | 1,389,499 |
| SolarEdge Technologies, Inc. (a) | | 91,004 | 25,114,374 |
| SunPower Corp. (a)(b) | | 135,128 | 3,243,072 |
| Synaptics, Inc. (a) | | 63,641 | 7,357,536 |
| Teradyne, Inc. | | 264,482 | 22,385,756 |
| Texas Instruments, Inc. | | 1,508,019 | 249,139,819 |
| Transphorm, Inc. (a) | | 19,448 | 107,936 |
| Ultra Clean Holdings, Inc. (a) | | 71,632 | 2,096,669 |
| Universal Display Corp. | | 70,329 | 7,857,859 |
| Veeco Instruments, Inc. (a)(b) | | 83,768 | 1,770,856 |
| Wolfspeed, Inc. (a)(b) | | 206,255 | 23,403,755 |
| | | | 3,076,935,546 |
| Software - 8.9% | | | |
| 8x8, Inc. (a)(b) | | 190,751 | 993,813 |
| A10 Networks, Inc. | | 96,958 | 1,347,716 |
| ACI Worldwide, Inc. (a) | | 193,880 | 4,594,956 |
| Adobe, Inc. (a) | | 774,871 | 289,367,826 |
| Agilysys, Inc. (a) | | 32,616 | 1,688,530 |
| Alarm.com Holdings, Inc. (a) | | 75,720 | 5,042,952 |
| Alfi, Inc. (a) | | 4,542 | 5,405 |
| Altair Engineering, Inc. Class A (a)(b) | | 87,287 | 4,539,797 |
| Alteryx, Inc. Class A (a) | | 96,247 | 5,998,113 |
| American Software, Inc. Class A | | 50,296 | 851,511 |
| Amplitude, Inc. (a)(b) | | 38,436 | 582,305 |
| ANSYS, Inc. (a) | | 142,313 | 35,336,318 |
| AppFolio, Inc. (a) | | 31,569 | 3,200,465 |
| Appian Corp. Class A (a)(b) | | 65,261 | 3,060,741 |
| AppLovin Corp. (a)(b) | | 64,858 | 1,597,453 |
| Arteris, Inc. | | 8,584 | 61,118 |
| Asana, Inc. (a)(b) | | 133,082 | 2,548,520 |
| Aspen Technology, Inc. (a) | | 45,760 | 9,637,056 |
| Asure Software, Inc. (a) | | 20,009 | 108,849 |
| AudioEye, Inc. (a)(b) | | 7,282 | 45,658 |
| Authid, Inc. (a)(b) | | 52,473 | 131,183 |
| Autodesk, Inc. (a) | | 358,579 | 72,339,727 |
| Avalara, Inc. (a) | | 141,740 | 12,981,967 |
| Avaya Holdings Corp. (a)(b) | | 136,835 | 217,568 |
| AvePoint, Inc. (a)(b) | | 168,039 | 786,423 |
| Benefitfocus, Inc. (a) | | 47,410 | 351,308 |
| Bentley Systems, Inc. Class B | | 304,195 | 11,185,250 |
| Bill.Com Holdings, Inc. (a) | | 152,181 | 24,635,060 |
| Black Knight, Inc. (a) | | 253,356 | 16,762,033 |
| Blackbaud, Inc. (a)(b) | | 73,535 | 3,845,881 |
| BlackLine, Inc. (a) | | 88,212 | 5,993,123 |
| Blend Labs, Inc. (a)(b) | | 43,697 | 137,646 |
| Box, Inc. Class A (a) | | 242,551 | 6,245,688 |
| Braze, Inc. (b) | | 22,115 | 910,696 |
| BSQUARE Corp. (a) | | 7,885 | 9,699 |
| BTCS, Inc. | | 11,578 | 19,104 |
| BTRS Holdings, Inc. (a) | | 114,576 | 774,534 |
| C3.Ai, Inc. (a)(b) | | 110,783 | 1,994,094 |
| Cadence Design Systems, Inc. (a) | | 451,010 | 78,372,008 |
| CCC Intelligent Solutions Holdings, Inc. Class A (a)(b) | | 108,559 | 1,037,824 |
| Cerence, Inc. (a) | | 64,901 | 1,298,669 |
| Ceridian HCM Holding, Inc. (a) | | 223,828 | 13,349,102 |
| ChannelAdvisor Corp. (a) | | 48,983 | 739,153 |
| Cipher Mining, Inc. (a) | | 86,576 | 174,018 |
| Citrix Systems, Inc. | | 202,604 | 20,821,613 |
| Cleanspark, Inc. (a)(b) | | 63,557 | 272,024 |
| Clear Secure, Inc. (a)(b) | | 23,519 | 539,526 |
| Clearwater Analytics Holdings, Inc. (b) | | 59,987 | 923,800 |
| CommVault Systems, Inc. (a) | | 75,435 | 4,095,366 |
| Confluent, Inc. (a)(b) | | 208,018 | 5,691,372 |
| Consensus Cloud Solutions, Inc. (a) | | 26,503 | 1,334,426 |
| CoreCard Corp. (a) | | 9,899 | 240,051 |
| Couchbase, Inc. (a)(b) | | 16,683 | 276,771 |
| Coupa Software, Inc. (a) | | 119,917 | 7,003,153 |
| Crowdstrike Holdings, Inc. (a) | | 351,276 | 64,146,510 |
| CS Disco, Inc. (a)(b) | | 20,124 | 277,711 |
| Cvent Holding Corp. (a)(b) | | 159,025 | 804,667 |
| Datadog, Inc. Class A (a) | | 422,024 | 44,291,419 |
| DatChat, Inc. (a)(b) | | 1,409 | 1,409 |
| Dave, Inc. (a)(b) | | 318,524 | 164,040 |
| Digimarc Corp. (a)(b) | | 21,760 | 387,763 |
| Digital Turbine, Inc. (a) | | 140,181 | 2,589,143 |
| DocuSign, Inc. (a) | | 327,265 | 19,053,368 |
| Dolby Laboratories, Inc. Class A | | 107,384 | 7,864,804 |
| Domo, Inc. Class B (a) | | 46,608 | 897,670 |
| Dropbox, Inc. Class A (a) | | 437,416 | 9,356,328 |
| Duck Creek Technologies, Inc. (a) | | 121,535 | 1,446,267 |
| Dynatrace, Inc. (a) | | 321,411 | 12,271,472 |
| E2open Parent Holdings, Inc. (a)(b) | | 292,971 | 2,012,711 |
| Ebix, Inc. | | 39,031 | 1,015,587 |
| eGain Communications Corp. (a) | | 36,168 | 333,107 |
| Elastic NV (a) | | 118,649 | 9,955,838 |
| Embark Technology, Inc. (a)(b) | | 17,544 | 159,650 |
| Enfusion, Inc. Class A (b) | | 35,823 | 443,847 |
| Envestnet, Inc. (a) | | 88,352 | 4,626,994 |
| Everbridge, Inc. (a) | | 64,367 | 2,560,519 |
| EverCommerce, Inc. (a) | | 30,974 | 360,537 |
| Expensify, Inc. | | 17,421 | 315,843 |
| Fair Isaac Corp. (a) | | 42,928 | 19,291,843 |
| Five9, Inc. (a) | | 112,223 | 11,010,199 |
| ForgeRock, Inc. | | 47,707 | 813,881 |
| Fortinet, Inc. (a) | | 1,093,790 | 53,256,635 |
| Freshworks, Inc. (b) | | 205,878 | 2,802,000 |
| GitLab, Inc. | | 64,219 | 3,844,792 |
| Greenidge Generation Holdings, Inc. (a)(b) | | 12,717 | 30,902 |
| GSE Systems, Inc. (a) | | 274 | 310 |
| Guidewire Software, Inc. (a) | | 134,219 | 9,624,844 |
| HashiCorp, Inc. | | 62,908 | 2,223,798 |
| HubSpot, Inc. (a) | | 74,324 | 25,050,161 |
| Informatica, Inc. (b) | | 50,196 | 1,107,826 |
| Intapp, Inc. (a) | | 17,108 | 247,895 |
| Intellicheck, Inc. (a)(b) | | 21,753 | 67,869 |
| InterDigital, Inc. | | 49,320 | 2,473,891 |
| Intrusion, Inc. (a)(b) | | 19,226 | 78,250 |
| Intuit, Inc. | | 463,694 | 200,213,795 |
| Inuvo, Inc. (a)(b) | | 121,663 | 62,863 |
| IronNet, Inc. Class A (a) | | 64,806 | 130,908 |
| Issuer Direct Corp. (a) | | 1,431 | 33,178 |
| Jamf Holding Corp. (a)(b) | | 91,119 | 2,182,300 |
| Kaltura, Inc. (a) | | 13,949 | 33,896 |
| Kaspien Holdings, Inc. (a) | | 105 | 274 |
| KnowBe4, Inc. (a) | | 146,126 | 2,808,542 |
| Latch, Inc. (a)(b) | | 154,028 | 164,810 |
| LivePerson, Inc. (a) | | 108,023 | 1,253,067 |
| Liveramp Holdings, Inc. (a) | | 113,355 | 2,250,097 |
| Livevox Holdings, Inc. (a) | | 31,761 | 67,969 |
| Mandiant, Inc. (a) | | 389,865 | 8,912,314 |
| Manhattan Associates, Inc. (a) | | 101,855 | 14,388,037 |
| Marathon Digital Holdings, Inc. (a)(b) | | 170,423 | 2,019,513 |
| Marin Software, Inc. (a)(b) | | 17,179 | 31,094 |
| Matterport, Inc. (a)(b) | | 338,619 | 1,561,034 |
| MeridianLink, Inc. (a)(b) | | 25,944 | 450,647 |
| Microsoft Corp. | | 12,261,721 | 3,206,072,190 |
| MicroStrategy, Inc. Class A (a)(b) | | 15,698 | 3,635,029 |
| Mitek Systems, Inc. (a) | | 78,096 | 798,141 |
| Model N, Inc. (a) | | 56,062 | 1,676,254 |
| Momentive Global, Inc. (a) | | 217,446 | 1,541,692 |
| N-able, Inc. (a) | | 116,706 | 1,162,392 |
| nCino, Inc. (a)(b) | | 90,734 | 2,861,750 |
| NCR Corp. (a) | | 219,126 | 6,803,862 |
| NetSol Technologies, Inc. (a) | | 11,760 | 41,983 |
| New Relic, Inc. (a) | | 95,163 | 5,777,346 |
| Nextnav, Inc. (a) | | 28,910 | 98,005 |
| NortonLifeLock, Inc. | | 948,316 | 21,422,458 |
| Nutanix, Inc. Class A (a) | | 349,133 | 6,040,001 |
| Oblong, Inc. (a) | | 15,734 | 4,012 |
| Olo, Inc. (a)(b) | | 143,089 | 1,117,525 |
| ON24, Inc. (a) | | 15,006 | 134,454 |
| Onespan, Inc. (a) | | 60,732 | 699,025 |
| Oracle Corp. | | 2,581,054 | 191,385,154 |
| Pagerduty, Inc. (a)(b) | | 122,206 | 3,182,244 |
| Palantir Technologies, Inc. (a)(b) | | 2,765,410 | 21,348,965 |
| Palo Alto Networks, Inc. (a) | | 161,086 | 89,694,296 |
| Park City Group, Inc. (a) | | 13,889 | 83,890 |
| Paycom Software, Inc. (a) | | 78,671 | 27,629,255 |
| Paycor HCM, Inc. (a)(b) | | 49,059 | 1,453,618 |
| Paylocity Holding Corp. (a) | | 65,094 | 15,687,654 |
| Pegasystems, Inc. | | 66,664 | 2,440,569 |
| Phunware, Inc. (a)(b) | | 120,842 | 160,720 |
| Ping Identity Holding Corp. (a) | | 102,552 | 2,885,813 |
| Progress Software Corp. | | 72,510 | 3,489,906 |
| PROS Holdings, Inc. (a) | | 68,199 | 1,421,949 |
| PTC, Inc. (a) | | 171,334 | 19,684,563 |
| Q2 Holdings, Inc. (a) | | 91,509 | 3,634,737 |
| Qualtrics International, Inc. (a) | | 163,887 | 2,007,616 |
| Qualys, Inc. (a) | | 54,722 | 8,312,272 |
| Quantum Computing, Inc. (a)(b) | | 39,536 | 117,027 |
| Qumu Corp. (a) | | 15,357 | 10,047 |
| Rapid7, Inc. (a) | | 92,217 | 5,302,478 |
| RealNetworks, Inc. (a) | | 24,148 | 16,686 |
| Rekor Systems, Inc. (a)(b) | | 55,063 | 78,189 |
| Rimini Street, Inc. (a) | | 49,057 | 247,247 |
| RingCentral, Inc. (a) | | 134,840 | 5,803,514 |
| Riot Blockchain, Inc. (a)(b) | | 167,347 | 1,199,878 |
| Roper Technologies, Inc. | | 173,211 | 69,731,284 |
| Salesforce.com, Inc. (a) | | 1,629,275 | 254,362,413 |
| Samsara, Inc. (b) | | 107,971 | 1,605,529 |
| SeaChange International, Inc. (a) | | 41,040 | 20,980 |
| SecureWorks Corp. (a) | | 18,591 | 193,346 |
| Semrush Holdings, Inc. (a)(b) | | 39,919 | 489,806 |
| SentinelOne, Inc. (a)(b) | | 327,526 | 8,944,735 |
| ServiceNow, Inc. (a) | | 328,609 | 142,820,044 |
| ShotSpotter, Inc. (a) | | 12,694 | 414,205 |
| Smartsheet, Inc. (a) | | 207,061 | 6,888,919 |
| Smith Micro Software, Inc. (a)(b) | | 72,155 | 175,337 |
| Soluna Holdings, Inc. (a)(b) | | 9,510 | 28,245 |
| SoundHound AI, Inc. (a) | | 200,205 | 570,584 |
| Splunk, Inc. (a) | | 262,897 | 23,668,617 |
| Sprinklr, Inc. (a)(b) | | 115,719 | 1,372,427 |
| Sprout Social, Inc. (a) | | 74,224 | 4,456,409 |
| SPS Commerce, Inc. (a) | | 57,894 | 7,070,015 |
| SRAX, Inc. (a)(b) | | 35,558 | 84,272 |
| Stronghold Digital Mining, Inc. Class A (b) | | 11,479 | 15,956 |
| Sumo Logic, Inc. (a) | | 142,857 | 1,254,284 |
| Synchronoss Technologies, Inc. (a) | | 125,684 | 203,608 |
| Synopsys, Inc. (a) | | 250,428 | 86,653,097 |
| Telos Corp. (a) | | 87,648 | 867,715 |
| Tenable Holdings, Inc. (a) | | 151,402 | 5,997,033 |
| Teradata Corp. (a) | | 174,399 | 5,737,727 |
| TeraWulf, Inc. (a)(b) | | 49,447 | 73,676 |
| The Trade Desk, Inc. (a) | | 732,387 | 45,920,665 |
| Tyler Technologies, Inc. (a) | | 67,542 | 25,092,528 |
| UiPath, Inc. Class A (a) | | 488,760 | 8,040,102 |
| Unity Software, Inc. (a)(b) | | 270,811 | 11,569,046 |
| Upland Software, Inc. (a) | | 45,690 | 478,374 |
| Varonis Systems, Inc. (a) | | 173,692 | 4,750,476 |
| Verb Technology Co., Inc. (a)(b) | | 67,557 | 33,225 |
| Verint Systems, Inc. (a) | | 106,920 | 5,184,551 |
| Veritone, Inc. (a)(b) | | 47,975 | 352,616 |
| Vertex, Inc. Class A (a) | | 42,236 | 577,788 |
| Viant Technology, Inc. (a) | | 17,145 | 77,495 |
| VirnetX Holding Corp. (a)(b) | | 93,487 | 190,713 |
| VMware, Inc. Class A | | 330,304 | 38,325,173 |
| Workday, Inc. Class A (a) | | 329,986 | 54,302,496 |
| Workiva, Inc. (a) | | 76,253 | 5,176,816 |
| Xperi Holding Corp. | | 172,052 | 2,737,347 |
| Yext, Inc. (a) | | 188,838 | 840,329 |
| Zendesk, Inc. (a) | | 198,916 | 15,270,781 |
| Zeta Global Holdings Corp. (a)(b) | | 38,459 | 269,213 |
| Zoom Video Communications, Inc. Class A (a) | | 377,021 | 30,312,488 |
| Zscaler, Inc. (a) | | 131,655 | 20,964,742 |
| Zuora, Inc. (a) | | 203,831 | 1,565,422 |
| | | | 5,782,822,655 |
| Technology Hardware, Storage & Peripherals - 6.4% | | | |
| 3D Systems Corp. (a) | | 204,729 | 2,073,905 |
| Apple, Inc. | | 25,208,998 | 3,963,358,613 |
| Astro-Med, Inc. (a) | | 8,893 | 115,164 |
| Avid Technology, Inc. (a) | | 61,835 | 1,691,187 |
| Boxlight Corp. (a)(b) | | 66,134 | 43,212 |
| CompoSecure, Inc. (a)(b) | | 7,956 | 45,986 |
| Corsair Gaming, Inc. (a)(b) | | 56,354 | 867,288 |
| CPI Card Group (a)(b) | | 3,868 | 74,150 |
| Dell Technologies, Inc. | | 444,781 | 17,030,664 |
| Diebold Nixdorf, Inc. (a) | | 123,042 | 428,186 |
| Eastman Kodak Co. (a)(b) | | 101,106 | 546,983 |
| Hewlett Packard Enterprise Co. | | 2,133,287 | 29,012,703 |
| HP, Inc. | | 1,729,783 | 49,662,070 |
| Immersion Corp. (a) | | 49,764 | 296,593 |
| Intevac, Inc. (a) | | 41,497 | 207,070 |
| IonQ, Inc. (a)(b) | | 184,843 | 1,097,967 |
| NetApp, Inc. | | 366,144 | 26,409,967 |
| One Stop Systems, Inc. (a) | | 15,326 | 60,078 |
| Pure Storage, Inc. Class A (a) | | 454,336 | 13,162,114 |
| Quantum Corp. (a) | | 114,107 | 179,148 |
| Seagate Technology Holdings PLC | | 326,259 | 21,846,303 |
| Socket Mobile, Inc. (a) | | 1,516 | 4,412 |
| Sonim Technologies, Inc. (a) | | 6,807 | 5,209 |
| Super Micro Computer, Inc. (a) | | 72,354 | 4,708,798 |
| Transact Technologies, Inc. (a) | | 14,803 | 68,242 |
| Turtle Beach Corp. (a) | | 27,960 | 262,544 |
| Western Digital Corp. (a) | | 513,729 | 21,710,188 |
| Xerox Holdings Corp. | | 220,528 | 3,665,175 |
| | | | 4,158,633,919 |
TOTAL INFORMATION TECHNOLOGY | | | 16,906,575,626 |
| MATERIALS - 2.8% | | | |
| Chemicals - 1.8% | | | |
| Advanced Emissions Solutions, Inc. (a) | | 27,740 | 103,748 |
| AdvanSix, Inc. | | 47,037 | 1,705,562 |
| AgroFresh Solutions, Inc. (a) | | 31,343 | 50,306 |
| Air Products & Chemicals, Inc. | | 363,945 | 91,877,915 |
| Albemarle Corp. | | 191,715 | 51,371,951 |
| American Vanguard Corp. | | 45,335 | 903,527 |
| Amyris, Inc. (a)(b) | | 317,283 | 932,812 |
| Ashland, Inc. | | 81,364 | 8,279,601 |
| Aspen Aerogels, Inc. (a) | | 42,482 | 552,691 |
| Avient Corp. | | 150,485 | 6,595,758 |
| Axalta Coating Systems Ltd. (a) | | 346,494 | 8,922,221 |
| Balchem Corp. | | 52,613 | 6,935,446 |
| Cabot Corp. | | 92,887 | 6,685,077 |
| Celanese Corp. Class A | | 175,748 | 19,483,423 |
| CF Industries Holdings, Inc. | | 340,949 | 35,274,584 |
| Chase Corp. | | 13,412 | 1,182,402 |
| Core Molding Technologies, Inc. (a) | | 12,523 | 155,285 |
| Corteva, Inc. | | 1,186,334 | 72,876,498 |
| Danimer Scientific, Inc. (a)(b) | | 137,656 | 612,569 |
| Diversey Holdings Ltd. (a) | | 84,791 | 519,769 |
| Dow, Inc. | | 1,195,142 | 60,952,242 |
| DuPont de Nemours, Inc. | | 832,824 | 46,338,327 |
| Eastman Chemical Co. | | 210,923 | 19,193,993 |
| Ecolab, Inc. | | 407,645 | 66,784,480 |
| Ecovyst, Inc. | | 81,681 | 754,732 |
| Element Solutions, Inc. | | 355,005 | 6,627,943 |
| Flotek Industries, Inc. (a)(b) | | 92,584 | 91,658 |
| FMC Corp. | | 205,517 | 22,212,277 |
| FutureFuel Corp. | | 46,867 | 341,660 |
| GCP Applied Technologies, Inc. (a) | | 82,802 | 2,601,639 |
| Ginkgo Bioworks Holdings, Inc. Class A (a)(b) | | 1,717,645 | 4,620,465 |
| H.B. Fuller Co. | | 86,385 | 5,602,931 |
| Hawkins, Inc. | | 29,582 | 1,133,582 |
| Huntsman Corp. | | 331,916 | 9,300,286 |
| Ingevity Corp. (a) | | 64,823 | 4,546,685 |
| Innospec, Inc. | | 39,620 | 3,702,885 |
| International Flavors & Fragrances, Inc. | | 418,016 | 46,182,408 |
| Intrepid Potash, Inc. (a) | | 16,359 | 764,456 |
| Koppers Holdings, Inc. | | 36,431 | 831,720 |
| Kronos Worldwide, Inc. | | 48,675 | 626,934 |
| Linde PLC | | 825,481 | 233,495,556 |
| Livent Corp. (a)(b) | | 262,314 | 8,441,265 |
| Loop Industries, Inc. (a)(b) | | 33,272 | 178,338 |
| LSB Industries, Inc. | | 59,614 | 940,709 |
| LyondellBasell Industries NV Class A | | 424,310 | 35,217,730 |
| Mativ, Inc. | | 109,791 | 2,593,263 |
| Minerals Technologies, Inc. | | 55,301 | 3,221,836 |
| NewMarket Corp. | | 11,259 | 3,233,697 |
| Northern Technologies International Corp. | | 7,327 | 85,360 |
| Olin Corp. | | 228,987 | 12,516,429 |
| Origin Materials, Inc. Class A (a)(b) | | 205,325 | 1,283,281 |
| Orion Engineered Carbons SA | | 98,087 | 1,653,747 |
| PPG Industries, Inc. | | 387,797 | 49,242,463 |
| PureCycle Technologies, Inc. (a)(b) | | 163,361 | 1,491,486 |
| Quaker Houghton | | 21,577 | 3,761,303 |
| Rayonier Advanced Materials, Inc. (a) | | 100,330 | 453,492 |
| RPM International, Inc. | | 211,170 | 19,672,597 |
| Sensient Technologies Corp. | | 68,461 | 5,454,288 |
| Sherwin-Williams Co. | | 392,518 | 91,103,428 |
| Stepan Co. | | 35,125 | 3,661,079 |
| The Chemours Co. LLC | | 258,466 | 8,718,058 |
| The Mosaic Co. | | 590,786 | 31,825,642 |
| The Scotts Miracle-Gro Co. Class A | | 66,149 | 4,428,676 |
| Tredegar Corp. | | 40,525 | 413,760 |
| Trinseo PLC | | 62,069 | 1,646,691 |
| Tronox Holdings PLC | | 187,909 | 2,749,109 |
| Valhi, Inc. | | 4,257 | 148,740 |
| Valvoline, Inc. | | 292,220 | 8,494,835 |
| Westlake Corp. | | 53,500 | 5,276,705 |
| Zymergen, Inc. (a) | | 28,321 | 67,121 |
| | | | 1,159,703,132 |
| Construction Materials - 0.1% | | | |
| Eagle Materials, Inc. | | 65,701 | 7,859,154 |
| Martin Marietta Materials, Inc. | | 102,061 | 35,487,630 |
| Smith-Midland Corp. (a) | | 5,629 | 129,523 |
| Summit Materials, Inc. (a) | | 192,423 | 5,468,662 |
| United States Lime & Minerals, Inc. | | 4,636 | 476,534 |
| Vulcan Materials Co. | | 217,069 | 36,139,818 |
| | | | 85,561,321 |
| Containers & Packaging - 0.4% | | | |
| Amcor PLC | | 2,474,025 | 29,713,040 |
| Aptargroup, Inc. | | 106,530 | 10,952,349 |
| Avery Dennison Corp. | | 134,789 | 24,749,956 |
| Ball Corp. | | 525,515 | 29,328,992 |
| Berry Global Group, Inc. (a) | | 217,610 | 11,822,751 |
| Crown Holdings, Inc. | | 203,214 | 18,409,156 |
| Cryptyde, Inc. (a)(b) | | 25,139 | 19,784 |
| Graphic Packaging Holding Co. | | 457,182 | 10,181,443 |
| Greif, Inc.: | | | |
| Class A (b) | | 42,211 | 2,830,248 |
| Class B | | 11,807 | 770,643 |
| International Paper Co. | | 602,464 | 25,074,552 |
| Myers Industries, Inc. | | 59,545 | 1,150,409 |
| O-I Glass, Inc. (a) | | 251,291 | 3,269,296 |
| Packaging Corp. of America | | 153,327 | 20,993,533 |
| Pactiv Evergreen, Inc. | | 69,904 | 775,934 |
| Ranpak Holdings Corp. (A Shares) (a) | | 65,732 | 347,722 |
| Sealed Air Corp. | | 238,191 | 12,817,058 |
| Silgan Holdings, Inc. | | 135,462 | 6,170,294 |
| Sonoco Products Co. | | 158,494 | 9,988,292 |
| TriMas Corp. | | 70,955 | 1,952,682 |
| WestRock Co. | | 414,329 | 16,817,614 |
| | | | 238,135,748 |
| Metals & Mining - 0.5% | | | |
| 5E Advanced Materials, Inc. (a) | | 53,316 | 799,740 |
| Alcoa Corp. | | 299,615 | 14,824,950 |
| Alpha Metallurgical Resources | | 29,324 | 4,608,267 |
| Ampco-Pittsburgh Corp. (a)(b) | | 10,622 | 45,356 |
| Arconic Corp. (a) | | 173,197 | 4,366,296 |
| Ascent Industries Co. (a) | | 13,621 | 228,016 |
| ATI, Inc. (a) | | 202,891 | 6,072,528 |
| Carpenter Technology Corp. | | 79,688 | 2,707,001 |
| Century Aluminum Co. (a) | | 81,655 | 630,377 |
| Cleveland-Cliffs, Inc. (a) | | 775,312 | 13,389,638 |
| Coeur d'Alene Mines Corp. (a) | | 443,023 | 1,222,743 |
| Commercial Metals Co. | | 197,179 | 7,987,721 |
| Compass Minerals International, Inc. | | 56,183 | 2,274,850 |
| Comstock Mining, Inc. (a)(b) | | 126,992 | 73,008 |
| Freeport-McMoRan, Inc. | | 2,376,089 | 70,332,234 |
| Friedman Industries | | 10,864 | 113,746 |
| Gatos Silver, Inc. (a) | | 77,452 | 235,454 |
| Gold Resource Corp. | | 159,439 | 271,046 |
| Golden Minerals Co. (a)(b) | | 97,441 | 25,432 |
| Haynes International, Inc. | | 21,795 | 865,044 |
| Hecla Mining Co. | | 873,018 | 3,439,691 |
| Hycroft Mining Holding Corp. (a) | | 178,670 | 142,954 |
| Idaho Strategic Resources, Inc. (a)(b) | | 3,623 | 19,492 |
| Kaiser Aluminum Corp. | | 26,703 | 1,916,207 |
| Materion Corp. | | 34,822 | 3,005,487 |
| McEwen Mining, Inc. (a)(b) | | 59,588 | 182,935 |
| MP Materials Corp. (a)(b) | | 120,463 | 4,215,000 |
| Newmont Corp. | | 1,303,001 | 53,892,121 |
| Nucor Corp. | | 436,149 | 57,981,648 |
| Olympic Steel, Inc. | | 15,009 | 395,037 |
| Paramount Gold Nevada Corp. (a)(b) | | 5,612 | 1,947 |
| Piedmont Lithium, Inc. (a)(b) | | 27,991 | 1,711,650 |
| Ramaco Resources, Inc. | | 20,697 | 218,146 |
| Reliance Steel & Aluminum Co. | | 101,879 | 19,151,214 |
| Royal Gold, Inc. | | 107,899 | 9,915,918 |
| Ryerson Holding Corp. | | 26,479 | 754,652 |
| Schnitzer Steel Industries, Inc. Class A | | 43,053 | 1,422,471 |
| Solitario Exploration & Royalty Corp. (a) | | 12,775 | 7,346 |
| Steel Dynamics, Inc. | | 292,706 | 23,627,228 |
| SunCoke Energy, Inc. | | 132,237 | 871,442 |
| TimkenSteel Corp. (a) | | 65,679 | 1,007,516 |
| U.S. Antimony Corp. (a)(b) | | 69,277 | 30,523 |
| U.S. Gold Corp. (a) | | 4,474 | 16,151 |
| United States Steel Corp. | | 431,682 | 9,872,567 |
| Universal Stainless & Alloy Products, Inc. (a) | | 11,782 | 94,138 |
| Warrior Metropolitan Coal, Inc. | | 83,544 | 2,719,357 |
| Worthington Industries, Inc. | | 53,974 | 2,752,134 |
| | | | 330,438,419 |
| Paper & Forest Products - 0.0% | | | |
| Clearwater Paper Corp. (a) | | 27,194 | 1,156,833 |
| Glatfelter Corp. | | 77,025 | 375,112 |
| Louisiana-Pacific Corp. | | 132,999 | 7,212,536 |
| Mercer International, Inc. (SBI) | | 69,747 | 1,131,296 |
| Resolute Forest Products, Inc. (a) | | 76,819 | 1,556,353 |
| Sylvamo Corp. | | 56,337 | 2,503,616 |
| | | | 13,935,746 |
TOTAL MATERIALS | | | 1,827,774,366 |
| REAL ESTATE - 3.5% | | | |
| Equity Real Estate Investment Trusts (REITs) - 3.3% | | | |
| Acadia Realty Trust (SBI) | | 146,424 | 2,332,534 |
| Agree Realty Corp. | | 119,639 | 9,011,209 |
| Alexander & Baldwin, Inc. | | 122,362 | 2,291,840 |
| Alexanders, Inc. | | 4,201 | 995,217 |
| Alexandria Real Estate Equities, Inc. | | 243,160 | 37,300,744 |
| Alpine Income Property Trust, Inc. | | 17,803 | 323,124 |
| American Assets Trust, Inc. | | 86,657 | 2,405,598 |
| American Homes 4 Rent Class A | | 501,179 | 17,821,925 |
| American Tower Corp. | | 761,922 | 193,566,284 |
| Americold Realty Trust | | 436,578 | 12,844,125 |
| Apartment Income (REIT) Corp. | | 252,462 | 10,313,073 |
| Apartment Investment & Management Co. Class A | | 224,110 | 1,981,132 |
| Apple Hospitality (REIT), Inc. | | 341,108 | 5,427,028 |
| Armada Hoffler Properties, Inc. | | 102,818 | 1,350,000 |
| Ashford Hospitality Trust, Inc. (a) | | 52,806 | 484,759 |
| AvalonBay Communities, Inc. | | 228,649 | 45,937,871 |
| Bluerock Residential Growth (REIT), Inc. | | 43,991 | 1,172,360 |
| Boston Properties, Inc. | | 231,253 | 18,368,426 |
| Braemar Hotels & Resorts, Inc. | | 89,458 | 460,709 |
| Brandywine Realty Trust (SBI) | | 268,007 | 2,152,096 |
| Brixmor Property Group, Inc. | | 479,739 | 10,304,794 |
| Broadstone Net Lease, Inc. | | 281,355 | 5,385,135 |
| BRT Apartments Corp. | | 38,608 | 921,573 |
| Camden Property Trust (SBI) | | 177,877 | 22,858,973 |
| CareTrust (REIT), Inc. | | 155,166 | 3,342,276 |
| CatchMark Timber Trust, Inc. | | 86,499 | 921,214 |
| Centerspace | | 24,687 | 1,860,906 |
| Chatham Lodging Trust (a) | | 72,371 | 880,031 |
| City Office REIT, Inc. | | 79,355 | 916,550 |
| Clipper Realty, Inc. | | 18,245 | 153,440 |
| Community Healthcare Trust, Inc. | | 39,903 | 1,472,022 |
| CorEnergy Infrastructure Trust, Inc. | | 20,064 | 46,950 |
| Corporate Office Properties Trust (SBI) | | 183,906 | 4,752,131 |
| Cousins Properties, Inc. | | 242,918 | 6,522,348 |
| Creative Media & Community Trust Corp. | | 40,536 | 284,563 |
| Crown Castle International Corp. | | 710,527 | 121,379,327 |
| CTO Realty Growth, Inc. | | 29,238 | 617,214 |
| CubeSmart | | 389,060 | 17,916,213 |
| DiamondRock Hospitality Co. | | 330,337 | 2,883,842 |
| Digital Realty Trust, Inc. | | 471,398 | 58,278,935 |
| Diversified Healthcare Trust (SBI) | | 369,964 | 540,147 |
| Douglas Emmett, Inc. | | 280,342 | 5,472,276 |
| Duke Realty Corp. | | 634,977 | 37,368,396 |
| Easterly Government Properties, Inc. | | 148,553 | 2,666,526 |
| EastGroup Properties, Inc. | | 67,286 | 11,104,209 |
| Empire State Realty Trust, Inc. | | 226,638 | 1,579,667 |
| EPR Properties | | 121,899 | 5,301,388 |
| Equinix, Inc. | | 149,639 | 98,368,189 |
| Equity Commonwealth | | 192,473 | 5,063,965 |
| Equity Lifestyle Properties, Inc. | | 281,590 | 19,739,459 |
| Equity Residential (SBI) | | 562,170 | 41,139,601 |
| Essential Properties Realty Trust, Inc. | | 237,340 | 5,373,378 |
| Essex Property Trust, Inc. | | 106,605 | 28,256,721 |
| Extra Space Storage, Inc. | | 219,669 | 43,654,820 |
| Farmland Partners, Inc. | | 63,109 | 915,712 |
| Federal Realty Investment Trust (SBI) | | 115,067 | 11,652,835 |
| First Industrial Realty Trust, Inc. | | 211,683 | 10,728,094 |
| Four Corners Property Trust, Inc. | | 125,188 | 3,366,305 |
| Franklin Street Properties Corp. | | 166,446 | 467,713 |
| Gaming & Leisure Properties | | 392,157 | 18,929,418 |
| Getty Realty Corp. | | 66,664 | 2,005,253 |
| Gladstone Commercial Corp. | | 68,755 | 1,311,158 |
| Gladstone Land Corp. | | 49,422 | 1,161,911 |
| Global Medical REIT, Inc. | | 111,695 | 1,210,774 |
| Global Net Lease, Inc. | | 177,350 | 2,442,110 |
| Global Self Storage, Inc. | | 1,725 | 10,040 |
| Healthcare Trust of America, Inc. | | 619,113 | 15,056,828 |
| Healthpeak Properties, Inc. | | 875,985 | 22,994,606 |
| Hersha Hospitality Trust (a) | | 63,989 | 620,693 |
| Highwoods Properties, Inc. (SBI) | | 172,950 | 5,259,410 |
| Host Hotels & Resorts, Inc. | | 1,161,714 | 20,643,658 |
| Hudson Pacific Properties, Inc. | | 242,333 | 3,201,219 |
| Independence Realty Trust, Inc. | | 381,450 | 7,419,203 |
| Indus Realty Trust, Inc. | | 10,779 | 662,046 |
| Industrial Logistics Properties Trust | | 114,465 | 857,343 |
| InvenTrust Properties Corp. | | 112,715 | 2,959,896 |
| Invitation Homes, Inc. | | 1,026,836 | 37,253,610 |
| Iron Mountain, Inc. | | 473,899 | 24,931,826 |
| iStar Financial, Inc. | | 128,235 | 1,765,796 |
| JBG SMITH Properties | | 189,372 | 4,160,503 |
| Kilroy Realty Corp. | | 170,989 | 8,339,134 |
| Kimco Realty Corp. | | 996,447 | 21,005,103 |
| Kite Realty Group Trust | | 356,305 | 6,898,065 |
| Lamar Advertising Co. Class A | | 141,254 | 13,262,338 |
| Life Storage, Inc. | | 145,604 | 18,528,109 |
| LTC Properties, Inc. | | 61,833 | 2,775,683 |
| LXP Industrial Trust (REIT) | | 458,383 | 4,611,333 |
| Medical Properties Trust, Inc. | | 971,738 | 14,197,092 |
| Mid-America Apartment Communities, Inc. | | 188,415 | 31,214,713 |
| National Health Investors, Inc. | | 77,251 | 5,060,713 |
| National Retail Properties, Inc. | | 284,258 | 12,763,184 |
| National Storage Affiliates Trust | | 134,503 | 6,795,092 |
| Necessity Retail (REIT), Inc./The | | 214,470 | 1,599,946 |
| NETSTREIT Corp. | | 83,011 | 1,631,996 |
| New York City REIT, Inc. | | 22,015 | 68,247 |
| NexPoint Residential Trust, Inc. | | 35,986 | 1,900,781 |
| Office Properties Income Trust | | 81,752 | 1,436,383 |
| Omega Healthcare Investors, Inc. | | 388,825 | 12,699,025 |
| One Liberty Properties, Inc. | | 29,137 | 703,659 |
| Orion Office (REIT), Inc. | | 87,055 | 859,233 |
| Outfront Media, Inc. | | 236,645 | 4,188,617 |
| Paramount Group, Inc. | | 268,972 | 1,863,976 |
| Park Hotels & Resorts, Inc. | | 384,077 | 5,377,078 |
| Pebblebrook Hotel Trust | | 212,843 | 3,750,294 |
| Pennsylvania Real Estate Investment Trust (SBI) (a)(b) | | 5,498 | 25,841 |
| Phillips Edison & Co., Inc. | | 198,094 | 6,471,731 |
| Physicians Realty Trust | | 354,273 | 5,902,188 |
| Piedmont Office Realty Trust, Inc. Class A | | 206,647 | 2,434,302 |
| Plymouth Industrial REIT, Inc. | | 59,965 | 1,215,491 |
| Postal Realty Trust, Inc. | | 34,051 | 505,657 |
| Potlatch Corp. | | 111,971 | 5,197,694 |
| Prologis (REIT), Inc. | | 1,213,705 | 151,118,410 |
| Public Storage | | 250,314 | 82,811,381 |
| Rayonier, Inc. | | 236,707 | 8,407,833 |
| Realty Income Corp. | | 985,106 | 67,263,038 |
| Regency Centers Corp. | | 252,669 | 15,372,382 |
| Retail Opportunity Investments Corp. | | 194,608 | 3,259,684 |
| Rexford Industrial Realty, Inc. | | 277,155 | 17,241,813 |
| RLJ Lodging Trust | | 270,255 | 3,259,275 |
| RPT Realty | | 129,153 | 1,243,743 |
| Ryman Hospitality Properties, Inc. | | 88,041 | 7,238,731 |
| Sabra Health Care REIT, Inc. | | 372,551 | 5,577,088 |
| Safehold, Inc. | | 25,633 | 974,823 |
| Saul Centers, Inc. | | 24,642 | 1,091,394 |
| SBA Communications Corp. Class A | | 176,716 | 57,476,879 |
| Service Properties Trust | | 270,254 | 1,848,537 |
| Simon Property Group, Inc. | | 537,222 | 54,785,900 |
| SITE Centers Corp. | | 294,649 | 3,818,651 |
| SL Green Realty Corp. | | 110,868 | 4,897,040 |
| Sotherly Hotels, Inc. (a) | | 1,919 | 4,586 |
| Spirit Realty Capital, Inc. | | 253,694 | 10,363,400 |
| Stag Industrial, Inc. | | 292,015 | 8,994,062 |
| Store Capital Corp. | | 409,003 | 11,034,901 |
| Summit Hotel Properties, Inc. | | 162,980 | 1,281,023 |
| Sun Communities, Inc. | | 206,445 | 31,732,661 |
| Sunstone Hotel Investors, Inc. | | 357,349 | 3,891,531 |
| Tanger Factory Outlet Centers, Inc. | | 164,834 | 2,541,740 |
| Terreno Realty Corp. | | 126,076 | 7,689,375 |
| The Macerich Co. | | 344,371 | 3,295,630 |
| UDR, Inc. | | 507,315 | 22,763,224 |
| UMH Properties, Inc. | | 77,907 | 1,405,442 |
| Uniti Group, Inc. | | 382,195 | 3,588,811 |
| Universal Health Realty Income Trust (SBI) | | 23,068 | 1,173,931 |
| Urban Edge Properties | | 178,440 | 2,806,861 |
| Urstadt Biddle Properties, Inc. Class A | | 52,535 | 878,385 |
| Ventas, Inc. | | 653,043 | 31,254,638 |
| Veris Residential, Inc. (a) | | 227,640 | 3,059,482 |
| VICI Properties, Inc. | | 1,578,508 | 52,074,979 |
| Vornado Realty Trust | | 255,796 | 6,706,971 |
| Washington REIT (SBI) | | 136,443 | 2,675,647 |
| Welltower Op | | 746,563 | 57,224,054 |
| Weyerhaeuser Co. | | 1,215,277 | 41,513,862 |
| Wheeler REIT, Inc. (a) | | 4,774 | 9,309 |
| Whitestone REIT Class B | | 74,493 | 733,011 |
| WP Carey, Inc. | | 313,475 | 26,341,304 |
| Xenia Hotels & Resorts, Inc. (a) | | 177,247 | 2,811,137 |
| | | | 2,164,674,450 |
| Real Estate Management & Development - 0.2% | | | |
| Alset Ehome International, Inc. (a) | | 9,493 | 2,563 |
| Altisource Asset Management Corp. (a)(b) | | 2,244 | 45,553 |
| Altisource Portfolio Solutions SA (a)(b) | | 15,310 | 179,280 |
| American Realty Investments, Inc. (a) | | 4,842 | 67,255 |
| Amrep Corp. (a) | | 2,310 | 32,178 |
| Anywhere Real Estate, Inc. (a) | | 188,869 | 1,845,250 |
| CBRE Group, Inc. (a) | | 529,878 | 41,839,167 |
| Comstock Holding Companies, Inc. (a) | | 1,055 | 4,452 |
| Cushman & Wakefield PLC (a) | | 242,908 | 3,633,904 |
| Digitalbridge Group, Inc. (a) | | 280,254 | 4,988,521 |
| Doma Holdings, Inc. Class A (a) | | 290,170 | 175,002 |
| Douglas Elliman, Inc. | | 103,122 | 475,392 |
| eXp World Holdings, Inc. (b) | | 109,956 | 1,421,731 |
| Fathom Holdings, Inc. (a)(b) | | 11,335 | 77,871 |
| Forestar Group, Inc. (a) | | 28,176 | 350,509 |
| FRP Holdings, Inc. (a) | | 12,591 | 724,234 |
| Howard Hughes Corp. (a) | | 66,728 | 4,245,903 |
| Jones Lang LaSalle, Inc. (a) | | 81,944 | 14,176,312 |
| Kennedy-Wilson Holdings, Inc. | | 188,433 | 3,308,883 |
| Marcus & Millichap, Inc. | | 39,258 | 1,467,464 |
| Maui Land & Pineapple, Inc. (a) | | 22,080 | 211,968 |
| Newmark Group, Inc. | | 268,821 | 2,755,415 |
| Offerpad Solutions, Inc. (a)(b) | | 130,169 | 197,857 |
| Opendoor Technologies, Inc. (a)(b) | | 617,469 | 2,673,641 |
| Rafael Holdings, Inc. (a)(b) | | 15,875 | 34,449 |
| RE/MAX Holdings, Inc. | | 28,435 | 647,181 |
| Redfin Corp. (a)(b) | | 169,228 | 1,385,977 |
| Seritage Growth Properties (a)(b) | | 62,696 | 786,208 |
| Stratus Properties, Inc. | | 9,831 | 350,082 |
| Tejon Ranch Co. (a) | | 35,655 | 561,923 |
| The RMR Group, Inc. | | 23,696 | 617,044 |
| The St. Joe Co. | | 54,397 | 2,077,965 |
| Transcontinental Realty Investors, Inc. (a) | | 14,533 | 624,919 |
| Trinity Place Holdings, Inc. (a) | | 9,882 | 9,508 |
| WeWork, Inc. (a) | | 342,012 | 1,402,249 |
| Zillow Group, Inc.: | | | |
| Class A (a) | | 108,370 | 3,619,558 |
| Class C (a)(b) | | 228,687 | 7,651,867 |
| | | | 104,669,235 |
TOTAL REAL ESTATE | | | 2,269,343,685 |
| UTILITIES - 3.0% | | | |
| Electric Utilities - 1.8% | | | |
| Allete, Inc. | | 92,460 | 5,471,783 |
| Alliant Energy Corp. | | 405,027 | 24,722,848 |
| American Electric Power Co., Inc. | | 839,264 | 84,094,253 |
| Avangrid, Inc. | | 119,685 | 5,912,439 |
| Constellation Energy Corp. | | 535,402 | 43,683,449 |
| Duke Energy Corp. | | 1,259,018 | 134,601,614 |
| Edison International | | 624,756 | 42,339,714 |
| Entergy Corp. | | 341,374 | 39,360,422 |
| Evergy, Inc. | | 375,188 | 25,711,634 |
| Eversource Energy | | 567,404 | 50,890,465 |
| Exelon Corp. | | 1,599,157 | 70,218,984 |
| FirstEnergy Corp. | | 937,776 | 37,089,041 |
| Genie Energy Ltd. Class B | | 35,001 | 365,410 |
| Hawaiian Electric Industries, Inc. | | 178,273 | 6,974,040 |
| IDACORP, Inc. | | 82,793 | 9,044,307 |
| MGE Energy, Inc. | | 59,045 | 4,547,646 |
| NextEra Energy, Inc. | | 3,221,980 | 274,061,619 |
| NRG Energy, Inc. | | 392,477 | 16,201,451 |
| OGE Energy Corp. | | 323,854 | 13,129,041 |
| Otter Tail Corp. | | 68,364 | 5,164,217 |
| PG&E Corp. (a) | | 2,468,168 | 30,432,511 |
| Pinnacle West Capital Corp. | | 183,513 | 13,827,705 |
| PNM Resources, Inc. | | 141,292 | 6,701,480 |
| Portland General Electric Co. (b) | | 145,601 | 7,523,204 |
| PPL Corp. | | 1,217,472 | 35,404,086 |
| Southern Co. | | 1,739,498 | 134,063,111 |
| Via Renewables, Inc. Class A, | | 22,429 | 191,319 |
| Xcel Energy, Inc. | | 891,262 | 66,176,204 |
| | | | 1,187,903,997 |
| Gas Utilities - 0.2% | | | |
| Atmos Energy Corp. | | 226,589 | 25,690,661 |
| Chesapeake Utilities Corp. | | 30,975 | 3,912,143 |
| National Fuel Gas Co. | | 148,883 | 10,610,891 |
| New Jersey Resources Corp. | | 159,211 | 7,027,574 |
| Northwest Natural Holding Co. | | 55,478 | 2,641,308 |
| ONE Gas, Inc. | | 87,728 | 6,866,471 |
| RGC Resources, Inc. | | 11,687 | 249,751 |
| South Jersey Industries, Inc. | | 187,289 | 6,339,733 |
| Southwest Gas Corp. | | 108,002 | 8,407,956 |
| Spire, Inc. | | 84,937 | 5,936,247 |
| UGI Corp. | | 342,747 | 13,538,507 |
| | | | 91,221,242 |
| Independent Power and Renewable Electricity Producers - 0.1% | | | |
| Altus Power, Inc. Class A (a) | | 118,937 | 1,246,460 |
| Clearway Energy, Inc.: | | | |
| Class A | | 52,418 | 1,807,373 |
| Class C | | 140,582 | 5,215,592 |
| Montauk Renewables, Inc. (a)(b) | | 104,280 | 1,850,970 |
| Ormat Technologies, Inc. (b) | | 70,556 | 6,595,575 |
| Sunnova Energy International, Inc. (a)(b) | | 150,766 | 3,802,319 |
| The AES Corp. | | 1,077,642 | 27,425,989 |
| Vistra Corp. | | 726,566 | 17,982,509 |
| | | | 65,926,787 |
| Multi-Utilities - 0.8% | | | |
| Ameren Corp. | | 424,424 | 39,310,151 |
| Avista Corp. | | 116,282 | 4,724,538 |
| Black Hills Corp. | | 103,572 | 7,817,615 |
| CenterPoint Energy, Inc. | | 1,017,375 | 32,077,834 |
| CMS Energy Corp. | | 474,336 | 32,036,653 |
| Consolidated Edison, Inc. | | 578,704 | 56,562,529 |
| Dominion Energy, Inc. | | 1,330,037 | 108,797,027 |
| DTE Energy Co. | | 318,455 | 41,507,425 |
| NiSource, Inc. | | 652,330 | 19,250,258 |
| NorthWestern Energy Corp. | | 87,272 | 4,623,671 |
| Public Service Enterprise Group, Inc. | | 821,317 | 52,859,962 |
| Sempra Energy | | 518,171 | 85,482,670 |
| Unitil Corp. | | 25,972 | 1,352,881 |
| WEC Energy Group, Inc. | | 518,645 | 53,493,045 |
| | | | 539,896,259 |
| Water Utilities - 0.1% | | | |
| American States Water Co. | | 60,151 | 4,990,728 |
| American Water Works Co., Inc. | | 299,705 | 44,491,207 |
| Artesian Resources Corp. Class A | | 15,316 | 836,713 |
| Cadiz, Inc. (a)(b) | | 51,666 | 197,881 |
| California Water Service Group | | 87,734 | 5,135,071 |
| Consolidated Water Co., Inc. | | 22,720 | 368,064 |
| Essential Utilities, Inc. | | 376,304 | 18,495,342 |
| Global Water Resources, Inc. | | 17,742 | 241,646 |
| Middlesex Water Co. | | 29,842 | 2,649,074 |
| Pure Cycle Corp. (a)(b) | | 34,178 | 352,717 |
| SJW Corp. | | 48,232 | 3,101,318 |
| York Water Co. | | 26,043 | 1,145,111 |
| | | | 82,004,872 |
TOTAL UTILITIES | | | 1,966,953,157 |
| TOTAL COMMON STOCKS (Cost $39,589,965,156) | | | 64,717,280,871 |
| | | | |
| Nonconvertible Preferred Stocks - 0.0% |
| | | Shares | Value ($) |
| INFORMATION TECHNOLOGY - 0.0% | | | |
| Software - 0.0% | | | |
SRAX, Inc. (c) (Cost $2,077) | | 35,558 | 1,778 |
| | | | |
| U.S. Treasury Obligations - 0.0% |
| | | Principal Amount (d) | Value ($) |
U.S. Treasury Bills, yield at date of purchase 1.15% 1/26/23 (e) (Cost $7,962,776) | | 8,000,000 | 7,900,657 |
| | | | |
| Money Market Funds - 1.3% |
| | | Shares | Value ($) |
| Fidelity Cash Central Fund 2.33% (f) | | 317 | 317 |
| Fidelity Securities Lending Cash Central Fund 2.34% (f)(g) | | 868,362,642 | 868,449,479 |
| TOTAL MONEY MARKET FUNDS (Cost $868,419,210) | | | 868,449,796 |
| | | | |
| TOTAL INVESTMENT IN SECURITIES - 101.1% (Cost $40,466,349,219) | 65,593,633,102 |
NET OTHER ASSETS (LIABILITIES) - (1.1)% | (739,247,890) |
| NET ASSETS - 100.0% | 64,854,385,212 |
| | |
| Futures Contracts |
| | Number of contracts | Expiration Date | Notional Amount ($) | Value ($) | Unrealized Appreciation/ (Depreciation) ($) |
| Purchased | | | | | |
| | | | | | |
| Equity Index Contracts | | | | | |
| CME E-mini Russell 2000 Index Contracts (United States) | 184 | Sep 2022 | 16,970,320 | 1,098,582 | 1,098,582 |
| CME E-mini S&P 500 Index Contracts (United States) | 579 | Sep 2022 | 114,540,675 | 5,160,374 | 5,160,374 |
| CME E-mini S&P MidCap 400 Index Contracts (United States) | 34 | Sep 2022 | 8,263,020 | 502,991 | 502,991 |
| | | | | | |
| TOTAL FUTURES CONTRACTS | | | | | 6,761,947 |
| The notional amount of futures purchased as a percentage of Net Assets is 0.2% |
Legend
| (b) | Security or a portion of the security is on loan at period end. |
| (d) | Amount is stated in United States dollars unless otherwise noted. |
| (e) | Security or a portion of the security was pledged to cover margin requirements for futures contracts. At period end, the value of securities pledged amounted to $5,844,511. |
| (f) | Affiliated fund that is generally available only to investment companies and other accounts managed by Fidelity Investments. The rate quoted is the annualized seven-day yield of the fund at period end. A complete unaudited listing of the fund's holdings as of its most recent quarter end is available upon request. In addition, each Fidelity Central Fund's financial statements are available on the SEC's website or upon request. |
| (g) | Investment made with cash collateral received from securities on loan. |
Affiliated Central Funds
Fiscal year to date information regarding the Fund's investments in Fidelity Central Funds, including the ownership percentage, is presented below.
| Affiliate | Value, beginning of period ($) | Purchases ($) | Sales Proceeds ($) | Dividend Income ($) | Realized Gain (loss) ($) | Change in Unrealized appreciation (depreciation) ($) | Value, end of period ($) | %ownership, end of period |
| Fidelity Cash Central Fund 2.33% | 105,050,927 | 1,400,804,858 | 1,505,855,469 | 680,933 | - | 1 | 317 | 0.0% |
| Fidelity Securities Lending Cash Central Fund 2.34% | 922,424,338 | 2,383,514,767 | 2,437,489,626 | 10,957,186 | - | - | 868,449,479 | 2.5% |
| Total | 1,027,475,265 | 3,784,319,625 | 3,943,345,095 | 11,638,119 | - | 1 | 868,449,796 | |
| | | | | | | | | |
Amounts in the income column in the above table include any capital gain distributions from underlying funds, which are presented in the corresponding line item in the Statement of Operations, if applicable.
Amount for Fidelity Securities Lending Cash Central Fund represents the income earned on investing cash collateral, less rebates paid to borrowers and any lending agent fees associated with the loan, plus any premium payments received for lending certain types of securities.
Investment Valuation
The following is a summary of the inputs used, as of August 31, 2022, involving the Fund's assets and liabilities carried at fair value. The inputs or methodology used for valuing securities may not be an indication of the risk associated with investing in those securities. For more information on valuation inputs, and their aggregation into the levels used below, please refer to the Investment Valuation section in the accompanying Notes to Financial Statements.
| Valuation Inputs at Reporting Date: |
| Description | Total ($) | Level 1 ($) | Level 2 ($) | Level 3 ($) |
Investments in Securities: | | | | |
|
| Equities: | | | | |
Communication Services | 4,961,917,764 | 4,961,879,016 | - | 38,748 |
Consumer Discretionary | 7,432,275,405 | 7,432,271,458 | - | 3,947 |
Consumer Staples | 3,996,619,024 | 3,996,611,313 | 7,711 | - |
Energy | 3,067,988,916 | 3,067,988,916 | - | - |
Financials | 7,531,423,962 | 7,531,423,962 | - | - |
Health Care | 9,029,455,223 | 9,029,119,806 | 6 | 335,411 |
Industrials | 5,726,953,743 | 5,726,953,703 | - | 40 |
Information Technology | 16,906,577,404 | 16,906,575,626 | - | 1,778 |
Materials | 1,827,774,366 | 1,827,774,366 | - | - |
Real Estate | 2,269,343,685 | 2,269,343,685 | - | - |
Utilities | 1,966,953,157 | 1,966,953,157 | - | - |
|
| U.S. Government and Government Agency Obligations | 7,900,657 | - | 7,900,657 | - |
|
| Money Market Funds | 868,449,796 | 868,449,796 | - | - |
| Total Investments in Securities: | 65,593,633,102 | 65,585,344,804 | 7,908,374 | 379,924 |
Derivative Instruments: | | | | |
|
| Assets | | | | |
Futures Contracts | 6,761,947 | 6,761,947 | - | - |
| Total Assets | 6,761,947 | 6,761,947 | - | - |
| Total Derivative Instruments: | 6,761,947 | 6,761,947 | - | - |
Value of Derivative Instruments
The following table is a summary of the Fund's value of derivative instruments by primary risk exposure as of August 31, 2022. For additional information on derivative instruments, please refer to the Derivative Instruments section in the accompanying Notes to Financial Statements.
Primary Risk Exposure / Derivative Type | Value |
| Asset ($) | Liability ($) |
| Equity Risk | | |
Futures Contracts (a) | 6,761,947 | 0 |
| Total Equity Risk | 6,761,947 | 0 |
| Total Value of Derivatives | 6,761,947 | 0 |
(a)Reflects gross cumulative appreciation (depreciation) on futures contracts as presented in the Schedule of Investments. In the Statement of Assets and Liabilities, the period end daily variation margin is included in receivable or payable for daily variation margin on futures contracts, and the net cumulative appreciation (depreciation) is included in Total accumulated earnings (loss).
Fidelity® Total Market Index Fund
| Statement of Assets and Liabilities |
| | | | August 31, 2022 (Unaudited) |
| | | | | |
| Assets | | | | |
| Investment in securities, at value (including securities loaned of $836,082,824) - See accompanying schedule: | | $64,725,183,306 | | |
Unaffiliated issuers (cost $39,597,930,009) | | | |
Fidelity Central Funds (cost $868,419,210) | | 868,449,796 | | |
| | | | | |
| Total Investment in Securities (cost $40,466,349,219) | | | $ | 65,593,633,102 |
| Receivable for investments sold | | | | 33,027,951 |
| Receivable for fund shares sold | | | | 26,126,965 |
| Dividends receivable | | | | 96,553,240 |
| Distributions receivable from Fidelity Central Funds | | | | 2,187,388 |
| Other receivables | | | | 1,012,712 |
Total assets | | | | 65,752,541,358 |
| Liabilities | | | | |
| Payable to custodian bank | | $3,408,629 | | |
| Payable for fund shares redeemed | | 16,743,405 | | |
| Accrued management fee | | 853,510 | | |
| Notes payable to affiliates | | 7,095,000 | | |
| Payable for daily variation margin on futures contracts | | 867,932 | | |
| Other payables and accrued expenses | | 979,260 | | |
| Collateral on securities loaned | | 868,208,410 | | |
| Total Liabilities | | | | 898,156,146 |
| Net Assets | | | $ | 64,854,385,212 |
| Net Assets consist of: | | | | |
| Paid in capital | | | $ | 39,713,626,491 |
| Total accumulated earnings (loss) | | | | 25,140,758,721 |
| Net Assets | | | $ | 64,854,385,212 |
Net Asset Value , offering price and redemption price per share ($64,854,385,212 ÷ 586,215,177 shares) | | | $ | 110.63 |
| | | | | |
| Statement of Operations |
| | | | Six months ended August 31, 2022 (Unaudited) |
| Investment Income | | | | |
| Dividends | | | $ | 530,892,099 |
| Interest | | | | 45,427 |
| Income from Fidelity Central Funds (including $10,957,186 from security lending) | | | | 11,638,119 |
| Total Income | | | | 542,575,645 |
| Expenses | | | | |
| Management fee | $ | 4,945,925 | | |
| Independent trustees' fees and expenses | | 108,798 | | |
| Total expenses before reductions | | 5,054,723 | | |
| Expense reductions | | (1,120) | | |
| Total expenses after reductions | | | | 5,053,603 |
| Net Investment income (loss) | | | | 537,522,042 |
| Realized and Unrealized Gain (Loss) | | | | |
| Net realized gain (loss) on: | | | | |
| Investment Securities: | | | | |
| Unaffiliated issuers | | 27,644,340 | | |
| Futures contracts | | (11,532,017) | | |
| Total net realized gain (loss) | | | | 16,112,323 |
| Change in net unrealized appreciation (depreciation) on: | | | | |
| Investment Securities: | | | | |
| Unaffiliated issuers | | (7,466,142,264) | | |
| Fidelity Central Funds | | 1 | | |
| Futures contracts | | 6,669,552 | | |
| Total change in net unrealized appreciation (depreciation) | | | | (7,459,472,711) |
| Net gain (loss) | | | | (7,443,360,388) |
| Net increase (decrease) in net assets resulting from operations | | | $ | (6,905,838,346) |
| Statement of Changes in Net Assets |
| |
| | Six months ended August 31, 2022 (Unaudited) | | Year ended February 28, 2022 |
| Increase (Decrease) in Net Assets | | | | |
| Operations | | | | |
| Net investment income (loss) | $ | 537,522,042 | $ | 914,107,445 |
| Net realized gain (loss) | | 16,112,323 | | 220,110,781 |
| Change in net unrealized appreciation (depreciation) | | (7,459,472,711) | | 6,034,559,018 |
| Net increase (decrease) in net assets resulting from operations | | (6,905,838,346) | | 7,168,777,244 |
| Distributions to shareholders | | (103,901,409) | | (871,074,643) |
| Share transactions | | | | |
| Proceeds from sales of shares | | 4,206,751,677 | | 12,792,374,740 |
| Reinvestment of distributions | | 93,025,466 | | 779,440,230 |
| Cost of shares redeemed | | (3,723,495,917) | | (8,465,837,461) |
Net increase (decrease) in net assets resulting from share transactions | | 576,281,226 | | 5,105,977,509 |
| Total increase (decrease) in net assets | | (6,433,458,529) | | 11,403,680,110 |
| | | | | |
| Net Assets | | | | |
| Beginning of period | | 71,287,843,741 | | 59,884,163,631 |
| End of period | $ | 64,854,385,212 | $ | 71,287,843,741 |
| | | | | |
| Other Information | | | | |
| Shares | | | | |
| Sold | | 36,408,660 | | 102,705,876 |
| Issued in reinvestment of distributions | | 745,995 | | 5,952,763 |
| Redeemed | | (32,463,032) | | (67,608,808) |
| Net increase (decrease) | | 4,691,623 | | 41,049,831 |
| | | | | |
| Fidelity® Total Market Index Fund |
| |
| | Six months ended (Unaudited) August 31, 2022 | | Years ended February 28, 2022 | | 2021 | | 2020 A | | 2019 | | 2018 |
Selected Per-Share Data | | | | | | | | | | | | |
| Net asset value, beginning of period | $ | 122.59 | $ | 110.80 | $ | 83.06 | $ | 79.36 | $ | 77.42 | $ | 68.19 |
| Income from Investment Operations | | | | | | | | | | | | |
Net investment income (loss) B,C | | .92 | | 1.62 | | 1.50 | | 1.57 | | 1.45 | | 1.36 |
| Net realized and unrealized gain (loss) | | (12.70) | | 11.70 | | 27.80 | | 3.88 | | 2.28 | | 9.65 |
| Total from investment operations | | (11.78) | | 13.32 | | 29.30 | | 5.45 | | 3.73 | | 11.01 |
| Distributions from net investment income | | (.18) | | (1.53) | | (1.56) | | (1.63) | | (1.46) | | (1.27) |
| Distributions from net realized gain | | - | | - | | - | | (.13) | | (.34) | | (.51) |
| Total distributions | | (.18) | | (1.53) | | (1.56) | | (1.75) D | | (1.79) D | | (1.78) |
| Net asset value, end of period | $ | 110.63 | $ | 122.59 | $ | 110.80 | $ | 83.06 | $ | 79.36 | $ | 77.42 |
Total Return E,F | | (9.63)% | | 11.94% | | 35.50% | | 6.77% | | 5.02% | | 16.25% |
Ratios to Average Net Assets C,G,H | | | | | | | | | | | | |
| Expenses before reductions | | .01% I,J | | .02% | | .02% | | .02% | | .02% | | .02% |
| Expenses net of fee waivers, if any | | .01% I,J | | .02% | | .02% | | .02% | | .02% | | .02% |
| Expenses net of all reductions | | .01% I,J | | .02% | | .02% | | .02% | | .02% | | .02% |
| Net investment income (loss) | | 1.59% J | | 1.29% | | 1.60% | | 1.84% | | 1.90% | | 1.86% |
| Supplemental Data | | | | | | | | | | | | |
| Net assets, end of period (000 omitted) | $ | 64,854,385 | $ | 71,287,844 | $ | 59,884,164 | $ | 45,985,996 | $ | 43,922,333 | $ | 6,114,864 |
Portfolio turnover rate K | | 1% J | | 3% | | 6% L | | 11% L | | 8% | | 2% |
A For the year ended February 29.
B Calculated based on average shares outstanding during the period.
C Net investment income (loss) is affected by the timing of the declaration of dividends by any underlying mutual funds or exchange-traded funds (ETFs). Net investment income (loss) of any such underlying funds is not included in the Fund's net investment income (loss) ratio.
D Total distributions per share do not sum due to rounding.
E Total returns for periods of less than one year are not annualized.
F Total returns would have been lower if certain expenses had not been reduced during the applicable periods shown.
G Fees and expenses of any underlying mutual funds or exchange-traded funds (ETFs) are not included in the Fund's expense ratio. The Fund indirectly bears its proportionate share of these expenses. For additional expense information related to investments in Fidelity Central Funds, please refer to the "Investments in Fidelity Central Funds" note found in the Notes to Financial Statements section of the most recent Annual or Semi-Annual report.
H Expense ratios reflect operating expenses of the class. Expenses before reductions do not reflect amounts reimbursed, waived, or reduced through arrangements with the investment adviser, brokerage services, or other offset arrangements, if applicable, and do not represent the amount paid by the class during periods when reimbursements, waivers or reductions occur.
I The size and fluctuation of net assets and expense amounts may cause ratios to differ from contractual rates.
J Annualized
K Amount does not include the portfolio activity of any underlying mutual funds or exchange-traded funds (ETFs).
L Portfolio turnover rate excludes securities received or delivered in-kind.
Top Holdings (% of Fund's net assets) |
| |
| Blackstone, Inc. | 1.1 | |
| Palo Alto Networks, Inc. | 0.9 | |
| Uber Technologies, Inc. | 0.8 | |
| Snowflake, Inc. | 0.7 | |
| Airbnb, Inc. Class A | 0.7 | |
| Marvell Technology, Inc. | 0.7 | |
| Crowdstrike Holdings, Inc. | 0.6 | |
| Cheniere Energy, Inc. | 0.6 | |
| lululemon athletica, Inc. | 0.6 | |
| Block, Inc. Class A | 0.6 | |
| | 7.3 | |
| |
| Market Sectors (% of Fund's net assets) |
| |
| Information Technology | 19.6 | |
| Financials | 15.8 | |
| Industrials | 13.9 | |
| Health Care | 13.3 | |
| Consumer Discretionary | 11.7 | |
| Real Estate | 7.0 | |
| Energy | 5.1 | |
| Materials | 4.4 | |
| Communication Services | 3.6 | |
| Consumer Staples | 2.9 | |
| Utilities | 2.5 | |
| |
Asset Allocation (% of Fund's net assets) |
|
Foreign investments - 4.5% |
|
Fidelity® Extended Market Index Fund
| Common Stocks - 99.8% |
| | | Shares | Value ($) |
| COMMUNICATION SERVICES - 3.6% | | | |
| Diversified Telecommunication Services - 0.5% | | | |
| Anterix, Inc. (a) | | 92,596 | 3,930,700 |
| AST SpaceMobile, Inc. (a)(b) | | 198,514 | 2,386,138 |
| ATN International, Inc. | | 50,765 | 2,378,340 |
| Bandwidth, Inc. (a) | | 123,500 | 1,914,250 |
| Charge Enterprises, Inc. (a)(b) | | 730,830 | 1,775,917 |
| Cogent Communications Group, Inc. | | 217,913 | 11,603,867 |
| Consolidated Communications Holdings, Inc. (a) | | 368,112 | 2,112,963 |
| Cuentas, Inc. (a)(b) | | 9,624 | 8,336 |
| EchoStar Holding Corp. Class A (a)(b) | | 194,018 | 3,571,871 |
| Frontier Communications Parent, Inc. (a)(b) | | 1,050,393 | 27,058,124 |
| Globalstar, Inc. (a)(b) | | 3,374,513 | 6,749,026 |
| IDT Corp. Class B (a) | | 90,754 | 2,320,580 |
| Iridium Communications, Inc. (a) | | 645,259 | 28,643,047 |
| Liberty Global PLC: | | | |
| Class A (a) | | 585,909 | 11,835,362 |
| Class B (a) | | 299 | 6,028 |
| Class C (a) | | 1,778,068 | 37,890,629 |
| Liberty Latin America Ltd.: | | | |
| Class A (a) | | 240,298 | 1,682,086 |
| Class C (a) | | 747,064 | 5,207,036 |
| Ooma, Inc. (a) | | 119,776 | 1,449,290 |
| Radius Global Infrastructure, Inc. (a)(b) | | 362,541 | 4,992,190 |
| Starry Group Holdings, Inc. Class A (a)(b) | | 511,730 | 1,151,393 |
| | | | 158,667,173 |
| Entertainment - 0.5% | | | |
| AMC Entertainment Holdings, Inc. Class A (a)(b) | | 2,602,147 | 23,731,581 |
| Ballantyne of Omaha, Inc. (a) | | 108,049 | 258,237 |
| Chicken Soup For The Soul Entertainment, Inc. (a)(b) | | 41,138 | 354,198 |
| Cinedigm Corp. (a)(b) | | 844,591 | 456,164 |
| Cinemark Holdings, Inc. (a) | | 534,201 | 7,521,550 |
| CuriosityStream, Inc. Class A (a)(b) | | 185,844 | 315,935 |
| Dolphin Entertainment, Inc. (a)(b) | | 42,583 | 178,849 |
| Gaia, Inc. Class A (a) | | 92,950 | 306,735 |
| Genius Brands International, Inc. (a)(b) | | 1,544,871 | 1,112,307 |
| Golden Matrix Group, Inc. (a)(b) | | 59,130 | 221,738 |
| Grom Social Enterprises, Inc. (a) | | 57,823 | 22,609 |
| Lions Gate Entertainment Corp.: | | | |
| Class A (a) | | 366,418 | 3,609,217 |
| Class B (a) | | 555,769 | 5,185,325 |
| LiveOne, Inc. (a)(b) | | 336,950 | 336,916 |
| Madison Square Garden Entertainment Corp. (a)(b) | | 127,118 | 7,062,676 |
| Madison Square Garden Sports Corp. (a) | | 84,052 | 13,471,014 |
| Marcus Corp. | | 110,813 | 1,782,981 |
| Motorsport Games, Inc. Class A (a) | | 18,764 | 11,983 |
| Moving Image Technologies, Inc. (a)(b) | | 73,437 | 113,827 |
| Playstudios, Inc. Class A (a) | | 404,763 | 1,465,242 |
| Playtika Holding Corp. (a) | | 522,777 | 5,504,842 |
| Reading International, Inc. Class A (a) | | 96,658 | 390,498 |
| Reservoir Media, Inc. (a)(b) | | 174,763 | 1,144,698 |
| Roku, Inc. Class A (a) | | 603,340 | 41,027,120 |
| Sciplay Corp. (A Shares) (a) | | 128,363 | 1,564,745 |
| Skillz, Inc. (a)(b) | | 1,316,189 | 1,750,531 |
| Warner Music Group Corp. Class A | | 581,915 | 15,577,865 |
| World Wrestling Entertainment, Inc. Class A (b) | | 218,032 | 14,828,356 |
| | | | 149,307,739 |
| Interactive Media & Services - 1.0% | | | |
| Angi, Inc. (a)(b) | | 393,463 | 1,597,460 |
| Autoweb, Inc. (a) | | 45,867 | 17,796 |
| Bumble, Inc. (a) | | 367,749 | 9,212,112 |
| BuzzFeed, Inc. (a)(b) | | 107,998 | 167,397 |
| CarGurus, Inc. Class A (a) | | 446,863 | 8,356,338 |
| Cars.com, Inc. (a) | | 328,629 | 4,190,020 |
| Creatd, Inc. (a)(b) | | 55,953 | 29,219 |
| DHI Group, Inc. (a) | | 206,573 | 1,053,522 |
| Eventbrite, Inc. (a)(b) | | 406,055 | 2,887,051 |
| EverQuote, Inc. Class A (a)(b) | | 117,218 | 1,013,936 |
| fuboTV, Inc. (a)(b) | | 949,033 | 3,435,499 |
| IAC (a) | | 426,398 | 27,404,599 |
| Izea Worldwide, Inc. (a) | | 292,509 | 249,890 |
| Kubient, Inc. (a)(b) | | 56,295 | 72,058 |
| Liberty TripAdvisor Holdings, Inc. (a) | | 382,593 | 459,112 |
| MediaAlpha, Inc. Class A (a) | | 109,672 | 915,761 |
| Nextdoor Holdings, Inc. (a)(b) | | 501,148 | 1,593,651 |
| Outbrain, Inc. (a)(b) | | 54,105 | 238,603 |
| Paltalk, Inc. (b) | | 16,172 | 28,786 |
| Pinterest, Inc. Class A (a) | | 2,899,080 | 66,794,803 |
| Professional Diversity Network, Inc. (a)(b) | | 32,687 | 24,188 |
| QuinStreet, Inc. (a) | | 259,460 | 3,116,115 |
| Shutterstock, Inc. | | 118,281 | 6,553,950 |
| Snap, Inc. Class A (a) | | 5,504,547 | 59,889,471 |
| Society Pass, Inc. (b) | | 22,204 | 41,966 |
| Super League Gaming, Inc. (a)(b) | | 185,472 | 165,089 |
| System1, Inc. (a)(b) | | 80,546 | 890,033 |
| The Arena Group Holdings, Inc. (b) | | 58,296 | 613,274 |
| Travelzoo, Inc. (a)(b) | | 35,573 | 207,391 |
| TripAdvisor, Inc. (a)(b) | | 506,667 | 12,058,675 |
| TrueCar, Inc. (a) | | 428,501 | 934,132 |
| Vimeo, Inc. (a) | | 809,349 | 4,791,346 |
| Vinco Ventures, Inc. (a)(b) | | 831,884 | 806,927 |
| Wejo Group Ltd. (a) | | 215,436 | 243,443 |
| Yelp, Inc. (a) | | 332,428 | 11,359,065 |
| Zedge, Inc. (a) | | 63,369 | 179,334 |
| Ziff Davis, Inc. (a) | | 239,695 | 18,523,630 |
| ZipRecruiter, Inc. (a) | | 64,501 | 1,075,877 |
| Zoominfo Technologies, Inc. (a) | | 1,524,692 | 69,251,511 |
| | | | 320,443,030 |
| Media - 1.5% | | | |
| AdTheorent Holding Co., Inc. Class A (a)(b) | | 258,204 | 681,659 |
| Advantage Solutions, Inc. Class A (a)(b) | | 521,966 | 1,899,956 |
| Altice U.S.A., Inc. Class A (a) | | 1,146,483 | 11,464,830 |
| AMC Networks, Inc. Class A (a) | | 152,998 | 4,098,816 |
| Audacy, Inc. Class A (a) | | 563,277 | 310,704 |
| Beasley Broadcast Group, Inc. Class A (a) | | 103,983 | 126,859 |
| Boston Omaha Corp. (a)(b) | | 93,356 | 2,504,741 |
| Cable One, Inc. | | 24,741 | 28,081,035 |
| Cardlytics, Inc. (a) | | 174,688 | 2,312,869 |
| Cbdmd, Inc. (a)(b) | | 207,684 | 82,887 |
| Clear Channel Outdoor Holdings, Inc. (a) | | 2,428,900 | 3,886,240 |
| comScore, Inc. (a)(b) | | 410,267 | 894,382 |
| Creative Realities, Inc. (a)(b) | | 128,206 | 83,911 |
| Cumulus Media, Inc. (a) | | 88,978 | 829,275 |
| Daily Journal Corp. (a) | | 4,370 | 1,141,444 |
| DallasNews Corp. | | 24,249 | 193,992 |
| Digital Media Solutions, Inc. Class A (a)(b) | | 83,733 | 108,016 |
| Direct Digital Holdings, Inc. (a) | | 12,409 | 37,599 |
| E.W. Scripps Co. Class A (a) | | 282,133 | 4,217,888 |
| Emerald Holding, Inc. (a) | | 126,319 | 483,802 |
| Entravision Communication Corp. Class A | | 287,642 | 1,461,221 |
| Fluent, Inc. (a) | | 244,244 | 390,790 |
| Gannett Co., Inc. (a)(b) | | 673,266 | 1,561,977 |
| Gray Television, Inc. | | 443,052 | 8,462,293 |
| Harte-Hanks, Inc. (a) | | 26,557 | 406,322 |
| Hemisphere Media Group, Inc. (a) | | 102,395 | 748,507 |
| IDW Media Holdings, Inc. Class B | | 17,754 | 32,312 |
| iHeartMedia, Inc. (a) | | 569,283 | 5,038,155 |
| Innovid Corp. (a) | | 339,759 | 1,246,916 |
| Insignia Systems, Inc. (a)(b) | | 8,987 | 64,706 |
| Integral Ad Science Holding Corp. (a) | | 89,759 | 729,741 |
| John Wiley & Sons, Inc. Class A | | 223,256 | 10,276,474 |
| Lee Enterprises, Inc. (a) | | 26,359 | 524,544 |
| Liberty Broadband Corp.: | | | |
| Class A (a) | | 17,858 | 1,800,444 |
| Class C (a) | | 746,290 | 75,897,693 |
| Liberty Media Corp.: | | | |
| Liberty Braves Class A (a)(b) | | 89,468 | 2,514,051 |
| Liberty Braves Class C (a) | | 155,013 | 4,238,055 |
| Liberty Formula One Group Series C (a) | | 1,113,520 | 70,908,954 |
| Liberty Media Class A (a) | | 24,736 | 1,437,904 |
| Liberty SiriusXM Series A (a)(b) | | 387,296 | 16,088,276 |
| Liberty SiriusXM Series C (a) | | 806,623 | 33,361,927 |
| Loyalty Ventures, Inc. (a) | | 96,031 | 202,625 |
| Magnite, Inc. (a) | | 588,822 | 4,433,830 |
| Marchex, Inc. Class B (a) | | 164,151 | 339,793 |
| Mediaco Holding, Inc. (a) | | 11,191 | 32,566 |
| Mobiquity Technologies, Inc. (a)(b) | | 3,607 | 5,771 |
| National CineMedia, Inc. (b) | | 225,448 | 279,556 |
| Nexstar Broadcasting Group, Inc. Class A | | 203,932 | 39,016,270 |
| Nextplay Technologies, Inc. (a)(b) | | 377,196 | 100,560 |
| PubMatic, Inc. (a)(b) | | 211,973 | 4,148,312 |
| Saga Communications, Inc. Class A | | 25,724 | 715,899 |
| Salem Communications Corp. Class A (a) | | 84,018 | 201,643 |
| Scholastic Corp. | | 152,350 | 6,994,389 |
| Sinclair Broadcast Group, Inc. Class A | | 222,651 | 4,918,361 |
| Sirius XM Holdings, Inc. (b) | | 4,568,786 | 27,823,907 |
| SPAR Group, Inc. (a)(b) | | 78,330 | 101,046 |
| Stagwell, Inc. (a) | | 405,138 | 2,746,836 |
| Stran & Co., Inc. (a)(b) | | 36,500 | 67,160 |
| TechTarget, Inc. (a) | | 133,943 | 8,692,901 |
| TEGNA, Inc. | | 1,106,218 | 23,673,065 |
| The New York Times Co. Class A | | 842,315 | 25,682,184 |
| Thryv Holdings, Inc. (a) | | 90,537 | 2,315,936 |
| Townsquare Media, Inc. (a) | | 57,269 | 498,240 |
| Troika Media Group, Inc. (a)(b) | | 45,005 | 31,711 |
| Urban One, Inc.: | | | |
| Class A (a) | | 29,683 | 162,069 |
| Class D (non-vtg.) (a) | | 126,515 | 530,098 |
| WideOpenWest, Inc. (a) | | 263,636 | 4,692,721 |
| Xcel Brands, Inc. (a)(b) | | 41,415 | 46,385 |
| | | | 459,086,001 |
| Wireless Telecommunication Services - 0.1% | | | |
| Gogo, Inc. (a) | | 343,172 | 5,099,536 |
| KORE Group Holdings, Inc. (a)(b) | | 162,118 | 484,733 |
| NII Holdings, Inc. (a)(c) | | 487,940 | 126,864 |
| Shenandoah Telecommunications Co. | | 251,679 | 5,609,925 |
| Spok Holdings, Inc. | | 96,353 | 693,742 |
| SurgePays, Inc. (a)(b) | | 44,656 | 188,002 |
| Telephone & Data Systems, Inc. | | 493,327 | 8,026,430 |
| U.S. Cellular Corp. (a) | | 75,725 | 2,164,978 |
| | | | 22,394,210 |
TOTAL COMMUNICATION SERVICES | | | 1,109,898,153 |
| CONSUMER DISCRETIONARY - 11.7% | | | |
| Auto Components - 0.9% | | | |
| Adient PLC (a) | | 480,152 | 15,941,046 |
| American Axle & Manufacturing Holdings, Inc. (a) | | 567,326 | 5,871,824 |
| Autoliv, Inc. | | 397,296 | 30,905,656 |
| Cooper-Standard Holding, Inc. (a)(b) | | 92,334 | 722,975 |
| Dana, Inc. | | 716,377 | 11,082,352 |
| Dorman Products, Inc. (a) | | 143,659 | 13,022,688 |
| Fox Factory Holding Corp. (a) | | 213,556 | 19,905,555 |
| Garrett Motion, Inc. (a)(b) | | 297,004 | 2,046,358 |
| Gentex Corp. | | 1,182,207 | 32,262,429 |
| Gentherm, Inc. (a) | | 168,678 | 10,103,812 |
| Holley, Inc. (a)(b) | | 192,916 | 1,093,834 |
| Horizon Global Corp. (a) | | 112,335 | 167,379 |
| LCI Industries | | 128,492 | 14,888,368 |
| Lear Corp. | | 299,538 | 41,527,948 |
| Luminar Technologies, Inc. (a)(b) | | 1,107,234 | 9,544,357 |
| Modine Manufacturing Co. (a) | | 261,097 | 3,911,233 |
| Motorcar Parts of America, Inc. (a) | | 97,500 | 1,448,850 |
| Patrick Industries, Inc. | | 112,630 | 5,966,011 |
| QuantumScape Corp. Class A (a)(b) | | 1,299,118 | 14,329,272 |
| Solid Power, Inc. (a) | | 562,798 | 3,703,211 |
| Standard Motor Products, Inc. | | 95,517 | 3,505,474 |
| Stoneridge, Inc. (a) | | 139,936 | 2,658,784 |
| Strattec Security Corp. (a) | | 19,462 | 531,313 |
| Superior Industries International, Inc. (a) | | 138,817 | 691,309 |
| Sypris Solutions, Inc. (a)(b) | | 63,996 | 122,872 |
| Tenneco, Inc. (a) | | 382,664 | 7,217,043 |
| The Goodyear Tire & Rubber Co. (a) | | 1,424,373 | 19,983,953 |
| Unique Fabricating, Inc. (a)(b) | | 27,077 | 20,308 |
| Visteon Corp. (a) | | 141,079 | 16,905,497 |
| Worksport Ltd. (a)(b) | | 97,706 | 208,114 |
| XL Fleet Corp. (Class A) (a)(b) | | 447,329 | 501,008 |
| XPEL, Inc. (a) | | 84,162 | 5,767,622 |
| | | | 296,558,455 |
| Automobiles - 0.5% | | | |
| Arcimoto, Inc. (a)(b) | | 159,972 | 350,339 |
| AYRO, Inc. (a)(b) | | 119,532 | 106,455 |
| Canoo, Inc. (a)(b) | | 736,470 | 2,349,339 |
| Faraday Future Intelligent Electric, Inc. (a)(b) | | 798,298 | 894,094 |
| Fisker, Inc. (a)(b) | | 724,464 | 6,541,910 |
| Harley-Davidson, Inc. | | 741,868 | 28,613,849 |
| Lordstown Motors Corp. Class A (a)(b) | | 632,932 | 1,354,474 |
| Lucid Group, Inc. Class A (a)(b) | | 2,856,866 | 43,824,324 |
| Mullen Automotive, Inc. (a)(b) | | 1,219,600 | 813,473 |
| Rivian Automotive, Inc. | | 806,995 | 26,396,806 |
| Thor Industries, Inc. (b) | | 278,881 | 22,592,150 |
| Volcon, Inc. (b) | | 73,763 | 224,240 |
| Winnebago Industries, Inc. (b) | | 164,895 | 9,494,654 |
| Workhorse Group, Inc. (a)(b) | | 793,375 | 2,483,264 |
| | | | 146,039,371 |
| Distributors - 0.0% | | | |
| Amcon Distributing Co. | | 1,008 | 196,550 |
| Educational Development Corp. | | 33,347 | 105,710 |
| Funko, Inc. (a) | | 137,784 | 3,068,450 |
| Kaival Brands Innovations Group, Inc. (a)(b) | | 69,923 | 90,900 |
| Weyco Group, Inc. | | 34,972 | 895,283 |
| | | | 4,356,893 |
| Diversified Consumer Services - 0.8% | | | |
| 2U, Inc. (a) | | 386,796 | 2,753,988 |
| ADT, Inc. | | 1,165,239 | 8,494,592 |
| Adtalem Global Education, Inc. (a) | | 227,136 | 8,560,756 |
| American Public Education, Inc. (a) | | 97,523 | 1,007,413 |
| Amesite, Inc. (a)(b) | | 81,397 | 32,559 |
| Aspen Group, Inc. (a) | | 110,439 | 88,572 |
| Bright Horizons Family Solutions, Inc. (a) | | 301,192 | 20,541,294 |
| Carriage Services, Inc. | | 68,654 | 2,431,038 |
| Chegg, Inc. (a) | | 641,032 | 12,615,510 |
| Coursera, Inc. (a) | | 428,261 | 4,925,002 |
| Duolingo, Inc. (a)(b) | | 103,491 | 9,730,224 |
| European Wax Center, Inc. (b) | | 87,156 | 1,885,184 |
| Frontdoor, Inc. (a) | | 414,605 | 9,734,925 |
| Graham Holdings Co. | | 19,889 | 11,245,837 |
| Grand Canyon Education, Inc. (a) | | 163,052 | 13,269,172 |
| H&R Block, Inc. | | 805,584 | 36,251,280 |
| Laureate Education, Inc. Class A | | 705,231 | 7,771,646 |
| Lincoln Educational Services Corp. (a) | | 122,211 | 794,372 |
| Mister Car Wash, Inc. (a)(b) | | 200,237 | 1,984,349 |
| Nerdy, Inc. Class A (a)(b) | | 290,308 | 888,342 |
| OneSpaWorld Holdings Ltd. (a) | | 309,873 | 2,729,981 |
| Perdoceo Education Corp. (a) | | 351,947 | 4,075,546 |
| PowerSchool Holdings, Inc. (a)(b) | | 215,723 | 3,883,014 |
| Regis Corp. (a)(b) | | 209,856 | 293,798 |
| Rover Group, Inc. Class A (a)(b) | | 406,744 | 1,549,695 |
| Service Corp. International | | 801,363 | 49,452,111 |
| StoneMor, Inc. (a) | | 123,953 | 426,398 |
| Strategic Education, Inc. | | 116,405 | 7,531,404 |
| Stride, Inc. (a) | | 216,133 | 8,243,313 |
| Terminix Global Holdings, Inc. (a) | | 613,755 | 26,176,651 |
| The Beachbody Co., Inc. (a)(b) | | 543,375 | 630,315 |
| Udemy, Inc. | | 80,259 | 1,192,649 |
| Universal Technical Institute, Inc. (a) | | 167,413 | 1,148,453 |
| Vivint Smart Home, Inc. Class A (a) | | 200,104 | 1,252,651 |
| WW International, Inc. (a) | | 277,427 | 1,448,169 |
| Xpresspa Group, Inc. (a)(b) | | 605,858 | 630,092 |
| Zovio, Inc. (a) | | 148,712 | 38,963 |
| | | | 265,709,258 |
| Hotels, Restaurants & Leisure - 2.7% | | | |
| Accel Entertainment, Inc. (a) | | 285,047 | 2,682,292 |
| Airbnb, Inc. Class A (a) | | 1,928,121 | 218,109,048 |
| Allied Esports Entertainment, Inc. (a) | | 91,636 | 137,454 |
| ARAMARK Holdings Corp. | | 1,295,108 | 46,248,307 |
| Ark Restaurants Corp. | | 10,363 | 204,255 |
| Bally's Corp. (a)(b) | | 131,566 | 3,116,799 |
| BBQ Holdings, Inc. (a) | | 51,624 | 887,417 |
| Biglari Holdings, Inc.: | | | |
| Class A (a) | | 350 | 231,000 |
| Class B (a) | | 4,661 | 628,582 |
| BJ's Restaurants, Inc. (a) | | 117,784 | 2,954,023 |
| Bloomin' Brands, Inc. | | 407,979 | 8,249,335 |
| Bluegreen Vacations Holding Corp. Class A | | 63,776 | 1,329,092 |
| Bowlero Corp. Class A (a)(b) | | 215,524 | 2,547,494 |
| Boyd Gaming Corp. | | 402,402 | 21,902,741 |
| Brinker International, Inc. (a) | | 221,334 | 5,424,896 |
| BurgerFi International, Inc. (a) | | 60,554 | 182,268 |
| Canterbury Park Holding Co. | | 13,576 | 298,672 |
| Carrols Restaurant Group, Inc. | | 205,108 | 451,238 |
| Century Casinos, Inc. (a) | | 138,238 | 1,018,814 |
| Choice Hotels International, Inc. | | 165,810 | 19,020,065 |
| Churchill Downs, Inc. | | 172,563 | 34,010,442 |
| Chuy's Holdings, Inc. (a) | | 95,686 | 2,136,668 |
| Cracker Barrel Old Country Store, Inc. (b) | | 117,737 | 12,708,532 |
| Dave & Buster's Entertainment, Inc. (a) | | 194,434 | 8,037,902 |
| Denny's Corp. (a) | | 308,360 | 2,914,002 |
| Dine Brands Global, Inc. | | 84,077 | 5,599,528 |
| Draftkings Holdings, Inc. (a)(b) | | 1,800,369 | 28,913,926 |
| Drive Shack, Inc. (a)(b) | | 464,681 | 501,855 |
| Dutch Bros, Inc. (b) | | 139,078 | 5,076,347 |
| Ebet, Inc. (a)(b) | | 11,054 | 20,560 |
| El Pollo Loco Holdings, Inc. (a) | | 106,097 | 960,178 |
| Elys Game Technology Corp. (a)(b) | | 28,618 | 15,946 |
| Esports Entertainment Group, Inc. (a)(b) | | 110,717 | 53,089 |
| Everi Holdings, Inc. (a) | | 466,891 | 8,637,484 |
| F45 Training Holdings, Inc. (a) | | 115,891 | 289,728 |
| FAT Brands, Inc.: | | | |
| Class A | | 11,896 | 100,759 |
| Class B | | 16,716 | 137,573 |
| Fiesta Restaurant Group, Inc. (a) | | 94,008 | 627,033 |
| First Watch Restaurant Group, Inc. | | 53,478 | 896,826 |
| Flanigans Enterprises, Inc. (b) | | 5,292 | 136,004 |
| Full House Resorts, Inc. (a) | | 169,294 | 1,141,042 |
| GAN Ltd. (a) | | 227,348 | 586,558 |
| Golden Entertainment, Inc. (a)(b) | | 103,067 | 3,943,343 |
| Good Times Restaurants, Inc. (a) | | 49,578 | 145,759 |
| Hall of Fame Resort & Entertainment Co. (a)(b) | | 301,562 | 240,254 |
| Hilton Grand Vacations, Inc. (a) | | 449,146 | 18,316,174 |
| Hyatt Hotels Corp. Class A (a) | | 257,861 | 23,109,503 |
| Inspirato, Inc. (a) | | 114,810 | 320,320 |
| Inspired Entertainment, Inc. (a) | | 130,968 | 1,371,235 |
| Jack in the Box, Inc. | | 106,457 | 8,501,656 |
| Krispy Kreme, Inc. (b) | | 150,652 | 1,770,161 |
| Kura Sushi U.S.A., Inc. Class A (a) | | 21,663 | 1,619,526 |
| Life Time Group Holdings, Inc. (b) | | 195,623 | 2,318,133 |
| Light & Wonder, Inc. Class A (a) | | 484,307 | 23,842,434 |
| Lindblad Expeditions Holdings (a) | | 156,839 | 1,212,365 |
| Lottery.Com, Inc. (a)(b) | | 175,095 | 62,351 |
| Marriott Vacations Worldwide Corp. | | 208,460 | 29,688,873 |
| Membership Collective Group, Inc. Class A (a)(b) | | 159,549 | 904,643 |
| Monarch Casino & Resort, Inc. (a) | | 67,607 | 4,082,787 |
| Muscle Maker, Inc. (a) | | 60,875 | 25,872 |
| Nathan's Famous, Inc. | | 15,544 | 1,010,360 |
| Noodles & Co. (a) | | 196,915 | 935,346 |
| Papa John's International, Inc. | | 160,881 | 13,004,011 |
| Planet Fitness, Inc. (a) | | 428,030 | 28,999,033 |
| Playa Hotels & Resorts NV (a) | | 688,884 | 4,519,079 |
| PlayAGS, Inc. (a) | | 144,775 | 1,065,544 |
| Portillo's, Inc. (b) | | 148,936 | 3,279,571 |
| Potbelly Corp. (a) | | 127,849 | 695,499 |
| Rave Restaurant Group, Inc. (a) | | 98,233 | 116,897 |
| RCI Hospitality Holdings, Inc. | | 40,243 | 2,624,246 |
| Red Robin Gourmet Burgers, Inc. (a)(b) | | 85,049 | 631,914 |
| Red Rock Resorts, Inc. (b) | | 265,848 | 10,160,711 |
| Rush Street Interactive, Inc. (a) | | 289,063 | 1,399,065 |
| Ruth's Hospitality Group, Inc. | | 154,262 | 2,810,654 |
| SeaWorld Entertainment, Inc. (a) | | 238,365 | 11,977,841 |
| Shake Shack, Inc. Class A (a) | | 197,539 | 9,414,709 |
| Six Flags Entertainment Corp. (a)(b) | | 393,183 | 8,709,003 |
| Sonder Holdings, Inc. (a)(b) | | 597,299 | 1,110,976 |
| Sweetgreen, Inc. Class A | | 67,439 | 1,140,393 |
| Target Hospitality Corp. (a)(b) | | 128,030 | 1,701,519 |
| Texas Roadhouse, Inc. Class A | | 340,902 | 30,258,462 |
| The Cheesecake Factory, Inc. (b) | | 250,170 | 7,660,205 |
| The ONE Group Hospitality, Inc. (a) | | 126,779 | 905,202 |
| Travel+Leisure Co. | | 432,172 | 18,324,093 |
| Vacasa, Inc. Class A (a) | | 478,072 | 1,912,288 |
| Vail Resorts, Inc. | | 204,466 | 45,939,421 |
| Wendy's Co. | | 860,422 | 16,502,894 |
| Wingstop, Inc. | | 151,452 | 17,244,325 |
| Wyndham Hotels & Resorts, Inc. | | 463,107 | 30,259,411 |
| Xponential Fitness, Inc. (a) | | 69,260 | 1,269,536 |
| | | | 846,183,371 |
| Household Durables - 1.0% | | | |
| Aterian, Inc. (a)(b) | | 256,653 | 585,169 |
| Bassett Furniture Industries, Inc. | | 47,178 | 899,213 |
| Beazer Homes U.S.A., Inc. (a) | | 150,762 | 2,146,851 |
| Cavco Industries, Inc. (a) | | 43,415 | 10,159,544 |
| Century Communities, Inc. | | 147,759 | 6,898,868 |
| Cricut, Inc. (a)(b) | | 217,972 | 1,360,145 |
| Dixie Group, Inc. (a) | | 66,738 | 75,414 |
| Dream Finders Homes, Inc. (a)(b) | | 101,453 | 1,252,945 |
| Emerson Radio Corp. (a) | | 23,862 | 15,534 |
| Ethan Allen Interiors, Inc. | | 109,597 | 2,605,121 |
| Flexsteel Industries, Inc. | | 27,032 | 472,790 |
| GoPro, Inc. Class A (a) | | 659,222 | 4,014,662 |
| Green Brick Partners, Inc. (a)(b) | | 231,791 | 5,646,429 |
| Hamilton Beach Brands Holding Co. Class A | | 38,454 | 474,907 |
| Harbor Custom Development, Inc. (a)(b) | | 65,638 | 74,171 |
| Helen of Troy Ltd. (a) | | 120,574 | 14,906,564 |
| Hooker Furnishings Corp. | | 59,954 | 951,470 |
| Hovnanian Enterprises, Inc. Class A (a) | | 24,821 | 995,074 |
| Installed Building Products, Inc. | | 117,616 | 10,651,305 |
| iRobot Corp. (a)(b) | | 136,283 | 8,024,343 |
| KB Home | | 435,715 | 12,483,235 |
| Koss Corp. (a)(b) | | 33,494 | 262,258 |
| La-Z-Boy, Inc. | | 219,341 | 5,788,409 |
| Landsea Homes Corp. (a) | | 72,411 | 485,154 |
| Legacy Housing Corp. (a) | | 55,443 | 947,521 |
| Leggett & Platt, Inc. | | 674,307 | 25,772,014 |
| LGI Homes, Inc. (a)(b) | | 106,132 | 10,072,988 |
| Lifetime Brands, Inc. | | 61,002 | 544,138 |
| Live Ventures, Inc. (a) | | 8,123 | 204,537 |
| Lovesac (a) | | 68,137 | 2,102,026 |
| M.D.C. Holdings, Inc. | | 288,263 | 8,959,214 |
| M/I Homes, Inc. (a) | | 143,058 | 6,185,828 |
| Meritage Homes Corp. (a) | | 185,567 | 14,539,174 |
| Nova LifeStyle, Inc. (a) | | 18,847 | 14,324 |
| Purple Innovation, Inc. (a)(b) | | 363,970 | 1,040,954 |
| Skyline Champion Corp. (a) | | 268,165 | 15,196,911 |
| Snap One Holdings Corp. (a) | | 73,281 | 820,014 |
| Sonos, Inc. (a) | | 647,679 | 9,741,092 |
| Taylor Morrison Home Corp. (a) | | 604,005 | 15,166,566 |
| Tempur Sealy International, Inc. | | 884,513 | 22,121,670 |
| Toll Brothers, Inc. | | 556,541 | 24,370,930 |
| TopBuild Corp. (a) | | 165,669 | 30,443,335 |
| Traeger, Inc. (a) | | 131,714 | 347,725 |
| TRI Pointe Homes, Inc. (a) | | 520,250 | 9,015,933 |
| Tupperware Brands Corp. (a)(b) | | 231,016 | 2,596,620 |
| Universal Electronics, Inc. (a) | | 63,869 | 1,419,808 |
| Vizio Holding Corp. (a) | | 186,468 | 1,998,937 |
| VOXX International Corp. (a)(b) | | 81,702 | 787,607 |
| Vuzix Corp. (a)(b) | | 300,126 | 2,253,946 |
| Weber, Inc. (b) | | 96,732 | 694,536 |
| ZAGG, Inc. rights (a)(c) | | 138,785 | 12,491 |
| | | | 298,600,414 |
| Internet & Direct Marketing Retail - 1.3% | | | |
| 1-800-FLOWERS.com, Inc. Class A (a) | | 144,213 | 1,251,769 |
| 1stDibs.com, Inc. (a) | | 32,527 | 220,208 |
| BARK, Inc. (a) | | 399,764 | 927,452 |
| Boxed, Inc. Class A (a) | | 251,637 | 266,735 |
| CarParts.com, Inc. (a)(b) | | 241,510 | 1,564,985 |
| Chewy, Inc. (a)(b) | | 459,308 | 15,768,044 |
| ContextLogic, Inc. (a)(b) | | 1,758,561 | 2,286,129 |
| Digital Brands Group, Inc. (a)(b) | | 13,186 | 1,797 |
| Doordash, Inc. (a) | | 840,513 | 50,346,729 |
| Duluth Holdings, Inc. (a)(b) | | 65,598 | 581,854 |
| Groupon, Inc. (a)(b) | | 108,871 | 1,078,912 |
| iMedia Brands, Inc. (a)(b) | | 73,178 | 73,544 |
| iPower, Inc. (a)(b) | | 15,769 | 16,400 |
| Kidpik Corp. (b) | | 17,334 | 36,401 |
| Lands' End, Inc. (a)(b) | | 66,380 | 917,372 |
| Liquidity Services, Inc. (a) | | 136,469 | 2,386,843 |
| Lulu's Fashion Lounge Holdings, Inc. (b) | | 28,545 | 182,117 |
| Lyft, Inc. (a) | | 1,531,872 | 22,564,475 |
| Overstock.com, Inc. (a)(b) | | 214,383 | 5,595,396 |
| PARTS iD, Inc. (a)(b) | | 15,012 | 19,681 |
| PetMed Express, Inc. | | 103,042 | 2,119,574 |
| Polished.Com, Inc. (a)(b) | | 575,876 | 404,323 |
| Porch Group, Inc. Class A (a)(b) | | 423,801 | 911,172 |
| Poshmark, Inc. (a) | | 211,335 | 2,286,645 |
| Quotient Technology, Inc. (a)(b) | | 435,914 | 810,800 |
| Qurate Retail, Inc. (b) | | 10,349 | 114,667 |
| Qurate Retail, Inc. Series A | | 1,719,742 | 5,331,200 |
| Remark Holdings, Inc. (a)(b) | | 529,587 | 210,829 |
| Rent the Runway, Inc. Class A (b) | | 92,317 | 410,811 |
| Revolve Group, Inc. (a)(b) | | 204,455 | 4,802,648 |
| RumbleON, Inc. Class B (a) | | 48,883 | 1,068,094 |
| Stitch Fix, Inc. (a)(b) | | 423,980 | 2,128,380 |
| The RealReal, Inc. (a) | | 419,320 | 897,345 |
| thredUP, Inc. (a)(b) | | 303,088 | 730,442 |
| Trxade Health, Inc. (a)(b) | | 24,550 | 27,987 |
| Uber Technologies, Inc. (a) | | 8,523,949 | 245,148,773 |
| Vivid Seats, Inc. Class A (b) | | 117,068 | 947,080 |
| Waitr Holdings, Inc. (a)(b) | | 530,764 | 136,778 |
| Wayfair LLC Class A (a)(b) | | 402,724 | 21,227,582 |
| Xometry, Inc. (a)(b) | | 49,606 | 2,431,190 |
| | | | 398,233,163 |
| Leisure Products - 0.6% | | | |
| Acushnet Holdings Corp. | | 171,887 | 8,190,416 |
| American Outdoor Brands, Inc. (a)(b) | | 68,069 | 584,713 |
| AMMO, Inc. (a)(b) | | 448,744 | 1,709,715 |
| Brunswick Corp. | | 382,363 | 28,566,340 |
| Callaway Golf Co. (a)(b) | | 586,110 | 12,970,614 |
| Clarus Corp. (b) | | 135,247 | 2,051,697 |
| Escalade, Inc. | | 50,326 | 589,317 |
| JAKKS Pacific, Inc. (a) | | 37,263 | 834,691 |
| Johnson Outdoors, Inc. Class A | | 36,990 | 2,261,569 |
| Latham Group, Inc. (a) | | 160,394 | 915,850 |
| Malibu Boats, Inc. Class A (a) | | 104,046 | 6,245,881 |
| Marine Products Corp. | | 46,979 | 466,501 |
| MasterCraft Boat Holdings, Inc. (a) | | 92,925 | 2,238,563 |
| Mattel, Inc. (a)(b) | | 1,776,038 | 39,285,961 |
| Nautilus, Inc. (a) | | 175,876 | 355,270 |
| Peloton Interactive, Inc. Class A (a)(b) | | 1,549,886 | 15,793,338 |
| Polaris, Inc. | | 282,221 | 31,967,173 |
| Smith & Wesson Brands, Inc. | | 234,589 | 3,120,034 |
| Solo Brands, Inc. Class A (b) | | 70,905 | 294,256 |
| Sturm, Ruger & Co., Inc. | | 89,349 | 4,668,485 |
| Vista Outdoor, Inc. (a) | | 284,696 | 8,005,652 |
| YETI Holdings, Inc. (a) | | 435,782 | 16,075,998 |
| | | | 187,192,034 |
| Multiline Retail - 0.3% | | | |
| Big Lots, Inc. | | 142,695 | 2,935,236 |
| Dillard's, Inc. Class A (b) | | 18,465 | 5,470,072 |
| Franchise Group, Inc. | | 137,450 | 4,658,181 |
| Kohl's Corp. | | 649,265 | 18,452,111 |
| Macy's, Inc. | | 1,441,671 | 24,969,742 |
| Nordstrom, Inc. | | 561,658 | 9,609,968 |
| Ollie's Bargain Outlet Holdings, Inc. (a) | | 296,347 | 16,390,953 |
| Tuesday Morning Corp. (a)(b) | | 300,685 | 108,698 |
| | | | 82,594,961 |
| Specialty Retail - 2.2% | | | |
| Abercrombie & Fitch Co. Class A (a) | | 252,301 | 3,630,611 |
| Academy Sports & Outdoors, Inc. | | 432,192 | 18,618,831 |
| America's Car Mart, Inc. (a) | | 30,097 | 2,426,119 |
| American Eagle Outfitters, Inc. | | 781,975 | 8,805,039 |
| Arhaus, Inc. (b) | | 64,975 | 556,186 |
| Arko Corp. | | 331,486 | 3,159,062 |
| Asbury Automotive Group, Inc. (a) | | 111,768 | 19,501,281 |
| AutoNation, Inc. (a) | | 179,902 | 22,415,789 |
| Barnes & Noble Education, Inc. (a) | | 203,641 | 521,321 |
| Bed Bath & Beyond, Inc. (a)(b) | | 402,235 | 3,833,300 |
| Big 5 Sporting Goods Corp. (b) | | 109,941 | 1,345,678 |
| Boot Barn Holdings, Inc. (a) | | 150,438 | 10,022,180 |
| Brilliant Earth Group, Inc. Class A | | 47,945 | 354,793 |
| Build-A-Bear Workshop, Inc. | | 75,036 | 1,149,552 |
| Burlington Stores, Inc. (a) | | 333,830 | 46,799,628 |
| Caleres, Inc. | | 192,184 | 4,904,536 |
| Camping World Holdings, Inc. (b) | | 191,893 | 5,779,817 |
| CarLotz, Inc. Class A (a)(b) | | 414,202 | 165,681 |
| Carvana Co. Class A (a)(b) | | 503,660 | 16,615,743 |
| Chico's FAS, Inc. (a) | | 639,699 | 3,633,490 |
| Citi Trends, Inc. (a) | | 44,911 | 907,202 |
| Conn's, Inc. (a)(b) | | 76,959 | 739,576 |
| Designer Brands, Inc. Class A | | 302,579 | 5,161,998 |
| Destination XL Group, Inc. (a)(b) | | 185,187 | 1,020,380 |
| Dick's Sporting Goods, Inc. | | 293,465 | 31,215,872 |
| Envela Corp. (a)(b) | | 42,457 | 308,238 |
| EVgo, Inc. Class A (a)(b) | | 347,483 | 3,297,614 |
| Express, Inc. (a)(b) | | 354,587 | 538,972 |
| Five Below, Inc. (a) | | 277,750 | 35,518,670 |
| Floor & Decor Holdings, Inc. Class A (a) | | 534,054 | 43,450,633 |
| Foot Locker, Inc. | | 416,054 | 15,327,429 |
| GameStop Corp. Class A (b) | | 1,246,843 | 35,709,584 |
| Gap, Inc. (b) | | 1,071,648 | 9,794,863 |
| Genesco, Inc. (a) | | 65,598 | 3,711,535 |
| Group 1 Automotive, Inc. | | 83,891 | 14,982,094 |
| GrowGeneration Corp. (a)(b) | | 267,481 | 1,270,535 |
| Guess?, Inc. | | 179,791 | 3,140,949 |
| Haverty Furniture Companies, Inc. | | 70,776 | 1,898,212 |
| Hibbett, Inc. | | 61,310 | 3,592,766 |
| J.Jill, Inc. (a) | | 22,669 | 367,238 |
| JOANN, Inc. | | 62,898 | 446,576 |
| Kirkland's, Inc. (a)(b) | | 68,190 | 278,215 |
| Lazydays Holdings, Inc. (a)(b) | | 47,997 | 790,031 |
| Leslie's, Inc. (a)(b) | | 696,338 | 9,874,073 |
| Lithia Motors, Inc. Class A (sub. vtg.) | | 145,672 | 38,667,176 |
| LL Flooring Holdings, Inc. (a) | | 147,660 | 1,201,952 |
| MarineMax, Inc. (a) | | 109,355 | 3,973,961 |
| Monro, Inc. | | 170,186 | 7,881,314 |
| Murphy U.S.A., Inc. | | 111,941 | 32,481,920 |
| National Vision Holdings, Inc. (a)(b) | | 410,785 | 13,650,386 |
| OneWater Marine, Inc. Class A (a) | | 58,603 | 2,335,330 |
| Party City Holdco, Inc. (a)(b) | | 544,042 | 1,071,763 |
| Penske Automotive Group, Inc. | | 149,164 | 17,587,927 |
| Petco Health & Wellness Co., Inc. (a)(b) | | 414,701 | 6,187,339 |
| Rent-A-Center, Inc. | | 271,447 | 7,014,190 |
| RH (a) | | 88,891 | 22,748,096 |
| Sally Beauty Holdings, Inc. (a) | | 541,531 | 8,057,981 |
| Shift Technologies, Inc. Class A (a)(b) | | 338,706 | 287,900 |
| Shoe Carnival, Inc. (b) | | 85,972 | 2,045,274 |
| Signet Jewelers Ltd. (b) | | 240,691 | 15,733,971 |
| Sleep Number Corp. (a)(b) | | 111,821 | 4,632,744 |
| Sonic Automotive, Inc. Class A (sub. vtg.) | | 98,365 | 5,232,034 |
| Sportsman's Warehouse Holdings, Inc. (a) | | 227,332 | 1,809,563 |
| The Aaron's Co., Inc. | | 157,029 | 1,868,645 |
| The Buckle, Inc. | | 148,415 | 4,790,836 |
| The Cato Corp. Class A (sub. vtg.) | | 87,127 | 941,843 |
| The Children's Place, Inc. (a)(b) | | 64,539 | 2,722,255 |
| The Container Store Group, Inc. (a) | | 164,970 | 1,118,497 |
| The ODP Corp. (a) | | 220,410 | 7,879,658 |
| Tile Shop Holdings, Inc. | | 162,858 | 638,403 |
| Tilly's, Inc. | | 114,696 | 860,220 |
| Torrid Holdings, Inc. (a)(b) | | 63,066 | 353,800 |
| TravelCenters of America LLC (a) | | 63,526 | 3,435,486 |
| Urban Outfitters, Inc. (a)(b) | | 325,438 | 6,551,067 |
| Victoria's Secret & Co. (a) | | 344,243 | 11,511,486 |
| Volta, Inc. (a)(b) | | 688,607 | 1,473,619 |
| Vroom, Inc. (a)(b) | | 661,414 | 1,078,105 |
| Warby Parker, Inc. (a)(b) | | 51,940 | 652,886 |
| Williams-Sonoma, Inc. (b) | | 353,751 | 52,620,461 |
| Winmark Corp. | | 14,992 | 3,093,899 |
| Zumiez, Inc. (a)(b) | | 82,889 | 2,151,798 |
| | | | 693,925,677 |
| Textiles, Apparel & Luxury Goods - 1.4% | | | |
| Allbirds, Inc. Class A (b) | | 471,666 | 1,938,547 |
| Capri Holdings Ltd. (a) | | 741,510 | 34,984,442 |
| Carter's, Inc. | | 203,962 | 15,062,594 |
| Charles & Colvard Ltd. (a) | | 137,585 | 174,733 |
| Columbia Sportswear Co. | | 167,571 | 11,937,758 |
| Crocs, Inc. (a) | | 311,643 | 22,968,089 |
| Crown Crafts, Inc. | | 21,797 | 132,962 |
| Culp, Inc. | | 47,992 | 220,763 |
| Deckers Outdoor Corp. (a) | | 137,431 | 44,193,687 |
| Delta Apparel, Inc. (a) | | 30,838 | 579,138 |
| Forward Industries, Inc. (NY Shares) (a)(b) | | 23,724 | 37,247 |
| Fossil Group, Inc. (a) | | 234,521 | 992,024 |
| G-III Apparel Group Ltd. (a) | | 219,400 | 4,622,758 |
| Hanesbrands, Inc. (b) | | 1,759,853 | 15,328,320 |
| Jerash Holdings U.S., Inc. | | 22,743 | 122,130 |
| Kontoor Brands, Inc. | | 237,138 | 8,828,648 |
| Lakeland Industries, Inc. (a)(b) | | 42,663 | 575,951 |
| Levi Strauss & Co. Class A (b) | | 488,568 | 8,251,914 |
| lululemon athletica, Inc. (a) | | 587,765 | 176,305,989 |
| Movado Group, Inc. | | 81,689 | 2,605,062 |
| Oxford Industries, Inc. | | 77,266 | 8,246,600 |
| PLBY Group, Inc. (a)(b) | | 116,884 | 525,978 |
| Rocky Brands, Inc. | | 35,816 | 935,872 |
| Skechers U.S.A., Inc. Class A (sub. vtg.) (a) | | 681,715 | 25,768,827 |
| Steven Madden Ltd. | | 382,638 | 11,138,592 |
| Superior Group of Companies, Inc. | | 51,609 | 573,376 |
| Toughbuilt Industries, Inc. (a) | | 4,468 | 13,136 |
| Under Armour, Inc.: | | | |
| Class A (sub. vtg.) (a) | | 937,248 | 7,891,628 |
| Class C (non-vtg.) (a) | | 1,040,571 | 7,897,934 |
| Unifi, Inc. (a) | | 68,706 | 780,500 |
| Vera Bradley, Inc. (a) | | 132,684 | 525,429 |
| Vince Holding Corp. (a) | | 16,662 | 119,133 |
| Wolverine World Wide, Inc. | | 411,624 | 8,043,133 |
| | | | 422,322,894 |
TOTAL CONSUMER DISCRETIONARY | | | 3,641,716,491 |
| CONSUMER STAPLES - 2.9% | | | |
| Beverages - 0.2% | | | |
| Alkaline Water Co., Inc. (a)(b) | | 508,168 | 280,712 |
| Boston Beer Co., Inc. Class A (a) | | 47,772 | 16,102,986 |
| Celsius Holdings, Inc. (a)(b) | | 194,151 | 20,092,687 |
| Coca-Cola Bottling Co. Consolidated | | 23,273 | 11,039,082 |
| Duckhorn Portfolio, Inc. (a) | | 160,302 | 2,923,908 |
| Eastside Distilling, Inc. (a)(b) | | 64,681 | 30,400 |
| MGP Ingredients, Inc. | | 63,644 | 6,966,472 |
| National Beverage Corp. (b) | | 117,867 | 6,536,904 |
| REED'S, Inc. (a)(b) | | 410,048 | 86,110 |
| Splash Beverage Group, Inc. (a)(b) | | 131,964 | 244,133 |
| The Vita Coco Co., Inc. | | 58,643 | 879,059 |
| Vintage Wine Estates, Inc. (a)(b) | | 149,169 | 881,589 |
| Willamette Valley Vineyards, Inc. (a) | | 13,587 | 87,636 |
| Zevia PBC (a)(b) | | 72,718 | 322,141 |
| | | | 66,473,819 |
| Food & Staples Retailing - 0.9% | | | |
| Albertsons Companies, Inc. | | 538,580 | 14,816,336 |
| Andersons, Inc. | | 159,227 | 5,896,176 |
| BJ's Wholesale Club Holdings, Inc. (a) | | 679,472 | 50,613,869 |
| Blue Apron Holdings, Inc.: | | | |
| warrants 11/4/28 (a) | | 89,331 | 20,848 |
| warrants 11/4/28 (a) | | 89,331 | 8,854 |
| warrants 11/4/28 (a) | | 89,331 | 4,003 |
| Class A (a)(b) | | 153,174 | 889,941 |
| Casey's General Stores, Inc. | | 186,623 | 39,894,399 |
| Chefs' Warehouse Holdings (a) | | 167,152 | 5,572,848 |
| Grocery Outlet Holding Corp. (a) | | 444,618 | 17,838,074 |
| HF Foods Group, Inc. (a) | | 175,889 | 895,275 |
| Ingles Markets, Inc. Class A | | 73,229 | 6,409,734 |
| MedAvail Holdings, Inc. (a)(b) | | 111,193 | 128,984 |
| Natural Grocers by Vitamin Cottage, Inc. | | 49,153 | 705,837 |
| Performance Food Group Co. (a) | | 779,956 | 38,982,201 |
| PriceSmart, Inc. | | 121,101 | 7,662,060 |
| Rite Aid Corp. (a)(b) | | 280,737 | 2,015,692 |
| SpartanNash Co. | | 179,330 | 5,457,012 |
| Sprouts Farmers Market LLC (a) | | 550,458 | 15,908,236 |
| U.S. Foods Holding Corp. (a) | | 1,123,344 | 34,396,793 |
| United Natural Foods, Inc. (a) | | 294,767 | 12,993,329 |
| Village Super Market, Inc. Class A | | 44,428 | 976,527 |
| Weis Markets, Inc. | | 83,990 | 6,526,863 |
| | | | 268,613,891 |
| Food Products - 1.3% | | | |
| Alico, Inc. | | 24,016 | 815,343 |
| AppHarvest, Inc. (a) | | 329,007 | 947,540 |
| Arcadia Biosciences, Inc. (a)(b) | | 122,559 | 106,933 |
| B&G Foods, Inc. Class A (b) | | 352,537 | 7,635,951 |
| Barfresh Food Group, Inc. (a) | | 24,395 | 84,895 |
| Benson Hill, Inc. (a)(b) | | 668,705 | 2,373,903 |
| Better Choice Co., Inc. (a) | | 94,932 | 172,776 |
| Beyond Meat, Inc. (a)(b) | | 307,164 | 7,494,802 |
| Blue Star Foods Corp. (b) | | 51,390 | 59,099 |
| BRC, Inc. Class A (a)(b) | | 157,758 | 1,538,141 |
| Bridgford Foods Corp. (a) | | 698 | 10,051 |
| Bunge Ltd. | | 766,461 | 76,009,937 |
| Cal-Maine Foods, Inc. | | 189,325 | 10,149,713 |
| Calavo Growers, Inc. | | 89,953 | 3,781,624 |
| Coffee Holding Co., Inc. | | 28,901 | 78,322 |
| Darling Ingredients, Inc. (a) | | 814,260 | 61,932,616 |
| Farmer Brothers Co. (a) | | 92,045 | 516,372 |
| Flowers Foods, Inc. | | 1,000,994 | 27,327,136 |
| Fresh Del Monte Produce, Inc. | | 172,433 | 4,714,318 |
| Freshpet, Inc. (a) | | 242,496 | 10,555,851 |
| Hostess Brands, Inc. Class A (a) | | 696,490 | 16,144,638 |
| Ingredion, Inc. | | 333,277 | 29,018,428 |
| J&J Snack Foods Corp. | | 75,271 | 11,217,637 |
| John B. Sanfilippo & Son, Inc. | | 45,294 | 3,656,585 |
| Laird Superfood, Inc. (a) | | 19,577 | 49,334 |
| Lancaster Colony Corp. | | 98,926 | 16,673,977 |
| Landec Corp. (a) | | 136,427 | 1,432,484 |
| Lifeway Foods, Inc. (a)(b) | | 26,597 | 166,231 |
| Limoneira Co. | | 78,888 | 967,167 |
| Local Bounti Corp. (a)(b) | | 165,637 | 616,170 |
| Mission Produce, Inc. (a) | | 187,860 | 3,024,546 |
| Nuzee, Inc. (a) | | 58,694 | 43,011 |
| Pilgrim's Pride Corp. (a) | | 242,721 | 6,910,267 |
| Post Holdings, Inc. (a) | | 281,561 | 24,991,354 |
| RiceBran Technologies (a)(b) | | 19,059 | 44,026 |
| Rocky Mountain Chocolate Factory, Inc. (a) | | 28,051 | 186,820 |
| S&W Seed Co. (a)(b) | | 103,340 | 132,275 |
| Seaboard Corp. | | 1,309 | 5,055,803 |
| Seneca Foods Corp. Class A (a) | | 34,924 | 1,845,035 |
| Sovos Brands, Inc. | | 122,985 | 1,877,981 |
| Stryve Foods, Inc. (a)(b) | | 41,006 | 26,666 |
| Tattooed Chef, Inc. (a)(b) | | 240,045 | 1,598,700 |
| The Hain Celestial Group, Inc. (a) | | 456,107 | 9,240,728 |
| The Real Good Food Co., Inc. | | 11,585 | 82,601 |
| The Simply Good Foods Co. (a) | | 446,751 | 13,648,243 |
| Tootsie Roll Industries, Inc. | | 90,263 | 3,234,123 |
| TreeHouse Foods, Inc. (a) | | 285,254 | 13,292,836 |
| Utz Brands, Inc. Class A (b) | | 332,117 | 5,533,069 |
| Vital Farms, Inc. (a)(b) | | 127,328 | 1,648,898 |
| Whole Earth Brands, Inc. Class A (a) | | 205,631 | 1,050,774 |
| | | | 389,715,730 |
| Household Products - 0.2% | | | |
| Central Garden & Pet Co. (a) | | 8,811 | 351,735 |
| Central Garden & Pet Co. Class A (non-vtg.) (a) | | 240,658 | 9,087,246 |
| Energizer Holdings, Inc. | | 329,006 | 9,245,069 |
| Oil-Dri Corp. of America | | 26,534 | 732,073 |
| Reynolds Consumer Products, Inc. | | 282,710 | 7,896,090 |
| Spectrum Brands Holdings, Inc. | | 207,116 | 13,046,237 |
| WD-40 Co. | | 69,564 | 13,158,726 |
| | | | 53,517,176 |
| Personal Products - 0.3% | | | |
| BellRing Brands, Inc. (a) | | 620,849 | 14,707,913 |
| Coty, Inc. Class A (a) | | 1,718,334 | 12,904,688 |
| Cyanotech Corp. (a) | | 22,872 | 54,207 |
| Edgewell Personal Care Co. | | 267,059 | 10,404,619 |
| elf Beauty, Inc. (a) | | 236,507 | 9,018,012 |
| Guardion Health Sciences, Inc. (a)(b) | | 98,328 | 14,828 |
| Herbalife Nutrition Ltd. (a) | | 482,767 | 12,595,391 |
| Inter Parfums, Inc. | | 89,815 | 7,052,274 |
| Jupiter Wellness, Inc. (a)(b) | | 52,808 | 44,375 |
| Lifemd, Inc. (a)(b) | | 112,823 | 289,955 |
| LifeVantage Corp. | | 65,746 | 261,669 |
| Mannatech, Inc. | | 4,396 | 102,735 |
| MediFast, Inc. | | 58,295 | 7,314,857 |
| Natural Alternatives International, Inc. (a) | | 22,019 | 255,641 |
| Natural Health Trends Corp. | | 33,839 | 178,332 |
| Nature's Sunshine Products, Inc. (a) | | 58,881 | 571,146 |
| Newage, Inc. (a)(b) | | 733,249 | 168,647 |
| Nu Skin Enterprises, Inc. Class A | | 252,959 | 10,356,141 |
| Olaplex Holdings, Inc. (b) | | 357,986 | 4,768,374 |
| The Beauty Health Co. (a) | | 488,477 | 5,666,333 |
| The Honest Co., Inc. (a) | | 141,751 | 511,721 |
| Thorne HealthTech, Inc. (b) | | 30,545 | 142,951 |
| United-Guardian, Inc. | | 15,532 | 245,406 |
| USANA Health Sciences, Inc. (a) | | 56,076 | 3,618,024 |
| Veru, Inc. (a)(b) | | 303,851 | 4,648,920 |
| Zivo Bioscience, Inc. (a)(b) | | 301,674 | 1,131,278 |
| | | | 107,028,437 |
| Tobacco - 0.0% | | | |
| 22nd Century Group, Inc. (a)(b) | | 865,151 | 1,159,302 |
| Turning Point Brands, Inc. | | 71,462 | 1,666,494 |
| Universal Corp. | | 124,430 | 6,350,907 |
| Vector Group Ltd. | | 657,664 | 6,445,107 |
| | | | 15,621,810 |
TOTAL CONSUMER STAPLES | | | 900,970,863 |
| ENERGY - 5.1% | | | |
| Energy Equipment & Services - 0.8% | | | |
| Archrock, Inc. | | 691,931 | 5,113,370 |
| Bristow Group, Inc. (a) | | 117,231 | 3,400,871 |
| Cactus, Inc. | | 308,127 | 12,309,674 |
| Championx Corp. | | 1,018,499 | 22,213,463 |
| Core Laboratories NV (b) | | 239,436 | 3,866,891 |
| Diamond Offshore Drilling, Inc. (a) | | 439,356 | 3,123,821 |
| DMC Global, Inc. (a) | | 100,280 | 2,238,250 |
| Dril-Quip, Inc. (a) | | 173,939 | 3,849,270 |
| Energy Services of America Corp. (a) | | 47,101 | 147,426 |
| ENGlobal Corp. (a)(b) | | 109,747 | 179,985 |
| Enservco Corp. (a)(b) | | 70,154 | 115,053 |
| Expro Group Holdings NV (a)(b) | | 155,016 | 2,095,816 |
| Exterran Corp. (a) | | 128,543 | 631,146 |
| Forum Energy Technologies, Inc. (a)(b) | | 23,879 | 641,868 |
| Geospace Technologies Corp. (a) | | 67,123 | 333,601 |
| Gulf Island Fabrication, Inc. (a) | | 52,214 | 212,511 |
| Helix Energy Solutions Group, Inc. (a)(b) | | 715,414 | 3,090,588 |
| Helmerich & Payne, Inc. | | 531,167 | 22,707,389 |
| Independence Contract Drilling, Inc. (a)(b) | | 58,141 | 186,051 |
| KLX Energy Services Holdings, Inc. (a)(b) | | 39,547 | 300,557 |
| Liberty Oilfield Services, Inc. Class A (a) | | 551,770 | 8,276,550 |
| Mammoth Energy Services, Inc. (a) | | 89,500 | 370,530 |
| MIND Technology, Inc. (a) | | 39,830 | 30,311 |
| Nabors Industries Ltd. (a) | | 44,618 | 5,912,331 |
| Natural Gas Services Group, Inc. (a) | | 52,807 | 587,742 |
| NCS Multistage Holdings, Inc. (a) | | 4,183 | 117,124 |
| Newpark Resources, Inc. (a) | | 472,008 | 1,359,383 |
| Nextier Oilfield Solutions, Inc. (a) | | 820,914 | 7,691,964 |
| Nine Energy Service, Inc. (a) | | 70,893 | 236,074 |
| Noble Corp. (a) | | 330,218 | 10,022,116 |
| NOV, Inc. | | 1,988,507 | 35,136,919 |
| Oceaneering International, Inc. (a) | | 501,826 | 4,441,160 |
| Oil States International, Inc. (a) | | 298,794 | 1,464,091 |
| Patterson-UTI Energy, Inc. | | 1,091,807 | 16,267,924 |
| Profire Energy, Inc. (a) | | 141,273 | 155,400 |
| ProFrac Holding Corp. | | 80,213 | 1,579,394 |
| ProPetro Holding Corp. (a) | | 428,946 | 3,929,145 |
| Ranger Energy Services, Inc. Class A (a)(b) | | 65,071 | 643,552 |
| RPC, Inc. | | 345,882 | 2,749,762 |
| SEACOR Marine Holdings, Inc. (a) | | 113,392 | 737,048 |
| Select Energy Services, Inc. Class A (a) | | 347,637 | 2,471,699 |
| Smart Sand, Inc. (a) | | 123,701 | 222,662 |
| Solaris Oilfield Infrastructure, Inc. Class A | | 141,311 | 1,512,028 |
| Superior Drilling Products, Inc. (a)(b) | | 60,454 | 55,104 |
| TechnipFMC PLC (a) | | 2,153,194 | 17,613,127 |
| TETRA Technologies, Inc. (a) | | 655,264 | 2,607,951 |
| Tidewater, Inc. (a) | | 211,282 | 4,682,009 |
| Transocean Ltd. (United States) (a)(b) | | 3,155,779 | 11,423,920 |
| U.S. Silica Holdings, Inc. (a) | | 378,186 | 5,305,950 |
| U.S. Well Services, Inc. (a)(b) | | 52,798 | 339,491 |
| Valaris Ltd. (a) | | 328,549 | 16,749,428 |
| Weatherford International PLC (a) | | 328,710 | 9,249,899 |
| | | | 260,699,389 |
| Oil, Gas & Consumable Fuels - 4.3% | | | |
| Adams Resources & Energy, Inc. | | 11,610 | 346,791 |
| Aemetis, Inc. (a)(b) | | 159,210 | 1,451,995 |
| Alto Ingredients, Inc. (a)(b) | | 362,447 | 1,565,771 |
| American Resources Corp. (a)(b) | | 285,694 | 948,504 |
| Amplify Energy Corp. (a) | | 195,031 | 1,452,981 |
| Antero Midstream GP LP | | 1,657,401 | 16,690,028 |
| Antero Resources Corp. (a) | | 1,426,360 | 57,168,509 |
| Arch Resources, Inc. | | 78,465 | 11,422,935 |
| Archaea Energy, Inc. (a)(b) | | 273,958 | 5,413,410 |
| Barnwell Industries, Inc. | | 51,325 | 157,568 |
| Battalion Oil Corp. (a)(b) | | 14,761 | 195,436 |
| Berry Corp. | | 331,660 | 3,034,689 |
| Brigham Minerals, Inc. Class A | | 264,070 | 7,856,083 |
| California Resources Corp. | | 392,914 | 19,629,983 |
| Callon Petroleum Co. (a) | | 240,929 | 10,253,938 |
| Camber Energy, Inc. (a)(b) | | 1,817,444 | 632,471 |
| Centennial Resource Development, Inc. Class A (a) | | 929,850 | 7,652,666 |
| Centrus Energy Corp. Class A (a)(b) | | 54,849 | 2,732,029 |
| Cheniere Energy, Inc. | | 1,192,134 | 190,956,024 |
| Chesapeake Energy Corp. (b) | | 570,896 | 57,369,339 |
| Chord Energy Corp. | | 206,158 | 29,181,665 |
| Civitas Resources, Inc. | | 365,563 | 24,562,178 |
| Clean Energy Fuels Corp. (a)(b) | | 863,317 | 5,801,490 |
| CNX Resources Corp. (a) | | 986,118 | 17,424,705 |
| Comstock Resources, Inc. (a) | | 456,522 | 8,947,831 |
| CONSOL Energy, Inc. | | 161,867 | 11,618,813 |
| Continental Resources, Inc. | | 293,255 | 20,477,997 |
| Crescent Energy, Inc. Class A | | 140,240 | 2,402,311 |
| CVR Energy, Inc. | | 147,048 | 4,802,588 |
| Delek U.S. Holdings, Inc. | | 354,223 | 10,006,800 |
| Denbury, Inc. (a) | | 253,101 | 22,508,272 |
| Dorian LPG Ltd. (b) | | 139,428 | 2,028,677 |
| DT Midstream, Inc. | | 489,617 | 27,031,755 |
| Earthstone Energy, Inc. (a)(b) | | 251,382 | 3,821,006 |
| Ecoark Holdings, Inc. (a) | | 91,035 | 170,235 |
| Empire Petroleum Corp. (a)(b) | | 45,837 | 676,554 |
| Enviva, Inc. (b) | | 145,380 | 10,106,818 |
| Epsilon Energy Ltd. | | 123,389 | 888,401 |
| EQT Corp. | | 1,493,411 | 71,385,046 |
| Equitrans Midstream Corp. | | 2,053,906 | 19,039,709 |
| Evolution Petroleum Corp. | | 162,008 | 1,124,336 |
| Excelerate Energy, Inc. | | 87,308 | 2,242,069 |
| Gevo, Inc. (a)(b) | | 1,000,262 | 3,130,820 |
| Green Plains, Inc. (a)(b) | | 272,529 | 9,982,737 |
| Gulfport Energy Corp. (a)(b) | | 58,530 | 5,721,893 |
| Hallador Energy Co. (a)(b) | | 125,955 | 821,227 |
| HF Sinclair Corp. | | 756,139 | 39,795,596 |
| Houston American Energy Corp. (a)(b) | | 40,984 | 178,280 |
| International Seaways, Inc. | | 208,917 | 6,169,319 |
| Kinetik Holdings, Inc. | | 97,862 | 3,608,172 |
| Kosmos Energy Ltd. (a) | | 2,293,276 | 16,213,461 |
| Laredo Petroleum, Inc. (a) | | 74,033 | 5,745,701 |
| Lightbridge Corp. (a)(b) | | 47,404 | 281,106 |
| Magnolia Oil & Gas Corp. Class A | | 767,597 | 18,322,540 |
| Matador Resources Co. | | 559,053 | 33,319,559 |
| Mexco Energy Corp. (a)(b) | | 8,201 | 159,632 |
| Murphy Oil Corp. | | 739,968 | 28,836,553 |
| NACCO Industries, Inc. Class A | | 20,591 | 925,977 |
| New Concept Energy, Inc. (a)(b) | | 18,203 | 28,761 |
| New Fortress Energy, Inc. | | 210,280 | 12,059,558 |
| Nextdecade Corp. (a)(b) | | 132,674 | 977,807 |
| Northern Oil & Gas, Inc. | | 331,368 | 10,484,484 |
| Overseas Shipholding Group, Inc. (a) | | 340,577 | 1,059,194 |
| Ovintiv, Inc. | | 1,306,943 | 69,450,951 |
| Par Pacific Holdings, Inc. (a) | | 232,171 | 4,364,815 |
| PBF Energy, Inc. Class A (a) | | 482,723 | 16,489,818 |
| PDC Energy, Inc. | | 483,016 | 32,801,617 |
| Peabody Energy Corp. (a)(b) | | 540,614 | 13,331,541 |
| Pedevco Corp. (a) | | 84,997 | 95,197 |
| Phx Minerals, Inc. Class A | | 152,312 | 502,630 |
| PrimeEnergy Corp. (a) | | 2,589 | 243,262 |
| Range Resources Corp. | | 1,305,770 | 42,907,602 |
| Ranger Oil Corp. | | 106,289 | 4,144,208 |
| Rex American Resources Corp. (a) | | 79,363 | 2,404,699 |
| Riley Exploration Permian, Inc. | | 19,401 | 487,741 |
| Ring Energy, Inc. (a)(b) | | 434,135 | 1,406,597 |
| SandRidge Energy, Inc. (a) | | 155,636 | 3,265,243 |
| SilverBow Resources, Inc. (a) | | 52,176 | 2,074,518 |
| Sitio Royalties Corp. (b) | | 52,126 | 1,326,085 |
| SM Energy Co. | | 612,961 | 27,013,191 |
| Southwestern Energy Co. (a) | | 5,622,960 | 42,115,970 |
| Talos Energy, Inc. (a) | | 207,119 | 4,293,577 |
| Targa Resources Corp. | | 1,151,194 | 78,545,967 |
| Tellurian, Inc. (a)(b) | | 2,349,541 | 9,398,164 |
| Texas Pacific Land Corp. | | 31,313 | 57,630,324 |
| U.S. Energy Corp. | | 62,290 | 216,146 |
| Uranium Energy Corp. (a)(b) | | 1,666,578 | 7,532,933 |
| VAALCO Energy, Inc. | | 283,105 | 1,418,356 |
| Vertex Energy, Inc. (a)(b) | | 239,516 | 2,035,886 |
| W&T Offshore, Inc. (a) | | 467,460 | 3,038,490 |
| World Fuel Services Corp. | | 318,774 | 8,224,369 |
| | | | 1,327,762,680 |
TOTAL ENERGY | | | 1,588,462,069 |
| FINANCIALS - 15.8% | | | |
| Banks - 5.8% | | | |
| 1st Source Corp. | | 84,755 | 3,999,588 |
| ACNB Corp. | | 45,711 | 1,625,483 |
| Allegiance Bancshares, Inc. | | 96,212 | 4,075,540 |
| Amalgamated Financial Corp. | | 75,064 | 1,688,940 |
| Amerant Bancorp, Inc. Class A | | 118,336 | 3,099,220 |
| American National Bankshares, Inc. | | 54,309 | 1,788,395 |
| Ameris Bancorp | | 335,546 | 15,663,287 |
| AmeriServ Financial, Inc. | | 98,131 | 372,898 |
| Ames National Corp. | | 49,585 | 1,083,928 |
| Arrow Financial Corp. | | 84,373 | 2,709,217 |
| Associated Banc-Corp. | | 754,905 | 15,128,296 |
| Atlantic Union Bankshares Corp. | | 380,487 | 12,346,803 |
| Auburn National Bancorp., Inc. | | 5,349 | 146,188 |
| Banc of California, Inc. | | 264,056 | 4,457,265 |
| BancFirst Corp. (b) | | 94,777 | 10,222,647 |
| Bancorp, Inc., Delaware (a) | | 289,191 | 6,859,611 |
| Bank First National Corp. | | 30,072 | 2,443,951 |
| Bank of Hawaii Corp. | | 204,014 | 15,917,172 |
| Bank of Marin Bancorp | | 79,181 | 2,446,693 |
| Bank of South Carolina Corp. | | 11,084 | 181,667 |
| Bank of the James Financial Group, Inc. | | 1,404 | 17,367 |
| Bank OZK | | 568,939 | 23,059,098 |
| Bank7 Corp. | | 14,924 | 355,340 |
| BankFinancial Corp. | | 61,144 | 608,383 |
| BankUnited, Inc. | | 412,294 | 15,275,493 |
| Bankwell Financial Group, Inc. | | 30,435 | 959,311 |
| Banner Corp. | | 172,968 | 10,509,536 |
| Bar Harbor Bankshares | | 76,014 | 2,153,477 |
| BayCom Corp. | | 68,236 | 1,269,872 |
| BayFirst Financial Corp. | | 6,218 | 116,898 |
| BCB Bancorp, Inc. | | 79,393 | 1,429,074 |
| Berkshire Hills Bancorp, Inc. | | 242,581 | 6,843,210 |
| Blue Ridge Bankshares, Inc. | | 87,765 | 1,287,513 |
| BOK Financial Corp. | | 150,711 | 13,393,687 |
| Brookline Bancorp, Inc., Delaware | | 390,818 | 4,873,500 |
| Business First Bancshares, Inc. | | 109,461 | 2,582,185 |
| Byline Bancorp, Inc. | | 118,789 | 2,590,788 |
| C & F Financial Corp. | | 16,784 | 818,220 |
| Cadence Bank | | 933,110 | 23,775,643 |
| California Bancorp, Inc. (a) | | 32,742 | 658,114 |
| Cambridge Bancorp | | 35,683 | 2,934,213 |
| Camden National Corp. | | 73,143 | 3,308,258 |
| Capital Bancorp, Inc. | | 43,924 | 1,087,997 |
| Capital City Bank Group, Inc. | | 65,170 | 2,080,878 |
| Capstar Financial Holdings, Inc. | | 95,601 | 1,926,360 |
| Carter Bankshares, Inc. (a) | | 124,851 | 2,056,296 |
| Cathay General Bancorp | | 382,122 | 16,026,197 |
| CB Financial Services, Inc. | | 25,723 | 560,761 |
| CBTX, Inc. | | 93,306 | 2,780,519 |
| Central Pacific Financial Corp. | | 137,551 | 2,997,236 |
| Central Valley Community Bancorp | | 50,205 | 893,649 |
| Chemung Financial Corp. | | 17,074 | 769,525 |
| ChoiceOne Financial Services, Inc. | | 34,483 | 747,764 |
| Citizens & Northern Corp. | | 80,550 | 1,933,200 |
| Citizens Community Bancorp, Inc. | | 18,015 | 228,791 |
| Citizens Holding Co. | | 17,906 | 313,355 |
| City Holding Co. | | 75,011 | 6,376,685 |
| Civista Bancshares, Inc. | | 70,981 | 1,501,248 |
| CNB Financial Corp., Pennsylvania | | 86,953 | 2,288,603 |
| Coastal Financial Corp. of Washington (a) | | 52,724 | 2,119,505 |
| Codorus Valley Bancorp, Inc. | | 41,321 | 826,833 |
| Colony Bankcorp, Inc. | | 80,700 | 1,139,484 |
| Columbia Banking Systems, Inc. | | 392,625 | 11,759,119 |
| Commerce Bancshares, Inc. | | 554,737 | 38,149,263 |
| Community Bank System, Inc. | | 268,753 | 17,571,071 |
| Community Financial Corp. | | 25,443 | 962,000 |
| Community Trust Bancorp, Inc. | | 77,256 | 3,264,066 |
| Community West Bancshares | | 399 | 5,626 |
| ConnectOne Bancorp, Inc. | | 178,895 | 4,477,742 |
| CrossFirst Bankshares, Inc. (a) | | 220,855 | 2,910,869 |
| Cullen/Frost Bankers, Inc. | | 287,373 | 37,346,995 |
| Customers Bancorp, Inc. (a) | | 153,725 | 5,332,720 |
| CVB Financial Corp. | | 667,347 | 17,511,185 |
| Dime Community Bancshares, Inc. (b) | | 168,442 | 5,265,497 |
| Eagle Bancorp Montana, Inc. | | 30,909 | 596,544 |
| Eagle Bancorp, Inc. | | 165,586 | 8,035,889 |
| East West Bancorp, Inc. | | 715,510 | 51,638,357 |
| Eastern Bankshares, Inc. | | 842,579 | 16,346,033 |
| Emclaire Financial Corp. | | 941 | 30,150 |
| Enterprise Bancorp, Inc. | | 45,976 | 1,479,508 |
| Enterprise Financial Services Corp. | | 191,806 | 8,769,370 |
| Equity Bancshares, Inc. | | 77,062 | 2,406,646 |
| Esquire Financial Holdings, Inc. | | 35,637 | 1,332,111 |
| Evans Bancorp, Inc. | | 28,580 | 1,092,613 |
| Farmers & Merchants Bancorp, Inc. | | 60,154 | 1,717,998 |
| Farmers National Banc Corp. | | 150,874 | 2,155,989 |
| FB Financial Corp. | | 182,316 | 7,223,360 |
| Fidelity D & D Bancorp, Inc. (b) | | 24,413 | 976,520 |
| Financial Institutions, Inc. | | 76,553 | 1,992,675 |
| Finward Bancorp | | 11,072 | 407,782 |
| FinWise BanCorp | | 20,483 | 220,397 |
| First Bancorp, North Carolina | | 173,885 | 6,331,153 |
| First Bancorp, Puerto Rico | | 991,684 | 14,181,081 |
| First Bancshares, Inc. | | 104,050 | 3,111,095 |
| First Bank Hamilton New Jersey | | 77,297 | 1,158,682 |
| First Busey Corp. | | 254,982 | 5,864,586 |
| First Business Finance Services, Inc. | | 37,628 | 1,252,260 |
| First Capital, Inc. | | 17,376 | 462,202 |
| First Citizens Bancshares, Inc. | | 67,340 | 54,677,386 |
| First Commonwealth Financial Corp. | | 473,582 | 6,383,885 |
| First Community Bankshares, Inc. | | 76,579 | 2,414,536 |
| First Community Corp. | | 39,319 | 707,742 |
| First Financial Bancorp, Ohio | | 489,400 | 10,561,252 |
| First Financial Bankshares, Inc. | | 649,327 | 27,602,891 |
| First Financial Corp., Indiana | | 56,401 | 2,622,647 |
| First Financial Northwest, Inc. | | 37,469 | 564,283 |
| First Foundation, Inc. | | 251,526 | 4,768,933 |
| First Guaranty Bancshares, Inc. (b) | | 31,522 | 702,310 |
| First Hawaiian, Inc. | | 645,114 | 16,585,881 |
| First Horizon National Corp. | | 2,704,562 | 61,177,192 |
| First Internet Bancorp | | 47,284 | 1,733,904 |
| First Interstate Bancsystem, Inc. | | 416,825 | 16,781,375 |
| First Merchants Corp. | | 286,794 | 11,420,137 |
| First Mid-Illinois Bancshares, Inc. | | 93,648 | 3,310,457 |
| First National Corp. | | 199 | 3,443 |
| First Northwest Bancorp | | 49,879 | 798,064 |
| First of Long Island Corp. | | 110,551 | 2,035,244 |
| First Savings Financial Group, Inc. | | 29,179 | 665,865 |
| First U.S. Bancshares, Inc. | | 8,310 | 78,530 |
| First United Corp. | | 31,448 | 550,340 |
| First Western Financial, Inc. (a) | | 37,163 | 985,934 |
| Five Star Bancorp | | 33,669 | 856,203 |
| Flushing Financial Corp. | | 151,071 | 3,119,616 |
| FNB Corp., Pennsylvania | | 1,710,269 | 20,386,406 |
| FNCB Bancorp, Inc. | | 77,353 | 611,862 |
| Franklin Financial Services Corp. | | 21,822 | 697,868 |
| Fulton Financial Corp. | | 835,803 | 13,565,083 |
| FVCBankcorp, Inc. (a)(b) | | 57,396 | 1,105,447 |
| German American Bancorp, Inc. | | 139,421 | 5,236,653 |
| Glacier Bancorp, Inc. | | 550,762 | 27,912,618 |
| Glen Burnie Bancorp | | 18,052 | 180,520 |
| Great Southern Bancorp, Inc. | | 47,991 | 2,820,911 |
| Guaranty Bancshares, Inc. Texas | | 43,637 | 1,512,022 |
| Hancock Whitney Corp. | | 436,445 | 21,049,742 |
| Hanmi Financial Corp. | | 156,310 | 3,863,983 |
| Hanover Bancorp, Inc. (b) | | 7,087 | 138,976 |
| HarborOne Bancorp, Inc. | | 233,102 | 3,179,511 |
| Hawthorn Bancshares, Inc. | | 37,757 | 902,770 |
| HBT Financial, Inc. | | 47,250 | 854,280 |
| Heartland Financial U.S.A., Inc. | | 203,864 | 9,106,605 |
| Heritage Commerce Corp. | | 311,307 | 3,514,656 |
| Heritage Financial Corp., Washington | | 177,344 | 4,609,171 |
| Hilltop Holdings, Inc. | | 254,166 | 6,709,982 |
| Home Bancshares, Inc. | | 950,851 | 22,373,524 |
| HomeStreet, Inc. | | 94,561 | 3,291,668 |
| HomeTrust Bancshares, Inc. | | 79,508 | 1,846,176 |
| Hope Bancorp, Inc. | | 617,647 | 8,937,352 |
| Horizon Bancorp, Inc. Indiana | | 196,590 | 3,719,483 |
| Independent Bank Corp. | | 236,027 | 18,464,392 |
| Independent Bank Corp. | | 107,778 | 2,211,605 |
| Independent Bank Group, Inc. | | 184,117 | 12,402,121 |
| International Bancshares Corp. | | 260,446 | 10,868,412 |
| Investar Holding Corp. | | 43,792 | 945,907 |
| John Marshall Bankcorp, Inc. (b) | | 57,729 | 1,455,348 |
| Lakeland Bancorp, Inc. | | 317,770 | 5,176,473 |
| Lakeland Financial Corp. | | 128,192 | 9,657,985 |
| Landmark Bancorp, Inc. | | 3,214 | 82,053 |
| LCNB Corp. | | 55,338 | 883,194 |
| Limestone Bancorp, Inc. | | 20,599 | 398,797 |
| Live Oak Bancshares, Inc. | | 164,778 | 5,971,555 |
| Macatawa Bank Corp. | | 124,143 | 1,181,841 |
| Mainstreet Bancshares, Inc. | | 30,227 | 732,098 |
| Malvern Bancorp, Inc. (a) | | 40,212 | 628,514 |
| Mercantile Bank Corp. | | 73,657 | 2,436,574 |
| Meridian Bank/Malvern, PA | | 25,873 | 784,469 |
| Metrocity Bankshares, Inc. | | 92,663 | 1,852,333 |
| Metropolitan Bank Holding Corp. (a) | | 52,995 | 3,793,912 |
| Mid Penn Bancorp, Inc. | | 64,412 | 1,873,745 |
| Middlefield Banc Corp. | | 28,540 | 770,865 |
| Midland States Bancorp, Inc. | | 107,098 | 2,687,089 |
| MidWestOne Financial Group, Inc. | | 72,678 | 2,216,679 |
| MVB Financial Corp. | | 55,376 | 1,770,924 |
| National Bank Holdings Corp. | | 150,490 | 6,039,164 |
| National Bankshares, Inc. | | 30,852 | 1,038,170 |
| NBT Bancorp, Inc. | | 218,246 | 8,463,580 |
| Nicolet Bankshares, Inc. (a) | | 59,369 | 4,546,478 |
| Northeast Bank | | 35,798 | 1,387,888 |
| Northrim Bancorp, Inc. | | 30,440 | 1,234,342 |
| Northwest Bancshares, Inc. | | 643,799 | 9,058,252 |
| Norwood Financial Corp. | | 41,015 | 1,045,883 |
| Oak Valley Bancorp Oakdale California | | 31,757 | 574,484 |
| OceanFirst Financial Corp. | | 298,886 | 5,810,344 |
| OFG Bancorp | | 244,948 | 6,662,586 |
| Ohio Valley Banc Corp. | | 21,250 | 621,775 |
| Old National Bancorp, Indiana | | 1,484,101 | 24,769,646 |
| Old Point Financial Corp. | | 8,567 | 201,582 |
| Old Second Bancorp, Inc. | | 206,740 | 2,836,473 |
| OptimumBank Holdings, Inc. (a) | | 5,769 | 23,941 |
| Orange County Bancorp, Inc. (b) | | 3,446 | 115,131 |
| Origin Bancorp, Inc. | | 113,845 | 4,650,568 |
| Orrstown Financial Services, Inc. | | 54,484 | 1,401,873 |
| Pacific Premier Bancorp, Inc. | | 487,902 | 15,983,670 |
| PacWest Bancorp | | 596,059 | 15,694,233 |
| Park National Corp. | | 73,943 | 9,747,906 |
| Parke Bancorp, Inc. | | 49,112 | 1,089,304 |
| Partners Bancorp | | 7,898 | 71,556 |
| Pathfinder Bancorp, Inc. | | 199 | 3,908 |
| Pathward Financial, Inc. | | 149,242 | 4,919,016 |
| Patriot National Bancorp, Inc. (a) | | 1,371 | 16,137 |
| PCB Bancorp | | 64,439 | 1,210,164 |
| PCSB Financial Corp. | | 75,622 | 1,399,763 |
| Peapack-Gladstone Financial Corp. | | 83,514 | 2,811,916 |
| Penns Woods Bancorp, Inc. | | 35,331 | 837,345 |
| Peoples Bancorp of North Carolina | | 30,275 | 787,150 |
| Peoples Bancorp, Inc. | | 124,751 | 3,728,807 |
| Peoples Financial Services Corp. | | 32,763 | 1,594,903 |
| Pinnacle Financial Partners, Inc. | | 385,637 | 31,124,762 |
| Plumas Bancorp | | 25,990 | 773,982 |
| Popular, Inc. | | 386,708 | 29,861,592 |
| Preferred Bank, Los Angeles | | 67,615 | 4,587,002 |
| Premier Financial Corp. | | 179,216 | 4,842,416 |
| Primis Financial Corp. | | 104,393 | 1,368,592 |
| Professional Holdings Corp. (A Shares) (a) | | 66,253 | 1,852,434 |
| Prosperity Bancshares, Inc. | | 466,394 | 33,058,007 |
| QCR Holdings, Inc. | | 81,299 | 4,540,549 |
| RBB Bancorp | | 73,286 | 1,619,621 |
| Red River Bancshares, Inc. | | 26,211 | 1,339,644 |
| Renasant Corp. | | 281,093 | 9,371,641 |
| Republic Bancorp, Inc., Kentucky Class A | | 46,065 | 1,957,763 |
| Republic First Bancorp, Inc. (a)(b) | | 250,438 | 796,393 |
| Richmond Mutual Bancorp., Inc. | | 62,777 | 880,134 |
| Riverview Bancorp, Inc. | | 141,880 | 1,000,254 |
| S&T Bancorp, Inc. | | 201,455 | 5,971,126 |
| Salisbury Bancorp, Inc. | | 26,337 | 622,607 |
| Sandy Spring Bancorp, Inc. | | 229,367 | 8,835,217 |
| SB Financial Group, Inc. | | 33,681 | 585,376 |
| Seacoast Banking Corp., Florida | | 307,242 | 9,930,061 |
| ServisFirst Bancshares, Inc. | | 245,875 | 20,742,015 |
| Shore Bancshares, Inc. | | 90,643 | 1,726,749 |
| Sierra Bancorp | | 67,805 | 1,404,920 |
| Silvergate Capital Corp. (a) | | 160,313 | 14,607,721 |
| Simmons First National Corp. Class A | | 639,449 | 15,084,602 |
| SmartFinancial, Inc. | | 76,784 | 1,926,511 |
| Sound Financial Bancorp, Inc. | | 11,495 | 495,664 |
| South Plains Financial, Inc. | | 66,287 | 1,798,366 |
| Southern First Bancshares, Inc. (a) | | 37,049 | 1,597,182 |
| Southern States Bancshares, Inc. | | 11,490 | 277,024 |
| Southside Bancshares, Inc. | | 162,063 | 6,106,534 |
| Southstate Corp. | | 381,839 | 29,798,716 |
| Stock Yards Bancorp, Inc. | | 135,471 | 8,976,308 |
| Summit Financial Group, Inc. | | 50,095 | 1,428,709 |
| Summit State Bank | | 219 | 3,285 |
| Synovus Financial Corp. | | 735,666 | 29,544,347 |
| Texas Capital Bancshares, Inc. (a) | | 256,814 | 15,159,730 |
| The Bank of Princeton | | 27,726 | 791,023 |
| The First Bancorp, Inc. | | 45,285 | 1,313,265 |
| Third Coast Bancshares, Inc. | | 17,879 | 325,398 |
| Tompkins Financial Corp. | | 58,926 | 4,221,459 |
| TowneBank | | 342,026 | 9,744,321 |
| Trico Bancshares | | 155,226 | 7,325,115 |
| Triumph Bancorp, Inc. (a) | | 119,820 | 7,418,056 |
| Trustmark Corp. | | 309,035 | 9,746,964 |
| UMB Financial Corp. | | 217,182 | 19,431,274 |
| Umpqua Holdings Corp. | | 1,109,010 | 19,673,837 |
| Union Bankshares, Inc. | | 25,423 | 648,287 |
| United Bancorp, Inc. | | 40,328 | 625,487 |
| United Bankshares, Inc., West Virginia | | 686,898 | 25,483,916 |
| United Community Bank, Inc. | | 521,942 | 17,500,715 |
| United Security Bancshares, California | | 71,656 | 508,758 |
| Unity Bancorp, Inc. | | 32,553 | 912,461 |
| Univest Corp. of Pennsylvania | | 147,639 | 3,661,447 |
| USCB Financial Holdings, Inc. (a) | | 29,128 | 378,664 |
| Valley National Bancorp | | 2,129,765 | 24,747,869 |
| Veritex Holdings, Inc. | | 280,429 | 8,443,717 |
| Village Bank & Trust Financial Corp. | | 8,640 | 417,398 |
| Virginia National Bankshares C | | 20,188 | 666,204 |
| Washington Federal, Inc. | | 328,394 | 10,511,892 |
| Washington Trust Bancorp, Inc. | | 88,648 | 4,488,248 |
| Webster Financial Corp. | | 896,602 | 42,185,124 |
| WesBanco, Inc. | | 304,730 | 10,424,813 |
| West Bancorp., Inc. | | 81,429 | 2,003,968 |
| Westamerica Bancorp. | | 136,017 | 7,610,151 |
| Western Alliance Bancorp. | | 547,025 | 41,967,758 |
| Wintrust Financial Corp. | | 302,402 | 25,504,585 |
| | | | 1,800,209,881 |
| Capital Markets - 3.7% | | | |
| Affiliated Managers Group, Inc. | | 194,066 | 24,716,246 |
| Ares Management Corp. | | 865,112 | 64,139,404 |
| Artisan Partners Asset Management, Inc. | | 341,861 | 11,541,227 |
| Ashford, Inc. (a) | | 11,455 | 205,617 |
| Assetmark Financial Holdings, Inc. (a) | | 101,275 | 1,958,659 |
| Associated Capital Group, Inc. | | 15,715 | 622,157 |
| B. Riley Financial, Inc. | | 81,935 | 4,077,905 |
| Bakkt Holdings, Inc. Class A (a)(b) | | 272,242 | 705,107 |
| BGC Partners, Inc. Class A | | 1,656,884 | 6,660,674 |
| Blackstone, Inc. | | 3,537,616 | 332,323,592 |
| Blucora, Inc. (a) | | 238,481 | 4,788,698 |
| Blue Owl Capital, Inc. Class A | | 1,743,166 | 19,349,143 |
| Bridge Investment Group Holdings, Inc. | | 124,690 | 2,033,694 |
| BrightSphere Investment Group, Inc. | | 161,251 | 2,755,780 |
| Carlyle Group LP | | 712,928 | 23,191,548 |
| Cohen & Co., Inc. | | 5,402 | 63,203 |
| Cohen & Steers, Inc. | | 128,936 | 9,203,452 |
| Coinbase Global, Inc. (a)(b) | | 166,826 | 11,143,977 |
| Cowen Group, Inc. Class A | | 137,572 | 5,289,643 |
| Diamond Hill Investment Group, Inc. | | 15,913 | 2,721,919 |
| Donnelley Financial Solutions, Inc. (a) | | 140,513 | 5,964,777 |
| Evercore, Inc. Class A | | 205,308 | 19,235,307 |
| Federated Hermes, Inc. | | 463,896 | 15,800,298 |
| Focus Financial Partners, Inc. Class A (a) | | 282,070 | 11,043,041 |
| Forge Global Holdings, Inc. Class A (a)(b) | | 507,994 | 1,940,537 |
| GAMCO Investors, Inc. Class A | | 21,403 | 432,983 |
| GCM Grosvenor, Inc. Class A | | 182,218 | 1,430,411 |
| Greenhill & Co., Inc. | | 75,267 | 588,588 |
| Hamilton Lane, Inc. Class A | | 176,989 | 12,314,895 |
| Hennessy Advisors, Inc. (b) | | 20,328 | 202,060 |
| Heritage Global, Inc. (a) | | 150,645 | 248,564 |
| Houlihan Lokey | | 252,668 | 19,834,438 |
| Interactive Brokers Group, Inc. | | 441,225 | 27,175,048 |
| Janus Henderson Group PLC | | 842,405 | 19,712,277 |
| Jefferies Financial Group, Inc. | | 965,793 | 30,992,297 |
| KKR & Co. LP | | 2,987,998 | 151,073,179 |
| Lazard Ltd. Class A | | 567,635 | 20,633,532 |
| LPL Financial | | 403,185 | 89,236,936 |
| Manning & Napier, Inc. Class A | | 71,855 | 914,714 |
| MarketWise, Inc. Class A (a)(b) | | 143,631 | 400,730 |
| Moelis & Co. Class A | | 329,270 | 13,717,388 |
| Morningstar, Inc. | | 118,805 | 27,086,352 |
| National Holdings Corp. warrants 1/18/22 (a)(c) | | 3,483 | 0 |
| Open Lending Corp. (a) | | 521,327 | 5,062,085 |
| Oppenheimer Holdings, Inc. Class A (non-vtg.) | | 45,711 | 1,659,309 |
| P10, Inc. | | 183,940 | 2,295,571 |
| Perella Weinberg Partners Class A | | 191,380 | 1,376,022 |
| Piper Jaffray Companies | | 71,631 | 8,206,764 |
| PJT Partners, Inc. | | 125,104 | 8,659,699 |
| Pzena Investment Management, Inc. | | 86,223 | 820,843 |
| Safeguard Scientifics, Inc. (a)(b) | | 118,368 | 488,860 |
| Sculptor Capital Management, Inc. Class A | | 102,183 | 963,586 |
| SEI Investments Co. | | 525,180 | 28,727,346 |
| Siebert Financial Corp. (a)(b) | | 57,599 | 99,646 |
| Silvercrest Asset Management Group Class A (b) | | 46,707 | 834,654 |
| StepStone Group, Inc. Class A | | 246,670 | 6,731,624 |
| Stifel Financial Corp. | | 537,285 | 31,866,373 |
| StoneX Group, Inc. (a) | | 85,860 | 7,971,242 |
| TPG, Inc. (b) | | 175,447 | 5,151,124 |
| Tradeweb Markets, Inc. Class A | | 543,137 | 37,796,904 |
| U.S. Global Investors, Inc. Class A | | 66,209 | 250,270 |
| Value Line, Inc. | | 5,143 | 421,777 |
| Victory Capital Holdings, Inc. | | 120,330 | 3,222,437 |
| Virtu Financial, Inc. Class A | | 405,308 | 9,305,872 |
| Virtus Investment Partners, Inc. | | 35,678 | 6,823,418 |
| Westwood Holdings Group, Inc. | | 41,901 | 565,664 |
| WisdomTree Investments, Inc. | | 551,914 | 2,765,089 |
| | | | 1,169,536,176 |
| Consumer Finance - 0.8% | | | |
| Ally Financial, Inc. | | 1,630,310 | 54,126,292 |
| Atlanticus Holdings Corp. (a)(b) | | 28,002 | 797,217 |
| Bread Financial Holdings, Inc. | | 251,141 | 9,651,349 |
| Consumer Portfolio Services, Inc. (a)(b) | | 55,273 | 643,378 |
| Credit Acceptance Corp. (a)(b) | | 37,874 | 20,151,998 |
| CURO Group Holdings Corp. | | 108,654 | 717,116 |
| Elevate Credit, Inc. (a) | | 98,429 | 145,675 |
| Encore Capital Group, Inc. (a)(b) | | 122,844 | 6,717,110 |
| Enova International, Inc. (a) | | 165,046 | 5,766,707 |
| EZCORP, Inc. (non-vtg.) Class A (a) | | 272,849 | 2,387,429 |
| FirstCash Holdings, Inc. | | 198,730 | 15,492,991 |
| Green Dot Corp. Class A (a) | | 277,885 | 5,638,287 |
| Katapult Holdings, Inc. (a)(b) | | 319,640 | 364,390 |
| LendingClub Corp. (a) | | 518,463 | 6,776,311 |
| LendingTree, Inc. (a) | | 55,295 | 1,685,945 |
| Medallion Financial Corp. | | 104,357 | 830,682 |
| MoneyLion, Inc. (a)(b) | | 496,890 | 710,553 |
| Navient Corp. | | 745,544 | 11,473,922 |
| Nelnet, Inc. Class A | | 99,625 | 8,392,410 |
| NerdWallet, Inc. (b) | | 38,135 | 396,223 |
| Nicholas Financial, Inc. (a) | | 55,821 | 495,690 |
| OneMain Holdings, Inc. | | 537,241 | 18,765,828 |
| Oportun Financial Corp. (a) | | 109,998 | 562,090 |
| OppFi, Inc. Class A (a)(b) | | 89,197 | 241,724 |
| PRA Group, Inc. (a) | | 199,401 | 7,365,873 |
| PROG Holdings, Inc. (a) | | 276,111 | 5,119,098 |
| Regional Management Corp. | | 47,068 | 1,585,721 |
| SLM Corp. | | 1,360,634 | 20,790,488 |
| SoFi Technologies, Inc. (a)(b) | | 3,703,301 | 21,923,542 |
| Sunlight Financial Holdings, Inc. Class A (a)(b) | | 199,065 | 609,139 |
| Upstart Holdings, Inc. (a)(b) | | 257,368 | 6,665,831 |
| World Acceptance Corp. (a)(b) | | 18,419 | 2,141,025 |
| | | | 239,132,034 |
| Diversified Financial Services - 0.7% | | | |
| A-Mark Precious Metals, Inc. | | 84,983 | 2,626,825 |
| Acacia Research Corp. (a) | | 238,672 | 1,071,637 |
| Alerus Financial Corp. | | 79,611 | 1,891,557 |
| Apollo Global Management, Inc. | | 1,884,583 | 104,745,123 |
| Cannae Holdings, Inc. (a) | | 404,289 | 8,736,685 |
| Equitable Holdings, Inc. | | 1,789,055 | 53,224,386 |
| FlexShopper, Inc. (a) | | 76,900 | 202,247 |
| Jackson Financial, Inc. | | 436,657 | 13,649,898 |
| LM Funding America, Inc. (a) | | 52,977 | 68,870 |
| SWK Holdings Corp. (a)(b) | | 19,397 | 339,060 |
| Voya Financial, Inc. | | 511,633 | 31,480,778 |
| | | | 218,037,066 |
| Insurance - 3.0% | | | |
| Alleghany Corp. (a) | | 67,977 | 57,180,893 |
| AMBAC Financial Group, Inc. (a) | | 232,257 | 3,504,758 |
| American Equity Investment Life Holding Co. | | 389,788 | 14,811,944 |
| American Financial Group, Inc. | | 334,748 | 42,740,625 |
| Amerisafe, Inc. | | 95,924 | 4,587,086 |
| Arch Capital Group Ltd. (a) | | 1,895,301 | 86,653,162 |
| Argo Group International Holdings, Ltd. | | 179,907 | 3,531,574 |
| Assured Guaranty Ltd. | | 320,986 | 16,392,755 |
| Atlantic American Corp. (b) | | 39,081 | 116,852 |
| Axis Capital Holdings Ltd. | | 394,346 | 20,959,490 |
| Brighthouse Financial, Inc. (a) | | 378,622 | 18,003,476 |
| BRP Group, Inc. (a) | | 282,236 | 8,862,210 |
| Citizens, Inc. Class A (a)(b) | | 248,378 | 941,353 |
| CNA Financial Corp. | | 137,663 | 5,294,519 |
| CNO Financial Group, Inc. | | 593,271 | 10,922,119 |
| Conifer Holdings, Inc. (a) | | 13,002 | 25,094 |
| Crawford & Co.: | | | |
| Class A | | 75,823 | 461,004 |
| Class B | | 50,546 | 298,221 |
| Donegal Group, Inc. Class A | | 80,187 | 1,164,315 |
| eHealth, Inc. (a) | | 127,581 | 816,518 |
| Employers Holdings, Inc. | | 140,198 | 5,490,154 |
| Enstar Group Ltd. (a) | | 61,736 | 11,683,538 |
| Erie Indemnity Co. Class A | | 125,813 | 27,040,988 |
| Fednat Holding Co. (a)(b) | | 54,059 | 17,412 |
| FG Financial Group, Inc. (a)(b) | | 9,506 | 13,403 |
| Fidelity National Financial, Inc. | | 1,418,774 | 55,474,063 |
| First American Financial Corp. | | 544,200 | 29,114,700 |
| Genworth Financial, Inc. Class A (a) | | 2,584,361 | 10,906,003 |
| GoHealth, Inc. (a)(b) | | 248,755 | 112,412 |
| Goosehead Insurance (b) | | 103,264 | 5,369,728 |
| Greenlight Capital Re, Ltd. (a) | | 146,667 | 1,157,203 |
| Hagerty, Inc. Class A (a)(b) | | 136,187 | 1,529,380 |
| Hallmark Financial Services, Inc. (a) | | 90,584 | 115,042 |
| Hanover Insurance Group, Inc. | | 180,240 | 23,321,254 |
| HCI Group, Inc. (b) | | 40,556 | 1,938,171 |
| Heritage Insurance Holdings, Inc. | | 140,025 | 369,666 |
| Hippo Holdings, Inc. (a)(b) | | 1,891,077 | 1,834,345 |
| Horace Mann Educators Corp. | | 208,008 | 7,440,446 |
| Investors Title Co. | | 7,427 | 1,094,368 |
| James River Group Holdings Ltd. | | 189,184 | 4,495,012 |
| Kemper Corp. | | 305,013 | 14,030,598 |
| Kingstone Companies, Inc. | | 37,937 | 149,092 |
| Kingsway Financial Services, Inc. (a) | | 22,293 | 156,051 |
| Kinsale Capital Group, Inc. | | 108,424 | 27,494,158 |
| Lemonade, Inc. (a)(b) | | 207,876 | 4,598,217 |
| Maiden Holdings Ltd. (a) | | 370,330 | 844,352 |
| Markel Corp. (a) | | 68,499 | 81,795,341 |
| Marpai, Inc. (b) | | 26,415 | 24,796 |
| MBIA, Inc. (a)(b) | | 243,136 | 2,866,573 |
| Mercury General Corp. | | 131,745 | 4,202,666 |
| Midwest Holding, Inc. (a)(b) | | 8,632 | 126,890 |
| National Western Life Group, Inc. | | 11,530 | 2,194,274 |
| NI Holdings, Inc. (a) | | 38,706 | 508,210 |
| Old Republic International Corp. | | 1,447,101 | 31,604,686 |
| Oscar Health, Inc. (a) | | 194,106 | 1,286,923 |
| Oxbridge Re Holdings Ltd. (a) | | 14,700 | 39,249 |
| Palomar Holdings, Inc. (a) | | 121,205 | 9,610,344 |
| Primerica, Inc. | | 195,111 | 24,730,319 |
| ProAssurance Corp. | | 276,044 | 5,904,581 |
| Reinsurance Group of America, Inc. | | 337,490 | 42,307,746 |
| Reliance Global Group, Inc. (a) | | 55,359 | 43,761 |
| RenaissanceRe Holdings Ltd. | | 222,891 | 30,148,237 |
| RLI Corp. | | 201,311 | 22,095,895 |
| Root, Inc. (a)(b) | | 34,409 | 426,328 |
| Ryan Specialty Group Holdings, Inc. (a)(b) | | 296,555 | 12,562,070 |
| Safety Insurance Group, Inc. | | 70,598 | 6,357,350 |
| Selective Insurance Group, Inc. | | 304,944 | 24,218,652 |
| Selectquote, Inc. (a)(b) | | 634,081 | 703,830 |
| Siriuspoint Ltd. (a) | | 441,406 | 1,973,085 |
| Stewart Information Services Corp. | | 136,729 | 6,923,957 |
| Tiptree, Inc. | | 107,992 | 1,290,504 |
| Trean Insurance Group, Inc. (a) | | 93,223 | 414,842 |
| Trupanion, Inc. (a)(b) | | 174,823 | 12,339,007 |
| United Fire Group, Inc. | | 108,875 | 3,204,191 |
| United Insurance Holdings Corp. | | 116,532 | 117,697 |
| Universal Insurance Holdings, Inc. | | 142,723 | 1,704,113 |
| Unum Group | | 1,015,200 | 38,425,320 |
| Vericity, Inc. (a) | | 18,166 | 127,344 |
| White Mountains Insurance Group Ltd. | | 14,820 | 20,303,400 |
| | | | 923,639,905 |
| Mortgage Real Estate Investment Trusts - 1.0% | | | |
| Acres Commercial Realty Corp. (a) | | 54,728 | 531,409 |
| AG Mortgage Investment Trust, Inc. (b) | | 120,512 | 772,482 |
| AGNC Investment Corp. | | 2,643,350 | 31,588,033 |
| Angel Oak Mortgage, Inc. (b) | | 35,770 | 496,130 |
| Annaly Capital Management, Inc. | | 8,416,710 | 54,287,780 |
| Apollo Commercial Real Estate Finance, Inc. (b) | | 686,762 | 8,000,777 |
| Arbor Realty Trust, Inc. | | 807,078 | 12,090,028 |
| Ares Commercial Real Estate Corp. | | 248,658 | 3,279,799 |
| Arlington Asset Investment Corp. (a) | | 193,930 | 620,576 |
| Armour Residential REIT, Inc. | | 526,054 | 3,734,983 |
| Blackstone Mortgage Trust, Inc. | | 851,186 | 24,667,370 |
| BrightSpire Capital, Inc. | | 483,669 | 4,062,820 |
| Broadmark Realty Capital, Inc. | | 682,180 | 4,400,061 |
| Cherry Hill Mortgage Investment Corp. (b) | | 104,324 | 674,976 |
| Chimera Investment Corp. | | 1,187,136 | 10,090,656 |
| Dynex Capital, Inc. | | 193,470 | 3,000,720 |
| Ellington Financial LLC | | 287,940 | 4,226,959 |
| Ellington Residential Mortgage REIT | | 80,867 | 653,405 |
| Franklin BSP Realty Trust, Inc. | | 422,923 | 5,455,707 |
| Granite Point Mortgage Trust, Inc. | | 281,958 | 2,656,044 |
| Great Ajax Corp. | | 121,949 | 1,103,638 |
| Hannon Armstrong Sustainable Infrastructure Capital, Inc. (b) | | 439,152 | 17,355,287 |
| Invesco Mortgage Capital, Inc. | | 171,975 | 2,732,683 |
| KKR Real Estate Finance Trust, Inc. | | 242,114 | 4,663,116 |
| Ladder Capital Corp. Class A | | 574,738 | 6,356,602 |
| Lument Finance Trust, Inc. (b) | | 231,863 | 581,976 |
| Manhattan Bridge Capital, Inc. | | 34,808 | 195,273 |
| MFA Financial, Inc. | | 458,579 | 5,012,268 |
| New York Mortgage Trust, Inc. | | 1,903,640 | 5,330,192 |
| Nexpoint Real Estate Finance, Inc. | | 46,285 | 949,768 |
| Orchid Island Capital, Inc. | | 185,487 | 2,507,784 |
| PennyMac Mortgage Investment Trust | | 471,511 | 7,001,938 |
| Ready Capital Corp. | | 345,015 | 4,519,697 |
| Redwood Trust, Inc. | | 605,395 | 4,691,811 |
| Rithm Capital Corp. | | 2,358,266 | 22,238,448 |
| Sachem Capital Corp. (b) | | 185,588 | 820,299 |
| Seven Hills Realty Trust | | 71,167 | 739,425 |
| Starwood Property Trust, Inc. | | 1,551,813 | 35,583,072 |
| TPG RE Finance Trust, Inc. | | 314,192 | 2,909,418 |
| Two Harbors Investment Corp. | | 1,731,674 | 8,398,619 |
| Western Asset Mortgage Capital Corp. (b) | | 37,595 | 509,036 |
| | | | 309,491,065 |
| Thrifts & Mortgage Finance - 0.8% | | | |
| Axos Financial, Inc. (a) | | 266,811 | 11,147,364 |
| Blue Foundry Bancorp (a)(b) | | 148,301 | 1,686,182 |
| Bogota Financial Corp. (a) | | 10,981 | 121,230 |
| Bridgewater Bancshares, Inc. (a) | | 117,700 | 2,022,086 |
| Broadway Financial Corp. (a) | | 199,035 | 216,948 |
| Capitol Federal Financial, Inc. | | 654,399 | 5,928,855 |
| Carver Bancorp, Inc. (a) | | 6,210 | 29,622 |
| Cf Bankshares, Inc. | | 3,719 | 78,471 |
| Columbia Financial, Inc. (a) | | 211,222 | 4,505,365 |
| ESSA Bancorp, Inc. | | 42,835 | 865,267 |
| Essent Group Ltd. | | 549,629 | 21,979,664 |
| Federal Agricultural Mortgage Corp. Class C (non-vtg.) | | 50,728 | 5,541,527 |
| FFBW, Inc. (a) | | 40,676 | 500,315 |
| Finance of America Companies, Inc. (a)(b) | | 111,217 | 135,685 |
| Flagstar Bancorp, Inc. | | 272,449 | 10,497,460 |
| FS Bancorp, Inc. | | 41,853 | 1,243,453 |
| Greene County Bancorp, Inc. | | 18,137 | 964,888 |
| Guild Holdings Co. Class A (b) | | 31,708 | 314,860 |
| Hingham Institution for Savings | | 8,089 | 2,401,624 |
| HMN Financial, Inc. | | 8,152 | 184,643 |
| Home Bancorp, Inc. | | 39,781 | 1,553,050 |
| Home Federal Bancorp, Inc. | | 1,327 | 25,624 |
| HV Bancorp, Inc. (a) | | 2,296 | 48,446 |
| IF Bancorp, Inc. | | 1,305 | 26,531 |
| Impac Mortgage Holdings, Inc. (a)(b) | | 64,113 | 32,012 |
| Income Opportun Realty Investments, Inc. (a)(b) | | 12,432 | 147,568 |
| Kearny Financial Corp. | | 366,547 | 4,163,974 |
| Kentucky First Federal Bancorp | | 23,132 | 168,864 |
| loanDepot, Inc. (b) | | 212,732 | 351,008 |
| Luther Burbank Corp. | | 65,212 | 854,929 |
| Merchants Bancorp | | 131,532 | 3,547,418 |
| MGIC Investment Corp. | | 1,576,095 | 22,522,398 |
| Mr. Cooper Group, Inc. (a) | | 374,943 | 15,860,089 |
| New York Community Bancorp, Inc. | | 2,367,100 | 23,173,909 |
| NMI Holdings, Inc. (a) | | 440,907 | 9,051,821 |
| Northeast Community Bancorp, Inc. | | 51,867 | 657,674 |
| Northfield Bancorp, Inc. | | 230,996 | 3,404,881 |
| Ocwen Financial Corp. (a) | | 42,251 | 1,106,131 |
| OP Bancorp | | 64,748 | 782,803 |
| PennyMac Financial Services, Inc. | | 148,607 | 7,894,004 |
| Pioneer Bancorp, Inc. (a) | | 49,448 | 462,339 |
| Ponce Financial Group, Inc. (a) | | 135,275 | 1,272,938 |
| Provident Bancorp, Inc. | | 89,475 | 1,296,493 |
| Provident Financial Holdings, Inc. | | 32,317 | 458,901 |
| Provident Financial Services, Inc. | | 384,026 | 8,920,924 |
| Radian Group, Inc. | | 874,927 | 18,469,709 |
| Randolph Bancorp, Inc. | | 27,666 | 736,192 |
| Rocket Companies, Inc. (b) | | 596,984 | 4,716,174 |
| Security National Financial Corp. Class A | | 86,361 | 656,344 |
| Southern Missouri Bancorp, Inc. | | 43,098 | 2,272,558 |
| Sterling Bancorp, Inc. (a)(b) | | 120,471 | 709,574 |
| Territorial Bancorp, Inc. | | 44,277 | 921,404 |
| TFS Financial Corp. | | 256,163 | 3,663,131 |
| Timberland Bancorp, Inc./Washington | | 42,576 | 1,129,116 |
| Trustco Bank Corp., New York | | 102,877 | 3,429,919 |
| UWM Holdings Corp. Class A (b) | | 431,133 | 1,560,701 |
| Velocity Financial, Inc. (a) | | 90,316 | 1,031,409 |
| Walker & Dunlop, Inc. | | 154,947 | 15,565,976 |
| Waterstone Financial, Inc. | | 116,073 | 2,006,902 |
| Western New England Bancorp, Inc. | | 119,103 | 992,128 |
| William Penn Bancorp, Inc. | | 58,592 | 673,808 |
| WSFS Financial Corp. | | 322,960 | 15,615,116 |
| | | | 252,300,399 |
TOTAL FINANCIALS | | | 4,912,346,526 |
| HEALTH CARE - 13.3% | | | |
| Biotechnology - 5.6% | | | |
| 180 Life Sciences Corp. (a)(b) | | 115,451 | 98,295 |
| 2seventy bio, Inc. (a) | | 190,707 | 2,809,114 |
| 4D Molecular Therapeutics, Inc. (a)(b) | | 130,063 | 1,022,295 |
| 89Bio, Inc. (a)(b) | | 46,008 | 205,196 |
| Aadi Bioscience, Inc. (a)(b) | | 109,330 | 1,481,422 |
| Aadi Bioscience, Inc. rights (a)(c) | | 252,937 | 3 |
| Abeona Therapeutics, Inc. (a) | | 20,352 | 74,081 |
| ACADIA Pharmaceuticals, Inc. (a) | | 601,678 | 9,885,570 |
| Achieve Life Sciences, Inc. (a)(b) | | 45,623 | 208,041 |
| Acorda Therapeutics, Inc. (a) | | 20,520 | 8,296 |
| Actinium Pharmaceuticals, Inc. (a) | | 121,876 | 856,788 |
| Acumen Pharmaceuticals, Inc. (a)(b) | | 56,984 | 324,239 |
| Adagio Therapeutics, Inc. (b) | | 94,755 | 432,083 |
| Adicet Bio, Inc. (a) | | 91,223 | 1,291,718 |
| Adicet Bio, Inc. rights (a)(c) | | 11,207 | 0 |
| Aditxt, Inc. (a)(b) | | 78,620 | 11,997 |
| ADMA Biologics, Inc. (a)(b) | | 901,527 | 2,434,123 |
| Adverum Biotechnologies, Inc. (a)(b) | | 441,730 | 512,407 |
| Aeglea BioTherapeutics, Inc. (a) | | 211,716 | 110,727 |
| Aerovate Therapeutics, Inc. (a)(b) | | 47,413 | 940,200 |
| Aevi Genomic Medicine, Inc. rights (a)(c) | | 123,543 | 4,156 |
| Agenus, Inc. (a)(b) | | 1,239,415 | 3,346,421 |
| AgeX Therapeutics, Inc. (a)(b) | | 60,935 | 34,733 |
| Agios Pharmaceuticals, Inc. (a) | | 276,977 | 7,062,914 |
| Aikido Pharma, Inc. (a) | | 23,615 | 139,329 |
| Aileron Therapeutics, Inc. (a) | | 356,684 | 66,022 |
| AIM ImmunoTech, Inc. (a)(b) | | 268,275 | 178,403 |
| Akebia Therapeutics, Inc. (a) | | 802,479 | 292,343 |
| Akero Therapeutics, Inc. (a)(b) | | 120,799 | 1,419,388 |
| Akouos, Inc. (a)(b) | | 113,144 | 379,032 |
| Alaunos Therapeutics, Inc. (a)(b) | | 1,109,315 | 2,728,915 |
| Albireo Pharma, Inc. (a)(b) | | 104,369 | 1,826,458 |
| Aldeyra Therapeutics, Inc. (a) | | 251,034 | 1,767,279 |
| Alector, Inc. (a) | | 301,062 | 3,115,992 |
| Aligos Therapeutics, Inc. (a) | | 103,032 | 128,790 |
| Alkermes PLC (a) | | 825,715 | 19,544,674 |
| Allakos, Inc. (a) | | 190,836 | 925,555 |
| Allarity Therapeutics, Inc. (a)(b) | | 11,267 | 13,182 |
| Allena Pharmaceuticals, Inc. (a)(b) | | 181,982 | 19,126 |
| Allogene Therapeutics, Inc. (a)(b) | | 373,778 | 5,124,496 |
| Allovir, Inc. (a)(b) | | 161,027 | 1,209,313 |
| Alnylam Pharmaceuticals, Inc. (a) | | 610,427 | 126,156,948 |
| Alpine Immune Sciences, Inc. (a) | | 63,909 | 479,957 |
| Altimmune, Inc. (a) | | 197,183 | 4,353,801 |
| ALX Oncology Holdings, Inc. (a) | | 99,465 | 1,293,045 |
| Amicus Therapeutics, Inc. (a) | | 1,279,060 | 14,363,844 |
| AnaptysBio, Inc. (a)(b) | | 98,522 | 2,287,681 |
| Anavex Life Sciences Corp. (a)(b) | | 385,878 | 3,700,570 |
| Anika Therapeutics, Inc. (a) | | 75,678 | 1,710,323 |
| Anixa Biosciences, Inc. (a) | | 139,242 | 580,639 |
| Annexon, Inc. (a)(b) | | 139,292 | 819,037 |
| Annovis Bio, Inc. (a)(b) | | 26,605 | 308,618 |
| Apellis Pharmaceuticals, Inc. (a) | | 456,067 | 27,596,614 |
| Applied Genetic Technologies Corp. (a) | | 257,117 | 103,310 |
| Applied Molecular Transport, Inc. (a)(b) | | 89,335 | 132,216 |
| Applied Therapeutics, Inc. (a) | | 88,039 | 120,613 |
| Aprea Therapeutics, Inc. (a)(b) | | 104,343 | 82,859 |
| Aptevo Therapeutics, Inc. (a) | | 32,870 | 116,360 |
| Aptinyx, Inc. (a) | | 201,276 | 83,530 |
| AquaBounty Technologies, Inc. (a) | | 246,655 | 295,986 |
| Aravive, Inc. (a) | | 72,953 | 49,046 |
| Arbutus Biopharma Corp. (a) | | 506,924 | 1,125,371 |
| ARCA Biopharma, Inc. (a)(b) | | 56,749 | 132,793 |
| Arcellx, Inc. | | 44,310 | 796,251 |
| Arcturus Therapeutics Holdings, Inc. (a)(b) | | 109,161 | 1,532,620 |
| Arcus Biosciences, Inc. (a) | | 234,096 | 5,637,032 |
| Arcutis Biotherapeutics, Inc. (a) | | 182,160 | 4,909,212 |
| Ardelyx, Inc. (a)(b) | | 515,545 | 488,685 |
| Aridis Pharmaceuticals, Inc. (a)(b) | | 80,060 | 116,888 |
| Armata Pharmaceuticals, Inc. (a)(b) | | 15,833 | 63,807 |
| Arrowhead Pharmaceuticals, Inc. (a) | | 535,783 | 21,275,943 |
| Assembly Biosciences, Inc. (a)(b) | | 220,255 | 411,877 |
| Astria Therapeutics, Inc. (a) | | 30,614 | 262,974 |
| Atara Biotherapeutics, Inc. (a) | | 481,272 | 1,929,901 |
| Athenex, Inc. (a) | | 304,168 | 145,849 |
| Athersys, Inc. (a)(b) | | 45,187 | 124,264 |
| Atossa Therapeutics, Inc. (a)(b) | | 674,635 | 621,339 |
| Atreca, Inc. (a)(b) | | 152,190 | 283,073 |
| aTyr Pharma, Inc. (a) | | 143,494 | 490,749 |
| Aura Biosciences, Inc. | | 28,674 | 383,085 |
| Avalo Therapeutics, Inc. (a) | | 40,784 | 193,724 |
| AVEO Pharmaceuticals, Inc. (a) | | 152,677 | 1,235,157 |
| Avid Bioservices, Inc. (a) | | 313,728 | 5,402,396 |
| Avidity Biosciences, Inc. (a)(b) | | 232,763 | 4,566,810 |
| Avita Medical, Inc. (a) | | 138,012 | 852,914 |
| AVROBIO, Inc. (a) | | 228,125 | 216,719 |
| Axcella Health, Inc. (a)(b) | | 145,495 | 357,918 |
| Aziyo Biologics, Inc. (a)(b) | | 6,020 | 43,946 |
| Beam Therapeutics, Inc. (a)(b) | | 233,757 | 12,763,132 |
| Bellerophon Therapeutics, Inc. (a)(b) | | 38,437 | 48,815 |
| Bellicum Pharmaceuticals, Inc. (a)(b) | | 37,377 | 47,095 |
| Benitec Biopharma, Inc. (a)(b) | | 30,132 | 22,599 |
| Bio Path Holdings, Inc. (a)(b) | | 36,507 | 133,616 |
| BioAtla, Inc. (a)(b) | | 96,266 | 838,477 |
| BioCardia, Inc. (a)(b) | | 58,079 | 114,996 |
| Biocept, Inc. (a)(b) | | 90,400 | 93,112 |
| BioCryst Pharmaceuticals, Inc. (a)(b) | | 931,624 | 12,949,574 |
| Biohaven Pharmaceutical Holding Co. Ltd. (a) | | 319,123 | 47,661,020 |
| BioMarin Pharmaceutical, Inc. (a) | | 933,116 | 83,233,947 |
| Biomea Fusion, Inc. (a)(b) | | 47,677 | 548,286 |
| Biora Therapeutics, Inc. (a)(b) | | 634,102 | 458,012 |
| BioRestorative Therapies, Inc. (b) | | 7,023 | 22,825 |
| BioVie, Inc. (a)(b) | | 18,946 | 68,395 |
| BioXcel Therapeutics, Inc. (a)(b) | | 99,227 | 1,357,425 |
| Black Diamond Therapeutics, Inc. (a)(b) | | 117,879 | 376,034 |
| bluebird bio, Inc. (a)(b) | | 369,200 | 2,156,128 |
| Blueprint Medicines Corp. (a) | | 302,075 | 22,117,932 |
| Bolt Biotherapeutics, Inc. (a)(b) | | 75,466 | 135,839 |
| BrainStorm Cell Therpeutic, Inc. (a)(b) | | 152,506 | 552,072 |
| Brickell Biotech, Inc. (a)(b) | | 7,100 | 17,892 |
| BridgeBio Pharma, Inc. (a)(b) | | 551,248 | 5,788,104 |
| Brooklyn ImmunoTherapeutics, Inc. (a)(b) | | 136,920 | 56,343 |
| C4 Therapeutics, Inc. (a)(b) | | 187,438 | 1,889,375 |
| Cabaletta Bio, Inc. (a)(b) | | 72,336 | 69,074 |
| Calithera Biosciences, Inc. (a)(b) | | 16,625 | 64,671 |
| Calyxt, Inc. (a)(b) | | 79,753 | 17,338 |
| Candel Therapeutics, Inc. (a)(b) | | 38,228 | 132,651 |
| Capricor Therapeutics, Inc. (a)(b) | | 116,683 | 679,095 |
| Cardiff Oncology, Inc. (a)(b) | | 210,301 | 565,710 |
| CareDx, Inc. (a) | | 271,424 | 5,317,196 |
| Caribou Biosciences, Inc. (a) | | 108,182 | 1,067,756 |
| CASI Pharmaceuticals, Inc. (a)(b) | | 59,328 | 222,480 |
| Catalyst Biosciences, Inc. (a) | | 163,968 | 323,017 |
| Catalyst Pharmaceutical Partners, Inc. (a) | | 477,137 | 6,460,435 |
| Cel-Sci Corp. (a)(b) | | 214,049 | 843,353 |
| Celcuity, Inc. (a) | | 55,248 | 516,569 |
| Celldex Therapeutics, Inc. (a) | | 238,030 | 7,236,112 |
| Cellectar Biosciences, Inc. (a) | | 25,577 | 141,952 |
| Celsion Corp. (a)(b) | | 29,597 | 63,042 |
| Century Therapeutics, Inc. (a) | | 53,678 | 564,693 |
| Cerevel Therapeutics Holdings (a) | | 285,220 | 8,299,902 |
| Checkpoint Therapeutics, Inc. (a)(b) | | 388,315 | 500,926 |
| ChemoCentryx, Inc. (a) | | 247,563 | 12,620,762 |
| Chimerix, Inc. (a) | | 337,678 | 742,892 |
| Chinook Therapeutics, Inc. (a) | | 236,062 | 4,910,090 |
| Chinook Therapeutics, Inc. rights (a)(c) | | 51,768 | 1 |
| Cidara Therapeutics, Inc. (a) | | 294,327 | 200,142 |
| Clene, Inc. (a)(b) | | 107,646 | 318,632 |
| Clovis Oncology, Inc. (a)(b) | | 748,550 | 838,376 |
| Codiak Biosciences, Inc. (a) | | 91,619 | 196,981 |
| Cogent Biosciences, Inc. (a) | | 191,953 | 3,165,305 |
| Cogent Biosciences, Inc. rights (a)(c) | | 43,783 | 0 |
| CohBar, Inc. (a)(b) | | 236,658 | 36,114 |
| Coherus BioSciences, Inc. (a) | | 326,396 | 3,649,107 |
| Concert Pharmaceuticals, Inc. (a) | | 133,168 | 876,245 |
| ContraFect Corp. (a)(b) | | 182,668 | 48,590 |
| Corbus Pharmaceuticals Holdings, Inc. (a) | | 567,747 | 114,458 |
| Corvus Pharmaceuticals, Inc. (a) | | 159,592 | 152,969 |
| Creative Medical Technology Holdings, Inc. | | 24,157 | 16,697 |
| Crinetics Pharmaceuticals, Inc. (a) | | 221,206 | 4,176,369 |
| CRISPR Therapeutics AG (a)(b) | | 361,186 | 23,509,597 |
| CTI BioPharma Corp. (a) | | 428,031 | 2,688,035 |
| Cue Biopharma, Inc. (a) | | 159,858 | 469,983 |
| Cullinan Oncology, Inc. (a) | | 124,014 | 1,671,709 |
| Curis, Inc. (a)(b) | | 421,839 | 409,184 |
| Cyclacel Pharmaceuticals, Inc. (a)(b) | | 38,619 | 64,880 |
| Cyclerion Therapeutics, Inc. (a) | | 201,187 | 168,997 |
| Cyclo Therapeutics, Inc. (a) | | 28,360 | 58,989 |
| Cyteir Therapeutics, Inc. (a) | | 34,368 | 74,235 |
| Cytokinetics, Inc. (a) | | 434,056 | 22,987,606 |
| CytomX Therapeutics, Inc. (a) | | 326,837 | 490,256 |
| Day One Biopharmaceuticals, Inc. (a) | | 104,407 | 2,452,520 |
| Decibel Therapeutics, Inc. (a) | | 40,000 | 197,600 |
| Deciphera Pharmaceuticals, Inc. (a) | | 242,362 | 3,933,535 |
| Denali Therapeutics, Inc. (a) | | 474,004 | 13,115,691 |
| DermTech, Inc. (a)(b) | | 142,168 | 790,454 |
| Design Therapeutics, Inc. (a)(b) | | 60,713 | 1,230,045 |
| DiaMedica Therapeutics, Inc. (a) | | 84,511 | 149,584 |
| Diffusion Pharmaceuticals, Inc. (a) | | 10,085 | 65,855 |
| Dyadic International, Inc. (a)(b) | | 102,363 | 274,845 |
| Dynavax Technologies Corp. (a)(b) | | 596,059 | 6,836,797 |
| Dyne Therapeutics, Inc. (a) | | 130,455 | 1,278,459 |
| Eagle Pharmaceuticals, Inc. (a) | | 56,410 | 1,848,556 |
| Edesa Biotech, Inc. (a) | | 40,850 | 75,164 |
| Editas Medicine, Inc. (a)(b) | | 341,792 | 5,024,342 |
| Effector Therapeutics, Inc. Class A (a)(b) | | 56,450 | 34,406 |
| Eiger Biopharmaceuticals, Inc. (a)(b) | | 208,730 | 1,724,110 |
| Eledon Pharmaceuticals, Inc. (a)(b) | | 75,883 | 284,561 |
| Elevation Oncology, Inc. (a) | | 4,404 | 5,065 |
| Eliem Therapeutics, Inc. | | 30,270 | 91,113 |
| Emergent BioSolutions, Inc. (a) | | 228,385 | 5,485,808 |
| Enanta Pharmaceuticals, Inc. (a) | | 92,636 | 5,639,680 |
| Enochian Biosciences, Inc. (a) | | 81,009 | 200,092 |
| Ensysce Biosciences, Inc. (a)(b) | | 61,501 | 25,978 |
| Entrada Therapeutics, Inc. (b) | | 47,093 | 594,785 |
| EQRx, Inc. (a)(b) | | 1,142,028 | 5,584,517 |
| Equillium, Inc. (a)(b) | | 90,225 | 245,412 |
| Erasca, Inc. (a) | | 105,536 | 951,935 |
| Evelo Biosciences, Inc. (a)(b) | | 157,015 | 343,863 |
| Exact Sciences Corp. (a) | | 881,260 | 31,328,793 |
| Exagen, Inc. (a)(b) | | 40,297 | 182,545 |
| Exelixis, Inc. (a) | | 1,622,367 | 28,780,791 |
| Exicure, Inc. (a)(b) | | 12,682 | 22,701 |
| F-star Therapeutics, Inc. (a) | | 109,999 | 738,093 |
| F-star Therapeutics, Inc.: | | | |
| rights (a)(c) | | 13,735 | 0 |
| rights (a)(c) | | 13,735 | 0 |
| Fate Therapeutics, Inc. (a)(b) | | 417,849 | 10,922,573 |
| FibroGen, Inc. (a) | | 443,873 | 5,521,780 |
| Finch Therapeutics Group, Inc. (a) | | 44,367 | 95,833 |
| First Wave BioPharma, Inc. (a)(b) | | 2,138 | 6,564 |
| Foghorn Therapeutics, Inc. (a)(b) | | 104,067 | 1,034,426 |
| Forma Therapeutics Holdings, Inc. (a) | | 165,744 | 2,220,970 |
| Forte Biosciences, Inc. (a) | | 61,662 | 80,161 |
| Fortress Biotech, Inc. (a) | | 369,175 | 376,559 |
| Frequency Therapeutics, Inc. (a) | | 189,248 | 389,851 |
| G1 Therapeutics, Inc. (a)(b) | | 178,352 | 2,587,888 |
| Gain Therapeutics, Inc. (a)(b) | | 8,260 | 28,497 |
| Galectin Therapeutics, Inc. (a)(b) | | 253,141 | 480,968 |
| Galecto, Inc. (a) | | 61,988 | 133,274 |
| Galera Therapeutics, Inc. (a) | | 44,814 | 60,051 |
| Gelesis Holdings, Inc. Class A (a)(b) | | 126,891 | 153,538 |
| Gemini Therapeutics, Inc. (a)(b) | | 154,557 | 239,563 |
| Generation Bio Co. (a)(b) | | 216,911 | 1,110,584 |
| Genprex, Inc. (a)(b) | | 252,166 | 403,466 |
| GeoVax Labs, Inc. (a) | | 31,605 | 37,610 |
| Geron Corp. (a)(b) | | 1,929,049 | 5,092,689 |
| Global Blood Therapeutics, Inc. (a) | | 298,752 | 20,285,261 |
| GlycoMimetics, Inc. (a) | | 215,193 | 163,547 |
| Gossamer Bio, Inc. (a)(b) | | 267,020 | 3,724,929 |
| Graphite Bio, Inc. (a) | | 79,101 | 261,824 |
| GreenLight Biosciences Holdings PBC Class A (a)(b) | | 303,524 | 862,008 |
| Greenwich Lifesciences, Inc. (a)(b) | | 21,394 | 202,815 |
| Gritstone Bio, Inc. (a)(b) | | 310,285 | 1,020,838 |
| Gt Biopharma, Inc. (a)(b) | | 155,663 | 401,611 |
| Halozyme Therapeutics, Inc. (a) | | 694,166 | 28,273,381 |
| Harpoon Therapeutics, Inc. (a)(b) | | 125,250 | 207,915 |
| HCW Biologics, Inc. (a)(b) | | 20,880 | 53,244 |
| Heron Therapeutics, Inc. (a)(b) | | 515,531 | 2,108,522 |
| HilleVax, Inc. | | 59,445 | 707,990 |
| Histogen, Inc. (a)(b) | | 7,001 | 14,002 |
| Homology Medicines, Inc. (a) | | 204,602 | 478,769 |
| Hookipa Pharma, Inc. (a) | | 228,913 | 341,080 |
| Horizon Therapeutics PLC (a) | | 1,160,481 | 68,712,080 |
| Humacyte, Inc. Class A (a)(b) | | 314,676 | 1,148,567 |
| Humanigen, Inc. (a)(b) | | 273,613 | 61,070 |
| iBio, Inc. (a)(b) | | 1,197,447 | 332,052 |
| Icosavax, Inc. (a)(b) | | 66,266 | 312,776 |
| Ideaya Biosciences, Inc. (a)(b) | | 168,861 | 1,659,904 |
| Idera Pharmaceuticals, Inc. (a)(b) | | 225,298 | 112,649 |
| IGM Biosciences, Inc. (a)(b) | | 44,373 | 861,280 |
| Imago BioSciences, Inc. (a)(b) | | 44,940 | 652,978 |
| Immix Biopharma, Inc. | | 56,171 | 102,231 |
| Immucell Corp. (a) | | 12,900 | 93,525 |
| Immuneering Corp. (a)(b) | | 37,648 | 210,076 |
| Immunic, Inc. (a) | | 107,247 | 477,249 |
| ImmunityBio, Inc. (a)(b) | | 347,604 | 1,390,416 |
| ImmunoGen, Inc. (a) | | 1,024,456 | 5,952,089 |
| Immunome, Inc. (a)(b) | | 46,798 | 268,621 |
| Immunovant, Inc. (a)(b) | | 222,730 | 1,147,060 |
| Impel Pharmaceuticals, Inc. (a)(b) | | 32,603 | 254,955 |
| In8bio, Inc. (a)(b) | | 1,408 | 3,647 |
| Indaptus Therapeutics, Inc. (a) | | 24,517 | 59,821 |
| Infinity Pharmaceuticals, Inc. (a) | | 481,335 | 774,949 |
| Inhibikase Therapeutics, Inc. (a) | | 42,952 | 41,217 |
| Inhibrx, Inc. (a)(b) | | 106,959 | 1,897,453 |
| Inmune Bio, Inc. (a)(b) | | 59,204 | 477,776 |
| Inovio Pharmaceuticals, Inc. (a)(b) | | 1,172,044 | 2,683,981 |
| Inozyme Pharma, Inc. (a) | | 135,185 | 405,555 |
| Insmed, Inc. (a) | | 600,914 | 14,794,503 |
| Instil Bio, Inc. (a)(b) | | 90,167 | 468,868 |
| Intellia Therapeutics, Inc. (a) | | 357,272 | 21,457,756 |
| Intercept Pharmaceuticals, Inc. (a)(b) | | 126,771 | 2,202,012 |
| Ionis Pharmaceuticals, Inc. (a) | | 708,324 | 30,117,936 |
| Iovance Biotherapeutics, Inc. (a)(b) | | 697,664 | 7,478,958 |
| Ironwood Pharmaceuticals, Inc. Class A (a)(b) | | 779,321 | 8,385,494 |
| IsoRay, Inc. (a) | | 721,486 | 266,950 |
| iTeos Therapeutics, Inc. (a) | | 103,161 | 2,288,111 |
| Iveric Bio, Inc. (a) | | 556,595 | 5,476,895 |
| Janux Therapeutics, Inc. (a)(b) | | 60,926 | 659,219 |
| Jasper Therapeutics, Inc. (a)(b) | | 76,971 | 146,245 |
| Jounce Therapeutics, Inc. (a) | | 174,068 | 637,089 |
| Kalvista Pharmaceuticals, Inc. (a) | | 107,920 | 1,777,442 |
| Karuna Therapeutics, Inc. (a) | | 128,195 | 32,697,417 |
| Karyopharm Therapeutics, Inc. (a)(b) | | 352,318 | 1,782,729 |
| Keros Therapeutics, Inc. (a) | | 68,117 | 2,409,298 |
| Kezar Life Sciences, Inc. (a)(b) | | 214,559 | 2,205,667 |
| Kiniksa Pharmaceuticals Ltd. (a) | | 150,713 | 1,766,356 |
| Kinnate Biopharma, Inc. (a)(b) | | 80,299 | 1,162,730 |
| Kintara Therapeutics, Inc. (a)(b) | | 154,581 | 23,976 |
| Kiromic BioPharma, Inc. (a)(b) | | 4,285 | 1,573 |
| Kodiak Sciences, Inc. (a) | | 171,782 | 1,719,538 |
| Kronos Bio, Inc. (a)(b) | | 221,656 | 886,624 |
| Krystal Biotech, Inc. (a)(b) | | 105,201 | 7,375,642 |
| Kura Oncology, Inc. (a) | | 332,798 | 4,612,580 |
| Kymera Therapeutics, Inc. (a)(b) | | 179,070 | 5,062,309 |
| Lantern Pharma, Inc. (a)(b) | | 32,722 | 169,173 |
| Larimar Therapeutics, Inc. (a) | | 66,309 | 180,360 |
| Leap Therapeutics, Inc. (a)(b) | | 332,376 | 471,974 |
| Lexicon Pharmaceuticals, Inc. (a) | | 364,947 | 1,003,604 |
| Ligand Pharmaceuticals, Inc.: | | | |
| Class B (a)(b) | | 85,442 | 7,893,986 |
| General CVR (a)(c) | | 26,087 | 137 |
| Glucagon CVR (a) | | 26,087 | 94 |
| rights (a) | | 26,087 | 183 |
| TR Beta CVR (a)(c) | | 26,087 | 3,391 |
| Lineage Cell Therapeutics, Inc. (a)(b) | | 691,977 | 975,688 |
| LogicBio Therapeutics, Inc. (a) | | 81,903 | 29,354 |
| Longeveron, Inc. (a)(b) | | 19,024 | 91,030 |
| Lumos Pharma, Inc. (a) | | 12,903 | 105,676 |
| Lyell Immunopharma, Inc. (a)(b) | | 129,918 | 870,451 |
| Macrogenics, Inc. (a) | | 273,144 | 1,084,382 |
| Madrigal Pharmaceuticals, Inc. (a) | | 63,111 | 4,551,565 |
| Magenta Therapeutics, Inc. (a)(b) | | 194,827 | 342,896 |
| MannKind Corp. (a)(b) | | 1,266,582 | 4,623,024 |
| Marker Therapeutics, Inc. (a) | | 377,839 | 117,130 |
| Matinas BioPharma Holdings, Inc. (a) | | 960,342 | 681,843 |
| MediciNova, Inc. (a)(b) | | 261,982 | 558,022 |
| MEI Pharma, Inc. (a)(b) | | 560,133 | 283,763 |
| Merrimack Pharmaceuticals, Inc. (a) | | 59,429 | 246,630 |
| Mersana Therapeutics, Inc. (a) | | 468,491 | 3,513,683 |
| Metacrine, Inc. (a)(b) | | 35,824 | 16,909 |
| MiMedx Group, Inc. (a)(b) | | 426,087 | 1,504,087 |
| Minerva Neurosciences, Inc. (a)(b) | | 20,882 | 235,549 |
| MiNK Therapeutics, Inc. | | 2,789 | 7,335 |
| Mirati Therapeutics, Inc. (a) | | 253,923 | 20,575,381 |
| Mirum Pharmaceuticals, Inc. (a)(b) | | 85,925 | 2,146,407 |
| Molecular Templates, Inc. (a)(b) | | 212,382 | 155,825 |
| Moleculin Biotech, Inc. (a)(b) | | 145,068 | 214,701 |
| Monopar Therapeutics, Inc. (a) | | 23,487 | 42,277 |
| Monte Rosa Therapeutics, Inc. (a)(b) | | 67,648 | 535,772 |
| Morphic Holding, Inc. (a) | | 137,753 | 3,790,963 |
| Mustang Bio, Inc. (a)(b) | | 353,824 | 214,948 |
| Myovant Sciences Ltd. (a)(b) | | 226,722 | 3,874,679 |
| Myriad Genetics, Inc. (a) | | 405,885 | 9,067,471 |
| NanoViricides, Inc. (a)(b) | | 83,087 | 198,578 |
| Natera, Inc. (a) | | 454,317 | 22,379,655 |
| Navidea Biopharmaceuticals, Inc. (a)(b) | | 69,656 | 23,195 |
| Neoleukin Therapeutics, Inc. (a) | | 175,635 | 180,904 |
| Neubase Therapeutics, Inc. (a)(b) | | 144,549 | 87,539 |
| Neurobo Pharmaceuticals, Inc. (a) | | 33,399 | 10,354 |
| Neurobo Pharmaceuticals, Inc. rights (a)(c) | | 1,349 | 0 |
| Neurocrine Biosciences, Inc. (a) | | 479,918 | 50,213,820 |
| Neximmune, Inc. (a)(b) | | 34,116 | 39,233 |
| NextCure, Inc. (a)(b) | | 79,656 | 326,590 |
| Nighthawk Biosciences, Inc. (a)(b) | | 157,528 | 340,260 |
| Nkarta, Inc. (a)(b) | | 138,966 | 1,999,721 |
| Novavax, Inc. (a)(b) | | 395,481 | 13,066,692 |
| Nurix Therapeutics, Inc. (a) | | 204,977 | 3,224,288 |
| Nuvalent, Inc. Class A (a)(b) | | 51,424 | 868,037 |
| Nuvectis Pharma, Inc. (b) | | 9,502 | 76,966 |
| Ocugen, Inc. (a)(b) | | 1,089,572 | 2,811,096 |
| Olema Pharmaceuticals, Inc. (a) | | 155,646 | 614,802 |
| Omega Therapeutics, Inc. (a) | | 35,495 | 158,663 |
| OncoCyte Corp. (a)(b) | | 604,716 | 477,726 |
| Oncorus, Inc. (a)(b) | | 72,340 | 94,042 |
| OncoSec Medical, Inc. (a) | | 165,620 | 111,495 |
| Oncternal Therapeutics, Inc. (a)(b) | | 223,216 | 250,002 |
| Oncternal Therapeutics, Inc. rights (a)(c) | | 6,762 | 0 |
| OpGen, Inc. (a) | | 197,564 | 92,045 |
| Oragenics, Inc. (a)(b) | | 486,720 | 152,003 |
| Organogenesis Holdings, Inc. Class A (a) | | 329,122 | 1,181,548 |
| Organovo Holdings, Inc. (a)(b) | | 36,597 | 85,637 |
| Orgenesis, Inc. (a)(b) | | 109,956 | 213,315 |
| ORIC Pharmaceuticals, Inc. (a)(b) | | 168,261 | 582,183 |
| Outlook Therapeutics, Inc. (a)(b) | | 531,315 | 595,073 |
| Ovid Therapeutics, Inc. (a) | | 277,267 | 557,307 |
| Oyster Point Pharma, Inc. (a)(b) | | 65,283 | 408,019 |
| Palatin Technologies, Inc. (a)(b) | | 41,394 | 207,798 |
| Panbela Therapeutics, Inc. (a)(b) | | 6,889 | 4,759 |
| Pardes Biosciences, Inc. (a)(b) | | 139,632 | 490,108 |
| Pasithea Therapeutics Corp. (b) | | 5,911 | 6,798 |
| Passage Bio, Inc. (a) | | 201,500 | 407,030 |
| PDL BioPharma, Inc. (a)(c) | | 562,926 | 827,501 |
| PDS Biotechnology Corp. (a)(b) | | 139,781 | 585,682 |
| PepGen, Inc. | | 45,860 | 435,670 |
| PharmaCyte Biotech, Inc. (a)(b) | | 82,855 | 217,909 |
| PhaseBio Pharmaceuticals, Inc. (a)(b) | | 165,422 | 175,347 |
| Phio Pharmaceuticals Corp. (a) | | 66,519 | 46,583 |
| Pieris Pharmaceuticals, Inc. (a)(b) | | 360,095 | 525,739 |
| Plus Therapeutics, Inc. (a) | | 93,003 | 78,067 |
| PMV Pharmaceuticals, Inc. (a)(b) | | 140,105 | 1,950,262 |
| Point Biopharma Global, Inc. (a)(b) | | 371,087 | 3,618,098 |
| Polarityte, Inc. (a)(b) | | 13,841 | 14,118 |
| Poseida Therapeutics, Inc. (a) | | 136,465 | 451,699 |
| Praxis Precision Medicines, Inc. (a)(b) | | 171,114 | 533,876 |
| Precigen, Inc. (a)(b) | | 512,461 | 1,132,539 |
| Precision BioSciences, Inc. (a) | | 305,637 | 492,076 |
| Prelude Therapeutics, Inc. (a)(b) | | 65,121 | 468,871 |
| Prometheus Biosciences, Inc. (a) | | 54,556 | 2,853,824 |
| Protagenic Therapeutics, Inc. (a) | | 68,807 | 51,268 |
| Protagonist Therapeutics, Inc. (a) | | 228,046 | 1,988,561 |
| Protara Therapeutics, Inc. (a) | | 54,196 | 186,976 |
| Prothena Corp. PLC (a) | | 182,260 | 5,024,908 |
| PTC Therapeutics, Inc. (a) | | 358,943 | 17,925,613 |
| Puma Biotechnology, Inc. (a) | | 207,790 | 556,877 |
| Pyxis Oncology, Inc. | | 60,356 | 156,322 |
| Qualigen Therapeutics, Inc. (a)(b) | | 120,440 | 45,839 |
| Qualigen Therapeutics, Inc. rights (a)(c) | | 2,906 | 196 |
| Quince Therapeutics, Inc. (a)(b) | | 69,041 | 121,512 |
| Rallybio Corp. (a) | | 31,395 | 346,915 |
| RAPT Therapeutics, Inc. (a) | | 98,845 | 2,640,150 |
| Recursion Pharmaceuticals, Inc. (a) | | 137,148 | 1,441,425 |
| REGENXBIO, Inc. (a) | | 191,246 | 5,641,757 |
| Regulus Therapeutics, Inc. (a)(b) | | 38,810 | 55,110 |
| Relay Therapeutics, Inc. (a)(b) | | 388,376 | 8,920,997 |
| Reneo Pharmaceuticals, Inc. (a) | | 23,983 | 75,546 |
| Renovacor, Inc. (a)(b) | | 5,659 | 9,960 |
| Repligen Corp. (a) | | 260,506 | 57,147,201 |
| Replimune Group, Inc. (a) | | 150,722 | 2,872,761 |
| Revolution Medicines, Inc. (a) | | 373,486 | 7,779,713 |
| Rezolute, Inc. (a)(b) | | 134,035 | 319,003 |
| Rhythm Pharmaceuticals, Inc. (a) | | 200,247 | 4,525,582 |
| Rigel Pharmaceuticals, Inc. (a) | | 904,208 | 1,283,975 |
| Rocket Pharmaceuticals, Inc. (a)(b) | | 228,908 | 3,527,472 |
| Rubius Therapeutics, Inc. (a) | | 225,781 | 158,047 |
| S.A.B. Biotherapeutics, Inc. (a)(b) | | 140,579 | 98,419 |
| Sage Therapeutics, Inc. (a) | | 261,054 | 9,831,294 |
| Salarius Pharmaceuticals, Inc. (a) | | 212,064 | 42,625 |
| Salarius Pharmaceuticals, Inc. warrants 1/20/25 (a) | | 42,326 | 35 |
| Sana Biotechnology, Inc. (a)(b) | | 416,101 | 2,833,648 |
| Sangamo Therapeutics, Inc. (a) | | 633,922 | 3,423,179 |
| Sarepta Therapeutics, Inc. (a) | | 439,070 | 48,025,477 |
| Savara, Inc. (a) | | 446,613 | 638,657 |
| Scholar Rock Holding Corp. (a) | | 130,718 | 1,090,188 |
| Scopus Biopharma, Inc. (a) | | 201,244 | 69,872 |
| Seagen, Inc. (a) | | 678,617 | 104,703,817 |
| Selecta Biosciences, Inc. (a)(b) | | 664,509 | 1,249,277 |
| Sellas Life Sciences Group, Inc. (a)(b) | | 79,324 | 242,731 |
| Sensei Biotherapeutics, Inc. (a) | | 47,222 | 90,194 |
| Sera Prognostics, Inc. (a) | | 5,373 | 11,283 |
| Seres Therapeutics, Inc. (a) | | 328,519 | 1,688,588 |
| Sesen Bio, Inc. (a) | | 1,024,802 | 707,113 |
| Shattuck Labs, Inc. (a) | | 144,083 | 468,270 |
| Sigilon Therapeutics, Inc. (a) | | 51,460 | 31,988 |
| Silverback Therapeutics, Inc. (a) | | 113,138 | 615,471 |
| Sio Gene Therapies, Inc. (a) | | 269,982 | 90,444 |
| Societal Cdmo, Inc. (a) | | 211,538 | 251,730 |
| Soleno Therapeutics, Inc. (a)(b) | | 17,554 | 38,619 |
| Solid Biosciences, Inc. (a) | | 322,919 | 206,668 |
| Soligenix, Inc. (a)(b) | | 188,785 | 146,875 |
| Sonnet Biotherapeutics Holding (a) | | 260,367 | 54,990 |
| Sorrento Therapeutics, Inc. (a)(b) | | 1,995,686 | 4,091,156 |
| Spectrum Pharmaceuticals, Inc. (a) | | 805,762 | 910,511 |
| Spero Therapeutics, Inc. (a) | | 160,839 | 129,781 |
| Springworks Therapeutics, Inc. (a)(b) | | 134,134 | 3,724,901 |
| Spruce Biosciences, Inc. (a)(b) | | 32,338 | 67,910 |
| SQZ Biotechnologies Co. (a)(b) | | 84,201 | 252,603 |
| Statera Biopharma, Inc. (a)(b) | | 54,957 | 9,925 |
| Stoke Therapeutics, Inc. (a) | | 118,636 | 1,786,658 |
| Surface Oncology, Inc. (a) | | 197,266 | 268,282 |
| Surrozen, Inc. (a)(b) | | 101,542 | 260,963 |
| Sutro Biopharma, Inc. (a) | | 236,442 | 1,338,262 |
| Synaptogenix, Inc. (a)(b) | | 38,515 | 323,911 |
| Syndax Pharmaceuticals, Inc. (a) | | 247,784 | 5,850,180 |
| Synlogic, Inc. (a) | | 192,271 | 192,271 |
| Synthetic Biologics, Inc. (a)(b) | | 68,203 | 100,258 |
| Syros Pharmaceuticals, Inc. (a) | | 289,353 | 231,656 |
| T2 Biosystems, Inc. (a)(b) | | 877,428 | 107,485 |
| Talaris Therapeutics, Inc. (a) | | 46,384 | 153,531 |
| Tango Therapeutics, Inc. (a) | | 331,285 | 1,358,269 |
| Taysha Gene Therapies, Inc. (a)(b) | | 132,610 | 419,048 |
| TCR2 Therapeutics, Inc. (a) | | 186,844 | 508,216 |
| Tempest Therapeutics, Inc. (a)(b) | | 6,737 | 14,821 |
| Tenax Therapeutics, Inc. (a) | | 1,469 | 351 |
| Tenaya Therapeutics, Inc. (a)(b) | | 64,521 | 283,247 |
| TG Therapeutics, Inc. (a) | | 688,071 | 4,905,946 |
| TONIX Pharmaceuticals Holding (a)(b) | | 73,991 | 75,471 |
| TRACON Pharmaceuticals, Inc. (a) | | 80,416 | 159,224 |
| TransCode Therapeutics, Inc. (a)(b) | | 53,467 | 64,695 |
| Travere Therapeutics, Inc. (a) | | 268,190 | 7,176,764 |
| Trevena, Inc. (a) | | 845,824 | 182,613 |
| TScan Therapeutics, Inc. (a) | | 13,968 | 38,412 |
| Twist Bioscience Corp. (a) | | 285,411 | 11,450,689 |
| Tyme Technologies, Inc. (a)(b) | | 487,157 | 140,106 |
| Tyra Biosciences, Inc. (b) | | 56,710 | 374,853 |
| Ultragenyx Pharmaceutical, Inc. (a) | | 355,403 | 16,949,169 |
| uniQure B.V. (a) | | 185,022 | 3,615,330 |
| United Therapeutics Corp. (a) | | 227,659 | 51,592,083 |
| UNITY Biotechnology, Inc. (a) | | 240,489 | 111,779 |
| Vaccinex, Inc. (a)(b) | | 167,802 | 145,518 |
| Vanda Pharmaceuticals, Inc. (a) | | 283,512 | 2,999,557 |
| Vaxart, Inc. (a)(b) | | 645,647 | 2,001,506 |
| Vaxcyte, Inc. (a) | | 176,138 | 4,607,770 |
| VBI Vaccines, Inc. (a)(b) | | 1,342,265 | 1,202,133 |
| Vera Therapeutics, Inc. (a)(b) | | 47,786 | 1,038,390 |
| Veracyte, Inc. (a) | | 363,963 | 7,424,845 |
| Verastem, Inc. (a) | | 980,411 | 1,137,277 |
| Vericel Corp. (a) | | 236,231 | 5,893,963 |
| Verve Therapeutics, Inc. (a)(b) | | 115,464 | 4,429,199 |
| Vigil Neuroscience, Inc. | | 31,906 | 271,520 |
| Viking Therapeutics, Inc. (a)(b) | | 372,721 | 1,185,253 |
| Vincerx Pharma, Inc. (a)(b) | | 75,733 | 115,114 |
| Vir Biotechnology, Inc. (a) | | 374,576 | 8,896,180 |
| Viracta Therapeutics, Inc. (a)(b) | | 117,958 | 477,730 |
| Viridian Therapeutics, Inc. (a)(b) | | 177,028 | 3,931,792 |
| Viridian Therapeutics, Inc. rights (a)(c) | | 167,699 | 2 |
| Virios Therapeutics, Inc. (a)(b) | | 22,946 | 158,786 |
| VistaGen Therapeutics, Inc. (a)(b) | | 1,015,557 | 186,862 |
| Vor Biopharma, Inc. (a)(b) | | 53,546 | 274,691 |
| Voyager Therapeutics, Inc. (a)(b) | | 139,542 | 833,066 |
| vTv Therapeutics, Inc. Class A (a)(b) | | 234,471 | 248,539 |
| Vyant Bio, Inc. (a) | | 114,063 | 81,327 |
| Werewolf Therapeutics, Inc. (a)(b) | | 39,565 | 200,199 |
| Windtree Therapeutics, Inc. (a)(b) | | 129,477 | 51,014 |
| X4 Pharmaceuticals, Inc. (a) | | 103,008 | 101,988 |
| Xbiotech, Inc. (a) | | 85,036 | 340,994 |
| Xencor, Inc. (a) | | 299,422 | 7,901,747 |
| Xenetic Biosciences, Inc. (a)(b) | | 62,412 | 45,873 |
| Xilio Therapeutics, Inc. | | 40,122 | 89,873 |
| XOMA Corp. (a)(b) | | 58,285 | 1,158,706 |
| Y-mAbs Therapeutics, Inc. (a)(b) | | 175,922 | 2,828,826 |
| Yield10 Bioscience, Inc. (a)(b) | | 22,292 | 69,328 |
| Yumanity Therapeutics, Inc. (a) | | 23,814 | 40,722 |
| Yumanity Therapeutics, Inc. rights (a)(c) | | 198,769 | 2 |
| Zentalis Pharmaceuticals, Inc. (a) | | 242,754 | 6,508,235 |
| | | | 1,751,724,278 |
| Health Care Equipment & Supplies - 2.7% | | | |
| Accelerate Diagnostics, Inc. (a)(b) | | 218,997 | 356,965 |
| Accuray, Inc. (a)(b) | | 486,714 | 1,158,379 |
| Acutus Medical, Inc. (a)(b) | | 105,444 | 125,478 |
| Aethlon Medical, Inc. (a)(b) | | 89,101 | 86,428 |
| Allied Healthcare Products, Inc. (a)(b) | | 17,020 | 31,147 |
| Alphatec Holdings, Inc. (a)(b) | | 342,537 | 2,599,856 |
| Angiodynamics, Inc. (a) | | 195,616 | 4,330,938 |
| Apollo Endosurgery, Inc. (a) | | 153,404 | 846,790 |
| Apyx Medical Corp. (a) | | 156,993 | 899,570 |
| Artivion, Inc. (a) | | 204,339 | 4,528,152 |
| Asensus Surgical, Inc. (a)(b) | | 1,225,747 | 661,903 |
| Aspira Women's Health, Inc. (a)(b) | | 332,858 | 169,758 |
| Atricure, Inc. (a) | | 233,584 | 10,656,102 |
| Atrion Corp. | | 7,056 | 4,261,471 |
| Avanos Medical, Inc. (a) | | 238,967 | 5,885,757 |
| Avinger, Inc. (a)(b) | | 23,921 | 33,968 |
| AxoGen, Inc. (a) | | 214,258 | 2,007,597 |
| Axonics Modulation Technologies, Inc. (a) | | 238,097 | 17,202,508 |
| Beyond Air, Inc. (a)(b) | | 126,876 | 1,190,097 |
| BioLase Technology, Inc. (a)(b) | | 29,726 | 113,999 |
| BioLife Solutions, Inc. (a) | | 156,427 | 3,693,241 |
| Biomerica, Inc. (a)(b) | | 51,378 | 181,878 |
| BioSig Technologies, Inc. (a)(b) | | 148,784 | 163,662 |
| Bioventus, Inc. (a)(b) | | 111,084 | 812,024 |
| Bluejay Diagnostics, Inc. (a)(b) | | 17,639 | 17,815 |
| Butterfly Network, Inc. Class A (a)(b) | | 686,819 | 4,278,882 |
| Cardiovascular Systems, Inc. (a) | | 207,227 | 2,737,469 |
| Cerus Corp. (a) | | 905,106 | 3,719,986 |
| Chembio Diagnostics, Inc. (a)(b) | | 158,663 | 96,102 |
| ClearPoint Neuro, Inc. (a)(b) | | 88,826 | 1,143,191 |
| Co.-Diagnostics, Inc. (a)(b) | | 168,893 | 570,858 |
| ConforMis, Inc. (a) | | 944,776 | 245,642 |
| CONMED Corp. | | 149,316 | 13,224,918 |
| CryoPort, Inc. (a)(b) | | 249,391 | 8,145,110 |
| Cutera, Inc. (a)(b) | | 82,500 | 3,939,375 |
| CVRx, Inc. (a)(b) | | 31,427 | 227,846 |
| CytoSorbents Corp. (a)(b) | | 213,954 | 406,513 |
| DarioHealth Corp. (a)(b) | | 102,978 | 491,205 |
| Delcath Systems, Inc. (a)(b) | | 39,299 | 163,484 |
| Dynatronics Corp. (a)(b) | | 60,408 | 36,801 |
| Eargo, Inc. (a)(b) | | 136,479 | 248,392 |
| Ekso Bionics Holdings, Inc. (a) | | 70,168 | 164,895 |
| electroCore, Inc. (a)(b) | | 301,911 | 159,922 |
| Electromed, Inc. (a) | | 34,409 | 333,767 |
| Embecta Corp. | | 294,822 | 9,410,718 |
| ENDRA Life Sciences, Inc. (a)(b) | | 194,668 | 56,785 |
| Enovis Corp. (a) | | 238,870 | 12,098,766 |
| Envista Holdings Corp. (a) | | 813,847 | 30,185,585 |
| Envveno Medical Corp. (a)(b) | | 40,111 | 296,420 |
| Figs, Inc. Class A (a) | | 193,747 | 2,239,715 |
| Fonar Corp. (a) | | 32,917 | 464,130 |
| GBS, Inc. (a)(b) | | 111,801 | 70,994 |
| Glaukos Corp. (a) | | 240,027 | 11,653,311 |
| Globus Medical, Inc. (a) | | 401,065 | 23,739,037 |
| Haemonetics Corp. (a) | | 257,239 | 19,300,642 |
| Helius Medical Technologies, Inc. (U.S.) (a)(b) | | 10,204 | 5,602 |
| Heska Corp. (a) | | 55,437 | 5,048,648 |
| Hyperfine, Inc. (a)(b) | | 163,016 | 218,441 |
| ICU Medical, Inc. (a)(b) | | 101,557 | 16,147,563 |
| Inari Medical, Inc. (a)(b) | | 172,197 | 11,941,862 |
| Inogen, Inc. (a) | | 104,921 | 3,003,888 |
| Inspire Medical Systems, Inc. (a) | | 139,699 | 26,750,962 |
| Insulet Corp. (a) | | 350,229 | 89,473,003 |
| Integer Holdings Corp. (a) | | 167,715 | 10,577,785 |
| Integra LifeSciences Holdings Corp. (a) | | 361,924 | 17,267,394 |
| Invacare Corp. (a)(b) | | 188,495 | 163,048 |
| InVivo Therapeutics Holdings Corp. (a)(b) | | 6,821 | 42,631 |
| INVO Bioscience, Inc. (a) | | 43,562 | 42,168 |
| IRadimed Corp. | | 34,299 | 1,150,731 |
| iRhythm Technologies, Inc. (a) | | 150,595 | 22,205,233 |
| Iridex Corp. (a)(b) | | 58,915 | 153,179 |
| Kewaunee Scientific Corp. (a) | | 10,678 | 212,919 |
| KORU Medical Systems, Inc. (a)(b) | | 163,966 | 404,996 |
| Lantheus Holdings, Inc. (a) | | 346,573 | 27,309,952 |
| LeMaitre Vascular, Inc. | | 99,555 | 4,916,026 |
| LENSAR, Inc. (a) | | 43,669 | 235,376 |
| LivaNova PLC (a) | | 270,350 | 15,207,188 |
| LogicMark, Inc. (a)(b) | | 52,164 | 59,467 |
| Lucid Diagnostics, Inc. (b) | | 16,277 | 35,321 |
| Lucira Health, Inc. (a) | | 46,479 | 82,268 |
| Masimo Corp. (a) | | 256,269 | 37,643,353 |
| Meridian Bioscience, Inc. (a) | | 220,441 | 7,184,172 |
| Merit Medical Systems, Inc. (a) | | 258,336 | 15,301,241 |
| Mesa Laboratories, Inc. | | 27,310 | 4,666,187 |
| Microbot Medical, Inc. (a)(b) | | 31,568 | 159,103 |
| Milestone Scientific, Inc. (a)(b) | | 237,717 | 228,208 |
| Minerva Surgical, Inc. (b) | | 9,131 | 15,523 |
| Motus GI Holdings, Inc. (a)(b) | | 10,808 | 35,450 |
| Myomo, Inc. (a) | | 28,862 | 53,683 |
| NanoVibronix, Inc. (a)(b) | | 109,619 | 56,750 |
| Nemaura Medical, Inc. (a) | | 68,969 | 131,041 |
| Neogen Corp. (a)(b) | | 549,136 | 11,476,942 |
| NeuroMetrix, Inc. (a)(b) | | 26,320 | 88,698 |
| Neuronetics, Inc. (a) | | 133,206 | 475,545 |
| NeuroOne Medical Technologies Corp. (a)(b) | | 34,045 | 86,815 |
| NeuroPace, Inc. (a)(b) | | 32,223 | 132,437 |
| Nevro Corp. (a) | | 179,698 | 8,143,913 |
| NEXGEL, Inc. (a) | | 177 | 317 |
| Novocure Ltd. (a)(b) | | 454,953 | 37,365,290 |
| NuVasive, Inc. (a) | | 259,974 | 11,051,495 |
| Nuwellis, Inc. (a)(b) | | 30,042 | 43,861 |
| Omnicell, Inc. (a) | | 223,765 | 22,888,922 |
| OraSure Technologies, Inc. (a) | | 357,239 | 1,461,108 |
| Orthofix International NV (a) | | 97,481 | 1,939,872 |
| OrthoPediatrics Corp. (a)(b) | | 71,464 | 3,508,168 |
| Outset Medical, Inc. (a) | | 213,865 | 3,911,591 |
| Owlet, Inc. (a)(b) | | 360,270 | 583,637 |
| Paragon 28, Inc. (b) | | 37,987 | 666,672 |
| PAVmed, Inc. (a)(b) | | 430,259 | 512,008 |
| Penumbra, Inc. (a) | | 179,126 | 29,407,115 |
| PetVivo Holdings, Inc. (b) | | 28,440 | 70,531 |
| Predictive Oncology, Inc. (a) | | 332,825 | 134,195 |
| Pro-Dex, Inc. (a)(b) | | 19,725 | 378,720 |
| PROCEPT BioRobotics Corp. | | 35,697 | 1,445,015 |
| Pulmonx Corp. (a)(b) | | 177,603 | 3,262,567 |
| Pulse Biosciences, Inc. (a)(b) | | 72,757 | 92,401 |
| QuidelOrtho Corp. (a) | | 253,474 | 20,090,349 |
| Quotient Ltd. (a) | | 482,149 | 93,682 |
| Ra Medical Systems, Inc. (a)(b) | | 41,515 | 6,443 |
| Reshape Lifesciences, Inc. (a) | | 86,640 | 36,146 |
| Retractable Technologies, Inc. (a)(b) | | 96,141 | 224,009 |
| Rockwell Medical Technologies, Inc. (a)(b) | | 38,832 | 70,286 |
| RxSight, Inc. (a)(b) | | 40,617 | 508,119 |
| Sanara Medtech, Inc. (a)(b) | | 13,576 | 464,978 |
| Seaspine Holdings Corp. (a) | | 171,451 | 1,097,286 |
| Semler Scientific, Inc. (a) | | 25,191 | 1,151,481 |
| Senseonics Holdings, Inc. (a)(b) | | 2,166,243 | 3,855,913 |
| Sensus Healthcare, Inc. (a) | | 69,066 | 859,872 |
| Shockwave Medical, Inc. (a)(b) | | 180,440 | 53,565,418 |
| SI-BONE, Inc. (a) | | 142,413 | 2,349,815 |
| Sientra, Inc. (a)(b) | | 330,816 | 213,509 |
| Sight Sciences, Inc. (a)(b) | | 54,323 | 378,631 |
| Silk Road Medical, Inc. (a)(b) | | 179,422 | 7,146,378 |
| Sintx Technologies, Inc. (a)(b) | | 80,683 | 37,114 |
| Sintx Technologies, Inc. rights 12/31/99 (a)(c) | | 81,201 | 1 |
| SmileDirectClub, Inc. (a)(b) | | 566,421 | 645,720 |
| Sonendo, Inc. (b) | | 40,818 | 48,573 |
| Staar Surgical Co. (a) | | 241,946 | 22,885,672 |
| Stereotaxis, Inc. (a) | | 236,585 | 487,365 |
| STRATA Skin Sciences, Inc. (a) | | 18,460 | 18,281 |
| Surgalign Holdings, Inc. (a)(b) | | 19,738 | 81,518 |
| SurModics, Inc. (a) | | 71,935 | 2,423,490 |
| Tactile Systems Technology, Inc. (a) | | 103,630 | 854,948 |
| Talis Biomedical Corp. (a) | | 79,818 | 71,836 |
| Tandem Diabetes Care, Inc. (a) | | 323,973 | 14,818,525 |
| Tela Bio, Inc. (a)(b) | | 40,384 | 341,245 |
| Thermogenesis Holdings, Inc. (a)(b) | | 31,810 | 7,809 |
| TransMedics Group, Inc. (a) | | 142,791 | 7,429,416 |
| Treace Medical Concepts, Inc. (a) | | 59,917 | 1,200,138 |
| UFP Technologies, Inc. (a) | | 34,525 | 3,210,480 |
| Utah Medical Products, Inc. | | 16,839 | 1,547,504 |
| Vapotherm, Inc. (a) | | 121,505 | 236,935 |
| Varex Imaging Corp. (a)(b) | | 203,443 | 4,290,613 |
| Venus Concept, Inc. (a)(b) | | 99,993 | 30,868 |
| Vicarious Surgical, Inc. (a) | | 199,263 | 743,251 |
| ViewRay, Inc. (a) | | 765,279 | 2,617,254 |
| Vivani Medical, Inc. (a)(b) | | 51,219 | 209,998 |
| Viveve Medical, Inc. (a)(b) | | 41,622 | 35,837 |
| VolitionRx Ltd. (a)(b) | | 174,786 | 295,388 |
| Xtant Medical Holdings, Inc. (a)(b) | | 21,131 | 10,885 |
| Zimvie, Inc. (a)(b) | | 104,040 | 1,583,489 |
| Zomedica Corp. (a)(b) | | 5,155,827 | 1,259,053 |
| Zynex, Inc. (b) | | 117,070 | 1,046,606 |
| | | | 829,706,268 |
| Health Care Providers & Services - 1.9% | | | |
| 1Life Healthcare, Inc. (a) | | 875,516 | 15,067,630 |
| 23andMe Holding Co. Class A (a)(b) | | 1,071,055 | 3,609,455 |
| Acadia Healthcare Co., Inc. (a) | | 455,936 | 37,354,836 |
| Accolade, Inc. (a) | | 296,415 | 3,017,505 |
| AdaptHealth Corp. (a)(b) | | 497,266 | 8,935,870 |
| Addus HomeCare Corp. (a) | | 82,074 | 7,322,642 |
| Agiliti, Inc. (a)(b) | | 140,416 | 2,255,081 |
| agilon health, Inc. (a) | | 247,660 | 5,146,375 |
| AirSculpt Technologies, Inc. | | 37,645 | 328,264 |
| Alerislife, Inc. (a) | | 97,375 | 108,086 |
| Alignment Healthcare, Inc. (a)(b) | | 142,622 | 2,169,281 |
| Amedisys, Inc. (a) | | 164,897 | 19,532,050 |
| American Shared Hospital Services (a) | | 6,046 | 16,082 |
| AMN Healthcare Services, Inc. (a) | | 226,613 | 23,259,558 |
| Apollo Medical Holdings, Inc. (a)(b) | | 193,445 | 8,343,283 |
| Assure Holdings Corp. (a) | | 6,383 | 5,719 |
| ATI Physical Therapy, Inc. (a)(b) | | 291,240 | 262,116 |
| Aveanna Healthcare Holdings, Inc. (a)(b) | | 217,381 | 395,633 |
| Biodesix, Inc. (a) | | 60,140 | 113,665 |
| Brookdale Senior Living, Inc. (a) | | 942,058 | 4,145,055 |
| Caladrius Biosciences, Inc. (a)(b) | | 234,237 | 115,010 |
| Cano Health, Inc. (a) | | 961,835 | 5,934,522 |
| CareMax, Inc. Class A (a) | | 332,596 | 2,274,957 |
| Castle Biosciences, Inc. (a) | | 124,542 | 3,611,718 |
| Chemed Corp. | | 74,934 | 35,682,821 |
| Clover Health Investments Corp. (a)(b) | | 1,581,195 | 4,126,919 |
| Community Health Systems, Inc. (a) | | 650,143 | 1,729,380 |
| Corvel Corp. (a) | | 47,296 | 7,348,852 |
| Covetrus, Inc. (a) | | 530,679 | 11,075,271 |
| Cross Country Healthcare, Inc. (a) | | 181,726 | 4,612,206 |
| CynergisTek, Inc. (a) | | 40,583 | 50,729 |
| DocGo, Inc. Class A (a)(b) | | 387,928 | 3,956,866 |
| Encompass Health Corp. | | 497,772 | 24,176,786 |
| Enhabit Home Health & Hospice (a) | | 249,327 | 4,138,828 |
| Enzo Biochem, Inc. (a) | | 222,942 | 539,520 |
| Fulgent Genetics, Inc. (a) | | 100,946 | 4,388,123 |
| Great Elm Group, Inc. (a) | | 108,115 | 227,042 |
| Guardant Health, Inc. (a) | | 515,771 | 25,819,496 |
| Hanger, Inc. (a) | | 189,298 | 3,526,622 |
| HealthEquity, Inc. (a) | | 427,070 | 28,220,786 |
| Hims & Hers Health, Inc. (a)(b) | | 637,471 | 4,054,316 |
| IMAC Holdings, Inc. (a) | | 114,643 | 54,341 |
| InfuSystems Holdings, Inc. (a) | | 96,612 | 744,879 |
| Innovage Holding Corp. (a)(b) | | 94,083 | 345,285 |
| Invitae Corp. (a)(b) | | 1,054,863 | 3,206,784 |
| LHC Group, Inc. (a) | | 156,378 | 25,250,356 |
| LifeStance Health Group, Inc. (a)(b) | | 208,897 | 1,313,962 |
| Modivcare, Inc. (a) | | 61,861 | 6,700,784 |
| National Healthcare Corp. | | 68,502 | 4,757,464 |
| National Research Corp. Class A | | 69,759 | 2,379,479 |
| Novo Integrated Sciences, Inc. (a) | | 7,705 | 12,713 |
| Oak Street Health, Inc. (a)(b) | | 700,859 | 18,362,506 |
| Ontrak, Inc. (a)(b) | | 75,546 | 49,135 |
| Opko Health, Inc. (a)(b) | | 2,084,599 | 4,544,426 |
| Option Care Health, Inc. (a) | | 752,994 | 23,312,694 |
| Owens & Minor, Inc. | | 383,864 | 11,327,827 |
| P3 Health Partners, Inc. Class A (a)(b) | | 73,743 | 362,816 |
| Patterson Companies, Inc. | | 440,975 | 12,298,793 |
| Pediatrix Medical Group, Inc. (a) | | 435,202 | 7,755,300 |
| Pennant Group, Inc. (a) | | 136,593 | 2,140,412 |
| PetIQ, Inc. Class A (a) | | 133,241 | 1,244,471 |
| Precipio, Inc. (a) | | 125,273 | 147,822 |
| Premier, Inc. | | 596,087 | 21,006,106 |
| Privia Health Group, Inc. (a)(b) | | 137,852 | 5,485,131 |
| Progyny, Inc. (a) | | 358,685 | 14,422,724 |
| Psychemedics Corp. | | 23,802 | 157,569 |
| R1 Rcm, Inc. (a) | | 679,067 | 14,837,614 |
| RadNet, Inc. (a) | | 239,316 | 4,807,858 |
| Regional Health Properties, Inc. (a)(b) | | 10,873 | 39,904 |
| Select Medical Holdings Corp. | | 522,213 | 13,389,541 |
| Sema4 Holdings Corp. Class A (a)(b) | | 1,331,208 | 1,357,832 |
| Signify Health, Inc. (a)(b) | | 127,017 | 3,543,774 |
| Sonida Senior Living, Inc. (a) | | 19,834 | 401,639 |
| Star Equity Holdings, Inc. (a)(b) | | 26,196 | 28,030 |
| SunLink Health Systems, Inc. (a)(b) | | 28,814 | 41,204 |
| Surgery Partners, Inc. (a) | | 183,246 | 5,044,762 |
| Talkspace, Inc. Class A (a)(b) | | 469,824 | 624,866 |
| Tenet Healthcare Corp. (a) | | 543,294 | 30,696,111 |
| The Ensign Group, Inc. | | 265,553 | 22,651,671 |
| The Joint Corp. (a) | | 72,037 | 1,313,955 |
| The Oncology Institute, Inc. (a)(b) | | 52,928 | 336,093 |
| U.S. Physical Therapy, Inc. | | 65,276 | 5,392,450 |
| Vivos Therapeutics, Inc. (a)(b) | | 112,282 | 138,107 |
| | | | 589,028,146 |
| Health Care Technology - 1.0% | | | |
| Allscripts Healthcare Solutions, Inc. (a) | | 581,805 | 9,890,685 |
| American Well Corp. (a) | | 1,032,234 | 4,696,665 |
| Augmedix, Inc. (b) | | 101,316 | 171,224 |
| Better Therapeutics, Inc. (a) | | 32,728 | 55,965 |
| Biotricity, Inc. (a)(b) | | 214,879 | 240,664 |
| CareCloud, Inc. (a) | | 42,042 | 135,796 |
| Certara, Inc. (a) | | 525,216 | 8,230,135 |
| Change Healthcare, Inc. (a) | | 1,269,540 | 31,192,598 |
| Computer Programs & Systems, Inc. (a) | | 76,087 | 2,321,414 |
| Convey Health Solutions Holdin (a) | | 72,482 | 760,336 |
| Definitive Healthcare Corp. (b) | | 135,386 | 2,718,551 |
| Doximity, Inc. (a)(b) | | 468,998 | 15,566,044 |
| Evolent Health, Inc. (a) | | 421,499 | 15,490,088 |
| Forian, Inc. (a) | | 97,079 | 401,907 |
| GoodRx Holdings, Inc. (a)(b) | | 348,216 | 2,124,118 |
| Health Catalyst, Inc. (a)(b) | | 276,946 | 3,323,352 |
| HealthStream, Inc. (a) | | 122,752 | 2,716,502 |
| HTG Molecular Diagnostics (a) | | 29,052 | 25,072 |
| iCAD, Inc. (a) | | 117,358 | 353,248 |
| iSpecimen, Inc. (a)(b) | | 12,588 | 27,568 |
| MultiPlan Corp. Class A (a)(b) | | 1,224,964 | 4,311,873 |
| NantHealth, Inc. (a)(b) | | 232,251 | 111,806 |
| Nextgen Healthcare, Inc. (a) | | 288,666 | 4,947,735 |
| OptimizeRx Corp. (a)(b) | | 93,768 | 1,488,098 |
| Pear Therapeutics, Inc. Class A (a) | | 166,914 | 293,769 |
| Phreesia, Inc. (a) | | 262,565 | 6,737,418 |
| Schrodinger, Inc. (a) | | 236,747 | 6,496,338 |
| SCWorx, Corp. (a) | | 37,084 | 24,661 |
| Sharecare, Inc. Class A (a)(b) | | 1,504,654 | 2,753,517 |
| Simulations Plus, Inc. | | 79,134 | 4,751,997 |
| Streamline Health Solutions, Inc. (a)(b) | | 197,716 | 324,254 |
| Tabula Rasa HealthCare, Inc. (a)(b) | | 123,857 | 600,706 |
| Teladoc Health, Inc. (a)(b) | | 815,797 | 25,338,655 |
| UpHealth, Inc. (a) | | 380,137 | 232,188 |
| Veeva Systems, Inc. Class A (a) | | 706,395 | 140,798,651 |
| | | | 299,653,598 |
| Life Sciences Tools & Services - 0.8% | | | |
| 10X Genomics, Inc. (a) | | 474,419 | 15,651,083 |
| Absci Corp. (a) | | 75,898 | 255,776 |
| Adaptive Biotechnologies Corp. (a) | | 550,739 | 4,912,592 |
| Akoya Biosciences, Inc. (a) | | 34,484 | 393,118 |
| Alpha Teknova, Inc. (a) | | 31,211 | 140,762 |
| Applied DNA Sciences, Inc. (a) | | 32,415 | 101,135 |
| Avantor, Inc. (a) | | 3,084,246 | 76,828,568 |
| Azenta, Inc. | | 378,814 | 19,967,286 |
| Berkeley Lights, Inc. (a)(b) | | 215,555 | 791,087 |
| BioNano Genomics, Inc. (a)(b) | | 1,438,955 | 3,568,608 |
| Bruker Corp. | | 504,347 | 28,243,432 |
| Champions Oncology, Inc. (a)(b) | | 21,092 | 168,314 |
| ChromaDex, Inc. (a)(b) | | 300,552 | 432,795 |
| Codex DNA, Inc. (a)(b) | | 39,730 | 76,282 |
| Codexis, Inc. (a) | | 298,103 | 2,089,702 |
| Cytek Biosciences, Inc. (a) | | 78,516 | 914,711 |
| Harvard Bioscience, Inc. (a) | | 190,061 | 627,201 |
| Inotiv, Inc. (a)(b) | | 78,028 | 1,527,008 |
| IsoPlexis Corp. | | 36,857 | 71,503 |
| Maravai LifeSciences Holdings, Inc. (a) | | 553,076 | 11,542,696 |
| Medpace Holdings, Inc. (a) | | 136,229 | 20,108,763 |
| Miromatrix Medical, Inc. (a) | | 16,685 | 56,062 |
| Nanostring Technologies, Inc. (a) | | 239,307 | 3,245,003 |
| Nautilus Biotechnology, Inc. (a)(b) | | 285,571 | 631,112 |
| NeoGenomics, Inc. (a) | | 636,122 | 6,393,026 |
| Pacific Biosciences of California, Inc. (a)(b) | | 1,134,594 | 6,648,721 |
| Personalis, Inc. (a) | | 201,015 | 665,360 |
| Quanterix Corp. (a) | | 171,227 | 1,600,972 |
| Quantum-Si, Inc. (a)(b) | | 414,055 | 1,291,852 |
| Rapid Micro Biosystems, Inc. (a)(b) | | 46,037 | 153,303 |
| Science 37 Holdings, Inc. (a)(b) | | 266,310 | 420,770 |
| Seer, Inc. (a)(b) | | 184,486 | 1,863,309 |
| Singular Genomics Systems, Inc. (a)(b) | | 60,225 | 160,801 |
| SomaLogic, Inc. Class A (a) | | 729,782 | 2,685,598 |
| Sotera Health Co. (a) | | 501,629 | 8,482,546 |
| Standard BioTools, Inc. (a)(b) | | 390,331 | 550,367 |
| Syneos Health, Inc. (a) | | 515,445 | 30,983,399 |
| | | | 254,244,623 |
| Pharmaceuticals - 1.3% | | | |
| 9 Meters Biopharma, Inc. (a) | | 1,231,676 | 326,517 |
| AcelRx Pharmaceuticals, Inc. (a)(b) | | 616,882 | 181,980 |
| Acer Therapeutics, Inc. (a)(b) | | 57,960 | 77,087 |
| Aclaris Therapeutics, Inc. (a) | | 257,185 | 4,091,813 |
| Adamis Pharmaceuticals Corp. (a)(b) | | 787,821 | 262,344 |
| Adial Pharmaceuticals, Inc. (a) | | 73,973 | 39,709 |
| Aerie Pharmaceuticals, Inc. (a) | | 241,375 | 3,644,763 |
| Agile Therapeutics, Inc. (a)(b) | | 10,499 | 4,226 |
| Alimera Sciences, Inc. (a)(b) | | 14,092 | 95,826 |
| Amneal Pharmaceuticals, Inc. (a) | | 514,275 | 1,115,977 |
| Amphastar Pharmaceuticals, Inc. (a) | | 190,450 | 5,637,320 |
| Ampio Pharmaceuticals, Inc. (a)(b) | | 930,408 | 93,971 |
| Amylyx Pharmaceuticals, Inc. (b) | | 54,562 | 1,377,145 |
| AN2 Therapeutics, Inc. (b) | | 26,000 | 445,640 |
| Anebulo Pharmaceuticals, Inc. (a)(b) | | 1,879 | 5,975 |
| Angion Biomedica Corp. (a) | | 27,222 | 27,766 |
| ANI Pharmaceuticals, Inc. (a)(b) | | 67,376 | 2,485,501 |
| Aquestive Therapeutics, Inc. (a) | | 129,256 | 186,775 |
| Artelo Biosciences, Inc. (a)(b) | | 6,776 | 26,088 |
| Arvinas Holding Co. LLC (a) | | 221,678 | 9,385,847 |
| Assertio Holdings, Inc. (a)(b) | | 228,514 | 582,711 |
| Atea Pharmaceuticals, Inc. (a) | | 268,134 | 2,011,005 |
| Athira Pharma, Inc. (a) | | 168,986 | 571,173 |
| Avenue Therapeutics, Inc. (a) | | 52,769 | 12,707 |
| Axsome Therapeutics, Inc. (a)(b) | | 155,998 | 9,952,672 |
| Aytu BioScience, Inc. (a)(b) | | 177,900 | 39,583 |
| Baudax Bio, Inc. (a)(b) | | 36,778 | 11,990 |
| Biofrontera, Inc. (b) | | 39,152 | 45,416 |
| Cara Therapeutics, Inc. (a)(b) | | 223,730 | 2,308,894 |
| Cassava Sciences, Inc. (a)(b) | | 191,684 | 4,932,029 |
| CinCor Pharma, Inc. | | 90,730 | 3,063,952 |
| Citius Pharmaceuticals, Inc. (a)(b) | | 717,285 | 882,261 |
| Clarus Therapeutics Holdings, Inc. (a)(b) | | 212,089 | 15,907 |
| Clearside Biomedical, Inc. (a) | | 292,230 | 400,355 |
| Clever Leaves Holdings, Inc. (a)(b) | | 104,774 | 85,810 |
| CNS Pharmaceuticals, Inc. (a)(b) | | 65,019 | 15,891 |
| Cocrystal Pharma, Inc. (a)(b) | | 542,932 | 217,661 |
| Collegium Pharmaceutical, Inc. (a) | | 170,711 | 3,001,099 |
| Context Therapeutics, Inc. | | 39,743 | 75,512 |
| Corcept Therapeutics, Inc. (a)(b) | | 485,514 | 12,535,971 |
| CorMedix, Inc. (a)(b) | | 198,412 | 700,394 |
| Cumberland Pharmaceuticals, Inc. (a) | | 32,599 | 76,608 |
| CymaBay Therapeutics, Inc. (a) | | 399,189 | 1,413,129 |
| Dare Bioscience, Inc. (a)(b) | | 456,489 | 493,008 |
| Dermata Therapeutics, Inc. | | 10,769 | 6,138 |
| DICE Therapeutics, Inc. | | 65,631 | 1,030,407 |
| Durect Corp. (a)(b) | | 1,191,484 | 866,805 |
| Edgewise Therapeutics, Inc. (a) | | 61,062 | 615,505 |
| Elanco Animal Health, Inc. (a) | | 2,379,106 | 35,995,874 |
| Elanco Animal Health, Inc. rights (a)(c) | | 223,265 | 2 |
| Eloxx Pharmaceuticals, Inc. (a) | | 361,433 | 130,116 |
| Enveric Biosciences, Inc. (a)(b) | | 2,397 | 13,375 |
| Esperion Therapeutics, Inc. (a)(b) | | 310,473 | 2,316,129 |
| Eton Pharmaceuticals, Inc. (a)(b) | | 93,991 | 212,420 |
| Evoke Pharma, Inc. (a) | | 11,800 | 31,860 |
| Evolus, Inc. (a)(b) | | 181,493 | 1,744,148 |
| Eyenovia, Inc. (a) | | 95,237 | 155,236 |
| Eyepoint Pharmaceuticals, Inc. (a)(b) | | 126,335 | 1,263,350 |
| Fulcrum Therapeutics, Inc. (a) | | 153,143 | 1,133,258 |
| Graybug Vision, Inc. (a) | | 43,204 | 43,195 |
| Harmony Biosciences Holdings, Inc. (a) | | 116,760 | 5,126,932 |
| Harrow Health, Inc. (a)(b) | | 129,103 | 1,160,636 |
| Hepion Pharmaceuticals, Inc. (a)(b) | | 400,635 | 273,514 |
| Hoth Therapeutics, Inc. (a) | | 64,818 | 27,872 |
| Ikena Oncology, Inc. (a) | | 45,994 | 218,472 |
| IMARA, Inc. (a) | | 23,095 | 27,252 |
| Innoviva, Inc. (a) | | 319,910 | 4,210,016 |
| Intra-Cellular Therapies, Inc. (a) | | 438,712 | 22,049,665 |
| Jaguar Health, Inc. (a)(b) | | 213,151 | 50,090 |
| Jazz Pharmaceuticals PLC (a) | | 314,182 | 48,767,330 |
| Kala Pharmaceuticals, Inc. (a)(b) | | 258,780 | 78,669 |
| KemPharm, Inc. (a)(b) | | 164,362 | 897,417 |
| Kiora Pharmaceuticals, Inc. (a)(b) | | 123,881 | 24,082 |
| Landos Biopharma, Inc. (a) | | 35,344 | 31,810 |
| Lannett Co., Inc. (a)(b) | | 228,505 | 115,144 |
| Lexaria Bioscience Corp. (a)(b) | | 39,912 | 118,140 |
| Lipocine, Inc. (a)(b) | | 487,608 | 282,813 |
| Liquidia Technologies, Inc. (a) | | 268,357 | 1,548,420 |
| Longboard Pharmaceuticals, Inc. (a) | | 2,450 | 8,208 |
| Lyra Therapeutics, Inc. (a)(b) | | 76,473 | 442,779 |
| Marinus Pharmaceuticals, Inc. (a)(b) | | 173,980 | 1,210,901 |
| MyMD Pharmaceuticals, Inc. (a)(b) | | 154,811 | 578,993 |
| Nektar Therapeutics (a)(b) | | 955,943 | 3,766,415 |
| NGM Biopharmaceuticals, Inc. (a) | | 192,159 | 2,711,363 |
| NovaBay Pharmaceuticals, Inc. (a)(b) | | 140,830 | 33,095 |
| Novan, Inc. (a)(b) | | 82,274 | 208,976 |
| NRX Pharmaceuticals, Inc. (a)(b) | | 166,834 | 108,442 |
| Nutriband, Inc. | | 35,535 | 136,810 |
| Nuvation Bio, Inc. (a)(b) | | 576,104 | 1,613,091 |
| Ocular Therapeutix, Inc. (a) | | 408,668 | 2,076,033 |
| Ocuphire Pharma, Inc. (a)(b) | | 64,450 | 146,302 |
| Ocuphire Pharma, Inc. rights (a)(c) | | 5,723 | 4,742 |
| Omeros Corp. (a)(b) | | 321,710 | 1,296,491 |
| Onconova Therapeutics, Inc. (a) | | 83,735 | 100,063 |
| Opiant Pharmaceuticals, Inc. (a) | | 27,850 | 333,922 |
| OptiNose, Inc. (a)(b) | | 317,959 | 1,160,550 |
| Otonomy, Inc. (a)(b) | | 256,182 | 93,763 |
| Pacira Biosciences, Inc. (a) | | 228,595 | 11,996,666 |
| Palisade Bio, Inc. (a)(b) | | 60,922 | 9,918 |
| Palisade Bio, Inc. rights (a)(c) | | 117,971 | 1 |
| Paratek Pharmaceuticals, Inc. (a)(b) | | 247,502 | 621,230 |
| Perrigo Co. PLC | | 680,580 | 25,467,304 |
| Petros Pharmaceuticals, Inc. (a)(b) | | 49,607 | 32,517 |
| Phathom Pharmaceuticals, Inc. (a)(b) | | 86,278 | 736,814 |
| Phibro Animal Health Corp. Class A | | 105,470 | 1,562,011 |
| Pliant Therapeutics, Inc. (a)(b) | | 166,041 | 3,201,270 |
| PLx Pharma PLC (a)(b) | | 134,654 | 111,911 |
| Prestige Brands Holdings, Inc. (a) | | 255,510 | 12,923,696 |
| Processa Pharmaceuticals, Inc. (a)(b) | | 31,272 | 85,998 |
| ProPhase Labs, Inc. (b) | | 65,600 | 794,416 |
| Provention Bio, Inc. (a) | | 271,256 | 1,171,826 |
| Pulmatrix, Inc. (a)(b) | | 14,082 | 62,242 |
| Rain Therapeutics, Inc. (a) | | 40,292 | 238,932 |
| Rani Therapeutics Holdings, Inc. (a)(b) | | 42,257 | 376,087 |
| Reata Pharmaceuticals, Inc. (a)(b) | | 137,151 | 3,279,280 |
| Relmada Therapeutics, Inc. (a)(b) | | 146,798 | 4,277,694 |
| Revance Therapeutics, Inc. (a) | | 339,889 | 6,763,791 |
| Reviva Pharmaceuticals Holdings, Inc. (a)(b) | | 56,975 | 124,775 |
| Roivant Sciences Ltd. (a)(b) | | 489,295 | 1,741,890 |
| Royalty Pharma PLC | | 1,822,666 | 76,205,665 |
| RVL Pharmaceuticals PLC (a)(b) | | 137,211 | 308,725 |
| Satsuma Pharmaceuticals, Inc. (a) | | 103,388 | 665,819 |
| scPharmaceuticals, Inc. (a)(b) | | 37,267 | 218,012 |
| SCYNEXIS, Inc. (a)(b) | | 117,806 | 298,049 |
| Seelos Therapeutics, Inc. (a)(b) | | 580,711 | 656,203 |
| Seelos Therapeutics, Inc. rights (a)(b)(c) | | 3,233 | 0 |
| SenesTech, Inc. (a)(b) | | 81,318 | 43,099 |
| SIGA Technologies, Inc. (b) | | 187,015 | 2,820,186 |
| Sonoma Pharmaceuticals, Inc. (a) | | 29,687 | 82,530 |
| Supernus Pharmaceuticals, Inc. (a) | | 268,379 | 9,186,613 |
| Tarsus Pharmaceuticals, Inc. (a)(b) | | 60,924 | 937,011 |
| Terns Pharmaceuticals, Inc. (a) | | 41,060 | 160,134 |
| TFF Pharmaceuticals, Inc. (a)(b) | | 110,224 | 508,133 |
| TherapeuticsMD, Inc. (a)(b) | | 1,409 | 13,963 |
| Theravance Biopharma, Inc. (a) | | 276,134 | 2,487,967 |
| Theseus Pharmaceuticals, Inc. (b) | | 54,526 | 371,867 |
| Timber Pharmaceuticals, Inc. (a)(b) | | 162,136 | 18,937 |
| Titan Pharmaceuticals, Inc. (a)(b) | | 30,736 | 40,572 |
| Trevi Therapeutics, Inc. (a) | | 122,665 | 390,075 |
| Tricida, Inc. (a)(b) | | 167,562 | 2,097,876 |
| Vallon Pharamceuticals, Inc. (a)(b) | | 8,271 | 3,391 |
| Ventyx Biosciences, Inc. (b) | | 50,347 | 1,027,079 |
| Verrica Pharmaceuticals, Inc. (a) | | 65,681 | 257,470 |
| Virpax Pharmaceuticals, Inc. (a)(b) | | 44,705 | 56,775 |
| Vyne Therapeutics, Inc. (a)(b) | | 270,515 | 84,752 |
| WAVE Life Sciences (a) | | 259,602 | 771,018 |
| Xeris Biopharma Holdings, Inc. (a)(b) | | 593,900 | 991,813 |
| Xeris Biopharma Holdings, Inc. rights (a)(c) | | 264,044 | 47,824 |
| Zynerba Pharmaceuticals, Inc. (a)(b) | | 244,290 | 285,819 |
| | | | 396,172,685 |
TOTAL HEALTH CARE | | | 4,120,529,598 |
| INDUSTRIALS - 13.9% | | | |
| Aerospace & Defense - 1.2% | | | |
| AAR Corp. (a) | | 166,193 | 7,126,356 |
| Aerojet Rocketdyne Holdings, Inc. (a) | | 379,358 | 16,338,949 |
| AeroVironment, Inc. (a) | | 117,975 | 10,458,484 |
| AerSale Corp. (a) | | 83,481 | 1,609,514 |
| Air Industries Group, Inc. (a) | | 121,183 | 84,440 |
| Archer Aviation, Inc. Class A (a)(b) | | 634,942 | 2,247,695 |
| Astra Space, Inc. Class A (a)(b) | | 614,719 | 524,294 |
| Astronics Corp. (a) | | 131,265 | 1,208,951 |
| Astrotech Corp. (a)(b) | | 268,705 | 123,604 |
| Axon Enterprise, Inc. (a) | | 358,777 | 41,862,100 |
| BWX Technologies, Inc. | | 460,355 | 23,998,306 |
| Byrna Technologies, Inc. (a)(b) | | 83,946 | 749,638 |
| Cadre Holdings, Inc. | | 30,864 | 787,032 |
| Curtiss-Wright Corp. | | 193,590 | 28,494,512 |
| Ducommun, Inc. (a) | | 56,378 | 2,480,632 |
| HEICO Corp. | | 220,841 | 33,634,084 |
| HEICO Corp. Class A | | 369,172 | 45,253,104 |
| Hexcel Corp. | | 423,973 | 24,874,496 |
| Innovative Solutions & Support, Inc. (a) | | 68,000 | 486,200 |
| Kaman Corp. | | 138,120 | 4,381,166 |
| Kratos Defense & Security Solutions, Inc. (a) | | 638,762 | 8,010,075 |
| Maxar Technologies, Inc. | | 372,977 | 8,888,042 |
| Mercury Systems, Inc. (a) | | 292,098 | 14,058,677 |
| Momentus, Inc. Class A (a)(b) | | 271,424 | 480,420 |
| Moog, Inc. Class A | | 146,205 | 10,962,451 |
| National Presto Industries, Inc. | | 25,906 | 1,767,307 |
| Park Aerospace Corp. | | 99,858 | 1,149,366 |
| Parsons Corp. (a) | | 134,602 | 5,569,831 |
| Redwire Corp. (a)(b) | | 87,570 | 241,693 |
| Rocket Lab U.S.A., Inc. Class A (a) | | 748,642 | 4,117,531 |
| Sidus Space, Inc. Class A (b) | | 18,519 | 50,557 |
| SIFCO Industries, Inc. (a) | | 15,619 | 51,699 |
| Sigma Additive Solutions, Inc. (a)(b) | | 59,467 | 59,467 |
| Spirit AeroSystems Holdings, Inc. Class A | | 531,276 | 15,991,408 |
| Terran Orbital Corp. Class A (a)(b) | | 278,027 | 1,167,713 |
| Triumph Group, Inc. (a) | | 326,522 | 4,241,521 |
| V2X, Inc. (a) | | 59,643 | 2,067,226 |
| Virgin Galactic Holdings, Inc. (a)(b) | | 901,276 | 5,326,541 |
| VirTra, Inc. (a) | | 50,422 | 268,245 |
| Woodward, Inc. | | 303,357 | 28,233,436 |
| | | | 359,426,763 |
| Air Freight & Logistics - 0.2% | | | |
| Air T, Inc. (a) | | 7,650 | 128,826 |
| Air Transport Services Group, Inc. (a) | | 294,819 | 8,882,896 |
| Atlas Air Worldwide Holdings, Inc. (a) | | 132,124 | 13,201,830 |
| Forward Air Corp. | | 136,484 | 13,244,407 |
| GXO Logistics, Inc. (a) | | 515,213 | 22,865,153 |
| Hub Group, Inc. Class A (a) | | 171,961 | 13,724,207 |
| Radiant Logistics, Inc. (a) | | 238,015 | 1,666,105 |
| | | | 73,713,424 |
| Airlines - 0.2% | | | |
| Allegiant Travel Co. (a) | | 77,525 | 7,481,163 |
| Blade Air Mobility, Inc. (a)(b) | | 245,515 | 1,266,857 |
| Frontier Group Holdings, Inc. (a) | | 153,420 | 1,979,118 |
| Hawaiian Holdings, Inc. (a) | | 253,678 | 3,802,633 |
| JetBlue Airways Corp. (a) | | 1,625,645 | 12,663,775 |
| Joby Aviation, Inc. (a)(b) | | 1,347,957 | 7,144,172 |
| Mesa Air Group, Inc. (a) | | 164,301 | 399,251 |
| SkyWest, Inc. (a) | | 257,095 | 5,473,553 |
| Spirit Airlines, Inc. (a) | | 550,444 | 12,484,070 |
| Sun Country Airlines Holdings, Inc. (a) | | 155,202 | 3,091,624 |
| Wheels Up Experience, Inc. Class A (a)(b) | | 876,767 | 1,639,554 |
| | | | 57,425,770 |
| Building Products - 1.5% | | | |
| AAON, Inc. | | 212,153 | 12,194,554 |
| Advanced Drain Systems, Inc. | | 287,015 | 38,947,936 |
| AeroClean Technologies, Inc. (b) | | 15,625 | 50,781 |
| Alpha PRO Tech Ltd. (a)(b) | | 59,581 | 246,070 |
| American Woodmark Corp. (a) | | 82,437 | 4,272,710 |
| Apogee Enterprises, Inc. | | 110,724 | 4,521,968 |
| Applied UV, Inc. (a)(b) | | 21,528 | 36,167 |
| Armstrong World Industries, Inc. | | 237,920 | 19,982,901 |
| Builders FirstSource, Inc. (a) | | 873,283 | 51,183,117 |
| Carlisle Companies, Inc. | | 260,149 | 76,915,653 |
| CEA Industrie, Inc. (a)(b) | | 43,158 | 55,242 |
| CSW Industrials, Inc. | | 79,656 | 10,084,450 |
| Gibraltar Industries, Inc. (a) | | 165,535 | 6,927,640 |
| Griffon Corp. | | 243,605 | 7,637,017 |
| Hayward Holdings, Inc. (a)(b) | | 302,980 | 3,184,320 |
| Insteel Industries, Inc. | | 99,699 | 2,881,301 |
| Janus International Group, Inc. (a) | | 282,350 | 2,916,676 |
| Jeld-Wen Holding, Inc. (a) | | 441,678 | 4,924,710 |
| Lennox International, Inc. | | 166,016 | 39,863,762 |
| Masonite International Corp. (a) | | 114,995 | 9,408,891 |
| Owens Corning | | 490,708 | 40,105,565 |
| PGT Innovations, Inc. (a) | | 300,506 | 6,286,586 |
| Quanex Building Products Corp. | | 171,714 | 3,829,222 |
| Resideo Technologies, Inc. (a) | | 736,272 | 15,329,183 |
| Simpson Manufacturing Co. Ltd. | | 219,136 | 20,300,759 |
| Tecnoglass, Inc. | | 105,859 | 2,305,609 |
| The AZEK Co., Inc. (a) | | 570,678 | 10,414,874 |
| Trex Co., Inc. (a) | | 569,499 | 26,646,858 |
| UFP Industries, Inc. | | 317,537 | 25,209,262 |
| View, Inc. Class A (a)(b) | | 322,453 | 573,966 |
| Zurn Elkay Water Solutions Cor | | 634,525 | 17,500,200 |
| | | | 464,737,950 |
| Commercial Services & Supplies - 1.1% | | | |
| ABM Industries, Inc. | | 338,858 | 15,723,011 |
| ACCO Brands Corp. | | 491,263 | 2,913,190 |
| Acme United Corp. | | 16,916 | 486,335 |
| ACV Auctions, Inc. Class A (a) | | 570,004 | 4,850,734 |
| Aqua Metals, Inc. (a)(b) | | 426,312 | 390,161 |
| ARC Document Solutions, Inc. | | 184,946 | 545,591 |
| Aris Water Solution, Inc. Class A (b) | | 102,336 | 1,739,712 |
| Aurora Innovation, Inc. (a)(b) | | 1,421,564 | 3,042,147 |
| Avalon Holdings Corp. Class A (a) | | 10,231 | 32,169 |
| Brady Corp. Class A | | 244,743 | 11,390,339 |
| BrightView Holdings, Inc. (a) | | 231,017 | 2,337,892 |
| Casella Waste Systems, Inc. Class A (a) | | 256,513 | 21,016,110 |
| CECO Environmental Corp. (a) | | 151,840 | 1,512,326 |
| Charah Solutions, Inc. (a) | | 88,754 | 227,210 |
| Cimpress PLC (a) | | 99,233 | 3,332,244 |
| Clean Harbors, Inc. (a) | | 251,831 | 29,569,996 |
| CompX International, Inc. Class A | | 7,210 | 172,824 |
| CoreCivic, Inc. (a) | | 614,943 | 5,860,407 |
| Deluxe Corp. | | 223,485 | 4,299,851 |
| Driven Brands Holdings, Inc. (a) | | 282,837 | 8,889,567 |
| DSS, Inc. (a) | | 376,284 | 132,264 |
| Ennis, Inc. | | 133,117 | 2,826,074 |
| Fuel Tech, Inc. (a) | | 99,607 | 140,446 |
| Harsco Corp. (a) | | 399,565 | 2,265,534 |
| Healthcare Services Group, Inc. | | 373,062 | 5,248,982 |
| Heritage-Crystal Clean, Inc. (a) | | 80,301 | 2,615,404 |
| HNI Corp. | | 217,619 | 6,963,808 |
| IAA, Inc. (a) | | 675,898 | 25,183,959 |
| Interface, Inc. | | 301,982 | 3,373,139 |
| JanOne, Inc. (a)(b) | | 13,104 | 38,919 |
| KAR Auction Services, Inc. (a)(b) | | 615,218 | 8,982,183 |
| Kimball International, Inc. Class B | | 188,569 | 1,442,553 |
| Knightscope, Inc. Class A | | 46,991 | 123,116 |
| Matthews International Corp. Class A | | 156,827 | 3,922,243 |
| Millerknoll, Inc. | | 382,446 | 10,586,105 |
| Montrose Environmental Group, Inc. (a) | | 136,999 | 5,508,730 |
| MSA Safety, Inc. | | 185,467 | 22,044,608 |
| NL Industries, Inc. | | 43,714 | 385,120 |
| Odyssey Marine Exploration, Inc. (a)(b) | | 41,628 | 129,879 |
| Performant Financial Corp. (a) | | 262,058 | 547,701 |
| Perma-Fix Environmental Services, Inc. (a) | | 23,571 | 120,684 |
| Pitney Bowes, Inc. | | 833,651 | 2,409,251 |
| Quad/Graphics, Inc. (a)(b) | | 173,630 | 548,671 |
| Quest Resource Holding Corp. (a) | | 61,357 | 385,936 |
| Recycling Asset Holdings, Inc. (a)(c) | | 12,605 | 441 |
| Shapeways Holdings, Inc. (a)(b) | | 54,973 | 46,969 |
| SP Plus Corp. (a) | | 119,151 | 3,948,664 |
| Steelcase, Inc. Class A | | 440,549 | 4,925,338 |
| Stericycle, Inc. (a) | | 461,915 | 23,137,322 |
| Team, Inc. (a) | | 193,530 | 249,654 |
| Tetra Tech, Inc. | | 270,708 | 36,764,853 |
| The Brink's Co. | | 237,960 | 13,154,429 |
| The GEO Group, Inc. (a) | | 631,484 | 5,165,539 |
| TOMI Environmental Solutions, Inc. (a)(b) | | 100,658 | 81,503 |
| UniFirst Corp. | | 75,234 | 13,561,681 |
| Viad Corp. (a) | | 104,186 | 3,977,821 |
| Virco Manufacturing Co. (a) | | 16,985 | 73,715 |
| VSE Corp. | | 54,767 | 2,291,999 |
| Wilhelmina International, Inc. (a) | | 27,350 | 124,716 |
| | | | 331,761,769 |
| Construction & Engineering - 1.2% | | | |
| AECOM | | 713,394 | 52,184,771 |
| Ameresco, Inc. Class A (a)(b) | | 157,724 | 10,859,297 |
| API Group Corp. (a) | | 1,044,315 | 16,239,098 |
| Arcosa, Inc. | | 244,128 | 14,269,282 |
| Argan, Inc. | | 74,124 | 2,563,949 |
| Bowman Consulting Group Ltd. (a) | | 33,071 | 504,333 |
| Comfort Systems U.S.A., Inc. | | 181,406 | 18,202,278 |
| Concrete Pumping Holdings, Inc. (a) | | 150,432 | 1,007,894 |
| Construction Partners, Inc. Class A (a) | | 206,411 | 6,039,586 |
| Dycom Industries, Inc. (a) | | 149,010 | 16,707,001 |
| EMCOR Group, Inc. | | 258,950 | 30,794,334 |
| Fluor Corp. (a) | | 715,471 | 18,917,053 |
| FTE Networks, Inc. (a)(b)(c) | | 20,159 | 29,835 |
| Granite Construction, Inc. | | 227,260 | 6,813,255 |
| Great Lakes Dredge & Dock Corp. (a) | | 333,320 | 3,189,872 |
| IES Holdings, Inc. (a) | | 46,943 | 1,426,598 |
| Infrastructure and Energy Alternatives, Inc. (a) | | 150,858 | 2,143,692 |
| INNOVATE Corp. (a)(b) | | 256,303 | 392,144 |
| iSun, Inc. (a)(b) | | 31,709 | 93,859 |
| Limbach Holdings, Inc. (a) | | 39,165 | 314,495 |
| MasTec, Inc. (a) | | 289,867 | 23,334,294 |
| Matrix Service Co. (a) | | 135,772 | 771,185 |
| MDU Resources Group, Inc. | | 1,030,622 | 31,073,253 |
| MYR Group, Inc. (a) | | 87,443 | 8,126,952 |
| Northwest Pipe Co. (a) | | 51,011 | 1,615,008 |
| NV5 Global, Inc. (a) | | 60,034 | 8,450,386 |
| Orbital Infrastructure Group I (a)(b) | | 366,499 | 293,199 |
| Orion Group Holdings, Inc. (a) | | 155,073 | 494,683 |
| Primoris Services Corp. | | 267,286 | 5,417,887 |
| QualTek Services, Inc. Class A (a)(b) | | 78,575 | 154,793 |
| SG Blocks, Inc. (a)(b) | | 45,139 | 102,917 |
| Sterling Construction Co., Inc. (a) | | 153,375 | 3,878,854 |
| Tutor Perini Corp. (a) | | 210,296 | 1,425,807 |
| Valmont Industries, Inc. | | 107,714 | 29,817,389 |
| Williams Industrial Services G (a) | | 94,490 | 155,909 |
| Willscot Mobile Mini Holdings (a) | | 1,125,319 | 45,170,305 |
| | | | 362,975,447 |
| Electrical Equipment - 1.7% | | | |
| Acuity Brands, Inc. | | 174,883 | 28,668,570 |
| Advent Technologies Holdings, Inc. Class A (a)(b) | | 184,912 | 580,624 |
| Allied Motion Technologies, Inc. | | 64,493 | 2,258,545 |
| American Superconductor Corp. (a)(b) | | 138,449 | 739,318 |
| Array Technologies, Inc. (a) | | 676,407 | 14,136,906 |
| Atkore, Inc. (a) | | 218,424 | 18,437,170 |
| AZZ, Inc. | | 124,515 | 5,305,584 |
| Babcock & Wilcox Enterprises, Inc. (a) | | 281,323 | 2,244,958 |
| Beam Global (a)(b) | | 48,293 | 708,458 |
| Bitnile Holdings, Inc. (a)(b) | | 1,410,157 | 422,906 |
| Blink Charging Co. (a)(b) | | 186,476 | 3,984,992 |
| Bloom Energy Corp. Class A (a)(b) | | 879,766 | 22,354,854 |
| Broadwind, Inc. (a) | | 84,152 | 254,139 |
| Capstone Turbine Corp. (a)(b) | | 63,494 | 153,021 |
| ChargePoint Holdings, Inc. Class A (a)(b) | | 902,437 | 14,682,650 |
| Encore Wire Corp. | | 100,092 | 13,021,969 |
| Energous Corp. (a)(b) | | 376,041 | 515,176 |
| Energy Focus, Inc. (a)(b) | | 14,609 | 10,955 |
| Energy Vault Holdings, Inc. Class A (a)(b) | | 283,710 | 1,563,242 |
| EnerSys | | 203,555 | 12,695,725 |
| Enovix Corp. (a)(b) | | 526,608 | 11,648,569 |
| Eos Energy Enterprises, Inc. (a)(b) | | 205,730 | 423,804 |
| Espey Manufacturing & Electronics Corp. (a) | | 5,225 | 77,748 |
| ESS Tech, Inc. Class A (a)(b) | | 308,835 | 1,371,227 |
| Fluence Energy, Inc. (b) | | 174,074 | 3,472,776 |
| Flux Power Holdings, Inc. (a)(b) | | 53,066 | 132,134 |
| FTC Solar, Inc. (a)(b) | | 125,740 | 520,564 |
| FuelCell Energy, Inc. (a)(b) | | 1,850,787 | 7,754,798 |
| GrafTech International Ltd. | | 997,170 | 5,863,360 |
| Heliogen, Inc. (a) | | 470,881 | 1,130,114 |
| Hubbell, Inc. Class B | | 270,816 | 55,869,341 |
| Ideal Power, Inc. (a)(b) | | 25,362 | 367,749 |
| KULR Technology Group, Inc. (a)(b) | | 322,838 | 468,115 |
| LSI Industries, Inc. | | 138,248 | 1,070,040 |
| NuScale Power Corp. (a)(b) | | 87,457 | 1,199,910 |
| Nuvve Holding Corp. (a)(b) | | 71,623 | 205,558 |
| nVent Electric PLC | | 837,784 | 27,613,361 |
| Ocean Power Technologies, Inc. (a)(b) | | 314,281 | 342,566 |
| Orion Energy Systems, Inc. (a) | | 147,086 | 247,104 |
| Pineapple Energy, Inc. (a)(b) | | 13,781 | 31,972 |
| Pineapple Energy, Inc. rights (a)(c) | | 13,969 | 0 |
| Pioneer Power Solutions, Inc. (a) | | 18,460 | 64,056 |
| Plug Power, Inc. (a)(b) | | 2,627,877 | 73,685,671 |
| Polar Power, Inc. (a)(b) | | 51,179 | 170,426 |
| Powell Industries, Inc. | | 47,626 | 1,174,457 |
| Preformed Line Products Co. | | 15,461 | 1,202,866 |
| Regal Rexnord Corp. | | 338,227 | 46,536,653 |
| Romeo Power, Inc. (a)(b) | | 540,198 | 332,222 |
| Sensata Technologies, Inc. PLC | | 792,956 | 31,940,268 |
| SES AI Corp. Class A (a)(b) | | 482,585 | 2,287,453 |
| Shoals Technologies Group, Inc. (a) | | 570,426 | 15,042,134 |
| Stem, Inc. (a)(b) | | 680,392 | 10,695,762 |
| Sunrun, Inc. (a) | | 1,062,176 | 35,083,673 |
| Sunworks, Inc. (a)(b) | | 174,556 | 598,727 |
| Thermon Group Holdings, Inc. (a) | | 167,328 | 2,936,606 |
| TPI Composites, Inc. (a)(b) | | 188,707 | 3,508,063 |
| Ultralife Corp. (a) | | 51,971 | 259,855 |
| Vertiv Holdings Co. | | 1,530,437 | 17,645,939 |
| Vicor Corp. (a) | | 109,186 | 7,767,492 |
| Westwater Resources, Inc. (a)(b) | | 262,784 | 367,898 |
| | | | 513,850,793 |
| Industrial Conglomerates - 0.0% | | | |
| Gaucho Group Holdings, Inc. (a)(b) | | 74,288 | 21,336 |
| Machinery - 2.7% | | | |
| AGCO Corp. | | 307,958 | 33,478,114 |
| AgEagle Aerial Systems, Inc. (a)(b) | | 460,161 | 264,316 |
| Agrify Corp. (a)(b) | | 103,852 | 73,745 |
| Alamo Group, Inc. | | 50,098 | 6,550,814 |
| Albany International Corp. Class A | | 155,885 | 13,747,498 |
| Allison Transmission Holdings, Inc. | | 484,999 | 17,586,064 |
| Altra Industrial Motion Corp. | | 330,767 | 12,552,608 |
| Art's-Way Manufacturing Co., Inc. (a) | | 31,377 | 77,815 |
| Astec Industries, Inc. | | 118,109 | 4,509,402 |
| Barnes Group, Inc. | | 238,850 | 7,416,293 |
| Berkshire Grey, Inc. Class A (a)(b) | | 228,638 | 461,849 |
| Blue Bird Corp. (a) | | 104,452 | 1,239,845 |
| Chart Industries, Inc. (a)(b) | | 180,561 | 35,003,555 |
| Chicago Rivet & Machine Co. | | 755 | 20,959 |
| CIRCOR International, Inc. (a) | | 103,389 | 1,685,241 |
| Columbus McKinnon Corp. (NY Shares) | | 142,881 | 4,376,445 |
| Commercial Vehicle Group, Inc. (a) | | 159,978 | 1,044,656 |
| Crane Holdings Co. | | 240,154 | 22,660,931 |
| Desktop Metal, Inc. (a)(b) | | 974,708 | 3,099,571 |
| Donaldson Co., Inc. | | 624,165 | 32,050,873 |
| Douglas Dynamics, Inc. | | 114,425 | 3,329,768 |
| Eastern Co. | | 28,584 | 572,538 |
| Energy Recovery, Inc. (a) | | 190,403 | 4,367,845 |
| Enerpac Tool Group Corp. Class A | | 307,097 | 5,957,682 |
| EnPro Industries, Inc. | | 102,261 | 9,260,756 |
| ESAB Corp. | | 229,879 | 9,445,728 |
| ESCO Technologies, Inc. | | 129,947 | 10,581,584 |
| Evoqua Water Technologies Corp. (a) | | 614,381 | 21,552,485 |
| Fast Radius, Inc. Class A (a)(b) | | 81,720 | 59,664 |
| Fathom Digital Manufacturing Corp. (a)(b) | | 42,183 | 160,295 |
| Federal Signal Corp. | | 308,830 | 12,313,052 |
| Flowserve Corp. | | 657,844 | 20,044,507 |
| Franklin Electric Co., Inc. | | 195,451 | 16,974,919 |
| FreightCar America, Inc. (a)(b) | | 61,296 | 254,991 |
| Gates Industrial Corp. PLC (a) | | 479,234 | 5,137,388 |
| Gencor Industries, Inc. (a) | | 33,483 | 333,826 |
| Gorman-Rupp Co. | | 116,806 | 3,084,846 |
| Graco, Inc. | | 854,543 | 54,554,025 |
| Graham Corp. | | 47,306 | 450,826 |
| Helios Technologies, Inc. | | 165,521 | 9,040,757 |
| Hillenbrand, Inc. | | 365,062 | 15,212,134 |
| Hillman Solutions Corp. Class A (a)(b) | | 532,969 | 4,471,610 |
| Hurco Companies, Inc. | | 30,319 | 735,842 |
| Hydrofarm Holdings Group, Inc. (a)(b) | | 192,358 | 654,017 |
| Hyliion Holdings Corp. Class A (a)(b) | | 566,325 | 1,987,801 |
| Hyster-Yale Materials Handling Class A | | 51,477 | 1,499,525 |
| Hyzon Motors, Inc. Class A (a)(b) | | 440,564 | 938,401 |
| ITT, Inc. | | 419,752 | 30,444,613 |
| John Bean Technologies Corp. | | 161,288 | 16,654,599 |
| Kadant, Inc. | | 59,504 | 10,676,803 |
| Kennametal, Inc. | | 423,298 | 9,922,105 |
| L.B. Foster Co. Class A (a) | | 57,034 | 747,145 |
| Lightning eMotors, Inc. (a)(b) | | 149,157 | 423,606 |
| Lincoln Electric Holdings, Inc. | | 293,042 | 40,055,911 |
| Lindsay Corp. | | 55,466 | 8,894,528 |
| LiqTech International, Inc. (a)(b) | | 84,048 | 39,503 |
| Luxfer Holdings PLC sponsored | | 144,429 | 2,375,857 |
| Manitex International, Inc. (a) | | 79,396 | 429,532 |
| Manitowoc Co., Inc. (a) | | 174,072 | 1,662,388 |
| Markforged Holding Corp. (a)(b) | | 366,669 | 891,006 |
| Mayville Engineering Co., Inc. (a) | | 38,921 | 270,890 |
| Microvast Holdings, Inc. (a)(b) | | 1,177,103 | 2,895,673 |
| Middleby Corp. (a) | | 274,838 | 39,527,201 |
| Miller Industries, Inc. | | 59,863 | 1,407,379 |
| Mueller Industries, Inc. | | 287,781 | 18,179,126 |
| Mueller Water Products, Inc. Class A | | 787,244 | 8,880,112 |
| Nikola Corp. (a)(b) | | 1,085,879 | 5,820,311 |
| NN, Inc. (a)(b) | | 226,937 | 485,645 |
| Omega Flex, Inc. (b) | | 16,014 | 1,617,734 |
| Oshkosh Corp. | | 332,255 | 26,500,659 |
| P&F Industries, Inc. Class A | | 17,745 | 100,259 |
| Park-Ohio Holdings Corp. | | 43,693 | 724,867 |
| Perma-Pipe International Holdings, Inc. (a) | | 40,568 | 381,339 |
| Proterra, Inc. Class A (a)(b) | | 957,612 | 5,783,976 |
| Proto Labs, Inc. (a) | | 138,213 | 5,307,379 |
| RBC Bearings, Inc. (a) | | 146,016 | 35,143,131 |
| REV Group, Inc. | | 171,872 | 1,979,965 |
| Sarcos Technology and Robotics Corp. Class A (a)(b) | | 305,363 | 1,001,591 |
| Shyft Group, Inc. (The) | | 160,521 | 3,844,478 |
| SPX Corp. (a) | | 230,844 | 13,171,959 |
| Standex International Corp. | | 60,136 | 5,436,896 |
| Taylor Devices, Inc. (a) | | 3,725 | 37,325 |
| Tennant Co. | | 94,460 | 5,700,661 |
| Terex Corp. | | 350,996 | 11,660,087 |
| The Greenbrier Companies, Inc. | | 161,874 | 4,615,028 |
| The L.S. Starrett Co. Class A (a) | | 19,876 | 177,890 |
| Timken Co. | | 337,077 | 21,232,480 |
| Titan International, Inc. (a) | | 258,337 | 3,624,468 |
| Toro Co. | | 528,138 | 43,798,484 |
| Trinity Industries, Inc. | | 347,103 | 8,462,371 |
| Twin Disc, Inc. (a) | | 42,540 | 395,622 |
| Urban-Gro, Inc. (a)(b) | | 46,704 | 176,074 |
| Velo3D, Inc. (a)(b) | | 322,566 | 1,390,259 |
| Wabash National Corp. | | 248,396 | 4,086,114 |
| Watts Water Technologies, Inc. Class A | | 137,719 | 19,076,836 |
| Xos, Inc. Class A (a)(b) | | 282,816 | 429,880 |
| | | | 837,419,151 |
| Marine - 0.1% | | | |
| Eagle Bulk Shipping, Inc. | | 70,444 | 3,060,087 |
| Genco Shipping & Trading Ltd. | | 184,663 | 2,531,730 |
| Kirby Corp. (a) | | 302,407 | 20,279,413 |
| Matson, Inc. | | 205,194 | 15,114,590 |
| Pangaea Logistics Solutions Ltd. | | 126,074 | 631,631 |
| | | | 41,617,451 |
| Professional Services - 2.1% | | | |
| Alight, Inc. Class A (a) | | 1,301,996 | 10,259,728 |
| ASGN, Inc. (a) | | 256,273 | 24,781,599 |
| Atlas Technical Consultants, Inc. (a) | | 91,209 | 777,101 |
| Barrett Business Services, Inc. | | 37,197 | 2,999,566 |
| BGSF, Inc. | | 47,154 | 570,483 |
| BlackSky Technology, Inc. Class A (a)(b) | | 314,286 | 638,001 |
| Booz Allen Hamilton Holding Corp. Class A | | 672,556 | 64,363,609 |
| CACI International, Inc. Class A (a) | | 118,107 | 33,172,713 |
| CBIZ, Inc. (a) | | 263,192 | 11,490,963 |
| Clarivate Analytics PLC (a) | | 1,978,556 | 23,089,749 |
| CoStar Group, Inc. (a) | | 1,998,454 | 139,172,337 |
| CRA International, Inc. | | 36,902 | 3,373,212 |
| DLH Holdings Corp. (a)(b) | | 53,551 | 876,630 |
| Dun & Bradstreet Holdings, Inc. | | 766,891 | 10,928,197 |
| Exponent, Inc. | | 262,743 | 24,661,058 |
| First Advantage Corp. (a) | | 212,083 | 2,935,229 |
| Forrester Research, Inc. (a) | | 56,488 | 2,349,336 |
| Franklin Covey Co. (a) | | 64,897 | 3,087,150 |
| FTI Consulting, Inc. (a) | | 174,159 | 27,969,935 |
| Gee Group, Inc. (a) | | 708,618 | 510,205 |
| Heidrick & Struggles International, Inc. | | 101,032 | 2,875,371 |
| Hill International, Inc. (a) | | 201,639 | 679,523 |
| Hirequest, Inc. | | 25,377 | 356,801 |
| HireRight Holdings Corp. | | 112,582 | 1,830,583 |
| Hudson Global, Inc. (a) | | 13,959 | 492,474 |
| Huron Consulting Group, Inc. (a) | | 107,134 | 7,167,265 |
| ICF International, Inc. | | 85,076 | 8,640,319 |
| Insperity, Inc. | | 178,870 | 19,500,407 |
| KBR, Inc. | | 702,181 | 33,915,342 |
| Kelly Services, Inc. Class A (non-vtg.) | | 171,724 | 2,766,474 |
| Kforce, Inc. | | 101,756 | 5,568,088 |
| Korn Ferry | | 269,045 | 16,390,221 |
| LegalZoom.com, Inc. (a)(b) | | 103,148 | 1,062,424 |
| Manpower, Inc. | | 267,277 | 19,596,750 |
| ManTech International Corp. Class A | | 139,286 | 13,358,920 |
| Mastech Digital, Inc. (a) | | 15,291 | 234,870 |
| MISTRAS Group, Inc. (a) | | 93,111 | 514,904 |
| Planet Labs PBC Class A (a) | | 946,547 | 5,187,078 |
| RCM Technologies, Inc. (a) | | 38,320 | 669,067 |
| Red Violet, Inc. (a)(b) | | 54,089 | 1,027,150 |
| Resources Connection, Inc. | | 158,722 | 3,101,428 |
| Science Applications International Corp. | | 282,342 | 25,712,886 |
| ShiftPixy, Inc. (a) | | 122,418 | 17,151 |
| Skillsoft Corp. (a) | | 403,990 | 1,300,848 |
| Spire Global, Inc. (a) | | 523,505 | 706,732 |
| Staffing 360 Solutions, Inc. (a)(b) | | 2,581 | 9,498 |
| Sterling Check Corp. (b) | | 71,496 | 1,521,435 |
| TransUnion Holding Co., Inc. | | 971,504 | 71,765,000 |
| TriNet Group, Inc. (a) | | 191,816 | 15,805,638 |
| TrueBlue, Inc. (a) | | 167,096 | 3,432,152 |
| Upwork, Inc. (a) | | 619,114 | 10,772,584 |
| Where Food Comes From, Inc. | | 8,444 | 90,351 |
| Willdan Group, Inc. (a)(b) | | 62,468 | 1,421,772 |
| | | | 665,498,307 |
| Road & Rail - 0.8% | | | |
| AMERCO | | 49,598 | 26,072,181 |
| ArcBest Corp. | | 124,180 | 10,000,215 |
| Avis Budget Group, Inc. (a) | | 172,823 | 28,927,114 |
| Bird Global, Inc. Class A (a)(b) | | 749,870 | 318,620 |
| Covenant Transport Group, Inc. Class A | | 50,854 | 1,430,014 |
| Daseke, Inc. (a) | | 306,905 | 1,859,844 |
| Heartland Express, Inc. | | 237,588 | 3,599,458 |
| Helbiz, Inc. (a)(b) | | 30,499 | 20,434 |
| Hertz Global Holdings, Inc. | | 247,309 | 4,565,324 |
| HyreCar, Inc. (a)(b) | | 91,186 | 72,493 |
| Knight-Swift Transportation Holdings, Inc. Class A | | 825,813 | 41,711,815 |
| Landstar System, Inc. | | 187,864 | 27,546,498 |
| Marten Transport Ltd. | | 303,094 | 6,004,292 |
| P.A.M. Transportation Services, Inc. | | 35,662 | 1,059,518 |
| Patriot Transportation Holding, Inc. (a) | | 5,678 | 43,607 |
| Ryder System, Inc. | | 258,070 | 19,726,871 |
| Saia, Inc. (a) | | 132,862 | 27,479,847 |
| Schneider National, Inc. Class B | | 177,060 | 4,047,592 |
| TuSimple Holdings, Inc. (a)(b) | | 184,761 | 1,328,432 |
| U.S. Xpress Enterprises, Inc. (a)(b) | | 129,152 | 317,714 |
| U.S.A. Truck, Inc. (a) | | 34,992 | 1,097,349 |
| Universal Logistics Holdings, Inc. | | 38,479 | 1,404,868 |
| Werner Enterprises, Inc. | | 301,006 | 11,977,029 |
| XPO Logistics, Inc. (a) | | 497,222 | 26,064,377 |
| Yellow Corp. (a)(b) | | 166,359 | 1,044,735 |
| | | | 247,720,241 |
| Trading Companies & Distributors - 1.1% | | | |
| Air Lease Corp. Class A | | 524,192 | 19,059,621 |
| Alta Equipment Group, Inc. | | 131,366 | 1,546,178 |
| Applied Industrial Technologies, Inc. | | 194,872 | 20,660,329 |
| Beacon Roofing Supply, Inc. (a) | | 274,749 | 15,086,468 |
| BlueLinx Corp. (a) | | 48,989 | 3,434,129 |
| Boise Cascade Co. | | 199,753 | 12,450,604 |
| Core & Main, Inc. (a)(b) | | 288,936 | 6,810,222 |
| Custom Truck One Source, Inc. Class A (a)(b) | | 257,925 | 1,697,147 |
| Distribution Solutions Group I (a) | | 98,453 | 3,912,522 |
| DXP Enterprises, Inc. (a) | | 85,653 | 2,276,657 |
| EVI Industries, Inc. (a) | | 28,596 | 357,450 |
| GATX Corp. | | 179,866 | 17,376,854 |
| Global Industrial Co. | | 82,878 | 2,492,970 |
| GMS, Inc. (a) | | 218,653 | 10,539,075 |
| H&E Equipment Services, Inc. | | 162,042 | 5,130,250 |
| Herc Holdings, Inc. | | 126,899 | 14,279,944 |
| Hudson Technologies, Inc. (a) | | 159,872 | 1,326,938 |
| India Globalization Capital, Inc. (a) | | 180,014 | 100,808 |
| Karat Packaging, Inc. (a) | | 23,140 | 413,975 |
| McGrath RentCorp. | | 121,729 | 10,288,535 |
| Mega Matrix Corp. | | 40,441 | 63,088 |
| MRC Global, Inc. (a) | | 314,649 | 3,061,535 |
| MSC Industrial Direct Co., Inc. Class A | | 238,534 | 18,894,278 |
| NOW, Inc. (a) | | 561,217 | 6,801,950 |
| Rush Enterprises, Inc.: | | | |
| Class A | | 252,425 | 11,879,121 |
| Class B | | 962 | 48,716 |
| SiteOne Landscape Supply, Inc. (a) | | 226,687 | 28,372,145 |
| Titan Machinery, Inc. (a) | | 103,422 | 3,183,329 |
| Transcat, Inc. (a) | | 36,486 | 2,703,248 |
| Triton International Ltd. | | 324,131 | 19,314,966 |
| Univar Solutions, Inc. (a) | | 854,181 | 21,542,445 |
| Veritiv Corp. (a) | | 70,733 | 8,430,666 |
| Watsco, Inc. | | 167,560 | 45,581,347 |
| WESCO International, Inc. (a) | | 224,878 | 29,611,935 |
| Willis Lease Finance Corp. (a) | | 13,095 | 479,277 |
| | | | 349,208,722 |
TOTAL INDUSTRIALS | | | 4,305,377,124 |
| INFORMATION TECHNOLOGY - 19.6% | | | |
| Communications Equipment - 0.7% | | | |
| ADTRAN Holdings, Inc. | | 388,833 | 9,036,479 |
| Airspan Networks Holdings, Inc. (a)(b) | | 155,572 | 329,813 |
| Applied Optoelectronics, Inc. (a)(b) | | 148,684 | 358,328 |
| Aviat Networks, Inc. (a) | | 47,167 | 1,476,327 |
| BK Technologies Corp. (b) | | 67,102 | 160,367 |
| CalAmp Corp. (a)(b) | | 188,613 | 1,165,628 |
| Calix, Inc. (a) | | 281,542 | 16,568,747 |
| Cambium Networks Corp. (a) | | 60,570 | 1,178,692 |
| Casa Systems, Inc. (a)(b) | | 184,600 | 716,248 |
| Ciena Corp. (a) | | 768,146 | 38,975,728 |
| Clearfield, Inc. (a)(b) | | 57,809 | 6,712,203 |
| ClearOne, Inc. (a) | | 67,572 | 43,922 |
| CommScope Holding Co., Inc. (a) | | 1,046,506 | 11,825,518 |
| COMSovereign Holding Corp. (a)(b) | | 204,541 | 26,570 |
| Comtech Telecommunications Corp. | | 134,757 | 1,521,407 |
| Digi International, Inc. (a) | | 179,130 | 5,930,994 |
| DZS, Inc. (a) | | 89,978 | 1,197,607 |
| EMCORE Corp. (a) | | 191,294 | 455,280 |
| Extreme Networks, Inc. (a) | | 660,601 | 9,466,412 |
| Franklin Wireless Corp. (a) | | 19,491 | 55,939 |
| Genasys, Inc. (a) | | 181,076 | 528,742 |
| Harmonic, Inc. (a)(b) | | 523,477 | 5,894,351 |
| Infinera Corp. (a)(b) | | 1,092,149 | 5,984,977 |
| Inseego Corp. (a)(b) | | 434,654 | 1,173,566 |
| KVH Industries, Inc. (a) | | 81,781 | 801,454 |
| Lantronix, Inc. (a) | | 116,027 | 703,124 |
| Lumentum Holdings, Inc. (a)(b) | | 345,845 | 28,895,350 |
| NETGEAR, Inc. (a) | | 147,137 | 3,470,962 |
| NetScout Systems, Inc. (a) | | 373,366 | 11,850,637 |
| Network-1 Security Solutions, Inc. | | 44,287 | 101,417 |
| Ondas Holdings, Inc. (a)(b) | | 150,971 | 712,583 |
| Optical Cable Corp. (a) | | 11,082 | 41,336 |
| PC-Tel, Inc. | | 83,168 | 457,424 |
| Ribbon Communications, Inc. (a) | | 632,914 | 2,221,528 |
| Tessco Technologies, Inc. (a) | | 29,509 | 146,365 |
| Ubiquiti, Inc. | | 30,352 | 9,420,957 |
| ViaSat, Inc. (a) | | 375,915 | 14,277,252 |
| Viavi Solutions, Inc. (a) | | 1,158,389 | 16,310,117 |
| Vislink Technologies, Inc. (a)(b) | | 294,457 | 159,596 |
| | | | 210,353,947 |
| Electronic Equipment & Components - 1.8% | | | |
| 908 Devices, Inc. (a)(b) | | 86,339 | 1,739,731 |
| ADDvantage Technologies Group, Inc. (a) | | 11,567 | 23,134 |
| Advanced Energy Industries, Inc. | | 191,324 | 17,178,982 |
| Aeva Technologies, Inc. (a) | | 460,058 | 1,416,979 |
| AEye, Inc. Class A (a)(b) | | 522,892 | 805,254 |
| Airgain, Inc. (a) | | 51,248 | 397,172 |
| Akoustis Technologies, Inc. (a)(b) | | 294,242 | 1,288,780 |
| Alpine 4 Holdings, Inc. (a) | | 809,957 | 603,418 |
| AmpliTech Group, Inc. (a)(b) | | 60,964 | 132,902 |
| Arlo Technologies, Inc. (a) | | 429,246 | 2,614,108 |
| Arrow Electronics, Inc. (a) | | 333,839 | 34,989,666 |
| Autoscope Technologies Corp. | | 30,922 | 156,775 |
| Avnet, Inc. | | 495,784 | 21,759,960 |
| Badger Meter, Inc. | | 145,837 | 13,809,306 |
| Bel Fuse, Inc. Class B (non-vtg.) | | 63,219 | 1,796,684 |
| Belden, Inc. | | 224,616 | 14,707,856 |
| Benchmark Electronics, Inc. | | 179,975 | 4,940,314 |
| Cemtrex, Inc. (a) | | 100,458 | 29,756 |
| Cepton, Inc. (a)(b) | | 76,319 | 134,321 |
| ClearSign Combustion Corp. (a)(b) | | 156,861 | 155,292 |
| Coda Octopus Group, Inc. (a)(b) | | 23,691 | 116,560 |
| Cognex Corp. | | 879,567 | 37,038,566 |
| CPS Technologies Corp. (a)(b) | | 52,412 | 169,291 |
| CTS Corp. | | 161,834 | 6,848,815 |
| Daktronics, Inc. (a) | | 194,613 | 622,762 |
| Data I/O Corp. (a) | | 27,105 | 94,596 |
| Digital Ally, Inc. (a)(b) | | 339,113 | 187,936 |
| Electro-Sensors, Inc. (a) | | 12,456 | 72,369 |
| eMagin Corp. (a)(b) | | 339,592 | 248,004 |
| ePlus, Inc. (a) | | 134,928 | 6,357,807 |
| Evolv Technologies Holdings, Inc. (a)(b) | | 278,571 | 632,356 |
| Fabrinet (a) | | 185,602 | 19,087,310 |
| FARO Technologies, Inc. (a) | | 93,813 | 3,147,426 |
| Focus Universal, Inc. (a)(b) | | 90,449 | 972,327 |
| Frequency Electronics, Inc. (a) | | 20,258 | 131,474 |
| Identiv, Inc. (a)(b) | | 112,942 | 1,685,095 |
| II-VI, Inc. (a)(b) | | 649,775 | 30,688,873 |
| Insight Enterprises, Inc. (a) | | 177,702 | 16,192,206 |
| IPG Photonics Corp. (a) | | 176,347 | 15,975,275 |
| Iteris, Inc. (a) | | 207,089 | 677,181 |
| Itron, Inc. (a) | | 229,582 | 10,923,512 |
| Jabil, Inc. | | 713,390 | 43,017,417 |
| KEY Tronic Corp. (a) | | 28,909 | 137,607 |
| Kimball Electronics, Inc. (a) | | 125,737 | 2,708,375 |
| Knowles Corp. (a) | | 463,680 | 7,024,752 |
| LGL Group, Inc. (a) | | 9,438 | 130,480 |
| LGL Group, Inc. warrants 11/16/25 (a) | | 6,067 | 2,851 |
| LightPath Technologies, Inc. Class A (a) | | 156,282 | 225,046 |
| Lightwave Logic, Inc. (a)(b) | | 521,609 | 4,157,224 |
| Littelfuse, Inc. | | 125,311 | 29,726,275 |
| Luna Innovations, Inc. (a) | | 167,455 | 962,866 |
| Methode Electronics, Inc. Class A | | 185,335 | 7,498,654 |
| MicroVision, Inc. (a)(b) | | 845,430 | 4,091,881 |
| MICT, Inc. (a)(b) | | 540,916 | 448,149 |
| Mirion Technologies, Inc. Class A (a)(b) | | 515,901 | 3,905,371 |
| Napco Security Technologies, Inc. | | 148,344 | 4,399,883 |
| National Instruments Corp. | | 664,658 | 26,426,802 |
| Neonode, Inc. (a)(b) | | 39,073 | 131,285 |
| nLIGHT, Inc. (a) | | 221,079 | 2,761,277 |
| Novanta, Inc. (a) | | 179,444 | 23,989,868 |
| OSI Systems, Inc. (a) | | 78,180 | 6,513,958 |
| Ouster, Inc. (a)(b) | | 406,843 | 610,265 |
| Par Technology Corp. (a)(b) | | 128,271 | 4,515,139 |
| PC Connection, Inc. | | 55,090 | 2,736,871 |
| Plexus Corp. (a) | | 140,460 | 13,165,316 |
| Powerfleet, Inc. (a) | | 188,580 | 601,570 |
| Quanergy Systems, Inc. Class A (a)(b) | | 70,880 | 20,640 |
| Red Cat Holdings, Inc. (a)(b) | | 142,804 | 340,588 |
| Research Frontiers, Inc. (a)(b) | | 117,242 | 270,829 |
| RF Industries Ltd. (a) | | 45,183 | 314,926 |
| Richardson Electronics Ltd. | | 50,858 | 825,425 |
| Rogers Corp. (a) | | 94,574 | 23,692,678 |
| Sanmina Corp. (a) | | 307,829 | 14,935,863 |
| ScanSource, Inc. (a) | | 125,623 | 3,639,298 |
| Sigmatron International, Inc. (a)(b) | | 22,334 | 171,748 |
| Smartrent, Inc. (a)(b) | | 457,736 | 1,478,487 |
| Sono-Tek Corp. (a) | | 20,373 | 110,014 |
| Taitron Components, Inc. Class A (sub. vtg.) | | 12,439 | 49,258 |
| TD SYNNEX Corp. | | 209,157 | 20,137,636 |
| TTM Technologies, Inc. (a) | | 507,313 | 7,980,033 |
| Universal Security Instruments, Inc. (a)(b) | | 11,858 | 46,009 |
| Velodyne Lidar, Inc. (a)(b) | | 548,985 | 686,231 |
| VerifyMe, Inc. (a) | | 31,735 | 44,746 |
| Vishay Intertechnology, Inc. | | 670,862 | 13,195,856 |
| Vishay Precision Group, Inc. (a) | | 64,341 | 2,207,540 |
| Vontier Corp. | | 814,125 | 17,845,620 |
| Wayside Technology Group, Inc. | | 21,054 | 614,566 |
| Wireless Telecom Group, Inc. (a) | | 113,851 | 165,084 |
| Wrap Technologies, Inc. (a)(b) | | 131,391 | 262,782 |
| | | | 569,475,170 |
| IT Services - 4.2% | | | |
| Affirm Holdings, Inc. (a)(b) | | 835,616 | 19,578,483 |
| AgileThought, Inc. Class A (a)(b) | | 137,608 | 575,201 |
| ALJ Regional Holdings, Inc. (a) | | 108,073 | 161,029 |
| American Virtual Cloud Technologies, Inc. (a)(b) | | 289,934 | 133,370 |
| AppTech Payments Corp. (a) | | 19,975 | 13,122 |
| AvidXchange Holdings, Inc. | | 123,322 | 960,678 |
| Backblaze, Inc. Class A (b) | | 38,154 | 248,383 |
| BigCommerce Holdings, Inc. (a) | | 305,174 | 5,087,251 |
| Block, Inc. Class A (a) | | 2,538,600 | 174,934,926 |
| BM Technologies, Inc. (a)(b) | | 51,552 | 325,809 |
| Brightcove, Inc. (a) | | 221,525 | 1,470,926 |
| Cantaloupe, Inc. (a) | | 305,638 | 1,946,914 |
| Cass Information Systems, Inc. | | 58,289 | 2,138,041 |
| Cerberus Cyber Sentinel Corp. (b) | | 196,893 | 535,549 |
| Cloudflare, Inc. (a) | | 1,418,669 | 88,766,119 |
| Computer Task Group, Inc. (a) | | 74,304 | 585,516 |
| Concentrix Corp. | | 217,598 | 27,369,476 |
| Conduent, Inc. (a) | | 814,554 | 3,331,526 |
| Core Scientific, Inc. (a)(b) | | 1,174,942 | 2,584,872 |
| Crexendo, Inc. | | 64,762 | 181,981 |
| CSG Systems International, Inc. | | 157,578 | 9,115,887 |
| CSP, Inc. | | 3,676 | 28,526 |
| Cyxtera Technologies, Inc. Class A (a) | | 181,061 | 1,147,927 |
| Data Storage Corp. (a) | | 23,816 | 55,729 |
| DecisionPoint Systems, Inc. (a)(b) | | 28,164 | 173,490 |
| Digitalocean Holdings, Inc. (a)(b) | | 85,726 | 3,608,207 |
| Edgio, Inc. (a) | | 702,646 | 2,585,737 |
| Euronet Worldwide, Inc. (a) | | 255,239 | 22,629,490 |
| EVERTEC, Inc. | | 330,064 | 11,090,150 |
| EVO Payments, Inc. Class A (a) | | 243,264 | 8,105,556 |
| Exela Technologies, Inc. (a)(b) | | 128,753 | 121,221 |
| ExlService Holdings, Inc. (a) | | 167,869 | 28,153,310 |
| Fastly, Inc. Class A (a)(b) | | 553,611 | 5,176,263 |
| Flywire Corp. (a) | | 57,607 | 1,432,110 |
| Genpact Ltd. | | 859,652 | 40,386,451 |
| GoDaddy, Inc. (a) | | 817,017 | 61,946,229 |
| GreenBox POS (a)(b) | | 95,595 | 110,890 |
| Grid Dynamics Holdings, Inc. (a) | | 236,392 | 4,777,482 |
| Hackett Group, Inc. | | 143,155 | 2,938,972 |
| i3 Verticals, Inc. Class A (a)(b) | | 112,412 | 2,625,944 |
| Information Services Group, Inc. | | 177,926 | 1,026,633 |
| Innodata, Inc. (a) | | 120,111 | 404,774 |
| Inpixon (a)(b) | | 672,799 | 92,914 |
| International Money Express, Inc. (a) | | 169,162 | 3,789,229 |
| Kyndryl Holdings, Inc. (a) | | 912,656 | 9,509,876 |
| Marqeta, Inc. Class A (a) | | 1,836,508 | 14,306,397 |
| Maximus, Inc. | | 311,250 | 18,858,638 |
| MoneyGram International, Inc. (a) | | 483,594 | 4,981,018 |
| MongoDB, Inc. Class A (a) | | 340,791 | 110,027,782 |
| Okta, Inc. (a) | | 759,659 | 69,432,833 |
| OMNIQ Corp. (a)(b) | | 2,304 | 15,022 |
| Paya Holdings, Inc. (a) | | 427,368 | 2,679,597 |
| Paymentus Holdings, Inc. (a)(b) | | 73,400 | 874,194 |
| Payoneer Global, Inc. (a) | | 989,143 | 6,548,127 |
| Paysign, Inc. (a)(b) | | 188,985 | 582,074 |
| Perficient, Inc. (a) | | 176,015 | 13,746,772 |
| PFSweb, Inc. (a) | | 86,337 | 816,748 |
| Priority Technology Holdings, Inc. (a) | | 83,002 | 332,008 |
| Rackspace Technology, Inc. (a)(b) | | 315,724 | 1,408,129 |
| Repay Holdings Corp. (a) | | 386,514 | 3,590,715 |
| Research Solutions, Inc. (a) | | 31,797 | 59,778 |
| Sabre Corp. (a) | | 1,652,476 | 11,881,302 |
| Shift4 Payments, Inc. (a)(b) | | 272,421 | 12,337,947 |
| Snowflake, Inc. (a) | | 1,222,852 | 221,275,069 |
| SolarWinds, Inc. (b) | | 229,648 | 2,082,907 |
| Squarespace, Inc. Class A (a) | | 143,498 | 3,013,458 |
| SS&C Technologies Holdings, Inc. | | 1,119,783 | 62,439,100 |
| StarTek, Inc. (a) | | 58,920 | 249,821 |
| Steel Connect, Inc. (a) | | 122,656 | 166,812 |
| Switch, Inc. Class A | | 698,715 | 23,721,374 |
| TaskUs, Inc. (a) | | 141,908 | 2,111,591 |
| The Glimpse Group, Inc. (a)(b) | | 14,948 | 82,662 |
| The OLB Group, Inc. (a)(b) | | 50,928 | 80,466 |
| The Western Union Co. (b) | | 1,954,375 | 28,963,838 |
| Thoughtworks Holding, Inc. | | 190,580 | 2,508,033 |
| Toast, Inc. | | 1,232,148 | 23,324,562 |
| TSR, Inc. (a)(b) | | 10,072 | 85,108 |
| Ttec Holdings, Inc. | | 93,367 | 4,887,762 |
| Tucows, Inc. (a) | | 46,379 | 2,179,349 |
| Twilio, Inc. Class A (a) | | 865,587 | 60,227,543 |
| Unisys Corp. (a) | | 341,382 | 3,178,266 |
| Usio, Inc. (a) | | 88,190 | 152,569 |
| Verra Mobility Corp. (a) | | 641,268 | 10,221,812 |
| WaveDancer, Inc. (a) | | 53,509 | 58,860 |
| WEX, Inc. (a) | | 226,566 | 34,947,806 |
| WidePoint Corp. (a)(b) | | 42,200 | 99,381 |
| | | | 1,310,499,399 |
| Semiconductors & Semiconductor Equipment - 2.7% | | | |
| ACM Research, Inc. (b) | | 187,452 | 3,166,064 |
| AEHR Test Systems (a) | | 118,282 | 1,719,820 |
| Allegro MicroSystems LLC (a) | | 277,022 | 6,460,153 |
| Alpha & Omega Semiconductor Ltd. (a) | | 108,713 | 4,202,845 |
| Ambarella, Inc. (a) | | 193,110 | 13,108,307 |
| Amkor Technology, Inc. | | 511,252 | 10,291,503 |
| Amtech Systems, Inc. (a) | | 62,965 | 698,912 |
| Atomera, Inc. (a)(b) | | 110,070 | 1,423,205 |
| Axcelis Technologies, Inc. (a) | | 166,487 | 11,144,640 |
| AXT, Inc. (a) | | 206,104 | 1,770,433 |
| CEVA, Inc. (a) | | 118,063 | 3,455,704 |
| Cirrus Logic, Inc. (a) | | 288,780 | 22,146,538 |
| Cohu, Inc. (a) | | 246,602 | 6,616,332 |
| Credo Technology Group Holding Ltd. (b) | | 100,121 | 1,380,669 |
| CVD Equipment Corp. (a) | | 12,479 | 67,262 |
| CyberOptics Corp. (a) | | 37,397 | 1,991,016 |
| Diodes, Inc. (a) | | 224,623 | 15,986,419 |
| Entegris, Inc. | | 751,352 | 71,288,278 |
| Everspin Technologies, Inc. (a) | | 76,386 | 557,618 |
| First Solar, Inc. (a) | | 501,068 | 63,911,223 |
| FormFactor, Inc. (a) | | 397,456 | 11,637,512 |
| GSI Technology, Inc. (a) | | 79,198 | 263,729 |
| Ichor Holdings Ltd. (a) | | 146,674 | 4,505,825 |
| Impinj, Inc. (a)(b) | | 98,351 | 8,780,777 |
| indie Semiconductor, Inc. (a)(b) | | 309,976 | 2,637,896 |
| Intest Corp. (a) | | 49,165 | 436,585 |
| Kopin Corp. (a) | | 409,336 | 560,790 |
| Kulicke & Soffa Industries, Inc. | | 300,530 | 12,634,281 |
| Lattice Semiconductor Corp. (a) | | 693,637 | 37,387,034 |
| MACOM Technology Solutions Holdings, Inc. (a) | | 245,607 | 13,545,226 |
| Marvell Technology, Inc. | | 4,289,877 | 200,852,041 |
| MaxLinear, Inc. Class A (a) | | 360,736 | 12,961,244 |
| Meta Materials, Inc. (a)(b) | | 1,245,897 | 1,077,701 |
| MKS Instruments, Inc. | | 286,882 | 28,576,316 |
| Navitas Semiconductor Corp. (a)(b) | | 399,785 | 2,362,729 |
| NVE Corp. | | 24,786 | 1,257,146 |
| Onto Innovation, Inc. (a) | | 250,872 | 17,809,403 |
| PDF Solutions, Inc. (a) | | 150,516 | 3,970,612 |
| Peraso, Inc. (a) | | 31,185 | 65,800 |
| Photronics, Inc. (a) | | 312,915 | 5,256,972 |
| Pixelworks, Inc. (a) | | 247,638 | 463,083 |
| Power Integrations, Inc. | | 295,598 | 21,144,125 |
| QuickLogic Corp. (a)(b) | | 58,294 | 394,650 |
| Rambus, Inc. (a) | | 559,996 | 14,442,297 |
| Rigetti Computing, Inc. Class A (a)(b) | | 361,587 | 1,439,116 |
| Rockley Photonics Holdings Ltd. (a)(b) | | 476,400 | 676,488 |
| Rubicon Technology, Inc. (a)(b) | | 6,312 | 20,766 |
| Semtech Corp. (a) | | 321,407 | 14,845,789 |
| Silicon Laboratories, Inc. (a) | | 184,244 | 23,091,301 |
| SiTime Corp. (a) | | 78,892 | 8,394,898 |
| SkyWater Technology, Inc. (a)(b) | | 35,668 | 463,684 |
| SMART Global Holdings, Inc. (a)(b) | | 235,522 | 4,321,829 |
| SunPower Corp. (a)(b) | | 423,958 | 10,174,992 |
| Synaptics, Inc. (a) | | 200,388 | 23,166,857 |
| Transphorm, Inc. (a) | | 99,000 | 549,450 |
| Trio-Tech International (a) | | 7,697 | 35,329 |
| Ultra Clean Holdings, Inc. (a) | | 227,614 | 6,662,262 |
| Universal Display Corp. | | 219,732 | 24,550,656 |
| Veeco Instruments, Inc. (a)(b) | | 262,359 | 5,546,269 |
| WiSA Technologies, Inc. (a) | | 72,739 | 45,389 |
| Wolfspeed, Inc. (a)(b) | | 624,513 | 70,863,490 |
| | | | 839,259,280 |
| Software - 9.7% | | | |
| 8x8, Inc. (a)(b) | | 590,695 | 3,077,521 |
| A10 Networks, Inc. | | 294,791 | 4,097,595 |
| ACI Worldwide, Inc. (a) | | 582,655 | 13,808,924 |
| Agilysys, Inc. (a) | | 99,811 | 5,167,215 |
| Alarm.com Holdings, Inc. (a) | | 234,255 | 15,601,383 |
| Alfi, Inc. (a)(b) | | 55,913 | 66,536 |
| Altair Engineering, Inc. Class A (a)(b) | | 261,703 | 13,611,173 |
| Alteryx, Inc. Class A (a) | | 305,434 | 19,034,647 |
| American Software, Inc. Class A | | 163,508 | 2,768,190 |
| Amplitude, Inc. (a)(b) | | 127,296 | 1,928,534 |
| AppFolio, Inc. (a) | | 100,761 | 10,215,150 |
| Appian Corp. Class A (a)(b) | | 207,698 | 9,741,036 |
| AppLovin Corp. (a)(b) | | 184,752 | 4,550,442 |
| Arteris, Inc. | | 27,039 | 192,518 |
| Asana, Inc. (a)(b) | | 420,402 | 8,050,698 |
| Aspen Technology, Inc. (a) | | 141,212 | 29,739,247 |
| Asure Software, Inc. (a) | | 83,410 | 453,750 |
| Auddia, Inc. (a)(b) | | 36,304 | 39,934 |
| AudioEye, Inc. (a)(b) | | 29,031 | 182,024 |
| Authid, Inc. (a)(b) | | 105,386 | 263,465 |
| Avalara, Inc. (a) | | 442,169 | 40,498,259 |
| Avaya Holdings Corp. (a)(b) | | 415,663 | 660,904 |
| AvePoint, Inc. (a)(b) | | 445,521 | 2,085,038 |
| Aware, Inc. (a) | | 23,789 | 49,243 |
| Benefitfocus, Inc. (a)(b) | | 158,396 | 1,173,714 |
| Bentley Systems, Inc. Class B | | 947,298 | 34,832,147 |
| Bill.Com Holdings, Inc. (a) | | 467,820 | 75,730,702 |
| Bio-Key International, Inc. (a)(b) | | 62,882 | 106,271 |
| Black Knight, Inc. (a) | | 787,474 | 52,099,280 |
| Blackbaud, Inc. (a) | | 230,380 | 12,048,874 |
| Blackboxstocks, Inc. (a)(b) | | 14,902 | 17,733 |
| BlackLine, Inc. (a) | | 271,672 | 18,457,396 |
| Blend Labs, Inc. (a)(b) | | 124,714 | 392,849 |
| Box, Inc. Class A (a)(b) | | 722,103 | 18,594,152 |
| Braze, Inc. (b) | | 49,537 | 2,039,934 |
| Bridgeline Digital, Inc. (a) | | 30,402 | 44,995 |
| BSQUARE Corp. (a) | | 59,361 | 73,014 |
| BTCS, Inc. | | 39,371 | 64,962 |
| BTRS Holdings, Inc. (a) | | 401,447 | 2,713,782 |
| C3.Ai, Inc. (a)(b) | | 358,203 | 6,447,654 |
| CCC Intelligent Solutions Holdings, Inc. Class A (a)(b) | | 319,261 | 3,052,135 |
| Cerence, Inc. (a) | | 198,107 | 3,964,121 |
| ChannelAdvisor Corp. (a) | | 159,617 | 2,408,621 |
| Cipher Mining, Inc. (a) | | 220,148 | 442,497 |
| Cleanspark, Inc. (a)(b) | | 201,327 | 861,680 |
| Clear Secure, Inc. (a)(b) | | 73,425 | 1,684,370 |
| Clearwater Analytics Holdings, Inc. (b) | | 197,567 | 3,042,532 |
| CommVault Systems, Inc. (a) | | 226,653 | 12,304,991 |
| Confluent, Inc. (a)(b) | | 592,722 | 16,216,874 |
| Consensus Cloud Solutions, Inc. (a) | | 81,174 | 4,087,111 |
| CoreCard Corp. (a) | | 35,341 | 857,019 |
| Couchbase, Inc. (a) | | 45,901 | 761,498 |
| Coupa Software, Inc. (a) | | 380,561 | 22,224,762 |
| Crowdstrike Holdings, Inc. (a) | | 1,076,977 | 196,666,770 |
| CS Disco, Inc. (a)(b) | | 65,508 | 904,010 |
| Cvent Holding Corp. (a)(b) | | 344,276 | 1,742,037 |
| Cyngn, Inc. (b) | | 25,010 | 31,513 |
| Datadog, Inc. Class A (a) | | 1,299,529 | 136,385,569 |
| DatChat, Inc. (a)(b) | | 42,295 | 42,295 |
| Dave, Inc. (a)(b) | | 862,800 | 444,342 |
| Digimarc Corp. (a)(b) | | 78,250 | 1,394,415 |
| Digital Turbine, Inc. (a) | | 446,203 | 8,241,369 |
| DocuSign, Inc. (a) | | 1,006,800 | 58,615,896 |
| Dolby Laboratories, Inc. Class A | | 327,428 | 23,980,827 |
| Domo, Inc. Class B (a) | | 155,187 | 2,988,902 |
| Dropbox, Inc. Class A (a) | | 1,353,958 | 28,961,162 |
| Duck Creek Technologies, Inc. (a) | | 383,132 | 4,559,271 |
| Duos Technologies Group, Inc. (a) | | 16,279 | 67,721 |
| Dynatrace, Inc. (a) | | 993,524 | 37,932,746 |
| E2open Parent Holdings, Inc. (a)(b) | | 905,915 | 6,223,636 |
| Ebix, Inc. | | 120,453 | 3,134,187 |
| eGain Communications Corp. (a) | | 118,397 | 1,090,436 |
| Elastic NV (a) | | 368,991 | 30,962,035 |
| Embark Technology, Inc. (a)(b) | | 51,168 | 465,629 |
| Enfusion, Inc. Class A (b) | | 102,570 | 1,270,842 |
| Envestnet, Inc. (a) | | 279,577 | 14,641,447 |
| Everbridge, Inc. (a) | | 199,882 | 7,951,306 |
| EverCommerce, Inc. (a) | | 104,895 | 1,220,978 |
| Expensify, Inc. (b) | | 51,658 | 936,560 |
| Fair Isaac Corp. (a) | | 130,751 | 58,759,499 |
| Five9, Inc. (a) | | 349,956 | 34,334,183 |
| ForgeRock, Inc. | | 152,202 | 2,596,566 |
| Freshworks, Inc. (b) | | 533,427 | 7,259,941 |
| GitLab, Inc. | | 185,983 | 11,134,802 |
| Greenidge Generation Holdings, Inc. (a)(b) | | 45,486 | 110,531 |
| GSE Systems, Inc. (a) | | 32,127 | 36,304 |
| Guidewire Software, Inc. (a) | | 419,736 | 30,099,269 |
| HashiCorp, Inc. | | 159,938 | 5,653,808 |
| HubSpot, Inc. (a) | | 228,746 | 77,096,552 |
| Informatica, Inc. (b) | | 158,080 | 3,488,826 |
| Intapp, Inc. (a) | | 59,088 | 856,185 |
| Intellicheck, Inc. (a) | | 88,070 | 274,778 |
| InterDigital, Inc. | | 156,323 | 7,841,162 |
| Intrusion, Inc. (a)(b) | | 72,446 | 294,855 |
| Inuvo, Inc. (a) | | 477,704 | 246,830 |
| IronNet, Inc. Class A (a)(b) | | 236,517 | 477,764 |
| Issuer Direct Corp. (a) | | 16,049 | 372,096 |
| Jamf Holding Corp. (a)(b) | | 281,664 | 6,745,853 |
| Kaltura, Inc. (a)(b) | | 79,662 | 193,579 |
| Kaspien Holdings, Inc. (a)(b) | | 3,767 | 9,832 |
| KnowBe4, Inc. (a) | | 385,402 | 7,407,426 |
| Latch, Inc. (a)(b) | | 440,467 | 471,300 |
| LivePerson, Inc. (a) | | 356,637 | 4,136,989 |
| Liveramp Holdings, Inc. (a) | | 347,050 | 6,888,943 |
| Livevox Holdings, Inc. (a) | | 91,257 | 195,290 |
| Mandiant, Inc. (a) | | 1,210,117 | 27,663,275 |
| Manhattan Associates, Inc. (a) | | 318,428 | 44,981,139 |
| Marathon Digital Holdings, Inc. (a)(b) | | 536,307 | 6,355,238 |
| Marin Software, Inc. (a)(b) | | 72,095 | 130,492 |
| Matterport, Inc. (a)(b) | | 1,079,090 | 4,974,605 |
| MeridianLink, Inc. (a)(b) | | 70,013 | 1,216,126 |
| MicroStrategy, Inc. Class A (a)(b) | | 47,105 | 10,907,634 |
| Mitek Systems, Inc. (a) | | 232,534 | 2,376,497 |
| Model N, Inc. (a) | | 167,940 | 5,021,406 |
| Momentive Global, Inc. (a) | | 668,994 | 4,743,167 |
| N-able, Inc. (a) | | 351,178 | 3,497,733 |
| nCino, Inc. (a)(b) | | 291,560 | 9,195,802 |
| NCR Corp. (a) | | 687,782 | 21,355,631 |
| NetSol Technologies, Inc. (a) | | 61,838 | 220,762 |
| New Relic, Inc. (a) | | 302,176 | 18,345,105 |
| Nextnav, Inc. (a)(b) | | 105,933 | 359,113 |
| Nutanix, Inc. Class A (a) | | 1,107,336 | 19,156,913 |
| Oblong, Inc. (a) | | 72,898 | 18,589 |
| Olo, Inc. (a)(b) | | 462,837 | 3,614,757 |
| ON24, Inc. (a) | | 41,287 | 369,932 |
| Onespan, Inc. (a) | | 176,886 | 2,035,958 |
| Pagerduty, Inc. (a) | | 396,733 | 10,330,927 |
| Palantir Technologies, Inc. (a)(b) | | 8,242,010 | 63,628,317 |
| Palo Alto Networks, Inc. (a) | | 497,122 | 276,802,501 |
| Park City Group, Inc. (a) | | 67,109 | 405,338 |
| Paycor HCM, Inc. (a)(b) | | 159,873 | 4,737,037 |
| Paylocity Holding Corp. (a) | | 200,350 | 48,284,350 |
| Pegasystems, Inc. | | 206,638 | 7,565,017 |
| Phunware, Inc. (a)(b) | | 430,958 | 573,174 |
| Ping Identity Holding Corp. (a) | | 309,958 | 8,722,218 |
| Progress Software Corp. | | 222,479 | 10,707,914 |
| PROS Holdings, Inc. (a) | | 205,285 | 4,280,192 |
| Q2 Holdings, Inc. (a) | | 289,585 | 11,502,316 |
| Qualtrics International, Inc. (a) | | 524,405 | 6,423,961 |
| Qualys, Inc. (a) | | 168,523 | 25,598,644 |
| Quantum Computing, Inc. (a)(b) | | 98,395 | 291,249 |
| Qumu Corp. (a) | | 74,179 | 48,528 |
| Rapid7, Inc. (a) | | 295,476 | 16,989,870 |
| RealNetworks, Inc. (a) | | 164,617 | 113,750 |
| Rekor Systems, Inc. (a)(b) | | 192,832 | 273,821 |
| Rimini Street, Inc. (a) | | 172,532 | 869,561 |
| RingCentral, Inc. (a) | | 430,814 | 18,542,235 |
| Riot Blockchain, Inc. (a)(b) | | 552,663 | 3,962,594 |
| Samsara, Inc. (b) | | 344,600 | 5,124,202 |
| SeaChange International, Inc. (a) | | 233,275 | 119,250 |
| SecureWorks Corp. (a) | | 51,520 | 535,808 |
| Semrush Holdings, Inc. (a)(b) | | 140,370 | 1,722,340 |
| SentinelOne, Inc. (a) | | 938,630 | 25,633,985 |
| ShotSpotter, Inc. (a) | | 45,037 | 1,469,557 |
| SilverSun Technologies, Inc. (A Shares) (a)(b) | | 16,804 | 61,335 |
| Smartsheet, Inc. (a) | | 653,639 | 21,746,570 |
| Smith Micro Software, Inc. (a)(b) | | 254,204 | 617,716 |
| Soluna Holdings, Inc. (a)(b) | | 40,191 | 119,367 |
| Sonic Foundry, Inc. (a)(b) | | 6,516 | 9,579 |
| SoundHound AI, Inc. (a)(b) | | 562,009 | 1,601,726 |
| Splunk, Inc. (a) | | 812,613 | 73,159,548 |
| Sprinklr, Inc. (a)(b) | | 281,615 | 3,339,954 |
| Sprout Social, Inc. (a) | | 235,852 | 14,160,554 |
| SPS Commerce, Inc. (a) | | 183,252 | 22,378,734 |
| SRAX, Inc. (a)(b) | | 115,745 | 274,316 |
| Stronghold Digital Mining, Inc. Class A (b) | | 36,386 | 50,577 |
| Sumo Logic, Inc. (a) | | 465,546 | 4,087,494 |
| Synchronoss Technologies, Inc. (a) | | 443,771 | 718,909 |
| Telos Corp. (a) | | 279,000 | 2,762,100 |
| Tenable Holdings, Inc. (a) | | 475,414 | 18,831,149 |
| Teradata Corp. (a) | | 530,478 | 17,452,726 |
| TeraWulf, Inc. (a)(b) | | 164,888 | 245,683 |
| TeraWulf, Inc. rights (a)(c) | | 5,763 | 0 |
| The Trade Desk, Inc. (a) | | 2,230,999 | 139,883,637 |
| UiPath, Inc. Class A (a) | | 1,404,919 | 23,110,918 |
| Unity Software, Inc. (a)(b) | | 834,582 | 35,653,343 |
| Upland Software, Inc. (a) | | 137,133 | 1,435,783 |
| Varonis Systems, Inc. (a) | | 557,115 | 15,237,095 |
| Verb Technology Co., Inc. (a)(b) | | 348,654 | 171,468 |
| Verint Systems, Inc. (a) | | 325,719 | 15,794,114 |
| Veritone, Inc. (a)(b) | | 160,487 | 1,179,579 |
| Vertex, Inc. Class A (a) | | 144,677 | 1,979,181 |
| Viant Technology, Inc. (a) | | 76,295 | 344,853 |
| VirnetX Holding Corp. (a)(b) | | 330,345 | 673,904 |
| VMware, Inc. Class A | | 1,020,415 | 118,398,752 |
| Workday, Inc. Class A (a) | | 1,002,505 | 164,972,223 |
| Workiva, Inc. (a) | | 243,997 | 16,564,956 |
| Xperi Holding Corp. | | 526,018 | 8,368,946 |
| Yext, Inc. (a) | | 597,093 | 2,657,064 |
| Zendesk, Inc. (a) | | 618,064 | 47,448,773 |
| Zeta Global Holdings Corp. (a)(b) | | 109,281 | 764,967 |
| Zoom Video Communications, Inc. Class A (a) | | 1,148,885 | 92,370,354 |
| Zscaler, Inc. (a) | | 405,858 | 64,628,828 |
| Zuora, Inc. (a) | | 615,016 | 4,723,323 |
| | | | 3,000,246,788 |
| Technology Hardware, Storage & Peripherals - 0.5% | | | |
| 3D Systems Corp. (a) | | 669,684 | 6,783,899 |
| Astro-Med, Inc. (a) | | 35,421 | 458,702 |
| Avid Technology, Inc. (a) | | 180,049 | 4,924,340 |
| Boxlight Corp. (a) | | 258,966 | 169,208 |
| CompoSecure, Inc. (a)(b) | | 55,494 | 320,755 |
| Corsair Gaming, Inc. (a)(b) | | 173,614 | 2,671,919 |
| CPI Card Group (a)(b) | | 19,187 | 367,815 |
| Dell Technologies, Inc. | | 1,384,535 | 53,013,845 |
| Diebold Nixdorf, Inc. (a) | | 363,675 | 1,265,589 |
| Eastman Kodak Co. (a)(b) | | 344,884 | 1,865,822 |
| Immersion Corp. (a) | | 161,311 | 961,414 |
| Intevac, Inc. (a) | | 132,228 | 659,818 |
| IonQ, Inc. (a)(b) | | 588,154 | 3,493,635 |
| Movano, Inc. (a) | | 16,424 | 45,987 |
| One Stop Systems, Inc. (a) | | 69,475 | 272,342 |
| Pure Storage, Inc. Class A (a) | | 1,420,030 | 41,138,269 |
| Quantum Corp. (a) | | 332,616 | 522,207 |
| Socket Mobile, Inc. (a) | | 29,194 | 84,955 |
| Sonim Technologies, Inc. (a)(b) | | 44,502 | 34,057 |
| Super Micro Computer, Inc. (a) | | 226,267 | 14,725,456 |
| Transact Technologies, Inc. (a) | | 31,410 | 144,800 |
| Turtle Beach Corp. (a) | | 79,127 | 743,003 |
| Xerox Holdings Corp. | | 596,454 | 9,913,065 |
| | | | 144,580,902 |
TOTAL INFORMATION TECHNOLOGY | | | 6,074,415,486 |
| MATERIALS - 4.4% | | | |
| Chemicals - 1.8% | | | |
| Advanced Emissions Solutions, Inc. (a) | | 95,592 | 357,514 |
| AdvanSix, Inc. | | 143,455 | 5,201,678 |
| AgroFresh Solutions, Inc. (a) | | 113,343 | 181,916 |
| American Vanguard Corp. | | 139,673 | 2,783,683 |
| Amyris, Inc. (a)(b) | | 1,007,476 | 2,961,979 |
| Ashland, Inc. | | 255,879 | 26,038,247 |
| Aspen Aerogels, Inc. (a)(b) | | 136,927 | 1,781,420 |
| Avient Corp. | | 456,958 | 20,028,469 |
| Axalta Coating Systems Ltd. (a) | | 1,051,243 | 27,069,507 |
| Balchem Corp. | | 162,430 | 21,411,523 |
| Cabot Corp. | | 285,030 | 20,513,609 |
| Chase Corp. | | 38,260 | 3,373,002 |
| Core Molding Technologies, Inc. (a) | | 33,502 | 415,425 |
| Crown ElectroKinetics Corp. (a) | | 72,292 | 29,466 |
| Danimer Scientific, Inc. (a)(b) | | 429,285 | 1,910,318 |
| Diversey Holdings Ltd. (a) | | 246,978 | 1,513,975 |
| Ecovyst, Inc. | | 272,443 | 2,517,373 |
| Element Solutions, Inc. | | 1,106,173 | 20,652,250 |
| Flotek Industries, Inc. (a)(b) | | 326,710 | 323,443 |
| FutureFuel Corp. | | 132,303 | 964,489 |
| GCP Applied Technologies, Inc. (a) | | 271,086 | 8,517,522 |
| Ginkgo Bioworks Holdings, Inc. Class A (a)(b) | | 4,868,482 | 13,096,217 |
| H.B. Fuller Co. | | 262,841 | 17,047,867 |
| Hawkins, Inc. | | 95,509 | 3,659,905 |
| Huntsman Corp. | | 1,006,543 | 28,203,335 |
| Ingevity Corp. (a) | | 195,122 | 13,685,857 |
| Innospec, Inc. | | 126,009 | 11,776,801 |
| Intrepid Potash, Inc. (a) | | 49,142 | 2,296,406 |
| Koppers Holdings, Inc. | | 106,189 | 2,424,295 |
| Kronos Worldwide, Inc. | | 113,685 | 1,464,263 |
| Livent Corp. (a)(b) | | 819,266 | 26,363,980 |
| Loop Industries, Inc. (a)(b) | | 117,681 | 630,770 |
| LSB Industries, Inc. | | 156,062 | 2,462,658 |
| Mativ, Inc. | | 281,400 | 6,646,668 |
| Minerals Technologies, Inc. | | 167,429 | 9,754,414 |
| NewMarket Corp. | | 34,379 | 9,873,993 |
| Northern Technologies International Corp. | | 39,524 | 460,455 |
| Olin Corp. | | 700,536 | 38,291,298 |
| Origin Materials, Inc. Class A (a)(b) | | 585,522 | 3,659,513 |
| Orion Engineered Carbons SA | | 307,086 | 5,177,470 |
| PureCycle Technologies, Inc. (a)(b) | | 514,984 | 4,701,804 |
| Quaker Houghton | | 67,975 | 11,849,402 |
| Rayonier Advanced Materials, Inc. (a) | | 318,323 | 1,438,820 |
| RPM International, Inc. | | 653,396 | 60,870,371 |
| Sensient Technologies Corp. | | 212,405 | 16,922,306 |
| Stepan Co. | | 106,894 | 11,141,562 |
| The Chemours Co. LLC | | 784,248 | 26,452,685 |
| The Scotts Miracle-Gro Co. Class A | | 204,822 | 13,712,833 |
| Tredegar Corp. | | 133,637 | 1,364,434 |
| Trinseo PLC | | 184,061 | 4,883,138 |
| Tronox Holdings PLC | | 584,713 | 8,554,351 |
| Valhi, Inc. | | 10,447 | 365,018 |
| Valvoline, Inc. | | 898,335 | 26,114,598 |
| Westlake Corp. | | 168,460 | 16,615,210 |
| Zymergen, Inc. (a) | | 106,523 | 252,460 |
| | | | 570,761,965 |
| Construction Materials - 0.1% | | | |
| Eagle Materials, Inc. | | 199,413 | 23,853,783 |
| Smith-Midland Corp. (a) | | 22,105 | 508,636 |
| Summit Materials, Inc. (a) | | 596,158 | 16,942,810 |
| United States Lime & Minerals, Inc. | | 11,437 | 1,175,609 |
| | | | 42,480,838 |
| Containers & Packaging - 0.8% | | | |
| Aptargroup, Inc. | | 330,276 | 33,955,676 |
| Berry Global Group, Inc. (a) | | 656,668 | 35,676,772 |
| Crown Holdings, Inc. | | 620,312 | 56,194,064 |
| Cryptyde, Inc. (a)(b) | | 83,139 | 65,430 |
| Graphic Packaging Holding Co. | | 1,428,390 | 31,810,245 |
| Greif, Inc.: | | | |
| Class A | | 128,030 | 8,584,412 |
| Class B | | 35,719 | 2,331,379 |
| Myers Industries, Inc. | | 185,574 | 3,585,290 |
| O-I Glass, Inc. (a) | | 793,018 | 10,317,164 |
| Pactiv Evergreen, Inc. | | 216,786 | 2,406,325 |
| Ranpak Holdings Corp. (A Shares) (a) | | 200,387 | 1,060,047 |
| Silgan Holdings, Inc. | | 424,372 | 19,330,145 |
| Sonoco Products Co. | | 493,341 | 31,090,350 |
| TriMas Corp. | | 215,896 | 5,941,458 |
| | | | 242,348,757 |
| Metals & Mining - 1.5% | | | |
| 5E Advanced Materials, Inc. (a) | | 139,423 | 2,091,345 |
| Alcoa Corp. | | 928,897 | 45,961,824 |
| Alpha Metallurgical Resources | | 88,826 | 13,959,006 |
| Ampco-Pittsburgh Corp. (a)(b) | | 61,033 | 260,611 |
| Arconic Corp. (a) | | 533,845 | 13,458,232 |
| Ascent Industries Co. (a) | | 41,634 | 696,953 |
| ATI, Inc. (a) | | 623,793 | 18,670,124 |
| Carpenter Technology Corp. | | 242,627 | 8,242,039 |
| Century Aluminum Co. (a)(b) | | 255,870 | 1,975,316 |
| Cleveland-Cliffs, Inc. (a) | | 2,407,113 | 41,570,842 |
| Coeur d'Alene Mines Corp. (a)(b) | | 1,413,097 | 3,900,148 |
| Commercial Metals Co. | | 614,851 | 24,907,614 |
| Compass Minerals International, Inc. | | 173,833 | 7,038,498 |
| Comstock Mining, Inc. (a)(b) | | 315,448 | 181,351 |
| Friedman Industries | | 34,709 | 363,403 |
| Gatos Silver, Inc. (a)(b) | | 249,533 | 758,580 |
| Gold Resource Corp. | | 432,921 | 735,966 |
| Golden Minerals Co. (a)(b) | | 537,586 | 140,310 |
| Haynes International, Inc. | | 63,011 | 2,500,907 |
| Hecla Mining Co. | | 2,742,357 | 10,804,887 |
| Hycroft Mining Holding Corp. (a) | | 642,377 | 513,966 |
| Idaho Strategic Resources, Inc. (a) | | 36,660 | 197,231 |
| Kaiser Aluminum Corp. | | 81,842 | 5,872,982 |
| Materion Corp. | | 103,808 | 8,959,668 |
| McEwen Mining, Inc. (a)(b) | | 186,249 | 571,784 |
| MP Materials Corp. (a)(b) | | 376,761 | 13,182,867 |
| Olympic Steel, Inc. | | 48,340 | 1,272,309 |
| Paramount Gold Nevada Corp. (a)(b) | | 22,246 | 7,719 |
| Piedmont Lithium, Inc. (a)(b) | | 90,229 | 5,517,503 |
| Ramaco Resources, Inc. | | 57,991 | 611,225 |
| Reliance Steel & Aluminum Co. | | 312,661 | 58,774,015 |
| Royal Gold, Inc. | | 332,539 | 30,560,334 |
| Ryerson Holding Corp. | | 84,126 | 2,397,591 |
| Schnitzer Steel Industries, Inc. Class A | | 134,063 | 4,429,442 |
| Solitario Exploration & Royalty Corp. (a) | | 218,892 | 125,863 |
| Steel Dynamics, Inc. | | 905,390 | 73,083,081 |
| SunCoke Energy, Inc. | | 418,396 | 2,757,230 |
| TimkenSteel Corp. (a) | | 211,414 | 3,243,091 |
| U.S. Antimony Corp. (a)(b) | | 399,486 | 176,014 |
| U.S. Gold Corp. (a) | | 33,587 | 121,249 |
| United States Steel Corp. | | 1,312,639 | 30,020,054 |
| Universal Stainless & Alloy Products, Inc. (a) | | 45,121 | 360,517 |
| Warrior Metropolitan Coal, Inc. | | 261,104 | 8,498,935 |
| Worthington Industries, Inc. | | 163,823 | 8,353,335 |
| | | | 457,825,961 |
| Paper & Forest Products - 0.2% | | | |
| Clearwater Paper Corp. (a) | | 85,394 | 3,632,661 |
| Glatfelter Corp. | | 232,348 | 1,131,535 |
| Louisiana-Pacific Corp. | | 415,819 | 22,549,864 |
| Mercer International, Inc. (SBI) | | 205,835 | 3,338,644 |
| Resolute Forest Products, Inc. (a) | | 230,972 | 4,679,493 |
| Sylvamo Corp. | | 178,976 | 7,953,693 |
| | | | 43,285,890 |
TOTAL MATERIALS | | | 1,356,703,411 |
| REAL ESTATE - 7.0% | | | |
| Equity Real Estate Investment Trusts (REITs) - 6.4% | | | |
| Acadia Realty Trust (SBI) | | 493,753 | 7,865,485 |
| Agree Realty Corp. | | 382,328 | 28,796,945 |
| Alexander & Baldwin, Inc. | | 366,536 | 6,865,219 |
| Alexanders, Inc. | | 11,692 | 2,769,835 |
| Alpine Income Property Trust, Inc. | | 67,018 | 1,216,377 |
| American Assets Trust, Inc. | | 269,794 | 7,489,481 |
| American Homes 4 Rent Class A | | 1,496,125 | 53,202,205 |
| Americold Realty Trust | | 1,354,500 | 39,849,390 |
| Apartment Income (REIT) Corp. | | 792,047 | 32,355,120 |
| Apartment Investment & Management Co. Class A | | 756,054 | 6,683,517 |
| Apple Hospitality (REIT), Inc. | | 1,072,020 | 17,055,838 |
| Armada Hoffler Properties, Inc. | | 356,464 | 4,680,372 |
| Ashford Hospitality Trust, Inc. (a) | | 177,426 | 1,628,771 |
| Bluerock Residential Growth (REIT), Inc. | | 139,829 | 3,726,443 |
| Braemar Hotels & Resorts, Inc. | | 326,657 | 1,682,284 |
| Brandywine Realty Trust (SBI) | | 871,607 | 6,999,004 |
| Brixmor Property Group, Inc. | | 1,517,956 | 32,605,695 |
| Broadstone Net Lease, Inc. (b) | | 871,321 | 16,677,084 |
| BRT Apartments Corp. | | 64,799 | 1,546,752 |
| CareTrust (REIT), Inc. | | 495,607 | 10,675,375 |
| CatchMark Timber Trust, Inc. | | 257,785 | 2,745,410 |
| Centerspace | | 78,674 | 5,930,446 |
| Chatham Lodging Trust (a) | | 248,446 | 3,021,103 |
| City Office REIT, Inc. | | 229,397 | 2,649,535 |
| Clipper Realty, Inc. | | 80,503 | 677,030 |
| Community Healthcare Trust, Inc. | | 126,593 | 4,670,016 |
| CorEnergy Infrastructure Trust, Inc. | | 89,224 | 208,784 |
| Corporate Office Properties Trust (SBI) | | 577,158 | 14,913,763 |
| Cousins Properties, Inc. | | 763,859 | 20,509,614 |
| Creative Media & Community Trust Corp. (b) | | 90,894 | 638,076 |
| CTO Realty Growth, Inc. | | 96,838 | 2,044,250 |
| CubeSmart | | 1,135,986 | 52,312,155 |
| DiamondRock Hospitality Co. | | 1,062,609 | 9,276,577 |
| Diversified Healthcare Trust (SBI) | | 1,195,057 | 1,744,783 |
| Douglas Emmett, Inc. | | 895,641 | 17,482,912 |
| Easterly Government Properties, Inc. | | 467,882 | 8,398,482 |
| EastGroup Properties, Inc. | | 210,859 | 34,798,061 |
| Empire State Realty Trust, Inc. | | 692,490 | 4,826,655 |
| EPR Properties | | 382,001 | 16,613,223 |
| Equity Commonwealth | | 568,988 | 14,970,074 |
| Equity Lifestyle Properties, Inc. | | 875,371 | 61,363,507 |
| Essential Properties Realty Trust, Inc. | | 710,511 | 16,085,969 |
| Farmland Partners, Inc. | | 163,751 | 2,376,027 |
| First Industrial Realty Trust, Inc. | | 669,884 | 33,949,721 |
| Four Corners Property Trust, Inc. | | 411,195 | 11,057,034 |
| Franklin Street Properties Corp. | | 479,644 | 1,347,800 |
| Gaming & Leisure Properties | | 1,184,559 | 57,178,663 |
| Generation Income Properties, Inc. | | 1,338 | 9,112 |
| Getty Realty Corp. | | 212,614 | 6,395,429 |
| Gladstone Commercial Corp. | | 204,629 | 3,902,275 |
| Gladstone Land Corp. | | 159,441 | 3,748,458 |
| Global Medical REIT, Inc. | | 325,582 | 3,529,309 |
| Global Net Lease, Inc. | | 547,001 | 7,532,204 |
| Global Self Storage, Inc. | | 73,533 | 427,962 |
| Healthcare Trust of America, Inc. | | 1,924,267 | 46,798,173 |
| Hersha Hospitality Trust (a) | | 161,244 | 1,564,067 |
| Highwoods Properties, Inc. (SBI) | | 543,041 | 16,513,877 |
| Hudson Pacific Properties, Inc. | | 745,893 | 9,853,247 |
| Independence Realty Trust, Inc. | | 1,124,617 | 21,873,801 |
| Indus Realty Trust, Inc. | | 35,617 | 2,187,596 |
| Industrial Logistics Properties Trust | | 337,906 | 2,530,916 |
| InnSuites Hospitality Trust (b) | | 27,442 | 67,233 |
| InvenTrust Properties Corp. | | 344,566 | 9,048,303 |
| Invitation Homes, Inc. | | 3,078,520 | 111,688,706 |
| iStar Financial, Inc. | | 417,355 | 5,746,978 |
| JBG SMITH Properties | | 548,283 | 12,045,778 |
| Kilroy Realty Corp. | | 534,170 | 26,051,471 |
| Kite Realty Group Trust | | 1,110,663 | 21,502,436 |
| Lamar Advertising Co. Class A | | 440,317 | 41,341,363 |
| Life Storage, Inc. | | 426,898 | 54,322,771 |
| LTC Properties, Inc. | | 201,012 | 9,023,429 |
| LXP Industrial Trust (REIT) | | 1,473,070 | 14,819,084 |
| Medalist Diversified (REIT), Inc. | | 211,661 | 173,816 |
| Medical Properties Trust, Inc. | | 3,029,352 | 44,258,833 |
| National Health Investors, Inc. | | 234,315 | 15,349,976 |
| National Retail Properties, Inc. | | 891,806 | 40,042,089 |
| National Storage Affiliates Trust | | 428,846 | 21,665,300 |
| Necessity Retail (REIT), Inc./The | | 681,146 | 5,081,349 |
| NETSTREIT Corp. | | 257,493 | 5,062,312 |
| New York City REIT, Inc. (b) | | 68,566 | 212,555 |
| NexPoint Residential Trust, Inc. | | 117,912 | 6,228,112 |
| Office Properties Income Trust | | 248,741 | 4,370,379 |
| Omega Healthcare Investors, Inc. | | 1,193,820 | 38,990,161 |
| One Liberty Properties, Inc. | | 88,784 | 2,144,134 |
| Orion Office (REIT), Inc. | | 284,031 | 2,803,386 |
| Outfront Media, Inc. | | 745,891 | 13,202,271 |
| Paramount Group, Inc. | | 835,972 | 5,793,286 |
| Park Hotels & Resorts, Inc. | | 1,185,119 | 16,591,666 |
| Pebblebrook Hotel Trust | | 658,483 | 11,602,470 |
| Pennsylvania Real Estate Investment Trust (SBI) (a)(b) | | 21,453 | 100,829 |
| Phillips Edison & Co., Inc. | | 581,200 | 18,987,804 |
| Physicians Realty Trust | | 1,144,375 | 19,065,288 |
| Piedmont Office Realty Trust, Inc. Class A | | 630,654 | 7,429,104 |
| Plymouth Industrial REIT, Inc. | | 213,738 | 4,332,469 |
| Postal Realty Trust, Inc. | | 95,340 | 1,415,799 |
| Potlatch Corp. | | 354,059 | 16,435,419 |
| Presidio Property Trust, Inc. Class A | | 78,485 | 243,304 |
| Rayonier, Inc. | | 742,249 | 26,364,684 |
| Retail Opportunity Investments Corp. | | 632,748 | 10,598,529 |
| Rexford Industrial Realty, Inc. | | 835,197 | 51,957,605 |
| RLJ Lodging Trust | | 839,309 | 10,122,067 |
| RPT Realty | | 438,548 | 4,223,217 |
| Ryman Hospitality Properties, Inc. | | 279,334 | 22,966,841 |
| Sabra Health Care REIT, Inc. | | 1,156,068 | 17,306,338 |
| Safehold, Inc. | | 81,163 | 3,086,629 |
| Saul Centers, Inc. | | 70,886 | 3,139,541 |
| Service Properties Trust | | 837,247 | 5,726,769 |
| SITE Centers Corp. | | 934,176 | 12,106,921 |
| SL Green Realty Corp. | | 323,736 | 14,299,419 |
| Sotherly Hotels, Inc. (a) | | 66,692 | 159,394 |
| Spirit Realty Capital, Inc. | | 685,550 | 28,004,718 |
| Stag Industrial, Inc. | | 910,818 | 28,053,194 |
| Store Capital Corp. | | 1,286,071 | 34,698,196 |
| Summit Hotel Properties, Inc. | | 539,244 | 4,238,458 |
| Sun Communities, Inc. | | 613,499 | 94,300,931 |
| Sunstone Hotel Investors, Inc. | | 1,081,607 | 11,778,700 |
| Tanger Factory Outlet Centers, Inc. | | 535,107 | 8,251,350 |
| Terreno Realty Corp. | | 385,317 | 23,500,484 |
| The Macerich Co. | | 1,097,269 | 10,500,864 |
| UMH Properties, Inc. | | 268,386 | 4,841,683 |
| Uniti Group, Inc. | | 1,197,286 | 11,242,516 |
| Universal Health Realty Income Trust (SBI) | | 67,775 | 3,449,070 |
| Urban Edge Properties | | 565,692 | 8,898,335 |
| Urstadt Biddle Properties, Inc. Class A | | 174,869 | 2,923,810 |
| Veris Residential, Inc. (a) | | 405,282 | 5,446,990 |
| Washington REIT (SBI) | | 441,426 | 8,656,364 |
| Wheeler REIT, Inc. (a)(b) | | 41,267 | 80,471 |
| Whitestone REIT Class B | | 240,859 | 2,370,053 |
| WP Carey, Inc. | | 974,980 | 81,927,569 |
| Xenia Hotels & Resorts, Inc. (a) | | 576,271 | 9,139,658 |
| | | | 1,984,628,319 |
| Real Estate Management & Development - 0.6% | | | |
| Alset Ehome International, Inc. (a) | | 176,692 | 47,707 |
| Altisource Asset Management Corp. (a) | | 2,411 | 48,943 |
| Altisource Portfolio Solutions SA (a)(b) | | 46,392 | 543,250 |
| American Realty Investments, Inc. (a)(b) | | 8,666 | 120,371 |
| Amrep Corp. (a) | | 12,209 | 170,071 |
| Anywhere Real Estate, Inc. (a) | | 600,122 | 5,863,192 |
| Avalon GloboCare Corp. (a)(b) | | 78,171 | 50,108 |
| Comstock Holding Companies, Inc. (a) | | 13,736 | 57,966 |
| Cushman & Wakefield PLC (a) | | 771,281 | 11,538,364 |
| Digitalbridge Group, Inc. (a) | | 758,575 | 13,502,635 |
| Doma Holdings, Inc. Class A (a) | | 885,508 | 534,050 |
| Douglas Elliman, Inc. | | 358,019 | 1,650,468 |
| eXp World Holdings, Inc. (b) | | 349,485 | 4,518,841 |
| Fathom Holdings, Inc. (a)(b) | | 40,294 | 276,820 |
| Forestar Group, Inc. (a) | | 95,757 | 1,191,217 |
| FRP Holdings, Inc. (a) | | 33,769 | 1,942,393 |
| Howard Hughes Corp. (a) | | 194,703 | 12,388,952 |
| InterGroup Corp. (a) | | 2,602 | 131,661 |
| J.W. Mays, Inc. (a) | | 1,228 | 63,365 |
| Jones Lang LaSalle, Inc. (a) | | 246,020 | 42,561,460 |
| Kennedy-Wilson Holdings, Inc. | | 594,622 | 10,441,562 |
| Marcus & Millichap, Inc. | | 124,175 | 4,641,662 |
| Maui Land & Pineapple, Inc. (a) | | 29,402 | 282,259 |
| Newmark Group, Inc. | | 787,662 | 8,073,536 |
| Offerpad Solutions, Inc. (a)(b) | | 355,809 | 540,830 |
| Opendoor Technologies, Inc. (a)(b) | | 1,993,532 | 8,631,994 |
| Rafael Holdings, Inc. (a)(b) | | 54,606 | 118,495 |
| RE/MAX Holdings, Inc. | | 100,128 | 2,278,913 |
| Redfin Corp. (a)(b) | | 545,183 | 4,465,049 |
| Seritage Growth Properties (a)(b) | | 184,765 | 2,316,953 |
| Stratus Properties, Inc. | | 36,062 | 1,284,168 |
| Tejon Ranch Co. (a) | | 125,425 | 1,976,698 |
| The RMR Group, Inc. | | 80,568 | 2,097,991 |
| The St. Joe Co. | | 167,084 | 6,382,609 |
| Transcontinental Realty Investors, Inc. (a)(b) | | 8,582 | 369,026 |
| Trinity Place Holdings, Inc. (a)(b) | | 50,313 | 48,411 |
| WeWork, Inc. (a)(b) | | 1,066,349 | 4,372,031 |
| Zillow Group, Inc.: | | | |
| Class A (a) | | 344,382 | 11,502,359 |
| Class C (a)(b) | | 661,617 | 22,137,705 |
| | | | 189,164,085 |
TOTAL REAL ESTATE | | | 2,173,792,404 |
| UTILITIES - 2.5% | | | |
| Electric Utilities - 0.9% | | | |
| Allete, Inc. | | 289,091 | 17,108,405 |
| Avangrid, Inc. (b) | | 351,440 | 17,361,136 |
| Genie Energy Ltd. Class B | | 108,445 | 1,132,166 |
| Hawaiian Electric Industries, Inc. | | 555,392 | 21,726,935 |
| IDACORP, Inc. | | 254,781 | 27,832,276 |
| MGE Energy, Inc. | | 181,324 | 13,965,574 |
| OGE Energy Corp. | | 1,009,784 | 40,936,643 |
| Otter Tail Corp. | | 207,490 | 15,673,795 |
| PG&E Corp. (a) | | 7,628,905 | 94,064,399 |
| PNM Resources, Inc. | | 434,195 | 20,593,869 |
| Portland General Electric Co. | | 448,873 | 23,193,268 |
| Via Renewables, Inc. Class A, | | 63,851 | 544,649 |
| | | | 294,133,115 |
| Gas Utilities - 0.6% | | | |
| Chesapeake Utilities Corp. | | 88,566 | 11,185,886 |
| National Fuel Gas Co. | | 461,980 | 32,925,315 |
| New Jersey Resources Corp. | | 485,498 | 21,429,882 |
| Northwest Natural Holding Co. | | 176,442 | 8,400,404 |
| ONE Gas, Inc. | | 272,730 | 21,346,577 |
| RGC Resources, Inc. | | 49,160 | 1,050,549 |
| South Jersey Industries, Inc. | | 616,390 | 20,864,802 |
| Southwest Gas Corp. | | 338,913 | 26,384,377 |
| Spire, Inc. | | 263,190 | 18,394,349 |
| UGI Corp. | | 1,062,953 | 41,986,644 |
| | | | 203,968,785 |
| Independent Power and Renewable Electricity Producers - 0.4% | | | |
| Altus Power, Inc. Class A (a) | | 204,597 | 2,144,177 |
| Clearway Energy, Inc.: | | | |
| Class A | | 176,759 | 6,094,650 |
| Class C | | 413,224 | 15,330,610 |
| Montauk Renewables, Inc. (a) | | 320,064 | 5,681,136 |
| Ormat Technologies, Inc. (b) | | 225,283 | 21,059,455 |
| Sunnova Energy International, Inc. (a)(b) | | 483,049 | 12,182,496 |
| Vistra Corp. | | 2,178,756 | 53,924,211 |
| | | | 116,416,735 |
| Multi-Utilities - 0.2% | | | |
| Avista Corp. | | 368,297 | 14,963,907 |
| Black Hills Corp. | | 328,102 | 24,765,139 |
| NorthWestern Energy Corp. | | 276,705 | 14,659,831 |
| Unitil Corp. | | 82,266 | 4,285,236 |
| | | | 58,674,113 |
| Water Utilities - 0.4% | | | |
| American States Water Co. | | 188,477 | 15,637,937 |
| Artesian Resources Corp. Class A | | 44,203 | 2,414,810 |
| Cadiz, Inc. (a) | | 154,221 | 590,666 |
| California Water Service Group | | 272,903 | 15,973,013 |
| Consolidated Water Co., Inc. | | 76,690 | 1,242,378 |
| Essential Utilities, Inc. | | 1,159,433 | 56,986,132 |
| Global Water Resources, Inc. | | 61,641 | 839,550 |
| Middlesex Water Co. | | 88,783 | 7,881,267 |
| Pure Cycle Corp. (a)(b) | | 103,958 | 1,072,847 |
| SJW Corp. | | 143,772 | 9,244,540 |
| York Water Co. | | 70,617 | 3,105,029 |
| | | | 114,988,169 |
TOTAL UTILITIES | | | 788,180,917 |
| TOTAL COMMON STOCKS (Cost $26,444,651,507) | | | 30,972,393,042 |
| | | | |
| Nonconvertible Preferred Stocks - 0.0% |
| | | Shares | Value ($) |
| INDUSTRIALS - 0.0% | | | |
| Air Freight & Logistics - 0.0% | | | |
| Air T Funding 8.00% | | 86 | 1,987 |
| INFORMATION TECHNOLOGY - 0.0% | | | |
| Software - 0.0% | | | |
| SRAX, Inc. (c) | | 117,390 | 5,870 |
| TOTAL NONCONVERTIBLE PREFERRED STOCKS (Cost $6,395) | | | 7,857 |
| | | | |
| U.S. Treasury Obligations - 0.0% |
| | | Principal Amount (d) | Value ($) |
U.S. Treasury Bills, yield at date of purchase 1.15% 1/26/23 (e) (Cost $4,976,735) | | 5,000,000 | 4,937,910 |
| | | | |
| Money Market Funds - 7.6% |
| | | Shares | Value ($) |
| Fidelity Cash Central Fund 2.33% (f) | | 52,565,848 | 52,576,361 |
| Fidelity Securities Lending Cash Central Fund 2.34% (f)(g) | | 2,324,522,447 | 2,324,754,900 |
| TOTAL MONEY MARKET FUNDS (Cost $2,377,331,261) | | | 2,377,331,261 |
| | | | |
| TOTAL INVESTMENT IN SECURITIES - 107.4% (Cost $28,826,965,898) | 33,354,670,070 |
NET OTHER ASSETS (LIABILITIES) - (7.4)% | (2,307,562,756) |
| NET ASSETS - 100.0% | 31,047,107,314 |
| | |
| Futures Contracts |
| | Number of contracts | Expiration Date | Notional Amount ($) | Value ($) | Unrealized Appreciation/ (Depreciation) ($) |
| Purchased | | | | | |
| | | | | | |
| Equity Index Contracts | | | | | |
| CME E-mini Russell 2000 Index Contracts (United States) | 480 | Sep 2022 | 44,270,400 | 2,751,090 | 2,751,090 |
| CME E-mini S&P MidCap 400 Index Contracts (United States) | 121 | Sep 2022 | 29,406,630 | 1,703,604 | 1,703,604 |
| | | | | | |
| TOTAL FUTURES CONTRACTS | | | | | 4,454,694 |
| The notional amount of futures purchased as a percentage of Net Assets is 0.2% |
Legend
| (b) | Security or a portion of the security is on loan at period end. |
| (d) | Amount is stated in United States dollars unless otherwise noted. |
| (e) | Security or a portion of the security was pledged to cover margin requirements for futures contracts. At period end, the value of securities pledged amounted to $4,254,504. |
| (f) | Affiliated fund that is generally available only to investment companies and other accounts managed by Fidelity Investments. The rate quoted is the annualized seven-day yield of the fund at period end. A complete unaudited listing of the fund's holdings as of its most recent quarter end is available upon request. In addition, each Fidelity Central Fund's financial statements are available on the SEC's website or upon request. |
| (g) | Investment made with cash collateral received from securities on loan. |
Affiliated Central Funds
Fiscal year to date information regarding the Fund's investments in Fidelity Central Funds, including the ownership percentage, is presented below.
| Affiliate | Value, beginning of period ($) | Purchases ($) | Sales Proceeds ($) | Dividend Income ($) | Realized Gain (loss) ($) | Change in Unrealized appreciation (depreciation) ($) | Value, end of period ($) | %ownership, end of period |
| Fidelity Cash Central Fund 2.33% | 182,474,717 | 1,961,985,313 | 2,091,883,669 | 314,968 | - | - | 52,576,361 | 0.1% |
| Fidelity Securities Lending Cash Central Fund 2.34% | 3,042,401,863 | 5,025,970,121 | 5,743,617,084 | 30,582,113 | - | - | 2,324,754,900 | 6.7% |
| Total | 3,224,876,580 | 6,987,955,434 | 7,835,500,753 | 30,897,081 | - | - | 2,377,331,261 | |
| | | | | | | | | |
Amounts in the income column in the above table include any capital gain distributions from underlying funds, which are presented in the corresponding line item in the Statement of Operations, if applicable.
Amount for Fidelity Securities Lending Cash Central Fund represents the income earned on investing cash collateral, less rebates paid to borrowers and any lending agent fees associated with the loan, plus any premium payments received for lending certain types of securities.
Other Affiliated Issuers
An affiliated company is a company in which the Fund has ownership of at least 5% of the voting securities. Fiscal year to date transactions with companies which are or were affiliates are as follows:
| Affiliate | Value, beginning of period ($) | Purchases ($) | Sales Proceeds ($) | Dividend Income ($) | Realized Gain (loss) ($) | Change in Unrealized appreciation (depreciation) ($) | Value, end of period ($) |
| Stran & Co., Inc. | 36,481 | 26,676 | 796 | - | 54 | 4,745 | - |
| Total | 36,481 | 26,676 | 796 | - | 54 | 4,745 | - |
Sales proceeds in the table above include the value of securities delivered through in-kind transactions, if applicable.
Investment Valuation
The following is a summary of the inputs used, as of August 31, 2022, involving the Fund's assets and liabilities carried at fair value. The inputs or methodology used for valuing securities may not be an indication of the risk associated with investing in those securities. For more information on valuation inputs, and their aggregation into the levels used below, please refer to the Investment Valuation section in the accompanying Notes to Financial Statements.
| Valuation Inputs at Reporting Date: |
| Description | Total ($) | Level 1 ($) | Level 2 ($) | Level 3 ($) |
Investments in Securities: | | | | |
|
| Equities: | | | | |
Communication Services | 1,109,898,153 | 1,109,771,289 | - | 126,864 |
Consumer Discretionary | 3,641,716,491 | 3,641,704,000 | - | 12,491 |
Consumer Staples | 900,970,863 | 900,937,158 | 33,705 | - |
Energy | 1,588,462,069 | 1,588,462,069 | - | - |
Financials | 4,912,346,526 | 4,912,346,526 | - | - |
Health Care | 4,120,529,598 | 4,119,641,604 | 35 | 887,959 |
Industrials | 4,305,379,111 | 4,305,348,835 | - | 30,276 |
Information Technology | 6,074,421,356 | 6,074,415,486 | - | 5,870 |
Materials | 1,356,703,411 | 1,356,703,411 | - | - |
Real Estate | 2,173,792,404 | 2,173,792,404 | - | - |
Utilities | 788,180,917 | 788,180,917 | - | - |
|
| U.S. Government and Government Agency Obligations | 4,937,910 | - | 4,937,910 | - |
|
| Money Market Funds | 2,377,331,261 | 2,377,331,261 | - | - |
| Total Investments in Securities: | 33,354,670,070 | 33,348,634,960 | 4,971,650 | 1,063,460 |
Derivative Instruments: | | | | |
|
| Assets | | | | |
Futures Contracts | 4,454,694 | 4,454,694 | - | - |
| Total Assets | 4,454,694 | 4,454,694 | - | - |
| Total Derivative Instruments: | 4,454,694 | 4,454,694 | - | - |
Value of Derivative Instruments
The following table is a summary of the Fund's value of derivative instruments by primary risk exposure as of August 31, 2022. For additional information on derivative instruments, please refer to the Derivative Instruments section in the accompanying Notes to Financial Statements.
Primary Risk Exposure / Derivative Type | Value |
| Asset ($) | Liability ($) |
| Equity Risk | | |
Futures Contracts (a) | 4,454,694 | 0 |
| Total Equity Risk | 4,454,694 | 0 |
| Total Value of Derivatives | 4,454,694 | 0 |
(a)Reflects gross cumulative appreciation (depreciation) on futures contracts as presented in the Schedule of Investments. In the Statement of Assets and Liabilities, the period end daily variation margin is included in receivable or payable for daily variation margin on futures contracts, and the net cumulative appreciation (depreciation) is included in Total accumulated earnings (loss).
Fidelity® Extended Market Index Fund
| Statement of Assets and Liabilities |
| | | | August 31, 2022 (Unaudited) |
| | | | | |
| Assets | | | | |
| Investment in securities, at value (including securities loaned of $2,233,649,989) - See accompanying schedule: | | $30,977,338,809 | | |
Unaffiliated issuers (cost $26,449,634,637) | | | |
Fidelity Central Funds (cost $2,377,331,261) | | 2,377,331,261 | | |
| | | | | |
| Total Investment in Securities (cost $28,826,965,898) | | | $ | 33,354,670,070 |
| Receivable for investments sold | | | | 330,919 |
| Receivable for fund shares sold | | | | 14,943,553 |
| Dividends receivable | | | | 21,861,487 |
| Distributions receivable from Fidelity Central Funds | | | | 5,473,025 |
| Other receivables | | | | 563,490 |
Total assets | | | | 33,397,842,544 |
| Liabilities | | | | |
| Payable to custodian bank | | 72,699 | | |
| Payable for fund shares redeemed | | 23,800,127 | | |
| Accrued management fee | | 959,346 | | |
| Payable for daily variation margin on futures contracts | | 453,789 | | |
| Other payables and accrued expenses | | 456,216 | | |
| Collateral on securities loaned | | 2,324,993,053 | | |
| Total Liabilities | | | | 2,350,735,230 |
| Net Assets | | | $ | 31,047,107,314 |
| Net Assets consist of: | | | | |
| Paid in capital | | | $ | 26,450,208,913 |
| Total accumulated earnings (loss) | | | | 4,596,898,401 |
| Net Assets | | | $ | 31,047,107,314 |
Net Asset Value , offering price and redemption price per share ($31,047,107,314 ÷ 460,305,783 shares) | | | $ | 67.45 |
| | | | | |
| Statement of Operations |
| | | | Six months ended August 31, 2022 (Unaudited) |
| Investment Income | | | | |
| Dividends | | | $ | 211,811,048 |
| Interest | | | | 28,854 |
| Income from Fidelity Central Funds (including $30,582,113 from security lending) | | | | 30,897,081 |
| Total Income | | | | 242,736,983 |
| Expenses | | | | |
| Management fee | $ | 5,803,561 | | |
| Independent trustees' fees and expenses | | 54,874 | | |
| Total expenses before reductions | | 5,858,435 | | |
| Expense reductions | | (5,704) | | |
| Total expenses after reductions | | | | 5,852,731 |
| Net Investment income (loss) | | | | 236,884,252 |
| Realized and Unrealized Gain (Loss) | | | | |
| Net realized gain (loss) on: | | | | |
| Investment Securities: | | | | |
| Unaffiliated issuers | | 163,681,301 | | |
| Affiliated issuers | | 54 | | |
| Futures contracts | | (1,905,461) | | |
| Total net realized gain (loss) | | | | 161,775,894 |
| Change in net unrealized appreciation (depreciation) on: | | | | |
| Investment Securities: | | | | |
| Unaffiliated issuers | | (5,508,945,799) | | |
| Affiliated issuers | | 4,745 | | |
| Futures contracts | | 2,593,274 | | |
| Total change in net unrealized appreciation (depreciation) | | | | (5,506,347,780) |
| Net gain (loss) | | | | (5,344,571,886) |
| Net increase (decrease) in net assets resulting from operations | | | $ | (5,107,687,634) |
| Statement of Changes in Net Assets |
| |
| | Six months ended August 31, 2022 (Unaudited) | | Year ended February 28, 2022 |
| Increase (Decrease) in Net Assets | | | | |
| Operations | | | | |
| Net investment income (loss) | $ | 236,884,252 | $ | 382,481,456 |
| Net realized gain (loss) | | 161,775,894 | | 971,839,623 |
| Change in net unrealized appreciation (depreciation) | | (5,506,347,780) | | (4,235,898,923) |
| Net increase (decrease) in net assets resulting from operations | | (5,107,687,634) | | (2,881,577,844) |
| Distributions to shareholders | | (174,067,626) | | (2,817,769,879) |
| Share transactions | | | | |
| Proceeds from sales of shares | | 3,297,382,776 | | 15,982,100,039 |
| Reinvestment of distributions | | 167,401,654 | | 2,714,273,707 |
| Cost of shares redeemed | | (5,868,167,163) | | (9,866,506,755) |
Net increase (decrease) in net assets resulting from share transactions | | (2,403,382,733) | | 8,829,866,991 |
| Total increase (decrease) in net assets | | (7,685,137,993) | | 3,130,519,268 |
| | | | | |
| Net Assets | | | | |
| Beginning of period | | 38,732,245,307 | | 35,601,726,039 |
| End of period | $ | 31,047,107,314 | $ | 38,732,245,307 |
| | | | | |
| Other Information | | | | |
| Shares | | | | |
| Sold | | 47,745,362 | | 181,358,691 |
| Issued in reinvestment of distributions | | 2,206,137 | | 31,248,026 |
| Redeemed | | (83,653,340) | | (112,858,194) |
| Net increase (decrease) | | (33,701,841) | | 99,748,523 |
| | | | | |
| Fidelity® Extended Market Index Fund |
| |
| | Six months ended (Unaudited) August 31, 2022 | | Years ended February 28, 2022 | | 2021 | | 2020 A | | 2019 | | 2018 |
Selected Per-Share Data | | | | | | | | | | | | |
| Net asset value, beginning of period | $ | 78.40 | $ | 90.30 | $ | 59.56 | $ | 62.22 | $ | 61.68 | $ | 58.09 |
| Income from Investment Operations | | | | | | | | | | | | |
Net investment income (loss) B,C | | .50 | | .82 | | .75 | | .86 | | .88 | | .83 |
| Net realized and unrealized gain (loss) | | (11.09) | | (6.19) | | 31.78 | | (.72) | | 2.89 | | 6.24 |
| Total from investment operations | | (10.59) | | (5.37) | | 32.53 | | .14 | | 3.77 | | 7.07 |
| Distributions from net investment income | | (.03) | | (.86) | | (.78) | | (.92) | | (.90) | | (.81) |
| Distributions from net realized gain | | (.33) | | (5.67) | | (1.01) | | (1.88) | | (2.33) | | (2.67) |
| Total distributions | | (.36) | | (6.53) | | (1.79) | | (2.80) | | (3.23) | | (3.48) |
| Net asset value, end of period | $ | 67.45 | $ | 78.40 | $ | 90.30 | $ | 59.56 | $ | 62.22 | $ | 61.68 |
Total Return D,E | | (13.56)% | | (6.58)% | | 56.23% | | -% F | | 6.77% | | 12.35% |
Ratios to Average Net Assets C,G,H | | | | | | | | | | | | |
| Expenses before reductions | | .03% I,J | | .03% | | .04% | | .05% | | .05% | | .05% |
| Expenses net of fee waivers, if any | | .03% I,J | | .03% | | .04% | | .05% | | .05% | | .05% |
| Expenses net of all reductions | | .03% I,J | | .03% | | .04% | | .05% | | .05% | | .05% |
| Net investment income (loss) | | 1.41% J | | .93% | | 1.12% | | 1.38% | | 1.47% | | 1.37% |
| Supplemental Data | | | | | | | | | | | | |
| Net assets, end of period (000 omitted) | $ | 31,047,107 | $ | 38,732,245 | $ | 35,601,726 | $ | 23,183,527 | $ | 23,012,061 | $ | 2,985,201 |
Portfolio turnover rate K | | 12% J,L | | 18% L | | 26% L | | 15% | | 13% L | | 11% |
A For the year ended February 29.
B Calculated based on average shares outstanding during the period.
C Net investment income (loss) is affected by the timing of the declaration of dividends by any underlying mutual funds or exchange-traded funds (ETFs). Net investment income (loss) of any such underlying funds is not included in the Fund's net investment income (loss) ratio.
D Total returns for periods of less than one year are not annualized.
E Total returns would have been lower if certain expenses had not been reduced during the applicable periods shown.
F Amount represents less than .005%.
G Fees and expenses of any underlying mutual funds or exchange-traded funds (ETFs) are not included in the Fund's expense ratio. The Fund indirectly bears its proportionate share of these expenses. For additional expense information related to investments in Fidelity Central Funds, please refer to the "Investments in Fidelity Central Funds" note found in the Notes to Financial Statements section of the most recent Annual or Semi-Annual report.
H Expense ratios reflect operating expenses of the class. Expenses before reductions do not reflect amounts reimbursed, waived, or reduced through arrangements with the investment adviser, brokerage services, or other offset arrangements, if applicable, and do not represent the amount paid by the class during periods when reimbursements, waivers or reductions occur.
I The size and fluctuation of net assets and expense amounts may cause ratios to differ from contractual rates.
J Annualized
K Amount does not include the portfolio activity of any underlying mutual funds or exchange-traded funds (ETFs).
L Portfolio turnover rate excludes securities received or delivered in-kind.
Top Holdings (% of Fund's net assets) |
| |
| Nestle SA (Reg. S) (Switzerland, Food Products) | 2.4 | |
| Roche Holding AG (participation certificate) (Switzerland, Pharmaceuticals) | 1.7 | |
| ASML Holding NV (Netherlands) (Netherlands, Semiconductors & Semiconductor Equipment) | 1.4 | |
| Shell PLC (London) (United Kingdom, Oil, Gas & Consumable Fuels) | 1.4 | |
| AstraZeneca PLC (United Kingdom) (United Kingdom, Pharmaceuticals) | 1.4 | |
| LVMH Moet Hennessy Louis Vuitton SE (France, Textiles, Apparel & Luxury Goods) | 1.3 | |
| Novo Nordisk A/S Series B (Denmark, Pharmaceuticals) | 1.3 | |
| Novartis AG (Switzerland, Pharmaceuticals) | 1.3 | |
| Toyota Motor Corp. (Japan, Automobiles) | 1.2 | |
| BHP Group Ltd. (Australia, Metals & Mining) | 1.0 | |
| | 14.4 | |
| |
| Market Sectors (% of Fund's net assets) |
| |
| Financials | 17.5 | |
| Industrials | 14.7 | |
| Health Care | 13.4 | |
| Consumer Discretionary | 11.0 | |
| Consumer Staples | 10.7 | |
| Information Technology | 8.1 | |
| Materials | 7.6 | |
| Energy | 4.8 | |
| Communication Services | 4.8 | |
| Utilities | 3.9 | |
| Real Estate | 2.1 | |
| |
Asset Allocation (% of Fund's net assets) |
|
Foreign investments - 98.3% |
|
Geographic Diversification (% of Fund's net assets) |
|
* Includes Short-Term investments and Net Other Assets (Liabilities). Percentages are based on country or territory of incorporation and are adjusted for the effect of futures contracts, if applicable. |
| |
Fidelity® International Index Fund
| Common Stocks - 97.8% |
| | | Shares | Value ($) |
| Australia - 7.9% | | | |
| Ampol Ltd. | | 600,694 | 14,118,938 |
| APA Group unit | | 2,984,547 | 22,505,953 |
| Aristocrat Leisure Ltd. | | 1,524,695 | 36,800,704 |
| ASX Ltd. | | 489,547 | 26,059,718 |
| Aurizon Holdings Ltd. | | 4,633,092 | 11,717,705 |
| Australia & New Zealand Banking Group Ltd. | | 7,530,605 | 116,412,262 |
| BHP Group Ltd. | | 12,796,955 | 349,101,146 |
| BlueScope Steel Ltd. | | 1,215,558 | 13,638,353 |
| Brambles Ltd. | | 3,629,908 | 30,550,148 |
| Cochlear Ltd. | | 166,318 | 24,212,087 |
| Coles Group Ltd. | | 3,377,214 | 40,422,483 |
| Commonwealth Bank of Australia | | 4,313,144 | 285,022,295 |
| Computershare Ltd. | | 1,373,774 | 22,911,402 |
| CSL Ltd. | | 1,217,709 | 243,563,381 |
| Dexus unit | | 2,725,540 | 16,121,507 |
| Dominos Pizza Enterprises Ltd. | | 152,596 | 6,577,211 |
| Endeavour Group Ltd. | | 3,396,628 | 16,809,294 |
| Evolution Mining Ltd. | | 4,621,127 | 7,426,397 |
| Fortescue Metals Group Ltd. | | 4,281,498 | 53,208,613 |
| Goodman Group unit | | 4,252,548 | 56,550,329 |
| IDP Education Ltd. | | 525,755 | 10,350,331 |
| Insurance Australia Group Ltd. | | 6,237,235 | 19,709,072 |
| Lendlease Group unit | | 1,745,057 | 12,160,459 |
| Macquarie Group Ltd. | | 921,191 | 110,223,539 |
| Medibank Private Ltd. | | 6,962,801 | 17,539,069 |
| Mineral Resources Ltd. | | 430,781 | 18,354,468 |
| Mirvac Group unit | | 9,995,982 | 14,235,603 |
| National Australia Bank Ltd. | | 8,112,803 | 168,228,143 |
| Newcrest Mining Ltd. | | 2,259,450 | 27,162,354 |
| Northern Star Resources Ltd. | | 2,936,121 | 15,518,114 |
| Orica Ltd. | | 1,133,502 | 11,856,600 |
| Origin Energy Ltd. | | 4,455,114 | 18,974,589 |
| Qantas Airways Ltd. (a) | | 2,325,362 | 8,356,723 |
| QBE Insurance Group Ltd. | | 3,750,158 | 30,746,640 |
| Ramsay Health Care Ltd. | | 462,819 | 22,555,889 |
| REA Group Ltd. | | 133,068 | 11,475,590 |
| Reece Ltd. | | 569,248 | 6,162,925 |
| Rio Tinto Ltd. | | 938,599 | 59,613,598 |
| Santos Ltd. | | 8,138,633 | 43,446,330 |
| Scentre Group unit | | 13,136,705 | 26,106,513 |
| SEEK Ltd. | | 846,960 | 11,949,489 |
| Sonic Healthcare Ltd. | | 1,153,322 | 26,670,575 |
| South32 Ltd. | | 11,748,776 | 32,352,699 |
| Stockland Corp. Ltd. unit | | 6,049,746 | 14,881,560 |
| Suncorp Group Ltd. | | 3,194,008 | 23,588,547 |
| Telstra Corp. Ltd. | | 10,264,252 | 27,757,034 |
| The GPT Group unit | | 4,857,581 | 13,841,693 |
| The Lottery Corp. (a) | | 5,640,346 | 16,953,146 |
| Transurban Group unit | | 7,763,950 | 73,660,248 |
| Treasury Wine Estates Ltd. | | 1,827,372 | 16,392,016 |
| Vicinity Centres unit | | 9,744,220 | 12,757,225 |
| Washington H. Soul Pattinson & Co. Ltd. | | 545,613 | 9,509,010 |
| Wesfarmers Ltd. | | 2,867,528 | 91,729,180 |
| Westpac Banking Corp. | | 8,849,891 | 129,894,544 |
| WiseTech Global Ltd. | | 371,566 | 14,676,662 |
| Woodside Energy Group Ltd. | | 4,800,367 | 111,505,403 |
| Woolworths Group Ltd. | | 3,068,478 | 75,646,398 |
TOTAL AUSTRALIA | | | 2,750,271,904 |
| Austria - 0.2% | | | |
| Erste Group Bank AG | | 870,659 | 19,579,161 |
| OMV AG | | 371,195 | 15,025,746 |
| Verbund AG | | 172,218 | 16,502,270 |
| Voestalpine AG | | 292,219 | 5,908,550 |
TOTAL AUSTRIA | | | 57,015,727 |
| Bailiwick of Jersey - 0.9% | | | |
| Experian PLC | | 2,328,063 | 70,646,140 |
| Ferguson PLC | | 542,063 | 62,883,298 |
| Glencore Xstrata PLC | | 24,922,672 | 136,266,182 |
| WPP PLC | | 2,765,185 | 23,816,668 |
TOTAL BAILIWICK OF JERSEY | | | 293,612,288 |
| Belgium - 0.8% | | | |
| Ageas | | 408,763 | 16,632,740 |
| Anheuser-Busch InBev SA NV | | 2,196,438 | 106,075,912 |
| D'ieteren Group | | 62,695 | 9,494,905 |
| ELIA GROUP SA/NV | | 83,158 | 12,109,240 |
| Groupe Bruxelles Lambert SA | | 252,445 | 19,153,943 |
| KBC Group NV | | 632,955 | 30,187,218 |
| Proximus | | 382,301 | 4,871,572 |
| Sofina SA | | 38,806 | 7,807,418 |
| Solvay SA Class A | | 186,700 | 15,130,013 |
| UCB SA | | 319,874 | 22,534,162 |
| Umicore SA | | 527,779 | 16,776,009 |
| Warehouses de Pauw | | 374,858 | 11,444,558 |
TOTAL BELGIUM | | | 272,217,690 |
| Bermuda - 0.1% | | | |
| CK Infrastructure Holdings Ltd. | | 1,587,615 | 9,654,303 |
| Hongkong Land Holdings Ltd. | | 2,858,762 | 13,819,521 |
| Jardine Matheson Holdings Ltd. | | 402,093 | 21,323,676 |
TOTAL BERMUDA | | | 44,797,500 |
| Cayman Islands - 0.7% | | | |
| Budweiser Brewing Co. APAC Ltd. (b) | | 4,339,784 | 12,756,535 |
| Chow Tai Fook Jewellery Group Ltd. | | 5,036,944 | 10,137,900 |
| CK Asset Holdings Ltd. | | 5,067,612 | 34,205,195 |
| CK Hutchison Holdings Ltd. | | 6,792,046 | 43,860,708 |
| ESR Cayman Ltd. (b) | | 5,069,384 | 14,194,798 |
| Futu Holdings Ltd. ADR (a)(c) | | 149,704 | 7,348,969 |
| Grab Holdings Ltd. (a)(c) | | 3,288,037 | 9,370,905 |
| Sands China Ltd. (a) | | 6,118,606 | 13,681,798 |
| Sea Ltd. ADR (a) | | 913,802 | 56,655,724 |
| SITC International Holdings Co. Ltd. | | 3,380,319 | 8,571,923 |
| WH Group Ltd. (b) | | 21,021,265 | 14,322,280 |
| Wharf Real Estate Investment Co. Ltd. | | 4,227,825 | 19,237,392 |
| Xinyi Glass Holdings Ltd. | | 4,559,500 | 8,420,903 |
TOTAL CAYMAN ISLANDS | | | 252,765,030 |
| Denmark - 2.7% | | | |
| A.P. Moller - Maersk A/S: | | | |
| Series A | | 8,033 | 18,843,074 |
| Series B | | 12,494 | 29,975,028 |
| Carlsberg A/S Series B | | 246,114 | 31,957,965 |
| Chr. Hansen Holding A/S | | 265,898 | 15,528,307 |
| Coloplast A/S Series B | | 300,290 | 34,302,431 |
| Danske Bank A/S | | 1,743,777 | 23,368,956 |
| Demant A/S (a) | | 233,262 | 7,202,022 |
| DSV A/S | | 473,279 | 70,121,329 |
| Genmab A/S (a) | | 166,304 | 59,198,611 |
| GN Store Nord A/S | | 330,815 | 9,400,452 |
| Novo Nordisk A/S Series B | | 4,184,237 | 447,352,855 |
| Novozymes A/S Series B | | 517,706 | 29,772,074 |
| ORSTED A/S (b) | | 478,292 | 46,682,506 |
| Pandora A/S | | 229,703 | 13,877,000 |
| Rockwool International A/S Series B | | 22,412 | 4,634,877 |
| Tryg A/S | | 908,896 | 20,589,321 |
| Vestas Wind Systems A/S | | 2,553,159 | 63,882,884 |
TOTAL DENMARK | | | 926,689,692 |
| Finland - 1.2% | | | |
| Elisa Corp. (A Shares) | | 359,838 | 19,259,839 |
| Fortum Corp. | | 1,119,451 | 11,525,546 |
| Kesko Oyj | | 688,286 | 14,511,720 |
| Kone OYJ (B Shares) | | 859,874 | 34,388,512 |
| Neste OYJ | | 1,069,726 | 52,944,791 |
| Nokia Corp. | | 13,680,946 | 68,943,254 |
| Nordea Bank ABP | | 8,622,568 | 80,199,589 |
| Orion Oyj (B Shares) | | 269,850 | 12,249,461 |
| Sampo Oyj (A Shares) | | 1,209,875 | 54,735,145 |
| Stora Enso Oyj (R Shares) | | 1,394,529 | 20,846,300 |
| UPM-Kymmene Corp. | | 1,349,361 | 45,956,207 |
| Wartsila Corp. | | 1,193,051 | 9,872,209 |
TOTAL FINLAND | | | 425,432,573 |
| France - 10.0% | | | |
| Accor SA (a) | | 428,587 | 10,281,012 |
| Aeroports de Paris SA (a) | | 74,797 | 10,286,638 |
| Air Liquide SA | | 926,928 | 116,155,966 |
| Alstom SA (c) | | 813,689 | 16,675,129 |
| Amundi SA (b) | | 154,689 | 7,881,554 |
| Arkema SA | | 149,626 | 12,687,938 |
| AXA SA | | 4,723,391 | 111,243,491 |
| bioMerieux SA | | 105,895 | 9,711,814 |
| BNP Paribas SA | | 2,808,323 | 130,503,297 |
| Bollore SA | | 2,225,276 | 10,680,526 |
| Bouygues SA | | 580,873 | 17,063,132 |
| Bureau Veritas SA | | 743,988 | 18,519,804 |
| Capgemini SA | | 414,071 | 71,988,873 |
| Carrefour SA | | 1,526,432 | 25,476,891 |
| Compagnie de St. Gobain | | 1,259,139 | 50,715,285 |
| Compagnie Generale des Etablissements Michelin SCA Series B | | 1,716,231 | 41,740,930 |
| Covivio | | 118,901 | 6,667,517 |
| Credit Agricole SA | | 3,061,041 | 28,172,813 |
| Danone SA | | 1,623,098 | 85,407,931 |
| Dassault Aviation SA | | 63,081 | 8,684,875 |
| Dassault Systemes SA | | 1,685,322 | 64,991,371 |
| Edenred SA | | 631,063 | 32,026,432 |
| EDF SA | | 1,417,157 | 16,997,492 |
| EDF SA (a) | | 200,740 | 2,407,691 |
| Eiffage SA | | 210,970 | 18,627,577 |
| Engie SA | | 4,616,456 | 54,830,095 |
| EssilorLuxottica SA | | 727,133 | 109,061,797 |
| Eurazeo SA | | 109,457 | 6,561,429 |
| Gecina SA | | 115,685 | 10,341,117 |
| Getlink SE | | 1,113,961 | 21,034,937 |
| Hermes International SCA | | 80,054 | 103,177,468 |
| Ipsen SA | | 94,993 | 9,121,510 |
| Kering SA | | 189,130 | 94,896,453 |
| Klepierre SA | | 541,958 | 11,165,134 |
| L'Oreal SA | | 408,113 | 140,164,006 |
| L'Oreal SA (a) | | 201,944 | 69,356,477 |
| La Francaise des Jeux SAEM (b) | | 264,643 | 8,608,898 |
| Legrand SA | | 676,500 | 48,947,951 |
| LVMH Moet Hennessy Louis Vuitton SE | | 701,684 | 452,773,476 |
| Orange SA | | 5,043,280 | 51,075,221 |
| Pernod Ricard SA | | 529,698 | 97,707,337 |
| Publicis Groupe SA | | 577,617 | 28,202,338 |
| Remy Cointreau SA | | 57,920 | 10,785,702 |
| Remy Cointreau SA rights 9/19/22 (a)(d) | | 58,795 | 59,086 |
| Renault SA (a) | | 484,148 | 13,920,039 |
| Safran SA | | 864,491 | 88,138,723 |
| Sanofi SA | | 2,878,585 | 235,323,863 |
| Sartorius Stedim Biotech | | 69,906 | 25,691,169 |
| Schneider Electric SA | | 1,371,601 | 163,024,913 |
| SEB SA | | 62,659 | 4,659,718 |
| Societe Generale Series A | | 2,011,209 | 44,337,939 |
| Sodexo SA (a) | | 84,696 | 6,506,209 |
| Sodexo SA | | 139,327 | 10,702,874 |
| Teleperformance | | 148,553 | 42,442,674 |
| Thales SA | | 269,909 | 32,590,093 |
| TotalEnergies SE | | 6,267,720 | 317,332,829 |
| Ubisoft Entertainment SA (a) | | 236,577 | 10,909,762 |
| Valeo SA | | 519,521 | 9,992,853 |
| Veolia Environnement SA | | 1,683,140 | 37,512,830 |
| VINCI SA | | 1,348,737 | 124,425,680 |
| Vivendi SA | | 1,826,640 | 16,557,501 |
| Wendel SA | | 67,380 | 5,315,512 |
| Worldline SA (a)(b) | | 603,967 | 25,875,577 |
TOTAL FRANCE | | | 3,468,727,169 |
| Germany - 6.8% | | | |
| adidas AG | | 437,287 | 64,842,286 |
| Allianz SE | | 1,032,424 | 174,517,330 |
| BASF AG | | 2,322,995 | 98,259,985 |
| Bayer AG | | 2,483,661 | 131,355,850 |
| Bayerische Motoren Werke AG (BMW) | | 838,532 | 61,781,904 |
| Bechtle AG | | 206,536 | 7,934,956 |
| Beiersdorf AG | | 254,992 | 25,738,899 |
| Brenntag SE | | 391,139 | 25,646,005 |
| Carl Zeiss Meditec AG | | 101,397 | 12,655,845 |
| Commerzbank AG (a) | | 2,682,843 | 17,875,296 |
| Continental AG | | 277,229 | 15,961,273 |
| Covestro AG (b) | | 486,624 | 14,672,654 |
| Daimler Truck Holding AG (a) | | 1,144,860 | 29,367,203 |
| Delivery Hero AG (a)(b)(c) | | 413,123 | 17,145,113 |
| Deutsche Bank AG | | 5,226,529 | 43,715,728 |
| Deutsche Borse AG | | 480,274 | 81,202,090 |
| Deutsche Lufthansa AG (a)(c) | | 1,505,778 | 8,952,284 |
| Deutsche Post AG | | 2,506,864 | 91,498,346 |
| Deutsche Telekom AG | | 8,193,125 | 154,417,758 |
| E.ON AG | | 5,677,241 | 48,424,541 |
| Evonik Industries AG | | 528,408 | 9,874,384 |
| Fresenius Medical Care AG & Co. KGaA | | 516,974 | 17,700,870 |
| Fresenius SE & Co. KGaA | | 1,059,585 | 26,212,310 |
| GEA Group AG | | 382,101 | 13,320,696 |
| Hannover Reuck SE | | 152,544 | 22,519,637 |
| HeidelbergCement AG | | 364,837 | 16,475,118 |
| HelloFresh AG (a) | | 416,428 | 9,985,155 |
| Henkel AG & Co. KGaA | | 263,939 | 16,506,574 |
| Infineon Technologies AG | | 3,302,569 | 80,810,097 |
| KION Group AG | | 181,722 | 7,261,040 |
| Knorr-Bremse AG | | 182,818 | 8,860,259 |
| LEG Immobilien AG | | 183,373 | 13,880,022 |
| Mercedes-Benz Group AG (Germany) | | 2,028,723 | 113,741,743 |
| Merck KGaA | | 326,745 | 56,128,245 |
| MTU Aero Engines AG | | 135,452 | 23,950,752 |
| Muenchener Rueckversicherungs-Gesellschaft AG in Muenchen | | 354,168 | 84,618,076 |
| Nemetschek Se | | 145,544 | 8,614,976 |
| Puma AG | | 267,685 | 16,414,993 |
| Rational AG | | 12,888 | 6,974,542 |
| Rheinmetall AG | | 109,782 | 17,475,547 |
| RWE AG | | 1,624,151 | 62,153,816 |
| SAP SE | | 2,639,931 | 224,841,315 |
| Scout24 AG (b) | | 202,202 | 11,692,295 |
| Siemens AG | | 1,934,267 | 195,929,821 |
| Siemens Energy AG | | 1,098,832 | 16,205,180 |
| Siemens Healthineers AG (b) | | 712,897 | 34,836,518 |
| Symrise AG | | 335,862 | 35,142,638 |
| Telefonica Deutschland Holding AG | | 2,617,162 | 6,798,852 |
| Uniper SE (c) | | 230,683 | 1,248,377 |
| United Internet AG | | 243,520 | 5,518,558 |
| Volkswagen AG | | 74,329 | 13,748,675 |
| Vonovia SE | | 1,812,168 | 49,058,176 |
| Zalando SE (a)(b) | | 561,264 | 12,994,856 |
TOTAL GERMANY | | | 2,367,459,459 |
| Hong Kong - 2.3% | | | |
| AIA Group Ltd. | | 30,449,546 | 292,962,283 |
| BOC Hong Kong (Holdings) Ltd. | | 9,358,532 | 32,210,206 |
| CLP Holdings Ltd. | | 4,153,231 | 35,785,471 |
| Galaxy Entertainment Group Ltd. | | 5,520,889 | 30,860,027 |
| Hang Lung Properties Ltd. | | 5,101,249 | 8,483,429 |
| Hang Seng Bank Ltd. | | 1,934,586 | 30,289,095 |
| Henderson Land Development Co. Ltd. | | 3,657,333 | 12,234,220 |
| Hong Kong & China Gas Co. Ltd. | | 28,327,354 | 27,927,437 |
| Hong Kong Exchanges and Clearing Ltd. | | 3,045,459 | 122,715,330 |
| Link (REIT) | | 5,339,410 | 41,321,832 |
| MTR Corp. Ltd. | | 3,906,066 | 20,004,217 |
| New World Development Co. Ltd. | | 3,806,665 | 12,404,330 |
| Power Assets Holdings Ltd. | | 3,509,922 | 20,993,572 |
| Sino Land Ltd. | | 8,801,677 | 12,870,906 |
| Sun Hung Kai Properties Ltd. | | 3,664,663 | 43,053,284 |
| Swire Pacific Ltd. (A Shares) | | 1,252,205 | 8,661,232 |
| Swire Properties Ltd. | | 2,945,266 | 6,788,016 |
| Techtronic Industries Co. Ltd. | | 3,479,889 | 41,042,660 |
TOTAL HONG KONG | | | 800,607,547 |
| Ireland - 0.7% | | | |
| CRH PLC | | 1,930,323 | 71,282,233 |
| DCC PLC (United Kingdom) | | 248,643 | 14,335,555 |
| Flutter Entertainment PLC (Ireland) (a) | | 422,269 | 53,150,994 |
| James Hardie Industries PLC CDI | | 1,126,665 | 25,536,280 |
| Kerry Group PLC Class A | | 402,526 | 41,604,728 |
| Kingspan Group PLC (Ireland) | | 390,636 | 22,235,145 |
| Smurfit Kappa Group PLC | | 625,297 | 21,082,559 |
TOTAL IRELAND | | | 249,227,494 |
| Isle of Man - 0.1% | | | |
| Entain PLC | | 1,489,583 | 21,915,687 |
| Israel - 0.9% | | | |
| Azrieli Group | | 106,801 | 8,896,610 |
| Bank Hapoalim BM (Reg.) | | 3,212,054 | 33,457,891 |
| Bank Leumi le-Israel BM | | 3,903,938 | 41,438,252 |
| Bezeq The Israel Telecommunication Corp. Ltd. | | 5,280,451 | 8,924,125 |
| Check Point Software Technologies Ltd. (a) | | 259,253 | 31,172,581 |
| CyberArk Software Ltd. (a)(c) | | 103,123 | 14,878,586 |
| Elbit Systems Ltd. (Israel) | | 66,973 | 14,336,279 |
| Icl Group Ltd. | | 1,784,389 | 17,140,590 |
| Israel Discount Bank Ltd. (Class A) | | 3,130,799 | 19,219,176 |
| Mizrahi Tefahot Bank Ltd. | | 389,506 | 15,901,545 |
| NICE Ltd. (a) | | 160,608 | 34,823,390 |
| Teva Pharmaceutical Industries Ltd. sponsored ADR (a) | | 2,808,222 | 25,386,327 |
| Tower Semiconductor Ltd. (a) | | 274,945 | 12,924,800 |
| Wix.com Ltd. (a) | | 145,213 | 9,190,531 |
| ZIM Integrated Shipping Services Ltd. (c) | | 213,264 | 7,696,698 |
TOTAL ISRAEL | | | 295,387,381 |
| Italy - 1.6% | | | |
| Amplifon SpA | | 313,711 | 8,212,624 |
| Assicurazioni Generali SpA | | 2,808,899 | 41,197,421 |
| Atlantia SpA | | 1,251,725 | 28,718,337 |
| DiaSorin SpA | | 63,403 | 8,343,721 |
| Enel SpA | | 20,566,980 | 96,645,704 |
| Eni SpA | | 6,383,159 | 75,403,770 |
| FinecoBank SpA | | 1,546,327 | 16,806,308 |
| Infrastrutture Wireless Italiane SpA (b) | | 843,964 | 7,853,791 |
| Intesa Sanpaolo SpA | | 41,772,144 | 71,910,305 |
| Mediobanca SpA | | 1,524,476 | 12,115,231 |
| Moncler SpA | | 519,349 | 23,298,499 |
| Nexi SpA (a)(b) | | 1,320,548 | 10,884,749 |
| Poste Italiane SpA (b) | | 1,315,182 | 10,562,964 |
| Prysmian SpA | | 644,836 | 19,836,135 |
| Recordati SpA | | 263,337 | 10,781,455 |
| Snam SpA | | 5,098,083 | 24,230,720 |
| Telecom Italia SpA (a) | | 25,068,215 | 5,170,548 |
| Terna - Rete Elettrica Nazionale | | 3,557,745 | 25,385,026 |
| UniCredit SpA | | 5,247,101 | 51,347,532 |
TOTAL ITALY | | | 548,704,840 |
| Japan - 22.5% | | | |
| Advantest Corp. | | 479,742 | 27,170,352 |
| AEON Co. Ltd. | | 1,654,667 | 32,275,508 |
| AGC, Inc. | | 487,330 | 16,539,469 |
| Aisin Seiki Co. Ltd. | | 371,467 | 11,045,448 |
| Ajinomoto Co., Inc. | | 1,154,861 | 31,920,181 |
| Ana Holdings, Inc. (a)(c) | | 402,812 | 7,744,603 |
| Asahi Group Holdings | | 1,154,828 | 38,719,367 |
| ASAHI INTECC Co. Ltd. | | 547,399 | 9,736,909 |
| Asahi Kasei Corp. | | 3,180,327 | 23,241,171 |
| Astellas Pharma, Inc. | | 4,642,843 | 65,825,244 |
| Azbil Corp. | | 292,255 | 8,327,338 |
| Bandai Namco Holdings, Inc. | | 505,365 | 37,920,879 |
| Bridgestone Corp. | | 1,444,077 | 55,415,288 |
| Brother Industries Ltd. | | 594,964 | 11,386,130 |
| Canon, Inc. | | 2,529,202 | 60,572,640 |
| Capcom Co. Ltd. | | 443,710 | 12,110,946 |
| Central Japan Railway Co. | | 365,007 | 42,972,294 |
| Chiba Bank Ltd. | | 1,336,180 | 7,217,827 |
| Chubu Electric Power Co., Inc. | | 1,631,357 | 16,588,961 |
| Chugai Pharmaceutical Co. Ltd. | | 1,699,022 | 43,848,494 |
| Concordia Financial Group Ltd. | | 2,744,640 | 8,703,918 |
| CyberAgent, Inc. | | 1,083,155 | 10,559,981 |
| Dai Nippon Printing Co. Ltd. | | 559,659 | 11,780,179 |
| Dai-ichi Mutual Life Insurance Co. | | 2,478,198 | 42,818,334 |
| Daifuku Co. Ltd. | | 255,240 | 14,890,204 |
| Daiichi Sankyo Kabushiki Kaisha | | 4,430,117 | 133,133,021 |
| Daikin Industries Ltd. | | 629,895 | 109,958,974 |
| Daito Trust Construction Co. Ltd. | | 157,293 | 15,474,097 |
| Daiwa House Industry Co. Ltd. | | 1,517,932 | 33,936,747 |
| Daiwa House REIT Investment Corp. | | 5,560 | 12,853,590 |
| Daiwa Securities Group, Inc. | | 3,380,595 | 14,757,063 |
| DENSO Corp. | | 1,096,148 | 59,828,568 |
| Dentsu Group, Inc. | | 545,110 | 17,555,271 |
| Disco Corp. | | 72,841 | 17,686,507 |
| East Japan Railway Co. | | 765,639 | 39,657,560 |
| Eisai Co. Ltd. | | 638,943 | 26,051,737 |
| ENEOS Holdings, Inc. | | 7,772,531 | 29,371,824 |
| FANUC Corp. | | 485,086 | 78,147,002 |
| Fast Retailing Co. Ltd. | | 147,541 | 86,271,930 |
| Fuji Electric Co. Ltd. | | 319,951 | 13,822,580 |
| FUJIFILM Holdings Corp. | | 911,625 | 46,280,295 |
| Fujitsu Ltd. | | 497,361 | 58,526,110 |
| GLP J-REIT | | 10,762 | 13,110,143 |
| GMO Payment Gateway, Inc. | | 106,077 | 8,412,362 |
| Hakuhodo DY Holdings, Inc. | | 588,794 | 5,252,922 |
| Hamamatsu Photonics K.K. | | 353,655 | 14,994,496 |
| Hankyu Hanshin Holdings, Inc. | | 577,152 | 17,307,940 |
| Hikari Tsushin, Inc. | | 51,645 | 6,529,241 |
| Hirose Electric Co. Ltd. | | 75,497 | 10,697,738 |
| Hitachi Construction Machinery Co. Ltd. | | 271,162 | 5,574,456 |
| Hitachi Ltd. | | 2,448,113 | 122,312,819 |
| Hitachi Metals Ltd. (a) | | 541,329 | 8,145,241 |
| Honda Motor Co. Ltd. | | 4,122,585 | 109,752,547 |
| Hoshizaki Corp. | | 274,247 | 8,147,463 |
| Hoya Corp. | | 924,818 | 94,309,957 |
| Hulic Co. Ltd. | | 965,734 | 7,318,297 |
| Ibiden Co. Ltd. | | 283,999 | 9,013,858 |
| Idemitsu Kosan Co. Ltd. | | 525,522 | 13,856,580 |
| Iida Group Holdings Co. Ltd. | | 370,870 | 5,649,415 |
| INPEX Corp. | | 2,631,265 | 30,245,410 |
| Isuzu Motors Ltd. | | 1,470,145 | 18,258,739 |
| ITO EN Ltd. | | 134,835 | 5,917,527 |
| Itochu Corp. | | 3,005,603 | 82,716,361 |
| ITOCHU Techno-Solutions Corp. | | 242,205 | 6,112,551 |
| Japan Airlines Co. Ltd. (a) | | 363,606 | 6,650,475 |
| Japan Exchange Group, Inc. | | 1,271,656 | 18,950,504 |
| Japan Post Bank Co. Ltd. | | 1,038,475 | 7,569,913 |
| Japan Post Holdings Co. Ltd. | | 6,009,650 | 41,459,287 |
| Japan Post Insurance Co. Ltd. | | 503,316 | 7,709,602 |
| Japan Real Estate Investment Corp. | | 3,145 | 14,566,316 |
| Japan Retail Fund Investment Corp. | | 17,636 | 14,006,114 |
| Japan Tobacco, Inc. | | 3,035,576 | 51,433,072 |
| JFE Holdings, Inc. | | 1,237,767 | 13,298,016 |
| JSR Corp. | | 455,966 | 10,171,156 |
| Kajima Corp. | | 1,066,396 | 11,221,198 |
| Kakaku.com, Inc. | | 336,141 | 6,187,650 |
| Kansai Electric Power Co., Inc. | | 1,773,783 | 17,190,885 |
| Kao Corp. | | 1,201,943 | 52,044,503 |
| KDDI Corp. | | 4,078,042 | 124,792,703 |
| Keio Corp. | | 259,402 | 9,870,339 |
| Keisei Electric Railway Co. | | 328,883 | 9,174,619 |
| Keyence Corp. | | 491,928 | 184,706,204 |
| Kikkoman Corp. | | 367,941 | 22,499,045 |
| Kintetsu Group Holdings Co. Ltd. | | 432,575 | 14,688,820 |
| Kirin Holdings Co. Ltd. | | 2,082,822 | 34,286,956 |
| Kobayashi Pharmaceutical Co. Ltd. | | 134,437 | 7,618,740 |
| Kobe Bussan Co. Ltd. | | 379,328 | 9,659,745 |
| Koei Tecmo Holdings Co. Ltd. | | 148,278 | 4,971,231 |
| Koito Manufacturing Co. Ltd. | | 263,500 | 9,002,329 |
| Komatsu Ltd. | | 2,338,447 | 48,917,381 |
| Konami Group Corp. | | 235,140 | 11,933,287 |
| Kose Corp. | | 83,986 | 7,909,303 |
| Kubota Corp. | | 2,581,977 | 40,098,723 |
| Kurita Water Industries Ltd. | | 263,599 | 10,255,957 |
| Kyocera Corp. | | 811,911 | 45,129,082 |
| Kyowa Hakko Kirin Co., Ltd. | | 680,630 | 15,256,135 |
| Lasertec Corp. | | 190,762 | 26,410,514 |
| LIXIL Group Corp. (c) | | 750,157 | 13,044,842 |
| M3, Inc. | | 1,116,311 | 35,757,540 |
| Makita Corp. | | 564,614 | 13,276,187 |
| Marubeni Corp. | | 3,909,785 | 40,748,882 |
| Mazda Motor Corp. | | 1,433,526 | 12,695,458 |
| McDonald's Holdings Co. (Japan) Ltd. | | 218,422 | 7,807,024 |
| Meiji Holdings Co. Ltd. | | 282,433 | 13,454,802 |
| Minebea Mitsumi, Inc. | | 914,885 | 15,724,209 |
| Misumi Group, Inc. | | 720,564 | 17,687,061 |
| Mitsubishi Chemical Holdings Corp. | | 3,226,453 | 16,938,742 |
| Mitsubishi Corp. | | 3,192,996 | 104,540,763 |
| Mitsubishi Electric Corp. | | 4,887,769 | 49,416,048 |
| Mitsubishi Estate Co. Ltd. | | 2,992,116 | 40,294,447 |
| Mitsubishi Heavy Industries Ltd. | | 810,739 | 31,254,496 |
| Mitsubishi UFJ Financial Group, Inc. | | 30,219,368 | 156,655,626 |
| Mitsubishi UFJ Lease & Finance Co. Ltd. | | 1,665,382 | 8,070,885 |
| Mitsui & Co. Ltd. | | 3,529,961 | 82,845,086 |
| Mitsui Chemicals, Inc. | | 464,146 | 10,427,287 |
| Mitsui Fudosan Co. Ltd. | | 2,291,443 | 46,380,223 |
| Mitsui OSK Lines Ltd. (c) | | 869,725 | 22,659,468 |
| Mizuho Financial Group, Inc. | | 6,099,564 | 69,842,312 |
| MonotaRO Co. Ltd. | | 631,583 | 11,332,048 |
| MS&AD Insurance Group Holdings, Inc. | | 1,126,248 | 33,602,665 |
| Murata Manufacturing Co. Ltd. | | 1,452,817 | 78,229,000 |
| NEC Corp. | | 621,800 | 22,678,088 |
| Nexon Co. Ltd. | | 1,253,251 | 24,954,863 |
| NGK Insulators Ltd. | | 599,351 | 8,557,223 |
| Nidec Corp. | | 1,131,006 | 75,135,008 |
| Nihon M&A Center Holdings, Inc. | | 763,035 | 9,456,480 |
| Nintendo Co. Ltd. | | 279,123 | 114,258,139 |
| Nippon Building Fund, Inc. | | 3,862 | 19,236,467 |
| Nippon Express Holdings, Inc. | | 193,997 | 10,674,242 |
| Nippon Paint Holdings Co. Ltd. | | 2,090,782 | 16,124,827 |
| Nippon Prologis REIT, Inc. | | 5,445 | 13,698,155 |
| Nippon Sanso Holdings Corp. | | 436,844 | 7,944,942 |
| Nippon Shinyaku Co. Ltd. | | 123,889 | 6,776,677 |
| Nippon Steel & Sumitomo Metal Corp. | | 2,044,121 | 32,289,178 |
| Nippon Telegraph & Telephone Corp. | | 3,021,741 | 81,902,146 |
| Nippon Yusen KK (c) | | 408,548 | 31,161,668 |
| Nissan Chemical Corp. | | 323,900 | 16,318,925 |
| Nissan Motor Co. Ltd. | | 5,879,771 | 23,132,159 |
| Nisshin Seifun Group, Inc. | | 499,030 | 5,616,048 |
| Nissin Food Holdings Co. Ltd. | | 157,645 | 11,278,936 |
| Nitori Holdings Co. Ltd. | | 202,904 | 19,397,920 |
| Nitto Denko Corp. | | 358,724 | 22,109,160 |
| Nomura Holdings, Inc. | | 7,367,088 | 26,675,429 |
| Nomura Real Estate Holdings, Inc. | | 298,626 | 7,336,609 |
| Nomura Real Estate Master Fund, Inc. | | 10,710 | 13,098,997 |
| Nomura Research Institute Ltd. | | 849,688 | 22,868,341 |
| NTT Data Corp. | | 1,596,849 | 22,471,445 |
| Obayashi Corp. | | 1,638,319 | 11,331,578 |
| OBIC Co. Ltd. | | 176,533 | 26,109,082 |
| Odakyu Electric Railway Co. Ltd. | | 743,531 | 10,157,409 |
| Oji Holdings Corp. | | 2,045,259 | 8,160,334 |
| Olympus Corp. | | 3,120,365 | 66,455,152 |
| OMRON Corp. | | 470,051 | 24,737,033 |
| Ono Pharmaceutical Co. Ltd. | | 916,702 | 21,881,837 |
| Open House Group Co. Ltd. | | 206,581 | 8,085,160 |
| Oracle Corp. Japan | | 96,922 | 5,773,769 |
| Oriental Land Co. Ltd. | | 505,836 | 75,413,796 |
| ORIX Corp. | | 3,024,112 | 49,708,503 |
| Osaka Gas Co. Ltd. | | 945,141 | 15,919,387 |
| Otsuka Corp. | | 287,581 | 9,295,750 |
| Otsuka Holdings Co. Ltd. | | 988,844 | 32,298,191 |
| Pan Pacific International Holdings Ltd. | | 958,968 | 17,218,844 |
| Panasonic Holdings Corp. | | 5,589,705 | 45,357,013 |
| Persol Holdings Co. Ltd. | | 447,293 | 8,979,054 |
| Rakuten Group, Inc. | | 2,193,575 | 10,645,995 |
| Recruit Holdings Co. Ltd. | | 3,645,173 | 115,882,259 |
| Renesas Electronics Corp. (a) | | 2,950,696 | 27,938,811 |
| Resona Holdings, Inc. | | 5,470,526 | 20,138,356 |
| Ricoh Co. Ltd. | | 1,446,134 | 11,365,815 |
| ROHM Co. Ltd. | | 220,655 | 16,508,964 |
| SBI Holdings, Inc. Japan | | 620,922 | 12,201,212 |
| SCSK Corp. | | 394,652 | 6,426,239 |
| Secom Co. Ltd. | | 531,056 | 33,833,180 |
| Seiko Epson Corp. | | 705,220 | 11,081,698 |
| Sekisui Chemical Co. Ltd. | | 941,998 | 12,842,558 |
| Sekisui House Ltd. | | 1,559,602 | 26,520,454 |
| Seven & i Holdings Co. Ltd. | | 1,905,129 | 75,682,237 |
| SG Holdings Co. Ltd. | | 726,017 | 12,042,250 |
| Sharp Corp. | | 617,154 | 4,417,925 |
| Shimadzu Corp. | | 596,954 | 17,434,676 |
| SHIMANO, Inc. | | 184,485 | 32,637,131 |
| SHIMIZU Corp. | | 1,391,947 | 7,632,696 |
| Shin-Etsu Chemical Co. Ltd. | | 948,299 | 110,128,658 |
| Shionogi & Co. Ltd. | | 670,097 | 32,717,430 |
| Shiseido Co. Ltd. | | 1,012,375 | 38,241,262 |
| Shizuoka Bank Ltd. | | 1,125,321 | 6,512,071 |
| SMC Corp. | | 144,859 | 68,725,410 |
| SoftBank Corp. | | 7,262,288 | 79,618,208 |
| SoftBank Group Corp. | | 3,049,462 | 120,793,950 |
| Sompo Holdings, Inc. | | 791,611 | 33,941,299 |
| Sony Group Corp. | | 3,188,201 | 253,472,523 |
| Square Enix Holdings Co. Ltd. | | 216,233 | 9,389,062 |
| Subaru Corp. | | 1,556,944 | 28,301,206 |
| Sumco Corp. | | 882,843 | 11,982,726 |
| Sumitomo Chemical Co. Ltd. | | 3,754,108 | 14,777,391 |
| Sumitomo Corp. | | 2,849,437 | 40,079,035 |
| Sumitomo Electric Industries Ltd. | | 1,801,317 | 20,633,355 |
| Sumitomo Metal Mining Co. Ltd. | | 623,057 | 19,605,509 |
| Sumitomo Mitsui Financial Group, Inc. | | 3,301,064 | 99,570,862 |
| Sumitomo Mitsui Trust Holdings, Inc. | | 854,772 | 26,586,140 |
| Sumitomo Realty & Development Co. Ltd. | | 783,954 | 19,172,323 |
| Suntory Beverage & Food Ltd. | | 350,471 | 12,801,538 |
| Suzuki Motor Corp. | | 931,818 | 32,568,111 |
| Sysmex Corp. | | 424,314 | 25,937,053 |
| T&D Holdings, Inc. | | 1,336,405 | 14,595,164 |
| Taisei Corp. | | 457,644 | 13,875,551 |
| Takeda Pharmaceutical Co. Ltd. | | 3,800,633 | 105,049,702 |
| TDK Corp. | | 983,239 | 34,376,239 |
| Terumo Corp. | | 1,632,619 | 52,409,788 |
| TIS, Inc. | | 569,689 | 16,222,888 |
| Tobu Railway Co. Ltd. | | 476,508 | 11,258,035 |
| Toho Co. Ltd. | | 281,963 | 10,708,613 |
| Tokio Marine Holdings, Inc. | | 1,547,093 | 85,738,943 |
| Tokyo Electric Power Co., Inc. (a) | | 3,846,337 | 15,021,748 |
| Tokyo Electron Ltd. | | 377,560 | 118,416,829 |
| Tokyo Gas Co. Ltd. | | 1,000,343 | 18,767,653 |
| Tokyu Corp. | | 1,339,168 | 15,919,684 |
| Toppan, Inc. | | 660,845 | 10,378,338 |
| Toray Industries, Inc. | | 3,513,335 | 20,048,643 |
| Toshiba Corp. | | 986,241 | 36,524,404 |
| Tosoh Corp. | | 655,167 | 8,471,209 |
| Toto Ltd. | | 357,030 | 12,306,400 |
| Toyota Industries Corp. | | 371,463 | 20,762,126 |
| Toyota Motor Corp. | | 26,808,525 | 401,191,414 |
| Toyota Tsusho Corp. | | 535,458 | 18,745,382 |
| Trend Micro, Inc. | | 338,297 | 20,828,304 |
| Unicharm Corp. | | 1,020,722 | 35,471,855 |
| USS Co. Ltd. | | 552,673 | 9,752,957 |
| Welcia Holdings Co. Ltd. | | 237,528 | 4,974,643 |
| West Japan Railway Co. | | 553,767 | 21,551,716 |
| Yakult Honsha Co. Ltd. | | 323,370 | 19,125,958 |
| Yamaha Corp. | | 353,996 | 13,808,993 |
| Yamaha Motor Co. Ltd. | | 750,397 | 15,551,451 |
| Yamato Holdings Co. Ltd. | | 734,607 | 11,451,839 |
| Yaskawa Electric Corp. | | 605,114 | 19,704,258 |
| Yokogawa Electric Corp. | | 575,659 | 10,047,162 |
| Z Holdings Corp. | | 6,734,831 | 19,799,565 |
| ZOZO, Inc. | | 314,050 | 6,941,519 |
TOTAL JAPAN | | | 7,801,226,024 |
| Luxembourg - 0.2% | | | |
| ArcelorMittal SA (Netherlands) | | 1,331,609 | 31,788,952 |
| Aroundtown SA | | 2,537,935 | 7,416,848 |
| Eurofins Scientific SA | | 340,225 | 23,625,920 |
| Tenaris SA | | 1,189,817 | 16,276,084 |
TOTAL LUXEMBOURG | | | 79,107,804 |
| Malta - 0.0% | | | |
| BGP Holdings PLC (a)(e) | | 5,796,476 | 58 |
| Multi-National - 0.1% | | | |
| HK Electric Investments & HK Electric Investments Ltd. unit | | 6,692,972 | 5,557,579 |
| HKT Trust/HKT Ltd. unit | | 9,597,718 | 12,876,109 |
| Unibail-Rodamco SE & WFD Unibail-Rodamco NV unit (a) | | 298,698 | 15,429,075 |
TOTAL MULTI-NATIONAL | | | 33,862,763 |
| Netherlands - 5.4% | | | |
| ABN AMRO Bank NV: | | | |
| GDR (b) | | 1,066,405 | 10,260,300 |
| rights (a)(d) | | 1,071,667 | 344,631 |
| Adyen BV (a)(b) | | 54,815 | 84,587,498 |
| AEGON NV | | 4,530,172 | 20,245,445 |
| AEGON NV rights (a)(d) | | 4,533,616 | 501,166 |
| AerCap Holdings NV (a) | | 341,646 | 15,049,506 |
| Airbus Group NV | | 1,494,614 | 146,461,930 |
| Akzo Nobel NV | | 459,735 | 28,963,937 |
| Argenx SE (a) | | 139,312 | 52,459,547 |
| ASM International NV (Netherlands) | | 118,440 | 32,268,024 |
| ASML Holding NV (Netherlands) | | 1,027,535 | 501,555,520 |
| CNH Industrial NV | | 2,588,221 | 31,680,578 |
| Davide Campari Milano NV | | 1,316,837 | 12,979,469 |
| Euronext NV (b) | | 215,870 | 16,010,066 |
| EXOR NV | | 275,196 | 16,665,398 |
| Ferrari NV (Italy) | | 318,670 | 61,871,801 |
| Heineken Holding NV | | 254,076 | 18,077,624 |
| Heineken NV (Bearer) | | 655,498 | 59,115,571 |
| IMCD NV | | 144,319 | 19,985,600 |
| ING Groep NV (Certificaten Van Aandelen) | | 9,878,116 | 86,576,147 |
| JDE Peet's BV | | 253,442 | 7,824,278 |
| Just Eat Takeaway.com NV (a)(b) | | 460,418 | 7,659,262 |
| Koninklijke Ahold Delhaize NV | | 2,643,406 | 72,711,684 |
| Koninklijke DSM NV | | 442,047 | 56,367,938 |
| Koninklijke KPN NV | | 8,350,494 | 26,572,069 |
| Koninklijke Philips Electronics NV | | 2,235,920 | 37,134,155 |
| NN Group NV | | 705,579 | 29,050,664 |
| NN Group NV rights (a)(c)(d) | | 724,382 | 727,968 |
| OCI NV | | 265,510 | 9,989,901 |
| Prosus NV | | 2,097,123 | 129,622,085 |
| QIAGEN NV (Germany) (a) | | 574,860 | 26,141,177 |
| Randstad NV | | 301,448 | 14,083,688 |
| Stellantis NV (Italy) | | 5,564,728 | 74,679,219 |
| STMicroelectronics NV (France) | | 1,727,998 | 60,221,049 |
| Universal Music Group NV | | 1,834,977 | 36,438,881 |
| Wolters Kluwer NV | | 663,635 | 64,984,684 |
| Wolters Kluwer NV rights (a)(d) | | 661,582 | 418,860 |
TOTAL NETHERLANDS | | | 1,870,287,320 |
| New Zealand - 0.2% | | | |
| Auckland International Airport Ltd. (a) | | 3,156,495 | 14,557,014 |
| Fisher & Paykel Healthcare Corp. | | 1,460,971 | 17,490,298 |
| Mercury Nz Ltd. | | 1,756,616 | 6,216,657 |
| Meridian Energy Ltd. | | 3,242,907 | 9,893,447 |
| Spark New Zealand Ltd. | | 4,743,414 | 15,690,821 |
| Xero Ltd. (a) | | 340,567 | 20,035,259 |
TOTAL NEW ZEALAND | | | 83,883,496 |
| Norway - 0.9% | | | |
| Adevinta ASA Class B (a) | | 734,613 | 5,998,666 |
| Aker BP ASA | | 799,870 | 27,985,409 |
| DNB Bank ASA | | 2,351,773 | 44,716,614 |
| Equinor ASA | | 2,471,023 | 95,902,013 |
| Gjensidige Forsikring ASA | | 503,907 | 10,242,579 |
| Kongsberg Gruppen ASA | | 225,352 | 7,709,885 |
| Mowi ASA | | 1,047,539 | 21,535,062 |
| Norsk Hydro ASA | | 3,403,059 | 23,382,769 |
| Orkla ASA | | 1,893,095 | 15,852,600 |
| Salmar ASA | | 148,450 | 9,851,505 |
| Telenor ASA | | 1,772,522 | 19,396,706 |
| Yara International ASA | | 417,336 | 17,696,523 |
TOTAL NORWAY | | | 300,270,331 |
| Portugal - 0.2% | | | |
| Banco Espirito Santo SA (Reg.) (a)(e) | | 2,598,658 | 26 |
| Energias de Portugal SA | | 7,018,563 | 33,587,838 |
| Galp Energia SGPS SA Class B | | 1,264,346 | 13,653,648 |
| Jeronimo Martins SGPS SA | | 715,556 | 15,892,066 |
TOTAL PORTUGAL | | | 63,133,578 |
| Singapore - 1.3% | | | |
| Ascendas Real Estate Investment Trust | | 8,469,538 | 17,069,567 |
| CapitaLand Investment Ltd. | | 6,588,079 | 17,344,955 |
| CapitaMall Trust | | 13,446,784 | 19,888,126 |
| City Developments Ltd. | | 1,030,515 | 5,983,384 |
| DBS Group Holdings Ltd. | | 4,579,171 | 106,619,154 |
| Genting Singapore Ltd. | | 15,253,984 | 8,441,689 |
| Keppel Corp. Ltd. | | 3,670,885 | 19,064,815 |
| Mapletree Logistics Trust (REIT) | | 8,253,999 | 9,845,753 |
| Mapletree Pan Asia Commercial | | 6,013,752 | 7,908,055 |
| Oversea-Chinese Banking Corp. Ltd. | | 8,561,637 | 73,793,993 |
| Singapore Airlines Ltd. (a) | | 3,374,211 | 12,811,391 |
| Singapore Exchange Ltd. | | 2,159,145 | 14,651,992 |
| Singapore Technologies Engineering Ltd. | | 3,937,729 | 10,493,071 |
| Singapore Telecommunications Ltd. | | 20,896,719 | 39,230,615 |
| United Overseas Bank Ltd. | | 2,984,584 | 58,197,761 |
| UOL Group Ltd. | | 1,167,389 | 5,775,998 |
| Venture Corp. Ltd. | | 699,448 | 9,138,181 |
| Wilmar International Ltd. | | 4,841,608 | 13,974,811 |
TOTAL SINGAPORE | | | 450,233,311 |
| Spain - 2.4% | | | |
| Acciona SA | | 62,446 | 12,243,522 |
| ACS Actividades de Construccion y Servicios SA | | 584,907 | 13,055,089 |
| Aena SME SA (a)(b) | | 189,861 | 23,319,050 |
| Amadeus IT Holding SA Class A (a) | | 1,138,920 | 60,122,859 |
| Banco Bilbao Vizcaya Argentaria SA | | 16,857,805 | 75,644,218 |
| Banco Santander SA (Spain) | | 43,178,360 | 104,521,713 |
| CaixaBank SA | | 11,209,081 | 33,845,852 |
| Cellnex Telecom SA (b) | | 1,374,201 | 53,515,139 |
| EDP Renovaveis SA | | 729,203 | 17,712,079 |
| Enagas SA | | 630,600 | 11,527,394 |
| Endesa SA | | 803,768 | 13,812,468 |
| Ferrovial SA | | 1,219,304 | 30,608,982 |
| Grifols SA (a)(c) | | 751,393 | 9,095,329 |
| Iberdrola SA | | 15,051,933 | 156,716,206 |
| Industria de Diseno Textil SA (c) | | 2,757,794 | 59,544,727 |
| Naturgy Energy Group SA | | 367,716 | 10,154,855 |
| Red Electrica Corporacion SA | | 1,026,205 | 18,805,477 |
| Repsol SA | | 3,670,369 | 47,671,051 |
| Siemens Gamesa Renewable Energy SA (a) | | 600,419 | 10,818,314 |
| Telefonica SA | | 13,242,883 | 54,653,607 |
TOTAL SPAIN | | | 817,387,931 |
| Sweden - 3.1% | | | |
| Alfa Laval AB | | 733,045 | 19,632,678 |
| Alleima AB (a) | | 27,009 | 108,441 |
| ASSA ABLOY AB (B Shares) | | 2,535,112 | 51,346,091 |
| Atlas Copco AB: | | | |
| (A Shares) | | 6,789,884 | 68,924,309 |
| (B Shares) | | 3,949,105 | 36,127,272 |
| Boliden AB | | 692,179 | 22,307,514 |
| Electrolux AB (B Shares) (c) | | 558,257 | 7,082,427 |
| Embracer Group AB (a)(c) | | 1,697,292 | 10,592,949 |
| Epiroc AB: | | | |
| (A Shares) | | 1,669,274 | 25,541,252 |
| (B Shares) | | 984,217 | 13,433,731 |
| EQT AB (c) | | 754,703 | 17,012,676 |
| Ericsson (B Shares) | | 7,379,875 | 55,189,830 |
| Essity AB (B Shares) | | 1,539,979 | 34,252,253 |
| Evolution AB (b) | | 462,517 | 37,002,883 |
| Fastighets AB Balder (a) | | 1,588,038 | 8,810,185 |
| Getinge AB (B Shares) | | 576,670 | 10,719,246 |
| H&M Hennes & Mauritz AB (B Shares) (c) | | 1,848,933 | 19,201,777 |
| Hexagon AB (B Shares) | | 4,923,003 | 50,308,377 |
| Holmen AB (B Shares) | | 236,558 | 10,176,876 |
| Husqvarna AB (B Shares) | | 1,056,153 | 7,106,255 |
| Industrivarden AB: | | | |
| (A Shares) | | 329,801 | 7,338,536 |
| (C Shares) | | 386,784 | 8,519,407 |
| Indutrade AB | | 688,299 | 12,797,454 |
| Investment AB Latour (B Shares) | | 372,933 | 7,381,694 |
| Investor AB: | | | |
| (A Shares) (c) | | 1,257,958 | 20,981,701 |
| (B Shares) | | 4,610,650 | 72,965,915 |
| Kinnevik AB (B Shares) (a) | | 610,224 | 8,726,890 |
| L E Lundbergforetagen AB | | 191,648 | 7,946,380 |
| Lifco AB | | 587,578 | 9,174,705 |
| Nibe Industrier AB (B Shares) | | 3,833,187 | 36,048,499 |
| Sagax AB | | 479,220 | 10,348,635 |
| Sandvik AB | | 2,697,398 | 42,053,785 |
| Securitas AB (B Shares) (c) | | 789,074 | 6,928,455 |
| Skandinaviska Enskilda Banken AB (A Shares) | | 4,115,674 | 41,176,044 |
| Skanska AB (B Shares) | | 857,935 | 12,728,182 |
| SKF AB (B Shares) | | 966,398 | 14,554,897 |
| Svenska Cellulosa AB SCA (B Shares) | | 1,533,063 | 23,060,662 |
| Svenska Handelsbanken AB (A Shares) | | 3,688,303 | 30,207,845 |
| Swedbank AB (A Shares) | | 2,290,714 | 29,607,274 |
| Swedish Match Co. AB | | 3,853,879 | 38,689,627 |
| Swedish Orphan Biovitrum AB (a) | | 426,053 | 9,416,331 |
| Tele2 AB (B Shares) | | 1,430,094 | 15,240,026 |
| Telia Co. AB | | 6,725,089 | 23,670,527 |
| Volvo AB: | | | |
| (A Shares) | | 504,449 | 8,418,525 |
| (B Shares) | | 3,818,353 | 60,483,832 |
| Volvo Car AB (c) | | 1,502,034 | 9,158,744 |
TOTAL SWEDEN | | | 1,072,501,594 |
| Switzerland - 10.3% | | | |
| ABB Ltd. (Reg.) | | 4,153,104 | 114,474,632 |
| Adecco SA (Reg.) | | 406,852 | 12,897,430 |
| Alcon, Inc. (Switzerland) | | 1,263,199 | 83,429,286 |
| Bachem Holding AG (B Shares) | | 84,128 | 5,848,079 |
| Baloise Holdings AG | | 115,545 | 16,714,131 |
| Barry Callebaut AG | | 9,001 | 18,453,201 |
| Clariant AG (Reg.) | | 544,006 | 10,078,720 |
| Coca-Cola HBC AG | | 507,197 | 11,607,452 |
| Compagnie Financiere Richemont SA Series A | | 1,319,604 | 147,569,250 |
| Credit Suisse Group AG | | 6,708,463 | 34,616,496 |
| Ems-Chemie Holding AG | | 17,690 | 12,459,913 |
| Geberit AG (Reg.) | | 90,775 | 42,058,309 |
| Givaudan SA | | 23,350 | 74,743,887 |
| Holcim AG | | 1,401,591 | 62,126,237 |
| Julius Baer Group Ltd. | | 559,878 | 27,053,138 |
| Kuehne & Nagel International AG | | 137,390 | 31,764,849 |
| Lindt & Spruengli AG | | 276 | 30,070,588 |
| Lindt & Spruengli AG (participation certificate) | | 2,709 | 28,655,816 |
| Logitech International SA (Reg.) | | 438,541 | 21,920,320 |
| Lonza Group AG | | 188,249 | 100,396,961 |
| Nestle SA (Reg. S) | | 7,115,755 | 832,706,830 |
| Novartis AG | | 5,467,716 | 442,272,996 |
| Partners Group Holding AG | | 57,396 | 55,569,897 |
| Roche Holding AG: | | | |
| (Bearer) (c) | | 68,772 | 26,326,836 |
| (participation certificate) | | 1,774,292 | 571,750,777 |
| Schindler Holding AG: | | | |
| (participation certificate) | | 102,715 | 17,937,034 |
| (Reg.) | | 59,091 | 9,986,530 |
| SGS SA (Reg.) | | 16,120 | 35,499,203 |
| Sig Group AG | | 777,422 | 18,276,376 |
| Sika AG | | 369,387 | 83,110,139 |
| Sonova Holding AG | | 135,757 | 35,928,732 |
| Straumann Holding AG | | 282,309 | 30,936,197 |
| Swatch Group AG (Bearer) | | 72,798 | 17,653,189 |
| Swatch Group AG (Bearer) (Reg.) | | 135,463 | 6,189,031 |
| Swiss Life Holding AG | | 79,740 | 41,799,259 |
| Swiss Prime Site AG | | 194,146 | 16,743,230 |
| Swiss Re Ltd. | | 762,647 | 59,300,150 |
| Swisscom AG | | 65,531 | 33,935,337 |
| Temenos Group AG | | 160,137 | 13,135,330 |
| UBS Group AG | | 8,892,252 | 141,275,369 |
| VAT Group AG (b) | | 68,059 | 16,334,160 |
| Zurich Insurance Group Ltd. | | 380,260 | 168,797,296 |
TOTAL SWITZERLAND | | | 3,562,402,593 |
| United Kingdom - 14.2% | | | |
| 3i Group PLC | | 2,460,279 | 34,631,581 |
| Abrdn PLC | | 5,488,032 | 9,362,344 |
| Admiral Group PLC | | 453,225 | 11,172,574 |
| Anglo American PLC (United Kingdom) | | 3,212,503 | 103,232,108 |
| Antofagasta PLC | | 994,477 | 12,719,676 |
| Ashtead Group PLC | | 1,119,867 | 55,290,353 |
| Associated British Foods PLC | | 898,087 | 15,910,442 |
| AstraZeneca PLC (United Kingdom) | | 3,916,733 | 484,469,862 |
| Auto Trader Group PLC (b) | | 2,383,310 | 17,995,616 |
| Aveva Group PLC | | 304,072 | 9,890,732 |
| Aviva PLC | | 7,153,211 | 34,793,489 |
| BAE Systems PLC | | 7,979,133 | 71,860,870 |
| Barclays PLC | | 42,327,607 | 80,705,700 |
| Barratt Developments PLC | | 2,577,438 | 12,794,258 |
| Berkeley Group Holdings PLC | | 282,515 | 11,995,625 |
| BP PLC | | 48,842,669 | 249,582,323 |
| British American Tobacco PLC (United Kingdom) | | 5,444,559 | 218,069,504 |
| British Land Co. PLC | | 2,220,185 | 11,111,146 |
| BT Group PLC | | 17,574,614 | 30,767,559 |
| Bunzl PLC | | 852,771 | 28,342,899 |
| Burberry Group PLC | | 1,003,832 | 20,384,331 |
| Compass Group PLC | | 4,510,642 | 97,028,688 |
| Croda International PLC | | 353,006 | 27,582,456 |
| Diageo PLC | | 5,780,983 | 251,162,869 |
| GSK PLC | | 10,281,707 | 164,353,257 |
| Haleon PLC (a) | | 12,844,693 | 38,624,768 |
| Halma PLC | | 960,415 | 23,151,068 |
| Hargreaves Lansdown PLC | | 896,053 | 8,510,764 |
| Hikma Pharmaceuticals PLC | | 421,082 | 6,422,815 |
| HSBC Holdings PLC (United Kingdom) | | 50,803,488 | 311,265,009 |
| Imperial Brands PLC | | 2,282,148 | 50,188,629 |
| Informa PLC | | 3,710,556 | 23,570,103 |
| InterContinental Hotel Group PLC | | 466,371 | 25,317,504 |
| Intertek Group PLC | | 406,998 | 18,718,531 |
| J Sainsbury PLC | | 4,444,981 | 10,503,036 |
| JD Sports Fashion PLC | | 6,494,905 | 8,522,226 |
| Johnson Matthey PLC | | 464,758 | 10,879,174 |
| Kingfisher PLC | | 5,108,963 | 13,724,049 |
| Land Securities Group PLC | | 1,775,907 | 13,422,341 |
| Legal & General Group PLC | | 15,096,643 | 44,219,107 |
| Lloyds Banking Group PLC | | 175,977,259 | 89,177,719 |
| London Stock Exchange Group PLC | | 833,060 | 78,142,298 |
| M&G PLC | | 6,505,716 | 14,794,179 |
| Melrose Industries PLC | | 11,018,446 | 17,472,176 |
| Mondi PLC | | 1,228,786 | 20,926,867 |
| National Grid PLC | | 9,215,208 | 114,746,370 |
| NatWest Group PLC | | 13,558,010 | 38,816,713 |
| Next PLC | | 330,132 | 22,289,854 |
| NMC Health PLC (a) | | 250,069 | 500 |
| Ocado Group PLC (a) | | 1,454,449 | 12,266,738 |
| Pearson PLC | | 1,694,959 | 16,963,115 |
| Persimmon PLC | | 804,845 | 13,800,429 |
| Phoenix Group Holdings PLC | | 1,891,169 | 13,234,553 |
| Prudential PLC | | 6,951,678 | 72,958,997 |
| Reckitt Benckiser Group PLC | | 1,807,305 | 139,454,543 |
| RELX PLC (London Stock Exchange) | | 4,864,712 | 127,577,603 |
| Rentokil Initial PLC | | 4,713,672 | 28,468,093 |
| Rio Tinto PLC | | 2,842,399 | 156,929,628 |
| Rolls-Royce Holdings PLC (a) | | 21,176,938 | 18,873,287 |
| Sage Group PLC | | 2,577,819 | 21,417,753 |
| Schroders PLC | | 312,962 | 9,772,707 |
| Segro PLC | | 3,056,099 | 33,479,048 |
| Severn Trent PLC | | 632,608 | 20,481,683 |
| Shell PLC: | | | |
| (London) | | 18,801,523 | 497,639,308 |
| rights (a)(d) | | 19,270,174 | 4,591,178 |
| Smith & Nephew PLC | | 2,205,793 | 25,946,159 |
| Smiths Group PLC | | 950,128 | 16,457,117 |
| Spirax-Sarco Engineering PLC | | 186,695 | 22,848,685 |
| SSE PLC | | 2,699,195 | 51,723,918 |
| St. James's Place PLC | | 1,377,326 | 17,712,438 |
| Standard Chartered PLC (United Kingdom) | | 6,376,758 | 44,313,937 |
| Taylor Wimpey PLC | | 9,052,974 | 11,389,738 |
| Tesco PLC | | 19,077,864 | 55,102,014 |
| Unilever PLC | | 6,450,268 | 292,599,134 |
| United Utilities Group PLC | | 1,723,088 | 21,118,667 |
| Vodafone Group PLC | | 67,529,416 | 90,411,897 |
| Whitbread PLC | | 509,192 | 14,758,098 |
TOTAL UNITED KINGDOM | | | 4,920,906,527 |
| United States of America - 0.1% | | | |
| Coca-Cola European Partners PLC | | 520,186 | 25,577,546 |
| TOTAL COMMON STOCKS (Cost $34,184,660,051) | | | 33,855,612,857 |
| | | | |
| Nonconvertible Preferred Stocks - 0.6% |
| | | Shares | Value ($) |
| France - 0.1% | | | |
| Air Liquide SA (a) | | 395,122 | 49,513,854 |
| Germany - 0.5% | | | |
| Bayerische Motoren Werke AG (BMW) (non-vtg.) | | 148,978 | 10,367,794 |
| Henkel AG & Co. KGaA | | 449,296 | 28,994,693 |
| Porsche Automobil Holding SE (Germany) | | 387,610 | 27,330,193 |
| Sartorius AG (non-vtg.) | | 61,544 | 25,722,851 |
| Volkswagen AG | | 469,768 | 66,819,374 |
TOTAL GERMANY | | | 159,234,905 |
| TOTAL NONCONVERTIBLE PREFERRED STOCKS (Cost $196,053,075) | | | 208,748,759 |
| | | | |
| Government Obligations - 0.1% |
| | | Principal Amount (f) | Value ($) |
| United States of America - 0.1% | | | |
U.S. Treasury Bills, yield at date of purchase 1.15% 1/26/23 (g) (Cost $39,813,882) | | 40,000,000 | 39,503,283 |
| | | | |
| Money Market Funds - 1.1% |
| | | Shares | Value ($) |
| Fidelity Cash Central Fund 2.33% (h) | | 243,113,878 | 243,162,501 |
| Fidelity Securities Lending Cash Central Fund 2.34% (h)(i) | | 132,880,140 | 132,893,428 |
| TOTAL MONEY MARKET FUNDS (Cost $376,055,929) | | | 376,055,929 |
| | | | |
| TOTAL INVESTMENT IN SECURITIES - 99.6% (Cost $34,796,582,937) | 34,479,920,828 |
NET OTHER ASSETS (LIABILITIES) - 0.4% | 135,477,190 |
| NET ASSETS - 100.0% | 34,615,398,018 |
| | |
| Futures Contracts |
| | Number of contracts | Expiration Date | Notional Amount ($) | Value ($) | Unrealized Appreciation/ (Depreciation) ($) |
| Purchased | | | | | |
| | | | | | |
| Equity Index Contracts | | | | | |
| ICE E-mini MSCI EAFE Index Contracts (United States) | 5,937 | Sep 2022 | 542,374,635 | (8,252,344) | (8,252,344) |
| | | | | | |
| The notional amount of futures purchased as a percentage of Net Assets is 1.6% |
Categorizations in the Schedule of Investments are based on country or territory of incorporation.
Legend
| (b) | Security exempt from registration under Rule 144A of the Securities Act of 1933. These securities may be resold in transactions exempt from registration, normally to qualified institutional buyers. At the end of the period, the value of these securities amounted to $517,649,062 or 1.5% of net assets. |
| (c) | Security or a portion of the security is on loan at period end. |
| (d) | Security or a portion of the security purchased on a delayed delivery or when-issued basis. |
| (f) | Amount is stated in United States dollars unless otherwise noted. |
| (g) | Security or a portion of the security was pledged to cover margin requirements for futures contracts. At period end, the value of securities pledged amounted to $26,418,808. |
| (h) | Affiliated fund that is generally available only to investment companies and other accounts managed by Fidelity Investments. The rate quoted is the annualized seven-day yield of the fund at period end. A complete unaudited listing of the fund's holdings as of its most recent quarter end is available upon request. In addition, each Fidelity Central Fund's financial statements are available on the SEC's website or upon request. |
| (i) | Investment made with cash collateral received from securities on loan. |
Affiliated Central Funds
Fiscal year to date information regarding the Fund's investments in Fidelity Central Funds, including the ownership percentage, is presented below.
| Affiliate | Value, beginning of period ($) | Purchases ($) | Sales Proceeds ($) | Dividend Income ($) | Realized Gain (loss) ($) | Change in Unrealized appreciation (depreciation) ($) | Value, end of period ($) | %ownership, end of period |
| Fidelity Cash Central Fund 2.33% | 1,172,807,446 | 3,154,489,238 | 4,084,134,183 | 3,004,842 | - | - | 243,162,501 | 0.5% |
| Fidelity Securities Lending Cash Central Fund 2.34% | 131,263,315 | 798,045,507 | 796,415,394 | 1,722,945 | - | - | 132,893,428 | 0.4% |
| Total | 1,304,070,761 | 3,952,534,745 | 4,880,549,577 | 4,727,787 | - | - | 376,055,929 | |
| | | | | | | | | |
Amounts in the income column in the above table include any capital gain distributions from underlying funds, which are presented in the corresponding line item in the Statement of Operations, if applicable.
Amount for Fidelity Securities Lending Cash Central Fund represents the income earned on investing cash collateral, less rebates paid to borrowers and any lending agent fees associated with the loan, plus any premium payments received for lending certain types of securities.
Investment Valuation
The following is a summary of the inputs used, as of August 31, 2022, involving the Fund's assets and liabilities carried at fair value. The inputs or methodology used for valuing securities may not be an indication of the risk associated with investing in those securities. For more information on valuation inputs, and their aggregation into the levels used below, please refer to the Investment Valuation section in the accompanying Notes to Financial Statements.
| Valuation Inputs at Reporting Date: |
| Description | Total ($) | Level 1 ($) | Level 2 ($) | Level 3 ($) |
Investments in Securities: | | | | |
|
| Equities: | | | | |
Communication Services | 1,655,895,470 | 252,359,922 | 1,403,535,548 | - |
Consumer Discretionary | 3,942,045,547 | 663,672,736 | 3,278,372,811 | - |
Consumer Staples | 3,743,322,968 | 545,792,057 | 3,197,530,911 | - |
Energy | 1,666,061,645 | 95,955,946 | 1,570,105,699 | - |
Financials | 5,956,458,193 | 1,153,210,369 | 4,803,247,740 | 84 |
Health Care | 4,478,036,225 | 423,967,664 | 4,054,068,561 | - |
Industrials | 5,177,816,892 | 1,193,959,106 | 3,983,857,786 | - |
Information Technology | 2,750,650,388 | 356,223,101 | 2,394,427,287 | - |
Materials | 2,537,349,266 | 496,722,860 | 2,040,626,406 | - |
Real Estate | 976,441,049 | 179,155,466 | 797,285,583 | - |
Utilities | 1,180,283,973 | 286,654,774 | 893,629,199 | - |
|
| Government Obligations | 39,503,283 | - | 39,503,283 | - |
|
| Money Market Funds | 376,055,929 | 376,055,929 | - | - |
| Total Investments in Securities: | 34,479,920,828 | 6,023,729,930 | 28,456,190,814 | 84 |
Derivative Instruments: | | | | |
|
| Liabilities | | | | |
Futures Contracts | (8,252,344) | (8,252,344) | - | - |
| Total Liabilities | (8,252,344) | (8,252,344) | - | - |
| Total Derivative Instruments: | (8,252,344) | (8,252,344) | - | - |
Value of Derivative Instruments
The following table is a summary of the Fund's value of derivative instruments by primary risk exposure as of August 31, 2022. For additional information on derivative instruments, please refer to the Derivative Instruments section in the accompanying Notes to Financial Statements.
Primary Risk Exposure / Derivative Type | Value |
| Asset ($) | Liability ($) |
| Equity Risk | | |
Futures Contracts (a) | 0 | (8,252,344) |
| Total Equity Risk | 0 | (8,252,344) |
| Total Value of Derivatives | 0 | (8,252,344) |
(a)Reflects gross cumulative appreciation (depreciation) on futures contracts as presented in the Schedule of Investments. In the Statement of Assets and Liabilities, the period end daily variation margin is included in receivable or payable for daily variation margin on futures contracts, and the net cumulative appreciation (depreciation) is included in Total accumulated earnings (loss).
Fidelity® International Index Fund
| Statement of Assets and Liabilities |
| | | | August 31, 2022 (Unaudited) |
| | | | | |
| Assets | | | | |
| Investment in securities, at value (including securities loaned of $117,724,027) - See accompanying schedule: | | $34,103,864,899 | | |
Unaffiliated issuers (cost $34,420,527,008) | | | |
Fidelity Central Funds (cost $376,055,929) | | 376,055,929 | | |
| | | | | |
| Total Investment in Securities (cost $34,796,582,937) | | | $ | 34,479,920,828 |
| Foreign currency held at value (cost $60,381,143) | | | | 59,299,999 |
| Receivable for investments sold | | | | 91,672,802 |
| Receivable for fund shares sold | | | | 94,555,440 |
| Dividends receivable | | | | 97,114,434 |
| Reclaims receivable | | | | 112,891,994 |
| Interest receivable | | | | 8,810 |
| Distributions receivable from Fidelity Central Funds | | | | 659,141 |
| Other receivables | | | | 444,334 |
Total assets | | | | 34,936,567,782 |
| Liabilities | | | | |
| Payable for investments purchased | | | | |
Regular delivery | | 135,073,203 | | |
Delayed delivery | | 6,631,919 | | |
| Payable for fund shares redeemed | | 41,328,602 | | |
| Accrued management fee | | 1,064,185 | | |
| Payable for daily variation margin on futures contracts | | 3,735,747 | | |
| Other payables and accrued expenses | | 449,422 | | |
| Collateral on securities loaned | | 132,886,686 | | |
| Total Liabilities | | | | 321,169,764 |
| Net Assets | | | $ | 34,615,398,018 |
| Net Assets consist of: | | | | |
| Paid in capital | | | $ | 37,242,751,388 |
| Total accumulated earnings (loss) | | | | (2,627,353,370) |
| Net Assets | | | $ | 34,615,398,018 |
Net Asset Value , offering price and redemption price per share ($34,615,398,018 ÷ 876,925,465 shares) | | | $ | 39.47 |
| | | | | |
| Statement of Operations |
| | | | Six months ended August 31, 2022 (Unaudited) |
| Investment Income | | | | |
| Dividends | | | $ | 837,300,802 |
| Non-Cash dividends | | | | 58,248,976 |
| Foreign Tax Reclaims | | | | 55,808,434 |
| Interest | | | | 53,530 |
| Income from Fidelity Central Funds (including $1,722,945 from security lending) | | | | 4,727,787 |
| Income before foreign taxes withheld | | | | 956,139,529 |
| Less foreign taxes withheld | | | | (132,842,707) |
| Total Income | | | | 823,296,822 |
| Expenses | | | | |
| Management fee | $ | 6,435,668 | | |
| Independent trustees' fees and expenses | | 60,500 | | |
| Total expenses before reductions | | 6,496,168 | | |
| Expense reductions | | (15) | | |
| Total expenses after reductions | | | | 6,496,153 |
| Net Investment income (loss) | | | | 816,800,669 |
| Realized and Unrealized Gain (Loss) | | | | |
| Net realized gain (loss) on: | | | | |
| Investment Securities: | | | | |
| Unaffiliated issuers | | 27,847,700 | | |
| Foreign currency transactions | | (16,240,813) | | |
| Futures contracts | | (204,811,448) | | |
| Total net realized gain (loss) | | | | (193,204,561) |
| Change in net unrealized appreciation (depreciation) on: | | | | |
| Investment Securities: | | | | |
| Unaffiliated issuers | | (6,274,020,777) | | |
| Assets and liabilities in foreign currencies | | (11,682,193) | | |
| Futures contracts | | 49,387,389 | | |
| Total change in net unrealized appreciation (depreciation) | | | | (6,236,315,581) |
| Net gain (loss) | | | | (6,429,520,142) |
| Net increase (decrease) in net assets resulting from operations | | | $ | (5,612,719,473) |
| Statement of Changes in Net Assets |
| |
| | Six months ended August 31, 2022 (Unaudited) | | Year ended February 28, 2022 |
| Increase (Decrease) in Net Assets | | | | |
| Operations | | | | |
| Net investment income (loss) | $ | 816,800,669 | $ | 1,059,133,620 |
| Net realized gain (loss) | | (193,204,561) | | (158,501,119) |
| Change in net unrealized appreciation (depreciation) | | (6,236,315,581) | | (307,736,335) |
| Net increase (decrease) in net assets resulting from operations | | (5,612,719,473) | | 592,896,166 |
| Distributions to shareholders | | - | | (1,209,317,079) |
| Share transactions | | | | |
| Proceeds from sales of shares | | 7,638,522,782 | | 13,946,782,203 |
| Reinvestment of distributions | | - | | 1,116,402,639 |
| Cost of shares redeemed | | (6,693,456,044) | | (7,549,788,013) |
Net increase (decrease) in net assets resulting from share transactions | | 945,066,738 | | 7,513,396,829 |
| Total increase (decrease) in net assets | | (4,667,652,735) | | 6,896,975,916 |
| | | | | |
| Net Assets | | | | |
| Beginning of period | | 39,283,050,753 | | 32,386,074,837 |
| End of period | $ | 34,615,398,018 | $ | 39,283,050,753 |
| | | | | |
| Other Information | | | | |
| Shares | | | | |
| Sold | | 181,061,691 | | 283,143,293 |
| Issued in reinvestment of distributions | | - | | 23,044,145 |
| Redeemed | | (159,232,688) | | (153,892,295) |
| Net increase (decrease) | | 21,829,003 | | 152,295,143 |
| | | | | |
| Fidelity® International Index Fund |
| |
| | Six months ended (Unaudited) August 31, 2022 | | Years ended February 28, 2022 | | 2021 | | 2020 A | | 2019 | | 2018 |
Selected Per-Share Data | | | | | | | | | | | | |
| Net asset value, beginning of period | $ | 45.94 | $ | 46.08 | $ | 38.65 | $ | 39.67 | $ | 43.09 | $ | 36.88 |
| Income from Investment Operations | | | | | | | | | | | | |
Net investment income (loss) B,C | | .93 | | 1.36 | | .97 | | 1.28 | | 1.23 | | 1.13 |
| Net realized and unrealized gain (loss) | | (7.40) | | .01 | | 7.30 | | (.93) | | (3.64) | | 6.16 |
| Total from investment operations | | (6.47) | | 1.37 | | 8.27 | | .35 | | (2.41) | | 7.29 |
| Distributions from net investment income | | - | | (1.51) | | (.84) | | (1.37) | | (1.01) | | (1.02) |
| Distributions from net realized gain | | - | | - | | - | | - | | - | | (.06) |
| Total distributions | | - | | (1.51) | | (.84) | | (1.37) | | (1.01) | | (1.08) |
| Net asset value, end of period | $ | 39.47 | $ | 45.94 | $ | 46.08 | $ | 38.65 | $ | 39.67 | $ | 43.09 |
Total Return D,E | | (14.08)% | | 2.81% | | 21.47% | | .58% | | (5.43)% | | 19.82% |
Ratios to Average Net Assets C,F,G | | | | | | | | | | | | |
| Expenses before reductions | | .03% H,I | | .04% | | .04% | | .04% | | .05% | | .05% |
| Expenses net of fee waivers, if any | | .03% H,I | | .04% | | .04% | | .04% | | .05% | | .05% |
| Expenses net of all reductions | | .03% H,I | | .04% | | .04% | | .04% | | .05% | | .05% |
| Net investment income (loss) | | 4.40% I | | 2.76% | | 2.40% | | 3.12% | | 3.12% | | 2.72% |
| Supplemental Data | | | | | | | | | | | | |
| Net assets, end of period (000 omitted) | $ | 34,615,398 | $ | 39,283,051 | $ | 32,386,075 | $ | 28,282,191 | $ | 25,169,575 | $ | 6,814,539 |
Portfolio turnover rate J | | 3% I,K | | 2% | | 7% | | 2% | | 3% K | | 2% K |
A For the year ended February 29.
B Calculated based on average shares outstanding during the period.
C Net investment income (loss) is affected by the timing of the declaration of dividends by any underlying mutual funds or exchange-traded funds (ETFs). Net investment income (loss) of any such underlying funds is not included in the Fund's net investment income (loss) ratio.
D Total returns for periods of less than one year are not annualized.
E Total returns would have been lower if certain expenses had not been reduced during the applicable periods shown.
F Fees and expenses of any underlying mutual funds or exchange-traded funds (ETFs) are not included in the Fund's expense ratio. The Fund indirectly bears its proportionate share of these expenses. For additional expense information related to investments in Fidelity Central Funds, please refer to the "Investments in Fidelity Central Funds" note found in the Notes to Financial Statements section of the most recent Annual or Semi-Annual report.
G Expense ratios reflect operating expenses of the class. Expenses before reductions do not reflect amounts reimbursed, waived, or reduced through arrangements with the investment adviser, brokerage services, or other offset arrangements, if applicable, and do not represent the amount paid by the class during periods when reimbursements, waivers or reductions occur.
H The size and fluctuation of net assets and expense amounts may cause ratios to differ from contractual rates.
I Annualized
J Amount does not include the portfolio activity of any underlying mutual funds or exchange-traded funds (ETFs).
K Portfolio turnover rate excludes securities received or delivered in-kind.
For the period ended August 31, 2022
1. Organization.
Fidelity Total Market Index Fund, Fidelity Extended Market Index Fund and Fidelity International Index Fund (the Funds) are funds of Fidelity Concord Street Trust (the Trust). Each Fund is authorized to issue an unlimited number of shares. Share transactions on the Statement of Changes in Net Assets may contain exchanges between affiliated funds. The Trust is registered under the Investment Company Act of 1940, as amended (the 1940 Act), as an open-end management investment company organized as a Massachusetts business trust.
2. Investments in Fidelity Central Funds.
Funds may invest in Fidelity Central Funds, which are open-end investment companies generally available only to other investment companies and accounts managed by the investment adviser and its affiliates. The Schedule of Investments lists any Fidelity Central Funds held as an investment as of period end, but does not include the underlying holdings of each Fidelity Central Fund. An investing fund indirectly bears its proportionate share of the expenses of the underlying Fidelity Central Funds.
Based on its investment objective, each Fidelity Central Fund may invest or participate in various investment vehicles or strategies that are similar to those of the investing fund. These strategies are consistent with the investment objectives of the investing fund and may involve certain economic risks which may cause a decline in value of each of the Fidelity Central Funds and thus a decline in the value of the investing fund.
| Fidelity Central Fund | Investment Manager | Investment Objective | Investment Practices | Expense Ratio A |
| Fidelity Money Market Central Funds | Fidelity Management & Research Company LLC (FMR) | Each fund seeks to obtain a high level of current income consistent with the preservation of capital and liquidity. | Short-term Investments | Less than .005% |
A Expenses expressed as a percentage of average net assets and are as of each underlying Central Fund's most recent annual or semi-annual shareholder report.
A complete unaudited list of holdings for each Fidelity Central Fund is available upon request or at the Securities and Exchange Commission website at www.sec.gov. In addition, the financial statements of the Fidelity Central Funds which contain the significant accounting policies (including investment valuation policies) of those funds, and are not covered by the Report of Independent Registered Public Accounting Firm, are available on the Securities and Exchange Commission website or upon request.
3. Significant Accounting Policies.
Each Fund is an investment company and applies the accounting and reporting guidance of the Financial Accounting Standards Board (FASB) Accounting Standards Codification Topic 946 Financial Services - Investment Companies . The financial statements have been prepared in conformity with accounting principles generally accepted in the United States of America (GAAP), which require management to make certain estimates and assumptions at the date of the financial statements. Actual results could differ from those estimates. Subsequent events, if any, through the date that the financial statements were issued have been evaluated in the preparation of the financial statements. Each Fund's Schedule of Investments lists any underlying mutual funds or exchange-traded funds (ETFs) but does not include the underlying holdings of these funds. The following summarizes the significant accounting policies of each Fund:
Investment Valuation. Investments are valued as of 4:00 p.m. Eastern time on the last calendar day of the period. The Board of Trustees (the Board) has delegated the day to day responsibility for the valuation of each Fund's investments to the Fair Value Committee (the Committee) established by each Fund's investment adviser. In accordance with valuation policies and procedures approved by the Board, each Fund attempts to obtain prices from one or more third party pricing vendors or brokers to value its investments. When current market prices, quotations or currency exchange rates are not readily available or reliable, investments will be fair valued in good faith by the Committee, in accordance with procedures adopted by the Board. Factors used in determining fair value vary by investment type and may include market or investment specific events, changes in interest rates and credit quality. The frequency with which these procedures are used cannot be predicted and they may be utilized to a significant extent. The Committee oversees each Fund's valuation policies and procedures and reports to the Board on the Committee's activities and fair value determinations. The Board monitors the appropriateness of the procedures used in valuing each Fund's investments and ratifies the fair value determinations of the Committee.
Each Fund categorizes the inputs to valuation techniques used to value its investments into a disclosure hierarchy consisting of three levels as shown below:
Level 1 - unadjusted quoted prices in active markets for identical investments
Level 2 - other significant observable inputs (including quoted prices for similar investments, interest rates, prepayment speeds, etc.)
Level 3 - unobservable inputs (including the Fund's own assumptions based on the best information available)
Valuation techniques used to value each Fund's investments by major category are as follows:
Equity securities, including restricted securities, for which market quotations are readily available, are valued at the last reported sale price or official closing price as reported by a third party pricing vendor on the primary market or exchange on which they are traded and are categorized as Level 1 in the hierarchy. In the event there were no sales during the day or closing prices are not available, securities are valued at the last quoted bid price or may be valued using the last available price and are generally categorized as Level 2 in the hierarchy. For foreign equity securities, when market or security specific events arise, comparisons to the valuation of American Depositary Receipts (ADRs), futures contracts, Exchange-Traded Funds (ETFs) and certain indexes as well as quoted prices for similar securities may be used and would be categorized as Level 2 in the hierarchy. For equity securities, including restricted securities, where observable inputs are limited, assumptions about market activity and risk are used and these securities may be categorized as Level 3 in the hierarchy.
Debt securities, including restricted securities, are valued based on evaluated prices received from third party pricing vendors or from brokers who make markets in such securities. U.S. government and government agency obligations are valued by pricing vendors who utilize matrix pricing which considers yield or price of bonds of comparable quality, coupon, maturity and type or by broker-supplied prices. When independent prices are unavailable or unreliable, debt securities may be valued utilizing pricing methodologies which consider similar factors that would be used by third party pricing vendors. Debt securities are generally categorized as Level 2 in the hierarchy but may be Level 3 depending on the circumstances.
Futures contracts are valued at the settlement price established each day by the board of trade or exchange on which they are traded and are categorized as Level 1 in the hierarchy. Investments in open-end mutual funds, including the Fidelity Central Funds, are valued at their closing net asset value (NAV) each business day and are categorized as Level 1 in the hierarchy.
Changes in valuation techniques may result in transfers in or out of an assigned level within the disclosure hierarchy. The aggregate value of investments by input level as of August 31, 2022 is included at the end of each Fund's Schedule of Investments.
Foreign Currency. Certain Funds may use foreign currency contracts to facilitate transactions in foreign-denominated securities. Gains and losses from these transactions may arise from changes in the value of the foreign currency or if the counterparties do not perform under the contracts' terms.
Foreign-denominated assets, including investment securities, and liabilities are translated into U.S. dollars at the exchange rates at period end. Purchases and sales of investment securities, income and dividends received, and expenses denominated in foreign currencies are translated into U.S. dollars at the exchange rate in effect on the transaction date.
The effects of exchange rate fluctuations on investments are included with the net realized and unrealized gain (loss) on investment securities. Other foreign currency transactions resulting in realized and unrealized gain (loss) are disclosed separately.
Investment Transactions and Income. For financial reporting purposes, the Funds' investment holdings and NAV include trades executed through the end of the last business day of the period. The NAV per share for processing shareholder transactions is calculated as of the close of business of the New York Stock Exchange (NYSE), normally 4:00 p.m. Eastern time and includes trades executed through the end of the prior business day. Gains and losses on securities sold are determined on the basis of identified cost and for certain Funds include proceeds received from litigation. Commissions paid to certain brokers with whom the investment adviser, or its affiliates, places trades on behalf of a fund include an amount in addition to trade execution, which may be rebated back to a fund. Any such rebates are included in net realized gain (loss) on investments in the Statement of Operations. Dividend income is recorded on the ex-dividend date, except for certain dividends from foreign securities where the ex-dividend date may have passed, which are recorded as soon as the Funds are informed of the ex-dividend date. Non-cash dividends included in dividend income, if any, are recorded at the fair market value of the securities received. Income and capital gain distributions from Fidelity Central Funds, if any, are recorded on the ex-dividend date. Certain distributions received by the Funds represent a return of capital or capital gain. The Funds determine the components of these distributions subsequent to the ex-dividend date, based upon receipt of tax filings or other correspondence relating to the underlying investment. These distributions are recorded as a reduction of cost of investments and/or as a realized gain. Interest income is accrued as earned and includes coupon interest and amortization of premium and accretion of discount on debt securities as applicable. Investment income is recorded net of foreign taxes withheld where recovery of such taxes is uncertain. Funds may file withholding tax reclaims in certain jurisdictions to recover a portion of amounts previously withheld. Any withholding tax reclaims income is included in the Statement of Operations in foreign tax reclaims. Any receivables for withholding tax reclaims are included in the Statement of Assets and Liabilities in reclaims receivable. Fidelity International Index Fund has filed tax reclaims for previously withheld taxes on dividends earned in certain European Union (EU) countries. These additional filings are subject to various administrative proceedings by the local jurisdictions' tax authorities within the EU, as well as a number of related judicial proceedings. Income recognized for EU reclaims is included with other reclaims in the Statement of Operations in foreign tax reclaims. These reclaims are recorded when the amount is known and there are no significant uncertainties on collectability.
Expenses. Expenses directly attributable to a fund are charged to that fund. Expenses attributable to more than one fund are allocated among the respective funds on the basis of relative net assets or other appropriate methods. Expenses included in the accompanying financial statements reflect the expenses of that fund and do not include any expenses associated with any underlying mutual funds or exchange-traded funds. Although not included in a fund's expenses, a fund indirectly bears its proportionate share of these expenses through the net asset value of each underlying mutual fund or exchange-traded fund. Expense estimates are accrued in the period to which they relate and adjustments are made when actual amounts are known.
Deferred Trustee Compensation. Under a Deferred Compensation Plan (the Plan) for certain Funds, certain independent Trustees have elected to defer receipt of a portion of their annual compensation. Deferred amounts are invested in affiliated mutual funds, are marked-to-market and remain in a fund until distributed in accordance with the Plan. The investment of deferred amounts and the offsetting payable to the Trustees presented below are included in the accompanying Statement of Assets and Liabilities in other receivables and other payables and accrued expenses, as applicable.
| Fidelity Total Market Index Fund | $967,262 |
| Fidelity Extended Market Index Fund | 494,925 |
| Fidelity International Index Fund | 444,334 |
Income Tax Information and Distributions to Shareholders. Each year, each Fund intends to qualify as a regulated investment company under Subchapter M of the Internal Revenue Code, including distributing substantially all of its taxable income and realized gains. As a result, no provision for U.S. Federal income taxes is required. Each Fund files a U.S. federal tax return, in addition to state and local tax returns as required. Each Fund's federal income tax returns are subject to examination by the Internal Revenue Service (IRS) for a period of three fiscal years after they are filed. State and local tax returns may be subject to examination for an additional fiscal year depending on the jurisdiction. Foreign taxes are provided for based on each Fund's understanding of the tax rules and rates that exist in the foreign markets in which it invests.
Distributions are declared and recorded on the ex-dividend date. Income and capital gain distributions are determined in accordance with income tax regulations, which may differ from GAAP.
Capital accounts within the financial statements are adjusted for permanent book-tax differences. These adjustments have no impact on net assets or the results of operations. Capital accounts are not adjusted for temporary book-tax differences which will reverse in a subsequent period.
Book-tax differences are primarily due to futures contracts, foreign currency transactions, passive foreign investment companies (PFIC), redemptions in kind, partnerships, certain deemed distributions, deferred Trustee compensation, equity-debt classifications, capital loss carryforwards and losses deferred due to wash sales and excise tax regulations.
As of period end, the cost and unrealized appreciation (depreciation) in securities, and derivatives if applicable, for federal income tax purposes were as follows for each Fund:
| | Tax cost | Gross unrealized appreciation | Gross unrealized depreciation | Net unrealized appreciation (depreciation) |
| Fidelity Total Market Index Fund | $40,771,974,480 | $29,967,940,800 | $(5,139,520,231) | $24,828,420,569 |
| Fidelity Extended Market Index Fund | 29,210,187,418 | 11,194,436,898 | (7,045,499,552) | 4,148,937,346 |
| Fidelity International Index Fund | 35,209,341,228 | 6,052,417,534 | (6,790,090,278) | (737,672,744) |
Capital loss carryforwards are only available to offset future capital gains of the Funds to the extent provided by regulations and may be limited. The capital loss carryforward information presented below, including any applicable limitation, is estimated as of prior fiscal period end and is subject to adjustment.
| | Short-term | Long-term | Total capital loss carryforward |
| Fidelity Total Market Index Fund | $(123,052,184) | $ (144,668,922) | $ (267,721,106) |
| Fidelity International Index Fund | (318,177,328) | (2,229,462,772) | (2,547,640,100) |
Certain of the Funds elected to defer to the next fiscal year ordinary losses recognized during the period January 1, 2022 to February 28, 2022. Loss deferrals were as follows:
| | Ordinary losses |
| Fidelity International Index Fund | $48,253,968 |
Delayed Delivery Transactions and When-Issued Securities. During the period, certain Funds transacted in securities on a delayed delivery or when-issued basis. Payment and delivery may take place after the customary settlement period for that security. The price of the underlying securities and the date when the securities will be delivered and paid for are fixed at the time the transaction is negotiated. Securities purchased on a delayed delivery or when-issued basis are identified as such in the Schedule of Investments. Compensation for interest forgone in the purchase of a delayed delivery or when-issued debt security may be received. With respect to purchase commitments, each applicable Fund identifies securities as segregated in its records with a value at least equal to the amount of the commitment. Payables and receivables associated with the purchases and sales of delayed delivery securities having the same coupon, settlement date and broker are offset. Delayed delivery or when-issued securities that have been purchased from and sold to different brokers are reflected as both payables and receivables in the Statement of Assets and Liabilities under the caption "Delayed delivery", as applicable. Losses may arise due to changes in the value of the underlying securities or if the counterparty does not perform under the contract's terms, or if the issuer does not issue the securities due to political, economic, or other factors.
Restricted Securities (including Private Placements). Funds may invest in securities that are subject to legal or contractual restrictions on resale. These securities generally may be resold in transactions exempt from registration or to the public if the securities are registered. Disposal of these securities may involve time-consuming negotiations and expense, and prompt sale at an acceptable price may be difficult. Information regarding restricted securities held at period end is included at the end of the Schedule of Investments, if applicable.
4. Derivative Instruments.
Risk Exposures and the Use of Derivative Instruments. Investment objectives allow a fund to enter into various types of derivative contracts, including futures contracts. Derivatives are investments whose value is primarily derived from underlying assets, indices or reference rates and may be transacted on an exchange or over-the-counter (OTC). Derivatives may involve a future commitment to buy or sell a specified asset based on specified terms, to exchange future cash flows at periodic intervals based on a notional principal amount, or for one party to make one or more payments upon the occurrence of specified events in exchange for periodic payments from the other party.
Derivatives were used to increase returns and to manage exposure to certain risks as defined below. The success of any strategy involving derivatives depends on analysis of numerous economic factors, and if the strategies for investment do not work as intended, the objectives may not be achieved.
Derivatives were used to increase or decrease exposure to the following risk(s):
| | |
| Equity Risk | Equity risk relates to the fluctuations in the value of financial instruments as a result of changes in market prices (other than those arising from interest rate risk or foreign exchange risk), whether caused by factors specific to an individual investment, its issuer, or all factors affecting all instruments traded in a market or market segment. |
Funds are also exposed to additional risks from investing in derivatives, such as liquidity risk and counterparty credit risk. Liquidity risk is the risk that a fund will be unable to close out the derivative in the open market in a timely manner. Counterparty credit risk is the risk that the counterparty will not be able to fulfill its obligation to a fund. Counterparty credit risk related to exchange-traded contracts may be mitigated by the protection provided by the exchange on which they trade.
Investing in derivatives may involve greater risks than investing in the underlying assets directly and, to varying degrees, may involve risk of loss in excess of any initial investment and collateral received and amounts recognized in the Statement of Assets and Liabilities. In addition, there may be the risk that the change in value of the derivative contract does not correspond to the change in value of the underlying instrument.
Futures Contracts. A futures contract is an agreement between two parties to buy or sell a specified underlying instrument for a fixed price at a specified future date. Futures contracts were used to manage exposure to the stock market.
Upon entering into a futures contract, a fund is required to deposit either cash or securities (initial margin) with a clearing broker in an amount equal to a certain percentage of the face value of the contract. Futures contracts are marked-to-market daily and subsequent daily payments are made or received by a fund depending on the daily fluctuations in the value of the futures contracts and are recorded as unrealized appreciation or (depreciation). This receivable and/or payable, if any, is included in daily variation margin on futures contracts in the Statement of Assets and Liabilities. Realized gain or (loss) is recorded upon the expiration or closing of a futures contract. The net realized gain (loss) and change in net unrealized appreciation (depreciation) on futures contracts during the period is presented in the Statement of Operations.
Any open futures contracts at period end are presented in the Schedule of Investments under the caption "Futures Contracts". The notional amount at value reflects each contract's exposure to the underlying instrument or index at period end, and is representative of volume of activity during the period unless an average notional amount is presented. Any securities deposited to meet initial margin requirements are identified in the Schedule of Investments. Any cash deposited to meet initial margin requirements is presented as segregated cash with brokers for derivative instruments in the Statement of Assets and Liabilities.
5. Purchases and Sales of Investments.
Purchases and sales of securities, other than short-term securities, U.S. government securities and in-kind transactions, as applicable, are noted in the table below.
| | Purchases ($) | Sales ($) |
| Fidelity Total Market Index Fund | 1,827,928,817 | 474,609,964 |
| Fidelity Extended Market Index Fund | 2,086,173,433 | 3,233,021,593 |
| Fidelity International Index Fund | 3,671,551,798 | 540,214,500 |
Unaffiliated Redemptions In-Kind. Shares that were redeemed in-kind for investments, including accrued interest and cash, if any, are shown in the table below. The net realized gain or loss on investments delivered through in-kind redemptions is included in the accompanying Statement of Operations. The amount of the in-kind redemptions is included in share transactions in the accompanying Statement of Changes in Net Assets. There was no gain or loss for federal income tax purposes.
| | Shares | Total net realized gain or loss ($) | Total Proceeds ($) |
| Fidelity Extended Market Index Fund | 8,351,070 | 331,140,585 | 547,163,450 |
| Fidelity International Index Fund | 18,103,796 | 345,133,005 | 737,189,970 |
Prior Fiscal Year Unaffiliated Redemptions In-Kind. Shares that were redeemed in-kind for investments, including accrued interest and cash, if any, are shown in the table below; along with realized gain or loss on investments delivered through in-kind redemptions. The amount of the in-kind redemptions is included in share transactions in the accompanying Statement of Changes in Net Assets. There was no gain or loss for federal income tax purposes.
| | Shares | Total net realized gain or loss ($) | Total Proceeds ($) |
| Fidelity Extended Market Index Fund | 11,358,735 | 659,324,385 | 1,030,395,694 |
6. Fees and Other Transactions with Affiliates.
Management Fee and Expense Contract. Fidelity Management & Research Company LLC (the investment adviser) and its affiliates provide the Funds with investment management related services for which the Funds pay a monthly management fee. The management fee is based on an annual rate of .015%, .035% and .035% of average net assets for Fidelity Total Market Index Fund, Fidelity Extended Market Index Fund and Fidelity International Index Fund, respectively. The management fee is reduced by an amount equal to the fees and expenses paid by each Fund to the independent Trustees. Under the management contract, the investment adviser pays all other operating expenses, except the compensation of the independent Trustees and certain other expenses such as interest expense.
Under the expense contract, the investment adviser pays all other operating expenses, except the compensation of the independent Trustees, as necessary so that the total expenses do not exceed .015%, .035% and .035% of average net assets for Fidelity Total Market Index Fund, Fidelity Extended Market Index Fund and Fidelity International Index Fund, respectively. These expense contracts will remain in place through April 30, 2023.
Sub-Adviser. Geode Capital Management, LLC (Geode), serves as sub-adviser for the Funds. Geode provides discretionary investment advisory services to the Funds and is paid by the investment adviser for providing these services.
Interfund Lending Program. Pursuant to an Exemptive Order issued by the Securities and Exchange Commission (the SEC), each Fund, along with other registered investment companies having management contracts with Fidelity Management & Research Company LLC (FMR), or other affiliated entities of FMR, may participate in an interfund lending program. This program provides an alternative credit facility allowing each Fund to borrow from, or lend money to, other participating affiliated funds. At period end, Fidelity Total Market Index Fund had interfund loans outstanding. Any open loans, including accrued interest, at period end are presented under the caption "Notes payable to affiliates" in the Statement of Assets and Liabilities. Activity in this program during the period for which loans were outstanding is presented in the table below. Interest expense on borrowings is paid by the investment adviser under the Expense Contract.
| | Borrower or Lender | Average Loan Balance | Weighted Average Interest Rate |
| Fidelity Total Market Index Fund | Borrower | $ 7,095,000 | 2.57% |
| Fidelity Extended Market Index Fund | Borrower | $47,240,237 | .82% |
Interfund Trades. Funds may purchase from or sell securities to other Fidelity Funds under procedures adopted by the Board. The procedures have been designed to ensure these interfund trades are executed in accordance with Rule 17a-7 of the 1940 Act. Any interfund trades are included within the respective purchases and sales amounts shown in the Purchases and Sales of Investments note. During the period, there were no interfund trades.
7. Committed Line of Credit.
Certain Funds participate with other funds managed by the investment adviser or an affiliate in a $4.25 billion credit facility (the "line of credit") to be utilized for temporary or emergency purposes to fund shareholder redemptions or for other short-term liquidity purposes. The commitment fees on the pro-rata portion of the line of credit are borne by the investment adviser. During the period, there were no borrowings on this line of credit.
8. Security Lending.
Funds lend portfolio securities from time to time in order to earn additional income. Lending agents are used, including National Financial Services (NFS), an affiliate of the investment adviser. Pursuant to a securities lending agreement, NFS will receive a fee, which is capped at 9.9% of a fund's daily lending revenue, for its services as lending agent. A fund may lend securities to certain qualified borrowers, including NFS. On the settlement date of the loan, a fund receives collateral (in the form of U.S. Treasury obligations, letters of credit and/or cash) against the loaned securities and maintains collateral in an amount not less than 100% of the market value of the loaned securities during the period of the loan. The market value of the loaned securities is determined at the close of business of a fund and any additional required collateral is delivered to a fund on the next business day. A fund or borrower may terminate the loan at any time, and if the borrower defaults on its obligation to return the securities loaned because of insolvency or other reasons, a fund may apply collateral received from the borrower against the obligation. A fund may experience delays and costs in recovering the securities loaned. Any cash collateral received is invested in the Fidelity Securities Lending Cash Central Fund. Any loaned securities are identified as such in the Schedule of Investments, and the value of loaned securities and cash collateral at period end, as applicable, are presented in the Statement of Assets and Liabilities. Security lending income represents the income earned on investing cash collateral, less rebates paid to borrowers and any lending agent fees associated with the loan, plus any premium payments received for lending certain types of securities. Security lending income is presented in the Statement of Operations as a component of income from Fidelity Central Funds. Affiliated security lending activity, if any, was as follows:
| | Total Security Lending Fees Paid to NFS | Security Lending Income From Securities Loaned to NFS | Value of Securities Loaned to NFS at Period End |
| Fidelity Total Market Index Fund | $ 1,137,575 | $ 458,578 | $10,006,498 |
| Fidelity Extended Market Index Fund | $ 3,243,646 | $ 1,041,577 | $26,019,863 |
| Fidelity International Index Fund | $ 184,513 | $ - | $ - |
9. Expense Reductions.
Through arrangements with each applicable Fund's custodian, credits realized as a result of certain uninvested cash balances were used to reduce each applicable Fund's expenses. All of the applicable expense reductions are noted in the table below.
| | Custodian credits |
| Fidelity Total Market Index Fund | $ 1,120 |
| Fidelity Extended Market Index Fund | 5,704 |
| Fidelity International Index Fund | 15 |
10. Other.
A fund's organizational documents provide former and current trustees and officers with a limited indemnification against liabilities arising in connection with the performance of their duties to the fund. In the normal course of business, a fund may also enter into contracts that provide general indemnifications. A fund's maximum exposure under these arrangements is unknown as this would be dependent on future claims that may be made against a fund. The risk of material loss from such claims is considered remote.
11. Risk and Uncertainties.
Many factors affect a fund's performance. Developments that disrupt global economies and financial markets, such as pandemics, epidemics, outbreaks of infectious diseases, war, terrorism, and environmental disasters, may significantly affect a fund's investment performance. The effects of these developments to a fund will be impacted by the types of securities in which a fund invests, the financial condition, industry, economic sector, and geographic location of an issuer, and a fund's level of investment in the securities of that issuer.
As a shareholder, you incur two types of costs: (1) transaction costs, which may include sales charges (loads) on purchase payments or redemption proceeds, as applicable and (2) ongoing costs, which generally include management fees, distribution and/or service (12b-1) fees and other Fund expenses. This Example is intended to help you understand your ongoing costs (in dollars) of investing in a fund and to compare these costs with the ongoing costs of investing in other mutual funds.
| The Example is based on an investment of $1,000 invested at the beginning of the period and held for the entire period (March 1, 2022 to August 31, 2022). |
Actual Expenses
The first line of the accompanying table provides information about actual account values and actual expenses. You may use the information in this line, together with the amount you invested, to estimate the expenses that you paid over the period. Simply divide your account value by $1,000.00 (for example, an $8,600 account value divided by $1,000.00 = 8.6), then multiply the result by the number in the first line for a class/Fund under the heading entitled "Expenses Paid During Period" to estimate the expenses you paid on your account during this period. If any fund is a shareholder of any underlying mutual funds or exchange-traded funds (ETFs) (the Underlying Funds), such fund indirectly bears its proportional share of the expenses of the Underlying Funds in addition to the direct expenses incurred presented in the table. These fees and expenses are not included in the annualized expense ratio used to calculate the expense estimate in the table below.
Hypothetical Example for Comparison Purposes
The second line of the accompanying table provides information about hypothetical account values and hypothetical expenses based on the actual expense ratio and an assumed rate of return of 5% per year before expenses, which is not the actual return. The hypothetical account values and expenses may not be used to estimate the actual ending account balance or expenses you paid for the period. You may use this information to compare the ongoing costs of investing in the Fund and other funds. To do so, compare this 5% hypothetical example with the 5% hypothetical examples that appear in the shareholder reports of the other funds. If any fund is a shareholder of any Underlying Funds, such fund indirectly bears its proportional share of the expenses of the Underlying Funds in addition to the direct expenses as presented in the table. These fees and expenses are not included in the annualized expense ratio used to calculate the expense estimate in the table below.
Please note that the expenses shown in the table are meant to highlight your ongoing costs only and do not reflect any transaction costs. Therefore, the second line of the table is useful in comparing ongoing costs only, and will not help you determine the relative total costs of owning different funds. In addition, if these transactional costs were included, your costs would have been higher.
| | | | | Annualized Expense Ratio- A | | Beginning Account Value March 1, 2022 | | Ending Account Value August 31, 2022 | | Expenses Paid During Period- C March 1, 2022 to August 31, 2022 |
| | | | | | | | | | |
| Fidelity® Total Market Index Fund | | | | .01% | | | | | | |
| Actual | | | | | | $ 1,000 | | $ 903.70 | | $ .05 |
Hypothetical- B | | | | | | $ 1,000 | | $ 1,025.16 | | $ .05 |
| | | | | | | | | | |
| Fidelity® Extended Market Index Fund | | | | .03% | | | | | | |
| Actual | | | | | | $ 1,000 | | $ 864.40 | | $ .14 |
Hypothetical- B | | | | | | $ 1,000 | | $ 1,025.05 | | $ .15 |
| | | | | | | | | | |
| Fidelity® International Index Fund | | | | .03% | | | | | | |
| Actual | | | | | | $ 1,000 | | $ 859.20 | | $ .14 |
Hypothetical- B | | | | | | $ 1,000 | | $ 1,025.05 | | $ .15 |
| |
A Annualized expense ratio reflects expenses net of applicable fee waivers.
B 5% return per year before expenses
C Expenses are equal to the annualized expense ratio, multiplied by the average account value over the period, multiplied by 184/ 365 (to reflect the one-half year period). The fees and expenses of any Underlying Funds are not included in each annualized expense ratio.
Fidelity Extended Market Index Fund
Fidelity International Index Fund
Fidelity Total Market Index Fund
Each year, the Board of Trustees, including the Independent Trustees (together, the Board), votes on the renewal of the management contract with Fidelity Management & Research Company LLC (FMR) and the sub-advisory agreement (Sub-Advisory Agreement) for each fund with Geode Capital Management, LLC (Geode) (together, the Advisory Contracts). FMR and Geode are referred to herein as the Investment Advisers. The Board, assisted by the advice of fund counsel and Independent Trustees' counsel, requests and considers a broad range of information relevant to the renewal of the Advisory Contracts throughout the year.
The Board meets regularly and, at each of its meetings, covers an extensive agenda of topics and materials and considers factors that are relevant to its annual consideration of the renewal of each fund's Advisory Contracts, including the services and support provided to each fund and its shareholders. The Board has established various standing committees (Committees), each composed of and chaired by Independent Trustees with varying backgrounds, to which the Board has assigned specific subject matter responsibilities in order to enhance effective decision-making by the Board. The Board, acting directly and through its Committees, requests and receives information concerning the annual consideration of the renewal of each fund's Advisory Contracts. The Board also meets as needed to review matters specifically related to the Board's annual consideration of the renewal of the Advisory Contracts. Members of the Board may also meet with trustees of other Fidelity funds through joint ad hoc committees to discuss certain matters relevant to all of the Fidelity funds.
At its May 2022 meeting, the Board unanimously determined to renew each fund's Advisory Contracts. In reaching its determination, the Board considered all factors it believed relevant, including (i) the nature, extent, and quality of the services provided to each fund and its shareholders (including the investment performance of each fund); (ii) the competitiveness relative to peer funds of each fund's management fee and total expense ratio; (iii) the total costs of the services provided by and the profits realized by Fidelity and Geode from their respective relationships with each fund; and (iv) the extent to which, if any, economies of scale exist and are realized as each fund grows, and whether any economies of scale are appropriately shared with fund shareholders.
In considering whether to renew the Advisory Contracts for each fund, the Board reached a determination, with the assistance of fund counsel and Independent Trustees' counsel and through the exercise of its business judgment, that the renewal of the Advisory Contracts was in the best interests of each fund and its shareholders and that the compensation payable under the Advisory Contracts was fair and reasonable. The Board's decision to renew the Advisory Contracts was not based on any single factor, but rather was based on a comprehensive consideration of all the information provided to the Board at its meetings throughout the year. The Board, in reaching its determination to renew the Advisory Contracts, was aware that shareholders of each fund have a broad range of investment choices available to them, including a wide choice among funds offered by Fidelity's competitors, and that each fund's shareholders, who have the opportunity to review and weigh the disclosure provided by the fund in its prospectus and other public disclosures, have chosen to invest in that fund, which is part of the Fidelity family of funds.
Nature, Extent, and Quality of Services Provided. The Board considered staffing as it relates to the funds, including the backgrounds of investment personnel of Fidelity and Geode, and also considered the funds' investment objectives, strategies, and related investment philosophies. The Independent Trustees also had discussions with senior management of Fidelity's investment operations and investment groups and with senior management of Geode. The Board considered the structure of the investment personnel compensation programs and whether the structures provide appropriate incentives to act in the best interests of each fund. Additionally, the Board considered the portfolio managers' investments, if any, in the funds that they manage. The Board also considered the steps Fidelity and Geode have taken to ensure the continued provision of high quality services to the Fidelity funds during the COVID-19 pandemic, including the expansion of staff in client facing positions to maintain service levels in periods of high volumes and volatility.
The Trustees also discussed with representatives of Fidelity, at meetings throughout the year, Fidelity's role in, among other things, overseeing compliance with federal securities laws and other applicable requirements by Geode with respect to the funds and monitoring and overseeing the performance and investment capabilities of Geode. The Trustees considered that the Board had received from Fidelity periodic reports about its oversight and due diligence processes, as well as periodic reports regarding the performance of Geode.
The Board also considered the nature, extent and quality of services provided by Geode. The Trustees noted that under the Sub-Advisory Agreement, subject to oversight by Fidelity, Geode is responsible for, among other things, identifying investments and arranging for execution of portfolio transactions to implement each fund's investment strategy. In addition, the Trustees noted that Geode is responsible for providing such reporting as may be requested by Fidelity to fulfill its oversight responsibilities discussed above.
Resources Dedicated to Investment Management and Support Services . The Board and the Fund Oversight and Research Committees reviewed the general qualifications and capabilities of Fidelity's and Geode's investment staffs, including their size, education, experience, and resources, as well as Fidelity's and Geode's approach to recruiting, training, managing, and compensating investment personnel. The Board considered that Fidelity's and Geode's investment professionals have extensive resources, tools and capabilities so as to provide competitive investment results over time, and that those professionals also have access to sophisticated tools that permit them to assess portfolio construction and risk and performance attribution characteristics continuously. Additionally, in its deliberations, the Board considered Fidelity's and Geode's trading, risk management, compliance, and technology and operations capabilities and resources, which are integral parts of the investment management process.
Shareholder and Administrative Services . The Board considered (i) the nature, extent, quality, and cost of advisory, administrative, and shareholder services performed by the Investment Advisers and their affiliates under the Advisory Contracts and by FMR's affiliates under separate agreements covering transfer agency, pricing and bookkeeping, and securities lending services for each fund; (ii) the nature and extent of the supervision of third party service providers, principally custodians, subcustodians, and pricing vendors; and (iii) the resources devoted to, and the record of compliance with, each fund's compliance policies and procedures. The Board also reviewed the allocation of fund brokerage, including allocations to brokers affiliated with the Investment Advisers.
The Board noted that the growth of fund assets over time across the complex allows Fidelity to reinvest in the development of services designed to enhance the value and convenience of the Fidelity funds as investment vehicles. These services include 24-hour access to account information and market information over the Internet and through telephone representatives, investor education materials, and asset allocation tools. The Board also considered that it reviews customer service metrics such as telephone response times, continuity of services on the website and metrics addressing services at Fidelity Investor Centers.
Investment in a Large Fund Family . The Board considered the benefits to shareholders of investing in a Fidelity fund, including the benefits of investing in a fund that is part of a large family of funds offering a variety of investment disciplines and providing a large variety of mutual fund investor services. The Board noted that Fidelity had taken, or had made recommendations that resulted in the Fidelity funds taking, a number of actions over the previous year that benefited particular funds, including: (i) continuing to dedicate additional resources to Fidelity's investment research process, which includes meetings with management of issuers of securities in which the funds invest; (ii) continuing efforts to enhance Fidelity's global research capabilities; (iii) launching new funds and ETFs with innovative structures, strategies and pricing and making other enhancements to meet client needs; (iv) launching new share classes of existing funds; (v) eliminating purchase minimums and broadening eligibility requirements for certain funds and share classes; (vi) reducing management fees and total expenses for certain target date funds and classes and index funds; (vii) lowering expenses for certain existing funds and classes by implementing or lowering expense caps; (viii) rationalizing product lines and gaining increased efficiencies from fund mergers and liquidations; (ix) continuing to develop, acquire and implement systems and technology to improve services to the funds and shareholders, strengthen information security, and increase efficiency; and (x) continuing to implement enhancements to further strengthen Fidelity's product line to increase investors' probability of success in achieving their investment goals, including retirement income goals.
Investment Performance .The Board considered whether each fund has operated in accordance with its investment objective, as well as its record of compliance with its investment restrictions and its performance history.
The Board took into account discussions that occur at Board meetings throughout the year with representatives of the Investment Advisers about fund investment performance. In this regard the Board noted that as part of regularly scheduled fund reviews and other reports to the Board on fund performance, the Board considers annualized return information for each fund for different time periods, measured against the securities market index the fund seeks to track. The Board also periodically considers each fund's tracking error versus its benchmark index. In its evaluation of fund investment performance, the Board gave particular attention to information indicating changes in performance of certain Fidelity funds for specific time periods and discussed with the Investment Advisers the reasons for any overperformance or underperformance.
In addition to reviewing absolute and relative fund performance, the Independent Trustees periodically consider the appropriateness of fund performance metrics in evaluating the results achieved. In general, the Independent Trustees believe that an index fund's performance should be evaluated based on net performance (after fees and expenses) of the fund compared to a fund's benchmark index, over appropriate time periods taking into account relevant factors including the following: general market conditions; the characteristics of the fund's benchmark index; the extent to which statistical sampling is employed; any securities lending revenues; and fund cash flows and other factors.
The Independent Trustees recognize that shareholders evaluate performance on a net basis over their own holding periods, for which one-, three-, and five-year periods are often used as a proxy. For this reason, the performance information reviewed by the Board also included net cumulative total return information for each fund and its benchmark index for the most recent one-, three-, and five-year periods ended September 30, 2021, as shown below. Peer groups are not shown below because each fund does not generally utilize a peer group for performance comparison purposes. For Fidelity International Index Fund, returns of the benchmark index are "net MA," i.e., adjusted for tax withholding rates applicable to U.S.-based funds organized as Massachusetts business trusts.
Fidelity Extended Market Index Fund
Fidelity International Index Fund
Fidelity Total Market Index Fund
Based on its review, the Board concluded that the nature, extent, and quality of services provided to each fund under the Advisory Contracts should continue to benefit the shareholders of each fund.
Competitiveness of Management Fee and Total Expense Ratio. The Board considered each fund's management fee and total expense ratio compared to "mapped groups" of competitive funds and classes created for the purpose of facilitating the Trustees' competitive analysis of management fees and total expenses. Fidelity creates "mapped groups" by combining similar Lipper investment objective categories that have comparable investment mandates. Combining Lipper investment objective categories aids the Board's management fee and total expense ratio comparisons by broadening the competitive group used for comparison.
Management Fee . The Board considered two proprietary management fee comparisons for the 12-month periods ended September 30 (June 30 for periods ended 2019 and 2018 and December 31 for periods prior to 2018) shown in basis points (BP) in the charts below. The group of Lipper funds used by the Board for management fee comparisons is referred to below as the "Total Mapped Group." The Total Mapped Group comparison focuses on a fund's standing in terms of gross management fees before expense reimbursements or caps relative to the total universe of funds with comparable investment mandates, regardless of whether their management fee structures also are comparable. Funds with comparable investment mandates offer exposure to similar types of securities. Funds with comparable management fee structures have similar management fee contractual arrangements (e.g., flat rate charged for advisory services, all-inclusive fee rate, etc.). "TMG %" represents the percentage of funds in the Total Mapped Group that had management fees that were lower than a fund's. For example, a hypothetical TMG % of 20% would mean that 80% of the funds in the Total Mapped Group had higher, and 20% had lower, management fees than a fund. The funds' actual TMG %s and the number of funds in the Total Mapped Group are in the charts below. The "Asset-Sized Peer Group" (ASPG) comparison focuses on a fund's standing relative to a subset of non-Fidelity funds within the Total Mapped Group that are similar in size and management fee structure. For example, if a fund is in the first quartile of the ASPG, the fund's management fee ranks in the least expensive or lowest 25% of funds in the ASPG. The ASPG represents at least 15% of the funds in the Total Mapped Group with comparable asset size and management fee structures, subject to a minimum of 50 funds (or all funds in the Total Mapped Group if fewer than 50). Additional information, such as the ASPG quartile in which a fund's management fee rate ranked, is also included in the charts and was considered by the Board.
Fidelity Extended Market Index Fund
The Board considered that (i) effective July 1, 2016, the fund's management fee rate was reduced from 0.06% to 0.045%, and (ii) effective May 1, 2020, the fund's management fee rate was further reduced from 0.045% to 0.035%. The Board considered that the chart below reflects the fund's lower management fee rates for 2016 and 2020, as if the lower fee rates were in effect for the entire year.
The Board noted that the fund's management fee rate ranked below the median of its Total Mapped Group and below the median of its ASPG for the 12-month period ended September 30, 2021.
Fidelity International Index Fund
The Board considered that (i) effective July 1, 2016, the fund's management fee rate was reduced from 0.06% to 0.05%, (ii) effective August 1, 2017, the fund's management fee rate was further reduced from 0.05% to 0.045%, and (iii) effective May 1, 2019, the fund's management fee rate was further reduced from 0.045% to 0.035%. The Board considered that the chart below reflects the fund's lower management fee rates for 2016, 2018 and 2019, as if the lower fee rates were in effect for the entire year.
The Board noted that the fund's management fee rate ranked below the median of its Total Mapped Group and below the median of its ASPG for the 12-month period ended September 30, 2021.
Fidelity Total Market Index Fund
The Board considered that effective July 1, 2016, the fund's management fee rate was reduced from 0.035% to 0.015%. The Board considered that the chart below reflects the fund's lower management fee rate for 2016, as if the lower fee rates were in effect for the entire year.
The Board noted that the fund's management fee rate ranked below the median of its Total Mapped Group and below the median of its ASPG for the 12-month period ended September 30, 2021.
Based on its review, the Board concluded that each fund's management fee is fair and reasonable in light of the services that the fund receives and the other factors considered.
Total Expense Ratio . In its review of the total expense ratio of each fund, the Board considered the fund's unitary fee rate as well as other fund expenses paid by FMR under the fund's management contract, such as transfer agent fees, pricing and bookkeeping fees, custodial, legal and audit fees. The Board also noted that Fidelity may agree to waive fees or reimburse expenses from time to time, and the extent to which, if any, it has done so for each fund. Each fund is compared to those funds and classes in the Total Mapped Group (used by the Board for management fee comparisons) that have a similar sales load structure. The Board also considered a total expense ASPG comparison for each fund, which focuses on the total expenses of the fund relative to a subset of non-Fidelity funds within the total expense similar sales load structure group. The total expense ASPG is limited to 15 larger and 15 smaller classes in fund average assets for a total of 30 classes, where possible. The total expense ASPG comparison excludes performance adjustments and fund-paid 12b-1 fees to eliminate variability in fee structures.
The Board noted that each fund's total net expense ratio ranked below the similar sales load structure group competitive median and below the ASPG competitive median for the 12-month period ended September 30, 2021.
The Board considered that current contractual arrangements for Fidelity Extended Market Index Fund oblige FMR to pay all "class-level" expenses of the fund to the extent necessary to limit total operating expenses, with certain exceptions, to 0.035%. These contractual arrangements may not be amended to increase the fees or expenses payable except by a vote of a majority of the Board.
The Board considered that current contractual arrangements for Fidelity International Index Fund oblige FMR to pay all "class-level" expenses of the fund to the extent necessary to limit total operating expenses, with certain exceptions, to 0.035%. These contractual arrangements may not be amended to increase the fees or expenses payable except by a vote of a majority of the Board.
The Board considered that current contractual arrangements for Fidelity Total Market Index Fund oblige FMR to pay all "class-level" expenses of the fund to the extent necessary to limit total operating expenses, with certain exceptions, to 0.015%. These contractual arrangements may not be amended to increase the fees or expenses payable except by a vote of a majority of the Board.
Fees Charged to Other Clients . The Board also considered fee structures applicable to clients of Fidelity and Geode, such as other funds advised or subadvised by Fidelity or Geode, pension plan clients, and other institutional clients with similar mandates. The Board noted that a joint ad hoc committee created by it and the boards of other Fidelity funds periodically reviews and compares Fidelity's institutional investment advisory business with its business of providing services to the Fidelity funds and also noted the most recent findings of the committee. The Board noted that the committee's review included a consideration of the differences in services provided, fees charged, and costs incurred, as well as competition in the markets serving the different categories of clients.
Based on its review of total expense ratios and fees charged to other Fidelity clients, the Board concluded that each fund's total expense ratio was reasonable in light of the services that the fund and its shareholders receive and the other factors considered.
Costs of the Services and Profitability. The Board considered the revenues earned and the expenses incurred by Fidelity in conducting the business of developing, marketing, distributing, managing, administering, and servicing each fund and servicing each fund's shareholders. The Board also considered the level of Fidelity's profits in respect of all the Fidelity funds.
On an annual basis, Fidelity presents to the Board information about the profitability of its relationships with each fund. Fidelity calculates profitability information for each fund, as well as aggregate profitability information for groups of Fidelity funds and all Fidelity funds, using a series of detailed revenue and cost allocation methodologies which originate with the books and records of Fidelity on which Fidelity's audited financial statements are based. The Audit Committee of the Board reviews any significant changes from the prior year's methodologies and the full Board approves such changes.
A public accounting firm has been engaged annually by the Board as part of the Board's assessment of Fidelity's profitability analysis. The engagement includes the review and assessment of the methodologies used by Fidelity in determining the revenues and expenses attributable to Fidelity's mutual fund business, and completion of agreed-upon procedures in respect of the mathematical accuracy of certain fund profitability information and its conformity to established allocation methodologies. After considering the reports issued under the engagement and information provided by Fidelity, the Board concluded that while other allocation methods may also be reasonable, Fidelity's profitability methodologies are reasonable in all material respects.
The Board also reviewed Fidelity's and Geode's non-fund businesses and potential indirect benefits such businesses may have received as a result of their association with Fidelity's mutual fund business (i.e., fall-out benefits) as well as cases where Fidelity's and Geode's affiliates may benefit from the funds' business. The Board considered areas where potential indirect benefits to the Fidelity funds from their relationships with Fidelity and Geode may exist. The Board's consideration of these matters was informed by the findings of a joint ad hoc committee created by it and the boards of other Fidelity funds to evaluate potential fall-out benefits.
The Board considered the costs of the services provided by and the profits realized by Fidelity in connection with the operation of each fund and was satisfied that the profitability was not excessive.
The Board also considered information regarding the profitability of Geode's relationship with each fund.
Economies of Scale. The Board considered whether there have been economies of scale in respect of the management of the Fidelity funds, whether the Fidelity funds (including each fund) have appropriately benefited from any such economies of scale, and whether there is potential for realization of any further economies of scale. The Board considered the extent to which each fund will benefit from economies of scale as assets grow through increased services to the fund, through waivers or reimbursements, or through fee or expense ratio reductions. The Board recognized that, due to each fund's current contractual arrangements, its expense ratio will not decline if the fund's operating costs decrease as assets grow, or rise as assets decrease. The Board also noted that a committee (the Economies of Scale Committee) created by it and the boards of other Fidelity funds periodically analyzes whether Fidelity attains economies of scale in respect of the management and servicing of the Fidelity funds, whether the Fidelity funds have appropriately benefited from such economies of scale, and whether there is potential for realization of any further economies of scale.
The Board concluded, taking into account the analysis of the Economies of Scale Committee, that economies of scale, if any, are being appropriately shared between fund shareholders and Fidelity.
Additional Information Requested by the Board. In order to develop fully the factual basis for consideration of the Fidelity funds' advisory contracts, the Board requested and received additional information on certain topics, including: (i) fund flow and performance trends, in particular the underperformance of certain funds and strategies, and Fidelity's long-term strategies for certain funds, including any consideration of fund liquidations or mergers; (ii) the operation of performance fees, competitor use of performance fees, and consideration of the expansion of performance fees to additional funds; (iii) Fidelity's pricing philosophy compared to competitors; (iv) fund profitability methodology and data; (v) evaluation of competitive fund data and peer group classifications and fee and expense comparisons; (vi) the management fee and expense structures for different funds and classes and information about the differences between various fee and expense structures; (vii) group fee breakpoints and related voluntary fee waivers; and (viii) information regarding other accounts managed by Fidelity and the funds' sub-advisory arrangements.
Based on its evaluation of all of the conclusions noted above, and after considering all factors it believed relevant, the Board concluded that the advisory and sub-advisory fee arrangements are fair and reasonable and that each fund's Advisory Contracts should be renewed.
1.929382.110
SIF-I-SANN-1022
Fidelity® 500 Index Fund
Semi-Annual Report
August 31, 2022
Contents
To view a fund's proxy voting guidelines and proxy voting record for the 12-month period ended June 30, visit http://www.fidelity.com/proxyvotingresults or visit the Securities and Exchange Commission's (SEC) web site at http://www.sec.gov.
You may also call 1-800-544-8544 to request a free copy of the proxy voting guidelines.
Standard & Poor's ® ; and S&P ® ; are registered trademarks of Standard & Poor's Financial Services LLC ("S&P") and Dow Jones ® ; is a registered trademark of Dow Jones Trademark Holdings LLC ("Dow Jones"). The fund is not sponsored, endorsed, sold or promoted by SPDJI, Dow Jones, S&P, or their respective affiliates and none of such parties make any representation regarding the advisability of investing in such product(s) nor do they have any liability for any errors, omissions, or interruptions of the index or indices.
Standard & Poor's, S&P and S&P 500 are registered service marks of The McGraw-Hill Companies, Inc. and have been licensed for use by Fidelity Distributors Corporation.
Other third-party marks appearing herein are the property of their respective owners.
All other marks appearing herein are registered or unregistered trademarks or service marks of FMR LLC or an affiliated company. © 2022 FMR LLC. All rights reserved.
This report and the financial statements contained herein are submitted for the general information of the shareholders of the Fund. This report is not authorized for distribution to prospective investors in the Fund unless preceded or accompanied by an effective prospectus.
A fund files its complete schedule of portfolio holdings with the SEC for the first and third quarters of each fiscal year on Form N-PORT. Forms N-PORT are available on the SEC's web site at http://www.sec.gov. A fund's Forms N-PORT may be reviewed and copied at the SEC's Public Reference Room in Washington, DC. Information regarding the operation of the SEC's Public Reference Room may be obtained by calling 1-800-SEC-0330.
For a complete list of a fund's portfolio holdings, view the most recent holdings listing, semiannual report, or annual report on Fidelity's web site at http://www.fidelity.com, http://www.institutional.fidelity.com, or http://www.401k.com, as applicable.
NOT FDIC INSURED •MAY LOSE VALUE •NO BANK GUARANTEE
Neither the Fund nor Fidelity Distributors Corporation is a bank.
Top Holdings (% of Fund's net assets) |
| |
| Apple, Inc. | 7.2 | |
| Microsoft Corp. | 5.9 | |
| Amazon.com, Inc. | 3.3 | |
| Tesla, Inc. | 2.1 | |
| Alphabet, Inc. Class A | 2.0 | |
| Alphabet, Inc. Class C | 1.8 | |
| Berkshire Hathaway, Inc. Class B | 1.5 | |
| UnitedHealth Group, Inc. | 1.5 | |
| Johnson & Johnson | 1.3 | |
| Exxon Mobil Corp. | 1.2 | |
| | 27.8 | |
| |
| Market Sectors (% of Fund's net assets) |
| |
| Information Technology | 27.3 | |
| Health Care | 14.0 | |
| Consumer Discretionary | 11.4 | |
| Financials | 10.8 | |
| Communication Services | 8.4 | |
| Industrials | 7.9 | |
| Consumer Staples | 6.8 | |
| Energy | 4.7 | |
| Utilities | 3.1 | |
| Real Estate | 2.9 | |
| Materials | 2.5 | |
| |
Asset Allocation (% of Fund's net assets) |
|
Foreign investments - 2.9% |
|
Showing Percentage of Net Assets
| Common Stocks - 99.8% |
| | | Shares | Value ($) (000s) |
| COMMUNICATION SERVICES - 8.4% | | | |
| Diversified Telecommunication Services - 0.9% | | | |
| AT&T, Inc. | | 76,783,504 | 1,346,783 |
| Lumen Technologies, Inc. (a) | | 9,971,954 | 99,321 |
| Verizon Communications, Inc. (a) | | 45,043,078 | 1,883,251 |
| | | | 3,329,355 |
| Entertainment - 1.4% | | | |
| Activision Blizzard, Inc. | | 8,386,024 | 658,219 |
| Electronic Arts, Inc. | | 3,016,232 | 382,669 |
| Live Nation Entertainment, Inc. (a)(b) | | 1,468,751 | 132,716 |
| Netflix, Inc. (b) | | 4,765,038 | 1,065,272 |
| Take-Two Interactive Software, Inc. (b) | | 1,695,573 | 207,809 |
| The Walt Disney Co. (a)(b) | | 19,536,231 | 2,189,621 |
| Warner Bros Discovery, Inc. (b) | | 23,686,383 | 313,608 |
| | | | 4,949,914 |
| Interactive Media & Services - 5.0% | | | |
| Alphabet, Inc.: | | | |
| Class A (b) | | 64,516,410 | 6,981,966 |
| Class C (a)(b) | | 59,155,525 | 6,456,826 |
| Match Group, Inc. (b) | | 3,063,115 | 173,158 |
| Meta Platforms, Inc. Class A (b) | | 24,599,027 | 4,007,919 |
| Twitter, Inc. (b) | | 8,181,173 | 317,020 |
| | | | 17,936,889 |
| Media - 0.8% | | | |
| Charter Communications, Inc. Class A (b) | | 1,242,243 | 512,587 |
| Comcast Corp. Class A | | 47,948,863 | 1,735,269 |
| DISH Network Corp. Class A (a)(b) | | 2,689,295 | 46,659 |
| Fox Corp.: | | | |
| Class A | | 3,333,669 | 113,945 |
| Class B | | 1,560,807 | 49,353 |
| Interpublic Group of Companies, Inc. | | 4,222,186 | 116,701 |
| News Corp.: | | | |
| Class A | | 4,149,219 | 70,205 |
| Class B | | 1,308,058 | 22,551 |
| Omnicom Group, Inc. (a) | | 2,206,566 | 147,619 |
| Paramount Global Class B (a) | | 6,525,302 | 152,627 |
| | | | 2,967,516 |
| Wireless Telecommunication Services - 0.3% | | | |
| T-Mobile U.S., Inc. (a)(b) | | 6,319,271 | 909,722 |
TOTAL COMMUNICATION SERVICES | | | 30,093,396 |
| CONSUMER DISCRETIONARY - 11.4% | | | |
| Auto Components - 0.1% | | | |
| Aptiv PLC (b) | | 2,905,859 | 271,494 |
| BorgWarner, Inc. | | 2,569,538 | 96,872 |
| | | | 368,366 |
| Automobiles - 2.4% | | | |
| Ford Motor Co. | | 42,353,877 | 645,473 |
| General Motors Co. | | 15,637,960 | 597,526 |
| Tesla, Inc. (a)(b) | | 27,001,370 | 7,441,848 |
| | | | 8,684,847 |
| Distributors - 0.2% | | | |
| Genuine Parts Co. | | 1,518,667 | 236,927 |
| LKQ Corp. | | 2,790,826 | 148,528 |
| Pool Corp. (a) | | 429,812 | 145,788 |
| | | | 531,243 |
| Hotels, Restaurants & Leisure - 1.9% | | | |
| Booking Holdings, Inc. (b) | | 435,700 | 817,290 |
| Caesars Entertainment, Inc. (a)(b) | | 2,299,173 | 99,140 |
| Carnival Corp. (a)(b) | | 10,469,264 | 99,039 |
| Chipotle Mexican Grill, Inc. (a)(b) | | 299,905 | 478,888 |
| Darden Restaurants, Inc. (a) | | 1,337,829 | 165,503 |
| Domino's Pizza, Inc. | | 386,598 | 143,760 |
| Expedia, Inc. (a)(b) | | 1,625,700 | 166,878 |
| Hilton Worldwide Holdings, Inc. | | 2,985,237 | 380,200 |
| Las Vegas Sands Corp. (b) | | 3,687,936 | 138,777 |
| Marriott International, Inc. Class A | | 2,948,751 | 453,341 |
| McDonald's Corp. | | 7,931,975 | 2,001,079 |
| MGM Resorts International | | 3,792,766 | 123,796 |
| Norwegian Cruise Line Holdings Ltd. (a)(b) | | 4,495,047 | 58,795 |
| Penn Entertainment, Inc. (a)(b) | | 1,753,253 | 54,754 |
| Royal Caribbean Cruises Ltd. (a)(b) | | 2,406,378 | 98,301 |
| Starbucks Corp. (a) | | 12,301,020 | 1,034,147 |
| Wynn Resorts Ltd. (a)(b) | | 1,131,834 | 68,578 |
| Yum! Brands, Inc. | | 3,058,510 | 340,229 |
| | | | 6,722,495 |
| Household Durables - 0.3% | | | |
| D.R. Horton, Inc. | | 3,435,873 | 244,462 |
| Garmin Ltd. (a) | | 1,636,368 | 144,802 |
| Lennar Corp. Class A (a) | | 2,773,830 | 214,833 |
| Mohawk Industries, Inc. (a)(b) | | 552,001 | 60,919 |
| Newell Brands, Inc. | | 3,947,120 | 70,456 |
| NVR, Inc. (b) | | 33,170 | 137,326 |
| PulteGroup, Inc. | | 2,548,650 | 103,628 |
| Whirlpool Corp. | | 602,791 | 94,397 |
| | | | 1,070,823 |
| Internet & Direct Marketing Retail - 3.4% | | | |
| Amazon.com, Inc. (b) | | 93,847,527 | 11,897,051 |
| eBay, Inc. | | 6,004,558 | 264,981 |
| Etsy, Inc. (a)(b) | | 1,363,409 | 143,990 |
| | | | 12,306,022 |
| Leisure Products - 0.0% | | | |
| Hasbro, Inc. | | 1,405,837 | 110,808 |
| Multiline Retail - 0.5% | | | |
| Dollar General Corp. | | 2,453,823 | 582,587 |
| Dollar Tree, Inc. (a)(b) | | 2,414,406 | 327,587 |
| Target Corp. (a) | | 4,959,643 | 795,229 |
| | | | 1,705,403 |
| Specialty Retail - 2.1% | | | |
| Advance Auto Parts, Inc. | | 655,228 | 110,498 |
| AutoZone, Inc. (b) | | 212,889 | 451,156 |
| Bath & Body Works, Inc. | | 2,557,912 | 95,487 |
| Best Buy Co., Inc. | | 2,171,594 | 153,510 |
| CarMax, Inc. (a)(b) | | 1,721,845 | 152,280 |
| Lowe's Companies, Inc. (a) | | 7,090,821 | 1,376,612 |
| O'Reilly Automotive, Inc. (a)(b) | | 704,930 | 491,421 |
| Ross Stores, Inc. | | 3,768,839 | 325,138 |
| The Home Depot, Inc. | | 11,083,316 | 3,196,650 |
| TJX Companies, Inc. (a) | | 12,596,335 | 785,381 |
| Tractor Supply Co. | | 1,199,985 | 222,177 |
| Ulta Beauty, Inc. (b) | | 560,158 | 235,194 |
| | | | 7,595,504 |
| Textiles, Apparel & Luxury Goods - 0.5% | | | |
| NIKE, Inc. Class B | | 13,608,026 | 1,448,574 |
| PVH Corp. | | 724,203 | 40,736 |
| Ralph Lauren Corp. (a) | | 496,439 | 45,340 |
| Tapestry, Inc. | | 2,700,680 | 93,795 |
| VF Corp. | | 3,462,050 | 143,502 |
| | | | 1,771,947 |
TOTAL CONSUMER DISCRETIONARY | | | 40,867,458 |
| CONSUMER STAPLES - 6.8% | | | |
| Beverages - 1.8% | | | |
| Brown-Forman Corp. Class B (non-vtg.) | | 1,960,385 | 142,520 |
| Constellation Brands, Inc. Class A (sub. vtg.) | | 1,745,708 | 429,531 |
| Keurig Dr. Pepper, Inc. | | 7,911,578 | 301,589 |
| Molson Coors Beverage Co. Class B | | 2,020,010 | 104,374 |
| Monster Beverage Corp. (b) | | 4,033,485 | 358,294 |
| PepsiCo, Inc. | | 14,829,913 | 2,554,749 |
| The Coca-Cola Co. | | 41,845,638 | 2,582,294 |
| | | | 6,473,351 |
| Food & Staples Retailing - 1.6% | | | |
| Costco Wholesale Corp. | | 4,753,777 | 2,481,947 |
| Kroger Co. (a) | | 7,036,470 | 337,328 |
| Sysco Corp. (a) | | 5,464,356 | 449,279 |
| Walgreens Boots Alliance, Inc. (a) | | 7,689,413 | 269,591 |
| Walmart, Inc. | | 15,057,663 | 1,995,893 |
| | | | 5,534,038 |
| Food Products - 1.1% | | | |
| Archer Daniels Midland Co. | | 6,035,297 | 530,442 |
| Campbell Soup Co. (a) | | 2,168,051 | 109,226 |
| Conagra Brands, Inc. (a) | | 5,146,873 | 176,949 |
| General Mills, Inc. | | 6,458,992 | 496,051 |
| Hormel Foods Corp. | | 3,039,572 | 152,830 |
| Kellogg Co. | | 2,717,873 | 197,698 |
| Lamb Weston Holdings, Inc. | | 1,549,255 | 123,212 |
| McCormick & Co., Inc. (non-vtg.) (a) | | 2,683,785 | 225,626 |
| Mondelez International, Inc. | | 14,843,203 | 918,201 |
| The Hershey Co. | | 1,565,816 | 351,792 |
| The J.M. Smucker Co. | | 1,163,260 | 162,845 |
| The Kraft Heinz Co. | | 7,613,912 | 284,760 |
| Tyson Foods, Inc. Class A | | 3,126,884 | 235,705 |
| | | | 3,965,337 |
| Household Products - 1.4% | | | |
| Church & Dwight Co., Inc. | | 2,603,829 | 217,967 |
| Colgate-Palmolive Co. | | 8,987,297 | 702,896 |
| Kimberly-Clark Corp. | | 3,613,671 | 460,815 |
| Procter & Gamble Co. | | 25,733,546 | 3,549,685 |
| The Clorox Co. (a) | | 1,320,089 | 190,542 |
| | | | 5,121,905 |
| Personal Products - 0.2% | | | |
| Estee Lauder Companies, Inc. Class A | | 2,486,213 | 632,443 |
| Tobacco - 0.7% | | | |
| Altria Group, Inc. | | 19,419,048 | 876,187 |
| Philip Morris International, Inc. | | 16,625,632 | 1,587,582 |
| | | | 2,463,769 |
TOTAL CONSUMER STAPLES | | | 24,190,843 |
| ENERGY - 4.7% | | | |
| Energy Equipment & Services - 0.3% | | | |
| Baker Hughes Co. Class A | | 10,032,026 | 253,409 |
| Halliburton Co. | | 9,674,101 | 291,481 |
| Schlumberger Ltd. | | 15,160,011 | 578,354 |
| | | | 1,123,244 |
| Oil, Gas & Consumable Fuels - 4.4% | | | |
| APA Corp. | | 3,627,689 | 141,879 |
| Chevron Corp. (a) | | 21,073,506 | 3,330,878 |
| ConocoPhillips Co. | | 13,872,837 | 1,518,382 |
| Coterra Energy, Inc. (a) | | 8,642,626 | 267,144 |
| Devon Energy Corp. | | 6,583,279 | 464,911 |
| Diamondback Energy, Inc. | | 1,832,930 | 244,293 |
| EOG Resources, Inc. | | 6,282,038 | 762,011 |
| Exxon Mobil Corp. | | 45,181,423 | 4,318,892 |
| Hess Corp. | | 2,971,210 | 358,863 |
| Kinder Morgan, Inc. (a) | | 20,914,921 | 383,161 |
| Marathon Oil Corp. | | 7,590,306 | 194,236 |
| Marathon Petroleum Corp. | | 5,802,415 | 584,593 |
| Occidental Petroleum Corp. | | 9,549,207 | 677,994 |
| ONEOK, Inc. | | 4,790,158 | 293,301 |
| Phillips 66 Co. | | 5,160,015 | 461,615 |
| Pioneer Natural Resources Co. | | 2,413,461 | 611,137 |
| The Williams Companies, Inc. | | 13,063,730 | 444,559 |
| Valero Energy Corp. (a) | | 4,377,014 | 512,636 |
| | | | 15,570,485 |
TOTAL ENERGY | | | 16,693,729 |
| FINANCIALS - 10.8% | | | |
| Banks - 3.7% | | | |
| Bank of America Corp. | | 76,044,051 | 2,555,841 |
| Citigroup, Inc. | | 20,827,984 | 1,016,614 |
| Citizens Financial Group, Inc. | | 5,260,742 | 192,964 |
| Comerica, Inc. | | 1,402,456 | 112,617 |
| Fifth Third Bancorp | | 7,358,596 | 251,296 |
| First Republic Bank (a) | | 1,924,929 | 292,262 |
| Huntington Bancshares, Inc. (a) | | 15,435,784 | 206,840 |
| JPMorgan Chase & Co. | | 31,501,190 | 3,582,630 |
| KeyCorp | | 10,001,158 | 176,920 |
| M&T Bank Corp. | | 1,924,329 | 349,805 |
| PNC Financial Services Group, Inc. | | 4,435,843 | 700,863 |
| Regions Financial Corp. | | 10,022,930 | 217,197 |
| Signature Bank | | 674,931 | 117,681 |
| SVB Financial Group (a)(b) | | 631,204 | 256,597 |
| Truist Financial Corp. | | 14,280,023 | 668,876 |
| U.S. Bancorp | | 14,501,064 | 661,394 |
| Wells Fargo & Co. | | 40,653,240 | 1,776,953 |
| Zions Bancorp NA | | 1,623,390 | 89,335 |
| | | | 13,226,685 |
| Capital Markets - 3.0% | | | |
| Ameriprise Financial, Inc. | | 1,178,769 | 315,922 |
| Bank of New York Mellon Corp. | | 7,970,884 | 331,031 |
| BlackRock, Inc. Class A | | 1,527,442 | 1,017,872 |
| Cboe Global Markets, Inc. | | 1,138,924 | 134,359 |
| Charles Schwab Corp. | | 16,175,670 | 1,147,664 |
| CME Group, Inc. | | 3,854,921 | 754,061 |
| FactSet Research Systems, Inc. | | 406,462 | 176,136 |
| Franklin Resources, Inc. (a) | | 3,002,662 | 78,279 |
| Goldman Sachs Group, Inc. | | 3,683,625 | 1,225,432 |
| Intercontinental Exchange, Inc. | | 5,987,657 | 603,855 |
| Invesco Ltd. | | 3,611,462 | 59,481 |
| MarketAxess Holdings, Inc. | | 404,800 | 100,629 |
| Moody's Corp. (a) | | 1,721,595 | 489,828 |
| Morgan Stanley | | 15,009,490 | 1,279,109 |
| MSCI, Inc. | | 870,081 | 390,875 |
| NASDAQ, Inc. | | 3,709,111 | 220,803 |
| Northern Trust Corp. | | 2,234,969 | 212,523 |
| Raymond James Financial, Inc. (a) | | 2,084,995 | 217,611 |
| S&P Global, Inc. | | 3,722,804 | 1,311,097 |
| State Street Corp. | | 3,937,477 | 269,127 |
| T. Rowe Price Group, Inc. (a) | | 2,437,862 | 292,543 |
| | | | 10,628,237 |
| Consumer Finance - 0.5% | | | |
| American Express Co. | | 6,542,296 | 994,429 |
| Capital One Financial Corp. | | 4,215,652 | 446,100 |
| Discover Financial Services | | 3,013,477 | 302,824 |
| Synchrony Financial | | 5,378,699 | 176,152 |
| | | | 1,919,505 |
| Diversified Financial Services - 1.5% | | | |
| Berkshire Hathaway, Inc. Class B (b) | | 19,404,230 | 5,448,708 |
| Insurance - 2.1% | | | |
| AFLAC, Inc. | | 6,356,244 | 377,688 |
| Allstate Corp. | | 2,949,320 | 355,393 |
| American International Group, Inc. | | 8,496,622 | 439,700 |
| Aon PLC | | 2,277,914 | 636,130 |
| Arthur J. Gallagher & Co. | | 2,253,075 | 409,091 |
| Assurant, Inc. | | 580,085 | 91,938 |
| Brown & Brown, Inc. | | 2,512,823 | 158,408 |
| Chubb Ltd. | | 4,544,493 | 859,136 |
| Cincinnati Financial Corp. (a) | | 1,599,489 | 155,086 |
| Everest Re Group Ltd. | | 422,989 | 113,805 |
| Globe Life, Inc. | | 972,925 | 94,559 |
| Hartford Financial Services Group, Inc. | | 3,527,227 | 226,836 |
| Lincoln National Corp. | | 1,733,554 | 79,847 |
| Loews Corp. | | 2,085,287 | 115,337 |
| Marsh & McLennan Companies, Inc. | | 5,383,253 | 868,696 |
| MetLife, Inc. | | 7,413,703 | 476,924 |
| Principal Financial Group, Inc. (a) | | 2,520,436 | 188,428 |
| Progressive Corp. | | 6,273,072 | 769,392 |
| Prudential Financial, Inc. | | 4,022,047 | 385,111 |
| The Travelers Companies, Inc. | | 2,573,692 | 416,012 |
| W.R. Berkley Corp. | | 2,247,002 | 145,606 |
| Willis Towers Watson PLC | | 1,195,760 | 247,319 |
| | | | 7,610,442 |
TOTAL FINANCIALS | | | 38,833,577 |
| HEALTH CARE - 14.0% | | | |
| Biotechnology - 2.0% | | | |
| AbbVie, Inc. (a) | | 18,953,053 | 2,548,428 |
| Amgen, Inc. | | 5,729,535 | 1,376,807 |
| Biogen, Inc. (b) | | 1,570,765 | 306,896 |
| Gilead Sciences, Inc. | | 13,453,076 | 853,867 |
| Incyte Corp. (b) | | 2,019,381 | 142,225 |
| Moderna, Inc. (b) | | 3,711,555 | 490,927 |
| Regeneron Pharmaceuticals, Inc. (b) | | 1,158,649 | 673,245 |
| Vertex Pharmaceuticals, Inc. (a)(b) | | 2,743,099 | 772,896 |
| | | | 7,165,291 |
| Health Care Equipment & Supplies - 2.6% | | | |
| Abbott Laboratories | | 18,779,644 | 1,927,730 |
| Abiomed, Inc. (a)(b) | | 488,694 | 126,709 |
| Align Technology, Inc. (b) | | 786,064 | 191,564 |
| Baxter International, Inc. | | 5,400,580 | 310,317 |
| Becton, Dickinson & Co. | | 3,057,452 | 771,762 |
| Boston Scientific Corp. (b) | | 15,332,794 | 618,065 |
| Dentsply Sirona, Inc. | | 2,310,815 | 75,725 |
| DexCom, Inc. (b) | | 4,209,784 | 346,086 |
| Edwards Lifesciences Corp. (b) | | 6,668,571 | 600,838 |
| Hologic, Inc. (b) | | 2,674,722 | 180,704 |
| IDEXX Laboratories, Inc. (b) | | 901,013 | 313,210 |
| Intuitive Surgical, Inc. (b) | | 3,849,977 | 792,094 |
| Medtronic PLC | | 14,388,614 | 1,265,047 |
| ResMed, Inc. | | 1,568,973 | 345,049 |
| STERIS PLC | | 1,073,907 | 216,263 |
| Stryker Corp. | | 3,609,727 | 740,716 |
| Teleflex, Inc. | | 503,024 | 113,814 |
| The Cooper Companies, Inc. | | 528,786 | 151,994 |
| Zimmer Biomet Holdings, Inc. | | 2,247,806 | 238,987 |
| | | | 9,326,674 |
| Health Care Providers & Services - 3.5% | | | |
| AmerisourceBergen Corp. | | 1,617,544 | 237,067 |
| Cardinal Health, Inc. | | 2,921,906 | 206,637 |
| Centene Corp. (b) | | 6,273,178 | 562,955 |
| Cigna Corp. | | 3,402,897 | 964,551 |
| CVS Health Corp. | | 14,064,383 | 1,380,419 |
| DaVita HealthCare Partners, Inc. (b) | | 649,362 | 55,384 |
| Elevance Health, Inc. | | 2,585,746 | 1,254,371 |
| HCA Holdings, Inc. | | 2,440,284 | 482,859 |
| Henry Schein, Inc. (b) | | 1,480,657 | 108,695 |
| Humana, Inc. | | 1,356,695 | 653,629 |
| Laboratory Corp. of America Holdings | | 994,250 | 223,975 |
| McKesson Corp. | | 1,559,104 | 572,191 |
| Molina Healthcare, Inc. (b) | | 629,584 | 212,403 |
| Quest Diagnostics, Inc. (a) | | 1,258,793 | 157,739 |
| UnitedHealth Group, Inc. | | 10,062,318 | 5,225,664 |
| Universal Health Services, Inc. Class B | | 719,977 | 70,443 |
| | | | 12,368,982 |
| Life Sciences Tools & Services - 1.8% | | | |
| Agilent Technologies, Inc. | | 3,218,849 | 412,817 |
| Bio-Rad Laboratories, Inc. Class A (b) | | 232,131 | 112,593 |
| Bio-Techne Corp. | | 420,802 | 139,626 |
| Charles River Laboratories International, Inc. (b) | | 544,907 | 111,842 |
| Danaher Corp. | | 6,940,425 | 1,873,290 |
| Illumina, Inc. (b) | | 1,684,969 | 339,757 |
| IQVIA Holdings, Inc. (b) | | 2,030,103 | 431,722 |
| Mettler-Toledo International, Inc. (b) | | 243,253 | 294,935 |
| PerkinElmer, Inc. (a) | | 1,352,995 | 182,736 |
| Thermo Fisher Scientific, Inc. | | 4,198,607 | 2,289,584 |
| Waters Corp. (a)(b) | | 646,047 | 192,910 |
| West Pharmaceutical Services, Inc. | | 794,499 | 235,720 |
| | | | 6,617,532 |
| Pharmaceuticals - 4.1% | | | |
| Bristol-Myers Squibb Co. | | 22,835,173 | 1,539,319 |
| Catalent, Inc. (a)(b) | | 1,922,141 | 169,148 |
| Eli Lilly & Co. | | 8,458,443 | 2,547,937 |
| Johnson & Johnson | | 28,222,975 | 4,553,495 |
| Merck & Co., Inc. | | 27,122,576 | 2,315,183 |
| Organon & Co. | | 2,720,363 | 77,612 |
| Pfizer, Inc. | | 60,179,396 | 2,721,914 |
| Viatris, Inc. | | 13,002,768 | 124,176 |
| Zoetis, Inc. Class A | | 5,047,709 | 790,118 |
| | | | 14,838,902 |
TOTAL HEALTH CARE | | | 50,317,381 |
| INDUSTRIALS - 7.9% | | | |
| Aerospace & Defense - 1.7% | | | |
| General Dynamics Corp. | | 2,472,167 | 565,953 |
| Howmet Aerospace, Inc. | | 4,034,080 | 142,927 |
| Huntington Ingalls Industries, Inc. | | 429,522 | 98,902 |
| L3Harris Technologies, Inc. | | 2,068,674 | 472,051 |
| Lockheed Martin Corp. | | 2,540,166 | 1,067,149 |
| Northrop Grumman Corp. (a) | | 1,567,185 | 749,099 |
| Raytheon Technologies Corp. | | 15,951,052 | 1,431,607 |
| Textron, Inc. | | 2,306,860 | 143,902 |
| The Boeing Co. (b) | | 5,964,830 | 955,864 |
| TransDigm Group, Inc. | | 556,177 | 333,923 |
| | | | 5,961,377 |
| Air Freight & Logistics - 0.7% | | | |
| C.H. Robinson Worldwide, Inc. | | 1,364,984 | 155,813 |
| Expeditors International of Washington, Inc. | | 1,799,234 | 185,123 |
| FedEx Corp. | | 2,557,418 | 539,129 |
| United Parcel Service, Inc. Class B | | 7,877,178 | 1,532,190 |
| | | | 2,412,255 |
| Airlines - 0.2% | | | |
| Alaska Air Group, Inc. (b) | | 1,352,393 | 58,910 |
| American Airlines Group, Inc. (a)(b) | | 6,966,318 | 90,492 |
| Delta Air Lines, Inc. (b) | | 6,875,634 | 213,626 |
| Southwest Airlines Co. (b) | | 6,359,720 | 233,402 |
| United Airlines Holdings, Inc. (b) | | 3,504,334 | 122,687 |
| | | | 719,117 |
| Building Products - 0.4% | | | |
| A.O. Smith Corp. | | 1,394,690 | 78,730 |
| Allegion PLC | | 941,744 | 89,560 |
| Carrier Global Corp. | | 9,097,782 | 355,905 |
| Fortune Brands Home & Security, Inc. | | 1,402,960 | 86,184 |
| Johnson Controls International PLC | | 7,461,368 | 403,958 |
| Masco Corp. | | 2,530,558 | 128,729 |
| Trane Technologies PLC | | 2,508,255 | 386,447 |
| | | | 1,529,513 |
| Commercial Services & Supplies - 0.5% | | | |
| Cintas Corp. | | 932,860 | 379,525 |
| Copart, Inc. (b) | | 2,292,537 | 274,302 |
| Republic Services, Inc. (a) | | 2,236,131 | 319,141 |
| Rollins, Inc. | | 2,429,654 | 82,025 |
| Waste Management, Inc. | | 4,097,022 | 692,520 |
| | | | 1,747,513 |
| Construction & Engineering - 0.1% | | | |
| Quanta Services, Inc. (a) | | 1,541,343 | 217,792 |
| Electrical Equipment - 0.5% | | | |
| AMETEK, Inc. | | 2,476,610 | 297,589 |
| Eaton Corp. PLC | | 4,279,453 | 584,744 |
| Emerson Electric Co. | | 6,370,914 | 520,759 |
| Generac Holdings, Inc. (a)(b) | | 684,606 | 150,894 |
| Rockwell Automation, Inc. | | 1,246,962 | 295,455 |
| | | | 1,849,441 |
| Industrial Conglomerates - 0.8% | | | |
| 3M Co. (a) | | 6,103,413 | 758,959 |
| General Electric Co. (a) | | 11,805,131 | 866,969 |
| Honeywell International, Inc. | | 7,301,169 | 1,382,476 |
| | | | 3,008,404 |
| Machinery - 1.6% | | | |
| Caterpillar, Inc. (a) | | 5,720,678 | 1,056,666 |
| Cummins, Inc. | | 1,513,341 | 325,928 |
| Deere & Co. | | 2,994,262 | 1,093,654 |
| Dover Corp. | | 1,546,212 | 193,215 |
| Fortive Corp. | | 3,844,518 | 243,473 |
| IDEX Corp. | | 815,198 | 164,026 |
| Illinois Tool Works, Inc. | | 3,039,734 | 592,231 |
| Ingersoll Rand, Inc. (a) | | 4,353,784 | 206,239 |
| Nordson Corp. (a) | | 577,941 | 131,291 |
| Otis Worldwide Corp. | | 4,534,657 | 327,493 |
| PACCAR, Inc. (a) | | 3,729,060 | 326,330 |
| Parker Hannifin Corp. | | 1,376,848 | 364,865 |
| Pentair PLC | | 1,773,986 | 78,942 |
| Snap-On, Inc. (a) | | 572,459 | 124,716 |
| Stanley Black & Decker, Inc. | | 1,619,169 | 142,649 |
| Westinghouse Air Brake Tech Co. | | 1,958,985 | 171,705 |
| Xylem, Inc. | | 1,931,580 | 175,967 |
| | | | 5,719,390 |
| Professional Services - 0.3% | | | |
| Equifax, Inc. | | 1,312,099 | 247,659 |
| Jacobs Solutions, Inc. | | 1,379,583 | 171,868 |
| Leidos Holdings, Inc. | | 1,465,761 | 139,321 |
| Nielsen Holdings PLC | | 3,857,864 | 107,403 |
| Robert Half International, Inc. | | 1,185,309 | 91,233 |
| Verisk Analytics, Inc. | | 1,693,571 | 316,969 |
| | | | 1,074,453 |
| Road & Rail - 0.9% | | | |
| CSX Corp. | | 23,319,927 | 738,076 |
| J.B. Hunt Transport Services, Inc. (a) | | 899,075 | 156,457 |
| Norfolk Southern Corp. | | 2,556,230 | 621,496 |
| Old Dominion Freight Lines, Inc. | | 984,776 | 267,278 |
| Union Pacific Corp. | | 6,735,853 | 1,512,266 |
| | | | 3,295,573 |
| Trading Companies & Distributors - 0.2% | | | |
| Fastenal Co. (a) | | 6,173,633 | 310,719 |
| United Rentals, Inc. (b) | | 768,071 | 224,307 |
| W.W. Grainger, Inc. | | 460,397 | 255,493 |
| | | | 790,519 |
TOTAL INDUSTRIALS | | | 28,325,347 |
| INFORMATION TECHNOLOGY - 27.3% | | | |
| Communications Equipment - 0.8% | | | |
| Arista Networks, Inc. (b) | | 2,413,576 | 289,339 |
| Cisco Systems, Inc. | | 44,555,328 | 1,992,514 |
| F5, Inc. (b) | | 648,588 | 101,867 |
| Juniper Networks, Inc. | | 3,465,326 | 98,485 |
| Motorola Solutions, Inc. | | 1,794,335 | 436,759 |
| | | | 2,918,964 |
| Electronic Equipment & Components - 0.7% | | | |
| Amphenol Corp. Class A | | 6,404,591 | 470,930 |
| CDW Corp. | | 1,449,180 | 247,375 |
| Corning, Inc. | | 8,152,970 | 279,810 |
| Keysight Technologies, Inc. (b) | | 1,951,766 | 319,875 |
| TE Connectivity Ltd. | | 3,455,464 | 436,114 |
| Teledyne Technologies, Inc. (b) | | 502,413 | 185,069 |
| Trimble, Inc. (a)(b) | | 2,682,891 | 169,693 |
| Zebra Technologies Corp. Class A (a)(b) | | 563,237 | 169,895 |
| | | | 2,278,761 |
| IT Services - 4.4% | | | |
| Accenture PLC Class A (a) | | 6,793,512 | 1,959,656 |
| Akamai Technologies, Inc. (b) | | 1,719,344 | 155,222 |
| Automatic Data Processing, Inc. | | 4,480,526 | 1,095,085 |
| Broadridge Financial Solutions, Inc. | | 1,257,313 | 215,214 |
| Cognizant Technology Solutions Corp. Class A (a) | | 5,589,829 | 353,109 |
| DXC Technology Co. (b) | | 2,622,132 | 64,976 |
| EPAM Systems, Inc. (a)(b) | | 612,970 | 261,432 |
| Fidelity National Information Services, Inc. | | 6,550,795 | 598,546 |
| Fiserv, Inc. (a)(b) | | 6,239,583 | 631,383 |
| FleetCor Technologies, Inc. (b) | | 829,517 | 176,297 |
| Gartner, Inc. (a)(b) | | 863,816 | 246,464 |
| Global Payments, Inc. | | 3,019,645 | 375,130 |
| IBM Corp. (a) | | 9,646,847 | 1,239,137 |
| Jack Henry & Associates, Inc. | | 781,477 | 150,200 |
| MasterCard, Inc. Class A | | 9,210,799 | 2,987,707 |
| Paychex, Inc. | | 3,446,142 | 425,047 |
| PayPal Holdings, Inc. (b) | | 12,420,504 | 1,160,572 |
| VeriSign, Inc. (b) | | 1,022,179 | 186,261 |
| Visa, Inc. Class A (a) | | 17,651,080 | 3,507,446 |
| | | | 15,788,884 |
| Semiconductors & Semiconductor Equipment - 5.1% | | | |
| Advanced Micro Devices, Inc. (b) | | 17,380,679 | 1,475,098 |
| Analog Devices, Inc. | | 5,612,790 | 850,506 |
| Applied Materials, Inc. | | 9,474,809 | 891,295 |
| Broadcom, Inc. | | 4,378,998 | 2,185,602 |
| Enphase Energy, Inc. (b) | | 1,448,236 | 414,833 |
| Intel Corp. | | 43,856,375 | 1,399,895 |
| KLA Corp. (a) | | 1,600,612 | 550,819 |
| Lam Research Corp. | | 1,487,781 | 651,514 |
| Microchip Technology, Inc. | | 5,963,255 | 389,102 |
| Micron Technology, Inc. (a) | | 11,976,757 | 677,046 |
| Monolithic Power Systems, Inc. | | 470,251 | 213,108 |
| NVIDIA Corp. | | 26,856,680 | 4,053,747 |
| NXP Semiconductors NV | | 2,816,128 | 463,478 |
| onsemi (b) | | 4,660,272 | 320,487 |
| Qorvo, Inc. (b) | | 1,162,981 | 104,412 |
| Qualcomm, Inc. | | 12,012,505 | 1,588,894 |
| Skyworks Solutions, Inc. | | 1,726,004 | 170,098 |
| SolarEdge Technologies, Inc. (a)(b) | | 594,051 | 163,940 |
| Teradyne, Inc. | | 1,718,247 | 145,432 |
| Texas Instruments, Inc. | | 9,890,302 | 1,633,977 |
| | | | 18,343,283 |
| Software - 8.8% | | | |
| Adobe, Inc. (b) | | 5,067,775 | 1,892,510 |
| ANSYS, Inc. (b) | | 933,006 | 231,665 |
| Autodesk, Inc. (b) | | 2,333,075 | 470,675 |
| Cadence Design Systems, Inc. (b) | | 2,957,638 | 513,949 |
| Ceridian HCM Holding, Inc. (a)(b) | | 1,473,465 | 87,877 |
| Citrix Systems, Inc. | | 1,337,708 | 137,476 |
| Fortinet, Inc. (b) | | 7,145,154 | 347,898 |
| Intuit, Inc. | | 3,033,286 | 1,309,712 |
| Microsoft Corp. | | 80,216,003 | 20,974,078 |
| NortonLifeLock, Inc. | | 6,240,716 | 140,978 |
| Oracle Corp. | | 16,884,141 | 1,251,959 |
| Paycom Software, Inc. (b) | | 516,456 | 181,379 |
| PTC, Inc. (b) | | 1,129,157 | 129,729 |
| Roper Technologies, Inc. | | 1,135,964 | 457,316 |
| Salesforce.com, Inc. (b) | | 10,656,015 | 1,663,617 |
| ServiceNow, Inc. (a)(b) | | 2,150,024 | 934,443 |
| Synopsys, Inc. (b) | | 1,642,055 | 568,184 |
| Tyler Technologies, Inc. (b) | | 444,827 | 165,258 |
| | | | 31,458,703 |
| Technology Hardware, Storage & Peripherals - 7.5% | | | |
| Apple, Inc. | | 164,913,701 | 25,927,747 |
| Hewlett Packard Enterprise Co. | | 13,944,567 | 189,646 |
| HP, Inc. | | 11,297,831 | 324,361 |
| NetApp, Inc. | | 2,386,802 | 172,160 |
| Seagate Technology Holdings PLC (a) | | 2,119,953 | 141,952 |
| Western Digital Corp. (b) | | 3,358,872 | 141,946 |
| | | | 26,897,812 |
TOTAL INFORMATION TECHNOLOGY | | | 97,686,407 |
| MATERIALS - 2.5% | | | |
| Chemicals - 1.8% | | | |
| Air Products & Chemicals, Inc. | | 2,378,616 | 600,482 |
| Albemarle Corp. | | 1,256,090 | 336,582 |
| Celanese Corp. Class A | | 1,161,661 | 128,782 |
| CF Industries Holdings, Inc. | | 2,237,351 | 231,476 |
| Corteva, Inc. | | 7,762,010 | 476,820 |
| Dow, Inc. | | 7,809,224 | 398,270 |
| DuPont de Nemours, Inc. | | 5,454,185 | 303,471 |
| Eastman Chemical Co. (a) | | 1,382,314 | 125,791 |
| Ecolab, Inc. | | 2,665,488 | 436,687 |
| FMC Corp. | | 1,350,753 | 145,989 |
| International Flavors & Fragrances, Inc. | | 2,733,254 | 301,970 |
| Linde PLC | | 5,397,927 | 1,526,858 |
| LyondellBasell Industries NV Class A | | 2,775,975 | 230,406 |
| PPG Industries, Inc. (a) | | 2,533,288 | 321,677 |
| Sherwin-Williams Co. | | 2,566,821 | 595,759 |
| The Mosaic Co. | | 3,882,539 | 209,152 |
| | | | 6,370,172 |
| Construction Materials - 0.1% | | | |
| Martin Marietta Materials, Inc. | | 668,892 | 232,580 |
| Vulcan Materials Co. | | 1,425,369 | 237,310 |
| | | | 469,890 |
| Containers & Packaging - 0.3% | | | |
| Amcor PLC | | 16,117,859 | 193,575 |
| Avery Dennison Corp. | | 876,419 | 160,928 |
| Ball Corp. | | 3,429,884 | 191,422 |
| International Paper Co. (a) | | 3,975,163 | 165,446 |
| Packaging Corp. of America | | 1,004,984 | 137,602 |
| Sealed Air Corp. | | 1,566,808 | 84,310 |
| WestRock Co. | | 2,733,395 | 110,949 |
| | | | 1,044,232 |
| Metals & Mining - 0.3% | | | |
| Freeport-McMoRan, Inc. | | 15,543,987 | 460,102 |
| Newmont Corp. | | 8,512,268 | 352,067 |
| Nucor Corp. (a) | | 2,853,634 | 379,362 |
| | | | 1,191,531 |
TOTAL MATERIALS | | | 9,075,825 |
| REAL ESTATE - 2.9% | | | |
| Equity Real Estate Investment Trusts (REITs) - 2.8% | | | |
| Alexandria Real Estate Equities, Inc. | | 1,593,035 | 244,372 |
| American Tower Corp. | | 4,984,085 | 1,266,207 |
| AvalonBay Communities, Inc. | | 1,499,613 | 301,287 |
| Boston Properties, Inc. | | 1,529,532 | 121,491 |
| Camden Property Trust (SBI) | | 1,142,483 | 146,820 |
| Crown Castle International Corp. | | 4,644,465 | 793,414 |
| Digital Realty Trust, Inc. (a) | | 3,053,239 | 377,472 |
| Duke Realty Corp. | | 4,123,454 | 242,665 |
| Equinix, Inc. | | 976,252 | 641,759 |
| Equity Residential (SBI) | | 3,670,235 | 268,588 |
| Essex Property Trust, Inc. | | 700,725 | 185,734 |
| Extra Space Storage, Inc. | | 1,440,214 | 286,214 |
| Federal Realty Investment Trust (SBI) | | 766,633 | 77,637 |
| Healthpeak Properties, Inc. | | 5,786,985 | 151,908 |
| Host Hotels & Resorts, Inc. | | 7,666,306 | 136,230 |
| Iron Mountain, Inc. | | 3,116,409 | 163,954 |
| Kimco Realty Corp. | | 6,628,396 | 139,727 |
| Mid-America Apartment Communities, Inc. | | 1,238,016 | 205,102 |
| Prologis (REIT), Inc. | | 7,939,700 | 988,572 |
| Public Storage | | 1,637,886 | 541,862 |
| Realty Income Corp. | | 6,452,416 | 440,571 |
| Regency Centers Corp. | | 1,663,789 | 101,225 |
| SBA Communications Corp. Class A | | 1,156,515 | 376,157 |
| Simon Property Group, Inc. | | 3,521,616 | 359,134 |
| UDR, Inc. | | 3,210,083 | 144,036 |
| Ventas, Inc. | | 4,286,920 | 205,172 |
| VICI Properties, Inc. | | 10,328,633 | 340,742 |
| Vornado Realty Trust | | 1,706,938 | 44,756 |
| Welltower Op | | 4,869,005 | 373,209 |
| Weyerhaeuser Co. | | 7,985,076 | 272,770 |
| | | | 9,938,787 |
| Real Estate Management & Development - 0.1% | | | |
| CBRE Group, Inc. (b) | | 3,505,733 | 276,813 |
TOTAL REAL ESTATE | | | 10,215,600 |
| UTILITIES - 3.1% | | | |
| Electric Utilities - 2.0% | | | |
| Alliant Energy Corp. (a) | | 2,690,092 | 164,203 |
| American Electric Power Co., Inc. | | 5,507,996 | 551,901 |
| Constellation Energy Corp. | | 3,503,995 | 285,891 |
| Duke Energy Corp. | | 8,257,527 | 882,812 |
| Edison International (a) | | 4,088,547 | 277,081 |
| Entergy Corp. | | 2,181,279 | 251,501 |
| Evergy, Inc. | | 2,461,248 | 168,669 |
| Eversource Energy (a) | | 3,698,976 | 331,761 |
| Exelon Corp. | | 10,513,196 | 461,634 |
| FirstEnergy Corp. | | 6,123,504 | 242,185 |
| NextEra Energy, Inc. | | 21,070,149 | 1,792,227 |
| NRG Energy, Inc. (a) | | 2,544,976 | 105,057 |
| Pinnacle West Capital Corp. | | 1,211,986 | 91,323 |
| PPL Corp. | | 7,892,883 | 229,525 |
| Southern Co. | | 11,396,061 | 878,294 |
| Xcel Energy, Inc. | | 5,841,655 | 433,743 |
| | | | 7,147,807 |
| Gas Utilities - 0.0% | | | |
| Atmos Energy Corp. | | 1,490,990 | 169,048 |
| Independent Power and Renewable Electricity Producers - 0.0% | | | |
| The AES Corp. | | 7,163,104 | 182,301 |
| Multi-Utilities - 1.0% | | | |
| Ameren Corp. | | 2,769,597 | 256,520 |
| CenterPoint Energy, Inc. | | 6,751,080 | 212,862 |
| CMS Energy Corp. | | 3,111,765 | 210,169 |
| Consolidated Edison, Inc. (a) | | 3,799,979 | 371,410 |
| Dominion Energy, Inc. | | 8,701,246 | 711,762 |
| DTE Energy Co. | | 2,077,936 | 270,838 |
| NiSource, Inc. | | 4,352,343 | 128,438 |
| Public Service Enterprise Group, Inc. | | 5,354,784 | 344,634 |
| Sempra Energy (a) | | 3,371,066 | 556,125 |
| WEC Energy Group, Inc. | | 3,383,192 | 348,942 |
| | | | 3,411,700 |
| Water Utilities - 0.1% | | | |
| American Water Works Co., Inc. (a) | | 1,949,382 | 289,386 |
TOTAL UTILITIES | | | 11,200,242 |
| TOTAL COMMON STOCKS (Cost $211,622,866) | | | 357,499,805 |
| | | | |
| U.S. Treasury Obligations - 0.0% |
| | | Principal Amount (c) (000s) | Value ($) (000s) |
U.S. Treasury Bills, yield at date of purchase 1.15% 1/26/23 (d) (Cost $84,604) | | 85,000 | 83,944 |
| | | | |
| Money Market Funds - 0.8% |
| | | Shares | Value ($) (000s) |
| Fidelity Cash Central Fund 2.33% (e) | | 300,317,019 | 300,377 |
| Fidelity Securities Lending Cash Central Fund 2.34% (e)(f) | | 2,370,694,079 | 2,370,931 |
| TOTAL MONEY MARKET FUNDS (Cost $2,671,301) | | | 2,671,308 |
| | | | |
| TOTAL INVESTMENT IN SECURITIES - 100.6% (Cost $214,378,771) | 360,255,057 |
NET OTHER ASSETS (LIABILITIES) - (0.6)% | (1,996,053) |
| NET ASSETS - 100.0% | 358,259,004 |
| | |
| Futures Contracts |
| | Number of contracts | Expiration Date | Notional Amount ($) (000s) | Value ($) (000s) | Unrealized Appreciation/ (Depreciation) ($) (000s) |
| Purchased | | | | | |
| | | | | | |
| Equity Index Contracts | | | | | |
| CME E-mini S&P 500 Index Contracts (United States) | 3,918 | Sep 2022 | 775,078 | 34,643 | 34,643 |
| | | | | | |
| The notional amount of futures purchased as a percentage of Net Assets is 0.2% |
Any values shown as $0 in the Schedule of Investments may reflect amounts less than $500.
Legend
| (a) | Security or a portion of the security is on loan at period end. |
| (c) | Amount is stated in United States dollars unless otherwise noted. |
| (d) | Security or a portion of the security was pledged to cover margin requirements for futures contracts. At period end, the value of securities pledged amounted to $34,706,000. |
| (e) | Affiliated fund that is generally available only to investment companies and other accounts managed by Fidelity Investments. The rate quoted is the annualized seven-day yield of the fund at period end. A complete unaudited listing of the fund's holdings as of its most recent quarter end is available upon request. In addition, each Fidelity Central Fund's financial statements are available on the SEC's website or upon request. |
| (f) | Investment made with cash collateral received from securities on loan. |
Affiliated Central Funds
Fiscal year to date information regarding the Fund's investments in Fidelity Central Funds, including the ownership percentage, is presented below.
| Affiliate (Amounts in thousands) | Value, beginning of period ($) | Purchases ($) | Sales Proceeds ($) | Dividend Income ($) | Realized Gain (loss) ($) | Change in Unrealized appreciation (depreciation) ($) | Value, end of period ($) | %ownership, end of period |
| Fidelity Cash Central Fund 2.33% | 1,073,614 | 8,879,493 | 9,652,730 | 4,309 | - | - | 300,377 | 0.6% |
| Fidelity Securities Lending Cash Central Fund 2.34% | 5,904,527 | 11,536,197 | 15,069,793 | 1,401 | - | - | 2,370,931 | 6.8% |
| Total | 6,978,141 | 20,415,690 | 24,722,523 | 5,710 | - | - | 2,671,308 | |
| | | | | | | | | |
Amounts in the income column in the above table include any capital gain distributions from underlying funds, which are presented in the corresponding line item in the Statement of Operations, if applicable.
Amount for Fidelity Securities Lending Cash Central Fund represents the income earned on investing cash collateral, less rebates paid to borrowers and any lending agent fees associated with the loan, plus any premium payments received for lending certain types of securities.
Investment Valuation
The following is a summary of the inputs used, as of August 31, 2022, involving the Fund's assets and liabilities carried at fair value. The inputs or methodology used for valuing securities may not be an indication of the risk associated with investing in those securities. For more information on valuation inputs, and their aggregation into the levels used below, please refer to the Investment Valuation section in the accompanying Notes to Financial Statements.
| Valuation Inputs at Reporting Date: |
Description (Amounts in thousands) | Total ($) | Level 1 ($) | Level 2 ($) | Level 3 ($) |
Investments in Securities: | | | | |
|
| Equities: | | | | |
Communication Services | 30,093,396 | 30,093,396 | - | - |
Consumer Discretionary | 40,867,458 | 40,867,458 | - | - |
Consumer Staples | 24,190,843 | 24,190,843 | - | - |
Energy | 16,693,729 | 16,693,729 | - | - |
Financials | 38,833,577 | 38,833,577 | - | - |
Health Care | 50,317,381 | 50,317,381 | - | - |
Industrials | 28,325,347 | 28,325,347 | - | - |
Information Technology | 97,686,407 | 97,686,407 | - | - |
Materials | 9,075,825 | 9,075,825 | - | - |
Real Estate | 10,215,600 | 10,215,600 | - | - |
Utilities | 11,200,242 | 11,200,242 | - | - |
|
| U.S. Government and Government Agency Obligations | 83,944 | - | 83,944 | - |
|
| Money Market Funds | 2,671,308 | 2,671,308 | - | - |
| Total Investments in Securities: | 360,255,057 | 360,171,113 | 83,944 | - |
Derivative Instruments: | | | | |
|
| Assets | | | | |
Futures Contracts | 34,643 | 34,643 | - | - |
| Total Assets | 34,643 | 34,643 | - | - |
| Total Derivative Instruments: | 34,643 | 34,643 | - | - |
Value of Derivative Instruments
The following table is a summary of the Fund's value of derivative instruments by primary risk exposure as of August 31, 2022. For additional information on derivative instruments, please refer to the Derivative Instruments section in the accompanying Notes to Financial Statements.
Primary Risk Exposure / Derivative Type | Value |
| (Amounts in thousands) | Asset ($) | Liability ($) |
| Equity Risk | | |
Futures Contracts (a) | 34,643 | 0 |
| Total Equity Risk | 34,643 | 0 |
| Total Value of Derivatives | 34,643 | 0 |
(a)Reflects gross cumulative appreciation (depreciation) on futures contracts as presented in the Schedule of Investments. In the Statement of Assets and Liabilities, the period end daily variation margin is included in receivable or payable for daily variation margin on futures contracts, and the net cumulative appreciation (depreciation) is included in Total accumulated earnings (loss).
| Statement of Assets and Liabilities |
| Amounts in thousands (except per-share amount) | | | | August 31, 2022 (Unaudited) |
| | | | | |
| Assets | | | | |
| Investment in securities, at value (including securities loaned of $2,293,340) - See accompanying schedule: | | $357,583,749 | | |
Unaffiliated issuers (cost $211,707,470) | | | |
Fidelity Central Funds (cost $2,671,301) | | 2,671,308 | | |
| | | | | |
| Total Investment in Securities (cost $214,378,771) | | | $ | 360,255,057 |
| Cash | | | | 375 |
| Receivable for fund shares sold | | | | 360,668 |
| Dividends receivable | | | | 585,627 |
| Distributions receivable from Fidelity Central Funds | | | | 1,553 |
| Other receivables | | | | 3,855 |
Total assets | | | | 361,207,135 |
| Liabilities | | | | |
| Payable for investments purchased | | $173,447 | | |
| Payable for fund shares redeemed | | 389,662 | | |
| Accrued management fee | | 4,718 | | |
| Payable for daily variation margin on futures contracts | | 5,722 | | |
| Other payables and accrued expenses | | 3,856 | | |
| Collateral on securities loaned | | 2,370,726 | | |
| Total Liabilities | | | | 2,948,131 |
| Net Assets | | | $ | 358,259,004 |
| Net Assets consist of: | | | | |
| Paid in capital | | | $ | 211,812,877 |
| Total accumulated earnings (loss) | | | | 146,446,127 |
| Net Assets | | | $ | 358,259,004 |
Net Asset Value , offering price and redemption price per share ($358,259,004 ÷ 2,603,490 shares) | | | $ | 137.61 |
| | | | | |
| Statement of Operations |
| Amounts in thousands | | | | Six months ended August 31, 2022 (Unaudited) |
| Investment Income | | | | |
| Dividends | | | $ | 3,007,527 |
| Interest | | | | 452 |
| Income from Fidelity Central Funds (including $1,401 from security lending) | | | | 5,710 |
| Total Income | | | | 3,013,689 |
| Expenses | | | | |
| Management fee | $ | 27,026 | | |
| Independent trustees' fees and expenses | | 592 | | |
| Interest | | 29 | | |
| Total expenses before reductions | | 27,647 | | |
| Expense reductions | | (1) | | |
| Total expenses after reductions | | | | 27,646 |
| Net Investment income (loss) | | | | 2,986,043 |
| Realized and Unrealized Gain (Loss) | | | | |
| Net realized gain (loss) on: | | | | |
| Investment Securities: | | | | |
| Unaffiliated issuers | | 2,864,493 | | |
| Futures contracts | | (36,616) | | |
| Total net realized gain (loss) | | | | 2,827,877 |
| Change in net unrealized appreciation (depreciation) on: | | | | |
| Investment Securities: | | | | |
| Unaffiliated issuers | | (40,002,523) | | |
| Futures contracts | | 43,953 | | |
| Total change in net unrealized appreciation (depreciation) | | | | (39,958,570) |
| Net gain (loss) | | | | (37,130,693) |
| Net increase (decrease) in net assets resulting from operations | | | $ | (34,144,650) |
| Statement of Changes in Net Assets |
| |
| Amount in thousands | | Six months ended August 31, 2022 (Unaudited) | | Year ended February 28, 2022 |
| Increase (Decrease) in Net Assets | | | | |
| Operations | | | | |
| Net investment income (loss) | $ | 2,986,043 | $ | 4,853,909 |
| Net realized gain (loss) | | 2,827,877 | | 2,483,806 |
| Change in net unrealized appreciation (depreciation) | | (39,958,570) | | 40,694,888 |
| Net increase (decrease) in net assets resulting from operations | | (34,144,650) | | 48,032,603 |
| Distributions to shareholders | | (2,659,487) | | (4,694,552) |
| Share transactions | | | | |
| Proceeds from sales of shares | | 49,248,204 | | 98,523,858 |
| Reinvestment of distributions | | 2,505,145 | | 4,431,085 |
| Cost of shares redeemed | | (37,698,863) | | (57,596,648) |
Net increase (decrease) in net assets resulting from share transactions | | 14,054,486 | | 45,358,295 |
| Total increase (decrease) in net assets | | (22,749,651) | | 88,696,346 |
| | | | | |
| Net Assets | | | | |
| Beginning of period | | 381,008,655 | | 292,312,309 |
| End of period | $ | 358,259,004 | $ | 381,008,655 |
| | | | | |
| Other Information | | | | |
| Shares | | | | |
| Sold | | 343,812 | | 647,125 |
| Issued in reinvestment of distributions | | 17,639 | | 28,989 |
| Redeemed | | (263,512) | | (378,181) |
| Net increase (decrease) | | 97,939 | | 297,933 |
| | | | | |
| | Six months ended (Unaudited) August 31, 2022 | | Years ended February 28, 2022 | | 2021 | | 2020 A | | 2019 | | 2018 |
Selected Per-Share Data | | | | | | | | | | | | |
| Net asset value, beginning of period | $ | 152.07 | $ | 132.41 | $ | 102.76 | $ | 97.10 | $ | 95.15 | $ | 83.00 |
| Income from Investment Operations | | | | | | | | | | | | |
Net investment income (loss) B,C | | 1.16 | | 2.08 | | 1.95 | | 2.05 | | 1.86 | | 1.74 |
| Net realized and unrealized gain (loss) | | (14.58) | | 19.60 | | 29.78 | | 5.92 | | 2.46 | | 12.25 |
| Total from investment operations | | (13.42) | | 21.68 | | 31.73 | | 7.97 | | 4.32 | | 13.99 |
| Distributions from net investment income | | (1.04) | | (2.02) | | (2.08) | | (2.19) | | (1.81) | | (1.69) |
| Distributions from net realized gain | | - | | - | | - | | (.12) | | (.57) | | (.15) |
| Total distributions | | (1.04) | | (2.02) | | (2.08) | | (2.31) | | (2.37) D | | (1.84) |
| Net asset value, end of period | $ | 137.61 | $ | 152.07 | $ | 132.41 | $ | 102.76 | $ | 97.10 | $ | 95.15 |
Total Return E,F | | (8.85)% | | 16.37% | | 31.29% | | 8.18% | | 4.67% | | 17.08% |
Ratios to Average Net Assets C,G,H | | | | | | | | | | | | |
| Expenses before reductions | | .02% I | | .02% | | .02% | | .02% | | .02% | | .02% |
| Expenses net of fee waivers, if any | | .02% I | | .02% | | .02% | | .02% | | .02% | | .02% |
| Expenses net of all reductions | | .02% I | | .02% | | .02% | | .02% | | .02% | | .02% |
| Net investment income (loss) | | 1.62% I | | 1.36% | | 1.69% | | 1.96% | | 1.99% | | 1.96% |
| Supplemental Data | | | | | | | | | | | | |
| Net assets, end of period (in millions) | $ | 358,259 | $ | 381,009 | $ | 292,312 | $ | 219,404 | $ | 179,593 | $ | 32,225 |
Portfolio turnover rate J,K | | 2% I | | 2% | | 7% | | 4% | | 4% | | 4% |
A For the year ended February 29.
B Calculated based on average shares outstanding during the period.
C Net investment income (loss) is affected by the timing of the declaration of dividends by any underlying mutual funds or exchange-traded funds (ETFs). Net investment income (loss) of any such underlying funds is not included in the Fund's net investment income (loss) ratio.
D Total distributions per share do not sum due to rounding.
E Total returns for periods of less than one year are not annualized.
F Total returns would have been lower if certain expenses had not been reduced during the applicable periods shown.
G Fees and expenses of any underlying mutual funds or exchange-traded funds (ETFs) are not included in the Fund's expense ratio. The Fund indirectly bears its proportionate share of these expenses. For additional expense information related to investments in Fidelity Central Funds, please refer to the "Investments in Fidelity Central Funds" note found in the Notes to Financial Statements section of the most recent Annual or Semi-Annual report.
H Expense ratios reflect operating expenses of the class. Expenses before reductions do not reflect amounts reimbursed, waived, or reduced through arrangements with the investment adviser, brokerage services, or other offset arrangements, if applicable, and do not represent the amount paid by the class during periods when reimbursements, waivers or reductions occur.
I Annualized
J Amount does not include the portfolio activity of any underlying mutual funds or exchange-traded funds (ETFs).
K Portfolio turnover rate excludes securities received or delivered in-kind.
For the period ended August 31, 2022
( Amounts in thousands except percentages)
1. Organization.
Fidelity 500 Index Fund (the Fund) is a fund of Fidelity Concord Street Trust (the Trust) and is authorized to issue an unlimited number of shares. Share transactions on the Statement of Changes in Net Assets may contain exchanges between affiliated funds. The Trust is registered under the Investment Company Act of 1940, as amended (the 1940 Act), as an open-end management investment company organized as a Massachusetts business trust.
2. Investments in Fidelity Central Funds.
Funds may invest in Fidelity Central Funds, which are open-end investment companies generally available only to other investment companies and accounts managed by the investment adviser and its affiliates. The Schedule of Investments lists any Fidelity Central Funds held as an investment as of period end, but does not include the underlying holdings of each Fidelity Central Fund. An investing fund indirectly bears its proportionate share of the expenses of the underlying Fidelity Central Funds.
Based on its investment objective, each Fidelity Central Fund may invest or participate in various investment vehicles or strategies that are similar to those of the investing fund. These strategies are consistent with the investment objectives of the investing fund and may involve certain economic risks which may cause a decline in value of each of the Fidelity Central Funds and thus a decline in the value of the investing fund.
| Fidelity Central Fund | Investment Manager | Investment Objective | Investment Practices | Expense Ratio A |
| Fidelity Money Market Central Funds | Fidelity Management & Research Company LLC (FMR) | Each fund seeks to obtain a high level of current income consistent with the preservation of capital and liquidity. | Short-term Investments | Less than .005% |
A Expenses expressed as a percentage of average net assets and are as of each underlying Central Fund's most recent annual or semi-annual shareholder report.
A complete unaudited list of holdings for each Fidelity Central Fund is available upon request or at the Securities and Exchange Commission website at www.sec.gov. In addition, the financial statements of the Fidelity Central Funds which contain the significant accounting policies (including investment valuation policies) of those funds, and are not covered by the Report of Independent Registered Public Accounting Firm, are available on the Securities and Exchange Commission website or upon request.
3. Significant Accounting Policies.
The Fund is an investment company and applies the accounting and reporting guidance of the Financial Accounting Standards Board (FASB) Accounting Standards Codification Topic 946 Financial Services - Investment Companies . The financial statements have been prepared in conformity with accounting principles generally accepted in the United States of America (GAAP), which require management to make certain estimates and assumptions at the date of the financial statements. Actual results could differ from those estimates. Subsequent events, if any, through the date that the financial statements were issued have been evaluated in the preparation of the financial statements. The Fund's Schedule of Investments lists any underlying mutual funds or exchange-traded funds (ETFs) but does not include the underlying holdings of these funds. The following summarizes the significant accounting policies of the Fund:
Investment Valuation. Investments are valued as of 4:00 p.m. Eastern time on the last calendar day of the period. The Board of Trustees (the Board) has delegated the day to day responsibility for the valuation of the Fund's investments to the Fair Value Committee (the Committee) established by the Fund's investment adviser. In accordance with valuation policies and procedures approved by the Board, the Fund attempts to obtain prices from one or more third party pricing vendors or brokers to value its investments. When current market prices, quotations or currency exchange rates are not readily available or reliable, investments will be fair valued in good faith by the Committee, in accordance with procedures adopted by the Board. Factors used in determining fair value vary by investment type and may include market or investment specific events, changes in interest rates and credit quality. The frequency with which these procedures are used cannot be predicted and they may be utilized to a significant extent. The Committee oversees the Fund's valuation policies and procedures and reports to the Board on the Committee's activities and fair value determinations. The Board monitors the appropriateness of the procedures used in valuing the Fund's investments and ratifies the fair value determinations of the Committee.
The Fund categorizes the inputs to valuation techniques used to value its investments into a disclosure hierarchy consisting of three levels as shown below:
Level 1 - unadjusted quoted prices in active markets for identical investments
Level 2 - other significant observable inputs (including quoted prices for similar investments, interest rates, prepayment speeds, etc.)
Level 3 - unobservable inputs (including the Fund's own assumptions based on the best information available)
Valuation techniques used to value the Fund's investments by major category are as follows:
Equity securities, including restricted securities, for which market quotations are readily available, are valued at the last reported sale price or official closing price as reported by a third party pricing vendor on the primary market or exchange on which they are traded and are categorized as Level 1 in the hierarchy. In the event there were no sales during the day or closing prices are not available, securities are valued at the last quoted bid price or may be valued using the last available price and are generally categorized as Level 2 in the hierarchy. For foreign equity securities, when market or security specific events arise, comparisons to the valuation of American Depositary Receipts (ADRs), futures contracts, ETFs and certain indexes as well as quoted prices for similar securities may be used and would be categorized as Level 2 in the hierarchy. For equity securities, including restricted securities, where observable inputs are limited, assumptions about market activity and risk are used and these securities may be categorized as Level 3 in the hierarchy.
Debt securities, including restricted securities, are valued based on evaluated prices received from third party pricing vendors or from brokers who make markets in such securities. U.S. government and government agency obligations are valued by pricing vendors who utilize matrix pricing which considers yield or price of bonds of comparable quality, coupon, maturity and type or by broker-supplied prices. When independent prices are unavailable or unreliable, debt securities may be valued utilizing pricing methodologies which consider similar factors that would be used by third party pricing vendors. Debt securities are generally categorized as Level 2 in the hierarchy but may be Level 3 depending on the circumstances.
Futures contracts are valued at the settlement price established each day by the board of trade or exchange on which they are traded and are categorized as Level 1 in the hierarchy. Investments in open-end mutual funds, including the Fidelity Central Funds, are valued at their closing net asset value (NAV) each business day and are categorized as Level 1 in the hierarchy.
Changes in valuation techniques may result in transfers in or out of an assigned level within the disclosure hierarchy. The aggregate value of investments by input level as of August 31, 2022 is included at the end of the Fund's Schedule of Investments.
Investment Transactions and Income. For financial reporting purposes, the Fund's investment holdings and NAV include trades executed through the end of the last business day of the period. The NAV per share for processing shareholder transactions is calculated as of the close of business of the New York Stock Exchange (NYSE), normally 4:00 p.m. Eastern time and includes trades executed through the end of the prior business day. Gains and losses on securities sold are determined on the basis of identified cost and include proceeds received from litigation. Commissions paid to certain brokers with whom the investment adviser, or its affiliates, places trades on behalf of a fund include an amount in addition to trade execution, which may be rebated back to a fund. Any such rebates are included in net realized gain (loss) on investments in the Statement of Operations. Dividend income is recorded on the ex-dividend date, except for certain dividends from foreign securities where the ex-dividend date may have passed, which are recorded as soon as the Fund is informed of the ex-dividend date. Non-cash dividends included in dividend income, if any, are recorded at the fair market value of the securities received. Income and capital gain distributions from Fidelity Central Funds, if any, are recorded on the ex-dividend date. Certain distributions received by the Fund represent a return of capital or capital gain. The Fund determines the components of these distributions subsequent to the ex-dividend date, based upon receipt of tax filings or other correspondence relating to the underlying investment. These distributions are recorded as a reduction of cost of investments and/or as a realized gain. Interest income is accrued as earned and includes coupon interest and amortization of premium and accretion of discount on debt securities as applicable.
Expenses. Expenses directly attributable to a fund are charged to that fund. Expenses attributable to more than one fund are allocated among the respective funds on the basis of relative net assets or other appropriate methods. Expenses included in the accompanying financial statements reflect the expenses of that fund and do not include any expenses associated with any underlying mutual funds or exchange-traded funds. Although not included in a fund's expenses, a fund indirectly bears its proportionate share of these expenses through the net asset value of each underlying mutual fund or exchange-traded fund. Expense estimates are accrued in the period to which they relate and adjustments are made when actual amounts are known.
Deferred Trustee Compensation. Under a Deferred Compensation Plan (the Plan) for certain Funds, certain independent Trustees have elected to defer receipt of a portion of their annual compensation. Deferred amounts are invested in affiliated mutual funds, are marked-to-market and remain in a fund until distributed in accordance with the Plan. The investment of deferred amounts and the offsetting payable to the Trustees presented below are included in the accompanying Statement of Assets and Liabilities in other receivables and other payables and accrued expenses, as applicable.
| Fidelity 500 Index Fund | $3,767 |
Income Tax Information and Distributions to Shareholders. Each year, the Fund intends to qualify as a regulated investment company under Subchapter M of the Internal Revenue Code, including distributing substantially all of its taxable income and realized gains. As a result, no provision for U.S. Federal income taxes is required. The Fund files a U.S. federal tax return, in addition to state and local tax returns as required. The Fund's federal income tax returns are subject to examination by the Internal Revenue Service (IRS) for a period of three fiscal years after they are filed. State and local tax returns may be subject to examination for an additional fiscal year depending on the jurisdiction.
Distributions are declared and recorded on the ex-dividend date. Income and capital gain distributions are determined in accordance with income tax regulations, which may differ from GAAP.
Capital accounts within the financial statements are adjusted for permanent book-tax differences. These adjustments have no impact on net assets or the results of operations. Capital accounts are not adjusted for temporary book-tax differences which will reverse in a subsequent period.
Book-tax differences are primarily due to futures contracts, redemptions in-kind, deferred trustees compensation, capital loss carryforwards and losses deferred due to wash sales.
As of period end, the cost and unrealized appreciation (depreciation) in securities, and derivatives if applicable, for federal income tax purposes were as follows:
| Gross unrealized appreciation | $ 161,197,630 |
| Gross unrealized depreciation | (17,684,152) |
| Net unrealized appreciation (depreciation) | $ 143,513,478 |
| Tax cost | $ 216,776,222 |
Capital loss carryforwards are only available to offset future capital gains of the Fund to the extent provided by regulations and may be limited. The capital loss carryforward information presented below, including any applicable limitation, is estimated as of prior fiscal period end and is subject to adjustment.
Short-term | $(679,731) |
Long-term | (800,094) |
| Total capital loss carryforward | $(1,479,825) |
4. Derivative Instruments.
Risk Exposures and the Use of Derivative Instruments. Investment objectives allow a fund to enter into various types of derivative contracts, including futures contracts. Derivatives are investments whose value is primarily derived from underlying assets, indices or reference rates and may be transacted on an exchange or over-the-counter (OTC). Derivatives may involve a future commitment to buy or sell a specified asset based on specified terms, to exchange future cash flows at periodic intervals based on a notional principal amount, or for one party to make one or more payments upon the occurrence of specified events in exchange for periodic payments from the other party.
Derivatives were used to increase returns and to manage exposure to certain risks as defined below. The success of any strategy involving derivatives depends on analysis of numerous economic factors, and if the strategies for investment do not work as intended, the objectives may not be achieved.
Derivatives were used to increase or decrease exposure to the following risk(s):
| | |
| Equity Risk | Equity risk relates to the fluctuations in the value of financial instruments as a result of changes in market prices (other than those arising from interest rate risk or foreign exchange risk), whether caused by factors specific to an individual investment, its issuer, or all factors affecting all instruments traded in a market or market segment. |
Funds are also exposed to additional risks from investing in derivatives, such as liquidity risk and counterparty credit risk. Liquidity risk is the risk that a fund will be unable to close out the derivative in the open market in a timely manner. Counterparty credit risk is the risk that the counterparty will not be able to fulfill its obligation to a fund. Counterparty credit risk related to exchange-traded contracts may be mitigated by the protection provided by the exchange on which they trade.
Investing in derivatives may involve greater risks than investing in the underlying assets directly and, to varying degrees, may involve risk of loss in excess of any initial investment and collateral received and amounts recognized in the Statement of Assets and Liabilities. In addition, there may be the risk that the change in value of the derivative contract does not correspond to the change in value of the underlying instrument.
Futures Contracts. A futures contract is an agreement between two parties to buy or sell a specified underlying instrument for a fixed price at a specified future date. Futures contracts were used to manage exposure to the stock market.
Upon entering into a futures contract, a fund is required to deposit either cash or securities (initial margin) with a clearing broker in an amount equal to a certain percentage of the face value of the contract. Futures contracts are marked-to-market daily and subsequent daily payments are made or received by a fund depending on the daily fluctuations in the value of the futures contracts and are recorded as unrealized appreciation or (depreciation). This receivable and/or payable, if any, is included in daily variation margin on futures contracts in the Statement of Assets and Liabilities. Realized gain or (loss) is recorded upon the expiration or closing of a futures contract. The net realized gain (loss) and change in net unrealized appreciation (depreciation) on futures contracts during the period is presented in the Statement of Operations.
Any open futures contracts at period end are presented in the Schedule of Investments under the caption "Futures Contracts". The notional amount at value reflects each contract's exposure to the underlying instrument or index at period end, and is representative of volume of activity during the period unless an average notional amount is presented. Any securities deposited to meet initial margin requirements are identified in the Schedule of Investments. Any cash deposited to meet initial margin requirements is presented as segregated cash with brokers for derivative instruments in the Statement of Assets and Liabilities.
5. Purchases and Sales of Investments.
Purchases and sales of securities, other than short-term securities and in-kind transactions, as applicable, are noted in the table below.
| | Purchases ($) | Sales ($) |
| Fidelity 500 Index Fund | 22,567,729 | 2,962,628 |
Unaffiliated Redemptions In-Kind. Shares that were redeemed in-kind for investments, including accrued interest and cash, if any, are shown in the table below. The net realized gain or loss on investments delivered through in-kind redemptions is included in the accompanying Statement of Operations. The amount of the in-kind redemptions is included in share transactions in the accompanying Statement of Changes in Net Assets. There was no gain or loss for federal income tax purposes.
| | Shares | Total net realized gain or loss ($) | Total Proceeds ($) |
| Fidelity 500 Index Fund | 30,545 | 3,416,100 | 4,344,229 |
Prior Fiscal Year Unaffiliated Redemptions In-Kind. Shares that were redeemed in-kind for investments, including accrued interest and cash, if any, are shown in the table below; along with realized gain or loss on investments delivered through in-kind redemptions. The amount of the in-kind redemptions is included in share transactions in the accompanying Statement of Changes in Net Assets. There was no gain or loss for federal income tax purposes.
| | Shares | Total net realized gain or loss ($) | Total Proceeds ($) |
| Fidelity 500 Index Fund | 15,650 | 2,000,139 | 2,466,602 |
Prior Year Unaffiliated Exchanges In-Kind. Shares that were exchanged for investments, including accrued interest and cash, if any, are shown in the table below. The amount of in-kind exchanges is included in share transactions in the accompanying Statement of Changes in Net Assets.
| | Shares | Total Proceeds ($) |
| Fidelity 500 Index Fund | 728 | 105,156 |
6. Fees and Other Transactions with Affiliates.
Management Fee and Expense Contract. Fidelity Management & Research Company LLC (the investment adviser) and its affiliates provide the Fund with investment management related services for which the Fund pays a monthly management fee. The management fee is based on an annual rate of .015% of the Fund's average net assets. The management fee is reduced by an amount equal to the fees and expenses paid by the Fund to the independent Trustees. Under the management contract, the investment adviser pays all other operating expenses, except the compensation of the independent Trustees and certain other expenses such as interest expense.
Under the expense contract, the investment adviser pays all other operating expenses, except the compensation of the independent Trustees, as necessary so that the total expenses do not exceed .015% of average net assets. This expense contract will remain in place through April 30, 2023.
Sub-Adviser. Geode Capital Management, LLC (Geode), serves as sub-adviser for the Fund. Geode provides discretionary investment advisory services to the Fund and is paid by the investment adviser for providing these services.
Interfund Lending Program. Pursuant to an Exemptive Order issued by the Securities and Exchange Commission (the SEC), the Fund, along with other registered investment companies having management contracts with Fidelity Management & Research Company LLC (FMR), or other affiliated entities of FMR, may participate in an interfund lending program. This program provides an alternative credit facility allowing the Fund to borrow from, or lend money to, other participating affiliated funds. At period end, there were no interfund loans outstanding. Activity in this program during the period for which loans were outstanding is presented in the table below. Interest expense on borrowings is paid by the investment adviser under the Expense Contract.
| | Borrower or Lender | Average Loan Balance | Weighted Average Interest Rate | Interest Expense |
| Fidelity 500 Index Fund | Borrower | $ 55,260 | 1.06% | $ 29 |
Interfund Trades. Funds may purchase from or sell securities to other Fidelity Funds under procedures adopted by the Board. The procedures have been designed to ensure these interfund trades are executed in accordance with Rule 17a-7 of the 1940 Act. Any interfund trades are included within the respective purchases and sales amounts shown in the Purchases and Sales of Investments note. During the period, there were no interfund trades.
7. Committed Line of Credit.
Certain Funds participate with other funds managed by the investment adviser or an affiliate in a $4.25 billion credit facility (the "line of credit") to be utilized for temporary or emergency purposes to fund shareholder redemptions or for other short-term liquidity purposes. The commitment fees on the pro-rata portion of the line of credit are borne by the investment adviser. During the period, there were no borrowings on this line of credit.
8. Security Lending.
Funds lend portfolio securities from time to time in order to earn additional income. Lending agents are used, including National Financial Services (NFS), an affiliate of the investment adviser. Pursuant to a securities lending agreement, NFS will receive a fee, which is capped at 9.9% of a fund's daily lending revenue, for its services as lending agent. A fund may lend securities to certain qualified borrowers, including NFS. On the settlement date of the loan, a fund receives collateral (in the form of U.S. Treasury obligations, letters of credit and/or cash) against the loaned securities and maintains collateral in an amount not less than 100% of the market value of the loaned securities during the period of the loan. The market value of the loaned securities is determined at the close of business of a fund and any additional required collateral is delivered to a fund on the next business day. A fund or borrower may terminate the loan at any time, and if the borrower defaults on its obligation to return the securities loaned because of insolvency or other reasons, a fund may apply collateral received from the borrower against the obligation. A fund may experience delays and costs in recovering the securities loaned. Any cash collateral received is invested in the Fidelity Securities Lending Cash Central Fund. Any loaned securities are identified as such in the Schedule of Investments, and the value of loaned securities and cash collateral at period end, as applicable, are presented in the Statement of Assets and Liabilities. Security lending income represents the income earned on investing cash collateral, less rebates paid to borrowers and any lending agent fees associated with the loan, plus any premium payments received for lending certain types of securities. Security lending income is presented in the Statement of Operations as a component of income from Fidelity Central Funds. Affiliated security lending activity, if any, was as follows:
| | Total Security Lending Fees Paid to NFS | Security Lending Income From Securities Loaned to NFS | Value of Securities Loaned to NFS at Period End |
| Fidelity 500 Index Fund | $ 144 | $ - A | $- |
A In the amount of less than five hundred dollars.
9. Expense Reductions.
Through arrangements with the Fund's custodian, credits realized as a result of certain uninvested cash balances were used to reduce the Fund's expenses by $1.
10. Other.
A fund's organizational documents provide former and current trustees and officers with a limited indemnification against liabilities arising in connection with the performance of their duties to the fund. In the normal course of business, a fund may also enter into contracts that provide general indemnifications. A fund's maximum exposure under these arrangements is unknown as this would be dependent on future claims that may be made against a fund. The risk of material loss from such claims is considered remote.
11. Risk and Uncertainties.
Many factors affect a fund's performance. Developments that disrupt global economies and financial markets, such as pandemics, epidemics, outbreaks of infectious diseases, war, terrorism, and environmental disasters, may significantly affect a fund's investment performance. The effects of these developments to a fund will be impacted by the types of securities in which a fund invests, the financial condition, industry, economic sector, and geographic location of an issuer, and a fund's level of investment in the securities of that issuer.
As a shareholder, you incur two types of costs: (1) transaction costs, which may include sales charges (loads) on purchase payments or redemption proceeds, as applicable and (2) ongoing costs, which generally include management fees, distribution and/or service (12b-1) fees and other Fund expenses. This Example is intended to help you understand your ongoing costs (in dollars) of investing in a fund and to compare these costs with the ongoing costs of investing in other mutual funds.
| The Example is based on an investment of $1,000 invested at the beginning of the period and held for the entire period (March 1, 2022 to August 31, 2022). |
Actual Expenses
The first line of the accompanying table provides information about actual account values and actual expenses. You may use the information in this line, together with the amount you invested, to estimate the expenses that you paid over the period. Simply divide your account value by $1,000.00 (for example, an $8,600 account value divided by $1,000.00 = 8.6), then multiply the result by the number in the first line for a class/Fund under the heading entitled "Expenses Paid During Period" to estimate the expenses you paid on your account during this period. If any fund is a shareholder of any underlying mutual funds or exchange-traded funds (ETFs) (the Underlying Funds), such fund indirectly bears its proportional share of the expenses of the Underlying Funds in addition to the direct expenses incurred presented in the table. These fees and expenses are not included in the annualized expense ratio used to calculate the expense estimate in the table below.
Hypothetical Example for Comparison Purposes
The second line of the accompanying table provides information about hypothetical account values and hypothetical expenses based on the actual expense ratio and an assumed rate of return of 5% per year before expenses, which is not the actual return. The hypothetical account values and expenses may not be used to estimate the actual ending account balance or expenses you paid for the period. You may use this information to compare the ongoing costs of investing in the Fund and other funds. To do so, compare this 5% hypothetical example with the 5% hypothetical examples that appear in the shareholder reports of the other funds. If any fund is a shareholder of any Underlying Funds, such fund indirectly bears its proportional share of the expenses of the Underlying Funds in addition to the direct expenses as presented in the table. These fees and expenses are not included in the annualized expense ratio used to calculate the expense estimate in the table below.
Please note that the expenses shown in the table are meant to highlight your ongoing costs only and do not reflect any transaction costs. Therefore, the second line of the table is useful in comparing ongoing costs only, and will not help you determine the relative total costs of owning different funds. In addition, if these transactional costs were included, your costs would have been higher.
| | | | | Annualized Expense Ratio- A | | Beginning Account Value March 1, 2022 | | Ending Account Value August 31, 2022 | | Expenses Paid During Period- C March 1, 2022 to August 31, 2022 |
| | | | | | | | | | |
| Fidelity® 500 Index Fund | | | | .02% | | | | | | |
| Actual | | | | | | $ 1,000 | | $ 911.50 | | $ .10 |
Hypothetical- B | | | | | | $ 1,000 | | $ 1,025.13 | | $ .10 |
| |
A Annualized expense ratio reflects expenses net of applicable fee waivers.
B 5% return per year before expenses
C Expenses are equal to the annualized expense ratio, multiplied by the average account value over the period, multiplied by 184/ 365 (to reflect the one-half year period). The fees and expenses of any Underlying Funds are not included in each annualized expense ratio.
Fidelity 500 Index Fund
Each year, the Board of Trustees, including the Independent Trustees (together, the Board), votes on the renewal of the management contract with Fidelity Management & Research Company LLC (FMR) and the sub-advisory agreement (Sub-Advisory Agreement) for the fund with Geode Capital Management, LLC (Geode) (together, the Advisory Contracts). FMR and Geode are referred to herein as the Investment Advisers. The Board, assisted by the advice of fund counsel and Independent Trustees' counsel, requests and considers a broad range of information relevant to the renewal of the Advisory Contracts throughout the year.
The Board meets regularly and, at each of its meetings, covers an extensive agenda of topics and materials and considers factors that are relevant to its annual consideration of the renewal of the fund's Advisory Contracts, including the services and support provided to the fund and its shareholders. The Board has established various standing committees (Committees), each composed of and chaired by Independent Trustees with varying backgrounds, to which the Board has assigned specific subject matter responsibilities in order to enhance effective decision-making by the Board. The Board, acting directly and through its Committees, requests and receives information concerning the annual consideration of the renewal of the fund's Advisory Contracts. The Board also meets as needed to review matters specifically related to the Board's annual consideration of the renewal of the Advisory Contracts. Members of the Board may also meet with trustees of other Fidelity funds through joint ad hoc committees to discuss certain matters relevant to all of the Fidelity funds.
At its May 2022 meeting, the Board unanimously determined to renew the fund's Advisory Contracts. In reaching its determination, the Board considered all factors it believed relevant, including (i) the nature, extent, and quality of the services provided to the fund and its shareholders (including the investment performance of the fund); (ii) the competitiveness relative to peer funds of the fund's management fee and total expense ratio; (iii) the total costs of the services provided by and the profits realized by Fidelity and Geode from their respective relationships with the fund; and (iv) the extent to which, if any, economies of scale exist and are realized as the fund grows, and whether any economies of scale are appropriately shared with fund shareholders.
In considering whether to renew the Advisory Contracts for the fund, the Board reached a determination, with the assistance of fund counsel and Independent Trustees' counsel and through the exercise of its business judgment, that the renewal of the Advisory Contracts was in the best interests of the fund and its shareholders and that the compensation payable under the Advisory Contracts was fair and reasonable. The Board's decision to renew the Advisory Contracts was not based on any single factor, but rather was based on a comprehensive consideration of all the information provided to the Board at its meetings throughout the year. The Board, in reaching its determination to renew the Advisory Contracts, was aware that shareholders of the fund have a broad range of investment choices available to them, including a wide choice among funds offered by Fidelity's competitors, and that the fund's shareholders, who have the opportunity to review and weigh the disclosure provided by the fund in its prospectus and other public disclosures, have chosen to invest in this fund, which is part of the Fidelity family of funds.
Nature, Extent, and Quality of Services Provided. The Board considered staffing as it relates to the fund, including the backgrounds of investment personnel of Fidelity and Geode, and also considered the fund's investment objective, strategies, and related investment philosophy. The Independent Trustees also had discussions with senior management of Fidelity's investment operations and investment groups and with senior management of Geode. The Board considered the structure of the investment personnel compensation programs and whether the structures provide appropriate incentives to act in the best interests of the fund. Additionally, the Board considered the portfolio managers' investments, if any, in the funds that they manage. The Board also considered the steps Fidelity and Geode have taken to ensure the continued provision of high quality services to the Fidelity funds during the COVID-19 pandemic, including the expansion of staff in client facing positions to maintain service levels in periods of high volumes and volatility.
The Trustees also discussed with representatives of Fidelity, at meetings throughout the year, Fidelity's role in, among other things, overseeing compliance with federal securities laws and other applicable requirements by Geode with respect to the fund and monitoring and overseeing the performance and investment capabilities of Geode. The Trustees considered that the Board had received from Fidelity periodic reports about its oversight and due diligence processes, as well as periodic reports regarding the performance of Geode.
The Board also considered the nature, extent and quality of services provided by Geode. The Trustees noted that under the Sub-Advisory Agreement, subject to oversight by Fidelity, Geode is responsible for, among other things, identifying investments and arranging for execution of portfolio transactions to implement the fund's investment strategy. In addition, the Trustees noted that Geode is responsible for providing such reporting as may be requested by Fidelity to fulfill its oversight responsibilities discussed above.
Resources Dedicated to Investment Management and Support Services. The Board and the Fund Oversight and Research Committees reviewed the general qualifications and capabilities of Fidelity's and Geode's investment staffs, including their size, education, experience, and resources, as well as Fidelity's and Geode's approach to recruiting, training, managing, and compensating investment personnel. The Board considered that Fidelity's and Geode's investment professionals have extensive resources, tools, and capabilities so as to provide competitive investment results over time, and that those professionals also have access to sophisticated tools that permit them to assess portfolio construction and risk and performance attribution characteristics continuously. Additionally, in its deliberations, the Board considered Fidelity's and Geode's trading, risk management, compliance, and technology and operations capabilities and resources, which are integral parts of the investment management process.
Shareholder and Administrative Services. The Board considered (i) the nature, extent, quality, and cost of advisory, administrative, and shareholder services performed by the Investment Advisers and their affiliates under the Advisory Contracts and by FMR's affiliates under separate agreements covering transfer agency, pricing and bookkeeping, and securities lending services for the fund; (ii) the nature and extent of the supervision of third party service providers, principally custodians, subcustodians, and pricing vendors; and (iii) the resources devoted to, and the record of compliance with, the fund's compliance policies and procedures. The Board also reviewed the allocation of fund brokerage, including allocations to brokers affiliated with the Investment Advisers.
The Board noted that the growth of fund assets over time across the complex allows Fidelity to reinvest in the development of services designed to enhance the value and convenience of the Fidelity funds as investment vehicles. These services include 24-hour access to account information and market information over the Internet and through telephone representatives, investor education materials, and asset allocation tools. The Board also considered that it reviews customer service metrics such as telephone response times, continuity of services on the website and metrics addressing services at Fidelity Investor Centers.
Investment in a Large Fund Family. The Board considered the benefits to shareholders of investing in a Fidelity fund, including the benefits of investing in a fund that is part of a large family of funds offering a variety of investment disciplines and providing a large variety of mutual fund investor services. The Board noted that Fidelity had taken, or had made recommendations that resulted in the Fidelity funds taking, a number of actions over the previous year that benefited particular funds, including: (i) continuing to dedicate additional resources to Fidelity's investment research process, which includes meetings with management of issuers of securities in which the funds invest; (ii) continuing efforts to enhance Fidelity's global research capabilities; (iii) launching new funds and ETFs with innovative structures, strategies and pricing and making other enhancements to meet client needs; (iv) launching new share classes of existing funds; (v) eliminating purchase minimums and broadening eligibility requirements for certain funds and share classes; (vi) reducing management fees and total expenses for certain target date funds and classes and index funds; (vii) lowering expenses for certain existing funds and classes by implementing or lowering expense caps; (viii) rationalizing product lines and gaining increased efficiencies from fund mergers and liquidations; (ix) continuing to develop, acquire and implement systems and technology to improve services to the funds and shareholders, strengthen information security, and increase efficiency; and (x) continuing to implement enhancements to further strengthen Fidelity's product line to increase investors' probability of success in achieving their investment goals, including retirement income goals.
Investment Performance. The Board considered whether the fund has operated in accordance with its investment objective, as well as its record of compliance with its investment restrictions and its performance history.
The Board took into account discussions that occur at Board meetings throughout the year with representatives of the Investment Advisers about fund investment performance. In this regard the Board noted that as part of regularly scheduled fund reviews and other reports to the Board on fund performance, the Board considers annualized return information for the fund for different time periods, measured against the securities market index the fund seeks to track and an appropriate peer group of funds with similar objectives (peer group). The Board also periodically considers the fund's tracking error versus its benchmark index. In its evaluation of fund investment performance, the Board gave particular attention to information indicating changes in performance of certain Fidelity funds for specific time periods and discussed with the Investment Advisers the reasons for any overperformance or underperformance.
In addition to reviewing absolute and relative fund performance, the Independent Trustees periodically consider the appropriateness of fund performance metrics in evaluating the results achieved. In general, the Independent Trustees believe that an index fund's performance should be evaluated based on net performance (after fees and expenses) of the fund compared to a fund's benchmark index, over appropriate time periods taking into account relevant factors including the following: general market conditions; the characteristics of the fund's benchmark index; the extent to which statistical sampling is employed; any securities lending revenues; and fund cash flows and other factors.
The Independent Trustees recognize that shareholders evaluate performance on a net basis over their own holding periods, for which one-, three-, and five-year periods are often used as a proxy. For this reason, the performance information reviewed by the Board also included net cumulative total return information for the fund and an appropriate benchmark index and peer group for the most recent one-, three-, and five-year periods ended September 30, 2021, as shown below. Returns are shown compared to the 25th percentile (top of box, 75% beaten) and 75th percentile (bottom of box, 25% beaten) of the peer universe.
Fidelity 500 Index Fund
Based on its review, the Board concluded that the nature, extent, and quality of services provided to the fund under the Advisory Contracts should continue to benefit the shareholders of the fund.
Competitiveness of Management Fee and Total Expense Ratio. The Board considered the fund's management fee and total expense ratio compared to "mapped groups" of competitive funds and classes created for the purpose of facilitating the Trustees' competitive analysis of management fees and total expenses. Fidelity creates "mapped groups" by combining similar Lipper investment objective categories that have comparable investment mandates. Combining Lipper investment objective categories aids the Board's management fee and total expense ratio comparisons by broadening the competitive group used for comparison.
Management Fee. The Board considered two proprietary management fee comparisons for the 12-month periods ended September 30 (June 30 for periods ended 2019 and 2018 and December 31 for periods prior to 2018) shown in basis points (BP) in the chart below. The group of Lipper funds used by the Board for management fee comparisons is referred to below as the "Total Mapped Group." The Total Mapped Group is broader than the Lipper peer group used by the Board for performance comparisons because the Total Mapped Group combines several Lipper investment objective categories while the Lipper peer group does not. The Total Mapped Group comparison focuses on a fund's standing in terms of gross management fees before expense reimbursements or caps relative to the total universe of funds with comparable investment mandates, regardless of whether their management fee structures also are comparable. Funds with comparable investment mandates offer exposure to similar types of securities. Funds with comparable management fee structures have similar management fee contractual arrangements (e.g., flat rate charged for advisory services, all-inclusive fee rate, etc.). "TMG %" represents the percentage of funds in the Total Mapped Group that had management fees that were lower than the fund's. For example, a hypothetical TMG % of 20% would mean that 80% of the funds in the Total Mapped Group had higher, and 20% had lower, management fees than the fund. The fund's actual TMG %s and the number of funds in the Total Mapped Group are in the chart below. The "Asset-Sized Peer Group" (ASPG) comparison focuses on a fund's standing relative to a subset of non-Fidelity funds within the Total Mapped Group that are similar in size and management fee structure. For example, if a fund is in the first quartile of the ASPG, the fund's management fee ranks in the least expensive or lowest 25% of funds in the ASPG. The ASPG represents at least 15% of the funds in the Total Mapped Group with comparable asset size and management fee structures, subject to a minimum of 50 funds (or all funds in the Total Mapped Group if fewer than 50). Additional information, such as the ASPG quartile in which the fund's management fee rate ranked, is also included in the chart and was considered by the Board.
Fidelity 500 Index Fund
The Board considered that effective July 1, 2016, the fund's management fee rate was reduced from 0.025% to 0.015%. The Board considered that the chart below reflects the fund's lower management fee rate for 2016, as if the lower fee rate were in effect for the entire year.
The Board noted that the fund's management fee rate ranked below the median of its Total Mapped Group and below the median of its ASPG for the 12-month period ended September 30, 2021.
Based on its review, the Board concluded that the fund's management fee is fair and reasonable in light of the services that the fund receives and the other factors considered.
Total Expense Ratio. In its review of the fund's total expense ratio, the Board considered the fund's unitary fee rate as well as other fund expenses paid by FMR under the fund's management contract, such as transfer agent fees, pricing and bookkeeping fees, and custodial, legal and audit fees. The Board also noted that Fidelity may agree to waive fees or reimburse expenses from time to time, and the extent to which, if any, it has done so for the fund. The fund is compared to those funds and classes in the Total Mapped Group (used by the Board for management fee comparisons) that have a similar sales load structure. The Board also considered a total expense ASPG comparison for the fund, which focuses on the total expenses of the fund relative to a subset of non-Fidelity funds within the total expense similar sales load structure group. The total expense ASPG is limited to 15 larger and 15 smaller classes in fund average assets for a total of 30 classes, where possible. The total expense ASPG comparison excludes performance adjustments and fund-paid 12b-1 fees to eliminate variability in fee structures.
The Board noted that the fund's total net expense ratio ranked below the similar sales load structure group competitive median and below the ASPG competitive median for the 12-month period ended September 30, 2021.
The Board considered that current contractual arrangements for the fund oblige FMR to pay all "class-level" expenses of the fund to the extent necessary to limit total operating expenses, with certain exceptions, to 0.015%. These contractual arrangements terminate on April 30, 2023 and may not be amended to increase the fees or expenses payable except by a vote of a majority of the Board.
Fees Charged to Other Clients . The Board also considered fee structures applicable to clients of Fidelity and Geode, such as other funds advised or subadvised by Fidelity or Geode, pension plan clients, and other institutional clients with similar mandates. The Board noted that a joint ad hoc committee created by it and the boards of other Fidelity funds periodically reviews and compares Fidelity's institutional investment advisory business with its business of providing services to the Fidelity funds and also noted the most recent findings of the committee. The Board noted that the committee's review included a consideration of the differences in services provided, fees charged, and costs incurred, as well as competition in the markets serving the different categories of clients.
Based on its review of total expense ratios and fees charged to other Fidelity clients, the Board concluded that the fund's total expense ratio was reasonable in light of the services that the fund and its shareholders receive and the other factors considered.
Costs of the Services and Profitability. The Board considered the revenues earned and the expenses incurred by Fidelity in conducting the business of developing, marketing, distributing, managing, administering, and servicing the fund and servicing the fund's shareholders. The Board also considered the level of Fidelity's profits in respect of all the Fidelity funds.
On an annual basis, Fidelity presents to the Board information about the profitability of its relationships with the fund. Fidelity calculates profitability information for each fund, as well as aggregate profitability information for groups of Fidelity funds and all Fidelity funds, using a series of detailed revenue and cost allocation methodologies which originate with the books and records of Fidelity on which Fidelity's audited financial statements are based. The Audit Committee of the Board reviews any significant changes from the prior year's methodologies and the full Board approves such changes.
A public accounting firm has been engaged annually by the Board as part of the Board's assessment of Fidelity's profitability analysis. The engagement includes the review and assessment of the methodologies used by Fidelity in determining the revenues and expenses attributable to Fidelity's mutual fund business, and completion of agreed-upon procedures in respect of the mathematical accuracy of certain fund profitability information and its conformity to established allocation methodologies. After considering the reports issued under the engagement and information provided by Fidelity, the Board concluded that while other allocation methods may also be reasonable, Fidelity's profitability methodologies are reasonable in all material respects.
The Board also reviewed Fidelity's and Geode's non-fund businesses and potential indirect benefits such businesses may have received as a result of their association with Fidelity's mutual fund business (i.e., fall-out benefits) as well as cases where Fidelity's and Geode's affiliates may benefit from the funds' business. The Board considered areas where potential indirect benefits to the Fidelity funds from their relationships with Fidelity and Geode may exist. The Board's consideration of these matters was informed by the findings of a joint ad hoc committee created by it and the boards of other Fidelity funds to evaluate potential fall-out benefits.
The Board considered the costs of the services provided by and the profits realized by Fidelity in connection with the operation of the fund and was satisfied that the profitability was not excessive.
The Board also considered information regarding the profitability of Geode's relationship with the fund.
Economies of Scale. The Board considered whether there have been economies of scale in respect of the management of the Fidelity funds, whether the Fidelity funds (including the fund) have appropriately benefited from any such economies of scale, and whether there is potential for realization of any further economies of scale. The Board considered the extent to which the fund will benefit from economies of scale as assets grow through increased services to the fund, through waivers or reimbursements, or through fee or expense ratio reductions. The Board recognized that, due to the fund's current contractual arrangements, its expense ratio will not decline if the fund's operating costs decrease as assets grow, or rise as assets decrease. The Board also noted that a committee (the Economies of Scale Committee) created by it and the boards of other Fidelity funds periodically analyzes whether Fidelity attains economies of scale in respect of the management and servicing of the Fidelity funds, whether the Fidelity funds have appropriately benefited from such economies of scale, and whether there is potential for realization of any further economies of scale.
The Board concluded, taking into account the analysis of the Economies of Scale Committee, that economies of scale, if any, are being appropriately shared between fund shareholders and Fidelity.
Additional Information Requested by the Board. In order to develop fully the factual basis for consideration of the Fidelity funds' advisory contracts, the Board requested and received additional information on certain topics, including: (i) fund flow and performance trends, in particular the underperformance of certain funds and strategies, and Fidelity's long-term strategies for certain funds, including any consideration of fund liquidations or mergers; (ii) the operation of performance fees, competitor use of performance fees, and consideration of the expansion of performance fees to additional funds; (iii) Fidelity's pricing philosophy compared to competitors; (iv) fund profitability methodology and data; (v) evaluation of competitive fund data and peer group classifications and fee and expense comparisons; (vi) the management fee and expense structures for different funds and classes and information about the differences between various fee and expense structures; (vii) group fee breakpoints and related voluntary fee waivers; and (viii) information regarding other accounts managed by Fidelity and the funds' sub-advisory arrangements.
Based on its evaluation of all of the conclusions noted above, and after considering all factors it believed relevant, the Board concluded that the advisory and sub-advisory fee arrangements are fair and reasonable and that the fund's Advisory Contracts should be renewed.
1.925892.111
U5I-U5A-SANN-1022
Item 2.
Code of Ethics
Not applicable.
Item 3.
Audit Committee Financial Expert
Not applicable.
Item 4.
Principal Accountant Fees and Services
Not applicable.
Item 5.
Audit Committee of Listed Registrants
Not applicable.
Item 6.
Investments
(a)
Not applicable.
(b)
Not applicable
Item 7.
Disclosure of Proxy Voting Policies and Procedures for Closed-End Management Investment Companies
Not applicable.
Item 8.
Portfolio Managers of Closed-End Management Investment Companies
Not applicable.
Item 9.
Purchase of Equity Securities by Closed-End Management Investment Company and Affiliated Purchasers
Not applicable.
Item 10.
Submission of Matters to a Vote of Security Holders
There were no material changes to the procedures by which shareholders may recommend nominees to the Fidelity Concord Street Trust’s Board of Trustees.
Item 11.
Controls and Procedures
(a)(i) The President and Treasurer and the Chief Financial Officer have concluded that the Fidelity Concord Street Trust’s (the “Trust”) disclosure controls and procedures (as defined in Rule 30a-3(c) under the Investment Company Act) provide reasonable assurances that material information relating to the Trust is made known to them by the appropriate persons, based on their evaluation of these controls and procedures as of a date within 90 days of the filing date of this report.
(a)(ii) There was no change in the Trust’s internal control over financial reporting (as defined in Rule 30a-3(d) under the Investment Company Act) that occurred during the period covered by this report that has materially affected, or is reasonably likely to materially affect, the Trust’s internal control over financial reporting.
Item 12.
Disclosure of Securities Lending Activities for Closed-End Management
Investment Companies
Not applicable.
Item 13.
Exhibits
SIGNATURES
Pursuant to the requirements of the Securities Exchange Act of 1934 and the Investment Company Act of 1940, the registrant has duly caused this report to be signed on its behalf by the undersigned, thereunto duly authorized.
Fidelity Concord Street Trust
| |
By: | /s/Stacie M. Smith |
| Stacie M. Smith |
| President and Treasurer |
|
|
Date: | October 20, 2022 |
Pursuant to the requirements of the Securities Exchange Act of 1934 and the Investment Company Act of 1940, this report has been signed below by the following persons on behalf of the registrant and in the capacities and on the dates indicated.
| |
By: | /s/Stacie M. Smith |
| Stacie M. Smith |
| President and Treasurer |
|
|
Date: | October 20, 2022 |
| |
By: | /s/John J. Burke III |
| John J. Burke III |
| Chief Financial Officer |
|
|
Date: | October 20, 2022 |