UNITED STATES
SECURITIES AND EXCHANGE COMMISSION
Washington, D.C. 20549
FORM N-CSR
CERTIFIED SHAREHOLDER REPORT OF REGISTERED
MANAGEMENT INVESTMENT COMPANIES
Investment Company Act file number 811-05251
Fidelity Concord Street Trust
(Exact name of registrant as specified in charter)
245 Summer St., Boston, MA 02210
(Address of principal executive offices) (Zip code)
Margaret Carey, Secretary
245 Summer St.
Boston, Massachusetts 02210
(Name and address of agent for service)
Registrant's telephone number, including area code:
617-563-7000
| |
Date of fiscal year end: | October 31 |
|
|
Date of reporting period: | April 30, 2023 |
Item 1.
Reports to Stockholders
Fidelity® SAI International Small Cap Index Fund
Semi-Annual Report
April 30, 2023
Offered exclusively to certain clients of the Adviser, or its affiliates, including Strategic Advisers LLC (Strategic Advisers) - not available for sale to the general public. Fidelity ® SAI is a product name of Fidelity ® funds dedicated to certain programs affiliated with Strategic Advisers.
Contents
To view a fund's proxy voting guidelines and proxy voting record for the 12-month period ended June 30, visit http://www.fidelity.com/proxyvotingresults or visit the Securities and Exchange Commission's (SEC) web site at http://www.sec.gov.
You may also call 1-800-544-3455 to request a free copy of the proxy voting guidelines.
The funds or securities referred to herein are not sponsored, endorsed, or promoted by MSCI, and MSCI bears no liability with respect to any such funds or securities or any index on which such funds or securities are based. The prospectus contains a more detailed description of the limited relationship MSCI has with Fidelity and any related funds.
Standard & Poor's, S&P and S&P 500 are registered service marks of The McGraw-Hill Companies, Inc. and have been licensed for use by Fidelity Distributors Corporation.
Other third-party marks appearing herein are the property of their respective owners.
All other marks appearing herein are registered or unregistered trademarks or service marks of FMR LLC or an affiliated company. © 2023 FMR LLC. All rights reserved.
This report and the financial statements contained herein are submitted for the general information of the shareholders of the Fund. This report is not authorized for distribution to prospective investors in the Fund unless preceded or accompanied by an effective prospectus.
A fund files its complete schedule of portfolio holdings with the SEC for the first and third quarters of each fiscal year on Form N-PORT. Forms N-PORT are available on the SEC's web site at http://www.sec.gov. A fund's Forms N-PORT may be reviewed and copied at the SEC's Public Reference Room in Washington, DC. Information regarding the operation of the SEC's Public Reference Room may be obtained by calling 1-800-SEC-0330.
For a complete list of a fund's portfolio holdings, view the most recent holdings listing, semiannual report, or annual report on Fidelity's web site at http://www.fidelity.com, http://www.institutional.fidelity.com, or http://www.401k.com, as applicable.
NOT FDIC INSURED •MAY LOSE VALUE •NO BANK GUARANTEE
Neither the Fund nor Fidelity Distributors Corporation is a bank.
Top Holdings (% of Fund's net assets) |
| |
| Centrica PLC (United Kingdom, Multi-Utilities) | 0.3 | |
| Melrose Industries PLC (United Kingdom, Aerospace & Defense) | 0.3 | |
| ASR Nederland NV (Netherlands, Insurance) | 0.3 | |
| BE Semiconductor Industries NV (Netherlands, Semiconductors & Semiconductor Equipment) | 0.3 | |
| Atlas Arteria Ltd. unit (Australia, Transportation Infrastructure) | 0.3 | |
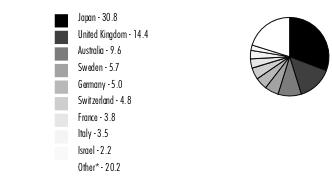
| Trelleborg AB (B Shares) (Sweden, Machinery) | 0.2 | |
| The Weir Group PLC (United Kingdom, Machinery) | 0.2 | |
| Rightmove PLC (United Kingdom, Interactive Media & Services) | 0.2 | |
| Georg Fischer AG (Reg.) (Switzerland, Machinery) | 0.2 | |
| Banco de Sabadell SA (Spain, Banks) | 0.2 | |
| | 2.5 | |
| |
| Market Sectors (% of Fund's net assets) |
| |
| Industrials | 22.8 | |
| Consumer Discretionary | 12.0 | |
| Financials | 11.6 | |
| Real Estate | 11.4 | |
| Materials | 9.8 | |
| Information Technology | 9.3 | |
| Health Care | 6.5 | |
| Consumer Staples | 6.2 | |
| Communication Services | 3.9 | |
| Utilities | 3.1 | |
| Energy | 2.6 | |
| |
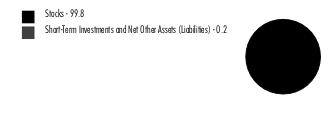
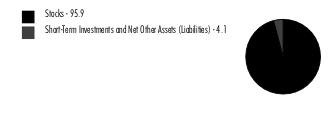
Asset Allocation (% of Fund's net assets) |
|
Futures - 1% |
|
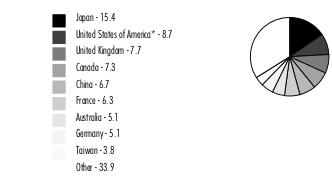
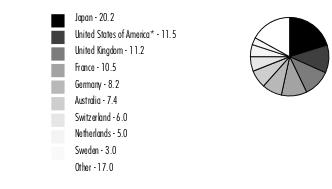
Geographic Diversification (% of Fund's net assets) |
|
* Includes Short-Term investments and Net Other Assets (Liabilities). Percentages are adjusted for the effect of derivatives, if applicable. |
| |
Showing Percentage of Net Assets
| Common Stocks - 98.9% |
| | | Shares | Value ($) |
| Australia - 9.6% | | | |
| 29Metals Ltd. | | 71,126 | 56,265 |
| Abacus Property Group unit | | 107,933 | 191,113 |
| Accent Group Ltd. | | 105,803 | 179,048 |
| Adbri Ltd. | | 97,577 | 103,025 |
| AGL Energy Ltd. | | 180,967 | 996,222 |
| Allkem Ltd. (a) | | 154,296 | 1,267,156 |
| ALS Ltd. | | 123,243 | 1,075,633 |
| Altium Ltd. | | 31,608 | 805,728 |
| Alumina Ltd. | | 651,516 | 661,250 |
| AMP Ltd. | | 782,922 | 591,935 |
| Ansell Ltd. | | 33,635 | 598,539 |
| APM Human Services International ltd. | | 74,853 | 93,795 |
| Arafura Rare Earths Ltd. (a) | | 471,006 | 129,391 |
| ARB Corp. Ltd. | | 21,301 | 455,050 |
| Arena (REIT) unit | | 91,498 | 227,457 |
| Argosy Minerals Ltd. (a) | | 323,986 | 88,179 |
| Atlas Arteria Ltd. unit | | 389,883 | 1,695,145 |
| Aub Group Ltd. | | 26,925 | 493,466 |
| Aussie Broadband Ltd. (a) | | 48,357 | 106,568 |
| Austal Ltd. | | 88,419 | 97,040 |
| Australian Agricultural Co. Ltd. (a) | | 54,804 | 55,824 |
| Australian Clinical Labs Ltd. | | 30,693 | 72,016 |
| Australian Ethical Investment Ltd. | | 21,824 | 47,103 |
| AVZ Minerals Ltd. (a)(b) | | 776,046 | 400,538 |
| Bank of Queensland Ltd. | | 174,382 | 673,399 |
| Bapcor Ltd. | | 88,809 | 387,526 |
| Beach Energy Ltd. | | 419,551 | 412,959 |
| Bega Cheese Ltd. | | 78,208 | 196,931 |
| Bellevue Gold Ltd. (a) | | 260,483 | 244,529 |
| Bendigo & Adelaide Bank Ltd. | | 151,905 | 874,555 |
| Blackmores Ltd. | | 4,468 | 282,229 |
| Boral Ltd. (a) | | 105,108 | 288,507 |
| Boss Energy Ltd. (a) | | 91,023 | 160,281 |
| BrainChip Holdings Ltd. (a)(c) | | 396,368 | 107,297 |
| Breville Group Ltd. | | 27,045 | 371,531 |
| Brickworks Ltd. | | 20,079 | 334,078 |
| BWP Trust | | 127,175 | 327,823 |
| Calix Ltd. (a) | | 39,045 | 122,960 |
| Capricorn Metals Ltd. (a) | | 76,681 | 225,634 |
| carsales.com Ltd. | | 95,578 | 1,515,706 |
| Centuria Capital Group unit | | 120,555 | 138,134 |
| Centuria Industrial REIT | | 154,107 | 320,482 |
| Centuria Office REIT unit | | 106,287 | 100,595 |
| Chalice Mining Ltd. (a) | | 89,823 | 477,534 |
| Challenger Ltd. | | 152,185 | 612,397 |
| Champion Iron Ltd. | | 89,271 | 387,871 |
| Charter Hall Group unit | | 126,135 | 938,426 |
| Charter Hall Long Wale REIT unit | | 163,871 | 474,371 |
| Charter Hall Retail REIT | | 137,897 | 354,964 |
| Charter Hall Social Infrastruc | | 91,948 | 184,967 |
| Cleanaway Waste Management Ltd. | | 595,831 | 959,561 |
| Clinuvel Pharmaceuticals Ltd. | | 10,728 | 144,365 |
| Codan Ltd./Australia | | 27,154 | 131,902 |
| Collins Foods Ltd. | | 30,404 | 175,291 |
| Core Lithium Ltd. (a)(c) | | 424,380 | 279,354 |
| Coronado Global Resources, Inc. CDI (d) | | 205,092 | 226,127 |
| Corporate Travel Management Ltd. | | 33,705 | 471,576 |
| Costa Group Holdings Ltd. | | 126,172 | 209,374 |
| Credit Corp. Group Ltd. | | 18,349 | 220,951 |
| Cromwell Property Group unit | | 386,451 | 146,440 |
| CSR Ltd. | | 126,357 | 442,341 |
| Data#3 Ltd. | | 39,519 | 199,500 |
| De Grey Mining Ltd. (a) | | 350,475 | 376,170 |
| Deterra Royalties Ltd. | | 109,176 | 334,774 |
| Dexus Industria (REIT) | | 59,137 | 109,580 |
| Dicker Data Ltd. | | 17,051 | 92,274 |
| Domain Holdings Australia Ltd. | | 68,856 | 153,570 |
| Dominos Pizza Enterprises Ltd. | | 16,439 | 553,329 |
| Downer EDI Ltd. | | 181,739 | 429,946 |
| Eagers Automotive Ltd. | | 41,514 | 392,036 |
| Elders Ltd. | | 42,355 | 228,040 |
| Evolution Mining Ltd. | | 492,243 | 1,160,699 |
| EVT Ltd. | | 29,113 | 233,319 |
| Firefinch Ltd. (a)(b) | | 325,521 | 43,079 |
| Fleetpartners Group Ltd. (a) | | 68,842 | 95,950 |
| Flight Centre Travel Group Ltd. (a) | | 42,247 | 554,777 |
| G8 Education Ltd. | | 206,114 | 166,902 |
| Gold Road Resources Ltd. | | 269,722 | 335,611 |
| GrainCorp Ltd. | | 58,766 | 266,256 |
| Grange Resources Ltd. | | 140,277 | 57,575 |
| Growthpoint Properties Australia Ltd. | | 72,411 | 156,962 |
| GUD Holdings Ltd. | | 38,138 | 243,280 |
| GWA Group Ltd. | | 56,749 | 66,290 |
| Hansen Technologies Ltd. | | 43,890 | 131,462 |
| Harvey Norman Holdings Ltd. | | 148,550 | 356,759 |
| Healius Ltd. | | 157,231 | 312,464 |
| Helia Group Ltd. | | 93,105 | 195,575 |
| Hmc Capital Ltd. | | 54,484 | 142,623 |
| HomeCo Daily Needs (REIT) unit | | 382,123 | 305,464 |
| HUB24 Ltd. | | 20,618 | 389,853 |
| Iluka Resources Ltd. | | 112,732 | 828,351 |
| Imdex Ltd. | | 107,220 | 148,161 |
| Imugene Ltd. (a) | | 1,469,358 | 122,659 |
| Incitec Pivot Ltd. | | 520,181 | 1,108,306 |
| Ingenia Communities Group unit | | 98,940 | 281,996 |
| Inghams Group Ltd. | | 100,229 | 187,097 |
| Insignia Financial Ltd. | | 159,871 | 317,307 |
| Integral Diagnostics Ltd. | | 53,216 | 111,480 |
| Invocare Ltd. | | 37,145 | 274,337 |
| ioneer Ltd. (a) | | 395,025 | 80,659 |
| IPH Ltd. | | 56,730 | 306,891 |
| Iress Ltd. | | 45,981 | 315,935 |
| JB Hi-Fi Ltd. | | 29,183 | 863,692 |
| Johns Lyng Group Ltd. | | 45,859 | 206,760 |
| Judo Capital Holdings Ltd. (a) | | 149,789 | 123,480 |
| Jumbo Interactive Ltd. | | 14,631 | 127,271 |
| Karoon Energy Ltd. (a) | | 152,132 | 217,474 |
| Kelsian Group Ltd. | | 35,619 | 145,202 |
| Lake Resources NL (a)(c) | | 337,543 | 95,272 |
| Leo Lithium Ltd. | | 241,627 | 84,863 |
| Lifestyle Communities Ltd. | | 25,453 | 288,184 |
| Link Administration Holdings Ltd. | | 137,768 | 194,367 |
| Liontown Resources Ltd. (a)(c) | | 441,403 | 811,747 |
| Lovisa Holdings Ltd. | | 15,984 | 283,575 |
| Lynas Rare Earths Ltd. (a) | | 242,249 | 1,040,437 |
| MA Financial Group Ltd. | | 26,504 | 81,525 |
| Maas Group Holdings Ltd. | | 26,313 | 52,828 |
| Magellan Financial Group Ltd. | | 37,387 | 202,619 |
| Magellan Financial Group Ltd. warrants 4/16/27 (a) | | 5,527 | 754 |
| Mayne Pharma Group Ltd. (a) | | 19,079 | 52,647 |
| McMillan Shakespeare Ltd. | | 16,479 | 168,337 |
| Megaport Ltd. (a) | | 40,203 | 152,014 |
| Mesoblast Ltd. (a)(c) | | 189,781 | 108,390 |
| Metcash Ltd. | | 257,591 | 667,551 |
| Mincor Resources NL (a)(c) | | 99,831 | 93,318 |
| Monadelphous Group Ltd. | | 24,763 | 204,124 |
| Mount Gibson Iron Ltd. (a) | | 164,689 | 52,072 |
| Nanosonics Ltd. (a) | | 69,633 | 265,276 |
| National Storage REIT unit | | 317,555 | 528,914 |
| Neometals Ltd. (a) | | 128,947 | 53,532 |
| Netwealth Group Ltd. | | 32,995 | 299,827 |
| Neuren Pharmaceuticals Ltd. (a) | | 28,866 | 272,280 |
| New Hope Corp. Ltd. | | 143,646 | 507,777 |
| NEXTDC Ltd. (a) | | 122,570 | 940,548 |
| NIB Holdings Ltd. | | 128,943 | 661,618 |
| Nick Scali Ltd. | | 17,611 | 113,984 |
| Nine Entertainment Co. Holdings Ltd. | | 392,019 | 540,756 |
| Novonix Ltd. (a)(c) | | 78,582 | 52,055 |
| NRW Holdings Ltd. | | 117,224 | 188,388 |
| Nufarm Ltd. | | 100,446 | 373,481 |
| Objective Corp. Ltd. | | 5,693 | 48,737 |
| Omni Bridgeway Ltd. (a) | | 68,946 | 105,134 |
| oOh!media Ltd. | | 128,790 | 141,109 |
| Orora Ltd. | | 224,986 | 514,215 |
| OZ Minerals Ltd. | | 89,872 | 1,575,910 |
| Paladin Energy Ltd. (Australia) (a) | | 726,418 | 319,494 |
| Pepper Money Ltd. | | 51,004 | 44,133 |
| Perenti Ltd. (a) | | 170,395 | 130,577 |
| Perpetual Trustees Australia Ltd. | | 30,404 | 496,889 |
| Perseus Mining Ltd. (Australia) | | 346,573 | 512,198 |
| PEXA Group Ltd. (a) | | 44,660 | 396,346 |
| Pinnacle Investment Management Group Ltd. | | 32,600 | 179,527 |
| Platinum Asset Management Ltd. | | 144,207 | 168,463 |
| PointsBet Holdings Ltd. | | 54,773 | 57,070 |
| PointsBet Holdings Ltd. warrants 7/8/24 (a)(b) | | 2,964 | 0 |
| PolyNovo Ltd. (a) | | 166,615 | 181,007 |
| Premier Investments Ltd. | | 23,062 | 401,356 |
| Pro Medicus Ltd. | | 12,361 | 507,381 |
| PWR Holdings Ltd. | | 20,303 | 135,621 |
| Qube Holdings Ltd. | | 448,923 | 918,405 |
| Ramelius Resources Ltd. | | 233,550 | 203,821 |
| Region RE Ltd. unit | | 301,843 | 493,954 |
| Regis Resources Ltd. | | 198,963 | 281,520 |
| Rural Funds Group unit | | 105,848 | 137,905 |
| Sandfire Resources NL | | 131,989 | 575,057 |
| Sayona Mining Ltd. (a)(c) | | 1,851,022 | 250,031 |
| Select Harvests Ltd. | | 32,611 | 95,691 |
| Seven Group Holdings Ltd. | | 43,783 | 691,577 |
| Seven West Media Ltd. (a) | | 251,394 | 64,290 |
| Sigma Healthcare Ltd. | | 284,839 | 132,199 |
| Silex Systems Ltd. (a) | | 41,739 | 93,274 |
| Silver Lake Resources Ltd. (a) | | 252,293 | 212,691 |
| SiteMinder Ltd. (a) | | 59,108 | 143,359 |
| Smartgroup Corp. Ltd. | | 34,093 | 152,603 |
| Solgold PLC (a) | | 319,599 | 76,315 |
| Steadfast Group Ltd. | | 276,067 | 1,088,369 |
| Strike Energy Ltd. (a) | | 524,309 | 165,626 |
| Super Retail Group Ltd. | | 42,859 | 386,785 |
| Syrah Resources Ltd. (a) | | 171,742 | 132,791 |
| Tabcorp Holdings Ltd. | | 618,383 | 431,332 |
| Technology One Ltd. | | 78,010 | 786,483 |
| Telix Pharmaceuticals Ltd. (a) | | 59,535 | 402,986 |
| Temple & Webster Group Ltd. (a) | | 23,963 | 64,249 |
| TerraCom Ltd. | | 152,351 | 64,925 |
| The Star Entertainment Group Ltd. (a) | | 392,133 | 332,402 |
| Tietto Minerals Ltd. (a) | | 177,430 | 70,448 |
| Tyro Payments Ltd. (a) | | 105,311 | 111,480 |
| United Malt Group Ltd. | | 68,053 | 199,375 |
| Ventia Services Group Pty Ltd. | | 127,759 | 222,513 |
| Viva Energy Group Ltd. (d) | | 225,070 | 465,220 |
| Vulcan Energy Resources Ltd. (a)(c) | | 25,354 | 100,967 |
| Vulcan Steel Ltd. | | 12,441 | 64,347 |
| Waypoint (REIT) unit | | 178,451 | 309,928 |
| Webjet Ltd. (a) | | 100,498 | 496,997 |
| Weebit Nano Ltd. (a) | | 44,635 | 158,079 |
| West African Resources Ltd. (a) | | 263,014 | 170,166 |
| Whitehaven Coal Ltd. | | 225,238 | 1,080,867 |
| WorleyParsons Ltd. | | 84,164 | 845,635 |
| Zip Co. Ltd. (a)(c) | | 167,891 | 57,358 |
TOTAL AUSTRALIA | | | 66,341,878 |
| Austria - 1.1% | | | |
| Agrana Beteiligungs AG | | 3,231 | 60,702 |
| ams-OSRAM AG (a)(c) | | 74,379 | 510,921 |
| Andritz AG | | 18,218 | 1,181,379 |
| AT&S Austria Technologie & Systemtechnik AG (c) | | 6,772 | 206,699 |
| BAWAG Group AG (d) | | 22,756 | 1,107,305 |
| CA Immobilien Anlagen AG (a) | | 11,569 | 335,269 |
| DO & CO Restaurants & Catering AG (a)(c) | | 1,842 | 215,554 |
| EVN AG | | 9,726 | 234,168 |
| Immofinanz AG (b) | | 25,803 | 0 |
| Immofinanz AG (a)(c) | | 9,022 | 147,331 |
| Kontron AG (c) | | 11,654 | 225,112 |
| Lenzing AG (c) | | 3,607 | 235,691 |
| Oesterreichische Post AG (c) | | 8,869 | 342,046 |
| Palfinger AG | | 4,194 | 137,948 |
| PORR AG | | 4,694 | 71,688 |
| Raiffeisen International Bank-Holding AG (a) | | 40,170 | 615,703 |
| S IMMO AG rights (a)(b) | | 11,010 | 0 |
| Schoeller-Bleckmann Oilfield Equipment AG | | 2,815 | 176,805 |
| Semperit AG Holding | | 2,838 | 74,584 |
| UNIQA Insurance Group AG | | 32,362 | 289,913 |
| Vienna Insurance Group AG | | 10,357 | 304,140 |
| Wienerberger AG | | 30,034 | 903,479 |
TOTAL AUSTRIA | | | 7,376,437 |
| Bailiwick of Guernsey - 0.0% | | | |
| Balanced Commercial Property Trust Ltd. | | 189,967 | 196,723 |
| Bailiwick of Jersey - 0.1% | | | |
| JTC PLC (d) | | 35,609 | 354,880 |
| Belgium - 1.6% | | | |
| Ackermans & Van Haaren SA | | 6,287 | 1,105,652 |
| Aedifica SA | | 10,569 | 882,183 |
| Agfa-Gevaert NV (a) | | 34,962 | 98,045 |
| Barco NV | | 18,899 | 551,441 |
| Bekaert SA | | 9,323 | 433,521 |
| Bpost SA | | 27,401 | 134,601 |
| Cofinimmo SA | | 8,318 | 794,200 |
| Colruyt NV | | 14,573 | 403,858 |
| Deme Group NV | | 1,988 | 262,431 |
| Econocom Group SA | | 27,561 | 94,601 |
| Euronav NV | | 47,140 | 805,125 |
| Exmar NV | | 8,742 | 114,438 |
| Fagron NV | | 18,790 | 349,081 |
| Galapagos NV (a) | | 12,501 | 485,030 |
| Immobel SA | | 1,255 | 62,506 |
| Intervest Offices & Warehouses NV | | 5,808 | 119,933 |
| Ion Beam Applications SA | | 5,750 | 105,303 |
| KBC Ancora | | 9,510 | 457,516 |
| Kinepolis Group NV | | 3,703 | 187,287 |
| Melexis NV | | 5,338 | 507,906 |
| Montea SICAFI SCA | | 3,412 | 298,519 |
| Ontex Group NV (a) | | 18,119 | 155,230 |
| Proximus | | 39,852 | 339,447 |
| Recticel SA | | 11,402 | 162,325 |
| Retail Estates NV | | 2,897 | 214,516 |
| Shurgard Self Storage Europe SARL | | 7,305 | 377,717 |
| Telenet Group Holding NV | | 12,245 | 283,888 |
| Tessenderlo Group | | 6,629 | 219,500 |
| VGP NV | | 3,325 | 348,063 |
| X-Fab Silicon Foundries SE (a)(d) | | 15,940 | 135,508 |
| Xior Student Housing NV (a) | | 7,039 | 223,381 |
TOTAL BELGIUM | | | 10,712,752 |
| Bermuda - 0.0% | | | |
| Cool Co. Ltd. | | 3,726 | 45,836 |
| China - 0.3% | | | |
| AustAsia Group Ltd. | | 24,480 | 9,980 |
| CITIC 1616 Holdings Ltd. | | 453,000 | 181,992 |
| E-Commodities Holdings Ltd. | | 356,000 | 59,115 |
| Fosun Tourism Group (a)(d) | | 67,800 | 79,034 |
| Health & Happiness H&H International Holdings Ltd. | | 61,500 | 105,317 |
| Kerry Logistics Network Ltd. | | 92,000 | 130,353 |
| Shangri-La Asia Ltd. (a) | | 290,000 | 267,529 |
| Theme International Holdings Ltd. (a) | | 1,300,000 | 151,061 |
| TI Fluid Systems PLC (d) | | 92,146 | 122,521 |
| Vesync Co. Ltd. | | 109,000 | 42,532 |
| VSTECS Holdings Ltd. | | 182,000 | 104,558 |
| Yangzijiang Shipbuilding Holdings Ltd. | | 699,900 | 652,684 |
| Yanlord Land Group Ltd. | | 158,400 | 101,245 |
TOTAL CHINA | | | 2,007,921 |
| Cyprus - 0.0% | | | |
| Atalaya Mining PLC | | 29,936 | 124,529 |
| Denmark - 2.2% | | | |
| ALK-Abello A/S (a) | | 35,777 | 451,675 |
| Alm. Brand A/S | | 229,074 | 422,963 |
| Ambu A/S Series B (a)(c) | | 45,404 | 719,537 |
| Bavarian Nordic A/S (a) | | 19,222 | 526,548 |
| Better Collective A/S (a) | | 8,281 | 175,229 |
| cBrain A/S | | 3,040 | 62,557 |
| Cementir SpA | | 12,845 | 107,711 |
| Chemometec A/S (a) | | 4,491 | 258,791 |
| D/S Norden A/S | | 6,028 | 378,193 |
| DFDS A/S | | 9,522 | 382,316 |
| FLSmidth & Co. A/S (c) | | 14,034 | 552,688 |
| GN Store Nord A/S (a) | | 35,318 | 939,795 |
| H Lundbeck A/S | | 74,857 | 395,726 |
| H Lundbeck A/S Class A | | 18,137 | 91,161 |
| ISS A/S | | 42,360 | 882,957 |
| Jyske Bank A/S (Reg.) (a) | | 12,984 | 946,472 |
| Matas A/S | | 9,923 | 124,688 |
| Netcompany Group A/S (a)(d) | | 10,840 | 417,928 |
| Nilfisk Holding A/S (a) | | 2,966 | 60,684 |
| NKT A/S (a)(c) | | 11,051 | 578,648 |
| NTG Nordic Transport Group A/S (a) | | 2,161 | 114,527 |
| Per Aarsleff Holding A/S | | 4,915 | 211,437 |
| Ringkjoebing Landbobank A/S | | 7,226 | 1,014,279 |
| Royal Unibrew A/S | | 13,492 | 1,204,297 |
| Scandinavian Tobacco Group A/S (d) | | 15,088 | 293,976 |
| Schouw & Co. | | 3,436 | 292,069 |
| SimCorp A/S | | 10,764 | 1,163,998 |
| Solar Holding A/S | | 1,496 | 122,298 |
| Spar Nord Bank A/S | | 22,959 | 372,326 |
| Sydbank A/S | | 15,799 | 703,475 |
| Topdanmark A/S | | 12,177 | 641,567 |
| Trifork Holding AG | | 3,549 | 84,364 |
| Zealand Pharma A/S (a) | | 12,010 | 405,157 |
TOTAL DENMARK | | | 15,100,037 |
| Egypt - 0.1% | | | |
| Centamin PLC | | 306,432 | 397,817 |
| Energean PLC | | 33,797 | 525,833 |
TOTAL EGYPT | | | 923,650 |
| Faroe Islands - 0.1% | | | |
| Bakkafrost | | 13,479 | 981,482 |
| Finland - 1.4% | | | |
| Aktia Bank Oyj (A Shares) | | 14,402 | 144,889 |
| Anora Group Oyj | | 10,152 | 59,288 |
| Cargotec Corp. (B Shares) | | 10,491 | 578,580 |
| Caverion Oyj | | 25,529 | 241,921 |
| Citycon Oyj | | 22,215 | 167,679 |
| F-Secure Corp. | | 30,793 | 99,078 |
| Finnair Oyj (a) | | 167,735 | 98,143 |
| Huhtamaki Oyj | | 26,088 | 938,281 |
| Incap Oyj (c) | | 4,332 | 53,462 |
| Jervois Global Ltd. (a) | | 446,222 | 26,255 |
| Kemira Oyj | | 29,148 | 510,358 |
| Kempower OYJ (a)(c) | | 4,501 | 163,669 |
| Kojamo OYJ | | 36,942 | 458,761 |
| Konecranes Oyj | | 16,117 | 629,923 |
| Marimekko Oyj | | 6,851 | 70,773 |
| Metsa Board OYJ (B Shares) | | 47,851 | 344,571 |
| Musti Group OYJ | | 8,678 | 179,675 |
| Nokian Tyres PLC | | 36,042 | 350,601 |
| Oriola-KD Oyj | | 30,130 | 48,273 |
| Outokumpu Oyj (A Shares) (c) | | 97,243 | 529,653 |
| Puuilo Oyj | | 13,816 | 106,795 |
| Qt Group Oyj (a) | | 4,499 | 386,384 |
| Revenio Group Oyj | | 6,481 | 243,522 |
| Rovio Entertainment OYJ (d) | | 11,163 | 114,579 |
| Sanoma Corp. | | 18,830 | 163,500 |
| Talenom OYJ | | 7,930 | 67,458 |
| TietoEVRY Oyj | | 23,766 | 758,397 |
| Tokmanni Group Corp. | | 13,498 | 184,579 |
| Uponor Oyj | | 14,911 | 397,288 |
| Valmet Corp. | | 44,655 | 1,506,668 |
| YIT OYJ | | 37,231 | 96,326 |
TOTAL FINLAND | | | 9,719,329 |
| France - 3.8% | | | |
| AB Science SA (a)(c) | | 6,846 | 48,279 |
| ABC Arbitrage SA | | 8,188 | 54,675 |
| Air France KLM (Reg.) (a) | | 314,017 | 542,725 |
| Akwel | | 2,255 | 33,545 |
| ALD SA (d) | | 38,421 | 461,887 |
| Altarea SCA | | 1,094 | 143,211 |
| ALTEN | | 7,866 | 1,334,802 |
| Antin Infrastructure Partners SA | | 9,573 | 161,392 |
| Atos SE (a)(c) | | 27,153 | 375,046 |
| Aubay | | 1,973 | 96,854 |
| Believe SA (a) | | 5,489 | 65,443 |
| Beneteau SA | | 10,065 | 161,701 |
| BIC SA | | 6,650 | 409,981 |
| Boiron SA | | 1,135 | 49,901 |
| Bonduelle SCA | | 3,810 | 48,028 |
| Carmila SA | | 15,544 | 262,743 |
| Casino Guichard Perrachon SA (a)(c) | | 11,813 | 100,359 |
| CGG SA (a) | | 194,688 | 145,878 |
| Chargeurs SA | | 4,724 | 77,456 |
| Coface SA | | 28,489 | 435,094 |
| Compagnie des Alpes | | 5,315 | 84,218 |
| Compagnie Plastic Omnium SA | | 15,735 | 277,935 |
| Derichebourg | | 26,303 | 162,161 |
| Elior SA (a)(d) | | 35,246 | 122,338 |
| Elis SA | | 52,349 | 1,038,301 |
| Equasens | | 1,272 | 100,496 |
| Eramet SA | | 2,714 | 263,468 |
| Esker SA | | 1,454 | 221,098 |
| Etablissements Maurel & Prom | | 14,221 | 54,344 |
| Euroapi SASU | | 14,109 | 169,381 |
| Eutelsat Communications (c) | | 45,656 | 303,108 |
| Faurecia SA (a) | | 42,183 | 871,527 |
| Fnac Darty SA | | 4,394 | 165,394 |
| Gaztransport et Technigaz SA | | 7,025 | 750,475 |
| ICADE | | 9,344 | 437,792 |
| ID Logistics Group (a) | | 694 | 203,798 |
| Imerys SA | | 8,879 | 364,348 |
| Interparfums SA | | 5,111 | 405,490 |
| Ipsos SA | | 10,834 | 586,871 |
| JCDecaux SA (a) | | 17,380 | 384,553 |
| Kaufman & Broad SA | | 3,466 | 112,666 |
| Korian SA (c) | | 19,959 | 172,754 |
| LISI | | 5,269 | 149,212 |
| Maisons du Monde SA (d) | | 7,866 | 82,775 |
| Manitou BF SA | | 2,742 | 67,680 |
| McPhy Energy SA (a)(c) | | 5,607 | 75,994 |
| Mercialys SA | | 20,325 | 204,253 |
| Mersen SA (c) | | 4,809 | 193,945 |
| Mersen SA rights 5/2/23 (a)(c) | | 4,809 | 7,812 |
| Metropole Television SA | | 6,847 | 110,455 |
| Neoen SA (d) | | 18,432 | 552,438 |
| Nexans SA | | 6,519 | 559,219 |
| Nexity | | 10,637 | 278,723 |
| Orpea (a)(c) | | 14,951 | 44,086 |
| Peugeot Invest | | 1,377 | 168,726 |
| Pierre Et Vacances La Defense | | 36,714 | 66,994 |
| Quadient SA | | 9,385 | 186,144 |
| Rexel SA | | 65,609 | 1,518,186 |
| Rubis SCA | | 24,775 | 731,083 |
| SCOR SE | | 40,860 | 1,054,454 |
| Seche Environment SA | | 613 | 70,113 |
| SES-imagotag SA (a) | | 1,290 | 206,110 |
| SMCP S.A.S. (a)(d) | | 11,380 | 100,568 |
| Soitec SA (a) | | 7,161 | 1,054,987 |
| Sopra Steria Group | | 4,164 | 899,309 |
| SPIE SA | | 34,961 | 1,089,445 |
| Technip Energies NV | | 36,576 | 811,301 |
| Television Francaise 1 SA | | 11,212 | 90,311 |
| Trigano SA | | 2,348 | 305,297 |
| Ubisoft Entertainment SA (a) | | 25,170 | 737,158 |
| Vallourec SA (a) | | 37,255 | 424,265 |
| Valneva SE (a)(c) | | 30,006 | 145,282 |
| Verallia SA (d) | | 20,021 | 812,291 |
| Vicat SA | | 4,883 | 142,316 |
| Vilmorin & Cie | | 1,510 | 71,630 |
| Virbac SA | | 1,148 | 391,512 |
| Voltalia SA (a)(c) | | 10,720 | 162,774 |
| Waga Energy SA (a) | | 1,380 | 36,191 |
| Wavestone | | 2,165 | 111,289 |
TOTAL FRANCE | | | 25,975,844 |
| Gabon - 0.0% | | | |
| BW Energy Ltd. (a) | | 24,507 | 65,769 |
| Georgia - 0.1% | | | |
| Bank of Georgia Group PLC | | 9,745 | 362,512 |
| TBC Bank Group PLC | | 11,162 | 330,356 |
TOTAL GEORGIA | | | 692,868 |
| Germany - 4.7% | | | |
| 1&1 AG | | 11,889 | 138,603 |
| Aareal Bank AG | | 15,633 | 532,283 |
| About You Holding AG (a)(c) | | 10,088 | 62,027 |
| Adesso AG | | 888 | 132,683 |
| ADVA Optical Networking SE (a) | | 4,519 | 99,590 |
| Aixtron AG | | 30,522 | 861,993 |
| Amadeus Fire AG | | 1,558 | 229,359 |
| ATOSS Software AG | | 1,073 | 214,713 |
| AURELIUS AG (c) | | 7,432 | 137,335 |
| Aurubis AG | | 8,348 | 780,046 |
| Auto1 Group SE (a)(d) | | 23,498 | 184,665 |
| Basler AG | | 3,024 | 65,043 |
| BayWa AG | | 3,874 | 165,628 |
| Bertrandt AG (a) | | 1,549 | 86,196 |
| Bilfinger Berger AG | | 8,358 | 361,019 |
| Borussia Dortmund GmbH & Co. KGaA (a) | | 20,697 | 103,197 |
| CANCOM AG | | 9,560 | 342,992 |
| CECONOMY AG (a) | | 39,523 | 120,112 |
| Cewe Stiftung & Co. KGAA | | 1,512 | 155,611 |
| CompuGroup Medical AG | | 7,276 | 399,107 |
| CropEnergies AG | | 7,114 | 82,152 |
| CTS Eventim AG | | 15,438 | 1,013,863 |
| CureVac NV (a) | | 15,379 | 112,861 |
| Datagroup AG | | 1,166 | 85,697 |
| Dermapharm Holding SE | | 5,172 | 259,078 |
| Deutsche Beteiligungs AG | | 3,877 | 122,395 |
| Deutsche EuroShop AG (c) | | 4,062 | 91,533 |
| Deutsche Pfandbriefbank AG (d) | | 36,138 | 332,501 |
| Deutz AG | | 30,974 | 205,293 |
| DIC Asset AG | | 11,297 | 85,768 |
| DIC Asset AG rights (a) | | 11,297 | 9,336 |
| Draegerwerk AG & Co. KGaA | | 811 | 37,354 |
| Duerr AG | | 13,876 | 480,105 |
| Eckert & Ziegler Strahlen-und Medizintechnik AG | | 4,038 | 208,235 |
| ELMOS Semiconductor AG | | 2,160 | 162,799 |
| ElringKlinger AG | | 7,372 | 82,613 |
| Encavis AG | | 32,721 | 565,166 |
| Energiekontor AG | | 1,725 | 137,806 |
| Evotec OAI AG (a) | | 37,827 | 692,956 |
| Fielmann AG | | 6,821 | 352,954 |
| Flatex AG (a) | | 17,997 | 193,351 |
| Fraport AG Frankfurt Airport Services Worldwide (a) | | 9,852 | 528,358 |
| Freenet AG | | 30,222 | 860,514 |
| Gerresheimer AG | | 9,296 | 1,011,010 |
| GFT Technologies AG | | 4,664 | 183,677 |
| Grand City Properties SA | | 26,568 | 221,321 |
| Grenkeleasing AG | | 7,555 | 270,142 |
| Hamborner (REIT) AG | | 18,358 | 144,635 |
| Hamburger Hafen und Logistik AG | | 7,203 | 99,371 |
| Heidelberger Druckmaschinen AG (a) | | 70,692 | 145,976 |
| Hensoldt AG | | 9,994 | 374,421 |
| Hochtief AG | | 7,361 | 614,415 |
| Hornbach Holding AG & Co. KGaA | | 2,274 | 192,940 |
| Hugo Boss AG | | 15,111 | 1,135,918 |
| Hypoport AG (a)(c) | | 1,064 | 170,118 |
| INDUS Holding AG | | 5,509 | 162,989 |
| Instone Real Estate Group BV (d) | | 12,822 | 102,432 |
| Jenoptik AG | | 13,982 | 444,947 |
| JOST Werke AG (d) | | 3,651 | 201,554 |
| K+S AG | | 51,135 | 1,019,293 |
| KION Group AG | | 19,571 | 806,973 |
| Kloeckner & Co. AG | | 20,161 | 223,265 |
| Krones AG | | 3,753 | 491,289 |
| KWS Saat AG | | 2,997 | 194,181 |
| Lanxess AG | | 21,861 | 887,907 |
| MBB SE | | 532 | 48,480 |
| Medios AG (a)(c) | | 3,771 | 75,626 |
| Metro Wholesale & Food Specialist AG (a) | | 33,388 | 283,469 |
| Montana Aerospace AG (a)(d) | | 5,924 | 107,101 |
| Morphosys AG (a)(c) | | 9,298 | 195,303 |
| Nagarro SE (a)(c) | | 2,235 | 239,625 |
| Nordex SE (a) | | 37,318 | 447,393 |
| NORMA Group AG | | 8,651 | 205,140 |
| OHB SE | | 1,543 | 54,832 |
| Patrizia Immobilien AG | | 12,611 | 135,348 |
| Pfeiffer Vacuum Technology AG | | 935 | 155,572 |
| PNE AG | | 9,400 | 153,503 |
| ProSiebenSat.1 Media AG | | 47,178 | 422,122 |
| PVA TePla AG (a) | | 5,342 | 114,195 |
| Salzgitter AG | | 8,152 | 321,940 |
| Schaeffler AG | | 33,418 | 241,929 |
| secunet Security Network AG | | 444 | 97,849 |
| SGL Carbon AG (a)(c) | | 16,688 | 153,360 |
| Siltronic AG | | 4,051 | 290,816 |
| Sirius Real Estate Ltd. | | 318,401 | 322,321 |
| Sixt SE | | 3,576 | 442,506 |
| SMA Solar Technology AG (a) | | 2,822 | 304,115 |
| Software AG (Bearer) | | 14,046 | 478,248 |
| Softwareone Holding AG | | 25,340 | 380,164 |
| Stabilus Se | | 6,713 | 437,906 |
| Steico AG | | 1,515 | 75,372 |
| STRATEC Biomedical Systems AG | | 2,157 | 148,075 |
| Stroeer SE & Co. KGaA | | 9,003 | 493,243 |
| Suedzucker AG (Bearer) | | 19,481 | 393,259 |
| SUSE SA (a) | | 11,478 | 216,274 |
| Synlab AG | | 18,202 | 192,144 |
| TAG Immobilien AG | | 47,715 | 407,473 |
| Takkt AG | | 8,933 | 142,924 |
| TeamViewer AG (a)(d) | | 37,430 | 687,746 |
| Thyssenkrupp AG (c) | | 125,144 | 896,877 |
| Tonies SE (a) | | 13,890 | 83,567 |
| TUI AG (GB) (a)(c) | | 115,025 | 733,486 |
| Varta AG (c) | | 4,982 | 128,733 |
| VERBIO Vereinigte BioEnergie AG | | 6,043 | 224,667 |
| VIB Vermoegen AG | | 2,168 | 44,291 |
| Vitesco Technologies Group AG (a) | | 5,440 | 371,649 |
| Vossloh AG | | 2,405 | 110,110 |
| Wacker Construction Equipment AG | | 7,213 | 175,651 |
| Wuestenrot & Wuerttembergische AG | | 5,955 | 108,270 |
TOTAL GERMANY | | | 32,716,338 |
| Ghana - 0.0% | | | |
| Tullow Oil PLC (a) | | 313,339 | 110,103 |
| Guatemala - 0.1% | | | |
| Millicom International Cellular SA (depository receipt) (a) | | 46,348 | 830,012 |
| Hong Kong - 1.7% | | | |
| ASMPT Ltd. | | 81,900 | 643,911 |
| Bank of East Asia Ltd. | | 324,202 | 427,269 |
| C-Mer Eye Care Holdings Ltd. (a) | | 152,000 | 87,071 |
| Cadeler A/S (a) | | 29,269 | 127,545 |
| Cafe de Coral Holdings Ltd. | | 96,000 | 134,466 |
| Champion (REIT) | | 711,000 | 296,778 |
| Chinese Estates Holdings Ltd. (a) | | 134,000 | 38,709 |
| Chow Sang Sang Holdings International Ltd. | | 103,000 | 135,332 |
| Citychamp Watch & Jewel Gr Ltd. (a) | | 338,000 | 50,844 |
| CK Life Sciences International Holding, Inc. | | 800,000 | 80,757 |
| Comba Telecom Systems Holdings Ltd. | | 528,000 | 103,332 |
| Cowell e Holdings, Inc. (a) | | 80,000 | 154,737 |
| Dah Sing Banking Group Ltd. | | 114,400 | 91,760 |
| Dah Sing Financial Holdings Ltd. | | 40,000 | 102,477 |
| EC Healthcare | | 130,000 | 87,537 |
| Far East Consortium International Ltd. | | 327,906 | 82,834 |
| Fortune (REIT) | | 394,000 | 329,608 |
| Guotai Junan International Holdings Ltd. | | 791,000 | 66,809 |
| Haitong International Securities Group Ltd. | | 635,700 | 53,660 |
| Hang Lung Group Ltd. | | 218,000 | 383,249 |
| HKBN Ltd. | | 224,000 | 158,066 |
| Hong Kong Television Network Ltd. (c) | | 153,000 | 96,240 |
| Hutchison Port Holdings Trust | | 1,425,600 | 270,439 |
| Hutchison Telecommunications Hong Kong Holdings Ltd. | | 376,000 | 65,228 |
| Hysan Development Co. Ltd. | | 166,000 | 469,124 |
| Johnson Electric Holdings Ltd. | | 100,000 | 111,806 |
| K Wah International Holdings Ltd. | | 305,000 | 105,397 |
| Kerry Properties Ltd. | | 154,500 | 398,626 |
| Kingkey Financial International Holdings Ltd. (a) | | 920,000 | 226,379 |
| Luk Fook Holdings International Ltd. | | 96,000 | 307,634 |
| Man Wah Holdings Ltd. | | 478,800 | 402,784 |
| Melco Crown Entertainment Ltd. sponsored ADR (a) | | 54,969 | 749,777 |
| Melco International Development Ltd. (a) | | 186,000 | 216,473 |
| Nissin Foods Co. Ltd. | | 65,000 | 58,067 |
| NWS Holdings Ltd. | | 421,000 | 364,654 |
| Pacific Basin Shipping Ltd. | | 1,401,000 | 487,487 |
| Pacific Textile Holdings Ltd. | | 247,000 | 79,474 |
| PAX Global Technology Ltd. | | 189,000 | 155,687 |
| PCCW Ltd. | | 1,126,000 | 587,353 |
| Perfect Shape (PRC) Holdings Ltd. | | 102,931 | 50,202 |
| Prosperity (REIT) | | 350,000 | 84,899 |
| Realord Group Holdings Ltd. (a)(c) | | 116,000 | 80,263 |
| Sa Sa International Holdings Ltd. (a) | | 294,000 | 69,124 |
| Shun Tak Holdings Ltd. (a) | | 372,000 | 67,528 |
| SmarTone Telecommunications Holdings Ltd. | | 92,000 | 55,996 |
| Stella International Holdings Ltd. | | 133,500 | 138,994 |
| Sun Hung Kai & Co. Ltd. | | 162,000 | 59,775 |
| Sunevision Holdings Ltd. | | 176,000 | 100,001 |
| Sunlight (REIT) | | 279,000 | 108,192 |
| Texhong International Group Lt | | 77,000 | 56,248 |
| The United Laboratories International Holdings Ltd. | | 276,000 | 223,472 |
| United Energy Group Ltd. | | 2,110,000 | 317,964 |
| Value Partners Group Ltd. | | 254,000 | 80,617 |
| Vitasoy International Holdings Ltd. | | 232,000 | 410,370 |
| Viva China Holdings Ltd. (a) | | 1,056,000 | 179,274 |
| Vtech Holdings Ltd. | | 42,900 | 257,552 |
| Yue Yuen Industrial (Holdings) Ltd. | | 217,500 | 327,322 |
TOTAL HONG KONG | | | 11,457,173 |
| Indonesia - 0.1% | | | |
| Bumitama Agri Ltd. | | 88,500 | 38,254 |
| First Pacific Co. Ltd. | | 624,000 | 208,955 |
| First Resources Ltd. | | 152,700 | 176,045 |
| Golden Agri-Resources Ltd. | | 1,709,500 | 353,547 |
| Nickel Industries Ltd. | | 280,577 | 178,513 |
TOTAL INDONESIA | | | 955,314 |
| Iraq - 0.0% | | | |
| Genel Energy PLC | | 41,866 | 58,508 |
| Gulf Keystone Petroleum Ltd. | | 57,730 | 98,526 |
TOTAL IRAQ | | | 157,034 |
| Ireland - 0.4% | | | |
| C&C Group PLC (United Kingdom) (a) | | 107,183 | 210,674 |
| Cairn Homes PLC | | 172,092 | 194,179 |
| COSMO Pharmaceuticals NV | | 2,412 | 145,446 |
| Dalata Hotel Group PLC (a) | | 53,877 | 270,417 |
| Glanbia PLC | | 51,329 | 777,692 |
| Glenveagh Properties PLC (a)(d) | | 157,943 | 164,639 |
| Greencore Group PLC (a) | | 139,519 | 150,354 |
| Irish Residential Properties REIT PLC | | 122,147 | 138,901 |
| Keywords Studios PLC | | 20,013 | 679,086 |
| Origin Enterprises PLC | | 31,605 | 137,735 |
| Uniphar PLC | | 62,320 | 208,071 |
TOTAL IRELAND | | | 3,077,194 |
| Israel - 2.2% | | | |
| AFI Properties Ltd. (a) | | 1,487 | 39,591 |
| Africa Israel Residences Ltd. | | 1,672 | 61,041 |
| Airport City Ltd. (a) | | 18,441 | 234,949 |
| Alony Hetz Properties & Investments Ltd. | | 41,306 | 322,654 |
| Altshuler Shaham Finance Ltd. | | 20,122 | 40,645 |
| Amot Investments Ltd. | | 63,378 | 334,584 |
| Arad Investment & Industrial Development Ltd. | | 853 | 90,486 |
| Ashtrom Group Ltd. | | 10,992 | 172,481 |
| AudioCodes Ltd. | | 6,674 | 66,623 |
| Azorim Investment Development & Construction Co. Ltd. | | 22,565 | 53,811 |
| Big Shopping Centers Ltd. (a) | | 3,218 | 272,205 |
| Blue Square Real Estate Ltd. | | 1,272 | 63,611 |
| Camtek Ltd. (a) | | 7,846 | 200,898 |
| Carasso Motors Ltd. | | 8,267 | 36,810 |
| Cellcom Israel Ltd. (Israel) (a) | | 24,760 | 88,006 |
| Clal Insurance Enterprises Holdings Ltd. (a) | | 16,901 | 258,403 |
| Danel Adir Yeoshua Ltd. | | 1,565 | 113,925 |
| Danya Cebus Ltd. | | 1,993 | 38,829 |
| Delek Automotive Systems Ltd. | | 14,352 | 115,074 |
| Delek Group Ltd. | | 2,489 | 267,255 |
| Delta Galil Industries Ltd. | | 3,163 | 133,602 |
| Doral Group Renewable Energy Resources Ltd. (a) | | 24,400 | 52,217 |
| Elco Ltd. | | 2,644 | 91,136 |
| Electra Consumer Products 1970 Ltd. | | 3,283 | 77,115 |
| Electra Israel Ltd. | | 567 | 242,151 |
| Electra Real Estate Ltd. | | 7,101 | 73,468 |
| Energix-Renewable Energies Ltd. | | 67,200 | 198,303 |
| Enlight Renewable Energy Ltd. (a) | | 31,286 | 513,596 |
| Equital Ltd. (a) | | 5,976 | 151,238 |
| Fattal Holdings 1998 Ltd. (a) | | 1,726 | 153,418 |
| FIBI Holdings Ltd. | | 4,831 | 179,298 |
| Formula Systems (1985) Ltd. | | 2,687 | 169,319 |
| Fox Wizel Ltd. | | 2,219 | 185,194 |
| G City Ltd. | | 23,023 | 71,428 |
| Gilat Satellite Networks Ltd. (a) | | 11,549 | 53,778 |
| Harel Insurance Investments and Financial Services Ltd. | | 31,465 | 280,288 |
| Hilan Ltd. | | 4,065 | 179,542 |
| IDI Insurance Co. Ltd. | | 2,196 | 56,695 |
| Innoviz Technologies Ltd. (a)(c) | | 29,665 | 74,163 |
| Isracard Ltd. | | 54,665 | 221,561 |
| Israel Canada T.R Ltd. | | 37,205 | 67,965 |
| Israel Corp. Ltd. (Class A) | | 1,052 | 304,352 |
| Israel Land Development - Urban Renewal Ltd. | | 4,948 | 36,374 |
| Isras Investment Co. Ltd. | | 507 | 88,007 |
| Ituran Location & Control Ltd. | | 3,710 | 77,168 |
| Kornit Digital Ltd. (a) | | 13,603 | 248,391 |
| M Yochananof & Sons Ltd. | | 1,326 | 61,343 |
| Magic Software Enterprises Ltd. | | 7,505 | 98,224 |
| Malam Team Ltd. | | 2,251 | 38,268 |
| Matrix IT Ltd. | | 9,347 | 167,117 |
| Maytronics Ltd. | | 13,445 | 140,438 |
| Mega Or Holdings Ltd. | | 6,410 | 125,609 |
| Melisron Ltd. | | 6,449 | 427,523 |
| Menora Mivtachim Holdings Ltd. | | 6,647 | 138,916 |
| Migdal Insurance & Financial Holdings Ltd. | | 115,804 | 124,121 |
| Mivne Real Estate KD Ltd. | | 160,492 | 446,628 |
| Nano Dimension Ltd. ADR (a)(c) | | 69,947 | 172,769 |
| Nano-X Imaging Ltd. (a)(c) | | 10,353 | 63,257 |
| Naphtha Israel Petroleum Corp. Ltd. | | 9,667 | 40,753 |
| Nayax Ltd. (a) | | 2,198 | 37,457 |
| NeoGames SA (a) | | 3,882 | 52,213 |
| Neto Malinda Trading Ltd. (a) | | 3,057 | 53,486 |
| Nova Ltd. (a) | | 7,815 | 715,319 |
| Oil Refineries Ltd. | | 563,569 | 156,057 |
| One Software Technologies Ltd. | | 11,050 | 118,284 |
| OPC Energy Ltd. (a) | | 27,386 | 194,302 |
| OY Nofar Energy Ltd. (a) | | 4,142 | 94,005 |
| Partner Communications Co. Ltd. (a) | | 37,883 | 184,126 |
| Paz Oil Co. Ltd. (a) | | 2,738 | 257,252 |
| Perion Network Ltd. (a) | | 10,967 | 385,274 |
| Plus500 Ltd. | | 25,285 | 529,086 |
| Prashkovsky Investments & Construction Ltd. | | 2,189 | 44,421 |
| Property & Building Corp. Ltd. (a) | | 792 | 36,006 |
| Radware Ltd. (a) | | 10,975 | 221,146 |
| Rami Levi Chain Stores Hashikma Marketing 2006 Ltd. | | 2,396 | 136,326 |
| Reit 1 Ltd. | | 52,849 | 225,704 |
| Retailors Ltd. | | 3,544 | 67,377 |
| Sapiens International Corp. NV | | 9,326 | 187,196 |
| Scope Metals Group Ltd. (a) | | 1,976 | 65,443 |
| Sella Capital Real Estate Ltd. | | 57,050 | 117,107 |
| Shapir Engineering and Industry Ltd. | | 38,494 | 273,325 |
| Shikun & Binui Ltd. (a) | | 71,694 | 153,152 |
| Shufersal Ltd. | | 72,021 | 364,932 |
| Sisram Medical Ltd. (d) | | 38,000 | 56,632 |
| Strauss Group Ltd. | | 14,206 | 315,367 |
| Summit Real Estate Holdings Ltd. | | 10,140 | 111,532 |
| Taboola.com Ltd. (a)(c) | | 37,914 | 87,581 |
| Tadiran Group Ltd. | | 929 | 82,652 |
| Tel Aviv Stock Exchange Ltd. | | 27,262 | 125,518 |
| The Phoenix Holdings Ltd. | | 41,412 | 441,008 |
| Tremor International Ltd. (a)(c) | | 23,835 | 66,726 |
| Turpaz Industries Ltd. | | 9,008 | 33,507 |
| YH Dimri Construction & Development Ltd. | | 2,054 | 110,245 |
| ZIM Integrated Shipping Services Ltd. (c) | | 24,408 | 416,645 |
TOTAL ISRAEL | | | 15,413,023 |
| Italy - 3.5% | | | |
| A2A SpA | | 419,509 | 739,611 |
| ACEA SpA | | 11,593 | 169,899 |
| Anima Holding SpA (d) | | 60,736 | 252,040 |
| Antares Vision SpA (a) | | 7,983 | 58,584 |
| Ariston Holding NV | | 23,070 | 262,851 |
| Arnoldo Mondadori Editore SpA | | 31,468 | 68,794 |
| Ascopiave SpA | | 14,035 | 45,004 |
| Autogrill SpA (a)(c) | | 50,395 | 368,721 |
| Azimut Holding SpA | | 29,173 | 650,630 |
| Banca Generali SpA | | 15,385 | 510,108 |
| Banca IFIS SpA | | 7,257 | 121,707 |
| Banca Mediolanum S.p.A. | | 60,341 | 544,817 |
| Banca Monte dei Paschi di Siena SpA (a) | | 119,602 | 275,308 |
| Banca Popolare di Sondrio SCARL | | 123,097 | 559,110 |
| Banco BPM SpA | | 387,707 | 1,574,285 |
| BFF Bank SpA (d) | | 42,607 | 409,392 |
| Biesse SpA | | 3,760 | 57,258 |
| BPER Banca | | 287,404 | 805,977 |
| Brembo SpA | | 40,732 | 597,387 |
| Brunello Cucinelli SpA | | 9,122 | 871,468 |
| Buzzi Unicem SpA | | 26,064 | 646,773 |
| Carel Industries SpA (d) | | 10,908 | 286,065 |
| CIR SpA (a) | | 164,445 | 69,400 |
| Credito Emiliano SpA | | 23,130 | 177,389 |
| Cromwell European (REIT) | | 92,390 | 156,944 |
| d'Amico International Shipping SA | | 116,269 | 51,695 |
| Danieli & C. Officine Meccaniche SpA | | 2,896 | 75,310 |
| Datalogic SpA | | 5,654 | 46,820 |
| De'Longhi SpA | | 20,239 | 469,667 |
| Digital Bros SpA (c) | | 1,405 | 31,923 |
| Digital Value SpA | | 948 | 69,153 |
| Dovalue SpA (d) | | 16,274 | 114,050 |
| El.En. Group SpA | | 11,860 | 152,902 |
| Enav SpA (d) | | 73,276 | 343,480 |
| ERG SpA | | 16,271 | 491,255 |
| Esprinet SpA | | 7,736 | 68,407 |
| Fila SpA | | 7,300 | 60,329 |
| Fincantieri Cantieri Navali It (a) | | 136,452 | 83,147 |
| Gruppo MutuiOnline SpA | | 7,100 | 221,405 |
| GVS SpA (a)(d) | | 18,777 | 127,763 |
| Hera SpA | | 222,277 | 691,674 |
| Illimity Bank SpA (c) | | 15,566 | 109,688 |
| Industrie de Nora SpA | | 8,978 | 178,467 |
| Interpump Group SpA | | 18,857 | 1,048,900 |
| Iren SpA | | 193,992 | 418,755 |
| Italgas SpA | | 130,632 | 853,584 |
| Iveco Group NV (a) | | 55,191 | 495,642 |
| Juventus Football Club SpA (a)(c) | | 273,661 | 87,268 |
| Leonardo SpA | | 108,657 | 1,293,673 |
| LU-VE SpA | | 2,378 | 79,658 |
| Maire Tecnimont SpA | | 40,018 | 171,445 |
| MARR SpA | | 8,898 | 139,227 |
| MFE-MediaForEurope NV | | 34,761 | 25,587 |
| MFE-MediaForEurope NV Class A | | 254,556 | 120,276 |
| OVS (d) | | 59,404 | 178,044 |
| Pharmanutra SpA | | 787 | 43,707 |
| Piaggio & C SpA | | 43,973 | 180,636 |
| Pirelli & C. SpA (d) | | 94,927 | 496,432 |
| Rai Way SpA (d) | | 24,707 | 158,175 |
| Reply SpA | | 5,957 | 692,504 |
| Safilo Group SpA (a) | | 60,681 | 87,258 |
| Saipem SpA (a) | | 298,728 | 456,227 |
| Salcef Group SpA | | 6,778 | 158,336 |
| Salvatore Ferragamo Italia SpA | | 13,702 | 240,515 |
| Sanlorenzo SpA | | 3,300 | 147,814 |
| Saras SpA | | 154,441 | 199,705 |
| Seco SpA (a)(c) | | 10,099 | 51,746 |
| Sesa SpA | | 2,094 | 255,888 |
| SOL SpA | | 9,839 | 284,050 |
| Tamburi Investment Partners SpA | | 29,817 | 284,199 |
| Technogym SpA (d) | | 37,916 | 345,309 |
| Technoprobe SpA (a) | | 34,258 | 243,480 |
| Tinexta SpA | | 5,788 | 117,862 |
| Tod's SpA (a) | | 2,698 | 113,863 |
| Unipol Gruppo SpA | | 105,593 | 592,935 |
| Webuild SpA (c) | | 109,377 | 235,019 |
| Webuild SpA warrants 8/2/30 (a) | | 6,588 | 14,156 |
| Wiit SpA | | 2,985 | 65,060 |
| Zignago Vetro SpA | | 8,448 | 156,761 |
TOTAL ITALY | | | 24,200,353 |
| Japan - 30.8% | | | |
| 77 Bank Ltd. | | 14,400 | 234,114 |
| ABC-MART, Inc. | | 8,800 | 500,093 |
| Activia Properties, Inc. | | 187 | 544,892 |
| Adastria Co. Ltd. | | 6,000 | 113,152 |
| Adeka Corp. | | 20,800 | 351,260 |
| Advance Logistics Investment Corp. | | 174 | 176,365 |
| Advance Residence Investment Corp. | | 353 | 915,895 |
| Adventure, Inc. | | 700 | 52,195 |
| Aeon (REIT) Investment Corp. | | 441 | 505,584 |
| Aeon Delight Co. Ltd. | | 5,500 | 121,885 |
| AEON Financial Service Co. Ltd. | | 28,400 | 252,976 |
| Aeon Hokkaido Corp. | | 11,300 | 67,792 |
| AEON MALL Co. Ltd. | | 27,600 | 372,118 |
| Ai Holdings Corp. | | 8,900 | 155,812 |
| Aica Kogyo Co. Ltd. | | 13,700 | 311,466 |
| Aichi Corp. | | 6,600 | 40,900 |
| Aichi Financial Group, Inc. | | 9,400 | 147,612 |
| Aida Engineering Ltd. | | 11,900 | 74,963 |
| Aiful Corp. | | 86,800 | 236,092 |
| Ain Holdings, Inc. | | 6,600 | 274,453 |
| Air Water, Inc. | | 48,800 | 616,626 |
| Airtrip Corp. | | 3,700 | 74,413 |
| Alfresa Holdings Corp. | | 43,400 | 628,410 |
| Alpen Co. Ltd. | | 3,800 | 58,105 |
| Alpha Systems, Inc. | | 1,800 | 54,783 |
| Alps Alpine Co. Ltd. | | 53,500 | 488,458 |
| Amada Co. Ltd. | | 92,300 | 861,805 |
| Amano Corp. | | 14,400 | 293,198 |
| Amvis Holdings, Inc. | | 10,600 | 230,839 |
| Anicom Holdings, Inc. | | 19,800 | 77,080 |
| Anritsu Corp. | | 36,500 | 334,213 |
| Aoki International Co. Ltd. | | 8,900 | 61,991 |
| Aozora Bank Ltd. | | 32,000 | 574,048 |
| Appier Group, Inc. (a) | | 15,200 | 172,607 |
| Arata Corp. | | 3,700 | 120,308 |
| Arcland Sakamoto Co. Ltd. | | 7,200 | 81,547 |
| Arcland Service Holdings Co. Ltd. | | 3,600 | 75,678 |
| ARCS Co. Ltd. | | 10,800 | 196,357 |
| Argo Graphics, Inc. | | 4,300 | 121,161 |
| Ariake Japan Co. Ltd. | | 4,900 | 198,727 |
| ARTERIA Networks Corp. | | 6,300 | 60,342 |
| As One Corp. | | 7,800 | 330,443 |
| Asahi Holdings, Inc. | | 19,300 | 284,140 |
| Asics Corp. | | 43,400 | 1,213,088 |
| ASKUL Corp. | | 10,500 | 139,932 |
| Atom Corp. (a) | | 31,000 | 190,929 |
| Autobacs Seven Co. Ltd. | | 17,300 | 196,731 |
| Avex, Inc. | | 8,600 | 98,493 |
| Axial Retailing, Inc. | | 4,400 | 114,195 |
| AZ-Com Maruwa Holdings, Inc. | | 10,700 | 157,776 |
| Bank of Kyoto Ltd. | | 15,300 | 752,797 |
| Belc Co. Ltd. | | 2,800 | 126,503 |
| Bell System24 Holdings, Inc. | | 9,000 | 92,525 |
| Belluna Co. Ltd. | | 12,900 | 70,776 |
| Benefit One, Inc. | | 21,600 | 297,309 |
| Benesse Holdings, Inc. | | 19,400 | 278,441 |
| Bengo4.Com, Inc. (a) | | 2,100 | 40,433 |
| Bic Camera, Inc. | | 25,500 | 213,345 |
| Biprogy, Inc. | | 19,100 | 460,493 |
| BML, Inc. | | 5,600 | 125,767 |
| Bunka Shutter Co. Ltd. | | 12,700 | 108,212 |
| Bushiroad, Inc. | | 7,800 | 51,196 |
| C. Uyemura & Co. Ltd. | | 3,000 | 144,757 |
| Calbee, Inc. | | 23,300 | 503,856 |
| Canon Electronics, Inc. | | 5,000 | 68,102 |
| Canon Marketing Japan, Inc. | | 12,000 | 300,036 |
| Casio Computer Co. Ltd. | | 50,500 | 480,498 |
| Cawachi Ltd. | | 3,500 | 60,002 |
| Cellebrite DI Ltd. (a)(c) | | 10,372 | 56,113 |
| CellSource Co. Ltd. (a) | | 1,800 | 34,023 |
| Central Glass Co. Ltd. | | 5,900 | 127,421 |
| Change Holdings, Inc. | | 10,000 | 169,179 |
| Chiyoda Corp. (a) | | 42,800 | 126,266 |
| Chofu Seisakusho Co. Ltd. | | 4,600 | 83,044 |
| Chudenko Corp. | | 7,000 | 114,803 |
| Chugin Financial Group, Inc. | | 36,900 | 247,600 |
| Chugoku Electric Power Co., Inc. | | 72,100 | 379,657 |
| Chugoku Marine Paints Ltd. | | 9,200 | 80,398 |
| Ci Takiron Corp. | | 9,600 | 35,361 |
| Citizen Watch Co. Ltd. | | 63,900 | 353,581 |
| CKD Corp. | | 13,500 | 205,640 |
| Coca-Cola West Co. Ltd. | | 35,800 | 385,790 |
| COLOPL, Inc. | | 15,300 | 71,943 |
| Colowide Co. Ltd. | | 20,100 | 307,945 |
| Comforia Residential REIT, Inc. | | 174 | 435,317 |
| COMSYS Holdings Corp. | | 30,100 | 575,998 |
| Comture Corp. | | 6,200 | 91,466 |
| Cosmo Energy Holdings Co. Ltd. | | 20,500 | 655,366 |
| Cosmos Pharmaceutical Corp. | | 5,400 | 531,118 |
| CRE Logistics REIT, Inc. | | 143 | 196,903 |
| Create Restaurants Holdings, Inc. | | 31,410 | 229,197 |
| Create SD Holdings Co. Ltd. | | 7,200 | 174,652 |
| Credit Saison Co. Ltd. | | 40,400 | 559,739 |
| Curves Holdings Co. Ltd. | | 13,800 | 80,456 |
| CYBERDYNE, Inc. (a) | | 28,300 | 58,492 |
| Cybozu, Inc. | | 6,500 | 129,751 |
| Daicel Chemical Industries Ltd. | | 69,300 | 546,352 |
| Daido Steel Co. Ltd. | | 6,800 | 261,869 |
| Daihen Corp. | | 5,200 | 171,243 |
| Daiho Corp. | | 1,800 | 51,714 |
| Daiichikosho Co. Ltd. | | 20,600 | 369,321 |
| Daiken Corp. | | 3,100 | 53,282 |
| Daiki Aluminum Industry Co. Ltd. | | 6,300 | 64,634 |
| Daikokutenbussan Co. Ltd. | | 1,400 | 56,050 |
| Daio Paper Corp. | | 23,200 | 188,017 |
| Daiseki Co. Ltd. | | 11,780 | 337,030 |
| Daishi Hokuetsu Financial Group, Inc. | | 10,000 | 222,845 |
| Daiwa Industries Ltd. | | 7,300 | 77,108 |
| Daiwa Office Investment Corp. | | 83 | 360,786 |
| Daiwa Securities Living Invest | | 519 | 441,281 |
| Daiwabo Holdings Co. Ltd. | | 22,100 | 417,010 |
| DCM Holdings Co. Ltd. | | 29,500 | 309,022 |
| Demae-Can Co. Ltd. (a)(c) | | 14,100 | 39,308 |
| DeNA Co. Ltd. | | 22,600 | 317,411 |
| Denka Co. Ltd. | | 20,400 | 408,560 |
| Descente Ltd. | | 7,400 | 235,039 |
| Dexerials Corp. | | 14,900 | 283,556 |
| Dic Corp. | | 20,400 | 376,858 |
| Digital Arts, Inc. | | 3,100 | 115,393 |
| Digital Garage, Inc. | | 9,000 | 317,519 |
| Dip Corp. | | 9,800 | 241,786 |
| Direct Marketing MiX, Inc. | | 5,600 | 49,342 |
| Dmg Mori Co. Ltd. | | 30,700 | 492,510 |
| Doshisha Co. Ltd. | | 5,300 | 83,448 |
| Doutor Nichires Holdings Co., Ltd. | | 7,900 | 124,579 |
| Dowa Holdings Co. Ltd. | | 14,000 | 457,387 |
| DTS Corp. | | 9,800 | 232,844 |
| Duskin Co. Ltd. | | 10,900 | 267,400 |
| Dydo Group Holdings, Inc. | | 2,100 | 78,496 |
| Earth Corp. | | 3,900 | 142,949 |
| Ebara Corp. | | 24,600 | 1,076,282 |
| EDION Corp. | | 21,000 | 206,660 |
| eGuarantee, Inc. | | 9,700 | 150,741 |
| Eiken Chemical Co. Ltd. | | 8,900 | 103,479 |
| Eizo Corp. | | 3,700 | 121,279 |
| Elan Corp. | | 7,700 | 57,662 |
| Elecom Co. Ltd. | | 14,000 | 132,854 |
| Electric Power Development Co. Ltd. | | 39,200 | 626,798 |
| EM Systems Co. Ltd. | | 9,200 | 53,110 |
| en japan, Inc. | | 8,800 | 157,963 |
| eRex Co. Ltd. | | 8,200 | 104,787 |
| ES-Con Japan Ltd. | | 8,400 | 53,623 |
| euglena Co. Ltd. (a) | | 26,300 | 172,262 |
| Exedy Corp. | | 7,400 | 106,519 |
| Exeo Group, Inc. | | 25,000 | 463,878 |
| Ezaki Glico Co. Ltd. | | 12,900 | 331,797 |
| Fancl Corp. | | 21,100 | 365,149 |
| FCC Co. Ltd. | | 9,400 | 121,180 |
| Ferrotec Holdings Corp. | | 12,100 | 273,660 |
| Financial Products Group Co. Ltd. | | 17,100 | 139,223 |
| Food & Life Companies Ltd. | | 29,900 | 720,177 |
| FP Corp. | | 12,700 | 315,914 |
| Freee KK (a) | | 10,800 | 309,023 |
| Frontier Real Estate Investment Corp. | | 132 | 476,912 |
| Fuji Co. Ltd. | | 7,000 | 91,390 |
| Fuji Corp. | | 19,700 | 330,431 |
| Fuji Kyuko Co. Ltd. | | 5,900 | 226,630 |
| Fuji Media Holdings, Inc. | | 12,500 | 117,184 |
| Fuji Oil Holdings, Inc. | | 12,100 | 186,936 |
| Fuji Seal International, Inc. | | 11,600 | 131,844 |
| Fuji Soft ABC, Inc. | | 6,800 | 406,262 |
| Fujicco Co. Ltd. | | 4,600 | 65,125 |
| Fujikura Ltd. | | 64,300 | 438,405 |
| Fujimi, Inc. | | 4,000 | 207,215 |
| Fujimori Kogyo Co. Ltd. | | 3,800 | 88,292 |
| Fujio Food Group, Inc. | | 4,400 | 45,589 |
| Fujitec Co. Ltd. | | 16,500 | 439,547 |
| Fujitsu General Ltd. | | 16,200 | 416,733 |
| Fujiya Co. Ltd. | | 2,500 | 46,414 |
| Fukui Computer Holdings, Inc. | | 3,000 | 59,547 |
| Fukuoka (REIT) Investment Fund | | 172 | 206,660 |
| Fukuoka Financial Group, Inc. | | 46,200 | 870,181 |
| Fukushima Industries Corp. | | 3,300 | 124,441 |
| Fukuyama Transporting Co. Ltd. | | 5,600 | 149,683 |
| Fullcast Holdings Co. Ltd. | | 5,100 | 92,593 |
| Funai Soken Holdings, Inc. | | 9,700 | 185,945 |
| Furukawa Co. Ltd. | | 7,300 | 72,145 |
| Furukawa Electric Co. Ltd. | | 18,100 | 331,384 |
| Fuso Chemical Co. Ltd. | | 4,800 | 133,573 |
| Future Corp. | | 11,800 | 150,938 |
| Fuyo General Lease Co. Ltd. | | 4,600 | 336,652 |
| G-7 Holdings, Inc. | | 6,400 | 67,484 |
| G-Tekt Corp. | | 5,500 | 60,252 |
| Genky DrugStores Co. Ltd. | | 2,200 | 65,030 |
| Geo Holdings Corp. | | 6,400 | 77,427 |
| Giken Ltd. | | 4,100 | 64,439 |
| Global One Real Estate Investment Corp. | | 245 | 189,576 |
| GLOBERIDE, Inc. | | 4,700 | 86,159 |
| Glory Ltd. | | 13,000 | 276,398 |
| GMO Financial Gate, Inc. | | 900 | 72,668 |
| GMO Financial Holdings, Inc. | | 10,200 | 46,574 |
| GMO GlobalSign Holdings KK | | 1,400 | 39,725 |
| GMO Internet, Inc. | | 17,800 | 358,077 |
| GNI Group Ltd. (a) | | 11,700 | 88,180 |
| Goldcrest Co. Ltd. | | 3,600 | 48,257 |
| GOLDWIN, Inc. | | 6,400 | 581,517 |
| GREE, Inc. | | 17,000 | 88,070 |
| GS Yuasa Corp. | | 17,400 | 306,236 |
| GungHo Online Entertainment, Inc. | | 12,300 | 236,149 |
| Gunma Bank Ltd. | | 92,700 | 317,445 |
| Gunze Ltd. | | 3,800 | 131,430 |
| H.I.S. Co. Ltd. (a) | | 14,100 | 212,441 |
| H.U. Group Holdings, Inc. | | 14,100 | 285,049 |
| H2O Retailing Corp. | | 21,900 | 259,507 |
| Hakuto Co. Ltd. | | 2,800 | 87,889 |
| Halows Co. Ltd. | | 2,800 | 66,403 |
| Hamakyorex Co. Ltd. | | 4,100 | 104,908 |
| Hankyu REIT, Inc. | | 159 | 170,393 |
| Hanwa Co. Ltd. | | 9,100 | 281,782 |
| Harmonic Drive Systems, Inc. | | 13,100 | 400,522 |
| Haseko Corp. | | 64,800 | 791,099 |
| Hazama Ando Corp. | | 43,100 | 284,516 |
| Heiwa Corp. | | 14,500 | 286,290 |
| Heiwa Real Estate (REIT), Inc. | | 257 | 301,009 |
| Heiwa Real Estate Co. Ltd. | | 8,300 | 237,500 |
| Heiwado Co. Ltd. | | 6,800 | 103,320 |
| Hiday Hidaka Corp. | | 6,800 | 114,380 |
| Hino Motors Ltd. (a) | | 75,800 | 298,661 |
| Hioki EE Corp. | | 2,500 | 166,509 |
| Hirata Corp. | | 2,300 | 114,796 |
| Hirogin Holdings, Inc. | | 66,600 | 330,304 |
| Hisamitsu Pharmaceutical Co., Inc. | | 12,600 | 348,511 |
| Hitachi Zosen Corp. | | 43,700 | 271,015 |
| Hogy Medical Co. Ltd. | | 7,100 | 177,855 |
| Hokkaido Electric Power Co., Inc. | | 46,600 | 175,547 |
| Hokkoku Financial Holdings, Inc. | | 6,200 | 216,665 |
| Hokuetsu Corp. | | 32,600 | 215,618 |
| Hokuhoku Financial Group, Inc. | | 30,900 | 222,702 |
| Hokuriku Electric Power Co., Inc. | | 46,100 | 215,378 |
| Hokuto Corp. | | 4,500 | 61,767 |
| Horiba Ltd. | | 9,200 | 506,853 |
| Hoshino Resorts REIT, Inc. | | 65 | 338,509 |
| Hosiden Corp. | | 12,300 | 157,520 |
| House Foods Group, Inc. | | 15,900 | 349,611 |
| Hulic (REIT), Inc. | | 344 | 396,358 |
| Ichibanya Co. Ltd. | | 3,900 | 154,926 |
| Ichigo Real Estate Investment Corp. | | 326 | 210,971 |
| Ichigo, Inc. | | 69,100 | 132,216 |
| Idec Corp. | | 7,800 | 191,009 |
| IDOM, Inc. | | 14,800 | 91,513 |
| IHI Corp. | | 37,400 | 942,409 |
| Iino Kaiun Kaisha Ltd. | | 20,800 | 156,520 |
| Inaba Denki Sangyo Co. Ltd. | | 13,000 | 290,368 |
| Inabata & Co. Ltd. | | 10,600 | 216,378 |
| Inageya Co. Ltd. | | 6,000 | 72,846 |
| Industrial & Infrastructure Fund Investment Corp. | | 532 | 609,681 |
| Infocom Corp. | | 6,400 | 106,347 |
| Infomart Corp. | | 53,400 | 114,784 |
| Information Services Inter-Dentsu Ltd. | | 7,000 | 246,766 |
| INFRONEER Holdings, Inc. | | 66,516 | 525,383 |
| Insource Co. Ltd. | | 12,800 | 117,449 |
| Internet Initiative Japan, Inc. | | 27,800 | 575,300 |
| Invincible Investment Corp. | | 1,654 | 714,127 |
| Iriso Electronics Co. Ltd. | | 5,300 | 181,417 |
| Isetan Mitsukoshi Holdings Ltd. | | 90,600 | 1,000,293 |
| ITO EN Ltd. | | 14,400 | 445,425 |
| Itochu Enex Co. Ltd. | | 12,400 | 106,134 |
| Itochushokuhin Co. Ltd. | | 1,200 | 48,114 |
| Itoham Yonekyu Holdings, Inc. | | 39,700 | 217,587 |
| Iwatani Corp. | | 11,900 | 563,379 |
| Iyogin Holdings, Inc. | | 59,800 | 350,146 |
| Izumi Co. Ltd. | | 8,800 | 206,941 |
| J Trust Co. Ltd. | | 19,500 | 56,885 |
| J-Oil Mills, Inc. | | 4,600 | 54,602 |
| J. Front Retailing Co. Ltd. | | 65,200 | 685,725 |
| JAC Recruitment Co. Ltd. | | 4,800 | 89,684 |
| JACCS Co. Ltd. | | 5,500 | 184,364 |
| JAFCO Co. Ltd. | | 13,200 | 168,196 |
| Japan Airport Terminal Co. Ltd. | | 16,200 | 793,849 |
| Japan Aviation Electronics Industry Ltd. | | 12,600 | 221,041 |
| Japan Display, Inc. (a) | | 158,200 | 47,893 |
| Japan Elevator Service Holdings Co. Ltd. | | 16,900 | 251,400 |
| Japan Excellent, Inc. | | 323 | 276,383 |
| Japan Hotel REIT Investment Corp. | | 1,212 | 684,772 |
| Japan Lifeline Co. Ltd. | | 14,600 | 100,424 |
| Japan Logistics Fund, Inc. | | 224 | 531,965 |
| Japan Material Co. Ltd. | | 18,500 | 277,387 |
| Japan Petroleum Exploration Co. Ltd. | | 8,200 | 272,849 |
| Japan Prime Realty Investment Corp. | | 226 | 587,638 |
| Japan Pulp & Paper Co. Ltd. | | 2,800 | 107,954 |
| Japan Securities Finance Co. Ltd. | | 24,300 | 183,392 |
| Japan Steel Works Ltd. | | 16,200 | 294,320 |
| Japan Wool Textile Co. Ltd./The | | 9,300 | 69,055 |
| JCR Pharmaceuticals Co. Ltd. | | 17,600 | 190,362 |
| Jcu Corp. | | 5,300 | 125,149 |
| JDC Corp. | | 12,700 | 57,451 |
| JEOL Ltd. | | 11,800 | 344,283 |
| JGC Holdings Corp. | | 59,100 | 739,357 |
| JINS Holdings, Inc. | | 3,600 | 77,525 |
| JMDC, Inc. | | 7,600 | 272,450 |
| Joshin Denki Co. Ltd. | | 4,300 | 64,133 |
| Joyful Honda Co. Ltd. | | 13,200 | 175,855 |
| JTEKT Corp. | | 54,700 | 451,713 |
| JTOWER, Inc. (a) | | 2,400 | 103,504 |
| Juroku Financial Group, Inc. | | 8,900 | 197,023 |
| Justsystems Corp. | | 9,500 | 251,038 |
| K's Holdings Corp. | | 42,400 | 375,801 |
| Kadokawa Corp. | | 25,100 | 535,302 |
| KAGA ELECTRONICS Co. Ltd. | | 4,300 | 152,550 |
| Kagome Co. Ltd. | | 20,400 | 495,493 |
| Kakaku.com, Inc. | | 36,100 | 496,690 |
| Kaken Pharmaceutical Co. Ltd. | | 8,100 | 223,035 |
| Kameda Seika Co. Ltd. | | 3,400 | 113,219 |
| Kamigumi Co. Ltd. | | 25,200 | 552,280 |
| Kanamoto Co. Ltd. | | 8,500 | 142,401 |
| Kandenko Co. Ltd. | | 28,000 | 210,973 |
| Kaneka Corp. | | 12,800 | 340,527 |
| Kanematsu Corp. | | 20,700 | 269,447 |
| Kansai Paint Co. Ltd. | | 47,400 | 668,244 |
| Kanto Denka Kogyo Co. Ltd. | | 10,600 | 80,416 |
| Kappa Create Co. Ltd. (a) | | 6,600 | 73,340 |
| Katakura Industries Co. Ltd. | | 4,600 | 61,461 |
| Katitas Co. Ltd. | | 13,800 | 269,499 |
| Kato Sangyo | | 6,200 | 164,865 |
| Kawasaki Heavy Industries Ltd. | | 40,500 | 881,048 |
| Kawasaki Kisen Kaisha Ltd. | | 42,100 | 1,003,257 |
| KeePer Technical Laboratory Co. Ltd. | | 3,400 | 126,425 |
| Keihan Electric Railway Co., Ltd. | | 25,800 | 710,179 |
| Keihanshin Bldg Co. Ltd. | | 7,600 | 71,701 |
| Keikyu Corp. | | 58,900 | 572,506 |
| Keiyo Co. Ltd. | | 10,000 | 61,846 |
| Kenedix Office Investment Corp. | | 231 | 510,702 |
| Kenedix Residential Investment Corp. | | 269 | 422,024 |
| Kenedix Retail REIT Corp. | | 162 | 291,473 |
| Kewpie Corp. | | 24,800 | 416,325 |
| Kfc Holdings Japan Ltd. | | 3,900 | 82,981 |
| KH Neochem Co. Ltd. | | 8,900 | 153,454 |
| Ki-Star Real Estate Co. Ltd. | | 2,400 | 72,121 |
| Kinden Corp. | | 33,700 | 459,489 |
| Kintetsu Department Store Co. Ltd. | | 2,300 | 41,969 |
| Kisoji Co. Ltd. | | 5,800 | 100,600 |
| Kissei Pharmaceutical Co. Ltd. | | 7,900 | 160,049 |
| Kitz Corp. | | 17,000 | 116,260 |
| Koa Corp. | | 8,300 | 104,128 |
| Kobe Steel Ltd. | | 90,100 | 671,321 |
| Kohnan Shoji Co. Ltd. | | 6,600 | 178,073 |
| Kokuyo Co. Ltd. | | 22,200 | 317,254 |
| KOMEDA Holdings Co. Ltd. | | 12,600 | 237,822 |
| KOMERI Co. Ltd. | | 8,000 | 186,086 |
| Konica Minolta, Inc. | | 121,200 | 505,570 |
| Konishi Co. Ltd. | | 7,800 | 117,166 |
| Konoike Transport Co. Ltd. | | 7,400 | 87,089 |
| Koshidaka Holdings Co. Ltd. | | 11,900 | 100,745 |
| Kotobuki Spirits Co. Ltd. | | 5,100 | 376,608 |
| Kumagai Gumi Co. Ltd. | | 9,200 | 195,600 |
| Kumiai Chemical Industry Co. Ltd. | | 20,100 | 133,776 |
| Kura Sushi, Inc. (c) | | 5,700 | 136,438 |
| Kuraray Co. Ltd. | | 85,500 | 799,563 |
| Kureha Chemical Industry Co. Ltd. | | 4,200 | 260,752 |
| Kusuri No Aoki Holdings Co. Ltd. | | 4,300 | 206,331 |
| Kyb Corp. | | 4,800 | 153,128 |
| Kyoei Steel Ltd. | | 5,400 | 73,012 |
| Kyokuto Kaihatsu Kogyo Co. Ltd. | | 8,100 | 102,134 |
| Kyorin Pharmaceutical Co. Ltd. | | 9,000 | 115,835 |
| Kyoritsu Maintenance Co. Ltd. | | 7,900 | 318,892 |
| Kyudenko Corp. | | 11,500 | 306,665 |
| Kyushu Electric Power Co., Inc. | | 109,000 | 634,696 |
| Kyushu Financial Group, Inc. | | 93,900 | 338,486 |
| Kyushu Railway Co. | | 35,800 | 812,974 |
| LaSalle Logiport REIT | | 480 | 570,241 |
| Lawson, Inc. | | 12,200 | 554,144 |
| Leopalace21 Corp. (a) | | 44,300 | 116,893 |
| LIFE Corp. | | 4,800 | 101,821 |
| Lifenet Insurance Co. (a) | | 13,100 | 114,173 |
| Link & Motivation, Inc. | | 10,700 | 38,417 |
| Lintec Corp. | | 9,700 | 162,214 |
| Lion Corp. | | 62,500 | 681,364 |
| LITALICO, Inc. | | 5,300 | 94,976 |
| M&A Capital Partners Co. Ltd. (a) | | 3,900 | 110,175 |
| M&A Research Institute Holding | | 1,300 | 97,301 |
| Mabuchi Motor Co. Ltd. | | 12,600 | 355,600 |
| Macnica Fuji Electronics Holdings, Inc. | | 12,600 | 346,252 |
| Maeda Kosen Co. Ltd. | | 4,900 | 117,248 |
| Makino Milling Machine Co. Ltd. | | 6,300 | 230,435 |
| Management Solutions Co. Ltd. | | 2,700 | 63,988 |
| Mandom Corp. | | 10,000 | 118,873 |
| Mani, Inc. | | 20,400 | 266,967 |
| Maruha Nichiro Corp. | | 10,800 | 201,066 |
| Marui Group Co. Ltd. | | 47,400 | 755,207 |
| Maruichi Steel Tube Ltd. | | 15,200 | 343,841 |
| Maruka Furusato Corp. | | 5,300 | 102,661 |
| Maruwa Ceramic Co. Ltd. | | 2,300 | 293,307 |
| Maruzen Showa Unyu Co. Ltd. | | 3,600 | 90,099 |
| Matsuda Sangyo Co. Ltd. | | 3,100 | 51,520 |
| Matsui Securities Co. Ltd. | | 29,600 | 169,386 |
| Matsuyafoods Holdings Co. Ltd. | | 2,200 | 69,165 |
| Max Co. Ltd. | | 7,200 | 114,984 |
| Maxell Ltd. | | 12,300 | 135,468 |
| Maxvalu Tokai Co. Ltd. | | 2,600 | 51,811 |
| MCJ Co. Ltd. | | 18,100 | 125,187 |
| Mebuki Financial Group, Inc. | | 247,900 | 635,034 |
| Medipal Holdings Corp. | | 49,200 | 751,674 |
| Medley, Inc. (a) | | 5,800 | 151,504 |
| Megachips Corp. | | 4,000 | 94,855 |
| Megmilk Snow Brand Co. Ltd. | | 12,600 | 180,845 |
| Meidensha Corp. | | 8,000 | 108,681 |
| Meiko Electronics Co. Ltd. | | 5,500 | 110,987 |
| Meitec Corp. | | 19,100 | 322,751 |
| Melco Holdings, Inc. | | 1,800 | 44,381 |
| Menicon Co. Ltd. | | 16,600 | 352,573 |
| Mercari, Inc. (a) | | 28,300 | 486,668 |
| Metawater Co. Ltd. | | 6,300 | 83,027 |
| Micronics Japan Co. Ltd. | | 7,400 | 67,415 |
| Midac Holdings Co. Ltd. | | 2,300 | 32,337 |
| Mie Kotsu Group Holdings, Inc. | | 11,500 | 49,708 |
| Milbon Co. Ltd. | | 7,100 | 299,353 |
| Mimasu Semiconductor Industries Co. Ltd. | | 4,300 | 83,089 |
| Mirai Corp. | | 472 | 157,630 |
| Mirait One Corp. | | 24,400 | 303,081 |
| Mitani Sekisan Co. Ltd. | | 2,700 | 95,409 |
| Mitsubishi Estate Logistics REIT Investment Corp. | | 129 | 395,597 |
| Mitsubishi Gas Chemical Co., Inc. | | 41,500 | 604,177 |
| Mitsubishi Logisnext Co. Ltd. | | 7,600 | 55,348 |
| Mitsubishi Logistics Corp. | | 13,100 | 324,608 |
| Mitsubishi Materials Corp. | | 31,000 | 507,614 |
| Mitsubishi Motors Corp. of Japan (a) | | 181,700 | 698,388 |
| Mitsubishi Pencil Co. Ltd. | | 9,600 | 125,583 |
| Mitsubishi Research Institute, Inc. | | 2,200 | 79,822 |
| Mitsubishi Shokuhin Co. Ltd. | | 4,100 | 105,918 |
| Mitsuboshi Belting Ltd. | | 6,200 | 177,628 |
| Mitsui Fudosan Logistics Park, Inc. | | 148 | 556,121 |
| Mitsui High-Tec, Inc. | | 5,300 | 319,622 |
| Mitsui Mining & Smelting Co. Ltd. | | 14,100 | 335,761 |
| Mitsui Sugar Co. Ltd. | | 4,100 | 68,759 |
| Mitsui-Soko Co. Ltd. | | 5,100 | 149,699 |
| Mitsuuroko Group Holdings Co. Ltd. | | 7,500 | 73,594 |
| Miura Co. Ltd. | | 23,700 | 631,303 |
| mixi, Inc. | | 10,100 | 213,526 |
| Mizuho Leasing Co. Ltd. | | 7,400 | 207,365 |
| Mizuno Corp. | | 4,800 | 119,811 |
| Mochida Pharmaceutical Co. Ltd. | | 6,100 | 156,766 |
| Modec, Inc. (a) | | 5,500 | 59,716 |
| Monex Group, Inc. | | 47,800 | 181,524 |
| Money Forward, Inc. (a) | | 11,700 | 487,239 |
| Mori Hills REIT Investment Corp. | | 414 | 467,901 |
| MORI TRUST Sogo (REIT), Inc. | | 667 | 351,056 |
| Morinaga & Co. Ltd. | | 9,100 | 269,683 |
| Morinaga Milk Industry Co. Ltd. | | 9,700 | 364,825 |
| Morita Holdings Corp. | | 7,900 | 83,256 |
| MOS Food Services, Inc. | | 6,100 | 140,150 |
| Musashi Seimitsu Industry Co. Ltd. | | 12,700 | 171,188 |
| Nabtesco Corp. | | 29,000 | 699,002 |
| Nachi-Fujikoshi Corp. | | 3,700 | 104,564 |
| Nafco Co. Ltd. | | 3,900 | 53,266 |
| Nagaileben Co. Ltd. | | 5,100 | 79,334 |
| Nagase & Co. Ltd. | | 25,800 | 406,483 |
| Nagawa Co. Ltd. | | 2,000 | 93,391 |
| Nagoya Railroad Co. Ltd. | | 50,100 | 808,220 |
| Nakanishi, Inc. | | 19,200 | 363,740 |
| Nankai Electric Railway Co. Ltd. | | 27,700 | 646,217 |
| NEC Networks & System Integration Corp. | | 18,000 | 224,379 |
| Net One Systems Co. Ltd. | | 21,400 | 504,577 |
| Nextage Co. Ltd. | | 12,000 | 217,685 |
| NH Foods Ltd. | | 22,300 | 650,781 |
| NHK Spring Co. Ltd. | | 52,700 | 390,725 |
| Nichias Corp. | | 14,500 | 293,254 |
| Nichicon Corp. | | 11,800 | 111,855 |
| Nichiden Corp. | | 2,400 | 35,576 |
| Nichiha Corp. | | 6,700 | 141,561 |
| Nichirei Corp. | | 28,600 | 586,732 |
| Nifco, Inc. | | 21,500 | 618,350 |
| Nihon Kohden Corp. | | 21,200 | 586,574 |
| Nihon Parkerizing Co. Ltd. | | 22,800 | 178,459 |
| Nikkiso Co. Ltd. | | 13,100 | 92,009 |
| Nikkon Holdings Co. Ltd. | | 13,900 | 269,359 |
| Nikon Corp. | | 80,900 | 836,269 |
| Nippn Corp. | | 12,600 | 163,795 |
| Nippon Accommodations Fund, Inc. | | 135 | 656,238 |
| Nippon Carbon Co. Ltd. | | 2,600 | 79,674 |
| Nippon Ceramic Co. Ltd. | | 5,100 | 102,079 |
| Nippon Densetsu Kogyo Co. Ltd. | | 10,000 | 129,677 |
| Nippon Electric Glass Co. Ltd. | | 21,100 | 402,804 |
| Nippon Gas Co. Ltd. | | 28,500 | 400,781 |
| Nippon Kanzai Holdings Co. Ltd. | | 5,000 | 97,410 |
| Nippon Kayaku Co. Ltd. | | 34,200 | 310,253 |
| Nippon Light Metal Holding Co. Ltd. | | 13,700 | 143,547 |
| Nippon Paper Industries Co. Ltd. | | 27,000 | 216,341 |
| Nippon Parking Development Co. Ltd. | | 51,500 | 88,763 |
| Nippon Pillar Packing Co. Ltd. | | 4,600 | 127,893 |
| Nippon REIT Investment Corp. | | 122 | 286,385 |
| Nippon Seiki Co. Ltd. | | 12,200 | 77,645 |
| Nippon Shokubai Co. Ltd. | | 7,700 | 308,706 |
| Nippon Signal Co. Ltd. | | 11,000 | 89,829 |
| Nippon Soda Co. Ltd. | | 5,900 | 203,506 |
| Nippon Television Network Corp. | | 14,300 | 128,679 |
| Nipro Corp. | | 39,100 | 294,482 |
| Nishi-Nippon Financial Holdings, Inc. | | 32,400 | 269,920 |
| Nishi-Nippon Railroad Co. Ltd. | | 16,200 | 297,114 |
| Nishimatsu Construction Co. Ltd. | | 9,000 | 236,502 |
| Nishimatsuya Chain Co. Ltd. | | 10,400 | 123,340 |
| Nishio Holdings Co. Ltd. | | 5,400 | 128,319 |
| Nissan Shatai Co. Ltd. | | 16,900 | 116,112 |
| Nissha Co. Ltd. | | 10,500 | 143,275 |
| Nisshin Oillio Group Ltd. | | 6,100 | 152,464 |
| Nisshinbo Holdings, Inc. | | 34,400 | 264,831 |
| Nissui Corp. | | 74,400 | 325,312 |
| Niterra Co. Ltd. | | 40,800 | 855,162 |
| Nitta Corp. | | 4,900 | 111,476 |
| Nittetsu Mining Co. Ltd. | | 3,100 | 83,866 |
| Nitto Boseki Co. Ltd. | | 7,100 | 99,182 |
| Nitto Kogyo Corp. | | 7,200 | 142,559 |
| Noevir Holdings Co. Ltd. | | 4,200 | 171,342 |
| NOF Corp. | | 17,900 | 817,877 |
| Nohmi Bosai Ltd. | | 5,500 | 70,934 |
| Nojima Co. Ltd. | | 16,900 | 181,296 |
| NOK Corp. | | 23,100 | 311,297 |
| NOMURA Co. Ltd. | | 21,200 | 146,841 |
| Noritake Co. Ltd. | | 2,300 | 78,994 |
| Noritsu Koki Co. Ltd. | | 4,900 | 80,544 |
| Noritz Corp. | | 7,500 | 101,703 |
| North Pacific Bank Ltd. | | 77,100 | 164,951 |
| NS Solutions Corp. | | 8,700 | 236,771 |
| Ns United Kaiun Kaisha Ltd. | | 2,600 | 76,145 |
| NSD Co. Ltd. | | 15,700 | 288,823 |
| NSK Ltd. | | 102,700 | 579,836 |
| NTN Corp. | | 107,700 | 266,036 |
| Ntt Ud (REIT) Investment Corp. | | 371 | 357,551 |
| Obara Group, Inc. | | 2,400 | 75,443 |
| OBIC Business Consultants Ltd. | | 8,100 | 307,587 |
| Ogaki Kyoritsu Bank Ltd. | | 8,700 | 118,476 |
| Ohsho Food Service Corp. | | 3,300 | 150,280 |
| Oiles Corp. | | 5,100 | 64,451 |
| Oisix Ra Daichi, Inc. (a) | | 7,300 | 136,584 |
| Okamoto Industries, Inc. | | 2,400 | 71,474 |
| Okamura Corp. | | 15,300 | 163,356 |
| Okasan Securities Group, Inc. | | 42,600 | 133,901 |
| Oki Electric Industry Co. Ltd. | | 22,200 | 120,423 |
| Okinawa Cellular Telephone Co. | | 6,600 | 147,455 |
| Okinawa Financial Group, Inc. | | 6,000 | 92,630 |
| Okuma Corp. | | 6,300 | 279,762 |
| Okumura Corp. | | 7,700 | 188,913 |
| One (REIT), Inc. | | 66 | 116,778 |
| Open Door, Inc. (a) | | 3,400 | 36,640 |
| Open Up Group, Inc. | | 15,900 | 235,546 |
| Optex Group Co. Ltd. | | 8,800 | 132,461 |
| Optorun Co. Ltd. | | 8,400 | 128,032 |
| Organo Corp. | | 7,000 | 169,033 |
| Orient Corp. | | 14,020 | 116,964 |
| ORIX JREIT, Inc. | | 704 | 910,055 |
| Osaka Organic Chemical Industry Ltd. | | 3,400 | 51,549 |
| Osaka Soda Co. Ltd. | | 3,700 | 119,679 |
| OSAKA Titanium technologies Co. Ltd. (c) | | 7,400 | 157,533 |
| OSG Corp. | | 22,500 | 316,073 |
| Outsourcing, Inc. | | 30,700 | 312,728 |
| Pacific Industrial Co. Ltd. | | 10,700 | 96,682 |
| Pacific Metals Co. Ltd. | | 3,700 | 51,485 |
| Pal Group Holdings Co. Ltd. | | 5,600 | 128,558 |
| PALTAC Corp. | | 8,600 | 329,955 |
| Paramount Bed Holdings Co. Ltd. | | 10,800 | 191,514 |
| Park24 Co. Ltd. (a) | | 34,800 | 537,906 |
| Pasona Group, Inc. | | 5,600 | 77,072 |
| Penta-Ocean Construction Co. Ltd. | | 73,100 | 355,389 |
| PeptiDream, Inc. (a) | | 26,500 | 358,041 |
| Pharma Foods International Co. Ltd. | | 6,000 | 77,798 |
| PHC Holdings Corp. | | 6,600 | 67,817 |
| Pigeon Corp. | | 30,900 | 481,162 |
| Pilot Corp. | | 7,900 | 263,285 |
| Piolax, Inc. | | 7,200 | 106,900 |
| PKSHA Technology, Inc. (a) | | 4,700 | 65,357 |
| Plus Alpha Consulting Co. Ltd. | | 3,300 | 70,640 |
| Pola Orbis Holdings, Inc. | | 24,700 | 343,334 |
| Pressance Corp. | | 6,600 | 95,314 |
| Prestige International, Inc. | | 26,400 | 115,232 |
| Prima Meat Packers Ltd. | | 6,000 | 101,604 |
| Raito Kogyo Co. Ltd. | | 10,000 | 147,498 |
| Raiznext Corp. | | 6,900 | 73,883 |
| Raksul, Inc. (a) | | 12,800 | 130,323 |
| Rakus Co. Ltd. | | 24,700 | 375,424 |
| Rakuten Bank Ltd. | | 11,700 | 156,486 |
| Relia, Inc. | | 9,800 | 105,216 |
| Relo Group, Inc. | | 28,800 | 447,736 |
| Rengo Co. Ltd. | | 50,400 | 328,698 |
| RENOVA, Inc. (a) | | 9,700 | 137,395 |
| Resonac Holdings Corp. | | 46,973 | 743,829 |
| Resorttrust, Inc. | | 22,000 | 363,282 |
| Restar Holdings Corp. | | 4,400 | 68,828 |
| Retail Partners Co. Ltd. | | 6,300 | 70,872 |
| Ricoh Leasing Co. Ltd. | | 3,800 | 109,920 |
| Riken Keiki Co. Ltd. | | 3,600 | 138,343 |
| Riken Vitamin Co. Ltd. | | 5,300 | 79,500 |
| Ringer Hut Co. Ltd. | | 5,600 | 99,405 |
| Rinnai Corp. | | 30,200 | 729,939 |
| Riso Kagaku Corp. | | 5,200 | 94,790 |
| Riso Kyoiku Co. Ltd. | | 29,100 | 63,521 |
| Rohto Pharmaceutical Co. Ltd. | | 50,800 | 1,053,952 |
| Roland Corp. | | 3,900 | 116,906 |
| Rorze Corp. | | 2,900 | 214,844 |
| Round One Corp. | | 54,100 | 234,024 |
| Royal Holdings Co. Ltd. | | 8,100 | 171,763 |
| RS Technologies Co. Ltd. | | 4,200 | 94,363 |
| Ryohin Keikaku Co. Ltd. | | 68,500 | 720,849 |
| Ryosan Co. Ltd. | | 4,200 | 99,204 |
| Ryoyo Electro Corp. | | 3,600 | 65,669 |
| S Foods, Inc. | | 4,900 | 109,017 |
| S-Pool, Inc. | | 18,400 | 85,355 |
| Saibu Gas Co. Ltd. | | 5,900 | 82,154 |
| Saizeriya Co. Ltd. | | 7,900 | 198,626 |
| Sakai Moving Service Co. Ltd. | | 2,800 | 98,641 |
| Sakata INX Corp. | | 9,800 | 79,942 |
| Sakata Seed Corp. | | 7,700 | 225,265 |
| SAMTY Co. Ltd. | | 6,300 | 102,829 |
| Samty Residential Investment Corp. | | 102 | 86,847 |
| San-A Co. Ltd. | | 5,200 | 175,824 |
| San-Ai Obbli Co. Ltd. | | 14,600 | 153,826 |
| SanBio Co. Ltd. (a) | | 10,400 | 47,970 |
| Sangetsu Corp. | | 11,300 | 188,428 |
| Sanken Electric Co. Ltd. | | 6,100 | 458,168 |
| Sanki Engineering Co. Ltd. | | 10,300 | 113,871 |
| Sankyo Co. Ltd. (Gunma) | | 10,700 | 472,045 |
| Sankyu, Inc. | | 14,200 | 500,830 |
| Sanrio Co. Ltd. | | 14,500 | 671,088 |
| Sansan, Inc. (a) | | 18,700 | 250,830 |
| Santen Pharmaceutical Co. Ltd. | | 93,600 | 787,516 |
| Sanwa Holdings Corp. | | 49,700 | 544,372 |
| Sanyo Chemical Industries Ltd. | | 3,200 | 100,464 |
| Sanyo Denki Co. Ltd. | | 2,300 | 114,897 |
| Sanyo Special Steel Co. Ltd. | | 5,200 | 92,033 |
| Sapporo Holdings Ltd. | | 16,800 | 468,689 |
| Sato Holding Corp. | | 7,200 | 121,840 |
| Sawai Group Holdings Co. Ltd. | | 9,900 | 286,462 |
| SB Technology Corp. | | 1,700 | 29,050 |
| SBI Shinsei Bank Ltd. | | 17,600 | 315,832 |
| SBS Holdings, Inc. | | 4,900 | 119,404 |
| Screen Holdings Co. Ltd. | | 10,300 | 837,794 |
| Sega Sammy Holdings, Inc. | | 42,000 | 785,044 |
| Seibu Holdings, Inc. | | 61,400 | 687,212 |
| Seiko Group Corp. | | 7,400 | 162,431 |
| Seino Holdings Co. Ltd. | | 33,700 | 374,137 |
| Seiren Co. Ltd. | | 11,200 | 186,221 |
| Sekisui House (REIT), Inc. | | 1,120 | 634,860 |
| Sekisui Jushi Corp. | | 6,300 | 101,196 |
| SENKO Co. Ltd. | | 27,200 | 194,380 |
| Septeni Holdings Co. Ltd. | | 18,500 | 50,950 |
| Seria Co. Ltd. | | 12,400 | 220,434 |
| Seven Bank Ltd. | | 156,000 | 319,330 |
| Shibaura Machine Co. Ltd. | | 4,800 | 111,746 |
| Shibuya Corp. | | 4,100 | 75,835 |
| SHIFT, Inc. (a) | | 3,300 | 614,336 |
| Shiga Bank Ltd. | | 10,200 | 212,625 |
| Shikoku Electric Power Co., Inc. | | 38,700 | 228,655 |
| Shikoku Kasei Holdings Corpora | | 7,900 | 82,343 |
| Shima Seiki Manufacturing Ltd. | | 6,600 | 90,265 |
| Shimamura Co. Ltd. | | 6,000 | 550,827 |
| Shin Nippon Biomedical Laboratories Ltd. | | 5,700 | 104,129 |
| Shin-Etsu Polymer Co. Ltd. | | 11,200 | 110,194 |
| Shinko Electric Industries Co. Ltd. | | 18,000 | 534,448 |
| Shinmaywa Industries Ltd. | | 14,300 | 128,763 |
| Ship Healthcare Holdings, Inc. | | 20,500 | 361,616 |
| Shizuoka Gas Co. Ltd. | | 10,100 | 85,879 |
| SHO-BOND Holdings Co. Ltd. | | 10,700 | 457,275 |
| Shochiku Co. Ltd. | | 2,400 | 215,500 |
| Shoei Co. Ltd. | | 13,200 | 244,874 |
| Shoei Foods Corp. | | 2,700 | 79,431 |
| Showa Sangyo Co. Ltd. | | 4,900 | 96,460 |
| Siix Corp. | | 7,600 | 76,303 |
| Simplex Holdings, Inc. | | 6,800 | 118,305 |
| SKY Perfect JSAT Holdings, Inc. | | 44,300 | 172,716 |
| Skylark Holdings Co. Ltd. (a) | | 61,000 | 818,453 |
| SMS Co., Ltd. | | 18,800 | 441,802 |
| Snow Peak, Inc. (c) | | 7,300 | 110,594 |
| Socionext, Inc. | | 5,900 | 488,949 |
| Sohgo Security Services Co., Ltd. | | 20,400 | 569,757 |
| Sojitz Corp. | | 64,060 | 1,349,201 |
| Solasto Corp. | | 13,900 | 64,823 |
| Sosei Group Corp. (a) | | 20,000 | 394,047 |
| SOSiLA Logistics REIT, Inc. | | 178 | 177,012 |
| Sotetsu Holdings, Inc. | | 21,100 | 401,758 |
| Sparx Group Co. Ltd. | | 4,720 | 51,483 |
| SRE Holdings Corp. (a) | | 2,700 | 60,559 |
| Stanley Electric Co. Ltd. | | 34,800 | 785,015 |
| Star Asia Investment Corp. | | 469 | 191,976 |
| Star Micronics Co. Ltd. | | 10,000 | 130,149 |
| Starts Corp., Inc. | | 8,200 | 154,962 |
| Starts Proceed Investment Corp. | | 61 | 103,296 |
| Strike Co. Ltd. | | 2,100 | 56,361 |
| Sugi Holdings Co. Ltd. | | 9,400 | 398,794 |
| Sumitomo Bakelite Co. Ltd. | | 9,300 | 355,660 |
| Sumitomo Dainippon Pharma Co., Ltd. | | 48,100 | 301,762 |
| Sumitomo Densetsu Co. Ltd. | | 4,200 | 87,357 |
| Sumitomo Forestry Co. Ltd. | | 37,800 | 816,640 |
| Sumitomo Heavy Industries Ltd. | | 29,600 | 715,195 |
| Sumitomo Mitsui Construction Co. Ltd. | | 37,400 | 106,035 |
| Sumitomo Osaka Cement Co. Ltd. | | 8,300 | 233,430 |
| Sumitomo Riko Co. Ltd. | | 10,500 | 55,908 |
| Sumitomo Rubber Industries Ltd. | | 46,200 | 423,743 |
| Sun Frontier Fudousan Co. Ltd. | | 7,800 | 75,721 |
| Sundrug Co. Ltd. | | 19,400 | 534,715 |
| Suruga Bank Ltd. | | 42,800 | 162,342 |
| Suzuken Co. Ltd. | | 15,300 | 435,449 |
| Systena Corp. | | 73,800 | 152,649 |
| T Hasegawa Co. Ltd. | | 8,800 | 209,507 |
| T-Gaia Corp. | | 5,200 | 63,795 |
| Tadano Ltd. | | 26,700 | 208,995 |
| Taihei Dengyo Kaisha Ltd. | | 2,900 | 88,454 |
| Taiheiyo Cement Corp. | | 30,900 | 554,072 |
| Taikisha Ltd. | | 6,800 | 184,223 |
| Taisho Pharmaceutical Holdings Co. Ltd. | | 10,300 | 444,815 |
| Taiyo Holdings Co. Ltd. | | 9,000 | 162,689 |
| Taiyo Yuden Co. Ltd. | | 31,400 | 961,425 |
| Takamatsu Construction Group C | | 3,500 | 56,788 |
| Takara Bio, Inc. | | 12,300 | 155,205 |
| Takara Holdings, Inc. | | 38,400 | 302,601 |
| Takara Leben Real Estate Investment Corp. | | 163 | 109,619 |
| Takara Standard Co. Ltd. | | 7,800 | 94,343 |
| Takasago International Corp. | | 3,000 | 57,214 |
| Takasago Thermal Engineering Co. Ltd. | | 12,500 | 209,891 |
| Takashimaya Co. Ltd. | | 38,600 | 570,212 |
| Takeuchi Manufacturing Co. Ltd. | | 9,100 | 249,737 |
| Takuma Co. Ltd. | | 16,900 | 176,805 |
| Tama Home Co. Ltd. | | 4,100 | 112,152 |
| Tamron Co. Ltd. | | 4,500 | 109,791 |
| Tbs Holdings, Inc. | | 9,200 | 138,715 |
| Techmatrix Corp. | | 10,400 | 124,093 |
| TechnoPro Holdings, Inc. | | 29,000 | 791,227 |
| Teijin Ltd. | | 47,600 | 531,642 |
| Tenma Corp. | | 3,600 | 62,018 |
| The Awa Bank Ltd. | | 8,900 | 133,116 |
| The Hachijuni Bank Ltd. | | 91,900 | 411,722 |
| The Hyakugo Bank Ltd. | | 56,000 | 161,694 |
| The Keiyo Bank Ltd. | | 25,800 | 107,150 |
| The Kiyo Bank Ltd. | | 15,800 | 184,758 |
| The Monogatari Corp. | | 8,100 | 170,260 |
| The Musashino Bank Ltd. | | 7,400 | 120,143 |
| The Nanto Bank Ltd. | | 7,300 | 132,983 |
| The Nippon Road Co. Ltd. | | 1,100 | 65,222 |
| The Okinawa Electric Power Co., Inc. | | 11,300 | 92,162 |
| The San-In Godo Bank Ltd. | | 37,800 | 212,409 |
| The Sumitomo Warehouse Co. Ltd. | | 14,400 | 239,231 |
| The Toho Bank Ltd. | | 50,300 | 83,027 |
| THK Co. Ltd. | | 31,300 | 702,214 |
| TKC Corp. | | 7,300 | 197,300 |
| TKP Corp. (a) | | 4,600 | 92,294 |
| TOA Corp. | | 3,000 | 65,117 |
| Toagosei Co. Ltd. | | 25,200 | 217,873 |
| Toc Co. Ltd. | | 8,800 | 43,341 |
| Tocalo Co. Ltd. | | 15,400 | 144,625 |
| Toda Corp. | | 56,600 | 331,142 |
| Toei Animation Co. Ltd. (c) | | 2,300 | 234,350 |
| Toei Co. Ltd. | | 1,600 | 215,440 |
| Toenec Corp. | | 1,900 | 48,431 |
| Toho Gas Co. Ltd. | | 19,900 | 372,337 |
| Toho Holdings Co. Ltd. | | 14,600 | 291,285 |
| Toho Titanium Co. Ltd. | | 8,600 | 128,377 |
| Tohoku Electric Power Co., Inc. | | 122,800 | 631,381 |
| Tokai Carbon Co. Ltd. | | 54,700 | 497,098 |
| Tokai Corp. | | 4,500 | 67,990 |
| TOKAI Holdings Corp. | | 25,800 | 167,592 |
| Tokai Rika Co. Ltd. | | 14,300 | 197,540 |
| Tokai Tokyo Financial Holdings | | 48,500 | 125,547 |
| Token Corp. | | 1,800 | 104,709 |
| Tokushu Tokai Paper Co. Ltd. | | 1,900 | 41,346 |
| Tokuyama Corp. | | 16,600 | 270,731 |
| Tokyo Century Corp. | | 10,000 | 344,022 |
| Tokyo Electron Device Ltd. | | 1,700 | 97,422 |
| Tokyo Ohka Kogyo Co. Ltd. | | 8,600 | 448,948 |
| Tokyo Seimitsu Co. Ltd. | | 10,200 | 376,298 |
| Tokyo Steel Manufacturing Co. Ltd. | | 15,800 | 158,999 |
| Tokyo Tatemono Co. Ltd. | | 50,400 | 638,316 |
| Tokyo TY Financial Group, Inc. | | 6,900 | 140,555 |
| Tokyotokeiba Co. Ltd. | | 3,900 | 123,125 |
| Tokyu Construction Co. Ltd. | | 20,100 | 106,571 |
| Tokyu Fudosan Holdings Corp. | | 164,200 | 833,281 |
| Tokyu REIT, Inc. | | 238 | 317,952 |
| TOMONY Holdings, Inc. | | 38,100 | 103,643 |
| Tomy Co. Ltd. | | 21,400 | 241,804 |
| Topcon Corp. | | 27,700 | 394,564 |
| Topre Corp. | | 9,800 | 99,303 |
| TORIDOLL Holdings Corp. | | 12,000 | 255,954 |
| Torii Pharmaceutical Co. Ltd. | | 2,800 | 71,086 |
| Tosei Corp. | | 7,600 | 90,441 |
| Toshiba Tec Corp. | | 7,100 | 206,207 |
| Totetsu Kogyo Co. Ltd. | | 6,400 | 127,873 |
| Towa Pharmaceutical Co. Ltd. | | 7,100 | 101,340 |
| Toyo Construction Co. Ltd. | | 17,900 | 128,197 |
| Toyo Gosei Co. Ltd. (c) | | 1,300 | 74,056 |
| Toyo Ink South Carolina Holdings Co. Ltd. | | 8,900 | 143,629 |
| Toyo Seikan Group Holdings Ltd. | | 35,800 | 505,709 |
| Toyo Suisan Kaisha Ltd. | | 23,900 | 1,067,062 |
| Toyo Tanso Co. Ltd. | | 4,000 | 116,294 |
| Toyo Tire Corp. | | 28,800 | 343,123 |
| Toyobo Co. Ltd. | | 21,700 | 163,802 |
| Toyoda Gosei Co. Ltd. | | 17,800 | 305,268 |
| Toyota Boshoku Corp. | | 20,500 | 324,489 |
| Trancom Co. Ltd. | | 1,900 | 95,362 |
| Transcosmos, Inc. | | 6,700 | 156,327 |
| TRE Holdings Corp. | | 12,400 | 108,645 |
| Tri Chemical Laboratories, Inc. | | 6,700 | 108,365 |
| Trusco Nakayama Corp. | | 12,600 | 218,878 |
| TS tech Co. Ltd. | | 23,800 | 320,930 |
| Tsubakimoto Chain Co. | | 6,800 | 168,427 |
| Tsuburaya Fields Holdings, Inc. | | 9,400 | 127,934 |
| Tsugami Corp. | | 11,100 | 115,300 |
| Tsumura & Co. | | 15,400 | 312,488 |
| Tsuruha Holdings, Inc. | | 10,600 | 694,255 |
| TV Asahi Corp. | | 6,300 | 72,829 |
| Uacj Corp. | | 8,400 | 167,645 |
| Ube Corp. | | 25,800 | 409,276 |
| Ulvac, Inc. | | 12,700 | 504,170 |
| Union Tool Co. | | 2,100 | 50,220 |
| United Arrows Ltd. | | 5,100 | 74,435 |
| United Super Markets Holdings, Inc. | | 14,600 | 126,135 |
| United Urban Investment Corp. | | 792 | 879,373 |
| Universal Entertainment Corp. (a) | | 6,600 | 138,941 |
| USEN-NEXT HOLDINGS Co. Ltd. | | 4,200 | 94,333 |
| Ushio, Inc. | | 25,700 | 319,697 |
| UT Group Co. Ltd. | | 7,800 | 149,309 |
| Valor Holdings Co. Ltd. | | 9,500 | 145,434 |
| ValueCommerce Co. Ltd. | | 4,300 | 41,651 |
| Vector, Inc. | | 7,900 | 74,708 |
| Vision, Inc. (a) | | 10,300 | 129,333 |
| Visional, Inc. (a) | | 4,700 | 246,485 |
| VT Holdings Co. Ltd. | | 18,300 | 71,874 |
| W-Scope Corp. (a) | | 14,200 | 117,956 |
| Wacoal Holdings Corp. | | 11,200 | 217,790 |
| Wacom Co. Ltd. | | 39,500 | 200,632 |
| Wakita & Co. Ltd. | | 8,900 | 90,597 |
| WDB Holdings Co. Ltd. | | 2,600 | 38,837 |
| WealthNavi, Inc. (a)(c) | | 7,900 | 69,506 |
| Weathernews, Inc. | | 1,400 | 70,242 |
| West Holdings Corp. | | 6,300 | 150,197 |
| WingArc1st, Inc. | | 5,200 | 84,880 |
| Workman Co. Ltd. | | 5,500 | 224,049 |
| YA-MAN Ltd. | | 7,900 | 68,219 |
| YAMABIKO Corp. | | 8,700 | 86,193 |
| Yamada Holdings Co. Ltd. | | 193,300 | 673,598 |
| Yamaguchi Financial Group, Inc. | | 53,500 | 328,957 |
| Yamato Kogyo Co. Ltd. | | 10,400 | 408,585 |
| Yamazaki Baking Co. Ltd. | | 32,700 | 438,153 |
| Yamazen Co. Ltd. | | 14,100 | 109,395 |
| Yaoko Co. Ltd. | | 4,800 | 251,614 |
| Yellow Hat Ltd. | | 8,600 | 122,236 |
| Yodogawa Steel Works Ltd. | | 4,500 | 94,315 |
| Yokogawa Bridge Holdings Corp. | | 8,800 | 144,023 |
| Yokohama Rubber Co. Ltd. | | 31,800 | 691,351 |
| Yokorei Co. Ltd. | | 11,600 | 93,360 |
| Yokowo Co. Ltd. | | 4,700 | 69,502 |
| YONEX Co. Ltd. | | 16,600 | 198,188 |
| Yoshinoya Holdings Co. Ltd. | | 17,500 | 323,560 |
| Yuasa Trading Co. Ltd. | | 4,500 | 130,690 |
| Yurtec Corp. | | 10,300 | 62,574 |
| Zenkoku Hosho Co. Ltd. | | 14,000 | 514,558 |
| Zenrin Co. Ltd. | | 6,700 | 43,346 |
| Zensho Holdings Co. Ltd. | | 24,900 | 791,146 |
| Zeon Corp. | | 34,100 | 351,838 |
| ZERIA Pharmaceutical Co. Ltd. | | 6,700 | 120,086 |
| Zojirushi Thermos | | 8,900 | 116,803 |
| Zuken, Inc. | | 4,000 | 101,557 |
TOTAL JAPAN | | | 213,216,042 |
| Liechtenstein - 0.0% | | | |
| Implantica AG (depository receipt) (a) | | 10,238 | 19,248 |
| Luxembourg - 0.2% | | | |
| Aperam SA | | 13,032 | 481,777 |
| B&S Group SARL (d) | | 8,350 | 36,113 |
| Global Fashion Group SA (a) | | 28,277 | 25,659 |
| SES SA (France) (depositary receipt) | | 102,740 | 635,670 |
TOTAL LUXEMBOURG | | | 1,179,219 |
| Macau - 0.1% | | | |
| MECOM Power & Construction Ltd. | | 286,500 | 52,294 |
| MECOM Power & Construction Ltd. warrants 5/24/23 (a) | | 22,700 | 35 |
| MGM China Holdings Ltd. (a) | | 258,800 | 353,487 |
| SJM Holdings Ltd. (a) | | 675,000 | 351,493 |
TOTAL MACAU | | | 757,309 |
| Malaysia - 0.0% | | | |
| Frencken Group Ltd. | | 82,400 | 64,741 |
| Malta - 0.1% | | | |
| Kambi Group PLC (a) | | 6,803 | 113,902 |
| Kindred Group PLC (depository receipt) | | 61,708 | 756,980 |
TOTAL MALTA | | | 870,882 |
| Mexico - 0.1% | | | |
| Borr Drilling Ltd. (a) | | 52,846 | 364,966 |
| Netherlands - 1.9% | | | |
| Aalberts Industries NV | | 26,614 | 1,225,239 |
| Alfen Beheer BV (a)(c)(d) | | 5,901 | 476,229 |
| AMG Advanced Metallurgical Group NV | | 7,507 | 279,427 |
| Arcadis NV | | 19,136 | 789,880 |
| ASR Nederland NV | | 40,304 | 1,769,333 |
| Basic-Fit NV (a)(c)(d) | | 14,106 | 597,177 |
| BE Semiconductor Industries NV | | 19,531 | 1,750,535 |
| Brunel International NV | | 4,996 | 67,492 |
| CM.com NV (a)(c) | | 3,562 | 39,446 |
| Corbion NV | | 16,071 | 504,696 |
| Ebusco Holding NV (a)(c) | | 4,037 | 39,724 |
| Eurocommercial Properties NV | | 11,596 | 277,786 |
| Fastned BV (Bearer) unit (a) | | 1,249 | 44,522 |
| Flow Traders Ltd. | | 8,858 | 219,419 |
| Fugro NV (Certificaten Van Aandelen) (a) | | 29,170 | 412,387 |
| Koninklijke BAM Groep NV | | 66,806 | 146,049 |
| Koninklijke BAM Groep NV rights (a)(e) | | 72,117 | 11,920 |
| Koninklijke Vopak NV | | 18,739 | 714,438 |
| Meltwater Holding BV (a) | | 38,318 | 62,203 |
| NSI NV | | 5,474 | 125,763 |
| NSI NV rights 5/11/23 (a)(e) | | 5,474 | 6,756 |
| Pharming Group NV (a) | | 176,513 | 198,779 |
| PostNL NV | | 94,095 | 168,900 |
| PostNL NV rights (a)(e) | | 94,095 | 2,074 |
| SBM Offshore NV | | 36,004 | 508,209 |
| SBM Offshore NV rights (a)(e) | | 36,004 | 39,925 |
| Shop Apotheke Europe NV (a)(d) | | 3,973 | 396,108 |
| Signify NV (d) | | 34,782 | 1,157,837 |
| Sligro Food Group NV | | 6,011 | 104,784 |
| TKH Group NV (bearer) (depositary receipt) | | 10,846 | 523,702 |
| TomTom Group BV (a) | | 19,773 | 168,965 |
| Van Lanschot Kempen NV (Bearer) | | 8,404 | 255,123 |
| VastNed Retail NV | | 3,044 | 69,264 |
| Wereldhave NV | | 8,671 | 132,904 |
TOTAL NETHERLANDS | | | 13,286,995 |
| New Zealand - 1.0% | | | |
| Air New Zealand Ltd. (a) | | 454,294 | 214,043 |
| Chorus Ltd. | | 118,643 | 634,382 |
| Contact Energy Ltd. | | 210,424 | 1,020,565 |
| Fletcher Building Ltd. | | 209,260 | 583,484 |
| Genesis Energy Ltd. | | 141,920 | 238,160 |
| Goodman Property Trust | | 285,508 | 386,153 |
| Infratil Ltd. | | 194,801 | 1,151,897 |
| Kiwi Property Group Ltd. | | 425,373 | 242,557 |
| Oceania Healthcare Ltd. | | 195,527 | 83,495 |
| Precinct Properties New Zealand Ltd. | | 363,613 | 278,995 |
| Pushpay Holdings Ltd. (a) | | 293,372 | 258,037 |
| Ryman Healthcare Ltd. | | 153,673 | 504,825 |
| SKYCITY Entertainment Group Ltd. | | 206,312 | 306,380 |
| Summerset Group Holdings Ltd. | | 61,632 | 310,594 |
| The a2 Milk Co. Ltd. (a) | | 198,852 | 726,282 |
| The Warehouse Group Ltd. | | 35,005 | 37,286 |
TOTAL NEW ZEALAND | | | 6,977,135 |
| Nigeria - 0.1% | | | |
| Airtel Africa PLC (d) | | 255,335 | 385,392 |
| Norway - 1.8% | | | |
| Aker ASA (A Shares) | | 6,058 | 369,493 |
| Aker Carbon Capture A/S (a) | | 90,860 | 92,846 |
| Aker Horizons ASA (a) | | 64,870 | 51,070 |
| Aker Solutions ASA | | 66,268 | 235,795 |
| Atea ASA | | 22,762 | 312,690 |
| Austevoll Seafood ASA | | 24,820 | 233,363 |
| BEWi ASA | | 13,071 | 51,391 |
| Bonheur A/S | | 5,792 | 129,351 |
| Borregaard ASA | | 24,414 | 408,234 |
| BW Offshore Ltd. | | 25,315 | 67,367 |
| Crayon Group Holding A/S (a)(d) | | 19,201 | 148,011 |
| DNO ASA (A Shares) | | 127,591 | 127,147 |
| Elkem ASA (d) | | 82,964 | 280,256 |
| Elopak ASA | | 30,543 | 68,640 |
| Entra ASA (d) | | 17,403 | 176,691 |
| Europris ASA (d) | | 42,995 | 307,624 |
| FLEX LNG Ltd. | | 8,009 | 277,913 |
| Frontline PLC | | 36,229 | 562,419 |
| Golden Ocean Group Ltd. | | 35,377 | 325,519 |
| Grieg Seafood ASA | | 12,410 | 103,989 |
| Hexagon Composites ASA (a) | | 32,736 | 99,280 |
| Hexagon Purus Holding A/S (a)(c) | | 21,301 | 44,972 |
| Hoegh Autoliners ASA | | 12,922 | 83,786 |
| Kahoot! A/S (a) | | 73,133 | 190,226 |
| Leroy Seafood Group ASA | | 73,024 | 384,065 |
| MPC Container Ships ASA | | 73,021 | 119,908 |
| NEL ASA (a) | | 423,693 | 580,652 |
| Nordic VLSI ASA (a) | | 44,404 | 479,788 |
| Norske Skog ASA (a)(d) | | 20,378 | 90,445 |
| Norwegian Air Shuttle A/S (a) | | 178,739 | 173,254 |
| Nykode Therapeutics A/S (a)(c) | | 26,934 | 64,953 |
| Odfjell Drilling Ltd. (a) | | 25,911 | 60,297 |
| PGS ASA (a) | | 234,255 | 168,552 |
| Protector Forsikring ASA | | 16,861 | 245,233 |
| Schibsted ASA: | | | |
| (A Shares) | | 19,785 | 350,511 |
| (B Shares) | | 25,172 | 407,682 |
| Sparebank 1 Oestlandet | | 9,439 | 111,067 |
| Sparebank 1 Sr Bank ASA (primary capital certificate) | | 47,521 | 556,052 |
| Sparebanken Midt-Norge | | 35,088 | 453,702 |
| Sparebanken Nord-Norge | | 24,332 | 220,327 |
| Stolt-Nielsen SA | | 4,774 | 137,750 |
| Storebrand ASA (A Shares) | | 126,266 | 972,020 |
| TGS ASA | | 32,493 | 508,568 |
| Tomra Systems ASA | | 63,621 | 973,086 |
| Veidekke ASA | | 28,008 | 322,207 |
| Volue A/S (a) | | 14,784 | 24,971 |
| Wallenius Wilhelmsen ASA | | 28,678 | 214,203 |
TOTAL NORWAY | | | 12,367,366 |
| Peru - 0.0% | | | |
| Hochschild Mining PLC | | 81,670 | 73,746 |
| Poland - 0.1% | | | |
| InPost SA (a) | | 60,208 | 644,192 |
| Portugal - 0.3% | | | |
| Altri SGPS SA (c) | | 19,416 | 100,340 |
| Banco Comercial Portugues SA (Reg.) | | 2,228,262 | 572,090 |
| Corticeira Amorim SGPS SA | | 10,211 | 115,215 |
| CTT Correios de Portugal SA | | 25,931 | 107,007 |
| Greenvolt-Energias Renovaveis SA (a) | | 15,153 | 102,938 |
| NOS SGPS | | 53,751 | 236,202 |
| REN - Redes Energeticas Nacionais SGPS SA | | 105,161 | 305,336 |
| Semapa Sociedade de Investimen | | 4,646 | 70,239 |
| Sonae SGPS SA | | 241,392 | 275,034 |
| The Navigator Co. SA | | 56,869 | 208,671 |
TOTAL PORTUGAL | | | 2,093,072 |
| Singapore - 1.8% | | | |
| AEM Holdings Ltd. | | 72,200 | 184,000 |
| AIMS APAC (REIT) | | 147,800 | 152,263 |
| Best World International Ltd. (a) | | 36,100 | 59,221 |
| BW LPG Ltd. (d) | | 22,905 | 184,516 |
| Capitaland Ascott Trust unit | | 561,200 | 455,641 |
| Capitaland India Trust | | 251,100 | 205,623 |
| CapitaRetail China Trust | | 315,900 | 263,458 |
| CDL Hospitality Trusts unit | | 234,000 | 221,964 |
| ComfortDelgro Corp. Ltd. | | 572,400 | 512,397 |
| Digital Core (REIT) | | 217,200 | 94,775 |
| ESR-LOGOS (REIT) | | 1,367,460 | 333,817 |
| Far East Hospitality Trust unit | | 272,100 | 126,722 |
| Frasers Centrepoint Trust | | 276,600 | 459,618 |
| Frasers Hospitality Trust unit | | 211,600 | 76,134 |
| Frasers Logistics & Industrial Trust | | 793,700 | 805,558 |
| Hafnia Ltd. | | 33,980 | 183,817 |
| iFast Corp. Ltd. | | 40,100 | 139,589 |
| IGG, Inc. (a) | | 206,000 | 170,290 |
| Kenon Holdings Ltd. | | 5,028 | 132,442 |
| Keppel (REIT) | | 505,500 | 330,586 |
| Keppel DC (REIT) | | 373,200 | 603,413 |
| Keppel Infrastructure Trust | | 918,600 | 337,677 |
| Keppel Infrastructure Trust rights 5/10/23 (a) | | 45,930 | 792 |
| Keppel Pacific Oak U.S. (REIT) | | 243,600 | 87,828 |
| Lendlease Global Commercial (REIT) | | 492,916 | 259,330 |
| Manulife U.S. REIT | | 462,300 | 83,030 |
| Mapletree Industrial (REIT) | | 541,487 | 967,972 |
| Nanofilm Technologies International Ltd. | | 73,000 | 82,675 |
| NetLink NBN Trust | | 737,000 | 483,809 |
| Olam Group Ltd. | | 259,700 | 313,459 |
| OUE Commercial (REIT) | | 592,600 | 144,682 |
| PARAGON REIT | | 305,300 | 214,293 |
| Parkway Life REIT | | 106,000 | 308,718 |
| Prime U.S. (REIT) | | 179,413 | 46,773 |
| Raffles Medical Group Ltd. | | 227,500 | 251,231 |
| Riverstone Holdings Ltd. | | 123,300 | 56,087 |
| Sasseur (REIT) | | 144,900 | 78,411 |
| SATS Ltd. (a) | | 236,758 | 452,276 |
| Sembcorp Industries Ltd. | | 263,400 | 847,529 |
| Sheng Siong Group Ltd. | | 176,500 | 234,412 |
| SIA Engineering Co. Ltd. (a) | | 76,600 | 128,475 |
| Silverlake Axis Ltd. Class A | | 235,700 | 59,346 |
| Singapore Post Ltd. | | 395,500 | 151,512 |
| Starhill Global (REIT) | | 398,031 | 156,900 |
| StarHub Ltd. | | 151,300 | 113,610 |
| Straits Trading Co. Ltd. | | 43,646 | 70,764 |
| Suntec (REIT) | | 612,700 | 621,085 |
| TDCX, Inc. ADR (a) | | 6,130 | 43,094 |
| The Hour Glass Ltd. | | 68,900 | 107,699 |
| UMS Holdings Ltd. | | 153,700 | 119,440 |
| Yangzijiang Financial Holding Ltd. | | 643,700 | 186,394 |
TOTAL SINGAPORE | | | 12,705,147 |
| South Africa - 0.0% | | | |
| Scatec Solar AS (d) | | 32,496 | 211,923 |
| Spain - 1.9% | | | |
| Acerinox SA | | 51,301 | 553,754 |
| Almirall SA | | 19,843 | 203,454 |
| Applus Services SA | | 35,969 | 301,418 |
| Atresmedia Corporacion de Medios de Comunicacion SA | | 23,778 | 95,005 |
| Audax Renovables SA (a)(c) | | 35,400 | 42,674 |
| Banco de Sabadell SA | | 1,517,349 | 1,579,674 |
| Bankinter SA | | 182,626 | 1,079,025 |
| Befesa SA (d) | | 10,843 | 486,996 |
| Cie Automotive SA | | 13,054 | 392,976 |
| Compania de Distribucion Integral Logista Holdings SA | | 17,960 | 488,024 |
| Construcciones y Auxiliar de Ferrocarriles | | 5,160 | 160,055 |
| Distribuidora Internacional de Alimentacion SA (a) | | 4,035,722 | 70,262 |
| Ebro Foods SA | | 18,366 | 340,799 |
| eDreams ODIGEO SA (a) | | 17,480 | 99,195 |
| Ence Energia y Celulosa SA | | 36,629 | 143,445 |
| Faes Farma SA | | 84,413 | 297,647 |
| Faes Farma SA rights | | 84,413 | 11,448 |
| Fluidra SA | | 26,389 | 451,582 |
| Gestamp Automocion SA (d) | | 47,118 | 203,731 |
| Global Dominion Access SA (d) | | 21,220 | 88,619 |
| Grenergy Renovables SA (a) | | 3,366 | 98,585 |
| Indra Sistemas SA | | 38,200 | 505,111 |
| Inmobiliaria Colonial SA | | 77,653 | 495,854 |
| Laboratorios Farmaceuticos ROVI SA | | 5,101 | 225,843 |
| Lar Espana Real Estate Socimi SA | | 15,825 | 89,455 |
| Linea Directa Aseguradora SA Compania de Seguros y Reaseguros | | 174,827 | 161,434 |
| MAPFRE SA (Reg.) | | 251,127 | 502,795 |
| Mediaset Espana Comunicacion SA (a)(c) | | 17,915 | 59,577 |
| Melia Hotels International SA (a) | | 32,640 | 210,941 |
| Merlin Properties Socimi SA | | 87,622 | 773,371 |
| Miquel y Costas & Miquel SA | | 4,055 | 54,423 |
| Neinor Homes SLU (d) | | 7,303 | 73,793 |
| Opdenergy Holdings SA | | 12,225 | 50,852 |
| Pharma Mar SA | | 3,954 | 164,168 |
| Prosegur Cash SA (d) | | 83,530 | 57,710 |
| Prosegur Compania de Seguridad SA (Reg.) | | 51,725 | 99,287 |
| Sacyr SA | | 108,596 | 359,225 |
| Solaria Energia y Medio Ambiente SA (a) | | 20,444 | 322,365 |
| Soltec Power Holdings SA (a) | | 10,022 | 57,259 |
| Talgo SA (d) | | 17,843 | 61,933 |
| Tecnicas Reunidas SA (a)(c) | | 9,131 | 84,717 |
| Tecnicas Reunidas SA rights 4/26/23 (a) | | 9,131 | 10,382 |
| Unicaja Banco SA (d) | | 397,198 | 402,440 |
| Vidrala SA | | 5,373 | 563,632 |
| Viscofan Envolturas Celulosicas SA | | 10,686 | 732,399 |
TOTAL SPAIN | | | 13,307,334 |
| Sweden - 5.7% | | | |
| AAK AB | | 48,577 | 977,693 |
| AcadeMedia AB (d) | | 22,910 | 116,281 |
| Addlife AB | | 29,475 | 348,352 |
| AddTech AB (B Shares) | | 69,722 | 1,393,753 |
| AFRY AB (B Shares) | | 24,570 | 461,209 |
| Alimak Group AB (d) | | 19,298 | 142,453 |
| Alleima AB | | 56,050 | 287,381 |
| Ambea AB (d) | | 19,004 | 72,272 |
| Arjo AB | | 58,843 | 260,274 |
| Atrium Ljungberg AB (B Shares) | | 12,316 | 228,785 |
| Attendo AB (a)(d) | | 27,362 | 96,987 |
| Avanza Bank Holding AB (c) | | 33,463 | 710,371 |
| Axfood AB | | 29,026 | 719,490 |
| Beijer Alma AB (B Shares) | | 12,395 | 281,621 |
| Beijer Ref AB (B Shares) | | 88,945 | 1,451,908 |
| Betsson AB (B Shares) | | 31,349 | 338,402 |
| BICO Group AB (a)(c) | | 12,137 | 72,455 |
| Bilia AB (A Shares) | | 18,319 | 206,501 |
| Billerud AB | | 60,776 | 582,925 |
| BioArctic AB (a)(d) | | 8,982 | 231,578 |
| BioGaia AB | | 23,667 | 234,938 |
| Biotage AB (A Shares) | | 17,963 | 223,157 |
| BONESUPPORT Holding AB (a)(d) | | 14,889 | 148,962 |
| Boozt AB (a)(d) | | 14,329 | 165,995 |
| Bravida Holding AB (d) | | 54,297 | 659,185 |
| Bufab AB | | 7,323 | 242,504 |
| Bure Equity AB | | 15,007 | 382,527 |
| Calliditas Therapeutics AB (a) | | 9,674 | 117,446 |
| Camurus AB (a) | | 8,149 | 185,308 |
| Castellum AB (c) | | 69,197 | 838,727 |
| Catena AB | | 8,804 | 337,049 |
| Cellavision AB | | 4,225 | 72,099 |
| Cibus Nordic Real Estate AB | | 10,648 | 113,696 |
| Cint Group AB (a) | | 40,539 | 63,486 |
| Clas Ohlson AB (B Shares) (c) | | 10,385 | 78,280 |
| Cloetta AB | | 52,815 | 111,758 |
| Collector Bank AB | | 17,013 | 54,083 |
| Coor Service Management Holding AB (d) | | 25,912 | 168,535 |
| Corem Property Group AB | | 154,062 | 121,987 |
| Creades AB (A Shares) (c) | | 15,318 | 127,039 |
| Dios Fastigheter AB | | 23,068 | 164,433 |
| Dometic Group AB (d) | | 86,674 | 619,351 |
| Duni AB | | 8,736 | 95,410 |
| Dustin Group AB (a)(d) | | 19,606 | 67,335 |
| Electrolux Professional AB | | 64,388 | 374,836 |
| Elekta AB (B Shares) | | 98,670 | 828,035 |
| Engcon AB (B Shares) | | 10,910 | 95,854 |
| Fabege AB | | 71,753 | 574,441 |
| Fortnox AB | | 130,402 | 896,724 |
| Garo AB | | 8,776 | 69,617 |
| Granges AB | | 27,871 | 276,670 |
| Hemnet Group AB | | 22,107 | 362,161 |
| Hexatronic Group AB | | 43,880 | 370,122 |
| HEXPOL AB (B Shares) | | 70,690 | 832,008 |
| HMS Networks AB | | 7,632 | 354,546 |
| Hufvudstaden AB (A Shares) | | 29,116 | 414,805 |
| Instalco AB | | 49,072 | 257,441 |
| Intrum AB (c) | | 20,041 | 180,925 |
| Investment AB Oresund | | 6,859 | 82,134 |
| INVISIO AB | | 11,068 | 227,187 |
| Inwido AB | | 15,593 | 163,456 |
| JM AB (B Shares) | | 13,861 | 222,072 |
| K-Fast Holding AB (a) | | 15,969 | 32,078 |
| Know IT AB | | 7,077 | 163,899 |
| Lindab International AB | | 19,477 | 311,289 |
| Loomis AB (B Shares) | | 20,097 | 642,787 |
| Medicover AB Class B | | 17,546 | 289,324 |
| Meko AB | | 10,745 | 131,706 |
| MIPS AB | | 7,086 | 381,834 |
| Modern Times Group MTG AB (B Shares) | | 24,053 | 193,150 |
| Munters Group AB (d) | | 35,181 | 344,432 |
| Mycronic AB | | 19,547 | 414,764 |
| NCC AB (B Shares) | | 21,949 | 218,098 |
| New Wave Group AB (B Shares) | | 11,371 | 229,304 |
| Nobia AB | | 34,714 | 50,607 |
| Nolato AB (B Shares) | | 55,711 | 308,568 |
| Nordnet AB | | 37,302 | 584,898 |
| Note AB (a) | | 4,625 | 103,459 |
| NP3 Fastigheter AB | | 7,282 | 139,959 |
| Nyfosa AB | | 44,162 | 301,661 |
| Orron Energy AB | | 54,124 | 63,017 |
| OX2 AB (a) | | 22,239 | 171,752 |
| Pandox AB | | 25,156 | 299,025 |
| Paradox Interactive AB | | 8,503 | 208,946 |
| Peab AB | | 49,550 | 261,640 |
| Platzer Fastigheter Holding AB | | 16,405 | 138,054 |
| PowerCell Sweden AB (a) | | 12,761 | 107,961 |
| Ratos AB (B Shares) | | 55,463 | 191,348 |
| Resurs Holding AB (d) | | 35,114 | 66,735 |
| RVRC Holding AB | | 10,449 | 31,179 |
| Saab AB (B Shares) | | 19,783 | 1,110,389 |
| Samhallsbyggnadsbolaget I Norden AB: | | | |
| (B Shares) (c) | | 290,668 | 340,807 |
| (D Shares) (c) | | 31,877 | 48,243 |
| Scandic Hotels Group AB (a)(d) | | 41,606 | 148,410 |
| Sdiptech AB (a) | | 8,240 | 189,949 |
| Sectra AB (B Shares) | | 36,084 | 568,967 |
| Sinch AB (a)(c)(d) | | 147,665 | 389,500 |
| SkiStar AB | | 11,348 | 145,957 |
| SSAB AB: | | | |
| (A Shares) | | 60,735 | 430,325 |
| (B Shares) | | 175,878 | 1,185,434 |
| Stillfront Group AB (a) | | 125,026 | 265,778 |
| Storskogen Group AB | | 370,197 | 336,370 |
| Surgical Science Sweden AB (a) | | 8,998 | 164,166 |
| Svolder AB (B Shares) | | 25,114 | 151,344 |
| Sweco AB (B Shares) | | 57,806 | 773,373 |
| Swedencare AB (c) | | 23,936 | 76,091 |
| Synsam Holding AB | | 10,805 | 43,673 |
| Thule Group AB (d) | | 27,958 | 806,157 |
| Trelleborg AB (B Shares) (c) | | 65,256 | 1,637,914 |
| Troax Group AB | | 10,617 | 240,395 |
| Truecaller AB (B Shares) (a) | | 53,298 | 158,620 |
| Vestum AB (a) | | 40,591 | 52,723 |
| Viaplay Group AB (B Shares) (a) | | 19,703 | 501,843 |
| Vimian Group AB (a)(c) | | 45,003 | 163,160 |
| Vitec Software Group AB | | 8,388 | 440,869 |
| Vitrolife AB | | 16,539 | 371,581 |
| Volati AB | | 6,510 | 65,004 |
| Wallenstam AB (B Shares) | | 93,187 | 369,111 |
| Wihlborgs Fastigheter AB | | 74,824 | 603,405 |
| XANO Industri AB | | 4,456 | 39,932 |
| Xvivo Perfusion AB (a) | | 6,039 | 180,197 |
TOTAL SWEDEN | | | 39,338,176 |
| Switzerland - 4.8% | | | |
| Accelleron Industries Ltd. | | 20,200 | 494,915 |
| Allreal Holding AG | | 3,964 | 701,577 |
| ALSO Holding AG | | 1,750 | 373,553 |
| Arbonia AG | | 14,150 | 172,235 |
| Aryzta AG (a) | | 255,920 | 453,518 |
| Autoneum Holding AG (a) | | 757 | 114,670 |
| Basilea Pharmaceutica AG (a) | | 3,169 | 153,159 |
| Belimo Holding AG (Reg.) | | 2,626 | 1,262,689 |
| Bell Food Group AG | | 598 | 189,332 |
| Bossard Holding AG | | 1,531 | 374,250 |
| Bucher Industries AG | | 1,760 | 789,179 |
| Burckhardt Compression Holding AG | | 831 | 511,327 |
| Burkhalter Holding AG | | 1,668 | 178,771 |
| Bystronic AG | | 372 | 268,434 |
| Cembra Money Bank AG | | 8,114 | 648,594 |
| COLTENE Holding AG | | 745 | 60,594 |
| Comet Holding AG | | 2,110 | 507,524 |
| Daetwyler Holdings AG | | 2,043 | 515,407 |
| DKSH Holding AG | | 9,560 | 758,832 |
| Dorma Kaba Holding AG | | 793 | 353,982 |
| Dottikon ES Holding AG (a) | | 767 | 199,076 |
| Dufry AG (a) | | 19,520 | 902,395 |
| EFG International | | 24,829 | 238,054 |
| Emmi AG | | 570 | 592,415 |
| Flughafen Zuerich AG | | 5,350 | 1,027,085 |
| Forbo Holding AG (Reg.) | | 242 | 355,751 |
| Galenica AG (d) | | 13,459 | 1,203,834 |
| Georg Fischer AG (Reg.) | | 21,909 | 1,587,076 |
| Gurit-Heberlein AG (Bearer) (c) | | 1,015 | 102,312 |
| Helvetia Holding AG (Reg.) | | 10,015 | 1,491,298 |
| Huber+Suhner AG | | 4,246 | 347,717 |
| Idorsia Ltd. (a)(c) | | 31,163 | 299,480 |
| Implenia AG | | 3,493 | 157,290 |
| INFICON Holding AG | | 463 | 501,409 |
| Interroll Holding AG | | 172 | 626,347 |
| Intershop Holding AG | | 305 | 214,287 |
| IWG PLC (a) | | 203,805 | 434,656 |
| Kardex AG | | 1,674 | 379,241 |
| Komax Holding AG (Reg.) | | 1,043 | 274,796 |
| Landis+Gyr Group AG | | 5,773 | 475,351 |
| LEM Holding SA | | 151 | 333,134 |
| Leonteq AG | | 2,588 | 139,555 |
| Medacta Group SA (d) | | 1,922 | 257,600 |
| Medartis Holding AG (a)(d) | | 1,164 | 96,495 |
| Mediclinic International PLC (London) | | 107,146 | 671,663 |
| Medmix AG (d) | | 6,715 | 158,888 |
| Metall Zug AG | | 52 | 107,333 |
| Meyer Burger Technology AG (a) | | 878,608 | 566,669 |
| Mobilezone Holding AG | | 11,167 | 170,157 |
| Mobimo Holding AG | | 1,932 | 516,583 |
| OC Oerlikon Corp. AG (Reg.) | | 48,925 | 272,472 |
| Orior AG | | 1,810 | 168,678 |
| Peach Property Group AG (c) | | 2,635 | 41,094 |
| PSP Swiss Property AG | | 12,330 | 1,449,777 |
| Rieter Holding AG (Reg.) | | 639 | 69,487 |
| Schweiter Technologies AG | | 270 | 215,070 |
| Sensirion Holding AG (a)(d) | | 2,551 | 275,691 |
| SFS Group AG | | 5,188 | 674,437 |
| Siegfried Holding AG | | 1,080 | 829,468 |
| SKAN Group AG | | 2,435 | 234,824 |
| St.Galler Kantonalbank AG | | 792 | 445,686 |
| Stadler Rail AG (c) | | 13,532 | 561,354 |
| Sulzer AG (Reg.) | | 4,963 | 413,653 |
| Swissquote Group Holding SA | | 2,714 | 577,809 |
| Tecan Group AG | | 3,424 | 1,485,515 |
| TX Group AG | | 725 | 84,192 |
| u-blox Holding AG | | 1,862 | 224,144 |
| V-ZUG Holding AG (a) | | 614 | 56,190 |
| Valiant Holding AG | | 4,185 | 485,055 |
| Vetropack Holding AG | | 3,184 | 164,926 |
| Vontobel Holdings AG | | 7,466 | 498,652 |
| Ypsomed Holding AG | | 1,110 | 257,677 |
| Zehnder Group AG | | 2,678 | 218,410 |
| Zur Rose Group AG (a)(c) | | 3,109 | 135,442 |
TOTAL SWITZERLAND | | | 33,150,192 |
| Tanzania - 0.0% | | | |
| Helios Towers PLC (a) | | 199,000 | 260,847 |
| Ukraine - 0.0% | | | |
| Ferrexpo PLC | | 79,474 | 107,969 |
| United Arab Emirates - 0.1% | | | |
| Network International Holdings PLC (a)(d) | | 133,210 | 648,218 |
| United Kingdom - 14.4% | | | |
| 888 Holdings PLC (a) | | 104,160 | 104,722 |
| A.G. Barr PLC | | 25,550 | 161,513 |
| Advanced Medical Solutions Group PLC | | 58,507 | 180,145 |
| AJ Bell PLC | | 83,618 | 342,794 |
| Allfunds Group PLC | | 68,317 | 451,295 |
| Alliance Pharma PLC | | 139,805 | 111,921 |
| Alpha Financial Markets Consulting PLC | | 31,148 | 182,025 |
| Alpha FX Group PLC | | 8,550 | 233,171 |
| Alphawave IP Group PLC (a) | | 73,962 | 94,253 |
| AO World PLC (a) | | 115,035 | 112,259 |
| Ascential PLC (a) | | 119,004 | 381,673 |
| Ashmore Group PLC | | 126,374 | 386,252 |
| ASOS PLC (a) | | 19,167 | 177,481 |
| Assura PLC | | 786,731 | 503,261 |
| Aston Martin Lagonda Global Holdings PLC (a)(c)(d) | | 113,731 | 345,894 |
| Auction Technology Group PLC (a) | | 24,464 | 215,523 |
| Avon Protection PLC | | 8,240 | 102,831 |
| B&M European Value Retail SA | | 256,691 | 1,547,495 |
| Babcock International Group PLC (a) | | 67,767 | 270,317 |
| Balfour Beatty PLC | | 160,124 | 770,733 |
| Beazley PLC | | 180,743 | 1,352,671 |
| Bellway PLC | | 33,048 | 1,001,778 |
| Big Yellow Group PLC | | 46,875 | 721,060 |
| Bodycote PLC | | 51,776 | 449,305 |
| Boohoo.Com PLC (a) | | 278,104 | 172,237 |
| Breedon Group PLC | | 414,943 | 358,257 |
| Bridgepoint Group Holdings Ltd. (d) | | 67,361 | 204,021 |
| Britvic PLC | | 69,224 | 794,720 |
| Bytes Technology Group PLC | | 57,986 | 303,010 |
| Capita Group PLC (a) | | 458,937 | 200,370 |
| Capricorn Energy PLC | | 85,050 | 234,509 |
| Central Asia Metals PLC | | 49,169 | 126,985 |
| Centrica PLC | | 1,584,263 | 2,279,725 |
| Ceres Power Holdings PLC (a)(c) | | 34,077 | 149,635 |
| Chemring Group PLC | | 76,210 | 272,006 |
| Civitas Social Housing PLC | | 166,419 | 111,475 |
| Clarkson PLC | | 7,385 | 287,714 |
| Close Brothers Group PLC | | 40,837 | 466,003 |
| CLS Holdings PLC | | 49,159 | 83,774 |
| CMC Markets PLC (d) | | 35,554 | 82,126 |
| Coats Group PLC | | 431,364 | 423,935 |
| Computacenter PLC | | 23,259 | 671,138 |
| ConvaTec Group PLC (d) | | 439,300 | 1,213,494 |
| Craneware PLC | | 7,244 | 122,903 |
| Cranswick PLC | | 14,343 | 578,621 |
| Crest Nicholson Holdings PLC | | 69,044 | 233,414 |
| Currys PLC | | 291,033 | 208,481 |
| Custodian (REIT) PLC | | 113,386 | 134,660 |
| CVS Group PLC | | 19,201 | 511,574 |
| Darktrace PLC (a)(c) | | 87,922 | 309,499 |
| Dechra Pharmaceuticals PLC | | 30,591 | 1,434,007 |
| Deliveroo PLC Class A (a)(d) | | 239,217 | 328,896 |
| Derwent London PLC | | 27,018 | 815,596 |
| Diploma PLC | | 33,499 | 1,130,802 |
| Direct Line Insurance Group PLC | | 355,091 | 766,006 |
| Discoverie Group PLC | | 25,979 | 275,885 |
| Domino's Pizza UK & IRL PLC | | 101,311 | 374,583 |
| Dowlais Group PLC | | 352,000 | 586,591 |
| Dr. Martens Ltd. | | 161,889 | 337,937 |
| Drax Group PLC | | 107,671 | 851,947 |
| DS Smith PLC | | 371,070 | 1,446,127 |
| Dunelm Group PLC | | 29,294 | 421,903 |
| easyJet PLC (a) | | 81,976 | 512,644 |
| Elementis PLC (a) | | 158,123 | 249,594 |
| EMIS Group PLC | | 15,529 | 318,502 |
| Empiric Student Property PLC | | 162,772 | 189,017 |
| EnQuest PLC (a) | | 413,226 | 86,831 |
| Ergomed PLC (a) | | 10,854 | 145,956 |
| Essentra PLC | | 81,742 | 212,136 |
| FD Technologies PLC (a) | | 6,484 | 153,523 |
| Fever-Tree Drinks PLC | | 28,527 | 486,144 |
| Firstgroup PLC | | 198,454 | 280,334 |
| Forterra PLC (d) | | 58,365 | 141,859 |
| Frasers Group PLC (a) | | 45,362 | 438,112 |
| Future PLC | | 31,016 | 439,687 |
| Games Workshop Group PLC | | 8,842 | 1,102,329 |
| Gamma Communications PLC | | 22,171 | 323,773 |
| GB Group PLC | | 64,851 | 265,369 |
| Genuit Group PLC | | 67,535 | 255,048 |
| Genus PLC | | 17,614 | 595,026 |
| Grafton Group PLC unit | | 57,453 | 625,865 |
| Grainger Trust PLC | | 197,257 | 641,076 |
| Great Portland Estates PLC | | 58,767 | 394,019 |
| Greatland Gold PLC (a) | | 1,240,085 | 125,302 |
| Greggs PLC | | 27,020 | 956,919 |
| Halfords Group PLC | | 59,693 | 157,690 |
| Hammerson PLC (c) | | 1,081,459 | 381,370 |
| Harbour Energy PLC | | 116,901 | 363,322 |
| Hays PLC | | 429,113 | 613,709 |
| Helical PLC | | 30,213 | 113,911 |
| Hill & Smith Holdings PLC | | 20,902 | 361,456 |
| Hiscox Ltd. | | 93,238 | 1,385,030 |
| Home (REIT) PLC (b) | | 235,236 | 112,488 |
| Howden Joinery Group PLC | | 148,196 | 1,275,035 |
| Hunting PLC | | 38,265 | 112,530 |
| Ibstock PLC (d) | | 103,661 | 221,078 |
| IG Group Holdings PLC | | 106,450 | 981,284 |
| IMI PLC | | 70,125 | 1,405,667 |
| Impact Healthcare REIT PLC | | 86,860 | 106,978 |
| Impax Asset Management Group PLC | | 23,456 | 231,110 |
| Inchcape PLC | | 100,662 | 1,022,809 |
| Indivior PLC (a) | | 36,720 | 704,216 |
| IntegraFin Holdings PLC | | 80,547 | 275,541 |
| Intermediate Capital Group PLC | | 77,640 | 1,269,927 |
| International Distributions Services PLC | | 204,536 | 650,852 |
| Investec PLC | | 187,278 | 1,043,358 |
| IP Group PLC | | 280,187 | 198,246 |
| ITM Power PLC (a)(c) | | 116,957 | 114,913 |
| ITV PLC | | 968,330 | 983,051 |
| J.D. Wetherspoon PLC (a) | | 26,382 | 236,399 |
| Jet2 PLC | | 42,964 | 661,979 |
| John Wood Group PLC (a) | | 187,515 | 531,176 |
| Johnson Service Group PLC | | 120,802 | 184,611 |
| Judges Scientific PLC | | 1,473 | 184,009 |
| Jupiter Fund Management PLC | | 120,805 | 197,368 |
| Just Group PLC | | 281,733 | 312,642 |
| Kainos Group PLC | | 21,795 | 339,647 |
| Kape Technologies PLC (a) | | 45,781 | 165,126 |
| Keller Group PLC | | 19,786 | 166,105 |
| Kier Group PLC (a) | | 118,746 | 114,463 |
| Lancashire Holdings Ltd. | | 66,035 | 508,311 |
| Learning Technologies Group PLC | | 160,465 | 226,872 |
| Liontrust Asset Management PLC | | 17,549 | 189,670 |
| Londonmetric Properity PLC | | 253,638 | 613,931 |
| LXI REIT PLC | | 441,329 | 584,591 |
| Man Group PLC | | 344,505 | 983,678 |
| Marks & Spencer Group PLC (a) | | 527,556 | 1,089,650 |
| Marlowe PLC (a) | | 22,148 | 140,286 |
| Marshalls PLC | | 61,538 | 232,478 |
| Melrose Industries PLC | | 365,244 | 1,877,393 |
| Mitchells & Butlers PLC (a) | | 73,536 | 161,821 |
| Mitie Group PLC | | 364,828 | 421,818 |
| Molten Ventures PLC (a) | | 37,663 | 132,438 |
| Moneysupermarket.com Group PLC | | 145,252 | 500,175 |
| Moonpig Group PLC (a) | | 60,150 | 103,488 |
| Morgan Advanced Materials PLC | | 77,392 | 298,109 |
| Morgan Sindall PLC | | 11,555 | 245,998 |
| National Express Group PLC Class L | | 143,226 | 218,519 |
| NCC Group Ltd. | | 83,600 | 112,839 |
| Next Fifteen Communications Group PLC | | 22,728 | 240,504 |
| Ninety One PLC | | 103,046 | 234,530 |
| OSB Group PLC | | 114,804 | 716,783 |
| Oxford BioMedica PLC (a) | | 19,501 | 106,364 |
| Oxford Instruments PLC | | 14,831 | 514,433 |
| Oxford Nanopore Technologies Ltd. (a) | | 89,516 | 258,523 |
| Pagegroup PLC | | 88,597 | 505,280 |
| Pan African Resources PLC | | 464,864 | 103,407 |
| Pantheon Resources PLC (a)(c) | | 196,540 | 46,115 |
| Paragon Banking Group PLC | | 61,821 | 390,410 |
| Pennon Group PLC | | 69,994 | 756,499 |
| Petrofac Ltd. (a)(c) | | 121,424 | 109,032 |
| Pets At Home Group PLC | | 130,994 | 634,801 |
| Picton Property Income Ltd. | | 148,854 | 142,736 |
| Playtech Ltd. (a) | | 62,149 | 450,670 |
| Polar Capital Holdings PLC | | 19,290 | 118,547 |
| Premier Foods PLC | | 176,040 | 277,433 |
| Primary Health Properties PLC | | 341,157 | 456,618 |
| PZ Cussons PLC Class L | | 63,111 | 159,026 |
| QinetiQ Group PLC | | 154,965 | 723,310 |
| Quilter PLC (d) | | 361,126 | 386,222 |
| Rank Group PLC (a) | | 57,344 | 69,545 |
| Rathbone Brothers PLC | | 16,357 | 401,677 |
| Reach PLC | | 81,856 | 86,927 |
| Redde Northgate PLC | | 57,614 | 272,248 |
| Redrow PLC | | 75,643 | 491,958 |
| Regional REIT Ltd. (d) | | 110,442 | 77,033 |
| Renewi PLC (a) | | 21,788 | 164,292 |
| Renishaw PLC | | 9,678 | 438,348 |
| Restore PLC | | 33,500 | 123,356 |
| Rightmove PLC | | 221,335 | 1,597,211 |
| Rotork PLC | | 227,840 | 936,325 |
| RS GROUP PLC | | 127,068 | 1,471,409 |
| RWS Holdings PLC | | 82,619 | 264,562 |
| S4 Capital PLC (a) | | 100,887 | 185,367 |
| Safestore Holdings PLC | | 57,405 | 714,584 |
| Savills PLC | | 38,682 | 467,420 |
| Serco Group PLC | | 313,847 | 599,924 |
| Serica Energy PLC | | 55,789 | 166,588 |
| Shaftesbury Capital PLC | | 369,204 | 546,589 |
| SIG PLC (a) | | 186,419 | 104,138 |
| Smart Metering Systems PLC | | 33,208 | 330,952 |
| Softcat PLC | | 34,975 | 587,676 |
| Spectris PLC | | 28,265 | 1,335,273 |
| Spire Healthcare Group PLC (d) | | 75,830 | 217,759 |
| Spirent Communications PLC | | 166,470 | 376,580 |
| SSP Group PLC (a) | | 212,149 | 687,342 |
| SThree PLC | | 34,095 | 180,608 |
| Subsea 7 SA | | 63,271 | 722,237 |
| Supermarket Income (REIT) PLC | | 335,174 | 368,576 |
| Synthomer PLC | | 101,823 | 153,047 |
| Target Healthcare (REIT) PLC | | 168,479 | 163,460 |
| Tate & Lyle PLC | | 107,844 | 1,104,594 |
| Team17 Group PLC (a) | | 29,660 | 134,936 |
| Telecom Plus PLC | | 17,159 | 389,456 |
| The PRS REIT PLC | | 141,784 | 153,597 |
| The Weir Group PLC | | 70,041 | 1,619,642 |
| THG PLC (a)(c) | | 205,443 | 258,139 |
| TORM PLC | | 7,884 | 245,920 |
| TP ICAP Group PLC | | 213,314 | 456,008 |
| Trainline PLC (a)(d) | | 130,772 | 409,883 |
| Travis Perkins PLC | | 56,045 | 674,763 |
| Tritax Big Box REIT PLC | | 499,818 | 974,255 |
| Trustpilot Group PLC (a)(d) | | 63,234 | 70,330 |
| Tyman PLC | | 53,365 | 165,319 |
| UK Commercial Property REIT Ltd. | | 214,470 | 144,471 |
| Unite Group PLC | | 90,832 | 1,094,728 |
| Urban Logistics REIT PLC | | 127,103 | 225,868 |
| Vanquis Banking Group PLC | | 66,308 | 187,498 |
| Vesuvius PLC | | 58,908 | 300,128 |
| Victoria PLC (a)(c) | | 17,340 | 113,537 |
| Victrex PLC | | 22,577 | 475,542 |
| Virgin Money UK PLC | | 335,478 | 657,293 |
| Vistry Group PLC | | 92,564 | 910,281 |
| Volex PLC | | 32,796 | 105,308 |
| Volution Group PLC | | 53,247 | 290,023 |
| Warehouse (REIT) PLC | | 110,545 | 151,987 |
| Watches of Switzerland Group PLC (a)(d) | | 65,021 | 679,461 |
| WH Smith PLC | | 35,417 | 700,592 |
| Wickes Group PLC | | 70,941 | 120,181 |
| Wincanton PLC | | 33,816 | 91,371 |
| Workspace Group PLC | | 39,124 | 234,733 |
| Yellow Cake PLC (a)(d) | | 47,300 | 223,510 |
| YouGov PLC | | 28,894 | 308,657 |
| Young & Co.'s Brewery PLC Class A | | 6,146 | 88,440 |
TOTAL UNITED KINGDOM | | | 99,659,869 |
| United States of America - 0.6% | | | |
| Burford Capital Ltd. | | 49,697 | 653,297 |
| Carnival PLC (a) | | 39,602 | 327,035 |
| Diversified Gas & Oil PLC | | 214,098 | 254,807 |
| Fiverr International Ltd. (a) | | 8,561 | 312,648 |
| InMode Ltd. (a) | | 18,856 | 702,575 |
| Maxeon Solar Technologies Ltd. (a)(c) | | 6,705 | 188,478 |
| PolyPeptide Group AG (d) | | 4,062 | 101,794 |
| REC Silicon ASA (a)(c) | | 74,306 | 111,490 |
| Reliance Worldwide Corp. Ltd. | | 213,690 | 582,761 |
| RHI Magnesita NV | | 7,066 | 200,692 |
| Riskified Ltd. (a) | | 14,234 | 69,889 |
| Sims Ltd. | | 43,123 | 451,918 |
| Taro Pharmaceutical Industries Ltd. (a) | | 2,470 | 62,244 |
| Vobile Group Ltd. (a) | | 402,000 | 156,878 |
TOTAL UNITED STATES OF AMERICA | | | 4,176,506 |
| Vietnam - 0.0% | | | |
| XP Power PLC | | 5,053 | 140,660 |
| TOTAL COMMON STOCKS (Cost $839,305,733) | | | 685,543,625 |
| | | | |
| Nonconvertible Preferred Stocks - 0.3% |
| | | Shares | Value ($) |
| Germany - 0.3% | | | |
| Draegerwerk AG & Co. KGaA (non-vtg.) | | 2,377 | 133,580 |
| Einhell Germany AG | | 446 | 77,157 |
| Fuchs Petrolub AG | | 18,628 | 734,838 |
| Jungheinrich AG | | 12,968 | 500,702 |
| Sixt SE Preference Shares | | 4,474 | 355,446 |
| Sto SE & Co. KGaA | | 697 | 135,787 |
TOTAL GERMANY | | | 1,937,510 |
| Italy - 0.0% | | | |
| Danieli & C. Officine Meccaniche SpA | | 11,010 | 225,168 |
| TOTAL NONCONVERTIBLE PREFERRED STOCKS (Cost $2,292,367) | | | 2,162,678 |
| | | | |
| Government Obligations - 0.0% |
| | | Principal Amount (f) | Value ($) |
| United States of America - 0.0% | | | |
U.S. Treasury Bills, yield at date of purchase 4.65% 6/29/23 (g) (Cost $496,261) | | 500,000 | 495,973 |
| | | | |
| Money Market Funds - 3.3% |
| | | Shares | Value ($) |
| Fidelity Cash Central Fund 4.88% (h) | | 1,207,649 | 1,207,891 |
| Fidelity Securities Lending Cash Central Fund 4.88% (h)(i) | | 21,591,625 | 21,593,784 |
| TOTAL MONEY MARKET FUNDS (Cost $22,801,675) | | | 22,801,675 |
| | | | |
| TOTAL INVESTMENT IN SECURITIES - 102.5% (Cost $864,896,036) | 711,003,951 |
NET OTHER ASSETS (LIABILITIES) - (2.5)% | (17,668,986) |
| NET ASSETS - 100.0% | 693,334,965 |
| | |
| Futures Contracts |
| | Number of contracts | Expiration Date | Notional Amount ($) | Value ($) | Unrealized Appreciation/ (Depreciation) ($) |
| Purchased | | | | | |
| | | | | | |
| Equity Index Contracts | | | | | |
| ICE E-mini MSCI EAFE Index Contracts (United States) | 67 | Jun 2023 | 7,201,160 | 283,255 | 283,255 |
| | | | | | |
| The notional amount of futures purchased as a percentage of Net Assets is 1.0% |
Legend
| (c) | Security or a portion of the security is on loan at period end. |
| (d) | Security exempt from registration under Rule 144A of the Securities Act of 1933. These securities may be resold in transactions exempt from registration, normally to qualified institutional buyers. At the end of the period, the value of these securities amounted to $27,409,193 or 4.0% of net assets. |
| (e) | Security or a portion of the security purchased on a delayed delivery or when-issued basis. |
| (f) | Amount is stated in United States dollars unless otherwise noted. |
| (g) | Security or a portion of the security was pledged to cover margin requirements for futures contracts. At period end, the value of securities pledged amounted to $244,019. |
| (h) | Affiliated fund that is generally available only to investment companies and other accounts managed by Fidelity Investments. The rate quoted is the annualized seven-day yield of the fund at period end. A complete unaudited listing of the fund's holdings as of its most recent quarter end is available upon request. In addition, each Fidelity Central Fund's financial statements are available on the SEC's website or upon request. |
| (i) | Investment made with cash collateral received from securities on loan. |
Affiliated Central Funds
Fiscal year to date information regarding the Fund's investments in Fidelity Central Funds, including the ownership percentage, is presented below.
| Affiliate | Value, beginning of period ($) | Purchases ($) | Sales Proceeds ($) | Dividend Income ($) | Realized Gain (loss) ($) | Change in Unrealized appreciation (depreciation) ($) | Value, end of period ($) | % ownership, end of period |
| Fidelity Cash Central Fund 4.88% | 5,135,838 | 36,450,908 | 40,378,855 | 94,042 | - | - | 1,207,891 | 0.0% |
| Fidelity Securities Lending Cash Central Fund 4.88% | 21,280,639 | 35,600,343 | 35,287,198 | 404,468 | - | - | 21,593,784 | 0.1% |
| Total | 26,416,477 | 72,051,251 | 75,666,053 | 498,510 | - | - | 22,801,675 | |
| | | | | | | | | |
Amounts in the dividend income column in the above table include any capital gain distributions from underlying funds, which are presented in the corresponding line item in the Statement of Operations, if applicable.
Amounts in the dividend income column for Fidelity Securities Lending Cash Central Fund represents the income earned on investing cash collateral, less rebates paid to borrowers and any lending agent fees associated with the loan, plus any premium payments received for lending certain types of securities.
Amounts included in the purchases and sales proceeds columns may include in-kind transactions, if applicable.
Investment Valuation
The following is a summary of the inputs used, as of April 30, 2023, involving the Fund's assets and liabilities carried at fair value. The inputs or methodology used for valuing securities may not be an indication of the risk associated with investing in those securities. For more information on valuation inputs, and their aggregation into the levels used below, please refer to the Investment Valuation section in the accompanying Notes to Financial Statements.
| Valuation Inputs at Reporting Date: |
| Description | Total ($) | Level 1 ($) | Level 2 ($) | Level 3 ($) |
Investments in Securities: | | | | |
|
| Equities: | | | | |
Communication Services | 28,693,194 | 17,392,708 | 11,300,486 | - |
Consumer Discretionary | 89,597,593 | 38,546,913 | 51,050,680 | - |
Consumer Staples | 43,502,982 | 17,917,341 | 25,585,641 | - |
Energy | 18,679,944 | 13,032,186 | 5,647,758 | - |
Financials | 79,264,111 | 54,225,952 | 25,038,159 | - |
Health Care | 44,741,931 | 27,137,186 | 17,604,745 | - |
Industrials | 160,004,567 | 95,625,475 | 64,379,092 | - |
Information Technology | 64,688,984 | 36,044,945 | 28,644,039 | - |
Materials | 65,546,910 | 26,969,532 | 38,133,761 | 443,617 |
Real Estate | 71,759,848 | 32,834,880 | 38,812,480 | 112,488 |
Utilities | 21,226,239 | 12,315,593 | 8,910,646 | - |
|
| Government Obligations | 495,973 | - | 495,973 | - |
|
| Money Market Funds | 22,801,675 | 22,801,675 | - | - |
| Total Investments in Securities: | 711,003,951 | 394,844,386 | 315,603,460 | 556,105 |
Derivative Instruments: | | | | |
|
| Assets | | | | |
Futures Contracts | 283,255 | 283,255 | - | - |
| Total Assets | 283,255 | 283,255 | - | - |
| Total Derivative Instruments: | 283,255 | 283,255 | - | - |
Value of Derivative Instruments
The following table is a summary of the Fund's value of derivative instruments by primary risk exposure as of April 30, 2023. For additional information on derivative instruments, please refer to the Derivative Instruments section in the accompanying Notes to Financial Statements.
Primary Risk Exposure / Derivative Type | Value |
| Asset ($) | Liability ($) |
| Equity Risk | | |
Futures Contracts (a) | 283,255 | 0 |
| Total Equity Risk | 283,255 | 0 |
| Total Value of Derivatives | 283,255 | 0 |
(a)Reflects gross cumulative appreciation (depreciation) on futures contracts as presented in the Schedule of Investments. In the Statement of Assets and Liabilities, the period end daily variation margin is included in receivable or payable for daily variation margin on futures contracts, and the net cumulative appreciation (depreciation) is included in Total accumulated earnings (loss).
| Statement of Assets and Liabilities |
| | | | April 30, 2023 (Unaudited) |
| | | | | |
| Assets | | | | |
| Investment in securities, at value (including securities loaned of $17,703,120) - See accompanying schedule: | | | | |
Unaffiliated issuers (cost $842,094,361) | $ | 688,202,276 | | |
Fidelity Central Funds (cost $22,801,675) | | 22,801,675 | | |
| | | | | |
| | | | | |
| Total Investment in Securities (cost $864,896,036) | | | $ | 711,003,951 |
| Cash | | | | 29,737 |
| Receivable for fund shares sold | | | | 16,856 |
| Dividends receivable | | | | 3,768,638 |
| Reclaims receivable | | | | 987,761 |
| Interest receivable | | | | 3,831 |
| Distributions receivable from Fidelity Central Funds | | | | 72,625 |
| Prepaid expenses | | | | 280 |
| Receivable from investment adviser for expense reductions | | | | 30,816 |
| Other receivables | | | | 4,771 |
Total assets | | | | 715,919,266 |
| Liabilities | | | | |
| Payable to custodian bank | $ | 715,281 | | |
| Payable for investments purchased | | | | |
Regular delivery | | 18,122 | | |
Delayed delivery | | 69,772 | | |
| Payable for fund shares redeemed | | 54,614 | | |
| Accrued management fee | | 57,335 | | |
| Payable for daily variation margin on futures contracts | | 6,803 | | |
| Other payables and accrued expenses | | 68,589 | | |
| Collateral on securities loaned | | 21,593,785 | | |
| Total Liabilities | | | | 22,584,301 |
| Net Assets | | | $ | 693,334,965 |
| Net Assets consist of: | | | | |
| Paid in capital | | | $ | 900,543,547 |
| Total accumulated earnings (loss) | | | | (207,208,582) |
| Net Assets | | | $ | 693,334,965 |
Net Asset Value , offering price and redemption price per share ($693,334,965 ÷ 85,906,404 shares) | | | $ | 8.07 |
| Statement of Operations |
| | | | Six months ended April 30, 2023 (Unaudited) |
| Investment Income | | | | |
| Dividends | | | $ | 10,947,548 |
| Interest | | | | 13,094 |
| Income from Fidelity Central Funds (including $404,468 from security lending) | | | | 498,510 |
| Income before foreign taxes withheld | | | $ | 11,459,152 |
| Less foreign taxes withheld | | | | (1,085,065) |
| Total Income | | | | 10,374,087 |
| Expenses | | | | |
| Management fee | $ | 347,486 | | |
| Custodian fees and expenses | | 69,874 | | |
| Independent trustees' fees and expenses | | 2,310 | | |
| Registration fees | | 5,825 | | |
| Audit | | 29,019 | | |
| Legal | | 524 | | |
| Interest | | 8,009 | | |
| Miscellaneous | | 1,523 | | |
| Total expenses before reductions | | 464,570 | | |
| Expense reductions | | (107,189) | | |
| Total expenses after reductions | | | | 357,381 |
| Net Investment income (loss) | | | | 10,016,706 |
| Realized and Unrealized Gain (Loss) | | | | |
| Net realized gain (loss) on: | | | | |
| Investment Securities: | | | | |
| Unaffiliated issuers | | (36,715,961) | | |
| Foreign currency transactions | | 218,776 | | |
| Futures contracts | | 1,370,496 | | |
| Total net realized gain (loss) | | | | (35,126,689) |
| Change in net unrealized appreciation (depreciation) on: | | | | |
| Investment Securities: | | | | |
| Unaffiliated issuers | | 147,464,050 | | |
| Assets and liabilities in foreign currencies | | 103,347 | | |
| Futures contracts | | 713,191 | | |
| Total change in net unrealized appreciation (depreciation) | | | | 148,280,588 |
| Net gain (loss) | | | | 113,153,899 |
| Net increase (decrease) in net assets resulting from operations | | | $ | 123,170,605 |
| Statement of Changes in Net Assets |
| |
| | Six months ended April 30, 2023 (Unaudited) | | Year ended October 31, 2022 |
| Increase (Decrease) in Net Assets | | | | |
| Operations | | | | |
| Net investment income (loss) | $ | 10,016,706 | $ | 23,260,160 |
| Net realized gain (loss) | | (35,126,689) | | (26,145,421) |
| Change in net unrealized appreciation (depreciation) | | 148,280,588 | | (297,069,291) |
| Net increase (decrease) in net assets resulting from operations | | 123,170,605 | | (299,954,552) |
| Distributions to shareholders | | (19,865,640) | | (11,052,522) |
| Share transactions | | | | |
| Proceeds from sales of shares | | 8,926,993 | | 175,719,119 |
| Reinvestment of distributions | | 19,858,109 | | 11,052,043 |
| Cost of shares redeemed | | (102,935,307) | | (85,002,656) |
Net increase (decrease) in net assets resulting from share transactions | | (74,150,205) | | 101,768,506 |
| Total increase (decrease) in net assets | | 29,154,760 | | (209,238,568) |
| | | | | |
| Net Assets | | | | |
| Beginning of period | | 664,180,205 | | 873,418,773 |
| End of period | $ | 693,334,965 | $ | 664,180,205 |
| | | | | |
| Other Information | | | | |
| Shares | | | | |
| Sold | | 1,155,374 | | 18,306,524 |
| Issued in reinvestment of distributions | | 2,669,101 | | 1,147,668 |
| Redeemed | | (13,314,283) | | (10,341,740) |
| Net increase (decrease) | | (9,489,808) | | 9,112,452 |
| | | | | |
Financial Highlights
| Fidelity® SAI International Small Cap Index Fund |
| |
| | Six months ended (Unaudited) April 30, 2023 | | Years ended October 31, 2022 | | 2021 A |
Selected Per-Share Data | | | | | | |
| Net asset value, beginning of period | $ | 6.96 | $ | 10.12 | $ | 10.00 |
| Income from Investment Operations | | | | | | |
Net investment income (loss) B,C | | .11 | | .24 | | .09 |
| Net realized and unrealized gain (loss) | | 1.23 | | (3.27) | | .03 D |
| Total from investment operations | | 1.34 | | (3.03) | | .12 |
| Distributions from net investment income | | (.23) | | (.13) | | - |
| Total distributions | | (.23) | | (.13) | | - |
| Net asset value, end of period | $ | 8.07 | $ | 6.96 | $ | 10.12 |
Total Return E,F | | 19.49% | | (30.31)% | | 1.20% |
Ratios to Average Net Assets C,G,H | | | | | | |
| Expenses before reductions | | .13% I | | .14% | | .19% I,J |
| Expenses net of fee waivers, if any | | .10% I | | .10% | | .10% I |
| Expenses net of all reductions | | .10% I | | .10% | | .10% I |
| Net investment income (loss) | | 2.88% I | | 2.85% | | 2.00% I |
| Supplemental Data | | | | | | |
| Net assets, end of period (000 omitted) | $ | 693,335 | $ | 664,180 | $ | 873,419 |
Portfolio turnover rate K | | 11% I | | 20% | | 1% L |
A For the period May 27, 2021 (commencement of operations) through October 31, 2021.
B Calculated based on average shares outstanding during the period.
C Net investment income (loss) is affected by the timing of the declaration of dividends by any underlying mutual funds or exchange-traded funds (ETFs). Net investment income (loss) of any mutual funds or ETFs is not included in the Fund's net investment income (loss) ratio.
D The amount shown for a share outstanding does not correspond with the aggregate net gain (loss) on investments for the period due to the timing of sales and repurchases of shares in relation to fluctuating market values of the investments of the Fund.
E Total returns for periods of less than one year are not annualized.
F Total returns would have been lower if certain expenses had not been reduced during the applicable periods shown.
G Fees and expenses of any underlying mutual funds or exchange-traded funds (ETFs) are not included in the Fund's expense ratio. The Fund indirectly bears its proportionate share of these expenses. For additional expense information related to investments in Fidelity Central Funds, please refer to the "Investments in Fidelity Central Funds" note found in the Notes to Financial Statements section of the most recent Annual or Semi-Annual report.
H Expense ratios reflect operating expenses of the class. Expenses before reductions do not reflect amounts reimbursed, waived, or reduced through arrangements with the investment adviser, brokerage services, or other offset arrangements, if applicable, and do not represent the amount paid by the class during periods when reimbursements, waivers or reductions occur.
I Annualized.
J Audit fees are not annualized.
K Amount does not include the portfolio activity of any underlying mutual funds or exchange-traded funds (ETFs).
L Amount not annualized.
For the period ended April 30, 2023
1. Organization.
Fidelity SAI International Small Cap Index Fund (the Fund) is a fund of Fidelity Concord Street Trust (the Trust) and is authorized to issue an unlimited number of shares. Shares are offered exclusively to certain clients of Fidelity Management & Research Company LLC (FMR) or its affiliates. The Trust is registered under the Investment Company Act of 1940, as amended (the 1940 Act), as an open-end management investment company organized as a Massachusetts business trust.
2. Investments in Fidelity Central Funds.
Funds may invest in Fidelity Central Funds, which are open-end investment companies generally available only to other investment companies and accounts managed by the investment adviser and its affiliates. The Schedule of Investments lists any Fidelity Central Funds held as an investment as of period end, but does not include the underlying holdings of each Fidelity Central Fund. An investing fund indirectly bears its proportionate share of the expenses of the underlying Fidelity Central Funds.
Based on its investment objective, each Fidelity Central Fund may invest or participate in various investment vehicles or strategies that are similar to those of the investing fund. These strategies are consistent with the investment objectives of the investing fund and may involve certain economic risks which may cause a decline in value of each of the Fidelity Central Funds and thus a decline in the value of the investing fund.
| Fidelity Central Fund | Investment Manager | Investment Objective | Investment Practices | Expense Ratio A |
| Fidelity Money Market Central Funds | Fidelity Management & Research Company LLC (FMR) | Each fund seeks to obtain a high level of current income consistent with the preservation of capital and liquidity. | Short-term Investments | Less than .005% |
A Expenses expressed as a percentage of average net assets and are as of each underlying Central Fund's most recent annual or semi-annual shareholder report.
A complete unaudited list of holdings for each Fidelity Central Fund is available upon request or at the Securities and Exchange Commission website at www.sec.gov. In addition, the financial statements of the Fidelity Central Funds which contain the significant accounting policies (including investment valuation policies) of those funds, and are not covered by the Report of Independent Registered Public Accounting Firm, are available on the Securities and Exchange Commission website or upon request.
3. Significant Accounting Policies.
The Fund is an investment company and applies the accounting and reporting guidance of the Financial Accounting Standards Board (FASB) Accounting Standards Codification Topic 946 Financial Services - Investment Companies . The financial statements have been prepared in conformity with accounting principles generally accepted in the United States of America (GAAP), which require management to make certain estimates and assumptions at the date of the financial statements. Actual results could differ from those estimates. Subsequent events, if any, through the date that the financial statements were issued have been evaluated in the preparation of the financial statements. The Fund's Schedule of Investments lists any underlying mutual funds or exchange-traded funds (ETFs) but does not include the underlying holdings of these funds. The following summarizes the significant accounting policies of the Fund:
Investment Valuation. Investments are valued as of 4:00 p.m. Eastern time on the last calendar day of the period. The Board of Trustees (the Board) has designated the Fund's investment adviser as the valuation designee responsible for the fair valuation function and performing fair value determinations as needed. The investment adviser has established a Fair Value Committee (the Committee) to carry out the day-to-day fair valuation responsibilities and has adopted policies and procedures to govern the fair valuation process and the activities of the Committee. In accordance with these fair valuation policies and procedures, which have been approved by the Board, the Fund attempts to obtain prices from one or more third party pricing services or brokers to value its investments. When current market prices, quotations or currency exchange rates are not readily available or reliable, investments will be fair valued in good faith by the Committee, in accordance with the policies and procedures. Factors used in determining fair value vary by investment type and may include market or investment specific events, transaction data, estimated cash flows, and market observations of comparable investments. The frequency that the fair valuation procedures are used cannot be predicted and they may be utilized to a significant extent. The Committee manages the Fund's fair valuation practices and maintains the fair valuation policies and procedures. The Fund's investment adviser reports to the Board information regarding the fair valuation process and related material matters.
The Fund categorizes the inputs to valuation techniques used to value its investments into a disclosure hierarchy consisting of three levels as shown below:
Level 1 - unadjusted quoted prices in active markets for identical investments
Level 2 - other significant observable inputs (including quoted prices for similar investments, interest rates, prepayment speeds, etc.)
Level 3 - unobservable inputs (including the Fund's own assumptions based on the best information available)
Valuation techniques used to value the Fund's investments by major category are as follows:
Equity securities, including restricted securities, for which market quotations are readily available, are valued at the last reported sale price or official closing price as reported by a third party pricing service on the primary market or exchange on which they are traded and are categorized as Level 1 in the hierarchy. In the event there were no sales during the day or closing prices are not available, securities are valued at the last quoted bid price or may be valued using the last available price and are generally categorized as Level 2 in the hierarchy. For foreign equity securities, when market or security specific events arise, comparisons to the valuation of American Depositary Receipts (ADRs), futures contracts, Exchange-Traded Funds (ETFs) and certain indexes as well as quoted prices for similar securities may be used and would be categorized as Level 2 in the hierarchy. For equity securities, including restricted securities, where observable inputs are limited, assumptions about market activity and risk are used and these securities may be categorized as Level 3 in the hierarchy.
Debt securities, including restricted securities, are valued based on evaluated prices received from third party pricing services or from brokers who make markets in such securities. U.S. government and government agency obligations, are valued by pricing services who utilize matrix pricing which considers yield or price of bonds of comparable quality, coupon, maturity and type or by broker-supplied prices. When independent prices are unavailable or unreliable, debt securities may be valued utilizing pricing methodologies which consider similar factors that would be used by third party pricing services. Debt securities are generally categorized as Level 2 in the hierarchy but may be Level 3 depending on the circumstances.
Futures contracts are valued at the settlement price established each day by the board of trade or exchange on which they are traded and are categorized as Level 1 in the hierarchy. Investments in open-end mutual funds ,including the Fidelity Central Funds, are valued at their closing net asset value (NAV) each business day and are categorized as Level 1 in the hierarchy.
Changes in valuation techniques may result in transfers in or out of an assigned level within the disclosure hierarchy. The aggregate value of investments by input level as of April 30, 2023 is included at the end of the Fund's Schedule of Investments.
Foreign Currency. Certain Funds may use foreign currency contracts to facilitate transactions in foreign-denominated securities. Gains and losses from these transactions may arise from changes in the value of the foreign currency or if the counterparties do not perform under the contracts' terms.
Foreign-denominated assets, including investment securities, and liabilities are translated into U.S. dollars at the exchange rates at period end. Purchases and sales of investment securities, income and dividends received, and expenses denominated in foreign currencies are translated into U.S. dollars at the exchange rate in effect on the transaction date.
The effects of exchange rate fluctuations on investments are included with the net realized and unrealized gain (loss) on investment securities. Other foreign currency transactions resulting in realized and unrealized gain (loss) are disclosed separately.
Investment Transactions and Income. For financial reporting purposes, the Fund's investment holdings and NAV include trades executed through the end of the last business day of the period. The NAV per share for processing shareholder transactions is calculated as of the close of business of the New York Stock Exchange (NYSE), normally 4:00 p.m. Eastern time and includes trades executed through the end of the prior business day. Gains and losses on securities sold are determined on the basis of identified cost. Commissions paid to certain brokers with whom the investment adviser, or its affiliates, places trades on behalf of a fund include an amount in addition to trade execution, which may be rebated back to a fund. Any such rebates are included in net realized gain (loss) on investments in the Statement of Operations. Dividend income is recorded on the ex-dividend date, except for certain dividends from foreign securities where the ex-dividend date may have passed, which are recorded as soon as the Fund is informed of the ex-dividend date. Non-cash dividends included in dividend income, if any, are recorded at the fair market value of the securities received. Income and capital gain distributions from Fidelity Central Funds, if any, are recorded on the ex-dividend date. Certain distributions received by the Fund represent a return of capital or capital gain. The Fund determines the components of these distributions subsequent to the ex-dividend date, based upon receipt of tax filings or other correspondence relating to the underlying investment. These distributions are recorded as a reduction of cost of investments and/or as a realized gain. Interest income is accrued as earned and includes coupon interest and amortization of premium and accretion of discount on debt securities as applicable. Investment income is recorded net of foreign taxes withheld where recovery of such taxes is uncertain. Funds may file withholding tax reclaims in certain jurisdictions to recover a portion of amounts previously withheld. Any withholding tax reclaims income is included in the Statement of Operations in foreign taxes withheld. Any receivables for withholding tax reclaims are included in the Statement of Assets and Liabilities in reclaims receivable.
Expenses. Expenses directly attributable to a fund are charged to that fund. Expenses attributable to more than one fund are allocated among the respective funds on the basis of relative net assets or other appropriate methods. Expenses included in the accompanying financial statements reflect the expenses of that fund and do not include any expenses associated with any underlying mutual funds or exchange-traded funds. Although not included in a fund's expenses, a fund indirectly bears its proportionate share of these expenses through the net asset value of each underlying mutual fund or exchange-traded fund. Expense estimates are accrued in the period to which they relate and adjustments are made when actual amounts are known.
Income Tax Information and Distributions to Shareholders. Each year, the Fund intends to qualify as a regulated investment company under Subchapter M of the Internal Revenue Code, including distributing substantially all of its taxable income and realized gains. As a result, no provision for U.S. Federal income taxes is required. The Fund files a U.S. federal tax return, in addition to state and local tax returns as required. The Fund's federal income tax returns are subject to examination by the Internal Revenue Service (IRS) for a period of three fiscal years after they are filed. State and local tax returns may be subject to examination for an additional fiscal year depending on the jurisdiction. Foreign taxes are provided for based on the Fund's understanding of the tax rules and rates that exist in the foreign markets in which it invests.
Distributions are declared and recorded on the ex-dividend date. Income and capital gain distributions are determined in accordance with income tax regulations, which may differ from GAAP.
Capital accounts within the financial statements are adjusted for permanent book-tax differences. These adjustments have no impact on net assets or the results of operations. Capital accounts are not adjusted for temporary book-tax differences which will reverse in a subsequent period.
Book-tax differences are primarily due to futures contracts, foreign currency transactions, passive foreign investment companies (PFIC), partnerships, capital loss carryforwards and losses deferred due to wash sales.
As of period end, the cost and unrealized appreciation (depreciation) in securities, and derivatives if applicable, for federal income tax purposes were as follows:
| Gross unrealized appreciation | $41,978,974 |
| Gross unrealized depreciation | (199,764,045) |
| Net unrealized appreciation (depreciation) | $(157,785,071) |
| Tax cost | $869,072,277 |
Capital loss carryforwards are only available to offset future capital gains of the Fund to the extent provided by regulations and may be limited. The capital loss carryforward information presented below, including any applicable limitation, is estimated as of prior fiscal period end and is subject to adjustment.
Short-term | $(21,711,323) |
Long-term | (409,701) |
| Total capital loss carryforward | $(22,121,024) |
Delayed Delivery Transactions and When-Issued Securities. During the period, certain Funds transacted in securities on a delayed delivery or when-issued basis. Payment and delivery may take place after the customary settlement period for that security. The price of the underlying securities and the date when the securities will be delivered and paid for are fixed at the time the transaction is negotiated. Securities purchased on a delayed delivery or when-issued basis are identified as such in the Schedule of Investments. Compensation for interest forgone in the purchase of a delayed delivery or when-issued debt security may be received. With respect to purchase commitments, each applicable Fund identifies securities as segregated in its records with a value at least equal to the amount of the commitment. Payables and receivables associated with the purchases and sales of delayed delivery securities having the same coupon, settlement date and broker are offset. Delayed delivery or when-issued securities that have been purchased from and sold to different brokers are reflected as both payables and receivables in the Statement of Assets and Liabilities under the caption "Delayed delivery", as applicable. Losses may arise due to changes in the value of the underlying securities or if the counterparty does not perform under the contract's terms, or if the issuer does not issue the securities due to political, economic, or other factors.
Restricted Securities (including Private Placements). Funds may invest in securities that are subject to legal or contractual restrictions on resale. These securities generally may be resold in transactions exempt from registration or to the public if the securities are registered. Disposal of these securities may involve time-consuming negotiations and expense, and prompt sale at an acceptable price may be difficult. Information regarding restricted securities held at period end is included at the end of the Schedule of Investments, if applicable.
4. Derivative Instruments.
Risk Exposures and the Use of Derivative Instruments. The Fund's investment objectives allow for various types of derivative instruments, including futures contracts. Derivatives are investments whose value is primarily derived from underlying assets, indices or reference rates and may be transacted on an exchange or over-the-counter (OTC). Derivatives may involve a future commitment to buy or sell a specified asset based on specified terms, to exchange future cash flows at periodic intervals based on a notional principal amount, or for one party to make one or more payments upon the occurrence of specified events in exchange for periodic payments from the other party.
Derivatives were used to increase returns and to manage exposure to certain risks as defined below. The success of any strategy involving derivatives depends on analysis of numerous economic factors, and if the strategies for investment do not work as intended, the objectives may not be achieved.
Derivatives were used to increase or decrease exposure to the following risk(s):
| | |
| Equity Risk | Equity risk relates to the fluctuations in the value of financial instruments as a result of changes in market prices (other than those arising from interest rate risk or foreign exchange risk), whether caused by factors specific to an individual investment, its issuer, or all factors affecting all instruments traded in a market or market segment. |
Funds are also exposed to additional risks from investing in derivatives, such as liquidity risk and counterparty credit risk. Liquidity risk is the risk that a fund will be unable to close out the derivative in the open market in a timely manner. Counterparty credit risk is the risk that the counterparty will not be able to fulfill its obligation to a fund. Counterparty credit risk related to exchange-traded contracts may be mitigated by the protection provided by the exchange on which they trade.
Investing in derivatives may involve greater risks than investing in the underlying assets directly and, to varying degrees, may involve risk of loss in excess of any initial investment and collateral received and amounts recognized in the Statement of Assets and Liabilities. In addition, there may be the risk that the change in value of the derivative contract does not correspond to the change in value of the underlying instrument.
Futures Contracts. A futures contract is an agreement between two parties to buy or sell a specified underlying instrument for a fixed price at a specified future date. Futures contracts were used to manage exposure to the stock market.
Upon entering into a futures contract, a fund is required to deposit either cash or securities (initial margin) with a clearing broker in an amount equal to a certain percentage of the face value of the contract. Futures contracts are marked-to-market daily and subsequent daily payments are made or received by a fund depending on the daily fluctuations in the value of the futures contracts and are recorded as unrealized appreciation or (depreciation). This receivable and/or payable, if any, is included in daily variation margin on futures contracts in the Statement of Assets and Liabilities. Realized gain or (loss) is recorded upon the expiration or closing of a futures contract. The net realized gain (loss) and change in net unrealized appreciation (depreciation) on futures contracts during the period is presented in the Statement of Operations.
Any open futures contracts at period end are presented in the Schedule of Investments under the caption "Futures Contracts". The notional amount at value reflects each contract's exposure to the underlying instrument or index at period end, and is representative of volume of activity during the period unless an average notional amount is presented. Any securities deposited to meet initial margin requirements are identified in the Schedule of Investments. Any cash deposited to meet initial margin requirements is presented as segregated cash with brokers for derivative instruments in the Statement of Assets and Liabilities.
5. Purchases and Sales of Investments.
Purchases and sales of securities, other than short-term securities, U.S. government securities, and in-kind transactions, as applicable, are noted in the table below.
| | Purchases ($) | Sales ($) |
| Fidelity SAI International Small Cap Index Fund | 38,863,956 | 108,386,120 |
6. Fees and Other Transactions with Affiliates.
Management Fee. Fidelity Management & Research Company LLC (the investment adviser) and its affiliates provide the Fund with investment management related services for which the Fund pays a monthly management fee that is based on an annual rate of .10% of the Fund's average net assets.
Sub-Adviser. Geode Capital Management, LLC (Geode), serves as sub-adviser for the Fund. Geode provides discretionary investment advisory services to the Fund and is paid by the investment adviser for providing these services.
Interfund Lending Program. Pursuant to an Exemptive Order issued by the Securities and Exchange Commission (the SEC), the Fund, along with other registered investment companies having management contracts with Fidelity Management & Research Company LLC (FMR), or other affiliated entities of FMR, may participate in an interfund lending program. This program provides an alternative credit facility allowing the Fund to borrow from, or lend money to, other participating affiliated funds. At period end, there were no interfund loans outstanding. Activity in this program during the period for which loans were outstanding was as follows:
| | Borrower or Lender | Average Loan Balance | Weighted Average Interest Rate | Interest Expense |
Fidelity SAI International Small Cap Index Fund | Borrower | $ 5,490,091 | 4.67% | $ 7,836 |
Interfund Trades. Funds may purchase from or sell securities to other Fidelity Funds under procedures adopted by the Board. The procedures have been designed to ensure these interfund trades are executed in accordance with Rule 17a-7 of the 1940 Act. Any interfund trades are included within the respective purchases and sales amounts shown in the Purchases and Sales of Investments note. During the period, there were no interfund trades.
7. Committed Line of Credit.
Certain Funds participate with other funds managed by the investment adviser or an affiliate in a $4.25 billion credit facility (the "line of credit") to be utilized for temporary or emergency purposes to fund shareholder redemptions or for other short-term liquidity purposes. The participating funds have agreed to pay commitment fees on their pro-rata portion of the line of credit, which are reflected in Miscellaneous expenses on the Statement of Operations, and are listed below. During the period, there were no borrowings on this line of credit.
| | Amount |
| Fidelity SAI International Small Cap Index Fund | $682 |
8. Security Lending.
Funds lend portfolio securities from time to time in order to earn additional income. Lending agents are used, including National Financial Services (NFS), an affiliate of the investment adviser. Pursuant to a securities lending agreement, NFS will receive a fee, which is capped at 9.9% of a fund's daily lending revenue, for its services as lending agent. A fund may lend securities to certain qualified borrowers, including NFS. On the settlement date of the loan, a fund receives collateral (in the form of U.S. Treasury obligations, letters of credit and/or cash) against the loaned securities and maintains collateral in an amount not less than 100% of the market value of the loaned securities during the period of the loan. The market value of the loaned securities is determined at the close of business of a fund and any additional required collateral is delivered to a fund on the next business day. A fund or borrower may terminate the loan at any time, and if the borrower defaults on its obligation to return the securities loaned because of insolvency or other reasons, a fund may apply collateral received from the borrower against the obligation. A fund may experience delays and costs in recovering the securities loaned. Any cash collateral received is invested in the Fidelity Securities Lending Cash Central Fund. Any loaned securities are identified as such in the Schedule of Investments, and the value of loaned securities and cash collateral at period end, as applicable, are presented in the Statement of Assets and Liabilities. Security lending income represents the income earned on investing cash collateral, less rebates paid to borrowers and any lending agent fees associated with the loan, plus any premium payments received for lending certain types of securities. Security lending income is presented in the Statement of Operations as a component of income from Fidelity Central Funds. Affiliated security lending activity, if any, was as follows:
| | Total Security Lending Fees Paid to NFS | Security Lending Income From Securities Loaned to NFS | Value of Securities Loaned to NFS at Period End |
| Fidelity SAI International Small Cap Index Fund | $42,730 | $ 908 | $30,837 |
9. Bank Borrowings.
The Fund is permitted to have bank borrowings for temporary or emergency purposes to fund shareholder redemptions or for other short-term liquidity requirements. The Fund has established borrowing arrangements with certain banks. The interest rate on the borrowings is the bank's base rate, as revised from time to time. Any open loans, including accrued interest, at period end are presented under the caption "Notes payable" in the Statement of Assets and Liabilities, if applicable. Activity in this program during the period for which loans were outstanding was as follows:
| | Average Loan Balance | Weighted Average Interest Rate | Interest Expense |
| Fidelity SAI International Small Cap Index Fund | $195,000 | 5.33% | $ 173 |
10. Expense Reductions.
The investment adviser contractually agreed to reimburse the Fund to the extent annual operating expenses exceeded .10% of average net assets. This reimbursement will remain in place through February 29, 2024. Some expenses, for example the compensation of the independent Trustees, and certain miscellaneous expenses such as proxy and shareholder meeting expenses, are excluded from this reimbursement. During the period this reimbursement reduced the Fund's expenses by $106,964.
Through arrangements with the Fund's custodian, credits realized as a result of certain uninvested cash balances were used to reduce the Fund's expenses by $225.
11. Other.
A fund's organizational documents provide former and current trustees and officers with a limited indemnification against liabilities arising in connection with the performance of their duties to the fund. In the normal course of business, a fund may also enter into contracts that provide general indemnifications. A fund's maximum exposure under these arrangements is unknown as this would be dependent on future claims that may be made against a fund. The risk of material loss from such claims is considered remote.
At the end of the period, the following mutual funds managed by the investment adviser or its affiliates were the owners of record of 10% or more of the total outstanding shares.
| | Strategic Advisers Fidelity International Fund | Strategic Advisers International Fund |
| Fidelity SAI International Small Cap Index Fund | 69% | 14% |
Mutual funds managed by the investment adviser or its affiliates, in aggregate, were the owners of record of more than 20% of the total outstanding shares.
| Fund | % of shares held |
| Fidelity SAI International Small Cap Index Fund | 83% |
12. Risk and Uncertainties.
Many factors affect a fund's performance. Developments that disrupt global economies and financial markets, such as pandemics, epidemics, outbreaks of infectious diseases, war, terrorism, and environmental disasters, may significantly affect a fund's investment performance. The effects of these developments to a fund will be impacted by the types of securities in which a fund invests, the financial condition, industry, economic sector, and geographic location of an issuer, and a fund's level of investment in the securities of that issuer. Significant concentrations in security types, issuers, industries, sectors, and geographic locations may magnify the factors that affect a fund's performance.
As a shareholder, you incur two types of costs: (1) transaction costs, which may include sales charges (loads) on purchase payments or redemption proceeds, as applicable and (2) ongoing costs, which generally include management fees, distribution and/or service (12b-1) fees and other Fund expenses. This Example is intended to help you understand your ongoing costs (in dollars) of investing in a fund and to compare these costs with the ongoing costs of investing in other mutual funds.
| The Example is based on an investment of $1,000 invested at the beginning of the period and held for the entire period (November 1, 2022 to April 30, 2023). |
Actual Expenses
The first line of the accompanying table provides information about actual account values and actual expenses. You may use the information in this line, together with the amount you invested, to estimate the expenses that you paid over the period. Simply divide your account value by $1,000.00 (for example, an $8,600 account value divided by $1,000.00 = 8.6), then multiply the result by the number in the first line for a class/Fund under the heading entitled "Expenses Paid During Period" to estimate the expenses you paid on your account during this period. If any fund is a shareholder of any underlying mutual funds or exchange-traded funds (ETFs) (the Underlying Funds), such fund indirectly bears its proportional share of the expenses of the Underlying Funds in addition to the direct expenses incurred presented in the table. These fees and expenses are not included in the annualized expense ratio used to calculate the expense estimate in the table below.
Hypothetical Example for Comparison Purposes
The second line of the accompanying table provides information about hypothetical account values and hypothetical expenses based on the actual expense ratio and an assumed rate of return of 5% per year before expenses, which is not the actual return. The hypothetical account values and expenses may not be used to estimate the actual ending account balance or expenses you paid for the period. You may use this information to compare the ongoing costs of investing in the Fund and other funds. To do so, compare this 5% hypothetical example with the 5% hypothetical examples that appear in the shareholder reports of the other funds. If any fund is a shareholder of any Underlying Funds, such fund indirectly bears its proportional share of the expenses of the Underlying Funds in addition to the direct expenses as presented in the table. These fees and expenses are not included in the annualized expense ratio used to calculate the expense estimate in the table below.
Please note that the expenses shown in the table are meant to highlight your ongoing costs only and do not reflect any transaction costs. Therefore, the second line of the table is useful in comparing ongoing costs only, and will not help you determine the relative total costs of owning different funds. In addition, if these transactional costs were included, your costs would have been higher.
| | | | | Annualized Expense Ratio- A | | Beginning Account Value November 1, 2022 | | Ending Account Value April 30, 2023 | | Expenses Paid During Period- C November 1, 2022 to April 30, 2023 |
| | | | | | | | | | |
| Fidelity® SAI International Small Cap Index Fund | | | | .10% | | | | | | |
| Actual | | | | | | $ 1,000 | | $ 1,194.90 | | $ .54 |
Hypothetical- B | | | | | | $ 1,000 | | $ 1,024.30 | | $ .50 |
| |
A Annualized expense ratio reflects expenses net of applicable fee waivers.
B 5% return per year before expenses
C Expenses are equal to the annualized expense ratio, multiplied by the average account value over the period, multiplied by 181/ 365 (to reflect the one-half year period). The fees and expenses of any Underlying Funds are not included in each annualized expense ratio.
The Securities and Exchange Commission adopted Rule 22e-4 under the Investment Company Act of 1940 (the Liquidity Rule) to promote effective liquidity risk management throughout the open-end investment company industry, thereby reducing the risk that funds will be unable to meet their redemption obligations and mitigating dilution of the interests of fund shareholders.
The Fund has adopted and implemented a liquidity risk management program (the Program) reasonably designed to assess and manage the Fund's liquidity risk and to comply with the requirements of the Liquidity Rule. The Fund's Board of Trustees (the Board) has designated the Fund's investment adviser as administrator of the Program. The Fidelity advisers have established a Liquidity Risk Management Committee (the LRM Committee) to manage the Program for each of the Fidelity Funds. The LRM Committee monitors the adequacy and effectiveness of implementation of the Program and on a periodic basis assesses each Fund's liquidity risk based on a variety of factors including (1) the Fund's investment strategy, (2) portfolio liquidity and cash flow projections during normal and reasonably foreseeable stressed conditions, (3) shareholder redemptions, (4) borrowings and other funding sources and (5) certain factors specific to ETFs including the effect of the Fund's prices and spreads, market participants, and basket compositions on the overall liquidity of the Fund's portfolio, as applicable.
In accordance with the Program, each of the Fund's portfolio investments is classified into one of four defined liquidity categories based on a determination of a reasonable expectation for how long it would take to convert the investment to cash (or sell or dispose of the investment) without significantly changing its market value.
- Highly liquid investments - cash or convertible to cash within three business days or less
- Moderately liquid investments - convertible to cash in three to seven calendar days
- Less liquid investments - can be sold or disposed of, but not settled, within seven calendar days
- Illiquid investments - cannot be sold or disposed of within seven calendar days
Liquidity classification determinations take into account a variety of factors including various market, trading and investment-specific considerations, as well as market depth, and generally utilize analysis from a third-party liquidity metrics service.
The Liquidity Rule places a 15% limit on a fund's illiquid investments and requires funds that do not primarily hold assets that are highly liquid investments to determine and maintain a minimum percentage of the fund's net assets to be invested in highly liquid investments (highly liquid investment minimum or HLIM). The Program includes provisions reasonably designed to comply with the 15% limit on illiquid investments and for determining, periodically reviewing and complying with the HLIM requirement as applicable.
At a recent meeting of the Fund's Board of Trustees, the LRM Committee provided a written report to the Board pertaining to the operation, adequacy, and effectiveness of the Program for the period December 1, 2021 through November 30, 2022. The report concluded that the Program is operating effectively and is reasonably designed to assess and manage the Fund's liquidity risk.
1.9903807.101
SCI-SANN-0623
Fidelity ZERO® Funds
Fidelity ZERO® Extended Market Index Fund
Fidelity ZERO® International Index Fund
Fidelity ZERO® Large Cap Index Fund
Fidelity ZERO® Total Market Index Fund
Semi-Annual Report
April 30, 2023
Contents
To view a fund's proxy voting guidelines and proxy voting record for the 12-month period ended June 30, visit http://www.fidelity.com/proxyvotingresults or visit the Securities and Exchange Commission's (SEC) web site at http://www.sec.gov.
You may also call 1-800-544-8544 to request a free copy of the proxy voting guidelines.
The funds or securities referred to herein are not sponsored, endorsed, or promoted by Fidelity Product Services LLC (FPS), and FPS bears no liability with respect to any such funds or securities or any index on which such funds or securities are based. The prospectus contains a more detailed description of the relationship between FPS and any related funds.
Standard & Poor's, S&P and S&P 500 are registered service marks of The McGraw-Hill Companies, Inc. and have been licensed for use by Fidelity Distributors Corporation.
Other third-party marks appearing herein are the property of their respective owners.
All other marks appearing herein are registered or unregistered trademarks or service marks of FMR LLC or an affiliated company. © 2023 FMR LLC. All rights reserved.
This report and the financial statements contained herein are submitted for the general information of the shareholders of the Funds. This report is not authorized for distribution to prospective investors in the Funds unless preceded or accompanied by an effective prospectus.
A fund files its complete schedule of portfolio holdings with the SEC for the first and third quarters of each fiscal year on Form N-PORT. Forms N-PORT are available on the SEC's web site at http://www.sec.gov. A fund's Forms N-PORT may be reviewed and copied at the SEC's Public Reference Room in Washington, DC. Information regarding the operation of the SEC's Public Reference Room may be obtained by calling 1-800-SEC-0330.
For a complete list of a fund's portfolio holdings, view the most recent holdings listing, semiannual report, or annual report on Fidelity's web site at http://www.fidelity.com, http://www.institutional.fidelity.com, or http://www.401k.com, as applicable.
NOT FDIC INSURED •MAY LOSE VALUE •NO BANK GUARANTEE
Neither the Funds nor Fidelity Distributors Corporation is a bank.
Top Holdings (% of Fund's net assets) |
| |
| Hubbell, Inc. Class B | 0.3 | |
| Builders FirstSource, Inc. | 0.3 | |
| Snap-On, Inc. | 0.3 | |
| Ares Management Corp. | 0.3 | |
| Graco, Inc. | 0.3 | |
| EQT Corp. | 0.3 | |
| Booz Allen Hamilton Holding Corp. Class A | 0.3 | |
| Deckers Outdoor Corp. | 0.3 | |
| Camden Property Trust (SBI) | 0.3 | |
| Equity Lifestyle Properties, Inc. | 0.2 | |
| | 2.9 | |
| |
| Market Sectors (% of Fund's net assets) |
| |
| Industrials | 19.0 | |
| Financials | 15.5 | |
| Consumer Discretionary | 13.7 | |
| Health Care | 13.3 | |
| Information Technology | 11.3 | |
| Real Estate | 7.3 | |
| Materials | 5.1 | |
| Energy | 4.7 | |
| Consumer Staples | 3.8 | |
| Communication Services | 3.1 | |
| Utilities | 3.0 | |
| |
Asset Allocation (% of Fund's net assets) |
|
Futures - 0.2% |
|
Fidelity ZERO® Extended Market Index Fund
Showing Percentage of Net Assets
| Common Stocks - 99.8% |
| | | Shares | Value ($) |
| COMMUNICATION SERVICES - 3.1% | | | |
| Diversified Telecommunication Services - 0.7% | | | |
| Anterix, Inc. (a) | | 5,018 | 158,468 |
| AST SpaceMobile, Inc. (a)(b) | | 15,847 | 84,148 |
| ATN International, Inc. | | 2,886 | 104,387 |
| Bandwidth, Inc. (a) | | 5,326 | 64,817 |
| Cogent Communications Group, Inc. | | 11,024 | 761,097 |
| Consolidated Communications Holdings, Inc. (a) | | 18,960 | 73,375 |
| EchoStar Holding Corp. Class A (a)(b) | | 9,139 | 156,003 |
| Frontier Communications Parent, Inc. (a)(b) | | 57,833 | 1,303,556 |
| Globalstar, Inc. (a)(b) | | 185,075 | 167,678 |
| IDT Corp. Class B (a) | | 5,137 | 170,600 |
| Iridium Communications, Inc. | | 32,535 | 2,064,996 |
| Liberty Global PLC: | | | |
| Class A (a) | | 44,386 | 865,971 |
| Class C (a) | | 66,425 | 1,351,085 |
| Liberty Latin America Ltd.: | | | |
| Class A (a) | | 1,799 | 15,957 |
| Class C (a) | | 45,255 | 401,864 |
| Lumen Technologies, Inc. (b) | | 239,958 | 568,700 |
| Radius Global Infrastructure, Inc. (a) | | 20,058 | 294,652 |
| | | | 8,607,354 |
| Entertainment - 0.9% | | | |
| AMC Entertainment Holdings, Inc. Class A (a)(b) | | 133,918 | 736,549 |
| Cinemark Holdings, Inc. (a)(b) | | 27,740 | 468,251 |
| Endeavor Group Holdings, Inc. (a) | | 45,032 | 1,160,925 |
| Genius Brands International, Inc. (a)(b) | | 7,544 | 19,464 |
| Lions Gate Entertainment Corp.: | | | |
| Class A (a) | | 18,797 | 216,166 |
| Class B (a) | | 28,880 | 308,150 |
| Live Nation Entertainment, Inc. (a) | | 36,945 | 2,504,132 |
| Madison Square Garden Entertainment Corp. (b) | | 6,816 | 219,952 |
| Madison Square Garden Sports Corp. | | 4,577 | 917,689 |
| Marcus Corp. (b) | | 6,390 | 111,953 |
| Playtika Holding Corp. (a) | | 23,064 | 230,640 |
| Roku, Inc. Class A (a) | | 31,587 | 1,775,505 |
| Sciplay Corp. (A Shares) (a) | | 6,101 | 104,205 |
| Skillz, Inc. (a)(b) | | 78,342 | 48,784 |
| Sphere Entertainment Co. (a)(b) | | 6,640 | 186,850 |
| Vivid Seats, Inc. Class A (a)(b) | | 5,638 | 40,481 |
| Warner Music Group Corp. Class A | | 30,457 | 928,025 |
| World Wrestling Entertainment, Inc. Class A (b) | | 11,220 | 1,202,447 |
| | | | 11,180,168 |
| Interactive Media & Services - 0.5% | | | |
| Angi, Inc. (a) | | 19,753 | 45,432 |
| Bumble, Inc. (a) | | 24,283 | 442,193 |
| CarGurus, Inc. Class A (a) | | 24,547 | 403,553 |
| Cars.com, Inc. (a) | | 16,107 | 315,214 |
| Eventbrite, Inc. (a)(b) | | 21,280 | 154,706 |
| EverQuote, Inc. Class A (a) | | 4,584 | 31,950 |
| fuboTV, Inc. (a)(b) | | 48,191 | 54,938 |
| IAC, Inc. (a) | | 20,264 | 1,049,067 |
| MediaAlpha, Inc. Class A (a) | | 5,950 | 44,030 |
| Nextdoor Holdings, Inc. (a)(b) | | 31,455 | 66,370 |
| QuinStreet, Inc. (a) | | 13,436 | 149,274 |
| Rumble, Inc. (a)(b) | | 20,808 | 165,632 |
| Shutterstock, Inc. (b) | | 6,171 | 413,457 |
| TripAdvisor, Inc. (a)(b) | | 27,228 | 482,752 |
| Vimeo, Inc. (a) | | 39,763 | 130,820 |
| Yelp, Inc. (a) | | 18,085 | 541,103 |
| Ziff Davis, Inc. (a) | | 12,233 | 894,722 |
| ZipRecruiter, Inc. (a) | | 13,444 | 227,741 |
| Zoominfo Technologies, Inc. (a) | | 70,120 | 1,536,329 |
| | | | 7,149,283 |
| Media - 0.9% | | | |
| Altice U.S.A., Inc. Class A (a) | | 57,452 | 201,082 |
| AMC Networks, Inc. Class A (a) | | 7,175 | 126,926 |
| Boston Omaha Corp. (a) | | 5,184 | 106,065 |
| Cable One, Inc. (b) | | 1,250 | 948,013 |
| Cardlytics, Inc. (a)(b) | | 8,367 | 54,302 |
| Clear Channel Outdoor Holdings, Inc. (a) | | 121,468 | 154,264 |
| DISH Network Corp. Class A (a) | | 65,420 | 491,304 |
| E.W. Scripps Co. Class A (a) | | 15,460 | 130,328 |
| Entravision Communication Corp. Class A | | 15,850 | 99,063 |
| Gannett Co., Inc. (a)(b) | | 36,271 | 68,915 |
| Gray Television, Inc. | | 22,106 | 170,437 |
| iHeartMedia, Inc. (a) | | 26,486 | 91,906 |
| Integral Ad Science Holding Corp. (a) | | 9,577 | 150,646 |
| John Wiley & Sons, Inc. Class A | | 11,155 | 430,248 |
| Magnite, Inc. (a) | | 30,788 | 289,407 |
| News Corp.: | | | |
| Class A | | 98,135 | 1,728,157 |
| Class B | | 31,504 | 559,196 |
| Nexstar Broadcasting Group, Inc. Class A | | 9,767 | 1,694,086 |
| PubMatic, Inc. (a) | | 11,372 | 155,342 |
| Quotient Technology, Inc. (a) | | 23,486 | 66,231 |
| Scholastic Corp. | | 7,565 | 291,026 |
| Sinclair Broadcast Group, Inc. Class A (b) | | 11,233 | 223,424 |
| Sirius XM Holdings, Inc. | | 181,441 | 689,476 |
| Stagwell, Inc. (a) | | 25,890 | 161,036 |
| TechTarget, Inc. (a) | | 7,003 | 238,732 |
| TEGNA, Inc. | | 57,805 | 988,466 |
| The New York Times Co. Class A | | 42,657 | 1,695,616 |
| Thryv Holdings, Inc. (a) | | 7,954 | 178,647 |
| WideOpenWest, Inc. (a) | | 13,631 | 155,802 |
| | | | 12,338,143 |
| Wireless Telecommunication Services - 0.1% | | | |
| Gogo, Inc. (a) | | 16,674 | 223,598 |
| NII Holdings, Inc. (a)(c) | | 10,174 | 0 |
| Shenandoah Telecommunications Co. | | 13,029 | 271,133 |
| Spok Holdings, Inc. | | 5,072 | 62,031 |
| Telephone & Data Systems, Inc. | | 26,050 | 260,500 |
| U.S. Cellular Corp. (a) | | 3,574 | 75,912 |
| | | | 893,174 |
TOTAL COMMUNICATION SERVICES | | | 40,168,122 |
| CONSUMER DISCRETIONARY - 13.7% | | | |
| Automobile Components - 1.4% | | | |
| Adient PLC (a) | | 24,718 | 913,083 |
| American Axle & Manufacturing Holdings, Inc. (a) | | 29,019 | 207,486 |
| Autoliv, Inc. (b) | | 20,084 | 1,723,408 |
| BorgWarner, Inc. | | 60,589 | 2,916,149 |
| Dana, Inc. | | 33,039 | 488,647 |
| Dorman Products, Inc. (a) | | 7,325 | 631,122 |
| Fox Factory Holding Corp. (a) | | 10,955 | 1,214,581 |
| Garrett Motion, Inc. (a)(b) | | 14,160 | 116,962 |
| Gentex Corp. (b) | | 60,770 | 1,676,644 |
| Gentherm, Inc. (a) | | 8,615 | 513,885 |
| Holley, Inc. (a)(b) | | 12,327 | 29,708 |
| LCI Industries | | 6,587 | 744,068 |
| Lear Corp. | | 15,319 | 1,955,624 |
| Luminar Technologies, Inc. (a)(b) | | 60,695 | 365,384 |
| Mobileye Global, Inc. (b) | | 12,118 | 456,122 |
| Modine Manufacturing Co. (a) | | 13,484 | 281,950 |
| Motorcar Parts of America, Inc. (a) | | 4,894 | 23,834 |
| Patrick Industries, Inc. | | 5,615 | 385,357 |
| QuantumScape Corp. Class A (a)(b) | | 72,268 | 505,876 |
| Solid Power, Inc. (a)(b) | | 28,684 | 65,113 |
| Standard Motor Products, Inc. | | 4,810 | 173,208 |
| Stoneridge, Inc. (a) | | 7,255 | 136,612 |
| The Goodyear Tire & Rubber Co. (a) | | 73,372 | 782,879 |
| Visteon Corp. (a) | | 7,292 | 1,023,724 |
| XPEL, Inc. (a) | | 5,079 | 371,072 |
| | | | 17,702,498 |
| Automobiles - 0.5% | | | |
| Canoo, Inc. (a)(b) | | 80,628 | 60,874 |
| Faraday Future Intelligent Electric, Inc. (a)(b) | | 133,032 | 22,682 |
| Fisker, Inc. (a)(b) | | 40,309 | 259,590 |
| Harley-Davidson, Inc. | | 34,485 | 1,279,394 |
| Lordstown Motors Corp. Class A (a)(b) | | 40,624 | 21,246 |
| Lucid Group, Inc. Class A (a) | | 165,875 | 1,317,048 |
| Mullen Automotive, Inc. (a)(b) | | 417,896 | 32,136 |
| Rivian Automotive, Inc. (a)(b) | | 142,035 | 1,820,889 |
| Thor Industries, Inc. (b) | | 13,879 | 1,096,719 |
| Winnebago Industries, Inc. | | 7,937 | 461,457 |
| Workhorse Group, Inc. (a)(b) | | 41,139 | 38,761 |
| | | | 6,410,796 |
| Broadline Retail - 0.3% | | | |
| Big Lots, Inc. (b) | | 7,171 | 64,467 |
| ContextLogic, Inc. (a)(b) | | 4,682 | 33,757 |
| Dillard's, Inc. Class A (b) | | 891 | 265,865 |
| Groupon, Inc. (a)(b) | | 5,032 | 18,015 |
| Kohl's Corp. (b) | | 28,686 | 631,953 |
| Macy's, Inc. | | 70,303 | 1,148,751 |
| Nordstrom, Inc. (b) | | 29,085 | 449,654 |
| Ollie's Bargain Outlet Holdings, Inc. (a)(b) | | 14,988 | 977,967 |
| Qurate Retail, Inc. Series A (a)(b) | | 88,050 | 70,141 |
| | | | 3,660,570 |
| Distributors - 0.0% | | | |
| Funko, Inc. (a)(b) | | 8,576 | 84,559 |
| Diversified Consumer Services - 1.0% | | | |
| 2U, Inc. (a) | | 19,915 | 110,329 |
| ADT, Inc. (b) | | 55,499 | 371,843 |
| Adtalem Global Education, Inc. (a) | | 11,744 | 476,454 |
| American Public Education, Inc. (a) | | 4,432 | 25,262 |
| Bright Horizons Family Solutions, Inc. (a) | | 14,959 | 1,138,679 |
| Carriage Services, Inc. | | 3,523 | 101,145 |
| Chegg, Inc. (a) | | 32,771 | 589,223 |
| Coursera, Inc. (a) | | 22,127 | 275,260 |
| Duolingo, Inc. (a) | | 6,564 | 893,754 |
| European Wax Center, Inc. (b) | | 7,620 | 143,561 |
| Frontdoor, Inc. (a) | | 21,129 | 578,089 |
| Graham Holdings Co. | | 990 | 569,814 |
| Grand Canyon Education, Inc. (a) | | 7,927 | 940,935 |
| H&R Block, Inc. | | 39,565 | 1,341,649 |
| Laureate Education, Inc. Class A | | 34,840 | 431,668 |
| Mister Car Wash, Inc. (a) | | 20,611 | 181,789 |
| Nerdy, Inc. Class A (a)(b) | | 15,243 | 60,515 |
| OneSpaWorld Holdings Ltd. (a) | | 15,616 | 187,392 |
| Perdoceo Education Corp. (a) | | 17,473 | 226,800 |
| Rover Group, Inc. Class A (a) | | 25,798 | 116,865 |
| Service Corp. International | | 39,806 | 2,793,983 |
| Strategic Education, Inc. (b) | | 5,798 | 510,224 |
| Stride, Inc. (a) | | 10,609 | 455,763 |
| Udemy, Inc. (a) | | 16,920 | 153,803 |
| WW International, Inc. (a) | | 14,037 | 117,209 |
| | | | 12,792,008 |
| Hotels, Restaurants & Leisure - 3.2% | | | |
| Accel Entertainment, Inc. (a) | | 14,642 | 129,582 |
| ARAMARK Holdings Corp. | | 67,469 | 2,341,174 |
| Bally's Corp. (a) | | 6,867 | 118,112 |
| BJ's Restaurants, Inc. (a) | | 5,983 | 194,687 |
| Bloomin' Brands, Inc. | | 22,772 | 564,062 |
| Bluegreen Vacations Holding Corp. Class A | | 2,113 | 60,833 |
| Bowlero Corp. Class A (a) | | 8,807 | 128,846 |
| Boyd Gaming Corp. | | 20,515 | 1,423,741 |
| Brinker International, Inc. (a) | | 11,422 | 455,966 |
| Choice Hotels International, Inc. (b) | | 7,169 | 914,191 |
| Churchill Downs, Inc. | | 8,514 | 2,490,600 |
| Chuy's Holdings, Inc. (a) | | 4,610 | 160,797 |
| Cracker Barrel Old Country Store, Inc. | | 5,757 | 611,163 |
| Dave & Buster's Entertainment, Inc. (a)(b) | | 10,930 | 387,578 |
| Denny's Corp. (a) | | 14,837 | 166,323 |
| Dine Brands Global, Inc. | | 4,105 | 266,538 |
| Draftkings Holdings, Inc. | | 116,273 | 2,547,541 |
| Dutch Bros, Inc. (a)(b) | | 7,634 | 237,799 |
| El Pollo Loco Holdings, Inc. | | 5,156 | 48,054 |
| Everi Holdings, Inc. (a) | | 23,264 | 353,613 |
| First Watch Restaurant Group, Inc. (a) | | 2,753 | 44,268 |
| Golden Entertainment, Inc. (a) | | 5,799 | 244,486 |
| Hilton Grand Vacations, Inc. (a) | | 20,565 | 880,182 |
| Hyatt Hotels Corp. Class A (a) | | 12,486 | 1,427,150 |
| Inspired Entertainment, Inc. (a) | | 6,210 | 79,488 |
| Jack in the Box, Inc. | | 5,280 | 489,403 |
| Krispy Kreme, Inc. (b) | | 17,356 | 266,935 |
| Kura Sushi U.S.A., Inc. Class A (a)(b) | | 1,026 | 70,712 |
| Life Time Group Holdings, Inc. (a)(b) | | 14,841 | 308,544 |
| Light & Wonder, Inc. Class A (a) | | 24,239 | 1,461,369 |
| Lindblad Expeditions Holdings (a) | | 8,334 | 94,258 |
| Marriott Vacations Worldwide Corp. (b) | | 9,924 | 1,335,373 |
| Monarch Casino & Resort, Inc. | | 3,437 | 238,390 |
| Norwegian Cruise Line Holdings Ltd. (a)(b) | | 109,221 | 1,458,100 |
| Papa John's International, Inc. | | 8,345 | 624,123 |
| Penn Entertainment, Inc. (a) | | 40,220 | 1,198,154 |
| Planet Fitness, Inc. (a) | | 21,602 | 1,795,990 |
| Playa Hotels & Resorts NV (a) | | 34,226 | 318,644 |
| PlayAGS, Inc. (a) | | 8,134 | 42,948 |
| Portillo's, Inc. (a)(b) | | 11,231 | 242,814 |
| RCI Hospitality Holdings, Inc. | | 2,267 | 169,798 |
| Red Robin Gourmet Burgers, Inc. (a)(b) | | 4,411 | 57,652 |
| Red Rock Resorts, Inc. | | 12,664 | 618,003 |
| Rush Street Interactive, Inc. (a) | | 14,012 | 43,577 |
| Ruth's Hospitality Group, Inc. | | 7,630 | 123,301 |
| Sabre Corp. (a)(b) | | 85,616 | 342,464 |
| SeaWorld Entertainment, Inc. (a) | | 10,296 | 552,483 |
| Shake Shack, Inc. Class A (a) | | 9,679 | 530,506 |
| Six Flags Entertainment Corp. (a)(b) | | 19,339 | 469,358 |
| Soho House & Co., Inc. Class A (a)(b) | | 10,251 | 66,939 |
| Sonder Holdings, Inc. (a) | | 38,270 | 15,695 |
| Sweetgreen, Inc. Class A (a)(b) | | 19,534 | 155,100 |
| Target Hospitality Corp. (a) | | 6,348 | 80,048 |
| Texas Roadhouse, Inc. Class A | | 17,321 | 1,916,049 |
| The Cheesecake Factory, Inc. (b) | | 12,412 | 418,160 |
| Travel+Leisure Co. | | 21,144 | 809,181 |
| Vail Resorts, Inc. | | 10,437 | 2,510,307 |
| Wendy's Co. | | 44,012 | 972,665 |
| Wingstop, Inc. | | 7,744 | 1,549,652 |
| Wyndham Hotels & Resorts, Inc. | | 22,903 | 1,562,443 |
| Wynn Resorts Ltd. (a) | | 26,700 | 3,051,276 |
| Xponential Fitness, Inc. (a) | | 5,845 | 193,353 |
| | | | 42,430,541 |
| Household Durables - 1.8% | | | |
| Beazer Homes U.S.A., Inc. (a) | | 7,827 | 166,793 |
| Cavco Industries, Inc. (a) | | 2,113 | 634,365 |
| Century Communities, Inc. | | 7,351 | 495,016 |
| Dream Finders Homes, Inc. (a)(b) | | 5,260 | 80,215 |
| Ethan Allen Interiors, Inc. | | 5,982 | 167,077 |
| GoPro, Inc. Class A (a) | | 33,188 | 142,045 |
| Green Brick Partners, Inc. (a) | | 7,011 | 261,300 |
| Helen of Troy Ltd. (a) | | 6,240 | 626,122 |
| Hovnanian Enterprises, Inc. Class A (a) | | 1,183 | 87,270 |
| Installed Building Products, Inc. | | 6,084 | 756,059 |
| iRobot Corp. (a)(b) | | 7,117 | 279,912 |
| KB Home | | 21,150 | 926,793 |
| La-Z-Boy, Inc. | | 11,198 | 321,719 |
| Leggett & Platt, Inc. | | 34,304 | 1,108,362 |
| LGI Homes, Inc. (a)(b) | | 5,313 | 631,184 |
| Lovesac (a)(b) | | 4,049 | 106,448 |
| M.D.C. Holdings, Inc. | | 15,041 | 616,230 |
| M/I Homes, Inc. (a) | | 7,101 | 480,312 |
| Meritage Homes Corp. | | 9,466 | 1,212,121 |
| Mohawk Industries, Inc. (a) | | 13,677 | 1,448,394 |
| Newell Brands, Inc. | | 97,548 | 1,185,208 |
| Purple Innovation, Inc. | | 16,686 | 49,557 |
| Skyline Champion Corp. (a) | | 13,746 | 1,019,541 |
| Sonos, Inc. (a)(b) | | 33,037 | 698,402 |
| Taylor Morrison Home Corp. (a) | | 28,033 | 1,207,942 |
| Tempur Sealy International, Inc. | | 44,136 | 1,653,776 |
| Toll Brothers, Inc. | | 26,592 | 1,699,495 |
| TopBuild Corp. (a) | | 8,281 | 1,867,200 |
| Traeger, Inc. (a)(b) | | 13,890 | 42,226 |
| TRI Pointe Homes, Inc. (a) | | 26,100 | 748,548 |
| Tupperware Brands Corp. (a) | | 9,369 | 11,711 |
| Universal Electronics, Inc. (a) | | 3,035 | 30,502 |
| Vizio Holding Corp. (a)(b) | | 14,416 | 123,545 |
| Vuzix Corp. (a)(b) | | 15,573 | 62,603 |
| Whirlpool Corp. | | 14,114 | 1,970,173 |
| ZAGG, Inc. rights (a)(c) | | 4,373 | 0 |
| | | | 22,918,166 |
| Leisure Products - 0.8% | | | |
| Acushnet Holdings Corp. (b) | | 8,408 | 421,493 |
| AMMO, Inc. (a)(b) | | 22,092 | 43,521 |
| Brunswick Corp. | | 18,788 | 1,593,035 |
| Clarus Corp. | | 7,643 | 74,366 |
| Hasbro, Inc. | | 33,659 | 1,993,286 |
| JAKKS Pacific, Inc. (a) | | 1,620 | 36,288 |
| Johnson Outdoors, Inc. Class A | | 1,486 | 86,188 |
| Latham Group, Inc. (a) | | 10,284 | 24,784 |
| Malibu Boats, Inc. Class A (a) | | 5,344 | 303,272 |
| MasterCraft Boat Holdings, Inc. (a) | | 4,649 | 136,076 |
| Mattel, Inc. (a) | | 91,885 | 1,653,930 |
| Peloton Interactive, Inc. Class A (a) | | 84,822 | 753,219 |
| Polaris, Inc. | | 14,127 | 1,534,899 |
| Smith & Wesson Brands, Inc. | | 11,744 | 141,163 |
| Solo Brands, Inc. Class A (a) | | 5,338 | 42,651 |
| Sturm, Ruger & Co., Inc. | | 4,564 | 262,704 |
| Topgolf Callaway Brands Corp. (a)(b) | | 35,931 | 796,590 |
| Vista Outdoor, Inc. (a) | | 14,793 | 356,511 |
| YETI Holdings, Inc. (a) | | 22,371 | 882,536 |
| | | | 11,136,512 |
| Specialty Retail - 3.0% | | | |
| 1-800-FLOWERS.com, Inc. Class A (a) | | 7,009 | 64,553 |
| Abercrombie & Fitch Co. Class A (a) | | 12,760 | 300,370 |
| Academy Sports & Outdoors, Inc. (b) | | 20,180 | 1,281,834 |
| Advance Auto Parts, Inc. | | 15,356 | 1,927,639 |
| America's Car Mart, Inc. (a)(b) | | 1,459 | 117,289 |
| American Eagle Outfitters, Inc. | | 45,202 | 605,255 |
| Arhaus, Inc. (a)(b) | | 5,568 | 44,655 |
| Arko Corp. | | 18,828 | 157,402 |
| Asbury Automotive Group, Inc. (a) | | 5,738 | 1,110,073 |
| AutoNation, Inc. (a) | | 8,865 | 1,167,521 |
| BARK, Inc. (a)(b) | | 25,383 | 27,921 |
| Bath & Body Works, Inc. | | 59,187 | 2,077,464 |
| Big 5 Sporting Goods Corp. | | 5,489 | 43,253 |
| Boot Barn Holdings, Inc. (a) | | 7,785 | 564,179 |
| Build-A-Bear Workshop, Inc. | | 3,485 | 80,852 |
| Caleres, Inc. | | 9,096 | 207,389 |
| Camping World Holdings, Inc. | | 10,470 | 234,423 |
| CarParts.com, Inc. (a) | | 12,667 | 60,042 |
| Carvana Co. Class A (a)(b) | | 26,113 | 181,224 |
| Chewy, Inc. (a)(b) | | 24,163 | 749,295 |
| Chico's FAS, Inc. (a) | | 31,601 | 159,269 |
| Citi Trends, Inc. (a) | | 2,045 | 35,297 |
| Designer Brands, Inc. Class A | | 12,600 | 103,194 |
| Destination XL Group, Inc. (a) | | 15,458 | 67,861 |
| Dick's Sporting Goods, Inc. | | 15,503 | 2,248,090 |
| EVgo, Inc. Class A (a)(b) | | 17,425 | 104,376 |
| Five Below, Inc. (a)(b) | | 14,380 | 2,838,037 |
| Floor & Decor Holdings, Inc. Class A (a)(b) | | 27,495 | 2,731,353 |
| Foot Locker, Inc. (b) | | 20,563 | 863,440 |
| Franchise Group, Inc. | | 6,970 | 203,873 |
| GameStop Corp. Class A (b) | | 65,523 | 1,263,939 |
| Gap, Inc. | | 54,952 | 527,539 |
| Genesco, Inc. (a) | | 3,101 | 107,481 |
| Group 1 Automotive, Inc. | | 3,777 | 847,861 |
| GrowGeneration Corp. (a)(b) | | 14,933 | 51,071 |
| Guess?, Inc. (b) | | 8,008 | 150,951 |
| Haverty Furniture Companies, Inc. | | 3,365 | 101,421 |
| Hibbett, Inc. | | 3,240 | 176,029 |
| Lands' End, Inc. (a)(b) | | 3,720 | 26,672 |
| Lazydays Holdings, Inc. (a)(b) | | 2,200 | 26,070 |
| Leslie's, Inc. (a)(b) | | 38,217 | 414,654 |
| Lithia Motors, Inc. Class A (sub. vtg.) | | 7,088 | 1,565,668 |
| LL Flooring Holdings, Inc. (a) | | 7,543 | 24,816 |
| MarineMax, Inc. (a) | | 5,871 | 170,964 |
| Monro, Inc. (b) | | 8,132 | 397,492 |
| Murphy U.S.A., Inc. | | 5,166 | 1,421,838 |
| National Vision Holdings, Inc. (a) | | 20,645 | 434,371 |
| OneWater Marine, Inc. Class A (a)(b) | | 2,957 | 78,065 |
| Overstock.com, Inc. (a) | | 11,937 | 243,037 |
| Penske Automotive Group, Inc. (b) | | 6,459 | 895,088 |
| Petco Health & Wellness Co., Inc. (a)(b) | | 20,265 | 201,839 |
| PetMed Express, Inc. (b) | | 5,339 | 82,060 |
| Rent the Runway, Inc. Class A (a)(b) | | 10,597 | 27,658 |
| Revolve Group, Inc. (a)(b) | | 10,782 | 222,648 |
| RH (a) | | 4,833 | 1,233,043 |
| Sally Beauty Holdings, Inc. (a) | | 27,885 | 396,804 |
| Shoe Carnival, Inc. (b) | | 4,303 | 100,045 |
| Signet Jewelers Ltd. | | 11,834 | 870,746 |
| Sleep Number Corp. (a)(b) | | 5,842 | 131,737 |
| Sonic Automotive, Inc. Class A (sub. vtg.) (b) | | 4,322 | 192,415 |
| Sportsman's Warehouse Holdings, Inc. (a) | | 9,678 | 60,197 |
| Stitch Fix, Inc. (a)(b) | | 19,203 | 65,482 |
| The Aaron's Co., Inc. | | 8,360 | 111,606 |
| The Buckle, Inc. | | 7,565 | 253,654 |
| The Cato Corp. Class A (sub. vtg.) | | 4,118 | 33,974 |
| The Children's Place, Inc. (a)(b) | | 3,253 | 96,419 |
| The Container Store Group, Inc. (a) | | 8,196 | 25,326 |
| The ODP Corp. (a) | | 10,465 | 452,193 |
| The RealReal, Inc. (a)(b) | | 24,065 | 26,953 |
| thredUP, Inc. (a) | | 19,232 | 50,772 |
| Tilly's, Inc. (a)(b) | | 5,945 | 44,647 |
| TravelCenters of America LLC (a) | | 3,254 | 280,267 |
| Upbound Group, Inc. | | 13,066 | 348,340 |
| Urban Outfitters, Inc. (a)(b) | | 15,550 | 420,783 |
| Victoria's Secret & Co. (a) | | 21,060 | 653,071 |
| Vroom, Inc. (a)(b) | | 33,162 | 26,825 |
| Warby Parker, Inc. (a) | | 16,236 | 170,965 |
| Wayfair LLC Class A (a)(b) | | 20,051 | 698,376 |
| Williams-Sonoma, Inc. (b) | | 17,262 | 2,089,392 |
| Winmark Corp. | | 699 | 233,410 |
| Zumiez, Inc. (a)(b) | | 3,888 | 67,982 |
| | | | 38,952,079 |
| Textiles, Apparel & Luxury Goods - 1.7% | | | |
| Allbirds, Inc. Class A (a)(b) | | 24,306 | 30,383 |
| Capri Holdings Ltd. (a) | | 32,524 | 1,349,746 |
| Carter's, Inc. (b) | | 9,914 | 691,700 |
| Columbia Sportswear Co. | | 9,178 | 766,730 |
| Crocs, Inc. (a) | | 15,994 | 1,977,978 |
| Deckers Outdoor Corp. (a) | | 6,827 | 3,272,454 |
| Fossil Group, Inc. (a) | | 11,335 | 38,086 |
| G-III Apparel Group Ltd. (a) | | 11,117 | 174,537 |
| Hanesbrands, Inc. (b) | | 90,831 | 475,954 |
| Kontoor Brands, Inc. (b) | | 12,803 | 578,312 |
| Levi Strauss & Co. Class A | | 24,858 | 359,447 |
| Movado Group, Inc. | | 4,138 | 106,016 |
| Oxford Industries, Inc. | | 3,853 | 397,591 |
| PVH Corp. | | 16,366 | 1,404,366 |
| Ralph Lauren Corp. | | 10,655 | 1,223,087 |
| Samsonite International SA (a)(d) | | 373,200 | 1,182,613 |
| Skechers U.S.A., Inc. Class A (sub. vtg.) (a) | | 34,766 | 1,849,204 |
| Steven Madden Ltd. | | 19,052 | 667,582 |
| Tapestry, Inc. | | 61,062 | 2,491,940 |
| Under Armour, Inc.: | | | |
| Class A (sub. vtg.) (a) | | 47,065 | 417,467 |
| Class C (non-vtg.) (a) | | 51,302 | 412,468 |
| Unifi, Inc. (a) | | 3,471 | 30,475 |
| VF Corp. | | 85,656 | 2,013,773 |
| Wolverine World Wide, Inc. | | 20,218 | 338,449 |
| | | | 22,250,358 |
TOTAL CONSUMER DISCRETIONARY | | | 178,338,087 |
| CONSUMER STAPLES - 3.8% | | | |
| Beverages - 0.5% | | | |
| Boston Beer Co., Inc. Class A (a) | | 2,446 | 776,629 |
| Celsius Holdings, Inc. (a)(b) | | 10,468 | 1,000,427 |
| Coca-Cola Bottling Co. Consolidated | | 1,194 | 703,815 |
| Duckhorn Portfolio, Inc. (a) | | 11,214 | 169,331 |
| MGP Ingredients, Inc. | | 3,973 | 392,056 |
| Molson Coors Beverage Co. Class B | | 48,666 | 2,894,654 |
| National Beverage Corp. (a)(b) | | 5,999 | 298,150 |
| The Vita Coco Co., Inc. (a) | | 6,145 | 133,039 |
| | | | 6,368,101 |
| Consumer Staples Distribution & Retail - 1.1% | | | |
| Albertsons Companies, Inc. | | 41,518 | 867,726 |
| Andersons, Inc. | | 8,054 | 360,014 |
| BJ's Wholesale Club Holdings, Inc. (a)(b) | | 34,818 | 2,659,051 |
| Blue Apron Holdings, Inc.: | | | |
| warrants 11/4/28 (a) | | 2,335 | 1 |
| warrants 11/4/28 (a) | | 2,335 | 0 |
| warrants 11/4/28 (a) | | 2,335 | 0 |
| Casey's General Stores, Inc. | | 9,644 | 2,206,740 |
| Chefs' Warehouse Holdings (a) | | 8,817 | 293,253 |
| Grocery Outlet Holding Corp. (a)(b) | | 23,030 | 685,833 |
| Ingles Markets, Inc. Class A | | 3,691 | 339,720 |
| Performance Food Group Co. (a) | | 40,394 | 2,532,300 |
| PriceSmart, Inc. | | 6,513 | 479,878 |
| Rite Aid Corp. (a)(b) | | 13,655 | 28,676 |
| SpartanNash Co. | | 9,238 | 226,516 |
| Sprouts Farmers Market LLC (a) | | 27,433 | 950,828 |
| U.S. Foods Holding Corp. (a) | | 53,006 | 2,035,430 |
| United Natural Foods, Inc. (a) | | 15,527 | 423,421 |
| Weis Markets, Inc. | | 4,311 | 355,614 |
| | | | 14,445,001 |
| Food Products - 1.4% | | | |
| Alico, Inc. | | 1,143 | 26,929 |
| B&G Foods, Inc. Class A | | 18,580 | 298,023 |
| Benson Hill, Inc. (a) | | 32,203 | 34,135 |
| Beyond Meat, Inc. (a)(b) | | 15,650 | 211,901 |
| BRC, Inc. Class A (a)(b) | | 9,835 | 51,240 |
| Cal-Maine Foods, Inc. | | 9,841 | 467,448 |
| Calavo Growers, Inc. | | 4,746 | 151,682 |
| Campbell Soup Co. | | 51,934 | 2,820,016 |
| Darling Ingredients, Inc. (a) | | 41,534 | 2,474,180 |
| Flowers Foods, Inc. (b) | | 49,695 | 1,367,109 |
| Fresh Del Monte Produce, Inc. | | 8,006 | 229,852 |
| Freshpet, Inc. (a)(b) | | 12,461 | 859,435 |
| Hostess Brands, Inc. Class A (a) | | 34,675 | 893,228 |
| Ingredion, Inc. | | 16,979 | 1,802,660 |
| J&J Snack Foods Corp. | | 3,879 | 594,263 |
| John B. Sanfilippo & Son, Inc. | | 2,329 | 242,100 |
| Lancaster Colony Corp. | | 5,138 | 1,074,459 |
| Lifecore Biomedical (a)(b) | | 6,797 | 28,887 |
| Mission Produce, Inc. (a) | | 10,560 | 120,278 |
| Pilgrim's Pride Corp. (a) | | 11,521 | 262,794 |
| Post Holdings, Inc. (a) | | 13,869 | 1,255,006 |
| Seaboard Corp. | | 67 | 264,052 |
| Seneca Foods Corp. Class A (a) | | 1,337 | 63,641 |
| Sovos Brands, Inc. (a) | | 9,912 | 169,991 |
| The Hain Celestial Group, Inc. (a) | | 23,218 | 416,299 |
| The Simply Good Foods Co. (a) | | 21,945 | 798,140 |
| Tootsie Roll Industries, Inc. | | 4,820 | 197,042 |
| TreeHouse Foods, Inc. (a) | | 12,998 | 692,144 |
| Utz Brands, Inc. Class A | | 17,394 | 328,921 |
| Vital Farms, Inc. (a) | | 7,309 | 94,140 |
| Westrock Coffee Holdings | | 3,129 | 38,268 |
| Whole Earth Brands, Inc. Class A (a) | | 9,100 | 21,840 |
| | | | 18,350,103 |
| Household Products - 0.2% | | | |
| Central Garden & Pet Co. (a) | | 2,318 | 85,395 |
| Central Garden & Pet Co. Class A (non-vtg.) (a) | | 10,880 | 384,390 |
| Energizer Holdings, Inc. | | 17,174 | 574,127 |
| Reynolds Consumer Products, Inc. | | 14,030 | 393,261 |
| Spectrum Brands Holdings, Inc. | | 10,616 | 705,964 |
| WD-40 Co. (b) | | 3,514 | 669,066 |
| | | | 2,812,203 |
| Personal Care Products - 0.5% | | | |
| BellRing Brands, Inc. (a) | | 34,529 | 1,242,699 |
| Coty, Inc. Class A (a) | | 94,789 | 1,125,145 |
| Edgewell Personal Care Co. | | 13,316 | 581,510 |
| elf Beauty, Inc. (a) | | 13,105 | 1,215,620 |
| Herbalife Ltd. (a) | | 25,648 | 381,129 |
| Inter Parfums, Inc. | | 4,619 | 701,118 |
| MediFast, Inc. (b) | | 2,797 | 256,345 |
| Nu Skin Enterprises, Inc. Class A | | 12,818 | 505,798 |
| The Beauty Health Co. (a)(b) | | 24,004 | 275,086 |
| The Honest Co., Inc. (a) | | 14,318 | 23,768 |
| USANA Health Sciences, Inc. (a) | | 2,920 | 193,800 |
| | | | 6,502,018 |
| Tobacco - 0.1% | | | |
| 22nd Century Group, Inc. (a)(b) | | 52,309 | 37,160 |
| Turning Point Brands, Inc. | | 3,826 | 91,021 |
| Universal Corp. | | 6,362 | 349,210 |
| Vector Group Ltd. | | 33,609 | 428,179 |
| | | | 905,570 |
TOTAL CONSUMER STAPLES | | | 49,382,996 |
| ENERGY - 4.7% | | | |
| Energy Equipment & Services - 1.2% | | | |
| Archrock, Inc. | | 34,924 | 359,368 |
| Bristow Group, Inc. (a) | | 6,271 | 140,282 |
| Cactus, Inc. | | 16,556 | 670,187 |
| Championx Corp. | | 51,443 | 1,393,076 |
| Core Laboratories NV | | 12,074 | 271,786 |
| Diamond Offshore Drilling, Inc. (a) | | 26,281 | 301,969 |
| DMC Global, Inc. (a) | | 4,613 | 87,370 |
| Dril-Quip, Inc. (a) | | 8,939 | 243,856 |
| Expro Group Holdings NV (a) | | 17,580 | 349,666 |
| Helix Energy Solutions Group, Inc. (a) | | 36,881 | 267,387 |
| Helmerich & Payne, Inc. | | 27,079 | 897,940 |
| Liberty Oilfield Services, Inc. Class A | | 38,658 | 495,209 |
| Nabors Industries Ltd. (a) | | 2,286 | 228,006 |
| Newpark Resources, Inc. (a) | | 22,454 | 89,816 |
| Nextier Oilfield Solutions, Inc. (a) | | 40,908 | 330,537 |
| Noble Corp. PLC | | 25,430 | 977,784 |
| NOV, Inc. | | 101,736 | 1,704,078 |
| Oceaneering International, Inc. (a) | | 25,949 | 460,076 |
| Oil States International, Inc. (a) | | 15,993 | 112,591 |
| Patterson-UTI Energy, Inc. | | 56,225 | 629,158 |
| ProFrac Holding Corp. | | 8,482 | 94,998 |
| ProPetro Holding Corp. (a) | | 25,171 | 174,687 |
| RPC, Inc. | | 20,975 | 155,005 |
| Select Energy Services, Inc. Class A | | 21,832 | 162,212 |
| Solaris Oilfield Infrastructure, Inc. Class A | | 9,067 | 69,635 |
| TechnipFMC PLC (a) | | 115,509 | 1,581,318 |
| TETRA Technologies, Inc. (a) | | 30,624 | 87,278 |
| Tidewater, Inc. (a) | | 13,057 | 587,957 |
| Transocean Ltd. (United States) (a)(b) | | 172,049 | 1,015,089 |
| U.S. Silica Holdings, Inc. (a) | | 19,592 | 255,676 |
| Valaris Ltd. (a) | | 15,584 | 935,040 |
| Weatherford International PLC (a) | | 16,675 | 1,077,705 |
| | | | 16,206,742 |
| Oil, Gas & Consumable Fuels - 3.5% | | | |
| Alto Ingredients, Inc. (a) | | 16,182 | 21,198 |
| Amplify Energy Corp. (a)(b) | | 9,847 | 68,043 |
| Antero Midstream GP LP | | 86,141 | 926,877 |
| Antero Resources Corp. (a) | | 71,580 | 1,645,624 |
| APA Corp. | | 83,288 | 3,069,163 |
| Arch Resources, Inc. | | 4,689 | 573,230 |
| Ardmore Shipping Corp. | | 9,440 | 138,674 |
| Berry Corp. | | 16,883 | 128,986 |
| California Resources Corp. | | 19,024 | 770,472 |
| Callon Petroleum Co. (a) | | 13,332 | 441,822 |
| Centrus Energy Corp. Class A (a) | | 3,016 | 88,369 |
| Chesapeake Energy Corp. | | 27,754 | 2,294,701 |
| Chord Energy Corp. | | 10,774 | 1,533,463 |
| Civitas Resources, Inc. (b) | | 13,449 | 928,653 |
| Clean Energy Fuels Corp. (a) | | 44,871 | 191,599 |
| CNX Resources Corp. (a) | | 43,910 | 681,922 |
| Comstock Resources, Inc. (b) | | 23,824 | 273,976 |
| CONSOL Energy, Inc. | | 8,460 | 502,016 |
| Crescent Energy, Inc. Class A (b) | | 10,028 | 116,525 |
| CVR Energy, Inc. | | 7,699 | 202,792 |
| Delek U.S. Holdings, Inc. | | 18,091 | 393,479 |
| Denbury, Inc. (a) | | 12,878 | 1,202,548 |
| Dorian LPG Ltd. | | 8,237 | 183,026 |
| DT Midstream, Inc. | | 24,999 | 1,231,701 |
| Earthstone Energy, Inc. (a)(b) | | 9,753 | 132,251 |
| Enviva, Inc. | | 8,035 | 172,753 |
| EQT Corp. | | 95,097 | 3,313,179 |
| Equitrans Midstream Corp. | | 112,373 | 578,721 |
| Evolution Petroleum Corp. | | 7,865 | 51,830 |
| Excelerate Energy, Inc. | | 4,494 | 96,621 |
| Gevo, Inc. (a)(b) | | 63,829 | 74,042 |
| Green Plains, Inc. (a)(b) | | 15,360 | 524,851 |
| Gulfport Energy Corp. (a)(b) | | 2,992 | 270,656 |
| Hallador Energy Co. (a) | | 6,306 | 50,700 |
| HF Sinclair Corp. | | 34,860 | 1,537,675 |
| International Seaways, Inc. | | 10,417 | 414,805 |
| Kinetik Holdings, Inc. | | 5,647 | 173,928 |
| Kosmos Energy Ltd. (a) | | 118,139 | 756,090 |
| Magnolia Oil & Gas Corp. Class A | | 43,264 | 913,736 |
| Matador Resources Co. | | 29,095 | 1,426,528 |
| Murphy Oil Corp. | | 37,853 | 1,389,584 |
| National Energy Services Reunited Corp. (a) | | 12,918 | 39,400 |
| New Fortress Energy, Inc. | | 12,445 | 376,959 |
| Nextdecade Corp. (a)(b) | | 14,129 | 88,024 |
| Northern Oil & Gas, Inc. | | 19,181 | 636,234 |
| Overseas Shipholding Group, Inc. (a) | | 16,895 | 64,877 |
| Par Pacific Holdings, Inc. (a) | | 14,580 | 341,609 |
| PBF Energy, Inc. Class A | | 29,638 | 1,033,181 |
| PDC Energy, Inc. | | 23,880 | 1,553,394 |
| Peabody Energy Corp. (b) | | 30,197 | 725,332 |
| Permian Resource Corp. Class A | | 60,550 | 632,748 |
| Range Resources Corp. (b) | | 62,611 | 1,656,061 |
| Ranger Oil Corp. | | 5,008 | 206,330 |
| Rex American Resources Corp. (a) | | 3,828 | 108,294 |
| Riley Exploration Permian, Inc. | | 1,030 | 43,270 |
| Ring Energy, Inc. (a)(b) | | 23,821 | 43,116 |
| SandRidge Energy, Inc. (a) | | 8,493 | 120,346 |
| Scorpio Tankers, Inc. | | 14,163 | 740,017 |
| SilverBow Resources, Inc. (a) | | 3,643 | 86,886 |
| Sitio Royalties Corp. | | 19,256 | 488,910 |
| SM Energy Co. | | 31,837 | 893,983 |
| Southwestern Energy Co. (a) | | 286,145 | 1,485,093 |
| Talos Energy, Inc. (a) | | 16,657 | 227,035 |
| Teekay Corp. (a) | | 17,590 | 99,384 |
| Teekay Tankers Ltd. (a) | | 6,080 | 246,179 |
| Tellurian, Inc. (a)(b) | | 136,536 | 193,881 |
| Texas Pacific Land Corp. (b) | | 1,597 | 2,359,807 |
| Uranium Energy Corp. (a)(b) | | 96,337 | 251,440 |
| VAALCO Energy, Inc. | | 28,291 | 121,085 |
| Vertex Energy, Inc. (a)(b) | | 15,881 | 125,460 |
| Vital Energy, Inc. (a)(b) | | 4,325 | 201,242 |
| Vitesse Energy, Inc. (b) | | 5,469 | 100,630 |
| W&T Offshore, Inc. (a) | | 23,720 | 103,656 |
| World Fuel Services Corp. | | 16,018 | 378,666 |
| | | | 45,259,338 |
TOTAL ENERGY | | | 61,466,080 |
| FINANCIALS - 15.5% | | | |
| Banks - 5.6% | | | |
| 1st Source Corp. | | 4,302 | 179,307 |
| Amalgamated Financial Corp. | | 4,650 | 75,702 |
| Amerant Bancorp, Inc. Class A | | 6,466 | 120,268 |
| Ameris Bancorp | | 16,767 | 561,695 |
| Associated Banc-Corp. | | 38,986 | 695,120 |
| Atlantic Union Bankshares Corp. | | 19,475 | 557,375 |
| Axos Financial, Inc. (a) | | 13,851 | 563,320 |
| Banc of California, Inc. | | 14,449 | 163,996 |
| BancFirst Corp. | | 4,555 | 363,899 |
| Bancorp, Inc., Delaware (a) | | 14,526 | 463,525 |
| Bank First National Corp. | | 1,828 | 125,017 |
| Bank of Hawaii Corp. (b) | | 10,340 | 500,766 |
| Bank of Marin Bancorp | | 3,579 | 63,098 |
| Bank OZK | | 28,560 | 1,020,163 |
| BankUnited, Inc. | | 19,653 | 443,175 |
| Banner Corp. | | 8,811 | 439,845 |
| Berkshire Hills Bancorp, Inc. | | 11,575 | 246,200 |
| BOK Financial Corp. | | 7,451 | 624,915 |
| Bridgewater Bancshares, Inc. (a) | | 5,426 | 53,989 |
| Brookline Bancorp, Inc., Delaware | | 22,824 | 217,741 |
| Business First Bancshares, Inc. | | 6,164 | 95,049 |
| Byline Bancorp, Inc. | | 5,900 | 114,165 |
| Cadence Bank | | 47,303 | 956,467 |
| Cambridge Bancorp | | 2,045 | 105,624 |
| Camden National Corp. | | 3,816 | 121,921 |
| Capitol Federal Financial, Inc. | | 32,096 | 198,995 |
| Cathay General Bancorp | | 18,876 | 601,578 |
| Central Pacific Financial Corp. | | 7,075 | 112,351 |
| City Holding Co. | | 3,826 | 348,893 |
| CNB Financial Corp., Pennsylvania | | 5,259 | 98,659 |
| Coastal Financial Corp. of Washington (a) | | 2,704 | 98,020 |
| Columbia Banking Systems, Inc. | | 53,918 | 1,151,688 |
| Columbia Financial, Inc. (a)(b) | | 8,413 | 141,170 |
| Comerica, Inc. | | 33,946 | 1,472,238 |
| Commerce Bancshares, Inc. | | 29,470 | 1,645,900 |
| Community Bank System, Inc. | | 13,949 | 696,892 |
| Community Trust Bancorp, Inc. | | 3,839 | 138,242 |
| ConnectOne Bancorp, Inc. | | 9,145 | 144,308 |
| CrossFirst Bankshares, Inc. (a) | | 10,653 | 106,850 |
| Cullen/Frost Bankers, Inc. | | 16,673 | 1,838,198 |
| Customers Bancorp, Inc. (a) | | 8,066 | 176,161 |
| CVB Financial Corp. | | 34,198 | 511,944 |
| Dime Community Bancshares, Inc. | | 8,508 | 175,265 |
| Eagle Bancorp, Inc. | | 7,990 | 200,549 |
| East West Bancorp, Inc. | | 36,535 | 1,888,494 |
| Eastern Bankshares, Inc. | | 41,603 | 484,675 |
| Enterprise Financial Services Corp. | | 9,654 | 412,805 |
| Equity Bancshares, Inc. | | 3,773 | 88,854 |
| Esquire Financial Holdings, Inc. | | 1,793 | 69,317 |
| Farmers National Banc Corp. | | 8,433 | 98,582 |
| FB Financial Corp. | | 8,930 | 262,810 |
| First Bancorp, North Carolina | | 10,569 | 325,314 |
| First Bancorp, Puerto Rico | | 47,571 | 558,959 |
| First Bancshares, Inc. | | 7,292 | 183,029 |
| First Busey Corp. | | 13,483 | 245,121 |
| First Citizens Bancshares, Inc. | | 3,077 | 3,099,093 |
| First Commonwealth Financial Corp. | | 26,774 | 334,140 |
| First Financial Bancorp, Ohio | | 24,581 | 508,827 |
| First Financial Bankshares, Inc. | | 33,663 | 984,979 |
| First Financial Corp., Indiana | | 2,916 | 100,748 |
| First Foundation, Inc. | | 12,569 | 79,059 |
| First Hawaiian, Inc. | | 33,051 | 631,605 |
| First Horizon National Corp. | | 138,971 | 2,438,941 |
| First Interstate Bancsystem, Inc. | | 23,019 | 589,056 |
| First Merchants Corp. | | 15,441 | 450,568 |
| First of Long Island Corp. | | 5,690 | 66,573 |
| First Republic Bank (b) | | 48,180 | 169,112 |
| Flushing Financial Corp. | | 7,023 | 84,487 |
| FNB Corp., Pennsylvania | | 93,315 | 1,071,256 |
| Fulton Financial Corp. | | 43,546 | 519,504 |
| German American Bancorp, Inc. | | 7,060 | 205,234 |
| Glacier Bancorp, Inc. | | 28,725 | 954,532 |
| Great Southern Bancorp, Inc. | | 2,440 | 124,147 |
| Hancock Whitney Corp. | | 22,215 | 811,292 |
| Hanmi Financial Corp. | | 8,024 | 129,668 |
| HarborOne Bancorp, Inc. | | 10,867 | 116,820 |
| Heartland Financial U.S.A., Inc. | | 9,817 | 319,642 |
| Heritage Commerce Corp. | | 15,587 | 132,490 |
| Heritage Financial Corp., Washington | | 9,216 | 162,294 |
| Hilltop Holdings, Inc. | | 11,776 | 365,292 |
| Hingham Institution for Savings | | 364 | 70,820 |
| Home Bancshares, Inc. | | 48,981 | 1,066,316 |
| HomeStreet, Inc. | | 4,381 | 42,759 |
| HomeTrust Bancshares, Inc. | | 3,765 | 78,576 |
| Hope Bancorp, Inc. | | 30,837 | 280,617 |
| Horizon Bancorp, Inc. Indiana | | 10,419 | 109,712 |
| Independent Bank Corp. | | 5,187 | 92,432 |
| Independent Bank Corp. | | 11,844 | 663,264 |
| Independent Bank Group, Inc. | | 9,140 | 332,513 |
| International Bancshares Corp. | | 13,648 | 582,360 |
| Kearny Financial Corp. | | 18,123 | 141,178 |
| Lakeland Bancorp, Inc. | | 17,009 | 243,909 |
| Lakeland Financial Corp. | | 6,586 | 333,713 |
| Live Oak Bancshares, Inc. | | 8,543 | 201,273 |
| Mercantile Bank Corp. | | 3,900 | 109,434 |
| Metropolitan Bank Holding Corp. (a) | | 2,719 | 87,253 |
| Midland States Bancorp, Inc. | | 5,966 | 119,320 |
| National Bank Holdings Corp. | | 9,627 | 306,139 |
| NBT Bancorp, Inc. | | 11,202 | 361,152 |
| New York Community Bancorp, Inc. | | 176,511 | 1,886,903 |
| Nicolet Bankshares, Inc. (a) | | 3,507 | 200,986 |
| Northfield Bancorp, Inc. | | 10,372 | 108,076 |
| Northwest Bancshares, Inc. | | 33,036 | 386,191 |
| OceanFirst Financial Corp. | | 15,507 | 248,112 |
| OFG Bancorp | | 12,160 | 310,931 |
| Old National Bancorp, Indiana | | 75,935 | 1,018,288 |
| Old Second Bancorp, Inc. | | 10,449 | 128,418 |
| Origin Bancorp, Inc. | | 7,441 | 218,989 |
| Pacific Premier Bancorp, Inc. | | 24,714 | 549,639 |
| PacWest Bancorp | | 30,657 | 311,169 |
| Park National Corp. | | 3,754 | 406,633 |
| Pathward Financial, Inc. | | 7,075 | 315,050 |
| Peapack-Gladstone Financial Corp. | | 3,969 | 105,417 |
| Peoples Bancorp, Inc. | | 7,345 | 191,411 |
| Pinnacle Financial Partners, Inc. | | 19,845 | 1,076,194 |
| Popular, Inc. | | 18,640 | 1,118,586 |
| Preferred Bank, Los Angeles | | 3,476 | 167,126 |
| Premier Financial Corp. | | 9,490 | 157,629 |
| Prosperity Bancshares, Inc. | | 23,645 | 1,480,650 |
| Provident Bancorp, Inc. (b) | | 3,925 | 26,808 |
| Provident Financial Services, Inc. | | 19,607 | 342,730 |
| QCR Holdings, Inc. | | 4,325 | 179,055 |
| Renasant Corp. | | 14,552 | 409,202 |
| S&T Bancorp, Inc. | | 10,115 | 278,466 |
| Sandy Spring Bancorp, Inc. | | 11,419 | 256,699 |
| Seacoast Banking Corp., Florida | | 21,730 | 482,189 |
| ServisFirst Bancshares, Inc. | | 12,692 | 640,946 |
| Simmons First National Corp. Class A | | 33,018 | 551,731 |
| Southern Missouri Bancorp, Inc. | | 2,481 | 90,011 |
| Southside Bancshares, Inc. | | 7,744 | 245,717 |
| Southstate Corp. | | 19,630 | 1,354,077 |
| Stellar Bancorp, Inc. | | 11,705 | 268,513 |
| Stock Yards Bancorp, Inc. | | 7,493 | 364,160 |
| Synovus Financial Corp. | | 37,721 | 1,161,807 |
| Texas Capital Bancshares, Inc. (a) | | 12,428 | 624,507 |
| Tompkins Financial Corp. | | 3,270 | 191,687 |
| TowneBank | | 17,599 | 416,920 |
| Trico Bancshares | | 8,658 | 310,043 |
| Triumph Bancorp, Inc. (a) | | 5,782 | 300,433 |
| Trustco Bank Corp., New York | | 4,920 | 146,813 |
| Trustmark Corp. | | 15,801 | 377,486 |
| UMB Financial Corp. | | 11,280 | 717,521 |
| United Bankshares, Inc., West Virginia | | 34,769 | 1,151,897 |
| United Community Bank, Inc. | | 29,788 | 741,721 |
| Univest Corp. of Pennsylvania | | 7,672 | 154,361 |
| Valley National Bancorp | | 109,116 | 1,023,508 |
| Veritex Holdings, Inc. | | 13,899 | 239,202 |
| Washington Federal, Inc. | | 16,979 | 476,091 |
| Washington Trust Bancorp, Inc. | | 4,378 | 123,066 |
| Webster Financial Corp. | | 45,104 | 1,682,379 |
| WesBanco, Inc. | | 15,330 | 408,085 |
| Westamerica Bancorp. | | 7,104 | 287,783 |
| Western Alliance Bancorp. | | 28,219 | 1,047,489 |
| Wintrust Financial Corp. | | 15,757 | 1,077,306 |
| WSFS Financial Corp. | | 15,970 | 561,665 |
| Zions Bancorp NA | | 38,784 | 1,080,522 |
| | | | 73,199,296 |
| Capital Markets - 3.0% | | | |
| Affiliated Managers Group, Inc. | | 9,754 | 1,408,283 |
| Ares Management Corp. | | 40,401 | 3,538,724 |
| Artisan Partners Asset Management, Inc. | | 17,531 | 607,800 |
| Assetmark Financial Holdings, Inc. (a) | | 5,606 | 171,992 |
| Avantax, Inc. (a) | | 10,257 | 260,220 |
| B. Riley Financial, Inc. | | 4,270 | 134,505 |
| Bakkt Holdings, Inc. Class A (a)(b) | | 18,370 | 24,800 |
| BGC Partners, Inc. Class A | | 84,073 | 380,851 |
| Blue Owl Capital, Inc. Class A (b) | | 92,281 | 1,039,084 |
| Bridge Investment Group Holdings, Inc. | | 7,923 | 79,151 |
| BrightSphere Investment Group, Inc. | | 8,301 | 187,437 |
| Carlyle Group LP | | 56,636 | 1,717,770 |
| Cohen & Steers, Inc. | | 6,532 | 392,312 |
| Coinbase Global, Inc. (a)(b) | | 41,245 | 2,218,569 |
| Diamond Hill Investment Group, Inc. | | 797 | 129,210 |
| Donnelley Financial Solutions, Inc. (a) | | 6,564 | 283,893 |
| Evercore, Inc. Class A | | 9,254 | 1,055,604 |
| Federated Hermes, Inc. | | 21,837 | 903,833 |
| Focus Financial Partners, Inc. Class A (a) | | 14,996 | 778,892 |
| Franklin Resources, Inc. | | 73,820 | 1,984,282 |
| Galaxy Digital Holdings Ltd. (a)(b) | | 26,698 | 98,528 |
| GCM Grosvenor, Inc. Class A | | 11,384 | 91,869 |
| Hamilton Lane, Inc. Class A | | 9,218 | 679,182 |
| Houlihan Lokey | | 13,072 | 1,194,519 |
| Interactive Brokers Group, Inc. | | 26,646 | 2,074,391 |
| Invesco Ltd. | | 117,806 | 2,018,017 |
| Janus Henderson Group PLC | | 34,340 | 891,123 |
| Jefferies Financial Group, Inc. | | 46,841 | 1,500,317 |
| Lazard Ltd. Class A | | 29,200 | 913,960 |
| Moelis & Co. Class A | | 16,573 | 627,785 |
| Morningstar, Inc. | | 6,481 | 1,155,627 |
| Open Lending Corp. (a) | | 27,625 | 194,204 |
| Oppenheimer Holdings, Inc. Class A (non-vtg.) | | 1,829 | 68,386 |
| P10, Inc. | | 9,426 | 97,371 |
| Perella Weinberg Partners Class A | | 10,686 | 84,419 |
| Piper Jaffray Companies | | 3,583 | 485,282 |
| PJT Partners, Inc. | | 6,328 | 435,177 |
| Robinhood Markets, Inc. (a)(b) | | 132,784 | 1,175,138 |
| SEI Investments Co. | | 26,341 | 1,551,748 |
| StepStone Group, Inc. Class A | | 12,792 | 281,808 |
| Stifel Financial Corp. | | 27,295 | 1,636,881 |
| StoneX Group, Inc. (a) | | 4,540 | 445,238 |
| TPG, Inc. (b) | | 13,234 | 383,389 |
| Tradeweb Markets, Inc. Class A | | 28,776 | 2,026,118 |
| Victory Capital Holdings, Inc. | | 7,020 | 214,391 |
| Virtu Financial, Inc. Class A | | 24,015 | 481,501 |
| Virtus Investment Partners, Inc. | | 1,774 | 323,241 |
| WisdomTree Investments, Inc. | | 28,438 | 177,453 |
| | | | 38,604,275 |
| Consumer Finance - 0.8% | | | |
| Ally Financial, Inc. | | 77,579 | 2,046,534 |
| Bread Financial Holdings, Inc. | | 13,022 | 359,407 |
| Credit Acceptance Corp. (a)(b) | | 1,564 | 765,578 |
| Encore Capital Group, Inc. (a) | | 6,079 | 312,339 |
| Enova International, Inc. (a) | | 8,040 | 353,117 |
| EZCORP, Inc. (non-vtg.) Class A (a)(b) | | 13,500 | 116,235 |
| FirstCash Holdings, Inc. | | 9,691 | 998,464 |
| Green Dot Corp. Class A (a) | | 12,203 | 209,770 |
| LendingClub Corp. (a) | | 28,459 | 204,336 |
| LendingTree, Inc. (a) | | 2,694 | 64,198 |
| Navient Corp. | | 25,863 | 427,774 |
| Nelnet, Inc. Class A | | 4,581 | 441,150 |
| NerdWallet, Inc. (a) | | 8,051 | 109,252 |
| OneMain Holdings, Inc. | | 31,276 | 1,200,060 |
| Oportun Financial Corp. (a)(b) | | 6,935 | 28,225 |
| PRA Group, Inc. (a) | | 10,198 | 369,881 |
| PROG Holdings, Inc. (a) | | 13,032 | 393,957 |
| SLM Corp. | | 62,144 | 933,403 |
| SoFi Technologies, Inc. (a)(b) | | 212,979 | 1,326,859 |
| Upstart Holdings, Inc. (a)(b) | | 18,409 | 255,885 |
| World Acceptance Corp. (a)(b) | | 915 | 92,324 |
| | | | 11,008,748 |
| Financial Services - 1.8% | | | |
| A-Mark Precious Metals, Inc. | | 4,780 | 171,124 |
| Affirm Holdings, Inc. (a)(b) | | 55,187 | 544,144 |
| AvidXchange Holdings, Inc. (a) | | 34,588 | 256,989 |
| Cannae Holdings, Inc. (a) | | 18,868 | 344,152 |
| Cantaloupe, Inc. (a) | | 15,278 | 84,182 |
| Cass Information Systems, Inc. | | 3,312 | 121,153 |
| Enact Holdings, Inc. | | 7,463 | 180,157 |
| Equitable Holdings, Inc. | | 89,194 | 2,318,152 |
| Essent Group Ltd. (b) | | 27,845 | 1,182,577 |
| Euronet Worldwide, Inc. (a) | | 12,207 | 1,351,803 |
| EVERTEC, Inc. | | 16,947 | 587,891 |
| Federal Agricultural Mortgage Corp. Class C (non-vtg.) | | 2,376 | 316,697 |
| Flywire Corp. (a) | | 16,243 | 473,808 |
| i3 Verticals, Inc. Class A (a) | | 5,901 | 137,198 |
| International Money Express, Inc. (a) | | 8,626 | 222,378 |
| Jackson Financial, Inc. | | 15,318 | 551,601 |
| Marqeta, Inc. Class A (a) | | 114,182 | 462,437 |
| Merchants Bancorp | | 6,498 | 150,754 |
| MGIC Investment Corp. | | 75,961 | 1,129,540 |
| MoneyGram International, Inc. (a) | | 24,946 | 253,451 |
| Mr. Cooper Group, Inc. (a) | | 18,009 | 833,817 |
| NMI Holdings, Inc. (a) | | 21,520 | 503,568 |
| Paymentus Holdings, Inc. (a)(b) | | 4,630 | 38,105 |
| Payoneer Global, Inc. (a) | | 51,805 | 282,855 |
| PennyMac Financial Services, Inc. | | 7,742 | 483,798 |
| Radian Group, Inc. (b) | | 40,628 | 986,042 |
| Remitly Global, Inc. (a) | | 25,191 | 423,209 |
| Repay Holdings Corp. (a) | | 20,225 | 126,811 |
| Rocket Companies, Inc. (a)(b) | | 32,079 | 285,824 |
| Shift4 Payments, Inc. (a) | | 13,742 | 931,295 |
| TFS Financial Corp. (b) | | 12,239 | 147,358 |
| The Western Union Co. | | 97,186 | 1,062,243 |
| Toast, Inc. (a) | | 80,603 | 1,466,975 |
| UWM Holdings Corp. Class A (b) | | 24,610 | 147,660 |
| Voya Financial, Inc. | | 25,120 | 1,921,178 |
| Walker & Dunlop, Inc. | | 8,006 | 538,884 |
| WEX, Inc. (a) | | 11,288 | 2,001,927 |
| | | | 23,021,737 |
| Insurance - 3.3% | | | |
| AMBAC Financial Group, Inc. (a) | | 11,450 | 182,628 |
| American Equity Investment Life Holding Co. | | 17,980 | 692,949 |
| American Financial Group, Inc. | | 18,086 | 2,219,695 |
| Amerisafe, Inc. | | 5,011 | 278,862 |
| Argo Group International Holdings, Ltd. | | 9,305 | 273,660 |
| Assurant, Inc. | | 13,692 | 1,685,896 |
| Assured Guaranty Ltd. | | 15,507 | 835,362 |
| Axis Capital Holdings Ltd. | | 19,948 | 1,127,860 |
| Brighthouse Financial, Inc. (a) | | 17,799 | 786,716 |
| BRP Group, Inc. (a) | | 15,913 | 400,848 |
| CNO Financial Group, Inc. | | 29,636 | 665,032 |
| eHealth, Inc. (a) | | 6,786 | 40,716 |
| Employers Holdings, Inc. | | 6,955 | 275,348 |
| Enstar Group Ltd. (a) | | 3,505 | 843,303 |
| Erie Indemnity Co. Class A | | 6,452 | 1,402,213 |
| First American Financial Corp. | | 26,811 | 1,544,582 |
| Genworth Financial, Inc. Class A (a) | | 128,109 | 744,313 |
| Globe Life, Inc. | | 23,410 | 2,540,453 |
| Goosehead Insurance (a)(b) | | 5,443 | 312,973 |
| Hagerty, Inc. Class A (a)(b) | | 8,240 | 82,482 |
| Hanover Insurance Group, Inc. | | 9,223 | 1,102,702 |
| HCI Group, Inc. (b) | | 1,704 | 86,325 |
| Hippo Holdings, Inc. (a)(b) | | 3,829 | 69,841 |
| Horace Mann Educators Corp. | | 10,618 | 332,131 |
| James River Group Holdings Ltd. | | 9,896 | 192,675 |
| Kemper Corp. | | 16,572 | 806,228 |
| Kinsale Capital Group, Inc. | | 5,619 | 1,835,783 |
| Lemonade, Inc. (a)(b) | | 12,026 | 130,362 |
| Lincoln National Corp. | | 39,945 | 868,005 |
| Loews Corp. | | 50,454 | 2,904,637 |
| MBIA, Inc. (a) | | 12,287 | 123,607 |
| Mercury General Corp. | | 6,767 | 205,784 |
| National Western Life Group, Inc. | | 640 | 163,187 |
| Old Republic International Corp. | | 71,393 | 1,804,101 |
| Oscar Health, Inc. (a) | | 29,642 | 199,491 |
| Palomar Holdings, Inc. (a) | | 6,549 | 329,153 |
| Primerica, Inc. | | 9,549 | 1,742,788 |
| ProAssurance Corp. | | 13,916 | 249,931 |
| Reinsurance Group of America, Inc. | | 17,256 | 2,455,874 |
| RenaissanceRe Holdings Ltd. | | 11,321 | 2,438,657 |
| RLI Corp. | | 10,475 | 1,456,549 |
| Ryan Specialty Group Holdings, Inc. (a)(b) | | 21,524 | 879,471 |
| Safety Insurance Group, Inc. | | 3,841 | 280,739 |
| Selective Insurance Group, Inc. | | 15,613 | 1,504,000 |
| Selectquote, Inc. (a) | | 34,646 | 36,725 |
| Siriuspoint Ltd. (a) | | 21,681 | 188,408 |
| Stewart Information Services Corp. | | 7,057 | 293,924 |
| Trupanion, Inc. (a)(b) | | 9,148 | 321,186 |
| United Fire Group, Inc. | | 5,516 | 148,380 |
| Universal Insurance Holdings, Inc. | | 6,912 | 106,583 |
| Unum Group | | 48,430 | 2,043,746 |
| White Mountains Insurance Group Ltd. | | 656 | 939,484 |
| | | | 43,176,348 |
| Mortgage Real Estate Investment Trusts - 1.0% | | | |
| AGNC Investment Corp. | | 149,131 | 1,477,888 |
| Annaly Capital Management, Inc. | | 121,435 | 2,426,271 |
| Apollo Commercial Real Estate Finance, Inc. | | 34,038 | 344,465 |
| Arbor Realty Trust, Inc. (b) | | 44,802 | 513,879 |
| Ares Commercial Real Estate Corp. (b) | | 13,929 | 119,929 |
| Armour Residential REIT, Inc. | | 42,693 | 217,734 |
| Blackstone Mortgage Trust, Inc. (b) | | 44,991 | 820,636 |
| BrightSpire Capital, Inc. | | 33,899 | 193,224 |
| Broadmark Realty Capital, Inc. | | 35,170 | 172,685 |
| Cherry Hill Mortgage Investment Corp. (b) | | 6,171 | 34,126 |
| Chimera Investment Corp. | | 60,905 | 345,940 |
| Claros Mortgage Trust, Inc. (b) | | 31,704 | 379,180 |
| Dynex Capital, Inc. | | 14,304 | 169,645 |
| Ellington Financial LLC | | 16,597 | 211,944 |
| Franklin BSP Realty Trust, Inc. | | 21,688 | 273,919 |
| Granite Point Mortgage Trust, Inc. | | 13,175 | 58,892 |
| Hannon Armstrong Sustainable Infrastructure Capital, Inc. (b) | | 23,055 | 654,301 |
| Invesco Mortgage Capital, Inc. (b) | | 9,617 | 102,036 |
| KKR Real Estate Finance Trust, Inc. | | 15,361 | 164,977 |
| Ladder Capital Corp. Class A | | 29,620 | 276,947 |
| MFA Financial, Inc. | | 23,668 | 253,011 |
| New York Mortgage Trust, Inc. | | 24,181 | 248,581 |
| Orchid Island Capital, Inc. | | 9,477 | 101,404 |
| PennyMac Mortgage Investment Trust | | 23,203 | 288,413 |
| Ready Capital Corp. (b) | | 25,507 | 273,690 |
| Redwood Trust, Inc. | | 29,877 | 187,628 |
| Rithm Capital Corp. | | 123,275 | 1,005,924 |
| Starwood Property Trust, Inc. (b) | | 80,574 | 1,441,469 |
| TPG RE Finance Trust, Inc. | | 15,316 | 109,203 |
| Two Harbors Investment Corp. | | 25,272 | 352,039 |
| | | | 13,219,980 |
TOTAL FINANCIALS | | | 202,230,384 |
| HEALTH CARE - 13.3% | | | |
| Biotechnology - 4.7% | | | |
| 2seventy bio, Inc. (a)(b) | | 10,005 | 95,148 |
| 4D Molecular Therapeutics, Inc. (a) | | 7,352 | 132,410 |
| Aadi Bioscience, Inc. (a) | | 4,205 | 32,631 |
| ACADIA Pharmaceuticals, Inc. (a) | | 31,145 | 664,323 |
| Actinium Pharmaceuticals, Inc. (a)(b) | | 6,651 | 58,529 |
| Adicet Bio, Inc. (a) | | 7,545 | 44,063 |
| ADMA Biologics, Inc. (a) | | 52,682 | 176,485 |
| Aerovate Therapeutics, Inc. (a)(b) | | 2,577 | 54,040 |
| Agenus, Inc. (a) | | 72,963 | 110,174 |
| Agios Pharmaceuticals, Inc. (a)(b) | | 14,308 | 327,224 |
| Akero Therapeutics, Inc. (a) | | 7,995 | 357,696 |
| Aldeyra Therapeutics, Inc. (a) | | 12,349 | 117,686 |
| Alector, Inc. (a) | | 15,522 | 102,445 |
| Alkermes PLC (a) | | 42,562 | 1,215,145 |
| Allakos, Inc. (a) | | 19,379 | 82,361 |
| Allogene Therapeutics, Inc. (a)(b) | | 23,875 | 129,641 |
| Allovir, Inc. (a) | | 11,038 | 37,971 |
| Altimmune, Inc. (a)(b) | | 11,159 | 56,353 |
| ALX Oncology Holdings, Inc. (a)(b) | | 5,080 | 30,175 |
| Amicus Therapeutics, Inc. (a) | | 64,745 | 747,157 |
| AnaptysBio, Inc. (a)(b) | | 5,017 | 104,454 |
| Anavex Life Sciences Corp. (a)(b) | | 19,904 | 162,019 |
| Anika Therapeutics, Inc. (a) | | 3,877 | 99,484 |
| Annexon, Inc. (a)(b) | | 10,347 | 54,891 |
| Apellis Pharmaceuticals, Inc. (a) | | 24,344 | 2,031,020 |
| Arbutus Biopharma Corp. (a) | | 28,553 | 71,668 |
| Arcellx, Inc. (a) | | 7,030 | 300,040 |
| Arcturus Therapeutics Holdings, Inc. (a) | | 6,092 | 162,169 |
| Arcus Biosciences, Inc. (a) | | 13,517 | 241,278 |
| Arcutis Biotherapeutics, Inc. (a) | | 10,113 | 139,964 |
| Ardelyx, Inc. (a)(b) | | 51,438 | 229,413 |
| Arrowhead Pharmaceuticals, Inc. (a) | | 28,064 | 993,746 |
| Ars Pharmaceuticals, Inc. (a)(b) | | 8,484 | 55,146 |
| Atara Biotherapeutics, Inc. (a) | | 26,508 | 71,837 |
| Avid Bioservices, Inc. (a) | | 16,105 | 290,695 |
| Avidity Biosciences, Inc. (a) | | 17,276 | 214,222 |
| Beam Therapeutics, Inc. (a)(b) | | 15,382 | 472,381 |
| BioAtla, Inc. (a)(b) | | 9,537 | 32,140 |
| BioCryst Pharmaceuticals, Inc. (a) | | 48,421 | 368,484 |
| Biohaven Ltd. | | 16,889 | 220,908 |
| Biomea Fusion, Inc. (a) | | 5,707 | 168,185 |
| BioXcel Therapeutics, Inc. (a)(b) | | 4,800 | 98,976 |
| bluebird bio, Inc. (a) | | 26,953 | 117,246 |
| Blueprint Medicines Corp. (a) | | 15,519 | 792,245 |
| BridgeBio Pharma, Inc. (a)(b) | | 30,353 | 440,726 |
| C4 Therapeutics, Inc. (a) | | 10,484 | 31,662 |
| CareDx, Inc. (a) | | 13,381 | 108,252 |
| Caribou Biosciences, Inc. (a) | | 13,109 | 56,369 |
| Carisma Therapeutics, Inc. rights (a)(c) | | 47,241 | 0 |
| Catalyst Pharmaceutical Partners, Inc. (a) | | 24,844 | 395,516 |
| Celldex Therapeutics, Inc. (a) | | 12,301 | 386,743 |
| Cerevel Therapeutics Holdings (a) | | 16,610 | 482,354 |
| Chimerix, Inc. (a) | | 21,254 | 24,655 |
| Chinook Therapeutics, Inc. (a) | | 11,448 | 229,074 |
| Cogent Biosciences, Inc. (a) | | 18,163 | 195,434 |
| Coherus BioSciences, Inc. (a) | | 17,011 | 122,990 |
| Crinetics Pharmaceuticals, Inc. (a) | | 11,374 | 222,248 |
| CRISPR Therapeutics AG (a)(b) | | 20,299 | 993,433 |
| CTI BioPharma Corp. (a)(b) | | 27,934 | 135,759 |
| Cullinan Oncology, Inc. (a) | | 6,121 | 59,557 |
| Cytokinetics, Inc. (a)(b) | | 24,528 | 917,347 |
| CytomX Therapeutics, Inc. (a) | | 17,554 | 28,613 |
| Day One Biopharmaceuticals, Inc. (a) | | 7,365 | 91,326 |
| Deciphera Pharmaceuticals, Inc. (a) | | 14,402 | 204,652 |
| Denali Therapeutics, Inc. (a) | | 28,528 | 708,636 |
| DermTech, Inc. (a)(b) | | 6,481 | 19,670 |
| Design Therapeutics, Inc. (a)(b) | | 7,113 | 45,879 |
| Dynavax Technologies Corp. (a)(b) | | 30,838 | 321,024 |
| Dyne Therapeutics, Inc. (a) | | 6,261 | 64,864 |
| Eagle Pharmaceuticals, Inc. (a) | | 2,672 | 75,030 |
| Editas Medicine, Inc. (a)(b) | | 18,422 | 150,324 |
| Emergent BioSolutions, Inc. (a) | | 11,208 | 98,967 |
| Enanta Pharmaceuticals, Inc. (a) | | 5,107 | 181,554 |
| EQRx, Inc. (a) | | 59,911 | 100,650 |
| Erasca, Inc. (a)(b) | | 19,415 | 53,585 |
| Exelixis, Inc. (a) | | 84,044 | 1,538,005 |
| Fate Therapeutics, Inc. (a)(b) | | 21,935 | 133,145 |
| FibroGen, Inc. (a) | | 22,852 | 391,226 |
| G1 Therapeutics, Inc. (a) | | 11,916 | 34,199 |
| Generation Bio Co. (a) | | 12,395 | 60,983 |
| Geron Corp. (a) | | 100,202 | 246,497 |
| Gossamer Bio, Inc. (a)(b) | | 18,546 | 23,924 |
| Gritstone Bio, Inc. (a) | | 18,617 | 44,308 |
| Halozyme Therapeutics, Inc. (a) | | 35,055 | 1,126,317 |
| Heron Therapeutics, Inc. (a)(b) | | 28,915 | 69,107 |
| HilleVax, Inc. | | 3,238 | 45,332 |
| Icosavax, Inc. (a)(b) | | 4,801 | 26,454 |
| Ideaya Biosciences, Inc. (a) | | 10,802 | 197,245 |
| IGM Biosciences, Inc. (a)(b) | | 2,067 | 22,386 |
| ImmunityBio, Inc. (a)(b) | | 25,150 | 70,420 |
| ImmunoGen, Inc. (a) | | 52,330 | 282,059 |
| Immunovant, Inc. (a) | | 14,576 | 235,257 |
| Inhibrx, Inc. (a)(b) | | 7,863 | 165,123 |
| Inovio Pharmaceuticals, Inc. (a)(b) | | 60,462 | 46,707 |
| Inozyme Pharma, Inc. (a) | | 6,196 | 34,140 |
| Insmed, Inc. (a) | | 34,801 | 678,620 |
| Intellia Therapeutics, Inc. (a) | | 21,507 | 811,889 |
| Intercept Pharmaceuticals, Inc. (a) | | 9,439 | 163,483 |
| Ionis Pharmaceuticals, Inc. (a) | | 36,805 | 1,301,793 |
| Iovance Biotherapeutics, Inc. (a) | | 36,090 | 203,548 |
| Ironwood Pharmaceuticals, Inc. Class A (a)(b) | | 34,910 | 363,413 |
| iTeos Therapeutics, Inc. (a) | | 6,668 | 91,618 |
| Iveric Bio, Inc. (a) | | 33,491 | 1,101,519 |
| Janux Therapeutics, Inc. (a)(b) | | 4,227 | 64,758 |
| Kalvista Pharmaceuticals, Inc. (a) | | 5,564 | 47,461 |
| Karuna Therapeutics, Inc. (a) | | 7,732 | 1,534,338 |
| Karyopharm Therapeutics, Inc. (a)(b) | | 27,065 | 96,893 |
| Keros Therapeutics, Inc. (a) | | 4,523 | 200,618 |
| Kezar Life Sciences, Inc. (a) | | 12,528 | 30,443 |
| Kiniksa Pharmaceuticals Ltd. (a) | | 7,375 | 79,281 |
| Kodiak Sciences, Inc. (a) | | 8,149 | 35,693 |
| Krystal Biotech, Inc. (a) | | 5,608 | 471,072 |
| Kura Oncology, Inc. (a) | | 16,398 | 159,717 |
| Kymera Therapeutics, Inc. (a)(b) | | 9,988 | 315,022 |
| Lyell Immunopharma, Inc. (a)(b) | | 37,710 | 76,551 |
| Macrogenics, Inc. (a) | | 13,218 | 91,072 |
| Madrigal Pharmaceuticals, Inc. (a)(b) | | 3,154 | 984,048 |
| MannKind Corp. (a) | | 67,369 | 259,371 |
| Mersana Therapeutics, Inc. (a) | | 24,117 | 105,632 |
| MiMedx Group, Inc. (a) | | 30,600 | 117,198 |
| MiNK Therapeutics, Inc. (a) | | 1,065 | 1,906 |
| Mirati Therapeutics, Inc. (a) | | 13,455 | 596,191 |
| Mirum Pharmaceuticals, Inc. (a)(b) | | 6,488 | 174,203 |
| Morphic Holding, Inc. (a) | | 7,797 | 368,486 |
| Myriad Genetics, Inc. (a) | | 21,018 | 447,473 |
| Natera, Inc. (a)(b) | | 28,175 | 1,429,036 |
| NeoImmuneTech, Inc. (depository receipt) unit (a) | | 17,230 | 41,176 |
| Neurocrine Biosciences, Inc. (a) | | 25,020 | 2,528,021 |
| Nkarta, Inc. (a)(b) | | 7,895 | 39,080 |
| Novavax, Inc. (a)(b) | | 22,313 | 171,141 |
| Nurix Therapeutics, Inc. (a) | | 11,427 | 110,042 |
| Nuvalent, Inc. Class A (a)(b) | | 6,663 | 235,804 |
| Ocugen, Inc. (a)(b) | | 52,348 | 37,356 |
| Omniab, Inc. (c) | | 1,470 | 3,528 |
| Omniab, Inc. (c) | | 1,470 | 3,308 |
| Organogenesis Holdings, Inc. Class A (a) | | 17,522 | 35,920 |
| ORIC Pharmaceuticals, Inc. (a)(b) | | 8,666 | 44,803 |
| PDL BioPharma, Inc. (a)(c) | | 15,583 | 19,635 |
| PDS Biotechnology Corp. (a) | | 7,028 | 42,730 |
| PMV Pharmaceuticals, Inc. (a)(b) | | 7,797 | 35,944 |
| Point Biopharma Global, Inc. (a)(b) | | 20,056 | 155,233 |
| Poseida Therapeutics, Inc. (a) | | 13,728 | 36,242 |
| Precigen, Inc. (a)(b) | | 37,499 | 45,374 |
| ProKidney Corp. (a)(b) | | 2,721 | 25,686 |
| Prometheus Biosciences, Inc. (a) | | 8,894 | 1,724,991 |
| Protagonist Therapeutics, Inc. (a) | | 11,948 | 270,025 |
| Prothena Corp. PLC (a) | | 10,212 | 537,355 |
| PTC Therapeutics, Inc. (a) | | 18,617 | 1,026,541 |
| Puma Biotechnology, Inc. (a) | | 10,003 | 26,808 |
| RAPT Therapeutics, Inc. (a) | | 6,453 | 117,445 |
| Recursion Pharmaceuticals, Inc. (a)(b) | | 33,365 | 159,151 |
| REGENXBIO, Inc. (a) | | 9,964 | 192,903 |
| Relay Therapeutics, Inc. (a)(b) | | 22,866 | 259,986 |
| Repligen Corp. (a) | | 13,385 | 2,029,568 |
| Replimune Group, Inc. (a) | | 9,609 | 160,759 |
| Revolution Medicines, Inc. (a) | | 23,093 | 542,455 |
| Rhythm Pharmaceuticals, Inc. (a) | | 11,299 | 227,901 |
| Rigel Pharmaceuticals, Inc. (a) | | 44,228 | 49,978 |
| Rocket Pharmaceuticals, Inc. (a) | | 15,331 | 274,732 |
| Sage Therapeutics, Inc. (a) | | 13,404 | 654,785 |
| Sana Biotechnology, Inc. (a)(b) | | 22,981 | 121,569 |
| Sangamo Therapeutics, Inc. (a)(b) | | 33,962 | 49,924 |
| Sarepta Therapeutics, Inc. (a) | | 22,743 | 2,792,158 |
| Scholar Rock Holding Corp. (a)(b) | | 8,475 | 54,240 |
| Selecta Biosciences, Inc. (a)(b) | | 26,112 | 31,073 |
| Seres Therapeutics, Inc. (a) | | 23,824 | 116,142 |
| SpringWorks Therapeutics, Inc. (a) | | 11,463 | 268,005 |
| Stoke Therapeutics, Inc. (a) | | 5,413 | 48,122 |
| Sutro Biopharma, Inc. (a) | | 13,233 | 56,373 |
| Syndax Pharmaceuticals, Inc. (a) | | 16,828 | 345,815 |
| Tango Therapeutics, Inc. (a) | | 11,550 | 39,270 |
| TG Therapeutics, Inc. (a) | | 35,770 | 888,169 |
| Travere Therapeutics, Inc. (a) | | 16,549 | 356,962 |
| Twist Bioscience Corp. (a) | | 14,825 | 185,016 |
| Ultragenyx Pharmaceutical, Inc. (a) | | 18,184 | 794,095 |
| uniQure B.V. (a)(b) | | 10,763 | 208,910 |
| United Therapeutics Corp. (a) | | 11,810 | 2,717,835 |
| Vanda Pharmaceuticals, Inc. (a) | | 15,130 | 92,898 |
| Vaxart, Inc. (a)(b) | | 33,405 | 27,175 |
| Vaxcyte, Inc. (a) | | 16,370 | 701,127 |
| Vera Therapeutics, Inc. (a) | | 7,352 | 48,891 |
| Veracyte, Inc. (a)(b) | | 18,631 | 421,806 |
| Vericel Corp. (a) | | 12,319 | 388,172 |
| Verve Therapeutics, Inc. (a)(b) | | 10,819 | 172,347 |
| Viking Therapeutics, Inc. (a) | | 22,289 | 474,979 |
| Vir Biotechnology, Inc. (a) | | 19,684 | 495,053 |
| Viridian Therapeutics, Inc. (a) | | 10,431 | 292,381 |
| Voyager Therapeutics, Inc. (a) | | 6,690 | 48,503 |
| X4 Pharmaceuticals, Inc. (a) | | 28,317 | 41,626 |
| Xencor, Inc. (a) | | 15,576 | 411,829 |
| Y-mAbs Therapeutics, Inc. (a) | | 8,063 | 48,297 |
| Zentalis Pharmaceuticals, Inc. (a) | | 11,460 | 252,464 |
| | | | 61,063,973 |
| Health Care Equipment & Supplies - 3.2% | | | |
| Alphatec Holdings, Inc. (a)(b) | | 18,244 | 263,443 |
| Angiodynamics, Inc. (a) | | 9,856 | 82,002 |
| Artivion, Inc. (a) | | 10,660 | 147,854 |
| Atricure, Inc. (a) | | 12,145 | 534,259 |
| Atrion Corp. | | 357 | 219,662 |
| Avanos Medical, Inc. (a) | | 12,091 | 357,168 |
| AxoGen, Inc. (a) | | 11,370 | 102,557 |
| Axonics Modulation Technologies, Inc. (a)(b) | | 12,847 | 738,189 |
| Beyond Air, Inc. (a)(b) | | 6,077 | 35,429 |
| Butterfly Network, Inc. Class A (a)(b) | | 38,752 | 83,704 |
| Cerus Corp. (a) | | 44,551 | 102,913 |
| CONMED Corp. | | 7,891 | 990,873 |
| Cutera, Inc. (a)(b) | | 4,486 | 102,281 |
| CVRx, Inc. (a) | | 2,854 | 33,221 |
| Dentsply Sirona, Inc. | | 55,670 | 2,334,243 |
| Embecta Corp. | | 14,829 | 411,505 |
| Enovis Corp. (a) | | 12,342 | 718,922 |
| Envista Holdings Corp. (a) | | 42,324 | 1,629,051 |
| Figs, Inc. Class A (a) | | 33,164 | 238,781 |
| Glaukos Corp. (a) | | 12,432 | 590,644 |
| Globus Medical, Inc. (a)(b) | | 20,184 | 1,173,498 |
| Haemonetics Corp. (a) | | 13,050 | 1,092,416 |
| Heska Corp. (a) | | 2,593 | 303,796 |
| ICU Medical, Inc. (a)(b) | | 5,220 | 987,311 |
| Inari Medical, Inc. (a)(b) | | 12,528 | 832,110 |
| Inogen, Inc. (a) | | 6,294 | 83,773 |
| Inspire Medical Systems, Inc. (a) | | 7,527 | 2,014,451 |
| Integer Holdings Corp. (a) | | 8,581 | 706,645 |
| Integra LifeSciences Holdings Corp. (a) | | 18,808 | 1,040,459 |
| iRhythm Technologies, Inc. (a) | | 7,800 | 1,024,920 |
| Lantheus Holdings, Inc. (a) | | 17,830 | 1,523,574 |
| LeMaitre Vascular, Inc. | | 5,016 | 270,864 |
| LivaNova PLC (a) | | 13,891 | 665,379 |
| Masimo Corp. (a) | | 12,520 | 2,368,033 |
| Merit Medical Systems, Inc. (a) | | 14,719 | 1,196,508 |
| Mesa Laboratories, Inc. | | 1,311 | 218,295 |
| Neogen Corp. (a)(b) | | 56,128 | 966,524 |
| Nevro Corp. (a) | | 9,105 | 266,503 |
| Novocure Ltd. (a)(b) | | 23,384 | 1,541,006 |
| NuVasive, Inc. (a) | | 13,513 | 581,600 |
| Omnicell, Inc. (a) | | 11,587 | 704,142 |
| OraSure Technologies, Inc. (a) | | 18,992 | 129,146 |
| Orthofix International NV (a) | | 8,888 | 167,361 |
| OrthoPediatrics Corp. (a) | | 4,160 | 209,830 |
| Outset Medical, Inc. (a) | | 12,413 | 223,310 |
| Paragon 28, Inc. (a) | | 6,652 | 122,530 |
| Penumbra, Inc. (a)(b) | | 9,836 | 2,794,604 |
| PROCEPT BioRobotics Corp. (a) | | 8,473 | 257,494 |
| Pulmonx Corp. (a) | | 9,773 | 114,833 |
| QuidelOrtho Corp. | | 13,862 | 1,246,887 |
| RxSight, Inc. (a) | | 4,353 | 77,919 |
| Semler Scientific, Inc. (a) | | 1,322 | 37,122 |
| Senseonics Holdings, Inc. (a)(b) | | 119,447 | 71,083 |
| Shockwave Medical, Inc. (a) | | 9,363 | 2,716,768 |
| SI-BONE, Inc. (a) | | 7,988 | 176,535 |
| Sight Sciences, Inc. (a) | | 6,365 | 61,550 |
| Silk Road Medical, Inc. (a)(b) | | 9,890 | 435,358 |
| Staar Surgical Co. (a)(b) | | 12,497 | 880,664 |
| SurModics, Inc. (a) | | 3,508 | 80,824 |
| Tactile Systems Technology, Inc. (a)(b) | | 5,013 | 91,387 |
| Tandem Diabetes Care, Inc. (a) | | 16,682 | 660,274 |
| TransMedics Group, Inc. (a) | | 8,271 | 654,236 |
| Treace Medical Concepts, Inc. (a) | | 9,006 | 220,557 |
| UFP Technologies, Inc. (a) | | 1,751 | 241,358 |
| Varex Imaging Corp. (a) | | 10,418 | 184,815 |
| ViewRay, Inc. (a) | | 38,198 | 45,074 |
| Zimvie, Inc. (a)(b) | | 5,110 | 42,055 |
| Zomedica Corp. (a)(b) | | 248,854 | 49,870 |
| Zynex, Inc. (a)(b) | | 5,381 | 61,559 |
| | | | 41,333,511 |
| Health Care Providers & Services - 2.6% | | | |
| 23andMe Holding Co. Class A (a)(b) | | 75,483 | 148,702 |
| Acadia Healthcare Co., Inc. (a) | | 23,565 | 1,703,514 |
| Accolade, Inc. (a) | | 16,402 | 221,919 |
| AdaptHealth Corp. (a) | | 19,581 | 232,622 |
| Addus HomeCare Corp. (a) | | 4,173 | 341,101 |
| Agiliti, Inc. (a)(b) | | 8,526 | 142,555 |
| agilon health, Inc. (a)(b) | | 51,234 | 1,243,449 |
| Alignment Healthcare, Inc. (a) | | 21,511 | 135,304 |
| Amedisys, Inc. (a) | | 8,437 | 677,491 |
| AMN Healthcare Services, Inc. (a) | | 11,243 | 970,833 |
| Apollo Medical Holdings, Inc. (a)(b) | | 10,314 | 366,044 |
| Brookdale Senior Living, Inc. (a) | | 47,560 | 204,032 |
| Cano Health, Inc. (a) | | 47,920 | 55,587 |
| CareMax, Inc. Class A (a) | | 20,196 | 50,894 |
| Castle Biosciences, Inc. (a) | | 6,222 | 140,804 |
| Chemed Corp. | | 3,850 | 2,122,313 |
| Clover Health Investments Corp. (a)(b) | | 79,738 | 58,894 |
| Community Health Systems, Inc. (a) | | 33,452 | 212,086 |
| Corvel Corp. (a) | | 2,380 | 480,831 |
| Cross Country Healthcare, Inc. (a) | | 9,184 | 201,864 |
| DaVita HealthCare Partners, Inc. (a) | | 14,238 | 1,286,546 |
| DocGo, Inc. Class A (a)(b) | | 21,017 | 178,645 |
| Encompass Health Corp. | | 25,829 | 1,656,930 |
| Enhabit Home Health & Hospice | | 12,558 | 153,836 |
| Fulgent Genetics, Inc. (a)(b) | | 5,033 | 148,826 |
| GeneDx Holdings Corp. Class A (a) | | 151,605 | 41,479 |
| Guardant Health, Inc. (a) | | 26,574 | 599,509 |
| HealthEquity, Inc. (a) | | 21,938 | 1,172,586 |
| Henry Schein, Inc. (a) | | 35,118 | 2,837,886 |
| Hims & Hers Health, Inc. (a) | | 31,637 | 366,673 |
| Invitae Corp. (a)(b) | | 57,281 | 77,902 |
| LifeStance Health Group, Inc. (a) | | 24,356 | 198,501 |
| Modivcare, Inc. (a) | | 3,239 | 206,000 |
| National Healthcare Corp. | | 3,552 | 205,696 |
| National Research Corp. Class A | | 3,703 | 161,192 |
| NeoGenomics, Inc. (a) | | 32,761 | 478,966 |
| Oak Street Health, Inc. (a) | | 30,213 | 1,177,401 |
| Opko Health, Inc. (a) | | 107,131 | 157,483 |
| Option Care Health, Inc. (a) | | 43,389 | 1,394,956 |
| Owens & Minor, Inc. (a) | | 19,816 | 307,941 |
| Patterson Companies, Inc. | | 22,481 | 609,460 |
| Pediatrix Medical Group, Inc. (a) | | 21,295 | 305,157 |
| Pennant Group, Inc. (a) | | 7,022 | 97,395 |
| PetIQ, Inc. Class A (a) | | 6,250 | 73,688 |
| Premier, Inc. | | 30,817 | 1,027,131 |
| Privia Health Group, Inc. (a) | | 13,090 | 361,677 |
| Progyny, Inc. (a) | | 19,520 | 648,845 |
| R1 Rcm, Inc. (b) | | 35,607 | 555,113 |
| RadNet, Inc. (a) | | 12,440 | 344,090 |
| Select Medical Holdings Corp. | | 26,951 | 822,006 |
| Surgery Partners, Inc. (a) | | 17,476 | 693,098 |
| Tenet Healthcare Corp. (a) | | 28,015 | 2,054,060 |
| The Ensign Group, Inc. | | 14,418 | 1,399,844 |
| The Joint Corp. (a) | | 3,592 | 56,718 |
| U.S. Physical Therapy, Inc. | | 3,349 | 356,535 |
| Universal Health Services, Inc. Class B | | 16,618 | 2,498,516 |
| | | | 34,423,126 |
| Health Care Technology - 0.5% | | | |
| American Well Corp. (a) | | 65,347 | 143,110 |
| Certara, Inc. (a) | | 27,324 | 660,421 |
| Computer Programs & Systems, Inc. (a) | | 3,798 | 98,292 |
| Definitive Healthcare Corp. (a)(b) | | 9,530 | 101,971 |
| Doximity, Inc. (a)(b) | | 30,781 | 1,131,202 |
| Evolent Health, Inc. (a)(b) | | 23,594 | 859,058 |
| GoodRx Holdings, Inc. (a) | | 18,712 | 87,385 |
| Health Catalyst, Inc. (a) | | 14,354 | 180,860 |
| HealthStream, Inc. | | 6,248 | 153,951 |
| MultiPlan Corp. Class A (a)(b) | | 57,107 | 55,868 |
| Nextgen Healthcare, Inc. (a) | | 13,886 | 232,452 |
| OptimizeRx Corp. (a) | | 4,492 | 67,515 |
| Phreesia, Inc. (a) | | 13,685 | 432,993 |
| Schrodinger, Inc. (a) | | 13,754 | 406,018 |
| Sharecare, Inc. Class A (a) | | 84,045 | 129,429 |
| Simulations Plus, Inc. | | 4,147 | 173,137 |
| Teladoc Health, Inc. (a)(b) | | 41,993 | 1,114,074 |
| Veradigm, Inc. (a)(b) | | 28,672 | 358,113 |
| | | | 6,385,849 |
| Life Sciences Tools & Services - 0.9% | | | |
| 10X Genomics, Inc. (a)(b) | | 24,771 | 1,298,744 |
| Adaptive Biotechnologies Corp. (a) | | 28,605 | 204,240 |
| Akoya Biosciences, Inc. (a) | | 4,547 | 31,647 |
| Azenta, Inc. (a) | | 17,855 | 776,514 |
| Bio-Rad Laboratories, Inc. Class A (a) | | 5,579 | 2,514,957 |
| BioLife Solutions, Inc. (a)(b) | | 9,000 | 158,040 |
| BioNano Genomics, Inc. (a)(b) | | 72,455 | 49,842 |
| Bruker Corp. | | 25,890 | 2,048,676 |
| Codexis, Inc. (a) | | 16,514 | 64,735 |
| CryoPort, Inc. (a) | | 12,929 | 272,026 |
| Cytek Biosciences, Inc. (a) | | 20,695 | 237,579 |
| Maravai LifeSciences Holdings, Inc. (a) | | 28,167 | 388,423 |
| MaxCyte, Inc. (a) | | 23,529 | 117,645 |
| Medpace Holdings, Inc. (a) | | 6,528 | 1,306,514 |
| Nanostring Technologies, Inc. (a) | | 11,369 | 111,416 |
| OmniAb, Inc. (a) | | 26,851 | 93,441 |
| Pacific Biosciences of California, Inc. (a)(b) | | 59,279 | 628,357 |
| Quanterix Corp. (a) | | 9,347 | 118,146 |
| Quantum-Si, Inc. (a) | | 20,908 | 30,735 |
| Seer, Inc. (a) | | 8,767 | 29,282 |
| SomaLogic, Inc. Class A (a) | | 39,916 | 111,765 |
| Sotera Health Co. (a) | | 25,801 | 432,683 |
| Syneos Health, Inc. (a) | | 26,671 | 1,047,103 |
| | | | 12,072,510 |
| Pharmaceuticals - 1.4% | | | |
| Aclaris Therapeutics, Inc. (a) | | 13,354 | 118,717 |
| Amneal Pharmaceuticals, Inc. (a) | | 25,517 | 49,248 |
| Amphastar Pharmaceuticals, Inc. (a) | | 9,870 | 353,050 |
| Amylyx Pharmaceuticals, Inc. (a) | | 10,309 | 292,776 |
| ANI Pharmaceuticals, Inc. (a) | | 3,124 | 117,837 |
| Arvinas Holding Co. LLC (a) | | 12,740 | 333,915 |
| Assertio Holdings, Inc. (a)(b) | | 12,571 | 69,266 |
| Atea Pharmaceuticals, Inc. (a) | | 18,514 | 60,541 |
| Axsome Therapeutics, Inc. (a)(b) | | 8,890 | 635,902 |
| Cara Therapeutics, Inc. (a) | | 10,943 | 45,961 |
| Cassava Sciences, Inc. (a)(b) | | 10,186 | 236,519 |
| Collegium Pharmaceutical, Inc. (a)(b) | | 8,831 | 205,497 |
| Corcept Therapeutics, Inc. (a)(b) | | 23,273 | 524,341 |
| CymaBay Therapeutics, Inc. (a)(b) | | 22,781 | 245,124 |
| DICE Therapeutics, Inc. (a) | | 8,826 | 286,845 |
| Edgewise Therapeutics, Inc. (a) | | 9,937 | 87,147 |
| Elanco Animal Health, Inc. (a) | | 115,780 | 1,096,437 |
| Esperion Therapeutics, Inc. (a) | | 16,091 | 21,240 |
| Evolus, Inc. (a)(b) | | 9,359 | 81,798 |
| Fulcrum Therapeutics, Inc. (a) | | 14,475 | 36,188 |
| Harmony Biosciences Holdings, Inc. (a) | | 7,746 | 249,731 |
| Harrow Health, Inc. (a) | | 7,072 | 178,427 |
| Innoviva, Inc. (a) | | 15,939 | 186,964 |
| Intra-Cellular Therapies, Inc. (a) | | 22,814 | 1,417,890 |
| Jazz Pharmaceuticals PLC (a) | | 16,305 | 2,290,363 |
| Ligand Pharmaceuticals, Inc. Class B (a) | | 4,161 | 317,692 |
| Liquidia Corp. (a) | | 12,586 | 84,452 |
| Marinus Pharmaceuticals, Inc. (a)(b) | | 12,076 | 109,892 |
| Mind Medicine (MindMed), Inc. (a)(b) | | 8,658 | 33,074 |
| Nektar Therapeutics (a) | | 46,086 | 34,671 |
| NGM Biopharmaceuticals, Inc. (a) | | 8,878 | 40,040 |
| Nuvation Bio, Inc. (a) | | 33,736 | 54,315 |
| Ocular Therapeutix, Inc. (a) | | 20,813 | 129,041 |
| Omeros Corp. (a)(b) | | 15,854 | 91,953 |
| Organon & Co. | | 65,889 | 1,622,846 |
| Pacira Biosciences, Inc. (a) | | 11,868 | 537,739 |
| Perrigo Co. PLC | | 34,861 | 1,296,481 |
| Phathom Pharmaceuticals, Inc. (a)(b) | | 5,749 | 61,514 |
| Phibro Animal Health Corp. Class A | | 5,513 | 85,782 |
| Pliant Therapeutics, Inc. (a) | | 10,937 | 308,970 |
| Prestige Brands Holdings, Inc. (a) | | 12,864 | 791,522 |
| Reata Pharmaceuticals, Inc. (a) | | 7,233 | 715,054 |
| Revance Therapeutics, Inc. (a) | | 21,331 | 678,966 |
| Scilex Holding Co. | | 12,947 | 84,363 |
| SIGA Technologies, Inc. (b) | | 9,772 | 56,971 |
| Supernus Pharmaceuticals, Inc. (a) | | 14,019 | 516,740 |
| Tarsus Pharmaceuticals, Inc. (a) | | 4,904 | 73,168 |
| Theravance Biopharma, Inc. (a)(b) | | 15,216 | 164,789 |
| Theseus Pharmaceuticals, Inc. (a) | | 3,795 | 38,861 |
| Ventyx Biosciences, Inc. (a) | | 7,236 | 272,074 |
| WAVE Life Sciences (a) | | 16,464 | 65,691 |
| Xeris Biopharma Holdings, Inc. (a)(b) | | 35,007 | 79,116 |
| Xeris Biopharma Holdings, Inc. rights (a)(c) | | 12,393 | 0 |
| | | | 17,567,501 |
TOTAL HEALTH CARE | | | 172,846,470 |
| INDUSTRIALS - 19.0% | | | |
| Aerospace & Defense - 1.2% | | | |
| AAR Corp. (a) | | 8,392 | 442,930 |
| Aerojet Rocketdyne Holdings, Inc. (a) | | 19,551 | 1,102,872 |
| AeroVironment, Inc. (a) | | 6,516 | 656,096 |
| AerSale Corp. (a) | | 4,093 | 66,225 |
| Archer Aviation, Inc. Class A (a)(b) | | 37,334 | 73,921 |
| Astronics Corp. (a) | | 6,472 | 95,397 |
| BWX Technologies, Inc. | | 23,593 | 1,523,636 |
| Cadre Holdings, Inc. | | 4,095 | 86,241 |
| Curtiss-Wright Corp. | | 9,913 | 1,683,525 |
| Ducommun, Inc. (a) | | 2,876 | 143,800 |
| Hexcel Corp. | | 21,836 | 1,573,939 |
| Huntington Ingalls Industries, Inc. | | 10,326 | 2,082,341 |
| Kaman Corp. | | 7,393 | 163,164 |
| Kratos Defense & Security Solutions, Inc. (a) | | 32,929 | 424,784 |
| Maxar Technologies, Inc. | | 19,341 | 1,019,658 |
| Mercury Systems, Inc. (a) | | 15,074 | 718,578 |
| Moog, Inc. Class A | | 7,422 | 668,796 |
| National Presto Industries, Inc. | | 1,360 | 92,507 |
| Park Aerospace Corp. | | 5,036 | 65,871 |
| Parsons Corp. (a) | | 8,522 | 370,707 |
| Rocket Lab U.S.A., Inc. Class A (a)(b) | | 56,649 | 222,064 |
| Spirit AeroSystems Holdings, Inc. Class A (b) | | 27,278 | 811,793 |
| Terran Orbital Corp. Class A (a)(b) | | 15,695 | 27,937 |
| Triumph Group, Inc. (a) | | 16,549 | 178,895 |
| V2X, Inc. (a) | | 2,788 | 120,442 |
| Virgin Galactic Holdings, Inc. (a)(b) | | 63,129 | 229,790 |
| Woodward, Inc. | | 15,484 | 1,486,774 |
| | | | 16,132,683 |
| Air Freight & Logistics - 0.2% | | | |
| Air Transport Services Group, Inc. (a) | | 14,497 | 294,434 |
| Forward Air Corp. | | 6,891 | 727,069 |
| GXO Logistics, Inc. (a)(b) | | 30,738 | 1,633,110 |
| Hub Group, Inc. Class A (a) | | 8,478 | 639,241 |
| | | | 3,293,854 |
| Building Products - 2.5% | | | |
| A.O. Smith Corp. | | 32,863 | 2,244,214 |
| AAON, Inc. | | 10,875 | 1,065,750 |
| Advanced Drain Systems, Inc. (b) | | 16,234 | 1,391,578 |
| Allegion PLC | | 22,762 | 2,514,746 |
| American Woodmark Corp. (a) | | 4,232 | 213,801 |
| Apogee Enterprises, Inc. | | 5,754 | 244,890 |
| Armstrong World Industries, Inc. | | 11,828 | 812,110 |
| AZZ, Inc. | | 6,464 | 243,887 |
| Builders FirstSource, Inc. (a) | | 38,124 | 3,613,011 |
| Carlisle Companies, Inc. | | 13,400 | 2,892,390 |
| CSW Industrials, Inc. | | 4,004 | 539,219 |
| Fortune Brands Home & Security, Inc. | | 33,216 | 2,148,743 |
| Gibraltar Industries, Inc. (a) | | 8,032 | 401,921 |
| Griffon Corp. | | 12,256 | 348,683 |
| Hayward Holdings, Inc. (a) | | 30,206 | 363,680 |
| Insteel Industries, Inc. | | 5,243 | 144,340 |
| Janus International Group, Inc. (a) | | 21,188 | 190,692 |
| Jeld-Wen Holding, Inc. (a) | | 22,134 | 282,873 |
| Lennox International, Inc. | | 8,352 | 2,354,512 |
| Masonite International Corp. (a) | | 5,781 | 528,441 |
| MasterBrand, Inc. | | 33,736 | 272,250 |
| Owens Corning | | 24,196 | 2,584,375 |
| PGT Innovations, Inc. (a) | | 15,504 | 397,833 |
| Quanex Building Products Corp. | | 8,735 | 166,839 |
| Resideo Technologies, Inc. (a) | | 37,784 | 672,555 |
| Simpson Manufacturing Co. Ltd. | | 11,026 | 1,386,850 |
| Tecnoglass, Inc. | | 5,294 | 232,142 |
| The AZEK Co., Inc. (a) | | 28,102 | 762,688 |
| Trex Co., Inc. (a) | | 28,429 | 1,553,929 |
| UFP Industries, Inc. | | 15,984 | 1,255,064 |
| Zurn Elkay Water Solutions Cor | | 37,731 | 813,103 |
| | | | 32,637,109 |
| Commercial Services & Supplies - 1.4% | | | |
| ABM Industries, Inc. | | 17,129 | 729,353 |
| ACCO Brands Corp. | | 23,642 | 108,280 |
| ACV Auctions, Inc. Class A (a) | | 30,538 | 397,910 |
| Aris Water Solution, Inc. Class A (b) | | 6,625 | 48,164 |
| Aurora Innovation, Inc. (a) | | 93,107 | 133,143 |
| Brady Corp. Class A | | 12,029 | 613,840 |
| BrightView Holdings, Inc. (a) | | 9,380 | 51,871 |
| Casella Waste Systems, Inc. Class A (a) | | 13,107 | 1,166,523 |
| CECO Environmental Corp. (a) | | 7,534 | 87,470 |
| Cimpress PLC (a) | | 5,126 | 266,296 |
| Clean Harbors, Inc. (a) | | 13,014 | 1,889,112 |
| CoreCivic, Inc. (a) | | 29,674 | 260,834 |
| Deluxe Corp. | | 11,195 | 169,604 |
| Driven Brands Holdings, Inc. (a) | | 14,233 | 436,953 |
| Ennis, Inc. | | 6,790 | 131,930 |
| Harsco Corp. (a) | | 21,111 | 145,033 |
| Healthcare Services Group, Inc. | | 19,231 | 300,196 |
| Heritage-Crystal Clean, Inc. (a) | | 4,042 | 141,308 |
| HNI Corp. | | 10,805 | 280,714 |
| Interface, Inc. | | 14,990 | 117,522 |
| KAR Auction Services, Inc. (a) | | 28,334 | 383,642 |
| Kimball International, Inc. Class B | | 9,382 | 115,492 |
| Liquidity Services, Inc. (a) | | 6,133 | 80,158 |
| Matthews International Corp. Class A | | 7,963 | 301,559 |
| Millerknoll, Inc. | | 19,674 | 334,655 |
| Montrose Environmental Group, Inc. (a) | | 6,951 | 211,727 |
| MSA Safety, Inc. | | 9,534 | 1,237,037 |
| Pitney Bowes, Inc. | | 43,137 | 151,411 |
| Rollins, Inc. | | 59,879 | 2,529,888 |
| SP Plus Corp. (a) | | 5,160 | 176,317 |
| Steelcase, Inc. Class A | | 23,472 | 187,776 |
| Stericycle, Inc. (a) | | 23,894 | 1,090,761 |
| Tetra Tech, Inc. | | 13,787 | 1,907,707 |
| The Brink's Co. | | 12,036 | 756,463 |
| The GEO Group, Inc. (a) | | 31,933 | 240,455 |
| UniFirst Corp. | | 3,918 | 641,298 |
| Viad Corp. (a) | | 5,388 | 102,534 |
| VSE Corp. | | 2,687 | 113,633 |
| | | | 18,038,569 |
| Construction & Engineering - 1.5% | | | |
| AECOM | | 35,949 | 2,985,564 |
| Ameresco, Inc. Class A (a)(b) | | 8,841 | 367,786 |
| API Group Corp. (a) | | 52,120 | 1,186,251 |
| Arcosa, Inc. | | 12,531 | 846,344 |
| Argan, Inc. | | 3,528 | 141,931 |
| Comfort Systems U.S.A., Inc. | | 9,264 | 1,384,875 |
| Construction Partners, Inc. Class A (a) | | 10,831 | 280,956 |
| Dycom Industries, Inc. (a) | | 7,662 | 709,654 |
| EMCOR Group, Inc. | | 12,340 | 2,110,140 |
| Fluor Corp. (a) | | 36,825 | 1,070,135 |
| Granite Construction, Inc. | | 11,372 | 433,614 |
| Great Lakes Dredge & Dock Corp. (a) | | 16,612 | 95,187 |
| MasTec, Inc. (a) | | 15,345 | 1,362,789 |
| MDU Resources Group, Inc. | | 52,495 | 1,533,904 |
| MYR Group, Inc. (a) | | 4,298 | 550,101 |
| Northwest Pipe Co. (a) | | 2,550 | 70,227 |
| Primoris Services Corp. | | 13,633 | 344,915 |
| Sterling Construction Co., Inc. (a) | | 7,854 | 289,970 |
| Tutor Perini Corp. (a) | | 10,133 | 53,705 |
| Valmont Industries, Inc. | | 5,527 | 1,605,925 |
| Willscot Mobile Mini Holdings (a) | | 54,135 | 2,457,729 |
| | | | 19,881,702 |
| Electrical Equipment - 1.9% | | | |
| Acuity Brands, Inc. | | 8,321 | 1,309,559 |
| Allied Motion Technologies, Inc. | | 3,595 | 123,740 |
| Array Technologies, Inc. (a) | | 36,257 | 741,456 |
| Atkore, Inc. (a) | | 10,211 | 1,289,956 |
| Babcock & Wilcox Enterprises, Inc. (a) | | 18,460 | 114,821 |
| Beam Global (a)(b) | | 1,918 | 17,109 |
| Blink Charging Co. (a)(b) | | 12,630 | 90,052 |
| Bloom Energy Corp. Class A (a)(b) | | 46,591 | 775,740 |
| ChargePoint Holdings, Inc. Class A (a)(b) | | 68,308 | 592,230 |
| Encore Wire Corp. | | 4,761 | 744,287 |
| Energy Vault Holdings, Inc. Class A (a) | | 18,049 | 30,503 |
| EnerSys | | 10,576 | 877,491 |
| Enovix Corp. (a)(b) | | 28,533 | 308,727 |
| Eos Energy Enterprises, Inc. (a)(b) | | 19,522 | 32,992 |
| Fluence Energy, Inc. (a)(b) | | 9,636 | 174,026 |
| FTC Solar, Inc. (a) | | 8,220 | 22,441 |
| FuelCell Energy, Inc. (a)(b) | | 107,957 | 202,959 |
| Generac Holdings, Inc. (a) | | 16,438 | 1,680,292 |
| GrafTech International Ltd. | | 50,142 | 236,169 |
| Hubbell, Inc. Class B | | 13,883 | 3,738,930 |
| LSI Industries, Inc. | | 7,310 | 92,764 |
| NuScale Power Corp. (a)(b) | | 5,394 | 47,845 |
| nVent Electric PLC | | 43,137 | 1,808,734 |
| Plug Power, Inc. (a) | | 136,146 | 1,229,398 |
| Powell Industries, Inc. | | 2,271 | 90,976 |
| Regal Rexnord Corp. | | 17,143 | 2,231,333 |
| Sensata Technologies, Inc. PLC | | 39,617 | 1,721,359 |
| SES AI Corp. Class A (a)(b) | | 37,838 | 61,676 |
| Shoals Technologies Group, Inc. (a) | | 41,566 | 868,314 |
| Stem, Inc. (a)(b) | | 38,787 | 164,069 |
| SunPower Corp. (a)(b) | | 22,032 | 291,263 |
| Sunrun, Inc. (a)(b) | | 55,246 | 1,162,376 |
| Thermon Group Holdings, Inc. (a) | | 8,467 | 175,944 |
| TPI Composites, Inc. (a)(b) | | 11,068 | 136,800 |
| Vertiv Holdings Co. | | 78,303 | 1,168,281 |
| Vicor Corp. (a) | | 5,887 | 252,964 |
| | | | 24,607,576 |
| Ground Transportation - 1.2% | | | |
| ArcBest Corp. | | 6,282 | 593,021 |
| Avis Budget Group, Inc. (a)(b) | | 6,450 | 1,139,522 |
| Covenant Transport Group, Inc. Class A | | 2,066 | 81,380 |
| Daseke, Inc. (a) | | 15,001 | 122,708 |
| FTAI Infrastructure LLC | | 25,693 | 79,648 |
| Heartland Express, Inc. | | 11,996 | 173,702 |
| Hertz Global Holdings, Inc. (a) | | 41,866 | 698,325 |
| Knight-Swift Transportation Holdings, Inc. Class A | | 41,650 | 2,345,728 |
| Landstar System, Inc. | | 9,296 | 1,636,375 |
| Lyft, Inc. (a) | | 83,451 | 855,373 |
| Marten Transport Ltd. | | 14,983 | 302,507 |
| RXO, Inc. | | 30,192 | 546,173 |
| Ryder System, Inc. | | 13,010 | 1,029,872 |
| Saia, Inc. (a) | | 6,860 | 2,042,702 |
| Schneider National, Inc. Class B | | 9,662 | 252,855 |
| TuSimple Holdings, Inc. (a) | | 33,026 | 39,961 |
| U-Haul Holding Co. (b) | | 2,795 | 170,663 |
| U-Haul Holding Co. (non-vtg.) | | 22,595 | 1,222,390 |
| Universal Logistics Holdings, Inc. | | 1,768 | 45,261 |
| Werner Enterprises, Inc. | | 15,211 | 687,081 |
| XPO, Inc. (a) | | 29,803 | 1,316,697 |
| | | | 15,381,944 |
| Machinery - 4.3% | | | |
| 3D Systems Corp. (a) | | 34,062 | 312,008 |
| AGCO Corp. | | 16,048 | 1,988,989 |
| Alamo Group, Inc. | | 2,665 | 470,985 |
| Albany International Corp. Class A | | 8,053 | 734,514 |
| Allison Transmission Holdings, Inc. | | 23,931 | 1,167,593 |
| Astec Industries, Inc. | | 5,937 | 245,079 |
| Barnes Group, Inc. | | 13,014 | 546,978 |
| Blue Bird Corp. (a) | | 4,348 | 81,308 |
| Chart Industries, Inc. (a)(b) | | 11,028 | 1,467,827 |
| CIRCOR International, Inc. (a) | | 5,195 | 144,629 |
| Columbus McKinnon Corp. (NY Shares) | | 7,362 | 255,535 |
| Crane Co. | | 12,350 | 890,065 |
| Crane Nxt Co. | | 12,332 | 584,044 |
| Desktop Metal, Inc. (a)(b) | | 60,188 | 132,414 |
| Donaldson Co., Inc. | | 31,417 | 1,996,550 |
| Douglas Dynamics, Inc. | | 5,884 | 172,460 |
| Energy Recovery, Inc. (a) | | 14,497 | 326,617 |
| Enerpac Tool Group Corp. Class A | | 14,799 | 351,624 |
| EnPro Industries, Inc. | | 5,392 | 508,304 |
| ESAB Corp. | | 13,380 | 780,857 |
| ESCO Technologies, Inc. | | 6,649 | 622,147 |
| Evoqua Water Technologies Corp. (a) | | 31,642 | 1,564,697 |
| Federal Signal Corp. | | 15,691 | 806,204 |
| Flowserve Corp. | | 33,824 | 1,129,383 |
| Franklin Electric Co., Inc. | | 10,078 | 901,679 |
| Gates Industrial Corp. PLC (a) | | 26,314 | 354,450 |
| Gorman-Rupp Co. | | 5,699 | 139,910 |
| Graco, Inc. | | 43,619 | 3,458,551 |
| Helios Technologies, Inc. | | 8,469 | 509,326 |
| Hillenbrand, Inc. | | 17,979 | 820,202 |
| Hillman Solutions Corp. Class A (a) | | 37,935 | 318,654 |
| Hyliion Holdings Corp. Class A (a)(b) | | 31,824 | 43,599 |
| Hyster-Yale Materials Handling, Inc. Class A | | 2,596 | 136,705 |
| ITT, Inc. | | 21,420 | 1,808,705 |
| John Bean Technologies Corp. | | 8,265 | 898,488 |
| Kadant, Inc. | | 3,029 | 562,879 |
| Kennametal, Inc. | | 20,879 | 542,019 |
| Lincoln Electric Holdings, Inc. | | 14,954 | 2,509,281 |
| Lindsay Corp. | | 2,832 | 341,936 |
| Luxfer Holdings PLC sponsored | | 6,864 | 104,676 |
| Manitowoc Co., Inc. (a) | | 8,964 | 137,060 |
| Microvast Holdings, Inc. (a)(b) | | 53,890 | 56,585 |
| Middleby Corp. (a) | | 13,960 | 1,966,685 |
| Mueller Industries, Inc. | | 14,759 | 1,060,434 |
| Mueller Water Products, Inc. Class A | | 40,507 | 542,794 |
| Nikola Corp. (a)(b) | | 95,378 | 84,457 |
| Nordson Corp. | | 13,918 | 3,010,603 |
| Omega Flex, Inc. | | 830 | 91,308 |
| Oshkosh Corp. | | 16,964 | 1,298,085 |
| Pentair PLC | | 42,624 | 2,475,602 |
| Proterra, Inc. Class A (a)(b) | | 48,038 | 56,204 |
| Proto Labs, Inc. (a) | | 6,978 | 200,757 |
| RBC Bearings, Inc. (a)(b) | | 7,515 | 1,705,980 |
| REV Group, Inc. | | 8,433 | 90,486 |
| Shyft Group, Inc. (The) | | 8,397 | 210,597 |
| Snap-On, Inc. | | 13,744 | 3,565,331 |
| SPX Technologies, Inc. (a) | | 11,695 | 744,738 |
| Standex International Corp. | | 3,082 | 378,500 |
| Tennant Co. | | 4,811 | 367,657 |
| Terex Corp. | | 17,517 | 781,083 |
| The Greenbrier Companies, Inc. | | 8,512 | 225,142 |
| Timken Co. | | 17,154 | 1,318,285 |
| Titan International, Inc. (a) | | 12,932 | 126,216 |
| Toro Co. | | 27,102 | 2,825,655 |
| Trinity Industries, Inc. | | 21,090 | 505,106 |
| Velo3D, Inc. (a)(b) | | 14,768 | 34,557 |
| Wabash National Corp. | | 12,534 | 321,748 |
| Watts Water Technologies, Inc. Class A | | 7,074 | 1,144,078 |
| | | | 56,057,604 |
| Marine Transportation - 0.2% | | | |
| Eagle Bulk Shipping, Inc. (b) | | 2,415 | 107,999 |
| Eneti, Inc. | | 5,577 | 47,795 |
| Genco Shipping & Trading Ltd. | | 9,841 | 151,650 |
| Kirby Corp. (a) | | 15,505 | 1,113,879 |
| Matson, Inc. | | 9,817 | 667,851 |
| | | | 2,089,174 |
| Passenger Airlines - 0.5% | | | |
| Alaska Air Group, Inc. (a) | | 33,040 | 1,435,918 |
| Allegiant Travel Co. (a) | | 4,051 | 420,939 |
| American Airlines Group, Inc. (a) | | 168,643 | 2,300,291 |
| Blade Air Mobility, Inc. (a)(b) | | 11,534 | 30,219 |
| Frontier Group Holdings, Inc. (a) | | 9,584 | 90,952 |
| Hawaiian Holdings, Inc. (a) | | 12,806 | 106,674 |
| JetBlue Airways Corp. (a) | | 84,293 | 601,852 |
| Joby Aviation, Inc. (a)(b) | | 76,043 | 329,266 |
| SkyWest, Inc. (a) | | 13,185 | 373,136 |
| Spirit Airlines, Inc. | | 28,214 | 482,459 |
| Sun Country Airlines Holdings, Inc. (a) | | 8,536 | 168,415 |
| Wheels Up Experience, Inc. Class A (a) | | 42,049 | 19,448 |
| | | | 6,359,569 |
| Professional Services - 2.5% | | | |
| Alight, Inc. Class A (a) | | 81,539 | 754,236 |
| ASGN, Inc. (a) | | 12,951 | 927,162 |
| Barrett Business Services, Inc. | | 1,796 | 150,164 |
| Booz Allen Hamilton Holding Corp. Class A | | 34,228 | 3,276,304 |
| CACI International, Inc. Class A (a) | | 6,081 | 1,905,299 |
| CBIZ, Inc. (a) | | 13,072 | 688,764 |
| Clarivate Analytics PLC (a)(b) | | 111,885 | 991,301 |
| Concentrix Corp. | | 11,089 | 1,070,199 |
| Conduent, Inc. (a) | | 43,460 | 152,545 |
| CRA International, Inc. | | 1,869 | 196,507 |
| CSG Systems International, Inc. | | 7,756 | 408,586 |
| Dun & Bradstreet Holdings, Inc. | | 56,507 | 631,183 |
| ExlService Holdings, Inc. (a) | | 8,552 | 1,525,506 |
| Exponent, Inc. | | 13,143 | 1,209,813 |
| First Advantage Corp. (a) | | 15,111 | 194,327 |
| FiscalNote Holdings, Inc. Class A (a)(b) | | 18,818 | 34,061 |
| Forrester Research, Inc. (a) | | 2,789 | 86,292 |
| Franklin Covey Co. (a) | | 3,267 | 119,964 |
| FTI Consulting, Inc. (a) | | 8,914 | 1,608,977 |
| Genpact Ltd. | | 43,525 | 1,939,039 |
| Heidrick & Struggles International, Inc. | | 5,333 | 133,912 |
| HireRight Holdings Corp. (a) | | 4,577 | 48,516 |
| Huron Consulting Group, Inc. (a) | | 5,154 | 437,008 |
| ICF International, Inc. | | 4,389 | 500,346 |
| Insperity, Inc. | | 9,207 | 1,127,489 |
| KBR, Inc. | | 35,502 | 2,014,028 |
| Kelly Services, Inc. Class A (non-vtg.) | | 9,152 | 150,184 |
| Kforce, Inc. | | 5,020 | 296,883 |
| Korn Ferry | | 13,697 | 657,730 |
| LegalZoom.com, Inc. (a) | | 24,498 | 229,791 |
| Manpower, Inc. | | 13,116 | 993,012 |
| Maximus, Inc. | | 15,735 | 1,316,233 |
| NV5 Global, Inc. (a) | | 3,276 | 310,335 |
| Planet Labs PBC Class A (a) | | 50,106 | 204,432 |
| RCM Technologies, Inc. (a) | | 1,821 | 20,468 |
| Resources Connection, Inc. | | 8,519 | 124,292 |
| Robert Half International, Inc. | | 27,941 | 2,039,693 |
| Science Applications International Corp. | | 14,122 | 1,440,868 |
| Sterling Check Corp. (a) | | 6,102 | 68,586 |
| TaskUs, Inc. (a)(b) | | 6,430 | 86,548 |
| TriNet Group, Inc. (a)(b) | | 9,513 | 882,616 |
| TrueBlue, Inc. (a) | | 8,362 | 126,684 |
| Ttec Holdings, Inc. | | 4,937 | 168,204 |
| Upwork, Inc. (a) | | 30,552 | 292,383 |
| Verra Mobility Corp. (a) | | 36,117 | 612,183 |
| | | | 32,152,653 |
| Trading Companies & Distributors - 1.6% | | | |
| Air Lease Corp. Class A | | 26,652 | 1,071,943 |
| Alta Equipment Group, Inc. | | 6,552 | 92,645 |
| Applied Industrial Technologies, Inc. | | 9,996 | 1,356,057 |
| Beacon Roofing Supply, Inc. (a) | | 13,159 | 791,909 |
| BlueLinx Corp. (a) | | 2,298 | 160,998 |
| Boise Cascade Co. | | 10,178 | 695,259 |
| Core & Main, Inc. (a)(b) | | 19,178 | 499,779 |
| Custom Truck One Source, Inc. Class A (a) | | 16,222 | 101,874 |
| DXP Enterprises, Inc. (a) | | 4,164 | 104,933 |
| GATX Corp. | | 9,072 | 1,033,392 |
| Global Industrial Co. | | 4,345 | 115,794 |
| GMS, Inc. (a) | | 10,817 | 628,035 |
| H&E Equipment Services, Inc. | | 8,754 | 319,521 |
| Herc Holdings, Inc. | | 6,461 | 646,229 |
| Hudson Technologies, Inc. (a) | | 9,596 | 74,177 |
| McGrath RentCorp. | | 6,321 | 561,810 |
| MRC Global, Inc. (a) | | 22,175 | 215,985 |
| MSC Industrial Direct Co., Inc. Class A | | 12,213 | 1,108,085 |
| NOW, Inc. (a) | | 28,697 | 306,197 |
| Rush Enterprises, Inc. Class A | | 10,960 | 582,086 |
| SiteOne Landscape Supply, Inc. (a)(b) | | 11,690 | 1,727,081 |
| Textainer Group Holdings Ltd. | | 10,902 | 382,660 |
| Titan Machinery, Inc. (a) | | 5,365 | 168,193 |
| Transcat, Inc. (a) | | 1,854 | 141,442 |
| Triton International Ltd. | | 15,231 | 1,259,147 |
| Univar Solutions, Inc. (a) | | 42,276 | 1,500,798 |
| Veritiv Corp. | | 3,457 | 397,106 |
| Watsco, Inc. (b) | | 8,617 | 2,984,756 |
| WESCO International, Inc. | | 11,598 | 1,670,112 |
| Xometry, Inc. (a)(b) | | 7,920 | 110,009 |
| | | | 20,808,012 |
TOTAL INDUSTRIALS | | | 247,440,449 |
| INFORMATION TECHNOLOGY - 11.3% | | | |
| Communications Equipment - 0.8% | | | |
| ADTRAN Holdings, Inc. | | 17,935 | 163,567 |
| Aviat Networks, Inc. (a) | | 2,706 | 88,784 |
| Calix, Inc. (a) | | 14,763 | 674,669 |
| Cambium Networks Corp. (a) | | 2,678 | 40,545 |
| Ciena Corp. (a) | | 38,466 | 1,770,975 |
| Clearfield, Inc. (a)(b) | | 3,293 | 143,838 |
| CommScope Holding Co., Inc. (a) | | 54,995 | 271,125 |
| Comtech Telecommunications Corp. | | 6,876 | 71,167 |
| Digi International, Inc. (a) | | 9,356 | 282,177 |
| DZS, Inc. (a) | | 3,985 | 27,098 |
| Extreme Networks, Inc. (a) | | 33,413 | 594,083 |
| Harmonic, Inc. (a) | | 28,476 | 401,227 |
| Infinera Corp. (a)(b) | | 49,657 | 314,329 |
| Juniper Networks, Inc. | | 83,875 | 2,528,831 |
| Lumentum Holdings, Inc. (a) | | 17,772 | 857,499 |
| NETGEAR, Inc. (a) | | 7,525 | 106,328 |
| NetScout Systems, Inc. (a) | | 17,548 | 477,481 |
| Ribbon Communications, Inc. (a) | | 21,848 | 55,931 |
| ViaSat, Inc. (a)(b) | | 19,799 | 693,559 |
| Viavi Solutions, Inc. (a) | | 58,696 | 525,916 |
| | | | 10,089,129 |
| Electronic Equipment, Instruments & Components - 2.3% | | | |
| 908 Devices, Inc. (a)(b) | | 5,275 | 35,659 |
| Advanced Energy Industries, Inc. | | 9,700 | 839,050 |
| Aeva Technologies, Inc. (a)(b) | | 26,633 | 26,417 |
| Akoustis Technologies, Inc. (a)(b) | | 18,614 | 53,050 |
| Arlo Technologies, Inc. (a) | | 23,442 | 150,966 |
| Arrow Electronics, Inc. (a) | | 15,146 | 1,733,157 |
| Avnet, Inc. | | 23,702 | 977,945 |
| Badger Meter, Inc. | | 7,564 | 1,000,944 |
| Bel Fuse, Inc. Class B (non-vtg.) | | 2,686 | 109,132 |
| Belden, Inc. | | 11,084 | 874,417 |
| Benchmark Electronics, Inc. | | 8,950 | 191,083 |
| Cognex Corp. | | 44,817 | 2,137,323 |
| Coherent Corp. (a)(b) | | 36,045 | 1,230,576 |
| CTS Corp. | | 8,270 | 324,267 |
| ePlus, Inc. (a) | | 6,888 | 299,904 |
| Evolv Technologies Holdings, Inc. (a) | | 17,267 | 62,161 |
| Fabrinet (a) | | 9,505 | 902,500 |
| FARO Technologies, Inc. (a) | | 5,058 | 118,104 |
| Insight Enterprises, Inc. (a) | | 7,853 | 949,820 |
| IPG Photonics Corp. (a) | | 8,330 | 957,783 |
| Itron, Inc. (a) | | 11,707 | 625,154 |
| Jabil, Inc. | | 34,517 | 2,697,504 |
| Kimball Electronics, Inc. (a) | | 6,612 | 133,100 |
| Knowles Corp. (a) | | 23,357 | 394,266 |
| Lightwave Logic, Inc. (a)(b) | | 30,003 | 135,014 |
| Littelfuse, Inc. | | 6,415 | 1,553,970 |
| Luna Innovations, Inc. (a)(b) | | 8,575 | 53,851 |
| Methode Electronics, Inc. Class A | | 9,289 | 380,756 |
| MicroVision, Inc. (a)(b) | | 41,585 | 83,170 |
| Mirion Technologies, Inc. Class A (a)(b) | | 31,566 | 255,685 |
| Napco Security Technologies, Inc. (a) | | 7,391 | 229,121 |
| National Instruments Corp. | | 33,807 | 1,968,582 |
| nLIGHT, Inc. (a) | | 12,009 | 105,319 |
| Novanta, Inc. (a) | | 9,239 | 1,412,089 |
| OSI Systems, Inc. (a) | | 4,053 | 457,827 |
| Ouster, Inc. (a)(b) | | 129 | 457 |
| Par Technology Corp. (a)(b) | | 7,084 | 216,700 |
| PC Connection, Inc. | | 3,010 | 121,213 |
| Plexus Corp. (a) | | 7,180 | 628,035 |
| Richardson Electronics Ltd. | | 2,944 | 45,426 |
| Rogers Corp. (a) | | 4,874 | 784,470 |
| Sanmina Corp. (a) | | 15,127 | 790,537 |
| ScanSource, Inc. (a) | | 6,596 | 180,401 |
| Smartrent, Inc. (a)(b) | | 29,932 | 77,225 |
| TD SYNNEX Corp. | | 10,877 | 968,488 |
| TTM Technologies, Inc. (a) | | 26,191 | 309,316 |
| Vishay Intertechnology, Inc. | | 33,579 | 714,897 |
| Vishay Precision Group, Inc. (a) | | 3,315 | 124,445 |
| Vontier Corp. | | 40,904 | 1,109,726 |
| | | | 29,531,002 |
| IT Services - 0.6% | | | |
| Amdocs Ltd. | | 31,279 | 2,854,209 |
| BigCommerce Holdings, Inc. (a) | | 15,290 | 112,993 |
| Digitalocean Holdings, Inc. (a)(b) | | 15,619 | 492,623 |
| DXC Technology Co. (a) | | 59,026 | 1,407,770 |
| Edgio, Inc. (a) | | 33,394 | 22,073 |
| Fastly, Inc. Class A (a) | | 29,036 | 429,152 |
| Grid Dynamics Holdings, Inc. (a) | | 13,660 | 148,484 |
| Hackett Group, Inc. | | 6,197 | 115,016 |
| Kyndryl Holdings, Inc. (a) | | 53,056 | 767,190 |
| Perficient, Inc. (a) | | 8,919 | 579,021 |
| Rackspace Technology, Inc. (a)(b) | | 13,828 | 20,189 |
| Squarespace, Inc. Class A (a) | | 10,578 | 328,976 |
| Thoughtworks Holding, Inc. (a) | | 17,312 | 107,854 |
| Tucows, Inc. (a)(b) | | 2,414 | 54,049 |
| Unisys Corp. (a) | | 16,373 | 52,557 |
| | | | 7,492,156 |
| Semiconductors & Semiconductor Equipment - 1.8% | | | |
| ACM Research, Inc. (a) | | 10,319 | 96,483 |
| AEHR Test Systems (a)(b) | | 6,624 | 163,944 |
| Allegro MicroSystems LLC (a) | | 16,850 | 602,725 |
| Alpha & Omega Semiconductor Ltd. (a) | | 5,678 | 135,591 |
| Ambarella, Inc. (a) | | 9,554 | 592,157 |
| Amkor Technology, Inc. | | 26,013 | 581,911 |
| Axcelis Technologies, Inc. (a) | | 8,486 | 1,003,894 |
| CEVA, Inc. (a) | | 6,110 | 153,544 |
| Cirrus Logic, Inc. (a) | | 14,324 | 1,228,856 |
| Cohu, Inc. (a) | | 12,344 | 417,721 |
| Credo Technology Group Holding Ltd. (a) | | 23,584 | 191,266 |
| Diodes, Inc. (a) | | 11,795 | 940,062 |
| FormFactor, Inc. (a) | | 19,972 | 545,435 |
| Ichor Holdings Ltd. (a) | | 7,539 | 209,961 |
| Impinj, Inc. (a) | | 5,498 | 486,078 |
| indie Semiconductor, Inc. (a)(b) | | 17,891 | 135,435 |
| Kulicke & Soffa Industries, Inc. (b) | | 14,724 | 701,746 |
| Lattice Semiconductor Corp. (a) | | 35,498 | 2,829,191 |
| MACOM Technology Solutions Holdings, Inc. (a) | | 13,383 | 780,764 |
| MaxLinear, Inc. Class A (a) | | 18,844 | 454,706 |
| Meta Materials, Inc. (a)(b) | | 77,835 | 14,337 |
| MKS Instruments, Inc. | | 14,826 | 1,243,457 |
| Navitas Semiconductor Corp. (a)(b) | | 21,056 | 112,228 |
| NVE Corp. | | 1,193 | 89,964 |
| Onto Innovation, Inc. (a) | | 12,848 | 1,040,431 |
| PDF Solutions, Inc. (a) | | 7,632 | 275,134 |
| Photronics, Inc. (a) | | 15,803 | 228,511 |
| Power Integrations, Inc. (b) | | 14,781 | 1,075,761 |
| Rambus, Inc. (a) | | 27,821 | 1,233,583 |
| Semtech Corp. (a) | | 16,388 | 319,402 |
| Silicon Laboratories, Inc. (a) | | 8,239 | 1,147,693 |
| SiTime Corp. (a) | | 4,177 | 453,079 |
| SkyWater Technology, Inc. (a) | | 2,337 | 21,126 |
| SMART Global Holdings, Inc. (a) | | 12,802 | 197,407 |
| Synaptics, Inc. (a) | | 10,231 | 906,057 |
| Ultra Clean Holdings, Inc. (a) | | 11,889 | 339,312 |
| Universal Display Corp. | | 11,260 | 1,502,760 |
| Veeco Instruments, Inc. (a)(b) | | 13,620 | 250,880 |
| Wolfspeed, Inc. (a)(b) | | 32,255 | 1,501,470 |
| | | | 24,204,062 |
| Software - 5.5% | | | |
| 8x8, Inc. (a)(b) | | 30,442 | 87,369 |
| A10 Networks, Inc. | | 16,549 | 234,003 |
| ACI Worldwide, Inc. (a) | | 29,113 | 737,432 |
| Adeia, Inc. | | 27,318 | 208,710 |
| Agilysys, Inc. (a) | | 5,147 | 401,672 |
| Alarm.com Holdings, Inc. (a) | | 12,950 | 617,586 |
| Alkami Technology, Inc. (a) | | 9,503 | 113,941 |
| Altair Engineering, Inc. Class A (a)(b) | | 13,560 | 936,318 |
| Alteryx, Inc. Class A (a) | | 15,982 | 657,340 |
| American Software, Inc. Class A | | 7,886 | 94,159 |
| Amplitude, Inc. (a) | | 14,074 | 159,740 |
| AppFolio, Inc. (a) | | 4,915 | 686,232 |
| Appian Corp. Class A (a)(b) | | 10,545 | 395,965 |
| AppLovin Corp. (a)(b) | | 31,887 | 542,079 |
| Asana, Inc. (a)(b) | | 19,835 | 320,930 |
| Aspen Technology, Inc. | | 7,543 | 1,335,111 |
| AvePoint, Inc. (a)(b) | | 23,121 | 100,345 |
| Bentley Systems, Inc. Class B | | 50,865 | 2,164,814 |
| Bill Holdings, Inc. (a) | | 24,820 | 1,906,424 |
| Black Knight, Inc. (a) | | 40,405 | 2,207,729 |
| Blackbaud, Inc. (a) | | 11,528 | 799,524 |
| BlackLine, Inc. (a) | | 14,096 | 785,288 |
| Blend Labs, Inc. (a)(b) | | 43,799 | 25,933 |
| Box, Inc. Class A (a) | | 37,017 | 979,470 |
| Braze, Inc. (a)(b) | | 9,183 | 269,980 |
| C3.ai, Inc. (a)(b) | | 22,139 | 394,517 |
| CCC Intelligent Solutions Holdings, Inc. Class A (a) | | 27,069 | 234,959 |
| Cerence, Inc. (a) | | 10,421 | 266,257 |
| Ceridian HCM Holding, Inc. (a) | | 39,850 | 2,529,678 |
| Cleanspark, Inc. (a)(b) | | 20,258 | 79,209 |
| Clear Secure, Inc. (b) | | 20,191 | 488,420 |
| Clearwater Analytics Holdings, Inc. (a)(b) | | 16,985 | 261,739 |
| CommVault Systems, Inc. (a) | | 11,537 | 672,261 |
| Confluent, Inc. (a) | | 39,835 | 876,370 |
| Consensus Cloud Solutions, Inc. (a) | | 4,628 | 172,763 |
| Couchbase, Inc. (a)(b) | | 6,554 | 100,669 |
| CS Disco, Inc. (a) | | 4,199 | 24,690 |
| Digimarc Corp. (a)(b) | | 3,311 | 56,419 |
| Digital Turbine, Inc. (a) | | 23,439 | 274,939 |
| Dolby Laboratories, Inc. Class A | | 15,576 | 1,303,555 |
| Domo, Inc. Class B (a) | | 8,336 | 132,376 |
| DoubleVerify Holdings, Inc. (a) | | 22,617 | 665,392 |
| Dropbox, Inc. Class A (a) | | 69,823 | 1,420,200 |
| Dynatrace, Inc. (a) | | 56,150 | 2,374,022 |
| E2open Parent Holdings, Inc. (a)(b) | | 44,582 | 280,421 |
| Ebix, Inc. | | 5,871 | 95,462 |
| Elastic NV (a) | | 20,063 | 1,148,607 |
| Enfusion, Inc. Class A (a) | | 3,041 | 25,484 |
| EngageSmart, Inc. (a) | | 7,798 | 133,892 |
| Envestnet, Inc. (a)(b) | | 14,293 | 905,890 |
| Everbridge, Inc. (a) | | 10,400 | 273,312 |
| Expensify, Inc. (a) | | 11,481 | 87,141 |
| Five9, Inc. (a) | | 18,271 | 1,184,692 |
| ForgeRock, Inc. (a) | | 9,310 | 186,479 |
| Freshworks, Inc. (a) | | 41,754 | 557,833 |
| GitLab, Inc. (a)(b) | | 16,328 | 495,718 |
| Guidewire Software, Inc. (a) | | 21,208 | 1,615,838 |
| HashiCorp, Inc. (a) | | 21,261 | 570,007 |
| Informatica, Inc. (a) | | 9,967 | 154,090 |
| Intapp, Inc. (a) | | 4,018 | 162,006 |
| InterDigital, Inc. | | 6,945 | 470,454 |
| Jamf Holding Corp. (a)(b) | | 11,687 | 221,118 |
| Life360, Inc. CDI (a)(d) | | 50,755 | 173,629 |
| LivePerson, Inc. (a) | | 17,353 | 80,344 |
| Liveramp Holdings, Inc. (a) | | 16,654 | 401,195 |
| Manhattan Associates, Inc. (a) | | 16,178 | 2,680,371 |
| Marathon Digital Holdings, Inc. (a)(b) | | 29,179 | 293,833 |
| Matterport, Inc. (a)(b) | | 58,661 | 136,680 |
| MeridianLink, Inc. (a)(b) | | 5,471 | 81,737 |
| MicroStrategy, Inc. Class A (a)(b) | | 2,483 | 815,368 |
| Mitek Systems, Inc. (a) | | 12,137 | 109,476 |
| Model N, Inc. (a) | | 8,809 | 271,317 |
| Momentive Global, Inc. (a) | | 32,914 | 309,062 |
| N-able, Inc. (a) | | 17,272 | 220,218 |
| nCino, Inc. (a)(b) | | 19,876 | 491,533 |
| NCR Corp. (a)(b) | | 35,736 | 796,555 |
| New Relic, Inc. (a) | | 15,162 | 1,083,628 |
| Nutanix, Inc. Class A (a) | | 59,591 | 1,428,992 |
| Olo, Inc. (a)(b) | | 27,577 | 188,902 |
| ON24, Inc. (a) | | 11,565 | 100,616 |
| Onespan, Inc. (a) | | 9,141 | 134,738 |
| Pagerduty, Inc. (a)(b) | | 21,214 | 637,693 |
| Paycor HCM, Inc. (a)(b) | | 12,492 | 293,562 |
| Paylocity Holding Corp. (a)(b) | | 10,690 | 2,066,270 |
| Pegasystems, Inc. | | 10,720 | 489,046 |
| Porch Group, Inc. Class A (a)(b) | | 20,292 | 18,468 |
| PowerSchool Holdings, Inc. (a) | | 10,298 | 215,022 |
| Procore Technologies, Inc. (a) | | 17,897 | 955,879 |
| Progress Software Corp. | | 11,216 | 615,534 |
| PROS Holdings, Inc. (a) | | 10,631 | 301,601 |
| Q2 Holdings, Inc. (a) | | 14,875 | 366,223 |
| Qualtrics International, Inc. (a) | | 29,168 | 522,982 |
| Qualys, Inc. (a) | | 8,956 | 1,011,491 |
| Rapid7, Inc. (a) | | 15,349 | 746,115 |
| Rimini Street, Inc. (a) | | 12,178 | 45,546 |
| RingCentral, Inc. (a) | | 20,096 | 553,846 |
| Riot Platforms, Inc. (a)(b) | | 43,355 | 518,526 |
| Samsara, Inc. (a)(b) | | 29,366 | 530,056 |
| Semrush Holdings, Inc. (a) | | 9,558 | 92,330 |
| SentinelOne, Inc. (a) | | 56,754 | 912,037 |
| Smartsheet, Inc. (a) | | 34,034 | 1,390,970 |
| SolarWinds, Inc. (a) | | 11,900 | 102,578 |
| SoundHound AI, Inc. | | 29,982 | 79,752 |
| SoundThinking, Inc. (a) | | 2,212 | 65,807 |
| Sprinklr, Inc. (a) | | 16,026 | 191,671 |
| Sprout Social, Inc. (a)(b) | | 12,267 | 604,272 |
| SPS Commerce, Inc. (a) | | 9,332 | 1,374,604 |
| Sumo Logic, Inc. (a) | | 28,838 | 346,056 |
| Telos Corp. (a) | | 13,067 | 22,214 |
| Tenable Holdings, Inc. (a) | | 29,290 | 1,083,437 |
| Teradata Corp. (a)(b) | | 26,359 | 1,020,357 |
| UiPath, Inc. Class A (a)(b) | | 91,467 | 1,287,855 |
| Unity Software, Inc. (a)(b) | | 63,189 | 1,704,207 |
| Upland Software, Inc. (a) | | 6,805 | 24,974 |
| Varonis Systems, Inc. (a) | | 27,801 | 643,871 |
| Verint Systems, Inc. (a) | | 17,083 | 623,359 |
| Veritone, Inc. (a)(b) | | 7,881 | 37,514 |
| Vertex, Inc. Class A (a) | | 9,155 | 189,051 |
| Vobile Group Ltd. (a)(b) | | 377,000 | 147,122 |
| Workiva, Inc. (a) | | 11,843 | 1,106,373 |
| Xperi, Inc. | | 11,144 | 105,757 |
| Yext, Inc. (a) | | 26,578 | 233,355 |
| Zeta Global Holdings Corp. (a) | | 32,501 | 315,585 |
| Zuora, Inc. (a) | | 32,282 | 251,477 |
| | | | 71,307,612 |
| Technology Hardware, Storage & Peripherals - 0.3% | | | |
| Avid Technology, Inc. (a) | | 8,443 | 249,153 |
| Corsair Gaming, Inc. (a)(b) | | 10,414 | 181,412 |
| Eastman Kodak Co. (a) | | 20,355 | 66,968 |
| Immersion Corp. | | 8,069 | 53,175 |
| IonQ, Inc. (a)(b) | | 39,427 | 217,243 |
| Pure Storage, Inc. Class A (a) | | 73,738 | 1,683,439 |
| Super Micro Computer, Inc. (a) | | 12,089 | 1,274,543 |
| Turtle Beach Corp. (a)(b) | | 4,127 | 44,860 |
| Xerox Holdings Corp. | | 29,097 | 455,950 |
| | | | 4,226,743 |
TOTAL INFORMATION TECHNOLOGY | | | 146,850,704 |
| MATERIALS - 5.1% | | | |
| Chemicals - 2.1% | | | |
| AdvanSix, Inc. | | 7,157 | 269,676 |
| American Vanguard Corp. | | 7,401 | 142,469 |
| Amyris, Inc. (a)(b) | | 69,351 | 56,701 |
| Ashland, Inc. | | 12,911 | 1,311,887 |
| Aspen Aerogels, Inc. (a) | | 13,773 | 86,219 |
| Avient Corp. | | 22,158 | 853,305 |
| Axalta Coating Systems Ltd. (a) | | 57,083 | 1,802,110 |
| Balchem Corp. | | 8,324 | 1,093,774 |
| Cabot Corp. | | 14,594 | 1,047,265 |
| Chase Corp. | | 1,927 | 210,679 |
| Danimer Scientific, Inc. (a)(b) | | 22,900 | 72,364 |
| Diversey Holdings Ltd. (a) | | 20,169 | 163,974 |
| Ecovyst, Inc. (a) | | 16,849 | 191,236 |
| Element Solutions, Inc. | | 58,433 | 1,060,559 |
| FutureFuel Corp. | | 6,362 | 47,715 |
| Ginkgo Bioworks Holdings, Inc. Class A (a)(b) | | 262,958 | 320,809 |
| H.B. Fuller Co. | | 13,921 | 921,153 |
| Hawkins, Inc. | | 4,882 | 196,940 |
| Huntsman Corp. | | 46,845 | 1,254,978 |
| Ingevity Corp. (a) | | 9,105 | 653,193 |
| Innospec, Inc. | | 6,416 | 652,058 |
| Intrepid Potash, Inc. (a) | | 2,699 | 69,580 |
| Koppers Holdings, Inc. | | 5,315 | 174,385 |
| Kronos Worldwide, Inc. (b) | | 5,130 | 47,709 |
| Livent Corp. (a)(b) | | 46,502 | 1,016,069 |
| LSB Industries, Inc. (a) | | 13,554 | 121,037 |
| Mativ, Inc. | | 14,076 | 272,652 |
| Minerals Technologies, Inc. | | 8,469 | 501,873 |
| NewMarket Corp. | | 1,733 | 692,507 |
| Olin Corp. | | 31,956 | 1,770,362 |
| Origin Materials, Inc. Class A (a)(b) | | 33,032 | 130,476 |
| Orion Engineered Carbons SA | | 14,599 | 353,442 |
| Perimeter Solutions SA (a)(b) | | 38,512 | 288,070 |
| PureCycle Technologies, Inc. (a)(b) | | 34,622 | 227,467 |
| Quaker Houghton | | 3,530 | 658,804 |
| Rayonier Advanced Materials, Inc. (a) | | 16,328 | 88,824 |
| RPM International, Inc. | | 33,443 | 2,743,329 |
| Sensient Technologies Corp. | | 10,879 | 810,050 |
| Stepan Co. | | 5,471 | 504,426 |
| The Chemours Co. LLC | | 38,516 | 1,119,660 |
| The Scotts Miracle-Gro Co. Class A (b) | | 10,590 | 707,518 |
| Trinseo PLC | | 9,234 | 167,320 |
| Tronox Holdings PLC | | 29,681 | 406,333 |
| Valvoline, Inc. | | 44,642 | 1,542,381 |
| Westlake Corp. | | 8,922 | 1,015,145 |
| | | | 27,838,483 |
| Construction Materials - 0.2% | | | |
| Eagle Materials, Inc. (b) | | 9,302 | 1,378,649 |
| Summit Materials, Inc. | | 30,693 | 841,295 |
| | | | 2,219,944 |
| Containers & Packaging - 1.3% | | | |
| Aptargroup, Inc. | | 16,885 | 2,001,041 |
| Ardagh Metal Packaging SA (b) | | 40,116 | 163,673 |
| Berry Global Group, Inc. | | 31,596 | 1,826,565 |
| Crown Holdings, Inc. | | 31,080 | 2,666,042 |
| Graphic Packaging Holding Co. | | 79,540 | 1,961,456 |
| Greif, Inc.: | | | |
| Class A | | 6,404 | 402,107 |
| Class B | | 1,577 | 124,173 |
| Myers Industries, Inc. | | 9,332 | 176,841 |
| O-I Glass, Inc. (a) | | 39,974 | 898,216 |
| Pactiv Evergreen, Inc. | | 10,229 | 80,809 |
| Ranpak Holdings Corp. (A Shares) (a) | | 9,938 | 40,547 |
| Sealed Air Corp. | | 37,493 | 1,799,289 |
| Silgan Holdings, Inc. | | 21,592 | 1,063,622 |
| Sonoco Products Co. | | 25,216 | 1,528,594 |
| TriMas Corp. | | 10,690 | 271,633 |
| WestRock Co. | | 66,002 | 1,975,440 |
| | | | 16,980,048 |
| Metals & Mining - 1.3% | | | |
| 5E Advanced Materials, Inc. (a)(b) | | 8,091 | 34,144 |
| Alcoa Corp. | | 45,903 | 1,704,837 |
| Alpha Metallurgical Resources | | 3,764 | 551,652 |
| Arconic Corp. (a) | | 26,331 | 651,692 |
| ATI, Inc. (a) | | 33,532 | 1,295,006 |
| Carpenter Technology Corp. | | 12,562 | 662,520 |
| Century Aluminum Co. (a) | | 12,767 | 109,669 |
| Cleveland-Cliffs, Inc. (a) | | 133,600 | 2,054,768 |
| Coeur d'Alene Mines Corp. (a) | | 71,489 | 243,063 |
| Commercial Metals Co. | | 30,367 | 1,417,835 |
| Compass Minerals International, Inc. | | 8,692 | 284,489 |
| Gatos Silver, Inc. (a) | | 11,944 | 71,306 |
| Haynes International, Inc. | | 3,221 | 151,419 |
| Hecla Mining Co. (b) | | 145,761 | 881,854 |
| Kaiser Aluminum Corp. | | 4,196 | 275,761 |
| Materion Corp. | | 5,319 | 576,101 |
| McEwen Mining, Inc. (a)(b) | | 9,570 | 78,474 |
| MP Materials Corp. (a)(b) | | 24,001 | 520,102 |
| Olympic Steel, Inc. | | 2,390 | 111,302 |
| Piedmont Lithium, Inc. (a)(b) | | 4,207 | 241,903 |
| Ramaco Resources, Inc. | | 6,426 | 52,243 |
| Royal Gold, Inc. | | 17,005 | 2,252,142 |
| Ryerson Holding Corp. | | 5,380 | 203,203 |
| Schnitzer Steel Industries, Inc. Class A | | 6,674 | 192,812 |
| SunCoke Energy, Inc. | | 21,965 | 170,888 |
| TimkenSteel Corp. (a) | | 10,442 | 174,799 |
| Tredegar Corp. | | 6,783 | 63,625 |
| United States Steel Corp. | | 58,568 | 1,340,036 |
| Warrior Metropolitan Coal, Inc. | | 13,396 | 463,100 |
| Worthington Industries, Inc. | | 7,856 | 466,568 |
| | | | 17,297,313 |
| Paper & Forest Products - 0.2% | | | |
| Clearwater Paper Corp. (a) | | 4,297 | 155,122 |
| Glatfelter Corp. | | 10,474 | 47,342 |
| Louisiana-Pacific Corp. | | 18,593 | 1,110,746 |
| Mercer International, Inc. (SBI) | | 10,886 | 105,921 |
| Sylvamo Corp. | | 8,312 | 380,856 |
| | | | 1,799,987 |
TOTAL MATERIALS | | | 66,135,775 |
| REAL ESTATE - 7.3% | | | |
| Equity Real Estate Investment Trusts (REITs) - 6.7% | | | |
| Acadia Realty Trust (SBI) | | 25,104 | 339,155 |
| Agree Realty Corp. | | 23,026 | 1,565,538 |
| Alexander & Baldwin, Inc. | | 19,175 | 368,735 |
| Alexanders, Inc. | | 584 | 108,665 |
| Alpine Income Property Trust, Inc. | | 3,760 | 60,461 |
| American Assets Trust, Inc. | | 13,850 | 252,070 |
| American Homes 4 Rent Class A | | 79,586 | 2,647,030 |
| Americold Realty Trust | | 69,803 | 2,065,471 |
| Apartment Income (REIT) Corp. | | 38,743 | 1,432,716 |
| Apartment Investment & Management Co. Class A | | 39,555 | 309,716 |
| Apple Hospitality (REIT), Inc. | | 55,373 | 824,504 |
| Armada Hoffler Properties, Inc. | | 18,002 | 210,983 |
| Ashford Hospitality Trust, Inc. (a) | | 8,684 | 29,526 |
| Boston Properties, Inc. | | 37,035 | 1,976,188 |
| Braemar Hotels & Resorts, Inc. (b) | | 16,400 | 62,320 |
| Brandywine Realty Trust (SBI) | | 45,539 | 178,968 |
| Brixmor Property Group, Inc. | | 77,925 | 1,662,140 |
| Broadstone Net Lease, Inc. | | 45,205 | 730,965 |
| Camden Property Trust (SBI) | | 28,593 | 3,146,660 |
| CareTrust (REIT), Inc. | | 25,884 | 504,479 |
| CBL & Associates Properties, Inc. | | 6,387 | 147,731 |
| Centerspace | | 3,954 | 222,927 |
| Chatham Lodging Trust | | 12,731 | 130,365 |
| City Office REIT, Inc. | | 10,298 | 59,934 |
| Community Healthcare Trust, Inc. | | 6,156 | 220,323 |
| Corporate Office Properties Trust (SBI) | | 29,384 | 672,600 |
| Cousins Properties, Inc. | | 39,456 | 860,535 |
| CTO Realty Growth, Inc. (b) | | 5,458 | 91,913 |
| CubeSmart | | 58,237 | 2,649,201 |
| DiamondRock Hospitality Co. | | 54,681 | 443,463 |
| Diversified Healthcare Trust (SBI) | | 61,445 | 56,124 |
| Douglas Emmett, Inc. | | 45,835 | 590,355 |
| Easterly Government Properties, Inc. | | 24,073 | 338,707 |
| EastGroup Properties, Inc. | | 11,314 | 1,884,460 |
| Elme Communities (SBI) | | 23,178 | 399,357 |
| Empire State Realty Trust, Inc. (b) | | 33,979 | 207,612 |
| EPR Properties | | 19,513 | 818,765 |
| Equity Commonwealth | | 28,600 | 592,592 |
| Equity Lifestyle Properties, Inc. | | 45,359 | 3,125,235 |
| Essential Properties Realty Trust, Inc. | | 37,108 | 918,423 |
| Farmland Partners, Inc. (b) | | 13,279 | 138,633 |
| Federal Realty Investment Trust (SBI) | | 19,010 | 1,879,899 |
| First Industrial Realty Trust, Inc. | | 34,403 | 1,805,125 |
| Four Corners Property Trust, Inc. | | 21,947 | 559,868 |
| Franklin Street Properties Corp. | | 22,300 | 25,868 |
| Getty Realty Corp. | | 11,111 | 370,330 |
| Gladstone Commercial Corp. | | 10,685 | 127,579 |
| Gladstone Land Corp. | | 8,924 | 143,766 |
| Global Medical REIT, Inc. | | 15,976 | 148,257 |
| Global Net Lease, Inc. | | 27,372 | 308,209 |
| Healthcare Trust of America, Inc. | | 98,746 | 1,953,196 |
| Hersha Hospitality Trust | | 8,483 | 53,443 |
| Highwoods Properties, Inc. (SBI) | | 27,456 | 629,292 |
| Hudson Pacific Properties, Inc. | | 32,952 | 183,213 |
| Independence Realty Trust, Inc. | | 58,424 | 972,760 |
| Indus Realty Trust, Inc. | | 1,309 | 87,140 |
| Industrial Logistics Properties Trust | | 16,834 | 34,678 |
| InvenTrust Properties Corp. | | 17,746 | 400,172 |
| JBG SMITH Properties | | 25,922 | 369,907 |
| Kilroy Realty Corp. | | 27,429 | 802,024 |
| Kimco Realty Corp. | | 160,501 | 3,080,014 |
| Kite Realty Group Trust | | 56,895 | 1,178,864 |
| Lamar Advertising Co. Class A | | 22,612 | 2,389,636 |
| Life Storage, Inc. | | 22,030 | 2,960,391 |
| LTC Properties, Inc. | | 10,538 | 352,496 |
| LXP Industrial Trust (REIT) | | 72,036 | 677,138 |
| Medical Properties Trust, Inc. (b) | | 155,446 | 1,363,261 |
| National Health Investors, Inc. | | 11,307 | 562,749 |
| National Retail Properties, Inc. | | 47,116 | 2,049,546 |
| National Storage Affiliates Trust | | 22,000 | 848,100 |
| Necessity Retail (REIT), Inc./The | | 34,498 | 190,084 |
| NETSTREIT Corp. | | 14,776 | 269,219 |
| NexPoint Diversified Real Estate Trust | | 8,721 | 92,966 |
| NexPoint Residential Trust, Inc. | | 5,960 | 255,863 |
| Office Properties Income Trust | | 13,320 | 86,846 |
| Omega Healthcare Investors, Inc. | | 60,776 | 1,626,366 |
| One Liberty Properties, Inc. | | 4,314 | 94,994 |
| Orion Office (REIT), Inc. | | 15,560 | 95,538 |
| Outfront Media, Inc. | | 38,058 | 634,046 |
| Paramount Group, Inc. | | 43,453 | 188,151 |
| Park Hotels & Resorts, Inc. | | 58,798 | 708,516 |
| Pebblebrook Hotel Trust | | 34,253 | 487,420 |
| Phillips Edison & Co., Inc. | | 30,564 | 963,989 |
| Physicians Realty Trust | | 59,521 | 858,293 |
| Piedmont Office Realty Trust, Inc. Class A | | 31,898 | 207,656 |
| Plymouth Industrial REIT, Inc. | | 10,258 | 207,622 |
| Postal Realty Trust, Inc. | | 4,871 | 74,867 |
| Potlatch Corp. (b) | | 21,015 | 971,523 |
| Rayonier, Inc. | | 38,294 | 1,200,900 |
| Regency Centers Corp. | | 39,969 | 2,455,296 |
| Retail Opportunity Investments Corp. | | 32,452 | 422,850 |
| Rexford Industrial Realty, Inc. | | 49,124 | 2,739,645 |
| RLJ Lodging Trust | | 42,394 | 428,179 |
| RPT Realty | | 22,403 | 208,348 |
| Ryman Hospitality Properties, Inc. | | 14,311 | 1,283,124 |
| Sabra Health Care REIT, Inc. | | 60,010 | 684,114 |
| Safehold, Inc. (b) | | 10,496 | 290,949 |
| Saul Centers, Inc. | | 3,543 | 127,654 |
| Service Properties Trust | | 43,178 | 378,671 |
| SITE Centers Corp. | | 48,180 | 594,541 |
| SL Green Realty Corp. | | 16,656 | 394,248 |
| Spirit Realty Capital, Inc. | | 36,327 | 1,397,136 |
| Stag Industrial, Inc. | | 46,618 | 1,578,952 |
| Star Holdings | | 3,604 | 58,169 |
| Summit Hotel Properties, Inc. | | 28,342 | 182,522 |
| Sunstone Hotel Investors, Inc. | | 54,904 | 523,235 |
| Tanger Factory Outlet Centers, Inc. | | 27,194 | 533,274 |
| Terreno Realty Corp. | | 19,036 | 1,172,427 |
| The Macerich Co. | | 55,999 | 559,430 |
| UMH Properties, Inc. | | 14,303 | 217,406 |
| Uniti Group, Inc. | | 61,288 | 209,605 |
| Universal Health Realty Income Trust (SBI) | | 3,453 | 150,206 |
| Urban Edge Properties | | 30,661 | 449,797 |
| Urstadt Biddle Properties, Inc. Class A | | 7,609 | 131,027 |
| Veris Residential, Inc. (a) | | 20,850 | 340,898 |
| Vornado Realty Trust | | 41,902 | 628,949 |
| Whitestone REIT Class B | | 11,949 | 106,944 |
| Xenia Hotels & Resorts, Inc. | | 29,894 | 378,458 |
| | | | 87,203,379 |
| Real Estate Management & Development - 0.6% | | | |
| Anywhere Real Estate, Inc. (a) | | 28,033 | 178,570 |
| Compass, Inc. (a) | | 66,095 | 154,662 |
| Cushman & Wakefield PLC (a)(b) | | 42,461 | 418,241 |
| Digitalbridge Group, Inc. | | 37,706 | 468,686 |
| Douglas Elliman, Inc. | | 16,633 | 53,059 |
| eXp World Holdings, Inc. | | 19,133 | 223,665 |
| Forestar Group, Inc. (a) | | 4,337 | 83,878 |
| Howard Hughes Corp. (a) | | 8,943 | 691,920 |
| Jones Lang LaSalle, Inc. (a) | | 12,317 | 1,712,556 |
| Kennedy-Wilson Holdings, Inc. | | 30,404 | 510,179 |
| Marcus & Millichap, Inc. | | 6,606 | 207,891 |
| Newmark Group, Inc. | | 32,020 | 203,007 |
| Opendoor Technologies, Inc. (a)(b) | | 129,227 | 178,333 |
| RE/MAX Holdings, Inc. | | 4,516 | 87,204 |
| Redfin Corp. (a)(b) | | 27,901 | 207,862 |
| Seritage Growth Properties (a) | | 8,927 | 66,863 |
| The RMR Group, Inc. | | 3,893 | 92,459 |
| The St. Joe Co. | | 8,778 | 360,776 |
| WeWork, Inc. (a)(b) | | 56,490 | 23,811 |
| Zillow Group, Inc.: | | | |
| Class A (a) | | 12,761 | 545,916 |
| Class C (a) | | 44,437 | 1,934,787 |
| | | | 8,404,325 |
TOTAL REAL ESTATE | | | 95,607,704 |
| UTILITIES - 3.0% | | | |
| Electric Utilities - 1.1% | | | |
| Allete, Inc. | | 14,802 | 923,349 |
| Avangrid, Inc. (b) | | 17,994 | 724,438 |
| Hawaiian Electric Industries, Inc. | | 28,362 | 1,112,074 |
| IDACORP, Inc. | | 13,074 | 1,452,783 |
| MGE Energy, Inc. | | 9,369 | 717,759 |
| NRG Energy, Inc. | | 59,714 | 2,040,427 |
| OGE Energy Corp. | | 51,849 | 1,946,411 |
| Otter Tail Corp. | | 10,787 | 776,125 |
| Pinnacle West Capital Corp. | | 29,297 | 2,298,643 |
| PNM Resources, Inc. | | 22,127 | 1,064,973 |
| Portland General Electric Co. (b) | | 23,102 | 1,169,423 |
| | | | 14,226,405 |
| Gas Utilities - 0.6% | | | |
| Chesapeake Utilities Corp. | | 4,605 | 568,718 |
| National Fuel Gas Co. | | 23,785 | 1,329,582 |
| New Jersey Resources Corp. | | 25,052 | 1,293,685 |
| Northwest Natural Holding Co. | | 9,091 | 426,913 |
| ONE Gas, Inc. | | 14,020 | 1,078,839 |
| Southwest Gas Holdings, Inc. | | 16,859 | 944,104 |
| Spire, Inc. | | 13,600 | 921,128 |
| UGI Corp. | | 54,297 | 1,839,582 |
| | | | 8,402,551 |
| Independent Power and Renewable Electricity Producers - 0.4% | | | |
| Altus Power, Inc. Class A (a)(b) | | 9,740 | 44,220 |
| Clearway Energy, Inc.: | | | |
| Class A | | 9,351 | 270,992 |
| Class C | | 20,947 | 636,160 |
| Montauk Renewables, Inc. (a)(b) | | 16,576 | 110,230 |
| Ormat Technologies, Inc. | | 13,594 | 1,166,501 |
| Sunnova Energy International, Inc. (a)(b) | | 25,755 | 462,560 |
| Vistra Corp. | | 96,918 | 2,312,463 |
| | | | 5,003,126 |
| Multi-Utilities - 0.5% | | | |
| Avista Corp. | | 19,095 | 841,517 |
| Black Hills Corp. | | 16,858 | 1,100,659 |
| NiSource, Inc. | | 105,201 | 2,994,020 |
| NorthWestern Energy Corp. | | 14,960 | 876,955 |
| Unitil Corp. | | 4,058 | 225,584 |
| | | | 6,038,735 |
| Water Utilities - 0.4% | | | |
| American States Water Co. | | 9,574 | 849,693 |
| Artesian Resources Corp. Class A | | 1,998 | 109,450 |
| California Water Service Group | | 14,219 | 797,402 |
| Consolidated Water Co., Inc. | | 3,677 | 62,141 |
| Essential Utilities, Inc. | | 61,866 | 2,641,678 |
| Middlesex Water Co. | | 4,599 | 335,635 |
| SJW Group | | 6,903 | 524,076 |
| York Water Co. | | 3,639 | 152,984 |
| | | | 5,473,059 |
TOTAL UTILITIES | | | 39,143,876 |
| TOTAL COMMON STOCKS (Cost $1,360,541,980) | | | 1,299,610,647 |
| | | | |
| U.S. Treasury Obligations - 0.0% |
| | | Principal Amount (e) | Value ($) |
U.S. Treasury Bills, yield at date of purchase 4.65% 6/29/23 (f) (Cost $198,505) | | 200,000 | 198,389 |
| | | | |
| Money Market Funds - 10.5% |
| | | Shares | Value ($) |
| Fidelity Cash Central Fund 4.88% (g) | | 744,600 | 744,749 |
| Fidelity Securities Lending Cash Central Fund 4.88% (g)(h) | | 136,714,128 | 136,727,800 |
| TOTAL MONEY MARKET FUNDS (Cost $137,472,549) | | | 137,472,549 |
| | | | |
| TOTAL INVESTMENT IN SECURITIES - 110.3% (Cost $1,498,213,034) | 1,437,281,585 |
NET OTHER ASSETS (LIABILITIES) - (10.3)% | (134,464,712) |
| NET ASSETS - 100.0% | 1,302,816,873 |
| | |
| Futures Contracts |
| | Number of contracts | Expiration Date | Notional Amount ($) | Value ($) | Unrealized Appreciation/ (Depreciation) ($) |
| Purchased | | | | | |
| | | | | | |
| Equity Index Contracts | | | | | |
| CME E-mini Russell 2000 Index Contracts (United States) | 14 | Jun 2023 | 1,242,360 | 21,449 | 21,449 |
| CME E-mini S&P MidCap 400 Index Contracts (United States) | 6 | Jun 2023 | 1,500,360 | 40,105 | 40,105 |
| | | | | | |
| TOTAL FUTURES CONTRACTS | | | | | 61,554 |
| The notional amount of futures purchased as a percentage of Net Assets is 0.2% |
For the period, the average monthly notional amount at value for futures contracts in the aggregate was $3,094,581.
Legend
| (b) | Security or a portion of the security is on loan at period end. |
| (d) | Security exempt from registration under Rule 144A of the Securities Act of 1933. These securities may be resold in transactions exempt from registration, normally to qualified institutional buyers. At the end of the period, the value of these securities amounted to $1,356,242 or 0.1% of net assets. |
| (e) | Amount is stated in United States dollars unless otherwise noted. |
| (f) | Security or a portion of the security was pledged to cover margin requirements for futures contracts. At period end, the value of securities pledged amounted to $198,389. |
| (g) | Affiliated fund that is generally available only to investment companies and other accounts managed by Fidelity Investments. The rate quoted is the annualized seven-day yield of the fund at period end. A complete unaudited listing of the fund's holdings as of its most recent quarter end is available upon request. In addition, each Fidelity Central Fund's financial statements are available on the SEC's website or upon request. |
| (h) | Investment made with cash collateral received from securities on loan. |
Affiliated Central Funds
Fiscal year to date information regarding the Fund's investments in Fidelity Central Funds, including the ownership percentage, is presented below.
| Affiliate | Value, beginning of period ($) | Purchases ($) | Sales Proceeds ($) | Dividend Income ($) | Realized Gain (loss) ($) | Change in Unrealized appreciation (depreciation) ($) | Value, end of period ($) | % ownership, end of period |
| Fidelity Cash Central Fund 4.88% | 4,450,016 | 114,667,498 | 118,372,765 | 102,014 | - | - | 744,749 | 0.0% |
| Fidelity Securities Lending Cash Central Fund 4.88% | 132,801,548 | 201,349,811 | 197,423,559 | 961,683 | - | - | 136,727,800 | 0.4% |
| Total | 137,251,564 | 316,017,309 | 315,796,324 | 1,063,697 | - | - | 137,472,549 | |
| | | | | | | | | |
Amounts in the dividend income column in the above table include any capital gain distributions from underlying funds, which are presented in the corresponding line item in the Statement of Operations, if applicable.
Amounts in the dividend income column for Fidelity Securities Lending Cash Central Fund represents the income earned on investing cash collateral, less rebates paid to borrowers and any lending agent fees associated with the loan, plus any premium payments received for lending certain types of securities.
Amounts included in the purchases and sales proceeds columns may include in-kind transactions, if applicable.
Investment Valuation
The following is a summary of the inputs used, as of April 30, 2023, involving the Fund's assets and liabilities carried at fair value. The inputs or methodology used for valuing securities may not be an indication of the risk associated with investing in those securities. For more information on valuation inputs, and their aggregation into the levels used below, please refer to the Investment Valuation section in the accompanying Notes to Financial Statements.
| Valuation Inputs at Reporting Date: |
| Description | Total ($) | Level 1 ($) | Level 2 ($) | Level 3 ($) |
Investments in Securities: | | | | |
|
| Equities: | | | | |
Communication Services | 40,168,122 | 40,168,122 | - | - |
Consumer Discretionary | 178,338,087 | 177,155,474 | 1,182,613 | - |
Consumer Staples | 49,382,996 | 49,382,995 | 1 | - |
Energy | 61,466,080 | 61,466,080 | - | - |
Financials | 202,230,384 | 202,230,384 | - | - |
Health Care | 172,846,470 | 172,694,460 | 125,539 | 26,471 |
Industrials | 247,440,449 | 247,440,449 | - | - |
Information Technology | 146,850,704 | 146,529,953 | 320,751 | - |
Materials | 66,135,775 | 66,135,775 | - | - |
Real Estate | 95,607,704 | 95,607,704 | - | - |
Utilities | 39,143,876 | 39,143,876 | - | - |
|
| U.S. Government and Government Agency Obligations | 198,389 | - | 198,389 | - |
|
| Money Market Funds | 137,472,549 | 137,472,549 | - | - |
| Total Investments in Securities: | 1,437,281,585 | 1,435,427,821 | 1,827,293 | 26,471 |
Derivative Instruments: | | | | |
|
| Assets | | | | |
Futures Contracts | 61,554 | 61,554 | - | - |
| Total Assets | 61,554 | 61,554 | - | - |
| Total Derivative Instruments: | 61,554 | 61,554 | - | - |
Value of Derivative Instruments
The following table is a summary of the Fund's value of derivative instruments by primary risk exposure as of April 30, 2023. For additional information on derivative instruments, please refer to the Derivative Instruments section in the accompanying Notes to Financial Statements.
Primary Risk Exposure / Derivative Type | Value |
| Asset ($) | Liability ($) |
| Equity Risk | | |
Futures Contracts (a) | 61,554 | 0 |
| Total Equity Risk | 61,554 | 0 |
| Total Value of Derivatives | 61,554 | 0 |
(a)Reflects gross cumulative appreciation (depreciation) on futures contracts as presented in the Schedule of Investments. In the Statement of Assets and Liabilities, the period end daily variation margin is included in receivable or payable for daily variation margin on futures contracts, and the net cumulative appreciation (depreciation) is included in Total accumulated earnings (loss).
Fidelity ZERO® Extended Market Index Fund
| Statement of Assets and Liabilities |
| | | | April 30, 2023 (Unaudited) |
| | | | | |
| Assets | | | | |
| Investment in securities, at value (including securities loaned of $133,155,269) - See accompanying schedule: | | | | |
Unaffiliated issuers (cost $1,360,740,485) | $ | 1,299,809,036 | | |
Fidelity Central Funds (cost $137,472,549) | | 137,472,549 | | |
| | | | | |
| | | | | |
| Total Investment in Securities (cost $1,498,213,034) | | | $ | 1,437,281,585 |
| Cash | | | | 2,003,206 |
| Foreign currency held at value (cost $522,822) | | | | 523,894 |
| Receivable for investments sold | | | | 13,837 |
| Receivable for fund shares sold | | | | 1,040,418 |
| Dividends receivable | | | | 565,390 |
| Distributions receivable from Fidelity Central Funds | | | | 227,940 |
| Receivable for daily variation margin on futures contracts | | | | 17,548 |
| Other receivables | | | | 13,357 |
Total assets | | | | 1,441,687,175 |
| Liabilities | | | | |
| Payable for investments purchased | $ | 1,297,203 | | |
| Payable for fund shares redeemed | | 844,812 | | |
| Collateral on securities loaned | | 136,728,287 | | |
| Total Liabilities | | | | 138,870,302 |
| Net Assets | | | $ | 1,302,816,873 |
| Net Assets consist of: | | | | |
| Paid in capital | | | $ | 1,371,799,652 |
| Total accumulated earnings (loss) | | | | (68,982,779) |
| Net Assets | | | $ | 1,302,816,873 |
Net Asset Value , offering price and redemption price per share ($1,302,816,873 ÷ 121,074,480 shares) | | | $ | 10.76 |
| Statement of Operations |
| | | | Six months ended April 30, 2023 (Unaudited) |
| Investment Income | | | | |
| Dividends | | | $ | 10,518,025 |
| Interest | | | | 5,157 |
| Income from Fidelity Central Funds (including $961,683 from security lending) | | | | 1,063,697 |
| Total Income | | | | 11,586,879 |
| Expenses | | | | |
| Independent trustees' fees and expenses | $ | 4,086 | | |
| Total expenses before reductions | | 4,086 | | |
| Expense reductions | | (2,958) | | |
| Total expenses after reductions | | | | 1,128 |
| Net Investment income (loss) | | | | 11,585,751 |
| Realized and Unrealized Gain (Loss) | | | | |
| Net realized gain (loss) on: | | | | |
| Investment Securities: | | | | |
| Unaffiliated issuers | | (7,212,771) | | |
| Redemptions in-kind | | 20,340,688 | | |
| Foreign currency transactions | | (5,053) | | |
| Futures contracts | | (283,793) | | |
| Total net realized gain (loss) | | | | 12,839,071 |
| Change in net unrealized appreciation (depreciation) on: | | | | |
| Investment Securities: | | | | |
| Unaffiliated issuers | | (21,615,776) | | |
| Assets and liabilities in foreign currencies | | 1,133 | | |
| Futures contracts | | (347,568) | | |
| Total change in net unrealized appreciation (depreciation) | | | | (21,962,211) |
| Net gain (loss) | | | | (9,123,140) |
| Net increase (decrease) in net assets resulting from operations | | | $ | 2,462,611 |
| Statement of Changes in Net Assets |
| |
| | Six months ended April 30, 2023 (Unaudited) | | Year ended October 31, 2022 |
| Increase (Decrease) in Net Assets | | | | |
| Operations | | | | |
| Net investment income (loss) | $ | 11,585,751 | $ | 20,572,367 |
| Net realized gain (loss) | | 12,839,071 | | 10,344,200 |
| Change in net unrealized appreciation (depreciation) | | (21,962,211) | | (280,915,122) |
| Net increase (decrease) in net assets resulting from operations | | 2,462,611 | | (249,998,555) |
| Distributions to shareholders | | (20,138,817) | | (92,792,463) |
| Share transactions | | | | |
| Proceeds from sales of shares | | 187,886,514 | | 414,184,532 |
| Reinvestment of distributions | | 18,225,185 | | 86,735,982 |
| Cost of shares redeemed | | (151,380,389) | | (287,442,103) |
Net increase (decrease) in net assets resulting from share transactions | | 54,731,310 | | 213,478,411 |
| Total increase (decrease) in net assets | | 37,055,104 | | (129,312,607) |
| | | | | |
| Net Assets | | | | |
| Beginning of period | | 1,265,761,769 | | 1,395,074,376 |
| End of period | $ | 1,302,816,873 | $ | 1,265,761,769 |
| | | | | |
| Other Information | | | | |
| Shares | | | | |
| Sold | | 17,141,926 | | 34,435,660 |
| Issued in reinvestment of distributions | | 1,734,080 | | 6,966,745 |
| Redeemed | | (13,896,022) | | (24,338,042) |
| Net increase (decrease) | | 4,979,984 | | 17,064,363 |
| | | | | |
Financial Highlights
| Fidelity ZERO® Extended Market Index Fund |
| |
| | Six months ended (Unaudited) April 30, 2023 | | Years ended October 31, 2022 | | 2021 | | 2020 | | 2019 | | 2018 A |
Selected Per-Share Data | | | | | | | | | | | | |
| Net asset value, beginning of period | $ | 10.90 | $ | 14.09 | $ | 9.48 | $ | 9.66 | $ | 8.99 | $ | 10.00 |
| Income from Investment Operations | | | | | | | | | | | | |
Net investment income (loss) B,C | | .10 | | .18 | | .18 | | .14 | | .15 | | .02 |
| Net realized and unrealized gain (loss) | | (.07) | | (2.46) | | 4.68 | | (.14) | | .56 | | (1.03) |
| Total from investment operations | | .03 | | (2.28) | | 4.86 | | - | | .71 | | (1.01) |
| Distributions from net investment income | | (.17) | | (.16) | | (.14) | | (.13) | | (.04) | | - |
| Distributions from net realized gain | | - | | (.75) | | (.11) | | (.06) | | - | | - |
| Total distributions | | (.17) | | (.91) | | (.25) | | (.18) D | | (.04) | | - |
| Net asset value, end of period | $ | 10.76 | $ | 10.90 | $ | 14.09 | $ | 9.48 | $ | 9.66 | $ | 8.99 |
Total Return E,F | | .34% | | (16.99)% | | 51.93% | | (.06)% | | 7.97% | | (10.10)% |
Ratios to Average Net Assets C,G,H | | | | | | | | | | | | |
Expenses before reductions I | | -% J | | -% | | -% | | -% | | -% | | -% J |
Expenses net of fee waivers, if any I | | -% J | | -% | | -% | | -% | | -% | | -% J |
Expenses net of all reductions I | | -% J | | -% | | -% | | -% | | -% | | -% J |
| Net investment income (loss) | | 1.78% J | | 1.57% | | 1.38% | | 1.55% | | 1.64% | | 1.31% J |
| Supplemental Data | | | | | | | | | | | | |
| Net assets, end of period (000 omitted) | $ | 1,302,817 | $ | 1,265,762 | $ | 1,395,074 | $ | 591,543 | $ | 452,039 | $ | 68,589 |
Portfolio turnover rate K | | 7% J,L | | 16% L | | 25% | | 26% | | 14% | | -% M,N |
A For the period September 13, 2018 (commencement of operations) through October 31, 2018.
B Calculated based on average shares outstanding during the period.
C Net investment income (loss) is affected by the timing of the declaration of dividends by any underlying mutual funds or exchange-traded funds (ETFs). Net investment income (loss) of any mutual funds or ETFs is not included in the Fund's net investment income (loss) ratio.
D Total distributions per share do not sum due to rounding.
E Total returns for periods of less than one year are not annualized.
F Total returns would have been lower if certain expenses had not been reduced during the applicable periods shown.
G Fees and expenses of any underlying mutual funds or exchange-traded funds (ETFs) are not included in the Fund's expense ratio. The Fund indirectly bears its proportionate share of these expenses. For additional expense information related to investments in Fidelity Central Funds, please refer to the "Investments in Fidelity Central Funds" note found in the Notes to Financial Statements section of the most recent Annual or Semi-Annual report.
H Expense ratios reflect operating expenses of the class. Expenses before reductions do not reflect amounts reimbursed, waived, or reduced through arrangements with the investment adviser, brokerage services, or other offset arrangements, if applicable, and do not represent the amount paid by the class during periods when reimbursements, waivers or reductions occur.
I Amount represents less than .005%.
J Annualized.
K Amount does not include the portfolio activity of any underlying mutual funds or exchange-traded funds (ETFs).
L Portfolio turnover rate excludes securities received or delivered in-kind.
M Amount not annualized.
N Amount represents less than 1%.
Top Holdings (% of Fund's net assets) |
| |
| Nestle SA (Reg. S) (United States of America, Food Products) | 1.4 | |
| Taiwan Semiconductor Manufacturing Co. Ltd. (Taiwan, Semiconductors & Semiconductor Equipment) | 1.2 | |
| Novo Nordisk A/S Series B (Denmark, Pharmaceuticals) | 1.0 | |
| Tencent Holdings Ltd. (China, Interactive Media & Services) | 1.0 | |
| ASML Holding NV (Netherlands) (Netherlands, Semiconductors & Semiconductor Equipment) | 1.0 | |
| Samsung Electronics Co. Ltd. (Korea (South), Technology Hardware, Storage & Peripherals) | 1.0 | |
| LVMH Moet Hennessy Louis Vuitton SE (France, Textiles, Apparel & Luxury Goods) | 1.0 | |
| Novartis AG (Switzerland, Pharmaceuticals) | 0.9 | |
| AstraZeneca PLC (United Kingdom) (United Kingdom, Pharmaceuticals) | 0.9 | |
| Roche Holding AG (participation certificate) (United States of America, Pharmaceuticals) | 0.9 | |
| | 10.3 | |
| |
| Market Sectors (% of Fund's net assets) |
| |
| Financials | 21.8 | |
| Industrials | 12.0 | |
| Consumer Discretionary | 11.2 | |
| Information Technology | 10.0 | |
| Health Care | 9.6 | |
| Consumer Staples | 8.3 | |
| Materials | 8.0 | |
| Communication Services | 5.4 | |
| Energy | 5.4 | |
| Utilities | 2.3 | |
| Real Estate | 1.9 | |
| |
Asset Allocation (% of Fund's net assets) |
|
Futures - 4.1% |
|
Geographic Diversification (% of Fund's net assets) |
|
* Includes Short-Term investments and Net Other Assets (Liabilities). Percentages are adjusted for the effect of derivatives, if applicable. |
| |
Fidelity ZERO® International Index Fund
Showing Percentage of Net Assets
| Common Stocks - 95.1% |
| | | Shares | Value ($) |
| Australia - 5.1% | | | |
| AGL Energy Ltd. | | 74,779 | 411,658 |
| Allkem Ltd. (a) | | 75,184 | 617,448 |
| ALS Ltd. | | 60,808 | 530,716 |
| Altium Ltd. | | 15,115 | 385,300 |
| Alumina Ltd. | | 299,982 | 304,464 |
| AMP Ltd. | | 395,292 | 298,864 |
| Ampol Ltd. | | 29,742 | 593,434 |
| AngloGold Ashanti Ltd. | | 52,944 | 1,415,011 |
| Ansell Ltd. | | 15,538 | 276,500 |
| ANZ Group Holdings Ltd. | | 380,045 | 6,171,265 |
| APA Group unit | | 154,188 | 1,052,709 |
| Aristocrat Leisure Ltd. | | 83,527 | 2,112,855 |
| ASX Ltd. | | 24,742 | 1,125,997 |
| Atlas Arteria Ltd. unit | | 150,576 | 654,679 |
| Aurizon Holdings Ltd. | | 225,925 | 513,674 |
| Bank of Queensland Ltd. | | 81,052 | 312,993 |
| Bendigo & Adelaide Bank Ltd. | | 70,300 | 404,734 |
| BHP Group Ltd. (b) | | 639,213 | 18,970,244 |
| BlueScope Steel Ltd. | | 58,254 | 774,296 |
| Brambles Ltd. | | 177,869 | 1,684,923 |
| carsales.com Ltd. | | 47,177 | 748,147 |
| Challenger Ltd. | | 72,291 | 290,901 |
| Charter Hall Group unit | | 58,264 | 433,476 |
| Cleanaway Waste Management Ltd. | | 276,507 | 445,303 |
| Cochlear Ltd. | | 8,301 | 1,361,095 |
| Coles Group Ltd. | | 171,777 | 2,075,097 |
| Commonwealth Bank of Australia | | 213,101 | 14,102,193 |
| Computershare Ltd. | | 71,971 | 1,071,347 |
| DEXUS Property Group unit | | 136,015 | 704,964 |
| Dominos Pizza Enterprises Ltd. | | 7,987 | 268,839 |
| EBOS Group Ltd. | | 20,329 | 557,889 |
| Endeavour Group Ltd. | | 169,051 | 761,947 |
| Evolution Mining Ltd. | | 230,753 | 544,111 |
| Flutter Entertainment PLC (a) | | 6,085 | 1,217,072 |
| Flutter Entertainment PLC (Ireland) (a) | | 13,315 | 2,657,063 |
| Fortescue Metals Group Ltd. (b) | | 213,015 | 2,980,427 |
| Glencore PLC | | 1,529,151 | 9,026,018 |
| Goodman Group unit | | 218,572 | 2,817,750 |
| IDP Education Ltd. | | 25,726 | 483,309 |
| IGO Ltd. | | 84,332 | 776,604 |
| Iluka Resources Ltd. | | 53,553 | 393,506 |
| Incitec Pivot Ltd. | | 241,867 | 515,326 |
| Insurance Australia Group Ltd. | | 311,764 | 1,032,902 |
| JB Hi-Fi Ltd. | | 13,629 | 403,360 |
| Lendlease Group unit | | 86,627 | 430,223 |
| Liontown Resources Ltd. (a) | | 236,967 | 435,786 |
| Lynas Rare Earths Ltd. (a) | | 113,876 | 489,087 |
| Macquarie Group Ltd. | | 45,978 | 5,608,940 |
| Magellan Financial Group Ltd. warrants 4/16/27 (a) | | 1,938 | 264 |
| Medibank Private Ltd. | | 355,287 | 840,808 |
| Metcash Ltd. | | 118,219 | 306,366 |
| Mineral Resources Ltd. | | 21,408 | 1,056,070 |
| Mirvac Group unit | | 493,903 | 792,925 |
| National Australia Bank Ltd. | | 396,808 | 7,639,014 |
| Newcrest Mining Ltd. | | 112,893 | 2,155,677 |
| NEXTDC Ltd. (a) | | 58,353 | 447,775 |
| Nine Entertainment Co. Holdings Ltd. | | 180,848 | 249,464 |
| Northern Star Resources Ltd. | | 144,676 | 1,290,483 |
| Orica Ltd. | | 56,402 | 608,793 |
| Origin Energy Ltd. | | 219,713 | 1,218,203 |
| Orora Ltd. | | 105,241 | 240,533 |
| OZ Minerals Ltd. | | 41,274 | 723,742 |
| Pilbara Minerals Ltd. | | 325,519 | 926,496 |
| Qantas Airways Ltd. (a) | | 114,502 | 504,948 |
| QBE Insurance Group Ltd. | | 189,495 | 1,937,738 |
| Qube Holdings Ltd. | | 217,423 | 444,803 |
| Ramsay Health Care Ltd. | | 23,854 | 1,025,752 |
| REA Group Ltd. | | 6,467 | 608,211 |
| Reece Ltd. | | 25,919 | 315,735 |
| Rio Tinto Ltd. | | 46,883 | 3,516,444 |
| Rio Tinto PLC | | 133,939 | 8,514,823 |
| Santos Ltd. | | 420,726 | 1,993,020 |
| Scentre Group unit | | 667,868 | 1,281,702 |
| SEEK Ltd. | | 44,596 | 727,642 |
| Sonic Healthcare Ltd. | | 61,525 | 1,450,326 |
| South32 Ltd. | | 576,991 | 1,631,011 |
| Steadfast Group Ltd. | | 128,323 | 505,902 |
| Stockland Corp. Ltd. unit | | 298,067 | 883,583 |
| Suncorp Group Ltd. | | 159,670 | 1,329,417 |
| Telstra Group Ltd. | | 502,512 | 1,457,897 |
| The GPT Group unit | | 238,369 | 700,930 |
| The Lottery Corp. Ltd. | | 281,608 | 944,227 |
| Transurban Group unit | | 388,695 | 3,876,571 |
| Treasury Wine Estates Ltd. | | 92,007 | 852,270 |
| Vicinity Centres unit | | 480,297 | 671,441 |
| Washington H. Soul Pattinson & Co. Ltd. | | 30,425 | 636,901 |
| Wesfarmers Ltd. | | 143,207 | 4,954,020 |
| Westpac Banking Corp. | | 444,507 | 6,653,906 |
| Whitehaven Coal Ltd. | | 116,077 | 557,028 |
| WiseTech Global Ltd. | | 22,403 | 1,026,186 |
| Woodside Energy Group Ltd. | | 239,874 | 5,442,821 |
| Woolworths Group Ltd. | | 154,687 | 3,990,436 |
| WorleyParsons Ltd. | | 45,722 | 459,391 |
TOTAL AUSTRALIA | | | 168,636,141 |
| Austria - 0.2% | | | |
| ams-OSRAM AG (a)(b) | | 32,810 | 225,377 |
| Andritz AG | | 8,982 | 582,454 |
| BAWAG Group AG (c) | | 10,449 | 508,447 |
| CA Immobilien Anlagen AG (a) | | 5,454 | 158,057 |
| Erste Group Bank AG | | 45,565 | 1,652,348 |
| Immofinanz AG (d) | | 7,756 | 0 |
| Lenzing AG (b) | | 1,487 | 97,165 |
| Mondi PLC | | 61,962 | 985,065 |
| Oesterreichische Post AG | | 4,147 | 159,935 |
| OMV AG | | 17,904 | 845,165 |
| Raiffeisen International Bank-Holding AG (a) | | 16,814 | 257,715 |
| UNIQA Insurance Group AG | | 15,017 | 134,529 |
| Verbund AG | | 3,887 | 346,502 |
| Voestalpine AG | | 14,328 | 495,428 |
| Wienerberger AG | | 13,507 | 406,316 |
TOTAL AUSTRIA | | | 6,854,503 |
| Belgium - 0.6% | | | |
| Ackermans & Van Haaren SA | | 2,798 | 492,065 |
| Aedifica SA | | 5,766 | 481,282 |
| Ageas | | 22,194 | 987,760 |
| Anheuser-Busch InBev SA NV | | 124,907 | 8,121,384 |
| Cofinimmo SA | | 3,775 | 360,436 |
| D'ieteren Group | | 2,817 | 529,241 |
| Elia Group SA/NV | | 4,607 | 631,511 |
| Euronav NV | | 18,666 | 318,805 |
| Galapagos NV (a) | | 5,942 | 230,545 |
| Groupe Bruxelles Lambert SA | | 12,497 | 1,119,537 |
| KBC Group NV | | 42,870 | 3,060,107 |
| Lotus Bakeries SA | | 51 | 351,793 |
| Sofina SA | | 1,996 | 457,034 |
| Solvay SA Class A | | 9,118 | 1,093,629 |
| UCB SA | | 15,992 | 1,487,614 |
| Umicore SA | | 25,821 | 846,736 |
| Warehouses de Pauw | | 19,424 | 580,458 |
| Warehouses de Pauw rights 5/12/23 (a)(e) | | 19,424 | 21,403 |
TOTAL BELGIUM | | | 21,171,340 |
| Brazil - 1.1% | | | |
| 3R Petroleum Oleo e Gas SA (a) | | 21,500 | 136,514 |
| 3R Petroleum Oleo e Gas SA rights 5/19/23 (a) | | 3,896 | 5,999 |
| Aliansce Sonae Shopping Centers SA | | 54,300 | 202,926 |
| Ambev SA | | 552,500 | 1,568,507 |
| Atacadao SA | | 62,500 | 134,704 |
| B3 SA - Brasil Bolsa Balcao | | 771,300 | 1,806,164 |
| Banco Bradesco SA | | 202,659 | 504,636 |
| Banco BTG Pactual SA unit | | 145,900 | 685,067 |
| Banco do Brasil SA | | 180,500 | 1,551,031 |
| BB Seguridade Participacoes SA | | 87,500 | 601,894 |
| BRF SA (a) | | 78,700 | 100,036 |
| CCR SA | | 146,200 | 397,757 |
| Centrais Eletricas Brasileiras SA (Electrobras) | | 155,051 | 1,052,263 |
| Companhia de Saneamento Basico do Estado de Sao Paulo (SABESP) | | 42,700 | 394,914 |
| Companhia Paranaense de Energia-COPEL | | 28,200 | 220,837 |
| Companhia Siderurgica Nacional SA (CSN) | | 74,200 | 211,392 |
| Compania de Saneamento do Parana | | 32,200 | 122,659 |
| Cosan SA | | 146,400 | 439,687 |
| Embraer SA (a) | | 87,600 | 341,071 |
| Energisa SA unit | | 36,200 | 303,372 |
| Eneva SA (a) | | 163,300 | 371,598 |
| ENGIE Brasil Energia SA | | 30,350 | 250,878 |
| Equatorial Energia SA | | 108,900 | 596,922 |
| Hapvida Participacoes e Investimentos SA (a)(c) | | 576,000 | 318,730 |
| Hypera SA | | 51,000 | 380,879 |
| Klabin SA unit | | 104,400 | 400,411 |
| Localiza Rent a Car SA | | 96,927 | 1,127,298 |
| Localiza Rent a Car SA rights 5/11/23 (a) | | 433 | 1,490 |
| Lojas Renner SA | | 126,740 | 402,494 |
| Magazine Luiza SA | | 368,980 | 247,082 |
| Multiplan Empreendimentos Imobiliarios SA | | 32,400 | 168,243 |
| Natura & Co. Holding SA | | 101,488 | 225,041 |
| Nu Holdings Ltd. (a) | | 288,607 | 1,489,212 |
| PagSeguro Digital Ltd. (a) | | 23,879 | 234,969 |
| Petro Rio SA (a) | | 87,300 | 608,219 |
| Petroleo Brasileiro SA - Petrobras (ON) | | 468,900 | 2,507,230 |
| Raia Drogasil SA | | 134,500 | 708,661 |
| Rede D'Oregon Sao Luiz SA (c) | | 108,305 | 496,599 |
| Rumo SA | | 141,900 | 560,454 |
| Sendas Distribuidora SA | | 150,100 | 369,848 |
| StoneCo Ltd. Class A (a) | | 32,973 | 406,227 |
| Suzano Papel e Celulose SA | | 98,053 | 782,411 |
| Telefonica Brasil SA | | 52,700 | 434,465 |
| TIM SA | | 103,400 | 290,228 |
| Totvs SA | | 54,500 | 280,378 |
| Transmissora Alianca de Energia Eletrica SA | | 26,600 | 194,495 |
| Ultrapar Participacoes SA | | 87,500 | 253,318 |
| Vale SA | | 488,343 | 7,088,503 |
| Vibra Energia SA | | 151,100 | 399,880 |
| Weg SA | | 186,700 | 1,539,176 |
| Wheaton Precious Metals Corp. | | 57,027 | 2,813,784 |
| XP, Inc. (depository receipt) (a) | | 32,774 | 476,254 |
| Yara International ASA | | 21,013 | 845,485 |
TOTAL BRAZIL | | | 38,052,292 |
| Cameroon - 0.0% | | | |
| Golar LNG Ltd. (a) | | 11,938 | 270,993 |
| Canada - 7.0% | | | |
| Agnico Eagle Mines Ltd. (Canada) | | 62,089 | 3,522,280 |
| Air Canada (a) | | 42,106 | 589,238 |
| Alamos Gold, Inc. | | 49,184 | 635,651 |
| Algonquin Power & Utilities Corp. | | 86,733 | 737,472 |
| Alimentation Couche-Tard, Inc. Class A (multi-vtg.) | | 96,830 | 4,832,745 |
| AltaGas Ltd. | | 35,413 | 619,469 |
| ARC Resources Ltd. | | 79,913 | 992,682 |
| ATCO Ltd. Class I (non-vtg.) | | 9,336 | 308,501 |
| B2Gold Corp. | | 135,715 | 533,905 |
| Bank of Montreal | | 88,864 | 8,010,452 |
| Bank of Nova Scotia | | 150,494 | 7,512,204 |
| Barrick Gold Corp. (Canada) | | 222,636 | 4,233,017 |
| BCE, Inc. | | 37,909 | 1,822,072 |
| BlackBerry Ltd. (a) | | 62,713 | 244,399 |
| Bombardier, Inc. Class B (sub. vtg.) (a) | | 10,771 | 465,232 |
| Brookfield Asset Management Ltd. Class A | | 45,321 | 1,519,341 |
| Brookfield Corp. (Canada) Class A | | 180,614 | 5,860,273 |
| Brookfield Infrastructure Corp. Class A | | 12,357 | 526,530 |
| CAE, Inc. (a) | | 39,581 | 890,744 |
| Cameco Corp. | | 54,508 | 1,498,633 |
| Canadian Imperial Bank of Commerce | | 114,724 | 4,809,627 |
| Canadian National Railway Co. | | 76,503 | 9,119,264 |
| Canadian Natural Resources Ltd. | | 140,051 | 8,534,237 |
| Canadian Pacific Kansas City Ltd. | | 117,305 | 9,246,909 |
| Canadian Tire Ltd. Class A (non-vtg.) | | 6,909 | 905,715 |
| Canadian Utilities Ltd. Class A (non-vtg.) | | 14,920 | 431,351 |
| CCL Industries, Inc. Class B | | 18,819 | 884,938 |
| Cenovus Energy, Inc. (Canada) | | 174,544 | 2,929,572 |
| CGI, Inc. Class A (sub. vtg.) (a) | | 26,864 | 2,726,552 |
| Constellation Software, Inc. | | 2,490 | 4,873,626 |
| Descartes Systems Group, Inc. (Canada) (a) | | 10,620 | 841,542 |
| Dollarama, Inc. | | 35,963 | 2,227,564 |
| Element Fleet Management Corp. | | 49,868 | 652,221 |
| Emera, Inc. | | 34,228 | 1,456,430 |
| Empire Co. Ltd. Class A (non-vtg.) | | 20,608 | 553,359 |
| Enbridge, Inc. | | 255,647 | 10,164,744 |
| Fairfax Financial Holdings Ltd. (sub. vtg.) | | 2,865 | 2,002,127 |
| Finning International, Inc. | | 19,399 | 502,712 |
| FirstService Corp. | �� | 4,972 | 747,901 |
| Fortis, Inc. | | 60,880 | 2,673,175 |
| Franco-Nevada Corp. | | 24,190 | 3,670,502 |
| George Weston Ltd. | | 8,337 | 1,119,435 |
| GFL Environmental, Inc. | | 21,769 | 790,680 |
| Gibson Energy, Inc. | | 18,772 | 318,536 |
| Gildan Activewear, Inc. | | 22,552 | 734,394 |
| Great-West Lifeco, Inc. | | 34,346 | 976,498 |
| Hydro One Ltd. (c) | | 40,919 | 1,198,410 |
| iA Financial Corp., Inc. | | 13,231 | 887,796 |
| Imperial Oil Ltd. | | 21,943 | 1,118,488 |
| Intact Financial Corp. | | 22,246 | 3,365,018 |
| Ivanhoe Mines Ltd. (a) | | 73,708 | 639,236 |
| Keyera Corp. | | 27,534 | 647,883 |
| Kinross Gold Corp. | | 156,889 | 790,901 |
| Loblaw Companies Ltd. | | 19,384 | 1,823,156 |
| Magna International, Inc. Class A (sub. vtg.) | | 33,533 | 1,748,364 |
| Manulife Financial Corp. | | 234,669 | 4,633,277 |
| MEG Energy Corp. (a) | | 33,701 | 561,165 |
| Methanex Corp. | | 8,561 | 383,234 |
| Metro, Inc. | | 30,254 | 1,724,334 |
| National Bank of Canada | | 42,417 | 3,162,999 |
| Northland Power, Inc. | | 32,703 | 802,821 |
| Nutrien Ltd. | | 65,727 | 4,559,679 |
| Nuvei Corp. (Canada) (a)(c) | | 8,402 | 341,202 |
| Onex Corp. (sub. vtg.) | | 8,905 | 410,070 |
| Open Text Corp. | | 34,481 | 1,305,842 |
| Pan American Silver Corp. | | 46,210 | 822,663 |
| Parkland Corp. | | 22,207 | 523,684 |
| Pembina Pipeline Corp. | | 70,532 | 2,321,827 |
| Power Corp. of Canada (sub. vtg.) | | 71,870 | 1,925,056 |
| Quebecor, Inc. Class B (sub. vtg.) | | 19,387 | 500,397 |
| Restaurant Brands International, Inc. | | 38,592 | 2,705,442 |
| RioCan (REIT) | | 17,929 | 277,633 |
| Ritchie Bros. Auctioneers, Inc. | | 22,933 | 1,312,150 |
| Rogers Communications, Inc. Class B (non-vtg.) | | 44,271 | 2,187,328 |
| Royal Bank of Canada | | 174,630 | 17,337,330 |
| Saputo, Inc. | | 30,356 | 785,983 |
| Shopify, Inc. Class A (a) | | 150,790 | 7,305,499 |
| SNC-Lavalin Group, Inc. | | 21,877 | 503,792 |
| SSR Mining, Inc. | | 25,118 | 359,663 |
| Stantec, Inc. | | 14,200 | 853,562 |
| Sun Life Financial, Inc. | | 73,978 | 3,628,872 |
| Suncor Energy, Inc. | | 170,782 | 5,347,140 |
| TC Energy Corp. | | 128,778 | 5,352,245 |
| Teck Resources Ltd. Class B (sub. vtg.) | | 56,646 | 2,638,616 |
| TELUS Corp. | | 60,060 | 1,273,147 |
| TFI International, Inc. (Canada) | | 9,763 | 1,052,215 |
| The Toronto-Dominion Bank | | 229,680 | 13,912,859 |
| Thomson Reuters Corp. | | 19,835 | 2,608,262 |
| TMX Group Ltd. | | 6,834 | 692,152 |
| Toromont Industries Ltd. | | 10,169 | 821,716 |
| Tourmaline Oil Corp. | | 40,278 | 1,809,589 |
| Tricon Residential, Inc. | | 34,473 | 276,323 |
| West Fraser Timber Co. Ltd. | | 7,545 | 545,750 |
| Whitecap Resources, Inc. | | 77,828 | 613,502 |
| WSP Global, Inc. | | 15,854 | 2,092,375 |
TOTAL CANADA | | | 231,739,098 |
| Chile - 0.1% | | | |
| Antofagasta PLC | | 42,902 | 787,459 |
| Banco de Chile | | 5,439,649 | 579,174 |
| Banco de Credito e Inversiones | | 7,332 | 221,163 |
| Banco Santander Chile | | 8,126,276 | 388,571 |
| Cencosud SA | | 158,349 | 322,681 |
| Compania Cervecerias Unidas SA | | 17,327 | 141,449 |
| Compania Sud Americana de Vapores SA | | 1,996,558 | 204,021 |
| Empresas CMPC SA | | 136,957 | 214,618 |
| Empresas COPEC SA | | 43,828 | 304,964 |
| Enel Americas SA | | 2,503,236 | 341,104 |
| Enel Chile SA | | 2,994,578 | 170,642 |
| Falabella SA | | 91,374 | 195,935 |
| Lundin Mining Corp. | | 82,997 | 634,033 |
| Parque Arauco SA | | 91,986 | 130,359 |
TOTAL CHILE | | | 4,636,173 |
| China - 6.7% | | | |
| AAC Technology Holdings, Inc. | | 88,000 | 186,048 |
| Agricultural Bank of China Ltd. (H Shares) | | 3,852,000 | 1,489,310 |
| Airtac International Group | | 17,650 | 640,150 |
| Akeso, Inc. (a)(c) | | 56,000 | 307,563 |
| Alibaba Group Holding Ltd. sponsored ADR (a) | | 245,680 | 20,806,639 |
| Alibaba Health Information Technology Ltd. (a) | | 546,000 | 393,562 |
| Aluminum Corp. of China Ltd. (H Shares) | | 518,000 | 307,723 |
| Anhui Conch Cement Co. Ltd. (H Shares) | | 144,000 | 454,683 |
| Anta Sports Products Ltd. | | 137,400 | 1,707,364 |
| Autohome, Inc. ADR Class A | | 7,066 | 209,507 |
| Baidu, Inc. sponsored ADR (a) | | 35,141 | 4,238,356 |
| Bank of China Ltd. (H Shares) | | 9,775,000 | 3,903,726 |
| Bank of Communications Co. Ltd. (H Shares) | | 2,686,000 | 1,734,888 |
| BeiGene Ltd. ADR (a) | | 8,351 | 2,129,171 |
| Bilibili, Inc. ADR (a) | | 28,595 | 582,194 |
| BOC Hong Kong (Holdings) Ltd. | | 453,500 | 1,431,574 |
| BYD Co. Ltd. (H Shares) | | 109,707 | 3,327,002 |
| BYD Electronic International Co. Ltd. | | 93,500 | 283,561 |
| CGN Power Co. Ltd. (H Shares) (c) | | 1,444,000 | 381,307 |
| China CITIC Bank Corp. Ltd. (H Shares) | | 1,155,000 | 624,815 |
| China Coal Energy Co. Ltd. (H Shares) | | 267,000 | 229,409 |
| China Conch Venture Holdings Ltd. | | 198,500 | 316,712 |
| China Construction Bank Corp. (H Shares) | | 12,437,000 | 8,314,463 |
| China Everbright International Ltd. | | 470,000 | 199,527 |
| China Evergrande New Energy Vehicle Group Ltd. (a)(b)(d) | | 366,500 | 112,056 |
| China Feihe Ltd. (c) | | 429,000 | 289,699 |
| China Galaxy Securities Co. Ltd. (H Shares) | | 465,500 | 252,837 |
| China Gas Holdings Ltd. | | 389,200 | 500,694 |
| China Hongqiao Group Ltd. | | 238,000 | 234,425 |
| China International Capital Corp. Ltd. (H Shares) (c) | | 191,200 | 401,762 |
| China Life Insurance Co. Ltd. (H Shares) | | 945,000 | 1,815,492 |
| China Literature Ltd. (a)(c) | | 51,200 | 236,548 |
| China Longyuan Power Grid Corp. Ltd. (H Shares) | | 419,000 | 439,726 |
| China Medical System Holdings Ltd. | | 160,000 | 265,619 |
| China Mengniu Dairy Co. Ltd. | | 386,000 | 1,558,117 |
| China Merchants Bank Co. Ltd. (H Shares) | | 420,500 | 2,029,807 |
| China Merchants Holdings International Co. Ltd. | | 162,346 | 240,893 |
| China Minsheng Banking Corp. Ltd. (H Shares) | | 789,500 | 290,019 |
| China National Building Materials Co. Ltd. (H Shares) | | 584,000 | 438,181 |
| China Overseas Land and Investment Ltd. | | 467,500 | 1,185,647 |
| China Pacific Insurance (Group) Co. Ltd. (H Shares) | | 297,600 | 888,941 |
| China Petroleum & Chemical Corp. (H Shares) | | 3,122,000 | 2,046,208 |
| China Power International Development Ltd. | | 601,000 | 228,139 |
| China Railway Group Ltd. (H Shares) | | 536,000 | 412,098 |
| China Resource Gas Group Ltd. | | 113,900 | 359,507 |
| China Resources Beer Holdings Co. Ltd. | | 196,000 | 1,514,057 |
| China Resources Land Ltd. | | 360,000 | 1,676,432 |
| China Resources Mixc Lifestyle Services Ltd. (c) | | 74,755 | 396,322 |
| China Resources Power Holdings Co. Ltd. | | 224,000 | 487,699 |
| China Shenhua Energy Co. Ltd. (H Shares) | | 430,500 | 1,429,927 |
| China State Construction International Holdings Ltd. | | 212,000 | 263,580 |
| China Taiping Insurance Group Ltd. | | 174,800 | 200,785 |
| China Tower Corp. Ltd. (H Shares) (c) | | 5,866,000 | 748,639 |
| China Vanke Co. Ltd. (H Shares) | | 280,200 | 438,035 |
| ChinaSoft International Ltd. | | 322,000 | 214,659 |
| Chow Tai Fook Jewellery Group Ltd. | | 274,600 | 551,455 |
| CIFI Holdings Group Co. Ltd. (d) | | 507,495 | 49,135 |
| CITIC Pacific Ltd. | | 793,000 | 995,446 |
| CITIC Securities Co. Ltd. (H Shares) | | 170,875 | 359,795 |
| Cmoc Group Ltd. (H Shares) | | 450,000 | 275,860 |
| COSCO SHIPPING Holdings Co. Ltd. (H Shares) | | 408,000 | 473,900 |
| Country Garden Holdings Co. Ltd. | | 1,343,120 | 345,988 |
| Country Garden Services Holdings Co. Ltd. | | 238,000 | 374,029 |
| CRRC Corp. Ltd. (H Shares) | | 538,000 | 348,141 |
| CSPC Pharmaceutical Group Ltd. | | 1,074,160 | 1,093,814 |
| Daqo New Energy Corp. ADR (a) | | 7,573 | 347,752 |
| ENN Energy Holdings Ltd. | | 97,100 | 1,331,397 |
| ESR Group Ltd. (c) | | 308,800 | 482,699 |
| Far East Horizon Ltd. | | 225,000 | 202,415 |
| Far East Horizon Ltd. rights (a) | | 1,890 | 0 |
| Full Truck Alliance Co. Ltd. ADR (a) | | 81,592 | 522,189 |
| Fuyao Glass Industries Group Co. Ltd. (H Shares) (c) | | 75,200 | 305,935 |
| Ganfeng Lithium Group Co. Ltd. (H Shares) (c) | | 48,720 | 321,443 |
| GCL Technology Holdings Ltd. | | 2,403,000 | 603,372 |
| Geely Automobile Holdings Ltd. | | 611,000 | 758,522 |
| Genscript Biotech Corp. (a) | | 130,000 | 343,639 |
| GF Securities Co. Ltd. (H Shares) | | 145,000 | 208,227 |
| Great Wall Motor Co. Ltd. (H Shares) | | 318,000 | 385,917 |
| Guangdong Investment Ltd. | | 366,000 | 349,887 |
| Guangzhou Automobile Group Co. Ltd. (H Shares) | | 338,000 | 210,952 |
| H World Group Ltd. ADR | | 18,164 | 851,892 |
| Haidilao International Holding Ltd. (c) | | 148,000 | 361,846 |
| Haier Smart Home Co. Ltd. | | 289,000 | 942,020 |
| Haitong Securities Co. Ltd. (H Shares) | | 365,600 | 242,834 |
| Hansoh Pharmaceutical Group Co. Ltd. (c) | | 128,000 | 233,511 |
| Hengan International Group Co. Ltd. | | 82,000 | 366,250 |
| Hua Hong Semiconductor Ltd. (a)(c) | | 72,000 | 295,856 |
| Huatai Securities Co. Ltd. (H Shares) (c) | | 191,600 | 247,474 |
| Hygeia Healthcare Holdings Co. (c) | | 43,400 | 319,823 |
| Industrial & Commercial Bank of China Ltd. (H Shares) | | 8,957,000 | 4,818,904 |
| Innovent Biologics, Inc. (a)(c) | | 146,000 | 701,979 |
| iQIYI, Inc. ADR (a) | | 57,684 | 351,872 |
| JD Health International, Inc. (a)(c) | | 134,100 | 967,682 |
| JD Logistics, Inc. (a)(c) | | 243,100 | 379,873 |
| JD.com, Inc. sponsored ADR | | 151,013 | 5,394,184 |
| JinkoSolar Holdings Co. Ltd. ADR (a)(b) | | 5,049 | 250,481 |
| Kanzhun Ltd. ADR (a) | | 25,882 | 478,558 |
| KE Holdings, Inc. ADR (a) | | 84,852 | 1,331,328 |
| Kingboard Chemical Holdings Ltd. | | 77,500 | 237,362 |
| Kingdee International Software Group Co. Ltd. (a) | | 345,000 | 530,494 |
| Kingsoft Corp. Ltd. | | 120,000 | 527,487 |
| Kuaishou Technology Class B (a)(c) | | 249,000 | 1,648,415 |
| Kunlun Energy Co. Ltd. | | 508,000 | 470,920 |
| Lenovo Group Ltd. | | 930,000 | 951,461 |
| Li Auto, Inc. ADR (a) | | 71,966 | 1,691,201 |
| Li Ning Co. Ltd. | | 298,500 | 2,134,758 |
| Longfor Properties Co. Ltd. (c) | | 211,500 | 578,769 |
| Meituan Class B (a)(c) | | 596,090 | 10,187,451 |
| Microport Scientific Corp. (a) | | 89,900 | 199,478 |
| Minth Group Ltd. | | 88,000 | 254,812 |
| NetEase, Inc. ADR | | 46,714 | 4,163,619 |
| New China Life Insurance Co. Ltd. (H Shares) | | 108,800 | 311,554 |
| New Oriental Education & Technology Group, Inc. sponsored ADR (a) | | 19,174 | 874,143 |
| NIO, Inc. sponsored ADR (a)(b) | | 178,552 | 1,405,204 |
| Nongfu Spring Co. Ltd. (H Shares) (c) | | 225,600 | 1,224,050 |
| PDD Holdings, Inc. ADR (a) | | 68,624 | 4,676,726 |
| People's Insurance Co. of China Group Ltd. (H Shares) | | 996,000 | 391,727 |
| PetroChina Co. Ltd. (H Shares) | | 2,664,000 | 1,850,507 |
| PICC Property & Casualty Co. Ltd. (H Shares) | | 882,000 | 1,066,742 |
| Ping An Insurance Group Co. of China Ltd. (H Shares) | | 780,000 | 5,690,506 |
| Pop Mart International Group Ltd. (c) | | 87,800 | 212,986 |
| Postal Savings Bank of China Co. Ltd. (H Shares) (c) | | 998,000 | 650,689 |
| Prosus NV | | 146,723 | 10,979,800 |
| Qifu Technology, Inc. ADR | | 18,219 | 321,383 |
| Shandong Weigao Medical Polymer Co. Ltd. (H Shares) | | 319,600 | 545,363 |
| Shanghai Fosun Pharmaceutical (Group) Co. Ltd. (H Shares) | | 55,500 | 158,652 |
| Shenzhou International Group Holdings Ltd. | | 100,100 | 961,477 |
| Silergy Corp. | | 41,000 | 646,705 |
| Sinopharm Group Co. Ltd. (H Shares) | | 164,400 | 582,351 |
| SITC International Holdings Co. Ltd. | | 170,000 | 314,446 |
| Smoore International Holdings Ltd. (c) | | 225,000 | 263,029 |
| Sunny Optical Technology Group Co. Ltd. | | 89,500 | 945,774 |
| TAL Education Group ADR (a) | | 64,280 | 376,681 |
| Tencent Holdings Ltd. | | 760,600 | 33,782,898 |
| Tencent Music Entertainment Group ADR (a) | | 81,494 | 603,871 |
| Tingyi (Cayman Islands) Holding Corp. | | 248,000 | 433,393 |
| Tongcheng Travel Holdings Ltd. (a) | | 131,200 | 279,089 |
| Topsports International Holdings Ltd. (c) | | 337,000 | 300,415 |
| Trip.com Group Ltd. ADR (a) | | 67,946 | 2,412,762 |
| Tsingtao Brewery Co. Ltd. (H Shares) | | 68,000 | 727,983 |
| Vipshop Holdings Ltd. ADR (a) | | 43,266 | 679,276 |
| Want Want China Holdings Ltd. | | 650,000 | 414,541 |
| Weichai Power Co. Ltd. (H Shares) | | 260,000 | 384,317 |
| Wharf Holdings Ltd. | | 160,000 | 365,858 |
| Wilmar International Ltd. | | 387,300 | 1,143,975 |
| WuXi AppTec Co. Ltd. (H Shares) (c) | | 49,784 | 437,847 |
| Wuxi Biologics (Cayman), Inc. (a)(c) | | 451,000 | 2,689,241 |
| Xiaomi Corp. Class B (a)(c) | | 1,822,800 | 2,587,291 |
| Xinyi Solar Holdings Ltd. | | 589,097 | 633,337 |
| XPeng, Inc. ADR (a) | | 67,707 | 643,217 |
| Yadea Group Holdings Ltd. (c) | | 146,000 | 341,352 |
| Yangzijiang Shipbuilding Holdings Ltd. | | 327,900 | 305,780 |
| Yankuang Energy Group Co. Ltd. (H Shares) | | 180,000 | 617,504 |
| Yum China Holdings, Inc. | | 52,896 | 3,236,177 |
| Zai Lab Ltd. ADR (a) | | 10,048 | 351,479 |
| Zhaojin Mining Industry Co. Ltd. (H Shares) | | 171,000 | 272,211 |
| ZhongAn Online P & C Insurance Co. Ltd. (H Shares) (a)(c) | | 79,200 | 246,552 |
| Zhongsheng Group Holdings Ltd. Class H | | 73,500 | 313,956 |
| Zhuzhou CRRC Times Electric Co. Ltd. (H Shares) | | 65,500 | 264,358 |
| Zijin Mining Group Co. Ltd. (H Shares) | | 714,000 | 1,208,842 |
| ZTE Corp. (H Shares) | | 96,000 | 309,195 |
| ZTO Express, Inc. sponsored ADR | | 52,289 | 1,447,360 |
TOTAL CHINA | | | 221,034,879 |
| Colombia - 0.0% | | | |
| Bancolombia SA | | 36,729 | 281,448 |
| Czech Republic - 0.0% | | | |
| CEZ A/S | | 20,156 | 1,082,674 |
| Komercni Banka A/S | | 9,158 | 295,280 |
| MONETA Money Bank A/S (c) | | 43,726 | 160,336 |
TOTAL CZECH REPUBLIC | | | 1,538,290 |
| Denmark - 1.9% | | | |
| A.P. Moller - Maersk A/S: | | | |
| Series A | | 383 | 682,260 |
| Series B | | 696 | 1,258,057 |
| Ascendis Pharma A/S sponsored ADR (a) | | 6,399 | 447,674 |
| Carlsberg A/S Series B | | 12,489 | 2,063,191 |
| Chr. Hansen Holding A/S | | 13,128 | 1,020,431 |
| Coloplast A/S Series B | | 15,102 | 2,172,259 |
| Danske Bank A/S (a) | | 86,380 | 1,820,307 |
| Demant A/S (a) | | 11,988 | 512,873 |
| DSV A/S | | 22,665 | 4,256,912 |
| Genmab A/S (a) | | 8,334 | 3,424,980 |
| Novo Nordisk A/S Series B | | 206,749 | 34,393,626 |
| Novozymes A/S Series B | | 26,723 | 1,388,198 |
| ORSTED A/S (c) | | 23,764 | 2,131,014 |
| Pandora A/S | | 12,233 | 1,128,811 |
| SimCorp A/S | | 4,849 | 524,362 |
| Tryg A/S | | 45,004 | 1,061,148 |
| Vestas Wind Systems A/S | | 127,362 | 3,524,182 |
TOTAL DENMARK | | | 61,810,285 |
| Egypt - 0.0% | | | |
| Abou Kir Fertilizers & Chemical Industries | | 42,838 | 69,858 |
| Commercial International Bank SAE | | 301,283 | 520,664 |
| EFG-Hermes Holding SAE | | 103,844 | 61,332 |
| Talaat Moustafa Group Holding | | 179,895 | 55,540 |
TOTAL EGYPT | | | 707,394 |
| Finland - 0.8% | | | |
| Elisa Corp. (A Shares) | | 18,769 | 1,164,786 |
| Fortum Corp. | | 55,515 | 827,657 |
| Huhtamaki Oyj | | 11,778 | 423,608 |
| Kesko Oyj | | 33,973 | 707,706 |
| Kone OYJ (B Shares) | | 50,780 | 2,892,847 |
| Metso Outotec Oyj | | 88,571 | 975,964 |
| Neste OYJ | | 54,759 | 2,651,293 |
| Nokia Corp. | | 676,546 | 2,862,568 |
| Nordea Bank ABP | | 404,769 | 4,492,500 |
| Orion Oyj (B Shares) | | 13,504 | 634,188 |
| Sampo Oyj (A Shares) | | 60,728 | 3,075,468 |
| Stora Enso Oyj (R Shares) | | 77,628 | 983,690 |
| UPM-Kymmene Corp. | | 67,917 | 2,162,811 |
| Valmet Corp. | | 20,880 | 704,495 |
| Wartsila Corp. | | 59,865 | 692,635 |
TOTAL FINLAND | | | 25,252,216 |
| France - 6.3% | | | |
| Accor SA | | 20,941 | 741,165 |
| Adevinta ASA Class B (a) | | 32,470 | 249,838 |
| Air Liquide SA | | 66,111 | 11,892,723 |
| Airbus Group NV | | 77,713 | 10,882,511 |
| Alstom SA | | 38,601 | 970,220 |
| Arkema SA | | 8,033 | 793,277 |
| AXA SA | | 251,482 | 8,208,415 |
| BNP Paribas SA | | 143,509 | 9,272,603 |
| Bouygues SA | | 26,303 | 962,245 |
| Bureau Veritas SA | | 35,961 | 1,035,809 |
| Capgemini SA | | 20,044 | 3,642,061 |
| Carrefour SA | | 73,914 | 1,537,456 |
| Compagnie de Saint-Gobain | | 65,214 | 3,775,546 |
| Compagnie Generale des Etablissements Michelin SCA Series B | | 90,986 | 2,897,685 |
| Credit Agricole SA | | 173,824 | 2,124,742 |
| Danone SA | | 80,245 | 5,310,908 |
| Dassault Systemes SA | | 87,648 | 3,541,564 |
| Edenred SA | | 31,826 | 2,066,270 |
| Eiffage SA | | 9,686 | 1,151,617 |
| Engie SA | | 233,310 | 3,731,836 |
| EssilorLuxottica SA | | 38,465 | 7,603,794 |
| Gecina SA | | 6,719 | 747,030 |
| Getlink SE | | 50,116 | 936,579 |
| Hermes International SCA | | 4,393 | 9,520,584 |
| Kering SA | | 9,102 | 5,814,098 |
| L'Oreal SA | | 31,763 | 15,146,098 |
| Legrand SA | | 33,729 | 3,185,125 |
| LVMH Moet Hennessy Louis Vuitton SE | | 32,954 | 31,697,837 |
| Orange SA | | 239,869 | 3,122,115 |
| Pernod Ricard SA | | 25,762 | 5,944,269 |
| Publicis Groupe SA | | 29,902 | 2,444,700 |
| Renault SA | | 26,627 | 986,714 |
| Safran SA | | 44,338 | 6,895,435 |
| Sartorius Stedim Biotech | | 3,057 | 816,863 |
| Societe Generale Series A | | 95,434 | 2,317,927 |
| Sodexo SA | | 10,563 | 1,131,347 |
| Teleperformance | | 7,533 | 1,500,751 |
| Thales SA | | 13,489 | 2,057,112 |
| TotalEnergies SE | | 295,629 | 18,890,676 |
| Unibail-Rodamco SE & WFD Unibail-Rodamco NV unit (a) | | 13,345 | 713,774 |
| Veolia Environnement SA | | 84,111 | 2,663,370 |
| VINCI SA | | 66,940 | 8,276,005 |
| Vivendi SA | | 100,922 | 1,106,944 |
| Worldline SA (a)(c) | | 31,625 | 1,372,298 |
TOTAL FRANCE | | | 209,679,936 |
| Germany - 4.9% | | | |
| adidas AG | | 22,592 | 3,978,586 |
| Allianz SE | | 50,903 | 12,782,092 |
| BASF AG | | 116,167 | 5,997,007 |
| Bayer AG | | 124,150 | 8,193,437 |
| Bayerische Motoren Werke AG (BMW) | | 40,221 | 4,495,772 |
| Beiersdorf AG | | 12,476 | 1,740,409 |
| BioNTech SE ADR | | 11,571 | 1,321,871 |
| Brenntag SE | | 19,823 | 1,611,574 |
| Carl Zeiss Meditec AG | | 4,613 | 619,117 |
| Commerzbank AG | | 134,099 | 1,487,242 |
| Continental AG | | 13,518 | 944,672 |
| Covestro AG (c) | | 24,454 | 1,072,808 |
| Daimler Truck Holding AG | | 65,958 | 2,176,013 |
| Deutsche Bank AG | | 260,546 | 2,854,592 |
| Deutsche Borse AG | | 23,946 | 4,566,709 |
| Deutsche Lufthansa AG (a) | | 76,132 | 816,248 |
| Deutsche Post AG | | 125,356 | 6,029,573 |
| Deutsche Telekom AG | | 440,469 | 10,620,485 |
| E.ON SE | | 284,480 | 3,763,189 |
| Evonik Industries AG | | 26,036 | 566,896 |
| Fresenius Medical Care AG & Co. KGaA | | 24,861 | 1,206,354 |
| Fresenius SE & Co. KGaA | | 51,655 | 1,492,407 |
| GEA Group AG | | 20,512 | 961,496 |
| Hannover Reuck SE | | 7,642 | 1,630,251 |
| HeidelbergCement AG | | 18,372 | 1,387,936 |
| HelloFresh AG (a) | | 21,666 | 578,461 |
| Henkel AG & Co. KGaA | | 12,384 | 914,277 |
| Infineon Technologies AG | | 164,903 | 6,005,235 |
| K+S AG | | 23,916 | 476,727 |
| Knorr-Bremse AG | | 8,242 | 576,153 |
| LEG Immobilien AG | | 9,244 | 574,285 |
| Mercedes-Benz Group AG (Germany) | | 98,621 | 7,691,060 |
| Merck KGaA | | 16,292 | 2,918,123 |
| MTU Aero Engines AG | | 6,841 | 1,791,806 |
| Muenchener Rueckversicherungs-Gesellschaft AG in Muenchen | | 17,650 | 6,622,226 |
| Nemetschek SE | | 6,855 | 533,128 |
| Puma AG | | 12,795 | 746,673 |
| Rheinmetall AG | | 5,474 | 1,601,443 |
| RWE AG | | 85,306 | 3,999,644 |
| SAP SE | | 138,120 | 18,689,873 |
| Scout24 AG (c) | | 10,135 | 630,978 |
| Siemens AG | | 94,468 | 15,571,372 |
| Siemens Energy AG (a) | | 50,336 | 1,230,219 |
| Siemens Healthineers AG (c) | | 35,832 | 2,227,647 |
| Symrise AG | | 16,799 | 2,029,698 |
| Vonovia SE | | 100,595 | 2,181,756 |
| Zalando SE (a)(c) | | 28,177 | 1,154,063 |
TOTAL GERMANY | | | 161,061,583 |
| Greece - 0.1% | | | |
| Alpha Bank SA (a) | | 243,901 | 305,036 |
| Eurobank Ergasias Services and Holdings SA (a) | | 311,590 | 439,477 |
| Hellenic Telecommunications Organization SA | | 25,813 | 376,874 |
| Jumbo SA | | 13,273 | 305,673 |
| Motor Oil (HELLAS) Corinth Refineries SA | | 7,803 | 185,720 |
| Mytilineos SA | | 13,078 | 379,000 |
| National Bank of Greece SA (a) | | 69,388 | 362,414 |
| OPAP SA | | 24,258 | 413,244 |
| Piraeus Financial Holdings SA (a) | | 77,461 | 182,658 |
| Public Power Corp. of Greece (a) | | 26,500 | 228,347 |
| Star Bulk Carriers Corp. (b) | | 9,697 | 204,704 |
| Terna Energy SA | | 6,405 | 141,718 |
TOTAL GREECE | | | 3,524,865 |
| Guatemala - 0.0% | | | |
| Millicom International Cellular SA (depository receipt) (a) | | 21,737 | 389,272 |
| Hong Kong - 1.6% | | | |
| AIA Group Ltd. | | 1,475,600 | 16,064,969 |
| ASMPT Ltd. | | 39,900 | 313,700 |
| CK Asset Holdings Ltd. | | 248,829 | 1,471,357 |
| CK Infrastructure Holdings Ltd. | | 76,000 | 432,697 |
| CLP Holdings Ltd. | | 213,000 | 1,585,940 |
| Futu Holdings Ltd. ADR (a)(b) | | 9,174 | 406,133 |
| Hang Lung Properties Ltd. | | 231,000 | 422,251 |
| Hang Seng Bank Ltd. | | 91,700 | 1,359,256 |
| Henderson Land Development Co. Ltd. | | 160,500 | 571,497 |
| HKT Trust/HKT Ltd. unit | | 451,000 | 592,737 |
| Hong Kong & China Gas Co. Ltd. | | 1,357,393 | 1,205,272 |
| Hong Kong Exchanges and Clearing Ltd. | | 150,553 | 6,250,494 |
| Hongkong Land Holdings Ltd. | | 131,339 | 584,516 |
| Hysan Development Co. Ltd. | | 76,000 | 214,779 |
| Jardine Matheson Holdings Ltd. | | 31,161 | 1,506,378 |
| Link (REIT) | | 320,734 | 2,097,886 |
| MTR Corp. Ltd. | | 192,613 | 962,396 |
| New World Development Co. Ltd. | | 173,000 | 461,370 |
| Orient Overseas International Ltd. | | 16,000 | 325,075 |
| Power Assets Holdings Ltd. | | 169,500 | 968,574 |
| Prudential PLC | | 347,256 | 5,313,378 |
| Sino Biopharmaceutical Ltd. | | 1,230,500 | 683,052 |
| Sino Land Ltd. | | 415,062 | 559,326 |
| Sun Hung Kai Properties Ltd. | | 192,000 | 2,673,272 |
| Swire Pacific Ltd. (A Shares) | | 55,500 | 440,566 |
| Swire Properties Ltd. | | 132,800 | 356,931 |
| Techtronic Industries Co. Ltd. | | 231,000 | 2,499,071 |
| WH Group Ltd. (c) | | 988,000 | 550,058 |
| Wharf Real Estate Investment Co. Ltd. | | 193,000 | 1,112,977 |
| Xinyi Glass Holdings Ltd. | | 334,000 | 611,067 |
TOTAL HONG KONG | | | 52,596,975 |
| Hungary - 0.1% | | | |
| MOL Hungarian Oil and Gas PLC Series A (For. Reg.) | | 62,979 | 510,080 |
| OTP Bank PLC | | 27,878 | 848,152 |
| Richter Gedeon PLC | | 16,682 | 402,574 |
TOTAL HUNGARY | | | 1,760,806 |
| India - 2.8% | | | |
| Adani Enterprises Ltd. | | 34,922 | 826,489 |
| Adani Ports & Special Economic Zone Ltd. | | 92,491 | 774,013 |
| Asian Paints Ltd. | | 57,444 | 2,046,496 |
| Axis Bank Ltd. | | 289,187 | 3,055,853 |
| Bajaj Finance Ltd. | | 33,619 | 2,595,877 |
| Bajaj Finserv Ltd. | | 47,307 | 787,843 |
| Bharti Airtel Ltd. | | 309,538 | 3,033,372 |
| HCL Technologies Ltd. | | 135,149 | 1,768,808 |
| HDFC Bank Ltd. | | 519,834 | 10,759,018 |
| Hindalco Industries Ltd. | | 181,902 | 977,015 |
| Hindustan Unilever Ltd. | | 112,463 | 3,388,673 |
| Housing Development Finance Corp. Ltd. | | 231,095 | 7,882,143 |
| ICICI Bank Ltd. | | 651,597 | 7,358,478 |
| IndusInd Bank Ltd. | | 72,392 | 1,026,211 |
| Infosys Ltd. | | 456,620 | 7,052,701 |
| ITC Ltd. | | 379,913 | 1,983,246 |
| Kotak Mahindra Bank Ltd. | | 138,387 | 3,297,095 |
| Larsen & Toubro Ltd. | | 86,539 | 2,511,628 |
| Mahindra & Mahindra Ltd. | | 122,276 | 1,841,664 |
| Maruti Suzuki India Ltd. | | 16,882 | 1,779,906 |
| NTPC Ltd. | | 606,775 | 1,281,142 |
| Oil & Natural Gas Corp. Ltd. | | 502,583 | 981,197 |
| Reliance Industries Ltd. | | 435,650 | 12,951,218 |
| State Bank of India | | 227,164 | 1,614,893 |
| Tata Consultancy Services Ltd. | | 129,176 | 5,112,579 |
| Tata Motors Ltd. (a) | | 222,253 | 1,327,461 |
| Tata Power Co. Ltd./The | | 207,037 | 511,928 |
| Tata Steel Ltd. | | 1,019,040 | 1,352,437 |
| Tech Mahindra Ltd. | | 78,668 | 990,939 |
| Titan Co. Ltd. | | 52,620 | 1,706,650 |
| Vedanta Ltd. | | 144,901 | 497,593 |
| Wipro Ltd. | | 185,952 | 881,433 |
TOTAL INDIA | | | 93,955,999 |
| Indonesia - 0.6% | | | |
| Indofood Sukses Makmur Tbk PT | | 584,200 | 257,149 |
| PT Adaro Energy Indonesia Tbk | | 1,717,300 | 367,612 |
| PT Aneka Tambang Tbk | | 1,042,100 | 149,911 |
| PT Astra International Tbk | | 2,516,400 | 1,160,737 |
| PT Bank Central Asia Tbk | | 7,020,300 | 4,344,523 |
| PT Bank Mandiri (Persero) Tbk | | 5,644,100 | 1,995,190 |
| PT Bank Negara Indonesia (Persero) Tbk | | 939,100 | 605,202 |
| PT Bank Rakyat Indonesia (Persero) Tbk | | 9,028,753 | 3,146,333 |
| PT Barito Pacific Tbk | | 3,300,680 | 188,221 |
| PT Bukit Asam Tbk | | 455,700 | 128,883 |
| PT Bumi Resources Minerals Tbk (a) | | 10,447,200 | 115,626 |
| PT Bumi Resources Tbk (a) | | 21,880,300 | 180,848 |
| PT Chandra Asri Petrochemical Tbk | | 3,042,800 | 490,397 |
| PT Charoen Pokphand Indonesia Tbk | | 872,600 | 273,190 |
| PT Elang Mahkota Teknologi Tbk | | 4,792,600 | 231,363 |
| PT GoTo Gojek Tokopedia Tbk | | 115,950,296 | 827,927 |
| PT Indah Kiat Pulp & Paper Tbk | | 309,300 | 164,354 |
| PT Indo Tambangraya Megah Tbk | | 53,600 | 121,940 |
| PT Indocement Tunggal Prakarsa Tbk | | 222,800 | 165,007 |
| PT Indofood CBP Sukses Makmur Tbk | | 261,200 | 188,596 |
| PT Kalbe Farma Tbk | | 2,388,000 | 345,744 |
| PT Merdeka Copper Gold Tbk (a) | | 1,807,910 | 487,700 |
| PT Mitra Keluarga Karyasehat Tbk | | 652,600 | 129,334 |
| PT Perusahaan Gas Negara Tbk Series B | | 1,266,800 | 123,923 |
| PT Sarana Menara Nusantara Tbk | | 2,660,500 | 186,322 |
| PT Semen Indonesia (Persero) Tbk | | 400,160 | 162,755 |
| PT Sumber Alfaria Trijaya Tbk | | 2,487,400 | 491,839 |
| PT Telkom Indonesia Persero Tbk | | 6,038,000 | 1,748,900 |
| PT United Tractors Tbk | | 182,000 | 359,282 |
| PT Vale Indonesia Tbk (a) | | 240,100 | 114,759 |
TOTAL INDONESIA | | | 19,253,567 |
| Ireland - 0.4% | | | |
| Bank of Ireland Group PLC | | 127,927 | 1,320,821 |
| CRH PLC | | 94,080 | 4,539,734 |
| Kerry Group PLC Class A | | 19,637 | 2,065,132 |
| Kingspan Group PLC (Ireland) | | 19,337 | 1,335,977 |
| Ryanair Holdings PLC sponsored ADR (a) | | 11,735 | 1,121,749 |
| Smurfit Kappa Group PLC | | 32,988 | 1,219,161 |
TOTAL IRELAND | | | 11,602,574 |
| Israel - 0.5% | | | |
| Airport City Ltd. (a) | | 8,600 | 109,569 |
| Alony Hetz Properties & Investments Ltd. | | 19,190 | 149,899 |
| Amot Investments Ltd. | | 26,702 | 140,965 |
| Azrieli Group | | 4,387 | 253,839 |
| Bank Hapoalim BM (Reg.) | | 157,738 | 1,346,011 |
| Bank Leumi le-Israel BM | | 197,010 | 1,545,964 |
| Bezeq The Israel Telecommunication Corp. Ltd. | | 248,225 | 336,292 |
| Big Shopping Centers Ltd. (a) | | 1,755 | 148,452 |
| Check Point Software Technologies Ltd. (a) | | 12,897 | 1,642,562 |
| Clal Insurance Enterprises Holdings Ltd. (a) | | 7,526 | 115,067 |
| Delek Group Ltd. | | 1,012 | 108,663 |
| Elbit Systems Ltd. (Israel) | | 3,107 | 571,944 |
| Electra Israel Ltd. | | 265 | 113,175 |
| Enlight Renewable Energy Ltd. (a) | | 13,217 | 216,972 |
| First International Bank of Israel | | 6,350 | 228,851 |
| Global-e Online Ltd. (a) | | 10,871 | 303,083 |
| Harel Insurance Investments and Financial Services Ltd. | | 16,348 | 145,627 |
| Icl Group Ltd. | | 90,426 | 554,363 |
| Isracard Ltd. | | 23,224 | 94,128 |
| Israel Corp. Ltd. (Class A) | | 529 | 153,044 |
| Israel Discount Bank Ltd. (Class A) | | 155,188 | 763,251 |
| JFrog Ltd. (a) | | 7,118 | 132,181 |
| Kornit Digital Ltd. (a) | | 6,035 | 110,199 |
| Melisron Ltd. | | 2,779 | 184,228 |
| Mivne Real Estate KD Ltd. | | 72,617 | 202,083 |
| Mizrahi Tefahot Bank Ltd. | | 18,791 | 610,946 |
| NICE Ltd. (a) | | 8,062 | 1,655,338 |
| Nova Ltd. (a) | | 3,487 | 319,170 |
| OPC Energy Ltd. (a) | | 12,463 | 88,424 |
| Paz Oil Co. Ltd. (a) | | 1,269 | 119,230 |
| Perion Network Ltd. (a) | | 5,708 | 199,951 |
| Plus500 Ltd. | | 12,784 | 267,504 |
| Radware Ltd. (a) | | 4,785 | 96,418 |
| Reit 1 Ltd. | | 25,237 | 107,781 |
| Shapir Engineering and Industry Ltd. | | 17,410 | 123,619 |
| Shufersal Ltd. | | 34,256 | 173,576 |
| Strauss Group Ltd. | | 6,955 | 154,398 |
| Teva Pharmaceutical Industries Ltd. sponsored ADR (a) | | 140,246 | 1,224,348 |
| The Phoenix Holdings Ltd. | | 20,884 | 222,400 |
| Tower Semiconductor Ltd. (a) | | 13,879 | 610,326 |
| Wix.com Ltd. (a) | | 7,122 | 621,252 |
| ZIM Integrated Shipping Services Ltd. (b) | | 9,587 | 163,650 |
TOTAL ISRAEL | | | 16,428,743 |
| Italy - 1.4% | | | |
| A2A SpA | | 193,743 | 341,577 |
| Amplifon SpA | | 12,052 | 441,962 |
| Assicurazioni Generali SpA | | 150,687 | 3,134,873 |
| Azimut Holding SpA | | 14,654 | 326,820 |
| Banco BPM SpA | | 188,293 | 764,564 |
| Brunello Cucinelli SpA | | 4,171 | 398,475 |
| Davide Campari Milano NV | | 67,462 | 868,249 |
| DiaSorin SpA | | 3,306 | 358,751 |
| Enel SpA | | 978,691 | 6,686,530 |
| Eni SpA | | 316,163 | 4,776,405 |
| Ferrari NV (Italy) | | 16,154 | 4,490,963 |
| FinecoBank SpA | | 78,343 | 1,185,258 |
| Hera SpA | | 97,238 | 302,582 |
| Infrastrutture Wireless Italiane SpA (c) | | 45,157 | 626,708 |
| Interpump Group SpA | | 10,326 | 574,373 |
| Intesa Sanpaolo SpA | | 2,157,563 | 5,673,077 |
| Italgas SpA | | 59,580 | 389,312 |
| Leonardo SpA | | 50,647 | 603,005 |
| Mediobanca SpA | | 81,893 | 878,015 |
| Moncler SpA | | 26,523 | 1,962,798 |
| Nexi SpA (a)(c) | | 105,761 | 874,735 |
| Poste Italiane SpA (c) | | 57,203 | 594,140 |
| Prada SpA | | 61,900 | 455,750 |
| Prysmian SpA | | 33,652 | 1,374,598 |
| Recordati SpA | | 12,645 | 581,446 |
| Reply SpA | | 2,772 | 322,246 |
| Snam SpA | | 261,100 | 1,450,039 |
| Telecom Italia SpA (a) | | 1,251,068 | 367,935 |
| Telecom Italia SpA (Risparmio Shares) (a) | | 775,827 | 223,980 |
| Terna - Rete Elettrica Nazionale | | 180,758 | 1,565,533 |
| UniCredit SpA | | 244,253 | 4,839,990 |
| Unipol Gruppo SpA | | 52,826 | 296,633 |
TOTAL ITALY | | | 47,731,322 |
| Japan - 15.4% | | | |
| Activia Properties, Inc. | | 92 | 268,075 |
| Adeka Corp. | | 13,800 | 233,047 |
| Advance Residence Investment Corp. | | 173 | 448,867 |
| Advantest Corp. | | 23,200 | 1,808,020 |
| AEON Co. Ltd. | | 111,300 | 2,268,517 |
| AGC, Inc. | | 29,300 | 1,092,447 |
| Aica Kogyo Co. Ltd. | | 8,200 | 186,425 |
| Air Water, Inc. | | 28,400 | 358,856 |
| Aisin Seiki Co. Ltd. | | 22,400 | 657,473 |
| Ajinomoto Co., Inc. | | 67,700 | 2,434,787 |
| Alfresa Holdings Corp. | | 24,500 | 354,748 |
| Alps Alpine Co. Ltd. | | 26,400 | 241,034 |
| Amada Co. Ltd. | | 49,200 | 459,380 |
| Ana Holdings, Inc. (a) | | 19,300 | 420,992 |
| Aozora Bank Ltd. | | 14,300 | 256,528 |
| Asahi Group Holdings | | 64,100 | 2,476,446 |
| ASAHI INTECC Co. Ltd. | | 28,900 | 522,982 |
| Asahi Kasei Corp. | | 179,000 | 1,264,306 |
| Asics Corp. | | 24,500 | 684,808 |
| Astellas Pharma, Inc. | | 232,400 | 3,501,005 |
| Azbil Corp. | | 16,600 | 464,248 |
| Bandai Namco Holdings, Inc. | | 85,000 | 1,930,811 |
| Bank of Kyoto Ltd. | | 9,300 | 457,583 |
| BayCurrent Consulting, Inc. | | 17,200 | 597,872 |
| Bic Camera, Inc. | | 19,500 | 163,146 |
| Biprogy, Inc. | | 10,000 | 241,096 |
| Bridgestone Corp. | | 77,400 | 3,108,257 |
| Brother Industries Ltd. | | 31,800 | 499,427 |
| Calbee, Inc. | | 13,700 | 296,259 |
| Canon, Inc. | | 132,300 | 3,151,037 |
| Capcom Co. Ltd. | | 19,800 | 744,037 |
| Casio Computer Co. Ltd. | | 28,000 | 266,415 |
| Central Japan Railway Co. | | 26,200 | 3,243,528 |
| Chiba Bank Ltd. | | 95,000 | 620,353 |
| Chubu Electric Power Co., Inc. | | 97,900 | 1,091,816 |
| Chugai Pharmaceutical Co. Ltd. | | 81,400 | 2,100,581 |
| Chugoku Electric Power Co., Inc. | | 39,500 | 207,995 |
| Coca-Cola West Co. Ltd. | | 19,100 | 205,826 |
| COMSYS Holdings Corp. | | 14,900 | 285,129 |
| Concordia Financial Group Ltd. | | 150,600 | 571,430 |
| Cosmo Energy Holdings Co. Ltd. | | 10,700 | 342,069 |
| Cosmos Pharmaceutical Corp. | | 2,700 | 265,559 |
| Credit Saison Co. Ltd. | | 19,800 | 274,327 |
| CyberAgent, Inc. | | 51,300 | 447,675 |
| Dai Nippon Printing Co. Ltd. | | 33,800 | 971,619 |
| Dai-ichi Mutual Life Insurance Co. | | 129,900 | 2,416,241 |
| Daicel Chemical Industries Ltd. | | 33,900 | 267,263 |
| Daifuku Co. Ltd. | | 48,000 | 884,390 |
| Daiichi Sankyo Kabushiki Kaisha | | 245,800 | 8,434,532 |
| Daikin Industries Ltd. | | 37,000 | 6,720,350 |
| Daito Trust Construction Co. Ltd. | | 8,700 | 824,566 |
| Daiwa House Industry Co. Ltd. | | 86,000 | 2,192,009 |
| Daiwa House REIT Investment Corp. | | 283 | 602,130 |
| Daiwa Office Investment Corp. | | 35 | 152,138 |
| Daiwa Securities Group, Inc. | | 185,800 | 862,985 |
| Denka Co. Ltd. | | 10,900 | 218,299 |
| DENSO Corp. | | 63,800 | 3,851,198 |
| Dentsu Group, Inc. | | 29,000 | 1,045,011 |
| Dic Corp. | | 10,100 | 186,582 |
| Disco Corp. | | 11,100 | 1,263,793 |
| Dowa Holdings Co. Ltd. | | 7,000 | 228,693 |
| East Japan Railway Co. | | 48,100 | 2,752,361 |
| Ebara Corp. | | 9,600 | 420,013 |
| Eisai Co. Ltd. | | 37,800 | 2,181,185 |
| Electric Power Development Co. Ltd. | | 22,200 | 354,972 |
| ENEOS Holdings, Inc. | | 411,700 | 1,464,633 |
| Exeo Group, Inc. | | 14,100 | 261,627 |
| Ezaki Glico Co. Ltd. | | 7,000 | 180,045 |
| Fancl Corp. | | 10,400 | 179,979 |
| FANUC Corp. | | 121,500 | 4,103,202 |
| Fast Retailing Co. Ltd. | | 23,700 | 5,612,199 |
| Food & Life Companies Ltd. | | 14,800 | 356,476 |
| Frontier Real Estate Investment Corp. | | 63 | 227,617 |
| Fuji Electric Co. Ltd. | | 19,000 | 766,945 |
| FUJIFILM Holdings Corp. | | 50,700 | 2,642,483 |
| Fujitsu Ltd. | | 23,000 | 3,065,378 |
| Fukuoka Financial Group, Inc. | | 24,100 | 453,926 |
| GLP J-REIT | | 590 | 674,120 |
| GMO Payment Gateway, Inc. | | 5,800 | 453,629 |
| GOLDWIN, Inc. | | 4,900 | 445,224 |
| Hakuhodo DY Holdings, Inc. | | 39,100 | 460,728 |
| Hamamatsu Photonics K.K. | | 18,500 | 980,756 |
| Hankyu Hanshin Holdings, Inc. | | 31,500 | 983,471 |
| Harmonic Drive Systems, Inc. | | 6,900 | 210,962 |
| Haseko Corp. | | 28,400 | 346,716 |
| Hikari Tsushin, Inc. | | 2,500 | 341,113 |
| Hirose Electric Co. Ltd. | | 4,000 | 539,836 |
| Hisamitsu Pharmaceutical Co., Inc. | | 9,600 | 265,532 |
| Hitachi Construction Machinery Co. Ltd. | | 13,100 | 322,809 |
| Hitachi Ltd. | | 118,600 | 6,560,316 |
| Honda Motor Co. Ltd. | | 214,900 | 5,699,799 |
| Horiba Ltd. | | 5,500 | 303,010 |
| Hoshizaki Corp. | | 14,600 | 514,229 |
| House Foods Group, Inc. | | 9,500 | 208,887 |
| Hoya Corp. | | 45,100 | 4,728,962 |
| Hulic Co. Ltd. | | 74,700 | 643,171 |
| Ibiden Co. Ltd. | | 17,600 | 692,494 |
| Idemitsu Kosan Co. Ltd. | | 27,957 | 595,290 |
| IHI Corp. | | 19,400 | 488,843 |
| Iida Group Holdings Co. Ltd. | | 22,100 | 392,922 |
| Industrial & Infrastructure Fund Investment Corp. | | 254 | 291,088 |
| INPEX Corp. | | 133,700 | 1,463,086 |
| Internet Initiative Japan, Inc. | | 17,000 | 351,802 |
| Invincible Investment Corp. | | 772 | 333,317 |
| Isetan Mitsukoshi Holdings Ltd. | | 50,000 | 552,038 |
| Isuzu Motors Ltd. | | 78,800 | 930,551 |
| ITO EN Ltd. | | 7,900 | 244,365 |
| Itochu Corp. | | 186,500 | 6,187,111 |
| ITOCHU Techno-Solutions Corp. | | 11,800 | 305,568 |
| Iwatani Corp. | | 6,500 | 307,728 |
| J. Front Retailing Co. Ltd. | | 33,200 | 349,173 |
| Japan Airlines Co. Ltd. | | 17,500 | 333,840 |
| Japan Airport Terminal Co. Ltd. | | 11,700 | 573,335 |
| Japan Exchange Group, Inc. | | 66,900 | 1,086,308 |
| Japan Hotel REIT Investment Corp. | | 566 | 319,786 |
| Japan Logistics Fund, Inc. | | 115 | 273,107 |
| Japan Post Bank Co. Ltd. | | 174,600 | 1,394,280 |
| Japan Post Holdings Co. Ltd. | | 306,300 | 2,521,439 |
| Japan Post Insurance Co. Ltd. | | 25,100 | 407,601 |
| Japan Prime Realty Investment Corp. | | 125 | 325,021 |
| Japan Real Estate Investment Corp. | | 172 | 681,533 |
| Japan Retail Fund Investment Corp. | | 871 | 637,760 |
| Japan Steel Works Ltd. | | 8,700 | 158,061 |
| Japan Tobacco, Inc. | | 139,700 | 3,005,909 |
| JEOL Ltd. | | 6,100 | 177,977 |
| JFE Holdings, Inc. | | 72,700 | 860,063 |
| JGC Holdings Corp. | | 32,900 | 411,588 |
| JSR Corp. | | 26,100 | 605,610 |
| JTEKT Corp. | | 31,800 | 262,604 |
| K's Holdings Corp. | | 21,600 | 191,446 |
| Kadokawa Corp. | | 14,000 | 298,575 |
| Kagome Co. Ltd. | | 10,900 | 264,749 |
| Kajima Corp. | | 58,800 | 777,956 |
| Kakaku.com, Inc. | | 14,700 | 202,253 |
| Kamigumi Co. Ltd. | | 13,300 | 291,481 |
| Kaneka Corp. | | 8,700 | 231,452 |
| Kansai Electric Power Co., Inc. | | 102,600 | 1,107,538 |
| Kansai Paint Co. Ltd. | | 31,700 | 446,906 |
| Kao Corp. | | 58,900 | 2,380,061 |
| Kawasaki Heavy Industries Ltd. | | 20,400 | 443,787 |
| Kawasaki Kisen Kaisha Ltd. | | 29,900 | 712,527 |
| KDDI Corp. | | 198,300 | 6,190,556 |
| Keihan Electric Railway Co., Ltd. | | 13,800 | 379,863 |
| Keikyu Corp. | | 33,600 | 326,591 |
| Keio Corp. | | 15,200 | 564,527 |
| Keisei Electric Railway Co. | | 21,900 | 772,828 |
| Kenedix Office Investment Corp. | | 106 | 234,348 |
| Kewpie Corp. | | 14,700 | 246,773 |
| Keyence Corp. | | 25,200 | 11,364,099 |
| Kikkoman Corp. | | 24,700 | 1,463,073 |
| Kinden Corp. | | 16,900 | 230,426 |
| Kintetsu Group Holdings Co. Ltd. | | 25,000 | 843,932 |
| Kirin Holdings Co. Ltd. | | 106,700 | 1,733,375 |
| Kobayashi Pharmaceutical Co. Ltd. | | 7,200 | 449,295 |
| Kobe Bussan Co. Ltd. | | 17,800 | 497,838 |
| Kobe Steel Ltd. | | 50,500 | 376,268 |
| Koei Tecmo Holdings Co. Ltd. | | 15,080 | 277,318 |
| Koito Manufacturing Co. Ltd. | | 31,600 | 611,253 |
| Kokuyo Co. Ltd. | | 13,300 | 190,067 |
| Komatsu Ltd. | | 123,600 | 3,073,916 |
| Konami Group Corp. | | 12,500 | 615,050 |
| Konica Minolta, Inc. | | 60,200 | 251,116 |
| Kose Corp. | | 4,500 | 525,129 |
| Kubota Corp. | | 144,000 | 2,182,032 |
| Kuraray Co. Ltd. | | 44,400 | 415,212 |
| Kurita Water Industries Ltd. | | 13,900 | 582,533 |
| Kyocera Corp. | | 44,100 | 2,314,701 |
| Kyowa Hakko Kirin Co., Ltd. | | 31,700 | 705,369 |
| Kyushu Electric Power Co., Inc. | | 61,600 | 358,690 |
| Kyushu Financial Group, Inc. | | 55,800 | 201,145 |
| Kyushu Railway Co. | | 19,300 | 438,280 |
| LaSalle Logiport REIT | | 217 | 257,797 |
| Lasertec Corp. | | 9,700 | 1,319,647 |
| Lawson, Inc. | | 6,000 | 272,530 |
| Lion Corp. | | 34,800 | 379,384 |
| LIXIL Group Corp. | | 35,200 | 554,085 |
| M3, Inc. | | 54,200 | 1,330,392 |
| Mabuchi Motor Co. Ltd. | | 7,100 | 200,378 |
| Makita Corp. | | 34,900 | 984,554 |
| Marubeni Corp. | | 216,400 | 3,071,408 |
| Marui Group Co. Ltd. | | 26,600 | 423,808 |
| Maruichi Steel Tube Ltd. | | 9,800 | 221,687 |
| MatsukiyoCocokara & Co. | | 17,900 | 958,543 |
| Mazda Motor Corp. | | 75,100 | 679,617 |
| McDonald's Holdings Co. (Japan) Ltd. | | 10,600 | 441,599 |
| Mebuki Financial Group, Inc. | | 137,900 | 353,252 |
| Medipal Holdings Corp. | | 26,700 | 407,921 |
| Meiji Holdings Co. Ltd. | | 35,900 | 866,257 |
| Mercari, Inc. (a) | | 13,700 | 235,595 |
| Minebea Mitsumi, Inc. | | 50,800 | 940,747 |
| Misumi Group, Inc. | | 35,700 | 900,611 |
| Mitsubishi Chemical Holdings Corp. | | 177,700 | 1,042,503 |
| Mitsubishi Corp. | | 186,100 | 6,899,820 |
| Mitsubishi Electric Corp. | | 272,500 | 3,378,695 |
| Mitsubishi Estate Co. Ltd. | | 160,300 | 1,975,586 |
| Mitsubishi Gas Chemical Co., Inc. | | 25,500 | 371,241 |
| Mitsubishi Heavy Industries Ltd. | | 42,600 | 1,615,403 |
| Mitsubishi Logistics Corp. | | 9,200 | 227,969 |
| Mitsubishi Materials Corp. | | 16,500 | 270,181 |
| Mitsubishi Motors Corp. of Japan (a) | | 87,100 | 334,781 |
| Mitsubishi UFJ Financial Group, Inc. | | 1,543,500 | 9,661,592 |
| Mitsubishi UFJ Lease & Finance Co. Ltd. | | 97,300 | 505,059 |
| Mitsui & Co. Ltd. | | 200,900 | 6,271,839 |
| Mitsui Chemicals, Inc. | | 24,300 | 614,814 |
| Mitsui Fudosan Co. Ltd. | | 120,700 | 2,397,346 |
| Mitsui Fudosan Logistics Park, Inc. | | 71 | 266,788 |
| Mitsui High-Tec, Inc. | | 2,900 | 174,888 |
| Mitsui OSK Lines Ltd. | | 45,500 | 1,127,973 |
| Miura Co. Ltd. | | 14,400 | 383,577 |
| Mizuho Financial Group, Inc. | | 320,140 | 4,640,695 |
| MonotaRO Co. Ltd. | | 30,600 | 462,944 |
| Mori Hills REIT Investment Corp. | | 199 | 224,909 |
| Morinaga & Co. Ltd. | | 5,600 | 165,959 |
| MS&AD Insurance Group Holdings, Inc. | | 56,300 | 1,847,897 |
| Murata Manufacturing Co. Ltd. | | 81,200 | 4,606,977 |
| Nabtesco Corp. | | 15,100 | 363,963 |
| Nagase & Co. Ltd. | | 15,700 | 247,356 |
| Nagoya Railroad Co. Ltd. | | 24,700 | 398,464 |
| Nankai Electric Railway Co. Ltd. | | 14,100 | 328,941 |
| NEC Corp. | | 34,700 | 1,334,400 |
| Net One Systems Co. Ltd. | | 10,100 | 238,142 |
| Nexon Co. Ltd. | | 56,300 | 1,271,837 |
| NGK Insulators Ltd. | | 33,400 | 419,231 |
| NH Foods Ltd. | | 13,000 | 379,379 |
| NHK Spring Co. Ltd. | | 27,400 | 203,147 |
| Nichirei Corp. | | 16,900 | 346,705 |
| Nidec Corp. | | 67,100 | 3,320,248 |
| Nifco, Inc. | | 11,200 | 322,117 |
| Nihon Kohden Corp. | | 10,400 | 287,753 |
| Nihon M&A Center Holdings, Inc. | | 36,000 | 275,178 |
| Nikon Corp. | | 43,600 | 450,696 |
| Nintendo Co. Ltd. | | 147,900 | 6,252,826 |
| Nippon Accommodations Fund, Inc. | | 62 | 301,383 |
| Nippon Building Fund, Inc. | | 211 | 884,769 |
| Nippon Express Holdings, Inc. | | 10,500 | 616,161 |
| Nippon Kayaku Co. Ltd. | | 22,000 | 199,578 |
| Nippon Paint Holdings Co. Ltd. | | 136,100 | 1,227,927 |
| Nippon Sanso Holdings Corp. | | 26,000 | 469,110 |
| Nippon Shinyaku Co. Ltd. | | 7,500 | 342,965 |
| Nippon Shokubai Co. Ltd. | | 4,300 | 172,394 |
| Nippon Steel & Sumitomo Metal Corp. | | 120,000 | 2,562,891 |
| Nippon Telegraph & Telephone Corp. | | 149,800 | 4,570,994 |
| Nippon Yusen KK | | 64,900 | 1,534,165 |
| Nishi-Nippon Railroad Co. Ltd. | | 9,900 | 181,569 |
| Nissan Chemical Corp. | | 17,700 | 786,624 |
| Nissan Motor Co. Ltd. | | 294,000 | 1,072,052 |
| Nisshin Seifun Group, Inc. | | 32,400 | 392,735 |
| Nissin Food Holdings Co. Ltd. | | 10,200 | 983,403 |
| Niterra Co. Ltd. | | 21,600 | 452,733 |
| Nitori Holdings Co. Ltd. | | 11,000 | 1,400,695 |
| Nitto Denko Corp. | | 19,000 | 1,228,316 |
| NOF Corp. | | 10,100 | 461,484 |
| Nomura Holdings, Inc. | | 385,900 | 1,383,414 |
| Nomura Real Estate Holdings, Inc. | | 14,400 | 358,834 |
| Nomura Real Estate Master Fund, Inc. | | 622 | 727,806 |
| Nomura Research Institute Ltd. | | 57,200 | 1,439,126 |
| NSK Ltd. | | 66,000 | 372,631 |
| NTT Data Corp. | | 81,100 | 1,101,593 |
| Obayashi Corp. | | 95,400 | 795,328 |
| OBIC Co. Ltd. | | 8,400 | 1,294,232 |
| Odakyu Electric Railway Co. Ltd. | | 43,800 | 611,813 |
| Oji Holdings Corp. | | 124,500 | 489,248 |
| Olympus Corp. | | 162,000 | 2,836,040 |
| OMRON Corp. | | 26,100 | 1,531,004 |
| Ono Pharmaceutical Co. Ltd. | | 60,400 | 1,216,160 |
| Open House Group Co. Ltd. | | 9,000 | 359,755 |
| Oracle Corp. Japan | | 4,100 | 294,252 |
| Oriental Land Co. Ltd. | | 147,200 | 5,209,288 |
| ORIX Corp. | | 149,200 | 2,538,268 |
| ORIX JREIT, Inc. | | 347 | 448,564 |
| Osaka Gas Co. Ltd. | | 51,800 | 856,835 |
| Otsuka Corp. | | 14,400 | 524,146 |
| Otsuka Holdings Co. Ltd. | | 70,800 | 2,408,670 |
| Pan Pacific International Holdings Ltd. | | 68,300 | 1,276,317 |
| Panasonic Holdings Corp. | | 294,400 | 2,772,890 |
| Park24 Co. Ltd. (a) | | 15,900 | 245,768 |
| Penta-Ocean Construction Co. Ltd. | | 36,300 | 176,479 |
| PeptiDream, Inc. (a) | | 11,800 | 159,429 |
| Persol Holdings Co. Ltd. | | 24,900 | 513,423 |
| Pigeon Corp. | | 15,000 | 233,574 |
| Rakuten Group, Inc. | | 116,600 | 581,595 |
| Recruit Holdings Co. Ltd. | | 214,400 | 6,014,693 |
| Relo Group, Inc. | | 14,400 | 223,868 |
| Renesas Electronics Corp. (a) | | 179,000 | 2,332,808 |
| Rengo Co. Ltd. | | 31,300 | 204,132 |
| Resona Holdings, Inc. | | 300,800 | 1,499,176 |
| Resonac Holdings Corp. | | 23,900 | 378,463 |
| Ricoh Co. Ltd. | | 76,800 | 635,883 |
| Rinnai Corp. | | 15,000 | 362,553 |
| ROHM Co. Ltd. | | 10,900 | 820,641 |
| Rohto Pharmaceutical Co. Ltd. | | 27,200 | 564,321 |
| Ryohin Keikaku Co. Ltd. | | 35,600 | 374,631 |
| Sankyu, Inc. | | 7,400 | 260,996 |
| Sanrio Co. Ltd. | | 8,500 | 393,396 |
| Santen Pharmaceutical Co. Ltd. | | 49,100 | 413,109 |
| Sanwa Holdings Corp. | | 28,500 | 312,165 |
| Sapporo Holdings Ltd. | | 10,300 | 287,351 |
| SBI Holdings, Inc. Japan | | 33,900 | 662,093 |
| Screen Holdings Co. Ltd. | | 5,700 | 463,634 |
| SCSK Corp. | | 18,600 | 280,819 |
| Secom Co. Ltd. | | 27,400 | 1,754,531 |
| Sega Sammy Holdings, Inc. | | 20,800 | 388,784 |
| Seibu Holdings, Inc. | | 33,400 | 373,826 |
| Seiko Epson Corp. | | 40,000 | 611,750 |
| Seino Holdings Co. Ltd. | | 22,400 | 248,685 |
| Sekisui Chemical Co. Ltd. | | 54,400 | 774,245 |
| Sekisui House (REIT), Inc. | | 529 | 299,858 |
| Sekisui House Ltd. | | 88,500 | 1,819,441 |
| Seven & i Holdings Co. Ltd. | | 101,100 | 4,581,594 |
| Seven Bank Ltd. | | 93,400 | 191,189 |
| SG Holdings Co. Ltd. | | 61,100 | 879,218 |
| Sharp Corp. | | 28,300 | 201,694 |
| SHIFT, Inc. (a) | | 1,600 | 297,860 |
| Shimadzu Corp. | | 34,700 | 1,085,304 |
| Shimamura Co. Ltd. | | 3,000 | 275,413 |
| SHIMANO, Inc. | | 10,600 | 1,639,316 |
| SHIMIZU Corp. | | 82,700 | 505,050 |
| Shin-Etsu Chemical Co. Ltd. | | 255,600 | 7,293,756 |
| Shinko Electric Industries Co. Ltd. | | 8,300 | 246,440 |
| Shionogi & Co. Ltd. | | 35,700 | 1,598,094 |
| Ship Healthcare Holdings, Inc. | | 10,700 | 188,746 |
| Shiseido Co. Ltd. | | 50,500 | 2,531,353 |
| Shizuoka Financial Group | | 71,300 | 537,434 |
| SHO-BOND Holdings Co. Ltd. | | 5,800 | 247,869 |
| Skylark Holdings Co. Ltd. (a) | | 27,500 | 368,975 |
| SMC Corp. | | 7,700 | 3,840,335 |
| SoftBank Corp. | | 348,800 | 3,927,074 |
| SoftBank Group Corp. | | 150,300 | 5,636,614 |
| Sohgo Security Services Co., Ltd. | | 10,900 | 304,429 |
| Sojitz Corp. | | 26,040 | 548,442 |
| Sompo Holdings, Inc. | | 44,400 | 1,852,794 |
| Sony Group Corp. | | 159,300 | 14,412,468 |
| Sotetsu Holdings, Inc. | | 12,500 | 238,009 |
| Square Enix Holdings Co. Ltd. | | 11,100 | 546,221 |
| Stanley Electric Co. Ltd. | | 18,900 | 426,344 |
| Subaru Corp. | | 79,000 | 1,289,424 |
| Sugi Holdings Co. Ltd. | | 4,500 | 190,912 |
| Sumco Corp. | | 44,000 | 605,953 |
| Sumitomo Chemical Co. Ltd. | | 205,900 | 695,782 |
| Sumitomo Corp. | | 159,300 | 2,855,112 |
| Sumitomo Electric Industries Ltd. | | 102,500 | 1,308,132 |
| Sumitomo Forestry Co. Ltd. | | 24,200 | 522,822 |
| Sumitomo Heavy Industries Ltd. | | 15,500 | 374,511 |
| Sumitomo Metal Mining Co. Ltd. | | 34,300 | 1,265,969 |
| Sumitomo Mitsui Financial Group, Inc. | | 173,600 | 7,095,664 |
| Sumitomo Mitsui Trust Holdings, Inc. | | 46,600 | 1,679,824 |
| Sumitomo Realty & Development Co. Ltd. | | 60,600 | 1,414,964 |
| Sumitomo Rubber Industries Ltd. | | 23,200 | 212,789 |
| Sundrug Co. Ltd. | | 8,100 | 223,257 |
| Suntory Beverage & Food Ltd. | | 16,400 | 617,385 |
| Suzuken Co. Ltd. | | 9,600 | 273,223 |
| Suzuki Motor Corp. | | 62,700 | 2,186,254 |
| Sysmex Corp. | | 21,700 | 1,395,814 |
| T&D Holdings, Inc. | | 75,800 | 928,273 |
| Taiheiyo Cement Corp. | | 14,800 | 265,381 |
| Taisei Corp. | | 24,900 | 846,872 |
| Taisho Pharmaceutical Holdings Co. Ltd. | | 7,300 | 315,257 |
| Taiyo Yuden Co. Ltd. | | 16,700 | 511,331 |
| Takara Holdings, Inc. | | 24,300 | 191,489 |
| Takashimaya Co. Ltd. | | 21,500 | 317,605 |
| Takeda Pharmaceutical Co. Ltd. | | 199,684 | 6,621,355 |
| TDK Corp. | | 49,100 | 1,688,005 |
| TechnoPro Holdings, Inc. | | 13,100 | 357,416 |
| Teijin Ltd. | | 25,500 | 284,808 |
| Terumo Corp. | | 94,700 | 2,835,867 |
| The Hachijuni Bank Ltd. | | 62,800 | 281,351 |
| THK Co. Ltd. | | 15,200 | 341,011 |
| TIS, Inc. | | 28,600 | 785,348 |
| Tobu Railway Co. Ltd. | | 26,300 | 671,328 |
| Toho Co. Ltd. | | 16,100 | 639,597 |
| Toho Gas Co. Ltd. | | 12,100 | 226,396 |
| Tohoku Electric Power Co., Inc. | | 61,400 | 315,690 |
| Tokai Carbon Co. Ltd. | | 28,700 | 260,817 |
| Tokio Marine Holdings, Inc. | | 257,300 | 5,173,540 |
| Tokyo Century Corp. | | 5,600 | 192,652 |
| Tokyo Electric Power Co., Inc. (a) | | 97,300 | 348,861 |
| Tokyo Electron Ltd. | | 59,600 | 6,824,528 |
| Tokyo Gas Co. Ltd. | | 52,100 | 1,067,166 |
| Tokyo Ohka Kogyo Co. Ltd. | | 4,900 | 255,796 |
| Tokyo Tatemono Co. Ltd. | | 26,000 | 329,290 |
| Tokyu Corp. | | 81,100 | 1,144,810 |
| Tokyu Fudosan Holdings Corp. | | 74,400 | 377,565 |
| Toppan, Inc. | | 43,300 | 920,504 |
| Toray Industries, Inc. | | 205,900 | 1,166,897 |
| Toshiba Corp. | | 54,700 | 1,762,422 |
| Tosoh Corp. | | 39,900 | 533,076 |
| Toto Ltd. | | 20,500 | 701,136 |
| Toyo Seikan Group Holdings Ltd. | | 18,900 | 266,980 |
| Toyo Suisan Kaisha Ltd. | | 12,800 | 571,481 |
| Toyo Tire Corp. | | 13,800 | 164,413 |
| Toyota Industries Corp. | | 26,200 | 1,522,689 |
| Toyota Motor Corp. | | 1,585,900 | 21,774,464 |
| Toyota Tsusho Corp. | | 30,400 | 1,263,646 |
| Trend Micro, Inc. | | 17,400 | 850,225 |
| Tsumura & Co. | | 9,300 | 188,710 |
| Tsuruha Holdings, Inc. | | 5,100 | 334,028 |
| Ube Corp. | | 11,100 | 176,084 |
| Ulvac, Inc. | | 5,700 | 226,281 |
| Unicharm Corp. | | 56,100 | 2,264,754 |
| United Urban Investment Corp. | | 379 | 420,811 |
| Ushio, Inc. | | 16,300 | 202,765 |
| USS Co. Ltd. | | 26,200 | 440,265 |
| Welcia Holdings Co. Ltd. | | 12,700 | 265,901 |
| West Japan Railway Co. | | 30,900 | 1,339,260 |
| Yakult Honsha Co. Ltd. | | 20,400 | 1,534,365 |
| Yamada Holdings Co. Ltd. | | 87,900 | 306,308 |
| Yamaguchi Financial Group, Inc. | | 30,300 | 186,307 |
| Yamaha Corp. | | 21,600 | 851,248 |
| Yamaha Motor Co. Ltd. | | 44,800 | 1,161,720 |
| Yamato Holdings Co. Ltd. | | 41,600 | 714,588 |
| Yamazaki Baking Co. Ltd. | | 21,400 | 286,742 |
| Yaskawa Electric Corp. | | 33,600 | 1,368,382 |
| Yokogawa Electric Corp. | | 31,100 | 505,089 |
| Yokohama Rubber Co. Ltd. | | 16,700 | 363,068 |
| Z Holdings Corp. | | 335,000 | 917,646 |
| Zenkoku Hosho Co. Ltd. | | 6,700 | 246,253 |
| Zensho Holdings Co. Ltd. | | 11,100 | 352,679 |
| Zeon Corp. | | 22,400 | 231,120 |
| ZOZO, Inc. | | 14,100 | 296,725 |
TOTAL JAPAN | | | 511,381,037 |
| Jordan - 0.0% | | | |
| Hikma Pharmaceuticals PLC | | 22,249 | 514,770 |
| Korea (South) - 3.4% | | | |
| Advanced Nano Products Co. Ltd. | | 1,013 | 113,608 |
| AfreecaTV Co. Ltd. | | 925 | 53,944 |
| Alteogen, Inc. | | 4,510 | 147,733 |
| AMOREPACIFIC Corp. | | 3,755 | 347,556 |
| AMOREPACIFIC Group, Inc. | | 3,556 | 97,533 |
| BGF Retail Co. Ltd. | | 1,057 | 147,524 |
| Bioneer Corp. (a) | | 2,875 | 125,553 |
| BNK Financial Group, Inc. | | 37,089 | 184,588 |
| Celltrion Healthcare Co. Ltd. | | 13,649 | 711,753 |
| Celltrion Pharm, Inc. | | 2,177 | 133,501 |
| Celltrion, Inc. | | 13,623 | 1,642,079 |
| Cheil Worldwide, Inc. | | 9,535 | 131,999 |
| Chunbo Co. Ltd. | | 655 | 95,443 |
| CJ CheilJedang Corp. | | 989 | 229,112 |
| CJ Corp. | | 2,025 | 138,708 |
| CJ ENM Co. Ltd. | | 1,525 | 91,089 |
| CJ Logistics Corp. | | 1,224 | 70,725 |
| Cosmax, Inc. | | 979 | 56,676 |
| Cosmo AM&T Co. Ltd. (a) | | 2,880 | 378,057 |
| Cosmochemical Co. Ltd. | | 3,256 | 142,683 |
| Coupang, Inc. Class A (a) | | 129,122 | 2,164,085 |
| Coway Co. Ltd. | | 7,069 | 259,651 |
| CS Wind Corp. | | 3,609 | 204,401 |
| Daeduck Electronics Co. Ltd. | | 4,174 | 67,705 |
| Daejoo Electronic Materials Co. Ltd. | | 1,573 | 116,306 |
| Daewoo Engineering & Construction Co. Ltd. (a) | | 31,772 | 100,509 |
| Daewoo Shipbuilding & Marine Engineering Co. Ltd. (a) | | 4,730 | 95,726 |
| DB HiTek Co. Ltd. | | 5,044 | 229,744 |
| Db Insurance Co. Ltd. | | 5,983 | 376,250 |
| Delivery Hero AG (a)(c) | | 24,037 | 956,953 |
| DGB Financial Group Co. Ltd. | | 23,590 | 121,020 |
| DL E&C Co. Ltd. | | 4,223 | 111,626 |
| Dongjin Semichem Co. Ltd. | | 4,032 | 89,402 |
| Dongkuk Steel Mill Co. Ltd. | | 7,689 | 68,944 |
| Doosan Bobcat, Inc. | | 6,706 | 257,388 |
| Doosan Co. Ltd. | | 1,402 | 98,081 |
| Doosan Fuel Cell Co. Ltd. (a) | | 4,950 | 111,238 |
| Doosan Heavy Industries & Construction Co. Ltd. (a) | | 51,578 | 646,527 |
| Douzone Bizon Co. Ltd. | | 3,311 | 75,642 |
| E-Mart, Inc. | | 2,429 | 177,721 |
| Ecopro BM Co. Ltd. | | 6,728 | 1,351,582 |
| Ecopro Co. Ltd. | | 2,364 | 1,298,881 |
| EO Technics Co. Ltd. | | 1,095 | 71,715 |
| F&F Co. Ltd. | | 2,125 | 224,935 |
| Fila Holdings Corp. | | 5,651 | 155,275 |
| Foosung Co. Ltd. | | 6,152 | 62,414 |
| Green Cross Corp. | | 736 | 68,223 |
| GS Engineering & Construction Corp. | | 9,228 | 149,809 |
| GS Holdings Corp. | | 11,248 | 334,328 |
| GS Retail Co. Ltd. | | 5,350 | 106,611 |
| Hana Financial Group, Inc. | | 37,092 | 1,166,028 |
| Hana Tour Service, Inc. (a) | | 1,756 | 72,578 |
| HanAll BioPharma Co. Ltd. (a) | | 4,391 | 67,564 |
| Hanjin Kal Corp. | | 2,444 | 72,391 |
| Hankook Tire Co. Ltd. | | 9,248 | 238,942 |
| Hanmi Pharm Co. Ltd. | | 778 | 188,245 |
| Hanmi Science Co. Ltd. | | 3,953 | 129,858 |
| Hanmi Semiconductor Co. Ltd. | | 6,639 | 102,800 |
| Hanon Systems | | 20,525 | 141,148 |
| Hansol Chemical Co. Ltd. | | 1,281 | 213,604 |
| Hanwha Aerospace Co. Ltd. | | 4,125 | 317,550 |
| Hanwha Corp. | | 6,192 | 125,803 |
| Hanwha Life Insurance Co. Ltd. (a) | | 28,247 | 52,505 |
| Hanwha Solutions Corp. (a) | | 13,979 | 503,205 |
| Hanwha Systems Co. Ltd. | | 9,598 | 101,798 |
| HD Hyundai Co. Ltd. | | 5,626 | 249,575 |
| HD Hyundai Heavy Industries Co. Ltd. (a) | | 2,345 | 193,009 |
| Hd Hyundai Infracore Co. Ltd. | | 13,373 | 98,983 |
| HD Korea Shipbuilding & Offshore Engineering Co. Ltd. (a) | | 5,554 | 353,398 |
| Hite Jinro Co. Ltd. | | 4,195 | 69,970 |
| HL Mando Co. Ltd. | | 4,182 | 145,344 |
| HLB Life Science Co. Ltd. | | 423 | 3,407 |
| HLB, Inc. | | 14,481 | 385,003 |
| HMM Co. Ltd. | | 45,576 | 698,377 |
| Hotel Shilla Co. | | 4,099 | 250,527 |
| HUGEL, Inc. (a) | | 785 | 66,840 |
| HYBE Co. Ltd. (a) | | 2,241 | 453,349 |
| Hyosung Advanced Materials Co. | | 303 | 88,413 |
| Hyosung TNC Co. Ltd. | | 344 | 97,290 |
| Hyundai Bioscience Co. Ltd. (a) | | 4,540 | 68,982 |
| Hyundai Department Store Co. Ltd. | | 1,691 | 65,501 |
| Hyundai Elevator Co. Ltd. | | 3,570 | 89,657 |
| Hyundai Engineering & Construction Co. Ltd. | | 9,603 | 295,579 |
| Hyundai Fire & Marine Insurance Co. Ltd. | | 6,711 | 188,613 |
| Hyundai Glovis Co. Ltd. | | 2,794 | 342,877 |
| Hyundai Mipo Dockyard Co. Ltd. (a) | | 2,787 | 153,473 |
| Hyundai Mobis | | 8,342 | 1,359,119 |
| Hyundai Motor Co. Ltd. | | 17,541 | 2,599,366 |
| Hyundai Rotem Co. Ltd. (a) | | 8,691 | 214,411 |
| Hyundai Steel Co. | | 11,266 | 308,164 |
| Hyundai Wia Corp. | | 2,121 | 89,214 |
| Industrial Bank of Korea | | 34,013 | 256,246 |
| JB Financial Group Co. Ltd. | | 12,995 | 81,342 |
| JYP Entertainment Corp. | | 3,286 | 222,379 |
| Kakao Corp. | | 39,649 | 1,736,900 |
| Kakao Games Corp. (a) | | 6,188 | 188,105 |
| Kakao Pay Corp. (a) | | 3,126 | 128,512 |
| KakaoBank Corp. | | 39,447 | 653,325 |
| Kangwon Land, Inc. | | 14,150 | 200,520 |
| KB Financial Group, Inc. | | 48,606 | 1,804,786 |
| KCC Corp. | | 541 | 90,214 |
| KEPCO E&C | | 1,496 | 78,873 |
| KEPCO Plant Service & Engineering Co. Ltd. | | 3,214 | 86,007 |
| Kia Corp. | | 34,007 | 2,154,630 |
| Kiwoom Securities Co. Ltd. | | 1,898 | 133,438 |
| Koh Young Technology, Inc. | | 5,425 | 53,942 |
| Kolon Industries, Inc. | | 1,827 | 58,657 |
| Korea Aerospace Industries Ltd. | | 8,794 | 361,364 |
| Korea Electric Power Corp. (a) | | 32,743 | 457,320 |
| Korea Gas Corp. | | 2,871 | 57,624 |
| Korea Investment Holdings Co. Ltd. | | 4,968 | 205,403 |
| Korea Petro Chemical Industries Co. Ltd. | | 536 | 58,369 |
| Korea Zinc Co. Ltd. | | 1,640 | 630,597 |
| Korean Air Lines Co. Ltd. | | 25,116 | 431,002 |
| Korean Reinsurance Co. | | 13,195 | 74,706 |
| KRAFTON, Inc. (a) | | 4,553 | 657,966 |
| KT&G Corp. | | 13,740 | 880,828 |
| Kum Yang Co. Ltd. (a) | | 4,561 | 229,257 |
| Kumho Petro Chemical Co. Ltd. | | 2,195 | 224,546 |
| L&F Co. Ltd. | | 2,968 | 592,684 |
| Leeno Industrial, Inc. | | 1,102 | 110,720 |
| LegoChem Biosciences, Inc. (a) | | 2,651 | 76,135 |
| LG Chemical Ltd. | | 5,933 | 3,296,989 |
| LG Corp. | | 16,490 | 1,079,724 |
| LG Display Co. Ltd. | | 27,880 | 310,924 |
| LG Electronics, Inc. | | 12,682 | 1,041,832 |
| LG Energy Solution (a) | | 5,317 | 2,318,256 |
| LG H & H Co. Ltd. | | 1,096 | 511,976 |
| LG Innotek Co. Ltd. | | 1,774 | 353,221 |
| LG Uplus Corp. | | 27,331 | 225,525 |
| Lotte Chemical Corp. | | 2,502 | 315,469 |
| Lotte Confectionery Co. Ltd. | | 4,679 | 98,193 |
| Lotte Energy Materials Corp. | | 2,500 | 113,147 |
| Lotte Fine Chemical Co. Ltd. | | 1,855 | 85,227 |
| Lotte Shopping Co. Ltd. | | 1,410 | 84,335 |
| LS Corp. | | 3,609 | 242,507 |
| LS Electric Co. Ltd. | | 2,064 | 97,842 |
| LX International Corp. | | 3,292 | 72,217 |
| Lx Semicon Co. Ltd. | | 1,275 | 100,844 |
| Medytox, Inc. | | 520 | 92,097 |
| Meritz Financial Holdings Co. | | 13,944 | 480,163 |
| Mirae Asset Securities Co. Ltd. | | 29,893 | 155,383 |
| Naturecell Co. Ltd. (a) | | 6,871 | 54,318 |
| NAVER Corp. | | 18,948 | 2,746,186 |
| NCSOFT Corp. | | 1,986 | 562,206 |
| Netmarble Corp. (c) | | 3,202 | 155,974 |
| NH Investment & Securities Co. Ltd. | | 18,838 | 131,944 |
| NongShim Co. Ltd. | | 539 | 159,756 |
| Oci Co. Ltd. (d) | | 2,576 | 230,669 |
| Orion Corp./Republic of Korea | | 2,986 | 323,858 |
| Pan Ocean Co., Ltd. (Korea) | | 32,842 | 134,082 |
| Paradise Co. Ltd. (a) | | 7,399 | 85,231 |
| Pearl Abyss Corp. (a) | | 4,446 | 144,044 |
| People & Technology, Inc. | | 2,248 | 91,117 |
| POSCO | | 9,317 | 2,637,799 |
| POSCO Chemtech Co. Ltd. | | 3,893 | 980,325 |
| Posco International Corp. | | 5,545 | 111,526 |
| S-Oil Corp. | | 5,295 | 296,679 |
| S.M. Entertainment Co. Ltd. | | 1,590 | 128,168 |
| S1 Corp. | | 1,857 | 81,134 |
| Sam Chun Dang Pharm Co. Ltd. (a) | | 1,826 | 103,069 |
| Samsung Biologics Co. Ltd. (a)(c) | | 2,532 | 1,481,448 |
| Samsung C&T Corp. | | 11,222 | 921,963 |
| Samsung Card Co. Ltd. | | 2,798 | 62,357 |
| Samsung Electro-Mechanics Co. Ltd. | | 7,208 | 779,819 |
| Samsung Electronics Co. Ltd. | | 647,022 | 31,848,744 |
| Samsung Engineering Co. Ltd. (a) | | 17,056 | 372,430 |
| Samsung Fire & Marine Insurance Co. Ltd. | | 4,099 | 689,832 |
| Samsung Heavy Industries Co. Ltd. (a) | | 95,669 | 407,693 |
| Samsung Life Insurance Co. Ltd. | | 11,783 | 584,385 |
| Samsung SDI Co. Ltd. | | 6,949 | 3,607,766 |
| Samsung SDS Co. Ltd. | | 5,560 | 489,077 |
| Samsung Securities Co. Ltd. | | 7,855 | 199,476 |
| SD Biosensor, Inc. | | 5,624 | 87,742 |
| Seegene, Inc. | | 5,148 | 93,853 |
| Shinhan Financial Group Co. Ltd. | | 64,784 | 1,696,744 |
| Shinsegae Co. Ltd. | | 915 | 141,317 |
| SK Biopharmaceuticals Co. Ltd. (a) | | 3,478 | 179,923 |
| SK Bioscience Co. Ltd. (a) | | 3,218 | 170,129 |
| SK Chemicals Co. Ltd. | | 1,309 | 69,945 |
| SK Hynix, Inc. | | 68,161 | 4,587,927 |
| SK IE Technology Co. Ltd. (a)(c) | | 3,387 | 196,996 |
| SK Innovation Co., Ltd. | | 6,614 | 861,145 |
| SK Square Co. Ltd. (a) | | 12,988 | 414,082 |
| SK, Inc. | | 4,846 | 591,203 |
| SKC Co. Ltd. | | 2,474 | 184,851 |
| SOLUM Co. Ltd. (a) | | 4,821 | 88,330 |
| Solus Advanced Materials Co. Lt | | 1,728 | 52,390 |
| Soulbrain Co. Ltd. | | 578 | 95,145 |
| Ssangyong Cement Industrial Co. Ltd. | | 17,076 | 74,799 |
| ST Pharm Co. Ltd. | | 1,103 | 65,382 |
| Studio Dragon Corp. (a) | | 1,551 | 77,005 |
| Taihan Electric Wire Co. Ltd. (a) | | 88,814 | 99,046 |
| WeMade Entertainment Co. Ltd. | | 2,139 | 89,677 |
| WONIK IPS Co. Ltd. | | 4,458 | 102,136 |
| Woori Financial Group, Inc. | | 81,331 | 715,610 |
| Youngone Corp. | | 2,607 | 86,317 |
| Yuhan Corp. | | 6,483 | 279,655 |
TOTAL KOREA (SOUTH) | | | 113,371,708 |
| Kuwait - 0.2% | | | |
| Agility Public Warehousing Co. KSC | | 193,037 | 388,027 |
| Boubyan Bank KSC | | 158,640 | 348,910 |
| Burgan Bank SAK | | 7,807 | 5,503 |
| Gulf Bank | | 258,651 | 237,171 |
| Kuwait Finance House KSCP | | 1,090,925 | 2,648,550 |
| Mabanee Co. SAKC | | 76,951 | 190,839 |
| Mobile Telecommunication Co. | | 270,406 | 502,075 |
| National Bank of Kuwait | | 1,002,057 | 3,279,697 |
| National Industries Group Holding SAK | | 270,492 | 190,655 |
TOTAL KUWAIT | | | 7,791,427 |
| Luxembourg - 0.1% | | | |
| Aperam SA | | 5,806 | 214,641 |
| ArcelorMittal SA (Netherlands) | | 72,738 | 2,060,657 |
| Eurofins Scientific SA | | 16,159 | 1,126,382 |
| RTL Group SA | | 4,681 | 219,112 |
| SES SA (France) (depositary receipt) | | 46,717 | 289,046 |
TOTAL LUXEMBOURG | | | 3,909,838 |
| Macau - 0.1% | | | |
| Galaxy Entertainment Group Ltd. | | 256,000 | 1,822,028 |
| Sands China Ltd. (a) | | 309,600 | 1,108,808 |
TOTAL MACAU | | | 2,930,836 |
| Malaysia - 0.4% | | | |
| AMMB Holdings Bhd | | 254,800 | 206,637 |
| Axiata Group Bhd | | 589,328 | 395,975 |
| CelcomDigi Bhd | | 430,800 | 425,469 |
| CIMB Group Holdings Bhd | | 909,496 | 1,033,298 |
| Dialog Group Bhd | | 511,400 | 263,287 |
| Gamuda Bhd | | 299,392 | 278,886 |
| Genting Bhd | | 267,800 | 282,857 |
| Genting Malaysia Bhd | | 385,300 | 234,668 |
| Hong Leong Bank Bhd | | 95,700 | 432,500 |
| IHH Healthcare Bhd | | 405,200 | 521,438 |
| Inari Amertron Bhd | | 294,400 | 152,838 |
| IOI Corp. Bhd | | 380,500 | 326,830 |
| Kuala Lumpur Kepong Bhd | | 70,920 | 342,549 |
| Malayan Banking Bhd | | 905,595 | 1,759,825 |
| Malaysia Airports Holdings Bhd | | 122,700 | 194,197 |
| Maxis Bhd | | 285,400 | 281,937 |
| MISC Bhd | | 169,700 | 278,102 |
| MR DIY Group M Sdn Bhd (c) | | 353,300 | 125,444 |
| Nestle (Malaysia) Bhd | | 7,800 | 238,368 |
| Petronas Chemicals Group Bhd | | 360,400 | 573,522 |
| Petronas Dagangan Bhd | | 42,800 | 217,494 |
| Petronas Gas Bhd | | 94,400 | 357,807 |
| PPB Group Bhd | | 89,900 | 327,766 |
| Press Metal Aluminium Holdings | | 467,500 | 541,729 |
| Public Bank Bhd | | 1,922,700 | 1,678,997 |
| QL Resources Bhd | | 154,700 | 196,022 |
| RHB Bank Bhd | | 484,210 | 595,611 |
| Sime Darby Bhd | | 378,000 | 184,185 |
| Sime Darby Plantation Bhd | | 424,167 | 408,254 |
| Telekom Malaysia Bhd | | 224,630 | 250,267 |
| Tenaga Nasional Bhd | | 356,000 | 711,052 |
| Top Glove Corp. Bhd (a) | | 635,100 | 140,055 |
| V.S. Industry Bhd warrants 6/14/24 (a) | | 38,200 | 172 |
TOTAL MALAYSIA | | | 13,958,038 |
| Malta - 0.0% | | | |
| Kindred Group PLC (depository receipt) | | 28,542 | 350,128 |
| Mexico - 0.7% | | | |
| Alfa SA de CV Series A | | 402,300 | 255,304 |
| America Movil S.A.B. de CV Series L | | 2,491,100 | 2,686,528 |
| Arca Continental S.A.B. de CV | | 59,500 | 566,225 |
| Banco del Bajio SA (c) | | 93,500 | 307,602 |
| Borr Drilling Ltd. (a) | | 24,646 | 170,211 |
| CEMEX S.A.B. de CV unit (a) | | 1,897,400 | 1,139,738 |
| Coca-Cola FEMSA S.A.B. de CV unit | | 64,050 | 528,766 |
| Fibra Uno Administracion SA de CV | | 357,600 | 494,051 |
| Fomento Economico Mexicano S.A.B. de CV unit | | 232,800 | 2,264,878 |
| Gruma S.A.B. de CV Series B | | 22,140 | 346,554 |
| Grupo Aeroportuario del Pacifico S.A.B. de CV Series B | | 45,500 | 809,533 |
| Grupo Aeroportuario del Sureste S.A.B. de CV Series B | | 23,815 | 683,541 |
| Grupo Aeroportuario Norte S.A.B. de CV | | 34,600 | 380,341 |
| Grupo Bimbo S.A.B. de CV Series A | | 171,500 | 918,571 |
| Grupo Carso SA de CV Series A1 | | 62,600 | 353,362 |
| Grupo Elektra SA de CV | | 7,170 | 459,571 |
| Grupo Financiero Banorte S.A.B. de CV Series O | | 312,800 | 2,704,978 |
| Grupo Financiero Inbursa S.A.B. de CV Series O (a) | | 247,700 | 602,873 |
| Grupo Mexico SA de CV Series B | | 397,100 | 1,952,647 |
| Grupo Televisa SA de CV | | 310,600 | 315,100 |
| Industrias Penoles SA de CV (a) | | 24,290 | 373,263 |
| Kimberly-Clark de Mexico SA de CV Series A | | 173,500 | 393,522 |
| Orbia Advance Corp. S.A.B. de CV | | 123,300 | 284,051 |
| Promotora y Operadora de Infraestructura S.A.B. de CV | | 24,525 | 255,092 |
| Ternium SA sponsored ADR | | 6,535 | 283,292 |
| Wal-Mart de Mexico SA de CV Series V | | 644,400 | 2,598,101 |
TOTAL MEXICO | | | 22,127,695 |
| Netherlands - 3.1% | | | |
| Adyen BV (a)(c) | | 3,916 | 6,292,431 |
| Akzo Nobel NV | | 22,238 | 1,841,234 |
| Argenx SE (a) | | 6,995 | 2,698,309 |
| ASM International NV (Netherlands) | | 5,843 | 2,112,118 |
| ASML Holding NV (Netherlands) | | 50,893 | 32,161,305 |
| Euronext NV (c) | | 12,523 | 994,915 |
| EXOR NV | | 14,430 | 1,184,263 |
| Heineken Holding NV | | 13,752 | 1,317,582 |
| Heineken NV (Bearer) | | 29,702 | 3,405,414 |
| IMCD NV | | 7,228 | 1,084,769 |
| ING Groep NV (Certificaten Van Aandelen) | | 470,693 | 5,808,954 |
| Koninklijke Ahold Delhaize NV | | 125,303 | 4,310,588 |
| Koninklijke KPN NV | | 405,870 | 1,480,161 |
| Koninklijke Philips Electronics NV | | 112,099 | 2,366,636 |
| NN Group NV | | 37,705 | 1,403,047 |
| Randstad NV | | 16,073 | 871,727 |
| Shell PLC (London) | | 897,874 | 27,590,027 |
| Universal Music Group NV | | 95,662 | 2,088,171 |
| Wolters Kluwer NV | | 32,594 | 4,315,227 |
TOTAL NETHERLANDS | | | 103,326,878 |
| New Zealand - 0.2% | | | |
| Auckland International Airport Ltd. (a) | | 152,612 | 835,605 |
| Chorus Ltd. | | 55,328 | 295,838 |
| Contact Energy Ltd. | | 96,779 | 469,382 |
| Fisher & Paykel Healthcare Corp. | | 73,202 | 1,255,628 |
| Fletcher Building Ltd. | | 97,165 | 270,927 |
| Infratil Ltd. | | 91,367 | 540,271 |
| Mainfreight Ltd. | | 10,979 | 487,610 |
| Mercury Nz Ltd. | | 82,533 | 324,183 |
| Meridian Energy Ltd. | | 149,261 | 505,501 |
| Spark New Zealand Ltd. | | 239,896 | 777,300 |
| The a2 Milk Co. Ltd. (a) | | 90,356 | 330,014 |
| Xero Ltd. (a) | | 17,829 | 1,112,989 |
TOTAL NEW ZEALAND | | | 7,205,248 |
| Norway - 0.5% | | | |
| Aker ASA (A Shares) | | 2,908 | 177,366 |
| Aker BP ASA | | 39,214 | 936,466 |
| AutoStore Holdings Ltd. (a)(c) | | 119,593 | 256,197 |
| DNB Bank ASA | | 113,530 | 1,994,249 |
| Entra ASA (c) | | 14,988 | 152,172 |
| Equinor ASA | | 132,178 | 3,805,541 |
| Europris ASA (c) | | 19,987 | 143,005 |
| Frontline PLC | | 16,708 | 259,375 |
| Gjensidige Forsikring ASA | | 23,214 | 403,635 |
| Kongsberg Gruppen ASA | | 11,253 | 504,519 |
| Leroy Seafood Group ASA | | 37,516 | 197,313 |
| Mowi ASA | | 58,509 | 1,115,053 |
| Nordic VLSI ASA (a) | | 22,241 | 240,315 |
| Norsk Hydro ASA | | 170,757 | 1,256,612 |
| Orkla ASA | | 97,906 | 703,722 |
| Salmar ASA | | 8,484 | 376,154 |
| Schibsted ASA: | | | |
| (A Shares) | | 8,552 | 151,507 |
| (B Shares) | | 13,570 | 219,778 |
| Sparebank 1 Sr Bank ASA (primary capital certificate) | | 23,883 | 279,459 |
| Sparebanken Midt-Norge | | 17,252 | 223,075 |
| Storebrand ASA (A Shares) | | 63,319 | 487,442 |
| Telenor ASA | | 80,504 | 1,004,312 |
| TGS ASA | | 15,898 | 248,829 |
| Tomra Systems ASA | | 28,470 | 435,450 |
TOTAL NORWAY | | | 15,571,546 |
| Pakistan - 0.0% | | | |
| Pakistan Petroleum Ltd. | | 127,006 | 29,801 |
| TRG Pakistan Ltd. (a) | | 46,000 | 17,756 |
TOTAL PAKISTAN | | | 47,557 |
| Peru - 0.0% | | | |
| Compania de Minas Buenaventura SAA sponsored ADR | | 28,982 | 204,903 |
| Credicorp Ltd. (United States) | | 8,648 | 1,171,631 |
TOTAL PERU | | | 1,376,534 |
| Philippines - 0.2% | | | |
| Aboitiz Equity Ventures, Inc. | | 273,430 | 270,272 |
| ACEN Corp. | | 971,170 | 105,543 |
| Ayala Corp. | | 31,300 | 361,910 |
| Ayala Land, Inc. | | 744,400 | 359,153 |
| Bank of the Philippine Islands (BPI) | | 246,391 | 478,432 |
| BDO Unibank, Inc. | | 263,910 | 686,716 |
| Globe Telecom, Inc. | | 4,158 | 127,722 |
| International Container Terminal Services, Inc. | | 102,760 | 402,302 |
| JG Summit Holdings, Inc. | | 378,845 | 347,179 |
| Jollibee Food Corp. | | 55,130 | 223,811 |
| Manila Electric Co. | | 34,630 | 212,049 |
| Metropolitan Bank & Trust Co. | | 220,914 | 233,618 |
| Monde Nissin Corp. (c) | | 879,200 | 148,397 |
| PLDT, Inc. | | 11,420 | 248,082 |
| SM Investments Corp. | | 61,710 | 998,262 |
| SM Prime Holdings, Inc. | | 1,439,800 | 882,935 |
| Universal Robina Corp. | | 105,690 | 280,776 |
TOTAL PHILIPPINES | | | 6,367,159 |
| Poland - 0.2% | | | |
| Allegro.eu SA (a)(c) | | 53,018 | 416,733 |
| Bank Polska Kasa Opieki SA | | 22,206 | 512,081 |
| CD Projekt RED SA | | 8,680 | 236,286 |
| Dino Polska SA (a)(c) | | 6,021 | 612,501 |
| Grupa Kety SA | | 1,236 | 168,379 |
| InPost SA (a) | | 26,435 | 282,840 |
| KGHM Polska Miedz SA (Bearer) | | 17,048 | 489,064 |
| Kruk SA | | 2,263 | 204,002 |
| LPP SA | | 131 | 377,694 |
| Orange Polska SA | | 82,276 | 143,278 |
| PGE Polska Grupa Energetyczna SA (a) | | 98,991 | 163,586 |
| Polski Koncern Naftowy Orlen SA | | 66,790 | 1,017,713 |
| Powszechna Kasa Oszczednosci Bank SA | | 107,980 | 832,012 |
| Powszechny Zaklad Ubezpieczen SA | | 71,240 | 655,557 |
| Santander Bank Polska SA | | 4,109 | 333,885 |
TOTAL POLAND | | | 6,445,611 |
| Portugal - 0.1% | | | |
| Banco Comercial Portugues SA (Reg.) | | 1,039,738 | 266,945 |
| Energias de Portugal SA | | 373,464 | 2,057,600 |
| Galp Energia SGPS SA Class B | | 56,775 | 687,538 |
| Jeronimo Martins SGPS SA | | 35,405 | 893,392 |
| NOS SGPS | | 28,646 | 125,881 |
| REN - Redes Energeticas Nacionais SGPS SA | | 45,779 | 132,920 |
TOTAL PORTUGAL | | | 4,164,276 |
| Qatar - 0.2% | | | |
| Barwa Real Estate Co. (a) | | 279,620 | 192,047 |
| Industries Qatar QSC (a) | | 251,832 | 882,796 |
| Masraf al Rayan | | 782,600 | 548,250 |
| Mesaieed Petrochemical Holding Co. (a) | | 529,234 | 287,880 |
| Qatar Electricity & Water Co. (a) | | 69,678 | 321,017 |
| Qatar Fuel Co. (a) | | 81,753 | 371,482 |
| Qatar Gas Transport Co. Ltd. (Nakilat) (a) | | 337,132 | 366,770 |
| Qatar International Islamic Bank QSC (a) | | 153,574 | 417,266 |
| Qatar Islamic Bank | | 206,214 | 1,014,074 |
| Qatar National Bank SAQ (a) | | 560,812 | 2,366,503 |
| The Commercial Bank of Qatar (a) | | 416,487 | 670,727 |
TOTAL QATAR | | | 7,438,812 |
| Romania - 0.0% | | | |
| NEPI Rockcastle PLC | | 60,404 | 365,016 |
| Russia - 0.0% | | | |
| Alrosa Co. Ltd. (a)(d) | | 280,800 | 54,352 |
| Gazprom OAO (d) | | 1,373,390 | 167,205 |
| LUKOIL PJSC (d) | | 41,065 | 14,788 |
| Magnit OJSC (a)(d) | | 8,984 | 215 |
| MMC Norilsk Nickel PJSC (d) | | 6,814 | 52,725 |
| Mobile TeleSystems OJSC sponsored ADR (a)(d) | | 50,085 | 49,884 |
| Novatek PJSC (d) | | 110,726 | 3,598 |
| Polyus PJSC (a)(d) | | 3,653 | 9,995 |
| Sberbank of Russia (d) | | 1,236,820 | 8,848 |
| Severstal PAO (a)(d) | | 21,400 | 556 |
| Surgutneftegas OJSC (d) | | 1,002,400 | 14,271 |
| Tatneft PAO (d) | | 175,192 | 25,352 |
| VK Co. Ltd. GDR (Reg. S) (a)(d) | | 12,713 | 25,426 |
| Yandex NV Series A (a)(d) | | 37,320 | 283,632 |
TOTAL RUSSIA | | | 710,847 |
| Saudi Arabia - 0.9% | | | |
| Abdullah Al Othaim Markets Co. | | 5,262 | 200,620 |
| ACWA Power Co. | | 16,676 | 696,260 |
| Advanced Polypropylene Co. | | 17,298 | 219,528 |
| Al Rajhi Bank | | 248,181 | 5,081,798 |
| Alinma Bank | | 123,093 | 1,038,711 |
| Almarai Co. Ltd. | | 30,369 | 476,907 |
| Arabian Internet and Communications Services Co. Ltd. | | 2,977 | 221,447 |
| Bank Al-Jazira | | 55,380 | 286,741 |
| Bank Albilad | | 62,587 | 689,997 |
| Banque Saudi Fransi | | 73,909 | 760,628 |
| Dar Al Arkan Real Estate Development Co. (a) | | 64,624 | 277,056 |
| Dr Sulaiman Al Habib Medical Services Group Co. | | 10,501 | 803,527 |
| Elm Co. | | 3,333 | 393,665 |
| Emaar The Economic City (a) | | 77,086 | 198,948 |
| Etihad Etisalat Co. | | 47,529 | 582,914 |
| Jarir Marketing Co. | | 7,702 | 335,128 |
| Mobile Telecommunications Co. Saudi Arabia (a) | | 53,784 | 214,522 |
| Mouwasat Medical Services Co. | | 5,688 | 374,276 |
| Nahdi Medical Co. | | 4,916 | 234,875 |
| National Industrialization Co. (a) | | 42,531 | 154,671 |
| Riyad Bank | | 185,729 | 1,485,555 |
| Sabic Agriculture-Nutrients Co. | | 29,040 | 1,034,405 |
| Sahara International Petrochemical Co. | | 45,946 | 474,074 |
| Saudi Arabian Mining Co. | | 102,103 | 1,889,234 |
| Saudi Basic Industries Corp. | | 114,248 | 2,811,499 |
| Saudi Cement Co. | | 8,721 | 130,674 |
| Saudi Electricity Co. | | 97,090 | 626,437 |
| Saudi Industrial Investment Group | | 47,905 | 325,055 |
| Saudi Investment Bank/The | | 64,193 | 280,343 |
| Saudi Kayan Petrochemical Co. (a) | | 94,153 | 317,801 |
| Saudi Research & Marketing Group (a) | | 4,260 | 239,424 |
| Saudi Tadawul Group Holding Co. | | 6,174 | 275,227 |
| Saudi Telecom Co. | | 228,215 | 2,738,069 |
| The Co. for Cooperative Insurance (a) | | 7,288 | 200,140 |
| The Saudi British Bank | | 45,680 | 440,273 |
| The Saudi National Bank | | 277,828 | 3,622,201 |
| The Savola Group | | 32,260 | 273,944 |
| Yanbu National Petrochemical Co. | | 33,570 | 400,080 |
TOTAL SAUDI ARABIA | | | 30,806,654 |
| Singapore - 1.1% | | | |
| CapitaLand Ascendas REIT | | 437,897 | 942,322 |
| Capitaland Ascott Trust unit (e) | | 17,512 | 14,218 |
| CapitaLand Investment Ltd. | | 307,173 | 859,846 |
| CapitaMall Trust | | 628,938 | 960,350 |
| City Developments Ltd. | | 64,500 | 337,418 |
| ComfortDelgro Corp. Ltd. | | 264,900 | 237,131 |
| DBS Group Holdings Ltd. | | 231,557 | 5,721,765 |
| Frasers Logistics & Industrial Trust | | 366,900 | 372,382 |
| Genting Singapore Ltd. | | 710,600 | 604,526 |
| Grab Holdings Ltd. (a)(b) | | 240,523 | 699,922 |
| Jardine Cycle & Carriage Ltd. | | 12,500 | 318,359 |
| Keppel Corp. Ltd. | | 172,600 | 801,448 |
| Keppel DC (REIT) | | 164,500 | 265,974 |
| Mapletree Industrial (REIT) | | 254,554 | 455,045 |
| Mapletree Logistics Trust (REIT) | | 411,892 | 539,030 |
| Mapletree Pan Asia Commercial Trust | | 293,018 | 388,146 |
| NetLink NBN Trust | | 366,700 | 240,723 |
| Oversea-Chinese Banking Corp. Ltd. | | 512,722 | 4,850,807 |
| SATS Ltd. (a) | | 119,523 | 228,323 |
| Sea Ltd. ADR (a) | | 45,716 | 3,482,188 |
| Seatrium Ltd. (a) | | 5,251,676 | 489,788 |
| Sembcorp Industries Ltd. | | 113,900 | 366,490 |
| Singapore Airlines Ltd. | | 165,050 | 725,937 |
| Singapore Exchange Ltd. | | 101,800 | 732,617 |
| Singapore Technologies Engineering Ltd. | | 194,000 | 528,131 |
| Singapore Telecommunications Ltd. | | 909,500 | 1,742,923 |
| STMicroelectronics NV (Italy) | | 82,792 | 3,539,029 |
| Suntec (REIT) | | 286,500 | 290,421 |
| United Overseas Bank Ltd. | | 195,500 | 4,152,021 |
| UOL Group Ltd. | | 58,600 | 305,709 |
| Venture Corp. Ltd. | | 33,400 | 426,710 |
TOTAL SINGAPORE | | | 35,619,699 |
| South Africa - 1.0% | | | |
| Absa Group Ltd. | | 107,117 | 1,040,222 |
| Anglo American Platinum Ltd. | | 7,354 | 435,483 |
| Anglo American PLC (United Kingdom) | | 169,056 | 5,209,322 |
| Aspen Pharmacare Holdings Ltd. | | 50,382 | 503,476 |
| Bid Corp. Ltd. | | 42,200 | 960,386 |
| Bidvest Group Ltd./The | | 42,770 | 585,815 |
| Capitec Bank Holdings Ltd. | | 12,349 | 1,075,323 |
| Clicks Group Ltd. | | 30,563 | 446,670 |
| Discovery Ltd. (a) | | 61,024 | 479,618 |
| Exxaro Resources Ltd. | | 30,371 | 318,478 |
| FirstRand Ltd. | | 710,738 | 2,500,648 |
| Foschini Group Ltd./The | | 44,590 | 230,769 |
| Gold Fields Ltd. | | 112,261 | 1,749,400 |
| Growthpoint Properties Ltd. | | 455,584 | 317,047 |
| Harmony Gold Mining Co. Ltd. | | 71,669 | 335,730 |
| Impala Platinum Holdings Ltd. | | 107,746 | 1,048,994 |
| Life Healthcare Group Holdings Ltd. | | 182,235 | 206,618 |
| Mr Price Group Ltd. | | 31,073 | 255,515 |
| MTN Group Ltd. | | 111,956 | 785,360 |
| MultiChoice Group Ltd. | | 57,615 | 360,604 |
| Naspers Ltd. Class N | | 27,460 | 4,895,588 |
| Nedbank Group Ltd. | | 60,391 | 696,762 |
| Northam Platinum Holdings Ltd. (a) | | 36,149 | 353,813 |
| Old Mutual Ltd. | | 585,250 | 371,770 |
| OUTsurance Group Ltd. | | 105,041 | 199,832 |
| Remgro Ltd. | | 64,549 | 494,126 |
| Sanlam Ltd. | | 229,604 | 708,299 |
| Sappi Ltd. | | 68,849 | 156,460 |
| Sasol Ltd. | | 73,049 | 951,251 |
| Shoprite Holdings Ltd. | | 60,706 | 739,888 |
| Sibanye-Stillwater Ltd. | | 350,708 | 775,357 |
| Spar Group Ltd./The | | 23,310 | 178,911 |
| Standard Bank Group Ltd. | | 171,461 | 1,605,552 |
| Thungela Resources Ltd. | | 17,378 | 162,679 |
| Tiger Brands Ltd. | | 19,823 | 214,772 |
| Vodacom Group Ltd. | | 104,571 | 715,890 |
| Woolworths Holdings Ltd. | | 129,384 | 460,103 |
TOTAL SOUTH AFRICA | | | 32,526,531 |
| Spain - 1.6% | | | |
| Acciona SA | | 3,104 | 574,610 |
| ACS Actividades de Construccion y Servicios SA | | 28,261 | 971,593 |
| Aena SME SA (c) | | 9,458 | 1,593,489 |
| Amadeus IT Holding SA Class A (a) | | 56,991 | 4,005,614 |
| Banco Bilbao Vizcaya Argentaria SA | | 760,220 | 5,565,562 |
| Banco de Sabadell SA | | 720,339 | 749,927 |
| Banco Santander SA (Spain) | | 2,122,367 | 7,452,064 |
| Bankinter SA | | 80,580 | 476,098 |
| CaixaBank SA | | 512,449 | 1,896,885 |
| Cellnex Telecom SA (c) | | 75,052 | 3,159,989 |
| EDP Renovaveis SA | | 26,095 | 579,682 |
| Enagas SA | | 31,286 | 625,876 |
| Endesa SA | | 39,682 | 890,690 |
| Ferrovial SA | | 62,560 | 1,959,818 |
| Grifols SA (a) | | 28,312 | 290,756 |
| Grifols SA ADR (a) | | 14,415 | 107,536 |
| Iberdrola SA | | 736,651 | 9,545,598 |
| Industria de Diseno Textil SA | | 141,669 | 4,864,234 |
| Merlin Properties Socimi SA | | 41,108 | 362,828 |
| Naturgy Energy Group SA | | 22,820 | 711,614 |
| Red Electrica Corporacion SA | | 54,702 | 994,858 |
| Repsol SA | | 168,736 | 2,481,238 |
| Telefonica SA | | 736,120 | 3,343,596 |
TOTAL SPAIN | | | 53,204,155 |
| Sweden - 2.2% | | | |
| AAK AB | | 23,185 | 466,637 |
| AddTech AB (B Shares) | | 32,038 | 640,444 |
| AFRY AB (B Shares) | | 11,041 | 207,253 |
| Alfa Laval AB | | 36,747 | 1,345,532 |
| ASSA ABLOY AB (B Shares) | | 126,313 | 3,004,153 |
| Atlas Copco AB: | | | |
| (A Shares) | | 321,022 | 4,636,092 |
| (B Shares) | | 198,552 | 2,542,150 |
| Avanza Bank Holding AB (b) | | 15,457 | 328,130 |
| Axfood AB | | 13,568 | 336,321 |
| Beijer Ref AB (B Shares) | | 42,008 | 685,725 |
| Billerud AB | | 27,137 | 260,281 |
| Boliden AB | | 34,978 | 1,249,038 |
| Bravida Holding AB (c) | | 24,441 | 296,723 |
| Castellum AB (b) | | 36,094 | 437,490 |
| Dometic Group AB (c) | | 38,483 | 274,990 |
| Electrolux AB (B Shares) | | 27,606 | 416,040 |
| Elekta AB (B Shares) | | 45,067 | 378,201 |
| Embracer Group AB (a) | | 104,904 | 546,357 |
| Epiroc AB: | | | |
| (A Shares) | | 77,665 | 1,555,869 |
| (B Shares) | | 51,351 | 881,801 |
| EQT AB | | 41,602 | 891,670 |
| Ericsson (B Shares) | | 387,072 | 2,131,101 |
| Essity AB (B Shares) | | 76,143 | 2,306,925 |
| Evolution AB (c) | | 24,181 | 3,219,559 |
| Fabege AB | | 32,794 | 262,543 |
| Fastighets AB Balder (a) | | 79,569 | 369,251 |
| Fortnox AB | | 61,523 | 423,070 |
| Getinge AB (B Shares) | | 28,021 | 710,153 |
| H&M Hennes & Mauritz AB (B Shares) | | 90,902 | 1,332,695 |
| Hexagon AB (B Shares) | | 269,128 | 3,081,438 |
| HEXPOL AB (B Shares) | | 32,145 | 378,341 |
| Holmen AB (B Shares) | | 11,507 | 434,582 |
| Hufvudstaden AB (A Shares) | | 15,232 | 217,005 |
| Husqvarna AB (B Shares) | | 54,760 | 471,505 |
| Industrivarden AB: | | | |
| (A Shares) | | 22,135 | 631,994 |
| (C Shares) | | 22,065 | 628,919 |
| Indutrade AB | | 33,964 | 813,741 |
| Investment AB Latour (B Shares) | | 16,608 | 358,718 |
| Investor AB: | | | |
| (A Shares) | | 70,738 | 1,547,882 |
| (B Shares) | | 230,778 | 4,946,344 |
| Kinnevik AB (B Shares) (a) | | 30,675 | 502,074 |
| L E Lundbergforetagen AB | | 7,765 | 371,704 |
| Lagercrantz Group AB (B Shares) | | 25,301 | 325,174 |
| Lifco AB | | 27,262 | 620,736 |
| Loomis AB (B Shares) | | 9,917 | 317,188 |
| Nibe Industrier AB (B Shares) | | 193,035 | 2,155,280 |
| Nordnet AB | | 19,444 | 304,883 |
| Saab AB (B Shares) | | 10,501 | 589,405 |
| Sagax AB | | 23,683 | 579,659 |
| Sandvik AB | | 138,048 | 2,806,716 |
| Securitas AB (B Shares) | | 66,368 | 594,106 |
| Sinch AB (a)(b)(c) | | 82,939 | 218,770 |
| Skandinaviska Enskilda Banken AB (A Shares) | | 215,942 | 2,453,157 |
| Skanska AB (B Shares) | | 50,548 | 825,129 |
| SKF AB (B Shares) | | 47,042 | 850,009 |
| SSAB AB (B Shares) | | 81,343 | 548,259 |
| Svenska Cellulosa AB SCA (B Shares) | | 75,975 | 1,040,530 |
| Svenska Handelsbanken AB (A Shares) | | 195,599 | 1,729,053 |
| Sweco AB (B Shares) | | 25,140 | 336,342 |
| Swedbank AB (A Shares) | | 116,461 | 2,021,449 |
| Swedish Orphan Biovitrum AB (a) | | 25,619 | 623,047 |
| Tele2 AB (B Shares) | | 67,929 | 721,680 |
| Telia Co. AB | | 301,650 | 839,845 |
| Thule Group AB (c) | | 12,582 | 362,797 |
| Trelleborg AB (B Shares) | | 30,732 | 771,368 |
| Viaplay Group AB (B Shares) (a) | | 9,403 | 239,498 |
| Vitrolife AB | | 9,506 | 213,571 |
| Volvo AB: | | | |
| (A Shares) | | 24,831 | 525,432 |
| (B Shares) | | 200,814 | 4,127,878 |
| Volvo Car AB (a) | | 65,853 | 270,731 |
| Wallenstam AB (B Shares) | | 52,192 | 206,731 |
| Wihlborgs Fastigheter AB | | 35,244 | 284,219 |
TOTAL SWEDEN | | | 74,023,083 |
| Switzerland - 3.6% | | | |
| ABB Ltd. (Reg.) | | 215,718 | 7,781,734 |
| Adecco SA (Reg.) | | 21,858 | 746,574 |
| Alcon, Inc. (Switzerland) | | 63,047 | 4,572,027 |
| Baloise Holdings AG | | 5,637 | 940,288 |
| Compagnie Financiere Richemont SA Series A | | 65,923 | 10,897,129 |
| DSM-Firmenich AG | | 22,336 | 2,922,926 |
| Geberit AG (Reg.) | | 4,533 | 2,570,145 |
| Givaudan SA | | 1,007 | 3,517,205 |
| Julius Baer Group Ltd. | | 26,931 | 1,919,834 |
| Kuehne & Nagel International AG | | 7,171 | 2,117,164 |
| Lindt & Spruengli AG | | 13 | 1,596,912 |
| Lindt & Spruengli AG (participation certificate) | | 137 | 1,689,031 |
| Logitech International SA (Reg.) | | 21,786 | 1,280,081 |
| Lonza Group AG | | 9,400 | 5,862,218 |
| Mediclinic International PLC | | 47,169 | 295,610 |
| Novartis AG | | 303,525 | 31,048,753 |
| Partners Group Holding AG | | 2,867 | 2,768,691 |
| Schindler Holding AG (participation certificate) | | 5,210 | 1,158,166 |
| SGS SA (Reg.) | | 19,181 | 1,728,726 |
| Sika AG | | 19,439 | 5,369,499 |
| Sonova Holding AG | | 6,517 | 2,054,585 |
| Straumann Holding AG | | 14,659 | 2,205,456 |
| Swatch Group AG (Bearer) | | 3,627 | 1,235,984 |
| Swiss Life Holding AG | | 3,893 | 2,555,700 |
| Swisscom AG | | 3,204 | 2,197,295 |
| UBS Group AG | | 445,367 | 9,001,012 |
| VAT Group AG (c) | | 3,415 | 1,196,979 |
| Zurich Insurance Group Ltd. | | 18,978 | 9,167,870 |
TOTAL SWITZERLAND | | | 120,397,594 |
| Taiwan - 3.8% | | | |
| Accton Technology Corp. | | 63,000 | 615,011 |
| Acer, Inc. | | 375,000 | 369,647 |
| Acer, Inc. rights 6/16/23 (a)(d) | | 167 | 0 |
| Advantech Co. Ltd. | | 57,696 | 698,089 |
| Alchip Technologies Ltd. | | 9,000 | 349,270 |
| AP Memory Technology Corp. | | 17,000 | 155,557 |
| ASE Technology Holding Co. Ltd. | | 431,000 | 1,415,944 |
| Asia Cement Corp. | | 326,000 | 466,594 |
| Asia Vital Components Co. Ltd. | | 41,000 | 210,811 |
| ASMedia Technology, Inc. | | 4,000 | 148,651 |
| ASPEED Tech, Inc. | | 3,300 | 282,384 |
| ASUSTeK Computer, Inc. | | 91,000 | 838,158 |
| AUO Corp. | | 901,000 | 500,063 |
| BizLink Holding, Inc. | | 18,000 | 154,487 |
| BizLink Holding, Inc. rights 5/8/23 (a) | | 383 | 411 |
| Catcher Technology Co. Ltd. | | 88,000 | 518,760 |
| Cathay Financial Holding Co. Ltd. | | 1,199,923 | 1,661,189 |
| Chailease Holding Co. Ltd. | | 191,096 | 1,390,804 |
| Chang Hwa Commercial Bank | | 831,156 | 481,661 |
| Cheng Shin Rubber Industry Co. Ltd. | | 264,000 | 325,123 |
| Chicony Electronics Co. Ltd. | | 80,000 | 252,590 |
| China Airlines Ltd. | | 382,000 | 236,811 |
| China Development Financial Ho | | 2,103,000 | 898,624 |
| China Petrochemical Development Corp. | | 442,277 | 145,557 |
| China Steel Corp. | | 1,589,000 | 1,506,010 |
| Chipbond Technology Corp. | | 80,000 | 171,663 |
| Chroma ATE, Inc. | | 49,000 | 303,965 |
| Chung Hsin Electric & Machinery Manufacturing Corp. | | 52,000 | 172,279 |
| Chung Hung Steel Co. Ltd. | | 97,000 | 77,526 |
| Chunghwa Telecom Co. Ltd. | | 485,000 | 2,005,449 |
| Compal Electronics, Inc. | | 508,000 | 396,165 |
| Compeq Manufacturing Co. Ltd. | | 128,000 | 180,188 |
| CTBC Financial Holding Co. Ltd. | | 2,476,000 | 1,823,880 |
| Delta Electronics, Inc. | | 244,000 | 2,388,546 |
| E Ink Holdings, Inc. | | 110,000 | 684,834 |
| E.SUN Financial Holdings Co. Ltd. | | 1,898,213 | 1,542,646 |
| ECLAT Textile Co. Ltd. | | 25,000 | 397,848 |
| Elan Microelectronics Corp. | | 33,000 | 101,574 |
| Elite Material Co. Ltd. | | 37,000 | 197,771 |
| Elite Semiconductor Memory Technology, Inc. | | 31,000 | 82,149 |
| eMemory Technology, Inc. | | 7,000 | 418,250 |
| ENNOSTAR, Inc. | | 85,500 | 139,341 |
| EVA Airways Corp. | | 315,619 | 276,573 |
| Evergreen Marine Corp. (Taiwan) | | 125,657 | 663,196 |
| Far Eastern International Bank | | 477,740 | 174,201 |
| Far Eastern New Century Corp. | | 493,000 | 512,106 |
| Far EasTone Telecommunications Co. Ltd. | | 202,000 | 518,649 |
| Faraday Technology Corp. | | 29,000 | 155,897 |
| Feng Tay Enterprise Co. Ltd. | | 69,480 | 431,954 |
| First Financial Holding Co. Ltd. | | 1,385,217 | 1,222,685 |
| Fitipower Integrated Technology, Inc. | | 20,000 | 103,432 |
| FLEXium Interconnect, Inc. | | 42,000 | 129,373 |
| Formosa Chemicals & Fibre Corp. | | 503,000 | 1,128,040 |
| Formosa Petrochemical Corp. | | 213,000 | 602,216 |
| Formosa Plastics Corp. | | 553,000 | 1,690,510 |
| Foxconn Technology Co. Ltd. | | 128,000 | 224,912 |
| Fubon Financial Holding Co. Ltd. | | 1,008,129 | 1,940,199 |
| Genius Electronic Optical Co. Ltd. | | 12,000 | 145,518 |
| Giant Manufacturing Co. Ltd. | | 38,341 | 229,825 |
| Gigabyte Technology Co. Ltd. | | 63,000 | 269,582 |
| Global Unichip Corp. | | 10,000 | 326,019 |
| GlobalWafers Co. Ltd. | | 27,000 | 424,042 |
| Great Wall Enterprise Co. Ltd. | | 111,977 | 187,129 |
| HannStar Display Corp. | | 323,000 | 128,692 |
| Highwealth Construction Corp. | | 171,342 | 234,504 |
| Himax Technologies, Inc. sponsored ADR (b) | | 14,808 | 98,325 |
| HIWIN Technologies Corp. | | 36,192 | 277,804 |
| Hon Hai Precision Industry Co. Ltd. (Foxconn) | | 1,525,800 | 5,195,606 |
| Hotai Motor Co. Ltd. | | 45,000 | 969,326 |
| HTC Corp. (a) | | 99,000 | 183,615 |
| Hua Nan Financial Holdings Co. Ltd. | | 1,273,755 | 908,946 |
| IBF Financial Holdings Co. Ltd. | | 348,946 | 140,138 |
| Innolux Corp. | | 1,195,435 | 523,331 |
| International Games Systems Co. Ltd. | | 16,000 | 279,236 |
| Inventec Corp. | | 384,000 | 413,910 |
| King Yuan Electronics Co. Ltd. | | 153,000 | 234,653 |
| King's Town Bank Co. Ltd. | | 132,000 | 151,427 |
| Kinsus Interconnect Technology Corp. | | 34,000 | 122,976 |
| Largan Precision Co. Ltd. | | 12,000 | 787,396 |
| Lien Hwa Industrial Corp. | | 118,067 | 234,727 |
| Lite-On Technology Corp. | | 274,000 | 655,914 |
| Lotes Co. Ltd. | | 11,398 | 326,602 |
| Macronix International Co. Ltd. | | 225,340 | 236,794 |
| Makalot Industrial Co. Ltd. | | 22,459 | 163,000 |
| MediaTek, Inc. | | 202,000 | 4,389,187 |
| Mega Financial Holding Co. Ltd. | | 1,397,675 | 1,549,548 |
| Merida Industry Co. Ltd. | | 26,000 | 145,497 |
| Micro-Star International Co. Ltd. | | 91,000 | 432,222 |
| momo.com, Inc. | | 9,440 | 255,608 |
| Nan Ya Plastics Corp. | | 720,000 | 1,828,656 |
| Nan Ya Printed Circuit Board Corp. | | 28,000 | 251,907 |
| Nanya Technology Corp. | | 152,000 | 336,642 |
| Nien Made Enterprise Co. Ltd. | | 24,000 | 264,059 |
| Novatek Microelectronics Corp. | | 72,000 | 983,633 |
| Oneness Biotech Co. Ltd. (a) | | 31,000 | 243,724 |
| Pegatron Corp. | | 266,000 | 606,629 |
| PharmaEssentia Corp. (a) | | 32,000 | 385,772 |
| Phison Electronics Corp. | | 20,000 | 253,691 |
| Polaris Group (a) | | 39,001 | 120,805 |
| Pou Chen Corp. | | 317,000 | 328,149 |
| Powerchip Semiconductor Manufacturing Corp. | | 348,000 | 337,876 |
| Powertech Technology, Inc. | | 86,000 | 257,335 |
| Poya International Co. Ltd. | | 9,221 | 172,469 |
| President Chain Store Corp. | | 70,000 | 616,262 |
| Primax Electronics Ltd. | | 46,000 | 89,959 |
| Qisda Corp. | | 219,000 | 246,936 |
| Quanta Computer, Inc. | | 343,000 | 959,747 |
| Radiant Opto-Electronics Corp. | | 60,000 | 220,928 |
| Realtek Semiconductor Corp. | | 61,000 | 714,845 |
| Ruentex Development Co. Ltd. | | 269,620 | 314,836 |
| Ruentex Industries Ltd. | | 102,790 | 193,621 |
| Shin Kong Financial Holding Co. Ltd. | | 1,947,432 | 531,872 |
| Silicon Motion Tech Corp. sponsored ADR | | 4,184 | 266,270 |
| Simplo Technology Co. Ltd. | | 23,000 | 230,726 |
| SINBON Electronics Co. Ltd. | | 27,000 | 299,149 |
| Sino-American Silicon Products, Inc. | | 73,000 | 351,587 |
| Sinopac Financial Holdings Co. | | 1,544,094 | 839,709 |
| Synnex Technology International Corp. | | 154,000 | 310,537 |
| Ta Chen Stainless Pipe Co. Ltd. | | 198,959 | 288,343 |
| Taichung Commercial Bank Co. Ltd. | | 444,775 | 204,100 |
| Taishin Financial Holdings Co. Ltd. | | 1,472,654 | 830,255 |
| Taiwan Business Bank | | 731,256 | 332,133 |
| Taiwan Cement Corp. | | 830,600 | 1,047,075 |
| Taiwan Cooperative Financial Holding Co. Ltd. | | 1,252,922 | 1,091,369 |
| Taiwan Fertilizer Co. Ltd. | | 95,000 | 182,796 |
| Taiwan High Speed Rail Corp. | | 293,000 | 296,093 |
| Taiwan Mobile Co. Ltd. | | 216,000 | 727,288 |
| Taiwan Semiconductor Manufacturing Co. Ltd. | | 2,390,000 | 39,110,316 |
| Tatung Co. Ltd. (a) | | 242,000 | 256,868 |
| TECO Electric & Machinery Co. Ltd. | | 192,000 | 276,214 |
| The Shanghai Commercial & Savings Bank Ltd. | | 614,218 | 928,287 |
| Tong Hsing Electronics Industries Ltd. | | 16,200 | 89,801 |
| Tripod Technology Corp. | | 57,000 | 213,524 |
| Tung Ho Steel Enterprise Corp. | | 60,300 | 113,323 |
| Uni-President Enterprises Corp. | | 605,000 | 1,449,388 |
| Unimicron Technology Corp. | | 158,000 | 750,188 |
| United Integrated Services Co. | | 23,000 | 162,425 |
| United Microelectronics Corp. | | 1,474,000 | 2,369,062 |
| United Renewable Energy Co. Ltd. (a) | | 172,004 | 116,393 |
| Vanguard International Semiconductor Corp. | | 99,000 | 280,381 |
| Voltronic Power Technology Corp. | | 9,250 | 531,504 |
| Walsin Lihwa Corp. | | 316,374 | 513,417 |
| Walsin Technology Corp. | | 48,000 | 149,526 |
| Wan Hai Lines Ltd. | | 181,000 | 384,549 |
| Win Semiconductors Corp. | | 45,000 | 240,090 |
| Winbond Electronics Corp. | | 345,000 | 292,567 |
| Wisdom Marine Lines Co. Ltd. | | 55,000 | 115,045 |
| Wistron Corp. | | 382,000 | 578,600 |
| Wiwynn Corp. | | 12,000 | 456,360 |
| WPG Holding Co. Ltd. | | 173,040 | 281,814 |
| Yageo Corp. | | 42,775 | 692,939 |
| Yang Ming Marine Transport Corp. | | 231,000 | 476,217 |
| YFY, Inc. | | 159,000 | 159,581 |
| Yuanta Financial Holding Co. Ltd. | | 1,561,934 | 1,148,948 |
| Yulon Finance Corp. | | 31,818 | 191,462 |
| Yulon Motor Co. Ltd. | | 78,000 | 204,945 |
| Zhen Ding Technology Holding Ltd. | | 77,000 | 280,314 |
TOTAL TAIWAN | | | 125,473,153 |
| Thailand - 0.6% | | | |
| Advanced Info Service PCL (For. Reg.) | | 29,300 | 183,983 |
| Advanced Information Service PCL NVDR | | 105,200 | 660,581 |
| Airports of Thailand PCL: | | | |
| (For. Reg.) (a) | | 335,700 | 721,298 |
| NVDR (a) | | 214,100 | 460,023 |
| Asset World Corp. PCL NVDR | | 943,300 | 146,898 |
| B. Grimm Power PCL: | | | |
| (For. Reg.) | | 11,600 | 13,228 |
| NVDR | | 104,400 | 119,053 |
| Bangkok Bank PCL: | | | |
| (For. Reg.) | | 11,400 | 52,578 |
| NVDR | | 60,400 | 278,569 |
| Bangkok Chain Hospital PCL NVDR | | 193,600 | 123,317 |
| Bangkok Commercial Asset Management PCL: | | | |
| (For. Reg.) | | 98,700 | 38,285 |
| NVDR | | 94,100 | 36,500 |
| Bangkok Dusit Medical Services PCL: | | | |
| (For. Reg.) | | 172,600 | 148,297 |
| NVDR | | 340,400 | 292,471 |
| Bangkok Expressway and Metro PCL: | | | |
| (For. Reg.) | | 573,400 | 148,889 |
| NVDR | | 375,700 | 97,554 |
| Banpu PCL NVDR | | 472,000 | 126,234 |
| Berli Jucker PCL: | | | |
| (For. Reg.) | | 39,000 | 44,681 |
| NVDR | | 91,600 | 104,943 |
| BTS Group Holdings PCL: | | | |
| (For. Reg.) | | 313,800 | 71,194 |
| NVDR | | 559,900 | 126,544 |
| Bumrungrad Hospital PCL: | | | |
| (For. Reg.) | | 26,700 | 186,489 |
| NVDR | | 22,200 | 155,058 |
| Carabao Group PCL: | | | |
| (For. Reg.) | | 16,700 | 35,110 |
| NVDR | | 38,100 | 80,102 |
| Central Pattana PCL: | | | |
| (For. Reg.) | | 91,900 | 183,675 |
| NVDR | | 77,500 | 154,895 |
| Central Plaza Hotel PCL NVDR (a) | | 62,200 | 99,953 |
| Central Retail Corp. PCL: | | | |
| (For. Reg.) | | 176,708 | 232,512 |
| NVDR | | 233,500 | 307,239 |
| Charoen Pokphand Foods PCL: | | | |
| (For. Reg.) | | 251,200 | 149,559 |
| NVDR | | 165,000 | 98,238 |
| Chularat Hospital PCL NVDR unit | | 606,600 | 62,222 |
| Com7 PCL NVDR | | 96,400 | 71,669 |
| CP ALL PCL: | | | |
| (For. Reg.) | | 203,100 | 386,013 |
| NVDR | | 344,600 | 654,949 |
| Delta Electronics PCL: | | | |
| (For. Reg.) | | 274,000 | 586,523 |
| NVDR | | 297,000 | 635,803 |
| Electricity Generating PCL NVDR | | 27,700 | 127,236 |
| Energy Absolute PCL: | | | |
| (For. Reg.) | | 126,300 | 251,474 |
| NVDR | | 104,100 | 207,272 |
| Global Power Synergy Public Co. Ltd.: | | | |
| (For. Reg.) | | 44,294 | 83,333 |
| NVDR | | 47,200 | 88,801 |
| Gulf Energy Development PCL: | | | |
| (For. Reg.) | | 311,100 | 464,068 |
| NVDR | | 378,800 | 565,057 |
| Gunkul Engineering PCL NVDR | | 477,300 | 53,054 |
| Hana Microelectronics PCL NVDR | | 70,400 | 86,140 |
| Home Product Center PCL: | | | |
| (For. Reg.) | | 164,700 | 67,777 |
| NVDR | | 299,300 | 123,168 |
| Indorama Ventures PCL NVDR | | 239,100 | 238,883 |
| Intouch Holdings PCL: | | | |
| (For. Reg.) | | 45,100 | 99,318 |
| NVDR | | 105,100 | 231,448 |
| IRPC PCL: | | | |
| (For. Reg.) | | 672,700 | 46,654 |
| NVDR | | 474,800 | 32,929 |
| Jaymart Group Holdings PCL NVDR | | 66,500 | 38,805 |
| JMT Network Services PCL: | | | |
| NVDR | | 81,422 | 94,636 |
| warrants (a) | | 3,605 | 300 |
| Kasikornbank PCL: | | | |
| (For. Reg.) | | 58,200 | 213,705 |
| NVDR | | 91,600 | 336,347 |
| KCE Electronics PCL NVDR | | 83,800 | 93,897 |
| Kiatnakin Bank PCL (For. Reg.) | | 51,800 | 91,266 |
| Krung Thai Bank PCL: | | | |
| (For. Reg.) | | 210,200 | 111,142 |
| NVDR | | 189,700 | 100,303 |
| Krungthai Card PCL: | | | |
| (For. Reg.) | | 54,000 | 83,697 |
| NVDR | | 74,700 | 115,781 |
| Land & House PCL: | | | |
| (For. Reg.) | | 205,900 | 59,199 |
| NVDR | | 248,400 | 71,419 |
| Minor International PCL: | | | |
| warrants 2/15/24 (a) | | 1,584 | 144 |
| (For. Reg.) | | 233,456 | 216,265 |
| NVDR unit | | 104,248 | 96,572 |
| Muangthai Leasing PCL: | | | |
| (For. Reg.) | | 29,100 | 29,136 |
| NVDR | | 52,900 | 52,965 |
| Ngern Tid Lor PCL NVDR | | 153,432 | 95,611 |
| Osotspa PCL: | | | |
| (For. Reg.) | | 72,200 | 62,516 |
| NVDR | | 94,600 | 81,912 |
| PTT Exploration and Production PCL: | | | |
| (For. Reg.) | | 102,600 | 446,483 |
| NVDR | | 78,200 | 340,302 |
| PTT Global Chemical PCL: | | | |
| (For. Reg.) | | 9,000 | 10,984 |
| NVDR | | 217,000 | 264,825 |
| PTT Oil & Retail Business PCL NVDR | | 399,200 | 259,969 |
| PTT PCL: | | | |
| (For. Reg.) | | 346,200 | 315,196 |
| NVDR | | 711,700 | 647,964 |
| Ratch Group PCL NVDR unit | | 92,500 | 102,462 |
| SCB X PCL: | | | |
| (For. Reg.) | | 6,250 | 19,014 |
| NVDR | | 109,600 | 333,434 |
| SCG Packaging PCL NVDR | | 148,900 | 192,465 |
| Siam Cement PCL: | | | |
| (For. Reg.) | | 5,500 | 50,686 |
| NVDR | | 31,900 | 293,980 |
| Siam Global House PCL NVDR | | 247,466 | 124,285 |
| Sri Trang Agro-Industry PCL NVDR | | 89,000 | 51,444 |
| Sri Trang Gloves Thailand PCL NVDR | | 136,100 | 36,338 |
| Srisawad Corp. PCL: | | | |
| (For. Reg.) | | 26,600 | 43,499 |
| NVDR | | 68,500 | 111,946 |
| Thai Beverage PCL | | 1,071,000 | 514,679 |
| Thai Life Insurance PCL | | 361,200 | 131,373 |
| Thai Oil PCL: | | | |
| (For. Reg.) | | 77,575 | 106,205 |
| NVDR | | 29,077 | 39,808 |
| Thai Union Frozen Products PCL: | | | |
| (For. Reg.) | | 86,400 | 34,969 |
| NVDR | | 196,700 | 79,611 |
| Thanachart Capital PCL: | | | |
| (For. Reg.) | | 28,000 | 35,682 |
| NVDR | | 47,900 | 60,784 |
| Thonburi Healthcare Group PCL NVDR | | 39,100 | 76,800 |
| TISCO Financial Group PCL: | | | |
| (For. Reg.) | | 8,600 | 22,758 |
| NVDR | | 38,300 | 101,354 |
| TMBThanachart Bank PCL: | | | |
| (For. Reg.) | | 1,955,587 | 83,323 |
| NVDR | | 3,712,571 | 158,184 |
| True Corp. PCL | | 617,650 | 144,681 |
| True Corp. PCL NVDR | | 1,118,549 | 262,014 |
| VGI PCL: | | | |
| (For. Reg.) | | 192,660 | 19,020 |
| NVDR | | 303,240 | 29,937 |
| warrants (For. Reg.) (a) | | 116,340 | 514 |
| WHA Corp. PCL: | | | |
| (For. Reg.) | | 369,000 | 47,693 |
| NVDR | | 705,800 | 91,225 |
TOTAL THAILAND | | | 18,573,249 |
| Turkey - 0.2% | | | |
| AG Anadolu Grubu Holding A/S | | 15,168 | 74,080 |
| Akbank TAS | | 369,703 | 305,053 |
| Aksa Akrilik Kimya Sanayii | | 12,254 | 41,358 |
| Aksa Enerji Uretim A/S | | 35,272 | 50,737 |
| Alarko Holding AS | | 19,695 | 59,637 |
| Anadolu Efes Biracilik Ve Malt Sanayii A/S | | 27,409 | 88,702 |
| Arcelik A/S | | 22,898 | 114,010 |
| Aselsan A/S | | 72,972 | 167,766 |
| Bera Holding A/S | | 78,276 | 40,885 |
| Bim Birlesik Magazalar A/S JSC | | 57,985 | 465,633 |
| Coca-Cola Icecek Sanayi A/S | | 9,888 | 119,714 |
| Dogan Sirketler Grubu Holding A/S | | 131,776 | 57,991 |
| Emlak Konut Gayrimenkul Yatirim Ortakligi A/S | | 236,463 | 73,061 |
| Enerjisa Enerji A/S (c) | | 34,232 | 48,995 |
| Enka Insaat ve Sanayi A/S | | 225,571 | 317,051 |
| Eregli Demir ve Celik Fabrikalari T.A.S. (a) | | 168,487 | 287,055 |
| Ford Otomotiv Sanayi A/S | | 9,074 | 250,694 |
| Haci Omer Sabanci Holding A/S | | 169,977 | 333,811 |
| Hektas Ticaret A/S (a) | | 131,394 | 181,978 |
| Kardemir Karabuk Demir Celik Sanayi ve Ticaret A/S Class D | | 95,920 | 73,870 |
| Koc Holding A/S | | 141,653 | 550,911 |
| Kontrolmatik Enerji Ve Muhendislik A/S | | 8,767 | 59,629 |
| Koza Altin Isletmeleri A/S | | 108,507 | 105,319 |
| Koza Anadolu Metal Madencilik Isletmeleri A/S (a) | | 23,901 | 43,498 |
| Migros Turk Ticaret A/S | | 11,400 | 102,211 |
| Nuh Cimento Sanayi A/S | | 7,790 | 51,702 |
| Otokar Otomotiv ve Savunma Sanayi A.S. | | 1,273 | 54,974 |
| Oyak Cimento Fabrikalari A/S (a) | | 40,831 | 63,393 |
| Pegasus Hava Tasimaciligi A/S (a) | | 4,300 | 98,085 |
| Petkim Petrokimya Holding A/S (a) | | 147,466 | 98,556 |
| Sarkuysan Elektrolitik Bakir Sanayi ve Ticaret A/S | | 42,682 | 63,766 |
| Sasa Polyester Sanayi A/S | | 53,786 | 275,407 |
| Sok Marketler Ticaret A/S (a) | | 43,806 | 74,859 |
| TAV Havalimanlari Holding A/S (a) | | 23,832 | 86,315 |
| Tekfen Holding A/S | | 22,549 | 33,386 |
| Tofas Turk Otomobil Fabrikasi A/S | | 14,762 | 145,711 |
| Turk Hava Yollari AO (a) | | 89,611 | 588,761 |
| Turk Traktor ve Ziraat Makinalari A/S | | 1,831 | 52,525 |
| Turkcell Iletisim Hizmet A/S | | 145,334 | 247,310 |
| Turkiye Is Bankasi A/S Series C | | 428,264 | 238,444 |
| Turkiye Petrol Rafinerileri A/S | | 118,811 | 404,965 |
| Turkiye Sise ve Cam Fabrikalari A/S | | 161,647 | 306,316 |
| Yapi ve Kredi Bankasi A/S | | 331,164 | 161,228 |
TOTAL TURKEY | | | 7,059,352 |
| United Arab Emirates - 0.4% | | | |
| Abu Dhabi Commercial Bank PJSC | | 365,782 | 878,522 |
| Abu Dhabi Islamic Bank | | 178,265 | 551,450 |
| Abu Dhabi National Oil Co. for Distribution PJSC | | 365,415 | 436,830 |
| ADNOC Drilling Co. PJSC | | 325,703 | 380,488 |
| Aldar Properties PJSC | | 460,911 | 677,755 |
| Dubai Electricity & Water Authority PJSC | | 1,128,100 | 761,835 |
| Dubai Islamic Bank Pakistan Ltd. (a) | | 359,664 | 544,545 |
| Emaar Properties PJSC | | 774,842 | 1,251,209 |
| Emirates NBD Bank PJSC (a) | | 315,960 | 1,213,146 |
| Emirates Telecommunications Corp. | | 441,584 | 2,885,934 |
| First Abu Dhabi Bank PJSC | | 559,611 | 2,160,849 |
| Multiply Group | | 424,603 | 388,494 |
TOTAL UNITED ARAB EMIRATES | | | 12,131,057 |
| United Kingdom - 7.7% | | | |
| 3i Group PLC | | 122,645 | 2,728,733 |
| Abrdn PLC | | 257,503 | 688,333 |
| Admiral Group PLC | | 34,181 | 992,736 |
| Ashtead Group PLC | | 56,650 | 3,258,590 |
| Associated British Foods PLC | | 45,552 | 1,119,761 |
| AstraZeneca PLC (United Kingdom) | | 195,636 | 28,790,378 |
| Auto Trader Group PLC (c) | | 123,459 | 987,299 |
| Aviva PLC | | 356,192 | 1,893,535 |
| B&M European Value Retail SA | | 110,764 | 667,755 |
| BAE Systems PLC | | 386,407 | 4,922,819 |
| Barclays PLC | | 1,901,218 | 3,829,837 |
| Barratt Developments PLC | | 124,513 | 782,409 |
| Beazley PLC | | 84,574 | 632,947 |
| Bellway PLC | | 16,201 | 491,098 |
| Berkeley Group Holdings PLC | | 13,981 | 781,366 |
| BP PLC | | 2,307,821 | 15,483,160 |
| British American Tobacco PLC (United Kingdom) | | 282,475 | 10,436,262 |
| British Land Co. PLC | | 114,649 | 576,629 |
| BT Group PLC | | 877,292 | 1,751,380 |
| Bunzl PLC | | 43,293 | 1,721,484 |
| Burberry Group PLC | | 50,961 | 1,659,412 |
| Centrica PLC | | 754,184 | 1,085,255 |
| CK Hutchison Holdings Ltd. | | 341,500 | 2,283,075 |
| CNH Industrial NV | | 126,669 | 1,778,903 |
| Coca-Cola European Partners PLC | | 25,536 | 1,646,306 |
| Compass Group PLC | | 225,217 | 5,941,441 |
| ConvaTec Group PLC (c) | | 201,472 | 556,533 |
| Croda International PLC | | 18,069 | 1,585,033 |
| DCC PLC (United Kingdom) | | 12,726 | 790,714 |
| Dechra Pharmaceuticals PLC | | 14,372 | 673,713 |
| Derwent London PLC | | 13,777 | 415,888 |
| Diageo PLC | | 294,494 | 13,433,671 |
| Diploma PLC | | 15,679 | 529,265 |
| Dowlais Group PLC | | 168,157 | 280,225 |
| DS Smith PLC | | 171,132 | 666,933 |
| Entain PLC | | 73,974 | 1,342,441 |
| Games Workshop Group PLC | | 4,108 | 512,143 |
| Halma PLC | | 47,813 | 1,386,854 |
| Hargreaves Lansdown PLC | | 46,131 | 465,540 |
| Hiscox Ltd. | | 44,888 | 666,802 |
| Howden Joinery Group PLC | | 73,545 | 632,760 |
| HSBC Holdings PLC (United Kingdom) | | 2,521,081 | 18,170,312 |
| IG Group Holdings PLC | | 51,406 | 473,874 |
| IMI PLC | | 34,772 | 697,010 |
| Imperial Brands PLC | | 121,483 | 3,007,202 |
| Inchcape PLC | | 52,099 | 529,369 |
| Informa PLC | | 181,660 | 1,649,705 |
| InterContinental Hotel Group PLC | | 23,776 | 1,634,759 |
| Intermediate Capital Group PLC | | 37,444 | 612,457 |
| International Consolidated Airlines Group SA CDI (a) | | 318,564 | 609,141 |
| Intertek Group PLC | | 20,962 | 1,094,856 |
| ITV PLC | | 445,924 | 452,703 |
| J Sainsbury PLC | | 218,706 | 759,710 |
| JD Sports Fashion PLC | | 308,703 | 624,814 |
| Johnson Matthey PLC | | 24,846 | 613,107 |
| Kingfisher PLC | | 243,475 | 789,126 |
| Land Securities Group PLC | | 98,119 | 831,363 |
| Legal & General Group PLC | | 760,810 | 2,238,342 |
| Lloyds Banking Group PLC | | 8,485,325 | 5,155,020 |
| London Stock Exchange Group PLC | | 47,876 | 5,026,658 |
| M&G PLC | | 296,916 | 765,329 |
| Man Group PLC | | 173,439 | 495,227 |
| Marks & Spencer Group PLC (a) | | 245,664 | 507,411 |
| Melrose Industries PLC | | 265,157 | 1,362,935 |
| National Grid PLC | | 489,686 | 7,021,081 |
| NatWest Group PLC | | 641,733 | 2,113,932 |
| Next PLC | | 16,223 | 1,374,168 |
| Nomad Foods Ltd. (a) | | 19,340 | 363,592 |
| Ocado Group PLC (a) | | 89,881 | 570,664 |
| Pearson PLC | | 91,077 | 1,013,303 |
| Pennon Group PLC | | 31,885 | 344,615 |
| Persimmon PLC | | 39,710 | 655,759 |
| Phoenix Group Holdings PLC | | 105,539 | 784,941 |
| Reckitt Benckiser Group PLC | | 92,996 | 7,514,990 |
| RELX PLC (London Stock Exchange) | | 250,719 | 8,337,311 |
| Rentokil Initial PLC | | 319,637 | 2,544,712 |
| Rightmove PLC | | 109,447 | 789,798 |
| Rolls-Royce Holdings PLC (a) | | 1,050,752 | 2,012,893 |
| RS GROUP PLC | | 58,741 | 680,203 |
| Sage Group PLC | | 139,279 | 1,432,868 |
| Schroders PLC | | 116,313 | 709,979 |
| Segro PLC | | 154,670 | 1,622,697 |
| Severn Trent PLC | | 32,127 | 1,183,813 |
| Smith & Nephew PLC | | 112,610 | 1,854,660 |
| Smiths Group PLC | | 43,851 | 926,395 |
| Spectris PLC | | 13,928 | 657,976 |
| Spirax-Sarco Engineering PLC | | 9,266 | 1,291,436 |
| SSE PLC | | 132,844 | 3,065,132 |
| St. James's Place PLC | | 68,036 | 1,031,609 |
| Standard Chartered PLC (United Kingdom) | | 308,583 | 2,437,009 |
| Subsea 7 SA | | 29,032 | 331,400 |
| Tate & Lyle PLC | | 48,908 | 500,941 |
| Taylor Wimpey PLC | | 452,470 | 728,999 |
| Tesco PLC | | 938,546 | 3,318,185 |
| The Weir Group PLC | | 32,543 | 752,531 |
| Tritax Big Box REIT PLC | | 236,339 | 460,677 |
| Unilever PLC | | 331,787 | 18,474,608 |
| Unite Group PLC | | 49,112 | 591,909 |
| United Utilities Group PLC | | 87,467 | 1,189,379 |
| Vodafone Group PLC | | 3,391,800 | 4,073,980 |
| Whitbread PLC | | 25,659 | 1,047,058 |
| WPP PLC | | 137,189 | 1,598,858 |
TOTAL UNITED KINGDOM | | | 254,373,909 |
| United States of America - 4.9% | | | |
| Bausch Health Cos., Inc. (Canada) (a) | | 34,747 | 255,694 |
| Brookfield Renewable Corp. | | 15,757 | 526,493 |
| CSL Ltd. | | 60,898 | 12,157,480 |
| CyberArk Software Ltd. (a)(b) | | 5,111 | 636,831 |
| DHT Holdings, Inc. | | 17,072 | 162,013 |
| Experian PLC | | 122,484 | 4,336,532 |
| Fiverr International Ltd. (a)(b) | | 3,958 | 144,546 |
| Flex Ltd. (a) | | 57,503 | 1,182,837 |
| Globant SA (a) | | 5,220 | 818,861 |
| GSK PLC | | 506,257 | 9,129,416 |
| Haleon PLC | | 640,986 | 2,818,222 |
| Holcim AG | | 71,769 | 4,722,775 |
| IBEX Ltd. (a) | | 1,261 | 25,813 |
| ICON PLC (a) | | 10,383 | 2,000,700 |
| InMode Ltd. (a) | | 8,315 | 309,817 |
| James Hardie Industries PLC CDI | | 55,615 | 1,241,055 |
| JBS SA | | 89,600 | 321,553 |
| Legend Biotech Corp. ADR (a) | | 7,233 | 496,979 |
| Monday.com Ltd. (a) | | 2,242 | 273,345 |
| Nestle SA (Reg. S) | | 347,167 | 44,537,876 |
| Parade Technologies Ltd. | | 9,000 | 275,455 |
| QIAGEN NV (Germany) (a) | | 29,301 | 1,307,937 |
| Reliance Worldwide Corp. Ltd. | | 97,751 | 266,580 |
| Roche Holding AG: | | | |
| (Bearer) | | 3,251 | 1,099,852 |
| (participation certificate) | | 88,839 | 27,819,063 |
| Sanofi SA | | 144,911 | 15,616,806 |
| Schneider Electric SA | | 72,145 | 12,581,503 |
| Spotify Technology SA (a) | | 17,828 | 2,381,821 |
| Stellantis NV (Italy) | | 272,819 | 4,509,289 |
| Stratasys Ltd. (a) | | 7,106 | 102,042 |
| Swiss Re Ltd. | | 36,619 | 3,675,624 |
| Tenaris SA | | 58,750 | 840,435 |
| Waste Connections, Inc. (Canada) | | 32,384 | 4,504,623 |
TOTAL UNITED STATES OF AMERICA | | | 161,079,868 |
| Zambia - 0.1% | | | |
| First Quantum Minerals Ltd. | | 71,448 | 1,736,036 |
| TOTAL COMMON STOCKS (Cost $3,026,925,422) | | | 3,156,329,995 |
| | | | |
| Nonconvertible Preferred Stocks - 0.8% |
| | | Shares | Value ($) |
| Brazil - 0.3% | | | |
| Banco Bradesco SA (PN) | | 665,179 | 1,847,053 |
| Bradespar SA (PN) | | 34,209 | 162,547 |
| Centrais Eletricas Brasileiras SA (Electrobras) (PN-B) | | 36,729 | 268,115 |
| Companhia Energetica de Minas Gerais (CEMIG) (PN) | | 188,134 | 465,828 |
| Gerdau SA | | 136,500 | 689,095 |
| Itau Unibanco Holding SA | | 611,650 | 3,178,549 |
| Itausa-Investimentos Itau SA (PN) | | 651,505 | 1,133,779 |
| Metalurgica Gerdau SA (PN) | | 84,400 | 197,302 |
| Petroleo Brasileiro SA - Petrobras (PN) (non-vtg.) | | 580,900 | 2,760,201 |
TOTAL BRAZIL | | | 10,702,469 |
| Chile - 0.1% | | | |
| Embotelladora Andina SA Class B | | 47,189 | 118,211 |
| Sociedad Quimica y Minera de Chile SA (PN-B) | | 18,066 | 1,223,050 |
TOTAL CHILE | | | 1,341,261 |
| Colombia - 0.0% | | | |
| Bancolombia SA (PN) | | 53,249 | 329,831 |
| Germany - 0.2% | | | |
| Henkel AG & Co. KGaA | | 22,590 | 1,826,368 |
| Porsche Automobil Holding SE (Germany) | | 19,822 | 1,104,030 |
| Sartorius AG (non-vtg.) | | 3,434 | 1,330,428 |
| Volkswagen AG | | 23,139 | 3,159,625 |
TOTAL GERMANY | | | 7,420,451 |
| Korea (South) - 0.2% | | | |
| Hyundai Motor Co. Ltd. | | 3,352 | 266,151 |
| Hyundai Motor Co. Ltd. Series 2 | | 4,973 | 412,684 |
| LG Chemical Ltd. | | 1,072 | 313,834 |
| Samsung Electronics Co. Ltd. | | 106,044 | 4,434,913 |
TOTAL KOREA (SOUTH) | | | 5,427,582 |
| Russia - 0.0% | | | |
| AK Transneft OAO (d) | | 168 | 56,718 |
| Sberbank of Russia (Russia) (d) | | 109,390 | 788 |
| Surgutneftegas OJSC (d) | | 841,000 | 17,024 |
TOTAL RUSSIA | | | 74,530 |
| TOTAL NONCONVERTIBLE PREFERRED STOCKS (Cost $30,583,769) | | | 25,296,124 |
| | | | |
| Government Obligations - 0.1% |
| | | Principal Amount (f) | Value ($) |
| United States of America - 0.1% | | | |
U.S. Treasury Bills, yield at date of purchase 4.65% 6/29/23 (g) (Cost $3,473,829) | | 3,500,000 | 3,471,814 |
| | | | |
| Money Market Funds - 3.8% |
| | | Shares | Value ($) |
| Fidelity Cash Central Fund 4.88% (h) | | 102,004,560 | 102,024,961 |
| Fidelity Securities Lending Cash Central Fund 4.88% (h)(i) | | 22,327,451 | 22,329,684 |
| TOTAL MONEY MARKET FUNDS (Cost $124,354,456) | | | 124,354,645 |
| | | | |
| TOTAL INVESTMENT IN SECURITIES - 99.8% (Cost $3,185,337,476) | 3,309,452,578 |
NET OTHER ASSETS (LIABILITIES) - 0.2% | 8,210,544 |
| NET ASSETS - 100.0% | 3,317,663,122 |
| | |
| Futures Contracts |
| | Number of contracts | Expiration Date | Notional Amount ($) | Value ($) | Unrealized Appreciation/ (Depreciation) ($) |
| Purchased | | | | | |
| | | | | | |
| Equity Index Contracts | | | | | |
| ICE E-mini MSCI EAFE Index Contracts (United States) | 826 | Jun 2023 | 88,778,480 | 3,624,011 | 3,624,011 |
| ICE E-mini MSCI Emerging Markets Index Contracts (United States) | 747 | Jun 2023 | 36,759,870 | 373,782 | 373,782 |
| TME S&P/TSX 60 Index Contracts (Canada) | 56 | Jun 2023 | 10,320,847 | 339,450 | 339,450 |
| | | | | | |
| TOTAL FUTURES CONTRACTS | | | | | 4,337,243 |
| The notional amount of futures purchased as a percentage of Net Assets is 4.1% |
Legend
| (b) | Security or a portion of the security is on loan at period end. |
| (c) | Security exempt from registration under Rule 144A of the Securities Act of 1933. These securities may be resold in transactions exempt from registration, normally to qualified institutional buyers. At the end of the period, the value of these securities amounted to $67,163,112 or 2.0% of net assets. |
| (e) | Security or a portion of the security purchased on a delayed delivery or when-issued basis. |
| (f) | Amount is stated in United States dollars unless otherwise noted. |
| (g) | Security or a portion of the security was pledged to cover margin requirements for futures contracts. At period end, the value of securities pledged amounted to $3,471,814. |
| (h) | Affiliated fund that is generally available only to investment companies and other accounts managed by Fidelity Investments. The rate quoted is the annualized seven-day yield of the fund at period end. A complete unaudited listing of the fund's holdings as of its most recent quarter end is available upon request. In addition, each Fidelity Central Fund's financial statements are available on the SEC's website or upon request. |
| (i) | Investment made with cash collateral received from securities on loan. |
Affiliated Central Funds
Fiscal year to date information regarding the Fund's investments in Fidelity Central Funds, including the ownership percentage, is presented below.
| Affiliate | Value, beginning of period ($) | Purchases ($) | Sales Proceeds ($) | Dividend Income ($) | Realized Gain (loss) ($) | Change in Unrealized appreciation (depreciation) ($) | Value, end of period ($) | % ownership, end of period |
| Fidelity Cash Central Fund 4.88% | 60,028,940 | 208,239,829 | 166,243,807 | 1,639,273 | - | (1) | 102,024,961 | 0.3% |
| Fidelity Securities Lending Cash Central Fund 4.88% | 8,407,556 | 51,145,235 | 37,223,107 | 107,716 | - | - | 22,329,684 | 0.1% |
| Total | 68,436,496 | 259,385,064 | 203,466,914 | 1,746,989 | - | (1) | 124,354,645 | |
| | | | | | | | | |
Amounts in the dividend income column in the above table include any capital gain distributions from underlying funds, which are presented in the corresponding line item in the Statement of Operations, if applicable.
Amounts in the dividend income column for Fidelity Securities Lending Cash Central Fund represents the income earned on investing cash collateral, less rebates paid to borrowers and any lending agent fees associated with the loan, plus any premium payments received for lending certain types of securities.
Amounts included in the purchases and sales proceeds columns may include in-kind transactions, if applicable.
Investment Valuation
The following is a summary of the inputs used, as of April 30, 2023, involving the Fund's assets and liabilities carried at fair value. The inputs or methodology used for valuing securities may not be an indication of the risk associated with investing in those securities. For more information on valuation inputs, and their aggregation into the levels used below, please refer to the Investment Valuation section in the accompanying Notes to Financial Statements.
| Valuation Inputs at Reporting Date: |
| Description | Total ($) | Level 1 ($) | Level 2 ($) | Level 3 ($) |
Investments in Securities: | | | | |
|
| Equities: | | | | |
Communication Services | 184,339,394 | 53,772,698 | 130,207,754 | 358,942 |
Consumer Discretionary | 374,633,875 | 129,819,418 | 244,814,457 | - |
Consumer Staples | 276,642,594 | 82,547,901 | 194,094,478 | 215 |
Energy | 174,027,370 | 63,089,454 | 110,638,960 | 298,956 |
Financials | 656,156,374 | 280,944,263 | 375,202,475 | 9,636 |
Health Care | 306,459,604 | 49,746,557 | 256,600,991 | 112,056 |
Industrials | 438,627,654 | 174,932,838 | 263,694,816 | - |
Information Technology | 333,421,415 | 76,274,210 | 257,147,205 | - |
Materials | 259,104,536 | 100,973,563 | 157,782,676 | 348,297 |
Real Estate | 75,459,462 | 19,510,481 | 55,899,846 | 49,135 |
Utilities | 102,753,841 | 48,312,589 | 54,441,252 | - |
|
| Government Obligations | 3,471,814 | - | 3,471,814 | - |
|
| Money Market Funds | 124,354,645 | 124,354,645 | - | - |
| Total Investments in Securities: | 3,309,452,578 | 1,204,278,617 | 2,103,996,724 | 1,177,237 |
Derivative Instruments: | | | | |
|
| Assets | | | | |
Futures Contracts | 4,337,243 | 4,337,243 | - | - |
| Total Assets | 4,337,243 | 4,337,243 | - | - |
| Total Derivative Instruments: | 4,337,243 | 4,337,243 | - | - |
Value of Derivative Instruments
The following table is a summary of the Fund's value of derivative instruments by primary risk exposure as of April 30, 2023. For additional information on derivative instruments, please refer to the Derivative Instruments section in the accompanying Notes to Financial Statements.
Primary Risk Exposure / Derivative Type | Value |
| Asset ($) | Liability ($) |
| Equity Risk | | |
Futures Contracts (a) | 4,337,243 | 0 |
| Total Equity Risk | 4,337,243 | 0 |
| Total Value of Derivatives | 4,337,243 | 0 |
(a)Reflects gross cumulative appreciation (depreciation) on futures contracts as presented in the Schedule of Investments. In the Statement of Assets and Liabilities, the period end daily variation margin is included in receivable or payable for daily variation margin on futures contracts, and the net cumulative appreciation (depreciation) is included in Total accumulated earnings (loss).
Fidelity ZERO® International Index Fund
| Statement of Assets and Liabilities |
| | | | April 30, 2023 (Unaudited) |
| | | | | |
| Assets | | | | |
| Investment in securities, at value (including securities loaned of $21,225,025) - See accompanying schedule: | | | | |
Unaffiliated issuers (cost $3,060,983,020) | $ | 3,185,097,933 | | |
Fidelity Central Funds (cost $124,354,456) | | 124,354,645 | | |
| | | | | |
| | | | | |
| Total Investment in Securities (cost $3,185,337,476) | | | $ | 3,309,452,578 |
| Segregated cash with brokers for derivative instruments | | | | 759,951 |
| Cash | | | | 16,805 |
| Foreign currency held at value (cost $9,476,133) | | | | 9,386,847 |
| Receivable for investments sold | | | | 328,795 |
| Receivable for fund shares sold | | | | 4,966,946 |
| Dividends receivable | | | | 12,715,776 |
| Reclaims receivable | | | | 5,815,469 |
| Interest receivable | | | | 137 |
| Distributions receivable from Fidelity Central Funds | | | | 352,919 |
| Receivable for daily variation margin on futures contracts | | | | 145,363 |
| Other receivables | | | | 43,955 |
Total assets | | | | 3,343,985,541 |
| Liabilities | | | | |
| Payable for investments purchased | | | | |
Regular delivery | $ | 65,448 | | |
Delayed delivery | | 35,708 | | |
| Payable for fund shares redeemed | | 1,710,029 | | |
| Deferred taxes | | 2,180,250 | | |
| Other payables and accrued expenses | | 1,203 | | |
| Collateral on securities loaned | | 22,329,781 | | |
| Total Liabilities | | | | 26,322,419 |
| Net Assets | | | $ | 3,317,663,122 |
| Net Assets consist of: | | | | |
| Paid in capital | | | $ | 3,284,446,702 |
| Total accumulated earnings (loss) | | | | 33,216,420 |
| Net Assets | | | $ | 3,317,663,122 |
Net Asset Value , offering price and redemption price per share ($3,317,663,122 ÷ 310,407,520 shares) | | | $ | 10.69 |
| Statement of Operations |
| | | | Six months ended April 30, 2023 (Unaudited) |
| Investment Income | | | | |
| Dividends | | | $ | 47,878,929 |
| Non-Cash dividends | | | | 2,423,769 |
| Interest | | | | 68,412 |
| Income from Fidelity Central Funds (including $107,716 from security lending) | | | | 1,746,989 |
| Income before foreign taxes withheld | | | $ | 52,118,099 |
| Less foreign taxes withheld | | | | (4,724,259) |
| Total Income | | | | 47,393,840 |
| Expenses | | | | |
| Independent trustees' fees and expenses | $ | 9,356 | | |
| Total expenses before reductions | | 9,356 | | |
| Expense reductions | | (9,999) | | |
| Total expenses after reductions | | | | (643) |
| Net Investment income (loss) | | | | 47,394,483 |
| Realized and Unrealized Gain (Loss) | | | | |
| Net realized gain (loss) on: | | | | |
| Investment Securities: | | | | |
| Unaffiliated issuers (net of foreign taxes of $261,573) | | (40,859,617) | | |
| Foreign currency transactions | | 195,817 | | |
| Futures contracts | | 4,395,412 | | |
| Total net realized gain (loss) | | | | (36,268,388) |
| Change in net unrealized appreciation (depreciation) on: | | | | |
| Investment Securities: | | | | |
| Unaffiliated issuers (net of decrease in deferred foreign taxes of $588,044) | | 531,684,122 | | |
| Fidelity Central Funds | | (1) | | |
| Assets and liabilities in foreign currencies | | 744,798 | | |
| Futures contracts | | 7,135,031 | | |
| Total change in net unrealized appreciation (depreciation) | | | | 539,563,950 |
| Net gain (loss) | | | | 503,295,562 |
| Net increase (decrease) in net assets resulting from operations | | | $ | 550,690,045 |
| Statement of Changes in Net Assets |
| |
| | Six months ended April 30, 2023 (Unaudited) | | Year ended October 31, 2022 |
| Increase (Decrease) in Net Assets | | | | |
| Operations | | | | |
| Net investment income (loss) | $ | 47,394,483 | $ | 91,993,550 |
| Net realized gain (loss) | | (36,268,388) | | (75,638,610) |
| Change in net unrealized appreciation (depreciation) | | 539,563,950 | | (855,127,261) |
| Net increase (decrease) in net assets resulting from operations | | 550,690,045 | | (838,772,321) |
| Distributions to shareholders | | (77,147,029) | | (81,189,445) |
| Share transactions | | | | |
| Proceeds from sales of shares | | 365,467,671 | | 833,661,261 |
| Reinvestment of distributions | | 68,275,410 | | 73,597,486 |
| Cost of shares redeemed | | (210,894,749) | | (505,121,413) |
Net increase (decrease) in net assets resulting from share transactions | | 222,848,332 | | 402,137,334 |
| Total increase (decrease) in net assets | | 696,391,348 | | (517,824,432) |
| | | | | |
| Net Assets | | | | |
| Beginning of period | | 2,621,271,774 | | 3,139,096,206 |
| End of period | $ | 3,317,663,122 | $ | 2,621,271,774 |
| | | | | |
| Other Information | | | | |
| Shares | | | | |
| Sold | | 35,534,091 | | 76,476,551 |
| Issued in reinvestment of distributions | | 7,009,796 | | 6,356,146 |
| Redeemed | | (20,674,477) | | (47,407,223) |
| Net increase (decrease) | | 21,869,410 | | 35,425,474 |
| | | | | |
Financial Highlights
| Fidelity ZERO® International Index Fund |
| |
| | Six months ended (Unaudited) April 30, 2023 | | Years ended October 31, 2022 | | 2021 | | 2020 | | 2019 | | 2018 A |
Selected Per-Share Data | | | | | | | | | | | | |
| Net asset value, beginning of period | $ | 9.08 | $ | 12.40 | $ | 9.67 | $ | 10.14 | $ | 9.13 | $ | 10.00 |
| Income from Investment Operations | | | | | | | | | | | | |
Net investment income (loss) B,C | | .16 | | .33 | | .30 | | .23 | | .32 | | .06 |
| Net realized and unrealized gain (loss) | | 1.72 | | (3.34) | | 2.62 | | (.45) | | .75 | | (.93) |
| Total from investment operations | | 1.88 | | (3.01) | | 2.92 | | (.22) | | 1.07 | | (.87) |
| Distributions from net investment income | | (.27) | | (.31) | | (.19) | | (.25) | | (.06) | | - |
| Total distributions | | (.27) | | (.31) | | (.19) | | (.25) | | (.06) | | - |
| Net asset value, end of period | $ | 10.69 | $ | 9.08 | $ | 12.40 | $ | 9.67 | $ | 10.14 | $ | 9.13 |
Total Return D,E | | 20.95% | | (24.79)% | | 30.39% | | (2.34)% | | 11.79% | | (8.70)% |
Ratios to Average Net Assets C,F,G | | | | | | | | | | | | |
Expenses before reductions H | | -% I | | -% | | -% | | -% | | -% | | -% I |
Expenses net of fee waivers, if any H | | -% I | | -% | | -% | | -% | | -% | | -% I |
Expenses net of all reductions H | | -% I | | -% | | -% | | -% | | -% | | -% I |
| Net investment income (loss) | | 3.09% I | | 3.11% | | 2.50% | | 2.39% | | 3.34% | | 2.42% I |
| Supplemental Data | | | | | | | | | | | | |
| Net assets, end of period (000 omitted) | $ | 3,317,663 | $ | 2,621,272 | $ | 3,139,096 | $ | 1,651,017 | $ | 1,260,503 | $ | 393,972 |
Portfolio turnover rate J | | 8% I | | 6% | | 8% | | 8% | | 4% | | -% K,L |
A For the period August 2, 2018 (commencement of operations) through October 31, 2018.
B Calculated based on average shares outstanding during the period.
C Net investment income (loss) is affected by the timing of the declaration of dividends by any underlying mutual funds or exchange-traded funds (ETFs). Net investment income (loss) of any mutual funds or ETFs is not included in the Fund's net investment income (loss) ratio.
D Total returns for periods of less than one year are not annualized.
E Total returns would have been lower if certain expenses had not been reduced during the applicable periods shown.
F Fees and expenses of any underlying mutual funds or exchange-traded funds (ETFs) are not included in the Fund's expense ratio. The Fund indirectly bears its proportionate share of these expenses. For additional expense information related to investments in Fidelity Central Funds, please refer to the "Investments in Fidelity Central Funds" note found in the Notes to Financial Statements section of the most recent Annual or Semi-Annual report.
G Expense ratios reflect operating expenses of the class. Expenses before reductions do not reflect amounts reimbursed, waived, or reduced through arrangements with the investment adviser, brokerage services, or other offset arrangements, if applicable, and do not represent the amount paid by the class during periods when reimbursements, waivers or reductions occur.
H Amount represents less than .005%.
I Annualized.
J Amount does not include the portfolio activity of any underlying mutual funds or exchange-traded funds (ETFs).
K Amount not annualized.
L Amount represents less than 1%.
Top Holdings (% of Fund's net assets) |
| |
| Apple, Inc. | 7.1 | |
| Microsoft Corp. | 6.4 | |
| Amazon.com, Inc. | 2.6 | |
| NVIDIA Corp. | 1.9 | |
| Alphabet, Inc. Class A | 1.8 | |
| Berkshire Hathaway, Inc. Class B | 1.7 | |
| Alphabet, Inc. Class C | 1.6 | |
| Meta Platforms, Inc. Class A | 1.5 | |
| Exxon Mobil Corp. | 1.4 | |
| UnitedHealth Group, Inc. | 1.3 | |
| | 27.3 | |
| |
| Market Sectors (% of Fund's net assets) |
| |
| Information Technology | 26.3 | |
| Health Care | 14.4 | |
| Financials | 13.2 | |
| Consumer Discretionary | 9.8 | |
| Industrials | 8.4 | |
| Communication Services | 8.3 | |
| Consumer Staples | 7.2 | |
| Energy | 4.6 | |
| Utilities | 2.7 | |
| Materials | 2.5 | |
| Real Estate | 2.5 | |
| |
Asset Allocation (% of Fund's net assets) |
|
Futures - 0.1% |
|
Fidelity ZERO® Large Cap Index Fund
Showing Percentage of Net Assets
| Common Stocks - 99.9% |
| | | Shares | Value ($) |
| COMMUNICATION SERVICES - 8.3% | | | |
| Diversified Telecommunication Services - 0.8% | | | |
| AT&T, Inc. | | 1,186,104 | 20,958,458 |
| Verizon Communications, Inc. | | 698,866 | 27,136,967 |
| | | | 48,095,425 |
| Entertainment - 1.4% | | | |
| Activision Blizzard, Inc. | | 118,507 | 9,209,179 |
| Electronic Arts, Inc. | | 43,350 | 5,517,588 |
| Liberty Media Corp. Liberty Braves: | | | |
| Class A (a)(b) | | 2,207 | 86,448 |
| Class C (a) | | 5,792 | 220,212 |
| Liberty Media Corp. Liberty Formula One: | | | |
| Class A (a) | | 4,048 | 262,229 |
| Series C (a) | | 34,460 | 2,487,667 |
| Netflix, Inc. (a) | | 74,106 | 24,449,793 |
| Roblox Corp. (a) | | 60,343 | 2,148,211 |
| Take-Two Interactive Software, Inc. (a) | | 26,382 | 3,279,019 |
| The Walt Disney Co. (a) | | 303,984 | 31,158,360 |
| Warner Bros Discovery, Inc. | | 367,710 | 5,004,533 |
| | | | 83,823,239 |
| Interactive Media & Services - 5.0% | | | |
| Alphabet, Inc.: | | | |
| Class A (a) | | 991,407 | 106,417,627 |
| Class C (a) | | 863,659 | 93,465,177 |
| Match Group, Inc. (a) | | 46,546 | 1,717,547 |
| Meta Platforms, Inc. Class A (a) | | 370,370 | 89,007,318 |
| Pinterest, Inc. Class A (a) | | 98,918 | 2,275,114 |
| Snap, Inc. Class A (a) | | 163,626 | 1,425,182 |
| | | | 294,307,965 |
| Media - 0.9% | | | |
| Charter Communications, Inc. Class A (a) | | 17,526 | 6,461,836 |
| Comcast Corp. Class A | | 699,988 | 28,958,504 |
| Fox Corp.: | | | |
| Class A | | 49,464 | 1,645,173 |
| Class B | | 22,860 | 698,144 |
| Interpublic Group of Companies, Inc. | | 64,643 | 2,309,694 |
| Liberty Broadband Corp.: | | | |
| Class A (a) | | 2,674 | 226,033 |
| Class C (a) | | 19,887 | 1,686,020 |
| Liberty Media Corp. Liberty SiriusXM: | | | |
| Series A (a) | | 12,287 | 345,265 |
| Series C (a) | | 25,512 | 712,805 |
| Omnicom Group, Inc. | | 33,730 | 3,054,926 |
| Paramount Global: | | | |
| Class A (b) | | 1,389 | 36,753 |
| Class B | | 84,131 | 1,962,776 |
| The Trade Desk, Inc. (a) | | 74,095 | 4,767,272 |
| | | | 52,865,201 |
| Wireless Telecommunication Services - 0.2% | | | |
| T-Mobile U.S., Inc. (a) | | 98,560 | 14,182,784 |
TOTAL COMMUNICATION SERVICES | | | 493,274,614 |
| CONSUMER DISCRETIONARY - 9.8% | | | |
| Automobile Components - 0.1% | | | |
| Aptiv PLC (a) | | 45,084 | 4,637,340 |
| Automobiles - 1.5% | | | |
| Ford Motor Co. | | 651,476 | 7,739,535 |
| General Motors Co. | | 232,054 | 7,667,064 |
| Tesla, Inc. (a) | | 447,535 | 73,534,476 |
| | | | 88,941,075 |
| Broadline Retail - 2.7% | | | |
| Amazon.com, Inc. (a) | | 1,483,493 | 156,434,337 |
| eBay, Inc. | | 90,296 | 4,192,443 |
| Etsy, Inc. (a) | | 20,913 | 2,112,840 |
| | | | 162,739,620 |
| Distributors - 0.2% | | | |
| Genuine Parts Co. | | 23,455 | 3,947,711 |
| LKQ Corp. | | 42,234 | 2,438,169 |
| Pool Corp. | | 6,497 | 2,282,526 |
| | | | 8,668,406 |
| Hotels, Restaurants & Leisure - 2.3% | | | |
| Airbnb, Inc. Class A (a) | | 66,267 | 7,930,172 |
| Booking Holdings, Inc. (a) | | 6,455 | 17,340,131 |
| Caesars Entertainment, Inc. (a) | | 35,762 | 1,619,661 |
| Carnival Corp. (a)(b) | | 166,324 | 1,531,844 |
| Chipotle Mexican Grill, Inc. (a) | | 4,596 | 9,502,782 |
| Darden Restaurants, Inc. | | 20,249 | 3,076,431 |
| Domino's Pizza, Inc. | | 5,892 | 1,870,533 |
| Doordash, Inc. (a) | | 43,737 | 2,676,267 |
| Expedia, Inc. (a) | | 24,594 | 2,310,852 |
| Hilton Worldwide Holdings, Inc. | | 44,336 | 6,385,271 |
| Las Vegas Sands Corp. (a) | | 54,686 | 3,491,701 |
| Marriott International, Inc. Class A | | 44,771 | 7,581,521 |
| McDonald's Corp. | | 121,878 | 36,045,419 |
| MGM Resorts International | | 52,352 | 2,351,652 |
| Royal Caribbean Cruises Ltd. (a) | | 36,579 | 2,393,364 |
| Starbucks Corp. | | 191,247 | 21,857,620 |
| Yum! Brands, Inc. | | 46,592 | 6,549,903 |
| | | | 134,515,124 |
| Household Durables - 0.3% | | | |
| D.R. Horton, Inc. | | 51,997 | 5,710,311 |
| Garmin Ltd. | | 25,510 | 2,504,317 |
| Lennar Corp.: | | | |
| Class A | | 42,190 | 4,759,454 |
| Class B | | 2,404 | 235,159 |
| NVR, Inc. (a) | | 504 | 2,943,360 |
| PulteGroup, Inc. | | 37,536 | 2,520,542 |
| | | | 18,673,143 |
| Specialty Retail - 2.1% | | | |
| AutoZone, Inc. (a) | | 3,123 | 8,317,517 |
| Best Buy Co., Inc. | | 32,764 | 2,441,573 |
| Burlington Stores, Inc. (a) | | 10,848 | 2,091,603 |
| CarMax, Inc. (a)(b) | | 26,349 | 1,845,220 |
| Lowe's Companies, Inc. | | 100,623 | 20,912,478 |
| O'Reilly Automotive, Inc. (a) | | 10,375 | 9,517,091 |
| Ross Stores, Inc. | | 57,303 | 6,115,949 |
| The Home Depot, Inc. | | 169,594 | 50,969,781 |
| TJX Companies, Inc. | | 192,279 | 15,155,431 |
| Tractor Supply Co. | | 18,380 | 4,381,792 |
| Ulta Beauty, Inc. (a) | | 8,466 | 4,668,406 |
| | | | 126,416,841 |
| Textiles, Apparel & Luxury Goods - 0.6% | | | |
| lululemon athletica, Inc. (a) | | 19,308 | 7,335,688 |
| NIKE, Inc. Class B | | 207,281 | 26,266,648 |
| | | | 33,602,336 |
TOTAL CONSUMER DISCRETIONARY | | | 578,193,885 |
| CONSUMER STAPLES - 7.2% | | | |
| Beverages - 1.8% | | | |
| Brown-Forman Corp. Class B (non-vtg.) | | 30,428 | 1,980,559 |
| Constellation Brands, Inc. Class A (sub. vtg.) | | 27,015 | 6,199,132 |
| Keurig Dr. Pepper, Inc. | | 141,397 | 4,623,682 |
| Monster Beverage Corp. | | 126,756 | 7,098,336 |
| PepsiCo, Inc. | | 229,181 | 43,748,361 |
| The Coca-Cola Co. | | 647,661 | 41,547,453 |
| | | | 105,197,523 |
| Consumer Staples Distribution & Retail - 1.9% | | | |
| Costco Wholesale Corp. | | 73,838 | 37,156,758 |
| Dollar General Corp. | | 37,203 | 8,238,976 |
| Dollar Tree, Inc. (a) | | 34,596 | 5,317,751 |
| Kroger Co. | | 108,391 | 5,271,054 |
| Sysco Corp. | | 84,465 | 6,481,844 |
| Target Corp. | | 76,596 | 12,083,019 |
| Walgreens Boots Alliance, Inc. | | 119,120 | 4,198,980 |
| Walmart, Inc. | | 233,357 | 35,229,906 |
| | | | 113,978,288 |
| Food Products - 1.1% | | | |
| Archer Daniels Midland Co. | | 91,033 | 7,107,857 |
| Bunge Ltd. | | 24,925 | 2,332,980 |
| Conagra Brands, Inc. | | 79,305 | 3,010,418 |
| General Mills, Inc. | | 98,113 | 8,695,755 |
| Hormel Foods Corp. | | 48,190 | 1,948,804 |
| Kellogg Co. | | 42,593 | 2,971,714 |
| Lamb Weston Holdings, Inc. | | 23,940 | 2,676,731 |
| McCormick & Co., Inc. (non-vtg.) | | 41,720 | 3,665,102 |
| Mondelez International, Inc. | | 226,865 | 17,405,083 |
| The Hershey Co. | | 24,456 | 6,677,955 |
| The J.M. Smucker Co. | | 17,743 | 2,739,697 |
| The Kraft Heinz Co. | | 132,496 | 5,203,118 |
| Tyson Foods, Inc. Class A | | 47,522 | 2,969,650 |
| | | | 67,404,864 |
| Household Products - 1.5% | | | |
| Church & Dwight Co., Inc. | | 40,579 | 3,941,032 |
| Colgate-Palmolive Co. | | 138,980 | 11,090,604 |
| Kimberly-Clark Corp. | | 56,164 | 8,137,602 |
| Procter & Gamble Co. | | 392,573 | 61,390,566 |
| The Clorox Co. | | 20,552 | 3,403,822 |
| | | | 87,963,626 |
| Personal Care Products - 0.2% | | | |
| Estee Lauder Companies, Inc. Class A | | 38,551 | 9,511,303 |
| Tobacco - 0.7% | | | |
| Altria Group, Inc. | | 297,111 | 14,115,744 |
| Philip Morris International, Inc. | | 257,962 | 25,788,461 |
| | | | 39,904,205 |
TOTAL CONSUMER STAPLES | | | 423,959,809 |
| ENERGY - 4.6% | | | |
| Energy Equipment & Services - 0.3% | | | |
| Baker Hughes Co. Class A | | 167,400 | 4,894,776 |
| Halliburton Co. | | 150,433 | 4,926,681 |
| Schlumberger Ltd. | | 236,322 | 11,662,491 |
| | | | 21,483,948 |
| Oil, Gas & Consumable Fuels - 4.3% | | | |
| Cheniere Energy, Inc. | | 41,376 | 6,330,528 |
| Chevron Corp. | | 296,022 | 49,903,389 |
| ConocoPhillips Co. | | 203,650 | 20,953,549 |
| Coterra Energy, Inc. | | 131,191 | 3,358,490 |
| Devon Energy Corp. | | 108,773 | 5,811,741 |
| Diamondback Energy, Inc. | | 30,579 | 4,348,334 |
| EOG Resources, Inc. | | 97,741 | 11,677,117 |
| Exxon Mobil Corp. | | 685,244 | 81,091,775 |
| Hess Corp. | | 46,172 | 6,697,710 |
| Kinder Morgan, Inc. | | 329,175 | 5,645,351 |
| Marathon Oil Corp. | | 105,654 | 2,552,601 |
| Marathon Petroleum Corp. | | 75,544 | 9,216,368 |
| Occidental Petroleum Corp. | | 120,991 | 7,444,576 |
| ONEOK, Inc. | | 74,371 | 4,864,607 |
| Ovintiv, Inc. | | 40,961 | 1,477,873 |
| Phillips 66 Co. | | 77,541 | 7,676,559 |
| Pioneer Natural Resources Co. | | 39,536 | 8,601,057 |
| Targa Resources Corp. | | 37,665 | 2,844,837 |
| The Williams Companies, Inc. | | 202,670 | 6,132,794 |
| Valero Energy Corp. | | 64,149 | 7,355,966 |
| | | | 253,985,222 |
TOTAL ENERGY | | | 275,469,170 |
| FINANCIALS - 13.2% | | | |
| Banks - 3.1% | | | |
| Bank of America Corp. | | 1,161,399 | 34,005,763 |
| Citigroup, Inc. | | 322,294 | 15,170,379 |
| Citizens Financial Group, Inc. | | 81,927 | 2,534,821 |
| Fifth Third Bancorp | | 113,704 | 2,979,045 |
| Huntington Bancshares, Inc. | | 240,106 | 2,689,187 |
| JPMorgan Chase & Co. | | 488,094 | 67,474,115 |
| KeyCorp | | 155,473 | 1,750,626 |
| M&T Bank Corp. | | 28,167 | 3,543,409 |
| PNC Financial Services Group, Inc. | | 66,724 | 8,690,801 |
| Regions Financial Corp. | | 155,391 | 2,837,440 |
| Truist Financial Corp. | | 220,780 | 7,193,012 |
| U.S. Bancorp | | 231,821 | 7,946,824 |
| Wells Fargo & Co. | | 634,070 | 25,204,283 |
| | | | 182,019,705 |
| Capital Markets - 3.0% | | | |
| Ameriprise Financial, Inc. | | 17,522 | 5,346,313 |
| Bank of New York Mellon Corp. | | 122,387 | 5,212,462 |
| BlackRock, Inc. Class A | | 24,920 | 16,726,304 |
| Blackstone, Inc. | | 118,190 | 10,557,913 |
| Cboe Global Markets, Inc. | | 17,651 | 2,465,845 |
| Charles Schwab Corp. | | 253,810 | 13,259,034 |
| CME Group, Inc. | | 59,859 | 11,120,006 |
| FactSet Research Systems, Inc. | | 6,365 | 2,620,407 |
| Goldman Sachs Group, Inc. | | 56,349 | 19,352,501 |
| Intercontinental Exchange, Inc. | | 92,995 | 10,129,945 |
| KKR & Co. LP | | 96,002 | 5,094,826 |
| LPL Financial | | 13,186 | 2,753,764 |
| MarketAxess Holdings, Inc. | | 6,264 | 1,994,270 |
| Moody's Corp. | | 26,217 | 8,209,067 |
| Morgan Stanley | | 217,404 | 19,559,838 |
| MSCI, Inc. | | 13,305 | 6,418,997 |
| NASDAQ, Inc. | | 56,404 | 3,123,089 |
| Northern Trust Corp. | | 34,679 | 2,710,511 |
| Raymond James Financial, Inc. | | 32,249 | 2,919,502 |
| S&P Global, Inc. | | 54,780 | 19,862,132 |
| State Street Corp. | | 58,075 | 4,196,500 |
| T. Rowe Price Group, Inc. | | 37,323 | 4,192,493 |
| | | | 177,825,719 |
| Consumer Finance - 0.5% | | | |
| American Express Co. | | 99,067 | 15,983,470 |
| Capital One Financial Corp. | | 63,446 | 6,173,296 |
| Discover Financial Services | | 44,426 | 4,596,758 |
| Synchrony Financial | | 72,722 | 2,146,026 |
| | | | 28,899,550 |
| Financial Services - 4.5% | | | |
| Apollo Global Management, Inc. | | 72,371 | 4,587,598 |
| Berkshire Hathaway, Inc. Class B (a) | | 299,810 | 98,502,576 |
| Block, Inc. Class A (a) | | 89,425 | 5,436,146 |
| Fidelity National Information Services, Inc. | | 98,736 | 5,797,778 |
| Fiserv, Inc. (a) | | 105,669 | 12,904,298 |
| FleetCor Technologies, Inc. (a) | | 12,270 | 2,624,798 |
| Global Payments, Inc. | | 43,775 | 4,933,880 |
| Jack Henry & Associates, Inc. | | 12,151 | 1,984,744 |
| MasterCard, Inc. Class A | | 140,398 | 53,355,452 |
| PayPal Holdings, Inc. (a) | | 188,259 | 14,307,684 |
| Visa, Inc. Class A | | 270,397 | 62,929,494 |
| | | | 267,364,448 |
| Insurance - 2.1% | | | |
| AFLAC, Inc. | | 93,169 | 6,507,855 |
| Allstate Corp. | | 43,761 | 5,065,773 |
| American International Group, Inc. | | 123,626 | 6,557,123 |
| Aon PLC | | 34,180 | 11,114,652 |
| Arch Capital Group Ltd. (a) | | 61,548 | 4,620,408 |
| Arthur J. Gallagher & Co. | | 35,294 | 7,343,270 |
| Brown & Brown, Inc. | | 39,112 | 2,518,422 |
| Chubb Ltd. | | 69,065 | 13,920,741 |
| Cincinnati Financial Corp. | | 26,154 | 2,783,832 |
| Everest Re Group Ltd. | | 6,517 | 2,463,426 |
| Fidelity National Financial, Inc. | | 45,351 | 1,609,507 |
| Hartford Financial Services Group, Inc. | | 52,426 | 3,721,722 |
| Markel Corp. (a) | | 2,234 | 3,057,296 |
| Marsh & McLennan Companies, Inc. | | 82,371 | 14,842,430 |
| MetLife, Inc. | | 109,664 | 6,725,693 |
| Principal Financial Group, Inc. | | 37,862 | 2,827,913 |
| Progressive Corp. | | 97,328 | 13,275,539 |
| Prudential Financial, Inc. | | 61,232 | 5,327,184 |
| The Travelers Companies, Inc. | | 38,454 | 6,965,558 |
| W.R. Berkley Corp. | | 33,908 | 1,997,859 |
| Willis Towers Watson PLC | | 17,764 | 4,114,142 |
| | | | 127,360,345 |
TOTAL FINANCIALS | | | 783,469,767 |
| HEALTH CARE - 14.4% | | | |
| Biotechnology - 2.5% | | | |
| AbbVie, Inc. | | 294,278 | 44,471,291 |
| Alnylam Pharmaceuticals, Inc. (a) | | 20,471 | 4,077,823 |
| Amgen, Inc. | | 88,854 | 21,301,858 |
| Biogen, Inc. (a) | | 23,961 | 7,289,655 |
| BioMarin Pharmaceutical, Inc. (a) | | 30,924 | 2,969,941 |
| Exact Sciences Corp. (a) | | 29,578 | 1,895,062 |
| Gilead Sciences, Inc. | | 207,502 | 17,058,739 |
| Horizon Therapeutics PLC (a) | | 37,710 | 4,191,844 |
| Incyte Corp. (a) | | 30,790 | 2,291,084 |
| Moderna, Inc. (a) | | 54,977 | 7,305,894 |
| Regeneron Pharmaceuticals, Inc. (a) | | 17,889 | 14,343,221 |
| Seagen, Inc. (a) | | 22,862 | 4,572,400 |
| Vertex Pharmaceuticals, Inc. (a) | | 42,780 | 14,576,429 |
| | | | 146,345,241 |
| Health Care Equipment & Supplies - 2.9% | | | |
| Abbott Laboratories | | 290,134 | 32,051,103 |
| Align Technology, Inc. (a) | | 12,088 | 3,932,226 |
| Baxter International, Inc. | | 83,972 | 4,003,785 |
| Becton, Dickinson & Co. | | 47,242 | 12,486,533 |
| Boston Scientific Corp. (a) | | 238,340 | 12,422,281 |
| DexCom, Inc. (a) | | 64,299 | 7,802,041 |
| Edwards Lifesciences Corp. (a) | | 102,878 | 9,051,206 |
| GE Healthcare Holding LLC | | 60,421 | 4,914,644 |
| Hologic, Inc. (a) | | 41,027 | 3,528,732 |
| IDEXX Laboratories, Inc. (a) | | 13,781 | 6,782,457 |
| Insulet Corp. (a) | | 11,556 | 3,675,270 |
| Intuitive Surgical, Inc. (a) | | 58,305 | 17,562,632 |
| Medtronic PLC | | 221,343 | 20,131,146 |
| ResMed, Inc. | | 24,446 | 5,890,508 |
| STERIS PLC | | 16,520 | 3,114,846 |
| Stryker Corp. | | 56,104 | 16,811,564 |
| Teleflex, Inc. | | 7,805 | 2,127,019 |
| The Cooper Companies, Inc. | | 8,212 | 3,132,467 |
| Zimmer Biomet Holdings, Inc. | | 34,921 | 4,834,463 |
| | | | 174,254,923 |
| Health Care Providers & Services - 3.0% | | | |
| AmerisourceBergen Corp. | | 26,926 | 4,492,603 |
| Cardinal Health, Inc. | | 42,871 | 3,519,709 |
| Centene Corp. (a) | | 91,644 | 6,317,021 |
| Cigna Group | | 49,700 | 12,588,513 |
| CVS Health Corp. | | 213,678 | 15,664,734 |
| Elevance Health, Inc. | | 39,741 | 18,624,620 |
| HCA Holdings, Inc. | | 35,284 | 10,138,152 |
| Humana, Inc. | | 20,796 | 11,032,070 |
| Laboratory Corp. of America Holdings | | 14,743 | 3,342,386 |
| McKesson Corp. | | 22,787 | 8,299,937 |
| Molina Healthcare, Inc. (a) | | 9,717 | 2,894,597 |
| Quest Diagnostics, Inc. | | 18,470 | 2,563,821 |
| UnitedHealth Group, Inc. | | 155,477 | 76,508,677 |
| | | | 175,986,840 |
| Health Care Technology - 0.1% | | | |
| Veeva Systems, Inc. Class A (a) | | 23,449 | 4,199,247 |
| Life Sciences Tools & Services - 1.7% | | | |
| Agilent Technologies, Inc. | | 49,229 | 6,667,083 |
| Avantor, Inc. (a) | | 112,165 | 2,184,974 |
| Bio-Techne Corp. | | 26,168 | 2,090,300 |
| Charles River Laboratories International, Inc. (a) | | 8,486 | 1,613,358 |
| Danaher Corp. | | 109,071 | 25,840,011 |
| Illumina, Inc. (a) | | 26,174 | 5,380,327 |
| IQVIA Holdings, Inc. (a) | | 30,898 | 5,815,931 |
| Mettler-Toledo International, Inc. (a) | | 3,678 | 5,485,737 |
| PerkinElmer, Inc. | | 21,016 | 2,742,378 |
| Thermo Fisher Scientific, Inc. | | 65,262 | 36,213,884 |
| Waters Corp. (a) | | 9,884 | 2,968,758 |
| West Pharmaceutical Services, Inc. | | 12,319 | 4,450,116 |
| | | | 101,452,857 |
| Pharmaceuticals - 4.2% | | | |
| Bristol-Myers Squibb Co. | | 353,793 | 23,622,759 |
| Catalent, Inc. (a) | | 30,049 | 1,506,056 |
| Eli Lilly & Co. | | 131,232 | 51,949,500 |
| Johnson & Johnson | | 435,053 | 71,218,176 |
| Merck & Co., Inc. | | 421,894 | 48,716,100 |
| Pfizer, Inc. | | 934,063 | 36,325,710 |
| Royalty Pharma PLC | | 61,651 | 2,167,033 |
| Viatris, Inc. | | 201,777 | 1,882,579 |
| Zoetis, Inc. Class A | | 77,554 | 13,632,442 |
| | | | 251,020,355 |
TOTAL HEALTH CARE | | | 853,259,463 |
| INDUSTRIALS - 8.4% | | | |
| Aerospace & Defense - 1.7% | | | |
| Axon Enterprise, Inc. (a) | | 11,250 | 2,370,488 |
| General Dynamics Corp. | | 37,447 | 8,176,178 |
| HEICO Corp. (b) | | 6,650 | 1,121,456 |
| HEICO Corp. Class A | | 11,591 | 1,555,860 |
| Howmet Aerospace, Inc. | | 61,264 | 2,713,383 |
| L3Harris Technologies, Inc. | | 31,683 | 6,182,937 |
| Lockheed Martin Corp. | | 37,809 | 17,560,390 |
| Northrop Grumman Corp. | | 23,940 | 11,042,804 |
| Raytheon Technologies Corp. | | 243,776 | 24,353,222 |
| Textron, Inc. | | 34,735 | 2,325,161 |
| The Boeing Co. (a) | | 93,575 | 19,349,439 |
| TransDigm Group, Inc. | | 8,631 | 6,602,715 |
| | | | 103,354,033 |
| Air Freight & Logistics - 0.6% | | | |
| C.H. Robinson Worldwide, Inc. | | 19,625 | 1,979,574 |
| Expeditors International of Washington, Inc. | | 26,477 | 3,014,142 |
| FedEx Corp. | | 38,638 | 8,800,964 |
| United Parcel Service, Inc. Class B | | 121,442 | 21,836,486 |
| | | | 35,631,166 |
| Building Products - 0.4% | | | |
| Carrier Global Corp. | | 138,804 | 5,804,783 |
| Johnson Controls International PLC | | 114,354 | 6,842,943 |
| Masco Corp. | | 37,488 | 2,005,983 |
| Trane Technologies PLC | | 38,117 | 7,082,520 |
| | | | 21,736,229 |
| Commercial Services & Supplies - 0.5% | | | |
| Cintas Corp. | | 14,374 | 6,551,238 |
| Copart, Inc. (a) | | 71,335 | 5,639,032 |
| Republic Services, Inc. | | 34,180 | 4,943,112 |
| Waste Management, Inc. | | 61,806 | 10,262,886 |
| | | | 27,396,268 |
| Construction & Engineering - 0.1% | | | |
| Quanta Services, Inc. | | 23,779 | 4,033,870 |
| Electrical Equipment - 0.5% | | | |
| AMETEK, Inc. | | 38,215 | 5,270,995 |
| Eaton Corp. PLC | | 66,177 | 11,059,500 |
| Emerson Electric Co. | | 95,080 | 7,916,361 |
| Rockwell Automation, Inc. | | 19,099 | 5,412,848 |
| | | | 29,659,704 |
| Ground Transportation - 0.9% | | | |
| CSX Corp. | | 349,837 | 10,719,006 |
| J.B. Hunt Transport Services, Inc. | | 13,809 | 2,420,580 |
| Norfolk Southern Corp. | | 37,902 | 7,695,243 |
| Old Dominion Freight Lines, Inc. | | 15,075 | 4,829,879 |
| Uber Technologies, Inc. (a) | | 331,867 | 10,304,470 |
| Union Pacific Corp. | | 101,816 | 19,925,391 |
| | | | 55,894,569 |
| Industrial Conglomerates - 0.8% | | | |
| 3M Co. | | 91,602 | 9,729,964 |
| General Electric Co. | | 181,260 | 17,939,302 |
| Honeywell International, Inc. | | 111,180 | 22,218,211 |
| | | | 49,887,477 |
| Machinery - 1.6% | | | |
| Caterpillar, Inc. | | 86,596 | 18,947,205 |
| Cummins, Inc. | | 23,512 | 5,526,260 |
| Deere & Co. | | 44,997 | 17,009,766 |
| Dover Corp. | | 23,246 | 3,397,635 |
| Fortive Corp. | | 58,717 | 3,704,456 |
| IDEX Corp. | | 12,550 | 2,589,316 |
| Illinois Tool Works, Inc. | | 46,196 | 11,176,660 |
| Ingersoll Rand, Inc. | | 67,377 | 3,841,837 |
| Otis Worldwide Corp. | | 69,033 | 5,888,515 |
| PACCAR, Inc. | | 86,861 | 6,487,648 |
| Parker Hannifin Corp. | | 21,343 | 6,933,914 |
| Stanley Black & Decker, Inc. | | 24,669 | 2,129,921 |
| Westinghouse Air Brake Tech Co. | | 30,262 | 2,955,690 |
| Xylem, Inc. | | 29,994 | 3,114,577 |
| | | | 93,703,400 |
| Passenger Airlines - 0.2% | | | |
| Delta Air Lines, Inc. (a) | | 106,689 | 3,660,500 |
| Southwest Airlines Co. | | 98,883 | 2,995,166 |
| United Airlines Holdings, Inc. (a) | | 54,396 | 2,382,545 |
| | | | 9,038,211 |
| Professional Services - 0.8% | | | |
| Automatic Data Processing, Inc. | | 68,950 | 15,169,000 |
| Broadridge Financial Solutions, Inc. | | 19,583 | 2,847,564 |
| CoStar Group, Inc. (a) | | 67,672 | 5,207,360 |
| Equifax, Inc. | | 20,383 | 4,247,410 |
| Jacobs Solutions, Inc. | | 21,083 | 2,434,243 |
| Leidos Holdings, Inc. | | 22,747 | 2,121,385 |
| Paychex, Inc. | | 53,382 | 5,864,547 |
| SS&C Technologies Holdings, Inc. | | 36,473 | 2,135,129 |
| TransUnion Holding Co., Inc. | | 32,070 | 2,206,737 |
| Verisk Analytics, Inc. | | 26,023 | 5,051,325 |
| | | | 47,284,700 |
| Trading Companies & Distributors - 0.3% | | | |
| Fastenal Co. | | 94,985 | 5,113,992 |
| Ferguson PLC | | 34,378 | 4,841,110 |
| United Rentals, Inc. | | 11,541 | 4,167,571 |
| W.W. Grainger, Inc. | | 7,483 | 5,204,950 |
| | | | 19,327,623 |
TOTAL INDUSTRIALS | | | 496,947,250 |
| INFORMATION TECHNOLOGY - 26.3% | | | |
| Communications Equipment - 0.8% | | | |
| Arista Networks, Inc. (a) | | 41,186 | 6,596,350 |
| Cisco Systems, Inc. | | 683,600 | 32,300,100 |
| F5, Inc. (a) | | 9,991 | 1,342,391 |
| Motorola Solutions, Inc. | | 27,824 | 8,107,914 |
| | | | 48,346,755 |
| Electronic Equipment, Instruments & Components - 0.6% | | | |
| Amphenol Corp. Class A | | 98,944 | 7,467,304 |
| CDW Corp. | | 22,528 | 3,820,524 |
| Corning, Inc. | | 126,663 | 4,207,745 |
| Keysight Technologies, Inc. (a) | | 29,676 | 4,292,337 |
| TE Connectivity Ltd. | | 52,659 | 6,443,882 |
| Teledyne Technologies, Inc. (a) | | 7,799 | 3,231,906 |
| Trimble, Inc. (a) | | 41,032 | 1,932,607 |
| Zebra Technologies Corp. Class A (a) | | 8,591 | 2,474,466 |
| | | | 33,870,771 |
| IT Services - 1.4% | | | |
| Accenture PLC Class A | | 104,789 | 29,371,309 |
| Akamai Technologies, Inc. (a) | | 26,161 | 2,144,417 |
| Cloudflare, Inc. (a) | | 47,682 | 2,243,438 |
| Cognizant Technology Solutions Corp. Class A | | 84,693 | 5,057,019 |
| EPAM Systems, Inc. (a) | | 9,569 | 2,702,668 |
| Gartner, Inc. (a) | | 13,148 | 3,976,744 |
| GoDaddy, Inc. (a) | | 25,808 | 1,953,149 |
| IBM Corp. | | 150,446 | 19,017,879 |
| MongoDB, Inc. Class A (a) | | 11,529 | 2,766,499 |
| Okta, Inc. (a) | | 25,466 | 1,745,185 |
| Snowflake, Inc. (a) | | 47,627 | 7,052,606 |
| Twilio, Inc. Class A (a) | | 29,085 | 1,530,162 |
| VeriSign, Inc. (a) | | 15,243 | 3,380,897 |
| | | | 82,941,972 |
| Semiconductors & Semiconductor Equipment - 6.0% | | | |
| Advanced Micro Devices, Inc. (a) | | 268,296 | 23,977,614 |
| Analog Devices, Inc. | | 84,342 | 15,171,439 |
| Applied Materials, Inc. | | 140,288 | 15,856,753 |
| Broadcom, Inc. | | 69,537 | 43,564,931 |
| Enphase Energy, Inc. (a) | | 22,618 | 3,713,876 |
| Entegris, Inc. | | 24,796 | 1,857,716 |
| First Solar, Inc. (a) | | 16,497 | 3,012,022 |
| Intel Corp. | | 688,399 | 21,381,673 |
| KLA Corp. | | 23,043 | 8,907,041 |
| Lam Research Corp. | | 22,453 | 11,767,168 |
| Marvell Technology, Inc. | | 141,967 | 5,604,857 |
| Microchip Technology, Inc. | | 91,151 | 6,653,111 |
| Micron Technology, Inc. | | 181,568 | 11,685,716 |
| Monolithic Power Systems, Inc. | | 7,446 | 3,439,829 |
| NVIDIA Corp. | | 409,349 | 113,590,254 |
| NXP Semiconductors NV | | 43,119 | 7,060,305 |
| onsemi (a) | | 71,877 | 5,172,269 |
| Qorvo, Inc. (a) | | 16,655 | 1,533,592 |
| Qualcomm, Inc. | | 185,537 | 21,670,722 |
| Skyworks Solutions, Inc. | | 26,451 | 2,801,161 |
| SolarEdge Technologies, Inc. (a) | | 9,301 | 2,656,645 |
| Teradyne, Inc. | | 25,914 | 2,368,021 |
| Texas Instruments, Inc. | | 150,795 | 25,212,924 |
| | | | 358,659,639 |
| Software - 10.2% | | | |
| Adobe, Inc. (a) | | 76,178 | 28,761,766 |
| ANSYS, Inc. (a) | | 14,495 | 4,550,270 |
| Atlassian Corp. PLC (a) | | 24,977 | 3,688,104 |
| Autodesk, Inc. (a) | | 35,903 | 6,993,545 |
| Cadence Design Systems, Inc. (a) | | 45,646 | 9,560,555 |
| Crowdstrike Holdings, Inc. (a) | | 36,321 | 4,360,336 |
| Datadog, Inc. Class A (a) | | 41,304 | 2,783,064 |
| DocuSign, Inc. (a) | | 33,498 | 1,656,141 |
| Fair Isaac Corp. (a) | | 4,186 | 3,047,199 |
| Fortinet, Inc. (a) | | 107,897 | 6,802,906 |
| Gen Digital, Inc. | | 94,772 | 1,674,621 |
| HubSpot, Inc. (a) | | 8,083 | 3,402,539 |
| Intuit, Inc. | | 46,746 | 20,752,887 |
| Microsoft Corp. | | 1,238,662 | 380,591,286 |
| Oracle Corp. | | 255,738 | 24,223,503 |
| Palantir Technologies, Inc. (a)(b) | | 293,108 | 2,271,587 |
| Palo Alto Networks, Inc. (a)(b) | | 50,312 | 9,179,928 |
| Paycom Software, Inc. (a) | | 8,022 | 2,329,348 |
| PTC, Inc. (a) | | 17,710 | 2,227,741 |
| Roper Technologies, Inc. | | 17,647 | 8,025,503 |
| Salesforce, Inc. (a) | | 166,401 | 33,008,966 |
| ServiceNow, Inc. (a) | | 33,779 | 15,518,748 |
| Splunk, Inc. (a) | | 25,058 | 2,161,002 |
| Synopsys, Inc. (a) | | 25,362 | 9,417,418 |
| Tyler Technologies, Inc. (a) | | 6,928 | 2,625,920 |
| VMware, Inc. Class A (a) | | 34,687 | 4,336,916 |
| Workday, Inc. Class A (a) | | 33,612 | 6,256,538 |
| Zoom Video Communications, Inc. Class A (a) | | 35,965 | 2,209,330 |
| Zscaler, Inc. (a) | | 14,120 | 1,272,212 |
| | | | 603,689,879 |
| Technology Hardware, Storage & Peripherals - 7.3% | | | |
| Apple, Inc. | | 2,474,831 | 419,929,317 |
| Dell Technologies, Inc. | | 40,367 | 1,755,561 |
| Hewlett Packard Enterprise Co. | | 213,264 | 3,053,940 |
| HP, Inc. | | 143,802 | 4,272,357 |
| NetApp, Inc. | | 35,866 | 2,255,613 |
| Seagate Technology Holdings PLC | | 31,980 | 1,879,465 |
| Western Digital Corp. (a) | | 53,125 | 1,829,625 |
| | | | 434,975,878 |
TOTAL INFORMATION TECHNOLOGY | | | 1,562,484,894 |
| MATERIALS - 2.5% | | | |
| Chemicals - 1.8% | | | |
| Air Products & Chemicals, Inc. | | 36,955 | 10,878,074 |
| Albemarle Corp. | | 19,493 | 3,615,172 |
| Celanese Corp. Class A | | 16,597 | 1,763,265 |
| CF Industries Holdings, Inc. | | 32,642 | 2,336,514 |
| Corteva, Inc. | | 118,613 | 7,249,627 |
| Dow, Inc. | | 117,290 | 6,380,576 |
| DuPont de Nemours, Inc. | | 76,230 | 5,314,756 |
| Eastman Chemical Co. | | 19,800 | 1,668,546 |
| Ecolab, Inc. | | 41,234 | 6,920,715 |
| FMC Corp. | | 20,959 | 2,590,113 |
| International Flavors & Fragrances, Inc. | | 42,424 | 4,113,431 |
| Linde PLC | | 81,958 | 30,279,383 |
| LyondellBasell Industries NV Class A | | 42,262 | 3,998,408 |
| PPG Industries, Inc. | | 39,108 | 5,485,288 |
| Sherwin-Williams Co. | | 39,240 | 9,321,070 |
| The Mosaic Co. | | 56,650 | 2,427,453 |
| | | | 104,342,391 |
| Construction Materials - 0.1% | | | |
| Martin Marietta Materials, Inc. | | 10,331 | 3,752,219 |
| Vulcan Materials Co. | | 22,114 | 3,872,604 |
| | | | 7,624,823 |
| Containers & Packaging - 0.2% | | | |
| Amcor PLC | | 247,205 | 2,711,839 |
| Avery Dennison Corp. | | 13,473 | 2,350,769 |
| Ball Corp. | | 52,230 | 2,777,591 |
| International Paper Co. | | 59,183 | 1,959,549 |
| Packaging Corp. of America | | 15,397 | 2,082,598 |
| | | | 11,882,346 |
| Metals & Mining - 0.4% | | | |
| Freeport-McMoRan, Inc. | | 237,841 | 9,016,552 |
| Newmont Corp. | | 132,078 | 6,260,497 |
| Nucor Corp. | | 42,099 | 6,238,230 |
| Reliance Steel & Aluminum Co. | | 9,766 | 2,420,015 |
| Steel Dynamics, Inc. | | 27,754 | 2,885,028 |
| | | | 26,820,322 |
TOTAL MATERIALS | | | 150,669,882 |
| REAL ESTATE - 2.5% | | | |
| Equity Real Estate Investment Trusts (REITs) - 2.4% | | | |
| Alexandria Real Estate Equities, Inc. | | 26,207 | 3,254,385 |
| American Tower Corp. | | 77,477 | 15,835,524 |
| AvalonBay Communities, Inc. | | 23,277 | 4,198,472 |
| Crown Castle International Corp. | | 72,050 | 8,868,635 |
| Digital Realty Trust, Inc. | | 47,840 | 4,743,336 |
| Equinix, Inc. | | 15,399 | 11,150,108 |
| Equity Residential (SBI) | | 56,670 | 3,584,378 |
| Essex Property Trust, Inc. | | 10,749 | 2,361,878 |
| Extra Space Storage, Inc. | | 22,282 | 3,387,755 |
| Gaming & Leisure Properties | | 42,857 | 2,228,564 |
| Healthpeak Properties, Inc. | | 91,039 | 2,000,127 |
| Host Hotels & Resorts, Inc. | | 119,033 | 1,924,764 |
| Invitation Homes, Inc. | | 96,651 | 3,225,244 |
| Iron Mountain, Inc. | | 48,373 | 2,672,125 |
| Mid-America Apartment Communities, Inc. | | 19,214 | 2,955,113 |
| Prologis (REIT), Inc. | | 153,602 | 19,238,651 |
| Public Storage | | 26,303 | 7,754,913 |
| Realty Income Corp. | | 104,359 | 6,557,920 |
| SBA Communications Corp. Class A | | 17,964 | 4,686,628 |
| Simon Property Group, Inc. | | 54,403 | 6,164,948 |
| Sun Communities, Inc. | | 20,614 | 2,863,903 |
| UDR, Inc. | | 51,464 | 2,127,007 |
| Ventas, Inc. | | 66,555 | 3,197,968 |
| VICI Properties, Inc. | | 167,023 | 5,668,761 |
| Welltower, Inc. | | 78,628 | 6,228,910 |
| Weyerhaeuser Co. | | 121,933 | 3,647,016 |
| WP Carey, Inc. | | 35,044 | 2,600,265 |
| | | | 143,127,298 |
| Real Estate Management & Development - 0.1% | | | |
| CBRE Group, Inc. (a) | | 52,571 | 4,030,093 |
TOTAL REAL ESTATE | | | 147,157,391 |
| UTILITIES - 2.7% | | | |
| Electric Utilities - 1.8% | | | |
| Alliant Energy Corp. | | 41,766 | 2,302,977 |
| American Electric Power Co., Inc. | | 85,508 | 7,902,649 |
| Constellation Energy Corp. | | 54,416 | 4,211,798 |
| Duke Energy Corp. | | 128,131 | 12,669,593 |
| Edison International | | 63,544 | 4,676,838 |
| Entergy Corp. | | 33,859 | 3,642,551 |
| Evergy, Inc. | | 38,194 | 2,372,229 |
| Eversource Energy | | 57,957 | 4,498,043 |
| Exelon Corp. | | 165,361 | 7,017,921 |
| FirstEnergy Corp. | | 90,377 | 3,597,005 |
| NextEra Energy, Inc. | | 330,671 | 25,339,319 |
| PG&E Corp. (a) | | 267,918 | 4,584,077 |
| PPL Corp. | | 122,520 | 3,518,774 |
| Southern Co. | | 181,161 | 13,324,392 |
| Xcel Energy, Inc. | | 91,064 | 6,366,284 |
| | | | 106,024,450 |
| Gas Utilities - 0.0% | | | |
| Atmos Energy Corp. | | 23,823 | 2,719,157 |
| Independent Power and Renewable Electricity Producers - 0.0% | | | |
| The AES Corp. | | 111,139 | 2,629,549 |
| Multi-Utilities - 0.8% | | | |
| Ameren Corp. | | 43,019 | 3,827,400 |
| CenterPoint Energy, Inc. | | 104,758 | 3,191,976 |
| CMS Energy Corp. | | 48,460 | 3,017,120 |
| Consolidated Edison, Inc. | | 59,053 | 5,814,949 |
| Dominion Energy, Inc. | | 138,656 | 7,922,804 |
| DTE Energy Co. | | 32,238 | 3,623,874 |
| Public Service Enterprise Group, Inc. | | 83,027 | 5,247,306 |
| Sempra Energy | | 52,307 | 8,133,215 |
| WEC Energy Group, Inc. | | 52,491 | 5,048,059 |
| | | | 45,826,703 |
| Water Utilities - 0.1% | | | |
| American Water Works Co., Inc. | | 32,112 | 4,760,604 |
TOTAL UTILITIES | | | 161,960,463 |
| TOTAL COMMON STOCKS (Cost $5,088,726,330) | | | 5,926,846,588 |
| | | | |
| U.S. Treasury Obligations - 0.0% |
| | | Principal Amount (c) | Value ($) |
U.S. Treasury Bills, yield at date of purchase 4.65% 6/29/23 (d) (Cost $794,018) | | 800,000 | 793,558 |
| | | | |
| Money Market Funds - 0.2% |
| | | Shares | Value ($) |
| Fidelity Cash Central Fund 4.88% (e) | | 3,449,375 | 3,450,065 |
| Fidelity Securities Lending Cash Central Fund 4.88% (e)(f) | | 10,411,652 | 10,412,693 |
| TOTAL MONEY MARKET FUNDS (Cost $13,862,758) | | | 13,862,758 |
| | | | |
| TOTAL INVESTMENT IN SECURITIES - 100.1% (Cost $5,103,383,106) | 5,941,502,904 |
NET OTHER ASSETS (LIABILITIES) - (0.1)% | (7,537,176) |
| NET ASSETS - 100.0% | 5,933,965,728 |
| | |
| Futures Contracts |
| | Number of contracts | Expiration Date | Notional Amount ($) | Value ($) | Unrealized Appreciation/ (Depreciation) ($) |
| Purchased | | | | | |
| | | | | | |
| Equity Index Contracts | | | | | |
| CME E-mini S&P 500 Index Contracts (United States) | 39 | Jun 2023 | 8,167,575 | 579,190 | 579,190 |
| | | | | | |
| The notional amount of futures purchased as a percentage of Net Assets is 0.1% |
Legend
| (b) | Security or a portion of the security is on loan at period end. |
| (c) | Amount is stated in United States dollars unless otherwise noted. |
| (d) | Security or a portion of the security was pledged to cover margin requirements for futures contracts. At period end, the value of securities pledged amounted to $515,812. |
| (e) | Affiliated fund that is generally available only to investment companies and other accounts managed by Fidelity Investments. The rate quoted is the annualized seven-day yield of the fund at period end. A complete unaudited listing of the fund's holdings as of its most recent quarter end is available upon request. In addition, each Fidelity Central Fund's financial statements are available on the SEC's website or upon request. |
| (f) | Investment made with cash collateral received from securities on loan. |
Affiliated Central Funds
Fiscal year to date information regarding the Fund's investments in Fidelity Central Funds, including the ownership percentage, is presented below.
| Affiliate | Value, beginning of period ($) | Purchases ($) | Sales Proceeds ($) | Dividend Income ($) | Realized Gain (loss) ($) | Change in Unrealized appreciation (depreciation) ($) | Value, end of period ($) | % ownership, end of period |
| Fidelity Cash Central Fund 4.88% | 13,176,399 | 244,032,273 | 253,758,607 | 340,280 | - | - | 3,450,065 | 0.0% |
| Fidelity Securities Lending Cash Central Fund 4.88% | 15,566,668 | 115,854,203 | 121,008,178 | 57,919 | - | - | 10,412,693 | 0.0% |
| Total | 28,743,067 | 359,886,476 | 374,766,785 | 398,199 | - | - | 13,862,758 | |
| | | | | | | | | |
Amounts in the dividend income column in the above table include any capital gain distributions from underlying funds, which are presented in the corresponding line item in the Statement of Operations, if applicable.
Amounts in the dividend income column for Fidelity Securities Lending Cash Central Fund represents the income earned on investing cash collateral, less rebates paid to borrowers and any lending agent fees associated with the loan, plus any premium payments received for lending certain types of securities.
Amounts included in the purchases and sales proceeds columns may include in-kind transactions, if applicable.
Investment Valuation
The following is a summary of the inputs used, as of April 30, 2023, involving the Fund's assets and liabilities carried at fair value. The inputs or methodology used for valuing securities may not be an indication of the risk associated with investing in those securities. For more information on valuation inputs, and their aggregation into the levels used below, please refer to the Investment Valuation section in the accompanying Notes to Financial Statements.
| Valuation Inputs at Reporting Date: |
| Description | Total ($) | Level 1 ($) | Level 2 ($) | Level 3 ($) |
Investments in Securities: | | | | |
|
| Equities: | | | | |
Communication Services | 493,274,614 | 493,274,614 | - | - |
Consumer Discretionary | 578,193,885 | 578,193,885 | - | - |
Consumer Staples | 423,959,809 | 423,959,809 | - | - |
Energy | 275,469,170 | 275,469,170 | - | - |
Financials | 783,469,767 | 783,469,767 | - | - |
Health Care | 853,259,463 | 853,259,463 | - | - |
Industrials | 496,947,250 | 496,947,250 | - | - |
Information Technology | 1,562,484,894 | 1,562,484,894 | - | - |
Materials | 150,669,882 | 150,669,882 | - | - |
Real Estate | 147,157,391 | 147,157,391 | - | - |
Utilities | 161,960,463 | 161,960,463 | - | - |
|
| U.S. Government and Government Agency Obligations | 793,558 | - | 793,558 | - |
|
| Money Market Funds | 13,862,758 | 13,862,758 | - | - |
| Total Investments in Securities: | 5,941,502,904 | 5,940,709,346 | 793,558 | - |
Derivative Instruments: | | | | |
|
| Assets | | | | |
Futures Contracts | 579,190 | 579,190 | - | - |
| Total Assets | 579,190 | 579,190 | - | - |
| Total Derivative Instruments: | 579,190 | 579,190 | - | - |
Value of Derivative Instruments
The following table is a summary of the Fund's value of derivative instruments by primary risk exposure as of April 30, 2023. For additional information on derivative instruments, please refer to the Derivative Instruments section in the accompanying Notes to Financial Statements.
Primary Risk Exposure / Derivative Type | Value |
| Asset ($) | Liability ($) |
| Equity Risk | | |
Futures Contracts (a) | 579,190 | 0 |
| Total Equity Risk | 579,190 | 0 |
| Total Value of Derivatives | 579,190 | 0 |
(a)Reflects gross cumulative appreciation (depreciation) on futures contracts as presented in the Schedule of Investments. In the Statement of Assets and Liabilities, the period end daily variation margin is included in receivable or payable for daily variation margin on futures contracts, and the net cumulative appreciation (depreciation) is included in Total accumulated earnings (loss).
Fidelity ZERO® Large Cap Index Fund
| Statement of Assets and Liabilities |
| | | | April 30, 2023 (Unaudited) |
| | | | | |
| Assets | | | | |
| Investment in securities, at value (including securities loaned of $10,128,943) - See accompanying schedule: | | | | |
Unaffiliated issuers (cost $5,089,520,348) | $ | 5,927,640,146 | | |
Fidelity Central Funds (cost $13,862,758) | | 13,862,758 | | |
| | | | | |
| | | | | |
| Total Investment in Securities (cost $5,103,383,106) | | | $ | 5,941,502,904 |
| Receivable for fund shares sold | | | | 4,248,554 |
| Dividends receivable | | | | 4,633,999 |
| Distributions receivable from Fidelity Central Funds | | | | 85,734 |
| Receivable for daily variation margin on futures contracts | | | | 67,135 |
| Other receivables | | | | 2 |
Total assets | | | | 5,950,538,328 |
| Liabilities | | | | |
| Payable for fund shares redeemed | $ | 6,159,675 | | |
| Collateral on securities loaned | | 10,412,925 | | |
| Total Liabilities | | | | 16,572,600 |
| Net Assets | | | $ | 5,933,965,728 |
| Net Assets consist of: | | | | |
| Paid in capital | | | $ | 5,175,731,943 |
| Total accumulated earnings (loss) | | | | 758,233,785 |
| Net Assets | | | $ | 5,933,965,728 |
Net Asset Value , offering price and redemption price per share ($5,933,965,728 ÷ 405,141,948 shares) | | | $ | 14.65 |
| Statement of Operations |
| | | | Six months ended April 30, 2023 (Unaudited) |
| Investment Income | | | | |
| Dividends | | | $ | 46,787,217 |
| Interest | | | | 19,069 |
| Income from Fidelity Central Funds (including $57,919 from security lending) | | | | 398,199 |
| Total Income | | | | 47,204,485 |
| Expenses | | | | |
| Independent trustees' fees and expenses | $ | 17,086 | | |
| Total expenses before reductions | | 17,086 | | |
| Expense reductions | | (1,407) | | |
| Total expenses after reductions | | | | 15,679 |
| Net Investment income (loss) | | | | 47,188,806 |
| Realized and Unrealized Gain (Loss) | | | | |
| Net realized gain (loss) on: | | | | |
| Investment Securities: | | | | |
| Unaffiliated issuers | | (43,889,386) | | |
| Futures contracts | | 2,233,057 | | |
| Total net realized gain (loss) | | | | (41,656,329) |
| Change in net unrealized appreciation (depreciation) on: | | | | |
| Investment Securities: | | | | |
| Unaffiliated issuers | | 456,284,711 | | |
| Futures contracts | | (344,411) | | |
| Total change in net unrealized appreciation (depreciation) | | | | 455,940,300 |
| Net gain (loss) | | | | 414,283,971 |
| Net increase (decrease) in net assets resulting from operations | | | $ | 461,472,777 |
| Statement of Changes in Net Assets |
| |
| | Six months ended April 30, 2023 (Unaudited) | | Year ended October 31, 2022 |
| Increase (Decrease) in Net Assets | | | | |
| Operations | | | | |
| Net investment income (loss) | $ | 47,188,806 | $ | 78,962,281 |
| Net realized gain (loss) | | (41,656,329) | | (52,165,460) |
| Change in net unrealized appreciation (depreciation) | | 455,940,300 | | (995,680,128) |
| Net increase (decrease) in net assets resulting from operations | | 461,472,777 | | (968,883,307) |
| Distributions to shareholders | | (80,225,687) | | (51,573,510) |
| Share transactions | | | | |
| Proceeds from sales of shares | | 612,452,722 | | 2,092,922,018 |
| Reinvestment of distributions | | 71,732,498 | | 48,118,514 |
| Cost of shares redeemed | | (437,740,286) | | (917,366,545) |
Net increase (decrease) in net assets resulting from share transactions | | 246,444,934 | | 1,223,673,987 |
| Total increase (decrease) in net assets | | 627,692,024 | | 203,217,170 |
| | | | | |
| Net Assets | | | | |
| Beginning of period | | 5,306,273,704 | | 5,103,056,534 |
| End of period | $ | 5,933,965,728 | $ | 5,306,273,704 |
| | | | | |
| Other Information | | | | |
| Shares | | | | |
| Sold | | 43,716,680 | | 137,692,315 |
| Issued in reinvestment of distributions | | 5,333,271 | | 2,992,445 |
| Redeemed | | (31,269,540) | | (61,684,064) |
| Net increase (decrease) | | 17,780,411 | | 79,000,696 |
| | | | | |
Financial Highlights
| Fidelity ZERO® Large Cap Index Fund |
| |
| | Six months ended (Unaudited) April 30, 2023 | | Years ended October 31, 2022 | | 2021 | | 2020 | | 2019 | | 2018 A |
Selected Per-Share Data | | | | | | | | | | | | |
| Net asset value, beginning of period | $ | 13.70 | $ | 16.55 | $ | 11.73 | $ | 10.65 | $ | 9.35 | $ | 10.00 |
| Income from Investment Operations | | | | | | | | | | | | |
Net investment income (loss) B,C | | .12 | | .22 | | .20 | | .20 | | .19 | | .02 |
| Net realized and unrealized gain (loss) | | 1.04 | | (2.91) | | 4.78 | | 1.01 | | 1.16 | | (.67) |
| Total from investment operations | | 1.16 | | (2.69) | | 4.98 | | 1.21 | | 1.35 | | (.65) |
| Distributions from net investment income | | (.21) | | (.16) | | (.16) | | (.13) | | (.04) | | - |
| Distributions from net realized gain | | - | | - | | - | | - | | (.01) | | - |
| Total distributions | | (.21) | | (.16) | | (.16) | | (.13) | | (.05) | | - |
| Net asset value, end of period | $ | 14.65 | $ | 13.70 | $ | 16.55 | $ | 11.73 | $ | 10.65 | $ | 9.35 |
Total Return D,E | | 8.56% | | (16.39)% | | 42.81% | | 11.45% | | 14.50% | | (6.50)% |
Ratios to Average Net Assets C,F,G | | | | | | | | | | | | |
Expenses before reductions H | | -% I | | -% | | -% | | -% | | -% | | -% I |
Expenses net of fee waivers, if any H | | -% I | | -% | | -% | | -% | | -% | | -% I |
Expenses net of all reductions H | | -% I | | -% | | -% | | -% | | -% | | -% I |
| Net investment income (loss) | | 1.69% I | | 1.48% | | 1.36% | | 1.80% | | 1.91% | | 1.29% I |
| Supplemental Data | | | | | | | | | | | | |
| Net assets, end of period (000 omitted) | $ | 5,933,966 | $ | 5,306,274 | $ | 5,103,057 | $ | 2,375,916 | $ | 1,162,779 | $ | 105,175 |
Portfolio turnover rate J | | 3% I | | 3% | | 5% K | | 5% | | 3% | | 1% L |
A For the period September 13, 2018 (commencement of operations) through October 31, 2018.
B Calculated based on average shares outstanding during the period.
C Net investment income (loss) is affected by the timing of the declaration of dividends by any underlying mutual funds or exchange-traded funds (ETFs). Net investment income (loss) of any mutual funds or ETFs is not included in the Fund's net investment income (loss) ratio.
D Total returns for periods of less than one year are not annualized.
E Total returns would have been lower if certain expenses had not been reduced during the applicable periods shown.
F Fees and expenses of any underlying mutual funds or exchange-traded funds (ETFs) are not included in the Fund's expense ratio. The Fund indirectly bears its proportionate share of these expenses. For additional expense information related to investments in Fidelity Central Funds, please refer to the "Investments in Fidelity Central Funds" note found in the Notes to Financial Statements section of the most recent Annual or Semi-Annual report.
G Expense ratios reflect operating expenses of the class. Expenses before reductions do not reflect amounts reimbursed, waived, or reduced through arrangements with the investment adviser, brokerage services, or other offset arrangements, if applicable, and do not represent the amount paid by the class during periods when reimbursements, waivers or reductions occur.
H Amount represents less than .005%.
I Annualized.
J Amount does not include the portfolio activity of any underlying mutual funds or exchange-traded funds (ETFs).
K Portfolio turnover rate excludes securities received or delivered in-kind.
L Amount not annualized.
Top Holdings (% of Fund's net assets) |
| |
| Apple, Inc. | 6.2 | |
| Microsoft Corp. | 5.6 | |
| Amazon.com, Inc. | 2.3 | |
| NVIDIA Corp. | 1.7 | |
| Alphabet, Inc. Class A | 1.6 | |
| Berkshire Hathaway, Inc. Class B | 1.5 | |
| Alphabet, Inc. Class C | 1.4 | |
| Meta Platforms, Inc. Class A | 1.3 | |
| Exxon Mobil Corp. | 1.2 | |
| UnitedHealth Group, Inc. | 1.1 | |
| | 23.9 | |
| |
| Market Sectors (% of Fund's net assets) |
| |
| Information Technology | 24.4 | |
| Health Care | 14.2 | |
| Financials | 13.5 | |
| Consumer Discretionary | 10.2 | |
| Industrials | 9.7 | |
| Communication Services | 7.6 | |
| Consumer Staples | 6.7 | |
| Energy | 4.6 | |
| Real Estate | 3.1 | |
| Materials | 2.8 | |
| Utilities | 2.8 | |
| |
Asset Allocation (% of Fund's net assets) |
|
Futures - 0.3% |
|
Fidelity ZERO® Total Market Index Fund
Showing Percentage of Net Assets
| Common Stocks - 99.6% |
| | | Shares | Value ($) |
| COMMUNICATION SERVICES - 7.6% | | | |
| Diversified Telecommunication Services - 0.8% | | | |
| Anterix, Inc. (a) | | 6,937 | 219,070 |
| AST SpaceMobile, Inc. (a)(b) | | 16,420 | 87,190 |
| AT&T, Inc. | | 2,436,391 | 43,051,029 |
| ATN International, Inc. | | 4,408 | 159,437 |
| Bandwidth, Inc. (a) | | 6,856 | 83,438 |
| Cogent Communications Group, Inc. | | 14,126 | 975,259 |
| Consolidated Communications Holdings, Inc. (a) | | 21,557 | 83,426 |
| EchoStar Holding Corp. Class A (a)(b) | | 11,187 | 190,962 |
| Frontier Communications Parent, Inc. (a)(b) | | 77,622 | 1,749,600 |
| Globalstar, Inc. (a)(b) | | 243,175 | 220,317 |
| IDT Corp. Class B (a) | | 7,292 | 242,167 |
| Iridium Communications, Inc. | | 42,599 | 2,703,759 |
| Liberty Global PLC: | | | |
| Class A (a) | | 50,034 | 976,163 |
| Class C (a) | | 95,852 | 1,949,630 |
| Liberty Latin America Ltd.: | | | |
| Class A (a) | | 15,780 | 139,969 |
| Class C (a) | | 45,576 | 404,715 |
| Lumen Technologies, Inc. (b) | | 331,320 | 785,228 |
| Radius Global Infrastructure, Inc. (a) | | 26,048 | 382,645 |
| Verizon Communications, Inc. | | 1,435,397 | 55,736,466 |
| | | | 110,140,470 |
| Entertainment - 1.3% | | | |
| Activision Blizzard, Inc. | | 243,472 | 18,920,209 |
| AMC Entertainment Holdings, Inc. Class A (a)(b) | | 174,481 | 959,646 |
| Cinemark Holdings, Inc. (a)(b) | | 36,069 | 608,845 |
| Electronic Arts, Inc. | | 89,064 | 11,336,066 |
| Endeavor Group Holdings, Inc. (a) | | 60,062 | 1,548,398 |
| Genius Brands International, Inc. (a)(b) | | 9,511 | 24,538 |
| Liberty Media Corp. Liberty Braves: | | | |
| Class A (a)(b) | | 5,111 | 200,198 |
| Class C (a) | | 12,813 | 487,150 |
| Liberty Media Corp. Liberty Formula One: | | | |
| Class A (a) | | 12,484 | 808,714 |
| Series C (a) | | 67,280 | 4,856,943 |
| Lions Gate Entertainment Corp.: | | | |
| Class A (a) | | 27,040 | 310,960 |
| Class B (a) | | 34,385 | 366,888 |
| Live Nation Entertainment, Inc. (a) | | 49,031 | 3,323,321 |
| Madison Square Garden Entertainment Corp. (b) | | 8,912 | 287,590 |
| Madison Square Garden Sports Corp. | | 5,959 | 1,194,780 |
| Marcus Corp. (b) | | 7,363 | 129,000 |
| Netflix, Inc. (a) | | 152,201 | 50,215,676 |
| Playtika Holding Corp. (a) | | 31,781 | 317,810 |
| Roblox Corp. (a) | | 123,648 | 4,401,869 |
| Roku, Inc. Class A (a) | | 41,778 | 2,348,341 |
| Sciplay Corp. (A Shares) (a) | | 7,334 | 125,265 |
| Skillz, Inc. (a)(b) | | 80,282 | 49,992 |
| Sphere Entertainment Co. (a)(b) | | 8,912 | 250,784 |
| Take-Two Interactive Software, Inc. (a) | | 54,269 | 6,745,094 |
| The Walt Disney Co. (a) | | 624,374 | 63,998,335 |
| Vivid Seats, Inc. Class A (a)(b) | | 7,498 | 53,836 |
| Warner Bros Discovery, Inc. | | 756,026 | 10,289,514 |
| Warner Music Group Corp. Class A | | 40,466 | 1,232,999 |
| World Wrestling Entertainment, Inc. Class A (b) | | 14,853 | 1,591,796 |
| | | | 186,984,557 |
| Interactive Media & Services - 4.4% | | | |
| Alphabet, Inc.: | | | |
| Class A (a) | | 2,041,828 | 219,169,818 |
| Class C (a) | | 1,767,880 | 191,319,974 |
| Angi, Inc. (a) | | 24,318 | 55,931 |
| Bumble, Inc. (a) | | 32,369 | 589,439 |
| CarGurus, Inc. Class A (a) | | 33,070 | 543,671 |
| Cars.com, Inc. (a) | | 21,357 | 417,956 |
| Eventbrite, Inc. (a) | | 30,281 | 220,143 |
| EverQuote, Inc. Class A (a) | | 6,308 | 43,967 |
| fuboTV, Inc. (a)(b) | | 64,568 | 73,608 |
| IAC, Inc. (a) | | 27,075 | 1,401,673 |
| Match Group, Inc. (a) | | 96,192 | 3,549,485 |
| MediaAlpha, Inc. Class A (a) | | 8,046 | 59,540 |
| Meta Platforms, Inc. Class A (a) | | 760,628 | 182,794,121 |
| Nextdoor Holdings, Inc. (a)(b) | | 40,427 | 85,301 |
| Pinterest, Inc. Class A (a) | | 203,731 | 4,685,813 |
| QuinStreet, Inc. (a) | | 18,108 | 201,180 |
| Rumble, Inc. (a)(b) | | 27,579 | 219,529 |
| Shutterstock, Inc. | | 8,105 | 543,035 |
| Snap, Inc. Class A (a) | | 335,080 | 2,918,547 |
| TripAdvisor, Inc. (a) | | 34,916 | 619,061 |
| Vimeo, Inc. (a) | | 47,609 | 156,634 |
| Yelp, Inc. (a) | | 24,487 | 732,651 |
| Ziff Davis, Inc. (a) | | 16,399 | 1,199,423 |
| ZipRecruiter, Inc. (a) | | 17,931 | 303,751 |
| Zoominfo Technologies, Inc. (a) | | 92,794 | 2,033,117 |
| | | | 613,937,368 |
| Media - 0.9% | | | |
| Altice U.S.A., Inc. Class A (a) | | 70,109 | 245,382 |
| AMC Networks, Inc. Class A (a) | | 9,034 | 159,811 |
| Boston Omaha Corp. (a) | | 7,072 | 144,693 |
| Cable One, Inc. (b) | | 1,619 | 1,227,866 |
| Cardlytics, Inc. (a)(b) | | 10,525 | 68,307 |
| Charter Communications, Inc. Class A (a) | | 36,038 | 13,287,211 |
| Clear Channel Outdoor Holdings, Inc. (a) | | 165,279 | 209,904 |
| Comcast Corp. Class A | | 1,437,954 | 59,488,157 |
| DISH Network Corp. Class A (a) | | 83,785 | 629,225 |
| E.W. Scripps Co. Class A (a) | | 20,708 | 174,568 |
| Entravision Communication Corp. Class A | | 19,868 | 124,175 |
| Fox Corp.: | | | |
| Class A | | 93,781 | 3,119,156 |
| Class B | | 55,647 | 1,699,459 |
| Gannett Co., Inc. (a)(b) | | 44,880 | 85,272 |
| Gray Television, Inc. | | 27,213 | 209,812 |
| iHeartMedia, Inc. (a) | | 33,631 | 116,700 |
| Integral Ad Science Holding Corp. (a) | | 12,922 | 203,263 |
| Interpublic Group of Companies, Inc. | | 132,470 | 4,733,153 |
| John Wiley & Sons, Inc. Class A | | 15,371 | 592,859 |
| Liberty Broadband Corp.: | | | |
| Class A (a) | | 6,220 | 525,777 |
| Class C (a) | | 40,170 | 3,405,613 |
| Liberty Media Corp. Liberty SiriusXM: | | | |
| Series A (a) | | 22,889 | 643,181 |
| Series C (a) | | 55,817 | 1,559,527 |
| Magnite, Inc. (a) | | 38,120 | 358,328 |
| News Corp.: | | | |
| Class A | | 121,826 | 2,145,356 |
| Class B | | 48,202 | 855,586 |
| Nexstar Broadcasting Group, Inc. Class A | | 12,980 | 2,251,381 |
| Omnicom Group, Inc. | | 69,123 | 6,260,470 |
| Paramount Global: | | | |
| Class A (b) | | 10,576 | 279,841 |
| Class B | | 165,159 | 3,853,159 |
| PubMatic, Inc. (a) | | 13,445 | 183,659 |
| Quotient Technology, Inc. (a) | | 31,851 | 89,820 |
| Scholastic Corp. | | 9,988 | 384,238 |
| Sinclair Broadcast Group, Inc. Class A (b) | | 14,082 | 280,091 |
| Sirius XM Holdings, Inc. | | 234,376 | 890,629 |
| Stagwell, Inc. (a) | | 34,282 | 213,234 |
| TechTarget, Inc. (a) | | 9,370 | 319,423 |
| TEGNA, Inc. | | 75,575 | 1,292,333 |
| The New York Times Co. Class A | | 56,726 | 2,254,859 |
| The Trade Desk, Inc. (a) | | 152,305 | 9,799,304 |
| Thryv Holdings, Inc. (a) | | 10,550 | 236,953 |
| WideOpenWest, Inc. (a) | | 16,462 | 188,161 |
| | | | 124,789,896 |
| Wireless Telecommunication Services - 0.2% | | | |
| Gogo, Inc. (a) | | 21,012 | 281,771 |
| NII Holdings, Inc. (a)(c) | | 11,652 | 0 |
| Shenandoah Telecommunications Co. | | 17,297 | 359,951 |
| Spok Holdings, Inc. | | 6,975 | 85,304 |
| T-Mobile U.S., Inc. (a) | | 202,384 | 29,123,058 |
| Telephone & Data Systems, Inc. | | 34,420 | 344,200 |
| U.S. Cellular Corp. (a) | | 4,421 | 93,902 |
| | | | 30,288,186 |
TOTAL COMMUNICATION SERVICES | | | 1,066,140,477 |
| CONSUMER DISCRETIONARY - 10.2% | | | |
| Automobile Components - 0.3% | | | |
| Adient PLC (a) | | 32,559 | 1,202,729 |
| American Axle & Manufacturing Holdings, Inc. (a) | | 39,688 | 283,769 |
| Aptiv PLC (a) | | 92,782 | 9,543,557 |
| Autoliv, Inc. | | 26,771 | 2,297,220 |
| BorgWarner, Inc. | | 80,706 | 3,884,380 |
| Dana, Inc. | | 42,087 | 622,467 |
| Dorman Products, Inc. (a) | | 9,433 | 812,747 |
| Fox Factory Holding Corp. (a) | | 14,444 | 1,601,406 |
| Garrett Motion, Inc. (a)(b) | | 17,747 | 146,590 |
| Gentex Corp. | | 80,363 | 2,217,215 |
| Gentherm, Inc. (a) | | 11,396 | 679,771 |
| Holley, Inc. (a)(b) | | 16,401 | 39,526 |
| LCI Industries | | 8,640 | 975,974 |
| Lear Corp. | | 20,149 | 2,572,221 |
| Luminar Technologies, Inc. (a)(b) | | 79,028 | 475,749 |
| Mobileye Global, Inc. (b) | | 16,076 | 605,101 |
| Modine Manufacturing Co. (a) | | 17,038 | 356,265 |
| Motorcar Parts of America, Inc. (a) | | 5,514 | 26,853 |
| Patrick Industries, Inc. | | 7,205 | 494,479 |
| QuantumScape Corp. Class A (a)(b) | | 93,476 | 654,332 |
| Solid Power, Inc. (a)(b) | | 40,168 | 91,181 |
| Standard Motor Products, Inc. | | 5,903 | 212,567 |
| Stoneridge, Inc. (a) | | 9,537 | 179,582 |
| The Goodyear Tire & Rubber Co. (a) | | 99,867 | 1,065,581 |
| Visteon Corp. (a) | | 9,632 | 1,352,236 |
| XPEL, Inc. (a) | | 6,930 | 506,306 |
| | | | 32,899,804 |
| Automobiles - 1.4% | | | |
| Canoo, Inc. (a)(b) | | 115,694 | 87,349 |
| Faraday Future Intelligent Electric, Inc. (a)(b) | | 193,616 | 33,012 |
| Fisker, Inc. (a)(b) | | 53,176 | 342,453 |
| Ford Motor Co. | | 1,335,889 | 15,870,361 |
| General Motors Co. | | 475,827 | 15,721,324 |
| Harley-Davidson, Inc. | | 46,136 | 1,711,646 |
| Lordstown Motors Corp. Class A (a)(b) | | 68,544 | 35,849 |
| Lucid Group, Inc. Class A (a)(b) | | 219,371 | 1,741,806 |
| Mullen Automotive, Inc. (a)(b) | | 833,333 | 64,083 |
| Rivian Automotive, Inc. (a)(b) | | 186,271 | 2,387,994 |
| Tesla, Inc. (a) | | 919,161 | 151,027,344 |
| Thor Industries, Inc. (b) | | 18,208 | 1,438,796 |
| Winnebago Industries, Inc. | | 10,148 | 590,005 |
| Workhorse Group, Inc. (a)(b) | | 46,078 | 43,415 |
| | | | 191,095,437 |
| Broadline Retail - 2.4% | | | |
| Amazon.com, Inc. (a) | | 3,046,613 | 321,265,341 |
| Big Lots, Inc. (b) | | 8,969 | 80,631 |
| ContextLogic, Inc. (a)(b) | | 5,840 | 42,106 |
| Dillard's, Inc. Class A (b) | | 1,127 | 336,286 |
| eBay, Inc. | | 185,734 | 8,623,630 |
| Etsy, Inc. (a) | | 43,049 | 4,349,240 |
| Groupon, Inc. (a)(b) | | 6,540 | 23,413 |
| Kohl's Corp. (b) | | 38,335 | 844,520 |
| Macy's, Inc. | | 92,580 | 1,512,757 |
| Nordstrom, Inc. (b) | | 37,293 | 576,550 |
| Ollie's Bargain Outlet Holdings, Inc. (a) | | 20,027 | 1,306,762 |
| Qurate Retail, Inc. Series A (a)(b) | | 107,271 | 85,452 |
| | | | 339,046,688 |
| Distributors - 0.1% | | | |
| Funko, Inc. (a)(b) | | 10,992 | 108,381 |
| Genuine Parts Co. | | 48,204 | 8,113,215 |
| LKQ Corp. | | 86,982 | 5,021,471 |
| Pool Corp. | | 13,294 | 4,670,448 |
| | | | 17,913,515 |
| Diversified Consumer Services - 0.1% | | | |
| 2U, Inc. (a) | | 26,426 | 146,400 |
| ADT, Inc. | | 71,088 | 476,290 |
| Adtalem Global Education, Inc. (a) | | 15,270 | 619,504 |
| American Public Education, Inc. (a) | | 5,877 | 33,499 |
| Bright Horizons Family Solutions, Inc. (a) | | 19,880 | 1,513,266 |
| Carriage Services, Inc. | | 4,464 | 128,161 |
| Chegg, Inc. (a) | | 43,613 | 784,162 |
| Coursera, Inc. (a) | | 29,757 | 370,177 |
| Duolingo, Inc. (a) | | 8,698 | 1,184,320 |
| European Wax Center, Inc. (b) | | 9,848 | 185,536 |
| Frontdoor, Inc. (a) | | 27,738 | 758,912 |
| Graham Holdings Co. | | 1,276 | 734,427 |
| Grand Canyon Education, Inc. (a) | | 10,661 | 1,265,461 |
| H&R Block, Inc. | | 51,244 | 1,737,684 |
| Laureate Education, Inc. Class A | | 45,304 | 561,317 |
| Mister Car Wash, Inc. (a) | | 28,432 | 250,770 |
| Nerdy, Inc. Class A (a)(b) | | 20,463 | 81,238 |
| OneSpaWorld Holdings Ltd. (a) | | 20,157 | 241,884 |
| Perdoceo Education Corp. (a) | | 25,281 | 328,147 |
| Rover Group, Inc. Class A (a) | | 34,944 | 158,296 |
| Service Corp. International | | 52,693 | 3,698,522 |
| Strategic Education, Inc. | | 7,405 | 651,640 |
| Stride, Inc. (a) | | 14,016 | 602,127 |
| Udemy, Inc. (a) | | 22,946 | 208,579 |
| WW International, Inc. (a)(b) | | 15,891 | 132,690 |
| | | | 16,853,009 |
| Hotels, Restaurants & Leisure - 2.4% | | | |
| Accel Entertainment, Inc. (a) | | 17,172 | 151,972 |
| Airbnb, Inc. Class A (a) | | 136,181 | 16,296,780 |
| ARAMARK Holdings Corp. | | 89,758 | 3,114,603 |
| Bally's Corp. (a) | | 8,473 | 145,736 |
| BJ's Restaurants, Inc. (a) | | 8,081 | 262,956 |
| Bloomin' Brands, Inc. | | 29,904 | 740,722 |
| Bluegreen Vacations Holding Corp. Class A | | 3,011 | 86,687 |
| Booking Holdings, Inc. (a) | | 13,256 | 35,609,725 |
| Bowlero Corp. Class A (a) | | 12,059 | 176,423 |
| Boyd Gaming Corp. | | 27,209 | 1,888,305 |
| Brinker International, Inc. (a) | | 14,549 | 580,796 |
| Caesars Entertainment, Inc. (a) | | 73,789 | 3,341,904 |
| Carnival Corp. (a)(b) | | 344,070 | 3,168,885 |
| Chipotle Mexican Grill, Inc. (a) | | 9,441 | 19,520,400 |
| Choice Hotels International, Inc. (b) | | 9,603 | 1,224,575 |
| Churchill Downs, Inc. | | 11,169 | 3,267,268 |
| Chuy's Holdings, Inc. (a) | | 6,350 | 221,488 |
| Cracker Barrel Old Country Store, Inc. | | 7,450 | 790,892 |
| Darden Restaurants, Inc. | | 41,705 | 6,336,241 |
| Dave & Buster's Entertainment, Inc. (a) | | 15,464 | 548,353 |
| Denny's Corp. (a) | | 20,084 | 225,142 |
| Dine Brands Global, Inc. | | 5,192 | 337,117 |
| Domino's Pizza, Inc. | | 12,131 | 3,851,229 |
| Doordash, Inc. (a) | | 90,032 | 5,509,058 |
| Draftkings Holdings, Inc. | | 152,798 | 3,347,804 |
| Dutch Bros, Inc. (a)(b) | | 9,997 | 311,407 |
| El Pollo Loco Holdings, Inc. | | 6,707 | 62,509 |
| Everi Holdings, Inc. (a) | | 29,457 | 447,746 |
| Expedia, Inc. (a) | | 50,613 | 4,755,597 |
| First Watch Restaurant Group, Inc. (a) | | 3,215 | 51,697 |
| Golden Entertainment, Inc. (a) | | 7,270 | 306,503 |
| Hilton Grand Vacations, Inc. (a) | | 27,036 | 1,157,141 |
| Hilton Worldwide Holdings, Inc. | | 90,825 | 13,080,617 |
| Hyatt Hotels Corp. Class A (a) | | 16,380 | 1,872,234 |
| Inspired Entertainment, Inc. (a) | | 8,914 | 114,099 |
| Jack in the Box, Inc. | | 6,947 | 643,917 |
| Krispy Kreme, Inc. (b) | | 23,494 | 361,338 |
| Kura Sushi U.S.A., Inc. Class A (a)(b) | | 1,424 | 98,142 |
| Las Vegas Sands Corp. (a) | | 112,275 | 7,168,759 |
| Life Time Group Holdings, Inc. (a)(b) | | 19,354 | 402,370 |
| Light & Wonder, Inc. Class A (a) | | 31,553 | 1,902,330 |
| Lindblad Expeditions Holdings (a) | | 11,546 | 130,585 |
| Marriott International, Inc. Class A | | 92,005 | 15,580,127 |
| Marriott Vacations Worldwide Corp. | | 13,255 | 1,783,593 |
| McDonald's Corp. | | 250,203 | 73,997,537 |
| MGM Resorts International | | 107,819 | 4,843,229 |
| Monarch Casino & Resort, Inc. | | 4,629 | 321,067 |
| Norwegian Cruise Line Holdings Ltd. (a)(b) | | 142,717 | 1,905,272 |
| Papa John's International, Inc. | | 11,472 | 857,991 |
| Penn Entertainment, Inc. (a) | | 53,537 | 1,594,867 |
| Planet Fitness, Inc. (a) | | 28,456 | 2,365,832 |
| Playa Hotels & Resorts NV (a) | | 45,053 | 419,443 |
| PlayAGS, Inc. (a) | | 8,714 | 46,010 |
| Portillo's, Inc. (a)(b) | | 15,792 | 341,423 |
| RCI Hospitality Holdings, Inc. | | 2,850 | 213,465 |
| Red Robin Gourmet Burgers, Inc. (a)(b) | | 5,267 | 68,840 |
| Red Rock Resorts, Inc. | | 16,095 | 785,436 |
| Royal Caribbean Cruises Ltd. (a) | | 74,822 | 4,895,603 |
| Rush Street Interactive, Inc. (a) | | 17,386 | 54,070 |
| Ruth's Hospitality Group, Inc. | | 12,382 | 200,093 |
| Sabre Corp. (a)(b) | | 107,740 | 430,960 |
| SeaWorld Entertainment, Inc. (a) | | 13,129 | 704,502 |
| Shake Shack, Inc. Class A (a) | | 12,901 | 707,104 |
| Six Flags Entertainment Corp. (a)(b) | | 25,223 | 612,162 |
| Soho House & Co., Inc. Class A (a)(b) | | 16,622 | 108,542 |
| Sonder Holdings, Inc. (a) | | 55,444 | 22,738 |
| Starbucks Corp. | | 392,621 | 44,872,654 |
| Sweetgreen, Inc. Class A (a)(b) | | 27,132 | 215,428 |
| Target Hospitality Corp. (a) | | 8,371 | 105,558 |
| Texas Roadhouse, Inc. Class A | | 22,754 | 2,517,047 |
| The Cheesecake Factory, Inc. (b) | | 15,739 | 530,247 |
| Travel+Leisure Co. | | 27,308 | 1,045,077 |
| Vail Resorts, Inc. | | 13,719 | 3,299,694 |
| Wendy's Co. | | 58,307 | 1,288,585 |
| Wingstop, Inc. | | 10,097 | 2,020,511 |
| Wyndham Hotels & Resorts, Inc. | | 30,257 | 2,064,133 |
| Wynn Resorts Ltd. (a) | | 35,374 | 4,042,541 |
| Xponential Fitness, Inc. (a) | | 8,322 | 275,292 |
| Yum! Brands, Inc. | | 95,643 | 13,445,493 |
| | | | 332,194,218 |
| Household Durables - 0.5% | | | |
| Beazer Homes U.S.A., Inc. (a) | | 11,980 | 255,294 |
| Cavco Industries, Inc. (a) | | 2,856 | 857,428 |
| Century Communities, Inc. | | 9,918 | 667,878 |
| D.R. Horton, Inc. | | 106,788 | 11,727,458 |
| Dream Finders Homes, Inc. (a)(b) | | 7,913 | 120,673 |
| Ethan Allen Interiors, Inc. | | 7,805 | 217,994 |
| Garmin Ltd. | | 52,187 | 5,123,198 |
| GoPro, Inc. Class A (a) | | 39,914 | 170,832 |
| Green Brick Partners, Inc. (a) | | 9,015 | 335,989 |
| Helen of Troy Ltd. (a) | | 7,992 | 801,917 |
| Hovnanian Enterprises, Inc. Class A (a) | | 1,785 | 131,679 |
| Installed Building Products, Inc. | | 8,167 | 1,014,913 |
| iRobot Corp. (a)(b) | | 9,392 | 369,387 |
| KB Home | | 27,839 | 1,219,905 |
| La-Z-Boy, Inc. | | 14,765 | 424,198 |
| Leggett & Platt, Inc. | | 46,029 | 1,487,197 |
| Lennar Corp.: | | | |
| Class A | | 84,579 | 9,541,357 |
| Class B | | 7,307 | 714,771 |
| LGI Homes, Inc. (a) | | 7,275 | 864,270 |
| Lovesac (a)(b) | | 5,816 | 152,903 |
| M.D.C. Holdings, Inc. | | 20,173 | 826,488 |
| M/I Homes, Inc. (a) | | 9,349 | 632,366 |
| Meritage Homes Corp. | | 12,467 | 1,596,399 |
| Mohawk Industries, Inc. (a) | | 18,100 | 1,916,790 |
| Newell Brands, Inc. | | 128,051 | 1,555,820 |
| NVR, Inc. (a) | | 1,033 | 6,032,720 |
| PulteGroup, Inc. | | 77,171 | 5,182,033 |
| Purple Innovation, Inc. | | 23,698 | 70,383 |
| Skyline Champion Corp. (a) | | 18,021 | 1,336,618 |
| Sonos, Inc. (a)(b) | | 42,281 | 893,820 |
| Taylor Morrison Home Corp. (a) | | 37,285 | 1,606,611 |
| Tempur Sealy International, Inc. | | 58,644 | 2,197,391 |
| Toll Brothers, Inc. | | 34,697 | 2,217,485 |
| TopBuild Corp. (a) | | 10,869 | 2,450,742 |
| Traeger, Inc. (a)(b) | | 20,534 | 62,423 |
| TRI Pointe Homes, Inc. (a) | | 35,358 | 1,014,067 |
| Tupperware Brands Corp. (a) | | 14,787 | 18,484 |
| Universal Electronics, Inc. (a) | | 4,159 | 41,798 |
| Vizio Holding Corp. (a)(b) | | 18,362 | 157,362 |
| Vuzix Corp. (a)(b) | | 22,555 | 90,671 |
| Whirlpool Corp. | | 18,808 | 2,625,409 |
| ZAGG, Inc. rights (a)(c) | | 5,004 | 0 |
| | | | 68,725,121 |
| Leisure Products - 0.1% | | | |
| Acushnet Holdings Corp. (b) | | 10,772 | 540,000 |
| AMMO, Inc. (a)(b) | | 26,348 | 51,906 |
| Brunswick Corp. | | 24,395 | 2,068,452 |
| Clarus Corp. | | 8,300 | 80,759 |
| Hasbro, Inc. | | 44,946 | 2,661,702 |
| JAKKS Pacific, Inc. (a) | | 2,987 | 66,909 |
| Johnson Outdoors, Inc. Class A | | 2,012 | 116,696 |
| Latham Group, Inc. (a) | | 10,095 | 24,329 |
| Malibu Boats, Inc. Class A (a) | | 7,061 | 400,712 |
| MasterCraft Boat Holdings, Inc. (a) | | 5,946 | 174,039 |
| Mattel, Inc. (a) | | 121,969 | 2,195,442 |
| Peloton Interactive, Inc. Class A (a) | | 114,969 | 1,020,925 |
| Polaris, Inc. | | 18,674 | 2,028,930 |
| Smith & Wesson Brands, Inc. | | 14,706 | 176,766 |
| Solo Brands, Inc. Class A (a) | | 5,239 | 41,860 |
| Sturm, Ruger & Co., Inc. | | 6,079 | 349,907 |
| Topgolf Callaway Brands Corp. (a)(b) | | 48,658 | 1,078,748 |
| Vista Outdoor, Inc. (a) | | 18,523 | 446,404 |
| YETI Holdings, Inc. (a) | | 29,886 | 1,179,003 |
| | | | 14,703,489 |
| Specialty Retail - 2.2% | | | |
| 1-800-FLOWERS.com, Inc. Class A (a) | | 9,976 | 91,879 |
| Abercrombie & Fitch Co. Class A (a) | | 16,815 | 395,825 |
| Academy Sports & Outdoors, Inc. (b) | | 26,869 | 1,706,719 |
| Advance Auto Parts, Inc. | | 20,396 | 2,560,310 |
| America's Car Mart, Inc. (a) | | 1,873 | 150,570 |
| American Eagle Outfitters, Inc. | | 61,371 | 821,758 |
| Arhaus, Inc. (a)(b) | | 9,191 | 73,712 |
| Arko Corp. | | 23,456 | 196,092 |
| Asbury Automotive Group, Inc. (a) | | 7,473 | 1,445,727 |
| AutoNation, Inc. (a) | | 11,553 | 1,521,530 |
| AutoZone, Inc. (a) | | 6,415 | 17,085,134 |
| BARK, Inc. (a) | | 37,811 | 41,592 |
| Bath & Body Works, Inc. | | 78,629 | 2,759,878 |
| Best Buy Co., Inc. | | 67,032 | 4,995,225 |
| Big 5 Sporting Goods Corp. (b) | | 6,167 | 48,596 |
| Boot Barn Holdings, Inc. (a) | | 9,902 | 717,598 |
| Build-A-Bear Workshop, Inc. | | 4,847 | 112,450 |
| Burlington Stores, Inc. (a) | | 22,348 | 4,308,918 |
| Caleres, Inc. | | 11,884 | 270,955 |
| Camping World Holdings, Inc. | | 13,785 | 308,646 |
| CarMax, Inc. (a)(b) | | 54,282 | 3,801,368 |
| CarParts.com, Inc. (a) | | 14,327 | 67,910 |
| Carvana Co. Class A (a)(b) | | 33,095 | 229,679 |
| Chewy, Inc. (a)(b) | | 31,785 | 985,653 |
| Chico's FAS, Inc. (a) | | 41,102 | 207,154 |
| Citi Trends, Inc. (a) | | 2,626 | 45,325 |
| Designer Brands, Inc. Class A | | 18,042 | 147,764 |
| Destination XL Group, Inc. (a) | | 15,979 | 70,148 |
| Dick's Sporting Goods, Inc. | | 20,388 | 2,956,464 |
| EVgo, Inc. Class A (a)(b) | | 24,760 | 148,312 |
| Five Below, Inc. (a) | | 19,049 | 3,759,511 |
| Floor & Decor Holdings, Inc. Class A (a)(b) | | 36,094 | 3,585,578 |
| Foot Locker, Inc. | | 27,745 | 1,165,013 |
| Franchise Group, Inc. | | 9,030 | 264,128 |
| GameStop Corp. Class A (b) | | 86,804 | 1,674,449 |
| Gap, Inc. | | 69,960 | 671,616 |
| Genesco, Inc. (a) | | 3,965 | 137,427 |
| Group 1 Automotive, Inc. | | 5,071 | 1,138,338 |
| GrowGeneration Corp. (a)(b) | | 21,926 | 74,987 |
| Guess?, Inc. (b) | | 10,656 | 200,866 |
| Haverty Furniture Companies, Inc. | | 4,330 | 130,506 |
| Hibbett, Inc. | | 4,391 | 238,563 |
| Lands' End, Inc. (a)(b) | | 4,138 | 29,669 |
| Lazydays Holdings, Inc. (a)(b) | | 2,780 | 32,943 |
| Leslie's, Inc. (a)(b) | | 50,834 | 551,549 |
| Lithia Motors, Inc. Class A (sub. vtg.) | | 9,269 | 2,047,429 |
| LL Flooring Holdings, Inc. (a) | | 8,215 | 27,027 |
| Lowe's Companies, Inc. | | 206,657 | 42,949,524 |
| MarineMax, Inc. (a) | | 7,632 | 222,244 |
| Monro, Inc. (b) | | 10,621 | 519,154 |
| Murphy U.S.A., Inc. | | 6,841 | 1,882,848 |
| National Vision Holdings, Inc. (a) | | 25,889 | 544,705 |
| O'Reilly Automotive, Inc. (a) | | 21,309 | 19,546,959 |
| OneWater Marine, Inc. Class A (a)(b) | | 3,554 | 93,826 |
| Overstock.com, Inc. (a) | | 14,993 | 305,257 |
| Penske Automotive Group, Inc. (b) | | 8,690 | 1,204,260 |
| Petco Health & Wellness Co., Inc. (a)(b) | | 28,457 | 283,432 |
| PetMed Express, Inc. (b) | | 6,573 | 101,027 |
| Rent the Runway, Inc. Class A (a)(b) | | 16,188 | 42,251 |
| Revolve Group, Inc. (a)(b) | | 14,429 | 297,959 |
| RH (a) | | 6,461 | 1,648,395 |
| Ross Stores, Inc. | | 117,713 | 12,563,508 |
| Sally Beauty Holdings, Inc. (a) | | 36,645 | 521,458 |
| Shoe Carnival, Inc. (b) | | 5,117 | 118,970 |
| Signet Jewelers Ltd. (b) | | 15,491 | 1,139,828 |
| Sleep Number Corp. (a)(b) | | 7,577 | 170,861 |
| Sonic Automotive, Inc. Class A (sub. vtg.) (b) | | 5,687 | 253,185 |
| Sportsman's Warehouse Holdings, Inc. (a) | | 12,954 | 80,574 |
| Stitch Fix, Inc. (a)(b) | | 25,015 | 85,301 |
| The Aaron's Co., Inc. | | 10,942 | 146,076 |
| The Buckle, Inc. | | 9,866 | 330,807 |
| The Cato Corp. Class A (sub. vtg.) | | 5,869 | 48,419 |
| The Children's Place, Inc. (a)(b) | | 4,166 | 123,480 |
| The Container Store Group, Inc. (a) | | 10,974 | 33,910 |
| The Home Depot, Inc. | | 348,275 | 104,670,569 |
| The ODP Corp. (a) | | 13,403 | 579,144 |
| The RealReal, Inc. (a)(b) | | 23,604 | 26,436 |
| thredUP, Inc. (a) | | 25,010 | 66,026 |
| Tilly's, Inc. (a)(b) | | 6,975 | 52,382 |
| TJX Companies, Inc. | | 394,681 | 31,108,756 |
| Tractor Supply Co. | | 37,794 | 9,010,090 |
| TravelCenters of America LLC (a) | | 4,081 | 351,497 |
| Ulta Beauty, Inc. (a) | | 17,402 | 9,595,985 |
| Upbound Group, Inc. | | 16,763 | 446,902 |
| Urban Outfitters, Inc. (a)(b) | | 21,835 | 590,855 |
| Victoria's Secret & Co. (a) | | 27,578 | 855,194 |
| Vroom, Inc. (a)(b) | | 38,425 | 31,082 |
| Warby Parker, Inc. (a) | | 22,586 | 237,831 |
| Wayfair LLC Class A (a)(b) | | 26,597 | 926,374 |
| Williams-Sonoma, Inc. (b) | | 22,795 | 2,759,107 |
| Winmark Corp. | | 941 | 314,219 |
| Zumiez, Inc. (a)(b) | | 5,577 | 97,514 |
| | | | 310,980,671 |
| Textiles, Apparel & Luxury Goods - 0.7% | | | |
| Allbirds, Inc. Class A (a)(b) | | 30,067 | 37,584 |
| Capri Holdings Ltd. (a) | | 42,494 | 1,763,501 |
| Carter's, Inc. (b) | | 13,358 | 931,988 |
| Columbia Sportswear Co. | | 11,964 | 999,473 |
| Crocs, Inc. (a) | | 21,002 | 2,597,317 |
| Deckers Outdoor Corp. (a) | | 9,022 | 4,324,605 |
| Fossil Group, Inc. (a) | | 13,488 | 45,320 |
| G-III Apparel Group Ltd. (a) | | 13,833 | 217,178 |
| Hanesbrands, Inc. (b) | | 115,594 | 605,713 |
| Kontoor Brands, Inc. (b) | | 16,644 | 751,809 |
| Levi Strauss & Co. Class A | | 31,729 | 458,801 |
| lululemon athletica, Inc. (a) | | 39,678 | 15,074,863 |
| Movado Group, Inc. | | 4,961 | 127,101 |
| NIKE, Inc. Class B | | 425,702 | 53,944,957 |
| Oxford Industries, Inc. | | 5,127 | 529,055 |
| PVH Corp. | | 21,817 | 1,872,117 |
| Ralph Lauren Corp. | | 14,207 | 1,630,822 |
| Samsonite International SA (a)(d) | | 486,000 | 1,540,059 |
| Skechers U.S.A., Inc. Class A (sub. vtg.) (a) | | 45,906 | 2,441,740 |
| Steven Madden Ltd. | | 25,209 | 883,323 |
| Tapestry, Inc. | | 80,500 | 3,285,205 |
| Under Armour, Inc.: | | | |
| Class A (sub. vtg.) (a) | | 66,210 | 587,283 |
| Class C (non-vtg.) (a) | | 65,421 | 525,985 |
| Unifi, Inc. (a) | | 3,888 | 34,137 |
| VF Corp. | | 112,939 | 2,655,196 |
| Wolverine World Wide, Inc. | | 26,576 | 444,882 |
| | | | 98,310,014 |
TOTAL CONSUMER DISCRETIONARY | | | 1,422,721,966 |
| CONSUMER STAPLES - 6.7% | | | |
| Beverages - 1.6% | | | |
| Boston Beer Co., Inc. Class A (a) | | 3,156 | 1,002,062 |
| Brown-Forman Corp. Class B (non-vtg.) | | 62,768 | 4,085,569 |
| Celsius Holdings, Inc. (a)(b) | | 13,910 | 1,329,379 |
| Coca-Cola Bottling Co. Consolidated | | 1,551 | 914,252 |
| Constellation Brands, Inc. Class A (sub. vtg.) | | 55,589 | 12,756,008 |
| Duckhorn Portfolio, Inc. (a) | | 14,458 | 218,316 |
| Keurig Dr. Pepper, Inc. | | 290,241 | 9,490,881 |
| MGP Ingredients, Inc. | | 5,479 | 540,668 |
| Molson Coors Beverage Co. Class B | | 63,664 | 3,786,735 |
| Monster Beverage Corp. | | 260,464 | 14,585,984 |
| National Beverage Corp. (a)(b) | | 8,393 | 417,132 |
| PepsiCo, Inc. | | 470,453 | 89,804,773 |
| The Coca-Cola Co. | | 1,329,331 | 85,276,584 |
| The Vita Coco Co., Inc. (a) | | 8,443 | 182,791 |
| | | | 224,391,134 |
| Consumer Staples Distribution & Retail - 1.8% | | | |
| Albertsons Companies, Inc. | | 55,259 | 1,154,913 |
| Andersons, Inc. | | 10,423 | 465,908 |
| BJ's Wholesale Club Holdings, Inc. (a) | | 46,000 | 3,513,020 |
| Blue Apron Holdings, Inc.: | | | |
| warrants 11/4/28 (a) | | 2,361 | 1 |
| warrants 11/4/28 (a) | | 2,361 | 0 |
| warrants 11/4/28 (a) | | 2,361 | 0 |
| Casey's General Stores, Inc. | | 12,750 | 2,917,455 |
| Chefs' Warehouse Holdings (a) | | 11,657 | 387,712 |
| Costco Wholesale Corp. | | 151,611 | 76,293,687 |
| Dollar General Corp. | | 76,415 | 16,922,866 |
| Dollar Tree, Inc. (a) | | 71,107 | 10,929,857 |
| Grocery Outlet Holding Corp. (a) | | 30,924 | 920,917 |
| Ingles Markets, Inc. Class A | | 4,724 | 434,797 |
| Kroger Co. | | 222,591 | 10,824,600 |
| Performance Food Group Co. (a) | | 53,530 | 3,355,796 |
| PriceSmart, Inc. | | 8,507 | 626,796 |
| Rite Aid Corp. (a)(b) | | 19,545 | 41,045 |
| SpartanNash Co. | | 12,270 | 300,860 |
| Sprouts Farmers Market LLC (a) | | 36,017 | 1,248,349 |
| Sysco Corp. | | 173,609 | 13,322,755 |
| Target Corp. | | 157,347 | 24,821,489 |
| U.S. Foods Holding Corp. (a) | | 69,472 | 2,667,725 |
| United Natural Foods, Inc. (a) | | 19,569 | 533,647 |
| Walgreens Boots Alliance, Inc. | | 244,445 | 8,616,686 |
| Walmart, Inc. | | 478,956 | 72,307,987 |
| Weis Markets, Inc. | | 5,396 | 445,116 |
| | | | 253,053,984 |
| Food Products - 1.2% | | | |
| Alico, Inc. | | 1,302 | 30,675 |
| Archer Daniels Midland Co. | | 187,042 | 14,604,239 |
| B&G Foods, Inc. Class A | | 24,534 | 393,525 |
| Benson Hill, Inc. (a) | | 41,028 | 43,490 |
| Beyond Meat, Inc. (a)(b) | | 20,790 | 281,497 |
| BRC, Inc. Class A (a)(b) | | 15,528 | 80,901 |
| Bunge Ltd. | | 51,342 | 4,805,611 |
| Cal-Maine Foods, Inc. | | 13,003 | 617,643 |
| Calavo Growers, Inc. | | 5,790 | 185,048 |
| Campbell Soup Co. | | 68,855 | 3,738,827 |
| Conagra Brands, Inc. | | 162,987 | 6,186,987 |
| Darling Ingredients, Inc. (a) | | 54,959 | 3,273,908 |
| Flowers Foods, Inc. (b) | | 65,865 | 1,811,946 |
| Fresh Del Monte Produce, Inc. | | 10,215 | 293,273 |
| Freshpet, Inc. (a)(b) | | 16,853 | 1,162,351 |
| General Mills, Inc. | | 201,458 | 17,855,223 |
| Hormel Foods Corp. | | 98,483 | 3,982,653 |
| Hostess Brands, Inc. Class A (a) | | 45,647 | 1,175,867 |
| Ingredion, Inc. | | 22,577 | 2,397,000 |
| J&J Snack Foods Corp. | | 5,119 | 784,231 |
| John B. Sanfilippo & Son, Inc. | | 3,286 | 341,580 |
| Kellogg Co. | | 87,471 | 6,102,852 |
| Lamb Weston Holdings, Inc. | | 49,166 | 5,497,250 |
| Lancaster Colony Corp. | | 6,790 | 1,419,925 |
| Lifecore Biomedical (a)(b) | | 7,264 | 30,872 |
| McCormick & Co., Inc. (non-vtg.) | | 85,743 | 7,532,523 |
| Mission Produce, Inc. (a) | | 15,823 | 180,224 |
| Mondelez International, Inc. | | 465,557 | 35,717,533 |
| Pilgrim's Pride Corp. (a) | | 14,928 | 340,508 |
| Post Holdings, Inc. (a) | | 18,621 | 1,685,014 |
| Seaboard Corp. | | 89 | 350,755 |
| Seneca Foods Corp. Class A (a) | | 1,775 | 84,490 |
| Sovos Brands, Inc. (a) | | 12,978 | 222,573 |
| The Hain Celestial Group, Inc. (a) | | 30,169 | 540,930 |
| The Hershey Co. | | 50,203 | 13,708,431 |
| The J.M. Smucker Co. | | 36,577 | 5,647,855 |
| The Kraft Heinz Co. | | 272,003 | 10,681,558 |
| The Simply Good Foods Co. (a) | | 29,484 | 1,072,333 |
| Tootsie Roll Industries, Inc. | | 5,987 | 244,749 |
| TreeHouse Foods, Inc. (a) | | 17,234 | 917,711 |
| Tyson Foods, Inc. Class A | | 97,199 | 6,073,966 |
| Utz Brands, Inc. Class A | | 23,065 | 436,159 |
| Vital Farms, Inc. (a) | | 9,921 | 127,782 |
| Westrock Coffee Holdings | | 6,229 | 76,181 |
| Whole Earth Brands, Inc. Class A (a) | | 12,713 | 30,511 |
| | | | 162,769,160 |
| Household Products - 1.3% | | | |
| Central Garden & Pet Co. (a) | | 4,368 | 160,917 |
| Central Garden & Pet Co. Class A (non-vtg.) (a) | | 12,892 | 455,474 |
| Church & Dwight Co., Inc. | | 83,221 | 8,082,424 |
| Colgate-Palmolive Co. | | 285,412 | 22,775,878 |
| Energizer Holdings, Inc. | | 21,770 | 727,771 |
| Kimberly-Clark Corp. | | 115,239 | 16,696,979 |
| Procter & Gamble Co. | | 805,761 | 126,004,905 |
| Reynolds Consumer Products, Inc. | | 18,341 | 514,098 |
| Spectrum Brands Holdings, Inc. | | 13,778 | 916,237 |
| The Clorox Co. | | 42,134 | 6,978,233 |
| WD-40 Co. (b) | | 4,751 | 904,590 |
| | | | 184,217,506 |
| Personal Care Products - 0.2% | | | |
| BellRing Brands, Inc. (a) | | 45,432 | 1,635,098 |
| Coty, Inc. Class A (a) | | 126,990 | 1,507,371 |
| Edgewell Personal Care Co. | | 16,989 | 741,910 |
| elf Beauty, Inc. (a) | | 17,353 | 1,609,664 |
| Estee Lauder Companies, Inc. Class A | | 79,219 | 19,544,912 |
| Herbalife Ltd. (a) | | 32,772 | 486,992 |
| Inter Parfums, Inc. | | 6,148 | 933,205 |
| MediFast, Inc. (b) | | 3,546 | 324,991 |
| Nu Skin Enterprises, Inc. Class A | | 16,670 | 657,798 |
| The Beauty Health Co. (a)(b) | | 34,495 | 395,313 |
| The Honest Co., Inc. (a) | | 21,936 | 36,414 |
| USANA Health Sciences, Inc. (a) | | 3,430 | 227,649 |
| | | | 28,101,317 |
| Tobacco - 0.6% | | | |
| 22nd Century Group, Inc. (a)(b) | | 68,027 | 48,326 |
| Altria Group, Inc. | | 610,557 | 29,007,563 |
| Philip Morris International, Inc. | | 529,772 | 52,961,307 |
| Turning Point Brands, Inc. | | 5,451 | 129,679 |
| Universal Corp. | | 8,422 | 462,284 |
| Vector Group Ltd. | | 45,212 | 576,001 |
| | | | 83,185,160 |
TOTAL CONSUMER STAPLES | | | 935,718,261 |
| ENERGY - 4.6% | | | |
| Energy Equipment & Services - 0.4% | | | |
| Archrock, Inc. | | 44,133 | 454,129 |
| Baker Hughes Co. Class A | | 344,687 | 10,078,648 |
| Bristow Group, Inc. (a) | | 7,165 | 160,281 |
| Cactus, Inc. | | 23,052 | 933,145 |
| Championx Corp. | | 67,740 | 1,834,399 |
| Core Laboratories NV | | 16,556 | 372,676 |
| Diamond Offshore Drilling, Inc. (a) | | 36,311 | 417,213 |
| DMC Global, Inc. (a) | | 5,938 | 112,466 |
| Dril-Quip, Inc. (a) | | 11,687 | 318,821 |
| Expro Group Holdings NV (a) | | 22,418 | 445,894 |
| Halliburton Co. | | 310,106 | 10,155,972 |
| Helix Energy Solutions Group, Inc. (a) | | 47,807 | 346,601 |
| Helmerich & Payne, Inc. | | 34,853 | 1,155,725 |
| Liberty Oilfield Services, Inc. Class A | | 50,365 | 645,176 |
| Nabors Industries Ltd. (a) | | 3,076 | 306,800 |
| Newpark Resources, Inc. (a) | | 30,303 | 121,212 |
| Nextier Oilfield Solutions, Inc. (a) | | 54,901 | 443,600 |
| Noble Corp. PLC | | 33,103 | 1,272,810 |
| NOV, Inc. | | 133,306 | 2,232,876 |
| Oceaneering International, Inc. (a) | | 33,728 | 597,997 |
| Oil States International, Inc. (a) | | 23,608 | 166,200 |
| Patterson-UTI Energy, Inc. | | 72,323 | 809,294 |
| ProFrac Holding Corp. | | 11,964 | 133,997 |
| ProPetro Holding Corp. (a) | | 33,424 | 231,963 |
| RPC, Inc. | | 27,485 | 203,114 |
| Schlumberger Ltd. | | 485,659 | 23,967,272 |
| Select Energy Services, Inc. Class A | | 25,456 | 189,138 |
| Solaris Oilfield Infrastructure, Inc. Class A | | 9,618 | 73,866 |
| TechnipFMC PLC (a) | | 153,829 | 2,105,919 |
| TETRA Technologies, Inc. (a) | | 39,064 | 111,332 |
| Tidewater, Inc. (a) | | 16,689 | 751,506 |
| Transocean Ltd. (United States) (a)(b) | | 227,560 | 1,342,604 |
| U.S. Silica Holdings, Inc. (a) | | 26,630 | 347,522 |
| Valaris Ltd. (a) | | 20,795 | 1,247,700 |
| Weatherford International PLC (a) | | 21,582 | 1,394,845 |
| | | | 65,482,713 |
| Oil, Gas & Consumable Fuels - 4.2% | | | |
| Alto Ingredients, Inc. (a) | | 22,163 | 29,034 |
| Amplify Energy Corp. (a)(b) | | 12,160 | 84,026 |
| Antero Midstream GP LP | | 117,983 | 1,269,497 |
| Antero Resources Corp. (a) | | 94,201 | 2,165,681 |
| APA Corp. | | 109,569 | 4,037,618 |
| Arch Resources, Inc. | | 6,131 | 749,515 |
| Ardmore Shipping Corp. | | 12,594 | 185,006 |
| Berry Corp. | | 22,204 | 169,639 |
| California Resources Corp. | | 25,653 | 1,038,947 |
| Callon Petroleum Co. (a) | | 18,134 | 600,961 |
| Centrus Energy Corp. Class A (a) | | 4,365 | 127,895 |
| Cheniere Energy, Inc. | | 85,013 | 13,006,989 |
| Chesapeake Energy Corp. | | 36,602 | 3,026,253 |
| Chevron Corp. | | 607,762 | 102,456,518 |
| Chord Energy Corp. | | 14,340 | 2,041,012 |
| Civitas Resources, Inc. (b) | | 18,063 | 1,247,250 |
| Clean Energy Fuels Corp. (a) | | 60,881 | 259,962 |
| CNX Resources Corp. (a)(b) | | 60,366 | 937,484 |
| Comstock Resources, Inc. (b) | | 31,412 | 361,238 |
| ConocoPhillips Co. | | 418,283 | 43,037,138 |
| CONSOL Energy, Inc. | | 11,070 | 656,894 |
| Coterra Energy, Inc. | | 270,072 | 6,913,843 |
| Crescent Energy, Inc. Class A (b) | | 13,409 | 155,813 |
| CVR Energy, Inc. | | 10,015 | 263,795 |
| Delek U.S. Holdings, Inc. | | 23,062 | 501,599 |
| Denbury, Inc. (a) | | 16,866 | 1,574,947 |
| Devon Energy Corp. | | 223,567 | 11,945,185 |
| Diamondback Energy, Inc. | | 62,803 | 8,930,587 |
| Dorian LPG Ltd. | | 11,167 | 248,131 |
| DT Midstream, Inc. | | 32,523 | 1,602,408 |
| Earthstone Energy, Inc. (a)(b) | | 12,328 | 167,168 |
| Enviva, Inc. | | 11,290 | 242,735 |
| EOG Resources, Inc. | | 200,812 | 23,991,010 |
| EQT Corp. | | 125,023 | 4,355,801 |
| Equitrans Midstream Corp. | | 145,705 | 750,381 |
| Evolution Petroleum Corp. | | 13,086 | 86,237 |
| Excelerate Energy, Inc. | | 6,772 | 145,598 |
| Exxon Mobil Corp. | | 1,407,056 | 166,511,007 |
| Gevo, Inc. (a)(b) | | 84,644 | 98,187 |
| Green Plains, Inc. (a)(b) | | 20,419 | 697,717 |
| Gulfport Energy Corp. (a)(b) | | 4,072 | 368,353 |
| Hallador Energy Co. (a) | | 8,781 | 70,599 |
| Hess Corp. | | 94,856 | 13,759,811 |
| HF Sinclair Corp. | | 45,776 | 2,019,179 |
| International Seaways, Inc. | | 13,976 | 556,524 |
| Kinder Morgan, Inc. | | 676,193 | 11,596,710 |
| Kinetik Holdings, Inc. | | 8,069 | 248,525 |
| Kosmos Energy Ltd. (a) | | 156,975 | 1,004,640 |
| Magnolia Oil & Gas Corp. Class A | | 55,664 | 1,175,624 |
| Marathon Oil Corp. | | 218,129 | 5,269,997 |
| Marathon Petroleum Corp. | | 155,225 | 18,937,450 |
| Matador Resources Co. | | 38,470 | 1,886,184 |
| Murphy Oil Corp. | | 49,575 | 1,819,898 |
| National Energy Services Reunited Corp. (a) | | 18,740 | 57,157 |
| New Fortress Energy, Inc. | | 16,237 | 491,819 |
| Nextdecade Corp. (a)(b) | | 20,951 | 130,525 |
| Northern Oil & Gas, Inc. | | 26,051 | 864,112 |
| Occidental Petroleum Corp. | | 248,666 | 15,300,419 |
| ONEOK, Inc. | | 152,870 | 9,999,227 |
| Overseas Shipholding Group, Inc. (a) | | 24,314 | 93,366 |
| Ovintiv, Inc. | | 84,399 | 3,045,116 |
| Par Pacific Holdings, Inc. (a) | | 19,127 | 448,146 |
| PBF Energy, Inc. Class A | | 38,613 | 1,346,049 |
| PDC Energy, Inc. | | 31,411 | 2,043,286 |
| Peabody Energy Corp. (b) | | 39,387 | 946,076 |
| Permian Resource Corp. Class A | | 80,982 | 846,262 |
| Phillips 66 Co. | | 159,339 | 15,774,561 |
| Pioneer Natural Resources Co. | | 81,236 | 17,672,892 |
| Range Resources Corp. | | 81,815 | 2,164,007 |
| Ranger Oil Corp. | | 6,464 | 266,317 |
| Rex American Resources Corp. (a) | | 4,956 | 140,205 |
| Riley Exploration Permian, Inc. | | 1,673 | 70,283 |
| Ring Energy, Inc. (a)(b) | | 25,461 | 46,084 |
| SandRidge Energy, Inc. (a) | | 9,484 | 134,388 |
| Scorpio Tankers, Inc. | | 18,693 | 976,709 |
| SilverBow Resources, Inc. (a) | | 4,422 | 105,465 |
| Sitio Royalties Corp. | | 24,759 | 628,631 |
| SM Energy Co. | | 42,568 | 1,195,309 |
| Southwestern Energy Co. (a) | | 373,609 | 1,939,031 |
| Talos Energy, Inc. (a) | | 21,056 | 286,993 |
| Targa Resources Corp. | | 77,560 | 5,858,107 |
| Teekay Corp. (a) | | 20,995 | 118,622 |
| Teekay Tankers Ltd. (a) | | 7,900 | 319,871 |
| Tellurian, Inc. (a)(b) | | 165,080 | 234,414 |
| Texas Pacific Land Corp. (b) | | 2,094 | 3,094,199 |
| The Williams Companies, Inc. | | 416,472 | 12,602,443 |
| Uranium Energy Corp. (a)(b) | | 121,674 | 317,569 |
| VAALCO Energy, Inc. | | 36,392 | 155,758 |
| Valero Energy Corp. | | 131,860 | 15,120,386 |
| Vertex Energy, Inc. (a)(b) | | 19,857 | 156,870 |
| Vital Energy, Inc. (a) | | 5,512 | 256,473 |
| Vitesse Energy, Inc. (b) | | 7,198 | 132,443 |
| W&T Offshore, Inc. (a) | | 29,817 | 130,300 |
| World Fuel Services Corp. | | 20,795 | 491,594 |
| | | | 581,385,684 |
TOTAL ENERGY | | | 646,868,397 |
| FINANCIALS - 13.5% | | | |
| Banks - 3.4% | | | |
| 1st Source Corp. | | 5,470 | 227,990 |
| Amalgamated Financial Corp. | | 6,379 | 103,850 |
| Amerant Bancorp, Inc. Class A | | 9,784 | 181,982 |
| Ameris Bancorp | | 22,854 | 765,609 |
| Associated Banc-Corp. | | 49,984 | 891,215 |
| Atlantic Union Bankshares Corp. | | 24,742 | 708,116 |
| Axos Financial, Inc. (a) | | 18,628 | 757,601 |
| Banc of California, Inc. | | 19,045 | 216,161 |
| BancFirst Corp. | | 6,144 | 490,844 |
| Bancorp, Inc., Delaware (a) | | 19,373 | 618,192 |
| Bank First National Corp. | | 2,399 | 164,068 |
| Bank of America Corp. | | 2,385,864 | 69,858,098 |
| Bank of Hawaii Corp. (b) | | 13,866 | 671,530 |
| Bank of Marin Bancorp | | 4,967 | 87,568 |
| Bank OZK | | 38,533 | 1,376,399 |
| BankUnited, Inc. | | 24,709 | 557,188 |
| Banner Corp. | | 11,573 | 577,724 |
| Berkshire Hills Bancorp, Inc. | | 15,438 | 328,366 |
| BOK Financial Corp. | | 9,542 | 800,288 |
| Bridgewater Bancshares, Inc. (a) | | 8,206 | 81,650 |
| Brookline Bancorp, Inc., Delaware | | 30,536 | 291,313 |
| Business First Bancshares, Inc. | | 8,718 | 134,432 |
| Byline Bancorp, Inc. | | 6,930 | 134,096 |
| Cadence Bank | | 63,484 | 1,283,646 |
| Cambridge Bancorp | | 2,836 | 146,479 |
| Camden National Corp. | | 4,374 | 139,749 |
| Capitol Federal Financial, Inc. | | 42,319 | 262,378 |
| Cathay General Bancorp | | 24,881 | 792,957 |
| Central Pacific Financial Corp. | | 9,557 | 151,765 |
| Citigroup, Inc. | | 662,519 | 31,184,769 |
| Citizens Financial Group, Inc. | | 169,995 | 5,259,645 |
| City Holding Co. | | 4,799 | 437,621 |
| CNB Financial Corp., Pennsylvania | | 7,368 | 138,224 |
| Coastal Financial Corp. of Washington (a) | | 3,953 | 143,296 |
| Columbia Banking Systems, Inc. | | 71,563 | 1,528,586 |
| Columbia Financial, Inc. (a)(b) | | 10,687 | 179,328 |
| Comerica, Inc. | | 44,767 | 1,941,545 |
| Commerce Bancshares, Inc. | | 38,802 | 2,167,092 |
| Community Bank System, Inc. | | 17,903 | 894,434 |
| Community Trust Bancorp, Inc. | | 5,035 | 181,310 |
| ConnectOne Bancorp, Inc. | | 13,416 | 211,704 |
| CrossFirst Bankshares, Inc. (a) | | 14,822 | 148,665 |
| Cullen/Frost Bankers, Inc. | | 22,177 | 2,445,014 |
| Customers Bancorp, Inc. (a) | | 10,786 | 235,566 |
| CVB Financial Corp. | | 43,443 | 650,342 |
| Dime Community Bancshares, Inc. | | 11,420 | 235,252 |
| Eagle Bancorp, Inc. | | 10,161 | 255,041 |
| East West Bancorp, Inc. | | 48,614 | 2,512,858 |
| Eastern Bankshares, Inc. | | 54,125 | 630,556 |
| Enterprise Financial Services Corp. | | 12,316 | 526,632 |
| Equity Bancshares, Inc. | | 4,827 | 113,676 |
| Esquire Financial Holdings, Inc. | | 2,566 | 99,202 |
| Farmers National Banc Corp. | | 12,826 | 149,936 |
| FB Financial Corp. | | 11,234 | 330,617 |
| Fifth Third Bancorp | | 232,786 | 6,098,993 |
| First Bancorp, North Carolina | | 14,078 | 433,321 |
| First Bancorp, Puerto Rico | | 61,891 | 727,219 |
| First Bancshares, Inc. | | 11,322 | 284,182 |
| First Busey Corp. | | 16,212 | 294,734 |
| First Citizens Bancshares, Inc. | | 4,071 | 4,100,230 |
| First Commonwealth Financial Corp. | | 33,124 | 413,388 |
| First Financial Bancorp, Ohio | | 31,433 | 650,663 |
| First Financial Bankshares, Inc. | | 45,259 | 1,324,278 |
| First Financial Corp., Indiana | | 3,822 | 132,050 |
| First Foundation, Inc. | | 18,004 | 113,245 |
| First Hawaiian, Inc. | | 42,349 | 809,289 |
| First Horizon National Corp. | | 182,471 | 3,202,366 |
| First Interstate Bancsystem, Inc. | | 31,539 | 807,083 |
| First Merchants Corp. | | 19,580 | 571,344 |
| First of Long Island Corp. | | 8,378 | 98,023 |
| First Republic Bank (b) | | 63,917 | 224,349 |
| Flushing Financial Corp. | | 9,636 | 115,921 |
| FNB Corp., Pennsylvania | | 123,784 | 1,421,040 |
| Fulton Financial Corp. | | 56,164 | 670,037 |
| German American Bancorp, Inc. | | 8,547 | 248,461 |
| Glacier Bancorp, Inc. | | 38,709 | 1,286,300 |
| Great Southern Bancorp, Inc. | | 2,889 | 146,992 |
| Hancock Whitney Corp. | | 28,405 | 1,037,351 |
| Hanmi Financial Corp. | | 9,825 | 158,772 |
| HarborOne Bancorp, Inc. | | 14,039 | 150,919 |
| Heartland Financial U.S.A., Inc. | | 12,456 | 405,567 |
| Heritage Commerce Corp. | | 20,271 | 172,304 |
| Heritage Financial Corp., Washington | | 11,047 | 194,538 |
| Hilltop Holdings, Inc. | | 15,230 | 472,435 |
| Hingham Institution for Savings | | 463 | 90,081 |
| Home Bancshares, Inc. | | 63,608 | 1,384,746 |
| HomeStreet, Inc. | | 5,686 | 55,495 |
| HomeTrust Bancshares, Inc. | | 4,770 | 99,550 |
| Hope Bancorp, Inc. | | 40,908 | 372,263 |
| Horizon Bancorp, Inc. Indiana | | 13,085 | 137,785 |
| Huntington Bancshares, Inc. | | 495,122 | 5,545,366 |
| Independent Bank Corp. | | 15,954 | 893,424 |
| Independent Bank Corp. | | 6,402 | 114,084 |
| Independent Bank Group, Inc. | | 11,959 | 435,068 |
| International Bancshares Corp. | | 17,480 | 745,872 |
| JPMorgan Chase & Co. | | 1,002,376 | 138,568,458 |
| Kearny Financial Corp. | | 21,286 | 165,818 |
| KeyCorp | | 320,111 | 3,604,450 |
| Lakeland Bancorp, Inc. | | 20,553 | 294,730 |
| Lakeland Financial Corp. | | 9,248 | 468,596 |
| Live Oak Bancshares, Inc. | | 11,585 | 272,943 |
| M&T Bank Corp. | | 57,736 | 7,263,189 |
| Mercantile Bank Corp. | | 4,125 | 115,748 |
| Metropolitan Bank Holding Corp. (a) | | 3,963 | 127,173 |
| Midland States Bancorp, Inc. | | 7,092 | 141,840 |
| National Bank Holdings Corp. | | 12,793 | 406,817 |
| NBT Bancorp, Inc. | | 14,848 | 478,700 |
| New York Community Bancorp, Inc. | | 234,832 | 2,510,354 |
| Nicolet Bankshares, Inc. (a) | | 4,705 | 269,644 |
| Northfield Bancorp, Inc. | | 14,808 | 154,299 |
| Northwest Bancshares, Inc. | | 41,873 | 489,495 |
| OceanFirst Financial Corp. | | 20,744 | 331,904 |
| OFG Bancorp | | 17,950 | 458,982 |
| Old National Bancorp, Indiana | | 102,920 | 1,380,157 |
| Old Second Bancorp, Inc. | | 12,454 | 153,060 |
| Origin Bancorp, Inc. | | 9,626 | 283,293 |
| Pacific Premier Bancorp, Inc. | | 32,049 | 712,770 |
| PacWest Bancorp | | 40,455 | 410,618 |
| Park National Corp. | | 5,025 | 544,308 |
| Pathward Financial, Inc. | | 9,805 | 436,617 |
| Peapack-Gladstone Financial Corp. | | 5,283 | 140,316 |
| Peoples Bancorp, Inc. | | 9,081 | 236,651 |
| Pinnacle Financial Partners, Inc. | | 26,808 | 1,453,798 |
| PNC Financial Services Group, Inc. | | 137,320 | 17,885,930 |
| Popular, Inc. | | 24,176 | 1,450,802 |
| Preferred Bank, Los Angeles | | 5,456 | 262,324 |
| Premier Financial Corp. | | 12,807 | 212,724 |
| Prosperity Bancshares, Inc. | | 30,646 | 1,919,053 |
| Provident Bancorp, Inc. | | 10,149 | 69,318 |
| Provident Financial Services, Inc. | | 24,202 | 423,051 |
| QCR Holdings, Inc. | | 5,670 | 234,738 |
| Regions Financial Corp. | | 317,737 | 5,801,878 |
| Renasant Corp. | | 18,864 | 530,456 |
| S&T Bancorp, Inc. | | 12,474 | 343,409 |
| Sandy Spring Bancorp, Inc. | | 15,119 | 339,875 |
| Seacoast Banking Corp., Florida | | 28,981 | 643,088 |
| ServisFirst Bancshares, Inc. | | 16,394 | 827,897 |
| Simmons First National Corp. Class A | | 42,337 | 707,451 |
| Southern Missouri Bancorp, Inc. | | 4,448 | 161,373 |
| Southside Bancshares, Inc. | | 9,669 | 306,797 |
| Southstate Corp. | | 26,316 | 1,815,278 |
| Stellar Bancorp, Inc. | | 14,404 | 330,428 |
| Stock Yards Bancorp, Inc. | | 10,270 | 499,122 |
| Synovus Financial Corp. | | 48,928 | 1,506,982 |
| Texas Capital Bancshares, Inc. (a) | | 16,586 | 833,447 |
| Tompkins Financial Corp. | | 4,354 | 255,231 |
| TowneBank | | 24,833 | 588,294 |
| Trico Bancshares | | 12,100 | 433,301 |
| Triumph Bancorp, Inc. (a) | | 7,387 | 383,829 |
| Truist Financial Corp. | | 453,933 | 14,789,137 |
| Trustco Bank Corp., New York | | 5,797 | 172,982 |
| Trustmark Corp. | | 20,680 | 494,045 |
| U.S. Bancorp | | 476,977 | 16,350,772 |
| UMB Financial Corp. | | 14,771 | 939,583 |
| United Bankshares, Inc., West Virginia | | 45,033 | 1,491,943 |
| United Community Bank, Inc. | | 39,479 | 983,027 |
| Univest Corp. of Pennsylvania | | 9,112 | 183,333 |
| Valley National Bancorp | | 147,218 | 1,380,905 |
| Veritex Holdings, Inc. | | 18,400 | 316,664 |
| Washington Federal, Inc. | | 23,203 | 650,612 |
| Washington Trust Bancorp, Inc. | | 5,190 | 145,891 |
| Webster Financial Corp. | | 58,875 | 2,196,038 |
| Wells Fargo & Co. | | 1,302,683 | 51,781,649 |
| WesBanco, Inc. | | 19,177 | 510,492 |
| Westamerica Bancorp. | | 8,997 | 364,468 |
| Western Alliance Bancorp. | | 36,740 | 1,363,789 |
| Wintrust Financial Corp. | | 21,305 | 1,456,623 |
| WSFS Financial Corp. | | 20,579 | 723,763 |
| Zions Bancorp NA | | 50,487 | 1,406,568 |
| | | | 470,384,381 |
| Capital Markets - 3.0% | | | |
| Affiliated Managers Group, Inc. | | 12,867 | 1,857,737 |
| Ameriprise Financial, Inc. | | 36,018 | 10,989,812 |
| Ares Management Corp. | | 53,118 | 4,652,606 |
| Artisan Partners Asset Management, Inc. | | 22,340 | 774,528 |
| Assetmark Financial Holdings, Inc. (a) | | 6,807 | 208,839 |
| Avantax, Inc. (a) | | 12,997 | 329,734 |
| B. Riley Financial, Inc. | | 5,016 | 158,004 |
| Bakkt Holdings, Inc. Class A (a)(b) | | 54,745 | 73,906 |
| Bank of New York Mellon Corp. | | 251,782 | 10,723,395 |
| BGC Partners, Inc. Class A | | 108,738 | 492,583 |
| BlackRock, Inc. Class A | | 51,171 | 34,345,975 |
| Blackstone, Inc. | | 242,800 | 21,689,324 |
| Blue Owl Capital, Inc. Class A (b) | | 122,851 | 1,383,302 |
| Bridge Investment Group Holdings, Inc. | | 7,750 | 77,423 |
| BrightSphere Investment Group, Inc. | | 10,420 | 235,284 |
| Carlyle Group LP | | 73,980 | 2,243,813 |
| Cboe Global Markets, Inc. | | 36,089 | 5,041,633 |
| Charles Schwab Corp. | | 521,412 | 27,238,563 |
| CME Group, Inc. | | 122,944 | 22,839,307 |
| Cohen & Steers, Inc. | | 8,414 | 505,345 |
| Coinbase Global, Inc. (a)(b) | | 54,622 | 2,938,117 |
| Diamond Hill Investment Group, Inc. | | 931 | 150,934 |
| Donnelley Financial Solutions, Inc. (a) | | 8,310 | 359,408 |
| Evercore, Inc. Class A | | 12,182 | 1,389,601 |
| FactSet Research Systems, Inc. | | 13,061 | 5,377,083 |
| Federated Hermes, Inc. | | 29,047 | 1,202,255 |
| Focus Financial Partners, Inc. Class A (a) | | 19,712 | 1,023,841 |
| Franklin Resources, Inc. | | 97,879 | 2,630,988 |
| Galaxy Digital Holdings Ltd. (a)(b) | | 35,773 | 132,018 |
| GCM Grosvenor, Inc. Class A | | 16,110 | 130,008 |
| Goldman Sachs Group, Inc. | | 115,729 | 39,745,968 |
| Hamilton Lane, Inc. Class A | | 12,018 | 885,486 |
| Houlihan Lokey | | 17,415 | 1,591,383 |
| Interactive Brokers Group, Inc. | | 35,056 | 2,729,110 |
| Intercontinental Exchange, Inc. | | 190,959 | 20,801,164 |
| Invesco Ltd. | | 155,652 | 2,666,319 |
| Janus Henderson Group PLC | | 45,092 | 1,170,137 |
| Jefferies Financial Group, Inc. | | 61,685 | 1,975,771 |
| KKR & Co. LP | | 197,393 | 10,475,647 |
| Lazard Ltd. Class A | | 39,080 | 1,223,204 |
| LPL Financial | | 27,049 | 5,648,913 |
| MarketAxess Holdings, Inc. | | 12,891 | 4,104,108 |
| Moelis & Co. Class A | | 22,010 | 833,739 |
| Moody's Corp. | | 53,835 | 16,856,815 |
| Morgan Stanley | | 446,448 | 40,166,927 |
| Morningstar, Inc. | | 8,665 | 1,545,056 |
| MSCI, Inc. | | 27,328 | 13,184,394 |
| NASDAQ, Inc. | | 115,708 | 6,406,752 |
| Northern Trust Corp. | | 71,030 | 5,551,705 |
| Open Lending Corp. (a) | | 36,951 | 259,766 |
| Oppenheimer Holdings, Inc. Class A (non-vtg.) | | 2,865 | 107,122 |
| P10, Inc. | | 11,448 | 118,258 |
| Perella Weinberg Partners Class A | | 13,243 | 104,620 |
| Piper Jaffray Companies | | 4,849 | 656,749 |
| PJT Partners, Inc. | | 8,518 | 585,783 |
| Raymond James Financial, Inc. | | 66,229 | 5,995,711 |
| Robinhood Markets, Inc. (a)(b) | | 175,405 | 1,552,334 |
| S&P Global, Inc. | | 112,463 | 40,776,835 |
| SEI Investments Co. | | 35,116 | 2,068,684 |
| State Street Corp. | | 119,036 | 8,601,541 |
| StepStone Group, Inc. Class A | | 16,848 | 371,161 |
| Stifel Financial Corp. | | 35,738 | 2,143,208 |
| StoneX Group, Inc. (a) | | 5,794 | 568,218 |
| T. Rowe Price Group, Inc. | | 76,759 | 8,622,338 |
| TPG, Inc. (b) | | 17,655 | 511,465 |
| Tradeweb Markets, Inc. Class A | | 37,960 | 2,672,764 |
| Victory Capital Holdings, Inc. | | 9,230 | 281,884 |
| Virtu Financial, Inc. Class A | | 30,502 | 611,565 |
| Virtus Investment Partners, Inc. | | 2,356 | 429,287 |
| WisdomTree Investments, Inc. | | 40,093 | 250,180 |
| | | | 416,047,437 |
| Consumer Finance - 0.5% | | | |
| Ally Financial, Inc. | | 101,883 | 2,687,674 |
| American Express Co. | | 203,570 | 32,843,984 |
| Bread Financial Holdings, Inc. | | 16,619 | 458,684 |
| Capital One Financial Corp. | | 130,157 | 12,664,276 |
| Credit Acceptance Corp. (a)(b) | | 2,051 | 1,003,965 |
| Discover Financial Services | | 90,986 | 9,414,321 |
| Encore Capital Group, Inc. (a) | | 7,568 | 388,844 |
| Enova International, Inc. (a) | | 10,729 | 471,218 |
| EZCORP, Inc. (non-vtg.) Class A (a)(b) | | 16,438 | 141,531 |
| FirstCash Holdings, Inc. | | 12,593 | 1,297,457 |
| Green Dot Corp. Class A (a) | | 15,779 | 271,241 |
| LendingClub Corp. (a) | | 36,247 | 260,253 |
| LendingTree, Inc. (a) | | 3,451 | 82,237 |
| Navient Corp. | | 35,478 | 586,806 |
| Nelnet, Inc. Class A | | 6,199 | 596,964 |
| NerdWallet, Inc. (a) | | 10,953 | 148,632 |
| OneMain Holdings, Inc. | | 41,865 | 1,606,360 |
| Oportun Financial Corp. (a)(b) | | 11,808 | 48,059 |
| PRA Group, Inc. (a) | | 13,070 | 474,049 |
| PROG Holdings, Inc. (a) | | 17,054 | 515,542 |
| SLM Corp. | | 83,452 | 1,253,449 |
| SoFi Technologies, Inc. (a)(b) | | 280,099 | 1,745,017 |
| Synchrony Financial | | 149,338 | 4,406,964 |
| Upstart Holdings, Inc. (a)(b) | | 24,639 | 342,482 |
| World Acceptance Corp. (a)(b) | | 1,251 | 126,226 |
| | | | 73,836,235 |
| Financial Services - 4.2% | | | |
| A-Mark Precious Metals, Inc. | | 6,118 | 219,024 |
| Affirm Holdings, Inc. (a)(b) | | 72,617 | 716,004 |
| Apollo Global Management, Inc. | | 148,861 | 9,436,299 |
| AvidXchange Holdings, Inc. (a) | | 46,984 | 349,091 |
| Berkshire Hathaway, Inc. Class B (a) | | 615,642 | 202,269,179 |
| Block, Inc. Class A (a) | | 183,822 | 11,174,539 |
| Cannae Holdings, Inc. (a) | | 24,549 | 447,774 |
| Cantaloupe, Inc. (a) | | 18,248 | 100,546 |
| Cass Information Systems, Inc. | | 4,361 | 159,525 |
| Enact Holdings, Inc. | | 10,244 | 247,290 |
| Equitable Holdings, Inc. | | 116,472 | 3,027,107 |
| Essent Group Ltd. | | 36,847 | 1,564,892 |
| Euronet Worldwide, Inc. (a) | | 15,936 | 1,764,753 |
| EVERTEC, Inc. | | 23,593 | 818,441 |
| Federal Agricultural Mortgage Corp. Class C (non-vtg.) | | 3,144 | 419,064 |
| Fidelity National Information Services, Inc. | | 203,009 | 11,920,688 |
| Fiserv, Inc. (a) | | 217,069 | 26,508,466 |
| FleetCor Technologies, Inc. (a) | | 25,104 | 5,370,248 |
| Flywire Corp. (a) | | 21,719 | 633,543 |
| Global Payments, Inc. | | 89,744 | 10,115,046 |
| i3 Verticals, Inc. Class A (a) | | 6,939 | 161,332 |
| International Money Express, Inc. (a) | | 10,855 | 279,842 |
| Jack Henry & Associates, Inc. | | 25,078 | 4,096,241 |
| Jackson Financial, Inc. | | 19,987 | 719,732 |
| Marqeta, Inc. Class A (a) | | 146,915 | 595,006 |
| MasterCard, Inc. Class A | | 288,223 | 109,533,387 |
| Merchants Bancorp | | 7,797 | 180,890 |
| MGIC Investment Corp. | | 98,168 | 1,459,758 |
| MoneyGram International, Inc. (a) | | 31,985 | 324,968 |
| Mr. Cooper Group, Inc. (a) | | 23,287 | 1,078,188 |
| NMI Holdings, Inc. (a) | | 27,757 | 649,514 |
| Paymentus Holdings, Inc. (a)(b) | | 4,048 | 33,315 |
| Payoneer Global, Inc. (a) | | 69,018 | 376,838 |
| PayPal Holdings, Inc. (a) | | 386,829 | 29,399,004 |
| PennyMac Financial Services, Inc. | | 10,009 | 625,462 |
| Radian Group, Inc. (b) | | 54,998 | 1,334,801 |
| Remitly Global, Inc. (a) | | 33,373 | 560,666 |
| Repay Holdings Corp. (a) | | 23,598 | 147,959 |
| Rocket Companies, Inc. (a)(b) | | 41,228 | 367,341 |
| Shift4 Payments, Inc. (a) | | 17,887 | 1,212,202 |
| TFS Financial Corp. (b) | | 16,063 | 193,399 |
| The Western Union Co. | | 131,171 | 1,433,699 |
| Toast, Inc. (a) | | 106,901 | 1,945,598 |
| UWM Holdings Corp. Class A (b) | | 27,849 | 167,094 |
| Visa, Inc. Class A | | 555,154 | 129,200,990 |
| Voya Financial, Inc. (b) | | 33,262 | 2,543,878 |
| Walker & Dunlop, Inc. | | 10,088 | 679,023 |
| WEX, Inc. (a) | | 15,038 | 2,666,989 |
| | | | 579,228,635 |
| Insurance - 2.3% | | | |
| AFLAC, Inc. | | 191,286 | 13,361,327 |
| Allstate Corp. | | 89,716 | 10,385,524 |
| AMBAC Financial Group, Inc. (a) | | 14,439 | 230,302 |
| American Equity Investment Life Holding Co. | | 23,719 | 914,130 |
| American Financial Group, Inc. | | 24,070 | 2,954,111 |
| American International Group, Inc. | | 254,379 | 13,492,262 |
| Amerisafe, Inc. | | 6,369 | 354,435 |
| Aon PLC | | 70,125 | 22,803,248 |
| Arch Capital Group Ltd. (a) | | 126,404 | 9,489,148 |
| Argo Group International Holdings, Ltd. | | 12,035 | 353,949 |
| Arthur J. Gallagher & Co. | | 72,415 | 15,066,665 |
| Assurant, Inc. | | 17,861 | 2,199,225 |
| Assured Guaranty Ltd. | | 20,224 | 1,089,467 |
| Axis Capital Holdings Ltd. | | 25,851 | 1,461,616 |
| Brighthouse Financial, Inc. (a) | | 23,155 | 1,023,451 |
| Brown & Brown, Inc. | | 80,442 | 5,179,660 |
| BRP Group, Inc. (a) | | 20,822 | 524,506 |
| Chubb Ltd. | | 141,840 | 28,589,270 |
| Cincinnati Financial Corp. | | 53,694 | 5,715,189 |
| CNO Financial Group, Inc. | | 38,828 | 871,300 |
| eHealth, Inc. (a) | | 7,677 | 46,062 |
| Employers Holdings, Inc. | | 8,870 | 351,163 |
| Enstar Group Ltd. (a) | | 4,644 | 1,117,346 |
| Erie Indemnity Co. Class A | | 8,451 | 1,836,656 |
| Everest Re Group Ltd. | | 13,371 | 5,054,238 |
| Fidelity National Financial, Inc. | | 93,544 | 3,319,877 |
| First American Financial Corp. | | 35,564 | 2,048,842 |
| Genworth Financial, Inc. Class A (a) | | 172,246 | 1,000,749 |
| Globe Life, Inc. | | 31,227 | 3,388,754 |
| Goosehead Insurance (a)(b) | | 7,257 | 417,278 |
| Hagerty, Inc. Class A (a) | | 11,741 | 117,527 |
| Hanover Insurance Group, Inc. | | 12,312 | 1,472,023 |
| Hartford Financial Services Group, Inc. | | 108,164 | 7,678,562 |
| HCI Group, Inc. (b) | | 2,402 | 121,685 |
| Hippo Holdings, Inc. (a)(b) | | 4,637 | 84,579 |
| Horace Mann Educators Corp. | | 15,103 | 472,422 |
| James River Group Holdings Ltd. | | 12,925 | 251,650 |
| Kemper Corp. | | 21,435 | 1,042,813 |
| Kinsale Capital Group, Inc. | | 7,431 | 2,427,782 |
| Lemonade, Inc. (a)(b) | | 14,797 | 160,399 |
| Lincoln National Corp. | | 52,127 | 1,132,720 |
| Loews Corp. | | 66,552 | 3,831,399 |
| Markel Corp. (a) | | 4,590 | 6,281,553 |
| Marsh & McLennan Companies, Inc. | | 169,006 | 30,453,191 |
| MBIA, Inc. (a) | | 14,633 | 147,208 |
| Mercury General Corp. | | 8,997 | 273,599 |
| MetLife, Inc. | | 225,559 | 13,833,533 |
| National Western Life Group, Inc. | | 831 | 211,888 |
| Old Republic International Corp. | | 93,691 | 2,367,572 |
| Oscar Health, Inc. (a) | | 37,831 | 254,603 |
| Palomar Holdings, Inc. (a) | | 8,493 | 426,858 |
| Primerica, Inc. | | 12,667 | 2,311,854 |
| Principal Financial Group, Inc. | | 77,906 | 5,818,799 |
| ProAssurance Corp. | | 18,561 | 333,356 |
| Progressive Corp. | | 199,892 | 27,265,269 |
| Prudential Financial, Inc. | | 126,067 | 10,967,829 |
| Reinsurance Group of America, Inc. | | 22,881 | 3,256,424 |
| RenaissanceRe Holdings Ltd. | | 14,978 | 3,226,411 |
| RLI Corp. | | 13,758 | 1,913,050 |
| Ryan Specialty Group Holdings, Inc. (a)(b) | | 28,489 | 1,164,061 |
| Safety Insurance Group, Inc. | | 5,152 | 376,560 |
| Selective Insurance Group, Inc. | | 20,888 | 2,012,141 |
| Selectquote, Inc. (a) | | 39,346 | 41,707 |
| Siriuspoint Ltd. (a) | | 30,921 | 268,703 |
| Stewart Information Services Corp. | | 9,323 | 388,303 |
| The Travelers Companies, Inc. | | 79,041 | 14,317,487 |
| Trupanion, Inc. (a)(b) | | 11,963 | 420,021 |
| United Fire Group, Inc. | | 7,455 | 200,540 |
| Universal Insurance Holdings, Inc. | | 9,249 | 142,620 |
| Unum Group | | 63,990 | 2,700,378 |
| W.R. Berkley Corp. | | 69,909 | 4,119,038 |
| White Mountains Insurance Group Ltd. | | 881 | 1,261,715 |
| Willis Towers Watson PLC | | 36,500 | 8,453,400 |
| | | | 318,642,982 |
| Mortgage Real Estate Investment Trusts - 0.1% | | | |
| AGNC Investment Corp. | | 197,684 | 1,959,048 |
| Annaly Capital Management, Inc. | | 161,648 | 3,229,727 |
| Apollo Commercial Real Estate Finance, Inc. | | 42,824 | 433,379 |
| Arbor Realty Trust, Inc. | | 57,778 | 662,714 |
| Ares Commercial Real Estate Corp. | | 18,967 | 163,306 |
| Armour Residential REIT, Inc. | | 60,805 | 310,106 |
| Blackstone Mortgage Trust, Inc. (b) | | 61,126 | 1,114,938 |
| BrightSpire Capital, Inc. | | 46,901 | 267,336 |
| Broadmark Realty Capital, Inc. | | 46,267 | 227,171 |
| Cherry Hill Mortgage Investment Corp. (b) | | 4,889 | 27,036 |
| Chimera Investment Corp. | | 79,963 | 454,190 |
| Claros Mortgage Trust, Inc. | | 42,483 | 508,097 |
| Dynex Capital, Inc. | | 21,837 | 258,987 |
| Ellington Financial LLC | | 23,986 | 306,301 |
| Franklin BSP Realty Trust, Inc. | | 27,470 | 346,946 |
| Granite Point Mortgage Trust, Inc. | | 16,503 | 73,768 |
| Hannon Armstrong Sustainable Infrastructure Capital, Inc. | | 30,248 | 858,438 |
| Invesco Mortgage Capital, Inc. | | 12,126 | 128,657 |
| KKR Real Estate Finance Trust, Inc. | | 19,207 | 206,283 |
| Ladder Capital Corp. Class A | | 37,512 | 350,737 |
| MFA Financial, Inc. | | 30,817 | 329,434 |
| New York Mortgage Trust, Inc. | | 32,033 | 329,299 |
| Orchid Island Capital, Inc. (b) | | 10,997 | 117,668 |
| PennyMac Mortgage Investment Trust | | 30,599 | 380,346 |
| Ready Capital Corp. | | 33,658 | 361,150 |
| Redwood Trust, Inc. | | 39,381 | 247,313 |
| Rithm Capital Corp. | | 166,589 | 1,359,366 |
| Starwood Property Trust, Inc. | | 106,658 | 1,908,112 |
| TPG RE Finance Trust, Inc. | | 23,761 | 169,416 |
| Two Harbors Investment Corp. | | 34,746 | 484,012 |
| | | | 17,573,281 |
TOTAL FINANCIALS | | | 1,875,712,951 |
| HEALTH CARE - 14.2% | | | |
| Biotechnology - 2.7% | | | |
| 2seventy bio, Inc. (a)(b) | | 12,594 | 119,769 |
| 4D Molecular Therapeutics, Inc. (a) | | 9,072 | 163,387 |
| Aadi Bioscience, Inc. (a) | | 9,036 | 70,119 |
| AbbVie, Inc. | | 604,282 | 91,319,096 |
| ACADIA Pharmaceuticals, Inc. (a) | | 40,567 | 865,294 |
| Actinium Pharmaceuticals, Inc. (a)(b) | | 9,174 | 80,731 |
| Adicet Bio, Inc. (a) | | 10,318 | 60,257 |
| ADMA Biologics, Inc. (a) | | 79,016 | 264,704 |
| Aerovate Therapeutics, Inc. (a) | | 4,130 | 86,606 |
| Agenus, Inc. (a) | | 93,183 | 140,706 |
| Agios Pharmaceuticals, Inc. (a)(b) | | 17,727 | 405,416 |
| Akero Therapeutics, Inc. (a) | | 10,481 | 468,920 |
| Aldeyra Therapeutics, Inc. (a) | | 17,662 | 168,319 |
| Alector, Inc. (a) | | 19,221 | 126,859 |
| Alkermes PLC (a) | | 54,983 | 1,569,765 |
| Allakos, Inc. (a) | | 23,765 | 101,001 |
| Allogene Therapeutics, Inc. (a)(b) | | 29,903 | 162,373 |
| Allovir, Inc. (a) | | 15,355 | 52,821 |
| Alnylam Pharmaceuticals, Inc. (a) | | 42,100 | 8,386,320 |
| Altimmune, Inc. (a)(b) | | 13,978 | 70,589 |
| ALX Oncology Holdings, Inc. (a)(b) | | 6,045 | 35,907 |
| Amgen, Inc. | | 182,468 | 43,744,878 |
| Amicus Therapeutics, Inc. (a) | | 87,798 | 1,013,189 |
| AnaptysBio, Inc. (a)(b) | | 6,176 | 128,584 |
| Anavex Life Sciences Corp. (a)(b) | | 26,175 | 213,065 |
| Anika Therapeutics, Inc. (a) | | 6,166 | 158,220 |
| Annexon, Inc. (a) | | 14,628 | 77,602 |
| Apellis Pharmaceuticals, Inc. (a) | | 32,125 | 2,680,189 |
| Arbutus Biopharma Corp. (a)(b) | | 46,823 | 117,526 |
| Arcellx, Inc. (a) | | 9,310 | 397,351 |
| Arcturus Therapeutics Holdings, Inc. (a) | | 8,899 | 236,891 |
| Arcus Biosciences, Inc. (a) | | 17,162 | 306,342 |
| Arcutis Biotherapeutics, Inc. (a) | | 13,101 | 181,318 |
| Ardelyx, Inc. (a) | | 68,536 | 305,671 |
| Arrowhead Pharmaceuticals, Inc. (a) | | 38,233 | 1,353,831 |
| Ars Pharmaceuticals, Inc. (a) | | 12,721 | 82,687 |
| Atara Biotherapeutics, Inc. (a) | | 34,659 | 93,926 |
| Avid Bioservices, Inc. (a) | | 22,024 | 397,533 |
| Avidity Biosciences, Inc. (a) | | 22,106 | 274,114 |
| Beam Therapeutics, Inc. (a)(b) | | 20,007 | 614,415 |
| BioAtla, Inc. (a)(b) | | 11,502 | 38,762 |
| BioCryst Pharmaceuticals, Inc. (a) | | 64,155 | 488,220 |
| Biogen, Inc. (a) | | 49,231 | 14,977,547 |
| Biohaven Ltd. | | 21,367 | 279,480 |
| BioMarin Pharmaceutical, Inc. (a) | | 63,594 | 6,107,568 |
| Biomea Fusion, Inc. (a) | | 7,596 | 223,854 |
| BioXcel Therapeutics, Inc. (a)(b) | | 6,995 | 144,237 |
| bluebird bio, Inc. (a) | | 28,762 | 125,115 |
| Blueprint Medicines Corp. (a) | | 20,748 | 1,059,185 |
| BridgeBio Pharma, Inc. (a)(b) | | 40,313 | 585,345 |
| C4 Therapeutics, Inc. (a) | | 13,378 | 40,402 |
| CareDx, Inc. (a) | | 18,423 | 149,042 |
| Caribou Biosciences, Inc. (a) | | 18,255 | 78,497 |
| Carisma Therapeutics, Inc. rights (a)(c) | | 58,324 | 1 |
| Catalyst Pharmaceutical Partners, Inc. (a) | | 32,604 | 519,056 |
| Celldex Therapeutics, Inc. (a) | | 15,732 | 494,614 |
| Cerevel Therapeutics Holdings (a) | | 21,990 | 638,590 |
| Chimerix, Inc. (a) | | 24,476 | 28,392 |
| Chinook Therapeutics, Inc. (a) | | 15,350 | 307,154 |
| Cogent Biosciences, Inc. (a) | | 21,286 | 229,037 |
| Coherus BioSciences, Inc. (a) | | 22,210 | 160,578 |
| Crinetics Pharmaceuticals, Inc. (a) | | 13,926 | 272,114 |
| CRISPR Therapeutics AG (a)(b) | | 26,627 | 1,303,125 |
| CTI BioPharma Corp. (a)(b) | | 36,399 | 176,899 |
| Cullinan Oncology, Inc. (a) | | 12,040 | 117,149 |
| Cytokinetics, Inc. (a) | | 31,991 | 1,196,463 |
| CytomX Therapeutics, Inc. (a) | | 16,848 | 27,462 |
| Day One Biopharmaceuticals, Inc. (a) | | 9,072 | 112,493 |
| Deciphera Pharmaceuticals, Inc. (a) | | 19,474 | 276,726 |
| Denali Therapeutics, Inc. (a) | | 38,845 | 964,910 |
| DermTech, Inc. (a)(b) | | 6,917 | 20,993 |
| Design Therapeutics, Inc. (a)(b) | | 10,115 | 65,242 |
| Dynavax Technologies Corp. (a)(b) | | 41,747 | 434,586 |
| Dyne Therapeutics, Inc. (a) | | 7,475 | 77,441 |
| Eagle Pharmaceuticals, Inc. (a) | | 3,834 | 107,659 |
| Editas Medicine, Inc. (a)(b) | | 21,325 | 174,012 |
| Emergent BioSolutions, Inc. (a) | | 13,974 | 123,390 |
| Enanta Pharmaceuticals, Inc. (a) | | 5,861 | 208,359 |
| EQRx, Inc. (a) | | 81,584 | 137,061 |
| Erasca, Inc. (a)(b) | | 20,892 | 57,662 |
| Exact Sciences Corp. (a) | | 60,804 | 3,895,712 |
| Exelixis, Inc. (a) | | 112,029 | 2,050,131 |
| Fate Therapeutics, Inc. (a)(b) | | 25,577 | 155,252 |
| FibroGen, Inc. (a) | | 29,509 | 505,194 |
| G1 Therapeutics, Inc. (a) | | 10,843 | 31,119 |
| Generation Bio Co. (a) | | 17,114 | 84,201 |
| Geron Corp. (a) | | 138,755 | 341,337 |
| Gilead Sciences, Inc. | | 426,104 | 35,030,010 |
| Gossamer Bio, Inc. (a)(b) | | 25,036 | 32,296 |
| Gritstone Bio, Inc. (a) | | 26,754 | 63,675 |
| Halozyme Therapeutics, Inc. (a) | | 45,845 | 1,473,000 |
| Heron Therapeutics, Inc. (a)(b) | | 31,910 | 76,265 |
| HilleVax, Inc. | | 5,527 | 77,378 |
| Horizon Therapeutics PLC (a) | | 77,430 | 8,607,119 |
| Icosavax, Inc. (a)(b) | | 7,220 | 39,782 |
| Ideaya Biosciences, Inc. (a) | | 13,934 | 254,435 |
| IGM Biosciences, Inc. (a)(b) | | 2,824 | 30,584 |
| ImmunityBio, Inc. (a)(b) | | 34,946 | 97,849 |
| ImmunoGen, Inc. (a) | | 66,040 | 355,956 |
| Immunovant, Inc. (a) | | 18,386 | 296,750 |
| Incyte Corp. (a) | | 63,560 | 4,729,500 |
| Inhibrx, Inc. (a)(b) | | 10,176 | 213,696 |
| Inovio Pharmaceuticals, Inc. (a)(b) | | 91,783 | 70,902 |
| Inozyme Pharma, Inc. (a) | | 12,500 | 68,875 |
| Insmed, Inc. (a) | | 45,045 | 878,378 |
| Intellia Therapeutics, Inc. (a) | | 27,995 | 1,056,811 |
| Intercept Pharmaceuticals, Inc. (a) | | 12,365 | 214,162 |
| Ionis Pharmaceuticals, Inc. (a) | | 47,605 | 1,683,789 |
| Iovance Biotherapeutics, Inc. (a) | | 47,583 | 268,368 |
| Ironwood Pharmaceuticals, Inc. Class A (a) | | 44,448 | 462,704 |
| iTeos Therapeutics, Inc. (a) | | 8,517 | 117,024 |
| Iveric Bio, Inc. (a) | | 43,750 | 1,438,938 |
| Janux Therapeutics, Inc. (a)(b) | | 6,701 | 102,659 |
| Kalvista Pharmaceuticals, Inc. (a) | | 8,523 | 72,701 |
| Karuna Therapeutics, Inc. (a) | | 10,217 | 2,027,461 |
| Karyopharm Therapeutics, Inc. (a)(b) | | 39,592 | 141,739 |
| Keros Therapeutics, Inc. (a) | | 5,452 | 241,823 |
| Kezar Life Sciences, Inc. (a) | | 15,863 | 38,547 |
| Kiniksa Pharmaceuticals Ltd. (a) | | 9,303 | 100,007 |
| Kodiak Sciences, Inc. (a) | | 9,832 | 43,064 |
| Krystal Biotech, Inc. (a) | | 7,279 | 611,436 |
| Kura Oncology, Inc. (a) | | 20,016 | 194,956 |
| Kymera Therapeutics, Inc. (a)(b) | | 12,873 | 406,014 |
| Lyell Immunopharma, Inc. (a)(b) | | 52,428 | 106,429 |
| Macrogenics, Inc. (a) | | 19,378 | 133,514 |
| Madrigal Pharmaceuticals, Inc. (a)(b) | | 4,103 | 1,280,136 |
| MannKind Corp. (a)(b) | | 89,792 | 345,699 |
| Mersana Therapeutics, Inc. (a) | | 30,006 | 131,426 |
| MiMedx Group, Inc. (a) | | 40,065 | 153,449 |
| MiNK Therapeutics, Inc. (a) | | 1,360 | 2,434 |
| Mirati Therapeutics, Inc. (a) | | 18,002 | 797,669 |
| Mirum Pharmaceuticals, Inc. (a)(b) | | 8,094 | 217,324 |
| Moderna, Inc. (a) | | 112,934 | 15,007,799 |
| Morphic Holding, Inc. (a) | | 10,248 | 484,320 |
| Myriad Genetics, Inc. (a) | | 27,848 | 592,884 |
| Natera, Inc. (a) | | 37,700 | 1,912,144 |
| NeoImmuneTech, Inc. (depository receipt) unit (a) | | 18,440 | 44,068 |
| Neurocrine Biosciences, Inc. (a) | | 33,037 | 3,338,058 |
| Nkarta, Inc. (a)(b) | | 9,727 | 48,149 |
| Novavax, Inc. (a)(b) | | 33,297 | 255,388 |
| Nurix Therapeutics, Inc. (a) | | 13,272 | 127,809 |
| Nuvalent, Inc. Class A (a)(b) | | 8,749 | 309,627 |
| Ocugen, Inc. (a)(b) | | 64,873 | 46,293 |
| Omniab, Inc. (c) | | 2,111 | 5,066 |
| Omniab, Inc. (c) | | 2,111 | 4,750 |
| Organogenesis Holdings, Inc. Class A (a) | | 19,995 | 40,990 |
| ORIC Pharmaceuticals, Inc. (a)(b) | | 8,946 | 46,251 |
| PDL BioPharma, Inc. (a)(c) | | 20,940 | 26,384 |
| PDS Biotechnology Corp. (a) | | 9,991 | 60,745 |
| PMV Pharmaceuticals, Inc. (a)(b) | | 10,036 | 46,266 |
| Point Biopharma Global, Inc. (a)(b) | | 27,108 | 209,816 |
| Poseida Therapeutics, Inc. (a) | | 27,985 | 73,880 |
| Precigen, Inc. (a) | | 54,612 | 66,081 |
| ProKidney Corp. (a)(b) | | 6,143 | 57,990 |
| Prometheus Biosciences, Inc. (a) | | 11,655 | 2,260,487 |
| Protagonist Therapeutics, Inc. (a) | | 16,191 | 365,917 |
| Prothena Corp. PLC (a) | | 14,119 | 742,942 |
| PTC Therapeutics, Inc. (a) | | 24,786 | 1,366,700 |
| Puma Biotechnology, Inc. (a) | | 11,360 | 30,445 |
| RAPT Therapeutics, Inc. (a) | | 8,799 | 160,142 |
| Recursion Pharmaceuticals, Inc. (a)(b) | | 43,844 | 209,136 |
| Regeneron Pharmaceuticals, Inc. (a) | | 36,741 | 29,458,566 |
| REGENXBIO, Inc. (a) | | 13,428 | 259,966 |
| Relay Therapeutics, Inc. (a) | | 30,178 | 343,124 |
| Repligen Corp. (a) | | 17,611 | 2,670,356 |
| Replimune Group, Inc. (a) | | 14,947 | 250,063 |
| Revolution Medicines, Inc. (a) | | 30,654 | 720,062 |
| Rhythm Pharmaceuticals, Inc. (a) | | 14,763 | 297,770 |
| Rigel Pharmaceuticals, Inc. (a) | | 51,477 | 58,169 |
| Rocket Pharmaceuticals, Inc. (a) | | 19,543 | 350,211 |
| Sage Therapeutics, Inc. (a) | | 18,405 | 899,084 |
| Sana Biotechnology, Inc. (a)(b) | | 25,993 | 137,503 |
| Sangamo Therapeutics, Inc. (a)(b) | | 39,552 | 58,141 |
| Sarepta Therapeutics, Inc. (a) | | 29,974 | 3,679,908 |
| Scholar Rock Holding Corp. (a) | | 12,532 | 80,205 |
| Seagen, Inc. (a) | | 46,914 | 9,382,800 |
| Selecta Biosciences, Inc. (a)(b) | | 43,098 | 51,287 |
| Seres Therapeutics, Inc. (a) | | 30,797 | 150,135 |
| SpringWorks Therapeutics, Inc. (a) | | 14,951 | 349,554 |
| Stoke Therapeutics, Inc. (a) | | 6,673 | 59,323 |
| Sutro Biopharma, Inc. (a) | | 18,800 | 80,088 |
| Syndax Pharmaceuticals, Inc. (a) | | 21,316 | 438,044 |
| Tango Therapeutics, Inc. (a) | | 20,718 | 70,441 |
| TG Therapeutics, Inc. (a) | | 47,333 | 1,175,278 |
| Travere Therapeutics, Inc. (a) | | 22,596 | 487,396 |
| Twist Bioscience Corp. (a) | | 19,242 | 240,140 |
| Ultragenyx Pharmaceutical, Inc. (a) | | 24,268 | 1,059,784 |
| uniQure B.V. (a) | | 13,598 | 263,937 |
| United Therapeutics Corp. (a) | | 15,646 | 3,600,614 |
| Vanda Pharmaceuticals, Inc. (a) | | 19,438 | 119,349 |
| Vaxart, Inc. (a)(b) | | 41,382 | 33,664 |
| Vaxcyte, Inc. (a) | | 21,988 | 941,746 |
| Vera Therapeutics, Inc. (a) | | 11,503 | 76,495 |
| Veracyte, Inc. (a)(b) | | 24,322 | 550,650 |
| Vericel Corp. (a) | | 15,829 | 498,772 |
| Vertex Pharmaceuticals, Inc. (a) | | 87,852 | 29,933,812 |
| Verve Therapeutics, Inc. (a)(b) | | 14,646 | 233,311 |
| Viking Therapeutics, Inc. (a) | | 29,450 | 627,580 |
| Vir Biotechnology, Inc. (a) | | 25,411 | 639,087 |
| Viridian Therapeutics, Inc. (a) | | 13,210 | 370,276 |
| Voyager Therapeutics, Inc. (a) | | 10,924 | 79,199 |
| X4 Pharmaceuticals, Inc. (a) | | 53,571 | 78,749 |
| Xencor, Inc. (a) | | 20,514 | 542,390 |
| Y-mAbs Therapeutics, Inc. (a) | | 10,575 | 63,344 |
| Zentalis Pharmaceuticals, Inc. (a) | | 15,016 | 330,802 |
| | | | 381,206,094 |
| Health Care Equipment & Supplies - 3.0% | | | |
| Abbott Laboratories | | 595,861 | 65,824,765 |
| Align Technology, Inc. (a) | | 24,827 | 8,076,223 |
| Alphatec Holdings, Inc. (a) | | 23,486 | 339,138 |
| Angiodynamics, Inc. (a) | | 13,521 | 112,495 |
| Artivion, Inc. (a) | | 13,796 | 191,351 |
| Atricure, Inc. (a) | | 15,969 | 702,476 |
| Atrion Corp. | | 466 | 286,730 |
| Avanos Medical, Inc. (a) | | 15,805 | 466,880 |
| AxoGen, Inc. (a) | | 13,463 | 121,436 |
| Axonics Modulation Technologies, Inc. (a) | | 17,027 | 978,371 |
| Baxter International, Inc. | | 172,024 | 8,202,104 |
| Becton, Dickinson & Co. | | 97,041 | 25,648,907 |
| Beyond Air, Inc. (a)(b) | | 8,539 | 49,782 |
| Boston Scientific Corp. (a) | | 489,538 | 25,514,721 |
| Butterfly Network, Inc. Class A (a)(b) | | 45,823 | 98,978 |
| Cerus Corp. (a) | | 53,786 | 124,246 |
| CONMED Corp. | | 10,172 | 1,277,298 |
| Cutera, Inc. (a)(b) | | 6,066 | 138,305 |
| CVRx, Inc. (a) | | 4,183 | 48,690 |
| Dentsply Sirona, Inc. | | 73,693 | 3,089,947 |
| DexCom, Inc. (a) | | 132,088 | 16,027,558 |
| Edwards Lifesciences Corp. (a) | | 211,398 | 18,598,796 |
| Embecta Corp. | | 19,393 | 538,156 |
| Enovis Corp. (a) | | 16,198 | 943,534 |
| Envista Holdings Corp. (a) | | 56,564 | 2,177,148 |
| Figs, Inc. Class A (a) | | 41,820 | 301,104 |
| GE Healthcare Holding LLC | | 124,067 | 10,091,610 |
| Glaukos Corp. (a) | | 16,036 | 761,870 |
| Globus Medical, Inc. (a)(b) | | 26,875 | 1,562,513 |
| Haemonetics Corp. (a) | | 17,228 | 1,442,156 |
| Heska Corp. (a) | | 3,328 | 389,908 |
| Hologic, Inc. (a) | | 84,326 | 7,252,879 |
| ICU Medical, Inc. (a)(b) | | 6,816 | 1,289,178 |
| IDEXX Laboratories, Inc. (a) | | 28,316 | 13,936,003 |
| Inari Medical, Inc. (a) | | 16,658 | 1,106,424 |
| Inogen, Inc. (a) | | 8,109 | 107,931 |
| Inspire Medical Systems, Inc. (a) | | 9,961 | 2,665,862 |
| Insulet Corp. (a) | | 23,723 | 7,544,863 |
| Integer Holdings Corp. (a) | | 11,446 | 942,578 |
| Integra LifeSciences Holdings Corp. (a) | | 24,456 | 1,352,906 |
| Intuitive Surgical, Inc. (a) | | 119,755 | 36,072,601 |
| iRhythm Technologies, Inc. (a) | | 10,136 | 1,331,870 |
| Lantheus Holdings, Inc. (a) | | 23,743 | 2,028,839 |
| LeMaitre Vascular, Inc. | | 6,572 | 354,888 |
| LivaNova PLC (a) | | 17,833 | 854,201 |
| Masimo Corp. (a) | | 16,551 | 3,130,456 |
| Medtronic PLC | | 454,704 | 41,355,329 |
| Merit Medical Systems, Inc. (a) | | 19,692 | 1,600,763 |
| Mesa Laboratories, Inc. | | 1,737 | 289,228 |
| Neogen Corp. (a) | | 75,524 | 1,300,523 |
| Nevro Corp. (a) | | 11,889 | 347,991 |
| Novocure Ltd. (a)(b) | | 30,910 | 2,036,969 |
| NuVasive, Inc. (a) | | 17,366 | 747,433 |
| Omnicell, Inc. (a) | | 14,975 | 910,031 |
| OraSure Technologies, Inc. (a) | | 29,028 | 197,390 |
| Orthofix International NV (a) | | 11,495 | 216,451 |
| OrthoPediatrics Corp. (a) | | 5,597 | 282,313 |
| Outset Medical, Inc. (a) | | 15,945 | 286,851 |
| Paragon 28, Inc. (a) | | 9,141 | 168,377 |
| Penumbra, Inc. (a) | | 12,999 | 3,693,276 |
| PROCEPT BioRobotics Corp. (a) | | 11,022 | 334,959 |
| Pulmonx Corp. (a) | | 11,674 | 137,170 |
| QuidelOrtho Corp. | | 18,162 | 1,633,672 |
| ResMed, Inc. | | 50,229 | 12,103,180 |
| RxSight, Inc. (a) | | 6,091 | 109,029 |
| Semler Scientific, Inc. (a) | | 2,238 | 62,843 |
| Senseonics Holdings, Inc. (a)(b) | | 147,041 | 87,504 |
| Shockwave Medical, Inc. (a) | | 12,362 | 3,586,958 |
| SI-BONE, Inc. (a) | | 9,534 | 210,701 |
| Sight Sciences, Inc. (a)(b) | | 9,593 | 92,764 |
| Silk Road Medical, Inc. (a)(b) | | 12,605 | 554,872 |
| Staar Surgical Co. (a)(b) | | 16,609 | 1,170,436 |
| STERIS PLC | | 33,850 | 6,382,418 |
| Stryker Corp. | | 115,205 | 34,521,178 |
| SurModics, Inc. (a) | | 4,498 | 103,634 |
| Tactile Systems Technology, Inc. (a)(b) | | 5,822 | 106,135 |
| Tandem Diabetes Care, Inc. (a) | | 22,144 | 876,460 |
| Teleflex, Inc. | | 15,967 | 4,351,327 |
| The Cooper Companies, Inc. | | 16,908 | 6,449,557 |
| TransMedics Group, Inc. (a) | | 10,959 | 866,857 |
| Treace Medical Concepts, Inc. (a) | | 12,168 | 297,994 |
| UFP Technologies, Inc. (a) | | 2,376 | 327,508 |
| Varex Imaging Corp. (a) | | 14,066 | 249,531 |
| ViewRay, Inc. (a) | | 48,669 | 57,429 |
| Zimmer Biomet Holdings, Inc. | | 71,758 | 9,934,178 |
| Zimvie, Inc. (a) | | 6,376 | 52,474 |
| Zomedica Corp. (a)(b) | | 318,952 | 63,918 |
| Zynex, Inc. (a)(b) | | 6,904 | 78,982 |
| | | | 412,335,268 |
| Health Care Providers & Services - 2.9% | | | |
| 23andMe Holding Co. Class A (a)(b) | | 101,077 | 199,122 |
| Acadia Healthcare Co., Inc. (a) | | 31,096 | 2,247,930 |
| Accolade, Inc. (a) | | 21,972 | 297,281 |
| AdaptHealth Corp. (a)(b) | | 24,801 | 294,636 |
| Addus HomeCare Corp. (a) | | 5,306 | 433,712 |
| Agiliti, Inc. (a)(b) | | 11,454 | 191,511 |
| agilon health, Inc. (a)(b) | | 67,461 | 1,637,278 |
| Alignment Healthcare, Inc. (a) | | 29,412 | 185,001 |
| Amedisys, Inc. (a) | | 10,828 | 869,488 |
| AmerisourceBergen Corp. | | 55,266 | 9,221,132 |
| AMN Healthcare Services, Inc. (a) | | 14,715 | 1,270,640 |
| Apollo Medical Holdings, Inc. (a)(b) | | 13,653 | 484,545 |
| Brookdale Senior Living, Inc. (a) | | 63,823 | 273,801 |
| Cano Health, Inc. (a) | | 60,882 | 70,623 |
| Cardinal Health, Inc. | | 87,750 | 7,204,275 |
| CareMax, Inc. Class A (a) | | 20,985 | 52,882 |
| Castle Biosciences, Inc. (a) | | 8,490 | 192,129 |
| Centene Corp. (a) | | 188,539 | 12,996,021 |
| Chemed Corp. | | 5,042 | 2,779,403 |
| Cigna Group | | 102,135 | 25,869,774 |
| Clover Health Investments Corp. (a)(b) | | 116,900 | 86,342 |
| Community Health Systems, Inc. (a) | | 43,017 | 272,728 |
| Corvel Corp. (a) | | 2,993 | 604,676 |
| Cross Country Healthcare, Inc. (a) | | 12,452 | 273,695 |
| CVS Health Corp. | | 439,025 | 32,184,923 |
| DaVita HealthCare Partners, Inc. (a) | | 19,019 | 1,718,557 |
| DocGo, Inc. Class A (a) | | 26,272 | 223,312 |
| Elevance Health, Inc. | | 81,639 | 38,260,117 |
| Encompass Health Corp. | | 33,815 | 2,169,232 |
| Enhabit Home Health & Hospice | | 17,436 | 213,591 |
| Fulgent Genetics, Inc. (a) | | 7,885 | 233,159 |
| GeneDx Holdings Corp. Class A (a) | | 206,794 | 56,579 |
| Guardant Health, Inc. (a) | | 35,268 | 795,646 |
| HCA Holdings, Inc. | | 72,454 | 20,818,208 |
| HealthEquity, Inc. (a) | | 28,548 | 1,525,891 |
| Henry Schein, Inc. (a) | | 46,060 | 3,722,109 |
| Hims & Hers Health, Inc. (a) | | 42,483 | 492,378 |
| Humana, Inc. | | 42,736 | 22,671,021 |
| Invitae Corp. (a)(b) | | 70,425 | 95,778 |
| Laboratory Corp. of America Holdings | | 30,364 | 6,883,822 |
| LifeStance Health Group, Inc. (a) | | 32,473 | 264,655 |
| McKesson Corp. | | 46,829 | 17,056,995 |
| Modivcare, Inc. (a) | | 4,347 | 276,469 |
| Molina Healthcare, Inc. (a) | | 19,984 | 5,953,034 |
| National Healthcare Corp. | | 5,149 | 298,179 |
| National Research Corp. Class A | | 5,245 | 228,315 |
| NeoGenomics, Inc. (a) | | 42,721 | 624,581 |
| Oak Street Health, Inc. (a) | | 39,891 | 1,554,552 |
| Opko Health, Inc. (a) | | 148,765 | 218,685 |
| Option Care Health, Inc. (a) | | 57,103 | 1,835,861 |
| Owens & Minor, Inc. (a) | | 24,735 | 384,382 |
| Patterson Companies, Inc. | | 29,184 | 791,178 |
| Pediatrix Medical Group, Inc. (a) | | 29,934 | 428,954 |
| Pennant Group, Inc. (a) | | 9,642 | 133,735 |
| PetIQ, Inc. Class A (a) | | 7,858 | 92,646 |
| Premier, Inc. | | 41,553 | 1,384,961 |
| Privia Health Group, Inc. (a) | | 16,936 | 467,942 |
| Progyny, Inc. (a) | | 25,300 | 840,972 |
| Quest Diagnostics, Inc. | | 37,814 | 5,248,961 |
| R1 Rcm, Inc. | | 46,238 | 720,850 |
| RadNet, Inc. (a) | | 16,293 | 450,664 |
| Select Medical Holdings Corp. | | 34,738 | 1,059,509 |
| Surgery Partners, Inc. (a) | | 23,240 | 921,698 |
| Tenet Healthcare Corp. (a) | | 36,918 | 2,706,828 |
| The Ensign Group, Inc. | | 19,188 | 1,862,963 |
| The Joint Corp. (a) | | 4,563 | 72,050 |
| U.S. Physical Therapy, Inc. | | 4,215 | 448,729 |
| UnitedHealth Group, Inc. | | 319,296 | 157,122,369 |
| Universal Health Services, Inc. Class B | | 21,859 | 3,286,501 |
| | | | 406,810,166 |
| Health Care Technology - 0.1% | | | |
| American Well Corp. (a) | | 80,468 | 176,225 |
| Certara, Inc. (a) | | 35,666 | 862,047 |
| Computer Programs & Systems, Inc. (a) | | 5,009 | 129,633 |
| Definitive Healthcare Corp. (a)(b) | | 12,689 | 135,772 |
| Doximity, Inc. (a)(b) | | 41,147 | 1,512,152 |
| Evolent Health, Inc. (a)(b) | | 31,835 | 1,159,112 |
| GoodRx Holdings, Inc. (a) | | 30,202 | 141,043 |
| Health Catalyst, Inc. (a) | | 17,674 | 222,692 |
| HealthStream, Inc. | | 8,543 | 210,500 |
| MultiPlan Corp. Class A (a)(b) | | 73,944 | 72,339 |
| Nextgen Healthcare, Inc. (a) | | 16,793 | 281,115 |
| OptimizeRx Corp. (a) | | 6,580 | 98,897 |
| Phreesia, Inc. (a) | | 17,282 | 546,802 |
| Schrodinger, Inc. (a) | | 18,235 | 538,297 |
| Sharecare, Inc. Class A (a) | | 100,938 | 155,445 |
| Simulations Plus, Inc. | | 4,935 | 206,036 |
| Teladoc Health, Inc. (a)(b) | | 54,272 | 1,439,836 |
| Veeva Systems, Inc. Class A (a) | | 48,265 | 8,643,296 |
| Veradigm, Inc. (a)(b) | | 36,080 | 450,639 |
| | | | 16,981,878 |
| Life Sciences Tools & Services - 1.6% | | | |
| 10X Genomics, Inc. (a)(b) | | 32,617 | 1,710,109 |
| Adaptive Biotechnologies Corp. (a) | | 37,298 | 266,308 |
| Agilent Technologies, Inc. | | 101,173 | 13,701,859 |
| Akoya Biosciences, Inc. (a) | | 10,121 | 70,442 |
| Avantor, Inc. (a) | | 229,679 | 4,474,147 |
| Azenta, Inc. (a) | | 23,647 | 1,028,408 |
| Bio-Rad Laboratories, Inc. Class A (a) | | 7,342 | 3,309,700 |
| Bio-Techne Corp. | | 53,495 | 4,273,181 |
| BioLife Solutions, Inc. (a)(b) | | 11,899 | 208,946 |
| BioNano Genomics, Inc. (a)(b) | | 91,524 | 62,959 |
| Bruker Corp. | | 34,203 | 2,706,483 |
| Charles River Laboratories International, Inc. (a) | | 17,376 | 3,303,525 |
| Codexis, Inc. (a) | | 23,624 | 92,606 |
| CryoPort, Inc. (a) | | 16,758 | 352,588 |
| Cytek Biosciences, Inc. (a) | | 27,783 | 318,949 |
| Danaher Corp. | | 223,947 | 53,055,284 |
| Illumina, Inc. (a) | | 53,795 | 11,058,100 |
| IQVIA Holdings, Inc. (a) | | 63,590 | 11,969,546 |
| Maravai LifeSciences Holdings, Inc. (a) | | 36,379 | 501,666 |
| MaxCyte, Inc. (a) | | 32,479 | 162,395 |
| Medpace Holdings, Inc. (a) | | 8,731 | 1,747,422 |
| Mettler-Toledo International, Inc. (a) | | 7,560 | 11,275,740 |
| Nanostring Technologies, Inc. (a) | | 13,993 | 137,131 |
| OmniAb, Inc. (a) | | 35,944 | 125,085 |
| Pacific Biosciences of California, Inc. (a)(b) | | 78,420 | 831,252 |
| PerkinElmer, Inc. | | 43,008 | 5,612,114 |
| Quanterix Corp. (a) | | 11,742 | 148,419 |
| Quantum-Si, Inc. (a) | | 26,118 | 38,393 |
| Seer, Inc. (a) | | 11,062 | 36,947 |
| SomaLogic, Inc. Class A (a) | | 51,802 | 145,046 |
| Sotera Health Co. (a) | | 33,004 | 553,477 |
| Syneos Health, Inc. (a) | | 34,638 | 1,359,888 |
| Thermo Fisher Scientific, Inc. | | 133,993 | 74,352,716 |
| Waters Corp. (a) | | 20,380 | 6,121,337 |
| West Pharmaceutical Services, Inc. | | 25,296 | 9,137,927 |
| | | | 224,250,095 |
| Pharmaceuticals - 3.9% | | | |
| Aclaris Therapeutics, Inc. (a) | | 16,091 | 143,049 |
| Amneal Pharmaceuticals, Inc. (a) | | 31,218 | 60,251 |
| Amphastar Pharmaceuticals, Inc. (a) | | 12,297 | 439,864 |
| Amylyx Pharmaceuticals, Inc. (a) | | 13,688 | 388,739 |
| ANI Pharmaceuticals, Inc. (a) | | 4,131 | 155,821 |
| Arvinas Holding Co. LLC (a) | | 16,490 | 432,203 |
| Assertio Holdings, Inc. (a)(b) | | 17,139 | 94,436 |
| Atea Pharmaceuticals, Inc. (a) | | 26,579 | 86,913 |
| Axsome Therapeutics, Inc. (a)(b) | | 11,814 | 845,055 |
| Bristol-Myers Squibb Co. | | 726,589 | 48,514,348 |
| Cara Therapeutics, Inc. (a) | | 16,619 | 69,800 |
| Cassava Sciences, Inc. (a)(b) | | 12,955 | 300,815 |
| Catalent, Inc. (a) | | 61,416 | 3,078,170 |
| Collegium Pharmaceutical, Inc. (a)(b) | | 11,744 | 273,283 |
| Corcept Therapeutics, Inc. (a) | | 30,397 | 684,844 |
| CymaBay Therapeutics, Inc. (a)(b) | | 30,440 | 327,534 |
| DICE Therapeutics, Inc. (a) | | 11,286 | 366,795 |
| Edgewise Therapeutics, Inc. (a) | | 14,107 | 123,718 |
| Elanco Animal Health, Inc. (a) | | 155,773 | 1,475,170 |
| Eli Lilly & Co. | | 269,482 | 106,677,145 |
| Esperion Therapeutics, Inc. (a) | | 22,866 | 30,183 |
| Evolus, Inc. (a)(b) | | 13,557 | 118,488 |
| Fulcrum Therapeutics, Inc. (a) | | 14,364 | 35,910 |
| Harmony Biosciences Holdings, Inc. (a) | | 9,597 | 309,407 |
| Harrow Health, Inc. (a) | | 9,427 | 237,843 |
| Innoviva, Inc. (a) | | 23,415 | 274,658 |
| Intra-Cellular Therapies, Inc. (a) | | 30,228 | 1,878,670 |
| Jazz Pharmaceuticals PLC (a) | | 21,361 | 3,000,580 |
| Johnson & Johnson | | 893,366 | 146,244,014 |
| Ligand Pharmaceuticals, Inc. Class B (a) | | 5,568 | 425,117 |
| Liquidia Corp. (a) | | 15,713 | 105,434 |
| Marinus Pharmaceuticals, Inc. (a)(b) | | 15,509 | 141,132 |
| Merck & Co., Inc. | | 866,342 | 100,036,511 |
| Mind Medicine (MindMed), Inc. (a)(b) | | 19,685 | 75,197 |
| Nektar Therapeutics (a) | | 56,169 | 42,256 |
| NGM Biopharmaceuticals, Inc. (a) | | 12,159 | 54,837 |
| Nuvation Bio, Inc. (a) | | 44,595 | 71,798 |
| Ocular Therapeutix, Inc. (a) | | 26,407 | 163,723 |
| Omeros Corp. (a)(b) | | 19,278 | 111,812 |
| Organon & Co. | | 86,584 | 2,132,564 |
| Pacira Biosciences, Inc. (a) | | 15,973 | 723,737 |
| Perrigo Co. PLC | | 46,561 | 1,731,604 |
| Pfizer, Inc. | | 1,918,213 | 74,599,304 |
| Phathom Pharmaceuticals, Inc. (a)(b) | | 6,609 | 70,716 |
| Phibro Animal Health Corp. Class A | | 6,283 | 97,763 |
| Pliant Therapeutics, Inc. (a) | | 14,463 | 408,580 |
| Prestige Brands Holdings, Inc. (a) | | 17,157 | 1,055,670 |
| Reata Pharmaceuticals, Inc. (a) | | 9,370 | 926,318 |
| Revance Therapeutics, Inc. (a) | | 27,676 | 880,927 |
| Royalty Pharma PLC | | 127,354 | 4,476,493 |
| Scilex Holding Co. | | 17,231 | 112,277 |
| SIGA Technologies, Inc. (b) | | 11,599 | 67,622 |
| Supernus Pharmaceuticals, Inc. (a) | | 18,119 | 667,866 |
| Tarsus Pharmaceuticals, Inc. (a) | | 7,299 | 108,901 |
| Theravance Biopharma, Inc. (a)(b) | | 22,741 | 246,285 |
| Theseus Pharmaceuticals, Inc. (a) | | 5,875 | 60,160 |
| Ventyx Biosciences, Inc. (a) | | 9,333 | 350,921 |
| Viatris, Inc. | | 413,452 | 3,857,507 |
| WAVE Life Sciences (a) | | 22,119 | 88,255 |
| Xeris Biopharma Holdings, Inc. (a)(b) | | 50,093 | 113,210 |
| Xeris Biopharma Holdings, Inc. rights (a)(c) | | 8,992 | 0 |
| Zoetis, Inc. Class A | | 159,290 | 27,999,996 |
| | | | 538,672,199 |
TOTAL HEALTH CARE | | | 1,980,255,700 |
| INDUSTRIALS - 9.7% | | | |
| Aerospace & Defense - 1.7% | | | |
| AAR Corp. (a) | | 11,188 | 590,503 |
| Aerojet Rocketdyne Holdings, Inc. (a) | | 26,411 | 1,489,845 |
| AeroVironment, Inc. (a) | | 8,725 | 878,520 |
| AerSale Corp. (a) | | 5,099 | 82,502 |
| Archer Aviation, Inc. Class A (a)(b) | | 44,165 | 87,447 |
| Astronics Corp. (a) | | 9,891 | 145,793 |
| Axon Enterprise, Inc. (a) | | 23,019 | 4,850,333 |
| BWX Technologies, Inc. | | 31,201 | 2,014,961 |
| Cadre Holdings, Inc. | | 5,048 | 106,311 |
| Curtiss-Wright Corp. | | 13,125 | 2,229,019 |
| Ducommun, Inc. (a) | | 3,558 | 177,900 |
| General Dynamics Corp. | | 77,021 | 16,816,765 |
| HEICO Corp. | | 13,684 | 2,307,670 |
| HEICO Corp. Class A | | 23,909 | 3,209,305 |
| Hexcel Corp. | | 28,797 | 2,075,688 |
| Howmet Aerospace, Inc. | | 125,128 | 5,541,919 |
| Huntington Ingalls Industries, Inc. | | 13,537 | 2,729,871 |
| Kaman Corp. | | 9,644 | 212,843 |
| Kratos Defense & Security Solutions, Inc. (a) | | 43,837 | 565,497 |
| L3Harris Technologies, Inc. | | 65,137 | 12,711,486 |
| Lockheed Martin Corp. | | 77,654 | 36,066,400 |
| Maxar Technologies, Inc. | | 25,602 | 1,349,737 |
| Mercury Systems, Inc. (a) | | 19,405 | 925,036 |
| Moog, Inc. Class A | | 9,560 | 861,452 |
| National Presto Industries, Inc. | | 1,477 | 100,466 |
| Northrop Grumman Corp. | | 49,183 | 22,686,642 |
| Park Aerospace Corp. | | 7,178 | 93,888 |
| Parsons Corp. (a) | | 10,782 | 469,017 |
| Raytheon Technologies Corp. | | 500,674 | 50,017,333 |
| Rocket Lab U.S.A., Inc. Class A (a)(b) | | 71,578 | 280,586 |
| Spirit AeroSystems Holdings, Inc. Class A | | 35,641 | 1,060,676 |
| Terran Orbital Corp. Class A (a)(b) | | 38,660 | 68,815 |
| Textron, Inc. | | 70,983 | 4,751,602 |
| The Boeing Co. (a) | | 192,218 | 39,746,838 |
| TransDigm Group, Inc. | | 17,696 | 13,537,440 |
| Triumph Group, Inc. (a) | | 22,251 | 240,533 |
| V2X, Inc. (a) | | 3,976 | 171,763 |
| Virgin Galactic Holdings, Inc. (a)(b) | | 82,509 | 300,333 |
| Woodward, Inc. | | 20,373 | 1,956,215 |
| | | | 233,508,950 |
| Air Freight & Logistics - 0.6% | | | |
| Air Transport Services Group, Inc. (a) | | 18,749 | 380,792 |
| C.H. Robinson Worldwide, Inc. | | 40,446 | 4,079,788 |
| Expeditors International of Washington, Inc. | | 54,301 | 6,181,626 |
| FedEx Corp. | | 79,367 | 18,078,215 |
| Forward Air Corp. | | 8,870 | 935,874 |
| GXO Logistics, Inc. (a) | | 40,757 | 2,165,419 |
| Hub Group, Inc. Class A (a) | | 10,924 | 823,670 |
| United Parcel Service, Inc. Class B | | 249,238 | 44,815,485 |
| | | | 77,460,869 |
| Building Products - 0.6% | | | |
| A.O. Smith Corp. (b) | | 43,045 | 2,939,543 |
| AAON, Inc. | | 14,342 | 1,405,516 |
| Advanced Drain Systems, Inc. (b) | | 21,552 | 1,847,437 |
| Allegion PLC | | 29,710 | 3,282,361 |
| American Woodmark Corp. (a) | | 5,774 | 291,702 |
| Apogee Enterprises, Inc. | | 7,502 | 319,285 |
| Armstrong World Industries, Inc. | | 15,347 | 1,053,725 |
| AZZ, Inc. | | 8,538 | 322,139 |
| Builders FirstSource, Inc. (a) | | 50,398 | 4,776,218 |
| Carlisle Companies, Inc. | | 17,578 | 3,794,211 |
| Carrier Global Corp. | | 284,762 | 11,908,747 |
| CSW Industrials, Inc. | | 5,456 | 734,760 |
| Fortune Brands Home & Security, Inc. | | 43,790 | 2,832,775 |
| Gibraltar Industries, Inc. (a) | | 10,470 | 523,919 |
| Griffon Corp. | | 17,083 | 486,011 |
| Hayward Holdings, Inc. (a)(b) | | 40,354 | 485,862 |
| Insteel Industries, Inc. | | 6,015 | 165,593 |
| Janus International Group, Inc. (a) | | 25,835 | 232,515 |
| Jeld-Wen Holding, Inc. (a) | | 27,474 | 351,118 |
| Johnson Controls International PLC | | 234,993 | 14,061,981 |
| Lennox International, Inc. | | 11,025 | 3,108,058 |
| Masco Corp. | | 76,879 | 4,113,795 |
| Masonite International Corp. (a) | | 7,583 | 693,162 |
| MasterBrand, Inc. | | 42,698 | 344,573 |
| Owens Corning | | 31,882 | 3,405,316 |
| PGT Innovations, Inc. (a) | | 21,255 | 545,403 |
| Quanex Building Products Corp. | | 11,580 | 221,178 |
| Resideo Technologies, Inc. (a) | | 49,150 | 874,870 |
| Simpson Manufacturing Co. Ltd. | | 14,800 | 1,861,544 |
| Tecnoglass, Inc. | | 6,528 | 286,253 |
| The AZEK Co., Inc. (a) | | 38,036 | 1,032,297 |
| Trane Technologies PLC | | 78,311 | 14,550,967 |
| Trex Co., Inc. (a) | | 37,062 | 2,025,809 |
| UFP Industries, Inc. | | 21,282 | 1,671,063 |
| Zurn Elkay Water Solutions Cor | | 51,315 | 1,105,838 |
| | | | 87,655,544 |
| Commercial Services & Supplies - 0.6% | | | |
| ABM Industries, Inc. | | 22,588 | 961,797 |
| ACCO Brands Corp. | | 28,567 | 130,837 |
| ACV Auctions, Inc. Class A (a) | | 39,379 | 513,108 |
| Aris Water Solution, Inc. Class A (b) | | 9,119 | 66,295 |
| Aurora Innovation, Inc. (a) | | 119,581 | 171,001 |
| Brady Corp. Class A | | 16,148 | 824,032 |
| BrightView Holdings, Inc. (a) | | 13,371 | 73,942 |
| Casella Waste Systems, Inc. Class A (a) | | 17,511 | 1,558,479 |
| CECO Environmental Corp. (a) | | 9,474 | 109,993 |
| Cimpress PLC (a) | | 6,683 | 347,182 |
| Cintas Corp. | | 29,498 | 13,444,303 |
| Clean Harbors, Inc. (a) | | 17,153 | 2,489,929 |
| Copart, Inc. (a) | | 146,332 | 11,567,545 |
| CoreCivic, Inc. (a) | | 37,462 | 329,291 |
| Deluxe Corp. | | 16,054 | 243,218 |
| Driven Brands Holdings, Inc. (a) | | 19,691 | 604,514 |
| Ennis, Inc. | | 8,567 | 166,457 |
| Harsco Corp. (a) | | 28,444 | 195,410 |
| Healthcare Services Group, Inc. | | 23,931 | 373,563 |
| Heritage-Crystal Clean, Inc. (a) | | 5,026 | 175,709 |
| HNI Corp. | | 13,029 | 338,493 |
| Interface, Inc. | | 18,084 | 141,779 |
| KAR Auction Services, Inc. (a) | | 37,020 | 501,251 |
| Kimball International, Inc. Class B | | 13,170 | 162,123 |
| Liquidity Services, Inc. (a) | | 8,300 | 108,481 |
| Matthews International Corp. Class A | | 10,641 | 402,975 |
| Millerknoll, Inc. | | 25,184 | 428,380 |
| Montrose Environmental Group, Inc. (a) | | 9,305 | 283,430 |
| MSA Safety, Inc. | | 12,606 | 1,635,629 |
| Pitney Bowes, Inc. | | 57,041 | 200,214 |
| Republic Services, Inc. | | 70,161 | 10,146,684 |
| Rollins, Inc. | | 78,964 | 3,336,229 |
| SP Plus Corp. (a) | | 6,961 | 237,857 |
| Steelcase, Inc. Class A | | 34,345 | 274,760 |
| Stericycle, Inc. (a) | | 31,811 | 1,452,172 |
| Tetra Tech, Inc. | | 18,198 | 2,518,057 |
| The Brink's Co. | | 16,192 | 1,017,667 |
| The GEO Group, Inc. (a) | | 41,516 | 312,615 |
| UniFirst Corp. | | 5,325 | 871,596 |
| Viad Corp. (a) | | 7,392 | 140,670 |
| VSE Corp. | | 3,357 | 141,968 |
| Waste Management, Inc. | | 126,865 | 21,065,933 |
| | | | 80,065,568 |
| Construction & Engineering - 0.2% | | | |
| AECOM | | 47,737 | 3,964,558 |
| Ameresco, Inc. Class A (a)(b) | | 11,319 | 470,870 |
| API Group Corp. (a) | | 69,142 | 1,573,672 |
| Arcosa, Inc. | | 16,605 | 1,121,502 |
| Argan, Inc. | | 4,635 | 186,466 |
| Comfort Systems U.S.A., Inc. | | 12,223 | 1,827,216 |
| Construction Partners, Inc. Class A (a) | | 14,060 | 364,716 |
| Dycom Industries, Inc. (a) | | 10,083 | 933,887 |
| EMCOR Group, Inc. | | 16,208 | 2,771,568 |
| Fluor Corp. (a) | | 48,326 | 1,404,354 |
| Granite Construction, Inc. | | 14,656 | 558,833 |
| Great Lakes Dredge & Dock Corp. (a) | | 20,417 | 116,989 |
| MasTec, Inc. (a) | | 20,205 | 1,794,406 |
| MDU Resources Group, Inc. | | 69,864 | 2,041,426 |
| MYR Group, Inc. (a) | | 5,498 | 703,689 |
| Northwest Pipe Co. (a) | | 3,168 | 87,247 |
| Primoris Services Corp. | | 17,943 | 453,958 |
| Quanta Services, Inc. | | 48,761 | 8,271,816 |
| Sterling Construction Co., Inc. (a) | | 10,313 | 380,756 |
| Tutor Perini Corp. (a) | | 13,797 | 73,124 |
| Valmont Industries, Inc. | | 7,283 | 2,116,148 |
| Willscot Mobile Mini Holdings (a) | | 71,879 | 3,263,307 |
| | | | 34,480,508 |
| Electrical Equipment - 0.7% | | | |
| Acuity Brands, Inc. | | 10,874 | 1,711,350 |
| Allied Motion Technologies, Inc. | | 4,829 | 166,214 |
| AMETEK, Inc. | | 78,599 | 10,841,160 |
| Array Technologies, Inc. (a) | | 47,391 | 969,146 |
| Atkore, Inc. (a) | | 13,503 | 1,705,834 |
| Babcock & Wilcox Enterprises, Inc. (a) | | 24,589 | 152,944 |
| Beam Global (a)(b) | | 2,551 | 22,755 |
| Blink Charging Co. (a)(b) | | 18,377 | 131,028 |
| Bloom Energy Corp. Class A (a)(b) | | 60,762 | 1,011,687 |
| ChargePoint Holdings, Inc. Class A (a)(b) | | 91,947 | 797,180 |
| Eaton Corp. PLC | | 135,989 | 22,726,482 |
| Emerson Electric Co. | | 195,429 | 16,271,419 |
| Encore Wire Corp. | | 6,371 | 995,978 |
| Energy Vault Holdings, Inc. Class A (a)(b) | | 46,584 | 78,727 |
| EnerSys | | 13,639 | 1,131,628 |
| Enovix Corp. (a)(b) | | 37,993 | 411,084 |
| Eos Energy Enterprises, Inc. (a)(b) | | 28,431 | 48,048 |
| Fluence Energy, Inc. (a)(b) | | 12,474 | 225,280 |
| FTC Solar, Inc. (a) | | 7,623 | 20,811 |
| FuelCell Energy, Inc. (a)(b) | | 139,857 | 262,931 |
| Generac Holdings, Inc. (a) | | 21,408 | 2,188,326 |
| GrafTech International Ltd. | | 66,525 | 313,333 |
| Hubbell, Inc. Class B | | 18,439 | 4,965,991 |
| LSI Industries, Inc. | | 9,599 | 121,811 |
| NuScale Power Corp. (a)(b) | | 8,475 | 75,173 |
| nVent Electric PLC | | 56,681 | 2,376,634 |
| Plug Power, Inc. (a)(b) | | 177,754 | 1,605,119 |
| Powell Industries, Inc. | | 3,022 | 121,061 |
| Regal Rexnord Corp. | | 22,685 | 2,952,680 |
| Rockwell Automation, Inc. | | 39,279 | 11,132,061 |
| Sensata Technologies, Inc. PLC | | 51,748 | 2,248,451 |
| SES AI Corp. Class A (a)(b) | | 53,245 | 86,789 |
| Shoals Technologies Group, Inc. (a) | | 54,739 | 1,143,498 |
| Stem, Inc. (a)(b) | | 49,904 | 211,094 |
| SunPower Corp. (a)(b) | | 28,907 | 382,151 |
| Sunrun, Inc. (a)(b) | | 71,992 | 1,514,712 |
| Thermon Group Holdings, Inc. (a) | | 10,840 | 225,255 |
| TPI Composites, Inc. (a)(b) | | 14,195 | 175,450 |
| Vertiv Holdings Co. | | 103,579 | 1,545,399 |
| Vicor Corp. (a) | | 8,066 | 346,596 |
| | | | 93,413,270 |
| Ground Transportation - 1.0% | | | |
| ArcBest Corp. | | 8,231 | 777,006 |
| Avis Budget Group, Inc. (a) | | 8,640 | 1,526,429 |
| Covenant Transport Group, Inc. Class A | | 2,964 | 116,752 |
| CSX Corp. | | 718,927 | 22,027,923 |
| Daseke, Inc. (a) | | 18,230 | 149,121 |
| FTAI Infrastructure LLC | | 35,993 | 111,578 |
| Heartland Express, Inc. | | 15,804 | 228,842 |
| Hertz Global Holdings, Inc. (a) | | 55,892 | 932,279 |
| J.B. Hunt Transport Services, Inc. | | 28,455 | 4,987,877 |
| Knight-Swift Transportation Holdings, Inc. Class A | | 54,925 | 3,093,376 |
| Landstar System, Inc. | | 12,264 | 2,158,832 |
| Lyft, Inc. (a) | | 107,900 | 1,105,975 |
| Marten Transport Ltd. | | 19,313 | 389,929 |
| Norfolk Southern Corp. | | 77,927 | 15,821,519 |
| Old Dominion Freight Lines, Inc. | | 30,976 | 9,924,401 |
| RXO, Inc. | | 40,297 | 728,973 |
| Ryder System, Inc. | | 16,840 | 1,333,054 |
| Saia, Inc. (a) | | 8,998 | 2,679,334 |
| Schneider National, Inc. Class B | | 12,811 | 335,264 |
| TuSimple Holdings, Inc. (a) | | 45,069 | 54,533 |
| U-Haul Holding Co. (b) | | 3,986 | 243,385 |
| U-Haul Holding Co. (non-vtg.) | | 29,842 | 1,614,452 |
| Uber Technologies, Inc. (a) | | 681,892 | 21,172,747 |
| Union Pacific Corp. | | 209,125 | 40,925,763 |
| Universal Logistics Holdings, Inc. | | 2,569 | 65,766 |
| Werner Enterprises, Inc. | | 19,572 | 884,067 |
| XPO, Inc. (a) | | 39,125 | 1,728,543 |
| | | | 135,117,720 |
| Industrial Conglomerates - 0.7% | | | |
| 3M Co. | | 188,296 | 20,000,801 |
| General Electric Co. | | 372,212 | 36,837,822 |
| Honeywell International, Inc. | | 228,286 | 45,620,674 |
| | | | 102,459,297 |
| Machinery - 1.9% | | | |
| 3D Systems Corp. (a) | | 44,401 | 406,713 |
| AGCO Corp. | | 21,322 | 2,642,649 |
| Alamo Group, Inc. | | 3,444 | 608,658 |
| Albany International Corp. Class A | | 10,686 | 974,670 |
| Allison Transmission Holdings, Inc. | | 31,401 | 1,532,055 |
| Astec Industries, Inc. | | 7,823 | 322,933 |
| Barnes Group, Inc. | | 16,606 | 697,950 |
| Blue Bird Corp. (a) | | 5,917 | 110,648 |
| Caterpillar, Inc. | | 177,872 | 38,918,394 |
| Chart Industries, Inc. (a) | | 14,670 | 1,952,577 |
| CIRCOR International, Inc. (a) | | 7,035 | 195,854 |
| Columbus McKinnon Corp. (NY Shares) | | 8,981 | 311,731 |
| Crane Co. | | 16,424 | 1,183,678 |
| Crane Nxt Co. | | 16,424 | 777,841 |
| Cummins, Inc. | | 48,352 | 11,364,654 |
| Deere & Co. | | 92,424 | 34,938,120 |
| Desktop Metal, Inc. (a)(b) | | 76,434 | 168,155 |
| Donaldson Co., Inc. | | 41,753 | 2,653,403 |
| Douglas Dynamics, Inc. | | 8,555 | 250,747 |
| Dover Corp. | | 47,713 | 6,973,732 |
| Energy Recovery, Inc. (a) | | 20,176 | 454,565 |
| Enerpac Tool Group Corp. Class A | | 20,582 | 489,028 |
| EnPro Industries, Inc. | | 7,013 | 661,116 |
| ESAB Corp. | | 17,982 | 1,049,430 |
| ESCO Technologies, Inc. | | 8,471 | 792,631 |
| Evoqua Water Technologies Corp. (a) | | 41,879 | 2,070,917 |
| Federal Signal Corp. | | 20,226 | 1,039,212 |
| Flowserve Corp. | | 45,509 | 1,519,546 |
| Fortive Corp. | | 120,169 | 7,581,462 |
| Franklin Electric Co., Inc. | | 13,275 | 1,187,714 |
| Gates Industrial Corp. PLC (a) | | 34,744 | 468,002 |
| Gorman-Rupp Co. | | 6,895 | 169,272 |
| Graco, Inc. | | 57,647 | 4,570,831 |
| Helios Technologies, Inc. | | 11,383 | 684,574 |
| Hillenbrand, Inc. | | 23,222 | 1,059,388 |
| Hillman Solutions Corp. Class A (a) | | 51,300 | 430,920 |
| Hyliion Holdings Corp. Class A (a)(b) | | 47,409 | 64,950 |
| Hyster-Yale Materials Handling, Inc. Class A | | 3,494 | 183,994 |
| IDEX Corp. | | 25,683 | 5,298,917 |
| Illinois Tool Works, Inc. | | 94,819 | 22,940,509 |
| Ingersoll Rand, Inc. | | 138,016 | 7,869,672 |
| ITT, Inc. | | 27,819 | 2,349,036 |
| John Bean Technologies Corp. | | 11,076 | 1,204,072 |
| Kadant, Inc. | | 4,124 | 766,363 |
| Kennametal, Inc. | | 26,855 | 697,156 |
| Lincoln Electric Holdings, Inc. | | 19,754 | 3,314,721 |
| Lindsay Corp. | | 3,979 | 480,424 |
| Luxfer Holdings PLC sponsored | | 8,629 | 131,592 |
| Manitowoc Co., Inc. (a) | | 13,155 | 201,140 |
| Microvast Holdings, Inc. (a)(b) | | 73,042 | 76,694 |
| Middleby Corp. (a) | | 18,243 | 2,570,074 |
| Mueller Industries, Inc. | | 19,734 | 1,417,888 |
| Mueller Water Products, Inc. Class A | | 50,985 | 683,199 |
| Nikola Corp. (a)(b) | | 114,728 | 101,592 |
| Nordson Corp. | | 18,284 | 3,955,012 |
| Omega Flex, Inc. | | 971 | 106,820 |
| Oshkosh Corp. | | 22,192 | 1,698,132 |
| Otis Worldwide Corp. | | 141,844 | 12,099,293 |
| PACCAR, Inc. | | 178,442 | 13,327,833 |
| Parker Hannifin Corp. | | 43,870 | 14,252,486 |
| Pentair PLC | | 55,723 | 3,236,392 |
| Proterra, Inc. Class A (a)(b) | | 61,403 | 71,842 |
| Proto Labs, Inc. (a) | | 9,482 | 272,797 |
| RBC Bearings, Inc. (a)(b) | | 9,840 | 2,233,778 |
| REV Group, Inc. | | 9,672 | 103,781 |
| Shyft Group, Inc. (The) | | 11,292 | 283,203 |
| Snap-On, Inc. | | 18,206 | 4,722,818 |
| SPX Technologies, Inc. (a) | | 15,131 | 963,542 |
| Standex International Corp. | | 4,171 | 512,241 |
| Stanley Black & Decker, Inc. | | 50,759 | 4,382,532 |
| Tennant Co. | | 6,402 | 489,241 |
| Terex Corp. | | 23,461 | 1,046,126 |
| The Greenbrier Companies, Inc. | | 10,943 | 289,442 |
| Timken Co. | | 23,018 | 1,768,933 |
| Titan International, Inc. (a) | | 18,182 | 177,456 |
| Toro Co. | | 35,599 | 3,711,552 |
| Trinity Industries, Inc. | | 28,913 | 692,466 |
| Velo3D, Inc. (a)(b) | | 18,700 | 43,758 |
| Wabash National Corp. | | 16,252 | 417,189 |
| Watts Water Technologies, Inc. Class A | | 9,495 | 1,535,626 |
| Westinghouse Air Brake Tech Co. | | 62,333 | 6,088,064 |
| Xylem, Inc. | | 61,478 | 6,383,876 |
| | | | 266,431,994 |
| Marine Transportation - 0.0% | | | |
| Eagle Bulk Shipping, Inc. (b) | | 3,118 | 139,437 |
| Eneti, Inc. | | 7,119 | 61,010 |
| Genco Shipping & Trading Ltd. | | 13,104 | 201,933 |
| Kirby Corp. (a) | | 20,894 | 1,501,025 |
| Matson, Inc. | | 13,323 | 906,364 |
| | | | 2,809,769 |
| Passenger Airlines - 0.2% | | | |
| Alaska Air Group, Inc. (a) | | 44,312 | 1,925,800 |
| Allegiant Travel Co. (a) | | 5,409 | 562,049 |
| American Airlines Group, Inc. (a) | | 221,720 | 3,024,261 |
| Blade Air Mobility, Inc. (a) | | 14,338 | 37,566 |
| Delta Air Lines, Inc. (a) | | 219,201 | 7,520,786 |
| Frontier Group Holdings, Inc. (a) | | 13,322 | 126,426 |
| Hawaiian Holdings, Inc. (a) | | 15,617 | 130,090 |
| JetBlue Airways Corp. (a) | | 107,951 | 770,770 |
| Joby Aviation, Inc. (a)(b) | | 100,001 | 433,004 |
| SkyWest, Inc. (a) | | 17,295 | 489,449 |
| Southwest Airlines Co. | | 203,693 | 6,169,861 |
| Spirit Airlines, Inc. | | 38,249 | 654,058 |
| Sun Country Airlines Holdings, Inc. (a) | | 12,035 | 237,451 |
| United Airlines Holdings, Inc. (a) | | 112,048 | 4,907,702 |
| Wheels Up Experience, Inc. Class A (a) | | 53,485 | 24,737 |
| | | | 27,014,010 |
| Professional Services - 1.0% | | | |
| Alight, Inc. Class A (a) | | 107,858 | 997,687 |
| ASGN, Inc. (a) | | 16,832 | 1,205,003 |
| Automatic Data Processing, Inc. | | 141,579 | 31,147,380 |
| Barrett Business Services, Inc. | | 2,204 | 184,276 |
| Booz Allen Hamilton Holding Corp. Class A | | 45,317 | 4,337,743 |
| Broadridge Financial Solutions, Inc. | | 40,334 | 5,864,967 |
| CACI International, Inc. Class A (a) | | 8,085 | 2,533,192 |
| CBIZ, Inc. (a) | | 16,764 | 883,295 |
| Clarivate Analytics PLC (a)(b) | | 145,929 | 1,292,931 |
| Concentrix Corp. | | 14,869 | 1,435,007 |
| Conduent, Inc. (a) | | 50,082 | 175,788 |
| CoStar Group, Inc. (a) | | 139,018 | 10,697,435 |
| CRA International, Inc. | | 2,273 | 238,983 |
| CSG Systems International, Inc. | | 10,032 | 528,486 |
| Dun & Bradstreet Holdings, Inc. | | 77,061 | 860,771 |
| Equifax, Inc. | | 41,891 | 8,729,247 |
| ExlService Holdings, Inc. (a) | | 11,308 | 2,017,121 |
| Exponent, Inc. | | 17,625 | 1,622,381 |
| First Advantage Corp. (a) | | 19,879 | 255,644 |
| FiscalNote Holdings, Inc. Class A (a)(b) | | 34,404 | 62,271 |
| Forrester Research, Inc. (a) | | 4,794 | 148,326 |
| Franklin Covey Co. (a) | | 3,875 | 142,290 |
| FTI Consulting, Inc. (a) | | 11,790 | 2,128,095 |
| Genpact Ltd. | | 57,249 | 2,550,443 |
| Heidrick & Struggles International, Inc. | | 6,800 | 170,748 |
| HireRight Holdings Corp. (a) | | 6,894 | 73,076 |
| Huron Consulting Group, Inc. (a) | | 6,620 | 561,310 |
| ICF International, Inc. | | 5,690 | 648,660 |
| Insperity, Inc. | | 12,220 | 1,496,461 |
| Jacobs Solutions, Inc. | | 43,114 | 4,977,942 |
| KBR, Inc. | | 46,510 | 2,638,512 |
| Kelly Services, Inc. Class A (non-vtg.) | | 10,915 | 179,115 |
| Kforce, Inc. | | 6,685 | 395,351 |
| Korn Ferry | | 17,744 | 852,067 |
| LegalZoom.com, Inc. (a) | | 33,450 | 313,761 |
| Leidos Holdings, Inc. | | 46,594 | 4,345,356 |
| Manpower, Inc. | | 17,109 | 1,295,322 |
| Maximus, Inc. | | 20,780 | 1,738,247 |
| NV5 Global, Inc. (a) | | 4,184 | 396,350 |
| Paychex, Inc. | | 109,817 | 12,064,496 |
| Planet Labs PBC Class A (a) | | 67,946 | 277,220 |
| RCM Technologies, Inc. (a) | | 3,329 | 37,418 |
| Resources Connection, Inc. | | 12,066 | 176,043 |
| Robert Half International, Inc. | | 36,863 | 2,690,999 |
| Science Applications International Corp. | | 18,576 | 1,895,309 |
| SS&C Technologies Holdings, Inc. | | 74,560 | 4,364,742 |
| Sterling Check Corp. (a) | | 8,445 | 94,922 |
| TaskUs, Inc. (a)(b) | | 8,249 | 111,032 |
| TransUnion Holding Co., Inc. | | 66,250 | 4,558,663 |
| TriNet Group, Inc. (a) | | 12,363 | 1,147,039 |
| TrueBlue, Inc. (a) | | 10,238 | 155,106 |
| Ttec Holdings, Inc. | | 6,434 | 219,206 |
| Upwork, Inc. (a) | | 39,258 | 375,699 |
| Verisk Analytics, Inc. | | 53,483 | 10,381,585 |
| Verra Mobility Corp. (a) | | 47,058 | 797,633 |
| | | | 139,468,152 |
| Trading Companies & Distributors - 0.5% | | | |
| Air Lease Corp. Class A | | 34,814 | 1,400,219 |
| Alta Equipment Group, Inc. | | 9,113 | 128,858 |
| Applied Industrial Technologies, Inc. | | 13,073 | 1,773,483 |
| Beacon Roofing Supply, Inc. (a) | | 17,194 | 1,034,735 |
| BlueLinx Corp. (a) | | 2,966 | 207,798 |
| Boise Cascade Co. | | 13,188 | 900,872 |
| Core & Main, Inc. (a)(b) | | 25,793 | 672,166 |
| Custom Truck One Source, Inc. Class A (a) | | 22,081 | 138,669 |
| DXP Enterprises, Inc. (a) | | 5,268 | 132,754 |
| Fastenal Co. | | 195,155 | 10,507,145 |
| Ferguson PLC | | 70,663 | 9,950,764 |
| GATX Corp. | | 12,391 | 1,411,459 |
| Global Industrial Co. | | 4,930 | 131,385 |
| GMS, Inc. (a) | | 14,225 | 825,904 |
| H&E Equipment Services, Inc. | | 11,325 | 413,363 |
| Herc Holdings, Inc. | | 8,767 | 876,875 |
| Hudson Technologies, Inc. (a) | | 11,729 | 90,665 |
| McGrath RentCorp. | | 8,061 | 716,462 |
| MRC Global, Inc. (a) | | 27,268 | 265,590 |
| MSC Industrial Direct Co., Inc. Class A | | 16,187 | 1,468,647 |
| NOW, Inc. (a) | | 38,338 | 409,066 |
| Rush Enterprises, Inc. Class A | | 15,099 | 801,908 |
| SiteOne Landscape Supply, Inc. (a)(b) | | 15,229 | 2,249,932 |
| Textainer Group Holdings Ltd. | | 13,671 | 479,852 |
| Titan Machinery, Inc. (a) | | 7,020 | 220,077 |
| Transcat, Inc. (a) | | 2,429 | 185,308 |
| Triton International Ltd. | | 20,245 | 1,673,654 |
| United Rentals, Inc. | | 23,756 | 8,578,529 |
| Univar Solutions, Inc. (a) | | 55,975 | 1,987,113 |
| Veritiv Corp. | | 4,711 | 541,153 |
| W.W. Grainger, Inc. | | 15,379 | 10,697,171 |
| Watsco, Inc. (b) | | 11,326 | 3,923,100 |
| WESCO International, Inc. | | 15,409 | 2,218,896 |
| Xometry, Inc. (a)(b) | | 9,451 | 131,274 |
| | | | 67,144,846 |
TOTAL INDUSTRIALS | | | 1,347,030,497 |
| INFORMATION TECHNOLOGY - 24.4% | | | |
| Communications Equipment - 0.8% | | | |
| ADTRAN Holdings, Inc. | | 22,701 | 207,033 |
| Arista Networks, Inc. (a) | | 84,612 | 13,551,458 |
| Aviat Networks, Inc. (a) | | 3,371 | 110,603 |
| Calix, Inc. (a) | | 19,564 | 894,075 |
| Cambium Networks Corp. (a) | | 3,883 | 58,789 |
| Ciena Corp. (a) | | 50,347 | 2,317,976 |
| Cisco Systems, Inc. | | 1,403,840 | 66,331,440 |
| Clearfield, Inc. (a)(b) | | 4,496 | 196,385 |
| CommScope Holding Co., Inc. (a) | | 69,390 | 342,093 |
| Comtech Telecommunications Corp. | | 10,348 | 107,102 |
| Digi International, Inc. (a) | | 11,591 | 349,585 |
| DZS, Inc. (a) | | 5,113 | 34,768 |
| Extreme Networks, Inc. (a) | | 43,774 | 778,302 |
| F5, Inc. (a) | | 20,872 | 2,804,362 |
| Harmonic, Inc. (a) | | 38,273 | 539,267 |
| Infinera Corp. (a)(b) | | 62,395 | 394,960 |
| Juniper Networks, Inc. | | 110,926 | 3,344,419 |
| Lumentum Holdings, Inc. (a) | | 23,577 | 1,137,590 |
| Motorola Solutions, Inc. | | 57,114 | 16,643,020 |
| NETGEAR, Inc. (a) | | 8,661 | 122,380 |
| NetScout Systems, Inc. (a) | | 23,233 | 632,170 |
| Ribbon Communications, Inc. (a) | | 27,276 | 69,827 |
| ViaSat, Inc. (a)(b) | | 26,315 | 921,814 |
| Viavi Solutions, Inc. (a) | | 78,602 | 704,274 |
| | | | 112,593,692 |
| Electronic Equipment, Instruments & Components - 0.8% | | | |
| 908 Devices, Inc. (a)(b) | | 7,790 | 52,660 |
| Advanced Energy Industries, Inc. | | 13,157 | 1,138,081 |
| Aeva Technologies, Inc. (a) | | 30,397 | 30,151 |
| Akoustis Technologies, Inc. (a)(b) | | 21,349 | 60,845 |
| Amphenol Corp. Class A | | 203,080 | 15,326,448 |
| Arlo Technologies, Inc. (a) | | 32,247 | 207,671 |
| Arrow Electronics, Inc. (a) | | 19,962 | 2,284,252 |
| Avnet, Inc. | | 32,245 | 1,330,429 |
| Badger Meter, Inc. | | 10,255 | 1,357,044 |
| Bel Fuse, Inc. Class B (non-vtg.) | | 3,654 | 148,462 |
| Belden, Inc. | | 14,294 | 1,127,654 |
| Benchmark Electronics, Inc. | | 12,076 | 257,823 |
| CDW Corp. | | 46,190 | 7,833,362 |
| Cognex Corp. | | 58,859 | 2,806,986 |
| Coherent Corp. (a) | | 47,045 | 1,606,116 |
| Corning, Inc. | | 260,365 | 8,649,325 |
| CTS Corp. | | 10,928 | 428,487 |
| ePlus, Inc. (a) | | 9,140 | 397,956 |
| Evolv Technologies Holdings, Inc. (a) | | 22,160 | 79,776 |
| Fabrinet (a) | | 12,561 | 1,192,667 |
| FARO Technologies, Inc. (a) | | 5,897 | 137,695 |
| Insight Enterprises, Inc. (a) | | 10,534 | 1,274,087 |
| IPG Photonics Corp. (a) | | 11,168 | 1,284,097 |
| Itron, Inc. (a) | | 15,081 | 805,325 |
| Jabil, Inc. | | 45,631 | 3,566,063 |
| Keysight Technologies, Inc. (a) | | 60,866 | 8,803,658 |
| Kimball Electronics, Inc. (a) | | 7,465 | 150,270 |
| Knowles Corp. (a) | | 30,169 | 509,253 |
| Lightwave Logic, Inc. (a)(b) | | 37,120 | 167,040 |
| Littelfuse, Inc. | | 8,368 | 2,027,064 |
| Luna Innovations, Inc. (a)(b) | | 11,952 | 75,059 |
| Methode Electronics, Inc. Class A | | 11,924 | 488,765 |
| MicroVision, Inc. (a)(b) | | 50,687 | 101,374 |
| Mirion Technologies, Inc. Class A (a)(b) | | 39,912 | 323,287 |
| Napco Security Technologies, Inc. (a) | | 10,503 | 325,593 |
| National Instruments Corp. | | 44,629 | 2,598,747 |
| nLIGHT, Inc. (a) | | 13,783 | 120,877 |
| Novanta, Inc. (a) | | 12,276 | 1,876,264 |
| OSI Systems, Inc. (a) | | 5,213 | 588,860 |
| Ouster, Inc. (a)(b) | | 11,130 | 39,400 |
| Par Technology Corp. (a)(b) | | 9,382 | 286,995 |
| PC Connection, Inc. | | 4,502 | 181,296 |
| Plexus Corp. (a) | | 9,361 | 818,807 |
| Richardson Electronics Ltd. | | 4,744 | 73,200 |
| Rogers Corp. (a) | | 6,467 | 1,040,864 |
| Sanmina Corp. (a) | | 20,600 | 1,076,556 |
| ScanSource, Inc. (a) | | 9,121 | 249,459 |
| Smartrent, Inc. (a)(b) | | 45,646 | 117,767 |
| TD SYNNEX Corp. | | 14,660 | 1,305,326 |
| TE Connectivity Ltd. | | 108,161 | 13,235,662 |
| Teledyne Technologies, Inc. (a) | | 16,025 | 6,640,760 |
| Trimble, Inc. (a) | | 84,275 | 3,969,353 |
| TTM Technologies, Inc. (a) | | 34,955 | 412,819 |
| Vishay Intertechnology, Inc. | | 45,050 | 959,115 |
| Vishay Precision Group, Inc. (a) | | 3,850 | 144,529 |
| Vontier Corp. | | 53,912 | 1,462,633 |
| Zebra Technologies Corp. Class A (a) | | 17,685 | 5,093,811 |
| | | | 108,647,925 |
| IT Services - 1.3% | | | |
| Accenture PLC Class A | | 215,218 | 60,323,453 |
| Akamai Technologies, Inc. (a) | | 53,827 | 4,412,199 |
| Amdocs Ltd. | | 41,517 | 3,788,426 |
| BigCommerce Holdings, Inc. (a) | | 21,862 | 161,560 |
| Cloudflare, Inc. (a) | | 98,215 | 4,621,016 |
| Cognizant Technology Solutions Corp. Class A | | 174,229 | 10,403,214 |
| Digitalocean Holdings, Inc. (a)(b) | | 20,760 | 654,770 |
| DXC Technology Co. (a) | | 77,605 | 1,850,879 |
| Edgio, Inc. (a) | | 41,575 | 27,481 |
| EPAM Systems, Inc. (a) | | 19,713 | 5,567,740 |
| Fastly, Inc. Class A (a) | | 38,103 | 563,162 |
| Gartner, Inc. (a) | | 27,028 | 8,174,889 |
| GoDaddy, Inc. (a) | | 52,691 | 3,987,655 |
| Grid Dynamics Holdings, Inc. (a) | | 18,042 | 196,117 |
| Hackett Group, Inc. | | 8,463 | 157,073 |
| IBM Corp. | | 308,984 | 39,058,667 |
| Kyndryl Holdings, Inc. (a) | | 69,882 | 1,010,494 |
| MongoDB, Inc. Class A (a) | | 23,758 | 5,700,970 |
| Okta, Inc. (a) | | 52,175 | 3,575,553 |
| Perficient, Inc. (a) | | 11,380 | 738,790 |
| Rackspace Technology, Inc. (a)(b) | | 19,323 | 28,212 |
| Snowflake, Inc. (a) | | 97,868 | 14,492,293 |
| Squarespace, Inc. Class A (a) | | 13,791 | 428,900 |
| Thoughtworks Holding, Inc. (a) | | 24,216 | 150,866 |
| Tucows, Inc. (a)(b) | | 3,265 | 73,103 |
| Twilio, Inc. Class A (a) | | 59,439 | 3,127,086 |
| Unisys Corp. (a) | | 20,443 | 65,622 |
| VeriSign, Inc. (a) | | 31,364 | 6,956,535 |
| | | | 180,296,725 |
| Semiconductors & Semiconductor Equipment - 5.5% | | | |
| ACM Research, Inc. (a) | | 12,759 | 119,297 |
| Advanced Micro Devices, Inc. (a) | | 551,074 | 49,249,483 |
| AEHR Test Systems (a)(b) | | 8,117 | 200,896 |
| Allegro MicroSystems LLC (a) | | 21,908 | 783,649 |
| Alpha & Omega Semiconductor Ltd. (a) | | 8,034 | 191,852 |
| Ambarella, Inc. (a) | | 12,728 | 788,881 |
| Amkor Technology, Inc. | | 34,869 | 780,020 |
| Analog Devices, Inc. | | 173,145 | 31,145,323 |
| Applied Materials, Inc. | | 288,140 | 32,568,464 |
| Axcelis Technologies, Inc. (a) | | 11,015 | 1,303,075 |
| Broadcom, Inc. | | 142,769 | 89,444,779 |
| CEVA, Inc. (a) | | 8,420 | 211,595 |
| Cirrus Logic, Inc. (a) | | 18,755 | 1,608,991 |
| Cohu, Inc. (a) | | 16,016 | 541,981 |
| Credo Technology Group Holding Ltd. (a) | | 31,677 | 256,900 |
| Diodes, Inc. (a) | | 15,376 | 1,225,467 |
| Enphase Energy, Inc. (a) | | 46,465 | 7,629,553 |
| Entegris, Inc. | | 50,637 | 3,793,724 |
| First Solar, Inc. (a) | | 33,866 | 6,183,254 |
| FormFactor, Inc. (a) | | 26,089 | 712,491 |
| Ichor Holdings Ltd. (a) | | 9,911 | 276,021 |
| Impinj, Inc. (a) | | 7,166 | 633,546 |
| indie Semiconductor, Inc. (a)(b) | | 24,314 | 184,057 |
| Intel Corp. | | 1,413,982 | 43,918,281 |
| KLA Corp. | | 47,325 | 18,293,006 |
| Kulicke & Soffa Industries, Inc. (b) | | 19,807 | 944,002 |
| Lam Research Corp. | | 46,122 | 24,171,618 |
| Lattice Semiconductor Corp. (a) | | 46,984 | 3,744,625 |
| MACOM Technology Solutions Holdings, Inc. (a) | | 17,829 | 1,040,144 |
| Marvell Technology, Inc. | | 291,951 | 11,526,225 |
| MaxLinear, Inc. Class A (a) | | 24,293 | 586,190 |
| Meta Materials, Inc. (a)(b) | | 114,171 | 21,030 |
| Microchip Technology, Inc. | | 187,270 | 13,668,837 |
| Micron Technology, Inc. | | 373,116 | 24,013,746 |
| MKS Instruments, Inc. | | 19,347 | 1,622,633 |
| Monolithic Power Systems, Inc. | | 15,314 | 7,074,609 |
| Navitas Semiconductor Corp. (a)(b) | | 23,886 | 127,312 |
| NVE Corp. | | 1,538 | 115,981 |
| NVIDIA Corp. | | 840,675 | 233,278,906 |
| NXP Semiconductors NV | | 88,551 | 14,499,341 |
| onsemi (a) | | 147,718 | 10,629,787 |
| Onto Innovation, Inc. (a) | | 16,969 | 1,374,150 |
| PDF Solutions, Inc. (a) | | 9,947 | 358,589 |
| Photronics, Inc. (a) | | 19,548 | 282,664 |
| Power Integrations, Inc. | | 19,553 | 1,423,067 |
| Qorvo, Inc. (a) | | 34,359 | 3,163,777 |
| Qualcomm, Inc. | | 380,998 | 44,500,566 |
| Rambus, Inc. (a) | | 36,470 | 1,617,080 |
| Semtech Corp. (a) | | 21,007 | 409,426 |
| Silicon Laboratories, Inc. (a) | | 10,779 | 1,501,515 |
| SiTime Corp. (a) | | 5,386 | 584,219 |
| SkyWater Technology, Inc. (a) | | 3,119 | 28,196 |
| Skyworks Solutions, Inc. | | 54,451 | 5,766,361 |
| SMART Global Holdings, Inc. (a) | | 16,970 | 261,677 |
| SolarEdge Technologies, Inc. (a) | | 19,149 | 5,469,529 |
| Synaptics, Inc. (a) | | 13,820 | 1,223,899 |
| Teradyne, Inc. | | 53,324 | 4,872,747 |
| Texas Instruments, Inc. | | 309,526 | 51,752,747 |
| Ultra Clean Holdings, Inc. (a) | | 15,342 | 437,861 |
| Universal Display Corp. | | 15,003 | 2,002,300 |
| Veeco Instruments, Inc. (a)(b) | | 17,807 | 328,005 |
| Wolfspeed, Inc. (a)(b) | | 42,905 | 1,997,228 |
| | | | 768,465,175 |
| Software - 9.6% | | | |
| 8x8, Inc. (a)(b) | | 34,699 | 99,586 |
| A10 Networks, Inc. | | 21,334 | 301,663 |
| ACI Worldwide, Inc. (a) | | 38,773 | 982,120 |
| Adeia, Inc. | | 35,658 | 272,427 |
| Adobe, Inc. (a) | | 156,468 | 59,076,058 |
| Agilysys, Inc. (a) | | 6,875 | 536,525 |
| Alarm.com Holdings, Inc. (a) | | 16,729 | 797,806 |
| Alkami Technology, Inc. (a) | | 13,323 | 159,743 |
| Altair Engineering, Inc. Class A (a)(b) | | 17,578 | 1,213,761 |
| Alteryx, Inc. Class A (a) | | 20,735 | 852,831 |
| American Software, Inc. Class A | | 9,792 | 116,916 |
| Amplitude, Inc. (a) | | 17,331 | 196,707 |
| ANSYS, Inc. (a) | | 29,799 | 9,354,502 |
| AppFolio, Inc. (a) | | 6,574 | 917,862 |
| Appian Corp. Class A (a)(b) | | 14,468 | 543,273 |
| AppLovin Corp. (a)(b) | | 42,657 | 725,169 |
| Asana, Inc. (a)(b) | | 26,189 | 423,738 |
| Aspen Technology, Inc. | | 9,995 | 1,769,115 |
| Atlassian Corp. PLC (a) | | 51,171 | 7,555,910 |
| Autodesk, Inc. (a) | | 73,804 | 14,376,281 |
| AvePoint, Inc. (a)(b) | | 27,937 | 121,247 |
| Bentley Systems, Inc. Class B | | 66,405 | 2,826,197 |
| Bill Holdings, Inc. (a) | | 32,832 | 2,521,826 |
| Black Knight, Inc. (a) | | 53,124 | 2,902,695 |
| Blackbaud, Inc. (a) | | 15,380 | 1,066,680 |
| BlackLine, Inc. (a) | | 18,421 | 1,026,234 |
| Blend Labs, Inc. (a)(b) | | 92,593 | 54,824 |
| Box, Inc. Class A (a) | | 48,006 | 1,270,239 |
| Braze, Inc. (a)(b) | | 12,514 | 367,912 |
| C3.ai, Inc. (a)(b) | | 28,361 | 505,393 |
| Cadence Design Systems, Inc. (a) | | 93,740 | 19,633,843 |
| CCC Intelligent Solutions Holdings, Inc. Class A (a) | | 37,050 | 321,594 |
| Cerence, Inc. (a) | | 13,679 | 349,498 |
| Ceridian HCM Holding, Inc. (a) | | 52,379 | 3,325,019 |
| Cleanspark, Inc. (a)(b) | | 27,873 | 108,983 |
| Clear Secure, Inc. (b) | | 27,810 | 672,724 |
| Clearwater Analytics Holdings, Inc. (a) | | 22,787 | 351,148 |
| CommVault Systems, Inc. (a) | | 15,384 | 896,426 |
| Confluent, Inc. (a) | | 52,727 | 1,159,994 |
| Consensus Cloud Solutions, Inc. (a) | | 5,763 | 215,133 |
| Couchbase, Inc. (a)(b) | | 8,685 | 133,402 |
| Crowdstrike Holdings, Inc. (a) | | 74,455 | 8,938,323 |
| CS Disco, Inc. (a) | | 3,718 | 21,862 |
| Datadog, Inc. Class A (a) | | 85,065 | 5,731,680 |
| Digimarc Corp. (a)(b) | | 4,248 | 72,386 |
| Digital Turbine, Inc. (a) | | 30,025 | 352,193 |
| DocuSign, Inc. (a) | | 68,938 | 3,408,295 |
| Dolby Laboratories, Inc. Class A | | 20,754 | 1,736,902 |
| Domo, Inc. Class B (a) | | 10,352 | 164,390 |
| DoubleVerify Holdings, Inc. (a) | | 29,918 | 880,188 |
| Dropbox, Inc. Class A (a) | | 92,573 | 1,882,935 |
| Dynatrace, Inc. (a) | | 74,088 | 3,132,441 |
| E2open Parent Holdings, Inc. (a)(b) | | 58,642 | 368,858 |
| Ebix, Inc. | | 7,181 | 116,763 |
| Elastic NV (a) | | 26,628 | 1,524,453 |
| Enfusion, Inc. Class A (a) | | 4,691 | 39,311 |
| EngageSmart, Inc. (a) | | 10,672 | 183,238 |
| Envestnet, Inc. (a)(b) | | 19,139 | 1,213,030 |
| Everbridge, Inc. (a) | | 13,599 | 357,382 |
| Expensify, Inc. (a) | | 16,217 | 123,087 |
| Fair Isaac Corp. (a) | | 8,604 | 6,263,282 |
| Five9, Inc. (a) | | 23,853 | 1,546,629 |
| ForgeRock, Inc. (a) | | 11,806 | 236,474 |
| Fortinet, Inc. (a) | | 221,661 | 13,975,726 |
| Freshworks, Inc. (a) | | 53,870 | 719,703 |
| Gen Digital, Inc. | | 192,961 | 3,409,621 |
| GitLab, Inc. (a)(b) | | 21,701 | 658,842 |
| Guidewire Software, Inc. (a) | | 28,243 | 2,151,834 |
| HashiCorp, Inc. (a) | | 28,316 | 759,152 |
| HubSpot, Inc. (a) | | 16,574 | 6,976,825 |
| Informatica, Inc. (a) | | 14,295 | 221,001 |
| Intapp, Inc. (a) | | 5,143 | 207,366 |
| InterDigital, Inc. | | 8,996 | 609,389 |
| Intuit, Inc. | | 96,018 | 42,627,191 |
| Jamf Holding Corp. (a) | | 14,680 | 277,746 |
| Life360, Inc. CDI (a)(d) | | 65,317 | 223,445 |
| LivePerson, Inc. (a) | | 22,811 | 105,615 |
| Liveramp Holdings, Inc. (a) | | 22,680 | 546,361 |
| Manhattan Associates, Inc. (a) | | 21,396 | 3,544,889 |
| Marathon Digital Holdings, Inc. (a)(b) | | 36,031 | 362,832 |
| Matterport, Inc. (a)(b) | | 80,570 | 187,728 |
| MeridianLink, Inc. (a)(b) | | 6,917 | 103,340 |
| Microsoft Corp. | | 2,543,801 | 781,608,295 |
| MicroStrategy, Inc. Class A (a)(b) | | 3,209 | 1,053,771 |
| Mitek Systems, Inc. (a) | | 14,079 | 126,993 |
| Model N, Inc. (a) | | 10,887 | 335,320 |
| Momentive Global, Inc. (a) | | 45,057 | 423,085 |
| N-able, Inc. (a) | | 22,738 | 289,910 |
| nCino, Inc. (a)(b) | | 26,445 | 653,985 |
| NCR Corp. (a) | | 45,774 | 1,020,302 |
| New Relic, Inc. (a) | | 19,873 | 1,420,323 |
| Nutanix, Inc. Class A (a) | | 78,852 | 1,890,871 |
| Olo, Inc. (a)(b) | | 34,451 | 235,989 |
| ON24, Inc. (a) | | 15,209 | 132,318 |
| Onespan, Inc. (a) | | 12,190 | 179,681 |
| Oracle Corp. | | 525,062 | 49,733,873 |
| Pagerduty, Inc. (a)(b) | | 28,371 | 852,832 |
| Palantir Technologies, Inc. (a)(b) | | 599,323 | 4,644,753 |
| Palo Alto Networks, Inc. (a) | | 103,359 | 18,858,883 |
| Paycom Software, Inc. (a) | | 16,476 | 4,784,136 |
| Paycor HCM, Inc. (a)(b) | | 15,384 | 361,524 |
| Paylocity Holding Corp. (a) | | 14,062 | 2,718,044 |
| Pegasystems, Inc. | | 14,156 | 645,797 |
| Porch Group, Inc. Class A (a)(b) | | 24,453 | 22,255 |
| PowerSchool Holdings, Inc. (a) | | 14,227 | 297,060 |
| Procore Technologies, Inc. (a) | | 23,724 | 1,267,099 |
| Progress Software Corp. | | 14,281 | 783,741 |
| PROS Holdings, Inc. (a) | | 13,766 | 390,541 |
| PTC, Inc. (a) | | 36,462 | 4,586,555 |
| Q2 Holdings, Inc. (a) | | 21,108 | 519,679 |
| Qualtrics International, Inc. (a) | | 37,985 | 681,071 |
| Qualys, Inc. (a) | | 11,697 | 1,321,059 |
| Rapid7, Inc. (a) | | 20,404 | 991,838 |
| Rimini Street, Inc. (a) | | 14,699 | 54,974 |
| RingCentral, Inc. (a) | | 26,229 | 722,871 |
| Riot Platforms, Inc. (a)(b) | | 55,728 | 666,507 |
| Roper Technologies, Inc. | | 36,246 | 16,483,956 |
| Salesforce, Inc. (a) | | 341,762 | 67,795,328 |
| Samsara, Inc. (a) | | 38,764 | 699,690 |
| Semrush Holdings, Inc. (a) | | 13,782 | 133,134 |
| SentinelOne, Inc. (a) | | 75,457 | 1,212,594 |
| ServiceNow, Inc. (a) | | 69,385 | 31,876,857 |
| Smartsheet, Inc. (a) | | 45,073 | 1,842,134 |
| SolarWinds, Inc. (a) | | 20,443 | 176,219 |
| SoundHound AI, Inc. (b) | | 40,615 | 108,036 |
| SoundThinking, Inc. (a) | | 2,852 | 84,847 |
| Splunk, Inc. (a) | | 51,690 | 4,457,746 |
| Sprinklr, Inc. (a) | | 23,801 | 284,660 |
| Sprout Social, Inc. (a) | | 16,061 | 791,165 |
| SPS Commerce, Inc. (a) | | 12,132 | 1,787,044 |
| Sumo Logic, Inc. (a) | | 38,298 | 459,576 |
| Synopsys, Inc. (a) | | 52,095 | 19,343,915 |
| Telos Corp. (a) | | 15,883 | 27,001 |
| Tenable Holdings, Inc. (a) | | 39,052 | 1,444,533 |
| Teradata Corp. (a) | | 34,449 | 1,333,521 |
| Tyler Technologies, Inc. (a) | | 14,162 | 5,367,823 |
| UiPath, Inc. Class A (a) | | 121,348 | 1,708,580 |
| Unity Software, Inc. (a)(b) | | 83,392 | 2,249,082 |
| Upland Software, Inc. (a) | | 8,204 | 30,109 |
| Varonis Systems, Inc. (a) | | 38,001 | 880,103 |
| Verint Systems, Inc. (a) | | 22,491 | 820,697 |
| Veritone, Inc. (a)(b) | | 10,561 | 50,270 |
| Vertex, Inc. Class A (a) | | 11,931 | 246,375 |
| VMware, Inc. Class A (a) | | 71,294 | 8,913,889 |
| Vobile Group Ltd. (a)(b) | | 565,000 | 220,488 |
| Workday, Inc. Class A (a) | | 69,093 | 12,860,971 |
| Workiva, Inc. (a) | | 15,498 | 1,447,823 |
| Xperi, Inc. | | 14,399 | 136,647 |
| Yext, Inc. (a) | | 36,994 | 324,807 |
| Zeta Global Holdings Corp. (a) | | 43,742 | 424,735 |
| Zoom Video Communications, Inc. Class A (a) | | 73,969 | 4,543,916 |
| Zscaler, Inc. (a) | | 28,992 | 2,612,179 |
| Zuora, Inc. (a) | | 42,953 | 334,604 |
| | | | 1,333,856,701 |
| Technology Hardware, Storage & Peripherals - 6.4% | | | |
| Apple, Inc. | | 5,082,391 | 862,380,074 |
| Avid Technology, Inc. (a) | | 10,844 | 320,006 |
| Corsair Gaming, Inc. (a)(b) | | 14,012 | 244,089 |
| Dell Technologies, Inc. | | 83,128 | 3,615,237 |
| Eastman Kodak Co. (a) | | 21,668 | 71,288 |
| Hewlett Packard Enterprise Co. | | 439,531 | 6,294,084 |
| HP, Inc. | | 295,040 | 8,765,638 |
| Immersion Corp. | | 9,873 | 65,063 |
| IonQ, Inc. (a)(b) | | 49,756 | 274,156 |
| NetApp, Inc. | | 73,521 | 4,623,736 |
| Pure Storage, Inc. Class A (a) | | 96,208 | 2,196,429 |
| Seagate Technology Holdings PLC | | 65,517 | 3,850,434 |
| Super Micro Computer, Inc. (a) | | 15,914 | 1,677,813 |
| Turtle Beach Corp. (a)(b) | | 4,485 | 48,752 |
| Western Digital Corp. (a) | | 109,681 | 3,777,414 |
| Xerox Holdings Corp. | | 40,475 | 634,243 |
| | | | 898,838,456 |
TOTAL INFORMATION TECHNOLOGY | | | 3,402,698,674 |
| MATERIALS - 2.8% | | | |
| Chemicals - 1.8% | | | |
| AdvanSix, Inc. | | 8,785 | 331,019 |
| Air Products & Chemicals, Inc. | | 75,894 | 22,340,158 |
| Albemarle Corp. | | 39,961 | 7,411,167 |
| American Vanguard Corp. | | 9,142 | 175,984 |
| Amyris, Inc. (a)(b) | | 75,824 | 61,994 |
| Ashland, Inc. | | 16,957 | 1,723,001 |
| Aspen Aerogels, Inc. (a) | | 19,359 | 121,187 |
| Avient Corp. | | 28,853 | 1,111,129 |
| Axalta Coating Systems Ltd. (a) | | 76,240 | 2,406,897 |
| Balchem Corp. | | 10,887 | 1,430,552 |
| Cabot Corp. | | 19,041 | 1,366,382 |
| Celanese Corp. Class A | | 34,256 | 3,639,357 |
| CF Industries Holdings, Inc. | | 67,268 | 4,815,043 |
| Chase Corp. | | 2,527 | 276,277 |
| Corteva, Inc. | | 243,774 | 14,899,467 |
| Danimer Scientific, Inc. (a)(b) | | 32,312 | 102,106 |
| Diversey Holdings Ltd. (a) | | 27,105 | 220,364 |
| Dow, Inc. | | 241,238 | 13,123,347 |
| DuPont de Nemours, Inc. | | 156,798 | 10,931,957 |
| Eastman Chemical Co. | | 40,711 | 3,430,716 |
| Ecolab, Inc. | | 84,727 | 14,220,580 |
| Ecovyst, Inc. (a) | | 23,218 | 263,524 |
| Element Solutions, Inc. | | 79,005 | 1,433,941 |
| FMC Corp. | | 43,064 | 5,321,849 |
| FutureFuel Corp. | | 8,155 | 61,163 |
| Ginkgo Bioworks Holdings, Inc. Class A (a)(b) | | 353,252 | 430,967 |
| H.B. Fuller Co. | | 18,239 | 1,206,875 |
| Hawkins, Inc. | | 6,316 | 254,787 |
| Huntsman Corp. | | 61,340 | 1,643,299 |
| Ingevity Corp. (a) | | 11,693 | 838,856 |
| Innospec, Inc. | | 8,255 | 838,956 |
| International Flavors & Fragrances, Inc. | | 86,918 | 8,427,569 |
| Intrepid Potash, Inc. (a) | | 3,029 | 78,088 |
| Koppers Holdings, Inc. | | 6,905 | 226,553 |
| Kronos Worldwide, Inc. (b) | | 6,321 | 58,785 |
| Linde PLC | | 168,272 | 62,168,090 |
| Livent Corp. (a)(b) | | 60,680 | 1,325,858 |
| LSB Industries, Inc. (a) | | 17,106 | 152,757 |
| LyondellBasell Industries NV Class A | | 86,845 | 8,216,405 |
| Mativ, Inc. | | 18,733 | 362,858 |
| Minerals Technologies, Inc. | | 10,948 | 648,778 |
| NewMarket Corp. | | 2,357 | 941,857 |
| Olin Corp. | | 42,111 | 2,332,949 |
| Origin Materials, Inc. Class A (a)(b) | | 46,549 | 183,869 |
| Orion Engineered Carbons SA | | 20,678 | 500,614 |
| Perimeter Solutions SA (a) | | 50,517 | 377,867 |
| PPG Industries, Inc. | | 80,429 | 11,280,972 |
| PureCycle Technologies, Inc. (a)(b) | | 43,234 | 284,047 |
| Quaker Houghton | | 4,801 | 896,011 |
| Rayonier Advanced Materials, Inc. (a) | | 19,903 | 108,272 |
| RPM International, Inc. | | 44,325 | 3,635,980 |
| Sensient Technologies Corp. | | 14,024 | 1,044,227 |
| Sherwin-Williams Co. | | 80,610 | 19,148,099 |
| Stepan Co. | | 6,919 | 637,932 |
| The Chemours Co. LLC | | 50,787 | 1,476,378 |
| The Mosaic Co. | | 116,333 | 4,984,869 |
| The Scotts Miracle-Gro Co. Class A (b) | | 14,107 | 942,489 |
| Trinseo PLC | | 11,617 | 210,500 |
| Tronox Holdings PLC | | 38,261 | 523,793 |
| Valvoline, Inc. | | 58,595 | 2,024,457 |
| Westlake Corp. | | 11,890 | 1,352,844 |
| | | | 250,986,668 |
| Construction Materials - 0.1% | | | |
| Eagle Materials, Inc. | | 12,435 | 1,842,991 |
| Martin Marietta Materials, Inc. | | 21,285 | 7,730,712 |
| Summit Materials, Inc. | | 39,560 | 1,084,340 |
| Vulcan Materials Co. | | 45,590 | 7,983,721 |
| | | | 18,641,764 |
| Containers & Packaging - 0.3% | | | |
| Amcor PLC | | 506,251 | 5,553,573 |
| Aptargroup, Inc. | | 22,292 | 2,641,825 |
| Ardagh Metal Packaging SA (b) | | 52,791 | 215,387 |
| Avery Dennison Corp. | | 27,600 | 4,815,648 |
| Ball Corp. | | 107,722 | 5,728,656 |
| Berry Global Group, Inc. | | 41,427 | 2,394,895 |
| Crown Holdings, Inc. | | 41,317 | 3,544,172 |
| Graphic Packaging Holding Co. | | 104,291 | 2,571,816 |
| Greif, Inc.: | | | |
| Class A | | 8,441 | 530,010 |
| Class B | | 2,073 | 163,228 |
| International Paper Co. | | 121,698 | 4,029,421 |
| Myers Industries, Inc. | | 13,001 | 246,369 |
| O-I Glass, Inc. (a) | | 54,116 | 1,215,987 |
| Packaging Corp. of America | | 31,752 | 4,294,776 |
| Pactiv Evergreen, Inc. | | 12,875 | 101,713 |
| Ranpak Holdings Corp. (A Shares) (a) | | 12,353 | 50,400 |
| Sealed Air Corp. | | 49,643 | 2,382,368 |
| Silgan Holdings, Inc. | | 28,556 | 1,406,669 |
| Sonoco Products Co. | | 33,175 | 2,011,069 |
| TriMas Corp. | | 13,768 | 349,845 |
| WestRock Co. | | 87,251 | 2,611,422 |
| | | | 46,859,249 |
| Metals & Mining - 0.6% | | | |
| 5E Advanced Materials, Inc. (a)(b) | | 14,313 | 60,401 |
| Alcoa Corp. | | 60,232 | 2,237,016 |
| Alpha Metallurgical Resources | | 4,903 | 718,584 |
| Arconic Corp. (a) | | 33,907 | 839,198 |
| ATI, Inc. (a) | | 44,954 | 1,736,123 |
| Carpenter Technology Corp. | | 16,086 | 848,376 |
| Century Aluminum Co. (a) | | 17,978 | 154,431 |
| Cleveland-Cliffs, Inc. (a) | | 175,352 | 2,696,914 |
| Coeur d'Alene Mines Corp. (a) | | 91,652 | 311,617 |
| Commercial Metals Co. | | 39,619 | 1,849,811 |
| Compass Minerals International, Inc. | | 11,625 | 380,486 |
| Freeport-McMoRan, Inc. | | 488,765 | 18,529,081 |
| Gatos Silver, Inc. (a) | | 14,059 | 83,932 |
| Haynes International, Inc. | | 4,363 | 205,105 |
| Hecla Mining Co. | | 191,678 | 1,159,652 |
| Kaiser Aluminum Corp. | | 5,328 | 350,156 |
| Materion Corp. | | 7,087 | 767,593 |
| McEwen Mining, Inc. (a)(b) | | 11,178 | 91,660 |
| MP Materials Corp. (a)(b) | | 31,301 | 678,293 |
| Newmont Corp. | | 271,481 | 12,868,199 |
| Nucor Corp. | | 86,525 | 12,821,275 |
| Olympic Steel, Inc. | | 3,261 | 151,865 |
| Piedmont Lithium, Inc. (a)(b) | | 5,288 | 304,060 |
| Ramaco Resources, Inc. | | 9,760 | 79,349 |
| Reliance Steel & Aluminum Co. | | 20,136 | 4,989,701 |
| Royal Gold, Inc. | | 22,522 | 2,982,814 |
| Ryerson Holding Corp. | | 6,804 | 256,987 |
| Schnitzer Steel Industries, Inc. Class A | | 8,955 | 258,710 |
| Steel Dynamics, Inc. | | 57,111 | 5,936,688 |
| SunCoke Energy, Inc. | | 29,168 | 226,927 |
| TimkenSteel Corp. (a) | | 12,754 | 213,502 |
| Tredegar Corp. | | 7,362 | 69,056 |
| United States Steel Corp. | | 78,166 | 1,788,438 |
| Warrior Metropolitan Coal, Inc. | | 17,362 | 600,204 |
| Worthington Industries, Inc. | | 10,286 | 610,886 |
| | | | 77,857,090 |
| Paper & Forest Products - 0.0% | | | |
| Clearwater Paper Corp. (a) | | 5,158 | 186,204 |
| Glatfelter Corp. | | 13,046 | 58,968 |
| Louisiana-Pacific Corp. | | 24,409 | 1,458,194 |
| Mercer International, Inc. (SBI) | | 12,114 | 117,869 |
| Sylvamo Corp. | | 10,832 | 496,322 |
| | | | 2,317,557 |
TOTAL MATERIALS | | | 396,662,328 |
| REAL ESTATE - 3.1% | | | |
| Equity Real Estate Investment Trusts (REITs) - 2.9% | | | |
| Acadia Realty Trust (SBI) | | 30,677 | 414,446 |
| Agree Realty Corp. | | 30,797 | 2,093,888 |
| Alexander & Baldwin, Inc. | | 26,088 | 501,672 |
| Alexanders, Inc. | | 649 | 120,759 |
| Alexandria Real Estate Equities, Inc. | | 53,762 | 6,676,165 |
| Alpine Income Property Trust, Inc. | | 5,164 | 83,037 |
| American Assets Trust, Inc. | | 18,071 | 328,892 |
| American Homes 4 Rent Class A | | 105,464 | 3,507,733 |
| American Tower Corp. | | 159,181 | 32,535,005 |
| Americold Realty Trust | | 91,795 | 2,716,214 |
| Apartment Income (REIT) Corp. | | 50,418 | 1,864,458 |
| Apartment Investment & Management Co. Class A | | 49,316 | 386,144 |
| Apple Hospitality (REIT), Inc. | | 71,110 | 1,058,828 |
| Armada Hoffler Properties, Inc. | | 24,117 | 282,651 |
| Ashford Hospitality Trust, Inc. (a) | | 11,762 | 39,991 |
| AvalonBay Communities, Inc. | | 47,717 | 8,606,715 |
| Boston Properties, Inc. | | 49,301 | 2,630,701 |
| Braemar Hotels & Resorts, Inc. | | 20,281 | 77,068 |
| Brandywine Realty Trust (SBI) | | 56,550 | 222,242 |
| Brixmor Property Group, Inc. | | 104,955 | 2,238,690 |
| Broadstone Net Lease, Inc. | | 60,772 | 982,683 |
| Camden Property Trust (SBI) | | 37,702 | 4,149,105 |
| CareTrust (REIT), Inc. | | 35,841 | 698,541 |
| CBL & Associates Properties, Inc. | | 7,779 | 179,928 |
| Centerspace | | 4,710 | 265,550 |
| Chatham Lodging Trust | | 17,031 | 174,397 |
| City Office REIT, Inc. | | 14,477 | 84,256 |
| Community Healthcare Trust, Inc. | | 7,436 | 266,134 |
| Corporate Office Properties Trust (SBI) | | 38,829 | 888,796 |
| Cousins Properties, Inc. | | 50,958 | 1,111,394 |
| Crown Castle International Corp. | | 148,161 | 18,237,137 |
| CTO Realty Growth, Inc. | | 9,635 | 162,253 |
| CubeSmart | | 77,201 | 3,511,873 |
| DiamondRock Hospitality Co. | | 69,978 | 567,522 |
| Digital Realty Trust, Inc. | | 98,506 | 9,766,870 |
| Diversified Healthcare Trust (SBI) | | 83,647 | 76,403 |
| Douglas Emmett, Inc. | | 59,591 | 767,532 |
| Easterly Government Properties, Inc. | | 31,042 | 436,761 |
| EastGroup Properties, Inc. | | 15,037 | 2,504,563 |
| Elme Communities (SBI) | | 32,050 | 552,222 |
| Empire State Realty Trust, Inc. | | 45,839 | 280,076 |
| EPR Properties | | 25,108 | 1,053,532 |
| Equinix, Inc. | | 31,633 | 22,904,823 |
| Equity Commonwealth | | 39,526 | 818,979 |
| Equity Lifestyle Properties, Inc. | | 60,092 | 4,140,339 |
| Equity Residential (SBI) | | 116,545 | 7,371,471 |
| Essential Properties Realty Trust, Inc. | | 50,327 | 1,245,593 |
| Essex Property Trust, Inc. | | 22,268 | 4,892,948 |
| Extra Space Storage, Inc. | | 45,872 | 6,974,379 |
| Farmland Partners, Inc. | | 16,344 | 170,631 |
| Federal Realty Investment Trust (SBI) | | 24,923 | 2,464,635 |
| First Industrial Realty Trust, Inc. | | 45,833 | 2,404,858 |
| Four Corners Property Trust, Inc. | | 29,856 | 761,627 |
| Franklin Street Properties Corp. | | 29,114 | 33,772 |
| Gaming & Leisure Properties | | 88,360 | 4,594,720 |
| Getty Realty Corp. | | 14,462 | 482,018 |
| Gladstone Commercial Corp. | | 13,900 | 165,966 |
| Gladstone Land Corp. | | 11,779 | 189,760 |
| Global Medical REIT, Inc. | | 23,218 | 215,463 |
| Global Net Lease, Inc. | | 34,908 | 393,064 |
| Healthcare Trust of America, Inc. | | 130,353 | 2,578,382 |
| Healthpeak Properties, Inc. | | 189,631 | 4,166,193 |
| Hersha Hospitality Trust | | 11,210 | 70,623 |
| Highwoods Properties, Inc. (SBI) | | 34,600 | 793,032 |
| Host Hotels & Resorts, Inc. | | 245,658 | 3,972,290 |
| Hudson Pacific Properties, Inc. | | 43,037 | 239,286 |
| Independence Realty Trust, Inc. | | 75,417 | 1,255,693 |
| Indus Realty Trust, Inc. | | 1,774 | 118,095 |
| Industrial Logistics Properties Trust | | 19,849 | 40,889 |
| InvenTrust Properties Corp. | | 22,191 | 500,407 |
| Invitation Homes, Inc. | | 198,307 | 6,617,505 |
| Iron Mountain, Inc. | | 99,411 | 5,491,464 |
| JBG SMITH Properties | | 32,937 | 470,011 |
| Kilroy Realty Corp. | | 35,133 | 1,027,289 |
| Kimco Realty Corp. | | 212,027 | 4,068,798 |
| Kite Realty Group Trust | | 74,688 | 1,547,535 |
| Lamar Advertising Co. Class A | | 29,721 | 3,140,915 |
| Life Storage, Inc. | | 29,020 | 3,899,708 |
| LTC Properties, Inc. | | 13,101 | 438,228 |
| LXP Industrial Trust (REIT) | | 91,891 | 863,775 |
| Medical Properties Trust, Inc. (b) | | 206,045 | 1,807,015 |
| Mid-America Apartment Communities, Inc. | | 39,538 | 6,080,944 |
| National Health Investors, Inc. | | 14,604 | 726,841 |
| National Retail Properties, Inc. | | 62,131 | 2,702,699 |
| National Storage Affiliates Trust | | 28,464 | 1,097,287 |
| Necessity Retail (REIT), Inc./The | | 46,453 | 255,956 |
| NETSTREIT Corp. | | 18,878 | 343,957 |
| NexPoint Diversified Real Estate Trust | | 12,344 | 131,587 |
| NexPoint Residential Trust, Inc. | | 8,722 | 374,435 |
| Office Properties Income Trust | | 16,838 | 109,784 |
| Omega Healthcare Investors, Inc. | | 80,329 | 2,149,604 |
| One Liberty Properties, Inc. | | 4,766 | 104,947 |
| Orion Office (REIT), Inc. | | 17,166 | 105,399 |
| Outfront Media, Inc. | | 48,995 | 816,257 |
| Paramount Group, Inc. | | 54,657 | 236,665 |
| Park Hotels & Resorts, Inc. | | 75,632 | 911,366 |
| Pebblebrook Hotel Trust | | 44,343 | 631,001 |
| Phillips Edison & Co., Inc. | | 40,786 | 1,286,390 |
| Physicians Realty Trust | | 81,945 | 1,181,647 |
| Piedmont Office Realty Trust, Inc. Class A | | 43,743 | 284,767 |
| Plymouth Industrial REIT, Inc. | | 13,371 | 270,629 |
| Postal Realty Trust, Inc. | | 6,481 | 99,613 |
| Potlatch Corp. | | 28,109 | 1,299,479 |
| Prologis (REIT), Inc. | | 315,561 | 39,524,015 |
| Public Storage | | 54,065 | 15,939,984 |
| Rayonier, Inc. | | 50,669 | 1,588,980 |
| Realty Income Corp. | | 214,650 | 13,488,606 |
| Regency Centers Corp. | | 53,080 | 3,260,704 |
| Retail Opportunity Investments Corp. | | 40,771 | 531,246 |
| Rexford Industrial Realty, Inc. | | 64,701 | 3,608,375 |
| RLJ Lodging Trust | | 52,688 | 532,149 |
| RPT Realty | | 29,667 | 275,903 |
| Ryman Hospitality Properties, Inc. | | 19,215 | 1,722,817 |
| Sabra Health Care REIT, Inc. | | 77,557 | 884,150 |
| Safehold, Inc. (b) | | 14,502 | 401,995 |
| Saul Centers, Inc. | | 4,575 | 164,837 |
| SBA Communications Corp. Class A | | 36,992 | 9,650,843 |
| Service Properties Trust | | 56,380 | 494,453 |
| Simon Property Group, Inc. | | 111,942 | 12,685,267 |
| SITE Centers Corp. | | 61,876 | 763,550 |
| SL Green Realty Corp. (b) | | 21,640 | 512,219 |
| Spirit Realty Capital, Inc. | | 48,585 | 1,868,579 |
| Stag Industrial, Inc. | | 60,672 | 2,054,961 |
| Star Holdings | | 4,914 | 79,312 |
| Summit Hotel Properties, Inc. | | 34,176 | 220,093 |
| Sun Communities, Inc. | | 42,320 | 5,879,518 |
| Sunstone Hotel Investors, Inc. | | 69,696 | 664,203 |
| Tanger Factory Outlet Centers, Inc. | | 35,588 | 697,881 |
| Terreno Realty Corp. | | 24,835 | 1,529,588 |
| The Macerich Co. | | 73,520 | 734,465 |
| UDR, Inc. | | 105,468 | 4,358,992 |
| UMH Properties, Inc. | | 18,869 | 286,809 |
| Uniti Group, Inc. | | 80,152 | 274,120 |
| Universal Health Realty Income Trust (SBI) | | 3,938 | 171,303 |
| Urban Edge Properties | | 40,141 | 588,868 |
| Urstadt Biddle Properties, Inc. Class A | | 9,182 | 158,114 |
| Ventas, Inc. | | 136,775 | 6,572,039 |
| Veris Residential, Inc. (a) | | 26,657 | 435,842 |
| VICI Properties, Inc. | | 343,092 | 11,644,542 |
| Vornado Realty Trust | | 53,330 | 800,483 |
| Welltower, Inc. | | 161,360 | 12,782,939 |
| Weyerhaeuser Co. | | 251,365 | 7,518,327 |
| Whitestone REIT Class B | | 14,298 | 127,967 |
| WP Carey, Inc. | | 72,380 | 5,370,596 |
| Xenia Hotels & Resorts, Inc. | | 39,119 | 495,247 |
| | | | 408,981,141 |
| Real Estate Management & Development - 0.2% | | | |
| Anywhere Real Estate, Inc. (a) | | 38,656 | 246,239 |
| CBRE Group, Inc. (a) | | 107,893 | 8,271,077 |
| Compass, Inc. (a) | | 88,260 | 206,528 |
| Cushman & Wakefield PLC (a) | | 53,870 | 530,620 |
| Digitalbridge Group, Inc. | | 47,909 | 595,509 |
| Douglas Elliman, Inc. | | 21,205 | 67,644 |
| eXp World Holdings, Inc. | | 24,883 | 290,882 |
| Forestar Group, Inc. (a) | | 5,366 | 103,778 |
| Howard Hughes Corp. (a) | | 12,134 | 938,808 |
| Jones Lang LaSalle, Inc. (a) | | 16,228 | 2,256,341 |
| Kennedy-Wilson Holdings, Inc. | | 38,507 | 646,147 |
| Marcus & Millichap, Inc. | | 8,525 | 268,282 |
| Newmark Group, Inc. | | 42,645 | 270,369 |
| Opendoor Technologies, Inc. (a)(b) | | 163,574 | 225,732 |
| RE/MAX Holdings, Inc. | | 5,463 | 105,491 |
| Redfin Corp. (a)(b) | | 37,670 | 280,642 |
| Seritage Growth Properties (a) | | 12,369 | 92,644 |
| The RMR Group, Inc. | | 4,552 | 108,110 |
| The St. Joe Co. | | 11,364 | 467,060 |
| WeWork, Inc. (a)(b) | | 80,275 | 33,836 |
| Zillow Group, Inc.: | | | |
| Class A (a) | | 17,820 | 762,340 |
| Class C (a) | | 57,711 | 2,512,737 |
| | | | 19,280,816 |
TOTAL REAL ESTATE | | | 428,261,957 |
| UTILITIES - 2.8% | | | |
| Electric Utilities - 1.7% | | | |
| Allete, Inc. | | 19,484 | 1,215,412 |
| Alliant Energy Corp. | | 86,131 | 4,749,263 |
| American Electric Power Co., Inc. | | 175,697 | 16,237,917 |
| Avangrid, Inc. (b) | | 24,530 | 987,578 |
| Constellation Energy Corp. | | 111,734 | 8,648,212 |
| Duke Energy Corp. | | 263,165 | 26,021,755 |
| Edison International | | 130,115 | 9,576,464 |
| Entergy Corp. | | 69,657 | 7,493,700 |
| Evergy, Inc. | | 78,681 | 4,886,877 |
| Eversource Energy | | 119,303 | 9,259,106 |
| Exelon Corp. | | 339,744 | 14,418,735 |
| FirstEnergy Corp. | | 185,529 | 7,384,054 |
| Hawaiian Electric Industries, Inc. | | 37,063 | 1,453,240 |
| IDACORP, Inc. | | 16,985 | 1,887,373 |
| MGE Energy, Inc. | | 12,313 | 943,299 |
| NextEra Energy, Inc. | | 678,924 | 52,025,946 |
| NRG Energy, Inc. | | 78,184 | 2,671,547 |
| OGE Energy Corp. | | 69,007 | 2,590,523 |
| Otter Tail Corp. | | 14,040 | 1,010,178 |
| PG&E Corp. (a) | | 549,885 | 9,408,532 |
| Pinnacle West Capital Corp. | | 38,504 | 3,021,024 |
| PNM Resources, Inc. | | 29,148 | 1,402,893 |
| Portland General Electric Co. | | 31,172 | 1,577,927 |
| PPL Corp. | | 251,087 | 7,211,219 |
| Southern Co. | | 371,903 | 27,353,466 |
| Xcel Energy, Inc. | | 186,848 | 13,062,544 |
| | | | 236,498,784 |
| Gas Utilities - 0.1% | | | |
| Atmos Energy Corp. | | 48,980 | 5,590,577 |
| Chesapeake Utilities Corp. | | 5,958 | 735,813 |
| National Fuel Gas Co. | | 31,605 | 1,766,720 |
| New Jersey Resources Corp. | | 32,800 | 1,693,792 |
| Northwest Natural Holding Co. | | 11,935 | 560,468 |
| ONE Gas, Inc. | | 18,511 | 1,424,421 |
| Southwest Gas Holdings, Inc. | | 22,512 | 1,260,672 |
| Spire, Inc. | | 18,170 | 1,230,654 |
| UGI Corp. | | 72,177 | 2,445,357 |
| | | | 16,708,474 |
| Independent Power and Renewable Electricity Producers - 0.1% | | | |
| Altus Power, Inc. Class A (a)(b) | | 16,593 | 75,332 |
| Clearway Energy, Inc.: | | | |
| Class A | | 13,535 | 392,244 |
| Class C | | 27,014 | 820,415 |
| Montauk Renewables, Inc. (a) | | 22,432 | 149,173 |
| Ormat Technologies, Inc. | | 17,937 | 1,539,174 |
| Sunnova Energy International, Inc. (a)(b) | | 32,594 | 585,388 |
| The AES Corp. | | 226,807 | 5,366,254 |
| Vistra Corp. | | 127,861 | 3,050,763 |
| | | | 11,978,743 |
| Multi-Utilities - 0.8% | | | |
| Ameren Corp. | | 88,302 | 7,856,229 |
| Avista Corp. | | 25,503 | 1,123,917 |
| Black Hills Corp. | | 22,434 | 1,464,716 |
| CenterPoint Energy, Inc. | | 215,134 | 6,555,133 |
| CMS Energy Corp. | | 99,879 | 6,218,467 |
| Consolidated Edison, Inc. | | 121,100 | 11,924,717 |
| Dominion Energy, Inc. | | 284,862 | 16,277,015 |
| DTE Energy Co. | | 66,256 | 7,447,837 |
| NiSource, Inc. | | 139,532 | 3,971,081 |
| NorthWestern Energy Corp. | | 19,135 | 1,121,694 |
| Public Service Enterprise Group, Inc. | | 170,486 | 10,774,715 |
| Sempra Energy | | 107,307 | 16,685,165 |
| Unitil Corp. | | 6,178 | 343,435 |
| WEC Energy Group, Inc. | | 107,695 | 10,357,028 |
| | | | 102,121,149 |
| Water Utilities - 0.1% | | | |
| American States Water Co. | | 12,403 | 1,100,766 |
| American Water Works Co., Inc. | | 65,913 | 9,771,602 |
| Artesian Resources Corp. Class A | | 2,810 | 153,932 |
| California Water Service Group | | 18,351 | 1,029,124 |
| Consolidated Water Co., Inc. | | 4,952 | 83,689 |
| Essential Utilities, Inc. | | 81,816 | 3,493,543 |
| Middlesex Water Co. | | 6,307 | 460,285 |
| SJW Group | | 9,183 | 697,173 |
| York Water Co. | | 4,485 | 188,549 |
| | | | 16,978,663 |
TOTAL UTILITIES | | | 384,285,813 |
| TOTAL COMMON STOCKS (Cost $11,886,313,430) | | | 13,886,357,021 |
| | | | |
| U.S. Treasury Obligations - 0.0% |
| | | Principal Amount (e) | Value ($) |
U.S. Treasury Bills, yield at date of purchase 4.65% 6/29/23 (f) (Cost $1,786,541) | | 1,800,000 | 1,785,504 |
| | | | |
| Money Market Funds - 1.4% |
| | | Shares | Value ($) |
| Fidelity Cash Central Fund 4.88% (g) | | 34,180,153 | 34,186,989 |
| Fidelity Securities Lending Cash Central Fund 4.88% (g)(h) | | 156,531,333 | 156,546,986 |
| TOTAL MONEY MARKET FUNDS (Cost $190,733,975) | | | 190,733,975 |
| | | | |
| TOTAL INVESTMENT IN SECURITIES - 101.0% (Cost $12,078,833,946) | 14,078,876,500 |
NET OTHER ASSETS (LIABILITIES) - (1.0)% | (139,450,393) |
| NET ASSETS - 100.0% | 13,939,426,107 |
| | |
| Futures Contracts |
| | Number of contracts | Expiration Date | Notional Amount ($) | Value ($) | Unrealized Appreciation/ (Depreciation) ($) |
| Purchased | | | | | |
| | | | | | |
| Equity Index Contracts | | | | | |
| CME E-mini Russell 2000 Index Contracts (United States) | 50 | Jun 2023 | 4,437,000 | 59,984 | 59,984 |
| CME E-mini S&P 500 Index Contracts (United States) | 221 | Jun 2023 | 46,282,925 | 2,070,695 | 2,070,695 |
| CME E-mini S&P MidCap 400 Index Contracts (United States) | 9 | Jun 2023 | 2,250,540 | 70,439 | 70,439 |
| | | | | | |
| TOTAL FUTURES CONTRACTS | | | | | 2,201,118 |
| The notional amount of futures purchased as a percentage of Net Assets is 0.3% |
Legend
| (b) | Security or a portion of the security is on loan at period end. |
| (d) | Security exempt from registration under Rule 144A of the Securities Act of 1933. These securities may be resold in transactions exempt from registration, normally to qualified institutional buyers. At the end of the period, the value of these securities amounted to $1,763,504 or 0.0% of net assets. |
| (e) | Amount is stated in United States dollars unless otherwise noted. |
| (f) | Security or a portion of the security was pledged to cover margin requirements for futures contracts. At period end, the value of securities pledged amounted to $1,785,504. |
| (g) | Affiliated fund that is generally available only to investment companies and other accounts managed by Fidelity Investments. The rate quoted is the annualized seven-day yield of the fund at period end. A complete unaudited listing of the fund's holdings as of its most recent quarter end is available upon request. In addition, each Fidelity Central Fund's financial statements are available on the SEC's website or upon request. |
| (h) | Investment made with cash collateral received from securities on loan. |
Affiliated Central Funds
Fiscal year to date information regarding the Fund's investments in Fidelity Central Funds, including the ownership percentage, is presented below.
| Affiliate | Value, beginning of period ($) | Purchases ($) | Sales Proceeds ($) | Dividend Income ($) | Realized Gain (loss) ($) | Change in Unrealized appreciation (depreciation) ($) | Value, end of period ($) | % ownership, end of period |
| Fidelity Cash Central Fund 4.88% | 44,219,120 | 742,729,277 | 752,761,408 | 903,071 | - | - | 34,186,989 | 0.1% |
| Fidelity Securities Lending Cash Central Fund 4.88% | 177,970,692 | 236,938,869 | 258,362,575 | 1,366,530 | - | - | 156,546,986 | 0.5% |
| Total | 222,189,812 | 979,668,146 | 1,011,123,983 | 2,269,601 | - | - | 190,733,975 | |
| | | | | | | | | |
Amounts in the dividend income column in the above table include any capital gain distributions from underlying funds, which are presented in the corresponding line item in the Statement of Operations, if applicable.
Amounts in the dividend income column for Fidelity Securities Lending Cash Central Fund represents the income earned on investing cash collateral, less rebates paid to borrowers and any lending agent fees associated with the loan, plus any premium payments received for lending certain types of securities.
Amounts included in the purchases and sales proceeds columns may include in-kind transactions, if applicable.
Investment Valuation
The following is a summary of the inputs used, as of April 30, 2023, involving the Fund's assets and liabilities carried at fair value. The inputs or methodology used for valuing securities may not be an indication of the risk associated with investing in those securities. For more information on valuation inputs, and their aggregation into the levels used below, please refer to the Investment Valuation section in the accompanying Notes to Financial Statements.
| Valuation Inputs at Reporting Date: |
| Description | Total ($) | Level 1 ($) | Level 2 ($) | Level 3 ($) |
Investments in Securities: | | | | |
|
| Equities: | | | | |
Communication Services | 1,066,140,477 | 1,066,140,477 | - | - |
Consumer Discretionary | 1,422,721,966 | 1,421,181,907 | 1,540,059 | - |
Consumer Staples | 935,718,261 | 935,718,260 | 1 | - |
Energy | 646,868,397 | 646,868,397 | - | - |
Financials | 1,875,712,951 | 1,875,712,951 | - | - |
Health Care | 1,980,255,700 | 1,980,063,154 | 156,345 | 36,201 |
Industrials | 1,347,030,497 | 1,347,030,497 | - | - |
Information Technology | 3,402,698,674 | 3,402,254,741 | 443,933 | - |
Materials | 396,662,328 | 396,662,328 | - | - |
Real Estate | 428,261,957 | 428,261,957 | - | - |
Utilities | 384,285,813 | 384,285,813 | - | - |
|
| U.S. Government and Government Agency Obligations | 1,785,504 | - | 1,785,504 | - |
|
| Money Market Funds | 190,733,975 | 190,733,975 | - | - |
| Total Investments in Securities: | 14,078,876,500 | 14,074,914,457 | 3,925,842 | 36,201 |
Derivative Instruments: | | | | |
|
| Assets | | | | |
Futures Contracts | 2,201,118 | 2,201,118 | - | - |
| Total Assets | 2,201,118 | 2,201,118 | - | - |
| Total Derivative Instruments: | 2,201,118 | 2,201,118 | - | - |
Value of Derivative Instruments
The following table is a summary of the Fund's value of derivative instruments by primary risk exposure as of April 30, 2023. For additional information on derivative instruments, please refer to the Derivative Instruments section in the accompanying Notes to Financial Statements.
Primary Risk Exposure / Derivative Type | Value |
| Asset ($) | Liability ($) |
| Equity Risk | | |
Futures Contracts (a) | 2,201,118 | 0 |
| Total Equity Risk | 2,201,118 | 0 |
| Total Value of Derivatives | 2,201,118 | 0 |
(a)Reflects gross cumulative appreciation (depreciation) on futures contracts as presented in the Schedule of Investments. In the Statement of Assets and Liabilities, the period end daily variation margin is included in receivable or payable for daily variation margin on futures contracts, and the net cumulative appreciation (depreciation) is included in Total accumulated earnings (loss).
Fidelity ZERO® Total Market Index Fund
| Statement of Assets and Liabilities |
| | | | April 30, 2023 (Unaudited) |
| | | | | |
| Assets | | | | |
| Investment in securities, at value (including securities loaned of $151,651,383) - See accompanying schedule: | | | | |
Unaffiliated issuers (cost $11,888,099,971) | $ | 13,888,142,525 | | |
Fidelity Central Funds (cost $190,733,975) | | 190,733,975 | | |
| | | | | |
| | | | | |
| Total Investment in Securities (cost $12,078,833,946) | | | $ | 14,078,876,500 |
| Segregated cash with brokers for derivative instruments | | | | 1,145,109 |
| Cash | | | | 952,683 |
| Receivable for investments sold | | | | 63,574 |
| Receivable for fund shares sold | | | | 10,418,409 |
| Dividends receivable | | | | 10,225,738 |
| Distributions receivable from Fidelity Central Funds | | | | 457,797 |
| Receivable for daily variation margin on futures contracts | | | | 384,927 |
| Other receivables | | | | 18,385 |
Total assets | | | | 14,102,543,122 |
| Liabilities | | | | |
| Payable to custodian bank | $ | 18,935 | | |
| Payable for fund shares redeemed | | 6,552,152 | | |
| Other payables and accrued expenses | | 374 | | |
| Collateral on securities loaned | | 156,545,554 | | |
| Total Liabilities | | | | 163,117,015 |
| Net Assets | | | $ | 13,939,426,107 |
| Net Assets consist of: | | | | |
| Paid in capital | | | $ | 12,000,034,776 |
| Total accumulated earnings (loss) | | | | 1,939,391,331 |
| Net Assets | | | $ | 13,939,426,107 |
Net Asset Value , offering price and redemption price per share ($13,939,426,107 ÷ 963,474,602 shares) | | | $ | 14.47 |
| Statement of Operations |
| | | | Six months ended April 30, 2023 (Unaudited) |
| Investment Income | | | | |
| Dividends | | | $ | 108,132,003 |
| Interest | | | | 51,788 |
| Income from Fidelity Central Funds (including $1,366,530 from security lending) | | | | 2,269,601 |
| Total Income | | | | 110,453,392 |
| Expenses | | | | |
| Independent trustees' fees and expenses | $ | 39,677 | | |
| Total expenses before reductions | | 39,677 | | |
| Expense reductions | | (7,125) | | |
| Total expenses after reductions | | | | 32,552 |
| Net Investment income (loss) | | | | 110,420,840 |
| Realized and Unrealized Gain (Loss) | | | | |
| Net realized gain (loss) on: | | | | |
| Investment Securities: | | | | |
| Unaffiliated issuers | | (43,867,613) | | |
| Foreign currency transactions | | 4,121 | | |
| Futures contracts | | 2,755,130 | | |
| Total net realized gain (loss) | | | | (41,108,362) |
| Change in net unrealized appreciation (depreciation) on: | | | | |
| Investment Securities: | | | | |
| Unaffiliated issuers | | 868,230,720 | | |
| Assets and liabilities in foreign currencies | | (123) | | |
| Futures contracts | | (451,510) | | |
| Total change in net unrealized appreciation (depreciation) | | | | 867,779,087 |
| Net gain (loss) | | | | 826,670,725 |
| Net increase (decrease) in net assets resulting from operations | | | $ | 937,091,565 |
| Statement of Changes in Net Assets |
| |
| | Six months ended April 30, 2023 (Unaudited) | | Year ended October 31, 2022 |
| Increase (Decrease) in Net Assets | | | | |
| Operations | | | | |
| Net investment income (loss) | $ | 110,420,840 | $ | 186,251,470 |
| Net realized gain (loss) | | (41,108,362) | | (45,093,139) |
| Change in net unrealized appreciation (depreciation) | | 867,779,087 | | (2,406,552,025) |
| Net increase (decrease) in net assets resulting from operations | | 937,091,565 | | (2,265,393,694) |
| Distributions to shareholders | | (189,994,752) | | (159,713,565) |
| Share transactions | | | | |
| Proceeds from sales of shares | | 1,583,197,283 | | 3,946,563,316 |
| Reinvestment of distributions | | 170,606,494 | | 148,391,780 |
| Cost of shares redeemed | | (789,242,411) | | (1,739,585,103) |
Net increase (decrease) in net assets resulting from share transactions | | 964,561,366 | | 2,355,369,993 |
| Total increase (decrease) in net assets | | 1,711,658,179 | | (69,737,266) |
| | | | | |
| Net Assets | | | | |
| Beginning of period | | 12,227,767,928 | | 12,297,505,194 |
| End of period | $ | 13,939,426,107 | $ | 12,227,767,928 |
| | | | | |
| Other Information | | | | |
| Shares | | | | |
| Sold | | 113,335,675 | | 260,748,573 |
| Issued in reinvestment of distributions | | 12,741,337 | | 9,274,532 |
| Redeemed | | (56,663,466) | | (117,256,805) |
| Net increase (decrease) | | 69,413,546 | | 152,766,300 |
| | | | | |
Financial Highlights
| Fidelity ZERO® Total Market Index Fund |
| |
| | Six months ended (Unaudited) April 30, 2023 | | Years ended October 31, 2022 | | 2021 | | 2020 | | 2019 | | 2018 A |
Selected Per-Share Data | | | | | | | | | | | | |
| Net asset value, beginning of period | $ | 13.68 | $ | 16.59 | $ | 11.67 | $ | 10.78 | $ | 9.56 | $ | 10.00 |
| Income from Investment Operations | | | | | | | | | | | | |
Net investment income (loss) B,C | | .12 | | .22 | | .20 | | .20 | | .19 | | .04 |
| Net realized and unrealized gain (loss) | | .88 | | (2.92) | | 4.89 | | .86 | | 1.10 | | (.48) |
| Total from investment operations | | 1.00 | | (2.70) | | 5.09 | | 1.06 | | 1.29 | | (.44) |
| Distributions from net investment income | | (.21) | | (.18) | | (.17) | | (.16) | | (.06) | | - |
| Distributions from net realized gain | | - | | (.03) | | - | | (.01) | | (.01) | | - |
| Total distributions | | (.21) | | (.21) | | (.17) | | (.17) | | (.07) | | - |
| Net asset value, end of period | $ | 14.47 | $ | 13.68 | $ | 16.59 | $ | 11.67 | $ | 10.78 | $ | 9.56 |
Total Return D,E | | 7.43% | | (16.46)% | | 44.00% | | 9.92% | | 13.57% | | (4.40)% |
Ratios to Average Net Assets C,F,G | | | | | | | | | | | | |
Expenses before reductions H | | -% I | | -% | | -% | | -% | | -% | | -% I |
Expenses net of fee waivers, if any H | | -% I | | -% | | -% | | -% | | -% | | -% I |
Expenses net of all reductions H | | -% I | | -% | | -% | | -% | | -% | | -% I |
| Net investment income (loss) | | 1.70% I | | 1.50% | | 1.37% | | 1.79% | | 1.91% | | 1.61% I |
| Supplemental Data | | | | | | | | | | | | |
| Net assets, end of period (000 omitted) | $ | 13,939,426 | $ | 12,227,768 | $ | 12,297,505 | $ | 6,053,570 | $ | 4,168,884 | $ | 1,364,146 |
Portfolio turnover rate J | | 2% I | | 3% | | 4% K | | 6% | | 3% | | -% L,M |
A For the period August 2, 2018 (commencement of operations) through October 31, 2018.
B Calculated based on average shares outstanding during the period.
C Net investment income (loss) is affected by the timing of the declaration of dividends by any underlying mutual funds or exchange-traded funds (ETFs). Net investment income (loss) of any mutual funds or ETFs is not included in the Fund's net investment income (loss) ratio.
D Total returns for periods of less than one year are not annualized.
E Total returns would have been lower if certain expenses had not been reduced during the applicable periods shown.
F Fees and expenses of any underlying mutual funds or exchange-traded funds (ETFs) are not included in the Fund's expense ratio. The Fund indirectly bears its proportionate share of these expenses. For additional expense information related to investments in Fidelity Central Funds, please refer to the "Investments in Fidelity Central Funds" note found in the Notes to Financial Statements section of the most recent Annual or Semi-Annual report.
G Expense ratios reflect operating expenses of the class. Expenses before reductions do not reflect amounts reimbursed, waived, or reduced through arrangements with the investment adviser, brokerage services, or other offset arrangements, if applicable, and do not represent the amount paid by the class during periods when reimbursements, waivers or reductions occur.
H Amount represents less than .005%.
I Annualized.
J Amount does not include the portfolio activity of any underlying mutual funds or exchange-traded funds (ETFs).
K Portfolio turnover rate excludes securities received or delivered in-kind.
L Amount not annualized.
M Amount represents less than 1%.
For the period ended April 30, 2023
1. Organization.
Fidelity ZERO Extended Market Index Fund, Fidelity ZERO International Index Fund, Fidelity ZERO Large Cap Index Fund and Fidelity ZERO Total Market Index Fund are funds of Fidelity Concord Street Trust (the Trust). The Trust is registered under the Investment Company Act of 1940, as amended (the 1940 Act), as an open-end management investment company organized as a Massachusetts business trust. Each Fund is authorized to issue an unlimited number of shares. Investments in emerging markets, if applicable, can be subject to social, economic, regulatory, and political uncertainties and can be extremely volatile.
2. Investments in Fidelity Central Funds.
Funds may invest in Fidelity Central Funds, which are open-end investment companies generally available only to other investment companies and accounts managed by the investment adviser and its affiliates. The Schedule of Investments lists any Fidelity Central Funds held as an investment as of period end, but does not include the underlying holdings of each Fidelity Central Fund. An investing fund indirectly bears its proportionate share of the expenses of the underlying Fidelity Central Funds.
Based on its investment objective, each Fidelity Central Fund may invest or participate in various investment vehicles or strategies that are similar to those of the investing fund. These strategies are consistent with the investment objectives of the investing fund and may involve certain economic risks which may cause a decline in value of each of the Fidelity Central Funds and thus a decline in the value of the investing fund.
| Fidelity Central Fund | Investment Manager | Investment Objective | Investment Practices | Expense Ratio A |
| Fidelity Money Market Central Funds | Fidelity Management & Research Company LLC (FMR) | Each fund seeks to obtain a high level of current income consistent with the preservation of capital and liquidity. | Short-term Investments | Less than .005% |
A Expenses expressed as a percentage of average net assets and are as of each underlying Central Fund's most recent annual or semi-annual shareholder report.
A complete unaudited list of holdings for each Fidelity Central Fund is available upon request or at the Securities and Exchange Commission website at www.sec.gov. In addition, the financial statements of the Fidelity Central Funds which contain the significant accounting policies (including investment valuation policies) of those funds, and are not covered by the Report of Independent Registered Public Accounting Firm, are available on the Securities and Exchange Commission website or upon request.
3. Significant Accounting Policies.
Each Fund is an investment company and applies the accounting and reporting guidance of the Financial Accounting Standards Board (FASB) Accounting Standards Codification Topic 946 Financial Services - Investment Companies . The financial statements have been prepared in conformity with accounting principles generally accepted in the United States of America (GAAP), which require management to make certain estimates and assumptions at the date of the financial statements. Actual results could differ from those estimates. Subsequent events, if any, through the date that the financial statements were issued have been evaluated in the preparation of the financial statements. Each Fund's Schedule of Investments lists any underlying mutual funds or exchange-traded funds (ETFs) but does not include the underlying holdings of these funds. The following summarizes the significant accounting policies of each Fund:
Investment Valuation. Investments are valued as of 4:00 p.m. Eastern time on the last calendar day of the period. The Board of Trustees (the Board) has designated each Fund's investment adviser as the valuation designee responsible for the fair valuation function and performing fair value determinations as needed. The investment adviser has established a Fair Value Committee (the Committee) to carry out the day-to-day fair valuation responsibilities and has adopted policies and procedures to govern the fair valuation process and the activities of the Committee. In accordance with these fair valuation policies and procedures, which have been approved by the Board, each Fund attempts to obtain prices from one or more third party pricing services or brokers to value its investments. When current market prices, quotations or currency exchange rates are not readily available or reliable, investments will be fair valued in good faith by the Committee, in accordance with the policies and procedures. Factors used in determining fair value vary by investment type and may include market or investment specific events, transaction data, estimated cash flows, and market observations of comparable investments. The frequency that the fair valuation procedures are used cannot be predicted and they may be utilized to a significant extent. The Committee manages each Fund's fair valuation practices and maintains the fair valuation policies and procedures. Each Fund's investment adviser reports to the Board information regarding the fair valuation process and related material matters.
Each Fund categorizes the inputs to valuation techniques used to value its investments into a disclosure hierarchy consisting of three levels as shown below:
Level 1 - unadjusted quoted prices in active markets for identical investments
Level 2 - other significant observable inputs (including quoted prices for similar investments, interest rates, prepayment speeds, etc.)
Level 3 - unobservable inputs (including the Fund's own assumptions based on the best information available)
Valuation techniques used to value each Fund's investments by major category are as follows:
Equity securities, including restricted securities, for which market quotations are readily available, are valued at the last reported sale price or official closing price as reported by a third party pricing service on the primary market or exchange on which they are traded and are categorized as Level 1 in the hierarchy. In the event there were no sales during the day or closing prices are not available, securities are valued at the last quoted bid price or may be valued using the last available price and are generally categorized as Level 2 in the hierarchy. For foreign equity securities, when market or security specific events arise, comparisons to the valuation of American Depositary Receipts (ADRs), futures contracts, ETFs and certain indexes as well as quoted prices for similar securities may be used and would be categorized as Level 2 in the hierarchy. For equity securities, including restricted securities, where observable inputs are limited, assumptions about market activity and risk are used and these securities may be categorized as Level 3 in the hierarchy.
Debt securities, including restricted securities, are valued based on evaluated prices received from third party pricing services or from brokers who make markets in such securities. U.S. government and government agency obligations are valued by pricing services who utilize matrix pricing which considers yield or price of bonds of comparable quality, coupon, maturity and type or by broker-supplied prices. When independent prices are unavailable or unreliable, debt securities may be valued utilizing pricing methodologies which consider similar factors that would be used by third party pricing services. Debt securities are generally categorized as Level 2 in the hierarchy but may be Level 3 depending on the circumstances.
Futures contracts are valued at the settlement price established each day by the board of trade or exchange on which they are traded and are categorized as Level 1 in the hierarchy. Investments in open-end mutual funds, including the Fidelity Central Funds, are valued at their closing net asset value (NAV) each business day and are categorized as Level 1 in the hierarchy.
Changes in valuation techniques may result in transfers in or out of an assigned level within the disclosure hierarchy. The aggregate value of investments by input level as of April 30, 2023 is included at the end of each Fund's Schedule of Investments.
Foreign Currency. Certain Funds may use foreign currency contracts to facilitate transactions in foreign-denominated securities. Gains and losses from these transactions may arise from changes in the value of the foreign currency or if the counterparties do not perform under the contracts' terms.
Foreign-denominated assets, including investment securities, and liabilities are translated into U.S. dollars at the exchange rates at period end. Purchases and sales of investment securities, income and dividends received, and expenses denominated in foreign currencies are translated into U.S. dollars at the exchange rate in effect on the transaction date.
The effects of exchange rate fluctuations on investments are included with the net realized and unrealized gain (loss) on investment securities. Other foreign currency transactions resulting in realized and unrealized gain (loss) are disclosed separately.
Investment Transactions and Income. For financial reporting purposes, the Funds' investment holdings and NAV include trades executed through the end of the last business day of the period. The NAV per share for processing shareholder transactions is calculated as of the close of business of the New York Stock Exchange (NYSE), normally 4:00 p.m. Eastern time and includes trades executed through the end of the prior business day. Gains and losses on securities sold are determined on the basis of identified cost and for certain Funds include proceeds received from litigation. Commissions paid to certain brokers with whom the investment adviser, or its affiliates, places trades on behalf of a fund include an amount in addition to trade execution, which may be rebated back to a fund. Any such rebates are included in net realized gain (loss) on investments in the Statement of Operations. Dividend income is recorded on the ex-dividend date, except for certain dividends from foreign securities where the ex-dividend date may have passed, which are recorded as soon as the Funds are informed of the ex-dividend date. Non-cash dividends included in dividend income, if any, are recorded at the fair market value of the securities received. Income and capital gain distributions from Fidelity Central Funds, if any, are recorded on the ex-dividend date. Certain distributions received by the Funds represent a return of capital or capital gain. The Funds determine the components of these distributions subsequent to the ex-dividend date, based upon receipt of tax filings or other correspondence relating to the underlying investment. These distributions are recorded as a reduction of cost of investments and/or as a realized gain. Interest income is accrued as earned and includes coupon interest and amortization of premium and accretion of discount on debt securities as applicable. Investment income is recorded net of foreign taxes withheld where recovery of such taxes is uncertain. Funds may file withholding tax reclaims in certain jurisdictions to recover a portion of amounts previously withheld. Any withholding tax reclaims income is included in the Statement of Operations in foreign taxes withheld. Any receivables for withholding tax reclaims are included in the Statement of Assets and Liabilities in dividends receivable or reclaims receivable, as applicable.
Expenses. Expenses directly attributable to a fund are charged to that fund. Expenses attributable to more than one fund are allocated among the respective funds on the basis of relative net assets or other appropriate methods. Expenses included in the accompanying financial statements reflect the expenses of that fund and do not include any expenses associated with any underlying mutual funds or exchange-traded funds. Although not included in a fund's expenses, a fund indirectly bears its proportionate share of these expenses through the net asset value of each underlying mutual fund or exchange-traded fund. Expense estimates are accrued in the period to which they relate and adjustments are made when actual amounts are known.
Income Tax Information and Distributions to Shareholders. Each year, each Fund intends to qualify as a regulated investment company under Subchapter M of the Internal Revenue Code, including distributing substantially all of its taxable income and realized gains. As a result, no provision for U.S. Federal income taxes is required. Each Fund files a U.S. federal tax return, in addition to state and local tax returns as required. Each Fund's federal income tax returns are subject to examination by the Internal Revenue Service (IRS) for a period of three fiscal years after they are filed. State and local tax returns may be subject to examination for an additional fiscal year depending on the jurisdiction. Foreign taxes are provided for based on each Fund's understanding of the tax rules and rates that exist in the foreign markets in which it invests. Fidelity ZERO International Index Fund is subject to a tax imposed on capital gains by certain countries in which it invests. An estimated deferred tax liability for net unrealized appreciation on the applicable securities is included in Other payables and accrued expenses or Deferred taxes on the Statement of Assets & Liabilities.
Distributions are declared and recorded on the ex-dividend date. Income and capital gain distributions are determined in accordance with income tax regulations, which may differ from GAAP.
Capital accounts within the financial statements are adjusted for permanent book-tax differences. These adjustments have no impact on net assets or the results of operations. Capital accounts are not adjusted for temporary book-tax differences which will reverse in a subsequent period.
Book-tax differences are primarily due to futures contracts, foreign currency transactions, certain foreign taxes, passive foreign investment companies (PFIC), redemptions in-kind, partnerships, capital loss carryforwards and losses deferred due to wash sales.
As of period end, the cost and unrealized appreciation (depreciation) in securities, and derivatives if applicable, for federal income tax purposes were as follows for each Fund:
| | Tax cost | Gross unrealized appreciation | Gross unrealized depreciation | Net unrealized appreciation (depreciation) |
Fidelity ZERO Extended Market Index Fund | $1,517,071,741 | $209,608,190 | $ (289,336,792) | $ (79,728,602) |
| Fidelity ZERO International Index Fund | 3,205,296,945 | 494,904,958 | (386,412,082) | 108,492,876 |
| Fidelity ZERO Large Cap Index Fund | 5,140,397,733 | 1,274,305,674 | (472,621,313) | 801,684,361 |
| Fidelity ZERO Total Market Index Fund | 12,170,250,752 | 3,239,218,973 | (1,328,392,107) | 1,910,826,866 |
Capital loss carryforwards are only available to offset future capital gains of the Funds to the extent provided by regulations and may be limited. The capital loss carryforward information presented below, including any applicable limitation, is estimated as of prior fiscal period end and is subject to adjustment.
| | Short-term | Long-term | Total capital loss carryforward |
Fidelity ZERO Extended Market Index Fund | $(7,367,005) | $- | $(7,367,005) |
| Fidelity ZERO International Index Fund | (28,666,838) | (41,247,980) | (69,914,818) |
| Fidelity ZERO Large Cap Index Fund | (11,000,641) | (20,093,388) | (31,094,029) |
| Fidelity ZERO Total Market Index Fund | (4,350,413) | - | (4,350,413) |
| | | | |
Delayed Delivery Transactions and When-Issued Securities. During the period, certain Funds transacted in securities on a delayed delivery or when-issued basis. Payment and delivery may take place after the customary settlement period for that security. The price of the underlying securities and the date when the securities will be delivered and paid for are fixed at the time the transaction is negotiated. Securities purchased on a delayed delivery or when-issued basis are identified as such in the Schedule of Investments. Compensation for interest forgone in the purchase of a delayed delivery or when-issued debt security may be received. With respect to purchase commitments, each applicable Fund identifies securities as segregated in its records with a value at least equal to the amount of the commitment. Payables and receivables associated with the purchases and sales of delayed delivery securities having the same coupon, settlement date and broker are offset. Delayed delivery or when-issued securities that have been purchased from and sold to different brokers are reflected as both payables and receivables in the Statement of Assets and Liabilities under the caption "Delayed delivery", as applicable. Losses may arise due to changes in the value of the underlying securities or if the counterparty does not perform under the contract's terms, or if the issuer does not issue the securities due to political, economic, or other factors.
Restricted Securities (including Private Placements). Funds may invest in securities that are subject to legal or contractual restrictions on resale. These securities generally may be resold in transactions exempt from registration or to the public if the securities are registered. Disposal of these securities may involve time-consuming negotiations and expense, and prompt sale at an acceptable price may be difficult. Information regarding restricted securities held at period end is included at the end of the Schedule of Investments, if applicable.
4. Derivative Instruments.
Risk Exposures and the Use of Derivative Instruments. Each Fund's investment objectives allow for various types of derivative instruments, including futures contracts. Derivatives are investments whose value is primarily derived from underlying assets, indices or reference rates and may be transacted on an exchange or over-the-counter (OTC). Derivatives may involve a future commitment to buy or sell a specified asset based on specified terms, to exchange future cash flows at periodic intervals based on a notional principal amount, or for one party to make one or more payments upon the occurrence of specified events in exchange for periodic payments from the other party.
Derivatives were used to increase returns and to manage exposure to certain risks as defined below. The success of any strategy involving derivatives depends on analysis of numerous economic factors, and if the strategies for investment do not work as intended, the objectives may not be achieved.
Derivatives were used to increase or decrease exposure to the following risk(s):
| | |
| Equity Risk | Equity risk relates to the fluctuations in the value of financial instruments as a result of changes in market prices (other than those arising from interest rate risk or foreign exchange risk), whether caused by factors specific to an individual investment, its issuer, or all factors affecting all instruments traded in a market or market segment. |
Funds are also exposed to additional risks from investing in derivatives, such as liquidity risk and counterparty credit risk. Liquidity risk is the risk that a fund will be unable to close out the derivative in the open market in a timely manner. Counterparty credit risk is the risk that the counterparty will not be able to fulfill its obligation to a fund. Counterparty credit risk related to exchange-traded contracts may be mitigated by the protection provided by the exchange on which they trade.
Investing in derivatives may involve greater risks than investing in the underlying assets directly and, to varying degrees, may involve risk of loss in excess of any initial investment and collateral received and amounts recognized in the Statement of Assets and Liabilities. In addition, there may be the risk that the change in value of the derivative contract does not correspond to the change in value of the underlying instrument.
Futures Contracts. A futures contract is an agreement between two parties to buy or sell a specified underlying instrument for a fixed price at a specified future date. Futures contracts were used to manage exposure to the stock market.
Upon entering into a futures contract, a fund is required to deposit either cash or securities (initial margin) with a clearing broker in an amount equal to a certain percentage of the face value of the contract. Futures contracts are marked-to-market daily and subsequent daily payments are made or received by a fund depending on the daily fluctuations in the value of the futures contracts and are recorded as unrealized appreciation or (depreciation). This receivable and/or payable, if any, is included in daily variation margin on futures contracts in the Statement of Assets and Liabilities. Realized gain or (loss) is recorded upon the expiration or closing of a futures contract. The net realized gain (loss) and change in net unrealized appreciation (depreciation) on futures contracts during the period is presented in the Statement of Operations.
Any open futures contracts at period end are presented in the Schedule of Investments under the caption "Futures Contracts". The notional amount at value reflects each contract's exposure to the underlying instrument or index at period end, and is representative of volume of activity during the period unless an average notional amount is presented. Any securities deposited to meet initial margin requirements are identified in the Schedule of Investments. Any cash deposited to meet initial margin requirements is presented as segregated cash with brokers for derivative instruments in the Statement of Assets and Liabilities.
5. Purchases and Sales of Investments.
Purchases and sales of securities, other than short-term securities, U.S. government securities and in-kind transactions, as applicable, are noted in the table below.
| | Purchases ($) | Sales ($) |
| Fidelity ZERO Extended Market Index Fund | 158,687,345 | 46,841,856 |
| Fidelity ZERO International Index Fund | 259,642,463 | 113,692,433 |
| Fidelity ZERO Large Cap Index Fund | 310,272,072 | 84,107,297 |
| Fidelity ZERO Total Market Index Fund | 1,058,283,631 | 140,781,910 |
Unaffiliated Redemptions In-Kind. Shares that were redeemed in-kind for investments, including accrued interest and cash, if any, are shown in the table below. The net realized gain or loss on investments delivered through in-kind redemptions is included in the "Net realized gain (loss) on: Redemptions in-kind" line in the accompanying Statement of Operations. The amount of the in-kind redemptions is included in share transactions in the accompanying Statement of Changes in Net Assets. There was no gain or loss for federal income tax purposes.
| | Shares | Total net realized gain or loss ($) | Total Proceeds ($) |
| Fidelity ZERO Extended Market Index Fund | 4,587,156 | 20,340,688 | 49,724,771 |
Prior Fiscal Year Unaffiliated Redemptions In-Kind. Shares that were redeemed in-kind for investments, including accrued interest and cash, if any, are shown in the table below; along with realized gain or loss on investments delivered through in-kind redemptions. The amount of the in-kind redemptions is included in share transactions in the accompanying Statement of Changes in Net Assets. There was no gain or loss for federal income tax purposes.
| | Shares | Total net realized gain or loss ($) | Total Proceeds ($) |
| Fidelity ZERO Extended Market Index Fund | 4,184,100 | 26,774,624 | 50,502,092 |
6. Fees and Other Transactions with Affiliates.
Management Fee. Fidelity Management & Research Company LLC (the investment adviser) and its affiliates provide the Funds with investment management services for which the Funds do not pay a management fee. Under the management contract, the investment adviser or an affiliate pays all ordinary operating expenses of the Funds, except fees and expenses of the independent Trustees.
Sub-Adviser. Geode Capital Management, LLC (Geode), serves as sub-adviser for the Funds. Geode provides discretionary investment advisory services to the Funds and is paid by the investment adviser for providing these services.
Interfund Trades. Funds may purchase from or sell securities to other Fidelity Funds under procedures adopted by the Board. The procedures have been designed to ensure these interfund trades are executed in accordance with Rule 17a-7 of the 1940 Act. Any interfund trades are included within the respective purchases and sales amounts shown in the Purchases and Sales of Investments note. During the period, there were no interfund trades.
7. Committed Line of Credit.
Certain Funds participate with other funds managed by the investment adviser or an affiliate in a $4.25 billion credit facility (the "line of credit") to be utilized for temporary or emergency purposes to fund shareholder redemptions or for other short-term liquidity purposes. The commitment fees on the pro-rata portion of the line of credit are borne by the investment adviser. During the period, there were no borrowings on this line of credit.
8. Security Lending.
Funds lend portfolio securities from time to time in order to earn additional income. Lending agents are used, including National Financial Services (NFS), an affiliate of the investment adviser. Pursuant to a securities lending agreement, NFS will receive a fee, which is capped at 9.9% of a fund's daily lending revenue, for its services as lending agent. A fund may lend securities to certain qualified borrowers, including NFS. On the settlement date of the loan, a fund receives collateral (in the form of U.S. Treasury obligations, letters of credit and/or cash) against the loaned securities and maintains collateral in an amount not less than 100% of the market value of the loaned securities during the period of the loan. The market value of the loaned securities is determined at the close of business of a fund and any additional required collateral is delivered to a fund on the next business day. A fund or borrower may terminate the loan at any time, and if the borrower defaults on its obligation to return the securities loaned because of insolvency or other reasons, a fund may apply collateral received from the borrower against the obligation. A fund may experience delays and costs in recovering the securities loaned. Any cash collateral received is invested in the Fidelity Securities Lending Cash Central Fund. Any loaned securities are identified as such in the Schedule of Investments, and the value of loaned securities and cash collateral at period end, as applicable, are presented in the Statement of Assets and Liabilities. Security lending income represents the income earned on investing cash collateral, less rebates paid to borrowers and any lending agent fees associated with the loan, plus any premium payments received for lending certain types of securities. Security lending income is presented in the Statement of Operations as a component of income from Fidelity Central Funds. Affiliated security lending activity, if any, was as follows:
| | Total Security Lending Fees Paid to NFS | Security Lending Income From Securities Loaned to NFS | Value of Securities Loaned to NFS at Period End |
| Fidelity ZERO Extended Market Index Fund | $104,202 | $23,038 | $440,194 |
| Fidelity ZERO International Index Fund | $11,340 | $11 | $- |
| Fidelity ZERO Large Cap Index Fund | $6,155 | $1,854 | $- |
| Fidelity ZERO Total Market Index Fund | $148,877 | $29,529 | $598,483 |
9. Expense Reductions.
Through arrangements with each applicable Fund's custodian, credits realized as a result of certain uninvested cash balances were used to reduce each applicable Fund's expenses. All of the applicable expense reductions are noted in the table below.
| | Custodian credits |
Fidelity ZERO Extended Market Index Fund | $2,958 |
Fidelity ZERO International Index Fund | 9,999 |
Fidelity ZERO Large Cap Index Fund . | 1,407 |
Fidelity ZERO Total Market Index Fund | 7,125 |
10. Other.
A fund's organizational documents provide former and current trustees and officers with a limited indemnification against liabilities arising in connection with the performance of their duties to the fund. In the normal course of business, a fund may also enter into contracts that provide general indemnifications. A fund's maximum exposure under these arrangements is unknown as this would be dependent on future claims that may be made against a fund. The risk of material loss from such claims is considered remote.
11. Risk and Uncertainties.
Many factors affect a fund's performance. Developments that disrupt global economies and financial markets, such as pandemics, epidemics, outbreaks of infectious diseases, war, terrorism, and environmental disasters, may significantly affect a fund's investment performance. The effects of these developments to a fund will be impacted by the types of securities in which a fund invests, the financial condition, industry, economic sector, and geographic location of an issuer, and a fund's level of investment in the securities of that issuer. Significant concentrations in security types, issuers, industries, sectors, and geographic locations may magnify the factors that affect a fund's performance.
As a shareholder, you incur two types of costs: (1) transaction costs, which may include sales charges (loads) on purchase payments or redemption proceeds, as applicable and (2) ongoing costs, which generally include management fees, distribution and/or service (12b-1) fees and other Fund expenses. This Example is intended to help you understand your ongoing costs (in dollars) of investing in a fund and to compare these costs with the ongoing costs of investing in other mutual funds.
| The Example is based on an investment of $1,000 invested at the beginning of the period and held for the entire period (November 1, 2022 to April 30, 2023). |
Actual Expenses
The first line of the accompanying table provides information about actual account values and actual expenses. You may use the information in this line, together with the amount you invested, to estimate the expenses that you paid over the period. Simply divide your account value by $1,000.00 (for example, an $8,600 account value divided by $1,000.00 = 8.6), then multiply the result by the number in the first line for a class/Fund under the heading entitled "Expenses Paid During Period" to estimate the expenses you paid on your account during this period. If any fund is a shareholder of any underlying mutual funds or exchange-traded funds (ETFs) (the Underlying Funds), such fund indirectly bears its proportional share of the expenses of the Underlying Funds in addition to the direct expenses incurred presented in the table. These fees and expenses are not included in the annualized expense ratio used to calculate the expense estimate in the table below.
Hypothetical Example for Comparison Purposes
The second line of the accompanying table provides information about hypothetical account values and hypothetical expenses based on the actual expense ratio and an assumed rate of return of 5% per year before expenses, which is not the actual return. The hypothetical account values and expenses may not be used to estimate the actual ending account balance or expenses you paid for the period. You may use this information to compare the ongoing costs of investing in the Fund and other funds. To do so, compare this 5% hypothetical example with the 5% hypothetical examples that appear in the shareholder reports of the other funds. If any fund is a shareholder of any Underlying Funds, such fund indirectly bears its proportional share of the expenses of the Underlying Funds in addition to the direct expenses as presented in the table. These fees and expenses are not included in the annualized expense ratio used to calculate the expense estimate in the table below.
Please note that the expenses shown in the table are meant to highlight your ongoing costs only and do not reflect any transaction costs. Therefore, the second line of the table is useful in comparing ongoing costs only, and will not help you determine the relative total costs of owning different funds. In addition, if these transactional costs were included, your costs would have been higher.
| | | | | Annualized Expense Ratio- A | | Beginning Account Value November 1, 2022 | | Ending Account Value April 30, 2023 | | Expenses Paid During Period- C November 1, 2022 to April 30, 2023 |
| | | | | | | | | | |
| Fidelity ZERO® Extended Market Index Fund | | | | -%- D | | | | | | |
| Actual | | | | | | $ 1,000 | | $ 1,003.40 | | $- E |
Hypothetical- B | | | | | | $ 1,000 | | $ 1,024.79 | | $- E |
| | | | | | | | | | |
| Fidelity ZERO® International Index Fund | | | | -%- D | | | | | | |
| Actual | | | | | | $ 1,000 | | $ 1,209.50 | | $- E |
Hypothetical- B | | | | | | $ 1,000 | | $ 1,024.79 | | $- E |
| | | | | | | | | | |
| Fidelity ZERO® Large Cap Index Fund | | | | -%- D | | | | | | |
| Actual | | | | | | $ 1,000 | | $ 1,085.60 | | $- E |
Hypothetical- B | | | | | | $ 1,000 | | $ 1,024.79 | | $- E |
| | | | | | | | | | |
| Fidelity ZERO® Total Market Index Fund | | | | -%- D | | | | | | |
| Actual | | | | | | $ 1,000 | | $ 1,074.30 | | $- E |
Hypothetical- B | | | | | | $ 1,000 | | $ 1,024.79 | | $- E |
| |
A Annualized expense ratio reflects expenses net of applicable fee waivers.
B 5% return per year before expenses
C Expenses are equal to the annualized expense ratio, multiplied by the average account value over the period, multiplied by 181/ 365 (to reflect the one-half year period). The fees and expenses of any Underlying Funds are not included in each annualized expense ratio.
D Amount represents less than .005%.
E Amount represents less than $.005.
The Securities and Exchange Commission adopted Rule 22e-4 under the Investment Company Act of 1940 (the Liquidity Rule) to promote effective liquidity risk management throughout the open-end investment company industry, thereby reducing the risk that funds will be unable to meet their redemption obligations and mitigating dilution of the interests of fund shareholders.
The Funds have adopted and implemented a liquidity risk management program (the Program) reasonably designed to assess and manage each Fund's liquidity risk and to comply with the requirements of the Liquidity Rule. Each Fund's Board of Trustees (the Board) has designated each Fund's investment adviser as administrator of the Program. The Fidelity advisers have established a Liquidity Risk Management Committee (the LRM Committee) to manage the Program for each of the Fidelity Funds. The LRM Committee monitors the adequacy and effectiveness of implementation of the Program and on a periodic basis assesses each Fund's liquidity risk based on a variety of factors including (1) the Fund's investment strategy, (2) portfolio liquidity and cash flow projections during normal and reasonably foreseeable stressed conditions, (3) shareholder redemptions, (4) borrowings and other funding sources and (5) certain factor specific to ETFs including the effect of the Fund's prices and spreads, market participants, and basket compositions on the overall liquidity of the Fund's portfolio, as applicable.
In accordance with the Program, each of the Fund's portfolio investments is classified into one of four defined liquidity categories based on a determination of a reasonable expectation for how long it would take to convert the investment to cash (or sell or dispose of the investment) without significantly changing its market value.
- Highly liquid investments - cash or convertible to cash within three business days or less
- Moderately liquid investments - convertible to cash in three to seven calendar days
- Less liquid investments - can be sold or disposed of, but not settled, within seven calendar days
- Illiquid investments - cannot be sold or disposed of within seven calendar days
Liquidity classification determinations take into account a variety of factors including various market, trading and investment-specific considerations, as well as market depth, and generally utilize analysis from a third-party liquidity metrics service.
The Liquidity Rule places a 15% limit on a fund's illiquid investments and requires funds that do not primarily hold assets that are highly liquid investments to determine and maintain a minimum percentage of the fund's net assets to be invested in highly liquid investments (highly liquid investment minimum or HLIM). The Program includes provisions reasonably designed to comply with the 15% limit on illiquid investments and for determining, periodically reviewing and complying with the HLIM requirement as applicable.
At a recent meeting of the Fund's Board of Trustees, the LRM Committee provided a written report to the Board pertaining to the operation, adequacy, and effectiveness of the Program for the period December 1, 2021 through November 30, 2022. The report concluded that the Program is operating effectively and is reasonably designed to assess and manage the Fund's liquidity risk.
1.9891447.104
EML-SANN-0623
Fidelity® SAI Japan Stock Index Fund
Semi-Annual Report
April 30, 2023
Offered exclusively to certain clients of the Adviser, or its affiliates, including Strategic Advisers LLC (Strategic Advisers) - not available for sale to the general public. Fidelity ® SAI is a product name of Fidelity ® funds dedicated to certain programs affiliated with Strategic Advisers.
Contents
To view a fund's proxy voting guidelines and proxy voting record for the 12-month period ended June 30, visit http://www.fidelity.com/proxyvotingresults or visit the Securities and Exchange Commission's (SEC) web site at http://www.sec.gov.
You may also call 1-800-544-3455 to request a free copy of the proxy voting guidelines.
The funds or securities referred to herein are not sponsored, endorsed, or promoted by MSCI, and MSCI bears no liability with respect to any such funds or securities or any index on which such funds or securities are based. The prospectus contains a more detailed description of the limited relationship MSCI has with Fidelity and any related funds.
Standard & Poor's, S&P and S&P 500 are registered service marks of The McGraw-Hill Companies, Inc. and have been licensed for use by Fidelity Distributors Corporation.
Other third-party marks appearing herein are the property of their respective owners.
All other marks appearing herein are registered or unregistered trademarks or service marks of FMR LLC or an affiliated company. © 2023 FMR LLC. All rights reserved.
This report and the financial statements contained herein are submitted for the general information of the shareholders of the Fund. This report is not authorized for distribution to prospective investors in the Fund unless preceded or accompanied by an effective prospectus.
A fund files its complete schedule of portfolio holdings with the SEC for the first and third quarters of each fiscal year on Form N-PORT. Forms N-PORT are available on the SEC's web site at http://www.sec.gov. A fund's Forms N-PORT may be reviewed and copied at the SEC's Public Reference Room in Washington, DC. Information regarding the operation of the SEC's Public Reference Room may be obtained by calling 1-800-SEC-0330.
For a complete list of a fund's portfolio holdings, view the most recent holdings listing, semiannual report, or annual report on Fidelity's web site at http://www.fidelity.com, http://www.institutional.fidelity.com, or http://www.401k.com, as applicable.
NOT FDIC INSURED •MAY LOSE VALUE •NO BANK GUARANTEE
Neither the Fund nor Fidelity Distributors Corporation is a bank.
Top Holdings (% of Fund's net assets) |
| |
| Toyota Motor Corp. (Automobiles) | 4.3 | |
| Sony Group Corp. (Household Durables) | 3.4 | |
| Keyence Corp. (Electronic Equipment, Instruments & Components) | 2.6 | |
| Mitsubishi UFJ Financial Group, Inc. (Banks) | 2.2 | |
| Daiichi Sankyo Kabushiki Kaisha (Pharmaceuticals) | 1.8 | |
| Hitachi Ltd. (Industrial Conglomerates) | 1.6 | |
| Sumitomo Mitsui Financial Group, Inc. (Banks) | 1.6 | |
| Shin-Etsu Chemical Co. Ltd. (Chemicals) | 1.6 | |
| Tokyo Electron Ltd. (Semiconductors & Semiconductor Equipment) | 1.5 | |
| KDDI Corp. (Wireless Telecommunication Services) | 1.5 | |
| | 22.1 | |
| |
| Market Sectors (% of Fund's net assets) |
| |
| Industrials | 22.4 | |
| Consumer Discretionary | 18.1 | |
| Information Technology | 13.4 | |
| Financials | 11.2 | |
| Health Care | 9.3 | |
| Communication Services | 7.9 | |
| Consumer Staples | 6.9 | |
| Materials | 4.6 | |
| Real Estate | 3.1 | |
| Utilities | 1.0 | |
| Energy | 0.8 | |
| |
Asset Allocation (% of Fund's net assets) |
|
Futures - 1.3% |
|
Geographic Diversification (% of Fund's net assets) |
|
* Includes Short-Term investments and Net Other Assets (Liabilities). Percentages are adjusted for the effect of derivatives, if applicable. |
| |
Showing Percentage of Net Assets
| Common Stocks - 98.7% |
| | | Shares | Value ($) |
| COMMUNICATION SERVICES - 7.9% | | | |
| Diversified Telecommunication Services - 1.1% | | | |
| Nippon Telegraph & Telephone Corp. | | 330,600 | 10,087,921 |
| Entertainment - 2.4% | | | |
| Capcom Co. Ltd. | | 47,900 | 1,799,968 |
| Koei Tecmo Holdings Co. Ltd. | | 32,500 | 597,668 |
| Konami Group Corp. | | 25,800 | 1,269,463 |
| Nexon Co. Ltd. | | 131,800 | 2,977,409 |
| Nintendo Co. Ltd. | | 305,300 | 12,907,287 |
| Square Enix Holdings Co. Ltd. | | 23,700 | 1,166,257 |
| Toho Co. Ltd. | | 30,900 | 1,227,550 |
| | | | 21,945,602 |
| Interactive Media & Services - 0.2% | | | |
| Z Holdings Corp. | | 739,100 | 2,024,573 |
| Media - 0.4% | | | |
| CyberAgent, Inc. | | 118,900 | 1,037,593 |
| Dentsu Group, Inc. | | 56,000 | 2,017,951 |
| Hakuhodo DY Holdings, Inc. | | 64,600 | 761,204 |
| | | | 3,816,748 |
| Wireless Telecommunication Services - 3.8% | | | |
| KDDI Corp. | | 445,800 | 13,917,044 |
| SoftBank Corp. | | 794,400 | 8,944,000 |
| SoftBank Group Corp. | | 333,600 | 12,510,808 |
| | | | 35,371,852 |
TOTAL COMMUNICATION SERVICES | | | 73,246,696 |
| CONSUMER DISCRETIONARY - 18.1% | | | |
| Automobile Components - 2.0% | | | |
| Aisin Seiki Co. Ltd. | | 40,700 | 1,194,605 |
| Bridgestone Corp. | | 157,900 | 6,341,004 |
| DENSO Corp. | | 119,900 | 7,237,597 |
| Koito Manufacturing Co. Ltd. | | 57,800 | 1,118,052 |
| Sumitomo Electric Industries Ltd. | | 197,600 | 2,521,823 |
| | | | 18,413,081 |
| Automobiles - 7.1% | | | |
| Honda Motor Co. Ltd. | | 450,900 | 11,959,234 |
| Isuzu Motors Ltd. | | 161,300 | 1,904,795 |
| Mazda Motor Corp. | | 157,300 | 1,423,485 |
| Nissan Motor Co. Ltd. | | 642,000 | 2,341,012 |
| Subaru Corp. | | 170,200 | 2,777,973 |
| Suzuki Motor Corp. | | 101,900 | 3,553,098 |
| Toyota Motor Corp. | | 2,933,000 | 40,270,192 |
| Yamaha Motor Co. Ltd. | | 82,300 | 2,134,141 |
| | | | 66,363,930 |
| Broadline Retail - 0.3% | | | |
| Pan Pacific International Holdings Ltd. | | 105,300 | 1,967,734 |
| Rakuten Group, Inc. | | 241,800 | 1,206,087 |
| | | | 3,173,821 |
| Hotels, Restaurants & Leisure - 1.2% | | | |
| McDonald's Holdings Co. (Japan) Ltd. | | 23,900 | 995,680 |
| Oriental Land Co. Ltd. | | 276,600 | 9,788,649 |
| | | | 10,784,329 |
| Household Durables - 4.8% | | | |
| Iida Group Holdings Co. Ltd. | | 39,900 | 709,394 |
| Open House Group Co. Ltd. | | 21,700 | 867,409 |
| Panasonic Holdings Corp. | | 610,900 | 5,753,934 |
| Sekisui Chemical Co. Ltd. | | 101,000 | 1,437,478 |
| Sekisui House Ltd. | | 170,400 | 3,503,196 |
| Sharp Corp. | | 63,000 | 449,001 |
| Sony Group Corp. | | 348,800 | 31,557,243 |
| | | | 44,277,655 |
| Leisure Products - 0.9% | | | |
| Bandai Namco Holdings, Inc. | | 165,800 | 3,766,217 |
| SHIMANO, Inc. | | 20,200 | 3,123,980 |
| Yamaha Corp. | | 38,900 | 1,533,035 |
| | | | 8,423,232 |
| Specialty Retail - 1.8% | | | |
| Fast Retailing Co. Ltd. | | 48,400 | 11,461,199 |
| Hikari Tsushin, Inc. | | 5,600 | 764,092 |
| Nitori Holdings Co. Ltd. | | 22,200 | 2,826,857 |
| USS Co. Ltd. | | 56,900 | 956,147 |
| ZOZO, Inc. | | 34,500 | 726,030 |
| | | | 16,734,325 |
TOTAL CONSUMER DISCRETIONARY | | | 168,170,373 |
| CONSUMER STAPLES - 6.9% | | | |
| Beverages - 1.1% | | | |
| Asahi Group Holdings | | 126,200 | 4,875,623 |
| Kirin Holdings Co. Ltd. | | 227,500 | 3,695,809 |
| Suntory Beverage & Food Ltd. | | 38,500 | 1,449,348 |
| | | | 10,020,780 |
| Consumer Staples Distribution & Retail - 1.8% | | | |
| AEON Co. Ltd. | | 180,900 | 3,687,104 |
| Kobe Bussan Co. Ltd. | | 41,600 | 1,163,486 |
| MatsukiyoCocokara & Co. | | 31,600 | 1,692,176 |
| Seven & i Holdings Co. Ltd. | | 208,400 | 9,444,157 |
| Welcia Holdings Co. Ltd. | | 26,100 | 546,457 |
| | | | 16,533,380 |
| Food Products - 1.4% | | | |
| Ajinomoto Co., Inc. | | 126,200 | 4,538,703 |
| Kikkoman Corp. | | 40,200 | 2,381,196 |
| Meiji Holdings Co. Ltd. | | 61,600 | 1,486,390 |
| Nisshin Seifun Group, Inc. | | 54,700 | 663,043 |
| Nissin Food Holdings Co. Ltd. | | 17,100 | 1,648,647 |
| Yakult Honsha Co. Ltd. | | 35,500 | 2,670,097 |
| | | | 13,388,076 |
| Household Products - 0.5% | | | |
| Unicharm Corp. | | 111,600 | 4,505,286 |
| Personal Care Products - 1.3% | | | |
| Kao Corp. | | 128,900 | 5,208,656 |
| Kobayashi Pharmaceutical Co. Ltd. | | 14,000 | 873,628 |
| Kose Corp. | | 9,200 | 1,073,596 |
| Shiseido Co. Ltd. | | 110,600 | 5,543,913 |
| | | | 12,699,793 |
| Tobacco - 0.8% | | | |
| Japan Tobacco, Inc. | | 331,900 | 7,141,456 |
TOTAL CONSUMER STAPLES | | | 64,288,771 |
| ENERGY - 0.8% | | | |
| Oil, Gas & Consumable Fuels - 0.8% | | | |
| ENEOS Holdings, Inc. | | 848,700 | 3,019,272 |
| Idemitsu Kosan Co. Ltd. | | 57,700 | 1,228,609 |
| INPEX Corp. | | 287,600 | 3,147,222 |
| | | | 7,395,103 |
| FINANCIALS - 11.2% | | | |
| Banks - 6.2% | | | |
| Chiba Bank Ltd. | | 146,600 | 957,303 |
| Concordia Financial Group Ltd. | | 301,100 | 1,142,482 |
| Japan Post Bank Co. Ltd. | | 408,200 | 3,259,710 |
| Mitsubishi UFJ Financial Group, Inc. | | 3,306,100 | 20,694,648 |
| Mizuho Financial Group, Inc. | | 667,200 | 9,671,617 |
| Resona Holdings, Inc. | | 597,600 | 2,978,416 |
| Shizuoka Financial Group | | 123,400 | 930,146 |
| Sumitomo Mitsui Financial Group, Inc. | | 361,200 | 14,763,558 |
| Sumitomo Mitsui Trust Holdings, Inc. | | 91,600 | 3,301,972 |
| | | | 57,699,852 |
| Capital Markets - 0.9% | | | |
| Daiwa Securities Group, Inc. | | 368,900 | 1,713,428 |
| Japan Exchange Group, Inc. | | 138,900 | 2,255,428 |
| Nomura Holdings, Inc. | | 804,900 | 2,885,488 |
| SBI Holdings, Inc. Japan | | 67,800 | 1,324,186 |
| | | | 8,178,530 |
| Financial Services - 0.8% | | | |
| GMO Payment Gateway, Inc. | | 11,600 | 907,257 |
| Mitsubishi UFJ Lease & Finance Co. Ltd. | | 182,600 | 947,828 |
| ORIX Corp. | | 330,600 | 5,624,340 |
| | | | 7,479,425 |
| Insurance - 3.3% | | | |
| Dai-ichi Mutual Life Insurance Co. | | 271,000 | 5,040,811 |
| Japan Post Holdings Co. Ltd. | | 657,600 | 5,413,314 |
| Japan Post Insurance Co. Ltd. | | 55,300 | 898,022 |
| MS&AD Insurance Group Holdings, Inc. | | 118,600 | 3,892,728 |
| Sompo Holdings, Inc. | | 86,500 | 3,609,610 |
| T&D Holdings, Inc. | | 146,600 | 1,795,315 |
| Tokio Marine Holdings, Inc. | | 507,800 | 10,210,352 |
| | | | 30,860,152 |
TOTAL FINANCIALS | | | 104,217,959 |
| HEALTH CARE - 9.3% | | | |
| Health Care Equipment & Supplies - 2.8% | | | |
| ASAHI INTECC Co. Ltd. | | 60,100 | 1,087,585 |
| Hoya Corp. | | 98,700 | 10,349,193 |
| Olympus Corp. | | 337,900 | 5,915,418 |
| Sysmex Corp. | | 46,400 | 2,984,598 |
| Terumo Corp. | | 178,600 | 5,348,319 |
| | | | 25,685,113 |
| Health Care Technology - 0.3% | | | |
| M3, Inc. | | 122,100 | 2,997,064 |
| Pharmaceuticals - 6.2% | | | |
| Astellas Pharma, Inc. | | 507,700 | 7,648,279 |
| Chugai Pharmaceutical Co. Ltd. | | 185,800 | 4,794,692 |
| Daiichi Sankyo Kabushiki Kaisha | | 484,600 | 16,628,863 |
| Eisai Co. Ltd. | | 69,700 | 4,021,921 |
| Kyowa Hakko Kirin Co., Ltd. | | 74,700 | 1,662,179 |
| Nippon Shinyaku Co. Ltd. | | 13,600 | 621,910 |
| Ono Pharmaceutical Co. Ltd. | | 100,200 | 2,017,537 |
| Otsuka Holdings Co. Ltd. | | 108,000 | 3,674,243 |
| Shionogi & Co. Ltd. | | 73,300 | 3,281,241 |
| Takeda Pharmaceutical Co. Ltd. | | 415,700 | 13,784,265 |
| | | | 58,135,130 |
TOTAL HEALTH CARE | | | 86,817,307 |
| INDUSTRIALS - 22.4% | | | |
| Air Freight & Logistics - 0.4% | | | |
| Nippon Express Holdings, Inc. | | 21,300 | 1,249,926 |
| SG Holdings Co. Ltd. | | 79,700 | 1,146,869 |
| Yamato Holdings Co. Ltd. | | 78,800 | 1,353,594 |
| | | | 3,750,389 |
| Building Products - 1.8% | | | |
| AGC, Inc. | | 53,500 | 1,994,740 |
| Daikin Industries Ltd. | | 68,900 | 12,514,381 |
| LIXIL Group Corp. | | 79,400 | 1,249,839 |
| Toto Ltd. | | 39,200 | 1,340,709 |
| | | | 17,099,669 |
| Commercial Services & Supplies - 0.8% | | | |
| Dai Nippon Printing Co. Ltd. | | 61,400 | 1,765,012 |
| Secom Co. Ltd. | | 58,100 | 3,720,375 |
| Toppan, Inc. | | 72,500 | 1,541,260 |
| | | | 7,026,647 |
| Construction & Engineering - 0.6% | | | |
| Kajima Corp. | | 117,000 | 1,547,973 |
| Obayashi Corp. | | 179,600 | 1,497,284 |
| SHIMIZU Corp. | | 152,700 | 932,540 |
| Taisei Corp. | | 50,000 | 1,700,545 |
| | | | 5,678,342 |
| Electrical Equipment - 1.5% | | | |
| Fuji Electric Co. Ltd. | | 35,100 | 1,416,830 |
| Mitsubishi Electric Corp. | | 534,500 | 6,627,202 |
| Nidec Corp. | | 123,700 | 6,120,933 |
| | | | 14,164,965 |
| Ground Transportation - 2.5% | | | |
| Central Japan Railway Co. | | 39,900 | 4,939,571 |
| East Japan Railway Co. | | 83,600 | 4,783,730 |
| Hankyu Hanshin Holdings, Inc. | | 63,300 | 1,976,309 |
| Keio Corp. | | 28,400 | 1,054,775 |
| Keisei Electric Railway Co. | | 35,800 | 1,263,344 |
| Kintetsu Group Holdings Co. Ltd. | | 47,500 | 1,603,471 |
| Odakyu Electric Railway Co. Ltd. | | 81,500 | 1,138,418 |
| Tobu Railway Co. Ltd. | | 52,200 | 1,332,447 |
| Tokyu Corp. | | 146,900 | 2,073,644 |
| West Japan Railway Co. | | 60,700 | 2,630,845 |
| | | | 22,796,554 |
| Industrial Conglomerates - 2.0% | | | |
| Hitachi Ltd. | | 267,900 | 14,818,791 |
| Toshiba Corp. | | 107,800 | 3,473,292 |
| | | | 18,292,083 |
| Machinery - 5.0% | | | |
| Daifuku Co. Ltd. | | 84,000 | 1,547,682 |
| FANUC Corp. | | 265,300 | 8,959,503 |
| Hitachi Construction Machinery Co. Ltd. | | 29,700 | 731,864 |
| Hoshizaki Corp. | | 30,000 | 1,056,635 |
| Komatsu Ltd. | | 255,800 | 6,361,713 |
| Kubota Corp. | | 280,000 | 4,242,840 |
| Kurita Water Industries Ltd. | | 28,900 | 1,211,166 |
| Makita Corp. | | 62,000 | 1,749,064 |
| Minebea Mitsumi, Inc. | | 100,400 | 1,859,271 |
| Misumi Group, Inc. | | 78,700 | 1,985,381 |
| Mitsubishi Heavy Industries Ltd. | | 88,600 | 3,359,734 |
| NGK Insulators Ltd. | | 65,800 | 825,910 |
| SMC Corp. | | 15,800 | 7,880,168 |
| Toyota Industries Corp. | | 40,600 | 2,359,587 |
| Yaskawa Electric Corp. | | 66,400 | 2,704,183 |
| | | | 46,834,701 |
| Marine Transportation - 0.6% | | | |
| Mitsui OSK Lines Ltd. (a) | | 95,100 | 2,357,588 |
| Nippon Yusen KK | | 134,000 | 3,167,614 |
| | | | 5,525,202 |
| Passenger Airlines - 0.2% | | | |
| Ana Holdings, Inc. (b) | | 44,200 | 964,137 |
| Japan Airlines Co. Ltd. | | 39,900 | 761,156 |
| | | | 1,725,293 |
| Professional Services - 1.5% | | | |
| BayCurrent Consulting, Inc. | | 36,500 | 1,268,740 |
| Nihon M&A Center Holdings, Inc. | | 83,800 | 640,554 |
| Persol Holdings Co. Ltd. | | 49,100 | 1,012,413 |
| Recruit Holdings Co. Ltd. | | 398,700 | 11,184,973 |
| | | | 14,106,680 |
| Trading Companies & Distributors - 5.5% | | | |
| Itochu Corp. | | 328,800 | 10,907,894 |
| Marubeni Corp. | | 427,700 | 6,070,431 |
| Mitsubishi Corp. | | 346,600 | 12,850,498 |
| Mitsui & Co. Ltd. | | 396,400 | 12,375,097 |
| MonotaRO Co. Ltd. | | 69,300 | 1,048,433 |
| Sumitomo Corp. | | 311,500 | 5,582,973 |
| Toyota Tsusho Corp. | | 58,800 | 2,444,158 |
| | | | 51,279,484 |
TOTAL INDUSTRIALS | | | 208,280,009 |
| INFORMATION TECHNOLOGY - 13.4% | | | |
| Electronic Equipment, Instruments & Components - 5.7% | | | |
| Azbil Corp. | | 31,800 | 889,343 |
| Hamamatsu Photonics K.K. | | 38,800 | 2,056,938 |
| Hirose Electric Co. Ltd. | | 8,200 | 1,106,663 |
| Ibiden Co. Ltd. | | 31,200 | 1,227,603 |
| Keyence Corp. | | 53,800 | 24,261,449 |
| Kyocera Corp. | | 88,800 | 4,660,895 |
| Murata Manufacturing Co. Ltd. | | 158,900 | 9,015,378 |
| OMRON Corp. | | 51,300 | 3,009,215 |
| Shimadzu Corp. | | 65,500 | 2,048,629 |
| TDK Corp. | | 107,500 | 3,695,735 |
| Yokogawa Electric Corp. | | 63,200 | 1,026,418 |
| | | | 52,998,266 |
| IT Services - 2.4% | | | |
| Fujitsu Ltd. | | 54,400 | 7,250,286 |
| ITOCHU Techno-Solutions Corp. | | 26,600 | 688,823 |
| NEC Corp. | | 67,900 | 2,611,116 |
| Nomura Research Institute Ltd. | | 109,900 | 2,765,034 |
| NTT Data Corp. | | 174,600 | 2,371,618 |
| OBIC Co. Ltd. | | 19,300 | 2,973,652 |
| Otsuka Corp. | | 31,500 | 1,146,570 |
| SCSK Corp. | | 43,200 | 652,226 |
| TIS, Inc. | | 62,500 | 1,716,233 |
| | | | 22,175,558 |
| Semiconductors & Semiconductor Equipment - 3.4% | | | |
| Advantest Corp. | | 50,300 | 3,919,975 |
| Disco Corp. | | 24,000 | 2,732,526 |
| Lasertec Corp. | | 20,900 | 2,843,362 |
| Renesas Electronics Corp. (b) | | 325,000 | 4,235,546 |
| ROHM Co. Ltd. | | 24,200 | 1,821,974 |
| Sumco Corp. | | 96,800 | 1,333,096 |
| Tokyo Electron Ltd. | | 123,900 | 14,187,232 |
| | | | 31,073,711 |
| Software - 0.3% | | | |
| Oracle Corp. Japan | | 10,600 | 760,749 |
| Trend Micro, Inc. | | 37,000 | 1,807,949 |
| | | | 2,568,698 |
| Technology Hardware, Storage & Peripherals - 1.6% | | | |
| Brother Industries Ltd. | | 64,200 | 1,008,277 |
| Canon, Inc. | | 276,700 | 6,590,263 |
| FUJIFILM Holdings Corp. | | 99,600 | 5,191,149 |
| Ricoh Co. Ltd. | | 151,700 | 1,256,035 |
| Seiko Epson Corp. | | 77,400 | 1,183,735 |
| | | | 15,229,459 |
TOTAL INFORMATION TECHNOLOGY | | | 124,045,692 |
| MATERIALS - 4.6% | | | |
| Chemicals - 3.6% | | | |
| Asahi Kasei Corp. | | 347,000 | 2,450,917 |
| JSR Corp. | | 49,000 | 1,136,969 |
| Mitsubishi Chemical Holdings Corp. | | 354,100 | 2,077,379 |
| Mitsui Chemicals, Inc. | | 51,000 | 1,290,351 |
| Nippon Paint Holdings Co. Ltd. | | 229,500 | 2,070,605 |
| Nippon Sanso Holdings Corp. | | 47,900 | 864,245 |
| Nissan Chemical Corp. | | 35,200 | 1,564,360 |
| Nitto Denko Corp. | | 39,300 | 2,540,676 |
| Shin-Etsu Chemical Co. Ltd. | | 511,500 | 14,596,073 |
| Sumitomo Chemical Co. Ltd. | | 412,200 | 1,392,916 |
| Toray Industries, Inc. | | 383,500 | 2,173,410 |
| Tosoh Corp. | | 71,900 | 960,605 |
| | | | 33,118,506 |
| Metals & Mining - 0.9% | | | |
| JFE Holdings, Inc. | | 135,900 | 1,607,738 |
| Nippon Steel & Sumitomo Metal Corp. | | 223,400 | 4,771,248 |
| Sumitomo Metal Mining Co. Ltd. | | 68,400 | 2,524,556 |
| | | | 8,903,542 |
| Paper & Forest Products - 0.1% | | | |
| Oji Holdings Corp. | | 224,400 | 881,825 |
TOTAL MATERIALS | | | 42,903,873 |
| REAL ESTATE - 3.1% | | | |
| Equity Real Estate Investment Trusts (REITs) - 1.1% | | | |
| Daiwa House REIT Investment Corp. | | 610 | 1,297,878 |
| GLP J-REIT | | 1,238 | 1,414,509 |
| Japan Real Estate Investment Corp. | | 345 | 1,367,029 |
| Japan Retail Fund Investment Corp. | | 1,933 | 1,415,372 |
| Nippon Building Fund, Inc. | | 423 | 1,773,730 |
| Nippon Prologis REIT, Inc. | | 591 | 1,346,341 |
| Nomura Real Estate Master Fund, Inc. | | 1,174 | 1,373,705 |
| | | | 9,988,564 |
| Real Estate Management & Development - 2.0% | | | |
| Daito Trust Construction Co. Ltd. | | 17,200 | 1,630,176 |
| Daiwa House Industry Co. Ltd. | | 165,900 | 4,228,538 |
| Hulic Co. Ltd. | | 106,200 | 914,388 |
| Mitsubishi Estate Co. Ltd. | | 311,300 | 3,836,556 |
| Mitsui Fudosan Co. Ltd. | | 250,600 | 4,977,422 |
| Nomura Real Estate Holdings, Inc. | | 32,900 | 819,836 |
| Sumitomo Realty & Development Co. Ltd. | | 85,600 | 1,998,694 |
| | | | 18,405,610 |
TOTAL REAL ESTATE | | | 28,394,174 |
| UTILITIES - 1.0% | | | |
| Electric Utilities - 0.6% | | | |
| Chubu Electric Power Co., Inc. | | 178,200 | 1,987,351 |
| Kansai Electric Power Co., Inc. | | 194,700 | 2,101,731 |
| Tokyo Electric Power Co., Inc. (b) | | 422,200 | 1,513,762 |
| | | | 5,602,844 |
| Gas Utilities - 0.4% | | | |
| Osaka Gas Co. Ltd. | | 103,700 | 1,715,323 |
| Tokyo Gas Co. Ltd. | | 108,200 | 2,216,264 |
| | | | 3,931,587 |
TOTAL UTILITIES | | | 9,534,431 |
| TOTAL COMMON STOCKS (Cost $1,044,690,239) | | | 917,294,388 |
| | | | |
| Government Obligations - 0.0% |
| | | Principal Amount (c) | Value ($) |
U.S. Treasury Bills, yield at date of purchase 4.65% 6/29/23 (d) (Cost $397,009) | | 400,000 | 396,779 |
| | | | |
| Money Market Funds - 0.2% |
| | | Shares | Value ($) |
| Fidelity Cash Central Fund 4.88% (e) | | 875,120 | 875,295 |
| Fidelity Securities Lending Cash Central Fund 4.88% (e)(f) | | 927,407 | 927,500 |
| TOTAL MONEY MARKET FUNDS (Cost $1,802,795) | | | 1,802,795 |
| | | | |
| TOTAL INVESTMENT IN SECURITIES - 98.9% (Cost $1,046,890,043) | 919,493,962 |
NET OTHER ASSETS (LIABILITIES) - 1.1% | 9,798,625 |
| NET ASSETS - 100.0% | 929,292,587 |
| | |
| Futures Contracts |
| | Number of contracts | Expiration Date | Notional Amount ($) | Value ($) | Unrealized Appreciation/ (Depreciation) ($) |
| Purchased | | | | | |
| | | | | | |
| Equity Index Contracts | | | | | |
| CME Yen Denominated Nikkei 225 Contracts (United States) | 112 | Jun 2023 | 11,946,420 | 467,618 | 467,618 |
| | | | | | |
| The notional amount of futures purchased as a percentage of Net Assets is 1.3% |
Legend
| (a) | Security or a portion of the security is on loan at period end. |
| (c) | Amount is stated in United States dollars unless otherwise noted. |
| (d) | Security or a portion of the security was pledged to cover margin requirements for futures contracts. At period end, the value of securities pledged amounted to $396,779. |
| (e) | Affiliated fund that is generally available only to investment companies and other accounts managed by Fidelity Investments. The rate quoted is the annualized seven-day yield of the fund at period end. A complete unaudited listing of the fund's holdings as of its most recent quarter end is available upon request. In addition, each Fidelity Central Fund's financial statements are available on the SEC's website or upon request. |
| (f) | Investment made with cash collateral received from securities on loan. |
Affiliated Central Funds
Fiscal year to date information regarding the Fund's investments in Fidelity Central Funds, including the ownership percentage, is presented below.
| Affiliate | Value, beginning of period ($) | Purchases ($) | Sales Proceeds ($) | Dividend Income ($) | Realized Gain (loss) ($) | Change in Unrealized appreciation (depreciation) ($) | Value, end of period ($) | % ownership, end of period |
| Fidelity Cash Central Fund 4.88% | 2,200,319 | 3,564,742 | 4,889,766 | 5,257 | - | - | 875,295 | 0.0% |
| Fidelity Securities Lending Cash Central Fund 4.88% | - | 76,054,021 | 75,126,521 | 38,175 | - | - | 927,500 | 0.0% |
| Total | 2,200,319 | 79,618,763 | 80,016,287 | 43,432 | - | - | 1,802,795 | |
| | | | | | | | | |
Amounts in the dividend income column in the above table include any capital gain distributions from underlying funds, which are presented in the corresponding line item in the Statement of Operations, if applicable.
Amounts in the dividend income column for Fidelity Securities Lending Cash Central Fund represents the income earned on investing cash collateral, less rebates paid to borrowers and any lending agent fees associated with the loan, plus any premium payments received for lending certain types of securities.
Amounts included in the purchases and sales proceeds columns may include in-kind transactions, if applicable.
Investment Valuation
The following is a summary of the inputs used, as of April 30, 2023, involving the Fund's assets and liabilities carried at fair value. The inputs or methodology used for valuing securities may not be an indication of the risk associated with investing in those securities. For more information on valuation inputs, and their aggregation into the levels used below, please refer to the Investment Valuation section in the accompanying Notes to Financial Statements.
| Valuation Inputs at Reporting Date: |
| Description | Total ($) | Level 1 ($) | Level 2 ($) | Level 3 ($) |
Investments in Securities: | | | | |
|
| Equities: | | | | |
Communication Services | 73,246,696 | - | 73,246,696 | - |
Consumer Discretionary | 168,170,373 | - | 168,170,373 | - |
Consumer Staples | 64,288,771 | - | 64,288,771 | - |
Energy | 7,395,103 | - | 7,395,103 | - |
Financials | 104,217,959 | - | 104,217,959 | - |
Health Care | 86,817,307 | - | 86,817,307 | - |
Industrials | 208,280,009 | - | 208,280,009 | - |
Information Technology | 124,045,692 | - | 124,045,692 | - |
Materials | 42,903,873 | - | 42,903,873 | - |
Real Estate | 28,394,174 | - | 28,394,174 | - |
Utilities | 9,534,431 | - | 9,534,431 | - |
|
| Government Obligations | 396,779 | - | 396,779 | - |
|
| Money Market Funds | 1,802,795 | 1,802,795 | - | - |
| Total Investments in Securities: | 919,493,962 | 1,802,795 | 917,691,167 | - |
Derivative Instruments: | | | | |
|
| Assets | | | | |
Futures Contracts | 467,618 | 467,618 | - | - |
| Total Assets | 467,618 | 467,618 | - | - |
| Total Derivative Instruments: | 467,618 | 467,618 | - | - |
Value of Derivative Instruments
The following table is a summary of the Fund's value of derivative instruments by primary risk exposure as of April 30, 2023. For additional information on derivative instruments, please refer to the Derivative Instruments section in the accompanying Notes to Financial Statements.
Primary Risk Exposure / Derivative Type | Value |
| Asset ($) | Liability ($) |
| Equity Risk | | |
Futures Contracts (a) | 467,618 | 0 |
| Total Equity Risk | 467,618 | 0 |
| Total Value of Derivatives | 467,618 | 0 |
(a)Reflects gross cumulative appreciation (depreciation) on futures contracts as presented in the Schedule of Investments. In the Statement of Assets and Liabilities, the period end daily variation margin is included in receivable or payable for daily variation margin on futures contracts, and the net cumulative appreciation (depreciation) is included in Total accumulated earnings (loss).
| Statement of Assets and Liabilities |
| | | | April 30, 2023 (Unaudited) |
| | | | | |
| Assets | | | | |
| Investment in securities, at value (including securities loaned of $876,794) - See accompanying schedule: | | | | |
Unaffiliated issuers (cost $1,045,087,248) | $ | 917,691,167 | | |
Fidelity Central Funds (cost $1,802,795) | | 1,802,795 | | |
| | | | | |
| | | | | |
| Total Investment in Securities (cost $1,046,890,043) | | | $ | 919,493,962 |
| Segregated cash with brokers for derivative instruments | | | | 202,510 |
| Foreign currency held at value (cost $851,538) | | | | 835,028 |
| Dividends receivable | | | | 9,659,741 |
| Distributions receivable from Fidelity Central Funds | | | | 8,921 |
| Receivable for daily variation margin on futures contracts | | | | 145,195 |
| Prepaid expenses | | | | 396 |
Total assets | | | | 930,345,753 |
| Liabilities | | | | |
| Accrued management fee | $ | 77,536 | | |
| Other payables and accrued expenses | | 48,130 | | |
| Collateral on securities loaned | | 927,500 | | |
| Total Liabilities | | | | 1,053,166 |
| Net Assets | | | $ | 929,292,587 |
| Net Assets consist of: | | | | |
| Paid in capital | | | $ | 1,181,662,005 |
| Total accumulated earnings (loss) | | | | (252,369,418) |
| Net Assets | | | $ | 929,292,587 |
Net Asset Value , offering price and redemption price per share ($929,292,587 ÷ 106,608,596 shares) | | | $ | 8.72 |
| Statement of Operations |
| | | | Six months ended April 30, 2023 (Unaudited) |
| Investment Income | | | | |
| Dividends | | | $ | 12,836,136 |
| Interest | | | | 1,463 |
| Income from Fidelity Central Funds (including $38,175 from security lending) | | | | 43,432 |
| Income before foreign taxes withheld | | | $ | 12,881,031 |
| Less foreign taxes withheld | | | | (1,282,898) |
| Total Income | | | | 11,598,133 |
| Expenses | | | | |
| Management fee | $ | 469,853 | | |
| Custodian fees and expenses | | 30,609 | | |
| Independent trustees' fees and expenses | | 3,273 | | |
| Registration fees | | 5,595 | | |
| Audit | | 31,449 | | |
| Legal | | 718 | | |
| Interest | | 43,538 | | |
| Miscellaneous | | 2,125 | | |
| Total expenses before reductions | | 587,160 | | |
| Expense reductions | | (14) | | |
| Total expenses after reductions | | | | 587,146 |
| Net Investment income (loss) | | | | 11,010,987 |
| Realized and Unrealized Gain (Loss) | | | | |
| Net realized gain (loss) on: | | | | |
| Investment Securities: | | | | |
| Unaffiliated issuers | | (49,631,945) | | |
| Foreign currency transactions | | 819,562 | | |
| Futures contracts | | 511,088 | | |
| Total net realized gain (loss) | | | | (48,301,295) |
| Change in net unrealized appreciation (depreciation) on: | | | | |
| Investment Securities: | | | | |
| Unaffiliated issuers | | 192,273,940 | | |
| Assets and liabilities in foreign currencies | | 54,616 | | |
| Futures contracts | | (108,662) | | |
| Total change in net unrealized appreciation (depreciation) | | | | 192,219,894 |
| Net gain (loss) | | | | 143,918,599 |
| Net increase (decrease) in net assets resulting from operations | | | $ | 154,929,586 |
| Statement of Changes in Net Assets |
| |
| | Six months ended April 30, 2023 (Unaudited) | | Year ended October 31, 2022 |
| Increase (Decrease) in Net Assets | | | | |
| Operations | | | | |
| Net investment income (loss) | $ | 11,010,987 | $ | 26,601,539 |
| Net realized gain (loss) | | (48,301,295) | | (87,686,440) |
| Change in net unrealized appreciation (depreciation) | | 192,219,894 | | (289,849,636) |
| Net increase (decrease) in net assets resulting from operations | | 154,929,586 | | (350,934,537) |
| Distributions to shareholders | | (21,029,630) | | (16,387,030) |
| Share transactions | | | | |
| Proceeds from sales of shares | | - | | 38,000,000 |
| Reinvestment of distributions | | 21,029,630 | | 16,387,030 |
| Cost of shares redeemed | | (194,000,000) | | (439,000,000) |
Net increase (decrease) in net assets resulting from share transactions | | (172,970,370) | | (384,612,970) |
| Total increase (decrease) in net assets | | (39,070,414) | | (751,934,537) |
| | | | | |
| Net Assets | | | | |
| Beginning of period | | 968,363,001 | | 1,720,297,538 |
| End of period | $ | 929,292,587 | $ | 968,363,001 |
| | | | | |
| Other Information | | | | |
| Shares | | | | |
| Sold | | - | | 4,919,261 |
| Issued in reinvestment of distributions | | 2,567,720 | | 1,622,478 |
| Redeemed | | (23,783,327) | | (47,655,992) |
| Net increase (decrease) | | (21,215,607) | | (41,114,253) |
| | | | | |
Financial Highlights
| Fidelity® SAI Japan Stock Index Fund |
| |
| | Six months ended (Unaudited) April 30, 2023 | | Years ended October 31, 2022 | | 2021 A |
Selected Per-Share Data | | | | | | |
| Net asset value, beginning of period | $ | 7.58 | $ | 10.18 | $ | 10.00 |
| Income from Investment Operations | | | | | | |
Net investment income (loss) B,C | | .10 | | .19 | | .10 |
| Net realized and unrealized gain (loss) | | 1.23 | | (2.69) | | .08 |
| Total from investment operations | | 1.33 | | (2.50) | | .18 |
| Distributions from net investment income | | (.19) | | (.10) | | - |
| Total distributions | | (.19) | | (.10) | | - |
| Net asset value, end of period | $ | 8.72 | $ | 7.58 | $ | 10.18 |
Total Return D,E | | 17.64% | | (24.83)% | | 1.80% |
Ratios to Average Net Assets C,F,G | | | | | | |
| Expenses before reductions | | .12% H | | .11% | | .14% H,I |
| Expenses net of fee waivers, if any | | .12% H | | .11% | | .14% H,I |
| Expenses net of all reductions | | .12% H | | .11% | | .14% H,I |
| Net investment income (loss) | | 2.34% H | | 2.12% | | 2.27% H,I |
| Supplemental Data | | | | | | |
| Net assets, end of period (000 omitted) | $ | 929,293 | $ | 968,363 | $ | 1,720,298 |
Portfolio turnover rate J | | 3% H | | 8% | | -% K,L |
A For the period May 27, 2021 (commencement of operations) through October 31, 2021.
B Calculated based on average shares outstanding during the period.
C Net investment income (loss) is affected by the timing of the declaration of dividends by any underlying mutual funds or exchange-traded funds (ETFs). Net investment income (loss) of any mutual funds or ETFs is not included in the Fund's net investment income (loss) ratio.
D Total returns for periods of less than one year are not annualized.
E Total returns would have been lower if certain expenses had not been reduced during the applicable periods shown.
F Fees and expenses of any underlying mutual funds or exchange-traded funds (ETFs) are not included in the Fund's expense ratio. The Fund indirectly bears its proportionate share of these expenses. For additional expense information related to investments in Fidelity Central Funds, please refer to the "Investments in Fidelity Central Funds" note found in the Notes to Financial Statements section of the most recent Annual or Semi-Annual report.
G Expense ratios reflect operating expenses of the class. Expenses before reductions do not reflect amounts reimbursed, waived, or reduced through arrangements with the investment adviser, brokerage services, or other offset arrangements, if applicable, and do not represent the amount paid by the class during periods when reimbursements, waivers or reductions occur.
H Annualized.
I Audit fees are not annualized.
J Amount does not include the portfolio activity of any underlying mutual funds or exchange-traded funds (ETFs).
K Amount not annualized.
L Amount represents less than 1%.
For the period ended April 30, 2023
1. Organization.
Fidelity SAI Japan Stock Index Fund (the Fund) is a fund of Fidelity Concord Street Trust (the Trust) and is authorized to issue an unlimited number of shares. Shares are offered exclusively to certain clients of Fidelity Management & Research Company LLC (FMR) or its affiliates. The Trust is registered under the Investment Company Act of 1940, as amended (the 1940 Act), as an open-end management investment company organized as a Massachusetts business trust.
2. Investments in Fidelity Central Funds.
Funds may invest in Fidelity Central Funds, which are open-end investment companies generally available only to other investment companies and accounts managed by the investment adviser and its affiliates. The Schedule of Investments lists any Fidelity Central Funds held as an investment as of period end, but does not include the underlying holdings of each Fidelity Central Fund. An investing fund indirectly bears its proportionate share of the expenses of the underlying Fidelity Central Funds.
Based on its investment objective, each Fidelity Central Fund may invest or participate in various investment vehicles or strategies that are similar to those of the investing fund. These strategies are consistent with the investment objectives of the investing fund and may involve certain economic risks which may cause a decline in value of each of the Fidelity Central Funds and thus a decline in the value of the investing fund.
| Fidelity Central Fund | Investment Manager | Investment Objective | Investment Practices | Expense Ratio A |
| Fidelity Money Market Central Funds | Fidelity Management & Research Company LLC (FMR) | Each fund seeks to obtain a high level of current income consistent with the preservation of capital and liquidity. | Short-term Investments | Less than .005% |
A Expenses expressed as a percentage of average net assets and are as of each underlying Central Fund's most recent annual or semi-annual shareholder report.
A complete unaudited list of holdings for each Fidelity Central Fund is available upon request or at the Securities and Exchange Commission website at www.sec.gov. In addition, the financial statements of the Fidelity Central Funds which contain the significant accounting policies (including investment valuation policies) of those funds, and are not covered by the Report of Independent Registered Public Accounting Firm, are available on the Securities and Exchange Commission website or upon request.
3. Significant Accounting Policies.
The Fund is an investment company and applies the accounting and reporting guidance of the Financial Accounting Standards Board (FASB) Accounting Standards Codification Topic 946 Financial Services - Investment Companies . The financial statements have been prepared in conformity with accounting principles generally accepted in the United States of America (GAAP), which require management to make certain estimates and assumptions at the date of the financial statements. Actual results could differ from those estimates. Subsequent events, if any, through the date that the financial statements were issued have been evaluated in the preparation of the financial statements. The Fund's Schedule of Investments lists any underlying mutual funds or exchange-traded funds (ETFs) but does not include the underlying holdings of these funds. The following summarizes the significant accounting policies of the Fund:
Investment Valuation. Investments are valued as of 4:00 p.m. Eastern time on the last calendar day of the period. The Board of Trustees (the Board) has designated the Fund's investment adviser as the valuation designee responsible for the fair valuation function and performing fair value determinations as needed. The investment adviser has established a Fair Value Committee (the Committee) to carry out the day-to-day fair valuation responsibilities and has adopted policies and procedures to govern the fair valuation process and the activities of the Committee. In accordance with these fair valuation policies and procedures, which have been approved by the Board, the Fund attempts to obtain prices from one or more third party pricing services or brokers to value its investments. When current market prices, quotations or currency exchange rates are not readily available or reliable, investments will be fair valued in good faith by the Committee, in accordance with the policies and procedures. Factors used in determining fair value vary by investment type and may include market or investment specific events, transaction data, estimated cash flows, and market observations of comparable investments. The frequency that the fair valuation procedures are used cannot be predicted and they may be utilized to a significant extent. The Committee manages the Fund's fair valuation practices and maintains the fair valuation policies and procedures. The Fund's investment adviser reports to the Board information regarding the fair valuation process and related material matters.
The Fund categorizes the inputs to valuation techniques used to value its investments into a disclosure hierarchy consisting of three levels as shown below:
Level 1 - unadjusted quoted prices in active markets for identical investments
Level 2 - other significant observable inputs (including quoted prices for similar investments, interest rates, prepayment speeds, etc.)
Level 3 - unobservable inputs (including the Fund's own assumptions based on the best information available)
Valuation techniques used to value the Fund's investments by major category are as follows:
Equity securities, including restricted securities, for which market quotations are readily available, are valued at the last reported sale price or official closing price as reported by a third party pricing service on the primary market or exchange on which they are traded and are categorized as Level 1 in the hierarchy. In the event there were no sales during the day or closing prices are not available, securities are valued at the last quoted bid price or may be valued using the last available price and are generally categorized as Level 2 in the hierarchy. For foreign equity securities, when market or security specific events arise, comparisons to the valuation of American Depositary Receipts (ADRs), futures contracts, ETFs and certain indexes as well as quoted prices for similar securities may be used and would be categorized as Level 2 in the hierarchy. For equity securities, including restricted securities, where observable inputs are limited, assumptions about market activity and risk are used and these securities may be categorized as Level 3 in the hierarchy.
Debt securities, including restricted securities, are valued based on evaluated prices received from third party pricing services or from brokers who make markets in such securities. U.S. government and government agency obligations are valued by pricing services who utilize matrix pricing which considers yield or price of bonds of comparable quality, coupon, maturity and type or by broker-supplied prices. When independent prices are unavailable or unreliable, debt securities may be valued utilizing pricing methodologies which consider similar factors that would be used by third party pricing services. Debt securities are generally categorized as Level 2 in the hierarchy but may be Level 3 depending on the circumstances.
Futures contracts are valued at the settlement price established each day by the board of trade or exchange on which they are traded and are categorized as Level 1 in the hierarchy. Investments in open-end mutual funds, including the Fidelity Central Funds, are valued at their closing net asset value (NAV) each business day and are categorized as Level 1 in the hierarchy.
Changes in valuation techniques may result in transfers in or out of an assigned level within the disclosure hierarchy. The aggregate value of investments by input level as of April 30, 2023 is included at the end of the Fund's Schedule of Investments.
Foreign Currency. Certain Funds may use foreign currency contracts to facilitate transactions in foreign-denominated securities. Gains and losses from these transactions may arise from changes in the value of the foreign currency or if the counterparties do not perform under the contracts' terms.
Foreign-denominated assets, including investment securities, and liabilities are translated into U.S. dollars at the exchange rates at period end. Purchases and sales of investment securities, income and dividends received, and expenses denominated in foreign currencies are translated into U.S. dollars at the exchange rate in effect on the transaction date.
The effects of exchange rate fluctuations on investments are included with the net realized and unrealized gain (loss) on investment securities. Other foreign currency transactions resulting in realized and unrealized gain (loss) are disclosed separately.
Investment Transactions and Income. For financial reporting purposes, the Fund's investment holdings and NAV include trades executed through the end of the last business day of the period. The NAV per share for processing shareholder transactions is calculated as of the close of business of the New York Stock Exchange (NYSE), normally 4:00 p.m. Eastern time and includes trades executed through the end of the prior business day. Gains and losses on securities sold are determined on the basis of identified cost. Commissions paid to certain brokers with whom the investment adviser, or its affiliates, places trades on behalf of a fund include an amount in addition to trade execution, which may be rebated back to a fund. Any such rebates are included in net realized gain (loss) on investments in the Statement of Operations. Dividend income is recorded on the ex-dividend date, except for certain dividends from foreign securities where the ex-dividend date may have passed, which are recorded as soon as the Fund is informed of the ex-dividend date. Non-cash dividends included in dividend income, if any, are recorded at the fair market value of the securities received. Income and capital gain distributions from Fidelity Central Funds, if any, are recorded on the ex-dividend date. Interest income is accrued as earned and includes coupon interest and amortization of premium and accretion of discount on debt securities as applicable. Investment income is recorded net of foreign taxes withheld where recovery of such taxes is uncertain.
Expenses. Expenses directly attributable to a fund are charged to that fund. Expenses attributable to more than one fund are allocated among the respective funds on the basis of relative net assets or other appropriate methods. Expenses included in the accompanying financial statements reflect the expenses of that fund and do not include any expenses associated with any underlying mutual funds or exchange-traded funds. Although not included in a fund's expenses, a fund indirectly bears its proportionate share of these expenses through the net asset value of each underlying mutual fund or exchange-traded fund. Expense estimates are accrued in the period to which they relate and adjustments are made when actual amounts are known.
Income Tax Information and Distributions to Shareholders. Each year, the Fund intends to qualify as a regulated investment company under Subchapter M of the Internal Revenue Code, including distributing substantially all of its taxable income and realized gains. As a result, no provision for U.S. Federal income taxes is required. The Fund files a U.S. federal tax return, in addition to state and local tax returns as required. The Fund's federal income tax returns are subject to examination by the Internal Revenue Service (IRS) for a period of three fiscal years after they are filed. State and local tax returns may be subject to examination for an additional fiscal year depending on the jurisdiction. Foreign taxes are provided for based on the Fund's understanding of the tax rules and rates that exist in the foreign markets in which it invests.
Distributions are declared and recorded on the ex-dividend date. Income and capital gain distributions are determined in accordance with income tax regulations, which may differ from GAAP.
Capital accounts within the financial statements are adjusted for permanent book-tax differences. These adjustments have no impact on net assets or the results of operations. Capital accounts are not adjusted for temporary book-tax differences which will reverse in a subsequent period.
Book-tax differences are primarily due to futures contracts, foreign currency transactions, passive foreign investment companies (PFIC), partnerships, capital loss carryforwards and losses deferred due to wash sales.
As of period end, the cost and unrealized appreciation (depreciation) in securities, and derivatives if applicable, for federal income tax purposes were as follows:
| Gross unrealized appreciation | $43,078,483 |
| Gross unrealized depreciation | (172,609,973) |
| Net unrealized appreciation (depreciation) | $(129,531,490) |
| Tax cost | $1,049,493,070 |
Capital loss carryforwards are only available to offset future capital gains of the Fund to the extent provided by regulations and may be limited. The capital loss carryforward information presented below, including any applicable limitation, is estimated as of prior fiscal period end and is subject to adjustment.
| Short-term | $(78,820,716) |
| Long-term | (2,238,510) |
| Total capital loss carryforward | $(81,059,226) |
4. Derivative Instruments.
Risk Exposures and the Use of Derivative Instruments. The Fund's investment objectives allow for various types of derivative instruments, including futures contracts. Derivatives are investments whose value is primarily derived from underlying assets, indices or reference rates and may be transacted on an exchange or over-the-counter (OTC). Derivatives may involve a future commitment to buy or sell a specified asset based on specified terms, to exchange future cash flows at periodic intervals based on a notional principal amount, or for one party to make one or more payments upon the occurrence of specified events in exchange for periodic payments from the other party.
Derivatives were used to increase returns and to manage exposure to certain risks as defined below. The success of any strategy involving derivatives depends on analysis of numerous economic factors, and if the strategies for investment do not work as intended, the objectives may not be achieved.
Derivatives were used to increase or decrease exposure to the following risk(s):
| | |
| Equity Risk | Equity risk relates to the fluctuations in the value of financial instruments as a result of changes in market prices (other than those arising from interest rate risk or foreign exchange risk), whether caused by factors specific to an individual investment, its issuer, or all factors affecting all instruments traded in a market or market segment. |
Funds are also exposed to additional risks from investing in derivatives, such as liquidity risk and counterparty credit risk. Liquidity risk is the risk that a fund will be unable to close out the derivative in the open market in a timely manner. Counterparty credit risk is the risk that the counterparty will not be able to fulfill its obligation to a fund. Counterparty credit risk related to exchange-traded contracts may be mitigated by the protection provided by the exchange on which they trade.
Investing in derivatives may involve greater risks than investing in the underlying assets directly and, to varying degrees, may involve risk of loss in excess of any initial investment and collateral received and amounts recognized in the Statement of Assets and Liabilities. In addition, there may be the risk that the change in value of the derivative contract does not correspond to the change in value of the underlying instrument.
Futures Contracts. A futures contract is an agreement between two parties to buy or sell a specified underlying instrument for a fixed price at a specified future date. Futures contracts were used to manage exposure to the stock market.
Upon entering into a futures contract, a fund is required to deposit either cash or securities (initial margin) with a clearing broker in an amount equal to a certain percentage of the face value of the contract. Futures contracts are marked-to-market daily and subsequent daily payments are made or received by a fund depending on the daily fluctuations in the value of the futures contracts and are recorded as unrealized appreciation or (depreciation). This receivable and/or payable, if any, is included in daily variation margin on futures contracts in the Statement of Assets and Liabilities. Realized gain or (loss) is recorded upon the expiration or closing of a futures contract. The net realized gain (loss) and change in net unrealized appreciation (depreciation) on futures contracts during the period is presented in the Statement of Operations.
Any open futures contracts at period end are presented in the Schedule of Investments under the caption "Futures Contracts". The notional amount at value reflects each contract's exposure to the underlying instrument or index at period end, and is representative of volume of activity during the period unless an average notional amount is presented. Any securities deposited to meet initial margin requirements are identified in the Schedule of Investments. Any cash deposited to meet initial margin requirements is presented as segregated cash with brokers for derivative instruments in the Statement of Assets and Liabilities.
5. Purchases and Sales of Investments.
Purchases and sales of securities, other than short-term securities, U.S. government securities and in-kind transactions, as applicable, are noted in the table below.
| | Purchases ($) | Sales ($) |
| Fidelity SAI Japan Stock Index Fund | 14,056,063 | 192,775,031 |
6. Fees and Other Transactions with Affiliates.
Management Fee. Fidelity Management & Research Company LLC (the investment adviser) and its affiliates provide the Fund with investment management related services for which the Fund pays a monthly management fee that is based on an annual rate of .10% of the Fund's average net assets.
Sub-Adviser. Geode Capital Management, LLC (Geode), serves as sub-adviser for the Fund. Geode provides discretionary investment advisory services to the Fund and is paid by the investment adviser for providing these services.
Interfund Lending Program. Pursuant to an Exemptive Order issued by the Securities and Exchange Commission (the SEC), the Fund, along with other registered investment companies having management contracts with Fidelity Management & Research Company LLC (FMR), or other affiliated entities of FMR, may participate in an interfund lending program. This program provides an alternative credit facility allowing the Fund to borrow from, or lend money to, other participating affiliated funds. At period end, there were no interfund loans outstanding. Activity in this program during the period for which loans were outstanding was as follows:
| | Borrower or Lender | Average Loan Balance | Weighted Average Interest Rate | Interest Expense |
| Fidelity SAI Japan Stock Index Fund | Borrower | $15,044,364 | 4.17% | $38,298 |
Interfund Trades. Funds may purchase from or sell securities to other Fidelity Funds under procedures adopted by the Board. The procedures have been designed to ensure these interfund trades are executed in accordance with Rule 17a-7 of the 1940 Act. Any interfund trades are included within the respective purchases and sales amounts shown in the Purchases and Sales of Investments note. During the period, there were no interfund trades.
7. Committed Line of Credit.
Certain Funds participate with other funds managed by the investment adviser or an affiliate in a $4.25 billion credit facility (the "line of credit") to be utilized for temporary or emergency purposes to fund shareholder redemptions or for other short-term liquidity purposes. The participating funds have agreed to pay commitment fees on their pro-rata portion of the line of credit, which are reflected in Miscellaneous expenses on the Statement of Operations, and are listed below. During the period, there were no borrowings on this line of credit.
| | Amount |
| Fidelity SAI Japan Stock Index Fund | $934 |
8. Security Lending.
Funds lend portfolio securities from time to time in order to earn additional income. Lending agents are used, including National Financial Services (NFS), an affiliate of the investment adviser. Pursuant to a securities lending agreement, NFS will receive a fee, which is capped at 9.9% of a fund's daily lending revenue, for its services as lending agent. A fund may lend securities to certain qualified borrowers, including NFS. On the settlement date of the loan, a fund receives collateral (in the form of U.S. Treasury obligations, letters of credit and/or cash) against the loaned securities and maintains collateral in an amount not less than 100% of the market value of the loaned securities during the period of the loan. The market value of the loaned securities is determined at the close of business of a fund and any additional required collateral is delivered to a fund on the next business day. A fund or borrower may terminate the loan at any time, and if the borrower defaults on its obligation to return the securities loaned because of insolvency or other reasons, a fund may apply collateral received from the borrower against the obligation. A fund may experience delays and costs in recovering the securities loaned. Any cash collateral received is invested in the Fidelity Securities Lending Cash Central Fund. Any loaned securities are identified as such in the Schedule of Investments, and the value of loaned securities and cash collateral at period end, as applicable, are presented in the Statement of Assets and Liabilities. Security lending income represents the income earned on investing cash collateral, less rebates paid to borrowers and any lending agent fees associated with the loan, plus any premium payments received for lending certain types of securities. Security lending income is presented in the Statement of Operations as a component of income from Fidelity Central Funds. Affiliated security lending activity, if any, was as follows:
| | Total Security Lending Fees Paid to NFS | Security Lending Income From Securities Loaned to NFS | Value of Securities Loaned to NFS at Period End |
| Fidelity SAI Japan Stock Index Fund | $4,043 | $- | $- |
9. Bank Borrowings.
The Fund is permitted to have bank borrowings for temporary or emergency purposes to fund shareholder redemptions or for other short-term liquidity requirements. The Fund has established borrowing arrangements with certain banks. The interest rate on the borrowings is the bank's base rate, as revised from time to time. Any open loans, including accrued interest, at period end are presented under the caption "Notes payable" in the Statement of Assets and Liabilities, if applicable. Activity in this program during the period for which loans were outstanding was as follows:
| | Average Loan Balance | Weighted Average Interest Rate | Interest Expense |
| Fidelity SAI Japan Stock Index Fund | $8,713,600 | 4.33% | $5,240 |
10. Expense Reductions.
Through arrangements with the Fund's custodian, credits realized as a result of certain uninvested cash balances were used to reduce the Fund's expenses by $14.
11. Other.
A fund's organizational documents provide former and current trustees and officers with a limited indemnification against liabilities arising in connection with the performance of their duties to the fund. In the normal course of business, a fund may also enter into contracts that provide general indemnifications. A fund's maximum exposure under these arrangements is unknown as this would be dependent on future claims that may be made against a fund. The risk of material loss from such claims is considered remote.
At the end of the period, the following mutual funds managed by the investment adviser or its affiliates were the owners of record of 10% or more of the total outstanding shares.
| | Strategic Advisers Fidelity International Fund | Strategic Advisers International Fund |
| Fidelity SAI Japan Stock Index Fund | 10% | 90% |
Mutual funds managed by the investment adviser or its affiliates, in aggregate, were the owners of record of more than 20% of the total outstanding shares.
| Fund | % of shares held |
| Fidelity SAI Japan Stock Index Fund | 100% |
12. Risk and Uncertainties.
Many factors affect a fund's performance. Developments that disrupt global economies and financial markets, such as pandemics, epidemics, outbreaks of infectious diseases, war, terrorism, and environmental disasters, may significantly affect a fund's investment performance. The effects of these developments to a fund will be impacted by the types of securities in which a fund invests, the financial condition, industry, economic sector, and geographic location of an issuer, and a fund's level of investment in the securities of that issuer. Significant concentrations in security types, issuers, industries, sectors, and geographic locations may magnify the factors that affect a fund's performance.
As a shareholder, you incur two types of costs: (1) transaction costs, which may include sales charges (loads) on purchase payments or redemption proceeds, as applicable and (2) ongoing costs, which generally include management fees, distribution and/or service (12b-1) fees and other Fund expenses. This Example is intended to help you understand your ongoing costs (in dollars) of investing in a fund and to compare these costs with the ongoing costs of investing in other mutual funds.
| The Example is based on an investment of $1,000 invested at the beginning of the period and held for the entire period (November 1, 2022 to April 30, 2023). |
Actual Expenses
The first line of the accompanying table provides information about actual account values and actual expenses. You may use the information in this line, together with the amount you invested, to estimate the expenses that you paid over the period. Simply divide your account value by $1,000.00 (for example, an $8,600 account value divided by $1,000.00 = 8.6), then multiply the result by the number in the first line for a class/Fund under the heading entitled "Expenses Paid During Period" to estimate the expenses you paid on your account during this period. If any fund is a shareholder of any underlying mutual funds or exchange-traded funds (ETFs) (the Underlying Funds), such fund indirectly bears its proportional share of the expenses of the Underlying Funds in addition to the direct expenses incurred presented in the table. These fees and expenses are not included in the annualized expense ratio used to calculate the expense estimate in the table below.
Hypothetical Example for Comparison Purposes
The second line of the accompanying table provides information about hypothetical account values and hypothetical expenses based on the actual expense ratio and an assumed rate of return of 5% per year before expenses, which is not the actual return. The hypothetical account values and expenses may not be used to estimate the actual ending account balance or expenses you paid for the period. You may use this information to compare the ongoing costs of investing in the Fund and other funds. To do so, compare this 5% hypothetical example with the 5% hypothetical examples that appear in the shareholder reports of the other funds. If any fund is a shareholder of any Underlying Funds, such fund indirectly bears its proportional share of the expenses of the Underlying Funds in addition to the direct expenses as presented in the table. These fees and expenses are not included in the annualized expense ratio used to calculate the expense estimate in the table below.
Please note that the expenses shown in the table are meant to highlight your ongoing costs only and do not reflect any transaction costs. Therefore, the second line of the table is useful in comparing ongoing costs only, and will not help you determine the relative total costs of owning different funds. In addition, if these transactional costs were included, your costs would have been higher.
| | | | | Annualized Expense Ratio- A | | Beginning Account Value November 1, 2022 | | Ending Account Value April 30, 2023 | | Expenses Paid During Period- C November 1, 2022 to April 30, 2023 |
| | | | | | | | | | |
| Fidelity® SAI Japan Stock Index Fund | | | | .12% | | | | | | |
| Actual | | | | | | $ 1,000 | | $ 1,176.40 | | $ .65 |
Hypothetical- B | | | | | | $ 1,000 | | $ 1,024.20 | | $ .60 |
| |
A Annualized expense ratio reflects expenses net of applicable fee waivers.
B 5% return per year before expenses
C Expenses are equal to the annualized expense ratio, multiplied by the average account value over the period, multiplied by 181/ 365 (to reflect the one-half year period). The fees and expenses of any Underlying Funds are not included in each annualized expense ratio.
The Securities and Exchange Commission adopted Rule 22e-4 under the Investment Company Act of 1940 (the Liquidity Rule) to promote effective liquidity risk management throughout the open-end investment company industry, thereby reducing the risk that funds will be unable to meet their redemption obligations and mitigating dilution of the interests of fund shareholders.
The Fund has adopted and implemented a liquidity risk management program (the Program) reasonably designed to assess and manage the Fund's liquidity risk and to comply with the requirements of the Liquidity Rule. The Fund's Board of Trustees (the Board) has designated the Fund's investment adviser as administrator of the Program. The Fidelity advisers have established a Liquidity Risk Management Committee (the LRM Committee) to manage the Program for each of the Fidelity Funds. The LRM Committee monitors the adequacy and effectiveness of implementation of the Program and on a periodic basis assesses each Fund's liquidity risk based on a variety of factors including (1) the Fund's investment strategy, (2) portfolio liquidity and cash flow projections during normal and reasonably foreseeable stressed conditions, (3) shareholder redemptions, (4) borrowings and other funding sources and (5) certain factors specific to ETFs including the effect of the Fund's prices and spreads, market participants, and basket compositions on the overall liquidity of the Fund's portfolio, as applicable.
In accordance with the Program, each of the Fund's portfolio investments is classified into one of four defined liquidity categories based on a determination of a reasonable expectation for how long it would take to convert the investment to cash (or sell or dispose of the investment) without significantly changing its market value.
- Highly liquid investments - cash or convertible to cash within three business days or less
- Moderately liquid investments - convertible to cash in three to seven calendar days
- Less liquid investments - can be sold or disposed of, but not settled, within seven calendar days
- Illiquid investments - cannot be sold or disposed of within seven calendar days
Liquidity classification determinations take into account a variety of factors including various market, trading and investment-specific considerations, as well as market depth, and generally utilize analysis from a third-party liquidity metrics service.
The Liquidity Rule places a 15% limit on a fund's illiquid investments and requires funds that do not primarily hold assets that are highly liquid investments to determine and maintain a minimum percentage of the fund's net assets to be invested in highly liquid investments (highly liquid investment minimum or HLIM). The Program includes provisions reasonably designed to comply with the 15% limit on illiquid investments and for determining, periodically reviewing and complying with the HLIM requirement as applicable.
At a recent meeting of the Fund's Board of Trustees, the LRM Committee provided a written report to the Board pertaining to the operation, adequacy, and effectiveness of the Program for the period December 1, 2021 through November 30, 2022. The report concluded that the Program is operating effectively and is reasonably designed to assess and manage the Fund's liquidity risk.
1.9901433.101
JSI-SANN-0623
Fidelity® Series International Index Fund
Semi-Annual Report
April 30, 2023
Contents
To view a fund's proxy voting guidelines and proxy voting record for the 12-month period ended June 30, visit http://www.fidelity.com/proxyvotingresults or visit the Securities and Exchange Commission's (SEC) web site at http://www.sec.gov.
You may also call 1-800-544-8544 to request a free copy of the proxy voting guidelines.
The funds or securities referred to herein are not sponsored, endorsed, or promoted by MSCI, and MSCI bears no liability with respect to any such funds or securities or any index on which such funds or securities are based. The prospectus contains a more detailed description of the limited relationship MSCI has with Fidelity and any related funds.
Standard & Poor's, S&P and S&P 500 are registered service marks of The McGraw-Hill Companies, Inc. and have been licensed for use by Fidelity Distributors Corporation.
Other third-party marks appearing herein are the property of their respective owners.
All other marks appearing herein are registered or unregistered trademarks or service marks of FMR LLC or an affiliated company. © 2023 FMR LLC. All rights reserved.
This report and the financial statements contained herein are submitted for the general information of the shareholders of the Fund. This report is not authorized for distribution to prospective investors in the Fund unless preceded or accompanied by an effective prospectus.
A fund files its complete schedule of portfolio holdings with the SEC for the first and third quarters of each fiscal year on Form N-PORT. Forms N-PORT are available on the SEC's web site at http://www.sec.gov. A fund's Forms N-PORT may be reviewed and copied at the SEC's Public Reference Room in Washington, DC. Information regarding the operation of the SEC's Public Reference Room may be obtained by calling 1-800-SEC-0330.
For a complete list of a fund's portfolio holdings, view the most recent holdings listing, semiannual report, or annual report on Fidelity's web site at http://www.fidelity.com, http://www.institutional.fidelity.com, or http://www.401k.com, as applicable.
NOT FDIC INSURED •MAY LOSE VALUE •NO BANK GUARANTEE
Neither the Fund nor Fidelity Distributors Corporation is a bank.
Top Holdings (% of Fund's net assets) |
| |
| Nestle SA (Reg. S) (United States of America, Food Products) | 2.2 | |
| Novo Nordisk A/S Series B (Denmark, Pharmaceuticals) | 1.7 | |
| LVMH Moet Hennessy Louis Vuitton SE (France, Textiles, Apparel & Luxury Goods) | 1.6 | |
| ASML Holding NV (Netherlands) (Netherlands, Semiconductors & Semiconductor Equipment) | 1.6 | |
| AstraZeneca PLC (United Kingdom) (United Kingdom, Pharmaceuticals) | 1.4 | |
| Novartis AG (Switzerland, Pharmaceuticals) | 1.4 | |
| Roche Holding AG (participation certificate) (United States of America, Pharmaceuticals) | 1.3 | |
| Shell PLC (London) (Netherlands, Oil, Gas & Consumable Fuels) | 1.3 | |
| TotalEnergies SE (France, Oil, Gas & Consumable Fuels) | 1.0 | |
| BHP Group Ltd. (Australia, Metals & Mining) | 0.9 | |
| | 14.4 | |
| |
| Market Sectors (% of Fund's net assets) |
| |
| Financials | 17.6 | |
| Industrials | 15.2 | |
| Health Care | 13.1 | |
| Consumer Discretionary | 11.4 | |
| Consumer Staples | 10.3 | |
| Materials | 7.3 | |
| Information Technology | 7.2 | |
| Energy | 4.4 | |
| Communication Services | 4.3 | |
| Utilities | 3.5 | |
| Real Estate | 1.5 | |
| |
Asset Allocation (% of Fund's net assets) |
|
Futures - 4.5% |
|
Geographic Diversification (% of Fund's net assets) |
|
* Includes Short-Term investments and Net Other Assets (Liabilities). Percentages are adjusted for the effect of derivatives, if applicable. |
| |
Showing Percentage of Net Assets
| Common Stocks - 95.1% |
| | | Shares | Value ($) |
| Australia - 7.4% | | | |
| Ampol Ltd. | | 5,015 | 100,063 |
| ANZ Group Holdings Ltd. | | 62,901 | 1,021,402 |
| APA Group unit | | 24,826 | 169,498 |
| Aristocrat Leisure Ltd. | | 12,490 | 315,940 |
| ASX Ltd. | | 4,074 | 185,406 |
| Aurizon Holdings Ltd. | | 38,740 | 88,081 |
| BHP Group Ltd. | | 106,744 | 3,167,895 |
| BlueScope Steel Ltd. | | 9,703 | 128,970 |
| Brambles Ltd. | | 29,176 | 276,379 |
| Cochlear Ltd. | | 1,384 | 226,931 |
| Coles Group Ltd. | | 28,112 | 339,598 |
| Commonwealth Bank of Australia | | 35,710 | 2,363,149 |
| Computershare Ltd. | | 11,428 | 170,115 |
| DEXUS Property Group unit | | 22,636 | 117,322 |
| EBOS Group Ltd. | | 3,496 | 95,941 |
| Endeavour Group Ltd. | | 30,147 | 135,879 |
| Flutter Entertainment PLC (Ireland) (a) | | 3,514 | 701,233 |
| Fortescue Metals Group Ltd. | | 35,626 | 498,466 |
| Glencore PLC | | 216,957 | 1,280,618 |
| Goodman Group unit | | 35,609 | 459,058 |
| IDP Education Ltd. | | 4,390 | 82,474 |
| IGO Ltd. | | 14,340 | 132,055 |
| Insurance Australia Group Ltd. | | 51,865 | 171,833 |
| Lendlease Group unit | | 14,505 | 72,037 |
| Macquarie Group Ltd. | | 7,725 | 942,387 |
| Medibank Private Ltd. | | 57,940 | 137,119 |
| Mineral Resources Ltd. | | 3,586 | 176,900 |
| Mirvac Group unit | | 83,033 | 133,303 |
| National Australia Bank Ltd. | | 66,502 | 1,280,241 |
| Newcrest Mining Ltd. | | 18,790 | 358,793 |
| Northern Star Resources Ltd. | | 24,513 | 218,651 |
| Orica Ltd. | | 9,455 | 102,056 |
| Origin Energy Ltd. | | 36,244 | 200,955 |
| Pilbara Minerals Ltd. | | 53,378 | 151,925 |
| Qantas Airways Ltd. (a) | | 19,425 | 85,663 |
| QBE Insurance Group Ltd. | | 31,206 | 319,106 |
| Ramsay Health Care Ltd. | | 3,882 | 166,931 |
| REA Group Ltd. | | 1,111 | 104,488 |
| Reece Ltd. | | 4,674 | 56,937 |
| Rio Tinto Ltd. | | 7,810 | 585,786 |
| Rio Tinto PLC | | 23,691 | 1,506,094 |
| Santos Ltd. | | 66,536 | 315,187 |
| Scentre Group unit | | 109,212 | 209,588 |
| SEEK Ltd. | | 7,088 | 115,650 |
| Sonic Healthcare Ltd. | | 9,597 | 226,230 |
| South32 Ltd. | | 96,564 | 272,963 |
| Stockland Corp. Ltd. unit | | 50,234 | 148,913 |
| Suncorp Group Ltd. | | 26,566 | 221,189 |
| Telstra Group Ltd. | | 85,054 | 246,760 |
| The GPT Group unit | | 40,314 | 118,544 |
| The Lottery Corp. Ltd. | | 46,823 | 156,997 |
| Transurban Group unit | | 64,679 | 645,063 |
| Treasury Wine Estates Ltd. | | 15,194 | 140,744 |
| Vicinity Centres unit | | 81,416 | 113,817 |
| Washington H. Soul Pattinson & Co. Ltd. | | 4,557 | 95,394 |
| Wesfarmers Ltd. | | 23,859 | 825,364 |
| Westpac Banking Corp. | | 73,653 | 1,102,525 |
| WiseTech Global Ltd. | | 3,090 | 141,540 |
| Woodside Energy Group Ltd. | | 39,946 | 906,388 |
| Woolworths Group Ltd. | | 25,703 | 663,056 |
TOTAL AUSTRALIA | | | 25,493,590 |
| Austria - 0.2% | | | |
| Erste Group Bank AG | | 7,234 | 262,330 |
| Mondi PLC | | 10,215 | 162,397 |
| OMV AG | | 3,099 | 146,290 |
| Verbund AG | | 1,433 | 127,743 |
| Voestalpine AG | | 2,442 | 84,439 |
TOTAL AUSTRIA | | | 783,199 |
| Belgium - 0.8% | | | |
| Ageas | | 3,393 | 151,008 |
| Anheuser-Busch InBev SA NV | | 18,274 | 1,188,165 |
| D'ieteren Group | | 524 | 98,446 |
| Elia Group SA/NV | | 696 | 95,405 |
| Groupe Bruxelles Lambert SA | | 2,092 | 187,411 |
| KBC Group NV | | 5,262 | 375,607 |
| Sofina SA | | 324 | 74,188 |
| Solvay SA Class A | | 1,559 | 186,989 |
| UCB SA | | 2,660 | 247,440 |
| Umicore SA | | 4,407 | 144,517 |
| Warehouses de Pauw | | 3,400 | 101,604 |
| Warehouses de Pauw rights 5/12/23 (a)(b) | | 3,400 | 3,746 |
TOTAL BELGIUM | | | 2,854,526 |
| Brazil - 0.0% | | | |
| Yara International ASA | | 3,483 | 140,143 |
| Chile - 0.1% | | | |
| Antofagasta PLC | | 8,296 | 152,272 |
| China - 0.5% | | | |
| BOC Hong Kong (Holdings) Ltd. | | 77,710 | 245,309 |
| Budweiser Brewing Co. APAC Ltd. (c) | | 36,280 | 104,821 |
| ESR Group Ltd. (c) | | 42,223 | 66,001 |
| Prosus NV | | 16,882 | 1,263,340 |
| SITC International Holdings Co. Ltd. | | 28,000 | 51,791 |
| Wilmar International Ltd. | | 40,422 | 119,395 |
TOTAL CHINA | | | 1,850,657 |
| Denmark - 3.0% | | | |
| A.P. Moller - Maersk A/S: | | | |
| Series A | | 68 | 121,132 |
| Series B | | 104 | 187,985 |
| Carlsberg A/S Series B | | 2,049 | 338,496 |
| Chr. Hansen Holding A/S | | 2,219 | 172,481 |
| Coloplast A/S Series B | | 2,500 | 359,598 |
| Danske Bank A/S (a) | | 14,512 | 305,815 |
| Demant A/S (a) | | 1,911 | 81,757 |
| DSV A/S | | 3,939 | 739,818 |
| Genmab A/S (a) | | 1,385 | 569,186 |
| Novo Nordisk A/S Series B | | 34,855 | 5,798,286 |
| Novozymes A/S Series B | | 4,304 | 223,583 |
| ORSTED A/S (c) | | 3,980 | 356,903 |
| Pandora A/S | | 1,909 | 176,155 |
| Rockwool International A/S Series B | | 195 | 47,060 |
| Tryg A/S | | 7,579 | 178,705 |
| Vestas Wind Systems A/S | | 21,247 | 587,917 |
TOTAL DENMARK | | | 10,244,877 |
| Finland - 1.1% | | | |
| Elisa Corp. (A Shares) | | 2,991 | 185,618 |
| Fortum Corp. | | 9,512 | 141,812 |
| Kesko Oyj | | 5,746 | 119,697 |
| Kone OYJ (B Shares) | | 7,150 | 407,323 |
| Metso Outotec Oyj | | 14,066 | 154,993 |
| Neste OYJ | | 8,901 | 430,964 |
| Nokia Corp. | | 113,835 | 481,653 |
| Nordea Bank ABP | | 69,735 | 773,983 |
| Orion Oyj (B Shares) | | 2,244 | 105,385 |
| Sampo Oyj (A Shares) | | 10,093 | 511,143 |
| Stora Enso Oyj (R Shares) | | 11,597 | 146,955 |
| UPM-Kymmene Corp. | | 11,229 | 357,586 |
| Wartsila Corp. | | 9,960 | 115,237 |
TOTAL FINLAND | | | 3,932,349 |
| France - 10.5% | | | |
| Accor SA | | 3,596 | 127,273 |
| Adevinta ASA Class B (a) | | 6,044 | 46,505 |
| Aeroports de Paris SA | | 625 | 99,240 |
| Air Liquide SA | | 11,030 | 1,984,189 |
| Airbus Group NV | | 12,456 | 1,744,271 |
| Alstom SA | | 6,727 | 169,080 |
| Amundi SA (c) | | 1,288 | 84,232 |
| Arkema SA | | 1,287 | 127,094 |
| AXA SA | | 39,634 | 1,293,661 |
| bioMerieux SA | | 881 | 92,126 |
| BNP Paribas SA | | 23,370 | 1,510,015 |
| Bollore SA | | 18,584 | 125,324 |
| Bouygues SA | | 4,754 | 173,916 |
| Bureau Veritas SA | | 6,181 | 178,035 |
| Capgemini SA | | 3,445 | 625,968 |
| Carrefour SA | | 12,489 | 259,779 |
| Compagnie de Saint-Gobain | | 10,349 | 599,152 |
| Compagnie Generale des Etablissements Michelin SCA Series B | | 14,273 | 454,561 |
| Covivio | | 997 | 56,578 |
| Covivio rights (a)(b) | | 997 | 4,120 |
| Credit Agricole SA | | 25,697 | 314,108 |
| Danone SA | | 13,505 | 893,810 |
| Dassault Aviation SA | | 527 | 102,958 |
| Dassault Systemes SA | | 14,021 | 566,542 |
| Edenred SA | | 5,249 | 340,786 |
| Eiffage SA | | 1,753 | 208,423 |
| Engie SA | | 38,424 | 614,599 |
| EssilorLuxottica SA | | 6,118 | 1,209,412 |
| Eurazeo SA | | 916 | 65,254 |
| Gecina SA | | 967 | 107,513 |
| Getlink SE | | 9,255 | 172,960 |
| Hermes International SCA | | 667 | 1,445,534 |
| Ipsen SA | | 794 | 96,240 |
| Kering SA | | 1,575 | 1,006,065 |
| Klepierre SA | | 4,527 | 114,531 |
| L'Oreal SA | | 5,087 | 2,425,722 |
| La Francaise des Jeux SAEM (c) | | 2,207 | 94,212 |
| Legrand SA | | 5,614 | 530,146 |
| LVMH Moet Hennessy Louis Vuitton SE | | 5,829 | 5,606,806 |
| Orange SA | | 41,953 | 546,057 |
| Pernod Ricard SA | | 4,341 | 1,001,633 |
| Publicis Groupe SA | | 4,806 | 392,925 |
| Remy Cointreau SA | | 488 | 84,343 |
| Renault SA | | 4,045 | 149,895 |
| Safran SA | | 7,190 | 1,118,187 |
| Sartorius Stedim Biotech | | 582 | 155,517 |
| SEB SA | | 534 | 61,077 |
| Societe Generale Series A | | 16,985 | 412,536 |
| Sodexo SA | | 1,861 | 199,322 |
| Teleperformance | | 1,244 | 247,834 |
| Thales SA | | 2,245 | 342,369 |
| TotalEnergies SE | | 52,408 | 3,348,868 |
| Unibail-Rodamco SE & WFD Unibail-Rodamco NV unit (a) | | 2,482 | 132,753 |
| Valeo SA | | 4,339 | 84,459 |
| Veolia Environnement SA | | 14,002 | 443,373 |
| VINCI SA | | 11,342 | 1,402,248 |
| Vivendi SA | | 15,145 | 166,115 |
| Wendel SA | | 571 | 63,925 |
| Worldline SA (a)(c) | | 5,031 | 218,309 |
TOTAL FRANCE | | | 36,242,485 |
| Germany - 7.7% | | | |
| adidas AG | | 3,415 | 601,402 |
| Allianz SE | | 8,497 | 2,133,655 |
| Aroundtown SA (d) | | 20,703 | 28,071 |
| BASF AG | | 19,322 | 997,479 |
| Bayer AG | | 20,668 | 1,364,011 |
| Bayerische Motoren Werke AG (BMW) | | 6,967 | 778,749 |
| Bechtle AG | | 1,722 | 79,789 |
| Beiersdorf AG | | 2,120 | 295,741 |
| Brenntag SE | | 3,250 | 264,219 |
| Carl Zeiss Meditec AG | | 847 | 113,677 |
| Commerzbank AG | | 22,395 | 248,375 |
| Continental AG | | 2,314 | 161,708 |
| Covestro AG (c) | | 4,064 | 178,289 |
| Daimler Truck Holding AG | | 9,521 | 314,106 |
| Deutsche Bank AG | | 43,480 | 476,375 |
| Deutsche Borse AG | | 3,997 | 762,262 |
| Deutsche Lufthansa AG (a) | | 12,564 | 134,705 |
| Deutsche Post AG | | 20,853 | 1,003,021 |
| Deutsche Telekom AG | | 68,290 | 1,646,592 |
| E.ON SE | | 47,232 | 624,800 |
| Evonik Industries AG | | 4,410 | 96,021 |
| Fresenius Medical Care AG & Co. KGaA | | 4,322 | 209,721 |
| Fresenius SE & Co. KGaA | | 8,888 | 256,790 |
| GEA Group AG | | 3,184 | 149,249 |
| Hannover Reuck SE | | 1,268 | 270,500 |
| HeidelbergCement AG | | 3,047 | 230,189 |
| HelloFresh AG (a) | | 3,477 | 92,833 |
| Henkel AG & Co. KGaA | | 2,202 | 162,568 |
| Infineon Technologies AG | | 27,472 | 1,000,442 |
| Knorr-Bremse AG | | 1,526 | 106,674 |
| LEG Immobilien AG | | 1,560 | 96,915 |
| Mercedes-Benz Group AG (Germany) | | 16,881 | 1,316,482 |
| Merck KGaA | | 2,719 | 487,011 |
| MTU Aero Engines AG | | 1,124 | 294,400 |
| Muenchener Rueckversicherungs-Gesellschaft AG in Muenchen | | 2,947 | 1,105,705 |
| Nemetschek SE | | 1,215 | 94,493 |
| Puma AG | | 2,221 | 129,610 |
| Rational AG | | 108 | 77,948 |
| Rheinmetall AG | | 916 | 267,980 |
| RWE AG | | 13,515 | 633,662 |
| SAP SE | | 22,001 | 2,977,092 |
| Scout24 AG (c) | | 1,686 | 104,966 |
| Siemens AG | | 16,114 | 2,656,107 |
| Siemens Energy AG (a) | | 10,939 | 267,351 |
| Siemens Healthineers AG (c) | | 5,933 | 368,850 |
| Symrise AG | | 2,793 | 337,457 |
| Telefonica Deutschland Holding AG | | 21,574 | 72,862 |
| United Internet AG | | 1,818 | 31,171 |
| Volkswagen AG | | 623 | 104,597 |
| Vonovia SE | | 15,071 | 326,868 |
| Zalando SE (a)(c) | | 4,711 | 192,951 |
TOTAL GERMANY | | | 26,726,491 |
| Hong Kong - 2.4% | | | |
| AIA Group Ltd. | | 248,845 | 2,709,194 |
| CK Asset Holdings Ltd. | | 41,726 | 246,731 |
| CK Infrastructure Holdings Ltd. | | 13,081 | 74,475 |
| CLP Holdings Ltd. | | 34,736 | 258,635 |
| Futu Holdings Ltd. ADR (a)(d) | | 1,236 | 54,718 |
| Hang Lung Properties Ltd. | | 42,400 | 77,504 |
| Hang Seng Bank Ltd. | | 16,076 | 238,292 |
| Henderson Land Development Co. Ltd. | | 31,140 | 110,881 |
| HKT Trust/HKT Ltd. unit | | 80,292 | 105,526 |
| Hong Kong & China Gas Co. Ltd. | | 235,697 | 209,283 |
| Hong Kong Exchanges and Clearing Ltd. | | 25,367 | 1,053,159 |
| Hongkong Land Holdings Ltd. | | 23,530 | 104,719 |
| Jardine Matheson Holdings Ltd. | | 3,375 | 163,154 |
| Link (REIT) | | 53,344 | 348,917 |
| MTR Corp. Ltd. | | 32,611 | 162,942 |
| New World Development Co. Ltd. | | 31,305 | 83,487 |
| Power Assets Holdings Ltd. | | 29,303 | 167,446 |
| Prudential PLC | | 57,839 | 884,997 |
| Sino Land Ltd. | | 73,904 | 99,591 |
| Sun Hung Kai Properties Ltd. | | 30,680 | 427,167 |
| Swire Pacific Ltd. (A Shares) | | 9,856 | 78,238 |
| Swire Properties Ltd. | | 24,165 | 64,949 |
| Techtronic Industries Co. Ltd. | | 29,292 | 316,895 |
| WH Group Ltd. (c) | | 175,577 | 97,751 |
| Wharf Real Estate Investment Co. Ltd. | | 34,814 | 200,763 |
| Xinyi Glass Holdings Ltd. | | 39,050 | 71,444 |
TOTAL HONG KONG | | | 8,410,858 |
| Ireland - 0.6% | | | |
| AerCap Holdings NV (a) | | 3,493 | 196,865 |
| AIB Group PLC | | 22,497 | 96,629 |
| Bank of Ireland Group PLC | | 22,517 | 232,484 |
| CRH PLC | | 15,773 | 761,110 |
| Kerry Group PLC Class A | | 3,350 | 352,304 |
| Kingspan Group PLC (Ireland) | | 3,249 | 224,471 |
| Smurfit Kappa Group PLC | | 5,200 | 192,180 |
TOTAL IRELAND | | | 2,056,043 |
| Israel - 0.6% | | | |
| Azrieli Group | | 881 | 50,976 |
| Bank Hapoalim BM (Reg.) | | 26,740 | 228,178 |
| Bank Leumi le-Israel BM | | 32,501 | 255,040 |
| Bezeq The Israel Telecommunication Corp. Ltd. | | 43,741 | 59,260 |
| Check Point Software Technologies Ltd. (a) | | 2,111 | 268,857 |
| Elbit Systems Ltd. (Israel) | | 560 | 103,086 |
| First International Bank of Israel | | 1,209 | 43,572 |
| Icl Group Ltd. | | 14,908 | 91,395 |
| Israel Discount Bank Ltd. (Class A) | | 26,056 | 128,150 |
| Mizrahi Tefahot Bank Ltd. | | 3,251 | 105,699 |
| NICE Ltd. (a) | | 1,337 | 274,521 |
| Teva Pharmaceutical Industries Ltd. sponsored ADR (a) | | 23,370 | 204,020 |
| Tower Semiconductor Ltd. (a) | | 2,301 | 101,186 |
| Wix.com Ltd. (a) | | 1,204 | 105,025 |
TOTAL ISRAEL | | | 2,018,965 |
| Italy - 2.1% | | | |
| Amplifon SpA | | 2,620 | 96,079 |
| Assicurazioni Generali SpA | | 23,358 | 485,937 |
| Coca-Cola HBC AG | | 4,242 | 129,227 |
| Davide Campari Milano NV | | 11,000 | 141,572 |
| DiaSorin SpA | | 530 | 57,513 |
| Enel SpA | | 171,105 | 1,169,009 |
| Eni SpA | | 52,592 | 794,529 |
| Ferrari NV (Italy) | | 2,652 | 737,281 |
| FinecoBank SpA | | 12,833 | 194,152 |
| Infrastrutture Wireless Italiane SpA (c) | | 7,059 | 97,968 |
| Intesa Sanpaolo SpA | | 340,325 | 894,848 |
| Mediobanca SpA | | 12,489 | 133,901 |
| Moncler SpA | | 4,318 | 319,548 |
| Nexi SpA (a)(c) | | 12,410 | 102,641 |
| Poste Italiane SpA (c) | | 10,984 | 114,085 |
| Prysmian SpA | | 5,359 | 218,901 |
| Recordati SpA | | 2,200 | 101,161 |
| Snam SpA | | 42,405 | 235,499 |
| Telecom Italia SpA (a) | | 213,146 | 62,686 |
| Terna - Rete Elettrica Nazionale | | 29,603 | 256,390 |
| UniCredit SpA | | 40,415 | 800,843 |
TOTAL ITALY | | | 7,143,770 |
| Japan - 20.2% | | | |
| Advantest Corp. | | 3,833 | 298,713 |
| AEON Co. Ltd. | | 13,791 | 281,088 |
| AGC, Inc. | | 4,094 | 152,644 |
| Aisin Seiki Co. Ltd. | | 3,074 | 90,226 |
| Ajinomoto Co., Inc. | | 9,583 | 344,647 |
| Ana Holdings, Inc. (a) | | 3,363 | 73,357 |
| Asahi Group Holdings | | 9,662 | 373,283 |
| ASAHI INTECC Co. Ltd. | | 4,526 | 81,904 |
| Asahi Kasei Corp. | | 26,393 | 186,418 |
| Astellas Pharma, Inc. | | 38,613 | 581,688 |
| Azbil Corp. | | 2,407 | 67,316 |
| Bandai Namco Holdings, Inc. | | 12,711 | 288,736 |
| BayCurrent Consulting, Inc. | | 2,800 | 97,328 |
| Bridgestone Corp. | | 12,084 | 485,274 |
| Brother Industries Ltd. | | 4,874 | 76,547 |
| Canon, Inc. | | 21,071 | 501,856 |
| Capcom Co. Ltd. | | 3,694 | 138,812 |
| Central Japan Railway Co. | | 3,040 | 376,348 |
| Chiba Bank Ltd. | | 11,105 | 72,516 |
| Chubu Electric Power Co., Inc. | | 13,595 | 151,616 |
| Chugai Pharmaceutical Co. Ltd. | | 14,122 | 364,428 |
| Concordia Financial Group Ltd. | | 22,926 | 86,989 |
| CyberAgent, Inc. | | 9,072 | 79,168 |
| Dai Nippon Printing Co. Ltd. | | 4,705 | 135,251 |
| Dai-ichi Mutual Life Insurance Co. | | 20,611 | 383,381 |
| Daifuku Co. Ltd. | | 6,510 | 119,945 |
| Daiichi Sankyo Kabushiki Kaisha | | 36,946 | 1,267,788 |
| Daikin Industries Ltd. | | 5,217 | 947,569 |
| Daito Trust Construction Co. Ltd. | | 1,309 | 124,064 |
| Daiwa House Industry Co. Ltd. | | 12,650 | 322,429 |
| Daiwa House REIT Investment Corp. | | 46 | 97,873 |
| Daiwa Securities Group, Inc. | | 28,056 | 130,312 |
| DENSO Corp. | | 9,122 | 550,637 |
| Dentsu Group, Inc. | | 4,263 | 153,617 |
| Disco Corp. | | 1,944 | 221,335 |
| East Japan Railway Co. | | 6,402 | 366,333 |
| Eisai Co. Ltd. | | 5,321 | 307,039 |
| ENEOS Holdings, Inc. | | 64,514 | 229,510 |
| FANUC Corp. | | 20,105 | 678,970 |
| Fast Retailing Co. Ltd. | | 3,591 | 850,355 |
| Fuji Electric Co. Ltd. | | 2,611 | 105,394 |
| FUJIFILM Holdings Corp. | | 7,600 | 396,112 |
| Fujitsu Ltd. | | 4,128 | 550,169 |
| GLP J-REIT | | 96 | 109,687 |
| GMO Payment Gateway, Inc. | | 869 | 67,966 |
| Hakuhodo DY Holdings, Inc. | | 4,980 | 58,681 |
| Hamamatsu Photonics K.K. | | 2,941 | 155,914 |
| Hankyu Hanshin Holdings, Inc. | | 4,775 | 149,082 |
| Hikari Tsushin, Inc. | | 390 | 53,214 |
| Hirose Electric Co. Ltd. | | 653 | 88,128 |
| Hitachi Construction Machinery Co. Ltd. | | 2,283 | 56,257 |
| Hitachi Ltd. | | 20,425 | 1,129,801 |
| Honda Motor Co. Ltd. | | 34,338 | 910,748 |
| Hoshizaki Corp. | | 2,268 | 79,882 |
| Hoya Corp. | | 7,528 | 789,349 |
| Hulic Co. Ltd. | | 8,100 | 69,741 |
| Ibiden Co. Ltd. | | 2,377 | 93,526 |
| Idemitsu Kosan Co. Ltd. | | 4,407 | 93,838 |
| Iida Group Holdings Co. Ltd. | | 3,037 | 53,996 |
| INPEX Corp. | | 21,910 | 239,762 |
| Isuzu Motors Ltd. | | 12,226 | 144,377 |
| Itochu Corp. | | 25,050 | 831,030 |
| ITOCHU Techno-Solutions Corp. | | 2,065 | 53,474 |
| Japan Airlines Co. Ltd. | | 3,037 | 57,936 |
| Japan Exchange Group, Inc. | | 10,563 | 171,520 |
| Japan Post Bank Co. Ltd. | | 31,162 | 248,846 |
| Japan Post Holdings Co. Ltd. | | 50,003 | 411,621 |
| Japan Post Insurance Co. Ltd. | | 4,167 | 67,668 |
| Japan Real Estate Investment Corp. | | 26 | 103,022 |
| Japan Retail Fund Investment Corp. | | 147 | 107,636 |
| Japan Tobacco, Inc. | | 25,208 | 542,398 |
| JFE Holdings, Inc. | | 10,320 | 122,089 |
| JSR Corp. | | 3,741 | 86,804 |
| Kajima Corp. | | 8,854 | 117,143 |
| Kansai Electric Power Co., Inc. | | 14,780 | 159,546 |
| Kao Corp. | | 9,806 | 396,246 |
| KDDI Corp. | | 33,900 | 1,058,295 |
| Keio Corp. | | 2,173 | 80,705 |
| Keisei Electric Railway Co. | | 2,719 | 95,951 |
| Keyence Corp. | | 4,105 | 1,851,176 |
| Kikkoman Corp. | | 3,042 | 180,189 |
| Kintetsu Group Holdings Co. Ltd. | | 3,587 | 121,087 |
| Kirin Holdings Co. Ltd. | | 17,274 | 280,622 |
| Kobayashi Pharmaceutical Co. Ltd. | | 1,081 | 67,457 |
| Kobe Bussan Co. Ltd. | | 3,205 | 89,639 |
| Koei Tecmo Holdings Co. Ltd. | | 2,496 | 45,901 |
| Koito Manufacturing Co. Ltd. | | 4,344 | 84,028 |
| Komatsu Ltd. | | 19,468 | 484,167 |
| Konami Group Corp. | | 1,955 | 96,194 |
| Kose Corp. | | 756 | 88,222 |
| Kubota Corp. | | 21,243 | 321,895 |
| Kurita Water Industries Ltd. | | 2,165 | 90,733 |
| Kyocera Corp. | | 6,738 | 353,661 |
| Kyowa Hakko Kirin Co., Ltd. | | 5,647 | 125,654 |
| Lasertec Corp. | | 1,625 | 221,075 |
| LIXIL Group Corp. | | 6,043 | 95,123 |
| M3, Inc. | | 9,338 | 229,210 |
| Makita Corp. | | 4,673 | 131,829 |
| Marubeni Corp. | | 32,572 | 462,301 |
| MatsukiyoCocokara & Co. | | 2,400 | 128,520 |
| Mazda Motor Corp. | | 11,972 | 108,340 |
| McDonald's Holdings Co. (Japan) Ltd. | | 1,814 | 75,572 |
| Meiji Holdings Co. Ltd. | | 4,582 | 110,562 |
| Minebea Mitsumi, Inc. | | 7,611 | 140,945 |
| Misumi Group, Inc. | | 5,967 | 150,531 |
| Mitsubishi Chemical Holdings Corp. | | 26,947 | 158,088 |
| Mitsubishi Corp. | | 26,435 | 980,101 |
| Mitsubishi Electric Corp. | | 40,656 | 504,089 |
| Mitsubishi Estate Co. Ltd. | | 23,784 | 293,121 |
| Mitsubishi Heavy Industries Ltd. | | 6,812 | 258,313 |
| Mitsubishi UFJ Financial Group, Inc. | | 251,521 | 1,574,404 |
| Mitsubishi UFJ Lease & Finance Co. Ltd. | | 13,878 | 72,037 |
| Mitsui & Co. Ltd. | | 30,229 | 943,710 |
| Mitsui Chemicals, Inc. | | 3,910 | 98,927 |
| Mitsui Fudosan Co. Ltd. | | 19,041 | 378,193 |
| Mitsui OSK Lines Ltd. | | 7,200 | 178,492 |
| Mizuho Financial Group, Inc. | | 50,899 | 737,823 |
| MonotaRO Co. Ltd. | | 5,322 | 80,516 |
| MS&AD Insurance Group Holdings, Inc. | | 9,043 | 296,812 |
| Murata Manufacturing Co. Ltd. | | 12,161 | 689,969 |
| NEC Corp. | | 5,135 | 197,468 |
| Nexon Co. Ltd. | | 10,014 | 226,220 |
| NGK Insulators Ltd. | | 5,041 | 63,274 |
| Nidec Corp. | | 9,449 | 467,556 |
| Nihon M&A Center Holdings, Inc. | | 6,396 | 48,890 |
| Nintendo Co. Ltd. | | 23,270 | 983,795 |
| Nippon Building Fund, Inc. | | 32 | 134,183 |
| Nippon Express Holdings, Inc. | | 1,623 | 95,241 |
| Nippon Paint Holdings Co. Ltd. | | 17,405 | 157,032 |
| Nippon Prologis REIT, Inc. | | 45 | 102,513 |
| Nippon Sanso Holdings Corp. | | 3,650 | 65,856 |
| Nippon Shinyaku Co. Ltd. | | 975 | 44,585 |
| Nippon Steel & Sumitomo Metal Corp. | | 16,982 | 362,692 |
| Nippon Telegraph & Telephone Corp. | | 25,145 | 767,274 |
| Nippon Yusen KK | | 10,165 | 240,290 |
| Nissan Chemical Corp. | | 2,607 | 115,860 |
| Nissan Motor Co. Ltd. | | 48,864 | 178,179 |
| Nisshin Seifun Group, Inc. | | 4,120 | 49,940 |
| Nissin Food Holdings Co. Ltd. | | 1,306 | 125,914 |
| Nitori Holdings Co. Ltd. | | 1,735 | 220,928 |
| Nitto Denko Corp. | | 3,063 | 198,018 |
| Nomura Holdings, Inc. | | 61,185 | 219,342 |
| Nomura Real Estate Holdings, Inc. | | 2,493 | 62,123 |
| Nomura Real Estate Master Fund, Inc. | | 89 | 104,139 |
| Nomura Research Institute Ltd. | | 8,339 | 209,805 |
| NTT Data Corp. | | 13,245 | 179,909 |
| Obayashi Corp. | | 13,693 | 114,155 |
| OBIC Co. Ltd. | | 1,516 | 233,578 |
| Odakyu Electric Railway Co. Ltd. | | 6,193 | 86,506 |
| Oji Holdings Corp. | | 17,055 | 67,021 |
| Olympus Corp. | | 25,653 | 449,092 |
| OMRON Corp. | | 3,911 | 229,416 |
| Ono Pharmaceutical Co. Ltd. | | 7,621 | 153,450 |
| Open House Group Co. Ltd. | | 1,600 | 63,956 |
| Oracle Corp. Japan | | 864 | 62,008 |
| Oriental Land Co. Ltd. | | 21,170 | 749,189 |
| ORIX Corp. | | 25,104 | 427,082 |
| Osaka Gas Co. Ltd. | | 7,936 | 131,271 |
| Otsuka Corp. | | 2,375 | 86,448 |
| Otsuka Holdings Co. Ltd. | | 8,254 | 280,807 |
| Pan Pacific International Holdings Ltd. | | 7,994 | 149,383 |
| Panasonic Holdings Corp. | | 46,409 | 437,116 |
| Persol Holdings Co. Ltd. | | 3,700 | 76,292 |
| Rakuten Group, Inc. | | 18,346 | 91,509 |
| Recruit Holdings Co. Ltd. | | 30,373 | 852,072 |
| Renesas Electronics Corp. (a) | | 24,703 | 321,941 |
| Resona Holdings, Inc. | | 45,477 | 226,656 |
| Ricoh Co. Ltd. | | 11,625 | 96,252 |
| ROHM Co. Ltd. | | 1,846 | 138,982 |
| SBI Holdings, Inc. Japan | | 5,197 | 101,501 |
| SCSK Corp. | | 3,358 | 50,698 |
| Secom Co. Ltd. | | 4,449 | 284,887 |
| Seiko Epson Corp. | | 5,844 | 89,377 |
| Sekisui Chemical Co. Ltd. | | 7,598 | 108,138 |
| Sekisui House Ltd. | | 12,934 | 265,906 |
| Seven & i Holdings Co. Ltd. | | 15,859 | 718,689 |
| SG Holdings Co. Ltd. | | 6,137 | 88,310 |
| Sharp Corp. | | 4,760 | 33,925 |
| Shimadzu Corp. | | 4,974 | 155,571 |
| SHIMANO, Inc. | | 1,524 | 235,690 |
| SHIMIZU Corp. | | 11,423 | 69,760 |
| Shin-Etsu Chemical Co. Ltd. | | 38,970 | 1,112,041 |
| Shionogi & Co. Ltd. | | 5,641 | 252,517 |
| Shiseido Co. Ltd. | | 8,469 | 424,515 |
| Shizuoka Financial Group | | 9,399 | 70,846 |
| SMC Corp. | | 1,196 | 596,499 |
| SoftBank Corp. | | 60,413 | 680,179 |
| SoftBank Group Corp. | | 25,424 | 953,462 |
| Sompo Holdings, Inc. | | 6,559 | 273,704 |
| Sony Group Corp. | | 26,513 | 2,398,730 |
| Square Enix Holdings Co. Ltd. | | 1,755 | 86,362 |
| Subaru Corp. | | 12,928 | 211,008 |
| Sumco Corp. | | 7,349 | 101,208 |
| Sumitomo Chemical Co. Ltd. | | 31,326 | 105,858 |
| Sumitomo Corp. | | 23,675 | 424,324 |
| Sumitomo Electric Industries Ltd. | | 15,044 | 191,996 |
| Sumitomo Metal Mining Co. Ltd. | | 5,186 | 191,409 |
| Sumitomo Mitsui Financial Group, Inc. | | 27,487 | 1,123,494 |
| Sumitomo Mitsui Trust Holdings, Inc. | | 6,955 | 250,712 |
| Sumitomo Realty & Development Co. Ltd. | | 6,522 | 152,284 |
| Suntory Beverage & Food Ltd. | | 2,932 | 110,376 |
| Suzuki Motor Corp. | | 7,818 | 272,602 |
| Sysmex Corp. | | 3,580 | 230,277 |
| T&D Holdings, Inc. | | 11,196 | 137,110 |
| Taisei Corp. | | 3,816 | 129,786 |
| Takeda Pharmaceutical Co. Ltd. | | 31,678 | 1,050,416 |
| TDK Corp. | | 8,151 | 280,223 |
| Terumo Corp. | | 13,580 | 406,664 |
| TIS, Inc. | | 4,772 | 131,038 |
| Tobu Railway Co. Ltd. | | 4,015 | 102,486 |
| Toho Co. Ltd. | | 2,390 | 94,946 |
| Tokio Marine Holdings, Inc. | | 38,668 | 777,499 |
| Tokyo Electric Power Co., Inc. (a) | | 32,125 | 115,181 |
| Tokyo Electron Ltd. | | 9,450 | 1,082,077 |
| Tokyo Gas Co. Ltd. | | 8,215 | 168,268 |
| Tokyu Corp. | | 11,217 | 158,339 |
| Toppan, Inc. | | 5,538 | 117,731 |
| Toray Industries, Inc. | | 29,202 | 165,497 |
| Toshiba Corp. | | 8,244 | 265,620 |
| Tosoh Corp. | | 5,427 | 72,506 |
| Toto Ltd. | | 2,935 | 100,382 |
| Toyota Industries Corp. | | 3,141 | 182,548 |
| Toyota Motor Corp. | | 223,390 | 3,067,153 |
| Toyota Tsusho Corp. | | 4,457 | 185,265 |
| Trend Micro, Inc. | | 2,820 | 137,795 |
| Unicharm Corp. | | 8,474 | 342,095 |
| USS Co. Ltd. | | 4,368 | 73,400 |
| Welcia Holdings Co. Ltd. | | 1,955 | 40,932 |
| West Japan Railway Co. | | 4,570 | 198,072 |
| Yakult Honsha Co. Ltd. | | 2,714 | 204,131 |
| Yamaha Corp. | | 3,023 | 119,135 |
| Yamaha Motor Co. Ltd. | | 6,272 | 162,641 |
| Yamato Holdings Co. Ltd. | | 6,012 | 103,272 |
| Yaskawa Electric Corp. | | 4,998 | 203,547 |
| Yokogawa Electric Corp. | | 4,779 | 77,615 |
| Z Holdings Corp. | | 56,117 | 153,718 |
| ZOZO, Inc. | | 2,582 | 54,337 |
TOTAL JAPAN | | | 69,847,580 |
| Jordan - 0.0% | | | |
| Hikma Pharmaceuticals PLC | | 3,474 | 80,377 |
| Korea (South) - 0.0% | | | |
| Delivery Hero AG (a)(c) | | 3,638 | 144,835 |
| Luxembourg - 0.2% | | | |
| ArcelorMittal SA (Netherlands) | | 11,080 | 313,895 |
| Eurofins Scientific SA | | 2,835 | 197,617 |
TOTAL LUXEMBOURG | | | 511,512 |
| Macau - 0.2% | | | |
| Galaxy Entertainment Group Ltd. | | 45,635 | 324,798 |
| Sands China Ltd. (a) | | 51,262 | 183,591 |
TOTAL MACAU | | | 508,389 |
| Netherlands - 5.0% | | | |
| ABN AMRO Bank NV: | | | |
| GDR (Bearer) (c) | | 8,498 | 135,918 |
| rights (a)(b) | | 8,498 | 6,274 |
| Adyen BV (a)(c) | | 456 | 732,724 |
| AEGON NV | | 37,590 | 171,513 |
| Akzo Nobel NV | | 3,821 | 316,366 |
| Argenx SE (a) | | 1,166 | 449,782 |
| ASM International NV (Netherlands) | | 985 | 356,056 |
| ASML Holding NV (Netherlands) | | 8,489 | 5,364,536 |
| Euronext NV (c) | | 1,803 | 143,243 |
| EXOR NV | | 2,281 | 187,201 |
| Heineken Holding NV | | 2,434 | 233,202 |
| Heineken NV (Bearer) | | 5,453 | 625,201 |
| IMCD NV | | 1,199 | 179,944 |
| ING Groep NV (Certificaten Van Aandelen) | | 78,485 | 968,605 |
| JDE Peet's BV | | 2,115 | 64,322 |
| Koninklijke Ahold Delhaize NV | | 21,998 | 756,760 |
| Koninklijke KPN NV | | 69,469 | 253,345 |
| Koninklijke Philips Electronics NV | | 18,710 | 395,006 |
| NN Group NV | | 5,869 | 218,392 |
| OCI NV | | 2,217 | 58,361 |
| Randstad NV | | 2,515 | 136,402 |
| Shell PLC (London) | | 148,600 | 4,566,206 |
| Universal Music Group NV | | 15,258 | 333,061 |
| Wolters Kluwer NV | | 5,432 | 719,160 |
TOTAL NETHERLANDS | | | 17,371,580 |
| New Zealand - 0.2% | | | |
| Auckland International Airport Ltd. (a) | | 26,367 | 144,369 |
| Fisher & Paykel Healthcare Corp. | | 12,151 | 208,425 |
| Mercury Nz Ltd. | | 14,328 | 56,279 |
| Meridian Energy Ltd. | | 27,172 | 92,023 |
| Spark New Zealand Ltd. | | 39,402 | 127,669 |
| Xero Ltd. (a) | | 2,841 | 177,352 |
TOTAL NEW ZEALAND | | | 806,117 |
| Norway - 0.6% | | | |
| Aker BP ASA | | 6,649 | 158,784 |
| DNB Bank ASA | | 19,567 | 343,711 |
| Equinor ASA | | 20,042 | 577,030 |
| Gjensidige Forsikring ASA | | 4,206 | 73,132 |
| Kongsberg Gruppen ASA | | 1,864 | 83,571 |
| Mowi ASA | | 8,702 | 165,841 |
| Norsk Hydro ASA | | 28,292 | 208,203 |
| Orkla ASA | | 15,792 | 113,509 |
| Salmar ASA | | 1,401 | 62,116 |
| Telenor ASA | | 14,719 | 183,624 |
TOTAL NORWAY | | | 1,969,521 |
| Portugal - 0.2% | | | |
| Energias de Portugal SA | | 61,653 | 339,677 |
| Galp Energia SGPS SA Class B | | 10,546 | 127,711 |
| Jeronimo Martins SGPS SA | | 5,956 | 150,291 |
TOTAL PORTUGAL | | | 617,679 |
| Singapore - 1.5% | | | |
| CapitaLand Ascendas REIT | | 70,751 | 152,251 |
| Capitaland Ascott Trust unit (b) | | 3,127 | 2,539 |
| CapitaLand Investment Ltd. | | 54,853 | 153,546 |
| CapitaMall Trust | | 111,723 | 170,594 |
| City Developments Ltd. | | 8,468 | 44,299 |
| DBS Group Holdings Ltd. | | 38,098 | 941,400 |
| Genting Singapore Ltd. | | 127,194 | 108,207 |
| Grab Holdings Ltd. (a)(d) | | 27,321 | 79,504 |
| Jardine Cycle & Carriage Ltd. | | 2,100 | 53,484 |
| Keppel Corp. Ltd. | | 30,616 | 142,162 |
| Mapletree Logistics Trust (REIT) | | 70,768 | 92,612 |
| Mapletree Pan Asia Commercial Trust | | 49,577 | 65,672 |
| Oversea-Chinese Banking Corp. Ltd. | | 71,228 | 673,880 |
| Sea Ltd. ADR (a) | | 7,602 | 579,044 |
| Seatrium Ltd. (a) | | 974,407 | 90,876 |
| Singapore Airlines Ltd. | | 28,162 | 123,865 |
| Singapore Exchange Ltd. | | 18,089 | 130,180 |
| Singapore Technologies Engineering Ltd. | | 32,893 | 89,545 |
| Singapore Telecommunications Ltd. | | 173,762 | 332,989 |
| STMicroelectronics NV (France) | | 14,378 | 615,049 |
| United Overseas Bank Ltd. | | 24,866 | 528,103 |
| UOL Group Ltd. | | 9,644 | 50,312 |
| Venture Corp. Ltd. | | 5,857 | 74,828 |
TOTAL SINGAPORE | | | 5,294,941 |
| South Africa - 0.2% | | | |
| Anglo American PLC (United Kingdom) | | 26,732 | 823,725 |
| Spain - 2.5% | | | |
| Acciona SA | | 520 | 96,262 |
| ACS Actividades de Construccion y Servicios SA | | 4,609 | 158,454 |
| Aena SME SA (c) | | 1,578 | 265,862 |
| Amadeus IT Holding SA Class A (a) | | 9,476 | 666,021 |
| Banco Bilbao Vizcaya Argentaria SA (d) | | 127,134 | 930,747 |
| Banco Santander SA (Spain) (d) | | 353,313 | 1,240,554 |
| CaixaBank SA | | 93,266 | 345,234 |
| Cellnex Telecom SA (c) | | 11,925 | 502,090 |
| Corp. ACCIONA Energias Renovables SA | | 1,365 | 48,973 |
| EDP Renovaveis SA | | 5,323 | 118,247 |
| Enagas SA | | 5,236 | 104,746 |
| Endesa SA | | 6,684 | 150,027 |
| Ferrovial SA | | 10,268 | 321,666 |
| Grifols SA (a) | | 6,277 | 64,463 |
| Iberdrola SA | | 129,270 | 1,675,094 |
| Industria de Diseno Textil SA (d) | | 22,947 | 787,890 |
| Naturgy Energy Group SA | | 3,059 | 95,391 |
| Red Electrica Corporacion SA | | 8,542 | 155,352 |
| Repsol SA | | 29,029 | 426,867 |
| Telefonica SA | | 109,329 | 496,593 |
TOTAL SPAIN | | | 8,650,533 |
| Sweden - 3.0% | | | |
| Alfa Laval AB | | 6,095 | 223,175 |
| ASSA ABLOY AB (B Shares) | | 21,087 | 501,521 |
| Atlas Copco AB: | | | |
| (A Shares) | | 56,508 | 816,070 |
| (B Shares) | | 32,837 | 420,427 |
| Boliden AB | | 5,754 | 205,471 |
| Electrolux AB (B Shares) | | 4,625 | 69,702 |
| Embracer Group AB (a) | | 13,676 | 71,227 |
| Epiroc AB: | | | |
| (A Shares) | | 13,853 | 277,518 |
| (B Shares) | | 8,218 | 141,120 |
| EQT AB (d) | | 7,534 | 161,479 |
| Ericsson (B Shares) | | 61,403 | 338,066 |
| Essity AB (B Shares) | | 12,814 | 388,229 |
| Evolution AB (c) | | 3,847 | 512,206 |
| Fastighets AB Balder (a) | | 13,286 | 61,656 |
| Getinge AB (B Shares) | | 4,815 | 122,029 |
| H&M Hennes & Mauritz AB (B Shares) | | 15,367 | 225,292 |
| Hexagon AB (B Shares) | | 40,944 | 468,797 |
| Holmen AB (B Shares) | | 1,974 | 74,552 |
| Husqvarna AB (B Shares) | | 8,831 | 76,038 |
| Industrivarden AB: | | | |
| (A Shares) | | 2,783 | 79,460 |
| (C Shares) | | 3,203 | 91,295 |
| Indutrade AB | | 5,750 | 137,764 |
| Investment AB Latour (B Shares) | | 3,070 | 66,309 |
| Investor AB: | | | |
| (A Shares) | | 10,595 | 231,839 |
| (B Shares) | | 38,578 | 826,855 |
| Kinnevik AB (B Shares) (a) | | 5,107 | 83,589 |
| L E Lundbergforetagen AB | | 1,601 | 76,638 |
| Lifco AB | | 4,907 | 111,729 |
| Nibe Industrier AB (B Shares) | | 31,885 | 356,003 |
| Sagax AB | | 4,015 | 98,270 |
| Sandvik AB | | 22,432 | 456,075 |
| Securitas AB (B Shares) | | 10,355 | 92,695 |
| Skandinaviska Enskilda Banken AB (A Shares) | | 33,998 | 386,226 |
| Skanska AB (B Shares) | | 7,161 | 116,894 |
| SKF AB (B Shares) | | 8,066 | 145,746 |
| Svenska Cellulosa AB SCA (B Shares) | | 12,750 | 174,620 |
| Svenska Handelsbanken AB (A Shares) | | 30,687 | 271,267 |
| Swedbank AB (A Shares) | | 19,054 | 330,726 |
| Swedish Orphan Biovitrum AB (a) | | 3,555 | 86,457 |
| Tele2 AB (B Shares) | | 11,990 | 127,382 |
| Telia Co. AB | | 55,923 | 155,699 |
| Volvo AB: | | | |
| (A Shares) | | 4,207 | 89,021 |
| (B Shares) | | 31,754 | 652,727 |
| Volvo Car AB (a) | | 12,356 | 50,797 |
TOTAL SWEDEN | | | 10,450,658 |
| Switzerland - 6.0% | | | |
| ABB Ltd. (Reg.) | | 33,070 | 1,192,955 |
| Adecco SA (Reg.) | | 3,367 | 115,002 |
| Alcon, Inc. (Switzerland) | | 10,513 | 762,379 |
| Bachem Holding AG (B Shares) | | 688 | 74,738 |
| Baloise Holdings AG | | 964 | 160,801 |
| Banque Cantonale Vaudoise | | 624 | 65,552 |
| Barry Callebaut AG | | 75 | 159,758 |
| BKW AG | | 445 | 76,171 |
| Clariant AG (Reg.) | | 4,540 | 75,476 |
| Compagnie Financiere Richemont SA Series A | | 10,982 | 1,815,334 |
| Credit Suisse Group AG | | 75,780 | 68,190 |
| DSM-Firmenich AG | | 3,677 | 481,178 |
| Ems-Chemie Holding AG | | 148 | 121,119 |
| Geberit AG (Reg.) | | 755 | 428,074 |
| Givaudan SA | | 194 | 677,595 |
| Julius Baer Group Ltd. | | 4,499 | 320,721 |
| Kuehne & Nagel International AG | | 1,144 | 337,754 |
| Lindt & Spruengli AG | | 2 | 245,679 |
| Lindt & Spruengli AG (participation certificate) | | 23 | 283,560 |
| Logitech International SA (Reg.) | | 3,642 | 213,993 |
| Lonza Group AG | | 1,567 | 977,244 |
| Novartis AG | | 45,560 | 4,660,510 |
| Partners Group Holding AG | | 478 | 461,609 |
| Schindler Holding AG: | | | |
| (participation certificate) | | 856 | 190,286 |
| (Reg.) | | 495 | 105,164 |
| SGS SA (Reg.) | | 3,350 | 301,925 |
| Sig Group AG | | 6,435 | 171,629 |
| Sika AG | | 3,073 | 848,833 |
| Sonova Holding AG | | 1,105 | 348,368 |
| Straumann Holding AG | | 2,349 | 353,409 |
| Swatch Group AG (Bearer) | | 608 | 207,190 |
| Swatch Group AG (Bearer) (Reg.) | | 1,109 | 69,727 |
| Swiss Life Holding AG | | 649 | 426,059 |
| Swiss Prime Site AG | | 1,616 | 146,169 |
| Swisscom AG | | 545 | 373,760 |
| Temenos Group AG | | 1,338 | 111,788 |
| UBS Group AG | | 70,446 | 1,423,737 |
| VAT Group AG (c) | | 568 | 199,088 |
| Zurich Insurance Group Ltd. | | 3,165 | 1,528,944 |
TOTAL SWITZERLAND | | | 20,581,468 |
| United Arab Emirates - 0.0% | | | |
| NMC Health PLC (a) | | 941 | 2 |
| United Kingdom - 11.2% | | | |
| 3i Group PLC | | 20,477 | 455,593 |
| Abrdn PLC | | 43,053 | 115,085 |
| Admiral Group PLC | | 3,790 | 110,075 |
| Ashtead Group PLC | | 9,233 | 531,096 |
| Associated British Foods PLC | | 7,495 | 184,242 |
| AstraZeneca PLC (United Kingdom) | | 32,622 | 4,800,751 |
| Auto Trader Group PLC (c) | | 19,458 | 155,605 |
| Aviva PLC | | 58,960 | 313,434 |
| BAE Systems PLC | | 65,095 | 829,309 |
| Barclays PLC | | 334,138 | 673,092 |
| Barratt Developments PLC | | 21,048 | 132,260 |
| Berkeley Group Holdings PLC | | 2,296 | 128,318 |
| BP PLC | | 382,130 | 2,563,708 |
| British American Tobacco PLC (United Kingdom) | | 44,785 | 1,654,617 |
| British Land Co. PLC | | 18,531 | 93,202 |
| BT Group PLC | | 146,215 | 291,896 |
| Bunzl PLC | | 7,102 | 282,401 |
| Burberry Group PLC | | 8,123 | 264,504 |
| CK Hutchison Holdings Ltd. | | 56,556 | 378,101 |
| CNH Industrial NV | | 21,525 | 302,291 |
| Coca-Cola European Partners PLC | | 4,325 | 278,833 |
| Compass Group PLC | | 37,009 | 976,333 |
| Croda International PLC | | 2,938 | 257,725 |
| DCC PLC (United Kingdom) | | 2,076 | 128,990 |
| Diageo PLC | | 47,845 | 2,182,503 |
| Entain PLC | | 12,386 | 224,775 |
| Halma PLC | | 7,985 | 231,611 |
| Hargreaves Lansdown PLC | | 7,486 | 75,546 |
| HSBC Holdings PLC (United Kingdom) | | 420,403 | 3,029,991 |
| Imperial Brands PLC | | 18,860 | 466,862 |
| Informa PLC | | 30,120 | 273,528 |
| InterContinental Hotel Group PLC | | 3,713 | 255,294 |
| Intertek Group PLC | | 3,395 | 177,323 |
| J Sainsbury PLC | | 36,986 | 128,477 |
| JD Sports Fashion PLC | | 54,264 | 109,830 |
| Johnson Matthey PLC | | 3,852 | 95,053 |
| Just Eat Takeaway.com NV (a)(c) | | 3,844 | 67,408 |
| Kingfisher PLC | | 41,395 | 134,165 |
| Land Securities Group PLC | | 14,883 | 126,104 |
| Legal & General Group PLC | | 125,651 | 369,672 |
| Lloyds Banking Group PLC | | 1,417,138 | 860,942 |
| London Stock Exchange Group PLC | | 7,957 | 835,431 |
| M&G PLC | | 47,426 | 122,245 |
| National Grid PLC | | 77,002 | 1,104,049 |
| NatWest Group PLC | | 111,805 | 368,297 |
| Next PLC | | 2,719 | 230,313 |
| Ocado Group PLC (a) | | 12,147 | 77,123 |
| Pearson PLC | | 13,641 | 151,767 |
| Persimmon PLC | | 6,716 | 110,906 |
| Phoenix Group Holdings PLC | | 15,777 | 117,341 |
| Reckitt Benckiser Group PLC | | 15,054 | 1,216,511 |
| RELX PLC (London Stock Exchange) | | 40,299 | 1,340,087 |
| Rentokil Initial PLC | | 53,202 | 423,555 |
| Rolls-Royce Holdings PLC (a) | | 176,037 | 337,229 |
| Sage Group PLC | | 21,427 | 220,436 |
| Schroders PLC | | 18,956 | 115,708 |
| Segro PLC | | 25,440 | 266,900 |
| Severn Trent PLC | | 5,291 | 194,962 |
| Smith & Nephew PLC | | 18,317 | 301,677 |
| Smiths Group PLC | | 7,502 | 158,487 |
| Spirax-Sarco Engineering PLC | | 1,548 | 215,750 |
| SSE PLC | | 23,186 | 534,974 |
| St. James's Place PLC | | 11,448 | 173,582 |
| Standard Chartered PLC (United Kingdom) | | 51,837 | 409,378 |
| Taylor Wimpey PLC | | 74,271 | 119,662 |
| Tesco PLC | | 155,733 | 550,587 |
| Unilever PLC | | 53,350 | 2,970,642 |
| United Utilities Group PLC | | 14,350 | 195,132 |
| Vodafone Group PLC | | 549,772 | 660,346 |
| Whitbread PLC | | 4,250 | 173,428 |
| WPP PLC | | 22,689 | 264,427 |
TOTAL UNITED KINGDOM | | | 38,671,477 |
| United States of America - 7.1% | | | |
| CSL Ltd. | | 10,163 | 2,028,909 |
| CyberArk Software Ltd. (a) | | 857 | 106,782 |
| Experian PLC | | 19,367 | 685,686 |
| GSK PLC | | 85,566 | 1,543,026 |
| Haleon PLC | | 106,849 | 469,783 |
| Holcim AG | | 11,663 | 767,486 |
| James Hardie Industries PLC CDI | | 9,377 | 209,249 |
| Nestle SA (Reg. S) | | 57,907 | 7,428,861 |
| QIAGEN NV (Germany) (a) | | 4,791 | 213,861 |
| Roche Holding AG: | | | |
| (Bearer) | | 561 | 189,793 |
| (participation certificate) | | 14,795 | 4,632,909 |
| Sanofi SA | | 24,024 | 2,589,025 |
| Schneider Electric SA | | 11,446 | 1,996,090 |
| Stellantis NV (Italy) | | 47,473 | 784,657 |
| Swiss Re Ltd. | | 6,346 | 636,978 |
| Tenaris SA | | 9,933 | 142,094 |
TOTAL UNITED STATES OF AMERICA | | | 24,425,189 |
| TOTAL COMMON STOCKS (Cost $300,535,029) | | | 328,805,808 |
| | | | |
| Nonconvertible Preferred Stocks - 0.5% |
| | | Shares | Value ($) |
| Germany - 0.5% | | | |
| Bayerische Motoren Werke AG (BMW) (non-vtg.) | | 1,249 | 132,466 |
| Dr. Ing. h.c. F. Porsche AG Series F (c) | | 2,396 | 299,393 |
| Henkel AG & Co. KGaA | | 3,766 | 304,476 |
| Porsche Automobil Holding SE (Germany) | | 3,222 | 179,456 |
| Sartorius AG (non-vtg.) | | 512 | 198,363 |
| Volkswagen AG | | 3,902 | 532,817 |
| | | | |
| TOTAL NONCONVERTIBLE PREFERRED STOCKS (Cost $1,709,511) | | | 1,646,971 |
| | | | |
| Government Obligations - 0.2% |
| | | Principal Amount (e) | Value ($) |
| United States of America - 0.2% | | | |
U.S. Treasury Bills, yield at date of purchase 4.65% 6/29/23 (f) (Cost $496,261) | | 500,000 | 495,973 |
| | | | |
| Money Market Funds - 5.5% |
| | | Shares | Value ($) |
| Fidelity Cash Central Fund 4.88% (g) | | 15,842,279 | 15,845,447 |
| Fidelity Securities Lending Cash Central Fund 4.88% (g)(h) | | 3,277,976 | 3,278,304 |
| TOTAL MONEY MARKET FUNDS (Cost $19,123,751) | | | 19,123,751 |
| | | | |
| TOTAL INVESTMENT IN SECURITIES - 101.3% (Cost $321,864,552) | 350,072,503 |
NET OTHER ASSETS (LIABILITIES) - (1.3)% | (4,374,944) |
| NET ASSETS - 100.0% | 345,697,559 |
| | |
| Futures Contracts |
| | Number of contracts | Expiration Date | Notional Amount ($) | Value ($) | Unrealized Appreciation/ (Depreciation) ($) |
| Purchased | | | | | |
| | | | | | |
| Equity Index Contracts | | | | | |
| ICE E-mini MSCI EAFE Index Contracts (United States) | 144 | Jun 2023 | 15,477,120 | 927,704 | 927,704 |
| | | | | | |
| The notional amount of futures purchased as a percentage of Net Assets is 4.5% |
Legend
| (b) | Security or a portion of the security purchased on a delayed delivery or when-issued basis. |
| (c) | Security exempt from registration under Rule 144A of the Securities Act of 1933. These securities may be resold in transactions exempt from registration, normally to qualified institutional buyers. At the end of the period, the value of these securities amounted to $5,340,351 or 1.5% of net assets. |
| (d) | Security or a portion of the security is on loan at period end. |
| (e) | Amount is stated in United States dollars unless otherwise noted. |
| (f) | Security or a portion of the security was pledged to cover margin requirements for futures contracts. At period end, the value of securities pledged amounted to $495,973. |
| (g) | Affiliated fund that is generally available only to investment companies and other accounts managed by Fidelity Investments. The rate quoted is the annualized seven-day yield of the fund at period end. A complete unaudited listing of the fund's holdings as of its most recent quarter end is available upon request. In addition, each Fidelity Central Fund's financial statements are available on the SEC's website or upon request. |
| (h) | Investment made with cash collateral received from securities on loan. |
Affiliated Central Funds
Fiscal year to date information regarding the Fund's investments in Fidelity Central Funds, including the ownership percentage, is presented below.
| Affiliate | Value, beginning of period ($) | Purchases ($) | Sales Proceeds ($) | Dividend Income ($) | Realized Gain (loss) ($) | Change in Unrealized appreciation (depreciation) ($) | Value, end of period ($) | % ownership, end of period |
| Fidelity Cash Central Fund 4.88% | 3,870,962 | 48,316,107 | 36,341,622 | 214,442 | - | - | 15,845,447 | 0.0% |
| Fidelity Securities Lending Cash Central Fund 4.88% | 2,022,594 | 10,950,152 | 9,694,442 | 19,626 | - | - | 3,278,304 | 0.0% |
| Total | 5,893,556 | 59,266,259 | 46,036,064 | 234,068 | - | - | 19,123,751 | |
| | | | | | | | | |
Amounts in the dividend income column in the above table include any capital gain distributions from underlying funds, which are presented in the corresponding line item in the Statement of Operations, if applicable.
Amounts in the dividend income column for Fidelity Securities Lending Cash Central Fund represents the income earned on investing cash collateral, less rebates paid to borrowers and any lending agent fees associated with the loan, plus any premium payments received for lending certain types of securities.
Amounts included in the purchases and sales proceeds columns may include in-kind transactions, if applicable.
Investment Valuation
The following is a summary of the inputs used, as of April 30, 2023, involving the Fund's assets and liabilities carried at fair value. The inputs or methodology used for valuing securities may not be an indication of the risk associated with investing in those securities. For more information on valuation inputs, and their aggregation into the levels used below, please refer to the Investment Valuation section in the accompanying Notes to Financial Statements.
| Valuation Inputs at Reporting Date: |
| Description | Total ($) | Level 1 ($) | Level 2 ($) | Level 3 ($) |
Investments in Securities: | | | | |
|
| Equities: | | | | |
Communication Services | 14,869,382 | 3,185,997 | 11,683,385 | - |
Consumer Discretionary | 40,145,247 | 11,016,377 | 29,128,870 | - |
Consumer Staples | 35,148,584 | 9,061,279 | 26,087,305 | - |
Energy | 15,263,193 | 1,290,616 | 13,972,577 | - |
Financials | 60,344,102 | 20,394,167 | 39,949,935 | - |
Health Care | 44,583,801 | 6,371,023 | 38,212,778 | - |
Industrials | 51,594,032 | 18,825,242 | 32,768,790 | - |
Information Technology | 24,476,782 | 8,721,583 | 15,755,199 | - |
Materials | 24,494,589 | 7,296,246 | 17,198,343 | - |
Real Estate | 7,990,339 | 1,481,242 | 6,509,097 | - |
Utilities | 11,542,728 | 4,661,753 | 6,880,975 | - |
|
| Government Obligations | 495,973 | - | 495,973 | - |
|
| Money Market Funds | 19,123,751 | 19,123,751 | - | - |
| Total Investments in Securities: | 350,072,503 | 111,429,276 | 238,643,227 | - |
Derivative Instruments: | | | | |
|
| Assets | | | | |
Futures Contracts | 927,704 | 927,704 | - | - |
| Total Assets | 927,704 | 927,704 | - | - |
| Total Derivative Instruments: | 927,704 | 927,704 | - | - |
Value of Derivative Instruments
The following table is a summary of the Fund's value of derivative instruments by primary risk exposure as of April 30, 2023. For additional information on derivative instruments, please refer to the Derivative Instruments section in the accompanying Notes to Financial Statements.
Primary Risk Exposure / Derivative Type | Value |
| Asset ($) | Liability ($) |
| Equity Risk | | |
Futures Contracts (a) | 927,704 | 0 |
| Total Equity Risk | 927,704 | 0 |
| Total Value of Derivatives | 927,704 | 0 |
(a)Reflects gross cumulative appreciation (depreciation) on futures contracts as presented in the Schedule of Investments. In the Statement of Assets and Liabilities, the period end daily variation margin is included in receivable or payable for daily variation margin on futures contracts, and the net cumulative appreciation (depreciation) is included in Total accumulated earnings (loss).
| Statement of Assets and Liabilities |
| | | | April 30, 2023 (Unaudited) |
| | | | | |
| Assets | | | | |
| Investment in securities, at value (including securities loaned of $2,983,918) - See accompanying schedule: | | | | |
Unaffiliated issuers (cost $302,740,801) | $ | 330,948,752 | | |
Fidelity Central Funds (cost $19,123,751) | | 19,123,751 | | |
| | | | | |
| | | | | |
| Total Investment in Securities (cost $321,864,552) | | | $ | 350,072,503 |
| Segregated cash with brokers for derivative instruments | | | | 125,104 |
| Foreign currency held at value (cost $1,050,129) | | | | 1,053,006 |
| Receivable for fund shares sold | | | | 5,848 |
| Dividends receivable | | | | 1,525,552 |
| Reclaims receivable | | | | 888,822 |
| Interest receivable | | | | 8 |
| Distributions receivable from Fidelity Central Funds | | | | 63,247 |
| Receivable from investment adviser for expense reductions | | | | 6,490 |
Total assets | | | | 353,740,580 |
| Liabilities | | | | |
| Payable for investments purchased on a delayed delivery basis | $ | 16,694 | | |
| Payable for fund shares redeemed | | 4,695,526 | | |
| Payable for daily variation margin on futures contracts | | 18,993 | | |
| Other payables and accrued expenses | | 33,504 | | |
| Collateral on securities loaned | | 3,278,304 | | |
| Total Liabilities | | | | 8,043,021 |
| Net Assets | | | $ | 345,697,559 |
| Net Assets consist of: | | | | |
| Paid in capital | | | $ | 326,154,664 |
| Total accumulated earnings (loss) | | | | 19,542,895 |
| Net Assets | | | $ | 345,697,559 |
Net Asset Value , offering price and redemption price per share ($345,697,559 ÷ 30,237,790 shares) | | | $ | 11.43 |
| Statement of Operations |
| | | | Six months ended April 30, 2023 (Unaudited) |
| Investment Income | | | | |
| Dividends | | | $ | 5,475,336 |
| Interest | | | | 8,544 |
| Income from Fidelity Central Funds (including $19,626 from security lending) | | | | 234,068 |
| Income before foreign taxes withheld | | | $ | 5,717,948 |
| Less foreign taxes withheld | | | | (552,136) |
| Total Income | | | | 5,165,812 |
| Expenses | | | | |
| Custodian fees and expenses | $ | 73,808 | | |
| Independent trustees' fees and expenses | | 954 | | |
| Interest | | 964 | | |
| Total expenses before reductions | | 75,726 | | |
| Expense reductions | | (54,709) | | |
| Total expenses after reductions | | | | 21,017 |
| Net Investment income (loss) | | | | 5,144,795 |
| Realized and Unrealized Gain (Loss) | | | | |
| Net realized gain (loss) on: | | | | |
| Investment Securities: | | | | |
| Unaffiliated issuers | | (6,040,041) | | |
| Foreign currency transactions | | (47,701) | | |
| Futures contracts | | 1,048,372 | | |
| Total net realized gain (loss) | | | | (5,039,370) |
| Change in net unrealized appreciation (depreciation) on: | | | | |
| Investment Securities: | | | | |
| Unaffiliated issuers | | 67,467,646 | | |
| Assets and liabilities in foreign currencies | | 73,517 | | |
| Futures contracts | | 683,091 | | |
| Total change in net unrealized appreciation (depreciation) | | | | 68,224,254 |
| Net gain (loss) | | | | 63,184,884 |
| Net increase (decrease) in net assets resulting from operations | | | $ | 68,329,679 |
| Statement of Changes in Net Assets |
| |
| | Six months ended April 30, 2023 (Unaudited) | | Year ended October 31, 2022 |
| Increase (Decrease) in Net Assets | | | | |
| Operations | | | | |
| Net investment income (loss) | $ | 5,144,795 | $ | 8,925,976 |
| Net realized gain (loss) | | (5,039,370) | | (6,635,095) |
| Change in net unrealized appreciation (depreciation) | | 68,224,254 | | (75,895,662) |
| Net increase (decrease) in net assets resulting from operations | | 68,329,679 | | (73,604,781) |
| Distributions to shareholders | | (7,730,928) | | (7,139,987) |
| Share transactions | | | | |
| Proceeds from sales of shares | | 37,859,557 | | 120,516,467 |
| Reinvestment of distributions | | 7,730,928 | | 7,139,987 |
| Cost of shares redeemed | | (43,903,676) | | (37,152,820) |
Net increase (decrease) in net assets resulting from share transactions | | 1,686,809 | | 90,503,634 |
| Total increase (decrease) in net assets | | 62,285,560 | | 9,758,866 |
| | | | | |
| Net Assets | | | | |
| Beginning of period | | 283,411,999 | | 273,653,133 |
| End of period | $ | 345,697,559 | $ | 283,411,999 |
| | | | | |
| Other Information | | | | |
| Shares | | | | |
| Sold | | 3,496,296 | | 11,145,325 |
| Issued in reinvestment of distributions | | 744,791 | | 592,530 |
| Redeemed | | (4,103,332) | | (3,449,396) |
| Net increase (decrease) | | 137,755 | | 8,288,459 |
| | | | | |
Financial Highlights
| Fidelity® Series International Index Fund |
| |
| | Six months ended (Unaudited) April 30, 2023 | | Years ended October 31, 2022 | | 2021 | | 2020 | | 2019 | | 2018 A |
Selected Per-Share Data | | | | | | | | | | | | |
| Net asset value, beginning of period | $ | 9.42 | $ | 12.55 | $ | 9.54 | $ | 10.41 | $ | 9.43 | $ | 10.00 |
| Income from Investment Operations | | | | | | | | | | | | |
Net investment income (loss) B,C | | .17 | | .34 | | .33 | | .24 | | .33 | | .05 |
| Net realized and unrealized gain (loss) | | 2.11 | | (3.17) | | 2.90 | | (.90) | | .71 | | (.62) |
| Total from investment operations | | 2.28 | | (2.83) | | 3.23 | | (.66) | | 1.04 | | (.57) |
| Distributions from net investment income | | (.27) | | (.30) | | (.22) | | (.20) | | (.06) | | - |
| Distributions from net realized gain | | - | | - | | - | | (.01) | | - | | - |
| Total distributions | | (.27) | | (.30) | | (.22) | | (.21) | | (.06) | | - |
| Net asset value, end of period | $ | 11.43 | $ | 9.42 | $ | 12.55 | $ | 9.54 | $ | 10.41 | $ | 9.43 |
Total Return D,E | | 24.45% | | (23.05)% | | 34.15% | | (6.52)% | | 11.06% | | (5.70)% |
Ratios to Average Net Assets C,F,G | | | | | | | | | | | | |
| Expenses before reductions | | .05% H | | .05% | | .06% | | .11% | | .24% | | 1.18% H |
| Expenses net of fee waivers, if any | | .01% H | | .01% | | .01% | | .02% | | .01% | | .01% H |
| Expenses net of all reductions | | .01% H | | .01% | | .01% | | .02% | | .01% | | .01% H |
| Net investment income (loss) | | 3.20% H | | 3.14% | | 2.73% | | 2.47% | | 3.33% | | 2.29% H |
| Supplemental Data | | | | | | | | | | | | |
| Net assets, end of period (000 omitted) | $ | 345,698 | $ | 283,412 | $ | 273,653 | $ | 129,230 | $ | 102,589 | $ | 9,630 |
Portfolio turnover rate I | | 10% H | | 5% | | 6% J | | 3% | | 2% | | 1% K |
A For the period August 17, 2018 (commencement of operations) through October 31, 2018.
B Calculated based on average shares outstanding during the period.
C Net investment income (loss) is affected by the timing of the declaration of dividends by any underlying mutual funds or exchange-traded funds (ETFs). Net investment income (loss) of any mutual funds or ETFs is not included in the Fund's net investment income (loss) ratio.
D Total returns for periods of less than one year are not annualized.
E Total returns would have been lower if certain expenses had not been reduced during the applicable periods shown.
F Fees and expenses of any underlying mutual funds or exchange-traded funds (ETFs) are not included in the Fund's expense ratio. The Fund indirectly bears its proportionate share of these expenses. For additional expense information related to investments in Fidelity Central Funds, please refer to the "Investments in Fidelity Central Funds" note found in the Notes to Financial Statements section of the most recent Annual or Semi-Annual report.
G Expense ratios reflect operating expenses of the class. Expenses before reductions do not reflect amounts reimbursed, waived, or reduced through arrangements with the investment adviser, brokerage services, or other offset arrangements, if applicable, and do not represent the amount paid by the class during periods when reimbursements, waivers or reductions occur.
H Annualized.
I Amount does not include the portfolio activity of any underlying mutual funds or exchange-traded funds (ETFs).
J Portfolio turnover rate excludes securities received or delivered in-kind.
K Amount not annualized.
For the period ended April 30, 2023
1. Organization.
Fidelity Series International Index Fund (the Fund) is a fund of Fidelity Concord Street Trust (the Trust) and is authorized to issue an unlimited number of shares. Shares are offered only to certain other Fidelity funds, Fidelity managed 529 plans, and Fidelity managed collective investment trusts. The Trust is registered under the Investment Company Act of 1940, as amended (the 1940 Act), as an open-end management investment company organized as a Massachusetts business trust.
2. Investments in Fidelity Central Funds.
Funds may invest in Fidelity Central Funds, which are open-end investment companies generally available only to other investment companies and accounts managed by the investment adviser and its affiliates. The Schedule of Investments lists any Fidelity Central Funds held as an investment as of period end, but does not include the underlying holdings of each Fidelity Central Fund. An investing fund indirectly bears its proportionate share of the expenses of the underlying Fidelity Central Funds.
Based on its investment objective, each Fidelity Central Fund may invest or participate in various investment vehicles or strategies that are similar to those of the investing fund. These strategies are consistent with the investment objectives of the investing fund and may involve certain economic risks which may cause a decline in value of each of the Fidelity Central Funds and thus a decline in the value of the investing fund.
| Fidelity Central Fund | Investment Manager | Investment Objective | Investment Practices | Expense Ratio A |
| Fidelity Money Market Central Funds | Fidelity Management & Research Company LLC (FMR) | Each fund seeks to obtain a high level of current income consistent with the preservation of capital and liquidity. | Short-term Investments | Less than .005% |
A Expenses expressed as a percentage of average net assets and are as of each underlying Central Fund's most recent annual or semi-annual shareholder report.
A complete unaudited list of holdings for each Fidelity Central Fund is available upon request or at the Securities and Exchange Commission website at www.sec.gov. In addition, the financial statements of the Fidelity Central Funds which contain the significant accounting policies (including investment valuation policies) of those funds, and are not covered by the Report of Independent Registered Public Accounting Firm, are available on the Securities and Exchange Commission website or upon request.
3. Significant Accounting Policies.
The Fund is an investment company and applies the accounting and reporting guidance of the Financial Accounting Standards Board (FASB) Accounting Standards Codification Topic 946 Financial Services - Investment Companies . The financial statements have been prepared in conformity with accounting principles generally accepted in the United States of America (GAAP), which require management to make certain estimates and assumptions at the date of the financial statements. Actual results could differ from those estimates. Subsequent events, if any, through the date that the financial statements were issued have been evaluated in the preparation of the financial statements. The Fund's Schedule of Investments lists any underlying mutual funds or exchange-traded funds (ETFs) but does not include the underlying holdings of these funds. The following summarizes the significant accounting policies of the Fund:
Investment Valuation. Investments are valued as of 4:00 p.m. Eastern time on the last calendar day of the period. The Board of Trustees (the Board) has designated the Fund's investment adviser as the valuation designee responsible for the fair valuation function and performing fair value determinations as needed. The investment adviser has established a Fair Value Committee (the Committee) to carry out the day-to-day fair valuation responsibilities and has adopted policies and procedures to govern the fair valuation process and the activities of the Committee. In accordance with these fair valuation policies and procedures, which have been approved by the Board, the Fund attempts to obtain prices from one or more third party pricing services or brokers to value its investments. When current market prices, quotations or currency exchange rates are not readily available or reliable, investments will be fair valued in good faith by the Committee, in accordance with the policies and procedures. Factors used in determining fair value vary by investment type and may include market or investment specific events, transaction data, estimated cash flows, and market observations of comparable investments. The frequency that the fair valuation procedures are used cannot be predicted and they may be utilized to a significant extent. The Committee manages the Fund's fair valuation practices and maintains the fair valuation policies and procedures. The Fund's investment adviser reports to the Board information regarding the fair valuation process and related material matters.
The Fund categorizes the inputs to valuation techniques used to value its investments into a disclosure hierarchy consisting of three levels as shown below:
Level 1 - unadjusted quoted prices in active markets for identical investments
Level 2 - other significant observable inputs (including quoted prices for similar investments, interest rates, prepayment speeds, etc.)
Level 3 - unobservable inputs (including the Fund's own assumptions based on the best information available)
Valuation techniques used to value the Fund's investments by major category are as follows:
Equity securities, including restricted securities, for which market quotations are readily available, are valued at the last reported sale price or official closing price as reported by a third party pricing service on the primary market or exchange on which they are traded and are categorized as Level 1 in the hierarchy. In the event there were no sales during the day or closing prices are not available, securities are valued at the last quoted bid price or may be valued using the last available price and are generally categorized as Level 2 in the hierarchy. For foreign equity securities, when market or security specific events arise, comparisons to the valuation of American Depositary Receipts (ADRs), futures contracts, ETFs and certain indexes as well as quoted prices for similar securities may be used and would be categorized as Level 2 in the hierarchy. For equity securities, including restricted securities, where observable inputs are limited, assumptions about market activity and risk are used and these securities may be categorized as Level 3 in the hierarchy.
Debt securities, including restricted securities, are valued based on evaluated prices received from third party pricing services or from brokers who make markets in such securities. U.S. government and government agency obligations are valued by pricing services who utilize matrix pricing which considers yield or price of bonds of comparable quality, coupon, maturity and type or by broker-supplied prices. When independent prices are unavailable or unreliable, debt securities may be valued utilizing pricing methodologies which consider similar factors that would be used by third party pricing services. Debt securities are generally categorized as Level 2 in the hierarchy but may be Level 3 depending on the circumstances.
Futures contracts are valued at the settlement price established each day by the board of trade or exchange on which they are traded and are categorized as Level 1 in the hierarchy. Investments in open-end mutual funds, including the Fidelity Central Funds, are valued at their closing net asset value (NAV) each business day and are categorized as Level 1 in the hierarchy.
Changes in valuation techniques may result in transfers in or out of an assigned level within the disclosure hierarchy. The aggregate value of investments by input level as of April 30, 2023 is included at the end of the Fund's Schedule of Investments.
Foreign Currency. Certain Funds may use foreign currency contracts to facilitate transactions in foreign-denominated securities. Gains and losses from these transactions may arise from changes in the value of the foreign currency or if the counterparties do not perform under the contracts' terms.
Foreign-denominated assets, including investment securities, and liabilities are translated into U.S. dollars at the exchange rates at period end. Purchases and sales of investment securities, income and dividends received, and expenses denominated in foreign currencies are translated into U.S. dollars at the exchange rate in effect on the transaction date.
The effects of exchange rate fluctuations on investments are included with the net realized and unrealized gain (loss) on investment securities. Other foreign currency transactions resulting in realized and unrealized gain (loss) are disclosed separately.
Investment Transactions and Income. For financial reporting purposes, the Fund's investment holdings and NAV include trades executed through the end of the last business day of the period. The NAV per share for processing shareholder transactions is calculated as of the close of business of the New York Stock Exchange (NYSE), normally 4:00 p.m. Eastern time and includes trades executed through the end of the prior business day. Gains and losses on securities sold are determined on the basis of identified cost. Commissions paid to certain brokers with whom the investment adviser, or its affiliates, places trades on behalf of a fund include an amount in addition to trade execution, which may be rebated back to a fund. Any such rebates are included in net realized gain (loss) on investments in the Statement of Operations. Dividend income is recorded on the ex-dividend date, except for certain dividends from foreign securities where the ex-dividend date may have passed, which are recorded as soon as the Fund is informed of the ex-dividend date. Non-cash dividends included in dividend income, if any, are recorded at the fair market value of the securities received. Income and capital gain distributions from Fidelity Central Funds, if any, are recorded on the ex-dividend date. Certain distributions received by the Fund represent a return of capital or capital gain. The Fund determines the components of these distributions subsequent to the ex-dividend date, based upon receipt of tax filings or other correspondence relating to the underlying investment. These distributions are recorded as a reduction of cost of investments and/or as a realized gain. Interest income is accrued as earned and includes coupon interest and amortization of premium and accretion of discount on debt securities as applicable. Investment income is recorded net of foreign taxes withheld where recovery of such taxes is uncertain. Funds may file withholding tax reclaims in certain jurisdictions to recover a portion of amounts previously withheld. Any withholding tax reclaims income is included in the Statement of Operations in foreign taxes withheld. Any receivables for withholding tax reclaims are included in the Statement of Assets and Liabilities in reclaims receivable.
Expenses. Expenses directly attributable to a fund are charged to that fund. Expenses attributable to more than one fund are allocated among the respective funds on the basis of relative net assets or other appropriate methods. Expenses included in the accompanying financial statements reflect the expenses of that fund and do not include any expenses associated with any underlying mutual funds or exchange-traded funds. Although not included in a fund's expenses, a fund indirectly bears its proportionate share of these expenses through the net asset value of each underlying mutual fund or exchange-traded fund. Expense estimates are accrued in the period to which they relate and adjustments are made when actual amounts are known.
Income Tax Information and Distributions to Shareholders. Each year, the Fund intends to qualify as a regulated investment company under Subchapter M of the Internal Revenue Code, including distributing substantially all of its taxable income and realized gains. As a result, no provision for U.S. Federal income taxes is required. The Fund files a U.S. federal tax return, in addition to state and local tax returns as required. The Fund's federal income tax returns are subject to examination by the Internal Revenue Service (IRS) for a period of three fiscal years after they are filed. State and local tax returns may be subject to examination for an additional fiscal year depending on the jurisdiction. Foreign taxes are provided for based on the Fund's understanding of the tax rules and rates that exist in the foreign markets in which it invests.
Distributions are declared and recorded on the ex-dividend date. Income and capital gain distributions are determined in accordance with income tax regulations, which may differ from GAAP.
Capital accounts within the financial statements are adjusted for permanent book-tax differences. These adjustments have no impact on net assets or the results of operations. Capital accounts are not adjusted for temporary book-tax differences which will reverse in a subsequent period.
Book-tax differences are primarily due to futures contracts, foreign currency transactions, passive foreign investment companies (PFIC), partnerships, capital loss carryforwards and losses deferred due to wash sales.
As of period end, the cost and unrealized appreciation (depreciation) in securities, and derivatives if applicable, for federal income tax purposes were as follows:
| Gross unrealized appreciation | $52,335,653 |
| Gross unrealized depreciation | (24,581,894) |
| Net unrealized appreciation (depreciation) | $27,753,759 |
| Tax cost | $323,246,448 |
Capital loss carryforwards are only available to offset future capital gains of the Fund to the extent provided by regulations and may be limited. The capital loss carryforward information presented below, including any applicable limitation, is estimated as of prior fiscal period end and is subject to adjustment.
| Short-term | $(2,121,022) |
| Long-term | (3,328,921) |
| Total capital loss carryforward | $(5,449,943) |
Delayed Delivery Transactions and When-Issued Securities. During the period, certain Funds transacted in securities on a delayed delivery or when-issued basis. Payment and delivery may take place after the customary settlement period for that security. The price of the underlying securities and the date when the securities will be delivered and paid for are fixed at the time the transaction is negotiated. Securities purchased on a delayed delivery or when-issued basis are identified as such in the Schedule of Investments. Compensation for interest forgone in the purchase of a delayed delivery or when-issued debt security may be received. With respect to purchase commitments, each applicable Fund identifies securities as segregated in its records with a value at least equal to the amount of the commitment. Payables and receivables associated with the purchases and sales of delayed delivery securities having the same coupon, settlement date and broker are offset. Delayed delivery or when-issued securities that have been purchased from and sold to different brokers are reflected as both payables and receivables in the Statement of Assets and Liabilities under the caption "Delayed delivery", as applicable. Losses may arise due to changes in the value of the underlying securities or if the counterparty does not perform under the contract's terms, or if the issuer does not issue the securities due to political, economic, or other factors.
Restricted Securities (including Private Placements). Funds may invest in securities that are subject to legal or contractual restrictions on resale. These securities generally may be resold in transactions exempt from registration or to the public if the securities are registered. Disposal of these securities may involve time-consuming negotiations and expense, and prompt sale at an acceptable price may be difficult. Information regarding restricted securities held at period end is included at the end of the Schedule of Investments, if applicable.
4. Derivative Instruments.
Risk Exposures and the Use of Derivative Instruments. The Fund's investment objectives allow for various types of derivative instruments, including futures contracts. Derivatives are investments whose value is primarily derived from underlying assets, indices or reference rates and may be transacted on an exchange or over-the-counter (OTC). Derivatives may involve a future commitment to buy or sell a specified asset based on specified terms, to exchange future cash flows at periodic intervals based on a notional principal amount, or for one party to make one or more payments upon the occurrence of specified events in exchange for periodic payments from the other party.
Derivatives were used to increase returns and to manage exposure to certain risks as defined below. The success of any strategy involving derivatives depends on analysis of numerous economic factors, and if the strategies for investment do not work as intended, the objectives may not be achieved.
Derivatives were used to increase or decrease exposure to the following risk(s):
| | |
| Equity Risk | Equity risk relates to the fluctuations in the value of financial instruments as a result of changes in market prices (other than those arising from interest rate risk or foreign exchange risk), whether caused by factors specific to an individual investment, its issuer, or all factors affecting all instruments traded in a market or market segment. |
Funds are also exposed to additional risks from investing in derivatives, such as liquidity risk and counterparty credit risk. Liquidity risk is the risk that a fund will be unable to close out the derivative in the open market in a timely manner. Counterparty credit risk is the risk that the counterparty will not be able to fulfill its obligation to a fund. Counterparty credit risk related to exchange-traded contracts may be mitigated by the protection provided by the exchange on which they trade.
Investing in derivatives may involve greater risks than investing in the underlying assets directly and, to varying degrees, may involve risk of loss in excess of any initial investment and collateral received and amounts recognized in the Statement of Assets and Liabilities. In addition, there may be the risk that the change in value of the derivative contract does not correspond to the change in value of the underlying instrument.
Futures Contracts. A futures contract is an agreement between two parties to buy or sell a specified underlying instrument for a fixed price at a specified future date. Futures contracts were used to manage exposure to the stock market.
Upon entering into a futures contract, a fund is required to deposit either cash or securities (initial margin) with a clearing broker in an amount equal to a certain percentage of the face value of the contract. Futures contracts are marked-to-market daily and subsequent daily payments are made or received by a fund depending on the daily fluctuations in the value of the futures contracts and are recorded as unrealized appreciation or (depreciation). This receivable and/or payable, if any, is included in daily variation margin on futures contracts in the Statement of Assets and Liabilities. Realized gain or (loss) is recorded upon the expiration or closing of a futures contract. The net realized gain (loss) and change in net unrealized appreciation (depreciation) on futures contracts during the period is presented in the Statement of Operations.
Any open futures contracts at period end are presented in the Schedule of Investments under the caption "Futures Contracts". The notional amount at value reflects each contract's exposure to the underlying instrument or index at period end, and is representative of volume of activity during the period unless an average notional amount is presented. Any securities deposited to meet initial margin requirements are identified in the Schedule of Investments. Any cash deposited to meet initial margin requirements is presented as segregated cash with brokers for derivative instruments in the Statement of Assets and Liabilities.
5. Purchases and Sales of Investments.
Purchases and sales of securities, other than short-term securities, U.S. government securities and in-kind transactions, as applicable, are noted in the table below.
| | Purchases ($) | Sales ($) |
| Fidelity Series International Index Fund | 15,339,051 | 25,299,414 |
6. Fees and Other Transactions with Affiliates.
Management Fee. Fidelity Management & Research Company LLC (the investment adviser) and its affiliates provide the Fund with investment management related services for which the Fund does not pay a management fee. Under the management contract, the investment adviser or an affiliate pays all ordinary operating expenses of the Fund, except custody fees, fees and expenses of the independent Trustees, and certain miscellaneous expenses such as proxy and shareholder meeting expenses.
Sub-Adviser. Geode Capital Management, LLC (Geode), serves as sub-adviser for the Fund. Geode provides discretionary investment advisory services to the Fund and is paid by the investment adviser for providing these services.
Interfund Lending Program. Pursuant to an Exemptive Order issued by the Securities and Exchange Commission (the SEC), the Fund, along with other registered investment companies having management contracts with Fidelity Management & Research Company LLC (FMR), or other affiliated entities of FMR, may participate in an interfund lending program. This program provides an alternative credit facility allowing the Fund to borrow from, or lend money to, other participating affiliated funds. At period end, there were no interfund loans outstanding. Activity in this program during the period for which loans were outstanding was as follows:
| | Borrower or Lender | Average Loan Balance | Weighted Average Interest Rate | Interest Expense |
| Fidelity Series International Index Fund | Borrower | $8,538,000 | 4.07% | $964 |
Interfund Trades. Funds may purchase from or sell securities to other Fidelity Funds under procedures adopted by the Board. The procedures have been designed to ensure these interfund trades are executed in accordance with Rule 17a-7 of the 1940 Act. Any interfund trades are included within the respective purchases and sales amounts shown in the Purchases and Sales of Investments note. During the period, there were no interfund trades.
7. Committed Line of Credit.
Certain Funds participate with other funds managed by the investment adviser or an affiliate in a $4.25 billion credit facility (the "line of credit") to be utilized for temporary or emergency purposes to fund shareholder redemptions or for other short-term liquidity purposes. The commitment fees on the pro-rata portion of the line of credit are borne by the investment adviser. During the period, there were no borrowings on this line of credit.
8. Security Lending.
Funds lend portfolio securities from time to time in order to earn additional income. Lending agents are used, including National Financial Services (NFS), an affiliate of the investment adviser. Pursuant to a securities lending agreement, NFS will receive a fee, which is capped at 9.9% of a fund's daily lending revenue, for its services as lending agent. A fund may lend securities to certain qualified borrowers, including NFS. On the settlement date of the loan, a fund receives collateral (in the form of U.S. Treasury obligations, letters of credit and/or cash) against the loaned securities and maintains collateral in an amount not less than 100% of the market value of the loaned securities during the period of the loan. The market value of the loaned securities is determined at the close of business of a fund and any additional required collateral is delivered to a fund on the next business day. A fund or borrower may terminate the loan at any time, and if the borrower defaults on its obligation to return the securities loaned because of insolvency or other reasons, a fund may apply collateral received from the borrower against the obligation. A fund may experience delays and costs in recovering the securities loaned. Any cash collateral received is invested in the Fidelity Securities Lending Cash Central Fund. Any loaned securities are identified as such in the Schedule of Investments, and the value of loaned securities and cash collateral at period end, as applicable, are presented in the Statement of Assets and Liabilities. Security lending income represents the income earned on investing cash collateral, less rebates paid to borrowers and any lending agent fees associated with the loan, plus any premium payments received for lending certain types of securities. Security lending income is presented in the Statement of Operations as a component of income from Fidelity Central Funds. Affiliated security lending activity, if any, was as follows:
| | Total Security Lending Fees Paid to NFS | Security Lending Income From Securities Loaned to NFS | Value of Securities Loaned to NFS at Period End |
| Fidelity Series International Index Fund | $2,098 | $- | $- |
9. Expense Reductions.
The investment adviser contractually agreed to reimburse the Fund to the extent annual operating expenses exceeded .013% of average net assets. This reimbursement will remain in place through February 28, 2026. Some expenses, for example the compensation of the independent Trustees, and certain other expenses such as interest expense, are excluded from this reimbursement. During the period this reimbursement reduced the Fund's expenses by $52,906.
Through arrangements with the Fund's custodian, credits realized as a result of certain uninvested cash balances were used to reduce the Fund's expenses by $1,803.
10. Other.
A fund's organizational documents provide former and current trustees and officers with a limited indemnification against liabilities arising in connection with the performance of their duties to the fund. In the normal course of business, a fund may also enter into contracts that provide general indemnifications. A fund's maximum exposure under these arrangements is unknown as this would be dependent on future claims that may be made against a fund. The risk of material loss from such claims is considered remote.
At the end of the period, mutual funds and accounts managed by FMR or its affiliates were the owners of record of all of the outstanding shares of the Fund.
11. Risk and Uncertainties.
Many factors affect a fund's performance. Developments that disrupt global economies and financial markets, such as pandemics, epidemics, outbreaks of infectious diseases, war, terrorism, and environmental disasters, may significantly affect a fund's investment performance. The effects of these developments to a fund will be impacted by the types of securities in which a fund invests, the financial condition, industry, economic sector, and geographic location of an issuer, and a fund's level of investment in the securities of that issuer. Significant concentrations in security types, issuers, industries, sectors, and geographic locations may magnify the factors that affect a fund's performance.
As a shareholder, you incur two types of costs: (1) transaction costs, which may include sales charges (loads) on purchase payments or redemption proceeds, as applicable and (2) ongoing costs, which generally include management fees, distribution and/or service (12b-1) fees and other Fund expenses. This Example is intended to help you understand your ongoing costs (in dollars) of investing in a fund and to compare these costs with the ongoing costs of investing in other mutual funds.
| The Example is based on an investment of $1,000 invested at the beginning of the period and held for the entire period (November 1, 2022 to April 30, 2023). |
Actual Expenses
The first line of the accompanying table provides information about actual account values and actual expenses. You may use the information in this line, together with the amount you invested, to estimate the expenses that you paid over the period. Simply divide your account value by $1,000.00 (for example, an $8,600 account value divided by $1,000.00 = 8.6), then multiply the result by the number in the first line for a class/Fund under the heading entitled "Expenses Paid During Period" to estimate the expenses you paid on your account during this period. If any fund is a shareholder of any underlying mutual funds or exchange-traded funds (ETFs) (the Underlying Funds), such fund indirectly bears its proportional share of the expenses of the Underlying Funds in addition to the direct expenses incurred presented in the table. These fees and expenses are not included in the annualized expense ratio used to calculate the expense estimate in the table below.
Hypothetical Example for Comparison Purposes
The second line of the accompanying table provides information about hypothetical account values and hypothetical expenses based on the actual expense ratio and an assumed rate of return of 5% per year before expenses, which is not the actual return. The hypothetical account values and expenses may not be used to estimate the actual ending account balance or expenses you paid for the period. You may use this information to compare the ongoing costs of investing in the Fund and other funds. To do so, compare this 5% hypothetical example with the 5% hypothetical examples that appear in the shareholder reports of the other funds. If any fund is a shareholder of any Underlying Funds, such fund indirectly bears its proportional share of the expenses of the Underlying Funds in addition to the direct expenses as presented in the table. These fees and expenses are not included in the annualized expense ratio used to calculate the expense estimate in the table below.
Please note that the expenses shown in the table are meant to highlight your ongoing costs only and do not reflect any transaction costs. Therefore, the second line of the table is useful in comparing ongoing costs only, and will not help you determine the relative total costs of owning different funds. In addition, if these transactional costs were included, your costs would have been higher.
| | | | | Annualized Expense Ratio- A | | Beginning Account Value November 1, 2022 | | Ending Account Value April 30, 2023 | | Expenses Paid During Period- C November 1, 2022 to April 30, 2023 |
| | | | | | | | | | |
| Fidelity® Series International Index Fund | | | | .01% | | | | | | |
| Actual | | | | | | $ 1,000 | | $ 1,244.50 | | $ .06 |
Hypothetical- B | | | | | | $ 1,000 | | $ 1,024.74 | | $ .05 |
| |
A Annualized expense ratio reflects expenses net of applicable fee waivers.
B 5% return per year before expenses
C Expenses are equal to the annualized expense ratio, multiplied by the average account value over the period, multiplied by 181/ 365 (to reflect the one-half year period). The fees and expenses of any Underlying Funds are not included in each annualized expense ratio.
The Securities and Exchange Commission adopted Rule 22e-4 under the Investment Company Act of 1940 (the Liquidity Rule) to promote effective liquidity risk management throughout the open-end investment company industry, thereby reducing the risk that funds will be unable to meet their redemption obligations and mitigating dilution of the interests of fund shareholders.
The Fund has adopted and implemented a liquidity risk management program (the Program) reasonably designed to assess and manage the Fund's liquidity risk and to comply with the requirements of the Liquidity Rule. The Fund's Board of Trustees (the Board) has designated the Fund's investment adviser as administrator of the Program. The Fidelity advisers have established a Liquidity Risk Management Committee (the LRM Committee) to manage the Program for each of the Fidelity Funds. The LRM Committee monitors the adequacy and effectiveness of implementation of the Program and on a periodic basis assesses each Fund's liquidity risk based on a variety of factors including (1) the Fund's investment strategy, (2) portfolio liquidity and cash flow projections during normal and reasonably foreseeable stressed conditions, (3) shareholder redemptions, (4) borrowings and other funding sources and (5) certain factors specific to ETFs including the effect of the Fund's prices and spreads, market participants, and basket compositions on the overall liquidity of the Fund's portfolio, as applicable.
In accordance with the Program, each of the Fund's portfolio investments is classified into one of four defined liquidity categories based on a determination of a reasonable expectation for how long it would take to convert the investment to cash (or sell or dispose of the investment) without significantly changing its market value.
- Highly liquid investments - cash or convertible to cash within three business days or less
- Moderately liquid investments - convertible to cash in three to seven calendar days
- Less liquid investments - can be sold or disposed of, but not settled, within seven calendar days
- Illiquid investments - cannot be sold or disposed of within seven calendar days
Liquidity classification determinations take into account a variety of factors including various market, trading and investment-specific considerations, as well as market depth, and generally utilize analysis from a third-party liquidity metrics service.
The Liquidity Rule places a 15% limit on a fund's illiquid investments and requires funds that do not primarily hold assets that are highly liquid investments to determine and maintain a minimum percentage of the fund's net assets to be invested in highly liquid investments (highly liquid investment minimum or HLIM). The Program includes provisions reasonably designed to comply with the 15% limit on illiquid investments and for determining, periodically reviewing and complying with the HLIM requirement as applicable.
At a recent meeting of the Fund's Board of Trustees, the LRM Committee provided a written report to the Board pertaining to the operation, adequacy, and effectiveness of the Program for the period December 1, 2021 through November 30, 2022. The report concluded that the Program is operating effectively and is reasonably designed to assess and manage the Fund's liquidity risk.
1.9891250.104
IIF-SANN-0623
Item 2.
Code of Ethics
Not applicable.
Item 3.
Audit Committee Financial Expert
Not applicable.
Item 4.
Principal Accountant Fees and Services
Not applicable.
Item 5.
Audit Committee of Listed Registrants
Not applicable.
Item 6.
Investments
(a)
Not applicable.
(b)
Not applicable
Item 7.
Disclosure of Proxy Voting Policies and Procedures for Closed-End Management Investment Companies
Not applicable.
Item 8.
Portfolio Managers of Closed-End Management Investment Companies
Not applicable.
Item 9.
Purchase of Equity Securities by Closed-End Management Investment Company and Affiliated Purchasers
Not applicable.
Item 10.
Submission of Matters to a Vote of Security Holders
There were no material changes to the procedures by which shareholders may recommend nominees to the Fidelity Concord Street Trust’s Board of Trustees.
Item 11.
Controls and Procedures
(a)(i) The President and Treasurer and the Chief Financial Officer have concluded that the Fidelity Concord Street Trust’s (the “Trust”) disclosure controls and procedures (as defined in Rule 30a-3(c) under the Investment Company Act) provide reasonable
assurances that material information relating to the Trust is made known to them by the appropriate persons, based on their evaluation of these controls and procedures as of a date within 90 days of the filing date of this report.
(a)(ii) There was no change in the Trust’s internal control over financial reporting (as defined in Rule 30a-3(d) under the Investment Company Act) that occurred during the period covered by this report that has materially affected, or is reasonably likely to materially affect, the Trust’s internal control over financial reporting.
Item 12.
Disclosure of Securities Lending Activities for Closed-End Management
Investment Companies
Not applicable.
Item 13.
Exhibits
SIGNATURES
Pursuant to the requirements of the Securities Exchange Act of 1934 and the Investment Company Act of 1940, the registrant has duly caused this report to be signed on its behalf by the undersigned, thereunto duly authorized.
Fidelity Concord Street Trust
| |
By: | /s/Stacie M. Smith |
| Stacie M. Smith |
| President and Treasurer |
|
|
Date: | June 22, 2023 |
Pursuant to the requirements of the Securities Exchange Act of 1934 and the Investment Company Act of 1940, this report has been signed below by the following persons on behalf of the registrant and in the capacities and on the dates indicated.
| |
By: | /s/Stacie M. Smith |
| Stacie M. Smith |
| President and Treasurer |
|
|
Date: | June 22, 2023 |
| |
By: | /s/John J. Burke III |
| John J. Burke III |
| Chief Financial Officer |
|
|
Date: | June 22, 2023 |