UNITED STATES
SECURITIES AND EXCHANGE COMMISSION
Washington, D.C. 20549
FORM N-CSR
CERTIFIED SHAREHOLDER REPORT OF REGISTERED
MANAGEMENT INVESTMENT COMPANIES
Investment Company Act file number 811-5251
Fidelity Concord Street Trust
(Exact name of registrant as specified in charter)
245 Summer St., Boston, Massachusetts 02210
(Address of principal executive offices) (Zip code)
William C. Coffey, Secretary
245 Summer St.
Boston, Massachusetts 02210
(Name and address of agent for service)
Registrant's telephone number, including area code:
617-563-7000
Date of fiscal year end: | April 30 |
|
|
Date of reporting period: | April 30, 2019 |
Item 1.
Reports to Stockholders
Fidelity® Mid-Cap Stock Fund Annual Report April 30, 2019 |
 |
Beginning on January 1, 2021, as permitted by regulations adopted by the Securities and Exchange Commission, paper copies of a fund’s shareholder reports will no longer be sent by mail, unless you specifically request paper copies of the reports from the fund or from your financial intermediary, such as a financial advisor, broker-dealer or bank. Instead, the reports will be made available on a website, and you will be notified by mail each time a report is posted and provided with a website link to access the report.
If you already elected to receive shareholder reports electronically, you will not be affected by this change and you need not take any action. You may elect to receive shareholder reports and other communications from a fund electronically, by contacting your financial intermediary. For Fidelity customers, visit Fidelity's web site or call Fidelity using the contact information listed below.
You may elect to receive all future reports in paper free of charge. If you wish to continue receiving paper copies of your shareholder reports, you may contact your financial intermediary or, if you are a Fidelity customer, visit Fidelity’s website, or call Fidelity at the applicable toll-free number listed below. Your election to receive reports in paper will apply to all funds held with the fund complex/your financial intermediary.
| Account Type | Website | Phone Number |
| Brokerage, Mutual Fund, or Annuity Contracts: | fidelity.com/mailpreferences | 1-800-343-3548 |
| Employer Provided Retirement Accounts: | netbenefits.fidelity.com/preferences (choose 'no' under Required Disclosures to continue to print) | 1-800-343-0860 |
| Advisor Sold Accounts Serviced Through Your Financial Intermediary: | Contact Your Financial Intermediary | Your Financial Intermediary's phone number |
| Advisor Sold Accounts Serviced by Fidelity: | institutional.fidelity.com | 1-877-208-0098 |
Contents
Board Approval of Investment Advisory Contracts and Management Fees |
To view a fund's proxy voting guidelines and proxy voting record for the 12-month period ended June 30, visit http://www.fidelity.com/proxyvotingresults or visit the Securities and Exchange Commission's (SEC) web site at http://www.sec.gov.
You may also call 1-800-544-8544 if you’re an individual investing directly with Fidelity, call 1-800-835-5092 if you’re a plan sponsor or participant with Fidelity as your recordkeeper or call 1-877-208-0098 on institutional accounts or if you’re an advisor or invest through one to request a free copy of the proxy voting guidelines.
Standard & Poor's, S&P and S&P 500 are registered service marks of The McGraw-Hill Companies, Inc. and have been licensed for use by Fidelity Distributors Corporation.
Other third-party marks appearing herein are the property of their respective owners.
All other marks appearing herein are registered or unregistered trademarks or service marks of FMR LLC or an affiliated company. © 2019 FMR LLC. All rights reserved.
This report and the financial statements contained herein are submitted for the general information of the shareholders of the Fund. This report is not authorized for distribution to prospective investors in the Fund unless preceded or accompanied by an effective prospectus.
A fund files its complete schedule of portfolio holdings with the SEC for the first and third quarters of each fiscal year on Form N-PORT. Forms N-PORT are available on the SEC’s web site at http://www.sec.gov. A fund's Forms N-PORT may be reviewed and copied at the SEC’s Public Reference Room in Washington, DC. Information regarding the operation of the SEC's Public Reference Room may be obtained by calling 1-800-SEC-0330.
For a complete list of a fund's portfolio holdings, view the most recent holdings listing, semiannual report, or annual report on Fidelity's web site at http://www.fidelity.com, http://www.institutional.fidelity.com, or http://www.401k.com, as applicable.
NOT FDIC INSURED •MAY LOSE VALUE •NO BANK GUARANTEE
Neither the Fund nor Fidelity Distributors Corporation is a bank.
Performance: The Bottom Line
Average annual total return reflects the change in the value of an investment, assuming reinvestment of distributions from dividend income and capital gains (the profits earned upon the sale of securities that have grown in value, if any) and assuming a constant rate of performance each year. The hypothetical investment and the average annual total returns do not reflect the deduction of taxes that a shareholder would pay on fund distributions or the redemption of fund shares. During periods of reimbursement by Fidelity, a fund’s total return will be greater than it would be had the reimbursement not occurred. How a fund did yesterday is no guarantee of how it will do tomorrow.
Average Annual Total Returns
| For the periods ended April 30, 2019 | Past 1 year | Past 5 years | Past 10 years |
| Fidelity® Mid-Cap Stock Fund | 7.90% | 8.53% | 15.34% |
| Class K | 7.99% | 8.64% | 15.50% |
$10,000 Over 10 Years
Let's say hypothetically that $10,000 was invested in Fidelity® Mid-Cap Stock Fund, a class of the fund, on April 30, 2009.
The chart shows how the value of your investment would have changed, and also shows how the S&P MidCap 400® Index performed over the same period.
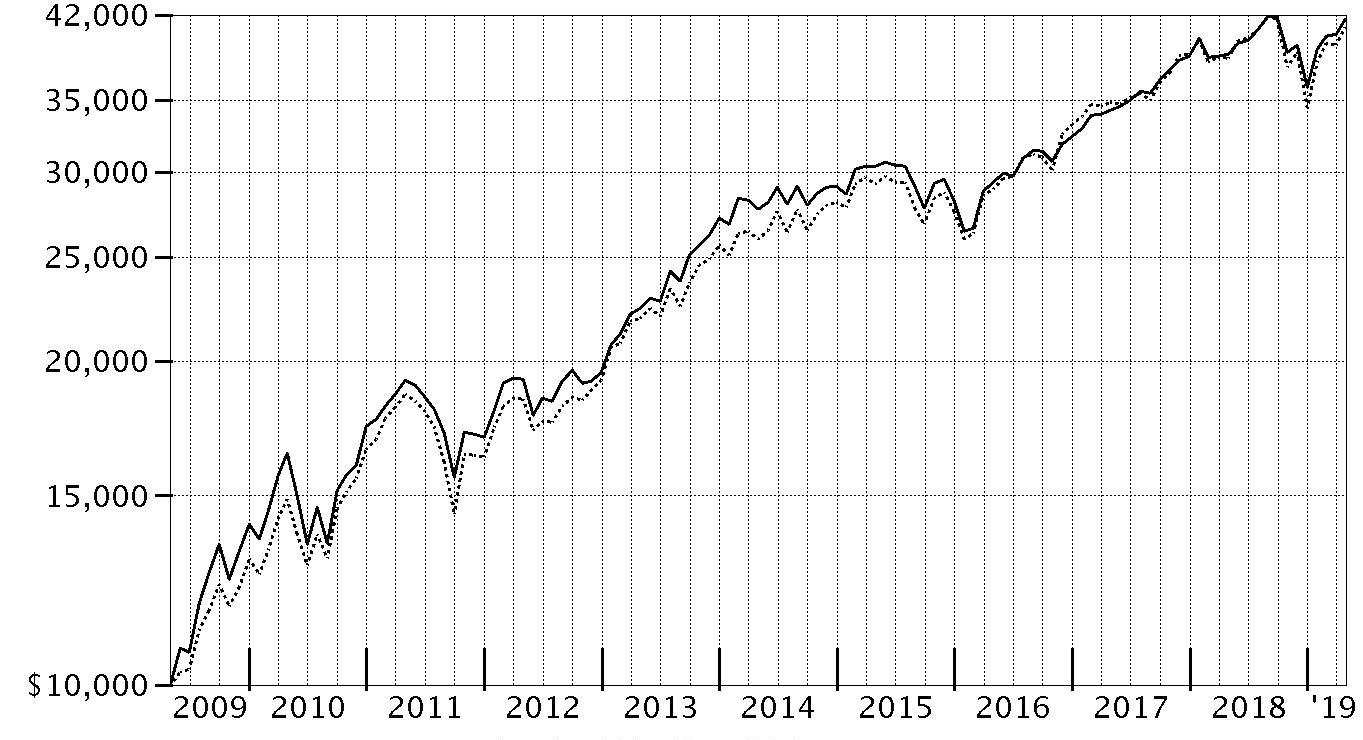
| Period Ending Values | ||
| $41,662 | Fidelity® Mid-Cap Stock Fund | |
| $40,920 | S&P MidCap 400® Index | |
Management's Discussion of Fund Performance
Market Recap: The S&P 500® index gained 13.49% for the 12 months ending April 30, 2019, as U.S. equities began the new year on a high note after enduring an historically volatile final quarter of 2018. The index rose 18.25% year to date, its strongest four-month opening since 1987, amid upbeat company earnings/outlooks and signs the Fed may pause on rates. After achieving a record close in late April, the S&P 500® moved a bit higher to end the period. The uptrend was in sharp contrast to late 2018, when rising U.S. Treasury yields and concern about peaking corporate earnings growth sent many investors fleeing from risk assets as they were still dealing with lingering uncertainty related to global trade and the Fed picking up the pace of interest rate hikes. The index returned -6.84% in October, at the time its largest monthly drop in seven years. But conditions worsened through Christmas, as jitters about the economy and another hike in rates led to a spike in market volatility and a -9.03% result for December. For the full period, eight of 11 sectors registered a double-digit gain, led by information technology (+25%). Three defensive groups also stood out: real estate (+21%), consumer staples (+18%) and utilities (+18%). Communication services – a mix of telecom stocks and media/entertainment names – gained 17%, followed by consumer discretionary (+16%). In contrast, energy (-7%) lost ground, while materials (+3%), financials (+4%), health care (+11%) and industrials (+11%) also trailed the broad market.Comments from Lead Portfolio Manager John Roth: For the fiscal year, the fund’s share classes returned about 8%, ahead of the 6.99% gain of the benchmark S&P MidCap 400® Index. Versus the benchmark, the fund benefited from its more-defensive posture during bouts of market turbulence the past 12 months. From a sector perspective, choices within financials – specifically among banks – contributed notably, followed by an overweighting in health care and an underweighting in materials. An overweighting and our stock picks in utilities also helped. Conversely, an underweighting among information technology names detracted from the fund’s relative return. An overweighting in energy also hurt, although this partially was offset by positive stock choices in the sector. The fund’s foreign holdings also detracted, partly due to currency fluctuations. Among individual stocks, a sizable stake in KeySight Technologies contributed more than any other fund holding. Shares of this manufacturer of electronic test and measurement equipment and software rose in early 2019 on better-than-expected first-quarter earnings. Positions in medical device maker DexCom and mortgage insurer Radian Group also contributed. Conversely, a sizable stake in food services company Aramark hurt the fund’s relative return due to the company’s earnings challenges. Liquefied natural gas company Golar also hurt the fund’s relative performance. All of the fund’s holdings mentioned except KeySight were non-benchmark stocks.The views expressed above reflect those of the portfolio manager(s) only through the end of the period as stated on the cover of this report and do not necessarily represent the views of Fidelity or any other person in the Fidelity organization. Any such views are subject to change at any time based upon market or other conditions and Fidelity disclaims any responsibility to update such views. These views may not be relied on as investment advice and, because investment decisions for a Fidelity fund are based on numerous factors, may not be relied on as an indication of trading intent on behalf of any Fidelity fund.
Investment Summary (Unaudited)
Top Ten Stocks as of April 30, 2019
| % of fund's net assets | |
| Atmos Energy Corp. | 1.6 |
| NVR, Inc. | 1.6 |
| Amphenol Corp. Class A | 1.4 |
| Leidos Holdings, Inc. | 1.4 |
| Arch Capital Group Ltd. | 1.4 |
| M&T Bank Corp. | 1.4 |
| Radian Group, Inc. | 1.4 |
| Huntington Bancshares, Inc. | 1.3 |
| IDACORP, Inc. | 1.2 |
| Black Knight, Inc. | 1.2 |
| 13.9 |
Top Five Market Sectors as of April 30, 2019
| % of fund's net assets | |
| Financials | 20.3 |
| Consumer Discretionary | 15.5 |
| Information Technology | 11.5 |
| Industrials | 10.9 |
| Health Care | 8.9 |
Asset Allocation (% of fund's net assets)
| As of April 30, 2019 * | ||
| Stocks | 90.0% | |
| Convertible Securities | 1.1% | |
| Other Investments | 0.1% | |
| Short-Term Investments and Net Other Assets (Liabilities) | 8.8% | |

* Foreign investments – 14.7%
Schedule of Investments April 30, 2019
Showing Percentage of Net Assets
| Common Stocks - 90.0% | |||
| Shares | Value (000s) | ||
| COMMUNICATION SERVICES - 1.1% | |||
| Diversified Telecommunication Services - 0.5% | |||
| Cogent Communications Group, Inc. | 382,900 | $21,148 | |
| Iridium Communications, Inc. (a) | 694,200 | 19,063 | |
| 40,211 | |||
| Entertainment - 0.3% | |||
| WME Entertainment Parent, LLC Class A (a)(b)(c)(d) | 8,815,374 | 26,711 | |
| Media - 0.3% | |||
| Nexstar Broadcasting Group, Inc. Class A | 165,300 | 19,348 | |
| TOTAL COMMUNICATION SERVICES | 86,270 | ||
| CONSUMER DISCRETIONARY - 14.7% | |||
| Automobiles - 0.8% | |||
| Fiat Chrysler Automobiles NV (e) | 3,841,800 | 59,202 | |
| Hotels, Restaurants & Leisure - 3.9% | |||
| ARAMARK Holdings Corp. | 2,228,010 | 69,247 | |
| Del Frisco's Restaurant Group, Inc. (a)(e) | 1,578,900 | 10,579 | |
| Drive Shack, Inc. (a) | 3,284,328 | 16,881 | |
| Dunkin' Brands Group, Inc. | 400,700 | 29,904 | |
| U.S. Foods Holding Corp. (a) | 2,357,600 | 86,170 | |
| Wyndham Hotels & Resorts, Inc. | 1,160,000 | 64,635 | |
| Wynn Resorts Ltd. | 153,000 | 22,101 | |
| 299,517 | |||
| Household Durables - 3.9% | |||
| D.R. Horton, Inc. | 1,206,433 | 53,457 | |
| Lennar Corp. Class A | 583,900 | 30,380 | |
| Newell Brands, Inc. | 1,189,100 | 17,099 | |
| NVR, Inc. (a) | 39,300 | 123,892 | |
| Toll Brothers, Inc. | 2,111,287 | 80,440 | |
| 305,268 | |||
| Leisure Products - 0.1% | |||
| New Academy Holding Co. LLC unit (a)(c)(d)(f) | 294,000 | 7,829 | |
| Multiline Retail - 1.3% | |||
| Dollar General Corp. | 582,200 | 73,410 | |
| Dollar Tree, Inc. (a) | 248,900 | 27,698 | |
| 101,108 | |||
| Specialty Retail - 2.0% | |||
| AutoZone, Inc. (a) | 68,000 | 69,925 | |
| Ross Stores, Inc. | 478,500 | 46,730 | |
| Tiffany & Co., Inc. | 338,000 | 36,443 | |
| 153,098 | |||
| Textiles, Apparel & Luxury Goods - 2.7% | |||
| Allbirds, Inc. (c)(d) | 10,775 | 598 | |
| Brunello Cucinelli SpA | 2,121,100 | 76,985 | |
| Prada SpA | 9,389,700 | 26,512 | |
| PVH Corp. | 311,800 | 40,219 | |
| Tapestry, Inc. | 1,120,000 | 36,142 | |
| Under Armour, Inc. Class A (sub. vtg.) (a)(e) | 1,119,400 | 25,847 | |
| 206,303 | |||
| TOTAL CONSUMER DISCRETIONARY | 1,132,325 | ||
| CONSUMER STAPLES - 2.1% | |||
| Beverages - 0.2% | |||
| Molson Coors Brewing Co. Class B | 231,400 | 14,854 | |
| Food Products - 1.8% | |||
| Amira Nature Foods Ltd. (a)(e) | 1,783,275 | 2,586 | |
| Conagra Brands, Inc. | 1,226,900 | 37,764 | |
| Greencore Group PLC (e) | 16,143,584 | 48,418 | |
| The Hershey Co. | 409,600 | 51,139 | |
| 139,907 | |||
| Personal Products - 0.1% | |||
| Coty, Inc. Class A | 980,150 | 10,605 | |
| TOTAL CONSUMER STAPLES | 165,366 | ||
| ENERGY - 5.8% | |||
| Energy Equipment & Services - 1.3% | |||
| Borr Drilling Ltd. (a) | 10,814,000 | 30,835 | |
| Oceaneering International, Inc. (a) | 2,016,670 | 38,720 | |
| Pacific Drilling SA (a) | 887,706 | 13,182 | |
| Pacific Drilling SA(a) | 51,434 | 764 | |
| TechnipFMC PLC | 674,200 | 16,579 | |
| 100,080 | |||
| Oil, Gas & Consumable Fuels - 4.5% | |||
| Cabot Oil & Gas Corp. | 1,508,700 | 39,060 | |
| Cheniere Energy, Inc. (a) | 746,000 | 48,005 | |
| GasLog Ltd. | 1,179,177 | 18,431 | |
| Golar LNG Ltd. | 2,001,245 | 39,104 | |
| Hess Corp. | 1,007,200 | 64,582 | |
| Kosmos Energy Ltd. | 7,258,324 | 48,558 | |
| Legacy Reserves, Inc. (a)(e) | 1,733,100 | 780 | |
| SM Energy Co. | 1,451,300 | 23,119 | |
| The Williams Companies, Inc. | 2,270,497 | 64,323 | |
| 345,962 | |||
| TOTAL ENERGY | 446,042 | ||
| FINANCIALS - 20.3% | |||
| Banks - 8.5% | |||
| Bank of Hawaii Corp. | 319,500 | 26,320 | |
| Cullen/Frost Bankers, Inc. | 699,800 | 71,163 | |
| First Horizon National Corp. | 3,459,600 | 52,205 | |
| First Republic Bank | 187,800 | 19,835 | |
| Huntington Bancshares, Inc. | 7,015,400 | 97,654 | |
| M&T Bank Corp. | 635,500 | 108,079 | |
| Metro Bank PLC (a)(e) | 838,036 | 8,196 | |
| Prosperity Bancshares, Inc. | 936,900 | 68,993 | |
| Regions Financial Corp. | 2,061,224 | 32,011 | |
| Signature Bank | 619,100 | 81,765 | |
| SunTrust Banks, Inc. | 630,900 | 41,311 | |
| UMB Financial Corp. | 631,300 | 44,103 | |
| 651,635 | |||
| Capital Markets - 2.1% | |||
| Cboe Global Markets, Inc. | 217,900 | 22,141 | |
| Lazard Ltd. Class A | 600,800 | 23,359 | |
| Northern Trust Corp. | 365,200 | 35,990 | |
| The NASDAQ OMX Group, Inc. | 468,900 | 43,233 | |
| TPG Specialty Lending, Inc. | 1,968,769 | 39,946 | |
| 164,669 | |||
| Diversified Financial Services - 0.3% | |||
| Focus Financial Partners, Inc. Class A | 617,888 | 23,171 | |
| Insurance - 7.0% | |||
| Arch Capital Group Ltd. (a) | 3,242,100 | 109,518 | |
| Axis Capital Holdings Ltd. | 656,600 | 37,328 | |
| Beazley PLC | 2,942,700 | 22,103 | |
| First American Financial Corp. | 1,325,200 | 75,616 | |
| FNF Group | 1,623,700 | 64,867 | |
| Hartford Financial Services Group, Inc. | 844,000 | 44,150 | |
| Hiscox Ltd. | 967,900 | 21,128 | |
| Principal Financial Group, Inc. | 570,600 | 32,615 | |
| Reinsurance Group of America, Inc. | 592,400 | 89,755 | |
| Torchmark Corp. | 500,300 | 43,856 | |
| 540,936 | |||
| Thrifts & Mortgage Finance - 2.4% | |||
| LIC Housing Finance Ltd. | 3,156,300 | 22,512 | |
| MGIC Investment Corp. (a) | 3,747,433 | 54,862 | |
| Radian Group, Inc. | 4,515,944 | 105,763 | |
| 183,137 | |||
| TOTAL FINANCIALS | 1,563,548 | ||
| HEALTH CARE - 8.7% | |||
| Health Care Equipment & Supplies - 1.6% | |||
| Boston Scientific Corp. (a) | 1,077,400 | 39,993 | |
| Hologic, Inc. (a) | 541,530 | 25,116 | |
| ResMed, Inc. | 265,400 | 27,737 | |
| Wright Medical Group NV (a) | 1,155,623 | 34,172 | |
| 127,018 | |||
| Health Care Providers & Services - 3.3% | |||
| Covetrus, Inc. (a) | 258,080 | 8,483 | |
| Henry Schein, Inc. (a) | 645,200 | 41,332 | |
| Molina Healthcare, Inc. (a) | 465,500 | 60,343 | |
| National Vision Holdings, Inc. (a) | 969,767 | 26,184 | |
| Premier, Inc. (a) | 841,800 | 27,973 | |
| Universal Health Services, Inc. Class B | 498,900 | 63,295 | |
| Wellcare Health Plans, Inc. (a) | 93,900 | 24,259 | |
| 251,869 | |||
| Health Care Technology - 0.4% | |||
| Cerner Corp. (a) | 446,400 | 29,663 | |
| Life Sciences Tools & Services - 1.4% | |||
| Agilent Technologies, Inc. | 401,100 | 31,486 | |
| Bruker Corp. | 803,300 | 31,007 | |
| Lonza Group AG | 138,924 | 42,904 | |
| 105,397 | |||
| Pharmaceuticals - 2.0% | |||
| Amneal Pharmaceuticals, Inc. (a) | 1,922,600 | 24,744 | |
| Catalent, Inc. (a) | 1,212,850 | 54,360 | |
| Nektar Therapeutics (a) | 266,200 | 8,524 | |
| Perrigo Co. PLC | 724,200 | 34,704 | |
| Recordati SpA | 562,400 | 22,702 | |
| Zogenix, Inc. (a) | 357,300 | 13,931 | |
| 158,965 | |||
| TOTAL HEALTH CARE | 672,912 | ||
| INDUSTRIALS - 10.8% | |||
| Aerospace & Defense - 2.1% | |||
| Huntington Ingalls Industries, Inc. | 369,700 | 82,288 | |
| Kratos Defense & Security Solutions, Inc. (a) | 2,256,100 | 35,827 | |
| Space Exploration Technologies Corp.: | |||
| Class A (a)(c)(d) | 139,629 | 28,484 | |
| Class C (a)(c)(d) | 2,034 | 415 | |
| Teledyne Technologies, Inc. (a) | 50,690 | 12,597 | |
| 159,611 | |||
| Air Freight & Logistics - 0.4% | |||
| C.H. Robinson Worldwide, Inc. | 421,900 | 34,174 | |
| Commercial Services & Supplies - 0.9% | |||
| KAR Auction Services, Inc. | 714,700 | 40,366 | |
| U.S. Ecology, Inc. | 457,981 | 27,941 | |
| 68,307 | |||
| Electrical Equipment - 2.6% | |||
| AMETEK, Inc. | 823,092 | 72,572 | |
| Generac Holdings, Inc. (a) | 817,700 | 44,965 | |
| Melrose Industries PLC | 18,157,741 | 47,876 | |
| Regal Beloit Corp. | 379,300 | 32,271 | |
| 197,684 | |||
| Machinery - 1.5% | |||
| Donaldson Co., Inc. | 1,499,500 | 80,283 | |
| Pentair PLC | 910,800 | 35,512 | |
| 115,795 | |||
| Marine - 0.3% | |||
| Goodbulk Ltd. (d)(g) | 1,505,822 | 25,046 | |
| Professional Services - 0.6% | |||
| Equifax, Inc. | 360,200 | 45,367 | |
| Road & Rail - 1.7% | |||
| Genesee & Wyoming, Inc. Class A (a) | 551,900 | 48,926 | |
| Knight-Swift Transportation Holdings, Inc. Class A | 1,328,900 | 44,319 | |
| Lyft, Inc. (e) | 44,300 | 2,649 | |
| Lyft, Inc. | 737,589 | 39,697 | |
| 135,591 | |||
| Trading Companies & Distributors - 0.7% | |||
| Bunzl PLC | 1,798,022 | 54,137 | |
| TOTAL INDUSTRIALS | 835,712 | ||
| INFORMATION TECHNOLOGY - 11.5% | |||
| Electronic Equipment & Components - 2.8% | |||
| Amphenol Corp. Class A | 1,122,200 | 111,726 | |
| Fabrinet (a) | 1,117,231 | 67,615 | |
| Keysight Technologies, Inc. (a) | 428,700 | 37,310 | |
| 216,651 | |||
| IT Services - 6.2% | |||
| Akamai Technologies, Inc. (a) | 559,700 | 44,810 | |
| Fidelity National Information Services, Inc. | 544,286 | 63,099 | |
| First Data Corp. Class A (a) | 2,455,073 | 63,488 | |
| Fiserv, Inc. (a) | 612,900 | 53,469 | |
| FleetCor Technologies, Inc. (a) | 129,400 | 33,767 | |
| Leidos Holdings, Inc. | 1,518,400 | 111,572 | |
| Verra Mobility Corp. (a) | 1,473,200 | 19,918 | |
| WNS Holdings Ltd. sponsored ADR (a) | 1,611,800 | 92,114 | |
| 482,237 | |||
| Software - 2.5% | |||
| Black Knight, Inc. (a) | 1,700,669 | 95,952 | |
| Citrix Systems, Inc. | 456,400 | 46,078 | |
| Red Hat, Inc. (a) | 257,400 | 46,983 | |
| 189,013 | |||
| TOTAL INFORMATION TECHNOLOGY | 887,901 | ||
| MATERIALS - 2.8% | |||
| Chemicals - 1.5% | |||
| International Flavors & Fragrances, Inc. | 329,500 | 45,402 | |
| LG Chemical Ltd. | 50,300 | 15,600 | |
| Nutrien Ltd. | 493,400 | 26,760 | |
| Olin Corp. | 1,362,152 | 29,545 | |
| 117,307 | |||
| Containers & Packaging - 0.4% | |||
| Packaging Corp. of America | 271,400 | 26,912 | |
| Metals & Mining - 0.9% | |||
| Franco-Nevada Corp. | 342,600 | 24,547 | |
| Newcrest Mining Ltd. | 1,286,984 | 22,691 | |
| Novagold Resources, Inc. (a) | 5,238,676 | 20,881 | |
| 68,119 | |||
| TOTAL MATERIALS | 212,338 | ||
| REAL ESTATE - 5.6% | |||
| Equity Real Estate Investment Trusts (REITs) - 5.6% | |||
| Apartment Investment & Management Co. Class A | 912,956 | 45,064 | |
| Cousins Properties, Inc. | 5,242,791 | 50,174 | |
| Essex Property Trust, Inc. | 262,600 | 74,185 | |
| Gaming & Leisure Properties | 393,043 | 15,871 | |
| Healthcare Realty Trust, Inc. | 1,239,500 | 38,276 | |
| Healthcare Trust of America, Inc. | 1,651,900 | 45,559 | |
| SBA Communications Corp. Class A (a) | 327,500 | 66,722 | |
| Spirit MTA REIT | 396,690 | 2,674 | |
| Spirit Realty Capital, Inc. | 793,380 | 32,100 | |
| VEREIT, Inc. | 3,822,100 | 31,571 | |
| VICI Properties, Inc. | 1,405,100 | 32,036 | |
| 434,232 | |||
| UTILITIES - 6.6% | |||
| Electric Utilities - 4.6% | |||
| Alliant Energy Corp. | 2,027,400 | 95,754 | |
| IDACORP, Inc. | 971,133 | 96,162 | |
| OGE Energy Corp. | 2,171,600 | 91,946 | |
| Xcel Energy, Inc. | 1,346,882 | 76,099 | |
| 359,961 | |||
| Gas Utilities - 2.0% | |||
| Atmos Energy Corp. | 1,214,597 | 124,303 | |
| Spire, Inc. | 333,000 | 28,035 | |
| 152,338 | |||
| TOTAL UTILITIES | 512,299 | ||
| TOTAL COMMON STOCKS | |||
| (Cost $5,288,192) | 6,948,945 | ||
| Preferred Stocks - 1.1% | |||
| Convertible Preferred Stocks - 1.1% | |||
| CONSUMER DISCRETIONARY - 0.8% | |||
| Leisure Products - 0.6% | |||
| Peloton Interactive, Inc.: | |||
| Series E (a)(c)(d) | 1,758,856 | 35,722 | |
| Series F (c)(d) | 748,920 | 15,211 | |
| 50,933 | |||
| Textiles, Apparel & Luxury Goods - 0.2% | |||
| Allbirds, Inc.: | |||
| Series A (c)(d) | 4,253 | 236 | |
| Series B (c)(d) | 747 | 41 | |
| Series C (c)(d) | 7,140 | 396 | |
| Bolt Threads, Inc. Series D (a)(c)(d) | 976,285 | 12,496 | |
| 13,169 | |||
| TOTAL CONSUMER DISCRETIONARY | 64,102 | ||
| HEALTH CARE - 0.2% | |||
| Health Care Equipment & Supplies - 0.2% | |||
| Butterfly Network, Inc. Series D (c)(d) | 1,647,945 | 16,463 | |
| INDUSTRIALS - 0.1% | |||
| Aerospace & Defense - 0.1% | |||
| Space Exploration Technologies Corp. Series H (a)(c)(d) | 18,837 | 3,843 | |
| TOTAL CONVERTIBLE PREFERRED STOCKS | 84,408 | ||
| Nonconvertible Preferred Stocks - 0.0% | |||
| CONSUMER DISCRETIONARY - 0.0% | |||
| Textiles, Apparel & Luxury Goods - 0.0% | |||
| Allbirds, Inc. (c)(d) | 2,285 | 127 | |
| TOTAL PREFERRED STOCKS | |||
| (Cost $56,257) | 84,535 | ||
| Principal Amount (000s) | Value (000s) | ||
| Nonconvertible Bonds - 0.0% | |||
| ENERGY - 0.0% | |||
| Energy Equipment & Services - 0.0% | |||
| Pacific Drilling Second Lien Escrow Issuer Ltd. 12% 4/1/24 pay-in-kind (h)(i) | |||
| (Cost $431) | $422 | $439 | |
| Shares | Value (000s) | ||
| Other - 0.1% | |||
| ENERGY - 0.1% | |||
| Oil, Gas & Consumable Fuels - 0.1% | |||
| Utica Shale Drilling Program (non-operating revenue interest) (b)(c)(d) | |||
| (Cost $20,398) | 20,397,834 | 10,276 | |
| Money Market Funds - 9.9% | |||
| Fidelity Cash Central Fund, 2.49% (j) | 673,964,735 | 674,100 | |
| Fidelity Securities Lending Cash Central Fund 2.49% (j)(k) | 87,854,280 | 87,863 | |
| TOTAL MONEY MARKET FUNDS | |||
| (Cost $761,917) | 761,963 | ||
| TOTAL INVESTMENT IN SECURITIES - 101.1% | |||
| (Cost $6,127,195) | 7,806,158 | ||
| NET OTHER ASSETS (LIABILITIES) - (1.1)% | (85,098) | ||
| NET ASSETS - 100% | $7,721,060 |
Legend
(a) Non-income producing
(b) Investment is owned by a wholly-owned subsidiary (Subsidiary) that is treated as a corporation for U.S. tax purposes.
(c) Restricted securities - Investment in securities not registered under the Securities Act of 1933 (excluding 144A issues). At the end of the period, the value of restricted securities (excluding 144A issues) amounted to $158,849,000 or 2.1% of net assets.
(d) Level 3 security
(e) Security or a portion of the security is on loan at period end.
(f) Investment is owned by an entity that is treated as a U.S. Corporation for tax purposes in which the Fund holds a percentage ownership.
(g) Affiliated company
(h) Security exempt from registration under Rule 144A of the Securities Act of 1933. These securities may be resold in transactions exempt from registration, normally to qualified institutional buyers. At the end of the period, the value of these securities amounted to $439,000 or 0.0% of net assets.
(i) Coupon rates for floating and adjustable rate securities reflect the rates in effect at period end.
(j) Affiliated fund that is generally available only to investment companies and other accounts managed by Fidelity Investments. The rate quoted is the annualized seven-day yield of the fund at period end. A complete unaudited listing of the fund's holdings as of its most recent quarter end is available upon request. In addition, each Fidelity Central Fund's financial statements, which are not covered by the Fund's Report of Independent Registered Public Accounting Firm, are available on the SEC's website or upon request.
(k) Investment made with cash collateral received from securities on loan.
Additional information on each restricted holding is as follows:
| Security | Acquisition Date | Acquisition Cost (000s) |
| Allbirds, Inc. | 10/9/18 | $591 |
| Allbirds, Inc. | 10/9/18 | $125 |
| Allbirds, Inc. Series A | 10/9/18 | $233 |
| Allbirds, Inc. Series B | 10/9/18 | $41 |
| Allbirds, Inc. Series C | 10/9/18 | $392 |
| Bolt Threads, Inc. Series D | 12/13/17 | $15,659 |
| Butterfly Network, Inc. Series D | 5/4/18 | $16,924 |
| New Academy Holding Co. LLC unit | 8/1/11 | $30,988 |
| Peloton Interactive, Inc. Series E | 3/31/17 | $9,525 |
| Peloton Interactive, Inc. Series F | 8/30/18 | $10,815 |
| Space Exploration Technologies Corp. Class A | 4/8/16 - 9/11/17 | $14,283 |
| Space Exploration Technologies Corp. Class C | 9/11/17 | $275 |
| Space Exploration Technologies Corp. Series H | 8/4/17 | $2,543 |
| Utica Shale Drilling Program (non-operating revenue interest) | 10/5/16 - 9/1/17 | $20,398 |
| WME Entertainment Parent, LLC Class A | 8/16/16 | $16,835 |
Affiliated Central Funds
Information regarding fiscal year to date income earned by the Fund from investments in Fidelity Central Funds is as follows:
| Fund | Income earned |
| (Amounts in thousands) | |
| Fidelity Cash Central Fund | $17,815 |
| Fidelity Securities Lending Cash Central Fund | 499 |
| Total | $18,314 |
Amounts in the income column in the above table include any capital gain distributions from underlying funds, which are presented in the corresponding line-item in the Statement of Operations, if applicable.
Other Affiliated Issuers
An affiliated company is a company in which the Fund has ownership of at least 5% of the voting securities. Fiscal year to date transactions with companies which are or were affiliates are as follows:
| Affiliate (Amounts in thousands) | Value, beginning of period | Purchases | Sales Proceeds | Dividend Income | Realized Gain (loss) | Change in Unrealized appreciation (depreciation) | Value, end of period |
| Goodbulk Ltd. | $26,341 | $2,737 | $7,374 | $1,397 | $751 | $2,591 | $25,046 |
| KEYW Holding Corp. | 35,073 | 982 | 51,743 | -- | (7,451) | 23,139 | -- |
| Total | $61,414 | $3,719 | $59,117 | $1,397 | $(6,700) | $25,730 | $25,046 |
Investment Valuation
The following is a summary of the inputs used, as of April 30, 2019, involving the Fund's assets and liabilities carried at fair value. The inputs or methodology used for valuing securities may not be an indication of the risk associated with investing in those securities. For more information on valuation inputs, and their aggregation into the levels used below, please refer to the Investment Valuation section in the accompanying Notes to Financial Statements.
| Valuation Inputs at Reporting Date: | ||||
| Description | Total | Level 1 | Level 2 | Level 3 |
| (Amounts in thousands) | ||||
| Investments in Securities: | ||||
| Equities: | ||||
| Communication Services | $86,270 | $59,559 | $-- | $26,711 |
| Consumer Discretionary | 1,196,554 | 1,123,898 | -- | 72,656 |
| Consumer Staples | 165,366 | 165,366 | -- | -- |
| Energy | 446,042 | 446,042 | -- | -- |
| Financials | 1,563,548 | 1,563,548 | -- | -- |
| Health Care | 689,375 | 630,008 | 42,904 | 16,463 |
| Industrials | 839,555 | 742,070 | 39,697 | 57,788 |
| Information Technology | 887,901 | 887,901 | -- | -- |
| Materials | 212,338 | 212,338 | -- | -- |
| Real Estate | 434,232 | 434,232 | -- | -- |
| Utilities | 512,299 | 512,299 | -- | -- |
| Corporate Bonds | 439 | -- | 439 | -- |
| Other | 10,276 | -- | -- | 10,276 |
| Money Market Funds | 761,963 | 761,963 | -- | -- |
| Total Investments in Securities: | $7,806,158 | $7,539,224 | $83,040 | $183,894 |
The following is a reconciliation of Investments in Securities and Derivative Instruments for which Level 3 inputs were used in determining value:
| (Amounts in thousands) | |
| Investments in Securities: | |
| Beginning Balance | $120,719 |
| Net Realized Gain (Loss) on Investment Securities | 751 |
| Net Unrealized Gain (Loss) on Investment Securities | 25,719 |
| Cost of Purchases | 31,947 |
| Proceeds of Sales | (21,583) |
| Amortization/Accretion | -- |
| Transfers into Level 3 | 26,341 |
| Transfers out of Level 3 | -- |
| Ending Balance | $183,894 |
| The change in unrealized gain (loss) for the period attributable to Level 3 securities held at April 30, 2019 | $25,719 |
The information used in the above reconciliations represents fiscal year to date activity for any Investments in Securities and Other Financial Instruments identified as using Level 3 inputs at either the beginning or the end of the current fiscal period. Transfers in or out of Level 3 represent the beginning value of any Security or Instrument where a change in the pricing level occurred from the beginning to the end of the period. The cost of purchases and the proceeds of sales may include securities received or delivered through corporate actions or exchanges. Realized and unrealized gains (losses) disclosed in the reconciliations are included in Net Gain (Loss) on the Fund's Statement of Operations.
Other Information
Distribution of investments by country or territory of incorporation, as a percentage of Total Net Assets, is as follows (Unaudited):
| United States of America | 85.3% |
| Bermuda | 4.0% |
| United Kingdom | 1.9% |
| Italy | 1.7% |
| Ireland | 1.5% |
| Netherlands | 1.2% |
| Bailiwick of Jersey | 1.2% |
| Others (Individually Less Than 1%) | 3.2% |
| 100.0% |
See accompanying notes which are an integral part of the financial statements.
Financial Statements
Statement of Assets and Liabilities
| Amounts in thousands (except per-share amounts) | April 30, 2019 | |
| Assets | ||
| Investment in securities, at value (including securities loaned of $83,656) — See accompanying schedule: Unaffiliated issuers (cost $5,346,178) | $7,019,149 | |
| Fidelity Central Funds (cost $761,917) | 761,963 | |
| Other affiliated issuers (cost $19,100) | 25,046 | |
| Total Investment in Securities (cost $6,127,195) | $7,806,158 | |
| Restricted cash | 721 | |
| Receivable for investments sold | 28,607 | |
| Receivable for fund shares sold | 3,132 | |
| Dividends receivable | 5,253 | |
| Distributions receivable from Fidelity Central Funds | 1,334 | |
| Prepaid expenses | 4 | |
| Other receivables | 536 | |
| Total assets | 7,845,745 | |
| Liabilities | ||
| Payable for investments purchased | $23,744 | |
| Payable for fund shares redeemed | 8,380 | |
| Accrued management fee | 3,381 | |
| Other affiliated payables | 845 | |
| Other payables and accrued expenses | 498 | |
| Collateral on securities loaned | 87,837 | |
| Total liabilities | 124,685 | |
| Net Assets | $7,721,060 | |
| Net Assets consist of: | ||
| Paid in capital | $5,925,967 | |
| Total distributable earnings (loss) | 1,795,093 | |
| Net Assets | $7,721,060 | |
| Net Asset Value and Maximum Offering Price | ||
| Mid-Cap Stock: | ||
| Net Asset Value, offering price and redemption price per share ($5,372,953 ÷ 152,184 shares) | $35.31 | |
| Class K: | ||
| Net Asset Value, offering price and redemption price per share ($2,348,107 ÷ 66,473 shares) | $35.32 |
See accompanying notes which are an integral part of the financial statements.
Statement of Operations
| Amounts in thousands | Year ended April 30, 2019 | |
| Investment Income | ||
| Dividends (including $1,397 earned from other affiliated issuers) | $108,112 | |
| Interest | 379 | |
| Income from Fidelity Central Funds | 18,314 | |
| Total income | 126,805 | |
| Expenses | ||
| Management fee | ||
| Basic fee | $42,772 | |
| Performance adjustment | (2,700) | |
| Transfer agent fees | 9,323 | |
| Accounting and security lending fees | 1,216 | |
| Custodian fees and expenses | 157 | |
| Independent trustees' fees and expenses | 46 | |
| Registration fees | 85 | |
| Audit | 67 | |
| Legal | 20 | |
| Miscellaneous | 56 | |
| Total expenses before reductions | 51,042 | |
| Expense reductions | (417) | |
| Total expenses after reductions | 50,625 | |
| Net investment income (loss) | 76,180 | |
| Realized and Unrealized Gain (Loss) | ||
| Net realized gain (loss) on: | ||
| Investment securities: | ||
| Unaffiliated issuers | 971,238 | |
| Fidelity Central Funds | (9) | |
| Other affiliated issuers | (6,700) | |
| Foreign currency transactions | (167) | |
| Total net realized gain (loss) | 964,362 | |
| Change in net unrealized appreciation (depreciation) on: | ||
| Investment securities: | ||
| Unaffiliated issuers | (464,951) | |
| Fidelity Central Funds | 2 | |
| Other affiliated issuers | 25,730 | |
| Assets and liabilities in foreign currencies | (23) | |
| Total change in net unrealized appreciation (depreciation) | (439,242) | |
| Net gain (loss) | 525,120 | |
| Net increase (decrease) in net assets resulting from operations | $601,300 |
See accompanying notes which are an integral part of the financial statements.
Statement of Changes in Net Assets
| Amounts in thousands | Year ended April 30, 2019 | Year ended April 30, 2018 |
| Increase (Decrease) in Net Assets | ||
| Operations | ||
| Net investment income (loss) | $76,180 | $49,254 |
| Net realized gain (loss) | 964,362 | 681,278 |
| Change in net unrealized appreciation (depreciation) | (439,242) | 228,744 |
| Net increase (decrease) in net assets resulting from operations | 601,300 | 959,276 |
| Distributions to shareholders | (1,189,126) | – |
| Distributions to shareholders from net investment income | – | (47,485) |
| Distributions to shareholders from net realized gain | – | (529,727) |
| Total distributions | (1,189,126) | (577,212) |
| Share transactions - net increase (decrease) | 325,889 | (233,893) |
| Total increase (decrease) in net assets | (261,937) | 148,171 |
| Net Assets | ||
| Beginning of period | 7,982,997 | 7,834,826 |
| End of period | $7,721,060 | $7,982,997 |
| Other Information | ||
| Distributions in excess of net investment income end of period | $(5,899) |
See accompanying notes which are an integral part of the financial statements.
Financial Highlights
Fidelity Mid-Cap Stock Fund
| Years ended April 30, | 2019 | 2018 | 2017 | 2016 | 2015 |
| Selected Per–Share Data | |||||
| Net asset value, beginning of period | $38.38 | $36.62 | $34.07 | $40.11 | $40.26 |
| Income from Investment Operations | |||||
| Net investment income (loss)A | .34 | .22 | .22 | .21 | .18 |
| Net realized and unrealized gain (loss) | 2.26 | 4.30 | 5.19 | (1.54) | 3.52 |
| Total from investment operations | 2.60 | 4.52 | 5.41 | (1.33) | 3.70 |
| Distributions from net investment income | (.29) | (.22) | (.27) | (.22) | (.09) |
| Distributions from net realized gain | (5.38) | (2.55) | (2.59) | (4.49) | (3.76) |
| Total distributions | (5.67) | (2.76)B | (2.86) | (4.71) | (3.85) |
| Redemption fees added to paid in capitalA | – | – | –C | –C | –C |
| Net asset value, end of period | $35.31 | $38.38 | $36.62 | $34.07 | $40.11 |
| Total ReturnD | 7.90% | 12.66% | 16.80% | (3.44)% | 9.83% |
| Ratios to Average Net AssetsE,F | |||||
| Expenses before reductions | .68% | .61% | .58% | .72% | .73% |
| Expenses net of fee waivers, if any | .67% | .61% | .58% | .72% | .72% |
| Expenses net of all reductions | .67% | .61% | .58% | .72% | .72% |
| Net investment income (loss) | .93% | .58% | .64% | .59% | .46% |
| Supplemental Data | |||||
| Net assets, end of period (in millions) | $5,373 | $5,629 | $5,622 | $5,136 | $5,874 |
| Portfolio turnover rateG | 29% | 22% | 27%H | 23%H | 29% |
A Calculated based on average shares outstanding during the period.
B Total distributions of $2.76 per share is comprised of distributions from net investment income of $.217 and distributions from net realized gain of $2.545 per share.
C Amount represents less than $.005 per share.
D Total returns would have been lower if certain expenses had not been reduced during the applicable periods shown.
E Fees and expenses of any underlying Fidelity Central Funds are not included in the Fund's expense ratio. The Fund indirectly bears its proportionate share of the expenses of any underlying Fidelity Central Funds.
F Expense ratios reflect operating expenses of the class. Expenses before reductions do not reflect amounts reimbursed by the investment adviser or reductions from brokerage service arrangements or reductions from other expense offset arrangements and do not represent the amount paid by the class during periods when reimbursements or reductions occur. Expenses net of fee waivers reflect expenses after reimbursement by the investment adviser but prior to reductions from brokerage service arrangements or other expense offset arrangements. Expenses net of all reductions represent the net expenses paid by the class.
G Amount does not include the portfolio activity of any underlying Fidelity Central Funds.
H Portfolio turnover rate excludes securities received or delivered in-kind.
See accompanying notes which are an integral part of the financial statements.
Fidelity Mid-Cap Stock Fund Class K
| Years ended April 30, | 2019 | 2018 | 2017 | 2016 | 2015 |
| Selected Per–Share Data | |||||
| Net asset value, beginning of period | $38.40 | $36.64 | $34.08 | $40.12 | $40.27 |
| Income from Investment Operations | |||||
| Net investment income (loss)A | .37 | .26 | .26 | .25 | .22 |
| Net realized and unrealized gain (loss) | 2.26 | 4.30 | 5.20 | (1.54) | 3.51 |
| Total from investment operations | 2.63 | 4.56 | 5.46 | (1.29) | 3.73 |
| Distributions from net investment income | (.33) | (.26) | (.31) | (.26) | (.13) |
| Distributions from net realized gain | (5.38) | (2.55) | (2.59) | (4.49) | (3.76) |
| Total distributions | (5.71) | (2.80)B | (2.90) | (4.75) | (3.88)C |
| Redemption fees added to paid in capitalA | – | – | –D | –D | –D |
| Net asset value, end of period | $35.32 | $38.40 | $36.64 | $34.08 | $40.12 |
| Total ReturnE | 7.99% | 12.78% | 16.96% | (3.33)% | 9.92% |
| Ratios to Average Net AssetsF,G | |||||
| Expenses before reductions | .57% | .51% | .46% | .60% | .61% |
| Expenses net of fee waivers, if any | .57% | .51% | .46% | .60% | .61% |
| Expenses net of all reductions | .57% | .50% | .46% | .60% | .61% |
| Net investment income (loss) | 1.03% | .69% | .76% | .71% | .57% |
| Supplemental Data | |||||
| Net assets, end of period (in millions) | $2,348 | $2,354 | $2,213 | $1,988 | $2,588 |
| Portfolio turnover rateH | 29% | 22% | 27%I | 23%I | 29% |
A Calculated based on average shares outstanding during the period.
B Total distributions of $2.80 per share is comprised of distributions from net investment income of $.259 and distributions from net realized gain of $2.545 per share.
C Total distributions of $3.88 per share is comprised of distributions from net investment income of $.127 and distributions from net realized gain of $3.757 per share.
D Amount represents less than $.005 per share.
E Total returns would have been lower if certain expenses had not been reduced during the applicable periods shown.
F Fees and expenses of any underlying Fidelity Central Funds are not included in the Fund's expense ratio. The Fund indirectly bears its proportionate share of the expenses of any underlying Fidelity Central Funds.
G Expense ratios reflect operating expenses of the class. Expenses before reductions do not reflect amounts reimbursed by the investment adviser or reductions from brokerage service arrangements or reductions from other expense offset arrangements and do not represent the amount paid by the class during periods when reimbursements or reductions occur. Expenses net of fee waivers reflect expenses after reimbursement by the investment adviser but prior to reductions from brokerage service arrangements or other expense offset arrangements. Expenses net of all reductions represent the net expenses paid by the class.
H Amount does not include the portfolio activity of any underlying Fidelity Central Funds.
I Portfolio turnover rate excludes securities received or delivered in-kind.
See accompanying notes which are an integral part of the financial statements.
Notes to Financial Statements
For the period ended April 30, 2019
(Amounts in thousands except percentages)
1. Organization.
Fidelity Mid-Cap Stock Fund (the Fund) is a fund of Fidelity Concord Street Trust (the Trust) and is authorized to issue an unlimited number of shares. The Trust is registered under the Investment Company Act of 1940, as amended (the 1940 Act), as an open-end management investment company organized as a Massachusetts business trust. The Fund offers Mid-Cap Stock and Class K shares, each of which has equal rights as to assets and voting privileges. Each class has exclusive voting rights with respect to matters that affect that class.
2. Investments in Fidelity Central Funds.
The Fund invests in Fidelity Central Funds, which are open-end investment companies generally available only to other investment companies and accounts managed by the investment adviser and its affiliates. The Fund's Schedule of Investments lists each of the Fidelity Central Funds held as of period end, if any, as an investment of the Fund, but does not include the underlying holdings of each Fidelity Central Fund. As an Investing Fund, the Fund indirectly bears its proportionate share of the expenses of the underlying Fidelity Central Funds.
The Money Market Central Funds seek preservation of capital and current income and are managed by Fidelity Investments Money Management, Inc. (FIMM), an affiliate of the investment adviser. Annualized expenses of the Money Market Central Funds as of their most recent shareholder report date are less than .005%.
A complete unaudited list of holdings for each Fidelity Central Fund is available upon request or at the Securities and Exchange Commission (the SEC) website at www.sec.gov. In addition, the financial statements of the Fidelity Central Funds, which are not covered by the Fund's Report of Independent Registered Public Accounting Firm, are available on the SEC website or upon request.
3. Significant Accounting Policies.
The Fund is an investment company and applies the accounting and reporting guidance of the Financial Accounting Standards Board (FASB) Accounting Standards Codification Topic 946 Financial Services – Investments Companies. The financial statements have been prepared in conformity with accounting principles generally accepted in the United States of America (GAAP), which require management to make certain estimates and assumptions at the date of the financial statements. Actual results could differ from those estimates. Subsequent events, if any, through the date that the financial statements were issued have been evaluated in the preparation of the financial statements. The following summarizes the significant accounting policies of the Fund:
Investment Valuation. Investments are valued as of 4:00 p.m. Eastern time on the last calendar day of the period. The Board of Trustees (the Board) has delegated the day to day responsibility for the valuation of the Fund's investments to the Fair Value Committee (the Committee) established by the Fund's investment adviser. In accordance with valuation policies and procedures approved by the Board, the Fund attempts to obtain prices from one or more third party pricing vendors or brokers to value its investments. When current market prices, quotations or currency exchange rates are not readily available or reliable, investments will be fair valued in good faith by the Committee, in accordance with procedures adopted by the Board. Factors used in determining fair value vary by investment type and may include market or investment specific events, changes in interest rates and credit quality. The frequency with which these procedures are used cannot be predicted and they may be utilized to a significant extent. The Committee oversees the Fund's valuation policies and procedures and reports to the Board on the Committee's activities and fair value determinations. The Board monitors the appropriateness of the procedures used in valuing the Fund's investments and ratifies the fair value determinations of the Committee.
The Fund categorizes the inputs to valuation techniques used to value its investments into a disclosure hierarchy consisting of three levels as shown below:
- Level 1 – quoted prices in active markets for identical investments
- Level 2 – other significant observable inputs (including quoted prices for similar investments, interest rates, prepayment speeds, etc.)
- Level 3 – unobservable inputs (including the Fund's own assumptions based on the best information available)
Valuation techniques used to value the Fund's investments by major category are as follows:
Equity securities, including restricted securities, for which market quotations are readily available, are valued at the last reported sale price or official closing price as reported by a third party pricing vendor on the primary market or exchange on which they are traded and are categorized as Level 1 in the hierarchy. In the event there were no sales during the day or closing prices are not available, securities are valued at the last quoted bid price or may be valued using the last available price and are generally categorized as Level 2 in the hierarchy. For foreign equity securities, when market or security specific events arise, comparisons to the valuation of American Depositary Receipts (ADRs), futures contracts, Exchange-Traded Funds (ETFs) and certain indexes as well as quoted prices for similar securities may be used and would be categorized as Level 2 in the hierarchy. For equity securities, including restricted securities, where observable inputs are limited, assumptions about market activity and risk are used and these securities may be categorized as Level 3 in the hierarchy.
Debt securities, including restricted securities, are valued based on evaluated prices received from third party pricing vendors or from brokers who make markets in such securities. Corporate bonds are valued by pricing vendors who utilize matrix pricing which considers yield or price of bonds of comparable quality, coupon, maturity and type or by broker-supplied prices. When independent prices are unavailable or unreliable, debt securities may be valued utilizing pricing methodologies which consider similar factors that would be used by third party pricing vendors. Debt securities are generally categorized as Level 2 in the hierarchy but may be Level 3 depending on the circumstances.
Investments in open-end mutual funds, including the Fidelity Central Funds, are valued at their closing net asset value (NAV) each business day and are categorized as Level 1 in the hierarchy.
The following provides information on Level 3 securities held by the Fund that were valued at period end based on unobservable inputs. These amounts exclude valuations provided by a broker.
| Asset Type | Fair Value | Valuation Technique(s) | Unobservable Input | Amount or Range/Weighted Average | Impact to Valuation from an Increase in Input(a) |
| Equities | $148,573 | Market comparable | Enterprise value/Sales multiple (EV/S) | 2.7 – 23.4/10.1 | Increase |
| Premium rate | 10.0% - 95.0%/ 71.3% | Increase | |||
| Enterprise value/EBITDA multiple (EV/EBITDA) | 6.7 | Increase | |||
| Discount for lack of marketability | 10.0% | Decrease | |||
| Market approach | Transaction Price | $19.55-$204.00/$66.72 | Increase | ||
| Other | $10,276 | Discount cash flow | Discount rate | 17.2% | Decrease |
(a) Represents the directional change in the fair value of the Level 3 investments that could have resulted from an increase in the corresponding input as of period end. A decrease to the unobservable input would have had the opposite effect. Significant changes in these inputs may have resulted in a significantly higher or lower fair value measurement at period end.
Changes in valuation techniques may result in transfers in or out of an assigned level within the disclosure hierarchy. The aggregate value of investments by input level as of April 30, 2019, as well as a roll forward of Level 3 investments, is included at the end of the Fund's Schedule of Investments.
Foreign Currency. The Fund may use foreign currency contracts to facilitate transactions in foreign-denominated securities. Gains and losses from these transactions may arise from changes in the value of the foreign currency or if the counterparties do not perform under the contracts' terms.
Foreign-denominated assets, including investment securities, and liabilities are translated into U.S. dollars at the exchange rates at period end. Purchases and sales of investment securities, income and dividends received and expenses denominated in foreign currencies are translated into U.S. dollars at the exchange rate in effect on the transaction date.
The effects of exchange rate fluctuations on investments are included with the net realized and unrealized gain (loss) on investment securities. Other foreign currency transactions resulting in realized and unrealized gain (loss) are disclosed separately.
Investment Transactions and Income.For financial reporting purposes, the Fund's investment holdings and NAV include trades executed through the end of the last business day of the period. The NAV per share for processing shareholder transactions is calculated as of the close of business of the New York Stock Exchange (NYSE), normally 4:00 p.m. Eastern time and includes trades executed through the end of the prior business day. Gains and losses on securities sold are determined on the basis of identified cost and include proceeds received from litigation. Dividend income is recorded on the ex-dividend date, except for certain dividends from foreign securities where the ex-dividend date may have passed, which are recorded as soon as the Fund is informed of the ex-dividend date. Non-cash dividends included in dividend income, if any, are recorded at the fair market value of the securities received. Income and capital gain distributions from Fidelity Central Funds, if any, are recorded on the ex-dividend date. Certain distributions received by the Fund represent a return of capital or capital gain. The Fund determines the components of these distributions subsequent to the ex-dividend date, based upon receipt of tax filings or other correspondence relating to the underlying investment. These distributions are recorded as a reduction of cost of investments and/or as a realized gain. Interest income is accrued as earned and includes coupon interest and amortization of premium and accretion of discount on debt securities as applicable. Paid in Kind (PIK) income is recorded at the fair market value of the securities received. Investment income is recorded net of foreign taxes withheld where recovery of such taxes is uncertain.
Class Allocations and Expenses. Investment income, realized and unrealized capital gains and losses, common expenses of the Fund, and certain fund-level expense reductions, if any, are allocated daily on a pro-rata basis to each class based on the relative net assets of each class to the total net assets of the Fund. Each class differs with respect to transfer agent fees incurred. Certain expense reductions may also differ by class. For the reporting period, the allocated portion of income and expenses to each class as a percent of its average net assets may vary due to the timing of recording these transactions in relation to fluctuating net assets of the classes. Expenses directly attributable to a fund are charged to that fund. Expenses attributable to more than one fund are allocated among the respective funds on the basis of relative net assets or other appropriate methods. Expense estimates are accrued in the period to which they relate and adjustments are made when actual amounts are known.
Deferred Trustee Compensation. Under a Deferred Compensation Plan (the Plan) for the Fund, certain independent Trustees have elected to defer receipt of a portion of their annual compensation. Deferred amounts are invested in a cross-section of Fidelity funds, are marked-to-market and remain in the Fund until distributed in accordance with the Plan. The investment of deferred amounts and the offsetting payable to the Trustees of $420 are included in the accompanying Statement of Assets and Liabilities in other receivables and other payables and accrued expenses, respectively.
Income Tax Information and Distributions to Shareholders. Each year, the Fund intends to qualify as a regulated investment company under Subchapter M of the Internal Revenue Code, including distributing substantially all of its taxable income and realized gains. As a result, no provision for U.S. Federal income taxes is required. As of April 30, 2019, the Fund did not have any unrecognized tax benefits in the financial statements; nor is the Fund aware of any tax positions for which it is reasonably possible that the total amounts of unrecognized tax benefits will significantly change in the next twelve months. The Fund files a U.S. federal tax return, in addition to state and local tax returns as required. The Fund's federal income tax returns are subject to examination by the Internal Revenue Service (IRS) for a period of three fiscal years after they are filed. State and local tax returns may be subject to examination for an additional fiscal year depending on the jurisdiction. Foreign taxes are provided for based on the Fund's understanding of the tax rules and rates that exist in the foreign markets in which it invests.
Distributions are declared and recorded on the ex-dividend date. Income and capital gain distributions are declared separately for each class. Income and capital gain distributions are determined in accordance with income tax regulations, which may differ from GAAP. In addition, the Fund claimed a portion of the payment made to redeeming shareholders as a distribution for income tax purposes.
Capital accounts within the financial statements are adjusted for permanent book-tax differences. These adjustments have no impact on net assets or the results of operations. Capital accounts are not adjusted for temporary book-tax differences which will reverse in a subsequent period.
Book-tax differences are primarily due to foreign transactions, partnerships, and passive foreign investment companies (PFIC), defaulted bonds, deferred trustees compensations, and losses deferred due to wash sales.
As of period end, the cost and unrealized appreciation (depreciation) in securities, and derivatives if applicable, for federal income tax purposes were as follows:
| Gross unrealized appreciation | $2,087,703 |
| Gross unrealized depreciation | (419,159) |
| Net unrealized appreciation (depreciation) | $1,668,544 |
| Tax Cost | $6,137,614 |
The tax-based components of distributable earnings as of period end were as follows:
| Undistributed ordinary income | $17,376 |
| Undistributed long-term capital gain | $109,609 |
| Net unrealized appreciation (depreciation) on securities and other investments | $1,668,529 |
The tax character of distributions paid was as follows:
| April 30, 2019 | April 30, 2018 | |
| Ordinary Income | $93,469 | $ 84,614 |
| Long-term Capital Gains | 1,095,657 | 492,598 |
| Total | $1,189,126 | $ 577,212 |
Restricted Securities. The Fund may invest in securities that are subject to legal or contractual restrictions on resale. These securities generally may be resold in transactions exempt from registration or to the public if the securities are registered. Disposal of these securities may involve time-consuming negotiations and expense, and prompt sale at an acceptable price may be difficult. Information regarding restricted securities is included at the end of the Fund's Schedule of Investments.
Consolidated Subsidiary. The Fund invests in certain investments through a wholly-owned subsidiary ("Subsidiary"), which may be subject to federal and state taxes upon disposition.
As of period end, the Fund held an investment of $37,708 in these Subsidiaries, representing .49% of the Fund's net assets. The financial statements have been consolidated and include accounts of the Fund and each Subsidiary. Accordingly, all inter-company transactions and balances have been eliminated.
Any cash held by the Subsidiaries is restricted as to its use and is presented as Restricted cash in the Statement of Assets and Liabilities.
New Rule Issuance. During August 2018, the U.S. Securities and Exchange Commission issued Final Rule Release No. 33-10532, Disclosure Update and Simplification. This Final Rule includes amendments specific to registered investment companies that are intended to eliminate overlap in disclosure requirements between Regulation S-X and GAAP. In accordance with these amendments, certain line-items in the Fund's financial statements have been combined or removed for the current period as outlined in the table below.
| Financial Statement | Current Line-Item Presentation (As Applicable) | Prior Line-Item Presentation (As Applicable) |
| Statement of Assets and Liabilities | Total distributable earnings (loss) | Undistributed/Distributions in excess of/Accumulated net investment income (loss) Accumulated/Undistributed net realized gain (loss) Net unrealized appreciation (depreciation) |
| Statement of Changes in Net Assets | N/A - removed | Undistributed/Distributions in excess of/Accumulated net investment income (loss) end of period |
| Statement of Changes in Net Assets | Distributions to shareholders | Distributions to shareholders from net investment income Distributions to shareholders from net realized gain |
| Distributions to Shareholders Note to Financial Statements | Distributions to shareholders | Distributions to shareholders from net investment income Distributions to shareholders from net realized gain |
4. Purchases and Sales of Investments.
Purchases and sales of securities, other than short-term securities, aggregated $2,085,313 and $2,904,413, respectively.
5. Fees and Other Transactions with Affiliates.
Management Fee. Fidelity Management & Research Company (the investment adviser) and its affiliates provide the Fund with investment management related services for which the Fund pays a monthly management fee. The management fee is the sum of an individual fund fee rate that is based on an annual rate of .30% of the Fund's average net assets and an annualized group fee rate that averaged .24% during the period. The group fee rate is based upon the average net assets of all the mutual funds advised by the investment adviser, including any mutual funds previously advised by the investment adviser that are currently advised by Fidelity SelectCo, LLC, an affiliate of the investment adviser. The group fee rate decreases as assets under management increase and increases as assets under management decrease. In addition, the management fee is subject to a performance adjustment (up to a maximum of +/-.20% of the Fund's average net assets over a 36 month performance period). The upward or downward adjustment to the management fee is based on the relative investment performance of Mid-Cap Stock as compared to its benchmark index, the S&P MidCap 400 Index, over the same 36 month performance period. For the reporting period, the total annual management fee rate, including the performance adjustment, was .50% of the Fund's average net assets. The performance adjustment included in the management fee rate may be higher or lower than the maximum performance adjustment rate due to the difference between the average net assets for the reporting and performance periods.
Transfer Agent Fees. Fidelity Investments Institutional Operations Company, Inc., (FIIOC), an affiliate of the investment adviser, is the transfer, dividend disbursing and shareholder servicing agent for each class of the Fund. FIIOC receives account fees and asset-based fees that vary according to the account size and type of account of the shareholders of Mid-Cap Stock, except for Class K. FIIOC receives an asset-based fee of Class K's average net assets. FIIOC pays for typesetting, printing and mailing of shareholder reports, except proxy statements.
For the period, transfer agent fees for each class were as follows:
| Amount | % of Class-Level Average Net Assets | |
| Mid-Cap Stock | $8,177 | .15 |
| Class K | 1,146 | .05 |
| $9,323 |
Accounting and Security Lending Fees. Fidelity Service Company, Inc. (FSC), an affiliate of the investment adviser, maintains the Fund's accounting records. The accounting fee is based on the level of average net assets for each month. Prior to April 1, 2019, FSC had a separate agreement with the Fund for administration of the security lending program, based on the number and duration of lending transactions. For the period, the total fees paid for accounting and administration of securities lending were equivalent to an annual rate of .02%.
Brokerage Commissions. The Fund placed a portion of its portfolio transactions with brokerage firms which are affiliates of the investment adviser. Brokerage commissions are included in net realized gain (loss) and change in net unrealized appreciation (depreciation) in the Statement of Operations. The commissions paid to these affiliated firms were $89 for the period.
Interfund Trades. The Fund may purchase from or sell securities to other Fidelity Funds under procedures adopted by the Board. The procedures have been designed to ensure these interfund trades are executed in accordance with Rule 17a-7 of the 1940 Act. Interfund trades are included within the respective purchases and sales amounts shown in the Purchases and Sales of Investments note.
Other. During the period, the investment adviser reimbursed the Fund for certain losses in the amount of $12,848.
6. Committed Line of Credit.
The Fund participates with other funds managed by the investment adviser or an affiliate in a $4.25 billion credit facility (the "line of credit") to be utilized for temporary or emergency purposes to fund shareholder redemptions or for other short-term liquidity purposes. The Fund has agreed to pay commitment fees on its pro-rata portion of the line of credit, which amounted to $22 and is reflected in Miscellaneous expenses on the Statement of Operations. During the period, the Fund did not borrow on this line of credit.
7. Security Lending.
The Fund lends portfolio securities through a lending agent from time to time in order to earn additional income. For equity securities, a lending agent is used and may loan securities to certain qualified borrowers, including Fidelity Capital Markets (FCM), a broker-dealer affiliated with the Fund. On the settlement date of the loan, the Fund receives collateral (in the form of U.S. Treasury obligations, letters of credit and/or cash) against the loaned securities and maintains collateral in an amount not less than 100% of the market value of the loaned securities during the period of the loan. The market value of the loaned securities is determined at the close of business of the Fund and any additional required collateral is delivered to the Fund on the next business day. The Fund or borrower may terminate the loan at any time, and if the borrower defaults on its obligation to return the securities loaned because of insolvency or other reasons, the Fund may apply collateral received from the borrower against the obligation. The Fund may experience delays and costs in recovering the securities loaned. Any cash collateral received is invested in the Fidelity Securities Lending Cash Central Fund. The value of loaned securities and cash collateral at period end are disclosed on the Fund's Statement of Assets and Liabilities. The value of securities loaned to FCM at period end was $76. Security lending income represents the income earned on investing cash collateral, less rebates paid to borrowers, plus any premium payments received for lending certain types of securities. Security lending income is presented in the Statement of Operations as a component of income from Fidelity Central Funds. Total security lending income during the period amounted to $499, including $16 from securities loaned to FCM.
8. Expense Reductions.
Commissions paid to certain brokers with whom the investment adviser, or its affiliates, places trades on behalf of the Fund include an amount in addition to trade execution, which may be rebated back to the Fund to offset certain expenses. This amount totaled $344 for the period. Through arrangements with the Fund's custodian, credits realized as a result of certain uninvested cash balances were used to reduce the Fund's expenses by $3.
In addition, during the period the investment adviser reimbursed and/or waived a portion of fund-level operating expenses in the amount of $70.
9. Distributions to Shareholders.
Distributions to shareholders of each class were as follows:
| Year ended April 30, 2019 | Year ended April 30, 2018 | |
| Distributions to shareholders | ||
| Mid-Cap Stock | $805,928 | $– |
| Class K | 383,198 | – |
| Total | $1,189,126 | $– |
| From net investment income | ||
| Mid-Cap Stock | $– | $31,785 |
| Class K | – | 15,700 |
| Total | $– | $47,485 |
| From net realized gain | ||
| Mid-Cap Stock | $– | $375,694 |
| Class K | – | 154,033 |
| Total | $– | $529,727 |
10. Share Transactions.
Share transactions for each class were as follows and may contain automatic conversions between classes or exchanges between affiliated funds:
| Shares | Shares | Dollars | Dollars | |
| Year ended April 30, 2019 | Year ended April 30, 2018 | Year ended April 30, 2019 | Year ended April 30, 2018 | |
| Mid-Cap Stock | ||||
| Shares sold | 9,727 | 9,051 | $346,378 | $343,875 |
| Reinvestment of distributions | 22,487 | 10,324 | 761,032 | 386,371 |
| Shares redeemed | (26,697) | (26,223) | (975,536) | (993,169) |
| Net increase (decrease) | 5,517 | (6,848) | $131,874 | $(262,923) |
| Class K | ||||
| Shares sold | 18,446 | 10,639 | $677,575 | $402,221 |
| Reinvestment of distributions | 11,384 | 4,532 | 383,198 | 169,733 |
| Shares redeemed | (24,667) | (14,271) | (866,758) | (542,924) |
| Net increase (decrease) | 5,163 | 900 | $194,015 | $29,030 |
11. Other.
The Fund's organizational documents provide former and current trustees and officers with a limited indemnification against liabilities arising in connection with the performance of their duties to the Fund. In the normal course of business, the Fund may also enter into contracts that provide general indemnifications. The Fund's maximum exposure under these arrangements is unknown as this would be dependent on future claims that may be made against the Fund. The risk of material loss from such claims is considered remote.
Report of Independent Registered Public Accounting Firm
To the Trustees of Fidelity Concord Street Trust and Shareholders of Fidelity Mid-Cap Stock Fund:
Opinion on the Financial Statements and Financial Highlights
We have audited the accompanying statement of assets and liabilities of Fidelity Mid-Cap Stock Fund (the "Fund"), a fund of Fidelity Concord Street Trust, including the schedule of investments, as of April 30, 2019, the related statement of operations for the year then ended, the statement of changes in net assets for each of the two years in the period then ended, the financial highlights for each of the five years in the period then ended, and the related notes. In our opinion, the financial statements and financial highlights present fairly, in all material respects, the financial position of the Fund as of April 30, 2019, and the results of its operations for the year then ended, the changes in its net assets for each of the two years in the period then ended, and the financial highlights for each of the five years in the period then ended, in conformity with accounting principles generally accepted in the United States of America.
Basis for Opinion
These financial statements and financial highlights are the responsibility of the Fund's management. Our responsibility is to express an opinion on the Fund's financial statements and financial highlights based on our audits. We are a public accounting firm registered with the Public Company Accounting Oversight Board (United States) (PCAOB) and are required to be independent with respect to the Fund in accordance with the U.S. federal securities laws and the applicable rules and regulations of the Securities and Exchange Commission and the PCAOB.
We conducted our audits in accordance with the standards of the PCAOB. Those standards require that we plan and perform the audit to obtain reasonable assurance about whether the financial statements and financial highlights are free of material misstatement, whether due to error or fraud. The Fund is not required to have, nor were we engaged to perform, an audit of its internal control over financial reporting. As part of our audits we are required to obtain an understanding of internal control over financial reporting but not for the purpose of expressing an opinion on the effectiveness of the Fund’s internal control over financial reporting. Accordingly, we express no such opinion.
Our audits included performing procedures to assess the risks of material misstatement of the financial statements and financial highlights, whether due to error or fraud, and performing procedures that respond to those risks. Such procedures included examining, on a test basis, evidence regarding the amounts and disclosures in the financial statements and financial highlights. Our audits also included evaluating the accounting principles used and significant estimates made by management, as well as evaluating the overall presentation of the financial statements and financial highlights. Our procedures included confirmation of securities owned as of April 30, 2019, by correspondence with the custodians and brokers; when replies were not received from brokers, we performed other auditing procedures. We believe that our audits provide a reasonable basis for our opinion.
/s/ Deloitte & Touche LLP
Boston, Massachusetts
June 11, 2019
We have served as the auditor of one or more of the Fidelity investment companies since 1999.
Trustees and Officers
The Trustees, Members of the Advisory Board (if any), and officers of the trust and fund, as applicable, are listed below. The Board of Trustees governs the fund and is responsible for protecting the interests of shareholders. The Trustees are experienced executives who meet periodically throughout the year to oversee the fund's activities, review contractual arrangements with companies that provide services to the fund, oversee management of the risks associated with such activities and contractual arrangements, and review the fund's performance. Except for Jonathan Chiel, each of the Trustees oversees 289 funds. Mr. Chiel oversees 158 funds.
The Trustees hold office without limit in time except that (a) any Trustee may resign; (b) any Trustee may be removed by written instrument, signed by at least two-thirds of the number of Trustees prior to such removal; (c) any Trustee who requests to be retired or who has become incapacitated by illness or injury may be retired by written instrument signed by a majority of the other Trustees; and (d) any Trustee may be removed at any special meeting of shareholders by a two-thirds vote of the outstanding voting securities of the trust. Each Trustee who is not an interested person (as defined in the 1940 Act) of the trust and the fund is referred to herein as an Independent Trustee. Each Independent Trustee shall retire not later than the last day of the calendar year in which his or her 75th birthday occurs. The Independent Trustees may waive this mandatory retirement age policy with respect to individual Trustees. Officers and Advisory Board Members hold office without limit in time, except that any officer or Advisory Board Member may resign or may be removed by a vote of a majority of the Trustees at any regular meeting or any special meeting of the Trustees. Except as indicated, each individual has held the office shown or other offices in the same company for the past five years.
The fund's Statement of Additional Information (SAI) includes more information about the Trustees. To request a free copy, call Fidelity at 1-800-544-8544 if you’re an individual investing directly with Fidelity, call 1-800-835-5092 if you’re a plan sponsor or participant with Fidelity as your recordkeeper or call 1-877-208-0098 on institutional accounts or if you’re an advisor or invest through one.
Experience, Skills, Attributes, and Qualifications of the Trustees. The Governance and Nominating Committee has adopted a statement of policy that describes the experience, qualifications, attributes, and skills that are necessary and desirable for potential Independent Trustee candidates (Statement of Policy). The Board believes that each Trustee satisfied at the time he or she was initially elected or appointed a Trustee, and continues to satisfy, the standards contemplated by the Statement of Policy. The Governance and Nominating Committee also engages professional search firms to help identify potential Independent Trustee candidates who have the experience, qualifications, attributes, and skills consistent with the Statement of Policy. From time to time, additional criteria based on the composition and skills of the current Independent Trustees, as well as experience or skills that may be appropriate in light of future changes to board composition, business conditions, and regulatory or other developments, have also been considered by the professional search firms and the Governance and Nominating Committee. In addition, the Board takes into account the Trustees' commitment and participation in Board and committee meetings, as well as their leadership of standing and ad hoc committees throughout their tenure.
In determining that a particular Trustee was and continues to be qualified to serve as a Trustee, the Board has considered a variety of criteria, none of which, in isolation, was controlling. The Board believes that, collectively, the Trustees have balanced and diverse experience, qualifications, attributes, and skills, which allow the Board to operate effectively in governing the fund and protecting the interests of shareholders. Information about the specific experience, skills, attributes, and qualifications of each Trustee, which in each case led to the Board's conclusion that the Trustee should serve (or continue to serve) as a trustee of the fund, is provided below.
Board Structure and Oversight Function. James C. Curvey is an interested person and currently serves as Chairman. The Trustees have determined that an interested Chairman is appropriate and benefits shareholders because an interested Chairman has a personal and professional stake in the quality and continuity of services provided to the fund. Independent Trustees exercise their informed business judgment to appoint an individual of their choosing to serve as Chairman, regardless of whether the Trustee happens to be independent or a member of management. The Independent Trustees have determined that they can act independently and effectively without having an Independent Trustee serve as Chairman and that a key structural component for assuring that they are in a position to do so is for the Independent Trustees to constitute a substantial majority for the Board. The Independent Trustees also regularly meet in executive session. Ned C. Lautenbach serves as Chairman of the Independent Trustees and as such (i) acts as a liaison between the Independent Trustees and management with respect to matters important to the Independent Trustees and (ii) with management prepares agendas for Board meetings.
Fidelity® funds are overseen by different Boards of Trustees. The fund's Board oversees Fidelity's high income and certain equity funds, and other Boards oversee Fidelity's investment-grade bond, money market, asset allocation, and other equity funds. The asset allocation funds may invest in Fidelity® funds overseen by the fund's Board. The use of separate Boards, each with its own committee structure, allows the Trustees of each group of Fidelity® funds to focus on the unique issues of the funds they oversee, including common research, investment, and operational issues. On occasion, the separate Boards establish joint committees to address issues of overlapping consequences for the Fidelity® funds overseen by each Board.
The Trustees operate using a system of committees to facilitate the timely and efficient consideration of all matters of importance to the Trustees, the fund, and fund shareholders and to facilitate compliance with legal and regulatory requirements and oversight of the fund's activities and associated risks. The Board, acting through its committees, has charged FMR and its affiliates with (i) identifying events or circumstances the occurrence of which could have demonstrably adverse effects on the fund's business and/or reputation; (ii) implementing processes and controls to lessen the possibility that such events or circumstances occur or to mitigate the effects of such events or circumstances if they do occur; and (iii) creating and maintaining a system designed to evaluate continuously business and market conditions in order to facilitate the identification and implementation processes described in (i) and (ii) above. Because the day-to-day operations and activities of the fund are carried out by or through FMR, its affiliates, and other service providers, the fund's exposure to risks is mitigated but not eliminated by the processes overseen by the Trustees. While each of the Board's committees has responsibility for overseeing different aspects of the fund's activities, oversight is exercised primarily through the Operations, Audit, and Compliance Committees. In addition, the Independent Trustees have worked with Fidelity to enhance the Board's oversight of investment and financial risks, legal and regulatory risks, technology risks, and operational risks, including the development of additional risk reporting to the Board. Appropriate personnel, including but not limited to the fund's Chief Compliance Officer (CCO), FMR's internal auditor, the independent accountants, the fund's Treasurer and portfolio management personnel, make periodic reports to the Board's committees, as appropriate, including an annual review of Fidelity's risk management program for the Fidelity® funds. The responsibilities of each standing committee, including their oversight responsibilities, are described further under "Standing Committees of the Trustees."
Interested Trustees*:
Correspondence intended for a Trustee who is an interested person may be sent to Fidelity Investments, 245 Summer Street, Boston, Massachusetts 02210.
Name, Year of Birth; Principal Occupations and Other Relevant Experience+
Jonathan Chiel (1957)
Year of Election or Appointment: 2016
Trustee
Mr. Chiel also serves as Trustee of other Fidelity® funds. Mr. Chiel is Executive Vice President and General Counsel for FMR LLC (diversified financial services company, 2012-present). Previously, Mr. Chiel served as general counsel (2004-2012) and senior vice president and deputy general counsel (2000-2004) for John Hancock Financial Services; a partner with Choate, Hall & Stewart (1996-2000) (law firm); and an Assistant United States Attorney for the United States Attorney’s Office of the District of Massachusetts (1986-95), including Chief of the Criminal Division (1993-1995). Mr. Chiel is a director on the boards of the Boston Bar Foundation and the Maimonides School.
James C. Curvey (1935)
Year of Election or Appointment: 2007
Trustee
Chairman of the Board of Trustees
Mr. Curvey also serves as Trustee of other Fidelity® funds. Mr. Curvey is Vice Chairman (2007-present) and Director of FMR LLC (diversified financial services company). In addition, Mr. Curvey is an Overseer Emeritus for the Boston Symphony Orchestra, a Director of Artis-Naples, and a Trustee of Brewster Academy in Wolfeboro, New Hampshire. Previously, Mr. Curvey served as a Director of Fidelity Research & Analysis Co. (investment adviser firm, 2009-2018), Director of Fidelity Investments Money Management, Inc. (investment adviser firm, 2009-2014) and a Director of FMR and FMR Co., Inc. (investment adviser firms, 2007-2014).
* Determined to be an “Interested Trustee” by virtue of, among other things, his or her affiliation with the trust or various entities under common control with FMR.
+ The information includes the Trustee's principal occupation during the last five years and other information relating to the experience, attributes, and skills relevant to the Trustee's qualifications to serve as a Trustee, which led to the conclusion that the Trustee should serve as a Trustee for the fund.
Independent Trustees:
Correspondence intended for an Independent Trustee may be sent to Fidelity Investments, P.O. Box 55235, Boston, Massachusetts 02205-5235.
Name, Year of Birth; Principal Occupations and Other Relevant Experience+
Dennis J. Dirks (1948)
Year of Election or Appointment: 2005
Trustee
Mr. Dirks also serves as Trustee of other Fidelity® funds. Prior to his retirement in May 2003, Mr. Dirks was Chief Operating Officer and a member of the Board of The Depository Trust & Clearing Corporation (DTCC). He also served as President, Chief Operating Officer, and Board member of The Depository Trust Company (DTC) and President and Board member of the National Securities Clearing Corporation (NSCC). In addition, Mr. Dirks served as Chief Executive Officer and Board member of the Government Securities Clearing Corporation, Chief Executive Officer and Board member of the Mortgage-Backed Securities Clearing Corporation, as a Trustee and a member of the Finance Committee of Manhattan College (2005-2008), as a Trustee and a member of the Finance Committee of AHRC of Nassau County (2006-2008), as a member of the Independent Directors Council (IDC) Governing Council (2010-2015), and as a member of the Board of Directors for The Brookville Center for Children’s Services, Inc. (2009-2017). Mr. Dirks is a member of the Finance Committee (2016-present) and Board of Directors (2017-present) and is Treasurer (2018-present) of the Asolo Repertory Theatre.
Donald F. Donahue (1950)
Year of Election or Appointment: 2018
Trustee
Mr. Donahue also serves as a Trustee of other Fidelity® funds. Mr. Donahue is President and Chief Executive Officer of Miranda Partners, LLC (risk consulting for the financial services industry, 2012-present). Previously, Mr. Donahue served as a Member of the Advisory Board of certain Fidelity® funds (2015-2018) and Chief Executive Officer (2006-2012), Chief Operating Officer (2003-2006), and Managing Director, Customer Marketing and Development (1999-2003) of The Depository Trust & Clearing Corporation (financial markets infrastructure). Mr. Donahue serves as a Member (2007-present) and Co-Chairman (2016-present) of the Board of Directors of United Way of New York, Member of the Board of Directors of NYC Leadership Academy (2012-present) and Member of the Board of Advisors of Ripple Labs, Inc. (financial services, 2015-present). He also served as Chairman (2010-2012) and Member of the Board of Directors (2012-2013) of Omgeo, LLC (financial services), Treasurer of United Way of New York (2012-2016), and Member of the Board of Directors of XBRL US (financial services non-profit, 2009-2012) and the International Securities Services Association (2009-2012).
Alan J. Lacy (1953)
Year of Election or Appointment: 2008
Trustee
Mr. Lacy also serves as Trustee of other Fidelity® funds. Mr. Lacy serves as a Director of Bristol-Myers Squibb Company (global pharmaceuticals, 2008-present). He is a Trustee of the California Chapter of The Nature Conservancy (2015-present) and a Director of the Center for Advanced Study in the Behavioral Sciences at Stanford University (2015-present). In addition, Mr. Lacy served as Senior Adviser (2007-2014) of Oak Hill Capital Partners, L.P. (private equity) and also served as Chief Executive Officer (2005) and Vice Chairman (2005-2006) of Sears Holdings Corporation (retail) and Chief Executive Officer and Chairman of the Board of Sears, Roebuck and Co. (retail, 2000-2005). Previously, Mr. Lacy served as Chairman (2014-2017) and a member (2010-2017) of the Board of Directors of Dave & Buster’s Entertainment, Inc. (restaurant and entertainment complexes), as Chairman (2008-2011) and a member (2006-2015) of the Board of Trustees of the National Parks Conservation Association, and as a member of the Board of Directors for The Hillman Companies, Inc. (hardware wholesalers, 2010-2014), Earth Fare, Inc. (retail grocery, 2010-2014), and The Western Union Company (global money transfer, 2006-2011).
Ned C. Lautenbach (1944)
Year of Election or Appointment: 2000
Trustee
Chairman of the Independent Trustees
Mr. Lautenbach also serves as Trustee of other Fidelity® funds. Mr. Lautenbach currently serves as Chair (2018-present) and Member (2013-present) of the Board of Governors, State University System of Florida and is a member of the Council on Foreign Relations (1994-present). He is also a member and has most recently served as Chairman of the Board of Directors of Artis-Naples (2012-present). Previously, Mr. Lautenbach served as a member and then Lead Director of the Board of Directors of Eaton Corporation (diversified industrial, 1997-2016). He was also a Partner and Advisory Partner at Clayton, Dubilier & Rice, LLC (private equity investment, 1998-2010), as well as a Director of Sony Corporation (2006-2007). In addition, Mr. Lautenbach also had a 30-year career with IBM (technology company) during which time he served as Senior Vice President and a member of the Corporate Executive Committee (1968-1998).
Joseph Mauriello (1944)
Year of Election or Appointment: 2008
Trustee
Mr. Mauriello also serves as Trustee of other Fidelity® funds. Prior to his retirement in January 2006, Mr. Mauriello served in numerous senior management positions including Deputy Chairman and Chief Operating Officer (2004-2005), and Vice Chairman of Financial Services (2002-2004) of KPMG LLP US (professional services, 1965-2005). Mr. Mauriello currently serves as a member of the Independent Directors Council (IDC) Governing Council (2015-present). Previously, Mr. Mauriello served as a member of the Board of Directors of XL Group plc. (global insurance and re-insurance, 2006-2018).
Cornelia M. Small (1944)
Year of Election or Appointment: 2005
Trustee
Ms. Small also serves as Trustee of other Fidelity® funds. Ms. Small is a member of the Board of Directors (2009-present) and Chair of the Investment Committee (2010-present) of the Teagle Foundation. Ms. Small also serves on the Investment Committee of the Berkshire Taconic Community Foundation (2008-present). Previously, Ms. Small served as Chairperson (2002-2008) and a member of the Investment Committee and Chairperson (2008-2012) and a member of the Board of Trustees of Smith College. In addition, Ms. Small served as Chief Investment Officer, Director of Global Equity Investments, and a member of the Board of Directors of Scudder, Stevens & Clark and Scudder Kemper Investments.
Garnett A. Smith (1947)
Year of Election or Appointment: 2018
Trustee
Mr. Smith also serves as Trustee of other Fidelity® funds. Prior to Mr. Smith's retirement, he served as Chairman and Chief Executive Officer of Inbrand Corp. (manufacturer of personal absorbent products, 1990-1997). He also served as President (1986-1990) of Inbrand Corp. Prior to his employment with Inbrand Corp., he was employed by a retail fabric chain and North Carolina National Bank. In addition, Mr. Smith served as a Member of the Advisory Board of certain Fidelity® funds (2012-2013) and as a board member of the Jackson Hole Land Trust (2009-2012).
David M. Thomas (1949)
Year of Election or Appointment: 2008
Trustee
Mr. Thomas also serves as Trustee of other Fidelity® funds. Mr. Thomas serves as Non-Executive Chairman of the Board of Directors of Fortune Brands Home and Security (home and security products, 2011-present) and as a member of the Board of Directors (2004-present) and Presiding Director (2013-present) of Interpublic Group of Companies, Inc. (marketing communication). Previously, Mr. Thomas served as Executive Chairman (2005-2006) and Chairman and Chief Executive Officer (2000-2005) of IMS Health, Inc. (pharmaceutical and healthcare information solutions), a Director of Fortune Brands, Inc. (consumer products, 2000-2011), and a member of the Board of Trustees of the University of Florida (2013-2018).
+ The information includes the Trustee's principal occupation during the last five years and other information relating to the experience, attributes, and skills relevant to the Trustee's qualifications to serve as a Trustee, which led to the conclusion that the Trustee should serve as a Trustee for the fund.
Advisory Board Members and Officers:
Correspondence intended for a Member of the Advisory Board (if any) may be sent to Fidelity Investments, P.O. Box 55235, Boston, Massachusetts 02205-5235. Correspondence intended for an officer or Peter S. Lynch may be sent to Fidelity Investments, 245 Summer Street, Boston, Massachusetts 02210. Officers appear below in alphabetical order.
Name, Year of Birth; Principal Occupation
Vicki L. Fuller (1957)
Year of Election or Appointment: 2018
Member of the Advisory Board
Ms. Fuller also serves as Member of the Advisory Board of other Fidelity® funds. Ms. Fuller serves as a member of the Board of Directors, Audit Committee, and Nominating and Governance Committee of The Williams Companies, Inc. (natural gas infrastructure, 2018-present). Previously, Ms. Fuller served as the Chief Investment Officer of the New York State Common Retirement Fund (2012-2018) and held a variety of positions at AllianceBernstein L.P. (global asset management, 1985-2012), including Managing Director (2006-2012) and Senior Vice President and Senior Portfolio Manager (2001-2006).
Peter S. Lynch (1944)
Year of Election or Appointment: 2003
Member of the Advisory Board
Mr. Lynch also serves as Member of the Advisory Board of other Fidelity® funds. Mr. Lynch is Vice Chairman and a Director of FMR (investment adviser firm) and FMR Co., Inc. (investment adviser firm). In addition, Mr. Lynch serves as a Trustee of Boston College and as the Chairman of the Inner-City Scholarship Fund. Previously, Mr. Lynch served on the Special Olympics International Board of Directors (1997-2006).
Carol B. Tomé (1957)
Year of Election or Appointment: 2018
Member of the Advisory Board
Ms. Tomé also serves as Member of the Advisory Board of other Fidelity® funds. Ms. Tomé is Chief Financial Officer (2001-present) and Executive Vice President of Corporate Services (2007-present) of The Home Depot, Inc. (home improvement retailer) and a Director (2003-present) and Chair of the Audit Committee (2004-present) of United Parcel Service, Inc. (package delivery and supply chain management). Previously, Ms. Tomé served as Trustee of certain Fidelity® funds (2017), Senior Vice President of Finance and Accounting/Treasurer (2000-2007) and Vice President and Treasurer (1995-2000) of The Home Depot, Inc. and Chair of the Board (2010-2012), Vice Chair of the Board (2009 and 2013), and a Director (2008-2013) of the Federal Reserve Bank of Atlanta. Ms. Tomé is also a director or trustee of many community and professional organizations.
Michael E. Wiley (1950)
Year of Election or Appointment: 2018
Member of the Advisory Board
Mr. Wiley also serves as Trustee or Member of the Advisory Board of other Fidelity® funds. Mr. Wiley serves as a Director of High Point Resources (exploration and production, 2005-present). Previously, Mr. Wiley served as a Director of Andeavor Corporation (independent oil refiner and marketer, 2005-2018), a Director of Andeavor Logistics LP (natural resources logistics, 2015-2018), a Director of Post Oak Bank (privately-held bank, 2004-2018), a Director of Asia Pacific Exploration Consolidated (international oil and gas exploration and production, 2008-2013), a member of the Board of Trustees of the University of Tulsa (2000-2006; 2007-2010), a Senior Energy Advisor of Katzenbach Partners, LLC (consulting, 2006-2007), an Advisory Director of Riverstone Holdings (private investment), a Director of Spinnaker Exploration Company (exploration and production, 2001-2005) and Chairman, President, and CEO of Baker Hughes, Inc. (oilfield services, 2000-2004).
Elizabeth Paige Baumann (1968)
Year of Election or Appointment: 2017
Anti-Money Laundering (AML) Officer
Ms. Baumann also serves as AML Officer of other funds. She is Chief AML Officer (2012-present) and Senior Vice President (2014-present) of FMR LLC (diversified financial services company) and is an employee of Fidelity Investments. Previously, Ms. Baumann served as AML Officer of the funds (2012-2016), and Vice President (2007-2014) and Deputy Anti-Money Laundering Officer (2007-2012) of FMR LLC.
Craig S. Brown (1977)
Year of Election or Appointment: 2019
Assistant Treasurer
Mr. Brown also serves as Assistant Treasurer of other funds. Mr. Brown is an employee of Fidelity Investments (2013-present).
John J. Burke III (1964)
Year of Election or Appointment: 2018
Chief Financial Officer
Mr. Burke also serves as Chief Financial Officer of other funds. Mr. Burke serves as Head of Investment Operations for Fidelity Fund and Investment Operations (2018-present) and is an employee of Fidelity Investments (1998-present). Previously Mr. Burke served as head of Asset Management Investment Operations (2012-2018).
William C. Coffey (1969)
Year of Election or Appointment: 2018
Secretary and Chief Legal Officer (CLO)
Mr. Coffey also serves as Secretary and CLO of other funds. Mr. Coffey serves as CLO, Secretary, and Senior Vice President of Fidelity Management & Research Company and FMR Co., Inc. (investment adviser firms, 2018-present); Secretary of Fidelity SelectCo, LLC and Fidelity Investments Money Management, Inc. (investment adviser firms, 2018-present); and CLO of Fidelity Management & Research (Hong Kong) Limited, FMR Investment Management (UK) Limited, and Fidelity Management & Research (Japan) Limited (investment adviser firms, 2018-present). He is Senior Vice President and Deputy General Counsel of FMR LLC (diversified financial services company, 2010-present), and is an employee of Fidelity Investments. Previously, Mr. Coffey served as Assistant Secretary of certain funds (2009-2018) and as Vice President and Associate General Counsel of FMR LLC (2005-2009).
Timothy M. Cohen (1969)
Year of Election or Appointment: 2018
Vice President
Mr. Cohen also serves as Vice President of other funds. Mr. Cohen serves as Executive Vice President of Fidelity SelectCo, LLC (2019-present), Co-Head of Equity (2018-present), a Director of Fidelity Management & Research (Japan) Limited (investment adviser firm, 2016-present), and is an employee of Fidelity Investments. Previously, Mr. Cohen served as Head of Global Equity Research (2016-2018), Chief Investment Officer - Equity and a Director of Fidelity Management & Research (U.K.) Inc. (investment adviser firm, 2013-2015) and as a Director of Fidelity Management & Research (Hong Kong) Limited (investment adviser firm, 2017).
Jonathan Davis (1968)
Year of Election or Appointment: 2010
Assistant Treasurer
Mr. Davis also serves as Assistant Treasurer of other funds. Mr. Davis serves as Assistant Treasurer of FMR Capital, Inc. (2017-present) and is an employee of Fidelity Investments. Previously, Mr. Davis served as Vice President and Associate General Counsel of FMR LLC (diversified financial services company, 2003-2010).
Adrien E. Deberghes (1967)
Year of Election or Appointment: 2016
Assistant Treasurer
Mr. Deberghes also serves as an officer of other funds. He serves as Assistant Treasurer of FMR Capital, Inc. (2017-present), Executive Vice President of Fidelity Investments Money Management, Inc. (FIMM) (investment adviser firm, 2016-present), and is an employee of Fidelity Investments (2008-present). Previously, Mr. Deberghes served as President and Treasurer of certain Fidelity® funds (2013-2018). Prior to joining Fidelity Investments, Mr. Deberghes was Senior Vice President of Mutual Fund Administration at State Street Corporation (2007-2008), Senior Director of Mutual Fund Administration at Investors Bank & Trust (2005-2007), and Director of Finance for Dunkin' Brands (2000-2005). Previously, Mr. Deberghes served in other fund officer roles.
Laura M. Del Prato (1964)
Year of Election or Appointment: 2018
Assistant Treasurer
Ms. Del Prato also serves as an officer of other funds. Ms. Del Prato is an employee of Fidelity Investments (2017-present). Prior to joining Fidelity Investments, Ms. Del Prato served as a Managing Director and Treasurer of the JPMorgan Mutual Funds (2014-2017). Prior to JPMorgan, Ms. Del Prato served as a partner at Cohen Fund Audit Services (accounting firm, 2012-2013) and KPMG LLP (accounting firm, 2004-2012).
Colm A. Hogan (1973)
Year of Election or Appointment: 2016
Deputy Treasurer
Mr. Hogan also serves as an officer of other funds. Mr. Hogan serves as Assistant Treasurer of FMR Capital, Inc. (2017-present) and is an employee of Fidelity Investments (2005-present). Previously, Mr. Hogan served as Assistant Treasurer of certain Fidelity® funds (2016-2018).
Pamela R. Holding (1964)
Year of Election or Appointment: 2018
Vice President
Ms. Holding also serves as Vice President of other funds. Ms. Holding serves as Executive Vice President of Fidelity SelectCo, LLC (2019-present), Co-Head of Equity (2018-present) and is an employee of Fidelity Investments (2013-present). Previously, Ms. Holding served as Chief Investment Officer of Fidelity Institutional Asset Management (2013-2018).
Chris Maher (1972)
Year of Election or Appointment: 2013
Assistant Treasurer
Mr. Maher serves as Assistant Treasurer of other funds. Mr. Maher is Vice President of Valuation Oversight, serves as Assistant Treasurer of FMR Capital, Inc. (2017-present), and is an employee of Fidelity Investments. Previously, Mr. Maher served as Vice President of Asset Management Compliance (2013), Vice President of the Program Management Group of FMR (investment adviser firm, 2010-2013), and Vice President of Valuation Oversight (2008-2010).
Kenneth B. Robins (1969)
Year of Election or Appointment: 2016
Chief Compliance Officer
Mr. Robins also serves as an officer of other funds. Mr. Robins serves as Compliance Officer of Fidelity Management & Research Company and FMR Co., Inc. (investment adviser firms, 2016-present) and is an employee of Fidelity Investments (2004-present). Previously, Mr. Robins served as Executive Vice President of Fidelity Investments Money Management, Inc. (investment adviser firm, 2013-2016) and served in other fund officer roles.
Stacie M. Smith (1974)
Year of Election or Appointment: 2016
President and Treasurer
Ms. Smith also serves as an officer of other funds. Ms. Smith serves as Assistant Treasurer of FMR Capital, Inc. (2017-present), is an employee of Fidelity Investments (2009-present), and has served in other fund officer roles. Prior to joining Fidelity Investments, Ms. Smith served as Senior Audit Manager of Ernst & Young LLP (accounting firm, 1996-2009). Previously, Ms. Smith served as Assistant Treasurer (2013-2018) and Deputy Treasurer (2013-2016) of certain Fidelity® funds.
Marc L. Spector (1972)
Year of Election or Appointment: 2016
Assistant Treasurer
Mr. Spector also serves as an officer of other funds. Mr. Spector serves as Assistant Treasurer of FMR Capital, Inc. (2017-present) and is an employee of Fidelity Investments (2016-present). Prior to joining Fidelity Investments, Mr. Spector served as Director at the Siegfried Group (accounting firm, 2013-2016), and prior to Siegfried Group as audit senior manager at Deloitte & Touche (accounting firm, 2005-2013).
Jim Wegmann (1979)
Year of Election or Appointment: 2019
Assistant Treasurer
Mr. Wegmann also serves as Assistant Treasurer of other funds. Mr. Wegmann is an employee of Fidelity Investments (2011-present).
Shareholder Expense Example
As a shareholder of the Fund, you incur two types of costs: (1) transaction costs, and (2) ongoing costs, including management fees and other Fund expenses. This Example is intended to help you understand your ongoing costs (in dollars) of investing in the Fund and to compare these costs with the ongoing costs of investing in other mutual funds.
The Example is based on an investment of $1,000 invested at the beginning of the period and held for the entire period (November 1, 2018 to April 30, 2019).
Actual Expenses
The first line of the accompanying table for each class of the Fund provides information about actual account values and actual expenses. You may use the information in this line, together with the amount you invested, to estimate the expenses that you paid over the period. Simply divide your account value by $1,000.00 (for example, an $8,600 account value divided by $1,000.00 = 8.6), then multiply the result by the number in the first line for a class of the Fund under the heading entitled "Expenses Paid During Period" to estimate the expenses you paid on your account during this period. In addition, the Fund, as a shareholder in the underlying Fidelity Central Funds, will indirectly bear its pro-rata share of the fees and expenses incurred by the underlying Fidelity Central Funds. These fees and expenses are not included in the Fund's annualized expense ratio used to calculate the expense estimate in the table below.
Hypothetical Example for Comparison Purposes
The second line of the accompanying table for each class of the Fund provides information about hypothetical account values and hypothetical expenses based on a Class' actual expense ratio and an assumed rate of return of 5% per year before expenses, which is not the Class' actual return. The hypothetical account values and expenses may not be used to estimate the actual ending account balance or expenses you paid for the period. You may use this information to compare the ongoing costs of investing in the Fund and other funds. To do so, compare this 5% hypothetical example with the 5% hypothetical examples that appear in the shareholder reports of the other funds. In addition, the Fund, as a shareholder in the underlying Fidelity Central Funds, will indirectly bear its pro-rata share of the fees and expenses incurred by the underlying Fidelity Central Funds. These fees and expenses are not included in the Fund's annualized expense ratio used to calculate the expense estimate in the table below.
Please note that the expenses shown in the table are meant to highlight your ongoing costs only and do not reflect any transaction costs. Therefore, the second line of the table is useful in comparing ongoing costs only, and will not help you determine the relative total costs of owning different funds.
| Annualized Expense Ratio-A | Beginning Account Value November 1, 2018 | Ending Account Value April 30, 2019 | Expenses Paid During Period-B November 1, 2018 to April 30, 2019 | |
| Mid-Cap Stock | .73% | |||
| Actual | $1,000.00 | $1,075.00 | $3.76 | |
| Hypothetical-C | $1,000.00 | $1,021.17 | $3.66 | |
| Class K | .62% | |||
| Actual | $1,000.00 | $1,075.20 | $3.19 | |
| Hypothetical-C | $1,000.00 | $1,021.72 | $3.11 |
A Annualized expense ratio reflects expenses net of applicable fee waivers.
B Expenses are equal to each Class' annualized expense ratio, multiplied by the average account value over the period, multiplied by 181/365 (to reflect the one-half year period).
C 5% return per year before expenses
Distributions (Unaudited)
The Board of Trustees of Fidelity Mid-Cap Stock Fund voted to pay to shareholders of record at the opening of business on record date, the following distributions per share derived from capital gains realized from sales of portfolio securities, and dividends derived from net investment income:
| Pay Date | Record Date | Dividends | Capital Gains | |
| Fidelity Mid-Cap Stock Fund | ||||
| Mid-Cap Stock Fund | 06/10/19 | 06/07/19 | $0.079 | $0.507 |
| Class K | 06/10/19 | 06/07/19 | $0.091 | $0.507 |
The fund hereby designates as a capital gain dividend with respect to the taxable year ended April 30, 2019, $912,468,538, or, if subsequently determined to be different, the net capital gain of such year.
Mid-Cap Stock Fund designates 81% and 82%; Class K designates 75% and 75%; of the dividends distributed in June and December, respectively during the fiscal year as qualifying for the dividends–received deduction for corporate shareholders.
Mid-Cap Stock Fund designates 100% and 100%; Class K designates 100% and 94%; of the dividends distributed in June and December, respectively during the fiscal year as amounts which may be taken into account as a dividend for purposes of the maximum rate under section 1(h)(11) of the Internal Revenue Code.
The fund will notify shareholders in January 2020 of amounts for use in preparing 2019 income tax returns.
Board Approval of Investment Advisory Contracts and Management Fees
Fidelity Mid-Cap Stock Fund
Each year, the Board of Trustees, including the Independent Trustees (together, the Board), votes on the renewal of the management contract with Fidelity Management & Research Company (FMR) and the sub-advisory agreements (together, the Advisory Contracts) for the fund. FMR and the sub-advisers are referred to herein as the Investment Advisers. The Board, assisted by the advice of fund counsel and Independent Trustees' counsel, requests and considers a broad range of information relevant to the renewal of the Advisory Contracts throughout the year.
The Board meets regularly and, at each of its meetings, covers an extensive agenda of topics and materials and considers factors that are relevant to its annual consideration of the renewal of the fund's Advisory Contracts, including the services and support provided to the fund and its shareholders. The Board has established various standing committees (Committees), each composed of and chaired by Independent Trustees with varying backgrounds, to which the Board has assigned specific subject matter responsibilities in order to enhance effective decision-making by the Board. The Board, acting directly and through its Committees, requests and receives information concerning the annual consideration of the renewal of the fund's Advisory Contracts. The Board also meets as needed to review matters specifically related to the Board's annual consideration of the renewal of the Advisory Contracts. Members of the Board may also meet with trustees of other Fidelity funds through joint ad hoc committees to discuss certain matters relevant to all of the Fidelity funds.
At its January 2019 meeting, the Board unanimously determined to renew the fund's Advisory Contracts. In reaching its determination, the Board considered all factors it believed relevant, including (i) the nature, extent, and quality of the services to be provided to the fund and its shareholders (including the investment performance of the fund); (ii) the competitiveness of the fund's management fee and total expense ratio relative to peer funds; (iii) the total costs of the services to be provided by and the profits to be realized by Fidelity from its relationships with the fund; and (iv) the extent to which, if any, economies of scale exist and would be realized as the fund grows, and whether any economies of scale are appropriately shared with fund shareholders.
In considering whether to renew the Advisory Contracts for the fund, the Board reached a determination, with the assistance of fund counsel and Independent Trustees' counsel and through the exercise of its business judgment, that the renewal of the Advisory Contracts was in the best interests of the fund and its shareholders and that the compensation payable under the Advisory Contracts was fair and reasonable. The Board's decision to renew the Advisory Contracts was not based on any single factor, but rather was based on a comprehensive consideration of all the information provided to the Board at its meetings throughout the year. The Board, in reaching its determination to renew the Advisory Contracts, was aware that shareholders of the fund have a broad range of investment choices available to them, including a wide choice among funds offered by Fidelity's competitors, and that the fund's shareholders, who have the opportunity to review and weigh the disclosure provided by the fund in its prospectus and other public disclosures, have chosen to invest in this fund, which is part of the Fidelity family of funds.
Nature, Extent, and Quality of Services Provided. The Board considered Fidelity's staffing as it relates to the fund, including the backgrounds of investment personnel of Fidelity, and also considered the fund's investment objective, strategies, and related investment philosophy. The Independent Trustees also had discussions with senior management of Fidelity's investment operations and investment groups. The Board considered the structure of the investment personnel compensation program and whether this structure provides appropriate incentives to act in the best interests of the fund. Additionally, the Board considered the portfolio managers' investments, if any, in the funds that they manage.Resources Dedicated to Investment Management and Support Services. The Board and the Fund Oversight and Research Committees reviewed the general qualifications and capabilities of Fidelity's investment staff, including its size, education, experience, and resources, as well as Fidelity's approach to recruiting, training, managing, and compensating investment personnel. The Board noted that Fidelity has continued to increase the resources devoted to non-U.S. offices, including expansion of Fidelity's global investment organization. The Board also noted that Fidelity's analysts have extensive resources, tools and capabilities that allow them to conduct sophisticated quantitative and fundamental analysis, as well as credit analysis of issuers, counterparties and guarantors. Further, the Board considered that Fidelity's investment professionals have sufficient access to global information and data so as to provide competitive investment results over time, and that those professionals also have access to sophisticated tools that permit them to assess portfolio construction and risk and performance attribution characteristics continuously, as well as to transmit new information and research conclusions rapidly around the world. Additionally, in its deliberations, the Board considered Fidelity's trading, risk management, compliance, and technology and operations capabilities and resources, which are integral parts of the investment management process.Shareholder and Administrative Services. The Board considered (i) the nature, extent, quality, and cost of advisory, administrative, and shareholder services performed by the Investment Advisers and their affiliates under the Advisory Contracts and under separate agreements covering transfer agency, pricing and bookkeeping, and securities lending services for the fund; (ii) the nature and extent of the supervision of third party service providers, principally custodians, subcustodians, and pricing vendors; and (iii) the resources devoted to, and the record of compliance with, the fund's compliance policies and procedures. The Board also reviewed the allocation of fund brokerage, including allocations to brokers affiliated with the Investment Advisers, the use of brokerage commissions to pay fund expenses, and the use of "soft" commission dollars to pay for research services.The Board noted that the growth of fund assets over time across the complex allows Fidelity to reinvest in the development of services designed to enhance the value and convenience of the Fidelity funds as investment vehicles. These services include 24-hour access to account information and market information through telephone representatives and over the Internet, investor education materials and asset allocation tools, and the expanded availability of Fidelity Investor Centers.The Board noted that it and the boards of certain other Fidelity funds had formed an ad hoc Committee on Transfer Agency Fees to review the variety of transfer agency fee structures throughout the industry and Fidelity's competitive positioning with respect to industry participants.Investment in a Large Fund Family. The Board considered the benefits to shareholders of investing in a Fidelity fund, including the benefits of investing in a fund that is part of a large family of funds offering a variety of investment disciplines and providing a large variety of mutual fund investor services. The Board noted that Fidelity had taken, or had made recommendations that resulted in the Fidelity funds taking, a number of actions over the previous year that benefited particular funds, including: (i) continuing to dedicate additional resources to Fidelity's investment research process, which includes meetings with management of issuers of securities in which the funds invest, and to the support of the senior management team that oversees asset management; (ii) continuing efforts to enhance Fidelity's global research capabilities; (iii) launching new funds and making other enhancements to meet client needs; (iv) launching new share classes of existing funds; (v) eliminating purchase minimums and broadening eligibility requirements for certain funds and share classes; (vi) reducing management fees and total expenses for certain growth equity funds and index funds; (vii) lowering expense caps for certain existing funds and classes, and converting certain voluntary expense caps to contractual caps, to reduce expenses borne by shareholders; (viii) eliminating short-term redemption fees for funds that had such fees; (ix) rationalizing product lines and gaining increased efficiencies from fund mergers and share class consolidations; (x) continuing to develop, acquire and implement systems and technology to improve services to the funds and shareholders, strengthen information security, and increase efficiency; and (xi) continuing to implement enhancements to further strengthen Fidelity's product line to increase investors' probability of success in achieving their investment goals, including retirement income goals.Investment Performance. The Board considered whether the fund has operated in accordance with its investment objective, as well as its record of compliance with its investment restrictions and its performance history. The Board noted that there was a portfolio management change for the fund in June 2017. The Board will continue to monitor closely the fund's performance, taking into account the portfolio manager change.The Board took into account discussions that occur at Board meetings throughout the year with representatives of the Investment Advisers about fund investment performance. In this regard the Board noted that as part of regularly scheduled fund reviews and other reports to the Board on fund performance, the Board considers annualized return information for the fund for different time periods, measured against an appropriate securities market index ("benchmark index") and a peer group of funds with similar objectives ("peer group"), if any. In its evaluation of fund investment performance, the Board gave particular attention to information indicating changes in performance of certain Fidelity funds for specific time periods and discussed with the Investment Advisers the reasons for any overperformance or underperformance.In addition to reviewing absolute and relative fund performance, the Independent Trustees periodically consider the appropriateness of fund performance metrics in evaluating the results achieved. In general, the Independent Trustees believe that fund performance should be evaluated based on net performance (after fees and expenses) of both the highest performing and lowest performing fund share classes, where applicable, compared to appropriate benchmark indices, over appropriate time periods that may include full market cycles, and compared to peer groups, as applicable, over the same periods, taking into account relevant factors including the following: general market conditions; issuer-specific information; and fund cash flows and other factors.The Independent Trustees recognize that shareholders evaluate performance on a net basis over their own holding periods, for which one-, three-, and five-year periods are often used as a proxy. For this reason, the performance information reviewed by the Board also included net cumulative total return information for the fund and an appropriate benchmark index and peer group for the most recent one-, three-, and five-year periods ended June 30, 2018, as shown below. Returns are shown compared to the 25th percentile (top of box, 75% beaten) and 75th percentile (bottom of box, 25% beaten) of the peer universe.Fidelity Mid-Cap Stock Fund
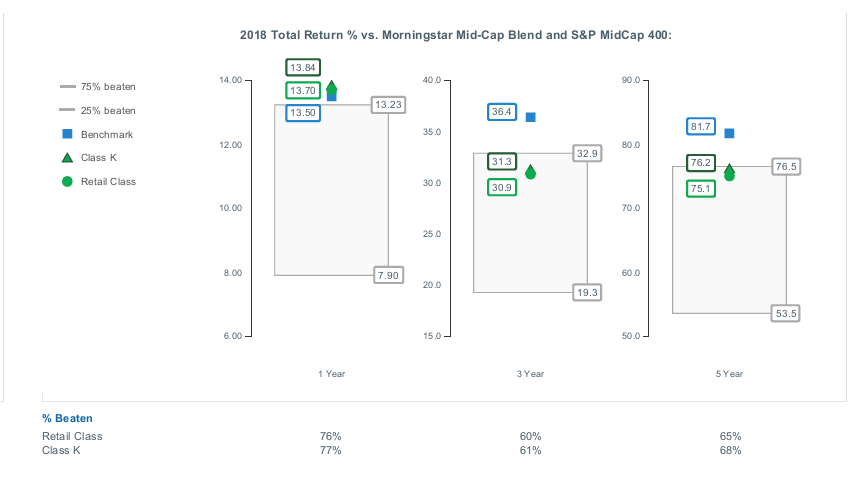
Fidelity Mid-Cap Stock Fund
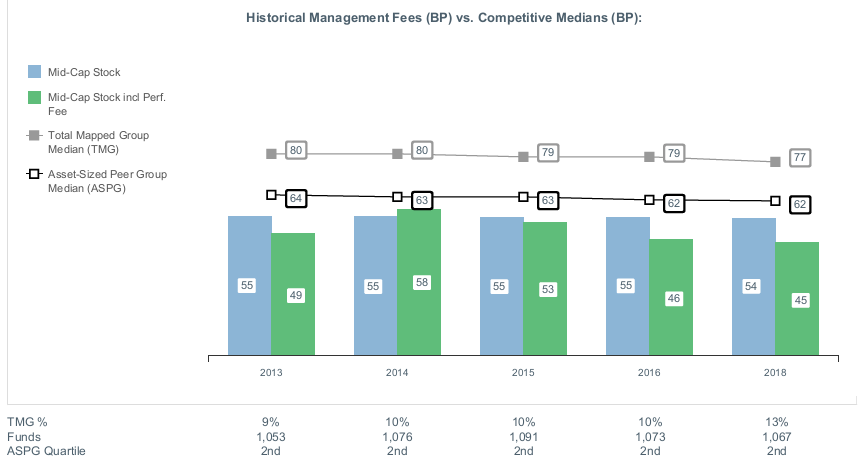
![]()
MCS-ANN-0619
1.703594.121
Fidelity® Large Cap Stock Fund Annual Report April 30, 2019 |
|
Beginning on January 1, 2021, as permitted by regulations adopted by the Securities and Exchange Commission, paper copies of a fund’s shareholder reports will no longer be sent by mail, unless you specifically request paper copies of the reports from the fund or from your financial intermediary, such as a financial advisor, broker-dealer or bank. Instead, the reports will be made available on a website, and you will be notified by mail each time a report is posted and provided with a website link to access the report.
If you already elected to receive shareholder reports electronically, you will not be affected by this change and you need not take any action. You may elect to receive shareholder reports and other communications from a fund electronically, by contacting your financial intermediary. For Fidelity customers, visit Fidelity's web site or call Fidelity using the contact information listed below.
You may elect to receive all future reports in paper free of charge. If you wish to continue receiving paper copies of your shareholder reports, you may contact your financial intermediary or, if you are a Fidelity customer, visit Fidelity’s website, or call Fidelity at the applicable toll-free number listed below. Your election to receive reports in paper will apply to all funds held with the fund complex/your financial intermediary.
| Account Type | Website | Phone Number |
| Brokerage, Mutual Fund, or Annuity Contracts: | fidelity.com/mailpreferences | 1-800-343-3548 |
| Employer Provided Retirement Accounts: | netbenefits.fidelity.com/preferences (choose 'no' under Required Disclosures to continue to print) | 1-800-343-0860 |
| Advisor Sold Accounts Serviced Through Your Financial Intermediary: | Contact Your Financial Intermediary | Your Financial Intermediary's phone number |
| Advisor Sold Accounts Serviced by Fidelity: | institutional.fidelity.com | 1-877-208-0098 |
Contents
Board Approval of Investment Advisory Contracts and Management Fees |
To view a fund's proxy voting guidelines and proxy voting record for the 12-month period ended June 30, visit http://www.fidelity.com/proxyvotingresults or visit the Securities and Exchange Commission's (SEC) web site at http://www.sec.gov.
You may also call 1-800-544-8544 to request a free copy of the proxy voting guidelines.
Standard & Poor's, S&P and S&P 500 are registered service marks of The McGraw-Hill Companies, Inc. and have been licensed for use by Fidelity Distributors Corporation.
Other third-party marks appearing herein are the property of their respective owners.
All other marks appearing herein are registered or unregistered trademarks or service marks of FMR LLC or an affiliated company. © 2019 FMR LLC. All rights reserved.
This report and the financial statements contained herein are submitted for the general information of the shareholders of the Fund. This report is not authorized for distribution to prospective investors in the Fund unless preceded or accompanied by an effective prospectus.
A fund files its complete schedule of portfolio holdings with the SEC for the first and third quarters of each fiscal year on Form N-PORT. Forms N-PORT are available on the SEC’s web site at http://www.sec.gov. A fund's Forms N-PORT may be reviewed and copied at the SEC’s Public Reference Room in Washington, DC. Information regarding the operation of the SEC's Public Reference Room may be obtained by calling 1-800-SEC-0330.
For a complete list of a fund's portfolio holdings, view the most recent holdings listing, semiannual report, or annual report on Fidelity's web site at http://www.fidelity.com, http://www.institutional.fidelity.com, or http://www.401k.com, as applicable.
NOT FDIC INSURED •MAY LOSE VALUE •NO BANK GUARANTEE
Neither the Fund nor Fidelity Distributors Corporation is a bank.
Performance: The Bottom Line
Average annual total return reflects the change in the value of an investment, assuming reinvestment of distributions from dividend income and capital gains (the profits earned upon the sale of securities that have grown in value, if any) and assuming a constant rate of performance each year. The hypothetical investment and the average annual total returns do not reflect the deduction of taxes that a shareholder would pay on fund distributions or the redemption of fund shares. During periods of reimbursement by Fidelity, a fund’s total return will be greater than it would be had the reimbursement not occurred. How a fund did yesterday is no guarantee of how it will do tomorrow.
Average Annual Total Returns
| For the periods ended April 30, 2019 | Past 1 year | Past 5 years | Past 10 years |
| Fidelity® Large Cap Stock Fund | 9.57% | 9.30% | 15.53% |
$10,000 Over 10 Years
Let's say hypothetically that $10,000 was invested in Fidelity® Large Cap Stock Fund on April 30, 2009.
The chart shows how the value of your investment would have changed, and also shows how the S&P 500® Index performed over the same period.
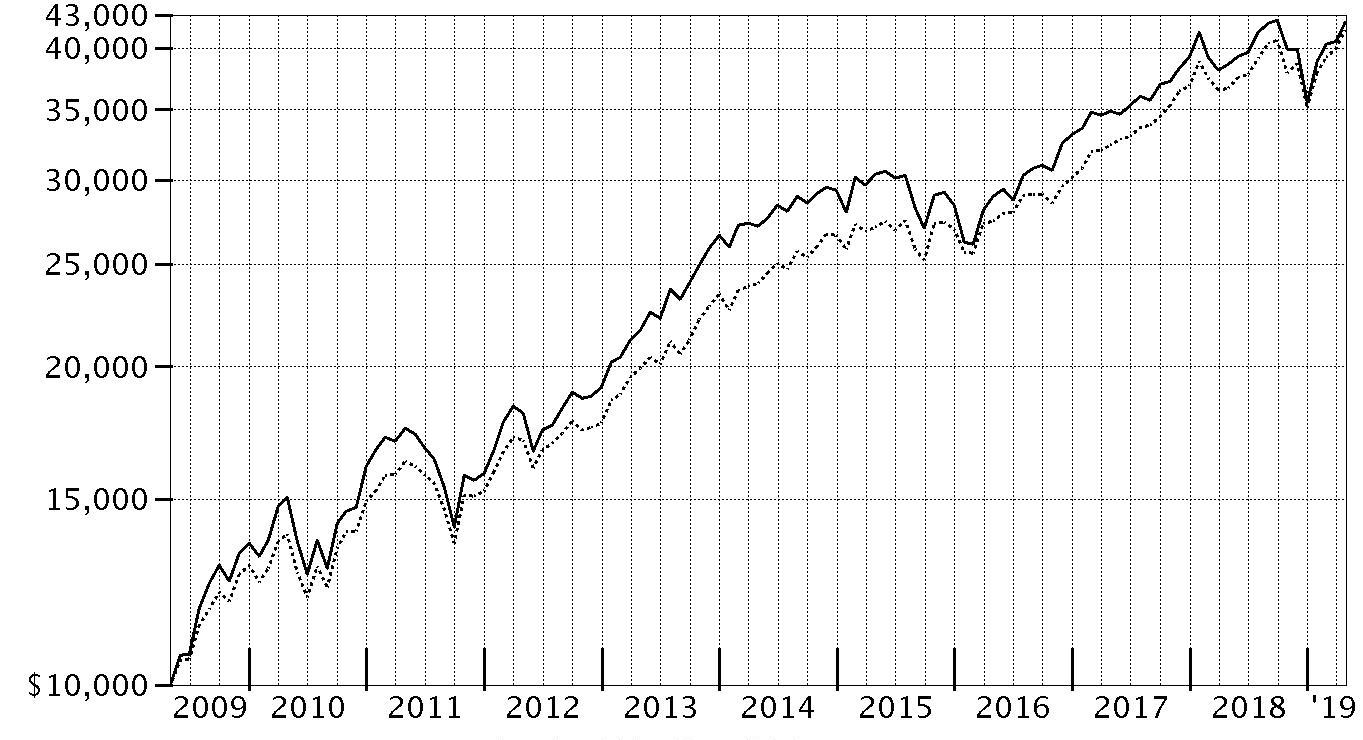
| Period Ending Values | ||
| $42,366 | Fidelity® Large Cap Stock Fund | |
| $41,602 | S&P 500® Index | |
Management's Discussion of Fund Performance
Market Recap: The S&P 500® index gained 13.49% for the 12 months ending April 30, 2019, as U.S. equities began the new year on a high note after enduring an historically volatile final quarter of 2018. The index rose 18.25% year to date, its strongest four-month opening since 1987, amid upbeat company earnings/outlooks and signs the Fed may pause on rates. After achieving a record close in late April, the S&P 500® moved a bit higher to end the period. The uptrend was in sharp contrast to late 2018, when rising U.S. Treasury yields and concern about peaking corporate earnings growth sent many investors fleeing from risk assets as they were still dealing with lingering uncertainty related to global trade and the Fed picking up the pace of interest rate hikes. The index returned -6.84% in October, at the time its largest monthly drop in seven years. But conditions worsened through Christmas, as jitters about the economy and another hike in rates led to a spike in market volatility and a -9.03% result for December. For the full period, eight of 11 sectors registered a double-digit gain, led by information technology (+25%). Three defensive groups also stood out: real estate (+21%), consumer staples (+18%) and utilities (+18%). Communication services – a mix of telecom stocks and media/entertainment names – gained 17%, followed by consumer discretionary (+16%). In contrast, energy (-7%) lost ground, while materials (+3%), financials (+4%), health care (+11%) and industrials (+11%) also trailed the broad market.Comments from Portfolio Manager Matthew Fruhan: For the fiscal year, the fund gained 9.57%, trailing the 13.49% advance of the benchmark S&P 500® index. Versus the benchmark, sector allocation detracted most, especially sizable overweights in two notable sector laggards, energy and financials, as well as an underweight in the index-leading information technology sector. This positioning was largely a function of my bottom-up security selection, which modestly contributed to our relative result. Many of the fund's largest individual detractors were stocks of companies facing near-term fundamental uncertainty but whose long-term prospects I believe remain undervalued. Picks in technology, communication services and energy were helpful, while those in health care – especially CVS Health and an out-of-index investment in Bayer, both of which have struggled with near-term financial challenges – and industrials hurt performance. An overweight in financial services company State Street also detracted; the company was hampered by the firm's plan to suspend a share buyback to finance what I consider an overpriced acquisition. Our top individual contributor was Qualcomm, which benefited from resolving a longstanding legal dispute with Apple. Media and communication service provider Comcast, one of our largest holdings, also contributed, as did timely positioning in poor-performing benchmark component Nvidia.The views expressed above reflect those of the portfolio manager(s) only through the end of the period as stated on the cover of this report and do not necessarily represent the views of Fidelity or any other person in the Fidelity organization. Any such views are subject to change at any time based upon market or other conditions and Fidelity disclaims any responsibility to update such views. These views may not be relied on as investment advice and, because investment decisions for a Fidelity fund are based on numerous factors, may not be relied on as an indication of trading intent on behalf of any Fidelity fund.
Investment Summary (Unaudited)
Top Ten Stocks as of April 30, 2019
| % of fund's net assets | |
| Microsoft Corp. | 5.1 |
| Exxon Mobil Corp. | 4.4 |
| General Electric Co. | 4.3 |
| Comcast Corp. Class A | 3.7 |
| Bank of America Corp. | 3.4 |
| Altria Group, Inc. | 3.2 |
| Qualcomm, Inc. | 2.5 |
| JPMorgan Chase & Co. | 2.5 |
| Wells Fargo & Co. | 2.1 |
| Apple, Inc. | 2.1 |
| 33.3 |
Top Five Market Sectors as of April 30, 2019
| % of fund's net assets | |
| Financials | 19.6 |
| Information Technology | 16.4 |
| Health Care | 15.5 |
| Industrials | 13.4 |
| Energy | 11.7 |
Asset Allocation (% of fund's net assets)
| As of April 30, 2019 * | ||
| Stocks | 97.7% | |
| Other Investments | 0.1% | |
| Short-Term Investments and Net Other Assets (Liabilities) | 2.2% | |

* Foreign investments - 11.9%
Schedule of Investments April 30, 2019
Showing Percentage of Net Assets
| Common Stocks - 97.7% | |||
| Shares | Value (000s) | ||
| COMMUNICATION SERVICES - 7.9% | |||
| Diversified Telecommunication Services - 1.2% | |||
| Verizon Communications, Inc. | 577,489 | $33,027 | |
| Entertainment - 1.4% | |||
| Activision Blizzard, Inc. | 149,338 | 7,200 | |
| Electronic Arts, Inc. (a) | 162,823 | 15,411 | |
| Vivendi SA | 559,192 | 16,231 | |
| 38,842 | |||
| Interactive Media & Services - 0.7% | |||
| Alphabet, Inc.: | |||
| Class A (a) | 8,529 | 10,226 | |
| Class C (a) | 7,955 | 9,454 | |
| 19,680 | |||
| Media - 4.6% | |||
| Comcast Corp. Class A | 2,347,147 | 102,171 | |
| Discovery Communications, Inc. Class A (a) | 44,977 | 1,390 | |
| Fox Corp. Class A (a) | 277,874 | 10,834 | |
| Interpublic Group of Companies, Inc. | 463,299 | 10,656 | |
| Omnicom Group, Inc. | 40,086 | 3,208 | |
| 128,259 | |||
| TOTAL COMMUNICATION SERVICES | 219,808 | ||
| CONSUMER DISCRETIONARY - 2.4% | |||
| Auto Components - 0.0% | |||
| Gentex Corp. | 23,674 | 545 | |
| Distributors - 0.1% | |||
| LKQ Corp. (a) | 133,352 | 4,014 | |
| Hotels, Restaurants & Leisure - 0.0% | |||
| Drive Shack, Inc. (a) | 171,204 | 880 | |
| Household Durables - 0.5% | |||
| Mohawk Industries, Inc. (a) | 95,894 | 13,066 | |
| Internet & Direct Marketing Retail - 0.7% | |||
| The Booking Holdings, Inc. (a) | 9,990 | 18,531 | |
| Multiline Retail - 0.2% | |||
| Dollar Tree, Inc. (a) | 45,246 | 5,035 | |
| Specialty Retail - 0.9% | |||
| Lowe's Companies, Inc. | 171,462 | 19,399 | |
| TJX Companies, Inc. | 83,340 | 4,574 | |
| 23,973 | |||
| TOTAL CONSUMER DISCRETIONARY | 66,044 | ||
| CONSUMER STAPLES - 8.5% | |||
| Beverages - 1.0% | |||
| The Coca-Cola Co. | 546,506 | 26,812 | |
| Food & Staples Retailing - 1.6% | |||
| Walgreens Boots Alliance, Inc. | 71,529 | 3,832 | |
| Walmart, Inc. | 405,012 | 41,651 | |
| 45,483 | |||
| Food Products - 0.5% | |||
| Nestle SA sponsored ADR | 78,400 | 7,568 | |
| The Hershey Co. | 47,302 | 5,906 | |
| 13,474 | |||
| Household Products - 1.3% | |||
| Procter & Gamble Co. | 297,243 | 31,650 | |
| Spectrum Brands Holdings, Inc. | 92,293 | 5,682 | |
| 37,332 | |||
| Tobacco - 4.1% | |||
| Altria Group, Inc. | 1,663,305 | 90,367 | |
| British American Tobacco PLC sponsored ADR | 648,563 | 25,424 | |
| 115,791 | |||
| TOTAL CONSUMER STAPLES | 238,892 | ||
| ENERGY - 11.6% | |||
| Energy Equipment & Services - 0.8% | |||
| Baker Hughes, a GE Co. Class A | 529,706 | 12,724 | |
| National Oilwell Varco, Inc. | 85,280 | 2,229 | |
| Oceaneering International, Inc. (a) | 322,926 | 6,200 | |
| 21,153 | |||
| Oil, Gas & Consumable Fuels - 10.8% | |||
| BP PLC sponsored ADR | 938,050 | 41,021 | |
| Cenovus Energy, Inc. (Canada) | 4,662,733 | 46,220 | |
| Chevron Corp. | 191,012 | 22,933 | |
| Equinor ASA sponsored ADR | 1,083,084 | 24,034 | |
| Exxon Mobil Corp. | 1,517,253 | 121,805 | |
| Galp Energia SGPS SA Class B | 297,260 | 4,991 | |
| Hess Corp. | 277,858 | 17,816 | |
| Kosmos Energy Ltd. | 2,170,541 | 14,521 | |
| Legacy Reserves, Inc. (a)(b) | 334,670 | 151 | |
| The Williams Companies, Inc. | 265,022 | 7,508 | |
| Valero Energy Corp. | 10,987 | 996 | |
| 301,996 | |||
| TOTAL ENERGY | 323,149 | ||
| FINANCIALS - 19.6% | |||
| Banks - 12.9% | |||
| Bank of America Corp. | 3,142,866 | 96,109 | |
| Citigroup, Inc. | 674,063 | 47,656 | |
| First Hawaiian, Inc. | 105,683 | 2,922 | |
| JPMorgan Chase & Co. | 605,582 | 70,278 | |
| M&T Bank Corp. | 23,574 | 4,009 | |
| PNC Financial Services Group, Inc. | 226,925 | 31,073 | |
| Standard Chartered PLC (United Kingdom) | 1,063 | 10 | |
| SunTrust Banks, Inc. | 433,370 | 28,377 | |
| U.S. Bancorp | 400,749 | 21,368 | |
| Wells Fargo & Co. | 1,209,427 | 58,548 | |
| 360,350 | |||
| Capital Markets - 4.3% | |||
| Cboe Global Markets, Inc. | 20,477 | 2,081 | |
| Charles Schwab Corp. | 277,001 | 12,681 | |
| KKR & Co. LP | 421,167 | 10,298 | |
| Morgan Stanley | 471,993 | 22,774 | |
| Northern Trust Corp. | 358,173 | 35,298 | |
| State Street Corp. | 557,169 | 37,698 | |
| 120,830 | |||
| Diversified Financial Services - 0.1% | |||
| KKR Renaissance Co-Invest LP unit (a)(c) | 9,907 | 4,050 | |
| Insurance - 0.6% | |||
| Chubb Ltd. | 62,431 | 9,065 | |
| The Travelers Companies, Inc. | 56,938 | 8,185 | |
| 17,250 | |||
| Thrifts & Mortgage Finance - 1.7% | |||
| MGIC Investment Corp. (a) | 784,856 | 11,490 | |
| Radian Group, Inc. | 1,484,807 | 34,774 | |
| 46,264 | |||
| TOTAL FINANCIALS | 548,744 | ||
| HEALTH CARE - 15.5% | |||
| Biotechnology - 2.5% | |||
| Alexion Pharmaceuticals, Inc. (a) | 191,424 | 26,059 | |
| Alnylam Pharmaceuticals, Inc. (a) | 47,946 | 4,283 | |
| AnaptysBio, Inc. (a) | 16,182 | 1,177 | |
| Atara Biotherapeutics, Inc. (a) | 85,475 | 2,872 | |
| Celgene Corp. (a) | 108,377 | 10,259 | |
| Gritstone Oncology, Inc. | 161,164 | 1,694 | |
| Heron Therapeutics, Inc. (a) | 32,164 | 697 | |
| Insmed, Inc. (a) | 185,798 | 5,656 | |
| Intercept Pharmaceuticals, Inc. (a)(b) | 154,872 | 13,347 | |
| Mirati Therapeutics, Inc. (a) | 56,138 | 3,340 | |
| 69,384 | |||
| Health Care Equipment & Supplies - 1.0% | |||
| Boston Scientific Corp. (a) | 736,616 | 27,343 | |
| Health Care Providers & Services - 5.3% | |||
| AmerisourceBergen Corp. | 213,272 | 15,944 | |
| Cardinal Health, Inc. | 384,628 | 18,735 | |
| Cigna Corp. | 131,530 | 20,892 | |
| Covetrus, Inc. (a) | 45,110 | 1,483 | |
| CVS Health Corp. | 748,581 | 40,708 | |
| Humana, Inc. | 16,999 | 4,342 | |
| McKesson Corp. | 242,468 | 28,914 | |
| UnitedHealth Group, Inc. | 73,758 | 17,191 | |
| 148,209 | |||
| Health Care Technology - 0.0% | |||
| Castlight Health, Inc. Class B (a) | 300,736 | 1,122 | |
| Pharmaceuticals - 6.7% | |||
| Bayer AG | 460,550 | 30,652 | |
| Bristol-Myers Squibb Co. | 782,147 | 36,315 | |
| GlaxoSmithKline PLC sponsored ADR | 1,021,500 | 42,014 | |
| Jazz Pharmaceuticals PLC (a) | 95,482 | 12,391 | |
| Johnson & Johnson | 274,054 | 38,696 | |
| Perrigo Co. PLC | 50,644 | 2,427 | |
| Sanofi SA | 81,368 | 7,099 | |
| Teva Pharmaceutical Industries Ltd. sponsored ADR (a) | 585,081 | 8,905 | |
| TherapeuticsMD, Inc. (a)(b) | 1,728,395 | 7,432 | |
| 185,931 | |||
| TOTAL HEALTH CARE | 431,989 | ||
| INDUSTRIALS - 13.4% | |||
| Aerospace & Defense - 1.9% | |||
| General Dynamics Corp. | 48,126 | 8,601 | |
| Huntington Ingalls Industries, Inc. | 23,081 | 5,137 | |
| United Technologies Corp. | 268,513 | 38,293 | |
| 52,031 | |||
| Air Freight & Logistics - 1.9% | |||
| C.H. Robinson Worldwide, Inc. | 68,400 | 5,540 | |
| FedEx Corp. | 36,142 | 6,847 | |
| United Parcel Service, Inc. Class B | 392,625 | 41,705 | |
| 54,092 | |||
| Building Products - 0.1% | |||
| A.O. Smith Corp. | 33,367 | 1,754 | |
| Commercial Services & Supplies - 0.1% | |||
| Stericycle, Inc. (a) | 64,191 | 3,748 | |
| Electrical Equipment - 0.6% | |||
| Acuity Brands, Inc. | 82,478 | 12,069 | |
| Hubbell, Inc. Class B | 45,752 | 5,838 | |
| 17,907 | |||
| Industrial Conglomerates - 4.3% | |||
| General Electric Co. | 11,935,746 | 121,387 | |
| Machinery - 0.9% | |||
| Flowserve Corp. | 321,962 | 15,786 | |
| Wabtec Corp. (b) | 125,958 | 9,330 | |
| 25,116 | |||
| Professional Services - 0.3% | |||
| Acacia Research Corp. (a) | 24,000 | 76 | |
| IHS Markit Ltd. (a) | 117,220 | 6,712 | |
| 6,788 | |||
| Road & Rail - 3.3% | |||
| J.B. Hunt Transport Services, Inc. | 206,354 | 19,496 | |
| Knight-Swift Transportation Holdings, Inc. Class A | 531,740 | 17,734 | |
| Lyft, Inc. | 125,143 | 6,735 | |
| Norfolk Southern Corp. | 84,201 | 17,179 | |
| Union Pacific Corp. | 176,700 | 31,283 | |
| 92,427 | |||
| TOTAL INDUSTRIALS | 375,250 | ||
| INFORMATION TECHNOLOGY - 16.4% | |||
| Communications Equipment - 0.1% | |||
| Cisco Systems, Inc. | 44,297 | 2,478 | |
| Electronic Equipment & Components - 0.1% | |||
| Itron, Inc. (a) | 74,835 | 4,016 | |
| IT Services - 3.1% | |||
| Interxion Holding N.V. (a) | 65,696 | 4,546 | |
| MasterCard, Inc. Class A | 66,362 | 16,872 | |
| Paychex, Inc. | 174,277 | 14,693 | |
| Unisys Corp. (a) | 412,571 | 4,625 | |
| Visa, Inc. Class A | 283,135 | 46,556 | |
| 87,292 | |||
| Semiconductors & Semiconductor Equipment - 3.7% | |||
| Analog Devices, Inc. | 29,359 | 3,413 | |
| Applied Materials, Inc. | 309,254 | 13,629 | |
| Lam Research Corp. | 34,559 | 7,169 | |
| Marvell Technology Group Ltd. | 44,300 | 1,108 | |
| NVIDIA Corp. | 41,236 | 7,464 | |
| Qualcomm, Inc. | 819,493 | 70,583 | |
| 103,366 | |||
| Software - 7.3% | |||
| Microsoft Corp. | 1,081,297 | 141,215 | |
| Oracle Corp. | 603,517 | 33,393 | |
| SAP SE sponsored ADR | 219,082 | 28,231 | |
| 202,839 | |||
| Technology Hardware, Storage & Peripherals - 2.1% | |||
| Apple, Inc. | 287,250 | 57,642 | |
| TOTAL INFORMATION TECHNOLOGY | 457,633 | ||
| MATERIALS - 1.0% | |||
| Chemicals - 1.0% | |||
| DowDuPont, Inc. | 111,876 | 4,302 | |
| International Flavors & Fragrances, Inc. | 20,877 | 2,877 | |
| Intrepid Potash, Inc. (a) | 998,083 | 3,713 | |
| Nutrien Ltd. | 235,374 | 12,766 | |
| The Scotts Miracle-Gro Co. Class A | 49,210 | 4,184 | |
| 27,842 | |||
| Construction Materials - 0.0% | |||
| Summit Materials, Inc. (a) | 64,229 | 1,125 | |
| TOTAL MATERIALS | 28,967 | ||
| REAL ESTATE - 0.7% | |||
| Equity Real Estate Investment Trusts (REITs) - 0.7% | |||
| American Tower Corp. | 33,347 | 6,513 | |
| Equinix, Inc. | 26,998 | 12,276 | |
| Simon Property Group, Inc. | 5,294 | 920 | |
| 19,709 | |||
| UTILITIES - 0.7% | |||
| Electric Utilities - 0.7% | |||
| Duke Energy Corp. | 25,572 | 2,330 | |
| Exelon Corp. | 166,672 | 8,492 | |
| PPL Corp. | 138,815 | 4,332 | |
| Southern Co. | 74,257 | 3,952 | |
| 19,106 | |||
| Multi-Utilities - 0.0% | |||
| Sempra Energy | 12,685 | 1,623 | |
| TOTAL UTILITIES | 20,729 | ||
| TOTAL COMMON STOCKS | |||
| (Cost $2,326,499) | 2,730,914 | ||
| Other - 0.1% | |||
| Energy - 0.1% | |||
| Oil, Gas & Consumable Fuels - 0.1% | |||
| Utica Shale Drilling Program (non-operating revenue interest)(c)(d)(e) | |||
| (Cost $6,968) | 6,967,758 | 3,510 | |
| Money Market Funds - 3.3% | |||
| Fidelity Cash Central Fund, 2.49% (f) | 70,975,718 | 70,990 | |
| Fidelity Securities Lending Cash Central Fund 2.49% (f)(g) | 21,375,866 | 21,378 | |
| TOTAL MONEY MARKET FUNDS | |||
| (Cost $92,368) | 92,368 | ||
| TOTAL INVESTMENT IN SECURITIES - 101.1% | |||
| (Cost $2,425,835) | 2,826,792 | ||
| NET OTHER ASSETS (LIABILITIES) - (1.1)% | (30,388) | ||
| NET ASSETS - 100% | $2,796,404 |
Legend
(a) Non-income producing
(b) Security or a portion of the security is on loan at period end.
(c) Restricted securities - Investment in securities not registered under the Securities Act of 1933 (excluding 144A issues). At the end of the period, the value of restricted securities (excluding 144A issues) amounted to $7,561,000 or 0.3% of net assets.
(d) Investment is owned by a wholly-owned subsidiary (Subsidiary) that is treated as a corporation for U.S. tax purposes.
(e) Level 3 security
(f) Affiliated fund that is generally available only to investment companies and other accounts managed by Fidelity Investments. The rate quoted is the annualized seven-day yield of the fund at period end. A complete unaudited listing of the fund's holdings as of its most recent quarter end is available upon request. In addition, each Fidelity Central Fund's financial statements, which are not covered by the Fund's Report of Independent Registered Public Accounting Firm, are available on the SEC's website or upon request.
(g) Investment made with cash collateral received from securities on loan.
Additional information on each restricted holding is as follows:
| Security | Acquisition Date | Acquisition Cost (000s) |
| KKR Renaissance Co-Invest LP unit | 7/25/13 | $1,045 |
| Utica Shale Drilling Program (non-operating revenue interest) | 10/5/16 - 9/1/17 | $6,968 |
Affiliated Central Funds
Information regarding fiscal year to date income earned by the Fund from investments in Fidelity Central Funds is as follows:
| Fund | Income earned |
| (Amounts in thousands) | |
| Fidelity Cash Central Fund | $699 |
| Fidelity Securities Lending Cash Central Fund | 309 |
| Total | $1,008 |
Amounts in the income column in the above table include any capital gain distributions from underlying funds, which are presented in the corresponding line-item in the Statement of Operations, if applicable.
Investment Valuation
The following is a summary of the inputs used, as of April 30, 2019, involving the Fund's assets and liabilities carried at fair value. The inputs or methodology used for valuing securities may not be an indication of the risk associated with investing in those securities. For more information on valuation inputs, and their aggregation into the levels used below, please refer to the Investment Valuation section in the accompanying Notes to Financial Statements.
| Valuation Inputs at Reporting Date: | ||||
| Description | Total | Level 1 | Level 2 | Level 3 |
| (Amounts in thousands) | ||||
| Investments in Securities: | ||||
| Equities: | ||||
| Communication Services | $219,808 | $203,577 | $16,231 | $-- |
| Consumer Discretionary | 66,044 | 66,044 | -- | -- |
| Consumer Staples | 238,892 | 238,892 | -- | -- |
| Energy | 323,149 | 323,149 | -- | -- |
| Financials | 548,744 | 544,694 | 4,050 | -- |
| Health Care | 431,989 | 424,890 | 7,099 | -- |
| Industrials | 375,250 | 368,515 | 6,735 | -- |
| Information Technology | 457,633 | 457,633 | -- | -- |
| Materials | 28,967 | 28,967 | -- | -- |
| Real Estate | 19,709 | 19,709 | -- | -- |
| Utilities | 20,729 | 20,729 | -- | -- |
| Other | 3,510 | -- | -- | 3,510 |
| Money Market Funds | 92,368 | 92,368 | -- | -- |
| Total Investments in Securities: | $2,826,792 | $2,789,167 | $34,115 | $3,510 |
Other Information
Distribution of investments by country or territory of incorporation, as a percentage of Total Net Assets, is as follows (Unaudited):
| United States of America | 88.1% |
| United Kingdom | 3.9% |
| Canada | 2.1% |
| Germany | 2.1% |
| Others (Individually Less Than 1%) | 3.8% |
| 100.0% |
See accompanying notes which are an integral part of the financial statements.
Financial Statements
Statement of Assets and Liabilities
| Amounts in thousands (except per-share amount) | April 30, 2019 | |
| Assets | ||
| Investment in securities, at value (including securities loaned of $20,549) — See accompanying schedule: Unaffiliated issuers (cost $2,333,467) | $2,734,424 | |
| Fidelity Central Funds (cost $92,368) | 92,368 | |
| Total Investment in Securities (cost $2,425,835) | $2,826,792 | |
| Restricted cash | 165 | |
| Foreign currency held at value (cost $407) | 407 | |
| Receivable for investments sold | 6,614 | |
| Receivable for fund shares sold | 1,904 | |
| Dividends receivable | 3,691 | |
| Distributions receivable from Fidelity Central Funds | 159 | |
| Prepaid expenses | 1 | |
| Other receivables | 58 | |
| Total assets | 2,839,791 | |
| Liabilities | ||
| Payable for investments purchased | $9,962 | |
| Payable for fund shares redeemed | 10,650 | |
| Accrued management fee | 901 | |
| Other affiliated payables | 443 | |
| Other payables and accrued expenses | 48 | |
| Collateral on securities loaned | 21,383 | |
| Total liabilities | 43,387 | |
| Net Assets | $2,796,404 | |
| Net Assets consist of: | ||
| Paid in capital | $2,346,153 | |
| Total distributable earnings (loss) | 450,251 | |
| Net Assets, for 87,098 shares outstanding | $2,796,404 | |
| Net Asset Value, offering price and redemption price per share ($2,796,404 ÷ 87,098 shares) | $32.11 |
See accompanying notes which are an integral part of the financial statements.
Statement of Operations
| Amounts in thousands | Year ended April 30, 2019 | |
| Investment Income | ||
| Dividends | $69,678 | |
| Non-Cash dividends | 4,104 | |
| Income from Fidelity Central Funds | 1,008 | |
| Total income | 74,790 | |
| Expenses | ||
| Management fee | ||
| Basic fee | $15,570 | |
| Performance adjustment | (3,058) | |
| Transfer agent fees | 4,616 | |
| Accounting and security lending fees | 855 | |
| Custodian fees and expenses | 62 | |
| Independent trustees' fees and expenses | 19 | |
| Registration fees | 85 | |
| Audit | 73 | |
| Legal | 15 | |
| Interest | 17 | |
| Miscellaneous | 22 | |
| Total expenses before reductions | 18,276 | |
| Expense reductions | (253) | |
| Total expenses after reductions | 18,023 | |
| Net investment income (loss) | 56,767 | |
| Realized and Unrealized Gain (Loss) | ||
| Net realized gain (loss) on: | ||
| Investment securities: | ||
| Unaffiliated issuers | 209,092 | |
| Redemptions in-kind with affiliated entities | 77,760 | |
| Fidelity Central Funds | 2 | |
| Total net realized gain (loss) | 286,854 | |
| Change in net unrealized appreciation (depreciation) on: | ||
| Investment securities: | ||
| Unaffiliated issuers | (72,879) | |
| Assets and liabilities in foreign currencies | 11 | |
| Total change in net unrealized appreciation (depreciation) | (72,868) | |
| Net gain (loss) | 213,986 | |
| Net increase (decrease) in net assets resulting from operations | $270,753 |
See accompanying notes which are an integral part of the financial statements.
Statement of Changes in Net Assets
| Amounts in thousands | Year ended April 30, 2019 | Year ended April 30, 2018 |
| Increase (Decrease) in Net Assets | ||
| Operations | ||
| Net investment income (loss) | $56,767 | $72,749 |
| Net realized gain (loss) | 286,854 | 768,160 |
| Change in net unrealized appreciation (depreciation) | (72,868) | (303,300) |
| Net increase (decrease) in net assets resulting from operations | 270,753 | 537,609 |
| Distributions to shareholders | (319,807) | – |
| Distributions to shareholders from net investment income | – | (59,615) |
| Distributions to shareholders from net realized gain | – | (121,639) |
| Total distributions | (319,807) | (181,254) |
| Share transactions | ||
| Proceeds from sales of shares | 755,068 | 3,709,467 |
| Reinvestment of distributions | 288,173 | 172,362 |
| Cost of shares redeemed | (2,062,176) | (5,029,558) |
| Net increase (decrease) in net assets resulting from share transactions | (1,018,935) | (1,147,729) |
| Total increase (decrease) in net assets | (1,067,989) | (791,374) |
| Net Assets | ||
| Beginning of period | 3,864,393 | 4,655,767 |
| End of period | $2,796,404 | $3,864,393 |
| Other Information | ||
| Undistributed net investment income end of period | $7,335 | |
| Shares | ||
| Sold | 24,059 | 113,746 |
| Issued in reinvestment of distributions | 9,565 | 5,376 |
| Redeemed | (63,553) | (153,033) |
| Net increase (decrease) | (29,929) | (33,911) |
See accompanying notes which are an integral part of the financial statements.
Financial Highlights
Fidelity Large Cap Stock Fund
| Years ended April 30, | 2019 | 2018 | 2017 | 2016 | 2015 |
| Selected Per–Share Data | |||||
| Net asset value, beginning of period | $33.02 | $30.85 | $26.62 | $29.28 | $27.76 |
| Income from Investment Operations | |||||
| Net investment income (loss)A | .63 | .47 | .38 | .37 | .31 |
| Net realized and unrealized gain (loss) | 2.17 | 2.87 | 4.91 | (1.74) | 2.92 |
| Total from investment operations | 2.80 | 3.34 | 5.29 | (1.37) | 3.23 |
| Distributions from net investment income | (.53)B | (.38) | (.41) | (.32) | (.27) |
| Distributions from net realized gain | (3.18)B | (.79) | (.65) | (.97) | (1.44) |
| Total distributions | (3.71) | (1.17) | (1.06) | (1.29) | (1.71) |
| Net asset value, end of period | $32.11 | $33.02 | $30.85 | $26.62 | $29.28 |
| Total ReturnC | 9.57% | 10.96% | 20.37% | (4.82)% | 11.97% |
| Ratios to Average Net AssetsD,E | |||||
| Expenses before reductions | .63% | .67% | .62% | .78% | .88% |
| Expenses net of fee waivers, if any | .63% | .67% | .62% | .77% | .88% |
| Expenses net of all reductions | .62% | .66% | .62% | .77% | .88% |
| Net investment income (loss) | 1.96% | 1.44% | 1.33% | 1.38% | 1.10% |
| Supplemental Data | |||||
| Net assets, end of period (in millions) | $2,796 | $3,864 | $4,656 | $2,580 | $3,207 |
| Portfolio turnover rateF | 35%G | 40%G | 32% | 31% | 36%G |
A Calculated based on average shares outstanding during the period.
B The amounts shown reflect certain reclassifications related to book to tax differences that were made in the year shown.
C Total returns would have been lower if certain expenses had not been reduced during the applicable periods shown.
D Fees and expenses of any underlying Fidelity Central Funds are not included in the Fund's expense ratio. The Fund indirectly bears its proportionate share of the expenses of any underlying Fidelity Central Funds.
E Expense ratios reflect operating expenses of the Fund. Expenses before reductions do not reflect amounts reimbursed by the investment adviser or reductions from brokerage service arrangements or reductions from other expense offset arrangements and do not represent the amount paid by the Fund during periods when reimbursements or reductions occur. Expenses net of fee waivers reflect expenses after reimbursement by the investment adviser but prior to reductions from brokerage service arrangements or other expense offset arrangements. Expenses net of all reductions represent the net expenses paid by the Fund.
F Amount does not include the portfolio activity of any underlying Fidelity Central Funds.
G Portfolio turnover rate excludes securities received or delivered in-kind.
See accompanying notes which are an integral part of the financial statements.
Notes to Financial Statements
For the period ended April 30, 2019
(Amounts in thousands except percentages)
1. Organization.
Fidelity Large Cap Stock Fund (the Fund) is a fund of Fidelity Concord Street Trust (the Trust) and is authorized to issue an unlimited number of shares. Share transactions on the Statement of Changes in Net Assets may contain exchanges between affiliated funds. The Trust is registered under the Investment Company Act of 1940, as amended (the 1940 Act), as an open-end management investment company organized as a Massachusetts business trust.
2. Investments in Fidelity Central Funds.
The Fund invests in Fidelity Central Funds, which are open-end investment companies generally available only to other investment companies and accounts managed by the investment adviser and its affiliates. The Fund's Schedule of Investments lists each of the Fidelity Central Funds held as of period end, if any, as an investment of the Fund, but does not include the underlying holdings of each Fidelity Central Fund. As an Investing Fund, the Fund indirectly bears its proportionate share of the expenses of the underlying Fidelity Central Funds.
The Money Market Central Funds seek preservation of capital and current income and are managed by Fidelity Investments Money Management, Inc. (FIMM), an affiliate of the investment adviser. Annualized expenses of the Money Market Central Funds as of their most recent shareholder report date are less than .005%.
A complete unaudited list of holdings for each Fidelity Central Fund is available upon request or at the Securities and Exchange Commission (the SEC) website at www.sec.gov. In addition, the financial statements of the Fidelity Central Funds, which are not covered by the Fund's Report of Independent Registered Public Accounting Firm, are available on the SEC website or upon request.
3. Significant Accounting Policies.
The Fund is an investment company and applies the accounting and reporting guidance of the Financial Accounting Standards Board (FASB) Accounting Standards Codification Topic 946 Financial Services – Investments Companies. The financial statements have been prepared in conformity with accounting principles generally accepted in the United States of America (GAAP), which require management to make certain estimates and assumptions at the date of the financial statements. Actual results could differ from those estimates. Subsequent events, if any, through the date that the financial statements were issued have been evaluated in the preparation of the financial statements. The following summarizes the significant accounting policies of the Fund:
Investment Valuation. Investments are valued as of 4:00 p.m. Eastern time on the last calendar day of the period. The Board of Trustees (the Board) has delegated the day to day responsibility for the valuation of the Fund's investments to the Fair Value Committee (the Committee) established by the Fund's investment adviser. In accordance with valuation policies and procedures approved by the Board, the Fund attempts to obtain prices from one or more third party pricing vendors or brokers to value its investments. When current market prices, quotations or currency exchange rates are not readily available or reliable, investments will be fair valued in good faith by the Committee, in accordance with procedures adopted by the Board. Factors used in determining fair value vary by investment type and may include market or investment specific events. The frequency with which these procedures are used cannot be predicted and they may be utilized to a significant extent. The Committee oversees the Fund's valuation policies and procedures and reports to the Board on the Committee's activities and fair value determinations. The Board monitors the appropriateness of the procedures used in valuing the Fund's investments and ratifies the fair value determinations of the Committee.
The Fund categorizes the inputs to valuation techniques used to value its investments into a disclosure hierarchy consisting of three levels as shown below:
- Level 1 – quoted prices in active markets for identical investments
- Level 2 – other significant observable inputs (including quoted prices for similar investments, interest rates, prepayment speeds, etc.)
- Level 3 – unobservable inputs (including the Fund's own assumptions based on the best information available)
Valuation techniques used to value the Fund's investments by major category are as follows:
Equity securities, including restricted securities, for which market quotations are readily available, are valued at the last reported sale price or official closing price as reported by a third party pricing vendor on the primary market or exchange on which they are traded and are categorized as Level 1 in the hierarchy. In the event there were no sales during the day or closing prices are not available, securities are valued at the last quoted bid price or may be valued using the last available price and are generally categorized as Level 2 in the hierarchy. For foreign equity securities, when market or security specific events arise, comparisons to the valuation of American Depositary Receipts (ADRs), futures contracts, Exchange-Traded Funds (ETFs) and certain indexes as well as quoted prices for similar securities may be used and would be categorized as Level 2 in the hierarchy. For equity securities, including restricted securities, where observable inputs are limited, assumptions about market activity and risk are used and these securities may be categorized as Level 3 in the hierarchy.
Investments in open-end mutual funds, including the Fidelity Central Funds, are valued at their closing net asset value (NAV) each business day and are categorized as Level 1 in the hierarchy.
Changes in valuation techniques may result in transfers in or out of an assigned level within the disclosure hierarchy. The aggregate value of investments by input level as of April 30, 2019, is included at the end of the Fund's Schedule of Investments.
Foreign Currency. The Fund may use foreign currency contracts to facilitate transactions in foreign-denominated securities. Gains and losses from these transactions may arise from changes in the value of the foreign currency or if the counterparties do not perform under the contracts' terms.
Foreign-denominated assets, including investment securities, and liabilities are translated into U.S. dollars at the exchange rates at period end. Purchases and sales of investment securities, income and dividends received and expenses denominated in foreign currencies are translated into U.S. dollars at the exchange rate in effect on the transaction date.
The effects of exchange rate fluctuations on investments are included with the net realized and unrealized gain (loss) on investment securities. Other foreign currency transactions resulting in realized and unrealized gain (loss) are disclosed separately.
Investment Transactions and Income. For financial reporting purposes, the Fund's investment holdings and NAV include trades executed through the end of the last business day of the period. The NAV per share for processing shareholder transactions is calculated as of the close of business of the New York Stock Exchange (NYSE), normally 4:00 p.m. Eastern time and includes trades executed through the end of the prior business day. Gains and losses on securities sold are determined on the basis of identified cost and include proceeds received from litigation. Dividend income is recorded on the ex-dividend date, except for certain dividends from foreign securities where the ex-dividend date may have passed, which are recorded as soon as the Fund is informed of the ex-dividend date. Non-cash dividends included in dividend income, if any, are recorded at the fair market value of the securities received. Income and capital gain distributions from Fidelity Central Funds, if any, are recorded on the ex-dividend date. Certain distributions received by the Fund represent a return of capital or capital gain. The Fund determines the components of these distributions subsequent to the ex-dividend date, based upon receipt of tax filings or other correspondence relating to the underlying investment. These distributions are recorded as a reduction of cost of investments and/or as a realized gain. Investment income is recorded net of foreign taxes withheld where recovery of such taxes is uncertain.
Expenses. Expenses directly attributable to a fund are charged to that fund. Expenses attributable to more than one fund are allocated among the respective funds on the basis of relative net assets or other appropriate methods. Expense estimates are accrued in the period to which they relate and adjustments are made when actual amounts are known.
Income Tax Information and Distributions to Shareholders. Each year, the Fund intends to qualify as a regulated investment company under Subchapter M of the Internal Revenue Code, including distributing substantially all of its taxable income and realized gains. As a result, no provision for U.S. Federal income taxes is required. As of April 30, 2019, the Fund did not have any unrecognized tax benefits in the financial statements; nor is the Fund aware of any tax positions for which it is reasonably possible that the total amounts of unrecognized tax benefits will significantly change in the next twelve months. The Fund files a U.S. federal tax return, in addition to state and local tax returns as required. The Fund's federal income tax returns are subject to examination by the Internal Revenue Service (IRS) for a period of three fiscal years after they are filed. State and local tax returns may be subject to examination for an additional fiscal year depending on the jurisdiction. Foreign taxes are provided for based on the Fund's understanding of the tax rules and rates that exist in the foreign markets in which it invests.
Distributions are declared and recorded on the ex-dividend date. Income and capital gain distributions are determined in accordance with income tax regulations, which may differ from GAAP. These differences resulted in distribution reclassifications. In addition, the Fund claimed a portion of the payment made to redeeming shareholders as a distribution for income tax purposes.
Capital accounts within the financial statements are adjusted for permanent book-tax differences. These adjustments have no impact on net assets or the results of operations. Capital accounts are not adjusted for temporary book-tax differences which will reverse in a subsequent period.
Book-tax differences are primarily due to foreign currency transactions, partnerships, redemptions in kind and losses deferred due to wash sales.
As of period end, the cost and unrealized appreciation (depreciation) in securities, and derivatives if applicable, for federal income tax purposes were as follows:
| Gross unrealized appreciation | $603,231 |
| Gross unrealized depreciation | (214,358) |
| Net unrealized appreciation (depreciation) | $388,873 |
| Tax Cost | $2,437,919 |
The tax-based components of distributable earnings as of period end were as follows:
| Undistributed ordinary income | $15,430 |
| Undistributed long-term capital gain | $48,498 |
| Net unrealized appreciation (depreciation) on securities and other investments | $386,322 |
The tax character of distributions paid was as follows:
| April 30, 2019 | April 30, 2018 | |
| Ordinary Income | $59,101 | $ 86,260 |
| Long-term Capital Gains | 260,706 | 94,994 |
| Total | $319,807 | $ 181,254 |
Restricted Securities. The Fund may invest in securities that are subject to legal or contractual restrictions on resale. These securities generally may be resold in transactions exempt from registration or to the public if the securities are registered. Disposal of these securities may involve time-consuming negotiations and expense, and prompt sale at an acceptable price may be difficult. Information regarding restricted securities is included at the end of the Fund's Schedule of Investments.
Consolidated Subsidiary. The Fund invests in certain investments through a wholly-owned subsidiary ("Subsidiary"), which may be subject to federal and state taxes upon disposition.
As of period end, the Fund held an investment of $3,675 in this Subsidiary, representing .13% of the Fund's net assets. The financial statements have been consolidated and include accounts of the Fund and the Subsidiary. Accordingly, all inter-company transactions and balances have been eliminated.
Any cash held by the Subsidiary is restricted as to its use and is presented as Restricted cash in the Statement of Assets and Liabilities.
New Rule Issuance. During August 2018, the U.S. Securities and Exchange Commission issued Final Rule Release No. 33-10532, Disclosure Update and Simplification. This Final Rule includes amendments specific to registered investment companies that are intended to eliminate overlap in disclosure requirements between Regulation S-X and GAAP. In accordance with these amendments, certain line-items in the Fund's financial statements have been combined or removed for the current period as outlined in the table below.
| Financial Statement | Current Line-Item Presentation (As Applicable) | Prior Line-Item Presentation (As Applicable) |
| Statement of Assets and Liabilities | Total distributable earnings (loss) | Undistributed/Distributions in excess of/Accumulated net investment income (loss) Accumulated/Undistributed net realized gain (loss) Net unrealized appreciation (depreciation) |
| Statement of Changes in Net Assets | N/A - removed | Undistributed/Distributions in excess of/Accumulated net investment income (loss) end of period |
| Statement of Changes in Net Assets | Distributions to shareholders | Distributions to shareholders from net investment income Distributions to shareholders from net realized gain |
4. Purchases and Sales of Investments.
Purchases and sales of securities, other than short-term securities and in-kind transactions, aggregated $1,019,890 and $1,993,698, respectively.
Unaffiliated Redemptions In-Kind. During the period, 97 shares of the Fund were redeemed in-kind for investments and cash with a value of $3,010. The net realized gain of $895 on investments delivered through in-kind redemptions is included in the accompanying Statement of Operations. The amount of the in-kind redemptions is included in share transactions in the accompanying Statement of Changes in Net Assets. The Fund recognized no gain or loss for federal income tax purposes.
Prior Fiscal Year Redemptions In-Kind. During the prior period, 1,511 shares of the Fund held by unaffiliated entities were redeemed in-kind for investments and cash with a value of $49,745. The Fund had a net realized gain of $20,788 on investments delivered through the in-kind redemptions. The amount of the redemptions is included in share transactions activity shown in the accompanying Statement of Changes in Net Assets. The Fund recognized no gain or loss for federal income tax purposes.
5. Fees and Other Transactions with Affiliates.
Management Fee. Fidelity Management & Research Company (the investment adviser) and its affiliates provide the Fund with investment management related services for which the Fund pays a monthly management fee. The management fee is the sum of an individual fund fee rate that is based on an annual rate of .30% of the Fund's average net assets and an annualized group fee rate that averaged .24% during the period. The group fee rate is based upon the average net assets of all the mutual funds advised by the investment adviser, including any mutual funds previously advised by the investment adviser that are currently advised by Fidelity SelectCo, LLC, an affiliate of the investment adviser. The group fee rate decreases as assets under management increase and increases as assets under management decrease. In addition, the management fee is subject to a performance adjustment (up to a maximum of +/- .20% of the Fund's average net assets over a 36 month performance period). The upward or downward adjustment to the management fee is based on the Fund's relative investment performance as compared to its benchmark index, the S&P 500 Index, over the same 36 month performance period. For the reporting period, the total annual management fee rate, including the performance adjustment, was .43% of the Fund's average net assets. The performance adjustment included in the management fee rate may be higher or lower than the maximum performance adjustment rate due to the difference between the average net assets for the reporting and performance periods.
Transfer Agent Fees. Fidelity Investments Institutional Operations Company, Inc. (FIIOC), an affiliate of the investment adviser, is the Fund's transfer, dividend disbursing and shareholder servicing agent. FIIOC receives account fees and asset-based fees that vary according to account size and type of account. FIIOC pays for typesetting, printing and mailing of shareholder reports, except proxy statements. For the period, the transfer agent fees were equivalent to an annual rate of .16% of average net assets.
Accounting and Security Lending Fees. Fidelity Service Company, Inc. (FSC), an affiliate of the investment adviser, maintains the Fund's accounting records. The accounting fee is based on the level of average net assets for each month. Prior to April 1, 2019, FSC had a separate agreement with the Fund for administration of the security lending program, based on the number and duration of lending transactions. For the period, the total fees paid for accounting and administration of securities lending were equivalent to an annual rate of .03%.
Brokerage Commissions. The Fund placed a portion of its portfolio transactions with brokerage firms which are affiliates of the investment adviser. Brokerage commissions are included in net realized gain (loss) and change in net unrealized appreciation (depreciation) in the Statement of Operations. The commissions paid to these affiliated firms were $29 for the period.
Interfund Lending Program. Pursuant to an Exemptive Order issued by the SEC, the Fund, along with other registered investment companies having management contracts with Fidelity Management & Research Company (FMR) or other affiliated entities of FMR, may participate in an interfund lending program. This program provides an alternative credit facility allowing the funds to borrow from, or lend money to, other participating affiliated funds. At period end, there were no interfund loans outstanding. The Fund's activity in this program during the period for which loans were outstanding was as follows:
| Borrower or Lender | Average Loan Balance | Weighted Average Interest Rate | Interest Expense |
| Borrower | $11,200 | 2.22% | $17 |
Interfund Trades. The Fund may purchase from or sell securities to other Fidelity Funds under procedures adopted by the Board. The procedures have been designed to ensure these interfund trades are executed in accordance with Rule 17a-7 of the 1940 Act. Interfund trades are included within the respective purchases and sales amounts shown in the Purchases and Sales of Investments note.
Affiliated Redemptions In-Kind. During the period, 7,586 shares of the Fund were redeemed in-kind for investments and cash with a value of $257,324. The net realized gain of $77,760 on investments delivered through in-kind redemptions is included in the accompanying Statement of Operations. The amount of the in-kind redemptions is included in share transactions in the accompanying Statement of Changes in Net Assets. The Fund recognized no gain or loss for federal income tax purposes.
Prior Fiscal Year Redemptions In-Kind. During the prior period, 39,788 shares of the Fund held by an affiliated entity were redeemed in-kind for investments and cash, with a value of $1,317,084. The Fund had a net realized gain of $469,876 on investments delivered through in-kind redemptions. The amount of the in-kind redemptions is included in share transactions in the accompanying Statement of Changes in Net Assets. The Fund recognized no gain or loss for federal income tax purposes.
Other. During the period, the investment adviser reimbursed the Fund for certain losses in the amount of $199.
6. Committed Line of Credit.
The Fund participates with other funds managed by the investment adviser or an affiliate in a $4.25 billion credit facility (the "line of credit") to be utilized for temporary or emergency purposes to fund shareholder redemptions or for other short-term liquidity purposes. The Fund has agreed to pay commitment fees on its pro-rata portion of the line of credit, which amounted to $9 and is reflected in Miscellaneous expenses on the Statement of Operations. During the period, the Fund did not borrow on this line of credit.
7. Security Lending.
The Fund lends portfolio securities through a lending agent from time to time in order to earn additional income. For equity securities, a lending agent is used and may loan securities to certain qualified borrowers, including Fidelity Capital Markets (FCM), a broker-dealer affiliated with the Fund. On the settlement date of the loan, the Fund receives collateral (in the form of U.S. Treasury obligations, letters of credit and/or cash) against the loaned securities and maintains collateral in an amount not less than 100% of the market value of the loaned securities during the period of the loan. The market value of the loaned securities is determined at the close of business of the Fund and any additional required collateral is delivered to the Fund on the next business day. The Fund or borrower may terminate the loan at any time, and if the borrower defaults on its obligation to return the securities loaned because of insolvency or other reasons, the Fund may apply collateral received from the borrower against the obligation. The Fund may experience delays and costs in recovering the securities loaned. Any cash collateral received is invested in the Fidelity Securities Lending Cash Central Fund. At period end, there were no security loans outstanding with FCM. Security lending income represents the income earned on investing cash collateral, less rebates paid to borrowers and any lending agent fees associated with the loan, plus any premium payments received for lending certain types of securities. Security lending income is presented in the Statement of Operations as a component of income from Fidelity Central Funds. Total security lending income during the period amounted to $309, including $51 from securities loaned to FCM.
8. Expense Reductions.
Commissions paid to certain brokers with whom the investment adviser, or its affiliates, places trades on behalf of the Fund include an amount in addition to trade execution, which may be rebated back to the Fund to offset certain expenses. This amount totaled $212 for the period. Through arrangements with the Fund's custodian, credits realized as a result of certain uninvested cash balances were used to reduce the Fund's expenses. During the period, these credits reduced the Fund's custody expenses by $4.
In addition, during the period the investment adviser reimbursed and/or waived a portion of operating expenses in the amount of $37.
9. Other.
The Fund's organizational documents provide former and current trustees and officers with a limited indemnification against liabilities arising in connection with the performance of their duties to the Fund. In the normal course of business, the Fund may also enter into contracts that provide general indemnifications. The Fund's maximum exposure under these arrangements is unknown as this would be dependent on future claims that may be made against the Fund. The risk of material loss from such claims is considered remote.
Report of Independent Registered Public Accounting Firm
To the Trustees of Fidelity Concord Street Trust and Shareholders of Fidelity Large Cap Stock Fund:
Opinion on the Financial Statements and Financial Highlights
We have audited the accompanying statement of assets and liabilities of Fidelity Large Cap Stock Fund (the "Fund"), a fund of Fidelity Concord Street Trust, including the schedule of investments, as of April 30, 2019, the related statement of operations for the year then ended, the statement of changes in net assets for each of the two years in the period then ended, the financial highlights for each of the five years in the period then ended, and the related notes. In our opinion, the financial statements and financial highlights present fairly, in all material respects, the financial position of the Fund as of April 30, 2019, and the results of its operations for the year then ended, the changes in its net assets for each of the two years in the period then ended, and the financial highlights for each of the five years in the period then ended, in conformity with accounting principles generally accepted in the United States of America.
Basis for Opinion
These financial statements and financial highlights are the responsibility of the Fund's management. Our responsibility is to express an opinion on the Fund's financial statements and financial highlights based on our audits. We are a public accounting firm registered with the Public Company Accounting Oversight Board (United States) (PCAOB) and are required to be independent with respect to the Fund in accordance with the U.S. federal securities laws and the applicable rules and regulations of the Securities and Exchange Commission and the PCAOB.
We conducted our audits in accordance with the standards of the PCAOB. Those standards require that we plan and perform the audit to obtain reasonable assurance about whether the financial statements and financial highlights are free of material misstatement, whether due to error or fraud. The Fund is not required to have, nor were we engaged to perform, an audit of its internal control over financial reporting. As part of our audits we are required to obtain an understanding of internal control over financial reporting but not for the purpose of expressing an opinion on the effectiveness of the Fund’s internal control over financial reporting. Accordingly, we express no such opinion.
Our audits included performing procedures to assess the risks of material misstatement of the financial statements and financial highlights, whether due to error or fraud, and performing procedures that respond to those risks. Such procedures included examining, on a test basis, evidence regarding the amounts and disclosures in the financial statements and financial highlights. Our audits also included evaluating the accounting principles used and significant estimates made by management, as well as evaluating the overall presentation of the financial statements and financial highlights. Our procedures included confirmation of securities owned as of April 30, 2019, by correspondence with the custodians and brokers; when replies were not received from brokers, we performed other auditing procedures. We believe that our audits provide a reasonable basis for our opinion.
/s/ Deloitte & Touche LLP
Boston, Massachusetts
June 11, 2019
We have served as the auditor of one or more of the Fidelity investment companies since 1999.
Trustees and Officers
The Trustees, Members of the Advisory Board (if any), and officers of the trust and fund, as applicable, are listed below. The Board of Trustees governs the fund and is responsible for protecting the interests of shareholders. The Trustees are experienced executives who meet periodically throughout the year to oversee the fund's activities, review contractual arrangements with companies that provide services to the fund, oversee management of the risks associated with such activities and contractual arrangements, and review the fund's performance. Except for Jonathan Chiel, each of the Trustees oversees 290 funds. Mr. Chiel oversees 158 funds.
The Trustees hold office without limit in time except that (a) any Trustee may resign; (b) any Trustee may be removed by written instrument, signed by at least two-thirds of the number of Trustees prior to such removal; (c) any Trustee who requests to be retired or who has become incapacitated by illness or injury may be retired by written instrument signed by a majority of the other Trustees; and (d) any Trustee may be removed at any special meeting of shareholders by a two-thirds vote of the outstanding voting securities of the trust. Each Trustee who is not an interested person (as defined in the 1940 Act) of the trust and the fund is referred to herein as an Independent Trustee. Each Independent Trustee shall retire not later than the last day of the calendar year in which his or her 75th birthday occurs. The Independent Trustees may waive this mandatory retirement age policy with respect to individual Trustees. Officers and Advisory Board Members hold office without limit in time, except that any officer or Advisory Board Member may resign or may be removed by a vote of a majority of the Trustees at any regular meeting or any special meeting of the Trustees. Except as indicated, each individual has held the office shown or other offices in the same company for the past five years.
The fund’s Statement of Additional Information (SAI) includes more information about the Trustees. To request a free copy, call Fidelity at 1-800-544-8544.
Experience, Skills, Attributes, and Qualifications of the Trustees. The Governance and Nominating Committee has adopted a statement of policy that describes the experience, qualifications, attributes, and skills that are necessary and desirable for potential Independent Trustee candidates (Statement of Policy). The Board believes that each Trustee satisfied at the time he or she was initially elected or appointed a Trustee, and continues to satisfy, the standards contemplated by the Statement of Policy. The Governance and Nominating Committee also engages professional search firms to help identify potential Independent Trustee candidates who have the experience, qualifications, attributes, and skills consistent with the Statement of Policy. From time to time, additional criteria based on the composition and skills of the current Independent Trustees, as well as experience or skills that may be appropriate in light of future changes to board composition, business conditions, and regulatory or other developments, have also been considered by the professional search firms and the Governance and Nominating Committee. In addition, the Board takes into account the Trustees' commitment and participation in Board and committee meetings, as well as their leadership of standing and ad hoc committees throughout their tenure.
In determining that a particular Trustee was and continues to be qualified to serve as a Trustee, the Board has considered a variety of criteria, none of which, in isolation, was controlling. The Board believes that, collectively, the Trustees have balanced and diverse experience, qualifications, attributes, and skills, which allow the Board to operate effectively in governing the fund and protecting the interests of shareholders. Information about the specific experience, skills, attributes, and qualifications of each Trustee, which in each case led to the Board's conclusion that the Trustee should serve (or continue to serve) as a trustee of the fund, is provided below.
Board Structure and Oversight Function. James C. Curvey is an interested person and currently serves as Chairman. The Trustees have determined that an interested Chairman is appropriate and benefits shareholders because an interested Chairman has a personal and professional stake in the quality and continuity of services provided to the fund. Independent Trustees exercise their informed business judgment to appoint an individual of their choosing to serve as Chairman, regardless of whether the Trustee happens to be independent or a member of management. The Independent Trustees have determined that they can act independently and effectively without having an Independent Trustee serve as Chairman and that a key structural component for assuring that they are in a position to do so is for the Independent Trustees to constitute a substantial majority for the Board. The Independent Trustees also regularly meet in executive session. Ned C. Lautenbach serves as Chairman of the Independent Trustees and as such (i) acts as a liaison between the Independent Trustees and management with respect to matters important to the Independent Trustees and (ii) with management prepares agendas for Board meetings.
Fidelity® funds are overseen by different Boards of Trustees. The fund's Board oversees Fidelity's high income and certain equity funds, and other Boards oversee Fidelity's investment-grade bond, money market, asset allocation, and other equity funds. The asset allocation funds may invest in Fidelity® funds overseen by the fund's Board. The use of separate Boards, each with its own committee structure, allows the Trustees of each group of Fidelity® funds to focus on the unique issues of the funds they oversee, including common research, investment, and operational issues. On occasion, the separate Boards establish joint committees to address issues of overlapping consequences for the Fidelity® funds overseen by each Board.
The Trustees operate using a system of committees to facilitate the timely and efficient consideration of all matters of importance to the Trustees, the fund, and fund shareholders and to facilitate compliance with legal and regulatory requirements and oversight of the fund's activities and associated risks. The Board, acting through its committees, has charged FMR and its affiliates with (i) identifying events or circumstances the occurrence of which could have demonstrably adverse effects on the fund's business and/or reputation; (ii) implementing processes and controls to lessen the possibility that such events or circumstances occur or to mitigate the effects of such events or circumstances if they do occur; and (iii) creating and maintaining a system designed to evaluate continuously business and market conditions in order to facilitate the identification and implementation processes described in (i) and (ii) above. Because the day-to-day operations and activities of the fund are carried out by or through FMR, its affiliates, and other service providers, the fund's exposure to risks is mitigated but not eliminated by the processes overseen by the Trustees. While each of the Board's committees has responsibility for overseeing different aspects of the fund's activities, oversight is exercised primarily through the Operations, Audit, and Compliance Committees. In addition, the Independent Trustees have worked with Fidelity to enhance the Board's oversight of investment and financial risks, legal and regulatory risks, technology risks, and operational risks, including the development of additional risk reporting to the Board. Appropriate personnel, including but not limited to the fund's Chief Compliance Officer (CCO), FMR's internal auditor, the independent accountants, the fund's Treasurer and portfolio management personnel, make periodic reports to the Board's committees, as appropriate, including an annual review of Fidelity's risk management program for the Fidelity® funds. The responsibilities of each standing committee, including their oversight responsibilities, are described further under "Standing Committees of the Trustees."
Interested Trustees*:
Correspondence intended for a Trustee who is an interested person may be sent to Fidelity Investments, 245 Summer Street, Boston, Massachusetts 02210.
Name, Year of Birth; Principal Occupations and Other Relevant Experience+
Jonathan Chiel (1957)
Year of Election or Appointment: 2016
Trustee
Mr. Chiel also serves as Trustee of other Fidelity® funds. Mr. Chiel is Executive Vice President and General Counsel for FMR LLC (diversified financial services company, 2012-present). Previously, Mr. Chiel served as general counsel (2004-2012) and senior vice president and deputy general counsel (2000-2004) for John Hancock Financial Services; a partner with Choate, Hall & Stewart (1996-2000) (law firm); and an Assistant United States Attorney for the United States Attorney’s Office of the District of Massachusetts (1986-95), including Chief of the Criminal Division (1993-1995). Mr. Chiel is a director on the boards of the Boston Bar Foundation and the Maimonides School.
James C. Curvey (1935)
Year of Election or Appointment: 2007
Trustee
Chairman of the Board of Trustees
Mr. Curvey also serves as Trustee of other Fidelity® funds. Mr. Curvey is Vice Chairman (2007-present) and Director of FMR LLC (diversified financial services company). In addition, Mr. Curvey is an Overseer Emeritus for the Boston Symphony Orchestra, a Director of Artis-Naples, and a Trustee of Brewster Academy in Wolfeboro, New Hampshire. Previously, Mr. Curvey served as a Director of Fidelity Research & Analysis Co. (investment adviser firm, 2009-2018), Director of Fidelity Investments Money Management, Inc. (investment adviser firm, 2009-2014) and a Director of FMR and FMR Co., Inc. (investment adviser firms, 2007-2014).
* Determined to be an “Interested Trustee” by virtue of, among other things, his or her affiliation with the trust or various entities under common control with FMR.
+ The information includes the Trustee's principal occupation during the last five years and other information relating to the experience, attributes, and skills relevant to the Trustee's qualifications to serve as a Trustee, which led to the conclusion that the Trustee should serve as a Trustee for the fund.
Independent Trustees:
Correspondence intended for an Independent Trustee may be sent to Fidelity Investments, P.O. Box 55235, Boston, Massachusetts 02205-5235.
Name, Year of Birth; Principal Occupations and Other Relevant Experience+
Dennis J. Dirks (1948)
Year of Election or Appointment: 2005
Trustee
Mr. Dirks also serves as Trustee of other Fidelity® funds. Prior to his retirement in May 2003, Mr. Dirks was Chief Operating Officer and a member of the Board of The Depository Trust & Clearing Corporation (DTCC). He also served as President, Chief Operating Officer, and Board member of The Depository Trust Company (DTC) and President and Board member of the National Securities Clearing Corporation (NSCC). In addition, Mr. Dirks served as Chief Executive Officer and Board member of the Government Securities Clearing Corporation, Chief Executive Officer and Board member of the Mortgage-Backed Securities Clearing Corporation, as a Trustee and a member of the Finance Committee of Manhattan College (2005-2008), as a Trustee and a member of the Finance Committee of AHRC of Nassau County (2006-2008), as a member of the Independent Directors Council (IDC) Governing Council (2010-2015), and as a member of the Board of Directors for The Brookville Center for Children’s Services, Inc. (2009-2017). Mr. Dirks is a member of the Finance Committee (2016-present) and Board of Directors (2017-present) and is Treasurer (2018-present) of the Asolo Repertory Theatre.
Donald F. Donahue (1950)
Year of Election or Appointment: 2018
Trustee
Mr. Donahue also serves as a Trustee of other Fidelity® funds. Mr. Donahue is President and Chief Executive Officer of Miranda Partners, LLC (risk consulting for the financial services industry, 2012-present). Previously, Mr. Donahue served as a Member of the Advisory Board of certain Fidelity® funds (2015-2018) and Chief Executive Officer (2006-2012), Chief Operating Officer (2003-2006), and Managing Director, Customer Marketing and Development (1999-2003) of The Depository Trust & Clearing Corporation (financial markets infrastructure). Mr. Donahue serves as a Member (2007-present) and Co-Chairman (2016-present) of the Board of Directors of United Way of New York, Member of the Board of Directors of NYC Leadership Academy (2012-present) and Member of the Board of Advisors of Ripple Labs, Inc. (financial services, 2015-present). He also served as Chairman (2010-2012) and Member of the Board of Directors (2012-2013) of Omgeo, LLC (financial services), Treasurer of United Way of New York (2012-2016), and Member of the Board of Directors of XBRL US (financial services non-profit, 2009-2012) and the International Securities Services Association (2009-2012).
Alan J. Lacy (1953)
Year of Election or Appointment: 2008
Trustee
Mr. Lacy also serves as Trustee of other Fidelity® funds. Mr. Lacy serves as a Director of Bristol-Myers Squibb Company (global pharmaceuticals, 2008-present). He is a Trustee of the California Chapter of The Nature Conservancy (2015-present) and a Director of the Center for Advanced Study in the Behavioral Sciences at Stanford University (2015-present). In addition, Mr. Lacy served as Senior Adviser (2007-2014) of Oak Hill Capital Partners, L.P. (private equity) and also served as Chief Executive Officer (2005) and Vice Chairman (2005-2006) of Sears Holdings Corporation (retail) and Chief Executive Officer and Chairman of the Board of Sears, Roebuck and Co. (retail, 2000-2005). Previously, Mr. Lacy served as Chairman (2014-2017) and a member (2010-2017) of the Board of Directors of Dave & Buster’s Entertainment, Inc. (restaurant and entertainment complexes), as Chairman (2008-2011) and a member (2006-2015) of the Board of Trustees of the National Parks Conservation Association, and as a member of the Board of Directors for The Hillman Companies, Inc. (hardware wholesalers, 2010-2014), Earth Fare, Inc. (retail grocery, 2010-2014), and The Western Union Company (global money transfer, 2006-2011).
Ned C. Lautenbach (1944)
Year of Election or Appointment: 2000
Trustee
Chairman of the Independent Trustees
Mr. Lautenbach also serves as Trustee of other Fidelity® funds. Mr. Lautenbach currently serves as Chair (2018-present) and Member (2013-present) of the Board of Governors, State University System of Florida and is a member of the Council on Foreign Relations (1994-present). He is also a member and has most recently served as Chairman of the Board of Directors of Artis-Naples (2012-present). Previously, Mr. Lautenbach served as a member and then Lead Director of the Board of Directors of Eaton Corporation (diversified industrial, 1997-2016). He was also a Partner and Advisory Partner at Clayton, Dubilier & Rice, LLC (private equity investment, 1998-2010), as well as a Director of Sony Corporation (2006-2007). In addition, Mr. Lautenbach also had a 30-year career with IBM (technology company) during which time he served as Senior Vice President and a member of the Corporate Executive Committee (1968-1998).
Joseph Mauriello (1944)
Year of Election or Appointment: 2008
Trustee
Mr. Mauriello also serves as Trustee of other Fidelity® funds. Prior to his retirement in January 2006, Mr. Mauriello served in numerous senior management positions including Deputy Chairman and Chief Operating Officer (2004-2005), and Vice Chairman of Financial Services (2002-2004) of KPMG LLP US (professional services, 1965-2005). Mr. Mauriello currently serves as a member of the Independent Directors Council (IDC) Governing Council (2015-present). Previously, Mr. Mauriello served as a member of the Board of Directors of XL Group plc. (global insurance and re-insurance, 2006-2018).
Cornelia M. Small (1944)
Year of Election or Appointment: 2005
Trustee
Ms. Small also serves as Trustee of other Fidelity® funds. Ms. Small is a member of the Board of Directors (2009-present) and Chair of the Investment Committee (2010-present) of the Teagle Foundation. Ms. Small also serves on the Investment Committee of the Berkshire Taconic Community Foundation (2008-present). Previously, Ms. Small served as Chairperson (2002-2008) and a member of the Investment Committee and Chairperson (2008-2012) and a member of the Board of Trustees of Smith College. In addition, Ms. Small served as Chief Investment Officer, Director of Global Equity Investments, and a member of the Board of Directors of Scudder, Stevens & Clark and Scudder Kemper Investments.
Garnett A. Smith (1947)
Year of Election or Appointment: 2018
Trustee
Mr. Smith also serves as Trustee of other Fidelity® funds. Prior to Mr. Smith's retirement, he served as Chairman and Chief Executive Officer of Inbrand Corp. (manufacturer of personal absorbent products, 1990-1997). He also served as President (1986-1990) of Inbrand Corp. Prior to his employment with Inbrand Corp., he was employed by a retail fabric chain and North Carolina National Bank. In addition, Mr. Smith served as a Member of the Advisory Board of certain Fidelity® funds (2012-2013) and as a board member of the Jackson Hole Land Trust (2009-2012).
David M. Thomas (1949)
Year of Election or Appointment: 2008
Trustee
Mr. Thomas also serves as Trustee of other Fidelity® funds. Mr. Thomas serves as Non-Executive Chairman of the Board of Directors of Fortune Brands Home and Security (home and security products, 2011-present) and as a member of the Board of Directors (2004-present) and Presiding Director (2013-present) of Interpublic Group of Companies, Inc. (marketing communication). Previously, Mr. Thomas served as Executive Chairman (2005-2006) and Chairman and Chief Executive Officer (2000-2005) of IMS Health, Inc. (pharmaceutical and healthcare information solutions), a Director of Fortune Brands, Inc. (consumer products, 2000-2011), and a member of the Board of Trustees of the University of Florida (2013-2018).
+ The information includes the Trustee's principal occupation during the last five years and other information relating to the experience, attributes, and skills relevant to the Trustee's qualifications to serve as a Trustee, which led to the conclusion that the Trustee should serve as a Trustee for the fund.
Advisory Board Members and Officers:
Correspondence intended for a Member of the Advisory Board (if any) may be sent to Fidelity Investments, P.O. Box 55235, Boston, Massachusetts 02205-5235. Correspondence intended for an officer or Peter S. Lynch may be sent to Fidelity Investments, 245 Summer Street, Boston, Massachusetts 02210. Officers appear below in alphabetical order.
Name, Year of Birth; Principal Occupation
Vicki L. Fuller (1957)
Year of Election or Appointment: 2018
Member of the Advisory Board
Ms. Fuller also serves as Member of the Advisory Board of other Fidelity® funds. Ms. Fuller serves as a member of the Board of Directors, Audit Committee, and Nominating and Governance Committee of The Williams Companies, Inc. (natural gas infrastructure, 2018-present). Previously, Ms. Fuller served as the Chief Investment Officer of the New York State Common Retirement Fund (2012-2018) and held a variety of positions at AllianceBernstein L.P. (global asset management, 1985-2012), including Managing Director (2006-2012) and Senior Vice President and Senior Portfolio Manager (2001-2006).
Peter S. Lynch (1944)
Year of Election or Appointment: 2003
Member of the Advisory Board
Mr. Lynch also serves as Member of the Advisory Board of other Fidelity® funds. Mr. Lynch is Vice Chairman and a Director of FMR (investment adviser firm) and FMR Co., Inc. (investment adviser firm). In addition, Mr. Lynch serves as a Trustee of Boston College and as the Chairman of the Inner-City Scholarship Fund. Previously, Mr. Lynch served on the Special Olympics International Board of Directors (1997-2006).
Carol B. Tomé (1957)
Year of Election or Appointment: 2018
Member of the Advisory Board
Ms. Tomé also serves as Member of the Advisory Board of other Fidelity® funds. Ms. Tomé is Chief Financial Officer (2001-present) and Executive Vice President of Corporate Services (2007-present) of The Home Depot, Inc. (home improvement retailer) and a Director (2003-present) and Chair of the Audit Committee (2004-present) of United Parcel Service, Inc. (package delivery and supply chain management). Previously, Ms. Tomé served as Trustee of certain Fidelity® funds (2017), Senior Vice President of Finance and Accounting/Treasurer (2000-2007) and Vice President and Treasurer (1995-2000) of The Home Depot, Inc. and Chair of the Board (2010-2012), Vice Chair of the Board (2009 and 2013), and a Director (2008-2013) of the Federal Reserve Bank of Atlanta. Ms. Tomé is also a director or trustee of many community and professional organizations.
Michael E. Wiley (1950)
Year of Election or Appointment: 2018
Member of the Advisory Board
Mr. Wiley also serves as Trustee or Member of the Advisory Board of other Fidelity® funds. Mr. Wiley serves as a Director of High Point Resources (exploration and production, 2005-present). Previously, Mr. Wiley served as a Director of Andeavor Corporation (independent oil refiner and marketer, 2005-2018), a Director of Andeavor Logistics LP (natural resources logistics, 2015-2018), a Director of Post Oak Bank (privately-held bank, 2004-2018), a Director of Asia Pacific Exploration Consolidated (international oil and gas exploration and production, 2008-2013), a member of the Board of Trustees of the University of Tulsa (2000-2006; 2007-2010), a Senior Energy Advisor of Katzenbach Partners, LLC (consulting, 2006-2007), an Advisory Director of Riverstone Holdings (private investment), a Director of Spinnaker Exploration Company (exploration and production, 2001-2005) and Chairman, President, and CEO of Baker Hughes, Inc. (oilfield services, 2000-2004).
Elizabeth Paige Baumann (1968)
Year of Election or Appointment: 2017
Anti-Money Laundering (AML) Officer
Ms. Baumann also serves as AML Officer of other funds. She is Chief AML Officer (2012-present) and Senior Vice President (2014-present) of FMR LLC (diversified financial services company) and is an employee of Fidelity Investments. Previously, Ms. Baumann served as AML Officer of the funds (2012-2016), and Vice President (2007-2014) and Deputy Anti-Money Laundering Officer (2007-2012) of FMR LLC.
Craig S. Brown (1977)
Year of Election or Appointment: 2019
Assistant Treasurer
Mr. Brown also serves as Assistant Treasurer of other funds. Mr. Brown is an employee of Fidelity Investments (2013-present).
John J. Burke III (1964)
Year of Election or Appointment: 2018
Chief Financial Officer
Mr. Burke also serves as Chief Financial Officer of other funds. Mr. Burke serves as Head of Investment Operations for Fidelity Fund and Investment Operations (2018-present) and is an employee of Fidelity Investments (1998-present). Previously Mr. Burke served as head of Asset Management Investment Operations (2012-2018).
William C. Coffey (1969)
Year of Election or Appointment: 2018
Secretary and Chief Legal Officer (CLO)
Mr. Coffey also serves as Secretary and CLO of other funds. Mr. Coffey serves as CLO, Secretary, and Senior Vice President of Fidelity Management & Research Company and FMR Co., Inc. (investment adviser firms, 2018-present); Secretary of Fidelity SelectCo, LLC and Fidelity Investments Money Management, Inc. (investment adviser firms, 2018-present); and CLO of Fidelity Management & Research (Hong Kong) Limited, FMR Investment Management (UK) Limited, and Fidelity Management & Research (Japan) Limited (investment adviser firms, 2018-present). He is Senior Vice President and Deputy General Counsel of FMR LLC (diversified financial services company, 2010-present), and is an employee of Fidelity Investments. Previously, Mr. Coffey served as Assistant Secretary of certain funds (2009-2018) and as Vice President and Associate General Counsel of FMR LLC (2005-2009).
Timothy M. Cohen (1969)
Year of Election or Appointment: 2018
Vice President
Mr. Cohen also serves as Vice President of other funds. Mr. Cohen serves as Executive Vice President of Fidelity SelectCo, LLC (2019-present), Co-Head of Equity (2018-present), a Director of Fidelity Management & Research (Japan) Limited (investment adviser firm, 2016-present), and is an employee of Fidelity Investments. Previously, Mr. Cohen served as Head of Global Equity Research (2016-2018), Chief Investment Officer - Equity and a Director of Fidelity Management & Research (U.K.) Inc. (investment adviser firm, 2013-2015) and as a Director of Fidelity Management & Research (Hong Kong) Limited (investment adviser firm, 2017).
Jonathan Davis (1968)
Year of Election or Appointment: 2010
Assistant Treasurer
Mr. Davis also serves as Assistant Treasurer of other funds. Mr. Davis serves as Assistant Treasurer of FMR Capital, Inc. (2017-present) and is an employee of Fidelity Investments. Previously, Mr. Davis served as Vice President and Associate General Counsel of FMR LLC (diversified financial services company, 2003-2010).
Adrien E. Deberghes (1967)
Year of Election or Appointment: 2016
Assistant Treasurer
Mr. Deberghes also serves as an officer of other funds. He serves as Assistant Treasurer of FMR Capital, Inc. (2017-present), Executive Vice President of Fidelity Investments Money Management, Inc. (FIMM) (investment adviser firm, 2016-present), and is an employee of Fidelity Investments (2008-present). Previously, Mr. Deberghes served as President and Treasurer of certain Fidelity® funds (2013-2018). Prior to joining Fidelity Investments, Mr. Deberghes was Senior Vice President of Mutual Fund Administration at State Street Corporation (2007-2008), Senior Director of Mutual Fund Administration at Investors Bank & Trust (2005-2007), and Director of Finance for Dunkin' Brands (2000-2005). Previously, Mr. Deberghes served in other fund officer roles.
Laura M. Del Prato (1964)
Year of Election or Appointment: 2018
Assistant Treasurer
Ms. Del Prato also serves as an officer of other funds. Ms. Del Prato is an employee of Fidelity Investments (2017-present). Prior to joining Fidelity Investments, Ms. Del Prato served as a Managing Director and Treasurer of the JPMorgan Mutual Funds (2014-2017). Prior to JPMorgan, Ms. Del Prato served as a partner at Cohen Fund Audit Services (accounting firm, 2012-2013) and KPMG LLP (accounting firm, 2004-2012).
Colm A. Hogan (1973)
Year of Election or Appointment: 2016
Deputy Treasurer
Mr. Hogan also serves as an officer of other funds. Mr. Hogan serves as Assistant Treasurer of FMR Capital, Inc. (2017-present) and is an employee of Fidelity Investments (2005-present). Previously, Mr. Hogan served as Assistant Treasurer of certain Fidelity® funds (2016-2018).
Pamela R. Holding (1964)
Year of Election or Appointment: 2018
Vice President
Ms. Holding also serves as Vice President of other funds. Ms. Holding serves as Executive Vice President of Fidelity SelectCo, LLC (2019-present), Co-Head of Equity (2018-present) and is an employee of Fidelity Investments (2013-present). Previously, Ms. Holding served as Chief Investment Officer of Fidelity Institutional Asset Management (2013-2018).
Chris Maher (1972)
Year of Election or Appointment: 2013
Assistant Treasurer
Mr. Maher serves as Assistant Treasurer of other funds. Mr. Maher is Vice President of Valuation Oversight, serves as Assistant Treasurer of FMR Capital, Inc. (2017-present), and is an employee of Fidelity Investments. Previously, Mr. Maher served as Vice President of Asset Management Compliance (2013), Vice President of the Program Management Group of FMR (investment adviser firm, 2010-2013), and Vice President of Valuation Oversight (2008-2010).
Kenneth B. Robins (1969)
Year of Election or Appointment: 2016
Chief Compliance Officer
Mr. Robins also serves as an officer of other funds. Mr. Robins serves as Compliance Officer of Fidelity Management & Research Company and FMR Co., Inc. (investment adviser firms, 2016-present) and is an employee of Fidelity Investments (2004-present). Previously, Mr. Robins served as Executive Vice President of Fidelity Investments Money Management, Inc. (investment adviser firm, 2013-2016) and served in other fund officer roles.
Stacie M. Smith (1974)
Year of Election or Appointment: 2016
President and Treasurer
Ms. Smith also serves as an officer of other funds. Ms. Smith serves as Assistant Treasurer of FMR Capital, Inc. (2017-present), is an employee of Fidelity Investments (2009-present), and has served in other fund officer roles. Prior to joining Fidelity Investments, Ms. Smith served as Senior Audit Manager of Ernst & Young LLP (accounting firm, 1996-2009). Previously, Ms. Smith served as Assistant Treasurer (2013-2018) and Deputy Treasurer (2013-2016) of certain Fidelity® funds.
Marc L. Spector (1972)
Year of Election or Appointment: 2016
Assistant Treasurer
Mr. Spector also serves as an officer of other funds. Mr. Spector serves as Assistant Treasurer of FMR Capital, Inc. (2017-present) and is an employee of Fidelity Investments (2016-present). Prior to joining Fidelity Investments, Mr. Spector served as Director at the Siegfried Group (accounting firm, 2013-2016), and prior to Siegfried Group as audit senior manager at Deloitte & Touche (accounting firm, 2005-2013).
Jim Wegmann (1979)
Year of Election or Appointment: 2019
Assistant Treasurer
Mr. Wegmann also serves as Assistant Treasurer of other funds. Mr. Wegmann is an employee of Fidelity Investments (2011-present).
Shareholder Expense Example
As a shareholder of the Fund, you incur two types of costs: (1) transaction costs, and (2) ongoing costs, including management fees and other Fund expenses. This Example is intended to help you understand your ongoing costs (in dollars) of investing in the Fund and to compare these costs with the ongoing costs of investing in other mutual funds.
The Example is based on an investment of $1,000 invested at the beginning of the period and held for the entire period (November 1, 2018 to April 30, 2019).
Actual Expenses
The first line of the accompanying table provides information about actual account values and actual expenses. You may use the information in this line, together with the amount you invested, to estimate the expenses that you paid over the period. Simply divide your account value by $1,000.00 (for example, an $8,600 account value divided by $1,000.00 = 8.6), then multiply the result by the number in the first line under the heading entitled "Expenses Paid During Period" to estimate the expenses you paid on your account during this period. In addition, the Fund, as a shareholder in the underlying Fidelity Central Funds, will indirectly bear its pro-rata share of the fees and expenses incurred by the underlying Fidelity Central Funds. These fees and expenses are not included in the Fund's annualized expense ratio used to calculate the expense estimate in the table below.
Hypothetical Example for Comparison Purposes
The second line of the accompanying table provides information about hypothetical account values and hypothetical expenses based on the Fund's actual expense ratio and an assumed rate of return of 5% per year before expenses, which is not the Fund's actual return. The hypothetical account values and expenses may not be used to estimate the actual ending account balance or expenses you paid for the period. You may use this information to compare the ongoing costs of investing in the Fund and other funds. To do so, compare this 5% hypothetical example with the 5% hypothetical examples that appear in the shareholder reports of the other funds. In addition, the Fund, as a shareholder in the underlying Fidelity Central Funds, will indirectly bear its pro-rata share of the fees and expenses incurred by the underlying Fidelity Central Funds. These fees and expenses are not included in the Fund's annualized expense ratio used to calculate the expense estimate in the table below.
Please note that the expenses shown in the table are meant to highlight your ongoing costs only and do not reflect any transaction costs. Therefore, the second line of the table is useful in comparing ongoing costs only, and will not help you determine the relative total costs of owning different funds.
| Annualized Expense Ratio-A | Beginning Account Value November 1, 2018 | Ending Account Value April 30, 2019 | Expenses Paid During Period-B November 1, 2018 to April 30, 2019 | |
| Actual | .67% | $1,000.00 | $1,062.50 | $3.43 |
| Hypothetical-C | $1,000.00 | $1,021.47 | $3.36 |
A Annualized expense ratio reflects expenses net of applicable fee waivers.
B Expenses are equal to the Fund's annualized expense ratio, multiplied by the average account value over the period, multiplied by 181/365 (to reflect the one-half year period).
C 5% return per year before expenses
Distributions (Unaudited)
The Board of Trustees of Fidelity Large Cap Stock Fund voted to pay on June 10, 2019, to shareholders of record at the opening of business on June 7, 2019, a distribution of $0.567 per share derived from capital gains realized from sales of portfolio securities and a dividend of $0.181 per share from net investment income.
The fund hereby designates as a capital gain dividend with respect to the taxable year ended April 30, 2019, $206,540,614, or, if subsequently determined to be different, the net capital gain of such year.
The fund designates 83% and 99% of the dividends distributed in June and December, respectively during the fiscal year as qualifying for the dividends–received deduction for corporate shareholders.
The fund designates 100% of the dividends distributed during the fiscal year as amounts which may be taken into account as a dividend for the purposes of the maximum rate under section 1(h)(11) of the Internal Revenue Code.
The fund will notify shareholders in January 2020 of amounts for use in preparing 2019 income tax returns.
Board Approval of Investment Advisory Contracts and Management Fees
Fidelity Large Cap Stock Fund
Each year, the Board of Trustees, including the Independent Trustees (together, the Board), votes on the renewal of the management contract with Fidelity Management & Research Company (FMR) and the sub-advisory agreements (together, the Advisory Contracts) for the fund. FMR and the sub-advisers are referred to herein as the Investment Advisers. The Board, assisted by the advice of fund counsel and Independent Trustees' counsel, requests and considers a broad range of information relevant to the renewal of the Advisory Contracts throughout the year.
The Board meets regularly and, at each of its meetings, covers an extensive agenda of topics and materials and considers factors that are relevant to its annual consideration of the renewal of the fund's Advisory Contracts, including the services and support provided to the fund and its shareholders. The Board has established various standing committees (Committees), each composed of and chaired by Independent Trustees with varying backgrounds, to which the Board has assigned specific subject matter responsibilities in order to enhance effective decision-making by the Board. The Board, acting directly and through its Committees, requests and receives information concerning the annual consideration of the renewal of the fund's Advisory Contracts. The Board also meets as needed to review matters specifically related to the Board's annual consideration of the renewal of the Advisory Contracts. Members of the Board may also meet with trustees of other Fidelity funds through joint ad hoc committees to discuss certain matters relevant to all of the Fidelity funds.
At its January 2019 meeting, the Board unanimously determined to renew the fund's Advisory Contracts. In reaching its determination, the Board considered all factors it believed relevant, including (i) the nature, extent, and quality of the services to be provided to the fund and its shareholders (including the investment performance of the fund); (ii) the competitiveness of the fund's management fee and total expense ratio relative to peer funds; (iii) the total costs of the services to be provided by and the profits to be realized by Fidelity from its relationships with the fund; and (iv) the extent to which, if any, economies of scale exist and would be realized as the fund grows, and whether any economies of scale are appropriately shared with fund shareholders.
In considering whether to renew the Advisory Contracts for the fund, the Board reached a determination, with the assistance of fund counsel and Independent Trustees' counsel and through the exercise of its business judgment, that the renewal of the Advisory Contracts was in the best interests of the fund and its shareholders and that the compensation payable under the Advisory Contracts was fair and reasonable. The Board's decision to renew the Advisory Contracts was not based on any single factor, but rather was based on a comprehensive consideration of all the information provided to the Board at its meetings throughout the year. The Board, in reaching its determination to renew the Advisory Contracts, was aware that shareholders of the fund have a broad range of investment choices available to them, including a wide choice among funds offered by Fidelity's competitors, and that the fund's shareholders, who have the opportunity to review and weigh the disclosure provided by the fund in its prospectus and other public disclosures, have chosen to invest in this fund, which is part of the Fidelity family of funds.
Nature, Extent, and Quality of Services Provided. The Board considered Fidelity's staffing as it relates to the fund, including the backgrounds of investment personnel of Fidelity, and also considered the fund's investment objective, strategies, and related investment philosophy. The Independent Trustees also had discussions with senior management of Fidelity's investment operations and investment groups. The Board considered the structure of the investment personnel compensation program and whether this structure provides appropriate incentives to act in the best interests of the fund. Additionally, the Board considered the portfolio managers' investments, if any, in the funds that they manage.Resources Dedicated to Investment Management and Support Services. The Board and the Fund Oversight and Research Committees reviewed the general qualifications and capabilities of Fidelity's investment staff, including its size, education, experience, and resources, as well as Fidelity's approach to recruiting, training, managing, and compensating investment personnel. The Board noted that Fidelity has continued to increase the resources devoted to non-U.S. offices, including expansion of Fidelity's global investment organization. The Board also noted that Fidelity's analysts have extensive resources, tools and capabilities that allow them to conduct sophisticated quantitative and fundamental analysis, as well as credit analysis of issuers, counterparties and guarantors. Further, the Board considered that Fidelity's investment professionals have sufficient access to global information and data so as to provide competitive investment results over time, and that those professionals also have access to sophisticated tools that permit them to assess portfolio construction and risk and performance attribution characteristics continuously, as well as to transmit new information and research conclusions rapidly around the world. Additionally, in its deliberations, the Board considered Fidelity's trading, risk management, compliance, and technology and operations capabilities and resources, which are integral parts of the investment management process.Shareholder and Administrative Services. The Board considered (i) the nature, extent, quality, and cost of advisory, administrative, and shareholder services performed by the Investment Advisers and their affiliates under the Advisory Contracts and under separate agreements covering transfer agency, pricing and bookkeeping, and securities lending services for the fund; (ii) the nature and extent of the supervision of third party service providers, principally custodians, subcustodians, and pricing vendors; and (iii) the resources devoted to, and the record of compliance with, the fund's compliance policies and procedures. The Board also reviewed the allocation of fund brokerage, including allocations to brokers affiliated with the Investment Advisers, the use of brokerage commissions to pay fund expenses, and the use of "soft" commission dollars to pay for research services.The Board noted that the growth of fund assets over time across the complex allows Fidelity to reinvest in the development of services designed to enhance the value and convenience of the Fidelity funds as investment vehicles. These services include 24-hour access to account information and market information through telephone representatives and over the Internet, investor education materials and asset allocation tools, and the expanded availability of Fidelity Investor Centers.The Board noted that it and the boards of certain other Fidelity funds had formed an ad hoc Committee on Transfer Agency Fees to review the variety of transfer agency fee structures throughout the industry and Fidelity's competitive positioning with respect to industry participants.Investment in a Large Fund Family. The Board considered the benefits to shareholders of investing in a Fidelity fund, including the benefits of investing in a fund that is part of a large family of funds offering a variety of investment disciplines and providing a large variety of mutual fund investor services. The Board noted that Fidelity had taken, or had made recommendations that resulted in the Fidelity funds taking, a number of actions over the previous year that benefited particular funds, including: (i) continuing to dedicate additional resources to Fidelity's investment research process, which includes meetings with management of issuers of securities in which the funds invest, and to the support of the senior management team that oversees asset management; (ii) continuing efforts to enhance Fidelity's global research capabilities; (iii) launching new funds and making other enhancements to meet client needs; (iv) launching new share classes of existing funds; (v) eliminating purchase minimums and broadening eligibility requirements for certain funds and share classes; (vi) reducing management fees and total expenses for certain growth equity funds and index funds; (vii) lowering expense caps for certain existing funds and classes, and converting certain voluntary expense caps to contractual caps, to reduce expenses borne by shareholders; (viii) eliminating short-term redemption fees for funds that had such fees; (ix) rationalizing product lines and gaining increased efficiencies from fund mergers and share class consolidations; (x) continuing to develop, acquire and implement systems and technology to improve services to the funds and shareholders, strengthen information security, and increase efficiency; and (xi) continuing to implement enhancements to further strengthen Fidelity's product line to increase investors' probability of success in achieving their investment goals, including retirement income goals.Investment Performance. The Board considered whether the fund has operated in accordance with its investment objective, as well as its record of compliance with its investment restrictions and its performance history.The Board took into account discussions that occur at Board meetings throughout the year with representatives of the Investment Advisers about fund investment performance. In this regard the Board noted that as part of regularly scheduled fund reviews and other reports to the Board on fund performance, the Board considers annualized return information for the fund for different time periods, measured against an appropriate securities market index ("benchmark index") and a peer group of funds with similar objectives ("peer group"), if any. In its evaluation of fund investment performance, the Board gave particular attention to information indicating changes in performance of certain Fidelity funds for specific time periods and discussed with the Investment Advisers the reasons for any overperformance or underperformance.In addition to reviewing absolute and relative fund performance, the Independent Trustees periodically consider the appropriateness of fund performance metrics in evaluating the results achieved. In general, the Independent Trustees believe that fund performance should be evaluated based on net performance (after fees and expenses) of both the highest performing and lowest performing fund share classes, where applicable, compared to appropriate benchmark indices, over appropriate time periods that may include full market cycles, and compared to peer groups, as applicable, over the same periods, taking into account relevant factors including the following: general market conditions; issuer-specific information; and fund cash flows and other factors.The Independent Trustees recognize that shareholders evaluate performance on a net basis over their own holding periods, for which one-, three-, and five-year periods are often used as a proxy. For this reason, the performance information reviewed by the Board also included net cumulative total return information for the fund and an appropriate benchmark index and peer group for the most recent one-, three-, and five-year periods ended June 30, 2018, as shown below. Returns are shown compared to the 25th percentile (top of box, 75% beaten) and 75th percentile (bottom of box, 25% beaten) of the peer universe.Fidelity Large Cap Stock Fund
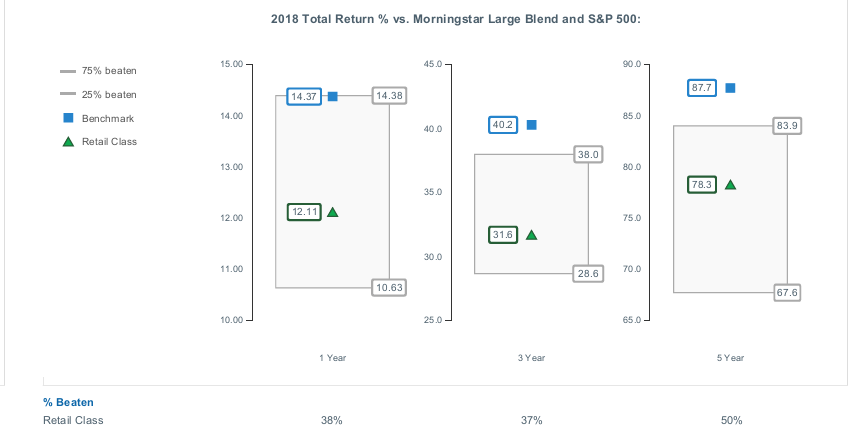
Fidelity Large Cap Stock Fund
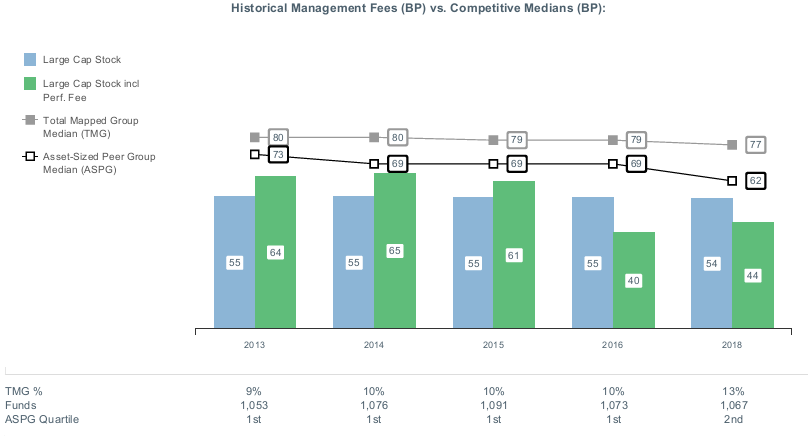
![]()
LCS-ANN-0619
1.703546.121
Fidelity® Small Cap Stock Fund Annual Report April 30, 2019 |
|
Beginning on January 1, 2021, as permitted by regulations adopted by the Securities and Exchange Commission, paper copies of a fund’s shareholder reports will no longer be sent by mail, unless you specifically request paper copies of the reports from the fund or from your financial intermediary, such as a financial advisor, broker-dealer or bank. Instead, the reports will be made available on a website, and you will be notified by mail each time a report is posted and provided with a website link to access the report.
If you already elected to receive shareholder reports electronically, you will not be affected by this change and you need not take any action. You may elect to receive shareholder reports and other communications from a fund electronically, by contacting your financial intermediary. For Fidelity customers, visit Fidelity's web site or call Fidelity using the contact information listed below.
You may elect to receive all future reports in paper free of charge. If you wish to continue receiving paper copies of your shareholder reports, you may contact your financial intermediary or, if you are a Fidelity customer, visit Fidelity’s website, or call Fidelity at the applicable toll-free number listed below. Your election to receive reports in paper will apply to all funds held with the fund complex/your financial intermediary.
| Account Type | Website | Phone Number |
| Brokerage, Mutual Fund, or Annuity Contracts: | fidelity.com/mailpreferences | 1-800-343-3548 |
| Employer Provided Retirement Accounts: | netbenefits.fidelity.com/preferences (choose 'no' under Required Disclosures to continue to print) | 1-800-343-0860 |
| Advisor Sold Accounts Serviced Through Your Financial Intermediary: | Contact Your Financial Intermediary | Your Financial Intermediary's phone number |
| Advisor Sold Accounts Serviced by Fidelity: | institutional.fidelity.com | 1-877-208-0098 |
Contents
Board Approval of Investment Advisory Contracts and Management Fees |
To view a fund's proxy voting guidelines and proxy voting record for the 12-month period ended June 30, visit http://www.fidelity.com/proxyvotingresults or visit the Securities and Exchange Commission's (SEC) web site at http://www.sec.gov.
You may also call 1-800-544-8544 to request a free copy of the proxy voting guidelines.
Standard & Poor's, S&P and S&P 500 are registered service marks of The McGraw-Hill Companies, Inc. and have been licensed for use by Fidelity Distributors Corporation.
Other third-party marks appearing herein are the property of their respective owners.
All other marks appearing herein are registered or unregistered trademarks or service marks of FMR LLC or an affiliated company. © 2019 FMR LLC. All rights reserved.
This report and the financial statements contained herein are submitted for the general information of the shareholders of the Fund. This report is not authorized for distribution to prospective investors in the Fund unless preceded or accompanied by an effective prospectus.
A fund files its complete schedule of portfolio holdings with the SEC for the first and third quarters of each fiscal year on Form N-PORT. Forms N-PORT are available on the SEC’s web site at http://www.sec.gov. A fund's Forms N-PORT may be reviewed and copied at the SEC’s Public Reference Room in Washington, DC. Information regarding the operation of the SEC's Public Reference Room may be obtained by calling 1-800-SEC-0330.
For a complete list of a fund's portfolio holdings, view the most recent holdings listing, semiannual report, or annual report on Fidelity's web site at http://www.fidelity.com, http://www.institutional.fidelity.com, or http://www.401k.com, as applicable.
NOT FDIC INSURED •MAY LOSE VALUE •NO BANK GUARANTEE
Neither the Fund nor Fidelity Distributors Corporation is a bank.
Performance: The Bottom Line
Average annual total return reflects the change in the value of an investment, assuming reinvestment of distributions from dividend income and capital gains (the profits earned upon the sale of securities that have grown in value, if any) and assuming a constant rate of performance each year. The hypothetical investment and the average annual total returns do not reflect the deduction of taxes that a shareholder would pay on fund distributions or the redemption of fund shares. During periods of reimbursement by Fidelity, a fund’s total return will be greater than it would be had the reimbursement not occurred. How a fund did yesterday is no guarantee of how it will do tomorrow.
Average Annual Total Returns
| For the periods ended April 30, 2019 | Past 1 year | Past 5 years | Past 10 years |
| Fidelity® Small Cap Stock Fund | 6.66% | 8.58% | 12.84% |
$10,000 Over 10 Years
Let's say hypothetically that $10,000 was invested in Fidelity® Small Cap Stock Fund on April 30, 2009.
The chart shows how the value of your investment would have changed, and also shows how the Russell 2000® Index performed over the same period.
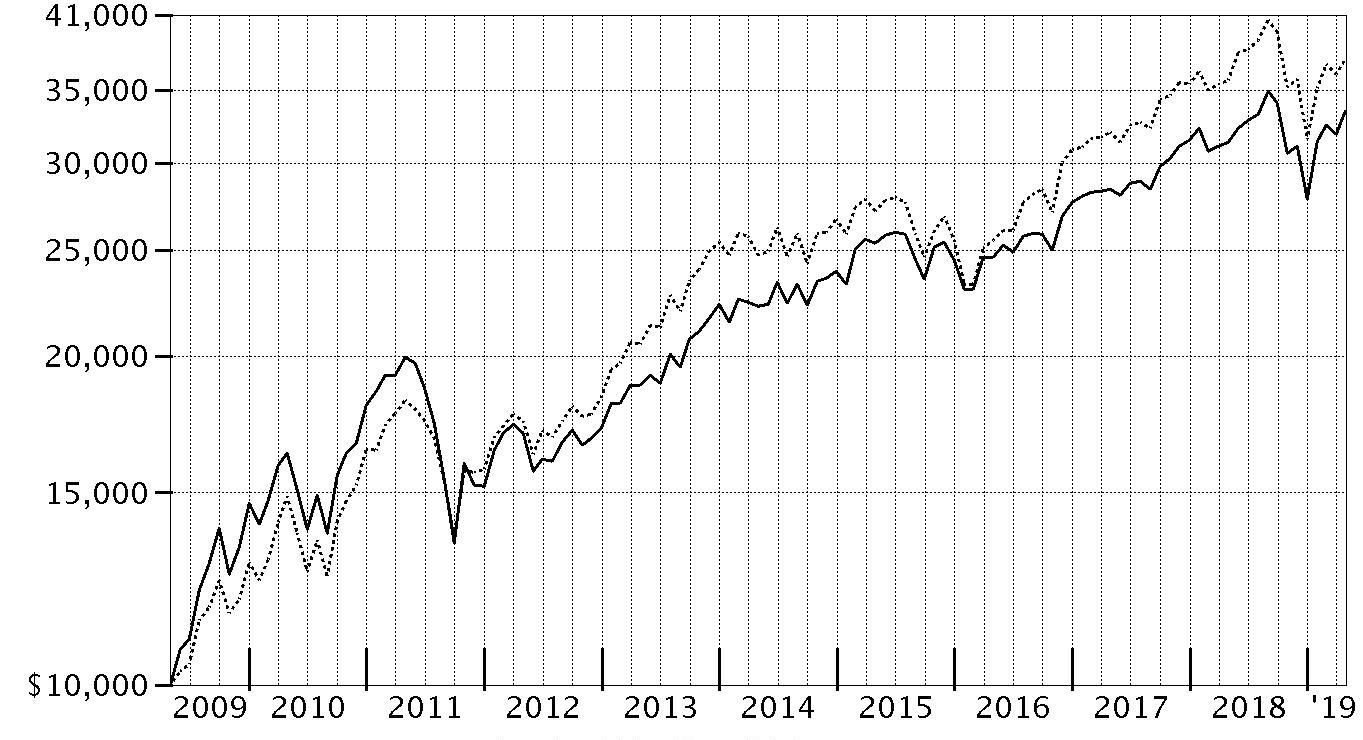
| Period Ending Values | ||
| $33,478 | Fidelity® Small Cap Stock Fund | |
| $37,383 | Russell 2000® Index | |
Management's Discussion of Fund Performance
Market Recap: The S&P 500® index gained 13.49% for the 12 months ending April 30, 2019, as U.S. equities began the new year on a high note after enduring an historically volatile final quarter of 2018. The index rose 18.25% year to date, its strongest four-month opening since 1987, amid upbeat company earnings/outlooks and signs the Fed may pause on rates. After achieving a record close in late April, the S&P 500® moved a bit higher to end the period. The uptrend was in sharp contrast to late 2018, when rising U.S. Treasury yields and concern about peaking corporate earnings growth sent many investors fleeing from risk assets as they were still dealing with lingering uncertainty related to global trade and the Fed picking up the pace of interest rate hikes. The index returned -6.84% in October, at the time its largest monthly drop in seven years. But conditions worsened through Christmas, as jitters about the economy and another hike in rates led to a spike in market volatility and a -9.03% result for December. For the full period, eight of 11 sectors registered a double-digit gain, led by information technology (+25%). Three defensive groups also stood out: real estate (+21%), consumer staples (+18%) and utilities (+18%). Communication services – a mix of telecom stocks and media/entertainment names – gained 17%, followed by consumer discretionary (+16%). In contrast, energy (-7%) lost ground, while materials (+3%), financials (+4%), health care (+11%) and industrials (+11%) also trailed the broad market.Comments from Portfolio Manager Kip Johann-Berkel: For the fiscal year, the fund's Retail Class shares gained 6.66%, outpacing the 4.61% increase for the benchmark Russell 2000® index. Favorable stock selection drove the fund's result relative to the index, particularly in the health care, industrials, materials, energy and financials sectors. Stock picks in information technology and, to a lesser extent, real estate and consumer discretionary, were negative factors. Among individual stocks, the top contributor was a position in Lending Tree, an online lending marketplace, which returned 57% for the fund. Lending Tree benefited from strong secular growth trends, a favorable competitive position and an attractive valuation entering the period, among other factors. Out-of-index positions in internet and cable service provider Cable One and Israel-based software provider Nice both added value, returning 58% and 38%, respectively. Meanwhile, foreign exposure contributed overall, despite currency headwinds. The fund's biggest individual relative detractor was Stamps.com(-62%), a provider of online mailing and shipping services whose shares plunged after the company voluntarily terminated an exclusive contract with the United States Postal Service as part of a business-strategy shift. Also hampering relative results was software provider Ebix (-34% for the fund), whose shares fell after the market expressed concern about a change in the company's primary auditor. I continued to find Ebix attractively valued, however, and it, along with Lending Tree and Nice, were among the fund's largest holdings on April 30.The views expressed above reflect those of the portfolio manager(s) only through the end of the period as stated on the cover of this report and do not necessarily represent the views of Fidelity or any other person in the Fidelity organization. Any such views are subject to change at any time based upon market or other conditions and Fidelity disclaims any responsibility to update such views. These views may not be relied on as investment advice and, because investment decisions for a Fidelity fund are based on numerous factors, may not be relied on as an indication of trading intent on behalf of any Fidelity fund.
Note to Shareholders: On June 30, 2018, Kip Johann-Berkel assumed sole management responsibilities for the fund after former Co-Manager Lionel Harris stepped down to pursue other opportunities within Fidelity.Investment Summary (Unaudited)
Top Ten Stocks as of April 30, 2019
| % of fund's net assets | |
| Career Education Corp. | 3.0 |
| SYNNEX Corp. | 2.8 |
| Innospec, Inc. | 2.3 |
| LendingTree, Inc. | 2.3 |
| NICE Systems Ltd. sponsored ADR | 2.2 |
| Primerica, Inc. | 2.2 |
| Inovalon Holdings, Inc. Class A | 2.1 |
| Boyd Group Income Fund | 2.0 |
| Ebix, Inc. | 1.9 |
| First Cash Financial Services, Inc. | 1.9 |
| 22.7 |
Top Five Market Sectors as of April 30, 2019
| % of fund's net assets | |
| Financials | 20.9 |
| Information Technology | 18.1 |
| Consumer Discretionary | 14.4 |
| Health Care | 13.9 |
| Industrials | 13.8 |
Asset Allocation (% of fund's net assets)
| As of April 30, 2019* | ||
| Stocks | 99.6% | |
| Short-Term Investments and Net Other Assets (Liabilities) | 0.4% | |

* Foreign investments – 23.5%
Schedule of Investments April 30, 2019
Showing Percentage of Net Assets
| Common Stocks - 99.6% | |||
| Shares | Value (000s) | ||
| COMMUNICATION SERVICES - 2.7% | |||
| Interactive Media & Services - 0.5% | |||
| CarGurus, Inc. Class A (a) | 110,000 | $4,481 | |
| LIFULL Co. Ltd. | 449,027 | 2,419 | |
| 6,900 | |||
| Media - 2.2% | |||
| 4Imprint Group PLC | 353,103 | 12,294 | |
| Cable One, Inc. | 18,076 | 19,170 | |
| Fluent, Inc. (a) | 334,586 | 2,352 | |
| 33,816 | |||
| TOTAL COMMUNICATION SERVICES | 40,716 | ||
| CONSUMER DISCRETIONARY - 14.4% | |||
| Auto Components - 1.0% | |||
| Burelle SA | 578 | 609 | |
| Compagnie Plastic Omnium | 240,131 | 7,269 | |
| Linamar Corp. | 197,204 | 7,481 | |
| 15,359 | |||
| Distributors - 0.2% | |||
| Educational Development Corp. | 305,913 | 2,753 | |
| Diversified Consumer Services - 3.9% | |||
| Arco Platform Ltd. Class A | 13,473 | 433 | |
| Career Education Corp. (a) | 2,507,217 | 45,510 | |
| Collectors Universe, Inc. | 87,707 | 1,525 | |
| Laureate Education, Inc. Class A (a) | 668,240 | 10,518 | |
| Redhill Education Ltd. | 440,894 | 674 | |
| 58,660 | |||
| Hotels, Restaurants & Leisure - 1.6% | |||
| MTY Food Group, Inc. | 498,399 | 20,591 | |
| SkiStar AB | 320,209 | 3,872 | |
| 24,463 | |||
| Household Durables - 5.0% | |||
| Cavco Industries, Inc. (a) | 58,254 | 7,268 | |
| Helen of Troy Ltd. (a) | 33,617 | 4,841 | |
| LGI Homes, Inc. (a)(b) | 396,079 | 27,452 | |
| New Home Co. LLC (a)(c) | 1,010,200 | 4,657 | |
| Skyline Champion Corp. | 492,362 | 10,394 | |
| TRI Pointe Homes, Inc. (a) | 1,649,129 | 21,521 | |
| 76,133 | |||
| Internet & Direct Marketing Retail - 2.2% | |||
| Kogan.Com Ltd. (b) | 2,590,939 | 10,228 | |
| Points International Ltd. (a) | 636,190 | 8,277 | |
| Stamps.com, Inc. (a) | 172,217 | 14,776 | |
| 33,281 | |||
| Specialty Retail - 0.5% | |||
| Winmark Corp. | 41,410 | 7,642 | |
| TOTAL CONSUMER DISCRETIONARY | 218,291 | ||
| CONSUMER STAPLES - 3.1% | |||
| Beverages - 0.2% | |||
| Nichols PLC | 145,054 | 3,372 | |
| Food & Staples Retailing - 1.5% | |||
| BJ's Wholesale Club Holdings, Inc. | 271,393 | 7,694 | |
| Performance Food Group Co. (a) | 377,034 | 15,440 | |
| 23,134 | |||
| Food Products - 0.1% | |||
| Armanino Foods of Distinction | 380,066 | 1,266 | |
| Household Products - 1.1% | |||
| Spectrum Brands Holdings, Inc. | 272,330 | 16,767 | |
| Personal Products - 0.2% | |||
| BWX Ltd. (b) | 1,522,942 | 2,319 | |
| TOTAL CONSUMER STAPLES | 46,858 | ||
| ENERGY - 2.9% | |||
| Energy Equipment & Services - 1.1% | |||
| Dril-Quip, Inc. (a) | 334,126 | 14,555 | |
| Profire Energy, Inc. (a) | 1,890,915 | 2,988 | |
| 17,543 | |||
| Oil, Gas & Consumable Fuels - 1.8% | |||
| Murphy Oil Corp. | 209,445 | 5,705 | |
| Texas Pacific Land Trust (b) | 9,982 | 8,009 | |
| World Fuel Services Corp. | 429,405 | 13,247 | |
| 26,961 | |||
| TOTAL ENERGY | 44,504 | ||
| FINANCIALS - 20.9% | |||
| Banks - 4.1% | |||
| Bank OZK | 485,246 | 15,843 | |
| Camden National Corp. | 173,230 | 7,619 | |
| First Citizens Bancshares, Inc. | 19,421 | 8,705 | |
| First Hawaiian, Inc. | 572,300 | 15,824 | |
| Plumas Bancorp | 67,910 | 1,776 | |
| Popular, Inc. | 209,327 | 12,080 | |
| 61,847 | |||
| Capital Markets - 4.5% | |||
| Ashford, Inc. | 81,836 | 4,534 | |
| Australian Ethical Investment Ltd. | 231,097 | 358 | |
| Impax Asset Management Group PLC | 1,771,541 | 5,394 | |
| INTL FCStone, Inc. (a) | 361,898 | 14,679 | |
| LPL Financial | 202,603 | 15,011 | |
| Morningstar, Inc. | 194,544 | 27,907 | |
| Tradeweb Markets, Inc. Class A | 6,487 | 261 | |
| 68,144 | |||
| Consumer Finance - 3.4% | |||
| Encore Capital Group, Inc. (a)(b) | 755,436 | 21,349 | |
| First Cash Financial Services, Inc. | 290,263 | 28,353 | |
| Network International Holdings PLC (d) | 180,437 | 1,226 | |
| 50,928 | |||
| Diversified Financial Services - 2.3% | |||
| Cannae Holdings, Inc. (a) | 341,550 | 8,768 | |
| Hypoport AG (a) | 17,966 | 3,671 | |
| Jefferies Financial Group, Inc. | 1,075,639 | 22,126 | |
| 34,565 | |||
| Insurance - 3.5% | |||
| First American Financial Corp. | 287,285 | 16,392 | |
| Investors Title Co. | 20,234 | 3,418 | |
| Primerica, Inc. | 252,346 | 32,878 | |
| 52,688 | |||
| Real Estate Management & Development - 0.6% | |||
| The RMR Group, Inc. | 166,310 | 9,619 | |
| Thrifts & Mortgage Finance - 2.5% | |||
| LendingTree, Inc. (a)(b) | 89,816 | 34,563 | |
| Timberland Bancorp, Inc. | 122,136 | 3,811 | |
| 38,374 | |||
| TOTAL FINANCIALS | 316,165 | ||
| HEALTH CARE - 13.9% | |||
| Biotechnology - 0.5% | |||
| AB-Biotics SA (a) | 1,546 | 7 | |
| BioGaia AB | 14,463 | 702 | |
| Bioventix PLC (b) | 22,372 | 1,167 | |
| Essex Bio-Technology Ltd. | 2,984,000 | 2,750 | |
| Shanghai Haohai Biological Technology Co. Ltd. (H Shares) (d) | 384,200 | 2,463 | |
| 7,089 | |||
| Health Care Equipment & Supplies - 3.2% | |||
| Boule Diagnostics AB | 17,802 | 116 | |
| Hamilton Thorne Ltd. (a) | 89,400 | 83 | |
| Kewaunee Scientific Corp. | 20,265 | 459 | |
| Medacta Group SA (d) | 108,100 | 9,903 | |
| Medistim ASA | 188,286 | 2,772 | |
| Tristel PLC | 964,293 | 3,867 | |
| Utah Medical Products, Inc. | 102,990 | 8,692 | |
| Varex Imaging Corp. (a) | 667,737 | 21,928 | |
| 47,820 | |||
| Health Care Providers & Services - 3.1% | |||
| Chemed Corp. | 36,876 | 12,050 | |
| Corvel Corp. (a) | 43,924 | 3,154 | |
| Encompass Health Corp. | 295,634 | 19,054 | |
| Magellan Health Services, Inc. (a) | 117,137 | 8,200 | |
| Viemed Healthcare, Inc. (a) | 839,513 | 4,950 | |
| 47,408 | |||
| Health Care Technology - 2.1% | |||
| Cegedim SA (a) | 2,549 | 74 | |
| Inovalon Holdings, Inc. Class A (a)(b) | 2,377,146 | 32,163 | |
| 32,237 | |||
| Life Sciences Tools & Services - 3.0% | |||
| Charles River Laboratories International, Inc. (a) | 196,413 | 27,590 | |
| ICON PLC (a) | 126,771 | 17,314 | |
| 44,904 | |||
| Pharmaceuticals - 2.0% | |||
| Alliance Pharma PLC | 9,900,413 | 10,147 | |
| BioSyent, Inc. (a) | 687,708 | 3,799 | |
| Dechra Pharmaceuticals PLC | 248,230 | 8,610 | |
| Mallinckrodt PLC (a) | 84,830 | 1,311 | |
| Phibro Animal Health Corp. Class A | 199,588 | 6,928 | |
| 30,795 | |||
| TOTAL HEALTH CARE | 210,253 | ||
| INDUSTRIALS - 13.8% | |||
| Building Products - 0.0% | |||
| Reliance Worldwide Corp. Ltd. | 45,338 | 156 | |
| Commercial Services & Supplies - 3.3% | |||
| Boyd Group Income Fund | 275,946 | 30,318 | |
| Bravida AB (d) | 250,000 | 2,190 | |
| Clipper Logistics PLC (b) | 436,679 | 1,640 | |
| Loomis AB (B Shares) | 336,790 | 12,460 | |
| VSE Corp. | 103,548 | 3,165 | |
| 49,773 | |||
| Construction & Engineering - 1.2% | |||
| AECOM (a) | 522,582 | 17,716 | |
| Industrial Conglomerates - 0.2% | |||
| Lifco AB | 67,880 | 3,233 | |
| Machinery - 2.8% | |||
| AGCO Corp. | 258,459 | 18,294 | |
| Allison Transmission Holdings, Inc. | 330,046 | 15,466 | |
| Middleby Corp. (a) | 69,414 | 9,172 | |
| 42,932 | |||
| Professional Services - 4.5% | |||
| Asiakastieto Group Oyj (d) | 30,938 | 930 | |
| Barrett Business Services, Inc. | 163,714 | 11,928 | |
| CBIZ, Inc. (a) | 1,279,245 | 24,702 | |
| Franklin Covey Co. (a) | 299,204 | 8,530 | |
| Insperity, Inc. | 134,131 | 16,037 | |
| SHL-JAPAN Ltd. (e) | 3,100 | 48 | |
| Talenom OYJ | 129,739 | 4,933 | |
| Tinexta SpA | 64,060 | 816 | |
| 67,924 | |||
| Trading Companies & Distributors - 1.4% | |||
| AerCap Holdings NV (a) | 338,802 | 16,818 | |
| Bufab AB | 79,912 | 906 | |
| Textainer Group Holdings Ltd. (a) | 408,190 | 3,915 | |
| 21,639 | |||
| Transportation Infrastructure - 0.4% | |||
| Macquarie Infrastructure Co. LLC | 151,447 | 6,135 | |
| TOTAL INDUSTRIALS | 209,508 | ||
| INFORMATION TECHNOLOGY - 18.1% | |||
| Electronic Equipment & Components - 2.8% | |||
| SYNNEX Corp. | 390,061 | 42,080 | |
| Internet Software & Services - 0.6% | |||
| Liberated Syndication, Inc. (a) | 3,651 | 9 | |
| LoopUp Group PLC (a) | 170,000 | 765 | |
| MSL Solutions Ltd. (a) | 12,061,576 | 1,275 | |
| Over The Wire Holdings Ltd. | 1,016,421 | 3,712 | |
| Redbubble Ltd. (a) | 4,471,676 | 2,963 | |
| 8,724 | |||
| IT Services - 5.8% | |||
| Adevinta ASA Class B | 58,482 | 575 | |
| Bouvet ASA | 61,312 | 1,983 | |
| Castleton Technology PLC (a) | 1,866,435 | 2,580 | |
| Computer Services, Inc. | 90,939 | 5,934 | |
| CoreLogic, Inc. (a) | 496,681 | 20,170 | |
| D4t4 Solutions PLC | 125,560 | 434 | |
| Econocom Group SA | 1,697,319 | 7,051 | |
| GetBusy PLC (a) | 2,277,981 | 876 | |
| GreenSky, Inc. Class A | 324,924 | 5,192 | |
| Hackett Group, Inc. | 204,728 | 3,143 | |
| Presidio, Inc. | 512,465 | 7,697 | |
| Prodware | 127,573 | 1,424 | |
| Sylogist Ltd. | 677,000 | 5,867 | |
| WEX, Inc. (a) | 115,677 | 24,327 | |
| 87,253 | |||
| Software - 8.9% | |||
| 2U, Inc. (a)(b) | 144,709 | 8,755 | |
| Admicom OYJ | 1,070 | 48 | |
| AppFolio, Inc. (a) | 46,902 | 4,555 | |
| Bigtincan Holdings Ltd. (a)(b) | 4,081,924 | 1,352 | |
| Cardlytics, Inc. (a) | 222,045 | 3,464 | |
| Ceridian HCM Holding, Inc. | 5,489 | 292 | |
| Ebix, Inc. (b) | 576,653 | 29,109 | |
| Enghouse Systems Ltd. | 320,157 | 7,826 | |
| Fortnox AB | 9,980 | 119 | |
| Hansen Technologies Ltd. | 3,167,429 | 6,721 | |
| j2 Global, Inc. | 226,092 | 19,810 | |
| LeadDesk Oyj (a) | 319 | 3 | |
| Lightspeed POS, Inc. (a) | 14,220 | 265 | |
| Micro Focus International PLC | 718,524 | 18,156 | |
| NICE Systems Ltd. sponsored ADR (a)(b) | 241,778 | 33,332 | |
| Red Violet, Inc. (a)(b) | 101,000 | 803 | |
| StoneCo Ltd. Class A (a) | 5,988 | 172 | |
| Vitec Software Group AB | 84,830 | 867 | |
| 135,649 | |||
| TOTAL INFORMATION TECHNOLOGY | 273,706 | ||
| MATERIALS - 4.2% | |||
| Chemicals - 2.8% | |||
| Core Molding Technologies, Inc. | 180,497 | 1,466 | |
| Innospec, Inc. | 415,561 | 35,248 | |
| Northern Technologies International Corp. | 71,461 | 1,892 | |
| PolyOne Corp. | 134,629 | 3,721 | |
| 42,327 | |||
| Containers & Packaging - 1.3% | |||
| Silgan Holdings, Inc. | 421,344 | 12,615 | |
| UFP Technologies, Inc. (a) | 189,987 | 6,916 | |
| 19,531 | |||
| Paper & Forest Products - 0.1% | |||
| Schweitzer-Mauduit International, Inc. | 64,638 | 2,299 | |
| TOTAL MATERIALS | 64,157 | ||
| REAL ESTATE - 5.1% | |||
| Equity Real Estate Investment Trusts (REITs) - 4.4% | |||
| CoreSite Realty Corp. | 71,856 | 7,862 | |
| EPR Properties | 291,414 | 22,981 | |
| Essential Properties Realty Trust, Inc. | 859,856 | 17,782 | |
| Store Capital Corp. | 520,913 | 17,357 | |
| 65,982 | |||
| Real Estate Management & Development - 0.7% | |||
| Consolidated-Tomoka Land Co. | 78,973 | 4,896 | |
| FRP Holdings, Inc. (a) | 47,629 | 2,414 | |
| Legacy Housing Corp. | 317,128 | 3,847 | |
| 11,157 | |||
| TOTAL REAL ESTATE | 77,139 | ||
| UTILITIES - 0.5% | |||
| Gas Utilities - 0.5% | |||
| Star Gas Partners LP | 836,576 | 7,939 | |
| TOTAL COMMON STOCKS | |||
| (Cost $1,359,134) | 1,509,236 | ||
| Money Market Funds - 8.4% | |||
| Fidelity Cash Central Fund, 2.49% (f) | 6,964,747 | 6,966 | |
| Fidelity Securities Lending Cash Central Fund 2.49% (f)(g) | 120,510,562 | 120,523 | |
| TOTAL MONEY MARKET FUNDS | |||
| (Cost $127,489) | 127,489 | ||
| TOTAL INVESTMENT IN SECURITIES - 108.0% | |||
| (Cost $1,486,623) | 1,636,725 | ||
| NET OTHER ASSETS (LIABILITIES) - (8.0)% | (121,371) | ||
| NET ASSETS - 100% | $1,515,354 |
Legend
(a) Non-income producing
(b) Security or a portion of the security is on loan at period end.
(c) Affiliated company
(d) Security exempt from registration under Rule 144A of the Securities Act of 1933. These securities may be resold in transactions exempt from registration, normally to qualified institutional buyers. At the end of the period, the value of these securities amounted to $16,712,000 or 1.1% of net assets.
(e) Security or a portion of the security purchased on a delayed delivery or when-issued basis.
(f) Affiliated fund that is generally available only to investment companies and other accounts managed by Fidelity Investments. The rate quoted is the annualized seven-day yield of the fund at period end. A complete unaudited listing of the fund's holdings as of its most recent quarter end is available upon request. In addition, each Fidelity Central Fund's financial statements, which are not covered by the Fund's Report of Independent Registered Public Accounting Firm, are available on the SEC's website or upon request.
(g) Investment made with cash collateral received from securities on loan.
Affiliated Central Funds
Information regarding fiscal year to date income earned by the Fund from investments in Fidelity Central Funds is as follows:
| Fund | Income earned |
| (Amounts in thousands) | |
| Fidelity Cash Central Fund | $175 |
| Fidelity Securities Lending Cash Central Fund | 512 |
| Total | $687 |
Amounts in the income column in the above table include any capital gain distributions from underlying funds, which are presented in the corresponding line-item in the Statement of Operations, if applicable.
Other Affiliated Issuers
An affiliated company is a company in which the Fund has ownership of at least 5% of the voting securities. Fiscal year to date transactions with companies which are or were affiliates are as follows:
| Affiliate (Amounts in thousands) | Value, beginning of period | Purchases | Sales Proceeds(a) | Dividend Income | Realized Gain (loss) | Change in Unrealized appreciation (depreciation) | Value, end of period |
| New Home Co. LLC | $10,184 | $-- | $69 | $-- | $(53) | $(5,405) | $4,657 |
| Total | $10,184 | $-- | $69 | $-- | $(53) | $(5,405) | $4,657 |
(a) Includes the value of securities delivered through in-kind transactions, if applicable.
Investment Valuation
The following is a summary of the inputs used, as of April 30, 2019, involving the Fund's assets and liabilities carried at fair value. The inputs or methodology used for valuing securities may not be an indication of the risk associated with investing in those securities. For more information on valuation inputs, and their aggregation into the levels used below, please refer to the Investment Valuation section in the accompanying Notes to Financial Statements.
| Valuation Inputs at Reporting Date: | ||||
| Description | Total | Level 1 | Level 2 | Level 3 |
| (Amounts in thousands) | ||||
| Investments in Securities: | ||||
| Equities: | ||||
| Communication Services | $40,716 | $40,716 | $-- | $-- |
| Consumer Discretionary | 218,291 | 214,419 | 3,872 | -- |
| Consumer Staples | 46,858 | 46,858 | -- | -- |
| Energy | 44,504 | 44,504 | -- | -- |
| Financials | 316,165 | 316,165 | -- | -- |
| Health Care | 210,253 | 209,435 | 818 | -- |
| Industrials | 209,508 | 190,719 | 18,789 | -- |
| Information Technology | 273,706 | 272,839 | 867 | -- |
| Materials | 64,157 | 64,157 | -- | -- |
| Real Estate | 77,139 | 77,139 | -- | -- |
| Utilities | 7,939 | 7,939 | -- | -- |
| Money Market Funds | 127,489 | 127,489 | -- | -- |
| Total Investments in Securities: | $1,636,725 | $1,612,379 | $24,346 | $-- |
Other Information
Distribution of investments by country or territory of incorporation, as a percentage of Total Net Assets, is as follows (Unaudited):
| United States of America | 76.5% |
| Canada | 5.8% |
| United Kingdom | 4.9% |
| Israel | 2.2% |
| Australia | 2.0% |
| Sweden | 1.6% |
| Ireland | 1.3% |
| Netherlands | 1.1% |
| Others (Individually Less Than 1%) | 4.6% |
| 100.0% |
See accompanying notes which are an integral part of the financial statements.
Financial Statements
Statement of Assets and Liabilities
| Amounts in thousands (except per-share amount) | April 30, 2019 | |
| Assets | ||
| Investment in securities, at value (including securities loaned of $117,158) — See accompanying schedule: Unaffiliated issuers (cost $1,347,634) | $1,504,579 | |
| Fidelity Central Funds (cost $127,489) | 127,489 | |
| Other affiliated issuers (cost $11,500) | 4,657 | |
| Total Investment in Securities (cost $1,486,623) | $1,636,725 | |
| Cash | 259 | |
| Foreign currency held at value (cost $30) | 30 | |
| Receivable for investments sold | 7,574 | |
| Receivable for fund shares sold | 462 | |
| Dividends receivable | 5,126 | |
| Distributions receivable from Fidelity Central Funds | 73 | |
| Prepaid expenses | 1 | |
| Other receivables | 21 | |
| Total assets | 1,650,271 | |
| Liabilities | ||
| Payable for investments purchased | ||
| Regular delivery | $10,893 | |
| Delayed delivery | 48 | |
| Payable for fund shares redeemed | 2,575 | |
| Accrued management fee | 577 | |
| Other affiliated payables | 245 | |
| Other payables and accrued expenses | 53 | |
| Collateral on securities loaned | 120,526 | |
| Total liabilities | 134,917 | |
| Net Assets | $1,515,354 | |
| Net Assets consist of: | ||
| Paid in capital | $1,367,480 | |
| Total distributable earnings (loss) | 147,874 | |
| Net Assets, for 89,741 shares outstanding | $1,515,354 | |
| Net Asset Value, offering price and redemption price per share ($1,515,354 ÷ 89,741 shares) | $16.89 |
See accompanying notes which are an integral part of the financial statements.
Statement of Operations
| Amounts in thousands | Year ended April 30, 2019 | |
| Investment Income | ||
| Dividends | $16,004 | |
| Special dividends | 3,793 | |
| Income from Fidelity Central Funds | 687 | |
| Total income | 20,484 | |
| Expenses | ||
| Management fee | ||
| Basic fee | $10,661 | |
| Performance adjustment | (3,543) | |
| Transfer agent fees | 2,568 | |
| Accounting and security lending fees | 502 | |
| Custodian fees and expenses | 74 | |
| Independent trustees' fees and expenses | 9 | |
| Registration fees | 33 | |
| Audit | 71 | |
| Legal | 10 | |
| Miscellaneous | 12 | |
| Total expenses before reductions | 10,397 | |
| Expense reductions | (86) | |
| Total expenses after reductions | 10,311 | |
| Net investment income (loss) | 10,173 | |
| Realized and Unrealized Gain (Loss) | ||
| Net realized gain (loss) on: | ||
| Investment securities: | ||
| Unaffiliated issuers | 142,393 | |
| Fidelity Central Funds | (3) | |
| Other affiliated issuers | (53) | |
| Foreign currency transactions | 7 | |
| Total net realized gain (loss) | 142,344 | |
| Change in net unrealized appreciation (depreciation) on: | ||
| Investment securities: | ||
| Unaffiliated issuers | (53,119) | |
| Other affiliated issuers | (5,405) | |
| Assets and liabilities in foreign currencies | (4) | |
| Total change in net unrealized appreciation (depreciation) | (58,528) | |
| Net gain (loss) | 83,816 | |
| Net increase (decrease) in net assets resulting from operations | $93,989 |
See accompanying notes which are an integral part of the financial statements.
Statement of Changes in Net Assets
| Amounts in thousands | Year ended April 30, 2019 | Year ended April 30, 2018 |
| Increase (Decrease) in Net Assets | ||
| Operations | ||
| Net investment income (loss) | $10,173 | $6,627 |
| Net realized gain (loss) | 142,344 | 297,790 |
| Change in net unrealized appreciation (depreciation) | (58,528) | (135,729) |
| Net increase (decrease) in net assets resulting from operations | 93,989 | 168,688 |
| Distributions to shareholders | (304,627) | – |
| Distributions to shareholders from net investment income | – | (5,830) |
| Distributions to shareholders from net realized gain | – | (145,081) |
| Total distributions | (304,627) | (150,911) |
| Share transactions | ||
| Proceeds from sales of shares | 94,706 | 72,556 |
| Reinvestment of distributions | 293,756 | 145,695 |
| Cost of shares redeemed | (257,940) | (417,777) |
| Net increase (decrease) in net assets resulting from share transactions | 130,522 | (199,526) |
| Redemption fees | – | 36 |
| Total increase (decrease) in net assets | (80,116) | (181,713) |
| Net Assets | ||
| Beginning of period | 1,595,470 | 1,777,183 |
| End of period | $1,515,354 | $1,595,470 |
| Other Information | ||
| Undistributed net investment income end of period | $609 | |
| Shares | ||
| Sold | 5,454 | 3,733 |
| Issued in reinvestment of distributions | 17,771 | 7,602 |
| Redeemed | (15,034) | (21,501) |
| Net increase (decrease) | 8,191 | (10,166) |
See accompanying notes which are an integral part of the financial statements.
Financial Highlights
Fidelity Small Cap Stock Fund
| Years ended April 30, | 2019 | 2018 | 2017 | 2016 | 2015 |
| Selected Per–Share Data | |||||
| Net asset value, beginning of period | $19.56 | $19.38 | $17.48 | $19.92 | $20.83 |
| Income from Investment Operations | |||||
| Net investment income (loss)A | .12B | .08C | .03 | .03 | .14 |
| Net realized and unrealized gain (loss) | .90 | 1.86 | 2.60 | (.50)D | 2.50 |
| Total from investment operations | 1.02 | 1.94 | 2.63 | (.47) | 2.64 |
| Distributions from net investment income | (.06) | (.07) | –E | (.11) | (.12) |
| Distributions from net realized gain | (3.64) | (1.69) | (.72) | (1.86) | (3.43) |
| Total distributions | (3.69)F | (1.76) | (.73)G | (1.97) | (3.55) |
| Redemption fees added to paid in capitalA | – | –E | –E | –E | –E |
| Net asset value, end of period | $16.89 | $19.56 | $19.38 | $17.48 | $19.92 |
| Total ReturnH | 6.66% | 10.39% | 15.44% | (2.79)%D | 14.23% |
| Ratios to Average Net AssetsI,J | |||||
| Expenses before reductions | .67% | .82% | 1.02% | 1.00% | .66% |
| Expenses net of fee waivers, if any | .67% | .82% | 1.02% | .99% | .66% |
| Expenses net of all reductions | .67% | .81% | 1.02% | .99% | .66% |
| Net investment income (loss) | .66%B | .39%C | .14% | .17% | .71% |
| Supplemental Data | |||||
| Net assets, end of period (in millions) | $1,515 | $1,595 | $1,777 | $1,956 | $1,913 |
| Portfolio turnover rateK | 66%L | 63%L | 48% | 59% | 64% |
A Calculated based on average shares outstanding during the period.
B Net investment income per share reflects a large, non-recurring dividend which amounted to $.04 per share. Excluding this non-recurring dividend, the ratio of net investment income (loss) to average net assets would have been .41%.
C Net investment income per share reflects a large, non-recurring dividend which amounted to $.02 per share. Excluding this non-recurring dividend, the ratio of net investment income (loss) to average net assets would have been .27%.
D Net realized and unrealized gain (loss) per share reflects proceeds received from litigation which amounted to $.03 per share. Excluding these litigation proceeds, the total return would have been (2.96)%.
E Amount represents less than $.005 per share.
F Total distributions of $3.69 per share is comprised of distributions from net investment income of $.058 and distributions from net realized gain of $3.636 per share
G Total distributions of $.73 per share is comprised of distributions from net investment income of $.003 and distributions from net realized gain of $.723 per share.
H Total returns would have been lower if certain expenses had not been reduced during the applicable periods shown.
I Fees and expenses of any underlying Fidelity Central Funds are not included in the Fund's expense ratio. The Fund indirectly bears its proportionate share of the expenses of any underlying Fidelity Central Funds.
J Expense ratios reflect operating expenses of the Fund. Expenses before reductions do not reflect amounts reimbursed by the investment adviser or reductions from brokerage service arrangements or reductions from other expense offset arrangements and do not represent the amount paid by the Fund during periods when reimbursements or reductions occur. Expenses net of fee waivers reflect expenses after reimbursement by the investment adviser but prior to reductions from brokerage service arrangements or other expense offset arrangements. Expenses net of all reductions represent the net expenses paid by the Fund.
K Amount does not include the portfolio activity of any underlying Fidelity Central Funds.
L Portfolio turnover rate excludes securities received or delivered in-kind.
See accompanying notes which are an integral part of the financial statements.
Notes to Financial Statements
For the period ended April 30, 2019
(Amounts in thousands except percentages)
1. Organization.
Fidelity Small Cap Stock Fund (the Fund) is a fund of Fidelity Concord Street Trust (the Trust) and is authorized to issue an unlimited number of shares. Share transactions on the Statement of Changes in Net Assets may contain exchanges between affiliated funds. The Trust is registered under the Investment Company Act of 1940, as amended (the 1940 Act), as an open-end management investment company organized as a Massachusetts business trust.
2. Investments in Fidelity Central Funds.
The Fund invests in Fidelity Central Funds, which are open-end investment companies generally available only to other investment companies and accounts managed by the investment adviser and its affiliates. The Fund's Schedule of Investments lists each of the Fidelity Central Funds held as of period end, if any, as an investment of the Fund, but does not include the underlying holdings of each Fidelity Central Fund. As an Investing Fund, the Fund indirectly bears its proportionate share of the expenses of the underlying Fidelity Central Funds.
The Money Market Central Funds seek preservation of capital and current income and are managed by Fidelity Investments Money Management, Inc. (FIMM), an affiliate of the investment adviser. Annualized expenses of the Money Market Central Funds as of their most recent shareholder report date are less than .005%.
A complete unaudited list of holdings for each Fidelity Central Fund is available upon request or at the Securities and Exchange Commission (the SEC) website at www.sec.gov. In addition, the financial statements of the Fidelity Central Funds, which are not covered by the Fund's Report of Independent Registered Public Accounting Firm, are available on the SEC website or upon request.
3. Significant Accounting Policies.
The Fund is an investment company and applies the accounting and reporting guidance of the Financial Accounting Standards Board (FASB) Accounting Standards Codification Topic 946 Financial Services – Investments Companies. The financial statements have been prepared in conformity with accounting principles generally accepted in the United States of America (GAAP), which require management to make certain estimates and assumptions at the date of the financial statements. Actual results could differ from those estimates. Subsequent events, if any, through the date that the financial statements were issued have been evaluated in the preparation of the financial statements. The following summarizes the significant accounting policies of the Fund:
Investment Valuation. Investments are valued as of 4:00 p.m. Eastern time on the last calendar day of the period. The Board of Trustees (the Board) has delegated the day to day responsibility for the valuation of the Fund's investments to the Fair Value Committee (the Committee) established by the Fund's investment adviser. In accordance with valuation policies and procedures approved by the Board, the Fund attempts to obtain prices from one or more third party pricing vendors or brokers to value its investments. When current market prices, quotations or currency exchange rates are not readily available or reliable, investments will be fair valued in good faith by the Committee, in accordance with procedures adopted by the Board. Factors used in determining fair value vary by investment type and may include market or investment specific events. The frequency with which these procedures are used cannot be predicted and they may be utilized to a significant extent. The Committee oversees the Fund's valuation policies and procedures and reports to the Board on the Committee's activities and fair value determinations. The Board monitors the appropriateness of the procedures used in valuing the Fund's investments and ratifies the fair value determinations of the Committee.
The Fund categorizes the inputs to valuation techniques used to value its investments into a disclosure hierarchy consisting of three levels as shown below:
- Level 1 – quoted prices in active markets for identical investments
- Level 2 – other significant observable inputs (including quoted prices for similar investments, interest rates, prepayment speeds, etc.)
- Level 3 – unobservable inputs (including the Fund's own assumptions based on the best information available)
Valuation techniques used to value the Fund's investments by major category are as follows:
Equity securities, including restricted securities, for which market quotations are readily available, are valued at the last reported sale price or official closing price as reported by a third party pricing vendor on the primary market or exchange on which they are traded and are categorized as Level 1 in the hierarchy. In the event there were no sales during the day or closing prices are not available, securities are valued at the last quoted bid price or may be valued using the last available price and are generally categorized as Level 2 in the hierarchy. For foreign equity securities, when market or security specific events arise, comparisons to the valuation of American Depositary Receipts (ADRs), futures contracts, Exchange-Traded Funds (ETFs) and certain indexes as well as quoted prices for similar securities may be used and would be categorized as Level 2 in the hierarchy. For equity securities, including restricted securities, where observable inputs are limited, assumptions about market activity and risk are used and these securities may be categorized as Level 3 in the hierarchy.
Investments in open-end mutual funds, including the Fidelity Central Funds, are valued at their closing net asset value (NAV) each business day and are categorized as Level 1 in the hierarchy.
Changes in valuation techniques may result in transfers in or out of an assigned level within the disclosure hierarchy. The aggregate value of investments by input level as of April 30, 2019 is included at the end of the Fund's Schedule of Investments.
Foreign Currency. The Fund may use foreign currency contracts to facilitate transactions in foreign-denominated securities. Gains and losses from these transactions may arise from changes in the value of the foreign currency or if the counterparties do not perform under the contracts' terms.
Foreign-denominated assets, including investment securities, and liabilities are translated into U.S. dollars at the exchange rates at period end. Purchases and sales of investment securities, income and dividends received and expenses denominated in foreign currencies are translated into U.S. dollars at the exchange rate in effect on the transaction date.
The effects of exchange rate fluctuations on investments are included with the net realized and unrealized gain (loss) on investment securities. Other foreign currency transactions resulting in realized and unrealized gain (loss) are disclosed separately.
Investment Transactions and Income. For financial reporting purposes, the Fund's investment holdings and NAV include trades executed through the end of the last business day of the period. The NAV per share for processing shareholder transactions is calculated as of the close of business of the New York Stock Exchange (NYSE), normally 4:00 p.m. Eastern time and includes trades executed through the end of the prior business day. Gains and losses on securities sold are determined on the basis of identified cost and include proceeds received from litigation. Dividend income is recorded on the ex-dividend date, except for certain dividends from foreign securities where the ex-dividend date may have passed, which are recorded as soon as the Fund is informed of the ex-dividend date. Non-cash dividends included in dividend income, if any, are recorded at the fair market value of the securities received. Income and capital gain distributions from Fidelity Central Funds, if any, are recorded on the ex-dividend date. Certain distributions received by the Fund represent a return of capital or capital gain. The Fund determines the components of these distributions subsequent to the ex-dividend date, based upon receipt of tax filings or other correspondence relating to the underlying investment. These distributions are recorded as a reduction of cost of investments and/or as a realized gain. Large, non-recurring dividends recognized by the Fund are presented separately on the Statement of Operations as "Special Dividends" and the impact of these dividends is presented in the Financial Highlights. Investment income is recorded net of foreign taxes withheld where recovery of such taxes is uncertain.
Expenses. Expenses directly attributable to a fund are charged to that fund. Expenses attributable to more than one fund are allocated among the respective funds on the basis of relative net assets or other appropriate methods. Expense estimates are accrued in the period to which they relate and adjustments are made when actual amounts are known.
Income Tax Information and Distributions to Shareholders. Each year, the Fund intends to qualify as a regulated investment company under Subchapter M of the Internal Revenue Code, including distributing substantially all of its taxable income and realized gains. As a result, no provision for U.S. Federal income taxes is required. As of April 30, 2019, the Fund did not have any unrecognized tax benefits in the financial statements; nor is the Fund aware of any tax positions for which it is reasonably possible that the total amounts of unrecognized tax benefits will significantly change in the next twelve months. The Fund files a U.S. federal tax return, in addition to state and local tax returns as required. The Fund's federal income tax returns are subject to examination by the Internal Revenue Service (IRS) for a period of three fiscal years after they are filed. State and local tax returns may be subject to examination for an additional fiscal year depending on the jurisdiction. Foreign taxes are provided for based on the Fund's understanding of the tax rules and rates that exist in the foreign markets in which it invests.
Distributions are declared and recorded on the ex-dividend date. Income and capital gain distributions are determined in accordance with income tax regulations, which may differ from GAAP. In addition, the Fund claimed a portion of the payment made to redeeming shareholders as a distribution for income tax purposes.
Capital accounts within the financial statements are adjusted for permanent book-tax differences. These adjustments have no impact on net assets or the results of operations. Capital accounts are not adjusted for temporary book-tax differences which will reverse in a subsequent period.
Book-tax differences are primarily due to foreign currency transactions, redemptions in kind, and losses deferred due to wash sales and excise tax regulations.
As of period end, the cost and unrealized appreciation (depreciation) in securities, and derivatives if applicable, for federal income tax purposes were as follows:
| Gross unrealized appreciation | $241,457 |
| Gross unrealized depreciation | (91,814) |
| Net unrealized appreciation (depreciation) | $149,643 |
| Tax Cost | $1,487,082 |
The tax-based components of distributable earnings as of period end were as follows:
| Undistributed tax-exempt income | $– |
| Undistributed ordinary income | $– |
| Net unrealized appreciation (depreciation) on securities and other investments | $149,622 |
The Fund intends to defer to its next fiscal year $1,749 of capital losses recognized during the period November 1, 2018 to April 30, 2019.
The tax character of distributions paid was as follows:
| April 30, 2019 | April 30, 2018 | |
| Ordinary Income | $27,464 | $ 5,830 |
| Long-term Capital Gains | 277,163 | 145,081 |
| Total | $304,627 | $ 150,911 |
Delayed Delivery Transactions and When-Issued Securities. During the period, the Fund transacted in securities on a delayed delivery or when-issued basis. Payment and delivery may take place after the customary settlement period for that security. The price of the underlying securities and the date when the securities will be delivered and paid for are fixed at the time the transaction is negotiated. The securities purchased on a delayed delivery or when-issued basis are identified as such in the Fund's Schedule of Investments. Losses may arise due to changes in the value of the underlying securities or if the counterparty does not perform under the contract's terms, or if the issuer does not issue the securities due to political, economic, or other factors.
Restricted Securities. The Fund may invest in securities that are subject to legal or contractual restrictions on resale. These securities generally may be resold in transactions exempt from registration or to the public if the securities are registered. Disposal of these securities may involve time-consuming negotiations and expense, and prompt sale at an acceptable price may be difficult. Information regarding restricted securities is included at the end of the Fund's Schedule of Investments.
New Rule Issuance. During August 2018, the U.S. Securities and Exchange Commission issued Final Rule Release No. 33-10532, Disclosure Update and Simplification. This Final Rule includes amendments specific to registered investment companies that are intended to eliminate overlap in disclosure requirements between Regulation S-X and GAAP. In accordance with these amendments, certain line-items in the Fund's financial statements have been combined or removed for the current period as outlined in the table below.
| Financial Statement | Current Line-Item Presentation (As Applicable) | Prior Line-Item Presentation (As Applicable) |
| Statement of Assets and Liabilities | Total distributable earnings (loss) | Undistributed/Distributions in excess of/Accumulated net investment income (loss) Accumulated/Undistributed net realized gain (loss) Net unrealized appreciation (depreciation) |
| Statement of Changes in Net Assets | N/A - removed | Undistributed/Distributions in excess of/Accumulated net investment income (loss) end of period |
| Statement of Changes in Net Assets | Distributions to shareholders | Distributions to shareholders from net investment income Distributions to shareholders from net realized gain |
4. Purchases and Sales of Investments.
Purchases and sales of securities, other than short-term securities and in-kind transactions, aggregated $1,017,286 and $1,155,815, respectively.
Unaffiliated Redemptions In-Kind. During the period, 181 shares of the Fund were redeemed in-kind for investments and cash with a value of $3,024. The net realized gain of $646 on investments delivered through in-kind redemptions is included in the accompanying Statement of Operations. The amount of the in-kind redemptions is included in share transactions in the accompanying Statement of Changes in Net Assets. The Fund recognized no gain or loss for federal income tax purposes.
Prior Fiscal Year Redemptions In-Kind. During the prior period, 2,482 shares of the Fund held by unaffiliated entities were redeemed in-kind for investments and cash with a value of $49,431. The Fund had a net realized gain of $13,272 on investments delivered through the in-kind redemptions. The amount of the redemptions is included in share transactions activity shown in the accompanying Statement of Changes in Net. The Fund recognized no gain or loss for federal income tax purposes.
5. Fees and Other Transactions with Affiliates.
Management Fee. Fidelity Management & Research Company (the investment adviser) and its affiliates provide the Fund with investment management related services for which the Fund pays a monthly management fee. The management fee is the sum of an individual fund fee rate that is based on an annual rate of .45% of the Fund's average net assets and an annualized group fee rate that averaged .24% during the period. The group fee rate is based upon the average net assets of all the mutual funds advised by the investment adviser, including any mutual funds previously advised by the investment adviser that are currently advised by Fidelity SelectCo, LLC, an affiliate of the investment adviser. The group fee rate decreases as assets under management increase and increases as assets under management decrease. In addition, the management fee is subject to a performance adjustment (up to a maximum of +/- .20% of the Fund's average net assets over a 36 month performance period). The upward or downward adjustment to the management fee is based on the Fund's relative investment performance as compared to its benchmark index, the Russell 2000 Index, over the same 36 month performance period. For the reporting period, the total annual management fee rate, including the performance adjustment, was .46% of the Fund's average net assets. The performance adjustment included in the management fee rate may be higher or lower than the maximum performance adjustment rate due to the difference between the average net assets for the reporting and performance periods.
Transfer Agent Fees. Fidelity Investments Institutional Operations Company, Inc. (FIIOC), an affiliate of the investment adviser, is the Fund's transfer, dividend disbursing and shareholder servicing agent. FIIOC receives account fees and asset-based fees that vary according to account size and type of account. FIIOC pays for typesetting, printing and mailing of shareholder reports, except proxy statements. For the period, the transfer agent fees were equivalent to an annual rate of .17% of average net assets.
Accounting and Security Lending Fees. Fidelity Service Company, Inc. (FSC), an affiliate of the investment adviser, maintains the Fund's accounting records. The accounting fee is based on the level of average net assets for each month. Prior to April 1, 2019, FSC had a separate agreement with the Fund for administration of the security lending program, based on the number and duration of lending transactions. For the period, the total fees paid for accounting and administration of securities lending were equivalent to an annual rate of .03%.
Brokerage Commissions. The Fund placed a portion of its portfolio transactions with brokerage firms which are affiliates of the investment adviser. Brokerage commissions are included in net realized gain (loss) and change in net unrealized appreciation (depreciation) in the Statement of Operations. The commissions paid to these affiliated firms were $41 for the period.
Interfund Trades. The Fund may purchase from or sell securities to other Fidelity Funds under procedures adopted by the Board. The procedures have been designed to ensure these interfund trades are executed in accordance with Rule 17a-7 of the 1940 Act. Interfund trades are included within the respective purchases and sales amounts shown in the Purchases and Sales of Investments note.
Other. During the period, the investment adviser reimbursed the fund for certain losses in the amount of $4,511.
Prior Fiscal Year Redemptions In-Kind. During the prior period, 2,452 shares of the Fund held by an affiliated entity were redeemed in-kind for investments and cash with a value of $46,842. The Fund had a net realized gain of $14,026 on investments delivered through the in-kind redemptions. The amount of the redemptions is included in share transactions activity shown in the accompanying Statement of Changes in Net Assets. The Fund recognized no gain or loss for federal income tax purposes.
6. Committed Line of Credit.
The Fund participates with other funds managed by the investment adviser or an affiliate in a $4.25 billion credit facility (the "line of credit") to be utilized for temporary or emergency purposes to fund shareholder redemptions or for other short-term liquidity purposes. The Fund has agreed to pay commitment fees on its pro-rata portion of the line of credit, which amounted to $4 and is reflected in Miscellaneous expenses on the Statement of Operations. During the period, the Fund did not borrow on this line of credit.
7. Security Lending.
The Fund lends portfolio securities through a lending agent from time to time in order to earn additional income. For equity securities, a lending agent is used and may loan securities to certain qualified borrowers, including Fidelity Capital Markets (FCM), a broker-dealer affiliated with the Fund. On the settlement date of the loan, the Fund receives collateral (in the form of U.S. Treasury obligations, letters of credit and/or cash) against the loaned securities and maintains collateral in an amount not less than 100% of the market value of the loaned securities during the period of the loan. The market value of the loaned securities is determined at the close of business of the Fund and any additional required collateral is delivered to the Fund on the next business day. The Fund or borrower may terminate the loan at any time, and if the borrower defaults on its obligation to return the securities loaned because of insolvency or other reasons, the Fund may apply collateral received from the borrower against the obligation. The Fund may experience delays and costs in recovering the securities loaned. Any cash collateral received is invested in the Fidelity Securities Lending Cash Central Fund. The value of loaned securities and cash collateral at period end are disclosed on the Fund's Statement of Assets and Liabilities. The value of securities loaned to FCM at period end was $80. Security lending income represents the income earned on investing cash collateral, less rebates paid to borrowers and any lending agent fees associated with the loan, plus any premium payments received for lending certain types of securities. Security lending income is presented in the Statement of Operations as a component of income from Fidelity Central Funds. Total security lending income during the period amounted to $512, including $11 from securities loaned to FCM.
8. Expense Reductions.
Commissions paid to certain brokers with whom the investment adviser, or its affiliates, places trades on behalf of the Fund include an amount in addition to trade execution, which may be rebated back to the Fund to offset certain expenses. This amount totaled $69 for the period. In addition, through arrangements with the Fund's custodian, credits realized as a result of certain uninvested cash balances were used to reduce the Fund's expenses. During the period, these credits reduced the Fund's custody expenses by $3.
In addition, during the period the investment adviser reimbursed and/or waived a portion of operating expenses in the amount of $14.
9. Other.
The Fund's organizational documents provide former and current trustees and officers with a limited indemnification against liabilities arising in connection with the performance of their duties to the Fund. In the normal course of business, the Fund may also enter into contracts that provide general indemnifications. The Fund's maximum exposure under these arrangements is unknown as this would be dependent on future claims that may be made against the Fund. The risk of material loss from such claims is considered remote.
Report of Independent Registered Public Accounting Firm
To the Trustees of Fidelity Concord Street Trust and Shareholders of Fidelity Small Cap Stock Fund:
Opinion on the Financial Statements and Financial Highlights
We have audited the accompanying statement of assets and liabilities of Fidelity Small Cap Stock Fund (the "Fund"), a fund of Fidelity Concord Street Trust, including the schedule of investments, as of April 30, 2019, the related statement of operations for the year then ended, the statement of changes in net assets for each of the two years in the period then ended, the financial highlights for each of the five years in the period then ended, and the related notes. In our opinion, the financial statements and financial highlights present fairly, in all material respects, the financial position of the Fund as of April 30, 2019, and the results of its operations for the year then ended, the changes in its net assets for each of the two years in the period then ended, and the financial highlights for each of the five years in the period then ended, in conformity with accounting principles generally accepted in the United States of America.
Basis for Opinion
These financial statements and financial highlights are the responsibility of the Fund's management. Our responsibility is to express an opinion on the Fund's financial statements and financial highlights based on our audits. We are a public accounting firm registered with the Public Company Accounting Oversight Board (United States) (PCAOB) and are required to be independent with respect to the Fund in accordance with the U.S. federal securities laws and the applicable rules and regulations of the Securities and Exchange Commission and the PCAOB.
We conducted our audits in accordance with the standards of the PCAOB. Those standards require that we plan and perform the audit to obtain reasonable assurance about whether the financial statements and financial highlights are free of material misstatement, whether due to error or fraud. The Fund is not required to have, nor were we engaged to perform, an audit of its internal control over financial reporting. As part of our audits we are required to obtain an understanding of internal control over financial reporting but not for the purpose of expressing an opinion on the effectiveness of the Fund’s internal control over financial reporting. Accordingly, we express no such opinion.
Our audits included performing procedures to assess the risks of material misstatement of the financial statements and financial highlights, whether due to error or fraud, and performing procedures that respond to those risks. Such procedures included examining, on a test basis, evidence regarding the amounts and disclosures in the financial statements and financial highlights. Our audits also included evaluating the accounting principles used and significant estimates made by management, as well as evaluating the overall presentation of the financial statements and financial highlights. Our procedures included confirmation of securities owned as of April 30, 2019, by correspondence with the custodians and brokers; when replies were not received from brokers, we performed other auditing procedures. We believe that our audits provide a reasonable basis for our opinion.
/s/ Deloitte & Touche LLP
Boston, Massachusetts
June 11, 2019
We have served as the auditor of one or more of the Fidelity investment companies since 1999.
Trustees and Officers
The Trustees, Members of the Advisory Board (if any), and officers of the trust and fund, as applicable, are listed below. The Board of Trustees governs the fund and is responsible for protecting the interests of shareholders. The Trustees are experienced executives who meet periodically throughout the year to oversee the fund's activities, review contractual arrangements with companies that provide services to the fund, oversee management of the risks associated with such activities and contractual arrangements, and review the fund's performance. Except for Jonathan Chiel, each of the Trustees oversees 289 funds. Mr Chiel oversees 158 funds.
The Trustees hold office without limit in time except that (a) any Trustee may resign; (b) any Trustee may be removed by written instrument, signed by at least two-thirds of the number of Trustees prior to such removal; (c) any Trustee who requests to be retired or who has become incapacitated by illness or injury may be retired by written instrument signed by a majority of the other Trustees; and (d) any Trustee may be removed at any special meeting of shareholders by a two-thirds vote of the outstanding voting securities of the trust. Each Trustee who is not an interested person (as defined in the 1940 Act) of the trust and the fund is referred to herein as an Independent Trustee. Each Independent Trustee shall retire not later than the last day of the calendar year in which his or her 75th birthday occurs. The Independent Trustees may waive this mandatory retirement age policy with respect to individual Trustees. Officers and Advisory Board Members hold office without limit in time, except that any officer or Advisory Board Member may resign or may be removed by a vote of a majority of the Trustees at any regular meeting or any special meeting of the Trustees. Except as indicated, each individual has held the office shown or other offices in the same company for the past five years.
The fund’s Statement of Additional Information (SAI) includes more information about the Trustees. To request a free copy, call Fidelity at 1-800-544-8544.
Experience, Skills, Attributes, and Qualifications of the Trustees. The Governance and Nominating Committee has adopted a statement of policy that describes the experience, qualifications, attributes, and skills that are necessary and desirable for potential Independent Trustee candidates (Statement of Policy). The Board believes that each Trustee satisfied at the time he or she was initially elected or appointed a Trustee, and continues to satisfy, the standards contemplated by the Statement of Policy. The Governance and Nominating Committee also engages professional search firms to help identify potential Independent Trustee candidates who have the experience, qualifications, attributes, and skills consistent with the Statement of Policy. From time to time, additional criteria based on the composition and skills of the current Independent Trustees, as well as experience or skills that may be appropriate in light of future changes to board composition, business conditions, and regulatory or other developments, have also been considered by the professional search firms and the Governance and Nominating Committee. In addition, the Board takes into account the Trustees' commitment and participation in Board and committee meetings, as well as their leadership of standing and ad hoc committees throughout their tenure.
In determining that a particular Trustee was and continues to be qualified to serve as a Trustee, the Board has considered a variety of criteria, none of which, in isolation, was controlling. The Board believes that, collectively, the Trustees have balanced and diverse experience, qualifications, attributes, and skills, which allow the Board to operate effectively in governing the fund and protecting the interests of shareholders. Information about the specific experience, skills, attributes, and qualifications of each Trustee, which in each case led to the Board's conclusion that the Trustee should serve (or continue to serve) as a trustee of the fund, is provided below.
Board Structure and Oversight Function. James C. Curvey is an interested person and currently serves as Chairman. The Trustees have determined that an interested Chairman is appropriate and benefits shareholders because an interested Chairman has a personal and professional stake in the quality and continuity of services provided to the fund. Independent Trustees exercise their informed business judgment to appoint an individual of their choosing to serve as Chairman, regardless of whether the Trustee happens to be independent or a member of management. The Independent Trustees have determined that they can act independently and effectively without having an Independent Trustee serve as Chairman and that a key structural component for assuring that they are in a position to do so is for the Independent Trustees to constitute a substantial majority for the Board. The Independent Trustees also regularly meet in executive session. Ned C. Lautenbach serves as Chairman of the Independent Trustees and as such (i) acts as a liaison between the Independent Trustees and management with respect to matters important to the Independent Trustees and (ii) with management prepares agendas for Board meetings.
Fidelity® funds are overseen by different Boards of Trustees. The fund's Board oversees Fidelity's high income and certain equity funds, and other Boards oversee Fidelity's investment-grade bond, money market, asset allocation, and other equity funds. The asset allocation funds may invest in Fidelity® funds overseen by the fund's Board. The use of separate Boards, each with its own committee structure, allows the Trustees of each group of Fidelity® funds to focus on the unique issues of the funds they oversee, including common research, investment, and operational issues. On occasion, the separate Boards establish joint committees to address issues of overlapping consequences for the Fidelity® funds overseen by each Board.
The Trustees operate using a system of committees to facilitate the timely and efficient consideration of all matters of importance to the Trustees, the fund, and fund shareholders and to facilitate compliance with legal and regulatory requirements and oversight of the fund's activities and associated risks. The Board, acting through its committees, has charged FMR and its affiliates with (i) identifying events or circumstances the occurrence of which could have demonstrably adverse effects on the fund's business and/or reputation; (ii) implementing processes and controls to lessen the possibility that such events or circumstances occur or to mitigate the effects of such events or circumstances if they do occur; and (iii) creating and maintaining a system designed to evaluate continuously business and market conditions in order to facilitate the identification and implementation processes described in (i) and (ii) above. Because the day-to-day operations and activities of the fund are carried out by or through FMR, its affiliates, and other service providers, the fund's exposure to risks is mitigated but not eliminated by the processes overseen by the Trustees. While each of the Board's committees has responsibility for overseeing different aspects of the fund's activities, oversight is exercised primarily through the Operations, Audit, and Compliance Committees. In addition, the Independent Trustees have worked with Fidelity to enhance the Board's oversight of investment and financial risks, legal and regulatory risks, technology risks, and operational risks, including the development of additional risk reporting to the Board. Appropriate personnel, including but not limited to the fund's Chief Compliance Officer (CCO), FMR's internal auditor, the independent accountants, the fund's Treasurer and portfolio management personnel, make periodic reports to the Board's committees, as appropriate, including an annual review of Fidelity's risk management program for the Fidelity® funds. The responsibilities of each standing committee, including their oversight responsibilities, are described further under "Standing Committees of the Trustees."
Interested Trustees*:
Correspondence intended for a Trustee who is an interested person may be sent to Fidelity Investments, 245 Summer Street, Boston, Massachusetts 02210.
Name, Year of Birth; Principal Occupations and Other Relevant Experience+
Jonathan Chiel (1957)
Year of Election or Appointment: 2016
Trustee
Mr. Chiel also serves as Trustee of other Fidelity® funds. Mr. Chiel is Executive Vice President and General Counsel for FMR LLC (diversified financial services company, 2012-present). Previously, Mr. Chiel served as general counsel (2004-2012) and senior vice president and deputy general counsel (2000-2004) for John Hancock Financial Services; a partner with Choate, Hall & Stewart (1996-2000) (law firm); and an Assistant United States Attorney for the United States Attorney’s Office of the District of Massachusetts (1986-95), including Chief of the Criminal Division (1993-1995). Mr. Chiel is a director on the boards of the Boston Bar Foundation and the Maimonides School.
James C. Curvey (1935)
Year of Election or Appointment: 2007
Trustee
Chairman of the Board of Trustees
Mr. Curvey also serves as Trustee of other Fidelity® funds. Mr. Curvey is Vice Chairman (2007-present) and Director of FMR LLC (diversified financial services company). In addition, Mr. Curvey is an Overseer Emeritus for the Boston Symphony Orchestra, a Director of Artis-Naples, and a Trustee of Brewster Academy in Wolfeboro, New Hampshire. Previously, Mr. Curvey served as a Director of Fidelity Research & Analysis Co. (investment adviser firm, 2009-2018), Director of Fidelity Investments Money Management, Inc. (investment adviser firm, 2009-2014) and a Director of FMR and FMR Co., Inc. (investment adviser firms, 2007-2014).
* Determined to be an “Interested Trustee” by virtue of, among other things, his or her affiliation with the trust or various entities under common control with FMR.
+ The information includes the Trustee's principal occupation during the last five years and other information relating to the experience, attributes, and skills relevant to the Trustee's qualifications to serve as a Trustee, which led to the conclusion that the Trustee should serve as a Trustee for the fund.
Independent Trustees:
Correspondence intended for an Independent Trustee may be sent to Fidelity Investments, P.O. Box 55235, Boston, Massachusetts 02205-5235.
Name, Year of Birth; Principal Occupations and Other Relevant Experience+
Dennis J. Dirks (1948)
Year of Election or Appointment: 2005
Trustee
Mr. Dirks also serves as Trustee of other Fidelity® funds. Prior to his retirement in May 2003, Mr. Dirks was Chief Operating Officer and a member of the Board of The Depository Trust & Clearing Corporation (DTCC). He also served as President, Chief Operating Officer, and Board member of The Depository Trust Company (DTC) and President and Board member of the National Securities Clearing Corporation (NSCC). In addition, Mr. Dirks served as Chief Executive Officer and Board member of the Government Securities Clearing Corporation, Chief Executive Officer and Board member of the Mortgage-Backed Securities Clearing Corporation, as a Trustee and a member of the Finance Committee of Manhattan College (2005-2008), as a Trustee and a member of the Finance Committee of AHRC of Nassau County (2006-2008), as a member of the Independent Directors Council (IDC) Governing Council (2010-2015), and as a member of the Board of Directors for The Brookville Center for Children’s Services, Inc. (2009-2017). Mr. Dirks is a member of the Finance Committee (2016-present) and Board of Directors (2017-present) and is Treasurer (2018-present) of the Asolo Repertory Theatre.
Donald F. Donahue (1950)
Year of Election or Appointment: 2018
Trustee
Mr. Donahue also serves as a Trustee of other Fidelity® funds. Mr. Donahue is President and Chief Executive Officer of Miranda Partners, LLC (risk consulting for the financial services industry, 2012-present). Previously, Mr. Donahue served as a Member of the Advisory Board of certain Fidelity® funds (2015-2018) and Chief Executive Officer (2006-2012), Chief Operating Officer (2003-2006), and Managing Director, Customer Marketing and Development (1999-2003) of The Depository Trust & Clearing Corporation (financial markets infrastructure). Mr. Donahue serves as a Member (2007-present) and Co-Chairman (2016-present) of the Board of Directors of United Way of New York, Member of the Board of Directors of NYC Leadership Academy (2012-present) and Member of the Board of Advisors of Ripple Labs, Inc. (financial services, 2015-present). He also served as Chairman (2010-2012) and Member of the Board of Directors (2012-2013) of Omgeo, LLC (financial services), Treasurer of United Way of New York (2012-2016), and Member of the Board of Directors of XBRL US (financial services non-profit, 2009-2012) and the International Securities Services Association (2009-2012).
Alan J. Lacy (1953)
Year of Election or Appointment: 2008
Trustee
Mr. Lacy also serves as Trustee of other Fidelity® funds. Mr. Lacy serves as a Director of Bristol-Myers Squibb Company (global pharmaceuticals, 2008-present). He is a Trustee of the California Chapter of The Nature Conservancy (2015-present) and a Director of the Center for Advanced Study in the Behavioral Sciences at Stanford University (2015-present). In addition, Mr. Lacy served as Senior Adviser (2007-2014) of Oak Hill Capital Partners, L.P. (private equity) and also served as Chief Executive Officer (2005) and Vice Chairman (2005-2006) of Sears Holdings Corporation (retail) and Chief Executive Officer and Chairman of the Board of Sears, Roebuck and Co. (retail, 2000-2005). Previously, Mr. Lacy served as Chairman (2014-2017) and a member (2010-2017) of the Board of Directors of Dave & Buster’s Entertainment, Inc. (restaurant and entertainment complexes), as Chairman (2008-2011) and a member (2006-2015) of the Board of Trustees of the National Parks Conservation Association, and as a member of the Board of Directors for The Hillman Companies, Inc. (hardware wholesalers, 2010-2014), Earth Fare, Inc. (retail grocery, 2010-2014), and The Western Union Company (global money transfer, 2006-2011).
Ned C. Lautenbach (1944)
Year of Election or Appointment: 2000
Trustee
Chairman of the Independent Trustees
Mr. Lautenbach also serves as Trustee of other Fidelity® funds. Mr. Lautenbach currently serves as Chair (2018-present) and Member (2013-present) of the Board of Governors, State University System of Florida and is a member of the Council on Foreign Relations (1994-present). He is also a member and has most recently served as Chairman of the Board of Directors of Artis-Naples (2012-present). Previously, Mr. Lautenbach served as a member and then Lead Director of the Board of Directors of Eaton Corporation (diversified industrial, 1997-2016). He was also a Partner and Advisory Partner at Clayton, Dubilier & Rice, LLC (private equity investment, 1998-2010), as well as a Director of Sony Corporation (2006-2007). In addition, Mr. Lautenbach also had a 30-year career with IBM (technology company) during which time he served as Senior Vice President and a member of the Corporate Executive Committee (1968-1998).
Joseph Mauriello (1944)
Year of Election or Appointment: 2008
Trustee
Mr. Mauriello also serves as Trustee of other Fidelity® funds. Prior to his retirement in January 2006, Mr. Mauriello served in numerous senior management positions including Deputy Chairman and Chief Operating Officer (2004-2005), and Vice Chairman of Financial Services (2002-2004) of KPMG LLP US (professional services, 1965-2005). Mr. Mauriello currently serves as a member of the Independent Directors Council (IDC) Governing Council (2015-present). Previously, Mr. Mauriello served as a member of the Board of Directors of XL Group plc. (global insurance and re-insurance, 2006-2018).
Cornelia M. Small (1944)
Year of Election or Appointment: 2005
Trustee
Ms. Small also serves as Trustee of other Fidelity® funds. Ms. Small is a member of the Board of Directors (2009-present) and Chair of the Investment Committee (2010-present) of the Teagle Foundation. Ms. Small also serves on the Investment Committee of the Berkshire Taconic Community Foundation (2008-present). Previously, Ms. Small served as Chairperson (2002-2008) and a member of the Investment Committee and Chairperson (2008-2012) and a member of the Board of Trustees of Smith College. In addition, Ms. Small served as Chief Investment Officer, Director of Global Equity Investments, and a member of the Board of Directors of Scudder, Stevens & Clark and Scudder Kemper Investments.
Garnett A. Smith (1947)
Year of Election or Appointment: 2018
Trustee
Mr. Smith also serves as Trustee of other Fidelity® funds. Prior to Mr. Smith's retirement, he served as Chairman and Chief Executive Officer of Inbrand Corp. (manufacturer of personal absorbent products, 1990-1997). He also served as President (1986-1990) of Inbrand Corp. Prior to his employment with Inbrand Corp., he was employed by a retail fabric chain and North Carolina National Bank. In addition, Mr. Smith served as a Member of the Advisory Board of certain Fidelity® funds (2012-2013) and as a board member of the Jackson Hole Land Trust (2009-2012).
David M. Thomas (1949)
Year of Election or Appointment: 2008
Trustee
Mr. Thomas also serves as Trustee of other Fidelity® funds. Mr. Thomas serves as Non-Executive Chairman of the Board of Directors of Fortune Brands Home and Security (home and security products, 2011-present) and as a member of the Board of Directors (2004-present) and Presiding Director (2013-present) of Interpublic Group of Companies, Inc. (marketing communication). Previously, Mr. Thomas served as Executive Chairman (2005-2006) and Chairman and Chief Executive Officer (2000-2005) of IMS Health, Inc. (pharmaceutical and healthcare information solutions), a Director of Fortune Brands, Inc. (consumer products, 2000-2011), and a member of the Board of Trustees of the University of Florida (2013-2018).
+ The information includes the Trustee's principal occupation during the last five years and other information relating to the experience, attributes, and skills relevant to the Trustee's qualifications to serve as a Trustee, which led to the conclusion that the Trustee should serve as a Trustee for the fund.
Advisory Board Members and Officers:
Correspondence intended for a Member of the Advisory Board (if any) may be sent to Fidelity Investments, P.O. Box 55235, Boston, Massachusetts 02205-5235. Correspondence intended for an officer or Peter S. Lynch may be sent to Fidelity Investments, 245 Summer Street, Boston, Massachusetts 02210. Officers appear below in alphabetical order.
Name, Year of Birth; Principal Occupation
Vicki L. Fuller (1957)
Year of Election or Appointment: 2018
Member of the Advisory Board
Ms. Fuller also serves as Member of the Advisory Board of other Fidelity® funds. Ms. Fuller serves as a member of the Board of Directors, Audit Committee, and Nominating and Governance Committee of The Williams Companies, Inc. (natural gas infrastructure, 2018-present). Previously, Ms. Fuller served as the Chief Investment Officer of the New York State Common Retirement Fund (2012-2018) and held a variety of positions at AllianceBernstein L.P. (global asset management, 1985-2012), including Managing Director (2006-2012) and Senior Vice President and Senior Portfolio Manager (2001-2006).
Peter S. Lynch (1944)
Year of Election or Appointment: 2003
Member of the Advisory Board
Mr. Lynch also serves as Member of the Advisory Board of other Fidelity® funds. Mr. Lynch is Vice Chairman and a Director of FMR (investment adviser firm) and FMR Co., Inc. (investment adviser firm). In addition, Mr. Lynch serves as a Trustee of Boston College and as the Chairman of the Inner-City Scholarship Fund. Previously, Mr. Lynch served on the Special Olympics International Board of Directors (1997-2006).
Carol B. Tomé (1957)
Year of Election or Appointment: 2018
Member of the Advisory Board
Ms. Tomé also serves as Member of the Advisory Board of other Fidelity® funds. Ms. Tomé is Chief Financial Officer (2001-present) and Executive Vice President of Corporate Services (2007-present) of The Home Depot, Inc. (home improvement retailer) and a Director (2003-present) and Chair of the Audit Committee (2004-present) of United Parcel Service, Inc. (package delivery and supply chain management). Previously, Ms. Tomé served as Trustee of certain Fidelity® funds (2017), Senior Vice President of Finance and Accounting/Treasurer (2000-2007) and Vice President and Treasurer (1995-2000) of The Home Depot, Inc. and Chair of the Board (2010-2012), Vice Chair of the Board (2009 and 2013), and a Director (2008-2013) of the Federal Reserve Bank of Atlanta. Ms. Tomé is also a director or trustee of many community and professional organizations.
Michael E. Wiley (1950)
Year of Election or Appointment: 2018
Member of the Advisory Board [Include if document contains trusts for which the individual serves as Advisory Board Member and trusts for which he/she does not serve as Advisory Board Member:of Name(s) of Trust(s)]
Mr. Wiley also serves as Trustee or Member of the Advisory Board of other Fidelity® funds. Mr. Wiley serves as a Director of High Point Resources (exploration and production, 2005-present). Previously, Mr. Wiley served as a Director of Andeavor Corporation (independent oil refiner and marketer, 2005-2018), a Director of Andeavor Logistics LP (natural resources logistics, 2015-2018), a Director of Post Oak Bank (privately-held bank, 2004-2018), a Director of Asia Pacific Exploration Consolidated (international oil and gas exploration and production, 2008-2013), a member of the Board of Trustees of the University of Tulsa (2000-2006; 2007-2010), a Senior Energy Advisor of Katzenbach Partners, LLC (consulting, 2006-2007), an Advisory Director of Riverstone Holdings (private investment), a Director of Spinnaker Exploration Company (exploration and production, 2001-2005) and Chairman, President, and CEO of Baker Hughes, Inc. (oilfield services, 2000-2004).
Elizabeth Paige Baumann (1968)
Year of Election or Appointment: 2017
Anti-Money Laundering (AML) Officer
Ms. Baumann also serves as AML Officer of other funds. She is Chief AML Officer (2012-present) and Senior Vice President (2014-present) of FMR LLC (diversified financial services company) and is an employee of Fidelity Investments. Previously, Ms. Baumann served as AML Officer of the funds (2012-2016), and Vice President (2007-2014) and Deputy Anti-Money Laundering Officer (2007-2012) of FMR LLC.
Craig S. Brown (1977)
Year of Election or Appointment: 2019
Assistant Treasurer
Mr. Brown also serves as Assistant Treasurer of other funds. Mr. Brown is an employee of Fidelity Investments (2013-present).
John J. Burke III (1964)
Year of Election or Appointment: 2018
Chief Financial Officer
Mr. Burke also serves as Chief Financial Officer of other funds. Mr. Burke serves as Head of Investment Operations for Fidelity Fund and Investment Operations (2018-present) and is an employee of Fidelity Investments (1998-present). Previously Mr. Burke served as head of Asset Management Investment Operations (2012-2018).
William C. Coffey (1969)
Year of Election or Appointment: 2018
Secretary and Chief Legal Officer (CLO)
Mr. Coffey also serves as Secretary and CLO of other funds. Mr. Coffey serves as CLO, Secretary, and Senior Vice President of Fidelity Management & Research Company and FMR Co., Inc. (investment adviser firms, 2018-present); Secretary of Fidelity SelectCo, LLC and Fidelity Investments Money Management, Inc. (investment adviser firms, 2018-present); and CLO of Fidelity Management & Research (Hong Kong) Limited, FMR Investment Management (UK) Limited, and Fidelity Management & Research (Japan) Limited (investment adviser firms, 2018-present). He is Senior Vice President and Deputy General Counsel of FMR LLC (diversified financial services company, 2010-present), and is an employee of Fidelity Investments. Previously, Mr. Coffey served as Assistant Secretary of certain funds (2009-2018) and as Vice President and Associate General Counsel of FMR LLC (2005-2009).
Timothy M. Cohen (1969)
Year of Election or Appointment: 2018
Vice President
Mr. Cohen also serves as Vice President of other funds. Mr. Cohen serves as Executive Vice President of Fidelity SelectCo, LLC (2019-present), Co-Head of Equity (2018-present), a Director of Fidelity Management & Research (Japan) Limited (investment adviser firm, 2016-present), and is an employee of Fidelity Investments. Previously, Mr. Cohen served as Head of Global Equity Research (2016-2018), Chief Investment Officer - Equity and a Director of Fidelity Management & Research (U.K.) Inc. (investment adviser firm, 2013-2015) and as a Director of Fidelity Management & Research (Hong Kong) Limited (investment adviser firm, 2017).
Jonathan Davis (1968)
Year of Election or Appointment: 2010
Assistant Treasurer
Mr. Davis also serves as Assistant Treasurer of other funds. Mr. Davis serves as Assistant Treasurer of FMR Capital, Inc. (2017-present) and is an employee of Fidelity Investments. Previously, Mr. Davis served as Vice President and Associate General Counsel of FMR LLC (diversified financial services company, 2003-2010).
Adrien E. Deberghes (1967)
Year of Election or Appointment: 2016
Assistant Treasurer
Mr. Deberghes also serves as an officer of other funds. He serves as Assistant Treasurer of FMR Capital, Inc. (2017-present), Executive Vice President of Fidelity Investments Money Management, Inc. (FIMM) (investment adviser firm, 2016-present), and is an employee of Fidelity Investments (2008-present). Previously, Mr. Deberghes served as President and Treasurer of certain Fidelity® funds (2013-2018). Prior to joining Fidelity Investments, Mr. Deberghes was Senior Vice President of Mutual Fund Administration at State Street Corporation (2007-2008), Senior Director of Mutual Fund Administration at Investors Bank & Trust (2005-2007), and Director of Finance for Dunkin' Brands (2000-2005). Previously, Mr. Deberghes served in other fund officer roles.
Laura M. Del Prato (1964)
Year of Election or Appointment: 2018
Assistant Treasurer
Ms. Del Prato also serves as an officer of other funds. Ms. Del Prato is an employee of Fidelity Investments (2017-present). Prior to joining Fidelity Investments, Ms. Del Prato served as a Managing Director and Treasurer of the JPMorgan Mutual Funds (2014-2017). Prior to JPMorgan, Ms. Del Prato served as a partner at Cohen Fund Audit Services (accounting firm, 2012-2013) and KPMG LLP (accounting firm, 2004-2012).
Colm A. Hogan (1973)
Year of Election or Appointment: 2016
Deputy Treasurer
Mr. Hogan also serves as an officer of other funds. Mr. Hogan serves as Assistant Treasurer of FMR Capital, Inc. (2017-present) and is an employee of Fidelity Investments (2005-present). Previously, Mr. Hogan served as Assistant Treasurer of certain Fidelity® funds (2016-2018).
Pamela R. Holding (1964)
Year of Election or Appointment: 2018
Vice President
Ms. Holding also serves as Vice President of other funds. Ms. Holding serves as Executive Vice President of Fidelity SelectCo, LLC (2019-present), Co-Head of Equity (2018-present) and is an employee of Fidelity Investments (2013-present). Previously, Ms. Holding served as Chief Investment Officer of Fidelity Institutional Asset Management (2013-2018).
Chris Maher (1972)
Year of Election or Appointment: 2013
Assistant Treasurer
Mr. Maher serves as Assistant Treasurer of other funds. Mr. Maher is Vice President of Valuation Oversight, serves as Assistant Treasurer of FMR Capital, Inc. (2017-present), and is an employee of Fidelity Investments. Previously, Mr. Maher served as Vice President of Asset Management Compliance (2013), Vice President of the Program Management Group of FMR (investment adviser firm, 2010-2013), and Vice President of Valuation Oversight (2008-2010).
Kenneth B. Robins (1969)
Year of Election or Appointment: 2016
Chief Compliance Officer
Mr. Robins also serves as an officer of other funds. Mr. Robins serves as Compliance Officer of Fidelity Management & Research Company and FMR Co., Inc. (investment adviser firms, 2016-present) and is an employee of Fidelity Investments (2004-present). Previously, Mr. Robins served as Executive Vice President of Fidelity Investments Money Management, Inc. (investment adviser firm, 2013-2016) and served in other fund officer roles.
Stacie M. Smith (1974)
Year of Election or Appointment: 2016
President and Treasurer
Ms. Smith also serves as an officer of other funds. Ms. Smith serves as Assistant Treasurer of FMR Capital, Inc. (2017-present), is an employee of Fidelity Investments (2009-present), and has served in other fund officer roles. Prior to joining Fidelity Investments, Ms. Smith served as Senior Audit Manager of Ernst & Young LLP (accounting firm, 1996-2009). Previously, Ms. Smith served as Assistant Treasurer (2013-2018) and Deputy Treasurer (2013-2016) of certain Fidelity® funds.
Marc L. Spector (1972)
Year of Election or Appointment: 2016
Assistant Treasurer
Mr. Spector also serves as an officer of other funds. Mr. Spector serves as Assistant Treasurer of FMR Capital, Inc. (2017-present) and is an employee of Fidelity Investments (2016-present). Prior to joining Fidelity Investments, Mr. Spector served as Director at the Siegfried Group (accounting firm, 2013-2016), and prior to Siegfried Group as audit senior manager at Deloitte & Touche (accounting firm, 2005-2013).
Jim Wegmann (1979)
Year of Election or Appointment: 2019
Assistant Treasurer
Mr. Wegmann also serves as Assistant Treasurer of other funds. Mr. Wegmann is an employee of Fidelity Investments (2011-present).
Shareholder Expense Example
As a shareholder of the Fund, you incur two types of costs: (1) transaction costs, and (2) ongoing costs, including management fees and other Fund expenses. This Example is intended to help you understand your ongoing costs (in dollars) of investing in the Fund and to compare these costs with the ongoing costs of investing in other mutual funds.
The Example is based on an investment of $1,000 invested at the beginning of the period and held for the entire period (November 1, 2018 to April 30, 2019).
Actual Expenses
The first line of the accompanying table provides information about actual account values and actual expenses. You may use the information in this line, together with the amount you invested, to estimate the expenses that you paid over the period. Simply divide your account value by $1,000.00 (for example, an $8,600 account value divided by $1,000.00 = 8.6), then multiply the result by the number in the first line under the heading entitled "Expenses Paid During Period" to estimate the expenses you paid on your account during this period. In addition, the Fund, as a shareholder in the underlying Fidelity Central Funds, will indirectly bear its pro-rata share of the fees and expenses incurred by the underlying Fidelity Central Funds. These fees and expenses are not included in the Fund's annualized expense ratio used to calculate the expense estimate in the table below.
Hypothetical Example for Comparison Purposes
The second line of the accompanying table provides information about hypothetical account values and hypothetical expenses based on the Fund's actual expense ratio and an assumed rate of return of 5% per year before expenses, which is not the Fund's actual return. The hypothetical account values and expenses may not be used to estimate the actual ending account balance or expenses you paid for the period. You may use this information to compare the ongoing costs of investing in the Fund and other funds. To do so, compare this 5% hypothetical example with the 5% hypothetical examples that appear in the shareholder reports of the other funds. In addition, the Fund, as a shareholder in the underlying Fidelity Central Funds, will indirectly bear its pro-rata share of the fees and expenses incurred by the underlying Fidelity Central Funds. These fees and expenses are not included in the Fund's annualized expense ratio used to calculate the expense estimate in the table below.
Please note that the expenses shown in the table are meant to highlight your ongoing costs only and do not reflect any transaction costs. Therefore, the second line of the table is useful in comparing ongoing costs only, and will not help you determine the relative total costs of owning different funds.
| Annualized Expense Ratio-A | Beginning Account Value November 1, 2018 | Ending Account Value April 30, 2019 | Expenses Paid During Period-B November 1, 2018 to April 30, 2019 | |
| Actual | .66% | $1,000.00 | $1,092.70 | $3.42 |
| Hypothetical-C | $1,000.00 | $1,021.52 | $3.31 |
A Annualized expense ratio reflects expenses net of applicable fee waivers.
B Expenses are equal to the Fund's annualized expense ratio, multiplied by the average account value over the period, multiplied by 181/365 (to reflect the one-half year period).
C 5% return per year before expenses
Distributions (Unaudited)
The fund hereby designates as a capital gain dividend with respect to the taxable year ended April 30, 2019, $116,469,251, or, if subsequently determined to be different, the net capital gain of such year.
The fund designates 94% and 28% of the dividends distributed in June and December, respectively during the fiscal year as qualifying for the dividends–received deduction for corporate shareholders.
The fund designates 93% and 34% of the dividends distributed in June and December respectively during the fiscal year as amounts which may be taken into account as a dividend for the purposes of the maximum rate under section 1(h)(11) of the Internal Revenue Code.
The fund will notify shareholders in January 2020 of amounts for use in preparing 2019 income tax returns.
Board Approval of Investment Advisory Contracts and Management Fees
Fidelity Small Cap Stock Fund
Each year, the Board of Trustees, including the Independent Trustees (together, the Board), votes on the renewal of the management contract with Fidelity Management & Research Company (FMR) and the sub-advisory agreements (together, the Advisory Contracts) for the fund. FMR and the sub-advisers are referred to herein as the Investment Advisers. The Board, assisted by the advice of fund counsel and Independent Trustees' counsel, requests and considers a broad range of information relevant to the renewal of the Advisory Contracts throughout the year.
The Board meets regularly and, at each of its meetings, covers an extensive agenda of topics and materials and considers factors that are relevant to its annual consideration of the renewal of the fund's Advisory Contracts, including the services and support provided to the fund and its shareholders. The Board has established various standing committees (Committees), each composed of and chaired by Independent Trustees with varying backgrounds, to which the Board has assigned specific subject matter responsibilities in order to enhance effective decision-making by the Board. The Board, acting directly and through its Committees, requests and receives information concerning the annual consideration of the renewal of the fund's Advisory Contracts. The Board also meets as needed to review matters specifically related to the Board's annual consideration of the renewal of the Advisory Contracts. Members of the Board may also meet with trustees of other Fidelity funds through joint ad hoc committees to discuss certain matters relevant to all of the Fidelity funds.
At its January 2019 meeting, the Board unanimously determined to renew the fund's Advisory Contracts. In reaching its determination, the Board considered all factors it believed relevant, including (i) the nature, extent, and quality of the services to be provided to the fund and its shareholders (including the investment performance of the fund); (ii) the competitiveness of the fund's management fee and total expense ratio relative to peer funds; (iii) the total costs of the services to be provided by and the profits to be realized by Fidelity from its relationships with the fund; and (iv) the extent to which, if any, economies of scale exist and would be realized as the fund grows, and whether any economies of scale are appropriately shared with fund shareholders.
In considering whether to renew the Advisory Contracts for the fund, the Board reached a determination, with the assistance of fund counsel and Independent Trustees' counsel and through the exercise of its business judgment, that the renewal of the Advisory Contracts was in the best interests of the fund and its shareholders and that the compensation payable under the Advisory Contracts was fair and reasonable. The Board's decision to renew the Advisory Contracts was not based on any single factor, but rather was based on a comprehensive consideration of all the information provided to the Board at its meetings throughout the year. The Board, in reaching its determination to renew the Advisory Contracts, was aware that shareholders of the fund have a broad range of investment choices available to them, including a wide choice among funds offered by Fidelity's competitors, and that the fund's shareholders, who have the opportunity to review and weigh the disclosure provided by the fund in its prospectus and other public disclosures, have chosen to invest in this fund, which is part of the Fidelity family of funds.
Nature, Extent, and Quality of Services Provided. The Board considered Fidelity's staffing as it relates to the fund, including the backgrounds of investment personnel of Fidelity, and also considered the fund's investment objective, strategies, and related investment philosophy. The Independent Trustees also had discussions with senior management of Fidelity's investment operations and investment groups. The Board considered the structure of the investment personnel compensation program and whether this structure provides appropriate incentives to act in the best interests of the fund. Additionally, the Board considered the portfolio managers' investments, if any, in the funds that they manage.Resources Dedicated to Investment Management and Support Services. The Board and the Fund Oversight and Research Committees reviewed the general qualifications and capabilities of Fidelity's investment staff, including its size, education, experience, and resources, as well as Fidelity's approach to recruiting, training, managing, and compensating investment personnel. The Board noted that Fidelity has continued to increase the resources devoted to non-U.S. offices, including expansion of Fidelity's global investment organization. The Board also noted that Fidelity's analysts have extensive resources, tools and capabilities that allow them to conduct sophisticated quantitative and fundamental analysis, as well as credit analysis of issuers, counterparties and guarantors. Further, the Board considered that Fidelity's investment professionals have sufficient access to global information and data so as to provide competitive investment results over time, and that those professionals also have access to sophisticated tools that permit them to assess portfolio construction and risk and performance attribution characteristics continuously, as well as to transmit new information and research conclusions rapidly around the world. Additionally, in its deliberations, the Board considered Fidelity's trading, risk management, compliance, and technology and operations capabilities and resources, which are integral parts of the investment management process.Shareholder and Administrative Services. The Board considered (i) the nature, extent, quality, and cost of advisory, administrative, and shareholder services performed by the Investment Advisers and their affiliates under the Advisory Contracts and under separate agreements covering transfer agency, pricing and bookkeeping, and securities lending services for the fund; (ii) the nature and extent of the supervision of third party service providers, principally custodians, subcustodians, and pricing vendors; and (iii) the resources devoted to, and the record of compliance with, the fund's compliance policies and procedures. The Board also reviewed the allocation of fund brokerage, including allocations to brokers affiliated with the Investment Advisers, the use of brokerage commissions to pay fund expenses, and the use of "soft" commission dollars to pay for research services.The Board noted that the growth of fund assets over time across the complex allows Fidelity to reinvest in the development of services designed to enhance the value and convenience of the Fidelity funds as investment vehicles. These services include 24-hour access to account information and market information through telephone representatives and over the Internet, investor education materials and asset allocation tools, and the expanded availability of Fidelity Investor Centers.The Board noted that it and the boards of certain other Fidelity funds had formed an ad hoc Committee on Transfer Agency Fees to review the variety of transfer agency fee structures throughout the industry and Fidelity's competitive positioning with respect to industry participants.Investment in a Large Fund Family. The Board considered the benefits to shareholders of investing in a Fidelity fund, including the benefits of investing in a fund that is part of a large family of funds offering a variety of investment disciplines and providing a large variety of mutual fund investor services. The Board noted that Fidelity had taken, or had made recommendations that resulted in the Fidelity funds taking, a number of actions over the previous year that benefited particular funds, including: (i) continuing to dedicate additional resources to Fidelity's investment research process, which includes meetings with management of issuers of securities in which the funds invest, and to the support of the senior management team that oversees asset management; (ii) continuing efforts to enhance Fidelity's global research capabilities; (iii) launching new funds and making other enhancements to meet client needs; (iv) launching new share classes of existing funds; (v) eliminating purchase minimums and broadening eligibility requirements for certain funds and share classes; (vi) reducing management fees and total expenses for certain growth equity funds and index funds; (vii) lowering expense caps for certain existing funds and classes, and converting certain voluntary expense caps to contractual caps, to reduce expenses borne by shareholders; (viii) eliminating short-term redemption fees for funds that had such fees; (ix) rationalizing product lines and gaining increased efficiencies from fund mergers and share class consolidations; (x) continuing to develop, acquire and implement systems and technology to improve services to the funds and shareholders, strengthen information security, and increase efficiency; and (xi) continuing to implement enhancements to further strengthen Fidelity's product line to increase investors' probability of success in achieving their investment goals, including retirement income goals.Investment Performance. The Board considered whether the fund has operated in accordance with its investment objective, as well as its record of compliance with its investment restrictions and its performance history. The fund had a portfolio manager change in February 2016. The Board will continue to monitor closely the fund's performance, taking into account the portfolio manager change.The Board took into account discussions that occur at Board meetings throughout the year with representatives of the Investment Advisers about fund investment performance. In this regard the Board noted that as part of regularly scheduled fund reviews and other reports to the Board on fund performance, the Board considers annualized return information for the fund for different time periods, measured against an appropriate securities market index ("benchmark index") and a peer group of funds with similar objectives ("peer group"), if any. In its evaluation of fund investment performance, the Board gave particular attention to information indicating changes in performance of certain Fidelity funds for specific time periods and discussed with the Investment Advisers the reasons for any overperformance or underperformance.In addition to reviewing absolute and relative fund performance, the Independent Trustees periodically consider the appropriateness of fund performance metrics in evaluating the results achieved. In general, the Independent Trustees believe that fund performance should be evaluated based on net performance (after fees and expenses) of both the highest performing and lowest performing fund share classes, where applicable, compared to appropriate benchmark indices, over appropriate time periods that may include full market cycles, and compared to peer groups, as applicable, over the same periods, taking into account relevant factors including the following: general market conditions; issuer-specific information; and fund cash flows and other factors.The Independent Trustees recognize that shareholders evaluate performance on a net basis over their own holding periods, for which one-, three-, and five-year periods are often used as a proxy. For this reason, the performance information reviewed by the Board also included net cumulative total return information for the fund and an appropriate benchmark index and peer group for the most recent one-, three-, and five-year periods ended June 30, 2018, as shown below. Returns are shown compared to the 25th percentile (top of box, 75% beaten) and 75th percentile (bottom of box, 25% beaten) of the peer universe.Fidelity Small Cap Stock Fund
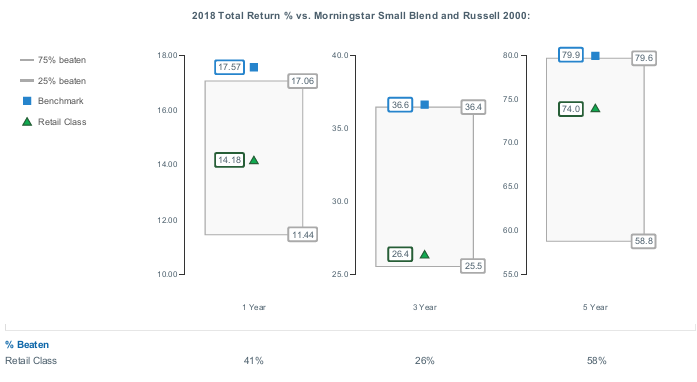
Fidelity Small Cap Stock Fund
The Board noted that the comparisons for 2015 and later reflect a revised Total Mapped Group that no longer includes funds with micro-cap objectives and that FMR believes this Total Mapped Group is a more appropriate comparison because the fund does not have a micro-cap objective.
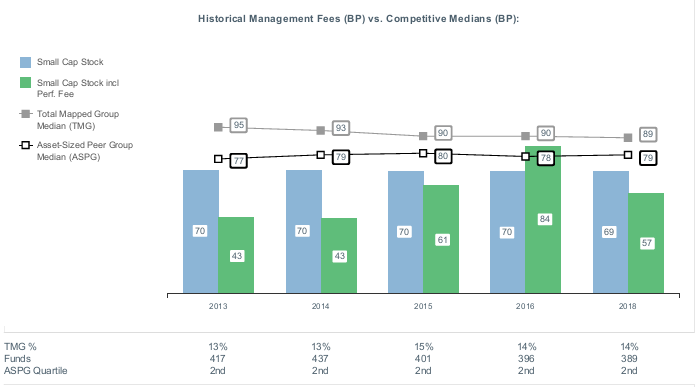
![]()
SLCX-ANN-0619
1.703590.121
Fidelity® Small Cap Discovery Fund Annual Report April 30, 2019 |
|
Beginning on January 1, 2021, as permitted by regulations adopted by the Securities and Exchange Commission, paper copies of a fund’s shareholder reports will no longer be sent by mail, unless you specifically request paper copies of the reports from the fund or from your financial intermediary, such as a financial advisor, broker-dealer or bank. Instead, the reports will be made available on a website, and you will be notified by mail each time a report is posted and provided with a website link to access the report.
If you already elected to receive shareholder reports electronically, you will not be affected by this change and you need not take any action. You may elect to receive shareholder reports and other communications from a fund electronically, by contacting your financial intermediary. For Fidelity customers, visit Fidelity's web site or call Fidelity using the contact information listed below.
You may elect to receive all future reports in paper free of charge. If you wish to continue receiving paper copies of your shareholder reports, you may contact your financial intermediary or, if you are a Fidelity customer, visit Fidelity’s website, or call Fidelity at the applicable toll-free number listed below. Your election to receive reports in paper will apply to all funds held with the fund complex/your financial intermediary.
| Account Type | Website | Phone Number |
| Brokerage, Mutual Fund, or Annuity Contracts: | fidelity.com/mailpreferences | 1-800-343-3548 |
| Employer Provided Retirement Accounts: | netbenefits.fidelity.com/preferences (choose 'no' under Required Disclosures to continue to print) | 1-800-343-0860 |
| Advisor Sold Accounts Serviced Through Your Financial Intermediary: | Contact Your Financial Intermediary | Your Financial Intermediary's phone number |
| Advisor Sold Accounts Serviced by Fidelity: | institutional.fidelity.com | 1-877-208-0098 |
Contents
Board Approval of Investment Advisory Contracts and Management Fees |
To view a fund's proxy voting guidelines and proxy voting record for the 12-month period ended June 30, visit http://www.fidelity.com/proxyvotingresults or visit the Securities and Exchange Commission's (SEC) web site at http://www.sec.gov.
You may also call 1-800-544-8544 to request a free copy of the proxy voting guidelines.
Standard & Poor's, S&P and S&P 500 are registered service marks of The McGraw-Hill Companies, Inc. and have been licensed for use by Fidelity Distributors Corporation.
Other third-party marks appearing herein are the property of their respective owners.
All other marks appearing herein are registered or unregistered trademarks or service marks of FMR LLC or an affiliated company. © 2019 FMR LLC. All rights reserved.
This report and the financial statements contained herein are submitted for the general information of the shareholders of the Fund. This report is not authorized for distribution to prospective investors in the Fund unless preceded or accompanied by an effective prospectus.
A fund files its complete schedule of portfolio holdings with the SEC for the first and third quarters of each fiscal year on Form N-PORT. Forms N-PORT are available on the SEC’s web site at http://www.sec.gov. A fund's Forms N-PORT may be reviewed and copied at the SEC’s Public Reference Room in Washington, DC. Information regarding the operation of the SEC's Public Reference Room may be obtained by calling 1-800-SEC-0330.
For a complete list of a fund's portfolio holdings, view the most recent holdings listing, semiannual report, or annual report on Fidelity's web site at http://www.fidelity.com, http://www.institutional.fidelity.com, or http://www.401k.com, as applicable.
NOT FDIC INSURED •MAY LOSE VALUE •NO BANK GUARANTEE
Neither the Fund nor Fidelity Distributors Corporation is a bank.
Performance: The Bottom Line
Average annual total return reflects the change in the value of an investment, assuming reinvestment of distributions from dividend income and capital gains (the profits earned upon the sale of securities that have grown in value, if any) and assuming a constant rate of performance each year. The hypothetical investment and the average annual total returns do not reflect the deduction of taxes that a shareholder would pay on fund distributions or the redemption of fund shares. During periods of reimbursement by Fidelity, a fund’s total return will be greater than it would be had the reimbursement not occurred. How a fund did yesterday is no guarantee of how it will do tomorrow.
Average Annual Total Returns
| For the periods ended April 30, 2019 | Past 1 year | Past 5 years | Past 10 years |
| Fidelity® Small Cap Discovery Fund | 4.96% | 6.59% | 15.62% |
$10,000 Over 10 Years
Let's say hypothetically that $10,000 was invested in Fidelity® Small Cap Discovery Fund on April 30, 2009.
The chart shows how the value of your investment would have changed, and also shows how the Russell 2000® Index performed over the same period.
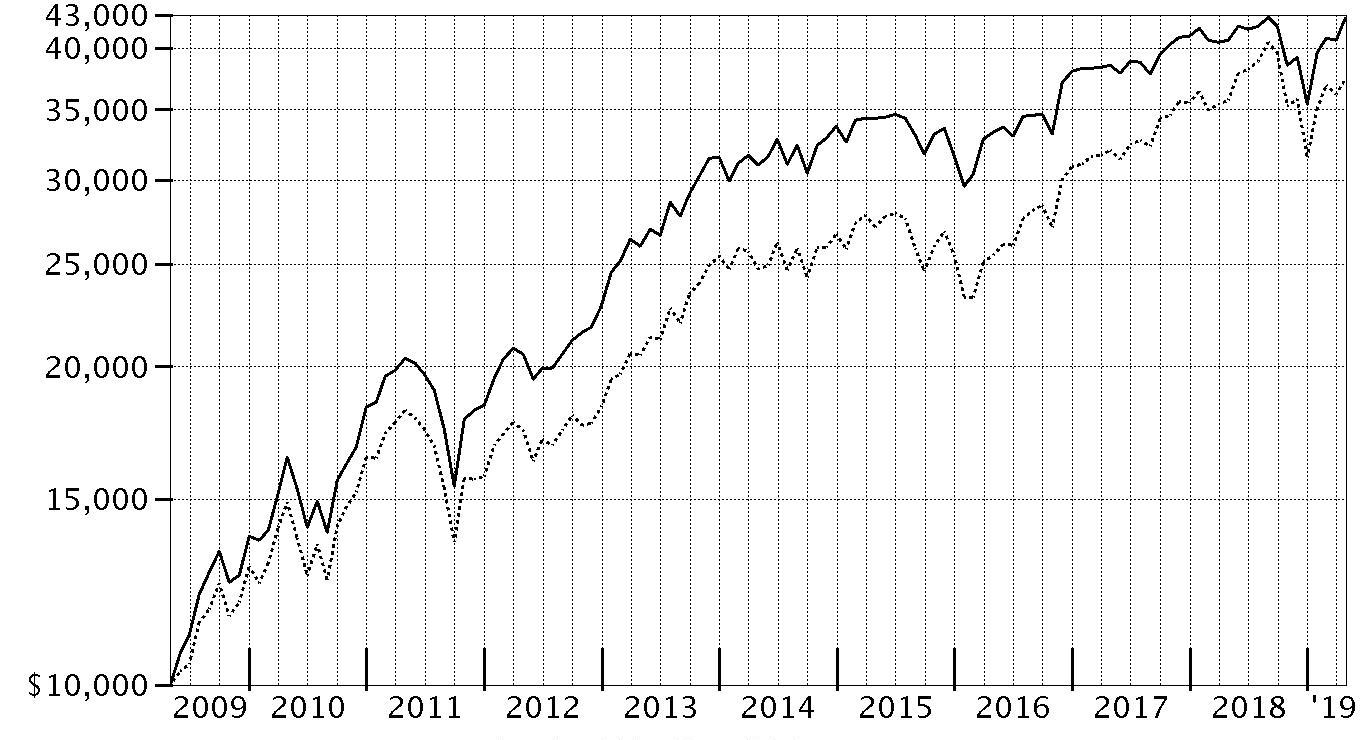
| Period Ending Values | ||
| $42,683 | Fidelity® Small Cap Discovery Fund | |
| $37,383 | Russell 2000® Index | |
Management's Discussion of Fund Performance
Market Recap: The S&P 500® index gained 13.49% for the 12 months ending April 30, 2019, as U.S. equities began the new year on a high note after enduring an historically volatile final quarter of 2018. The index rose 18.25% year to date, its strongest four-month opening since 1987, amid upbeat company earnings/outlooks and signs the Fed may pause on rates. After achieving a record close in late April, the S&P 500® moved a bit higher to end the period. The uptrend was in sharp contrast to late 2018, when rising U.S. Treasury yields and concern about peaking corporate earnings growth sent many investors fleeing from risk assets as they were still dealing with lingering uncertainty related to global trade and the Fed picking up the pace of interest rate hikes. The index returned -6.84% in October, at the time its largest monthly drop in seven years. But conditions worsened through Christmas, as jitters about the economy and another hike in rates led to a spike in market volatility and a -9.03% result for December. For the full period, eight of 11 sectors registered a double-digit gain, led by information technology (+25%). Three defensive groups also stood out: real estate (+21%), consumer staples (+18%) and utilities (+18%). Communication services – a mix of telecom stocks and media/entertainment names – gained 17%, followed by consumer discretionary (+16%). In contrast, energy (-7%) lost ground, while materials (+3%), financials (+4%), health care (+11%) and industrials (+11%) also trailed the broad market.Comments from Portfolio Manager Derek Janssen: For the fiscal year, the fund gained 4.96%, outpacing the 4.61% advance of the benchmark Russell 2000® index. In relative terms, security selection and sector positioning added to fund performance. Stock picking in financials, industrials, real estate and consumer staples contributed. Significantly underweighting health care also helped. Stock picking in information technology and communication services detracted, as did a combination of security selection and an unhelpful overweighting in the lagging energy sector. Looking at individual stocks, overweighting CareTrust REIT (+91%), an owner of skilled nursing facilities, and the fund's non-benchmark position in triple-net real estate investment trust (REIT) Store Capital (+38%) added significant value. Other notable contributors included the fund's overweighted stakes in homebuilder LGI Homes (+37%), and waste management company Advanced Disposal Services (+47%), the latter of which agreed to be acquired during the period. Conversely, the fund's overweighting in energy services company Oil States International (-46%) detracted more than any other fund holding. A non-benchmark stake in business process outsourcing company Conduent (-34%), also hurt the fund's relative return.The views expressed above reflect those of the portfolio manager(s) only through the end of the period as stated on the cover of this report and do not necessarily represent the views of Fidelity or any other person in the Fidelity organization. Any such views are subject to change at any time based upon market or other conditions and Fidelity disclaims any responsibility to update such views. These views may not be relied on as investment advice and, because investment decisions for a Fidelity fund are based on numerous factors, may not be relied on as an indication of trading intent on behalf of any Fidelity fund.
Investment Summary (Unaudited)
Top Ten Stocks as of April 30, 2019
| % of fund's net assets | |
| SYNNEX Corp. | 4.0 |
| First American Financial Corp. | 3.3 |
| First Citizens Bancshares, Inc. Class A | 3.0 |
| Hilton Grand Vacations, Inc. | 2.9 |
| Emerald Expositions Events, Inc. | 2.8 |
| LGI Homes, Inc. | 2.8 |
| First Hawaiian, Inc. | 2.7 |
| j2 Global, Inc. | 2.6 |
| ABM Industries, Inc. | 2.5 |
| ShawCor Ltd. Class A | 2.5 |
| 29.1 |
Top Five Market Sectors as of April 30, 2019
| % of fund's net assets | |
| Financials | 23.0 |
| Information Technology | 17.2 |
| Industrials | 15.5 |
| Consumer Discretionary | 13.0 |
| Real Estate | 6.9 |
Asset Allocation (% of fund's net assets)
| As of April 30, 2019* | ||
| Stocks | 98.0% | |
| Short-Term Investments and Net Other Assets (Liabilities) | 2.0% | |

* Foreign investments - 17.7%
Schedule of Investments April 30, 2019
Showing Percentage of Net Assets
| Common Stocks - 98.0% | |||
| Shares | Value | ||
| COMMUNICATION SERVICES - 5.4% | |||
| Diversified Telecommunication Services - 1.0% | |||
| Atn International, Inc. | 499,000 | $30,463,950 | |
| Entertainment - 1.6% | |||
| Cinemark Holdings, Inc. | 1,150,000 | 48,357,500 | |
| Media - 2.8% | |||
| Emerald Expositions Events, Inc. (a) | 6,000,000 | 84,300,000 | |
| TOTAL COMMUNICATION SERVICES | 163,121,450 | ||
| CONSUMER DISCRETIONARY - 13.0% | |||
| Auto Components - 0.3% | |||
| Linamar Corp. | 250,000 | 9,483,466 | |
| Hotels, Restaurants & Leisure - 4.4% | |||
| Cedar Fair LP (depositary unit) | 850,000 | 45,874,500 | |
| Hilton Grand Vacations, Inc. (b) | 2,719,700 | 87,139,188 | |
| 133,013,688 | |||
| Household Durables - 6.8% | |||
| LGI Homes, Inc. (a)(b)(c) | 1,200,000 | 83,172,000 | |
| Taylor Morrison Home Corp. (b) | 3,000,000 | 58,080,000 | |
| TRI Pointe Homes, Inc. (b) | 5,000,000 | 65,250,000 | |
| 206,502,000 | |||
| Specialty Retail - 1.5% | |||
| Aaron's, Inc. Class A | 800,000 | 44,552,000 | |
| TOTAL CONSUMER DISCRETIONARY | 393,551,154 | ||
| CONSUMER STAPLES - 1.8% | |||
| Food & Staples Retailing - 1.0% | |||
| BJ's Wholesale Club Holdings, Inc. | 1,000,000 | 28,350,000 | |
| Food Products - 0.8% | |||
| Inghams Group Ltd. (c) | 8,000,000 | 25,096,220 | |
| TOTAL CONSUMER STAPLES | 53,446,220 | ||
| ENERGY - 4.4% | |||
| Energy Equipment & Services - 4.4% | |||
| Oil States International, Inc. (b) | 3,000,000 | 57,960,000 | |
| ShawCor Ltd. Class A (a) | 5,000,000 | 74,195,715 | |
| 132,155,715 | |||
| FINANCIALS - 23.0% | |||
| Banks - 13.1% | |||
| Associated Banc-Corp. | 450,000 | 10,210,500 | |
| BOK Financial Corp. | 500,000 | 43,570,000 | |
| Cullen/Frost Bankers, Inc. | 250,000 | 25,422,500 | |
| First Citizens Bancshares, Inc. | 130,000 | 58,272,500 | |
| First Citizens Bancshares, Inc. Class A (b) | 200,000 | 89,650,000 | |
| First Hawaiian, Inc. | 3,000,000 | 82,950,000 | |
| Hilltop Holdings, Inc. | 2,612,700 | 54,945,081 | |
| Prosperity Bancshares, Inc. | 313,660 | 23,097,922 | |
| Wintrust Financial Corp. | 100,000 | 7,620,000 | |
| 395,738,503 | |||
| Capital Markets - 1.9% | |||
| Donnelley Financial Solutions, Inc. (b) | 606,707 | 9,288,684 | |
| Morningstar, Inc. | 50,000 | 7,172,500 | |
| OM Asset Management Ltd. | 2,664,900 | 39,067,434 | |
| 55,528,618 | |||
| Diversified Financial Services - 1.3% | |||
| Cannae Holdings, Inc. (b) | 1,500,000 | 38,505,000 | |
| Insurance - 6.7% | |||
| Amerisafe, Inc. | 360,100 | 21,325,122 | |
| Enstar Group Ltd. (b) | 400,000 | 70,904,000 | |
| First American Financial Corp. | 1,750,000 | 99,855,000 | |
| Sul America SA unit | 1,348,700 | 10,731,540 | |
| 202,815,662 | |||
| TOTAL FINANCIALS | 692,587,783 | ||
| HEALTH CARE - 5.9% | |||
| Health Care Equipment & Supplies - 2.6% | |||
| Hill-Rom Holdings, Inc. | 550,000 | 55,781,000 | |
| Integra LifeSciences Holdings Corp. (b) | 449,700 | 23,469,843 | |
| 79,250,843 | |||
| Life Sciences Tools & Services - 2.3% | |||
| Charles River Laboratories International, Inc. (b) | 500,000 | 70,235,000 | |
| Pharmaceuticals - 1.0% | |||
| Prestige Brands Holdings, Inc. (b) | 1,000,000 | 29,420,000 | |
| TOTAL HEALTH CARE | 178,905,843 | ||
| INDUSTRIALS - 15.5% | |||
| Aerospace & Defense - 1.7% | |||
| Ultra Electronics Holdings PLC | 2,460,554 | 51,080,313 | |
| Airlines - 2.0% | |||
| Spirit Airlines, Inc. (b) | 1,124,800 | 61,166,624 | |
| Commercial Services & Supplies - 6.1% | |||
| ABM Industries, Inc. | 2,000,000 | 75,940,000 | |
| ADS Waste Holdings, Inc. (b) | 1,500,000 | 48,510,000 | |
| Cimpress NV (b) | 500,000 | 45,200,000 | |
| Knoll, Inc. | 577,800 | 12,619,152 | |
| 182,269,152 | |||
| Construction & Engineering - 0.2% | |||
| Mirait Holdings Corp. (d) | 386,900 | 5,664,831 | |
| Electrical Equipment - 0.7% | |||
| Regal Beloit Corp. | 250,000 | 21,270,000 | |
| Machinery - 1.6% | |||
| Apergy Corp. (b) | 700,000 | 27,783,000 | |
| Mueller Industries, Inc. | 700,000 | 20,419,000 | |
| 48,202,000 | |||
| Marine - 0.4% | |||
| MPC Container Ships ASA (b) | 3,500,000 | 12,535,570 | |
| Professional Services - 0.1% | |||
| Intertrust NV (e) | 147,080 | 2,789,557 | |
| Road & Rail - 1.3% | |||
| Genesee & Wyoming, Inc. Class A (b) | 450,000 | 39,892,500 | |
| Trading Companies & Distributors - 1.1% | |||
| Beacon Roofing Supply, Inc. (b) | 350,000 | 13,181,000 | |
| Diploma PLC | 200,000 | 4,172,800 | |
| Fortress Transportation & Infrastructure Investors LLC | 1,000,000 | 16,250,000 | |
| 33,603,800 | |||
| Transportation Infrastructure - 0.3% | |||
| Macquarie Infrastructure Co. LLC | 250,000 | 10,127,500 | |
| TOTAL INDUSTRIALS | 468,601,847 | ||
| INFORMATION TECHNOLOGY - 17.2% | |||
| Electronic Equipment & Components - 6.2% | |||
| Flextronics International Ltd. (b) | 1,000,000 | 11,040,000 | |
| SYNNEX Corp. | 1,125,100 | 121,375,790 | |
| Tech Data Corp. (b) | 400,000 | 42,644,000 | |
| TTM Technologies, Inc. (b) | 1,000,000 | 13,240,000 | |
| 188,299,790 | |||
| IT Services - 5.1% | |||
| Conduent, Inc. (b) | 5,000,000 | 64,150,000 | |
| Presidio, Inc. (a) | 4,300,000 | 64,586,000 | |
| Tucows, Inc. (b)(c) | 300,000 | 26,457,000 | |
| 155,193,000 | |||
| Semiconductors & Semiconductor Equipment - 1.0% | |||
| Advanced Energy Industries, Inc. (b) | 500,000 | 28,880,000 | |
| Software - 4.3% | |||
| Hansen Technologies Ltd. | 3,961,915 | 8,406,785 | |
| j2 Global, Inc. | 900,000 | 78,858,000 | |
| Micro Focus International PLC | 1,659,200 | 41,926,179 | |
| 129,190,964 | |||
| Technology Hardware, Storage & Peripherals - 0.6% | |||
| Elecom Co. Ltd. | 500,000 | 16,697,338 | |
| TOTAL INFORMATION TECHNOLOGY | 518,261,092 | ||
| MATERIALS - 4.7% | |||
| Construction Materials - 2.7% | |||
| Eagle Materials, Inc. | 150,000 | 13,636,500 | |
| Wienerberger AG | 3,000,000 | 68,843,808 | |
| 82,480,308 | |||
| Containers & Packaging - 2.0% | |||
| Silgan Holdings, Inc. | 2,000,000 | 59,880,000 | |
| TOTAL MATERIALS | 142,360,308 | ||
| REAL ESTATE - 6.9% | |||
| Equity Real Estate Investment Trusts (REITs) - 5.8% | |||
| Brookfield Property REIT, Inc. Class A | 2,500,000 | 52,075,000 | |
| CareTrust (REIT), Inc. | 1,000,000 | 24,250,000 | |
| Corporate Office Properties Trust (SBI) | 2,500,000 | 69,700,000 | |
| iStar Financial, Inc. | 481,756 | 4,176,825 | |
| Store Capital Corp. | 750,000 | 24,990,000 | |
| 175,191,825 | |||
| Real Estate Management & Development - 1.1% | |||
| Cushman & Wakefield PLC | 1,731,708 | 34,010,745 | |
| TOTAL REAL ESTATE | 209,202,570 | ||
| UTILITIES - 0.2% | |||
| Electric Utilities - 0.2% | |||
| Portland General Electric Co. | 100,000 | 5,231,000 | |
| TOTAL COMMON STOCKS | |||
| (Cost $2,525,408,859) | 2,957,424,982 | ||
| Money Market Funds - 2.5% | |||
| Fidelity Cash Central Fund, 2.49% (f) | 31,379,078 | 31,385,354 | |
| Fidelity Securities Lending Cash Central Fund 2.49% (f)(g) | 45,209,945 | 45,214,466 | |
| TOTAL MONEY MARKET FUNDS | |||
| (Cost $76,599,820) | 76,599,820 | ||
| TOTAL INVESTMENT IN SECURITIES - 100.5% | |||
| (Cost $2,602,008,679) | 3,034,024,802 | ||
| NET OTHER ASSETS (LIABILITIES) - (0.5)% | (14,999,482) | ||
| NET ASSETS - 100% | $3,019,025,320 |
Legend
(a) Affiliated company
(b) Non-income producing
(c) Security or a portion of the security is on loan at period end.
(d) Security or a portion of the security purchased on a delayed delivery or when-issued basis.
(e) Security exempt from registration under Rule 144A of the Securities Act of 1933. These securities may be resold in transactions exempt from registration, normally to qualified institutional buyers. At the end of the period, the value of these securities amounted to $2,789,557 or 0.1% of net assets.
(f) Affiliated fund that is generally available only to investment companies and other accounts managed by Fidelity Investments. The rate quoted is the annualized seven-day yield of the fund at period end. A complete unaudited listing of the fund's holdings as of its most recent quarter end is available upon request. In addition, each Fidelity Central Fund's financial statements, which are not covered by the Fund's Report of Independent Registered Public Accounting Firm, are available on the SEC's website or upon request.
(g) Includes investment made with cash collateral received from securities on loan.
Affiliated Central Funds
Information regarding fiscal year to date income earned by the Fund from investments in Fidelity Central Funds is as follows:
| Fund | Income earned |
| Fidelity Cash Central Fund | $679,472 |
| Fidelity Securities Lending Cash Central Fund | 706,061 |
| Total | $1,385,533 |
Amounts in the income column in the above table include any capital gain distributions from underlying funds, which are presented in the corresponding line-item in the Statement of Operations, if applicable.
Other Affiliated Issuers
An affiliated company is a company in which the Fund has ownership of at least 5% of the voting securities. Fiscal year to date transactions with companies which are or were affiliates are as follows:
| Affiliate | Value, beginning of period | Purchases | Sales Proceeds | Dividend Income | Realized Gain (loss) | Change in Unrealized appreciation (depreciation) | Value, end of period |
| Amerisafe, Inc. | $59,300,000 | $-- | $40,375,176 | $2,390,025 | $28,604,876 | $(26,204,578) | $-- |
| CareTrust (REIT), Inc. | 59,445,000 | -- | 71,029,859 | 2,673,882 | 18,040,997 | 18,156,835 | -- |
| Emerald Expositions Events, Inc. | 86,715,000 | 20,565,156 | 4,858,598 | 1,382,055 | (258,983) | (17,862,575) | 84,300,000 |
| iStar Financial, Inc. | 36,023,009 | -- | 25,853,356 | 315,000 | (9,607,344) | 4,253,978 | -- |
| LGI Homes, Inc. | -- | 53,473,258 | -- | -- | -- | 29,698,742 | 83,172,000 |
| Oil States International, Inc. | 125,825,000 | -- | 16,373,595 | -- | 2,487,218 | (53,978,623) | -- |
| Presidio, Inc. | 76,600,000 | -- | 10,195,150 | 572,000 | (630,480) | (1,188,370) | 64,586,000 |
| Prestige Brands Holdings, Inc. | 88,320,000 | -- | 65,684,111 | -- | (37,382,607) | 44,166,718 | -- |
| ShawCor Ltd. Class A | 96,732,739 | -- | -- | 1,948,095 | -- | (22,537,024) | 74,195,715 |
| Super Micro Computer, Inc. | 44,250,000 | -- | 37,794,678 | -- | (22,789,634) | 16,334,312 | -- |
| Total | $673,210,748 | $74,038,414 | $272,164,523 | $9,281,057 | $(21,535,957) | $(9,160,585) | $306,253,715 |
Investment Valuation
All investments are categorized as Level 1 under the Fair Value Hierarchy. The inputs or methodology used for valuing securities may not be an indication of the risk associated with investing in those securities. For more information on valuation inputs please refer to the Investment Valuation section in the accompanying Notes to Financial Statements.
Other Information
Distribution of investments by country or territory of incorporation, as a percentage of Total Net Assets, is as follows (Unaudited):
| United States of America | 82.3% |
| United Kingdom | 5.6% |
| Canada | 2.8% |
| Bermuda | 2.3% |
| Austria | 2.3% |
| Netherlands | 1.6% |
| Australia | 1.1% |
| Others (Individually Less Than 1%) | 2.0% |
| 100.0% |
See accompanying notes which are an integral part of the financial statements.
Financial Statements
Statement of Assets and Liabilities
| April 30, 2019 | ||
| Assets | ||
| Investment in securities, at value (including securities loaned of $44,235,884) — See accompanying schedule: Unaffiliated issuers (cost $2,193,471,132) | $2,651,171,267 | |
| Fidelity Central Funds (cost $76,599,820) | 76,599,820 | |
| Other affiliated issuers (cost $331,937,727) | 306,253,715 | |
| Total Investment in Securities (cost $2,602,008,679) | $3,034,024,802 | |
| Receivable for investments sold | 30,256,014 | |
| Receivable for fund shares sold | 1,130,302 | |
| Dividends receivable | 10,687,866 | |
| Distributions receivable from Fidelity Central Funds | 97,349 | |
| Prepaid expenses | 2,094 | |
| Other receivables | 105,798 | |
| Total assets | 3,076,304,225 | |
| Liabilities | ||
| Payable for investments purchased | ||
| Regular delivery | $5,260,819 | |
| Delayed delivery | 753,283 | |
| Payable for fund shares redeemed | 4,569,547 | |
| Accrued management fee | 929,168 | |
| Other affiliated payables | 484,380 | |
| Other payables and accrued expenses | 66,783 | |
| Collateral on securities loaned | 45,214,925 | |
| Total liabilities | 57,278,905 | |
| Net Assets | $3,019,025,320 | |
| Net Assets consist of: | ||
| Paid in capital | $2,515,150,969 | |
| Total distributable earnings (loss) | 503,874,351 | |
| Net Assets, for 127,921,121 shares outstanding | $3,019,025,320 | |
| Net Asset Value, offering price and redemption price per share ($3,019,025,320 ÷ 127,921,121 shares) | $23.60 |
See accompanying notes which are an integral part of the financial statements.
Statement of Operations
| Year ended April 30, 2019 | ||
| Investment Income | ||
| Dividends (including $9,281,057 earned from other affiliated issuers) | $47,845,949 | |
| Non-Cash dividends | 11,125,000 | |
| Special dividends | 8,759,213 | |
| Interest | 76,585 | |
| Income from Fidelity Central Funds | 1,385,533 | |
| Total income | 69,192,280 | |
| Expenses | ||
| Management fee | ||
| Basic fee | $25,166,727 | |
| Performance adjustment | (10,096,802) | |
| Transfer agent fees | 6,056,197 | |
| Accounting and security lending fees | 983,263 | |
| Custodian fees and expenses | 86,219 | |
| Independent trustees' fees and expenses | 22,393 | |
| Registration fees | 36,958 | |
| Audit | 56,264 | |
| Legal | 8,803 | |
| Interest | 24,600 | |
| Miscellaneous | 29,945 | |
| Total expenses before reductions | 22,374,567 | |
| Expense reductions | (331,139) | |
| Total expenses after reductions | 22,043,428 | |
| Net investment income (loss) | 47,148,852 | |
| Realized and Unrealized Gain (Loss) | ||
| Net realized gain (loss) on: | ||
| Investment securities: | ||
| Unaffiliated issuers | 526,670,564 | |
| Fidelity Central Funds | (912) | |
| Other affiliated issuers | (21,535,957) | |
| Foreign currency transactions | (201,433) | |
| Total net realized gain (loss) | 504,932,262 | |
| Change in net unrealized appreciation (depreciation) on: | ||
| Investment securities: | ||
| Unaffiliated issuers | (438,308,433) | |
| Affiliated issuers | (9,160,585) | |
| Assets and liabilities in foreign currencies | 6,734 | |
| Total change in net unrealized appreciation (depreciation) | (447,462,284) | |
| Net gain (loss) | 57,469,978 | |
| Net increase (decrease) in net assets resulting from operations | $104,618,830 |
See accompanying notes which are an integral part of the financial statements.
Statement of Changes in Net Assets
| Year ended April 30, 2019 | Year ended April 30, 2018 | |
| Increase (Decrease) in Net Assets | ||
| Operations | ||
| Net investment income (loss) | $47,148,852 | $31,111,783 |
| Net realized gain (loss) | 504,932,262 | 1,124,609,868 |
| Change in net unrealized appreciation (depreciation) | (447,462,284) | (878,434,661) |
| Net increase (decrease) in net assets resulting from operations | 104,618,830 | 277,286,990 |
| Distributions to shareholders | (995,959,068) | – |
| Distributions to shareholders from net investment income | – | (30,365,108) |
| Distributions to shareholders from net realized gain | – | (642,336,031) |
| Total distributions | (995,959,068) | (672,701,139) |
| Share transactions | ||
| Proceeds from sales of shares | 242,716,170 | 368,900,524 |
| Reinvestment of distributions | 930,559,253 | 617,878,103 |
| Cost of shares redeemed | (1,770,361,701) | (1,716,978,022) |
| Net increase (decrease) in net assets resulting from share transactions | (597,086,278) | (730,199,395) |
| Redemption fees | – | 91,951 |
| Total increase (decrease) in net assets | (1,488,426,516) | (1,125,521,593) |
| Net Assets | ||
| Beginning of period | 4,507,451,836 | 5,632,973,429 |
| End of period | $3,019,025,320 | $4,507,451,836 |
| Other Information | ||
| Undistributed net investment income end of period | $6,957,019 | |
| Shares | ||
| Sold | 9,871,392 | 12,052,303 |
| Issued in reinvestment of distributions | 38,988,158 | 20,441,252 |
| Redeemed | (73,162,041) | (56,034,178) |
| Net increase (decrease) | (24,302,491) | (23,540,623) |
See accompanying notes which are an integral part of the financial statements.
Financial Highlights
Fidelity Small Cap Discovery Fund
| Years ended April 30, | 2019 | 2018 | 2017 | 2016 | 2015 |
| Selected Per–Share Data | |||||
| Net asset value, beginning of period | $29.61 | $32.05 | $27.81 | $30.62 | $30.77 |
| Income from Investment Operations | |||||
| Net investment income (loss)A | .32B | .19 | .20 | .15 | .11 |
| Net realized and unrealized gain (loss) | .68 | 1.53 | 4.18 | (.99) | 3.00 |
| Total from investment operations | 1.00 | 1.72 | 4.38 | (.84) | 3.11 |
| Distributions from net investment income | (.22) | (.19) | (.14) | (.15) | (.08) |
| Distributions from net realized gain | (6.78) | (3.97) | – | (1.82) | (3.18) |
| Total distributions | (7.01)C | (4.16) | (.14) | (1.97) | (3.26) |
| Redemption fees added to paid in capitalA | – | –D | –D | –D | –D |
| Net asset value, end of period | $23.60 | $29.61 | $32.05 | $27.81 | $30.62 |
| Total ReturnE | 4.96% | 5.46% | 15.76% | (2.94)% | 10.62% |
| Ratios to Average Net AssetsF,G | |||||
| Expenses before reductions | .61% | .69% | .87% | 1.01% | 1.06% |
| Expenses net of fee waivers, if any | .61% | .69% | .87% | 1.01% | 1.06% |
| Expenses net of all reductions | .60% | .68% | .87% | 1.00% | 1.05% |
| Net investment income (loss) | 1.29%B | .61% | .66% | .53% | .36% |
| Supplemental Data | |||||
| Net assets, end of period (000 omitted) | $3,019,025 | $4,507,452 | $5,632,973 | $5,330,816 | $6,052,079 |
| Portfolio turnover rateH | 32% | 41% | 18% | 25% | 13% |
A Calculated based on average shares outstanding during the period.
B Net investment income per share reflects a large, non-recurring dividend which amounted to $.06 per share. Excluding this non-recurring dividend, the ratio of net investment income (loss) to average net assets would have been 1.05%.
C Total distributions of $7.01 per share is comprised of distributions from net investment income of $.223 and distributions from net realized gain of $6.783 per share.
D Amount represents less than $.005 per share.
E Total returns would have been lower if certain expenses had not been reduced during the applicable periods shown.
F Fees and expenses of any underlying Fidelity Central Funds are not included in the Fund's expense ratio. The Fund indirectly bears its proportionate share of the expenses of any underlying Fidelity Central Funds.
G Expense ratios reflect operating expenses of the Fund. Expenses before reductions do not reflect amounts reimbursed by the investment adviser or reductions from brokerage service arrangements or reductions from other expense offset arrangements and do not represent the amount paid by the Fund during periods when reimbursements or reductions occur. Expenses net of fee waivers reflect expenses after reimbursement by the investment adviser but prior to reductions from brokerage service arrangements or other expense offset arrangements. Expenses net of all reductions represent the net expenses paid by the Fund.
H Amount does not include the portfolio activity of any underlying Fidelity Central Funds.
See accompanying notes which are an integral part of the financial statements.
Notes to Financial Statements
For the period ended April 30, 2019
1. Organization.
Fidelity Small Cap Discovery Fund (the Fund) is a fund of Fidelity Concord Street Trust (the Trust) and is authorized to issue an unlimited number of shares. Share transactions on the Statement of Changes in Net Assets may contain exchanges between affiliated funds. The Trust is registered under the Investment Company Act of 1940, as amended (the 1940 Act), as an open-end management investment company organized as a Massachusetts business trust. The Fund is closed to new accounts with certain exceptions.
2. Investments in Fidelity Central Funds.
The Fund invests in Fidelity Central Funds, which are open-end investment companies generally available only to other investment companies and accounts managed by the investment adviser and its affiliates. The Fund's Schedule of Investments lists each of the Fidelity Central Funds held as of period end, if any, as an investment of the Fund, but does not include the underlying holdings of each Fidelity Central Fund. As an Investing Fund, the Fund indirectly bears its proportionate share of the expenses of the underlying Fidelity Central Funds.
The Money Market Central Funds seek preservation of capital and current income and are managed by Fidelity Investments Money Management, Inc. (FIMM), an affiliate of the investment adviser. Annualized expenses of the Money Market Central Funds as of their most recent shareholder report date are less than .005%.
A complete unaudited list of holdings for each Fidelity Central Fund is available upon request or at the Securities and Exchange Commission (the SEC) website at www.sec.gov. In addition, the financial statements of the Fidelity Central Funds, which are not covered by the Fund's Report of Independent Registered Public Accounting Firm, are available on the SEC website or upon request.
3. Significant Accounting Policies.
The Fund is an investment company and applies the accounting and reporting guidance of the Financial Accounting Standards Board (FASB) Accounting Standards Codification Topic 946 Financial Services – Investments Companies. The financial statements have been prepared in conformity with accounting principles generally accepted in the United States of America (GAAP), which require management to make certain estimates and assumptions at the date of the financial statements. Actual results could differ from those estimates. Subsequent events, if any, through the date that the financial statements were issued have been evaluated in the preparation of the financial statements. The following summarizes the significant accounting policies of the Fund:
Investment Valuation. Investments are valued as of 4:00 p.m. Eastern time on the last calendar day of the period. The Board of Trustees (the Board) has delegated the day to day responsibility for the valuation of the Fund's investments to the Fair Value Committee (the Committee) established by the Fund's investment adviser. In accordance with valuation policies and procedures approved by the Board, the Fund attempts to obtain prices from one or more third party pricing vendors or brokers to value its investments. When current market prices, quotations or currency exchange rates are not readily available or reliable, investments will be fair valued in good faith by the Committee, in accordance with procedures adopted by the Board. Factors used in determining fair value vary by investment type and may include market or investment specific events. The frequency with which these procedures are used cannot be predicted and they may be utilized to a significant extent. The Committee oversees the Fund's valuation policies and procedures and reports to the Board on the Committee's activities and fair value determinations. The Board monitors the appropriateness of the procedures used in valuing the Fund's investments and ratifies the fair value determinations of the Committee.
The Fund categorizes the inputs to valuation techniques used to value its investments into a disclosure hierarchy consisting of three levels as shown below:
- Level 1 – quoted prices in active markets for identical investments
- Level 2 – other significant observable inputs (including quoted prices for similar investments, interest rates, prepayment speeds, etc.)
- Level 3 – unobservable inputs (including the Fund's own assumptions based on the best information available)
Valuation techniques used to value the Fund's investments by major category are as follows:
Equity securities, including restricted securities, for which market quotations are readily available, are valued at the last reported sale price or official closing price as reported by a third party pricing vendor on the primary market or exchange on which they are traded and are categorized as Level 1 in the hierarchy. In the event there were no sales during the day or closing prices are not available, securities are valued at the last quoted bid price or may be valued using the last available price and are generally categorized as Level 2 in the hierarchy. For foreign equity securities, when market or security specific events arise, comparisons to the valuation of American Depositary Receipts (ADRs), futures contracts, Exchange-Traded Funds (ETFs) and certain indexes as well as quoted prices for similar securities may be used and would be categorized as Level 2 in the hierarchy. For equity securities, including restricted securities, where observable inputs are limited, assumptions about market activity and risk are used and these securities may be categorized as Level 3 in the hierarchy.
Investments in open-end mutual funds, including the Fidelity Central Funds, are valued at their closing net asset value (NAV) each business day and are categorized as Level 1 in the hierarchy.
Changes in valuation techniques may result in transfers in or out of an assigned level within the disclosure hierarchy.
Foreign Currency. The Fund may use foreign currency contracts to facilitate transactions in foreign-denominated securities. Gains and losses from these transactions may arise from changes in the value of the foreign currency or if the counterparties do not perform under the contracts' terms.
Foreign-denominated assets, including investment securities, and liabilities are translated into U.S. dollars at the exchange rates at period end. Purchases and sales of investment securities, income and dividends received and expenses denominated in foreign currencies are translated into U.S. dollars at the exchange rate in effect on the transaction date.
The effects of exchange rate fluctuations on investments are included with the net realized and unrealized gain (loss) on investment securities. Other foreign currency transactions resulting in realized and unrealized gain (loss) are disclosed separately.
Investment Transactions and Income. For financial reporting purposes, the Fund's investment holdings and NAV include trades executed through the end of the last business day of the period. The NAV per share for processing shareholder transactions is calculated as of the close of business of the New York Stock Exchange (NYSE), normally 4:00 p.m. Eastern time and includes trades executed through the end of the prior business day. Gains and losses on securities sold are determined on the basis of identified cost and include proceeds received from litigation. Dividend income is recorded on the ex-dividend date, except for certain dividends from foreign securities where the ex-dividend date may have passed, which are recorded as soon as the Fund is informed of the ex-dividend date. Non-cash dividends included in dividend income, if any, are recorded at the fair market value of the securities received. Income and capital gain distributions from Fidelity Central Funds, if any, are recorded on the ex-dividend date. Certain distributions received by the Fund represent a return of capital or capital gain. The Fund determines the components of these distributions subsequent to the ex-dividend date, based upon receipt of tax filings or other correspondence relating to the underlying investment. These distributions are recorded as a reduction of cost of investments and/or as a realized gain. Large, non-recurring dividends recognized by the Fund are presented separately on the Statement of Operations as "Special Dividends" and the impact of these dividends is presented in the Financial Highlights. Interest income is accrued as earned and includes coupon interest and amortization of premium and accretion of discount on debt securities as applicable. Investment income is recorded net of foreign taxes withheld where recovery of such taxes is uncertain.
Expenses. Expenses directly attributable to a fund are charged to that fund. Expenses attributable to more than one fund are allocated among the respective funds on the basis of relative net assets or other appropriate methods. Expense estimates are accrued in the period to which they relate and adjustments are made when actual amounts are known.
Income Tax Information and Distributions to Shareholders. Each year, the Fund intends to qualify as a regulated investment company under Subchapter M of the Internal Revenue Code, including distributing substantially all of its taxable income and realized gains. As a result, no provision for U.S. Federal income taxes is required. As of April 30, 2019, the Fund did not have any unrecognized tax benefits in the financial statements; nor is the Fund aware of any tax positions for which it is reasonably possible that the total amounts of unrecognized tax benefits will significantly change in the next twelve months. The Fund files a U.S. federal tax return, in addition to state and local tax returns as required. The Fund's federal income tax returns are subject to examination by the Internal Revenue Service (IRS) for a period of three fiscal years after they are filed. State and local tax returns may be subject to examination for an additional fiscal year depending on the jurisdiction. Foreign taxes are provided for based on the Fund's understanding of the tax rules and rates that exist in the foreign markets in which it invests.
Distributions are declared and recorded on the ex-dividend date. Income and capital gain distributions are determined in accordance with income tax regulations, which may differ from GAAP. In addition, the Fund claimed a portion of the payment made to redeeming shareholders as a distribution for income tax purposes.
Capital accounts within the financial statements are adjusted for permanent book-tax differences. These adjustments have no impact on net assets or the results of operations. Capital accounts are not adjusted for temporary book-tax differences which will reverse in a subsequent period.
Book-tax differences are primarily due to foreign currency transactions, partnership and losses deferred due to wash sales.
As of period end, the cost and unrealized appreciation (depreciation) in securities, and derivatives if applicable, for federal income tax purposes were as follows:
| Gross unrealized appreciation | $653,532,161 |
| Gross unrealized depreciation | (216,596,419) |
| Net unrealized appreciation (depreciation) | $436,935,742 |
| Tax Cost | $2,597,089,060 |
The tax-based components of distributable earnings as of period end were as follows:
| Undistributed ordinary income | $8,366,087 |
| Undistributed long-term capital gain | $59,586,068 |
| Net unrealized appreciation (depreciation) on securities and other investments | $435,922,197 |
The tax character of distributions paid was as follows:
| April 30, 2019 | April 30, 2018 | |
| Ordinary Income | $30,754,218 | $ 30,365,108 |
| Long-term Capital Gains | 965,204,850 | 642,336,031 |
| Total | $995,959,068 | $ 672,701,139 |
Delayed Delivery Transactions and When-Issued Securities. During the period, the Fund transacted in securities on a delayed delivery or when-issued basis. Payment and delivery may take place after the customary settlement period for that security. The price of the underlying securities and the date when the securities will be delivered and paid for are fixed at the time the transaction is negotiated. The securities purchased on a delayed delivery or when-issued basis are identified as such in the Fund's Schedule of Investments. Losses may arise due to changes in the value of the underlying securities or if the counterparty does not perform under the contract's terms, or if the issuer does not issue the securities due to political, economic, or other factors.
Restricted Securities. The Fund may invest in securities that are subject to legal or contractual restrictions on resale. These securities generally may be resold in transactions exempt from registration or to the public if the securities are registered. Disposal of these securities may involve time-consuming negotiations and expense, and prompt sale at an acceptable price may be difficult. Information regarding restricted securities is included at the end of the Fund's Schedule of Investments.
New Rule Issuance. During August 2018, the U.S. Securities and Exchange Commission issued Final Rule Release No. 33-10532, Disclosure Update and Simplification. This Final Rule includes amendments specific to registered investment companies that are intended to eliminate overlap in disclosure requirements between Regulation S-X and GAAP. In accordance with these amendments, certain line-items in the Fund's financial statements have been combined or removed for the current period as outlined in the table below.
| Financial Statement | Current Line-Item Presentation (As Applicable) | Prior Line-Item Presentation (As Applicable) |
| Statement of Assets and Liabilities | Total distributable earnings (loss) | Undistributed/Distributions in excess of/Accumulated net investment income (loss) Accumulated/Undistributed net realized gain (loss) Net unrealized appreciation (depreciation) |
| Statement of Changes in Net Assets | N/A - removed | Undistributed/Distributions in excess of/Accumulated net investment income (loss) end of period |
| Statement of Changes in Net Assets | Distributions to shareholders | Distributions to shareholders from net investment income Distributions to shareholders from net realized gain |
4. Purchases and Sales of Investments.
Purchases and sales of securities, other than short-term securities, aggregated $1,143,266,467 and $2,709,720,834, respectively.
5. Fees and Other Transactions with Affiliates.
Management Fee. Fidelity Management & Research Company (the investment adviser) and its affiliates provide the Fund with investment management related services for which the Fund pays a monthly management fee. The management fee is the sum of an individual fund fee rate that is based on an annual rate of .45% of the Fund's average net assets and an annualized group fee rate that averaged .24% during the period. The group fee rate is based upon the average net assets of all the mutual funds advised by the investment adviser, including any mutual funds previously advised by the investment adviser that are currently advised by Fidelity SelectCo, LLC, an affiliate of the investment adviser. The group fee rate decreases as assets under management increase and increases as assets under management decrease. In addition, the management fee is subject to a performance adjustment (up to a maximum of +/- .20% of the Fund's average net assets over a 36 month performance period). The upward or downward adjustment to the management fee is based on the Fund's relative investment performance as compared to its benchmark index, the Russell 2000 Index, over the same 36 month performance period. For the reporting period, the total annual management fee rate, including the performance adjustment, was .41% of the Fund's average net assets. The performance adjustment included in the management fee rate may be higher or lower than the maximum performance adjustment rate due to the difference between the average net assets for the reporting and performance periods.
Transfer Agent Fees. Fidelity Investments Institutional Operations Company, Inc. (FIIOC), an affiliate of the investment adviser, is the Fund's transfer, dividend disbursing and shareholder servicing agent. FIIOC receives account fees and asset-based fees that vary according to account size and type of account. FIIOC pays for typesetting, printing and mailing of shareholder reports, except proxy statements. For the period, the transfer agent fees were equivalent to an annual rate of .17% of average net assets.
Accounting and Security Lending Fees. Fidelity Service Company, Inc. (FSC), an affiliate of the investment adviser, maintains the Fund's accounting records. The accounting fee is based on the level of average net assets for each month. Prior to April 1, 2019, FSC had a separate agreement with the Fund for administration of the security lending program, based on the number and duration of lending transactions. For the period, the total fees paid for accounting and administration of securities lending were equivalent to an annual rate of .03%.
Brokerage Commissions. The Fund placed a portion of its portfolio transactions with brokerage firms which are affiliates of the investment adviser. Brokerage commissions are included in net realized gain (loss) and change in net unrealized appreciation (depreciation) in the Statement of Operations. The commissions paid to these affiliated firms were $67,078 for the period.
Interfund Lending Program. Pursuant to an Exemptive Order issued by the SEC, the Fund, along with other registered investment companies having management contracts with Fidelity Management & Research Company (FMR) or other affiliated entities of FMR, may participate in an interfund lending program. This program provides an alternative credit facility allowing the funds to borrow from, or lend money to, other participating affiliated funds. At period end, there were no interfund loans outstanding. The Fund's activity in this program during the period for which loans were outstanding was as follows:
| Borrower or Lender | Average Loan Balance | Weighted Average Interest Rate | Interest Expense |
| Borrower | $22,709,267 | 2.57% | $24,318 |
Interfund Trades. The Fund may purchase from or sell securities to other Fidelity Funds under procedures adopted by the Board. The procedures have been designed to ensure these interfund trades are executed in accordance with Rule 17a-7 of the 1940 Act. Interfund trades are included within the respective purchases and sales amounts shown in the Purchases and Sales of Investments note.
6. Committed Line of Credit.
The Fund participates with other funds managed by the investment adviser or an affiliate in a $4.25 billion credit facility (the "line of credit") to be utilized for temporary or emergency purposes to fund shareholder redemptions or for other short-term liquidity purposes. The Fund has agreed to pay commitment fees on its pro-rata portion of the line of credit, which amounted to $10,310 and is reflected in Miscellaneous expenses on the Statement of Operations. During the period, the Fund did not borrow on this line of credit.
7. Security Lending.
The Fund lends portfolio securities through a lending agent from time to time in order to earn additional income. For equity securities, a lending agent is used and may loan securities to certain qualified borrowers, including Fidelity Capital Markets (FCM), a broker-dealer affiliated with the Fund. On the settlement date of the loan, the Fund receives collateral (in the form of U.S. Treasury obligations, letters of credit and/or cash) against the loaned securities and maintains collateral in an amount not less than 100% of the market value of the loaned securities during the period of the loan. The market value of the loaned securities is determined at the close of business of the Fund and any additional required collateral is delivered to the Fund on the next business day. The Fund or borrower may terminate the loan at any time, and if the borrower defaults on its obligation to return the securities loaned because of insolvency or other reasons, the Fund may apply collateral received from the borrower against the obligation. The Fund may experience delays and costs in recovering the securities loaned. Any cash collateral received is invested in the Fidelity Securities Lending Cash Central Fund. The value of loaned securities and cash collateral at period end are disclosed on the Fund's Statement of Assets and Liabilities. At period end, there were no security loans outstanding with FCM. Security lending income represents the income earned on investing cash collateral, less rebates paid to borrowers and any lending agent fees associated with the loan, plus any premium payments received for lending certain types of securities. Security lending income is presented in the Statement of Operations as a component of income from Fidelity Central Funds. Total security lending income during the period amounted to $706,061, including $81,549 from securities loaned to FCM.
8. Bank Borrowings.
The Fund is permitted to have bank borrowings for temporary or emergency purposes to fund shareholder redemptions or for other short-term liquidity requirements. The Fund has established borrowing arrangements with certain banks. The interest rate on the borrowings is the bank's base rate, as revised from time to time. The average loan balance during the period for which loans were outstanding amounted to $3,770,000. The weighted average interest rate was 2.70%. The interest expense amounted to $283 under the bank borrowing program. At period end, there were no bank borrowings outstanding.
9. Expense Reductions.
Commissions paid to certain brokers with whom the investment adviser, or its affiliates, places trades on behalf of the Fund include an amount in addition to trade execution, which may be rebated back to the Fund to offset certain expenses. This amount totaled $290,751 for the period. In addition, through arrangements with the Fund's custodian, credits realized as a result of certain uninvested cash balances were used to reduce the Fund's expenses. During the period, these credits reduced the Fund's expenses by $3,095.
In addition, during the period the investment adviser reimbursed and/or waived a portion of operating expenses in the amount of $37,293.
10. Other.
The Fund's organizational documents provide former and current trustees and officers with a limited indemnification against liabilities arising in connection with the performance of their duties to the Fund. In the normal course of business, the Fund may also enter into contracts that provide general indemnifications. The Fund's maximum exposure under these arrangements is unknown as this would be dependent on future claims that may be made against the Fund. The risk of material loss from such claims is considered remote.
Report of Independent Registered Public Accounting Firm
To the Trustees of Fidelity Concord Street Trust and Shareholders of Fidelity Small Cap Discovery Fund:
Opinion on the Financial Statements and Financial Highlights
We have audited the accompanying statement of assets and liabilities of Fidelity Small Cap Discovery Fund (the "Fund"), a fund of Fidelity Concord Street Trust, including the schedule of investments, as of April 30, 2019, the related statement of operations for the year then ended, the statement of changes in net assets for each of the two years in the period then ended, the financial highlights for each of the five years in the period then ended, and the related notes. In our opinion, the financial statements and financial highlights present fairly, in all material respects, the financial position of the Fund as of April 30, 2019, and the results of its operations for the year then ended, the changes in its net assets for each of the two years in the period then ended, and the financial highlights for each of the five years in the period then ended, in conformity with accounting principles generally accepted in the United States of America.
Basis for Opinion
These financial statements and financial highlights are the responsibility of the Fund's management. Our responsibility is to express an opinion on the Fund's financial statements and financial highlights based on our audits. We are a public accounting firm registered with the Public Company Accounting Oversight Board (United States) (PCAOB) and are required to be independent with respect to the Fund in accordance with the U.S. federal securities laws and the applicable rules and regulations of the Securities and Exchange Commission and the PCAOB.
We conducted our audits in accordance with the standards of the PCAOB. Those standards require that we plan and perform the audit to obtain reasonable assurance about whether the financial statements and financial highlights are free of material misstatement, whether due to error or fraud. The Fund is not required to have, nor were we engaged to perform, an audit of its internal control over financial reporting. As part of our audits we are required to obtain an understanding of internal control over financial reporting but not for the purpose of expressing an opinion on the effectiveness of the Fund’s internal control over financial reporting. Accordingly, we express no such opinion.
Our audits included performing procedures to assess the risks of material misstatement of the financial statements and financial highlights, whether due to error or fraud, and performing procedures that respond to those risks. Such procedures included examining, on a test basis, evidence regarding the amounts and disclosures in the financial statements and financial highlights. Our audits also included evaluating the accounting principles used and significant estimates made by management, as well as evaluating the overall presentation of the financial statements and financial highlights. Our procedures included confirmation of securities owned as of April 30, 2019, by correspondence with the custodians and brokers; when replies were not received from brokers, we performed other auditing procedures. We believe that our audits provide a reasonable basis for our opinion.
/s/ Deloitte & Touche LLP
Boston, Massachusetts
June 11, 2019
We have served as the auditor of one or more of the Fidelity investment companies since 1999.
Trustees and Officers
The Trustees, Members of the Advisory Board (if any), and officers of the trust for central funds and fund, as applicable, are listed below. The Board of Trustees governs the fund and is responsible for protecting the interests of shareholders. The Trustees are experienced executives who meet periodically throughout the year to oversee the fund's activities, review contractual arrangements with companies that provide services to the fund, oversee management of the risks associated with such activities and contractual arrangements, and review the fund's performance. Except for Jonathan Chiel, each of the Trustees oversees 289 funds. Mr. Chiel oversees 158 funds.
The Trustees hold office without limit in time except that (a) any Trustee may resign; (b) any Trustee may be removed by written instrument, signed by at least two-thirds of the number of Trustees prior to such removal; (c) any Trustee who requests to be retired or who has become incapacitated by illness or injury may be retired by written instrument signed by a majority of the other Trustees; and (d) any Trustee may be removed at any special meeting of shareholders by a two-thirds vote of the outstanding voting securities of the trust. Each Trustee who is not an interested person (as defined in the 1940 Act) of the trust and the fund is referred to herein as an Independent Trustee. Each Independent Trustee shall retire not later than the last day of the calendar year in which his or her 75th birthday occurs. The Independent Trustees may waive this mandatory retirement age policy with respect to individual Trustees. Officers and Advisory Board Members hold office without limit in time, except that any officer or Advisory Board Member may resign or may be removed by a vote of a majority of the Trustees at any regular meeting or any special meeting of the Trustees. Except as indicated, each individual has held the office shown or other offices in the same company for the past five years.
The fund’s Statement of Additional Information (SAI) includes more information about the Trustees. To request a free copy, call Fidelity at 1-800-544-8544.
Experience, Skills, Attributes, and Qualifications of the Trustees. The Governance and Nominating Committee has adopted a statement of policy that describes the experience, qualifications, attributes, and skills that are necessary and desirable for potential Independent Trustee candidates (Statement of Policy). The Board believes that each Trustee satisfied at the time he or she was initially elected or appointed a Trustee, and continues to satisfy, the standards contemplated by the Statement of Policy. The Governance and Nominating Committee also engages professional search firms to help identify potential Independent Trustee candidates who have the experience, qualifications, attributes, and skills consistent with the Statement of Policy. From time to time, additional criteria based on the composition and skills of the current Independent Trustees, as well as experience or skills that may be appropriate in light of future changes to board composition, business conditions, and regulatory or other developments, have also been considered by the professional search firms and the Governance and Nominating Committee. In addition, the Board takes into account the Trustees' commitment and participation in Board and committee meetings, as well as their leadership of standing and ad hoc committees throughout their tenure.
In determining that a particular Trustee was and continues to be qualified to serve as a Trustee, the Board has considered a variety of criteria, none of which, in isolation, was controlling. The Board believes that, collectively, the Trustees have balanced and diverse experience, qualifications, attributes, and skills, which allow the Board to operate effectively in governing the fund and protecting the interests of shareholders. Information about the specific experience, skills, attributes, and qualifications of each Trustee, which in each case led to the Board's conclusion that the Trustee should serve (or continue to serve) as a trustee of the fund, is provided below.
Board Structure and Oversight Function. James C. Curvey is an interested person and currently serves as Chairman. The Trustees have determined that an interested Chairman is appropriate and benefits shareholders because an interested Chairman has a personal and professional stake in the quality and continuity of services provided to the fund. Independent Trustees exercise their informed business judgment to appoint an individual of their choosing to serve as Chairman, regardless of whether the Trustee happens to be independent or a member of management. The Independent Trustees have determined that they can act independently and effectively without having an Independent Trustee serve as Chairman and that a key structural component for assuring that they are in a position to do so is for the Independent Trustees to constitute a substantial majority for the Board. The Independent Trustees also regularly meet in executive session. Ned C. Lautenbach serves as Chairman of the Independent Trustees and as such (i) acts as a liaison between the Independent Trustees and management with respect to matters important to the Independent Trustees and (ii) with management prepares agendas for Board meetings.
Fidelity® funds are overseen by different Boards of Trustees. The fund's Board oversees Fidelity's high income and certain equity funds, and other Boards oversee Fidelity's investment-grade bond, money market, asset allocation, and other equity funds. The asset allocation funds may invest in Fidelity® funds overseen by the fund's Board. The use of separate Boards, each with its own committee structure, allows the Trustees of each group of Fidelity® funds to focus on the unique issues of the funds they oversee, including common research, investment, and operational issues. On occasion, the separate Boards establish joint committees to address issues of overlapping consequences for the Fidelity® funds overseen by each Board.
The Trustees operate using a system of committees to facilitate the timely and efficient consideration of all matters of importance to the Trustees, the fund, and fund shareholders and to facilitate compliance with legal and regulatory requirements and oversight of the fund's activities and associated risks. The Board, acting through its committees, has charged FMR and its affiliates with (i) identifying events or circumstances the occurrence of which could have demonstrably adverse effects on the fund's business and/or reputation; (ii) implementing processes and controls to lessen the possibility that such events or circumstances occur or to mitigate the effects of such events or circumstances if they do occur; and (iii) creating and maintaining a system designed to evaluate continuously business and market conditions in order to facilitate the identification and implementation processes described in (i) and (ii) above. Because the day-to-day operations and activities of the fund are carried out by or through FMR, its affiliates, and other service providers, the fund's exposure to risks is mitigated but not eliminated by the processes overseen by the Trustees. While each of the Board's committees has responsibility for overseeing different aspects of the fund's activities, oversight is exercised primarily through the Operations, Audit, and Compliance Committees. In addition, the Independent Trustees have worked with Fidelity to enhance the Board's oversight of investment and financial risks, legal and regulatory risks, technology risks, and operational risks, including the development of additional risk reporting to the Board. Appropriate personnel, including but not limited to the fund's Chief Compliance Officer (CCO), FMR's internal auditor, the independent accountants, the fund's Treasurer and portfolio management personnel, make periodic reports to the Board's committees, as appropriate, including an annual review of Fidelity's risk management program for the Fidelity® funds. The responsibilities of each standing committee, including their oversight responsibilities, are described further under "Standing Committees of the Trustees."
Interested Trustees*:
Correspondence intended for a Trustee who is an interested person may be sent to Fidelity Investments, 245 Summer Street, Boston, Massachusetts 02210.
Name, Year of Birth; Principal Occupations and Other Relevant Experience+
Jonathan Chiel (1957)
Year of Election or Appointment: 2016
Trustee
Mr. Chiel also serves as Trustee of other Fidelity® funds. Mr. Chiel is Executive Vice President and General Counsel for FMR LLC (diversified financial services company, 2012-present). Previously, Mr. Chiel served as general counsel (2004-2012) and senior vice president and deputy general counsel (2000-2004) for John Hancock Financial Services; a partner with Choate, Hall & Stewart (1996-2000) (law firm); and an Assistant United States Attorney for the United States Attorney’s Office of the District of Massachusetts (1986-95), including Chief of the Criminal Division (1993-1995). Mr. Chiel is a director on the boards of the Boston Bar Foundation and the Maimonides School.
James C. Curvey (1935)
Year of Election or Appointment: 2007
Trustee
Chairman of the Board of Trustees
Mr. Curvey also serves as Trustee of other Fidelity® funds. Mr. Curvey is Vice Chairman (2007-present) and Director of FMR LLC (diversified financial services company). In addition, Mr. Curvey is an Overseer Emeritus for the Boston Symphony Orchestra, a Director of Artis-Naples, and a Trustee of Brewster Academy in Wolfeboro, New Hampshire. Previously, Mr. Curvey served as a Director of Fidelity Research & Analysis Co. (investment adviser firm, 2009-2018), Director of Fidelity Investments Money Management, Inc. (investment adviser firm, 2009-2014) and a Director of FMR and FMR Co., Inc. (investment adviser firms, 2007-2014).
* Determined to be an “Interested Trustee” by virtue of, among other things, his or her affiliation with the trust or various entities under common control with FMR.
+ The information includes the Trustee's principal occupation during the last five years and other information relating to the experience, attributes, and skills relevant to the Trustee's qualifications to serve as a Trustee, which led to the conclusion that the Trustee should serve as a Trustee for the fund.
Independent Trustees:
Correspondence intended for an Independent Trustee may be sent to Fidelity Investments, P.O. Box 55235, Boston, Massachusetts 02205-5235.
Name, Year of Birth; Principal Occupations and Other Relevant Experience+
Dennis J. Dirks (1948)
Year of Election or Appointment: 2005
Trustee
Mr. Dirks also serves as Trustee of other Fidelity® funds. Prior to his retirement in May 2003, Mr. Dirks was Chief Operating Officer and a member of the Board of The Depository Trust & Clearing Corporation (DTCC). He also served as President, Chief Operating Officer, and Board member of The Depository Trust Company (DTC) and President and Board member of the National Securities Clearing Corporation (NSCC). In addition, Mr. Dirks served as Chief Executive Officer and Board member of the Government Securities Clearing Corporation, Chief Executive Officer and Board member of the Mortgage-Backed Securities Clearing Corporation, as a Trustee and a member of the Finance Committee of Manhattan College (2005-2008), as a Trustee and a member of the Finance Committee of AHRC of Nassau County (2006-2008), as a member of the Independent Directors Council (IDC) Governing Council (2010-2015), and as a member of the Board of Directors for The Brookville Center for Children’s Services, Inc. (2009-2017). Mr. Dirks is a member of the Finance Committee (2016-present) and Board of Directors (2017-present) and is Treasurer (2018-present) of the Asolo Repertory Theatre.
Donald F. Donahue (1950)
Year of Election or Appointment: 2018
Trustee
Mr. Donahue also serves as a Trustee of other Fidelity® funds. Mr. Donahue is President and Chief Executive Officer of Miranda Partners, LLC (risk consulting for the financial services industry, 2012-present). Previously, Mr. Donahue served as a Member of the Advisory Board of certain Fidelity® funds (2015-2018) and Chief Executive Officer (2006-2012), Chief Operating Officer (2003-2006), and Managing Director, Customer Marketing and Development (1999-2003) of The Depository Trust & Clearing Corporation (financial markets infrastructure). Mr. Donahue serves as a Member (2007-present) and Co-Chairman (2016-present) of the Board of Directors of United Way of New York, Member of the Board of Directors of NYC Leadership Academy (2012-present) and Member of the Board of Advisors of Ripple Labs, Inc. (financial services, 2015-present). He also served as Chairman (2010-2012) and Member of the Board of Directors (2012-2013) of Omgeo, LLC (financial services), Treasurer of United Way of New York (2012-2016), and Member of the Board of Directors of XBRL US (financial services non-profit, 2009-2012) and the International Securities Services Association (2009-2012).
Alan J. Lacy (1953)
Year of Election or Appointment: 2008
Trustee
Mr. Lacy also serves as Trustee of other Fidelity® funds. Mr. Lacy serves as a Director of Bristol-Myers Squibb Company (global pharmaceuticals, 2008-present). He is a Trustee of the California Chapter of The Nature Conservancy (2015-present) and a Director of the Center for Advanced Study in the Behavioral Sciences at Stanford University (2015-present). In addition, Mr. Lacy served as Senior Adviser (2007-2014) of Oak Hill Capital Partners, L.P. (private equity) and also served as Chief Executive Officer (2005) and Vice Chairman (2005-2006) of Sears Holdings Corporation (retail) and Chief Executive Officer and Chairman of the Board of Sears, Roebuck and Co. (retail, 2000-2005). Previously, Mr. Lacy served as Chairman (2014-2017) and a member (2010-2017) of the Board of Directors of Dave & Buster’s Entertainment, Inc. (restaurant and entertainment complexes), as Chairman (2008-2011) and a member (2006-2015) of the Board of Trustees of the National Parks Conservation Association, and as a member of the Board of Directors for The Hillman Companies, Inc. (hardware wholesalers, 2010-2014), Earth Fare, Inc. (retail grocery, 2010-2014), and The Western Union Company (global money transfer, 2006-2011).
Ned C. Lautenbach (1944)
Year of Election or Appointment: 2000
Trustee
Chairman of the Independent Trustees
Mr. Lautenbach also serves as Trustee of other Fidelity® funds. Mr. Lautenbach currently serves as Chair (2018-present) and Member (2013-present) of the Board of Governors, State University System of Florida and is a member of the Council on Foreign Relations (1994-present). He is also a member and has most recently served as Chairman of the Board of Directors of Artis-Naples (2012-present). Previously, Mr. Lautenbach served as a member and then Lead Director of the Board of Directors of Eaton Corporation (diversified industrial, 1997-2016). He was also a Partner and Advisory Partner at Clayton, Dubilier & Rice, LLC (private equity investment, 1998-2010), as well as a Director of Sony Corporation (2006-2007). In addition, Mr. Lautenbach also had a 30-year career with IBM (technology company) during which time he served as Senior Vice President and a member of the Corporate Executive Committee (1968-1998).
Joseph Mauriello (1944)
Year of Election or Appointment: 2008
Trustee
Mr. Mauriello also serves as Trustee of other Fidelity® funds. Prior to his retirement in January 2006, Mr. Mauriello served in numerous senior management positions including Deputy Chairman and Chief Operating Officer (2004-2005), and Vice Chairman of Financial Services (2002-2004) of KPMG LLP US (professional services, 1965-2005). Mr. Mauriello currently serves as a member of the Independent Directors Council (IDC) Governing Council (2015-present). Previously, Mr. Mauriello served as a member of the Board of Directors of XL Group plc. (global insurance and re-insurance, 2006-2018).
Cornelia M. Small (1944)
Year of Election or Appointment: 2005
Trustee
Ms. Small also serves as Trustee of other Fidelity® funds. Ms. Small is a member of the Board of Directors (2009-present) and Chair of the Investment Committee (2010-present) of the Teagle Foundation. Ms. Small also serves on the Investment Committee of the Berkshire Taconic Community Foundation (2008-present). Previously, Ms. Small served as Chairperson (2002-2008) and a member of the Investment Committee and Chairperson (2008-2012) and a member of the Board of Trustees of Smith College. In addition, Ms. Small served as Chief Investment Officer, Director of Global Equity Investments, and a member of the Board of Directors of Scudder, Stevens & Clark and Scudder Kemper Investments.
Garnett A. Smith (1947)
Year of Election or Appointment: 2018
Trustee
Mr. Smith also serves as Trustee of other Fidelity® funds. Prior to Mr. Smith's retirement, he served as Chairman and Chief Executive Officer of Inbrand Corp. (manufacturer of personal absorbent products, 1990-1997). He also served as President (1986-1990) of Inbrand Corp. Prior to his employment with Inbrand Corp., he was employed by a retail fabric chain and North Carolina National Bank. In addition, Mr. Smith served as a Member of the Advisory Board of certain Fidelity® funds (2012-2013) and as a board member of the Jackson Hole Land Trust (2009-2012).
David M. Thomas (1949)
Year of Election or Appointment: 2008
Trustee
Mr. Thomas also serves as Trustee of other Fidelity® funds. Mr. Thomas serves as Non-Executive Chairman of the Board of Directors of Fortune Brands Home and Security (home and security products, 2011-present) and as a member of the Board of Directors (2004-present) and Presiding Director (2013-present) of Interpublic Group of Companies, Inc. (marketing communication). Previously, Mr. Thomas served as Executive Chairman (2005-2006) and Chairman and Chief Executive Officer (2000-2005) of IMS Health, Inc. (pharmaceutical and healthcare information solutions), a Director of Fortune Brands, Inc. (consumer products, 2000-2011), and a member of the Board of Trustees of the University of Florida (2013-2018).
+ The information includes the Trustee's principal occupation during the last five years and other information relating to the experience, attributes, and skills relevant to the Trustee's qualifications to serve as a Trustee, which led to the conclusion that the Trustee should serve as a Trustee for the fund.
Advisory Board Members and Officers:
Correspondence intended for a Member of the Advisory Board (if any) may be sent to Fidelity Investments, P.O. Box 55235, Boston, Massachusetts 02205-5235. Correspondence intended for an officer or Peter S. Lynch may be sent to Fidelity Investments, 245 Summer Street, Boston, Massachusetts 02210. Officers appear below in alphabetical order.
Name, Year of Birth; Principal Occupation
Vicki L. Fuller (1957)
Year of Election or Appointment: 2018
Member of the Advisory Board
Ms. Fuller also serves as Member of the Advisory Board of other Fidelity® funds. Ms. Fuller serves as a member of the Board of Directors, Audit Committee, and Nominating and Governance Committee of The Williams Companies, Inc. (natural gas infrastructure, 2018-present). Previously, Ms. Fuller served as the Chief Investment Officer of the New York State Common Retirement Fund (2012-2018) and held a variety of positions at AllianceBernstein L.P. (global asset management, 1985-2012), including Managing Director (2006-2012) and Senior Vice President and Senior Portfolio Manager (2001-2006).
Peter S. Lynch (1944)
Year of Election or Appointment: 2003
Member of the Advisory Board
Mr. Lynch also serves as Member of the Advisory Board of other Fidelity® funds. Mr. Lynch is Vice Chairman and a Director of FMR (investment adviser firm) and FMR Co., Inc. (investment adviser firm). In addition, Mr. Lynch serves as a Trustee of Boston College and as the Chairman of the Inner-City Scholarship Fund. Previously, Mr. Lynch served on the Special Olympics International Board of Directors (1997-2006).
Carol B. Tomé (1957)
Year of Election or Appointment: 2018
Member of the Advisory Board
Ms. Tomé also serves as Member of the Advisory Board of other Fidelity® funds. Ms. Tomé is Chief Financial Officer (2001-present) and Executive Vice President of Corporate Services (2007-present) of The Home Depot, Inc. (home improvement retailer) and a Director (2003-present) and Chair of the Audit Committee (2004-present) of United Parcel Service, Inc. (package delivery and supply chain management). Previously, Ms. Tomé served as Trustee of certain Fidelity® funds (2017), Senior Vice President of Finance and Accounting/Treasurer (2000-2007) and Vice President and Treasurer (1995-2000) of The Home Depot, Inc. and Chair of the Board (2010-2012), Vice Chair of the Board (2009 and 2013), and a Director (2008-2013) of the Federal Reserve Bank of Atlanta. Ms. Tomé is also a director or trustee of many community and professional organizations.
Michael E. Wiley (1950)
Year of Election or Appointment: 2018
Member of the Advisory Board
Mr. Wiley also serves as Trustee or Member of the Advisory Board of other Fidelity® funds. Mr. Wiley serves as a Director of High Point Resources (exploration and production, 2005-present). Previously, Mr. Wiley served as a Director of Andeavor Corporation (independent oil refiner and marketer, 2005-2018), a Director of Andeavor Logistics LP (natural resources logistics, 2015-2018), a Director of Post Oak Bank (privately-held bank, 2004-2018), a Director of Asia Pacific Exploration Consolidated (international oil and gas exploration and production, 2008-2013), a member of the Board of Trustees of the University of Tulsa (2000-2006; 2007-2010), a Senior Energy Advisor of Katzenbach Partners, LLC (consulting, 2006-2007), an Advisory Director of Riverstone Holdings (private investment), a Director of Spinnaker Exploration Company (exploration and production, 2001-2005) and Chairman, President, and CEO of Baker Hughes, Inc. (oilfield services, 2000-2004).
Elizabeth Paige Baumann (1968)
Year of Election or Appointment: 2017
Anti-Money Laundering (AML) Officer
Ms. Baumann also serves as AML Officer of other funds. She is Chief AML Officer (2012-present) and Senior Vice President (2014-present) of FMR LLC (diversified financial services company) and is an employee of Fidelity Investments. Previously, Ms. Baumann served as AML Officer of the funds (2012-2016), and Vice President (2007-2014) and Deputy Anti-Money Laundering Officer (2007-2012) of FMR LLC.
Craig S. Brown (1977)
Year of Election or Appointment: 2019
Assistant Treasurer
Mr. Brown also serves as Assistant Treasurer of other funds. Mr. Brown is an employee of Fidelity Investments (2013-present).
John J. Burke III (1964)
Year of Election or Appointment: 2018
Chief Financial Officer
Mr. Burke also serves as Chief Financial Officer of other funds. Mr. Burke serves as Head of Investment Operations for Fidelity Fund and Investment Operations (2018-present) and is an employee of Fidelity Investments (1998-present). Previously Mr. Burke served as head of Asset Management Investment Operations (2012-2018).
William C. Coffey (1969)
Year of Election or Appointment: 2018
Secretary and Chief Legal Officer (CLO)
Mr. Coffey also serves as Secretary and CLO of other funds. Mr. Coffey serves as CLO, Secretary, and Senior Vice President of Fidelity Management & Research Company and FMR Co., Inc. (investment adviser firms, 2018-present); Secretary of Fidelity SelectCo, LLC and Fidelity Investments Money Management, Inc. (investment adviser firms, 2018-present); and CLO of Fidelity Management & Research (Hong Kong) Limited, FMR Investment Management (UK) Limited, and Fidelity Management & Research (Japan) Limited (investment adviser firms, 2018-present). He is Senior Vice President and Deputy General Counsel of FMR LLC (diversified financial services company, 2010-present), and is an employee of Fidelity Investments. Previously, Mr. Coffey served as Assistant Secretary of certain funds (2009-2018) and as Vice President and Associate General Counsel of FMR LLC (2005-2009).
Timothy M. Cohen (1969)
Year of Election or Appointment: 2018
Vice President
Mr. Cohen also serves as Vice President of other funds. Mr. Cohen serves as Executive Vice President of Fidelity SelectCo, LLC (2019-present), Co-Head of Equity (2018-present), a Director of Fidelity Management & Research (Japan) Limited (investment adviser firm, 2016-present), and is an employee of Fidelity Investments. Previously, Mr. Cohen served as Head of Global Equity Research (2016-2018), Chief Investment Officer - Equity and a Director of Fidelity Management & Research (U.K.) Inc. (investment adviser firm, 2013-2015) and as a Director of Fidelity Management & Research (Hong Kong) Limited (investment adviser firm, 2017).
Jonathan Davis (1968)
Year of Election or Appointment: 2010
Assistant Treasurer
Mr. Davis also serves as Assistant Treasurer of other funds. Mr. Davis serves as Assistant Treasurer of FMR Capital, Inc. (2017-present) and is an employee of Fidelity Investments. Previously, Mr. Davis served as Vice President and Associate General Counsel of FMR LLC (diversified financial services company, 2003-2010).
Adrien E. Deberghes (1967)
Year of Election or Appointment: 2016
Assistant Treasurer
Mr. Deberghes also serves as an officer of other funds. He serves as Assistant Treasurer of FMR Capital, Inc. (2017-present), Executive Vice President of Fidelity Investments Money Management, Inc. (FIMM) (investment adviser firm, 2016-present), and is an employee of Fidelity Investments (2008-present). Previously, Mr. Deberghes served as President and Treasurer of certain Fidelity® funds (2013-2018). Prior to joining Fidelity Investments, Mr. Deberghes was Senior Vice President of Mutual Fund Administration at State Street Corporation (2007-2008), Senior Director of Mutual Fund Administration at Investors Bank & Trust (2005-2007), and Director of Finance for Dunkin' Brands (2000-2005). Previously, Mr. Deberghes served in other fund officer roles.
Laura M. Del Prato (1964)
Year of Election or Appointment: 2018
Assistant Treasurer
Ms. Del Prato also serves as an officer of other funds. Ms. Del Prato is an employee of Fidelity Investments (2017-present). Prior to joining Fidelity Investments, Ms. Del Prato served as a Managing Director and Treasurer of the JPMorgan Mutual Funds (2014-2017). Prior to JPMorgan, Ms. Del Prato served as a partner at Cohen Fund Audit Services (accounting firm, 2012-2013) and KPMG LLP (accounting firm, 2004-2012).
Colm A. Hogan (1973)
Year of Election or Appointment: 2016
Deputy Treasurer
Mr. Hogan also serves as an officer of other funds. Mr. Hogan serves as Assistant Treasurer of FMR Capital, Inc. (2017-present) and is an employee of Fidelity Investments (2005-present). Previously, Mr. Hogan served as Assistant Treasurer of certain Fidelity® funds (2016-2018).
Pamela R. Holding (1964)
Year of Election or Appointment: 2018
Vice President
Ms. Holding also serves as Vice President of other funds. Ms. Holding serves as Executive Vice President of Fidelity SelectCo, LLC (2019-present), Co-Head of Equity (2018-present) and is an employee of Fidelity Investments (2013-present). Previously, Ms. Holding served as Chief Investment Officer of Fidelity Institutional Asset Management (2013-2018).
Chris Maher (1972)
Year of Election or Appointment: 2013
Assistant Treasurer
Mr. Maher serves as Assistant Treasurer of other funds. Mr. Maher is Vice President of Valuation Oversight, serves as Assistant Treasurer of FMR Capital, Inc. (2017-present), and is an employee of Fidelity Investments. Previously, Mr. Maher served as Vice President of Asset Management Compliance (2013), Vice President of the Program Management Group of FMR (investment adviser firm, 2010-2013), and Vice President of Valuation Oversight (2008-2010).
Kenneth B. Robins (1969)
Year of Election or Appointment: 2016
Chief Compliance Officer
Mr. Robins also serves as an officer of other funds. Mr. Robins serves as Compliance Officer of Fidelity Management & Research Company and FMR Co., Inc. (investment adviser firms, 2016-present) and is an employee of Fidelity Investments (2004-present). Previously, Mr. Robins served as Executive Vice President of Fidelity Investments Money Management, Inc. (investment adviser firm, 2013-2016) and served in other fund officer roles.
Stacie M. Smith (1974)
Year of Election or Appointment: 2016
President and Treasurer
Ms. Smith also serves as an officer of other funds. Ms. Smith serves as Assistant Treasurer of FMR Capital, Inc. (2017-present), is an employee of Fidelity Investments (2009-present), and has served in other fund officer roles. Prior to joining Fidelity Investments, Ms. Smith served as Senior Audit Manager of Ernst & Young LLP (accounting firm, 1996-2009). Previously, Ms. Smith served as Assistant Treasurer (2013-2018) and Deputy Treasurer (2013-2016) of certain Fidelity® funds.
Marc L. Spector (1972)
Year of Election or Appointment: 2016
Assistant Treasurer
Mr. Spector also serves as an officer of other funds. Mr. Spector serves as Assistant Treasurer of FMR Capital, Inc. (2017-present) and is an employee of Fidelity Investments (2016-present). Prior to joining Fidelity Investments, Mr. Spector served as Director at the Siegfried Group (accounting firm, 2013-2016), and prior to Siegfried Group as audit senior manager at Deloitte & Touche (accounting firm, 2005-2013).
Jim Wegmann (1979)
Year of Election or Appointment: 2019
Assistant Treasurer
Mr. Wegmann also serves as Assistant Treasurer of other funds. Mr. Wegmann is an employee of Fidelity Investments (2011-present).
Shareholder Expense Example
As a shareholder of the Fund, you incur two types of costs: (1) transaction costs, and (2) ongoing costs, including management fees and other Fund expenses. This Example is intended to help you understand your ongoing costs (in dollars) of investing in the Fund and to compare these costs with the ongoing costs of investing in other mutual funds.
The Example is based on an investment of $1,000 invested at the beginning of the period and held for the entire period (November 1, 2018 to April 30, 2019).
Actual Expenses
The first line of the accompanying table provides information about actual account values and actual expenses. You may use the information in this line, together with the amount you invested, to estimate the expenses that you paid over the period. Simply divide your account value by $1,000.00 (for example, an $8,600 account value divided by $1,000.00 = 8.6), then multiply the result by the number in the first line under the heading entitled "Expenses Paid During Period" to estimate the expenses you paid on your account during this period. In addition, the Fund, as a shareholder in the underlying Fidelity Central Funds, will indirectly bear its pro-rata share of the fees and expenses incurred by the underlying Fidelity Central Funds. These fees and expenses are not included in the Fund's annualized expense ratio used to calculate the expense estimate in the table below.
Hypothetical Example for Comparison Purposes
The second line of the accompanying table provides information about hypothetical account values and hypothetical expenses based on the Fund's actual expense ratio and an assumed rate of return of 5% per year before expenses, which is not the Fund's actual return. The hypothetical account values and expenses may not be used to estimate the actual ending account balance or expenses you paid for the period. You may use this information to compare the ongoing costs of investing in the Fund and other funds. To do so, compare this 5% hypothetical example with the 5% hypothetical examples that appear in the shareholder reports of the other funds. In addition, the Fund, as a shareholder in the underlying Fidelity Central Funds, will indirectly bear its pro-rata share of the fees and expenses incurred by the underlying Fidelity Central Funds. These fees and expenses are not included in the Fund's annualized expense ratio used to calculate the expense estimate in the table below.
Please note that the expenses shown in the table are meant to highlight your ongoing costs only and do not reflect any transaction costs. Therefore, the second line of the table is useful in comparing ongoing costs only, and will not help you determine the relative total costs of owning different funds.
| Annualized Expense Ratio-A | Beginning Account Value November 1, 2018 | Ending Account Value April 30, 2019 | Expenses Paid During Period-B November 1, 2018 to April 30, 2019 | |
| Actual | .57% | $1,000.00 | $1,106.40 | $2.98 |
| Hypothetical-C | $1,000.00 | $1,021.97 | $2.86 |
A Annualized expense ratio reflects expenses net of applicable fee waivers.
B Expenses are equal to the Fund's annualized expense ratio, multiplied by the average account value over the period, multiplied by 181/365 (to reflect the one-half year period).
C 5% return per year before expenses
Distributions (Unaudited)
The Board of Trustees of Fidelity Small Cap Discovery Fund voted to pay on June 10, 2019, to shareholders of record at the opening of business on June 7, 2019, a distribution of $0.478 per share derived from capital gains realized from sales of portfolio securities and a dividend of $0.067 per share from net investment income.
The fund hereby designates as a capital gain dividend with respect to the taxable year ended April 30, 2019, $507,017,968 or, if subsequently determined to be different, the net capital gain of such year.
The fund designates 100% of the dividends distributed during the fiscal year as qualifying for the dividends–received deduction for corporate shareholders.
The fund designates 100% of the dividends distributed during the fiscal year as amounts which may be taken into account as a dividend for the purposes of the maximum rate under section 1(h)(11) of the Internal Revenue Code.
The fund will notify shareholders in January 2020 of amounts for use in preparing 2019 income tax returns.
Board Approval of Investment Advisory Contracts and Management Fees
Fidelity Small Cap Discovery Fund
Each year, the Board of Trustees, including the Independent Trustees (together, the Board), votes on the renewal of the management contract with Fidelity Management & Research Company (FMR) and the sub-advisory agreements (together, the Advisory Contracts) for the fund. FMR and the sub-advisers are referred to herein as the Investment Advisers. The Board, assisted by the advice of fund counsel and Independent Trustees' counsel, requests and considers a broad range of information relevant to the renewal of the Advisory Contracts throughout the year.
The Board meets regularly and, at each of its meetings, covers an extensive agenda of topics and materials and considers factors that are relevant to its annual consideration of the renewal of the fund's Advisory Contracts, including the services and support provided to the fund and its shareholders. The Board has established various standing committees (Committees), each composed of and chaired by Independent Trustees with varying backgrounds, to which the Board has assigned specific subject matter responsibilities in order to enhance effective decision-making by the Board. The Board, acting directly and through its Committees, requests and receives information concerning the annual consideration of the renewal of the fund's Advisory Contracts. The Board also meets as needed to review matters specifically related to the Board's annual consideration of the renewal of the Advisory Contracts. Members of the Board may also meet with trustees of other Fidelity funds through joint ad hoc committees to discuss certain matters relevant to all of the Fidelity funds.
At its January 2019 meeting, the Board unanimously determined to renew the fund's Advisory Contracts. In reaching its determination, the Board considered all factors it believed relevant, including (i) the nature, extent, and quality of the services to be provided to the fund and its shareholders (including the investment performance of the fund); (ii) the competitiveness of the fund's management fee and total expense ratio relative to peer funds; (iii) the total costs of the services to be provided by and the profits to be realized by Fidelity from its relationships with the fund; and (iv) the extent to which, if any, economies of scale exist and would be realized as the fund grows, and whether any economies of scale are appropriately shared with fund shareholders.
In considering whether to renew the Advisory Contracts for the fund, the Board reached a determination, with the assistance of fund counsel and Independent Trustees' counsel and through the exercise of its business judgment, that the renewal of the Advisory Contracts was in the best interests of the fund and its shareholders and that the compensation payable under the Advisory Contracts was fair and reasonable. The Board's decision to renew the Advisory Contracts was not based on any single factor, but rather was based on a comprehensive consideration of all the information provided to the Board at its meetings throughout the year. The Board, in reaching its determination to renew the Advisory Contracts, was aware that shareholders of the fund have a broad range of investment choices available to them, including a wide choice among funds offered by Fidelity's competitors, and that the fund's shareholders, who have the opportunity to review and weigh the disclosure provided by the fund in its prospectus and other public disclosures, have chosen to invest in this fund, which is part of the Fidelity family of funds.
Nature, Extent, and Quality of Services Provided. The Board considered Fidelity's staffing as it relates to the fund, including the backgrounds of investment personnel of Fidelity, and also considered the fund's investment objective, strategies, and related investment philosophy. The Independent Trustees also had discussions with senior management of Fidelity's investment operations and investment groups. The Board considered the structure of the investment personnel compensation program and whether this structure provides appropriate incentives to act in the best interests of the fund. Additionally, the Board considered the portfolio managers' investments, if any, in the funds that they manage.Resources Dedicated to Investment Management and Support Services. The Board and the Fund Oversight and Research Committees reviewed the general qualifications and capabilities of Fidelity's investment staff, including its size, education, experience, and resources, as well as Fidelity's approach to recruiting, training, managing, and compensating investment personnel. The Board noted that Fidelity has continued to increase the resources devoted to non-U.S. offices, including expansion of Fidelity's global investment organization. The Board also noted that Fidelity's analysts have extensive resources, tools and capabilities that allow them to conduct sophisticated quantitative and fundamental analysis, as well as credit analysis of issuers, counterparties and guarantors. Further, the Board considered that Fidelity's investment professionals have sufficient access to global information and data so as to provide competitive investment results over time, and that those professionals also have access to sophisticated tools that permit them to assess portfolio construction and risk and performance attribution characteristics continuously, as well as to transmit new information and research conclusions rapidly around the world. Additionally, in its deliberations, the Board considered Fidelity's trading, risk management, compliance, and technology and operations capabilities and resources, which are integral parts of the investment management process.Shareholder and Administrative Services. The Board considered (i) the nature, extent, quality, and cost of advisory, administrative, and shareholder services performed by the Investment Advisers and their affiliates under the Advisory Contracts and under separate agreements covering transfer agency, pricing and bookkeeping, and securities lending services for the fund; (ii) the nature and extent of the supervision of third party service providers, principally custodians, subcustodians, and pricing vendors; and (iii) the resources devoted to, and the record of compliance with, the fund's compliance policies and procedures. The Board also reviewed the allocation of fund brokerage, including allocations to brokers affiliated with the Investment Advisers, the use of brokerage commissions to pay fund expenses, and the use of "soft" commission dollars to pay for research services.The Board noted that the growth of fund assets over time across the complex allows Fidelity to reinvest in the development of services designed to enhance the value and convenience of the Fidelity funds as investment vehicles. These services include 24-hour access to account information and market information through telephone representatives and over the Internet, investor education materials and asset allocation tools, and the expanded availability of Fidelity Investor Centers.The Board noted that it and the boards of certain other Fidelity funds had formed an ad hoc Committee on Transfer Agency Fees to review the variety of transfer agency fee structures throughout the industry and Fidelity's competitive positioning with respect to industry participants.Investment in a Large Fund Family. The Board considered the benefits to shareholders of investing in a Fidelity fund, including the benefits of investing in a fund that is part of a large family of funds offering a variety of investment disciplines and providing a large variety of mutual fund investor services. The Board noted that Fidelity had taken, or had made recommendations that resulted in the Fidelity funds taking, a number of actions over the previous year that benefited particular funds, including: (i) continuing to dedicate additional resources to Fidelity's investment research process, which includes meetings with management of issuers of securities in which the funds invest, and to the support of the senior management team that oversees asset management; (ii) continuing efforts to enhance Fidelity's global research capabilities; (iii) launching new funds and making other enhancements to meet client needs; (iv) launching new share classes of existing funds; (v) eliminating purchase minimums and broadening eligibility requirements for certain funds and share classes; (vi) reducing management fees and total expenses for certain growth equity funds and index funds; (vii) lowering expense caps for certain existing funds and classes, and converting certain voluntary expense caps to contractual caps, to reduce expenses borne by shareholders; (viii) eliminating short-term redemption fees for funds that had such fees; (ix) rationalizing product lines and gaining increased efficiencies from fund mergers and share class consolidations; (x) continuing to develop, acquire and implement systems and technology to improve services to the funds and shareholders, strengthen information security, and increase efficiency; and (xi) continuing to implement enhancements to further strengthen Fidelity's product line to increase investors' probability of success in achieving their investment goals, including retirement income goals.Investment Performance. The Board considered whether the fund has operated in accordance with its investment objective, as well as its record of compliance with its investment restrictions and its performance history. The fund had a portfolio manager change in January 2018 and June 2018. The Board will continue to monitor closely the fund's performance, taking into account the portfolio manager changes.The Board took into account discussions that occur at Board meetings throughout the year with representatives of the Investment Advisers about fund investment performance. In this regard the Board noted that as part of regularly scheduled fund reviews and other reports to the Board on fund performance, the Board considers annualized return information for the fund for different time periods, measured against an appropriate securities market index ("benchmark index") and a peer group of funds with similar objectives ("peer group"), if any. In its evaluation of fund investment performance, the Board gave particular attention to information indicating changes in performance of certain Fidelity funds for specific time periods and discussed with the Investment Advisers the reasons for any overperformance or underperformance.In addition to reviewing absolute and relative fund performance, the Independent Trustees periodically consider the appropriateness of fund performance metrics in evaluating the results achieved. In general, the Independent Trustees believe that fund performance should be evaluated based on net performance (after fees and expenses) of both the highest performing and lowest performing fund share classes, where applicable, compared to appropriate benchmark indices, over appropriate time periods that may include full market cycles, and compared to peer groups, as applicable, over the same periods, taking into account relevant factors including the following: general market conditions; issuer-specific information; and fund cash flows and other factors.The Independent Trustees recognize that shareholders evaluate performance on a net basis over their own holding periods, for which one-, three-, and five-year periods are often used as a proxy. For this reason, the performance information reviewed by the Board also included net cumulative total return information for the fund and an appropriate benchmark index and peer group for the most recent one-, three-, and five-year periods ended June 30, 2018, as shown below. Returns are shown compared to the 25th percentile (top of box, 75% beaten) and 75th percentile (bottom of box, 25% beaten) of the peer universe.Fidelity Small Cap Discovery Fund
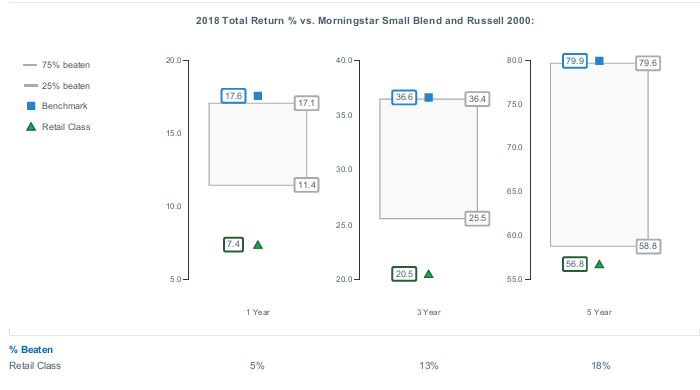
Fidelity Small Cap Discovery Fund
The Board noted that the comparisons for 2015 and later reflect a revised Total Mapped Group that no longer includes funds with micro-cap objectives and that FMR believes this Total Mapped Group is a more appropriate comparison because the fund does not have a micro-cap objective.
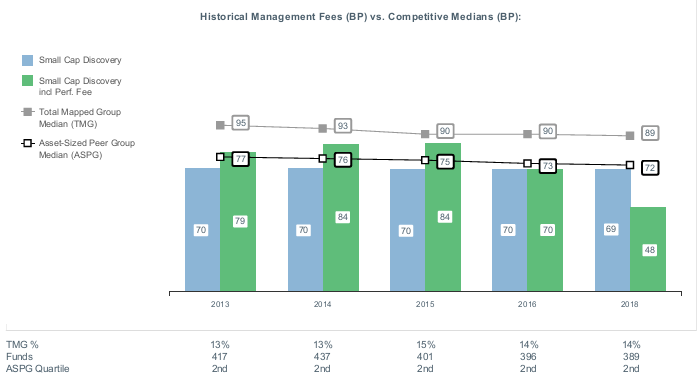
![]()
SMR-ANN-0619
1.757239.118
Fidelity® Series Small Cap Discovery Fund Annual Report April 30, 2019 |
|
Beginning on January 1, 2021, as permitted by regulations adopted by the Securities and Exchange Commission, paper copies of a fund’s shareholder reports will no longer be sent by mail, unless you specifically request paper copies of the reports from the fund or from your financial intermediary, such as a financial advisor, broker-dealer or bank. Instead, the reports will be made available on a website, and you will be notified by mail each time a report is posted and provided with a website link to access the report.
If you already elected to receive shareholder reports electronically, you will not be affected by this change and you need not take any action. You may elect to receive shareholder reports and other communications from a fund electronically, by contacting your financial intermediary. For Fidelity customers, visit Fidelity's web site or call Fidelity using the contact information listed below.
You may elect to receive all future reports in paper free of charge. If you wish to continue receiving paper copies of your shareholder reports, you may contact your financial intermediary or, if you are a Fidelity customer, visit Fidelity’s website, or call Fidelity at the applicable toll-free number listed below. Your election to receive reports in paper will apply to all funds held with the fund complex/your financial intermediary.
| Account Type | Website | Phone Number |
| Brokerage, Mutual Fund, or Annuity Contracts: | fidelity.com/mailpreferences | 1-800-343-3548 |
| Employer Provided Retirement Accounts: | netbenefits.fidelity.com/preferences (choose 'no' under Required Disclosures to continue to print) | 1-800-343-0860 |
| Advisor Sold Accounts Serviced Through Your Financial Intermediary: | Contact Your Financial Intermediary | Your Financial Intermediary's phone number |
| Advisor Sold Accounts Serviced by Fidelity: | institutional.fidelity.com | 1-877-208-0098 |
Contents
Board Approval of Investment Advisory Contracts and Management Fees |
To view a fund's proxy voting guidelines and proxy voting record for the 12-month period ended June 30, visit http://www.fidelity.com/proxyvotingresults or visit the Securities and Exchange Commission's (SEC) web site at http://www.sec.gov.
You may also call 1-800-544-8544 to request a free copy of the proxy voting guidelines.
Standard & Poor's, S&P and S&P 500 are registered service marks of The McGraw-Hill Companies, Inc. and have been licensed for use by Fidelity Distributors Corporation.
Other third-party marks appearing herein are the property of their respective owners.
All other marks appearing herein are registered or unregistered trademarks or service marks of FMR LLC or an affiliated company. © 2019 FMR LLC. All rights reserved.
This report and the financial statements contained herein are submitted for the general information of the shareholders of the Fund. This report is not authorized for distribution to prospective investors in the Fund unless preceded or accompanied by an effective prospectus.
A fund files its complete schedule of portfolio holdings with the SEC for the first and third quarters of each fiscal year on Form N-PORT. Forms N-PORT are available on the SEC’s web site at http://www.sec.gov. A fund's Forms N-PORT may be reviewed and copied at the SEC’s Public Reference Room in Washington, DC. Information regarding the operation of the SEC's Public Reference Room may be obtained by calling 1-800-SEC-0330.
For a complete list of a fund's portfolio holdings, view the most recent holdings listing, semiannual report, or annual report on Fidelity's web site at http://www.fidelity.com, http://www.institutional.fidelity.com, or http://www.401k.com, as applicable.
NOT FDIC INSURED •MAY LOSE VALUE •NO BANK GUARANTEE
Neither the Fund nor Fidelity Distributors Corporation is a bank.
Performance: The Bottom Line
Average annual total return reflects the change in the value of an investment, assuming reinvestment of distributions from dividend income and capital gains (the profits earned upon the sale of securities that have grown in value, if any) and assuming a constant rate of performance each year. The hypothetical investment and the average annual total returns do not reflect the deduction of taxes that a shareholder would pay on fund distributions or the redemption of fund shares. During periods of reimbursement by Fidelity, a fund’s total return will be greater than it would be had the reimbursement not occurred. How a fund did yesterday is no guarantee of how it will do tomorrow.
Average Annual Total Returns
| For the periods ended April 30, 2019 | Past 1 year | Past 5 years | Life of fundA |
| Fidelity® Series Small Cap Discovery Fund | 7.68% | 7.50% | 7.15% |
A From November 7, 2013
$10,000 Over Life of Fund
Let's say hypothetically that $10,000 was invested in Fidelity® Series Small Cap Discovery Fund on November 7, 2013, when the fund started.
The chart shows how the value of your investment would have changed, and also shows how the Russell 2000® Index performed over the same period.
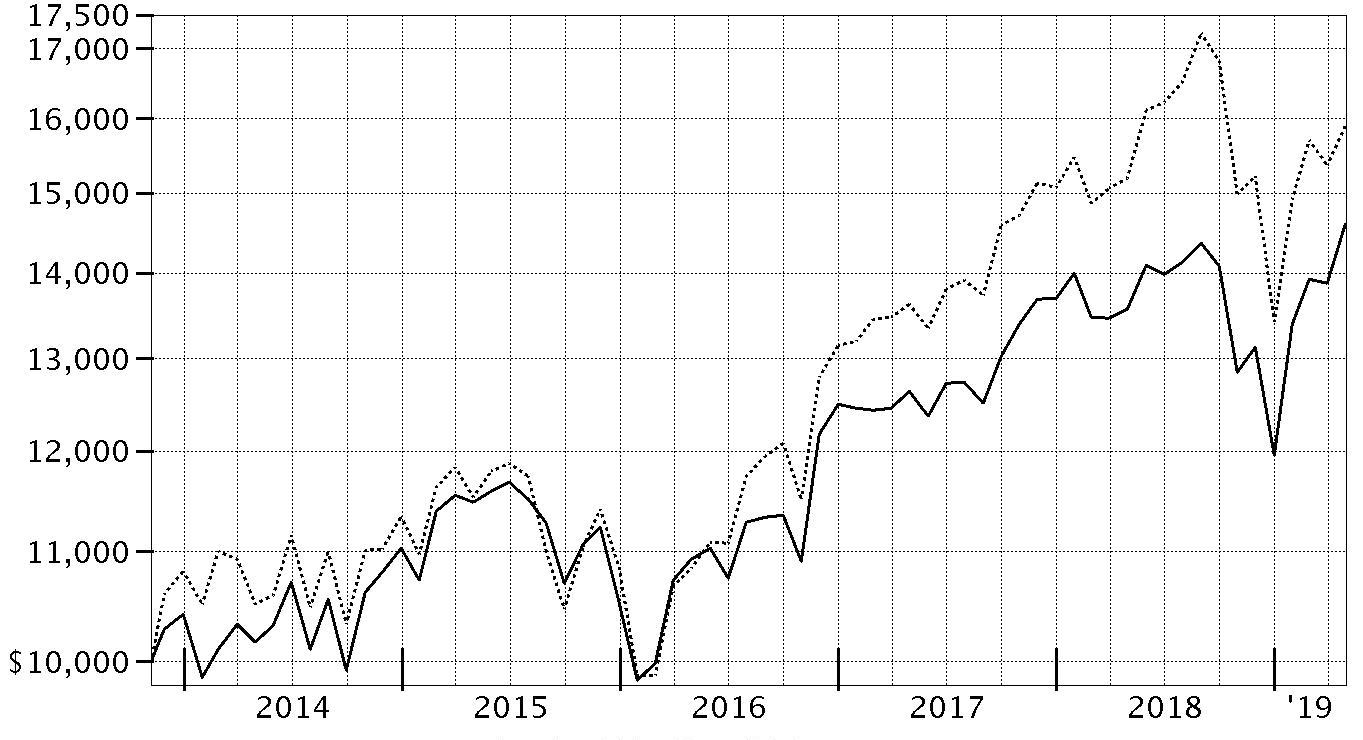
| Period Ending Values | ||
| $14,602 | Fidelity® Series Small Cap Discovery Fund | |
| $15,891 | Russell 2000® Index | |
Management's Discussion of Fund Performance
Market Recap: The S&P 500® index gained 13.49% for the 12 months ending April 30, 2019, as U.S. equities began the new year on a high note after enduring an historically volatile final quarter of 2018. The index rose 18.25% year to date, its strongest four-month opening since 1987, amid upbeat company earnings/outlooks and signs the Fed may pause on rates. After achieving a record close in late April, the S&P 500® moved a bit higher to end the period. The uptrend was in sharp contrast to late 2018, when rising U.S. Treasury yields and concern about peaking corporate earnings growth sent many investors fleeing from risk assets as they were still dealing with lingering uncertainty related to global trade and the Fed picking up the pace of interest rate hikes. The index returned -6.84% in October, at the time its largest monthly drop in seven years. But conditions worsened through Christmas, as jitters about the economy and another hike in rates led to a spike in market volatility and a -9.03% result for December. For the full period, eight of 11 sectors registered a double-digit gain, led by information technology (+25%). Three defensive groups also stood out: real estate (+21%), consumer staples (+18%) and utilities (+18%). Communication services – a mix of telecom stocks and media/entertainment names – gained 17%, followed by consumer discretionary (+16%). In contrast, energy (-7%) lost ground, while materials (+3%), financials (+4%), health care (+11%) and industrials (+11%) also trailed the broad market.Comments from Portfolio Manager Derek Janssen: For the fiscal year, the fund gained 7.68%, outpacing the 4.61% advance of the benchmark Russell 2000® index. In relative terms, security selection and sector positioning added to fund performance. Stock picking in industrials, health care, consumer staples and real estate contributed. Overweighting information technology and significantly underweighting health care also helped. Stock picking in information technology and communication services, however, detracted, as did a combination of security selection and an unhelpful overweighting in the lagging energy sector. Looking at individual stocks, the fund's overweighted stake in homebuilder LGI Homes (+40%), contributed more than any other fund position. Overweightings in special needs health care services provider Civitas Solutions and Spirit Airlines helped as well. Elsewhere, a non-benchmark position in triple-net-real estate investment trust (REIT) Store Capital (+37%) and overweighting CareTrust REIT (+91%), an owner of skilled nursing facilities, added value. Conversely, the fund's overweighting in energy services company Oil States International (-46%) detracted more than any other fund holding. A non-benchmark stake in business process outsourcing company Conduent (-34%) also hurt the fund's relative return.The views expressed above reflect those of the portfolio manager(s) only through the end of the period as stated on the cover of this report and do not necessarily represent the views of Fidelity or any other person in the Fidelity organization. Any such views are subject to change at any time based upon market or other conditions and Fidelity disclaims any responsibility to update such views. These views may not be relied on as investment advice and, because investment decisions for a Fidelity fund are based on numerous factors, may not be relied on as an indication of trading intent on behalf of any Fidelity fund.
Investment Summary (Unaudited)
Top Ten Stocks as of April 30, 2019
| % of fund's net assets | |
| First Citizens Bancshares, Inc. | 3.3 |
| SYNNEX Corp. | 3.1 |
| LGI Homes, Inc. | 3.0 |
| First American Financial Corp. | 2.8 |
| Hilton Grand Vacations, Inc. | 2.8 |
| ABM Industries, Inc. | 2.8 |
| Emerald Expositions Events, Inc. | 2.6 |
| j2 Global, Inc. | 2.6 |
| Charles River Laboratories International, Inc. | 2.5 |
| First Hawaiian, Inc. | 2.4 |
| 27.9 |
Top Five Market Sectors as of April 30, 2019
| % of fund's net assets | |
| Financials | 20.5 |
| Information Technology | 18.3 |
| Industrials | 17.5 |
| Consumer Discretionary | 12.7 |
| Real Estate | 7.7 |
Asset Allocation (% of fund's net assets)
| As of April 30, 2019 * | ||
| Stocks | 98.4% | |
| Short-Term Investments and Net Other Assets (Liabilities) | 1.6% | |

* Foreign investments - 14.1%
Schedule of Investments April 30, 2019
Showing Percentage of Net Assets
| Common Stocks - 98.4% | |||
| Shares | Value | ||
| COMMUNICATION SERVICES - 5.3% | |||
| Diversified Telecommunication Services - 0.7% | |||
| Atn International, Inc. | 200,000 | $12,210,000 | |
| Entertainment - 2.0% | |||
| Cinemark Holdings, Inc. | 800,000 | 33,640,000 | |
| Media - 2.6% | |||
| Emerald Expositions Events, Inc. | 3,180,000 | 44,679,000 | |
| TOTAL COMMUNICATION SERVICES | 90,529,000 | ||
| CONSUMER DISCRETIONARY - 12.7% | |||
| Diversified Consumer Services - 0.5% | |||
| Career Education Corp. (a) | 500,000 | 9,075,000 | |
| Hotels, Restaurants & Leisure - 4.4% | |||
| Cedar Fair LP (depositary unit) | 500,000 | 26,985,000 | |
| Hilton Grand Vacations, Inc. (a) | 1,483,400 | 47,528,136 | |
| 74,513,136 | |||
| Household Durables - 6.2% | |||
| LGI Homes, Inc. (a)(b) | 750,000 | 51,982,500 | |
| Taylor Morrison Home Corp. (a) | 1,750,000 | 33,880,000 | |
| TRI Pointe Homes, Inc. (a) | 1,500,000 | 19,575,000 | |
| 105,437,500 | |||
| Specialty Retail - 1.6% | |||
| Aaron's, Inc. Class A | 500,000 | 27,845,000 | |
| TOTAL CONSUMER DISCRETIONARY | 216,870,636 | ||
| CONSUMER STAPLES - 1.8% | |||
| Food & Staples Retailing - 0.8% | |||
| BJ's Wholesale Club Holdings, Inc. | 504,700 | 14,308,245 | |
| Food Products - 1.0% | |||
| Inghams Group Ltd. (b) | 3,500,000 | 10,979,596 | |
| Post Holdings, Inc. (a) | 50,000 | 5,639,000 | |
| 16,618,596 | |||
| TOTAL CONSUMER STAPLES | 30,926,841 | ||
| ENERGY - 3.9% | |||
| Energy Equipment & Services - 3.2% | |||
| Oil States International, Inc. (a) | 1,500,000 | 28,980,000 | |
| ShawCor Ltd. Class A | 1,051,745 | 15,606,995 | |
| Total Energy Services, Inc. | 1,455,230 | 10,645,110 | |
| 55,232,105 | |||
| Oil, Gas & Consumable Fuels - 0.7% | |||
| PDC Energy, Inc. (a) | 250,000 | 10,872,500 | |
| TOTAL ENERGY | 66,104,605 | ||
| FINANCIALS - 20.5% | |||
| Banks - 12.1% | |||
| Associated Banc-Corp. | 200,000 | 4,538,000 | |
| BOK Financial Corp. | 390,600 | 34,036,884 | |
| Cullen/Frost Bankers, Inc. | 200,000 | 20,338,000 | |
| First Citizens Bancshares, Inc. | 125,000 | 56,031,250 | |
| First Hawaiian, Inc. | 1,500,000 | 41,475,000 | |
| Hilltop Holdings, Inc. | 1,000,000 | 21,030,000 | |
| Prosperity Bancshares, Inc. | 313,654 | 23,097,481 | |
| Wintrust Financial Corp. | 68,602 | 5,227,472 | |
| 205,774,087 | |||
| Capital Markets - 2.3% | |||
| Monex Group, Inc. (b) | 2,000,000 | 6,068,495 | |
| OM Asset Management Ltd. | 2,220,700 | 32,555,462 | |
| 38,623,957 | |||
| Consumer Finance - 1.1% | |||
| First Cash Financial Services, Inc. | 200,000 | 19,536,000 | |
| Diversified Financial Services - 1.5% | |||
| Cannae Holdings, Inc. (a) | 1,000,000 | 25,670,000 | |
| Insurance - 3.5% | |||
| Enstar Group Ltd. (a) | 50,000 | 8,863,000 | |
| First American Financial Corp. | 850,000 | 48,501,000 | |
| Sul America SA unit | 400,000 | 3,182,780 | |
| 60,546,780 | |||
| TOTAL FINANCIALS | 350,150,824 | ||
| HEALTH CARE - 6.3% | |||
| Health Care Equipment & Supplies - 3.0% | |||
| Hill-Rom Holdings, Inc. | 350,000 | 35,497,000 | |
| Integra LifeSciences Holdings Corp. (a) | 300,000 | 15,657,000 | |
| 51,154,000 | |||
| Life Sciences Tools & Services - 2.5% | |||
| Charles River Laboratories International, Inc. (a) | 300,000 | 42,141,000 | |
| Pharmaceuticals - 0.8% | |||
| Prestige Brands Holdings, Inc. (a) | 500,000 | 14,710,000 | |
| TOTAL HEALTH CARE | 108,005,000 | ||
| INDUSTRIALS - 17.5% | |||
| Aerospace & Defense - 0.9% | |||
| Ultra Electronics Holdings PLC | 757,500 | 15,725,458 | |
| Airlines - 2.4% | |||
| Spirit Airlines, Inc. (a) | 750,000 | 40,785,000 | |
| Commercial Services & Supplies - 7.0% | |||
| ABM Industries, Inc. | 1,250,000 | 47,462,500 | |
| ADS Waste Holdings, Inc. (a) | 750,000 | 24,255,000 | |
| Cimpress NV (a) | 300,000 | 27,120,000 | |
| Knoll, Inc. | 1,000,000 | 21,840,000 | |
| 120,677,500 | |||
| Construction & Engineering - 0.2% | |||
| Mirait Holdings Corp. (c) | 220,600 | 3,229,935 | |
| Electrical Equipment - 1.0% | |||
| Regal Beloit Corp. | 200,000 | 17,016,000 | |
| Machinery - 2.2% | |||
| Apergy Corp. (a) | 400,000 | 15,876,000 | |
| Mueller Industries, Inc. | 750,000 | 21,877,500 | |
| 37,753,500 | |||
| Marine - 0.4% | |||
| MPC Container Ships ASA (a) | 2,000,000 | 7,163,183 | |
| Professional Services - 0.6% | |||
| Capita Group PLC (a) | 5,000,000 | 8,309,740 | |
| Intertrust NV (d) | 84,814 | 1,608,604 | |
| 9,918,344 | |||
| Road & Rail - 1.3% | |||
| Genesee & Wyoming, Inc. Class A (a) | 250,000 | 22,162,500 | |
| Trading Companies & Distributors - 1.5% | |||
| Beacon Roofing Supply, Inc. (a) | 350,000 | 13,181,000 | |
| Fortress Transportation & Infrastructure Investors LLC | 750,000 | 12,187,500 | |
| 25,368,500 | |||
| TOTAL INDUSTRIALS | 299,799,920 | ||
| INFORMATION TECHNOLOGY - 18.3% | |||
| Communications Equipment - 0.4% | |||
| InterDigital, Inc. | 100,000 | 6,539,000 | |
| Electronic Equipment & Components - 6.1% | |||
| Flextronics International Ltd. (a) | 1,500,000 | 16,560,000 | |
| SYNNEX Corp. | 500,000 | 53,940,000 | |
| Tech Data Corp. (a) | 250,000 | 26,652,500 | |
| TTM Technologies, Inc. (a) | 500,000 | 6,620,000 | |
| 103,772,500 | |||
| IT Services - 5.6% | |||
| Computer Services, Inc. | 353,760 | 23,082,840 | |
| Conduent, Inc. (a) | 2,000,000 | 25,660,000 | |
| Presidio, Inc. | 2,200,000 | 33,044,000 | |
| Tucows, Inc. (a) | 150,000 | 13,228,500 | |
| 95,015,340 | |||
| Semiconductors & Semiconductor Equipment - 2.0% | |||
| Advanced Energy Industries, Inc. (a) | 250,000 | 14,440,000 | |
| Entegris, Inc. | 500,000 | 20,430,000 | |
| 34,870,000 | |||
| Software - 3.7% | |||
| Hansen Technologies Ltd. | 1,972,415 | 4,185,266 | |
| j2 Global, Inc. | 500,000 | 43,810,000 | |
| Micro Focus International PLC | 622,200 | 15,722,317 | |
| 63,717,583 | |||
| Technology Hardware, Storage & Peripherals - 0.5% | |||
| Elecom Co. Ltd. | 250,000 | 8,348,669 | |
| TOTAL INFORMATION TECHNOLOGY | 312,263,092 | ||
| MATERIALS - 4.4% | |||
| Construction Materials - 2.7% | |||
| Eagle Materials, Inc. | 250,000 | 22,727,500 | |
| Wienerberger AG | 1,000,000 | 22,947,936 | |
| 45,675,436 | |||
| Containers & Packaging - 1.7% | |||
| Silgan Holdings, Inc. | 1,000,000 | 29,940,000 | |
| TOTAL MATERIALS | 75,615,436 | ||
| REAL ESTATE - 7.7% | |||
| Equity Real Estate Investment Trusts (REITs) - 6.5% | |||
| Brookfield Property REIT, Inc. Class A | 1,500,000 | 31,245,000 | |
| CareTrust (REIT), Inc. | 1,000,000 | 24,250,000 | |
| Corporate Office Properties Trust (SBI) | 1,250,000 | 34,850,000 | |
| iStar Financial, Inc. | 500,000 | 4,335,000 | |
| Store Capital Corp. | 500,000 | 16,660,000 | |
| 111,340,000 | |||
| Real Estate Management & Development - 1.2% | |||
| Cushman & Wakefield PLC | 1,000,000 | 19,640,000 | |
| TOTAL REAL ESTATE | 130,980,000 | ||
| TOTAL COMMON STOCKS | |||
| (Cost $1,434,410,298) | 1,681,245,354 | ||
| Money Market Funds - 5.9% | |||
| Fidelity Cash Central Fund, 2.49% (e) | 41,318,635 | 41,326,899 | |
| Fidelity Securities Lending Cash Central Fund 2.49% (e)(f) | 59,107,161 | 59,113,071 | |
| TOTAL MONEY MARKET FUNDS | |||
| (Cost $100,439,624) | 100,439,970 | ||
| TOTAL INVESTMENT IN SECURITIES - 104.3% | |||
| (Cost $1,534,849,922) | 1,781,685,324 | ||
| NET OTHER ASSETS (LIABILITIES) - (4.3)% | (74,187,818) | ||
| NET ASSETS - 100% | $1,707,497,506 |
Legend
(a) Non-income producing
(b) Security or a portion of the security is on loan at period end.
(c) Security or a portion of the security purchased on a delayed delivery or when-issued basis.
(d) Security exempt from registration under Rule 144A of the Securities Act of 1933. These securities may be resold in transactions exempt from registration, normally to qualified institutional buyers. At the end of the period, the value of these securities amounted to $1,608,604 or 0.1% of net assets.
(e) Affiliated fund that is generally available only to investment companies and other accounts managed by Fidelity Investments. The rate quoted is the annualized seven-day yield of the fund at period end. A complete unaudited listing of the fund's holdings as of its most recent quarter end is available upon request. In addition, each Fidelity Central Fund's financial statements , which are not covered by the Fund's Report of Independent Registered Public Accounting Firm, are available on the SEC's website or upon request.
(f) Investment made with cash collateral received from securities on loan.
Affiliated Central Funds
Information regarding fiscal year to date income earned by the Fund from investments in Fidelity Central Funds is as follows:
| Fund | Income earned |
| Fidelity Cash Central Fund | $477,229 |
| Fidelity Securities Lending Cash Central Fund | 448,929 |
| Total | $926,158 |
Amounts in the income column in the above table include any capital gain distributions from underlying funds, which are presented in the corresponding line-item in the Statement of Operations, if applicable.
Other Affiliated Issuers
An affiliated company is a company in which the Fund has ownership of at least 5% of the voting securities. Fiscal year to date transactions with companies which are or were affiliates are as follows:
| Affiliate | Value, beginning of period | Purchases | Sales Proceeds | Dividend Income | Realized Gain (loss) | Change in Unrealized appreciation (depreciation) | Value, end of period |
| Civitas Solutions, Inc. | $35,625,000 | $-- | $43,568,640 | $-- | $1,589,297 | $6,354,343 | $-- |
| Total | $35,625,000 | $-- | $43,568,640 | $-- | $1,589,297 | $6,354,343 | $-- |
Investment Valuation
All investments are categorized as Level 1 under the Fair Value Hierarchy. The inputs or methodology used for valuing securities may not be an indication of the risk associated with investing in those securities. For more information on valuation inputs please refer to the Investment Valuation section in the accompanying Notes to Financial Statements.
Other Information
Distribution of investments by country or territory of incorporation, as a percentage of Total Net Assets, is as follows (Unaudited):
| United States of America | 85.9% |
| United Kingdom | 5.4% |
| Netherlands | 1.7% |
| Canada | 1.5% |
| Austria | 1.4% |
| Japan | 1.1% |
| Singapore | 1.0% |
| Others (Individually Less Than 1%) | 2.0% |
| 100.0% |
See accompanying notes which are an integral part of the financial statements.
Financial Statements
Statement of Assets and Liabilities
| April 30, 2019 | ||
| Assets | ||
| Investment in securities, at value (including securities loaned of $58,144,675) — See accompanying schedule: Unaffiliated issuers (cost $1,434,410,298) | $1,681,245,354 | |
| Fidelity Central Funds (cost $100,439,624) | 100,439,970 | |
| Total Investment in Securities (cost $1,534,849,922) | $1,781,685,324 | |
| Foreign currency held at value (cost $55,398) | 55,398 | |
| Receivable for investments sold | 18,570,263 | |
| Receivable for fund shares sold | 259,341 | |
| Dividends receivable | 4,115,412 | |
| Distributions receivable from Fidelity Central Funds | 77,296 | |
| Other receivables | 150 | |
| Total assets | 1,804,763,184 | |
| Liabilities | ||
| Payable for investments purchased | ||
| Regular delivery | $2,219,151 | |
| Delayed delivery | 433,987 | |
| Payable for fund shares redeemed | 35,489,403 | |
| Other payables and accrued expenses | 10,482 | |
| Collateral on securities loaned | 59,112,655 | |
| Total liabilities | 97,265,678 | |
| Net Assets | $1,707,497,506 | |
| Net Assets consist of: | ||
| Paid in capital | $1,440,383,497 | |
| Total distributable earnings (loss) | 267,114,009 | |
| Net Assets | $1,707,497,506 | |
| Net Asset Value and Maximum Offering Price | ||
| Net Asset Value, offering price and redemption price per share ($1,707,497,506 ÷ 145,967,935 shares) | $11.70 |
See accompanying notes which are an integral part of the financial statements.
Statement of Operations
| Year ended April 30, 2019 | ||
| Investment Income | ||
| Dividends | $22,162,625 | |
| Non-Cash dividends | 2,709,000 | |
| Special dividends | 3,284,705 | |
| Interest | 46,126 | |
| Income from Fidelity Central Funds | 926,158 | |
| Total income | 29,128,614 | |
| Expenses | ||
| Custodian fees and expenses | $35,229 | |
| Independent trustees' fees and expenses | 9,704 | |
| Miscellaneous | 4,571 | |
| Total expenses before reductions | 49,504 | |
| Expense reductions | (35,256) | |
| Total expenses after reductions | 14,248 | |
| Net investment income (loss) | 29,114,366 | |
| Realized and Unrealized Gain (Loss) | ||
| Net realized gain (loss) on: | ||
| Investment securities: | ||
| Unaffiliated issuers | 96,401,258 | |
| Fidelity Central Funds | (1,086) | |
| Other affiliated issuers | 1,589,297 | |
| Foreign currency transactions | 11,411 | |
| Total net realized gain (loss) | 98,000,880 | |
| Change in net unrealized appreciation (depreciation) on: | ||
| Investment securities: | ||
| Unaffiliated issuers | (7,965,876) | |
| Fidelity Central Funds | 346 | |
| Other affiliated issuers | 6,354,343 | |
| Assets and liabilities in foreign currencies | 2,497 | |
| Total change in net unrealized appreciation (depreciation) | (1,608,690) | |
| Net gain (loss) | 96,392,190 | |
| Net increase (decrease) in net assets resulting from operations | $125,506,556 |
See accompanying notes which are an integral part of the financial statements.
Statement of Changes in Net Assets
| Year ended April 30, 2019 | Year ended April 30, 2018 | |
| Increase (Decrease) in Net Assets | ||
| Operations | ||
| Net investment income (loss) | $29,114,366 | $19,300,450 |
| Net realized gain (loss) | 98,000,880 | 193,792,080 |
| Change in net unrealized appreciation (depreciation) | (1,608,690) | (93,337,372) |
| Net increase (decrease) in net assets resulting from operations | 125,506,556 | 119,755,158 |
| Distributions to shareholders | (208,936,940) | – |
| Distributions to shareholders from net investment income | – | (20,661,296) |
| Total distributions | (208,936,940) | (20,661,296) |
| Share transactions - net increase (decrease) | 76,474,125 | (50,275,058) |
| Total increase (decrease) in net assets | (6,956,259) | 48,818,804 |
| Net Assets | ||
| Beginning of period | 1,714,453,765 | 1,665,634,961 |
| End of period | $1,707,497,506 | $1,714,453,765 |
| Other Information | ||
| Undistributed net investment income end of period | $4,801,162 |
See accompanying notes which are an integral part of the financial statements.
Financial Highlights
Fidelity Series Small Cap Discovery Fund
| Years ended April 30, | 2019 | 2018 | 2017 | 2016 | 2015 |
| Selected Per–Share Data | |||||
| Net asset value, beginning of period | $12.40 | $11.69 | $10.16 | $11.23 | $10.16 |
| Income from Investment Operations | |||||
| Net investment income (loss)A | .20B | .14 | .09C | .03 | .02 |
| Net realized and unrealized gain (loss) | .59 | .71 | 1.49 | (.54) | 1.28 |
| Total from investment operations | .79 | .85 | 1.58 | (.51) | 1.30 |
| Distributions from net investment income | (.19) | (.14) | (.05) | (.02) | (.02) |
| Distributions from net realized gain | (1.30) | – | – | (.54) | (.21) |
| Total distributions | (1.49) | (.14) | (.05) | (.56) | (.23) |
| Net asset value, end of period | $11.70 | $12.40 | $11.69 | $10.16 | $11.23 |
| Total ReturnD,E | 7.68% | 7.33% | 15.60% | (4.82)% | 12.92% |
| Ratios to Average Net AssetsF,G | |||||
| Expenses before reductions | - %H | .06% | .87% | .96% | .97% |
| Expenses net of fee waivers, if any | - %H | .06% | .87% | .96% | .97% |
| Expenses net of all reductions | - %H | .05% | .86% | .95% | .97% |
| Net investment income (loss) | 1.73%B | 1.15% | .80%C | .29% | .17% |
| Supplemental Data | |||||
| Net assets, end of period (000 omitted) | $1,707,498 | $1,714,454 | $652,818 | $614,362 | $659,747 |
| Portfolio turnover rateI | 41% | 44% | 24% | 35% | 28% |
A Calculated based on average shares outstanding during the period.
B Net investment income per share reflects a large, non-recurring dividend which amounted to $.02 per share. Excluding this non-recurring dividend, the ratio of net investment income (loss) to average net assets would have been 1.54%.
C Net investment income per share reflects a large, non-recurring dividend which amounted to $.04 per share. Excluding this non-recurring dividend, the ratio of net investment income (loss) to average net assets would have been .40%.
D Total returns for periods of less than one year are not annualized.
E Total returns would have been lower if certain expenses had not been reduced during the applicable periods shown.
F Fees and expenses of any underlying Fidelity Central Funds are not included in the Fund's expense ratio. The Fund indirectly bears its proportionate share of the expenses of any underlying Fidelity Central Funds.
G Expense ratios reflect operating expenses of the Fund. Expenses before reductions do not reflect amounts reimbursed by the investment adviser or reductions from brokerage service arrangements or reductions from other expense offset arrangements and do not represent the amount paid by the Fund during periods when reimbursements or reductions occur. Expenses net of fee waivers reflect expenses after reimbursement by the investment adviser but prior to reductions from brokerage service arrangements or other expense offset arrangements. Expenses net of all reductions represent the net expenses paid by the Fund.
H Amount represents less than .005%.
I Amount does not include the portfolio activity of any underlying Fidelity Central Funds.
See accompanying notes which are an integral part of the financial statements.
Notes to Financial Statements
For the period ended April 30, 2019
1. Organization.
Fidelity Series Small Cap Discovery Fund (the Fund) is a fund of Fidelity Concord Street Trust (the Trust) and is authorized to issue an unlimited number of shares. Shares of the Fund are only available for purchase by mutual funds for which Fidelity Management & Research Company (FMR) or an affiliate serves as an investment manager. The Trust is registered under the Investment Company Act of 1940, as amended (the 1940 Act), as an open-end management investment company organized as a Massachusetts business trust. Effective August 28, 2017, the Fund no longer offered Class F, and all outstanding shares of Class F were exchanged for shares of Series Small Cap Discovery.
2. Investments in Fidelity Central Funds.
The Fund invests in Fidelity Central Funds, which are open-end investment companies generally available only to other investment companies and accounts managed by the investment adviser and its affiliates. The Fund's Schedule of Investments lists each of the Fidelity Central Funds held as of period end, if any, as an investment of the Fund, but does not include the underlying holdings of each Fidelity Central Fund. As an Investing Fund, the Fund indirectly bears its proportionate share of the expenses of the underlying Fidelity Central Funds.
The Money Market Central Funds seek preservation of capital and current income and are managed by Fidelity Investments Money Management, Inc. (FIMM), an affiliate of the investment adviser. Annualized expenses of the Money Market Central Funds as of their most recent shareholder report date are less than .005%.
A complete unaudited list of holdings for each Fidelity Central Fund is available upon request or at the Securities and Exchange Commission (the SEC) website at www.sec.gov. In addition, the financial statements of the Fidelity Central Funds, which are not covered by the Fund's Report of Independent Registered Public Accounting Firm, are available on the SEC website or upon request.
3. Significant Accounting Policies.
The Fund is an investment company and applies the accounting and reporting guidance of the Financial Accounting Standards Board (FASB) Accounting Standards Codification Topic 946 Financial Services – Investments Companies. The financial statements have been prepared in conformity with accounting principles generally accepted in the United States of America (GAAP), which require management to make certain estimates and assumptions at the date of the financial statements. Actual results could differ from those estimates. Subsequent events, if any, through the date that the financial statements were issued have been evaluated in the preparation of the financial statements. The following summarizes the significant accounting policies of the Fund:
Investment Valuation. Investments are valued as of 4:00 p.m. Eastern time on the last calendar day of the period. The Board of Trustees (the Board) has delegated the day to day responsibility for the valuation of the Fund's investments to the Fair Value Committee (the Committee) established by the Fund's investment adviser. In accordance with valuation policies and procedures approved by the Board, the Fund attempts to obtain prices from one or more third party pricing vendors or brokers to value its investments. When current market prices, quotations or currency exchange rates are not readily available or reliable, investments will be fair valued in good faith by the Committee, in accordance with procedures adopted by the Board. Factors used in determining fair value vary by investment type and may include market or investment specific events. The frequency with which these procedures are used cannot be predicted and they may be utilized to a significant extent. The Committee oversees the Fund's valuation policies and procedures and reports to the Board on the Committee's activities and fair value determinations. The Board monitors the appropriateness of the procedures used in valuing the Fund's investments and ratifies the fair value determinations of the Committee.
The Fund categorizes the inputs to valuation techniques used to value its investments into a disclosure hierarchy consisting of three levels as shown below:
- Level 1 – quoted prices in active markets for identical investments
- Level 2 – other significant observable inputs (including quoted prices for similar investments, interest rates, prepayment speeds, etc.)
- Level 3 – unobservable inputs (including the Fund's own assumptions based on the best information available)
Valuation techniques used to value the Fund's investments by major category are as follows:
Equity securities, including restricted securities, for which market quotations are readily available, are valued at the last reported sale price or official closing price as reported by a third party pricing vendor on the primary market or exchange on which they are traded and are categorized as Level 1 in the hierarchy. In the event there were no sales during the day or closing prices are not available, securities are valued at the last quoted bid price or may be valued using the last available price and are generally categorized as Level 2 in the hierarchy. For foreign equity securities, when market or security specific events arise, comparisons to the valuation of American Depositary Receipts (ADRs), futures contracts, Exchange-Traded Funds (ETFs) and certain indexes as well as quoted prices for similar securities may be used and would be categorized as Level 2 in the hierarchy. For equity securities, including restricted securities, where observable inputs are limited, assumptions about market activity and risk are used and these securities may be categorized as Level 3 in the hierarchy.
Investments in open-end mutual funds, including the Fidelity Central Funds, are valued at their closing net asset value (NAV) each business day and are categorized as Level 1 in the hierarchy.
Changes in valuation techniques may result in transfers in or out of an assigned level within the disclosure hierarchy.
Foreign Currency. The Fund may use foreign currency contracts to facilitate transactions in foreign-denominated securities. Gains and losses from these transactions may arise from changes in the value of the foreign currency or if the counterparties do not perform under the contracts' terms.
Foreign-denominated assets, including investment securities, and liabilities are translated into U.S. dollars at the exchange rates at period end. Purchases and sales of investment securities, income and dividends received and expenses denominated in foreign currencies are translated into U.S. dollars at the exchange rate in effect on the transaction date.
The effects of exchange rate fluctuations on investments are included with the net realized and unrealized gain (loss) on investment securities. Other foreign currency transactions resulting in realized and unrealized gain (loss) are disclosed separately.
Investment Transactions and Income. For financial reporting purposes, the Fund's investment holdings and NAV include trades executed through the end of the last business day of the period. The NAV per share for processing shareholder transactions is calculated as of the close of business of the New York Stock Exchange (NYSE), normally 4:00 p.m. Eastern time and includes trades executed through the end of the prior business day. Gains and losses on securities sold are determined on the basis of identified cost and include proceeds received from litigation. Dividend income is recorded on the ex-dividend date, except for certain dividends from foreign securities where the ex-dividend date may have passed, which are recorded as soon as the Fund is informed of the ex-dividend date. Non-cash dividends included in dividend income, if any, are recorded at the fair market value of the securities received. Income and capital gain distributions from Fidelity Central Funds, if any, are recorded on the ex-dividend date. Certain distributions received by the Fund represent a return of capital or capital gain. The Fund determines the components of these distributions subsequent to the ex-dividend date, based upon receipt of tax filings or other correspondence relating to the underlying investment. These distributions are recorded as a reduction of cost of investments and/or as a realized gain. Large, non-recurring dividends recognized by the Fund are presented separately on the Statement of Operations as "Special Dividends" and the impact of these dividends is presented in the Financial Highlights. Interest income is accrued as earned and includes coupon interest and amortization of premium and accretion of discount on debt securities as applicable. Investment income is recorded net of foreign taxes withheld where recovery of such taxes is uncertain.
Expenses. Expenses directly attributable to a fund are charged to that fund. Expenses attributable to more than one fund are allocated among the respective funds on the basis of relative net assets or other appropriate methods. Expense estimates are accrued in the period to which they relate and adjustments are made when actual amounts are known.
Income Tax Information and Distributions to Shareholders. Each year, the Fund intends to qualify as a regulated investment company under Subchapter M of the Internal Revenue Code, including distributing substantially all of its taxable income and realized gains. As a result, no provision for U.S. Federal income taxes is required. As of April 30, 2019, the Fund did not have any unrecognized tax benefits in the financial statements; nor is the Fund aware of any tax positions for which it is reasonably possible that the total amounts of unrecognized tax benefits will significantly change in the next twelve months. The Fund files a U.S. federal tax return, in addition to state and local tax returns as required. The Fund's federal income tax returns are subject to examination by the Internal Revenue Service (IRS) for a period of three fiscal years after they are filed. State and local tax returns may be subject to examination for an additional fiscal year depending on the jurisdiction. Foreign taxes are provided for based on the Fund's understanding of the tax rules and rates that exist in the foreign markets in which it invests.
Distributions are declared and recorded on the ex-dividend date. Income and capital gain distributions are determined in accordance with income tax regulations, which may differ from GAAP.
Capital accounts within the financial statements are adjusted for permanent book-tax differences. These adjustments have no impact on net assets or the results of operations. Capital accounts are not adjusted for temporary book-tax differences which will reverse in a subsequent period.
Book-tax differences are primarily due to foreign currency transactions, partnerships and losses deferred due to excise tax regulations.
As of period end, the cost and unrealized appreciation (depreciation) in securities, and derivatives if applicable, for federal income tax purposes were as follows:
| Gross unrealized appreciation | $345,840,066 |
| Gross unrealized depreciation | (94,988,673) |
| Net unrealized appreciation (depreciation) | $250,851,393 |
| Tax Cost | $1,530,833,931 |
The tax-based components of distributable earnings as of period end were as follows:
| Undistributed ordinary income | $8,209,013 |
| Undistributed long-term capital gain | $28,107,891 |
| Net unrealized appreciation (depreciation) on securities and other investments | $246,954,396 |
The Fund intends to elect to defer to its next fiscal year $16,157,292 of capital losses recognized during the period November 1, 2018 to April 30, 2019.
The tax character of distributions paid was as follows:
| April 30, 2019 | April 30, 2018 | |
| Ordinary Income | $48,074,474 | $ 20,661,296 |
| Long-term Capital Gains | 160,862,465 | – |
| Total | $208,936,939 | $ 20,661,296 |
Delayed Delivery Transactions and When-Issued Securities. During the period, the Fund transacted in securities on a delayed delivery or when-issued basis. Payment and delivery may take place after the customary settlement period for that security. The price of the underlying securities and the date when the securities will be delivered and paid for are fixed at the time the transaction is negotiated. The securities purchased on a delayed delivery or when-issued basis are identified as such in the Fund's Schedule of Investments. Losses may arise due to changes in the value of the underlying securities or if the counterparty does not perform under the contract's terms, or if the issuer does not issue the securities due to political, economic, or other factors.
Restricted Securities. The Fund may invest in securities that are subject to legal or contractual restrictions on resale. These securities generally may be resold in transactions exempt from registration or to the public if the securities are registered. Disposal of these securities may involve time-consuming negotiations and expense, and prompt sale at an acceptable price may be difficult. Information regarding restricted securities is included at the end of the Fund's Schedule of Investments.
New Rule Issuance. During August 2018, the U.S. Securities and Exchange Commission issued Final Rule Release No. 33-10532, Disclosure Update and Simplification. This Final Rule includes amendments specific to registered investment companies that are intended to eliminate overlap in disclosure requirements between Regulation S-X and GAAP. In accordance with these amendments, certain line-items in the Fund's financial statements have been combined or removed for the current period as outlined in the table below.
| Financial Statement | Current Line-Item Presentation (As Applicable) | Prior Line-Item Presentation (As Applicable) |
| Statement of Assets and Liabilities | Total distributable earnings (loss) | Undistributed/Distributions in excess of/Accumulated net investment income (loss) Accumulated/Undistributed net realized gain (loss) Net unrealized appreciation (depreciation) |
| Statement of Changes in Net Assets | N/A - removed | Undistributed/Distributions in excess of/Accumulated net investment income (loss) end of period |
| Statement of Changes in Net Assets | Distributions to shareholders | Distributions to shareholders from net investment income Distributions to shareholders from net realized gain |
| Distributions to Shareholders Note to Financial Statements | Distributions to shareholders | Distributions to shareholders from net investment income Distributions to shareholders from net realized gain |
4. Purchases and Sales of Investments.
Purchases and sales of securities, other than short-term securities, aggregated $679,827,487 and $793,778,786, respectively.
5. Fees and Other Transactions with Affiliates.
Management Fee. Fidelity Management & Research Company (the investment adviser) and its affiliates provide the Fund with investment management related services for which the Fund does not pay a management fee. Under the management contract, the investment adviser or an affiliate pays all ordinary operating expenses of the Fund, except custody fees, fees and expenses of the independent Trustees, and certain miscellaneous expenses such as proxy and shareholder meeting expenses.
Brokerage Commissions. The Fund placed a portion of its portfolio transactions with brokerage firms which are affiliates of the investment adviser. Brokerage commissions are included in net realized gain (loss) and change in net unrealized appreciation (depreciation) in the Statement of Operations. The commissions paid to these affiliated firms were $28,965 for the period.
Interfund Trades. The Fund may purchase from or sell securities to other Fidelity Funds under procedures adopted by the Board. The procedures have been designed to ensure these interfund trades are executed in accordance with Rule 17a-7 of the 1940 Act. Interfund trades are included within the respective purchases and sales amounts shown in the Purchases and Sales of Investments note.
6. Committed Line of Credit.
The Fund participates with other funds managed by the investment adviser or an affiliate in a $4.25 billion credit facility (the "line of credit") to be utilized for temporary or emergency purposes to fund shareholder redemptions or for other short-term liquidity purposes. The Fund has agreed to pay commitment fees on its pro-rata portion of the line of credit, which amounted to $4,571 and is reflected in Miscellaneous expenses on the Statement of Operations. During the period, the Fund did not borrow on this line of credit.
7. Security Lending.
The Fund lends portfolio securities through a lending agent from time to time in order to earn additional income. For equity securities, a lending agent is used and may loan securities to certain qualified borrowers, including Fidelity Capital Markets (FCM), a broker-dealer affiliated with the Fund. On the settlement date of the loan, the Fund receives collateral (in the form of U.S. Treasury obligations, letters of credit and/or cash) against the loaned securities and maintains collateral in an amount not less than 100% of the market value of the loaned securities during the period of the loan. The market value of the loaned securities is determined at the close of business of the Fund and any additional required collateral is delivered to the Fund on the next business day. The Fund or borrower may terminate the loan at any time, and if the borrower defaults on its obligation to return the securities loaned because of insolvency or other reasons, the Fund may apply collateral received from the borrower against the obligation. The Fund may experience delays and costs in recovering the securities loaned. Any cash collateral received is invested in the Fidelity Securities Lending Cash Central Fund. The value of loaned securities and cash collateral at period end are disclosed on the Fund's Statement of Assets and Liabilities. At period end, there were no security loans outstanding with FCM. Security lending income represents the income earned on investing cash collateral, less rebates paid to borrowers and any lending agent fees associated with the loan, plus any premium payments received for lending certain types of securities. Security lending income is presented in the Statement of Operations as a component of income from Fidelity Central Funds. Total security lending income during the period amounted to $448,929, including $24,225 from securities loaned to FCM.
8. Expense Reductions.
Commissions paid to certain brokers with whom the investment adviser, or its affiliates, places trades on behalf of the Fund include an amount in addition to trade execution, which may be rebated back to the Fund to offset certain expenses. This amount totaled $33,757 for the period. In addition, through arrangements with the Fund's custodian, credits realized as a result of certain uninvested cash balances were used to reduce the Fund's expenses. During the period, these credits reduced the Fund's custody expenses by $1,499.
9. Distributions to Shareholders.
Distributions to shareholders of each class were as follows:
| Year ended April 30, 2019 | Year ended April 30, 2018 | |
| Distributions to shareholders | ||
| Series Small Cap Discovery | $208,936,940 | $– |
| Total | $208,936,940 | $ - |
| From net investment income | ||
| Series Small Cap Discovery | $– | $15,635,148 |
| Class F | – | 5,026,148 |
| Total | $– | $20,661,296 |
10. Share Transactions.
Transactions for each class of shares were as follows:
| Shares | Shares | Dollars | Dollars | |
| Year ended April 30, 2019 | Year ended April 30, 2018 | Year ended April 30, 2019 | Year ended April 30, 2018 | |
| Series Small Cap Discovery | ||||
| Shares sold | 9,823,635 | 96,171,488 | $112,274,438 | $1,101,331,795 |
| Reinvestment of distributions | 19,135,616 | 1,267,885 | 208,936,940 | 15,635,148 |
| Shares redeemed | (21,277,858) | (15,019,418) | (244,737,253) | (180,378,441) |
| Net increase (decrease) | 7,681,393 | 82,419,955 | $76,474,125 | $936,588,502 |
| Class F | ||||
| Shares sold | – | 2,548,036 | $– | $29,763,723 |
| Reinvestment of distributions | – | 428,852 | – | 5,026,148 |
| Shares redeemed | – | (89,584,939) | – | (1,021,653,431) |
| Net increase (decrease) | – | (86,608,051) | $– | $(986,863,560) |
11. Other.
The Fund's organizational documents provide former and current trustees and officers with a limited indemnification against liabilities arising in connection with the performance of their duties to the Fund. In the normal course of business, the Fund may also enter into contracts that provide general indemnifications. The Fund's maximum exposure under these arrangements is unknown as this would be dependent on future claims that may be made against the Fund. The risk of material loss from such claims is considered remote.
At the end of the period, mutual funds managed by the investment adviser or its affiliates were the owners of record of all of the outstanding shares of the Fund.
Report of Independent Registered Public Accounting Firm
To the Trustees of Fidelity Concord Street Trust and Shareholders of Fidelity Series Small Cap Discovery Fund:
Opinion on the Financial Statements and Financial Highlights
We have audited the accompanying statement of assets and liabilities of Fidelity Series Small Cap Discovery Fund (the "Fund"), a fund of Fidelity Concord Street Trust, including the schedule of investments, as of April 30, 2019, the related statement of operations for the year then ended, the statement of changes in net assets for each of the two years in the period then ended, the financial highlights for each of the five years in the period then ended, and the related notes. In our opinion, the financial statements and financial highlights present fairly, in all material respects, the financial position of the Fund as of April 30, 2019, and the results of its operations for the year then ended, the changes in its net assets for each of the two years in the period then ended, and the financial highlights for each of the five years in the period then ended, in conformity with accounting principles generally accepted in the United States of America.
Basis for Opinion
These financial statements and financial highlights are the responsibility of the Fund's management. Our responsibility is to express an opinion on the Fund's financial statements and financial highlights based on our audits. We are a public accounting firm registered with the Public Company Accounting Oversight Board (United States) (PCAOB) and are required to be independent with respect to the Fund in accordance with the U.S. federal securities laws and the applicable rules and regulations of the Securities and Exchange Commission and the PCAOB.
We conducted our audits in accordance with the standards of the PCAOB. Those standards require that we plan and perform the audit to obtain reasonable assurance about whether the financial statements and financial highlights are free of material misstatement, whether due to error or fraud. The Fund is not required to have, nor were we engaged to perform, an audit of its internal control over financial reporting. As part of our audits we are required to obtain an understanding of internal control over financial reporting but not for the purpose of expressing an opinion on the effectiveness of the Fund’s internal control over financial reporting. Accordingly, we express no such opinion.
Our audits included performing procedures to assess the risks of material misstatement of the financial statements and financial highlights, whether due to error or fraud, and performing procedures that respond to those risks. Such procedures included examining, on a test basis, evidence regarding the amounts and disclosures in the financial statements and financial highlights. Our audits also included evaluating the accounting principles used and significant estimates made by management, as well as evaluating the overall presentation of the financial statements and financial highlights. Our procedures included confirmation of securities owned as of April 30, 2019, by correspondence with the custodians and brokers; when replies were not received from brokers, we performed other auditing procedures. We believe that our audits provide a reasonable basis for our opinion.
/s/ Deloitte & Touche LLP
Boston, Massachusetts
June 18, 2019
We have served as the auditor of one or more of the Fidelity investment companies since 1999.
Trustees and Officers
The Trustees, Members of the Advisory Board (if any), and officers of the trust and fund, as applicable, are listed below. The Board of Trustees governs the fund and is responsible for protecting the interests of shareholders. The Trustees are experienced executives who meet periodically throughout the year to oversee the fund's activities, review contractual arrangements with companies that provide services to the fund, oversee management of the risks associated with such activities and contractual arrangements, and review the fund's performance. Except for Jonathan Chiel, each of the Trustees oversees 289 funds. Mr. Chiel oversees 158 funds.
The Trustees hold office without limit in time except that (a) any Trustee may resign; (b) any Trustee may be removed by written instrument, signed by at least two-thirds of the number of Trustees prior to such removal; (c) any Trustee who requests to be retired or who has become incapacitated by illness or injury may be retired by written instrument signed by a majority of the other Trustees; and (d) any Trustee may be removed at any special meeting of shareholders by a two-thirds vote of the outstanding voting securities of the trust. Each Trustee who is not an interested person (as defined in the 1940 Act) of the trust and the fund is referred to herein as an Independent Trustee. Each Independent Trustee shall retire not later than the last day of the calendar year in which his or her 75th birthday occurs. The Independent Trustees may waive this mandatory retirement age policy with respect to individual Trustees. Officers and Advisory Board Members hold office without limit in time, except that any officer or Advisory Board Member may resign or may be removed by a vote of a majority of the Trustees at any regular meeting or any special meeting of the Trustees. Except as indicated, each individual has held the office shown or other offices in the same company for the past five years.
The fund’s Statement of Additional Information (SAI) includes more information about the Trustees. To request a free copy, call Fidelity at 1-800-554-8544.
Experience, Skills, Attributes, and Qualifications of the Trustees. The Governance and Nominating Committee has adopted a statement of policy that describes the experience, qualifications, attributes, and skills that are necessary and desirable for potential Independent Trustee candidates (Statement of Policy). The Board believes that each Trustee satisfied at the time he or she was initially elected or appointed a Trustee, and continues to satisfy, the standards contemplated by the Statement of Policy. The Governance and Nominating Committee also engages professional search firms to help identify potential Independent Trustee candidates who have the experience, qualifications, attributes, and skills consistent with the Statement of Policy. From time to time, additional criteria based on the composition and skills of the current Independent Trustees, as well as experience or skills that may be appropriate in light of future changes to board composition, business conditions, and regulatory or other developments, have also been considered by the professional search firms and the Governance and Nominating Committee. In addition, the Board takes into account the Trustees' commitment and participation in Board and committee meetings, as well as their leadership of standing and ad hoc committees throughout their tenure.
In determining that a particular Trustee was and continues to be qualified to serve as a Trustee, the Board has considered a variety of criteria, none of which, in isolation, was controlling. The Board believes that, collectively, the Trustees have balanced and diverse experience, qualifications, attributes, and skills, which allow the Board to operate effectively in governing the fund and protecting the interests of shareholders. Information about the specific experience, skills, attributes, and qualifications of each Trustee, which in each case led to the Board's conclusion that the Trustee should serve (or continue to serve) as a trustee of the fund, is provided below.
Board Structure and Oversight Function. James C. Curvey is an interested person and currently serves as Chairman. The Trustees have determined that an interested Chairman is appropriate and benefits shareholders because an interested Chairman has a personal and professional stake in the quality and continuity of services provided to the fund. Independent Trustees exercise their informed business judgment to appoint an individual of their choosing to serve as Chairman, regardless of whether the Trustee happens to be independent or a member of management. The Independent Trustees have determined that they can act independently and effectively without having an Independent Trustee serve as Chairman and that a key structural component for assuring that they are in a position to do so is for the Independent Trustees to constitute a substantial majority for the Board. The Independent Trustees also regularly meet in executive session. Ned C. Lautenbach serves as Chairman of the Independent Trustees and as such (i) acts as a liaison between the Independent Trustees and management with respect to matters important to the Independent Trustees and (ii) with management prepares agendas for Board meetings.
Fidelity® funds are overseen by different Boards of Trustees. The fund's Board oversees Fidelity's high income and certain equity funds, and other Boards oversee Fidelity's investment-grade bond, money market, asset allocation, and other equity funds. The asset allocation funds may invest in Fidelity® funds overseen by the fund's Board. The use of separate Boards, each with its own committee structure, allows the Trustees of each group of Fidelity® funds to focus on the unique issues of the funds they oversee, including common research, investment, and operational issues. On occasion, the separate Boards establish joint committees to address issues of overlapping consequences for the Fidelity® funds overseen by each Board.
The Trustees operate using a system of committees to facilitate the timely and efficient consideration of all matters of importance to the Trustees, the fund, and fund shareholders and to facilitate compliance with legal and regulatory requirements and oversight of the fund's activities and associated risks. The Board, acting through its committees, has charged FMR and its affiliates with (i) identifying events or circumstances the occurrence of which could have demonstrably adverse effects on the fund's business and/or reputation; (ii) implementing processes and controls to lessen the possibility that such events or circumstances occur or to mitigate the effects of such events or circumstances if they do occur; and (iii) creating and maintaining a system designed to evaluate continuously business and market conditions in order to facilitate the identification and implementation processes described in (i) and (ii) above. Because the day-to-day operations and activities of the fund are carried out by or through FMR, its affiliates, and other service providers, the fund's exposure to risks is mitigated but not eliminated by the processes overseen by the Trustees. While each of the Board's committees has responsibility for overseeing different aspects of the fund's activities, oversight is exercised primarily through the Operations, Audit, and Compliance Committees. In addition, the Independent Trustees have worked with Fidelity to enhance the Board's oversight of investment and financial risks, legal and regulatory risks, technology risks, and operational risks, including the development of additional risk reporting to the Board. Appropriate personnel, including but not limited to the fund's Chief Compliance Officer (CCO), FMR's internal auditor, the independent accountants, the fund's Treasurer and portfolio management personnel, make periodic reports to the Board's committees, as appropriate, including an annual review of Fidelity's risk management program for the Fidelity® funds. The responsibilities of each standing committee, including their oversight responsibilities, are described further under "Standing Committees of the Trustees."
Interested Trustees*:
Correspondence intended for a Trustee who is an interested person may be sent to Fidelity Investments, 245 Summer Street, Boston, Massachusetts 02210.
Name, Year of Birth; Principal Occupations and Other Relevant Experience+
Jonathan Chiel (1957)
Year of Election or Appointment: 2016
Trustee
Mr. Chiel also serves as Trustee of other Fidelity® funds. Mr. Chiel is Executive Vice President and General Counsel for FMR LLC (diversified financial services company, 2012-present). Previously, Mr. Chiel served as general counsel (2004-2012) and senior vice president and deputy general counsel (2000-2004) for John Hancock Financial Services; a partner with Choate, Hall & Stewart (1996-2000) (law firm); and an Assistant United States Attorney for the United States Attorney’s Office of the District of Massachusetts (1986-95), including Chief of the Criminal Division (1993-1995). Mr. Chiel is a director on the boards of the Boston Bar Foundation and the Maimonides School.
James C. Curvey (1935)
Year of Election or Appointment: 2007
Trustee
Chairman of the Board of Trustees
Mr. Curvey also serves as Trustee of other Fidelity® funds. Mr. Curvey is Vice Chairman (2007-present) and Director of FMR LLC (diversified financial services company). In addition, Mr. Curvey is an Overseer Emeritus for the Boston Symphony Orchestra, a Director of Artis-Naples, and a Trustee of Brewster Academy in Wolfeboro, New Hampshire. Previously, Mr. Curvey served as a Director of Fidelity Research & Analysis Co. (investment adviser firm, 2009-2018), Director of Fidelity Investments Money Management, Inc. (investment adviser firm, 2009-2014) and a Director of FMR and FMR Co., Inc. (investment adviser firms, 2007-2014).
* Determined to be an “Interested Trustee” by virtue of, among other things, his or her affiliation with the trust or various entities under common control with FMR.
+ The information includes the Trustee's principal occupation during the last five years and other information relating to the experience, attributes, and skills relevant to the Trustee's qualifications to serve as a Trustee, which led to the conclusion that the Trustee should serve as a Trustee for the fund.
Independent Trustees:
Correspondence intended for an Independent Trustee may be sent to Fidelity Investments, P.O. Box 55235, Boston, Massachusetts 02205-5235.
Name, Year of Birth; Principal Occupations and Other Relevant Experience+
Dennis J. Dirks (1948)
Year of Election or Appointment: 2005
Trustee
Mr. Dirks also serves as Trustee of other Fidelity® funds. Prior to his retirement in May 2003, Mr. Dirks was Chief Operating Officer and a member of the Board of The Depository Trust & Clearing Corporation (DTCC). He also served as President, Chief Operating Officer, and Board member of The Depository Trust Company (DTC) and President and Board member of the National Securities Clearing Corporation (NSCC). In addition, Mr. Dirks served as Chief Executive Officer and Board member of the Government Securities Clearing Corporation, Chief Executive Officer and Board member of the Mortgage-Backed Securities Clearing Corporation, as a Trustee and a member of the Finance Committee of Manhattan College (2005-2008), as a Trustee and a member of the Finance Committee of AHRC of Nassau County (2006-2008), as a member of the Independent Directors Council (IDC) Governing Council (2010-2015), and as a member of the Board of Directors for The Brookville Center for Children’s Services, Inc. (2009-2017). Mr. Dirks is a member of the Finance Committee (2016-present) and Board of Directors (2017-present) and is Treasurer (2018-present) of the Asolo Repertory Theatre.
Donald F. Donahue (1950)
Year of Election or Appointment: 2018
Trustee
Mr. Donahue also serves as a Trustee of other Fidelity® funds. Mr. Donahue is President and Chief Executive Officer of Miranda Partners, LLC (risk consulting for the financial services industry, 2012-present). Previously, Mr. Donahue served as a Member of the Advisory Board of certain Fidelity® funds (2015-2018) and Chief Executive Officer (2006-2012), Chief Operating Officer (2003-2006), and Managing Director, Customer Marketing and Development (1999-2003) of The Depository Trust & Clearing Corporation (financial markets infrastructure). Mr. Donahue serves as a Member (2007-present) and Co-Chairman (2016-present) of the Board of Directors of United Way of New York, Member of the Board of Directors of NYC Leadership Academy (2012-present) and Member of the Board of Advisors of Ripple Labs, Inc. (financial services, 2015-present). He also served as Chairman (2010-2012) and Member of the Board of Directors (2012-2013) of Omgeo, LLC (financial services), Treasurer of United Way of New York (2012-2016), and Member of the Board of Directors of XBRL US (financial services non-profit, 2009-2012) and the International Securities Services Association (2009-2012).
Alan J. Lacy (1953)
Year of Election or Appointment: 2008
Trustee
Mr. Lacy also serves as Trustee of other Fidelity® funds. Mr. Lacy serves as a Director of Bristol-Myers Squibb Company (global pharmaceuticals, 2008-present). He is a Trustee of the California Chapter of The Nature Conservancy (2015-present) and a Director of the Center for Advanced Study in the Behavioral Sciences at Stanford University (2015-present). In addition, Mr. Lacy served as Senior Adviser (2007-2014) of Oak Hill Capital Partners, L.P. (private equity) and also served as Chief Executive Officer (2005) and Vice Chairman (2005-2006) of Sears Holdings Corporation (retail) and Chief Executive Officer and Chairman of the Board of Sears, Roebuck and Co. (retail, 2000-2005). Previously, Mr. Lacy served as Chairman (2014-2017) and a member (2010-2017) of the Board of Directors of Dave & Buster’s Entertainment, Inc. (restaurant and entertainment complexes), as Chairman (2008-2011) and a member (2006-2015) of the Board of Trustees of the National Parks Conservation Association, and as a member of the Board of Directors for The Hillman Companies, Inc. (hardware wholesalers, 2010-2014), Earth Fare, Inc. (retail grocery, 2010-2014), and The Western Union Company (global money transfer, 2006-2011).
Ned C. Lautenbach (1944)
Year of Election or Appointment: 2000
Trustee
Chairman of the Independent Trustees
Mr. Lautenbach also serves as Trustee of other Fidelity® funds. Mr. Lautenbach currently serves as Chair (2018-present) and Member (2013-present) of the Board of Governors, State University System of Florida and is a member of the Council on Foreign Relations (1994-present). He is also a member and has most recently served as Chairman of the Board of Directors of Artis-Naples (2012-present). Previously, Mr. Lautenbach served as a member and then Lead Director of the Board of Directors of Eaton Corporation (diversified industrial, 1997-2016). He was also a Partner and Advisory Partner at Clayton, Dubilier & Rice, LLC (private equity investment, 1998-2010), as well as a Director of Sony Corporation (2006-2007). In addition, Mr. Lautenbach also had a 30-year career with IBM (technology company) during which time he served as Senior Vice President and a member of the Corporate Executive Committee (1968-1998).
Joseph Mauriello (1944)
Year of Election or Appointment: 2008
Trustee
Mr. Mauriello also serves as Trustee of other Fidelity® funds. Prior to his retirement in January 2006, Mr. Mauriello served in numerous senior management positions including Deputy Chairman and Chief Operating Officer (2004-2005), and Vice Chairman of Financial Services (2002-2004) of KPMG LLP US (professional services, 1965-2005). Mr. Mauriello currently serves as a member of the Independent Directors Council (IDC) Governing Council (2015-present). Previously, Mr. Mauriello served as a member of the Board of Directors of XL Group plc. (global insurance and re-insurance, 2006-2018).
Cornelia M. Small (1944)
Year of Election or Appointment: 2005
Trustee
Ms. Small also serves as Trustee of other Fidelity® funds. Ms. Small is a member of the Board of Directors (2009-present) and Chair of the Investment Committee (2010-present) of the Teagle Foundation. Ms. Small also serves on the Investment Committee of the Berkshire Taconic Community Foundation (2008-present). Previously, Ms. Small served as Chairperson (2002-2008) and a member of the Investment Committee and Chairperson (2008-2012) and a member of the Board of Trustees of Smith College. In addition, Ms. Small served as Chief Investment Officer, Director of Global Equity Investments, and a member of the Board of Directors of Scudder, Stevens & Clark and Scudder Kemper Investments.
Garnett A. Smith (1947)
Year of Election or Appointment: 2018
Trustee
Mr. Smith also serves as Trustee of other Fidelity® funds. Prior to Mr. Smith's retirement, he served as Chairman and Chief Executive Officer of Inbrand Corp. (manufacturer of personal absorbent products, 1990-1997). He also served as President (1986-1990) of Inbrand Corp. Prior to his employment with Inbrand Corp., he was employed by a retail fabric chain and North Carolina National Bank. In addition, Mr. Smith served as a Member of the Advisory Board of certain Fidelity® funds (2012-2013) and as a board member of the Jackson Hole Land Trust (2009-2012).
David M. Thomas (1949)
Year of Election or Appointment: 2008
Trustee
Mr. Thomas also serves as Trustee of other Fidelity® funds. Mr. Thomas serves as Non-Executive Chairman of the Board of Directors of Fortune Brands Home and Security (home and security products, 2011-present) and as a member of the Board of Directors (2004-present) and Presiding Director (2013-present) of Interpublic Group of Companies, Inc. (marketing communication). Previously, Mr. Thomas served as Executive Chairman (2005-2006) and Chairman and Chief Executive Officer (2000-2005) of IMS Health, Inc. (pharmaceutical and healthcare information solutions), a Director of Fortune Brands, Inc. (consumer products, 2000-2011), and a member of the Board of Trustees of the University of Florida (2013-2018).
+ The information includes the Trustee's principal occupation during the last five years and other information relating to the experience, attributes, and skills relevant to the Trustee's qualifications to serve as a Trustee, which led to the conclusion that the Trustee should serve as a Trustee for the fund.
Advisory Board Members and Officers:
Correspondence intended for a Member of the Advisory Board (if any) may be sent to Fidelity Investments, P.O. Box 55235, Boston, Massachusetts 02205-5235. Correspondence intended for an officer or Peter S. Lynch may be sent to Fidelity Investments, 245 Summer Street, Boston, Massachusetts 02210. Officers appear below in alphabetical order.
Name, Year of Birth; Principal Occupation
Vicki L. Fuller (1957)
Year of Election or Appointment: 2018
Member of the Advisory Board
Ms. Fuller also serves as Member of the Advisory Board of other Fidelity® funds. Ms. Fuller serves as a member of the Board of Directors, Audit Committee, and Nominating and Governance Committee of The Williams Companies, Inc. (natural gas infrastructure, 2018-present). Previously, Ms. Fuller served as the Chief Investment Officer of the New York State Common Retirement Fund (2012-2018) and held a variety of positions at AllianceBernstein L.P. (global asset management, 1985-2012), including Managing Director (2006-2012) and Senior Vice President and Senior Portfolio Manager (2001-2006).
Peter S. Lynch (1944)
Year of Election or Appointment: 2003
Member of the Advisory Board
Mr. Lynch also serves as Member of the Advisory Board of other Fidelity® funds. Mr. Lynch is Vice Chairman and a Director of FMR (investment adviser firm) and FMR Co., Inc. (investment adviser firm). In addition, Mr. Lynch serves as a Trustee of Boston College and as the Chairman of the Inner-City Scholarship Fund. Previously, Mr. Lynch served on the Special Olympics International Board of Directors (1997-2006).
Carol B. Tomé (1957)
Year of Election or Appointment: 2018
Member of the Advisory Board
Ms. Tomé also serves as Member of the Advisory Board of other Fidelity® funds. Ms. Tomé is Chief Financial Officer (2001-present) and Executive Vice President of Corporate Services (2007-present) of The Home Depot, Inc. (home improvement retailer) and a Director (2003-present) and Chair of the Audit Committee (2004-present) of United Parcel Service, Inc. (package delivery and supply chain management). Previously, Ms. Tomé served as Trustee of certain Fidelity® funds (2017), Senior Vice President of Finance and Accounting/Treasurer (2000-2007) and Vice President and Treasurer (1995-2000) of The Home Depot, Inc. and Chair of the Board (2010-2012), Vice Chair of the Board (2009 and 2013), and a Director (2008-2013) of the Federal Reserve Bank of Atlanta. Ms. Tomé is also a director or trustee of many community and professional organizations.
Michael E. Wiley (1950)
Year of Election or Appointment: 2018
Member of the Advisory Board
Mr. Wiley also serves as Trustee or Member of the Advisory Board of other Fidelity® funds. Mr. Wiley serves as a Director of High Point Resources (exploration and production, 2005-present). Previously, Mr. Wiley served as a Director of Andeavor Corporation (independent oil refiner and marketer, 2005-2018), a Director of Andeavor Logistics LP (natural resources logistics, 2015-2018), a Director of Post Oak Bank (privately-held bank, 2004-2018), a Director of Asia Pacific Exploration Consolidated (international oil and gas exploration and production, 2008-2013), a member of the Board of Trustees of the University of Tulsa (2000-2006; 2007-2010), a Senior Energy Advisor of Katzenbach Partners, LLC (consulting, 2006-2007), an Advisory Director of Riverstone Holdings (private investment), a Director of Spinnaker Exploration Company (exploration and production, 2001-2005) and Chairman, President, and CEO of Baker Hughes, Inc. (oilfield services, 2000-2004).
Elizabeth Paige Baumann (1968)
Year of Election or Appointment: 2017
Anti-Money Laundering (AML) Officer
Ms. Baumann also serves as AML Officer of other funds. She is Chief AML Officer (2012-present) and Senior Vice President (2014-present) of FMR LLC (diversified financial services company) and is an employee of Fidelity Investments. Previously, Ms. Baumann served as AML Officer of the funds (2012-2016), and Vice President (2007-2014) and Deputy Anti-Money Laundering Officer (2007-2012) of FMR LLC.
Craig S. Brown (1977)
Year of Election or Appointment: 2019
Assistant Treasurer
Mr. Brown also serves as Assistant Treasurer of other funds. Mr. Brown is an employee of Fidelity Investments (2013-present).
John J. Burke III (1964)
Year of Election or Appointment: 2018
Chief Financial Officer
Mr. Burke also serves as Chief Financial Officer of other funds. Mr. Burke serves as Head of Investment Operations for Fidelity Fund and Investment Operations (2018-present) and is an employee of Fidelity Investments (1998-present). Previously Mr. Burke served as head of Asset Management Investment Operations (2012-2018).
William C. Coffey (1969)
Year of Election or Appointment: 2018
Secretary and Chief Legal Officer (CLO)
Mr. Coffey also serves as Secretary and CLO of other funds. Mr. Coffey serves as CLO, Secretary, and Senior Vice President of Fidelity Management & Research Company and FMR Co., Inc. (investment adviser firms, 2018-present); Secretary of Fidelity SelectCo, LLC and Fidelity Investments Money Management, Inc. (investment adviser firms, 2018-present); and CLO of Fidelity Management & Research (Hong Kong) Limited, FMR Investment Management (UK) Limited, and Fidelity Management & Research (Japan) Limited (investment adviser firms, 2018-present). He is Senior Vice President and Deputy General Counsel of FMR LLC (diversified financial services company, 2010-present), and is an employee of Fidelity Investments. Previously, Mr. Coffey served as Assistant Secretary of certain funds (2009-2018) and as Vice President and Associate General Counsel of FMR LLC (2005-2009).
Timothy M. Cohen (1969)
Year of Election or Appointment: 2018
Vice President
Mr. Cohen also serves as Vice President of other funds. Mr. Cohen serves as Executive Vice President of Fidelity SelectCo, LLC (2019-present), Co-Head of Equity (2018-present), a Director of Fidelity Management & Research (Japan) Limited (investment adviser firm, 2016-present), and is an employee of Fidelity Investments. Previously, Mr. Cohen served as Head of Global Equity Research (2016-2018), Chief Investment Officer - Equity and a Director of Fidelity Management & Research (U.K.) Inc. (investment adviser firm, 2013-2015) and as a Director of Fidelity Management & Research (Hong Kong) Limited (investment adviser firm, 2017).
Jonathan Davis (1968)
Year of Election or Appointment: 2010
Assistant Treasurer
Mr. Davis also serves as Assistant Treasurer of other funds. Mr. Davis serves as Assistant Treasurer of FMR Capital, Inc. (2017-present) and is an employee of Fidelity Investments. Previously, Mr. Davis served as Vice President and Associate General Counsel of FMR LLC (diversified financial services company, 2003-2010).
Adrien E. Deberghes (1967)
Year of Election or Appointment: 2016
Assistant Treasurer
Mr. Deberghes also serves as an officer of other funds. He serves as Assistant Treasurer of FMR Capital, Inc. (2017-present), Executive Vice President of Fidelity Investments Money Management, Inc. (FIMM) (investment adviser firm, 2016-present), and is an employee of Fidelity Investments (2008-present). Previously, Mr. Deberghes served as President and Treasurer of certain Fidelity® funds (2013-2018). Prior to joining Fidelity Investments, Mr. Deberghes was Senior Vice President of Mutual Fund Administration at State Street Corporation (2007-2008), Senior Director of Mutual Fund Administration at Investors Bank & Trust (2005-2007), and Director of Finance for Dunkin' Brands (2000-2005). Previously, Mr. Deberghes served in other fund officer roles.
Laura M. Del Prato (1964)
Year of Election or Appointment: 2018
Assistant Treasurer
Ms. Del Prato also serves as an officer of other funds. Ms. Del Prato is an employee of Fidelity Investments (2017-present). Prior to joining Fidelity Investments, Ms. Del Prato served as a Managing Director and Treasurer of the JPMorgan Mutual Funds (2014-2017). Prior to JPMorgan, Ms. Del Prato served as a partner at Cohen Fund Audit Services (accounting firm, 2012-2013) and KPMG LLP (accounting firm, 2004-2012).
Colm A. Hogan (1973)
Year of Election or Appointment: 2016
Deputy Treasurer
Mr. Hogan also serves as an officer of other funds. Mr. Hogan serves as Assistant Treasurer of FMR Capital, Inc. (2017-present) and is an employee of Fidelity Investments (2005-present). Previously, Mr. Hogan served as Assistant Treasurer of certain Fidelity® funds (2016-2018).
Pamela R. Holding (1964)
Year of Election or Appointment: 2018
Vice President
Ms. Holding also serves as Vice President of other funds. Ms. Holding serves as Executive Vice President of Fidelity SelectCo, LLC (2019-present), Co-Head of Equity (2018-present) and is an employee of Fidelity Investments (2013-present). Previously, Ms. Holding served as Chief Investment Officer of Fidelity Institutional Asset Management (2013-2018).
Chris Maher (1972)
Year of Election or Appointment: 2013
Assistant Treasurer
Mr. Maher serves as Assistant Treasurer of other funds. Mr. Maher is Vice President of Valuation Oversight, serves as Assistant Treasurer of FMR Capital, Inc. (2017-present), and is an employee of Fidelity Investments. Previously, Mr. Maher served as Vice President of Asset Management Compliance (2013), Vice President of the Program Management Group of FMR (investment adviser firm, 2010-2013), and Vice President of Valuation Oversight (2008-2010).
Kenneth B. Robins (1969)
Year of Election or Appointment: 2016
Chief Compliance Officer
Mr. Robins also serves as an officer of other funds. Mr. Robins serves as Compliance Officer of Fidelity Management & Research Company and FMR Co., Inc. (investment adviser firms, 2016-present) and is an employee of Fidelity Investments (2004-present). Previously, Mr. Robins served as Executive Vice President of Fidelity Investments Money Management, Inc. (investment adviser firm, 2013-2016) and served in other fund officer roles.
Stacie M. Smith (1974)
Year of Election or Appointment: 2016
President and Treasurer
Ms. Smith also serves as an officer of other funds. Ms. Smith serves as Assistant Treasurer of FMR Capital, Inc. (2017-present), is an employee of Fidelity Investments (2009-present), and has served in other fund officer roles. Prior to joining Fidelity Investments, Ms. Smith served as Senior Audit Manager of Ernst & Young LLP (accounting firm, 1996-2009). Previously, Ms. Smith served as Assistant Treasurer (2013-2018) and Deputy Treasurer (2013-2016) of certain Fidelity® funds.
Marc L. Spector (1972)
Year of Election or Appointment: 2016
Assistant Treasurer
Mr. Spector also serves as an officer of other funds. Mr. Spector serves as Assistant Treasurer of FMR Capital, Inc. (2017-present) and is an employee of Fidelity Investments (2016-present). Prior to joining Fidelity Investments, Mr. Spector served as Director at the Siegfried Group (accounting firm, 2013-2016), and prior to Siegfried Group as audit senior manager at Deloitte & Touche (accounting firm, 2005-2013).
Jim Wegmann (1979)
Year of Election or Appointment: 2019
Assistant Treasurer
Mr. Wegmann also serves as Assistant Treasurer of other funds. Mr. Wegmann is an employee of Fidelity Investments (2011-present).
Shareholder Expense Example
As a shareholder of the Fund, you incur two types of costs: (1) transaction costs and (2) ongoing costs, including other Fund expenses. This Example is intended to help you understand your ongoing costs (in dollars) of investing in the Fund and to compare these costs with the ongoing costs of investing in other mutual funds.
The Example is based on an investment of $1,000 invested at the beginning of the period and held for the entire period (November 1, 2018 to April 30, 2019).
Actual Expenses
The first line of the accompanying table provides information about actual account values and actual expenses. You may use the information in this line, together with the amount you invested, to estimate the expenses that you paid over the period. Simply divide your account value by $1,000.00 (for example, an $8,600 account value divided by $1,000.00 = 8.6), then multiply the result by the number in the first line under the heading entitled "Expenses Paid During Period" to estimate the expenses you paid on your account during this period. In addition, the Fund, as a shareholder in the underlying Fidelity Central Funds, will indirectly bear its pro-rata share of the fees and expenses incurred by the underlying Fidelity Central Funds. These fees and expenses are not included in the Fund's annualized expense ratio used to calculate the expense estimate in the table below.
Hypothetical Example for Comparison Purposes
The second line of the accompanying table provides information about hypothetical account values and hypothetical expenses based on the Fund's actual expense ratio and an assumed rate of return of 5% per year before expenses, which is not the Fund's actual return. The hypothetical account values and expenses may not be used to estimate the actual ending account balance or expenses you paid for the period. You may use this information to compare the ongoing costs of investing in the Fund and other funds. To do so, compare this 5% hypothetical example with the 5% hypothetical examples that appear in the shareholder reports of the other funds. In addition, the Fund, as a shareholder in the underlying Fidelity Central Funds, will indirectly bear its pro-rata share of the fees and expenses incurred by the underlying Fidelity Central Funds. These fees and expenses are not included in the Fund's annualized expense ratio used to calculate the expense estimate in the table below.
Please note that the expenses shown in the table are meant to highlight your ongoing costs only and do not reflect any transaction costs. Therefore, the second line of the table is useful in comparing ongoing costs only, and will not help you determine the relative total costs of owning different funds.
| Annualized Expense Ratio-A | Beginning Account Value November 1, 2018 | Ending Account Value April 30, 2019 | Expenses Paid During Period-B November 1, 2018 to April 30, 2019 | |
| Series Small Cap Discovery | - %-C | |||
| Actual | $1,000.00 | $1,136.30 | $--D | |
| Hypothetical-E | $1,000.00 | $1,024.79 | $--D |
A Annualized expense ratio reflects expenses net of applicable fee waivers.
B Expenses are equal to the Fund's annualized expense ratio, multiplied by the average account value over the period, multiplied by 181/365 (to reflect the one-half year period).
C Amount represents less than .005%.
D Amount represents less than $.005.
E 5% return per year before expenses
Distributions (Unaudited)
The Board of Trustees of Fidelity Series Small Cap Discovery Fund voted to pay on June 10, 2019, to shareholders of record at the opening of business on June 07, 2019, a distribution of $.195 per share derived from capital gains realized from sales of portfolio securities and a dividend of $.057 per share from net investment income.
The fund hereby designates as a capital gain dividend with respect to the taxable year ended April 30, 2019, $106,247,162, or, if subsequently determined to be different, the net capital gain of such year.
The fund designates 18% and 32% of the dividends distributed in June and December, respectively during the fiscal year as qualifying for the dividends–received deduction for corporate shareholders.
The fund designates 25% and 46% of the dividends distributed in June and December, respectively during the fiscal year as amounts which may be taken into account as a dividend for the purposes of the maximum rate under section 1(h)(11) of the Internal Revenue Code.
The fund will notify shareholders in January 2020 of amounts for use in preparing 2019 income tax returns.
Board Approval of Investment Advisory Contracts and Management Fees
Fidelity Series Small Cap Discovery Fund
Each year, the Board of Trustees, including the Independent Trustees (together, the Board), votes on the renewal of the management contract with Fidelity Management & Research Company (FMR) and the sub-advisory agreements (together, the Advisory Contracts) for the fund. FMR and the sub-advisers are referred to herein as the Investment Advisers. The Board, assisted by the advice of fund counsel and Independent Trustees' counsel, requests and considers a broad range of information relevant to the renewal of the Advisory Contracts throughout the year.
The Board meets regularly and, at each of its meetings, covers an extensive agenda of topics and materials and considers factors that are relevant to its annual consideration of the renewal of the fund's Advisory Contracts, including the services and support provided to the fund and its shareholders. The Board has established various standing committees (Committees), each composed of and chaired by Independent Trustees with varying backgrounds, to which the Board has assigned specific subject matter responsibilities in order to enhance effective decision-making by the Board. The Board, acting directly and through its Committees, requests and receives information concerning the annual consideration of the renewal of the fund's Advisory Contracts. The Board also meets as needed to review matters specifically related to the Board's annual consideration of the renewal of the Advisory Contracts. Members of the Board may also meet with trustees of other Fidelity funds through joint ad hoc committees to discuss certain matters relevant to all of the Fidelity funds.
At its January 2019 meeting, the Board unanimously determined to renew the fund's Advisory Contracts. In considering whether to renew the Advisory Contracts for the fund, the Board considered all factors it believed relevant and reached a determination, with the assistance of fund counsel and Independent Trustees' counsel and through the exercise of its business judgment, that the renewal of the Advisory Contracts was in the best interests of the fund and its shareholders and the fact that no fee is payable under the management contract was fair and reasonable.
Nature, Extent, and Quality of Services Provided. The Board considered Fidelity's staffing as it relates to the fund, including the backgrounds of investment personnel of Fidelity, and also considered the fund's investment objective, strategies, and related investment philosophy. The Independent Trustees also had discussions with senior management of Fidelity's investment operations and investment groups. The Board considered the structure of the investment personnel compensation program and whether this structure provides appropriate incentives to act in the best interests of the fund.Resources Dedicated to Investment Management and Support Services. The Board and the Fund Oversight and Research Committees reviewed the general qualifications and capabilities of Fidelity's investment staff, including its size, education, experience, and resources, as well as Fidelity's approach to recruiting, training, managing, and compensating investment personnel. The Board noted that Fidelity has continued to increase the resources devoted to non-U.S. offices, including expansion of Fidelity's global investment organization. The Board also noted that Fidelity's analysts have extensive resources, tools and capabilities that allow them to conduct sophisticated quantitative and fundamental analysis, as well as credit analysis of issuers, counterparties and guarantors. Further, the Board considered that Fidelity's investment professionals have sufficient access to global information and data so as to provide competitive investment results over time, and that those professionals also have access to sophisticated tools that permit them to assess portfolio construction and risk and performance attribution characteristics continuously, as well as to transmit new information and research conclusions rapidly around the world. Additionally, in its deliberations, the Board considered Fidelity's trading, risk management, compliance, and technology and operations capabilities and resources, which are integral parts of the investment management process.Administrative Services. The Board considered (i) the nature, extent, quality, and cost of advisory and administrative services performed by the Investment Advisers and their affiliates under the Advisory Contracts and under separate agreements covering transfer agency, pricing and bookkeeping, and securities lending services for the fund; (ii) the nature and extent of the supervision of third party service providers, principally custodians, subcustodians, and pricing vendors; and (iii) the resources devoted to, and the record of compliance with, the fund's compliance policies and procedures. The Board also reviewed the allocation of fund brokerage, including allocations to brokers affiliated with the Investment Advisers, the use of brokerage commissions to pay fund expenses, and the use of "soft" commission dollars to pay for research services.Investment Performance. The Board considered whether the fund has operated in accordance with its investment objective, as well as its record of compliance with its investment restrictions. The Board reviewed the fund's absolute investment performance, as well as the fund's relative investment performance, but did not consider performance to be a material factor in its decision to renew the fund's Advisory Contracts, as the fund is not publicly offered as a stand-alone investment product. In this regard, the Board noted that the fund is designed to offer an investment option for other investment companies managed by Fidelity and ultimately to enhance the performance of those investment companies.Based on its review, the Board concluded that the nature, extent, and quality of services provided to the fund under the Advisory Contracts should continue to benefit the shareholders of the fund.Competitiveness of Management Fee and Total Expense Ratio. The Board considered that the fund does not pay FMR a management fee for investment advisory services. The Board also noted that FMR or an affiliate undertakes to pay all operating expenses of the fund with certain exceptions.In connection with the renewal of the Advisory Contracts, the Board also approved amendments to the management contract for the fund to clarify that the fund pays its non-operating expenses, including brokerage commissions and fees and expenses associated with the fund's securities lending program. The Board considered that the amendments would not change the services provided to the fund or the party responsible for making such payments under the current management contract.The Board further considered that FMR has contractually agreed to reimburse the fund to the extent that total operating expenses, with certain exceptions, as a percentage of its average net assets, exceed 0.014% through June 30, 2020.Based on its review, the Board considered that the fund does not pay a management fee and concluded that the total expense ratio of each class of the fund was reasonable in light of the services that the fund and its shareholders receive and the other factors considered.Costs of the Services and Profitability. The Board considered the level of Fidelity's profits in respect of all the Fidelity funds.PricewaterhouseCoopers LLP (PwC), auditor to Fidelity and certain Fidelity funds, has been engaged annually by the Board as part of the Board's assessment of Fidelity's profitability analysis. PwC's engagement includes the review and assessment of the methodologies used by Fidelity in determining the revenues and expenses attributable to Fidelity's mutual fund business, and completion of agreed-upon procedures in respect of the mathematical accuracy of the fund profitability information and its conformity to established allocation methodologies. After considering PwC's reports issued under the engagement and information provided by Fidelity, the Board concluded that while other allocation methods may also be reasonable, Fidelity's profitability methodologies are reasonable in all material respects.The Board also reviewed Fidelity's non-fund businesses and potential indirect benefits such businesses may have received as a result of their association with Fidelity's mutual fund business (i.e., fall-out benefits) as well as cases where Fidelity's affiliates may benefit from the fund's business. The Board noted that changes to fall-out benefits year-over-year reflect business developments at Fidelity's various businesses.The Board concluded that the costs of the services provided by and the profits realized by Fidelity in connection with the operation of the fund were not relevant to the renewal of the Advisory Contracts because the fund pays no advisory fees and FMR or an affiliate bears all expenses of the fund with certain exceptions.Economies of Scale. The Board concluded that because the fund pays no advisory fees and FMR or an affiliate bears all expenses of the fund with certain exceptions, the realization of economies of scale was not a material factor in the Board's decision to renew the fund's Advisory Contracts.Additional Information Requested by the Board. In order to develop fully the factual basis for consideration of the Fidelity funds' advisory contracts, the Board requested and received additional information on certain topics, including: (i) fund performance trends, in particular the underperformance of certain funds, and Fidelity's long-term strategies for certain funds; (ii) Fidelity's fund profitability methodology, profitability trends for certain funds, and the impact of certain factors on fund profitability results; (iii) metrics for evaluating index fund and ETF performance and information about ETF trading characteristics; (iv) the methodology with respect to the evaluation of competitive fund data and peer group classifications and fee comparisons; (v) the expense structures for different funds and classes; (vi) information regarding other accounts managed by Fidelity, including collective investment trusts; and (vii) Fidelity's philosophies and strategies for evaluating funds and classes with lower or declining asset levels.Based on its evaluation of all of the conclusions noted above, and after considering all factors it believed relevant, the Board concluded that the advisory fee arrangements are fair and reasonable, and that the fund's Advisory Contracts should be renewed.![]()
XS4-ANN-0619
1.968029.105
Fidelity® Event Driven Opportunities Fund Annual Report April 30, 2019 |
|
Beginning on January 1, 2021, as permitted by regulations adopted by the Securities and Exchange Commission, paper copies of a fund’s shareholder reports will no longer be sent by mail, unless you specifically request paper copies of the reports from the fund or from your financial intermediary, such as a financial advisor, broker-dealer or bank. Instead, the reports will be made available on a website, and you will be notified by mail each time a report is posted and provided with a website link to access the report.
If you already elected to receive shareholder reports electronically, you will not be affected by this change and you need not take any action. You may elect to receive shareholder reports and other communications from a fund electronically, by contacting your financial intermediary. For Fidelity customers, visit Fidelity's web site or call Fidelity using the contact information listed below.
You may elect to receive all future reports in paper free of charge. If you wish to continue receiving paper copies of your shareholder reports, you may contact your financial intermediary or, if you are a Fidelity customer, visit Fidelity’s website, or call Fidelity at the applicable toll-free number listed below. Your election to receive reports in paper will apply to all funds held with the fund complex/your financial intermediary.
| Account Type | Website | Phone Number |
| Brokerage, Mutual Fund, or Annuity Contracts: | fidelity.com/mailpreferences | 1-800-343-3548 |
| Employer Provided Retirement Accounts: | netbenefits.fidelity.com/preferences (choose 'no' under Required Disclosures to continue to print) | 1-800-343-0860 |
| Advisor Sold Accounts Serviced Through Your Financial Intermediary: | Contact Your Financial Intermediary | Your Financial Intermediary's phone number |
| Advisor Sold Accounts Serviced by Fidelity: | institutional.fidelity.com | 1-877-208-0098 |
Contents
Board Approval of Investment Advisory Contracts and Management Fees |
To view a fund's proxy voting guidelines and proxy voting record for the 12-month period ended June 30, visit http://www.fidelity.com/proxyvotingresults or visit the Securities and Exchange Commission's (SEC) web site at http://www.sec.gov.
You may also call 1-800-544-8544 to request a free copy of the proxy voting guidelines.
Standard & Poor's, S&P and S&P 500 are registered service marks of The McGraw-Hill Companies, Inc. and have been licensed for use by Fidelity Distributors Corporation.
Other third-party marks appearing herein are the property of their respective owners.
All other marks appearing herein are registered or unregistered trademarks or service marks of FMR LLC or an affiliated company. © 2019 FMR LLC. All rights reserved.
This report and the financial statements contained herein are submitted for the general information of the shareholders of the Fund. This report is not authorized for distribution to prospective investors in the Fund unless preceded or accompanied by an effective prospectus.
A fund files its complete schedule of portfolio holdings with the SEC for the first and third quarters of each fiscal year on Form N-PORT. Forms N-PORT are available on the SEC’s web site at http://www.sec.gov. A fund's Forms N-PORT may be reviewed and copied at the SEC’s Public Reference Room in Washington, DC. Information regarding the operation of the SEC's Public Reference Room may be obtained by calling 1-800-SEC-0330.
For a complete list of a fund's portfolio holdings, view the most recent holdings listing, semiannual report, or annual report on Fidelity's web site at http://www.fidelity.com, http://www.institutional.fidelity.com, or http://www.401k.com, as applicable.
NOT FDIC INSURED •MAY LOSE VALUE •NO BANK GUARANTEE
Neither the Fund nor Fidelity Distributors Corporation is a bank.
Performance: The Bottom Line
Average annual total return reflects the change in the value of an investment, assuming reinvestment of distributions from dividend income and capital gains (the profits earned upon the sale of securities that have grown in value, if any) and assuming a constant rate of performance each year. The hypothetical investment and the average annual total returns do not reflect the deduction of taxes that a shareholder would pay on fund distributions or the redemption of fund shares. During periods of reimbursement by Fidelity, a fund’s total return will be greater than it would be had the reimbursement not occurred. How a fund did yesterday is no guarantee of how it will do tomorrow.
Average Annual Total Returns
| For the periods ended April 30, 2019 | Past 1 year | Past 5 years | Life of fundA |
| Fidelity® Event Driven Opportunities Fund | (15.98)% | 5.57% | 6.27% |
A From December 12, 2013
$10,000 Over Life of Fund
Let's say hypothetically that $10,000 was invested in Fidelity® Event Driven Opportunities Fund on December 12, 2013, when the fund started.
The chart shows how the value of your investment would have changed, and also shows how the Russell 3000® Index performed over the same period.
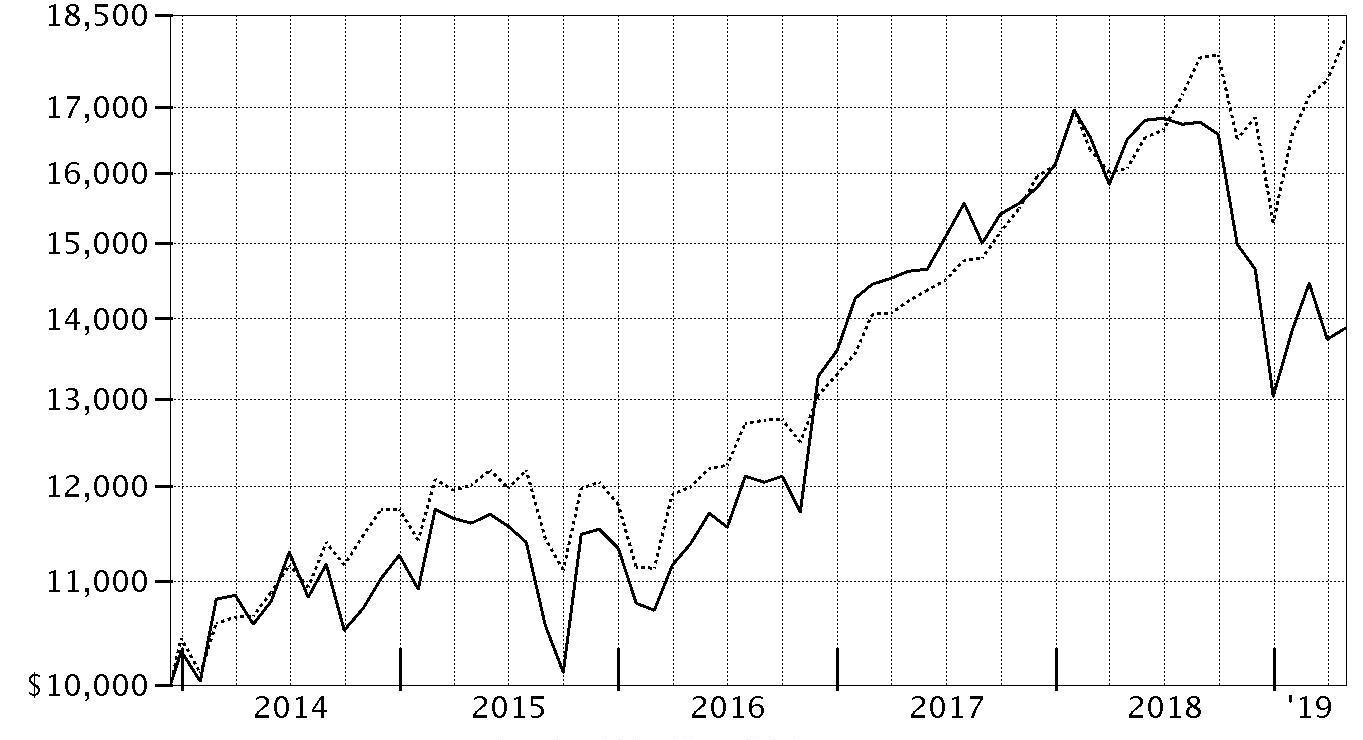
| Period Ending Values | ||
| $13,873 | Fidelity® Event Driven Opportunities Fund | |
| $18,114 | Russell 3000® Index | |
Management's Discussion of Fund Performance
Market Recap: The S&P 500® index gained 13.49% for the 12 months ending April 30, 2019, as U.S. equities began the new year on a high note after enduring an historically volatile final quarter of 2018. The index rose 18.25% year to date, its strongest four-month opening since 1987, amid upbeat company earnings/outlooks and signs the Fed may pause on rates. After achieving a record close in late April, the S&P 500® moved a bit higher to end the period. The uptrend was in sharp contrast to late 2018, when rising U.S. Treasury yields and concern about peaking corporate earnings growth sent many investors fleeing from risk assets as they were still dealing with lingering uncertainty related to global trade and the Fed picking up the pace of interest rate hikes. The index returned -6.84% in October, at the time its largest monthly drop in seven years. But conditions worsened through Christmas, as jitters about the economy and another hike in rates led to a spike in market volatility and a -9.03% result for December. For the full period, eight of 11 sectors registered a double-digit gain, led by information technology (+25%). Three defensive groups also stood out: real estate (+21%), consumer staples (+18%) and utilities (+18%). Communication services – a mix of telecom stocks and media/entertainment names – gained 17%, followed by consumer discretionary (+16%). In contrast, energy (-7%) lost ground, while materials (+3%), financials (+4%), health care (+11%) and industrials (+11%) also trailed the broad market.Comments from Portfolio Manager Arvind Navaratnam: For the fiscal year, the fund’s Retail shares returned -15.98%, significantly trailing the 12.68% gain of the benchmark Russell 3000® Index. Security selection hurt the fund’s relative result, as did its small-cap bias, as small-caps lagged the large-cap names that dominate the benchmark. A large non-index stake in CorePoint Lodging (-50%) detracted more than any other fund position, weighed down by consecutive quarters of disappointing financial results and costs associated with the firm's La Quinta spinoff. Large non-index investments in Germany-based online pet supply retailer Zooplus and U.K.-based online electronics and appliances retailer AO World also weighed heavily on the relative result. Conversely, a sizable position in sports and entertainment holding company Madison Square Garden contributed more than any other single stock by far. The stock hit a record high in late June after the firm announced its plans to spin off its New York Knicks and Rangers sports franchises. We sold our position in MSG shortly thereafter. The fund’s position in MSG advanced about 22% for the period. Elsewhere, a non-benchmark position in Mellanox Technologies, supplier of computer networking products, was another plus. We sold the stock from the fund by period end to lock in profits.The views expressed above reflect those of the portfolio manager(s) only through the end of the period as stated on the cover of this report and do not necessarily represent the views of Fidelity or any other person in the Fidelity organization. Any such views are subject to change at any time based upon market or other conditions and Fidelity disclaims any responsibility to update such views. These views may not be relied on as investment advice and, because investment decisions for a Fidelity fund are based on numerous factors, may not be relied on as an indication of trading intent on behalf of any Fidelity fund.
Investment Summary (Unaudited)
Top Ten Stocks as of April 30, 2019
| % of fund's net assets | |
| iShares Russell 3000 ETF | 7.4 |
| Alliance Data Systems Corp. | 6.7 |
| CorePoint Lodging, Inc. | 6.4 |
| AO World PLC | 5.4 |
| SPDR Portfolio Total Stock Market ETF | 5.3 |
| Arcosa, Inc. | 5.2 |
| Alcon, Inc. | 3.3 |
| Magellan Health Services, Inc. | 3.1 |
| Brighthouse Financial, Inc. | 3.1 |
| Perspecta, Inc. | 3.0 |
| 48.9 |
Top Five Market Sectors as of April 30, 2019
| % of fund's net assets | |
| Information Technology | 30.0 |
| Consumer Discretionary | 15.9 |
| Health Care | 14.3 |
| Financials | 8.9 |
| Real Estate | 7.5 |
Asset Allocation (% of fund's net assets)
| As of April 30, 2019 * | ||
| Stocks, Investment Companies and Equity Futures | 97.5% | |
| Short-Term Investments and Net Other Assets (Liabilities) | 2.5% | |

* Foreign investments - 23.5%
Schedule of Investments April 30, 2019
Showing Percentage of Net Assets
| Common Stocks - 83.1% | |||
| Shares | Value | ||
| COMMUNICATION SERVICES - 0.1% | |||
| Media - 0.1% | |||
| comScore, Inc. (a) | 1,502 | $18,850 | |
| Reach PLC | 227,802 | 219,820 | |
| 238,670 | |||
| CONSUMER DISCRETIONARY - 15.9% | |||
| Automobiles - 0.0% | |||
| Fiat Chrysler Automobiles NV | 1,500 | 23,115 | |
| Hotels, Restaurants & Leisure - 1.7% | |||
| Melco International Development Ltd. | 8,000 | 19,621 | |
| Wyndham Hotels & Resorts, Inc. | 57,006 | 3,176,374 | |
| 3,195,995 | |||
| Household Durables - 1.5% | |||
| Hamilton Beach Brands Holding Co. Class A | 157,585 | 2,852,289 | |
| Internet & Direct Marketing Retail - 6.1% | |||
| AO World PLC (a)(b) | 7,377,753 | 10,390,237 | |
| Ocado Group PLC (a) | 6,600 | 117,262 | |
| Pinduoduo, Inc. ADR | 900 | 20,007 | |
| Zooplus AG (a)(b) | 11,100 | 1,203,892 | |
| 11,731,398 | |||
| Multiline Retail - 0.0% | |||
| Avenue Supermarts Ltd. (a)(c) | 2,161 | 40,197 | |
| Specialty Retail - 3.2% | |||
| Cars.com, Inc. (a)(b) | 256,648 | 5,340,845 | |
| GameStop Corp. Class A | 89,028 | 770,092 | |
| 6,110,937 | |||
| Textiles, Apparel & Luxury Goods - 3.4% | |||
| Puma AG | 1,800 | 1,113,412 | |
| Unifi, Inc. (a) | 264,522 | 5,343,344 | |
| 6,456,756 | |||
| TOTAL CONSUMER DISCRETIONARY | 30,410,687 | ||
| CONSUMER STAPLES - 1.2% | |||
| Beverages - 0.0% | |||
| Primo Water Corp. (a) | 1,400 | 22,050 | |
| Food Products - 1.2% | |||
| Kaveri Seed Co. Ltd. | 350,600 | 2,240,111 | |
| SunOpta, Inc. (a) | 6,688 | 23,742 | |
| 2,263,853 | |||
| Personal Products - 0.0% | |||
| Avon Products, Inc. (a) | 7,700 | 24,486 | |
| TOTAL CONSUMER STAPLES | 2,310,389 | ||
| ENERGY - 0.0% | |||
| Energy Equipment & Services - 0.0% | |||
| Exterran Corp. (a) | 1,626 | 23,122 | |
| FINANCIALS - 8.9% | |||
| Capital Markets - 2.9% | |||
| Interactive Brokers Group, Inc. | 700 | 37,968 | |
| KKR & Co. LP | 224,273 | 5,483,475 | |
| 5,521,443 | |||
| Consumer Finance - 2.8% | |||
| Encore Capital Group, Inc. (a) | 978 | 27,638 | |
| SLM Corp. | 523,963 | 5,323,464 | |
| 5,351,102 | |||
| Diversified Financial Services - 0.1% | |||
| Rafael Holdings, Inc. (a) | 15,000 | 243,000 | |
| Insurance - 3.1% | |||
| Brighthouse Financial, Inc. (a) | 139,819 | 5,843,036 | |
| TOTAL FINANCIALS | 16,958,581 | ||
| HEALTH CARE - 14.3% | |||
| Health Care Equipment & Supplies - 3.3% | |||
| Alcon, Inc. (a) | 108,400 | 6,308,880 | |
| Arjo AB | 5,700 | 21,160 | |
| 6,330,040 | |||
| Health Care Providers & Services - 8.6% | |||
| Covetrus, Inc. (a) | 164,700 | 5,413,689 | |
| Elanco Animal Health, Inc. | 101,100 | 3,184,650 | |
| Magellan Health Services, Inc. (a) | 84,100 | 5,887,000 | |
| Patterson Companies, Inc. | 86,200 | 1,882,608 | |
| 16,367,947 | |||
| Pharmaceuticals - 2.4% | |||
| Perrigo Co. PLC | 96,200 | 4,609,904 | |
| TOTAL HEALTH CARE | 27,307,891 | ||
| INDUSTRIALS - 5.2% | |||
| Airlines - 0.0% | |||
| AirAsia Group BHD | 42,300 | 27,931 | |
| Ryanair Holdings PLC sponsored ADR (a) | 500 | 38,820 | |
| Wizz Air Holdings PLC (a)(c) | 1,361 | 60,341 | |
| 127,092 | |||
| Construction & Engineering - 5.2% | |||
| Arcosa, Inc. | 318,958 | 9,929,163 | |
| TOTAL INDUSTRIALS | 10,056,255 | ||
| INFORMATION TECHNOLOGY - 30.0% | |||
| Electronic Equipment & Components - 3.0% | |||
| Cardtronics PLC (a) | 158,452 | 5,666,244 | |
| Knowles Corp. (a) | 2,300 | 43,424 | |
| 5,709,668 | |||
| IT Services - 12.5% | |||
| Adevinta ASA Class B | 548,400 | 5,395,359 | |
| Alliance Data Systems Corp. | 80,125 | 12,828,013 | |
| DXC Technology Co. | 403 | 26,493 | |
| Perspecta, Inc. | 248,698 | 5,739,950 | |
| 23,989,815 | |||
| Software - 11.6% | |||
| Black Knight, Inc. (a) | 101,418 | 5,722,004 | |
| Instructure, Inc. (a) | 118,900 | 5,122,212 | |
| LogMeIn, Inc. | 442 | 36,421 | |
| Micro Focus International PLC sponsored ADR | 1,939 | 48,650 | |
| Onespan, Inc. (a) | 306,257 | 5,678,005 | |
| Symantec Corp. | 231,100 | 5,594,931 | |
| 22,202,223 | |||
| Technology Hardware, Storage & Peripherals - 2.9% | |||
| 3D Systems Corp. (a) | 2,883 | 30,675 | |
| Seagate Technology LLC | 112,597 | 5,440,687 | |
| 5,471,362 | |||
| TOTAL INFORMATION TECHNOLOGY | 57,373,068 | ||
| REAL ESTATE - 7.5% | |||
| Equity Real Estate Investment Trusts (REITs) - 6.4% | |||
| CorePoint Lodging, Inc. | 986,801 | 12,335,013 | |
| JBG SMITH Properties | 1,089 | 46,337 | |
| 12,381,350 | |||
| Real Estate Management & Development - 1.1% | |||
| Midland Holdings Ltd. | 16,000 | 3,488 | |
| Sunteck Realty Ltd. (a) | 308,940 | 2,046,899 | |
| 2,050,387 | |||
| TOTAL REAL ESTATE | 14,431,737 | ||
| TOTAL COMMON STOCKS | |||
| (Cost $169,219,174) | 159,110,400 | ||
| Investment Companies - 12.7% | |||
| iShares Russell 3000 ETF | 82,200 | 14,240,324 | |
| SPDR Portfolio Total Stock Market ETF | 275,300 | 10,070,474 | |
| TOTAL INVESTMENT COMPANIES | |||
| (Cost $21,530,352) | 24,310,798 | ||
| Principal Amount | Value | ||
| U.S. Treasury Obligations - 0.3% | |||
| U.S. Treasury Bills, yield at date of purchase 2.41% to 2.42% 5/30/19 to 6/6/19 (d) | |||
| (Cost $618,638) | 620,000 | 618,647 | |
| Shares | Value | ||
| Money Market Funds - 7.4% | |||
| Fidelity Cash Central Fund, 2.49% (e) | 4,534,944 | $4,535,851 | |
| Fidelity Securities Lending Cash Central Fund 2.49% (e)(f) | 9,606,968 | 9,607,929 | |
| TOTAL MONEY MARKET FUNDS | |||
| (Cost $14,142,002) | 14,143,780 | ||
| TOTAL INVESTMENT IN SECURITIES - 103.5% | |||
| (Cost $205,510,166) | 198,183,625 | ||
| NET OTHER ASSETS (LIABILITIES) - (3.5)% | (6,779,214) | ||
| NET ASSETS - 100% | $191,404,411 |
| Futures Contracts | |||||
| Number of contracts | Expiration Date | Notional Amount | Value | Unrealized Appreciation/(Depreciation) | |
| Purchased | |||||
| Equity Index Contracts | |||||
| CME E-mini Russell 2000 Index Contracts (United States) | 3 | June 2019 | $239,130 | $9,543 | $9,543 |
| CME E-mini S&P 500 Index Contracts (United States) | 21 | June 2019 | 3,095,925 | 206,292 | 206,292 |
| TOTAL FUTURES CONTRACTS | $215,835 |
The notional amount of futures purchased as a percentage of Net Assets is 1.7%
For the period, the average monthly notional amount at value for futures contracts in the aggregate was $41,208,079.
Security Type Abbreviations
ETF – Exchange-Traded Fund
Legend
(a) Non-income producing
(b) Security or a portion of the security is on loan at period end.
(c) Security exempt from registration under Rule 144A of the Securities Act of 1933. These securities may be resold in transactions exempt from registration, normally to qualified institutional buyers. At the end of the period, the value of these securities amounted to $100,538 or 0.1% of net assets.
(d) Security or a portion of the security was pledged to cover margin requirements for futures contracts. At period end, the value of securities pledged amounted to $159,621.
(e) Affiliated fund that is generally available only to investment companies and other accounts managed by Fidelity Investments. The rate quoted is the annualized seven-day yield of the fund at period end. A complete unaudited listing of the fund's holdings as of its most recent quarter end is available upon request. In addition, each Fidelity Central Fund's financial statements, which are not covered by the Fund's Report of Independent Registered Public Accounting Firm, are available on the SEC's website or upon request.
(f) Investment made with cash collateral received from securities on loan.
Affiliated Central Funds
Information regarding fiscal year to date income earned by the Fund from investments in Fidelity Central Funds is as follows:
| Fund | Income earned |
| Fidelity Cash Central Fund | $976,053 |
| Fidelity Securities Lending Cash Central Fund | 409,949 |
| Total | $1,386,002 |
Amounts in the income column in the above table include any capital gain distributions from underlying funds, which are presented in the corresponding line-item in the Statement of Operations, if applicable.
Investment Valuation
The following is a summary of the inputs used, as of April 30, 2019, involving the Fund's assets and liabilities carried at fair value. The inputs or methodology used for valuing securities may not be an indication of the risk associated with investing in those securities. For more information on valuation inputs, and their aggregation into the levels used below, please refer to the Investment Valuation section in the accompanying Notes to Financial Statements.
| Valuation Inputs at Reporting Date: | ||||
| Description | Total | Level 1 | Level 2 | Level 3 |
| Investments in Securities: | ||||
| Equities: | ||||
| Communication Services | $238,670 | $238,670 | $-- | $-- |
| Consumer Discretionary | 30,410,687 | 30,410,687 | -- | -- |
| Consumer Staples | 2,310,389 | 2,310,389 | -- | -- |
| Energy | 23,122 | 23,122 | -- | -- |
| Financials | 16,958,581 | 16,958,581 | -- | -- |
| Health Care | 27,307,891 | 27,286,731 | 21,160 | -- |
| Industrials | 10,056,255 | 10,056,255 | -- | -- |
| Information Technology | 57,373,068 | 57,373,068 | -- | -- |
| Real Estate | 14,431,737 | 14,431,737 | -- | -- |
| Investment Companies | 24,310,798 | 24,310,798 | -- | -- |
| U.S. Government and Government Agency Obligations | 618,647 | -- | 618,647 | -- |
| Money Market Funds | 14,143,780 | 14,143,780 | -- | -- |
| Total Investments in Securities: | $198,183,625 | $197,543,818 | $639,807 | $-- |
| Derivative Instruments: | ||||
| Assets | ||||
| Futures Contracts | $215,835 | $215,835 | $-- | $-- |
| Total Assets | $215,835 | $215,835 | $-- | $-- |
| Total Derivative Instruments: | $215,835 | $215,835 | $-- | $-- |
Value of Derivative Instruments
The following table is a summary of the Fund's value of derivative instruments by primary risk exposure as of April 30, 2019. For additional information on derivative instruments, please refer to the Derivative Instruments section in the accompanying Notes to Financial Statements.
| Primary Risk Exposure / Derivative Type | Value | |
| Asset | Liability | |
| Equity Risk | ||
| Futures Contracts(a) | $215,835 | $0 |
| Total Equity Risk | 215,835 | 0 |
| Total Value of Derivatives | $215,835 | $0 |
(a) Reflects gross cumulative appreciation (depreciation) on futures contracts as presented in the Schedule of Investments. In the Statement of Assets and Liabilities, the period end daily variation margin is included in receivable or payable for daily variation margin on futures contracts, and the net cumulative appreciation (depreciation) is included in net unrealized appreciation (depreciation).
Other Information
Distribution of investments by country or territory of incorporation, as a percentage of Total Net Assets, is as follows (Unaudited):
| United States of America | 76.5% |
| United Kingdom | 8.6% |
| Ireland | 5.3% |
| Switzerland | 3.3% |
| Norway | 2.8% |
| India | 2.3% |
| Germany | 1.2% |
| Others (Individually Less Than 1%) | 0.0% |
| 100.0% |
See accompanying notes which are an integral part of the financial statements.
Financial Statements
Statement of Assets and Liabilities
| April 30, 2019 | ||
| Assets | ||
| Investment in securities, at value (including securities loaned of $4,680,416) — See accompanying schedule: Unaffiliated issuers (cost $191,368,164) | $184,039,845 | |
| Fidelity Central Funds (cost $14,142,002) | 14,143,780 | |
| Total Investment in Securities (cost $205,510,166) | $198,183,625 | |
| Receivable for investments sold | 6,609,206 | |
| Receivable for fund shares sold | 29,026 | |
| Dividends receivable | 11,100 | |
| Distributions receivable from Fidelity Central Funds | 40,121 | |
| Receivable for daily variation margin on futures contracts | 4,680 | |
| Prepaid expenses | 230 | |
| Other receivables | 19,455 | |
| Total assets | 204,897,443 | |
| Liabilities | ||
| Payable for investments purchased | $2,491,073 | |
| Payable for fund shares redeemed | 1,141,312 | |
| Accrued management fee | 113,535 | |
| Other affiliated payables | 44,016 | |
| Other payables and accrued expenses | 97,847 | |
| Collateral on securities loaned | 9,605,249 | |
| Total liabilities | 13,493,032 | |
| Net Assets | $191,404,411 | |
| Net Assets consist of: | ||
| Paid in capital | $238,671,796 | |
| Total distributable earnings (loss) | (47,267,385) | |
| Net Assets, for 17,154,787 shares outstanding | $191,404,411 | |
| Net Asset Value, offering price and redemption price per share ($191,404,411 ÷ 17,154,787 shares) | $11.16 |
See accompanying notes which are an integral part of the financial statements.
Statement of Operations
| Year ended April 30, 2019 | ||
| Investment Income | ||
| Dividends | $3,715,350 | |
| Interest | 41,731 | |
| Income from Fidelity Central Funds (including $409,949 from security lending) | 1,386,002 | |
| Total income | 5,143,083 | |
| Expenses | ||
| Management fee | ||
| Basic fee | $2,996,143 | |
| Performance adjustment | (118,006) | |
| Transfer agent fees | 641,367 | |
| Accounting and security lending fees | 143,387 | |
| Custodian fees and expenses | 18,425 | |
| Independent trustees' fees and expenses | 2,244 | |
| Registration fees | 39,003 | |
| Audit | 42,423 | |
| Legal | 4,056 | |
| Miscellaneous | 2,608 | |
| Total expenses before reductions | 3,771,650 | |
| Expense reductions | (57,862) | |
| Total expenses after reductions | 3,713,788 | |
| Net investment income (loss) | 1,429,295 | |
| Realized and Unrealized Gain (Loss) | ||
| Net realized gain (loss) on: | ||
| Investment securities: | ||
| Unaffiliated issuers | (20,599,280) | |
| Fidelity Central Funds | 255 | |
| Foreign currency transactions | 52,466 | |
| Futures contracts | (1,519,622) | |
| Total net realized gain (loss) | (22,066,181) | |
| Change in net unrealized appreciation (depreciation) on: | ||
| Investment securities: | ||
| Unaffiliated issuers (net of increase in deferred foreign taxes of $62,172) | (46,765,954) | |
| Fidelity Central Funds | 857 | |
| Assets and liabilities in foreign currencies | 282 | |
| Futures contracts | 1,691,915 | |
| Total change in net unrealized appreciation (depreciation) | (45,072,900) | |
| Net gain (loss) | (67,139,081) | |
| Net increase (decrease) in net assets resulting from operations | $(65,709,786) |
See accompanying notes which are an integral part of the financial statements.
Statement of Changes in Net Assets
| Year ended April 30, 2019 | Year ended April 30, 2018 | |
| Increase (Decrease) in Net Assets | ||
| Operations | ||
| Net investment income (loss) | $1,429,295 | $291,935 |
| Net realized gain (loss) | (22,066,181) | 52,170,544 |
| Change in net unrealized appreciation (depreciation) | (45,072,900) | (1,870,427) |
| Net increase (decrease) in net assets resulting from operations | (65,709,786) | 50,592,052 |
| Distributions to shareholders | (25,036,824) | – |
| Distributions to shareholders from net investment income | – | (242,124) |
| Distributions to shareholders from net realized gain | – | (39,805,952) |
| Total distributions | (25,036,824) | (40,048,076) |
| Share transactions | ||
| Proceeds from sales of shares | 74,303,972 | 238,513,115 |
| Reinvestment of distributions | 23,439,538 | 37,303,360 |
| Cost of shares redeemed | (281,846,432) | (175,498,394) |
| Net increase (decrease) in net assets resulting from share transactions | (184,102,922) | 100,318,081 |
| Total increase (decrease) in net assets | (274,849,532) | 110,862,057 |
| Net Assets | ||
| Beginning of period | 466,253,943 | 355,391,886 |
| End of period | $191,404,411 | $466,253,943 |
| Other Information | ||
| Undistributed net investment income end of period | $5,114 | |
| Shares | ||
| Sold | 5,376,777 | 16,783,267 |
| Issued in reinvestment of distributions | 1,928,191 | 2,726,787 |
| Redeemed | (22,783,133) | (12,397,405) |
| Net increase (decrease) | (15,478,165) | 7,112,649 |
See accompanying notes which are an integral part of the financial statements.
Financial Highlights
Fidelity Event Driven Opportunities Fund
| Years ended April 30, | 2019 | 2018 | 2017 | 2016 | 2015 |
| Selected Per–Share Data | |||||
| Net asset value, beginning of period | $14.29 | $13.93 | $11.04 | $11.36 | $10.57 |
| Income from Investment Operations | |||||
| Net investment income (loss)A | .05 | .01 | –B | .14C | .06 |
| Net realized and unrealized gain (loss) | (2.29) | 1.71 | 3.12 | (.35)D | .95E |
| Total from investment operations | (2.24) | 1.72 | 3.12 | (.21) | 1.01 |
| Distributions from net investment income | (.07) | (.01) | (.09)F | (.06) | (.06) |
| Distributions from net realized gain | (.82) | (1.35) | (.14)F | (.05) | (.16) |
| Total distributions | (.89) | (1.36) | (.23) | (.11) | (.22) |
| Net asset value, end of period | $11.16 | $14.29 | $13.93 | $11.04 | $11.36 |
| Total ReturnG | (15.98)% | 12.89% | 28.57% | (1.89)%D | 9.64%E |
| Ratios to Average Net AssetsH,I | |||||
| Expenses before reductions | 1.05% | 1.12% | 1.11% | 1.06% | 1.13% |
| Expenses net of fee waivers, if any | 1.05% | 1.12% | 1.11% | 1.06% | 1.13% |
| Expenses net of all reductions | 1.03% | 1.10% | 1.10% | 1.04% | 1.12% |
| Net investment income (loss) | .40% | .07% | .01% | 1.31%C | .58% |
| Supplemental Data | |||||
| Net assets, end of period (000 omitted) | $191,404 | $466,254 | $355,392 | $168,612 | $193,389 |
| Portfolio turnover rateJ | 95% | 89% | 117% | 111% | 119% |
A Calculated based on average shares outstanding during the period.
B Amount represents less than $.005 per share.
C Net investment income per share reflects a large, non-recurring dividend which amounted to $.05 per share. Excluding this non-recurring dividends, the ratio of net investment income (loss) to average net assets would have been .82%.
D Amount includes a reimbursement from the investment adviser for an operational error which amounted to less than $.01 per share. Excluding this reimbursement, the total return would have been (1.92)%.
E Amount includes a reimbursement from the investment adviser for an operational error which amounted to less than $.01 per share. Excluding this reimbursement, the total return would have been 9.57%.
F The amounts shown reflect certain reclassifications related to book to tax differences that were made in the year shown.
G Total returns would have been lower if certain expenses had not been reduced during the applicable periods shown.
H Fees and expenses of any underlying Fidelity Central Funds are not included in the Fund's expense ratio. The Fund indirectly bears its proportionate share of the expenses of any underlying Fidelity Central Funds.
I Expense ratios reflect operating expenses of the Fund. Expenses before reductions do not reflect amounts reimbursed by the investment adviser or reductions from brokerage service arrangements or reductions from other expense offset arrangements and do not represent the amount paid by the Fund during periods when reimbursements or reductions occur. Expenses net of fee waivers reflect expenses after reimbursement by the investment adviser but prior to reductions from brokerage service arrangements or other expense offset arrangements. Expenses net of all reductions represent the net expenses paid by the Fund.
J Amount does not include the portfolio activity of any underlying Fidelity Central Funds.
See accompanying notes which are an integral part of the financial statements.
Notes to Financial Statements
For the period ended April 30, 2019
1. Organization.
Fidelity Event Driven Opportunities Fund (the Fund) is a non-diversified fund of Fidelity Concord Street Trust (the Trust) and is authorized to issue an unlimited number of shares. Share transactions on the Statement of Changes in Net Assets may contain exchanges between affiliated funds. The Trust is registered under the Investment Company Act of 1940, as amended (the 1940 Act), as an open-end management investment company organized as a Massachusetts business trust.
2. Investments in Fidelity Central Funds.
The Fund invests in Fidelity Central Funds, which are open-end investment companies generally available only to other investment companies and accounts managed by the investment adviser and its affiliates. The Fund's Schedule of Investments lists each of the Fidelity Central Funds held as of period end, if any, as an investment of the Fund, but does not include the underlying holdings of each Fidelity Central Fund. As an Investing Fund, the Fund indirectly bears its proportionate share of the expenses of the underlying Fidelity Central Funds.
The Money Market Central Funds seek preservation of capital and current income and are managed by Fidelity Investments Money Management, Inc. (FIMM), an affiliate of the investment adviser. Annualized expenses of the Money Market Central Funds as of their most recent shareholder report date are less than .005%.
A complete unaudited list of holdings for each Fidelity Central Fund is available upon request or at the Securities and Exchange Commission (the SEC) website at www.sec.gov. In addition, the financial statements of the Fidelity Central Funds, which are not covered by the Fund's Report of Independent Registered Public Accounting Firm, are available on the SEC website or upon request.
3. Significant Accounting Policies.
The Fund is an investment company and applies the accounting and reporting guidance of the Financial Accounting Standards Board (FASB) Accounting Standards Codification Topic 946 Financial Services – Investments Companies. The financial statements have been prepared in conformity with accounting principles generally accepted in the United States of America (GAAP), which require management to make certain estimates and assumptions at the date of the financial statements. Actual results could differ from those estimates. Subsequent events, if any, through the date that the financial statements were issued have been evaluated in the preparation of the financial statements. The following summarizes the significant accounting policies of the Fund:
Investment Valuation. Investments are valued as of 4:00 p.m. Eastern time on the last calendar day of the period. The Board of Trustees (the Board) has delegated the day to day responsibility for the valuation of the Fund's investments to the Fair Value Committee (the Committee) established by the Fund's investment adviser. In accordance with valuation policies and procedures approved by the Board, the Fund attempts to obtain prices from one or more third party pricing vendors or brokers to value its investments. When current market prices, quotations or currency exchange rates are not readily available or reliable, investments will be fair valued in good faith by the Committee, in accordance with procedures adopted by the Board. Factors used in determining fair value vary by investment type and may include market or investment specific events, changes in interest rates and credit quality. The frequency with which these procedures are used cannot be predicted and they may be utilized to a significant extent. The Committee oversees the Fund's valuation policies and procedures and reports to the Board on the Committee's activities and fair value determinations. The Board monitors the appropriateness of the procedures used in valuing the Fund's investments and ratifies the fair value determinations of the Committee.
The Fund categorizes the inputs to valuation techniques used to value its investments into a disclosure hierarchy consisting of three levels as shown below:
- Level 1 – quoted prices in active markets for identical investments
- Level 2 – other significant observable inputs (including quoted prices for similar investments, interest rates, prepayment speeds, etc.)
- Level 3 – unobservable inputs (including the Fund's own assumptions based on the best information available)
Valuation techniques used to value the Fund's investments by major category are as follows:
Equity securities, including restricted securities, for which market quotations are readily available, are valued at the last reported sale price or official closing price as reported by a third party pricing vendor on the primary market or exchange on which they are traded and are categorized as Level 1 in the hierarchy. In the event there were no sales during the day or closing prices are not available, securities are valued at the last quoted bid price or may be valued using the last available price and are generally categorized as Level 2 in the hierarchy. For foreign equity securities, when market or security specific events arise, comparisons to the valuation of American Depositary Receipts (ADRs), futures contracts, Exchange-Traded Funds (ETFs) and certain indexes as well as quoted prices for similar securities may be used and would be categorized as Level 2 in the hierarchy. For equity securities, including restricted securities, where observable inputs are limited, assumptions about market activity and risk are used and these securities may be categorized as Level 3 in the hierarchy.
Debt securities, including restricted securities, are valued based on evaluated prices received from third party pricing vendors or from brokers who make markets in such securities. U.S. government and government agency obligations are valued by pricing vendors who utilize matrix pricing which considers yield or price of bonds of comparable quality, coupon, maturity and type or by broker-supplied prices. When independent prices are unavailable or unreliable, debt securities may be valued utilizing pricing methodologies which consider similar factors that would be used by third party pricing vendors. Debt securities are generally categorized as Level 2 in the hierarchy but may be Level 3 depending on the circumstances. Exchange-Traded Funds (ETFs) are valued at their last sale price or official closing price as reported by a third party pricing vendor on the primary market or exchange on which they are traded and are categorized as Level 1 in the hierarchy. In the event there were no sales during the day but the exchange reports a closing bid level, ETFs are valued at the closing bid and would be categorized as Level 1 in the hierarchy. In the event there was no closing bid, ETFs may be valued by another method that the Board believes reflects fair value in accordance with the Board's fair value pricing policies and may be categorized as Level 2 in the hierarchy.
Futures contracts are valued at the settlement price established each day by the board of trade or exchange on which they are traded and are categorized as Level 1 in the hierarchy. Investments in open-end mutual funds, including the Fidelity Central Funds, are valued at their closing net asset value (NAV) each business day and are categorized as Level 1 in the hierarchy.
Changes in valuation techniques may result in transfers in or out of an assigned level within the disclosure hierarchy. The aggregate value of investments by input level as of April 30, 2019, is included at the end of the Fund's Schedule of Investments.
Foreign Currency. The Fund may use foreign currency contracts to facilitate transactions in foreign-denominated securities. Gains and losses from these transactions may arise from changes in the value of the foreign currency or if the counterparties do not perform under the contracts' terms.
Foreign-denominated assets, including investment securities, and liabilities are translated into U.S. dollars at the exchange rates at period end. Purchases and sales of investment securities, income and dividends received and expenses denominated in foreign currencies are translated into U.S. dollars at the exchange rate in effect on the transaction date.
The effects of exchange rate fluctuations on investments are included with the net realized and unrealized gain (loss) on investment securities. Other foreign currency transactions resulting in realized and unrealized gain (loss) are disclosed separately.
Investment Transactions and Income. For financial reporting purposes, the Fund's investment holdings and NAV include trades executed through the end of the last business day of the period. The NAV per share for processing shareholder transactions is calculated as of the close of business of the New York Stock Exchange (NYSE), normally 4:00 p.m. Eastern time and includes trades executed through the end of the prior business day. Gains and losses on securities sold are determined on the basis of identified cost and include proceeds received from litigation. Dividend income is recorded on the ex-dividend date, except for certain dividends from foreign securities where the ex-dividend date may have passed, which are recorded as soon as the Fund is informed of the ex-dividend date. Non-cash dividends included in dividend income, if any, are recorded at the fair market value of the securities received. Income and capital gain distributions from Fidelity Central Funds, if any, are recorded on the ex-dividend date. Certain distributions received by the Fund represent a return of capital or capital gain. The Fund determines the components of these distributions subsequent to the ex-dividend date, based upon receipt of tax filings or other correspondence relating to the underlying investment. These distributions are recorded as a reduction of cost of investments and/or as a realized gain. Interest income is accrued as earned and includes coupon interest and amortization of premium and accretion of discount on debt securities as applicable. Investment income is recorded net of foreign taxes withheld where recovery of such taxes is uncertain.
Expenses. Expenses directly attributable to a fund are charged to that fund. Expenses attributable to more than one fund are allocated among the respective funds on the basis of relative net assets or other appropriate methods. Expense estimates are accrued in the period to which they relate and adjustments are made when actual amounts are known.
Income Tax Information and Distributions to Shareholders. Each year, the Fund intends to qualify as a regulated investment company under Subchapter M of the Internal Revenue Code, including distributing substantially all of its taxable income and realized gains. As a result, no provision for U.S. Federal income taxes is required. As of April 30, 2019, the Fund did not have any unrecognized tax benefits in the financial statements; nor is the Fund aware of any tax positions for which it is reasonably possible that the total amounts of unrecognized tax benefits will significantly change in the next twelve months. The Fund files a U.S. federal tax return, in addition to state and local tax returns as required. The Fund's federal income tax returns are subject to examination by the Internal Revenue Service (IRS) for a period of three fiscal years after they are filed. State and local tax returns may be subject to examination for an additional fiscal year depending on the jurisdiction. Foreign taxes are provided for based on the Fund's understanding of the tax rules and rates that exist in the foreign markets in which it invests. The Fund is subject to a tax imposed on capital gains by certain countries in which it invests. An estimated deferred tax liability for net unrealized appreciation on the applicable securities is included in Other payables and accrued expenses on the Statement of Assets & Liabilities.
Distributions are declared and recorded on the ex-dividend date. Income and capital gain distributions are determined in accordance with income tax regulations, which may differ from GAAP. In addition, the Fund claimed a portion of the payment made to redeeming shareholders as a distribution for income tax purposes.
Capital accounts within the financial statements are adjusted for permanent book-tax differences. These adjustments have no impact on net assets or the results of operations. Capital accounts are not adjusted for temporary book-tax differences which will reverse in a subsequent period.
Book-tax differences are primarily due to futures contracts, foreign currency transactions, market discount, partnerships and losses deferred due to wash sales and excise tax regulations.
As of period end, the cost and unrealized appreciation (depreciation) in securities, and derivatives if applicable, for federal income tax purposes were as follows:
| Gross unrealized appreciation | $14,062,915 |
| Gross unrealized depreciation | (21,927,521) |
| Net unrealized appreciation (depreciation) | $(7,864,606) |
| Tax Cost | $206,048,231 |
The tax-based components of distributable earnings as of period end were as follows:
| Net unrealized appreciation (depreciation) on securities and other investments | $(7,859,083) |
The Fund intends to elect to defer to its next fiscal year $682,153 of ordinary losses recognized during the period January 1, 2019 to April 30, 2019.
The Fund intends to elect to defer to its next fiscal year $38,655,675 of capital losses recognized during the period November 1, 2018 to April 30, 2019.
The tax character of distributions paid was as follows:
| April 30, 2019 | April 30, 2018�� | |
| Ordinary Income | $7,056,816 | $ 7,550,422 |
| Long-term Capital Gains | 17,980,008 | 32,497,654 |
| Total | $25,036,824 | $ 40,048,076 |
Restricted Securities. The Fund may invest in securities that are subject to legal or contractual restrictions on resale. These securities generally may be resold in transactions exempt from registration or to the public if the securities are registered. Disposal of these securities may involve time-consuming negotiations and expense, and prompt sale at an acceptable price may be difficult. Information regarding restricted securities is included at the end of the Fund's Schedule of Investments.
New Rule Issuance. During August 2018, the U.S. Securities and Exchange Commission issued Final Rule Release No. 33-10532, Disclosure Update and Simplification. This Final Rule includes amendments specific to registered investment companies that are intended to eliminate overlap in disclosure requirements between Regulation S-X and GAAP. In accordance with these amendments, certain line-items in the Fund's financial statements have been combined or removed for the current period as outlined in the table below.
| Financial Statement | Current Line-Item Presentation (As Applicable) | Prior Line-Item Presentation (As Applicable) |
| Statement of Assets and Liabilities | Total distributable earnings (loss) | Undistributed/Distributions in excess of/Accumulated net investment income (loss) Accumulated/Undistributed net realized gain (loss) Net unrealized appreciation (depreciation) |
| Statement of Changes in Net Assets | N/A - removed | Undistributed/Distributions in excess of/Accumulated net investment income (loss) end of period |
| Statement of Changes in Net Assets | Distributions to shareholders | Distributions to shareholders from net investment income Distributions to shareholders from net realized gain |
4. Derivative Instruments.
Risk Exposures and the Use of Derivative Instruments. The Fund's investment objective allows the Fund to enter into various types of derivative contracts, including futures contracts. Derivatives are investments whose value is primarily derived from underlying assets, indices or reference rates and may be transacted on an exchange or over-the-counter (OTC). Derivatives may involve a future commitment to buy or sell a specified asset based on specified terms, to exchange future cash flows at periodic intervals based on a notional principal amount, or for one party to make one or more payments upon the occurrence of specified events in exchange for periodic payments from the other party.
The Fund used derivatives to increase returns and to manage exposure to certain risks as defined below. The success of any strategy involving derivatives depends on analysis of numerous economic factors, and if the strategies for investment do not work as intended, the Fund may not achieve its objectives.
The Fund's use of derivatives increased or decreased its exposure to the following risk:
| Equity Risk | Equity risk relates to the fluctuations in the value of financial instruments as a result of changes in market prices (other than those arising from interest rate risk or foreign exchange risk), whether caused by factors specific to an individual investment, its issuer, or all factors affecting all instruments traded in a market or market segment. |
The Fund is also exposed to additional risks from investing in derivatives, such as liquidity risk and counterparty credit risk. Liquidity risk is the risk that the Fund will be unable to close out the derivative in the open market in a timely manner. Counterparty credit risk is the risk that the counterparty will not be able to fulfill its obligation to the Fund. Counterparty credit risk related to exchange-traded futures contracts may be mitigated by the protection provided by the exchange on which they trade.
Investing in derivatives may involve greater risks than investing in the underlying assets directly and, to varying degrees, may involve risk of loss in excess of any initial investment and collateral received and amounts recognized in the Statement of Assets and Liabilities. In addition, there may be the risk that the change in value of the derivative contract does not correspond to the change in value of the underlying instrument.
Futures Contracts. A futures contract is an agreement between two parties to buy or sell a specified underlying instrument for a fixed price at a specified future date. The Fund used futures contracts to manage its exposure to the stock market.
Upon entering into a futures contract, a fund is required to deposit either cash or securities (initial margin) with a clearing broker in an amount equal to a certain percentage of the face value of the contract. Futures contracts are marked-to-market daily and subsequent daily payments (variation margin) are made or received by a fund depending on the daily fluctuations in the value of the futures contracts and are recorded as unrealized appreciation or (depreciation). This receivable and/or payable, if any, is included in daily variation margin on futures contracts in the Statement of Assets and Liabilities. Realized gain or (loss) is recorded upon the expiration or closing of a futures contract. The net realized gain (loss) and change in net unrealized appreciation (depreciation) on futures contracts during the period is presented in the Statement of Operations.
Any open futures contracts at period end are presented in the Schedule of Investments under the caption "Futures Contracts". The notional amount at value reflects each contract's exposure to the underlying instrument or index at period end. Securities deposited to meet initial margin requirements are identified in the Schedule of Investments.
5. Purchases and Sales of Investments.
Purchases and sales of securities, other than short-term securities, aggregated $288,393,349 and $449,124,930, respectively.
6. Fees and Other Transactions with Affiliates.
Management Fee. Fidelity Management & Research Company (the investment adviser) and its affiliates provide the Fund with investment management related services for which the Fund pays a monthly management fee. The management fee is the sum of an individual fund fee rate that is based on an annual rate of .60% of the Fund's average net assets and an annualized group fee rate that averaged .24% during the period. The group fee rate is based upon the average net assets of all the mutual funds advised by the investment adviser, including any mutual funds previously advised by the investment adviser that are currently advised by Fidelity SelectCo, LLC, an affiliate of the investment adviser. The group fee rate decreases as assets under management increase and increases as assets under management decrease. In addition, the management fee is subject to a performance adjustment (up to a maximum of +/- .10% of the Fund's average net assets over a 36 month performance period). The upward or downward adjustment to the management fee is based on the Fund's relative investment performance as compared to its benchmark index, the Russell 3000 Index, over the same 36 month performance period. For the reporting period, the total annual management fee rate, including the performance adjustment, was .80% of the Fund's average net assets. The performance adjustment included in the management fee rate may be higher or lower than the maximum performance adjustment rate due to the difference between the average net assets for the reporting and performance periods.
Transfer Agent Fees. Fidelity Investments Institutional Operations Company, Inc. (FIIOC), an affiliate of the investment adviser, is the Fund's transfer, dividend disbursing and shareholder servicing agent. FIIOC receives account fees and asset-based fees that vary according to account size and type of account. FIIOC pays for typesetting, printing and mailing of shareholder reports, except proxy statements. For the period, the transfer agent fees were equivalent to an annual rate of .18% of average net assets.
Accounting and Security Lending Fees. Fidelity Service Company, Inc. (FSC), an affiliate of the investment adviser, maintains the Fund's accounting records. The accounting fee is based on the level of average net assets for each month. Prior to April 1, 2019, FSC had a separate agreement with the Fund for administration of the security lending program, based on the number and duration of lending transactions. For the period, the total fees paid for accounting and administration of securities lending were equivalent to an annual rate of .04%.
Brokerage Commissions. The Fund placed a portion of its portfolio transactions with brokerage firms which are affiliates of the investment adviser. Brokerage commissions are included in net realized gain (loss) and change in net unrealized appreciation (depreciation) in the Statement of Operations. The commissions paid to these affiliated firms were $16,750 for the period.
Interfund Trades. The Fund may purchase from or sell securities to other Fidelity Funds under procedures adopted by the Board. The procedures have been designed to ensure these interfund trades are executed in accordance with Rule 17a-7 of the 1940 Act. Interfund trades are included within the respective purchases and sales amounts shown in the Purchases and Sales of Investments note.
7. Committed Line of Credit.
The Fund participates with other funds managed by the investment adviser or an affiliate in a $4.25 billion credit facility (the "line of credit") to be utilized for temporary or emergency purposes to fund shareholder redemptions or for other short-term liquidity purposes. The Fund has agreed to pay commitment fees on its pro-rata portion of the line of credit, which amounted to $1,024 and is reflected in Miscellaneous expenses on the Statement of Operations. During the period, the Fund did not borrow on this line of credit.
8. Security Lending.
The Fund lends portfolio securities through a lending agent from time to time in order to earn additional income. For equity securities, a lending agent is used and may loan securities to certain qualified borrowers, including Fidelity Capital Markets (FCM), a broker-dealer affiliated with the Fund. On the settlement date of the loan, the Fund receives collateral (in the form of U.S. Treasury obligations, letters of credit and/or cash) against the loaned securities and maintains collateral in an amount not less than 100% of the market value of the loaned securities during the period of the loan. The market value of the loaned securities is determined at the close of business of the Fund and any additional required collateral is delivered to the Fund on the next business day. The Fund or borrower may terminate the loan at any time, and if the borrower defaults on its obligation to return the securities loaned because of insolvency or other reasons, the Fund may apply collateral received from the borrower against the obligation. The Fund may experience delays and costs in recovering the securities loaned. Any cash collateral received is invested in the Fidelity Securities Lending Cash Central Fund. The value of loaned securities and cash collateral at period end are disclosed on the Fund's Statement of Assets and Liabilities. At period end, there were no security loans outstanding with FCM. Security lending income represents the income earned on investing cash collateral, less rebates paid to borrowers and any lending agent fees associated with the loan, plus any premium payments received for lending certain types of securities. Security lending income is presented in the Statement of Operations as a component of income from Fidelity Central Funds and includes $13,045 from securities loaned to FCM.
9. Expense Reductions.
Commissions paid to certain brokers with whom the investment adviser, or its affiliates, places trades on behalf of the Fund include an amount in addition to trade execution, which may be rebated back to the Fund to offset certain expenses. This amount totaled $52,989 for the period. In addition, through arrangements with the Fund's custodian, credits realized as a result of certain uninvested cash balances were used to reduce the Fund's expenses. During the period, these credits reduced the Fund's custody expenses by $1,564.
In addition, during the period the investment adviser reimbursed and/or waived a portion of operating expenses in the amount of $3,309.
10. Other.
The Fund's organizational documents provide former and current trustees and officers with a limited indemnification against liabilities arising in connection with the performance of their duties to the Fund. In the normal course of business, the Fund may also enter into contracts that provide general indemnifications. The Fund's maximum exposure under these arrangements is unknown as this would be dependent on future claims that may be made against the Fund. The risk of material loss from such claims is considered remote.
Report of Independent Registered Public Accounting Firm
To the Board of Trustees of Fidelity Concord Street Trust and Shareholders of Fidelity Event Driven Opportunities Fund:
Opinion on the Financial Statements
We have audited the accompanying statement of assets and liabilities, including the schedule of investments, of Fidelity Event Driven Opportunities Fund (one of the funds constituting Fidelity Concord Street Trust, referred to herafter as the "Fund") as of April 30, 2019, the related statement of operations for the year ended April 30, 2019, the statement of changes in net assets for each of the two years in the period ended April 30, 2019, including the related notes, and the financial highlights for each of the five years in the period ended April 30, 2019 (collectively referred to as the “financial statements”). In our opinion, the financial statements present fairly, in all material respects, the financial position of the Fund as of April 30, 2019, the results of its operations for the year then ended, the changes in its net assets for each of the two years in the period ended April 30, 2019 and the financial highlights for each of the five years in the period ended april 30, 2019 in conformity with accounting principles generally accepted in the United States of America.
Basis for Opinion
These financial statements are the responsibility of the Fund’s management. Our responsibility is to express an opinion on the Fund’s financial statements based on our audits. We are a public accounting firm registered with the Public Company Accounting Oversight Board (United States) (PCAOB) and are required to be independent with respect to the Fund in accordance with the U.S. federal securities laws and the applicable rules and regulations of the Securities and Exchange Commission and the PCAOB.
We conducted our audits of these financial statements in accordance with the standards of the PCAOB. Those standards require that we plan and perform the audit to obtain reasonable assurance about whether the financial statements are free of material misstatement, whether due to error or fraud.
Our audits included performing procedures to assess the risks of material misstatement of the financial statements, whether due to error or fraud, and performing procedures that respond to those risks. Such procedures included examining, on a test basis, evidence regarding the amounts and disclosures in the financial statements. Our audits also included evaluating the accounting principles used and significant estimates made by management, as well as evaluating the overall presentation of the financial statements. Our procedures included confirmation of securities owned as of April 30, 2019 by correspondence with the custodian, and brokers; when replies were not received from brokers, we performed other auditing procedures. We believe that our audits provide a reasonable basis for our opinion.
PricewaterhouseCoopers LLP
Boston, Massachusetts
June 17, 2019
We have served as the auditor of one or more investment companies in the Fidelity group of funds since 1932.
Trustees and Officers
The Trustees, Members of the Advisory Board (if any), and officers of the trust and fund, as applicable, are listed below. The Board of Trustees governs the fund and is responsible for protecting the interests of shareholders. The Trustees are experienced executives who meet periodically throughout the year to oversee the fund's activities, review contractual arrangements with companies that provide services to the fund, oversee management of the risks associated with such activities and contractual arrangements, and review the fund's performance. Except for Jonathan Chiel, each of the Trustees oversees 289 funds. Mr. Chiel oversees 158 funds.
The Trustees hold office without limit in time except that (a) any Trustee may resign; (b) any Trustee may be removed by written instrument, signed by at least two-thirds of the number of Trustees prior to such removal; (c) any Trustee who requests to be retired or who has become incapacitated by illness or injury may be retired by written instrument signed by a majority of the other Trustees; and (d) any Trustee may be removed at any special meeting of shareholders by a two-thirds vote of the outstanding voting securities of the trust. Each Trustee who is not an interested person (as defined in the 1940 Act) of the trust and the fund is referred to herein as an Independent Trustee. Each Independent Trustee shall retire not later than the last day of the calendar year in which his or her 75th birthday occurs. The Independent Trustees may waive this mandatory retirement age policy with respect to individual Trustees. Officers and Advisory Board Members hold office without limit in time, except that any officer or Advisory Board Member may resign or may be removed by a vote of a majority of the Trustees at any regular meeting or any special meeting of the Trustees. Except as indicated, each individual has held the office shown or other offices in the same company for the past five years.
The fund’s Statement of Additional Information (SAI) includes more information about the Trustees. To request a free copy, call Fidelity at 1-800-544-8544.
Experience, Skills, Attributes, and Qualifications of the Trustees. The Governance and Nominating Committee has adopted a statement of policy that describes the experience, qualifications, attributes, and skills that are necessary and desirable for potential Independent Trustee candidates (Statement of Policy). The Board believes that each Trustee satisfied at the time he or she was initially elected or appointed a Trustee, and continues to satisfy, the standards contemplated by the Statement of Policy. The Governance and Nominating Committee also engages professional search firms to help identify potential Independent Trustee candidates who have the experience, qualifications, attributes, and skills consistent with the Statement of Policy. From time to time, additional criteria based on the composition and skills of the current Independent Trustees, as well as experience or skills that may be appropriate in light of future changes to board composition, business conditions, and regulatory or other developments, have also been considered by the professional search firms and the Governance and Nominating Committee. In addition, the Board takes into account the Trustees' commitment and participation in Board and committee meetings, as well as their leadership of standing and ad hoc committees throughout their tenure.
In determining that a particular Trustee was and continues to be qualified to serve as a Trustee, the Board has considered a variety of criteria, none of which, in isolation, was controlling. The Board believes that, collectively, the Trustees have balanced and diverse experience, qualifications, attributes, and skills, which allow the Board to operate effectively in governing the fund and protecting the interests of shareholders. Information about the specific experience, skills, attributes, and qualifications of each Trustee, which in each case led to the Board's conclusion that the Trustee should serve (or continue to serve) as a trustee of the fund, is provided below.
Board Structure and Oversight Function. James C. Curvey is an interested person and currently serves as Chairman. The Trustees have determined that an interested Chairman is appropriate and benefits shareholders because an interested Chairman has a personal and professional stake in the quality and continuity of services provided to the fund. Independent Trustees exercise their informed business judgment to appoint an individual of their choosing to serve as Chairman, regardless of whether the Trustee happens to be independent or a member of management. The Independent Trustees have determined that they can act independently and effectively without having an Independent Trustee serve as Chairman and that a key structural component for assuring that they are in a position to do so is for the Independent Trustees to constitute a substantial majority for the Board. The Independent Trustees also regularly meet in executive session. Ned C. Lautenbach serves as Chairman of the Independent Trustees and as such (i) acts as a liaison between the Independent Trustees and management with respect to matters important to the Independent Trustees and (ii) with management prepares agendas for Board meetings.
Fidelity® funds are overseen by different Boards of Trustees. The fund's Board oversees Fidelity's high income and certain equity funds, and other Boards oversee Fidelity's investment-grade bond, money market, asset allocation, and other equity funds. The asset allocation funds may invest in Fidelity® funds overseen by the fund's Board. The use of separate Boards, each with its own committee structure, allows the Trustees of each group of Fidelity® funds to focus on the unique issues of the funds they oversee, including common research, investment, and operational issues. On occasion, the separate Boards establish joint committees to address issues of overlapping consequences for the Fidelity® funds overseen by each Board.
The Trustees operate using a system of committees to facilitate the timely and efficient consideration of all matters of importance to the Trustees, the fund, and fund shareholders and to facilitate compliance with legal and regulatory requirements and oversight of the fund's activities and associated risks. The Board, acting through its committees, has charged FMR and its affiliates with (i) identifying events or circumstances the occurrence of which could have demonstrably adverse effects on the fund's business and/or reputation; (ii) implementing processes and controls to lessen the possibility that such events or circumstances occur or to mitigate the effects of such events or circumstances if they do occur; and (iii) creating and maintaining a system designed to evaluate continuously business and market conditions in order to facilitate the identification and implementation processes described in (i) and (ii) above. Because the day-to-day operations and activities of the fund are carried out by or through FMR, its affiliates, and other service providers, the fund's exposure to risks is mitigated but not eliminated by the processes overseen by the Trustees. While each of the Board's committees has responsibility for overseeing different aspects of the fund's activities, oversight is exercised primarily through the Operations, Audit, and Compliance Committees. In addition, the Independent Trustees have worked with Fidelity to enhance the Board's oversight of investment and financial risks, legal and regulatory risks, technology risks, and operational risks, including the development of additional risk reporting to the Board. Appropriate personnel, including but not limited to the fund's Chief Compliance Officer (CCO), FMR's internal auditor, the independent accountants, the fund's Treasurer and portfolio management personnel, make periodic reports to the Board's committees, as appropriate, including an annual review of Fidelity's risk management program for the Fidelity® funds. The responsibilities of each standing committee, including their oversight responsibilities, are described further under "Standing Committees of the Trustees."
Interested Trustees*:
Correspondence intended for a Trustee who is an interested person may be sent to Fidelity Investments, 245 Summer Street, Boston, Massachusetts 02210.
Name, Year of Birth; Principal Occupations and Other Relevant Experience+
Jonathan Chiel (1957)
Year of Election or Appointment: 2016
Trustee
Mr. Chiel also serves as Trustee of other Fidelity® funds. Mr. Chiel is Executive Vice President and General Counsel for FMR LLC (diversified financial services company, 2012-present). Previously, Mr. Chiel served as general counsel (2004-2012) and senior vice president and deputy general counsel (2000-2004) for John Hancock Financial Services; a partner with Choate, Hall & Stewart (1996-2000) (law firm); and an Assistant United States Attorney for the United States Attorney’s Office of the District of Massachusetts (1986-95), including Chief of the Criminal Division (1993-1995). Mr. Chiel is a director on the boards of the Boston Bar Foundation and the Maimonides School.
James C. Curvey (1935)
Year of Election or Appointment: 2007
Trustee
Chairman of the Board of Trustees
Mr. Curvey also serves as Trustee of other Fidelity® funds. Mr. Curvey is Vice Chairman (2007-present) and Director of FMR LLC (diversified financial services company). In addition, Mr. Curvey is an Overseer Emeritus for the Boston Symphony Orchestra, a Director of Artis-Naples, and a Trustee of Brewster Academy in Wolfeboro, New Hampshire. Previously, Mr. Curvey served as a Director of Fidelity Research & Analysis Co. (investment adviser firm, 2009-2018), Director of Fidelity Investments Money Management, Inc. (investment adviser firm, 2009-2014) and a Director of FMR and FMR Co., Inc. (investment adviser firms, 2007-2014).
* Determined to be an “Interested Trustee” by virtue of, among other things, his or her affiliation with the trust or various entities under common control with FMR.
+ The information includes the Trustee's principal occupation during the last five years and other information relating to the experience, attributes, and skills relevant to the Trustee's qualifications to serve as a Trustee, which led to the conclusion that the Trustee should serve as a Trustee for the fund.
Independent Trustees:
Correspondence intended for an Independent Trustee may be sent to Fidelity Investments, P.O. Box 55235, Boston, Massachusetts 02205-5235.
Name, Year of Birth; Principal Occupations and Other Relevant Experience+
Dennis J. Dirks (1948)
Year of Election or Appointment: 2005
Trustee
Mr. Dirks also serves as Trustee of other Fidelity® funds. Prior to his retirement in May 2003, Mr. Dirks was Chief Operating Officer and a member of the Board of The Depository Trust & Clearing Corporation (DTCC). He also served as President, Chief Operating Officer, and Board member of The Depository Trust Company (DTC) and President and Board member of the National Securities Clearing Corporation (NSCC). In addition, Mr. Dirks served as Chief Executive Officer and Board member of the Government Securities Clearing Corporation, Chief Executive Officer and Board member of the Mortgage-Backed Securities Clearing Corporation, as a Trustee and a member of the Finance Committee of Manhattan College (2005-2008), as a Trustee and a member of the Finance Committee of AHRC of Nassau County (2006-2008), as a member of the Independent Directors Council (IDC) Governing Council (2010-2015), and as a member of the Board of Directors for The Brookville Center for Children’s Services, Inc. (2009-2017). Mr. Dirks is a member of the Finance Committee (2016-present) and Board of Directors (2017-present) and is Treasurer (2018-present) of the Asolo Repertory Theatre.
Donald F. Donahue (1950)
Year of Election or Appointment: 2018
Trustee
Mr. Donahue also serves as a Trustee of other Fidelity® funds. Mr. Donahue is President and Chief Executive Officer of Miranda Partners, LLC (risk consulting for the financial services industry, 2012-present). Previously, Mr. Donahue served as a Member of the Advisory Board of certain Fidelity® funds (2015-2018) and Chief Executive Officer (2006-2012), Chief Operating Officer (2003-2006), and Managing Director, Customer Marketing and Development (1999-2003) of The Depository Trust & Clearing Corporation (financial markets infrastructure). Mr. Donahue serves as a Member (2007-present) and Co-Chairman (2016-present) of the Board of Directors of United Way of New York, Member of the Board of Directors of NYC Leadership Academy (2012-present) and Member of the Board of Advisors of Ripple Labs, Inc. (financial services, 2015-present). He also served as Chairman (2010-2012) and Member of the Board of Directors (2012-2013) of Omgeo, LLC (financial services), Treasurer of United Way of New York (2012-2016), and Member of the Board of Directors of XBRL US (financial services non-profit, 2009-2012) and the International Securities Services Association (2009-2012).
Alan J. Lacy (1953)
Year of Election or Appointment: 2008
Trustee
Mr. Lacy also serves as Trustee of other Fidelity® funds. Mr. Lacy serves as a Director of Bristol-Myers Squibb Company (global pharmaceuticals, 2008-present). He is a Trustee of the California Chapter of The Nature Conservancy (2015-present) and a Director of the Center for Advanced Study in the Behavioral Sciences at Stanford University (2015-present). In addition, Mr. Lacy served as Senior Adviser (2007-2014) of Oak Hill Capital Partners, L.P. (private equity) and also served as Chief Executive Officer (2005) and Vice Chairman (2005-2006) of Sears Holdings Corporation (retail) and Chief Executive Officer and Chairman of the Board of Sears, Roebuck and Co. (retail, 2000-2005). Previously, Mr. Lacy served as Chairman (2014-2017) and a member (2010-2017) of the Board of Directors of Dave & Buster’s Entertainment, Inc. (restaurant and entertainment complexes), as Chairman (2008-2011) and a member (2006-2015) of the Board of Trustees of the National Parks Conservation Association, and as a member of the Board of Directors for The Hillman Companies, Inc. (hardware wholesalers, 2010-2014), Earth Fare, Inc. (retail grocery, 2010-2014), and The Western Union Company (global money transfer, 2006-2011).
Ned C. Lautenbach (1944)
Year of Election or Appointment: 2000
Trustee
Chairman of the Independent Trustees
Mr. Lautenbach also serves as Trustee of other Fidelity® funds. Mr. Lautenbach currently serves as Chair (2018-present) and Member (2013-present) of the Board of Governors, State University System of Florida and is a member of the Council on Foreign Relations (1994-present). He is also a member and has most recently served as Chairman of the Board of Directors of Artis-Naples (2012-present). Previously, Mr. Lautenbach served as a member and then Lead Director of the Board of Directors of Eaton Corporation (diversified industrial, 1997-2016). He was also a Partner and Advisory Partner at Clayton, Dubilier & Rice, LLC (private equity investment, 1998-2010), as well as a Director of Sony Corporation (2006-2007). In addition, Mr. Lautenbach also had a 30-year career with IBM (technology company) during which time he served as Senior Vice President and a member of the Corporate Executive Committee (1968-1998).
Joseph Mauriello (1944)
Year of Election or Appointment: 2008
Trustee
Mr. Mauriello also serves as Trustee of other Fidelity® funds. Prior to his retirement in January 2006, Mr. Mauriello served in numerous senior management positions including Deputy Chairman and Chief Operating Officer (2004-2005), and Vice Chairman of Financial Services (2002-2004) of KPMG LLP US (professional services, 1965-2005). Mr. Mauriello currently serves as a member of the Independent Directors Council (IDC) Governing Council (2015-present). Previously, Mr. Mauriello served as a member of the Board of Directors of XL Group plc. (global insurance and re-insurance, 2006-2018).
Cornelia M. Small (1944)
Year of Election or Appointment: 2005
Trustee
Ms. Small also serves as Trustee of other Fidelity® funds. Ms. Small is a member of the Board of Directors (2009-present) and Chair of the Investment Committee (2010-present) of the Teagle Foundation. Ms. Small also serves on the Investment Committee of the Berkshire Taconic Community Foundation (2008-present). Previously, Ms. Small served as Chairperson (2002-2008) and a member of the Investment Committee and Chairperson (2008-2012) and a member of the Board of Trustees of Smith College. In addition, Ms. Small served as Chief Investment Officer, Director of Global Equity Investments, and a member of the Board of Directors of Scudder, Stevens & Clark and Scudder Kemper Investments.
Garnett A. Smith (1947)
Year of Election or Appointment: 2018
Trustee
Mr. Smith also serves as Trustee of other Fidelity® funds. Prior to Mr. Smith's retirement, he served as Chairman and Chief Executive Officer of Inbrand Corp. (manufacturer of personal absorbent products, 1990-1997). He also served as President (1986-1990) of Inbrand Corp. Prior to his employment with Inbrand Corp., he was employed by a retail fabric chain and North Carolina National Bank. In addition, Mr. Smith served as a Member of the Advisory Board of certain Fidelity® funds (2012-2013) and as a board member of the Jackson Hole Land Trust (2009-2012).
David M. Thomas (1949)
Year of Election or Appointment: 2008
Trustee
Mr. Thomas also serves as Trustee of other Fidelity® funds. Mr. Thomas serves as Non-Executive Chairman of the Board of Directors of Fortune Brands Home and Security (home and security products, 2011-present) and as a member of the Board of Directors (2004-present) and Presiding Director (2013-present) of Interpublic Group of Companies, Inc. (marketing communication). Previously, Mr. Thomas served as Executive Chairman (2005-2006) and Chairman and Chief Executive Officer (2000-2005) of IMS Health, Inc. (pharmaceutical and healthcare information solutions), a Director of Fortune Brands, Inc. (consumer products, 2000-2011), and a member of the Board of Trustees of the University of Florida (2013-2018).
+ The information includes the Trustee's principal occupation during the last five years and other information relating to the experience, attributes, and skills relevant to the Trustee's qualifications to serve as a Trustee, which led to the conclusion that the Trustee should serve as a Trustee for the fund.
Advisory Board Members and Officers:
Correspondence intended for a Member of the Advisory Board (if any) may be sent to Fidelity Investments, P.O. Box 55235, Boston, Massachusetts 02205-5235. Correspondence intended for an officer or Peter S. Lynch may be sent to Fidelity Investments, 245 Summer Street, Boston, Massachusetts 02210. Officers appear below in alphabetical order.
Name, Year of Birth; Principal Occupation
Vicki L. Fuller (1957)
Year of Election or Appointment: 2018
Member of the Advisory Board
Ms. Fuller also serves as Member of the Advisory Board of other Fidelity® funds. Ms. Fuller serves as a member of the Board of Directors, Audit Committee, and Nominating and Governance Committee of The Williams Companies, Inc. (natural gas infrastructure, 2018-present). Previously, Ms. Fuller served as the Chief Investment Officer of the New York State Common Retirement Fund (2012-2018) and held a variety of positions at AllianceBernstein L.P. (global asset management, 1985-2012), including Managing Director (2006-2012) and Senior Vice President and Senior Portfolio Manager (2001-2006).
Peter S. Lynch (1944)
Year of Election or Appointment: 2003
Member of the Advisory Board
Mr. Lynch also serves as Member of the Advisory Board of other Fidelity® funds. Mr. Lynch is Vice Chairman and a Director of FMR (investment adviser firm) and FMR Co., Inc. (investment adviser firm). In addition, Mr. Lynch serves as a Trustee of Boston College and as the Chairman of the Inner-City Scholarship Fund. Previously, Mr. Lynch served on the Special Olympics International Board of Directors (1997-2006).
Carol B. Tomé (1957)
Year of Election or Appointment: 2018
Member of the Advisory Board
Ms. Tomé also serves as Member of the Advisory Board of other Fidelity® funds. Ms. Tomé is Chief Financial Officer (2001-present) and Executive Vice President of Corporate Services (2007-present) of The Home Depot, Inc. (home improvement retailer) and a Director (2003-present) and Chair of the Audit Committee (2004-present) of United Parcel Service, Inc. (package delivery and supply chain management). Previously, Ms. Tomé served as Trustee of certain Fidelity® funds (2017), Senior Vice President of Finance and Accounting/Treasurer (2000-2007) and Vice President and Treasurer (1995-2000) of The Home Depot, Inc. and Chair of the Board (2010-2012), Vice Chair of the Board (2009 and 2013), and a Director (2008-2013) of the Federal Reserve Bank of Atlanta. Ms. Tomé is also a director or trustee of many community and professional organizations.
Michael E. Wiley (1950)
Year of Election or Appointment: 2018
Member of the Advisory Board
Mr. Wiley also serves as Trustee or Member of the Advisory Board of other Fidelity® funds. Mr. Wiley serves as a Director of High Point Resources (exploration and production, 2005-present). Previously, Mr. Wiley served as a Director of Andeavor Corporation (independent oil refiner and marketer, 2005-2018), a Director of Andeavor Logistics LP (natural resources logistics, 2015-2018), a Director of Post Oak Bank (privately-held bank, 2004-2018), a Director of Asia Pacific Exploration Consolidated (international oil and gas exploration and production, 2008-2013), a member of the Board of Trustees of the University of Tulsa (2000-2006; 2007-2010), a Senior Energy Advisor of Katzenbach Partners, LLC (consulting, 2006-2007), an Advisory Director of Riverstone Holdings (private investment), a Director of Spinnaker Exploration Company (exploration and production, 2001-2005) and Chairman, President, and CEO of Baker Hughes, Inc. (oilfield services, 2000-2004).
Elizabeth Paige Baumann (1968)
Year of Election or Appointment: 2017
Anti-Money Laundering (AML) Officer
Ms. Baumann also serves as AML Officer of other funds. She is Chief AML Officer (2012-present) and Senior Vice President (2014-present) of FMR LLC (diversified financial services company) and is an employee of Fidelity Investments. Previously, Ms. Baumann served as AML Officer of the funds (2012-2016), and Vice President (2007-2014) and Deputy Anti-Money Laundering Officer (2007-2012) of FMR LLC.
Craig S. Brown (1977)
Year of Election or Appointment: 2019
Assistant Treasurer
Mr. Brown also serves as Assistant Treasurer of other funds. Mr. Brown is an employee of Fidelity Investments (2013-present).
John J. Burke III (1964)
Year of Election or Appointment: 2018
Chief Financial Officer
Mr. Burke also serves as Chief Financial Officer of other funds. Mr. Burke serves as Head of Investment Operations for Fidelity Fund and Investment Operations (2018-present) and is an employee of Fidelity Investments (1998-present). Previously Mr. Burke served as head of Asset Management Investment Operations (2012-2018).
William C. Coffey (1969)
Year of Election or Appointment: 2018
Secretary and Chief Legal Officer (CLO)
Mr. Coffey also serves as Secretary and CLO of other funds. Mr. Coffey serves as CLO, Secretary, and Senior Vice President of Fidelity Management & Research Company and FMR Co., Inc. (investment adviser firms, 2018-present); Secretary of Fidelity SelectCo, LLC and Fidelity Investments Money Management, Inc. (investment adviser firms, 2018-present); and CLO of Fidelity Management & Research (Hong Kong) Limited, FMR Investment Management (UK) Limited, and Fidelity Management & Research (Japan) Limited (investment adviser firms, 2018-present). He is Senior Vice President and Deputy General Counsel of FMR LLC (diversified financial services company, 2010-present), and is an employee of Fidelity Investments. Previously, Mr. Coffey served as Assistant Secretary of certain funds (2009-2018) and as Vice President and Associate General Counsel of FMR LLC (2005-2009).
Timothy M. Cohen (1969)
Year of Election or Appointment: 2018
Vice President
Mr. Cohen also serves as Vice President of other funds. Mr. Cohen serves as Executive Vice President of Fidelity SelectCo, LLC (2019-present), Co-Head of Equity (2018-present), a Director of Fidelity Management & Research (Japan) Limited (investment adviser firm, 2016-present), and is an employee of Fidelity Investments. Previously, Mr. Cohen served as Head of Global Equity Research (2016-2018), Chief Investment Officer - Equity and a Director of Fidelity Management & Research (U.K.) Inc. (investment adviser firm, 2013-2015) and as a Director of Fidelity Management & Research (Hong Kong) Limited (investment adviser firm, 2017).
Jonathan Davis (1968)
Year of Election or Appointment: 2010
Assistant Treasurer
Mr. Davis also serves as Assistant Treasurer of other funds. Mr. Davis serves as Assistant Treasurer of FMR Capital, Inc. (2017-present) and is an employee of Fidelity Investments. Previously, Mr. Davis served as Vice President and Associate General Counsel of FMR LLC (diversified financial services company, 2003-2010).
Adrien E. Deberghes (1967)
Year of Election or Appointment: 2016
Assistant Treasurer
Mr. Deberghes also serves as an officer of other funds. He serves as Assistant Treasurer of FMR Capital, Inc. (2017-present), Executive Vice President of Fidelity Investments Money Management, Inc. (FIMM) (investment adviser firm, 2016-present), and is an employee of Fidelity Investments (2008-present). Previously, Mr. Deberghes served as President and Treasurer of certain Fidelity® funds (2013-2018). Prior to joining Fidelity Investments, Mr. Deberghes was Senior Vice President of Mutual Fund Administration at State Street Corporation (2007-2008), Senior Director of Mutual Fund Administration at Investors Bank & Trust (2005-2007), and Director of Finance for Dunkin' Brands (2000-2005). Previously, Mr. Deberghes served in other fund officer roles.
Laura M. Del Prato (1964)
Year of Election or Appointment: 2018
Assistant Treasurer
Ms. Del Prato also serves as an officer of other funds. Ms. Del Prato is an employee of Fidelity Investments (2017-present). Prior to joining Fidelity Investments, Ms. Del Prato served as a Managing Director and Treasurer of the JPMorgan Mutual Funds (2014-2017). Prior to JPMorgan, Ms. Del Prato served as a partner at Cohen Fund Audit Services (accounting firm, 2012-2013) and KPMG LLP (accounting firm, 2004-2012).
Colm A. Hogan (1973)
Year of Election or Appointment: 2016
Deputy Treasurer
Mr. Hogan also serves as an officer of other funds. Mr. Hogan serves as Assistant Treasurer of FMR Capital, Inc. (2017-present) and is an employee of Fidelity Investments (2005-present). Previously, Mr. Hogan served as Assistant Treasurer of certain Fidelity® funds (2016-2018).
Pamela R. Holding (1964)
Year of Election or Appointment: 2018
Vice President
Ms. Holding also serves as Vice President of other funds. Ms. Holding serves as Executive Vice President of Fidelity SelectCo, LLC (2019-present), Co-Head of Equity (2018-present) and is an employee of Fidelity Investments (2013-present). Previously, Ms. Holding served as Chief Investment Officer of Fidelity Institutional Asset Management (2013-2018).
Chris Maher (1972)
Year of Election or Appointment: 2013
Assistant Treasurer
Mr. Maher serves as Assistant Treasurer of other funds. Mr. Maher is Vice President of Valuation Oversight, serves as Assistant Treasurer of FMR Capital, Inc. (2017-present), and is an employee of Fidelity Investments. Previously, Mr. Maher served as Vice President of Asset Management Compliance (2013), Vice President of the Program Management Group of FMR (investment adviser firm, 2010-2013), and Vice President of Valuation Oversight (2008-2010).
Kenneth B. Robins (1969)
Year of Election or Appointment: 2016
Chief Compliance Officer
Mr. Robins also serves as an officer of other funds. Mr. Robins serves as Compliance Officer of Fidelity Management & Research Company and FMR Co., Inc. (investment adviser firms, 2016-present) and is an employee of Fidelity Investments (2004-present). Previously, Mr. Robins served as Executive Vice President of Fidelity Investments Money Management, Inc. (investment adviser firm, 2013-2016) and served in other fund officer roles.
Stacie M. Smith (1974)
Year of Election or Appointment: 2016
President and Treasurer
Ms. Smith also serves as an officer of other funds. Ms. Smith serves as Assistant Treasurer of FMR Capital, Inc. (2017-present), is an employee of Fidelity Investments (2009-present), and has served in other fund officer roles. Prior to joining Fidelity Investments, Ms. Smith served as Senior Audit Manager of Ernst & Young LLP (accounting firm, 1996-2009). Previously, Ms. Smith served as Assistant Treasurer (2013-2018) and Deputy Treasurer (2013-2016) of certain Fidelity® funds.
Marc L. Spector (1972)
Year of Election or Appointment: 2016
Assistant Treasurer
Mr. Spector also serves as an officer of other funds. Mr. Spector serves as Assistant Treasurer of FMR Capital, Inc. (2017-present) and is an employee of Fidelity Investments (2016-present). Prior to joining Fidelity Investments, Mr. Spector served as Director at the Siegfried Group (accounting firm, 2013-2016), and prior to Siegfried Group as audit senior manager at Deloitte & Touche (accounting firm, 2005-2013).
Jim Wegmann (1979)
Year of Election or Appointment: 2019
Assistant Treasurer
Mr. Wegmann also serves as Assistant Treasurer of other funds. Mr. Wegmann is an employee of Fidelity Investments (2011-present).
Shareholder Expense Example
As a shareholder of the Fund, you incur two types of costs: (1) transaction costs and (2) ongoing costs, including management fees, and other Fund expenses. This Example is intended to help you understand your ongoing costs (in dollars) of investing in the Fund and to compare these costs with the ongoing costs of investing in other mutual funds.
The Example is based on an investment of $1,000 invested at the beginning of the period and held for the entire period (November 1, 2018 to April 30, 2019).
Actual Expenses
The first line of the accompanying table provides information about actual account values and actual expenses. You may use the information in this line, together with the amount you invested, to estimate the expenses that you paid over the period. Simply divide your account value by $1,000.00 (for example, an $8,600 account value divided by $1,000.00 = 8.6), then multiply the result by the number in the first line under the heading entitled "Expenses Paid During Period" to estimate the expenses you paid on your account during this period. In addition, the Fund, as a shareholder in the underlying Fidelity Central Funds, will indirectly bear its pro-rata share of the fees and expenses incurred by the underlying Fidelity Central Funds. These fees and expenses are not included in the Fund's annualized expense ratio used to calculate the expense estimate in the table below.
Hypothetical Example for Comparison Purposes
The second line of the accompanying table provides information about hypothetical account values and hypothetical expenses based on the Fund's actual expense ratio and an assumed rate of return of 5% per year before expenses, which is not the Fund's actual return. The hypothetical account values and expenses may not be used to estimate the actual ending account balance or expenses you paid for the period. You may use this information to compare the ongoing costs of investing in the Fund and other funds. To do so, compare this 5% hypothetical example with the 5% hypothetical examples that appear in the shareholder reports of the other funds. In addition, the Fund, as a shareholder in the underlying Fidelity Central Funds, will indirectly bear its pro-rata share of the fees and expenses incurred by the underlying Fidelity Central Funds. These fees and expenses are not included in the Fund's annualized expense ratio used to calculate the expense estimate in the table below.
Please note that the expenses shown in the table are meant to highlight your ongoing costs only and do not reflect any transaction costs. Therefore, the second line of the table is useful in comparing ongoing costs only, and will not help you determine the relative total costs of owning different funds.
| Annualized Expense Ratio-A | Beginning Account Value November 1, 2018 | Ending Account Value April 30, 2019 | Expenses Paid During Period-B November 1, 2018 to April 30, 2019 | |
| Actual | .98% | $1,000.00 | $925.40 | $4.68 |
| Hypothetical-C | $1,000.00 | $1,019.93 | $4.91 |
A Annualized expense ratio reflects expenses net of applicable fee waivers.
B Expenses are equal to the Fund's annualized expense ratio, multiplied by the average account value over the period, multiplied by 181/365 (to reflect the one-half year period).
C 5% return per year before expenses
Distributions (Unaudited)
The fund hereby designates as a capital gain dividend with respect to the taxable year ended April 30, 2019, $17,573,943, or, if subsequently determined to be different, the net capital gain of such year.
The fund designates 14% and 100% of the dividends distributed in June and December, respectively during the fiscal year as qualifying for the dividends–received deduction for corporate shareholders.
The fund designates 12%, and 100% of the dividends distributed in June and December, respectively during the fiscal year as amounts which may be taken into account as a dividend for the purposes of the maximum rate under section 1(h)(11) of the Internal Revenue Code.
The fund will notify shareholders in January 2020 of amounts for use in preparing 2019 income tax returns.
Board Approval of Investment Advisory Contracts and Management Fees
Fidelity Event Driven Opportunities Fund
Each year, the Board of Trustees, including the Independent Trustees (together, the Board), votes on the renewal of the management contract with Fidelity Management & Research Company (FMR) and the sub-advisory agreements (together, the Advisory Contracts) for the fund. FMR and the sub-advisers are referred to herein as the Investment Advisers. The Board, assisted by the advice of fund counsel and Independent Trustees' counsel, requests and considers a broad range of information relevant to the renewal of the Advisory Contracts throughout the year.
The Board meets regularly and, at each of its meetings, covers an extensive agenda of topics and materials and considers factors that are relevant to its annual consideration of the renewal of the fund's Advisory Contracts, including the services and support provided to the fund and its shareholders. The Board has established various standing committees (Committees), each composed of and chaired by Independent Trustees with varying backgrounds, to which the Board has assigned specific subject matter responsibilities in order to enhance effective decision-making by the Board. The Board, acting directly and through its Committees, requests and receives information concerning the annual consideration of the renewal of the fund's Advisory Contracts. The Board also meets as needed to review matters specifically related to the Board's annual consideration of the renewal of the Advisory Contracts. Members of the Board may also meet with trustees of other Fidelity funds through joint ad hoc committees to discuss certain matters relevant to all of the Fidelity funds.
At its January 2019 meeting, the Board unanimously determined to renew the fund's Advisory Contracts. In reaching its determination, the Board considered all factors it believed relevant, including (i) the nature, extent, and quality of the services to be provided to the fund and its shareholders (including the investment performance of the fund); (ii) the competitiveness of the fund's management fee and total expense ratio relative to peer funds; (iii) the total costs of the services to be provided by and the profits to be realized by Fidelity from its relationships with the fund; and (iv) the extent to which, if any, economies of scale exist and would be realized as the fund grows, and whether any economies of scale are appropriately shared with fund shareholders.
In considering whether to renew the Advisory Contracts for the fund, the Board reached a determination, with the assistance of fund counsel and Independent Trustees' counsel and through the exercise of its business judgment, that the renewal of the Advisory Contracts was in the best interests of the fund and its shareholders and that the compensation payable under the Advisory Contracts was fair and reasonable. The Board's decision to renew the Advisory Contracts was not based on any single factor, but rather was based on a comprehensive consideration of all the information provided to the Board at its meetings throughout the year. The Board, in reaching its determination to renew the Advisory Contracts, was aware that shareholders of the fund have a broad range of investment choices available to them, including a wide choice among funds offered by Fidelity's competitors, and that the fund's shareholders, who have the opportunity to review and weigh the disclosure provided by the fund in its prospectus and other public disclosures, have chosen to invest in this fund, which is part of the Fidelity family of funds.
Nature, Extent, and Quality of Services Provided. The Board considered Fidelity's staffing as it relates to the fund, including the backgrounds of investment personnel of Fidelity, and also considered the fund's investment objective, strategies, and related investment philosophy. The Independent Trustees also had discussions with senior management of Fidelity's investment operations and investment groups. The Board considered the structure of the investment personnel compensation program and whether this structure provides appropriate incentives to act in the best interests of the fund. Additionally, the Board considered the portfolio managers' investments, if any, in the funds that they manage.Resources Dedicated to Investment Management and Support Services. The Board and the Fund Oversight and Research Committees reviewed the general qualifications and capabilities of Fidelity's investment staff, including its size, education, experience, and resources, as well as Fidelity's approach to recruiting, training, managing, and compensating investment personnel. The Board noted that Fidelity has continued to increase the resources devoted to non-U.S. offices, including expansion of Fidelity's global investment organization. The Board also noted that Fidelity's analysts have extensive resources, tools and capabilities that allow them to conduct sophisticated quantitative and fundamental analysis, as well as credit analysis of issuers, counterparties and guarantors. Further, the Board considered that Fidelity's investment professionals have sufficient access to global information and data so as to provide competitive investment results over time, and that those professionals also have access to sophisticated tools that permit them to assess portfolio construction and risk and performance attribution characteristics continuously, as well as to transmit new information and research conclusions rapidly around the world. Additionally, in its deliberations, the Board considered Fidelity's trading, risk management, compliance, and technology and operations capabilities and resources, which are integral parts of the investment management process.Shareholder and Administrative Services. The Board considered (i) the nature, extent, quality, and cost of advisory, administrative, and shareholder services performed by the Investment Advisers and their affiliates under the Advisory Contracts and under separate agreements covering transfer agency, pricing and bookkeeping, and securities lending services for the fund; (ii) the nature and extent of the supervision of third party service providers, principally custodians, subcustodians, and pricing vendors; and (iii) the resources devoted to, and the record of compliance with, the fund's compliance policies and procedures. The Board also reviewed the allocation of fund brokerage, including allocations to brokers affiliated with the Investment Advisers, the use of brokerage commissions to pay fund expenses, and the use of "soft" commission dollars to pay for research services.The Board noted that the growth of fund assets over time across the complex allows Fidelity to reinvest in the development of services designed to enhance the value and convenience of the Fidelity funds as investment vehicles. These services include 24-hour access to account information and market information through telephone representatives and over the Internet, investor education materials and asset allocation tools, and the expanded availability of Fidelity Investor Centers.The Board noted that it and the boards of certain other Fidelity funds had formed an ad hoc Committee on Transfer Agency Fees to review the variety of transfer agency fee structures throughout the industry and Fidelity's competitive positioning with respect to industry participants.Investment in a Large Fund Family. The Board considered the benefits to shareholders of investing in a Fidelity fund, including the benefits of investing in a fund that is part of a large family of funds offering a variety of investment disciplines and providing a large variety of mutual fund investor services. The Board noted that Fidelity had taken, or had made recommendations that resulted in the Fidelity funds taking, a number of actions over the previous year that benefited particular funds, including: (i) continuing to dedicate additional resources to Fidelity's investment research process, which includes meetings with management of issuers of securities in which the funds invest, and to the support of the senior management team that oversees asset management; (ii) continuing efforts to enhance Fidelity's global research capabilities; (iii) launching new funds and making other enhancements to meet client needs; (iv) launching new share classes of existing funds; (v) eliminating purchase minimums and broadening eligibility requirements for certain funds and share classes; (vi) reducing management fees and total expenses for certain growth equity funds and index funds; (vii) lowering expense caps for certain existing funds and classes, and converting certain voluntary expense caps to contractual caps, to reduce expenses borne by shareholders; (viii) eliminating short-term redemption fees for funds that had such fees; (ix) rationalizing product lines and gaining increased efficiencies from fund mergers and share class consolidations; (x) continuing to develop, acquire and implement systems and technology to improve services to the funds and shareholders, strengthen information security, and increase efficiency; and (xi) continuing to implement enhancements to further strengthen Fidelity's product line to increase investors' probability of success in achieving their investment goals, including retirement income goals.Investment Performance. The Board considered whether the fund has operated in accordance with its investment objective, as well as its record of compliance with its investment restrictions and its performance history.The Board took into account discussions that occur at Board meetings throughout the year with representatives of the Investment Advisers about fund investment performance. In this regard the Board noted that as part of regularly scheduled fund reviews and other reports to the Board on fund performance, the Board considers annualized return information for the fund for different time periods, measured against an appropriate securities market index ("benchmark index") and a peer group of funds with similar objectives ("peer group"), if any. In its evaluation of fund investment performance, the Board gave particular attention to information indicating changes in performance of certain Fidelity funds for specific time periods and discussed with the Investment Advisers the reasons for any overperformance or underperformance.In addition to reviewing absolute and relative fund performance, the Independent Trustees periodically consider the appropriateness of fund performance metrics in evaluating the results achieved. In general, the Independent Trustees believe that fund performance should be evaluated based on net performance (after fees and expenses) of both the highest performing and lowest performing fund share classes, where applicable, compared to appropriate benchmark indices, over appropriate time periods that may include full market cycles, and compared to peer groups, as applicable, over the same periods, taking into account relevant factors including the following: general market conditions; issuer-specific information; and fund cash flows and other factors.The Independent Trustees recognize that shareholders evaluate performance on a net basis over their own holding periods, for which one-, three-, and five-year periods are often used as a proxy. For this reason, the performance information reviewed by the Board also included net cumulative total return information for the fund and an appropriate benchmark index for the most recent one- and three-year periods ended June 30, 2018, as shown below. A peer group is not shown below because the fund does not generally utilize a peer group for performance comparison purposes.Fidelity Event Driven Opportunities Fund
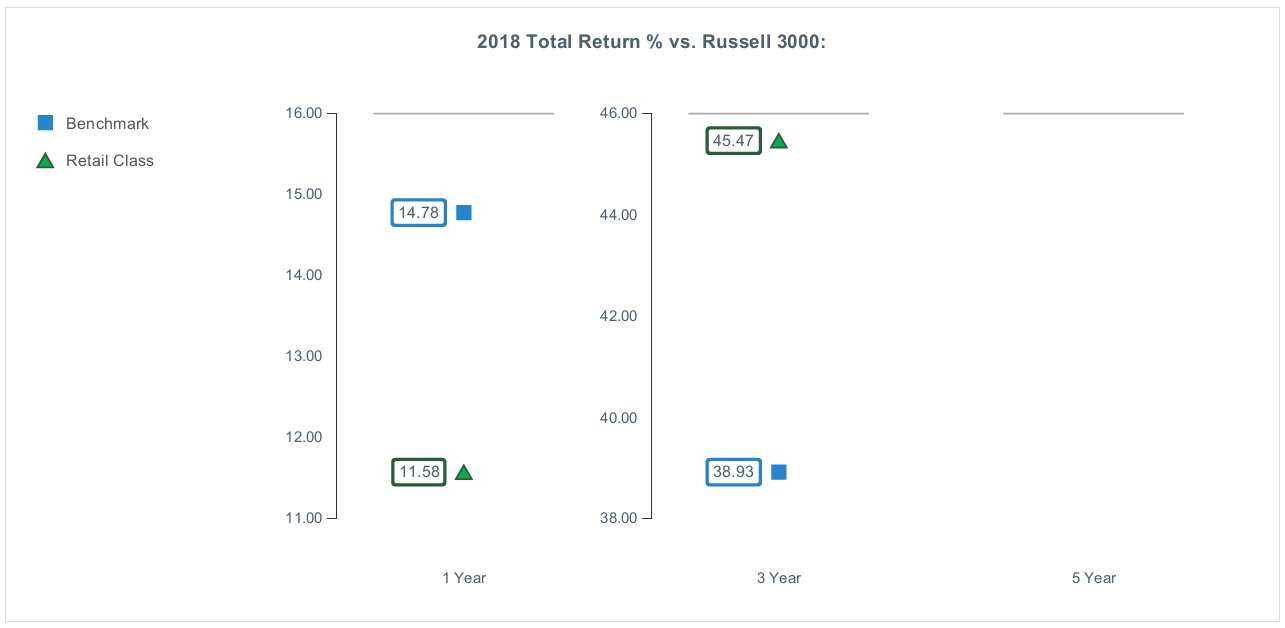
Fidelity Event Driven Opportunities Fund
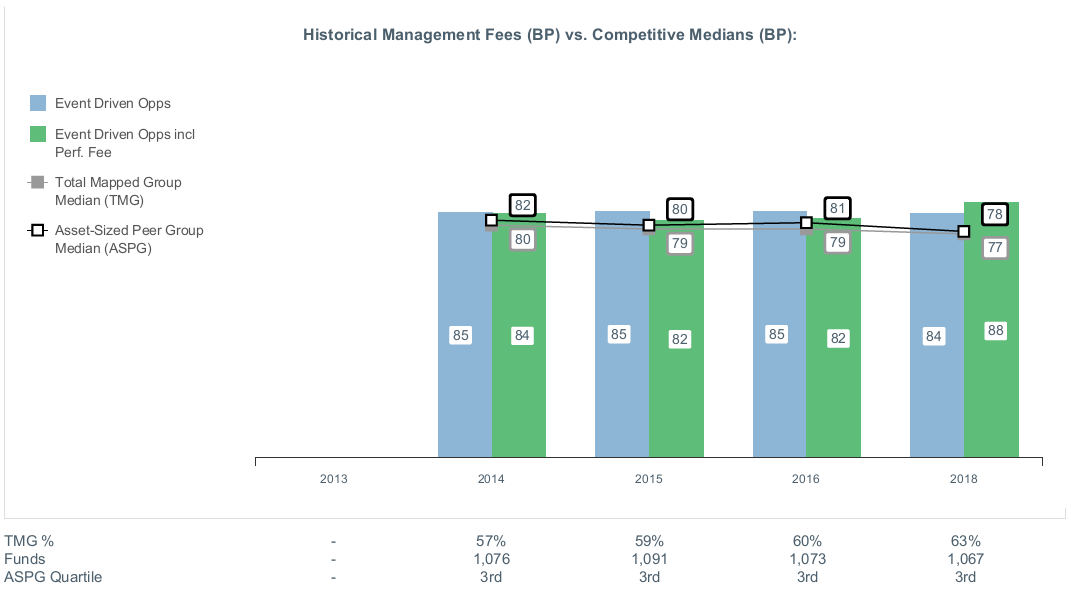
![]()
EDO-ANN-0619
1.9585357.105
Fidelity Advisor® Event Driven Opportunities Fund Annual Report April 30, 2019 |
|
Beginning on January 1, 2021, as permitted by regulations adopted by the Securities and Exchange Commission, paper copies of a fund’s shareholder reports will no longer be sent by mail, unless you specifically request paper copies of the reports from the fund or from your financial intermediary, such as a financial advisor, broker-dealer or bank. Instead, the reports will be made available on a website, and you will be notified by mail each time a report is posted and provided with a website link to access the report.
If you already elected to receive shareholder reports electronically, you will not be affected by this change and you need not take any action. You may elect to receive shareholder reports and other communications from a fund electronically, by contacting your financial intermediary. For Fidelity customers, visit Fidelity's web site or call Fidelity using the contact information listed below.
You may elect to receive all future reports in paper free of charge. If you wish to continue receiving paper copies of your shareholder reports, you may contact your financial intermediary or, if you are a Fidelity customer, visit Fidelity’s website, or call Fidelity at the applicable toll-free number listed below. Your election to receive reports in paper will apply to all funds held with the fund complex/your financial intermediary.
| Account Type | Website | Phone Number |
| Brokerage, Mutual Fund, or Annuity Contracts: | fidelity.com/mailpreferences | 1-800-343-3548 |
| Employer Provided Retirement Accounts: | netbenefits.fidelity.com/preferences (choose 'no' under Required Disclosures to continue to print) | 1-800-343-0860 |
| Advisor Sold Accounts Serviced Through Your Financial Intermediary: | Contact Your Financial Intermediary | Your Financial Intermediary's phone number |
| Advisor Sold Accounts Serviced by Fidelity: | institutional.fidelity.com | 1-877-208-0098 |
Contents
Board Approval of Investment Advisory Contracts and Management Fees |
To view a fund's proxy voting guidelines and proxy voting record for the 12-month period ended June 30, visit http://www.fidelity.com/proxyvotingresults or visit the Securities and Exchange Commission's (SEC) web site at http://www.sec.gov.
You may also call 1-877-208-0098 to request a free copy of the proxy voting guidelines.
Standard & Poor's, S&P and S&P 500 are registered service marks of The McGraw-Hill Companies, Inc. and have been licensed for use by Fidelity Distributors Corporation.
Other third-party marks appearing herein are the property of their respective owners.
All other marks appearing herein are registered or unregistered trademarks or service marks of FMR LLC or an affiliated company. © 2019 FMR LLC. All rights reserved.
This report and the financial statements contained herein are submitted for the general information of the shareholders of the Fund. This report is not authorized for distribution to prospective investors in the Fund unless preceded or accompanied by an effective prospectus.
A fund files its complete schedule of portfolio holdings with the SEC for the first and third quarters of each fiscal year on Form N-PORT. Forms N-PORT are available on the SEC’s web site at http://www.sec.gov. A fund's Forms N-PORT may be reviewed and copied at the SEC’s Public Reference Room in Washington, DC. Information regarding the operation of the SEC's Public Reference Room may be obtained by calling 1-800-SEC-0330.
For a complete list of a fund's portfolio holdings, view the most recent holdings listing, semiannual report, or annual report on Fidelity's web site at http://www.fidelity.com, http://www.institutional.fidelity.com, or http://www.401k.com, as applicable.
NOT FDIC INSURED •MAY LOSE VALUE •NO BANK GUARANTEE
Neither the Fund nor Fidelity Distributors Corporation is a bank.
Performance: The Bottom Line
Average annual total return reflects the change in the value of an investment, assuming reinvestment of distributions from dividend income and capital gains (the profits earned upon the sale of securities that have grown in value, if any) and assuming a constant rate of performance each year. The hypothetical investment and the average annual total returns do not reflect the deduction of taxes that a shareholder would pay on fund distributions or the redemption of fund shares. During periods of reimbursement by Fidelity, a fund’s total return will be greater than it would be had the reimbursement not occurred. How a fund did yesterday is no guarantee of how it will do tomorrow.
Average Annual Total Returns
| For the periods ended April 30, 2019 | Past 1 year | Past 5 years | Life of fundA |
| Class A (incl. 5.75% sales charge) | (22.15)% | 3.25% | 4.10% |
| Class M (incl. 3.50% sales charge) | (20.49)% | 3.49% | 4.30% |
| Class C (incl. contingent deferred sales charge) | (18.83)% | 3.69% | 4.46% |
| Class I | (17.24)% | 4.74% | 5.52% |
| Class Z | (17.14)% | 4.77% | 5.54% |
A From December 12, 2013
Class C shares' contingent deferred sales charges included in the past one year, past five years, and life of fund total return figures are 1%, 0%, and 0%, respectively.
The initial offering of Class Z shares took place on October 2, 2018. Returns prior to October 2, 2018, are those of Class I.
$10,000 Over Life of Fund
Let's say hypothetically that $10,000 was invested in Fidelity Advisor® Event Driven Opportunities Fund - Class A on December 12, 2013, when the fund started, and the current 5.75% sales charge was paid.
The chart shows how the value of your investment would have changed, and also shows how the Russell 3000® Index performed over the same period.
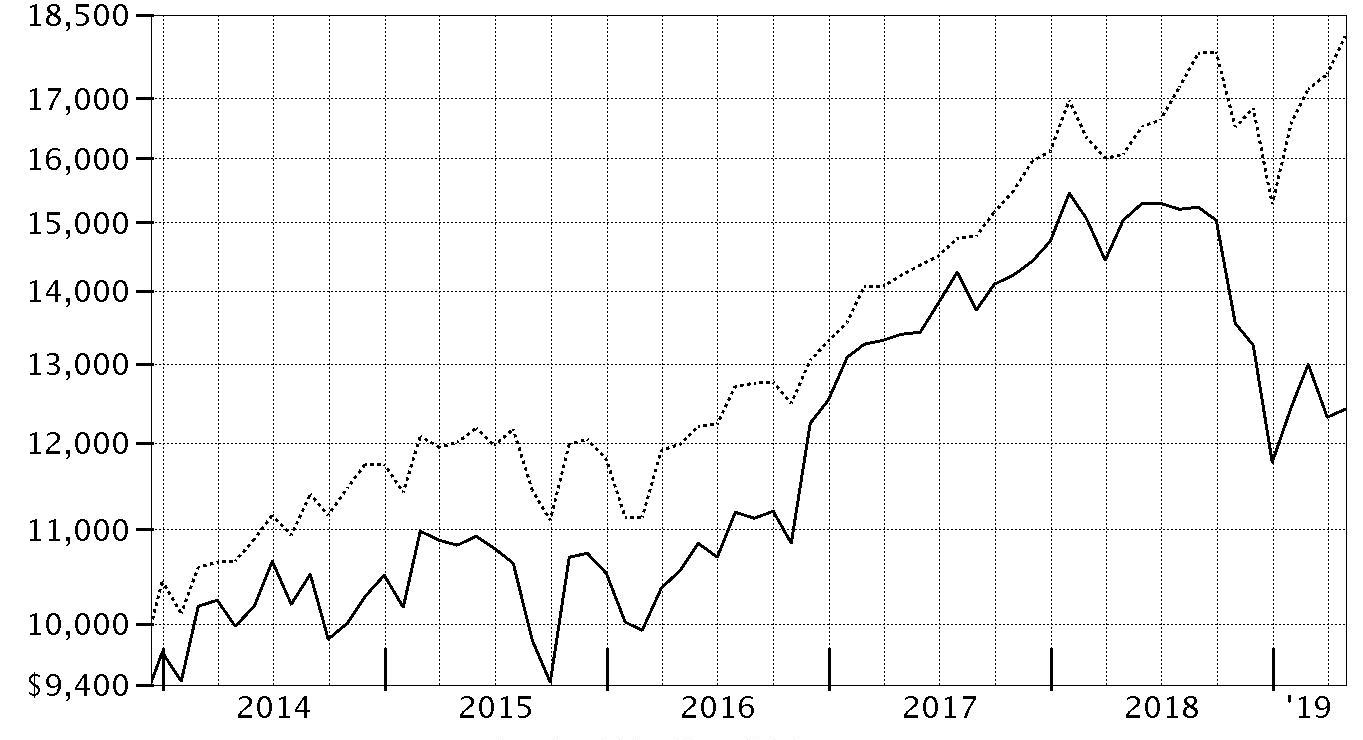
| Period Ending Values | ||
| $12,414 | Fidelity Advisor® Event Driven Opportunities Fund - Class A | |
| $18,114 | Russell 3000® Index | |
Management's Discussion of Fund Performance
Market Recap: The S&P 500® index gained 13.49% for the 12 months ending April 30, 2019, as U.S. equities began the new year on a high note after enduring an historically volatile final quarter of 2018. The index rose 18.25% year to date, its strongest four-month opening since 1987, amid upbeat company earnings/outlooks and signs the Fed may pause on rates. After achieving a record close in late April, the S&P 500® moved a bit higher to end the period. The uptrend was in sharp contrast to late 2018, when rising U.S. Treasury yields and concern about peaking corporate earnings growth sent many investors fleeing from risk assets as they were still dealing with lingering uncertainty related to global trade and the Fed picking up the pace of interest rate hikes. The index returned -6.84% in October, at the time its largest monthly drop in seven years. But conditions worsened through Christmas, as jitters about the economy and another hike in rates led to a spike in market volatility and a -9.03% result for December. For the full period, eight of 11 sectors registered a double-digit gain, led by information technology (+25%). Three defensive groups also stood out: real estate (+21%), consumer staples (+18%) and utilities (+18%). Communication services – a mix of telecom stocks and media/entertainment names – gained 17%, followed by consumer discretionary (+16%). In contrast, energy (-7%) lost ground, while materials (+3%), financials (+4%), health care (+11%) and industrials (+11%) also trailed the broad market.Comments from Portfolio Manager Arvind Navaratnam: For the fiscal year, the fund’s share classes returned in a range roughly between -16% and -18% (excluding sales charges, if applicable), significantly trailing the 12.68% gain of the benchmark Russell 3000® Index. Security selection hurt the fund’s relative result, as did its small-cap bias, as small-caps lagged the large-cap names that dominate the benchmark. A large non-index stake in CorePoint Lodging (-50%) detracted more than any other fund position, weighed down by consecutive quarters of disappointing financial results and costs associated with the firm's La Quinta spinoff. Large non-index investments in Germany-based online pet supply retailer Zooplus and U.K.-based online electronics and appliances retailer AO World also weighed heavily on the relative result. Conversely, a sizable position in sports and entertainment holding company Madison Square Garden contributed more than any other single stock by far. The stock hit a record high in late June after the firm announced its plans to spin off its New York Knicks and Rangers sports franchises. We sold our position in MSG shortly thereafter. The fund’s position in MSG advanced about 22% for the period. Elsewhere, a non-benchmark position in Mellanox Technologies, supplier of computer networking products, was another plus. We sold the stock from the fund by period end to lock in profits.The views expressed above reflect those of the portfolio manager(s) only through the end of the period as stated on the cover of this report and do not necessarily represent the views of Fidelity or any other person in the Fidelity organization. Any such views are subject to change at any time based upon market or other conditions and Fidelity disclaims any responsibility to update such views. These views may not be relied on as investment advice and, because investment decisions for a Fidelity fund are based on numerous factors, may not be relied on as an indication of trading intent on behalf of any Fidelity fund.
Investment Summary (Unaudited)
Top Ten Stocks as of April 30, 2019
| % of fund's net assets | |
| Alliance Data Systems Corp. | 6.8 |
| CorePoint Lodging, Inc. | 6.1 |
| AO World PLC | 5.4 |
| Arcosa, Inc. | 4.6 |
| Alcon, Inc. | 3.2 |
| Sunteck Realty Ltd. | 3.0 |
| Magellan Health Services, Inc. | 2.9 |
| Brighthouse Financial, Inc. | 2.9 |
| KKR & Co. LP | 2.9 |
| Unifi, Inc. | 2.9 |
| 40.7 |
Top Five Market Sectors as of April 30, 2019
| % of fund's net assets | |
| Information Technology | 28.8 |
| Consumer Discretionary | 16.1 |
| Health Care | 13.7 |
| Real Estate | 9.1 |
| Financials | 8.8 |
Asset Allocation (% of fund's net assets)
| As of April 30, 2019* | ||
| Stocks, Investment Companies and Equity Futures | 97.6% | |
| Short-Term Investments and Net Other Assets (Liabilities) | 2.4% | |

* Foreign investments - 24.9%
Schedule of Investments April 30, 2019
Showing Percentage of Net Assets
| Common Stocks - 82.6% | |||
| Shares | Value | ||
| COMMUNICATION SERVICES - 0.2% | |||
| Media - 0.2% | |||
| comScore, Inc. (a) | 112 | $1,406 | |
| Reach PLC | 39,300 | 37,923 | |
| 39,329 | |||
| CONSUMER DISCRETIONARY - 16.1% | |||
| Automobiles - 0.0% | |||
| Fiat Chrysler Automobiles NV | 100 | 1,541 | |
| Hotels, Restaurants & Leisure - 1.8% | |||
| Melco International Development Ltd. | 1,000 | 2,453 | |
| Wyndham Hotels & Resorts, Inc. | 5,975 | 332,927 | |
| 335,380 | |||
| Household Durables - 1.7% | |||
| Hamilton Beach Brands Holding Co. Class A | 16,700 | 302,270 | |
| Internet & Direct Marketing Retail - 6.0% | |||
| AO World PLC (a)(b) | 703,464 | 990,702 | |
| Ocado Group PLC (a) | 634 | 11,264 | |
| Pinduoduo, Inc. ADR | 100 | 2,223 | |
| Zooplus AG (a) | 1,004 | 108,893 | |
| 1,113,082 | |||
| Multiline Retail - 0.0% | |||
| Avenue Supermarts Ltd. (a)(c) | 220 | 4,092 | |
| Specialty Retail - 3.0% | |||
| Cars.com, Inc. (a)(b) | 23,483 | 488,681 | |
| GameStop Corp. Class A | 8,000 | 69,200 | |
| 557,881 | |||
| Textiles, Apparel & Luxury Goods - 3.6% | |||
| Puma AG | 200 | 123,712 | |
| Unifi, Inc. (a) | 26,323 | 531,725 | |
| 655,437 | |||
| TOTAL CONSUMER DISCRETIONARY | 2,969,683 | ||
| CONSUMER STAPLES - 1.2% | |||
| Beverages - 0.0% | |||
| Primo Water Corp. (a) | 100 | 1,575 | |
| Food Products - 1.2% | |||
| Kaveri Seed Co. Ltd. | 32,300 | 206,376 | |
| SunOpta, Inc. (a) | 718 | 2,549 | |
| 208,925 | |||
| Personal Products - 0.0% | |||
| Avon Products, Inc. (a) | 700 | 2,226 | |
| TOTAL CONSUMER STAPLES | 212,726 | ||
| ENERGY - 0.0% | |||
| Energy Equipment & Services - 0.0% | |||
| Exterran Corp. (a) | 66 | 939 | |
| FINANCIALS - 8.8% | |||
| Capital Markets - 2.9% | |||
| Interactive Brokers Group, Inc. | 100 | 5,424 | |
| KKR & Co. LP | 21,954 | 536,775 | |
| 542,199 | |||
| Consumer Finance - 2.8% | |||
| Encore Capital Group, Inc. (a) | 135 | 3,815 | |
| SLM Corp. | 49,727 | 505,226 | |
| 509,041 | |||
| Diversified Financial Services - 0.1% | |||
| Rafael Holdings, Inc. (a) | 1,500 | 24,300 | |
| Insurance - 3.0% | |||
| Brighthouse Financial, Inc. (a) | 12,885 | 538,464 | |
| Stewart Information Services Corp. | 450 | 19,130 | |
| 557,594 | |||
| TOTAL FINANCIALS | 1,633,134 | ||
| HEALTH CARE - 13.7% | |||
| Health Care Equipment & Supplies - 3.2% | |||
| Alcon, Inc. (a) | 10,100 | 587,820 | |
| Arjo AB | 500 | 1,856 | |
| 589,676 | |||
| Health Care Providers & Services - 8.2% | |||
| Covetrus, Inc. (a) | 15,100 | 496,337 | |
| Elanco Animal Health, Inc. | 9,650 | 303,975 | |
| Magellan Health Services, Inc. (a) | 7,700 | 539,000 | |
| Patterson Companies, Inc. | 7,800 | 170,352 | |
| 1,509,664 | |||
| Pharmaceuticals - 2.3% | |||
| Perrigo Co. PLC | 8,800 | 421,696 | |
| TOTAL HEALTH CARE | 2,521,036 | ||
| INDUSTRIALS - 4.7% | |||
| Airlines - 0.1% | |||
| AirAsia Group BHD | 4,300 | 2,839 | |
| Ryanair Holdings PLC sponsored ADR (a) | 50 | 3,882 | |
| Wizz Air Holdings PLC (a)(c) | 102 | 4,522 | |
| 11,243 | |||
| Construction & Engineering - 4.6% | |||
| Arcosa, Inc. | 27,538 | 857,258 | |
| TOTAL INDUSTRIALS | 868,501 | ||
| INFORMATION TECHNOLOGY - 28.8% | |||
| Electronic Equipment & Components - 2.8% | |||
| Cardtronics PLC (a) | 14,578 | 521,309 | |
| Knowles Corp. (a) | 203 | 3,833 | |
| 525,142 | |||
| IT Services - 12.3% | |||
| Adevinta ASA Class B | 50,500 | 496,837 | |
| Alliance Data Systems Corp. | 7,773 | 1,244,457 | |
| DXC Technology Co. | 46 | 3,024 | |
| Perspecta, Inc. | 22,648 | 522,716 | |
| 2,267,034 | |||
| Software - 11.0% | |||
| Black Knight, Inc. (a) | 9,319 | 525,778 | |
| Instructure, Inc. (a) | 11,100 | 478,188 | |
| LogMeIn, Inc. | 67 | 5,521 | |
| Micro Focus International PLC sponsored ADR | 217 | 5,445 | |
| Onespan, Inc. (a) | 27,088 | 502,212 | |
| Symantec Corp. | 21,100 | 510,831 | |
| 2,027,975 | |||
| Technology Hardware, Storage & Peripherals - 2.7% | |||
| 3D Systems Corp. (a) | 300 | 3,192 | |
| Seagate Technology LLC | 10,243 | 494,942 | |
| 498,134 | |||
| TOTAL INFORMATION TECHNOLOGY | 5,318,285 | ||
| REAL ESTATE - 9.1% | |||
| Equity Real Estate Investment Trusts (REITs) - 6.1% | |||
| CorePoint Lodging, Inc. | 89,260 | 1,115,750 | |
| JBG SMITH Properties | 103 | 4,383 | |
| 1,120,133 | |||
| Real Estate Management & Development - 3.0% | |||
| Sunteck Realty Ltd. (a) | 84,500 | 559,859 | |
| TOTAL REAL ESTATE | 1,679,992 | ||
| TOTAL COMMON STOCKS | |||
| (Cost $16,047,133) | 15,243,625 | ||
| Investment Companies - 10.9% | |||
| iShares Russell 3000 ETF | 8,061 | 1,396,488 | |
| SPDR Portfolio Total Stock Market ETF | 16,800 | 614,544 | |
| TOTAL INVESTMENT COMPANIES | |||
| (Cost $1,773,161) | 2,011,032 | ||
| Principal Amount | Value | ||
| U.S. Treasury Obligations - 0.3% | |||
| U.S. Treasury Bills, yield at date of purchase 2.39% to 2.43% 6/13/19 to 7/5/19 (d) | |||
| (Cost $49,838) | 50,000 | 49,838 | |
| Shares | Value | ||
| Money Market Funds - 12.6% | |||
| Fidelity Cash Central Fund, 2.49% (e) | 830,026 | $830,192 | |
| Fidelity Securities Lending Cash Central Fund 2.49% (e)(f) | 1,492,395 | 1,492,544 | |
| TOTAL MONEY MARKET FUNDS | |||
| (Cost $2,322,736) | 2,322,736 | ||
| TOTAL INVESTMENT IN SECURITIES - 106.4% | |||
| (Cost $20,192,868) | 19,627,231 | ||
| NET OTHER ASSETS (LIABILITIES) - (6.4)% | (1,178,158) | ||
| NET ASSETS - 100% | $18,449,073 |
| Futures Contracts | |||||
| Number of contracts | Expiration Date | Notional Amount | Value | Unrealized Appreciation/(Depreciation) | |
| Purchased | |||||
| Equity Index Contracts | |||||
| CME E-mini Russell 2000 Index Contracts (United States) | 4 | June 2019 | $318,840 | $9,758 | $9,758 |
| CME E-mini S&P 500 Index Contracts (United States) | 3 | June 2019 | 442,275 | 13,644 | 13,644 |
| TOTAL FUTURES CONTRACTS | $23,402 |
The notional amount of futures purchased as a percentage of Net Assets is 4.1%
For the period, the average monthly notional amount at value for futures contracts in the aggregate was $3,543,943.
Security Type Abbreviations
ETF – Exchange-Traded Fund
Legend
(a) Non-income producing
(b) Security or a portion of the security is on loan at period end.
(c) Security exempt from registration under Rule 144A of the Securities Act of 1933. These securities may be resold in transactions exempt from registration, normally to qualified institutional buyers. At the end of the period, the value of these securities amounted to $8,614 or 0.0% of net assets.
(d) Security or a portion of the security was pledged to cover margin requirements for futures contracts. At period end, the value of securities pledged amounted to $49,838.
(e) Affiliated fund that is generally available only to investment companies and other accounts managed by Fidelity Investments. The rate quoted is the annualized seven-day yield of the fund at period end. A complete unaudited listing of the fund's holdings as of its most recent quarter end is available upon request. In addition, each Fidelity Central Fund's financial statements, which are not covered by the Fund's Report of Independent Registered Public Accounting Firm, are available on the SEC's website or upon request.
(f) Investment made with cash collateral received from securities on loan.
Affiliated Central Funds
Information regarding fiscal year to date income earned by the Fund from investments in Fidelity Central Funds is as follows:
| Fund | Income earned |
| Fidelity Cash Central Fund | $82,600 |
| Fidelity Securities Lending Cash Central Fund | 90,527 |
| Total | $173,127 |
Amounts in the income column in the above table include any capital gain distributions from underlying funds, which are presented in the corresponding line-item in the Statement of Operations, if applicable.
Investment Valuation
The following is a summary of the inputs used, as of April 30, 2019, involving the Fund's assets and liabilities carried at fair value. The inputs or methodology used for valuing securities may not be an indication of the risk associated with investing in those securities. For more information on valuation inputs, and their aggregation into the levels used below, please refer to the Investment Valuation section in the accompanying Notes to Financial Statements.
| Valuation Inputs at Reporting Date: | ||||
| Description | Total | Level 1 | Level 2 | Level 3 |
| Investments in Securities: | ||||
| Equities: | ||||
| Communication Services | $39,329 | $39,329 | $-- | $-- |
| Consumer Discretionary | 2,969,683 | 2,969,683 | -- | -- |
| Consumer Staples | 212,726 | 212,726 | -- | -- |
| Energy | 939 | 939 | -- | -- |
| Financials | 1,633,134 | 1,633,134 | -- | -- |
| Health Care | 2,521,036 | 2,519,180 | 1,856 | -- |
| Industrials | 868,501 | 868,501 | -- | -- |
| Information Technology | 5,318,285 | 5,318,285 | -- | -- |
| Real Estate | 1,679,992 | 1,679,992 | -- | -- |
| Investment Companies | 2,011,032 | 2,011,032 | -- | -- |
| U.S. Government and Government Agency Obligations | 49,838 | -- | 49,838 | -- |
| Money Market Funds | 2,322,736 | 2,322,736 | -- | -- |
| Total Investments in Securities: | $19,627,231 | $19,575,537 | $51,694 | $-- |
| Derivative Instruments: | ||||
| Assets | ||||
| Futures Contracts | $23,402 | $23,402 | $-- | $-- |
| Total Assets | $23,402 | $23,402 | $-- | $-- |
| Total Derivative Instruments: | $23,402 | $23,402 | $-- | $-- |
Value of Derivative Instruments
The following table is a summary of the Fund's value of derivative instruments by primary risk exposure as of April 30, 2019. For additional information on derivative instruments, please refer to the Derivative Instruments section in the accompanying Notes to Financial Statements.
| Primary Risk Exposure / Derivative Type | Value | |
| Asset | Liability | |
| Equity Risk | ||
| Futures Contracts(a) | $23,402 | $0 |
| Total Equity Risk | 23,402 | 0 |
| Total Value of Derivatives | $23,402 | $0 |
(a) Reflects gross cumulative appreciation (depreciation) on futures contracts as presented in the Schedule of Investments. In the Statement of Assets and Liabilities, the period end daily variation margin is included in receivable or payable for daily variation margin on futures contracts, and the net cumulative appreciation (depreciation) is included in distributable earnings.
Other Information
Distribution of investments by country or territory of incorporation, as a percentage of Total Net Assets, is as follows (Unaudited):
| United States of America | 75.1% |
| United Kingdom | 8.4% |
| Ireland | 5.0% |
| India | 4.2% |
| Switzerland | 3.2% |
| Norway | 2.7% |
| Germany | 1.3% |
| Others (Individually Less Than 1%) | 0.1% |
| 100.0% |
See accompanying notes which are an integral part of the financial statements.
Financial Statements
Statement of Assets and Liabilities
| April 30, 2019 | ||
| Assets | ||
| Investment in securities, at value (including securities loaned of $1,447,631) — See accompanying schedule: Unaffiliated issuers (cost $17,870,132) | $17,304,495 | |
| Fidelity Central Funds (cost $2,322,736) | 2,322,736 | |
| Total Investment in Securities (cost $20,192,868) | $19,627,231 | |
| Receivable for investments sold | 640,866 | |
| Receivable for fund shares sold | 621 | |
| Dividends receivable | 1,201 | |
| Distributions receivable from Fidelity Central Funds | 5,397 | |
| Prepaid expenses | 24 | |
| Receivable from investment adviser for expense reductions | 4,801 | |
| Other receivables | 2,069 | |
| Total assets | 20,282,210 | |
| Liabilities | ||
| Payable for investments purchased | $243,399 | |
| Payable for fund shares redeemed | 12,731 | |
| Accrued management fee | 10,787 | |
| Distribution and service plan fees payable | 5,515 | |
| Payable for daily variation margin on futures contracts | 760 | |
| Other affiliated payables | 4,404 | |
| Other payables and accrued expenses | 63,190 | |
| Collateral on securities loaned | 1,492,351 | |
| Total liabilities | 1,833,137 | |
| Net Assets | $18,449,073 | |
| Net Assets consist of: | ||
| Paid in capital | $24,351,836 | |
| Total distributable earnings (loss) | (5,902,763) | |
| Net Assets | $18,449,073 | |
| Net Asset Value and Maximum Offering Price | ||
| Class A: | ||
| Net Asset Value and redemption price per share ($7,832,005 ÷ 716,626 shares) | $10.93 | |
| Maximum offering price per share (100/94.25 of $10.93) | $11.60 | |
| Class M: | ||
| Net Asset Value and redemption price per share ($2,191,574 ÷ 201,330 shares) | $10.89 | |
| Maximum offering price per share (100/96.50 of $10.89) | $11.28 | |
| Class C: | ||
| Net Asset Value and offering price per share ($3,409,919 ÷ 318,372 shares)(a) | $10.71 | |
| Class I: | ||
| Net Asset Value, offering price and redemption price per share ($4,529,327 ÷ 412,305 shares) | $10.99 | |
| Class Z: | ||
| Net Asset Value, offering price and redemption price per share ($486,248 ÷ 44,287 shares) | $10.98 |
(a) Redemption price per share is equal to net asset value less any applicable contingent deferred sales charge.
See accompanying notes which are an integral part of the financial statements.
Statement of Operations
| Year ended April 30, 2019 | ||
| Investment Income | ||
| Dividends | $377,964 | |
| Interest | 3,903 | |
| Income from Fidelity Central Funds (including $90,527 from security lending) | 173,127 | |
| Total income | 554,994 | |
| Expenses | ||
| Management fee | ||
| Basic fee | $299,650 | |
| Performance adjustment | (13,244) | |
| Transfer agent fees | 73,483 | |
| Distribution and service plan fees | 88,122 | |
| Accounting and security lending fees | 14,831 | |
| Custodian fees and expenses | 11,650 | |
| Independent trustees' fees and expenses | 223 | |
| Registration fees | 78,283 | |
| Audit | 50,636 | |
| Legal | 3,496 | |
| Miscellaneous | 311 | |
| Total expenses before reductions | 607,441 | |
| Expense reductions | (57,719) | |
| Total expenses after reductions | 549,722 | |
| Net investment income (loss) | 5,272 | |
| Realized and Unrealized Gain (Loss) | ||
| Net realized gain (loss) on: | ||
| Investment securities: | ||
| Unaffiliated issuers | (3,729,709) | |
| Fidelity Central Funds | 434 | |
| Foreign currency transactions | 3,398 | |
| Futures contracts | (88,947) | |
| Total net realized gain (loss) | (3,814,824) | |
| Change in net unrealized appreciation (depreciation) on: | ||
| Investment securities: | ||
| Unaffiliated issuers (net of increase in deferred foreign taxes of $23,303) | (3,461,723) | |
| Fidelity Central Funds | (79) | |
| Assets and liabilities in foreign currencies | 18 | |
| Futures contracts | 151,765 | |
| Total change in net unrealized appreciation (depreciation) | (3,310,019) | |
| Net gain (loss) | (7,124,843) | |
| Net increase (decrease) in net assets resulting from operations | $(7,119,571) |
See accompanying notes which are an integral part of the financial statements.
Statement of Changes in Net Assets
| Year ended April 30, 2019 | Year ended April 30, 2018 | |
| Increase (Decrease) in Net Assets | ||
| Operations | ||
| Net investment income (loss) | $5,272 | $(125,323) |
| Net realized gain (loss) | (3,814,824) | 3,355,101 |
| Change in net unrealized appreciation (depreciation) | (3,310,019) | 351,728 |
| Net increase (decrease) in net assets resulting from operations | (7,119,571) | 3,581,506 |
| Distributions to shareholders | (1,890,124) | – |
| Distributions to shareholders from net realized gain | – | (2,300,863) |
| Total distributions | (1,890,124) | (2,300,863) |
| Share transactions - net increase (decrease) | (19,582,271) | 19,977,448 |
| Total increase (decrease) in net assets | (28,591,966) | 21,258,091 |
| Net Assets | ||
| Beginning of period | 47,041,039 | 25,782,948 |
| End of period | $18,449,073 | $47,041,039 |
| Other Information | ||
| Undistributed net investment income end of period | $626 |
See accompanying notes which are an integral part of the financial statements.
Financial Highlights
Fidelity Advisor Event Driven Opportunities Fund Class A
| Years ended April 30, | 2019 | 2018 | 2017 | 2016 | 2015 |
| Selected Per–Share Data | |||||
| Net asset value, beginning of period | $13.97 | $13.39 | $10.87 | $11.26 | $10.58 |
| Income from Investment Operations | |||||
| Net investment income (loss)A | –B | (.05) | (.06) | .08C | .01 |
| Net realized and unrealized gain (loss) | (2.40) | 1.62 | 2.95 | (.36)D | .89E |
| Total from investment operations | (2.40) | 1.57 | 2.89 | (.28) | .90 |
| Distributions from net investment income | (.04) | – | (.04) | – | (.01) |
| Distributions from net realized gain | (.60) | (.99) | (.32) | (.11) | (.20) |
| Total distributions | (.64) | (.99) | (.37)F | (.11) | (.22)G |
| Net asset value, end of period | $10.93 | $13.97 | $13.39 | $10.87 | $11.26 |
| Total ReturnH,I,J | (17.40)% | 12.15% | 26.97% | (2.49)%D | 8.55%E |
| Ratios to Average Net AssetsK,L | |||||
| Expenses before reductions | 1.77% | 1.80% | 2.34% | 2.76% | 2.82% |
| Expenses net of fee waivers, if any | 1.55% | 1.55% | 1.55% | 1.55% | 1.55% |
| Expenses net of all reductions | 1.53% | 1.53% | 1.54% | 1.54% | 1.53% |
| Net investment income (loss) | .01% | (.38)% | (.53)% | .74%C | .10% |
| Supplemental Data | |||||
| Net assets, end of period (000 omitted) | $7,832 | $11,752 | $6,407 | $2,513 | $2,983 |
| Portfolio turnover rateM | 97% | 86% | 120% | 113% | 150% |
A Calculated based on average shares outstanding during the period.
B Amount represents less than $.005 per share.
C Net investment income per share reflects a large, non-recurring dividend which amounted to $.06 per share. Excluding this non-recurring dividend, the ratio of net investment income (loss) to average net assets would have been .22%.
D Amount includes a reimbursement from the investment adviser for an operational error which amounted to less than $.01 per share. Excluding this reimbursement, the total return would have been (2.52)%.
E Amount includes a reimbursement from the investment adviser for an operational error which amounted to less than $.01 per share. Excluding this reimbursement, the total return would have been 8.47%.
F Total distributions of $.37 per share is comprised of distributions from net investment income of $.043 and distributions from net realized gain of $.323 per share.
G Total distributions of $.22 per share is comprised of distributions from net investment income of $.014 and distributions from net realized gain of $.201 per share.
H Total returns for periods of less than one year are not annualized.
I Total returns would have been lower if certain expenses had not been reduced during the applicable periods shown.
J Total returns do not include the effect of the sales charges.
K Fees and expenses of any underlying Fidelity Central Funds are not included in the Fund's expense ratio. The Fund indirectly bears its proportionate share of the expenses of any underlying Fidelity Central Funds.
L Expense ratios reflect operating expenses of the class. Expenses before reductions do not reflect amounts reimbursed by the investment adviser or reductions from brokerage service arrangements or reductions from other expense offset arrangements and do not represent the amount paid by the class during periods when reimbursements or reductions occur. Expenses net of fee waivers reflect expenses after reimbursement by the investment adviser but prior to reductions from brokerage service arrangements or other expense offset arrangements. Expenses net of all reductions represent the net expenses paid by the class.
M Amount does not include the portfolio activity of any underlying Fidelity Central Funds.
See accompanying notes which are an integral part of the financial statements.
Fidelity Advisor Event Driven Opportunities Fund Class M
| Years ended April 30, | 2019 | 2018 | 2017 | 2016 | 2015 |
| Selected Per–Share Data | |||||
| Net asset value, beginning of period | $13.91 | $13.33 | $10.83 | $11.25 | $10.57 |
| Income from Investment Operations | |||||
| Net investment income (loss)A | (.03) | (.09) | (.09) | .05B | (.02) |
| Net realized and unrealized gain (loss) | (2.38) | 1.63 | 2.93 | (.36)C | .89D |
| Total from investment operations | (2.41) | 1.54 | 2.84 | (.31) | .87 |
| Distributions from net investment income | (.02) | – | (.03) | – | (.01) |
| Distributions from net realized gain | (.59) | (.96) | (.31) | (.11) | (.18) |
| Total distributions | (.61) | (.96) | (.34) | (.11) | (.19) |
| Net asset value, end of period | $10.89 | $13.91 | $13.33 | $10.83 | $11.25 |
| Total ReturnE,F,G | (17.60)% | 11.91% | 26.59% | (2.76)%C | 8.35%D |
| Ratios to Average Net AssetsH,I | |||||
| Expenses before reductions | 2.04% | 2.10% | 2.60% | 2.98% | 3.18% |
| Expenses net of fee waivers, if any | 1.80% | 1.80% | 1.80% | 1.80% | 1.80% |
| Expenses net of all reductions | 1.78% | 1.78% | 1.79% | 1.79% | 1.78% |
| Net investment income (loss) | (.24)% | (.63)% | (.78)% | .49%B | (.15)% |
| Supplemental Data | |||||
| Net assets, end of period (000 omitted) | $2,192 | $3,149 | $2,568 | $966 | $1,977 |
| Portfolio turnover rateJ | 97% | 86% | 120% | 113% | 150% |
A Calculated based on average shares outstanding during the period.
B Net investment income per share reflects a large, non-recurring dividend which amounted to $.06 per share. Excluding this non-recurring dividend, the ratio of net investment income (loss) to average net assets would have been (.03) %.
C Amount includes a reimbursement from the investment adviser for an operational error which amounted to less than $.01 per share. Excluding this reimbursement, the total return would have been (2.79)%.
D Amount includes a reimbursement from the investment adviser for an operational error which amounted to less than $.01 per share. Excluding this reimbursement, the total return would have been 8.27%.
E Total returns for periods of less than one year are not annualized.
F Total returns would have been lower if certain expenses had not been reduced during the applicable periods shown.
G Total returns do not include the effect of the sales charges.
H Fees and expenses of any underlying Fidelity Central Funds are not included in the Fund's expense ratio. The Fund indirectly bears its proportionate share of the expenses of any underlying Fidelity Central Funds.
I Expense ratios reflect operating expenses of the class. Expenses before reductions do not reflect amounts reimbursed by the investment adviser or reductions from brokerage service arrangements or reductions from other expense offset arrangements and do not represent the amount paid by the class during periods when reimbursements or reductions occur. Expenses net of fee waivers reflect expenses after reimbursement by the investment adviser but prior to reductions from brokerage service arrangements or other expense offset arrangements. Expenses net of all reductions represent the net expenses paid by the class.
J Amount does not include the portfolio activity of any underlying Fidelity Central Funds.
See accompanying notes which are an integral part of the financial statements.
Fidelity Advisor Event Driven Opportunities Fund Class C
| Years ended April 30, | 2019 | 2018 | 2017 | 2016 | 2015 |
| Selected Per–Share Data | |||||
| Net asset value, beginning of period | $13.73 | $13.18 | $10.72 | $11.19 | $10.55 |
| Income from Investment Operations | |||||
| Net investment income (loss)A | (.09) | (.15) | (.15) | –B,C | (.07) |
| Net realized and unrealized gain (loss) | (2.36) | 1.61 | 2.90 | (.36)D | .88E |
| Total from investment operations | (2.45) | 1.46 | 2.75 | (.36) | .81 |
| Distributions from net investment income | – | – | (.02) | – | – |
| Distributions from net realized gain | (.57) | (.91) | (.28) | (.11) | (.17) |
| Total distributions | (.57) | (.91) | (.29)F | (.11) | (.17) |
| Net asset value, end of period | $10.71 | $13.73 | $13.18 | $10.72 | $11.19 |
| Total ReturnG,H,I | (18.05)% | 11.39% | 25.96% | (3.23)%D | 7.75%E |
| Ratios to Average Net AssetsJ,K | |||||
| Expenses before reductions | 2.51% | 2.55% | 3.03% | 3.46% | 3.63% |
| Expenses net of fee waivers, if any | 2.30% | 2.30% | 2.30% | 2.30% | 2.30% |
| Expenses net of all reductions | 2.28% | 2.28% | 2.29% | 2.29% | 2.29% |
| Net investment income (loss) | (.74)% | (1.13)% | (1.28)% | (.01)%B | (.65)% |
| Supplemental Data | |||||
| Net assets, end of period (000 omitted) | $3,410 | $5,290 | $3,663 | $1,046 | $1,846 |
| Portfolio turnover rateL | 97% | 86% | 120% | 113% | 150% |
A Calculated based on average shares outstanding during the period.
B Net investment income per share reflects a large, non-recurring dividend which amounted to $.06 per share. Excluding this non-recurring dividend, the ratio of net investment income (loss) to average net assets would have been (.53) %.
C Amount represents less than $.005 per share.
D Amount includes a reimbursement from the investment adviser for an operational error which amounted to less than $.01 per share. Excluding this reimbursement, the total return would have been (3.26)%.
E Amount includes a reimbursement from the investment adviser for an operational error which amounted to less than $.01 per share. Excluding this reimbursement, the total return would have been 7.67%.
F Total distributions of $.29 per share is comprised of distributions from net investment income of $.015 and distributions from net realized gain of $.275 per share.
G Total returns for periods of less than one year are not annualized.
H Total returns would have been lower if certain expenses had not been reduced during the applicable periods shown.
I Total returns do not include the effect of the contingent deferred sales charge.
J Fees and expenses of any underlying Fidelity Central Funds are not included in the Fund's expense ratio. The Fund indirectly bears its proportionate share of the expenses of any underlying Fidelity Central Funds.
K Expense ratios reflect operating expenses of the class. Expenses before reductions do not reflect amounts reimbursed by the investment adviser or reductions from brokerage service arrangements or reductions from other expense offset arrangements and do not represent the amount paid by the class during periods when reimbursements or reductions occur. Expenses net of fee waivers reflect expenses after reimbursement by the investment adviser but prior to reductions from brokerage service arrangements or other expense offset arrangements. Expenses net of all reductions represent the net expenses paid by the class.
L Amount does not include the portfolio activity of any underlying Fidelity Central Funds.
See accompanying notes which are an integral part of the financial statements.
Fidelity Advisor Event Driven Opportunities Fund Class I
| Years ended April 30, | 2019 | 2018 | 2017 | 2016 | 2015 |
| Selected Per–Share Data | |||||
| Net asset value, beginning of period | $14.05 | $13.45 | $10.91 | $11.28 | $10.59 |
| Income from Investment Operations | |||||
| Net investment income (loss)A | .03 | (.02) | (.03) | .11B | .04 |
| Net realized and unrealized gain (loss) | (2.41) | 1.64 | 2.96 | (.37)C | .89D |
| Total from investment operations | (2.38) | 1.62 | 2.93 | (.26) | .93 |
| Distributions from net investment income | (.05) | – | (.05) | – | (.03) |
| Distributions from net realized gain | (.62) | (1.02) | (.34) | (.11) | (.21) |
| Total distributions | (.68)E | (1.02) | (.39) | (.11) | (.24) |
| Net asset value, end of period | $10.99 | $14.05 | $13.45 | $10.91 | $11.28 |
| Total ReturnF,G | (17.24)% | 12.50% | 27.33% | (2.31)%C | 8.86%D |
| Ratios to Average Net AssetsH,I | |||||
| Expenses before reductions | 1.36% | 1.46% | 1.97% | 2.17% | 2.63% |
| Expenses net of fee waivers, if any | 1.30% | 1.30% | 1.30% | 1.30% | 1.30% |
| Expenses net of all reductions | 1.29% | 1.28% | 1.29% | 1.28% | 1.28% |
| Net investment income (loss) | .26% | (.13)% | (.28)% | 1.00%B | .35% |
| Supplemental Data | |||||
| Net assets, end of period (000 omitted) | $4,529 | $26,849 | $13,145 | $3,604 | $1,990 |
| Portfolio turnover rateJ | 97% | 86% | 120% | 113% | 150% |
A Calculated based on average shares outstanding during the period.
B Net investment income per share reflects a large, non-recurring dividend which amounted to $.06 per share. Excluding this non-recurring dividend, the ratio of net investment income (loss) to average net assets would have been .47%.
C Amount includes a reimbursement from the investment adviser for an operational error which amounted to less than $.01 per share. Excluding this reimbursement, the total return would have been (2.34)%.
D Amount includes a reimbursement from the investment adviser for an operational error which amounted to less than $.01 per share. Excluding this reimbursement, the total return would have been 8.78%.
E Total distributions of $.68 per share is comprised of distributions from net investment income of $.053 and distributions from net realized gain of $.622 per share.
F Total returns for periods of less than one year are not annualized.
G Total returns would have been lower if certain expenses had not been reduced during the applicable periods shown.
H Fees and expenses of any underlying Fidelity Central Funds are not included in the Fund's expense ratio. The Fund indirectly bears its proportionate share of the expenses of any underlying Fidelity Central Funds.
I Expense ratios reflect operating expenses of the class. Expenses before reductions do not reflect amounts reimbursed by the investment adviser or reductions from brokerage service arrangements or reductions from other expense offset arrangements and do not represent the amount paid by the class during periods when reimbursements or reductions occur. Expenses net of fee waivers reflect expenses after reimbursement by the investment adviser but prior to reductions from brokerage service arrangements or other expense offset arrangements. Expenses net of all reductions represent the net expenses paid by the class.
J Amount does not include the portfolio activity of any underlying Fidelity Central Funds.
See accompanying notes which are an integral part of the financial statements.
Fidelity Advisor Event Driven Opportunities Fund Class Z
| Year ended April 30, | 2019 A |
| Selected Per–Share Data | |
| Net asset value, beginning of period | $13.70 |
| Income from Investment Operations | |
| Net investment income (loss)B | .03 |
| Net realized and unrealized gain (loss) | (2.30) |
| Total from investment operations | (2.27) |
| Distributions from net investment income | (.08) |
| Distributions from net realized gain | (.38) |
| Total distributions | (.45)C |
| Net asset value, end of period | $10.98 |
| Total ReturnD,E | (16.46)% |
| Ratios to Average Net AssetsF,G | |
| Expenses before reductions | 1.57%H |
| Expenses net of fee waivers, if any | 1.15%H |
| Expenses net of all reductions | 1.13%H |
| Net investment income (loss) | .40%H |
| Supplemental Data | |
| Net assets, end of period (000 omitted) | $486 |
| Portfolio turnover rateI | 97% |
A For the period October 2, 2018 (commencement of sale of shares) to April 30, 2019.
B Calculated based on average shares outstanding during the period.
C Total distributions of $.45 per share is comprised of distributions from net investment income of $.076 and distributions from net realized gain of $.376 per share.
D Total returns for periods of less than one year are not annualized.
E Total returns would have been lower if certain expenses had not been reduced during the applicable periods shown.
F Fees and expenses of any underlying Fidelity Central Funds are not included in the Fund's expense ratio. The Fund indirectly bears its proportionate share of the expenses of any underlying Fidelity Central Funds.
G Expense ratios reflect operating expenses of the class. Expenses before reductions do not reflect amounts reimbursed by the investment adviser or reductions from brokerage service arrangements or reductions from other expense offset arrangements and do not represent the amount paid by the class during periods when reimbursements or reductions occur. Expense ratios before reductions for start-up periods may not be representative of longer-term operating periods. Expenses net of fee waivers reflect expenses after reimbursement by the investment adviser but prior to reductions from brokerage service arrangements or other expense offset arrangements. Expenses net of all reductions represent the net expenses paid by the class.
H Annualized
I Amount does not include the portfolio activity of any underlying Fidelity Central Funds.
See accompanying notes which are an integral part of the financial statements.
Notes to Financial Statements
For the period ended April 30, 2019
1. Organization.
Fidelity Advisor Event Driven Opportunities Fund (the Fund) is a non-diversified fund of Fidelity Concord Street Trust (the Trust) and is authorized to issue an unlimited number of shares. The Trust is registered under the Investment Company Act of 1940, as amended (the 1940 Act), as an open-end management investment company organized as a Massachusetts business trust. The Fund commenced sale of Class Z shares on October 2, 2018. The Fund offers Class A, Class M, Class C, Class I and Class Z shares, each of which has equal rights as to assets and voting privileges. Each class has exclusive voting rights with respect to matters that affect that class. Effective March 1, 2019, Class C shares will automatically convert to Class A shares after a holding period of ten years from the initial date of purchase, with certain exceptions.
2. Investments in Fidelity Central Funds.
The Fund invests in Fidelity Central Funds, which are open-end investment companies generally available only to other investment companies and accounts managed by the investment adviser and its affiliates. The Fund's Schedule of Investments lists each of the Fidelity Central Funds held as of period end, if any, as an investment of the Fund, but does not include the underlying holdings of each Fidelity Central Fund. As an Investing Fund, the Fund indirectly bears its proportionate share of the expenses of the underlying Fidelity Central Funds.
The Money Market Central Funds seek preservation of capital and current income and are managed by Fidelity Investments Money Management, Inc. (FIMM), an affiliate of the investment adviser. Annualized expenses of the Money Market Central Funds as of their most recent shareholder report date are less than .005%.
A complete unaudited list of holdings for each Fidelity Central Fund is available upon request or at the Securities and Exchange Commission (the SEC) website at www.sec.gov. In addition, the financial statements of the Fidelity Central Funds, which are not covered by the Fund's Report of Independent Registered Public Accounting Firm, are available on the SEC website or upon request.
3. Significant Accounting Policies.
The Fund is an investment company and applies the accounting and reporting guidance of the Financial Accounting Standards Board (FASB) Accounting Standards Codification Topic 946 Financial Services – Investments Companies. The financial statements have been prepared in conformity with accounting principles generally accepted in the United States of America (GAAP), which require management to make certain estimates and assumptions at the date of the financial statements. Actual results could differ from those estimates. Subsequent events, if any, through the date that the financial statements were issued have been evaluated in the preparation of the financial statements. The following summarizes the significant accounting policies of the Fund:
Investment Valuation. Investments are valued as of 4:00 p.m. Eastern time on the last calendar day of the period. The Board of Trustees (the Board) has delegated the day to day responsibility for the valuation of the Fund's investments to the Fair Value Committee (the Committee) established by the Fund's investment adviser. In accordance with valuation policies and procedures approved by the Board, the Fund attempts to obtain prices from one or more third party pricing vendors or brokers to value its investments. When current market prices, quotations or currency exchange rates are not readily available or reliable, investments will be fair valued in good faith by the Committee, in accordance with procedures adopted by the Board. Factors used in determining fair value vary by investment type and may include market or investment specific events, changes in interest rates and credit quality. The frequency with which these procedures are used cannot be predicted and they may be utilized to a significant extent. The Committee oversees the Fund's valuation policies and procedures and reports to the Board on the Committee's activities and fair value determinations. The Board monitors the appropriateness of the procedures used in valuing the Fund's investments and ratifies the fair value determinations of the Committee.
The Fund categorizes the inputs to valuation techniques used to value its investments into a disclosure hierarchy consisting of three levels as shown below:
- Level 1 – quoted prices in active markets for identical investments
- Level 2 – other significant observable inputs (including quoted prices for similar investments, interest rates, prepayment speeds, etc.)
- Level 3 – unobservable inputs (including the Fund's own assumptions based on the best information available)
Valuation techniques used to value the Fund's investments by major category are as follows:
Equity securities, including restricted securities, for which market quotations are readily available, are valued at the last reported sale price or official closing price as reported by a third party pricing vendor on the primary market or exchange on which they are traded and are categorized as Level 1 in the hierarchy. In the event there were no sales during the day or closing prices are not available, securities are valued at the last quoted bid price or may be valued using the last available price and are generally categorized as Level 2 in the hierarchy. For foreign equity securities, when market or security specific events arise, comparisons to the valuation of American Depositary Receipts (ADRs), futures contracts, Exchange-Traded Funds (ETFs) and certain indexes as well as quoted prices for similar securities may be used and would be categorized as Level 2 in the hierarchy. For equity securities, including restricted securities, where observable inputs are limited, assumptions about market activity and risk are used and these securities may be categorized as Level 3 in the hierarchy.
Debt securities, including restricted securities, are valued based on evaluated prices received from third party pricing vendors or from brokers who make markets in such securities. U.S. government and government agency obligations are valued by pricing vendors who utilize matrix pricing which considers yield or price of bonds of comparable quality, coupon, maturity and type or by broker-supplied prices. When independent prices are unavailable or unreliable, debt securities may be valued utilizing pricing methodologies which consider similar factors that would be used by third party pricing vendors. Debt securities are generally categorized as Level 2 in the hierarchy but may be Level 3 depending on the circumstances. ETFs are valued at their last sale price or official closing price as reported by a third party pricing vendor on the primary market or exchange on which they are traded and are categorized as Level 1 in the hierarchy. In the event there were no sales during the day but the exchange reports a closing bid level, ETFs are valued at the closing bid and would be categorized as Level 1 in the hierarchy. In the event there was no closing bid, ETFs may be valued by another method that the Board believes reflects fair value in accordance with the Board's fair value pricing policies and may be categorized as Level 2 in the hierarchy.
Futures contracts are valued at the settlement price established each day by the board of trade or exchange on which they are traded and are categorized as Level 1 in the hierarchy. Investments in open-end mutual funds, including the Fidelity Central Funds, are valued at their closing net asset value (NAV) each business day and are categorized as Level 1 in the hierarchy.
Changes in valuation techniques may result in transfers in or out of an assigned level within the disclosure hierarchy. The aggregate value of investments by input level as of April 30, 2019 is included at the end of the Fund's Schedule of Investments.
Foreign Currency. The Fund may use foreign currency contracts to facilitate transactions in foreign-denominated securities. Gains and losses from these transactions may arise from changes in the value of the foreign currency or if the counterparties do not perform under the contracts' terms.
Foreign-denominated assets, including investment securities, and liabilities are translated into U.S. dollars at the exchange rates at period end. Purchases and sales of investment securities, income and dividends received and expenses denominated in foreign currencies are translated into U.S. dollars at the exchange rate in effect on the transaction date.
The effects of exchange rate fluctuations on investments are included with the net realized and unrealized gain (loss) on investment securities. Other foreign currency transactions resulting in realized and unrealized gain (loss) are disclosed separately.
Investment Transactions and Income. For financial reporting purposes, the Fund's investment holdings and NAV include trades executed through the end of the last business day of the period. The NAV per share for processing shareholder transactions is calculated as of the close of business of the New York Stock Exchange (NYSE), normally 4:00 p.m. Eastern time and includes trades executed through the end of the prior business day. Gains and losses on securities sold are determined on the basis of identified cost and include proceeds received from litigation. Dividend income is recorded on the ex-dividend date, except for certain dividends from foreign securities where the ex-dividend date may have passed, which are recorded as soon as the Fund is informed of the ex-dividend date. Non-cash dividends included in dividend income, if any, are recorded at the fair market value of the securities received. Income and capital gain distributions from Fidelity Central Funds, if any, are recorded on the ex-dividend date. Certain distributions received by the Fund represent a return of capital or capital gain. The Fund determines the components of these distributions subsequent to the ex-dividend date, based upon receipt of tax filings or other correspondence relating to the underlying investment. These distributions are recorded as a reduction of cost of investments and/or as a realized gain. Interest income is accrued as earned and includes coupon interest and amortization of premium and accretion of discount on debt securities as applicable. Investment income is recorded net of foreign taxes withheld where recovery of such taxes is uncertain.
Class Allocations and Expenses. Investment income, realized and unrealized capital gains and losses, common expenses of the Fund, and certain fund-level expense reductions, if any, are allocated daily on a pro-rata basis to each class based on the relative net assets of each class to the total net assets of the Fund. Each class differs with respect to transfer agent and distribution and service plan fees incurred. Certain expense reductions may also differ by class. For the reporting period, the allocated portion of income and expenses to each class as a percent of its average net assets may vary due to the timing of recording these transactions in relation to fluctuating net assets of the classes. Expenses directly attributable to a fund are charged to that fund. Expenses attributable to more than one fund are allocated among the respective funds on the basis of relative net assets or other appropriate methods. Expense estimates are accrued in the period to which they relate and adjustments are made when actual amounts are known.
Income Tax Information and Distributions to Shareholders. Each year, the Fund intends to qualify as a regulated investment company under Subchapter M of the Internal Revenue Code, including distributing substantially all of its taxable income and realized gains. As a result, no provision for U.S. Federal income taxes is required. As of April 30, 2019, the Fund did not have any unrecognized tax benefits in the financial statements; nor is the Fund aware of any tax positions for which it is reasonably possible that the total amounts of unrecognized tax benefits will significantly change in the next twelve months. The Fund files a U.S. federal tax return, in addition to state and local tax returns as required. The Fund's federal income tax returns are subject to examination by the Internal Revenue Service (IRS) for a period of three fiscal years after they are filed. State and local tax returns may be subject to examination for an additional fiscal year depending on the jurisdiction. Foreign taxes are provided for based on the Fund's understanding of the tax rules and rates that exist in the foreign markets in which it invests. The Fund is subject to a tax imposed on capital gains by certain countries in which it invests. An estimated deferred tax liability for net unrealized appreciation on the applicable securities is included in Other payables and accrued expenses on the Statement of Assets & Liabilities.
Distributions are declared and recorded on the ex-dividend date. Income and capital gain distributions are declared separately for each class. Income and capital gain distributions are determined in accordance with income tax regulations, which may differ from GAAP. In addition, the Fund claimed a portion of the payment made to redeeming shareholders as a distribution for income tax purposes.
Capital accounts within the financial statements are adjusted for permanent book-tax differences. These adjustments have no impact on net assets or the results of operations. Capital accounts are not adjusted for temporary book-tax differences which will reverse in a subsequent period.
Book-tax differences are primarily due to futures contracts, foreign currency transactions, partnerships, market discount and losses deferred due to wash sales and excise tax regulations.
As of period end, the cost and unrealized appreciation (depreciation) in securities, and derivatives if applicable, for federal income tax purposes were as follows:
| Gross unrealized appreciation | $1,380,954 |
| Gross unrealized depreciation | (2,009,135) |
| Net unrealized appreciation (depreciation) | $(628,181) |
| Tax Cost | $20,255,412 |
The tax-based components of distributable earnings as of period end were as follows:
| Undistributed ordinary income | $– |
| Net unrealized appreciation (depreciation) on securities and other investments | $(628,428) |
The Fund intends to elect to defer to its next fiscal year $5,139,826 of capital losses recognized during the period November 1, 2018 to April 30, 2019, and $111,206 of ordinary losses recognized during the period January 1, 2019 to April 30, 2019.
The tax character of distributions paid was as follows:
| April 30, 2019 | April 30, 2018 | |
| Ordinary Income | $546,745 | $ 458,567 |
| Long-term Capital Gains | 1,343,379 | 1,842,296 |
| Total | $1,890,124 | $ 2,300,863 |
Restricted Securities. The Fund may invest in securities that are subject to legal or contractual restrictions on resale. These securities generally may be resold in transactions exempt from registration or to the public if the securities are registered. Disposal of these securities may involve time-consuming negotiations and expense, and prompt sale at an acceptable price may be difficult. Information regarding restricted securities is included at the end of the Fund's Schedule of Investments.
New Rule Issuance. During August 2018, the U.S. Securities and Exchange Commission issued Final Rule Release No. 33-10532, Disclosure Update and Simplification. This Final Rule includes amendments specific to registered investment companies that are intended to eliminate overlap in disclosure requirements between Regulation S-X and GAAP. In accordance with these amendments, certain line-items in the Fund's financial statements have been combined or removed for the current period as outlined in the table below.
| Financial Statement | Current Line-Item Presentation (As Applicable) | Prior Line-Item Presentation (As Applicable) |
| Statement of Assets and Liabilities | Total distributable earnings (loss) | Undistributed/Distributions in excess of/Accumulated net investment income (loss) Accumulated/Undistributed net realized gain (loss) Net unrealized appreciation (depreciation) |
| Statement of Changes in Net Assets | N/A - removed | Undistributed/Distributions in excess of/Accumulated net investment income (loss) end of period |
| Statement of Changes in Net Assets | Distributions to shareholders | Distributions to shareholders from net investment income Distributions to shareholders from net realized gain |
| Distributions to Shareholders Note to Financial Statements | Distributions to shareholders | Distributions to shareholders from net investment income Distributions to shareholders from net realized gain |
4. Derivative Instruments.
Risk Exposures and the Use of Derivative Instruments. The Fund's investment objective allows the Fund to enter into various types of derivative contracts, including futures contracts. Derivatives are investments whose value is primarily derived from underlying assets, indices or reference rates and may be transacted on an exchange or over-the-counter (OTC). Derivatives may involve a future commitment to buy or sell a specified asset based on specified terms, to exchange future cash flows at periodic intervals based on a notional principal amount, or for one party to make one or more payments upon the occurrence of specified events in exchange for periodic payments from the other party.
The Fund used derivatives to increase returns and to manage exposure to certain risks as defined below. The success of any strategy involving derivatives depends on analysis of numerous economic factors, and if the strategies for investment do not work as intended, the Fund may not achieve its objectives.
The Fund's use of derivatives increased or decreased its exposure to the following risk:
| Equity Risk | Equity risk relates to the fluctuations in the value of financial instruments as a result of changes in market prices (other than those arising from interest rate risk or foreign exchange risk), whether caused by factors specific to an individual investment, its issuer, or all factors affecting all instruments traded in a market or market segment. |
The Fund is also exposed to additional risks from investing in derivatives, such as liquidity risk and counterparty credit risk. Liquidity risk is the risk that the Fund will be unable to close out the derivative in the open market in a timely manner. Counterparty credit risk is the risk that the counterparty will not be able to fulfill its obligation to the Fund. Counterparty credit risk related to exchange-traded futures contracts may be mitigated by the protection provided by the exchange on which they trade.
Investing in derivatives may involve greater risks than investing in the underlying assets directly and, to varying degrees, may involve risk of loss in excess of any initial investment and collateral received and amounts recognized in the Statement of Assets and Liabilities. In addition, there may be the risk that the change in value of the derivative contract does not correspond to the change in value of the underlying instrument.
Futures Contracts. A futures contract is an agreement between two parties to buy or sell a specified underlying instrument for a fixed price at a specified future date. The Fund used futures contracts to manage its exposure to the stock market.
Upon entering into a futures contract, a fund is required to deposit either cash or securities (initial margin) with a clearing broker in an amount equal to a certain percentage of the face value of the contract. Futures contracts are marked-to-market daily and subsequent daily payments (variation margin) are made or received by a fund depending on the daily fluctuations in the value of the futures contracts and are recorded as unrealized appreciation or (depreciation). This receivable and/or payable, if any, is included in daily variation margin on futures contracts in the Statement of Assets and Liabilities. Realized gain or (loss) is recorded upon the expiration or closing of a futures contract. The net realized gain (loss) and change in net unrealized appreciation (depreciation) on futures contracts during the period is presented in the Statement of Operations.
Any open futures contracts at period end are presented in the Schedule of Investments under the caption "Futures Contracts". The notional amount at value reflects each contract's exposure to the underlying instrument or index at period end. Securities deposited to meet initial margin requirements are identified in the Schedule of Investments.
5. Purchases and Sales of Investments.
Purchases and sales of securities, other than short-term securities, aggregated $29,941,579 and $46,482,554, respectively.
6. Fees and Other Transactions with Affiliates.
Management Fee. Fidelity Management & Research Company (the investment adviser) and its affiliates provide the Fund with investment management related services for which the Fund pays a monthly management fee. The management fee is the sum of an individual fund fee rate that is based on an annual rate of .60% of the Fund's average net assets and an annualized group fee rate that averaged .24% during the period. The group fee rate is based upon the average net assets of all the mutual funds advised by the investment adviser, including any mutual funds previously advised by the investment adviser that are currently advised by Fidelity SelectCo, LLC, an affiliate of the investment adviser. The group fee rate decreases as assets under management increase and increases as assets under management decrease. In addition, the management fee is subject to a performance adjustment (up to a maximum of +/- .10% of the Fund's average net assets over a 36 month performance period). The upward or downward adjustment to the management fee is based on the relative investment performance of Class I of the Fund as compared to its benchmark index, the Russell 3000 Index, over the same 36 month performance period. For the reporting period, the total annual management fee rate, including the performance adjustment, was .80% of the Fund's average net assets. The performance adjustment included in the management fee rate may be higher or lower than the maximum performance adjustment rate due to the difference between the average net assets for the reporting and performance periods.
Distribution and Service Plan Fees. In accordance with Rule 12b-1 of the 1940 Act, the Fund has adopted separate Distribution and Service Plans for each class of shares. Certain classes pay Fidelity Distributors Corporation (FDC), an affiliate of the investment adviser, separate Distribution and Service Fees, each of which is based on an annual percentage of each class' average net assets. In addition, FDC may pay financial intermediaries for selling shares of the Fund and providing shareholder support services. For the period, the Distribution and Service Fee rates, total fees and amounts retained by FDC were as follows:
| Distribution Fee | Service Fee | Total Fees | Retained by FDC | |
| Class A | -% | .25% | $26,753 | $2,375 |
| Class M | .25% | .25% | 14,316 | – |
| Class C | .75% | .25% | 47,053 | 10,941 |
| $88,122 | $13,316 |
Sales Load. FDC may receive a front-end sales charge of up to 5.75% for selling Class A shares and 3.50% for selling Class M shares, some of which is paid to financial intermediaries for selling shares of the Fund. Depending on the holding period, FDC may receive contingent deferred sales charges levied on Class A, Class M and Class C redemptions. The deferred sales charges are 1.00% for Class C shares, 1.00% for certain purchases of Class A shares and .25% for certain purchases of Class M shares.
For the period, sales charge amounts retained by FDC were as follows:
| Retained by FDC | |
| Class A | $7,500 |
| Class M | 718 |
| Class C(a) | 653 |
| $8,871 |
(a) When Class C shares are initially sold, FDC pays commissions from its own resources to financial intermediaries through which the sales are made.
Transfer Agent Fees. Fidelity Investments Institutional Operations Company, Inc., (FIIOC), an affiliate of the investment adviser, is the transfer, dividend disbursing and shareholder servicing agent for each class of the Fund. FIIOC receives account fees and asset-based fees that vary according to the account size and type of account of the shareholders of the respective classes of the Fund, except for Class Z. FIIOC receives an asset-based fee of Class Z's average net assets. FIIOC pays for typesetting, printing and mailing of shareholder reports, except proxy statements.
For the period, transfer agent fees for each class were as follows:
| Amount | % of Class-Level Average Net Assets | |
| Class A | $26,893 | .25 |
| Class M | 7,630 | .27 |
| Class C | 11,202 | .24 |
| Class I | 27,537 | .16 |
| Class Z | 221 | .05(a) |
| $73,483 |
(a) Annualized
Accounting and Security Lending Fees. Fidelity Service Company, Inc. (FSC), an affiliate of the investment adviser, maintains the Fund's accounting records. The accounting fee is based on the level of average net assets for each month. Prior to April 1, 2019, FSC had a separate agreement with the Fund for administration of the security lending program, based on the number and duration of lending transactions. For the period, the total fees paid for accounting and administration of securities lending were equivalent to an annual rate of .04%.
Brokerage Commissions. The Fund placed a portion of its portfolio transactions with brokerage firms which are affiliates of the investment adviser. Brokerage commissions are included in net realized gain (loss) and change in net unrealized appreciation (depreciation) in the Statement of Operations. The commissions paid to these affiliated firms were $1,793 for the period.
Interfund Trades. The Fund may purchase from or sell securities to other Fidelity Funds under procedures adopted by the Board. The procedures have been designed to ensure these interfund trades are executed in accordance with Rule 17a-7 of the 1940 Act. Interfund trades are included within the respective purchases and sales amounts shown in the Purchases and Sales of Investments note.
7. Committed Line of Credit.
The Fund participates with other funds managed by the investment adviser or an affiliate in a $4.25 billion credit facility (the "line of credit") to be utilized for temporary or emergency purposes to fund shareholder redemptions or for other short-term liquidity purposes. The Fund has agreed to pay commitment fees on its pro-rata portion of the line of credit, which amounted to $102 and is reflected in Miscellaneous expenses on the Statement of Operations. During the period, the Fund did not borrow on this line of credit.
8. Security Lending.
The Fund lends portfolio securities through a lending agent from time to time in order to earn additional income. For equity securities, a lending agent is used and may loan securities to certain qualified borrowers, including Fidelity Capital Markets (FCM), a broker-dealer affiliated with the Fund. On the settlement date of the loan, the Fund receives collateral (in the form of U.S. Treasury obligations, letters of credit and/or cash) against the loaned securities and maintains collateral in an amount not less than 100% of the market value of the loaned securities during the period of the loan. The market value of the loaned securities is determined at the close of business of the Fund and any additional required collateral is delivered to the Fund on the next business day. The Fund or borrower may terminate the loan at any time, and if the borrower defaults on its obligation to return the securities loaned because of insolvency or other reasons, the Fund may apply collateral received from the borrower against the obligation. The Fund may experience delays and costs in recovering the securities loaned. Any cash collateral received is invested in the Fidelity Securities Lending Cash Central Fund. The value of loaned securities and cash collateral at period end are disclosed on the Fund's Statement of Assets and Liabilities. At period end, there were no security loans outstanding with FCM. Security lending income represents the income earned on investing cash collateral, less rebates paid to borrowers and any lending agent fees associated with the loan, plus any premium payments received for lending certain types of securities. Security lending income is presented in the Statement of Operations as a component of income from Fidelity Central Funds, and includes $2,554 from securities loaned to FCM.
9. Expense Reductions.
The investment adviser contractually agreed to reimburse each class to the extent annual operating expenses exceeded certain levels of class-level average net assets as noted in the table below. This reimbursement will remain in place through August 31, 2020. Some expenses, for example the compensation of the independent Trustees, and certain miscellaneous expenses such as proxy and shareholder meeting expenses, are excluded from this reimbursement.
The following classes were in reimbursement during the period:
| Expense Limitations | Reimbursement | |
| Class A | 1.55% | $16,498 |
| Class M | 1.80% | 4,851 |
| Class C | 2.30% | 6,620 |
| Class I | 1.30% | 5,095 |
| Class Z | 1.15% | 1,593 |
| $34,657 |
Commissions paid to certain brokers with whom the investment adviser, or its affiliates, places trades on behalf of the Fund include an amount in addition to trade execution, which may be rebated back to the Fund to offset certain expenses. This amount totaled $6,475 for the period. In addition, through arrangements with the Fund's custodian, credits realized as a result of certain uninvested cash balances were used to reduce the Fund's expenses. During the period, these credits reduced the Fund's custody expenses by $163.
In addition, during the period the investment adviser reimbursed and/or waived a portion of fund-level operating expenses in the amount of $286 and a portion of class-level operating expenses as follows:
| Amount | |
| Class A | $6,682 |
| Class M | 1,889 |
| Class C | 3,020 |
| Class I | 4,117 |
| Class Z | 430 |
| $16,138 |
10. Distributions to Shareholders.
Distributions to shareholders of each class were as follows:
| Year ended April 30, 2019(a) | Year ended April 30, 2018 | |
| Distributions to shareholders | ||
| Class A | $544,268 | $– |
| Class M | 136,286 | – |
| Class C | 219,562 | – |
| Class I | 935,781 | – |
| Class Z | 54,227 | – |
| Total | $1,890,124 | $ - |
| From net realized gain | ||
| Class A | $– | $593,053 |
| Class M | – | 184,264 |
| Class C | – | 298,372 |
| Class I | – | 1,225,174 |
| Total | $– | $2,300,863 |
(a) Distributions for Class Z are for the period October 2, 2018 (commencement of sale of shares) to April 30, 2019.
11. Share Transactions.
Share transactions for each class were as follows and may contain automatic conversions between classes or exchanges between affiliated funds:
| Shares | Shares | Dollars | Dollars | |
| Year ended April 30, 2019(a) | Year ended April 30, 2018 | Year ended April 30, 2019 (a) | Year ended April 30, 2018 | |
| Class A | ||||
| Shares sold | 238,741 | 450,756 | $3,058,992 | $6,238,605 |
| Reinvestment of distributions | 46,215 | 44,180 | 541,683 | 591,573 |
| Shares redeemed | (409,304) | (132,477) | (4,769,599) | (1,823,574) |
| Net increase (decrease) | (124,348) | 362,459 | $(1,168,924) | $5,006,604 |
| Class M | ||||
| Shares sold | 29,846 | 94,566 | $384,279 | $1,299,217 |
| Reinvestment of distributions | 11,670 | 13,813 | 136,286 | 184,264 |
| Shares redeemed | (66,594) | (74,588) | (762,229) | (1,015,070) |
| Net increase (decrease) | (25,078) | 33,791 | $(241,664) | $468,411 |
| Class C | ||||
| Shares sold | 86,038 | 164,128 | $1,131,579 | $2,231,576 |
| Reinvestment of distributions | 19,042 | 22,465 | 219,142 | 296,504 |
| Shares redeemed | (171,996) | (79,141) | (2,055,378) | (1,067,604) |
| Net increase (decrease) | (66,916) | 107,452 | $(704,657) | $1,460,476 |
| Class I | ||||
| Shares sold | 551,800 | 1,360,275 | $7,517,728 | $18,956,142 |
| Reinvestment of distributions | 66,193 | 57,819 | 803,114 | 777,083 |
| Shares redeemed | (2,117,175) | (483,947) | (26,454,593) | (6,691,268) |
| Net increase (decrease) | (1,499,182) | 934,147 | $(18,133,751) | $13,041,957 |
| Class Z | ||||
| Shares sold | 171,060 | �� | $2,096,921 | $– |
| Reinvestment of distributions | 5,027 | – | 53,589 | – |
| Shares redeemed | (131,800) | – | (1,483,785) | – |
| Net increase (decrease) | 44,287 | – | $666,725 | $– |
(a) Share transactions for Class Z are for the period October 2, 2018 (commencement of sale of shares) to April 30, 2019
12. Other.
The Fund's organizational documents provide former and current trustees and officers with a limited indemnification against liabilities arising in connection with the performance of their duties to the Fund. In the normal course of business, the Fund may also enter into contracts that provide general indemnifications. The Fund's maximum exposure under these arrangements is unknown as this would be dependent on future claims that may be made against the Fund. The risk of material loss from such claims is considered remote.
Report of Independent Registered Public Accounting Firm
To the Board of Trustees of Fidelity Concord Street Trust and Shareholders of Fidelity Advisor Event Driven Opportunities Fund:
Opinion on the Financial Statements
We have audited the accompanying statement of assets and liabilities, including the schedule of investments, of Fidelity Advisor Event Driven Opportunities Fund (one of the funds constituting Fidelity Concord Street Trust, referred to hereafter as the "Fund") as of April 30, 2019, the related statement of operations for the year ended April 30, 2019, the statement of changes in net assets for each of the two years in the period ended April 30, 2019, including the related notes, and the financial highlights for each of the periods indicated therein (collectively referred to as the "financial statements"). In our opinion, the financial statements present fairly, in all material respects, the financial position of the Fund as of April 30, 2019, the results of its operations for the year then ended, the changes in its net assets for each of the two years in the period ended April 30, 2019 and the financial highlights for each of the periods indicated therein in conformity with accounting principles generally accepted in the United States of America.
Basis for Opinion
These financial statements are the responsibility of the Fund’s management. Our responsibility is to express an opinion on the Fund’s financial statements based on our audits. We are a public accounting firm registered with the Public Company Accounting Oversight Board (United States) (PCAOB) and are required to be independent with respect to the Fund in accordance with the U.S. federal securities laws and the applicable rules and regulations of the Securities and Exchange Commission and the PCAOB.
We conducted our audits of these financial statements in accordance with the standards of the PCAOB. Those standards require that we plan and perform the audit to obtain reasonable assurance about whether the financial statements are free of material misstatement, whether due to error or fraud.
Our audits included performing procedures to assess the risks of material misstatement of the financial statements, whether due to error or fraud, and performing procedures that respond to those risks. Such procedures included examining, on a test basis, evidence regarding the amounts and disclosures in the financial statements. Our audits also included evaluating the accounting principles used and significant estimates made by management, as well as evaluating the overall presentation of the financial statements. Our procedures included confirmation of securities owned as of April 30, 2019 by correspondence with the custodian, and brokers; when replies were not received from brokers, we performed other auditing procedures. We believe that our audits provide a reasonable basis for our opinion.
PricewaterhouseCoopers LLP
Boston, Massachusetts
June 17, 2019
We have served as the auditor of one or more investment companies in the Fidelity group of funds since 1932.
Trustees and Officers
The Trustees, Members of the Advisory Board (if any), and officers of the trust and fund, as applicable, are listed below. The Board of Trustees governs the fund and is responsible for protecting the interests of shareholders. The Trustees are experienced executives who meet periodically throughout the year to oversee the fund's activities, review contractual arrangements with companies that provide services to the fund, oversee management of the risks associated with such activities and contractual arrangements, and review the fund's performance. Except for Jonathan Chiel, each of the Trustees oversees 289 funds. Mr. Chiel oversees 158 funds.
The Trustees hold office without limit in time except that (a) any Trustee may resign; (b) any Trustee may be removed by written instrument, signed by at least two-thirds of the number of Trustees prior to such removal; (c) any Trustee who requests to be retired or who has become incapacitated by illness or injury may be retired by written instrument signed by a majority of the other Trustees; and (d) any Trustee may be removed at any special meeting of shareholders by a two-thirds vote of the outstanding voting securities of the trust. Each Trustee who is not an interested person (as defined in the 1940 Act) of the trust and the fund is referred to herein as an Independent Trustee. Each Independent Trustee shall retire not later than the last day of the calendar year in which his or her 75th birthday occurs. The Independent Trustees may waive this mandatory retirement age policy with respect to individual Trustees. Officers and Advisory Board Members hold office without limit in time, except that any officer or Advisory Board Member may resign or may be removed by a vote of a majority of the Trustees at any regular meeting or any special meeting of the Trustees. Except as indicated, each individual has held the office shown or other offices in the same company for the past five years.
The fund’s Statement of Additional Information (SAI) includes more information about the Trustees. To request a free copy, call Fidelity at 1-877-208-0098.
Experience, Skills, Attributes, and Qualifications of the Trustees. The Governance and Nominating Committee has adopted a statement of policy that describes the experience, qualifications, attributes, and skills that are necessary and desirable for potential Independent Trustee candidates (Statement of Policy). The Board believes that each Trustee satisfied at the time he or she was initially elected or appointed a Trustee, and continues to satisfy, the standards contemplated by the Statement of Policy. The Governance and Nominating Committee also engages professional search firms to help identify potential Independent Trustee candidates who have the experience, qualifications, attributes, and skills consistent with the Statement of Policy. From time to time, additional criteria based on the composition and skills of the current Independent Trustees, as well as experience or skills that may be appropriate in light of future changes to board composition, business conditions, and regulatory or other developments, have also been considered by the professional search firms and the Governance and Nominating Committee. In addition, the Board takes into account the Trustees' commitment and participation in Board and committee meetings, as well as their leadership of standing and ad hoc committees throughout their tenure.
In determining that a particular Trustee was and continues to be qualified to serve as a Trustee, the Board has considered a variety of criteria, none of which, in isolation, was controlling. The Board believes that, collectively, the Trustees have balanced and diverse experience, qualifications, attributes, and skills, which allow the Board to operate effectively in governing the fund and protecting the interests of shareholders. Information about the specific experience, skills, attributes, and qualifications of each Trustee, which in each case led to the Board's conclusion that the Trustee should serve (or continue to serve) as a trustee of the fund, is provided below.
Board Structure and Oversight Function. James C. Curvey is an interested person and currently serves as Chairman. The Trustees have determined that an interested Chairman is appropriate and benefits shareholders because an interested Chairman has a personal and professional stake in the quality and continuity of services provided to the fund. Independent Trustees exercise their informed business judgment to appoint an individual of their choosing to serve as Chairman, regardless of whether the Trustee happens to be independent or a member of management. The Independent Trustees have determined that they can act independently and effectively without having an Independent Trustee serve as Chairman and that a key structural component for assuring that they are in a position to do so is for the Independent Trustees to constitute a substantial majority for the Board. The Independent Trustees also regularly meet in executive session. Ned C. Lautenbach serves as Chairman of the Independent Trustees and as such (i) acts as a liaison between the Independent Trustees and management with respect to matters important to the Independent Trustees and (ii) with management prepares agendas for Board meetings.
Fidelity® funds are overseen by different Boards of Trustees. The fund's Board oversees Fidelity's high income and certain equity funds, and other Boards oversee Fidelity's investment-grade bond, money market, asset allocation, and other equity funds. The asset allocation funds may invest in Fidelity® funds overseen by the fund's Board. The use of separate Boards, each with its own committee structure, allows the Trustees of each group of Fidelity® funds to focus on the unique issues of the funds they oversee, including common research, investment, and operational issues. On occasion, the separate Boards establish joint committees to address issues of overlapping consequences for the Fidelity® funds overseen by each Board.
The Trustees operate using a system of committees to facilitate the timely and efficient consideration of all matters of importance to the Trustees, the fund, and fund shareholders and to facilitate compliance with legal and regulatory requirements and oversight of the fund's activities and associated risks. The Board, acting through its committees, has charged FMR and its affiliates with (i) identifying events or circumstances the occurrence of which could have demonstrably adverse effects on the fund's business and/or reputation; (ii) implementing processes and controls to lessen the possibility that such events or circumstances occur or to mitigate the effects of such events or circumstances if they do occur; and (iii) creating and maintaining a system designed to evaluate continuously business and market conditions in order to facilitate the identification and implementation processes described in (i) and (ii) above. Because the day-to-day operations and activities of the fund are carried out by or through FMR, its affiliates, and other service providers, the fund's exposure to risks is mitigated but not eliminated by the processes overseen by the Trustees. While each of the Board's committees has responsibility for overseeing different aspects of the fund's activities, oversight is exercised primarily through the Operations, Audit, and Compliance Committees. In addition, the Independent Trustees have worked with Fidelity to enhance the Board's oversight of investment and financial risks, legal and regulatory risks, technology risks, and operational risks, including the development of additional risk reporting to the Board. Appropriate personnel, including but not limited to the fund's Chief Compliance Officer (CCO), FMR's internal auditor, the independent accountants, the fund's Treasurer and portfolio management personnel, make periodic reports to the Board's committees, as appropriate, including an annual review of Fidelity's risk management program for the Fidelity® funds. The responsibilities of each standing committee, including their oversight responsibilities, are described further under "Standing Committees of the Trustees."
Interested Trustees*:
Correspondence intended for a Trustee who is an interested person may be sent to Fidelity Investments, 245 Summer Street, Boston, Massachusetts 02210.
Name, Year of Birth; Principal Occupations and Other Relevant Experience+
Jonathan Chiel (1957)
Year of Election or Appointment: 2016
Trustee
Mr. Chiel also serves as Trustee of other Fidelity® funds. Mr. Chiel is Executive Vice President and General Counsel for FMR LLC (diversified financial services company, 2012-present). Previously, Mr. Chiel served as general counsel (2004-2012) and senior vice president and deputy general counsel (2000-2004) for John Hancock Financial Services; a partner with Choate, Hall & Stewart (1996-2000) (law firm); and an Assistant United States Attorney for the United States Attorney’s Office of the District of Massachusetts (1986-95), including Chief of the Criminal Division (1993-1995). Mr. Chiel is a director on the boards of the Boston Bar Foundation and the Maimonides School.
James C. Curvey (1935)
Year of Election or Appointment: 2007
Trustee
Chairman of the Board of Trustees
Mr. Curvey also serves as Trustee of other Fidelity® funds. Mr. Curvey is Vice Chairman (2007-present) and Director of FMR LLC (diversified financial services company). In addition, Mr. Curvey is an Overseer Emeritus for the Boston Symphony Orchestra, a Director of Artis-Naples, and a Trustee of Brewster Academy in Wolfeboro, New Hampshire. Previously, Mr. Curvey served as a Director of Fidelity Research & Analysis Co. (investment adviser firm, 2009-2018), Director of Fidelity Investments Money Management, Inc. (investment adviser firm, 2009-2014) and a Director of FMR and FMR Co., Inc. (investment adviser firms, 2007-2014).
* Determined to be an “Interested Trustee” by virtue of, among other things, his or her affiliation with the trust[s] or various entities under common control with FMR.
+ The information includes the Trustee's principal occupation during the last five years and other information relating to the experience, attributes, and skills relevant to the Trustee's qualifications to serve as a Trustee, which led to the conclusion that the Trustee should serve as a Trustee for the fund.
Independent Trustees:
Correspondence intended for an Independent Trustee may be sent to Fidelity Investments, P.O. Box 55235, Boston, Massachusetts 02205-5235.
Name, Year of Birth; Principal Occupations and Other Relevant Experience+
Dennis J. Dirks (1948)
Year of Election or Appointment: 2005
Trustee
Mr. Dirks also serves as Trustee of other Fidelity® funds. Prior to his retirement in May 2003, Mr. Dirks was Chief Operating Officer and a member of the Board of The Depository Trust & Clearing Corporation (DTCC). He also served as President, Chief Operating Officer, and Board member of The Depository Trust Company (DTC) and President and Board member of the National Securities Clearing Corporation (NSCC). In addition, Mr. Dirks served as Chief Executive Officer and Board member of the Government Securities Clearing Corporation, Chief Executive Officer and Board member of the Mortgage-Backed Securities Clearing Corporation, as a Trustee and a member of the Finance Committee of Manhattan College (2005-2008), as a Trustee and a member of the Finance Committee of AHRC of Nassau County (2006-2008), as a member of the Independent Directors Council (IDC) Governing Council (2010-2015), and as a member of the Board of Directors for The Brookville Center for Children’s Services, Inc. (2009-2017). Mr. Dirks is a member of the Finance Committee (2016-present) and Board of Directors (2017-present) and is Treasurer (2018-present) of the Asolo Repertory Theatre.
Donald F. Donahue (1950)
Year of Election or Appointment: 2018
Trustee
Mr. Donahue also serves as a Trustee of other Fidelity® funds. Mr. Donahue is President and Chief Executive Officer of Miranda Partners, LLC (risk consulting for the financial services industry, 2012-present). Previously, Mr. Donahue served as a Member of the Advisory Board of certain Fidelity® funds (2015-2018) and Chief Executive Officer (2006-2012), Chief Operating Officer (2003-2006), and Managing Director, Customer Marketing and Development (1999-2003) of The Depository Trust & Clearing Corporation (financial markets infrastructure). Mr. Donahue serves as a Member (2007-present) and Co-Chairman (2016-present) of the Board of Directors of United Way of New York, Member of the Board of Directors of NYC Leadership Academy (2012-present) and Member of the Board of Advisors of Ripple Labs, Inc. (financial services, 2015-present). He also served as Chairman (2010-2012) and Member of the Board of Directors (2012-2013) of Omgeo, LLC (financial services), Treasurer of United Way of New York (2012-2016), and Member of the Board of Directors of XBRL US (financial services non-profit, 2009-2012) and the International Securities Services Association (2009-2012).
Alan J. Lacy (1953)
Year of Election or Appointment: 2008
Trustee
Mr. Lacy also serves as Trustee of other Fidelity® funds. Mr. Lacy serves as a Director of Bristol-Myers Squibb Company (global pharmaceuticals, 2008-present). He is a Trustee of the California Chapter of The Nature Conservancy (2015-present) and a Director of the Center for Advanced Study in the Behavioral Sciences at Stanford University (2015-present). In addition, Mr. Lacy served as Senior Adviser (2007-2014) of Oak Hill Capital Partners, L.P. (private equity) and also served as Chief Executive Officer (2005) and Vice Chairman (2005-2006) of Sears Holdings Corporation (retail) and Chief Executive Officer and Chairman of the Board of Sears, Roebuck and Co. (retail, 2000-2005). Previously, Mr. Lacy served as Chairman (2014-2017) and a member (2010-2017) of the Board of Directors of Dave & Buster’s Entertainment, Inc. (restaurant and entertainment complexes), as Chairman (2008-2011) and a member (2006-2015) of the Board of Trustees of the National Parks Conservation Association, and as a member of the Board of Directors for The Hillman Companies, Inc. (hardware wholesalers, 2010-2014), Earth Fare, Inc. (retail grocery, 2010-2014), and The Western Union Company (global money transfer, 2006-2011).
Ned C. Lautenbach (1944)
Year of Election or Appointment: 2000
Trustee
Chairman of the Independent Trustees
Mr. Lautenbach also serves as Trustee of other Fidelity® funds. Mr. Lautenbach currently serves as Chair (2018-present) and Member (2013-present) of the Board of Governors, State University System of Florida and is a member of the Council on Foreign Relations (1994-present). He is also a member and has most recently served as Chairman of the Board of Directors of Artis-Naples (2012-present). Previously, Mr. Lautenbach served as a member and then Lead Director of the Board of Directors of Eaton Corporation (diversified industrial, 1997-2016). He was also a Partner and Advisory Partner at Clayton, Dubilier & Rice, LLC (private equity investment, 1998-2010), as well as a Director of Sony Corporation (2006-2007). In addition, Mr. Lautenbach also had a 30-year career with IBM (technology company) during which time he served as Senior Vice President and a member of the Corporate Executive Committee (1968-1998).
Joseph Mauriello (1944)
Year of Election or Appointment: 2008
Trustee
Mr. Mauriello also serves as Trustee of other Fidelity® funds. Prior to his retirement in January 2006, Mr. Mauriello served in numerous senior management positions including Deputy Chairman and Chief Operating Officer (2004-2005), and Vice Chairman of Financial Services (2002-2004) of KPMG LLP US (professional services, 1965-2005). Mr. Mauriello currently serves as a member of the Independent Directors Council (IDC) Governing Council (2015-present). Previously, Mr. Mauriello served as a member of the Board of Directors of XL Group plc. (global insurance and re-insurance, 2006-2018).
Cornelia M. Small (1944)
Year of Election or Appointment: 2005
Trustee
Ms. Small also serves as Trustee of other Fidelity® funds. Ms. Small is a member of the Board of Directors (2009-present) and Chair of the Investment Committee (2010-present) of the Teagle Foundation. Ms. Small also serves on the Investment Committee of the Berkshire Taconic Community Foundation (2008-present). Previously, Ms. Small served as Chairperson (2002-2008) and a member of the Investment Committee and Chairperson (2008-2012) and a member of the Board of Trustees of Smith College. In addition, Ms. Small served as Chief Investment Officer, Director of Global Equity Investments, and a member of the Board of Directors of Scudder, Stevens & Clark and Scudder Kemper Investments.
Garnett A. Smith (1947)
Year of Election or Appointment: 2018
Trustee
Mr. Smith also serves as Trustee of other Fidelity® funds. Prior to Mr. Smith's retirement, he served as Chairman and Chief Executive Officer of Inbrand Corp. (manufacturer of personal absorbent products, 1990-1997). He also served as President (1986-1990) of Inbrand Corp. Prior to his employment with Inbrand Corp., he was employed by a retail fabric chain and North Carolina National Bank. In addition, Mr. Smith served as a Member of the Advisory Board of certain Fidelity® funds (2012-2013) and as a board member of the Jackson Hole Land Trust (2009-2012).
David M. Thomas (1949)
Year of Election or Appointment: 2008
Trustee
Mr. Thomas also serves as Trustee of other Fidelity® funds. Mr. Thomas serves as Non-Executive Chairman of the Board of Directors of Fortune Brands Home and Security (home and security products, 2011-present) and as a member of the Board of Directors (2004-present) and Presiding Director (2013-present) of Interpublic Group of Companies, Inc. (marketing communication). Previously, Mr. Thomas served as Executive Chairman (2005-2006) and Chairman and Chief Executive Officer (2000-2005) of IMS Health, Inc. (pharmaceutical and healthcare information solutions), a Director of Fortune Brands, Inc. (consumer products, 2000-2011), and a member of the Board of Trustees of the University of Florida (2013-2018).
+ The information includes the Trustee's principal occupation during the last five years and other information relating to the experience, attributes, and skills relevant to the Trustee's qualifications to serve as a Trustee, which led to the conclusion that the Trustee should serve as a Trustee for the fund.
Advisory Board Members and Officers:
Correspondence intended for a Member of the Advisory Board (if any) may be sent to Fidelity Investments, P.O. Box 55235, Boston, Massachusetts 02205-5235. Correspondence intended for an officer or Peter S. Lynch may be sent to Fidelity Investments, 245 Summer Street, Boston, Massachusetts 02210. Officers appear below in alphabetical order.
Name, Year of Birth; Principal Occupation
Vicki L. Fuller (1957)
Year of Election or Appointment: 2018
Member of the Advisory Board
Ms. Fuller also serves as Member of the Advisory Board of other Fidelity® funds. Ms. Fuller serves as a member of the Board of Directors, Audit Committee, and Nominating and Governance Committee of The Williams Companies, Inc. (natural gas infrastructure, 2018-present). Previously, Ms. Fuller served as the Chief Investment Officer of the New York State Common Retirement Fund (2012-2018) and held a variety of positions at AllianceBernstein L.P. (global asset management, 1985-2012), including Managing Director (2006-2012) and Senior Vice President and Senior Portfolio Manager (2001-2006).
Peter S. Lynch (1944)
Year of Election or Appointment: 2003
Member of the Advisory Board
Mr. Lynch also serves as Member of the Advisory Board of other Fidelity® funds. Mr. Lynch is Vice Chairman and a Director of FMR (investment adviser firm) and FMR Co., Inc. (investment adviser firm). In addition, Mr. Lynch serves as a Trustee of Boston College and as the Chairman of the Inner-City Scholarship Fund. Previously, Mr. Lynch served on the Special Olympics International Board of Directors (1997-2006).
Carol B. Tomé (1957)
Year of Election or Appointment: 2018
Member of the Advisory Board
Ms. Tomé also serves as Member of the Advisory Board of other Fidelity® funds. Ms. Tomé is Chief Financial Officer (2001-present) and Executive Vice President of Corporate Services (2007-present) of The Home Depot, Inc. (home improvement retailer) and a Director (2003-present) and Chair of the Audit Committee (2004-present) of United Parcel Service, Inc. (package delivery and supply chain management). Previously, Ms. Tomé served as Trustee of certain Fidelity® funds (2017), Senior Vice President of Finance and Accounting/Treasurer (2000-2007) and Vice President and Treasurer (1995-2000) of The Home Depot, Inc. and Chair of the Board (2010-2012), Vice Chair of the Board (2009 and 2013), and a Director (2008-2013) of the Federal Reserve Bank of Atlanta. Ms. Tomé is also a director or trustee of many community and professional organizations.
Michael E. Wiley (1950)
Year of Election or Appointment: 2018
Member of the Advisory Board
Mr. Wiley also serves as Trustee or Member of the Advisory Board of other Fidelity® funds. Mr. Wiley serves as a Director of High Point Resources (exploration and production, 2005-present). Previously, Mr. Wiley served as a Director of Andeavor Corporation (independent oil refiner and marketer, 2005-2018), a Director of Andeavor Logistics LP (natural resources logistics, 2015-2018), a Director of Post Oak Bank (privately-held bank, 2004-2018), a Director of Asia Pacific Exploration Consolidated (international oil and gas exploration and production, 2008-2013), a member of the Board of Trustees of the University of Tulsa (2000-2006; 2007-2010), a Senior Energy Advisor of Katzenbach Partners, LLC (consulting, 2006-2007), an Advisory Director of Riverstone Holdings (private investment), a Director of Spinnaker Exploration Company (exploration and production, 2001-2005) and Chairman, President, and CEO of Baker Hughes, Inc. (oilfield services, 2000-2004).
Elizabeth Paige Baumann (1968)
Year of Election or Appointment: 2017
Anti-Money Laundering (AML) Officer
Ms. Baumann also serves as AML Officer of other funds. She is Chief AML Officer (2012-present) and Senior Vice President (2014-present) of FMR LLC (diversified financial services company) and is an employee of Fidelity Investments. Previously, Ms. Baumann served as AML Officer of the funds (2012-2016), and Vice President (2007-2014) and Deputy Anti-Money Laundering Officer (2007-2012) of FMR LLC.
Craig S. Brown (1977)
Year of Election or Appointment: 2019
Assistant Treasurer
Mr. Brown also serves as Assistant Treasurer of other funds. Mr. Brown is an employee of Fidelity Investments (2013-present).
John J. Burke III (1964)
Year of Election or Appointment: 2018
Chief Financial Officer
Mr. Burke also serves as Chief Financial Officer of other funds. Mr. Burke serves as Head of Investment Operations for Fidelity Fund and Investment Operations (2018-present) and is an employee of Fidelity Investments (1998-present). Previously Mr. Burke served as head of Asset Management Investment Operations (2012-2018).
William C. Coffey (1969)
Year of Election or Appointment: 2018
Secretary and Chief Legal Officer (CLO)
Mr. Coffey also serves as Secretary and CLO of other funds. Mr. Coffey serves as CLO, Secretary, and Senior Vice President of Fidelity Management & Research Company and FMR Co., Inc. (investment adviser firms, 2018-present); Secretary of Fidelity SelectCo, LLC and Fidelity Investments Money Management, Inc. (investment adviser firms, 2018-present); and CLO of Fidelity Management & Research (Hong Kong) Limited, FMR Investment Management (UK) Limited, and Fidelity Management & Research (Japan) Limited (investment adviser firms, 2018-present). He is Senior Vice President and Deputy General Counsel of FMR LLC (diversified financial services company, 2010-present), and is an employee of Fidelity Investments. Previously, Mr. Coffey served as Assistant Secretary of certain funds (2009-2018) and as Vice President and Associate General Counsel of FMR LLC (2005-2009).
Timothy M. Cohen (1969)
Year of Election or Appointment: 2018
Vice President
Mr. Cohen also serves as Vice President of other funds. Mr. Cohen serves as Executive Vice President of Fidelity SelectCo, LLC (2019-present), Co-Head of Equity (2018-present), a Director of Fidelity Management & Research (Japan) Limited (investment adviser firm, 2016-present), and is an employee of Fidelity Investments. Previously, Mr. Cohen served as Head of Global Equity Research (2016-2018), Chief Investment Officer - Equity and a Director of Fidelity Management & Research (U.K.) Inc. (investment adviser firm, 2013-2015) and as a Director of Fidelity Management & Research (Hong Kong) Limited (investment adviser firm, 2017).
Jonathan Davis (1968)
Year of Election or Appointment: 2010
Assistant Treasurer
Mr. Davis also serves as Assistant Treasurer of other funds. Mr. Davis serves as Assistant Treasurer of FMR Capital, Inc. (2017-present) and is an employee of Fidelity Investments. Previously, Mr. Davis served as Vice President and Associate General Counsel of FMR LLC (diversified financial services company, 2003-2010).
Adrien E. Deberghes (1967)
Year of Election or Appointment: 2016
Assistant Treasurer
Mr. Deberghes also serves as an officer of other funds. He serves as Assistant Treasurer of FMR Capital, Inc. (2017-present), Executive Vice President of Fidelity Investments Money Management, Inc. (FIMM) (investment adviser firm, 2016-present), and is an employee of Fidelity Investments (2008-present). Previously, Mr. Deberghes served as President and Treasurer of certain Fidelity® funds (2013-2018). Prior to joining Fidelity Investments, Mr. Deberghes was Senior Vice President of Mutual Fund Administration at State Street Corporation (2007-2008), Senior Director of Mutual Fund Administration at Investors Bank & Trust (2005-2007), and Director of Finance for Dunkin' Brands (2000-2005). Previously, Mr. Deberghes served in other fund officer roles.
Laura M. Del Prato (1964)
Year of Election or Appointment: 2018
Assistant Treasurer
Ms. Del Prato also serves as an officer of other funds. Ms. Del Prato is an employee of Fidelity Investments (2017-present). Prior to joining Fidelity Investments, Ms. Del Prato served as a Managing Director and Treasurer of the JPMorgan Mutual Funds (2014-2017). Prior to JPMorgan, Ms. Del Prato served as a partner at Cohen Fund Audit Services (accounting firm, 2012-2013) and KPMG LLP (accounting firm, 2004-2012).
Colm A. Hogan (1973)
Year of Election or Appointment: 2016
Deputy Treasurer
Mr. Hogan also serves as an officer of other funds. Mr. Hogan serves as Assistant Treasurer of FMR Capital, Inc. (2017-present) and is an employee of Fidelity Investments (2005-present). Previously, Mr. Hogan served as Assistant Treasurer of certain Fidelity® funds (2016-2018).
Pamela R. Holding (1964)
Year of Election or Appointment: 2018
Vice President
Ms. Holding also serves as Vice President of other funds. Ms. Holding serves as Executive Vice President of Fidelity SelectCo, LLC (2019-present), Co-Head of Equity (2018-present) and is an employee of Fidelity Investments (2013-present). Previously, Ms. Holding served as Chief Investment Officer of Fidelity Institutional Asset Management (2013-2018).
Chris Maher (1972)
Year of Election or Appointment: 2013
Assistant Treasurer
Mr. Maher serves as Assistant Treasurer of other funds. Mr. Maher is Vice President of Valuation Oversight, serves as Assistant Treasurer of FMR Capital, Inc. (2017-present), and is an employee of Fidelity Investments. Previously, Mr. Maher served as Vice President of Asset Management Compliance (2013), Vice President of the Program Management Group of FMR (investment adviser firm, 2010-2013), and Vice President of Valuation Oversight (2008-2010).
Kenneth B. Robins (1969)
Year of Election or Appointment: 2016
Chief Compliance Officer
Mr. Robins also serves as an officer of other funds. Mr. Robins serves as Compliance Officer of Fidelity Management & Research Company and FMR Co., Inc. (investment adviser firms, 2016-present) and is an employee of Fidelity Investments (2004-present). Previously, Mr. Robins served as Executive Vice President of Fidelity Investments Money Management, Inc. (investment adviser firm, 2013-2016) and served in other fund officer roles.
Stacie M. Smith (1974)
Year of Election or Appointment: 2016
President and Treasurer
Ms. Smith also serves as an officer of other funds. Ms. Smith serves as Assistant Treasurer of FMR Capital, Inc. (2017-present), is an employee of Fidelity Investments (2009-present), and has served in other fund officer roles. Prior to joining Fidelity Investments, Ms. Smith served as Senior Audit Manager of Ernst & Young LLP (accounting firm, 1996-2009). Previously, Ms. Smith served as Assistant Treasurer (2013-2018) and Deputy Treasurer (2013-2016) of certain Fidelity® funds.
Marc L. Spector (1972)
Year of Election or Appointment: 2016
Assistant Treasurer
Mr. Spector also serves as an officer of other funds. Mr. Spector serves as Assistant Treasurer of FMR Capital, Inc. (2017-present) and is an employee of Fidelity Investments (2016-present). Prior to joining Fidelity Investments, Mr. Spector served as Director at the Siegfried Group (accounting firm, 2013-2016), and prior to Siegfried Group as audit senior manager at Deloitte & Touche (accounting firm, 2005-2013).
Jim Wegmann (1979)
Year of Election or Appointment: 2019
Assistant Treasurer
Mr. Wegmann also serves as Assistant Treasurer of other funds. Mr. Wegmann is an employee of Fidelity Investments (2011-present).
Shareholder Expense Example
As a shareholder of the Fund, you incur two types of costs: (1) transaction costs, including sales charges (loads) on purchase payments or redemption proceeds, and (2) ongoing costs, including management fees, distribution and/or service (12b-1) fees and other Fund expenses. This Example is intended to help you understand your ongoing costs (in dollars) of investing in the Fund and to compare these costs with the ongoing costs of investing in other mutual funds.
The Example is based on an investment of $1,000 invested at the beginning of the period and held for the entire period (November 1, 2018 to April 30, 2019).
Actual Expenses
The first line of the accompanying table for each class of the Fund provides information about actual account values and actual expenses. You may use the information in this line, together with the amount you invested, to estimate the expenses that you paid over the period. Simply divide your account value by $1,000.00 (for example, an $8,600 account value divided by $1,000.00 = 8.6), then multiply the result by the number in the first line for a class of the Fund under the heading entitled "Expenses Paid During Period" to estimate the expenses you paid on your account during this period. In addition, the Fund, as a shareholder in the underlying Fidelity Central Funds, will indirectly bear its pro-rata share of the fees and expenses incurred by the underlying Fidelity Central Funds. These fees and expenses are not included in the Fund's annualized expense ratio used to calculate the expense estimate in the table below.
Hypothetical Example for Comparison Purposes
The second line of the accompanying table for each class of the Fund provides information about hypothetical account values and hypothetical expenses based on a Class' actual expense ratio and an assumed rate of return of 5% per year before expenses, which is not the Class' actual return. The hypothetical account values and expenses may not be used to estimate the actual ending account balance or expenses you paid for the period. You may use this information to compare the ongoing costs of investing in the Fund and other funds. To do so, compare this 5% hypothetical example with the 5% hypothetical examples that appear in the shareholder reports of the other funds. In addition, the Fund, as a shareholder in the underlying Fidelity Central Funds, will indirectly bear its pro-rata share of the fees and expenses incurred by the underlying Fidelity Central Funds. These fees and expenses are not included in the Fund's annualized expense ratio used to calculate the expense estimate in the table below.
Please note that the expenses shown in the table are meant to highlight your ongoing costs only and do not reflect any transaction costs. Therefore, the second line of the table is useful in comparing ongoing costs only, and will not help you determine the relative total costs of owning different funds. In addition, if these transactional costs were included, your costs would have been higher.
| Annualized Expense Ratio-A | Beginning Account Value November 1, 2018 | Ending Account Value April 30, 2019 | Expenses Paid During Period-B November 1, 2018 to April 30, 2019 | |
| Class A | 1.55% | |||
| Actual | $1,000.00 | $915.90 | $7.36 | |
| Hypothetical-C | $1,000.00 | $1,017.11 | $7.75 | |
| Class M | 1.80% | |||
| Actual | $1,000.00 | $915.00 | $8.55 | |
| Hypothetical-C | $1,000.00 | $1,015.87 | $9.00 | |
| Class C | 2.30% | |||
| Actual | $1,000.00 | $912.40 | $10.91 | |
| Hypothetical-C | $1,000.00 | $1,013.39 | $11.48 | |
| Class I | 1.30% | |||
| Actual | $1,000.00 | $916.70 | $6.18 | |
| Hypothetical-C | $1,000.00 | $1,018.35 | $6.51 | |
| Class Z | 1.15% | |||
| Actual | $1,000.00 | $917.80 | $5.47 | |
| Hypothetical-C | $1,000.00 | $1,019.09 | $5.76 |
A Annualized expense ratio reflects expenses net of applicable fee waivers.
B Expenses are equal to each Class' annualized expense ratio, multiplied by the average account value over the period, multiplied by 181/365 (to reflect the one-half year period).
C 5% return per year before expenses
Distributions (Unaudited)
The fund hereby designates as a capital gain dividend with respect to the taxable year ended April 30, 2019, $1,425,537, or, if subsequently determined to be different, the net capital gain of such year.
A percentage of the dividends distributed during the fiscal year for the fund qualify for the dividends–received deduction for corporate shareholders:
| Class A | Class M | Class C | Class I | Class Z | |
| Fidelity Advisor Event Driven Opportunities Fund | |||||
| June 2018 | 13% | 15% | 18% | 12% | – |
| December 2018 | 100% | 100% | 0% | 100% | 100% |
A percentage of the dividends distributed during the fiscal year for the fund may be taken into account as a dividend for purposes of the maximum rate under section 1(h)(11) of the Internal Revenue Code.
| Class A | Class M | Class C | Class I | Class Z | |
| Fidelity Advisor Event Driven Opportunities Fund | |||||
| June 2018 | 13% | 15% | 17% | 11% | – |
| December 2018 | 100% | 100% | 0% | 100% | 100% |
The fund will notify shareholders in January 2020 of amounts for use in preparing 2019 income tax returns.
Board Approval of Investment Advisory Contracts and Management Fees
Fidelity Advisor Event Driven Opportunities Fund
Each year, the Board of Trustees, including the Independent Trustees (together, the Board), votes on the renewal of the management contract with Fidelity Management & Research Company (FMR) and the sub-advisory agreements (together, the Advisory Contracts) for the fund. FMR and the sub-advisers are referred to herein as the Investment Advisers. The Board, assisted by the advice of fund counsel and Independent Trustees' counsel, requests and considers a broad range of information relevant to the renewal of the Advisory Contracts throughout the year.
The Board meets regularly and, at each of its meetings, covers an extensive agenda of topics and materials and considers factors that are relevant to its annual consideration of the renewal of the fund's Advisory Contracts, including the services and support provided to the fund and its shareholders. The Board has established various standing committees (Committees), each composed of and chaired by Independent Trustees with varying backgrounds, to which the Board has assigned specific subject matter responsibilities in order to enhance effective decision-making by the Board. The Board, acting directly and through its Committees, requests and receives information concerning the annual consideration of the renewal of the fund's Advisory Contracts. The Board also meets as needed to review matters specifically related to the Board's annual consideration of the renewal of the Advisory Contracts. Members of the Board may also meet with trustees of other Fidelity funds through joint ad hoc committees to discuss certain matters relevant to all of the Fidelity funds.
At its January 2019 meeting, the Board unanimously determined to renew the fund's Advisory Contracts. In reaching its determination, the Board considered all factors it believed relevant, including (i) the nature, extent, and quality of the services to be provided to the fund and its shareholders (including the investment performance of the fund); (ii) the competitiveness of the fund's management fee and total expense ratio relative to peer funds; (iii) the total costs of the services to be provided by and the profits to be realized by Fidelity from its relationships with the fund; and (iv) the extent to which, if any, economies of scale exist and would be realized as the fund grows, and whether any economies of scale are appropriately shared with fund shareholders.
In considering whether to renew the Advisory Contracts for the fund, the Board reached a determination, with the assistance of fund counsel and Independent Trustees' counsel and through the exercise of its business judgment, that the renewal of the Advisory Contracts was in the best interests of the fund and its shareholders and that the compensation payable under the Advisory Contracts was fair and reasonable. The Board's decision to renew the Advisory Contracts was not based on any single factor, but rather was based on a comprehensive consideration of all the information provided to the Board at its meetings throughout the year. The Board, in reaching its determination to renew the Advisory Contracts, was aware that shareholders of the fund have a broad range of investment choices available to them, including a wide choice among funds offered by Fidelity's competitors, and that the fund's shareholders, who have the opportunity to review and weigh the disclosure provided by the fund in its prospectus and other public disclosures, have chosen to invest in this fund, which is part of the Fidelity family of funds.
Nature, Extent, and Quality of Services Provided. The Board considered Fidelity's staffing as it relates to the fund, including the backgrounds of investment personnel of Fidelity, and also considered the fund's investment objective, strategies, and related investment philosophy. The Independent Trustees also had discussions with senior management of Fidelity's investment operations and investment groups. The Board considered the structure of the investment personnel compensation program and whether this structure provides appropriate incentives to act in the best interests of the fund. Additionally, the Board considered the portfolio managers' investments, if any, in the funds that they manage.Resources Dedicated to Investment Management and Support Services. The Board and the Fund Oversight and Research Committees reviewed the general qualifications and capabilities of Fidelity's investment staff, including its size, education, experience, and resources, as well as Fidelity's approach to recruiting, training, managing, and compensating investment personnel. The Board noted that Fidelity has continued to increase the resources devoted to non-U.S. offices, including expansion of Fidelity's global investment organization. The Board also noted that Fidelity's analysts have extensive resources, tools and capabilities that allow them to conduct sophisticated quantitative and fundamental analysis, as well as credit analysis of issuers, counterparties and guarantors. Further, the Board considered that Fidelity's investment professionals have sufficient access to global information and data so as to provide competitive investment results over time, and that those professionals also have access to sophisticated tools that permit them to assess portfolio construction and risk and performance attribution characteristics continuously, as well as to transmit new information and research conclusions rapidly around the world. Additionally, in its deliberations, the Board considered Fidelity's trading, risk management, compliance, and technology and operations capabilities and resources, which are integral parts of the investment management process.Shareholder and Administrative Services. The Board considered (i) the nature, extent, quality, and cost of advisory, administrative, and shareholder services performed by the Investment Advisers and their affiliates under the Advisory Contracts and under separate agreements covering transfer agency, pricing and bookkeeping, and securities lending services for the fund; (ii) the nature and extent of the supervision of third party service providers, principally custodians, subcustodians, and pricing vendors; and (iii) the resources devoted to, and the record of compliance with, the fund's compliance policies and procedures. The Board also reviewed the allocation of fund brokerage, including allocations to brokers affiliated with the Investment Advisers, the use of brokerage commissions to pay fund expenses, and the use of "soft" commission dollars to pay for research services.The Board noted that the growth of fund assets over time across the complex allows Fidelity to reinvest in the development of services designed to enhance the value and convenience of the Fidelity funds as investment vehicles. These services include 24-hour access to account information and market information through telephone representatives and over the Internet, investor education materials and asset allocation tools, and the expanded availability of Fidelity Investor Centers.The Board noted that it and the boards of certain other Fidelity funds had formed an ad hoc Committee on Transfer Agency Fees to review the variety of transfer agency fee structures throughout the industry and Fidelity's competitive positioning with respect to industry participants.Investment in a Large Fund Family. The Board considered the benefits to shareholders of investing in a Fidelity fund, including the benefits of investing in a fund that is part of a large family of funds offering a variety of investment disciplines and providing a large variety of mutual fund investor services. The Board noted that Fidelity had taken, or had made recommendations that resulted in the Fidelity funds taking, a number of actions over the previous year that benefited particular funds, including: (i) continuing to dedicate additional resources to Fidelity's investment research process, which includes meetings with management of issuers of securities in which the funds invest, and to the support of the senior management team that oversees asset management; (ii) continuing efforts to enhance Fidelity's global research capabilities; (iii) launching new funds and making other enhancements to meet client needs; (iv) launching new share classes of existing funds; (v) eliminating purchase minimums and broadening eligibility requirements for certain funds and share classes; (vi) reducing management fees and total expenses for certain growth equity funds and index funds; (vii) lowering expense caps for certain existing funds and classes, and converting certain voluntary expense caps to contractual caps, to reduce expenses borne by shareholders; (viii) eliminating short-term redemption fees for funds that had such fees; (ix) rationalizing product lines and gaining increased efficiencies from fund mergers and share class consolidations; (x) continuing to develop, acquire and implement systems and technology to improve services to the funds and shareholders, strengthen information security, and increase efficiency; and (xi) continuing to implement enhancements to further strengthen Fidelity's product line to increase investors' probability of success in achieving their investment goals, including retirement income goals.Investment Performance. The Board considered whether the fund has operated in accordance with its investment objective, as well as its record of compliance with its investment restrictions and its performance history.The Board took into account discussions that occur at Board meetings throughout the year with representatives of the Investment Advisers about fund investment performance. In this regard the Board noted that as part of regularly scheduled fund reviews and other reports to the Board on fund performance, the Board considers annualized return information for the fund for different time periods, measured against an appropriate securities market index ("benchmark index") and a peer group of funds with similar objectives ("peer group"), if any. In its evaluation of fund investment performance, the Board gave particular attention to information indicating changes in performance of certain Fidelity funds for specific time periods and discussed with the Investment Advisers the reasons for any overperformance or underperformance.In addition to reviewing absolute and relative fund performance, the Independent Trustees periodically consider the appropriateness of fund performance metrics in evaluating the results achieved. In general, the Independent Trustees believe that fund performance should be evaluated based on net performance (after fees and expenses) of both the highest performing and lowest performing fund share classes, where applicable, compared to appropriate benchmark indices, over appropriate time periods that may include full market cycles, and compared to peer groups, as applicable, over the same periods, taking into account relevant factors including the following: general market conditions; issuer-specific information; and fund cash flows and other factors.The Independent Trustees recognize that shareholders evaluate performance on a net basis over their own holding periods, for which one-, three-, and five-year periods are often used as a proxy. For this reason, the performance information reviewed by the Board also included net cumulative total return information for the fund and an appropriate benchmark index for the most recent one- and three-year periods ended June 30, 2018, as shown below. A peer group is not shown below because the fund does not generally utilize a peer group for performance comparison purposes.Fidelity Advisor Event Driven Opportunities Fund
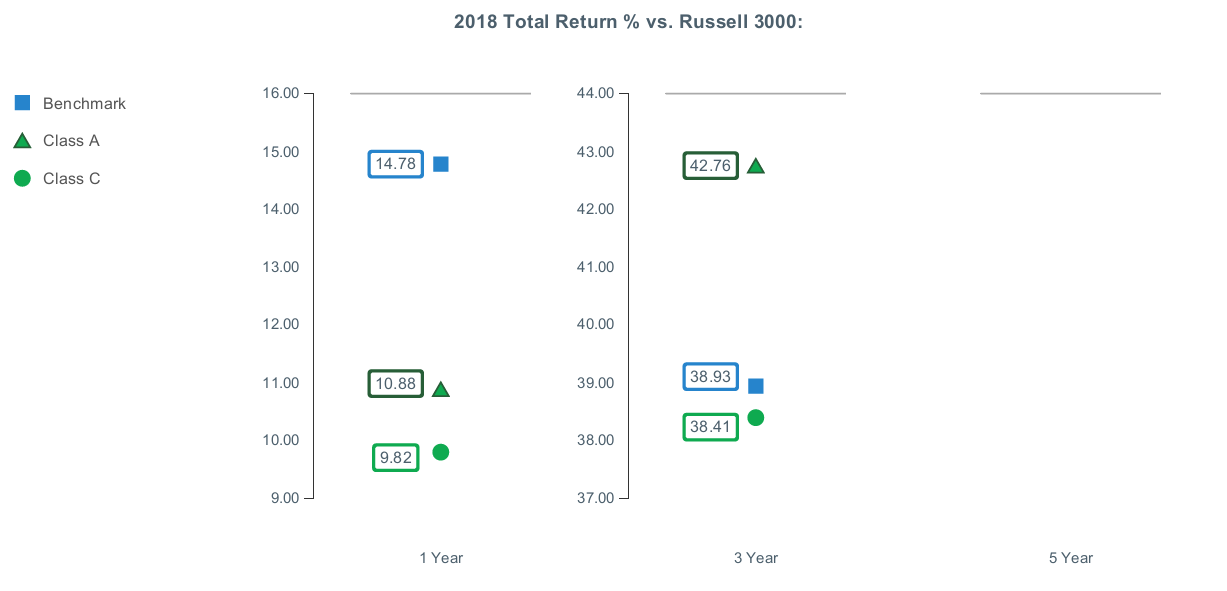
Fidelity Advisor Event Driven Opportunities Fund
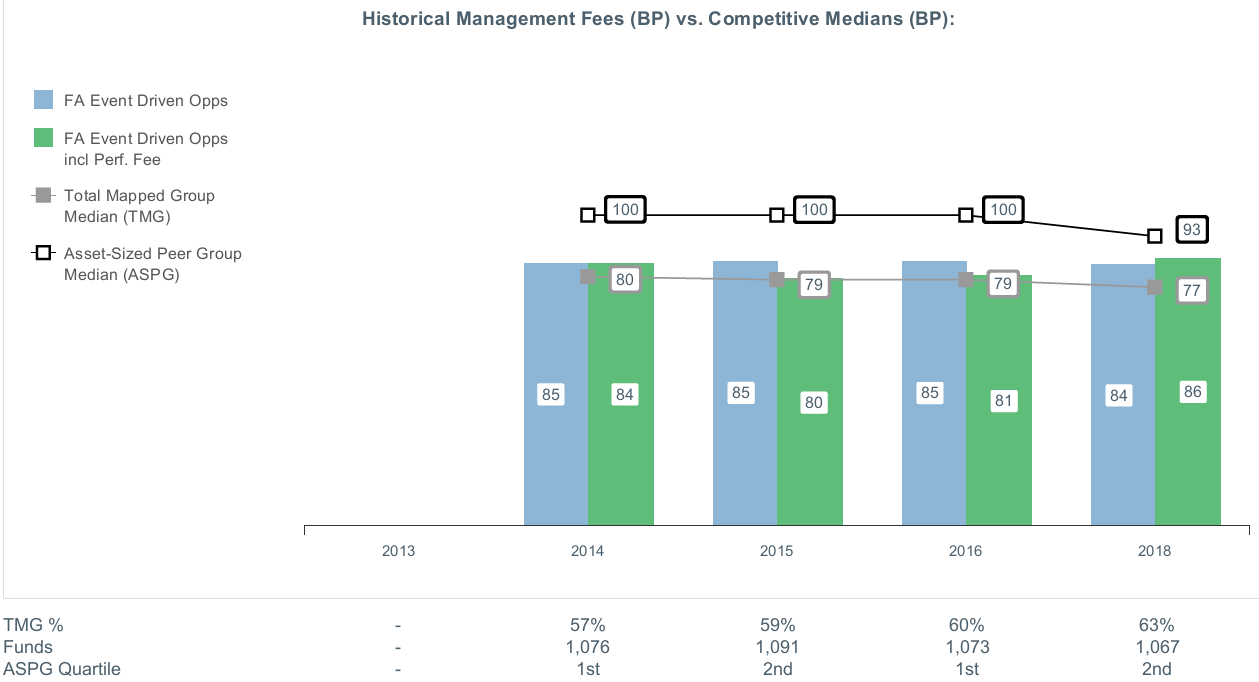
![]()
AEDO-ANN-0619
1.9585367.105
Fidelity® Large Cap Stock K6 Fund Annual Report April 30, 2019 |
|
Beginning on January 1, 2021, as permitted by regulations adopted by the Securities and Exchange Commission, paper copies of a fund’s shareholder reports will no longer be sent by mail, unless you specifically request paper copies of the reports from the fund or from your financial intermediary, such as a financial advisor, broker-dealer or bank. Instead, the reports will be made available on a website, and you will be notified by mail each time a report is posted and provided with a website link to access the report.
If you already elected to receive shareholder reports electronically, you will not be affected by this change and you need not take any action. You may elect to receive shareholder reports and other communications from a fund electronically, by contacting your financial intermediary. For Fidelity customers, visit Fidelity's web site or call Fidelity using the contact information listed below.
You may elect to receive all future reports in paper free of charge. If you wish to continue receiving paper copies of your shareholder reports, you may contact your financial intermediary or, if you are a Fidelity customer, visit Fidelity’s website, or call Fidelity at the applicable toll-free number listed below. Your election to receive reports in paper will apply to all funds held with the fund complex/your financial intermediary.
| Account Type | Website | Phone Number |
| Brokerage, Mutual Fund, or Annuity Contracts: | fidelity.com/mailpreferences | 1-800-343-3548 |
| Employer Provided Retirement Accounts: | netbenefits.fidelity.com/preferences (choose 'no' under Required Disclosures to continue to print) | 1-800-343-0860 |
| Advisor Sold Accounts Serviced Through Your Financial Intermediary: | Contact Your Financial Intermediary | Your Financial Intermediary's phone number |
| Advisor Sold Accounts Serviced by Fidelity: | institutional.fidelity.com | 1-877-208-0098 |
Contents
Board Approval of Investment Advisory Contracts and Management Fees |
To view a fund's proxy voting guidelines and proxy voting record for the 12-month period ended June 30, visit http://www.fidelity.com/proxyvotingresults or visit the Securities and Exchange Commission's (SEC) web site at http://www.sec.gov.
You may also call 1-800-835-5092 to request a free copy of the proxy voting guidelines.
Standard & Poor's, S&P and S&P 500 are registered service marks of The McGraw-Hill Companies, Inc. and have been licensed for use by Fidelity Distributors Corporation.
Other third-party marks appearing herein are the property of their respective owners.
All other marks appearing herein are registered or unregistered trademarks or service marks of FMR LLC or an affiliated company. © 2019 FMR LLC. All rights reserved.
This report and the financial statements contained herein are submitted for the general information of the shareholders of the Fund. This report is not authorized for distribution to prospective investors in the Fund unless preceded or accompanied by an effective prospectus.
A fund files its complete schedule of portfolio holdings with the SEC for the first and third quarters of each fiscal year on Form N-PORT. Forms N-PORT are available on the SEC’s web site at http://www.sec.gov. A fund's Forms N-PORT may be reviewed and copied at the SEC’s Public Reference Room in Washington, DC. Information regarding the operation of the SEC's Public Reference Room may be obtained by calling 1-800-SEC-0330.
For a complete list of a fund's portfolio holdings, view the most recent holdings listing, semiannual report, or annual report on Fidelity's web site at http://www.fidelity.com, http://www.institutional.fidelity.com, or http://www.401k.com, as applicable.
NOT FDIC INSURED •MAY LOSE VALUE •NO BANK GUARANTEE
Neither the Fund nor Fidelity Distributors Corporation is a bank.
Performance: The Bottom Line
Average annual total return reflects the change in the value of an investment, assuming reinvestment of distributions from dividend income and capital gains (the profits earned upon the sale of securities that have grown in value, if any) and assuming a constant rate of performance each year. The hypothetical investment and the average annual total returns do not reflect the deduction of taxes that a shareholder would pay on fund distributions or the redemption of fund shares. During periods of reimbursement by Fidelity, a fund’s total return will be greater than it would be had the reimbursement not occurred. How a fund did yesterday is no guarantee of how it will do tomorrow.
Average Annual Total Returns
| For the periods ended April 30, 2019 | Past 1 year | Life of fundA |
| Fidelity® Large Cap Stock K6 Fund | 10.12% | 10.77% |
A From May 25, 2017
$10,000 Over Life of Fund
Let's say hypothetically that $10,000 was invested in Fidelity® Large Cap Stock K6 Fund on May 25, 2017, when the fund started.
The chart shows how the value of your investment would have changed, and also shows how the S&P 500® Index performed over the same period.
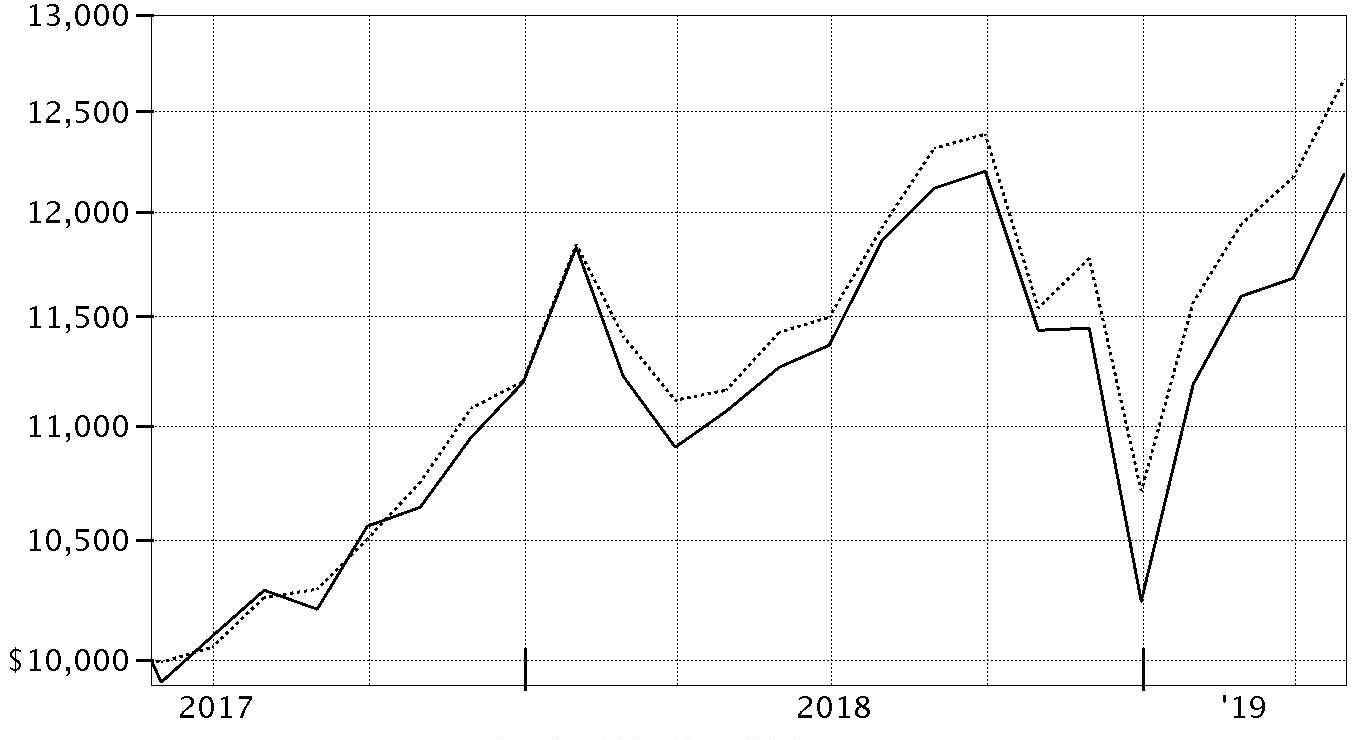
| Period Ending Values | ||
| $12,185 | Fidelity® Large Cap Stock K6 Fund | |
| $12,665 | S&P 500® Index | |
Management's Discussion of Fund Performance
Market Recap: The S&P 500® index gained 13.49% for the 12 months ending April 30, 2019, as U.S. equities began the new year on a high note after enduring an historically volatile final quarter of 2018. The index rose 18.25% year to date, its strongest four-month opening since 1987, amid upbeat company earnings/outlooks and signs the Fed may pause on rates. After achieving a record close in late April, the S&P 500® moved a bit higher to end the period. The uptrend was in sharp contrast to late 2018, when rising U.S. Treasury yields and concern about peaking corporate earnings growth sent many investors fleeing from risk assets as they were still dealing with lingering uncertainty related to global trade and the Fed picking up the pace of interest rate hikes. The index returned -6.84% in October, at the time its largest monthly drop in seven years. But conditions worsened through Christmas, as jitters about the economy and another hike in rates led to a spike in market volatility and a -9.03% result for December. For the full period, eight of 11 sectors registered a double-digit gain, led by information technology (+25%). Three defensive groups also stood out: real estate (+21%), consumer staples (+18%) and utilities (+18%). Communication services – a mix of telecom stocks and media/entertainment names – gained 17%, followed by consumer discretionary (+16%). In contrast, energy (-7%) lost ground, while materials (+3%), financials (+4%), health care (+11%) and industrials (+11%) also trailed the broad market.Comments from Portfolio Manager Matthew Fruhan: For the fiscal year, the fund gained 10.12%, trailing the 13.49% advance of the benchmark S&P 500® index. Versus the benchmark, sector allocation detracted, especially sizable overweights in two notable sector laggards, energy and financials, as well as an underweight in the index-leading information technology sector. This positioning was largely a function of my bottom-up security selection, which modestly contributed to our relative result. Many of the fund's largest individual detractors were stocks of companies facing near-term fundamental uncertainty but whose long-term prospects I believe remain undervalued. Picks in technology, communication services and energy were helpful, while those in health care – especially CVS Health and an out-of-index investment in Bayer, both of which have struggled with near-term financial challenges – and industrials hurt performance. An overweight in financial services company State Street also detracted; the company was hampered by the firm's plan to suspend a share buyback to finance what I consider an overpriced acquisition. Our top individual contributor was Qualcomm, which benefited from resolving a longstanding legal dispute with Apple. Media and communication service provider Comcast, one of our largest holdings, also contributed, as did an out-of-benchmark stake in mortgage insurer Radian Group.The views expressed above reflect those of the portfolio manager(s) only through the end of the period as stated on the cover of this report and do not necessarily represent the views of Fidelity or any other person in the Fidelity organization. Any such views are subject to change at any time based upon market or other conditions and Fidelity disclaims any responsibility to update such views. These views may not be relied on as investment advice and, because investment decisions for a Fidelity fund are based on numerous factors, may not be relied on as an indication of trading intent on behalf of any Fidelity fund.
Investment Summary (Unaudited)
Top Ten Stocks as of April 30, 2019
| % of fund's net assets | |
| Microsoft Corp. | 5.1 |
| Exxon Mobil Corp. | 4.3 |
| General Electric Co. | 4.2 |
| Comcast Corp. Class A | 3.8 |
| Bank of America Corp. | 3.4 |
| Altria Group, Inc. | 3.2 |
| Qualcomm, Inc. | 2.5 |
| JPMorgan Chase & Co. | 2.5 |
| Apple, Inc. | 2.1 |
| Wells Fargo & Co. | 2.1 |
| 33.2 |
Top Five Market Sectors as of April 30, 2019
| % of fund's net assets | |
| Financials | 19.5 |
| Information Technology | 16.5 |
| Health Care | 15.6 |
| Industrials | 13.4 |
| Energy | 11.6 |
Asset Allocation (% of fund's net assets)
| As of April 30, 2019* | ||
| Stocks | 97.9% | |
| Short-Term Investments and Net Other Assets (Liabilities) | 2.1% | |

* Foreign investments – 11.9%
Schedule of Investments April 30, 2019
Showing Percentage of Net Assets
| Common Stocks - 97.9% | |||
| Shares | Value | ||
| COMMUNICATION SERVICES - 7.9% | |||
| Diversified Telecommunication Services - 1.2% | |||
| Verizon Communications, Inc. | 17,832 | $1,019,812 | |
| Entertainment - 1.3% | |||
| Activision Blizzard, Inc. | 4,562 | 219,934 | |
| Electronic Arts, Inc. (a) | 4,977 | 471,073 | |
| Vivendi SA | 17,308 | 502,379 | |
| 1,193,386 | |||
| Interactive Media & Services - 0.7% | |||
| Alphabet, Inc.: | |||
| Class A (a) | 269 | 322,520 | |
| Class C (a) | 253 | 300,685 | |
| 623,205 | |||
| Media - 4.7% | |||
| Comcast Corp. Class A | 75,191 | 3,273,064 | |
| Discovery Communications, Inc. Class A (a) | 1,323 | 40,881 | |
| Fox Corp. Class A (a) | 8,626 | 336,328 | |
| Interpublic Group of Companies, Inc. | 14,577 | 335,271 | |
| Omnicom Group, Inc. | 1,342 | 107,400 | |
| 4,092,944 | |||
| TOTAL COMMUNICATION SERVICES | 6,929,347 | ||
| CONSUMER DISCRETIONARY - 2.3% | |||
| Auto Components - 0.0% | |||
| Gentex Corp. | 726 | 16,720 | |
| Distributors - 0.1% | |||
| LKQ Corp. (a) | 4,148 | 124,855 | |
| Hotels, Restaurants & Leisure - 0.0% | |||
| Drive Shack, Inc. (a) | 5,500 | 28,270 | |
| Household Durables - 0.5% | |||
| Mohawk Industries, Inc. (a) | 3,003 | 409,159 | |
| Internet & Direct Marketing Retail - 0.6% | |||
| The Booking Holdings, Inc. (a) | 295 | 547,222 | |
| Multiline Retail - 0.2% | |||
| Dollar Tree, Inc. (a) | 1,404 | 156,237 | |
| Specialty Retail - 0.9% | |||
| Lowe's Companies, Inc. | 5,445 | 616,047 | |
| TJX Companies, Inc. | 2,726 | 149,603 | |
| 765,650 | |||
| TOTAL CONSUMER DISCRETIONARY | 2,048,113 | ||
| CONSUMER STAPLES - 8.5% | |||
| Beverages - 1.0% | |||
| The Coca-Cola Co. | 17,052 | 836,571 | |
| Food & Staples Retailing - 1.6% | |||
| Walgreens Boots Alliance, Inc. | 2,271 | 121,657 | |
| Walmart, Inc. | 12,763 | 1,312,547 | |
| 1,434,204 | |||
| Food Products - 0.5% | |||
| Nestle SA sponsored ADR | 2,300 | 222,019 | |
| The Hershey Co. | 1,408 | 175,789 | |
| 397,808 | |||
| Household Products - 1.3% | |||
| Procter & Gamble Co. | 9,255 | 985,472 | |
| Spectrum Brands Holdings, Inc. | 2,307 | 142,042 | |
| 1,127,514 | |||
| Tobacco - 4.1% | |||
| Altria Group, Inc. | 51,704 | 2,809,078 | |
| British American Tobacco PLC sponsored ADR | 20,182 | 791,134 | |
| 3,600,212 | |||
| TOTAL CONSUMER STAPLES | 7,396,309 | ||
| ENERGY - 11.6% | |||
| Energy Equipment & Services - 0.8% | |||
| Baker Hughes, a GE Co. Class A | 17,003 | 408,412 | |
| National Oilwell Varco, Inc. | 2,618 | 68,435 | |
| Oceaneering International, Inc. (a) | 11,220 | 215,424 | |
| 692,271 | |||
| Oil, Gas & Consumable Fuels - 10.8% | |||
| BP PLC sponsored ADR | 29,055 | 1,270,575 | |
| Cenovus Energy, Inc. (Canada) | 135,050 | 1,338,706 | |
| Chevron Corp. | 6,442 | 773,427 | |
| Equinor ASA sponsored ADR | 33,686 | 747,492 | |
| Exxon Mobil Corp. | 46,759 | 3,753,813 | |
| Galp Energia SGPS SA Class B | 11,936 | 200,410 | |
| Hess Corp. | 8,607 | 551,881 | |
| Kosmos Energy Ltd. | 68,605 | 458,967 | |
| Legacy Reserves, Inc. (a) | 11,023 | 4,960 | |
| The Williams Companies, Inc. | 8,839 | 250,409 | |
| Valero Energy Corp. | 413 | 37,443 | |
| 9,388,083 | |||
| TOTAL ENERGY | 10,080,354 | ||
| FINANCIALS - 19.5% | |||
| Banks - 12.9% | |||
| Bank of America Corp. | 97,752 | 2,989,256 | |
| Citigroup, Inc. | 21,101 | 1,491,841 | |
| First Hawaiian, Inc. | 3,317 | 91,715 | |
| JPMorgan Chase & Co. | 18,865 | 2,189,283 | |
| M&T Bank Corp. | 726 | 123,471 | |
| PNC Financial Services Group, Inc. | 7,046 | 964,809 | |
| Standard Chartered PLC (United Kingdom) | 34 | 310 | |
| SunTrust Banks, Inc. | 13,435 | 879,724 | |
| U.S. Bancorp | 12,876 | 686,548 | |
| Wells Fargo & Co. | 37,628 | 1,821,571 | |
| 11,238,528 | |||
| Capital Markets - 4.4% | |||
| Cboe Global Markets, Inc. | 623 | 63,303 | |
| Charles Schwab Corp. | 8,638 | 395,448 | |
| KKR & Co. LP | 13,659 | 333,963 | |
| Morgan Stanley | 14,867 | 717,333 | |
| Northern Trust Corp. | 11,213 | 1,105,041 | |
| State Street Corp. | 17,547 | 1,187,230 | |
| 3,802,318 | |||
| Insurance - 0.6% | |||
| Chubb Ltd. | 2,069 | 300,419 | |
| The Travelers Companies, Inc. | 1,811 | 260,331 | |
| 560,750 | |||
| Thrifts & Mortgage Finance - 1.6% | |||
| MGIC Investment Corp. (a) | 24,309 | 355,884 | |
| Radian Group, Inc. | 46,615 | 1,091,723 | |
| 1,447,607 | |||
| TOTAL FINANCIALS | 17,049,203 | ||
| HEALTH CARE - 15.6% | |||
| Biotechnology - 2.6% | |||
| Alexion Pharmaceuticals, Inc. (a) | 5,972 | 812,968 | |
| Alnylam Pharmaceuticals, Inc. (a) | 1,454 | 129,900 | |
| AnaptysBio, Inc. (a) | 518 | 37,669 | |
| Atara Biotherapeutics, Inc. (a) | 2,525 | 84,840 | |
| Celgene Corp. (a) | 3,347 | 316,827 | |
| Gritstone Oncology, Inc. | 5,036 | 52,928 | |
| Heron Therapeutics, Inc. (a) | 1,036 | 22,460 | |
| Insmed, Inc. (a) | 6,175 | 187,967 | |
| Intercept Pharmaceuticals, Inc. (a) | 5,968 | 514,322 | |
| Mirati Therapeutics, Inc. (a) | 1,762 | 104,821 | |
| 2,264,702 | |||
| Health Care Equipment & Supplies - 1.0% | |||
| Boston Scientific Corp. (a) | 23,720 | 880,486 | |
| Health Care Providers & Services - 5.3% | |||
| AmerisourceBergen Corp. | 6,618 | 494,762 | |
| Cardinal Health, Inc. | 12,073 | 588,076 | |
| Cigna Corp. | 4,058 | 644,573 | |
| Covetrus, Inc. (a) | 1,430 | 47,004 | |
| CVS Health Corp. | 23,373 | 1,271,024 | |
| Humana, Inc. | 552 | 140,986 | |
| McKesson Corp. | 7,523 | 897,118 | |
| UnitedHealth Group, Inc. | 2,281 | 531,633 | |
| 4,615,176 | |||
| Health Care Technology - 0.0% | |||
| Castlight Health, Inc. Class B (a) | 9,855 | 36,759 | |
| Pharmaceuticals - 6.7% | |||
| Bayer AG | 14,294 | 951,348 | |
| Bristol-Myers Squibb Co. | 24,353 | 1,130,710 | |
| GlaxoSmithKline PLC sponsored ADR | 31,797 | 1,307,811 | |
| Jazz Pharmaceuticals PLC (a) | 2,929 | 380,096 | |
| Johnson & Johnson | 8,469 | 1,195,823 | |
| Perrigo Co. PLC | 1,556 | 74,564 | |
| Sanofi SA | 2,648 | 231,036 | |
| Teva Pharmaceutical Industries Ltd. sponsored ADR (a) | 18,082 | 275,208 | |
| TherapeuticsMD, Inc. (a)(b) | 58,021 | 249,490 | |
| 5,796,086 | |||
| TOTAL HEALTH CARE | 13,593,209 | ||
| INDUSTRIALS - 13.4% | |||
| Aerospace & Defense - 1.9% | |||
| General Dynamics Corp. | 1,519 | 271,476 | |
| Huntington Ingalls Industries, Inc. | 719 | 160,035 | |
| United Technologies Corp. | 8,496 | 1,211,615 | |
| 1,643,126 | |||
| Air Freight & Logistics - 1.9% | |||
| C.H. Robinson Worldwide, Inc. | 2,149 | 174,069 | |
| FedEx Corp. | 1,142 | 216,363 | |
| United Parcel Service, Inc. Class B | 12,144 | 1,289,936 | |
| 1,680,368 | |||
| Building Products - 0.1% | |||
| A.O. Smith Corp. | 1,033 | 54,305 | |
| Commercial Services & Supplies - 0.1% | |||
| Stericycle, Inc. (a) | 1,927 | 112,518 | |
| Electrical Equipment - 0.7% | |||
| Acuity Brands, Inc. | 2,663 | 389,677 | |
| Hubbell, Inc. Class B | 1,498 | 191,145 | |
| 580,822 | |||
| Industrial Conglomerates - 4.2% | |||
| General Electric Co. | 363,450 | 3,696,287 | |
| Machinery - 0.9% | |||
| Flowserve Corp. | 10,256 | 502,852 | |
| Wabtec Corp. (b) | 4,100 | 303,687 | |
| 806,539 | |||
| Professional Services - 0.3% | |||
| IHS Markit Ltd. (a) | 3,871 | 221,653 | |
| Road & Rail - 3.3% | |||
| J.B. Hunt Transport Services, Inc. | 6,438 | 608,262 | |
| Knight-Swift Transportation Holdings, Inc. Class A | 16,530 | 551,276 | |
| Lyft, Inc. | 3,653 | 196,604 | |
| Norfolk Southern Corp. | 2,653 | 541,265 | |
| Union Pacific Corp. | 5,590 | 989,654 | |
| 2,887,061 | |||
| TOTAL INDUSTRIALS | 11,682,679 | ||
| INFORMATION TECHNOLOGY - 16.5% | |||
| Communications Equipment - 0.1% | |||
| Cisco Systems, Inc. | 1,494 | 83,589 | |
| Electronic Equipment & Components - 0.1% | |||
| Itron, Inc. (a) | 2,365 | 126,906 | |
| IT Services - 3.2% | |||
| Interxion Holding N.V. (a) | 1,997 | 138,172 | |
| MasterCard, Inc. Class A | 2,134 | 542,548 | |
| Paychex, Inc. | 5,413 | 456,370 | |
| Unisys Corp. (a) | 13,681 | 153,364 | |
| Visa, Inc. Class A | 8,886 | 1,461,125 | |
| 2,751,579 | |||
| Semiconductors & Semiconductor Equipment - 3.7% | |||
| Analog Devices, Inc. | 1,041 | 121,006 | |
| Applied Materials, Inc. | 9,846 | 433,913 | |
| Lam Research Corp. | 1,051 | 218,009 | |
| Marvell Technology Group Ltd. | 1,400 | 35,028 | |
| NVIDIA Corp. | 1,364 | 246,884 | |
| Qualcomm, Inc. | 25,529 | 2,198,813 | |
| 3,253,653 | |||
| Software - 7.3% | |||
| Microsoft Corp. | 33,664 | 4,396,518 | |
| Oracle Corp. | 18,853 | 1,043,136 | |
| SAP SE sponsored ADR | 6,835 | 880,758 | |
| 6,320,412 | |||
| Technology Hardware, Storage & Peripherals - 2.1% | |||
| Apple, Inc. | 9,246 | 1,855,395 | |
| TOTAL INFORMATION TECHNOLOGY | 14,391,534 | ||
| MATERIALS - 1.1% | |||
| Chemicals - 1.0% | |||
| DowDuPont, Inc. | 3,457 | 132,922 | |
| International Flavors & Fragrances, Inc. | 723 | 99,622 | |
| Intrepid Potash, Inc. (a) | 30,223 | 112,430 | |
| Nutrien Ltd. | 7,511 | 407,367 | |
| The Scotts Miracle-Gro Co. Class A | 1,695 | 144,109 | |
| 896,450 | |||
| Construction Materials - 0.1% | |||
| Summit Materials, Inc. (a) | 2,071 | 36,284 | |
| TOTAL MATERIALS | 932,734 | ||
| REAL ESTATE - 0.7% | |||
| Equity Real Estate Investment Trusts (REITs) - 0.7% | |||
| American Tower Corp. | 1,038 | 202,721 | |
| Equinix, Inc. | 834 | 379,220 | |
| Simon Property Group, Inc. | 206 | 35,782 | |
| 617,723 | |||
| UTILITIES - 0.8% | |||
| Electric Utilities - 0.7% | |||
| Duke Energy Corp. | 828 | 75,447 | |
| Exelon Corp. | 5,286 | 269,322 | |
| PPL Corp. | 4,348 | 135,701 | |
| Southern Co. | 2,433 | 129,484 | |
| 609,954 | |||
| Multi-Utilities - 0.1% | |||
| Sempra Energy | 415 | 53,099 | |
| TOTAL UTILITIES | 663,053 | ||
| TOTAL COMMON STOCKS | |||
| (Cost $78,675,396) | 85,384,258 | ||
| Money Market Funds - 2.7% | |||
| Fidelity Cash Central Fund, 2.49% (c) | 1,779,619 | 1,779,975 | |
| Fidelity Securities Lending Cash Central Fund 2.49% (c)(d) | 555,283 | 555,339 | |
| TOTAL MONEY MARKET FUNDS | |||
| (Cost $2,335,314) | 2,335,314 | ||
| TOTAL INVESTMENT IN SECURITIES - 100.6% | |||
| (Cost $81,010,710) | 87,719,572 | ||
| NET OTHER ASSETS (LIABILITIES) - (0.6)% | (551,787) | ||
| NET ASSETS - 100% | $87,167,785 |
Legend
(a) Non-income producing
(b) Security or a portion of the security is on loan at period end.
(c) Affiliated fund that is generally available only to investment companies and other accounts managed by Fidelity Investments. The rate quoted is the annualized seven-day yield of the fund at period end. A complete unaudited listing of the fund's holdings as of its most recent quarter end is available upon request. In addition, each Fidelity Central Fund's financial statements, which are not covered by the Fund's Report of Independent Registered Public Accounting Firm, are available on the SEC's website or upon request.
(d) Investment made with cash collateral received from securities on loan.
Affiliated Central Funds
Information regarding fiscal year to date income earned by the Fund from investments in Fidelity Central Funds is as follows:
| Fund | Income earned |
| Fidelity Cash Central Fund | $26,326 |
| Fidelity Securities Lending Cash Central Fund | 7,300 |
| Total | $33,626 |
Amounts in the income column in the above table include any capital gain distributions from underlying funds, which are presented in the corresponding line-item in the Statement of Operations, if applicable.
Investment Valuation
The following is a summary of the inputs used, as of April 30, 2019, involving the Fund's assets and liabilities carried at fair value. The inputs or methodology used for valuing securities may not be an indication of the risk associated with investing in those securities. For more information on valuation inputs, and their aggregation into the levels used below, please refer to the Investment Valuation section in the accompanying Notes to Financial Statements.
| Valuation Inputs at Reporting Date: | ||||
| Description | Total | Level 1 | Level 2 | Level 3 |
| Investments in Securities: | ||||
| Equities: | ||||
| Communication Services | $6,929,347 | $6,426,968 | $502,379 | $-- |
| Consumer Discretionary | 2,048,113 | 2,048,113 | -- | -- |
| Consumer Staples | 7,396,309 | 7,396,309 | -- | -- |
| Energy | 10,080,354 | 10,080,354 | -- | -- |
| Financials | 17,049,203 | 17,049,203 | -- | -- |
| Health Care | 13,593,209 | 13,362,173 | 231,036 | -- |
| Industrials | 11,682,679 | 11,486,075 | 196,604 | -- |
| Information Technology | 14,391,534 | 14,391,534 | -- | -- |
| Materials | 932,734 | 932,734 | -- | -- |
| Real Estate | 617,723 | 617,723 | -- | -- |
| Utilities | 663,053 | 663,053 | -- | -- |
| Money Market Funds | 2,335,314 | 2,335,314 | -- | -- |
| Total Investments in Securities: | $87,719,572 | $86,789,553 | $930,019 | $-- |
Other Information
Distribution of investments by country or territory of incorporation, as a percentage of Total Net Assets, is as follows (Unaudited):
| United States of America | 88.1% |
| United Kingdom | 3.9% |
| Germany | 2.1% |
| Canada | 2.0% |
| Others (Individually Less Than 1%) | 3.9% |
| 100.0% |
See accompanying notes which are an integral part of the financial statements.
Financial Statements
Statement of Assets and Liabilities
| April 30, 2019 | ||
| Assets | ||
| Investment in securities, at value (including securities loaned of $538,273) — See accompanying schedule: Unaffiliated issuers (cost $78,675,396) | $85,384,258 | |
| Fidelity Central Funds (cost $2,335,314) | 2,335,314 | |
| Total Investment in Securities (cost $81,010,710) | $87,719,572 | |
| Foreign currency held at value (cost $6,718) | 6,718 | |
| Receivable for investments sold | 50,185 | |
| Receivable for fund shares sold | 67,413 | |
| Dividends receivable | 111,308 | |
| Distributions receivable from Fidelity Central Funds | 3,910 | |
| Other receivables | 1,687 | |
| Total assets | 87,960,793 | |
| Liabilities | ||
| Payable for investments purchased | $178,657 | |
| Payable for fund shares redeemed | 27,033 | |
| Accrued management fee | 31,868 | |
| Collateral on securities loaned | 555,450 | |
| Total liabilities | 793,008 | |
| Net Assets | $87,167,785 | |
| Net Assets consist of: | ||
| Paid in capital | $80,968,979�� | |
| Total distributable earnings (loss) | 6,198,806 | |
| Net Assets, for 7,508,704 shares outstanding | $87,167,785 | |
| Net Asset Value, offering price and redemption price per share ($87,167,785 ÷ 7,508,704 shares) | $11.61 |
See accompanying notes which are an integral part of the financial statements.
Statement of Operations
| Year ended April 30, 2019 | ||
| Investment Income | ||
| Dividends | $2,040,039 | |
| Non-Cash dividends | 124,988 | |
| Income from Fidelity Central Funds | 33,626 | |
| Total income | 2,198,653 | |
| Expenses | ||
| Management fee | $390,968 | |
| Independent trustees' fees and expenses | 492 | |
| Commitment fees | 233 | |
| Total expenses before reductions | 391,693 | |
| Expense reductions | (5,556) | |
| Total expenses after reductions | 386,137 | |
| Net investment income (loss) | 1,812,516 | |
| Realized and Unrealized Gain (Loss) | ||
| Net realized gain (loss) on: | ||
| Investment securities: | ||
| Unaffiliated issuers | 680,779 | |
| Fidelity Central Funds | (166) | |
| Foreign currency transactions | 445 | |
| Total net realized gain (loss) | 681,058 | |
| Change in net unrealized appreciation (depreciation) on: | ||
| Investment securities: | ||
| Unaffiliated issuers | 4,887,505 | |
| Assets and liabilities in foreign currencies | 210 | |
| Total change in net unrealized appreciation (depreciation) | 4,887,715 | |
| Net gain (loss) | 5,568,773 | |
| Net increase (decrease) in net assets resulting from operations | $7,381,289 |
See accompanying notes which are an integral part of the financial statements.
Statement of Changes in Net Assets
| Year ended April 30, 2019 | For the period May 25, 2017 (commencement of operations) to April 30, 2018 | |
| Increase (Decrease) in Net Assets | ||
| Operations | ||
| Net investment income (loss) | $1,812,516 | $668,095 |
| Net realized gain (loss) | 681,058 | 310,259 |
| Change in net unrealized appreciation (depreciation) | 4,887,715 | 1,821,176 |
| Net increase (decrease) in net assets resulting from operations | 7,381,289 | 2,799,530 |
| Distributions to shareholders | (3,617,047) | – |
| Distributions to shareholders from net investment income | – | (290,555) |
| Distributions to shareholders from net realized gain | – | (72,639) |
| Total distributions | (3,617,047) | (363,194) |
| Share transactions | ||
| Proceeds from sales of shares | 21,947,649 | 95,862,843 |
| Reinvestment of distributions | 3,617,047 | 363,194 |
| Cost of shares redeemed | (26,378,256) | (14,445,270) |
| Net increase (decrease) in net assets resulting from share transactions | (813,560) | 81,780,767 |
| Total increase (decrease) in net assets | 2,950,682 | 84,217,103 |
| Net Assets | ||
| Beginning of period | 84,217,103 | – |
| End of period | $87,167,785 | $84,217,103 |
| Other Information | ||
| Undistributed net investment income end of period | $358,283 | |
| Shares | ||
| Sold | 1,967,708 | 8,938,068 |
| Issued in reinvestment of distributions | 342,490 | 33,168 |
| Redeemed | (2,457,463) | (1,315,267) |
| Net increase (decrease) | (147,265) | 7,655,969 |
See accompanying notes which are an integral part of the financial statements.
Financial Highlights
Fidelity Large Cap Stock K6 Fund
| Years ended April 30, | 2019 | 2018 A |
| Selected Per–Share Data | ||
| Net asset value, beginning of period | $11.00 | $10.00 |
| Income from Investment Operations | ||
| Net investment income (loss)B | .23 | .16 |
| Net realized and unrealized gain (loss) | .84 | .91 |
| Total from investment operations | 1.07 | 1.07 |
| Distributions from net investment income | (.20) | (.05) |
| Distributions from net realized gain | (.26) | (.01) |
| Total distributions | (.46) | (.07)C |
| Net asset value, end of period | $11.61 | $11.00 |
| Total ReturnD,E | 10.12% | 10.65% |
| Ratios to Average Net AssetsF,G | ||
| Expenses before reductions | .45% | .45%H |
| Expenses net of fee waivers, if any | .45% | .45%H |
| Expenses net of all reductions | .44% | .45%H |
| Net investment income (loss) | 2.09% | 1.55%H |
| Supplemental Data | ||
| Net assets, end of period (000 omitted) | $87,168 | $84,217 |
| Portfolio turnover rateI | 49%J | 67%H,J |
A For the period May 25, 2017 (commencement of operations) to April 30, 2018.
B Calculated based on average shares outstanding during the period.
C Total distributions of $.07 per share is comprised of distributions from net investment income of $.052 and distributions from net realized gain of $.013 per share.
D Total returns for periods of less than one year are not annualized.
E Total returns would have been lower if certain expenses had not been reduced during the applicable periods shown.
F Fees and expenses of any underlying Fidelity Central Funds are not included in the Fund's expense ratio. The Fund indirectly bears its proportionate share of the expenses of any underlying Fidelity Central Funds.
G Expense ratios reflect operating expenses of the Fund. Expenses before reductions do not reflect amounts reimbursed by the investment adviser or reductions from brokerage service arrangements or reductions from other expense offset arrangements and do not represent the amount paid by the Fund during periods when reimbursements or reductions occur. Expenses net of fee waivers reflect expenses after reimbursement by the investment adviser but prior to reductions from brokerage service arrangements or other expense offset arrangements. Expenses net of all reductions represent the net expenses paid by the Fund.
H Annualized
I Amount does not include the portfolio activity of any underlying Fidelity Central Funds.
J Portfolio turnover rate excludes securities received or delivered in-kind.
See accompanying notes which are an integral part of the financial statements.
Notes to Financial Statements
For the period ended April 30, 2019
1. Organization.
Fidelity Large Cap Stock K6 Fund (the Fund) is a fund of Fidelity Concord Street Trust (the Trust) and is authorized to issue an unlimited number of shares. Share transactions on the Statement of Changes in Net Assets may contain exchanges between affiliated funds. The Trust is registered under the Investment Company Act of 1940, as amended (the 1940 Act), as an open-end management investment company organized as a Massachusetts business trust. Shares generally are available only to employer-sponsored retirement plans that are recordkept by Fidelity, or to certain employer-sponsored retirement plans that are not recordkept by Fidelity.
2. Investments in Fidelity Central Funds.
The Fund invests in Fidelity Central Funds, which are open-end investment companies generally available only to other investment companies and accounts managed by the investment adviser and its affiliates. The Fund's Schedule of Investments lists each of the Fidelity Central Funds held as of period end, if any, as an investment of the Fund, but does not include the underlying holdings of each Fidelity Central Fund. As an Investing Fund, the Fund indirectly bears its proportionate share of the expenses of the underlying Fidelity Central Funds.
The Money Market Central Funds seek preservation of capital and current income and are managed by Fidelity Investments Money Management, Inc. (FIMM), an affiliate of the investment adviser. Annualized expenses of the Money Market Central Funds as of their most recent shareholder report date are less than .005%.
A complete unaudited list of holdings for each Fidelity Central Fund is available upon request or at the Securities and Exchange Commission (the SEC) website at www.sec.gov. In addition, the financial statements of the Fidelity Central Funds, which are not covered by the Fund's Report of Independent Registered Public Accounting Firm, are available on the SEC website or upon request.
3. Significant Accounting Policies.
The Fund is an investment company and applies the accounting and reporting guidance of the Financial Accounting Standards Board (FASB) Accounting Standards Codification Topic 946 Financial Services – Investments Companies. The financial statements have been prepared in conformity with accounting principles generally accepted in the United States of America (GAAP), which require management to make certain estimates and assumptions at the date of the financial statements. Actual results could differ from those estimates. Subsequent events, if any, through the date that the financial statements were issued have been evaluated in the preparation of the financial statements. The following summarizes the significant accounting policies of the Fund:
Investment Valuation. Investments are valued as of 4:00 p.m. Eastern time on the last calendar day of the period. The Board of Trustees (the Board) has delegated the day to day responsibility for the valuation of the Fund's investments to the Fair Value Committee (the Committee) established by the Fund's investment adviser. In accordance with valuation policies and procedures approved by the Board, the Fund attempts to obtain prices from one or more third party pricing vendors or brokers to value its investments. When current market prices, quotations or currency exchange rates are not readily available or reliable, investments will be fair valued in good faith by the Committee, in accordance with procedures adopted by the Board. Factors used in determining fair value vary by investment type and may include market or investment specific events. The frequency with which these procedures are used cannot be predicted and they may be utilized to a significant extent. The Committee oversees the Fund's valuation policies and procedures and reports to the Board on the Committee's activities and fair value determinations. The Board monitors the appropriateness of the procedures used in valuing the Fund's investments and ratifies the fair value determinations of the Committee.
The Fund categorizes the inputs to valuation techniques used to value its investments into a disclosure hierarchy consisting of three levels as shown below:
- Level 1 – quoted prices in active markets for identical investments
- Level 2 – other significant observable inputs (including quoted prices for similar investments, interest rates, prepayment speeds, etc.)
- Level 3 – unobservable inputs (including the Fund's own assumptions based on the best information available)
Valuation techniques used to value the Fund's investments by major category are as follows:
Equity securities, including restricted securities, for which market quotations are readily available, are valued at the last reported sale price or official closing price as reported by a third party pricing vendor on the primary market or exchange on which they are traded and are categorized as Level 1 in the hierarchy. In the event there were no sales during the day or closing prices are not available, securities are valued at the last quoted bid price or may be valued using the last available price and are generally categorized as Level 2 in the hierarchy. For foreign equity securities, when market or security specific events arise, comparisons to the valuation of American Depositary Receipts (ADRs), futures contracts, Exchange-Traded Funds (ETFs) and certain indexes as well as quoted prices for similar securities may be used and would be categorized as Level 2 in the hierarchy. For equity securities, including restricted securities, where observable inputs are limited, assumptions about market activity and risk are used and these securities may be categorized as Level 3 in the hierarchy.
Investments in open-end mutual funds, including the Fidelity Central Funds, are valued at their closing net asset value (NAV) each business day and are categorized as Level 1 in the hierarchy.
Changes in valuation techniques may result in transfers in or out of an assigned level within the disclosure hierarchy. The aggregate value of investments by input level as of April 30, 2019 is included at the end of the Fund's Schedule of Investments.
Foreign Currency. The Fund may use foreign currency contracts to facilitate transactions in foreign-denominated securities. Gains and losses from these transactions may arise from changes in the value of the foreign currency or if the counterparties do not perform under the contracts' terms.
Foreign-denominated assets, including investment securities, and liabilities are translated into U.S. dollars at the exchange rates at period end. Purchases and sales of investment securities, income and dividends received and expenses denominated in foreign currencies are translated into U.S. dollars at the exchange rate in effect on the transaction date.
The effects of exchange rate fluctuations on investments are included with the net realized and unrealized gain (loss) on investment securities. Other foreign currency transactions resulting in realized and unrealized gain (loss) are disclosed separately.
Investment Transactions and Income. For financial reporting purposes, the Fund's investment holdings and NAV include trades executed through the end of the last business day of the period. The NAV per share for processing shareholder transactions is calculated as of the close of business of the New York Stock Exchange (NYSE), normally 4:00 p.m. Eastern time and includes trades executed through the end of the prior business day. Gains and losses on securities sold are determined on the basis of identified cost. Dividend income is recorded on the ex-dividend date, except for certain dividends from foreign securities where the ex-dividend date may have passed, which are recorded as soon as the Fund is informed of the ex-dividend date. Non-cash dividends included in dividend income, if any, are recorded at the fair market value of the securities received. Income and capital gain distributions from Fidelity Central Funds, if any, are recorded on the ex-dividend date. Certain distributions received by the Fund represent a return of capital or capital gain. The Fund determines the components of these distributions subsequent to the ex-dividend date, based upon receipt of tax filings or other correspondence relating to the underlying investment. These distributions are recorded as a reduction of cost of investments and/or as a realized gain. Investment income is recorded net of foreign taxes withheld where recovery of such taxes is uncertain.
Expenses. Expenses directly attributable to a fund are charged to that fund. Expenses attributable to more than one fund are allocated among the respective funds on the basis of relative net assets or other appropriate methods. Expense estimates are accrued in the period to which they relate and adjustments are made when actual amounts are known.
Income Tax Information and Distributions to Shareholders. Each year, the Fund intends to qualify as a regulated investment company under Subchapter M of the Internal Revenue Code, including distributing substantially all of its taxable income and realized gains. As a result, no provision for U.S. Federal income taxes is required. As of April 30, 2019, the Fund did not have any unrecognized tax benefits in the financial statements; nor is the Fund aware of any tax positions for which it is reasonably possible that the total amounts of unrecognized tax benefits will significantly change in the next twelve months. The Fund files a U.S. federal tax return, in addition to state and local tax returns as required. The Fund's federal income tax returns are subject to examination by the Internal Revenue Service (IRS) for a period of three fiscal years after they are filed. State and local tax returns may be subject to examination for an additional fiscal year depending on the jurisdiction. Foreign taxes are provided for based on the Fund's understanding of the tax rules and rates that exist in the foreign markets in which it invests.
Distributions are declared and recorded on the ex-dividend date. Income and capital gain distributions are determined in accordance with income tax regulations, which may differ from GAAP.
Capital accounts within the financial statements are adjusted for permanent book-tax differences. These adjustments have no impact on net assets or the results of operations. Capital accounts are not adjusted for temporary book-tax differences which will reverse in a subsequent period.
Book-tax differences are primarily due to foreign currency transactions, partnerships, and losses due to wash sales and excise tax regulations.
As of period end, the cost and unrealized appreciation (depreciation) in securities, and derivatives if applicable, for federal income tax purposes were as follows:
| Gross unrealized appreciation | $10,690,610 |
| Gross unrealized depreciation | (4,688,428) |
| Net unrealized appreciation (depreciation) | $6,002,182 |
| Tax Cost | $81,717,390 |
The tax-based components of distributable earnings as of period end were as follows:
| Undistributed ordinary income | $576,239 |
| Net unrealized appreciation (depreciation) on securities and other investments | $6,002,211 |
The Fund intends to elect to defer to its next fiscal year $379,612 of capital losses recognized during the period November 1, 2018 to April 30, 2019.
The tax character of distributions paid was as follows:
| April 30, 2019 | April 30, 2018 | |
| Ordinary Income | $2,701,462 | $ 363,194 |
| Long-term Capital Gains | 915,585 | – |
| Total | $3,617,047 | $ 363,194 |
New Rule Issuance. During August 2018, the U.S. Securities and Exchange Commission issued Final Rule Release No. 33-10532, Disclosure Update and Simplification. This Final Rule includes amendments specific to registered investment companies that are intended to eliminate overlap in disclosure requirements between Regulation S-X and GAAP. In accordance with these amendments, certain line-items in the Fund's financial statements have been combined or removed for the current period as outlined in the table below.
| Financial Statement | Current Line-Item Presentation (As Applicable) | Prior Line-Item Presentation (As Applicable) |
| Statement of Assets and Liabilities | Total distributable earnings (loss) | Undistributed/Distributions in excess of/Accumulated net investment income (loss) Accumulated/Undistributed net realized gain (loss) Net unrealized appreciation (depreciation) |
| Statement of Changes in Net Assets | N/A - removed | Undistributed/Distributions in excess of/Accumulated net investment income (loss) end of period |
| Statement of Changes in Net Assets | Distributions to shareholders | Distributions to shareholders from net investment income Distributions to shareholders from net realized gain |
4. Purchases and Sales of Investments.
Purchases and sales of securities, other than short-term securities and in-kind transactions, aggregated $41,862,869 and $47,234,261, respectively.
Unaffiliated Exchanges In-Kind. During the period, the Fund received investments and cash valued at $3,009,509 in exchange for 268,268 shares of the Fund. The amount of in-kind exchanges is included in share transactions in the accompanying Statement of Changes in Net Assets.
Prior Fiscal Year Exchanges In-Kind. During the prior period, investments and cash received in-kind through subscriptions totaled $49,744,521 in exchange for 4,593,796 shares of the Fund. The amount of in-kind exchanges is included in share transactions in the accompanying Statement of Changes in Net. The Fund recognized no gain or loss for federal income tax purposes.
5. Fees and Other Transactions with Affiliates.
Management Fee. Fidelity Management & Research Company (the investment adviser) and its affiliates provide the Fund with investment management related services for which the Fund pays a monthly management fee that is based on an annual rate of .45% of average net assets. Under the management contract, the investment adviser or an affiliate pays all other expenses of the Fund, excluding fees and expenses of the independent Trustees, and certain miscellaneous expenses such as proxy and shareholder meeting expenses.
Brokerage Commissions. The Fund placed a portion of its portfolio transactions with brokerage firms which are affiliates of the investment adviser. Brokerage commissions are included in net realized gain (loss) and change in net unrealized appreciation (depreciation) in the Statement of Operations. The commissions paid to these affiliated firms were $1,497 for the period.
Interfund Trades. The Fund may purchase from or sell securities to other Fidelity Funds under procedures adopted by the Board. The procedures have been designed to ensure these interfund trades are executed in accordance with Rule 17a-7 of the 1940 Act. Interfund trades are included within the respective purchases and sales amounts shown in the Purchases and Sales of Investments note.
Prior Fiscal Year Exchanges In-Kind. During the prior period, an affiliated entity completed an exchange in-kind with the Fund. The affiliated entity delivered investments and cash valued at $28,434,880 in exchange for 2,763,351 shares of the Fund. The amount of in-kind exchanges is included in share transactions in the accompanying Statement of Changes in Net Assets. The Fund recognized no gain or loss for federal income tax purposes.
6. Committed Line of Credit.
The Fund participates with other funds managed by the investment adviser or an affiliate in a $4.25 billion credit facility (the "line of credit") to be utilized for temporary or emergency purposes to fund shareholder redemptions or for other short-term liquidity purposes. The Fund has agreed to pay commitment fees on its pro-rata portion of the line of credit, which amounted to $233 and is reflected in Commitment fees on the Statement of Operations. During the period, the Fund did not borrow on this line of credit.
7. Security Lending.
The Fund lends portfolio securities through a lending agent from time to time in order to earn additional income. For equity securities, a lending agent is used and may loan securities to certain qualified borrowers, including Fidelity Capital Markets (FCM), a broker-dealer affiliated with the Fund. On the settlement date of the loan, the Fund receives collateral (in the form of U.S. Treasury obligations, letters of credit and/or cash) against the loaned securities and maintains collateral in an amount not less than 100% of the market value of the loaned securities during the period of the loan. The market value of the loaned securities is determined at the close of business of the Fund and any additional required collateral is delivered to the Fund on the next business day. The Fund or borrower may terminate the loan at any time, and if the borrower defaults on its obligation to return the securities loaned because of insolvency or other reasons, the Fund may apply collateral received from the borrower against the obligation. The Fund may experience delays and costs in recovering the securities loaned. Any cash collateral received is invested in the Fidelity Securities Lending Cash Central Fund. The value of loaned securities and cash collateral at period end are disclosed on the Fund's Statement of Assets and Liabilities. The value of securities loaned to FCM at period end was $242,090. Security lending income represents the income earned on investing cash collateral, less rebates paid to borrowers and any lending agent fees associated with the loan, plus any premium payments received for lending certain types of securities. Security lending income is presented in the Statement of Operations as a component of income from Fidelity Central Funds. Total security lending income during the period amounted to $7,300, including $2,841 from securities loaned to FCM.
8. Expense Reductions.
Commissions paid to certain brokers with whom the investment adviser, or its affiliates, places trades on behalf of the Fund include an amount in addition to trade execution, which may be rebated back to the Fund to offset certain expenses. This amount totaled $5,452 for the period. In addition, through arrangements with the Fund's custodian, credits realized as a result of certain uninvested cash balances were used to reduce the Fund's expenses. During the period, these credits reduced the Fund's expenses by $104.
9. Other.
The Fund's organizational documents provide former and current trustees and officers with a limited indemnification against liabilities arising in connection with the performance of their duties to the Fund. In the normal course of business, the Fund may also enter into contracts that provide general indemnifications. The Fund's maximum exposure under these arrangements is unknown as this would be dependent on future claims that may be made against the Fund. The risk of material loss from such claims is considered remote.
Report of Independent Registered Public Accounting Firm
To the Trustees of Fidelity Concord Street Trust and Shareholders of Fidelity Large Cap Stock K6 Fund:
Opinion on the Financial Statements and Financial Highlights
We have audited the accompanying statement of assets and liabilities of Fidelity Large Cap Stock K6 Fund (the "Fund"), a fund of Fidelity Concord Street Trust, including the schedule of investments, as of April 30, 2019, the related statement of operations for the year then ended, the statement of changes in net assets and the financial highlights for the year then ended and for the period from May 25, 2017 (commencement of operations) to April 30, 2018, and the related notes. In our opinion, the financial statements and financial highlights present fairly, in all material respects, the financial position of the Fund as of April 30, 2019, the results of its operations for the year then ended, and the changes in its net assets and the financial highlights for the year then ended and for the period from May 25, 2017 (commencement of operations) to April 30, 2018, in conformity with accounting principles generally accepted in the United States of America.
Basis for Opinion
These financial statements and financial highlights are the responsibility of the Fund's management. Our responsibility is to express an opinion on the Fund's financial statements and financial highlights based on our audits. We are a public accounting firm registered with the Public Company Accounting Oversight Board (United States) (PCAOB) and are required to be independent with respect to the Fund in accordance with the U.S. federal securities laws and the applicable rules and regulations of the Securities and Exchange Commission and the PCAOB.
We conducted our audits in accordance with the standards of the PCAOB. Those standards require that we plan and perform the audit to obtain reasonable assurance about whether the financial statements and financial highlights are free of material misstatement, whether due to error or fraud. The Fund is not required to have, nor were we engaged to perform, an audit of its internal control over financial reporting. As part of our audits we are required to obtain an understanding of internal control over financial reporting but not for the purpose of expressing an opinion on the effectiveness of the Fund’s internal control over financial reporting. Accordingly, we express no such opinion.
Our audits included performing procedures to assess the risks of material misstatement of the financial statements and financial highlights, whether due to error or fraud, and performing procedures that respond to those risks. Such procedures included examining, on a test basis, evidence regarding the amounts and disclosures in the financial statements and financial highlights. Our audits also included evaluating the accounting principles used and significant estimates made by management, as well as evaluating the overall presentation of the financial statements and financial highlights. Our procedures included confirmation of securities owned as of April 30, 2019, by correspondence with the custodians and brokers; when replies were not received from brokers, we performed other auditing procedures. We believe that our audits provide a reasonable basis for our opinion.
/s/ Deloitte & Touche LLP
Boston, Massachusetts
June 17, 2019
We have served as the auditor of one or more of the Fidelity investment companies since 1999.
Trustees and Officers
The Trustees, Members of the Advisory Board (if any), and officers of the trust and fund, as applicable, are listed below. The Board of Trustees governs the fund and is responsible for protecting the interests of shareholders. The Trustees are experienced executives who meet periodically throughout the year to oversee the fund's activities, review contractual arrangements with companies that provide services to the fund, oversee management of the risks associated with such activities and contractual arrangements, and review the fund's performance. Except for Jonathan Chiel, each of the Trustees oversees 289 funds. Mr. Chiel oversees 158.
The Trustees hold office without limit in time except that (a) any Trustee may resign; (b) any Trustee may be removed by written instrument, signed by at least two-thirds of the number of Trustees prior to such removal; (c) any Trustee who requests to be retired or who has become incapacitated by illness or injury may be retired by written instrument signed by a majority of the other Trustees; and (d) any Trustee may be removed at any special meeting of shareholders by a two-thirds vote of the outstanding voting securities of the trust. Each Trustee who is not an interested person (as defined in the 1940 Act) of the trust and the fund is referred to herein as an Independent Trustee. Each Independent Trustee shall retire not later than the last day of the calendar year in which his or her 75th birthday occurs. The Independent Trustees may waive this mandatory retirement age policy with respect to individual Trustees. Officers and Advisory Board Members hold office without limit in time, except that any officer or Advisory Board Member may resign or may be removed by a vote of a majority of the Trustees at any regular meeting or any special meeting of the Trustees. Except as indicated, each individual has held the office shown or other offices in the same company for the past five years.
The fund’s Statement of Additional Information (SAI) includes more information about the Trustees. To request a free copy, call Fidelity at 1-800-835-5092.
Experience, Skills, Attributes, and Qualifications of the Trustees. The Governance and Nominating Committee has adopted a statement of policy that describes the experience, qualifications, attributes, and skills that are necessary and desirable for potential Independent Trustee candidates (Statement of Policy). The Board believes that each Trustee satisfied at the time he or she was initially elected or appointed a Trustee, and continues to satisfy, the standards contemplated by the Statement of Policy. The Governance and Nominating Committee also engages professional search firms to help identify potential Independent Trustee candidates who have the experience, qualifications, attributes, and skills consistent with the Statement of Policy. From time to time, additional criteria based on the composition and skills of the current Independent Trustees, as well as experience or skills that may be appropriate in light of future changes to board composition, business conditions, and regulatory or other developments, have also been considered by the professional search firms and the Governance and Nominating Committee. In addition, the Board takes into account the Trustees' commitment and participation in Board and committee meetings, as well as their leadership of standing and ad hoc committees throughout their tenure.
In determining that a particular Trustee was and continues to be qualified to serve as a Trustee, the Board has considered a variety of criteria, none of which, in isolation, was controlling. The Board believes that, collectively, the Trustees have balanced and diverse experience, qualifications, attributes, and skills, which allow the Board to operate effectively in governing the fund and protecting the interests of shareholders. Information about the specific experience, skills, attributes, and qualifications of each Trustee, which in each case led to the Board's conclusion that the Trustee should serve (or continue to serve) as a trustee of the fund, is provided below.
Board Structure and Oversight Function. James C. Curvey is an interested person and currently serves as Chairman. The Trustees have determined that an interested Chairman is appropriate and benefits shareholders because an interested Chairman has a personal and professional stake in the quality and continuity of services provided to the fund. Independent Trustees exercise their informed business judgment to appoint an individual of their choosing to serve as Chairman, regardless of whether the Trustee happens to be independent or a member of management. The Independent Trustees have determined that they can act independently and effectively without having an Independent Trustee serve as Chairman and that a key structural component for assuring that they are in a position to do so is for the Independent Trustees to constitute a substantial majority for the Board. The Independent Trustees also regularly meet in executive session. Ned C. Lautenbach serves as Chairman of the Independent Trustees and as such (i) acts as a liaison between the Independent Trustees and management with respect to matters important to the Independent Trustees and (ii) with management prepares agendas for Board meetings.
Fidelity® funds are overseen by different Boards of Trustees. The fund's Board oversees Fidelity's high income and certain equity funds, and other Boards oversee Fidelity's investment-grade bond, money market, asset allocation, and other equity funds. The asset allocation funds may invest in Fidelity® funds overseen by the fund's Board. The use of separate Boards, each with its own committee structure, allows the Trustees of each group of Fidelity® funds to focus on the unique issues of the funds they oversee, including common research, investment, and operational issues. On occasion, the separate Boards establish joint committees to address issues of overlapping consequences for the Fidelity® funds overseen by each Board.
The Trustees operate using a system of committees to facilitate the timely and efficient consideration of all matters of importance to the Trustees, the fund, and fund shareholders and to facilitate compliance with legal and regulatory requirements and oversight of the fund's activities and associated risks. The Board, acting through its committees, has charged FMR and its affiliates with (i) identifying events or circumstances the occurrence of which could have demonstrably adverse effects on the fund's business and/or reputation; (ii) implementing processes and controls to lessen the possibility that such events or circumstances occur or to mitigate the effects of such events or circumstances if they do occur; and (iii) creating and maintaining a system designed to evaluate continuously business and market conditions in order to facilitate the identification and implementation processes described in (i) and (ii) above. Because the day-to-day operations and activities of the fund are carried out by or through FMR, its affiliates, and other service providers, the fund's exposure to risks is mitigated but not eliminated by the processes overseen by the Trustees. While each of the Board's committees has responsibility for overseeing different aspects of the fund's activities, oversight is exercised primarily through the Operations, Audit, and Compliance Committees. In addition, the Independent Trustees have worked with Fidelity to enhance the Board's oversight of investment and financial risks, legal and regulatory risks, technology risks, and operational risks, including the development of additional risk reporting to the Board. Appropriate personnel, including but not limited to the fund's Chief Compliance Officer (CCO), FMR's internal auditor, the independent accountants, the fund's Treasurer and portfolio management personnel, make periodic reports to the Board's committees, as appropriate, including an annual review of Fidelity's risk management program for the Fidelity® funds. The responsibilities of each standing committee, including their oversight responsibilities, are described further under "Standing Committees of the Trustees."
Interested Trustees*:
Correspondence intended for a Trustee who is an interested person may be sent to Fidelity Investments, 245 Summer Street, Boston, Massachusetts 02210.
Name, Year of Birth; Principal Occupations and Other Relevant Experience+
Jonathan Chiel (1957)
Year of Election or Appointment: 2016
Trustee
Mr. Chiel also serves as Trustee of other Fidelity® funds. Mr. Chiel is Executive Vice President and General Counsel for FMR LLC (diversified financial services company, 2012-present). Previously, Mr. Chiel served as general counsel (2004-2012) and senior vice president and deputy general counsel (2000-2004) for John Hancock Financial Services; a partner with Choate, Hall & Stewart (1996-2000) (law firm); and an Assistant United States Attorney for the United States Attorney’s Office of the District of Massachusetts (1986-95), including Chief of the Criminal Division (1993-1995). Mr. Chiel is a director on the boards of the Boston Bar Foundation and the Maimonides School.
James C. Curvey (1935)
Year of Election or Appointment: 2007
Trustee
Chairman of the Board of Trustees
Mr. Curvey also serves as Trustee of other Fidelity® funds. Mr. Curvey is Vice Chairman (2007-present) and Director of FMR LLC (diversified financial services company). In addition, Mr. Curvey is an Overseer Emeritus for the Boston Symphony Orchestra, a Director of Artis-Naples, and a Trustee of Brewster Academy in Wolfeboro, New Hampshire. Previously, Mr. Curvey served as a Director of Fidelity Research & Analysis Co. (investment adviser firm, 2009-2018), Director of Fidelity Investments Money Management, Inc. (investment adviser firm, 2009-2014) and a Director of FMR and FMR Co., Inc. (investment adviser firms, 2007-2014).
* Determined to be an “Interested Trustee” by virtue of, among other things, his or her affiliation with the trust or various entities under common control with FMR.
+ The information includes the Trustee's principal occupation during the last five years and other information relating to the experience, attributes, and skills relevant to the Trustee's qualifications to serve as a Trustee, which led to the conclusion that the Trustee should serve as a Trustee for the fund.
Independent Trustees:
Correspondence intended for an Independent Trustee may be sent to Fidelity Investments, P.O. Box 55235, Boston, Massachusetts 02205-5235.
Name, Year of Birth; Principal Occupations and Other Relevant Experience+
Dennis J. Dirks (1948)
Year of Election or Appointment: 2005
Trustee
Mr. Dirks also serves as Trustee of other Fidelity® funds. Prior to his retirement in May 2003, Mr. Dirks was Chief Operating Officer and a member of the Board of The Depository Trust & Clearing Corporation (DTCC). He also served as President, Chief Operating Officer, and Board member of The Depository Trust Company (DTC) and President and Board member of the National Securities Clearing Corporation (NSCC). In addition, Mr. Dirks served as Chief Executive Officer and Board member of the Government Securities Clearing Corporation, Chief Executive Officer and Board member of the Mortgage-Backed Securities Clearing Corporation, as a Trustee and a member of the Finance Committee of Manhattan College (2005-2008), as a Trustee and a member of the Finance Committee of AHRC of Nassau County (2006-2008), as a member of the Independent Directors Council (IDC) Governing Council (2010-2015), and as a member of the Board of Directors for The Brookville Center for Children’s Services, Inc. (2009-2017). Mr. Dirks is a member of the Finance Committee (2016-present) and Board of Directors (2017-present) and is Treasurer (2018-present) of the Asolo Repertory Theatre.
Donald F. Donahue (1950)
Year of Election or Appointment: 2018
Trustee
Mr. Donahue also serves as a Trustee of other Fidelity® funds. Mr. Donahue is President and Chief Executive Officer of Miranda Partners, LLC (risk consulting for the financial services industry, 2012-present). Previously, Mr. Donahue served as a Member of the Advisory Board of certain Fidelity® funds (2015-2018) and Chief Executive Officer (2006-2012), Chief Operating Officer (2003-2006), and Managing Director, Customer Marketing and Development (1999-2003) of The Depository Trust & Clearing Corporation (financial markets infrastructure). Mr. Donahue serves as a Member (2007-present) and Co-Chairman (2016-present) of the Board of Directors of United Way of New York, Member of the Board of Directors of NYC Leadership Academy (2012-present) and Member of the Board of Advisors of Ripple Labs, Inc. (financial services, 2015-present). He also served as Chairman (2010-2012) and Member of the Board of Directors (2012-2013) of Omgeo, LLC (financial services), Treasurer of United Way of New York (2012-2016), and Member of the Board of Directors of XBRL US (financial services non-profit, 2009-2012) and the International Securities Services Association (2009-2012).
Alan J. Lacy (1953)
Year of Election or Appointment: 2008
Trustee
Mr. Lacy also serves as Trustee of other Fidelity® funds. Mr. Lacy serves as a Director of Bristol-Myers Squibb Company (global pharmaceuticals, 2008-present). He is a Trustee of the California Chapter of The Nature Conservancy (2015-present) and a Director of the Center for Advanced Study in the Behavioral Sciences at Stanford University (2015-present). In addition, Mr. Lacy served as Senior Adviser (2007-2014) of Oak Hill Capital Partners, L.P. (private equity) and also served as Chief Executive Officer (2005) and Vice Chairman (2005-2006) of Sears Holdings Corporation (retail) and Chief Executive Officer and Chairman of the Board of Sears, Roebuck and Co. (retail, 2000-2005). Previously, Mr. Lacy served as Chairman (2014-2017) and a member (2010-2017) of the Board of Directors of Dave & Buster’s Entertainment, Inc. (restaurant and entertainment complexes), as Chairman (2008-2011) and a member (2006-2015) of the Board of Trustees of the National Parks Conservation Association, and as a member of the Board of Directors for The Hillman Companies, Inc. (hardware wholesalers, 2010-2014), Earth Fare, Inc. (retail grocery, 2010-2014), and The Western Union Company (global money transfer, 2006-2011).
Ned C. Lautenbach (1944)
Year of Election or Appointment: 2000
Trustee
Chairman of the Independent Trustees
Mr. Lautenbach also serves as Trustee of other Fidelity® funds. Mr. Lautenbach currently serves as Chair (2018-present) and Member (2013-present) of the Board of Governors, State University System of Florida and is a member of the Council on Foreign Relations (1994-present). He is also a member and has most recently served as Chairman of the Board of Directors of Artis-Naples (2012-present). Previously, Mr. Lautenbach served as a member and then Lead Director of the Board of Directors of Eaton Corporation (diversified industrial, 1997-2016). He was also a Partner and Advisory Partner at Clayton, Dubilier & Rice, LLC (private equity investment, 1998-2010), as well as a Director of Sony Corporation (2006-2007). In addition, Mr. Lautenbach also had a 30-year career with IBM (technology company) during which time he served as Senior Vice President and a member of the Corporate Executive Committee (1968-1998).
Joseph Mauriello (1944)
Year of Election or Appointment: 2008
Trustee
Mr. Mauriello also serves as Trustee of other Fidelity® funds. Prior to his retirement in January 2006, Mr. Mauriello served in numerous senior management positions including Deputy Chairman and Chief Operating Officer (2004-2005), and Vice Chairman of Financial Services (2002-2004) of KPMG LLP US (professional services, 1965-2005). Mr. Mauriello currently serves as a member of the Independent Directors Council (IDC) Governing Council (2015-present). Previously, Mr. Mauriello served as a member of the Board of Directors of XL Group plc. (global insurance and re-insurance, 2006-2018).
Cornelia M. Small (1944)
Year of Election or Appointment: 2005
Trustee
Ms. Small also serves as Trustee of other Fidelity® funds. Ms. Small is a member of the Board of Directors (2009-present) and Chair of the Investment Committee (2010-present) of the Teagle Foundation. Ms. Small also serves on the Investment Committee of the Berkshire Taconic Community Foundation (2008-present). Previously, Ms. Small served as Chairperson (2002-2008) and a member of the Investment Committee and Chairperson (2008-2012) and a member of the Board of Trustees of Smith College. In addition, Ms. Small served as Chief Investment Officer, Director of Global Equity Investments, and a member of the Board of Directors of Scudder, Stevens & Clark and Scudder Kemper Investments.
Garnett A. Smith (1947)
Year of Election or Appointment: 2018
Trustee
Mr. Smith also serves as Trustee of other Fidelity® funds. Prior to Mr. Smith's retirement, he served as Chairman and Chief Executive Officer of Inbrand Corp. (manufacturer of personal absorbent products, 1990-1997). He also served as President (1986-1990) of Inbrand Corp. Prior to his employment with Inbrand Corp., he was employed by a retail fabric chain and North Carolina National Bank. In addition, Mr. Smith served as a Member of the Advisory Board of certain Fidelity® funds (2012-2013) and as a board member of the Jackson Hole Land Trust (2009-2012).
David M. Thomas (1949)
Year of Election or Appointment: 2008
Trustee
Mr. Thomas also serves as Trustee of other Fidelity® funds. Mr. Thomas serves as Non-Executive Chairman of the Board of Directors of Fortune Brands Home and Security (home and security products, 2011-present) and as a member of the Board of Directors (2004-present) and Presiding Director (2013-present) of Interpublic Group of Companies, Inc. (marketing communication). Previously, Mr. Thomas served as Executive Chairman (2005-2006) and Chairman and Chief Executive Officer (2000-2005) of IMS Health, Inc. (pharmaceutical and healthcare information solutions), a Director of Fortune Brands, Inc. (consumer products, 2000-2011), and a member of the Board of Trustees of the University of Florida (2013-2018).
+ The information includes the Trustee's principal occupation during the last five years and other information relating to the experience, attributes, and skills relevant to the Trustee's qualifications to serve as a Trustee, which led to the conclusion that the Trustee should serve as a Trustee for the fund.
Advisory Board Members and Officers:
Correspondence intended for a Member of the Advisory Board (if any) may be sent to Fidelity Investments, P.O. Box 55235, Boston, Massachusetts 02205-5235. Correspondence intended for an officer or Peter S. Lynch may be sent to Fidelity Investments, 245 Summer Street, Boston, Massachusetts 02210. Officers appear below in alphabetical order.
Name, Year of Birth; Principal Occupation
Vicki L. Fuller (1957)
Year of Election or Appointment: 2018
Member of the Advisory Board
Ms. Fuller also serves as Member of the Advisory Board of other Fidelity® funds. Ms. Fuller serves as a member of the Board of Directors, Audit Committee, and Nominating and Governance Committee of The Williams Companies, Inc. (natural gas infrastructure, 2018-present). Previously, Ms. Fuller served as the Chief Investment Officer of the New York State Common Retirement Fund (2012-2018) and held a variety of positions at AllianceBernstein L.P. (global asset management, 1985-2012), including Managing Director (2006-2012) and Senior Vice President and Senior Portfolio Manager (2001-2006).
Peter S. Lynch (1944)
Year of Election or Appointment: 2003
Member of the Advisory Board
Mr. Lynch also serves as Member of the Advisory Board of other Fidelity® funds. Mr. Lynch is Vice Chairman and a Director of FMR (investment adviser firm) and FMR Co., Inc. (investment adviser firm). In addition, Mr. Lynch serves as a Trustee of Boston College and as the Chairman of the Inner-City Scholarship Fund. Previously, Mr. Lynch served on the Special Olympics International Board of Directors (1997-2006).
Carol B. Tomé (1957)
Year of Election or Appointment: 2018
Member of the Advisory Board
Ms. Tomé also serves as Member of the Advisory Board of other Fidelity® funds. Ms. Tomé is Chief Financial Officer (2001-present) and Executive Vice President of Corporate Services (2007-present) of The Home Depot, Inc. (home improvement retailer) and a Director (2003-present) and Chair of the Audit Committee (2004-present) of United Parcel Service, Inc. (package delivery and supply chain management). Previously, Ms. Tomé served as Trustee of certain Fidelity® funds (2017), Senior Vice President of Finance and Accounting/Treasurer (2000-2007) and Vice President and Treasurer (1995-2000) of The Home Depot, Inc. and Chair of the Board (2010-2012), Vice Chair of the Board (2009 and 2013), and a Director (2008-2013) of the Federal Reserve Bank of Atlanta. Ms. Tomé is also a director or trustee of many community and professional organizations.
Michael E. Wiley (1950)
Year of Election or Appointment: 2018
Member of the Advisory Board
Mr. Wiley also serves as Trustee or Member of the Advisory Board of other Fidelity® funds. Mr. Wiley serves as a Director of High Point Resources (exploration and production, 2005-present). Previously, Mr. Wiley served as a Director of Andeavor Corporation (independent oil refiner and marketer, 2005-2018), a Director of Andeavor Logistics LP (natural resources logistics, 2015-2018), a Director of Post Oak Bank (privately-held bank, 2004-2018), a Director of Asia Pacific Exploration Consolidated (international oil and gas exploration and production, 2008-2013), a member of the Board of Trustees of the University of Tulsa (2000-2006; 2007-2010), a Senior Energy Advisor of Katzenbach Partners, LLC (consulting, 2006-2007), an Advisory Director of Riverstone Holdings (private investment), a Director of Spinnaker Exploration Company (exploration and production, 2001-2005) and Chairman, President, and CEO of Baker Hughes, Inc. (oilfield services, 2000-2004).
Elizabeth Paige Baumann (1968)
Year of Election or Appointment: 2017
Anti-Money Laundering (AML) Officer
Ms. Baumann also serves as AML Officer of other funds. She is Chief AML Officer (2012-present) and Senior Vice President (2014-present) of FMR LLC (diversified financial services company) and is an employee of Fidelity Investments. Previously, Ms. Baumann served as AML Officer of the funds (2012-2016), and Vice President (2007-2014) and Deputy Anti-Money Laundering Officer (2007-2012) of FMR LLC.
Craig S. Brown (1977)
Year of Election or Appointment: 2019
Assistant Treasurer
Mr. Brown also serves as Assistant Treasurer of other funds. Mr. Brown is an employee of Fidelity Investments (2013-present).
John J. Burke III (1964)
Year of Election or Appointment: 2018
Chief Financial Officer
Mr. Burke also serves as Chief Financial Officer of other funds. Mr. Burke serves as Head of Investment Operations for Fidelity Fund and Investment Operations (2018-present) and is an employee of Fidelity Investments (1998-present). Previously Mr. Burke served as head of Asset Management Investment Operations (2012-2018).
William C. Coffey (1969)
Year of Election or Appointment: 2018
Secretary and Chief Legal Officer (CLO)
Mr. Coffey also serves as Secretary and CLO of other funds. Mr. Coffey serves as CLO, Secretary, and Senior Vice President of Fidelity Management & Research Company and FMR Co., Inc. (investment adviser firms, 2018-present); Secretary of Fidelity SelectCo, LLC and Fidelity Investments Money Management, Inc. (investment adviser firms, 2018-present); and CLO of Fidelity Management & Research (Hong Kong) Limited, FMR Investment Management (UK) Limited, and Fidelity Management & Research (Japan) Limited (investment adviser firms, 2018-present). He is Senior Vice President and Deputy General Counsel of FMR LLC (diversified financial services company, 2010-present), and is an employee of Fidelity Investments. Previously, Mr. Coffey served as Assistant Secretary of certain funds (2009-2018) and as Vice President and Associate General Counsel of FMR LLC (2005-2009).
Timothy M. Cohen (1969)
Year of Election or Appointment: 2018
Vice President
Mr. Cohen also serves as Vice President of other funds. Mr. Cohen serves as Executive Vice President of Fidelity SelectCo, LLC (2019-present), Co-Head of Equity (2018-present), a Director of Fidelity Management & Research (Japan) Limited (investment adviser firm, 2016-present), and is an employee of Fidelity Investments. Previously, Mr. Cohen served as Head of Global Equity Research (2016-2018), Chief Investment Officer - Equity and a Director of Fidelity Management & Research (U.K.) Inc. (investment adviser firm, 2013-2015) and as a Director of Fidelity Management & Research (Hong Kong) Limited (investment adviser firm, 2017).
Jonathan Davis (1968)
Year of Election or Appointment: 2010
Assistant Treasurer
Mr. Davis also serves as Assistant Treasurer of other funds. Mr. Davis serves as Assistant Treasurer of FMR Capital, Inc. (2017-present) and is an employee of Fidelity Investments. Previously, Mr. Davis served as Vice President and Associate General Counsel of FMR LLC (diversified financial services company, 2003-2010).
Adrien E. Deberghes (1967)
Year of Election or Appointment: 2016
Assistant Treasurer
Mr. Deberghes also serves as an officer of other funds. He serves as Assistant Treasurer of FMR Capital, Inc. (2017-present), Executive Vice President of Fidelity Investments Money Management, Inc. (FIMM) (investment adviser firm, 2016-present), and is an employee of Fidelity Investments (2008-present). Previously, Mr. Deberghes served as President and Treasurer of certain Fidelity® funds (2013-2018). Prior to joining Fidelity Investments, Mr. Deberghes was Senior Vice President of Mutual Fund Administration at State Street Corporation (2007-2008), Senior Director of Mutual Fund Administration at Investors Bank & Trust (2005-2007), and Director of Finance for Dunkin' Brands (2000-2005). Previously, Mr. Deberghes served in other fund officer roles.
Laura M. Del Prato (1964)
Year of Election or Appointment: 2018
Assistant Treasurer
Ms. Del Prato also serves as an officer of other funds. Ms. Del Prato is an employee of Fidelity Investments (2017-present). Prior to joining Fidelity Investments, Ms. Del Prato served as a Managing Director and Treasurer of the JPMorgan Mutual Funds (2014-2017). Prior to JPMorgan, Ms. Del Prato served as a partner at Cohen Fund Audit Services (accounting firm, 2012-2013) and KPMG LLP (accounting firm, 2004-2012).
Colm A. Hogan (1973)
Year of Election or Appointment: 2016
Deputy Treasurer
Mr. Hogan also serves as an officer of other funds. Mr. Hogan serves as Assistant Treasurer of FMR Capital, Inc. (2017-present) and is an employee of Fidelity Investments (2005-present). Previously, Mr. Hogan served as Assistant Treasurer of certain Fidelity® funds (2016-2018).
Pamela R. Holding (1964)
Year of Election or Appointment: 2018
Vice President
Ms. Holding also serves as Vice President of other funds. Ms. Holding serves as Executive Vice President of Fidelity SelectCo, LLC (2019-present), Co-Head of Equity (2018-present) and is an employee of Fidelity Investments (2013-present). Previously, Ms. Holding served as Chief Investment Officer of Fidelity Institutional Asset Management (2013-2018).
Chris Maher (1972)
Year of Election or Appointment: 2013
Assistant Treasurer
Mr. Maher serves as Assistant Treasurer of other funds. Mr. Maher is Vice President of Valuation Oversight, serves as Assistant Treasurer of FMR Capital, Inc. (2017-present), and is an employee of Fidelity Investments. Previously, Mr. Maher served as Vice President of Asset Management Compliance (2013), Vice President of the Program Management Group of FMR (investment adviser firm, 2010-2013), and Vice President of Valuation Oversight (2008-2010).
Kenneth B. Robins (1969)
Year of Election or Appointment: 2016
Chief Compliance Officer
Mr. Robins also serves as an officer of other funds. Mr. Robins serves as Compliance Officer of Fidelity Management & Research Company and FMR Co., Inc. (investment adviser firms, 2016-present) and is an employee of Fidelity Investments (2004-present). Previously, Mr. Robins served as Executive Vice President of Fidelity Investments Money Management, Inc. (investment adviser firm, 2013-2016) and served in other fund officer roles.
Stacie M. Smith (1974)
Year of Election or Appointment: 2016
President and Treasurer
Ms. Smith also serves as an officer of other funds. Ms. Smith serves as Assistant Treasurer of FMR Capital, Inc. (2017-present), is an employee of Fidelity Investments (2009-present), and has served in other fund officer roles. Prior to joining Fidelity Investments, Ms. Smith served as Senior Audit Manager of Ernst & Young LLP (accounting firm, 1996-2009). Previously, Ms. Smith served as Assistant Treasurer (2013-2018) and Deputy Treasurer (2013-2016) of certain Fidelity® funds.
Marc L. Spector (1972)
Year of Election or Appointment: 2016
Assistant Treasurer
Mr. Spector also serves as an officer of other funds. Mr. Spector serves as Assistant Treasurer of FMR Capital, Inc. (2017-present) and is an employee of Fidelity Investments (2016-present). Prior to joining Fidelity Investments, Mr. Spector served as Director at the Siegfried Group (accounting firm, 2013-2016), and prior to Siegfried Group as audit senior manager at Deloitte & Touche (accounting firm, 2005-2013).
Jim Wegmann (1979)
Year of Election or Appointment: 2019
Assistant Treasurer
Mr. Wegmann also serves as Assistant Treasurer of other funds. Mr. Wegmann is an employee of Fidelity Investments (2011-present).
Shareholder Expense Example
As a shareholder of the Fund, you incur two types of costs: (1) transaction costs, and (2) ongoing costs, including management fees and other Fund expenses. This Example is intended to help you understand your ongoing costs (in dollars) of investing in the Fund and to compare these costs with the ongoing costs of investing in other mutual funds.
The Example is based on an investment of $1,000 invested at the beginning of the period and held for the entire period (November 1, 2018 to April 30, 2019).
Actual Expenses
The first line of the accompanying table provides information about actual account values and actual expenses. You may use the information in this line, together with the amount you invested, to estimate the expenses that you paid over the period. Simply divide your account value by $1,000.00 (for example, an $8,600 account value divided by $1,000.00 = 8.6), then multiply the result by the number in the first line under the heading entitled "Expenses Paid During Period" to estimate the expenses you paid on your account during this period. In addition, the Fund, as a shareholder in the underlying Fidelity Central Funds, will indirectly bear its pro-rata share of the fees and expenses incurred by the underlying Fidelity Central Funds. These fees and expenses are not included in the Fund's annualized expense ratio used to calculate the expense estimate in the table below.
Hypothetical Example for Comparison Purposes
The second line of the accompanying table provides information about hypothetical account values and hypothetical expenses based on the Fund's actual expense ratio and an assumed rate of return of 5% per year before expenses, which is not the Fund's actual return. The hypothetical account values and expenses may not be used to estimate the actual ending account balance or expenses you paid for the period. You may use this information to compare the ongoing costs of investing in the Fund and other funds. To do so, compare this 5% hypothetical example with the 5% hypothetical examples that appear in the shareholder reports of the other funds. In addition, the Fund, as a shareholder in the underlying Fidelity Central Funds, will indirectly bear its pro-rata share of the fees and expenses incurred by the underlying Fidelity Central Funds. These fees and expenses are not included in the Fund's annualized expense ratio used to calculate the expense estimate in the table below.
Please note that the expenses shown in the table are meant to highlight your ongoing costs only and do not reflect any transaction costs. Therefore, the second line of the table is useful in comparing ongoing costs only, and will not help you determine the relative total costs of owning different funds.
| Annualized Expense Ratio-A | Beginning Account Value November 1, 2018 | Ending Account Value April 30, 2019 | Expenses Paid During Period-B November 1, 2018 to April 30, 2019 | |
| Actual | .45% | $1,000.00 | $1,065.40 | $2.30 |
| Hypothetical-C | $1,000.00 | $1,022.56 | $2.26 |
A Annualized expense ratio reflects expenses net of applicable fee waivers.
B Expenses are equal to the Fund's annualized expense ratio, multiplied by the average account value over the period, multiplied by 181/365 (to reflect the one-half year period).
C 5% return per year before expenses
Distributions (Unaudited)
The fund hereby designates as a capital gain dividend with respect to the taxable year ended April 30, 2019, $897,601, or, if subsequently determined to be different, the net capital gain of such year.
The fund designates 51% and 60% of the dividends distributed in June and December, respectively during the fiscal year as qualifying for the dividends–received deduction for corporate shareholders.
The fund designates 60% and 72% of the dividends distributed in June and December, respectively during the fiscal year as amounts which may be taken into account as a dividend for the purposes of the maximum rate under section 1(h)(11) of the Internal Revenue Code.
The fund will notify shareholders in January 2020 of amounts for use in preparing 2019 income tax returns.
Board Approval of Investment Advisory Contracts and Management Fees
Fidelity Large Cap Stock K6 Fund
Each year, the Board of Trustees, including the Independent Trustees (together, the Board), votes on the renewal of the management contract with Fidelity Management & Research Company (FMR) and the sub-advisory agreements (together, the Advisory Contracts) for the fund. FMR and the sub-advisers are referred to herein as the Investment Advisers. The Board, assisted by the advice of fund counsel and Independent Trustees' counsel, requests and considers a broad range of information relevant to the renewal of the Advisory Contracts throughout the year.
The Board meets regularly and, at each of its meetings, covers an extensive agenda of topics and materials and considers factors that are relevant to its annual consideration of the renewal of the fund's Advisory Contracts, including the services and support provided to the fund and its shareholders. The Board has established various standing committees (Committees), each composed of and chaired by Independent Trustees with varying backgrounds, to which the Board has assigned specific subject matter responsibilities in order to enhance effective decision-making by the Board. The Board, acting directly and through its Committees, requests and receives information concerning the annual consideration of the renewal of the fund's Advisory Contracts. The Board also meets as needed to review matters specifically related to the Board's annual consideration of the renewal of the Advisory Contracts. Members of the Board may also meet with trustees of other Fidelity funds through joint ad hoc committees to discuss certain matters relevant to all of the Fidelity funds.
At its January 2019 meeting, the Board unanimously determined to renew the fund's Advisory Contracts. In reaching its determination, the Board considered all factors it believed relevant, including (i) the nature, extent, and quality of the services to be provided to the fund and its shareholders (including the investment performance of the fund); (ii) the competitiveness of the fund's management fee and total expense ratio relative to peer funds; (iii) the total costs of the services to be provided by and the profits to be realized by Fidelity from its relationships with the fund; and (iv) the extent to which, if any, economies of scale exist and would be realized as the fund grows, and whether any economies of scale are appropriately shared with fund shareholders.
In considering whether to renew the Advisory Contracts for the fund, the Board reached a determination, with the assistance of fund counsel and Independent Trustees' counsel and through the exercise of its business judgment, that the renewal of the Advisory Contracts was in the best interests of the fund and its shareholders and that the compensation payable under the Advisory Contracts was fair and reasonable. The Board's decision to renew the Advisory Contracts was not based on any single factor, but rather was based on a comprehensive consideration of all the information provided to the Board at its meetings throughout the year. The Board, in reaching its determination to renew the Advisory Contracts, was aware that shareholders of the fund have a broad range of investment choices available to them, including a wide choice among funds offered by Fidelity's competitors, and that the fund's shareholders, who have the opportunity to review and weigh the disclosure provided by the fund in its prospectus and other public disclosures, have chosen to invest in this fund, which is part of the Fidelity family of funds.
Nature, Extent, and Quality of Services Provided. The Board considered Fidelity's staffing as it relates to the fund, including the backgrounds of investment personnel of Fidelity, and also considered the fund's investment objective, strategies, and related investment philosophy. The Independent Trustees also had discussions with senior management of Fidelity's investment operations and investment groups. The Board considered the structure of the investment personnel compensation program and whether this structure provides appropriate incentives to act in the best interests of the fund. Additionally, the Board considered the portfolio managers' investments, if any, in the funds that they manage.Resources Dedicated to Investment Management and Support Services. The Board and the Fund Oversight and Research Committees reviewed the general qualifications and capabilities of Fidelity's investment staff, including its size, education, experience, and resources, as well as Fidelity's approach to recruiting, training, managing, and compensating investment personnel. The Board noted that Fidelity has continued to increase the resources devoted to non-U.S. offices, including expansion of Fidelity's global investment organization. The Board also noted that Fidelity's analysts have extensive resources, tools and capabilities that allow them to conduct sophisticated quantitative and fundamental analysis, as well as credit analysis of issuers, counterparties and guarantors. Further, the Board considered that Fidelity's investment professionals have sufficient access to global information and data so as to provide competitive investment results over time, and that those professionals also have access to sophisticated tools that permit them to assess portfolio construction and risk and performance attribution characteristics continuously, as well as to transmit new information and research conclusions rapidly around the world. Additionally, in its deliberations, the Board considered Fidelity's trading, risk management, compliance, and technology and operations capabilities and resources, which are integral parts of the investment management process.Shareholder and Administrative Services. The Board considered (i) the nature, extent, quality, and cost of advisory, administrative, and shareholder services performed by the Investment Advisers and their affiliates under the Advisory Contracts and under separate agreements covering transfer agency, pricing and bookkeeping, and securities lending services for the fund; (ii) the nature and extent of the supervision of third party service providers, principally custodians, subcustodians, and pricing vendors; and (iii) the resources devoted to, and the record of compliance with, the fund's compliance policies and procedures. The Board also reviewed the allocation of fund brokerage, including allocations to brokers affiliated with the Investment Advisers, the use of brokerage commissions to pay fund expenses, and the use of "soft" commission dollars to pay for research services.The Board noted that the growth of fund assets over time across the complex allows Fidelity to reinvest in the development of services designed to enhance the value and convenience of the Fidelity funds as investment vehicles. These services include 24-hour access to account information and market information through telephone representatives and over the Internet, investor education materials and asset allocation tools, and the expanded availability of Fidelity Investor Centers.The Board noted that it and the boards of certain other Fidelity funds had formed an ad hoc Committee on Transfer Agency Fees to review the variety of transfer agency fee structures throughout the industry and Fidelity's competitive positioning with respect to industry participants.Investment in a Large Fund Family. The Board considered the benefits to shareholders of investing in a Fidelity fund, including the benefits of investing in a fund that is part of a large family of funds offering a variety of investment disciplines and providing a large variety of mutual fund investor services. The Board noted that Fidelity had taken, or had made recommendations that resulted in the Fidelity funds taking, a number of actions over the previous year that benefited particular funds, including: (i) continuing to dedicate additional resources to Fidelity's investment research process, which includes meetings with management of issuers of securities in which the funds invest, and to the support of the senior management team that oversees asset management; (ii) continuing efforts to enhance Fidelity's global research capabilities; (iii) launching new funds and making other enhancements to meet client needs; (iv) launching new share classes of existing funds; (v) eliminating purchase minimums and broadening eligibility requirements for certain funds and share classes; (vi) reducing management fees and total expenses for certain growth equity funds and index funds; (vii) lowering expense caps for certain existing funds and classes, and converting certain voluntary expense caps to contractual caps, to reduce expenses borne by shareholders; (viii) eliminating short-term redemption fees for funds that had such fees; (ix) rationalizing product lines and gaining increased efficiencies from fund mergers and share class consolidations; (x) continuing to develop, acquire and implement systems and technology to improve services to the funds and shareholders, strengthen information security, and increase efficiency; and (xi) continuing to implement enhancements to further strengthen Fidelity's product line to increase investors' probability of success in achieving their investment goals, including retirement income goals.Investment Performance. The Board considered whether the fund has operated in accordance with its investment objective, as well as its record of compliance with its investment restrictions and its performance history.The Board took into account discussions that occur at Board meetings throughout the year with representatives of the Investment Advisers about fund investment performance. In this regard the Board noted that as part of regularly scheduled fund reviews and other reports to the Board on fund performance, the Board considers annualized return information for the fund for different time periods, measured against an appropriate securities market index ("benchmark index") and a peer group of funds with similar objectives ("peer group"), if any. In its evaluation of fund investment performance, the Board gave particular attention to information indicating changes in performance of certain Fidelity funds for specific time periods and discussed with the Investment Advisers the reasons for any overperformance or underperformance.In addition to reviewing absolute and relative fund performance, the Independent Trustees periodically consider the appropriateness of fund performance metrics in evaluating the results achieved. In general, the Independent Trustees believe that fund performance should be evaluated based on net performance (after fees and expenses) of both the highest performing and lowest performing fund share classes, where applicable, compared to appropriate benchmark indices, over appropriate time periods that may include full market cycles, and compared to peer groups, as applicable, over the same periods, taking into account relevant factors including the following: general market conditions; issuer-specific information; and fund cash flows and other factors.The Independent Trustees recognize that shareholders evaluate performance on a net basis over their own holding periods, for which one-, three-, and five-year periods are often used as a proxy. For this reason, the performance information reviewed by the Board also included net total return information for the fund and an appropriate benchmark index and peer group for the most recent one-year period ended June 30, 2018, as shown below. Returns are shown compared to the 25th percentile (top of box, 75% beaten) and 75th percentile (bottom of box, 25% beaten) of the peer universe.Fidelity Large Cap Stock K6 Fund
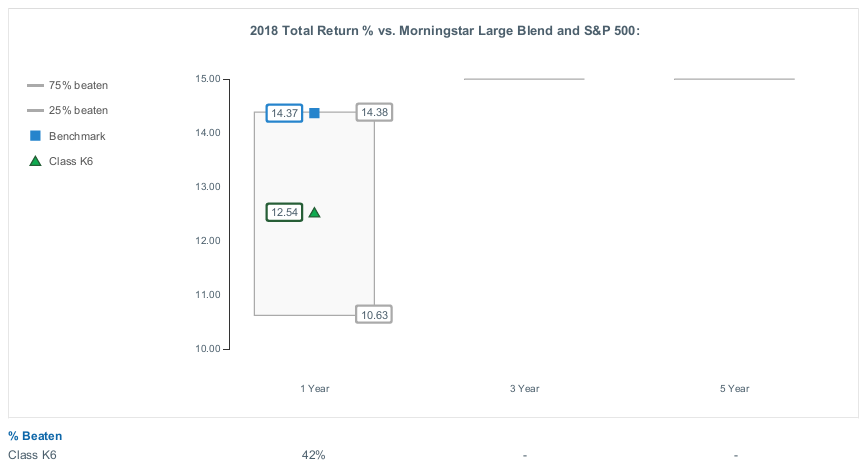
Fidelity Large Cap Stock K6 Fund
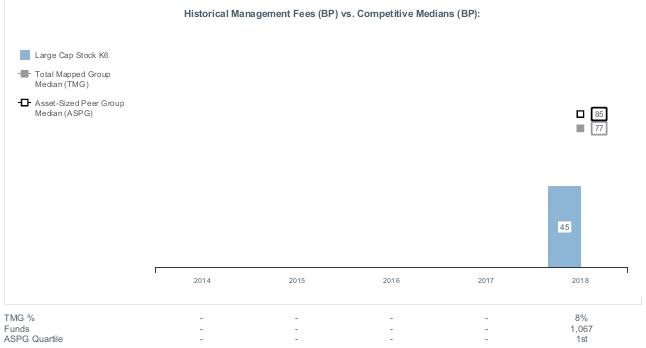
![]()
LCSK6-ANN-0619
1.9883971.101
Fidelity® Small Cap Stock K6 Fund Annual Report April 30, 2019 |
|
Beginning on January 1, 2021, as permitted by regulations adopted by the Securities and Exchange Commission, paper copies of a fund’s shareholder reports will no longer be sent by mail, unless you specifically request paper copies of the reports from the fund or from your financial intermediary, such as a financial advisor, broker-dealer or bank. Instead, the reports will be made available on a website, and you will be notified by mail each time a report is posted and provided with a website link to access the report.
If you already elected to receive shareholder reports electronically, you will not be affected by this change and you need not take any action. You may elect to receive shareholder reports and other communications from a fund electronically, by contacting your financial intermediary. For Fidelity customers, visit Fidelity's web site or call Fidelity using the contact information listed below.
You may elect to receive all future reports in paper free of charge. If you wish to continue receiving paper copies of your shareholder reports, you may contact your financial intermediary or, if you are a Fidelity customer, visit Fidelity’s website, or call Fidelity at the applicable toll-free number listed below. Your election to receive reports in paper will apply to all funds held with the fund complex/your financial intermediary.
| Account Type | Website | Phone Number |
| Brokerage, Mutual Fund, or Annuity Contracts: | fidelity.com/mailpreferences | 1-800-343-3548 |
| Employer Provided Retirement Accounts: | netbenefits.fidelity.com/preferences (choose 'no' under Required Disclosures to continue to print) | 1-800-343-0860 |
| Advisor Sold Accounts Serviced Through Your Financial Intermediary: | Contact Your Financial Intermediary | Your Financial Intermediary's phone number |
| Advisor Sold Accounts Serviced by Fidelity: | institutional.fidelity.com | 1-877-208-0098 |
Contents
Board Approval of Investment Advisory Contracts and Management Fees |
To view a fund's proxy voting guidelines and proxy voting record for the 12-month period ended June 30, visit http://www.fidelity.com/proxyvotingresults or visit the Securities and Exchange Commission's (SEC) web site at http://www.sec.gov.
You may also call 1-800-835-5092 to request a free copy of the proxy voting guidelines.
Standard & Poor's, S&P and S&P 500 are registered service marks of The McGraw-Hill Companies, Inc. and have been licensed for use by Fidelity Distributors Corporation.
Other third-party marks appearing herein are the property of their respective owners.
All other marks appearing herein are registered or unregistered trademarks or service marks of FMR LLC or an affiliated company. © 2019 FMR LLC. All rights reserved.
This report and the financial statements contained herein are submitted for the general information of the shareholders of the Fund. This report is not authorized for distribution to prospective investors in the Fund unless preceded or accompanied by an effective prospectus.
A fund files its complete schedule of portfolio holdings with the SEC for the first and third quarters of each fiscal year on Form N-PORT. Forms N-PORT are available on the SEC’s web site at http://www.sec.gov. A fund's Forms N-PORT may be reviewed and copied at the SEC’s Public Reference Room in Washington, DC. Information regarding the operation of the SEC's Public Reference Room may be obtained by calling 1-800-SEC-0330.
For a complete list of a fund's portfolio holdings, view the most recent holdings listing, semiannual report, or annual report on Fidelity's web site at http://www.fidelity.com, http://www.institutional.fidelity.com, or http://www.401k.com, as applicable.
NOT FDIC INSURED •MAY LOSE VALUE •NO BANK GUARANTEE
Neither the Fund nor Fidelity Distributors Corporation is a bank.
Performance: The Bottom Line
Average annual total return reflects the change in the value of an investment, assuming reinvestment of distributions from dividend income and capital gains (the profits earned upon the sale of securities that have grown in value, if any) and assuming a constant rate of performance each year. The hypothetical investment and the average annual total returns do not reflect the deduction of taxes that a shareholder would pay on fund distributions or the redemption of fund shares. During periods of reimbursement by Fidelity, a fund’s total return will be greater than it would be had the reimbursement not occurred. How a fund did yesterday is no guarantee of how it will do tomorrow.
Average Annual Total Returns
| For the periods ended April 30, 2019 | Past 1 year | Life of fundA |
| Fidelity® Small Cap Stock K6 Fund | 6.43% | 8.93% |
A From May 25, 2017
$10,000 Over Life of Fund
Let's say hypothetically that $10,000 was invested in Fidelity® Small Cap Stock K6 Fund on May 25, 2017, when the fund started.
The chart shows how the value of your investment would have changed, and also shows how the Russell 2000® Index performed over the same period.
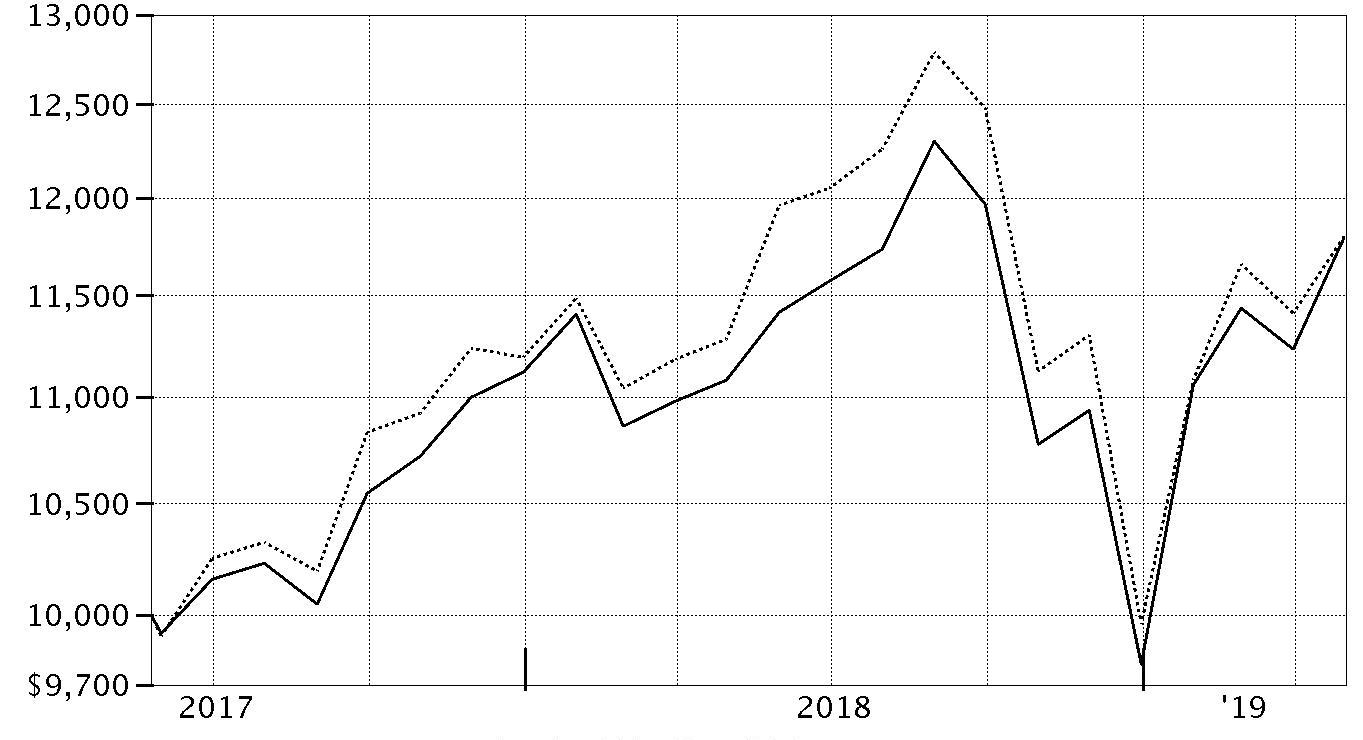
| Period Ending Values | ||
| $11,795 | Fidelity® Small Cap Stock K6 Fund | |
| $11,801 | Russell 2000® Index | |
Management's Discussion of Fund Performance
Market Recap: The S&P 500® index gained 13.49% for the 12 months ending April 30, 2019, as U.S. equities began the new year on a high note after enduring an historically volatile final quarter of 2018. The index rose 18.25% year to date, its strongest four-month opening since 1987, amid upbeat company earnings/outlooks and signs the Fed may pause on rates. After achieving a record close in late April, the S&P 500® moved a bit higher to end the period. The uptrend was in sharp contrast to late 2018, when rising U.S. Treasury yields and concern about peaking corporate earnings growth sent many investors fleeing from risk assets as they were still dealing with lingering uncertainty related to global trade and the Fed picking up the pace of interest rate hikes. The index returned -6.84% in October, at the time its largest monthly drop in seven years. But conditions worsened through Christmas, as jitters about the economy and another hike in rates led to a spike in market volatility and a -9.03% result for December. For the full period, eight of 11 sectors registered a double-digit gain, led by information technology (+25%). Three defensive groups also stood out: real estate (+21%), consumer staples (+18%) and utilities (+18%). Communication services – a mix of telecom stocks and media/entertainment names – gained 17%, followed by consumer discretionary (+16%). In contrast, energy (-7%) lost ground, while materials (+3%), financials (+4%), health care (+11%) and industrials (+11%) also trailed the broad market.Comments from Portfolio Manager Kip Johann-Berkel: For the fiscal year, the fund returned 6.43%, outpacing the 4.61% increase for the benchmark Russell 2000® Index. Favorable stock selection drove the fund's result relative to the index, particularly in the industrials, health care, materials, energy and financials sectors. Stock picks in information technology and, to a lesser extent, real estate and consumer discretionary, were negative factors. Among individual stocks, the top contributor was a position in Lending Tree, an online lending marketplace, which returned 53% for the fund. Lending Tree benefited from strong secular-growth trends, a favorable competitive position and an attractive valuation entering the period, among other factors. Out-of-index positions in internet and cable service provider Cable One and Israel-based software provider Nice both added value, returning 55% and 34% for the fund, respectively. Meanwhile, foreign exposure contributed overall, despite currency headwinds. The fund's biggest individual relative detractor was Stamps.com (-63% for the fund), a provider of online mailing and shipping services, whose shares plunged after the company voluntarily terminated an exclusive contract with the United States Postal Service as part of a business-strategy shift. Also hampering relative results was software provider Ebix (-35% for the fund), whose shares fell after the market expressed concern about a change in the company's primary auditor. I continued to find Ebix attractively valued, however, and it, along with Lending Tree and Nice, were among the fund's largest holdings on April 30.The views expressed above reflect those of the portfolio manager(s) only through the end of the period as stated on the cover of this report and do not necessarily represent the views of Fidelity or any other person in the Fidelity organization. Any such views are subject to change at any time based upon market or other conditions and Fidelity disclaims any responsibility to update such views. These views may not be relied on as investment advice and, because investment decisions for a Fidelity fund are based on numerous factors, may not be relied on as an indication of trading intent on behalf of any Fidelity fund.
Note to Shareholders: On June 30, 2018, Lionel Harris retired from investment management, leaving Kip Johann-Berkel as sole manager of the fund.Investment Summary (Unaudited)
Top Ten Stocks as of April 30, 2019
| % of fund's net assets | |
| Career Education Corp. | 3.0 |
| SYNNEX Corp. | 2.8 |
| Innospec, Inc. | 2.3 |
| LendingTree, Inc. | 2.2 |
| NICE Systems Ltd. sponsored ADR | 2.2 |
| Primerica, Inc. | 2.2 |
| Inovalon Holdings, Inc. Class A | 2.1 |
| Boyd Group Income Fund | 2.0 |
| Ebix, Inc. | 1.9 |
| First Cash Financial Services, Inc. | 1.9 |
| 22.6 |
Top Five Market Sectors as of April 30, 2019
| % of fund's net assets | |
| Financials | 20.8 |
| Information Technology | 18.1 |
| Consumer Discretionary | 14.4 |
| Health Care | 14.0 |
| Industrials | 13.8 |
Asset Allocation (% of fund's net assets)
| As of April 30, 2019* | ||
| Stocks | 99.8% | |
| Short-Term Investments and Net Other Assets (Liabilities) | 0.2% | |

* Foreign investments – 23.4%
Schedule of Investments April 30, 2019
Showing Percentage of Net Assets
| Common Stocks - 99.8% | |||
| Shares | Value | ||
| COMMUNICATION SERVICES - 2.7% | |||
| Interactive Media & Services - 0.5% | |||
| CarGurus, Inc. Class A (a) | 6,500 | $264,810 | |
| LIFULL Co. Ltd. | 25,098 | 135,184 | |
| 399,994 | |||
| Media - 2.2% | |||
| 4Imprint Group PLC | 20,796 | 724,050 | |
| Cable One, Inc. | 1,047 | 1,110,375 | |
| Fluent, Inc. (a) | 19,200 | 134,976 | |
| 1,969,401 | |||
| TOTAL COMMUNICATION SERVICES | 2,369,395 | ||
| CONSUMER DISCRETIONARY - 14.4% | |||
| Auto Components - 1.0% | |||
| Burelle SA | 51 | 53,770 | |
| Compagnie Plastic Omnium | 14,451 | 437,460 | |
| Linamar Corp. | 11,522 | 437,074 | |
| 928,304 | |||
| Distributors - 0.2% | |||
| Educational Development Corp. | 17,970 | 161,730 | |
| Diversified Consumer Services - 3.9% | |||
| Arco Platform Ltd. Class A | 827 | 26,572 | |
| Career Education Corp. (a) | 147,165 | 2,671,050 | |
| Collectors Universe, Inc. | 4,808 | 83,611 | |
| Laureate Education, Inc. Class A (a) | 38,742 | 609,799 | |
| Redhill Education Ltd. | 25,500 | 39,008 | |
| 3,430,040 | |||
| Hotels, Restaurants & Leisure - 1.6% | |||
| MTY Food Group, Inc. | 28,888 | 1,193,514 | |
| SkiStar AB | 18,956 | 229,240 | |
| 1,422,754 | |||
| Household Durables - 5.0% | |||
| Cavco Industries, Inc. (a) | 3,441 | 429,334 | |
| Helen of Troy Ltd. (a) | 1,919 | 276,336 | |
| LGI Homes, Inc. (a)(b) | 22,899 | 1,587,130 | |
| New Home Co. LLC (a) | 56,728 | 261,516 | |
| Skyline Champion Corp. | 28,853 | 609,087 | |
| TRI Pointe Homes, Inc. (a) | 96,102 | 1,254,131 | |
| 4,417,534 | |||
| Internet & Direct Marketing Retail - 2.2% | |||
| Kogan.Com Ltd. (b) | 150,319 | 593,417 | |
| Points International Ltd. (a) | 37,493 | 487,784 | |
| Stamps.com, Inc. (a) | 10,035 | 861,003 | |
| 1,942,204 | |||
| Specialty Retail - 0.5% | |||
| Winmark Corp. | 2,340 | 431,847 | |
| TOTAL CONSUMER DISCRETIONARY | 12,734,413 | ||
| CONSUMER STAPLES - 3.2% | |||
| Beverages - 0.2% | |||
| Nichols PLC | 8,196 | 190,506 | |
| Food & Staples Retailing - 1.6% | |||
| BJ's Wholesale Club Holdings, Inc. | 18,799 | 532,952 | |
| Performance Food Group Co. (a) | 22,387 | 916,748 | |
| 1,449,700 | |||
| Food Products - 0.1% | |||
| Armanino Foods of Distinction | 17,362 | 57,815 | |
| Household Products - 1.1% | |||
| Spectrum Brands Holdings, Inc. | 16,437 | 1,012,026 | |
| Personal Products - 0.2% | |||
| BWX Ltd. (b) | 97,470 | 148,417 | |
| TOTAL CONSUMER STAPLES | 2,858,464 | ||
| ENERGY - 2.9% | |||
| Energy Equipment & Services - 1.2% | |||
| Dril-Quip, Inc. (a) | 19,512 | 849,943 | |
| Profire Energy, Inc. (a) | 120,681 | 190,676 | |
| 1,040,619 | |||
| Oil, Gas & Consumable Fuels - 1.7% | |||
| Murphy Oil Corp. | 12,054 | 328,351 | |
| Texas Pacific Land Trust | 573 | 459,741 | |
| World Fuel Services Corp. | 25,191 | 777,142 | |
| 1,565,234 | |||
| TOTAL ENERGY | 2,605,853 | ||
| FINANCIALS - 20.8% | |||
| Banks - 4.1% | |||
| Bank OZK | 28,256 | 922,558 | |
| Camden National Corp. | 10,162 | 446,925 | |
| First Citizens Bancshares, Inc. | 1,123 | 503,385 | |
| First Hawaiian, Inc. | 33,521 | 926,856 | |
| Plumas Bancorp | 4,135 | 108,130 | |
| Popular, Inc. | 12,305 | 710,122 | |
| 3,617,976 | |||
| Capital Markets - 4.4% | |||
| Ashford, Inc. | 4,052 | 224,481 | |
| Australian Ethical Investment Ltd. | 5,800 | 8,995 | |
| Impax Asset Management Group PLC | 105,259 | 320,497 | |
| INTL FCStone, Inc. (a) | 21,124 | 856,789 | |
| LPL Financial | 11,997 | 888,858 | |
| Morningstar, Inc. | 11,352 | 1,628,444 | |
| Tradeweb Markets, Inc. Class A | 413 | 16,623 | |
| 3,944,687 | |||
| Consumer Finance - 3.4% | |||
| Encore Capital Group, Inc. (a)(b) | 43,787 | 1,237,421 | |
| First Cash Financial Services, Inc. | 17,185 | 1,678,631 | |
| Network International Holdings PLC (c) | 10,563 | 71,763 | |
| 2,987,815 | |||
| Diversified Financial Services - 2.3% | |||
| Cannae Holdings, Inc. (a) | 19,992 | 513,195 | |
| Hypoport AG (a) | 1,034 | 211,304 | |
| Jefferies Financial Group, Inc. | 63,102 | 1,298,008 | |
| 2,022,507 | |||
| Insurance - 3.5% | |||
| First American Financial Corp. | 17,053 | 973,044 | |
| Investors Title Co. | 1,144 | 193,244 | |
| Primerica, Inc. | 14,812 | 1,929,855 | |
| 3,096,143 | |||
| Real Estate Management & Development - 0.6% | |||
| The RMR Group, Inc. | 9,640 | 557,578 | |
| Thrifts & Mortgage Finance - 2.5% | |||
| LendingTree, Inc. (a) | 5,208 | 2,004,143 | |
| Timberland Bancorp, Inc. | 7,694 | 240,053 | |
| 2,244,196 | |||
| TOTAL FINANCIALS | 18,470,902 | ||
| HEALTH CARE - 14.0% | |||
| Biotechnology - 0.5% | |||
| BioGaia AB | 912 | 44,242 | |
| Bioventix PLC | 1,534 | 80,013 | |
| Essex Bio-Technology Ltd. | 194,000 | 178,796 | |
| Shanghai Haohai Biological Technology Co. Ltd. (H Shares) (c) | 22,600 | 144,909 | |
| 447,960 | |||
| Health Care Equipment & Supplies - 3.3% | |||
| Boule Diagnostics AB | 1,336 | 8,709 | |
| Hamilton Thorne Ltd. (a) | 200 | 187 | |
| Kewaunee Scientific Corp. | 935 | 21,168 | |
| Medacta Group SA (c) | 6,300 | 577,168 | |
| Medistim ASA | 11,121 | 163,706 | |
| Tristel PLC | 57,444 | 230,339 | |
| Utah Medical Products, Inc. | 6,728 | 567,843 | |
| Varex Imaging Corp. (a) | 39,856 | 1,308,871 | |
| 2,877,991 | |||
| Health Care Providers & Services - 3.2% | |||
| Chemed Corp. | 2,167 | 708,132 | |
| Corvel Corp. (a) | 2,574 | 184,813 | |
| Encompass Health Corp. | 17,092 | 1,101,579 | |
| Magellan Health Services, Inc. (a) | 6,996 | 489,720 | |
| Viemed Healthcare, Inc. (a) | 51,767 | 305,262 | |
| 2,789,506 | |||
| Health Care Technology - 2.1% | |||
| Cegedim SA (a) | 51 | 1,484 | |
| Inovalon Holdings, Inc. Class A (a)(b) | 139,455 | 1,886,826 | |
| 1,888,310 | |||
| Life Sciences Tools & Services - 2.9% | |||
| Charles River Laboratories International, Inc. (a) | 11,467 | 1,610,769 | |
| ICON PLC (a) | 7,306 | 997,853 | |
| 2,608,622 | |||
| Pharmaceuticals - 2.0% | |||
| Alliance Pharma PLC | 577,703 | 592,113 | |
| BioSyent, Inc. (a) | 42,290 | 233,594 | |
| Dechra Pharmaceuticals PLC | 14,026 | 486,511 | |
| Mallinckrodt PLC (a) | 4,679 | 72,337 | |
| Phibro Animal Health Corp. Class A | 12,071 | 418,984 | |
| 1,803,539 | |||
| TOTAL HEALTH CARE | 12,415,928 | ||
| INDUSTRIALS - 13.8% | |||
| Building Products - 0.0% | |||
| Reliance Worldwide Corp. Ltd. | 2,854 | 9,818 | |
| Commercial Services & Supplies - 3.3% | |||
| Boyd Group Income Fund | 16,198 | 1,779,640 | |
| Bravida AB (c) | 15,000 | 131,378 | |
| Clipper Logistics PLC (b) | 27,799 | 104,400 | |
| Loomis AB (B Shares) | 19,797 | 732,435 | |
| VSE Corp. | 6,147 | 187,914 | |
| 2,935,767 | |||
| Construction & Engineering - 1.2% | |||
| AECOM (a) | 30,657 | 1,039,272 | |
| Industrial Conglomerates - 0.2% | |||
| Lifco AB | 3,820 | 181,951 | |
| Machinery - 2.8% | |||
| AGCO Corp. | 15,158 | 1,072,883 | |
| Allison Transmission Holdings, Inc. | 19,218 | 900,555 | |
| Middleby Corp. (a) | 3,952 | 522,178 | |
| 2,495,616 | |||
| Professional Services - 4.5% | |||
| Asiakastieto Group Oyj (c) | 1,262 | 37,934 | |
| Barrett Business Services, Inc. | 9,642 | 702,516 | |
| CBIZ, Inc. (a) | 74,653 | 1,441,549 | |
| Franklin Covey Co. (a) | 17,966 | 512,211 | |
| Insperity, Inc. | 7,881 | 942,252 | |
| SHL-JAPAN Ltd. (d) | 500 | 7,765 | |
| Talenom OYJ | 7,561 | 287,486 | |
| Tinexta SpA | 5,106 | 65,057 | |
| 3,996,770 | |||
| Trading Companies & Distributors - 1.4% | |||
| AerCap Holdings NV (a) | 19,845 | 985,106 | |
| Bufab AB | 4,188 | 47,492 | |
| Textainer Group Holdings Ltd. (a) | 23,249 | 222,958 | |
| 1,255,556 | |||
| Transportation Infrastructure - 0.4% | |||
| Macquarie Infrastructure Co. LLC | 8,714 | 353,004 | |
| TOTAL INDUSTRIALS | 12,267,754 | ||
| INFORMATION TECHNOLOGY - 18.1% | |||
| Electronic Equipment & Components - 2.8% | |||
| SYNNEX Corp. | 23,155 | 2,497,961 | |
| Internet Software & Services - 0.6% | |||
| Liberated Syndication, Inc. (a) | 6 | 14 | |
| LoopUp Group PLC (a) | 9,900 | 44,538 | |
| MSL Solutions Ltd. (a) | 726,400 | 76,811 | |
| Over The Wire Holdings Ltd. | 64,200 | 234,435 | |
| Redbubble Ltd. (a) | 270,589 | 179,307 | |
| 535,105 | |||
| IT Services - 5.8% | |||
| Adevinta ASA Class B | 3,418 | 33,628 | |
| Bouvet ASA | 4,123 | 133,332 | |
| Castleton Technology PLC (a) | 113,050 | 156,262 | |
| Computer Services, Inc. | 5,139 | 335,320 | |
| CoreLogic, Inc. (a) | 29,094 | 1,181,507 | |
| D4t4 Solutions PLC | 11,052 | 38,191 | |
| Econocom Group SA | 100,534 | 417,659 | |
| GetBusy PLC (a) | 156,075 | 60,039 | |
| GreenSky, Inc. Class A | 25,450 | 406,691 | |
| Hackett Group, Inc. | 5,803 | 89,076 | |
| Presidio, Inc. | 30,444 | 457,269 | |
| Prodware | 8,071 | 90,072 | |
| Sylogist Ltd. | 38,295 | 331,869 | |
| WEX, Inc. (a) | 6,762 | 1,422,049 | |
| 5,152,964 | |||
| Software - 8.9% | |||
| 2U, Inc. (a) | 8,590 | 519,695 | |
| Admicom OYJ | 202 | 9,017 | |
| AppFolio, Inc. (a) | 2,698 | 262,003 | |
| Bigtincan Holdings Ltd. (a)(b) | 274,921 | 91,089 | |
| Cardlytics, Inc. (a) | 12,821 | 200,008 | |
| Ceridian HCM Holding, Inc. | 11 | 585 | |
| Ebix, Inc. (b) | 33,882 | 1,710,363 | |
| Enghouse Systems Ltd. | 18,089 | 442,200 | |
| Fortnox AB | 520 | 6,220 | |
| Hansen Technologies Ltd. | 183,549 | 389,473 | |
| j2 Global, Inc. | 13,104 | 1,148,172 | |
| Lightspeed POS, Inc. (a) | 829 | 15,464 | |
| Micro Focus International PLC | 41,646 | 1,052,349 | |
| NICE Systems Ltd. sponsored ADR (a) | 14,178 | 1,954,579 | |
| Red Violet, Inc. (a) | 8,001 | 63,608 | |
| StoneCo Ltd. Class A (a) | 412 | 11,861 | |
| Vitec Software Group AB | 3,782 | 38,637 | |
| 7,915,323 | |||
| TOTAL INFORMATION TECHNOLOGY | 16,101,353 | ||
| MATERIALS - 4.3% | |||
| Chemicals - 2.8% | |||
| Core Molding Technologies, Inc. | 11,300 | 91,756 | |
| Innospec, Inc. | 24,392 | 2,068,929 | |
| Northern Technologies International Corp. | 4,964 | 131,447 | |
| PolyOne Corp. | 7,993 | 220,927 | |
| 2,513,059 | |||
| Containers & Packaging - 1.3% | |||
| Silgan Holdings, Inc. | 24,230 | 725,446 | |
| UFP Technologies, Inc. (a) | 11,012 | 400,837 | |
| 1,126,283 | |||
| Paper & Forest Products - 0.2% | |||
| Schweitzer-Mauduit International, Inc. | 3,791 | 134,846 | |
| TOTAL MATERIALS | 3,774,188 | ||
| REAL ESTATE - 5.1% | |||
| Equity Real Estate Investment Trusts (REITs) - 4.3% | |||
| CoreSite Realty Corp. | 4,060 | 444,205 | |
| EPR Properties | 16,848 | 1,328,633 | |
| Essential Properties Realty Trust, Inc. | 50,644 | 1,047,318 | |
| Store Capital Corp. | 30,275 | 1,008,763 | |
| 3,828,919 | |||
| Real Estate Management & Development - 0.8% | |||
| Consolidated-Tomoka Land Co. | 4,621 | 286,502 | |
| FRP Holdings, Inc. (a) | 2,638 | 133,720 | |
| Legacy Housing Corp. | 19,740 | 239,446 | |
| 659,668 | |||
| TOTAL REAL ESTATE | 4,488,587 | ||
| UTILITIES - 0.5% | |||
| Gas Utilities - 0.5% | |||
| Star Gas Partners LP | 47,270 | 448,592 | |
| TOTAL COMMON STOCKS | |||
| (Cost $82,341,508) | 88,535,429 | ||
| Money Market Funds - 4.9% | |||
| Fidelity Cash Central Fund, 2.49% (e) | 200,097 | 200,137 | |
| Fidelity Securities Lending Cash Central Fund 2.49% (e)(f) | 4,124,890 | 4,125,302 | |
| TOTAL MONEY MARKET FUNDS | |||
| (Cost $4,325,439) | 4,325,439 | ||
| TOTAL INVESTMENT IN SECURITIES - 104.7% | |||
| (Cost $86,666,947) | 92,860,868 | ||
| NET OTHER ASSETS (LIABILITIES) - (4.7)% | (4,174,369) | ||
| NET ASSETS - 100% | $88,686,499 |
Legend
(a) Non-income producing
(b) Security or a portion of the security is on loan at period end.
(c) Security exempt from registration under Rule 144A of the Securities Act of 1933. These securities may be resold in transactions exempt from registration, normally to qualified institutional buyers. At the end of the period, the value of these securities amounted to $963,152 or 1.1% of net assets.
(d) Security or a portion of the security purchased on a delayed delivery or when-issued basis.
(e) Affiliated fund that is generally available only to investment companies and other accounts managed by Fidelity Investments. The rate quoted is the annualized seven-day yield of the fund at period end. A complete unaudited listing of the fund's holdings as of its most recent quarter end is available upon request. In addition, each Fidelity Central Fund's financial statements , which are not covered by the Fund's Report of Independent Registered Public Accounting Firm, are available on the SEC's website or upon request.
(f) Investment made with cash collateral received from securities on loan.
Affiliated Central Funds
Information regarding fiscal year to date income earned by the Fund from investments in Fidelity Central Funds is as follows:
| Fund | Income earned |
| Fidelity Cash Central Fund | $13,175 |
| Fidelity Securities Lending Cash Central Fund | 22,328 |
| Total | $35,503 |
Amounts in the income column in the above table include any capital gain distributions from underlying funds, which are presented in the corresponding line-item in the Statement of Operations, if applicable.
Investment Valuation
The following is a summary of the inputs used, as of April 30, 2019, involving the Fund's assets and liabilities carried at fair value. The inputs or methodology used for valuing securities may not be an indication of the risk associated with investing in those securities. For more information on valuation inputs, and their aggregation into the levels used below, please refer to the Investment Valuation section in the accompanying Notes to Financial Statements.
| Valuation Inputs at Reporting Date: | ||||
| Description | Total | Level 1 | Level 2 | Level 3 |
| Investments in Securities: | ||||
| Equities: | ||||
| Communication Services | $2,369,395 | $2,369,395 | $-- | $-- |
| Consumer Discretionary | 12,734,413 | 12,505,173 | 229,240 | -- |
| Consumer Staples | 2,858,464 | 2,858,464 | -- | -- |
| Energy | 2,605,853 | 2,605,853 | -- | -- |
| Financials | 18,470,902 | 18,470,902 | -- | -- |
| Health Care | 12,415,928 | 12,362,977 | 52,951 | -- |
| Industrials | 12,267,754 | 11,174,498 | 1,093,256 | -- |
| Information Technology | 16,101,353 | 16,062,716 | 38,637 | -- |
| Materials | 3,774,188 | 3,774,188 | -- | -- |
| Real Estate | 4,488,587 | 4,488,587 | -- | -- |
| Utilities | 448,592 | 448,592 | -- | -- |
| Money Market Funds | 4,325,439 | 4,325,439 | -- | -- |
| Total Investments in Securities: | $92,860,868 | $91,446,784 | $1,414,084 | $-- |
Other Information
Distribution of investments by country or territory of incorporation, as a percentage of Total Net Assets, is as follows (Unaudited):
| United States of America | 76.6% |
| Canada | 5.8% |
| United Kingdom | 4.7% |
| Israel | 2.2% |
| Australia | 2.1% |
| Sweden | 1.7% |
| Ireland | 1.2% |
| Netherlands | 1.1% |
| Others (Individually Less Than 1%) | 4.6% |
| 100.0% |
See accompanying notes which are an integral part of the financial statements.
Financial Statements
Statement of Assets and Liabilities
| April 30, 2019 | ||
| Assets | ||
| Investment in securities, at value (including securities loaned of $3,990,147) — See accompanying schedule: Unaffiliated issuers (cost $82,341,508) | $88,535,429 | |
| Fidelity Central Funds (cost $4,325,439) | 4,325,439 | |
| Total Investment in Securities (cost $86,666,947) | $92,860,868 | |
| Foreign currency held at value (cost $1,593) | 1,592 | |
| Receivable for investments sold | 453,728 | |
| Receivable for fund shares sold | 19,661 | |
| Dividends receivable | 269,121 | |
| Distributions receivable from Fidelity Central Funds | 3,630 | |
| Other receivables | 1,574 | |
| Total assets | 93,610,174 | |
| Liabilities | ||
| Payable for investments purchased | ||
| Regular delivery | $652,702 | |
| Delayed delivery | 7,733 | |
| Payable for fund shares redeemed | 94,477 | |
| Accrued management fee | 43,265 | |
| Collateral on securities loaned | 4,125,498 | |
| Total liabilities | 4,923,675 | |
| Net Assets | $88,686,499 | |
| Net Assets consist of: | ||
| Paid in capital | $85,075,222 | |
| Total distributable earnings (loss) | 3,611,277 | |
| Net Assets, for 7,944,352 shares outstanding | $88,686,499 | |
| Net Asset Value, offering price and redemption price per share ($88,686,499 ÷ 7,944,352 shares) | $11.16 |
See accompanying notes which are an integral part of the financial statements.
Statement of Operations
| Year ended April 30, 2019 | ||
| Investment Income | ||
| Dividends | $951,095 | |
| Special dividends | 219,861 | |
| Income from Fidelity Central Funds | 35,503 | |
| Total income | 1,206,459 | |
| Expenses | ||
| Management fee | $553,622 | |
| Independent trustees' fees and expenses | 523 | |
| Interest | 491 | |
| Commitment fees | 248 | |
| Total expenses before reductions | 554,884 | |
| Expense reductions | (6,367) | |
| Total expenses after reductions | 548,517 | |
| Net investment income (loss) | 657,942 | |
| Realized and Unrealized Gain (Loss) | ||
| Net realized gain (loss) on: | ||
| Investment securities: | ||
| Unaffiliated issuers | 563,607 | |
| Fidelity Central Funds | (204) | |
| Foreign currency transactions | 638 | |
| Total net realized gain (loss) | 564,041 | |
| Change in net unrealized appreciation (depreciation) on: | ||
| Investment securities: | ||
| Unaffiliated issuers | 3,500,712 | |
| Assets and liabilities in foreign currencies | 497 | |
| Total change in net unrealized appreciation (depreciation) | 3,501,209 | |
| Net gain (loss) | 4,065,250 | |
| Net increase (decrease) in net assets resulting from operations | $4,723,192 |
See accompanying notes which are an integral part of the financial statements.
Statement of Changes in Net Assets
| Year ended April 30, 2019 | For the period May 25, 2017 (commencement of operations) to April 30, 2018 | |
| Increase (Decrease) in Net Assets | ||
| Operations | ||
| Net investment income (loss) | $657,942 | $255,669 |
| Net realized gain (loss) | 564,041 | 533,022 |
| Change in net unrealized appreciation (depreciation) | 3,501,209 | 2,692,391 |
| Net increase (decrease) in net assets resulting from operations | 4,723,192 | 3,481,082 |
| Distributions to shareholders | (4,262,130) | – |
| Distributions to shareholders from net investment income | – | (144,088) |
| Distributions to shareholders from net realized gain | – | (186,781) |
| Total distributions | (4,262,130) | (330,869) |
| Share transactions | ||
| Proceeds from sales of shares | 12,966,287 | 103,510,837 |
| Reinvestment of distributions | 4,262,131 | 330,869 |
| Cost of shares redeemed | (25,528,120) | (10,466,780) |
| Net increase (decrease) in net assets resulting from share transactions | (8,299,702) | 93,374,926 |
| Total increase (decrease) in net assets | (7,838,640) | 96,525,139 |
| Net Assets | ||
| Beginning of period | 96,525,139 | – |
| End of period | $88,686,499 | $96,525,139 |
| Other Information | ||
| Undistributed net investment income end of period | $99,776 | |
| Shares | ||
| Sold | 1,179,305 | 9,698,327 |
| Issued in reinvestment of distributions | 424,435 | 30,411 |
| Redeemed | (2,422,198) | (965,928) |
| Net increase (decrease) | (818,458) | 8,762,810 |
See accompanying notes which are an integral part of the financial statements.
Financial Highlights
Fidelity Small Cap Stock K6 Fund
| Years ended April 30, | 2019 | 2018 A |
| Selected Per–Share Data | ||
| Net asset value, beginning of period | $11.02 | $10.00 |
| Income from Investment Operations | ||
| Net investment income (loss)B | .08C | .06 |
| Net realized and unrealized gain (loss) | .57 | 1.02 |
| Total from investment operations | .65 | 1.08 |
| Distributions from net investment income | (.05) | (.03) |
| Distributions from net realized gain | (.46) | (.04) |
| Total distributions | (.51) | (.06)D |
| Net asset value, end of period | $11.16 | $11.02 |
| Total ReturnE,F | 6.43% | 10.83% |
| Ratios to Average Net AssetsG,H | ||
| Expenses before reductions | .60% | .60%I |
| Expenses net of fee waivers, if any | .60% | .60%I |
| Expenses net of all reductions | .59% | .59%I |
| Net investment income (loss) | .71%C | .56%I |
| Supplemental Data | ||
| Net assets, end of period (000 omitted) | $88,686 | $96,525 |
| Portfolio turnover rateJ,K | 75%K | 90%I,K |
A For the period May 25, 2017 (commencement of operations) to April 30, 2018.
B Calculated based on average shares outstanding during the period.
C Net investment income per share reflects a large, non-recurring dividend which amounted to $.03 per share. Excluding this non-recurring dividend, the ratio of net investment income (loss) to average net assets would have been .47%.
D Total distributions of $.06 per share is comprised of distributions from net investment income of $.027 and distributions from net realized gain of $.035 per share.
E Total returns for periods of less than one year are not annualized.
F Total returns would have been lower if certain expenses had not been reduced during the applicable periods shown.
G Fees and expenses of any underlying Fidelity Central Funds are not included in the Fund's expense ratio. The Fund indirectly bears its proportionate share of the expenses of any underlying Fidelity Central Funds.
H Expense ratios reflect operating expenses of the Fund. Expenses before reductions do not reflect amounts reimbursed by the investment adviser or reductions from brokerage service arrangements or reductions from other expense offset arrangements and do not represent the amount paid by the Fund during periods when reimbursements or reductions occur. Expense ratios before reductions for start-up periods may not be representative of longer term operating periods. Expenses net of fee waivers reflect expenses after reimbursement by the investment adviser but prior to reductions from brokerage service arrangements or other expense offset arrangements. Expenses net of all reductions represent the net expenses paid by the Fund.
I Annualized
J Amount does not include the portfolio activity of any underlying Fidelity Central Funds.
K Portfolio turnover rate excludes securities received or delivered in-kind.
See accompanying notes which are an integral part of the financial statements.
Notes to Financial Statements
For the period ended April 30, 2019
1. Organization.
Fidelity Small Cap Stock K6 Fund (the Fund) is a fund of Fidelity Concord Street Trust (the Trust) and is authorized to issue an unlimited number of shares. Share transactions on the Statement of Changes in Net Assets may contain exchanges between affiliated funds. The Trust is registered under the Investment Company Act of 1940, as amended (the 1940 Act), as an open-end management investment company organized as a Massachusetts business trust. Shares generally are available only to employer-sponsored retirement plans that are recordkept by Fidelity, or to certain employer-sponsored retirement plans that are not recordkept by Fidelity.
2. Investments in Fidelity Central Funds.
The Fund invests in Fidelity Central Funds, which are open-end investment companies generally available only to other investment companies and accounts managed by the investment adviser and its affiliates. The Fund's Schedule of Investments lists each of the Fidelity Central Funds held as of period end, if any, as an investment of the Fund, but does not include the underlying holdings of each Fidelity Central Fund. As an Investing Fund, the Fund indirectly bears its proportionate share of the expenses of the underlying Fidelity Central Funds.
The Money Market Central Funds seek preservation of capital and current income and are managed by Fidelity Investments Money Management, Inc. (FIMM), an affiliate of the investment adviser. Annualized expenses of the Money Market Central Funds as of their most recent shareholder report date are less than .005%.
A complete unaudited list of holdings for each Fidelity Central Fund is available upon request or at the Securities and Exchange Commission (the SEC) website at www.sec.gov. In addition, the financial statements of the Fidelity Central Funds, which are not covered by the Fund's Report of Independent Registered Public Accounting Firm, are available on the SEC website or upon request.
3. Significant Accounting Policies.
The Fund is an investment company and applies the accounting and reporting guidance of the Financial Accounting Standards Board (FASB) Accounting Standards Codification Topic 946 Financial Services – Investments Companies. The financial statements have been prepared in conformity with accounting principles generally accepted in the United States of America (GAAP), which require management to make certain estimates and assumptions at the date of the financial statements. Actual results could differ from those estimates. Subsequent events, if any, through the date that the financial statements were issued have been evaluated in the preparation of the financial statements. The following summarizes the significant accounting policies of the Fund:
Investment Valuation. Investments are valued as of 4:00 p.m. Eastern time on the last calendar day of the period. The Board of Trustees (the Board) has delegated the day to day responsibility for the valuation of the Fund's investments to the Fair Value Committee (the Committee) established by the Fund's investment adviser. In accordance with valuation policies and procedures approved by the Board, the Fund attempts to obtain prices from one or more third party pricing vendors or brokers to value its investments. When current market prices, quotations or currency exchange rates are not readily available or reliable, investments will be fair valued in good faith by the Committee, in accordance with procedures adopted by the Board. Factors used in determining fair value vary by investment type and may include market or investment specific events. The frequency with which these procedures are used cannot be predicted and they may be utilized to a significant extent. The Committee oversees the Fund's valuation policies and procedures and reports to the Board on the Committee's activities and fair value determinations. The Board monitors the appropriateness of the procedures used in valuing the Fund's investments and ratifies the fair value determinations of the Committee.
The Fund categorizes the inputs to valuation techniques used to value its investments into a disclosure hierarchy consisting of three levels as shown below:
- Level 1 – quoted prices in active markets for identical investments
- Level 2 – other significant observable inputs (including quoted prices for similar investments, interest rates, prepayment speeds, etc.)
- Level 3 – unobservable inputs (including the Fund's own assumptions based on the best information available)
Valuation techniques used to value the Fund's investments by major category are as follows:
Equity securities, including restricted securities, for which market quotations are readily available, are valued at the last reported sale price or official closing price as reported by a third party pricing vendor on the primary market or exchange on which they are traded and are categorized as Level 1 in the hierarchy. In the event there were no sales during the day or closing prices are not available, securities are valued at the last quoted bid price or may be valued using the last available price and are generally categorized as Level 2 in the hierarchy. For foreign equity securities, when market or security specific events arise, comparisons to the valuation of American Depositary Receipts (ADRs), futures contracts, Exchange-Traded Funds (ETFs) and certain indexes as well as quoted prices for similar securities may be used and would be categorized as Level 2 in the hierarchy. For equity securities, including restricted securities, where observable inputs are limited, assumptions about market activity and risk are used and these securities may be categorized as Level 3 in the hierarchy.
Investments in open-end mutual funds, including the Fidelity Central Funds, are valued at their closing net asset value (NAV) each business day and are categorized as Level 1 in the hierarchy.
Changes in valuation techniques may result in transfers in or out of an assigned level within the disclosure hierarchy. The aggregate value of investments by input level as of April 30, 2019 is included at the end of the Fund's Schedule of Investments.
Foreign Currency. The Fund may use foreign currency contracts to facilitate transactions in foreign-denominated securities. Gains and losses from these transactions may arise from changes in the value of the foreign currency or if the counterparties do not perform under the contracts' terms.
Foreign-denominated assets, including investment securities, and liabilities are translated into U.S. dollars at the exchange rates at period end. Purchases and sales of investment securities, income and dividends received and expenses denominated in foreign currencies are translated into U.S. dollars at the exchange rate in effect on the transaction date.
The effects of exchange rate fluctuations on investments are included with the net realized and unrealized gain (loss) on investment securities. Other foreign currency transactions resulting in realized and unrealized gain (loss) are disclosed separately.
Investment Transactions and Income. For financial reporting purposes, the Fund's investment holdings and NAV include trades executed through the end of the last business day of the period. The NAV per share for processing shareholder transactions is calculated as of the close of business of the New York Stock Exchange (NYSE), normally 4:00 p.m. Eastern time and includes trades executed through the end of the prior business day. Gains and losses on securities sold are determined on the basis of identified cost. Dividend income is recorded on the ex-dividend date, except for certain dividends from foreign securities where the ex-dividend date may have passed, which are recorded as soon as the Fund is informed of the ex-dividend date. Non-cash dividends included in dividend income, if any, are recorded at the fair market value of the securities received. Income and capital gain distributions from Fidelity Central Funds, if any, are recorded on the ex-dividend date. Certain distributions received by the Fund represent a return of capital or capital gain. The Fund determines the components of these distributions subsequent to the ex-dividend date, based upon receipt of tax filings or other correspondence relating to the underlying investment. These distributions are recorded as a reduction of cost of investments and/or as a realized gain. Large, non-recurring dividends recognized by the Fund are presented separately on the Statement of Operations as "Special Dividends" and the impact of these dividends is presented in the Financial Highlights. Investment income is recorded net of foreign taxes withheld where recovery of such taxes is uncertain.
Expenses. Expenses directly attributable to a fund are charged to that fund. Expenses attributable to more than one fund are allocated among the respective funds on the basis of relative net assets or other appropriate methods. Expense estimates are accrued in the period to which they relate and adjustments are made when actual amounts are known.
Income Tax Information and Distributions to Shareholders. Each year, the Fund intends to qualify as a regulated investment company under Subchapter M of the Internal Revenue Code, including distributing substantially all of its taxable income and realized gains. As a result, no provision for U.S. Federal income taxes is required. As of April 30, 2019, the Fund did not have any unrecognized tax benefits in the financial statements; nor is the Fund aware of any tax positions for which it is reasonably possible that the total amounts of unrecognized tax benefits will significantly change in the next twelve months. The Fund files a U.S. federal tax return, in addition to state and local tax returns as required. The Fund's federal income tax returns are subject to examination by the Internal Revenue Service (IRS) for a period of three fiscal years after they are filed. State and local tax returns may be subject to examination for an additional fiscal year depending on the jurisdiction. Foreign taxes are provided for based on the Fund's understanding of the tax rules and rates that exist in the foreign markets in which it invests.
Distributions are declared and recorded on the ex-dividend date. Income and capital gain distributions are determined in accordance with income tax regulations, which may differ from GAAP.
Capital accounts within the financial statements are adjusted for permanent book-tax differences. These adjustments have no impact on net assets or the results of operations. Capital accounts are not adjusted for temporary book-tax differences which will reverse in a subsequent period.
Book-tax differences are primarily due to partnerships, foreign currency transactions and losses deferred due to wash sales and excise tax regulations.
As of period end, the cost and unrealized appreciation (depreciation) in securities, and derivatives if applicable, for federal income tax purposes were as follows:
| Gross unrealized appreciation | $11,181,590 |
| Gross unrealized depreciation | (5,626,039) |
| Net unrealized appreciation (depreciation) | $5,555,551 |
| Tax Cost | $87,305,317 |
The Fund intends to elect to defer to its next fiscal year $2,275,491 of capital losses recognized during the period November 1, 2018 to April 30, 2019.
The tax-based components of distributable earnings as of period end were as follows:
| Undistributed ordinary income | $331,724 |
| Net unrealized appreciation (depreciation) on securities and other investments | $5,555,042 |
The tax character of distributions paid was as follows:
| April 30, 2019 | April 30, 2018 | |
| Ordinary Income | $3,304,072 | $ 325,532 |
| Long-term Capital Gains | 958,058 | 5,337 |
| Total | $4,262,130 | $ 330,869 |
Delayed Delivery Transactions and When-Issued Securities. During the period, the Fund transacted in securities on a delayed delivery or when-issued basis. Payment and delivery may take place after the customary settlement period for that security. The price of the underlying securities and the date when the securities will be delivered and paid for are fixed at the time the transaction is negotiated. The securities purchased on a delayed delivery or when-issued basis are identified as such in the Fund's Schedule of Investments. Losses may arise due to changes in the value of the underlying securities or if the counterparty does not perform under the contract's terms, or if the issuer does not issue the securities due to political, economic, or other factors.
Restricted Securities. The Fund may invest in securities that are subject to legal or contractual restrictions on resale. These securities generally may be resold in transactions exempt from registration or to the public if the securities are registered. Disposal of these securities may involve time-consuming negotiations and expense, and prompt sale at an acceptable price may be difficult. Information regarding restricted securities is included at the end of the Fund's Schedule of Investments.
New Rule Issuance. During August 2018, the U.S. Securities and Exchange Commission issued Final Rule Release No. 33-10532, Disclosure Update and Simplification. This Final Rule includes amendments specific to registered investment companies that are intended to eliminate overlap in disclosure requirements between Regulation S-X and GAAP. In accordance with these amendments, certain line-items in the Fund's financial statements have been combined or removed for the current period as outlined in the table below.
| Financial Statement | Current Line-Item Presentation (As Applicable) | Prior Line-Item Presentation (As Applicable) |
| Statement of Assets and Liabilities | Total distributable earnings (loss) | Undistributed/Distributions in excess of/Accumulated net investment income (loss) Accumulated/Undistributed net realized gain (loss) Net unrealized appreciation (depreciation) |
| Statement of Changes in Net Assets | N/A - removed | Undistributed/Distributions in excess of/Accumulated net investment income (loss) end of period |
| Statement of Changes in Net Assets | Distributions to shareholders | Distributions to shareholders from net investment income Distributions to shareholders from net realized gain |
4. Purchases and Sales of Investments.
Purchases and sales of securities, other than short-term securities and in-kind transactions, aggregated $68,845,804 and $82,514,694, respectively.
Unaffiliated Exchanges In-Kind. Investments and cash received in-kind through subscriptions totaled $3,023,506 in exchange for 274,365 shares of the Fund. The amount of in-kind exchanges is included in share transactions in the accompanying Statement of Changes in Net Assets.
Prior Fiscal Year Exchanges In-Kind. During the prior period, investments and cash received in-kind through subscriptions totaled $49,431,374 in exchange for 4,449,152 shares of the Fund. The amount of in-kind exchanges is included in share transactions in the accompanying Statement of Changes in Net Assets. The Fund recognized no gain or loss for federal income tax purposes.
5. Fees and Other Transactions with Affiliates.
Management Fee. Fidelity Management & Research Company (the investment adviser) and its affiliates provide the Fund with investment management related services for which the Fund pays a monthly management fee that is based on an annual rate of .60% of average net assets. Under the management contract, the investment adviser or an affiliate pays all other expenses of the Fund, excluding fees and expenses of the independent Trustees, and certain miscellaneous expenses such as proxy and shareholder meeting expenses.
Brokerage Commissions. The Fund placed a portion of its portfolio transactions with brokerage firms which are affiliates of the investment adviser. Brokerage commissions are included in net realized gain (loss) and change in net unrealized appreciation (depreciation) in the Statement of Operations. The commissions paid to these affiliated firms were $2,475 for the period.
Interfund Lending Program. Pursuant to an Exemptive Order issued by the SEC, the Fund, along with other registered investment companies having management contracts with Fidelity Management & Research Company (FMR) or other affiliated entities of FMR, may participate in an interfund lending program. This program provides an alternative credit facility allowing the funds to borrow from, or lend money to, other participating affiliated funds. At period end, there were no interfund loans outstanding. The Fund's activity in this program during the period for which loans were outstanding was as follows:
| Borrower or Lender | Average Loan Balance | Weighted Average Interest Rate | Interest Expense |
| Borrower | $6,657,000 | 2.66% | $491 |
Interfund Trades. The Fund may purchase from or sell securities to other Fidelity Funds under procedures adopted by the Board. The procedures have been designed to ensure these interfund trades are executed in accordance with Rule 17a-7 of the 1940 Act. Interfund trades are included within the respective purchases and sales amounts shown in the Purchases and Sales of Investments note.
Prior Fiscal Year Exchanges In-Kind. During the prior period, an affiliated entity completed an exchange in-kind with the Fund. The affiliated entity delivered investments and cash valued at $46,842,473 in exchange for 4,578,932 shares of the Fund. The amount of in-kind exchanges is included in share transactions in the accompanying Statement of Changes in Net Assets. The Fund recognized no gain or loss for federal income tax purposes.
6. Committed Line of Credit.
The Fund participates with other funds managed by the investment adviser or an affiliate in a $4.25 billion credit facility (the "line of credit") to be utilized for temporary or emergency purposes to fund shareholder redemptions or for other short-term liquidity purposes. The Fund has agreed to pay commitment fees on its pro-rata portion of the line of credit, which amounted to $248 and is reflected in Commitment fees on the Statement of Operations. During the period, the Fund did not borrow on this line of credit.
7. Security Lending.
The Fund lends portfolio securities through a lending agent from time to time in order to earn additional income. For equity securities, a lending agent is used and may loan securities to certain qualified borrowers, including Fidelity Capital Markets (FCM), a broker-dealer affiliated with the Fund. On the settlement date of the loan, the Fund receives collateral (in the form of U.S. Treasury obligations, letters of credit and/or cash) against the loaned securities and maintains collateral in an amount not less than 100% of the market value of the loaned securities during the period of the loan. The market value of the loaned securities is determined at the close of business of the Fund and any additional required collateral is delivered to the Fund on the next business day. The Fund or borrower may terminate the loan at any time, and if the borrower defaults on its obligation to return the securities loaned because of insolvency or other reasons, the Fund may apply collateral received from the borrower against the obligation. The Fund may experience delays and costs in recovering the securities loaned. Any cash collateral received is invested in the Fidelity Securities Lending Cash Central Fund. The value of loaned securities and cash collateral at period end are disclosed on the Fund's Statement of Assets and Liabilities. At period end, there were no security loans outstanding with FCM. Security lending income represents the income earned on investing cash collateral, less rebates paid to borrowers and any lending agent fees associated with the loan, plus any premium payments received for lending certain types of securities. Security lending income is presented in the Statement of Operations as a component of income from Fidelity Central Funds. Total security lending income during the period amounted to $22,328, including $2,750 from securities loaned to FCM.
8. Expense Reductions.
Commissions paid to certain brokers with whom the investment adviser, or its affiliates, places trades on behalf of the Fund include an amount in addition to trade execution, which may be rebated back to the Fund to offset certain expenses. This amount totaled $6,170 for the period. In addition, through arrangements with the Fund's custodian, credits realized as a result of certain uninvested cash balances were used to reduce the Fund's expenses. During the period, these credits reduced the Fund's custody expenses by $197.
9. Other.
The Fund's organizational documents provide former and current trustees and officers with a limited indemnification against liabilities arising in connection with the performance of their duties to the Fund. In the normal course of business, the Fund may also enter into contracts that provide general indemnifications. The Fund's maximum exposure under these arrangements is unknown as this would be dependent on future claims that may be made against the Fund. The risk of material loss from such claims is considered remote.
Report of Independent Registered Public Accounting Firm
To the Trustees of Fidelity Concord Street Trust and Shareholders of Fidelity Small Cap Stock K6 Fund:
Opinion on the Financial Statements and Financial Highlights
We have audited the accompanying statement of assets and liabilities of Fidelity Small Cap Stock K6 Fund (the "Fund"), a fund of Fidelity Concord Street Trust, including the schedule of investments, as of April 30, 2019, the related statement of operations for the year then ended, the statement of changes in net assets and the financial highlights for the year then ended and for the period from May 25, 2017 (commencement of operations) to April 30, 2018, and the related notes. In our opinion, the financial statements and financial highlights present fairly, in all material respects, the financial position of the Fund as of April 30, 2019, the results of its operations for the year then ended, and the changes in its net assets and the financial highlights for the year then ended and for the period from May 25, 2017 (commencement of operations) to April 30, 2018, in conformity with accounting principles generally accepted in the United States of America.
Basis for Opinion
These financial statements and financial highlights are the responsibility of the Fund's management. Our responsibility is to express an opinion on the Fund's financial statements and financial highlights based on our audits. We are a public accounting firm registered with the Public Company Accounting Oversight Board (United States) (PCAOB) and are required to be independent with respect to the Fund in accordance with the U.S. federal securities laws and the applicable rules and regulations of the Securities and Exchange Commission and the PCAOB.
We conducted our audits in accordance with the standards of the PCAOB. Those standards require that we plan and perform the audit to obtain reasonable assurance about whether the financial statements and financial highlights are free of material misstatement, whether due to error or fraud. The Fund is not required to have, nor were we engaged to perform, an audit of its internal control over financial reporting. As part of our audits we are required to obtain an understanding of internal control over financial reporting but not for the purpose of expressing an opinion on the effectiveness of the Fund’s internal control over financial reporting. Accordingly, we express no such opinion.
Our audits included performing procedures to assess the risks of material misstatement of the financial statements and financial highlights, whether due to error or fraud, and performing procedures that respond to those risks. Such procedures included examining, on a test basis, evidence regarding the amounts and disclosures in the financial statements and financial highlights. Our audits also included evaluating the accounting principles used and significant estimates made by management, as well as evaluating the overall presentation of the financial statements and financial highlights. Our procedures included confirmation of securities owned as of April 30, 2019, by correspondence with the custodians and brokers; when replies were not received from brokers, we performed other auditing procedures. We believe that our audits provide a reasonable basis for our opinion.
/s/ Deloitte & Touche LLP
Boston, Massachusetts
June 17, 2019
We have served as the auditor of one or more of the Fidelity investment companies since 1999.
Trustees and Officers
The Trustees, Members of the Advisory Board (if any), and officers of the trust and fund, as applicable, are listed below. The Board of Trustees governs the fund and is responsible for protecting the interests of shareholders. The Trustees are experienced executives who meet periodically throughout the year to oversee the fund's activities, review contractual arrangements with companies that provide services to the fund, oversee management of the risks associated with such activities and contractual arrangements, and review the fund's performance. Except for Jonathan Chiel and Michael E. Wiley, each of the Trustees oversees 289 funds. Mr. Chiel oversees 158. Mr. Wiley oversees 196.
The Trustees hold office without limit in time except that (a) any Trustee may resign; (b) any Trustee may be removed by written instrument, signed by at least two-thirds of the number of Trustees prior to such removal; (c) any Trustee who requests to be retired or who has become incapacitated by illness or injury may be retired by written instrument signed by a majority of the other Trustees; and (d) any Trustee may be removed at any special meeting of shareholders by a two-thirds vote of the outstanding voting securities of the trust. Each Trustee who is not an interested person (as defined in the 1940 Act) of the trust and the fund is referred to herein as an Independent Trustee. Each Independent Trustee shall retire not later than the last day of the calendar year in which his or her 75th birthday occurs. The Independent Trustees may waive this mandatory retirement age policy with respect to individual Trustees. Officers and Advisory Board Members hold office without limit in time, except that any officer or Advisory Board Member may resign or may be removed by a vote of a majority of the Trustees at any regular meeting or any special meeting of the Trustees. Except as indicated, each individual has held the office shown or other offices in the same company for the past five years.
The fund’s Statement of Additional Information (SAI) includes more information about the Trustees. To request a free copy, call Fidelity at 1-800-835-5092.
Experience, Skills, Attributes, and Qualifications of the Trustees. The Governance and Nominating Committee has adopted a statement of policy that describes the experience, qualifications, attributes, and skills that are necessary and desirable for potential Independent Trustee candidates (Statement of Policy). The Board believes that each Trustee satisfied at the time he or she was initially elected or appointed a Trustee, and continues to satisfy, the standards contemplated by the Statement of Policy. The Governance and Nominating Committee also engages professional search firms to help identify potential Independent Trustee candidates who have the experience, qualifications, attributes, and skills consistent with the Statement of Policy. From time to time, additional criteria based on the composition and skills of the current Independent Trustees, as well as experience or skills that may be appropriate in light of future changes to board composition, business conditions, and regulatory or other developments, have also been considered by the professional search firms and the Governance and Nominating Committee. In addition, the Board takes into account the Trustees' commitment and participation in Board and committee meetings, as well as their leadership of standing and ad hoc committees throughout their tenure.
In determining that a particular Trustee was and continues to be qualified to serve as a Trustee, the Board has considered a variety of criteria, none of which, in isolation, was controlling. The Board believes that, collectively, the Trustees have balanced and diverse experience, qualifications, attributes, and skills, which allow the Board to operate effectively in governing the fund and protecting the interests of shareholders. Information about the specific experience, skills, attributes, and qualifications of each Trustee, which in each case led to the Board's conclusion that the Trustee should serve (or continue to serve) as a trustee of the fund, is provided below.
Board Structure and Oversight Function. James C. Curvey is an interested person and currently serves as Chairman. The Trustees have determined that an interested Chairman is appropriate and benefits shareholders because an interested Chairman has a personal and professional stake in the quality and continuity of services provided to the fund. Independent Trustees exercise their informed business judgment to appoint an individual of their choosing to serve as Chairman, regardless of whether the Trustee happens to be independent or a member of management. The Independent Trustees have determined that they can act independently and effectively without having an Independent Trustee serve as Chairman and that a key structural component for assuring that they are in a position to do so is for the Independent Trustees to constitute a substantial majority for the Board. The Independent Trustees also regularly meet in executive session. Ned C. Lautenbach serves as Chairman of the Independent Trustees and as such (i) acts as a liaison between the Independent Trustees and management with respect to matters important to the Independent Trustees and (ii) with management prepares agendas for Board meetings.
Fidelity® funds are overseen by different Boards of Trustees. The fund's Board oversees Fidelity's high income and certain equity funds, and other Boards oversee Fidelity's investment-grade bond, money market, asset allocation, and other equity funds. The asset allocation funds may invest in Fidelity® funds overseen by the fund's Board. The use of separate Boards, each with its own committee structure, allows the Trustees of each group of Fidelity® funds to focus on the unique issues of the funds they oversee, including common research, investment, and operational issues. On occasion, the separate Boards establish joint committees to address issues of overlapping consequences for the Fidelity® funds overseen by each Board.
The Trustees operate using a system of committees to facilitate the timely and efficient consideration of all matters of importance to the Trustees, the fund, and fund shareholders and to facilitate compliance with legal and regulatory requirements and oversight of the fund's activities and associated risks. The Board, acting through its committees, has charged FMR and its affiliates with (i) identifying events or circumstances the occurrence of which could have demonstrably adverse effects on the fund's business and/or reputation; (ii) implementing processes and controls to lessen the possibility that such events or circumstances occur or to mitigate the effects of such events or circumstances if they do occur; and (iii) creating and maintaining a system designed to evaluate continuously business and market conditions in order to facilitate the identification and implementation processes described in (i) and (ii) above. Because the day-to-day operations and activities of the fund are carried out by or through FMR, its affiliates, and other service providers, the fund's exposure to risks is mitigated but not eliminated by the processes overseen by the Trustees. While each of the Board's committees has responsibility for overseeing different aspects of the fund's activities, oversight is exercised primarily through the Operations, Audit, and Compliance Committees. In addition, the Independent Trustees have worked with Fidelity to enhance the Board's oversight of investment and financial risks, legal and regulatory risks, technology risks, and operational risks, including the development of additional risk reporting to the Board. Appropriate personnel, including but not limited to the fund's Chief Compliance Officer (CCO), FMR's internal auditor, the independent accountants, the fund's Treasurer and portfolio management personnel, make periodic reports to the Board's committees, as appropriate, including an annual review of Fidelity's risk management program for the Fidelity® funds. The responsibilities of each standing committee, including their oversight responsibilities, are described further under "Standing Committees of the Trustees."
Interested Trustees*:
Correspondence intended for a Trustee who is an interested person may be sent to Fidelity Investments, 245 Summer Street, Boston, Massachusetts 02210.
Name, Year of Birth; Principal Occupations and Other Relevant Experience+
Jonathan Chiel (1957)
Year of Election or Appointment: 2016
Trustee
Mr. Chiel also serves as Trustee of other Fidelity® funds. Mr. Chiel is Executive Vice President and General Counsel for FMR LLC (diversified financial services company, 2012-present). Previously, Mr. Chiel served as general counsel (2004-2012) and senior vice president and deputy general counsel (2000-2004) for John Hancock Financial Services; a partner with Choate, Hall & Stewart (1996-2000) (law firm); and an Assistant United States Attorney for the United States Attorney’s Office of the District of Massachusetts (1986-95), including Chief of the Criminal Division (1993-1995). Mr. Chiel is a director on the boards of the Boston Bar Foundation and the Maimonides School.
James C. Curvey (1935)
Year of Election or Appointment: 2007
Trustee
Chairman of the Board of Trustees
Mr. Curvey also serves as Trustee of other Fidelity® funds. Mr. Curvey is Vice Chairman (2007-present) and Director of FMR LLC (diversified financial services company). In addition, Mr. Curvey is an Overseer Emeritus for the Boston Symphony Orchestra, a Director of Artis-Naples, and a Trustee of Brewster Academy in Wolfeboro, New Hampshire. Previously, Mr. Curvey served as a Director of Fidelity Research & Analysis Co. (investment adviser firm, 2009-2018), Director of Fidelity Investments Money Management, Inc. (investment adviser firm, 2009-2014) and a Director of FMR and FMR Co., Inc. (investment adviser firms, 2007-2014).
* Determined to be an “Interested Trustee” by virtue of, among other things, his or her affiliation with the trust or various entities under common control with FMR.
+ The information includes the Trustee's principal occupation during the last five years and other information relating to the experience, attributes, and skills relevant to the Trustee's qualifications to serve as a Trustee, which led to the conclusion that the Trustee should serve as a Trustee for the fund.
Independent Trustees:
Correspondence intended for an Independent Trustee may be sent to Fidelity Investments, P.O. Box 55235, Boston, Massachusetts 02205-5235.
Name, Year of Birth; Principal Occupations and Other Relevant Experience+
Dennis J. Dirks (1948)
Year of Election or Appointment: 2005
Trustee
Mr. Dirks also serves as Trustee of other Fidelity® funds. Prior to his retirement in May 2003, Mr. Dirks was Chief Operating Officer and a member of the Board of The Depository Trust & Clearing Corporation (DTCC). He also served as President, Chief Operating Officer, and Board member of The Depository Trust Company (DTC) and President and Board member of the National Securities Clearing Corporation (NSCC). In addition, Mr. Dirks served as Chief Executive Officer and Board member of the Government Securities Clearing Corporation, Chief Executive Officer and Board member of the Mortgage-Backed Securities Clearing Corporation, as a Trustee and a member of the Finance Committee of Manhattan College (2005-2008), as a Trustee and a member of the Finance Committee of AHRC of Nassau County (2006-2008), as a member of the Independent Directors Council (IDC) Governing Council (2010-2015), and as a member of the Board of Directors for The Brookville Center for Children’s Services, Inc. (2009-2017). Mr. Dirks is a member of the Finance Committee (2016-present) and Board of Directors (2017-present) and is Treasurer (2018-present) of the Asolo Repertory Theatre.
Donald F. Donahue (1950)
Year of Election or Appointment: 2018
Trustee
Mr. Donahue also serves as a Trustee of other Fidelity® funds. Mr. Donahue is President and Chief Executive Officer of Miranda Partners, LLC (risk consulting for the financial services industry, 2012-present). Previously, Mr. Donahue served as a Member of the Advisory Board of certain Fidelity® funds (2015-2018) and Chief Executive Officer (2006-2012), Chief Operating Officer (2003-2006), and Managing Director, Customer Marketing and Development (1999-2003) of The Depository Trust & Clearing Corporation (financial markets infrastructure). Mr. Donahue serves as a Member (2007-present) and Co-Chairman (2016-present) of the Board of Directors of United Way of New York, Member of the Board of Directors of NYC Leadership Academy (2012-present) and Member of the Board of Advisors of Ripple Labs, Inc. (financial services, 2015-present). He also served as Chairman (2010-2012) and Member of the Board of Directors (2012-2013) of Omgeo, LLC (financial services), Treasurer of United Way of New York (2012-2016), and Member of the Board of Directors of XBRL US (financial services non-profit, 2009-2012) and the International Securities Services Association (2009-2012).
Alan J. Lacy (1953)
Year of Election or Appointment: 2008
Trustee
Mr. Lacy also serves as Trustee of other Fidelity® funds. Mr. Lacy serves as a Director of Bristol-Myers Squibb Company (global pharmaceuticals, 2008-present). He is a Trustee of the California Chapter of The Nature Conservancy (2015-present) and a Director of the Center for Advanced Study in the Behavioral Sciences at Stanford University (2015-present). In addition, Mr. Lacy served as Senior Adviser (2007-2014) of Oak Hill Capital Partners, L.P. (private equity) and also served as Chief Executive Officer (2005) and Vice Chairman (2005-2006) of Sears Holdings Corporation (retail) and Chief Executive Officer and Chairman of the Board of Sears, Roebuck and Co. (retail, 2000-2005). Previously, Mr. Lacy served as Chairman (2014-2017) and a member (2010-2017) of the Board of Directors of Dave & Buster’s Entertainment, Inc. (restaurant and entertainment complexes), as Chairman (2008-2011) and a member (2006-2015) of the Board of Trustees of the National Parks Conservation Association, and as a member of the Board of Directors for The Hillman Companies, Inc. (hardware wholesalers, 2010-2014), Earth Fare, Inc. (retail grocery, 2010-2014), and The Western Union Company (global money transfer, 2006-2011).
Ned C. Lautenbach (1944)
Year of Election or Appointment: 2000
Trustee
Chairman of the Independent Trustees
Mr. Lautenbach also serves as Trustee of other Fidelity® funds. Mr. Lautenbach currently serves as Chair (2018-present) and Member (2013-present) of the Board of Governors, State University System of Florida and is a member of the Council on Foreign Relations (1994-present). He is also a member and has most recently served as Chairman of the Board of Directors of Artis-Naples (2012-present). Previously, Mr. Lautenbach served as a member and then Lead Director of the Board of Directors of Eaton Corporation (diversified industrial, 1997-2016). He was also a Partner and Advisory Partner at Clayton, Dubilier & Rice, LLC (private equity investment, 1998-2010), as well as a Director of Sony Corporation (2006-2007). In addition, Mr. Lautenbach also had a 30-year career with IBM (technology company) during which time he served as Senior Vice President and a member of the Corporate Executive Committee (1968-1998).
Joseph Mauriello (1944)
Year of Election or Appointment: 2008
Trustee
Mr. Mauriello also serves as Trustee of other Fidelity® funds. Prior to his retirement in January 2006, Mr. Mauriello served in numerous senior management positions including Deputy Chairman and Chief Operating Officer (2004-2005), and Vice Chairman of Financial Services (2002-2004) of KPMG LLP US (professional services, 1965-2005). Mr. Mauriello currently serves as a member of the Independent Directors Council (IDC) Governing Council (2015-present). Previously, Mr. Mauriello served as a member of the Board of Directors of XL Group plc. (global insurance and re-insurance, 2006-2018).
Cornelia M. Small (1944)
Year of Election or Appointment: 2005
Trustee
Ms. Small also serves as Trustee of other Fidelity® funds. Ms. Small is a member of the Board of Directors (2009-present) and Chair of the Investment Committee (2010-present) of the Teagle Foundation. Ms. Small also serves on the Investment Committee of the Berkshire Taconic Community Foundation (2008-present). Previously, Ms. Small served as Chairperson (2002-2008) and a member of the Investment Committee and Chairperson (2008-2012) and a member of the Board of Trustees of Smith College. In addition, Ms. Small served as Chief Investment Officer, Director of Global Equity Investments, and a member of the Board of Directors of Scudder, Stevens & Clark and Scudder Kemper Investments.
Garnett A. Smith (1947)
Year of Election or Appointment: 2018
Trustee
Mr. Smith also serves as Trustee of other Fidelity® funds. Prior to Mr. Smith's retirement, he served as Chairman and Chief Executive Officer of Inbrand Corp. (manufacturer of personal absorbent products, 1990-1997). He also served as President (1986-1990) of Inbrand Corp. Prior to his employment with Inbrand Corp., he was employed by a retail fabric chain and North Carolina National Bank. In addition, Mr. Smith served as a Member of the Advisory Board of certain Fidelity® funds (2012-2013) and as a board member of the Jackson Hole Land Trust (2009-2012).
David M. Thomas (1949)
Year of Election or Appointment: 2008
Trustee
Mr. Thomas also serves as Trustee of other Fidelity® funds. Mr. Thomas serves as Non-Executive Chairman of the Board of Directors of Fortune Brands Home and Security (home and security products, 2011-present) and as a member of the Board of Directors (2004-present) and Presiding Director (2013-present) of Interpublic Group of Companies, Inc. (marketing communication). Previously, Mr. Thomas served as Executive Chairman (2005-2006) and Chairman and Chief Executive Officer (2000-2005) of IMS Health, Inc. (pharmaceutical and healthcare information solutions), a Director of Fortune Brands, Inc. (consumer products, 2000-2011), and a member of the Board of Trustees of the University of Florida (2013-2018).
+ The information includes the Trustee's principal occupation during the last five years and other information relating to the experience, attributes, and skills relevant to the Trustee's qualifications to serve as a Trustee, which led to the conclusion that the Trustee should serve as a Trustee for the fund.
Advisory Board Members and Officers:
Correspondence intended for a Member of the Advisory Board (if any) may be sent to Fidelity Investments, P.O. Box 55235, Boston, Massachusetts 02205-5235. Correspondence intended for an officer or Peter S. Lynch may be sent to Fidelity Investments, 245 Summer Street, Boston, Massachusetts 02210. Officers appear below in alphabetical order.
Name, Year of Birth; Principal Occupation
Vicki L. Fuller (1957)
Year of Election or Appointment: 2018
Member of the Advisory Board
Ms. Fuller also serves as Member of the Advisory Board of other Fidelity® funds. Ms. Fuller serves as a member of the Board of Directors, Audit Committee, and Nominating and Governance Committee of The Williams Companies, Inc. (natural gas infrastructure, 2018-present). Previously, Ms. Fuller served as the Chief Investment Officer of the New York State Common Retirement Fund (2012-2018) and held a variety of positions at AllianceBernstein L.P. (global asset management, 1985-2012), including Managing Director (2006-2012) and Senior Vice President and Senior Portfolio Manager (2001-2006).
Peter S. Lynch (1944)
Year of Election or Appointment: 2003
Member of the Advisory Board
Mr. Lynch also serves as Member of the Advisory Board of other Fidelity® funds. Mr. Lynch is Vice Chairman and a Director of FMR (investment adviser firm) and FMR Co., Inc. (investment adviser firm). In addition, Mr. Lynch serves as a Trustee of Boston College and as the Chairman of the Inner-City Scholarship Fund. Previously, Mr. Lynch served on the Special Olympics International Board of Directors (1997-2006).
Carol B. Tomé (1957)
Year of Election or Appointment: 2018
Member of the Advisory Board
Ms. Tomé also serves as Member of the Advisory Board of other Fidelity® funds. Ms. Tomé is Chief Financial Officer (2001-present) and Executive Vice President of Corporate Services (2007-present) of The Home Depot, Inc. (home improvement retailer) and a Director (2003-present) and Chair of the Audit Committee (2004-present) of United Parcel Service, Inc. (package delivery and supply chain management). Previously, Ms. Tomé served as Trustee of certain Fidelity® funds (2017), Senior Vice President of Finance and Accounting/Treasurer (2000-2007) and Vice President and Treasurer (1995-2000) of The Home Depot, Inc. and Chair of the Board (2010-2012), Vice Chair of the Board (2009 and 2013), and a Director (2008-2013) of the Federal Reserve Bank of Atlanta. Ms. Tomé is also a director or trustee of many community and professional organizations.
Michael E. Wiley (1950)
Year of Election or Appointment: 2018
Member of the Advisory Board
Mr. Wiley also serves as Trustee or Member of the Advisory Board of other Fidelity® funds. Mr. Wiley serves as a Director of High Point Resources (exploration and production, 2005-present). Previously, Mr. Wiley served as a Director of Andeavor Corporation (independent oil refiner and marketer, 2005-2018), a Director of Andeavor Logistics LP (natural resources logistics, 2015-2018), a Director of Post Oak Bank (privately-held bank, 2004-2018), a Director of Asia Pacific Exploration Consolidated (international oil and gas exploration and production, 2008-2013), a member of the Board of Trustees of the University of Tulsa (2000-2006; 2007-2010), a Senior Energy Advisor of Katzenbach Partners, LLC (consulting, 2006-2007), an Advisory Director of Riverstone Holdings (private investment), a Director of Spinnaker Exploration Company (exploration and production, 2001-2005) and Chairman, President, and CEO of Baker Hughes, Inc. (oilfield services, 2000-2004).
Elizabeth Paige Baumann (1968)
Year of Election or Appointment: 2017
Anti-Money Laundering (AML) Officer
Ms. Baumann also serves as AML Officer of other funds. She is Chief AML Officer (2012-present) and Senior Vice President (2014-present) of FMR LLC (diversified financial services company) and is an employee of Fidelity Investments. Previously, Ms. Baumann served as AML Officer of the funds (2012-2016), and Vice President (2007-2014) and Deputy Anti-Money Laundering Officer (2007-2012) of FMR LLC.
Craig S. Brown (1977)
Year of Election or Appointment: 2019
Assistant Treasurer
Mr. Brown also serves as Assistant Treasurer of other funds. Mr. Brown is an employee of Fidelity Investments (2013-present).
John J. Burke III (1964)
Year of Election or Appointment: 2018
Chief Financial Officer
Mr. Burke also serves as Chief Financial Officer of other funds. Mr. Burke serves as Head of Investment Operations for Fidelity Fund and Investment Operations (2018-present) and is an employee of Fidelity Investments (1998-present). Previously Mr. Burke served as head of Asset Management Investment Operations (2012-2018).
William C. Coffey (1969)
Year of Election or Appointment: 2018
Secretary and Chief Legal Officer (CLO)
Mr. Coffey also serves as Secretary and CLO of other funds. Mr. Coffey serves as CLO, Secretary, and Senior Vice President of Fidelity Management & Research Company and FMR Co., Inc. (investment adviser firms, 2018-present); Secretary of Fidelity SelectCo, LLC and Fidelity Investments Money Management, Inc. (investment adviser firms, 2018-present); and CLO of Fidelity Management & Research (Hong Kong) Limited, FMR Investment Management (UK) Limited, and Fidelity Management & Research (Japan) Limited (investment adviser firms, 2018-present). He is Senior Vice President and Deputy General Counsel of FMR LLC (diversified financial services company, 2010-present), and is an employee of Fidelity Investments. Previously, Mr. Coffey served as Assistant Secretary of certain funds (2009-2018) and as Vice President and Associate General Counsel of FMR LLC (2005-2009).
Timothy M. Cohen (1969)
Year of Election or Appointment: 2018
Vice President
Mr. Cohen also serves as Vice President of other funds. Mr. Cohen serves as Executive Vice President of Fidelity SelectCo, LLC (2019-present), Co-Head of Equity (2018-present), a Director of Fidelity Management & Research (Japan) Limited (investment adviser firm, 2016-present), and is an employee of Fidelity Investments. Previously, Mr. Cohen served as Head of Global Equity Research (2016-2018), Chief Investment Officer - Equity and a Director of Fidelity Management & Research (U.K.) Inc. (investment adviser firm, 2013-2015) and as a Director of Fidelity Management & Research (Hong Kong) Limited (investment adviser firm, 2017).
Jonathan Davis (1968)
Year of Election or Appointment: 2010
Assistant Treasurer
Mr. Davis also serves as Assistant Treasurer of other funds. Mr. Davis serves as Assistant Treasurer of FMR Capital, Inc. (2017-present) and is an employee of Fidelity Investments. Previously, Mr. Davis served as Vice President and Associate General Counsel of FMR LLC (diversified financial services company, 2003-2010).
Adrien E. Deberghes (1967)
Year of Election or Appointment: 2016
Assistant Treasurer
Mr. Deberghes also serves as an officer of other funds. He serves as Assistant Treasurer of FMR Capital, Inc. (2017-present), Executive Vice President of Fidelity Investments Money Management, Inc. (FIMM) (investment adviser firm, 2016-present), and is an employee of Fidelity Investments (2008-present). Previously, Mr. Deberghes served as President and Treasurer of certain Fidelity® funds (2013-2018). Prior to joining Fidelity Investments, Mr. Deberghes was Senior Vice President of Mutual Fund Administration at State Street Corporation (2007-2008), Senior Director of Mutual Fund Administration at Investors Bank & Trust (2005-2007), and Director of Finance for Dunkin' Brands (2000-2005). Previously, Mr. Deberghes served in other fund officer roles.
Laura M. Del Prato (1964)
Year of Election or Appointment: 2018
Assistant Treasurer
Ms. Del Prato also serves as an officer of other funds. Ms. Del Prato is an employee of Fidelity Investments (2017-present). Prior to joining Fidelity Investments, Ms. Del Prato served as a Managing Director and Treasurer of the JPMorgan Mutual Funds (2014-2017). Prior to JPMorgan, Ms. Del Prato served as a partner at Cohen Fund Audit Services (accounting firm, 2012-2013) and KPMG LLP (accounting firm, 2004-2012).
Colm A. Hogan (1973)
Year of Election or Appointment: 2016
Deputy Treasurer
Mr. Hogan also serves as an officer of other funds. Mr. Hogan serves as Assistant Treasurer of FMR Capital, Inc. (2017-present) and is an employee of Fidelity Investments (2005-present). Previously, Mr. Hogan served as Assistant Treasurer of certain Fidelity® funds (2016-2018).
Pamela R. Holding (1964)
Year of Election or Appointment: 2018
Vice President
Ms. Holding also serves as Vice President of other funds. Ms. Holding serves as Executive Vice President of Fidelity SelectCo, LLC (2019-present), Co-Head of Equity (2018-present) and is an employee of Fidelity Investments (2013-present). Previously, Ms. Holding served as Chief Investment Officer of Fidelity Institutional Asset Management (2013-2018).
Chris Maher (1972)
Year of Election or Appointment: 2013
Assistant Treasurer
Mr. Maher serves as Assistant Treasurer of other funds. Mr. Maher is Vice President of Valuation Oversight, serves as Assistant Treasurer of FMR Capital, Inc. (2017-present), and is an employee of Fidelity Investments. Previously, Mr. Maher served as Vice President of Asset Management Compliance (2013), Vice President of the Program Management Group of FMR (investment adviser firm, 2010-2013), and Vice President of Valuation Oversight (2008-2010).
Kenneth B. Robins (1969)
Year of Election or Appointment: 2016
Chief Compliance Officer
Mr. Robins also serves as an officer of other funds. Mr. Robins serves as Compliance Officer of Fidelity Management & Research Company and FMR Co., Inc. (investment adviser firms, 2016-present) and is an employee of Fidelity Investments (2004-present). Previously, Mr. Robins served as Executive Vice President of Fidelity Investments Money Management, Inc. (investment adviser firm, 2013-2016) and served in other fund officer roles.
Stacie M. Smith (1974)
Year of Election or Appointment: 2016
President and Treasurer
Ms. Smith also serves as an officer of other funds. Ms. Smith serves as Assistant Treasurer of FMR Capital, Inc. (2017-present), is an employee of Fidelity Investments (2009-present), and has served in other fund officer roles. Prior to joining Fidelity Investments, Ms. Smith served as Senior Audit Manager of Ernst & Young LLP (accounting firm, 1996-2009). Previously, Ms. Smith served as Assistant Treasurer (2013-2018) and Deputy Treasurer (2013-2016) of certain Fidelity® funds.
Marc L. Spector (1972)
Year of Election or Appointment: 2016
Assistant Treasurer
Mr. Spector also serves as an officer of other funds. Mr. Spector serves as Assistant Treasurer of FMR Capital, Inc. (2017-present) and is an employee of Fidelity Investments (2016-present). Prior to joining Fidelity Investments, Mr. Spector served as Director at the Siegfried Group (accounting firm, 2013-2016), and prior to Siegfried Group as audit senior manager at Deloitte & Touche (accounting firm, 2005-2013).
Jim Wegmann (1979)
Year of Election or Appointment: 2019
Assistant Treasurer
Mr. Wegmann also serves as Assistant Treasurer of other funds. Mr. Wegmann is an employee of Fidelity Investments (2011-present).
Shareholder Expense Example
As a shareholder of the Fund, you incur two types of costs: (1) transaction costs, and (2) ongoing costs, including management fees and other Fund expenses. This Example is intended to help you understand your ongoing costs (in dollars) of investing in the Fund and to compare these costs with the ongoing costs of investing in other mutual funds.
The Example is based on an investment of $1,000 invested at the beginning of the period and held for the entire period (November 1, 2018 to April 30, 2019).
Actual Expenses
The first line of the accompanying table provides information about actual account values and actual expenses. You may use the information in this line, together with the amount you invested, to estimate the expenses that you paid over the period. Simply divide your account value by $1,000.00 (for example, an $8,600 account value divided by $1,000.00 = 8.6), then multiply the result by the number in the first line under the heading entitled "Expenses Paid During Period" to estimate the expenses you paid on your account during this period. In addition, the Fund, as a shareholder in the underlying Fidelity Central Funds, will indirectly bear its pro-rata share of the fees and expenses incurred by the underlying Fidelity Central Funds. These fees and expenses are not included in the Fund's annualized expense ratio used to calculate the expense estimate in the table below.
Hypothetical Example for Comparison Purposes
The second line of the accompanying table provides information about hypothetical account values and hypothetical expenses based on the Fund's actual expense ratio and an assumed rate of return of 5% per year before expenses, which is not the Fund's actual return. The hypothetical account values and expenses may not be used to estimate the actual ending account balance or expenses you paid for the period. You may use this information to compare the ongoing costs of investing in the Fund and other funds. To do so, compare this 5% hypothetical example with the 5% hypothetical examples that appear in the shareholder reports of the other funds. In addition, the Fund, as a shareholder in the underlying Fidelity Central Funds, will indirectly bear its pro-rata share of the fees and expenses incurred by the underlying Fidelity Central Funds. These fees and expenses are not included in the Fund's annualized expense ratio used to calculate the expense estimate in the table below.
Please note that the expenses shown in the table are meant to highlight your ongoing costs only and do not reflect any transaction costs. Therefore, the second line of the table is useful in comparing ongoing costs only, and will not help you determine the relative total costs of owning different funds.
| Annualized Expense Ratio-A | Beginning Account Value November 1, 2018 | Ending Account Value April 30, 2019 | Expenses Paid During Period-B November 1, 2018 to April 30, 2019 | |
| Actual | .60% | $1,000.00 | $1,094.80 | $3.12 |
| Hypothetical-C | $1,000.00 | $1,021.82 | $3.01 |
A Annualized expense ratio reflects expenses net of applicable fee waivers.
B Expenses are equal to the Fund's annualized expense ratio, multiplied by the average account value over the period, multiplied by 181/365 (to reflect the one-half year period).
C 5% return per year before expenses
Distributions (Unaudited)
The fund hereby designates as a capital gain dividend with respect to the taxable year ended April 30, 2019, $957,835 or, if subsequently determined to be different, the net capital gain of such year.
The fund designates 33% and 16% of the dividends distributed in June and December, respectively during the fiscal year as qualifying for the dividends–received deduction for corporate shareholders.
The fund designates 45% and 21% of the dividends distributed in June and December, respectively during the fiscal year as amounts which may be taken into account as a dividend for the purposes of the maximum rate under section 1(h)(11) of the Internal Revenue Code.
The fund will notify shareholders in January 2020 of amounts for use in preparing 2019 income tax returns.
Board Approval of Investment Advisory Contracts and Management Fees
Fidelity Small Cap Stock K6 Fund
Each year, the Board of Trustees, including the Independent Trustees (together, the Board), votes on the renewal of the management contract with Fidelity Management & Research Company (FMR) and the sub-advisory agreements (together, the Advisory Contracts) for the fund. FMR and the sub-advisers are referred to herein as the Investment Advisers. The Board, assisted by the advice of fund counsel and Independent Trustees' counsel, requests and considers a broad range of information relevant to the renewal of the Advisory Contracts throughout the year.
The Board meets regularly and, at each of its meetings, covers an extensive agenda of topics and materials and considers factors that are relevant to its annual consideration of the renewal of the fund's Advisory Contracts, including the services and support provided to the fund and its shareholders. The Board has established various standing committees (Committees), each composed of and chaired by Independent Trustees with varying backgrounds, to which the Board has assigned specific subject matter responsibilities in order to enhance effective decision-making by the Board. The Board, acting directly and through its Committees, requests and receives information concerning the annual consideration of the renewal of the fund's Advisory Contracts. The Board also meets as needed to review matters specifically related to the Board's annual consideration of the renewal of the Advisory Contracts. Members of the Board may also meet with trustees of other Fidelity funds through joint ad hoc committees to discuss certain matters relevant to all of the Fidelity funds.
At its January 2019 meeting, the Board unanimously determined to renew the fund's Advisory Contracts. In reaching its determination, the Board considered all factors it believed relevant, including (i) the nature, extent, and quality of the services to be provided to the fund and its shareholders (including the investment performance of the fund); (ii) the competitiveness of the fund's management fee and total expense ratio relative to peer funds; (iii) the total costs of the services to be provided by and the profits to be realized by Fidelity from its relationships with the fund; and (iv) the extent to which, if any, economies of scale exist and would be realized as the fund grows, and whether any economies of scale are appropriately shared with fund shareholders.
In considering whether to renew the Advisory Contracts for the fund, the Board reached a determination, with the assistance of fund counsel and Independent Trustees' counsel and through the exercise of its business judgment, that the renewal of the Advisory Contracts was in the best interests of the fund and its shareholders and that the compensation payable under the Advisory Contracts was fair and reasonable. The Board's decision to renew the Advisory Contracts was not based on any single factor, but rather was based on a comprehensive consideration of all the information provided to the Board at its meetings throughout the year. The Board, in reaching its determination to renew the Advisory Contracts, was aware that shareholders of the fund have a broad range of investment choices available to them, including a wide choice among funds offered by Fidelity's competitors, and that the fund's shareholders, who have the opportunity to review and weigh the disclosure provided by the fund in its prospectus and other public disclosures, have chosen to invest in this fund, which is part of the Fidelity family of funds.
Nature, Extent, and Quality of Services Provided. The Board considered Fidelity's staffing as it relates to the fund, including the backgrounds of investment personnel of Fidelity, and also considered the fund's investment objective, strategies, and related investment philosophy. The Independent Trustees also had discussions with senior management of Fidelity's investment operations and investment groups. The Board considered the structure of the investment personnel compensation program and whether this structure provides appropriate incentives to act in the best interests of the fund. Additionally, the Board considered the portfolio managers' investments, if any, in the funds that they manage.Resources Dedicated to Investment Management and Support Services. The Board and the Fund Oversight and Research Committees reviewed the general qualifications and capabilities of Fidelity's investment staff, including its size, education, experience, and resources, as well as Fidelity's approach to recruiting, training, managing, and compensating investment personnel. The Board noted that Fidelity has continued to increase the resources devoted to non-U.S. offices, including expansion of Fidelity's global investment organization. The Board also noted that Fidelity's analysts have extensive resources, tools and capabilities that allow them to conduct sophisticated quantitative and fundamental analysis, as well as credit analysis of issuers, counterparties and guarantors. Further, the Board considered that Fidelity's investment professionals have sufficient access to global information and data so as to provide competitive investment results over time, and that those professionals also have access to sophisticated tools that permit them to assess portfolio construction and risk and performance attribution characteristics continuously, as well as to transmit new information and research conclusions rapidly around the world. Additionally, in its deliberations, the Board considered Fidelity's trading, risk management, compliance, and technology and operations capabilities and resources, which are integral parts of the investment management process.Shareholder and Administrative Services. The Board considered (i) the nature, extent, quality, and cost of advisory, administrative, and shareholder services performed by the Investment Advisers and their affiliates under the Advisory Contracts and under separate agreements covering transfer agency, pricing and bookkeeping, and securities lending services for the fund; (ii) the nature and extent of the supervision of third party service providers, principally custodians, subcustodians, and pricing vendors; and (iii) the resources devoted to, and the record of compliance with, the fund's compliance policies and procedures. The Board also reviewed the allocation of fund brokerage, including allocations to brokers affiliated with the Investment Advisers, the use of brokerage commissions to pay fund expenses, and the use of "soft" commission dollars to pay for research services.The Board noted that the growth of fund assets over time across the complex allows Fidelity to reinvest in the development of services designed to enhance the value and convenience of the Fidelity funds as investment vehicles. These services include 24-hour access to account information and market information through telephone representatives and over the Internet, investor education materials and asset allocation tools, and the expanded availability of Fidelity Investor Centers.The Board noted that it and the boards of certain other Fidelity funds had formed an ad hoc Committee on Transfer Agency Fees to review the variety of transfer agency fee structures throughout the industry and Fidelity's competitive positioning with respect to industry participants.Investment in a Large Fund Family. The Board considered the benefits to shareholders of investing in a Fidelity fund, including the benefits of investing in a fund that is part of a large family of funds offering a variety of investment disciplines and providing a large variety of mutual fund investor services. The Board noted that Fidelity had taken, or had made recommendations that resulted in the Fidelity funds taking, a number of actions over the previous year that benefited particular funds, including: (i) continuing to dedicate additional resources to Fidelity's investment research process, which includes meetings with management of issuers of securities in which the funds invest, and to the support of the senior management team that oversees asset management; (ii) continuing efforts to enhance Fidelity's global research capabilities; (iii) launching new funds and making other enhancements to meet client needs; (iv) launching new share classes of existing funds; (v) eliminating purchase minimums and broadening eligibility requirements for certain funds and share classes; (vi) reducing management fees and total expenses for certain growth equity funds and index funds; (vii) lowering expense caps for certain existing funds and classes, and converting certain voluntary expense caps to contractual caps, to reduce expenses borne by shareholders; (viii) eliminating short-term redemption fees for funds that had such fees; (ix) rationalizing product lines and gaining increased efficiencies from fund mergers and share class consolidations; (x) continuing to develop, acquire and implement systems and technology to improve services to the funds and shareholders, strengthen information security, and increase efficiency; and (xi) continuing to implement enhancements to further strengthen Fidelity's product line to increase investors' probability of success in achieving their investment goals, including retirement income goals.Investment Performance. The Board considered whether the fund has operated in accordance with its investment objective, as well as its record of compliance with its investment restrictions and its performance history.The Board considered whether the fund has operated in accordance with its investment objective, as well as its record of compliance with its investment restrictions and its performance history. The fund had a portfolio manager change in February 2016. The Board will continue to monitor closely the fund's performance, taking into account the portfolio manager change.The Board took into account discussions that occur at Board meetings throughout the year with representatives of the Investment Advisers about fund investment performance. In this regard the Board noted that as part of regularly scheduled fund reviews and other reports to the Board on fund performance, the Board considers annualized return information for the fund for different time periods, measured against an appropriate securities market index ("benchmark index") and a peer group of funds with similar objectives ("peer group"), if any. In its evaluation of fund investment performance, the Board gave particular attention to information indicating changes in performance of certain Fidelity funds for specific time periods and discussed with the Investment Advisers the reasons for any overperformance or underperformance.In addition to reviewing absolute and relative fund performance, the Independent Trustees periodically consider the appropriateness of fund performance metrics in evaluating the results achieved. In general, the Independent Trustees believe that fund performance should be evaluated based on net performance (after fees and expenses) of both the highest performing and lowest performing fund share classes, where applicable, compared to appropriate benchmark indices, over appropriate time periods that may include full market cycles, and compared to peer groups, as applicable, over the same periods, taking into account relevant factors including the following: general market conditions; issuer-specific information; and fund cash flows and other factors.The Independent Trustees recognize that shareholders evaluate performance on a net basis over their own holding periods, for which one-, three-, and five-year periods are often used as a proxy. For this reason, the performance information reviewed by the Board also included net total return information for the fund and an appropriate benchmark index and peer group for the most recent one-year period ended June 30, 2018, as shown below. Returns are shown compared to the 25th percentile (top of box, 75% beaten) and 75th percentile (bottom of box, 25% beaten) of the peer universe.The Independent Trustees recognize that shareholders evaluate performance on a net basis over their own holding periods, for which one-, three-, and five-year periods are often used as a proxy. For this reason, the performance information reviewed by the Board also included net cumulative total return information for the fund and an appropriate benchmark index and peer group for the most recent one-, three-, and five-year periods ended June 30, 2018, as shown below. Returns are shown compared to the 25th percentile (top of box, 75% beaten) and 75th percentile (bottom of box, 25% beaten) of the peer universe.Fidelity Small Cap Stock Fund
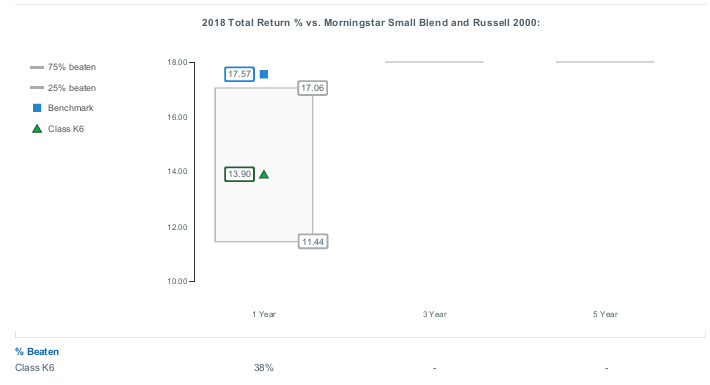
Fidelity Small Cap Stock K6 Fund
The Board noted that the comparisons for 2015 and later reflect a revised Total Mapped Group that no longer includes funds with micro-cap objectives and that FMR believes this Total Mapped Group is a more appropriate comparison because the fund does not have a micro-cap objective.
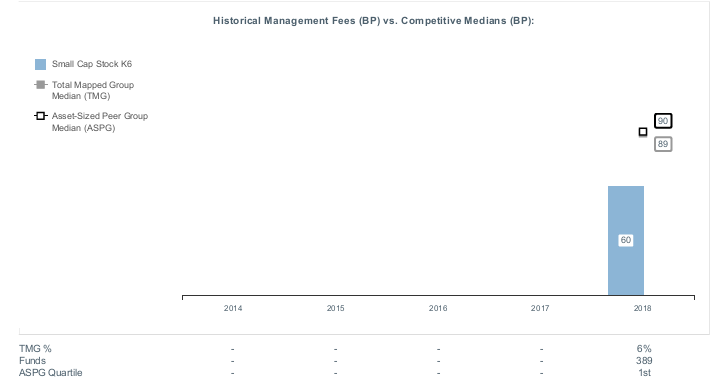
![]()
SLCXK6-ANN-0619
1.9883975.101
Fidelity® Founders Fund Annual Report April 30, 2019 Includes Fidelity and Fidelity Advisor share classes |
|
Beginning on January 1, 2021, as permitted by regulations adopted by the Securities and Exchange Commission, paper copies of a fund’s shareholder reports will no longer be sent by mail, unless you specifically request paper copies of the reports from the fund or from your financial intermediary, such as a financial advisor, broker-dealer or bank. Instead, the reports will be made available on a website, and you will be notified by mail each time a report is posted and provided with a website link to access the report.
If you already elected to receive shareholder reports electronically, you will not be affected by this change and you need not take any action. You may elect to receive shareholder reports and other communications from a fund electronically, by contacting your financial intermediary. For Fidelity customers, visit Fidelity's web site or call Fidelity using the contact information listed below.
You may elect to receive all future reports in paper free of charge. If you wish to continue receiving paper copies of your shareholder reports, you may contact your financial intermediary or, if you are a Fidelity customer, visit Fidelity’s website, or call Fidelity at the applicable toll-free number listed below. Your election to receive reports in paper will apply to all funds held with the fund complex/your financial intermediary.
| Account Type | Website | Phone Number |
| Brokerage, Mutual Fund, or Annuity Contracts: | fidelity.com/mailpreferences | 1-800-343-3548 |
| Employer Provided Retirement Accounts: | netbenefits.fidelity.com/preferences (choose 'no' under Required Disclosures to continue to print) | 1-800-343-0860 |
| Advisor Sold Accounts Serviced Through Your Financial Intermediary: | Contact Your Financial Intermediary | Your Financial Intermediary's phone number |
| Advisor Sold Accounts Serviced by Fidelity: | institutional.fidelity.com | 1-877-208-0098 |
Contents
Board Approval of Investment Advisory Contracts and Management Fees |
To view a fund's proxy voting guidelines and proxy voting record for the 12-month period ended June 30, visit http://www.fidelity.com/proxyvotingresults or visit the Securities and Exchange Commission's (SEC) web site at http://www.sec.gov.
You may also call 1-800-544-8544 if you’re an individual investing directly with Fidelity, call 1-800-835-5092 if you’re a plan sponsor or participant with Fidelity as your recordkeeper or call 1-877-208-0098 on institutional accounts or if you’re an advisor or invest through one to request a free copy of the proxy voting guidelines.
Standard & Poor's, S&P and S&P 500 are registered service marks of The McGraw-Hill Companies, Inc. and have been licensed for use by Fidelity Distributors Corporation.
Other third-party marks appearing herein are the property of their respective owners.
All other marks appearing herein are registered or unregistered trademarks or service marks of FMR LLC or an affiliated company. © 2019 FMR LLC. All rights reserved.
This report and the financial statements contained herein are submitted for the general information of the shareholders of the Fund. This report is not authorized for distribution to prospective investors in the Fund unless preceded or accompanied by an effective prospectus.
A fund files its complete schedule of portfolio holdings with the SEC for the first and third quarters of each fiscal year on Form N-PORT. Forms N-PORT are available on the SEC’s web site at http://www.sec.gov. A fund's Forms N-PORT may be reviewed and copied at the SEC’s Public Reference Room in Washington, DC. Information regarding the operation of the SEC's Public Reference Room may be obtained by calling 1-800-SEC-0330.
For a complete list of a fund's portfolio holdings, view the most recent holdings listing, semiannual report, or annual report on Fidelity's web site at http://www.fidelity.com, http://www.institutional.fidelity.com, or http://www.401k.com, as applicable.
NOT FDIC INSURED •MAY LOSE VALUE •NO BANK GUARANTEE
Neither the Fund nor Fidelity Distributors Corporation is a bank.
Performance: The Bottom Line
Average annual total return reflects the change in the value of an investment, assuming reinvestment of distributions from dividend income and capital gains (the profits earned upon the sale of securities that have grown in value, if any) and assuming a constant rate of performance each year. The hypothetical investment and the average annual total returns do not reflect the deduction of taxes that a shareholder would pay on fund distributions or the redemption of fund shares. During periods of reimbursement by Fidelity, a fund’s total return will be greater than it would be had the reimbursement not occurred. How a fund did yesterday is no guarantee of how it will do tomorrow.
Average annual total returns for Fidelity® Founders Fund will be reported once the fund is a year old.
Investment Summary (Unaudited)
Top Five Stocks as of April 30, 2019
| % of fund's net assets | |
| Microsoft Corp. | 6.5 |
| Amazon.com, Inc. | 4.9 |
| Salesforce.com, Inc. | 4.5 |
| Alphabet, Inc. Class C | 4.2 |
| Workday, Inc. Class A | 3.2 |
| 23.3 |
Top Five Market Sectors as of April 30, 2019
| % of fund's net assets | |
| Information Technology | 36.5 |
| Consumer Discretionary | 16.2 |
| Health Care | 11.4 |
| Communication Services | 10.1 |
| Financials | 6.6 |
Asset Allocation (% of fund's net assets)
| As of April 30, 2019 * | ||
| Stocks | 98.7% | |
| Short-Term Investments and Net Other Assets (Liabilities) | 1.3% | |

* Foreign investments - 9.9%
Schedule of Investments April 30, 2019
Showing Percentage of Net Assets
| Common Stocks - 98.7% | |||
| Shares | Value | ||
| COMMUNICATION SERVICES - 10.1% | |||
| Entertainment - 1.8% | |||
| Netflix, Inc. (a) | 491 | $181,935 | |
| Spotify Technology SA (a) | 247 | 33,535 | |
| World Wrestling Entertainment, Inc. Class A | 1,211 | 101,542 | |
| 317,012 | |||
| Interactive Media & Services - 8.3% | |||
| Alphabet, Inc. Class C (a) | 635 | 754,685 | |
| CarGurus, Inc. Class A (a) | 2,195 | 89,424 | |
| Facebook, Inc. Class A (a) | 1,658 | 320,657 | |
| Momo, Inc. ADR | 1,259 | 44,153 | |
| Tencent Holdings Ltd. sponsored ADR | 1,859 | 91,537 | |
| Twitter, Inc. (a) | 4,435 | 177,001 | |
| 1,477,457 | |||
| TOTAL COMMUNICATION SERVICES | 1,794,469 | ||
| CONSUMER DISCRETIONARY - 16.2% | |||
| Diversified Consumer Services - 0.2% | |||
| Arco Platform Ltd. Class A | 1,083 | 34,797 | |
| Hotels, Restaurants & Leisure - 2.9% | |||
| Boyd Gaming Corp. | 1,534 | 44,149 | |
| Chipotle Mexican Grill, Inc. (a) | 177 | 121,783 | |
| Melco Crown Entertainment Ltd. sponsored ADR | 1,855 | 46,561 | |
| Monarch Casino & Resort, Inc. (a) | 240 | 10,246 | |
| Planet Fitness, Inc. (a) | 1,091 | 82,589 | |
| Sea Ltd. ADR (a) | 5,097 | 126,864 | |
| Shake Shack, Inc. Class A (a) | 1,225 | 75,093 | |
| 507,285 | |||
| Household Durables - 1.2% | |||
| D.R. Horton, Inc. | 2,953 | 130,847 | |
| Toll Brothers, Inc. | 1,926 | 73,381 | |
| 204,228 | |||
| Internet & Direct Marketing Retail - 7.1% | |||
| Alibaba Group Holding Ltd. sponsored ADR (a) | 757 | 140,476 | |
| Amazon.com, Inc. (a) | 455 | 876,567 | |
| GrubHub, Inc. (a) | 1,276 | 85,224 | |
| MercadoLibre, Inc. (a) | 156 | 75,526 | |
| Overstock.com, Inc. (a) | 10 | 132 | |
| Pinduoduo, Inc. ADR | 3,372 | 74,960 | |
| Wayfair LLC Class A (a) | 42 | 6,810 | |
| 1,259,695 | |||
| Multiline Retail - 2.4% | |||
| Dollar Tree, Inc. (a) | 3,123 | 347,527 | |
| Ollie's Bargain Outlet Holdings, Inc. (a) | 911 | 87,128 | |
| 434,655 | |||
| Specialty Retail - 1.0% | |||
| Five Below, Inc. (a) | 852 | 124,724 | |
| Nitori Holdings Co. Ltd. | 500 | 59,473 | |
| 184,197 | |||
| Textiles, Apparel & Luxury Goods - 1.4% | |||
| Canada Goose Holdings, Inc. (a) | 788 | 42,079 | |
| Capri Holdings Ltd. (a) | 1,031 | 45,446 | |
| Gildan Activewear, Inc. | 768 | 28,316 | |
| Ralph Lauren Corp. | 278 | 36,579 | |
| Under Armour, Inc. Class A (sub. vtg.) (a) | 4,337 | 100,141 | |
| 252,561 | |||
| TOTAL CONSUMER DISCRETIONARY | 2,877,418 | ||
| CONSUMER STAPLES - 2.3% | |||
| Beverages - 1.6% | |||
| Boston Beer Co., Inc. Class A (a) | 444 | 137,644 | |
| Fever-Tree Drinks PLC | 1,823 | 74,739 | |
| Monster Beverage Corp. (a) | 1,223 | 72,891 | |
| 285,274 | |||
| Food & Staples Retailing - 0.0% | |||
| Sprouts Farmers Market LLC (a) | 332 | 7,111 | |
| Personal Products - 0.7% | |||
| BWX Ltd. | 4,508 | 6,864 | |
| Estee Lauder Companies, Inc. Class A | 624 | 107,209 | |
| 114,073 | |||
| TOTAL CONSUMER STAPLES | 406,458 | ||
| ENERGY - 3.9% | |||
| Oil, Gas & Consumable Fuels - 3.9% | |||
| Continental Resources, Inc. (a) | 1,564 | 71,928 | |
| Devon Energy Corp. | 4,998 | 160,636 | |
| Hess Corp. | 2,938 | 188,385 | |
| Parsley Energy, Inc. Class A (a) | 1,530 | 30,539 | |
| Pioneer Natural Resources Co. | 1,487 | 247,526 | |
| 699,014 | |||
| FINANCIALS - 6.6% | |||
| Banks - 2.6% | |||
| First Republic Bank | 2,702 | 285,385 | |
| Signature Bank | 1,390 | 183,577 | |
| 468,962 | |||
| Capital Markets - 2.7% | |||
| BlackRock, Inc. Class A | 186 | 90,255 | |
| Charles Schwab Corp. | 1,514 | 69,311 | |
| IntercontinentalExchange, Inc. | 1,438 | 116,981 | |
| Morningstar, Inc. | 575 | 82,484 | |
| The Blackstone Group LP | 2,616 | 103,227 | |
| Tradeweb Markets, Inc. Class A | 200 | 8,050 | |
| 470,308 | |||
| Diversified Financial Services - 1.0% | |||
| Berkshire Hathaway, Inc. Class B (a) | 806 | 174,668 | |
| Thrifts & Mortgage Finance - 0.3% | |||
| LendingTree, Inc. (a) | 126 | 48,487 | |
| TOTAL FINANCIALS | 1,162,425 | ||
| HEALTH CARE - 11.4% | |||
| Biotechnology - 2.5% | |||
| Argenx SE ADR (a) | 90 | 11,526 | |
| Ascendis Pharma A/S sponsored ADR (a) | 484 | 53,908 | |
| Blueprint Medicines Corp. (a) | 348 | 26,312 | |
| Vertex Pharmaceuticals, Inc. (a) | 2,058 | 347,761 | |
| 439,507 | |||
| Health Care Equipment & Supplies - 6.3% | |||
| Boston Scientific Corp. (a) | 4,393 | 163,068 | |
| Danaher Corp. | 3,485 | 461,553 | |
| Genmark Diagnostics, Inc. (a) | 883 | 6,393 | |
| Hologic, Inc. (a) | 1,682 | 78,011 | |
| Masimo Corp. (a) | 1,451 | 188,848 | |
| Penumbra, Inc. (a) | 1,247 | 167,722 | |
| ResMed, Inc. | 445 | 46,507 | |
| 1,112,102 | |||
| Health Care Providers & Services - 2.0% | |||
| UnitedHealth Group, Inc. | 1,541 | 359,161 | |
| Health Care Technology - 0.6% | |||
| Veeva Systems, Inc. Class A (a) | 827 | 115,672 | |
| TOTAL HEALTH CARE | 2,026,442 | ||
| INDUSTRIALS - 5.9% | |||
| Aerospace & Defense - 3.0% | |||
| HEICO Corp. Class A | 959 | 85,763 | |
| TransDigm Group, Inc. (a) | 947 | 456,946 | |
| 542,709 | |||
| Airlines - 0.3% | |||
| Southwest Airlines Co. | 913 | 49,512 | |
| Commercial Services & Supplies - 1.2% | |||
| Cintas Corp. | 408 | 88,593 | |
| Copart, Inc. (a) | 1,285 | 86,506 | |
| Waste Connection, Inc. (United States) | 361 | 33,490 | |
| 208,589 | |||
| Electrical Equipment - 1.0% | |||
| Fortive Corp. | 2,013 | 173,802 | |
| Trading Companies & Distributors - 0.4% | |||
| Indutrade AB | 2,400 | 73,379 | |
| TOTAL INDUSTRIALS | 1,047,991 | ||
| INFORMATION TECHNOLOGY - 36.5% | |||
| IT Services - 7.3% | |||
| Adyen BV (b) | 79 | 64,293 | |
| Elastic NV | 199 | 17,024 | |
| EPAM Systems, Inc. (a) | 499 | 89,501 | |
| Euronet Worldwide, Inc. (a) | 432 | 64,752 | |
| GoDaddy, Inc. (a) | 2,161 | 176,122 | |
| MongoDB, Inc. Class A (a) | 1,948 | 274,512 | |
| Okta, Inc. (a) | 1,252 | 130,246 | |
| Square, Inc. (a) | 1,200 | 87,384 | |
| VeriSign, Inc. (a) | 1,213 | 239,507 | |
| Virtusa Corp. (a) | 1,281 | 71,160 | |
| Wix.com Ltd. (a) | 648 | 86,936 | |
| 1,301,437 | |||
| Semiconductors & Semiconductor Equipment - 1.3% | |||
| Analog Devices, Inc. | 756 | 87,877 | |
| NVIDIA Corp. | 757 | 137,017 | |
| 224,894 | |||
| Software - 27.9% | |||
| 2U, Inc. (a) | 2,530 | 153,065 | |
| Adobe, Inc. (a) | 1,499 | 433,586 | |
| Atlassian Corp. PLC (a) | 796 | 87,679 | |
| BlackLine, Inc. (a) | 673 | 34,377 | |
| DocuSign, Inc. | 983 | 55,707 | |
| Dropbox, Inc. Class A (a) | 1,209 | 29,475 | |
| Guidewire Software, Inc. (a) | 396 | 42,174 | |
| HubSpot, Inc. (a) | 874 | 161,244 | |
| Intuit, Inc. | 720 | 180,763 | |
| Microsoft Corp. | 8,811 | 1,150,720 | |
| Nutanix, Inc. Class A (a) | 637 | 27,512 | |
| Paycom Software, Inc. (a) | 626 | 126,784 | |
| Paylocity Holding Corp. (a) | 1,102 | 106,398 | |
| Pivotal Software, Inc. | 962 | 20,875 | |
| RingCentral, Inc. (a) | 714 | 83,088 | |
| Salesforce.com, Inc. (a) | 4,882 | 807,239 | |
| SAP SE sponsored ADR | 263 | 33,890 | |
| ServiceNow, Inc. (a) | 1,186 | 322,011 | |
| SS&C Technologies Holdings, Inc. | 415 | 28,079 | |
| SurveyMonkey | 1,793 | 32,095 | |
| Tableau Software, Inc. (a) | 740 | 90,139 | |
| The Trade Desk, Inc. (a) | 966 | 213,950 | |
| Workday, Inc. Class A (a) | 2,774 | 570,418 | |
| Yext, Inc. (a) | 915 | 20,048 | |
| Zendesk, Inc. (a) | 869 | 76,281 | |
| Zoom Video Communications, Inc. Class A | 200 | 14,494 | |
| Zscaler, Inc. (a) | 926 | 63,255 | |
| 4,965,346 | |||
| TOTAL INFORMATION TECHNOLOGY | 6,491,677 | ||
| MATERIALS - 2.7% | |||
| Chemicals - 0.7% | |||
| Westlake Chemical Corp. | 1,736 | 121,086 | |
| Metals & Mining - 2.0% | |||
| Barrick Gold Corp. | 27,780 | 353,362 | |
| Steel Dynamics, Inc. | 155 | 4,910 | |
| 358,272 | |||
| TOTAL MATERIALS | 479,358 | ||
| REAL ESTATE - 2.5% | |||
| Equity Real Estate Investment Trusts (REITs) - 2.5% | |||
| Alexandria Real Estate Equities, Inc. | 360 | 51,260 | |
| Crown Castle International Corp. | 2,435 | 306,274 | |
| Public Storage | 420 | 92,896 | |
| 450,430 | |||
| UTILITIES - 0.6% | |||
| Water Utilities - 0.6% | |||
| AquaVenture Holdings Ltd. (a) | 5,190 | 100,946 | |
| TOTAL COMMON STOCKS | |||
| (Cost $16,613,297) | 17,536,628 | ||
| Money Market Funds - 2.1% | |||
| Fidelity Cash Central Fund, 2.49% (c) | |||
| (Cost $371,821) | 371,747 | 371,821 | |
| TOTAL INVESTMENT IN SECURITIES - 100.8% | |||
| (Cost $16,985,118) | 17,908,449 | ||
| NET OTHER ASSETS (LIABILITIES) - (0.8)% | (139,717) | ||
| NET ASSETS - 100% | $17,768,732 |
Legend
(a) Non-income producing
(b) Security exempt from registration under Rule 144A of the Securities Act of 1933. These securities may be resold in transactions exempt from registration, normally to qualified institutional buyers. At the end of the period, the value of these securities amounted to $64,293 or 0.4% of net assets.
(c) Affiliated fund that is generally available only to investment companies and other accounts managed by Fidelity Investments. The rate quoted is the annualized seven-day yield of the fund at period end. A complete unaudited listing of the fund's holdings as of its most recent quarter end is available upon request. In addition, each Fidelity Central Fund's financial statements, which are not covered by the Fund's Report of Independent Registered Public Accounting Firm, are available on the SEC's website or upon request.
Affiliated Central Funds
Information regarding fiscal year to date income earned by the Fund from investments in Fidelity Central Funds is as follows:
| Fund | Income earned |
| Fidelity Cash Central Fund | $1,809 |
| Total | $1,809 |
Amounts in the income column in the above table include any capital gain distributions from underlying funds, which are presented in the corresponding line-item in the Statement of Operations, if applicable.
Investment Valuation
The following is a summary of the inputs used, as of April 30, 2019, involving the Fund's assets and liabilities carried at fair value. The inputs or methodology used for valuing securities may not be an indication of the risk associated with investing in those securities. For more information on valuation inputs, and their aggregation into the levels used below, please refer to the Investment Valuation section in the accompanying Notes to Financial Statements.
| Valuation Inputs at Reporting Date: | ||||
| Description | Total | Level 1 | Level 2 | Level 3 |
| Investments in Securities: | ||||
| Equities: | ||||
| Communication Services | $1,794,469 | $1,794,469 | $-- | $-- |
| Consumer Discretionary | 2,877,418 | 2,877,418 | -- | -- |
| Consumer Staples | 406,458 | 406,458 | -- | -- |
| Energy | 699,014 | 699,014 | -- | -- |
| Financials | 1,162,425 | 1,162,425 | -- | -- |
| Health Care | 2,026,442 | 2,026,442 | -- | -- |
| Industrials | 1,047,991 | 974,612 | 73,379 | -- |
| Information Technology | 6,491,677 | 6,491,677 | -- | -- |
| Materials | 479,358 | 479,358 | -- | -- |
| Real Estate | 450,430 | 450,430 | -- | -- |
| Utilities | 100,946 | 100,946 | -- | -- |
| Money Market Funds | 371,821 | 371,821 | -- | -- |
| Total Investments in Securities: | $17,908,449 | $17,835,070 | $73,379 | $-- |
See accompanying notes which are an integral part of the financial statements.
Financial Statements
Statement of Assets and Liabilities
| April 30, 2019 | ||
| Assets | ||
| Investment in securities, at value — See accompanying schedule: Unaffiliated issuers (cost $16,613,297) | $17,536,628 | |
| Fidelity Central Funds (cost $371,821) | 371,821 | |
| Total Investment in Securities (cost $16,985,118) | $17,908,449 | |
| Receivable for fund shares sold | 533,962 | |
| Dividends receivable | 2,443 | |
| Distributions receivable from Fidelity Central Funds | 411 | |
| Prepaid expenses | 84,942 | |
| Receivable from investment adviser for expense reductions | 29,086 | |
| Total assets | 18,559,293 | |
| Liabilities | ||
| Payable for investments purchased | $736,975 | |
| Payable for fund shares redeemed | 14,539 | |
| Accrued management fee | 6,358 | |
| Distribution and service plan fees payable | 268 | |
| Other affiliated payables | 2,470 | |
| Other payables and accrued expenses | 29,951 | |
| Total liabilities | 790,561 | |
| Net Assets | $17,768,732 | |
| Net Assets consist of: | ||
| Paid in capital | $16,865,341 | |
| Total distributable earnings (loss) | 903,391 | |
| Net Assets | $17,768,732 | |
| Net Asset Value and Maximum Offering Price | ||
| Class A: | ||
| Net Asset Value and redemption price per share ($219,645 ÷ 20,239 shares) | $10.85 | |
| Maximum offering price per share (100/94.25 of $10.85) | $11.51 | |
| Class M: | ||
| Net Asset Value and redemption price per share ($204,811 ÷ 18,882 shares) | $10.85 | |
| Maximum offering price per share (100/96.50 of $10.85) | $11.24 | |
| Class C: | ||
| Net Asset Value and offering price per share ($173,371 ÷ 16,000 shares)(a) | $10.84 | |
| Fidelity Founders Fund: | ||
| Net Asset Value, offering price and redemption price per share ($10,595,497 ÷ 975,828 shares) | $10.86 | |
| Class I: | ||
| Net Asset Value, offering price and redemption price per share ($830,732 ÷ 76,505 shares) | $10.86 | |
| Class Z: | ||
| Net Asset Value, offering price and redemption price per share ($5,744,676 ÷ 528,946 shares) | $10.86 |
(a) Redemption price per share is equal to net asset value less any applicable contingent deferred sales charge.
See accompanying notes which are an integral part of the financial statements.
Statement of Operations
| For the period February 14, 2019 (commencement of operations) to April 30, 2019 | ||
| Investment Income | ||
| Dividends | $9,615 | |
| Income from Fidelity Central Funds | 1,809 | |
| Total income | 11,424 | |
| Expenses | ||
| Management fee | $11,933 | |
| Transfer agent fees | 3,705 | |
| Distribution and service plan fees | 634 | |
| Accounting fees and expenses | 863 | |
| Custodian fees and expenses | 5,882 | |
| Independent trustees' fees and expenses | 5 | |
| Registration fees | 29,494 | |
| Audit | 24,724 | |
| Miscellaneous | 412 | |
| Total expenses before reductions | 77,652 | |
| Expense reductions | (56,008) | |
| Total expenses after reductions | 21,644 | |
| Net investment income (loss) | (10,220) | |
| Realized and Unrealized Gain (Loss) | ||
| Net realized gain (loss) on: | ||
| Investment securities: | ||
| Unaffiliated issuers | (20,909) | |
| Foreign currency transactions | (20) | |
| Total net realized gain (loss) | (20,929) | |
| Change in net unrealized appreciation (depreciation) on: | ||
| Investment securities: | ||
| Unaffiliated issuers | 923,331 | |
| Assets and liabilities in foreign currencies | (2) | |
| Total change in net unrealized appreciation (depreciation) | 923,329 | |
| Net gain (loss) | 902,400 | |
| Net increase (decrease) in net assets resulting from operations | $892,180 |
See accompanying notes which are an integral part of the financial statements.
Statement of Changes in Net Assets
| For the period February 14, 2019 (commencement of operations) to April 30, 2019 | |
| Increase (Decrease) in Net Assets | |
| Operations | |
| Net investment income (loss) | $(10,220) |
| Net realized gain (loss) | (20,929) |
| Change in net unrealized appreciation (depreciation) | 923,329 |
| Net increase (decrease) in net assets resulting from operations | 892,180 |
| Share transactions - net increase (decrease) | 16,876,552 |
| Total increase (decrease) in net assets | 17,768,732 |
| Net Assets | |
| Beginning of period | – |
| End of period | $17,768,732 |
See accompanying notes which are an integral part of the financial statements.
Financial Highlights
Fidelity Founders Fund Class A
| Year ended April 30, | 2019 A |
| Selected Per–Share Data | |
| Net asset value, beginning of period | $10.00 |
| Income from Investment Operations | |
| Net investment income (loss)B | (.02) |
| Net realized and unrealized gain (loss) | .87 |
| Total from investment operations | .85 |
| Net asset value, end of period | $10.85 |
| Total ReturnC,D,E | 8.50% |
| Ratios to Average Net AssetsF,G | |
| Expenses before reductions | 4.81%H |
| Expenses net of fee waivers, if any | 1.25%H |
| Expenses net of all reductions | 1.25%H |
| Net investment income (loss) | (.74)%H |
| Supplemental Data | |
| Net assets, end of period (000 omitted) | $220 |
| Portfolio turnover rateI | 4%J |
A For the period February 14, 2019 (commencement of operations) to April 30, 2019.
B Calculated based on average shares outstanding during the period.
C Total returns for periods of less than one year are not annualized.
D Total returns would have been lower if certain expenses had not been reduced during the applicable periods shown.
E Total returns do not include the effect of the sales charges.
F Fees and expenses of any underlying Fidelity Central Funds are not included in the Fund's expense ratio. The Fund indirectly bears its proportionate share of the expenses of any underlying Fidelity Central Funds.
G Expense ratios reflect operating expenses of the class. Expenses before reductions do not reflect amounts reimbursed by the investment adviser or reductions from expense offset arrangements and do not represent the amount paid by the class during periods when reimbursements or reductions occur. Expense ratios before reductions for start-up periods may not be representative of longer-term operating periods. Expenses net of fee waivers reflect expenses after reimbursement by the investment adviser but prior to reductions from expense offset arrangements. Expenses net of all reductions represent the net expenses paid by the class.
H Annualized
I Amount does not include the portfolio activity of any underlying Fidelity Central Funds.
J Amount not annualized.
See accompanying notes which are an integral part of the financial statements.
Fidelity Founders Fund Class M
| Year ended April 30, | 2019 A |
| Selected Per–Share Data | |
| Net asset value, beginning of period | $10.00 |
| Income from Investment Operations | |
| Net investment income (loss)B | (.02) |
| Net realized and unrealized gain (loss) | .87 |
| Total from investment operations | .85 |
| Net asset value, end of period | $10.85 |
| Total ReturnC,D,E | 8.50% |
| Ratios to Average Net AssetsF,G | |
| Expenses before reductions | 5.05%H |
| Expenses net of fee waivers, if any | 1.50%H |
| Expenses net of all reductions | 1.50%H |
| Net investment income (loss) | (.99)%H |
| Supplemental Data | |
| Net assets, end of period (000 omitted) | $205 |
| Portfolio turnover rateI | 4%J |
A For the period February 14, 2019 (commencement of operations) to April 30, 2019.
B Calculated based on average shares outstanding during the period.
C Total returns for periods of less than one year are not annualized.
D Total returns would have been lower if certain expenses had not been reduced during the applicable periods shown.
E Total returns do not include the effect of the sales charges.
F Fees and expenses of any underlying Fidelity Central Funds are not included in the Fund's expense ratio. The Fund indirectly bears its proportionate share of the expenses of any underlying Fidelity Central Funds.
G Expense ratios reflect operating expenses of the class. Expenses before reductions do not reflect amounts reimbursed by the investment adviser or reductions from expense offset arrangements and do not represent the amount paid by the class during periods when reimbursements or reductions occur. Expense ratios before reductions for start-up periods may not be representative of longer-term operating periods. Expenses net of fee waivers reflect expenses after reimbursement by the investment adviser but prior to reductions from expense offset arrangements. Expenses net of all reductions represent the net expenses paid by the class.
H Annualized
I Amount does not include the portfolio activity of any underlying Fidelity Central Funds.
J Amount not annualized.
See accompanying notes which are an integral part of the financial statements.
Fidelity Founders Fund Class C
| Year ended April 30, | 2019 A |
| Selected Per–Share Data | |
| Net asset value, beginning of period | $10.00 |
| Income from Investment Operations | |
| Net investment income (loss)B | (.03) |
| Net realized and unrealized gain (loss) | .87 |
| Total from investment operations | .84 |
| Net asset value, end of period | $10.84 |
| Total ReturnC,D,E | 8.40% |
| Ratios to Average Net AssetsF,G | |
| Expenses before reductions | 5.67%H |
| Expenses net of fee waivers, if any | 2.00%H |
| Expenses net of all reductions | 2.00%H |
| Net investment income (loss) | (1.49)%H |
| Supplemental Data | |
| Net assets, end of period (000 omitted) | $173 |
| Portfolio turnover rateI | 4%J |
A For the period February 14, 2019 (commencement of operations) to April 30, 2019.
B Calculated based on average shares outstanding during the period.
C Total returns for periods of less than one year are not annualized.
D Total returns would have been lower if certain expenses had not been reduced during the applicable periods shown.
E Total returns do not include the effect of the contingent deferred sales charge.
F Fees and expenses of any underlying Fidelity Central Funds are not included in the Fund's expense ratio. The Fund indirectly bears its proportionate share of the expenses of any underlying Fidelity Central Funds.
G Expense ratios reflect operating expenses of the class. Expenses before reductions do not reflect amounts reimbursed by the investment adviser or reductions from expense offset arrangements and do not represent the amount paid by the class during periods when reimbursements or reductions occur. Expense ratios before reductions for start-up periods may not be representative of longer-term operating periods. Expenses net of fee waivers reflect expenses after reimbursement by the investment adviser but prior to reductions from expense offset arrangements. Expenses net of all reductions represent the net expenses paid by the class.
H Annualized
I Amount does not include the portfolio activity of any underlying Fidelity Central Funds.
J Amount not annualized.
See accompanying notes which are an integral part of the financial statements.
Fidelity Founders Fund
| Year ended April 30, | 2019 A |
| Selected Per–Share Data | |
| Net asset value, beginning of period | $10.00 |
| Income from Investment Operations | |
| Net investment income (loss)B | (.01) |
| Net realized and unrealized gain (loss) | .87 |
| Total from investment operations | .86 |
| Net asset value, end of period | $10.86 |
| Total ReturnC,D | 8.60% |
| Ratios to Average Net AssetsE,F | |
| Expenses before reductions | 3.49%G |
| Expenses net of fee waivers, if any | 1.00%G |
| Expenses net of all reductions | 1.00%G |
| Net investment income (loss) | (.48)%G |
| Supplemental Data | |
| Net assets, end of period (000 omitted) | $10,595 |
| Portfolio turnover rateH | 4%I |
A For the period February 14, 2019 (commencement of operations) to April 30, 2019.
B Calculated based on average shares outstanding during the period.
C Total returns for periods of less than one year are not annualized.
D Total returns would have been lower if certain expenses had not been reduced during the applicable periods shown.
E Fees and expenses of any underlying Fidelity Central Funds are not included in the Fund's expense ratio. The Fund indirectly bears its proportionate share of the expenses of any underlying Fidelity Central Funds.
F Expense ratios reflect operating expenses of the class. Expenses before reductions do not reflect amounts reimbursed by the investment adviser or reductions from expense offset arrangements and do not represent the amount paid by the class during periods when reimbursements or reductions occur. Expense ratios before reductions for start-up periods may not be representative of longer-term operating periods. Expenses net of fee waivers reflect expenses after reimbursement by the investment adviser but prior to reductions from expense offset arrangements. Expenses net of all reductions represent the net expenses paid by the class.
G Annualized
H Amount does not include the portfolio activity of any underlying Fidelity Central Funds.
I Amount not annualized.
See accompanying notes which are an integral part of the financial statements.
Fidelity Founders Fund Class I
| Year ended April 30, | 2019 A |
| Selected Per–Share Data | |
| Net asset value, beginning of period | $10.00 |
| Income from Investment Operations | |
| Net investment income (loss)B | (.01) |
| Net realized and unrealized gain (loss) | .87 |
| Total from investment operations | .86 |
| Net asset value, end of period | $10.86 |
| Total ReturnC,D | 8.60% |
| Ratios to Average Net AssetsE,F | |
| Expenses before reductions | 4.10%G |
| Expenses net of fee waivers, if any | 1.00%G |
| Expenses net of all reductions | 1.00%G |
| Net investment income (loss) | (.48)%G |
| Supplemental Data | |
| Net assets, end of period (000 omitted) | $831 |
| Portfolio turnover rateH | 4%I |
A For the period February 14, 2019 (commencement of operations) to April 30, 2019.
B Calculated based on average shares outstanding during the period.
C Total returns for periods of less than one year are not annualized.
D Total returns would have been lower if certain expenses had not been reduced during the applicable periods shown.
E Fees and expenses of any underlying Fidelity Central Funds are not included in the Fund's expense ratio. The Fund indirectly bears its proportionate share of the expenses of any underlying Fidelity Central Funds.
F Expense ratios reflect operating expenses of the class. Expenses before reductions do not reflect amounts reimbursed by the investment adviser or reductions from expense offset arrangements and do not represent the amount paid by the class during periods when reimbursements or reductions occur. Expense ratios before reductions for start-up periods may not be representative of longer-term operating periods. Expenses net of fee waivers reflect expenses after reimbursement by the investment adviser but prior to reductions from expense offset arrangements. Expenses net of all reductions represent the net expenses paid by the class.
G Annualized
H Amount does not include the portfolio activity of any underlying Fidelity Central Funds.
I Amount not annualized.
See accompanying notes which are an integral part of the financial statements.
Fidelity Founders Fund Class Z
| Year ended April 30, | 2019 A |
| Selected Per–Share Data | |
| Net asset value, beginning of period | $10.00 |
| Income from Investment Operations | |
| Net investment income (loss)B | (.01) |
| Net realized and unrealized gain (loss) | .87 |
| Total from investment operations | .86 |
| Net asset value, end of period | $10.86 |
| Total ReturnC,D | 8.60% |
| Ratios to Average Net AssetsE,F | |
| Expenses before reductions | 3.18%G |
| Expenses net of fee waivers, if any | .85%G |
| Expenses net of all reductions | .85%G |
| Net investment income (loss) | (.34)%G |
| Supplemental Data | |
| Net assets, end of period (000 omitted) | $5,745 |
| Portfolio turnover rateH | 4%I |
A For the period February 14, 2019 (commencement of operations) to April 30, 2019.
B Calculated based on average shares outstanding during the period.
C Total returns for periods of less than one year are not annualized.
D Total returns would have been lower if certain expenses had not been reduced during the applicable periods shown.
E Fees and expenses of any underlying Fidelity Central Funds are not included in the Fund's expense ratio. The Fund indirectly bears its proportionate share of the expenses of any underlying Fidelity Central Funds.
F Expense ratios reflect operating expenses of the class. Expenses before reductions do not reflect amounts reimbursed by the investment adviser or reductions from expense offset arrangements and do not represent the amount paid by the class during periods when reimbursements or reductions occur. Expense ratios before reductions for start-up periods may not be representative of longer-term operating periods. Expenses net of fee waivers reflect expenses after reimbursement by the investment adviser but prior to reductions from expense offset arrangements. Expenses net of all reductions represent the net expenses paid by the class.
G Annualized
H Amount does not include the portfolio activity of any underlying Fidelity Central Funds.
I Amount not annualized.
See accompanying notes which are an integral part of the financial statements.
Notes to Financial Statements
For the period ended April 30, 2019
1. Organization.
Fidelity Founders Fund (the Fund) is a fund of Fidelity Concord Street Trust (the Trust) and is authorized to issue an unlimited number of shares. The Trust is registered under the Investment Company Act of 1940, as amended (the 1940 Act), as an open-end management investment company organized as a Massachusetts business trust. The Fund offers Class A, Class M, Class C, Fidelity Founders Fund, Class I and Class Z shares, each of which has equal rights as to assets and voting privileges. Each class has exclusive voting rights with respect to matters that affect that class. Effective March 1, 2019, Class C shares will automatically convert to Class A shares after a holding period of ten years from the initial date of purchase, with certain exceptions.
2. Investments in Fidelity Central Funds.
The Fund invests in Fidelity Central Funds, which are open-end investment companies generally available only to other investment companies and accounts managed by the investment adviser and its affiliates. The Fund's Schedule of Investments lists each of the Fidelity Central Funds held as of period end, if any, as an investment of the Fund, but does not include the underlying holdings of each Fidelity Central Fund. As an Investing Fund, the Fund indirectly bears its proportionate share of the expenses of the underlying Fidelity Central Funds.
The Money Market Central Funds seek preservation of capital and current income and are managed by Fidelity Investments Money Management, Inc. (FIMM), an affiliate of the investment adviser. Annualized expenses of the Money Market Central Funds as of their most recent shareholder report date are less than .005%.
A complete unaudited list of holdings for each Fidelity Central Fund is available upon request or at the Securities and Exchange Commission (the SEC) website at www.sec.gov. In addition, the financial statements of the Fidelity Central Funds, which are not covered by the Fund's Report of Independent Registered Public Accounting Firm, are available on the SEC website or upon request.
3. Significant Accounting Policies.
The Fund is an investment company and applies the accounting and reporting guidance of the Financial Accounting Standards Board (FASB) Accounting Standards Codification Topic 946 Financial Services – Investments Companies. The financial statements have been prepared in conformity with accounting principles generally accepted in the United States of America (GAAP), which require management to make certain estimates and assumptions at the date of the financial statements. Actual results could differ from those estimates. Subsequent events, if any, through the date that the financial statements were issued have been evaluated in the preparation of the financial statements. The following summarizes the significant accounting policies of the Fund:
Investment Valuation. Investments are valued as of 4:00 p.m. Eastern time on the last calendar day of the period. The Board of Trustees (the Board) has delegated the day to day responsibility for the valuation of the Fund's investments to the Fair Value Committee (the Committee) established by the Fund's investment adviser. In accordance with valuation policies and procedures approved by the Board, the Fund attempts to obtain prices from one or more third party pricing vendors or brokers to value its investments. When current market prices, quotations or currency exchange rates are not readily available or reliable, investments will be fair valued in good faith by the Committee, in accordance with procedures adopted by the Board. Factors used in determining fair value vary by investment type and may include market or investment specific events. The frequency with which these procedures are used cannot be predicted and they may be utilized to a significant extent. The Committee oversees the Fund's valuation policies and procedures and reports to the Board on the Committee's activities and fair value determinations. The Board monitors the appropriateness of the procedures used in valuing the Fund's investments and ratifies the fair value determinations of the Committee.
The Fund categorizes the inputs to valuation techniques used to value its investments into a disclosure hierarchy consisting of three levels as shown below:
- Level 1 – quoted prices in active markets for identical investments
- Level 2 – other significant observable inputs (including quoted prices for similar investments, interest rates, prepayment speeds, etc.)
- Level 3 – unobservable inputs (including the Fund's own assumptions based on the best information available)
Valuation techniques used to value the Fund's investments by major category are as follows:
Equity securities, including restricted securities, for which market quotations are readily available, are valued at the last reported sale price or official closing price as reported by a third party pricing vendor on the primary market or exchange on which they are traded and are categorized as Level 1 in the hierarchy. In the event there were no sales during the day or closing prices are not available, securities are valued at the last quoted bid price or may be valued using the last available price and are generally categorized as Level 2 in the hierarchy. For foreign equity securities, when market or security specific events arise, comparisons to the valuation of American Depositary Receipts (ADRs), futures contracts, Exchange-Traded Funds (ETFs) and certain indexes as well as quoted prices for similar securities may be used and would be categorized as Level 2 in the hierarchy. For equity securities, including restricted securities, where observable inputs are limited, assumptions about market activity and risk are used and these securities may be categorized as Level 3 in the hierarchy.
Investments in open-end mutual funds, including the Fidelity Central Funds, are valued at their closing net asset value (NAV) each business day and are categorized as Level 1 in the hierarchy.
Changes in valuation techniques may result in transfers in or out of an assigned level within the disclosure hierarchy. The aggregate value of investments by input level as of April 30, 2019 is included at the end of the Fund's Schedule of Investments.
Foreign Currency. The Fund may use foreign currency contracts to facilitate transactions in foreign-denominated securities. Gains and losses from these transactions may arise from changes in the value of the foreign currency or if the counterparties do not perform under the contracts' terms.
Foreign-denominated assets, including investment securities, and liabilities are translated into U.S. dollars at the exchange rates at period end. Purchases and sales of investment securities, income and dividends received and expenses denominated in foreign currencies are translated into U.S. dollars at the exchange rate in effect on the transaction date.
The effects of exchange rate fluctuations on investments are included with the net realized and unrealized gain (loss) on investment securities. Other foreign currency transactions resulting in realized and unrealized gain (loss) are disclosed separately.
Investment Transactions and Income. For financial reporting purposes, the Fund's investment holdings and NAV include trades executed through the end of the last business day of the period. The NAV per share for processing shareholder transactions is calculated as of the close of business of the New York Stock Exchange (NYSE), normally 4:00 p.m. Eastern time and includes trades executed through the end of the prior business day. Gains and losses on securities sold are determined on the basis of identified cost. Dividend income is recorded on the ex-dividend date, except for certain dividends from foreign securities where the ex-dividend date may have passed, which are recorded as soon as the Fund is informed of the ex-dividend date. Non-cash dividends included in dividend income, if any, are recorded at the fair market value of the securities received. Income and capital gain distributions from Fidelity Central Funds, if any, are recorded on the ex-dividend date. Certain distributions received by the Fund represent a return of capital or capital gain. The Fund determines the components of these distributions subsequent to the ex-dividend date, based upon receipt of tax filings or other correspondence relating to the underlying investment. These distributions are recorded as a reduction of cost of investments and/or as a realized gain. Investment income is recorded net of foreign taxes withheld where recovery of such taxes is uncertain.
Class Allocations and Expenses. Investment income, realized and unrealized capital gains and losses, common expenses of the Fund, and certain fund-level expense reductions, if any, are allocated daily on a pro-rata basis to each class based on the relative net assets of each class to the total net assets of the Fund. Each class differs with respect to transfer agent and distribution and service plan fees incurred. Certain expense reductions may also differ by class. For the reporting period, the allocated portion of income and expenses to each class as a percent of its average net assets may vary due to the timing of recording these transactions in relation to fluctuating net assets of the classes. Expenses directly attributable to a fund are charged to that fund. Expenses attributable to more than one fund are allocated among the respective funds on the basis of relative net assets or other appropriate methods. Expense estimates are accrued in the period to which they relate and adjustments are made when actual amounts are known.
Income Tax Information and Distributions to Shareholders. Each year, the Fund intends to qualify as a regulated investment company under Subchapter M of the Internal Revenue Code, including distributing substantially all of its taxable income and realized gains. As a result, no provision for U.S. Federal income taxes is required. As of April 30, 2019, the Fund did not have any unrecognized tax benefits in the financial statements; nor is the Fund aware of any tax positions for which it is reasonably possible that the total amounts of unrecognized tax benefits will significantly change in the next twelve months. The Fund files a U.S. federal tax return, in addition to state and local tax returns as required. The Fund's federal income tax returns are subject to examination by the Internal Revenue Service (IRS) for a period of three fiscal years after they are filed. State and local tax returns may be subject to examination for an additional fiscal year depending on the jurisdiction. Foreign taxes are provided for based on the Fund's understanding of the tax rules and rates that exist in the foreign markets in which it invests.
Distributions are declared and recorded on the ex-dividend date. Income and capital gain distributions are declared separately for each class. Income and capital gain distributions are determined in accordance with income tax regulations, which may differ from GAAP.
Capital accounts within the financial statements are adjusted for permanent book-tax differences. These adjustments have no impact on net assets or the results of operations. Capital accounts are not adjusted for temporary book-tax differences which will reverse in a subsequent period.
Book-tax differences are primarily due to foreign currency transactions, net operating losses, capital loss carryforwards and losses deferred due to wash sales.
As of period end, the cost and unrealized appreciation (depreciation) in securities, and derivatives if applicable, for federal income tax purposes were as follows:
| Gross unrealized appreciation | $1,158,021 |
| Gross unrealized depreciation | (234,339) |
| Net unrealized appreciation (depreciation) | $923,682 |
| Tax Cost | $16,984,767 |
The tax-based components of distributable earnings as of period end were as follows:
| Capital loss carryforward | $(20,292) |
| Net unrealized appreciation (depreciation) on securities and other investments | $923,683 |
Capital loss carryforwards are only available to offset future capital gains of the Fund to the extent provided by regulations and may be limited. Under the Regulated Investment Company Modernization Act of 2010 (the Act), the Fund is permitted to carry forward capital losses incurred in taxable years beginning after December 22, 2010 for an unlimited period and such capital losses are required to be used prior to any losses that expire. The capital loss carryforward information presented below, including any applicable limitation, is estimated as of fiscal period end and is subject to adjustment.
| No expiration | |
| Short-term | $(20,292) |
| Total no expiration | $(20,292) |
Restricted Securities. The Fund may invest in securities that are subject to legal or contractual restrictions on resale. These securities generally may be resold in transactions exempt from registration or to the public if the securities are registered. Disposal of these securities may involve time-consuming negotiations and expense, and prompt sale at an acceptable price may be difficult. Information regarding restricted securities is included at the end of the Fund's Schedule of Investments.
4. Purchases and Sales of Investments.
Purchases and sales of securities, other than short-term securities, aggregated $17,079,886 and $445,073, respectively.
5. Fees and Other Transactions with Affiliates.
Management Fee. Fidelity Management & Research Company (the investment adviser) and its affiliates provide the Fund with investment management related services for which the Fund pays a monthly management fee. The management fee is the sum of an individual fund fee rate that is based on an annual rate of .30% of the Fund's average net assets and an annualized group fee rate that averaged .24% during the period. The group fee rate is based upon the average net assets of all the mutual funds advised by the investment adviser, including any mutual funds previously advised by the investment adviser that are currently advised by Fidelity SelectCo, LLC, an affiliate of the investment adviser. The group fee rate decreases as assets under management increase and increases as assets under management decrease. In addition, the management fee is subject to a performance adjustment (up to a maximum of +/- .10% of the Fund's average net assets over a 36 month performance period). The upward or downward adjustment to the management fee is based on the relative investment performance of Fidelity Founders Fund as compared to its benchmark index, the Russell 3000 Index, over the same 36 month performance period. The Fund's performance adjustment will not take effect until February 1, 2020. Subsequent months will be added until the performance period includes 36 months. For the reporting period, the total annualized management fee rate was .53% of the Fund's average net assets.
Distribution and Service Plan Fees. In accordance with Rule 12b-1 of the 1940 Act, the Fund has adopted separate Distribution and Service Plans for each class of shares. Certain classes pay Fidelity Distributors Corporation (FDC), an affiliate of the investment adviser, separate Distribution and Service Fees, each of which is based on an annual percentage of each class' average net assets. In addition, FDC may pay financial intermediaries for selling shares of the Fund and providing shareholder support services. For the period, the Distribution and Service Fee rates, total fees and amounts retained by FDC were as follows:
| Distribution Fee | Service Fee | Total Fees | Retained by FDC | |
| Class A | -% | .25% | $95 | $94 |
| Class M | .25% | .25% | 190 | 175 |
| Class C | .75% | .25% | 349 | 349 |
| $634 | $618 |
Sales Load. FDC may receive a front-end sales charge of up to 5.75% for selling Class A shares and 3.50% for selling Class M shares, some of which is paid to financial intermediaries for selling shares of the Fund. Depending on the holding period, FDC may receive contingent deferred sales charges levied on Class A, Class M and Class C redemptions. The deferred sales charges are 1.00% for Class C shares, 1.00% for certain purchases of Class A shares and .25% for certain purchases of Class M shares.
For the period, there were no sales charge amounts retained by FDC.
Transfer Agent Fees. Fidelity Investments Institutional Operations Company, Inc., (FIIOC), an affiliate of the investment adviser, is the transfer, dividend disbursing and shareholder servicing agent for each class of the Fund. FIIOC receives account fees and asset-based fees that vary according to the account size and type of account of the shareholders of the respective classes of the Fund, except for Class Z. FIIOC receives an asset-based fee of Class Z's average net assets. FIIOC pays for typesetting, printing and mailing of shareholder reports, except proxy statements.
For the period, transfer agent fees for each class were as follows:
| Amount | % of Class-Level Average Net Assets(a) | |
| Class A | $45 | .12 |
| Class M | 43 | .11 |
| Class C | 38 | .11 |
| Fidelity Founders Fund | 3,084 | .25 |
| Class I | 112 | .17 |
| Class Z | 383 | .05 |
| $3,705 |
(a) Annualized
Accounting Fees. Fidelity Service Company, Inc. (FSC), an affiliate of the investment adviser, maintains the Fund's accounting records. The fee is based on the level of average net assets for each month. For the period, the fees were equivalent to an annualized rate of .04%.
Brokerage Commissions. The Fund placed a portion of its portfolio transactions with brokerage firms which are affiliates of the investment adviser. Brokerage commissions are included in net realized gain (loss) and change in net unrealized appreciation (depreciation) in the Statement of Operations. The commissions paid to these affiliated firms were $92 for the period.
Interfund Trades. The Fund may purchase from or sell securities to other Fidelity Funds under procedures adopted by the Board. The procedures have been designed to ensure these interfund trades are executed in accordance with Rule 17a-7 of the 1940 Act. Interfund trades are included within the respective purchases and sales amounts shown in the Purchases and Sales of Investments note.
6. Committed Line of Credit.
The Fund participates with other funds managed by the investment adviser or an affiliate in a $4.25 billion credit facility (the "line of credit") to be utilized for temporary or emergency purposes to fund shareholder redemptions or for other short-term liquidity purposes. The Fund has agreed to pay commitment fees on its pro-rata portion of the line of credit, which amounted to $2 and is reflected in Miscellaneous expenses on the Statement of Operations. During the period, the Fund did not borrow on this line of credit.
7. Expense Reductions.
The investment adviser contractually agreed to reimburse each class to the extent annual operating expenses exceeded certain levels of class-level average net assets as noted in the table below. This reimbursement will remain in place through August 31, 2020. Some expenses, for example the compensation of the independent Trustees are excluded from this reimbursement.
The following classes were in reimbursement during the period:
| Expense Limitations | Reimbursement | |
| Class A | 1.25% | $1,350 |
| Class M | 1.50% | 1,347 |
| Class C | 2.00% | 1,285 |
| Fidelity Founders Fund | 1.00% | 30,335 |
| Class I | 1.00% | 2,064 |
| Class Z | .85% | 19,627 |
| $56,008 |
8. Share Transactions.
Share transactions for each class were as follows and may contain automatic conversions between classes or exchanges between affiliated funds:
| Shares | Dollars | |
| Year ended April 30, 2019(a) | Year ended April 30, 2019(a) | |
| Class A | ||
| Shares sold | 20,239 | $204,750 |
| Net increase (decrease) | 20,239 | $204,750 |
| Class M | ||
| Shares sold | 18,882 | $190,000 |
| Net increase (decrease) | 18,882 | $190,000 |
| Class C | ||
| Shares sold | 16,000 | $160,000 |
| Net increase (decrease) | 16,000 | $160,000 |
| Fidelity Founders Fund | ||
| Shares sold | 988,331 | $10,221,260 |
| Shares redeemed | (12,503) | (133,257) |
| Net increase (decrease) | 975,828 | $10,088,003 |
| Class I | ||
| Shares sold | 76,622 | $800,402 |
| Shares redeemed | (117) | (1,269) |
| Net increase (decrease) | 76,505 | $799,133 |
| Class Z | ||
| Shares sold | 534,265 | $5,490,165 |
| Shares redeemed | (5,319) | (55,499) |
| Net increase (decrease) | 528,946 | $5,434,666 |
(a) For the period February 14, 2019 (commencement of operations) to April 30, 2019.
9. Other.
The Fund's organizational documents provide former and current trustees and officers with a limited indemnification against liabilities arising in connection with the performance of their duties to the Fund. In the normal course of business, the Fund may also enter into contracts that provide general indemnifications. The Fund's maximum exposure under these arrangements is unknown as this would be dependent on future claims that may be made against the Fund. The risk of material loss from such claims is considered remote.
Report of Independent Registered Public Accounting Firm
To the Board of Trustees of Fidelity Concord Street Trust and Shareholders of Fidelity Founders Fund:
Opinion on the Financial Statements
We have audited the accompanying statement of assets and liabilities, including the schedule of investments, of Fidelity Founders Fund (one of the funds constituting Fidelity Concord Street Trust, referred to hereafter as the "Fund") as of April 30, 2019, and the related statements of operations and changes in net assets, including the related notes, and the financial highlights for the period February 14, 2019 (commencement of operations) through April 30, 2019 (collectively referred to as the “financial statements”). In our opinion, the financial statements present fairly, in all material respects, the financial position of the Fund as of April 30, 2019, and the results of its operations, changes in its net assets, and the financial highlights for the period February 14, 2019 (commencement of operations) through April 30, 2019 in conformity with accounting principles generally accepted in the United States of America.
Basis for Opinion
These financial statements are the responsibility of the Fund’s management. Our responsibility is to express an opinion on the Fund’s financial statements based on our audit. We are a public accounting firm registered with the Public Company Accounting Oversight Board (United States) (PCAOB) and are required to be independent with respect to the Fund in accordance with the U.S. federal securities laws and the applicable rules and regulations of the Securities and Exchange Commission and the PCAOB.
We conducted our audit of these financial statements in accordance with the standards of the PCAOB. Those standards require that we plan and perform the audit to obtain reasonable assurance about whether the financial statements are free of material misstatement, whether due to error or fraud.
Our audit included performing procedures to assess the risks of material misstatement of the financial statements, whether due to error or fraud, and performing procedures that respond to those risks. Such procedures included examining, on a test basis, evidence regarding the amounts and disclosures in the financial statements. Our audit also included evaluating the accounting principles used and significant estimates made by management, as well as evaluating the overall presentation of the financial statements. Our procedures included confirmation of securities owned as of April 30, 2019 by correspondence with the custodian, and brokers; when replies were not received from brokers, we performed other auditing procedures. We believe that our audit provides a reasonable basis for our opinion.
PricewaterhouseCoopers LLP
Boston, Massachusetts
June 17, 2019
We have served as the auditor of one or more investment companies in the Fidelity group of funds since 1932.
Trustees and Officers
The Trustees, Members of the Advisory Board (if any), and officers of the trust and fund, as applicable, are listed below. The Board of Trustees governs the fund and is responsible for protecting the interests of shareholders. The Trustees are experienced executives who meet periodically throughout the year to oversee the fund's activities, review contractual arrangements with companies that provide services to the fund, oversee management of the risks associated with such activities and contractual arrangements, and review the fund's performance. Except for Jonathan Chiel, each of the Trustees oversees 289 funds. Mr. Chiel oversees 158 funds.
The Trustees hold office without limit in time except that (a) any Trustee may resign; (b) any Trustee may be removed by written instrument, signed by at least two-thirds of the number of Trustees prior to such removal; (c) any Trustee who requests to be retired or who has become incapacitated by illness or injury may be retired by written instrument signed by a majority of the other Trustees; and (d) any Trustee may be removed at any special meeting of shareholders by a two-thirds vote of the outstanding voting securities of the trust. Each Trustee who is not an interested person (as defined in the 1940 Act) of the trust and the fund is referred to herein as an Independent Trustee. Each Independent Trustee shall retire not later than the last day of the calendar year in which his or her 75th birthday occurs. The Independent Trustees may waive this mandatory retirement age policy with respect to individual Trustees. Officers and Advisory Board Members hold office without limit in time, except that any officer or Advisory Board Member may resign or may be removed by a vote of a majority of the Trustees at any regular meeting or any special meeting of the Trustees. Except as indicated, each individual has held the office shown or other offices in the same company for the past five years.
The fund's Statement of Additional Information (SAI) includes more information about the Trustees. To request a free copy, call Fidelity at 1-800-544-8544 if you’re an individual investing directly with Fidelity, call 1-800-835-5092 if you’re a plan sponsor or participant with Fidelity as your recordkeeper or call 1-877-208-0098 on institutional accounts or if you’re an advisor or invest through one.
Experience, Skills, Attributes, and Qualifications of the Trustees. The Governance and Nominating Committee has adopted a statement of policy that describes the experience, qualifications, attributes, and skills that are necessary and desirable for potential Independent Trustee candidates (Statement of Policy). The Board believes that each Trustee satisfied at the time he or she was initially elected or appointed a Trustee, and continues to satisfy, the standards contemplated by the Statement of Policy. The Governance and Nominating Committee also engages professional search firms to help identify potential Independent Trustee candidates who have the experience, qualifications, attributes, and skills consistent with the Statement of Policy. From time to time, additional criteria based on the composition and skills of the current Independent Trustees, as well as experience or skills that may be appropriate in light of future changes to board composition, business conditions, and regulatory or other developments, have also been considered by the professional search firms and the Governance and Nominating Committee. In addition, the Board takes into account the Trustees' commitment and participation in Board and committee meetings, as well as their leadership of standing and ad hoc committees throughout their tenure.
In determining that a particular Trustee was and continues to be qualified to serve as a Trustee, the Board has considered a variety of criteria, none of which, in isolation, was controlling. The Board believes that, collectively, the Trustees have balanced and diverse experience, qualifications, attributes, and skills, which allow the Board to operate effectively in governing the fund and protecting the interests of shareholders. Information about the specific experience, skills, attributes, and qualifications of each Trustee, which in each case led to the Board's conclusion that the Trustee should serve (or continue to serve) as a trustee of the fund, is provided below.
Board Structure and Oversight Function. James C. Curvey is an interested person and currently serves as Chairman. The Trustees have determined that an interested Chairman is appropriate and benefits shareholders because an interested Chairman has a personal and professional stake in the quality and continuity of services provided to the fund. Independent Trustees exercise their informed business judgment to appoint an individual of their choosing to serve as Chairman, regardless of whether the Trustee happens to be independent or a member of management. The Independent Trustees have determined that they can act independently and effectively without having an Independent Trustee serve as Chairman and that a key structural component for assuring that they are in a position to do so is for the Independent Trustees to constitute a substantial majority for the Board. The Independent Trustees also regularly meet in executive session. Ned C. Lautenbach serves as Chairman of the Independent Trustees and as such (i) acts as a liaison between the Independent Trustees and management with respect to matters important to the Independent Trustees and (ii) with management prepares agendas for Board meetings.
Fidelity® funds are overseen by different Boards of Trustees. The fund's Board oversees Fidelity's high income and certain equity funds, and other Boards oversee Fidelity's investment-grade bond, money market, asset allocation, and other equity funds. The asset allocation funds may invest in Fidelity® funds overseen by the fund's Board. The use of separate Boards, each with its own committee structure, allows the Trustees of each group of Fidelity® funds to focus on the unique issues of the funds they oversee, including common research, investment, and operational issues. On occasion, the separate Boards establish joint committees to address issues of overlapping consequences for the Fidelity® funds overseen by each Board.
The Trustees operate using a system of committees to facilitate the timely and efficient consideration of all matters of importance to the Trustees, the fund, and fund shareholders and to facilitate compliance with legal and regulatory requirements and oversight of the fund's activities and associated risks. The Board, acting through its committees, has charged FMR and its affiliates with (i) identifying events or circumstances the occurrence of which could have demonstrably adverse effects on the fund's business and/or reputation; (ii) implementing processes and controls to lessen the possibility that such events or circumstances occur or to mitigate the effects of such events or circumstances if they do occur; and (iii) creating and maintaining a system designed to evaluate continuously business and market conditions in order to facilitate the identification and implementation processes described in (i) and (ii) above. Because the day-to-day operations and activities of the fund are carried out by or through FMR, its affiliates, and other service providers, the fund's exposure to risks is mitigated but not eliminated by the processes overseen by the Trustees. While each of the Board's committees has responsibility for overseeing different aspects of the fund's activities, oversight is exercised primarily through the Operations, Audit, and Compliance Committees. In addition, the Independent Trustees have worked with Fidelity to enhance the Board's oversight of investment and financial risks, legal and regulatory risks, technology risks, and operational risks, including the development of additional risk reporting to the Board. Appropriate personnel, including but not limited to the fund's Chief Compliance Officer (CCO), FMR's internal auditor, the independent accountants, the fund's Treasurer and portfolio management personnel, make periodic reports to the Board's committees, as appropriate, including an annual review of Fidelity's risk management program for the Fidelity® funds. The responsibilities of each standing committee, including their oversight responsibilities, are described further under "Standing Committees of the Trustees."
Interested Trustees*:
Correspondence intended for a Trustee who is an interested person may be sent to Fidelity Investments, 245 Summer Street, Boston, Massachusetts 02210.
Name, Year of Birth; Principal Occupations and Other Relevant Experience+
Jonathan Chiel (1957)
Year of Election or Appointment: 2016
Trustee
Mr. Chiel also serves as Trustee of other Fidelity® funds. Mr. Chiel is Executive Vice President and General Counsel for FMR LLC (diversified financial services company, 2012-present). Previously, Mr. Chiel served as general counsel (2004-2012) and senior vice president and deputy general counsel (2000-2004) for John Hancock Financial Services; a partner with Choate, Hall & Stewart (1996-2000) (law firm); and an Assistant United States Attorney for the United States Attorney’s Office of the District of Massachusetts (1986-95), including Chief of the Criminal Division (1993-1995). Mr. Chiel is a director on the boards of the Boston Bar Foundation and the Maimonides School.
James C. Curvey (1935)
Year of Election or Appointment: 2007
Trustee
Chairman of the Board of Trustees
Mr. Curvey also serves as Trustee of other Fidelity® funds. Mr. Curvey is Vice Chairman (2007-present) and Director of FMR LLC (diversified financial services company). In addition, Mr. Curvey is an Overseer Emeritus for the Boston Symphony Orchestra, a Director of Artis-Naples, and a Trustee of Brewster Academy in Wolfeboro, New Hampshire. Previously, Mr. Curvey served as a Director of Fidelity Research & Analysis Co. (investment adviser firm, 2009-2018), Director of Fidelity Investments Money Management, Inc. (investment adviser firm, 2009-2014) and a Director of FMR and FMR Co., Inc. (investment adviser firms, 2007-2014).
* Determined to be an “Interested Trustee” by virtue of, among other things, his or her affiliation with the trust or various entities under common control with FMR.
+ The information includes the Trustee's principal occupation during the last five years and other information relating to the experience, attributes, and skills relevant to the Trustee's qualifications to serve as a Trustee, which led to the conclusion that the Trustee should serve as a Trustee for the fund.
Independent Trustees:
Correspondence intended for an Independent Trustee may be sent to Fidelity Investments, P.O. Box 55235, Boston, Massachusetts 02205-5235.
Name, Year of Birth; Principal Occupations and Other Relevant Experience+
Dennis J. Dirks (1948)
Year of Election or Appointment: 2005
Trustee
Mr. Dirks also serves as Trustee of other Fidelity® funds. Prior to his retirement in May 2003, Mr. Dirks was Chief Operating Officer and a member of the Board of The Depository Trust & Clearing Corporation (DTCC). He also served as President, Chief Operating Officer, and Board member of The Depository Trust Company (DTC) and President and Board member of the National Securities Clearing Corporation (NSCC). In addition, Mr. Dirks served as Chief Executive Officer and Board member of the Government Securities Clearing Corporation, Chief Executive Officer and Board member of the Mortgage-Backed Securities Clearing Corporation, as a Trustee and a member of the Finance Committee of Manhattan College (2005-2008), as a Trustee and a member of the Finance Committee of AHRC of Nassau County (2006-2008), as a member of the Independent Directors Council (IDC) Governing Council (2010-2015), and as a member of the Board of Directors for The Brookville Center for Children’s Services, Inc. (2009-2017). Mr. Dirks is a member of the Finance Committee (2016-present) and Board of Directors (2017-present) and is Treasurer (2018-present) of the Asolo Repertory Theatre.
Donald F. Donahue (1950)
Year of Election or Appointment: 2018
Trustee
Mr. Donahue also serves as a Trustee of other Fidelity® funds. Mr. Donahue is President and Chief Executive Officer of Miranda Partners, LLC (risk consulting for the financial services industry, 2012-present). Previously, Mr. Donahue served as a Member of the Advisory Board of certain Fidelity® funds (2015-2018) and Chief Executive Officer (2006-2012), Chief Operating Officer (2003-2006), and Managing Director, Customer Marketing and Development (1999-2003) of The Depository Trust & Clearing Corporation (financial markets infrastructure). Mr. Donahue serves as a Member (2007-present) and Co-Chairman (2016-present) of the Board of Directors of United Way of New York, Member of the Board of Directors of NYC Leadership Academy (2012-present) and Member of the Board of Advisors of Ripple Labs, Inc. (financial services, 2015-present). He also served as Chairman (2010-2012) and Member of the Board of Directors (2012-2013) of Omgeo, LLC (financial services), Treasurer of United Way of New York (2012-2016), and Member of the Board of Directors of XBRL US (financial services non-profit, 2009-2012) and the International Securities Services Association (2009-2012).
Alan J. Lacy (1953)
Year of Election or Appointment: 2008
Trustee
Mr. Lacy also serves as Trustee of other Fidelity® funds. Mr. Lacy serves as a Director of Bristol-Myers Squibb Company (global pharmaceuticals, 2008-present). He is a Trustee of the California Chapter of The Nature Conservancy (2015-present) and a Director of the Center for Advanced Study in the Behavioral Sciences at Stanford University (2015-present). In addition, Mr. Lacy served as Senior Adviser (2007-2014) of Oak Hill Capital Partners, L.P. (private equity) and also served as Chief Executive Officer (2005) and Vice Chairman (2005-2006) of Sears Holdings Corporation (retail) and Chief Executive Officer and Chairman of the Board of Sears, Roebuck and Co. (retail, 2000-2005). Previously, Mr. Lacy served as Chairman (2014-2017) and a member (2010-2017) of the Board of Directors of Dave & Buster’s Entertainment, Inc. (restaurant and entertainment complexes), as Chairman (2008-2011) and a member (2006-2015) of the Board of Trustees of the National Parks Conservation Association, and as a member of the Board of Directors for The Hillman Companies, Inc. (hardware wholesalers, 2010-2014), Earth Fare, Inc. (retail grocery, 2010-2014), and The Western Union Company (global money transfer, 2006-2011).
Ned C. Lautenbach (1944)
Year of Election or Appointment: 2000
Trustee
Chairman of the Independent Trustees
Mr. Lautenbach also serves as Trustee of other Fidelity® funds. Mr. Lautenbach currently serves as Chair (2018-present) and Member (2013-present) of the Board of Governors, State University System of Florida and is a member of the Council on Foreign Relations (1994-present). He is also a member and has most recently served as Chairman of the Board of Directors of Artis-Naples (2012-present). Previously, Mr. Lautenbach served as a member and then Lead Director of the Board of Directors of Eaton Corporation (diversified industrial, 1997-2016). He was also a Partner and Advisory Partner at Clayton, Dubilier & Rice, LLC (private equity investment, 1998-2010), as well as a Director of Sony Corporation (2006-2007). In addition, Mr. Lautenbach also had a 30-year career with IBM (technology company) during which time he served as Senior Vice President and a member of the Corporate Executive Committee (1968-1998).
Joseph Mauriello (1944)
Year of Election or Appointment: 2008
Trustee
Mr. Mauriello also serves as Trustee of other Fidelity® funds. Prior to his retirement in January 2006, Mr. Mauriello served in numerous senior management positions including Deputy Chairman and Chief Operating Officer (2004-2005), and Vice Chairman of Financial Services (2002-2004) of KPMG LLP US (professional services, 1965-2005). Mr. Mauriello currently serves as a member of the Independent Directors Council (IDC) Governing Council (2015-present). Previously, Mr. Mauriello served as a member of the Board of Directors of XL Group plc. (global insurance and re-insurance, 2006-2018).
Cornelia M. Small (1944)
Year of Election or Appointment: 2005
Trustee
Ms. Small also serves as Trustee of other Fidelity® funds. Ms. Small is a member of the Board of Directors (2009-present) and Chair of the Investment Committee (2010-present) of the Teagle Foundation. Ms. Small also serves on the Investment Committee of the Berkshire Taconic Community Foundation (2008-present). Previously, Ms. Small served as Chairperson (2002-2008) and a member of the Investment Committee and Chairperson (2008-2012) and a member of the Board of Trustees of Smith College. In addition, Ms. Small served as Chief Investment Officer, Director of Global Equity Investments, and a member of the Board of Directors of Scudder, Stevens & Clark and Scudder Kemper Investments.
Garnett A. Smith (1947)
Year of Election or Appointment: 2018
Trustee
Mr. Smith also serves as Trustee of other Fidelity® funds. Prior to Mr. Smith's retirement, he served as Chairman and Chief Executive Officer of Inbrand Corp. (manufacturer of personal absorbent products, 1990-1997). He also served as President (1986-1990) of Inbrand Corp. Prior to his employment with Inbrand Corp., he was employed by a retail fabric chain and North Carolina National Bank. In addition, Mr. Smith served as a Member of the Advisory Board of certain Fidelity® funds (2012-2013) and as a board member of the Jackson Hole Land Trust (2009-2012).
David M. Thomas (1949)
Year of Election or Appointment: 2008
Trustee
Mr. Thomas also serves as Trustee of other Fidelity® funds. Mr. Thomas serves as Non-Executive Chairman of the Board of Directors of Fortune Brands Home and Security (home and security products, 2011-present) and as a member of the Board of Directors (2004-present) and Presiding Director (2013-present) of Interpublic Group of Companies, Inc. (marketing communication). Previously, Mr. Thomas served as Executive Chairman (2005-2006) and Chairman and Chief Executive Officer (2000-2005) of IMS Health, Inc. (pharmaceutical and healthcare information solutions), a Director of Fortune Brands, Inc. (consumer products, 2000-2011), and a member of the Board of Trustees of the University of Florida (2013-2018).
+ The information includes the Trustee's principal occupation during the last five years and other information relating to the experience, attributes, and skills relevant to the Trustee's qualifications to serve as a Trustee, which led to the conclusion that the Trustee should serve as a Trustee for the fund.
Advisory Board Members and Officers:
Correspondence intended for a Member of the Advisory Board (if any) may be sent to Fidelity Investments, P.O. Box 55235, Boston, Massachusetts 02205-5235. Correspondence intended for an officer or Peter S. Lynch may be sent to Fidelity Investments, 245 Summer Street, Boston, Massachusetts 02210. Officers appear below in alphabetical order.
Name, Year of Birth; Principal Occupation
Vicki L. Fuller (1957)
Year of Election or Appointment: 2018
Member of the Advisory Board
Ms. Fuller also serves as Member of the Advisory Board of other Fidelity® funds. Ms. Fuller serves as a member of the Board of Directors, Audit Committee, and Nominating and Governance Committee of The Williams Companies, Inc. (natural gas infrastructure, 2018-present). Previously, Ms. Fuller served as the Chief Investment Officer of the New York State Common Retirement Fund (2012-2018) and held a variety of positions at AllianceBernstein L.P. (global asset management, 1985-2012), including Managing Director (2006-2012) and Senior Vice President and Senior Portfolio Manager (2001-2006).
Peter S. Lynch (1944)
Year of Election or Appointment: 2003
Member of the Advisory Board
Mr. Lynch also serves as Member of the Advisory Board of other Fidelity® funds. Mr. Lynch is Vice Chairman and a Director of FMR (investment adviser firm) and FMR Co., Inc. (investment adviser firm). In addition, Mr. Lynch serves as a Trustee of Boston College and as the Chairman of the Inner-City Scholarship Fund. Previously, Mr. Lynch served on the Special Olympics International Board of Directors (1997-2006).
Carol B. Tomé (1957)
Year of Election or Appointment: 2018
Member of the Advisory Board
Ms. Tomé also serves as Member of the Advisory Board of other Fidelity® funds. Ms. Tomé is Chief Financial Officer (2001-present) and Executive Vice President of Corporate Services (2007-present) of The Home Depot, Inc. (home improvement retailer) and a Director (2003-present) and Chair of the Audit Committee (2004-present) of United Parcel Service, Inc. (package delivery and supply chain management). Previously, Ms. Tomé served as Trustee of certain Fidelity® funds (2017), Senior Vice President of Finance and Accounting/Treasurer (2000-2007) and Vice President and Treasurer (1995-2000) of The Home Depot, Inc. and Chair of the Board (2010-2012), Vice Chair of the Board (2009 and 2013), and a Director (2008-2013) of the Federal Reserve Bank of Atlanta. Ms. Tomé is also a director or trustee of many community and professional organizations.
Michael E. Wiley (1950)
Year of Election or Appointment: 2018
Member of the Advisory Board
Mr. Wiley also serves as Trustee or Member of the Advisory Board of other Fidelity® funds. Mr. Wiley serves as a Director of High Point Resources (exploration and production, 2005-present). Previously, Mr. Wiley served as a Director of Andeavor Corporation (independent oil refiner and marketer, 2005-2018), a Director of Andeavor Logistics LP (natural resources logistics, 2015-2018), a Director of Post Oak Bank (privately-held bank, 2004-2018), a Director of Asia Pacific Exploration Consolidated (international oil and gas exploration and production, 2008-2013), a member of the Board of Trustees of the University of Tulsa (2000-2006; 2007-2010), a Senior Energy Advisor of Katzenbach Partners, LLC (consulting, 2006-2007), an Advisory Director of Riverstone Holdings (private investment), a Director of Spinnaker Exploration Company (exploration and production, 2001-2005) and Chairman, President, and CEO of Baker Hughes, Inc. (oilfield services, 2000-2004).
Elizabeth Paige Baumann (1968)
Year of Election or Appointment: 2017
Anti-Money Laundering (AML) Officer
Ms. Baumann also serves as AML Officer of other funds. She is Chief AML Officer (2012-present) and Senior Vice President (2014-present) of FMR LLC (diversified financial services company) and is an employee of Fidelity Investments. Previously, Ms. Baumann served as AML Officer of the funds (2012-2016), and Vice President (2007-2014) and Deputy Anti-Money Laundering Officer (2007-2012) of FMR LLC.
Craig S. Brown (1977)
Year of Election or Appointment: 2019
Assistant Treasurer
Mr. Brown also serves as Assistant Treasurer of other funds. Mr. Brown is an employee of Fidelity Investments (2013-present).
John J. Burke III (1964)
Year of Election or Appointment: 2018
Chief Financial Officer
Mr. Burke also serves as Chief Financial Officer of other funds. Mr. Burke serves as Head of Investment Operations for Fidelity Fund and Investment Operations (2018-present) and is an employee of Fidelity Investments (1998-present). Previously Mr. Burke served as head of Asset Management Investment Operations (2012-2018).
William C. Coffey (1969)
Year of Election or Appointment: 2018
Secretary and Chief Legal Officer (CLO)
Mr. Coffey also serves as Secretary and CLO of other funds. Mr. Coffey serves as CLO, Secretary, and Senior Vice President of Fidelity Management & Research Company and FMR Co., Inc. (investment adviser firms, 2018-present); Secretary of Fidelity SelectCo, LLC and Fidelity Investments Money Management, Inc. (investment adviser firms, 2018-present); and CLO of Fidelity Management & Research (Hong Kong) Limited, FMR Investment Management (UK) Limited, and Fidelity Management & Research (Japan) Limited (investment adviser firms, 2018-present). He is Senior Vice President and Deputy General Counsel of FMR LLC (diversified financial services company, 2010-present), and is an employee of Fidelity Investments. Previously, Mr. Coffey served as Assistant Secretary of certain funds (2009-2018) and as Vice President and Associate General Counsel of FMR LLC (2005-2009).
Timothy M. Cohen (1969)
Year of Election or Appointment: 2018
Vice President
Mr. Cohen also serves as Vice President of other funds. Mr. Cohen serves as Executive Vice President of Fidelity SelectCo, LLC (2019-present), Co-Head of Equity (2018-present), a Director of Fidelity Management & Research (Japan) Limited (investment adviser firm, 2016-present), and is an employee of Fidelity Investments. Previously, Mr. Cohen served as Head of Global Equity Research (2016-2018), Chief Investment Officer - Equity and a Director of Fidelity Management & Research (U.K.) Inc. (investment adviser firm, 2013-2015) and as a Director of Fidelity Management & Research (Hong Kong) Limited (investment adviser firm, 2017).
Jonathan Davis (1968)
Year of Election or Appointment: 2010
Assistant Treasurer
Mr. Davis also serves as Assistant Treasurer of other funds. Mr. Davis serves as Assistant Treasurer of FMR Capital, Inc. (2017-present) and is an employee of Fidelity Investments. Previously, Mr. Davis served as Vice President and Associate General Counsel of FMR LLC (diversified financial services company, 2003-2010).
Adrien E. Deberghes (1967)
Year of Election or Appointment: 2016
Assistant Treasurer
Mr. Deberghes also serves as an officer of other funds. He serves as Assistant Treasurer of FMR Capital, Inc. (2017-present), Executive Vice President of Fidelity Investments Money Management, Inc. (FIMM) (investment adviser firm, 2016-present), and is an employee of Fidelity Investments (2008-present). Previously, Mr. Deberghes served as President and Treasurer of certain Fidelity® funds (2013-2018). Prior to joining Fidelity Investments, Mr. Deberghes was Senior Vice President of Mutual Fund Administration at State Street Corporation (2007-2008), Senior Director of Mutual Fund Administration at Investors Bank & Trust (2005-2007), and Director of Finance for Dunkin' Brands (2000-2005). Previously, Mr. Deberghes served in other fund officer roles.
Laura M. Del Prato (1964)
Year of Election or Appointment: 2018
Assistant Treasurer
Ms. Del Prato also serves as an officer of other funds. Ms. Del Prato is an employee of Fidelity Investments (2017-present). Prior to joining Fidelity Investments, Ms. Del Prato served as a Managing Director and Treasurer of the JPMorgan Mutual Funds (2014-2017). Prior to JPMorgan, Ms. Del Prato served as a partner at Cohen Fund Audit Services (accounting firm, 2012-2013) and KPMG LLP (accounting firm, 2004-2012).
Colm A. Hogan (1973)
Year of Election or Appointment: 2016
Deputy Treasurer
Mr. Hogan also serves as an officer of other funds. Mr. Hogan serves as Assistant Treasurer of FMR Capital, Inc. (2017-present) and is an employee of Fidelity Investments (2005-present). Previously, Mr. Hogan served as Assistant Treasurer of certain Fidelity® funds (2016-2018).
Pamela R. Holding (1964)
Year of Election or Appointment: 2018
Vice President
Ms. Holding also serves as Vice President of other funds. Ms. Holding serves as Executive Vice President of Fidelity SelectCo, LLC (2019-present), Co-Head of Equity (2018-present) and is an employee of Fidelity Investments (2013-present). Previously, Ms. Holding served as Chief Investment Officer of Fidelity Institutional Asset Management (2013-2018).
Chris Maher (1972)
Year of Election or Appointment: 2013
Assistant Treasurer
Mr. Maher serves as Assistant Treasurer of other funds. Mr. Maher is Vice President of Valuation Oversight, serves as Assistant Treasurer of FMR Capital, Inc. (2017-present), and is an employee of Fidelity Investments. Previously, Mr. Maher served as Vice President of Asset Management Compliance (2013), Vice President of the Program Management Group of FMR (investment adviser firm, 2010-2013), and Vice President of Valuation Oversight (2008-2010).
Kenneth B. Robins (1969)
Year of Election or Appointment: 2016
Chief Compliance Officer
Mr. Robins also serves as an officer of other funds. Mr. Robins serves as Compliance Officer of Fidelity Management & Research Company and FMR Co., Inc. (investment adviser firms, 2016-present) and is an employee of Fidelity Investments (2004-present). Previously, Mr. Robins served as Executive Vice President of Fidelity Investments Money Management, Inc. (investment adviser firm, 2013-2016) and served in other fund officer roles.
Stacie M. Smith (1974)
Year of Election or Appointment: 2016
President and Treasurer
Ms. Smith also serves as an officer of other funds. Ms. Smith serves as Assistant Treasurer of FMR Capital, Inc. (2017-present), is an employee of Fidelity Investments (2009-present), and has served in other fund officer roles. Prior to joining Fidelity Investments, Ms. Smith served as Senior Audit Manager of Ernst & Young LLP (accounting firm, 1996-2009). Previously, Ms. Smith served as Assistant Treasurer (2013-2018) and Deputy Treasurer (2013-2016) of certain Fidelity® funds.
Marc L. Spector (1972)
Year of Election or Appointment: 2016
Assistant Treasurer
Mr. Spector also serves as an officer of other funds. Mr. Spector serves as Assistant Treasurer of FMR Capital, Inc. (2017-present) and is an employee of Fidelity Investments (2016-present). Prior to joining Fidelity Investments, Mr. Spector served as Director at the Siegfried Group (accounting firm, 2013-2016), and prior to Siegfried Group as audit senior manager at Deloitte & Touche (accounting firm, 2005-2013).
Jim Wegmann (1979)
Year of Election or Appointment: 2019
Assistant Treasurer
Mr. Wegmann also serves as Assistant Treasurer of other funds. Mr. Wegmann is an employee of Fidelity Investments (2011-present).
Shareholder Expense Example
As a shareholder of the Fund, you incur two types of costs: (1) transaction costs, including sales charges (loads) on purchase payments or redemption proceeds, and (2) ongoing costs, including management fees and other Fund expenses. This Example is intended to help you understand your ongoing costs (in dollars) of investing in the Fund and to compare these costs with the ongoing costs of investing in other mutual funds.
The actual expense Example is based on an investment of $1,000 invested at the beginning of the period and held for the entire period (February 14, 2019 to April 30, 2019). The hypothetical expense Example is based on an investment of $1,000 invested for the one-half year period (November 1, 2018 to April 30, 2019).
Actual Expenses
The first line of the accompanying table for each class of the Fund provides information about actual account values and actual expenses. You may use the information in this line, together with the amount you invested, to estimate the expenses that you paid over the period. Simply divide your account value by $1,000.00 (for example, an $8,600 account value divided by $1,000.00 = 8.6), then multiply the result by the number in the first line for a class of the Fund under the heading entitled "Expenses Paid During Period" to estimate the expenses you paid on your account during this period. In addition, the Fund, as a shareholder in the underlying Fidelity Central Funds, will indirectly bear its pro-rata share of the fees and expenses incurred by the underlying Fidelity Central Funds. These fees and expenses are not included in the Fund's annualized expense ratio used to calculate the expense estimate in the table below.
Hypothetical Example for Comparison Purposes
The second line of the accompanying table for each class of the Fund provides information about hypothetical account values and hypothetical expenses based on a Class' actual expense ratio and an assumed rate of return of 5% per year before expenses, which is not the Class' actual return. The hypothetical account values and expenses may not be used to estimate the actual ending account balance or expenses you paid for the period. You may use this information to compare the ongoing costs of investing in the Fund and other funds. To do so, compare this 5% hypothetical example with the 5% hypothetical examples that appear in the shareholder reports of the other funds. In addition, the Fund, as a shareholder in the underlying Fidelity Central Funds, will indirectly bear its pro-rata share of the fees and expenses incurred by the underlying Fidelity Central Funds. These fees and expenses are not included in the Fund's annualized expense ratio used to calculate the expense estimate in the table below.
Please note that the expenses shown in the table are meant to highlight your ongoing costs only and do not reflect any transaction costs. Therefore, the second line of the table is useful in comparing ongoing costs only, and will not help you determine the relative total costs of owning different funds. In addition, if these transactional costs were included, your costs would have been higher.
| Annualized Expense Ratio-A | Beginning Account Value | Ending Account Value April 30, 2019 | Expenses Paid During Period | |
| Class A | 1.25% | |||
| Actual | $1,000.00 | $1,085.00 | $2.71-B | |
| Hypothetical-C | $1,000.00 | $1,018.60 | $6.26-D | |
| Class M | 1.50% | |||
| Actual | $1,000.00 | $1,085.00 | $3.26-B | |
| Hypothetical-C | $1,000.00 | $1,017.36 | $7.50-D | |
| Class C | 2.00% | |||
| Actual | $1,000.00 | $1,084.00 | $4.34-B | |
| Hypothetical-C | $1,000.00 | $1,014.88 | $9.99-D | |
| Fidelity Founders Fund | 1.00% | |||
| Actual | $1,000.00 | $1,086.00 | $2.17-B | |
| Hypothetical-C | $1,000.00 | $1,019.84 | $5.01-D | |
| Class I | 1.00% | |||
| Actual | $1,000.00 | $1,086.00 | $2.17-B | |
| Hypothetical-C | $1,000.00 | $1,019.84 | $5.01-D | |
| Class Z | .85% | |||
| Actual | $1,000.00 | $1,086.00 | $1.85-B | |
| Hypothetical-C | $1,000.00 | $1,020.58 | $4.26-D |
A Annualized expense ratio reflects expenses net of applicable fee waivers.
B Actual expenses are equal to each Class' annualized expense ratio, multiplied by the average account value over the period, multiplied by 76/365 (to reflect the period February 14, 2019 to April 30, 2019).
C 5% return per year before expenses
D Hypothetical expenses are equal to each Class' annualized expense ratio, multiplied by the average account value over the period, multiplied by 181/365 (to reflect the one-half year period).
Board Approval of Investment Advisory Contracts and Management Fees
Fidelity Founders Fund
On November 14, 2018, the Board of Trustees, including the Independent Trustees (together, the Board), voted to approve the management contract with Fidelity Management & Research Company (FMR) and the sub-advisory agreements with affiliates of FMR (together, the Advisory Contracts) for the fund. FMR and the sub-advisers are collectively referred to herein as the Investment Advisers. The Board, assisted by the advice of fund counsel and Independent Trustees' counsel, considered a broad range of information.
Nature, Extent, and Quality of Services Provided. The Board considered Fidelity's staffing as it relates to the fund, including the backgrounds of investment personnel of Fidelity, and also considered the fund's investment objective, strategies, and related investment philosophies. The Board considered the structure of the investment personnel compensation program and whether this structure provides appropriate incentives to act in the best interests of the fund.Resources Dedicated to Investment Management and Support Services. The Board reviewed the general qualifications and capabilities of Fidelity's investment staff, including its size, education, experience, and resources, as well as Fidelity's approach to recruiting, training, managing, and compensating investment personnel. The Board noted that Fidelity has continued to increase the resources devoted to non-U.S. offices, including expansion of Fidelity's global investment organization. The Board also noted that Fidelity's analysts have extensive resources, tools and capabilities that allow them to conduct sophisticated quantitative and fundamental analysis, as well as credit analysis of issuers, counterparties and guarantors. Further, the Board considered that Fidelity's investment professionals have sufficient access to global information and data so as to provide competitive investment results over time, and that those professionals also have access to sophisticated tools that permit them to assess portfolio construction and risk and performance attribution characteristics continuously, as well as to transmit new information and research conclusions rapidly around the world. Additionally, in its deliberations, the Board considered Fidelity's trading, risk management, compliance, and technology and operationscapabilities and resources, which are integral parts of the investment management process.Shareholder and Administrative Services. The Board considered the nature, extent, quality, and cost of advisory, administrative, and shareholder services to be performed by the Investment Advisers and their affiliates under the Advisory Contracts and under separate agreements covering transfer agency, pricing and bookkeeping, and securities lending services for the fund. The Board also considered the nature and extent of the supervision of third party service providers, principally custodians, subcustodians, and pricing vendors.The Board noted that the growth of fund assets over time across the complex allows Fidelity to reinvest in the development of services designed to enhance the value and convenience of the Fidelity funds as investment vehicles. These services include 24-hour access to account information and market information through telephone representatives and over the Internet, investor education materials and asset allocation tools, and the expanded availability of Fidelity Investor Centers.Investment Performance. The fund is a new fund and therefore had no historical performance for the Board to review at the time it approved the fund's Advisory Contracts. The Board considered the Investment Advisers' strength in fundamental, research-driven security selection, which the Board is familiar with through its supervision of other Fidelity funds.Based on its review, the Board concluded that the nature, extent, and quality of services to be provided to the fund under the Advisory Contracts should benefit the shareholders of the fund.Competitiveness of Management Fee and Total Expense Ratio ..In reviewing the Advisory Contracts, the Board considered the fund's proposed management fee rate and the projected total expense ratio of each class of the fund. The Board noted that the fund's proposed management fee rate is lower than the median fee rate of funds with similar Lipper investment objective categories and comparable investment mandates, regardless of whether their management fee structures are comparable. The Board also considered that the projected total expense ratio for certain classes would rank above the median for funds with the same load structure but considered that the projected total expense ratios are comparable to those of similar classes and funds that Fidelity offers to shareholders. The Board, recognizing that the fund is a new fund and therefore had no historical performance upon which to evaluate the effect of the performance adjustment, noted that it would be able to evaluate its effects in connection with future renewals of the fund's Advisory Contracts.The Board also noted that FMR has contractually agreed to reimburse each class of the fund to the extent that total operating expenses (excluding interest, certain taxes, fees and expenses associated with the fund's securities lending program, brokerage commissions, fees and expenses of the Independent Trustees, proxy and shareholder meeting expenses, extraordinary expenses, and acquired fund fees and expenses, if any), as a percentage of its average net assets of each class, exceed a certain limit through August 31, 2020.Based on its review, the Board concluded that the management fee and the projected total expense ratio of each class of the fund were reasonable in light of the services that the fund and its shareholders will receive and the other factors considered.Costs of the Services and Profitability. The fund is a new fund and therefore no revenue, cost, or profitability data was available for the Board to review in respect of the fund at the time it approved the Advisory Contracts. In connection with its future renewal of the fund's Advisory Contracts, the Board will consider the revenues earned and the expenses incurred by Fidelity in conducting the business of developing, marketing, distributing, managing, administering and servicing the fund and servicing the fund's shareholders.Economies of Scale. The Board will consider economies of scale when there is operating experience to permit assessment thereof. It noted that, notwithstanding the entrepreneurial risk associated with a new fund, the management fee was at a level normally associated, by comparison with competitors, with very high fund net assets, and Fidelity asserted to the Board that the level of the fee anticipated economies of scale at lower asset levels even before, if ever, economies of scale are achieved. The Board also noted that the fund and its shareholders would have access to the very considerable number and variety of services available through Fidelity and its affiliates.Based on its evaluation of all of the conclusions noted above, and after considering all factors it believed relevant, the Board concluded that the advisory fee arrangements are fair and reasonable, and that the fund's Advisory Contracts should be approved.![]()
RFFF-ANN-0619
1.9892518.100
Item 2.
Code of Ethics
As of the end of the period, April 30, 2019, Fidelity Concord Street Trust (the trust) has adopted a code of ethics, as defined in Item 2 of Form N-CSR, that applies to its President and Treasurer and its Chief Financial Officer. A copy of the code of ethics is filed as an exhibit to this Form N-CSR.
Item 3.
Audit Committee Financial Expert
The Board of Trustees of the trust has determined that Joseph Mauriello is an audit committee financial expert, as defined in Item 3 of Form N-CSR. Mr. Mauriello is independent for purposes of Item 3 of Form N-CSR.
Item 4.
Principal Accountant Fees and Services
Fees and Services
The following table presents fees billed by Deloitte & Touche LLP, the member firms of Deloitte Touche Tohmatsu, and their respective affiliates (collectively, “Deloitte Entities”) in each of the last two fiscal years for services rendered to Fidelity Large Cap Stock Fund, Fidelity Large Cap Stock K6 Fund, Fidelity Mid-Cap Stock Fund, Fidelity Series Small Cap Discovery Fund, Fidelity Small Cap Discovery Fund, Fidelity Small Cap Stock Fund and Fidelity Small Cap Stock K6 Fund (the “Funds”):
Services Billed by Deloitte Entities
April 30, 2019 FeesA
| Audit Fees | Audit-Related Fees | Tax Fees | All Other Fees |
Fidelity Large Cap Stock Fund | $60,000 | $100 | $5,500 | $1,300 |
Fidelity Large Cap Stock K6 Fund | $66,000 | $100 | $5,600 | $1,200 |
Fidelity Mid-Cap Stock Fund | $49,000 | $100 | $7,100 | $1,400 |
Fidelity Series Small Cap Discovery Fund | $42,000 | $100 | $5,100 | $1,200 |
Fidelity Small Cap Discovery Fund | $44,000 | $100 | $4,800 | $1,300 |
Fidelity Small Cap Stock Fund | $59,000 | $100 | $5,000 | $1,300 |
Fidelity Small Cap Stock K6 Fund | $73,000 | $100 | $5,200 | $1,200 |
April 30, 2018 FeesA,B
| Audit Fees | Audit-Related Fees | Tax Fees | All Other Fees |
Fidelity Large Cap Stock Fund | $44,000 | $100 | $5,200 | $1,200 |
Fidelity Large Cap Stock K6 Fund | $38,000 | $100 | $4,800 | $1,000 |
Fidelity Mid-Cap Stock Fund | $56,000 | $100 | $7,100 | $1,400 |
Fidelity Series Small Cap Discovery Fund | $43,000 | $100 | $5,100 | $1,200 |
Fidelity Small Cap Discovery Fund | $45,000 | $100 | $4,800 | $1,300 |
Fidelity Small Cap Stock Fund | $45,000 | $100 | $4,800 | $1,300 |
Fidelity Small Cap Stock K6 Fund | $39,000 | $100 | $4,800 | $1,000 |
AAmounts may reflect rounding.
BFidelity Large Cap Stock K6 Fund and Fidelity Small Cap Stock K6 Fund commenced operations on May 25, 2017.
The following table presents fees billed by PricewaterhouseCoopers LLP (“PwC”) in each of the last two fiscal years for services rendered to Fidelity Advisor Event Driven Opportunities Fund, Fidelity Event Driven Opportunities Fund and Fidelity Founders Fund (the “Funds”):
Services Billed by PwC
April 30, 2019 FeesA,B
April 30, 2018 FeesA,B
AAmounts may reflect rounding.
BFidelity Founders Fund commenced operations on February 14, 2019.
The following table presents fees billed by Deloitte Entities and PwC that were required to be approved by the Audit Committee for services that relate directly to the operations and financial reporting of the Funds and that are rendered on behalf of Fidelity Management & Research Company (“FMR”) and entities controlling, controlled by, or under common control with FMR (not including any sub-adviser whose role is primarily portfolio management and is subcontracted with or overseen by another investment adviser) that provide ongoing services to the Funds (“Fund Service Providers”):
Services Billed by Deloitte Entities
| April 30, 2019A | April 30, 2018A,B |
Audit-Related Fees | $290,000 | $5,000 |
Tax Fees | $5,000 | $5,000 |
All Other Fees | $- | $- |
A Amounts may reflect rounding.
BMay include amounts billed prior to the Fidelity Large Cap Stock K6 Fund and Fidelity Small Cap Stock K6 Fund’s commencement of operations.
Services Billed by PwC
| April 30, 2019A,B | April 30, 2018A,B |
Audit-Related Fees | $7,775,000 | $7,745,000 |
Tax Fees | $15,000 | $15,000 |
All Other Fees | $- | $- |
A Amounts may reflect rounding.
BMay include amounts billed prior to the Fidelity Founders Fund’s commencement of operations.
“Audit-Related Fees” represent fees billed for assurance and related services that are reasonably related to the performance of the fund audit or the review of the fund's financial statements and that are not reported under Audit Fees.
“Tax Fees” represent fees billed for tax compliance, tax advice or tax planning that relate directly to the operations and financial reporting of the fund.
“All Other Fees” represent fees billed for services provided to the fund or Fund Service Provider, a significant portion of which are assurance related, that relate directly to the operations and financial reporting of the fund, excluding those services that are reported under Audit Fees, Audit-Related Fees or Tax Fees.
Assurance services must be performed by an independent public accountant.
* * *
The aggregate non-audit fees billed by Deloitte Entities and PwC for services rendered to the Funds, FMR (not including any sub-adviser whose role is primarily portfolio management and is subcontracted with or overseen by another investment adviser), and any Fund Service Provider for each of the last two fiscal years of the Funds are as follows:
Billed By | April 30, 2019A,B | April 30, 2018A,B,C |
Deloitte Entities | $755,000 | $395,000 |
PwC | $10,175,000 | $10,910,000 |
A Amounts may reflect rounding.
BMay include amounts billed prior to the Fidelity Founders Fund’s commencement of operations.
CMay include amounts billed prior to the Fidelity Large Cap Stock K6 Fund and Fidelity Small Cap Stock K6 Fund’s commencement of operations.
The trust's Audit Committee has considered non-audit services that were not pre-approved that were provided by Deloitte Entities and PwC to Fund Service Providers to be compatible with maintaining the independence of Deloitte Entities and PwC in their audits of the Funds, taking into account representations from Deloitte Entities and PwC, in accordance with Public Company Accounting Oversight Board rules, regarding their independence from the Funds and their related entities and FMR’s review of the appropriateness and permissibility under applicable law of such non-audit services prior to their provision to the Fund Service Providers.
Audit Committee Pre-Approval Policies and Procedures
The trust’s Audit Committee must pre-approve all audit and non-audit services provided by a fund’s independent registered public accounting firm relating to the operations or financial reporting of the fund. Prior to the commencement of any audit or non-audit services to a fund, the Audit Committee reviews the services to determine whether they are appropriate and permissible under applicable law.
The Audit Committee has adopted policies and procedures to, among other purposes, provide a framework for the Committee’s consideration of non-audit services by the audit firms that audit the Fidelity funds. The policies and procedures require that any non-audit service provided by a fund audit firm to a Fidelity fund and any non-audit service provided by a fund auditor to a Fund Service Provider that relates directly to the operations and financial reporting of a Fidelity fund (“Covered Service”) are subject to approval by the Audit Committee before such service is provided.
All Covered Services must be approved in advance of provision of the service either: (i) by formal resolution of the Audit Committee, or (ii) by oral or written approval of the service by the Chair of the Audit Committee (or if the Chair is unavailable, such other member of the Audit Committee as may be designated by the Chair to act in the Chair’s absence). The approval contemplated by (ii) above is permitted where the Treasurer determines that action on such an engagement is necessary before the next meeting of the Audit Committee.
Non-audit services provided by a fund audit firm to a Fund Service Provider that do not relate directly to the operations and financial reporting of a Fidelity fund are reported to the Audit Committee periodically.
Non-Audit Services Approved Pursuant to Rule 2-01(c)(7)(i)(C) and (ii) of Regulation S-X (“De Minimis Exception”)
There were no non-audit services approved or required to be approved by the Audit Committee pursuant to the De Minimis Exception during the Funds’ last two fiscal years relating to services provided to (i) the Funds or (ii) any Fund Service Provider that relate directly to the operations and financial reporting of the Funds.
Item 5.
Audit Committee of Listed Registrants
Not applicable.
Item 6.
Investments
(a)
Not applicable.
(b)
Not applicable
Item 7.
Disclosure of Proxy Voting Policies and Procedures for Closed-End Management Investment Companies
Not applicable.
Item 8.
Portfolio Managers of Closed-End Management Investment Companies
Not applicable.
Item 9.
Purchase of Equity Securities by Closed-End Management Investment Company and Affiliated Purchasers
Not applicable.
Item 10.
Submission of Matters to a Vote of Security Holders
There were no material changes to the procedures by which shareholders may recommend nominees to the trust’s Board of Trustees.
Item 11.
Controls and Procedures
(a)(i) The President and Treasurer and the Chief Financial Officer have concluded that the trust’s disclosure controls and procedures (as defined in Rule 30a-3(c) under the Investment Company Act) provide reasonable assurances that material information relating to the trust is made known to them by the appropriate persons, based on their evaluation of these controls and procedures as of a date within 90 days of the filing date of this report.
(a)(ii) There was no change in the trust’s internal control over financial reporting (as defined in Rule 30a-3(d) under the Investment Company Act) that occurred during the period covered by this report that has materially affected, or is reasonably likely to materially affect, the trust’s internal control over financial reporting.
Item 12.
Disclosure of Securities Lending Activities for Closed-End Management
Investment Companies
Not applicable.
Item 13.
Exhibits
(a) | (1) | Code of Ethics pursuant to Item 2 of Form N-CSR is filed and attached hereto as EX-99.CODE ETH. |
(a) | (2) | Certification pursuant to Rule 30a-2(a) under the Investment Company Act of 1940 (17 CFR 270.30a-2(a)) is filed and attached hereto as Exhibit 99.CERT. |
(a) | (3) | Not applicable. |
(b) |
| Certification pursuant to Rule 30a-2(b) under the Investment Company Act of 1940 (17 CFR 270.30a-2(b)) is furnished and attached hereto as Exhibit 99.906CERT. |
SIGNATURES
Pursuant to the requirements of the Securities Exchange Act of 1934 and the Investment Company Act of 1940, the registrant has duly caused this report to be signed on its behalf by the undersigned, thereunto duly authorized.
Fidelity Concord Street Trust
By: | /s/Stacie M. Smith |
| Stacie M. Smith |
| President and Treasurer |
|
|
Date: | June 26, 2019 |
Pursuant to the requirements of the Securities Exchange Act of 1934 and the Investment Company Act of 1940, this report has been signed below by the following persons on behalf of the registrant and in the capacities and on the dates indicated.
By: | /s/Stacie M. Smith |
| Stacie M. Smith |
| President and Treasurer |
|
|
Date: | June 26, 2019 |
By: | /s/John J. Burke III |
| John J. Burke III |
| Chief Financial Officer |
|
|
Date: | June 26, 2019 |