UNITED STATES
SECURITIES AND EXCHANGE COMMISSION
Washington, D.C. 20549
FORM N-CSR
CERTIFIED SHAREHOLDER REPORT OF REGISTERED
MANAGEMENT INVESTMENT COMPANIES
Investment Company Act file number 811-05251
Fidelity Concord Street Trust
(Exact name of registrant as specified in charter)
245 Summer St., Boston, Massachusetts 02210
(Address of principal executive offices) (Zip code)
Cynthia Lo Bessette, Secretary
245 Summer St.
Boston, Massachusetts 02210
(Name and address of agent for service)
Registrant's telephone number, including area code:
617-563-7000
Date of fiscal year end: | November 30 |
Date of reporting period: | November 30, 2019 |
Item 1.
Reports to Stockholders
Fidelity® Nasdaq Composite Index® Fund
Annual Report
November 30, 2019

See the inside front cover for important information about access to your fund’s shareholder reports.
Beginning on January 1, 2021, as permitted by regulations adopted by the Securities and Exchange Commission, paper copies of a fund’s shareholder reports will no longer be sent by mail, unless you specifically request paper copies of the reports from the fund or from your financial intermediary, such as a financial advisor, broker-dealer or bank. Instead, the reports will be made available on a website, and you will be notified by mail each time a report is posted and provided with a website link to access the report.
If you already elected to receive shareholder reports electronically, you will not be affected by this change and you need not take any action. You may elect to receive shareholder reports and other communications from a fund electronically, by contacting your financial intermediary. For Fidelity customers, visit Fidelity's web site or call Fidelity using the contact information listed below.
You may elect to receive all future reports in paper free of charge. If you wish to continue receiving paper copies of your shareholder reports, you may contact your financial intermediary or, if you are a Fidelity customer, visit Fidelity’s website, or call Fidelity at the applicable toll-free number listed below. Your election to receive reports in paper will apply to all funds held with the fund complex/your financial intermediary.
| Account Type | Website | Phone Number |
| Brokerage, Mutual Fund, or Annuity Contracts: | fidelity.com/mailpreferences | 1-800-343-3548 |
| Employer Provided Retirement Accounts: | netbenefits.fidelity.com/preferences (choose 'no' under Required Disclosures to continue to print) | 1-800-343-0860 |
| Advisor Sold Accounts Serviced Through Your Financial Intermediary: | Contact Your Financial Intermediary | Your Financial Intermediary's phone number |
| Advisor Sold Accounts Serviced by Fidelity: | institutional.fidelity.com | 1-877-208-0098 |
Contents
To view a fund's proxy voting guidelines and proxy voting record for the 12-month period ended June 30, visit http://www.fidelity.com/proxyvotingresults or visit the Securities and Exchange Commission's (SEC) web site at http://www.sec.gov.
You may also call 1-800-544-8544 to request a free copy of the proxy voting guidelines.
Nasdaq®, OMX®, NASDAQ OMX®, Nasdaq Composite®, and The Nasdaq Stock Market®, Inc. are registered trademarks of The NASDAQ OMXGroup, Inc. (which with its Affiliates are the Corporations) and are licensed for use by Fidelity. The product has not been passed on by the Corporations as to its legality or suitability. The product is not issued, endorsed or sold by the Corporations. The Corporations make no warranties and bear no liability with respect to shares of the product.
Standard & Poor's, S&P and S&P 500 are registered service marks of The McGraw-Hill Companies, Inc. and have been licensed for use by Fidelity Distributors Corporation.
Other third-party marks appearing herein are the property of their respective owners.
All other marks appearing herein are registered or unregistered trademarks or service marks of FMR LLC or an affiliated company. © 2020 FMR LLC. All rights reserved.
This report and the financial statements contained herein are submitted for the general information of the shareholders of the Fund. This report is not authorized for distribution to prospective investors in the Fund unless preceded or accompanied by an effective prospectus.
A fund files its complete schedule of portfolio holdings with the SEC for the first and third quarters of each fiscal year on Form N-PORT. Forms N-PORT are available on the SEC’s web site at http://www.sec.gov. A fund's Forms N-PORT may be reviewed and copied at the SEC’s Public Reference Room in Washington, DC. Information regarding the operation of the SEC's Public Reference Room may be obtained by calling 1-800-SEC-0330.
For a complete list of a fund's portfolio holdings, view the most recent holdings listing, semiannual report, or annual report on Fidelity's web site at http://www.fidelity.com, http://www.institutional.fidelity.com, or http://www.401k.com, as applicable.
NOT FDIC INSURED •MAY LOSE VALUE •NO BANK GUARANTEE
Neither the Fund nor Fidelity Distributors Corporation is a bank.
Performance: The Bottom Line
Average annual total return reflects the change in the value of an investment, assuming reinvestment of distributions from dividend income and capital gains (the profits earned upon the sale of securities that have grown in value, if any) and assuming a constant rate of performance each year. The hypothetical investment and the average annual total returns do not reflect the deduction of taxes that a shareholder would pay on fund distributions or the redemption of fund shares. During periods of reimbursement by Fidelity, a fund’s total return will be greater than it would be had the reimbursement not occurred. How a fund did yesterday is no guarantee of how it will do tomorrow.
Average Annual Total Returns
| For the periods ended November 30, 2019 | Past 1 year | Past 5 years | Past 10 years |
| Fidelity® Nasdaq Composite Index® Fund | 19.55% | 13.67% | 16.12% |
$10,000 Over 10 Years
Let's say hypothetically that $10,000 was invested in Fidelity® Nasdaq Composite Index® Fund on November 30, 2009.
The chart shows how the value of your investment would have changed, and also shows how the Nasdaq Composite Index® performed over the same period.
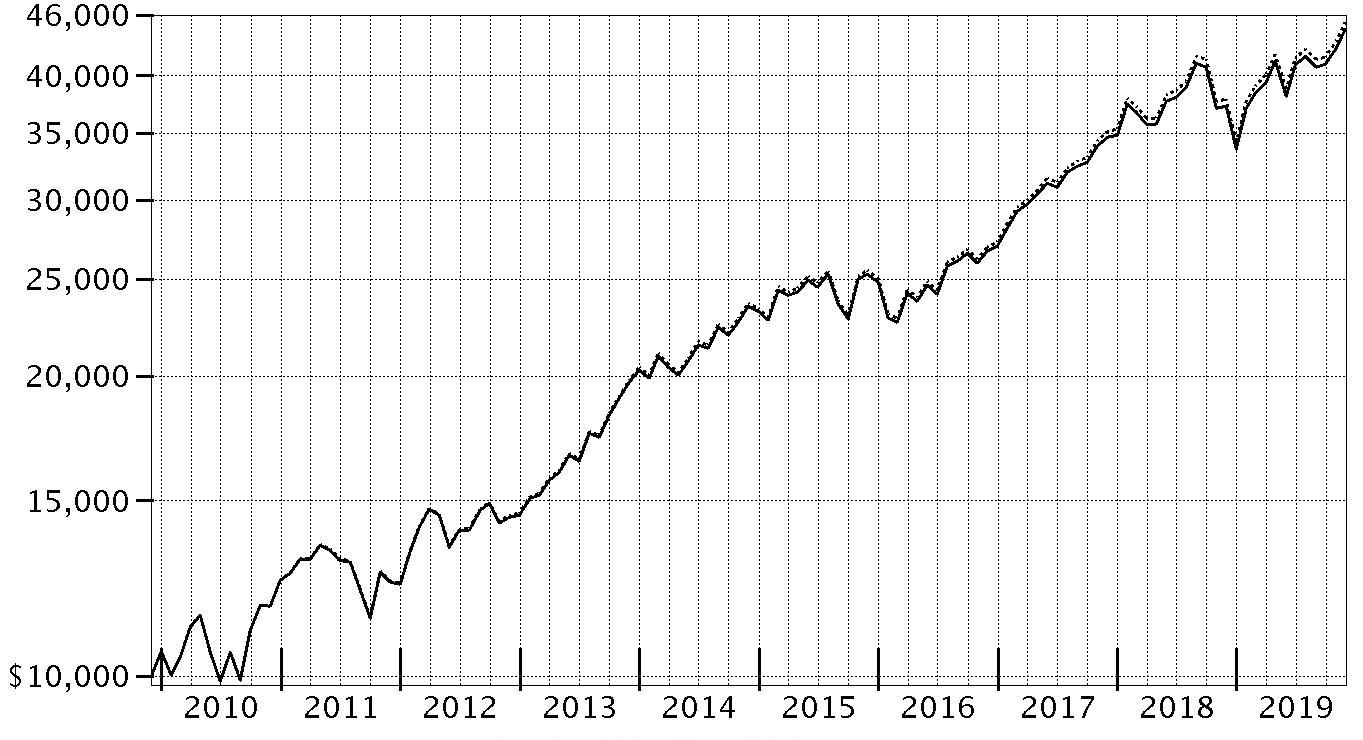
| Period Ending Values | ||
| $44,555 | Fidelity® Nasdaq Composite Index® Fund | |
| $45,271 | Nasdaq Composite Index® | |
Management's Discussion of Fund Performance
Market Recap: U.S. stocks continued to roll for the year ending November 30, 2019, with the S&P 500® index soaring 16.11% and marking history as the longest and strongest bull market ever, despite persistent, nagging concerns about global growth and trade. After a rough December 2018, upbeat company earnings, along with signs the Fed may pause on rates, boosted stocks to an all-time high on April 30. In May, however, volatility spiked and the index sunk as trade negotiations between the U.S. and China broke down. The bull market roared back to recorded a series of highs in July, when the Fed, affirming a dovish shift in policy, cut interest rates for the first time since 2008. Volatility intensified in August, however, as the Treasury yield curve inverted for the first time since 2007, which some investors viewed as a sign the U.S. economy could be heading for recession. The market proved resilient, however, achieving a new high on October 30, when the Fed lowered rates for the third time this year. The rally continued with a strong November (+4%). Information technology (+32%) led the way, as investors regained comfort taking on risk. Communication services (+21%) also stood out, followed by real estate (+18%) and utilities (+17%). In contrast, energy (-8%) was by far the weakest group – struggling amid sluggish oil prices – while several solid gainers nonetheless fell short of the market: health care (+7%), consumer staples and materials (+13% each), financials and consumer discretionary (+14% each), and industrials (+16%).Comments from the Geode Capital Management, LLC, passive equity index team: For the fiscal year, the fund gained 19.55%, compared with an increase of 19.51% for the benchmark NASDAQ Composite Index. At the individual-stock level, the largest positive impact on performance came from the two largest companies in the index, Apple and Microsoft. Apple (+52%), a maker of consumer electronics and personal computers, reported especially strong growth in services and wearable electronics, while software company Microsoft (+38%) benefited from strong earnings growth and a decision to buy back stock and increase its quarterly dividend. Better-than-expected financial results lifted shares of social media company Facebook (+43%). Other notable contributors included Alphabet (combining its Class A and Class C shares), parent company of online search giant Google – whose shares rose on the company's strong financial results and announcement of a $25 billion share buyback plan – and online retailer Amazon.com (+7%). In contrast, Kraft Heinz (-37%) detracted, with much of its decline coming in February, after the packaged-foods company reported an exceptionally large charge to its quarterly earnings and simultaneously announced a government inquiry into the firm's accounting practices. Weak financial results weighed on shares of pharmacy retail chain Walgreens Boots Alliance (-27%). China-based Baidu (-37%) struggled, as the company anticipated continued challenges for its core online search-advertising business.The views expressed above reflect those of the portfolio manager(s) only through the end of the period as stated on the cover of this report and do not necessarily represent the views of Fidelity or any other person in the Fidelity organization. Any such views are subject to change at any time based upon market or other conditions and Fidelity disclaims any responsibility to update such views. These views may not be relied on as investment advice and, because investment decisions for a Fidelity fund are based on numerous factors, may not be relied on as an indication of trading intent on behalf of any Fidelity fund.
Note to Shareholders: On March 22, 2019, Pat Waddell retired and is no longer a portfolio manager with Geode Capital Management.Investment Summary (Unaudited)
Top Ten Stocks as of November 30, 2019
| % of fund's net assets | |
| Apple, Inc. | 7.4 |
| Microsoft Corp. | 7.1 |
| Amazon.com, Inc. | 5.4 |
| Facebook, Inc. Class A | 3.0 |
| Alphabet, Inc. Class C | 2.8 |
| Alphabet, Inc. Class A | 2.4 |
| Intel Corp. | 1.6 |
| Comcast Corp. Class A | 1.2 |
| Cisco Systems, Inc. | 1.2 |
| PepsiCo, Inc. | 1.2 |
| 33.3 |
Top Market Sectors as of November 30, 2019
| % of fund's net assets | |
| Information Technology | 33.4 |
| Communication Services | 14.3 |
| Consumer Discretionary | 11.2 |
| Health Care | 9.3 |
| Financials | 6.0 |
| Industrials | 3.8 |
| Consumer Staples | 3.6 |
| Real Estate | 1.2 |
| Utilities | 0.7 |
| Materials | 0.3 |
Asset Allocation (% of fund's net assets)
| As of November 30, 2019 * | ||
| Stocks and Equity Futures | 100.0% | |

* Foreign investments - 5.3%
Schedule of Investments November 30, 2019
Showing Percentage of Net Assets
| Common Stocks - 84.1% | |||
| Shares | Value | ||
| COMMUNICATION SERVICES - 14.3% | |||
| Diversified Telecommunication Services - 0.1% | |||
| Alaska Communication Systems Group, Inc. (a) | 34,501 | $61,412 | |
| ATN International, Inc. | 12,205 | 685,311 | |
| B Communications Ltd. (a) | 11,465 | 19,834 | |
| Bandwidth, Inc. (a) | 3,809 | 213,037 | |
| Cogent Communications Group, Inc. | 28,718 | 1,800,044 | |
| Consolidated Communications Holdings, Inc. (b) | 44,289 | 160,769 | |
| GCI Liberty, Inc. (a) | 58,039 | 4,120,189 | |
| Iridium Communications, Inc. (a)(b) | 70,331 | 1,638,712 | |
| ORBCOMM, Inc. (a) | 50,478 | 202,417 | |
| Pareteum Corp. (a)(b) | 52,424 | 22,857 | |
| PDVWireless, Inc. (a) | 11,876 | 504,374 | |
| Sify Technologies Ltd. sponsored ADR (b) | 1,965 | 2,574 | |
| 9,431,530 | |||
| Entertainment - 1.8% | |||
| Activision Blizzard, Inc. | 322,463 | 17,680,646 | |
| Bilibili, Inc. ADR (a) | 57,632 | 995,881 | |
| Changyou.com Ltd. (A Shares) ADR | 9,360 | 89,388 | |
| Electronic Arts, Inc. (a) | 128,746 | 13,004,633 | |
| Gaia, Inc. Class A (a)(b) | 26,637 | 222,952 | |
| GigaMedia Ltd. (a) | 1,007 | 2,497 | |
| Global Eagle Entertainment, Inc. (a)(b) | 101,998 | 48,449 | |
| Glu Mobile, Inc. (a) | 83,327 | 460,798 | |
| Gravity Co. Ltd. ADR (a)(b) | 4,254 | 164,928 | |
| iQIYI, Inc. ADR (a)(b) | 163,309 | 3,127,367 | |
| NetEase, Inc. ADR | 32,256 | 10,170,962 | |
| Netflix, Inc. (a) | 184,629 | 58,095,361 | |
| Reading International, Inc. Class A (a) | 14,207 | 152,441 | |
| Roku, Inc. Class A (a) | 45,420 | 7,284,005 | |
| Take-Two Interactive Software, Inc. (a) | 47,825 | 5,803,564 | |
| The9 Ltd. sponsored ADR (a) | 23,845 | 23,399 | |
| Viacom, Inc.: | |||
| Class A (b) | 27,682 | 723,054 | |
| Class B (non-vtg.) | 197,876 | 4,762,875 | |
| Zynga, Inc. (a) | 431,068 | 2,685,554 | |
| 125,498,754 | |||
| Interactive Media & Services - 8.8% | |||
| Alphabet, Inc.: | |||
| Class A (a) | 129,616 | 169,030,929 | |
| Class C (a) | 152,222 | 198,643,621 | |
| ANGI Homeservices, Inc. Class A (a)(b) | 46,175 | 357,856 | |
| Autoweb, Inc. (a)(b) | 20,851 | 51,085 | |
| Baidu.com, Inc. sponsored ADR (a) | 117,527 | 13,930,475 | |
| CarGurus, Inc. Class A (a)(b) | 50,178 | 2,011,636 | |
| EverQuote, Inc. Class A (a) | 4,250 | 149,643 | |
| Facebook, Inc. Class A (a) | 1,049,204 | 211,561,495 | |
| IAC/InterActiveCorp (a)(b) | 43,477 | 9,682,328 | |
| Liberty TripAdvisor Holdings, Inc. (a) | 42,562 | 294,955 | |
| Match Group, Inc. (b) | 38,897 | 2,741,461 | |
| MeetMe, Inc. (a) | 66,976 | 324,164 | |
| Momo, Inc. ADR | 87,228 | 3,264,944 | |
| Professional Diversity Network, Inc. (a)(c) | 1,922 | 1,749 | |
| QuinStreet, Inc. (a)(b) | 27,593 | 434,314 | |
| Qutoutiao, Inc. ADR (a)(b) | 18,799 | 55,081 | |
| SINA Corp. (a) | 39,741 | 1,386,563 | |
| Sohu.Com Ltd. ADR (a) | 28,762 | 294,523 | |
| Super League Gaming, Inc. (b) | 2,228 | 5,503 | |
| Travelzoo, Inc. (a) | 6,862 | 70,884 | |
| TripAdvisor, Inc. | 69,698 | 1,979,423 | |
| TrueCar, Inc. (a) | 53,075 | 278,644 | |
| Weibo Corp. sponsored ADR (a)(b) | 41,342 | 1,769,851 | |
| Yandex NV Series A (a) | 159,298 | 6,685,737 | |
| YY, Inc. ADR (a) | 27,597 | 1,760,413 | |
| Zillow Group, Inc.: | |||
| Class A (a)(b) | 32,454 | 1,267,653 | |
| Class C (a)(b) | 65,949 | 2,581,903 | |
| 630,616,833 | |||
| Media - 3.0% | |||
| AirMedia Group, Inc. ADR (a)(b) | 4,175 | 4,217 | |
| AMC Networks, Inc. Class A (a) | 25,176 | 967,514 | |
| Beasley Broadcast Group, Inc. Class A | 6,549 | 18,566 | |
| Boston Omaha Corp. (a)(b) | 12,606 | 268,886 | |
| Cardlytics, Inc. (a) | 5,974 | 334,843 | |
| Central European Media Enterprises Ltd. Class A (a) | 135,521 | 609,845 | |
| Charter Communications, Inc. Class A (a)(b) | 97,849 | 45,990,008 | |
| Comcast Corp. Class A | 1,909,865 | 84,320,540 | |
| comScore, Inc. (a) | 33,893 | 138,622 | |
| Criteo SA sponsored ADR (a) | 35,411 | 632,086 | |
| Daily Journal Corp. (a)(b) | 886 | 251,713 | |
| Discovery Communications, Inc.: | |||
| Class A (a)(b) | 86,979 | 2,865,088 | |
| Class B (a) | 615 | 24,600 | |
| Class C (non-vtg.) (a) | 200,078 | 6,106,381 | |
| DISH Network Corp.: | |||
| rights 12/9/19 (a) | 7,215 | 4,906 | |
| Class A (a) | 133,303 | 4,554,964 | |
| E.W. Scripps Co. Class A (b) | 37,206 | 555,114 | |
| Emmis Communications Corp. Class A (a) | 7,203 | 32,630 | |
| Fluent, Inc. (a)(b) | 61,565 | 100,967 | |
| Fox Corp.: | |||
| Class A | 149,990 | 5,363,642 | |
| Class B | 113,054 | 3,954,629 | |
| Hemisphere Media Group, Inc. (a) | 14,863 | 208,082 | |
| Insignia Systems, Inc. (a) | 7,572 | 6,513 | |
| Liberty Broadband Corp.: | |||
| Class A (a) | 14,735 | 1,743,298 | |
| Class C (a) | 85,362 | 10,199,905 | |
| Liberty Global PLC: | |||
| Class A (a) | 83,817 | 1,890,073 | |
| Class B (a) | 327 | 7,354 | |
| Class C (a) | 202,530 | 4,354,395 | |
| Liberty Latin America Ltd.: | |||
| Class A (a)(b) | 27,916 | 496,905 | |
| Class C (a)(b) | 68,584 | 1,230,397 | |
| Liberty Media Corp.: | |||
| Class B (a) | 5 | 243 | |
| Liberty Braves Class A (a) | 12,004 | 340,794 | |
| Liberty Braves Class C (a) | 20,116 | 569,283 | |
| Liberty Formula One Group Series C (a) | 117,580 | 5,301,682 | |
| Liberty Media Class A (a) | 14,368 | 618,830 | |
| Liberty SiriusXM Series A (a) | 66,386 | 3,232,998 | |
| Liberty SiriusXM Series C (a) | 97,065 | 4,708,623 | |
| Loral Space & Communications Ltd. (a) | 13,720 | 464,559 | |
| Marchex, Inc. Class B (a) | 34,542 | 138,859 | |
| MDC Partners, Inc. Class A (a) | 47,873 | 111,544 | |
| News Corp.: | |||
| Class A | 214,103 | 2,757,647 | |
| Class B | 111,410 | 1,467,270 | |
| Nexstar Broadcasting Group, Inc. Class A | 25,789 | 2,777,733 | |
| Perion Network Ltd. (a) | 4,851 | 26,050 | |
| Salem Communications Corp. Class A | 10,029 | 14,843 | |
| Scholastic Corp. | 18,793 | 697,784 | |
| Sinclair Broadcast Group, Inc. Class A (b) | 40,729 | 1,418,591 | |
| Sirius XM Holdings, Inc. (b) | 1,877,701 | 13,106,353 | |
| TechTarget, Inc. (a) | 19,894 | 527,589 | |
| Tribune Publishing Co. | 23,863 | 298,765 | |
| Urban One, Inc. Class D (non-vtg.) (a) | 18,618 | 36,864 | |
| 215,853,587 | |||
| Wireless Telecommunication Services - 0.6% | |||
| Boingo Wireless, Inc. (a)(b) | 26,067 | 300,031 | |
| Gogo, Inc. (a)(b) | 65,948 | 333,697 | |
| Millicom International Cellular SA (b) | 45,551 | 2,041,140 | |
| NII Holdings, Inc. (a) | 5,182 | 9,639 | |
| Partner Communications Co. Ltd. ADR (a) | 1,446 | 6,550 | |
| Shenandoah Telecommunications Co. | 34,510 | 1,295,851 | |
| Spok Holdings, Inc. | 14,862 | 182,951 | |
| T-Mobile U.S., Inc. (a) | 358,956 | 28,195,994 | |
| VEON Ltd. sponsored ADR | 828,386 | 2,186,939 | |
| Vodafone Group PLC sponsored ADR | 257,256 | 5,098,814 | |
| 39,651,606 | |||
| TOTAL COMMUNICATION SERVICES | 1,021,052,310 | ||
| CONSUMER DISCRETIONARY - 11.2% | |||
| Auto Components - 0.2% | |||
| China Automotive Systems, Inc. (a) | 13,333 | 42,266 | |
| China XD Plastics Co. Ltd. (a) | 26,293 | 50,483 | |
| Dorman Products, Inc. (a)(b) | 18,396 | 1,367,191 | |
| Fox Factory Holding Corp. (a)(b) | 21,185 | 1,396,727 | |
| Gentex Corp. | 144,258 | 4,096,927 | |
| Gentherm, Inc. (a)(b) | 20,636 | 863,617 | |
| Kandi Technolgies, Inc. (a)(b) | 45,300 | 216,081 | |
| Motorcar Parts of America, Inc. (a)(b) | 13,721 | 267,697 | |
| Shiloh Industries, Inc. (a) | 15,910 | 60,617 | |
| SORL Auto Parts, Inc. (a)(b) | 7,832 | 34,617 | |
| Strattec Security Corp. | 1,501 | 35,093 | |
| The Goodyear Tire & Rubber Co. | 128,398 | 2,053,084 | |
| Visteon Corp. (a)(b) | 15,468 | 1,446,722 | |
| Workhorse Group, Inc. (a)(b) | 35,585 | 97,859 | |
| 12,028,981 | |||
| Automobiles - 0.3% | |||
| Tesla, Inc. (a)(b) | 73,489 | 24,246,961 | |
| Distributors - 0.2% | |||
| Core-Mark Holding Co., Inc. | 29,431 | 793,165 | |
| Educational Development Corp. | 10,900 | 66,490 | |
| LKQ Corp. (a) | 178,030 | 6,280,898 | |
| Pool Corp. | 22,239 | 4,591,242 | |
| Weyco Group, Inc. | 10,577 | 259,665 | |
| 11,991,460 | |||
| Diversified Consumer Services - 0.2% | |||
| American Public Education, Inc. (a) | 8,624 | 213,530 | |
| Arco Platform Ltd. Class A (a) | 3,306 | 142,158 | |
| Career Education Corp. (a) | 41,490 | 692,053 | |
| Collectors Universe, Inc. | 11,030 | 289,758 | |
| Frontdoor, Inc. (a)(b) | 47,340 | 2,142,608 | |
| Grand Canyon Education, Inc. (a) | 26,904 | 2,291,952 | |
| Houghton Mifflin Harcourt Co. (a) | 79,374 | 465,925 | |
| HyreCar, Inc. (a)(b) | 3,092 | 8,101 | |
| Laureate Education, Inc. Class A (a) | 59,732 | 1,036,350 | |
| Lincoln Educational Services Corp. (a)(b) | 11,240 | 19,670 | |
| Strategic Education, Inc. | 16,424 | 2,327,938 | |
| Tarena International, Inc. ADR (a)(b) | 26,977 | 23,740 | |
| Weight Watchers International, Inc. (a) | 37,310 | 1,615,150 | |
| Xpresspa Group, Inc. (a) | 407 | 309 | |
| 11,269,242 | |||
| Hotels, Restaurants & Leisure - 1.6% | |||
| BBQ Holdings, Inc. (a) | 3,113 | 14,662 | |
| BJ's Restaurants, Inc. | 11,501 | 473,266 | |
| Bloomin' Brands, Inc. (b) | 51,284 | 1,233,380 | |
| Caesars Entertainment Corp. (a) | 315,469 | 4,113,716 | |
| Carrols Restaurant Group, Inc. (a)(b) | 24,955 | 197,644 | |
| Century Casinos, Inc. (a) | 18,295 | 148,190 | |
| Churchill Downs, Inc. (b) | 18,774 | 2,440,808 | |
| Chuy's Holdings, Inc. (a)(b) | 9,648 | 278,055 | |
| Cracker Barrel Old Country Store, Inc. (b) | 13,337 | 2,050,430 | |
| Dave & Buster's Entertainment, Inc. (b) | 21,332 | 857,120 | |
| Del Taco Restaurants, Inc. (a) | 26,399 | 197,729 | |
| Denny's Corp. (a) | 38,990 | 761,865 | |
| Diversified Restaurant Holdings, Inc. (a) | 14,071 | 14,493 | |
| Dunkin' Brands Group, Inc. | 45,904 | 3,513,951 | |
| El Pollo Loco Holdings, Inc. (a)(b) | 20,392 | 328,719 | |
| Eldorado Resorts, Inc. (a)(b) | 36,330 | 1,944,018 | |
| Extended Stay America, Inc. unit | 105,950 | 1,563,822 | |
| Fiesta Restaurant Group, Inc. (a)(b) | 14,421 | 142,768 | |
| Golden Entertainment, Inc. (a) | 11,711 | 212,203 | |
| Good Times Restaurants, Inc. (a) | 8,038 | 12,861 | |
| Habit Restaurants, Inc. Class A (a)(b) | 20,233 | 215,279 | |
| Huazhu Group Ltd. ADR (b) | 81,086 | 2,773,952 | |
| Inspired Entertainment, Inc. (a) | 11,329 | 79,190 | |
| Jack in the Box, Inc. (b) | 15,092 | 1,196,645 | |
| Lindblad Expeditions Holdings (a) | 32,411 | 502,371 | |
| Marriott International, Inc. Class A | 147,990 | 20,771,876 | |
| Melco Crown Entertainment Ltd. sponsored ADR | 134,103 | 2,853,712 | |
| Monarch Casino & Resort, Inc. (a) | 10,789 | 491,978 | |
| Nathan's Famous, Inc. | 3,678 | 274,195 | |
| Noodles & Co. (a)(b) | 27,889 | 175,701 | |
| Papa John's International, Inc. (b) | 19,371 | 1,225,797 | |
| Penn National Gaming, Inc. (a)(b) | 54,931 | 1,265,061 | |
| Playa Hotels & Resorts NV (a) | 74,578 | 587,675 | |
| Potbelly Corp. (a) | 13,868 | 70,172 | |
| Rave Restaurant Group, Inc. (a)(b) | 4,931 | 8,383 | |
| RCI Hospitality Holdings, Inc. | 7,136 | 131,302 | |
| Red Robin Gourmet Burgers, Inc. (a) | 6,865 | 187,209 | |
| Red Rock Resorts, Inc. | 32,954 | 771,124 | |
| Ruth's Hospitality Group, Inc. | 18,941 | 442,651 | |
| Scientific Games Corp. Class A (a)(b) | 49,089 | 1,343,075 | |
| Starbucks Corp. | 526,494 | 44,978,382 | |
| Texas Roadhouse, Inc. Class A | 39,896 | 2,309,978 | |
| The Cheesecake Factory, Inc. (b) | 25,301 | 1,103,377 | |
| The Stars Group, Inc. (a) | 151,271 | 3,673,871 | |
| Town Sports International Holdings, Inc. (a)(b) | 21,501 | 33,112 | |
| Tuniu Corp. Class A sponsored ADR (a) | 18,162 | 45,950 | |
| Wendy's Co. | 108,197 | 2,319,744 | |
| Wingstop, Inc. | 16,204 | 1,296,320 | |
| Wynn Resorts Ltd. | 45,846 | 5,540,489 | |
| 117,168,271 | |||
| Household Durables - 0.3% | |||
| Bassett Furniture Industries, Inc. | 7,501 | 114,165 | |
| Cavco Industries, Inc. (a) | 5,290 | 1,058,053 | |
| Flexsteel Industries, Inc. | 5,816 | 106,898 | |
| Garmin Ltd. | 105,981 | 10,353,284 | |
| GoPro, Inc. Class A (a)(b) | 67,299 | 271,888 | |
| Green Brick Partners, Inc. (a) | 26,169 | 298,588 | |
| Helen of Troy Ltd. (a) | 13,978 | 2,256,329 | |
| Hooker Furniture Corp. | 6,220 | 148,098 | |
| iRobot Corp. (a)(b) | 15,168 | 660,718 | |
| LGI Homes, Inc. (a)(b) | 11,902 | 860,158 | |
| Lifetime Brands, Inc. | 11,982 | 78,123 | |
| Live Ventures, Inc. (a) | 1,151 | 9,289 | |
| Lovesac (a)(b) | 4,530 | 69,128 | |
| Newell Brands, Inc. | 198,552 | 3,816,169 | |
| Nova LifeStyle, Inc. (a)(b) | 8,342 | 3,837 | |
| Sonos, Inc. (a)(b) | 56,460 | 781,971 | |
| Turtle Beach Corp. (a)(b) | 7,033 | 58,655 | |
| Universal Electronics, Inc. (a) | 7,428 | 412,997 | |
| VOXX International Corp. (a) | 10,039 | 46,280 | |
| Vuzix Corp. (a)(b) | 40,728 | 99,376 | |
| Zagg, Inc. (a)(b) | 14,972 | 114,985 | |
| 21,618,989 | |||
| Internet & Direct Marketing Retail - 6.9% | |||
| 1-800-FLOWERS.com, Inc. Class A (a) | 32,541 | 438,327 | |
| Amazon.com, Inc. (a) | 215,530 | 388,126,424 | |
| Baozun, Inc. sponsored ADR (a)(b) | 24,322 | 923,506 | |
| CNOVA NV (a) | 178,552 | 491,821 | |
| Ctrip.com International Ltd. ADR (a) | 205,080 | 6,816,859 | |
| Duluth Holdings, Inc. (a)(b) | 18,517 | 170,912 | |
| eBay, Inc. (b) | 417,329 | 14,823,526 | |
| Etsy, Inc. (a) | 66,434 | 2,882,571 | |
| EVINE Live, Inc. (a)(b) | 96,670 | 50,268 | |
| Expedia, Inc. | 68,477 | 6,961,372 | |
| Groupon, Inc. (a) | 318,729 | 924,314 | |
| JD.com, Inc. sponsored ADR (a) | 390,893 | 12,762,656 | |
| Jmu Ltd. sponsored ADR (a) | 6,133 | 5,826 | |
| Lands' End, Inc. (a)(b) | 17,966 | 211,639 | |
| Liberty Interactive Corp. QVC Group (a) | 205 | 1,927 | |
| Liberty Interactive Corp. QVC Group Series A (a) | 228,404 | 2,160,702 | |
| Liquidity Services, Inc. (a) | 23,372 | 163,370 | |
| MakeMyTrip Ltd. (a) | 32,196 | 838,062 | |
| MercadoLibre, Inc. (a) | 20,480 | 11,890,278 | |
| Overstock.com, Inc. (a)(b) | 19,935 | 151,307 | |
| PetMed Express, Inc. (b) | 11,596 | 264,737 | |
| Pinduoduo, Inc. ADR (a)(b) | 142,290 | 5,115,326 | |
| Points International Ltd. (a) | 16,254 | 216,666 | |
| Remark Holdings, Inc. (a)(b) | 34,230 | 23,105 | |
| RumbleON, Inc. Class B (a) | 2,665 | 3,305 | |
| Stamps.com, Inc. (a) | 9,758 | 851,386 | |
| Stitch Fix, Inc. (a)(b) | 15,353 | 362,024 | |
| The Booking Holdings, Inc. (a) | 19,508 | 37,143,817 | |
| The RealReal, Inc. (b) | 39,200 | 674,240 | |
| U.S. Auto Parts Network, Inc. (a) | 40,489 | 90,695 | |
| Uxin Ltd. ADR (a)(b) | 103,512 | 257,745 | |
| Yatra Online, Inc. (a)(b) | 56,191 | 201,726 | |
| 496,000,439 | |||
| Leisure Products - 0.1% | |||
| American Outdoor Brands Corp. (a) | 31,272 | 273,317 | |
| BRP, Inc. | 24,000 | 1,192,321 | |
| Clarus Corp. | 14,880 | 187,339 | |
| Escalade, Inc. | 6,771 | 76,851 | |
| Hasbro, Inc. | 53,136 | 5,403,931 | |
| Johnson Outdoors, Inc. Class A (b) | 5,775 | 373,065 | |
| Malibu Boats, Inc. Class A (a) | 12,246 | 484,207 | |
| Mattel, Inc. (a)(b) | 191,729 | 2,243,229 | |
| MCBC Holdings, Inc. (a) | 12,347 | 205,084 | |
| Summer Infant, Inc. (a) | 1,750 | 560 | |
| 10,439,904 | |||
| Multiline Retail - 0.2% | |||
| Dollar Tree, Inc. (a) | 100,500 | 9,191,730 | |
| Ollie's Bargain Outlet Holdings, Inc. (a)(b) | 35,059 | 2,292,859 | |
| 11,484,589 | |||
| Specialty Retail - 0.9% | |||
| America's Car Mart, Inc. (a)(b) | 3,745 | 409,179 | |
| Ascena Retail Group, Inc. (a) | 118,628 | 53,466 | |
| Bed Bath & Beyond, Inc. (b) | 80,385 | 1,172,013 | |
| Big 5 Sporting Goods Corp. (b) | 22,393 | 60,461 | |
| Citi Trends, Inc. | 7,084 | 145,435 | |
| Conn's, Inc. (a)(b) | 16,466 | 361,099 | |
| DavidsTea, Inc. (a)(b) | 21,923 | 34,748 | |
| Destination XL Group, Inc. (a) | 28,678 | 35,274 | |
| Five Below, Inc. (a)(b) | 30,949 | 3,828,701 | |
| Hibbett Sports, Inc. (a)(b) | 12,390 | 351,504 | |
| Kirkland's, Inc. (a)(b) | 8,678 | 13,538 | |
| Michaels Companies, Inc. (a)(b) | 97,703 | 799,211 | |
| Monro, Inc. (b) | 18,906 | 1,387,700 | |
| National Vision Holdings, Inc. (a) | 43,756 | 1,321,431 | |
| O'Reilly Automotive, Inc. (a) | 34,515 | 15,265,294 | |
| Office Depot, Inc. (b) | 293,964 | 655,540 | |
| Rent-A-Center, Inc. | 30,235 | 787,017 | |
| Ross Stores, Inc. (b) | 159,756 | 18,555,659 | |
| Shoe Carnival, Inc. (b) | 8,600 | 305,300 | |
| Sleep Number Corp. (a) | 23,390 | 1,129,035 | |
| Sportsman's Warehouse Holdings, Inc. (a) | 40,983 | 299,586 | |
| Tandy Leather Factory, Inc. (a) | 5,773 | 30,135 | |
| The Children's Place Retail Stores, Inc. (b) | 10,570 | 763,788 | |
| Tractor Supply Co. | 67,865 | 6,409,171 | |
| Trans World Entertainment Corp. (a) | 477 | 1,288 | |
| TravelCenters of America LLC (a) | 5,108 | 51,948 | |
| Ulta Beauty, Inc. (a) | 25,815 | 6,037,096 | |
| Urban Outfitters, Inc. (a)(b) | 65,559 | 1,682,244 | |
| Winmark Corp. | 2,473 | 437,721 | |
| Zumiez, Inc. (a) | 13,387 | 395,452 | |
| 62,780,034 | |||
| Textiles, Apparel & Luxury Goods - 0.3% | |||
| Centric Brands, Inc. (a)(b) | 3,423 | 10,337 | |
| Charles & Colvard Ltd. (a) | 4,097 | 6,105 | |
| Columbia Sportswear Co. (b) | 38,158 | 3,529,615 | |
| Crocs, Inc. (a) | 41,108 | 1,434,669 | |
| Crown Crafts, Inc. | 8,885 | 59,530 | |
| Fossil Group, Inc. (a) | 27,464 | 205,705 | |
| G-III Apparel Group Ltd. (a) | 26,962 | 798,075 | |
| Kingold Jewelry, Inc. (a)(b) | 4,491 | 7,141 | |
| Lakeland Industries, Inc. (a) | 6,566 | 67,695 | |
| lululemon athletica, Inc. (a) | 57,563 | 12,991,393 | |
| Rocky Brands, Inc. | 7,518 | 209,602 | |
| Sequential Brands Group, Inc. (a)(b) | 33,822 | 13,529 | |
| Steven Madden Ltd. | 48,076 | 2,041,788 | |
| Superior Group of Companies, Inc. | 8,722 | 117,136 | |
| Vera Bradley, Inc. (a) | 18,019 | 198,930 | |
| 21,691,250 | |||
| TOTAL CONSUMER DISCRETIONARY | 800,720,120 | ||
| CONSUMER STAPLES - 3.6% | |||
| Beverages - 1.4% | |||
| Celsius Holdings, Inc. (a)(b) | 39,333 | 190,765 | |
| Coca-Cola Bottling Co. Consolidated | 4,469 | 1,207,345 | |
| Craft Brew Alliance, Inc. (a) | 16,286 | 268,393 | |
| MGP Ingredients, Inc. (b) | 9,515 | 434,074 | |
| Monster Beverage Corp. (a) | 235,393 | 14,081,209 | |
| National Beverage Corp. (b) | 26,081 | 1,294,661 | |
| New Age Beverages Corp. (a)(b) | 46,863 | 101,224 | |
| PepsiCo, Inc. | 598,284 | 81,264,916 | |
| Primo Water Corp. (a)(b) | 26,082 | 266,036 | |
| 99,108,623 | |||
| Food & Staples Retailing - 1.2% | |||
| Andersons, Inc. | 17,151 | 396,188 | |
| Casey's General Stores, Inc. | 20,434 | 3,550,816 | |
| Chefs' Warehouse Holdings (a) | 16,733 | 595,025 | |
| China Jo-Jo Drugstores, Inc. (a)(b) | 105,303 | 147,424 | |
| Costco Wholesale Corp. | 186,297 | 55,853,704 | |
| G Willi-Food International Ltd. (a) | 4,242 | 51,116 | |
| iFresh, Inc. (a) | 31,015 | 11,165 | |
| Ingles Markets, Inc. Class A | 11,952 | 531,147 | |
| PriceSmart, Inc. | 17,300 | 1,293,002 | |
| SpartanNash Co. | 18,179 | 257,415 | |
| Sprouts Farmers Market LLC (a) | 71,511 | 1,415,918 | |
| Walgreens Boots Alliance, Inc. | 402,418 | 23,984,113 | |
| 88,087,033 | |||
| Food Products - 1.0% | |||
| Alico, Inc. | 5,485 | 185,722 | |
| Beyond Meat, Inc. (b) | 31,790 | 2,637,298 | |
| Bridgford Foods Corp. (a)(b) | 457 | 12,238 | |
| Cal-Maine Foods, Inc. (b) | 23,771 | 1,034,752 | |
| Calavo Growers, Inc. (b) | 9,847 | 878,254 | |
| Farmer Brothers Co. (a) | 11,563 | 175,411 | |
| Freshpet, Inc. (a) | 20,178 | 1,084,366 | |
| Future FinTech Group, Inc. (a)(b) | 23,108 | 12,016 | |
| Hostess Brands, Inc. Class A (a)(b) | 56,044 | 753,792 | |
| J&J Snack Foods Corp. | 10,498 | 1,942,130 | |
| John B. Sanfilippo & Son, Inc. | 4,608 | 450,386 | |
| Lancaster Colony Corp. | 15,280 | 2,414,698 | |
| Landec Corp. (a) | 22,245 | 254,928 | |
| Lifeway Foods, Inc. (a) | 8,620 | 17,585 | |
| Limoneira Co. (b) | 11,551 | 228,075 | |
| Mondelez International, Inc. | 616,918 | 32,412,872 | |
| Origin Agritech Ltd. (a)(b) | 2,834 | 14,737 | |
| Pilgrim's Pride Corp. (a) | 138,186 | 4,352,859 | |
| Pingtan Marine Enterprise Ltd. (a)(b) | 37,129 | 49,382 | |
| S&W Seed Co. (a) | 10,249 | 23,163 | |
| Sanderson Farms, Inc. | 12,392 | 2,051,867 | |
| Seneca Foods Corp. Class A (a) | 5,997 | 234,483 | |
| SunOpta, Inc. (a)(b) | 45,709 | 132,829 | |
| The Hain Celestial Group, Inc. (a)(b) | 57,981 | 1,433,290 | |
| The Kraft Heinz Co. | 515,729 | 15,729,735 | |
| The Simply Good Foods Co. (a) | 44,451 | 1,228,181 | |
| Village Farms International, Inc. (a) | 24,746 | 163,570 | |
| 69,908,619 | |||
| Household Products - 0.0% | |||
| Central Garden & Pet Co. Class A (non-vtg.) (a) | 27,533 | 688,600 | |
| WD-40 Co. (b) | 7,722 | 1,491,195 | |
| 2,179,795 | |||
| Personal Products - 0.0% | |||
| Inter Parfums, Inc. | 17,219 | 1,213,767 | |
| LifeVantage Corp. (a) | 12,732 | 191,871 | |
| Mannatech, Inc. | 1,439 | 23,413 | |
| Natural Alternatives International, Inc. (a) | 3,874 | 30,062 | |
| Natural Health Trends Corp. (b) | 6,237 | 35,987 | |
| Nature's Sunshine Products, Inc. (a) | 9,832 | 98,762 | |
| Neptune Technologies & Bioressources, Inc. (a)(b) | 76,890 | 221,125 | |
| Reliv International, Inc. (a) | 131 | 523 | |
| United-Guardian, Inc. | 2,237 | 44,874 | |
| Veru, Inc. (a)(b) | 19,258 | 40,827 | |
| Youngevity International, Inc. (a)(b) | 4,487 | 19,788 | |
| 1,920,999 | |||
| TOTAL CONSUMER STAPLES | 261,205,069 | ||
| ENERGY - 0.3% | |||
| Energy Equipment & Services - 0.1% | |||
| CSI Compressco LP | 40,747 | 99,015 | |
| Dawson Geophysical Co. (a)(b) | 25,066 | 56,649 | |
| DMC Global, Inc. (b) | 9,729 | 448,410 | |
| ENGlobal Corp. (a) | 14,877 | 16,513 | |
| Geospace Technologies Corp. (a) | 17,981 | 259,286 | |
| Gulf Island Fabrication, Inc. (a)(b) | 16,055 | 87,339 | |
| KLX Energy Services Holdings, Inc. (a)(b) | 14,667 | 82,869 | |
| Mammoth Energy Services, Inc. (b) | 24,626 | 38,663 | |
| Matrix Service Co. (a) | 14,130 | 295,882 | |
| Mitcham Industries, Inc. (a) | 6,441 | 13,977 | |
| NCS Multistage Holdings, Inc. (a)(b) | 43,968 | 94,531 | |
| Patterson-UTI Energy, Inc. | 115,875 | 1,035,923 | |
| Profire Energy, Inc. (a) | 42,605 | 60,925 | |
| RigNet, Inc. (a) | 14,173 | 73,700 | |
| SAExploration Holdings, Inc. (a)(b) | 22,492 | 53,531 | |
| SAExploration Holdings, Inc.: | |||
| Series A warrants 7/27/21 (a)(d) | 30 | 0 | |
| Series B warrants 7/27/21 (a)(d) | 30 | 0 | |
| Smart Sand, Inc. (a)(b) | 21,813 | 50,606 | |
| Synthesis Energy Systems, Inc. (a)(b) | 1,363 | 7,715 | |
| 2,775,534 | |||
| Oil, Gas & Consumable Fuels - 0.2% | |||
| Abraxas Petroleum Corp. (a)(b) | 86,340 | 22,189 | |
| Aemetis, Inc. (a)(b) | 6,669 | 6,536 | |
| Alliance Resource Partners LP | 70,562 | 740,901 | |
| Altus Midstream Co. (a)(b) | 48,954 | 94,481 | |
| Amplify Energy Corp. New warrants 5/4/22 (a) | 717 | 7 | |
| Berry Petroleum Corp. | 42,400 | 337,928 | |
| Blueknight Energy Partners LP | 42,817 | 45,814 | |
| Calumet Specialty Products Partners LP (a) | 61,788 | 190,925 | |
| Capital Product Partners LP | 9,983 | 115,204 | |
| Carrizo Oil & Gas, Inc. (a) | 51,622 | 330,897 | |
| Centennial Resource Development, Inc. Class A (a) | 146,786 | 453,569 | |
| Clean Energy Fuels Corp. (a) | 161,939 | 315,781 | |
| Diamondback Energy, Inc. | 91,756 | 7,096,409 | |
| Dorchester Minerals LP | 27,616 | 479,966 | |
| Extraction Oil & Gas, Inc. (a)(b) | 95,555 | 137,599 | |
| Gevo, Inc. (a)(b) | 22,927 | 52,503 | |
| Golar LNG Ltd. (b) | 55,145 | 717,988 | |
| Golar LNG Partners LP | 40,472 | 384,889 | |
| Green Plains Partners LP | 15,501 | 208,488 | |
| Green Plains, Inc. | 21,706 | 331,017 | |
| Gulfport Energy Corp. (a)(b) | 102,132 | 242,053 | |
| Hallador Energy Co. (b) | 23,992 | 71,736 | |
| Lonestar Resources U.S., Inc. (a)(b) | 22,387 | 44,326 | |
| Marine Petroleum Trust | 339 | 675 | |
| Martin Midstream Partners LP | 28,709 | 119,142 | |
| Mid-Con Energy Partners LP (a) | 12,520 | 2,970 | |
| New Fortress Energy LLC | 1,841 | 27,560 | |
| Nextdecade Corp. (a)(b) | 65,743 | 430,617 | |
| Pacific Ethanol, Inc. (a)(b) | 84,787 | 41,028 | |
| PDC Energy, Inc. (a) | 36,660 | 833,282 | |
| Penn Virginia Corp. (a) | 8,755 | 211,433 | |
| PrimeEnergy Corp. (a) | 482 | 71,770 | |
| Renewable Energy Group, Inc. (a) | 19,160 | 326,870 | |
| StealthGas, Inc. (a)(b) | 21,084 | 73,372 | |
| Tellurian, Inc. (a)(b) | 137,676 | 1,003,658 | |
| Torchlight Energy Resources, Inc. (a)(b) | 84,218 | 60,637 | |
| TransGlobe Energy Corp. | 84,684 | 96,268 | |
| U.S. Energy Corp. (a) | 529 | 179 | |
| Vertex Energy, Inc. (a)(b) | 18,165 | 29,246 | |
| Viper Energy Partners LP | 35,053 | 831,457 | |
| Westwater Resources, Inc. (a)(b) | 828 | 2,145 | |
| Zion Oil & Gas, Inc. (a)(b) | 135,287 | 24,081 | |
| 16,607,596 | |||
| TOTAL ENERGY | 19,383,130 | ||
| FINANCIALS - 6.0% | |||
| Banks - 2.6% | |||
| 1st Constitution Bancorp | 4,489 | 91,486 | |
| 1st Source Corp. | 16,617 | 854,280 | |
| ACNB Corp. | 4,529 | 159,511 | |
| Allegiance Bancshares, Inc. (a)(b) | 13,633 | 489,152 | |
| American National Bankshares, Inc. | 6,086 | 230,233 | |
| American River Bankshares | 3,241 | 48,615 | |
| Ameris Bancorp | 43,699 | 1,907,461 | |
| Ames National Corp. | 6,067 | 171,029 | |
| Arrow Financial Corp. | 9,057 | 324,784 | |
| Atlantic Capital Bancshares, Inc. (a) | 20,721 | 392,041 | |
| BancFirst Corp. | 20,722 | 1,224,463 | |
| Bancorp, Inc., Delaware (a) | 36,694 | 406,936 | |
| Bank of Commerce Holdings | 11,306 | 129,454 | |
| Bank of Marin Bancorp | 13,628 | 615,032 | |
| Bank OZK | 71,682 | 2,127,522 | |
| BankFinancial Corp. | 14,628 | 199,672 | |
| Bankwell Financial Group, Inc. | 4,285 | 125,465 | |
| Banner Corp. | 19,210 | 1,049,442 | |
| BCB Bancorp, Inc. | 9,394 | 127,195 | |
| BOK Financial Corp. (b) | 40,141 | 3,345,351 | |
| Boston Private Financial Holdings, Inc. | 54,176 | 636,026 | |
| Bridge Bancorp, Inc. | 16,145 | 527,619 | |
| Brookline Bancorp, Inc., Delaware | 43,929 | 705,060 | |
| Bryn Mawr Bank Corp. | 10,749 | 422,113 | |
| C & F Financial Corp. | 2,765 | 155,670 | |
| Camden National Corp. | 10,935 | 475,016 | |
| Capital City Bank Group, Inc. | 17,094 | 494,529 | |
| Capstar Financial Holdings, Inc. | 13,933 | 234,074 | |
| Carolina Financial Corp. | 12,628 | 534,038 | |
| Cathay General Bancorp | 45,230 | 1,665,369 | |
| Centerstate Banks of Florida, Inc. | 72,405 | 1,841,259 | |
| Central Valley Community Bancorp | 8,707 | 183,718 | |
| Century Bancorp, Inc. Class A (non-vtg.) | 2,504 | 218,474 | |
| Chemung Financial Corp. | 4,490 | 205,507 | |
| Citizens Community Bancorp, Inc. | 3,814 | 45,577 | |
| Citizens Holding Co. (b) | 1,310 | 29,108 | |
| City Holding Co. | 11,138 | 885,248 | |
| Civista Bancshares, Inc. | 12,037 | 260,962 | |
| CNB Financial Corp., Pennsylvania | 11,686 | 369,979 | |
| Codorus Valley Bancorp, Inc. | 7,465 | 160,572 | |
| Colony Bankcorp, Inc. | 3,930 | 63,705 | |
| Columbia Banking Systems, Inc. (b) | 40,980 | 1,601,498 | |
| Commerce Bancshares, Inc. (b) | 61,941 | 4,151,905 | |
| Community Bankers Trust Corp. | 16,444 | 142,898 | |
| Community Financial Corp. | 3,550 | 122,369 | |
| Community Trust Bancorp, Inc. | 10,703 | 480,993 | |
| ConnectOne Bancorp, Inc. | 20,190 | 508,586 | |
| County Bancorp, Inc. | 3,530 | 85,214 | |
| CVB Financial Corp. | 78,520 | 1,677,187 | |
| DNB Financial Corp. | 2,582 | 119,263 | |
| Eagle Bancorp Montana, Inc. | 2,037 | 43,551 | |
| Eagle Bancorp, Inc. | 20,439 | 907,900 | |
| East West Bancorp, Inc. | 80,678 | 3,696,666 | |
| Enterprise Bancorp, Inc. | 7,478 | 238,473 | |
| Enterprise Financial Services Corp. | 14,907 | 673,796 | |
| Equity Bancshares, Inc. (a) | 10,160 | 299,212 | |
| Farmers & Merchants Bancorp, Inc. (b) | 7,012 | 181,961 | |
| Farmers National Banc Corp. | 18,733 | 287,364 | |
| Fifth Third Bancorp | 427,468 | 12,905,259 | |
| Financial Institutions, Inc. | 9,689 | 315,668 | |
| First Bancorp, North Carolina | 16,272 | 636,235 | |
| First Bancshares, Inc. | 10,617 | 356,307 | |
| First Bank Hamilton New Jersey | 14,532 | 157,382 | |
| First Busey Corp. | 30,575 | 813,295 | |
| First Capital, Inc. (b) | 704 | 47,837 | |
| First Citizens Bancshares, Inc. | 5,801 | 3,015,360 | |
| First Community Bankshares, In | 14,247 | 434,391 | |
| First Community Corp. | 3,289 | 67,523 | |
| First Financial Bancorp, Ohio (b) | 54,824 | 1,333,320 | |
| First Financial Bankshares, Inc. (b) | 75,890 | 2,623,517 | |
| First Financial Corp., Indiana | 8,773 | 387,942 | |
| First Financial Northwest, Inc. | 10,995 | 161,956 | |
| First Foundation, Inc. | 23,394 | 383,428 | |
| First Guaranty Bancshares, Inc. | 6,656 | 143,104 | |
| First Hawaiian, Inc. | 75,226 | 2,146,950 | |
| First Internet Bancorp | 8,630 | 195,901 | |
| First Interstate Bancsystem, Inc. | 23,763 | 1,000,422 | |
| First Merchants Corp. | 33,307 | 1,348,600 | |
| First Mid-Illinois Bancshares, Inc. | 11,244 | 393,315 | |
| First Midwest Bancorp, Inc., Delaware | 59,323 | 1,279,004 | |
| First Northwest Bancorp | 6,852 | 120,801 | |
| First of Long Island Corp. | 18,772 | 454,846 | |
| Flushing Financial Corp. | 19,256 | 408,227 | |
| Fulton Financial Corp. | 98,096 | 1,683,327 | |
| German American Bancorp, Inc. | 17,425 | 587,223 | |
| Glacier Bancorp, Inc. (b) | 47,138 | 2,067,001 | |
| Great Southern Bancorp, Inc. | 10,419 | 635,872 | |
| Grupo Financiero Galicia SA sponsored ADR | 38,413 | 513,198 | |
| Guaranty Bancshares, Inc. Texas | 8,164 | 269,820 | |
| Hancock Whitney Corp. | 47,418 | 1,925,645 | |
| Hanmi Financial Corp. | 20,339 | 399,255 | |
| HarborOne Bancorp, Inc. | 37,204 | 394,734 | |
| Hawthorn Bancshares, Inc. | 792 | 19,269 | |
| Heartland Financial U.S.A., Inc. | 19,354 | 913,896 | |
| Heritage Commerce Corp. | 29,498 | 368,725 | |
| Heritage Financial Corp., Washington | 22,026 | 607,477 | |
| Home Bancshares, Inc. | 94,396 | 1,776,533 | |
| HomeTrust Bancshares, Inc. | 11,346 | 296,471 | |
| Hope Bancorp, Inc. | 71,026 | 1,030,587 | |
| Horizon Bancorp, Inc. Indiana | 31,602 | 594,750 | |
| Howard Bancorp, Inc. (a) | 11,970 | 199,420 | |
| Huntington Bancshares, Inc. | 593,654 | 8,839,508 | |
| IBERIABANK Corp. | 30,726 | 2,242,691 | |
| Independent Bank Corp. | 20,718 | 463,047 | |
| Independent Bank Corp., Massachusetts | 19,887 | 1,674,485 | |
| Independent Bank Group, Inc. | 24,511 | 1,412,569 | |
| International Bancshares Corp. | 40,448 | 1,715,804 | |
| Investar Holding Corp. | 8,715 | 218,049 | |
| Investors Bancorp, Inc. | 163,153 | 1,967,625 | |
| Lakeland Bancorp, Inc. | 40,167 | 669,986 | |
| Lakeland Financial Corp. (b) | 16,292 | 767,679 | |
| Landmark Bancorp, Inc. | 2,434 | 57,808 | |
| LCNB Corp. | 12,147 | 224,598 | |
| Live Oak Bancshares, Inc. (b) | 19,604 | 357,773 | |
| Macatawa Bank Corp. | 20,908 | 223,925 | |
| Mercantil Bank Holding Corp. Class A (b) | 10,100 | 222,604 | |
| Mercantile Bank Corp. | 12,064 | 425,256 | |
| Midland States Bancorp, Inc. | 16,529 | 464,134 | |
| MidWestOne Financial Group, Inc. | 8,799 | 299,166 | |
| MutualFirst Financial, Inc. | 4,994 | 198,012 | |
| National Bankshares, Inc. | 4,034 | 172,978 | |
| NBT Bancorp, Inc. | 26,688 | 1,067,520 | |
| Nicolet Bankshares, Inc. (a) | 7,073 | 512,510 | |
| Northeast Bank | 7,547 | 163,015 | |
| Northrim Bancorp, Inc. | 5,057 | 189,486 | |
| Norwood Financial Corp. | 3,432 | 120,120 | |
| Oak Valley Bancorp Oakdale California (b) | 5,104 | 95,598 | |
| Old National Bancorp, Indiana (b) | 98,049 | 1,772,726 | |
| Old Point Financial Corp. | 2,751 | 78,404 | |
| Old Second Bancorp, Inc. | 25,460 | 314,431 | |
| Opus Bank (b) | 23,539 | 605,188 | |
| Orrstown Financial Services, Inc. | 7,486 | 164,093 | |
| Pacific Mercantile Bancorp (a) | 11,962 | 85,648 | |
| Pacific Premier Bancorp, Inc. | 41,228 | 1,320,945 | |
| PacWest Bancorp (b) | 67,576 | 2,516,530 | |
| Patriot National Bancorp, Inc. | 1,723 | 21,624 | |
| Peapack-Gladstone Financial Corp. | 13,648 | 408,075 | |
| Penns Woods Bancorp, Inc. | 4,912 | 155,563 | |
| People's Utah Bancorp | 12,757 | 374,418 | |
| Peoples Bancorp of North Carolina | 2,809 | 88,484 | |
| Peoples Bancorp, Inc. | 13,997 | 457,842 | |
| Peoples Financial Services Corp. | 4,097 | 201,245 | |
| Peoples United Financial, Inc. | 243,455 | 4,017,008 | |
| Pinnacle Financial Partners, Inc. | 43,093 | 2,646,772 | |
| Popular, Inc. | 55,903 | 3,091,995 | |
| Preferred Bank, Los Angeles (b) | 9,881 | 544,937 | |
| Premier Financial Bancorp, Inc. | 14,394 | 261,251 | |
| QCR Holdings, Inc. | 9,138 | 381,968 | |
| RBB Bancorp | 10,860 | 217,417 | |
| Reliant Bancorp, Inc. (b) | 8,809 | 196,793 | |
| Renasant Corp. | 31,733 | 1,123,348 | |
| Republic Bancorp, Inc., Kentucky Class A | 13,488 | 623,146 | |
| Republic First Bancorp, Inc. (a) | 51,967 | 205,789 | |
| S&T Bancorp, Inc. | 20,420 | 770,242 | |
| Salisbury Bancorp, Inc. | 1,410 | 66,975 | |
| Sandy Spring Bancorp, Inc. | 19,903 | 703,770 | |
| SB Financial Group, Inc. | 3,090 | 56,362 | |
| SB One Bancorp | 5,449 | 128,814 | |
| Seacoast Banking Corp., Florida (a) | 27,356 | 813,841 | |
| Select Bancorp, Inc. New (a) | 7,749 | 92,446 | |
| ServisFirst Bancshares, Inc. (b) | 31,925 | 1,160,793 | |
| Shore Bancshares, Inc. | 9,065 | 151,748 | |
| Sierra Bancorp | 9,675 | 259,290 | |
| Signature Bank | 29,716 | 3,665,766 | |
| Simmons First National Corp. Class A | 51,609 | 1,337,189 | |
| SmartFinancial, Inc. | 10,154 | 231,511 | |
| Sound Financial Bancorp, Inc. | 560 | 20,076 | |
| South State Corp. | 19,799 | 1,648,861 | |
| Southern First Bancshares, Inc. (a) | 4,670 | 200,016 | |
| Southern National Bancorp of Virginia, Inc. | 16,511 | 263,020 | |
| Southside Bancshares, Inc. | 18,447 | 647,674 | |
| Stock Yards Bancorp, Inc. | 17,937 | 742,412 | |
| Summit Financial Group, Inc. | 12,099 | 326,068 | |
| Summit State Bank | 3,173 | 39,187 | |
| SVB Financial Group (a) | 29,443 | 6,822,826 | |
| Tcf Financial Corp. | 73,163 | 3,108,696 | |
| Texas Capital Bancshares, Inc. (a) | 27,968 | 1,616,550 | |
| The Bank of Princeton | 4,360 | 124,958 | |
| The First Bancorp, Inc. | 6,253 | 178,085 | |
| TowneBank | 39,887 | 1,122,819 | |
| Trico Bancshares | 20,207 | 781,001 | |
| TriState Capital Holdings, Inc. (a) | 23,198 | 562,088 | |
| Triumph Bancorp, Inc. (a) | 13,714 | 491,784 | |
| Trustmark Corp. (b) | 44,476 | 1,528,195 | |
| UMB Financial Corp. (b) | 27,775 | 1,868,424 | |
| Umpqua Holdings Corp. | 122,752 | 2,009,450 | |
| Union Bankshares Corp. | 45,844 | 1,732,903 | |
| Union Bankshares, Inc. (b) | 2,141 | 72,751 | |
| United Bankshares, Inc., West Virginia (b) | 57,556 | 2,179,646 | |
| United Community Bank, Inc. | 45,447 | 1,408,857 | |
| United Security Bancshares, Inc. | 3,330 | 35,631 | |
| Unity Bancorp, Inc. | 5,768 | 127,761 | |
| Univest Corp. of Pennsylvania | 18,579 | 485,098 | |
| Valley National Bancorp (b) | 185,720 | 2,150,638 | |
| Veritex Holdings, Inc. | 30,535 | 794,215 | |
| Washington Trust Bancorp, Inc. (b) | 11,648 | 607,909 | |
| Wellesley Bancorp, Inc. | 1,635 | 53,236 | |
| WesBanco, Inc. | 43,671 | 1,593,118 | |
| West Bancorp., Inc. | 9,814 | 238,284 | |
| Westamerica Bancorp. (b) | 16,135 | 1,048,775 | |
| Wintrust Financial Corp. | 31,414 | 2,133,325 | |
| Zions Bancorp NA | 103,830 | 5,168,657 | |
| 184,778,703 | |||
| Capital Markets - 1.9% | |||
| AGM Group Holdings, Inc. (a)(b) | 2,452 | 50,732 | |
| B. Riley Financial, Inc. (b) | 14,066 | 410,868 | |
| BGC Partners, Inc. Class A | 163,907 | 950,661 | |
| Blucora, Inc. (a) | 26,443 | 622,468 | |
| Capital Southwest Corp. | 11,586 | 256,051 | |
| Capitala Finance Corp. | 9,727 | 82,582 | |
| Carlyle Group LP | 66,783 | 1,990,133 | |
| China Finance Online Co. Ltd. ADR (a) | 8,455 | 4,819 | |
| China Internet Nationwide Financial Services, Inc. (a)(b) | 11,616 | 9,874 | |
| CM Finance, Inc. | 10,178 | 73,383 | |
| CME Group, Inc. | 199,269 | 40,397,804 | |
| Cowen Group, Inc. Class A (a)(b) | 15,542 | 238,103 | |
| Diamond Hill Investment Group, Inc. | 2,071 | 282,795 | |
| E*TRADE Financial Corp. | 104,344 | 4,622,439 | |
| Focus Financial Partners, Inc. Class A (a) | 25,930 | 728,892 | |
| Hamilton Lane, Inc. Class A | 15,282 | 886,356 | |
| Harvest Capital Credit Corp. | 3,546 | 32,588 | |
| Hennessy Advisors, Inc. (b) | 3,812 | 45,287 | |
| Horizon Technology Finance Corp. | 12,178 | 152,103 | |
| Interactive Brokers Group, Inc. | 33,600 | 1,626,912 | |
| INTL FCStone, Inc. (a) | 11,087 | 443,480 | |
| LPL Financial | 48,249 | 4,455,795 | |
| MarketAxess Holdings, Inc. | 22,691 | 9,163,080 | |
| Morningstar, Inc. | 23,865 | 3,749,192 | |
| Newtek Business Services Corp. (b) | 17,076 | 399,066 | |
| Northern Trust Corp. | 122,182 | 13,102,798 | |
| SEI Investments Co. | 85,434 | 5,513,056 | |
| Siebert Financial Corp. (a)(b) | 13,759 | 146,396 | |
| Silvercrest Asset Management Group Class A | 5,385 | 69,736 | |
| T. Rowe Price Group, Inc. | 132,166 | 16,330,431 | |
| TD Ameritrade Holding Corp. | 313,476 | 16,247,461 | |
| The NASDAQ OMX Group, Inc. | 92,405 | 9,684,044 | |
| U.S. Global Investments, Inc. Class A (b) | 15,643 | 22,526 | |
| Value Line, Inc. | 5,177 | 141,902 | |
| Virtu Financial, Inc. Class A (b) | 54,933 | 911,888 | |
| Virtus Investment Partners, Inc. (b) | 4,331 | 510,192 | |
| Wins Finance Holdings, Inc. (a) | 9,151 | 106,701 | |
| WisdomTree Investments, Inc. (b) | 86,714 | 421,430 | |
| Yintech Investment Holdings Ltd. sponsored ADR (a) | 5,350 | 25,948 | |
| 134,909,972 | |||
| Consumer Finance - 0.2% | |||
| Atlanticus Holdings Corp. (a) | 2,688 | 21,208 | |
| Consumer Portfolio Services, Inc. (a) | 11,810 | 39,564 | |
| Credit Acceptance Corp. (a)(b) | 10,504 | 4,521,552 | |
| Encore Capital Group, Inc. (a)(b) | 18,864 | 687,970 | |
| EZCORP, Inc. (non-vtg.) Class A (a)(b) | 27,154 | 139,028 | |
| First Cash Financial Services, Inc. | 27,098 | 2,190,602 | |
| LexinFintech Holdings Ltd. ADR (a)(b) | 49,254 | 586,615 | |
| Navient Corp. | 148,246 | 2,127,330 | |
| Nicholas Financial, Inc. (a) | 4,973 | 43,563 | |
| PRA Group, Inc. (a)(b) | 26,291 | 963,302 | |
| SLM Corp. | 242,531 | 2,068,789 | |
| World Acceptance Corp. (a) | 6,070 | 576,589 | |
| 13,966,112 | |||
| Diversified Financial Services - 0.0% | |||
| A-Mark Precious Metals, Inc. (a) | 3,619 | 34,236 | |
| GWG Holdings, Inc. (a)(b) | 1,575 | 16,380 | |
| LM Funding America, Inc. (a) | 30,394 | 24,926 | |
| Marlin Business Services Corp. | 10,171 | 218,066 | |
| 293,608 | |||
| Insurance - 0.9% | |||
| 1347 Property Insurance Holdings, Inc. (a) | 2,663 | 12,010 | |
| AMBAC Financial Group, Inc. (a) | 23,824 | 496,016 | |
| American National Insurance Co. | 15,004 | 1,770,472 | |
| Amerisafe, Inc. | 10,118 | 683,977 | |
| Arch Capital Group Ltd. (a) | 225,167 | 9,450,259 | |
| Atlas Financial Holdings, Inc. (a)(b) | 12,786 | 6,911 | |
| Brighthouse Financial, Inc. (a) | 65,112 | 2,680,010 | |
| Cincinnati Financial Corp. | 91,149 | 9,757,500 | |
| Conifer Holdings, Inc. (a) | 3,170 | 11,571 | |
| Donegal Group, Inc. Class A | 11,965 | 175,048 | |
| eHealth, Inc. (a)(b) | 13,205 | 1,218,293 | |
| Enstar Group Ltd. (a) | 10,015 | 2,045,163 | |
| Erie Indemnity Co. Class A (b) | 25,761 | 4,361,337 | |
| Fanhua, Inc. ADR | 19,517 | 530,862 | |
| Fednat Holding Co. | 9,090 | 135,532 | |
| Global Indemnity Ltd. | 6,861 | 197,391 | |
| Goosehead Insurance (b) | 10,642 | 431,214 | |
| Greenlight Capital Re, Ltd. (a)(b) | 22,256 | 232,353 | |
| Hallmark Financial Services, Inc. (a) | 9,995 | 190,605 | |
| Health Insurance Innovations, Inc. (a)(b) | 7,603 | 136,626 | |
| Investors Title Co. | 1,165 | 186,691 | |
| James River Group Holdings Ltd. | 16,877 | 667,654 | |
| Kingstone Companies, Inc. | 5,340 | 40,744 | |
| Kinsale Capital Group, Inc. | 12,990 | 1,315,367 | |
| Maiden Holdings Ltd. (a) | 82,019 | 62,105 | |
| National General Holdings Corp. | 59,537 | 1,267,543 | |
| National Western Life Group, Inc. | 1,801 | 454,266 | |
| NI Holdings, Inc. (a) | 11,932 | 199,742 | |
| Oxbridge Re Holdings Ltd. (a)(b) | 1,344 | 1,129 | |
| Principal Financial Group, Inc. | 155,346 | 8,559,565 | |
| Protective Insurance Corp. Class B | 6,937 | 117,027 | |
| Safety Insurance Group, Inc. | 9,688 | 946,033 | |
| Selective Insurance Group, Inc. | 32,753 | 2,168,904 | |
| Sirius International Insurance (a) | 65 | 553 | |
| State Auto Financial Corp. | 24,267 | 795,472 | |
| Tiptree, Inc. | 19,919 | 155,169 | |
| Trupanion, Inc. (a)(b) | 19,285 | 657,233 | |
| Unico American Corp. (a) | 761 | 4,756 | |
| United Fire Group, Inc. | 14,078 | 618,587 | |
| United Insurance Holdings Corp. (b) | 27,483 | 348,759 | |
| Willis Group Holdings PLC | 55,728 | 10,947,208 | |
| 64,037,657 | |||
| Mortgage Real Estate Investment Trusts - 0.1% | |||
| AGNC Investment Corp. | 300,028 | 5,196,485 | |
| Manhattan Bridge Capital, Inc. | 5,249 | 33,069 | |
| New York Mortgage Trust, Inc. | 103,794 | 646,637 | |
| 5,876,191 | |||
| Thrifts & Mortgage Finance - 0.3% | |||
| America First Tax Exempt Investors LP | 39,141 | 291,209 | |
| Capitol Federal Financial, Inc. | 78,815 | 1,117,597 | |
| Carver Bancorp, Inc. (a)(b) | 695 | 1,897 | |
| Columbia Financial, Inc. (a) | 64,365 | 1,072,321 | |
| Dime Community Bancshares, Inc. | 28,629 | 577,161 | |
| Entegra Financial Corp. (a) | 4,492 | 134,940 | |
| First Defiance Financial Corp. | 14,450 | 435,668 | |
| FS Bancorp, Inc. | 2,413 | 144,249 | |
| Greene County Bancorp, Inc. | 3,965 | 114,668 | |
| Hingham Institution for Savings | 1,454 | 278,819 | |
| HMN Financial, Inc. (a) | 2,379 | 49,816 | |
| Home Bancorp, Inc. | 7,434 | 286,804 | |
| HomeStreet, Inc. (a) | 17,959 | 573,251 | |
| Kearny Financial Corp. (b) | 52,753 | 743,817 | |
| LendingTree, Inc. (a)(b) | 7,582 | 2,733,538 | |
| Meridian Bancorp, Inc. Maryland | 33,634 | 677,052 | |
| Meta Financial Group, Inc. | 21,290 | 757,285 | |
| MMA Capital Management, LLC (a) | 3,757 | 120,111 | |
| NMI Holdings, Inc. (a) | 38,659 | 1,297,783 | |
| Northfield Bancorp, Inc. | 40,297 | 681,019 | |
| Northwest Bancshares, Inc. | 57,834 | 962,358 | |
| OceanFirst Financial Corp. | 28,615 | 686,188 | |
| Oritani Financial Corp. | 30,646 | 570,016 | |
| PB Bancorp, Inc. | 4,855 | 73,408 | |
| PCSB Financial Corp. | 16,016 | 326,726 | |
| Provident Bancorp, Inc. (a) | 14,544 | 171,619 | |
| Prudential Bancorp, Inc. | 4,228 | 76,104 | |
| Randolph Bancorp, Inc. (a) | 3,346 | 53,536 | |
| Riverview Bancorp, Inc. | 11,994 | 86,717 | |
| Severn Bancorp, Inc. | 2,731 | 24,333 | |
| Southern Missouri Bancorp, Inc. | 6,368 | 238,036 | |
| TFS Financial Corp. (b) | 158,293 | 3,211,765 | |
| Timberland Bancorp, Inc. | 4,312 | 127,786 | |
| Trustco Bank Corp., New York | 71,787 | 630,290 | |
| United Community Financial Corp. | 40,273 | 447,433 | |
| Washington Federal, Inc. | 44,185 | 1,626,450 | |
| Waterstone Financial, Inc. | 20,236 | 381,853 | |
| Westfield Financial, Inc. | 19,217 | 188,519 | |
| WMI Holdings Corp. (a) | 48,924 | 657,539 | |
| WSFS Financial Corp. | 34,542 | 1,540,228 | |
| 24,169,909 | |||
| TOTAL FINANCIALS | 428,032,152 | ||
| HEALTH CARE - 9.3% | |||
| Biotechnology - 5.4% | |||
| Abeona Therapeutics, Inc. (a) | 21,245 | 71,596 | |
| AC Immune SA (a)(b) | 32,299 | 258,392 | |
| ACADIA Pharmaceuticals, Inc. (a) | 83,310 | 3,773,110 | |
| Acceleron Pharma, Inc. (a) | 28,917 | 1,415,776 | |
| Achillion Pharmaceuticals, Inc. (a) | 100,610 | 624,788 | |
| Acorda Therapeutics, Inc. (a) | 24,577 | 39,323 | |
| Adamas Pharmaceuticals, Inc. (a) | 14,212 | 84,561 | |
| Adaptimmune Therapeutics PLC sponsored ADR (a)(b) | 64,000 | 74,880 | |
| ADMA Biologics, Inc. (a)(b) | 46,418 | 220,486 | |
| Aduro Biotech, Inc. (a) | 72,379 | 86,131 | |
| Adverum Biotechnologies, Inc. (a)(b) | 49,267 | 537,503 | |
| Aeglea BioTherapeutics, Inc. (a) | 17,024 | 145,555 | |
| AEterna Zentaris, Inc. (a) | 23,853 | 21,587 | |
| Affimed NV (a) | 66,074 | 170,471 | |
| Agenus, Inc. (a)(b) | 62,916 | 263,618 | |
| Agios Pharmaceuticals, Inc. (a)(b) | 34,646 | 1,347,729 | |
| Aileron Therapeutics, Inc. (a)(b) | 30,009 | 14,407 | |
| Aimmune Therapeutics, Inc. (a)(b) | 32,857 | 917,367 | |
| Akebia Therapeutics, Inc. (a) | 62,149 | 390,917 | |
| Albireo Pharma, Inc. (a)(b) | 8,861 | 200,436 | |
| Aldeyra Therapeutics, Inc. (a) | 13,303 | 106,158 | |
| Alector, Inc. (b) | 5,346 | 99,649 | |
| Alexion Pharmaceuticals, Inc. (a) | 94,170 | 10,729,730 | |
| Alkermes PLC (a)(b) | 86,661 | 1,821,614 | |
| Allakos, Inc. (a)(b) | 34,164 | 3,245,580 | |
| Allogene Therapeutics, Inc. (a)(b) | 67,741 | 1,908,941 | |
| Alnylam Pharmaceuticals, Inc. (a)(b) | 58,893 | 6,898,726 | |
| Alpine Immune Sciences, Inc. (a) | 7,313 | 21,829 | |
| Alterity Therapeutics Ltd. ADR (a) | 12,128 | 11,642 | |
| Altimmune, Inc. (a) | 14,423 | 26,250 | |
| AMAG Pharmaceuticals, Inc. (a)(b) | 20,946 | 223,075 | |
| Amarin Corp. PLC ADR (a)(b) | 184,502 | 3,924,358 | |
| Amgen, Inc. | 270,232 | 63,428,855 | |
| Amicus Therapeutics, Inc. (a)(b) | 124,177 | 1,301,375 | |
| AnaptysBio, Inc. (a) | 14,537 | 196,104 | |
| Anavex Life Sciences Corp. (a)(b) | 43,868 | 105,283 | |
| Anika Therapeutics, Inc. (a) | 7,769 | 449,048 | |
| Apellis Pharmaceuticals, Inc. (a) | 33,426 | 898,491 | |
| Applied Genetic Technologies Corp. (a) | 25,159 | 68,936 | |
| Aptevo Therapeutics, Inc. (a)(b) | 52,050 | 33,833 | |
| Aptinyx, Inc. (a)(b) | 17,575 | 71,355 | |
| Aptorum Group Ltd. (a)(b) | 470 | 7,276 | |
| Aptose Biosciences, Inc. (a) | 32,455 | 87,953 | |
| AquaBounty Technologies, Inc. (a)(b) | 28,451 | 64,015 | |
| AquaMed Technologies, Inc. (c) | 19,156 | 0 | |
| Arbutus Biopharma Corp. (a)(b) | 47,582 | 79,462 | |
| Arcturus Therapeutics Holdings, Inc. (a) | 13,473 | 150,493 | |
| Ardelyx, Inc. (a) | 7,211 | 53,578 | |
| Arena Pharmaceuticals, Inc. (a) | 27,622 | 1,308,730 | |
| Argenx SE ADR (a)(b) | 12,861 | 1,904,071 | |
| ArQule, Inc. (a)(b) | 89,320 | 856,579 | |
| Arrowhead Pharmaceuticals, Inc. (a)(b) | 52,260 | 3,815,503 | |
| Ascendis Pharma A/S sponsored ADR (a) | 25,209 | 2,903,573 | |
| Assembly Biosciences, Inc. (a) | 15,822 | 256,633 | |
| Atara Biotherapeutics, Inc. (a)(b) | 25,727 | 365,581 | |
| Athenex, Inc. (a)(b) | 37,801 | 588,940 | |
| Athersys, Inc. (a)(b) | 104,254 | 137,615 | |
| aTyr Pharma, Inc. (b) | 5,845 | 28,641 | |
| Audentes Therapeutics, Inc. (a) | 23,737 | 689,085 | |
| Aurinia Pharmaceuticals, Inc. (a) | 64,985 | 515,981 | |
| Autolus Therapeutics Ltd. ADR (a)(b) | 11,332 | 169,980 | |
| AVEO Pharmaceuticals, Inc. (a) | 89,830 | 68,271 | |
| Avid Bioservices, Inc. (a) | 31,449 | 173,284 | |
| AVROBIO, Inc. (a) | 16,680 | 267,547 | |
| Axovant Gene Therapies Ltd. (a)(b) | 20,115 | 108,822 | |
| Baudax Bio, Inc. (a)(b) | 5,464 | 29,342 | |
| BeiGene Ltd. ADR (a) | 21,618 | 4,394,723 | |
| Bellicum Pharmaceuticals, Inc. (a)(b) | 29,218 | 25,338 | |
| BeyondSpring, Inc. (a)(b) | 11,563 | 143,959 | |
| Bio Path Holdings, Inc. (a)(b) | 1,554 | 11,267 | |
| BioCryst Pharmaceuticals, Inc. (a) | 67,634 | 192,757 | |
| Biogen, Inc. (a) | 86,763 | 26,012,415 | |
| BioLine RX Ltd. sponsored ADR (a)(b) | 5,772 | 15,123 | |
| BioMarin Pharmaceutical, Inc. (a) | 74,966 | 6,050,506 | |
| Biospecifics Technologies Corp. (a) | 5,980 | 328,900 | |
| BioXcel Therapeutics, Inc. (a)(b) | 1,586 | 9,865 | |
| bluebird bio, Inc. (a)(b) | 30,565 | 2,473,931 | |
| Blueprint Medicines Corp. (a) | 27,301 | 2,239,774 | |
| BrainStorm Cell Therpeutic, Inc. (a)(b) | 33,327 | 132,308 | |
| Bridgebio Pharma, Inc. | 54,500 | 1,580,500 | |
| Calithera Biosciences, Inc. (a) | 35,631 | 175,305 | |
| Calyxt, Inc. (a)(b) | 20,759 | 76,393 | |
| Cancer Genetics, Inc. (a)(b) | 4,795 | 42,244 | |
| Capricor Therapeutics, Inc. (a)(b) | 2,408 | 3,732 | |
| CareDx, Inc. (a) | 24,964 | 512,261 | |
| CASI Pharmaceuticals, Inc. (a)(b) | 57,733 | 191,096 | |
| Catabasis Pharmaceuticals, Inc. (a) | 1,462 | 8,275 | |
| Catalyst Biosciences, Inc. (a) | 8,396 | 45,758 | |
| Catalyst Pharmaceutical Partners, Inc. (a) | 57,815 | 268,262 | |
| Celldex Therapeutics, Inc. (a)(b) | 25,901 | 62,162 | |
| Cellectis SA sponsored ADR (a) | 8,366 | 116,287 | |
| Cellular Biomedicine Group, Inc. (a)(b) | 11,474 | 207,220 | |
| Celsion Corp. (a)(b) | 19,262 | 25,426 | |
| Checkpoint Therapeutics, Inc. (a) | 3,982 | 5,256 | |
| ChemoCentryx, Inc. (a) | 30,300 | 918,999 | |
| Chimerix, Inc. (a) | 38,096 | 83,811 | |
| China Biologic Products Holdings, Inc. (a)(b) | 21,949 | 2,559,473 | |
| Cidara Therapeutics, Inc. (a)(b) | 16,334 | 38,385 | |
| Clementia Pharmaceuticals, Inc. rights 12/31/99 (a)(c) | 21,066 | 28,439 | |
| Cleveland Biolabs, Inc. (a)(b) | 5,822 | 5,589 | |
| Clovis Oncology, Inc. (a)(b) | 31,645 | 472,460 | |
| Coherus BioSciences, Inc. (a)(b) | 41,375 | 744,336 | |
| Conatus Pharmaceuticals, Inc. (a)(b) | 78,690 | 29,084 | |
| Concert Pharmaceuticals, Inc. (a) | 16,713 | 126,016 | |
| Constellation Pharmaceuticals, Inc. (a) | 3,912 | 182,143 | |
| ContraFect Corp. (a) | 97,445 | 33,667 | |
| Corbus Pharmaceuticals Holdings, Inc. (a)(b) | 45,502 | 213,859 | |
| Cortexyme, Inc. (b) | 4,430 | 116,288 | |
| Corvus Pharmaceuticals, Inc. (a)(b) | 26,261 | 80,096 | |
| Crinetics Pharmaceuticals, Inc. (a)(b) | 14,734 | 288,197 | |
| CRISPR Therapeutics AG (a)(b) | 29,218 | 2,093,470 | |
| CTI BioPharma Corp. (a)(b) | 59,493 | 56,257 | |
| Cue Biopharma, Inc. (a) | 14,498 | 171,656 | |
| Curis, Inc. (a)(b) | 67,371 | 121,268 | |
| Cyclacel Pharmaceuticals, Inc. (a) | 62,636 | 33,510 | |
| Cyclerion Therapeutics, Inc. (a)(b) | 14,506 | 26,836 | |
| Cytokinetics, Inc. (a) | 37,780 | 365,333 | |
| CytomX Therapeutics, Inc. (a) | 23,173 | 145,063 | |
| DBV Technologies SA sponsored ADR (a) | 18,600 | 145,080 | |
| Deciphera Pharmaceuticals, Inc. (a) | 19,458 | 920,169 | |
| DelMar Pharmaceuticals, Inc. (a)(b) | 2,797 | 2,071 | |
| Denali Therapeutics, Inc. (a)(b) | 54,017 | 960,962 | |
| Dicerna Pharmaceuticals, Inc. (a) | 40,083 | 964,397 | |
| Dyadic International, Inc. (a)(b) | 10,556 | 65,236 | |
| Dynavax Technologies Corp. (a)(b) | 23,641 | 133,572 | |
| Eagle Pharmaceuticals, Inc. (a)(b) | 7,815 | 457,021 | |
| Edge Therapeutics, Inc. (a) | 11,050 | 25,857 | |
| Editas Medicine, Inc. (a)(b) | 29,210 | 884,479 | |
| Eidos Therapeutics, Inc. (a)(b) | 21,341 | 1,202,139 | |
| Eiger Biopharmaceuticals, Inc. (a) | 12,883 | 169,411 | |
| Enanta Pharmaceuticals, Inc. (a) | 10,515 | 669,385 | |
| Enlivex Therapeutics Ltd. (a)(b) | 620 | 5,344 | |
| Enochian Biosciences, Inc. (a)(b) | 2,164 | 12,573 | |
| Epizyme, Inc. (a)(b) | 50,580 | 835,582 | |
| Esperion Therapeutics, Inc. (a)(b) | 15,036 | 772,249 | |
| Evelo Biosciences, Inc. (a)(b) | 11,710 | 52,812 | |
| Exact Sciences Corp. (a) | 70,707 | 5,727,974 | |
| Exelixis, Inc. (a)(b) | 167,513 | 2,785,741 | |
| Fate Therapeutics, Inc. (a) | 43,000 | 671,660 | |
| Fibrocell Science, Inc. (a)(b) | 27,920 | 83,760 | |
| FibroGen, Inc. (a)(b) | 47,669 | 2,019,736 | |
| Five Prime Therapeutics, Inc. (a) | 18,559 | 72,751 | |
| Flexion Therapeutics, Inc. (a)(b) | 22,770 | 403,712 | |
| Fortress Biotech, Inc. (a)(b) | 102,429 | 211,004 | |
| Forty Seven, Inc. (a) | 21,768 | 275,148 | |
| Forward Pharma A/S sponsored ADR (a) | 3,498 | 2,868 | |
| G1 Therapeutics, Inc. (a)(b) | 19,940 | 430,704 | |
| Galapagos Genomics NV sponsored ADR (a)(b) | 5,742 | 1,124,341 | |
| Galectin Therapeutics, Inc. (a)(b) | 32,120 | 103,748 | |
| Galmed Pharmaceuticals Ltd. (a)(b) | 19,960 | 89,820 | |
| Gamida Cell Ltd. (a)(b) | 3,734 | 19,118 | |
| Gemphire Therapeutics, Inc. (a) | 15,305 | 5,410 | |
| Genocea Biosciences, Inc. (a) | 2,597 | 6,493 | |
| GenVec, Inc. rights (a)(c) | 385 | 0 | |
| Geron Corp. (a)(b) | 89,652 | 128,202 | |
| Gilead Sciences, Inc. | 544,389 | 36,604,716 | |
| Global Blood Therapeutics, Inc. (a)(b) | 31,502 | 2,094,883 | |
| GlycoMimetics, Inc. (a)(b) | 25,873 | 152,133 | |
| Gossamer Bio, Inc. | 7,625 | 194,438 | |
| Grifols SA ADR | 80,663 | 1,845,569 | |
| Gritstone Oncology, Inc. (a)(b) | 22,773 | 198,353 | |
| Halozyme Therapeutics, Inc. (a)(b) | 79,013 | 1,532,062 | |
| Heron Therapeutics, Inc. (a)(b) | 37,137 | 949,222 | |
| Homology Medicines, Inc. (a)(b) | 24,210 | 387,360 | |
| Idera Pharmaceuticals, Inc. (a)(b) | 34,140 | 59,745 | |
| Immunic, Inc. (a) | 3,262 | 22,867 | |
| ImmunoGen, Inc. (a) | 106,264 | 383,613 | |
| Immunomedics, Inc. (a)(b) | 108,124 | 2,030,569 | |
| Incyte Corp. (a) | 90,388 | 8,510,934 | |
| Infinity Pharmaceuticals, Inc. (a) | 33,793 | 42,917 | |
| InflaRx NV (a)(b) | 14,516 | 49,354 | |
| Inovio Pharmaceuticals, Inc. (a)(b) | 50,135 | 126,340 | |
| Insmed, Inc. (a) | 43,109 | 993,662 | |
| Intec Pharma Ltd. (a)(b) | 27,156 | 13,475 | |
| Intellia Therapeutics, Inc. (a)(b) | 30,035 | 520,507 | |
| Intercept Pharmaceuticals, Inc. (a)(b) | 17,915 | 1,941,449 | |
| Intrexon Corp. (a)(b) | 89,597 | 499,055 | |
| Ionis Pharmaceuticals, Inc. (a) | 76,971 | 4,923,065 | |
| Iovance Biotherapeutics, Inc. (a)(b) | 69,225 | 1,580,407 | |
| Ironwood Pharmaceuticals, Inc. Class A (a) | 84,201 | 1,012,096 | |
| Jounce Therapeutics, Inc. (a) | 23,443 | 126,827 | |
| Kalvista Pharmaceuticals, Inc. (a) | 14,657 | 212,233 | |
| Kamada (a)(b) | 21,224 | 157,694 | |
| Karyopharm Therapeutics, Inc. (a)(b) | 36,698 | 642,949 | |
| Kezar Life Sciences, Inc. (a) | 12,206 | 31,858 | |
| Kindred Biosciences, Inc. (a) | 19,674 | 154,834 | |
| Kiniksa Pharmaceuticals Ltd. (a)(b) | 13,830 | 147,290 | |
| Kodiak Sciences, Inc. (a)(b) | 7,324 | 216,790 | |
| Krystal Biotech, Inc. (a)(b) | 10,024 | 566,456 | |
| Kura Oncology, Inc. (a) | 21,217 | 338,199 | |
| La Jolla Pharmaceutical Co. (a)(b) | 30,869 | 84,581 | |
| Leap Therapeutics, Inc. (a)(b) | 43,420 | 31,262 | |
| Lexicon Pharmaceuticals, Inc. (a)(b) | 55,890 | 197,292 | |
| Ligand Pharmaceuticals, Inc.: | |||
| Class B (a)(b) | 11,364 | 1,284,132 | |
| General CVR (a) | 1,518 | 5 | |
| Glucagon CVR (a) | 1,518 | 61 | |
| rights (a) | 1,518 | 3 | |
| TR Beta CVR (a) | 1,518 | 315 | |
| LogicBio Therapeutics, Inc. (a)(b) | 7,717 | 62,045 | |
| Macrogenics, Inc. (a) | 25,781 | 244,146 | |
| Madrigal Pharmaceuticals, Inc. (a)(b) | 7,955 | 880,539 | |
| Magenta Therapeutics, Inc. (a) | 21,391 | 283,217 | |
| MannKind Corp. (a)(b) | 116,841 | 143,714 | |
| Marker Therapeutics, Inc. (a)(b) | 38,560 | 128,790 | |
| MediciNova, Inc. (a)(b) | 25,966 | 184,878 | |
| MEI Pharma, Inc. (a) | 46,651 | 91,436 | |
| MeiraGTx Holdings PLC (a)(b) | 20,488 | 394,804 | |
| Mereo Biopharma Group PLC: | |||
| ADR (a) | 8,456 | 19,449 | |
| rights 12/31/99 (a)(c) | 66,222 | 1 | |
| Mersana Therapeutics, Inc. (a) | 20,842 | 80,242 | |
| Merus B.V. (a)(b) | 16,443 | 270,981 | |
| Mesoblast Ltd. sponsored ADR (a)(b) | 11,676 | 73,092 | |
| Minerva Neurosciences, Inc. (a)(b) | 31,456 | 196,600 | |
| Miragen Therapeutics, Inc. (a)(b) | 30,380 | 24,304 | |
| Mirati Therapeutics, Inc. (a)(b) | 19,926 | 2,007,943 | |
| Moderna, Inc. (b) | 184,112 | 3,748,520 | |
| Molecular Templates, Inc. (a) | 21,082 | 274,698 | |
| Momenta Pharmaceuticals, Inc. (a) | 52,680 | 885,024 | |
| Morphosys AG sponsored ADR (a)(b) | 5,687 | 174,136 | |
| Mustang Bio, Inc. (a) | 16,234 | 51,462 | |
| Myriad Genetics, Inc. (a) | 40,846 | 1,051,376 | |
| NantKwest, Inc. (a)(b) | 64,846 | 111,535 | |
| Natera, Inc. (a) | 40,331 | 1,471,678 | |
| Neoleukin Therapeutics, Inc. (a) | 21,270 | 118,687 | |
| Neon Therapeutics, Inc. (a)(b) | 22,419 | 25,558 | |
| Neubase Therapeutics, Inc. (a) | 2,551 | 17,219 | |
| Neurocrine Biosciences, Inc. (a) | 50,516 | 5,890,671 | |
| NewLink Genetics Corp. (a)(b) | 37,734 | 57,356 | |
| Novavax, Inc. (a)(b) | 16,621 | 80,612 | |
| NuCana PLC ADR (a)(b) | 7,160 | 61,290 | |
| Nymox Pharmaceutical Corp. (a)(b) | 26,172 | 48,811 | |
| ObsEva SA (a)(b) | 13,125 | 59,719 | |
| Ocugen, Inc. (a) | 1,145 | 434 | |
| OncoMed Pharmaceuticals, Inc. rights (a)(c) | 66,222 | 1 | |
| OncoSec Medical, Inc. (a) | 6,995 | 14,899 | |
| Oncternal Therapeutics, Inc. (a)(b) | 4,320 | 24,192 | |
| Oncternal Therapeutics, Inc. rights (a)(c) | 4,319 | 0 | |
| Opko Health, Inc. (a)(b) | 327,340 | 520,471 | |
| Orchard Therapeutics PLC ADR (a) | 5,320 | 60,595 | |
| Organogenesis Holdings, Inc. Class A (a) | 1,911 | 9,803 | |
| Organovo Holdings, Inc. (a) | 121,146 | 61,070 | |
| Outlook Therapeutics, Inc. (a)(b) | 25,028 | 26,029 | |
| OvaScience, Inc. (a)(b) | 2,106 | 16,027 | |
| Ovid Therapeutics, Inc. (a)(b) | 44,626 | 190,107 | |
| PDL BioPharma, Inc. (a) | 72,841 | 225,807 | |
| PhaseBio Pharmaceuticals, Inc. (a)(b) | 7,274 | 23,713 | |
| Pieris Pharmaceuticals, Inc. (a) | 45,039 | 183,309 | |
| Pluristem Therapeutics, Inc. (a)(b) | 16,193 | 54,247 | |
| Polarityte, Inc. (a)(b) | 16,092 | 52,138 | |
| Portola Pharmaceuticals, Inc. (a)(b) | 37,130 | 1,060,062 | |
| Precision BioSciences, Inc. (a)(b) | 8,714 | 154,848 | |
| Principia Biopharma, Inc. (a) | 13,380 | 479,405 | |
| Progenics Pharmaceuticals, Inc. (a) | 44,482 | 232,196 | |
| ProQR Therapeutics BV (a)(b) | 29,511 | 252,024 | |
| Protagonist Therapeutics, Inc. (a)(b) | 18,825 | 163,778 | |
| Proteon Therapeutics, Inc. (a)(b) | 125,899 | 37,770 | |
| Proteostasis Therapeutics, Inc. (a)(b) | 39,785 | 97,075 | |
| Prothena Corp. PLC (a) | 20,886 | 267,759 | |
| PTC Therapeutics, Inc. (a) | 32,054 | 1,505,256 | |
| Puma Biotechnology, Inc. (a)(b) | 19,906 | 188,908 | |
| Ra Pharmaceuticals, Inc. (a) | 27,123 | 1,267,458 | |
| Radius Health, Inc. (a) | 32,063 | 718,211 | |
| Recro Pharma, Inc. (a)(b) | 13,660 | 225,936 | |
| Regeneron Pharmaceuticals, Inc. (a) | 45,414 | 16,757,766 | |
| REGENXBIO, Inc. (a) | 20,288 | 849,256 | |
| Regulus Therapeutics, Inc. (a)(b) | 26,459 | 21,961 | |
| Repligen Corp. (a) | 24,657 | 2,188,309 | |
| Replimune Group, Inc. (a)(b) | 18,986 | 263,905 | |
| Retrophin, Inc. (a) | 21,000 | 291,270 | |
| Rhythm Pharmaceuticals, Inc. (a)(b) | 17,832 | 400,328 | |
| Rigel Pharmaceuticals, Inc. (a) | 85,359 | 191,204 | |
| Rocket Pharmaceuticals, Inc. (a)(b) | 28,198 | 496,003 | |
| Rubius Therapeutics, Inc. (a)(b) | 48,503 | 373,473 | |
| Sage Therapeutics, Inc. (a)(b) | 28,483 | 4,408,314 | |
| Salarius Pharmaceuticals, Inc. (a)(b) | 4,894 | 19,576 | |
| Salarius Pharmaceuticals, Inc. rights 12/31/19 (a)(c) | 122,366 | 15,051 | |
| Sangamo Therapeutics, Inc. (a)(b) | 63,203 | 682,592 | |
| Sarepta Therapeutics, Inc. (a)(b) | 39,653 | 4,460,566 | |
| Savara, Inc. (a)(b) | 23,271 | 29,321 | |
| Scholar Rock Holding Corp. (a)(b) | 17,412 | 148,176 | |
| Seattle Genetics, Inc. (a)(b) | 89,290 | 10,746,052 | |
| Selecta Biosciences, Inc. (a)(b) | 39,533 | 64,834 | |
| Sellas Life Sciences Group, Inc. (a)(b) | 832 | 3,827 | |
| Seneca Biopharma, Inc. (a)(b) | 816 | 706 | |
| Seres Therapeutics, Inc. (a)(b) | 36,830 | 145,479 | |
| Sesen Bio, Inc. (a) | 53,077 | 62,631 | |
| Sierra Oncology, Inc. (a)(b) | 48,539 | 16,828 | |
| Sinovac Biotech Ltd. (a)(b)(c) | 27,717 | 179,329 | |
| Soleno Therapeutics, Inc. (a)(b) | 6,062 | 10,245 | |
| Solid Biosciences, Inc. (a)(b) | 21,532 | 84,621 | |
| Sophiris Bio, Inc. (a)(b) | 50,621 | 19,970 | |
| Sorrento Therapeutics, Inc. (a)(b) | 119,320 | 348,414 | |
| Spark Therapeutics, Inc. (a) | 21,183 | 2,354,279 | |
| Spectrum Pharmaceuticals, Inc. (a) | 62,195 | 558,511 | |
| Spero Therapeutics, Inc. (a) | 2,790 | 33,368 | |
| Spring Bank Pharmaceuticals, Inc. (a) | 7,420 | 32,203 | |
| Stemline Therapeutics, Inc. (a) | 20,419 | 218,279 | |
| Stoke Therapeutics, Inc. | 2,779 | 68,086 | |
| Summit Therapeutics PLC sponsored ADR (a)(b) | 1,658 | 2,487 | |
| Sunesis Pharmaceuticals, Inc. (a)(b) | 57,085 | 24,547 | |
| Surface Oncology, Inc. (a)(b) | 21,797 | 45,774 | |
| Sutro Biopharma, Inc. (a) | 2,538 | 28,121 | |
| Syndax Pharmaceuticals, Inc. (a) | 20,405 | 148,752 | |
| Synlogic, Inc. (a) | 16,162 | 34,587 | |
| Synthorx, Inc. (b) | 4,362 | 78,080 | |
| Syros Pharmaceuticals, Inc. (a)(b) | 30,508 | 155,591 | |
| T2 Biosystems, Inc. (a)(b) | 39,511 | 53,735 | |
| TCR2 Therapeutics, Inc. (b) | 1,183 | 20,052 | |
| Tenax Therapeutics, Inc. (a) | 31,497 | 38,741 | |
| TG Therapeutics, Inc. (a)(b) | 28,603 | 234,259 | |
| The Medicines Company (a)(b) | 42,065 | 3,541,873 | |
| Therapix Biosciences Ltd. ADR (a)(b) | 9,380 | 14,633 | |
| Tobira Therapeutics, Inc. rights (a)(c) | 6,103 | 50,228 | |
| Tocagen, Inc. (a)(b) | 27,851 | 18,242 | |
| TONIX Pharmaceuticals Holding (a)(b) | 1,253 | 1,416 | |
| TRACON Pharmaceuticals, Inc. (a) | 6,894 | 24,818 | |
| Translate Bio, Inc. (a)(b) | 32,385 | 325,469 | |
| Trevena, Inc. (a)(b) | 26,067 | 17,869 | |
| Trillium Therapeutics, Inc. (a) | 102,725 | 33,396 | |
| Turning Point Therapeutics, Inc. (b) | 8,362 | 470,112 | |
| Twist Bioscience Corp. (b) | 19,707 | 469,618 | |
| Tyme, Inc. (a)(b) | 74,416 | 84,090 | |
| Ultragenyx Pharmaceutical, Inc. (a)(b) | 31,680 | 1,256,112 | |
| uniQure B.V. (a)(b) | 21,974 | 1,223,073 | |
| United Therapeutics Corp. (a) | 24,437 | 2,254,558 | |
| UNITY Biotechnology, Inc. (a)(b) | 24,125 | 186,245 | |
| Unum Therapeutics, Inc. (a)(b) | 12,548 | 9,229 | |
| UroGen Pharma Ltd. (a)(b) | 11,085 | 350,729 | |
| Vanda Pharmaceuticals, Inc. (a) | 27,249 | 455,876 | |
| Vaxart, Inc. (a) | 30,160 | 9,802 | |
| VBI Vaccines, Inc. (a)(b) | 76,721 | 68,918 | |
| VBL Therapeutics (a)(b) | 11,422 | 14,849 | |
| Veracyte, Inc. (a)(b) | 31,185 | 895,633 | |
| Verastem, Inc. (a)(b) | 62,032 | 84,984 | |
| Vericel Corp. (a) | 23,148 | 431,942 | |
| Vertex Pharmaceuticals, Inc. (a) | 108,111 | 23,973,614 | |
| Viking Therapeutics, Inc. (a)(b) | 27,141 | 198,672 | |
| VistaGen Therapeutics, Inc. (a) | 32,116 | 15,416 | |
| Voyager Therapeutics, Inc. (a) | 19,838 | 270,590 | |
| vTv Therapeutics, Inc. Class A (a)(b) | 46,935 | 69,464 | |
| X4 Pharmaceuticals, Inc. (a) | 6,823 | 72,528 | |
| Xbiotech, Inc. (a)(b) | 29,608 | 340,196 | |
| Xencor, Inc. (a) | 31,196 | 1,229,122 | |
| Xenon Pharmaceuticals, Inc. (a)(b) | 19,242 | 227,633 | |
| XOMA Corp. (a) | 5,948 | 145,607 | |
| XOMA Corp. rights 12/18/19 | 398 | 0 | |
| Y-mAbs Therapeutics, Inc. (a) | 19,179 | 647,291 | |
| Yield10 Bioscience, Inc. (a) | 4,696 | 587 | |
| Zafgen, Inc. (a)(b) | 32,424 | 26,263 | |
| Zai Lab Ltd. ADR (a) | 11,050 | 439,790 | |
| Zealand Pharma A/S sponsored ADR (a)(b) | 4,264 | 131,118 | |
| ZIOPHARM Oncology, Inc. (a)(b) | 93,264 | 485,905 | |
| 383,752,829 | |||
| Health Care Equipment & Supplies - 1.9% | |||
| Abiomed, Inc. (a) | 25,225 | 4,948,641 | |
| Accuray, Inc. (a)(b) | 66,563 | 205,014 | |
| Aethlon Medical, Inc. (a)(b) | 2,749 | 7,972 | |
| Align Technology, Inc. (a) | 33,834 | 9,383,522 | |
| Alphatec Holdings, Inc. (a) | 9,991 | 70,437 | |
| Angiodynamics, Inc. (a) | 20,203 | 310,520 | |
| Antares Pharma, Inc. (a) | 98,062 | 463,833 | |
| Atossa Genetics, Inc. (a)(b) | 9,613 | 13,170 | |
| Atricure, Inc. (a) | 21,627 | 643,403 | |
| Atrion Corp. | 1,242 | 875,237 | |
| AxoGen, Inc. (a)(b) | 19,730 | 341,921 | |
| Axonics Modulation Technologies, Inc. (a)(b) | 9,808 | 239,217 | |
| Bellerophon Therapeutics, Inc. (a)(b) | 85,949 | 36,958 | |
| BioLase Technology, Inc. (a)(b) | 6,537 | 3,825 | |
| BioLife Solutions, Inc. (a)(b) | 13,623 | 228,185 | |
| BioSig Technologies, Inc. (a)(b) | 9,591 | 65,123 | |
| Bovie Medical Corp. (a) | 6,528 | 52,093 | |
| Cardiovascular Systems, Inc. (a) | 18,268 | 832,290 | |
| Cerus Corp. (a) | 91,130 | 395,504 | |
| Chembio Diagnostics, Inc. (a)(b) | 20,145 | 83,602 | |
| Chf Solutions, Inc. (a)(b) | 9,440 | 8,453 | |
| ConforMis, Inc. (a)(b) | 88,612 | 164,818 | |
| CONMED Corp. | 15,360 | 1,739,827 | |
| CryoPort, Inc. (a)(b) | 24,681 | 388,726 | |
| Cutera, Inc. (a) | 7,173 | 274,726 | |
| CytoSorbents Corp. (a)(b) | 23,932 | 95,489 | |
| Dare Bioscience, Inc. (a)(b) | 85,829 | 69,521 | |
| Dentsply Sirona, Inc. | 124,516 | 7,040,135 | |
| DexCom, Inc. (a) | 50,353 | 11,445,740 | |
| EDAP TMS SA sponsored ADR (a) | 33,404 | 169,024 | |
| Ekso Bionics Holdings, Inc. (a)(b) | 46,881 | 26,952 | |
| Elbit Imaging Ltd. (a) | 37 | 33 | |
| electroCore, Inc. (a)(b) | 23,325 | 35,221 | |
| Endologix, Inc. (a)(b) | 8,953 | 23,278 | |
| ENDRA Life Sciences, Inc. (a)(b) | 35,458 | 29,753 | |
| Establishment Labs Holdings, Inc. (a)(b) | 669 | 16,150 | |
| Fonar Corp. (a) | 3,366 | 66,882 | |
| Genmark Diagnostics, Inc. (a) | 39,251 | 219,021 | |
| Heska Corp.(a)(b) | 3,929 | 375,220 | |
| Hologic, Inc. (a) | 162,993 | 8,364,801 | |
| ICU Medical, Inc. (a) | 11,443 | 2,145,334 | |
| IDEXX Laboratories, Inc. (a) | 37,062 | 9,324,058 | |
| Innocoll Holdings PLC rights (a)(c) | 9,257 | 0 | |
| Inogen, Inc. (a) | 12,245 | 901,354 | |
| Insulet Corp. (a) | 31,809 | 5,906,931 | |
| Integra LifeSciences Holdings Corp. (a) | 48,069 | 2,931,728 | |
| IntriCon Corp. (a)(b) | 5,239 | 98,598 | |
| Intuitive Surgical, Inc. (a) | 48,332 | 28,656,043 | |
| InVivo Therapeutics Holdings Corp. (a)(b) | 3,296 | 470 | |
| IRadimed Corp. (a) | 7,542 | 165,773 | |
| iRhythm Technologies, Inc. (a)(b) | 12,962 | 934,431 | |
| Iridex Corp. (a) | 4,918 | 10,672 | |
| Kewaunee Scientific Corp. | 1,782 | 30,276 | |
| Lantheus Holdings, Inc. (a) | 21,338 | 445,964 | |
| LeMaitre Vascular, Inc. (b) | 13,069 | 464,864 | |
| Lianluo Smart Ltd. (a) | 837 | 407 | |
| LivaNova PLC (a) | 26,912 | 2,254,149 | |
| Masimo Corp. (a) | 29,749 | 4,613,177 | |
| Meridian Bioscience, Inc. | 34,794 | 318,365 | |
| Merit Medical Systems, Inc. (a) | 30,666 | 858,648 | |
| Mesa Laboratories, Inc. (b) | 2,161 | 505,933 | |
| Microbot Medical, Inc. (a)(b) | 19,737 | 98,093 | |
| Misonix, Inc. (a) | 7,809 | 160,631 | |
| Motus GI Holdings, Inc. (a)(b) | 7,140 | 13,495 | |
| Natus Medical, Inc. (a) | 17,480 | 559,185 | |
| Neogen Corp. (a) | 29,057 | 1,934,324 | |
| Neovasc, Inc. (a)(b) | 8,602 | 25,634 | |
| Neuronetics, Inc. (a) | 13,311 | 57,504 | |
| Novocure Ltd. (a)(b) | 57,775 | 5,325,700 | |
| NuVasive, Inc. (a) | 28,894 | 2,087,303 | |
| Obalon Therapeutics, Inc. (a)(b) | 4,977 | 9,058 | |
| OraSure Technologies, Inc. (a) | 31,978 | 259,022 | |
| Orthofix International NV (a) | 10,129 | 459,857 | |
| OrthoPediatrics Corp. (a)(b) | 12,686 | 499,067 | |
| Oxford Immunotec Global PLC (a) | 18,869 | 315,112 | |
| Pro-Dex, Inc. (a) | 5,104 | 71,609 | |
| Pulse Biosciences, Inc. (a)(b) | 12,866 | 186,814 | |
| Quidel Corp. (a) | 18,021 | 1,236,601 | |
| Quotient Ltd. (a)(b) | 54,054 | 464,324 | |
| ReWalk Robotics Ltd. (a)(b) | 11,372 | 28,885 | |
| Rockwell Medical Technologies, Inc. (a)(b) | 48,247 | 110,003 | |
| RTI Biologics, Inc. (a) | 44,518 | 82,358 | |
| Seaspine Holdings Corp. (a) | 16,598 | 219,592 | |
| Second Sight Medical Products, Inc. (a)(b) | 73,704 | 66,326 | |
| Shockwave Medical, Inc. (a)(b) | 12,628 | 494,512 | |
| Sientra, Inc. (a) | 14,846 | 127,082 | |
| Silk Road Medical, Inc. | 7,566 | 272,527 | |
| Soliton, Inc. (b) | 6,531 | 74,192 | |
| Staar Surgical Co. (a)(b) | 23,445 | 864,183 | |
| STRATA Skin Sciences, Inc. (a) | 17,447 | 43,269 | |
| SurModics, Inc. (a) | 7,764 | 318,635 | |
| Tactile Systems Technology, Inc. (a)(b) | 10,542 | 676,902 | |
| Tandem Diabetes Care, Inc. (a) | 32,090 | 2,215,173 | |
| Thermogenesis Holdings, Inc. (a) | 530 | 1,791 | |
| Trinity Biotech PLC sponsored ADR (a)(b) | 13,909 | 13,909 | |
| Utah Medical Products, Inc. | 4,044 | 431,980 | |
| Valeritas Holdings, Inc. (a)(b) | 5,420 | 8,835 | |
| Varex Imaging Corp. (a) | 21,352 | 639,279 | |
| Vermillion, Inc. (a)(b) | 34,227 | 26,868 | |
| ViewRay, Inc. (a)(b) | 35,896 | 119,175 | |
| Viveve Medical, Inc. (a) | 620 | 523 | |
| Wright Medical Group NV (a) | 59,144 | 1,760,717 | |
| Zosano Pharma Corp. (a)(b) | 6,478 | 12,114 | |
| Zynex, Inc. (b) | 12,953 | 136,007 | |
| 132,829,582 | |||
| Health Care Providers & Services - 0.4% | |||
| Acadia Healthcare Co., Inc. (a)(b) | 48,686 | 1,565,742 | |
| Addus HomeCare Corp. (a) | 7,402 | 689,940 | |
| Amedisys, Inc. (a) | 18,415 | 3,000,908 | |
| Apollo Medical Holdings, Inc. (a)(b) | 10,370 | 189,460 | |
| BioScrip, Inc. (a) | 104,552 | 325,157 | |
| BioTelemetry, Inc. (a) | 18,811 | 871,137 | |
| Catasys, Inc. (a)(b) | 19,612 | 302,025 | |
| Corvel Corp. (a) | 13,108 | 1,081,541 | |
| Covetrus, Inc. (a)(b) | 61,295 | 877,131 | |
| Cross Country Healthcare, Inc. (a) | 19,440 | 234,641 | |
| Digirad Corp. (a) | 1,225 | 3,932 | |
| Five Star Sr Living, Inc. (a)(b) | 1,785 | 8,479 | |
| Fulgent Genetics, Inc. (a) | 8,707 | 99,260 | |
| Guardant Health, Inc. (a) | 43,322 | 3,364,820 | |
| HealthEquity, Inc. (a) | 34,820 | 2,189,830 | |
| Henry Schein, Inc. (a)(b) | 66,690 | 4,594,941 | |
| Interpace Diagnostics Group, Inc. (a)(b) | 68,387 | 32,819 | |
| LHC Group, Inc. (a) | 17,804 | 2,375,054 | |
| Magellan Health Services, Inc. (a) | 13,571 | 1,054,874 | |
| National Research Corp. Class A | 15,817 | 1,020,355 | |
| Patterson Companies, Inc. | 53,059 | 1,032,528 | |
| Pennant Group, Inc. (a) | 14,608 | 342,119 | |
| PetIQ, Inc. Class A (a)(b) | 13,183 | 303,209 | |
| Premier, Inc. (a)(b) | 35,680 | 1,268,067 | |
| Providence Service Corp. (a) | 6,861 | 409,533 | |
| Psychemedics Corp. | 3,315 | 30,100 | |
| R1 RCM, Inc. (a) | 66,926 | 862,676 | |
| RadNet, Inc. (a) | 32,432 | 621,397 | |
| Sharps Compliance Corp. (a) | 5,820 | 24,502 | |
| Telemynd, Inc. (a)(c) | 9,238 | 0 | |
| The Ensign Group, Inc. | 29,217 | 1,268,894 | |
| The Joint Corp. (a)(b) | 17,994 | 344,585 | |
| Tivity Health, Inc. (a) | 24,797 | 561,652 | |
| 30,951,308 | |||
| Health Care Technology - 0.2% | |||
| Allscripts Healthcare Solutions, Inc. (a)(b) | 93,091 | 1,003,521 | |
| Cerner Corp. | 139,064 | 9,955,592 | |
| Computer Programs & Systems, Inc. | 10,872 | 289,086 | |
| HealthStream, Inc. (a) | 20,504 | 597,282 | |
| HMS Holdings Corp. (a) | 48,095 | 1,452,469 | |
| HTG Molecular Diagnostics (a)(b) | 54,140 | 35,732 | |
| iCAD, Inc. (a)(b) | 22,216 | 166,842 | |
| Inovalon Holdings, Inc. Class A (a)(b) | 44,722 | 804,996 | |
| Medical Transcription Billing Corp. (a) | 18,156 | 74,440 | |
| NantHealth, Inc. (a)(b) | 64,525 | 76,140 | |
| Nextgen Healthcare, Inc. (a) | 41,534 | 765,056 | |
| Omnicell, Inc. (a) | 23,057 | 1,844,329 | |
| OptimizeRx Corp. (a)(b) | 10,189 | 109,022 | |
| SCWorx, Corp. (a)(b) | 3,428 | 9,598 | |
| Simulations Plus, Inc. (b) | 16,838 | 562,726 | |
| Streamline Health Solutions, Inc. (a) | 5,177 | 6,471 | |
| Tabula Rasa HealthCare, Inc. (a)(b) | 12,248 | 546,383 | |
| 18,299,685 | |||
| Life Sciences Tools & Services - 0.7% | |||
| Accelerate Diagnostics, Inc. (a)(b) | 26,905 | 401,961 | |
| Adaptive Biotechnologies Corp. (b) | 57,300 | 1,557,987 | |
| Bio-Techne Corp. (b) | 20,994 | 4,581,941 | |
| Bruker Corp. | 86,722 | 4,439,299 | |
| Champions Oncology, Inc. (a)(b) | 13,144 | 75,709 | |
| ChromaDex, Inc. (a)(b) | 43,892 | 159,767 | |
| Codexis, Inc. (a) | 30,471 | 473,519 | |
| Compugen Ltd. (a)(b) | 44,192 | 269,129 | |
| Fluidigm Corp. (a) | 46,950 | 118,314 | |
| Harvard Bioscience, Inc. (a)(b) | 31,153 | 90,344 | |
| ICON PLC (a) | 30,193 | 4,926,290 | |
| Illumina, Inc. (a) | 62,172 | 19,942,291 | |
| Luminex Corp. | 23,369 | 493,787 | |
| Medpace Holdings, Inc. (a) | 19,992 | 1,532,787 | |
| Nanostring Technologies, Inc. (a)(b) | 21,629 | 582,253 | |
| NeoGenomics, Inc. (a) | 53,269 | 1,374,873 | |
| Pacific Biosciences of California, Inc. (a) | 93,912 | 482,708 | |
| PRA Health Sciences, Inc. (a) | 36,346 | 3,954,808 | |
| Quanterix Corp. (a)(b) | 12,174 | 308,367 | |
| Syneos Health, Inc. (a) | 57,805 | 3,174,073 | |
| 48,940,207 | |||
| Pharmaceuticals - 0.7% | |||
| Acasti Pharma, Inc. (a) | 61,235 | 121,858 | |
| AcelRx Pharmaceuticals, Inc. (a)(b) | 70,942 | 131,952 | |
| Acer Therapeutics, Inc. (a)(b) | 7,869 | 27,384 | |
| Aclaris Therapeutics, Inc. (a)(b) | 32,837 | 53,853 | |
| Adamis Pharmaceuticals Corp. (a)(b) | 45,840 | 26,711 | |
| Adial Pharmaceuticals, Inc. (a)(b) | 13,581 | 19,828 | |
| Aerie Pharmaceuticals, Inc. (a)(b) | 25,449 | 483,277 | |
| Agile Therapeutics, Inc. (a) | 69,665 | 146,297 | |
| Akcea Therapeutics, Inc. (a)(b) | 51,473 | 1,002,179 | |
| Akorn, Inc. (a) | 66,088 | 241,221 | |
| Alimera Sciences, Inc. (a)(b) | 1,355 | 7,669 | |
| Amphastar Pharmaceuticals, Inc. (a) | 33,818 | 659,789 | |
| ANI Pharmaceuticals, Inc. (a) | 6,202 | 382,167 | |
| ANI Pharmaceuticals, Inc. rights (a)(c) | 1,389 | 0 | |
| Arvinas Holding Co. LLC (a) | 24,761 | 950,822 | |
| Assertio Therapeutics, Inc. (a) | 40,669 | 30,908 | |
| AstraZeneca PLC rights (a)(c) | 3,011 | 0 | |
| Auris Medical Holding AG (a)(b) | 5,405 | 8,053 | |
| Avadel Pharmaceuticals PLC sponsored ADR (a)(b) | 46,220 | 293,497 | |
| Avenue Therapeutics, Inc. (a) | 8,034 | 47,401 | |
| Axsome Therapeutics, Inc. (a)(b) | 22,240 | 875,589 | |
| Biodelivery Sciences International, Inc. (a) | 86,428 | 589,439 | |
| Cara Therapeutics, Inc. (a)(b) | 19,895 | 516,872 | |
| Cassava Sciences, Inc. (a)(b) | 49,084 | 72,644 | |
| Cerecor, Inc. (a)(b) | 5,724 | 21,579 | |
| Chiasma, Inc. (a)(b) | 28,211 | 150,929 | |
| Clearside Biomedical, Inc. (a)(b) | 54,238 | 78,103 | |
| Collegium Pharmaceutical, Inc. (a) | 21,046 | 457,330 | |
| Corcept Therapeutics, Inc. (a)(b) | 63,549 | 815,334 | |
| Correvio Pharma Corp. (a)(b) | 45,429 | 94,038 | |
| Cronos Group, Inc. (a)(b) | 83,224 | 569,530 | |
| Cumberland Pharmaceuticals, Inc. (a) | 7,820 | 37,458 | |
| CymaBay Therapeutics, Inc. (a) | 37,588 | 66,155 | |
| Dermira, Inc. (a)(b) | 31,371 | 255,360 | |
| Dova Pharmaceuticals, Inc. rights 12/31/99 (a)(c) | 23,572 | 12,729 | |
| Durect Corp. (a)(b) | 119,193 | 253,881 | |
| Elanco Animal Health, Inc. rights 12/31/99 (a)(c) | 45,364 | 0 | |
| Eloxx Pharmaceuticals, Inc. (a)(b) | 11,412 | 59,571 | |
| Endo International PLC (a) | 131,322 | 667,116 | |
| Evofem Biosciences, Inc. (a)(b) | 26,709 | 163,192 | |
| Evoke Pharma, Inc. (a)(b) | 91,497 | 151,885 | |
| Evolus, Inc. (a)(b) | 16,552 | 231,562 | |
| Eyenovia, Inc. (a)(b) | 12,538 | 53,788 | |
| Eyepoint Pharmaceuticals, Inc. (a)(b) | 101,760 | 156,710 | |
| Foamix Pharmaceuticals Ltd. (a)(b) | 43,737 | 139,084 | |
| GW Pharmaceuticals PLC ADR (a)(b) | 16,221 | 1,656,326 | |
| Harrow Health, Inc. (a)(b) | 41,986 | 262,413 | |
| Horizon Pharma PLC (a)(b) | 94,256 | 3,089,712 | |
| Hoth Therapeutics, Inc. (a)(b) | 142 | 696 | |
| Hutchison China Meditech Ltd. sponsored ADR (a) | 19,400 | 467,734 | |
| Innovate Biopharmaceuticals, Inc. (a)(b) | 32,567 | 25,402 | |
| Innoviva, Inc. (a) | 60,265 | 812,372 | |
| Intersect ENT, Inc. (a) | 14,825 | 321,406 | |
| Intra-Cellular Therapies, Inc. (a)(b) | 43,332 | 420,754 | |
| Jazz Pharmaceuticals PLC (a) | 32,460 | 4,905,355 | |
| Kala Pharmaceuticals, Inc. (a)(b) | 33,718 | 140,604 | |
| Kaleido Biosciences, Inc. (a)(b) | 2,243 | 19,537 | |
| KemPharm, Inc. (a)(b) | 55,554 | 24,999 | |
| Lipocine, Inc. (a)(b) | 29,085 | 12,946 | |
| Liquidia Technologies, Inc. (a) | 18,562 | 80,745 | |
| Marinus Pharmaceuticals, Inc. (a)(b) | 41,838 | 55,226 | |
| MediWound Ltd. (a) | 23,801 | 71,403 | |
| Melinta Therapeutics, Inc. (a)(b) | 31,489 | 51,012 | |
| Mylan NV (a) | 217,007 | 4,075,391 | |
| MyoKardia, Inc. (a)(b) | 25,345 | 1,651,227 | |
| Nabriva Therapeutics PLC (a)(b) | 62,669 | 126,591 | |
| Nektar Therapeutics (a)(b) | 96,260 | 1,953,115 | |
| Neos Therapeutics, Inc. (a)(b) | 56,543 | 93,861 | |
| NGM Biopharmaceuticals, Inc. (b) | 3,444 | 56,757 | |
| Novan, Inc. (a)(b) | 19,649 | 39,102 | |
| Novus Therapeutics, Inc. (a) | 4,977 | 3,096 | |
| Ocular Therapeutix, Inc. (a)(b) | 2,864 | 11,427 | |
| Odonate Therapeutics, Inc. (a) | 14,695 | 505,214 | |
| Omeros Corp. (a)(b) | 31,699 | 469,145 | |
| Onconova Therapeutics, Inc. (a)(b) | 21,720 | 4,083 | |
| Opiant Pharmaceuticals, Inc. (a)(b) | 1,206 | 17,270 | |
| OptiNose, Inc. (a)(b) | 20,670 | 193,058 | |
| Oramed Pharmaceuticals, Inc. (a)(b) | 16,957 | 74,780 | |
| Osmotica Pharmaceuticals PLC (a)(b) | 16,911 | 113,050 | |
| Pacira Biosciences, Inc. (a) | 23,041 | 1,064,955 | |
| Paratek Pharmaceuticals, Inc. (a)(b) | 30,126 | 88,269 | |
| Phibro Animal Health Corp. Class A | 13,881 | 336,753 | |
| ProPhase Labs, Inc. | 1,566 | 3,210 | |
| Provention Bio, Inc. (a) | 17,016 | 169,479 | |
| Pulmatrix, Inc. (a)(b) | 28,209 | 23,131 | |
| Reata Pharmaceuticals, Inc. (a) | 14,994 | 2,925,779 | |
| RedHill Biopharma Ltd. sponsored ADR (a)(b) | 16,864 | 115,518 | |
| resTORbio, Inc. (a)(b) | 24,069 | 28,883 | |
| Revance Therapeutics, Inc. (a)(b) | 36,768 | 658,147 | |
| Sanofi SA sponsored ADR | 120,850 | 5,641,278 | |
| SCYNEXIS, Inc. (a)(b) | 74,353 | 80,301 | |
| Seelos Therapeutics, Inc. | 17,345 | 14,918 | |
| Seelos Therapeutics, Inc. rights (b)(c) | 2,932 | 0 | |
| SIGA Technologies, Inc. (a)(b) | 32,227 | 157,912 | |
| Strongbridge Biopharma PLC (a) | 47,608 | 86,170 | |
| Supernus Pharmaceuticals, Inc. (a) | 28,417 | 664,389 | |
| Tetraphase Pharmaceuticals, Inc. (a) | 4,217 | 10,964 | |
| TherapeuticsMD, Inc. (a)(b) | 130,336 | 327,143 | |
| Theravance Biopharma, Inc. (a)(b) | 37,687 | 820,069 | |
| Tilray, Inc. Class 2 (a)(b) | 36,775 | 729,616 | |
| Titan Pharmaceuticals, Inc. (a)(b) | 28,491 | 4,331 | |
| Tricida, Inc. (a)(b) | 28,570 | 1,141,657 | |
| Urovant Sciences Ltd. (a)(b) | 4,187 | 47,313 | |
| Verrica Pharmaceuticals, Inc. (a) | 1,110 | 16,728 | |
| VIVUS, Inc. (a)(b) | 10,397 | 28,904 | |
| WAVE Life Sciences (a)(b) | 19,484 | 645,895 | |
| Xeris Pharmaceuticals, Inc. (a)(b) | 22,300 | 199,139 | |
| Zogenix, Inc. (a) | 23,613 | 1,128,229 | |
| Zynerba Pharmaceuticals, Inc. (a)(b) | 10,986 | 69,541 | |
| 50,159,174 | |||
| TOTAL HEALTH CARE | 664,932,785 | ||
| INDUSTRIALS - 3.8% | |||
| Aerospace & Defense - 0.2% | |||
| Ability, Inc. (a)(b) | 8,280 | 3,171 | |
| AeroVironment, Inc. (a) | 13,397 | 821,772 | |
| Arotech Corp. (a) | 12,878 | 38,634 | |
| Astronics Corp. (a) | 16,075 | 468,586 | |
| Astrotech Corp. (a)(b) | 716 | 1,504 | |
| Axon Enterprise, Inc. (a)(b) | 32,964 | 2,432,743 | |
| Elbit Systems Ltd. (b) | 24,467 | 4,044,395 | |
| Kratos Defense & Security Solutions, Inc. (a) | 59,238 | 1,069,838 | |
| Mercury Systems, Inc. (a) | 26,903 | 1,970,645 | |
| RADA Electronic Industries Ltd. (a)(b) | 37,947 | 206,432 | |
| TAT Technologies Ltd. (a) | 4,822 | 26,183 | |
| 11,083,903 | |||
| Air Freight & Logistics - 0.2% | |||
| Air Transport Services Group, Inc. (a) | 33,127 | 815,255 | |
| Atlas Air Worldwide Holdings, Inc. (a) | 14,482 | 377,835 | |
| C.H. Robinson Worldwide, Inc. (b) | 76,418 | 5,872,723 | |
| Echo Global Logistics, Inc. (a) | 16,109 | 322,663 | |
| Expeditors International of Washington, Inc. | 96,038 | 7,179,801 | |
| Forward Air Corp. | 15,404 | 1,078,742 | |
| Hub Group, Inc. Class A (a) | 19,096 | 975,233 | |
| 16,622,252 | |||
| Airlines - 0.4% | |||
| Allegiant Travel Co. | 9,085 | 1,541,997 | |
| American Airlines Group, Inc. | 200,299 | 5,756,593 | |
| Hawaiian Holdings, Inc. (b) | 28,263 | 856,086 | |
| JetBlue Airways Corp. (a)(b) | 166,852 | 3,215,238 | |
| Ryanair Holdings PLC sponsored ADR (a) | 56,237 | 4,685,667 | |
| SkyWest, Inc. | 28,791 | 1,803,468 | |
| United Continental Holdings, Inc. (a) | 114,512 | 10,626,714 | |
| 28,485,763 | |||
| Building Products - 0.1% | |||
| AAON, Inc. (b) | 28,942 | 1,428,867 | |
| American Woodmark Corp. (a)(b) | 9,820 | 1,010,478 | |
| Apogee Enterprises, Inc. | 14,782 | 565,264 | |
| Builders FirstSource, Inc. (a) | 64,810 | 1,646,822 | |
| Caesarstone Sdot-Yam Ltd. (b) | 18,101 | 283,462 | |
| China Ceramics Co. Ltd. (a)(b) | 10,848 | 8,678 | |
| CSW Industrials, Inc. | 8,084 | 596,842 | |
| Gibraltar Industries, Inc. (a) | 18,018 | 940,900 | |
| Insteel Industries, Inc. | 13,739 | 320,531 | |
| Patrick Industries, Inc. | 13,038 | 645,642 | |
| Universal Forest Products, Inc. | 34,940 | 1,733,024 | |
| 9,180,510 | |||
| Commercial Services & Supplies - 0.6% | |||
| Casella Waste Systems, Inc. Class A (a) | 25,677 | 1,199,373 | |
| CECO Environmental Corp. (a) | 21,695 | 170,740 | |
| China Customer Relations Centers, Inc. (a)(b) | 7,958 | 85,230 | |
| China Recycling Energy Corp. (a)(b) | 32,325 | 6,465 | |
| Cimpress NV (a)(b) | 17,164 | 2,199,395 | |
| Cintas Corp. | 44,907 | 11,543,793 | |
| Copart, Inc. (a) | 127,678 | 11,363,342 | |
| Fuel Tech, Inc. (a) | 39,532 | 38,445 | |
| Healthcare Services Group, Inc. (b) | 41,308 | 1,038,896 | |
| Heritage-Crystal Clean, Inc. (a) | 16,899 | 522,686 | |
| Herman Miller, Inc. | 33,182 | 1,585,436 | |
| Hudson Technologies, Inc. (a)(b) | 45,365 | 31,075 | |
| Industrial Services of America, Inc. (a) | 694 | 763 | |
| Interface, Inc. | 31,344 | 526,266 | |
| Kimball International, Inc. Class B | 29,221 | 624,745 | |
| Matthews International Corp. Class A (b) | 16,846 | 646,044 | |
| McGrath RentCorp. | 12,871 | 943,959 | |
| Mobile Mini, Inc. | 25,153 | 954,808 | |
| Odyssey Marine Exploration, Inc. (a)(b) | 4,993 | 17,026 | |
| Performant Financial Corp. (a) | 18,514 | 17,588 | |
| Perma-Fix Environmental Services, Inc. (a) | 5,364 | 38,084 | |
| PICO Holdings, Inc. (a) | 19,423 | 213,265 | |
| SP Plus Corp. (a) | 16,607 | 728,217 | |
| Stericycle, Inc. (a)(b) | 50,885 | 3,196,596 | |
| Tetra Tech, Inc. | 31,814 | 2,808,858 | |
| U.S. Ecology, Inc. | 13,844 | 761,282 | |
| Virco Manufacturing Co. | 609 | 2,345 | |
| VSE Corp. (b) | 8,808 | 359,278 | |
| 41,624,000 | |||
| Construction & Engineering - 0.0% | |||
| Aegion Corp. (a) | 23,002 | 498,223 | |
| Great Lakes Dredge & Dock Corp. (a) | 35,442 | 378,521 | |
| Ies Holdings, Inc. (a) | 13,864 | 300,710 | |
| Limbach Holdings, Inc. (a) | 6,648 | 19,811 | |
| MYR Group, Inc. (a) | 11,190 | 384,488 | |
| Northwest Pipe Co. (a) | 8,243 | 282,982 | |
| NV5 Holdings, Inc. (a) | 7,172 | 344,901 | |
| Primoris Services Corp. | 28,950 | 637,479 | |
| Sterling Construction Co., Inc. (a) | 15,145 | 220,663 | |
| 3,067,778 | |||
| Electrical Equipment - 0.1% | |||
| Allied Motion Technologies, Inc. | 6,381 | 285,869 | |
| American Superconductor Corp. (a)(b) | 13,822 | 115,414 | |
| Ballard Power Systems, Inc. (a) | 120,039 | 796,163 | |
| Broadwind Energy, Inc. (a) | 6,588 | 9,618 | |
| CBAK Energy Technology, Inc. (a)(b) | 782 | 629 | |
| Encore Wire Corp. | 10,986 | 640,923 | |
| Energous Corp. (a)(b) | 13,422 | 28,186 | |
| Energy Focus, Inc. (a)(b) | 18,505 | 7,402 | |
| FuelCell Energy, Inc. (a) | 6,351 | 4,305 | |
| Ideal Power, Inc. (a)(b) | 917 | 2,393 | |
| LSI Industries, Inc. | 17,145 | 93,097 | |
| Orion Energy Systems, Inc. (a)(b) | 11,781 | 34,518 | |
| Pioneer Power Solutions, Inc. | 3,776 | 8,874 | |
| Plug Power, Inc. (a)(b) | 113,048 | 440,887 | |
| Polar Power, Inc. (a)(b) | 5,654 | 13,909 | |
| Powell Industries, Inc. | 6,368 | 264,845 | |
| Preformed Line Products Co. | 3,095 | 222,531 | |
| Sunrun, Inc. (a)(b) | 63,580 | 882,490 | |
| TPI Composites, Inc. (a) | 17,956 | 324,106 | |
| Ultralife Corp. (a) | 12,841 | 108,763 | |
| Vicor Corp. (a) | 15,946 | 654,902 | |
| 4,939,824 | |||
| Industrial Conglomerates - 0.1% | |||
| Icahn Enterprises LP | 109,798 | 6,917,274 | |
| Raven Industries, Inc. | 20,117 | 691,421 | |
| 7,608,695 | |||
| Machinery - 0.6% | |||
| Altra Industrial Motion Corp. (b) | 36,081 | 1,185,982 | |
| Astec Industries, Inc. | 13,073 | 489,715 | |
| Blue Bird Cor (a)(b) | 17,587 | 357,895 | |
| Chart Industries, Inc. (a) | 17,617 | 972,458 | |
| Columbus McKinnon Corp. (NY Shares) | 12,176 | 500,190 | |
| Commercial Vehicle Group, Inc. (a) | 24,542 | 175,230 | |
| Eastern Co. | 4,547 | 124,952 | |
| Energy Recovery, Inc. (a)(b) | 35,074 | 305,495 | |
| ExOne Co. (a)(b) | 20,871 | 142,549 | |
| Franklin Electric Co., Inc. | 26,553 | 1,472,895 | |
| FreightCar America, Inc. (a) | 6,576 | 12,757 | |
| Gencor Industries, Inc. (a) | 8,433 | 105,834 | |
| Hebron Technology Co. Ltd. (a)(b) | 4,198 | 19,437 | |
| Hurco Companies, Inc. | 4,416 | 158,004 | |
| Jason Industries, Inc. (a) | 14,677 | 2,554 | |
| Kornit Digital Ltd. (a)(b) | 18,114 | 617,687 | |
| L.B. Foster Co. Class A (a) | 5,419 | 102,636 | |
| Lincoln Electric Holdings, Inc. | 35,384 | 3,264,528 | |
| LiqTech International, Inc. (a)(b) | 5,548 | 30,126 | |
| Manitex International, Inc. (a)(b) | 10,479 | 56,063 | |
| MFRI, Inc. (a) | 4,058 | 36,887 | |
| Middleby Corp. (a) | 30,948 | 3,582,540 | |
| NN, Inc. | 21,557 | 187,761 | |
| Nordson Corp. (b) | 32,023 | 5,310,374 | |
| Omega Flex, Inc. (b) | 6,310 | 604,561 | |
| PACCAR, Inc. | 146,966 | 11,958,623 | |
| Park-Ohio Holdings Corp. | 7,531 | 238,206 | |
| RBC Bearings, Inc. (a) | 13,843 | 2,296,277 | |
| Spartan Motors, Inc. | 23,588 | 418,687 | |
| Sun Hydraulics Corp. (b) | 17,927 | 802,771 | |
| Taylor Devices, Inc. (a) | 1,597 | 16,721 | |
| TriMas Corp. (a) | 25,565 | 792,004 | |
| Twin Disc, Inc. (a) | 9,749 | 99,245 | |
| Westport Fuel Systems, Inc. (a) | 70,640 | 172,362 | |
| Woodward, Inc. | 34,370 | 4,014,072 | |
| 40,628,078 | |||
| Marine - 0.0% | |||
| Eagle Bulk Shipping, Inc. (a)(b) | 67,219 | 320,635 | |
| EuroDry Ltd. (a) | 54 | 442 | |
| Euroseas Ltd. (a) | 273 | 130 | |
| Golden Ocean Group Ltd. (b) | 71,759 | 432,707 | |
| Seanergy Martime Holdings Corp. (a) | 6,401 | 3,386 | |
| Star Bulk Carriers Corp. (b) | 51,696 | 568,139 | |
| 1,325,439 | |||
| Professional Services - 0.5% | |||
| 51job, Inc. sponsored ADR (a) | 19,924 | 1,566,425 | |
| Acacia Research Corp. (a) | 44,233 | 131,372 | |
| Barrett Business Services, Inc. | 5,442 | 480,855 | |
| CoStar Group, Inc. (a) | 20,391 | 12,496,828 | |
| CRA International, Inc. | 5,134 | 263,220 | |
| Exponent, Inc. | 30,734 | 1,953,146 | |
| Forrester Research, Inc. | 13,856 | 553,270 | |
| Heidrick & Struggles International, Inc. | 9,964 | 309,083 | |
| Hudson Global, Inc. (a) | 1,283 | 15,601 | |
| Huron Consulting Group, Inc. (a) | 14,055 | 942,388 | |
| ICF International, Inc. | 10,532 | 945,036 | |
| InnerWorkings, Inc. (a)(b) | 42,664 | 200,947 | |
| Kelly Services, Inc. Class A (non-vtg.) | 20,284 | 444,422 | |
| Kforce, Inc. | 14,214 | 561,737 | |
| Lightbridge Corp. (a)(b) | 1,611 | 6,347 | |
| RCM Technologies, Inc. (a) | 3,957 | 10,723 | |
| Red Violet, Inc. (a)(b) | 13,190 | 225,021 | |
| Resources Connection, Inc. | 24,682 | 381,337 | |
| Spherix, Inc. (a) | 4,137 | 4,633 | |
| Upwork, Inc. (a)(b) | 59,490 | 693,059 | |
| Verisk Analytics, Inc. | 69,094 | 10,189,983 | |
| Willdan Group, Inc. (a) | 7,660 | 218,387 | |
| 32,593,820 | |||
| Road & Rail - 0.8% | |||
| AMERCO | 10,930 | 3,959,065 | |
| ArcBest Corp. | 13,492 | 388,300 | |
| Avis Budget Group, Inc. (a) | 42,620 | 1,267,945 | |
| China Bat Group, Inc. (a)(b) | 16,515 | 20,313 | |
| Covenant Transport Group, Inc. Class A (a) | 8,404 | 112,866 | |
| CSX Corp. | 353,381 | 25,280,877 | |
| Daseke, Inc. (a)(b) | 31,805 | 93,825 | |
| Heartland Express, Inc. | 46,571 | 997,085 | |
| J.B. Hunt Transport Services, Inc. | 45,907 | 5,307,767 | |
| Landstar System, Inc. | 23,422 | 2,609,445 | |
| Lyft, Inc. (b) | 152,730 | 7,480,715 | |
| Marten Transport Ltd. | 28,573 | 603,747 | |
| Old Dominion Freight Lines, Inc. (b) | 45,410 | 8,700,102 | |
| P.A.M. Transportation Services, Inc. (a) | 3,246 | 169,441 | |
| Patriot Transportation Holding, Inc. (a) | 1,759 | 30,607 | |
| Saia, Inc. (a) | 14,277 | 1,354,887 | |
| U.S.A. Truck, Inc. (a)(b) | 8,729 | 66,428 | |
| Universal Logistics Holdings, Inc. | 19,143 | 381,711 | |
| Werner Enterprises, Inc. | 40,295 | 1,481,244 | |
| YRC Worldwide, Inc. (a)(b) | 25,116 | 87,655 | |
| 60,394,025 | |||
| Trading Companies & Distributors - 0.2% | |||
| Beacon Roofing Supply, Inc. (a) | 38,147 | 1,131,059 | |
| BMC Stock Holdings, Inc. (a) | 36,928 | 1,093,438 | |
| DXP Enterprises, Inc. (a) | 11,467 | 441,824 | |
| Fastenal Co. | 242,791 | 8,623,936 | |
| General Finance Corp. (a) | 18,913 | 204,450 | |
| H&E Equipment Services, Inc. | 18,782 | 619,806 | |
| HD Supply Holdings, Inc. (a) | 98,710 | 3,930,632 | |
| Houston Wire & Cable Co. (a)(b) | 7,080 | 27,824 | |
| Huttig Building Products, Inc. (a)(b) | 16,567 | 29,986 | |
| Lawson Products, Inc. (a) | 4,692 | 241,920 | |
| Rush Enterprises, Inc.: | |||
| Class A | 19,790 | 906,778 | |
| Class B | 4,471 | 203,967 | |
| Titan Machinery, Inc. (a) | 11,661 | 157,074 | |
| Transcat, Inc. (a) | 3,442 | 112,863 | |
| Willis Lease Finance Corp. (a) | 3,362 | 201,720 | |
| 17,927,277 | |||
| Transportation Infrastructure - 0.0% | |||
| Grupo Aeroportuario Norte S.A.B. de CV ADR | 4,198 | 223,376 | |
| TOTAL INDUSTRIALS | 275,704,740 | ||
| INFORMATION TECHNOLOGY - 33.4% | |||
| Communications Equipment - 1.6% | |||
| Acacia Communications, Inc. (a) | 22,632 | 1,508,196 | |
| ADTRAN, Inc. | 25,196 | 231,551 | |
| Applied Optoelectronics, Inc. (a)(b) | 10,366 | 110,916 | |
| AudioCodes Ltd. | 20,574 | 493,159 | |
| Aviat Networks, Inc. (a) | 2,287 | 31,629 | |
| CalAmp Corp. (a) | 25,327 | 265,680 | |
| Casa Systems, Inc. (a) | 47,588 | 175,124 | |
| Ceragon Networks Ltd. (a)(b) | 36,506 | 71,552 | |
| Cisco Systems, Inc. | 1,855,709 | 84,082,175 | |
| Clearfield, Inc. (a) | 10,561 | 143,313 | |
| ClearOne, Inc. (a) | 3,124 | 5,186 | |
| CommScope Holding Co., Inc. (a)(b) | 106,669 | 1,450,698 | |
| Communications Systems, Inc. | 2,071 | 16,133 | |
| Comtech Telecommunications Corp. | 12,403 | 468,709 | |
| Dasan Zhone Solutions, Inc. (a) | 3,200 | 25,504 | |
| Digi International, Inc. (a) | 19,090 | 340,566 | |
| EchoStar Holding Corp. Class A (a) | 26,004 | 1,093,988 | |
| EMCORE Corp. (a) | 13,673 | 43,207 | |
| Ericsson (B Shares) sponsored ADR | 182,398 | 1,648,878 | |
| EXFO, Inc. (sub. vtg.) (a) | 11,624 | 52,069 | |
| Extreme Networks, Inc. (a) | 60,885 | 428,022 | |
| F5 Networks, Inc. (a) | 33,263 | 4,846,752 | |
| Gilat Satellite Networks Ltd. (b) | 23,036 | 193,272 | |
| Harmonic, Inc. (a) | 67,463 | 557,244 | |
| Infinera Corp. (a)(b) | 98,666 | 629,489 | |
| Inseego Corp. (a)(b) | 47,483 | 301,517 | |
| InterDigital, Inc. | 18,494 | 1,050,459 | |
| Ituran Location & Control Ltd. | 11,982 | 287,568 | |
| KVH Industries, Inc. (a) | 9,269 | 106,130 | |
| Lantronix, Inc. (a)(b) | 8,577 | 28,647 | |
| Lumentum Holdings, Inc. (a) | 42,467 | 3,128,119 | |
| NETGEAR, Inc. (a) | 16,467 | 413,486 | |
| NetScout Systems, Inc. (a) | 51,307 | 1,292,936 | |
| PC-Tel, Inc. | 8,979 | 77,399 | |
| Radcom Ltd. (a)(b) | 13,668 | 138,730 | |
| Radware Ltd. (a) | 22,995 | 553,950 | |
| Resonant, Inc. (a)(b) | 46,660 | 100,319 | |
| Sierra Wireless, Inc. (a)(b) | 18,794 | 165,575 | |
| Silicom Ltd. (a)(b) | 3,732 | 123,417 | |
| Sonus Networks, Inc. (a) | 61,452 | 180,054 | |
| Tessco Technologies, Inc. | 7,463 | 83,735 | |
| UTStarcom Holdings Corp. (a) | 21,290 | 63,657 | |
| ViaSat, Inc. (a) | 33,741 | 2,479,964 | |
| Viavi Solutions, Inc. (a) | 129,272 | 1,941,665 | |
| Westell Technologies, Inc. Class A (a) | 4,115 | 4,280 | |
| Wi-Lan, Inc. | 61,937 | 84,398 | |
| 111,519,017 | |||
| Electronic Equipment & Components - 1.0% | |||
| Akoustis Technologies, Inc. (a)(b) | 17,133 | 130,725 | |
| Applied DNA Sciences, Inc. (a) | 157 | 656 | |
| Avnet, Inc. (b) | 62,191 | 2,528,064 | |
| Bel Fuse, Inc.: | |||
| Class A | 1,125 | 15,221 | |
| Class B (non-vtg.) | 5,258 | 87,125 | |
| CDW Corp. | 82,093 | 11,086,660 | |
| ClearSign Combustion Corp. (a)(b) | 23,777 | 24,490 | |
| Coda Octopus Group, Inc. (a)(b) | 2,615 | 18,828 | |
| Cognex Corp. | 95,341 | 4,784,211 | |
| Coherent, Inc. (a) | 13,625 | 2,055,468 | |
| Daktronics, Inc. | 31,984 | 197,021 | |
| Data I/O Corp. (a) | 15,054 | 61,420 | |
| Deswell Industries, Inc. (b) | 1,530 | 3,978 | |
| Digital Ally, Inc. (a)(b) | 14,670 | 17,237 | |
| ePlus, Inc. (a) | 7,202 | 601,871 | |
| FARO Technologies, Inc. (a) | 8,942 | 435,654 | |
| Flextronics International Ltd. (a) | 290,666 | 3,450,205 | |
| FLIR Systems, Inc. | 76,554 | 4,100,232 | |
| Frequency Electronics, Inc. (a) | 4,423 | 44,274 | |
| Hollysys Automation Technologies Ltd. | 31,795 | 467,704 | |
| Identiv, Inc. (a) | 5,445 | 29,784 | |
| II-VI, Inc. (a)(b) | 49,504 | 1,445,022 | |
| Insight Enterprises, Inc. (a) | 19,973 | 1,310,029 | |
| IPG Photonics Corp. (a)(b) | 29,609 | 4,207,143 | |
| Iteris, Inc. (a) | 15,658 | 80,952 | |
| Itron, Inc. (a) | 22,624 | 1,811,730 | |
| KEY Tronic Corp. (a) | 4,924 | 27,328 | |
| Kimball Electronics, Inc. (a) | 15,945 | 279,675 | |
| LightPath Technologies, Inc. Class A (a) | 12,016 | 6,969 | |
| Littelfuse, Inc. | 13,789 | 2,501,462 | |
| LRAD Corp. (a) | 17,031 | 61,482 | |
| Luna Innovations, Inc. (a) | 10,388 | 76,663 | |
| Magal Security Systems Ltd. (a)(b) | 11,406 | 49,046 | |
| MicroVision, Inc. (a)(b) | 49,848 | 39,400 | |
| MTS Systems Corp. (b) | 11,884 | 539,771 | |
| Napco Security Technolgies, Inc. (a)(b) | 11,834 | 369,813 | |
| National Instruments Corp. | 74,124 | 3,122,103 | |
| Neonode, Inc. (a)(b) | 2,017 | 2,622 | |
| nLIGHT, Inc. (a) | 19,849 | 395,591 | |
| Novanta, Inc. (a) | 19,467 | 1,813,935 | |
| OSI Systems, Inc. (a) | 10,117 | 1,006,540 | |
| PC Connection, Inc. | 13,938 | 687,422 | |
| Perceptron, Inc. (a) | 6,131 | 27,773 | |
| Plexus Corp. (a) | 19,194 | 1,456,825 | |
| Powerfleet, Inc. (a)(b) | 12,373 | 74,609 | |
| Research Frontiers, Inc. (a)(b) | 12,098 | 38,472 | |
| Richardson Electronics Ltd. | 6,648 | 36,830 | |
| Sanmina Corp. (a) | 39,232 | 1,247,970 | |
| ScanSource, Inc. (a) | 15,799 | 559,601 | |
| SGOCO Technology Ltd. (a)(b) | 500 | 470 | |
| Supercom Ltd. (a) | 7,335 | 5,208 | |
| Tech Data Corp. (a) | 20,644 | 2,991,109 | |
| Trimble, Inc. (a) | 139,789 | 5,665,648 | |
| TTM Technologies, Inc. (a)(b) | 58,843 | 789,085 | |
| Wayside Technology Group, Inc. | 2,644 | 38,153 | |
| Zebra Technologies Corp. Class A (a) | 30,144 | 7,564,335 | |
| 70,471,614 | |||
| IT Services - 3.1% | |||
| 21Vianet Group, Inc. ADR (a) | 34,836 | 235,840 | |
| 3PEA International, Inc. (a)(b) | 29,164 | 299,223 | |
| Akamai Technologies, Inc. (a) | 91,125 | 7,938,810 | |
| Alithya Group, Inc. (a) | 7,200 | 16,560 | |
| ALJ Regional Holdings, Inc. (a) | 15,043 | 19,255 | |
| Amdocs Ltd. | 77,592 | 5,377,126 | |
| Automatic Data Processing, Inc. | 184,353 | 31,483,805 | |
| Brightcove, Inc. (a) | 29,726 | 265,750 | |
| Carbonite, Inc. (a) | 17,700 | 407,100 | |
| Cardtronics PLC (a)(b) | 26,764 | 1,129,976 | |
| Cass Information Systems, Inc. | 10,791 | 609,368 | |
| China Information Technology, Inc. (a)(b) | 20,266 | 9,120 | |
| Cognizant Technology Solutions Corp. Class A | 245,286 | 15,725,285 | |
| Computer Task Group, Inc. (a)(b) | 19,062 | 116,278 | |
| CSG Systems International, Inc. | 17,701 | 1,012,320 | |
| CSP, Inc. | 2,505 | 32,264 | |
| Endurance International Group Holdings, Inc. (a) | 87,857 | 355,821 | |
| Euronet Worldwide, Inc. (a) | 28,831 | 4,531,945 | |
| Exela Technologies, Inc. (a) | 87,567 | 28,363 | |
| ExlService Holdings, Inc. (a) | 18,932 | 1,321,643 | |
| Fiserv, Inc. (a) | 310,494 | 36,091,823 | |
| GDS Holdings Ltd. ADR (a)(b) | 40,017 | 1,873,596 | |
| Hackett Group, Inc. | 15,503 | 237,661 | |
| Information Services Group, Inc. (a) | 21,642 | 53,239 | |
| Innodata, Inc. (a) | 162 | 194 | |
| Internap Network Services Corp. (a)(b) | 11,104 | 13,325 | |
| Jack Henry & Associates, Inc. | 43,186 | 6,561,681 | |
| Limelight Networks, Inc. (a) | 58,347 | 249,142 | |
| ManTech International Corp. Class A | 14,305 | 1,109,782 | |
| Marathon Patent Group, Inc. (a)(b) | 9,296 | 11,899 | |
| ModusLink Global Solutions, Inc. (a) | 31,319 | 44,786 | |
| MoneyGram International, Inc. (a)(b) | 47,439 | 145,638 | |
| MongoDB, Inc. Class A (a) | 22,250 | 3,308,575 | |
| Net 1 UEPS Technologies, Inc. (a) | 36,698 | 128,443 | |
| NIC, Inc. | 37,287 | 846,042 | |
| Okta, Inc. (a) | 56,105 | 7,281,307 | |
| Paychex, Inc. | 151,829 | 13,075,513 | |
| PayPal Holdings, Inc. (a) | 497,167 | 53,699,008 | |
| Perficient, Inc. (a) | 17,917 | 757,531 | |
| PFSweb, Inc. (a) | 12,471 | 45,644 | |
| Presidio, Inc. | 53,683 | 886,306 | |
| PRG-Schultz International, Inc. (a) | 12,252 | 55,134 | |
| QIWI PLC Class B sponsored ADR | 23,733 | 470,388 | |
| Sabre Corp. | 153,068 | 3,433,315 | |
| ServiceSource International, Inc. (a) | 52,351 | 80,097 | |
| StoneCo Ltd. Class A (a)(b) | 81,340 | 3,333,313 | |
| Sykes Enterprises, Inc. (a) | 26,201 | 920,703 | |
| Ttec Holdings, Inc. | 25,550 | 1,173,512 | |
| Tucows, Inc. (a)(b) | 5,567 | 315,927 | |
| VeriSign, Inc. (a) | 52,068 | 9,931,450 | |
| Verra Mobility Corp. (a)(b) | 35,640 | 533,531 | |
| Virtusa Corp. (a) | 16,798 | 750,703 | |
| Wix.com Ltd. (a) | 26,770 | 3,236,225 | |
| 221,571,285 | |||
| Semiconductors & Semiconductor Equipment - 8.1% | |||
| Adesto Technologies Corp. (a)(b) | 15,552 | 111,974 | |
| Advanced Energy Industries, Inc. (a) | 23,294 | 1,495,708 | |
| Advanced Micro Devices, Inc. (a) | 474,711 | 18,584,936 | |
| Alpha & Omega Semiconductor Ltd. (a) | 13,400 | 159,326 | |
| Ambarella, Inc. (a) | 17,500 | 957,950 | |
| Amkor Technology, Inc. (a) | 137,406 | 1,661,239 | |
| Amtech Systems, Inc. (a) | 7,143 | 42,715 | |
| Analog Devices, Inc. | 155,765 | 17,593,657 | |
| Applied Materials, Inc. | 416,673 | 24,125,367 | |
| ASML Holding NV | 31,459 | 8,513,435 | |
| Atomera, Inc. (a)(b) | 6,089 | 18,571 | |
| Axcelis Technologies, Inc. (a) | 16,834 | 360,921 | |
| AXT, Inc. (a) | 19,692 | 62,227 | |
| Broadcom, Inc. | 171,154 | 54,120,606 | |
| Brooks Automation, Inc. | 38,897 | 1,741,419 | |
| Cabot Microelectronics Corp. | 16,145 | 2,153,904 | |
| Camtek Ltd. | 18,904 | 199,437 | |
| Canadian Solar, Inc. (a) | 30,896 | 505,150 | |
| Ceva, Inc. (a) | 11,720 | 303,782 | |
| ChipMOS TECHNOLOGIES, Inc. sponsored ADR | 4,820 | 107,727 | |
| Cirrus Logic, Inc. (a) | 33,116 | 2,374,417 | |
| Cohu, Inc. | 21,267 | 377,277 | |
| Cree, Inc. (a)(b) | 57,227 | 2,530,006 | |
| CVD Equipment Corp. (a) | 3,218 | 10,619 | |
| CyberOptics Corp. (a) | 5,253 | 93,293 | |
| Cypress Semiconductor Corp. | 202,066 | 4,738,448 | |
| Diodes, Inc. (a) | 28,211 | 1,301,656 | |
| DSP Group, Inc. (a) | 21,373 | 302,855 | |
| Enphase Energy, Inc. (a)(b) | 59,343 | 1,297,831 | |
| Entegris, Inc. | 75,648 | 3,579,663 | |
| Everspin Technologies, Inc. (a) | 17,264 | 90,291 | |
| First Solar, Inc. (a) | 58,472 | 3,229,993 | |
| FormFactor, Inc. (a) | 41,778 | 966,743 | |
| GSI Technology, Inc. (a) | 9,353 | 68,464 | |
| Himax Technologies, Inc. sponsored ADR (a)(b) | 56,996 | 131,091 | |
| Ichor Holdings Ltd. (a)(b) | 13,558 | 427,755 | |
| Intel Corp. | 1,909,193 | 110,828,654 | |
| KLA-Tencor Corp. | 72,158 | 11,823,810 | |
| Kopin Corp. (a)(b) | 69,037 | 34,774 | |
| Kulicke & Soffa Industries, Inc. | 36,135 | 906,627 | |
| Lam Research Corp. | 68,530 | 18,285,860 | |
| Lattice Semiconductor Corp. (a) | 82,938 | 1,566,699 | |
| MACOM Technology Solutions Holdings, Inc. (a) | 35,418 | 873,762 | |
| Marvell Technology Group Ltd. (b) | 367,769 | 9,698,069 | |
| Maxim Integrated Products, Inc. | 116,720 | 6,614,522 | |
| Mellanox Technologies Ltd. (a) | 30,073 | 3,455,388 | |
| Microchip Technology, Inc. (b) | 99,728 | 9,428,285 | |
| Micron Technology, Inc. (a) | 466,679 | 22,171,919 | |
| MKS Instruments, Inc. | 30,119 | 3,201,047 | |
| Monolithic Power Systems, Inc. | 23,524 | 3,779,836 | |
| Nova Measuring Instruments Ltd. (a) | 14,705 | 531,145 | |
| NVE Corp. | 3,557 | 226,190 | |
| NVIDIA Corp. (b) | 256,278 | 55,545,694 | |
| NXP Semiconductors NV | 129,628 | 14,982,404 | |
| O2Micro International Ltd. sponsored ADR (a) | 13,662 | 22,406 | |
| ON Semiconductor Corp. (a) | 229,033 | 4,917,339 | |
| PDF Solutions, Inc. (a) | 23,680 | 375,091 | |
| Photronics, Inc. (a) | 36,838 | 433,215 | |
| Pixelworks, Inc. (a)(b) | 39,202 | 132,111 | |
| Power Integrations, Inc. | 16,158 | 1,478,295 | |
| Qorvo, Inc. (a) | 68,573 | 7,145,992 | |
| Qualcomm, Inc. | 511,806 | 42,761,391 | |
| QuickLogic Corp. (a) | 50,325 | 13,336 | |
| Rambus, Inc. (a) | 61,561 | 803,371 | |
| Rubicon Technology, Inc. (a) | 229 | 1,864 | |
| SemiLEDs Corp. (a) | 5,650 | 12,995 | |
| Semtech Corp. (a) | 37,146 | 1,800,095 | |
| Silicon Laboratories, Inc. (a)(b) | 23,698 | 2,510,329 | |
| Silicon Motion Technology Corp. sponsored ADR | 20,181 | 894,018 | |
| Skyworks Solutions, Inc. | 76,613 | 7,531,058 | |
| SMART Global Holdings, Inc. (a) | 11,675 | 359,590 | |
| SolarEdge Technologies, Inc. (a)(b) | 26,381 | 2,152,953 | |
| SunPower Corp. (a)(b) | 74,111 | 555,091 | |
| Synaptics, Inc. (a)(b) | 18,324 | 1,047,400 | |
| Teradyne, Inc. | 99,420 | 6,222,698 | |
| Texas Instruments, Inc. | 408,877 | 49,151,104 | |
| Tower Semiconductor Ltd. (a) | 58,385 | 1,279,799 | |
| Ultra Clean Holdings, Inc. (a) | 20,395 | 453,585 | |
| Universal Display Corp. | 26,182 | 5,085,068 | |
| Veeco Instruments, Inc. (a) | 25,984 | 355,721 | |
| Xilinx, Inc. | 107,049 | 9,932,006 | |
| Xperi Corp. (b) | 29,018 | 574,266 | |
| 576,297,325 | |||
| Software - 11.8% | |||
| 2U, Inc. (a)(b) | 32,420 | 808,555 | |
| ACI Worldwide, Inc. (a)(b) | 65,452 | 2,454,450 | |
| Adobe, Inc. (a) | 206,231 | 63,834,681 | |
| Agilysys, Inc. (a) | 26,463 | 670,308 | |
| Alarm.com Holdings, Inc. (a) | 26,659 | 1,162,866 | |
| Allot Ltd. (a) | 21,262 | 184,979 | |
| Altair Engineering, Inc. Class A (a)(b) | 21,670 | 718,794 | |
| American Software, Inc. Class A | 21,038 | 332,611 | |
| ANSYS, Inc. (a) | 46,862 | 11,935,283 | |
| AppFolio, Inc. (a)(b) | 10,046 | 1,134,394 | |
| Appian Corp. Class A (a)(b) | 6,095 | 262,573 | |
| Aspen Technology, Inc. (a) | 38,690 | 4,851,726 | |
| Asure Software, Inc. (a)(b) | 8,060 | 66,092 | |
| Atlassian Corp. PLC (a) | 64,285 | 8,171,266 | |
| AudioEye, Inc. (a)(b) | 1,728 | 8,813 | |
| Aurora Mobile Ltd. ADR (a)(b) | 8,728 | 20,947 | |
| Autodesk, Inc. (a) | 92,428 | 16,720,225 | |
| Aware, Inc. (a) | 11,224 | 37,713 | |
| Benefitfocus, Inc. (a)(b) | 20,346 | 487,897 | |
| Blackbaud, Inc. | 27,006 | 2,238,257 | |
| BlackLine, Inc. (a)(b) | 30,809 | 1,658,140 | |
| Bottomline Technologies, Inc. (a) | 24,163 | 1,195,827 | |
| BroadVision, Inc. (a) | 599 | 1,671 | |
| BSQUARE Corp. (a) | 4,329 | 5,411 | |
| Cadence Design Systems, Inc. (a) | 119,558 | 8,398,950 | |
| CDK Global, Inc. | 69,325 | 3,712,354 | |
| Cerence, Inc. (a)(b) | 20,049 | 311,962 | |
| Check Point Software Technologies Ltd. (a) | 66,557 | 7,845,739 | |
| Citrix Systems, Inc. | 56,700 | 6,396,327 | |
| CommVault Systems, Inc. (a) | 25,608 | 1,296,277 | |
| Cornerstone OnDemand, Inc. (a) | 33,471 | 2,064,157 | |
| CounterPath Corp. (a) | 17,127 | 17,983 | |
| Coupa Software, Inc. (a)(b) | 33,141 | 5,086,812 | |
| Crowdstrike Holdings, Inc. (b) | 9,840 | 570,720 | |
| CyberArk Software Ltd. (a) | 19,514 | 2,391,441 | |
| Descartes Systems Group, Inc. (Canada) (a) | 45,955 | 1,968,561 | |
| Digimarc Corp. (a)(b) | 9,497 | 307,513 | |
| Digital Turbine, Inc. (a)(b) | 70,098 | 622,470 | |
| DocuSign, Inc. (a) | 91,817 | 6,538,289 | |
| Domo, Inc. Class B (a)(b) | 16,775 | 315,370 | |
| Dropbox, Inc. Class A (a) | 132,672 | 2,453,105 | |
| Ebix, Inc. (b) | 17,154 | 596,616 | |
| eGain Communications Corp. (a) | 19,235 | 146,763 | |
| Everbridge, Inc. (a)(b) | 18,345 | 1,613,259 | |
| Evolving Systems, Inc. (a) | 7,319 | 6,737 | |
| FireEye, Inc. (a)(b) | 99,351 | 1,665,123 | |
| Five9, Inc. (a) | 34,023 | 2,319,348 | |
| Forescout Technologies, Inc. (a) | 21,926 | 785,609 | |
| Fortinet, Inc. (a) | 95,459 | 10,033,695 | |
| GTY Govtech, Inc. (a)(b) | 28,848 | 142,221 | |
| Ideanomics, Inc. (a)(b) | 109,229 | 99,431 | |
| Intuit, Inc. | 109,382 | 28,317,906 | |
| j2 Global, Inc. (b) | 27,504 | 2,668,438 | |
| LivePerson, Inc. (a)(b) | 35,362 | 1,403,518 | |
| LogMeIn, Inc. | 28,371 | 2,212,371 | |
| Magic Software Enterprises Ltd. | 23,096 | 233,501 | |
| Manhattan Associates, Inc. (a)(b) | 36,121 | 3,016,465 | |
| Materialise NV ADR (a)(b) | 17,134 | 302,758 | |
| Microsoft Corp. | 3,355,398 | 507,940,149 | |
| MicroStrategy, Inc. Class A (a) | 5,388 | 809,978 | |
| Mimecast Ltd. (a) | 33,843 | 1,500,937 | |
| Mitek Systems, Inc. (a) | 30,316 | 216,153 | |
| MMTEC, Inc. (b) | 2,116 | 4,634 | |
| MobileIron, Inc. (a) | 72,399 | 349,687 | |
| My Size, Inc. (a)(b) | 3,094 | 11,138 | |
| NetSol Technologies, Inc. (a) | 5,108 | 19,717 | |
| NICE Systems Ltd. sponsored ADR (a)(b) | 23,386 | 3,542,745 | |
| Nortonlifelock, Inc. | 270,212 | 6,728,279 | |
| Nuance Communications, Inc. (a)(b) | 160,392 | 2,875,829 | |
| Nutanix, Inc. Class A (a) | 80,918 | 3,022,287 | |
| NXT-ID, Inc. (a) | 34,241 | 18,148 | |
| Onespan, Inc. (a) | 24,175 | 450,864 | |
| Open Text Corp. | 150,279 | 6,550,594 | |
| Opera Ltd. ADR (a) | 1,040 | 10,546 | |
| Parametric Technology Corp. (a)(b) | 65,927 | 5,050,008 | |
| Park City Group, Inc. (a)(b) | 9,653 | 45,369 | |
| Paylocity Holding Corp. (a) | 29,509 | 3,609,541 | |
| Pegasystems, Inc. | 42,409 | 3,291,787 | |
| Phunware, Inc. (a)(b) | 9,499 | 12,159 | |
| Pluralsight, Inc. (a)(b) | 53,091 | 902,016 | |
| Progress Software Corp. | 25,286 | 1,062,265 | |
| Proofpoint, Inc. (a)(b) | 26,293 | 3,120,716 | |
| QAD, Inc. Class A | 11,878 | 607,085 | |
| Qualys, Inc. (a)(b) | 22,053 | 1,929,858 | |
| Qumu Corp. (a) | 2,780 | 7,089 | |
| Rapid7, Inc. (a) | 26,447 | 1,482,883 | |
| RealPage, Inc. (a) | 44,359 | 2,441,076 | |
| Rimini Street, Inc. (a) | 3,161 | 12,549 | |
| Riot Blockchain, Inc. (a)(b) | 50,376 | 70,023 | |
| Sapiens International Corp. NV | 29,782 | 670,393 | |
| SeaChange International, Inc. (a)(b) | 24,750 | 86,625 | |
| SecureWorks Corp. (a)(b) | 19,240 | 218,182 | |
| SharpSpring, Inc. (a)(b) | 7,519 | 94,589 | |
| ShotSpotter, Inc. (a)(b) | 8,669 | 212,564 | |
| SITO Mobile Ltd. (a)(b) | 29,695 | 12,068 | |
| Smith Micro Software, Inc. (a)(b) | 40,199 | 189,739 | |
| Sphere 3D Corp. (a) | 12,002 | 9,401 | |
| Splunk, Inc. (a) | 82,496 | 12,310,053 | |
| SPS Commerce, Inc. (a) | 20,954 | 1,180,339 | |
| SS&C Technologies Holdings, Inc. | 140,035 | 8,409,102 | |
| Support.com, Inc. (a) | 16,704 | 32,823 | |
| SurveyMonkey (a) | 74,642 | 1,274,139 | |
| Synacor, Inc. (a)(b) | 19,246 | 34,065 | |
| Synchronoss Technologies, Inc. (a)(b) | 16,012 | 72,694 | |
| Synopsys, Inc. (a) | 63,040 | 8,891,162 | |
| Talend SA ADR (a)(b) | 16,712 | 634,388 | |
| TeleNav, Inc. (a) | 34,719 | 198,593 | |
| Tenable Holdings, Inc. (a) | 57,300 | 1,555,695 | |
| The Trade Desk, Inc. (a)(b) | 21,659 | 5,703,681 | |
| TiVo Corp. | 64,768 | 505,838 | |
| Upland Software, Inc. (a) | 13,837 | 535,630 | |
| Varonis Systems, Inc. (a) | 15,211 | 1,188,131 | |
| Verint Systems, Inc. (a) | 34,844 | 1,693,767 | |
| Veritone, Inc. (a)(b) | 13,641 | 41,196 | |
| Workday, Inc. Class A (a) | 68,763 | 12,316,829 | |
| Xunlei Ltd. sponsored ADR (a)(b) | 19,309 | 99,828 | |
| Zix Corp. (a) | 44,061 | 332,220 | |
| Zoom Video Communications, Inc. Class A (b) | 26,875 | 2,002,188 | |
| Zscaler, Inc. (a)(b) | 69,583 | 3,627,362 | |
| 846,654,661 | |||
| Technology Hardware, Storage & Peripherals - 7.8% | |||
| Apple, Inc. | 1,987,319 | 531,111,001 | |
| Astro-Med, Inc. | 3,663 | 56,593 | |
| Avid Technology, Inc. (a)(b) | 21,480 | 169,048 | |
| CPI Card Group (a) | 1,132 | 1,347 | |
| Immersion Corp. (a) | 16,408 | 110,754 | |
| Intevac, Inc. (a)(b) | 24,594 | 146,826 | |
| Logitech International SA (b) | 92,137 | 4,013,488 | |
| NetApp, Inc. | 129,047 | 7,818,958 | |
| Seagate Technology LLC | 157,253 | 9,384,859 | |
| Stratasys Ltd. (a)(b) | 30,177 | 556,464 | |
| Transact Technologies, Inc. | 5,746 | 64,528 | |
| Western Digital Corp. (b) | 125,586 | 6,320,743 | |
| 559,754,609 | |||
| TOTAL INFORMATION TECHNOLOGY | 2,386,268,511 | ||
| MATERIALS - 0.3% | |||
| Chemicals - 0.1% | |||
| A. Schulman, Inc. rights (a)(c) | 15,464 | 6,696 | |
| Advanced Emissions Solutions, Inc. (b) | 9,725 | 98,903 | |
| AgroFresh Solutions, Inc. (a)(b) | 31,402 | 74,423 | |
| Amyris, Inc. (a)(b) | 32,836 | 132,001 | |
| Balchem Corp. | 17,987 | 1,792,045 | |
| Fuwei Films Holdings Co. Ltd. (a)(b) | 5,412 | 16,777 | |
| Gulf Resources, Inc. (a) | 18,051 | 9,748 | |
| Hawkins, Inc. | 5,991 | 247,548 | |
| Innophos Holdings, Inc. | 10,285 | 328,092 | |
| Innospec, Inc. | 13,670 | 1,345,128 | |
| Marrone Bio Innovations, Inc. (a)(b) | 67,680 | 73,094 | |
| Methanex Corp. | 44,064 | 1,644,729 | |
| Northern Technologies International Corp. (b) | 4,760 | 58,310 | |
| Tantech Holdings Ltd. (a)(b) | 31,503 | 64,581 | |
| 5,892,075 | |||
| Construction Materials - 0.0% | |||
| China Advanced Construction Materials Group, Inc. (a)(b) | 8,694 | 19,648 | |
| Tecnoglass, Inc. | 18,608 | 149,050 | |
| U.S. Concrete, Inc. (a) | 10,081 | 412,615 | |
| United States Lime & Minerals, Inc. | 2,950 | 303,467 | |
| 884,780 | |||
| Containers & Packaging - 0.0% | |||
| Silgan Holdings, Inc. | 61,572 | 1,897,033 | |
| UFP Technologies, Inc. (a) | 5,073 | 235,134 | |
| 2,132,167 | |||
| Metals & Mining - 0.2% | |||
| Century Aluminum Co. (a) | 46,076 | 324,836 | |
| China Natural Resources, Inc. (a)(b) | 11,233 | 21,006 | |
| Ferroglobe PLC (a) | 90,348 | 57,705 | |
| Ferroglobe Representation & Warranty Insurance (a)(c) | 23,476 | 0 | |
| Haynes International, Inc. | 9,313 | 341,973 | |
| Kaiser Aluminum Corp. | 9,749 | 1,068,295 | |
| Mountain Province Diamonds, Inc. (a) | 73,559 | 62,577 | |
| Olympic Steel, Inc. | 10,897 | 182,634 | |
| Pan American Silver Corp. (b) | 115,585 | 2,225,011 | |
| Ramaco Resources, Inc. (a)(b) | 21,088 | 72,121 | |
| Royal Gold, Inc. | 36,584 | 4,290,206 | |
| Schnitzer Steel Industries, Inc. Class A | 18,445 | 397,490 | |
| SSR Mining, Inc. (a) | 67,684 | 1,058,852 | |
| Steel Dynamics, Inc. | 126,145 | 4,254,871 | |
| Synalloy Corp. | 4,836 | 62,578 | |
| Universal Stainless & Alloy Products, Inc. (a) | 7,722 | 106,950 | |
| ZK International Group Co. Ltd. (a)(b) | 8,117 | 10,390 | |
| 14,537,495 | |||
| Paper & Forest Products - 0.0% | |||
| Mercer International, Inc. (SBI) | 43,521 | 545,318 | |
| Pope Resources, Inc. LP | 1,792 | 159,703 | |
| 705,021 | |||
| TOTAL MATERIALS | 24,151,538 | ||
| REAL ESTATE - 1.2% | |||
| Equity Real Estate Investment Trusts (REITs) - 1.0% | |||
| American Finance Trust, Inc. (b) | 58,496 | 865,156 | |
| Brookfield Property REIT, Inc. Class A | 34,710 | 660,184 | |
| CareTrust (REIT), Inc. | 49,853 | 1,040,931 | |
| CIM Commercial Trust Corp. | 10,595 | 153,628 | |
| CyrusOne, Inc. | 53,081 | 3,306,946 | |
| Equinix, Inc. | 47,035 | 26,661,790 | |
| Gaming & Leisure Properties | 114,924 | 4,849,793 | |
| Gladstone Commercial Corp. | 18,518 | 421,840 | |
| Gladstone Land Corp. | 13,642 | 172,981 | |
| Global Self Storage, Inc. | 4,374 | 18,633 | |
| Global Self Storage, Inc. rights 12/13/19 (a) | 4,374 | 126 | |
| Government Properties Income Trust (b) | 22,561 | 752,635 | |
| Hospitality Properties Trust (SBI) | 91,316 | 2,126,750 | |
| Industrial Logistics Properties Trust | 30,522 | 660,496 | |
| Lamar Advertising Co. Class A | 46,677 | 3,894,262 | |
| Potlatch Corp. | 37,739 | 1,639,005 | |
| Regency Centers Corp. | 95,165 | 6,189,532 | |
| Retail Opportunity Investments Corp. | 61,376 | 1,119,498 | |
| Sabra Health Care REIT, Inc. | 101,548 | 2,262,489 | |
| SBA Communications Corp. Class A | 53,108 | 12,558,449 | |
| Senior Housing Properties Trust (SBI) | 136,980 | 1,002,694 | |
| Sotherly Hotels, Inc. | 13,575 | 88,102 | |
| Uniti Group, Inc. | 120,795 | 811,742 | |
| Wheeler REIT, Inc. (a)(b) | 15,634 | 29,861 | |
| 71,287,523 | |||
| Real Estate Management & Development - 0.2% | |||
| Altisource Portfolio Solutions SA (a)(b) | 11,426 | 205,897 | |
| Brookfield Property Partners LP | 237,287 | 4,521,369 | |
| China HGS Real Estate, Inc. (a)(b) | 13,939 | 11,151 | |
| Colliers International Group, Inc. (b) | 23,509 | 1,699,947 | |
| Cresud S.A.C.I.F. y A. sponsored ADR | 24,152 | 138,874 | |
| eXp World Holdings, Inc. (a)(b) | 33,873 | 370,909 | |
| FirstService Corp. | 22,078 | 2,117,059 | |
| FRP Holdings, Inc. (a) | 8,211 | 409,729 | |
| Griffin Industrial Realty, Inc. | 2,554 | 98,712 | |
| Gyrodyne LLC (a) | 1,037 | 20,014 | |
| Landmark Infrastructure Partners LP | 12,077 | 189,850 | |
| Newmark Group, Inc. | 147,628 | 1,926,545 | |
| Redfin Corp. (a)(b) | 50,422 | 972,136 | |
| Stratus Properties, Inc. (a) | 4,283 | 122,494 | |
| The RMR Group, Inc. | 8,763 | 411,598 | |
| 13,216,284 | |||
| TOTAL REAL ESTATE | 84,503,807 | ||
| UTILITIES - 0.7% | |||
| Electric Utilities - 0.6% | |||
| Alliant Energy Corp. | 132,080 | 7,000,240 | |
| Exelon Corp. | 436,500 | 19,380,600 | |
| MGE Energy, Inc. | 21,282 | 1,649,781 | |
| Otter Tail Corp. | 23,594 | 1,159,881 | |
| Spark Energy, Inc. Class A, (b) | 5,832 | 64,327 | |
| Xcel Energy, Inc. | 218,248 | 13,420,070 | |
| 42,674,899 | |||
| Gas Utilities - 0.0% | |||
| RGC Resources, Inc. | 3,685 | 108,265 | |
| Independent Power and Renewable Electricity Producers - 0.1% | |||
| Atlantica Yield PLC | 56,076 | 1,453,490 | |
| Pattern Energy Group, Inc. | 53,705 | 1,477,962 | |
| Terraform Power, Inc. | 116,644 | 1,809,148 | |
| VivoPower International PLC (a)(b) | 1,305 | 1,436 | |
| 4,742,036 | |||
| Water Utilities - 0.0% | |||
| Artesian Resources Corp. Class A | 5,784 | 215,165 | |
| Cadiz, Inc. (a)(b) | 19,334 | 221,568 | |
| Global Water Resources, Inc. | 9,461 | 127,440 | |
| Middlesex Water Co. | 13,345 | 838,199 | |
| Pure Cycle Corp. (a) | 12,765 | 158,541 | |
| York Water Co. | 7,627 | 338,105 | |
| 1,899,018 | |||
| TOTAL UTILITIES | 49,424,218 | ||
| TOTAL COMMON STOCKS | |||
| (Cost $3,284,503,096) | 6,015,378,380 | ||
| Principal Amount | Value | ||
| U.S. Treasury Obligations - 0.6% | |||
| U.S. Treasury Bills, yield at date of purchase 1.7% to 1.82% 12/19/19 to 3/19/20 (e) | |||
| (Cost $45,854,757) | 46,000,000 | 45,877,229 | |
| Shares | Value | ||
| Money Market Funds - 20.2% | |||
| Fidelity Cash Central Fund 1.61% (f) | 1,086,126,682 | $1,086,343,907 | |
| Fidelity Securities Lending Cash Central Fund 1.61% (f)(g) | 354,902,146 | 354,937,636 | |
| TOTAL MONEY MARKET FUNDS | |||
| (Cost $1,441,273,586) | 1,441,281,543 | ||
| TOTAL INVESTMENT IN SECURITIES - 104.9% | |||
| (Cost $4,771,631,439) | 7,502,537,152 | ||
| NET OTHER ASSETS (LIABILITIES) - (4.9)% | (348,248,875) | ||
| NET ASSETS - 100% | $7,154,288,277 |
| Futures Contracts | |||||
| Number of contracts | Expiration Date | Notional Amount | Value | Unrealized Appreciation/(Depreciation) | |
| Purchased | |||||
| Equity Index Contracts | |||||
| CME E-mini NASDAQ 100 Index Contracts (United States) | 6,761 | Dec. 2019 | $1,138,214,350 | $69,759,195 | $69,759,195 |
The notional amount of futures purchased as a percentage of Net Assets is 15.9%
For the period, the average monthly notional amount at value for futures contracts in the aggregate was $958,731,503.
Legend
(a) Non-income producing
(b) Security or a portion of the security is on loan at period end.
(c) Level 3 security
(d) Security exempt from registration under Rule 144A of the Securities Act of 1933. These securities may be resold in transactions exempt from registration, normally to qualified institutional buyers. At the end of the period, the value of these securities amounted to $0 or 0.0% of net assets.
(e) Security or a portion of the security was pledged to cover margin requirements for futures contracts. At period end, the value of securities pledged amounted to $45,877,229.
(f) Affiliated fund that is generally available only to investment companies and other accounts managed by Fidelity Investments. The rate quoted is the annualized seven-day yield of the fund at period end. A complete unaudited listing of the fund's holdings as of its most recent quarter end is available upon request. In addition, each Fidelity Central Fund's financial statements, which are not covered by the Fund's Report of Independent Registered Public Accounting Firm, are available on the SEC's website or upon request.
(g) Investment made with cash collateral received from securities on loan.
Affiliated Central Funds
Information regarding fiscal year to date income earned by the Fund from investments in Fidelity Central Funds is as follows:
| Fund | Income earned |
| Fidelity Cash Central Fund | $20,337,620 |
| Fidelity Securities Lending Cash Central Fund | 6,379,348 |
| Total | $26,716,968 |
Amounts in the income column in the above table include any capital gain distributions from underlying funds, which are presented in the corresponding line-item in the Statement of Operations, if applicable. Amount for Fidelity Securities Lending Cash Central Fund represents the income earned on investing cash collateral, less rebates paid to borrowers and any lending agent fees associated with the loan, plus any premium payments received for lending certain types of securities.
Investment Valuation
The following is a summary of the inputs used, as of November 30, 2019, involving the Fund's assets and liabilities carried at fair value. The inputs or methodology used for valuing securities may not be an indication of the risk associated with investing in those securities. For more information on valuation inputs, and their aggregation into the levels used below, please refer to the Investment Valuation section in the accompanying Notes to Financial Statements.
| Valuation Inputs at Reporting Date: | ||||
| Description | Total | Level 1 | Level 2 | Level 3 |
| Investments in Securities: | ||||
| Equities: | ||||
| Communication Services | $1,021,052,310 | $1,021,050,561 | $-- | $1,749 |
| Consumer Discretionary | 800,720,120 | 800,720,120 | -- | -- |
| Consumer Staples | 261,205,069 | 261,205,069 | -- | -- |
| Energy | 19,383,130 | 19,383,130 | -- | -- |
| Financials | 428,032,152 | 428,032,152 | -- | -- |
| Health Care | 664,932,785 | 664,647,007 | -- | 285,778 |
| Industrials | 275,704,740 | 275,704,740 | -- | -- |
| Information Technology | 2,386,268,511 | 2,386,268,511 | -- | -- |
| Materials | 24,151,538 | 24,144,842 | -- | 6,696 |
| Real Estate | 84,503,807 | 84,503,681 | 126 | -- |
| Utilities | 49,424,218 | 49,424,218 | -- | -- |
| U.S. Government and Government Agency Obligations | 45,877,229 | -- | 45,877,229 | -- |
| Money Market Funds | 1,441,281,543 | 1,441,281,543 | -- | -- |
| Total Investments in Securities: | $7,502,537,152 | $7,456,365,574 | $45,877,355 | $294,223 |
| Derivative Instruments: | ||||
| Assets | ||||
| Futures Contracts | $69,759,195 | $69,759,195 | $-- | $-- |
| Total Assets | $69,759,195 | $69,759,195 | $-- | $-- |
| Total Derivative Instruments: | $69,759,195 | $69,759,195 | $-- | $-- |
Value of Derivative Instruments
The following table is a summary of the Fund's value of derivative instruments by primary risk exposure as of November 30, 2019. For additional information on derivative instruments, please refer to the Derivative Instruments section in the accompanying Notes to Financial Statements.
| Primary Risk Exposure / Derivative Type | Value | |
| Asset | Liability | |
| Equity Risk | ||
| Futures Contracts(a) | $69,759,195 | $0 |
| Total Equity Risk | 69,759,195 | 0 |
| Total Value of Derivatives | $69,759,195 | $0 |
(a) Reflects gross cumulative appreciation (depreciation) on futures contracts as presented in the Schedule of Investments. In the Statement of Assets and Liabilities, the period end daily variation margin is included in receivable or payable for daily variation margin on futures contracts, and the net cumulative appreciation (depreciation) is included in Total accumulated earnings (loss).
See accompanying notes which are an integral part of the financial statements.
Financial Statements
Statement of Assets and Liabilities
| November 30, 2019 | ||
| Assets | ||
| Investment in securities, at value (including securities loaned of $344,276,800) — See accompanying schedule: Unaffiliated issuers (cost $3,330,357,853) | $6,061,255,609 | |
| Fidelity Central Funds (cost $1,441,273,586) | 1,441,281,543 | |
| Total Investment in Securities (cost $4,771,631,439) | $7,502,537,152 | |
| Segregated cash with brokers for derivative instruments | 3,211,389 | |
| Foreign currency held at value (cost $22,936) | 22,253 | |
| Receivable for investments sold | 34,483 | |
| Receivable for fund shares sold | 6,035,961 | |
| Dividends receivable | 5,808,102 | |
| Distributions receivable from Fidelity Central Funds | 1,719,820 | |
| Prepaid expenses | 10,447 | |
| Receivable from investment adviser for expense reductions | 329,341 | |
| Total assets | 7,519,708,948 | |
| Liabilities | ||
| Payable to custodian bank | $412,771 | |
| Payable for fund shares redeemed | 3,021,631 | |
| Accrued management fee | 1,403,036 | |
| Payable for daily variation margin on futures contracts | 5,030,990 | |
| Other affiliated payables | 592,931 | |
| Other payables and accrued expenses | 87,985 | |
| Collateral on securities loaned | 354,871,327 | |
| Total liabilities | 365,420,671 | |
| Net Assets | $7,154,288,277 | |
| Net Assets consist of: | ||
| Paid in capital | $4,126,072,166 | |
| Total accumulated earnings (loss) | 3,028,216,111 | |
| Net Assets | $7,154,288,277 | |
| Net Asset Value, offering price and redemption price per share ($7,154,288,277 ÷ 62,987,748 shares) | $113.58 |
See accompanying notes which are an integral part of the financial statements.
Statement of Operations
| Year ended November 30, 2019 | ||
| Investment Income | ||
| Dividends | $61,855,688 | |
| Interest | 1,116,591 | |
| Income from Fidelity Central Funds (including $6,379,348 from security lending) | 26,716,968 | |
| Total income | 89,689,247 | |
| Expenses | ||
| Management fee | $15,435,231 | |
| Transfer agent fees | 6,777,571 | |
| Accounting and security lending fees | 249,416 | |
| Custodian fees and expenses | 45,560 | |
| Independent trustees' fees and expenses | 36,491 | |
| Registration fees | 133,737 | |
| Audit | 81,366 | |
| Legal | 34,574 | |
| Miscellaneous | 40,369 | |
| Total expenses before reductions | 22,834,315 | |
| Expense reductions | (4,115,045) | |
| Total expenses after reductions | 18,719,270 | |
| Net investment income (loss) | 70,969,977 | |
| Realized and Unrealized Gain (Loss) | ||
| Net realized gain (loss) on: | ||
| Investment securities: | ||
| Unaffiliated issuers | 84,026,521 | |
| Fidelity Central Funds | (3,619) | |
| Foreign currency transactions | 946 | |
| Futures contracts | 32,490,806 | |
| Total net realized gain (loss) | 116,514,654 | |
| Change in net unrealized appreciation (depreciation) on: | ||
| Investment securities: | ||
| Unaffiliated issuers | 836,705,409 | |
| Fidelity Central Funds | 6,421 | |
| Assets and liabilities in foreign currencies | 232 | |
| Futures contracts | 137,982,012 | |
| Total change in net unrealized appreciation (depreciation) | 974,694,074 | |
| Net gain (loss) | 1,091,208,728 | |
| Net increase (decrease) in net assets resulting from operations | $1,162,178,705 |
See accompanying notes which are an integral part of the financial statements.
Statement of Changes in Net Assets
| Year ended November 30, 2019 | Year ended November 30, 2018 | |
| Increase (Decrease) in Net Assets | ||
| Operations | ||
| Net investment income (loss) | $70,969,977 | $52,555,222 |
| Net realized gain (loss) | 116,514,654 | 158,124,791 |
| Change in net unrealized appreciation (depreciation) | 974,694,074 | 139,110,287 |
| Net increase (decrease) in net assets resulting from operations | 1,162,178,705 | 349,790,300 |
| Distributions to shareholders | (101,247,668) | (35,982,925) |
| Share transactions | ||
| Proceeds from sales of shares | 1,368,442,356 | 2,022,386,654 |
| Reinvestment of distributions | 96,704,103 | 34,510,575 |
| Cost of shares redeemed | (1,374,121,905) | (1,268,156,368) |
| Net increase (decrease) in net assets resulting from share transactions | 91,024,554 | 788,740,861 |
| Total increase (decrease) in net assets | 1,151,955,591 | 1,102,548,236 |
| Net Assets | ||
| Beginning of period | 6,002,332,686 | 4,899,784,450 |
| End of period | $7,154,288,277 | $6,002,332,686 |
| Other Information | ||
| Shares | ||
| Sold | 13,650,276 | 20,776,948 |
| Issued in reinvestment of distributions | 1,137,160 | 378,987 |
| Redeemed | (13,769,028) | (13,076,546) |
| Net increase (decrease) | 1,018,408 | 8,079,389 |
See accompanying notes which are an integral part of the financial statements.
Financial Highlights
Fidelity Nasdaq Composite Index Fund
| Years ended November 30, | 2019 | 2018 | 2017 | 2016 | 2015 |
| Selected Per–Share Data | |||||
| Net asset value, beginning of period | $96.86 | $90.92 | $70.45 | $67.89 | $63.84 |
| Income from Investment Operations | |||||
| Net investment income (loss)A | 1.12 | .89 | .76 | .78 | .68 |
| Net realized and unrealized gain (loss) | 17.26 | 5.71 | 20.38 | 2.80 | 4.13 |
| Total from investment operations | 18.38 | 6.60 | 21.14 | 3.58 | 4.81 |
| Distributions from net investment income | (.81) | (.64) | (.65) | (.55) | (.52) |
| Distributions from net realized gain | (.85) | (.02) | (.03) | (.48) | (.26) |
| Total distributions | (1.66) | (.66) | (.67)B | (1.03) | (.78) |
| Redemption fees added to paid in capitalA | – | – | –C | .01 | .02 |
| Net asset value, end of period | $113.58 | $96.86 | $90.92 | $70.45 | $67.89 |
| Total ReturnD | 19.55% | 7.30% | 30.26% | 5.43% | 7.70% |
| Ratios to Average Net AssetsE,F | |||||
| Expenses before reductions | .35% | .40% | .41% | .42% | .52% |
| Expenses net of fee waivers, if any | .29% | .29% | .29% | .29% | .29% |
| Expenses net of all reductions | .29% | .29% | .29% | .29% | .29% |
| Net investment income (loss) | 1.10% | .90% | .94% | 1.20% | 1.05% |
| Supplemental Data | |||||
| Net assets, end of period (000 omitted) | $7,154,288 | $6,002,333 | $4,899,784 | $2,715,137 | $2,076,377 |
| Portfolio turnover rateG | 6% | 15% | 11% | 4% | 9% |
A Calculated based on average shares outstanding during the period.
B Total distributions of $.67 per share is comprised of distributions from net investment income of $.645 and distributions from net realized gain of $.027 per share.
C Amount represents less than $.005 per share.
D Total returns would have been lower if certain expenses had not been reduced during the applicable periods shown.
E Fees and expenses of any underlying Fidelity Central Funds are not included in the Fund's expense ratio. The Fund indirectly bears its proportionate share of the expenses of any underlying Fidelity Central Funds.
F Expense ratios reflect operating expenses of the Fund. Expenses before reductions do not reflect amounts reimbursed by the investment adviser or reductions from expense offset arrangements and do not represent the amount paid by the Fund during periods when reimbursements or reductions occur. Expenses net of fee waivers reflect expenses after reimbursement by the investment adviser but prior to reductions from expense offset arrangements. Expenses net of all reductions represent the net expenses paid by the Fund.
G Amount does not include the portfolio activity of any underlying Fidelity Central Funds.
See accompanying notes which are an integral part of the financial statements.
Notes to Financial Statements
For the period ended November 30, 2019
1. Organization.
Fidelity Nasdaq Composite Index Fund (the Fund) is a fund of Fidelity Concord Street Trust (the Trust) and is authorized to issue an unlimited number of shares. Share transactions on the Statement of Changes in Net Assets may contain exchanges between affiliated funds. The Trust is registered under the Investment Company Act of 1940, as amended (the 1940 Act), as an open-end management investment company organized as a Massachusetts business trust.
2. Investments in Fidelity Central Funds.
The Fund invests in Fidelity Central Funds, which are open-end investment companies generally available only to other investment companies and accounts managed by the investment adviser and its affiliates. The Fund's Schedule of Investments lists each of the Fidelity Central Funds held as of period end, if any, as an investment of the Fund, but does not include the underlying holdings of each Fidelity Central Fund. As an Investing Fund, the Fund indirectly bears its proportionate share of the expenses of the underlying Fidelity Central Funds.
The Money Market Central Funds seek preservation of capital and current income and are managed by Fidelity Investments Money Management, Inc. (FIMM), an affiliate of the investment adviser. Annualized expenses of the Money Market Central Funds as of their most recent shareholder report date ranged from less than .005% to .01%.
A complete unaudited list of holdings for each Fidelity Central Fund is available upon request or at the Securities and Exchange Commission (the SEC) website at www.sec.gov. In addition, the financial statements of the Fidelity Central Funds, which are not covered by the Fund's Report of Independent Registered Public Accounting Firm, are available on the SEC website or upon request.
3. Significant Accounting Policies.
The Fund is an investment company and applies the accounting and reporting guidance of the Financial Accounting Standards Board (FASB) Accounting Standards Codification Topic 946 Financial Services – Investments Companies. The financial statements have been prepared in conformity with accounting principles generally accepted in the United States of America (GAAP), which require management to make certain estimates and assumptions at the date of the financial statements. Actual results could differ from those estimates. Subsequent events, if any, through the date that the financial statements were issued have been evaluated in the preparation of the financial statements. The following summarizes the significant accounting policies of the Fund:
Investment Valuation. Investments are valued as of 4:00 p.m. Eastern time on the last calendar day of the period. The Board of Trustees (the Board) has delegated the day to day responsibility for the valuation of the Fund's investments to the Fair Value Committee (the Committee) established by the Fund's investment adviser. In accordance with valuation policies and procedures approved by the Board, the Fund attempts to obtain prices from one or more third party pricing vendors or brokers to value its investments. When current market prices, quotations or currency exchange rates are not readily available or reliable, investments will be fair valued in good faith by the Committee, in accordance with procedures adopted by the Board. Factors used in determining fair value vary by investment type and may include market or investment specific events, changes in interest rates and credit quality. The frequency with which these procedures are used cannot be predicted and they may be utilized to a significant extent. The Committee oversees the Fund's valuation policies and procedures and reports to the Board on the Committee's activities and fair value determinations. The Board monitors the appropriateness of the procedures used in valuing the Fund's investments and ratifies the fair value determinations of the Committee.
The Fund categorizes the inputs to valuation techniques used to value its investments into a disclosure hierarchy consisting of three levels as shown below:
- Level 1 – quoted prices in active markets for identical investments
- Level 2 – other significant observable inputs (including quoted prices for similar investments, interest rates, prepayment speeds, etc.)
- Level 3 – unobservable inputs (including the Fund's own assumptions based on the best information available)
Valuation techniques used to value the Fund's investments by major category are as follows:
Equity securities, including restricted securities, for which market quotations are readily available, are valued at the last reported sale price or official closing price as reported by a third party pricing vendor on the primary market or exchange on which they are traded and are categorized as Level 1 in the hierarchy. In the event there were no sales during the day or closing prices are not available, securities are valued at the last quoted bid price or may be valued using the last available price and are generally categorized as Level 2 in the hierarchy. For foreign equity securities, when market or security specific events arise, comparisons to the valuation of American Depositary Receipts (ADRs), futures contracts, Exchange-Traded Funds (ETFs) and certain indexes as well as quoted prices for similar securities may be used and would be categorized as Level 2 in the hierarchy. For equity securities, including restricted securities, where observable inputs are limited, assumptions about market activity and risk are used and these securities may be categorized as Level 3 in the hierarchy.
Debt securities, including restricted securities, are valued based on evaluated prices received from third party pricing vendors or from brokers who make markets in such securities. U.S. government and government agency obligations are valued by pricing vendors who utilize matrix pricing which considers yield or price of bonds of comparable quality, coupon, maturity and type or by broker-supplied prices. When independent prices are unavailable or unreliable, debt securities may be valued utilizing pricing methodologies which consider similar factors that would be used by third party pricing vendors. Debt securities are generally categorized as Level 2 in the hierarchy but may be Level 3 depending on the circumstances.
Futures contracts are valued at the settlement price established each day by the board of trade or exchange on which they are traded and are categorized as Level 1 in the hierarchy. Investments in open-end mutual funds, including the Fidelity Central Funds, are valued at their closing net asset value (NAV) each business day and are categorized as Level 1 in the hierarchy.
Changes in valuation techniques may result in transfers in or out of an assigned level within the disclosure hierarchy. The aggregate value of investments by input level as of November 30, 2019 is included at the end of the Fund's Schedule of Investments.
Foreign Currency. The Fund may use foreign currency contracts to facilitate transactions in foreign-denominated securities. Gains and losses from these transactions may arise from changes in the value of the foreign currency or if the counterparties do not perform under the contracts' terms.
Foreign-denominated assets, including investment securities, and liabilities are translated into U.S. dollars at the exchange rates at period end. Purchases and sales of investment securities, income and dividends received and expenses denominated in foreign currencies are translated into U.S. dollars at the exchange rate in effect on the transaction date.
The effects of exchange rate fluctuations on investments are included with the net realized and unrealized gain (loss) on investment securities. Other foreign currency transactions resulting in realized and unrealized gain (loss) are disclosed separately.
Investment Transactions and Income. For financial reporting purposes, the Fund's investment holdings and NAV include trades executed through the end of the last business day of the period. The NAV per share for processing shareholder transactions is calculated as of the close of business of the New York Stock Exchange (NYSE), normally 4:00 p.m. Eastern time and includes trades executed through the end of the prior business day. Gains and losses on securities sold are determined on the basis of identified cost and include proceeds received from litigation. Dividend income is recorded on the ex-dividend date, except for certain dividends from foreign securities where the ex-dividend date may have passed, which are recorded as soon as the Fund is informed of the ex-dividend date. Non-cash dividends included in dividend income, if any, are recorded at the fair market value of the securities received. Income and capital gain distributions from Fidelity Central Funds, if any, are recorded on the ex-dividend date. Certain distributions received by the Fund represent a return of capital or capital gain. The Fund determines the components of these distributions subsequent to the ex-dividend date, based upon receipt of tax filings or other correspondence relating to the underlying investment. These distributions are recorded as a reduction of cost of investments and/or as a realized gain. Interest income is accrued as earned and includes coupon interest and amortization of premium and accretion of discount on debt securities as applicable. Investment income is recorded net of foreign taxes withheld where recovery of such taxes is uncertain.
Expenses. Expenses directly attributable to a fund are charged to that fund. Expenses attributable to more than one fund are allocated among the respective funds on the basis of relative net assets or other appropriate methods. Expense estimates are accrued in the period to which they relate and adjustments are made when actual amounts are known.
Income Tax Information and Distributions to Shareholders. Each year, the Fund intends to qualify as a regulated investment company under Subchapter M of the Internal Revenue Code, including distributing substantially all of its taxable income and realized gains. As a result, no provision for U.S. Federal income taxes is required. As of November 30, 2019, the Fund did not have any unrecognized tax benefits in the financial statements; nor is the Fund aware of any tax positions for which it is reasonably possible that the total amounts of unrecognized tax benefits will significantly change in the next twelve months. The Fund files a U.S. federal tax return, in addition to state and local tax returns as required. The Fund's federal income tax returns are subject to examination by the Internal Revenue Service (IRS) for a period of three fiscal years after they are filed. State and local tax returns may be subject to examination for an additional fiscal year depending on the jurisdiction. Foreign taxes are provided for based on the Fund's understanding of the tax rules and rates that exist in the foreign markets in which it invests.
Distributions are declared and recorded on the ex-dividend date. Income and capital gain distributions are determined in accordance with income tax regulations, which may differ from GAAP. In addition, the Fund claimed a portion of the payment made to redeeming shareholders as a distribution for income tax purposes.
Capital accounts within the financial statements are adjusted for permanent book-tax differences. These adjustments have no impact on net assets or the results of operations. Capital accounts are not adjusted for temporary book-tax differences which will reverse in a subsequent period.
Book-tax differences are primarily due to futures contracts, foreign currency transactions, passive foreign investment companies (PFIC), market discount, partnerships and losses deferred due to wash sales.
As of period end, the cost and unrealized appreciation (depreciation) in securities, and derivatives if applicable, for federal income tax purposes were as follows:
| Gross unrealized appreciation | $2,987,861,319 |
| Gross unrealized depreciation | (265,960,389) |
| Net unrealized appreciation (depreciation) | $2,721,900,930 |
| Tax Cost | $4,780,636,222 |
The tax-based components of distributable earnings as of period end were as follows:
| Undistributed ordinary income | $125,068,645 |
| Undistributed long-term capital gain | $182,485,683 |
| Net unrealized appreciation (depreciation) on securities and other investments | $2,720,661,784 |
The tax character of distributions paid was as follows:
| November 30, 2019 | November 30, 2018 | |
| Ordinary Income | $49,221,004 | $ 35,982,925 |
| Long-term Capital Gains | 52,026,664 | – |
| Total | $101,247,668 | $ 35,982,925 |
Restricted Securities. The Fund may invest in securities that are subject to legal or contractual restrictions on resale. These securities generally may be resold in transactions exempt from registration or to the public if the securities are registered. Disposal of these securities may involve time-consuming negotiations and expense, and prompt sale at an acceptable price may be difficult.
4. Derivative Instruments.
Risk Exposures and the Use of Derivative Instruments. The Fund's investment objective allows the Fund to enter into various types of derivative contracts, including futures contracts. Derivatives are investments whose value is primarily derived from underlying assets, indices or reference rates and may be transacted on an exchange or over-the-counter (OTC). Derivatives may involve a future commitment to buy or sell a specified asset based on specified terms, to exchange future cash flows at periodic intervals based on a notional principal amount, or for one party to make one or more payments upon the occurrence of specified events in exchange for periodic payments from the other party.
The Fund used derivatives to increase returns and to manage exposure to certain risks as defined below. The success of any strategy involving derivatives depends on analysis of numerous economic factors, and if the strategies for investment do not work as intended, the Fund may not achieve its objectives.
The Fund's use of derivatives increased or decreased its exposure to the following risk:
| Equity Risk | Equity risk relates to the fluctuations in the value of financial instruments as a result of changes in market prices (other than those arising from interest rate risk or foreign exchange risk), whether caused by factors specific to an individual investment, its issuer, or all factors affecting all instruments traded in a market or market segment. |
The Fund is also exposed to additional risks from investing in derivatives, such as liquidity risk and counterparty credit risk. Liquidity risk is the risk that the Fund will be unable to close out the derivative in the open market in a timely manner. Counterparty credit risk is the risk that the counterparty will not be able to fulfill its obligation to the Fund. Counterparty credit risk related to exchange-traded futures contracts may be mitigated by the protection provided by the exchange on which they trade.
Investing in derivatives may involve greater risks than investing in the underlying assets directly and, to varying degrees, may involve risk of loss in excess of any initial investment and collateral received and amounts recognized in the Statement of Assets and Liabilities. In addition, there may be the risk that the change in value of the derivative contract does not correspond to the change in value of the underlying instrument.
Futures Contracts. A futures contract is an agreement between two parties to buy or sell a specified underlying instrument for a fixed price at a specified future date. The Fund used futures contracts to manage its exposure to the stock market.
Upon entering into a futures contract, a fund is required to deposit either cash or securities (initial margin) with a clearing broker in an amount equal to a certain percentage of the face value of the contract. Futures contracts are marked-to-market daily and subsequent daily payments (variation margin) are made or received by a fund depending on the daily fluctuations in the value of the futures contracts and are recorded as unrealized appreciation or (depreciation). This receivable and/or payable, if any, is included in daily variation margin on futures contracts in the Statement of Assets and Liabilities. Realized gain or (loss) is recorded upon the expiration or closing of a futures contract. The net realized gain (loss) and change in net unrealized appreciation (depreciation) on futures contracts during the period is presented in the Statement of Operations.
Any open futures contracts at period end are presented in the Schedule of Investments under the caption "Futures Contracts". The notional amount at value reflects each contract's exposure to the underlying instrument or index at period end. Securities deposited to meet initial margin requirements are identified in the Schedule of Investments. Cash deposited to meet initial margin requirements is presented as segregated cash with brokers for derivative instruments in the Statement of Assets and Liabilities
5. Purchases and Sales of Investments.
Purchases and sales of securities, other than short-term securities, aggregated $340,734,332 and $336,344,912, respectively.
6. Fees and Other Transactions with Affiliates.
Management Fee. Fidelity Management & Research Company (the investment adviser) and its affiliates provide the Fund with investment management related services for which the Fund pays a monthly management fee that is based on an annual rate of .24% of the Fund's average net assets.
Sub-Adviser. Geode Capital Management, LLC (Geode), serves as sub-adviser for the Fund. Geode provides discretionary investment advisory services to the Fund and is paid by the investment adviser for providing these services.
Transfer Agent Fees. Fidelity Investments Institutional Operations Company, Inc. (FIIOC), an affiliate of the investment adviser, is the Fund's transfer, dividend disbursing and shareholder servicing agent. FIIOC receives an asset-based fee of .11% of the Fund's average net assets. FIIOC pays for typesetting, printing and mailing of shareholder reports, except proxy statements.
Accounting and Security Lending Fees. Fidelity Service Company, Inc. (FSC), an affiliate of the investment adviser, maintains the Fund's accounting records. The accounting fee is based on the level of average net assets for each month. Prior to April 1, 2019, FSC had a separate agreement with the Fund for administration of the security lending program, based on the number and duration of lending transactions. For the period, the total fees paid for accounting and administration of securities lending were equivalent to an annual rate of less than .005%.
Interfund Trades. The Fund may purchase from or sell securities to other Fidelity Funds under procedures adopted by the Board. The procedures have been designed to ensure these interfund trades are executed in accordance with Rule 17a-7 of the 1940 Act. Interfund trades are included within the respective purchases and sales amounts shown in the Purchases and Sales of Investments note.
7. Committed Line of Credit.
The Fund participates with other funds managed by the investment adviser or an affiliate in a $4.25 billion credit facility (the "line of credit") to be utilized for temporary or emergency purposes to fund shareholder redemptions or for other short-term liquidity purposes. The Fund has agreed to pay commitment fees on its pro-rata portion of the line of credit, which amounted to $16,643 and is reflected in Miscellaneous expenses on the Statement of Operations. During the period, the Fund did not borrow on this line of credit.
8. Security Lending.
The Fund lends portfolio securities from time to time in order to earn additional income. For equity securities, lending agents are used, including National Financial Services (NFS), an affiliate of the Fund. Pursuant to a securities lending agreement, NFS will receive a fee, which is capped at 9.9% of daily lending revenue, for its services as lending agent. The Fund may lend securities to certain qualified borrowers, including NFS. On the settlement date of the loan, the Fund receives collateral (in the form of U.S. Treasury obligations, letters of credit and/or cash) against the loaned securities and maintains collateral in an amount not less than 100% of the market value of the loaned securities during the period of the loan. The market value of the loaned securities is determined at the close of business of the Fund and any additional required collateral is delivered to the Fund on the next business day. The Fund or borrower may terminate the loan at any time, and if the borrower defaults on its obligation to return the securities loaned because of insolvency or other reasons, the Fund may apply collateral received from the borrower against the obligation. The Fund may experience delays and costs in recovering the securities loaned. Any cash collateral received is invested in the Fidelity Securities Lending Cash Central Fund. The value of loaned securities and cash collateral at period end are disclosed on the Fund's Statement of Assets and Liabilities. The value of securities loaned to NFS, as affiliated borrower, at period end was $4,167,311. Total fees paid by the Fund to NFS, as lending agent, amounted to $281,741. Security lending income represents the income earned on investing cash collateral, less rebates paid to borrowers and any lending agent fees associated with the loan, plus any premium payments received for lending certain types of securities. Security lending income is presented in the Statement of Operations as a component of income from Fidelity Central Funds, and includes $173,546 from securities loaned to NFS, as affiliated borrower.
9. Expense Reductions.
The investment adviser contractually agreed to reimburse the Fund to the extent annual operating expenses exceeded .29% of average net assets. This reimbursement will remain in place through March 31, 2021. Some expenses, for example the compensation of the independent Trustees, and certain miscellaneous expenses such as proxy and shareholder meeting expenses, are excluded from this reimbursement. During the period this reimbursement reduced the Fund's expenses by $4,106,530.
In addition, through arrangements with the Fund's custodian, credits realized as a result of certain uninvested cash balances were used to reduce the Fund's expenses by $8,515.
10. Other.
The Fund's organizational documents provide former and current trustees and officers with a limited indemnification against liabilities arising in connection with the performance of their duties to the Fund. In the normal course of business, the Fund may also enter into contracts that provide general indemnifications. The Fund's maximum exposure under these arrangements is unknown as this would be dependent on future claims that may be made against the Fund. The risk of material loss from such claims is considered remote.
Effective January 1, 2020, following any required regulatory notices and approvals:
Investment advisers Fidelity Investments Money Management, Inc., FMR Co., Inc., and Fidelity SelectCo, LLC, merged with and into Fidelity Management & Research Company. In connection with the merger transactions, the resulting, merged investment adviser was then redomiciled from Massachusetts to Delaware, changed its corporate structure from a corporation to a limited liability company, and changed its name to "Fidelity Management & Research Company LLC".
Fidelity Investments Institutional Operations Company, Inc. (FIIOC) converted from a Massachusetts corporation to a Massachusetts LLC, and changed its name to "Fidelity Investments Institutional Operations Company LLC".
Report of Independent Registered Public Accounting Firm
To the Trustees of Fidelity Concord Street Trust and Shareholders of Fidelity Nasdaq Composite Index Fund:
Opinion on the Financial Statements and Financial Highlights
We have audited the accompanying statement of assets and liabilities of Fidelity Nasdaq Composite Index Fund (the "Fund"), a fund of Fidelity Concord Street Trust, including the schedule of investments, as of November 30, 2019, the related statement of operations for the year then ended, the statement of changes in net assets for each of the two years in the period then ended, the financial highlights for each of the five years in the period then ended, and the related notes. In our opinion, the financial statements and financial highlights present fairly, in all material respects, the financial position of the Fund as of November 30, 2019, and the results of its operations for the year then ended, the changes in its net assets for each of the two years in the period then ended, and the financial highlights for each of the five years in the period then ended in conformity with accounting principles generally accepted in the United States of America.
Basis for Opinion
These financial statements and financial highlights are the responsibility of the Fund's management. Our responsibility is to express an opinion on the Fund's financial statements and financial highlights based on our audits. We are a public accounting firm registered with the Public Company Accounting Oversight Board (United States) (PCAOB) and are required to be independent with respect to the Fund in accordance with the U.S. federal securities laws and the applicable rules and regulations of the Securities and Exchange Commission and the PCAOB.
We conducted our audits in accordance with the standards of the PCAOB. Those standards require that we plan and perform the audit to obtain reasonable assurance about whether the financial statements and financial highlights are free of material misstatement, whether due to error or fraud. The Fund is not required to have, nor were we engaged to perform, an audit of its internal control over financial reporting. As part of our audits we are required to obtain an understanding of internal control over financial reporting but not for the purpose of expressing an opinion on the effectiveness of the Fund’s internal control over financial reporting. Accordingly, we express no such opinion.
Our audits included performing procedures to assess the risks of material misstatement of the financial statements and financial highlights, whether due to error or fraud, and performing procedures that respond to those risks. Such procedures included examining, on a test basis, evidence regarding the amounts and disclosures in the financial statements and financial highlights. Our audits also included evaluating the accounting principles used and significant estimates made by management, as well as evaluating the overall presentation of the financial statements and financial highlights. Our procedures included confirmation of securities owned as of November 30, 2019, by correspondence with the custodians and brokers; when replies were not received from brokers, we performed other auditing procedures. We believe that our audits provide a reasonable basis for our opinion.
/s/ Deloitte & Touche LLP
Boston, Massachusetts
January 14, 2020
We have served as the auditor of one or more of the Fidelity investment companies since 1999.
Trustees and Officers
The Trustees, Members of the Advisory Board (if any), and officers of the trust and fund, as applicable, are listed below. The Board of Trustees governs the fund and is responsible for protecting the interests of shareholders. The Trustees are experienced executives who meet periodically throughout the year to oversee the fund's activities, review contractual arrangements with companies that provide services to the fund, oversee management of the risks associated with such activities and contractual arrangements, and review the fund's performance. Except for Jonathan Chiel, each of the Trustees oversees 302 funds. Mr. Chiel oversees 173 funds.
The Trustees hold office without limit in time except that (a) any Trustee may resign; (b) any Trustee may be removed by written instrument, signed by at least two-thirds of the number of Trustees prior to such removal; (c) any Trustee who requests to be retired or who has become incapacitated by illness or injury may be retired by written instrument signed by a majority of the other Trustees; and (d) any Trustee may be removed at any special meeting of shareholders by a two-thirds vote of the outstanding voting securities of the trust. Each Trustee who is not an interested person (as defined in the 1940 Act) of the trust and the fund is referred to herein as an Independent Trustee. Each Independent Trustee shall retire not later than the last day of the calendar year in which his or her 75th birthday occurs. The Independent Trustees may waive this mandatory retirement age policy with respect to individual Trustees. Officers and Advisory Board Members hold office without limit in time, except that any officer or Advisory Board Member may resign or may be removed by a vote of a majority of the Trustees at any regular meeting or any special meeting of the Trustees. Except as indicated, each individual has held the office shown or other offices in the same company for the past five years.
The fund’s Statement of Additional Information (SAI) includes more information about the Trustees. To request a free copy, call Fidelity at 1-800-544-8544.
Experience, Skills, Attributes, and Qualifications of the Trustees. The Governance and Nominating Committee has adopted a statement of policy that describes the experience, qualifications, attributes, and skills that are necessary and desirable for potential Independent Trustee candidates (Statement of Policy). The Board believes that each Trustee satisfied at the time he or she was initially elected or appointed a Trustee, and continues to satisfy, the standards contemplated by the Statement of Policy. The Governance and Nominating Committee also engages professional search firms to help identify potential Independent Trustee candidates who have the experience, qualifications, attributes, and skills consistent with the Statement of Policy. From time to time, additional criteria based on the composition and skills of the current Independent Trustees, as well as experience or skills that may be appropriate in light of future changes to board composition, business conditions, and regulatory or other developments, have also been considered by the professional search firms and the Governance and Nominating Committee. In addition, the Board takes into account the Trustees' commitment and participation in Board and committee meetings, as well as their leadership of standing and ad hoc committees throughout their tenure.
In determining that a particular Trustee was and continues to be qualified to serve as a Trustee, the Board has considered a variety of criteria, none of which, in isolation, was controlling. The Board believes that, collectively, the Trustees have balanced and diverse experience, qualifications, attributes, and skills, which allow the Board to operate effectively in governing the fund and protecting the interests of shareholders. Information about the specific experience, skills, attributes, and qualifications of each Trustee, which in each case led to the Board's conclusion that the Trustee should serve (or continue to serve) as a trustee of the fund, is provided below.
Board Structure and Oversight Function. James C. Curvey is an interested person and currently serves as Chairman. The Trustees have determined that an interested Chairman is appropriate and benefits shareholders because an interested Chairman has a personal and professional stake in the quality and continuity of services provided to the fund. Independent Trustees exercise their informed business judgment to appoint an individual of their choosing to serve as Chairman, regardless of whether the Trustee happens to be independent or a member of management. The Independent Trustees have determined that they can act independently and effectively without having an Independent Trustee serve as Chairman and that a key structural component for assuring that they are in a position to do so is for the Independent Trustees to constitute a substantial majority for the Board. The Independent Trustees also regularly meet in executive session. Ned C. Lautenbach serves as Chairman of the Independent Trustees and as such (i) acts as a liaison between the Independent Trustees and management with respect to matters important to the Independent Trustees and (ii) with management prepares agendas for Board meetings.
Fidelity® funds are overseen by different Boards of Trustees. The fund's Board oversees Fidelity's high income and certain equity funds, and other Boards oversee Fidelity's investment-grade bond, money market, asset allocation, and other equity funds. The asset allocation funds may invest in Fidelity® funds overseen by the fund's Board. The use of separate Boards, each with its own committee structure, allows the Trustees of each group of Fidelity® funds to focus on the unique issues of the funds they oversee, including common research, investment, and operational issues. On occasion, the separate Boards establish joint committees to address issues of overlapping consequences for the Fidelity® funds overseen by each Board.
The Trustees operate using a system of committees to facilitate the timely and efficient consideration of all matters of importance to the Trustees, the fund, and fund shareholders and to facilitate compliance with legal and regulatory requirements and oversight of the fund's activities and associated risks. The Board, acting through its committees, has charged FMR and its affiliates with (i) identifying events or circumstances the occurrence of which could have demonstrably adverse effects on the fund's business and/or reputation; (ii) implementing processes and controls to lessen the possibility that such events or circumstances occur or to mitigate the effects of such events or circumstances if they do occur; and (iii) creating and maintaining a system designed to evaluate continuously business and market conditions in order to facilitate the identification and implementation processes described in (i) and (ii) above. Because the day-to-day operations and activities of the fund are carried out by or through FMR, its affiliates, and other service providers, the fund's exposure to risks is mitigated but not eliminated by the processes overseen by the Trustees. While each of the Board's committees has responsibility for overseeing different aspects of the fund's activities, oversight is exercised primarily through the Operations, Audit, and Compliance Committees. Appropriate personnel, including but not limited to the fund's Chief Compliance Officer (CCO), FMR's internal auditor, the independent accountants, the fund's Treasurer and portfolio management personnel, make periodic reports to the Board's committees, as appropriate, including an annual review of Fidelity's risk management program for the Fidelity® funds. The responsibilities of each standing committee, including their oversight responsibilities, are described further under "Standing Committees of the Trustees."
Interested Trustees*:
Correspondence intended for a Trustee who is an interested person may be sent to Fidelity Investments, 245 Summer Street, Boston, Massachusetts 02210.
Name, Year of Birth; Principal Occupations and Other Relevant Experience+
Jonathan Chiel (1957)
Year of Election or Appointment: 2016
Trustee
Mr. Chiel also serves as Trustee of other Fidelity® funds. Mr. Chiel is Executive Vice President and General Counsel for FMR LLC (diversified financial services company, 2012-present). Previously, Mr. Chiel served as general counsel (2004-2012) and senior vice president and deputy general counsel (2000-2004) for John Hancock Financial Services; a partner with Choate, Hall & Stewart (1996-2000) (law firm); and an Assistant United States Attorney for the United States Attorney’s Office of the District of Massachusetts (1986-95), including Chief of the Criminal Division (1993-1995). Mr. Chiel is a director on the boards of the Boston Bar Foundation and the Maimonides School.
James C. Curvey (1935)
Year of Election or Appointment: 2007
Trustee
Chairman of the Board of Trustees
Mr. Curvey also serves as Trustee of other Fidelity® funds. Mr. Curvey is Vice Chairman (2007-present) and Director of FMR LLC (diversified financial services company). In addition, Mr. Curvey is an Overseer Emeritus for the Boston Symphony Orchestra, a Director of Artis-Naples, and a Trustee of Brewster Academy in Wolfeboro, New Hampshire. Previously, Mr. Curvey served as a Director of Fidelity Research & Analysis Co. (investment adviser firm, 2009-2018), Director of Fidelity Investments Money Management, Inc. (investment adviser firm, 2009-2014) and a Director of FMR and FMR Co., Inc. (investment adviser firms, 2007-2014).
* Determined to be an “Interested Trustee” by virtue of, among other things, his or her affiliation with the trust or various entities under common control with FMR.
+ The information includes the Trustee's principal occupation during the last five years and other information relating to the experience, attributes, and skills relevant to the Trustee's qualifications to serve as a Trustee, which led to the conclusion that the Trustee should serve as a Trustee for the fund.
Independent Trustees:
Correspondence intended for an Independent Trustee may be sent to Fidelity Investments, P.O. Box 55235, Boston, Massachusetts 02205-5235.
Name, Year of Birth; Principal Occupations and Other Relevant Experience+
Dennis J. Dirks (1948)
Year of Election or Appointment: 2005
Trustee
Mr. Dirks also serves as Trustee of other Fidelity® funds. Prior to his retirement in May 2003, Mr. Dirks was Chief Operating Officer and a member of the Board of The Depository Trust & Clearing Corporation (DTCC). He also served as President, Chief Operating Officer, and Board member of The Depository Trust Company (DTC) and President and Board member of the National Securities Clearing Corporation (NSCC). In addition, Mr. Dirks served as Chief Executive Officer and Board member of the Government Securities Clearing Corporation, Chief Executive Officer and Board member of the Mortgage-Backed Securities Clearing Corporation, as a Trustee and a member of the Finance Committee of Manhattan College (2005-2008), as a Trustee and a member of the Finance Committee of AHRC of Nassau County (2006-2008), as a member of the Independent Directors Council (IDC) Governing Council (2010-2015), and as a member of the Board of Directors for The Brookville Center for Children’s Services, Inc. (2009-2017). Mr. Dirks is a member of the Finance Committee (2016-present) and Board of Directors (2017-present) and is Treasurer (2018-present) of the Asolo Repertory Theatre.
Donald F. Donahue (1950)
Year of Election or Appointment: 2018
Trustee
Mr. Donahue also serves as a Trustee of other Fidelity® funds. Mr. Donahue is President and Chief Executive Officer of Miranda Partners, LLC (risk consulting for the financial services industry, 2012-present). Previously, Mr. Donahue served as a Member of the Advisory Board of certain Fidelity® funds (2015-2018) and Chief Executive Officer (2006-2012), Chief Operating Officer (2003-2006), and Managing Director, Customer Marketing and Development (1999-2003) of The Depository Trust & Clearing Corporation (financial markets infrastructure). Mr. Donahue serves as a Member (2007-present) and Co-Chairman (2016-present) of the Board of Directors of United Way of New York, Member of the Board of Directors of NYC Leadership Academy (2012-present) and Member of the Board of Advisors of Ripple Labs, Inc. (financial services, 2015-present). He also served as Chairman (2010-2012) and Member of the Board of Directors (2012-2013) of Omgeo, LLC (financial services), Treasurer of United Way of New York (2012-2016), and Member of the Board of Directors of XBRL US (financial services non-profit, 2009-2012) and the International Securities Services Association (2009-2012).
Alan J. Lacy (1953)
Year of Election or Appointment: 2008
Trustee
Mr. Lacy also serves as Trustee of other Fidelity® funds. Mr. Lacy serves as a Director of Bristol-Myers Squibb Company (global pharmaceuticals, 2008-present). He is a Trustee of the California Chapter of The Nature Conservancy (2015-present) and a Director of the Center for Advanced Study in the Behavioral Sciences at Stanford University (2015-present). In addition, Mr. Lacy served as Senior Adviser (2007-2014) of Oak Hill Capital Partners, L.P. (private equity) and also served as Chief Executive Officer (2005) and Vice Chairman (2005-2006) of Sears Holdings Corporation (retail) and Chief Executive Officer and Chairman of the Board of Sears, Roebuck and Co. (retail, 2000-2005). Previously, Mr. Lacy served as Chairman (2014-2017) and a member (2010-2017) of the Board of Directors of Dave & Buster’s Entertainment, Inc. (restaurant and entertainment complexes), as Chairman (2008-2011) and a member (2006-2015) of the Board of Trustees of the National Parks Conservation Association, and as a member of the Board of Directors for The Hillman Companies, Inc. (hardware wholesalers, 2010-2014), Earth Fare, Inc. (retail grocery, 2010-2014), and The Western Union Company (global money transfer, 2006-2011).
Ned C. Lautenbach (1944)
Year of Election or Appointment: 2000
Trustee
Chairman of the Independent Trustees
Mr. Lautenbach also serves as Trustee of other Fidelity® funds. Mr. Lautenbach currently serves as Chair (2018-present) and Member (2013-present) of the Board of Governors, State University System of Florida and is a member of the Council on Foreign Relations (1994-present). He is also a member and has most recently served as Chairman of the Board of Directors of Artis-Naples (2012-present). Previously, Mr. Lautenbach served as a member and then Lead Director of the Board of Directors of Eaton Corporation (diversified industrial, 1997-2016). He was also a Partner and Advisory Partner at Clayton, Dubilier & Rice, LLC (private equity investment, 1998-2010), as well as a Director of Sony Corporation (2006-2007). In addition, Mr. Lautenbach also had a 30-year career with IBM (technology company) during which time he served as Senior Vice President and a member of the Corporate Executive Committee (1968-1998).
Joseph Mauriello (1944)
Year of Election or Appointment: 2008
Trustee
Mr. Mauriello also serves as Trustee of other Fidelity® funds. Prior to his retirement in January 2006, Mr. Mauriello served in numerous senior management positions including Deputy Chairman and Chief Operating Officer (2004-2005), and Vice Chairman of Financial Services (2002-2004) of KPMG LLP US (professional services, 1965-2005). Mr. Mauriello currently serves as a member of the Independent Directors Council (IDC) Governing Council (2015-present). Previously, Mr. Mauriello served as a member of the Board of Directors of XL Group plc. (global insurance and re-insurance, 2006-2018).
Cornelia M. Small (1944)
Year of Election or Appointment: 2005
Trustee
Ms. Small also serves as Trustee of other Fidelity® funds. Ms. Small is a member of the Board of Directors (2009-present) and Chair of the Investment Committee (2010-present) of the Teagle Foundation. Ms. Small also serves on the Investment Committee of the Berkshire Taconic Community Foundation (2008-present). Previously, Ms. Small served as Chairperson (2002-2008) and a member of the Investment Committee and Chairperson (2008-2012) and a member of the Board of Trustees of Smith College. In addition, Ms. Small served as Chief Investment Officer, Director of Global Equity Investments, and a member of the Board of Directors of Scudder, Stevens & Clark and Scudder Kemper Investments.
Garnett A. Smith (1947)
Year of Election or Appointment: 2018
Trustee
Mr. Smith also serves as Trustee of other Fidelity® funds. Prior to Mr. Smith's retirement, he served as Chairman and Chief Executive Officer of Inbrand Corp. (manufacturer of personal absorbent products, 1990-1997). He also served as President (1986-1990) of Inbrand Corp. Prior to his employment with Inbrand Corp., he was employed by a retail fabric chain and North Carolina National Bank. In addition, Mr. Smith served as a Member of the Advisory Board of certain Fidelity® funds (2012-2013) and as a board member of the Jackson Hole Land Trust (2009-2012).
David M. Thomas (1949)
Year of Election or Appointment: 2008
Trustee
Mr. Thomas also serves as Trustee of other Fidelity® funds. Mr. Thomas serves as Non-Executive Chairman of the Board of Directors of Fortune Brands Home and Security (home and security products, 2011-present) and as a member of the Board of Directors (2004-present) and Presiding Director (2013-present) of Interpublic Group of Companies, Inc. (marketing communication). Previously, Mr. Thomas served as Executive Chairman (2005-2006) and Chairman and Chief Executive Officer (2000-2005) of IMS Health, Inc. (pharmaceutical and healthcare information solutions), a Director of Fortune Brands, Inc. (consumer products, 2000-2011), and a member of the Board of Trustees of the University of Florida (2013-2018).
+ The information includes the Trustee's principal occupation during the last five years and other information relating to the experience, attributes, and skills relevant to the Trustee's qualifications to serve as a Trustee, which led to the conclusion that the Trustee should serve as a Trustee for the fund.
Advisory Board Members and Officers:
Correspondence intended for a Member of the Advisory Board (if any) may be sent to Fidelity Investments, P.O. Box 55235, Boston, Massachusetts 02205-5235. Correspondence intended for an officer or Peter S. Lynch may be sent to Fidelity Investments, 245 Summer Street, Boston, Massachusetts 02210. Officers appear below in alphabetical order.
Name, Year of Birth; Principal Occupation
Vicki L. Fuller (1957)
Year of Election or Appointment: 2018
Member of the Advisory Board
Ms. Fuller also serves as Member of the Advisory Board of other Fidelity® funds. Ms. Fuller serves as a member of the Board of Directors, Audit Committee, and Nominating and Governance Committee of The Williams Companies, Inc. (natural gas infrastructure, 2018-present). Previously, Ms. Fuller served as the Chief Investment Officer of the New York State Common Retirement Fund (2012-2018) and held a variety of positions at AllianceBernstein L.P. (global asset management, 1985-2012), including Managing Director (2006-2012) and Senior Vice President and Senior Portfolio Manager (2001-2006).
Peter S. Lynch (1944)
Year of Election or Appointment: 2003
Member of the Advisory Board
Mr. Lynch also serves as Member of the Advisory Board of other Fidelity® funds. Mr. Lynch is Vice Chairman and a Director of Fidelity Management & Research Company LLC (investment adviser firm). In addition, Mr. Lynch serves as a Trustee of Boston College and as the Chairman of the Inner-City Scholarship Fund. Previously, Mr. Lynch served as Vice Chairman and a Director of FMR Co., Inc. (investment adviser firm) and on the Special Olympics International Board of Directors (1997-2006).
Michael E. Wiley (1950)
Year of Election or Appointment: 2018
Member of the Advisory Board
Mr. Wiley also serves as Trustee or Member of the Advisory Board of other Fidelity® funds. Mr. Wiley serves as a Director of High Point Resources (exploration and production, 2005-present). Previously, Mr. Wiley served as a Director of Andeavor Corporation (independent oil refiner and marketer, 2005-2018), a Director of Andeavor Logistics LP (natural resources logistics, 2015-2018), a Director of Post Oak Bank (privately-held bank, 2004-2018), a Director of Asia Pacific Exploration Consolidated (international oil and gas exploration and production, 2008-2013), a member of the Board of Trustees of the University of Tulsa (2000-2006; 2007-2010), a Senior Energy Advisor of Katzenbach Partners, LLC (consulting, 2006-2007), an Advisory Director of Riverstone Holdings (private investment), a Director of Spinnaker Exploration Company (exploration and production, 2001-2005) and Chairman, President, and CEO of Baker Hughes, Inc. (oilfield services, 2000-2004).
Elizabeth Paige Baumann (1968)
Year of Election or Appointment: 2017
Anti-Money Laundering (AML) Officer
Ms. Baumann also serves as AML Officer of other funds. She is Chief AML Officer (2012-present) and Senior Vice President (2014-present) of FMR LLC (diversified financial services company) and is an employee of Fidelity Investments. Previously, Ms. Baumann served as AML Officer of the funds (2012-2016), and Vice President (2007-2014) and Deputy Anti-Money Laundering Officer (2007-2012) of FMR LLC.
Craig S. Brown (1977)
Year of Election or Appointment: 2019
Assistant Treasurer
Mr. Brown also serves as Assistant Treasurer of other funds. Mr. Brown is an employee of Fidelity Investments (2013-present).
John J. Burke III (1964)
Year of Election or Appointment: 2018
Chief Financial Officer
Mr. Burke also serves as Chief Financial Officer of other funds. Mr. Burke serves as Head of Investment Operations for Fidelity Fund and Investment Operations (2018-present) and is an employee of Fidelity Investments (1998-present). Previously Mr. Burke served as head of Asset Management Investment Operations (2012-2018).
William C. Coffey (1969)
Year of Election or Appointment: 2019
Assistant Secretary
Mr. Coffey also serves as Assistant Secretary of other funds. He is Senior Vice President and Deputy General Counsel of FMR LLC (diversified financial services company, 2010-present), and is an employee of Fidelity Investments. Previously, Mr. Coffey served as Secretary and CLO of certain funds (2018-2019); CLO, Secretary, and Senior Vice President of Fidelity Management & Research Company and FMR Co., Inc. (investment adviser firms, 2018-2019); Secretary of Fidelity SelectCo, LLC and Fidelity Investments Money Management, Inc. (investment adviser firms, 2018-2019); CLO of Fidelity Management & Research (Hong Kong) Limited, FMR Investment Management (UK) Limited, and Fidelity Management & Research (Japan) Limited (investment adviser firms, 2018-2019); and Assistant Secretary of certain funds (2009-2018).
Timothy M. Cohen (1969)
Year of Election or Appointment: 2018
Vice President
Mr. Cohen also serves as Vice President of other funds. Mr. Cohen serves as Co-Head of Equity (2018-present), a Director of Fidelity Management & Research (Japan) Limited (investment adviser firm, 2016-present), and is an employee of Fidelity Investments. Previously, Mr. Cohen served as Executive Vice President of Fidelity SelectCo, LLC (2019), Head of Global Equity Research (2016-2018), Chief Investment Officer - Equity and a Director of Fidelity Management & Research (U.K.) Inc. (investment adviser firm, 2013-2015) and as a Director of Fidelity Management & Research (Hong Kong) Limited (investment adviser firm, 2017).
Jonathan Davis (1968)
Year of Election or Appointment: 2010
Assistant Treasurer
Mr. Davis also serves as Assistant Treasurer of other funds. Mr. Davis serves as Assistant Treasurer of FMR Capital, Inc. (2017-present) and is an employee of Fidelity Investments. Previously, Mr. Davis served as Vice President and Associate General Counsel of FMR LLC (diversified financial services company, 2003-2010).
Laura M. Del Prato (1964)
Year of Election or Appointment: 2018
Assistant Treasurer
Ms. Del Prato also serves as an officer of other funds. Ms. Del Prato is an employee of Fidelity Investments (2017-present). Prior to joining Fidelity Investments, Ms. Del Prato served as a Managing Director and Treasurer of the JPMorgan Mutual Funds (2014-2017). Prior to JPMorgan, Ms. Del Prato served as a partner at Cohen Fund Audit Services (accounting firm, 2012-2013) and KPMG LLP (accounting firm, 2004-2012).
Colm A. Hogan (1973)
Year of Election or Appointment: 2016
Deputy Treasurer
Mr. Hogan also serves as an officer of other funds. Mr. Hogan serves as Assistant Treasurer of FMR Capital, Inc. (2017-present) and is an employee of Fidelity Investments (2005-present). Previously, Mr. Hogan served as Assistant Treasurer of certain Fidelity® funds (2016-2018).
Pamela R. Holding (1964)
Year of Election or Appointment: 2018
Vice President
Ms. Holding also serves as Vice President of other funds. Ms. Holding serves as Co-Head of Equity (2018-present) and is an employee of Fidelity Investments (2013-present). Previously, Ms. Holding served as Executive Vice President of Fidelity SelectCo, LLC (2019) and as Chief Investment Officer of Fidelity Institutional Asset Management (2013-2018).
Cynthia Lo Bessette (1969)
Year of Election or Appointment: 2019
Secretary and Chief Legal Officer (CLO)
Ms. Lo Bessette also serves as Secretary and CLO of other funds. Ms. Lo Bessette serves as CLO, Secretary, and Senior Vice President of Fidelity Management & Research Company LLC (investment adviser firm, 2019-present); and CLO of Fidelity Management & Research (Hong Kong) Limited, FMR Investment Management (UK) Limited, and Fidelity Management & Research (Japan) Limited (investment adviser firms, 2019-present). She is a Senior Vice President and Deputy General Counsel of FMR LLC (diversified financial services company, 2019-present), and is an employee of Fidelity Investments. Previously, Ms. Lo Bessette served as CLO, Secretary, and Senior Vice President of FMR Co., Inc. (investment adviser firm, 2019); Secretary of Fidelity SelectCo, LLC and Fidelity Investments Money Management, Inc. (investment adviser firms, 2019). Prior to joining Fidelity Investments, Ms. Lo Bessette was Executive Vice President, General Counsel (2016-2019) and Senior Vice President, Deputy General Counsel (2015-2016) of OppenheimerFunds (investment management company) and Deputy Chief Legal Officer (2013-2015) of Jennison Associates LLC (investment adviser firm).
Chris Maher (1972)
Year of Election or Appointment: 2013
Assistant Treasurer
Mr. Maher serves as Assistant Treasurer of other funds. Mr. Maher is Vice President of Valuation Oversight, serves as Assistant Treasurer of FMR Capital, Inc. (2017-present), and is an employee of Fidelity Investments. Previously, Mr. Maher served as Vice President of Asset Management Compliance (2013), Vice President of the Program Management Group of FMR (investment adviser firm, 2010-2013), and Vice President of Valuation Oversight (2008-2010).
Kenneth B. Robins (1969)
Year of Election or Appointment: 2016
Chief Compliance Officer
Mr. Robins also serves as an officer of other funds. Mr. Robins serves as Compliance Officer of Fidelity Management & Research Company LLC (investment adviser firm, 2016-present) and is an employee of Fidelity Investments (2004-present). Previously, Mr. Robins served as Compliance Officer of FMR Co., Inc. (investment adviser firm, 2016-2019), as Executive Vice President of Fidelity Investments Money Management, Inc. (investment adviser firm, 2013-2016) and served in other fund officer roles.
Stacie M. Smith (1974)
Year of Election or Appointment: 2016
President and Treasurer
Ms. Smith also serves as an officer of other funds. Ms. Smith serves as Assistant Treasurer of FMR Capital, Inc. (2017-present), is an employee of Fidelity Investments (2009-present), and has served in other fund officer roles. Prior to joining Fidelity Investments, Ms. Smith served as Senior Audit Manager of Ernst & Young LLP (accounting firm, 1996-2009). Previously, Ms. Smith served as Assistant Treasurer (2013-2019) and Deputy Treasurer (2013-2016) of certain Fidelity® funds.
Marc L. Spector (1972)
Year of Election or Appointment: 2016
Assistant Treasurer
Mr. Spector also serves as an officer of other funds. Mr. Spector serves as Assistant Treasurer of FMR Capital, Inc. (2017-present) and is an employee of Fidelity Investments (2016-present). Prior to joining Fidelity Investments, Mr. Spector served as Director at the Siegfried Group (accounting firm, 2013-2016), and prior to Siegfried Group as audit senior manager at Deloitte & Touche (accounting firm, 2005-2013).
Jim Wegmann (1979)
Year of Election or Appointment: 2019
Assistant Treasurer
Mr. Wegmann also serves as Assistant Treasurer of other funds. Mr. Wegmann is an employee of Fidelity Investments (2011-present).
Shareholder Expense Example
As a shareholder of the Fund, you incur two types of costs: (1) transaction costs and (2) ongoing costs, including management fees and other Fund expenses. This Example is intended to help you understand your ongoing costs (in dollars) of investing in the Fund and to compare these costs with the ongoing costs of investing in other mutual funds.
The Example is based on an investment of $1,000 invested at the beginning of the period and held for the entire period (June 1, 2019 to November 30, 2019).
Actual Expenses
The first line of the accompanying table provides information about actual account values and actual expenses. You may use the information in this line, together with the amount you invested, to estimate the expenses that you paid over the period. Simply divide your account value by $1,000.00 (for example, an $8,600 account value divided by $1,000.00 = 8.6), then multiply the result by the number in the first line under the heading entitled "Expenses Paid During Period" to estimate the expenses you paid on your account during this period. In addition, the Fund, as a shareholder in the underlying Fidelity Central Funds, will indirectly bear its pro-rata share of the fees and expenses incurred by the underlying Fidelity Central Funds. These fees and expenses are not included in the Fund's annualized expense ratio used to calculate the expense estimate in the table below.
Hypothetical Example for Comparison Purposes
The second line of the accompanying table provides information about hypothetical account values and hypothetical expenses based on the Fund's actual expense ratio and an assumed rate of return of 5% per year before expenses, which is not the Fund's actual return. The hypothetical account values and expenses may not be used to estimate the actual ending account balance or expenses you paid for the period. You may use this information to compare the ongoing costs of investing in the Fund and other funds. To do so, compare this 5% hypothetical example with the 5% hypothetical examples that appear in the shareholder reports of the other funds. In addition, the Fund, as a shareholder in the underlying Fidelity Central Funds, will indirectly bear its pro-rata share of the fees and expenses incurred by the underlying Fidelity Central Funds. These fees and expenses are not included in the Fund's annualized expense ratio used to calculate the expense estimate in the table below.
Please note that the expenses shown in the table are meant to highlight your ongoing costs only and do not reflect any transaction costs. Therefore, the second line of the table is useful in comparing ongoing costs only, and will not help you determine the relative total costs of owning different funds.
| Annualized Expense Ratio-A | Beginning Account Value June 1, 2019 | Ending Account Value November 30, 2019 | Expenses Paid During Period-B June 1, 2019 to November 30, 2019 | |
| Actual | .29% | $1,000.00 | $1,169.10 | $1.58 |
| Hypothetical-C | $1,000.00 | $1,023.61 | $1.47 |
A Annualized expense ratio reflects expenses net of applicable fee waivers.
B Expenses are equal to the Fund's annualized expense ratio, multiplied by the average account value over the period, multiplied by 183/365 (to reflect the one-half year period).
C 5% return per year before expenses
Distributions (Unaudited)
The Board of Trustees of Fidelity Nasdaq Composite Index Fund voted to pay on December 30, 2019, to shareholders of record at the opening of business on December 27, 2019, a distribution of $3.871 per share derived from capital gains realized from sales of portfolio securities and a dividend of $1.096 per share from net investment income.
The fund hereby designates as a capital gain dividend with respect to the taxable year ended November 30, 2019, $182,555,616, or, if subsequently determined to be different, the net capital gain of such year.
The fund designates 96% of the dividends distributed during the fiscal year as qualifying for the dividends–received deduction for corporate shareholders.
The fund designates 98% of the dividends distributed during the fiscal year as amounts which may be taken into account as a dividend for purposes of the maximum rate under section 1(h)(11) of the Internal Revenue Code.
The fund will notify shareholders in January 2020 of amounts for use in preparing 2019 income tax returns.
Board Approval of Investment Advisory Contracts
Fidelity Nasdaq Composite Index Fund
At its November 2019 meeting, the Board of Trustees, including the Independent Trustees (together, the Board), voted to approve an amended and restated management contract and amended and restated sub-advisory agreements, including a sub-advisory agreement with Geode Capital Management, LLC (Geode) (together, the Amended and Restated Contracts) for the fund, effective January 1, 2020, for a one month period through January 31, 2020, in connection with an upcoming consolidation of certain of Fidelity's advisory businesses.The Board considered that, on or about January 1, 2020, each of FMR Co., Inc. (FMRC), Fidelity Investments Money Management, Inc. (FIMM), and SelectCo, LLC (SelectCo) will merge with and into Fidelity Management & Research Company (FMR) and that, after the merger, FMR will redomicile as a Delaware limited liability company. The Board also approved the termination of the sub-advisory agreement with FMRC upon the completion of the merger. The Board noted that the Amended and Restated Contracts would be updated to reflect the renamed adviser, Fidelity Management & Research Company LLC and its new form of organization and domicile. The Board also noted that the Amended and Restated Contracts will not change the investment processes, the level or nature of services provided, the resources and personnel allocated, trading and compliance operations, or any fees or expenses paid by the fund.The Board concluded that the fund's Amended and Restated Contracts are fair and reasonable, and that the fund's Advisory Contracts should be approved through January 31, 2020.In connection with its consideration of future renewals of the fund's Amended and Restated Contracts, the Board will consider: (i) the nature, extent and quality of services provided to the fund, including shareholder and administrative services and investment performance; (ii) the competitiveness of the management fee and total expenses for the fund; (iii) the costs of the services and profitability, including the revenues earned and the expenses incurred in conducting the business of developing, marketing, distributing, managing, administering, and servicing the fund and its shareholders, to the extent applicable; and (iv) whether there have been economies of scale in respect of the Fidelity funds, whether the Fidelity funds (including the fund) have appropriately benefited from any such economies of scale, and whether there is the potential for realization of any further economies.Based on its evaluation of all of the conclusions noted above, and after considering all factors it believed relevant, the Board ultimately concluded that the fund's management fee structure is fair and reasonable, and that the continuation of the fund's Amended and Restated Contracts should be approved.![]()
EIF-ANN-0120
1.795539.116
Item 2.
Code of Ethics
As of the end of the period, November 30, 2019, Fidelity Concord Street Trust (the trust) has adopted a code of ethics, as defined in Item 2 of Form N-CSR, that applies to its President and Treasurer and its Chief Financial Officer. A copy of the code of ethics is filed as an exhibit to this Form N-CSR.
Item 3.
Audit Committee Financial Expert
The Board of Trustees of the trust has determined that Joseph Mauriello is an audit committee financial expert, as defined in Item 3 of Form N-CSR. Mr. Mauriello is independent for purposes of Item 3 of Form N-CSR.
Item 4.
Principal Accountant Fees and Services
Fees and Services
The following table presents fees billed by Deloitte & Touche LLP, the member firms of Deloitte Touche Tohmatsu, and their respective affiliates (collectively, “Deloitte Entities”) in each of the last two fiscal years for services rendered to Fidelity Nasdaq Composite Index Fund (the “Fund”):
Services Billed by Deloitte Entities
November 30, 2019 FeesA
Audit Fees | Audit-Related Fees | Tax Fees | All Other Fees | |
Fidelity Nasdaq Composite Index Fund | $65,000 | $100 | $7,000 | $1,600 |
November 30, 2018 FeesA
Audit Fees | Audit-Related Fees | Tax Fees | All Other Fees | |
Fidelity Nasdaq Composite Index Fund | $67,000 | $100 | $6,400 | $1,900 |
AAmounts may reflect rounding.
The following table(s) present(s) fees billed by Deloitte Entities that were required to be approved by the Audit Committee for services that relate directly to the operations and financial reporting of the Fund(s) and that are rendered on behalf of Fidelity Management & Research Company ("FMR") and entities controlling, controlled by, or under common control with FMR (not including any sub-adviser whose role is primarily portfolio
management and is subcontracted with or overseen by another investment adviser) that provide ongoing services to the Fund(s) (“Fund Service Providers”):
Services Billed by Deloitte Entities
November 30, 2019A | November 30, 2018A | |
Audit-Related Fees | $290,000 | $5,000 |
Tax Fees | $5,000 | $5,000 |
All Other Fees | $- | $- |
A Amounts may reflect rounding.
“Audit-Related Fees” represent fees billed for assurance and related services that are reasonably related to the performance of the fund audit or the review of the fund's financial statements and that are not reported under Audit Fees.
“Tax Fees” represent fees billed for tax compliance, tax advice or tax planning that relate directly to the operations and financial reporting of the fund.
“All Other Fees” represent fees billed for services provided to the fund or Fund Service Provider, a significant portion of which are assurance related, that relate directly to the operations and financial reporting of the fund, excluding those services that are reported under Audit Fees, Audit-Related Fees or Tax Fees.
Assurance services must be performed by an independent public accountant.
* * *
The aggregate non-audit fees billed by Deloitte Entities for services rendered to the Fund(s), FMR (not including any sub-adviser whose role is primarily portfolio management and is subcontracted with or overseen by another investment adviser), and any Fund Service Provider for each of the last two fiscal years of the Fund(s) are as follows:
Billed By | November 30, 2019A | November 30, 2018A |
Deloitte Entities | $585,000 | $490,000 |
A Amounts may reflect rounding.
The trust's Audit Committee has considered non-audit services that were not pre-approved that were provided by Deloitte Entities to Fund Service Providers to be compatible with maintaining the independence of Deloitte Entities in its(their) audit of the Fund(s), taking into account representations from Deloitte Entities, in accordance with Public Company Accounting Oversight Board rules, regarding its independence
from the Fund(s) and its(their) related entities and FMR’s review of the appropriateness and permissibility under applicable law of such non-audit services prior to their provision to the Fund(s) Service Providers.
Audit Committee Pre-Approval Policies and Procedures
The trust’s Audit Committee must pre-approve all audit and non-audit services provided by a fund’s independent registered public accounting firm relating to the operations or financial reporting of the fund. Prior to the commencement of any audit or non-audit services to a fund, the Audit Committee reviews the services to determine whether they are appropriate and permissible under applicable law.
The Audit Committee has adopted policies and procedures to, among other purposes, provide a framework for the Committee’s consideration of non-audit services by the audit firms that audit the Fidelity funds. The policies and procedures require that any non-audit service provided by a fund audit firm to a Fidelity fund and any non-audit service provided by a fund auditor to a Fund Service Provider that relates directly to the operations and financial reporting of a Fidelity fund (“Covered Service”) are subject to approval by the Audit Committee before such service is provided.
All Covered Services must be approved in advance of provision of the service either: (i) by formal resolution of the Audit Committee, or (ii) by oral or written approval of the service by the Chair of the Audit Committee (or if the Chair is unavailable, such other member of the Audit Committee as may be designated by the Chair to act in the Chair’s absence). The approval contemplated by (ii) above is permitted where the Treasurer determines that action on such an engagement is necessary before the next meeting of the Audit Committee.
Non-audit services provided by a fund audit firm to a Fund Service Provider that do not relate directly to the operations and financial reporting of a Fidelity fund are reported to the Audit Committee periodically.
Non-Audit Services Approved Pursuant to Rule 2-01(c)(7)(i)(C) and (ii) of Regulation S-X (“De Minimis Exception”)
There were no non-audit services approved or required to be approved by the Audit Committee pursuant to the De Minimis Exception during the Fund’s(s’) last two fiscal years relating to services provided to (i) the Fund(s) or (ii) any Fund Service Provider that relate directly to the operations and financial reporting of the Fund(s).
Item 5.
Audit Committee of Listed Registrants
Not applicable.
Item 6.
Investments
(a)
Not applicable.
(b)
Not applicable.
Item 7.
Disclosure of Proxy Voting Policies and Procedures for Closed-End Management Investment Companies
Not applicable.
Item 8.
Portfolio Managers of Closed-End Management Investment Companies
Not applicable.
Item 9.
Purchase of Equity Securities by Closed-End Management Investment Company and Affiliated Purchasers
Not applicable.
Item 10.
Submission of Matters to a Vote of Security Holders
There were no material changes to the procedures by which shareholders may recommend nominees to the trust’s Board of Trustees.
Item 11.
Controls and Procedures
(a)(i) The President and Treasurer and the Chief Financial Officer have concluded that the trust’s disclosure controls and procedures (as defined in Rule 30a-3(c) under the Investment Company Act) provide reasonable assurances that material information relating to the trust is made known to them by the appropriate persons, based on their evaluation of these controls and procedures as of a date within 90 days of the filing date of this report.
(a)(ii) There was no change in the trust’s internal control over financial reporting (as defined in Rule 30a-3(d) under the Investment Company Act) that occurred during the period covered by this report that has materially affected, or is reasonably likely to materially affect, the trust’s internal control over financial reporting.
Item 12.
Disclosure of Securities Lending Activities for Closed-End Management
Investment Companies
Not applicable.
Item 13.
Exhibits
(a) | (1) | Code of Ethics pursuant to Item 2 of Form N-CSR is filed and attached hereto as EX-99.CODE ETH. |
(a) | (2) | Certification pursuant to Rule 30a-2(a) under the Investment Company Act of 1940 (17 CFR 270.30a-2(a)) is filed and attached hereto as Exhibit 99.CERT. |
(a) | (3) | Not applicable. |
(b) | Certification pursuant to Rule 30a-2(b) under the Investment Company Act of 1940 (17 CFR 270.30a-2(b)) is furnished and attached hereto as Exhibit 99.906CERT. |
SIGNATURES
Pursuant to the requirements of the Securities Exchange Act of 1934 and the Investment Company Act of 1940, the registrant has duly caused this report to be signed on its behalf by the undersigned, thereunto duly authorized.
Fidelity Concord Street Trust
By: | /s/Stacie M. Smith |
Stacie M. Smith | |
President and Treasurer | |
Date: | January 24, 2020 |
Pursuant to the requirements of the Securities Exchange Act of 1934 and the Investment Company Act of 1940, this report has been signed below by the following persons on behalf of the registrant and in the capacities and on the dates indicated.
By: | /s/Stacie M. Smith |
Stacie M. Smith | |
President and Treasurer | |
Date: | January 24, 2020 |
By: | /s/John J. Burke III |
John J. Burke III | |
Chief Financial Officer | |
Date: | January 24, 2020 |