UNITED STATES
SECURITIES AND EXCHANGE COMMISSION
Washington, D.C. 20549
FORM N-CSR
CERTIFIED SHAREHOLDER REPORT OF
REGISTERED MANAGEMENT INVESTMENT COMPANIES
Investment Company Act file number 811-5262
MFS SERIES TRUST VIII
(Exact name of registrant as specified in charter)
500 Boylston Street, Boston, Massachusetts 02116
(Address of principal executive offices) (Zip code)
Susan S. Newton
Massachusetts Financial Services Company
500 Boylston Street
Boston, Massachusetts 02116
(Name and address of agents for service)
Registrant’s telephone number, including area code: (617) 954-5000
Date of fiscal year end: October 31
Date of reporting period: October 31, 2008
| ITEM 1. | REPORTS TO STOCKHOLDERS. |

MFS®
INVESTMENT MANAGEMENT
Annual report
MFS® Global Growth Fund
SIPC Contact Information:
You may obtain information about the Securities Investor Protection Corporation (“SIPC”), including the SIPC Brochure, by contacting SIPC either by telephone (202-371-8300) or by accessing SIPC’s website address (www.sipc.org).
Note to Shareholders: At the close of business on April 18, 2008, Class R shares and Class R2 shares converted into Class R3 shares. Following this conversion, Class R3, Class R4, and Class R5 shares were renamed Class R2, Class R3, and Class R4 shares, respectively.
The report is prepared for the general information of shareholders. It is authorized for distribution to prospective investors only when preceded or accompanied by a current prospectus.
NOT FDIC INSURED Ÿ MAY LOSE VALUE Ÿ
NO BANK OR CREDIT UNION GUARANTEE Ÿ NOT A DEPOSIT Ÿ
NOT INSURED BY ANY FEDERAL GOVERNMENT AGENCY OR
NCUA/NCUSIF
10/31/08
WGF-ANN

LETTER FROM THE CEO
Dear Shareholders:
The global economy is not a very welcoming place these days. Headlines tell the story of slowing growth, accelerating inflation, and credit collapse. We have watched the rampant selling that has typified equity and credit markets since the strains in the financial system first became apparent last year.
The volatility in commodity and currency markets has further complicated investment choices. There are so many parts moving in so many directions; it has become very easy to get overwhelmed.
At MFS® we remind investors to keep their eye on the long term and not become panicked by the uncertainty of the day to day.
Remember that what goes down could very easily come back up. And that is where we as money managers like to turn our focus.
Investment opportunities may arise in declining markets. When markets experience substantial selloffs, assets often become undervalued. At MFS, we have a team of global sector analysts located in Boston, London, Mexico City, Singapore, Sydney, and Tokyo working together to do the kind of bottom-up research that will root out these investment opportunities.
In times like these, we encourage our investors to check in with their advisors to ensure they have an investment plan in place that will pay heed to the present, but that is firmly tailored to the future.
Respectfully,

Robert J. Manning
Chief Executive Officer and Chief Investment Officer
MFS Investment Management®
December 15, 2008
The opinions expressed in this letter are subject to change, may not be relied upon for investment advice, and no forecasts can be guaranteed.
1
PORTFOLIO COMPOSITION
Portfolio structure

| | |
| Top ten holdings | | |
| Nestle S.A. | | 2.8% |
| Roche Holding AG | | 2.4% |
| TOTAL S.A. | | 1.9% |
| 3M Co. | | 1.7% |
| Novo Nordisk A/S, “B” | | 1.7% |
| Procter & Gamble Co. | | 1.5% |
| INPEX Holdings, Inc. | | 1.5% |
| WPP Group PLC | | 1.5% |
LVMH Moet Hennessy Louis
Vuitton S.A. | | 1.5% |
| Novartis AG | | 1.4% |
| | |
| Equity sectors | | |
| Technology | | 17.9% |
| Consumer Staples | | 13.3% |
| Health Care | | 13.3% |
| Financial Services | | 11.9% |
| Basic Materials | | 8.8% |
| Retailing | | 7.5% |
| Energy | | 6.6% |
| Special Products & Services | | 5.5% |
| Leisure | | 5.4% |
| Utilities & Communications | | 4.8% |
| Industrial Goods & Services | | 3.3% |
| Transportation | | 1.1% |
| |
| Country weightings | | |
| United States | | 34.4% |
| Switzerland | | 11.5% |
| Japan | | 9.7% |
| France | | 8.3% |
| United Kingdom | | 6.2% |
| Germany | | 6.0% |
| Spain | | 2.1% |
| Mexico | | 2.0% |
| India | | 2.0% |
| Other Countries | | 17.8% |
Percentages are based on net assets as of 10/31/08.
The portfolio is actively managed and current holdings may be different.
2
MANAGEMENT REVIEW
Summary of Results
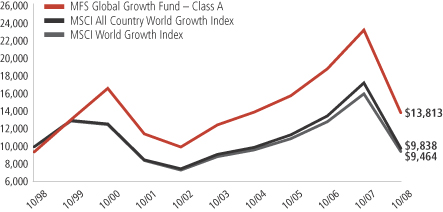
For the twelve months ended October 31, 2008, Class A shares of the MFS Global Growth Fund provided a total return of –40.34%, at net asset value. This compares with a return of –42.80% for the fund’s benchmark, the MSCI All Country World Growth Index, and a return of –40.65% for the fund’s other benchmark, the MSCI World Growth Index.
Market Environment
The U.S. economy and financial markets experienced significant deterioration and extraordinary volatility over the reporting period. U.S. economic growth slowed significantly, despite the short-term bounce from the second quarter fiscal stimulus. Strong domestic headwinds included accelerated deterioration in the housing market, anemic corporate investment, a markedly weaker job market, and a much tighter credit environment. During the second half of the period, a seemingly continuous series of tumultuous financial events hammered markets, including: the distressed sale of failing Bear Stearns to JPMorgan, the conservatorship of Government Sponsored Enterprises (GSEs) Fannie Mae and Freddie Mac, the bankruptcy of investment bank Lehman Brothers, the Federal Reserve Bank’s complex intervention of insurance company American International Group (AIG), the nationalization of several large European banks, the failure of Washington Mutual, and the distressed sale of Wachovia. As a result of this barrage of turbulent news, global equity markets pushed significantly lower and credit markets witnessed the worst dislocation since the beginning of the credit crisis.
While reasonably resilient during the first half of the period, the global economy and financial system increasingly experienced considerable negative spillovers from the U.S. slowdown. Not only did Europe and Japan show obvious signs of economic softening, the more powerful engine of global growth – emerging markets – also began to display weakening dynamics.
During the reporting period, the U.S. Federal Reserve Board cut interest rates aggressively and introduced a multitude of new lending facilities to alleviate ever-tightening credit markets, while the U.S. federal government moved quickly to design and implement a modest fiscal stimulus package. Although several other global central banks also cut rates, the dilemma of rising energy and food prices heightened concerns among central bankers that inflationary expectations might become unhinged despite weaker growth. Only late in the reporting period did slowing global growth result in a precipitous decline in commodity prices, which began to ease inflation and inflationary expectations. As inflationary concerns diminished in the face of global deleveraging, and equity and credit markets deteriorated more sharply, a coordinated rate cut
3
Management Review – continued
marked the beginning of much more aggressive easing by the major global central banks.
Contributors to Performance
A combination of stock selection and an underweighted position in the industrial goods and services sector was the principal contributor to performance relative to the MSCI All Country World Growth Index. Industrial machinery manufacturer Bucyrus International (aa)(g) was among the fund’s top performers. Shares of Bucyrus rose as a major new contract with an Eastern European mine was signed.
Stock selection in the special products and services sector also boosted relative returns. The fund’s positioning in credit card company Visa was a top contributor in this sector. Shares of Visa rose as profits were up due to a higher volume of credit card transactions around the world.
In the health care sector, stock selection was a positive factor in relative performance. Overweighted positions in diabetes care company Novo Nordisk (Denmark), global biotechnology company Genzyme, agrochemical company Synthes (Swiss), and pharmaceutical company Roche Holding (Swiss) aided relative returns as stocks of these companies outperformed the benchmark.
Stocks in other sectors that contributed to relative performance included global food company Nestle S.A. (Switzerland), beauty and personal care company Alberto-Culver (aa), and industrial conglomerate 3M.
The fund’s cash position was also a contributor to relative performance. The fund holds cash to buy new holdings and to provide liquidity. In a period when equity markets declined, as measured by the fund’s benchmark, holding cash helped performance versus the benchmark, which has no cash position.
Detractors from Performance
An overweighted position in the financial services sector hurt relative performance. The fund’s positioning in financial services firms, UBS (Switzerland) (g), Erste Group Bank (g), Raiffeisen International Bank (Austria), and Goldman Sachs, held back relative results over the reporting period. Shares of UBS dropped as market concerns increased about additional write-downs by the investment banking unit. Holdings of banking firm Unicredito Italiano (Italy) (aa)(g) also hindered relative performance.
Stock selection in the retailing sector held back relative returns. Not holding strong-performing retail giant Wal-Mart dampened results as the stock performed well during the reporting period.
An underweighted position in the autos and housing sector was also a detractor from relative results. Not holding auto maker Volkswagen (Germany) had a negative impact on relative returns as the company’s stock rose significantly during the period.
4
Management Review – continued
Elsewhere, holdings of poor-performing oil company Inpex (Japan) and advertising and marketing firm WPP Group (U.K.) dampened relative returns. Not holding relatively strong-performing biotechnology firm Amgen (g) also hurt.
Respectfully,
| | |
| Jeffrey Constantino | | Barry Dargan |
| Portfolio Manager | | Portfolio Manager |
| (aa) | Security is not a benchmark constituent. |
| (g) | Security was not held in the portfolio at period end. |
Note to Shareholders: Effective July 2008, Jeffrey Constantino became a co-manager of the fund.
The views expressed in this report are those of the portfolio managers only through the end of the period of the report as stated on the cover and do not necessarily reflect the views of MFS or any other person in the MFS organization. These views are subject to change at any time based on market or other conditions, and MFS disclaims any responsibility to update such views. These views may not be relied upon as investment advice or an indication of trading intent on behalf of any MFS portfolio. References to specific securities are not recommendations of such securities, and may not be representative of any MFS portfolio’s current or future investments.
5
PERFORMANCE SUMMARY THROUGH 10/31/08
The following chart illustrates a representative class of the fund’s historical performance in comparison to its benchmarks. Performance results include the deduction of the maximum applicable sales charge and reflect the percentage change in net asset value, including reinvestment of dividends and capital gains distributions. The performance of other share classes will be greater than or less than that of the class depicted below. Benchmark comparisons are unmanaged; do not reflect sales charges, commissions or expenses; and cannot be invested in directly. (See Notes to Performance Summary).
Performance data shown represents past performance and is no guarantee of future results. Investment return and principal value fluctuate so your shares, when sold, may be worth more or less than the original cost; current performance may be lower or higher than quoted. The performance shown does not reflect the deduction of taxes, if any, that a shareholder would pay on fund distributions or the redemption of fund shares.
Growth of a Hypothetical $10,000 Investment
6
Performance Summary – continued
Total Returns through 10/31/08
Average annual without sales charge
| | | | | | | | | | | | |
| | | Share class | | Class inception date | | 1-yr | | 5-yr | | 10-yr | | |
| | | A | | 11/18/93 | | (40.34)% | | 2.08% | | 3.90% | | |
| | | B | | 11/18/93 | | (40.77)% | | 1.31% | | 3.13% | | |
| | | C | | 1/03/94 | | (40.77)% | | 1.31% | | 3.12% | | |
| | | I | | 1/02/97 | | (40.16)% | | 2.34% | | 4.16% | | |
| | | R1 | | 4/01/05 | | (40.80)% | | 1.23% | | 3.09% | | |
| | | R2
(formerly R3) | | 10/31/03 | | (40.70)% | | 1.58% | | 3.27% | | |
| | | R3
(formerly R4) | | 4/01/05 | | (40.37)% | | 2.00% | | 3.85% | | |
| | | R4
(formerly R5) | | 4/01/05 | | (40.20)% | | 2.21% | | 3.96% | | |
Comparative benchmark
| | | | | | | | | | | | |
| | | MSCI All Country World Growth Index (f) | | (42.80)% | | 1.50% | | (0.16)% | | |
| | | MSCI World Growth Index (f) | | (40.65)% | | 1.27% | | (0.55)% | | |
Average annual with sales charge
| | | | | | | | | | | | |
| | | A With Initial Sales Charge (5.75%) | | (43.77)% | | 0.88% | | 3.28% | | |
| | | B With CDSC (Declining over six years from 4% to 0%) (x) | | (43.14)% | | 0.93% | | 3.13% | | |
| | | C With CDSC (1% for 12 months) (x) | | (41.36)% | | 1.31% | | 3.12% | | |
Class I, R1, R2, R3, and R4 shares do not have a sales charge.
CDSC – Contingent Deferred Sales Charge.
| (f) | Source: FactSet Research Systems Inc. |
| (x) | Assuming redemption at the end of the applicable period. |
Benchmark Definitions
MSCI All Country World Growth Index – a market capitalization-weighted index that is designed to measure equity market performance for growth securities in the global developed and emerging markets.
MSCI World Growth Index – a market capitalization-weighted index that is designed to measure equity market performance for growth securities in the global developed markets.
It is not possible to invest directly in an index.
7
Performance Summary – continued
Notes to Performance Summary
Performance for Class R3 and Class R4 shares includes the performance of the fund’s Class A shares for periods prior to their offering. Performance for Class R1 and Class R2 shares includes the performance of the fund’s Class B shares for periods prior to their offering. This blended class performance has been adjusted to take into account differences in sales loads, if any, applicable to these share classes, but has not been adjusted to take into account differences in class specific operating expenses (such as Rule 12b-1 fees). Compared to performance these share classes would have experienced had they been offered for the entire period, the use of blended performance generally results in higher performance for share classes with higher operating expenses than the share class to which it is blended, and lower performance for share classes with lower operating expenses than the share class to which it is blended.
Performance results reflect any applicable expense subsidies and waivers in effect during the periods shown. Without such subsidies and waivers the fund’s performance results would be less favorable. Please see the prospectus and financial statements for complete details.
From time to time the fund may receive proceeds from litigation settlements, without which performance would be lower.
8
EXPENSE TABLE
Fund expenses borne by the shareholders during the period,
May 1, 2008 through October 31, 2008
As a shareholder of the fund, you incur two types of costs: (1) transaction costs, including sales charges (loads) on certain purchase or redemption payments, and (2) ongoing costs, including management fees; distribution and service (12b-1) fees; and other fund expenses. This example is intended to help you understand your ongoing costs (in dollars) of investing in the fund and to compare these costs with the ongoing costs of investing in other mutual funds.
The example is based on an investment of $1,000 invested at the beginning of the period and held for the entire period May 1, 2008 through October 31, 2008.
Actual Expenses
The first line for each share class in the following table provides information about actual account values and actual expenses. You may use the information in this line, together with the amount you invested, to estimate the expenses that you paid over the period. Simply divide your account value by $1,000 (for example, an $8,600 account value divided by $1,000 = 8.6), then multiply the result by the number in the first line under the heading entitled “Expenses Paid During Period” to estimate the expenses you paid on your account during this period.
Hypothetical Example for Comparison Purposes
The second line for each share class in the following table provides information about hypothetical account values and hypothetical expenses based on the fund’s actual expense ratio and an assumed rate of return of 5% per year before expenses, which is not the fund’s actual return. The hypothetical account values and expenses may not be used to estimate the actual ending account balance or expenses you paid for the period. You may use this information to compare the ongoing costs of investing in the fund and other funds. To do so, compare this 5% hypothetical example with the 5% hypothetical examples that appear in the shareholder reports of the other funds.
Please note that the expenses shown in the table are meant to highlight your ongoing costs only and do not reflect any transactional costs, such as sales charges (loads). Therefore, the second line for each share class in the table is useful in comparing ongoing costs only, and will not help you determine the relative total costs of owning different funds. In addition, if these transactional costs were included, your costs would have been higher.
9
Expense Table – continued
| | | | | | | | | | |
Share
Class | | | | Annualized
Expense
Ratio | | Beginning
Account Value
5/01/08 | | Ending
Account Value
10/31/08 | | Expenses
Paid During
Period (p)
5/01/08-10/31/08 |
| A | | Actual | | 1.50% | | $1,000.00 | | $647.15 | | $6.21 |
| | Hypothetical (h) | | 1.50% | | $1,000.00 | | $1,017.60 | | $7.61 |
| B | | Actual | | 2.26% | | $1,000.00 | | $644.70 | | $9.34 |
| | Hypothetical (h) | | 2.26% | | $1,000.00 | | $1,013.77 | | $11.44 |
| C | | Actual | | 2.26% | | $1,000.00 | | $644.75 | | $9.34 |
| | Hypothetical (h) | | 2.26% | | $1,000.00 | | $1,013.77 | | $11.44 |
| I | | Actual | | 1.25% | | $1,000.00 | | $648.03 | | $5.18 |
| | Hypothetical (h) | | 1.25% | | $1,000.00 | | $1,018.85 | | $6.34 |
| R1 | | Actual | | 2.26% | | $1,000.00 | | $644.58 | | $9.34 |
| | Hypothetical (h) | | 2.26% | | $1,000.00 | | $1,013.77 | | $11.44 |
| R2 (formerly R3) | | Actual | | 1.75% | | $1,000.00 | | $644.00 | | $7.23 |
| | Hypothetical (h) | | 1.75% | | $1,000.00 | | $1,016.34 | | $8.87 |
| R3 (formerly R4) | | Actual | | 1.51% | | $1,000.00 | | $646.84 | | $6.25 |
| | Hypothetical (h) | | 1.51% | | $1,000.00 | | $1,017.55 | | $7.66 |
| R4 (formerly R5) | | Actual | | 1.25% | | $1,000.00 | | $647.93 | | $5.18 |
| | Hypothetical (h) | | 1.25% | | $1,000.00 | | $1,018.85 | | $6.34 |
| (h) | 5% class return per year before expenses. |
| (p) | Expenses paid is equal to each class’ annualized expense ratio, as shown above, multiplied by the average account value over the period, multiplied by the number of days in the period, divided by the number of days in the year. Expenses paid do not include any applicable sales charges (loads). If these transaction costs had been included, your costs would have been higher. |
10
PORTFOLIO OF INVESTMENTS
10/31/08
The Portfolio of Investments is a complete list of all securities owned by your fund. It is categorized by broad-based asset classes.
| | | | | |
| Common Stocks - 99.4% | | | | | |
| Issuer | | Shares/Par | | Value ($) |
| | | | | |
| Aerospace - 1.1% | | | | | |
| United Technologies Corp. | | 40,240 | | $ | 2,211,588 |
| | |
| Alcoholic Beverages - 1.9% | | | | | |
| Companhia de Bebidas das Americas, ADR | | 44,490 | | $ | 1,890,825 |
| Pernod Ricard S.A. | | 28,816 | | | 1,877,351 |
| | | | | |
| | | | | $ | 3,768,176 |
| Apparel Manufacturers - 4.2% | | | | | |
| Compagnie Financiere Richemont S.A. | | 52,735 | | $ | 1,121,270 |
| Li & Fung Ltd. | | 636,200 | | | 1,279,237 |
| LVMH Moet Hennessy Louis Vuitton S.A. | | 42,440 | | | 2,831,598 |
| NIKE, Inc., “B” | | 34,220 | | | 1,972,099 |
| Swatch Group Ltd. | | 5,856 | | | 915,922 |
| | | | | |
| | | | | $ | 8,120,126 |
| Biotechnology - 2.1% | | | | | |
| Actelion Ltd. (a) | | 32,249 | | $ | 1,705,073 |
| Genzyme Corp. (a) | | 32,060 | | | 2,336,533 |
| | | | | |
| | | | | $ | 4,041,606 |
| Broadcasting - 4.0% | | | | | |
| Grupo Televisa S.A., ADR | | 114,580 | | $ | 2,023,483 |
| Societe Television Francaise 1 | | 70,093 | | | 898,956 |
| Walt Disney Co. | | 75,160 | | | 1,946,644 |
| WPP Group PLC (a) | | 482,320 | | | 2,910,831 |
| | | | | |
| | | | | $ | 7,779,914 |
| Brokerage & Asset Managers - 3.7% | | | | | |
| Daiwa Securities Group, Inc. | | 285,000 | | $ | 1,582,991 |
| Deutsche Boerse AG | | 26,760 | | | 2,136,769 |
| Goldman Sachs Group, Inc. | | 16,190 | | | 1,497,575 |
| Julius Baer Holding Ltd. | | 49,845 | | | 1,962,111 |
| | | | | |
| | | | | $ | 7,179,446 |
| Business Services - 4.8% | | | | | |
| Accenture Ltd., “A” | | 63,760 | | $ | 2,107,268 |
| Infosys Technologies Ltd., ADR | | 66,980 | | | 1,963,854 |
| Intertek Group PLC | | 106,160 | | | 1,256,106 |
11
Portfolio of Investments – continued
| | | | | |
| Issuer | | Shares/Par | | Value ($) |
| | | | | |
| Common Stocks - continued | | | | | |
| Business Services - continued | | | | | |
| MasterCard, Inc., “A” | | 9,730 | | $ | 1,438,289 |
| Visa, Inc., “A” | | 47,480 | | | 2,628,018 |
| | | | | |
| | | | | $ | 9,393,535 |
| Chemicals - 1.7% | | | | | |
| 3M Co. | | 50,450 | | $ | 3,243,935 |
| | |
| Computer Software - 2.2% | | | | | |
| Oracle Corp. (a) | | 139,640 | | $ | 2,554,016 |
| SAP AG | | 49,340 | | | 1,754,246 |
| | | | | |
| | | | | $ | 4,308,262 |
| Computer Software - Systems - 3.2% | | | | | |
| Apple, Inc. (a) | | 20,050 | | $ | 2,157,180 |
| EMC Corp. (a) | | 179,690 | | | 2,116,748 |
| International Business Machines Corp. | | 21,330 | | | 1,983,050 |
| | | | | |
| | | | | $ | 6,256,978 |
| Conglomerates - 0.7% | | | | | |
| Siemens AG | | 21,750 | | $ | 1,301,286 |
| | |
| Consumer Goods & Services - 6.3% | | | | | |
| Alberto-Culver Co. | | 70,340 | | $ | 1,809,848 |
| Colgate-Palmolive Co. | | 19,660 | | | 1,233,862 |
| Hengan International Group Co. Ltd. | | 696,000 | | | 1,962,902 |
| Procter & Gamble Co. | | 46,320 | | | 2,989,493 |
| Reckitt Benckiser Group PLC | | 57,250 | | | 2,404,731 |
| Shiseido Co. Ltd. | | 91,000 | | | 1,843,355 |
| | | | | |
| | | | | $ | 12,244,191 |
| Containers - 1.3% | | | | | |
| Brambles Ltd. | | 479,910 | | $ | 2,541,516 |
| | |
| Electrical Equipment - 2.2% | | | | | |
| Danaher Corp. | | 17,340 | | $ | 1,027,222 |
| Keyence Corp. | | 6,700 | | | 1,293,854 |
| Schneider Electric S.A. | | 33,797 | | | 2,033,023 |
| | | | | |
| | | | | $ | 4,354,099 |
| Electronics - 7.5% | | | | | |
| Canon, Inc. | | 42,300 | | $ | 1,455,608 |
| Hirose Electric Co. Ltd. | | 24,000 | | | 2,098,101 |
| Hoya Corp. | | 51,700 | | | 958,329 |
12
Portfolio of Investments – continued
| | | | | |
| Issuer | | Shares/Par | | Value ($) |
| | | | | |
| Common Stocks - continued | | | | | |
| Electronics - continued | | | | | |
| Intel Corp. | | 115,010 | | $ | 1,840,160 |
| Konica Minolta Holdings, Inc. | | 103,500 | | | 673,754 |
| National Semiconductor Corp. | | 120,860 | | | 1,591,726 |
| Royal Philips Electronics N.V. | | 59,240 | | | 1,093,713 |
| Samsung Electronics Co. Ltd. | | 6,370 | | | 2,661,907 |
| Taiwan Semiconductor Manufacturing Co. Ltd., ADR | | 273,935 | | | 2,262,703 |
| | | | | |
| | | | | $ | 14,636,001 |
| Energy - Independent - 1.5% | | | | | |
| INPEX Holdings, Inc. | | 513 | | $ | 2,983,162 |
| | |
| Energy - Integrated - 3.8% | | | | | |
| OAO Gazprom, ADR | | 110,210 | | $ | 2,224,037 |
| Petroleo Brasileiro S.A., ADR | | 54,760 | | | 1,472,496 |
| TOTAL S.A. | | 66,790 | | | 3,668,426 |
| | | | | |
| | | | | $ | 7,364,959 |
| Food & Beverages - 5.1% | | | | | |
| Groupe Danone | | 33,671 | | $ | 1,864,244 |
| Nestle S.A. | | 140,282 | | | 5,468,117 |
| PepsiCo, Inc. | | 44,570 | | | 2,540,936 |
| | | | | |
| | | | | $ | 9,873,297 |
| Food & Drug Stores - 2.0% | | | | | |
| CVS Caremark Corp. | | 71,500 | | $ | 2,191,475 |
| Tesco PLC | | 320,479 | | | 1,750,499 |
| | | | | |
| | | | | $ | 3,941,974 |
| Gaming & Lodging - 0.4% | | | | | |
| International Game Technology | | 59,800 | | $ | 837,200 |
| | |
| Internet - 1.2% | | | | | |
| Google, Inc., “A” (a) | | 6,570 | | $ | 2,360,995 |
| | |
| Major Banks - 5.7% | | | | | |
| Bank of New York Mellon Corp. | | 48,320 | | $ | 1,575,232 |
| Credit Suisse Group AG | | 48,940 | | | 1,867,871 |
| Erste Bank der oesterreichischen Sparkassen AG | | 51,560 | | | 1,395,603 |
| HSBC Holdings PLC | | 163,536 | | | 1,973,960 |
| Raiffeisen International Bank Holding AG | | 22,070 | | | 698,655 |
| Standard Chartered PLC | | 109,223 | | | 1,813,370 |
| State Street Corp. | | 38,500 | | | 1,668,975 |
| | | | | |
| | | | | $ | 10,993,666 |
13
Portfolio of Investments – continued
| | | | | |
| Issuer | | Shares/Par | | Value ($) |
| | | | | |
| Common Stocks - continued | | | | | |
| Medical Equipment - 3.7% | | | | | |
| Essilor International S.A. | | 26,080 | | $ | 1,170,973 |
| Medtronic, Inc. | | 48,580 | | | 1,959,231 |
| Synthes, Inc. | | 15,180 | | | 1,959,975 |
| Zimmer Holdings, Inc. (a) | | 46,900 | | | 2,177,567 |
| | | | | |
| | | | | $ | 7,267,746 |
| Network & Telecom - 3.8% | | | | | |
| Cisco Systems, Inc. (a) | | 137,080 | | $ | 2,435,912 |
| NICE Systems Ltd., ADR (a) | | 46,080 | | | 1,030,349 |
| Nokia Oyj | | 139,280 | | | 2,124,444 |
| Research in Motion Ltd. (a) | | 33,760 | | | 1,702,517 |
| | | | | |
| | | | | $ | 7,293,222 |
| Oil Services - 1.3% | | | | | |
| Halliburton Co. | | 47,050 | | $ | 931,120 |
| Schlumberger Ltd. | | 31,590 | | | 1,631,624 |
| Vallourec S.A. | | 40 | | | 4,498 |
| | | | | |
| | | | | $ | 2,567,242 |
| Other Banks & Diversified Financials - 2.5% | | | | | |
| Aeon Credit Service Co. Ltd. (a) | | 148,900 | | $ | 1,617,646 |
| American Express Co. | | 48,690 | | | 1,338,975 |
| Housing Development Finance Corp. Ltd. | | 53,259 | | | 1,954,239 |
| | | | | |
| | | | | $ | 4,910,860 |
| Pharmaceuticals - 7.5% | | | | | |
| Allergan, Inc. | | 57,420 | | $ | 2,277,851 |
| Bayer AG | | 30,700 | | | 1,688,794 |
| Novartis AG | | 54,360 | | | 2,749,999 |
| Novo Nordisk A/S, “B” | | 60,175 | | | 3,221,200 |
| Roche Holding AG | | 30,070 | | | 4,602,688 |
| | | | | |
| | | | | $ | 14,540,532 |
| Railroad & Shipping - 1.1% | | | | | |
| East Japan Railway Co. | | 297 | | $ | 2,110,504 |
| | |
| Restaurants - 1.0% | | | | | |
| YUM! Brands, Inc. | | 68,260 | | $ | 1,980,223 |
| | |
| Specialty Chemicals - 5.8% | | | | | |
| Akzo Nobel N.V. | | 50,320 | | $ | 2,093,849 |
| L’Air Liquide S.A. | | 21,552 | | | 1,857,588 |
| Linde AG | | 23,750 | | | 1,966,438 |
14
Portfolio of Investments – continued
| | | | | | | |
| Issuer | | Shares/Par | | Value ($) | |
| | | | | | | |
| Common Stocks - continued | | | | | | | |
| Specialty Chemicals - continued | | | | | | | |
| Praxair, Inc. | | | 30,000 | | $ | 1,954,500 | |
| Shin-Etsu Chemical Co. Ltd. | | | 44,900 | | | 2,349,735 | |
| Symrise AG | | | 88,757 | | | 1,098,168 | |
| | | | | | | |
| | | | | | $ | 11,320,278 | |
| Specialty Stores - 1.3% | | | | | | | |
| Industria de Diseno Textile S.A. | | | 41,000 | | $ | 1,385,113 | |
| Staples, Inc. | | | 53,780 | | | 1,044,945 | |
| | | | | | | |
| | | | | | $ | 2,430,058 | |
| Telecommunications - Wireless - 2.5% | | | | | | | |
| America Movil S.A.B. de C.V., “L”, ADR | | | 62,960 | | $ | 1,947,982 | |
| MTN Group Ltd. | | | 133,450 | | | 1,505,995 | |
| Rogers Communications, Inc., “B” | | | 48,220 | | | 1,399,832 | |
| | | | | | | |
| | | | | | $ | 4,853,809 | |
| Telephone Services - 1.4% | | | | | | | |
| Telefonica S.A. | | | 146,850 | | $ | 2,716,312 | |
| | |
| Utilities - Electric Power - 0.9% | | | | | | | |
| E.ON AG | | | 45,663 | | $ | 1,742,806 | |
| Total Common Stocks (Identified Cost, $267,371,596) | | | | | $ | 193,469,504 | |
| | |
| Money Market Funds (v) - 1.3% | | | | | | | |
MFS Institutional Money Market Portfolio, 0.93%,
at Cost and Net Asset Value | | $ | 2,572,621 | | $ | 2,572,621 | |
| Total Investments (Identified Cost, $269,944,217) (k) | | | | | $ | 196,042,125 | |
| | |
| Other Assets, Less Liabilities - (0.7)% | | | | | | (1,378,863 | ) |
| Net Assets - 100.0% | | | | | $ | 194,663,262 | |
| (a) | Non-income producing security. |
| (k) | As of October 31, 2008 the fund had 50 securities that were fair valued, aggregating $96,488,840 and 49.22% of market value, in accordance with the policies adopted by the Board of Trustees. |
| (v) | Underlying fund that is available only to investment companies managed by MFS. The rate quoted is the annualized seven-day yield of the fund at period end. |
The following abbreviations are used in this report and are defined:
| ADR | | American Depository Receipt |
See Notes to Financial Statements
15
Financial Statements
STATEMENT OF ASSETS AND LIABILITIES
At 10/31/08
This statement represents your fund’s balance sheet, which details the assets and liabilities comprising the total value of the fund.
| | | | | |
| Assets | | | | | |
Investments- | | | | | |
Non-affiliated issuers, at value (identified cost, $267,371,596) | | $193,469,504 | | | |
Underlying funds, at cost and value | | 2,572,621 | | | |
Total investments, at value (identified cost, $269,944,217) | | | | | $196,042,125 |
Foreign currency, at value (identified cost, $2,914) | | 2,914 | | | |
Receivable for investments sold | | 2,697,423 | | | |
Receivable for fund shares sold | | 36,637 | | | |
Interest and dividends receivable | | 380,283 | | | |
Total assets | | | | | $199,159,382 |
| Liabilities | | | | | |
Payable to custodian | | $58,226 | | | |
Payable for investments purchased | | 2,412,878 | | | |
Payable for fund shares reacquired | | 1,767,886 | | | |
Payable to affiliates | | | | | |
Management fee | | 9,279 | | | |
Shareholder servicing costs | | 83,258 | | | |
Distribution and service fees | | 3,801 | | | |
Administrative services fee | | 222 | | | |
Payable for independent trustees’ compensation | | 42,107 | | | |
Accrued expenses and other liabilities | | 118,463 | | | |
Total liabilities | | | | | $4,496,120 |
Net assets | | | | | $194,663,262 |
| Net assets consist of | | | | | |
Paid-in capital | | $274,491,312 | | | |
Unrealized appreciation (depreciation) on investments and translation of assets and liabilities in foreign currencies | | (73,903,850 | ) | | |
Accumulated net realized gain (loss) on investments and foreign currency transactions | | (5,898,348 | ) | | |
Accumulated distributions in excess of net investment income | | (25,852 | ) | | |
Net assets | | | | | $194,663,262 |
Shares of beneficial interest outstanding | | | | | 11,348,853 |
16
Statement of Assets and Liabilities – continued
| | | | |
Class A shares | | | | |
Net assets | | $153,184,207 | | |
Shares outstanding | | 8,829,256 | | |
Net asset value per share | | | | $17.35 |
Offering price per share (100/94.25 × net asset value per share) | | | | $18.41 |
Class B shares | | | | |
Net assets | | $19,582,321 | | |
Shares outstanding | | 1,205,907 | | |
Net asset value and offering price per share | | | | $16.24 |
Class C shares | | | | |
Net assets | | $10,325,615 | | |
Shares outstanding | | 642,279 | | |
Net asset value and offering price per share | | | | $16.08 |
Class I shares | | | | |
Net assets | | $4,306,003 | | |
Shares outstanding | | 242,929 | | |
Net asset value, offering price, and redemption price per share | | | | $17.73 |
Class R1 shares | | | | |
Net assets | | $631,735 | | |
Shares outstanding | | 39,353 | | |
Net asset value, offering price, and redemption price per share | | | | $16.05 |
Class R2 shares (formerly Class R3 shares) | | | | |
Net assets | | $4,808,426 | | |
Shares outstanding | | 283,624 | | |
Net asset value, offering price, and redemption price per share | | | | $16.95 |
Class R3 shares (formerly Class R4 shares) | | | | |
Net assets | | $1,778,528 | | |
Shares outstanding | | 102,838 | | |
Net asset value, offering price, and redemption price per share | | | | $17.29 |
Class R4 shares (formerly Class R5 shares) | | | | |
Net assets | | $46,427 | | |
Shares outstanding | | 2,667 | | |
Net asset value, offering price, and redemption price per share | | | | $17.41 |
On sales of $50,000 or more, the offering price of Class A shares is reduced. A contingent deferred sales charge may be imposed on redemptions of Class A, Class B, and Class C shares.
Shares outstanding are rounded for presentation purposes.
See Notes to Financial Statements
17
Financial Statements
STATEMENT OF OPERATIONS
Year ended 10/31/08
This statement describes how much your fund earned in investment income and accrued in expenses. It also describes any gains and/or losses generated by fund operations.
| | | | | | |
| Net investment income | | | | | | |
Income | | | | | | |
Dividends | | $5,865,774 | | | | |
Interest | | 121,562 | | | | |
Dividends from underlying funds | | 90,456 | | | | |
Foreign taxes withheld | | (378,466 | ) | | | |
Total investment income | | | | | $5,699,326 | |
Expenses | | | | | | |
Management fee | | $2,826,530 | | | | |
Distribution and service fees | | 1,457,316 | | | | |
Shareholder servicing costs | | 638,046 | | | | |
Administrative services fee | | 52,301 | | | | |
Retirement plan administration and services fees | | 4,107 | | | | |
Independent trustees’ compensation | | 5,424 | | | | |
Custodian fee | | 208,262 | | | | |
Shareholder communications | | 26,978 | | | | |
Auditing fees | | 73,928 | | | | |
Legal fees | | 6,921 | | | | |
Miscellaneous | | 142,512 | | | | |
Total expenses | | | | | $5,442,325 | |
Fees paid indirectly | | (766 | ) | | | |
Reduction of expenses by investment adviser and distributor | | (239,987 | ) | | | |
Net expenses | | | | | $5,201,572 | |
Net investment income | | | | | $497,754 | |
Realized and unrealized gain (loss) on investments
and foreign currency transactions | | | | | | |
Realized gain (loss) (identified cost basis) | | | | | | |
Investment transactions | | $3,899,229 | | | | |
Foreign currency transactions | | (180,452 | ) | | | |
Net realized gain (loss) on investments
and foreign currency transactions | | | | | $3,718,777 | |
Change in unrealized appreciation (depreciation) | | | | | | |
Investments (net of $81,167 decrease in deferred country tax) | | $(148,469,051 | ) | | | |
Translation of assets and liabilities in foreign currencies | | (19,128 | ) | | | |
Net unrealized gain (loss) on investments
and foreign currency translation | | | | | $(148,488,179 | ) |
Net realized and unrealized gain (loss) on investments
and foreign currency | | | | | $(144,769,402 | ) |
Change in net assets from operations | | | | | $(144,271,648 | ) |
See Notes to Financial Statements
18
Financial Statements
STATEMENTS OF CHANGES IN NET ASSETS
These statements describe the increases and/or decreases in net assets resulting from operations, any distributions, and any shareholder transactions.
| | | | | | |
| | | Year ended 10/31 | |
| | | 2008 | | | 2007 | |
| Change in net assets | | | | | | |
| From operations | | | | | | |
Net investment income | | $497,754 | | | $3,167,148 | |
Net realized gain (loss) on investments and
foreign currency transactions | | 3,718,777 | | | 61,903,461 | |
Net unrealized gain (loss) on investments and
foreign currency translation | | (148,488,179 | ) | | 17,282,988 | |
Change in net assets from operations | | $(144,271,648 | ) | | $82,353,597 | |
| Distributions declared to shareholders | | | | | | |
From net investment income | | | | | | |
Class A | | $(1,726,947 | ) | | $(2,861,070 | ) |
Class B | | — | | | (164,047 | ) |
Class C | | (2,099 | ) | | (60,897 | ) |
Class I | | (59,758 | ) | | (88,085 | ) |
Class R (b) | | — | | | (27,079 | ) |
Class R1 | | (7,483 | ) | | (526 | ) |
Former Class R2 (b) | | (2,230 | ) | | (1,478 | ) |
Class R2 (formerly Class R3) | | (32,323 | ) | | (3,363 | ) |
Class R3 (formerly Class R4) | | (19,553 | ) | | (17,370 | ) |
Class R4 (formerly Class R5) | | (555 | ) | | (727 | ) |
Total distributions declared to shareholders | | $(1,850,948 | ) | | $(3,224,642 | ) |
Change in net assets from fund share transactions | | $(61,887,349 | ) | | $(77,431,825 | ) |
Total change in net assets | | $(208,009,945 | ) | | $1,697,130 | |
| Net assets | | | | | | |
At beginning of period | | 402,673,207 | | | 400,976,077 | |
At end of period (including accumulated distributions in excess of net investment income of $25,852 and undistributed net investment income of $1,778,279, respectively) | | $194,663,262 | | | $402,673,207 | |
| (b) | At the close of business on April 18, 2008, Class R and Class R2 shares converted into Class R3 shares. Following the conversion, Class R3 shares were renamed Class R2 shares. |
See Notes to Financial Statements
19
Financial Statements
FINANCIAL HIGHLIGHTS
The financial highlights table is intended to help you understand the fund’s financial performance for the past 5 years (or life of a particular share class, if shorter). Certain information reflects financial results for a single fund share. The total returns in the table represent the rate by which an investor would have earned (or lost) on an investment in the fund share class (assuming reinvestment of all distributions) held for the entire period.
| | | | | | | | | | | | | |
| Class A | | Years ended 10/31 | |
| | | 2008 | | | 2007 | | | 2006 | | 2005 | | 2004 | |
Net asset value, beginning of period | | $29.26 | | | $23.97 | | | $20.10 | | $17.76 | | $15.91 | |
| Income (loss) from investment operations | | | | | | | | | | | | | |
Net investment income (loss) (d) | | $0.08 | | | $0.25 | | | $0.11 | | $0.01 | | $(0.01 | ) |
Net realized and unrealized gain (loss)
on investments and foreign currency | | (11.82 | ) | | 5.28 | | | 3.76 | | 2.33 | | 1.86 | |
Total from investment operations | | $(11.74 | ) | | $5.53 | | | $3.87 | | $2.34 | | $1.85 | |
Less distributions declared to
shareholders | | | | | | | | | | | | | |
From net investment income | | $(0.17 | ) | | $(0.24 | ) | | $— | | $— | | $— | |
Net asset value, end of period | | $17.35 | | | $29.26 | | | $23.97 | | $20.10 | | $17.76 | |
Total return (%) (r)(s)(t) | | (40.34 | ) | | 23.24 | | | 19.25 | | 13.18 | | 11.70 | (b)(q) |
Ratios (%) (to average net assets)
and Supplemental data: | | | | | | | | | | | | | |
Expenses before expense reductions (f) | | 1.62 | | | 1.58 | | | 1.61 | | 1.69 | | 1.70 | |
Expenses after expense reductions (f) | | 1.52 | | | 1.48 | | | 1.51 | | 1.59 | | 1.60 | |
Net investment income (loss) | | 0.30 | | | 0.97 | | | 0.49 | | 0.07 | | (0.04 | ) |
Portfolio turnover | | 88 | | | 68 | | | 96 | | 92 | | 163 | |
Net assets at end of period (000 Omitted) | | $153,184 | | | $297,956 | | | $290,952 | | $290,256 | | $304,348 | |
See Notes to Financial Statements
20
Financial Highlights – continued
| | | | | | | | | | | | | | | |
| Class B | | Years ended 10/31 | |
| | | 2008 | | | 2007 | | | 2006 | | | 2005 | | | 2004 | |
Net asset value, beginning of period | | $27.42 | | | $22.46 | | | $18.98 | | | $16.90 | | | $15.25 | |
| Income (loss) from investment operations | | | | | | | | | | | | | | | |
Net investment income (loss) (d) | | $(0.11 | ) | | $0.06 | | | $(0.05 | ) | | $(0.13 | ) | | $(0.13 | ) |
Net realized and unrealized gain (loss)
on investments and foreign currency | | (11.07 | ) | | 4.95 | | | 3.53 | | | 2.21 | | | 1.78 | |
Total from investment operations | | $(11.18 | ) | | $5.01 | | | $3.48 | | | $2.08 | | | $1.65 | |
Less distributions declared to
shareholders | | | | | | | | | | | | | | | |
From net investment income | | $— | | | $(0.05 | ) | | $— | | | $— | | | $— | |
Net asset value, end of period | | $16.24 | | | $27.42 | | | $22.46 | | | $18.98 | | | $16.90 | |
Total return (%) (r)(s)(t) | | (40.77 | ) | | 22.35 | | | 18.34 | | | 12.31 | | | 10.82 | (b)(q) |
Ratios (%) (to average net assets)
and Supplemental data: | | | | | | | | | | | | | | | |
Expenses before expense reductions (f) | | 2.27 | | | 2.23 | | | 2.26 | | | 2.34 | | | 2.35 | |
Expenses after expense reductions (f) | | 2.27 | | | 2.23 | | | 2.26 | | | 2.34 | | | 2.35 | |
Net investment income (loss) | | (0.47 | ) | | 0.25 | | | (0.26 | ) | | (0.70 | ) | | (0.81 | ) |
Portfolio turnover | | 88 | | | 68 | | | 96 | | | 92 | | | 163 | |
Net assets at end of period (000 Omitted) | | $19,582 | | | $64,416 | | | $75,573 | | | $87,769 | | | $108,750 | |
| | | | | | | | | | | | | | | |
| Class C | | Years ended 10/31 | |
| | | 2008 | | | 2007 | | | 2006 | | | 2005 | | | 2004 | |
Net asset value, beginning of period | | $27.15 | | | $22.26 | | | $18.80 | | | $16.74 | | | $15.11 | |
| Income (loss) from investment operations | | | | | | | | | | | | | | | |
Net investment income (loss) (d) | | $(0.11 | ) | | $0.05 | | | $(0.06 | ) | | $(0.13 | ) | | $(0.13 | ) |
Net realized and unrealized gain (loss)
on investments and foreign currency | | (10.96 | ) | | 4.91 | | | 3.52 | | | 2.19 | | | 1.76 | |
Total from investment operations | | $(11.07 | ) | | $4.96 | | | $3.46 | | | $2.06 | | | $1.63 | |
Less distributions declared to
shareholders | | | | | | | | | | | | | | | |
From net investment income | | $(0.00 | )(w) | | $(0.07 | ) | | $— | | | $— | | | $— | |
Net asset value, end of period | | $16.08 | | | $27.15 | | | $22.26 | | | $18.80 | | | $16.74 | |
Total return (%) (r)(s)(t) | | (40.77 | ) | | 22.33 | | | 18.40 | | | 12.31 | | | 10.79 | (b)(q) |
Ratios (%) (to average net assets)
and Supplemental data: | | | | | | | | | | | | | | | |
Expenses before expense reductions (f) | | 2.27 | | | 2.23 | | | 2.26 | | | 2.34 | | | 2.35 | |
Expenses after expense reductions (f) | | 2.27 | | | 2.23 | | | 2.26 | | | 2.34 | | | 2.35 | |
Net investment income (loss) | | (0.45 | ) | | 0.21 | | | (0.27 | ) | | (0.69 | ) | | (0.81 | ) |
Portfolio turnover | | 88 | | | 68 | | | 96 | | | 92 | | | 163 | |
Net assets at end of period (000 Omitted) | | $10,326 | | | $20,249 | | | $20,450 | | | $20,924 | | | $21,945 | |
See Notes to Financial Statements
21
Financial Highlights – continued
| | | | | | | | | | | | | |
| Class I | | Years ended 10/31 | |
| | | 2008 | | | 2007 | | | 2006 | | 2005 | | 2004 | |
Net asset value, beginning of period | | $29.87 | | | $24.46 | | | $20.46 | | $18.04 | | $16.11 | |
| Income (loss) from investment operations | | | | | | | | | | | | | |
Net investment income (d) | | $0.14 | | | $0.32 | | | $0.17 | | $0.06 | | $0.04 | |
Net realized and unrealized gain (loss)
on investments and foreign currency | | (12.05 | ) | | 5.39 | | | 3.83 | | 2.36 | | 1.89 | |
Total from investment operations | | $(11.91 | ) | | $5.71 | | | $4.00 | | $2.42 | | $1.93 | |
Less distributions declared to
shareholders | | | | | | | | | | | | | |
From net investment income | | $(0.23 | ) | | $(0.30 | ) | | $— | | $— | | $— | |
Net asset value, end of period | | $17.73 | | | $29.87 | | | $24.46 | | $20.46 | | $18.04 | |
Total return (%) (r)(s) | | (40.16 | ) | | 23.57 | | | 19.55 | | 13.41 | | 11.98 | (b)(q) |
Ratios (%) (to average net assets)
and Supplemental data: | | | | | | | | | | | | | |
Expenses before expense reductions (f) | | 1.27 | | | 1.23 | | | 1.26 | | 1.34 | | 1.34 | |
Expenses after expense reductions (f) | | 1.27 | | | 1.23 | | | 1.26 | | 1.34 | | 1.34 | |
Net investment income | | 0.54 | | | 1.22 | | | 0.74 | | 0.31 | | 0.21 | |
Portfolio turnover | | 88 | | | 68 | | | 96 | | 92 | | 163 | |
Net assets at end of period (000 Omitted) | | $4,306 | | | $7,739 | | | $7,368 | | $7,233 | | $7,011 | |
| | | | | | | | | | | | |
| Class R1 | | Years ended 10/31 | |
| | | 2008 | | | 2007 | | | 2006 | | | 2005 (i) | |
Net asset value, beginning of period | | $27.29 | | | $22.42 | | | $18.96 | | | $18.12 | |
| Income (loss) from investment operations | | | | | | | | | | | | |
Net investment loss (d) | | $(0.12 | ) | | $(0.10 | ) | | $(0.07 | ) | | $(0.08 | ) |
Net realized and unrealized gain (loss)
on investments and foreign currency | | (10.95 | ) | | 5.06 | | | 3.53 | | | 0.92 | (g) |
Total from investment operations | | $(11.07 | ) | | $4.96 | | | $3.46 | | | $0.84 | |
| Less distributions declared to shareholders | | | | | | | | | | | | |
From net investment income | | $(0.17 | ) | | $(0.09 | ) | | $— | | | $— | |
Net asset value, end of period | | $16.05 | | | $27.29 | | | $22.42 | | | $18.96 | |
Total return (%) (r)(s) | | (40.80 | ) | | 22.17 | | | 18.25 | | | 4.64 | (n) |
Ratios (%) (to average net assets)
and Supplemental data: | | | | | | | | | | | | |
Expenses before expense reductions (f) | | 2.31 | | | 2.35 | | | 2.45 | | | 2.54 | (a) |
Expenses after expense reductions (f) | | 2.31 | | | 2.33 | | | 2.35 | | | 2.52 | (a) |
Net investment loss | | (0.53 | ) | | (0.43 | ) | | (0.35 | ) | | (0.77 | )(a) |
Portfolio turnover | | 88 | | | 68 | | | 96 | | | 92 | |
Net assets at end of period (000 Omitted) | | $632 | | | $1,009 | | | $127 | | | $104 | |
See Notes to Financial Statements
22
Financial Highlights – continued
| | | | | | | | | | | | | | |
| Class R2 (formerly Class R3) | | Years ended 10/31 | |
| | | 2008 | | | 2007 | | | 2006 | | 2005 | | | 2004 | |
Net asset value, beginning of period | | $28.77 | | | $23.58 | | | $19.85 | | $17.63 | | | $15.87 | |
| Income (loss) from investment operations | | | | | | | | | | | | | | |
Net investment income (loss) (d) | | $0.02 | | | $0.04 | | | $0.03 | | $(0.06 | ) | | $(0.07 | ) |
Net realized and unrealized gain (loss)
on investments and foreign currency | | (11.66 | ) | | 5.29 | | | 3.70 | | 2.28 | | | 1.83 | |
Total from investment operations | | $(11.64 | ) | | $5.33 | | | $3.73 | | $2.22 | | | $1.76 | |
Less distributions declared to
shareholders | | | | | | | | | | | | | | |
From net investment income | | $(0.18 | ) | | $(0.14 | ) | | $— | | $— | | | $— | |
Net asset value, end of period | | $16.95 | | | $28.77 | | | $23.58 | | $19.85 | | | $17.63 | |
Total return (%) (r)(s) | | (40.70 | ) | | 22.73 | | | 18.79 | | 12.59 | | | 11.09 | (b)(q) |
Ratios (%) (to average net assets)
and Supplemental data: | | | | | | | | | | | | | | |
Expenses before expense reductions (f) | | 1.79 | | | 1.90 | | | 2.00 | | 2.10 | | | 2.08 | |
Expenses after expense reductions (f) | | 1.79 | | | 1.88 | | | 1.90 | | 2.09 | | | 2.08 | |
Net investment income (loss) | | 0.06 | | | 0.16 | | | 0.15 | | (0.29 | ) | | (0.45 | ) |
Portfolio turnover | | 88 | | | 68 | | | 96 | | 92 | | | 163 | |
Net assets at end of period (000 Omitted) | | $4,808 | | | $4,168 | | | $619 | | $466 | | | $239 | |
| | | | | | | | | | | |
| Class R3 (formerly Class R4) | | Years ended 10/31 | |
| | | 2008 | �� | | 2007 | | | 2006 | | 2005 (i) | |
Net asset value, beginning of period | | $29.16 | | | $23.91 | | | $20.08 | | $19.10 | |
| Income (loss) from investment operations | | | | | | | | | | | |
Net investment income (d) | | $0.07 | | | $0.15 | | | $0.11 | | $0.02 | |
Net realized and unrealized gain (loss)
on investments and foreign currency | | (11.78 | ) | | 5.33 | | | 3.72 | | 0.96 | (g) |
Total from investment operations | | $(11.71 | ) | | $5.48 | | | $3.83 | | $0.98 | |
| Less distributions declared to shareholders | | | | | | | | | | | |
From net investment income | | $(0.16 | ) | | $(0.23 | ) | | $— | | $— | |
Net asset value, end of period | | $17.29 | | | $29.16 | | | $23.91 | | $20.08 | |
Total return (%) (r)(s) | | (40.37 | ) | | 23.10 | | | 19.07 | | 5.13 | (n) |
Ratios (%) (to average net assets)
and Supplemental data: | | | | | | | | | | | |
Expenses before expense reductions (f) | | 1.55 | | | 1.62 | | | 1.64 | | 1.75 | (a) |
Expenses after expense reductions (f) | | 1.55 | | | 1.62 | | | 1.64 | | 1.75 | (a) |
Net investment income | | 0.28 | | | 0.58 | | | 0.48 | | 0.20 | (a) |
Portfolio turnover | | 88 | | | 68 | | | 96 | | 92 | |
Net assets at end of period (000 Omitted) | | $1,779 | | | $3,563 | | | $1,857 | | $53 | |
See Notes to Financial Statements
23
Financial Highlights – continued
| | | | | | | | | | | |
| Class R4 (formerly Class R5) | | Years ended 10/31 | |
| | | 2008 | | | 2007 | | | 2006 | | 2005 (i) | |
Net asset value, beginning of period | | $29.33 | | | $24.02 | | | $20.11 | | $19.10 | |
| Income (loss) from investment operations | | | | | | | | | | | |
Net investment income (d) | | $0.14 | | | $0.28 | | | $0.14 | | $0.06 | |
Net realized and unrealized gain (loss)
on investments and foreign currency | | (11.85 | ) | | 5.31 | | | 3.77 | | 0.95 | (g) |
Total from investment operations | | $(11.71 | ) | | $5.59 | | | $3.91 | | $1.01 | |
| Less distributions declared to shareholders | | | | | | | | | | | |
From net investment income | | $(0.21 | ) | | $(0.28 | ) | | $— | | $— | |
Net asset value, end of period | | $17.41 | | | $29.33 | | | $24.02 | | $20.11 | |
Total return (%) (r)(s) | | (40.20 | ) | | 23.47 | | | 19.44 | | 5.29 | (n) |
Ratios (%) (to average net assets)
and Supplemental data: | | | | | | | | | | | |
Expenses before expense reductions (f) | | 1.29 | | | 1.33 | | | 1.35 | | 1.45 | (a) |
Expenses after expense reductions (f) | | 1.29 | | | 1.33 | | | 1.35 | | 1.45 | (a) |
Net investment income | | 0.54 | | | 1.07 | | | 0.65 | | 0.50 | (a) |
Portfolio turnover | | 88 | | | 68 | | | 96 | | 92 | |
Net assets at end of period (000 Omitted) | | $46 | | | $78 | | | $63 | | $53 | |
Any redemption fees charged by the fund during the 2004 and 2005 fiscal years resulted in a per share impact of less than $0.01.
| (b) | The fund’s net asset value and total return calculation include a non-recurring accrual recorded as a result of an administrative proceeding regarding disclosure of brokerage allocation practices in connection with fund sales. The non-recurring accrual did not have a material impact on the net asset value per share based on the shares outstanding on the day the proceeds were recorded. |
| (d) | Per share data are based on average shares outstanding. |
| (f) | Ratios do not reflect reductions from fees paid indirectly, if applicable. |
| (g) | The per share amount is not in accordance with the net realized and unrealized gain/loss for the period because of the timing of sales of fund shares and the per share amount of realized and unrealized gains and losses at such time. |
| (i) | For the period from the class’ inception, April 1, 2005 (Classes R1, R3, and R4) through the stated period end. |
| (q) | The fund’s net asset value and total return calculation include proceeds received on March 19, 2004 for the remaining payment of a non-recurring litigation settlement from Cendant Corporation, recorded as a realized gain on investment transactions. The proceeds resulted in an increase in the net asset value of $0.01 per share based on shares outstanding on the day the proceeds were received. Excluding the effect of this payment from the ending net asset value per shared, total return for the year ended October 31, 2004 for Class A, Class B, Class C, Class I, Class R and Class R2 (formerly Class R3) would have been 0.05%, 0.05%, 0.06%, 0.05%, 0.06%, and 0.05% lower, respectively. |
| (r) | Certain expenses have been reduced without which performance would have been lower. |
| (s) | From time to time the fund may receive proceeds from litigation settlements, without which performance would be lower. |
| (t) | Total returns do not include any applicable sales charges. |
| (w) | Per share amount was less than $0.01. |
See Notes to Financial Statements
24
NOTES TO FINANCIAL STATEMENTS
| (1) | | Business and Organization |
MFS Global Growth Fund (the fund) is a series of MFS Series Trust VIII (the trust). The trust is organized as a Massachusetts business trust and is registered under the Investment Company Act of 1940, as amended, as an open-end management investment company.
| (2) | | Significant Accounting Policies |
General – The preparation of financial statements in conformity with U.S. generally accepted accounting principles requires management to make estimates and assumptions that affect the reported amounts of assets and liabilities, and disclosure of contingent assets and liabilities at the date of the financial statements and the reported amounts of revenues and expenses during the reporting period. Actual results could differ from those estimates. The fund can invest in foreign securities, including securities of emerging market issuers. Investments in foreign securities are vulnerable to the effects of changes in the relative values of the local currency and the U.S. dollar and to the effects of changes in each country’s legal, political, and economic environment. The markets of emerging markets countries are generally more volatile than the markets of developed countries with more mature economies. All of the risks of investing in foreign securities previously described are heightened when investing in emerging markets countries.
FASB Statement No. 161, Disclosures about Derivative Instruments and Hedging Activities, effective for financial statements issued for fiscal years and interim periods beginning after November 15, 2008, and FASB Staff Position (FSP) 133-1, effective for fiscal years and interim periods ending after November 15, 2008 (the “Standards”) were recently issued. These Standards provide enhanced disclosures about the fund’s use of and accounting for derivative instruments and the effect of derivative instruments on the fund’s results of operations and financial position. Management is evaluating the application of the Standards to the fund, and has not at this time determined the impact, resulting from the adoption of these Standards on the fund’s financial statements.
Investment Valuations – Equity securities, including restricted equity securities, are generally valued at the last sale or official closing price as reported by a third party pricing service on the market or exchange on which they are primarily traded. For securities for which there were no sales reported that day, equity securities are generally valued at the last quoted daily bid quotation as reported by a third party pricing service on the market or exchange on which they are primarily traded. For securities held short for which there were no sales reported for the day, the position is generally valued
25
Notes to Financial Statements – continued
at the last quoted daily ask quotation as reported by a third party pricing service on the market or exchange on which such securities are primarily traded. Short-term instruments with a maturity at issuance of 60 days or less may be valued at amortized cost, which approximates market value. Open-end investment companies are generally valued at net asset value per share. Securities and other assets generally valued on the basis of information from a third party pricing service may also be valued at a broker-dealer bid quotation. Values obtained from pricing services can utilize both dealer-supplied valuations and electronic data processing techniques, which take into account factors such as institutional-size trading in similar groups of securities, yield, quality, coupon rate, maturity, type of issue, trading characteristics, and other market data. The values of foreign securities and other assets and liabilities expressed in foreign currencies are converted to U.S. dollars using the mean of bid and asked prices for rates reported by a third party pricing service.
The Board of Trustees has delegated primary responsibility for determining or causing to be determined the value of the fund’s investments (including any fair valuation) to the adviser pursuant to valuation policies and procedures approved by the Board. If the adviser determines that reliable market quotations are not readily available, investments are valued at fair value as determined in good faith by the adviser in accordance with such procedures under the oversight of the Board of Trustees. Under the fund’s valuation policies and procedures, market quotations are not considered to be readily available for most types of debt instruments and floating rate loans and many types of derivatives. These investments are generally valued at fair value based on information from independent pricing services. In addition, investments may be valued at fair value if the adviser determines that an investment’s value has been materially affected by events occurring after the close of the exchange or market on which the investment is principally traded (such as foreign exchange or market) and prior to the determination of the fund’s net asset value, or after the halting of trading of a specific security where trading does not resume prior to the close of the exchange or market on which the security is principally traded. Events that occur on a frequent basis after foreign markets close (such as developments in foreign markets and significant movements in the U.S. markets) and prior to the determination of the fund’s net asset value may be deemed to have a material affect on the value of securities traded in foreign markets. Accordingly, the fund’s foreign equity securities may often be valued at fair value. The adviser may rely on third party pricing services or other information (such as the correlation with price movements of similar securities in the same or other markets; the type, cost and investment characteristics of the security; the business and financial condition of the issuer; and trading and other market data) to assist in determining whether to fair value and at what value to fair value an
26
Notes to Financial Statements – continued
investment. The value of an investment for purposes of calculating the fund’s net asset value can differ depending on the source and method used to determine value. When fair valuation is used, the value of investments used to determine the fund’s net asset value may differ from quoted or published prices for the same investments.
In September 2006, FASB Statement No. 157, Fair Value Measurements (the “Statement”) was issued, and is effective for fiscal years beginning after November 15, 2007 and for all interim periods within those fiscal years. This Statement provides a single definition of fair value, a hierarchy for measuring fair value and expanded disclosures about fair value measurements. Management is evaluating the application of the Statement to the fund, and believes the impact will be limited to expanded disclosures resulting from the adoption of this Statement in the fund’s financial statements.
Repurchase Agreements – The fund may enter into repurchase agreements with approved counterparties. Each repurchase agreement is recorded at cost. The fund requires that the securities collateral in a repurchase transaction be transferred to a custodian. The fund monitors, on a daily basis, the value of the collateral to ensure that its value, including accrued interest, is greater than amounts owed to the fund under each such repurchase agreement.
Foreign Currency Translation – Purchases and sales of foreign investments, income, and expenses are converted into U.S. dollars based upon currency exchange rates prevailing on the respective dates of such transactions or on the reporting date for foreign denominated receivables and payables. Gains and losses attributable to foreign currency exchange rates on sales of securities are recorded for financial statement purposes as net realized gains and losses on investments. Gains and losses attributable to foreign exchange rate movements on receivables, payables, income and expenses are recorded for financial statement purposes as foreign currency transaction gains and losses. That portion of both realized and unrealized gains and losses on investments that results from fluctuations in foreign currency exchange rates is not separately disclosed.
Security Loans – JPMorgan Chase and Co. (“Chase”), as lending agent, may loan the securities of the fund to certain qualified institutions (the “Borrowers”) approved by the fund. The loans are collateralized at all times by cash and/or U.S. Treasury and federal agency obligations in an amount at least equal to the market value of the securities loaned. Security lending activity through Chase is further collateralized by an irrevocable standby letter of credit. Chase provides the fund with indemnification against Borrower default. The fund bears the risk of loss with respect to the investment of cash collateral. On loans collateralized by cash, the cash collateral is invested in short-term securities. A portion of the income generated upon investment of the collateral is remitted to the Borrowers, and the remainder is allocated between the fund
27
Notes to Financial Statements – continued
and the lending agent. On loans collateralized by U.S. Treasury and/or federal agency obligations, a fee is received from the Borrower, and is allocated between the fund and the lending agent. Income from securities lending is included in interest income on the Statement of Operations. The dividend and interest income earned on the securities loaned is accounted for in the same manner as other dividend and interest income. At October 31, 2008, there were no securities on loan.
Indemnifications – Under the fund’s organizational documents, its officers and trustees may be indemnified against certain liabilities and expenses arising out of the performance of their duties to the fund. Additionally, in the normal course of business, the fund enters into agreements with service providers that may contain indemnification clauses. The fund’s maximum exposure under these agreements is unknown as this would involve future claims that may be made against the fund that have not yet occurred.
Investment Transactions and Income – Investment transactions are recorded on the trade date. Interest income is recorded on the accrual basis. All premium and discount is amortized or accreted for financial statement purposes in accordance with U.S. generally accepted accounting principles. Dividends received in cash are recorded on the ex-dividend date. Certain dividends from foreign securities will be recorded when the fund is informed of the dividend if such information is obtained subsequent to the ex-dividend date. Dividend and interest payments received in additional securities are recorded on the ex-dividend or ex-interest date in an amount equal to the value of the security on such date. The fund may receive proceeds from litigation settlements. Any proceeds received from litigation involving portfolio holdings are reflected in the Statement of Operations in realized gain/loss if the security has been disposed of by the fund or in unrealized gain/loss if the security is still held by the fund. Any other proceeds from litigation not related to portfolio holdings are reflected as other income in the Statement of Operations.
Fees Paid Indirectly – The fund’s custody fee may be reduced according to an arrangement that measures the value of cash deposited with the custodian by the fund. This amount, for the year ended October 31, 2008, is shown as a reduction of total expenses on the Statement of Operations.
Tax Matters and Distributions – The fund intends to qualify as a regulated investment company, as defined under Subchapter M of the Internal Revenue Code, and to distribute all of its taxable income, including realized capital gains. As a result, no provision for federal income tax is required. The fund adopted the provisions of FASB Interpretation No. 48, Accounting for Uncertainty in Income Taxes (“the Interpretation”) on the first day of the fund’s fiscal year. The Interpretation prescribes a minimum threshold for financial statement recognition of the benefit of a tax position taken or
28
Notes to Financial Statements – continued
expected to be taken in a tax return. There was no impact resulting from the adoption of this Interpretation on the fund’s financial statements. Each of the fund’s federal tax returns for the prior three fiscal years remains subject to examination by the Internal Revenue Service. Foreign taxes, if any, have been accrued by the fund in the accompanying financial statements.
Distributions to shareholders are recorded on the ex-dividend date. Income and capital gain distributions are determined in accordance with income tax regulations, which may differ from U.S. generally accepted accounting principles. Certain capital accounts in the financial statements are periodically adjusted for permanent differences in order to reflect their tax character. These adjustments have no impact on net assets or net asset value per share. Temporary differences which arise from recognizing certain items of income, expense, gain or loss in different periods for financial statement and tax purposes will reverse at some time in the future. Distributions in excess of net investment income or net realized gains are temporary overdistributions for financial statement purposes resulting from differences in the recognition or classification of income or distributions for financial statement and tax purposes.
Book/tax differences primarily relate to wash sale loss deferrals, foreign currency transactions, and foreign taxes.
The tax character of distributions declared to shareholders for the last two fiscal years is as follows:
| | | | |
| | | 10/31/08 | | 10/31/07 |
| Ordinary income (including any short-term capital gains) | | $1,850,948 | | $3,224,642 |
The federal tax cost and the tax basis components of distributable earnings were as follows:
| | | |
| As of 10/31/08 | | | |
| Cost of investments | | $270,889,890 | |
| Gross appreciation | | 1,691,043 | |
| Gross depreciation | | (76,538,808 | ) |
| Net unrealized appreciation (depreciation) | | $(74,847,765 | ) |
| Undistributed ordinary income | | 23,641 | |
| Capital loss carryforwards | | (4,551,465 | ) |
| Other temporary differences | | (452,461 | ) |
As of October 31, 2008, the fund had capital loss carryforwards available to offset future realized gains. Such losses expire as follows:
29
Notes to Financial Statements – continued
Multiple Classes of Shares of Beneficial Interest – The fund offers multiple classes of shares, which differ in their respective distribution, service, and retirement plan administration and services fees. The fund’s income, realized and unrealized gain (loss), and common expenses are allocated to shareholders based on the daily net assets of each class. Dividends are declared separately for each class. Differences in per share dividend rates are generally due to differences in separate class expenses. Class B shares will convert to Class A shares approximately eight years after purchase. At the close of business on April 18, 2008, Class R and Class R2 shares converted into Class R3 shares. Following this conversion, Class R3, Class R4, and Class R5 shares were renamed Class R2, Class R3, and Class R4 shares, respectively.
| (3) | | Transactions with Affiliates |
Investment Adviser – The fund has an investment advisory agreement with Massachusetts Financial Services Company (MFS) to provide overall investment management and related administrative services and facilities to the fund. The management fee is computed daily and paid monthly at the following annual rates:
| | | |
| First $1 billion of average daily net assets | | 0.90 | % |
| Next $1 billion of average daily net assets | | 0.75 | % |
| Average daily net assets in excess of $2 billion | | 0.65 | % |
The management fee incurred for the year ended October 31, 2008 was equivalent to an annual effective rate of 0.90% of the fund’s average daily net assets.
Distributor – MFS Fund Distributors, Inc. (MFD), a wholly-owned subsidiary of MFS, as distributor, received $12,799 for the year ended October 31, 2008, as its portion of the initial sales charge on sales of Class A shares of the fund.
The Board of Trustees has adopted a distribution plan for certain class shares pursuant to Rule 12b-1 of the Investment Company Act of 1940.
The fund’s distribution plan provides that the fund will pay MFD for services provided by MFD and financial intermediaries in connection with the distribution and servicing of certain share classes. One component of the plan is a distribution fee paid to MFD and another component of the plan is a service fee paid to MFD. MFD may subsequently pay all, or a portion, of the distribution and/or service fees to financial intermediaries.
30
Notes to Financial Statements – continued
Distribution Plan Fee Table:
| | | | | | | | | | |
| | | Distribution
Fee Rate | | Service
Fee Rate | | Total
Distribution
Plan (d) | | Annual
Effective
Rate (e) | | Distribution
and Service
Fee |
| Class A | | 0.10% | | 0.25% | | 0.35% | | 0.25% | | $834,111 |
| Class B | | 0.75% | | 0.25% | | 1.00% | | 1.00% | | 396,137 |
| Class C | | 0.75% | | 0.25% | | 1.00% | | 1.00% | | 164,124 |
| Class R (b) | | 0.25% | | 0.25% | | 0.50% | | 0.50% | | 2,518 |
| Class R1 | | 0.75% | | 0.25% | | 1.00% | | 0.91% | | 8,953 |
| Former Class R2 (b) | | 0.25% | | 0.25% | | 0.50% | | 0.50% | | 2,187 |
| Class R2 (formerly Class R3) | | 0.25% | | 0.25% | | 0.50% | | 0.50% | | 41,501 |
| Class R3 (formerly Class R4) | | — | | 0.25% | | 0.25% | | 0.25% | | 7,785 |
| Total Distribution and Service Fees | | | | | | $1,457,316 |
| (b) | At the close of business on April 18, 2008, Class R and Class R2 shares converted into Class R3 shares. Following the conversion, Class R3 shares were renamed Class R2 shares. |
| (d) | In accordance with the distribution plan for certain classes, the fund pays distribution and/or service fees up to these annual percentage rates of each class’ average daily net assets. |
| (e) | The annual effective rates represent actual fees incurred under the distribution plan for the year ended October 31, 2008 based on each class’ average daily net assets. 0.10% of the Class A distribution fee is currently being waived under a written waiver arrangement through February 29, 2009. For the year ended October 31, 2008, this waiver amounted to $238,315 and is reflected as a reduction of total expenses in the Statement of Operations. Effective March 1, 2008, the distribution fee rate for Class R1 shares increased from 0.50% to 0.75%. |
Certain Class A shares purchased prior to September 1, 2008 are subject to a contingent deferred sales charge (CDSC) in the event of a shareholder redemption within 12 months of purchase. Certain Class A shares purchased on or subsequent to September 1, 2008 are subject to a CDSC in the event of a shareholder redemption within 24 months of purchase. Class C shares are subject to a CDSC in the event of a shareholder redemption within 12 months of purchase. Class B shares are subject to a CDSC in the event of a shareholder redemption within six years of purchase. All contingent deferred sales charges are paid to MFD and during the year ended October 31, 2008, were as follows:
| | |
| | | Amount |
| Class A | | $2,310 |
| Class B | | 32,159 |
| Class C | | 762 |
Shareholder Servicing Agent – MFS Service Center, Inc. (MFSC), a wholly-owned subsidiary of MFS, receives a fee from the fund for its services as shareholder servicing agent calculated as a percentage of the average daily net assets of the fund as determined periodically under the supervision of the fund’s Board of Trustees. For the year ended October 31, 2008, the fee was $264,485, which equated to 0.0843% annually of the fund’s average daily net assets. MFSC also receives payment from the fund for out-of-pocket expenses, sub-accounting and other shareholder servicing costs which may be paid to
31
Notes to Financial Statements – continued
affiliated and unaffiliated service providers. For the year ended October 31, 2008, these out-of-pocket expenses, sub-accounting and other shareholder servicing costs amounted to $373,561.
Administrator – MFS provides certain financial, legal, shareholder communications, compliance, and other administrative services to the fund. Under an administrative services agreement, the fund partially reimburses MFS the costs incurred to provide these services. The fund is charged a fixed amount plus a fee based on average daily net assets. The fund’s annual fixed amount is $17,500.
The administrative services fee incurred for the year ended October 31, 2008 was equivalent to an annual effective rate of 0.0167% of the fund’s average daily net assets.
In addition to the administrative services provided by MFS to the fund as described above, prior to March 1, 2008, MFS was responsible for providing certain retirement plan administration and services with respect to certain shares. These services included various administrative, recordkeeping, and communication/educational services with respect to the retirement plans which invest in these shares, and may have been provided directly by MFS or by a third party. MFS generally paid all, or a portion, of the retirement plan administration and services fee to affiliated or unaffiliated third parties. For the year ended October 31, 2008, the fund paid MFS an annual retirement plan administration and services fee up to the following annual percentage rates of each class’ average daily net assets:
| | | | | | | | | | |
| | | Beginning
of period
through
12/31/07 | | Effective
1/01/08 | | Effective
3/01/08 | | Annual
Effective
Rate (g) | | Total
Amount |
Class R1 | | 0.35% | | 0.35% | | — | | 0.13% | | $1,330 |
Former Class R2 (b) | | 0.25% | | — | | — | | 0.08% | | 354 |
Class R2 (formerly Class R3) | | 0.15% | | — | | — | | 0.02% | | 1,544 |
Class R3 (formerly Class R4) | | 0.15% | | — | | — | | 0.03% | | 867 |
Class R4 (formerly Class R5) | | 0.10% | | — | | — | | 0.02% | | 12 |
| Total Retirement Plan Administration and Services Fees | | $4,107 |
| (b) | At the close of business on April 18, 2008, Class R and Class R2 shares converted into Class R3 shares. Following the conversion, Class R3 shares were renamed Class R2 shares. |
| (g) | Effective January 1, 2008, the annual retirement plan administration and services fee was eliminated for all R share classes, other than Class R1 shares. Effective March 1, 2008, the annual retirement plan administration and services fee was eliminated for Class R1 shares. |
Trustees’ and Officers’ Compensation – The fund pays compensation to independent trustees in the form of a retainer, attendance fees, and additional compensation to Board and Committee chairpersons. The fund does not pay compensation directly to trustees or officers of the fund who are also officers
32
Notes to Financial Statements – continued
of the investment adviser, all of whom receive remuneration for their services to the fund from MFS. Certain officers and trustees of the fund are officers or directors of MFS, MFD, and MFSC.
The fund has an unfunded, defined benefit plan for certain retired independent trustees which resulted in a pension expense of $1,660. The fund also has an unfunded retirement benefit deferral plan for certain independent trustees which resulted in a net decrease in expense of $7,809. Both amounts are included in independent trustees’ compensation for the year ended October 31, 2008. The liability for deferred retirement benefits payable to certain independent trustees under both plans amounted to $40,706 at October 31, 2008, and is included in payable for independent trustees’ compensation.
Other – This fund and certain other MFS funds (the funds) have entered into services agreements (the Agreements) which provide for payment of fees by the funds to Tarantino LLC and Griffin Compliance LLC in return for the provision of services of an Independent Chief Compliance Officer (ICCO) and Assistant ICCO, respectively, for the funds. The ICCO and Assistant ICCO are officers of the funds and the sole members of Tarantino LLC and Griffin Compliance LLC, respectively. The funds can terminate the Agreements with Tarantino LLC and Griffin Compliance LLC at any time under the terms of the Agreements. For the year ended October 31, 2008, the aggregate fees paid by the fund to Tarantino LLC and Griffin Compliance LLC were $2,535 and are included in miscellaneous expense on the Statement of Operations. MFS has agreed to reimburse the fund for a portion of the payments made by the fund in the amount of $1,672, which is shown as a reduction of total expenses in the Statement of Operations. Additionally, MFS has agreed to bear all expenses associated with office space, other administrative support, and supplies provided to the ICCO and Assistant ICCO.
The fund may invest in a money market fund managed by MFS which seeks a high level of current income consistent with preservation of capital and liquidity. Income earned on this investment is included in dividends from underlying funds on the Statement of Operations. This money market fund does not pay a management fee to MFS.
Purchases and sales of investments, other than U.S. Government securities, purchased option transactions, and short-term obligations, aggregated $276,112,478 and $341,331,183, respectively.
33
Notes to Financial Statements – continued
| (5) | | Shares of Beneficial Interest |
The fund’s Declaration of Trust permits the Trustees to issue an unlimited number of full and fractional shares of beneficial interest. Transactions in fund shares were as follows:
| | | | | | | | | | | | |
| | | Year ended
10/31/08 | | | Year ended
10/31/07 | |
| | | Shares | | | Amount | | | Shares | | | Amount | |
| Shares sold | | | | | | | | | | | | |
Class A | | 1,789,254 | | | $47,308,074 | | | 2,196,393 | | | $58,788,397 | |
Class B | | 114,426 | | | 2,757,320 | | | 249,794 | | | 6,158,115 | |
Class C | | 90,910 | | | 2,225,010 | | | 88,316 | | | 2,139,680 | |
Class I | | 30,594 | | | 791,240 | | | 282,888 | | | 8,110,897 | |
Class R (b) | | 60,868 | | | 1,660,911 | | | 31,447 | | | 816,660 | |
Class R1 | | 23,194 | | | 575,325 | | | 36,580 | | | 922,708 | |
Former Class R2 (b) | | 35,692 | | | 935,263 | | | 25,258 | | | 629,611 | |
Class R2 (formerly Class R3) | | 334,453 | | | 8,938,882 | | | 168,169 | | | 4,449,783 | |
Class R3 (formerly Class R4) | | 22,620 | | | 583,288 | | | 196,281 | | | 5,104,113 | |
| | 2,502,011 | | | $65,775,313 | | | 3,275,126 | | | $87,119,964 | |
| Shares issued to shareholders in reinvestment of distributions | | | | | | | | | | | | |
Class A | | 55,569 | | | $1,565,367 | | | 104,834 | | | $2,600,943 | |
Class B | | — | | | — | | | 6,688 | | | 156,489 | |
Class C | | 65 | | | 1,719 | | | 2,211 | | | 51,239 | |
Class I | | 2,081 | | | 59,758 | | | 3,486 | | | 88,085 | |
Class R (b) | | — | | | — | | | 1,100 | | | 27,079 | |
Class R1 | | 285 | | | 7,483 | | | 23 | | | 526 | |
Former Class R2 (b) | | 84 | | | 2,230 | | | 63 | | | 1,478 | |
Class R2 (formerly Class R3) | | 1,167 | | | 32,323 | | | 137 | | | 3,363 | |
Class R3 (formerly Class R4) | | 696 | | | 19,553 | | | 702 | | | 17,370 | |
Class R4 (formerly Class R5) | | 20 | | | 555 | | | 29 | | | 727 | |
| | 59,967 | | | $1,688,988 | | | 119,273 | | | $2,947,299 | |
| Shares reacquired | | | | | | | | | | | | |
Class A | | (3,199,956 | ) | | $(81,615,479 | ) | | (4,256,084 | ) | | $(112,509,795 | ) |
Class B | | (1,257,559 | ) | | (30,606,975 | ) | | (1,271,659 | ) | | (31,239,465 | ) |
Class C | | (194,505 | ) | | (4,510,502 | ) | | (263,416 | ) | | (6,379,886 | ) |
Class I | | (48,802 | ) | | (1,245,809 | ) | | (328,544 | ) | | (9,315,129 | ) |
Class R (b) | | (156,361 | ) | | (4,248,884 | ) | | (93,866 | ) | | (2,453,051 | ) |
Class R1 | | (21,096 | ) | | (491,139 | ) | | (5,298 | ) | | (130,365 | ) |
Former Class R2 (b) | | (62,264 | ) | | (1,566,393 | ) | | (9,761 | ) | | (238,174 | ) |
Class R2 (formerly Class R3) | | (196,848 | ) | | (4,144,770 | ) | | (49,716 | ) | | (1,280,345 | ) |
Class R3 (formerly Class R4) | | (42,685 | ) | | (921,699 | ) | | (152,454 | ) | | (3,952,878 | ) |
| | (5,180,076 | ) | | $(129,351,650 | ) | | (6,430,798 | ) | | $(167,499,088 | ) |
34
Notes to Financial Statements – continued
| | | | | | | | | | | | |
| | | Year ended
10/31/08 | | | Year ended
10/31/07 | |
| | | Shares | | | Amount | | | Shares | | | Amount | |
| Net change | | | | | | | | | | | | |
Class A | | (1,355,133 | ) | | $(32,742,038 | ) | | (1,954,857 | ) | | $(51,120,455 | ) |
Class B | | (1,143,133 | ) | | (27,849,655 | ) | | (1,015,177 | ) | | (24,924,861 | ) |
Class C | | (103,530 | ) | | (2,283,773 | ) | | (172,889 | ) | | (4,188,967 | ) |
Class I | | (16,127 | ) | | (394,811 | ) | | (42,170 | ) | | (1,116,147 | ) |
Class R (b) | | (95,493 | ) | | (2,587,973 | ) | | (61,319 | ) | | (1,609,312 | ) |
Class R1 | | 2,383 | | | 91,669 | | | 31,305 | | | 792,869 | |
Former Class R2 (b) | | (26,488 | ) | | (628,900 | ) | | 15,560 | | | 392,915 | |
Class R2 (formerly Class R3) | | 138,772 | | | 4,826,435 | | | 118,590 | | | 3,172,801 | |
Class R3 (formerly Class R4) | | (19,369 | ) | | (318,858 | ) | | 44,529 | | | 1,168,605 | |
Class R4 (formerly Class R5) | | 20 | | | 555 | | | 29 | | | 727 | |
| | (2,618,098 | ) | | $(61,887,349 | ) | | (3,036,399 | ) | | $(77,431,825 | ) |
| (b) | At the close of business on April 18, 2008, Class R and Class R2 shares converted into Class R3 shares. Following the conversion, Class R3 shares were renamed Class R2 shares. |
The fund and other funds managed by MFS participate in a $1 billion unsecured committed line of credit provided by a syndication of banks under a credit agreement. In addition, the fund and other funds managed by MFS have established uncommitted borrowing arrangements with certain banks. Borrowings may be made for temporary financing needs. Interest is charged to each fund, based on its borrowings, generally at a rate equal to the Federal Reserve funds rate plus 0.30%. In addition, a commitment fee, based on the average daily, unused portion of the committed line of credit, is allocated among the participating funds at the end of each calendar quarter. For the year ended October 31, 2008, the fund’s commitment fee and interest expense were $1,453 and $0, respectively, and are included in miscellaneous expense on the Statement of Operations.
| (7) | | Transactions in Underlying Funds-Affiliated Issuers |
An affiliated issuer may be considered one in which the fund owns 5% or more of the outstanding voting securities, or a company which is under common control. For the purposes of this report, the fund assumes the following to be affiliated issuers:
| | | | | | | | | |
| Underlying Funds | | Beginning
Shares/Par
Amount | | Acquisitions
Shares/Par
Amount | | Dispositions
Shares/Par
Amount | | | Ending
Shares/Par
Amount |
MFS Institutional Money
Market Portfolio | | 5,217,288 | | 119,469,188 | | (122,113,855 | ) | | 2,572,621 |
| | | | |
| Underlying Funds | | Realized
Gain (Loss) | | Capital Gain
Distributions | | Dividend
Income | | | Ending
Value |
MFS Institutional Money
Market Portfolio | | $— | | $— | | $90,456 | | | $2,572,621 |
35
REPORT OF INDEPENDENT REGISTERED
PUBLIC ACCOUNTING FIRM
To the Trustees of MFS Series Trust VIII and the Shareholders of MFS Global Growth Fund:
We have audited the accompanying statement of assets and liabilities, including the portfolio of investments, of MFS Global Growth Fund (one of the portfolios comprising MFS Series Trust VIII) (the “Trust”) as of October 31, 2008, and the related statement of operations for the year then ended, the statements of changes in net assets for each of the two years in the period then ended, and the financial highlights for each of the five years in the period then ended. These financial statements and financial highlights are the responsibility of the Trust’s management. Our responsibility is to express an opinion on these financial statements and financial highlights based on our audits.
We conducted our audits in accordance with the standards of the Public Company Accounting Oversight Board (United States). Those standards require that we plan and perform the audit to obtain reasonable assurance about whether the financial statements and financial highlights are free of material misstatement. The Trust is not required to have, nor were we engaged to perform, an audit of its internal control over financial reporting. Our audits included consideration of internal control over financial reporting as a basis for designing audit procedures that are appropriate in the circumstances, but not for the purpose of expressing an opinion on the effectiveness of the Trust’s internal control over financial reporting. Accordingly, we express no such opinion. An audit also includes examining, on a test basis, evidence supporting the amounts and disclosures in the financial statements, assessing the accounting principles used and significant estimates made by management, as well as evaluating the overall financial statement presentation. Our procedures included confirmation of securities owned as of October 31, 2008, by correspondence with the custodian and brokers; where replies were not received from brokers, we performed other auditing procedures. We believe that our audits provide a reasonable basis for our opinion.
In our opinion, such financial statements and financial highlights present fairly, in all material respects, the financial position of MFS Global Growth Fund as of October 31, 2008, the results of its operations for the year then ended, the changes in its net assets for each of the two years in the period then ended, and the financial highlights for each of the five years in the period then ended, in conformity with accounting principles generally accepted in the United States of America.
DELOITTE & TOUCHE LLP
Boston, Massachusetts
December 17, 2008
36
TRUSTEES AND OFFICERS — IDENTIFICATION AND BACKGROUND
The Trustees and officers of the Trust, as of December 1, 2008, are listed below, together with their principal occupations during the past five years. (Their titles may have varied during that period.) The address of each Trustee and officer is 500 Boylston Street, Boston, Massachusetts 02116.
| | | | | | |
Name, Date of Birth | | Position(s) Held
with Fund | | Trustee/Officer
Since (h) | | Principal Occupations During
the Past Five Years & Other
Directorships (j) |
| INTERESTED TRUSTEES | | | | |
Robert J. Manning (k)
(born 10/20/63) | | Trustee | | February 2004 | | Massachusetts Financial Services Company, Chief Executive Officer, President, Chief Investment Officer and Director |
Robert C. Pozen (k)
(born 8/08/46) | | Trustee | | February 2004 | | Massachusetts Financial Services Company, Chairman (since February 2004); Harvard Business School (education), Senior Lecturer (since 2008); Bell Canada Enterprises (telecommunications), Director (since March 2002); The Bank of New York, Director (finance), (March 2004 to May 2005); The Commonwealth of Massachusetts, Secretary of Economic Affairs (January 2002 to December 2002); Fidelity Investments, (investment advisor), Vice Chairman (until December 2001); Fidelity Management & Research Company (investment adviser), President (until July 2001); Telesat (satellite communications), Director (until November 2007) |
| INDEPENDENT TRUSTEES | | | | |
J. Atwood Ives
(born 5/01/36) | | Trustee and Chair of Trustees | | February 1992 | | Private investor; KeySpan Corporation (energy related services), Director until 2004; Woodstock Corporation (investment advisory firm), Director until 2003 |
Robert E. Butler (n)
(born 11/29/41) | | Trustee | | January 2006 | | Consultant – regulatory and compliance matters (since July 2002); PricewaterhouseCoopers LLP (professional services firm), Partner (until 2002) |
37
Trustees and Officers – continued
| | | | | | |
Name, Date of Birth | | Position(s) Held
with Fund | | Trustee/Officer
Since (h) | | Principal Occupations During
the Past Five Years & Other
Directorships (j) |
Lawrence H. Cohn, M.D.
(born 3/11/37) | | Trustee | | August 1993 | | Brigham and Women’s Hospital, Senior Cardiac Surgeon (since 2005); Harvard Medical School, Professor of Cardiac Surgery; Partners HealthCare, Physician Director of Medical Device Technology (since 2006); Brigham and Women’s Hospital, Chief of Cardiac Surgery (until 2005) |
David H. Gunning
(born 5/30/42) | | Trustee | | January 2004 | | Retired; Cleveland-Cliffs Inc. (mining products and service provider), Vice Chairman/Director (until May 2007); Lincoln Electric Holdings, Inc. (welding equipment manufacturer), Director; Development Alternatives, Inc. (consulting), Director/Non Executive Chairman; Portman Limited (mining), Director (since 2005); Southwest Gas Corp. (natural gas distribution), Director (until May 2004) |
William R. Gutow
(born 9/27/41) | | Trustee | | December 1993 | | Private investor and real estate consultant; Capital Entertainment Management Company (video franchise), Vice Chairman; Texas Donuts (donut franchise), Vice Chairman (since 2007); Atlantic Coast Tan (tanning salons), Vice Chairman (until 2007) |
Michael Hegarty
(born 12/21/44) | | Trustee | | December 2004 | | Retired; AXA Financial (financial services and insurance), Vice Chairman and Chief Operating Officer (until 2001); The Equitable Life Assurance Society (insurance), President and Chief Operating Officer (until 2001) |
Lawrence T. Perera
(born 6/23/35) | | Trustee | | July 1981 | | Hemenway & Barnes (attorneys), Counsel |
J. Dale Sherratt
(born 9/23/38) | | Trustee | | August 1993 | | Insight Resources, Inc. (acquisition planning specialists), President; Wellfleet Investments (investor in health care companies), Managing General Partner |
38
Trustees and Officers – continued
| | | | | | |
Name, Date of Birth | | Position(s) Held
with Fund | | Trustee/Officer
Since (h) | | Principal Occupations During
the Past Five Years & Other
Directorships (j) |
Laurie J. Thomsen
(born 8/05/57) | | Trustee | | March 2005 | | New Profit, Inc. (venture philanthropy), Partner (since 2006); Private investor; Prism Venture Partners (venture capital), Co-founder and General Partner (until June 2004); The Travelers Companies (commercial property liability insurance), Director |
Robert W. Uek
(born 5/18/41) | | Trustee | | January 2006 | | Consultant to investment company industry; PricewaterhouseCoopers LLP (professional services firm), Partner (until 1999); TT International Funds (mutual fund complex), Trustee (until 2005); Hillview Investment Trust II Funds (mutual fund complex), Trustee (until 2005) |
| OFFICERS | | | | | | |
Maria F. Dwyer (k)
(born 12/01/58) | | President | | November 2005 | | Massachusetts Financial Services Company, Executive Vice President and Chief Regulatory Officer (since March 2004) Chief Compliance Officer (since December 2006); Fidelity Management & Research Company, Vice President (prior to March 2004); Fidelity Group of Funds, President and Treasurer (until March 2004) |
Christopher R. Bohane (k)
(born 1/18/74) | | Assistant Secretary and Assistant Clerk | | July 2005 | | Massachusetts Financial Services Company, Vice President and Senior Counsel |
John M. Corcoran (k)
(born 4/13/65) | | Treasurer | | October 2008 | | Massachusetts Financial Services Company, Senior Vice President (since October 2008); State Street Bank and Trust (financial services provider), Senior Vice President, (until September 2008) |
Ethan D. Corey (k)
(born 11/21/63) | | Assistant Secretary and Assistant Clerk | | July 2005 | | Massachusetts Financial Services Company, Senior Vice President and Associate General Counsel (since 2004); Dechert LLP (law firm), Counsel (prior to December 2004) |
39
Trustees and Officers – continued
| | | | | | |
Name, Date of Birth | | Position(s) Held
with Fund | | Trustee/Officer
Since (h) | | Principal Occupations During
the Past Five Years & Other
Directorships (j) |
David L. DiLorenzo (k)
(born 8/10/68) | | Assistant Treasurer | | July 2005 | | Massachusetts Financial Services Company, Vice President (since June 2005); JP Morgan Investor Services, Vice President (until June 2005) |
Timothy M. Fagan (k)
(born 7/10/68) | | Assistant Secretary and Assistant Clerk | | September 2005 | | Massachusetts Financial Services Company, Vice President and Senior Counsel (since September 2005); John Hancock Advisers, LLC, Vice President, Senior Attorney and Chief Compliance Officer (until August 2005) |
Mark D. Fischer (k)
(born 10/27/70) | | Assistant Treasurer | | July 2005 | | Massachusetts Financial Services Company, Vice President (since May 2005); JP Morgan Investment Management Company, Vice President (until May 2005) |
Robyn L. Griffin
(born 7/04/75) | | Assistant Independent Chief Compliance Officer | | August 1, 2008 | | Griffin Compliance LLC (provider of compliance services), Principal (since August 2008); State Street Corporation (financial services provider), Mutual Fund Administration Assistant Director (October 2006 – July 2008); Liberty Mutual Group (insurance), Personal Market Assistant Controller (April 2006 – October 2006); Deloitte & Touche LLP (professional services firm), Senior Manager (prior to April 2006) |
Brian E. Langenfeld (k)
(born 3/07/73) | | Assistant Secretary and Assistant Clerk | | June 2006 | | Massachusetts Financial Services Company, Vice President and Senior Counsel (since May 2006); John Hancock Advisers, LLC, Assistant Vice President and Counsel (until April 2006) |
Ellen Moynihan (k)
(born 11/13/57) | | Assistant Treasurer | | April 1997 | | Massachusetts Financial Services Company, Senior Vice President |
Susan S. Newton (k)
(born 3/07/50) | | Assistant Secretary and Assistant Clerk | | May 2005 | | Massachusetts Financial Services Company, Senior Vice President and Associate General Counsel (since April 2005); John Hancock Advisers, LLC, Senior Vice President, Secretary and Chief Legal Officer (until April 2005) |
40
Trustees and Officers – continued
| | | | | | |
Name, Date of Birth | | Position(s) Held
with Fund | | Trustee/Officer
Since (h) | | Principal Occupations During
the Past Five Years & Other
Directorships (j) |
Susan A. Pereira (k)
(born 11/05/70) | | Assistant Secretary and Assistant Clerk | | July 2005 | | Massachusetts Financial Services Company, Vice President and Senior Counsel (since June 2004); Bingham McCutchen LLP (law firm), Associate (until June 2004) |
Mark N. Polebaum (k)
(born 5/01/52) | | Secretary and Clerk | | January 2006 | | Massachusetts Financial Services Company, Executive Vice President, General Counsel and Secretary (since January 2006); Wilmer Cutler Pickering Hale and Dorr LLP (law firm), Partner (until January 2006) |
Frank L. Tarantino
(born 3/07/44) | | Independent Chief Compliance Officer | | June 2004 | | Tarantino LLC (provider of compliance services), Principal (since June 2004); CRA Business Strategies Group (consulting services), Executive Vice President (until June 2004) |
Richard S. Weiztel (k)
(born 7/16/70) | | Assistant Secretary and Assistant Clerk | | October 2007 | | Massachusetts Financial Services Company, Vice President and Assistant General Counsel (since 2004); Massachusetts Department of Business and Technology, General Counsel (until April 2004) |
James O. Yost (k)
(born 6/12/60) | | Assistant Treasurer | | September 1990 | | Massachusetts Financial Services Company, Senior Vice President |
| (h) | Date first appointed to serve as Trustee/officer of an MFS fund. Each Trustee has served continuously since appointment unless indicated otherwise. For the period from December 15, 2004 until February 22, 2005, Messrs. Pozen and Manning served as Advisory Trustees. For the period March 2008 until October 2008, Ms. Dwyer served as Treasurer of the Funds. |
| (j) | Directorships or trusteeships of companies required to report to the Securities and Exchange Commission (i.e., “public companies”). |
| (k) | “Interested person” of the Trust within the meaning of the Investment Company Act of 1940 (referred to as the 1940 Act), which is the principal federal law governing investment companies like the fund, as a result of position with MFS. The address of MFS is 500 Boylston Street, Boston, Massachusetts 02116. |
| (n) | In 2004 and 2005, Mr. Butler provided consulting services to the independent compliance consultant retained by MFS pursuant to its settlement with the SEC concerning market timing and related matters. The terms of that settlement required that compensation and expenses related to the independent compliance consultant be borne exclusively by MFS and, therefore, MFS paid Mr. Butler for the services he rendered to the independent compliance consultant. In 2004 and 2005, MFS paid Mr. Butler a total of $351,119.29. |
Each Trustee (except Mr. Butler and Mr. Uek) has been elected by shareholders and each Trustee and officer holds office until his or her successor is chosen and qualified or until his or her earlier death, resignation, retirement or
41
Trustees and Officers – continued
removal. The Trust held a shareholders’ meeting in 2005 to elect Trustees, and will hold a shareholders’ meeting at least once every five years thereafter, to elect Trustees. Messrs. Butler, Sherratt, Gutow, Uek and Ms. Thomsen are members of the Trust’s Audit Committee.
Each of the Fund’s Trustees and officers holds comparable positions with certain other funds of which MFS or a subsidiary is the investment adviser or distributor, and, in the case of the officers, with certain affiliates of MFS. As of January 1, 2008, the Trustees served as board members of 100 funds within the MFS Family of Funds.
The Statement of Additional Information for the Fund and further information about the Trustees are available without charge upon request by calling 1-800-225-2606.
| | |
| Investment Adviser | | Custodian |
Massachusetts Financial Services Company
500 Boylston Street, Boston, MA 02116-3741 | | JPMorgan Chase Bank
One Chase Manhattan Plaza, New York, NY 10081 |
| Distributor | | Independent Registered Public Accounting Firm |
MFS Fund Distributors, Inc.
500 Boylston Street, Boston, MA 02116-3741 | | Deloitte & Touche LLP 200 Berkeley Street, Boston, MA 02116 |
| Portfolio Managers | | |
Jeffrey Constantino Barry Dargan | | |
42
BOARD REVIEW OF INVESTMENT
ADVISORY AGREEMENT
The Investment Company Act of 1940 requires that both the full Board of Trustees and a majority of the non-interested (“independent”) Trustees, voting separately, annually approve the continuation of the Fund’s investment advisory agreement with MFS. The Trustees consider matters bearing on the Fund and its advisory arrangements at their meetings throughout the year, including a review of performance data at each regular meeting. In addition, the independent Trustees met several times over the course of three months beginning in May and ending in July, 2008 (“contract review meetings”) for the specific purpose of considering whether to approve the continuation of the investment advisory agreement for the Fund and the other investment companies that the Board oversees (the “MFS Funds”). The independent Trustees were assisted in their evaluation of the Fund’s investment advisory agreement by independent legal counsel, from whom they received separate legal advice and with whom they met separately from MFS during various contract review meetings. The independent Trustees were also assisted in this process by the MFS Funds’ Independent Chief Compliance Officer, a full-time senior officer appointed by and reporting to the independent Trustees.
In connection with their deliberations regarding the continuation of the investment advisory agreement, the Trustees, including the independent Trustees, considered such information and factors as they believed, in light of the legal advice furnished to them and their own business judgment, to be relevant. The investment advisory agreement for the Fund was considered separately, although the Trustees also took into account the common interests of all MFS Funds in their review. As described below, the Trustees considered the nature, quality, and extent of the various investment advisory, administrative, and shareholder services performed by MFS under the existing investment advisory agreement and other arrangements with the Fund.
In connection with their contract review meetings, the Trustees received and relied upon materials that included, among other items: (i) information provided by Lipper Inc., an independent third party, on the investment performance of the Fund for various time periods ended December 31, 2007 and the investment performance of a group of funds with substantially similar investment classifications/objectives (the “Lipper performance universe”), (ii) information provided by Lipper Inc. on the Fund’s advisory fees and other expenses and the advisory fees and other expenses of comparable funds identified by Lipper Inc. (the “Lipper expense group”), (iii) information provided by MFS on the advisory fees of comparable portfolios of other clients of MFS, including institutional separate accounts and other clients, (iv) information as to whether and to what extent applicable expense waivers,
43
Board Review of Investment Advisory Agreement – continued
reimbursements or fee “breakpoints” are observed for the Fund, (v) information regarding MFS’ financial results and financial condition, including MFS’ and certain of its affiliates’ estimated profitability from services performed for the Fund and the MFS Funds as a whole, (vi) MFS’ views regarding the outlook for the mutual fund industry and the strategic business plans of MFS, (vii) descriptions of various functions performed by MFS for the Funds, such as compliance monitoring and portfolio trading practices, and (viii) information regarding the overall organization of MFS, including information about MFS’ senior management and other personnel providing investment advisory, administrative and other services to the Fund and the other MFS Funds. The comparative performance, fee and expense information prepared and provided by Lipper Inc. was not independently verified and the independent Trustees did not independently verify any information provided to them by MFS.
The Trustees’ conclusion as to the continuation of the investment advisory agreement was based on a comprehensive consideration of all information provided to the Trustees and not the result of any single factor. Some of the factors that figured particularly in the Trustees’ deliberations are described below, although individual Trustees may have evaluated the information presented differently from one another, giving different weights to various factors. It is also important to recognize that the fee arrangements for the Fund and other MFS Funds are the result of years of review and discussion between the independent Trustees and MFS, that certain aspects of such arrangements may receive greater scrutiny in some years than in others, and that the Trustees’ conclusions may be based, in part, on their consideration of these same arrangements during the course of the year and in prior years.
Based on information provided by Lipper Inc., the Trustees reviewed the Fund’s total return investment performance as well as the performance of peer groups of funds over various time periods. The Trustees placed particular emphasis on the total return performance of the Fund’s Class A shares in comparison to the performance of funds in its Lipper performance universe over the three-year period ended December 31, 2007, which the Trustees believed was a long enough period to reflect differing market conditions. The total return performance of the Fund’s Class A shares was in the 3rd quintile relative to the other funds in the universe for this three-year period (the 1st quintile being the best performers and the 5th quintile being the worst performers). The total return performance of the Fund’s Class A shares was in the 3rd quintile for each of the one and five-year periods ended December 31, 2007 relative to the Lipper performance universe. Because of the passage of time, these performance results may differ from the performance results for more recent periods, including those shown elsewhere in this report.
44
Board Review of Investment Advisory Agreement – continued
In the course of their deliberations, the Trustees took into account information provided by MFS in connection with the contract review meetings, as well as during investment review meetings conducted with portfolio management personnel during the course of the year regarding the Fund’s performance. After reviewing these and related factors, the Trustees concluded, within the context of their overall conclusions regarding the investment advisory agreement, that they were satisfied with MFS’ responses and efforts relating to investment performance.
In assessing the reasonableness of the Fund’s advisory fee, the Trustees considered, among other information, the Fund’s advisory fee and the total expense ratio of the Fund’s Class A shares as a percentage of average daily net assets and the advisory fee and total expense ratios of peer groups of funds based on information provided by Lipper Inc. The Trustees considered that MFS Fund Distributors, Inc. (“MFD”), an affiliate of MFS, currently observes a Class A 12b-1 fee waiver. The Trustees also considered that, according to the Lipper data (which takes into account the Class A 12b-1 fee waiver), the Fund’s effective advisory fee rate was higher than the Lipper expense group median, and the Fund’s total expense ratio was approximately at the Lipper expense group median.
The Trustees also considered the advisory fees charged by MFS to institutional accounts. In comparing these fees, the Trustees considered information provided by MFS as to the generally broader scope of services provided by MFS to the Fund in comparison to institutional accounts, the higher demands placed on MFS’ investment personnel and trading infrastructure as a result of the daily cash in-flows and out-flows of the Fund, and the impact on MFS and expenses associated with the more extensive regulatory regime to which the Fund is subject in comparison to institutional accounts.
The Trustees also considered whether the Fund is likely to benefit from any economies of scale in the management of the Fund in the event of growth in assets of the Fund. They noted that the Fund’s advisory fee rate schedule is currently subject to contractual breakpoints that reduce the Fund’s advisory fee rate on average daily net assets over $1 billion and $2 billion. The Trustees concluded that the existing breakpoints were sufficient to allow the Fund to benefit from economies of scale as its assets grow.
The Trustees also considered information prepared by MFS relating to MFS’ costs and profits with respect to the Fund, the MFS Funds considered as a group, and other investment companies and accounts advised by MFS, as well as MFS’ methodologies used to determine and allocate its costs to the MFS Funds, the Fund and other accounts and products for purposes of estimating profitability.
After reviewing these and other factors described herein, the Trustees concluded, within the context of their overall conclusions regarding the
45
Board Review of Investment Advisory Agreement – continued
investment advisory agreement, that the advisory fees charged to the Fund represent reasonable compensation in light of the nature and quality of the services being provided by MFS to the Fund.
In addition, the Trustees considered MFS’ resources and related efforts to continue to retain, attract and motivate capable personnel to serve the Fund. The Trustees also considered current and developing conditions in the financial services industry, including the entry into the industry of large and well-capitalized companies which are spending, and appear to be prepared to continue to spend, substantial sums to engage personnel and to provide services to competing investment companies. In this regard, the Trustees also considered the financial resources of MFS and its ultimate parent, Sun Life Financial Inc. The Trustees also considered the advantages and possible disadvantages to the Fund of having an adviser that also serves other investment companies as well as other accounts.
The Trustees also considered the nature, quality, cost, and extent of administrative, transfer agency, and distribution services provided to the Fund by MFS and its affiliates under agreements and plans other than the investment advisory agreement, including any 12b-1 fees the Fund pays to MFD. The Trustees also considered the nature, extent and quality of certain other services MFS performs or arranges for on the Fund’s behalf, which may include securities lending programs, directed expense payment programs, class action recovery programs, and MFS’ interaction with third-party service providers, principally custodians and sub-custodians. The Trustees concluded that the various non-advisory services provided by MFS and its affiliates on behalf of the Funds were satisfactory.
The Trustees also considered benefits to MFS from the use of the Fund’s portfolio brokerage commissions, if applicable, to pay for investment research (excluding third-party research, for which MFS pays directly), and various other factors. Additionally, the Trustees considered so-called “fall-out benefits” to MFS such as reputational value derived from serving as investment manager to the Fund.
Based on their evaluation of factors that they deemed to be material, including those factors described above, the Board of Trustees, including a majority of the independent Trustees, concluded that the Fund’s investment advisory agreement with MFS should be continued for an additional one-year period, commencing August 1, 2008.
Note: MFD has agreed to the Trustees’ recommendation to eliminate the distribution fee component of the 12b-1 fee (currently being waived as described above) paid by the Fund’s Class A shares, effective March 1, 2009.
46
Board Review of Investment Advisory Agreement – continued
A discussion regarding the Board’s most recent review and renewal of the fund’s Investment Advisory Agreement with MFS is available by clicking on the fund’s name under “Mutual Funds” in the “Products and Performance” section of the MFS Web site (mfs.com).
47
PROXY VOTING POLICIES AND INFORMATION
A general description of the MFS funds’ proxy voting policies and procedures is available without charge, upon request, by calling
1-800-225-2606, by visiting the Proxy Voting section of mfs.com or by visiting the SEC’s Web site at http://www.sec.gov.
Information regarding how the fund voted proxies relating to portfolio securities during the most recent twelve-month period ended June 30 is available without charge by visiting the Proxy Voting section of mfs.com or by visiting the SEC’s Web site at http://www.sec.gov.
QUARTERLY PORTFOLIO DISCLOSURE
The fund will file a complete schedule of portfolio holdings with the Securities and Exchange Commission (the Commission) for the first and third quarters of each fiscal year on Form N-Q. The fund’s Form N-Q may be reviewed and copied at the:
Public Reference Room
Securities and Exchange Commission
100 F Street, NE, Room 1580
Washington, D.C. 20549
Information on the operation of the Public Reference Room may be obtained by calling the Commission at 1-800-SEC-0330. The fund’s Form N-Q is available on the EDGAR database on the Commission’s Internet Web site at http://www.sec.gov, and copies of this information may be obtained, upon payment of a duplicating fee, by electronic request at the following e-mail address: publicinfo@sec.gov or by writing the Public Reference Section at the above address.
A shareholder can also obtain the quarterly portfolio holdings report at mfs.com.
FEDERAL TAX INFORMATION (unaudited)
The fund will notify shareholders of amounts for use in preparing 2008 income tax forms in January 2009. The following information is provided pursuant to provisions of the Internal Revenue Code.
The fund designates the maximum amount allowable as qualified dividend income eligible for the 15% tax rate.
For corporate shareholders, 96.28% of the ordinary income dividends paid during the fiscal year qualify for the corporate dividends received deduction.
Income derived from foreign sources was $2,451,921. The fund intends to pass through foreign tax credits of $142,667 for the fiscal year.
48
MFS® PRIVACY NOTICE
Privacy is a concern for every investor today. At MFS Investment Management® and the MFS funds, we take this concern very seriously. We want you to understand our policies about the investment products and services that we offer, and how we protect the nonpublic personal information of investors who have a direct relationship with us and our wholly owned subsidiaries.
Throughout our business relationship, you provide us with personal information. We maintain information and records about you, your investments, and the services you use. Examples of the nonpublic personal information we maintain include
| | Ÿ | | data from investment applications and other forms |
| | Ÿ | | share balances and transactional history with us, our affiliates, or others |
| | Ÿ | | facts from a consumer reporting agency |
We do not disclose any nonpublic personal information about our customers or former customers to anyone, except as permitted by law. We may share nonpublic personal information with third parties or certain of our affiliates in connection with servicing your account or processing your transactions. We may share information with companies or financial institutions that perform marketing services on our behalf or with other financial institutions with which we have joint marketing arrangements, subject to any legal requirements.
Authorization to access your nonpublic personal information is limited to appropriate personnel who provide products, services, or information to you. We maintain physical, electronic, and procedural safeguards to help protect the personal information we collect about you.
If you have any questions about the MFS privacy policy, please call 1-800-225-2606 any business day between 8 a.m. and 8 p.m. Eastern time.
Note: If you own MFS products or receive MFS services in the name of a third party such as a bank or broker-dealer, their privacy policy may apply to you instead of ours.
49

CONTACT US
Web site
Mailing address
mfs.com
MFS Service Center, Inc.
P.O. Box 55824
MFS TALK
Boston, MA 02205-5824
1-800-637-8255
24 hours a day
Overnight mail
MFS Service Center, Inc.
Account service and
c/o Boston Financial Data Services
literature
30 Dan Road
Canton, MA 02021-2809
Shareholders
1-800-225-2606
8 a.m. to 8 p.m. Eastern time
Investment professionals
1-800-343-2829
8 a.m. to 8 p.m. Eastern time
Retirement plan services
1-800-637-1255
8 a.m. to 8 p.m. Eastern time
eDelivery
Save paper with eDelivery. MFS® will send you prospectuses, reports, and proxies directly via e-mail so you will get information faster with less mailbox clutter. To sign up: 1. go to mfs.com. 2. log in via MFS® Access. 3. select eDelivery. If you own your MFS fund shares through a financial institution or a retirement plan, MFS® TALK, MFS Access, and eDelivery may not be available to you.
MFS®
INVESTMENT MANAGEMENT

MFS®
INVESTMENT MANAGEMENT
Annual report
MFS® Strategic Income Fund
SIPC Contact Information:
You may obtain information about the Securities Investor Protection Corporation (“SIPC”), including the SIPC Brochure, by contacting SIPC either by telephone (202-371-8300) or by accessing SIPC’s website address (www.sipc.org).
The report is prepared for the general information of shareholders. It is authorized for distribution to prospective investors only when preceded or accompanied by a current prospectus.
NOT FDIC INSURED Ÿ MAY LOSE VALUE Ÿ
NO BANK OR CREDIT UNION GUARANTEE Ÿ NOT A DEPOSIT Ÿ
NOT INSURED BY ANY FEDERAL GOVERNMENT AGENCY OR
NCUA/NCUSIF
10/31/08
MFO-ANN

LETTER FROM THE CEO
Dear Shareholders:
The global economy is not a very welcoming place these days. Headlines tell the story of slowing growth, accelerating inflation, and credit collapse. We have watched the rampant selling that has typified equity and credit markets since the strains in the financial system first became apparent last year.
The volatility in commodity and currency markets has further complicated investment choices. There are so many parts moving in so many directions; it has become very easy to get overwhelmed.
At MFS® we remind investors to keep their eye on the long term and not become panicked by the uncertainty of the day to day.
Remember that what goes down could very easily come back up. And that is where we as money managers like to turn our focus.
Investment opportunities may arise in declining markets. When markets experience substantial selloffs, assets often become undervalued. At MFS, we have a team of global sector analysts located in Boston, London, Mexico City, Singapore, Sydney, and Tokyo working together to do the kind of bottom-up research that will root out these investment opportunities.
In times like these, we encourage our investors to check in with their advisors to ensure they have an investment plan in place that will pay heed to the present, but that is firmly tailored to the future.
Respectfully,

Robert J. Manning
Chief Executive Officer and Chief Investment Officer
MFS Investment Management®
December 15, 2008
The opinions expressed in this letter are subject to change, may not be relied upon for investment advice, and no forecasts can be guaranteed.
1
PORTFOLIO COMPOSITION
Portfolio structure (i)
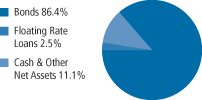
| | |
| Fixed income sectors (i) | | |
| High Yield Corporates | | 24.2% |
| Non-U.S. Government Bonds | | 21.7% |
| High Grade Corporates | | 21.3% |
| Mortgage-Backed Securities | | 5.5% |
| Emerging Markets Bonds | | 4.9% |
| Commercial Mortgage-Backed Securities | | 4.6% |
| U.S. Treasury Securities | | 3.2% |
| Floating Rate Loans | | 2.5% |
| Asset-Backed Securities | | 0.6% |
| Collateralized Debt Obligations | | 0.4% |
| |
| Credit quality of bonds (r) | | |
| AAA | | 25.9% |
| AA | | 8.7% |
| A | | 10.1% |
| BBB | | 19.0% |
| BB | | 12.6% |
| B | | 17.8% |
| CCC | | 5.1% |
| D (o) | | 0.0% |
| Not Rated | | 0.8% |
| | |
| Portfolio facts | | |
| Average Duration (d)(i) | | 4.5 |
| Average Life (i)(m) | | 6.7 yrs. |
| Average Maturity (i)(m) | | 10.0 yrs. |
| Average Credit Quality of Rated Securities (long-term) (a) | | BBB+ |
| Average Credit Quality of Rated Securities (short-term) (a) | | A-1 |
| |
| Country weightings (i) | | |
| United States | | 63.8% |
| Japan | | 7.6% |
| Germany | | 4.2% |
| France | | 3.6% |
| United Kingdom | | 3.4% |
| Spain | | 2.5% |
| Ireland | | 1.8% |
| Canada | | 1.8% |
| Austria | | 1.5% |
| Other Countries | | 9.8% |
| (a) | The average credit quality of rated securities is based upon a market weighted average of portfolio holdings that are rated by public rating agencies. |
| (d) | Duration is a measure of how much a bond’s price is likely to fluctuate with general changes in interest rates, e.g., if rates rise 1.00%, a bond with a 5-year duration is likely to lose about 5.00% of its value. |
2
Portfolio Composition – continued
| (i) | For purposes of this presentation, the bond component includes accrued interest amounts and may be positively or negatively impacted by the equivalent exposure from any derivative holdings, if applicable. |
| (m) | The average maturity shown is calculated using the final stated maturity on the portfolio’s holdings without taking into account any holdings which have been pre-refunded or pre-paid to an earlier date or which have a mandatory put date prior to the stated maturity. The average life shown takes into account these earlier dates. |
| (r) | Each security is assigned a rating from Moody’s Investors Service. If not rated by Moody’s, the rating will be that assigned by Standard & Poor’s. Likewise, if not assigned a rating by Standard & Poor’s, it will be based on the rating assigned by Fitch, Inc. For those portfolios that hold a security which is not rated by any of the three agencies, the security is considered Not Rated. Holdings in U.S. Treasuries and government agency mortgage-backed securities, if any, are included in the “AAA”-rating category. Percentages are based on the total market value of investments as of 10/31/08. |
Percentages are based on net assets as of 10/31/08, unless otherwise noted.
The portfolio is actively managed and current holdings may be different.
3
MANAGEMENT REVIEW
Summary of Results
For the twelve months ended October 31, 2008, Class A shares of the MFS Strategic Income Fund provided a total return of –13.37%, at net asset value. This compares with a return of –25.81% for the fund’s benchmark, the Barclays Capital U.S. High-Yield Corporate Bond Index (formerly the Lehman Brothers U.S. High-Yield Corporate Bond Index). Over the same period, the fund’s other benchmarks, the Barclays Capital U.S. Aggregate Bond Index (formerly the Lehman Brothers U.S. Aggregate Bond Index), JPMorgan Emerging Markets Bond Index Global, and Citigroup World Government Bond Non-Dollar Hedged Index, generated returns of 0.30%, –19.13%, and 4.54%, respectively.
Market Environment
The U.S. economy and financial markets experienced significant deterioration and extraordinary volatility over the reporting period. U.S. economic growth slowed significantly, despite the short-term bounce from the second quarter fiscal stimulus. Strong domestic headwinds included accelerated deterioration in the housing market, anemic corporate investment, a markedly weaker job market, and a much tighter credit environment. During the second half of the period, a seemingly continuous series of tumultuous financial events hammered markets, including: the distressed sale of failing Bear Stearns to JPMorgan, the conservatorship of Government Sponsored Enterprises (GSEs) Fannie Mae and Freddie Mac, the bankruptcy of investment bank Lehman Brothers, the Federal Reserve Bank’s complex intervention of insurance company American International Group (AIG), the nationalization of several large European banks, the failure of Washington Mutual, and the distressed sale of Wachovia. As a result of this barrage of turbulent news, global equity markets pushed significantly lower and credit markets witnessed the worst dislocation since the beginning of the credit crisis.
While reasonably resilient during the first half of the period, the global economy and financial system increasingly experienced considerable negative spillovers from the U.S. slowdown. Not only did Europe and Japan show obvious signs of economic softening, the more powerful engine of global growth – emerging markets – also began to display weakening dynamics.
During the reporting period, the U.S. Federal Reserve Board cut interest rates aggressively and introduced a multitude of new lending facilities to alleviate ever-tightening credit markets, while the U.S. federal government moved quickly to design and implement a modest fiscal stimulus package. Although several other global central banks also cut rates, the dilemma of rising energy and food prices heightened concerns among central bankers that inflationary expectations might become unhinged despite weaker growth. Only late in the
4
Management Review – continued
reporting period did slowing global growth result in a precipitous decline in commodity prices, which began to ease inflation and inflationary expectations. As inflationary concerns diminished in the face of global deleveraging, and equity and credit markets deteriorated more sharply, a coordinated rate cut marked the beginning of much more aggressive easing by the major global central banks.
Detractors from Performance
The fund’s greater relative exposure to the financial and banking sectors held back performance as holdings within these sectors suffered amid the global credit crisis. Similarly, the fund’s greater relative exposure to the industrial sector was another negative factor.
Credit quality, particularly holdings of “BBB” and “B” rated (s) securities, detracted from performance as credit spreads widened.
Contributors to Performance
During the reporting period, the fund generated a high level of income which had a positive impact on performance. The fund’s exposure to U.S. and sovereign government bonds also helped.
Respectfully,
| | | | |
John Addeo Portfolio Manager | | James Calmas Portfolio Manager | | Robert Persons Portfolio Manager |
| | |
Matthew Ryan Portfolio Manager | | Erik Weisman Portfolio Manager | | |
| (s) | Bonds rated “BBB”, “Baa”, or higher are considered investment grade; bonds rated “BB”, “Ba”, or below are considered non-investment grade. The primary source for bond quality ratings is Moody’s Investors Service. If not available, ratings by Standard & Poor’s are used, else ratings by Fitch, Inc. For securities which are not rated by any of the three agencies, the security is considered Not Rated. |
The views expressed in this report are those of the portfolio manager only through the end of the period of the report as stated on the cover and do not necessarily reflect the views of MFS or any other person in the MFS organization. These views are subject to change at any time based on market or other conditions, and MFS disclaims any responsibility to update such views. These views may not be relied upon as investment advice or an indication of trading intent on behalf of any MFS portfolio. References to specific securities are not recommendations of such securities, and may not be representative of any MFS portfolio’s current or future investments.
5
PERFORMANCE SUMMARY THROUGH 10/31/08
The following chart illustrates a representative class of the fund’s historical performance in comparison to its benchmark. Performance results include the deduction of the maximum applicable sales charge and reflect the percentage change in net asset value, including reinvestment of dividends and capital gains distributions. The performance of other share classes will be greater than or less than that of the class depicted below. Benchmark comparisons are unmanaged; do not reflect sales charges, commissions or expenses; and cannot be invested in directly. (See Notes to Performance Summary).
Performance data shown represents past performance and is no guarantee of future results. Investment return and principal value fluctuate so your shares, when sold, may be worth more or less than the original cost; current performance may be lower or higher than quoted. The performance shown does not reflect the deduction of taxes, if any, that a shareholder would pay on fund distributions or the redemption of fund shares.
Growth of a Hypothetical $10,000 Investment
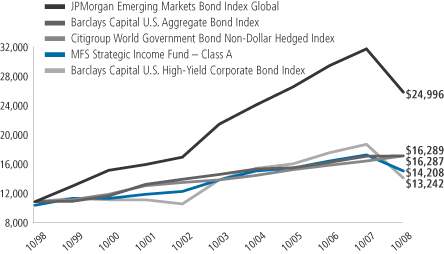
6
Performance Summary – continued
Total Returns through 10/31/08
Average annual without sales charge
| | | | | | | | | | | | |
| | | Share class | | Class inception date | | 1-yr | | 5-yr | | 10-yr | | |
| | | A | | 10/29/87 | | (13.37)% | | 1.83% | | 4.08% | | |
| | | B | | 9/07/93 | | (13.70)% | | 1.20% | | 3.43% | | |
| | | C | | 9/01/94 | | (13.79)% | | 1.18% | | 3.41% | | |
| | | I | | 1/08/97 | | (12.93)% | | 2.16% | | 4.44% | | |
Comparative benchmarks
| | | | | | | | | | | | |
| | | JPMorgan Emerging Markets Bond Index Global (f) | | (19.13)% | | 3.96% | | 9.59% | | |
| | | Barclays Capital U.S. Aggregate Bond Index (f) | | 0.30% | | 3.48% | | 5.00% | | |
| | | Citigroup World Government Bond Non-Dollar Hedged
Index (f) | | 4.54% | | 4.64% | | 5.00% | | |
| | | Barclays Capital U.S. High-Yield Corporate Bond Index (f) | | (25.81)% | | 0.43% | | 2.85% | | |
Average annual with sales charge
| | | | | | | | | | | | |
| | | A With Initial Sales Charge (4.75%) | | (17.48)% | | 0.85% | | 3.57% | | |
| | | B With CDSC (Declining over six years from 4% to 0%) (x) | | (16.97)% | | 0.89% | | 3.43% | | |
| | | C With CDSC (1% for 12 months) (x) | | (14.60)% | | 1.18% | | 3.41% | | |
Class I shares do not have a sales charge.
CDSC – Contingent Deferred Sales Charge.
| (f) | Source: FactSet Research Systems Inc. |
| (x) | Assuming redemption at the end of the applicable period. |
Benchmark Definitions
JPMorgan Emerging Markets Bond Index Global – measures the performance of U.S.-dollar-denominated debt instruments issued by emerging market sovereign and quasi-sovereign entities: Brady bonds, loans, Eurobonds.
Barclays Capital U.S. Aggregate Bond Index (formerly Lehman Brothers U.S. Aggregate Bond Index) – a market capitalization-weighted index that measures the performance of the U.S. investment-grade, fixed rate bond market, with index components for government and corporate securities, mortgage pass-through securities, and asset-backed securities with at least one year to final maturity.
Citigroup World Government Bond Non-Dollar Hedged Index – a market capitalization-weighted index that is designed to represent the currency-hedged performance of the international developed government bond markets, excluding the United States.
7
Performance Summary – continued
Barclays Capital U.S. High-Yield Corporate Bond Index (formerly Lehman Brothers U.S. High-Yield Corporate Bond Index) – a market capitalization-weighted index that measures the performance of non-investment grade, fixed rate debt. Eurobonds and debt issues from countries designated as emerging markets (e.g., Argentina, Brazil, Venezuela, etc.) are excluded.
It is not possible to invest directly in an index.
Notes to Performance Summary
Performance results reflect any applicable expense subsidies and waivers in effect during the periods shown. Without such subsidies and waivers the fund’s performance results would be less favorable. Please see the prospectus and financial statements for complete details.
From time to time the fund may receive proceeds from litigation settlements, without which performance would be lower.
8
EXPENSE TABLE
Fund expenses borne by the shareholders during the period,
May 1, 2008 through October 31, 2008
As a shareholder of the fund, you incur two types of costs: (1) transaction costs, including sales charges (loads) on certain purchase or redemption payments, and (2) ongoing costs, including management fees; distribution and service (12b-1) fees; and other fund expenses. This example is intended to help you understand your ongoing costs (in dollars) of investing in the fund and to compare these costs with the ongoing costs of investing in other mutual funds.
The example is based on an investment of $1,000 invested at the beginning of the period and held for the entire period May 1, 2008 through October 31, 2008.
Actual Expenses
The first line for each share class in the following table provides information about actual account values and actual expenses. You may use the information in this line, together with the amount you invested, to estimate the expenses that you paid over the period. Simply divide your account value by $1,000 (for example, an $8,600 account value divided by $1,000 = 8.6), then multiply the result by the number in the first line under the heading entitled “Expenses Paid During Period” to estimate the expenses you paid on your account during this period.
Hypothetical Example for Comparison Purposes
The second line for each share class in the following table provides information about hypothetical account values and hypothetical expenses based on the fund’s actual expense ratio and an assumed rate of return of 5% per year before expenses, which is not the fund’s actual return. The hypothetical account values and expenses may not be used to estimate the actual ending account balance or expenses you paid for the period. You may use this information to compare the ongoing costs of investing in the fund and other funds. To do so, compare this 5% hypothetical example with the 5% hypothetical examples that appear in the shareholder reports of the other funds.
Please note that the expenses shown in the table are meant to highlight your ongoing costs only and do not reflect any transactional costs, such as sales charges (loads). Therefore, the second line for each share class in the table is useful in comparing ongoing costs only, and will not help you determine the relative total costs of owning different funds. In addition, if these transactional costs were included, your costs would have been higher.
9
Expense Table – continued
| | | | | | | | | | |
Share
Class | | | | Annualized
Expense Ratio | | Beginning
Account Value
5/01/08 | | Ending Account Value 10/31/08 | | Expenses
Paid During
Period (p)
5/01/08-10/31/08 |
| A | | Actual | | 0.83% | | $1,000.00 | | $859.87 | | $3.88 |
| | Hypothetical (h) | | 0.83% | | $1,000.00 | | $1,020.96 | | $4.22 |
| B | | Actual | | 1.48% | | $1,000.00 | | $858.28 | | $6.91 |
| | Hypothetical (h) | | 1.48% | | $1,000.00 | | $1,017.70 | | $7.51 |
| C | | Actual | | 1.48% | | $1,000.00 | | $857.50 | | $6.91 |
| | Hypothetical (h) | | 1.48% | | $1,000.00 | | $1,017.70 | | $7.51 |
| I | | Actual | | 0.48% | | $1,000.00 | | $861.39 | | $2.25 |
| | Hypothetical (h) | | 0.48% | | $1,000.00 | | $1,022.72 | | $2.44 |
| (h) | 5% class return per year before expenses. |
| (p) | Expenses paid is equal to each class’ annualized expense ratio, as shown above, multiplied by the average account value over the period, multiplied by the number of days in the period, divided by the number of days in the year. Expenses paid do not include any applicable sales charges (loads). If these transaction costs had been included, your costs would have been higher. |
10
PORTFOLIO OF INVESTMENTS
10/31/08
The Portfolio of Investments is a complete list of all securities owned by your fund. It is categorized by broad-based asset classes.
| | | | | | |
| Bonds - 85.7% | | | | | | |
| Issuer | | Shares/Par | | Value ($) |
| | | | | | |
| Aerospace - 0.2% | | | | | | |
| Vought Aircraft Industries, Inc., 8%, 2011 | | $ | 625,000 | | $ | 468,750 |
| | |
| Airlines - 0.2% | | | | | | |
| Continental Airlines, Inc., 7.339%, 2014 | | $ | 548,000 | | $ | 394,560 |
| | |
| Asset Backed & Securitized - 5.6% | | | | | | |
| Anthracite Ltd., CDO, 6%, 2037 (z) | | $ | 1,200,000 | | $ | 456,000 |
| ARCap REIT, Inc., CDO, “H”, 6.1%, 2045 (n) | | | 900,000 | | | 180,000 |
Bayview Financial Revolving Mortgage Loan Trust, FRN,
4.04%, 2040 (z) | | | 674,286 | | | 484,001 |
| Brazilian Merchant Voucher Receivables Ltd., 5.911%, 2011 (z) | | | 808,440 | | | 751,849 |
| Chase Commercial Mortgage Securities Corp., 6.6%, 2029 (z) | | | 1,333,680 | | | 1,281,782 |
| Countrywide Asset-Backed Certificates, FRN, 4.575%, 2035 | | | 20,740 | | | 20,260 |
| Crest Ltd., CDO, 7%, 2040 | | | 400,000 | | | 140,499 |
| Deutsche Mortgage & Asset Receiving Corp., FRN, 7.5%, 2031 | | | 1,050,000 | | | 1,024,906 |
| DLJ Commercial Mortgage Corp., 6.04%, 2031 (z) | | | 550,000 | | | 511,557 |
| Falcon Franchise Loan LLC, 6.5%, 2014 (z) | | | 700,000 | | | 367,780 |
| Falcon Franchise Loan LLC, FRN, 2.97%, 2021 (i)(n) | | | 4,438,068 | | | 246,756 |
| Falcon Franchise Loan LLC, FRN, 3.737%, 2025 (i)(z) | | | 3,367,413 | | | 152,206 |
First Union-Lehman Brothers Bank of America, FRN,
0.542%, 2035 (i) | | | 16,683,950 | | | 242,301 |
First Union-Lehman Brothers Commercial Mortgage Trust,
7%, 2029 (n) | | | 425,566 | | | 412,167 |
GMAC Commercial Mortgage Securities, Inc., FRN,
6.02%, 2033 (z) | | | 1,758,000 | | | 1,510,280 |
| JPMorgan Chase Commercial Mortgage Securities Corp., FRN, 5.35%, 2043 | | | 1,789,097 | | | 1,203,276 |
| KKR Financial CLO Ltd., “C”, CDO, FRN, 4.254%, 2021 (n) | | | 523,730 | | | 126,219 |
| Morgan Stanley Capital I, Inc., 1.442%, 2039 (i) | | | 10,951,115 | | | 383,288 |
Prudential Securities Secured Financing Corp., FRN,
7.254%, 2013 (z) | | | 875,000 | | | 544,348 |
Salomon Brothers Mortgage Securities, Inc., FRN,
7.037%, 2032 (z) | | | 1,800,000 | | | 1,714,424 |
| | | | | | |
| | | | | | $ | 11,753,899 |
| Automotive - 1.1% | | | | | | |
| Accuride Corp., 8.5%, 2015 | | $ | 150,000 | | $ | 60,000 |
| Allison Transmission, Inc., 11%, 2015 (n) | | | 620,000 | | | 387,500 |
11
Portfolio of Investments – continued
| | | | | | |
| Issuer | | Shares/Par | | Value ($) |
| | | | | | |
| Bonds - continued | | | | | | |
| Automotive - continued | | | | | | |
| FCE Bank PLC, 7.125%, 2012 | | EUR | 700,000 | | $ | 597,763 |
| Ford Motor Credit Co. LLC, 9.75%, 2010 | | $ | 275,000 | | | 187,012 |
| Ford Motor Credit Co. LLC, 12%, 2015 | | | 386,000 | | | 245,147 |
| Ford Motor Credit Co. LLC, 8%, 2016 | | | 610,000 | | | 334,079 |
| General Motors Corp., 8.375%, 2033 | | | 804,000 | | | 261,299 |
| Johnson Controls, Inc., 5.25%, 2011 | | | 290,000 | | | 270,243 |
| | | | | | |
| | | | | | $ | 2,343,043 |
| Broadcasting - 1.7% | | | | | | |
| Allbritton Communications Co., 7.75%, 2012 | | $ | 485,000 | | $ | 329,799 |
| CanWest MediaWorks LP, 9.25%, 2015 (n) | | | 305,000 | | | 186,050 |
| Clear Channel Communications, 10.75%, 2016 (z) | | | 150,000 | | | 58,500 |
| DIRECTV Holdings LLC, 7.625%, 2016 (n) | | | 530,000 | | | 445,200 |
| Lamar Media Corp., 6.625%, 2015 | | | 435,000 | | | 319,725 |
| Lamar Media Corp., “C”, 6.625%, 2015 | | | 275,000 | | | 202,125 |
| LBI Media, Inc., 8.5%, 2017 (n) | | | 300,000 | | | 180,000 |
| LIN TV Corp., 6.5%, 2013 | | | 625,000 | | | 350,000 |
| Local TV Finance LLC, 9.25%, 2015 (n)(p) | | | 455,000 | | | 227,500 |
| Newport Television LLC, 13%, 2017 (n)(p) | | | 460,000 | | | 195,500 |
| News America, Inc., 6.4%, 2035 | | | 890,000 | | | 673,671 |
| Nexstar Broadcasting Group, Inc., 7%, 2014 | | | 510,000 | | | 295,800 |
| Univision Communications, Inc., 9.75%, 2015 (n)(p) | | | 455,000 | | | 93,275 |
| | | | | | |
| | | | | | $ | 3,557,145 |
| Brokerage & Asset Managers - 0.3% | | | | | | |
| Lehman Brothers Holdings, Inc., 6.5%, 2017 (d) | | $ | 740,000 | | $ | 925 |
| Merrill Lynch & Co., Inc., 6.4%, 2017 | | | 400,000 | | | 337,982 |
| Nuveen Investments, Inc., 10.5%, 2015 (n) | | | 745,000 | | | 201,150 |
| | | | | | |
| | | | | | $ | 540,057 |
| Building - 1.6% | | | | | | |
| Associated Materials, Inc., 0% to 2009, 11.25% to 2014 | | $ | 355,000 | | $ | 191,700 |
| Building Materials Corp. of America, 7.75%, 2014 | | | 325,000 | | | 224,250 |
| CRH PLC, 8.125%, 2018 | | | 1,430,000 | | | 1,175,031 |
| Lafarge S.A., 6.15%, 2011 | | | 1,320,000 | | | 1,250,461 |
| Nortek Holdings, Inc., 8.5%, 2014 | | | 130,000 | | | 46,800 |
| Nortek, Inc., 10%, 2013 | | | 225,000 | | | 165,375 |
| Ply Gem Industries, Inc., 9%, 2012 | | | 295,000 | | | 103,250 |
| Ply Gem Industries, Inc., 11.75%, 2013 | | | 195,000 | | | 128,700 |
| | | | | | |
| | | | | | $ | 3,285,567 |
12
Portfolio of Investments – continued
| | | | | | |
| Issuer | | Shares/Par | | Value ($) |
| | | | | | |
| Bonds - continued | | | | | | |
| Business Services - 0.3% | | | | | | |
| First Data Corp., 9.875%, 2015 | | $ | 425,000 | | $ | 272,000 |
| SunGard Data Systems, Inc., 10.25%, 2015 | | | 418,000 | | | 292,600 |
| | | | | | |
| | | | | | $ | 564,600 |
| Cable TV - 1.3% | | | | | | |
| CCH II Holdings LLC, 10.25%, 2010 | | $ | 455,000 | | $ | 316,225 |
| CCO Holdings LLC, 8.75%, 2013 | | | 1,080,000 | | | 712,800 |
| CSC Holdings, Inc., 6.75%, 2012 | | | 365,000 | | | 315,725 |
| Mediacom LLC, 9.5%, 2013 | | | 530,000 | | | 417,375 |
| NTL Cable PLC, 9.125%, 2016 | | | 350,000 | | | 231,000 |
| TCI Communications, Inc., 9.8%, 2012 | | | 841,000 | | | 850,851 |
| | | | | | |
| | | | | | $ | 2,843,976 |
| Chemicals - 1.5% | | | | | | |
| Braskem S.A., 7.25%, 2018 (n) | | $ | 127,000 | | $ | 90,805 |
| Innophos, Inc., 8.875%, 2014 | | | 405,000 | | | 356,400 |
| Koppers Holdings, Inc., 9.875%, 2013 | | | 300,000 | | | 270,000 |
| Momentive Performance Materials, Inc., 9.75%, 2014 | | | 145,000 | | | 81,200 |
| Momentive Performance Materials, Inc., 11.5%, 2016 | | | 382,000 | | | 164,260 |
| Nalco Co., 7.75%, 2011 | | | 450,000 | | | 409,500 |
| Nalco Co., 8.875%, 2013 | | | 310,000 | | | 266,600 |
| Nalco Finance Holdings, Inc., 0% to 2009, 9% to 2014 | | | 450,000 | | | 360,000 |
| Yara International A.S.A., 5.25%, 2014 (n) | | | 1,300,000 | | | 1,089,457 |
| | | | | | |
| | | | | | $ | 3,088,222 |
| Construction - 0.4% | | | | | | |
| Lennar Corp., 5.125%, 2010 | | $ | 1,110,000 | | $ | 843,600 |
| | |
| Consumer Goods & Services - 1.9% | | | | | | |
| Corrections Corp. of America, 6.25%, 2013 | | $ | 200,000 | | $ | 172,500 |
| Fortune Brands, Inc., 5.125%, 2011 | | | 1,025,000 | | | 947,887 |
| Jarden Corp., 7.5%, 2017 | | | 295,000 | | | 219,775 |
| KAR Holdings, Inc., 10%, 2015 | | | 310,000 | | | 175,150 |
| Service Corp. International, 7%, 2017 | | | 435,000 | | | 331,688 |
| Service Corp. International, 7.625%, 2018 | | | 425,000 | | | 333,625 |
| Ticketmaster, 10.75%, 2016 (n) | | | 195,000 | | | 163,800 |
| Western Union Co., 5.4%, 2011 | | | 1,800,000 | | | 1,750,527 |
| | | | | | |
| | | | | | $ | 4,094,952 |
| Containers - 1.0% | | | | | | |
| Crown Americas LLC, 7.75%, 2015 | | $ | 250,000 | | $ | 218,125 |
| Graham Packaging Co. LP, 9.875%, 2014 | | | 450,000 | | | 283,500 |
| Greif, Inc., 6.75%, 2017 | | | 915,000 | | | 750,300 |
13
Portfolio of Investments – continued
| | | | | | |
| Issuer | | Shares/Par | | Value ($) |
| | | | | | |
| Bonds - continued | | | | | | |
| Containers - continued | | | | | | |
| Owens-Brockway Glass Container, Inc., 8.25%, 2013 | | $ | 1,000,000 | | $ | 935,000 |
| | | | | | |
| | | | | | $ | 2,186,925 |
| Defense Electronics - 1.0% | | | | | | |
| BAE Systems Holdings, Inc., 5.2%, 2015 (n) | | $ | 1,297,000 | | $ | 1,148,499 |
| L-3 Communications Corp., 6.125%, 2014 | | | 700,000 | | | 598,500 |
| L-3 Communications Corp., 5.875%, 2015 | | | 330,000 | | | 270,600 |
| | | | | | |
| | | | | | $ | 2,017,599 |
| Electronics - 0.3% | | | | | | |
| Avago Technologies Finance, 11.875%, 2015 | | $ | 160,000 | | $ | 129,600 |
| Flextronics International Ltd., 6.25%, 2014 | | | 420,000 | | | 319,200 |
| Freescale Semiconductor, Inc., 8.875%, 2014 | | | 230,000 | | | 102,350 |
| Spansion LLC, 11.25%, 2016 (n) | | | 375,000 | | | 67,500 |
| | | | | | |
| | | | | | $ | 618,650 |
| Emerging Market Quasi-Sovereign - 1.4% | | | | | | |
Banco Nacional de Desenvolvimento Economico e Social,
6.369%, 2018 (n) | | $ | 519,000 | | $ | 410,010 |
| Corporación Nacional del Cobre de Chile, 4.75%, 2014 | | | 529,000 | | | 463,155 |
| National Power Corp., 7.061%, 2011 | | | 389,000 | | | 324,577 |
| Pemex Project Funding Master Trust, 5.75%, 2018 (n) | | | 1,145,000 | | | 893,100 |
| Ras Laffan Liquefied Natural Gas Co. Ltd., 5.832%, 2016 (n) | | | 890,000 | | | 813,522 |
| | | | | | |
| | | | | | $ | 2,904,364 |
| Emerging Market Sovereign - 1.1% | | | | | | |
| Federative Republic of Brazil, 6%, 2017 | | $ | 151,000 | | $ | 136,278 |
| Gabonese Republic, 8.2%, 2017 (n) | | | 422,000 | | | 274,300 |
| Republic of Argentina, FRN, 3.127%, 2012 | | | 329,550 | | | 115,690 |
| Republic of Colombia, 7.375%, 2017 | | | 704,000 | | | 633,600 |
| Republic of Indonesia, 6.875%, 2018 (n) | | | 278,000 | | | 186,260 |
| Republic of Indonesia, 7.75%, 2038 (n) | | | 211,000 | | | 137,150 |
| Republic of Philippines, 9.375%, 2017 | | | 272,000 | | | 272,000 |
| Republic of Turkey, 7%, 2019 | | | 281,000 | | | 213,560 |
| Republic of Uruguay, 8%, 2022 | | | 535,000 | | | 363,800 |
| | | | | | |
| | | | | | $ | 2,332,638 |
| Energy - Independent - 2.1% | | | | | | |
| Chaparral Energy, Inc., 8.875%, 2017 | | $ | 320,000 | | $ | 163,200 |
| Chesapeake Energy Corp., 6.375%, 2015 | | | 555,000 | | | 425,963 |
| Forest Oil Corp., 7.25%, 2019 | | | 290,000 | | | 197,200 |
| Hilcorp Energy I LP, 7.75%, 2015 (n) | | | 430,000 | | | 305,300 |
| Hilcorp Energy I LP, 9%, 2016 (n) | | | 310,000 | | | 226,300 |
14
Portfolio of Investments – continued
| | | | | | |
| Issuer | | Shares/Par | | Value ($) |
| | | | | | |
| Bonds - continued | | | | | | |
| Energy - Independent - continued | | | | | | |
| Mariner Energy, Inc., 8%, 2017 | | $ | 270,000 | | $ | 159,300 |
| Newfield Exploration Co., 6.625%, 2014 | | | 400,000 | | | 309,000 |
| Nexen, Inc., 6.4%, 2037 | | | 1,100,000 | | | 750,288 |
| OPTI Canada, Inc., 8.25%, 2014 | | | 625,000 | | | 371,875 |
| Plains Exploration & Production Co., 7%, 2017 | | | 830,000 | | | 543,650 |
| Quicksilver Resources, Inc., 7.125%, 2016 | | | 690,000 | | | 441,600 |
| SandRidge Energy, Inc., 8.625%, 2015 (p) | | | 175,000 | | | 115,500 |
| SandRidge Energy, Inc., 8%, 2018 (n) | | | 265,000 | | | 176,225 |
| Southwestern Energy Co., 7.5%, 2018 (n) | | | 200,000 | | | 164,000 |
| | | | | | |
| | | | | | $ | 4,349,401 |
| Energy - Integrated - 0.1% | | | | | | |
| Petroleum Co. of Trinidad & Tobago Ltd., 6%, 2022 (n) | | $ | 264,000 | | $ | 200,587 |
| | |
| Entertainment - 0.5% | | | | | | |
| AMC Entertainment, Inc., 11%, 2016 | | $ | 285,000 | | $ | 225,150 |
| Marquee Holdings, Inc., 12%, 2014 | | | 225,000 | | | 135,000 |
| Time Warner, Inc., 6.5%, 2036 | | | 110,000 | | | 78,182 |
| Turner Broadcasting System, Inc., 8.375%, 2013 | | | 653,000 | | | 604,381 |
| | | | | | |
| | | | | | $ | 1,042,713 |
| Financial Institutions - 1.8% | | | | | | |
| American Express Centurion Bank, 5.2%, 2010 | | $ | 840,000 | | $ | 762,505 |
| General Electric Capital Corp., 2.931%, 2012 | | | 770,000 | | | 629,113 |
| General Motors Acceptance Corp., 6.875%, 2011 | | | 795,000 | | | 465,591 |
| General Motors Acceptance Corp., 8%, 2031 | | | 415,000 | | | 188,158 |
| ILFC E-Capital Trust I, 5.9% to 2010, FRN to 2065 (n) | | | 1,400,000 | | | 470,833 |
| ORIX Corp., 5.48%, 2011 | | | 1,580,000 | | | 1,394,034 |
| | | | | | |
| | | | | | $ | 3,910,234 |
| Food & Beverages - 2.0% | | | | | | |
| ARAMARK Corp., 8.5%, 2015 | | $ | 820,000 | | $ | 701,100 |
| Dean Foods Co., 7%, 2016 | | | 455,000 | | | 345,800 |
| Del Monte Corp., 6.75%, 2015 | | | 360,000 | | | 297,000 |
| Kraft Foods, Inc., 6.125%, 2018 | | | 720,000 | | | 612,539 |
| Michael Foods, Inc., 8%, 2013 | | | 495,000 | | | 428,175 |
| Miller Brewing Co., 5.5%, 2013 (n) | | | 1,370,000 | | | 1,311,104 |
| Tyson Foods, Inc., 7.35%, 2016 | | | 660,000 | | | 488,873 |
| | | | | | |
| | | | | | $ | 4,184,591 |
| Food & Drug Stores - 0.1% | | | | | | |
| CVS Caremark Corp., 5.75%, 2017 | | $ | 178,000 | | $ | 143,655 |
15
Portfolio of Investments – continued
| | | | | | |
| Issuer | | Shares/Par | | Value ($) |
| | | | | | |
| Bonds - continued | | | | | | |
| Forest & Paper Products - 1.5% | | | | | | |
| Buckeye Technologies, Inc., 8%, 2010 | | $ | 26,000 | | $ | 23,660 |
| Buckeye Technologies, Inc., 8.5%, 2013 | | | 1,075,000 | | | 940,625 |
| Georgia-Pacific Corp., 7.125%, 2017 (n) | | | 255,000 | | | 177,225 |
| Georgia-Pacific Corp., 8%, 2024 | | | 150,000 | | | 95,250 |
| Graphic Packaging International Corp., 9.5%, 2013 | | | 230,000 | | | 157,550 |
| International Paper Co., 7.95%, 2018 | | | 390,000 | | | 315,863 |
| Jefferson Smurfit Corp., 8.25%, 2012 | | | 195,000 | | | 99,450 |
| Millar Western Forest Products Ltd., 7.75%, 2013 | | | 530,000 | | | 291,500 |
| NewPage Holding Corp., 10%, 2012 | | | 160,000 | | | 108,800 |
| Smurfit Kappa Group PLC, 7.75%, 2015 | | EUR | 530,000 | | | 391,797 |
| Smurfit-Stone Container Corp., 8%, 2017 | | $ | 141,000 | | | 69,090 |
| Stora Enso Oyj, 6.404%, 2016 (n) | | | 690,000 | | | 532,052 |
| | | | | | |
| | | | | | $ | 3,202,862 |
| Gaming & Lodging - 1.7% | | | | | | |
| Boyd Gaming Corp., 6.75%, 2014 | | $ | 295,000 | | $ | 185,850 |
| Firekeepers Development Authority, 13.875%, 2015 (z) | | | 260,000 | | | 184,600 |
| Fontainebleau Las Vegas Holdings LLC, 10.25%, 2015 (n) | | | 680,000 | | | 91,800 |
| Harrah’s Operating Co., Inc., 5.5%, 2010 | | | 265,000 | | | 138,131 |
| Harrah’s Operating Co., Inc., 10.75%, 2016 (n) | | | 1,125,000 | | | 365,625 |
| Host Hotels & Resorts, Inc., 7.125%, 2013 | | | 275,000 | | | 215,875 |
| Host Hotels & Resorts, Inc., 6.75%, 2016 | | | 140,000 | | | 101,500 |
| MGM Mirage, 8.375%, 2011 | | | 960,000 | | | 556,800 |
| MGM Mirage, 6.75%, 2013 | | | 210,000 | | | 131,250 |
| Pinnacle Entertainment, Inc., 7.5%, 2015 | | | 605,000 | | | 378,125 |
| Scientific Games Corp., 6.25%, 2012 | | | 750,000 | | | 571,875 |
| Station Casinos, Inc., 6%, 2012 | | | 225,000 | | | 82,688 |
| Station Casinos, Inc., 6.5%, 2014 | | | 620,000 | | | 67,425 |
| Station Casinos, Inc., 6.875%, 2016 | | | 1,060,000 | | | 95,400 |
| Trump Entertainment Resorts Holdings, Inc., 8.5%, 2015 | | | 995,000 | | | 256,213 |
| Wyndham Worldwide Corp., 6%, 2016 | | | 380,000 | | | 249,368 |
| | | | | | |
| | | | | | $ | 3,672,525 |
| Industrial - 0.9% | | | | | | |
| Blount, Inc., 8.875%, 2012 | | $ | 610,000 | | $ | 521,550 |
| JohnsonDiversey, Inc., 9.625%, 2012 | | EUR | 140,000 | | | 153,456 |
| JohnsonDiversey, Inc., “B”, 9.625%, 2012 | | $ | 635,000 | | | 565,150 |
| Steelcase, Inc., 6.5%, 2011 | | | 618,000 | | | 646,301 |
| | | | | | |
| | | | | | $ | 1,886,457 |
| Insurance - 1.1% | | | | | | |
| Allianz AG, 5.5%, 2049 | | EUR | 947,000 | | $ | 917,101 |
| American International Group, Inc., 6.25%, 2037 | | $ | 930,000 | | | 125,392 |
16
Portfolio of Investments – continued
| | | | | | |
| Issuer | | Shares/Par | | Value ($) |
| | | | | | |
| Bonds - continued | | | | | | |
| Insurance - continued | | | | | | |
Hartford Financial Services Group, Inc.,
8.125% to 2018, FRN to 2038 | | $ | 150,000 | | $ | 74,867 |
| ING Groep N.V., 5.775% to 2015, FRN to 2049 | | | 2,010,000 | | | 1,105,500 |
| | | | | | |
| | | | | | $ | 2,222,860 |
| Insurance - Property & Casualty - 1.0% | | | | | | |
| AXIS Capital Holdings Ltd., 5.75%, 2014 | | $ | 1,555,000 | | $ | 1,323,467 |
| USI Holdings Corp., 9.75%, 2015 (n) | | | 320,000 | | | 201,600 |
| ZFS Finance USA Trust V, 6.5% to 2017, FRN to 2037 (n) | | | 1,080,000 | | | 583,200 |
| | | | | | |
| | | | | | $ | 2,108,267 |
| International Market Quasi-Sovereign - 0.2% | | | | | | |
| Canada Housing Trust, 4.6%, 2011 | | CAD | 500,000 | | $ | 432,664 |
| | |
| International Market Sovereign - 21.2% | | | | | | |
| Dutch Government, 3.75%, 2014 | | EUR | 335,000 | | $ | 426,022 |
| Federal Republic of Germany, 5.25%, 2010 | | EUR | 2,503,000 | | | 3,321,571 |
| Federal Republic of Germany, 3.75%, 2015 | | EUR | 1,232,000 | | | 1,591,303 |
| Federal Republic of Germany, 6.25%, 2030 | | EUR | 1,421,000 | | | 2,189,210 |
| Government of Australia, 6%, 2017 | | AUD | 467,000 | | | 330,089 |
| Government of Canada, 4.5%, 2015 | | CAD | 845,000 | | | 751,246 |
| Government of Canada, 5.75%, 2033 | | CAD | 218,000 | | | 218,161 |
| Government of Japan, 1.5%, 2012 | | JPY | 113,000,000 | | | 1,177,998 |
| Government of Japan, 1.3%, 2014 | | JPY | 498,000,000 | | | 5,141,356 |
| Government of Japan, 1.7%, 2017 | | JPY | 371,000,000 | | | 3,892,664 |
| Government of Japan, 2.2%, 2027 | | JPY | 214,000,000 | | | 2,212,407 |
| Government of Japan, 2.4%, 2037 | | JPY | 121,000,000 | | | 1,265,522 |
| Kingdom of Denmark, 4%, 2015 | | DKK | 1,837,000 | | | 305,307 |
| Kingdom of Spain, 5.35%, 2011 | | EUR | 3,066,000 | | | 4,116,367 |
| Kingdom of Sweden, 4.5%, 2015 | | SEK | 3,365,000 | | | 464,812 |
| Republic of Austria, 4.65%, 2018 | | EUR | 2,376,000 | | | 3,071,636 |
| Republic of France, 4.75%, 2012 | | EUR | 521,000 | | | 696,751 |
| Republic of France, 5%, 2016 | | EUR | 1,291,000 | | | 1,740,633 |
| Republic of France, 6%, 2025 | | EUR | 625,000 | | | 914,952 |
| Republic of France, 4.75%, 2035 | | EUR | 2,339,000 | | | 2,996,794 |
| Republic of Ireland, 4.6%, 2016 | | EUR | 2,645,000 | | | 3,396,469 |
| United Kingdom Treasury, 8%, 2015 | | GBP | 1,247,000 | | | 2,436,388 |
| United Kingdom Treasury, 8%, 2021 | | GBP | 394,000 | | | 830,586 |
| United Kingdom Treasury, 4.25%, 2036 | | GBP | 835,000 | | | 1,259,416 |
| | | | | | |
| | | | | | $ | 44,747,660 |
17
Portfolio of Investments – continued
| | | | | | |
| Issuer | | Shares/Par | | Value ($) |
| | | | | | |
| Bonds - continued | | | | | | |
| Machinery & Tools - 0.8% | | | | | | |
| Atlas Copco AB, 5.6%, 2017 (n) | | $ | 1,470,000 | | $ | 1,318,869 |
| Case New Holland, Inc., 7.125%, 2014 | | | 625,000 | | | 465,625 |
| | | | | | |
| | | | | | $ | 1,784,494 |
| Major Banks - 1.7% | | | | | | |
| BAC Capital Trust XIV, 5.63% to 2012, FRN to 2049 | | $ | 1,840,000 | | $ | 865,113 |
| BNP Paribas, 5.186% to 2015, FRN to 2049 (n) | | | 226,000 | | | 147,146 |
| BNP Paribas, 7.195% to 2037, FRN to 2049 (n) | | | 600,000 | | | 383,152 |
| Natixis S.A., 10% to 2018, FRN to 2049 (n) | | | 820,000 | | | 510,795 |
| Royal Bank of Scotland Group PLC, 9.118%, 2049 | | | 857,000 | | | 793,643 |
UniCredito Italiano Capital Trust II, 9.2% to 2010,
FRN to 2049 (n) | | | 1,187,000 | | | 807,159 |
| | | | | | |
| | | | | | $ | 3,507,008 |
| Medical & Health Technology & Services - 3.7% | | | | | | |
| Biomet, Inc., 10%, 2017 | | $ | 435,000 | | $ | 400,200 |
| Biomet, Inc., 11.625%, 2017 | | | 290,000 | | | 252,300 |
| Cardinal Health, Inc., 5.8%, 2016 | | | 840,000 | | | 680,928 |
| Community Health Systems, Inc., 8.875%, 2015 | | | 860,000 | | | 720,250 |
| Cooper Cos., Inc., 7.125%, 2015 | | | 410,000 | | | 328,000 |
| DaVita, Inc., 7.25%, 2015 | | | 1,115,000 | | | 953,325 |
| HCA, Inc., 6.375%, 2015 | | | 855,000 | | | 508,725 |
| HCA, Inc., 9.25%, 2016 | | | 1,320,000 | | | 1,122,000 |
| Hospira, Inc., 5.55%, 2012 | | | 450,000 | | | 408,719 |
| Hospira, Inc., 6.05%, 2017 | | | 410,000 | | | 344,402 |
| McKesson Corp., 5.7%, 2017 | | | 370,000 | | | 303,641 |
| Owens & Minor, Inc., 6.35%, 2016 | | | 710,000 | | | 684,647 |
| Psychiatric Solutions, Inc., 7.75%, 2015 | | | 320,000 | | | 263,200 |
| U.S. Oncology, Inc., 10.75%, 2014 | | | 495,000 | | | 386,100 |
| Universal Hospital Services, Inc., 8.5%, 2015 (p) | | | 305,000 | | | 244,000 |
| Universal Hospital Services, Inc., FRN, 6.303%, 2015 | | | 90,000 | | | 61,200 |
| VWR Funding, Inc., 10.25%, 2015 (p) | | | 265,000 | | | 157,675 |
| | | | | | |
| | | | | | $ | 7,819,312 |
| Metals & Mining - 1.2% | | | | | | |
| Arch Western Finance LLC, 6.75%, 2013 | | $ | 345,000 | | $ | 289,800 |
| FMG Finance Ltd., 10.625%, 2016 (n) | | | 720,000 | | | 493,200 |
| Freeport-McMoRan Copper & Gold, Inc., 8.375%, 2017 | | | 1,160,000 | | | 910,600 |
| Freeport-McMoRan Copper & Gold, Inc., FRN, 7.084%, 2015 | | | 160,000 | | | 124,749 |
| Peabody Energy Corp., 7.375%, 2016 | | | 155,000 | | | 130,975 |
| Peabody Energy Corp., “B”, 6.875%, 2013 | | | 665,000 | | | 583,538 |
| | | | | | |
| | | | | | $ | 2,532,862 |
18
Portfolio of Investments – continued
| | | | | | |
| Issuer | | Shares/Par | | Value ($) |
| | | | | | |
| Bonds - continued | | | | | | |
| Mortgage Backed - 5.5% | | | | | | |
| Fannie Mae, 5.5%, 2019-2035 | | $ | 8,394,555 | | $ | 8,262,465 |
| Fannie Mae, 6.5%, 2031 | | | 244,878 | | | 250,772 |
| Fannie Mae, 6%, 2034 (f) | | | 3,030,077 | | | 3,037,495 |
| | | | | | |
| | | | | | $ | 11,550,732 |
| Natural Gas - Distribution - 0.2% | | | | | | |
| AmeriGas Partners LP, 7.125%, 2016 | | $ | 385,000 | | $ | 283,938 |
| Inergy LP, 6.875%, 2014 | | | 335,000 | | | 247,900 |
| | | | | | |
| | | | | | $ | 531,838 |
| Natural Gas - Pipeline - 2.8% | | | | | | |
| Atlas Pipeline Partners LP, 8.125%, 2015 | | $ | 300,000 | | $ | 209,250 |
| Atlas Pipeline Partners LP, 8.75%, 2018 (n) | | | 270,000 | | | 182,250 |
| CenterPoint Energy, Inc., 7.875%, 2013 | | | 1,826,000 | | | 1,719,800 |
Deutsche Bank (El Paso Performance-Linked Trust, CLN),
7.75%, 2011 (n) | | | 695,000 | | | 578,973 |
| El Paso Corp., 7.25%, 2018 | | | 280,000 | | | 210,000 |
| Intergas Finance B.V., 6.875%, 2011 | | | 228,000 | | | 148,200 |
| Kinder Morgan Energy Partners LP, 6%, 2017 | | | 830,000 | | | 663,161 |
| Kinder Morgan Finance Corp., 5.35%, 2011 | | | 1,516,000 | | | 1,349,240 |
| Spectra Energy Capital LLC, 8%, 2019 | | | 679,000 | | | 612,360 |
| Williams Partners LP, 7.25%, 2017 | | | 300,000 | | | 238,500 |
| | | | | | |
| | | | | | $ | 5,911,734 |
| Network & Telecom - 2.7% | | | | | | |
| Cincinnati Bell, Inc., 8.375%, 2014 | | $ | 535,000 | | $ | 386,538 |
| Citizens Communications Co., 9.25%, 2011 | | | 768,000 | | | 652,800 |
| Citizens Communications Co., 9%, 2031 | | | 630,000 | | | 340,200 |
| Deutsche Telekom International Finance B.V., 8.5%, 2010 | | | 543,000 | | | 534,817 |
| Nordic Telephone Co. Holdings, 8.875%, 2016 (n) | | | 465,000 | | | 390,600 |
| Qwest Capital Funding, Inc., 7.25%, 2011 | | | 710,000 | | | 543,150 |
| Qwest Corp., 8.875%, 2012 | | | 290,000 | | | 253,750 |
| Qwest Corp., 7.5%, 2014 | | | 560,000 | | | 431,200 |
| Telecom Italia Capital, 4.875%, 2010 | | | 248,000 | | | 213,630 |
| Telefonica Europe B.V., 7.75%, 2010 | | | 1,090,000 | | | 1,055,218 |
| Verizon Communications, Inc., 8.75%, 2018 | | | 690,000 | | | 704,559 |
| Windstream Corp., 8.625%, 2016 | | | 300,000 | | | 226,500 |
| | | | | | |
| | | | | | $ | 5,732,962 |
| Oil Services - 0.5% | | | | | | |
| Basic Energy Services, Inc., 7.125%, 2016 | | $ | 505,000 | | $ | 333,300 |
| KazMunaiGaz Finance B.V., 8.375%, 2013 (n) | | | 451,000 | | | 315,700 |
| KazMunaiGaz Finance B.V., 9.125%, 2018 (n) | | | 352,000 | | | 228,800 |
19
Portfolio of Investments – continued
| | | | | | |
| Issuer | | Shares/Par | | Value ($) |
| | | | | | |
| Bonds - continued | | | | | | |
| Oil Services - continued | | | | | | |
| Weatherford International Ltd., 6.35%, 2017 | | $ | 340,000 | | $ | 280,882 |
| | | | | | |
| | | | | | $ | 1,158,682 |
| Oils - 0.6% | | | | | | |
| Premcor Refining Group, Inc., 7.5%, 2015 | | $ | 1,290,000 | | $ | 1,184,259 |
| | |
| Other Banks & Diversified Financials - 1.8% | | | | | | |
Alfa Diversified Payment Rights Finance Co. S.A., FRN,
4.719%, 2011 (n) | | $ | 442,000 | | $ | 277,222 |
| Banco Mercantil del Norte S.A., 5.875% to 2009, FRN to 2014 (n) | | | 588,000 | | | 588,941 |
| Bosphorus Financial Services Ltd., FRN, 4.604%, 2012 (z) | | | 700,000 | | | 677,187 |
| Resona Bank Ltd., 5.85% to 2016, FRN to 2049 (n) | | | 246,000 | | | 155,450 |
| Swedbank AB, 9% to 2010, FRN to 2049 (n) | | | 800,000 | | | 703,216 |
| UBS Preferred Funding Trust V, 6.243% to 2016, FRN to 2049 | | | 1,120,000 | | | 670,667 |
| UFJ Finance Aruba AEC, 6.75%, 2013 | | | 648,000 | | | 684,688 |
| | | | | | |
| | | | | | $ | 3,757,371 |
| Pharmaceuticals - 0.1% | | | | | | |
| Teva Pharmaceutical Finance LLC, 5.55%, 2016 | | $ | 359,000 | | $ | 308,076 |
| | |
| Pollution Control - 0.2% | | | | | | |
| Allied Waste North America, Inc., 7.125%, 2016 | | $ | 375,000 | | $ | 330,000 |
| | |
| Precious Metals & Minerals - 0.1% | | | | | | |
| Alrosa Finance S.A., 8.875%, 2014 | | $ | 488,000 | | $ | 253,379 |
| | |
| Printing & Publishing - 0.5% | | | | | | |
| American Media Operations, Inc., 10.25%, 2009 (z) | | $ | 16,107 | | $ | 7,973 |
| American Media Operations, Inc., “B”, 10.25%, 2009 | | | 443,000 | | | 219,285 |
| Dex Media West LLC, 9.875%, 2013 | | | 849,000 | | | 318,375 |
| Idearc, Inc., 8%, 2016 | | | 568,000 | | | 78,810 |
| Nielsen Finance LLC, 10%, 2014 | | | 430,000 | | | 311,750 |
| Nielsen Finance LLC, 0% to 2011, 12.5% to 2016 | | | 533,000 | | | 205,205 |
| Quebecor World, Inc., 6.125%, 2013 (d) | | | 210,000 | | | 18,900 |
| | | | | | |
| | | | | | $ | 1,160,298 |
| Railroad & Shipping - 0.1% | | | | | | |
| Panama Canal Railway Co., 7%, 2026 (n) | | $ | 337,000 | | $ | 195,460 |
| | |
| Real Estate - 0.8% | | | | | | |
| ERP Operating LP, REIT, 5.75%, 2017 | | $ | 630,000 | | $ | 429,314 |
| Simon Property Group, Inc., REIT, 6.1%, 2016 | | | 1,790,000 | | | 1,333,077 |
| | | | | | |
| | | | | | $ | 1,762,391 |
20
Portfolio of Investments – continued
| | | | | | |
| Issuer | | Shares/Par | | Value ($) |
| | | | | | |
| Bonds - continued | | | | | | |
| Retailers - 0.7% | | | | | | |
| Couche-Tard, Inc., 7.5%, 2013 | | $ | 490,000 | | $ | 377,300 |
| Limited Brands, Inc., 5.25%, 2014 | | | 671,000 | | | 422,111 |
| Macy’s Retail Holdings, Inc., 7.875%, 2015 | | | 860,000 | | | 647,269 |
| Sally Beauty Holdings, Inc., 10.5%, 2016 | | | 175,000 | | | 127,750 |
| | | | | | |
| | | | | | $ | 1,574,430 |
| Specialty Stores - 0.1% | | | | | | |
| Payless ShoeSource, Inc., 8.25%, 2013 | | $ | 310,000 | | $ | 232,500 |
| | |
| Steel - 0.1% | | | | | | |
| Steel Capital S.A., 9.75%, 2013 (n) | | $ | 277,000 | | $ | 116,340 |
| | |
| Supermarkets - 0.2% | | | | | | |
| Safeway, Inc., 4.95%, 2010 | | $ | 470,000 | | $ | 463,726 |
| | |
| Telecommunications - Wireless - 1.4% | | | | | | |
| Alltel Corp., 7%, 2012 | | $ | 462,000 | | $ | 415,800 |
| MetroPCS Wireless, Inc., 9.25%, 2014 | | | 345,000 | | | 287,213 |
| Rogers Cable, Inc., 5.5%, 2014 | | | 659,000 | | | 567,463 |
| Sprint Capital Corp., 8.375%, 2012 | | | 610,000 | | | 491,050 |
| Vodafone Group PLC, 5.375%, 2015 | | | 1,080,000 | | | 910,563 |
| Wind Acquisition Finance S.A., 10.75%, 2015 (n) | | | 442,000 | | | 340,340 |
| | | | | | |
| | | | | | $ | 3,012,429 |
| Tobacco - 0.4% | | | | | | |
| Reynolds American, Inc., 6.75%, 2017 | | $ | 1,040,000 | | $ | 780,307 |
| | |
| Transportation - 0.3% | | | | | | |
| IIRSA Norte Finance Ltd., 8.75%, 2024 | | $ | 561,569 | | $ | 426,793 |
| Peru Enhanced Pass-Through Trust, 0%, 2018 (n) | | | 246,100 | | | 120,589 |
| | | | | | |
| | | | | | $ | 547,382 |
| Transportation - Services - 0.1% | | | | | | |
| Hertz Corp., 8.875%, 2014 | | $ | 440,000 | | $ | 321,200 |
| | |
| Utilities - Electric Power - 4.0% | | | | | | |
| Beaver Valley Funding Corp., 9%, 2017 | | $ | 1,545,000 | | $ | 1,641,238 |
| Dynegy Holdings, Inc., 7.5%, 2015 | | | 300,000 | | | 219,000 |
| Edison Mission Energy, 7%, 2017 | | | 1,470,000 | | | 1,163,138 |
| Enersis S.A., 7.375%, 2014 | | | 191,000 | | | 178,921 |
| FirstEnergy Corp., 6.45%, 2011 | | | 857,000 | | | 807,284 |
| HQI Transelec Chile S.A., 7.875%, 2011 | | | 1,200,000 | | | 1,177,158 |
21
Portfolio of Investments – continued
| | | | | | |
| Issuer | | Shares/Par | | Value ($) |
| | | | | | |
| Bonds - continued | | | | | | |
| Utilities - Electric Power - continued | | | | | | |
| Mirant Americas Generation LLC, 8.3%, 2011 | | $ | 100,000 | | $ | 91,750 |
| Mirant North America LLC, 7.375%, 2013 | | | 585,000 | | | 511,145 |
| NRG Energy, Inc., 7.375%, 2016 | | | 1,170,000 | | | 1,009,125 |
| Reliant Energy, Inc., 7.875%, 2017 | | | 20,000 | | | 15,300 |
Texas Competitive Electric Holdings LLC, 10.25% to 2010,
10.5% to 2015 (n) | | | 1,555,000 | | | 1,185,688 |
| Waterford 3 Funding Corp., 8.09%, 2017 | | | 518,001 | | | 528,227 |
| | | | | | |
| | | | | | $ | 8,527,974 |
| Total Bonds (Identified Cost, $225,648,567) | | | | | $ | 181,000,169 |
| | |
| Floating Rate Loans - 2.5% (g)(r) | | | | | | |
| Aerospace - 0.2% | | | | | | |
| Hawker Beechcraft Acquisition Co., Letter of Credit, 5.76%, 2014 | | $ | 26,430 | | $ | 16,821 |
| Hawker Beechcraft Acquisition Co., Term Loan B, 5.76%, 2014 | | | 600,106 | | | 381,925 |
| | | | | | |
| | | | | | $ | 398,746 |
| Automotive - 0.6% | | | | | | |
| Allison Transmission, Inc., Term Loan B, 6.08%, 2014 | | $ | 333,245 | | $ | 225,536 |
| Federal Mogul Corp., Term Loan B, 5.98%, 2014 | | | 354,766 | | | 209,755 |
| Ford Motor Co., Term Loan B, 7.59%, 2013 | | | 185,344 | | | 101,807 |
| General Motors Corp., Term Loan B, 2013 (o) | | | 545,903 | | | 296,971 |
Goodyear Tire & Rubber Co., Second Lien Term Loan,
4.78%, 2014 | | | 573,442 | | | 401,409 |
| | | | | | |
| | | | | | $ | 1,235,478 |
| Broadcasting - 0.1% | | | | | | |
| Gray Television, Inc., Term Loan B, 2014 (q) | | $ | 100,329 | | $ | 55,682 |
| Young Broadcasting, Inc., Term Loan, 6.3%, 2012 | | | 250,410 | | | 159,949 |
| Young Broadcasting, Inc., Term Loan B-1, 6.56%, 2012 | | | 133,421 | | | 85,223 |
| | | | | | |
| | | | | | $ | 300,854 |
| Business Services - 0.2% | | | | | | |
| First Data Corp., Term Loan B-1, 6.05%, 2014 | | $ | 466,504 | | $ | 340,723 |
| | |
| Cable TV - 0.2% | | | | | | |
| Charter Communications Operating LLC, Term Loan B, 2014 (o) | | $ | 154,733 | | $ | 115,373 |
| CSC Holdings, Inc., Term Loan B, 4.57%, 2013 | | | 368,979 | | | 317,586 |
| | | | | | |
| | | | | | $ | 432,959 |
| Electronics - 0.1% | | | | | | |
| Freescale Semiconductor, Inc., Term Loan B, 2013 (o) | | $ | 157,408 | | $ | 105,726 |
| | |
| Forest & Paper Products - 0.0% | | | | | | |
| Abitibi-Consolidated, Inc., Term Loan, 11.75%, 2009 | | $ | 130,082 | | $ | 104,066 |
22
Portfolio of Investments – continued
| | | | | | |
| Issuer | | Shares/Par | | Value ($) |
| | | | | | |
| Floating Rate Loans (g)(r) - continued | | | | | | |
| Gaming & Lodging - 0.1% | | | | | | |
Green Valley Ranch Gaming LLC, Second Lien Term Loan,
6%, 2014 | | $ | 310,737 | | $ | 119,634 |
| | |
| Medical & Health Technology & Services - 0.2% | | | | | | |
| Community Health Systems, Inc., Delayed Draw Term Loan B, 2014 (q) | | $ | 3,876 | | $ | 3,095 |
| Community Health Systems, Inc., Term Loan, 5.22%, 2014 | | | 75,780 | | | 60,520 |
| HCA, Inc., Term Loan B, 6.01%, 2013 | | | 175,278 | | | 144,232 |
| Psychiatric Solutions, Term Loan B, 2012 (o) | | | 277,203 | | | 224,881 |
| | | | | | |
| | | | | | $ | 432,728 |
| Printing & Publishing - 0.2% | | | | | | |
| Idearc, Inc., Term Loan B, 5.74%, 2014 | | $ | 45,075 | | $ | 19,007 |
| Nielsen Co., 2013 (o) | | | 170,546 | | | 122,879 |
| Tribune Co., Term Loan B, 6.5%, 2014 | | | 540,238 | | | 194,486 |
| | | | | | |
| | | | | | $ | 336,372 |
| Retailers - 0.0% | | | | | | |
| Burlington Coat Factory, Term Loan B, 5.06%, 2013 | | $ | 158,339 | | $ | 85,008 |
| | |
| Specialty Stores - 0.1% | | | | | | |
| Michaels Stores, Inc., Term Loan B, 5.35%, 2013 | | $ | 513,607 | | $ | 297,892 |
| | |
| Utilities - Electric Power - 0.5% | | | | | | |
| Calpine Corp., Term Loan, 6.65%, 2014 | | $ | 394,054 | | $ | 314,258 |
| NRG Energy, Inc., Letter of Credit, 2013 (o) | | | 106,904 | | | 92,412 |
| NRG Energy, Inc., Term Loan B, 2013 (o) | | | 218,513 | | | 188,893 |
| TXU Corp. Term Loan B-3, 6.44%, 2014 | | | 666,838 | | | 517,383 |
| | | | | | |
| | | | | | $ | 1,112,946 |
| Total Floating Rate Loans (Identified Cost, $6,979,394) | | | | | $ | 5,303,132 |
| | |
| Money Market Funds (v) - 9.0% | | | | | | |
MFS Institutional Money Market Portfolio, 0.93%,
at Cost and Net Asset Value | | | 19,148,150 | | $ | 19,148,150 |
| | |
| Rights - 0.0% | | | | | | |
| Emerging Market Sovereign - 0.0% | | | | | | |
Banco Central del Uruguay, Value Recovery Rights,
Expiring January 2021 (Identified Cost, $0) (a) | | | 1,250,000 | | $ | 0 |
| Total Investments (Identified Cost, $251,776,111) (k) | | | | | $ | 205,451,451 |
| | |
| Other Assets, Less Liabilities - 2.8% | | | | | | 5,811,538 |
| Net Assets - 100.0% | | | | | $ | 211,262,989 |
23
Portfolio of Investments – continued
| (a) | Non-income producing security. |
| (d) | Non-income producing security – in default. |
| (f) | All or a portion of the security has been segregated as collateral for open futures contracts. |
| (g) | The rate shown represents a weighted average coupon rate on settled positions at period end, unless otherwise indicated. |
| (i) | Interest only security for which the fund receives interest on notional principal (Par amount). Par amount shown is the notional principal and does not reflect the cost of the security. |
| (k) | As of October 31, 2008, the fund held securities fair valued in accordance with the policies adopted by the Board of Trustees, aggregating $185,397,958 and 90.24% of market value. An independent pricing service provided an evaluated bid for 89.78% of the market value. |
| (n) | Securities exempt from registration under Rule 144A of the Securities Act of 1933. These securities may be sold in the ordinary course of business in transactions exempt from registration, normally to qualified institutional buyers. At period end, the aggregate value of these securities was $22,506,256 representing 10.7% of net assets. |
| (o) | All or a portion of this position has not settled. Upon settlement date, interest rates for unsettled amounts will be determined. The rate shown represents the weighted average coupon rate for settled amounts. |
| (p) | Payment-in-kind security. |
| (q) | All or a portion of this position represents an unfunded loan commitment. The rate shown represents a weighted average coupon rate on the full position, including the unfunded loan commitment which has no current coupon rate. |
| (r) | Remaining maturities of floating rate loans may be less than stated maturities shown as a result of contractual or optional prepayments by the borrower. Such prepayments cannot be predicted with certainty. These loans may be subject to restrictions on resale. Floating rate loans generally have rates of interest which are determined periodically by reference to a base lending rate plus a premium. |
| (v) | Underlying fund that is available only to investment companies managed by MFS. The rate quoted is the annualized seven-day yield of the fund at period end. |
| (z) | Restricted securities are not registered under the Securities Act of 1933 and are subject to legal restrictions on resale. These securities generally may be resold in transactions exempt from registration or to the public if the securities are subsequently registered. Disposal of these securities may involve time-consuming negotiations and prompt sale at an acceptable price may be difficult. The fund holds the following restricted securities: |
| | | | | | |
| Restricted Securities | | Acquisition
Date | | Cost | | Current
Market
Value |
| American Media Operations, Inc., 10.25%, 2009 | | 12/01/06 | | $15,921 | | $7,973 |
| Anthracite Ltd., CDO, 6%, 2037 | | 5/14/02 | | 1,004,942 | | 456,000 |
| Bayview Financial Revolving Mortgage Loan Trust, FRN, 4.04%, 2040 | | 3/01/06 | | 674,286 | | 484,001 |
| Bosphorus Financial Services Ltd., FRN, 4.604%, 2012 | | 3/08/05 | | 700,000 | | 677,187 |
| Brazilian Merchant Voucher Receivables Ltd., 5.911%, 2011 | | 3/08/07 | | 811,041 | | 751,849 |
| Chase Commercial Mortgage Securities Corp., 6.6%, 2029 | | 6/07/00 | | 1,286,079 | | 1,281,782 |
| Clear Channel Communications, 10.75%, 2016 | | 10/23/08 | | 60,182 | | 58,500 |
| DLJ Commercial Mortgage Corp., 6.04%, 2031 | | 7/23/04 | | 542,361 | | 511,557 |
| Falcon Franchise Loan LLC, 6.5%, 2014 | | 7/15/05 | | 642,862 | | 367,780 |
| Falcon Franchise Loan LLC, FRN, 3.737%, 2025 | | 1/29/03 | | 407,836 | | 152,206 |
| Firekeepers Development Authority, 13.875%, 2015 | | 4/22/08 | | 253,100 | | 184,600 |
24
Portfolio of Investments – continued
| | | | | | |
| Restricted Securities (continued) | | Acquisition
Date | | Cost | | Current
Market
Value |
| GMAC Commercial Mortgage Securities, Inc., FRN, 6.02%, 2033 | | 11/17/00 | | $1,638,856 | | $1,510,280 |
| Prudential Securities Secured Financing Corp., FRN, 7.254%, 2013 | | 12/16/04 | | 928,860 | | 544,348 |
| Salomon Brothers Mortgage Securities, Inc., FRN, 7.037%, 2032 | | 1/07/05 | | 1,970,085 | | 1,714,424 |
| Total Restricted Securities | | | | | | $8,702,487 |
| % of Net Assets | | | | | | 4.1% |
The following abbreviations are used in this report and are defined:
| CDO | | Collateralized Debt Obligation |
| CLO | | Collateralized Loan Obligation |
| FRN | | Floating Rate Note. Interest rate resets periodically and may not be the rate reported at period end. |
| REIT | | Real Estate Investment Trust |
Abbreviations indicate amounts shown in currencies other than the U.S. dollar. All amounts are stated in U.S. dollars unless otherwise indicated. A list of abbreviations is shown below:
Derivative Contracts at 10/31/08
Forward Foreign Currency Exchange Contracts at 10/31/08
| | | | | | | | | | | | | |
| Type | | Currency | | Contracts to
Deliver/Receive | | Settlement
Date Range | | In Exchange
for | | Contracts
at Value | | Net
Unrealized
Appreciation
(Depreciation) | |
| Appreciation | | | | | | | | | | | | | |
SELL | | AUD | | 762,688 | | 11/10/08-11/12/08 | | $640,501 | | $506,503 | | $133,998 | |
SELL | | CAD | | 1,704,823 | | 12/22/08 | | 1,438,147 | | 1,414,321 | | 23,826 | |
SELL | | DKK | | 1,922,095 | | 11/12/08 | | 393,002 | | 328,803 | | 64,199 | |
SELL | | EUR | | 16,034,843 | | 12/22/08 | | 21,504,748 | | 20,409,950 | | 1,094,798 | |
SELL | | GBP | | 2,812,717 | | 12/17/08 | | 4,811,111 | | 4,515,161 | | 295,950 | |
BUY | | JPY | | 224,541,488 | | 12/18/08 | | 2,216,037 | | 2,283,895 | | 67,858 | |
SELL | | JPY | | 567,629,213 | | 12/17/08 | | 5,829,910 | | 5,773,193 | | 56,717 | |
SELL | | SEK | | 3,500,909 | | 11/28/08 | | 517,978 | | 450,809 | | 67,169 | |
| | | | | | | | | | | | $1,804,515 | |
| | | | | | | | | | | | | |
| | | | | | |
| Depreciation | | | | | | | | | | | | | |
BUY | | AUD | | 304,907 | | 11/10/08 | | $239,855 | | $202,504 | | $(37,351 | ) |
BUY | | EUR | | 2,817,298 | | 12/22/08 | | 3,779,687 | | 3,585,998 | | (193,689 | ) |
BUY | | MXN | | 3,111,529 | | 11/12/08 | | 307,175 | | 241,234 | | (65,941 | ) |
| | | | | | | | | | | | $(296,981 | ) |
| | | | | | | | | | | | | |
25
Portfolio of Investments – continued
Futures contracts outstanding at 10/31/08
| | | | | | | | |
| Description | | Contracts | | Value | | Expiration
Date | | Unrealized
Appreciation
(Depreciation) |
| U.S. Treasury Note 5 yr (Long) | | 59 | | $6,682,211 | | Dec-08 | | $68,473 |
Swap Agreements at 10/31/08
| | | | | | | | | | | | | |
| Expiration | | Notional
Amount | | Counterparty | | Cash Flows
to Receive | | Cash Flows
to Pay | | Value | |
| Credit Default Swaps | | | |
| 6/20/09 | | USD | | 300,000 | | JPMorgan Chase Bank | | 4.1% (fixed rate) | | (1) | | $(114,752 | ) |
| 9/20/10 | | USD | | 1,130,000 | | Merrill Lynch International | | (2) | | 0.68% (fixed rate) | | 158,875 | |
| 3/20/13 | | USD | | 1,790,000 | | Goldman Sachs International | | (3) | | 2.129% (fixed rate) | | 172,926 | |
| 6/20/13 | | USD | | 6,800,000 | | Morgan Stanley Capital Services, Inc. (a) | | (4) | | 5.00% (fixed rate) | | 1,024,785 | |
| 9/20/13 | | USD | | 630,000 | | Merrill Lynch International | | (5) | | 0.77% (fixed rate) | | 15,331 | |
| 12/20/13 | | USD | | 620,000 | | JPMorgan Chase Bank | | (6) | | 0.78% (fixed rate) | | 13,564 | |
| | | | | | | | | | | | $1,270,729 | |
| | | | | | | | | | | | | |
| (1) | Fund to pay notional amount upon a defined credit event by Abitibi Consolidated, Inc., 8.375%, 4/01/2015. |
| (2) | Fund to receive notional amount upon a defined credit event by Lennar Corp., 5.95%, 3/01/2013. |
| (3) | Fund to receive notional amount upon a defined credit event by Simon Property Group, 6.350%, 8/28/2012. |
| (4) | Fund to receive notional amount upon a defined credit event by a reference obligation specified in the CDX High Yield Index. |
| (5) | Fund to receive notional amount upon a defined credit event by AutoZone, Inc., 5.875%, 10/15/12. |
| (6) | Fund to receive notional amount upon a defined credit event by Arrow Electronics, Inc., 6.875%, 6/01/18. |
| (a) | Net unamortized premiums paid by the fund amounted to $419,789. |
At October 31, 2008, the fund had sufficient cash and/or other liquid securities to cover any commitments under these derivative contracts.
See Notes to Financial Statements
26
Financial Statements
STATEMENT OF ASSETS AND LIABILITIES
At 10/31/08
This statement represents your fund’s balance sheet, which details the assets and liabilities comprising the total value of the fund.
| | | | | |
| Assets | | | | | |
Investments- | | | | | |
Non-affiliated issuers, at value (identified cost, $232,627,961) | | $186,303,301 | | | |
Underlying funds, at cost and value | | 19,148,150 | | | |
Total investments, at value (identified cost, $251,776,111) | | | | | $205,451,451 |
Cash | | 166,765 | | | |
Receivable for forward foreign currency exchange contracts | | 1,804,515 | | | |
Receivable for investments sold | | 1,675,080 | | | |
Receivable for fund shares sold | | 214,523 | | | |
Interest and dividends receivable | | 4,195,694 | | | |
Receivable from investment adviser | | 18,232 | | | |
Swaps, at value (net unamortized premiums paid, $419,789) | | 1,385,481 | | | |
Other assets | | 1,229 | | | |
Total assets | | | | | $214,912,970 |
| Liabilities | | | | | |
Distributions payable | | $322,208 | | | |
Payable for forward foreign currency exchange contracts | | 296,981 | | | |
Payable for daily variation margin on open futures contracts | | 8,297 | | | |
Payable for investments purchased | | 2,220,396 | | | |
Payable for fund shares reacquired | | 483,806 | | | |
Swaps, at value | | 114,752 | | | |
Payable to affiliates | | | | | |
Management fee | | 4,634 | | | |
Shareholder servicing costs | | 48,682 | | | |
Distribution and service fees | | 6,243 | | | |
Administrative services fee | | 244 | | | |
Payable for independent trustees’ compensation | | 43,814 | | | |
Accrued expenses and other liabilities | | 99,924 | | | |
Total liabilities | | | | | $3,649,981 |
Net assets | | | | | $211,262,989 |
| Net assets consist of | | | | | |
Paid-in capital | | $309,880,576 | | | |
Unrealized appreciation (depreciation) on investments and translation of assets and liabilities in foreign currencies | | (44,008,975 | ) | | |
Accumulated net realized gain (loss) on investments and foreign currency transactions | | (57,157,554 | ) | | |
Undistributed net investment income | | 2,548,942 | | | |
Net assets | | | | | $211,262,989 |
Shares of beneficial interest outstanding | | | | | 39,045,055 |
27
Statement of Assets and Liabilities – continued
| | | | |
Class A shares | | | | |
Net assets | | $147,254,927 | | |
Shares outstanding | | 27,122,416 | | |
Net asset value per share | | | | $5.43 |
Offering price per share (100/95.25 × net asset value
per share) | | | | $5.70 |
Class B shares | | | | |
Net assets | | $38,838,000 | | |
Shares outstanding | | 7,224,502 | | |
Net asset value and offering price per share | | | | $5.38 |
Class C shares | | | | |
Net assets | | $23,491,399 | | |
Shares outstanding | | 4,388,775 | | |
Net asset value and offering price per share | | | | $5.35 |
Class I shares | | | | |
Net assets | | $1,678,663 | | |
Shares outstanding | | 309,362 | | |
Net asset value, offering price, and redemption price per share | | | | $5.43 |
On sales of $50,000 or more, the offering price of Class A shares is reduced. A contingent deferred sales charge may be imposed on redemptions of Class A, Class B, and Class C shares.
See Notes to Financial Statements
28
Financial Statements
STATEMENT OF OPERATIONS
Year ended 10/31/08
This statement describes how much your fund earned in investment income and accrued in expenses. It also describes any gains and/or losses generated by fund operations.
| | | | | | |
| Net investment income | | | | | | |
Income | | | | | | |
Interest | | $16,491,901 | | | | |
Dividends | | 76 | | | | |
Dividends from underlying funds | | 456,139 | | | | |
Total investment income | | | | | $16,948,116 | |
Expenses | | | | | | |
Management fee | | $1,670,699 | | | | |
Distribution and service fees | | 1,409,304 | | | | |
Shareholder servicing costs | | 428,884 | | | | |
Administrative services fee | | 44,954 | | | | |
Independent trustees’ compensation | | 12,096 | | | | |
Custodian fee | | 70,801 | | | | |
Shareholder communications | | 28,061 | | | | |
Auditing fees | | 62,972 | | | | |
Legal fees | | 5,863 | | | | |
Miscellaneous | | 80,249 | | | | |
Total expenses | | | | | $3,813,883 | |
Reduction of expenses by investment adviser | | (1,168,845 | ) | | | |
Net expenses | | | | | $2,645,038 | |
Net investment income | | | | | $14,303,078 | |
Realized and unrealized gain (loss) on investments
and foreign currency transactions | | | | | | |
Realized gain (loss) (identified cost basis) | | | | | | |
Investment transactions: | | | | | | |
Non-affiliated issuers | | $(4,857,336 | ) | | | |
Futures contracts | | (209,555 | ) | | | |
Swap transactions | | (192,696 | ) | | | |
Foreign currency transactions | | 1,845,238 | | | | |
Net realized gain (loss) on investments
and foreign currency transactions | | | | | $(3,414,349 | ) |
Change in unrealized appreciation (depreciation) | | | | | | |
Investments | | $(47,354,491 | ) | | | |
Futures contracts | | 157,785 | | | | |
Swap transactions | | 774,704 | | | | |
Translation of assets and liabilities in foreign currencies | | 1,728,708 | | | | |
Net unrealized gain (loss) on investments
and foreign currency translation | | | | | $(44,693,294 | ) |
Net realized and unrealized gain (loss) on investments
and foreign currency | | | | | $(48,107,643 | ) |
Change in net assets from operations | | | | | $(33,804,565 | ) |
See Notes to Financial Statements
29
Financial Statements
STATEMENTS OF CHANGES IN NET ASSETS
These statements describe the increases and/or decreases in net assets resulting from operations, any distributions, and any shareholder transactions.
| | | | | | |
| | | Years ended 10/31 | |
| | | 2008 | | | 2007 | |
| Change in net assets | | | | | | |
| From operations | | | | | | |
Net investment income | | $14,303,078 | | | $16,911,981 | |
Net realized gain (loss) on investments and
foreign currency transactions | | (3,414,349 | ) | | 1,551,797 | |
Net unrealized gain (loss) on investments and
foreign currency translation | | (44,693,294 | ) | | (3,299,444 | ) |
Change in net assets from operations | | $(33,804,565 | ) | | $15,164,334 | |
| Distributions declared to shareholders | | | | | | |
From net investment income | | | | | | |
Class A | | $(10,816,567 | ) | | $(10,847,144 | ) |
Class B | | (2,799,912 | ) | | (3,511,831 | ) |
Class C | | (1,589,846 | ) | | (1,569,001 | ) |
Class I | | (145,955 | ) | | (823,261 | ) |
Total distributions declared to shareholders | | $(15,352,280 | ) | | $(16,751,237 | ) |
Change in net assets from fund share transactions | | $(17,660,200 | ) | | $(36,860,144 | ) |
Total change in net assets | | $(66,817,045 | ) | | $(38,447,047 | ) |
| Net assets | | | | | | |
At beginning of period | | 278,080,034 | | | 316,527,081 | |
At end of period (including undistributed net investment income of $2,548,942 and accumulated distributions in excess of net investment income of $24,081, respectively) | | $211,262,989 | | | $278,080,034 | |
See Notes to Financial Statements
30
Financial Statements
FINANCIAL HIGHLIGHTS
The financial highlights table is intended to help you understand the fund’s financial performance for the past 5 years (or life of a particular share class, if shorter). Certain information reflects financial results for a single fund share. The total returns in the table represent the rate by which an investor would have earned (or lost) on an investment in the fund share class (assuming reinvestment of all distributions) held for the entire period.
| | | | | | | | | | | | | | | |
| Class A | | Years ended 10/31 | |
| | | 2008 | | | 2007 | | | 2006 | | | 2005 | | | 2004 | |
Net asset value, beginning of period | | $6.67 | | | $6.70 | | | $6.67 | | | $6.90 | | | $6.69 | |
| Income (loss) from investment operations | | | | | | | | | | | | | | | |
Net investment income (d) | | $0.37 | | | $0.39 | | | $0.37 | | | $0.38 | | | $0.40 | |
Net realized and unrealized gain (loss)
on investments and foreign currency | | (1.22 | ) | | (0.04 | ) | | 0.05 | | | (0.20 | ) | | 0.22 | |
Total from investment operations | | $(0.85 | ) | | $0.35 | | | $0.42 | | | $0.18 | | | $0.62 | |
| Less distributions declared to shareholders | | | | | | | | | | | | | | | |
From net investment income | | $(0.39 | ) | | $(0.38 | ) | | $(0.39 | ) | | $(0.41 | ) | | $(0.41 | ) |
Net asset value, end of period | | $5.43 | | | $6.67 | | | $6.70 | | | $6.67 | | | $6.90 | |
Total return (%) (r)(s)(t) | | (13.37 | ) | | 5.41 | | | 6.59 | | | 2.68 | | | 9.57 | |
Ratios (%) (to average net assets)
and Supplemental data: | | | | | | | | | | | | | | | |
Expenses before expense reductions (f) | | 1.28 | | | 1.29 | | | 1.33 | | | 1.34 | | | 1.32 | |
Expenses after expense reductions (f) | | 0.83 | | | 0.83 | | | 0.83 | | | 0.83 | | | 0.87 | |
Net investment income | | 5.74 | | | 5.79 | | | 5.55 | | | 5.51 | | | 5.92 | |
Portfolio turnover | | 45 | | | 55 | | | 66 | | | 63 | | | 64 | |
Net assets at end of period (000 Omitted) | | $147,255 | | | $185,193 | | | $194,376 | | | $196,672 | | | $190,165 | |
See Notes to Financial Statements
31
Financial Highlights – continued
| | | | | | | | | | | | | | | |
| Class B | | Years ended 10/31 | |
| | | 2008 | | | 2007 | | | 2006 | | | 2005 | | | 2004 | |
Net asset value, beginning of period | | $6.59 | | | $6.63 | | | $6.59 | | | $6.83 | | | $6.62 | |
| Income (loss) from investment operations | | | | | | | | | | | | | | | |
Net investment income (d) | | $0.33 | | | $0.34 | | | $0.32 | | | $0.33 | | | $0.35 | |
Net realized and unrealized gain (loss)
on investments and foreign currency | | (1.19 | ) | | (0.04 | ) | | 0.07 | | | (0.21 | ) | | 0.22 | |
Total from investment operations | | $(0.86 | ) | | $0.30 | | | $0.39 | | | $0.12 | | | $0.57 | |
| Less distributions declared to shareholders | | | | | | | | | | | | | | | |
From net investment income | | $(0.35 | ) | | $(0.34 | ) | | $(0.35 | ) | | $(0.36 | ) | | $(0.36 | ) |
Net asset value, end of period | | $5.38 | | | $6.59 | | | $6.63 | | | $6.59 | | | $6.83 | |
Total return (%) (r)(s)(t) | | (13.70 | ) | | 4.57 | | | 6.06 | | | 1.83 | | | 8.90 | |
Ratios (%) (to average net assets)
and Supplemental data: | | | | | | | | | | | | | | | |
Expenses before expense reductions (f) | | 1.94 | | | 1.94 | | | 1.97 | | | 1.99 | | | 1.97 | |
Expenses after expense reductions (f) | | 1.48 | | | 1.48 | | | 1.48 | | | 1.48 | | | 1.52 | |
Net investment income | | 5.16 | | | 5.13 | | | 4.90 | | | 4.89 | | | 5.27 | |
Portfolio turnover | | 45 | | | 55 | | | 66 | | | 63 | | | 64 | |
Net assets at end of period (000 Omitted) | | $38,838 | | | $60,044 | | | $77,822 | | | $105,223 | | | $130,075 | |
| |
| Class C | | Years ended 10/31 | |
| | | 2008 | | | 2007 | | | 2006 | | | 2005 | | | 2004 | |
Net asset value, beginning of period | | $6.56 | | | $6.60 | | | $6.56 | | | $6.80 | | | $6.59 | |
| Income (loss) from investment operations | | | | | | | | | | | | | | | |
Net investment income (d) | | $0.33 | | | $0.34 | | | $0.32 | | | $0.33 | | | $0.35 | |
Net realized and unrealized gain (loss)
on investments and foreign currency | | (1.19 | ) | | (0.04 | ) | | 0.07 | | | (0.21 | ) | | 0.22 | |
Total from investment operations | | $(0.86 | ) | | $0.30 | | | $0.39 | | | $0.12 | | | $0.57 | |
| Less distributions declared to shareholders | | | | | | | | | | | | | | | |
From net investment income | | $(0.35 | ) | | $(0.34 | ) | | $(0.35 | ) | | $(0.36 | ) | | $(0.36 | ) |
Net asset value, end of period | | $5.35 | | | $6.56 | | | $6.60 | | | $6.56 | | | $6.80 | |
Total return (%) (r)(s)(t) | | (13.79 | ) | | 4.56 | | | 6.07 | | | 1.81 | | | 8.91 | |
Ratios (%) (to average net assets)
and Supplemental data: | | | | | | | | | | | | | | | |
Expenses before expense reductions (f) | | 1.95 | | | 1.94 | | | 1.98 | | | 1.99 | | | 1.98 | |
Expenses after expense reductions (f) | | 1.48 | | | 1.48 | | | 1.48 | | | 1.48 | | | 1.53 | |
Net investment income | | 5.19 | | | 5.14 | | | 4.90 | | | 4.87 | | | 5.26 | |
Portfolio turnover | | 45 | | | 55 | | | 66 | | | 63 | | | 64 | |
Net assets at end of period (000 Omitted) | | $23,491 | | | $30,385 | | | $29,892 | | | $32,413 | | | $36,537 | |
See Notes to Financial Statements
32
Financial Highlights – continued
| | | | | | | | | | | | | | | |
| Class I | | Years ended 10/31 | |
| | | 2008 | | | 2007 | | | 2006 | | | 2005 | | | 2004 | |
Net asset value, beginning of period | | $6.66 | | | $6.71 | | | $6.67 | | | $6.91 | | | $6.70 | |
| Income (loss) from investment operations | | | | | | | | | | | | | | | |
Net investment income (d) | | $0.39 | | | $0.42 | | | $0.39 | | | $0.40 | | | $0.42 | |
Net realized and unrealized gain (loss)
on investments and foreign currency | | (1.20 | ) | | (0.06 | ) | | 0.07 | | | (0.20 | ) | | 0.22 | |
Total from investment operations | | $(0.81 | ) | | $0.36 | | | $0.46 | | | $0.20 | | | $0.64 | |
| Less distributions declared to shareholders | | | | | | | | | | | | | | | |
From net investment income | | $(0.42 | ) | | $(0.41 | ) | | $(0.42 | ) | | $(0.44 | ) | | $(0.43 | ) |
Net asset value, end of period | | $5.43 | | | $6.66 | | | $6.71 | | | $6.67 | | | $6.91 | |
Total return (%) (r)(s) | | (12.93 | ) | | 5.46 | | | 7.11 | | | 2.90 | | | 9.95 | |
Ratios (%) (to average net assets)
and Supplemental data: | | | | | | | | | | | | | | | |
Expenses before expense reductions (f) | | 0.93 | | | 0.95 | | | 0.98 | | | 0.99 | | | 0.97 | |
Expenses after expense reductions (f) | | 0.48 | | | 0.48 | | | 0.48 | | | 0.48 | | | 0.52 | |
Net investment income | | 6.10 | | | 6.08 | | | 5.89 | | | 5.86 | | | 6.28 | |
Portfolio turnover | | 45 | | | 55 | | | 66 | | | 63 | | | 64 | |
Net assets at end of period (000 Omitted) | | $1,679 | | | $2,458 | | | $14,437 | | | $12,947 | | | $11,965 | |
Any redemption fees charged by the fund during the 2004 and 2005 fiscal years resulted in a per share impact of less than $0.01.
| (d) | Per share data is based on average shares outstanding. |
| (f) | Ratios do not reflect reductions from fees paid indirectly, if applicable. |
| (r) | Certain expenses have been reduced without which performance would have been lower. |
| (s) | From time to time the fund may receive proceeds from litigation settlements, without which performance would be lower. |
| (t) | Total returns do not include any applicable sales charges. |
See Notes to Financial Statements
33
NOTES TO FINANCIAL STATEMENTS
| (1) | | Business and Organization |
MFS Strategic Income Fund (the fund) is a series of MFS Series Trust VIII (the trust). The trust is organized as a Massachusetts business trust and is registered under the Investment Company Act of 1940, as amended, as an open-end management investment company.
| (2) | | Significant Accounting Policies |
General – The preparation of financial statements in conformity with U.S. generally accepted accounting principles requires management to make estimates and assumptions that affect the reported amounts of assets and liabilities, and disclosure of contingent assets and liabilities at the date of the financial statements and the reported amounts of revenues and expenses during the reporting period. Actual results could differ from those estimates. The fund can invest up to 100% of its portfolio in high-yield securities rated below investment grade. Investments in high-yield securities involve greater degrees of credit and market risk than investments in higher-rated securities and tend to be more sensitive to economic conditions. The fund can invest in foreign securities, including securities of emerging market issuers. Investments in foreign securities are vulnerable to the effects of changes in the relative values of the local currency and the U.S. dollar and to the effects of changes in each country’s legal, political, and economic environment. The markets of emerging markets countries are generally more volatile than the markets of developed countries with more mature economies. All of the risks of investing in foreign securities previously described are heightened when investing in emerging markets countries.
Investment Valuations – Equity securities, including restricted equity securities, are generally valued at the last sale or official closing price as reported by a third party pricing service on the market or exchange on which they are primarily traded. For securities for which there were no sales reported that day, equity securities are generally valued at the last quoted daily bid quotation as reported by a third party pricing service on the market or exchange on which they are primarily traded. For securities held short for which there were no sales reported for the day, the position is generally valued at the last quoted daily ask quotation as reported by a third party pricing service on the market or exchange on which such securities are primarily traded. Debt instruments and floating rate loans (other than short-term instruments), including restricted debt instruments, are generally valued at an evaluated or composite bid as reported by a third party pricing service. Short-term instruments with a maturity at issuance of 60 days or less may be valued at amortized cost, which approximates market value. Futures contracts are generally valued at last posted settlement price as reported by a third party
34
Notes to Financial Statements – continued
pricing service on the market on which they are primarily traded. Futures contracts for which there were no trades that day for a particular position are generally valued at the closing bid quotation as reported by a third party pricing service on the market on which such futures contracts are primarily traded. Forward foreign currency contracts are generally valued at the mean of bid and asked prices for the time period interpolated from rates reported by a third party pricing service for proximate time periods. Swaps are generally valued at an evaluated bid as reported by a third party pricing service. Open-end investment companies are generally valued at net asset value per share. Securities and other assets generally valued on the basis of information from a third party pricing service may also be valued at a broker-dealer bid quotation. Values obtained from pricing services can utilize both dealer-supplied valuations and electronic data processing techniques, which take into account factors such as institutional-size trading in similar groups of securities, yield, quality, coupon rate, maturity, type of issue, trading characteristics, and other market data. The values of foreign securities and other assets and liabilities expressed in foreign currencies are converted to U.S. dollars using the mean of bid and asked prices for rates reported by a third party pricing service.
The Board of Trustees has delegated primary responsibility for determining or causing to be determined the value of the fund’s investments (including any fair valuation) to the adviser pursuant to valuation policies and procedures approved by the Board. If the adviser determines that reliable market quotations are not readily available, investments are valued at fair value as determined in good faith by the adviser in accordance with such procedures under the oversight of the Board of Trustees. Under the fund’s valuation policies and procedures, market quotations are not considered to be readily available for most types of debt instruments and floating rate loans and many types of derivatives. These investments are generally valued at fair value based on information from third party pricing services. In addition, investments may be valued at fair value if the adviser determines that an investment’s value has been materially affected by events occurring after the close of the exchange or market on which the investment is principally traded (such as foreign exchange or market) and prior to the determination of the fund’s net asset value, or after the halting of trading of a specific security where trading does not resume prior to the close of the exchange or market on which the security is principally traded. Events that occur on a frequent basis after foreign markets close (such as developments in foreign markets and significant movements in the U.S. markets) and prior to the determination of the fund’s net asset value may be deemed to have a material affect on the value of securities traded in foreign markets. Accordingly, the fund’s foreign equity securities may often be valued at fair value. The adviser may rely on third party pricing services or other information (such as the correlation with price
35
Notes to Financial Statements – continued
movements of similar securities in the same or other markets; the type, cost and investment characteristics of the security; the business and financial condition of the issuer; and trading and other market data) to assist in determining whether to fair value and at what value to fair value an investment. The value of an investment for purposes of calculating the fund’s net asset value can differ depending on the source and method used to determine value. When fair valuation is used, the value of investments used to determine the fund’s net asset value may differ from quoted or published prices for the same investments.
In September 2006, FASB Statement No. 157, Fair Value Measurements (the “Statement”) was issued, and is effective for fiscal years beginning after November 15, 2007 and for all interim periods within those fiscal years. This Statement provides a single definition of fair value, a hierarchy for measuring fair value and expanded disclosures about fair value measurements. Management is evaluating the application of the Statement to the fund, and believes the impact will be limited to expanded disclosures resulting from the adoption of this Statement in the fund’s financial statements.
Repurchase Agreements – The fund may enter into repurchase agreements with approved counterparties. Each repurchase agreement is recorded at cost. The fund requires that the securities collateral in a repurchase transaction be transferred to a custodian. The fund monitors, on a daily basis, the value of the collateral to ensure that its value, including accrued interest, is greater than amounts owed to the fund under each such repurchase agreement.
Foreign Currency Translation – Purchases and sales of foreign investments, income, and expenses are converted into U.S. dollars based upon currency exchange rates prevailing on the respective dates of such transactions or on the reporting date for foreign denominated receivables and payables. Gains and losses attributable to foreign currency exchange rates on sales of securities are recorded for financial statement purposes as net realized gains and losses on investments. Gains and losses attributable to foreign exchange rate movements on receivables, payables, income and expenses are recorded for financial statement purposes as foreign currency transaction gains and losses. That portion of both realized and unrealized gains and losses on investments that results from fluctuations in foreign currency exchange rates is not separately disclosed.
Derivative Risk – The fund may invest in derivatives for hedging or non-hedging purposes. While hedging can reduce or eliminate losses, it can also reduce or eliminate gains. When the fund uses derivatives as an investment to gain market exposure, or for hedging purposes, gains and losses from derivative instruments may be substantially greater than the derivative’s original cost. Cash that has been segregated on behalf of certain derivative contracts will be reported separately on the Statement of Assets and Liabilities
36
Notes to Financial Statements – continued
as restricted cash. On some over-the-counter derivatives, the fund attempts to reduce its exposure to counterparty credit risk by entering into an ISDA Master Agreement on a bilateral basis with each of the counterparties with whom it undertakes a significant volume of transactions. The ISDA Master Agreement gives the fund the right, upon an event of default by the applicable counterparty, to close out all transactions traded under such agreement and to net amounts owed under each transaction to one net amount payable by one party to the other. This right to close out and net payments across all transactions traded under the ISDA Master Agreement could result in a reduction of the fund’s credit risk to such counterparty equal to any amounts payable by the fund under the applicable transactions, if any. However, absent an event of default by the counterparty, the ISDA Master Agreement does not result in an offset of reported balance sheet assets and liabilities across transactions between the fund and the applicable counterparty. Derivative instruments include futures contracts, forward foreign currency exchange contracts, and swap agreements.
FASB Statement No. 161, Disclosures about Derivative Instruments and Hedging Activities, effective for financial statements issued for fiscal years and interim periods beginning after November 15, 2008, and FASB Staff Position (FSP) 133-1, effective for fiscal years and interim periods ending after November 15, 2008 (the “Standards”) were recently issued. These Standards provide enhanced disclosures about the fund’s use of and accounting for derivative instruments and the effect of derivative instruments on the fund’s results of operations and financial position. Management is evaluating the application of these Standards to the fund, and has not at this time determined the impact, resulting from the adoption of these Standards on the fund’s financial statements.
Futures Contracts – The fund may enter into futures contracts for the delayed delivery of securities or currency, or contracts based on financial indices at a fixed price on a future date. In entering such contracts, the fund is required to deposit with the broker either in cash or securities an amount equal to a certain percentage of the contract amount. Subsequent payments are made or received by the fund each day, depending on the daily fluctuations in the value of the contract, and are recorded for financial statement purposes as unrealized gains or losses by the fund. Upon entering into such contracts, the fund bears the risk of interest or exchange rates or securities prices moving unexpectedly, in which case, the fund may not achieve the anticipated benefits of the futures contracts and may realize a loss.
Forward Foreign Currency Exchange Contracts – The fund may enter into forward foreign currency exchange contracts for the purchase or sale of a specific foreign currency at a fixed price on a future date. Risks may arise upon entering into these contracts from the potential inability of counterparties to
37
Notes to Financial Statements – continued
meet the terms of their contracts and from unanticipated movements in the value of the contract. The fund may enter into forward foreign currency exchange contracts for hedging purposes as well as for non-hedging purposes. For hedging purposes, the fund may enter into contracts to deliver or receive foreign currency it will receive from or require for its normal investment activities. The fund may also use contracts in a manner intended to protect foreign currency denominated securities from declines in value due to unfavorable exchange rate movements. For non-hedging purposes, the fund may enter into contracts with the intent of changing the relative exposure of the fund’s portfolio of securities to different currencies to take advantage of anticipated changes. The forward foreign currency exchange contracts are adjusted by the daily exchange rate of the underlying currency and any gains or losses are recorded as unrealized until the contract settlement date. On contract settlement date, the gains or losses are recorded as realized gains or losses on foreign currency transactions.
Swap Agreements – The fund may enter into swap agreements. A swap is an exchange of cash payments between the fund and another party. Net cash payments are exchanged at specified intervals and are recorded as a realized gain or loss in the Statement of Operations. The value of the swap is adjusted daily and the change in value, including accruals of periodic amounts of interest to be paid or received, is recorded as unrealized appreciation or depreciation in the Statement of Operations. Amounts paid or received at the inception of the swap are reflected as premiums paid or received on the Statement of Assets and Liabilities and are amortized using the effective interest method over the term of the agreement. A liquidation payment received or made upon early termination is recorded as a realized gain or loss in the Statement of Operations. Collateral, in the form of cash or securities, may be required to be held in segregated accounts with the fund’s custodian in connection with these agreements. Risk of loss may exceed amounts recognized on the Statement of Assets and Liabilities. These risks include the possible lack of a liquid market, failure of the counterparty to perform under the terms of the agreements, and unfavorable market and interest rate movements of the underlying instrument.
The fund may hold credit default swaps in which one party makes a stream of payments based on a fixed percentage applied to the notional amount to another party in exchange for the right to receive a specified return in the event of a default by a third party, such as a corporate issuer or foreign issuer, on its obligation. The fund may enter into credit default swaps to limit or to reduce its risk exposure to defaults of corporate and sovereign issuers or to create direct or synthetic short or long exposure to corporate debt securities or certain sovereign debt securities to which it is not otherwise exposed.
38
Notes to Financial Statements – continued
Hybrid Instruments – The fund may invest in indexed or hybrid securities on which any combination of interest payments, the principal or stated amount payable at maturity is determined by reference to prices of other securities, currencies, indexes, economic factors or other measures, including interest rates, currency exchange rates, or securities indices. The risks of investing in hybrid instruments reflect a combination of the risks of investing in securities, swaps, options, futures and currencies. Hybrid instruments are potentially more volatile and carry greater market risks than traditional debt instruments. Depending on the structure of the particular hybrid instrument, changes in a benchmark, underlying assets or economic indicator may be magnified by the terms of the hybrid instrument and have an even more dramatic and substantial effect upon the value of the hybrid instrument. Also, the prices of the hybrid instrument and the benchmark, underlying asset or economic indicator may not move in the same direction or at the same time.
Loans and Other Direct Debt Instruments – The fund may invest in loans and loan participations or other receivables. These investments may include standby financing commitments, including revolving credit facilities, which obligate the fund to supply additional cash to the borrower on demand. At October 31, 2008, the portfolio had unfunded loan commitments of $104,205, which could be extended at the option of the borrower and which are covered by sufficient cash and/or liquid securities held by the fund. The market value and obligation of the fund on these unfunded loan commitments is included in Investments, at value and Payable for investments purchased, respectively, on the Statement of Assets and Liabilities. Loan participations involve a risk of insolvency of the lending bank or other financial intermediary.
Indemnifications – Under the fund’s organizational documents, its officers and trustees may be indemnified against certain liabilities and expenses arising out of the performance of their duties to the fund. Additionally, in the normal course of business, the fund enters into agreements with service providers that may contain indemnification clauses. The fund’s maximum exposure under these agreements is unknown as this would involve future claims that may be made against the fund that have not yet occurred.
Investment Transactions and Income – Investment transactions are recorded on the trade date. Interest income is recorded on the accrual basis. All premium and discount is amortized or accreted for financial statement purposes in accordance with U.S. generally accepted accounting principles. The fund earns certain fees in connection with its floating rate loan purchasing activities. These fees are in addition to interest payments earned and may include amendment fees, commitment fees, facility fees, consent fees, and prepayment fees. Commitment fees are recorded on an accrual basis as income in the accompanying financial statements. Dividends received in cash are
39
Notes to Financial Statements – continued
recorded on the ex-dividend date. Certain dividends from foreign securities will be recorded when the fund is informed of the dividend if such information is obtained subsequent to the ex-dividend date. Dividend and interest payments received in additional securities are recorded on the ex-dividend or ex-interest date in an amount equal to the value of the security on such date.
The fund may receive proceeds from litigation settlements. Any proceeds received from litigation involving portfolio holdings are reflected in the Statement of Operations in realized gain/loss if the security has been disposed of by the fund or in unrealized gain/loss if the security is still held by the fund. Any other proceeds from litigation not related to portfolio holdings are reflected as other income in the Statement of Operations.
Fees Paid Indirectly – The fund’s custody fee may be reduced according to an arrangement that measures the value of cash deposited with the custodian by the fund. For the year ended October 31, 2008, custody fees were not reduced.
Tax Matters and Distributions – The fund intends to qualify as a regulated investment company, as defined under Subchapter M of the Internal Revenue Code, and to distribute all of its taxable income, including realized capital gains. As a result, no provision for federal income tax is required. The fund adopted the provisions of FASB Interpretation No. 48, Accounting for Uncertainty in Income Taxes (“the Interpretation”) on the first day of the fund’s fiscal year. The Interpretation prescribes a minimum threshold for financial statement recognition of the benefit of a tax position taken or expected to be taken in a tax return. There was no impact resulting from the adoption of this Interpretation on the fund’s financial statements. Each of the fund’s federal tax returns for the prior three fiscal years remains subject to examination by the Internal Revenue Service. Foreign taxes, if any, have been accrued by the fund in the accompanying financial statements.
Distributions to shareholders are recorded on the ex-dividend date. Income and capital gain distributions are determined in accordance with income tax regulations, which may differ from U.S. generally accepted accounting principles. Certain capital accounts in the financial statements are periodically adjusted for permanent differences in order to reflect their tax character. These adjustments have no impact on net assets or net asset value per share. Temporary differences which arise from recognizing certain items of income, expense, gain or loss in different periods for financial statement and tax purposes will reverse at some time in the future. Distributions in excess of net investment income or net realized gains are temporary overdistributions for financial statement purposes resulting from differences in the recognition or classification of income or distributions for financial statement and tax purposes.
40
Notes to Financial Statements – continued
Book/tax differences primarily relate to expiration of capital loss carryforwards, derivative transactions, amortization and accretion of debt securities, straddle loss deferrals, and foreign currency transactions.
The tax character of distributions declared to shareholders for the last two fiscal years is as follows:
| | | | |
| | | 10/31/08 | | 10/31/07 |
| Ordinary income (including any short-term capital gains) | | $15,352,280 | | $16,751,237 |
The federal tax cost and the tax basis components of distributable earnings were as follows:
| | | |
| As of 10/31/08 | | | |
| Cost of investments | | $253,350,491 | |
| Gross appreciation | | 1,324,032 | |
| Gross depreciation | | (49,223,072 | ) |
| Net unrealized appreciation (depreciation) | | $(47,899,040 | ) |
| Undistributed ordinary income | | 6,928,678 | |
| Capital loss carryforwards | | (55,530,826 | ) |
| Other temporary differences | | (2,116,399 | ) |
As of October 31, 2008, the fund had capital loss carryforwards available to offset future realized gains. Such losses expire as follows:
| | | |
| 10/31/09 | | $(17,590,678 | ) |
| 10/31/10 | | (28,105,973 | ) |
| 10/31/14 | | (3,352,139 | ) |
| 10/31/16 | | (6,482,036 | ) |
| | $(55,530,826 | ) |
Multiple Classes of Shares of Beneficial Interest – The fund offers multiple classes of shares, which differ in their respective distribution and service fees. The fund’s income and common expenses are allocated to shareholders based on the value of settled shares outstanding of each class. The fund’s realized and unrealized gain (loss) are allocated to shareholders based on the daily net assets of each class. Dividends are declared separately for each class. Differences in per share dividend rates are generally due to differences in separate class expenses. Class B shares will convert to Class A shares approximately eight years after purchase.
| (3) | | Transactions with Affiliates |
Investment Adviser – The fund has an investment advisory agreement with Massachusetts Financial Services Company (MFS) to provide overall investment management and related administrative services and facilities to the fund. The management fee is computed daily and paid monthly at an annual rate of 0.65% of the fund’s average daily net assets. As part of a settlement agreement with the New York Attorney General concerning market
41
Notes to Financial Statements – continued
timing and related matters, MFS has agreed to reduce the management fee to 0.40% of the fund’s average daily net assets for the period March 1, 2004 through February 28, 2009. For the year ended October 31, 2008, this waiver amounted to $642,575 and is reflected as a reduction of total expenses in the Statement of Operations. The management fee incurred for the year ended October 31, 2008 was equivalent to an annual effective rate of 0.40% of the fund’s average daily net assets.
The investment adviser has agreed in writing to pay a portion of the fund’s operating expenses, exclusive of management fee, distribution and service fees, interest, taxes, extraordinary expenses, brokerage and transaction costs and investment-related expenses, such that operating expenses do not exceed 0.08% annually of the fund’s average daily net assets. This written agreement will continue until modified by the fund’s Board of Trustees, but such agreements will continue at least until February 28, 2009. For the year ended October 31, 2008, this reduction amounted to $524,930 and is reflected as a reduction of total expenses in the Statement of Operations.
Distributor – MFS Fund Distributors, Inc. (MFD), a wholly-owned subsidiary of MFS, as distributor, received $28,961 for the year ended October 31, 2008, as its portion of the initial sales charge on sales of Class A shares of the fund.
The Board of Trustees has adopted a distribution plan for certain class shares pursuant to Rule 12b-1 of the Investment Company Act of 1940.
The fund’s distribution plan provides that the fund will pay MFD for services provided by MFD and financial intermediaries in connection with the distribution and servicing of certain share classes. One component of the plan is a distribution fee paid to MFD and another component of the plan is a service fee paid to MFD. MFD may subsequently pay all, or a portion, of the distribution and/or service fees to financial intermediaries.
Distribution Plan Fee Table:
| | | | | | | | | | |
| | | Distribution
Fee Rate | | Service
Fee Rate | | Total
Distribution
Plan (d) | | Annual
Effective
Rate (e) | | Distribution
and Service
Fee |
| Class A | | 0.10% | | 0.25% | | 0.35% | | 0.35% | | $613,095 |
| Class B | | 0.75% | | 0.25% | | 1.00% | | 1.00% | | 508,232 |
| Class C | | 0.75% | | 0.25% | | 1.00% | | 1.00% | | 287,977 |
| Total Distribution and Service Fees | | | | | | $1,409,304 |
| (d) | In accordance with the distribution plan for certain classes, the fund pays distribution and/or service fees up to these annual percentage rates of each class’ average daily net assets. |
| (e) | The annual effective rates represent actual fees incurred under the distribution plan for the year ended October 31, 2008 based on each class’ average daily net assets. Assets attributable to Class A shares sold prior to May 14, 1991 are subject to a service fee of 0.15% annually. |
Certain Class A shares purchased prior to September 1, 2008 are subject to a contingent deferred sales charge (CDSC) in the event of a shareholder
42
Notes to Financial Statements – continued
redemption within 12 months of purchase. Certain Class A shares purchased on or subsequent to September 1, 2008 are subject to a CDSC in the event of a shareholder redemption within 24 months of purchase. Class C shares are subject to a CDSC in the event of a shareholder redemption within 12 months of purchase. Class B shares are subject to a CDSC in the event of a shareholder redemption within six years of purchase. All contingent deferred sales charges are paid to MFD and during the year ended October 31, 2008, were as follows:
| | |
| | | Amount |
| Class A | | $107 |
| Class B | | 69,350 |
| Class C | | 8,353 |
Shareholder Servicing Agent – MFS Service Center, Inc. (MFSC), a wholly-owned subsidiary of MFS, receives a fee from the fund for its services as shareholder servicing agent calculated as a percentage of the average daily net assets of the fund as determined periodically under the supervision of the fund’s Board of Trustees. For the year ended October 31, 2008, the fee was $220,775, which equated to 0.0860% annually of the fund’s average daily net assets. MFSC also receives payment from the fund for out-of-pocket expenses, sub-accounting and other shareholder servicing costs which may be paid to affiliated and unaffiliated service providers. For the year ended October 31, 2008, these out-of-pocket expenses, sub-accounting and other shareholder servicing costs amounted to $208,109.
Administrator – MFS provides certain financial, legal, shareholder communications, compliance, and other administrative services to the fund. Under an administrative services agreement, the fund partially reimburses MFS the costs incurred to provide these services. The fund is charged a fixed amount plus a fee based on average daily net assets. The fund’s annual fixed amount is $17,500.
The administrative services fee incurred for the year ended October 31, 2008 was equivalent to an annual effective rate of 0.0175% of the fund’s average daily net assets.
Trustees’ and Officers’ Compensation – The fund pays compensation to independent trustees in the form of a retainer, attendance fees, and additional compensation to Board and Committee chairpersons. The fund does not pay compensation directly to trustees or officers of the fund who are also officers of the investment adviser, all of whom receive remuneration for their services to the fund from MFS. Certain officers and trustees of the fund are officers or directors of MFS, MFD, and MFSC.
The fund has an unfunded, defined benefit plan for certain retired independent trustees which resulted in a pension expense of $1,858. The fund also has an unfunded retirement benefit deferral plan for certain independent
43
Notes to Financial Statements – continued
trustees which resulted in a net decrease in expense of $992. Both amounts are included in independent trustees’ compensation for the year ended October 31, 2008. The liability for deferred retirement benefits payable to certain independent trustees under both plans amounted to $42,473 at October 31, 2008, and is included in payable for independent trustees’ compensation.
Other – This fund and certain other MFS funds (the funds) have entered into services agreements (the Agreements) which provide for payment of fees by the funds to Tarantino LLC and Griffin Compliance LLC in return for the provision of services of an Independent Chief Compliance Officer (ICCO) and Assistant ICCO, respectively, for the funds. The ICCO and Assistant ICCO are officers of the funds and the sole members of Tarantino LLC and Griffin Compliance LLC, respectively. The funds can terminate the Agreements with Tarantino LLC and Griffin Compliance LLC at any time under the terms of the Agreements. For the year ended October 31, 2008, the aggregate fees paid by the fund to Tarantino LLC and Griffin Compliance LLC were $2,014 and are included in miscellaneous expense on the Statement of Operations. MFS has agreed to reimburse the fund for a portion of the payments made by the fund in the amount of $1,340, which is shown as a reduction of total expenses in the Statement of Operations. Additionally, MFS has agreed to bear all expenses associated with office space, other administrative support, and supplies provided to the ICCO and Assistant ICCO.
The fund may invest in a money market fund managed by MFS which seeks a high level of current income consistent with preservation of capital and liquidity. Income earned on this investment is included in dividends from underlying funds on the Statement of Operations. This money market fund does not pay a management fee to MFS.
Purchases and sales of investments, other than U.S. Government securities, purchased option transactions, and short-term obligations, aggregated $106,954,264 and $130,455,969, respectively.
| (5) | | Shares of Beneficial Interest |
The fund’s Declaration of Trust permits the Trustees to issue an unlimited number of full and fractional shares of beneficial interest. Transactions in fund shares were as follows:
| | | | | | | | |
| | | Year ended
10/31/08 | | Year ended
10/31/07 |
| | | Shares | | Amount | | Shares | | Amount |
| Shares sold | | | | | | | | |
Class A | | 5,841,720 | | $37,206,742 | | 6,784,277 | | $45,519,352 |
Class B | | 1,636,436 | | 10,305,020 | | 1,657,912 | | 11,002,247 |
Class C | | 1,159,339 | | 7,264,892 | | 1,143,624 | | 7,569,074 |
Class I | | 47,188 | | 301,734 | | 1,311,765 | | 8,809,457 |
| | 8,684,683 | | $55,078,388 | | 10,897,578 | | $72,900,130 |
44
Notes to Financial Statements – continued
| | | | | | | | | | | | |
| | | Year ended
10/31/08 | | | Year ended
10/31/07 | |
| | | Shares | | | Amount | | | Shares | | | Amount | |
| Shares issued to shareholders in reinvestment of distributions | | | | | | | | | | | | |
Class A | | 1,294,126 | | | $8,184,249 | | | 1,225,746 | | | $8,216,066 | |
Class B | | 291,019 | | | 1,825,756 | | | 348,575 | | | 2,311,745 | |
Class C | | 167,516 | | | 1,043,896 | | | 159,119 | | | 1,049,920 | |
Class I | | 22,606 | | | 142,928 | | | 114,102 | | | 765,954 | |
| | 1,775,267 | | | $11,196,829 | | | 1,847,542 | | | $12,343,685 | |
| Shares reacquired | | | | | | | | | | | | |
Class A | | (7,794,082 | ) | | $(49,466,698 | ) | | (9,248,229 | ) | | $(62,024,583 | ) |
Class B | | (3,808,122 | ) | | (24,017,068 | ) | | (4,645,331 | ) | | (30,814,004 | ) |
Class C | | (1,567,613 | ) | | (9,652,268 | ) | | (1,205,471 | ) | | (7,936,261 | ) |
Class I | | (129,307 | ) | | (799,383 | ) | | (3,209,631 | ) | | (21,329,111 | ) |
| | (13,299,124 | ) | | $(83,935,417 | ) | | (18,308,662 | ) | | $(122,103,959 | ) |
| Net change | | | | | | | | | | | | |
Class A | | (658,236 | ) | | $(4,075,707 | ) | | (1,238,206 | ) | | $(8,289,165 | ) |
Class B | | (1,880,667 | ) | | (11,886,292 | ) | | (2,638,844 | ) | | (17,500,012 | ) |
Class C | | (240,758 | ) | | (1,343,480 | ) | | 97,272 | | | 682,733 | |
Class I | | (59,513 | ) | | (354,721 | ) | | (1,783,764 | ) | | (11,753,700 | ) |
| | (2,839,174 | ) | | $(17,660,200 | ) | | (5,563,542 | ) | | $(36,860,144 | ) |
The fund and other funds managed by MFS participate in a $1 billion unsecured committed line of credit provided by a syndication of banks under a credit agreement. In addition, the fund and other funds managed by MFS have established uncommitted borrowing arrangements with certain banks. Borrowings may be made for temporary financing needs. Interest is charged to each fund, based on its borrowings, generally at a rate equal to the Federal Reserve funds rate plus 0.30%. In addition, a commitment fee, based on the average daily, unused portion of the committed line of credit, is allocated among the participating funds at the end of each calendar quarter. For the year ended October 31, 2008, the fund’s commitment fee and interest expense were $1,148 and $0, respectively, and are included in miscellaneous expense on the Statement of Operations.
45
Notes to Financial Statements – continued
| (7) | | Transactions in Underlying Funds-Affiliated Issuers |
An affiliated issuer may be considered one in which the fund owns 5% or more of the outstanding voting securities, or a company which is under common control. For the purposes of this report, the fund assumes the following to be affiliated issuers:
| | | | | | | | |
| Underlying Funds | | Beginning
Shares/Par
Amount | | Acquisitions
Shares/Par
Amount | | Dispositions
Shares/Par
Amount | | Ending
Shares/Par
Amount |
MFS Institutional Money
Market Portfolio | | — | | 94,441,898 | | 75,293,748 | | 19,148,150 |
| | | | |
| Underlying Funds | | Realized
Gain (Loss) | | Capital Gain
Distributions | | Dividend
Income | | Ending
Value |
MFS Institutional Money
Market Portfolio | | $— | | $— | | $456,139 | | $19,148,150 |
46
REPORT OF INDEPENDENT REGISTERED
PUBLIC ACCOUNTING FIRM
To the Trustees of MFS Series Trust VIII and Shareholders of MFS Strategic Income Fund:
We have audited the accompanying statement of assets and liabilities of MFS Strategic Income Fund (the Fund), (one of the portfolios comprising MFS Series Trust VIII), including the portfolio of investments, as of October 31, 2008, and the related statement of operations for the year then ended, the statements of changes in net assets for each of the two years in the period then ended, and the financial highlights for each of the five years in the period then ended. These financial statements and financial highlights are the responsibility of the Fund’s management. Our responsibility is to express an opinion on these financial statements and financial highlights based on our audits.
We conducted our audits in accordance with the standards of the Public Company Accounting Oversight Board (United States). Those standards require that we plan and perform the audit to obtain reasonable assurance about whether the financial statements and financial highlights are free of material misstatement. We were not engaged to perform an audit of the Fund’s internal control over financial reporting. Our audits included consideration of internal control over financial reporting as a basis for designing audit procedures that are appropriate in the circumstances, but not for the purpose of expressing an opinion on the effectiveness of the Fund’s internal control over financial reporting. Accordingly, we express no such opinion. An audit also includes examining, on a test basis, evidence supporting the amounts and disclosures in the financial statements and financial highlights, assessing the accounting principles used and significant estimates made by management, and evaluating the overall financial statement presentation. Our procedures included confirmation of securities owned as of October 31, 2008, by correspondence with the Fund’s custodian and brokers or by other appropriate auditing procedures where replies from brokers were not received. We believe that our audits provide a reasonable basis for our opinion.
In our opinion, the financial statements and financial highlights referred to above present fairly, in all material respects, the financial position of MFS Strategic Income Fund at October 31, 2008, the results of its operations for the year then ended, the changes in its net assets for each of the two years in the period then ended, and its financial highlights for each of the five years in the period then ended, in conformity with U.S. generally accepted accounting principles.

Boston, Massachusetts
December 17, 2008
47
TRUSTEES AND OFFICERS — IDENTIFICATION AND BACKGROUND
The Trustees and officers of the Trust, as of December 1, 2008, are listed below, together with their principal occupations during the past five years. (Their titles may have varied during that period.) The address of each Trustee and officer is 500 Boylston Street, Boston, Massachusetts 02116.
| | | | | | |
Name, Date of Birth | | Position(s) Held
with Fund | | Trustee/Officer
Since (h) | | Principal Occupations During
the Past Five Years & Other
Directorships (j) |
| INTERESTED TRUSTEES | | | | |
Robert J. Manning (k)
(born 10/20/63) | | Trustee | | February 2004 | | Massachusetts Financial Services Company, Chief Executive Officer, President, Chief Investment Officer and Director |
Robert C. Pozen (k)
(born 8/08/46) | | Trustee | | February 2004 | | Massachusetts Financial Services Company, Chairman (since February 2004); Harvard Business School (education), Senior Lecturer (since 2008); Bell Canada Enterprises (telecommunications), Director (since March 2002); The Bank of New York, Director (finance), (March 2004 to May 2005); The Commonwealth of Massachusetts, Secretary of Economic Affairs (January 2002 to December 2002); Fidelity Investments, (investment advisor), Vice Chairman (until December 2001); Fidelity Management & Research Company (investment adviser), President (until July 2001); Telesat (satellite communications), Director (until November 2007) |
| INDEPENDENT TRUSTEES | | | | |
J. Atwood Ives
(born 5/01/36) | | Trustee and Chair of Trustees | | February 1992 | | Private investor; KeySpan Corporation (energy related services), Director until 2004; Woodstock Corporation (investment advisory firm), Director until 2003 |
Robert E. Butler (n)
(born 11/29/41) | | Trustee | | January 2006 | | Consultant – regulatory and compliance matters (since July 2002); PricewaterhouseCoopers LLP (professional services firm), Partner (until 2002) |
48
Trustees and Officers – continued
| | | | | | |
Name, Date of Birth | | Position(s) Held
with Fund | | Trustee/Officer
Since (h) | | Principal Occupations During
the Past Five Years & Other
Directorships (j) |
Lawrence H. Cohn, M.D.
(born 3/11/37) | | Trustee | | August 1993 | | Brigham and Women’s Hospital, Senior Cardiac Surgeon (since 2005); Harvard Medical School, Professor of Cardiac Surgery; Partners HealthCare, Physician Director of Medical Device Technology (since 2006); Brigham and Women’s Hospital, Chief of Cardiac Surgery (until 2005) |
David H. Gunning
(born 5/30/42) | | Trustee | | January 2004 | | Retired; Cleveland-Cliffs Inc. (mining products and service provider), Vice Chairman/Director (until May 2007); Lincoln Electric Holdings, Inc. (welding equipment manufacturer), Director; Development Alternatives, Inc. (consulting), Director/Non Executive Chairman; Portman Limited (mining), Director (since 2005); Southwest Gas Corp. (natural gas distribution), Director (until May 2004) |
William R. Gutow
(born 9/27/41) | | Trustee | | December 1993 | | Private investor and real estate consultant; Capital Entertainment Management Company (video franchise), Vice Chairman; Texas Donuts (donut franchise), Vice Chairman (since 2007); Atlantic Coast Tan (tanning salons), Vice Chairman (until 2007) |
Michael Hegarty
(born 12/21/44) | | Trustee | | December 2004 | | Retired; AXA Financial (financial services and insurance), Vice Chairman and Chief Operating Officer (until 2001); The Equitable Life Assurance Society (insurance), President and Chief Operating Officer (until 2001) |
Lawrence T. Perera
(born 6/23/35) | | Trustee | | July 1981 | | Hemenway & Barnes (attorneys), Counsel |
J. Dale Sherratt
(born 9/23/38) | | Trustee | | August 1993 | | Insight Resources, Inc. (acquisition planning specialists), President; Wellfleet Investments (investor in health care companies), Managing General Partner |
49
Trustees and Officers – continued
| | | | | | |
Name, Date of Birth | | Position(s) Held
with Fund | | Trustee/Officer
Since (h) | | Principal Occupations During
the Past Five Years & Other
Directorships (j) |
Laurie J. Thomsen
(born 8/05/57) | | Trustee | | March 2005 | | New Profit, Inc. (venture philanthropy), Partner (since 2006); Private investor; Prism Venture Partners (venture capital), Co-founder and General Partner (until June 2004); The Travelers Companies (commercial property liability insurance), Director |
Robert W. Uek
(born 5/18/41) | | Trustee | | January 2006 | | Consultant to investment company industry; PricewaterhouseCoopers LLP (professional services firm), Partner (until 1999); TT International Funds (mutual fund complex), Trustee (until 2005); Hillview Investment Trust II Funds (mutual fund complex), Trustee (until 2005) |
| OFFICERS | | | | | | |
Maria F. Dwyer (k)
(born 12/01/58) | | President | | November 2005 | | Massachusetts Financial Services Company, Executive Vice President and Chief Regulatory Officer (since March 2004) Chief Compliance Officer (since December 2006); Fidelity Management & Research Company, Vice President (prior to March 2004); Fidelity Group of Funds, President and Treasurer (until March 2004) |
Christopher R. Bohane (k)
(born 1/18/74) | | Assistant Secretary and Assistant Clerk | | July 2005 | | Massachusetts Financial Services Company, Vice President and Senior Counsel |
John M. Corcoran (k)
(born 4/13/65) | | Treasurer | | October 2008 | | Massachusetts Financial Services Company, Senior Vice President (since October 2008); State Street Bank and Trust (financial services provider), Senior Vice President, (until September 2008) |
Ethan D. Corey (k)
(born 11/21/63) | | Assistant Secretary and Assistant Clerk | | July 2005 | | Massachusetts Financial Services Company, Senior Vice President and Associate General Counsel (since 2004); Dechert LLP (law firm), Counsel (prior to December 2004) |
50
Trustees and Officers – continued
| | | | | | |
Name, Date of Birth | | Position(s) Held
with Fund | | Trustee/Officer
Since (h) | | Principal Occupations During
the Past Five Years & Other
Directorships (j) |
David L. DiLorenzo (k)
(born 8/10/68) | | Assistant Treasurer | | July 2005 | | Massachusetts Financial Services Company, Vice President (since June 2005); JP Morgan Investor Services, Vice President (until June 2005) |
Timothy M. Fagan (k)
(born 7/10/68) | | Assistant Secretary and Assistant Clerk | | September 2005 | | Massachusetts Financial Services Company, Vice President and Senior Counsel (since September 2005); John Hancock Advisers, LLC, Vice President, Senior Attorney and Chief Compliance Officer (until August 2005) |
Mark D. Fischer (k)
(born 10/27/70) | | Assistant Treasurer | | July 2005 | | Massachusetts Financial Services Company, Vice President (since May 2005); JP Morgan Investment Management Company, Vice President (until May 2005) |
Robyn L. Griffin
(born 7/04/75) | | Assistant Independent Chief Compliance Officer | | August 1, 2008 | | Griffin Compliance LLC (provider of compliance services), Principal (since August 2008); State Street Corporation (financial services provider), Mutual Fund Administration Assistant Director (October 2006 – July 2008); Liberty Mutual Group (insurance), Personal Market Assistant Controller (April 2006 – October 2006); Deloitte & Touche LLP (professional services firm), Senior Manager (prior to April 2006) |
Brian E. Langenfeld (k)
(born 3/07/73) | | Assistant Secretary and Assistant Clerk | | June 2006 | | Massachusetts Financial Services Company, Vice President and Senior Counsel (since May 2006); John Hancock Advisers, LLC, Assistant Vice President and Counsel (until April 2006) |
Ellen Moynihan (k)
(born 11/13/57) | | Assistant Treasurer | | April 1997 | | Massachusetts Financial Services Company, Senior Vice President |
Susan S. Newton (k)
(born 3/07/50) | | Assistant Secretary and Assistant Clerk | | May 2005 | | Massachusetts Financial Services Company, Senior Vice President and Associate General Counsel (since April 2005); John Hancock Advisers, LLC, Senior Vice President, Secretary and Chief Legal Officer (until April 2005) |
51
Trustees and Officers – continued
| | | | | | |
Name, Date of Birth | | Position(s) Held
with Fund | | Trustee/Officer
Since (h) | | Principal Occupations During
the Past Five Years & Other
Directorships (j) |
Susan A. Pereira (k)
(born 11/05/70) | | Assistant Secretary and Assistant Clerk | | July 2005 | | Massachusetts Financial Services Company, Vice President and Senior Counsel (since June 2004); Bingham McCutchen LLP (law firm), Associate (until June 2004) |
Mark N. Polebaum (k)
(born 5/01/52) | | Secretary and Clerk | | January 2006 | | Massachusetts Financial Services Company, Executive Vice President, General Counsel and Secretary (since January 2006); Wilmer Cutler Pickering Hale and Dorr LLP (law firm), Partner (until January 2006) |
Frank L. Tarantino
(born 3/07/44) | | Independent Chief Compliance Officer | | June 2004 | | Tarantino LLC (provider of compliance services), Principal (since June 2004); CRA Business Strategies Group (consulting services), Executive Vice President (until June 2004) |
Richard S. Weiztel (k)
(born 7/16/70) | | Assistant Secretary and Assistant Clerk | | October 2007 | | Massachusetts Financial Services Company, Vice President and Assistant General Counsel (since 2004); Massachusetts Department of Business and Technology, General Counsel (until April 2004) |
James O. Yost (k)
(born 6/12/60) | | Assistant Treasurer | | September 1990 | | Massachusetts Financial Services Company, Senior Vice President |
| (h) | Date first appointed to serve as Trustee/officer of an MFS fund. Each Trustee has served continuously since appointment unless indicated otherwise. For the period from December 15, 2004 until February 22, 2005, Messrs. Pozen and Manning served as Advisory Trustees. For the period March 2008 until October 2008, Ms. Dwyer served as Treasurer of the Funds. |
| (j) | Directorships or trusteeships of companies required to report to the Securities and Exchange Commission (i.e., “public companies”). |
| (k) | “Interested person” of the Trust within the meaning of the Investment Company Act of 1940 (referred to as the 1940 Act), which is the principal federal law governing investment companies like the fund, as a result of position with MFS. The address of MFS is 500 Boylston Street, Boston, Massachusetts 02116. |
| (n) | In 2004 and 2005, Mr. Butler provided consulting services to the independent compliance consultant retained by MFS pursuant to its settlement with the SEC concerning market timing and related matters. The terms of that settlement required that compensation and expenses related to the independent compliance consultant be borne exclusively by MFS and, therefore, MFS paid Mr. Butler for the services he rendered to the independent compliance consultant. In 2004 and 2005, MFS paid Mr. Butler a total of $351,119.29. |
Each Trustee (except Mr. Butler and Mr. Uek) has been elected by shareholders and each Trustee and officer holds office until his or her successor is chosen and qualified or until his or her earlier death, resignation, retirement or
52
Trustees and Officers – continued
removal. The Trust held a shareholders’ meeting in 2005 to elect Trustees, and will hold a shareholders’ meeting at least once every five years thereafter, to elect Trustees. Messrs. Butler, Sherratt, Gutow, Uek and Ms. Thomsen are members of the Trust’s Audit Committee.
Each of the Fund’s Trustees and officers holds comparable positions with certain other funds of which MFS or a subsidiary is the investment adviser or distributor, and, in the case of the officers, with certain affiliates of MFS. As of January 1, 2008, the Trustees served as board members of 100 funds within the MFS Family of Funds.
The Statement of Additional Information for the Fund and further information about the Trustees are available without charge upon request by calling 1-800-225-2606.
| | |
| Investment Adviser | | Custodian |
Massachusetts Financial Services Company
500 Boylston Street, Boston, MA 02116-3741 | | JPMorgan Chase Bank One Chase Manhattan Plaza, New York, NY 10081 |
| Distributor | | Independent Registered Public Accounting Firm |
MFS Fund Distributors, Inc.
500 Boylston Street, Boston, MA 02116-3741 | | Ernst & Young LLP
200 Clarendon Street, Boston, MA 02116 |
| Portfolio Managers | | |
John Addeo James Calmas Robert Persons Matthew Ryan Erik Weisman | | |
53
BOARD REVIEW OF INVESTMENT ADVISORY AGREEMENT
The Investment Company Act of 1940 requires that both the full Board of Trustees and a majority of the non-interested (“independent”) Trustees, voting separately, annually approve the continuation of the Fund’s investment advisory agreement with MFS. The Trustees consider matters bearing on the Fund and its advisory arrangements at their meetings throughout the year, including a review of performance data at each regular meeting. In addition, the independent Trustees met several times over the course of three months beginning in May and ending in July, 2008 (“contract review meetings”) for the specific purpose of considering whether to approve the continuation of the investment advisory agreement for the Fund and the other investment companies that the Board oversees (the “MFS Funds”). The independent Trustees were assisted in their evaluation of the Fund’s investment advisory agreement by independent legal counsel, from whom they received separate legal advice and with whom they met separately from MFS during various contract review meetings. The independent Trustees were also assisted in this process by the MFS Funds’ Independent Chief Compliance Officer, a full-time senior officer appointed by and reporting to the independent Trustees.
In connection with their deliberations regarding the continuation of the investment advisory agreement, the Trustees, including the independent Trustees, considered such information and factors as they believed, in light of the legal advice furnished to them and their own business judgment, to be relevant. The investment advisory agreement for the Fund was considered separately, although the Trustees also took into account the common interests of all MFS Funds in their review. As described below, the Trustees considered the nature, quality, and extent of the various investment advisory, administrative, and shareholder services performed by MFS under the existing investment advisory agreement and other arrangements with the Fund.
In connection with their contract review meetings, the Trustees received and relied upon materials that included, among other items: (i) information provided by Lipper Inc., an independent third party, on the investment performance of the Fund for various time periods ended December 31, 2007 and the investment performance of a group of funds with substantially similar investment classifications/objectives (the “Lipper performance universe”), (ii) information provided by Lipper Inc. on the Fund’s advisory fees and other expenses and the advisory fees and other expenses of comparable funds identified by Lipper Inc. (the “Lipper expense group”), (iii) information provided by MFS on the advisory fees of comparable portfolios of other clients of MFS, including institutional separate accounts and other clients, (iv) information as to whether and to what extent applicable expense waivers,
54
Board Review of Investment Advisory Agreement – continued
reimbursements or fee “breakpoints” are observed for the Fund, (v) information regarding MFS’ financial results and financial condition, including MFS’ and certain of its affiliates’ estimated profitability from services performed for the Fund and the MFS Funds as a whole, (vi) MFS’ views regarding the outlook for the mutual fund industry and the strategic business plans of MFS, (vii) descriptions of various functions performed by MFS for the Funds, such as compliance monitoring and portfolio trading practices, and (viii) information regarding the overall organization of MFS, including information about MFS’ senior management and other personnel providing investment advisory, administrative and other services to the Fund and the other MFS Funds. The comparative performance, fee and expense information prepared and provided by Lipper Inc. was not independently verified and the independent Trustees did not independently verify any information provided to them by MFS.
The Trustees’ conclusion as to the continuation of the investment advisory agreement was based on a comprehensive consideration of all information provided to the Trustees and not the result of any single factor. Some of the factors that figured particularly in the Trustees’ deliberations are described below, although individual Trustees may have evaluated the information presented differently from one another, giving different weights to various factors. It is also important to recognize that the fee arrangements for the Fund and other MFS Funds are the result of years of review and discussion between the independent Trustees and MFS, that certain aspects of such arrangements may receive greater scrutiny in some years than in others, and that the Trustees’ conclusions may be based, in part, on their consideration of these same arrangements during the course of the year and in prior years.
Based on information provided by Lipper Inc. and MFS, the Trustees reviewed the Fund’s total return investment performance as well as the performance of peer groups of funds over various time periods. The Trustees placed particular emphasis on the total return performance of the Fund’s Class A shares in comparison to the performance of funds in its Lipper performance universe over the three-year period ended December 31, 2007, which the Trustees believed was a long enough period to reflect differing market conditions. The total return performance of the Fund’s Class A shares was in the 4th quintile relative to the other funds in the universe for this three-year period (the 1st quintile being the best performers and the 5th quintile being the worst performers). The total return performance of the Fund’s Class A shares was in the 4th quintile for each of the one and five-year periods ended December 31, 2007 relative to the Lipper performance universe. Because of the passage of time, these performance results may differ from the performance results for more recent periods, including those shown elsewhere in this report.
55
Board Review of Investment Advisory Agreement – continued
The Trustees expressed concern to MFS about the substandard investment performance of the Fund. In the course of their deliberations, the Trustees took into account information provided by MFS in connection with the contract review meetings, as well as during investment review meetings conducted with portfolio management personnel during the course of the year, as to MFS’ efforts to improve the Fund’s performance. In addition, the Trustees requested that they receive a separate update on the Fund’s performance at each of their regular meetings. After reviewing these and related factors, the Trustees concluded, within the context of their overall conclusions regarding the investment advisory agreement, that MFS’ responses and efforts and plans to improve investment performance were sufficient to support approval of the continuance of the investment advisory agreement for an additional one year period, but that they would continue to closely monitor the performance of the Fund.
In assessing the reasonableness of the Fund’s advisory fee, the Trustees considered, among other information, the Fund’s advisory fee and the total expense ratio of the Fund’s Class A shares as a percentage of average daily net assets and the advisory fee and total expense ratios of peer groups of funds based on information provided by Lipper Inc. The Trustees considered that MFS observes an advisory fee reduction that will remain in effect for the Fund through February 28, 2009 as part of MFS’ settlement with the New York Attorney General concerning market timing and related matters (the “NYAG Settlement”), and that MFS currently observes an expense limitation for the Fund. The Trustees also considered that, according to the Lipper data (which takes into account the advisory fee reduction and expense limitation), the Fund’s effective advisory fee rate and total expense ratio were each lower than the Lipper expense group median.
The Trustees also considered the advisory fees charged by MFS to institutional accounts. In comparing these fees, the Trustees considered information provided by MFS as to the generally broader scope of services provided by MFS to the Fund in comparison to institutional accounts, the higher demands placed on MFS’ investment personnel and trading infrastructure as a result of the daily cash in-flows and out-flows of the Fund, and the impact on MFS and expenses associated with the more extensive regulatory regime to which the Fund is subject in comparison to institutional accounts.
The Trustees also considered whether the Fund is likely to benefit from any economies of scale in the management of the Fund in the event of growth in assets of the Fund. They noted that the Fund’s advisory fee rate schedule is not currently subject to any breakpoints. Taking into account the advisory fee reduction and expense limitation noted above, the Trustees determined not to recommend any advisory fee breakpoints for the Fund at this time.
56
Board Review of Investment Advisory Agreement – continued
The Trustees also considered information prepared by MFS relating to MFS’ costs and profits with respect to the Fund, the MFS Funds considered as a group, and other investment companies and accounts advised by MFS, as well as MFS’ methodologies used to determine and allocate its costs to the MFS Funds, the Fund and other accounts and products for purposes of estimating profitability.
After reviewing these and other factors described herein, the Trustees concluded, within the context of their overall conclusions regarding the investment advisory agreement, that the advisory fees charged to the Fund represent reasonable compensation in light of the services being provided by MFS to the Fund.
In addition, the Trustees considered MFS’ resources and related efforts to continue to retain, attract and motivate capable personnel to serve the Fund. The Trustees also considered current and developing conditions in the financial services industry, including the entry into the industry of large and well-capitalized companies which are spending, and appear to be prepared to continue to spend, substantial sums to engage personnel and to provide services to competing investment companies. In this regard, the Trustees also considered the financial resources of MFS and its ultimate parent, Sun Life Financial Inc. The Trustees also considered the advantages and possible disadvantages to the Fund of having an adviser that also serves other investment companies as well as other accounts.
The Trustees also considered the nature, quality, cost, and extent of administrative, transfer agency, and distribution services provided to the Fund by MFS and its affiliates under agreements and plans other than the investment advisory agreement, including any 12b-1 fees the Fund pays to MFS Fund Distributors, Inc. (“MFD”), an affiliate of MFS. The Trustees also considered the nature, extent and quality of certain other services MFS performs or arranges for on the Fund’s behalf, which may include securities lending programs, directed expense payment programs, class action recovery programs, and MFS’ interaction with third-party service providers, principally custodians and sub-custodians. The Trustees concluded that the various non-advisory services provided by MFS and its affiliates on behalf of the Funds were satisfactory.
The Trustees also considered benefits to MFS from the use of the Fund’s portfolio brokerage commissions, if applicable, to pay for investment research and other similar services (excluding third-party research, for which MFS pays directly), and various other factors. Additionally, the Trustees considered so-called “fall-out benefits” to MFS such as reputational value derived from serving as investment manager to the Fund.
57
Board Review of Investment Advisory Agreement – continued
Based on their evaluation of factors that they deemed to be material, including those factors described above, the Board of Trustees, including a majority of the independent Trustees, concluded that the Fund’s investment advisory agreement with MFS should be continued for an additional one-year period, commencing August 1, 2008.
Note: The advisory fee reduction required by the NYAG Settlement with respect to the Fund will expire on February 28, 2009. At the time MFS entered into the NYAG Settlement, MFS also agreed with the Board that it would not eliminate such advisory fee reduction without the Board’s consent. Following discussions between MFS and the Board at the contract review meetings, MFS and the Board agreed that, effective March 1, 2009, the advisory fee reduction will be changed, resulting in an effective advisory fee rate of 0.60% of the Fund’s average daily net assets, and that, effective March 1, 2009, MFS will observe an expense limitation for the Fund, each of which may not be modified by MFS without the consent of the Board.
In addition, MFD has agreed to the Trustees’ recommendation to eliminate the distribution fee component of the 12b-1 fee paid by the Fund’s Class A shares, effective March 1, 2009.
A discussion regarding the Board’s most recent review and renewal of the fund’s Investment Advisory Agreement with MFS is available by clicking on the fund’s name under “Mutual Funds” in the “Products and Performance” section of the MFS Web site (mfs.com).
58
PROXY VOTING POLICIES AND INFORMATION
A general description of the MFS funds’ proxy voting policies and procedures is available without charge, upon request, by calling
1-800-225-2606, by visiting the Proxy Voting section of mfs.com or by visiting the SEC’s Web site at http://www.sec.gov.
Information regarding how the fund voted proxies relating to portfolio securities during the most recent twelve-month period ended June 30 is available without charge by visiting the Proxy Voting section of mfs.com or by visiting the SEC’s Web site at http://www.sec.gov.
QUARTERLY PORTFOLIO DISCLOSURE
The fund will file a complete schedule of portfolio holdings with the Securities and Exchange Commission (the Commission) for the first and third quarters of each fiscal year on Form N-Q. The fund’s Form N-Q may be reviewed and copied at the:
Public Reference Room
Securities and Exchange Commission
100 F Street, NE, Room 1580
Washington, D.C. 20549
Information on the operation of the Public Reference Room may be obtained by calling the Commission at 1-800-SEC-0330. The fund’s Form N-Q is available on the EDGAR database on the Commission’s Internet Web site at http://www.sec.gov, and copies of this information may be obtained, upon payment of a duplicating fee, by electronic request at the following e-mail address: publicinfo@sec.gov or by writing the Public Reference Section at the above address.
A shareholder can also obtain the quarterly portfolio holdings report at mfs.com.
FEDERAL TAX INFORMATION (unaudited)
The fund will notify shareholders of amounts for use in preparing 2008 income tax forms in January 2009.
59
MFS® PRIVACY NOTICE
Privacy is a concern for every investor today. At MFS Investment Management® and the MFS funds, we take this concern very seriously. We want you to understand our policies about the investment products and services that we offer, and how we protect the nonpublic personal information of investors who have a direct relationship with us and our wholly owned subsidiaries.
Throughout our business relationship, you provide us with personal information. We maintain information and records about you, your investments, and the services you use. Examples of the nonpublic personal information we maintain include
| | Ÿ | | data from investment applications and other forms |
| | Ÿ | | share balances and transactional history with us, our affiliates, or others |
| | Ÿ | | facts from a consumer reporting agency |
We do not disclose any nonpublic personal information about our customers or former customers to anyone, except as permitted by law. We may share nonpublic personal information with third parties or certain of our affiliates in connection with servicing your account or processing your transactions. We may share information with companies or financial institutions that perform marketing services on our behalf or with other financial institutions with which we have joint marketing arrangements, subject to any legal requirements.
Authorization to access your nonpublic personal information is limited to appropriate personnel who provide products, services, or information to you. We maintain physical, electronic, and procedural safeguards to help protect the personal information we collect about you.
If you have any questions about the MFS privacy policy, please call 1-800-225-2606 any business day between 8 a.m. and 8 p.m. Eastern time.
Note: If you own MFS products or receive MFS services in the name of a third party such as a bank or broker-dealer, their privacy policy may apply to you instead of ours.
60

CONTACT US
Web site
Mailing address
mfs.com
MFS Service Center, Inc.
P.O. Box 55824
MFS TALK
Boston, MA 02205-5824
1-800-637-8255
24 hours a day
Overnight mail
MFS Service Center, Inc.
Account service and
c/o Boston Financial Data Services
literature
30 Dan Road
Canton, MA 02021-2809
Shareholders
1-800-225-2606
8 a.m. to 8 p.m. Eastern time
Investment professionals
1-800-343-2829
8 a.m. to 8 p.m. Eastern time
Retirement plan services
1-800-637-1255
8 a.m. to 8 p.m. Eastern time
Go paperless with eDelivery: Arrange to have MFS® send prospectuses, reports, and proxies directly to your e-mail inbox. You’ll get timely information and less clutter in your mailbox (not to mention help your fund save printing and postage costs).
Sign up: If your account is registered with us, simply go to mfs.com, log in to your account via MFS® Access, and select the eDelivery sign-up options.
If you own your MFS fund shares through a financial institution or a retirement plan, MFS® TALK, MFS Access, and eDelivery may not be available to you.
MFS® INVESTMENT MANAGEMENT
The Registrant has adopted a Code of Ethics pursuant to Section 406 of the Sarbanes-Oxley Act and as defined in Form N-CSR that applies to the Registrant’s principal executive officer and principal financial and accounting officer. The Registrant has not amended any provision in its Code of Ethics (the “Code”) that relates to an element of the Code’s definitions enumerated in paragraph (b) of Item 2 of this Form N-CSR.
A copy of the Code of Ethics is filed as an exhibit to this Form N-CSR.
| ITEM 3. | AUDIT COMMITTEE FINANCIAL EXPERT. |
Messrs. Robert E. Butler and Robert W. Uek and Ms. Laurie J. Thomsen, members of the Audit Committee, have been determined by the Board of Trustees in their reasonable business judgment to meet the definition of “audit committee financial expert” as such term is defined in Form N-CSR. In addition, Messrs. Butler and Uek and Ms. Thomsen are “independent” members of the Audit Committee (as such term has been defined by the Securities and Exchange Commission in regulations implementing Section 407 of the Sarbanes-Oxley Act of 2002). The Securities and Exchange Commission has stated that the designation of a person as an audit committee financial expert pursuant to this Item 3 on the Form N-CSR does not impose on such a person any duties, obligations or liability that are greater than the duties, obligations or liability imposed on such person as a member of the Audit Committee and the Board of Trustees in the absence of such designation or identification.
| ITEM 4. | PRINCIPAL ACCOUNTANT FEES AND SERVICES. |
Items 4(a) through 4(d) and 4(g):
The Board of Trustees has appointed Deloitte & Touche LLP (“Deloitte”) to serve as independent accountants to certain series of the Registrant and Ernst & Young LLP (“E&Y”) to serve in the same capacity to certain other series of the Registrant (the series referred to collectively as the “Funds” and singularly as a “Fund”). The tables below set forth the audit fees billed to the Funds as well as fees for non-audit services provided to the Funds and/or to the Funds’ investment adviser, Massachusetts Financial Services Company (“MFS”) and to various entities either controlling, controlled by, or under common control with MFS that provide ongoing services to the Funds (“MFS Related Entities”).
For the fiscal years ended October 31, 2008 and 2007, audit fees billed to the Funds by Deloitte and E&Y were as follows:
| | | | |
| | | Audit Fees |
| | | 2008 | | 2007 |
Fees billed by Deloitte: | | | | |
MFS Global Growth Fund | | 50,812 | | 50,674 |
| | | | |
| | | Audit Fees |
| | | 2008 | | 2007 |
Fees billed by E&Y: | | | | |
MFS Strategic Income Fund | | 44,487 | | 44,010 |
For the fiscal years ended October 31, 2008 and 2007, fees billed by Deloitte and E&Y for audit-related, tax and other services provided to the Funds and for audit-related, tax and other services provided to MFS and MFS Related Entities were as follows:
| | | | | | | | | | | | |
| | | Audit-Related Fees1 | | Tax Fees2 | | All Other Fees3 |
| | | 2008 | | 2007 | | 2008 | | 2007 | | 2008 | | 2007 |
Fees billed by Deloitte: | | | | | | | | | | | | |
To MFS Global Growth Fund | | 0 | | 0 | | 5,246 | | 5,690 | | 1,580 | | 765 |
To MFS and MFS Related Entities of MFS Global Growth Fund * | | 1,149,427 | | 1,177,035 | | 0 | | 0 | | 189,730 | | 545,253 |
| | | | |
| | | 2008 | | 2007 |
Aggregate fees for non-audit services: | | | | |
To MFS Global Growth Fund, MFS and MFS Related Entities# | | 1,445,808 | | 1,906,118 |
| | | | | | | | | | | | |
| | | Audit-Related
Fees1 | | Tax Fees2 | | All Other
Fees4 |
| | | 2008 | | 2007 | | 2008 | | 2007 | | 2008 | | 2007 |
Fees billed by E&Y: | | | | | | | | | | | | |
To MFS Strategic Income Fund | | 0 | | 0 | | 9,673 | | 8,380 | | 0 | | 0 |
To MFS and MFS Related Entities of MFS Strategic Income Fund* | | 0 | | 0 | | 0 | | 0 | | 0 | | 0 |
| | | | |
| | | 2008 | | 2007 |
Aggregate fees for non-audit services: | | | | |
To MFS Strategic Income Fund, MFS and MFS Related Entities# | | 220,926 | | 209,396 |
| * | This amount reflects the fees billed to MFS and MFS Related Entities for non-audit services relating directly to the operations and financial reporting of the Funds (portions of which services also related to the operations and financial reporting of other funds within the MFS Funds complex). |
| # | This amount reflects the aggregate fees billed by Deloitte or E&Y, as the case may be, for non-audit services rendered to the Funds and for non-audit services rendered to MFS and the MFS Related Entities. |
1 | The fees included under “Audit-Related Fees” are fees related to assurance and related services that are reasonably related to the performance of the audit or review of financial statements, but not reported under “Audit Fees,” including accounting consultations, agreed-upon procedure reports, attestation reports, comfort letters and internal control reviews. |
2 | The fees included under “Tax Fees” are fees associated with tax compliance, tax advice and tax planning, including services relating to the filing or amendment of federal, state or local income tax returns, regulated investment company qualification reviews and tax distribution and analysis. |
3 | The fees included under “All Other Fees” are fees for products and services provided by Deloitte other than those reported under “Audit Fees,” “Audit-Related Fees” and “Tax Fees,” including fees for services related to sales tax refunds, consultation on internal cost allocations, consultation on allocation of monies pursuant to an administrative proceeding regarding disclosure of brokerage allocation practices in connection with fund sales, analysis of certain portfolio holdings versus investment styles, review of internal controls and review of Rule 38a-1 compliance program. |
4 | The fees included under “All Other Fees” are fees for products and services provided by E&Y other than those reported under “Audit Fees,” “Audit-Related Fees” and “Tax Fees,” including fees for the subscription to tax treatise and for services related to analysis of fund administrative expenses, compliance program and records management projects. |
Item 4(e)(1):
Set forth below are the policies and procedures established by the Audit Committee of the Board of Trustees relating to the pre-approval of audit and non-audit related services:
To the extent required by applicable law, pre-approval by the Audit Committee of the Board is needed for all audit and permissible non-audit services rendered to the Funds and all permissible non-audit services rendered to MFS or MFS Related Entities if the services relate directly to the operations and financial reporting of the Registrant. Pre-approval is currently on an engagement-by-engagement basis. In the event pre-approval of such services is necessary between regular meetings of the Audit Committee and it is not practical to wait to seek pre-approval at the next regular meeting of the Audit Committee, pre-approval of such services may be referred to the Chair of the Audit Committee for approval; provided that the Chair may not pre-approve any individual engagement for such services exceeding $50,000 or multiple engagements for such services in the aggregate exceeding $100,000 in each period between regular meetings of the Audit Committee. Any engagement pre-approved by the Chair between regular meetings of the Audit Committee shall be presented for ratification by the entire Audit Committee at its next regularly scheduled meeting.
Item 4(e)(2):
None, or 0%, of the services relating to the Audit-Related Fees, Tax Fees and All Other Fees paid by the Fund and MFS and MFS Related Entities relating directly to the operations and financial reporting of the Registrant disclosed above were approved by the audit committee pursuant to paragraphs (c)(7)(i)(C) of Rule 2-01 of Regulation S-X (which permits audit committee approval after the start of the engagement with respect to services other than audit, review or attest services, if certain conditions are satisfied).
Item 4(f): Not applicable.
Item 4(h): The Registrant’s Audit Committee has considered whether the provision by a Registrant’s independent registered public accounting firm of non-audit services to MFS and MFS Related Entities that were not pre-approved by the Committee (because such services did not relate directly to the operations and financial reporting of the Registrant) was compatible with maintaining the independence of the independent registered public accounting firm as the Registrant’s principal auditors.
| ITEM 5. | AUDIT COMMITTEE OF LISTED REGISTRANTS. |
Not applicable to the Registrant.
A schedule of investments of the Registrant is included as part of the report to shareholders of such series under Item 1 of this Form N-CSR.
| ITEM 7. | DISCLOSURE OF PROXY VOTING POLICIES AND PROCEDURES FOR CLOSED-END MANAGEMENT INVESTMENT COMPANIES. |
Not applicable to the Registrant.
| ITEM 8. | PORTFOLIO MANAGERS OF CLOSED-END MANAGEMENT INVESTMENT COMPANIES. |
Not applicable to the Registrant.
| ITEM 9. | PURCHASES OF EQUITY SECURITIES BY CLOSED-END MANAGEMENT INVESTMENT COMPANY AND AFFILIATED PURCHASERS. |
Not applicable to the Registrant.
| ITEM 10. | SUBMISSION OF MATTERS TO A VOTE OF SECURITY HOLDERS. |
There were no material changes to the procedures by which shareholders may send recommendations to the Board for nominees to the Registrant’s Board since the Registrant last provided disclosure as to such procedures in response to the requirements of Item 407 (c)(2)(iv) of Regulation S-K or this Item.
| ITEM 11. | CONTROLS AND PROCEDURES. |
| (a) | Based upon their evaluation of the effectiveness of the registrant’s disclosure controls and procedures (as defined in Rule 30a-3(c) under the Investment Company Act of 1940 (the “Act”)) as conducted within 90 days of the filing date of this report on Form N-CSR, the registrant’s principal financial officer and principal executive officer have concluded that those disclosure controls and procedures provide reasonable assurance that the material information required to be disclosed by the registrant on this report is recorded, processed, summarized and reported within the time periods specified in the Securities and Exchange Commission’s rules and forms. |
| (b) | There were no changes in the registrant’s internal controls over financial reporting (as defined in Rule 30a-3(d) under the Act) that occurred during the second fiscal quarter of the period covered by the report that have materially affected, or are reasonably likely to materially affect, the registrant’s internal control over financial reporting. |
| (a) | File the exhibits listed below as part of this form. Letter or number the exhibits in the sequence indicated. |
| | (1) | Any code of ethics, or amendment thereto, that is the subject of the disclosure required by Item 2, to the extent that the registrant intends to satisfy the Item 2 requirements through filing of an exhibit: Code of Ethics attached hereto. |
| | (2) | A separate certification for each principal executive officer and principal financial officer of the registrant as required by Rule 30a-2 under the Act (17 CFR 270.30a-2): Attached hereto. |
| (b) | If the report is filed under Section 13(a) or 15(d) of the Exchange Act, provide the certifications required by Rule 30a-2(b) under the Act (17 CFR 270.30a-2(b)), Rule 13a-14(b) or Rule 15d-14(b) under the Exchange Act (17 CFR 240.13a-14(b) or 240.15d-14(b)) and Section 1350 of Chapter 63 of Title 18 of the United States Code (18 U.S.C. 1350) as an exhibit. A certification furnished pursuant to this paragraph will not be deemed “filed” for the purposes of Section 18 of the Exchange Act (15 U.S.C. 78r), or otherwise subject to the liability of that section. Such certification will not be deemed to be incorporated by reference into any filing under the Securities Act of 1933 or the Exchange Act, except to the extent that the registrant specifically incorporates it by reference: Attached hereto. |
Notice
A copy of the Amended and Restated Declaration of Trust, as amended, of the Registrant is on file with the Secretary of State of The Commonwealth of Massachusetts and notice is hereby given that this instrument is executed on behalf of the Registrant by an officer of the Registrant as an officer and not individually and the obligations of or arising out of this instrument are not binding upon any of the Trustees or shareholders individually, but are binding only upon the assets and property of the respective constituent series of the Registrant.
SIGNATURES
Pursuant to the requirements of the Securities Exchange Act of 1934 and the Investment Company Act of 1940, the registrant has duly caused this report to be signed on its behalf by the undersigned, thereunto duly authorized.
| | |
| (Registrant) MFS SERIES TRUST VIII |
| |
| By (Signature and Title)* | | MARIA F. DWYER |
| | Maria F. Dwyer, President |
Date: December 17, 2008
Pursuant to the requirements of the Securities Exchange Act of 1934 and the Investment Company Act of 1940, this report has been signed below by the following persons on behalf of the registrant and in the capacities and on the dates indicated.
| | |
| |
| By (Signature and Title)* | | MARIA F. DWYER |
| | Maria F. Dwyer, President (Principal Executive Officer) |
Date: December 17, 2008
| | |
| |
| By (Signature and Title)* | | JOHN M. CORCORAN |
| | John M. Corcoran, Treasurer (Principal Financial Officer and Accounting Officer) |
Date: December 17, 2008
| * | Print name and title of each signing officer under his or her signature. |