UNITED STATES
SECURITIES AND EXCHANGE COMMISSION
Washington, D.C. 20549
FORM N-CSR
CERTIFIED SHAREHOLDER REPORT OF
REGISTERED MANAGEMENT INVESTMENT COMPANIES
Investment Company Act file number 811-5262
MFS SERIES TRUST VIII
(Exact name of registrant as specified in charter)
500 Boylston Street, Boston, Massachusetts 02116
(Address of principal executive offices) (Zip code)
Susan S. Newton
Massachusetts Financial Services Company
500 Boylston Street
Boston, Massachusetts 02116
(Name and address of agents for service)
Registrant’s telephone number, including area code: (617) 954-5000
Date of fiscal year end: October 31
Date of reporting period: October 31, 2010
| ITEM 1. | REPORTS TO STOCKHOLDERS. |

MFS® Global Growth Fund
SIPC Contact Information:
You may obtain information about the Securities Investor Protection Corporation (“SIPC”), including the SIPC Brochure, by contacting SIPC either by telephone (202-371-8300) or by accessing SIPC’s website address (www.sipc.org).
The report is prepared for the general information of shareholders. It is authorized for distribution to prospective investors only when preceded or accompanied by a current prospectus.
NOT FDIC INSURED Ÿ MAY LOSE VALUE Ÿ NO BANK GUARANTEE
10/31/10
WGF-ANN

LETTER FROM THE CEO
Dear Shareholders:
After an extended rebound in the financial markets, uncertainty returned in early 2010 as investors began to question the durability of the recovery for global economies and markets. That uncertainty led to increased risk aversion, especially as investors saw the eurozone struggle with the debt woes of many of its members. In September, the U.S. Federal Reserve Board’s promises to further loosen monetary policy helped assuage market fears and drive asset prices off their recent lows. A combination of solid earnings and improving economic data gave an additional boost to investor sentiment. As we near the end of 2010, we are cautiously optimistic that economic growth will continue to improve and that the global economies will recover from the shocks of the past few years. We expect the pace of recovery worldwide will be uneven and volatile.
As always, we continue to be mindful of the many challenges faced at the individual, national, and international levels. It is in times such as these that we want to remind investors of the merits of maintaining a long-term view, adhering to basic investing principles such as asset allocation and diversification, and working closely with their advisors to research and identify investment opportunities.
Respectfully,

Robert J. Manning
Chairman and Chief Executive Officer
MFS Investment Management®
December 15, 2010
The opinions expressed in this letter are subject to change, may not be relied upon for investment advice, and no forecasts can be guaranteed.
1
PORTFOLIO COMPOSITION
Portfolio structure

| | | | |
| Top ten holdings | | | | |
| BHP Billiton PLC | | | 2.8% | |
| Cisco Systems, Inc. | | | 2.4% | |
| Taiwan Semiconductor Manufacturing Co. Ltd., ADR | | | 2.2% | |
| Danaher Corp. | | | 2.2% | |
| Oracle Corp. | | | 2.0% | |
| National Oilwell Varco, Inc. | | | 2.0% | |
| Schlumberger Ltd. | | | 1.9% | |
| Groupe Danone | | | 1.8% | |
| Pernod Ricard S.A. | | | 1.7% | |
| Accenture Ltd., “A” | | | 1.7% | |
| | | | |
| Equity sectors | | | | |
| Financial Services | | | 18.0% | |
| Technology | | | 17.3% | |
| Consumer Staples | | | 14.2% | |
| Health Care | | | 13.0% | |
| Basic Materials | | | 9.3% | |
| Retailing | | | 8.0% | |
| Energy | | | 6.7% | |
| Special Products & Services | | | 6.0% | |
| Industrial Goods & Services | | | 5.2% | |
| Leisure | | | 0.8% | |
| Utilities & Communications | | | 0.7% | |
| |
| Issuer country weightings | | | | |
| United States | | | 47.7% | |
| United Kingdom | | | 11.1% | |
| France | | | 8.5% | |
| Switzerland | | | 7.0% | |
| Germany | | | 5.0% | |
| Japan | | | 5.0% | |
| Brazil | | | 3.6% | |
| Taiwan | | | 3.3% | |
| Netherlands | | | 2.0% | |
| Other Countries | | | 6.8% | |
Percentages are based on net assets as of 10/31/10.
The portfolio is actively managed and current holdings may be different.
2
MANAGEMENT REVIEW
Summary of Results
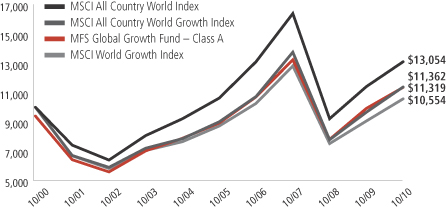
For the twelve months ended October 31, 2010, Class A shares of the MFS Global Growth Fund (the “fund”) provided a total return of 13.92%, at net asset value. This compares with a return of 17.48% for the fund’s benchmark, the Morgan Stanley Capital International (MSCI) All Country World Growth Index. Effective September 30, 2010, the MSCI All Country World Index replaced the MSCI World Growth Index as the fund’s other benchmark. For the twelve months ended October 31, 2010, the MSCI All Country World Index generated a return of 14.65% and the MSCI World Growth Index generated a return of 16.33%.
Market Environment
The first half of the reporting period witnessed a continuation of the financial market and macroeconomic rebounds that had begun in early 2009. These recoveries in global activity and asset valuations were generally synchronized around the world, led importantly by emerging Asian economies, but broadening to include most of the global economy to varying degrees. Primary drivers of the recoveries included an unwinding of the inventory destocking that took place earlier, the production of manufacturing and capital goods, as well as massive fiscal and monetary stimulus.
During the second half of the period, heightened risk surrounding the public-debt profiles of several of the peripheral European countries impaired market sentiment. At the same time, the improving trend in global macroeconomic data began to weaken somewhat. These two dynamics caused many asset prices to retrench significantly, as many questioned the durability of the global recovery.
Towards the end of the period, the U.S. Federal Reserve led markets to believe that further monetary loosening would be forthcoming if macroeconomic activity did not show signs of improvement. Although policy uncertainty remained very elevated, the prospects for more easing by the Fed improved market sentiment and drove asset prices well off their recent lows.
Detractors from Performance
A combination of stock selection and an overweighted position in the financial services sector detracted from the fund’s performance relative to the MSCI All Country World Growth Index. The fund’s holdings of brokerage houses, Nomura Holdings (Japan) (b) and Charles Schwab, stock exchange Deutsche Boerse (Germany), and financial services provider Bank of New York Mellon (b) were among the fund’s top relative detractors.
Bank of New York Mellon underperformed the market during the latter part of the reporting period as the custody bank’s near-term earnings continued to be
3
Management Review – continued
hurt by record low interest rates, which squeezed its net interest revenue and reduced profit from its fixed income portfolios and securities lending business.
Security selection in the energy sector was also a negative factor for relative performance. Our overweighted position in oil and gas exploration company INPEX (Japan), and the timing of our ownership in shares of integrated oil company Total S.A. (France) (h), had a negative impact on relative returns. Shares of INPEX plunged as the company announced that it was going to raise capital using a stock issue to finance the development of the Ichthys natural gas project in Australia.
An underweighted position in the basic materials sector hindered relative results. No individual stocks within this sector were among the fund’s top relative detractors for the reporting period.
Securities in other sectors that held back relative performance included Hong Kong-headquartered retailer Esprit Holdings, telecommunications company China Unicom (Hong Kong) Ltd. (b)(h), and business information provider Dun & Bradstreet Corp.
During the reporting period, the fund’s currency exposure also detracted from relative returns. All of MFS’ investment decisions are driven by the fundamentals of each individual opportunity and as such, it is common for our funds to have different currency exposures than the benchmark.
The fund’s cash position was another negative factor for relative results. The fund holds cash to buy new holdings and to provide liquidity. In a period when equity markets rose, as measured by the fund’s benchmark, holding cash hurt performance versus the benchmark, which has no cash position.
Contributors to Performance
Favorable stock selection in the technology sector boosted relative performance. Not owning poor-performing software giant Microsoft and computer products and services provider Hewlett-Packard benefited relative returns.
Security selection in the retailing sector also contributed to relative results. The fund’s overweighted positions in strong-performing luxury goods companies, Compagnie Financiere Richemont S.A. (Switzerland) and LVMH Moët Hennessy Louis Vuitton (France), had a positive effect on relative performance. Shares of LVMH appreciated after the company reported a significant profit increase during the first half of the reporting period which exceeded analysts’ expectations. In addition, demand for luxury goods has been increasing in China, and U.S. and European retailers have been replenishing inventories following the recession.
4
Management Review – continued
Stock selection in the special products & services sector aided relative returns. Within this sector, the timing of our ownership in product safety testing company Intertek Group (U.K) had a positive impact on results. The company forecasted strong growth in its food and alternative energy divisions due to increases in regulations and product launches. U.S. regulators recently proposed new guidelines to reduce food-borne illnesses and the European Union tightened food-packaging rules. Intertek expects these regulations to result in increased demand for its testing services.
Individual standout contributors in other sectors that bolstered relative performance included oil and gas drilling equipment manufacturer National Oilwell Varco, Brazilian brewer Companhia de Bebidas das Americas, financial services holding company Credicorp (Peru) (h), electrical distribution equipment manufacturer Schneider Electric (France) (b) , and flavors and fragrances supplier Symrise (Germany) (b).
Respectfully,
| | |
| David Antonelli | | Jeffrey Constantino |
| Portfolio Manager | | Portfolio Manager |
| (b) | Security is not a benchmark constituent. |
| (h) | Security was not held in the portfolio at period end. |
Note to Shareholders: Effective January 12, 2010, David Antonelli became a co-manager of the fund. Previously, the fund was co-managed by Barry Dargan.
The views expressed in this report are those of the portfolio managers only through the end of the period of the report as stated on the cover and do not necessarily reflect the views of MFS or any other person in the MFS organization. These views are subject to change at any time based on market or other conditions, and MFS disclaims any responsibility to update such views. These views may not be relied upon as investment advice or an indication of trading intent on behalf of any MFS portfolio. References to specific securities are not recommendations of such securities, and may not be representative of any MFS portfolio’s current or future investments.
5
PERFORMANCE SUMMARY THROUGH 10/31/10
The following chart illustrates a representative class of the fund’s historical performance in comparison to its benchmark(s). Performance results include the deduction of the maximum applicable sales charge and reflect the percentage change in net asset value, including reinvestment of dividends and capital gains distributions. The performance of other share classes will be greater than or less than that of the class depicted below. Benchmarks are unmanaged and may not be invested in directly. Benchmark returns do not reflect sales charges, commissions or expenses. (See Notes to Performance Summary.)
Performance data shown represents past performance and is no guarantee of future results. Investment return and principal value fluctuate so your shares, when sold, may be worth more or less than the original cost; current performance may be lower or higher than quoted. The performance shown does not reflect the deduction of taxes, if any, that a shareholder would pay on fund distributions or the redemption of fund shares.
Growth of a Hypothetical $10,000 Investment
6
Performance Summary – continued
Total Returns through 10/31/10
Average annual without sales charge
| | | | | | | | | | | | | | |
| | | Share class | | Class inception date | | 1-yr | | 5-yr | | 10-yr | | Life (t) | | |
| | | A | | 11/18/93 | | 13.92% | | 4.77% | | 1.85% | | N/A | | |
| | | B | | 11/18/93 | | 13.06% | | 3.99% | | 1.09% | | N/A | | |
| | | C | | 1/03/94 | | 13.09% | | 4.01% | | 1.08% | | N/A | | |
| | | I | | 1/02/97 | | 14.18% | | 5.04% | | 2.09% | | N/A | | |
| | | R1 | | 4/01/05 | | 13.06% | | 3.94% | | N/A | | 4.36% | | |
| | | R2 | | 10/31/03 | | 13.66% | | 4.38% | | N/A | | 6.37% | | |
| | | R3 | | 4/01/05 | | 13.93% | | 4.71% | | N/A | | 5.15% | | |
| | | R4 | | 4/01/05 | | 14.21% | | 5.00% | | N/A | | 5.43% | | |
| Comparative benchmarks | | | | | | |
| | | MSCI All Country World
Growth Index (f) | | 17.48% | | 4.68% | | 1.28% | | N/A | | |
| | | MSCI All Country World Index (f) | | 14.65% | | 4.23% | | 2.70% | | N/A | | |
| | | MSCI World Growth Index (f) | | 16.33% | | 3.83% | | 0.54% | | N/A | | |
| Average annual with sales charge | | | | | | | | | | |
| | | A
With Initial Sales Charge (5.75%) | | 7.37% | | 3.54% | | 1.25% | | N/A | | |
| | | B
With CDSC (Declining over six years from 4% to 0%) (x) | | 9.06% | | 3.64% | | 1.09% | | N/A | | |
| | | C
With CDSC (1% for 12 months) (x) | | 12.09% | | 4.01% | | 1.08% | | N/A | | |
Class I, R1, R2, R3, and R4 shares do not have a sales charge.
CDSC – Contingent Deferred Sales Charge.
| (f) | Source: FactSet Research Systems Inc. |
| (t) | For the period from the class inception date through the stated period end (for those share classes with less than 10 years of performance history). No comparative benchmark performance information is provided for “life” periods. (See Notes to Performance Summary.) |
| (x) | Assuming redemption at the end of the applicable period. |
Benchmark Definitions
MSCI All Country World Growth Index – a market capitalization-weighted index that is designed to measure equity market performance for growth securities in the global developed and emerging markets.
MSCI All Country World Index – a market capitalization-weighted index that is designed to measure equity market performance in the global developed and emerging markets.
7
Performance Summary – continued
MSCI World Growth Index – a market capitalization-weighted index that is designed to measure equity market performance for growth securities in the global developed markets.
It is not possible to invest directly in an index.
Notes to Shareholders: Effective September 30, 2010, the MSCI All Country World Index became the fund’s other benchmark, replacing the MSCI World Growth Index because MFS believes that the MSCI All Country World Index more closely represents the fund’s investment policies and strategies.
Notes to Performance Summary
Average annual total return represents the average annual change in value for each share class for the periods presented. Life returns are presented where the share class has less than 10 years of performance history and represent the average annual total return from the class inception date to the stated period end date. As the fund’s share classes may have different inception dates, the life returns may represent different time periods and may not be comparable. As a result, no comparative benchmark performance information is provided for life periods.
Performance results reflect any applicable expense subsidies and waivers in effect during the periods shown. Without such subsidies and waivers the fund’s performance results would be less favorable. Please see the prospectus and financial statements for complete details.
From time to time the fund may receive proceeds from litigation settlements, without which performance would be lower.
8
EXPENSE TABLE
Fund expenses borne by the shareholders during the period, May 1, 2010 through October 31, 2010
As a shareholder of the fund, you incur two types of costs: (1) transaction costs, including sales charges (loads) on certain purchase or redemption payments, and (2) ongoing costs, including management fees; distribution and service (12b-1) fees; and other fund expenses. This example is intended to help you understand your ongoing costs (in dollars) of investing in the fund and to compare these costs with the ongoing costs of investing in other mutual funds.
The example is based on an investment of $1,000 invested at the beginning of the period and held for the entire period May 1, 2010 through October 31, 2010.
Actual Expenses
The first line for each share class in the following table provides information about actual account values and actual expenses. You may use the information in this line, together with the amount you invested, to estimate the expenses that you paid over the period. Simply divide your account value by $1,000 (for example, an $8,600 account value divided by $1,000 = 8.6), then multiply the result by the number in the first line under the heading entitled “Expenses Paid During Period” to estimate the expenses you paid on your account during this period.
Hypothetical Example for Comparison Purposes
The second line for each share class in the following table provides information about hypothetical account values and hypothetical expenses based on the fund’s actual expense ratio and an assumed rate of return of 5% per year before expenses, which is not the fund’s actual return. The hypothetical account values and expenses may not be used to estimate the actual ending account balance or expenses you paid for the period. You may use this information to compare the ongoing costs of investing in the fund and other funds. To do so, compare this 5% hypothetical example with the 5% hypothetical examples that appear in the shareholder reports of the other funds.
Please note that the expenses shown in the table are meant to highlight your ongoing costs only and do not reflect any transactional costs, such as sales charges (loads). Therefore, the second line for each share class in the table is useful in comparing ongoing costs only, and will not help you determine the relative total costs of owning different funds. In addition, if these transactional costs were included, your costs would have been higher.
9
Expense Table – continued
| | | | | | | | | | | | | | | | | | |
Share
Class | | | | Annualized
Expense Ratio | | | Beginning
Account Value
5/01/10 | | | Ending Account Value
10/31/10 | | | Expenses Paid During
Period (p)
5/01/10-10/31/10 | |
| A | | Actual | | | 1.54% | | | | $1,000.00 | | | | $1,040.13 | | | | $7.92 | |
| | Hypothetical (h) | | | 1.54% | | | | $1,000.00 | | | | $1,017.44 | | | | $7.83 | |
| B | | Actual | | | 2.29% | | | | $1,000.00 | | | | $1,035.52 | | | | $11.75 | |
| | Hypothetical (h) | | | 2.29% | | | | $1,000.00 | | | | $1,013.66 | | | | $11.62 | |
| C | | Actual | | | 2.29% | | | | $1,000.00 | | | | $1,035.88 | | | | $11.75 | |
| | Hypothetical (h) | | | 2.29% | | | | $1,000.00 | | | | $1,013.66 | | | | $11.62 | |
| I | | Actual | | | 1.29% | | | | $1,000.00 | | | | $1,041.00 | | | | $6.64 | |
| | Hypothetical (h) | | | 1.29% | | | | $1,000.00 | | | | $1,018.70 | | | | $6.56 | |
| R1 | | Actual | | | 2.29% | | | | $1,000.00 | | | | $1,035.94 | | | | $11.75 | |
| | Hypothetical (h) | | | 2.29% | | | | $1,000.00 | | | | $1,013.66 | | | | $11.62 | |
| R2 | | Actual | | | 1.79% | | | | $1,000.00 | | | | $1,038.54 | | | | $9.20 | |
| | Hypothetical (h) | | | 1.79% | | | | $1,000.00 | | | | $1,016.18 | | | | $9.10 | |
| R3 | | Actual | | | 1.54% | | | | $1,000.00 | | | | $1,039.83 | | | | $7.92 | |
| | Hypothetical (h) | | | 1.54% | | | | $1,000.00 | | | | $1,017.44 | | | | $7.83 | |
| R4 | | Actual | | | 1.29% | | | | $1,000.00 | | | | $1,041.32 | | | | $6.64 | |
| | Hypothetical (h) | | | 1.29% | | | | $1,000.00 | | | | $1,018.70 | | | | $6.56 | |
| (h) | 5% class return per year before expenses. |
| (p) | Expenses paid is equal to each class’ annualized expense ratio, as shown above, multiplied by the average account value over the period, multiplied by the number of days in the period, divided by the number of days in the year. Expenses paid do not include any applicable sales charges (loads). If these transaction costs had been included, your costs would have been higher. |
10
PORTFOLIO OF INVESTMENTS
10/31/10
The Portfolio of Investments is a complete list of all securities owned by your fund. It is categorized by broad-based asset classes.
| | | | | | | | |
| Common Stocks - 99.1% | | | | | | | | |
| Issuer | | Shares/Par | | | Value ($) | |
| | | | | | | | |
| Aerospace - 0.9% | | | | | | | | |
| United Technologies Corp. | | | 28,740 | | | $ | 2,148,889 | |
| | |
| Alcoholic Beverages - 5.2% | | | | | | | | |
| Companhia de Bebidas das Americas, ADR | | | 22,860 | | | $ | 3,183,026 | |
| Diageo PLC | | | 172,770 | | | | 3,189,174 | |
| Heineken N.V. | | | 30,190 | | | | 1,530,312 | |
| Pernod Ricard S.A. | | | 42,810 | | | | 3,796,030 | |
| | | | | | | | |
| | | | | | | $ | 11,698,542 | |
| Apparel Manufacturers - 3.9% | | | | | | | | |
| Compagnie Financiere Richemont S.A. | | | 37,091 | | | $ | 1,849,933 | |
| Li & Fung Ltd. | | | 300,200 | | | | 1,595,970 | |
| LVMH Moet Hennessy Louis Vuitton S.A. | | | 22,140 | | | | 3,469,707 | |
| NIKE, Inc., “B” | | | 22,460 | | | | 1,829,142 | |
| | | | | | | | |
| | | | | | | $ | 8,744,752 | |
| Broadcasting - 0.8% | | | | | | | | |
| Publicis Groupe | | | 38,130 | | | $ | 1,899,351 | |
| | |
| Brokerage & Asset Managers - 6.5% | | | | | | | | |
| BM&F Bovespa S.A. | | | 214,600 | | | $ | 1,798,536 | |
| Charles Schwab Corp. | | | 128,430 | | | | 1,977,822 | |
| CME Group, Inc. | | | 8,270 | | | | 2,395,406 | |
| Deutsche Boerse AG | | | 31,230 | | | | 2,197,637 | |
| Franklin Resources, Inc. | | | 21,880 | | | | 2,509,636 | |
| ICAP PLC | | | 338,790 | | | | 2,476,528 | |
| Nomura Holdings, Inc. | | | 277,200 | | | | 1,445,441 | |
| | | | | | | | |
| | | | | | | $ | 14,801,006 | |
| Business Services - 6.0% | | | | | | | | |
| Accenture Ltd., “A” | | | 84,590 | | | $ | 3,782,019 | |
| Cognizant Technology Solutions Corp., “A” (a) | | | 22,950 | | | | 1,496,111 | |
| Dun & Bradstreet Corp. | | | 40,750 | | | | 3,032,208 | |
| Hays PLC | | | 639,080 | | | | 1,131,553 | |
| Intertek Group PLC | | | 48,490 | | | | 1,441,297 | |
| MSCI, Inc., “A” (a) | | | 45,570 | | | | 1,633,685 | |
| Verisk Analytics, Inc., “A” (a) | | | 40,710 | | | | 1,213,565 | |
| | | | | | | | |
| | | | | | | $ | 13,730,438 | |
11
Portfolio of Investments – continued
| | | | | | | | |
| Issuer | | Shares/Par | | | Value ($) | |
| | | | | | | | |
| Common Stocks - continued | | | | | | | | |
| Chemicals - 1.0% | | | | | | | | |
| Monsanto Co. | | | 39,800 | | | $ | 2,364,916 | |
| | |
| Computer Software - 3.1% | | | | | | | | |
| Autodesk, Inc. (a) | | | 69,020 | | | $ | 2,497,144 | |
| Oracle Corp. (s) | | | 155,100 | | | | 4,559,940 | |
| | | | | | | | |
| | | | | | | $ | 7,057,084 | |
| Computer Software - Systems - 5.5% | | | | | | | | |
| Acer, Inc. | | | 846,510 | | | $ | 2,463,840 | |
| Apple, Inc. (a) | | | 11,280 | | | | 3,393,814 | |
| EMC Corp. (a) | | | 56,560 | | | | 1,188,326 | |
| International Business Machines Corp. | | | 25,870 | | | | 3,714,932 | |
| Konica Minolta Holdings, Inc. | | | 170,000 | | | | 1,638,804 | |
| | | | | | | | |
| | | | | | | $ | 12,399,716 | |
| Consumer Products - 4.6% | | | | | | | | |
| Beiersdorf AG | | | 16,680 | | | $ | 1,086,705 | |
| Church & Dwight Co., Inc. | | | 28,380 | | | | 1,868,823 | |
| Colgate-Palmolive Co. | | | 34,270 | | | | 2,642,902 | |
| Procter & Gamble Co. | | | 35,730 | | | | 2,271,356 | |
| Reckitt Benckiser Group PLC | | | 44,690 | | | | 2,499,871 | |
| | | | | | | | |
| | | | | | | $ | 10,369,657 | |
| Electrical Equipment - 3.8% | | | | | | | | |
| Danaher Corp. | | | 113,150 | | | $ | 4,906,184 | |
| Schneider Electric S.A. | | | 25,837 | | | | 3,667,914 | |
| | | | | | | | |
| | | | | | | $ | 8,574,098 | |
| Electronics - 5.5% | | | | | | | | |
| Hoya Corp. | | | 81,800 | | | $ | 1,902,729 | |
| Microchip Technology, Inc. | | | 58,130 | | | | 1,870,623 | |
| Samsung Electronics Co. Ltd. | | | 2,982 | | | | 1,979,951 | |
| Taiwan Semiconductor Manufacturing Co. Ltd., ADR | | | 455,808 | | | | 4,972,865 | |
| Tokyo Electron Ltd. | | | 31,200 | | | | 1,749,479 | |
| | | | | | | | |
| | | | | | | $ | 12,475,647 | |
| Energy - Independent - 0.9% | | | | | | | | |
| INPEX Corp. | | | 406 | | | $ | 2,118,850 | |
| | |
| Energy - Integrated - 1.9% | | | | | | | | |
| Chevron Corp. | | | 19,000 | | | $ | 1,569,590 | |
| Hess Corp. | | | 24,430 | | | | 1,539,823 | |
| Suncor Energy, Inc. | | | 38,010 | | | | 1,217,930 | |
| | | | | | | | |
| | | | | | | $ | 4,327,343 | |
12
Portfolio of Investments – continued
| | | | | | | | |
| Issuer | | Shares/Par | | | Value ($) | |
| | | | | | | | |
| Common Stocks - continued | | | | | | | | |
| Food & Beverages - 4.4% | | | | | | | | |
| Groupe Danone | | | 65,440 | | | $ | 4,141,835 | |
| Mead Johnson Nutrition Co., “A” | | | 18,430 | | | | 1,084,053 | |
| Nestle S.A. | | | 39,767 | | | | 2,178,183 | |
| PepsiCo, Inc. | | | 40,330 | | | | 2,633,549 | |
| | | | | | | | |
| | | | | | | $ | 10,037,620 | |
| Food & Drug Stores - 1.2% | | | | | | | | |
| Tesco PLC | | | 397,573 | | | $ | 2,719,253 | |
| | |
| General Merchandise - 0.7% | | | | | | | | |
| Kohl’s Corp. (a) | | | 28,770 | | | $ | 1,473,024 | |
| | |
| Internet - 0.8% | | | | | | | | |
| Google, Inc., “A” (a) | | | 3,010 | | | $ | 1,845,100 | |
| | |
| Machinery & Tools - 0.5% | | | | | | | | |
| Schindler Holding AG | | | 10,242 | | | $ | 1,098,045 | |
| | |
| Major Banks - 6.1% | | | | | | | | |
| Bank of New York Mellon Corp. | | | 94,520 | | | $ | 2,368,671 | |
| Credit Suisse Group AG | | | 57,610 | | | | 2,379,804 | |
| HSBC Holdings PLC | | | 237,926 | | | | 2,474,634 | |
| Julius Baer Group Ltd. | | | 58,399 | | | | 2,465,215 | |
| Standard Chartered PLC | | | 89,989 | | | | 2,603,420 | |
| State Street Corp. | | | 36,630 | | | | 1,529,669 | |
| | | | | | | | |
| | | | | | | $ | 13,821,413 | |
| Medical & Health Technology & Services - 1.3% | | | | | | | | |
| Fresenius Medical Care AG & Co. KGaA | | | 19,360 | | | $ | 1,233,284 | |
| Patterson Cos., Inc. | | | 64,390 | | | | 1,780,384 | |
| | | | | | | | |
| | | | | | | $ | 3,013,668 | |
| Medical Equipment - 6.8% | | | | | | | | |
| Becton, Dickinson & Co. | | | 19,610 | | | $ | 1,480,947 | |
| DENTSPLY International, Inc. | | | 62,680 | | | | 1,967,525 | |
| Essilor International S.A. | | | 17,800 | | | | 1,188,658 | |
| Medtronic, Inc. | | | 45,630 | | | | 1,606,632 | |
| Sonova Holding AG | | | 16,808 | | | | 1,947,169 | |
| St. Jude Medical, Inc. (a) | | | 26,660 | | | | 1,021,078 | |
| Synthes, Inc. | | | 21,176 | | | | 2,526,358 | |
| Thermo Fisher Scientific, Inc. (a) | | | 45,420 | | | | 2,335,496 | |
| Waters Corp. (a) | | | 18,840 | | | | 1,396,609 | |
| | | | | | | | |
| | | | | | | $ | 15,470,472 | |
13
Portfolio of Investments – continued
| | | | | | | | |
| Issuer | | Shares/Par | | | Value ($) | |
| | | | | | | | |
| Common Stocks - continued | | | | | | | | |
| Metals & Mining - 2.8% | | | | | | | | |
| BHP Billiton PLC | | | 177,000 | | | $ | 6,277,839 | |
| | |
| Network & Telecom - 2.4% | | | | | | | | |
| Cisco Systems, Inc. (a)(s) | | | 242,660 | | | $ | 5,539,928 | |
| | |
| Oil Services - 3.9% | | | | | | | | |
| National Oilwell Varco, Inc. | | | 84,790 | | | $ | 4,558,310 | |
| Schlumberger Ltd. (s) | | | 61,130 | | | | 4,272,376 | |
| | | | | | | | |
| | | | | | | $ | 8,830,686 | |
| Other Banks & Diversified Financials - 5.3% | | | | | | | | |
| Banco Santander Brasil S.A., ADR | | | 225,330 | | | $ | 3,244,752 | |
| China Construction Bank | | | 1,746,000 | | | | 1,667,985 | |
| HDFC Bank Ltd. | | | 23,000 | | | | 1,180,365 | |
| MasterCard, Inc., “A” | | | 12,920 | | | | 3,101,575 | |
| Visa, Inc., “A” | | | 36,160 | | | | 2,826,627 | |
| | | | | | | | |
| | | | | | | $ | 12,021,304 | |
| Pharmaceuticals - 4.9% | | | | | | | | |
| Abbott Laboratories | | | 20,820 | | | $ | 1,068,482 | |
| Allergan, Inc. | | | 18,510 | | | | 1,340,309 | |
| Bayer AG | | | 36,221 | | | | 2,703,112 | |
| Johnson & Johnson | | | 33,000 | | | | 2,101,110 | |
| Roche Holding AG | | | 9,400 | | | | 1,380,316 | |
| Teva Pharmaceutical Industries Ltd., ADR | | | 50,930 | | | | 2,643,267 | |
| | | | | | | | |
| | | | | | | $ | 11,236,596 | |
| Specialty Chemicals - 5.5% | | | | | | | | |
| Akzo Nobel N.V. (l) | | | 48,890 | | | $ | 2,902,804 | |
| L’Air Liquide S.A. | | | 9,259 | | | | 1,197,688 | |
| Linde AG | | | 19,992 | | | | 2,878,482 | |
| Praxair, Inc. | | | 21,680 | | | | 1,980,251 | |
| Shin-Etsu Chemical Co. Ltd. | | | 48,000 | | | | 2,415,564 | |
| Symrise AG | | | 38,820 | | | | 1,179,198 | |
| | | | | | | | |
| | | | | | | $ | 12,553,987 | |
| Specialty Stores - 2.2% | | | | | | | | |
| Esprit Holdings Ltd. | | | 290,930 | | | $ | 1,578,028 | |
| Industria de Diseno Textil S.A. | | | 26,480 | | | | 2,211,660 | |
| Staples, Inc. | | | 54,590 | | | | 1,117,457 | |
| | | | | | | | |
| | | | | | | $ | 4,907,145 | |
14
Portfolio of Investments – continued
| | | | | | | | |
| Issuer | | Shares/Par | | | Value ($) | |
| | | | | | | | |
| Common Stocks - continued | | | | | | | | |
| Telecommunications - Wireless - 0.7% | | | | | |
| MTN Group Ltd. | | | 88,320 | | | $ | 1,588,625 | |
| Total Common Stocks (Identified Cost, $209,826,910) | | | | | | $ | 225,144,994 | |
| | | | | | | | | | | | | | | | |
| | | | |
| | | Strike Price | | | First Exercise | | | | | | | |
| Rights - 0.1% | | | | | | | | | | | | | | | | |
| Major Banks - 0.1% | | | | | | | | | | | | | | | | |
Standard Chartered PLC (1 share for
1 right) (Identified Cost, $0) (a) | | | GBP 12.80 | | | | 10/22/10 | | | | 11,248 | | | $ | 94,712 | |
| | | |
| Collateral for Securities Loaned - 0.4% | | | | | | | | | | | | | |
| Morgan Stanley Repurchase Agreement, 0.21%, dated 10/29/10, due 11/01/10, total to be received $945,017 (secured by U.S. Treasury and Federal Agency obligations valued at $963,903 in an individually traded account), at Cost | | | $ | 945,000 | | | $ | 945,000 | |
| | | | |
| Money Market Funds (v) - 0.7% | | | | | | | | | | | | | | | | |
MFS Institutional Money Market Portfolio, 0.21%,
at Cost and Net Asset Value | | | | | | | | 1,592,737 | | | $ | 1,592,737 | |
| Total Investments (Identified Cost, $212,364,647) | | | | | | | | | | | $ | 227,777,443 | |
| | | |
| Other Assets, Less Liabilities - (0.3)% | | | | | | | | | | | | (656,694 | ) |
| Net Assets - 100.0% | | | | | | | | | | | | | | $ | 227,120,749 | |
| (a) | Non-income producing security. |
| (l) | All or a portion of this security is on loan. |
| (s) | Security or a portion of the security was pledged to cover collateral requirements for securities sold short. At October 31, 2010, the value of securities pledged amounted to $182,230. At October 31, 2010, the fund had no short sales outstanding. |
| (v) | Underlying fund that is available only to investment companies managed by MFS. The rate quoted is the annualized seven-day yield of the fund at period end. |
The following abbreviations are used in this report and are defined:
| ADR | | American Depository Receipt |
| PLC | | Public Limited Company |
Abbreviations indicate amounts shown in currencies other than the U.S. dollar. All amounts are stated in U.S. dollars unless otherwise indicated. A list of abbreviations is shown below:
See Notes to Financial Statements
15
Financial Statements
STATEMENT OF ASSETS AND LIABILITIES
At 10/31/10
This statement represents your fund’s balance sheet, which details the assets and liabilities comprising the total value of the fund.
| | | | |
| Assets | | | | |
| Investments- | | | | |
| Non-affiliated issuers, at value (identified cost, $210,771,910) | | | $226,184,706 | |
Underlying funds, at cost and value | | | 1,592,737 | |
Total investments, at value, including $889,396 of securities on loan
(identified cost, $212,364,647) | | | $227,777,443 | |
| Foreign currency, at value (identified cost, $774) | | | 775 | |
Receivables for | | | | |
Investments sold | | | 108,288 | |
Fund shares sold | | | 46,576 | |
Interest and dividends | | | 497,296 | |
Total assets | | | $228,430,378 | |
| Liabilities | | | | |
| Payables for | | | | |
Investments purchased | | | $768 | |
Fund shares reacquired | | | 177,058 | |
Collateral for securities loaned, at value | | | 945,000 | |
| Payable to affiliates | | | | |
Investment adviser | | | 22,392 | |
Shareholder servicing costs | | | 77,871 | |
Distribution and service fees | | | 8,542 | |
Administrative services fee | | | 430 | |
| Payable for independent Trustees’ compensation | | | 41,809 | |
Accrued expenses and other liabilities | | | 35,759 | |
Total liabilities | | | $1,309,629 | |
Net assets | | | $227,120,749 | |
| Net assets consist of | | | | |
Paid-in capital | | | $233,483,826 | |
Unrealized appreciation (depreciation) on investments
and translation of assets and liabilities in foreign currencies | | | 15,432,853 | |
Accumulated net realized gain (loss) on investments
and foreign currency transactions | | | (22,210,734 | ) |
Undistributed net investment income | | | 414,804 | |
Net assets | | | $227,120,749 | |
| Shares of beneficial interest outstanding | | | 9,229,697 | |
16
Statement of Assets and Liabilities – continued
| | | | | | | | | | | | |
| | | Net assets | | | Shares
outstanding | | | Net asset value
per share (a) | |
| Class A | | | $183,544,486 | | | | 7,378,317 | | | | $24.88 | |
| Class B | | | 13,562,831 | | | | 588,826 | | | | 23.03 | |
| Class C | | | 14,484,735 | | | | 635,146 | | | | 22.81 | |
| Class I | | | 6,788,046 | | | | 267,322 | | | | 25.39 | |
| Class R1 | | | 790,815 | | | | 34,734 | | | | 22.77 | |
| Class R2 | | | 5,250,492 | | | | 216,530 | | | | 24.25 | |
| Class R3 | | | 2,528,098 | | | | 101,958 | | | | 24.80 | |
| Class R4 | | | 171,246 | | | | 6,864 | | | | 24.95 | |
| (a) | Maximum offering price per share was equal to the net asset value per share for all share classes, except for Class A, for which the maximum offering price per share was $26.40 [100 / 94.25 x $24.88]. On sales of $50,000 or more, the maximum offering price of Class A shares is reduced. A contingent deferred sales charge may be imposed on redemptions of Class A, Class B, and Class C shares. Redemption price per share was equal to the net asset value per share for Classes I, R1, R2, R3, and R4. |
See Notes to Financial Statements
17
Financial Statements
STATEMENT OF OPERATIONS
Year ended 10/31/10
This statement describes how much your fund earned in investment income and accrued in expenses. It also describes any gains and/or losses generated by fund operations.
| | | | |
| Net investment income | | | | |
Income | | | | |
Dividends | | | $4,407,485 | |
Interest | | | 54,540 | |
Dividends from underlying funds | | | 6,157 | |
Foreign taxes withheld | | | (247,496 | ) |
Total investment income | | | $4,220,686 | |
Expenses | | | | |
Management fee | | | $2,013,554 | |
Distribution and service fees | | | 782,042 | |
Shareholder servicing costs | | | 510,896 | |
Administrative services fee | | | 41,693 | |
Independent Trustees’ compensation | | | 14,853 | |
Custodian fee | | | 93,938 | |
Shareholder communications | | | 36,691 | |
Auditing fees | | | 73,241 | |
Legal fees | | | 4,154 | |
Miscellaneous | | | 120,811 | |
Total expenses | | | $3,691,873 | |
Fees paid indirectly | | | (14 | ) |
Reduction of expenses by investment adviser | | | (1,085 | ) |
Net expenses | | | $3,690,774 | |
Net investment income | | | $529,912 | |
Realized and unrealized gain (loss) on investments
and foreign currency transactions | | | | |
Realized gain (loss) (identified cost basis) | | | | |
Investment transactions (net of $772 country tax) | | | $8,359,018 | |
Foreign currency transactions | | | (68,008 | ) |
Net realized gain (loss) on investments
and foreign currency transactions | | | $8,291,010 | |
Change in unrealized appreciation (depreciation) | | | | |
Investments | | | $19,880,556 | |
Translation of assets and liabilities in foreign currencies | | | 10,991 | |
Net unrealized gain (loss) on investments
and foreign currency translation | | | $19,891,547 | |
Net realized and unrealized gain (loss) on investments
and foreign currency | | | $28,182,557 | |
Change in net assets from operations | | | $28,712,469 | |
See notes to financial statements
18
Financial Statements
STATEMENTS OF CHANGES IN NET ASSETS
These statements describe the increases and/or decreases in net assets resulting from operations, any distributions, and any shareholder transactions.
| | | | | | | | |
| | | Years ended 10/31 | |
| | | 2010 | | | 2009 | |
| Change in net assets | | | | | | |
| From operations | | | | | | | | |
Net investment income | | | $529,912 | | | | $911,276 | |
Net realized gain (loss) on investments and
foreign currency transactions | | | 8,291,010 | | | | (24,756,718 | ) |
Net unrealized gain (loss) on investments and
foreign currency translation | | | 19,891,547 | | | | 69,445,156 | |
Change in net assets from operations | | | $28,712,469 | | | | $45,599,714 | |
| Distributions declared to shareholders | | | | | | | | |
From net investment income | | | $(823,079 | ) | | | $(24,131 | ) |
Change in net assets from fund share transactions | | | $(26,067,852 | ) | | | $(14,939,634 | ) |
Total change in net assets | | | $1,821,538 | | | | $30,635,949 | |
| Net assets | | | | | | | | |
At beginning of period | | | 225,299,211 | | | | 194,663,262 | |
At end of period (including undistributed net investment
income of $414,804 and $775,207, respectively) | | | $227,120,749 | | | | $225,299,211 | |
See notes to financial statements
19
Financial Statements
FINANCIAL HIGHLIGHTS
The financial highlights table is intended to help you understand the fund’s financial performance for the past 5 years. Certain information reflects financial results for a single fund share. The total returns in the table represent the rate by which an investor would have earned (or lost) on an investment in the fund share class (assuming reinvestment of all distributions) held for the entire period.
| | | | | | | | | | | | | | | | | | | | |
| Class A | | Years ended 10/31 | |
| | | 2010 | | | 2009 | | | 2008 | | | 2007 | | | 2006 | |
Net asset value, beginning of period | | | $21.93 | | | | $17.35 | | | | $29.26 | | | | $23.97 | | | | $20.10 | |
| Income (loss) from investment operations | | | | | | | | | | | | | | | | | | | | |
Net investment income (d) | | | $0.08 | | | | $0.11 | | | | $0.08 | | | | $0.25 | | | | $0.11 | |
Net realized and unrealized gain (loss) on investments and foreign currency | | | 2.96 | | | | 4.47 | | | | (11.82 | ) | | | 5.28 | | | | 3.76 | |
Total from investment operations | | | $3.04 | | | | $4.58 | | | | $(11.74 | ) | | | $5.53 | | | | $3.87 | |
| Less distributions declared to shareholders | | | | | | | | | | | | | | | | | | | | |
From net investment income | | | $(0.09 | ) | | | $(0.00 | )(w) | | | $(0.17 | ) | | | $(0.24 | ) | | | $— | |
Net asset value, end of period | | | $24.88 | | | | $21.93 | | | | $17.35 | | | | $29.26 | | | | $23.97 | |
Total return (%) (r)(s)(t) | | | 13.92 | | | | 26.40 | | | | (40.34 | ) | | | 23.24 | | | | 19.25 | |
| Ratios (%) (to average net assets) and Supplemental data: | | | | | | | | | | | | | | | | | | | | |
Expenses before expense reductions (f) | | | 1.55 | | | | 1.70 | | | | 1.62 | | | | 1.58 | | | | 1.61 | |
Expenses after expense reductions (f) | | | 1.55 | | | | 1.67 | | | | 1.52 | | | | 1.48 | | | | 1.51 | |
Net investment income | | | 0.34 | | | | 0.59 | | | | 0.30 | | | | 0.97 | | | | 0.49 | |
Portfolio turnover | | | 63 | | | | 83 | | | | 88 | | | | 68 | | | | 96 | |
Net assets at end of period (000 omitted) | | | $183,544 | | | | $180,278 | | | | $153,184 | | | | $297,956 | | | | $290,952 | |
See Notes to Financial Statements
20
Financial Highlights – continued
| | | | | | | | | | | | | | | | | | | | |
| Class B | | Years ended 10/31 | |
| | | 2010 | | | 2009 | | | 2008 | | | 2007 | | | 2006 | |
Net asset value, beginning of period | | | $20.37 | | | | $16.24 | | | | $27.42 | | | | $22.46 | | | | $18.98 | |
| Income (loss) from investment operations | | | | | | | | | | | | | | | | | | | | |
Net investment income (loss) (d) | | | $(0.09 | ) | | | $(0.03 | ) | | | $(0.11 | ) | | | $0.06 | | | | $(0.05 | ) |
Net realized and unrealized gain (loss)
on investments and foreign currency | | | 2.75 | | | | 4.16 | | | | (11.07 | ) | | | 4.95 | | | | 3.53 | |
Total from investment operations | | | $2.66 | | | | $4.13 | | | | $(11.18 | ) | | | $5.01 | | | | $3.48 | |
Less distributions declared to
shareholders | | | | | | | | | | | | | | | | | | | | |
From net investment income | | | $— | | | | $— | | | | $— | | | | $(0.05 | ) | | | $— | |
Net asset value, end of period | | | $23.03 | | | | $20.37 | | | | $16.24 | | | | $27.42 | | | | $22.46 | |
Total return (%) (r)(s)(t) | | | 13.06 | | | | 25.43 | | | | (40.77 | ) | | | 22.35 | | | | 18.34 | |
Ratios (%) (to average net assets)
and Supplemental data: | | | | | | | | | | | | | | | | | | | | |
Expenses before expense reductions (f) | | | 2.30 | | | | 2.43 | | | | 2.27 | | | | 2.23 | | | | 2.26 | |
Expenses after expense reductions (f) | | | 2.30 | | | | 2.43 | | | | 2.27 | | | | 2.23 | | | | 2.26 | |
Net investment income (loss) | | | (0.43 | ) | | | (0.19 | ) | | | (0.47 | ) | | | 0.25 | | | | (0.26 | ) |
Portfolio turnover | | | 63 | | | | 83 | | | | 88 | | | | 68 | | | | 96 | |
Net assets at end of period (000 omitted) | | | $13,563 | | | | $17,219 | | | | $19,582 | | | | $64,416 | | | | $75,573 | |
| |
| Class C | | Years ended 10/31 | |
| | | 2010 | | | 2009 | | | 2008 | | | 2007 | | | 2006 | |
Net asset value, beginning of period | | | $20.17 | | | | $16.08 | | | | $27.15 | | | | $22.26 | | | | $18.80 | |
| Income (loss) from investment operations | | | | | | | | | | | | | | | | | | | | |
Net investment income (loss) (d) | | | $(0.09 | ) | | | $(0.03 | ) | | | $(0.11 | ) | | | $0.05 | | | | $(0.06 | ) |
Net realized and unrealized gain (loss)
on investments and foreign currency | | | 2.73 | | | | 4.12 | | | | (10.96 | ) | | | 4.91 | | | | 3.52 | |
Total from investment operations | | | $2.64 | | | | $4.09 | | | | $(11.07 | ) | | | $4.96 | | | | $3.46 | |
Less distributions declared to
shareholders | | | | | | | | | | | | | | | | | | | | |
From net investment income | | | $— | | | | $— | | | | $ (0.00 | )(w) | | | $(0.07 | ) | | | $— | |
Net asset value, end of period | | | $22.81 | | | | $20.17 | | | | $16.08 | | | | $27.15 | | | | $22.26 | |
Total return (%) (r)(s)(t) | | | 13.09 | | | | 25.44 | | | | (40.77 | ) | | | 22.33 | | | | 18.40 | |
Ratios (%) (to average net assets)
and Supplemental data: | | | | | | | | | | | | | | | | | | | | |
Expenses before expense reductions (f) | | | 2.30 | | | | 2.42 | | | | 2.27 | | | | 2.23 | | | | 2.26 | |
Expenses after expense reductions (f) | | | 2.30 | | | | 2.41 | | | | 2.27 | | | | 2.23 | | | | 2.26 | |
Net investment income (loss) | | | (0.41 | ) | | | (0.19 | ) | | | (0.45 | ) | | | 0.21 | | | | (0.27 | ) |
Portfolio turnover | | | 63 | | | | 83 | | | | 88 | | | | 68 | | | | 96 | |
Net assets at end of period (000 omitted) | | | $14,485 | | | | $13,598 | | | | $10,326 | | | | $20,249 | | | | $20,450 | |
See Notes to Financial Statements
21
Financial Highlights – continued
| | | | | | | | | | | | | | | | | | | | |
| Class I | | Years ended 10/31 | |
| | | 2010 | | | 2009 | | | 2008 | | | 2007 | | | 2006 | |
Net asset value, beginning of period | | | $22.37 | | | | $17.73 | | | | $29.87 | | | | $24.46 | | | | $20.46 | |
| Income (loss) from investment operations | | | | | | | | | | | | | | | | | | | | |
Net investment income (d) | | | $0.14 | | | | $0.16 | | | | $0.14 | | | | $0.32 | | | | $0.17 | |
Net realized and unrealized gain (loss) on investments and foreign currency | | | 3.02 | | | | 4.55 | | | | (12.05 | ) | | | 5.39 | | | | 3.83 | |
Total from investment operations | | | $3.16 | | | | $4.71 | | | | $(11.91 | ) | | | $5.71 | | | | $4.00 | |
Less distributions declared to
shareholders | | | | | | | | | | | | | | | | | | | | |
From net investment income | | | $(0.14 | ) | | | $(0.07 | ) | | | $(0.23 | ) | | | $(0.30 | ) | | | $— | |
Net asset value, end of period | | | $25.39 | | | | $22.37 | | | | $17.73 | | | | $29.87 | | | | $24.46 | |
Total return (%) (r)(s) | | | 14.18 | | | | 26.68 | | | | (40.16 | ) | | | 23.57 | | | | 19.55 | |
Ratios (%) (to average net assets)
and Supplemental data: | | | | | | | | | | | | | | | | | | | | |
Expenses before expense reductions (f) | | | 1.30 | | | | 1.42 | | | | 1.27 | | | | 1.23 | | | | 1.26 | |
Expenses after expense reductions (f) | | | 1.30 | | | | 1.41 | | | | 1.27 | | | | 1.23 | | | | 1.26 | |
Net investment income | | | 0.60 | | | | 0.84 | | | | 0.54 | | | | 1.22 | | | | 0.74 | |
Portfolio turnover | | | 63 | | | | 83 | | | | 88 | | | | 68 | | | | 96 | |
Net assets at end of period (000 omitted) | | | $6,788 | | | | $5,875 | | | | $4,306 | | | | $7,739 | | | | $7,368 | |
| |
| Class R1 | | Years ended 10/31 | |
| | | 2010 | | | 2009 | | | 2008 | | | 2007 | | | 2006 | |
Net asset value, beginning of period | | | $20.14 | | | | $16.05 | | | | $27.29 | | | | $22.42 | | | | $18.96 | |
| Income (loss) from investment operations | | | | | | | | | | | | | | | | | | | | |
Net investment loss (d) | | | $(0.08 | ) | | | $(0.02 | ) | | | $(0.12 | ) | | | $(0.10 | ) | | | $(0.07 | ) |
Net realized and unrealized gain (loss)
on investments and foreign currency | | | 2.71 | | | | 4.11 | | | | (10.95 | ) | | | 5.06 | | | | 3.53 | |
Total from investment operations | | | $2.63 | | | | $4.09 | | | | $(11.07 | ) | | | $4.96 | | | | $3.46 | |
Less distributions declared to
shareholders | | | | | | | | | | | | | | | | | | | | |
From net investment income | | | $— | | | | $— | | | | $(0.17 | ) | | | $(0.09 | ) | | | $— | |
Net asset value, end of period | | | $22.77 | | | | $20.14 | | | | $16.05 | | | | $27.29 | | | | $22.42 | |
Total return (%) (r)(s) | | | 13.06 | | | | 25.48 | | | | (40.80 | ) | | | 22.17 | | | | 18.25 | |
Ratios (%) (to average net assets)
and Supplemental data: | | | | | | | | | | | | | | | | | �� | | | |
Expenses before expense reductions (f) | | | 2.30 | | | | 2.41 | | | | 2.31 | | | | 2.35 | | | | 2.45 | |
Expenses after expense reductions (f) | | | 2.30 | | | | 2.41 | | | | 2.31 | | | | 2.33 | | | | 2.35 | |
Net investment loss | | | (0.38 | ) | | | (0.11 | ) | | | (0.53 | ) | | | (0.43 | ) | | | (0.35 | ) |
Portfolio turnover | | | 63 | | | | 83 | | | | 88 | | | | 68 | | | | 96 | |
Net assets at end of period (000 omitted) | | | $791 | | | | $886 | | | | $632 | | | | $1,009 | | | | $127 | |
See Notes to Financial Statements
22
Financial Highlights – continued
| | | | | | | | | | | | | | | | | | | | |
| Class R2 | | Years ended 10/31 | |
| | | 2010 | | | 2009 | | | 2008 | | | 2007 | | | 2006 | |
Net asset value, beginning of period | | | $21.37 | | | | $16.95 | | | | $28.77 | | | | $23.58 | | | | $19.85 | |
| Income (loss) from investment operations | | | | | | | | | | | | | | | | | | | | |
Net investment income (d) | | | $0.02 | | | | $0.06 | | | | $0.02 | | | | $0.04 | | | | $0.03 | |
Net realized and unrealized gain (loss)
on investments and foreign currency | | | 2.90 | | | | 4.36 | | | | (11.66 | ) | | | 5.29 | | | | 3.70 | |
Total from investment operations | | | $2.92 | | | | $4.42 | | | | $(11.64 | ) | | | $5.33 | | | | $3.73 | |
Less distributions declared to
shareholders | | | | | | | | | | | | | | | | | | | | |
From net investment income | | | $(0.04 | ) | | | $— | | | | $(0.18 | ) | | | $(0.14 | ) | | | $— | |
Net asset value, end of period | | | $24.25 | | | | $21.37 | | | | $16.95 | | | | $28.77 | | | | $23.58 | |
Total return (%) (r)(s) | | | 13.66 | | | | 26.08 | | | | (40.70 | ) | | | 22.73 | | | | 18.79 | |
Ratios (%) (to average net assets)
and Supplemental data: | | | | | | | | | | | | | | | | | | | | |
Expenses before expense reductions (f) | | | 1.80 | | | | 1.93 | | | | 1.79 | | | | 1.90 | | | | 2.00 | |
Expenses after expense reductions (f) | | | 1.80 | | | | 1.93 | | | | 1.79 | | | | 1.88 | | | | 1.90 | |
Net investment income | | | 0.10 | | | | 0.36 | | | | 0.06 | | | | 0.16 | | | | 0.15 | |
Portfolio turnover | | | 63 | | | | 83 | | | | 88 | | | | 68 | | | | 96 | |
Net assets at end of period (000 omitted) | | | $5,250 | | | | $5,128 | | | | $4,808 | | | | $4,168 | | | | $619 | |
| |
| Class R3 | | Years ended 10/31 | |
| | | 2010 | | | 2009 | | | 2008 | | | 2007 | | | 2006 | |
Net asset value, beginning of period | | | $21.86 | | | | $17.29 | | | | $29.16 | | | | $23.91 | | | | $20.08 | |
| Income (loss) from investment operations | | | | | | | | | | | | | | | | | | | | |
Net investment income (d) | | | $0.08 | | | | $0.11 | | | | $0.07 | | | | $0.15 | | | | $0.11 | |
Net realized and unrealized gain (loss)
on investments and foreign currency | | | 2.96 | | | | 4.46 | | | | (11.78 | ) | | | 5.33 | | | | 3.72 | |
Total from investment operations | | | $3.04 | | | | $4.57 | | | | $(11.71 | ) | | | $5.48 | | | | $3.83 | |
Less distributions declared to
shareholders | | | | | | | | | | | | | | | | | | | | |
From net investment income | | | $(0.10 | ) | | | $— | | | | $(0.16 | ) | | | $(0.23 | ) | | | $— | |
Net asset value, end of period | | | $24.80 | | | | $21.86 | | | | $17.29 | | | | $29.16 | | | | $23.91 | |
Total return (%) (r)(s) | | | 13.93 | | | | 26.43 | | | | (40.37 | ) | | | 23.10 | | | | 19.07 | |
Ratios (%) (to average net assets)
and Supplemental data: | | | | | | | | | | | | | | | | | | | | |
Expenses before expense reductions (f) | | | 1.55 | | | | 1.67 | | | | 1.55 | | | | 1.62 | | | | 1.64 | |
Expenses after expense reductions (f) | | | 1.55 | | | | 1.67 | | | | 1.55 | | | | 1.62 | | | | 1.64 | |
Net investment income | | | 0.34 | | | | 0.60 | | | | 0.28 | | | | 0.58 | | | | 0.48 | |
Portfolio turnover | | | 63 | | | | 83 | | | | 88 | | | | 68 | | | | 96 | |
Net assets at end of period (000 omitted) | | | $2,528 | | | | $2,168 | | | | $1,779 | | | | $3,563 | | | | $1,857 | |
See Notes to Financial Statements
23
Financial Highlights – continued
| | | | | | | | | | | | | | | | | | | | |
| Class R4 | | Years ended 10/31 | |
| | | 2010 | | | 2009 | | | 2008 | | | 2007 | | | 2006 | |
Net asset value, beginning of period | | | $21.98 | | | | $17.41 | | | | $29.33 | | | | $24.02 | | | | $20.11 | |
| Income (loss) from investment operations | | | | | | | | | | | | | | | | | | | | |
Net investment income (d) | | | $0.14 | | | | $0.19 | | | | $0.14 | | | | $0.28 | | | | $0.14 | |
Net realized and unrealized gain (loss)
on investments and foreign currency | | | 2.97 | | | | 4.44 | | | | (11.85 | ) | | | 5.31 | | | | 3.77 | |
Total from investment operations | | | $3.11 | | | | $4.63 | | | | $(11.71 | ) | | | $5.59 | | | | $3.91 | |
Less distributions declared to
shareholders | | | | | | | | | | | | | | | | | | | | |
From net investment income | | | $(0.14 | ) | | | $(0.06 | ) | | | $(0.21 | ) | | | $(0.28 | ) | | | $— | |
Net asset value, end of period | | | $24.95 | | | | $21.98 | | | | $17.41 | | | | $29.33 | | | | $24.02 | |
Total return (%) (r)(s) | | | 14.21 | | | | 26.73 | | | | (40.20 | ) | | | 23.47 | | | | 19.44 | |
Ratios (%) (to average net assets)
and Supplemental data: | | | | | | | | | | | | | | | | | | | | |
Expenses before expense reductions (f) | | | 1.30 | | | | 1.38 | | | | 1.29 | | | | 1.33 | | | | 1.35 | |
Expenses after expense reductions (f) | | | 1.30 | | | | 1.38 | | | | 1.29 | | | | 1.33 | | | | 1.35 | |
Net investment income | | | 0.60 | | | | 1.03 | | | | 0.54 | | | | 1.07 | | | | 0.65 | |
Portfolio turnover | | | 63 | | | | 83 | | | | 88 | | | | 68 | | | | 96 | |
Net assets at end of period (000 omitted) | | | $171 | | | | $146 | | | | $46 | | | | $78 | | | | $63 | |
| (d) | Per share data is based on average shares outstanding. |
| (f) | Ratios do not reflect reductions from fees paid indirectly, if applicable. |
| (r) | Certain expenses have been reduced without which performance would have been lower. |
| (s) | From time to time the fund may receive proceeds from litigation settlements, without which performance would be lower. |
| (t) | Total returns do not include any applicable sales charges. |
| (w) | Per share amount was less than $0.01. |
See Notes to Financial Statements
24
NOTES TO FINANCIAL STATEMENTS
| (1) | | Business and Organization |
MFS Global Growth Fund (the fund) is a series of MFS Series Trust VIII (the trust). The trust is organized as a Massachusetts business trust and is registered under the Investment Company Act of 1940, as amended, as an open-end management investment company.
| (2) | | Significant Accounting Policies |
General – The preparation of financial statements in conformity with U.S. generally accepted accounting principles requires management to make estimates and assumptions that affect the reported amounts of assets and liabilities, and disclosure of contingent assets and liabilities at the date of the financial statements and the reported amounts of revenues and expenses during the reporting period. Actual results could differ from those estimates. In the preparation of these financial statements, management has evaluated subsequent events occurring after the date of the fund’s Statement of Assets and Liabilities through the date that the financial statements were issued. The fund can invest in foreign securities, including securities of emerging market issuers. Investments in foreign securities are vulnerable to the effects of changes in the relative values of the local currency and the U.S. dollar and to the effects of changes in each country’s legal, political, and economic environment. The markets of emerging markets countries are generally more volatile than the markets of developed countries with more mature economies. All of the risks of investing in foreign securities previously described are heightened when investing in emerging markets countries.
Investment Valuations – Equity securities, including restricted equity securities, are generally valued at the last sale or official closing price as provided by a third-party pricing service on the market or exchange on which they are primarily traded. Equity securities, for which there were no sales reported that day, are generally valued at the last quoted daily bid quotation as provided by a third-party pricing service on the market or exchange on which such securities are primarily traded. Equity securities held short, for which there were no sales reported for that day, are generally valued at the last quoted daily ask quotation as provided by a third-party pricing service on the market or exchange on which such securities are primarily traded. Short-term instruments with a maturity at issuance of 60 days or less generally are valued at amortized cost, which approximates market value. Open-end investment companies are generally valued at net asset value per share. Securities and other assets generally valued on the basis of information from a third-party pricing service may also be valued at a broker/dealer bid quotation. Values obtained from third-party pricing services can utilize both transaction data and
25
Notes to Financial Statements – continued
market information such as yield, quality, coupon rate, maturity, type of issue, trading characteristics, and other market data. The values of foreign securities and other assets and liabilities expressed in foreign currencies are converted to U.S. dollars using the mean of bid and asked prices for rates provided by a third-party pricing service.
The Board of Trustees has delegated primary responsibility for determining or causing to be determined the value of the fund’s investments (including any fair valuation) to the adviser pursuant to valuation policies and procedures approved by the Board. If the adviser determines that reliable market quotations are not readily available, investments are valued at fair value as determined in good faith by the adviser in accordance with such procedures under the oversight of the Board of Trustees. Under the fund’s valuation policies and procedures, market quotations are not considered to be readily available for most types of debt instruments and floating rate loans and many types of derivatives. These investments are generally valued at fair value based on information from third-party pricing services. In addition, investments may be valued at fair value if the adviser determines that an investment’s value has been materially affected by events occurring after the close of the exchange or market on which the investment is principally traded (such as foreign exchange or market) and prior to the determination of the fund’s net asset value, or after the halting of trading of a specific security where trading does not resume prior to the close of the exchange or market on which the security is principally traded. Events that occur on a frequent basis after foreign markets close (such as developments in foreign markets and significant movements in the U.S. markets) and prior to the determination of the fund’s net asset value may be deemed to have a material effect on the value of securities traded in foreign markets. Accordingly, the fund’s foreign equity securities may often be valued at fair value. The adviser generally relies on third-party pricing services or other information (such as the correlation with price movements of similar securities in the same or other markets; the type, cost and investment characteristics of the security; the business and financial condition of the issuer; and trading and other market data) to assist in determining whether to fair value and at what value to fair value an investment. The value of an investment for purposes of calculating the fund’s net asset value can differ depending on the source and method used to determine value. When fair valuation is used, the value of an investment used to determine the fund’s net asset value may differ from quoted or published prices for the same investment. There can be no assurance that the fund could obtain the fair value assigned to an investment if it were to sell the investment at the same time at which the fund determines its net asset value per share.
26
Notes to Financial Statements – continued
Various inputs are used in determining the value of the fund’s assets or liabilities. These inputs are categorized into three broad levels. In certain cases, the inputs used to measure fair value may fall into different levels of the fair value hierarchy. In such cases, an investment’s level within the fair value hierarchy is based on the lowest level of input that is significant to the fair value measurement. The fund’s assessment of the significance of a particular input to the fair value measurement in its entirety requires judgment, and considers factors specific to the investment. Level 1 includes unadjusted quoted prices in active markets for identical assets or liabilities. Level 2 includes other significant observable market-based inputs (including quoted prices for similar securities, interest rates, prepayment speed, and credit risk). Level 3 includes unobservable inputs, which may include the adviser’s own assumptions in determining the fair value of investments. The following is a summary of the levels used as of October 31, 2010 in valuing the fund’s assets or liabilities:
| | | | | | | | | | | | | | | | |
| Investments at Value | | Level 1 | | | Level 2 | | | Level 3 | | | Total | |
| Equity Securities: | | | | | | | | | | | | | | | | |
United States | | | $106,836,019 | | | | $— | | | | $— | | | | $106,836,019 | |
United Kingdom | | | 24,908,280 | | | | — | | | | — | | | | 24,908,280 | |
France | | | 19,361,184 | | | | — | | | | — | | | | 19,361,184 | |
Switzerland | | | 15,825,023 | | | | — | | | | — | | | | 15,825,023 | |
Germany | | | 11,278,417 | | | | — | | | | — | | | | 11,278,417 | |
Japan | | | — | | | | 11,270,867 | | | | — | | | | 11,270,867 | |
Brazil | | | 8,226,314 | | | | — | | | | — | | | | 8,226,314 | |
Taiwan | | | 4,972,866 | | | | 2,463,840 | | | | — | | | | 7,436,706 | |
Netherlands | | | 4,433,116 | | | | — | | | | — | | | | 4,433,116 | |
Other Countries | | | 8,841,847 | | | | 6,821,933 | | | | — | | | | 15,663,780 | |
| Short Term Securities | | | — | | | | 945,000 | | | | — | | | | 945,000 | |
| Mutual Funds | | | 1,592,737 | | | | — | | | | — | | | | 1,592,737 | |
| Total Investments | | | $206,275,803 | | | | $21,501,640 | | | | $— | | | | $227,777,443 | |
For further information regarding security characteristics, see the Portfolio of Investments. Of the Level 1 investments presented above, equity investments amounting to $54,905,745 were considered level 2 investments at the beginning of the period. The primary reason for changes in the classifications between levels 1 and 2 occurs when foreign equity securities are fair valued using other observable market-based inputs in place of the closing exchange price due to events occurring after the close of the exchange or market on which the investment is principally traded. The fund’s foreign equity securities may often be valued at fair value.
Repurchase Agreements – The fund entered into repurchase agreements with approved counterparties. Each repurchase agreement is recorded at cost. The fund requires that the securities collateral in a repurchase transaction be
27
Notes to Financial Statements – continued
transferred to a custodian. The fund monitors, on a daily basis, the value of the collateral to ensure that its value, including accrued interest, is greater than amounts owed to the fund under each such repurchase agreement.
Foreign Currency Translation – Purchases and sales of foreign investments, income, and expenses are converted into U.S. dollars based upon currency exchange rates prevailing on the respective dates of such transactions or on the reporting date for foreign denominated receivables and payables. Gains and losses attributable to foreign currency exchange rates on sales of securities are recorded for financial statement purposes as net realized gains and losses on investments. Gains and losses attributable to foreign exchange rate movements on receivables, payables, income and expenses are recorded for financial statement purposes as foreign currency transaction gains and losses. That portion of both realized and unrealized gains and losses on investments that results from fluctuations in foreign currency exchange rates is not separately disclosed.
Short Sales – The fund may enter into short sales whereby it sells a security it does not own in anticipation of a decline in the value of that security. The fund will realize a gain if the security price decreases and a loss if the security price increases between the date of the short sale and the date on which the fund replaces the borrowed security. Losses from short sales can exceed the proceeds of the security sold; and they can also exceed the potential loss from an ordinary buy and sell transaction. The amount of any premium, dividends, or interest the fund may be required to pay in connection with a short sale will be recognized as a fund expense. The fund segregates cash or marketable securities in an amount that, when combined with the amount of proceeds from the short sale deposited with the broker, at least equals the current market value of the security sold short. At October 31, 2010, the fund has yet to enter into such transactions.
Security Loans – JPMorgan Chase and Co. (“Chase”), as lending agent, loans the securities of the fund to certain qualified institutions (the “Borrowers”) approved by the fund. The loans are collateralized by cash and/or U.S. Treasury and federal agency obligations in an amount typically at least equal to the market value of the securities loaned. The market value of the loaned securities is determined at the close of business of the fund and any additional required collateral is delivered to the fund on the next business day. Chase provides the fund with indemnification against Borrower default. The fund bears the risk of loss with respect to the investment of cash collateral. On loans collateralized by cash, the cash collateral is invested in short-term securities. A portion of the income generated upon investment of the collateral is remitted to the Borrowers, and the remainder is allocated between the fund and the lending agent. On loans collateralized by U.S. Treasury and/or federal agency
28
Notes to Financial Statements – continued
obligations, a fee is received from the Borrower, and is allocated between the fund and the lending agent. Income from securities lending is included in interest income on the Statement of Operations. The dividend and interest income earned on the securities loaned is accounted for in the same manner as other dividend and interest income.
Indemnifications – Under the fund’s organizational documents, its officers and Trustees may be indemnified against certain liabilities and expenses arising out of the performance of their duties to the fund. Additionally, in the normal course of business, the fund enters into agreements with service providers that may contain indemnification clauses. The fund’s maximum exposure under these agreements is unknown as this would involve future claims that may be made against the fund that have not yet occurred.
Investment Transactions and Income – Investment transactions are recorded on the trade date. Interest income is recorded on the accrual basis. All premium and discount is amortized or accreted for financial statement purposes in accordance with U.S. generally accepted accounting principles. Dividends received in cash are recorded on the ex-dividend date. Certain dividends from foreign securities will be recorded when the fund is informed of the dividend if such information is obtained subsequent to the ex-dividend date. Dividend and interest payments received in additional securities are recorded on the ex-dividend or ex-interest date in an amount equal to the value of the security on such date.
The fund may receive proceeds from litigation settlements. Any proceeds received from litigation involving portfolio holdings are reflected in the Statement of Operations in realized gain/loss if the security has been disposed of by the fund or in unrealized gain/loss if the security is still held by the fund. Any other proceeds from litigation not related to portfolio holdings are reflected as other income in the Statement of Operations.
Fees Paid Indirectly – The fund’s custody fee may be reduced according to an arrangement that measures the value of cash deposited with the custodian by the fund. This amount, for the year ended October 31, 2010, is shown as a reduction of total expenses on the Statement of Operations.
Tax Matters and Distributions – The fund intends to qualify as a regulated investment company, as defined under Subchapter M of the Internal Revenue Code, and to distribute all of its taxable income, including realized capital gains. As a result, no provision for federal income tax is required. The fund’s federal tax returns for the prior three fiscal years remain subject to examination by the Internal Revenue Service. Foreign taxes, if any, have been accrued by the fund in the accompanying financial statements.
29
Notes to Financial Statements – continued
Distributions to shareholders are recorded on the ex-dividend date. Income and capital gain distributions are determined in accordance with income tax regulations, which may differ from U.S. generally accepted accounting principles. Certain capital accounts in the financial statements are periodically adjusted for permanent differences in order to reflect their tax character. These adjustments have no impact on net assets or net asset value per share. Temporary differences which arise from recognizing certain items of income, expense, gain or loss in different periods for financial statement and tax purposes will reverse at some time in the future. Distributions in excess of net investment income or net realized gains are temporary overdistributions for financial statement purposes resulting from differences in the recognition or classification of income or distributions for financial statement and tax purposes.
Book/tax differences primarily relate to wash sale loss deferrals and foreign taxes.
The tax character of distributions declared to shareholders for the last two fiscal years is as follows:
| | | | | | | | |
| | | 10/31/10 | | | 10/31/09 | |
Ordinary income (including any
short-term capital gains) | | | $823,079 | | | | $24,131 | |
The federal tax cost and the tax basis components of distributable earnings were as follows:
| | | | |
| As of 10/31/10 | | | |
| Cost of investments | | | $212,614,749 | |
| Gross appreciation | | | 26,972,420 | |
| Gross depreciation | | | (11,809,726 | ) |
| Net unrealized appreciation (depreciation) | | | $15,162,694 | |
| |
| Undistributed ordinary income | | | 468,030 | |
| Capital loss carryforwards | | | (21,960,632 | ) |
| Other temporary differences | | | (33,169 | ) |
As of October 31, 2010 the fund had capital loss carryforwards available to offset future realized gains. Such losses expire as follows:
Multiple Classes of Shares of Beneficial Interest – The fund offers multiple classes of shares, which differ in their respective distribution and service fees. The fund’s income, realized and unrealized gain (loss), and common expenses are allocated to shareholders based on the daily net assets of each class. Dividends are declared separately for each class. Differences in per share dividend rates are generally due to differences in separate class expenses.
30
Notes to Financial Statements – continued
Class B shares will convert to Class A shares approximately eight years after purchase. The fund’s distributions declared to shareholders as reported on the Statements of Changes in Net Assets are presented by class as follows:
| | | | | | | | |
| | | From net investment
income | |
| | | Year ended
10/31/10 | | | Year ended
10/31/09 | |
| Class A | | | $767,065 | | | | $7,021 | |
| Class I | | | 37,502 | | | | 16,937 | |
| Class R2 | | | 7,879 | | | | — | |
| Class R3 | | | 9,694 | | | | — | |
| Class R4 | | | 939 | | | | 173 | |
| Total | | | $823,079 | | | | $24,131 | |
| (3) | | Transactions with Affiliates |
Investment Adviser – The fund has an investment advisory agreement with MFS to provide overall investment management and related administrative services and facilities to the fund. The management fee is computed daily and paid monthly at the following annual rates:
| | | | |
| First $1 billion of average daily net assets | | | 0.90 | % |
| Next $1 billion of average daily net assets | | | 0.75 | % |
| Average daily net assets in excess of $2 billion | | | 0.65 | % |
The management fee incurred for the year ended October 31, 2010 was equivalent to an annual effective rate of 0.90% of the fund’s average daily net assets.
Distributor – MFS Fund Distributors, Inc. (MFD), a wholly-owned subsidiary of MFS, as distributor, received $13,371 for the year ended October 31, 2010, as its portion of the initial sales charge on sales of Class A shares of the fund.
The Board of Trustees has adopted a distribution plan for certain class shares pursuant to Rule 12b-1 of the Investment Company Act of 1940.
The fund’s distribution plan provides that the fund will pay MFD for services provided by MFD and financial intermediaries in connection with the distribution and servicing of certain share classes. One component of the plan is a distribution fee paid to MFD and another component of the plan is a service fee paid to MFD. MFD may subsequently pay all, or a portion, of the distribution and/or service fees to financial intermediaries.
31
Notes to Financial Statements – continued
Distribution Plan Fee Table:
| | | | | | | | | | | | | | | | | | | | |
| | | Distribution
Fee Rate (d) | | | Service
Fee Rate (d) | | | Total
Distribution
Plan (d) | | | Annual
Effective
Rate (e) | | | Distribution
and Service
Fee | |
| Class A | | | — | | | | 0.25% | | | | 0.25% | | | | 0.25% | | | | $449,142 | |
| Class B | | | 0.75% | | | | 0.25% | | | | 1.00% | | | | 1.00% | | | | 152,139 | |
| Class C | | | 0.75% | | | | 0.25% | | | | 1.00% | | | | 1.00% | | | | 141,000 | |
| Class R1 | | | 0.75% | | | | 0.25% | | | | 1.00% | | | | 1.00% | | | | 9,133 | |
| Class R2 | | | 0.25% | | | | 0.25% | | | | 0.50% | | | | 0.50% | | | | 24,830 | |
| Class R3 | | | — | | | | 0.25% | | | | 0.25% | | | | 0.25% | | | | 5,798 | |
| Total Distribution and Service Fees | | | | | | | | $782,042 | |
| (d) | In accordance with the distribution plan for certain classes, the fund pays distribution and/or service fees equal to these annual percentage rates of each class’ average daily net assets. The distribution and service fee rates disclosed by class represent the current rates in effect at the end of the reporting period. Any rate changes, if applicable, are detailed below. |
| (e) | The annual effective rates represent actual fees incurred under the distribution plan for the year ended October 31, 2010 based on each class’ average daily net assets. |
Certain Class A shares are subject to a contingent deferred sales charge (CDSC) in the event of a shareholder redemption within 24 months of purchase. Class C shares are subject to a CDSC in the event of a shareholder redemption within 12 months of purchase. Class B shares are subject to a CDSC in the event of a shareholder redemption within six years of purchase. All contingent deferred sales charges are paid to MFD and during the year ended October 31, 2010, were as follows:
| | | | |
| | | Amount | |
| Class A | | | $78 | |
| Class B | | | 14,267 | |
| Class C | | | 227 | |
Shareholder Servicing Agent – MFS Service Center, Inc. (MFSC), a wholly-owned subsidiary of MFS, receives a fee from the fund for its services as shareholder servicing agent calculated as a percentage of the average daily net assets of the fund as determined periodically under the supervision of the fund’s Board of Trustees. For the year ended October 31, 2010, the fee was $232,772, which equated to 0.1040% annually of the fund’s average daily net assets. MFSC also receives payment from the fund for out-of-pocket expenses, sub-accounting and other shareholder servicing costs which may be paid to affiliated and unaffiliated service providers. For the year ended October 31, 2010, these out-of-pocket expenses, sub-accounting and other shareholder servicing costs amounted to $278,124.
Administrator – MFS provides certain financial, legal, shareholder communications, compliance, and other administrative services to the fund. Under an administrative services agreement, the fund partially reimburses MFS the costs incurred to provide these services. The fund is charged an
32
Notes to Financial Statements – continued
annual fixed amount of $17,500 plus a fee based on average daily net assets. The administrative services fee incurred for the year ended October 31, 2010 was equivalent to an annual effective rate of 0.0186% of the fund’s average daily net assets.
Trustees’ and Officers’ Compensation – The fund pays compensation to independent Trustees in the form of a retainer, attendance fees, and additional compensation to Board and Committee chairpersons. The fund does not pay compensation directly to Trustees or officers of the fund who are also officers of the investment adviser, all of whom receive remuneration for their services to the fund from MFS. Certain officers and Trustees of the fund are officers or directors of MFS, MFD, and MFSC.
Prior to December 31, 2001, the fund had an unfunded defined benefit plan (“DB plan”) for independent Trustees. As of December 31, 2001, the Board took action to terminate the DB plan with respect to then-current and any future independent Trustees, such that the DB Plan covers only certain of those former independent Trustees who retired on or before December 31, 2001. Effective January 1, 2002, accrued benefits under the DB Plan for then-current independent Trustees who continued were credited to an unfunded retirement deferral plan (the “Retirement Deferral plan”), which was established for and exists solely with respect to these credited amounts, and is not available for other deferrals by these or other independent Trustees. Although the Retirement Deferral plan is unfunded, amounts deferred under the plan are periodically adjusted for investment experience as if they had been invested in shares of the fund. The DB Plan resulted in a pension expense of $1,702 and the Retirement Deferral plan resulted in an expense of $1,960. Both amounts are included in independent Trustees’ compensation for the year ended October 31, 2010. The liability for deferred retirement benefits payable to certain independent Trustees under both Plans amounted to $40,369 at October 31, 2010, and is included in payable for independent Trustees’ compensation on the Statement of Assets and Liabilities.
Other – This fund and certain other funds managed by MFS (the funds) have entered into services agreements (the Agreements) which provide for payment of fees by the funds to Tarantino LLC and Griffin Compliance LLC in return for the provision of services of an Independent Chief Compliance Officer (ICCO) and Assistant ICCO, respectively, for the funds. The ICCO and Assistant ICCO are officers of the funds and the sole members of Tarantino LLC and Griffin Compliance LLC, respectively. The funds can terminate the Agreements with Tarantino LLC and Griffin Compliance LLC at any time under the terms of the Agreements. For the year ended October 31, 2010, the aggregate fees paid by the fund to Tarantino LLC and Griffin Compliance LLC were $2,198 and are included in miscellaneous expense on the Statement of Operations. MFS has
33
Notes to Financial Statements – continued
agreed to reimburse the fund for a portion of the payments made by the fund in the amount of $1,085, which is shown as a reduction of total expenses in the Statement of Operations. Additionally, MFS has agreed to bear all expenses associated with office space, other administrative support, and supplies provided to the ICCO and Assistant ICCO.
The fund may invest in the MFS Institutional Money Market Portfolio which is managed by MFS and seeks a high level of current income consistent with preservation of capital and liquidity. Income earned on this investment is included in dividends from underlying funds on the Statement of Operations. This money market fund does not pay a management fee to MFS.
Purchases and sales of investments, other than U.S. Government securities, purchased option transactions, and short-term obligations, aggregated $136,907,691 and $160,626,443, respectively.
| (5) | | Shares of Beneficial Interest |
The fund’s Declaration of Trust permits the Trustees to issue an unlimited number of full and fractional shares of beneficial interest. Transactions in fund shares were as follows:
| | | | | | | | | | | | | | | | |
| | | Year ended
10/31/10 | | | Year ended
10/31/09 | |
| | | Shares | | | Amount | | | Shares | | | Amount | |
| Shares sold | | | | | | | | | | | | | | | | |
Class A | | | 636,830 | | | | $14,714,935 | | | | 1,140,621 | | | | $20,468,985 | |
Class B | | | 68,804 | | | | 1,483,216 | | | | 136,125 | | | | 2,332,213 | |
Class C | | | 55,651 | | | | 1,192,224 | | | | 164,062 | | | | 2,919,260 | |
Class I | | | 41,895 | | | | 993,123 | | | | 54,872 | | | | 1,070,421 | |
Class R1 | | | 11,708 | | | | 246,765 | | | | 13,039 | | | | 204,677 | |
Class R2 | | | 35,124 | | | | 797,411 | | | | 51,191 | | | | 896,132 | |
Class R3 | | | 16,990 | | | | 383,631 | | | | 14,357 | | | | 260,422 | |
Class R4 | | | 230 | | | | 5,312 | | | | 3,992 | | | | 61,365 | |
| | | 867,232 | | | | $19,816,617 | | | | 1,578,259 | | | | $28,213,475 | |
| Shares issued to shareholders in reinvestment of distributions | | | | | | | | | | | | | | | | |
Class A | | | 30,668 | | | | $703,849 | | | | 408 | | | | $6,991 | |
Class I | | | 1,468 | | | | 34,318 | | | | 975 | | | | 16,937 | |
Class R2 | | | 325 | | | | 7,282 | | | | — | | | | — | |
Class R3 | | | 424 | | | | 9,694 | | | | — | | | | — | |
Class R4 | | | 41 | | | | 939 | | | | 10 | | | | 173 | |
| | | 32,926 | | | | $756,082 | | | | 1,393 | | | | $24,101 | |
34
Notes to Financial Statements – continued
| | | | | | | | | | | | | | | | |
| | | Year ended
10/31/10 | | | Year ended
10/31/09 | |
| | | Shares | | | Amount | | | Shares | | | Amount | |
| Shares reacquired | | | | | | | | | | | | | | | | |
Class A | | | (1,511,518 | ) | | | $(34,644,075 | ) | | | (1,747,948 | ) | | | $(30,336,311 | ) |
Class B | | | (325,277 | ) | | | (6,971,206 | ) | | | (496,733 | ) | | | (7,982,943 | ) |
Class C | | | (94,798 | ) | | | (2,020,863 | ) | | | (132,048 | ) | | | (2,100,034 | ) |
Class I | | | (38,694 | ) | | | (918,873 | ) | | | (36,123 | ) | | | (673,974 | ) |
Class R1 | | | (20,998 | ) | | | (428,188 | ) | | | (8,368 | ) | | | (146,491 | ) |
Class R2 | | | (58,868 | ) | | | (1,323,025 | ) | | | (94,866 | ) | | | (1,625,381 | ) |
Class R3 | | | (14,657 | ) | | | (332,767 | ) | | | (17,994 | ) | | | (311,949 | ) |
Class R4 | | | (69 | ) | | | (1,554 | ) | | | (7 | ) | | | (127 | ) |
| | | (2,064,879 | ) | | | $(46,640,551 | ) | | | (2,534,087 | ) | | | $(43,177,210 | ) |
| Net change | | | | | | | | | | | | | | | | |
Class A | | | (844,020 | ) | | | $(19,225,291 | ) | | | (606,919 | ) | | | $(9,860,335 | ) |
Class B | | | (256,473 | ) | | | (5,487,990 | ) | | | (360,608 | ) | | | (5,650,730 | ) |
Class C | | | (39,147 | ) | | | (828,639 | ) | | | 32,014 | | | | 819,226 | |
Class I | | | 4,669 | | | | 108,568 | | | | 19,724 | | | | 413,384 | |
Class R1 | | | (9,290 | ) | | | (181,423 | ) | | | 4,671 | | | | 58,186 | |
Class R2 | | | (23,419 | ) | | | (518,332 | ) | | | (43,675 | ) | | | (729,249 | ) |
Class R3 | | | 2,757 | | | | 60,558 | | | | (3,637 | ) | | | (51,527 | ) |
Class R4 | | | 202 | | | | 4,697 | | | | 3,995 | | | | 61,411 | |
| | | (1,164,721 | ) | | | $(26,067,852 | ) | | | (954,435 | ) | | | $(14,939,634 | ) |
The fund and certain other funds managed by MFS participate in a $1.1 billion unsecured committed line of credit, subject to a $1 billion sublimit, provided by a syndication of banks under a credit agreement. Borrowings may be made for temporary financing needs. Interest is charged to each fund, based on its borrowings, generally at a rate equal to the higher of the Federal Reserve funds rate or one month LIBOR plus an agreed upon spread. A commitment fee, based on the average daily, unused portion of the committed line of credit, is allocated among the participating funds at the end of each calendar quarter. In addition, the fund and other funds managed by MFS have established unsecured uncommitted borrowing arrangements with certain banks for temporary financing needs. Interest is charged to each fund, based on its borrowings, at a rate equal to the Federal Reserve funds rate plus an agreed upon spread. For the year ended October 31, 2010, the fund’s commitment fee and interest expense were $2,778 and $0, respectively, and are included in miscellaneous expense on the Statement of Operations.
35
Notes to Financial Statements – continued
| (7) | | Transactions in Underlying Funds-Affiliated Issuers |
An affiliated issuer may be considered one in which the fund owns 5% or more of the outstanding voting securities, or a company which is under common control. For the purposes of this report, the fund assumes the following to be affiliated issuers:
| | | | | | | | | | | | | | | | |
| Underlying Funds | | Beginning
Shares/Par
Amount | | | Acquisitions
Shares/Par
Amount | | | Dispositions
Shares/Par
Amount | | | Ending
Shares/Par
Amount | |
MFS Institutional Money
Market Portfolio | | | 4,379,498 | | | | 47,500,135 | | | | (50,286,896 | ) | | | 1,592,737 | |
| | | | |
| Underlying Funds | | Realized
Gain (Loss) | | | Capital Gain
Distributions | | | Dividend
Income | | | Ending
Value | |
| MFS Institutional Money Market Portfolio | | | $— | | | | $— | | | | $6,157 | | | | $1,592,737 | |
36
REPORT OF INDEPENDENT REGISTERED PUBLIC ACCOUNTING FIRM
To the Board of Trustees of MFS Series Trust VIII and the Shareholders of MFS Global Growth Fund:
We have audited the accompanying statement of assets and liabilities, including the portfolio of investments, of MFS Global Growth Fund (one of the portfolios comprising MFS Series Trust VIII) (the “Fund”) as of October 31, 2010, and the related statement of operations for the year then ended, the statements of changes in net assets for each of the two years in the period then ended, and the financial highlights for each of the five years in the period then ended. These financial statements and financial highlights are the responsibility of the Fund’s management. Our responsibility is to express an opinion on these financial statements and financial highlights based on our audits.
We conducted our audits in accordance with the standards of the Public Company Accounting Oversight Board (United States). Those standards require that we plan and perform the audit to obtain reasonable assurance about whether the financial statements and financial highlights are free of material misstatement. The Fund is not required to have, nor were we engaged to perform, an audit of its internal control over financial reporting. Our audits included consideration of internal control over financial reporting as a basis for designing audit procedures that are appropriate in the circumstances, but not for the purpose of expressing an opinion on the effectiveness of the Fund’s internal control over financial reporting. Accordingly, we express no such opinion. An audit also includes examining, on a test basis, evidence supporting the amounts and disclosures in the financial statements, assessing the accounting principles used and significant estimates made by management, as well as evaluating the overall financial statement presentation. Our procedures included confirmation of securities owned as of October 31, 2010, by correspondence with the custodian and brokers; where replies were not received from brokers, we performed other auditing procedures. We believe that our audits provide a reasonable basis for our opinion.
In our opinion, the financial statements and financial highlights referred to above present fairly, in all material respects, the financial position of MFS Global Growth Fund as of October 31, 2010, the results of its operations for the year then ended, the changes in its net assets for each of the two years in the period then ended, and the financial highlights for each of the five years in the period then ended, in conformity with accounting principles generally accepted in the United States of America.
DELOITTE & TOUCHE LLP
Boston, Massachusetts
December 16, 2010
37
TRUSTEES AND OFFICERS — IDENTIFICATION AND BACKGROUND
The Trustees and officers of the Trust, as of December 1, 2010, are listed below, together with their principal occupations during the past five years. (Their titles may have varied during that period.) The address of each Trustee and officer is 500 Boylston Street, Boston, Massachusetts 02116.
| | | | | | |
Name, Date of Birth | | Position(s) Held
with Fund | | Trustee/Officer
Since (h) | | Principal Occupations During
the Past Five Years & Other
Directorships (j) |
| INTERESTED TRUSTEES | | | | |
| Robert J. Manning (k) (born 10/20/63) | | Trustee | | February 2004 | | Massachusetts Financial Services Company, Chairman, Chief Executive Officer and Director; President (until December 2009); Chief Investment Officer (until July 2010) |
Robert C. Pozen (k)
(born 8/08/46) | | Trustee | | February 2004 | | Massachusetts Financial Services Company, Chairman Emeritus; Chairman (until July 2010); Medtronic, Inc, (medical devices), Director (since 2004); Harvard Business School (education), Senior Lecturer (since 2008); Telesat (satellite communications), Director (until November 2007); Bell Canada Enterprises (telecommunications), Director (until February 2009) |
| INDEPENDENT TRUSTEES | | | | |
David H. Gunning
(born 5/30/42) | | Trustee and Chair of Trustees | | January 2004 | | Retired; Cleveland-Cliffs Inc. (mining products and service provider), Vice Chairman/Director (until May 2007); Lincoln Electric Holdings, Inc. (welding equipment manufacturer), Director; Development Alternatives, Inc. (consulting), Portman Limited (mining), Director (until 2008) |
Robert E. Butler
(born 11/29/41) | | Trustee | | January 2006 | | Consultant – investment company industry regulatory and compliance matters; PricewaterhouseCoopers LLP (professional services firm), Partner (until 2002) |
38
Trustees and Officers – continued
| | | | | | |
Name, Date of Birth | | Position(s) Held
with Fund | | Trustee/Officer
Since (h) | | Principal Occupations During
the Past Five Years & Other
Directorships (j) |
| Lawrence H. Cohn, M.D. (born 3/11/37) | | Trustee | | June 1989 | | Brigham and Women’s Hospital, Senior Cardiac Surgeon (since 2005); Harvard Medical School, Professor of Cardiac Surgery; Partners HealthCare, Physician Director of Medical Device Technology (since 2006); Brigham and Women’s Hospital, Chief of Cardiac Surgery (until 2005) |
Maureen R. Goldfarb (born 4/6/55) | | Trustee | | January 2009 | | Private investor; John Hancock Financial Services, Inc., Executive Vice President (until 2004); John Hancock Mutual Funds, Trustee and Chief Executive Officer (until 2004) |
William R. Gutow
(born 9/27/41) | | Trustee | | December 1993 | | Private investor and real estate consultant ; Capital Entertainment Management Company (video franchise), Vice Chairman; Texas Donuts (donut franchise), Vice Chairman (since 2007); Atlantic Coast Tan (tanning salons), Vice Chairman (until 2007) |
Michael Hegarty
(born 12/21/44) | | Trustee | | December 2004 | | Private investor; AXA Financial (financial services and insurance), Vice Chairman and Chief Operating Officer (until 2001); The Equitable Life Assurance Society (insurance), President and Chief Operating Officer (until 2001) |
John P. Kavanaugh (born 11/4/54) | | Trustee | | January 2009 | | Private investor; The Hanover Insurance Group, Inc., Vice President and Chief Investment Officer (until 2006); Allmerica Investment Trust, Allmerica Securities Trust and Opus Investment Trust (investment companies), Chairman, President and Trustee (until 2006) |
J. Dale Sherratt
(born 9/23/38) | | Trustee | | June 1989 | | Insight Resources, Inc. (acquisition planning specialists), President; Wellfleet Investments (investor in health care companies), Managing General Partner |
39
Trustees and Officers – continued
| | | | | | |
Name, Date of Birth | | Position(s) Held
with Fund | | Trustee/Officer
Since (h) | | Principal Occupations During
the Past Five Years & Other
Directorships (j) |
Laurie J. Thomsen
(born 8/05/57) | | Trustee | | March 2005 | | Private investor; The Travelers Companies (property and casualty insurance), Director; New Profit, Inc. (venture philanthropy), Executive Partner (until 2010) |
Robert W. Uek
(born 5/18/41) | | Trustee | | January 2006 | | Consultant to investment company industry; PricewaterhouseCoopers LLP (professional services firm), Partner (until 1999); TT International Funds (mutual fund complex), Trustee (until 2005); Hillview Investment Trust II Funds (mutual fund complex), Trustee (until 2005) |
| OFFICERS | | | | | | |
| Maria F. DiOrioDwyer (k) (born 12/01/58) | | President | | March 2004 | | Massachusetts Financial Services Company, Executive Vice President and Chief Regulatory Officer (since March 2004) Chief Compliance Officer (since December 2006) |
| Christopher R. Bohane (k) (born 1/18/74) | | Assistant Secretary and Assistant Clerk | | July 2005 | | Massachusetts Financial Services Company, Vice President and Senior Counsel |
John M. Corcoran (k) (born 4/13/65) | | Treasurer | | October
2008 | | Massachusetts Financial Services Company, Senior Vice President (since October 2008); State Street Bank and Trust (financial services provider), Senior Vice President, (until September 2008) |
Ethan D. Corey (k)
(born 11/21/63) | | Assistant Secretary and Assistant Clerk | | July 2005 | | Massachusetts Financial Services Company, Senior Vice President and Associate General Counsel |
| David L. DiLorenzo (k) (born 8/10/68) | | Assistant Treasurer | | July 2005 | | Massachusetts Financial Services Company, Vice President (since June 2005); JP Morgan Investor Services, Vice President (until June 2005) |
40
Trustees and Officers – continued
| | | | | | |
Name, Date of Birth | | Position(s) Held
with Fund | | Trustee/Officer
Since (h) | | Principal Occupations During
the Past Five Years & Other
Directorships (j) |
Timothy M. Fagan (k)
(born 7/10/68) | | Assistant Secretary and Assistant Clerk | | September 2005 | | Massachusetts Financial Services Company, Vice President and Senior Counsel (since September 2005); John Hancock Advisers, LLC, Vice President, Senior Attorney and Chief Compliance Officer (until August 2005) |
Mark D. Fischer (k)
(born 10/27/70) | | Assistant Treasurer | | July 2005 | | Massachusetts Financial Services Company, Vice President (since May 2005); JP Morgan Investment Management Company, Vice President (until May 2005) |
Robyn L. Griffin
(born 7/04/75) | | Assistant Independent Chief Compliance Officer | | August 2008 | | Griffin Compliance LLC (provider of compliance services), Principal (since August 2008); State Street Corporation (financial services provider), Mutual Fund Administration Assistant Vice President (October 2006 – July 2008); Liberty Mutual Group (insurance), Personal Market Assistant Controller (April 2006 – October 2006); Deloitte & Touche LLP (professional services firm), Senior Manager (prior to April 2006) |
Brian E. Langenfeld (k) (born 3/07/73) | | Assistant Secretary and Assistant Clerk | | June 2006 | | Massachusetts Financial Services Company, Vice President and Senior Counsel (since May 2006); John Hancock Advisers, LLC, Assistant Vice President and Counsel (until April 2006) |
Ellen Moynihan (k)
(born 11/13/57) | | Assistant Treasurer | | April 1997 | | Massachusetts Financial Services Company, Senior Vice President |
Susan S. Newton (k) (born 3/07/50) | | Assistant Secretary and Assistant Clerk | | May 2005 | | Massachusetts Financial Services Company, Senior Vice President and Associate General Counsel |
Susan A. Pereira (k)
(born 11/05/70) | | Assistant Secretary and Assistant Clerk | | July 2005 | | Massachusetts Financial Services Company, Vice President and Senior Counsel |
41
Trustees and Officers – continued
| | | | | | |
Name, Date of Birth | | Position(s) Held
with Fund | | Trustee/Officer
Since (h) | | Principal Occupations During
the Past Five Years & Other
Directorships (j) |
| Mark N. Polebaum (k) (born 5/01/52) | | Secretary and Clerk | | January 2006 | | Massachusetts Financial Services Company, Executive Vice President, General Counsel and Secretary (since January 2006); Wilmer Cutler Pickering Hale and Dorr LLP (law firm), Partner (until January 2006) |
Frank L. Tarantino
(born 3/07/44) | | Independent Chief Compliance Officer | | June 2004 | | Tarantino LLC (provider of compliance services), Principal |
| Richard S. Weitzel (k) (born 7/16/70) | | Assistant Secretary and Assistant Clerk | | October 2007 | | Massachusetts Financial Services Company, Vice President and Assistant General Counsel |
James O. Yost (k)
(born 6/12/60) | | Assistant Treasurer | | September 1990 | | Massachusetts Financial Services Company, Senior Vice President |
| (h) | Date first appointed to serve as Trustee/officer of an MFS fund. Each Trustee has served continuously since appointment unless indicated otherwise. For the period from December 15, 2004 until February 22, 2005, Messrs. Pozen and Manning served as Advisory Trustees. For the period March 2008 until October 2008, Ms. DiOrioDwyer served as Treasurer of the Funds. |
| (j) | Directorships or trusteeships of companies required to report to the Securities and Exchange Commission (i.e., “public companies”). |
| (k) | “Interested person” of the Trust within the meaning of the Investment Company Act of 1940 (referred to as the 1940 Act), which is the principal federal law governing investment companies like the fund, as a result of position with MFS. The address of MFS is 500 Boylston Street, Boston, Massachusetts 02116. |
Each Trustee has been elected by shareholders and each Trustee and officer holds office until his or her successor is chosen and qualified or until his or her earlier death, resignation, retirement or removal. The Trust does not hold annual meetings for the purpose of electing Trustees, and Trustees are not elected for fixed terms. Messrs. Butler, Kavanaugh, Sherratt, Uek and Ms. Thomsen are members of the Trust’s Audit Committee.
Each of the Fund’s Trustees and officers holds comparable positions with certain other funds of which MFS or a subsidiary is the investment adviser or distributor, and, in the case of the officers, with certain affiliates of MFS. As of January 1, 2010, the Trustees served as board members of 99 funds within the MFS Family of Funds.
42
Trustees and Officers – continued
The Statement of Additional Information for the Fund includes further information about the Trustees and is available without charge upon request by calling 1-800-225-2606.
| | |
| Investment Adviser | | Custodian |
Massachusetts Financial Services Company
500 Boylston Street, Boston, MA 02116-3741 Distributor MFS Fund Distributors, Inc.
500 Boylston Street, Boston, MA 02116-3741 Portfolio Managers David Antonelli Jeffrey Constantino | | JPMorgan Chase Bank One Chase Manhattan Plaza, New York, NY 10081 Independent Registered Public Accounting Firm Deloitte & Touche LLP 200 Berkeley Street, Boston, MA 02116 |
43
BOARD REVIEW OF INVESTMENT ADVISORY AGREEMENT
The Investment Company Act of 1940 requires that both the full Board of Trustees and a majority of the non-interested (“independent”) Trustees, voting separately, annually approve the continuation of the Fund’s investment advisory agreement with MFS. The Trustees consider matters bearing on the Fund and its advisory arrangements at their meetings throughout the year, including a review of performance data at each regular meeting. In addition, the independent Trustees met several times over the course of three months beginning in May and ending in July, 2010 (“contract review meetings”) for the specific purpose of considering whether to approve the continuation of the investment advisory agreement for the Fund and the other investment companies that the Board oversees (the “MFS Funds”). The independent Trustees were assisted in their evaluation of the Fund’s investment advisory agreement by independent legal counsel, from whom they received separate legal advice and with whom they met separately from MFS during various contract review meetings. The independent Trustees were also assisted in this process by the MFS Funds’ Independent Chief Compliance Officer, a full-time senior officer appointed by and reporting to the independent Trustees.
In connection with their deliberations regarding the continuation of the investment advisory agreement, the Trustees, including the independent Trustees, considered such information and factors as they believed, in light of the legal advice furnished to them and their own business judgment, to be relevant. The investment advisory agreement for the Fund was considered separately, although the Trustees also took into account the common interests of all MFS Funds in their review. As described below, the Trustees considered the nature, quality, and extent of the various investment advisory, administrative, and shareholder services performed by MFS under the existing investment advisory agreement and other arrangements with the Fund.
In connection with their contract review meetings, the Trustees received and relied upon materials that included, among other items: (i) information provided by Lipper Inc., an independent third party, on the investment performance of the Fund for various time periods ended December 31, 2009 and the investment performance of a group of funds with substantially similar investment classifications/objectives (the “Lipper performance universe”), (ii) information provided by Lipper Inc. on the Fund’s advisory fees and other expenses and the advisory fees and other expenses of comparable funds identified by Lipper Inc. (the “Lipper expense group”), (iii) information provided by MFS on the advisory fees of comparable portfolios of other clients of MFS, including institutional separate accounts and other clients, (iv) information as to whether and to what extent applicable expense waivers,
44
Board Review of Investment Advisory Agreement – continued
reimbursements or fee “breakpoints” are observed for the Fund, (v) information regarding MFS’ financial results and financial condition, including MFS’ and certain of its affiliates’ estimated profitability from services performed for the Fund and the MFS Funds as a whole, and compared to MFS’ institutional business, (vi) MFS’ views regarding the outlook for the mutual fund industry and the strategic business plans of MFS, (vii) descriptions of various functions performed by MFS for the Funds, such as compliance monitoring and portfolio trading practices, and (viii) information regarding the overall organization of MFS, including information about MFS’ senior management and other personnel providing investment advisory, administrative and other services to the Fund and the other MFS Funds. The comparative performance, fee and expense information prepared and provided by Lipper Inc. was not independently verified and the independent Trustees did not independently verify any information provided to them by MFS.
The Trustees’ conclusion as to the continuation of the investment advisory agreement was based on a comprehensive consideration of all information provided to the Trustees and not the result of any single factor. Some of the factors that figured particularly in the Trustees’ deliberations are described below, although individual Trustees may have evaluated the information presented differently from one another, giving different weights to various factors. It is also important to recognize that the fee arrangements for the Fund and other MFS Funds are the result of years of review and discussion between the independent Trustees and MFS, that certain aspects of such arrangements may receive greater scrutiny in some years than in others, and that the Trustees’ conclusions may be based, in part, on their consideration of these same arrangements during the course of the year and in prior years.
Based on information provided by Lipper Inc., the Trustees reviewed the Fund’s total return investment performance as well as the performance of peer groups of funds over various time periods. The Trustees placed particular emphasis on the total return performance of the Fund’s Class A shares in comparison to the performance of funds in its Lipper performance universe over the three-year period ended December 31, 2009, which the Trustees believed was a long enough period to reflect differing market conditions. The total return performance of the Fund’s Class A shares was in the 1st quintile relative to the other funds in the universe for this three-year period (the 1st quintile being the best performers and the 5th quintile being the worst performers). The total return performance of the Fund’s Class A shares was in the 1st quintile for each of the one-and five-year periods ended December 31, 2009 relative to the Lipper performance universe. Because of the passage of time, these performance results are likely to differ from the performance results for more recent periods, including those shown elsewhere in this report.
45
Board Review of Investment Advisory Agreement – continued
In the course of their deliberations, the Trustees took into account information provided by MFS in connection with the contract review meetings, as well as during investment review meetings conducted with portfolio management personnel during the course of the year regarding the Fund’s performance. After reviewing these and related factors, the Trustees concluded, within the context of their overall conclusions regarding the investment advisory agreement, that they were satisfied with MFS’ responses and efforts relating to investment performance.
In assessing the reasonableness of the Fund’s advisory fee, the Trustees considered, among other information, the Fund’s advisory fee and the total expense ratio of the Fund’s Class A shares as a percentage of average daily net assets and the advisory fee and total expense ratios of peer groups of funds based on information provided by Lipper Inc. The Trustees considered that, according to the Lipper data (which takes into account any fee reductions or expense limitations that were in effect during the Fund’s last fiscal year), the Fund’s effective advisory fee rate and total expense ratio were each higher than the Lipper expense group median.
The Trustees also considered the advisory fees charged by MFS to institutional accounts. In comparing these fees, the Trustees considered information provided by MFS as to the generally broader scope of services provided by MFS to the Fund in comparison to institutional accounts, the higher demands placed on MFS’ investment personnel and trading infrastructure as a result of the daily cash in-flows and out-flows of the Fund, and the impact on MFS and expenses associated with the more extensive regulatory regime to which the Fund is subject in comparison to institutional accounts.
The Trustees also considered whether the Fund is likely to benefit from any economies of scale in the management of the Fund in the event of growth in assets of the Fund. They noted that the Fund’s advisory fee rate schedule is subject to contractual breakpoints that reduce the Fund’s advisory fee rate on average daily net assets over $1 billion and $2 billion. The Trustees concluded that the existing breakpoints were sufficient to allow the Fund to benefit from economies of scale as its assets grow.
The Trustees also considered information prepared by MFS relating to MFS’ costs and profits with respect to the Fund, the MFS Funds considered as a group, and other investment companies and accounts advised by MFS, as well as MFS’ methodologies used to determine and allocate its costs to the MFS Funds, the Fund and other accounts and products for purposes of estimating profitability.
After reviewing these and other factors described herein, the Trustees concluded, within the context of their overall conclusions regarding the investment advisory agreement, that the advisory fees charged to the Fund
46
Board Review of Investment Advisory Agreement – continued
represent reasonable compensation in light of the nature and quality of the services being provided by MFS to the Fund.
In addition, the Trustees considered MFS’ resources and related efforts to continue to retain, attract and motivate capable personnel to serve the Fund. The Trustees also considered current and developing conditions in the financial services industry, including the presence of large and well-capitalized companies which are spending, and appear to be prepared to continue to spend, substantial sums to engage personnel and to provide services to competing investment companies. In this regard, the Trustees also considered the financial resources of MFS and its ultimate parent, Sun Life Financial Inc. The Trustees also considered the advantages and possible disadvantages to the Fund of having an adviser that also serves other investment companies as well as other accounts.
The Trustees also considered the nature, quality, cost, and extent of administrative, transfer agency, and distribution services provided to the Fund by MFS and its affiliates under agreements and plans other than the investment advisory agreement, including any 12b-1 fees the Fund pays to MFS Fund Distributors, Inc., an affiliate of MFS. The Trustees also considered the nature, extent and quality of certain other services MFS performs or arranges for on the Fund’s behalf, which may include securities lending programs, directed expense payment programs, class action recovery programs, and MFS’ interaction with third-party service providers, principally custodians and sub-custodians. The Trustees concluded that the various non-advisory services provided by MFS and its affiliates on behalf of the Funds were satisfactory.
The Trustees also considered benefits to MFS from the use of the Fund’s portfolio brokerage commissions, if applicable, to pay for investment research, and various other factors. Additionally, the Trustees considered so-called “fall-out benefits” to MFS such as reputational value derived from serving as investment manager to the Fund.
Based on their evaluation of factors that they deemed to be material, including those factors described above, the Board of Trustees, including a majority of the independent Trustees, concluded that the Fund’s investment advisory agreement with MFS should be continued for an additional one-year period, commencing August 1, 2010.
A discussion regarding the Board’s most recent review and renewal of the fund’s Investment Advisory Agreement with MFS is available by clicking on the fund’s name under “Mutual Funds” in the “Products and Performance” section of the MFS Web site (mfs.com).
47
PROXY VOTING POLICIES AND INFORMATION
A general description of the MFS funds’ proxy voting policies and procedures is available without charge, upon request, by calling
1-800-225-2606, by visiting the Proxy Voting section of mfs.com or by visiting the SEC’s Web site at http://www.sec.gov.
Information regarding how the fund voted proxies relating to portfolio securities during the most recent twelve-month period ended June 30 is available without charge by visiting the Proxy Voting section of mfs.com or by visiting the SEC’s Web site at http://www.sec.gov.
QUARTERLY PORTFOLIO DISCLOSURE
The fund will file a complete schedule of portfolio holdings with the Securities and Exchange Commission (the Commission) for the first and third quarters of each fiscal year on Form N-Q. The fund’s Form N-Q may be reviewed and copied at the:
Public Reference Room
Securities and Exchange Commission
100 F Street, NE, Room 1580
Washington, D.C. 20549
Information on the operation of the Public Reference Room may be obtained by calling the Commission at 1-800-SEC-0330. The fund’s Form N-Q is available on the EDGAR database on the Commission’s Internet Web site at http://www.sec.gov, and copies of this information may be obtained, upon payment of a duplicating fee, by electronic request at the following e-mail address: publicinfo@sec.gov or by writing the Public Reference Section at the above address.
A shareholder can also obtain the quarterly portfolio holdings report at mfs.com.
FURTHER INFORMATION
From time to time, MFS may post important information about the fund or the MFS funds on the MFS web site (mfs.com). This information is available by visiting the “News & Commentary” section of mfs.com or by clicking on the fund’s name under “Mutual Funds” in the “Products and Performance” section of mfs.com.
FEDERAL TAX INFORMATION (unaudited)
The fund will notify shareholders of amounts for use in preparing 2010 income tax forms in January 2011. The following information is provided pursuant to provisions of the Internal Revenue Code.
The fund designates the maximum amount allowable as qualified dividend income eligible for the 15% tax rate.
For corporate shareholders, 87.83% of the ordinary income dividends paid during the fiscal year qualify for the corporate dividends received deduction.
Income derived from foreign sources was $2,781,986. The fund intends to pass through foreign tax credits of $179,598 for the fiscal year.
48
MFS® PRIVACY NOTICE
Privacy is a concern for every investor today. At MFS Investment Management® and the MFS funds, we take this concern very seriously. We want you to understand our policies about the investment products and services that we offer, and how we protect the nonpublic personal information of investors who have a direct relationship with us and our wholly owned subsidiaries.
Throughout our business relationship, you provide us with personal information. We maintain information and records about you, your investments, and the services you use. Examples of the nonpublic personal information we maintain include
| | Ÿ | | data from investment applications and other forms |
| | Ÿ | | share balances and transactional history with us, our affiliates, or others |
| | Ÿ | | facts from a consumer reporting agency |
We do not disclose any nonpublic personal information about our customers or former customers to anyone, except as permitted by law. We may share nonpublic personal information with third parties or certain of our affiliates in connection with servicing your account or processing your transactions. We may share information with companies or financial institutions that perform marketing services on our behalf or with other financial institutions with which we have joint marketing arrangements, subject to any legal requirements.
Authorization to access your nonpublic personal information is limited to appropriate personnel who provide products, services, or information to you. We maintain physical, electronic, and procedural safeguards to help protect the personal information we collect about you.
If you have any questions about the MFS privacy policy, please call 1-800-225-2606 any business day.
Note: If you own MFS products or receive MFS services in the name of a third party such as a bank or broker-dealer, their privacy policy may apply to you instead of ours.
49
CONTACT US
Web site
mfs.com
MFS TALK
1-800-637-8255
24 hours a day
Account service and literature
Shareholders
1-800-225-2606
Investment professionals
1-800-343-2829
Retirement plan services
1-800-637-1255
Mailing address
MFS Service Center, Inc.
P.O. Box 55824
Boston, MA 02205-5824
Overnight mail
MFS Service Center, Inc.
c/o Boston Financial Data Services
30 Dan Road
Canton, MA 02021-2809

Save paper with eDelivery. MFS® will send you prospectuses, reports, and proxies directly via e-mail so you will get information faster with less mailbox clutter. To sign up: 1. go to mfs.com. 2. log in via MFS® Access. 3. select eDelivery. If you own your MFS fund shares through a financial institution or a retirement plan, MFS® TALK, MFS Access, and eDelivery may not be available to you.


MFS® Strategic Income Fund
SIPC Contact Information:
You may obtain information about the Securities Investor Protection Corporation (“SIPC”), including the SIPC Brochure, by contacting SIPC either by telephone (202-371-8300) or by accessing SIPC’s website address (www.sipc.org).
The report is prepared for the general information of shareholders. It is authorized for distribution to prospective investors only when preceded or accompanied by a current prospectus.
NOT FDIC INSURED Ÿ MAY LOSE VALUE Ÿ
NO BANK GUARANTEE
10/31/10
MFO-ANN

LETTER FROM THE CEO
Dear Shareholders:
After an extended rebound in the financial markets, uncertainty returned in early 2010 as investors began to question the durability of the recovery for global economies and markets. That uncertainty led to increased risk aversion, especially as investors saw the eurozone struggle with the debt woes of many of its members. In September, the U.S. Federal Reserve Board’s promises to further loosen monetary policy helped assuage market fears and drive asset prices off their recent lows. A combination of solid earnings and improving economic data gave an additional boost to investor sentiment. As we near the end of 2010, we are cautiously optimistic that economic growth will continue to improve and that the global economies will recover from the shocks of the past few years. We expect the pace of recovery worldwide will be uneven and volatile.
As always, we continue to be mindful of the many challenges faced at the individual, national, and international levels. It is in times such as these that we want to remind investors of the merits of maintaining a long-term view, adhering to basic investing principles such as asset allocation and diversification, and working closely with their advisors to research and identify investment opportunities.
Respectfully,

Robert J. Manning
Chairman and Chief Executive Officer
MFS Investment Management®
December 15, 2010
The opinions expressed in this letter are subject to change, may not be relied upon for investment advice, and no forecasts can be guaranteed.
1
PORTFOLIO COMPOSITION
Portfolio structure (i)
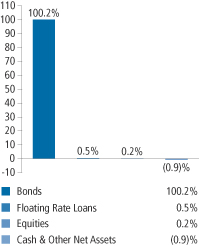
| | | | |
| Fixed income sectors (i) | | | | |
| High Grade Corporates | | | 37.2% | |
| High Yield Corporates | | | 32.8% | |
| Non-U.S. Government Bonds | | | 17.2% | |
| Emerging Markets Bonds | | | 7.4% | |
| Commercial Mortgage-Backed Securities | | | 2.5% | |
| Mortgage-Backed Securities | | | 1.8% | |
| Collateralized Debt Obligations | | | 0.8% | |
| Asset-Backed Securities | | | 0.5% | |
Floating Rate Loans | | | 0.5% | |
| U.S. Treasury Securities (o) | | | (0.0)% | |
| | | | |
| Composition including fixed income credit quality (a)(i) | |
| AAA | | | 11.6% | |
| AA | | | 13.4% | |
| A | | | 14.5% | |
| BBB | | | 23.2% | |
| BB | | | 14.9% | |
| B | | | 15.1% | |
| CCC | | | 5.3% | |
| CC | | | 0.1% | |
| C (o) | | | 0.0% | |
| D | | | 0.1% | |
| U.S. Agency (NR) | | | 1.8% | |
| Other Fixed Income (NR) | | | 0.7% | |
| Non-Fixed Income (NR) | | | 0.2% | |
| Cash & Other | | | (0.9)% | |
| |
| Portfolio facts (i) | | | | |
| Average Duration (d) | | | 4.9 | |
Average Effective Maturity (m) | | | 7.4 yrs. | |
| |
| Issuer country weightings (i) | | | | |
| United States | | | 61.2% | |
| Japan | | | 5.1% | |
| United Kingdom | | | 4.7% | |
| France | | | 3.6% | |
| Germany | | | 3.1% | |
| Italy | | | 2.7% | |
| Canada | | | 2.6% | |
| Netherlands | | | 2.6% | |
| Russia | | | 1.5% | |
Other Countries | | | 12.9% | |
| (a) | The rating categories include debt securities, fixed-income structured products, and securities underlying credit default swaps where these have long-term public ratings. The credit default swap itself is not rated. All ratings are assigned in accordance with the following hierarchy: If a security is rated by Moody’s, then that rating is used; if not rated by Moody’s, then a Standard & Poor’s rating is used; if not rated by S&P, then a Fitch rating is used. Ratings from Moody’s are shown in the S&P and Fitch scale |
2
Portfolio Composition – continued
| | (e.g., AAA). All ratings are subject to change. U.S. Agency (NR) includes unrated U.S. Agency fixed income securities and CMOs of U.S. Agency mortgage-backed securities. Other Fixed Income (NR) includes unrated long-term fixed income securities, interest rate swaps and fixed income futures. Non-Fixed Income (NR) includes equity securities (including convertible bonds and equity derivatives) and commodities. Cash and Other includes cash, other assets less liabilities, offsets to derivative positions and short-term securities. The fund may not hold all of these instruments. |
| (d) | Duration is a measure of how much a bond’s price is likely to fluctuate with general changes in interest rates, e.g., if rates rise 1.00%, a bond with a 5-year duration is likely to lose about 5.00% of its value due to the interest rate move. |
| (i) | For purposes of this presentation, the components include the market value of securities, and reflect the impact of the equivalent exposure of derivative positions, if applicable. These amounts may be negative from time to time. The bond component will include any accrued interest amounts. Equivalent exposure is a calculated amount that translates the derivative position into a reasonable approximation of the amount of the underlying asset that the portfolio would have to hold at a given point in time to have the same price sensitivity that results from the portfolio’s ownership of the derivative contract. When dealing with derivatives, equivalent exposure is a more representative measure of the potential impact of a position on portfolio performance than market value. Where the fund holds convertible bonds, these are treated as part of the equity portion of the portfolio. |
| (m) | In determining an instrument’s effective maturity for purposes of calculating the fund’s dollar-weighted average effective maturity, MFS uses the instrument’s stated maturity or, if applicable, an earlier date on which MFS believes it is probable that a maturity-shortening device (such as a put, pre-refunding or prepayment) will cause the instrument to be repaid. Such an earlier date can be substantially shorter than the instrument’s stated maturity. |
”From time to time “Cash & Other Net Assets” may be negative due to timing of cash receipts and/or equivalent exposure from any derivative holdings.”
Percentages are based on net assets as of 10/31/10.
The portfolio is actively managed and current holdings may be different.
3
MANAGEMENT REVIEW
Summary of Results
For the twelve months ended October 31, 2010, Class A shares of the MFS Strategic Income Fund (the “fund”) provided a total return of 12.56%, at net asset value. This compares with a return of 19.35% for the fund’s benchmark, the Barclays Capital U.S. High-Yield Corporate Bond Index. Over the same period, the fund’s other benchmark, the Strategic Income Blended Index (the “Blended Index”), generated a return of 12.49%. The Blended Index reflects the blended returns of various fixed income market indices, with percentage allocations to each index designed to resemble the fixed income allocations of the fund. The market indices and related percentage allocations used to compile the Blended Index are set forth in the Performance Summary.
Market Environment
The first half of the reporting period witnessed a continuation of the financial market and macroeconomic rebounds that had begun in early 2009. These recoveries in global activity and asset valuations were generally synchronized around the world, led importantly by emerging Asian economies, but broadening to include most of the global economy to varying degrees. Primary drivers of the recoveries included an unwinding of the inventory destocking that took place earlier, the production of manufacturing and capital goods, as well as massive fiscal and monetary stimulus.
During the second half of the period, heightened risk surrounding the public-debt profiles of several of the peripheral European countries impaired market sentiment. At the same time, the improving trend in global macroeconomic data began to weaken somewhat. These two dynamics caused many asset prices to retrench significantly, as many questioned the durability of the global recovery.
Towards the end of the period, the U.S. Federal Reserve led markets to believe that further monetary loosening would be forthcoming if macroeconomic activity did not show signs of improvement. Although policy uncertainty remained very elevated, the prospects for more easing by the Fed improved market sentiment and drove asset prices well off their recent lows.
Detractors from Performance
Relative to the Blended Index, the fund’s lesser exposure to emerging markets debt held back results as this market segment turned in strong performance over the reporting period.
The fund’s lesser exposure to mortgage-backed securities, particularly to Federal National Mortgage Association (Fannie Mae) and Federal Home Loan
4
Management Review – continued
Mortgage Corporation (Freddie Mac), also detracted from relative performance as these securities outperformed U.S. Treasury securities.
A lower relative exposure to “CCC” rated (r) securities also detracted from performance as credit spreads narrowed over the reporting period.
Contributors to Performance
A greater exposure to high-grade corporate bonds in the financial and banking sectors boosted performance, relative to the Blended Index, as holdings within these sectors exhibited strong returns for the reporting period. Similarly, the fund’s greater exposure to high-grade securities in the industrial sector was another positive factor for performance.
Yield curve (y) positioning, particularly the fund’s greater exposure to shifts in the middle portion of the yield curve (centered around maturities of 7 years), was another area of relative strength.
Respectfully,
| | | | |
| John Addeo | | James Calmas | | Robert Persons |
| Portfolio Manager | | Portfolio Manager | | Portfolio Manager |
| | |
| Matthew Ryan | | Erik Weisman | | |
| Portfolio Manager | | Portfolio Manager | | |
| (r) | Bonds rated “BBB”, “Baa”, or higher are considered investment grade; bonds rated “BB”, “Ba”, or below are considered non-investment grade. The primary source for bond quality ratings is Moody’s Investors Service. If not available, ratings by Standard & Poor’s are used, else ratings by Fitch, Inc. For securities which are not rated by any of the three agencies, the security is considered Not Rated. |
| (y) | A yield curve graphically depicts the yields of different maturity bonds of the same credit quality and type; a normal yield curve is upward sloping, with short-term rates lower than long-term rates. |
The views expressed in this report are those of the portfolio managers only through the end of the period of the report as stated on the cover and do not necessarily reflect the views of MFS or any other person in the MFS organization. These views are subject to change at any time based on market or other conditions, and MFS disclaims any responsibility to update such views. These views may not be relied upon as investment advice or an indication of trading intent on behalf of any MFS portfolio. References to specific securities are not recommendations of such securities, and may not be representative of any MFS portfolio’s current or future investments.
5
PERFORMANCE SUMMARY THROUGH 10/31/10
The following chart illustrates a representative class of the fund’s historical performance in comparison to its benchmark(s). Performance results include the deduction of the maximum applicable sales charge and reflect the percentage change in net asset value, including reinvestment of dividends and capital gains distributions. The performance of other share classes will be greater than or less than that of the class depicted below. Benchmarks are unmanaged and may not be invested in directly. Benchmark returns do not reflect sales charges, commissions or expenses. (See Notes to Performance Summary.)
Performance data shown represents past performance and is no guarantee of future results. Investment return and principal value fluctuate so your shares, when sold, may be worth more or less than the original cost; current performance may be lower or higher than quoted. The performance shown does not reflect the deduction of taxes, if any, that a shareholder would pay on fund distributions or the redemption of fund shares.
Growth of a Hypothetical $10,000 Investment
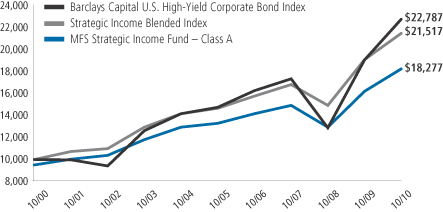
6
Performance Summary – continued
Total Returns through 10/31/10
Average annual without sales charge
| | | | | | | | | | | | | | |
| | | Share class | | Class inception date | | 1-yr | | 5-yr | | 10-yr | | | | |
| | | A | | 10/29/87 | | 12.56% | | 6.55% | | 6.73% | | | | |
| | | B | | 9/07/93 | | 11.80% | | 5.90% | | 6.04% | | | | |
| | | C | | 9/01/94 | | 11.82% | | 5.93% | | 6.05% | | | | |
| | | I | | 1/08/97 | | 12.84% | | 6.89% | | 7.07% | | | | |
| Comparative benchmarks | | | | | | | | | | |
| | | Barclays Capital U.S. High-Yield Corporate Bond
Index (f) | | 19.35% | | 9.08% | | 8.58% | | | | |
| | | Strategic Income Blended Index (f) (y) | | 12.49% | | 7.96% | | 7.96% | | | | |
| | | Barclays Capital U.S. Credit Bond Index (f) | | 11.17% | | 6.74% | | 7.10% | | | | |
| | | Barclays Capital U.S. Government/Mortgage Bond
Index (f) | | 6.50% | | 6.51% | | 6.18% | | | | |
| | | Citigroup World Government Bond Non-Dollar
Hedged Index (f) | | 4.34% | | 4.76% | | 5.10% | | | | |
| | | Citigroup World Government Bond Non-Dollar
Index (f) | | 6.40% | | 8.21% | | 8.45% | | | | |
| | | JPMorgan Emerging Markets Bond Index Global (f) | | 17.70% | | 9.87% | | 11.12% | | | | |
| Average annual with sales charge | | | | | | | | | | |
| | | A
With Initial Sales Charge (4.75%) | | 7.21% | | 5.52% | | 6.22% | | | | |
| | | B
With CDSC (Declining over six years from 4% to 0%) (x) | | 7.80% | | 5.58% | | 6.04% | | | | |
| | | C
With CDSC (1% for 12 months) (x) | | 10.82% | | 5.93% | | 6.05% | | | | |
Class I shares do not have a sales charge.
CDSC – Contingent Deferred Sales Charge.
| (f) | Source: FactSet Research Systems Inc. |
| (x) | Assuming redemption at the end of the applicable period. |
| (y) | Strategic Income Blended Index is at a point in time and allocations during the period can change. As of October 31, 2010 the blended index was comprised of 10% Barclays Capital U.S. Credit Bond Index, 26% Barclays Capital U.S. Government/Mortgage Bond Index, 33% Barclays Capital U.S. High-Yield Corporate Bond Index, 8.5% Citigroup World Government Bond Non-Dollar Hedged Index, 8.5% Citigroup World Government Bond Non-Dollar Index, and 14% JPMorgan Emerging Markets Bond Index Global. |
Benchmark Definitions
Barclays Capital U.S. Credit Bond Index – a market capitalization-weighted index that measures the performance of publicly issued, SEC-registered,U.S. corporate and specified foreign debentures and secured notes that meet specified maturity, liquidity, and quality requirements.
7
Performance Summary – continued
Barclays Capital U.S. Government/Mortgage Bond Index – measures debt issued by the U.S. Government, and its agencies, as well as mortgage-backed pass-through securities of Ginnie Mae (GNMA), Fannie Mae (FNMA), and Freddie Mac (FHLMC).
Barclays Capital U.S. High-Yield Corporate Bond Index – a market capitalization-weighted index that measures the performance of non-investment grade, fixed rate debt. Eurobonds and debt issues from countries designated as emerging markets (e.g., Argentina, Brazil, Venezuela, etc.) are excluded.
Citigroup World Government Bond Non-Dollar Hedged Index- a market capitalization-weighted index that is designed to represent the currency-hedged performance of the international developed government bond markets, excluding the United States.
Citigroup World Government Bond Non-Dollar Index – a market capitalization-weighted index that is designed to represent the performance of the international developed government bond markets, excluding the United States.
JPMorgan Emerging Markets Bond Index Global – measures the performance of U.S.-dollar-denominated debt instruments issued by emergingmarket sovereign and quasi-sovereign entities: Brady bonds, loans, Eurobonds.
It is not possible to invest directly in an index.
Notes to Performance Summary
Average annual total return represents the average annual change in value for each share class for the periods presented.
Performance results reflect any applicable expense subsidies and waivers in effect during the periods shown. Without such subsidies and waivers the fund’s performance results would be less favorable. Please see the prospectus and financial statements for complete details.
From time to time the fund may receive proceeds from litigation settlements, without which performance would be lower.
8
EXPENSE TABLE
Fund expenses borne by the shareholders during the period,
May 1, 2010 through October 31, 2010
As a shareholder of the fund, you incur two types of costs: (1) transaction costs, including sales charges (loads) on certain purchase or redemption payments, and (2) ongoing costs, including management fees; distribution and service (12b-1) fees; and other fund expenses. This example is intended to help you understand your ongoing costs (in dollars) of investing in the fund and to compare these costs with the ongoing costs of investing in other mutual funds.
The example is based on an investment of $1,000 invested at the beginning of the period and held for the entire period May 1, 2010 through October 31, 2010.
Actual Expenses
The first line for each share class in the following table provides information about actual account values and actual expenses. You may use the information in this line, together with the amount you invested, to estimate the expenses that you paid over the period. Simply divide your account value by $1,000 (for example, an $8,600 account value divided by $1,000 = 8.6), then multiply the result by the number in the first line under the heading entitled “Expenses Paid During Period” to estimate the expenses you paid on your account during this period.
Hypothetical Example for Comparison Purposes
The second line for each share class in the following table provides information about hypothetical account values and hypothetical expenses based on the fund’s actual expense ratio and an assumed rate of return of 5% per year before expenses, which is not the fund’s actual return. The hypothetical account values and expenses may not be used to estimate the actual ending account balance or expenses you paid for the period. You may use this information to compare the ongoing costs of investing in the fund and other funds. To do so, compare this 5% hypothetical example with the 5% hypothetical examples that appear in the shareholder reports of the other funds.
Please note that the expenses shown in the table are meant to highlight your ongoing costs only and do not reflect any transactional costs, such as sales charges (loads). Therefore, the second line for each share class in the table is useful in comparing ongoing costs only, and will not help you determine the relative total costs of owning different funds. In addition, if these transactional costs were included, your costs would have been higher.
9
Expense Table – continued
| | | | | | | | | | | | | | | | | | |
Share
Class | | | | Annualized
Expense
Ratio | | | Beginning
Account Value
5/01/10 | | | Ending
Account Value
10/31/10 | | | Expenses
Paid During
Period (p)
5/01/10-10/31/10 | |
| A | | Actual | | | 1.05% | | | | $1,000.00 | | | | $1,066.15 | | | | $5.47 | |
| | Hypothetical (h) | | | 1.05% | | | | $1,000.00 | | | | $1,019.91 | | | | $5.35 | |
| B | | Actual | | | 1.80% | | | | $1,000.00 | | | | $1,062.59 | | | | $9.36 | |
| | Hypothetical (h) | | | 1.80% | | | | $1,000.00 | | | | $1,016.13 | | | | $9.15 | |
| C | | Actual | | | 1.80% | | | | $1,000.00 | | | | $1,062.71 | | | | $9.36 | |
| | Hypothetical (h) | | | 1.80% | | | | $1,000.00 | | | | $1,016.13 | | | | $9.15 | |
| I | | Actual | | | 0.80% | | | | $1,000.00 | | | | $1,067.47 | | | | $4.17 | |
| | Hypothetical (h) | | | 0.80% | | | | $1,000.00 | | | | $1,021.17 | | | | $4.08 | |
| (h) | 5% class return per year before expenses. |
| (p) | Expenses paid is equal to each class’ annualized expense ratio, as shown above, multiplied by the average account value over the period, multiplied by the number of days in the period, divided by the number of days in the year. Expenses paid do not include any applicable sales charges (loads). If these transaction costs had been included, your costs would have been higher. |
10
PORTFOLIO OF INVESTMENTS
10/31/10
The Portfolio of Investments is a complete list of all securities owned by your fund. It is categorized by broad-based asset classes.
| | | | | | | | |
| Bonds - 98.3% | | | | | | | | |
| Issuer | | Shares/Par | | | Value ($) | |
| | | | | | | | |
| Aerospace - 0.6% | | | | | | | | |
| Alliant Techsystems, Inc., 6.875%, 2020 | | $ | 175,000 | | | $ | 184,188 | |
| BE Aerospace, Inc., 8.5%, 2018 | | | 260,000 | | | | 291,200 | |
| BE Aerospace, Inc., 6.875%, 2020 | | | 100,000 | | | | 106,250 | |
| Bombardier, Inc., 7.5%, 2018 (n) | | | 470,000 | | | | 513,475 | |
| Hawker Beechcraft Acquisition Co. LLC, 8.5%, 2015 | | | 375,000 | | | | 302,344 | |
| Oshkosh Corp., 8.25%, 2017 | | | 105,000 | | | | 114,713 | |
| Oshkosh Corp., 8.5%, 2020 | | | 155,000 | | | | 171,663 | |
| | | | | | | | |
| | | | | | | $ | 1,683,833 | |
| Airlines - 0.1% | | | | | | | | |
| American Airlines Pass-Through Trust, 7.377%, 2019 | | $ | 133,588 | | | $ | 126,240 | |
| | |
| Apparel Manufacturers - 0.2% | | | | | | | | |
| Hanesbrands, Inc., 8%, 2016 | | $ | 265,000 | | | $ | 286,863 | |
| Phillips-Van Heusen Corp., 7.375%, 2020 | | | 305,000 | | | | 330,544 | |
| | | | | | | | |
| | | | | | | $ | 617,407 | |
| Asset-Backed & Securitized - 4.8% | | | | | | | | |
| Anthracite Ltd., “A”, CDO, FRN, 0.616%, 2019 (z) | | $ | 449,768 | | | $ | 337,326 | |
| Anthracite Ltd., CDO, 6%, 2037 (z) | | | 1,200,000 | | | | 60,000 | |
| ARCap REIT, Inc., CDO, “H”, 6.1%, 2045 (z) | | | 900,000 | | | | 56,250 | |
| Bank of Nova Scotia, 1.45%, 2013 (n) | | | 1,310,000 | | | | 1,329,279 | |
Bayview Financial Revolving Mortgage Loan Trust, FRN,
1.855%, 2040 (z) | | | 510,578 | | | | 228,228 | |
| Brazilian Merchant Voucher Receivables Ltd., 5.911%, 2011 (z) | | | 233,574 | | | | 237,077 | |
| Capital Trust Realty Ltd., CDO, 5.16%, 2035 (z) | | | 900,000 | | | | 900,000 | |
| Chase Commercial Mortgage Securities Corp., 6.6%, 2029 (z) | | | 943,427 | | | | 997,404 | |
| Compagnie de Financement Foncier, FRN, 1.038%, 2012 (n) | | | 1,900,000 | | | | 1,897,625 | |
| Crest Ltd., “A1” CDO, FRN, 0.769%, 2018 (z) | | | 817,069 | | | | 669,996 | |
| Crest Ltd., CDO, 7%, 2040 | | | 414,123 | | | | 20,706 | |
| Deutsche Mortgage & Asset Receiving Corp., FRN, 7.5%, 2031 | | | 660,343 | | | | 665,355 | |
| DLJ Commercial Mortgage Corp., 6.04%, 2031 (z) | | | 511,186 | | | | 529,354 | |
| Falcon Franchise Loan LLC, 6.5%, 2014 (z) | | | 339,611 | | | | 288,669 | |
| Falcon Franchise Loan LLC, FRN, 3.36%, 2023 (i)(z) | | | 2,740,711 | | | | 122,784 | |
| Falcon Franchise Loan LLC, FRN, 3.26%, 2025 (i)(z) | | | 2,777,747 | | | | 220,275 | |
| First Union-Lehman Brothers Bank of America, FRN, 0.43%, 2035 (i) | | | 12,384,300 | | | | 222,233 | |
First Union-Lehman Brothers Commercial Mortgage Trust,
7%, 2029 (n) | | | 335,643 | | | | 351,746 | |
11
Portfolio of Investments – continued
| | | | | | | | |
| Issuer | | Shares/Par | | | Value ($) | |
| | | | | | | | |
| Bonds - continued | | | | | | | | |
| Asset-Backed & Securitized - continued | | | | | | | | |
| GMAC LLC, FRN, 6.02%, 2033 (z) | | $ | 1,758,000 | | | $ | 1,815,573 | |
| Hertz Global Holdings, Inc., 4.26%, 2014 (n) | | | 770,000 | | | | 808,627 | |
| Hertz Vehicle Financing LLC, 2010-1A, “A1”, 2.6%, 2015 (z) | | | 310,000 | | | | 316,790 | |
| KKR Financial CLO Ltd., “C”, FRN, 1.826%, 2021 (n) | | | 523,730 | | | | 413,747 | |
| Morgan Stanley Capital I, Inc., 1%, 2039 (i)(z) | | | 8,300,901 | | | | 244,877 | |
Prudential Securities Secured Financing Corp., FRN,
7.285%, 2013 (z) | | | 875,000 | | | | 884,740 | |
| Salomon Brothers Mortgage Securities, Inc., FRN, 6.724%, 2032 (z) | | | 1,075,000 | | | | 1,140,958 | |
| | | | | | | | |
| | | | | | | $ | 14,759,619 | |
| Automotive - 1.3% | | | | | | | | |
| Accuride Corp., 9.5%, 2018 (n) | | $ | 285,000 | | | $ | 310,650 | |
| Allison Transmission, Inc., 11%, 2015 (n) | | | 385,000 | | | | 417,725 | |
| Ford Motor Credit Co. LLC, 12%, 2015 | | | 1,778,000 | | | | 2,279,003 | |
| General Motors Corp., 7.125%, 2013 (d) | | | 285,000 | | | | 99,750 | |
| Goodyear Tire & Rubber Co., 10.5%, 2016 | | | 405,000 | | | | 463,725 | |
| Hyundai Capital America, 3.75%, 2016 (n) | | | 159,000 | | | | 161,954 | |
| Johnson Controls, Inc., 5.25%, 2011 | | | 290,000 | | | | 292,699 | |
| | | | | | | | |
| | | | | | | $ | 4,025,506 | |
| Basic Industry - 0.1% | | | | | | | | |
| TriMas Corp., 9.75%, 2017 (n) | | $ | 285,000 | | | $ | 311,006 | |
| | |
| Biotechnology - 0.0% | | | | | | | | |
| UHS Escrow Corp., 7%, 2018 (n) | | $ | 50,000 | | | $ | 52,750 | |
| | |
| Broadcasting - 2.4% | | | | | | | | |
| Allbritton Communications Co., 8%, 2018 | | $ | 155,000 | | | $ | 160,038 | |
| CBS Corp., 5.75%, 2020 | | | 260,000 | | | | 288,165 | |
| Entravision Communications Corp., 8.75%, 2017 (n) | | | 75,000 | | | | 80,344 | |
| Inmarsat Finance PLC, 7.375%, 2017 (n) | | | 380,000 | | | | 406,600 | |
| Intelsat Jackson Holdings Ltd., 9.5%, 2016 | | | 1,060,000 | | | | 1,131,550 | |
| Intelsat Jackson Holdings Ltd., 7.25%, 2020 (n) | | | 190,000 | | | | 194,275 | |
| Lamar Media Corp., 6.625%, 2015 | | | 335,000 | | | | 343,794 | |
| Lamar Media Corp., “C”, 6.625%, 2015 | | | 130,000 | | | | 133,088 | |
| LBI Media, Inc., 8.5%, 2017 (z) | | | 190,000 | | | | 160,788 | |
| Local TV Finance LLC, 10%, 2015 (p)(z) | | | 346,118 | | | | 297,373 | |
| NBC Universal, Inc., 5.95%, 2041 (n) | | | 939,000 | | | | 958,970 | |
| Newport Television LLC, 13%, 2017 (n)(p) | | | 121,491 | | | | 105,900 | |
| News America, Inc., 6.4%, 2035 | | | 890,000 | | | | 965,223 | |
| News America, Inc., 6.9%, 2039 | | | 251,000 | | | | 290,565 | |
| Nexstar Broadcasting Group, Inc., 0.5% to 2011, 7% to 2014 (n)(p) | | | 383,041 | | | | 355,654 | |
12
Portfolio of Investments – continued
| | | | | | | | |
| Issuer | | Shares/Par | | | Value ($) | |
| | | | | | | | |
| Bonds - continued | | | | | | | | |
| Broadcasting - continued | | | | | | | | |
| Nexstar Broadcasting Group, Inc., 7%, 2014 | | $ | 126,000 | | | $ | 119,700 | |
| Salem Communications Corp., 9.625%, 2016 | | | 75,000 | | | | 81,938 | |
| Sinclair Broadcast Group, Inc., 9.25%, 2017 (n) | | | 130,000 | | | | 143,000 | |
| Sinclair Broadcast Group, Inc., 8.375%, 2018 (n) | | | 50,000 | | | | 52,000 | |
| SIRIUS XM Radio, Inc., 8.75%, 2015 (n) | | | 180,000 | | | | 194,175 | |
| Univision Communications, Inc., 12%, 2014 (n) | | | 62,000 | | | | 68,588 | |
| Univision Communications, Inc., 10.5%, 2015 (n)(p) | | | 771,490 | | | | 807,943 | |
| Univision Communications, Inc., 7.875%, 2020 (z) | | | 135,000 | | | | 141,750 | |
| | | | | | | | |
| | | | | | | $ | 7,481,421 | |
| Brokerage & Asset Managers - 1.1% | | | | | | | | |
| BlackRock, Inc., 3.5%, 2014 | | $ | 700,000 | | | $ | 744,359 | |
| E*TRADE Financial Corp., 7.875%, 2015 | | | 225,000 | | | | 222,469 | |
| E*TRADE Financial Corp., 12.5%, 2017 | | | 130,000 | | | | 150,475 | |
| Janus Capital Group, Inc., 6.95%, 2017 | | | 375,000 | | | | 392,732 | |
| Nuveen Investments, Inc., 10.5%, 2015 | | | 115,000 | | | | 120,175 | |
| TD AMERITRADE Holding Corp., 5.6%, 2019 | | | 1,600,000 | | | | 1,749,440 | |
| | | | | | | | |
| | | | | | | $ | 3,379,650 | |
| Building - 1.4% | | | | | | | | |
| Associated Materials, Inc., 11.25%, 2014 | | $ | 355,000 | | | $ | 368,668 | |
| Building Materials Holding Corp., 6.875%, 2018 (n) | | | 125,000 | | | | 125,000 | |
| Building Materials Holding Corp., 7%, 2020 (n) | | | 290,000 | | | | 302,325 | |
| CEMEX Finance LLC, 9.5%, 2016 (n) | | | 363,000 | | | | 366,630 | |
| CEMEX Finance LLC, 9.625%, 2017 (n) | | EUR | 150,000 | | | | 198,853 | |
| CRH PLC, 8.125%, 2018 | | $ | 590,000 | | | | 709,809 | |
| Lafarge S.A., 6.15%, 2011 | | | 1,320,000 | | | | 1,365,391 | |
| Masco Corp., 7.125%, 2020 | | | 125,000 | | | | 131,208 | |
| Nortek, Inc., 11%, 2013 | | | 446,377 | | | | 475,392 | |
| Ply Gem Industries, Inc., 11.75%, 2013 | | | 190,000 | | | | 204,013 | |
| | | | | | | | |
| | | | | | | $ | 4,247,289 | |
| Business Services - 0.4% | | | | | | | | |
| First Data Corp., 9.875%, 2015 | | $ | 300,000 | | | $ | 253,500 | |
| Interactive Data Corp., 10.25%, 2018 (n) | | | 195,000 | | | | 213,281 | |
| Iron Mountain, Inc., 6.625%, 2016 | | | 320,000 | | | | 321,600 | |
| Iron Mountain, Inc., 8.375%, 2021 | | | 130,000 | | | | 145,763 | |
| SunGard Data Systems, Inc., 10.25%, 2015 | | | 318,000 | | | | 335,093 | |
| | | | | | | | |
| | | | | | | $ | 1,269,237 | |
| Cable TV - 2.2% | | | | | | | | |
| Cablevision Systems Corp., 8.625%, 2017 | | $ | 210,000 | | | $ | 237,038 | |
| CCH II LLC, 13.5%, 2016 | | | 90,000 | | | | 107,775 | |
13
Portfolio of Investments – continued
| | | | | | | | |
| Issuer | | Shares/Par | | | Value ($) | |
| | | | | | | | |
| Bonds - continued | | | | | | | | |
| Cable TV - continued | | | | | | | | |
| Charter Communications Holding Co. LLC, 7.875%, 2018 (n) | | $ | 465,000 | | | $ | 494,063 | |
| Charter Communications Holding Co. LLC, 8.125%, 2020 (n) | | | 50,000 | | | | 54,000 | |
| Charter Communications Operating LLC, 10.875%, 2014 (n) | | | 195,000 | | | | 222,300 | |
| CSC Holdings LLC, 8.5%, 2014 | | | 410,000 | | | | 457,150 | |
| CSC Holdings LLC, 8.5%, 2015 | | | 150,000 | | | | 165,188 | |
| DIRECTV Holdings LLC, 5.875%, 2019 | | | 370,000 | | | | 421,441 | |
| EchoStar Corp., 7.125%, 2016 | | | 390,000 | | | | 413,400 | |
| Insight Communications Co., Inc., 9.375%, 2018 (n) | | | 175,000 | | | | 189,875 | |
| Mediacom LLC, 9.125%, 2019 | | | 285,000 | | | | 301,388 | |
| Myriad International Holdings B.V., 6.375%, 2017 (n) | | | 751,000 | | | | 789,677 | |
| TCI Communications, Inc., 9.8%, 2012 | | | 841,000 | | | | 928,974 | |
| Time Warner Cable, Inc., 8.25%, 2019 | | | 920,000 | | | | 1,197,350 | |
| Videotron LTEE, 6.875%, 2014 | | | 190,000 | | | | 192,613 | |
| Virgin Media Finance PLC, 9.125%, 2016 | | | 350,000 | | | | 374,063 | |
| Virgin Media Finance PLC, 9.5%, 2016 | | | 155,000 | | | | 176,119 | |
| | | | | | | | |
| | | | | | | $ | 6,722,414 | |
| Chemicals - 2.2% | | | | | | | | |
| Ashland, Inc., 9.125%, 2017 | | $ | 500,000 | | | $ | 576,250 | |
| Braskem S.A., 7%, 2020 (n) | | | 710,000 | | | | 762,540 | |
| Celanese U.S. Holdings LLC, 6.625%, 2018 (n) | | | 190,000 | | | | 201,875 | |
| Dow Chemical Co., 8.55%, 2019 | | | 1,410,000 | | | | 1,810,915 | |
| Hexion Specialty Chemicals, Inc., 8.875%, 2018 | | | 435,000 | | | | 467,081 | |
| Hexion U.S. Finance Corp/Hexion Nova Scotia Finance, 9%, 2020 (z) | | | 70,000 | | | | 72,800 | |
| Huntsman International LLC, 8.625%, 2021 (n) | | | 450,000 | | | | 493,313 | |
| Lyondell Chemical Co., 11%, 2018 | | | 418,097 | | | | 468,269 | |
| Momentive Performance Materials, Inc., 12.5%, 2014 | | | 325,000 | | | | 371,313 | |
| Momentive Performance Materials, Inc., 11.5%, 2016 | | | 127,000 | | | | 137,478 | |
| Momentive Performance Materials, Inc., 9%, 2021 (z) | | | 145,000 | | | | 150,438 | |
| Nalco Finance Holdings, Inc., 9%, 2014 | | | 450,000 | | | | 464,063 | |
| Omnova Solutions, Inc., 7.875%, 2018 (z) | | | 95,000 | | | | 97,138 | |
| Sociedad Quimica y Minera de Chile S.A., 5.5%, 2020 (n) | | | 347,000 | | | | 368,991 | |
| Solutia, Inc., 7.875%, 2020 | | | 385,000 | | | | 424,944 | |
| | | | | | | | |
| | | | | | | $ | 6,867,408 | |
| Computer Software - 0.2% | | | | | | | | |
| Oracle Corp., 5.375%, 2040 (n) | | $ | 607,000 | | | $ | 634,259 | |
| | |
| Computer Software - Systems - 0.1% | | | | | | | | |
| DuPont Fabros Technology, Inc., REIT, 8.5%, 2017 | | $ | 255,000 | | | $ | 276,038 | |
14
Portfolio of Investments – continued
| | | | | | | | |
| Issuer | | Shares/Par | | | Value ($) | |
| | | | | | | | |
| Bonds - continued | | | | | | | | |
| Conglomerates - 0.1% | | | | | | | | |
| Amsted Industries, Inc., 8.125%, 2018 (n) | | $ | 305,000 | | | $ | 321,775 | |
| Pinafore LLC, 9%, 2018 (n) | | | 100,000 | | | | 107,000 | |
| | | | | | | | |
| | | | | | | $ | 428,775 | |
| Construction - 0.1% | | | | | | | | |
| Corporacion GEO S.A.B. de C.V., 8.875%, 2014 (n) | | $ | 227,000 | | | $ | 256,226 | |
| Corporacion GEO S.A.B. de C.V., 9.25%, 2020 (n) | | | 111,000 | | | | 128,066 | |
| | | | | | | | |
| | | | | | | $ | 384,292 | |
| Consumer Products - 1.2% | | | | | | | | |
| ACCO Brands Corp., 10.625%, 2015 | | $ | 30,000 | | | $ | 33,863 | |
| ACCO Brands Corp., 7.625%, 2015 | | | 135,000 | | | | 133,650 | |
| Central Garden & Pet Co., 8.25%, 2018 | | | 200,000 | | | | 210,000 | |
| Easton-Bell Sports, Inc., 9.75%, 2016 | | | 160,000 | | | | 175,200 | |
| Fortune Brands, Inc., 5.125%, 2011 | | | 1,235,000 | | | | 1,244,674 | |
| Jarden Corp., 7.5%, 2017 | | | 320,000 | | | | 340,400 | |
| Libbey Glass, Inc., 10%, 2015 (n) | | | 240,000 | | | | 261,000 | |
| NBTY, Inc., 9%, 2018 (n) | | | 35,000 | | | | 37,188 | |
| Newell Rubbermaid, Inc., 4.7%, 2020 | | | 577,000 | | | | 599,826 | |
| Visant Corp., 10%, 2017 (n) | | | 250,000 | | | | 266,250 | |
| Whirlpool Corp., 8%, 2012 | | | 429,000 | | | | 468,126 | |
| | | | | | | | |
| | | | | | | $ | 3,770,177 | |
| Consumer Services - 1.2% | | | | | | | | |
| KAR Holdings, Inc., 10%, 2015 | | $ | 110,000 | | | $ | 116,325 | |
| KAR Holdings, Inc., FRN, 4.286%, 2014 | | | 170,000 | | | | 158,950 | |
| Service Corp. International, 7%, 2017 | | | 975,000 | | | | 1,038,375 | |
| Service Corp. International, 7.625%, 2018 | | | 312,000 | | | | 339,300 | |
| Ticketmaster Entertainment, Inc., 10.75%, 2016 | | | 195,000 | | | | 215,963 | |
| Western Union Co., 5.4%, 2011 | | | 1,610,000 | | | | 1,685,607 | |
| | | | | | | | |
| | | | | | | $ | 3,554,520 | |
| Containers - 0.7% | | | | | | | | |
| Crown Americas LLC, 7.75%, 2015 | | $ | 250,000 | | | $ | 260,000 | |
| Graham Packaging Holdings Co., 9.875%, 2014 | | | 450,000 | | | | 466,875 | |
| Graham Packaging Holdings Co., 8.25%, 2018 (n) | | | 50,000 | | | | 51,750 | |
| Greif, Inc., 6.75%, 2017 | | | 915,000 | | | | 953,888 | |
| Owens-Illinois, Inc., 7.375%, 2016 | | | 185,000 | | | | 201,650 | |
| Reynolds Group, 7.75%, 2016 (n) | | | 105,000 | | | | 111,300 | |
| Reynolds Group, 7.125%, 2019 (z) | | | 150,000 | | | | 156,375 | |
| | | | | | | | |
| | | | | | | $ | 2,201,838 | |
15
Portfolio of Investments – continued
| | | | | | | | |
| Issuer | | Shares/Par | | | Value ($) | |
| | | | | | | | |
| Bonds - continued | | | | | | | | |
| Defense Electronics - 0.7% | | | | | | | | |
| BAE Systems Holdings, Inc., 5.2%, 2015 (n) | | $ | 1,297,000 | | | $ | 1,436,007 | |
| BAE Systems Holdings, Inc., 6.375%, 2019 (n) | | | 380,000 | | | | 443,170 | |
| ManTech International Corp., 7.25%, 2018 | | | 200,000 | | | | 212,500 | |
| MOOG, Inc., 7.25%, 2018 | | | 150,000 | | | | 157,125 | |
| | | | | | | | |
| | | | | | | $ | 2,248,802 | |
| Electronics - 0.3% | | | | | | | | |
| Freescale Semiconductor, Inc., 10.125%, 2018 (n) | | $ | 130,000 | | | $ | 142,675 | |
| Freescale Semiconductor, Inc., 9.25%, 2018 (n) | | | 185,000 | | | | 197,950 | |
| Jabil Circuit, Inc., 7.75%, 2016 | | | 260,000 | | | | 299,650 | |
| NXP B.V., 7.875%, 2014 | | | 145,000 | | | | 150,438 | |
| | | | | | | | |
| | | | | | | $ | 790,713 | |
| Emerging Market Quasi-Sovereign - 2.4% | | | | | | | | |
| Banco del Estado de Chile, 4.125%, 2020 (z) | | $ | 100,000 | | | $ | 100,577 | |
| Banco do Brasil S.A., 5.375%, 2021 (n) | | | 929,000 | | | | 937,129 | |
| Corporacion Nacional del Cobre de Chile, 3.75%, 2020 (z) | | | 422,000 | | | | 418,227 | |
| Dubai Electricity & Water Authority, 6.375%, 2016 (z) | | | 127,000 | | | | 125,802 | |
| Dubai Electricity & Water Authority, 7.375%, 2020 (z) | | | 456,000 | | | | 448,464 | |
| Empresa Nacional del Petroleo, 5.25%, 2020 (n) | | | 100,000 | | | | 105,513 | |
| IIRSA Norte Finance Ltd., 8.75%, 2024 | | | 270,976 | | | | 317,719 | |
| KazMunaiGaz Finance B.V., 9.125%, 2018 (n) | | | 176,000 | | | | 211,710 | |
| Petroleos Mexicanos, 5.5%, 2021 | | | 618,000 | | | | 671,890 | |
| Qtel International Finance Ltd., 7.875%, 2019 (n) | | | 178,000 | | | | 218,678 | |
| Qtel International Finance Ltd., 7.875%, 2019 | | | 314,000 | | | | 385,758 | |
| Ras Laffan Liquefied Natural Gas Co. Ltd., 5.832%, 2016 (n) | | | 794,058 | | | | 863,848 | |
| SCF Capital Ltd., 5.375%, 2017 (z) | | | 526,000 | | | | 516,000 | |
| VEB Finance Ltd., 6.902%, 2020 (n) | | | 618,000 | | | | 660,642 | |
| VTB Capital S.A., 6.465%, 2015 (n) | | | 375,000 | | | | 388,125 | |
| VTB Capital S.A., 6.551%, 2020 (z) | | | 1,069,000 | | | | 1,079,904 | |
| | | | | | | | |
| | | | | | | $ | 7,449,986 | |
| Emerging Market Sovereign - 0.8% | | | | | | | | |
| Dominican Republic, 7.5%, 2021 (n) | | $ | 100,000 | | | $ | 114,500 | |
| Government of Ukraine, 6.875%, 2015 (n) | | | 101,000 | | | | 101,354 | |
| Government of Ukraine, 7.75%, 2020 (n) | | | 100,000 | | | | 101,000 | |
| Republic of Argentina, FRN, 0.677%, 2012 | | | 417,525 | | | | 387,586 | |
| Republic of Philippines, 6.375%, 2034 | | | 599,000 | | | | 693,343 | |
| Republic of South Africa, 5.5%, 2020 | | | 615,000 | | | | 696,488 | |
| Republic of Turkey, 5.625%, 2021 | | | 115,000 | | | | 128,513 | |
| United Mexican States, 5.75%, 2110 | | | 58,000 | | | | 57,615 | |
| | | | | | | | |
| | | | | | | $ | 2,280,399 | |
16
Portfolio of Investments – continued
| | | | | | | | |
| Issuer | | Shares/Par | | | Value ($) | |
| | | | | | | | |
| Bonds - continued | | | | | | | | |
| Energy - Independent - 2.7% | | | | | | | | |
| Anadarko Petroleum Corp., 5.95%, 2016 | | $ | 1,120,000 | | | $ | 1,224,888 | |
| Anadarko Petroleum Corp., 8.7%, 2019 | | | 150,000 | | | | 185,697 | |
| Atlas Energy Operating Co. LLC, 10.75%, 2018 | | | 115,000 | | | | 129,375 | |
| Carrizo Oil & Gas, Inc., 8.625%, 2018 (z) | | | 335,000 | | | | 339,188 | |
| Denbury Resources, Inc., 8.25%, 2020 | | | 285,000 | | | | 317,775 | |
| Harvest Operations Corp., 6.875%, 2017 (n) | | | 300,000 | | | | 315,000 | |
| Hilcorp Energy I LP, 9%, 2016 (n) | | | 455,000 | | | | 480,025 | |
| Linn Energy LLC, 8.625%, 2020 (n) | | | 105,000 | | | | 113,400 | |
| Linn Energy LLC, 7.75%, 2021 (n) | | | 206,000 | | | | 212,695 | |
| Newfield Exploration Co., 6.625%, 2014 | | | 255,000 | | | | 260,738 | |
| Newfield Exploration Co., 6.625%, 2016 | | | 270,000 | | | | 280,800 | |
| OPTI Canada, Inc., 9.75%, 2013 (n) | | | 230,000 | | | | 234,600 | |
| OPTI Canada, Inc., 8.25%, 2014 | | | 345,000 | | | | 261,338 | |
| Penn Virginia Corp., 10.375%, 2016 | | | 450,000 | | | | 495,000 | |
| Pioneer Natural Resources Co., 6.875%, 2018 | | | 280,000 | | | | 305,827 | |
| Pioneer Natural Resources Co., 7.5%, 2020 | | | 725,000 | | | | 816,567 | |
| Plains Exploration & Production Co., 7%, 2017 | | | 580,000 | | | | 600,300 | |
| QEP Resources, Inc., 6.875%, 2021 | | | 310,000 | | | | 337,125 | |
| Quicksilver Resources, Inc., 8.25%, 2015 | | | 280,000 | | | | 284,900 | |
| Quicksilver Resources, Inc., 9.125%, 2019 | | | 275,000 | | | | 293,563 | |
| Range Resources Corp., 8%, 2019 | | | 190,000 | | | | 210,425 | |
| SandRidge Energy, Inc., 8%, 2018 (n) | | | 535,000 | | | | 535,000 | |
| Talisman Energy, Inc., 7.75%, 2019 | | | 120,000 | | | | 155,293 | |
| | | | | | | | |
| | | | | | | $ | 8,389,519 | |
| Energy - Integrated - 1.0% | | | | | | | | |
| BP Capital Markets PLC, 4.5%, 2020 | | $ | 272,000 | | | $ | 281,745 | |
| CCL Finance Ltd., 9.5%, 2014 (n) | | | 365,000 | | | | 425,681 | |
| CCL Finance Ltd., 9.5%, 2014 | | | 243,000 | | | | 283,399 | |
| Cenovus Energy, Inc., 4.5%, 2014 | | | 320,000 | | | | 353,489 | |
| Hess Corp., 8.125%, 2019 | | | 270,000 | | | | 356,132 | |
| Pacific Rubiales Energy Corp., 8.75%, 2016 (n) | | | 465,000 | | | | 527,194 | |
| Petro-Canada, 5%, 2014 | | | 860,000 | | | | 952,375 | |
| | | | | | | | |
| | | | | | | $ | 3,180,015 | |
| Entertainment - 0.3% | | | | | | | | |
| AMC Entertainment, Inc., 11%, 2016 | | $ | 285,000 | | | $ | 303,881 | |
| AMC Entertainment, Inc., 8.75%, 2019 | | | 270,000 | | | | 289,238 | |
| Cinemark USA, Inc., 8.625%, 2019 | | | 385,000 | | | | 415,319 | |
| | | | | | | | |
| | | | | | | $ | 1,008,438 | |
17
Portfolio of Investments – continued
| | | | | | | | |
| Issuer | | Shares/Par | | | Value ($) | |
| | | | | | | | |
| Bonds - continued | | | | | | | | |
| Financial Institutions - 2.4% | | | | | | | | |
| American General Finance Corp., 6.9%, 2017 | | $ | 310,000 | | | $ | 258,075 | |
| CIT Group, Inc., 7%, 2014 | | | 350,000 | | | | 351,750 | |
| CIT Group, Inc., 7%, 2016 | | | 475,000 | | | | 473,219 | |
| CIT Group, Inc., 7%, 2017 | | | 1,125,000 | | | | 1,119,375 | |
| General Electric Capital Corp., 6%, 2019 | | | 300,000 | | | | 338,913 | |
| General Electric Capital Corp., 5.5%, 2020 | | | 710,000 | | | | 781,500 | |
| General Electric Capital Corp., FRN, 0.416%, 2012 | | | 770,000 | | | | 762,702 | |
| GMAC, Inc., 6.75%, 2014 | | | 945,000 | | | | 989,888 | |
| International Lease Finance Corp., 5.625%, 2013 | | | 175,000 | | | | 176,094 | |
| International Lease Finance Corp., 8.75%, 2017 (n) | | | 380,000 | | | | 432,250 | |
| International Lease Finance Corp., 7.125%, 2018 (n) | | | 390,000 | | | | 429,000 | |
| Nationstar Mortgage LLC, 10.875%, 2015 (z) | | | 130,000 | | | | 117,650 | |
| ORIX Corp., 5.48%, 2011 | | | 970,000 | | | | 1,007,174 | |
| SLM Corp., 8%, 2020 | | | 200,000 | | | | 202,154 | |
| | | | | | | | |
| | | | | | | $ | 7,439,744 | |
| Food & Beverages - 2.1% | | | | | | | | |
| Anheuser-Busch InBev S.A., 7.75%, 2019 (n) | | $ | 1,100,000 | | | $ | 1,422,472 | |
| ARAMARK Corp., 8.5%, 2015 | | | 240,000 | | | | 252,000 | |
| B&G Foods, Inc., 7.625%, 2018 | | | 200,000 | | | | 213,000 | |
| CEDC Finance Corp. International, Inc., 9.125%, 2016 (n) | | | 179,000 | | | | 193,320 | |
| Constellation Brands, Inc., 7.25%, 2016 | | | 145,000 | | | | 159,500 | |
| Del Monte Foods Co., 6.75%, 2015 | | | 360,000 | | | | 370,800 | |
| Kraft Foods, Inc., 6.125%, 2018 | | | 720,000 | | | | 851,025 | |
| Miller Brewing Co., 5.5%, 2013 (n) | | | 1,370,000 | | | | 1,508,971 | |
| Pinnacle Foods Finance LLC, 9.25%, 2015 | | | 360,000 | | | | 379,350 | |
| TreeHouse Foods, Inc., 7.75%, 2018 | | | 305,000 | | | | 334,356 | |
| Tyson Foods, Inc., 6.6%, 2016 | | | 560,000 | | | | 623,000 | |
| | | | | | | | |
| | | | | | | $ | 6,307,794 | |
| Forest & Paper Products - 0.8% | | | | | | | | |
| Boise, Inc., 8%, 2020 | | $ | 280,000 | | | $ | 302,400 | |
| Cascades, Inc., 7.75%, 2017 | | | 185,000 | | | | 197,719 | |
| Georgia-Pacific Corp., 7.125%, 2017 (n) | | | 255,000 | | | | 274,125 | |
| Georgia-Pacific Corp., 5.4%, 2020 (z) | | | 156,000 | | | | 157,560 | |
| Georgia-Pacific Corp., 8%, 2024 | | | 400,000 | | | | 489,000 | |
| Georgia-Pacific Corp., 7.25%, 2028 | | | 85,000 | | | | 93,500 | |
| Graphic Packaging Holding Co., 7.875%, 2018 | | | 190,000 | | | | 200,925 | |
| JSG Funding PLC, 7.75%, 2015 | | | 25,000 | | | | 25,688 | |
| Millar Western Forest Products Ltd., 7.75%, 2013 | | | 340,000 | | | | 311,100 | |
| Sappi Papier Holding GmbH, 6.75%, 2012 (z) | | | 145,000 | | | | 146,810 | |
| Sino-Forest Corp., 6.25%, 2017 (z) | | | 35,000 | | | | 35,131 | |
18
Portfolio of Investments – continued
| | | | | | | | |
| Issuer | | Shares/Par | | | Value ($) | |
| | | | | | | | |
| Bonds - continued | | | | | | | | |
| Forest & Paper Products - continued | | | | | | | | |
| Smurfit Kappa Group PLC, 7.75%, 2019 (n) | | EUR | 195,000 | | | $ | 288,364 | |
| | | | | | | | |
| | | | | | | $ | 2,522,322 | |
| Gaming & Lodging - 1.9% | | | | | | | | |
| Firekeepers Development Authority, 13.875%, 2015 (n) | | $ | 270,000 | | | $ | 316,575 | |
| Fontainebleau Las Vegas Holdings LLC, 10.25%, 2015 (d)(n) | | | 315,000 | | | | 904 | |
| Gaylord Entertainment Co., 6.75%, 2014 | | | 310,000 | | | | 310,775 | |
| GWR Operating Partnership LLP, 10.875%, 2017 (n) | | | 200,000 | | | | 211,000 | |
| Harrah’s Operating Co., Inc., 11.25%, 2017 | | | 565,000 | | | | 624,325 | |
| Harrah’s Operating Co., Inc., 10%, 2018 | | | 3,000 | | | | 2,603 | |
| Harrah’s Operating Co., Inc., 10%, 2018 | | | 133,000 | | | | 115,378 | |
| Host Hotels & Resorts, Inc., 6.75%, 2016 | | | 285,000 | | | | 296,044 | |
| Host Hotels & Resorts, Inc., 9%, 2017 | | | 265,000 | | | | 298,788 | |
| Marriott International, Inc., 5.625%, 2013 | | | 630,000 | | | | 682,560 | |
| MGM Mirage, 10.375%, 2014 | | | 45,000 | | | | 50,625 | |
| MGM Mirage, 11.125%, 2017 | | | 120,000 | | | | 138,000 | |
| MGM Mirage, 9%, 2020 (n) | | | 250,000 | | | | 273,438 | |
| MGM Resorts International, 11.375%, 2018 | | | 250,000 | | | | 259,375 | |
| Penn National Gaming, Inc., 8.75%, 2019 | | | 270,000 | | | | 299,025 | |
| Pinnacle Entertainment, Inc., 7.5%, 2015 | | | 145,000 | | | | 144,275 | |
| Royal Caribbean Cruises Ltd., 11.875%, 2015 | | | 70,000 | | | | 87,500 | |
| Station Casinos, Inc., 6.5%, 2014 (d) | | | 620,000 | | | | 856 | |
| Station Casinos, Inc., 6.875%, 2016 (d) | | | 1,060,000 | | | | 127 | |
| Wyndham Worldwide Corp., 6%, 2016 | | | 380,000 | | | | 405,794 | |
| Wyndham Worldwide Corp., 5.75%, 2018 | | | 760,000 | | | | 789,738 | |
| Wyndham Worldwide Corp., 7.375%, 2020 | | | 245,000 | | | | 271,725 | |
| Wynn Las Vegas LLC, 7.75%, 2020 (n) | | | 125,000 | | | | 135,625 | |
| | | | | | | | |
| | | | | | | $ | 5,715,055 | |
| Industrial - 1.1% | | | | | | | | |
| Altra Holdings, Inc., 8.125%, 2016 | | $ | 190,000 | | | $ | 198,788 | |
| Baldor Electric Co., 8.625%, 2017 | | | 480,000 | | | | 512,400 | |
| Diversey, Inc., 8.25%, 2019 | | | 165,000 | | | | 180,469 | |
| Great Lakes Dredge & Dock Corp., 7.75%, 2013 | | | 230,000 | | | | 232,875 | |
| Johns Hopkins University, 5.25%, 2019 | | | 1,180,000 | | | | 1,360,705 | |
| Mueller Water Products, Inc., 7.375%, 2017 | | | 120,000 | | | | 108,600 | |
| Mueller Water Products, Inc., 8.75%, 2020 (n) | | | 149,000 | | | | 161,479 | |
| Steelcase, Inc., 6.5%, 2011 | | | 589,000 | | | | 605,103 | |
| | | | | | | | |
| | | | | | | $ | 3,360,419 | |
| Insurance - 3.2% | | | | | | | | |
| Aflac, Inc., 6.45%, 2040 | | $ | 660,000 | | | $ | 672,796 | |
| Allianz AG, 5.5%, 2049 | | EUR | 947,000 | | | | 1,311,444 | |
19
Portfolio of Investments – continued
| | | | | | | | |
| Issuer | | Shares/Par | | | Value ($) | |
| | | | | | | | |
| Bonds - continued | | | | | | | | |
| Insurance - continued | | | | | | | | |
American International Group, Inc.,
8.175% to 2038, FRN to 2058 | | $ | 985,000 | | | $ | 1,049,025 | |
| ING Groep N.V., 5.775% to 2015, FRN to 2049 | | | 2,010,000 | | | | 1,854,225 | |
| MetLife, Inc., 9.25% to 2038, FRN to 2068 (n) | | | 400,000 | | | | 482,000 | |
| Metropolitan Life Global Funding, 2.875%, 2012 (n) | | | 830,000 | | | | 855,911 | |
| Metropolitan Life Global Funding, 5.125%, 2014 (n) | | | 430,000 | | | | 479,407 | |
| Principal Financial Group, Inc., 8.875%, 2019 | | | 650,000 | | | | 849,112 | |
| Prudential Financial, Inc., 6.2%, 2015 | | | 660,000 | | | | 749,625 | |
| Prudential Financial, Inc., 5.375%, 2020 | | | 530,000 | | | | 576,323 | |
| Unum Group, 7.125%, 2016 | | | 870,000 | | | | 1,004,241 | |
| | | | | | | | |
| | | | | | | $ | 9,884,109 | |
| Insurance - Property & Casualty - 2.3% | | | | | | | | |
| Aon Corp., 3.5%, 2015 | | $ | 760,000 | | | $ | 784,350 | |
| AXIS Capital Holdings Ltd., 5.75%, 2014 | | | 1,035,000 | | | | 1,106,427 | |
| AXIS Capital Holdings Ltd., 5.875%, 2020 | | | 370,000 | | | | 378,684 | |
| CNA Financial Corp., 5.875%, 2020 | | | 990,000 | | | | 1,012,750 | |
| Liberty Mutual Group, Inc., 10.75% to 2038, FRN to 2058 (n) | | | 435,000 | | | | 539,400 | |
| PartnerRe Ltd., 5.5%, 2020 | | | 583,000 | | | | 608,373 | |
| Travelers Cos., Inc., 3.9%, 2020 | | | 1,270,000 | | | | 1,288,943 | |
| USI Holdings Corp., 9.75%, 2015 (z) | | | 320,000 | | | | 320,800 | |
| ZFS Finance USA Trust V, 6.5% to 2017, FRN to 2037 (n) | | | 1,095,000 | | | | 1,047,094 | |
| | | | | | | | |
| | | | | | | $ | 7,086,821 | |
| International Market Quasi-Sovereign - 3.1% | | | | | | | | |
| Bank of Ireland, 2.75%, 2012 (n) | | $ | 560,000 | | | $ | 540,904 | |
| Canada Housing Trust, 4.6%, 2011 (n) | | CAD | 500,000 | | | | 504,471 | |
| EDF Energies Nouvelles S.A., 6.5%, 2019 (n) | | $ | 1,090,000 | | | | 1,348,936 | |
| ING Bank N.V., 3.9%, 2014 (n) | | | 1,060,000 | | | | 1,160,218 | |
| Irish Life & Permanent PLC, 3.6%, 2013 (e)(n) | | | 1,300,000 | | | | 1,217,993 | |
| LeasePlan Corp. N.V., 3%, 2012 (n) | | | 470,000 | | | | 485,586 | |
| Lloyds TSB Bank PLC, FRN, 1.29%, 2012 (n) | | | 1,000,000 | | | | 1,010,563 | |
| Royal Bank of Scotland PLC, FRN, 0.985%, 2012 (n) | | | 1,497,000 | | | | 1,504,994 | |
| Swedbank AB, 2.8%, 2012 (n) | | | 300,000 | | | | 308,611 | |
| Vestjysk Bank A/S, FRN, 0.842%, 2013 (z) | | | 710,000 | | | | 716,134 | |
| Westpac Banking Corp., 3.45%, 2014 (n) | | | 520,000 | | | | 553,731 | |
| | | | | | | | |
| | | | | | | $ | 9,352,141 | |
| International Market Sovereign - 13.7% | | | | | | | | |
| Federal Republic of Germany, 3.75%, 2015 | | EUR | 1,737,000 | | | $ | 2,631,220 | |
| Federal Republic of Germany, 4.25%, 2018 | | EUR | 2,072,000 | | | | 3,278,055 | |
| Federal Republic of Germany, 6.25%, 2030 | | EUR | 843,000 | | | | 1,713,363 | |
| Government of Bermuda, 5.603%, 2020 (n) | | $ | 295,000 | | | | 321,521 | |
20
Portfolio of Investments – continued
| | | | | | | | |
| Issuer | | Shares/Par | | | Value ($) | |
| | | | | | | | |
| Bonds - continued | | | | | | | | |
| International Market Sovereign - continued | | | | | | | | |
| Government of Canada, 4.5%, 2015 | | CAD | 546,000 | | | $ | 597,008 | |
| Government of Canada, 4.25%, 2018 | | CAD | 290,000 | | | | 318,554 | |
| Government of Canada, 5.75%, 2033 | | CAD | 86,000 | | | | 114,958 | |
| Government of Japan, 1.5%, 2012 | | JPY | 125,000,000 | | | | 1,587,554 | |
| Government of Japan, 1.3%, 2014 | | JPY | 273,300,000 | | | | 3,538,096 | |
| Government of Japan, 1.7%, 2017 | | JPY | 384,350,000 | | | | 5,159,121 | |
| Government of Japan, 2.2%, 2027 | | JPY | 123,300,000 | | | | 1,654,581 | |
| Government of Japan, 2.4%, 2037 | | JPY | 130,200,000 | | | | 1,764,941 | |
| Kingdom of Belgium, 5.5%, 2017 | | EUR | 377,000 | | | | 610,971 | |
| Kingdom of Spain, 4.6%, 2019 | | EUR | 409,000 | | | | 591,065 | |
| Kingdom of the Netherlands, 3.75%, 2014 | | EUR | 1,846,000 | | | | 2,776,166 | |
| Kingdom of the Netherlands, 5.5%, 2028 | | EUR | 226,000 | | | | 415,236 | |
| Republic of Austria, 4.65%, 2018 | | EUR | 893,000 | | | | 1,409,833 | |
| Republic of France, 4.75%, 2012 | | EUR | 844,000 | | | | 1,256,989 | |
| Republic of France, 6%, 2025 | | EUR | 707,000 | | | | 1,314,145 | |
| Republic of France, 4.75%, 2035 | | EUR | 958,000 | | | | 1,633,280 | |
| Republic of Italy, 4.75%, 2013 | | EUR | 1,713,000 | | | | 2,521,504 | |
| Republic of Italy, 5.25%, 2017 | | EUR | 2,300,000 | | | | 3,580,155 | |
| United Kingdom Treasury, 8%, 2015 | | GBP | 874,000 | | | | 1,820,744 | |
| United Kingdom Treasury, 8%, 2021 | | GBP | 330,000 | | | | 759,311 | |
| United Kingdom Treasury, 4.25%, 2036 | | GBP | 458,000 | | | | 747,857 | |
| | | | | | | | |
| | | | | | | $ | 42,116,228 | |
| Local Authorities - 0.6% | | | | | | | | |
| Louisiana Gas & Fuels Tax Rev. (Build America Bonds), FRN, 2.756%, 2043 | | $ | 820,000 | | | $ | 828,462 | |
| Province of Ontario, 5.45%, 2016 | | | 745,000 | | | | 879,464 | |
| | | | | | | | |
| | | | | | | $ | 1,707,926 | |
| Machinery & Tools - 0.7% | | | | | | | | |
| Atlas Copco AB, 5.6%, 2017 (n) | | $ | 1,073,000 | | | $ | 1,183,165 | |
| Case Corp., 7.25%, 2016 | | | 145,000 | | | | 158,050 | |
| Case New Holland, Inc., 7.875%, 2017 (n) | | | 580,000 | | | | 648,150 | |
| Rental Service Corp., 9.5%, 2014 | | | 195,000 | | | | 203,531 | |
| | | | | | | | |
| | | | | | | $ | 2,192,896 | |
| Major Banks - 5.0% | | | | | | | | |
| BAC Capital Trust XIV, 5.63% to 2012, FRN to 2049 | | $ | 1,840,000 | | | $ | 1,301,800 | |
| Bank of America Corp., 7.375%, 2014 | | | 460,000 | | | | 521,479 | |
| Bank of America Corp., 8% to 2018, FRN to 2049 | | | 465,000 | | | | 469,264 | |
| Bank of New York Mellon Corp., 4.3%, 2014 | | | 480,000 | | | | 526,177 | |
| Barclays Bank PLC, 5.125%, 2020 | | | 770,000 | | | | 834,142 | |
| BNP Paribas, 5.186% to 2015, FRN to 2049 (n) | | | 226,000 | | | | 216,395 | |
21
Portfolio of Investments – continued
| | | | | | | | |
| Issuer | | Shares/Par | | | Value ($) | |
| | | | | | | | |
| Bonds - continued | | | | | | | | |
| Major Banks - continued | | | | | | | | |
| BNP Paribas, 7.195% to 2037, FRN to 2049 (n) | | $ | 600,000 | | | $ | 604,500 | |
| Commonwealth Bank of Australia, 5%, 2019 (n) | | | 760,000 | | | | 824,787 | |
| Credit Suisse New York, 5.5%, 2014 | | | 650,000 | | | | 731,469 | |
| Goldman Sachs Group, Inc., 6%, 2014 | | | 450,000 | | | | 505,528 | |
| Goldman Sachs Group, Inc., 7.5%, 2019 | | | 804,000 | | | | 967,818 | |
| HSBC USA, Inc., 4.875%, 2020 | | | 930,000 | | | | 966,251 | |
| JPMorgan Chase Capital XXII, 6.45%, 2037 | | | 616,000 | | | | 593,571 | |
| JPMorgan Chase Capital XXVII, 7%, 2039 | | | 161,000 | | | | 162,864 | |
| Macquarie Group Ltd., 6%, 2020 (n) | | | 933,000 | | | | 972,111 | |
| Merrill Lynch & Co., Inc., 6.4%, 2017 | | | 400,000 | | | | 435,809 | |
| Morgan Stanley, 6.75%, 2011 | | | 640,000 | | | | 657,434 | |
| Morgan Stanley, 6%, 2014 | | | 620,000 | | | | 682,098 | |
| Morgan Stanley, 7.3%, 2019 | | | 250,000 | | | | 288,339 | |
| Morgan Stanley, 5.625%, 2019 | | | 420,000 | | | | 441,025 | |
| Royal Bank of Scotland Group PLC, 6.99% to 2017, FRN to 2049 (d)(n) | | | 145,000 | | | | 119,081 | |
| Royal Bank of Scotland Group PLC, 7.648% to 2031, FRN to 2049 | | | 505,000 | | | | 489,850 | |
| Standard Chartered PLC, 3.85%, 2015 (n) | | | 850,000 | | | | 898,306 | |
| UFJ Finance Aruba AEC, 6.75%, 2013 | | | 648,000 | | | | 737,203 | |
| Wells Fargo & Co., 7.98% to 2018, FRN to 2049 | | | 405,000 | | | | 425,250 | |
| | | | | | | | |
| | | | | | | $ | 15,372,551 | |
| Medical & Health Technology & Services - 3.1% | | | | | | | | |
| Biomet, Inc., 10%, 2017 | | $ | 190,000 | | | $ | 210,900 | |
| Biomet, Inc., 11.625%, 2017 | | | 290,000 | | | | 326,613 | |
| Cardinal Health, Inc., 5.8%, 2016 | | | 840,000 | | | | 982,135 | |
| Community Health Systems, Inc., 8.875%, 2015 | | | 610,000 | | | | 652,700 | |
| Cooper Cos., Inc., 7.125%, 2015 | | | 265,000 | | | | 274,938 | |
| Davita, Inc., 6.375%, 2018 | | | 265,000 | | | | 270,963 | |
| Davita, Inc., 6.625%, 2020 | | | 125,000 | | | | 128,594 | |
| Fresenius Medical Care AG & Co. KGaA, 9%, 2015 (n) | | | 185,000 | | | | 215,988 | |
| HCA, Inc., 9.25%, 2016 | | | 1,240,000 | | | | 1,342,300 | |
| HCA, Inc., 8.5%, 2019 | | | 205,000 | | | | 230,625 | |
| HealthSouth Corp., 8.125%, 2020 | | | 500,000 | | | | 540,000 | |
| Hospira, Inc., 6.05%, 2017 | | | 490,000 | | | | 567,056 | |
| McKesson Corp., 5.7%, 2017 | | | 370,000 | | | | 423,767 | |
| Owens & Minor, Inc., 6.35%, 2016 | | | 710,000 | | | | 728,477 | |
| Psychiatric Solutions, Inc., 7.75%, 2015 | | | 175,000 | | | | 182,000 | |
| Psychiatric Solutions, Inc., 7.75%, 2015 | | | 100,000 | | | | 104,000 | |
| Tenet Healthcare Corp., 9.25%, 2015 | | | 470,000 | | | | 519,350 | |
| Tenet Healthcare Corp., 8%, 2020 (n) | | | 100,000 | | | | 101,625 | |
| U.S. Oncology, Inc., 10.75%, 2014 | | | 275,000 | | | | 284,969 | |
| United Surgical Partners International, Inc., 8.875%, 2017 | | | 85,000 | | | | 89,463 | |
22
Portfolio of Investments – continued
| | | | | | | | |
| Issuer | | Shares/Par | | | Value ($) | |
| | | | | | | | |
| Bonds - continued | | | | | | | | |
| Medical & Health Technology & Services - continued | | | | | | | | |
| United Surgical Partners International, Inc., 9.25%, 2017 (p) | | $ | 130,000 | | | $ | 137,475 | |
| Universal Hospital Services, Inc., 8.5%, 2015 (p) | | | 475,000 | | | | 495,188 | |
| Universal Hospital Services, Inc., FRN, 4.134%, 2015 | | | 90,000 | | | | 81,000 | |
| Vanguard Health Systems, Inc., 8%, 2018 | | | 320,000 | | | | 337,200 | |
| VWR Funding, Inc., 10.25%, 2015 (p) | | | 359,125 | | | | 379,775 | |
| | | | | | | | |
| | | | | | | $ | 9,607,101 | |
| Metals & Mining - 1.4% | | | | | | | | |
| Arch Coal, Inc., 7.25%, 2020 | | $ | 125,000 | | | $ | 136,875 | |
| Arch Western Finance LLC, 6.75%, 2013 | | | 139,000 | | | | 140,390 | |
| Bumi Investment Pte Ltd., 10.75%, 2017 (n) | | | 100,000 | | | | 104,333 | |
| Cloud Peak Energy, Inc., 8.25%, 2017 | | | 275,000 | | | | 299,063 | |
| Cloud Peak Energy, Inc., 8.5%, 2019 | | | 365,000 | | | | 401,500 | |
| CONSOL Energy, Inc., 8%, 2017 (n) | | | 195,000 | | | | 213,525 | |
| CONSOL Energy, Inc., 8.25%, 2020 (n) | | | 130,000 | | | | 144,950 | |
| Gold Fields Orogen Holdings Ltd., 4.875%, 2020 (z) | | | 1,238,000 | | | | 1,215,142 | |
| Southern Copper Corp., 5.375%, 2020 | | | 135,000 | | | | 143,220 | |
| Southern Copper Corp., 6.75%, 2040 | | | 450,000 | | | | 483,482 | |
| Teck Resources Ltd., 10.25%, 2016 | | | 44,000 | | | | 54,340 | |
| U.S. Steel Corp., 7.375%, 2020 | | | 195,000 | | | | 203,531 | |
| Vale Overseas Ltd., 4.625%, 2020 | | | 437,000 | | | | 452,428 | |
| Vale Overseas Ltd., 6.875%, 2039 | | | 303,000 | | | | 347,667 | |
| | | | | | | | |
| | | | | | | $ | 4,340,446 | |
| Mortgage-Backed - 1.8% | | | | | | | | |
| Fannie Mae, 5.5%, 2019 - 2034 | | $ | 2,268,845 | | | $ | 2,462,138 | |
| Fannie Mae, 6.5%, 2031 | | | 153,173 | | | | 173,285 | |
| Fannie Mae, 6%, 2034 (f) | | | 1,807,087 | | | | 2,002,357 | |
| Freddie Mac, 4.224%, 2020 | | | 818,658 | | | | 874,667 | |
| | | | | | | | |
| | | | | | | $ | 5,512,447 | |
| Natural Gas - Distribution - 0.4% | | | | | | | | |
| AmeriGas Partners LP, 7.125%, 2016 | | $ | 300,000 | | | $ | 312,750 | |
| Ferrellgas Partners LP, 8.625%, 2020 | | | 295,000 | | | | 325,975 | |
| Inergy LP, 6.875%, 2014 | | | 250,000 | | | | 255,625 | |
| Inergy LP, 7%, 2018 (n) | | | 240,000 | | | | 250,800 | |
| | | | | | | | |
| | | | | | | $ | 1,145,150 | |
| Natural Gas - Pipeline - 2.0% | | | | | | | | |
| Atlas Pipeline Partners LP, 8.125%, 2015 | | $ | 240,000 | | | $ | 247,200 | |
| Atlas Pipeline Partners LP, 8.75%, 2018 | | | 270,000 | | | | 282,150 | |
| CenterPoint Energy, Inc., 7.875%, 2013 | | | 1,096,000 | | | | 1,262,153 | |
| Crosstex Energy, Inc., 8.875%, 2018 | | | 300,000 | | | | 324,000 | |
23
Portfolio of Investments – continued
| | | | | | | | |
| Issuer | | Shares/Par | | | Value ($) | |
| | | | | | | | |
| Bonds - continued | | | | | | | | |
| Natural Gas - Pipeline - continued | | | | | | | | |
| El Paso Corp., 8.25%, 2016 | | $ | 275,000 | | | $ | 312,469 | |
| El Paso Corp., 7%, 2017 | | | 410,000 | | | | 446,916 | |
| El Paso Corp., 7.75%, 2032 | | | 145,000 | | | | 155,276 | |
| Energy Transfer Equity LP, 7.5%, 2020 | | | 125,000 | | | | 136,250 | |
| Enterprise Products Partners LP, FRN, 8.375%, 2066 | | | 181,000 | | | | 190,955 | |
| Enterprise Products Partners LP, FRN, 7.034%, 2068 | | | 113,000 | | | | 116,673 | |
| Kinder Morgan Finance Corp., 5.35%, 2011 | | | 1,516,000 | | | | 1,527,370 | |
| MarkWest Energy Partners LP, 6.875%, 2014 | | | 235,000 | | | | 240,288 | |
| Markwest Energy Partners LP, 6.75%, 2020 | | | 60,000 | | | | 61,350 | |
| Spectra Energy Capital LLC, 8%, 2019 | | | 679,000 | | | | 858,348 | |
| | | | | | | | |
| | | | | | | $ | 6,161,398 | |
| Network & Telecom - 2.8% | | | | | | | | |
| AT&T, Inc., 5.5%, 2018 | | $ | 660,000 | | | $ | 768,369 | |
| Axtel S.A.B. de C.V., 9%, 2019 (n) | | | 372,000 | | | | 343,635 | |
| CenturyLink, Inc., 7.6%, 2039 | | | 840,000 | | | | 840,177 | |
| Cincinnati Bell, Inc., 8.25%, 2017 | | | 90,000 | | | | 91,350 | |
| Cincinnati Bell, Inc., 8.75%, 2018 | | | 310,000 | | | | 299,925 | |
| Citizens Communications Co., 9%, 2031 | | | 115,000 | | | | 128,225 | |
| France Telecom, 4.375%, 2014 | | | 640,000 | | | | 706,798 | |
| Frontier Communications Corp., 8.5%, 2020 | | | 310,000 | | | | 358,050 | |
| Nordic Telephone Co. Holdings, 8.875%, 2016 (n) | | | 465,000 | | | | 492,900 | |
| Qwest Communications International, Inc., 8%, 2015 | | | 105,000 | | | | 114,188 | |
| Qwest Communications International, Inc., 7.125%, 2018 (n) | | | 270,000 | | | | 286,875 | |
| Qwest Corp., 7.5%, 2014 | | | 560,000 | | | | 639,800 | |
| Telefonica S.A., 5.877%, 2019 | | | 760,000 | | | | 870,868 | |
| Telemar Norte Leste S.A., 5.5%, 2020 (z) | | | 242,000 | | | | 243,513 | |
| Verizon Communications, Inc., 8.75%, 2018 | | | 690,000 | | | | 948,611 | |
| Verizon New England, Inc., 6.5%, 2011 | | | 450,000 | | | | 471,547 | |
| Windstream Corp., 8.625%, 2016 | | | 585,000 | | | | 621,563 | |
| Windstream Corp., 8.125%, 2018 (n) | | | 55,000 | | | | 59,263 | |
| Windstream Corp., 7.75%, 2020 (n) | | | 150,000 | | | | 159,000 | |
| | | | | | | | |
| | | | | | | $ | 8,444,657 | |
| Oil Services - 0.5% | | | | | | | | |
| Allis-Chalmers Energy, Inc., 8.5%, 2017 | | $ | 115,000 | | | $ | 115,575 | |
| Basic Energy Services, Inc., 7.125%, 2016 | | | 105,000 | | | | 99,750 | |
| Edgen Murray Corp., 12.25%, 2015 | | | 175,000 | | | | 142,188 | |
| Expro Finance Luxembourg, 8.5%, 2016 (n) | | | 320,000 | | | | 315,200 | |
| McJunkin Red Man Holding Corp., 9.5%, 2016 (n) | | | 150,000 | | | | 138,000 | |
| Pioneer Drilling Co., 9.875%, 2018 | | | 220,000 | | | | 231,000 | |
| Pride International, Inc., 6.875%, 2020 | | | 400,000 | | | | 453,000 | |
| | | | | | | | |
| | | | | | | $ | 1,494,713 | |
24
Portfolio of Investments – continued
| | | | | | | | |
| Issuer | | Shares/Par | | | Value ($) | |
| | | | | | | | |
| Bonds - continued | | | | | | | | |
| Oils - 0.3% | | | | | | | | |
| LUKOIL International Finance B.V., 6.125%, 2020 (z) | | $ | 758,000 | | | $ | 751,034 | |
| Petroplus Holdings AG, 9.375%, 2019 (n) | | | 210,000 | | | | 201,600 | |
| | | | | | | | |
| | | | | | | $ | 952,634 | |
| Other Banks & Diversified Financials - 4.5% | | | | | | | | |
| Alfa Bank, 7.875%, 2017 (n) | | $ | 490,000 | | | $ | 494,949 | |
| American Express Centurion Bank, 5.2%, 2010 | | | 840,000 | | | | 842,246 | |
| American Express Centurion Bank, 5.5%, 2013 | | | 510,000 | | | | 556,194 | |
| Banco Internacional del Peru, 5.75%, 2020 (z) | | | 103,000 | | | | 103,515 | |
| Banco Santander U.S. Debt S.A.U., 2.991%, 2013 (z) | | | 800,000 | | | | 804,189 | |
| Bangkok Bank (Hong Kong), 4.8%, 2020 (z) | | | 494,000 | | | | 488,447 | |
| Bank of China (Hong Kong) Ltd., 5.55%, 2020 (n) | | | 1,153,000 | | | | 1,219,312 | |
| Bosphorus Financial Services Ltd., FRN, 2.176%, 2012 (z) | | | 300,000 | | | | 295,013 | |
| Capital One Financial Corp., 8.8%, 2019 | | | 660,000 | | | | 837,149 | |
| Capital One Financial Corp., 10.25%, 2039 | | | 910,000 | | | | 987,350 | |
| Citigroup Capital XXI, 8.3% to 2037, FRN to 2077 | | | 200,000 | | | | 209,250 | |
| Citigroup, Inc., 6.375%, 2014 | | | 630,000 | | | | 707,114 | |
| Citigroup, Inc., 6.01%, 2015 | | | 530,000 | | | | 587,362 | |
| Citigroup, Inc., 8.5%, 2019 | | | 461,000 | | | | 578,867 | |
| Groupe BPCE S.A., 12.5% to 2019, FRN to 2049 (n) | | | 645,000 | | | | 738,086 | |
| LBG Capital No. 1 PLC, 7.875%, 2020 (n) | | | 375,000 | | | | 371,250 | |
| Lloyds TSB Bank PLC, 5.8%, 2020 (n) | | | 1,090,000 | | | | 1,166,495 | |
| Svenska Handelsbanken AB, 4.875%, 2014 (n) | | | 910,000 | | | | 1,002,088 | |
| UBS AG, 4.875%, 2020 | | | 250,000 | | | | 268,036 | |
| UBS Preferred Funding Trust V, 6.243% to 2016, FRN to 2049 | | | 1,120,000 | | | | 1,107,456 | |
| Zhaikmunai Finance B.V., 10.5%, 2015 (z) | | | 318,000 | | | | 313,628 | |
| | | | | | | | |
| | | | | | | $ | 13,677,996 | |
| Pharmaceuticals - 1.4% | | | | | | | | |
| Celgene Corp., 3.95%, 2020 | | $ | 890,000 | | | $ | 887,795 | |
| Pfizer, Inc., 6.2%, 2019 | | | 1,280,000 | | | | 1,569,344 | |
| Roche Holdings, Inc., 6%, 2019 (n) | | | 1,130,000 | | | | 1,363,314 | |
| Teva Pharmaceutical Finance LLC, 5.55%, 2016 | | | 359,000 | | | | 419,568 | |
| Valeant Pharmaceuticals International, Inc., 6.75%, 2017 (n) | | | 25,000 | | | | 26,094 | |
| Valeant Pharmaceuticals International, Inc., 7%, 2020 (n) | | | 25,000 | | | | 26,250 | |
| | | | | | | | |
| | | | | | | $ | 4,292,365 | |
| Pollution Control - 0.6% | | | | | | | | |
| Allied Waste North America, Inc., 7.125%, 2016 | | $ | 1,015,000 | | | $ | 1,082,244 | |
| Republic Services, Inc., 5.25%, 2021 | | | 730,000 | | | | 809,785 | |
| | | | | | | | |
| | | | | | | $ | 1,892,029 | |
25
Portfolio of Investments – continued
| | | | | | | | |
| Issuer | | Shares/Par | | | Value ($) | |
| | | | | | | | |
| Bonds - continued | | | | | | | | |
| Precious Metals & Minerals - 0.1% | | | | | | | | |
| ALROSA Finance S.A., 7.75%, 2020 (z) | | $ | 413,000 | | | $ | 414,313 | |
| | |
| Printing & Publishing - 0.4% | | | | | | | | |
| American Media Operations, Inc., 9%, 2013 (p)(z) | | $ | 28,417 | | | $ | 27,707 | |
| American Media Operations, Inc., 14%, 2013 (p)(z) | | | 298,068 | | | | 179,627 | |
| Nielsen Finance LLC, 10%, 2014 | | | 55,000 | | | | 57,819 | |
| Nielsen Finance LLC, 11.5%, 2016 | | | 205,000 | | | | 235,750 | |
| Nielsen Finance LLC, 0% to 2011, 12.5% to 2016 | | | 533,000 | | | | 542,994 | |
| Nielsen Finance LLC, 7.75%, 2018 (z) | | | 125,000 | | | | 129,531 | |
| | | | | | | | |
| | | | | | | $ | 1,173,428 | |
| Railroad & Shipping - 0.2% | | | | | | | | |
| Kansas City Southern Railway, 8%, 2015 | | $ | 380,000 | | | $ | 410,400 | |
| Panama Canal Railway Co., 7%, 2026 (n) | | | 320,487 | | | | 276,821 | |
| | | | | | | | |
| | | | | | | $ | 687,221 | |
| Real Estate - 1.1% | | | | | | | | |
| Developers Diversified Realty Corp., REIT, 7.875%, 2020 | | $ | 125,000 | | | $ | 135,678 | |
| Entertainment Properties Trust, REIT, 7.75%, 2020 (n) | | | 250,000 | | | | 259,375 | |
| Kimco Realty Corp., REIT, 6.875%, 2019 | | | 191,000 | | | | 221,601 | |
| Simon Property Group, Inc., REIT, 6.1%, 2016 | | | 1,790,000 | | | | 2,087,677 | |
| WEA Finance LLC, REIT, 6.75%, 2019 (n) | | | 590,000 | | | | 695,044 | |
| | | | | | | | |
| | | | | | | $ | 3,399,375 | |
| Retailers - 2.1% | | | | | | | | |
| AutoZone, Inc., 6.5%, 2014 | | $ | 1,210,000 | | | $ | 1,375,906 | |
| Couche-Tard, Inc., 7.5%, 2013 | | | 490,000 | | | | 497,350 | |
| Express LLC/Express Finance Corp., 8.75%, 2018 | | | 180,000 | | | | 191,700 | |
| Limited Brands, Inc., 5.25%, 2014 | | | 242,000 | | | | 250,470 | |
| Limited Brands, Inc., 6.9%, 2017 | | | 205,000 | | | | 222,425 | |
| Limited Brands, Inc., 6.95%, 2033 | | | 115,000 | | | | 107,238 | |
| Macy’s, Inc., 8.375%, 2015 | | | 860,000 | | | | 1,004,050 | |
| Neiman Marcus Group, Inc., 10.375%, 2015 | | | 285,000 | | | | 300,675 | |
| QVC, Inc., 7.375%, 2020 (n) | | | 225,000 | | | | 240,750 | |
| Rent-A-Center, Inc., 6.625%, 2020 | | | 45,000 | | | | 45,450 | |
| Sally Beauty Holdings, Inc., 10.5%, 2016 | | | 560,000 | | | | 614,600 | |
| Staples, Inc., 9.75%, 2014 | | | 690,000 | | | | 854,679 | |
| Toys “R” Us, Inc., 10.75%, 2017 | | | 415,000 | | | | 474,138 | |
| Toys “R” Us, Inc., 8.5%, 2017 (n) | | | 150,000 | | | | 162,375 | |
| | | | | | | | |
| | | | | | | $ | 6,341,806 | |
| Specialty Stores - 0.2% | | | | | | | | |
| Michaels Stores, Inc., 11.375%, 2016 | | $ | 210,000 | | | $ | 231,525 | |
26
Portfolio of Investments – continued
| | | | | | | | |
| Issuer | | Shares/Par | | | Value ($) | |
| | | | | | | | |
| Bonds - continued | | | | | | | | |
| Specialty Stores - continued | | | | | | | | |
| Michaels Stores, Inc., 7.75%, 2018 (z) | | $ | 210,000 | | | $ | 207,900 | |
| Payless ShoeSource, Inc., 8.25%, 2013 | | | 276,000 | | | | 280,830 | |
| | | | | | | | |
| | | | | | | $ | 720,255 | |
| Steel - 0.0% | | | | | | | | |
| Steel Capital S.A., 6.7%, 2017 (z) | | $ | 114,000 | | | $ | 113,296 | |
| | |
| Supermarkets - 0.3% | | | | | | | | |
| Delhaize Group, 5.875%, 2014 | | $ | 740,000 | | | $ | 837,013 | |
| | |
| Telecommunications - Wireless - 2.5% | | | | | | | | |
| American Tower Corp., 4.625%, 2015 | | $ | 440,000 | | | $ | 474,041 | |
| Clearwire Corp., 12%, 2015 (n) | | | 630,000 | | | | 697,725 | |
| Cricket Communications, Inc., 7.75%, 2016 | | | 195,000 | | | | 210,113 | |
| Crown Castle International Corp., 9%, 2015 | | | 175,000 | | | | 195,563 | |
| Crown Castle International Corp., 7.75%, 2017 (n) | | | 125,000 | | | | 140,313 | |
| Crown Castle International Corp., 7.125%, 2019 | | | 445,000 | | | | 489,500 | |
| Crown Castle Towers LLC, 6.113%, 2020 (n) | | | 838,000 | | | | 932,023 | |
| Digicel Group Ltd., 12%, 2014 (n) | | | 100,000 | | | | 117,125 | |
| Digicel Group Ltd., 10.5%, 2018 (n) | | | 345,000 | | | | 379,931 | |
Globo Communicacoes e Participacoes S.A., 6.25% to 2015,
9.375% to 2049 (n) | | | 100,000 | | | | 103,000 | |
| MetroPCS Wireless, Inc., 9.25%, 2014 | | | 53,000 | | | | 55,518 | |
| MetroPCS Wireless, Inc., 7.875%, 2018 | | | 125,000 | | | | 134,063 | |
| MTS International Funding Ltd., 8.625%, 2020 (n) | | | 100,000 | | | | 116,125 | |
| Net Servicos de Comunicacao S.A., 7.5%, 2020 (n) | | | 359,000 | | | | 415,991 | |
| Nextel Communications, 7.375%, 2015 | | | 210,000 | | | | 210,788 | |
| NII Holdings, Inc., 10%, 2016 | | | 255,000 | | | | 289,106 | |
| NII Holdings, Inc., 8.875%, 2019 | | | 165,000 | | | | 183,563 | |
| Rogers Cable, Inc., 5.5%, 2014 | | | 659,000 | | | | 742,389 | |
| SBA Communications Corp., 8.25%, 2019 | | | 100,000 | | | | 112,500 | |
| Sprint Capital Corp., 6.875%, 2028 | | | 145,000 | | | | 136,663 | |
| Sprint Nextel Corp., 8.375%, 2017 | | | 580,000 | | | | 639,450 | |
| Sprint Nextel Corp., 8.75%, 2032 | | | 155,000 | | | | 170,113 | |
| Wind Acquisition Finance S.A., 12%, 2015 (n) | | | 532,000 | | | | 563,920 | |
| | | | | | | | |
| | | | | | | $ | 7,509,523 | |
| Telephone Services - 0.1% | | | | | | | | |
| Frontier Communications Corp., 8.125%, 2018 | | $ | 315,000 | | | $ | 359,100 | |
| | |
| Tobacco - 1.5% | | | | | | | | |
| Alliance One International, Inc., 10%, 2016 | | $ | 170,000 | | | $ | 187,000 | |
| Altria Group, Inc., 9.25%, 2019 | | | 1,040,000 | | | | 1,427,893 | |
27
Portfolio of Investments – continued
| | | | | | | | |
| Issuer | | Shares/Par | | | Value ($) | |
| | | | | | | | |
| Bonds - continued | | | | | | | | |
| Tobacco - continued | | | | | | | | |
| B.A.T. International Finance PLC, 8.125%, 2013 (n) | | $ | 810,000 | | | $ | 960,492 | |
| Lorillard Tobacco Co., 8.125%, 2019 | | | 329,000 | | | | 380,124 | |
| Lorillard Tobacco Co., 6.875%, 2020 | | | 480,000 | | | | 515,092 | |
| Reynolds American, Inc., 6.75%, 2017 | | | 1,040,000 | | | | 1,178,923 | |
| | | | | | | | |
| | | | | | | $ | 4,649,524 | |
| Transportation - Services - 0.8% | | | | | | | | |
| American Petroleum Tankers LLC, 10.25%, 2015 (z) | | $ | 65,000 | | | $ | 67,600 | |
| Commercial Barge Line Co., 12.5%, 2017 | | | 475,000 | | | | 535,563 | |
| Erac USA Finance Co., 6.375%, 2017 (n) | | | 930,000 | | | | 1,087,788 | |
| Hertz Corp., 8.875%, 2014 | | | 440,000 | | | | 452,100 | |
| Hertz Corp., 7.5%, 2018 (n) | | | 195,000 | | | | 200,850 | |
| Navios Maritime Acquisition Corp., 8.625%, 2017 (z) | | | 120,000 | | | | 121,200 | |
| | | | | | | | |
| | | | | | | $ | 2,465,101 | |
| Utilities - Electric Power - 4.3% | | | | | | | | |
| AES Corp., 8%, 2017 | | $ | 670,000 | | | $ | 737,000 | |
| Allegheny Energy, Inc., 5.75%, 2019 (n) | | | 800,000 | | | | 839,078 | |
| Calpine Corp., 8%, 2016 (n) | | | 280,000 | | | | 303,100 | |
| Calpine Corp., 7.875%, 2020 (n) | | | 50,000 | | | | 52,375 | |
| CMS Energy Corp., 4.25%, 2015 | | | 760,000 | | | | 775,092 | |
| Colbun S.A., 6%, 2020 (n) | | | 637,000 | | | | 689,198 | |
| Duke Energy Corp., 3.35%, 2015 | | | 1,130,000 | | | | 1,203,842 | |
| Dynegy Holdings, Inc., 7.75%, 2019 | | | 530,000 | | | | 361,725 | |
| Edison Mission Energy, 7%, 2017 | �� | | 490,000 | | | | 361,375 | |
| EDP Finance B.V., 6%, 2018 (n) | | | 1,100,000 | | | | 1,141,446 | |
| Enel Finance International S.A., 5.125%, 2019 (n) | | | 1,478,000 | | | | 1,601,298 | |
| Energy Future Holdings Corp., 10%, 2020 (n) | | | 360,000 | | | | 377,065 | |
| Energy Future Holdings Corp., 10%, 2020 | | | 590,000 | | | | 617,967 | |
| Entergy Corp., 5.125%, 2020 | | | 630,000 | | | | 637,799 | |
| Exelon Generation Co. LLC, 5.2%, 2019 | | | 360,000 | | | | 397,383 | |
| Exelon Generation Co. LLC, 6.25%, 2039 | | | 740,000 | | | | 770,726 | |
| FirstEnergy Corp., 6.45%, 2011 | | | 39,000 | | | | 40,750 | |
| Genon Escrow Corp., 9.875%, 2020 (z) | | | 225,000 | | | | 219,375 | |
| Mirant North America LLC, 7.375%, 2013 | | | 385,000 | | | | 395,106 | |
| NRG Energy, Inc., 7.375%, 2016 | | | 400,000 | | | | 416,456 | |
| Pacific Gas & Electric Co., 4.2%, 2011 | | | 630,000 | | | | 637,677 | |
| Texas Competitive Electric Holdings LLC, 10.25%, 2015 | | | 300,000 | | | | 186,000 | |
| Waterford 3 Funding Corp., 8.09%, 2017 | | | 433,207 | | | | 441,634 | |
| | | | | | | | |
| | | | | | | $ | 13,203,467 | |
| Utilities - Gas - 0.4% | | | | | | | | |
| Keyspan Corp., 7.625%, 2010 | | $ | 1,281,000 | | | $ | 1,283,408 | |
| Total Bonds (Identified Cost, $282,808,563) | | | | | | $ | 301,877,323 | |
28
Portfolio of Investments – continued
| | | | | | | | |
| Floating Rate Loans (g)(r) - 0.5% | | | | | | | | |
| Issuer | | Shares/Par | | | Value ($) | |
| | | | | | | | |
| Automotive - 0.2% | | | | | | | | |
| Allison Transmission, Inc., Term Loan B, 3.02%, 2014 | | $ | 315,901 | | | $ | 302,871 | |
| Ford Motor Co., Term Loan B, 3.03%, 2013 | | | 250,726 | | | | 248,113 | |
| | | | | | | | |
| | | | | | | $ | 550,984 | |
| Broadcasting - 0.1% | | | | | | | | |
| Gray Television, Inc., Term Loan B, 3.76%, 2014 | | $ | 113,214 | | | $ | 109,534 | |
| New Young Broadcasting Holding Co., Inc., Term Loan, 8%, 2015 | | | 84,919 | | | | 84,777 | |
| | | | | | | | |
| | | | | | | $ | 194,311 | |
| Consumer Services - 0.0% | | | | | | | | |
| Realogy Corp., Letter of Credit B, 3.25%, 2013 | | $ | 18,454 | | | $ | 16,688 | |
| Realogy Corp., Term Loan B, 3.25%, 2013 | | | 135,383 | | | | 122,425 | |
| | | | | | | | |
| | | | | | | $ | 139,113 | |
| Financial Institutions - 0.0% | | | | | | | | |
| American General Finance Corp., Term Loan, 7.25%, 2015 | | $ | 49,540 | | | $ | 49,966 | |
| | |
| Gaming & Lodging - 0.1% | | | | | | | | |
Green Valley Ranch Gaming LLC, Second Lien Term Loan,
3.5%, 2014 (d) | | $ | 310,737 | | | $ | 5,438 | |
| MGM Mirage, Inc., Term Loan E, 7%, 2014 (o) | | | 419,278 | | | | 395,111 | |
| | | | | | | | |
| | | | | | | $ | 400,549 | |
| Utilities - Electric Power - 0.1% | | | | | | | | |
| TXU Corp., Term Loan B-2, 3.92%, 2014 | | $ | 250,181 | | | $ | 196,048 | |
| Total Floating Rate Loans (Identified Cost, $1,679,424) | | | | | | $ | 1,530,971 | |
| | |
| Common Stocks - 0.1% | | | | | | | | |
| Automotive - 0.0% | | | | | | | | |
| Accuride Corp. | | | 26,727 | | | $ | 33,141 | |
| | |
| Broadcasting - 0.0% | | | | | | | | |
| New Young Broadcasting Holding Co., Inc. | | | 38 | | | $ | 81,700 | |
| | |
| Construction - 0.1% | | | | | | | | |
| Nortek, Inc. | | | 2,424 | | | $ | 101,032 | |
| | |
| Printing & Publishing - 0.0% | | | | | | | | |
| American Media, Inc. (a) | | | 4,766 | | | $ | 29,171 | |
| Quad/Graphics, Inc. | | | 312 | | | | 13,950 | |
| | | | | | | | |
| | | | | | | $ | 43,121 | |
| Total Common Stocks (Identified Cost, $234,605) | | | $ | 258,994 | |
29
Portfolio of Investments – continued
| | | | | | | | | | | | | | | | |
| Preferred Stocks - 0.0% | | | | | | | | | | | | | | | | |
| Issuer | | | | | | | | Shares/Par | | | Value ($) | |
| | | | | | | | | | | | | | | | |
| Other Banks & Diversified Financials - 0.0% | | | | | |
Citigroup Capital XIII, 7.875%
(Identified Cost, $60,625) | | | | | | | | | | | 2,425 | | | $ | 64,263 | |
| | | | |
| | | Strike Price | | | First Exercise | | | | | | | |
| Warrants - 0.1% | | | | | | | | | | | | | | | | |
New Young Broadcasting Holding Co., Inc. (1 share for 1 warrant)
(Identified Cost, $196,176) (a) | | $ | 0.01 | | | | 7/14/10 | | | | 103 | | | $ | 221,450 | |
| | | | |
| Convertible Bonds - 0.0% | | | | | | | | | | | | | | | | |
| Automotive - 0.0% | | | | | | | | | | | | | | | | |
Accuride Corp., 7.5%, 2020
(Identified Cost, $39,613) | | | $ | 39,613 | | | $ | 116,858 | |
| | | | |
| Money Market Funds (v) -1.0% | | | | | | | | | | | | | | | | |
MFS Institutional Money Market Portfolio, 0.21%,
at Cost and Net Asset Value | | | | 3,146,433 | | | $ | 3,146,433 | |
| Total Investments (Identified Cost, $288,165,439) | | | | | | | $ | 307,216,292 | |
| | |
| Other Assets, Less Liabilities - 0.0% | | | | | | | | 63,600 | |
| Net Assets - 100.0% | | | | | | | $ | 307,279,892 | |
| (a) | Non-income producing security. |
| (d) | Non-income producing security – in default. |
| (e) | Guaranteed by Minister for Finance of Ireland. |
| (f) | All or a portion of the security has been segregated as collateral for open futures contracts. |
| (g) | The rate shown represents a weighted average coupon rate on settled positions at period end, unless otherwise indicated. |
| (i) | Interest only security for which the fund receives interest on notional principal (Par amount). Par amount shown is the notional principal and does not reflect the cost of the security. |
| (n) | Securities exempt from registration under Rule 144A of the Securities Act of 1933. These securities may be sold in the ordinary course of business in transactions exempt from registration, normally to qualified institutional buyers. At period end, the aggregate value of these securities was $70,923,559, representing 23.1% of net assets. |
| (o) | All or a portion of this position has not settled. Upon settlement date, interest rates for unsettled amounts will be determined. The rate shown represents the weighted average coupon rate for settled amounts. |
| (p) | Payment-in-kind security. |
| (r) | Remaining maturities of floating rate loans may be less than stated maturities shown as a result of contractual or optional prepayments by the borrower. Such prepayments cannot be predicted with certainty. These loans may be subject to restrictions on resale. Floating rate loans generally have rates of interest which are determined periodically by reference to a base lending rate plus a premium. |
| (v) | Underlying fund that is available only to investment companies managed by MFS. The rate quoted is the annualized seven-day yield of the fund at period end. |
| (z) | Restricted securities are not registered under the Securities Act of 1933 and are subject to legal restrictions on resale. These securities generally may be resold in transactions exempt from registration or |
30
Portfolio of Investments – continued
| | to the public if the securities are subsequently registered. Disposal of these securities may involve time-consuming negotiations and prompt sale at an acceptable price may be difficult. The fund holds the following restricted securities: |
| | | | | | | | | | |
| Restricted Securities | | Acquisition
Date | | Cost | | | Current
Market
Value | |
| ALROSA Finance S.A., 7.75%, 2020 | | 10/28/10 | | | $413,000 | | | | $414,313 | |
| American Media Operations, Inc., 9%, 2013 | | 1/30/09-5/30/10 | | | 20,433 | | | | 27,707 | |
| American Media Operations, Inc., 14%, 2013 | | 1/30/09-6/28/10 | | | 198,897 | | | | 179,627 | |
American Petroleum Tankers LLC,
10.25%, 2015 | | 5/06/10 | | | 63,312 | | | | 67,600 | |
| Anthracite Ltd., “A”, CDO, FRN, 0.616%, 2019 | | 1/28/10 | | | 325,993 | | | | 337,326 | |
| Anthracite Ltd., CDO, 6%, 2037 | | 5/14/02 | | | 1,074,596 | | | | 60,000 | |
| ARCap REIT, Inc., CDO, “H”, 6.1%, 2045 | | 9/21/04 | | | 788,284 | | | | 56,250 | |
| Banco Internacional del Peru, 5.75%, 2020 | | 9/30/10 | | | 102,816 | | | | 103,515 | |
Banco Santander U.S. Debt S.A.U.,
2.991%, 2013 | | 9/27/10 | | | 800,000 | | | | 804,189 | |
| Banco del Estado de Chile, 4.125%, 2020 | | 9/30/10 | | | 99,244 | | | | 100,577 | |
| Bangkok Bank (Hong Kong), 4.8%, 2020 | | 10/13/10 | | | 491,912 | | | | 488,447 | |
| Bayview Financial Revolving Mortgage Loan Trust, FRN, 1.855%, 2040 | | 3/01/06 | | | 510,578 | | | | 228,228 | |
| Bosphorus Financial Services Ltd., FRN, 2.176%, 2012 | | 3/08/05 | | | 300,000 | | | | 295,013 | |
| Brazilian Merchant Voucher Receivables Ltd., 5.911%, 2011 | | 3/08/07 | | | 233,762 | | | | 237,077 | |
| Capital Trust Realty Ltd., CDO, 5.16%, 2035 | | 9/16/10 | | | 901,122 | | | | 900,000 | |
| Carrizo Oil & Gas, Inc., 8.625%, 2018 | | 10/28/10-10/29/10 | | | 336,969 | | | | 339,188 | |
| Chase Commercial Mortgage Securities Corp., 6.6%, 2029 | | 6/07/00 | | | 943,427 | | | | 997,404 | |
| Corporacion Nacional del Cobre de Chile, 3.75%, 2020 | | 10/28/10 | | | 414,569 | | | | 418,227 | |
| Crest Ltd., “A1” CDO, FRN, 0.769%, 2018 | | 1/21/10 | | | 615,988 | | | | 669,996 | |
| DLJ Commercial Mortgage Corp., 6.04%, 2031 | | 7/23/04 | | | 504,383 | | | | 529,354 | |
Dubai Electricity & Water Authority,
6.375%, 2016 | | 10/14/10 | | | 127,000 | | | | 125,802 | |
Dubai Electricity & Water Authority,
7.375%, 2020 | | 10/14/10 | | | 456,000 | | | | 448,464 | |
| Falcon Franchise Loan LLC, 6.5%, 2014 | | 7/15/05 | | | 321,194 | | | | 288,669 | |
| Falcon Franchise Loan LLC, FRN, 3.36%, 2023 | | 1/29/03 | | | 122,754 | | | | 122,784 | |
| Falcon Franchise Loan LLC, FRN, 3.26%, 2025 | | 10/28/02 | | | 261,332 | | | | 220,275 | |
| GMAC LLC, FRN, 6.02%, 2033 | | 11/17/00 | | | 1,758,000 | | | | 1,815,573 | |
| Genon Escrow Corp., 9.875%, 2020 | | 10/08/10 | | | 221,635 | | | | 219,375 | |
| Georgia-Pacific Corp., 5.4%, 2020 | | 10/27/10 | | | 155,084 | | | | 157,560 | |
Gold Fields Orogen Holdings Ltd.,
4.875%, 2020 | | 9/30/10 | | | 1,229,343 | | | | 1,215,142 | |
31
Portfolio of Investments – continued
| | | | | | | | | | |
| Restricted Securities (continued) | | Acquisition
Date | | Cost | | | Current
Market
Value | |
| Hertz Vehicle Financing LLC, 2010-1A, “A1”, 2.6%, 2015 | | 7/16/10 | | | $309,917 | | | | $316,790 | |
| Hexion U.S. Finance Corp/Hexion Nova Scotia Finance, 9%, 2020 | | 10/27/10 | | | 70,000 | | | | 72,800 | |
| LBI Media, Inc., 8.5%, 2017 | | 7/18/07 | | | 187,612 | | | | 160,788 | |
| LUKOIL International Finance B.V., 6.125%, 2020 | | 10/29/10 | | | 751,034 | | | | 751,034 | |
| Local TV Finance LLC, 10%, 2015 | | 11/13/07-6/15/10 | | | 339,885 | | | | 297,373 | |
| Michaels Stores, Inc., 7.75%, 2018 | | 10/07/10-10/20/10 | | | 207,845 | | | | 207,900 | |
| Momentive Performance Materials, Inc., 9%, 2021 | | 10/27/10 | | | 145,000 | | | | 150,438 | |
| Morgan Stanley Capital I, Inc., 1%, 2039 | | 7/20/04 | | | 219,105 | | | | 244,877 | |
| Nationstar Mortgage LLC, 10.875%, 2015 | | 3/23/10 | | | 126,702 | | | | 117,650 | |
| Navios Maritime Acquisition Corp., 8.625%, 2017 | | 10/06/10 | | | 120,000 | | | | 121,200 | |
| Nielsen Finance LLC, 7.75%, 2018 | | 9/30/10 | | | 124,088 | | | | 129,531 | |
| Omnova Solutions, Inc., 7.875%, 2018 | | 10/22/10 | | | 95,000 | | | | 97,138 | |
| Prudential Securities Secured Financing Corp., FRN, 7.285%, 2013 | | 12/06/04 | | | 906,860 | | | | 884,740 | |
| Reynolds Group, 7.125%, 2019 | | 10/06/10 | | | 150,000 | | | | 156,375 | |
| SCF Capital Ltd., 5.375%, 2017 | | 10/20/10 | | | 526,000 | | | | 516,000 | |
| Salomon Brothers Mortgage Securities, Inc., FRN, 6.724%, 2032 | | 1/07/05 | | | 1,172,667 | | | | 1,140,958 | |
| Sappi Papier Holding GmbH, 6.75%, 2012 | | 7/29/10-8/02/10 | | | 145,898 | | | | 146,810 | |
| Sino-Forest Corp., 6.25%, 2017 | | 10/14/10 | | | 35,000 | | | | 35,131 | |
| Steel Capital S.A., 6.7%, 2017 | | 10/14/10 | | | 114,000 | | | | 113,296 | |
| Telemar Norte Leste S.A., 5.5%, 2020 | | 4/23/09 | | | 197,306 | | | | 243,513 | |
| USI Holdings Corp., 9.75%, 2015 | | 4/26/07-9/13/07 | | | 322,026 | | | | 320,800 | |
| Univision Communications, Inc., 7.875%, 2020 | | 10/18/10-10/25/10 | | | 138,822 | | | | 141,750 | |
| VTB Capital S.A., 6.551%, 2020 | | 10/06/10 | | | 1,069,000 | | | | 1,079,904 | |
| Vestjysk Bank A/S, FRN, 0.842%, 2013 | | 6/10/10 | | | 710,000 | | | | 716,134 | |
| Zhaikmunai Finance B.V., 10.5%, 2015 | | 10/12/10 | | | 318,000 | | | | 313,628 | |
| Total Restricted Securities | | | | | | | | | $20,344,240 | |
| % of Net Assets | | | | | | | | | 6.6% | |
The following abbreviations are used in this report and are defined:
| CDO | | Collateralized Debt Obligation |
| CLO | | Collateralized Loan Obligation |
| FRN | | Floating Rate Note. Interest rate resets periodically and may not be the rate reported at period end. |
| PLC | | Public Limited Company |
| REIT | | Real Estate Investment Trust |
32
Portfolio of Investments – continued
Abbreviations indicate amounts shown in currencies other than the U.S. dollar. All amounts are stated in U.S. dollars unless otherwise indicated. A list of abbreviations is shown below:
| CNY | | Chinese Yuan Renminbi |
Derivative Contracts at 10/31/10
Forward Foreign Currency Exchange Contracts at 10/31/10
| | | | | | | | | | | | | | | | | | | | | | | | |
| Type | | Currency | | Counterparty | | Contracts
to
Deliver/
Receive | | | Settlement
Date Range | | | In
Exchange
For | | | Contracts
at Value | | | Net
Unrealized
Appreciation
(Depreciation) | |
| Asset Derivatives | |
| BUY | | CAD | | Goldman Sachs International | | | 1,303,933 | | | | 11/03/10 | | | | $1,276,680 | | | | $1,278,462 | | | | $1,782 | |
| SELL | | CAD | | CS First Boston | | | 331,814 | | | | 1/12/11 | | | | 329,910 | | | | 324,780 | | | | 5,130 | |
| SELL | | CAD | | HSBC Bank | | | 79,053 | | | | 11/03/10 | | | | 77,774 | | | | 77,509 | | | | 265 | |
| SELL | | IDR | | JP Morgan Chase Bank | | | 4,086,041,000 | | | | 11/03/10 | | | | 457,307 | | | | 457,105 | | | | 202 | |
| BUY | | SEK | | CS First Boston | | | 281,704 | | | | 1/12/11 | | | | 42,007 | | | | 42,072 | | | | 65 | |
| | | | | | | | | | | | | | | | | | | | | | | | |
| | | | | | | | | | | | | | | | | | | | | | | $7,444 | |
| | | | | | | | | | | | | | | | | | | | | | | | |
|
| Liability Derivatives | |
| SELL | | CAD | | Goldman Sachs International | | | 2,528,813 | | |
| 11/03/10-
1/12/11 |
| | | $2,469,403 | | | | $2,477,246 | | | | $(7,843 | ) |
| BUY | | CNY | | HSBC Bank | | | 9,233,000 | | | | 12/15/10 | | | | 1,396,400 | | | | 1,385,741 | | | | (10,659 | ) |
| BUY | | EUR | | JPMorgan Chase Bank | | | 1,143,355 | | | | 1/12/11 | | | | 1,591,578 | | | | 1,589,811 | | | | (1,767 | ) |
| SELL | | EUR | | UBS AG | | | 9,885,885 | | | | 12/15/10 | | | | 12,663,300 | | | | 13,752,221 | | | | (1,088,921 | ) |
| SELL | | GBP | | Barclays | | | 1,021,362 | | | | 1/12/11 | | | | 1,626,008 | | | | 1,635,677 | | | | (9,669 | ) |
| SELL | | GBP | | Deutsche Bank | | | 1,021,362 | | | | 1/12/11 | | | | 1,625,641 | | | | 1,635,677 | | | | (10,036 | ) |
| BUY | | IDR | | HSBC Bank | | | 4,086,041,000 | | | | 11/03/10 | | | | 458,179 | | | | 457,105 | | | | (1,074 | ) |
| BUY | | IDR | | JP Morgan Chase Bank | | | 4,086,041,000 | | | | 12/20/10 | | | | 455,879 | | | | 453,747 | | | | (2,132 | ) |
| SELL | | JPY | | JPMorgan Chase Bank | | | 256,897,547 | | | | 1/12/11 | | | | 3,141,210 | | | | 3,194,792 | | | | (53,582 | ) |
| BUY | | KRW | | JP Morgan Chase Bank | | | 517,083,000 | | | | 12/06/10 | | | | 462,341 | | | | 458,839 | | | | (3,502 | ) |
| | | | | | | | | | | | | | | | | | | | | | | | |
| | | | | | | | | | | | | | | | | | | | | | | $(1,189,185 | ) |
| | | | | | | | | | | | | | | | | | | | | | | | |
33
Portfolio of Investments – continued
Futures Contracts Outstanding at 10/31/10
| | | | | | | | | | | | | | | | | | |
| Description | | Currency | | | Contracts | | | Value | | | Expiration Date | | Unrealized
Appreciation
(Depreciation) | |
| Asset Derivatives | | | | | | | | | | | | | | | | | | |
| Interest Rate Futures | | | | | | | | | | | | | | | | | | |
| U.S. Treasury Bond 10 yr (Long) | | | USD | | | | 15 | | | | $1,894,219 | | | December - 2010 | | | $13,424 | |
| U.S. Treasury Bond 30 yr (Short) | | | USD | | | | 15 | | | | 1,964,063 | | | December - 2010 | | | 41,483 | |
| | | | | | | | | | | | | | | | | | |
| | | | | | | | | | | | | | | | | $54,907 | |
| | | | | | | | | | | | | | | | | | |
Swap Agreements at 10/31/10
| | | | | | | | | | | | | | | | | | |
| Expiration | | | | | Notional
Amount | | | Counterparty | | Cash Flows
to Receive | | Cash Flows
to Pay | | Fair
Value | |
| Asset Derivatives | |
| Credit Default Swaps | |
| 9/20/14 | | | USD | | | | 1,260,000 (a | ) | | Goldman Sachs International | | 1.00% (fixed rate) | | (1) | | | $22,750 | |
| | | | | | | | | | | | | | | | | | |
| (1) | Fund, as protection seller, to pay notional amount upon a defined credit event by Cargill Inc., 7.375%, 10/01/2025, an A2 rated bond. The fund entered into the contract to gain issuer exposure. |
| (a) | Net unamortized premiums received by the fund amounted to $2,253 |
The credit ratings presented here are an indicator of the current payment/performance risk of the related swap, the reference obligation for which may be either a single security or, in case of a credit default index, a basket of securities issued by corporate or sovereign issuers. Each reference security, including each individual security within a reference basket of securities, is assigned a rating from Moody’s Investor Service. If not rated by Moody’s, the rating will be that assigned by Standard & Poor’s. Likewise, if not assigned by Standard & Poor’s, it will be based on the rating assigned by Fitch, Inc. The ratings for a credit default index are calculated by MFS as a weighted average of the external credit ratings of the individual securities that compose the index’s reference basket of securities.
At October 31, 2010, the fund had sufficient cash and/or other liquid securities to cover any commitments under these derivative contracts.
See Notes to Financial Statements
34
Financial Statements
STATEMENT OF ASSETS AND LIABILITIES
At 10/31/10
This statement represents your fund’s balance sheet, which details the assets and liabilities comprising the total value of the fund.
| | | | |
| Assets | | | | |
Investments- | | | | |
Non-affiliated issuers, at value (identified cost, $285,019,006) | | | $304,069,859 | |
Underlying funds, at cost and value | | | 3,146,433 | |
Total investments, at value (identified cost, $288,165,439) | | | $307,216,292 | |
Cash | | | 12,602 | |
Receivables for | | | | |
Forward foreign currency exchange contracts | | | 7,444 | |
Investments sold | | | 2,138,438 | |
Fund shares sold | | | 764,867 | |
Interest and dividends | | | 4,771,400 | |
Swaps, at value (net unamortized premiums received, $2,253) | | | 22,750 | |
Receivable from investment adviser | | | 49,581 | |
Total assets | | | $314,983,374 | |
| Liabilities | | | | |
Payables for | | | | |
Distributions | | | $375,494 | |
Forward foreign currency exchange contracts | | | 1,189,185 | |
Daily variation margin on open futures contracts | | | 4,453 | |
Investments purchased | | | 4,813,150 | |
Fund shares reacquired | | | 1,067,766 | |
Payable to affiliates | | | | |
Investment adviser | | | 20,150 | |
Shareholder servicing costs | | | 68,217 | |
Distribution and service fees | | | 15,330 | |
Administrative services fee | | | 537 | |
Payable for independent Trustees’ compensation | | | 44,677 | |
Accrued expenses and other liabilities | | | 104,523 | |
Total liabilities | | | $7,703,482 | |
Net assets | | | $307,279,892 | |
| Net assets consist of | | | | |
Paid-in capital | | | $307,747,466 | |
Unrealized appreciation (depreciation) on investments and translation of assets and liabilities in foreign currencies | | | 17,976,631 | |
Accumulated net realized gain (loss) on investments and foreign currency transactions | | | (18,860,161 | ) |
Undistributed net investment income | | | 415,956 | |
Net assets | | | $307,279,892 | |
Shares of beneficial interest outstanding | | | 45,865,063 | |
| | | | | | | | | | | | |
| | | Net assets | | | Shares
outstanding | | | Net asset value
per share (a) | |
Class A | | | $216,199,878 | | | | 32,171,274 | | | | $6.72 | |
Class B | | | 39,468,160 | | | | 5,924,758 | | | | 6.66 | |
Class C | | | 46,789,057 | | | | 7,051,012 | | | | 6.64 | |
Class I | | | 4,822,797 | | | | 718,019 | | | | 6.72 | |
| (a) | Maximum offering price per share was equal to the net asset value per share for all share classes, except for Class A, for which the maximum offering price per share was $7.06 [100 / 95.25 x $6.72]. On sales of $50,000 or more, the maximum offering price of Class A shares is reduced. A contingent deferred sales charge may be imposed on redemptions of Class A, Class B, and Class C shares. Redemption price per share was equal to the net asset value per share for Class I. |
See Notes to Financial Statements
35
Financial Statements
STATEMENT OF OPERATIONS
Year ended 10/31/10
This statement describes how much your fund earned in investment income and accrued in expenses.
It also describes any gains and/or losses generated by fund operations.
| | | | |
| Net investment income | | | | |
Income | | | | |
Interest | | | $17,704,987 | |
Dividends | | | 10,775 | |
Dividends from underlying funds | | | 16,486 | |
Foreign taxes withheld | | | (60 | ) |
Total investment income | | | $17,732,188 | |
Expenses | | | | |
Management fee | | | $1,863,756 | |
Distribution and service fees | | | 1,317,897 | |
Shareholder servicing costs | | | 443,735 | |
Administrative services fee | | | 50,408 | |
Independent Trustees’ compensation | | | 16,914 | |
Custodian fee | | | 88,425 | |
Shareholder communications | | | 55,338 | |
Auditing fees | | | 56,498 | |
Legal fees | | | 6,528 | |
Miscellaneous | | | 92,911 | |
Total expenses | | | $3,992,410 | |
Fees paid indirectly | | | (105 | ) |
Reduction of expenses by investment adviser | | | (467,349 | ) |
Net expenses | | | $3,524,956 | |
Net investment income | | | $14,207,232 | |
| Realized and unrealized gain (loss) on investments and foreign currency transactions | | | | |
Realized gain (loss) (identified cost basis) | | | | |
Investment transactions | | | $2,951,199 | |
Futures contracts | | | 137,320 | |
Swap transactions | | | (1,948 | ) |
Foreign currency transactions | | | 1,924,161 | |
Net realized gain (loss) on investments
and foreign currency transactions | | | $5,010,732 | |
Change in unrealized appreciation (depreciation) | | | | |
Investments | | | $15,608,535 | |
Futures contracts | | | (22,500 | ) |
Swap transactions | | | (4,333 | ) |
Translation of assets and liabilities in foreign currencies | | | (1,080,227 | ) |
Net unrealized gain (loss) on investments
and foreign currency translation | | | $14,501,475 | |
Net realized and unrealized gain (loss) on investments
and foreign currency | | | $19,512,207 | |
Change in net assets from operations | | | $33,719,439 | |
See Notes to Financial Statements
36
Financial Statements
STATEMENTS OF CHANGES IN NET ASSETS
These statements describe the increases and/or decreases in net assets resulting from operations, any distributions, and any shareholder transactions.
| | | | | | | | |
| | | Years ended 10/31 | |
| | | 2010 | | | 2009 | |
| Change in net assets | | | | | | |
| From operations | | | | | | | | |
Net investment income | | | $14,207,232 | | | | $12,959,964 | |
Net realized gain (loss) on investments and
foreign currency transactions | | | 5,010,732 | | | | (7,667,469 | ) |
Net unrealized gain (loss) on investments and
foreign currency translation | | | 14,501,475 | | | | 47,484,131 | |
Change in net assets from operations | | | $33,719,439 | | | | $52,776,626 | |
| Distributions declared to shareholders | | | | | | | | |
From net investment income | | | $(14,890,727 | ) | | | $(16,971,763 | ) |
Change in net assets from fund share transactions | | | $18,819,504 | | | | $22,563,824 | |
Total change in net assets | | | $37,648,216 | | | | $58,368,687 | |
| Net assets | | | | | | | | |
At beginning of period | | | 269,631,676 | | | | 211,262,989 | |
At end of period (including undistributed net investment income of $415,956 and accumulated distributions in excess of net investment income of $1,444,787, respectively) | | | $307,279,892 | | | | $269,631,676 | |
See Notes to Financial Statements
37
Financial Statements
FINANCIAL HIGHLIGHTS
The financial highlights table is intended to help you understand the fund’s financial performance for the past 5 years. Certain information reflects financial results for a single fund share. The total returns in the table represent the rate by which an investor would have earned (or lost) on an investment in the fund share class (assuming reinvestment of all distributions) held for the entire period.
| | | | | | | | | | | | | | | | | | | | |
| Class A | | Years ended 10/31 | |
| | | 2010 | | | 2009 | | | 2008 | | | 2007 | | | 2006 | |
Net asset value, beginning of period | | | $6.30 | | | | $5.43 | | | | $6.67 | | | | $6.70 | | | | $6.67 | |
| Income (loss) from investment operations | | | | | | | | | | | | | | | | | |
Net investment income (d) | | | $0.33 | | | | $0.33 | | | | $0.37 | | | | $0.39 | | | | $0.37 | |
Net realized and unrealized gain (loss)
on investments and foreign currency | | | 0.44 | | | | 0.98 | | | | (1.22 | ) | | | (0.04 | ) | | | 0.05 | |
Total from investment operations | | | $0.77 | | | | $1.31 | | | | $(0.85 | ) | | | $0.35 | | | | $0.42 | |
| Less distributions declared to shareholders | | | | | | | | | | | | | | | | | |
From net investment income | | | $(0.35 | ) | | | $(0.44 | ) | | | $(0.39 | ) | | | $(0.38 | ) | | | $(0.39 | ) |
Net asset value, end of period | | | $6.72 | | | | $6.30 | | | | $5.43 | | | | $6.67 | | | | $6.70 | |
Total return (%) (r)(s)(t) | | | 12.56 | | | | 25.36 | | | | (13.37 | ) | | | 5.41 | | | | 6.59 | |
Ratios (%) (to average net assets)
and Supplemental data: | | | | | | | | | | | | | | | | | |
Expenses before expense reductions (f) | | | 1.18 | | | | 1.28 | | | | 1.28 | | | | 1.29 | | | | 1.33 | |
Expenses after expense reductions (f) | | | 1.02 | | | | 0.92 | | | | 0.83 | | | | 0.83 | | | | 0.83 | |
Net investment income | | | 5.14 | | | | 5.86 | | | | 5.74 | | | | 5.79 | | | | 5.55 | |
Portfolio turnover | | | 49 | | | | 53 | | | | 45 | | | | 55 | | | | 66 | |
Net assets at end of period (000 omitted) | | | $216,200 | | | | $188,786 | | | | $147,255 | | | | $185,193 | | | | $194,376 | |
See Notes to Financial Statements
38
Financial Statements – continued
| | | | | | | | | | | | | | | | | | | | |
| Class B | | Years ended 10/31 | |
| | | 2010 | | | 2009 | | | 2008 | | | 2007 | | | 2006 | |
Net asset value, beginning of period | | | $6.24 | | | | $5.38 | | | | $6.59 | | | | $6.63 | | | | $6.59 | |
| Income (loss) from investment operations | | | | | | | | | | | | | | | | | |
Net investment income (d) | | | $0.28 | | | | $0.29 | | | | $0.33 | | | | $0.34 | | | | $0.32 | |
Net realized and unrealized gain (loss)
on investments and foreign currency | | | 0.44 | | | | 0.96 | | | | (1.19 | ) | | | (0.04 | ) | | | 0.07 | |
Total from investment operations | | | $0.72 | | | | $1.25 | | | | $(0.86 | ) | | | $0.30 | | | | $0.39 | |
| Less distributions declared to shareholders | | | | | | | | | | | | | | | | | |
From net investment income | | | $(0.30 | ) | | | $(0.39 | ) | | | $(0.35 | ) | | | $(0.34 | ) | | | $(0.35 | ) |
Net asset value, end of period | | | $6.66 | | | | $6.24 | | | | $5.38 | | | | $6.59 | | | | $6.63 | |
Total return (%) (r)(s)(t) | | | 11.80 | | | | 24.45 | | | | (13.70 | ) | | | 4.57 | | | | 6.06 | |
Ratios (%) (to average net assets)
and Supplemental data: | | | | | | | | | | | | | | | | | |
Expenses before expense reductions (f) | | | 1.94 | | | | 2.01 | | | | 1.94 | | | | 1.94 | | | | 1.97 | |
Expenses after expense reductions (f) | | | 1.77 | | | | 1.63 | | | | 1.48 | | | | 1.48 | | | | 1.48 | |
Net investment income | | | 4.46 | | | | 5.22 | | | | 5.16 | | | | 5.13 | | | | 4.90 | |
Portfolio turnover | | | 49 | | | | 53 | | | | 45 | | | | 55 | | | | 66 | |
Net assets at end of period (000 omitted) | | | $39,468 | | | | $39,976 | | | | $38,838 | | | | $60,044 | | | | $77,822 | |
| | | | | | | | | | | | | | | | | | | | |
| Class C | | Years ended 10/31 | |
| | | 2010 | | | 2009 | | | 2008 | | | 2007 | | | 2006 | |
Net asset value, beginning of period | | | $6.22 | | | | $5.35 | | | | $6.56 | | | | $6.60 | | | | $6.56 | |
| Income (loss) from investment operations | | | | | | | | | | | | | | | | | |
Net investment income (d) | | | $0.28 | | | | $0.29 | | | | $0.33 | | | | $0.34 | | | | $0.32 | |
Net realized and unrealized gain (loss)
on investments and foreign currency | | | 0.44 | | | | 0.97 | | | | (1.19 | ) | | | (0.04 | ) | | | 0.07 | |
Total from investment operations | | | $0.72 | | | | $1.26 | | | | $(0.86 | ) | | | $0.30 | | | | $0.39 | |
| Less distributions declared to shareholders | | | | | | | | | | | | | | | | | |
From net investment income | | | $(0.30 | ) | | | $(0.39 | ) | | | $(0.35 | ) | | | $(0.34 | ) | | | $(0.35 | ) |
Net asset value, end of period | | | $6.64 | | | | $6.22 | | | | $5.35 | | | | $6.56 | | | | $6.60 | |
Total return (%) (r)(s)(t) | | | 11.82 | | | | 24.74 | | | | (13.79 | ) | | | 4.56 | | | | 6.07 | |
Ratios (%) (to average net assets)
and Supplemental data: | | | | | | | | | | | | | | | | | |
Expenses before expense reductions (f) | | | 1.94 | | | | 2.01 | | | | 1.95 | | | | 1.94 | | | | 1.98 | |
Expenses after expense reductions (f) | | | 1.77 | | | | 1.64 | | | | 1.48 | | | | 1.48 | | | | 1.48 | |
Net investment income | | | 4.47 | | | | 5.19 | | | | 5.19 | | | | 5.14 | | | | 4.90 | |
Portfolio turnover | | | 49 | | | | 53 | | | | 45 | | | | 55 | | | | 66 | |
Net assets at end of period (000 omitted) | | | $46,789 | | | | $37,931 | | | | $23,491 | | | | $30,385 | | | | $29,892 | |
See Notes to Financial Statements
39
Financial Statements – continued
| | | | | | | | | | | | | | | | | | | | |
| Class I | | Years ended 10/31 | |
| | | 2010 | | | 2009 | | | 2008 | | | 2007 | | | 2006 | |
Net asset value, beginning of period | | | $6.30 | | | | $5.43 | | | | $6.66 | | | | $6.71 | | | | $6.67 | |
| Income (loss) from investment operations | | | | | | | | | | | | | | | | | | | | |
Net investment income (d) | | | $0.35 | | | | $0.35 | | | | $0.39 | | | | $0.42 | | | | $0.39 | |
Net realized and unrealized gain (loss)
on investments and foreign currency | | | 0.43 | | | | 0.97 | | | | (1.20 | ) | | | (0.06 | ) | | | 0.07 | |
Total from investment operations | | | $0.78 | | | | $1.32 | | | | $(0.81 | ) | | | $0.36 | | | | $0.46 | |
| Less distributions declared to shareholders | | | | | | | | | | | | | | | | | | | | |
From net investment income | | | $(0.36 | ) | | | $(0.45 | ) | | | $(0.42 | ) | | | $(0.41 | ) | | | $(0.42 | ) |
Net asset value, end of period | | | $6.72 | | | | $6.30 | | | | $5.43 | | | | $6.66 | | | | $6.71 | |
Total return (%) (r)(s) | | | 12.84 | | | | 25.71 | | | | (12.93 | ) | | | 5.46 | | | | 7.11 | |
Ratios (%) (to average net assets)
and Supplemental data: | | | | | | | | | | | | | | | | | | | | |
Expenses before expense reductions (f) | | | 0.93 | | | | 1.00 | | | | 0.93 | | | | 0.95 | | | | 0.98 | |
Expenses after expense reductions (f) | | | 0.77 | | | | 0.64 | | | | 0.48 | | | | 0.48 | | | | 0.48 | |
Net investment income | | | 5.36 | | | | 6.10 | | | | 6.10 | | | | 6.08 | | | | 5.89 | |
Portfolio turnover | | | 49 | | | | 53 | | | | 45 | | | | 55 | | | | 66 | |
Net assets at end of period (000 omitted) | | | $4,823 | | | | $2,939 | | | | $1,679 | | | | $2,458 | | | | $14,437 | |
| (d) | Per share data is based on average shares outstanding. |
| (f) | Ratios do not reflect reductions from fees paid indirectly, if applicable. |
| (r) | Certain expenses have been reduced without which performance would have been lower. |
| (s) | From time to time the fund may receive proceeds from litigation settlements, without which performance would be lower. |
| (t) | Total returns do not include any applicable sales charges. |
See Notes to Financial Statements
40
NOTES TO FINANCIAL STATEMENTS
| (1) | | Business and Organization |
MFS Strategic Income Fund (the fund) is a series of MFS Series Trust VIII (the trust). The trust is organized as a Massachusetts business trust and is registered under the Investment Company Act of 1940, as amended, as an open-end management investment company.
| (2) | | Significant Accounting Policies |
General – The preparation of financial statements in conformity with U.S. generally accepted accounting principles requires management to make estimates and assumptions that affect the reported amounts of assets and liabilities, and disclosure of contingent assets and liabilities at the date of the financial statements and the reported amounts of revenues and expenses during the reporting period. Actual results could differ from those estimates. In the preparation of these financial statements, management has evaluated subsequent events occurring after the date of the fund’s Statement of Assets and Liabilities through the date that the financial statements were issued. The fund may invest up to 100% of its portfolio in high-yield securities rated below investment grade. Investments in high-yield securities involve greater degrees of credit and market risk than investments in higher-rated securities and tend to be more sensitive to economic conditions. The fund can invest in foreign securities, including securities of emerging market issuers. Investments in foreign securities are vulnerable to the effects of changes in the relative values of the local currency and the U.S. dollar and to the effects of changes in each country’s legal, political, and economic environment. The markets of emerging markets countries are generally more volatile than the markets of developed countries with more mature economies. All of the risks of investing in foreign securities previously described are heightened when investing in emerging markets countries.
Investment Valuations – Debt instruments and floating rate loans (other than short-term instruments), including restricted debt instruments, are generally valued at an evaluated or composite bid as provided by a third-party pricing service. Equity securities, including restricted equity securities, are generally valued at the last sale or official closing price as provided by a third-party pricing service on the market or exchange on which they are primarily traded. Equity securities, for which there were no sales reported that day, are generally valued at the last quoted daily bid quotation as provided by a third-party pricing service on the market or exchange on which such securities are primarily traded. Equity securities held short, for which there were no sales reported for that day, are generally valued at the last quoted daily ask quotation as provided by a third-party pricing service on the market or
41
Notes to Financial Statements – continued
exchange on which such securities are primarily traded. Short-term instruments with a maturity at issuance of 60 days or less generally are valued at amortized cost, which approximates market value. Exchange-traded options are generally valued at the last sale or official closing price as provided by a third-party pricing service on the exchange on which such options are primarily traded. Exchange-traded options for which there were no sales reported that day are generally valued at the last daily bid quotation as provided by a third-party pricing service on the exchange on which such options are primarily traded. Options not traded on an exchange are generally valued at a broker/dealer bid quotation. Foreign currency options are generally valued at valuations provided by a third-party pricing service. Futures contracts are generally valued at last posted settlement price as provided by a third-party pricing service on the market on which they are primarily traded. Futures contracts for which there were no trades that day for a particular position are generally valued at the closing bid quotation as provided by a third-party pricing service on the market on which such futures contracts are primarily traded. Forward foreign currency contracts are generally valued at the mean of bid and asked prices for the time period interpolated from rates provided by a third-party pricing service for proximate time periods. Swaps are generally valued at valuations provided by a third-party pricing service. Open-end investment companies are generally valued at net asset value per share. Securities and other assets generally valued on the basis of information from a third-party pricing service may also be valued at a broker/dealer bid quotation. Values obtained from third-party pricing services can utilize both transaction data and market information such as yield, quality, coupon rate, maturity, type of issue, trading characteristics, and other market data. The values of foreign securities and other assets and liabilities expressed in foreign currencies are converted to U.S. dollars using the mean of bid and asked prices for rates provided by a third-party pricing service.
The Board of Trustees has delegated primary responsibility for determining or causing to be determined the value of the fund’s investments (including any fair valuation) to the adviser pursuant to valuation policies and procedures approved by the Board. If the adviser determines that reliable market quotations are not readily available, investments are valued at fair value as determined in good faith by the adviser in accordance with such procedures under the oversight of the Board of Trustees. Under the fund’s valuation policies and procedures, market quotations are not considered to be readily available for most types of debt instruments and floating rate loans and many types of derivatives. These investments are generally valued at fair value based on information from third-party pricing services. In addition, investments may be valued at fair value if the adviser determines that an investment’s value has been materially affected by events occurring after the close of the exchange or
42
Notes to Financial Statements – continued
market on which the investment is principally traded (such as foreign exchange or market) and prior to the determination of the fund’s net asset value, or after the halting of trading of a specific security where trading does not resume prior to the close of the exchange or market on which the security is principally traded. The adviser generally relies on third-party pricing services or other information (such as the correlation with price movements of similar securities in the same or other markets; the type, cost and investment characteristics of the security; the business and financial condition of the issuer; and trading and other market data) to assist in determining whether to fair value and at what value to fair value an investment. The value of an investment for purposes of calculating the fund’s net asset value can differ depending on the source and method used to determine value. When fair valuation is used, the value of an investment used to determine the fund’s net asset value may differ from quoted or published prices for the same investment. There can be no assurance that the fund could obtain the fair value assigned to an investment if it were to sell the investment at the same time at which the fund determines its net asset value per share.
Various inputs are used in determining the value of the fund’s assets or liabilities. These inputs are categorized into three broad levels. In certain cases, the inputs used to measure fair value may fall into different levels of the fair value hierarchy. In such cases, an investment’s level within the fair value hierarchy is based on the lowest level of input that is significant to the fair value measurement. The fund’s assessment of the significance of a particular input to the fair value measurement in its entirety requires judgment, and considers factors specific to the investment. Level 1 includes unadjusted quoted prices in active markets for identical assets or liabilities. Level 2 includes other significant observable market-based inputs (including quoted prices for similar securities, interest rates, prepayment speed, and credit risk). Level 3 includes unobservable inputs, which may include the adviser’s own assumptions in determining the fair value of investments. Other financial instruments are derivative instruments not reflected in total investments, such
43
Notes to Financial Statements – continued
as futures, forwards, swap contracts, and written options. The following is a summary of the levels used as of October 31, 2010 in valuing the fund’s assets or liabilities:
| | | | | | | | | | | | | | | | |
| Investments at Value | | Level 1 | | | Level 2 | | | Level 3 | | | Total | |
| Equity Securities | | | $111,354 | | | | $404,182 | | | | $29,171 | | | | $544,707 | |
| Non-U.S. Sovereign Debt | | | — | | | | 61,198,754 | | | | — | | | | 61,198,754 | |
| Corporate Bonds | | | — | | | | 167,538,856 | | | | — | | | | 167,538,856 | |
| Residential Mortgage-Backed Securities | | | — | | | | 5,512,447 | | | | — | | | | 5,512,447 | |
| Commercial Mortgage-Backed Securities | | | — | | | | 7,483,968 | | | | — | | | | 7,483,968 | |
Asset-Backed Securities
(including CDOs) | | | — | | | | 4,048,748 | | | | — | | | | 4,048,748 | |
| Foreign Bonds | | | — | | | | 56,211,408 | | | | — | | | | 56,211,408 | |
| Floating Rate Loans | | | — | | | | 1,530,971 | | | | — | | | | 1,530,971 | |
| Mutual Funds | | | 3,146,433 | | | | — | | | | — | | | | 3,146,433 | |
| Total Investments | | | $3,257,787 | | | | $303,929,334 | | | | $29,171 | | | | $307,216,292 | |
| | | | |
| Other Financial Instruments | | | | | | | | | | | | |
| Futures | | | $54,907 | | | | $— | | | | $— | | | | $54,907 | |
| Swaps | | | — | | | | 22,750 | | | | — | | | | 22,750 | |
| Forward Currency Contracts | | | — | | | | (1,181,741 | ) | | | — | | | | (1,181,741 | ) |
For further information regarding security characteristics, see the Portfolio of Investments.
The following is a reconciliation of Level 3 assets for which significant unobservable inputs were used to determine fair value. The table presents the activity of Level 3 securities held at the beginning and the end of the period.
| | | | |
| | | Equity Securities | |
| Balance as of 10/31/09 | | | $6,387 | |
Accrued discounts/premiums | | | — | |
Realized gain (loss) | | | — | |
Change in unrealized appreciation (depreciation) | | | 22,784 | |
Net purchases (sales) | | | — | |
Transfers in and/or out of Level 3 | | | — | |
| Balance as of 10/31/10 | | | $29,171 | |
The net change in unrealized appreciation (depreciation) from investments still held as Level 3 at October 31, 2010 is $22,784.
Foreign Currency Translation – Purchases and sales of foreign investments, income, and expenses are converted into U.S. dollars based upon currency exchange rates prevailing on the respective dates of such transactions or on the reporting date for foreign denominated receivables and payables. Gains and losses attributable to foreign currency exchange rates on sales of securities are
44
Notes to Financial Statements – continued
recorded for financial statement purposes as net realized gains and losses on investments. Gains and losses attributable to foreign exchange rate movements on receivables, payables, income and expenses are recorded for financial statement purposes as foreign currency transaction gains and losses. That portion of both realized and unrealized gains and losses on investments that results from fluctuations in foreign currency exchange rates is not separately disclosed.
Derivatives – The fund may use derivatives for different purposes, including to earn income and enhance returns, to increase or decrease exposure to a particular market, to manage or adjust the risk profile of the fund, or as alternatives to direct investments. Derivatives may be used for hedging or non-hedging purposes. While hedging can reduce or eliminate losses, it can also reduce or eliminate gains. When the fund uses derivatives as an investment to increase market exposure, or for hedging purposes, gains and losses from derivative instruments may be substantially greater than the derivative’s original cost.
Derivative instruments include written options, purchased options, futures contracts, forward foreign currency exchange contracts, and swap agreements. The fund’s period end derivatives, as presented in the Portfolio of Investments and the associated Derivative Contract Tables, generally are indicative of the volume of its derivative activity during the period.
The following table presents, by major type of derivative contract, the fair value, on a gross basis, of the asset and liability components of derivatives held by the fund at October 31, 2010 as reported in the Statement of Assets and Liabilities:
| | | | | | | | | | |
| | | | | Fair Value (a) | |
| Risk | | Derivative | | Asset Derivatives | | | Liability Derivatives | |
| Interest Rate Contracts | | Interest Rate Futures | | | $54,907 | | | | $— | |
| Foreign Exchange Contracts | | Foreign Exchange Contracts | | | 7,444 | | | | (1,189,185 | ) |
| Credit Contracts | | Credit Default Swaps | | | 22,750 | | | | — | |
| Total | | | | | $85,101 | | | | $(1,189,185) | |
| (a) | The value of futures contracts outstanding includes cumulative appreciation (depreciation) as reported in the fund’s Portfolio of Investments. Only the current day variation margin for futures contracts is separately reported within the fund’s Statement of Assets and Liabilities. |
45
Notes to Financial Statements – continued
The following table presents, by major type of derivative contract, the realized gain (loss) on derivatives held by the fund for the year ended October 31, 2010 as reported in the Statement of Operations:
| | | | | | | | | | | | | | | | |
| Risk | | Futures
Contracts | | | Swap
Transactions | | | Foreign
Currency
Transactions | | | Investment
Transactions
(Purchased
Options) | |
| Interest Rate Contracts | | | $137,320 | | | | $— | | | | $— | | | | $— | |
| Foreign Exchange Contracts | | | | | | | — | | | | 1,997,749 | | | | (8,198 | ) |
| Credit Contracts | | | — | | | | (1,948 | ) | | | — | | | | — | |
| Total | | | $137,320 | | | | $(1,948 | ) | | | $1,997,749 | | | | $(8,198 | ) |
The following table presents, by major type of derivative contract, the change in unrealized appreciation (depreciation) on derivatives held by the fund for the year ended October 31, 2010 as reported in the Statement of Operations:
| | | | | | | | | | | | | | | | |
| Risk | | Futures
Contracts | | | Swap
Transactions | | | Translation
of Assets and
Liabilities in
Foreign
Currencies | | | Investments
(Purchased
Options) | |
| Interest Rate Contracts | | | $(22,500 | ) | | | $— | | | | $— | | | | $— | |
| Foreign Exchange Contracts | | | — | | | | — | | | | (1,086,418 | ) | | | 3,151 | |
| Credit Contracts | | | — | | | | (4,333 | ) | | | — | | | | — | |
| Total | | | $(22,500 | ) | | | $(4,333 | ) | | | $(1,086,418 | ) | | | $3,151 | |
Derivative counterparty credit risk is managed through formal evaluation of the creditworthiness of all potential counterparties. On certain over-the-counter derivatives, the fund attempts to reduce its exposure to counterparty credit risk whenever possible by entering into an International Swaps and Derivatives Association (ISDA) Master Agreement on a bilateral basis with each of the counterparties with whom it undertakes a significant volume of transactions. The ISDA Master Agreement gives each party to the agreement the right to terminate all transactions traded under such agreement if there is a certain deterioration in the credit quality of the other party. The ISDA Master Agreement gives the fund the right, upon an event of default by the applicable counterparty or a termination of the agreement, to close out all transactions traded under such agreement and to net amounts owed under each transaction to one net amount payable by one party to the other. This right to close out and net payments across all transactions traded under the ISDA Master Agreement could result in a reduction of the fund’s credit risk to such counterparty equal to any amounts payable by the fund under the applicable transactions, if any. However, absent an event of default by the counterparty or a termination of the agreement, the ISDA Master Agreement does not result in an offset of reported balance sheet assets and liabilities across transactions between the fund and the applicable counterparty.
46
Notes to Financial Statements – continued
Collateral requirements differ by type of derivative. Collateral or margin requirements are set by the broker or exchange clearing house for exchange traded derivatives (i.e., futures and exchange-traded options) while collateral terms are contract specific for over-the-counter traded derivatives (i.e., forwards, swaps and over-the-counter options). For derivatives traded under an ISDA Master Agreement, the collateral requirements are netted across all transactions traded under such agreement and one amount is posted from one party to the other to collateralize such obligations. Cash collateral that has been pledged to cover obligations of the fund under derivative contracts will be reported separately on the Statement of Assets and Liabilities as restricted cash. Securities collateral pledged for the same purpose is noted in the Portfolio of Investments.
Purchased Options – The fund purchased call options for a premium. Purchased call options entitle the holder to buy a specified number of shares or units of a particular security, currency or index at a specified price at a specified date or within a specified period of time. Purchasing call options may be used to hedge against an anticipated increase in the dollar cost of securities or currency to be acquired or to increase the fund’s exposure to an underlying instrument.
The premium paid is initially recorded as an investment in the Statement of Assets and Liabilities. That investment is subsequently marked-to-market daily with the difference between the premium paid and the market value of the purchased option being recorded as unrealized appreciation or depreciation. Premiums paid for purchased call options which have expired are treated as realized losses on investments in the Statement of Operations. Upon the exercise or closing of a purchased call option, the premium paid is added to the cost of the security or financial instrument.
The risk in purchasing an option is that the fund pays a premium whether or not the option is exercised. The fund’s maximum risk of loss due to counterparty credit risk is limited to the market value of the option. For over-the-counter options, this risk is mitigated in cases where there is an ISDA Master Agreement between the fund and the counterparty providing for netting as described above and for posting of collateral by the counterparty to the fund to cover the fund’s exposure to the counterparty under such ISDA Master Agreement.
Futures Contracts – The fund entered into futures contracts which may be used to gain or to hedge against broad market, interest rate or currency exposure. A futures contract represents a commitment for the future purchase or sale of an asset at a specified price on a specified date.
Upon entering into a futures contract, the fund is required to deposit with the broker, either in cash or securities, an initial margin in an amount equal to a
47
Notes to Financial Statements – continued
certain percentage of the notional amount of the contract. Subsequent payments (variation margin) are made or received by the fund each day, depending on the daily fluctuations in the value of the contract, and are recorded for financial statement purposes as unrealized gain or loss by the fund until the contract is closed or expires at which point the gain or loss on futures is realized.
The fund bears the risk of interest rates, exchange rates or securities prices moving unexpectedly, in which case, the fund may not achieve the anticipated benefits of the futures contracts and may realize a loss. While futures may present less counterparty risk to the fund since the contracts are exchange traded and the exchange’s clearinghouse guarantees payments to the broker, there is still counterparty credit risk due to the insolvency of the broker. The fund’s maximum risk of loss due to counterparty credit risk is equal to the margin posted by the fund to the broker plus any gains or minus any losses on the outstanding futures contracts.
Forward Foreign Currency Exchange Contracts – The fund entered into forward foreign currency exchange contracts for the purchase or sale of a specific foreign currency at a fixed price on a future date. These contracts may be used to hedge the fund’s currency risk or for non-hedging purposes. For hedging purposes, the fund may enter into contracts to deliver or receive foreign currency that the fund will receive from or use in its normal investment activities. The fund may also use contracts to hedge against declines in the value of foreign currency denominated securities due to unfavorable exchange rate movements. For non-hedging purposes, the fund may enter into contracts with the intent of changing the relative exposure of the fund’s portfolio of securities to different currencies to take advantage of anticipated exchange rate changes.
Forward foreign currency exchange contracts are adjusted by the daily exchange rate of the underlying currency and any unrealized gains or losses are recorded as a receivable or payable for forward foreign currency exchange contracts until the contract settlement date. On contract settlement date, any gain or loss on the contract is recorded as realized gains or losses on foreign currency transactions.
Risks may arise upon entering into these contracts from unanticipated movements in the value of the contract and from the potential inability of counterparties to meet the terms of their contracts. Generally, the fund’s maximum risk due to counterparty credit risk is the unrealized gain on of the contract due to our use of continuous linked settlement, an industry accepted settlement system. This risk is mitigated in cases where there is an ISDA Master Agreement between the fund and the counterparty providing for netting as described above and for posting of collateral by the counterparty to the fund to cover the fund’s exposure to the counterparty under such ISDA Master Agreement.
48
Notes to Financial Statements – continued
Swap Agreements – The fund entered into swap agreements. A swap is generally an exchange of cash payments, at specified intervals or upon the occurrence of specified events, between the fund and a counterparty. The net cash payments exchanged are recorded as a realized gain or loss on swap transactions in the Statement of Operations. The value of the swap, which is adjusted daily and includes any related interest accruals to be paid or received by the fund, is recorded on the Statement of Assets and Liabilities. The daily change in value, including any related interest accruals to be paid or received, is recorded as unrealized appreciation or depreciation on swap transactions in the Statement of Operations. Amounts paid or received at the inception of the swap are reflected as premiums paid or received on the Statement of Assets and Liabilities and are amortized using the effective interest method over the term of the agreement. A liquidation payment received or made upon early termination is recorded as a realized gain or loss on swap transactions in the Statement of Operations.
Risks related to swap agreements include the possible lack of a liquid market, unfavorable market and interest rate movements of the underlying instrument and the failure of the counterparty to perform under the terms of the agreements. To address counterparty risk, swap transactions are limited to only highly-rated counterparties. The risk is further mitigated by having an ISDA Master Agreement between the fund and the counterparty providing for netting as described above and by the posting of collateral by the counterparty to the fund to cover the fund’s exposure to the counterparty under such ISDA Master Agreement.
The fund entered into credit default swaps in order to manage its exposure to the market or certain sectors of the market, to reduce its credit risk exposure to defaults of corporate and sovereign issuers or to create exposure to corporate or sovereign issuers to which it is not otherwise exposed. In a credit default swap, the protection buyer can make an upfront payment and will make a stream of payments based on a fixed percentage applied to the contract notional amount to the protection seller in exchange for the right to receive a specified return upon the occurrence of a defined credit event on the reference obligation (which may be either a single security or a basket of securities issued by corporate or sovereign issuers) and, with respect to the rare cases where physical settlement applies, the delivery by the buyer to the seller of a defined deliverable obligation. Although contract-specific, credit events generally consist of a combination of the following: bankruptcy, failure to pay, restructuring, obligation acceleration, obligation default, or repudiation/moratorium, each as defined in the 2003 ISDA Credit Derivatives Definitions as amended by the relevant contract. Restructuring is generally not applicable when the reference obligation is issued by a North American corporation and
49
Notes to Financial Statements – continued
obligation acceleration, obligation default, or repudiation/moratorium are generally only applicable when the reference obligation is issued by a sovereign entity or an entity in an emerging country. Upon determination of the final price for the deliverable obligation (or upon delivery of the deliverable obligation in the case of physical settlement), the difference between the value of the deliverable obligation and the swap’s notional amount is recorded as realized gain or loss on swap transactions in the Statement of Operations.
Credit default swaps are considered to have credit-risk-related contingent features since they trigger payment by the protection seller to the protection buyer upon the occurrence of a defined credit event. The aggregate fair value of credit default swaps in a net liability position, if any, as of October 31, 2010 is disclosed in the footnotes to the Portfolio of Investments. As discussed earlier in this note, any collateral requirements for these swaps are based generally on the market value of the swap netted against collateral requirements for other types of over-the-counter derivatives traded under each counterparty’s ISDA Master Agreement. The maximum amount of future, undiscounted payments that the fund, as protection seller, could be required to make is equal to the swap’s notional amount. The protection seller’s payment obligation would be offset to the extent of the value of the contract’s deliverable obligation. At October 31, 2010, the fund did not hold any credit default swaps at an unrealized loss where it is the protection seller.
The fund’s maximum risk of loss from counterparty risk, either as the protection seller or as the protection buyer, is the fair value of the contract. This risk is mitigated by having an ISDA Master Agreement between the fund and the counterparty providing for netting as described above and by the posting of collateral by the counterparty to the fund to cover the fund’s exposure to the counterparty under such ISDA Master Agreement.
Loans and Other Direct Debt Instruments – The fund invests in loans and loan participations or other receivables. These investments may include standby financing commitments, including revolving credit facilities, which obligate the fund to supply additional cash to the borrower on demand. Loan participations involve a risk of insolvency of the lending bank or other financial intermediary.
Indemnifications – Under the fund’s organizational documents, its officers and Trustees may be indemnified against certain liabilities and expenses arising out of the performance of their duties to the fund. Additionally, in the normal course of business, the fund enters into agreements with service providers that may contain indemnification clauses. The fund’s maximum exposure under these agreements is unknown as this would involve future claims that may be made against the fund that have not yet occurred.
50
Notes to Financial Statements – continued
Investment Transactions and Income – Investment transactions are recorded on the trade date. Interest income is recorded on the accrual basis. All premium and discount is amortized or accreted for financial statement purposes in accordance with U.S. generally accepted accounting principles. The fund earns certain fees in connection with its floating rate loan purchasing activities. These fees are in addition to interest payments earned and may include amendment fees, commitment fees, facility fees, consent fees, and prepayment fees. Commitment fees are recorded on an accrual basis as income in the accompanying financial statements. Dividends received in cash are recorded on the ex-dividend date. Certain dividends from foreign securities will be recorded when the fund is informed of the dividend if such information is obtained subsequent to the ex-dividend date. Dividend and interest payments received in additional securities are recorded on the ex-dividend or ex-interest date in an amount equal to the value of the security on such date. Debt obligations may be placed on non-accrual status or set to accrue at a rate of interest less than the contractual coupon when the collection of all or a portion of interest has become doubtful. Interest income for those debt obligations may be further reduced by the write-off of the related interest receivables when deemed uncollectible.
The fund may receive proceeds from litigation settlements. Any proceeds received from litigation involving portfolio holdings are reflected in the Statement of Operations in realized gain/loss if the security has been disposed of by the fund or in unrealized gain/loss if the security is still held by the fund. Any other proceeds from litigation not related to portfolio holdings are reflected as other income in the Statement of Operations.
Fees Paid Indirectly – The fund’s custody fee may be reduced according to an arrangement that measures the value of cash deposited with the custodian by the fund. This amount, for the year ended October 31, 2010, is shown as a reduction of total expenses on the Statement of Operations.
Tax Matters and Distributions – The fund intends to qualify as a regulated investment company, as defined under Subchapter M of the Internal Revenue Code, and to distribute all of its taxable income, including realized capital gains. As a result, no provision for federal income tax is required. The fund’s federal tax returns for the prior three fiscal years remain subject to examination by the Internal Revenue Service. Foreign taxes, if any, have been accrued by the fund in the accompanying financial statements.
Distributions to shareholders are recorded on the ex-dividend date. Income and capital gain distributions are determined in accordance with income tax regulations, which may differ from U.S. generally accepted accounting principles. Certain capital accounts in the financial statements are periodically adjusted for permanent differences in order to reflect their tax character. These
51
Notes to Financial Statements – continued
adjustments have no impact on net assets or net asset value per share. Temporary differences which arise from recognizing certain items of income, expense, gain or loss in different periods for financial statement and tax purposes will reverse at some time in the future. Distributions in excess of net investment income or net realized gains are temporary overdistributions for financial statement purposes resulting from differences in the recognition or classification of income or distributions for financial statement and tax purposes.
Book/tax differences primarily relate to expiration of capital loss carryforwards, amortization and accretion of debt securities, straddle loss deferrals, and derivative transactions.
The tax character of distributions declared to shareholders for the last two fiscal years is as follows:
| | | | | | | | |
| | | 10/31/10 | | | 10/31/09 | |
| Ordinary income (including any short-term capital gains) | | | $14,890,727 | | | | $16,971,763 | |
The federal tax cost and the tax basis components of distributable earnings were as follows:
| | | | |
| As of 10/31/10 | | | |
| Cost of investments | | | $289,583,976 | |
| Gross appreciation | | | 24,507,982 | |
| Gross depreciation | | | (6,875,666 | ) |
| Net unrealized appreciation (depreciation) | | | $17,632,316 | |
| Undistributed ordinary income | | | 2,139,252 | |
| Capital loss carryforwards | | | (16,572,294 | ) |
| Other temporary differences | | | (3,666,848 | ) |
As of October 31, 2010, the fund had capital loss carryforwards available to offset future realized gains. Such losses expire as follows:
| | | | |
| 10/31/14 | | | $(3,352,139 | ) |
| 10/31/16 | | | (6,482,036 | ) |
| 10/31/17 | | | (6,738,119 | ) |
| | | $(16,572,294 | ) |
Multiple Classes of Shares of Beneficial Interest – The fund offers multiple classes of shares, which differ in their respective distribution and service fees. The fund’s income and common expenses are allocated to shareholders based on the value of settled shares outstanding of each class. The fund’s realized and unrealized gain (loss) are allocated to shareholders based on the daily net assets of each class. Dividends are declared separately for each class. Differences in per share dividend rates are generally due to differences in separate class expenses. Class B shares will convert to Class A shares approximately eight
52
Notes to Financial Statements – continued
years after purchase. The fund’s distributions declared to shareholders as reported on the Statements of Changes in Net Assets are presented by class as follows:
| | | | | | | | |
| | | From net investment
income | |
| | | Year ended
10/31/10 | | | Year ended
10/31/09 | |
| Class A | | | $10,912,847 | | | | $12,207,575 | |
| Class B | | | 1,843,592 | | | | 2,716,432 | |
| Class C | | | 1,941,557 | | | | 1,890,447 | |
| Class I | | | 192,731 | | | | 157,309 | |
| Total | | | $14,890,727 | | | | $16,971,763 | |
| (3) | | Transactions with Affiliates |
Investment Adviser – The fund has an investment advisory agreement with MFS to provide overall investment management and related administrative services and facilities to the fund. The management fee is computed daily and paid monthly at an annual rate of 0.65% of the fund’s average daily net assets.
The investment adviser has agreed in writing to reduce its management fee to 0.60% of average daily net assets. This written agreement will continue until modified by the fund’s Board of Trustees, but such agreement will continue at least until February 29, 2012. For the year ended October 31, 2010, this waiver amounted to $143,370 and is reflected as a reduction of total expenses in the Statement of Operations. The management fee incurred for the year ended October 31, 2010 was equivalent to an annual effective rate of 0.60% of the fund’s average daily net assets.
Prior to March 1, 2010, the investment adviser had agreed in writing to pay a portion of the fund’s total annual operating expenses, exclusive of interest, taxes, extraordinary expenses, brokerage and transaction costs, and investment-related expenses, such that total annual fund operating expenses did not exceed the following rates annually of the fund’s average daily net assets:
| | | | | | | | | | | | |
| Class A | | Class B | | | Class C | | | Class I | |
| 0.95% | | | 1.70% | | | | 1.70% | | | | 0.70% | |
This written agreement terminated on February 28, 2010. For the period November 1, 2009 through February 28, 2010, this reduction amounted to $151,452 and is reflected as a reduction of total expenses in the Statement of Operations.
Effective March 1, 2010, the investment adviser has agreed in writing to pay a portion of the fund’s total annual operating expenses, exclusive of interest, taxes, extraordinary expenses, brokerage and transaction costs and
53
Notes to Financial Statements – continued
investment-related expenses, such that total annual fund operating expenses do not exceed the following rates annually of the fund’s average daily net assets:
| | | | | | | | | | | | |
| Class A | | Class B | | | Class C | | | Class I | |
| 1.05% | | | 1.80% | | | | 1.80% | | | | 0.80% | |
This written agreement will continue until modified by the fund’s Board of Trustees, but such agreement will continue at least until February 29, 2012. For the period March 1, 2010 through October 31, 2010 this reduction amounted to $171,114 and is reflected as a reduction of total expenses in the Statement of Operations.
Distributor – MFS Fund Distributors, Inc. (MFD), a wholly-owned subsidiary of MFS, as distributor, received $66,731 for the year ended October 31, 2010, as its portion of the initial sales charge on sales of Class A shares of the fund.
The Board of Trustees has adopted a distribution plan for certain class shares pursuant to Rule 12b-1 of the Investment Company Act of 1940.
The fund’s distribution plan provides that the fund will pay MFD for services provided by MFD and financial intermediaries in connection with the distribution and servicing of certain share classes. One component of the plan is a distribution fee paid to MFD and another component of the plan is a service fee paid to MFD. MFD may subsequently pay all, or a portion, of the distribution and/or service fees to financial intermediaries.
Distribution Plan Fee Table:
| | | | | | | | | | | | | | | | | | | | |
| | | Distribution
Fee Rate (d) | | | Service
Fee Rate (d) | | | Total
Distribution
Plan (d) | | | Annual
Effective
Rate (e) | | | Distribution
and Service
Fee | |
| Class A | | | — | | | | 0.25% | | | | 0.25% | | | | 0.25% | | | | $505,052 | |
| Class B | | | 0.75% | | | | 0.25% | | | | 1.00% | | | | 1.00% | | | | 395,381 | |
| Class C | | | 0.75% | | | | 0.25% | | | | 1.00% | | | | 1.00% | | | | 417,464 | |
| Total Distribution and Service Fees | | | | | | | | | | | | $1,317,897 | |
| (d) | In accordance with the distribution plan for certain classes, the fund pays distribution and/or service fees equal to these annual percentage rates of each class’ average daily net assets. The distribution and service fee rates disclosed by class represent the current rates in effect at the end of the reporting period. Any rate changes, if applicable, are detailed below. |
| (e) | The annual effective rates represent actual fees incurred under the distribution plan for the year ended October 31, 2010 based on each class’ average daily net assets. Assets attributable to Class A shares sold prior to May 14, 1991 are subject to a service fee of 0.15% annually. This agreement terminates on January 1, 2011. |
Certain Class A shares are subject to a contingent deferred sales charge (CDSC) in the event of a shareholder redemption within 24 months of purchase. Class C shares are subject to a CDSC in the event of a shareholder redemption within 12 months of purchase. Class B shares are subject to a CDSC in the event of a shareholder redemption within six years of purchase. All contingent
54
Notes to Financial Statements – continued
deferred sales charges are paid to MFD and during the year ended October 31, 2010, were as follows:
| | | | |
| | | Amount | |
| Class A | | | $49 | |
| Class B | | | 36,029 | |
| Class C | | | 4,676 | |
Shareholder Servicing Agent – MFS Service Center, Inc. (MFSC), a wholly-owned subsidiary of MFS, receives a fee from the fund for its services as shareholder servicing agent calculated as a percentage of the average daily net assets of the fund as determined periodically under the supervision of the fund’s Board of Trustees. For the year ended October 31, 2010, the fee was $219,757, which equated to 0.0766% annually of the fund’s average daily net assets. MFSC also receives payment from the fund for out-of-pocket expenses, sub-accounting and other shareholder servicing costs which may be paid to affiliated and unaffiliated service providers. For the year ended October 31, 2010, these out-of-pocket expenses, sub-accounting and other shareholder servicing costs amounted to $223,978.
Administrator – MFS provides certain financial, legal, shareholder communications, compliance, and other administrative services to the fund. Under an administrative services agreement, the fund partially reimburses MFS the costs incurred to provide these services. The fund is charged an annual fixed amount of $17,500 plus a fee based on average daily net assets . The administrative services fee incurred for the year ended October 31, 2010 was equivalent to an annual effective rate of 0.0176% of the fund’s average daily net assets.
Trustees’ and Officers’ Compensation – The fund pays compensation to independent Trustees in the form of a retainer, attendance fees, and additional compensation to Board and Committee chairpersons. The fund does not pay compensation directly to Trustees or officers of the fund who are also officers of the investment adviser, all of whom receive remuneration for their services to the fund from MFS. Certain officers and Trustees of the fund are officers or directors of MFS, MFD, and MFSC.
Prior to December 31, 2001, the fund had an unfunded defined benefit plan (“DB plan”) for independent Trustees. As of December 31, 2001, the Board took action to terminate the DB plan with respect to then-current and any future independent Trustees, such that the DB Plan covers only certain of those former independent Trustees who retired on or before December 31, 2001. Effective January 1, 2002, accrued benefits under the DB Plan for then-current independent Trustees who continued were credited to an unfunded retirement deferral plan (the “Retirement Deferral plan”), which was established for and exists solely with respect to these credited amounts, and is not available for
55
Notes to Financial Statements – continued
other deferrals by these or other independent Trustees. Although the Retirement Deferral plan is unfunded, amounts deferred under the plan are periodically adjusted for investment experience as if they had been invested in shares of the fund. The DB Plan resulted in a pension expense of $1,760 and the Retirement Deferral plan resulted in an expense of $2,896. Both amounts are included in independent Trustees’ compensation for the year ended October 31, 2010. The liability for deferred retirement benefits payable to certain independent Trustees under both plans amounted to $43,187 at October 31, 2010, and is included in payable for independent Trustees’ compensation on the Statement of Assets and Liabilities.
Other – This fund and certain other funds managed by MFS (the funds) have entered into services agreements (the Agreements) which provide for payment of fees by the funds to Tarantino LLC and Griffin Compliance LLC in return for the provision of services of an Independent Chief Compliance Officer (ICCO) and Assistant ICCO, respectively, for the funds. The ICCO and Assistant ICCO are officers of the funds and the sole members of Tarantino LLC and Griffin Compliance LLC, respectively. The funds can terminate the Agreements with Tarantino LLC and Griffin Compliance LLC at any time under the terms of the Agreements. For the year ended October 31, 2010, the aggregate fees paid by the fund to Tarantino LLC and Griffin Compliance LLC were $2,778 and are included in miscellaneous expense on the Statement of Operations. MFS has agreed to reimburse the fund for a portion of the payments made by the fund in the amount of $1,413, which is shown as a reduction of total expenses in the Statement of Operations. Additionally, MFS has agreed to bear all expenses associated with office space, other administrative support, and supplies provided to the ICCO and Assistant ICCO.
The fund may invest in the MFS Institutional Money Market Portfolio which is managed by MFS and seeks a high level of current income consistent with preservation of capital and liquidity. Income earned on this investment is included in dividends from underlying funds on the Statement of Operations. This money market fund does not pay a management fee to MFS.
Purchases and sales of investments, other than purchased option transactions, and short-term obligations, were as follows:
| | | | | | | | |
| | | Purchases | | | Sales | |
| U.S. Government securities | | | $20,797,879 | | | | $24,844,221 | |
| Investments (non-U.S. Government securities) | | | $139,703,978 | | | | $111,470,937 | |
56
Notes to Financial Statements – continued
| (5) | | Shares of Beneficial Interest |
The fund’s Declaration of Trust permits the Trustees to issue an unlimited number of full and fractional shares of beneficial interest. Transactions in fund shares were as follows:
| | | | | | | | | | | | | | | | |
| | | Year ended
10/31/10 | | | Year ended
10/31/09 | |
| | | Shares | | | Amount | | | Shares | | | Amount | |
| Shares sold | | | | | | | | | | | | | | | | |
Class A | | | 6,776,547 | | | | $43,542,988 | | | | 7,278,579 | | | | $41,244,386 | |
Class B | | | 1,461,804 | | | | 9,325,057 | | | | 2,163,150 | | | | 11,984,005 | |
Class C | | | 1,833,402 | | | | 11,669,423 | | | | 2,714,835 | | | | 15,369,915 | |
Class I | | | 373,594 | | | | 2,438,072 | | | | 157,034 | | | | 936,819 | |
| | | 10,445,347 | | | | $66,975,540 | | | | 12,313,598 | | | | $69,535,125 | |
Shares issued to shareholders in
reinvestment of distributions | | | | | | | | | |
Class A | | | 1,224,323 | | | | $7,903,233 | | | | 1,619,265 | | | | $9,135,421 | |
Class B | | | 186,593 | | | | 1,192,386 | | | | 311,483 | | | | 1,732,051 | |
Class C | | | 196,495 | | | | 1,252,762 | | | | 220,676 | | | | 1,231,959 | |
Class I | | | 23,393 | | | | 151,167 | | | | 26,528 | | | | 149,897 | |
| | | 1,630,804 | | | | $10,499,548 | | | | 2,177,952 | | | | $12,249,328 | |
| Shares reacquired | | | | | | | | | | | | | | | | |
Class A | | | (5,785,189 | ) | | | $(37,277,442 | ) | | | (6,064,667 | ) | | | $(34,061,041 | ) |
Class B | | | (2,126,695 | ) | | | (13,574,117 | ) | | | (3,296,079 | ) | | | (18,229,066 | ) |
Class C | | | (1,079,391 | ) | | | (6,858,191 | ) | | | (1,223,780 | ) | | | (6,778,080 | ) |
Class I | | | (145,550 | ) | | | (945,834 | ) | | | (26,342 | ) | | | (152,442 | ) |
| | | (9,136,825 | ) | | | $(58,655,584 | ) | | | (10,610,868 | ) | | | $(59,220,629 | ) |
| Net change | | | | | | | | | | | | | | | | |
Class A | | | 2,215,681 | | | | $14,168,779 | | | | 2,833,177 | | | | $16,318,766 | |
Class B | | | (478,298 | ) | | | (3,056,674 | ) | | | (821,446 | ) | | | (4,513,010 | ) |
Class C | | | 950,506 | | | | 6,063,994 | | | | 1,711,731 | | | | 9,823,794 | |
Class I | | | 251,437 | | | | 1,643,405 | | | | 157,220 | | | | 934,274 | |
| | | 2,939,326 | | | | $18,819,504 | | | | 3,880,682 | | | | $22,563,824 | |
The fund and certain other funds managed by MFS participate in a $1.1 billion unsecured committed line of credit, subject to a $1 billion sublimit, provided by a syndication of banks under a credit agreement. Borrowings may be made for temporary financing needs. Interest is charged to each fund, based on its borrowings, generally at a rate equal to the higher of the Federal Reserve funds rate or one month LIBOR plus an agreed upon spread. A commitment fee, based on the average daily, unused portion of the committed line of credit, is allocated among the participating funds at the end of each calendar quarter. In addition, the fund and other funds managed by MFS have established
57
Notes to Financial Statements – continued
unsecured uncommitted borrowing arrangements with certain banks for temporary financing needs. Interest is charged to each fund, based on its borrowings, at a rate equal to the Federal Reserve funds rate plus an agreed upon spread. For the year ended October 31, 2010, the fund’s commitment fee and interest expense were $3,392 and $0, respectively, and are included in miscellaneous expense on the Statement of Operations.
| (7) | | Transactions in Underlying Funds-Affiliated Issuers |
An affiliated issuer may be considered one in which the fund owns 5% or more of the outstanding voting securities, or a company which is under common control. For the purposes of this report, the fund assumes the following to be affiliated issuers:
| | | | | | | | | | | | | | | | |
| Underlying Funds | | Beginning
Shares/Par
Amount | | | Acquisitions
Shares/Par
Amount | | | Dispositions
Shares/Par
Amount | | | Ending
Shares/Par
Amount | |
MFS Institutional Money
Market Portfolio | | | 1,778,316 | | | | 85,739,712 | | | | (84,371,595 | ) | | | 3,146,433 | |
| | | | |
| Underlying Funds | | Realized
Gain (Loss) | | | Capital Gain
Distributions | | | Dividend
Income | | | Ending
Value | |
MFS Institutional Money
Market Portfolio | | | $— | | | | $— | | | | $16,486 | | | | $3,146,433 | |
58
REPORT OF INDEPENDENT REGISTERED
PUBLIC ACCOUNTING FIRM
To the Trustees of MFS Series Trust VIII and Shareholders of MFS Strategic Income Fund:
We have audited the accompanying statement of assets and liabilities of MFS Strategic Income Fund (the Fund), (one of the portfolios comprising MFS Series Trust VIII), including the portfolio of investments, as of October 31, 2010, and the related statement of operations for the year then ended, the statements of changes in net assets for each of the two years in the period then ended, and the financial highlights for each of the five years in the period then ended. These financial statements and financial highlights are the responsibility of the Fund’s management. Our responsibility is to express an opinion on these financial statements and financial highlights based on our audits.
We conducted our audits in accordance with the standards of the Public Company Accounting Oversight Board (United States). Those standards require that we plan and perform the audit to obtain reasonable assurance about whether the financial statements and financial highlights are free of material misstatement. We were not engaged to perform an audit of the Fund’s internal control over financial reporting. Our audits included consideration of internal control over financial reporting as a basis for designing audit procedures that are appropriate in the circumstances, but not for the purpose of expressing an opinion on the effectiveness of the Fund’s internal control over financial reporting. Accordingly, we express no such opinion. An audit also includes examining, on a test basis, evidence supporting the amounts and disclosures in the financial statements and financial highlights, assessing the accounting principles used and significant estimates made by management, and evaluating the overall financial statement presentation. Our procedures included confirmation of securities owned as of October 31, 2010, by correspondence with the Fund’s custodian and brokers or by other appropriate auditing procedures where replies from brokers were not received. We believe that our audits provide a reasonable basis for our opinion.
In our opinion, the financial statements and financial highlights referred to above present fairly, in all material respects, the financial position of MFS Strategic Income Fund at October 31, 2010, the results of its operations for the year then ended, the changes in its net assets for each of the two years in the period then ended, and its financial highlights for each of the five years in the period then ended, in conformity with U.S. generally accepted accounting principles.

Boston, Massachusetts
December 16, 2010
59
TRUSTEES AND OFFICERS — IDENTIFICATION AND BACKGROUND
The Trustees and officers of the Trust, as of December 1, 2010, are listed below, together with their principal occupations during the past five years. (Their titles may have varied during that period.) The address of each Trustee and officer is 500 Boylston Street, Boston, Massachusetts 02116.
| | | | | | |
Name, Date of Birth | | Position(s) Held
with Fund | | Trustee/Officer
Since (h) | | Principal Occupations During
the Past Five Years & Other
Directorships (j) |
| INTERESTED TRUSTEES | | | | |
| Robert J. Manning (k) (born 10/20/63) | | Trustee | | February 2004 | | Massachusetts Financial Services Company, Chairman, Chief Executive Officer and Director; President (until December 2009); Chief Investment Officer (until July 2010) |
Robert C. Pozen (k)
(born 8/08/46) | | Trustee | | February 2004 | | Massachusetts Financial Services Company, Chairman Emeritus; Chairman (until July 2010); Medtronic, Inc, (medical devices), Director (since 2004); Harvard Business School (education), Senior Lecturer (since 2008); Telesat (satellite communications), Director (until November 2007); Bell Canada Enterprises (telecommunications), Director (until February 2009) |
| INDEPENDENT TRUSTEES | | | | |
David H. Gunning
(born 5/30/42) | | Trustee and Chair of Trustees | | January 2004 | | Retired; Cleveland-Cliffs Inc. (mining products and service provider), Vice Chairman/Director (until May 2007); Lincoln Electric Holdings, Inc. (welding equipment manufacturer), Director; Development Alternatives, Inc. (consulting), Portman Limited (mining), Director (until 2008) |
Robert E. Butler
(born 11/29/41) | | Trustee | | January 2006 | | Consultant – investment company industry regulatory and compliance matters; PricewaterhouseCoopers LLP (professional services firm), Partner (until 2002) |
60
Trustees and Officers – continued
| | | | | | |
Name, Date of Birth | | Position(s) Held
with Fund | | Trustee/Officer
Since (h) | | Principal Occupations During
the Past Five Years & Other
Directorships (j) |
| Lawrence H. Cohn, M.D. (born 3/11/37) | | Trustee | | June 1989 | | Brigham and Women’s Hospital, Senior Cardiac Surgeon (since 2005); Harvard Medical School, Professor of Cardiac Surgery; Partners HealthCare, Physician Director of Medical Device Technology (since 2006); Brigham and Women’s Hospital, Chief of Cardiac Surgery (until 2005) |
Maureen R. Goldfarb (born 4/6/55) | | Trustee | | January 2009 | | Private investor; John Hancock Financial Services, Inc., Executive Vice President (until 2004); John Hancock Mutual Funds, Trustee and Chief Executive Officer (until 2004) |
William R. Gutow
(born 9/27/41) | | Trustee | | December 1993 | | Private investor and real estate consultant ; Capital Entertainment Management Company (video franchise), Vice Chairman; Texas Donuts (donut franchise), Vice Chairman (since 2007); Atlantic Coast Tan (tanning salons), Vice Chairman (until 2007) |
Michael Hegarty
(born 12/21/44) | | Trustee | | December 2004 | | Private investor; AXA Financial (financial services and insurance), Vice Chairman and Chief Operating Officer (until 2001); The Equitable Life Assurance Society (insurance), President and Chief Operating Officer (until 2001) |
John P. Kavanaugh (born 11/4/54) | | Trustee | | January 2009 | | Private investor; The Hanover Insurance Group, Inc., Vice President and Chief Investment Officer (until 2006); Allmerica Investment Trust, Allmerica Securities Trust and Opus Investment Trust (investment companies), Chairman, President and Trustee (until 2006) |
J. Dale Sherratt
(born 9/23/38) | | Trustee | | June 1989 | | Insight Resources, Inc. (acquisition planning specialists), President; Wellfleet Investments (investor in health care companies), Managing General Partner |
61
Trustees and Officers – continued
| | | | | | |
Name, Date of Birth | | Position(s) Held
with Fund | | Trustee/Officer
Since (h) | | Principal Occupations During
the Past Five Years & Other
Directorships (j) |
Laurie J. Thomsen
(born 8/05/57) | | Trustee | | March 2005 | | Private investor; The Travelers Companies (property and casualty insurance), Director; New Profit, Inc. (venture philanthropy), Executive Partner (until 2010) |
Robert W. Uek
(born 5/18/41) | | Trustee | | January 2006 | | Consultant to investment company industry; PricewaterhouseCoopers LLP (professional services firm), Partner (until 1999); TT International Funds (mutual fund complex), Trustee (until 2005); Hillview Investment Trust II Funds (mutual fund complex), Trustee (until 2005) |
| OFFICERS | | | | | | |
| Maria F. DiOrioDwyer (k) (born 12/01/58) | | President | | March 2004 | | Massachusetts Financial Services Company, Executive Vice President and Chief Regulatory Officer (since March 2004) Chief Compliance Officer (since December 2006) |
| Christopher R. Bohane (k) (born 1/18/74) | | Assistant Secretary and Assistant Clerk | | July 2005 | | Massachusetts Financial Services Company, Vice President and Senior Counsel |
John M. Corcoran (k) (born 4/13/65) | | Treasurer | | October 2008 | | Massachusetts Financial Services Company, Senior Vice President (since October 2008); State Street Bank and Trust (financial services provider), Senior Vice President, (until September 2008) |
Ethan D. Corey (k)
(born 11/21/63) | | Assistant Secretary and Assistant Clerk | | July 2005 | | Massachusetts Financial Services Company, Senior Vice President and Associate General Counsel |
| David L. DiLorenzo (k) (born 8/10/68) | | Assistant Treasurer | | July 2005 | | Massachusetts Financial Services Company, Vice President (since June 2005); JP Morgan Investor Services, Vice President (until June 2005) |
62
Trustees and Officers – continued
| | | | | | |
Name, Date of Birth | | Position(s) Held
with Fund | | Trustee/Officer
Since (h) | | Principal Occupations During
the Past Five Years & Other
Directorships (j) |
Timothy M. Fagan (k)
(born 7/10/68) | | Assistant Secretary and Assistant Clerk | | September 2005 | | Massachusetts Financial Services Company, Vice President and Senior Counsel (since September 2005); John Hancock Advisers, LLC, Vice President, Senior Attorney and Chief Compliance Officer (until August 2005) |
Mark D. Fischer (k)
(born 10/27/70) | | Assistant Treasurer | | July 2005 | | Massachusetts Financial Services Company, Vice President (since May 2005); JP Morgan Investment Management Company, Vice President (until May 2005) |
Robyn L. Griffin
(born 7/04/75) | | Assistant Independent Chief Compliance Officer | | August 2008 | | Griffin Compliance LLC (provider of compliance services), Principal (since August 2008); State Street Corporation (financial services provider), Mutual Fund Administration Assistant Vice President (October 2006 – July 2008); Liberty Mutual Group (insurance), Personal Market Assistant Controller (April 2006 – October 2006); Deloitte & Touche LLP (professional services firm), Senior Manager (prior to April 2006) |
Brian E. Langenfeld (k) (born 3/07/73) | | Assistant Secretary and Assistant Clerk | | June 2006 | | Massachusetts Financial Services Company, Vice President and Senior Counsel (since May 2006); John Hancock Advisers, LLC, Assistant Vice President and Counsel (until April 2006) |
Ellen Moynihan (k)
(born 11/13/57) | | Assistant Treasurer | | April 1997 | | Massachusetts Financial Services Company, Senior Vice President |
Susan S. Newton (k) (born 3/07/50) | | Assistant Secretary and Assistant Clerk | | May 2005 | | Massachusetts Financial Services Company, Senior Vice President and Associate General Counsel |
Susan A. Pereira (k)
(born 11/05/70) | | Assistant Secretary and Assistant Clerk | | July 2005 | | Massachusetts Financial Services Company, Vice President and Senior Counsel |
63
Trustees and Officers – continued
| | | | | | |
Name, Date of Birth | | Position(s) Held
with Fund | | Trustee/Officer
Since (h) | | Principal Occupations During
the Past Five Years & Other
Directorships (j) |
| Mark N. Polebaum (k) (born 5/01/52) | | Secretary and Clerk | | January 2006 | | Massachusetts Financial Services Company, Executive Vice President, General Counsel and Secretary (since January 2006); Wilmer Cutler Pickering Hale and Dorr LLP (law firm), Partner (until January 2006) |
Frank L. Tarantino
(born 3/07/44) | | Independent Chief Compliance Officer | | June 2004 | | Tarantino LLC (provider of compliance services), Principal |
| Richard S. Weitzel (k) (born 7/16/70) | | Assistant Secretary and Assistant Clerk | | October 2007 | | Massachusetts Financial Services Company, Vice President and Assistant General Counsel |
James O. Yost (k)
(born 6/12/60) | | Assistant Treasurer | | September 1990 | | Massachusetts Financial Services Company, Senior Vice President |
| (h) | Date first appointed to serve as Trustee/officer of an MFS fund. Each Trustee has served continuously since appointment unless indicated otherwise. For the period from December 15, 2004 until February 22, 2005, Messrs. Pozen and Manning served as Advisory Trustees. For the period March 2008 until October 2008, Ms. DiOrioDwyer served as Treasurer of the Funds. |
| (j) | Directorships or trusteeships of companies required to report to the Securities and Exchange Commission (i.e., “public companies”). |
| (k) | “Interested person” of the Trust within the meaning of the Investment Company Act of 1940 (referred to as the 1940 Act), which is the principal federal law governing investment companies like the fund, as a result of position with MFS. The address of MFS is 500 Boylston Street, Boston, Massachusetts 02116. |
Each Trustee has been elected by shareholders and each Trustee and officer holds office until his or her successor is chosen and qualified or until his or her earlier death, resignation, retirement or removal. The Trust does not hold annual meetings for the purpose of electing Trustees, and Trustees are not elected for fixed terms. Messrs. Butler, Kavanaugh, Sherratt, Uek and Ms. Thomsen are members of the Trust’s Audit Committee.
Each of the Fund’s Trustees and officers holds comparable positions with certain other funds of which MFS or a subsidiary is the investment adviser or distributor, and, in the case of the officers, with certain affiliates of MFS. As of January 1, 2010, the Trustees served as board members of 99 funds within the MFS Family of Funds.
64
Trustees and Officers – continued
The Statement of Additional Information for the Fund includes further information about the Trustees and is available without charge upon request by calling 1-800-225-2606.
| | |
| Investment Adviser | | Custodian |
Massachusetts Financial Services Company
500 Boylston Street, Boston, MA 02116-3741 | | JPMorgan Chase Bank One Chase Manhattan Plaza, New York, NY 10081 |
| Distributor | | Independent Registered Public Accounting Firm |
MFS Fund Distributors, Inc.
500 Boylston Street, Boston, MA 02116-3741 | | Ernst & Young LLP 200 Clarendon Street, Boston, MA 02116 |
| Portfolio Managers | | |
John Addeo | | |
James Calmas | | |
| Robert Persons | | |
| Matthew Ryan | | |
| Erik Weisman | | |
65
BOARD REVIEW OF INVESTMENT ADVISORY AGREEMENT
The Investment Company Act of 1940 requires that both the full Board of Trustees and a majority of the non-interested (“independent”) Trustees, voting separately, annually approve the continuation of the Fund’s investment advisory agreement with MFS. The Trustees consider matters bearing on the Fund and its advisory arrangements at their meetings throughout the year, including a review of performance data at each regular meeting. In addition, the independent Trustees met several times over the course of three months beginning in May and ending in July, 2010 (“contract review meetings”) for the specific purpose of considering whether to approve the continuation of the investment advisory agreement for the Fund and the other investment companies that the Board oversees (the “MFS Funds”). The independent Trustees were assisted in their evaluation of the Fund’s investment advisory agreement by independent legal counsel, from whom they received separate legal advice and with whom they met separately from MFS during various contract review meetings. The independent Trustees were also assisted in this process by the MFS Funds’ Independent Chief Compliance Officer, a full-time senior officer appointed by and reporting to the independent Trustees.
In connection with their deliberations regarding the continuation of the investment advisory agreement, the Trustees, including the independent Trustees, considered such information and factors as they believed, in light of the legal advice furnished to them and their own business judgment, to be relevant. The investment advisory agreement for the Fund was considered separately, although the Trustees also took into account the common interests of all MFS Funds in their review. As described below, the Trustees considered the nature, quality, and extent of the various investment advisory, administrative, and shareholder services performed by MFS under the existing investment advisory agreement and other arrangements with the Fund.
In connection with their contract review meetings, the Trustees received and relied upon materials that included, among other items: (i) information provided by Lipper Inc., an independent third party, on the investment performance of the Fund for various time periods ended December 31, 2009 and the investment performance of a group of funds with substantially similar investment classifications/objectives (the “Lipper performance universe”), (ii) information provided by Lipper Inc. on the Fund’s advisory fees and other expenses and the advisory fees and other expenses of comparable funds identified by Lipper Inc. (the “Lipper expense group”), (iii) information provided by MFS on the advisory fees of comparable portfolios of other clients of MFS, including institutional separate accounts and other clients, (iv) information as to whether and to what extent applicable expense waivers,
66
Board Review of Investment Advisory Agreement – continued
reimbursements or fee “breakpoints” are observed for the Fund, (v) information regarding MFS’ financial results and financial condition, including MFS’ and certain of its affiliates’ estimated profitability from services performed for the Fund and the MFS Funds as a whole, and compared to MFS’ institutional business, (vi) MFS’ views regarding the outlook for the mutual fund industry and the strategic business plans of MFS, (vii) descriptions of various functions performed by MFS for the Funds, such as compliance monitoring and portfolio trading practices, and (viii) information regarding the overall organization of MFS, including information about MFS’ senior management and other personnel providing investment advisory, administrative and other services to the Fund and the other MFS Funds. The comparative performance, fee and expense information prepared and provided by Lipper Inc. was not independently verified and the independent Trustees did not independently verify any information provided to them by MFS.
The Trustees’ conclusion as to the continuation of the investment advisory agreement was based on a comprehensive consideration of all information provided to the Trustees and not the result of any single factor. Some of the factors that figured particularly in the Trustees’ deliberations are described below, although individual Trustees may have evaluated the information presented differently from one another, giving different weights to various factors. It is also important to recognize that the fee arrangements for the Fund and other MFS Funds are the result of years of review and discussion between the independent Trustees and MFS, that certain aspects of such arrangements may receive greater scrutiny in some years than in others, and that the Trustees’ conclusions may be based, in part, on their consideration of these same arrangements during the course of the year and in prior years.
Based on information provided by Lipper Inc., the Trustees reviewed the Fund’s total return investment performance as well as the performance of peer groups of funds over various time periods. The Trustees placed particular emphasis on the total return performance of the Fund’s Class A shares in comparison to the performance of funds in its Lipper performance universe over the three-year period ended December 31, 2009, which the Trustees believed was a long enough period to reflect differing market conditions. The total return performance of the Fund’s Class A shares was in the 3rd quintile relative to the other funds in the universe for this three-year period (the 1st quintile being the best performers and the 5th quintile being the worst performers). The total return performance of the Fund’s Class A shares was in the 4th quintile for each of the one and five-year periods ended December 31, 2009 relative to the Lipper performance universe. Because of the passage of time, these performance results are likely to differ from the performance results for more recent periods, including those shown elsewhere in this report.
67
Board Review of Investment Advisory Agreement – continued
In the course of their deliberations, the Trustees took into account information provided by MFS in connection with the contract review meetings, as well as during investment review meetings conducted with portfolio management personnel during the course of the year regarding the Fund’s performance. After reviewing these and related factors, the Trustees concluded, within the context of their overall conclusions regarding the investment advisory agreement, that they were satisfied with MFS’ responses and efforts relating to investment performance.
In assessing the reasonableness of the Fund’s advisory fee, the Trustees considered, among other information, the Fund’s advisory fee and the total expense ratio of the Fund’s Class A shares as a percentage of average daily net assets and the advisory fee and total expense ratios of peer groups of funds based on information provided by Lipper Inc. The Trustees considered that MFS has agreed in writing to reduce its advisory fee, and that MFS currently observes an expense limitation for the Fund, each of which may not be changed without the Trustees’ approval. The Trustees also considered that, according to the Lipper data (which takes into account any fee reductions or expense limitations that were in effect during the Fund’s last fiscal year), the Fund’s effective advisory fee rate and total expense ratio were each lower than the Lipper expense group median.
The Trustees also considered the advisory fees charged by MFS to institutional accounts. In comparing these fees, the Trustees considered information provided by MFS as to the generally broader scope of services provided by MFS to the Fund in comparison to institutional accounts, the higher demands placed on MFS’ investment personnel and trading infrastructure as a result of the daily cash in-flows and out-flows of the Fund, and the impact on MFS and expenses associated with the more extensive regulatory regime to which the Fund is subject in comparison to institutional accounts.
The Trustees also considered whether the Fund is likely to benefit from any economies of scale in the management of the Fund in the event of growth in assets of the Fund. They noted that the Fund’s advisory fee rate schedule is not subject to any breakpoints. Taking into account the advisory fee waiver and the expense limitation noted above, the Trustees determined not to recommend any advisory fee breakpoints for the Fund at this time.
The Trustees also considered information prepared by MFS relating to MFS’ costs and profits with respect to the Fund, the MFS Funds considered as a group, and other investment companies and accounts advised by MFS, as well as MFS’ methodologies used to determine and allocate its costs to the MFS Funds, the Fund and other accounts and products for purposes of estimating profitability.
68
Board Review of Investment Advisory Agreement – continued
After reviewing these and other factors described herein, the Trustees concluded, within the context of their overall conclusions regarding the investment advisory agreement, that the advisory fees charged to the Fund represent reasonable compensation in light of the services being provided by MFS to the Fund.
In addition, the Trustees considered MFS’ resources and related efforts to continue to retain, attract and motivate capable personnel to serve the Fund. The Trustees also considered current and developing conditions in the financial services industry, including the presence of large and well-capitalized companies which are spending, and appear to be prepared to continue to spend, substantial sums to engage personnel and to provide services to competing investment companies. In this regard, the Trustees also considered the financial resources of MFS and its ultimate parent, Sun Life Financial Inc. The Trustees also considered the advantages and possible disadvantages to the Fund of having an adviser that also serves other investment companies as well as other accounts.
The Trustees also considered the nature, quality, cost, and extent of administrative, transfer agency, and distribution services provided to the Fund by MFS and its affiliates under agreements and plans other than the investment advisory agreement, including any 12b-1 fees the Fund pays to MFS Fund Distributors, Inc., an affiliate of MFS. The Trustees also considered the nature, extent and quality of certain other services MFS performs or arranges for on the Fund’s behalf, which may include securities lending programs, directed expense payment programs, class action recovery programs, and MFS’ interaction with third-party service providers, principally custodians and sub-custodians. The Trustees concluded that the various non-advisory services provided by MFS and its affiliates on behalf of the Funds were satisfactory.
The Trustees also considered benefits to MFS from the use of the Fund’s portfolio brokerage commissions, if applicable, to pay for investment research and other similar services, and various other factors. Additionally, the Trustees considered so-called “fall-out benefits” to MFS such as reputational value derived from serving as investment manager to the Fund.
Based on their evaluation of factors that they deemed to be material, including those factors described above, the Board of Trustees, including a majority of the independent Trustees, concluded that the Fund’s investment advisory agreement with MFS should be continued for an additional one-year period, commencing August 1, 2010.
A discussion regarding the Board’s most recent review and renewal of the fund’s Investment Advisory Agreement with MFS is available by clicking on the fund’s name under “Mutual Funds” in the “Products and Performance” section of the MFS Web site (mfs.com).
69
PROXY VOTING POLICIES AND INFORMATION
A general description of the MFS funds’ proxy voting policies and procedures is available without charge, upon request, by calling 1-800-225-2606, by visiting the Proxy Voting section of mfs.com or by visiting the SEC’s Web site at http://www.sec.gov.
Information regarding how the fund voted proxies relating to portfolio securities during the most recent twelve-month period ended June 30 is available without charge by visiting the Proxy Voting section of mfs.com or by visiting the SEC’s Web site at http://www.sec.gov.
QUARTERLY PORTFOLIO DISCLOSURE
The fund will file a complete schedule of portfolio holdings with the Securities and Exchange Commission (the Commission) for the first and third quarters of each fiscal year on Form N-Q. The fund’s Form N-Q may be reviewed and copied at the:
Public Reference Room
Securities and Exchange Commission
100 F Street, NE, Room 1580
Washington, D.C. 20549
Information on the operation of the Public Reference Room may be obtained by calling the Commission at 1-800-SEC-0330. The fund’s Form N-Q is available on the EDGAR database on the Commission’s Internet Web site at http://www.sec.gov, and copies of this information may be obtained, upon payment of a duplicating fee, by electronic request at the following e-mail address: publicinfo@sec.gov or by writing the Public Reference Section at the above address.
A shareholder can also obtain the quarterly portfolio holdings report at mfs.com.
FURTHER INFORMATION
From time to time, MFS may post important information about the fund or the MFS funds on the MFS web site (mfs.com). This information is available by visiting the “News & Commentary” section of mfs.com or by clicking on the fund’s name under “Mutual Funds” in the “Products and Performance” section of mfs.com.
FEDERAL TAX INFORMATION (unaudited)
The fund will notify shareholders of amounts for use in preparing 2010 income tax forms in January 2011.
70
MFS® PRIVACY NOTICE
Privacy is a concern for every investor today. At MFS Investment Management® and the MFS funds, we take this concern very seriously. We want you to understand our policies about the investment products and services that we offer, and how we protect the nonpublic personal information of investors who have a direct relationship with us and our wholly owned subsidiaries.
Throughout our business relationship, you provide us with personal information. We maintain information and records about you, your investments, and the services you use. Examples of the nonpublic personal information we maintain include
| | Ÿ | | data from investment applications and other forms |
| | Ÿ | | share balances and transactional history with us, our affiliates, or others |
| | Ÿ | | facts from a consumer reporting agency |
We do not disclose any nonpublic personal information about our customers or former customers to anyone, except as permitted by law. We may share nonpublic personal information with third parties or certain of our affiliates in connection with servicing your account or processing your transactions. We may share information with companies or financial institutions that perform marketing services on our behalf or with other financial institutions with which we have joint marketing arrangements, subject to any legal requirements.
Authorization to access your nonpublic personal information is limited to appropriate personnel who provide products, services, or information to you. We maintain physical, electronic, and procedural safeguards to help protect the personal information we collect about you.
If you have any questions about the MFS privacy policy, please call 1-800-225-2606 any business day.
Note: If you own MFS products or receive MFS services in the name of a third party such as a bank or broker-dealer, their privacy policy may apply to you instead of ours.
71
CONTACT US
Web site
mfs.com
MFS TALK
1-800-637-8255
24 hours a day
Account service and literature
Shareholders
1-800-225-2606
Investment professionals
1-800-343-2829
Retirement plan services
1-800-637-1255
Mailing address
MFS Service Center, Inc.
P.O. Box 55824
Boston, MA 02205-5824
Overnight mail
MFS Service Center, Inc.
c/o Boston Financial Data Services
30 Dan Road
Canton, MA 02021-2809

Save paper with eDelivery. MFS® will send you prospectuses, reports, and proxies directly via e-mail so you will get information faster with less mailbox clutter. To sign up: 1. go to mfs.com. 2. log in via MFS® Access. 3. select eDelivery. If you own your MFS fund shares through a financial institution or a retirement plan, MFS® TALK, MFS Access, and eDelivery may not be available to you.

The Registrant has adopted a Code of Ethics pursuant to Section 406 of the Sarbanes-Oxley Act and as defined in Form N-CSR that applies to the Registrant’s principal executive officer and principal financial and accounting officer. The Registrant has not amended any provision in its Code of Ethics (the “Code”) that relates to an element of the Code’s definitions enumerated in paragraph (b) of Item 2 of this Form N-CSR. During the period covered by this report, the Registrant did not grant a waiver, including an implicit waiver, from any provision of the Code.
A copy of the Code of Ethics is filed as an exhibit to this Form N-CSR.
| ITEM 3. | AUDIT COMMITTEE FINANCIAL EXPERT. |
Messrs. Robert E. Butler, John P. Kavanaugh and Robert W. Uek and Ms. Laurie J. Thomsen, members of the Audit Committee, have been determined by the Board of Trustees in their reasonable business judgment to meet the definition of “audit committee financial expert” as such term is defined in Form N-CSR. In addition, Messrs. Butler, Kavanaugh and Uek and Ms. Thomsen are “independent” members of the Audit Committee (as such term has been defined by the Securities and Exchange Commission in regulations implementing Section 407 of the Sarbanes-Oxley Act of 2002). The Securities and Exchange Commission has stated that the designation of a person as an audit committee financial expert pursuant to this Item 3 on the Form N-CSR does not impose on such a person any duties, obligations or liability that are greater than the duties, obligations or liability imposed on such person as a member of the Audit Committee and the Board of Trustees in the absence of such designation or identification.
| ITEM 4. | PRINCIPAL ACCOUNTANT FEES AND SERVICES. |
Items 4(a) through 4(d) and 4(g):
The Board of Trustees has appointed Deloitte & Touche LLP (“Deloitte”) to serve as independent accountants to a certain series of the Registrant and Ernst & Young LLP (“E&Y”) to serve in the same capacity to a certain other series of the Registrant (the series referred to collectively as the “Funds” and singularly as a “Fund”). The tables below set forth the audit fees billed to the Funds as well as fees for non-audit services provided to the Funds and/or to the Funds’ investment adviser, Massachusetts Financial Services Company (“MFS”) and to various entities either controlling, controlled by, or under common control with MFS that provide ongoing services to the Funds (“MFS Related Entities”).
For the fiscal years ended October 31, 2010 and 2009, audit fees billed to the Funds by Deloitte and E&Y were as follows:
| | | | | | | | |
| | | Audit Fees | |
| | | 2010 | | | 2009 | |
Fees billed by Deloitte: | | | | | | | | |
MFS Global Growth Fund | | | 501,812 | | | | 50,812 | |
| |
| | | Audit Fees | |
| | | 2010 | | | 2009 | |
Fees billed by E&Y: | | | | | | | | |
MFS Strategic Income Fund | | | 46,252 | | | | 45,361 | |
For the fiscal years ended October 31, 2010 and 2009, fees billed by Deloitte and E&Y for audit-related, tax and other services provided to the Funds and for audit-related, tax and other services provided to MFS and MFS Related Entities were as follows:
| | | | | | | | | | | | | | | | | | | | | | | | |
| | | Audit-Related Fees1 | | | Tax Fees2 | | | All Other Fees3 | |
| | | 2010 | | | 2009 | | | 2010 | | | 2009 | | | 2010 | | | 2009 | |
Fees billed by Deloitte: | | | | | | | | | | | | | | | | | | | | | | | | |
To MFS Global Growth Fund | | | 0 | | | | 0 | | | | 5,524 | | | | 5,416 | | | | 2,035 | | | | 695 | |
To MFS and MFS Related Entities of MFS Global Growth Fund * | | | 1,422,611 | | | | 1,091,529 | | | | 0 | | | | 0 | | | | 0 | | | | 142,584 | |
| | | | | | | | |
| | | 2010 | | | 2009 | |
Aggregate fees for non-audit services: | | | | | | | | |
To MFS Global Growth Fund, MFS and MFS Related Entities# | | | 1,736,995 | | | | 1,288,349 | |
| | | | | | | | | | | | | | | | | | | | | | | | |
| | | Audit-Related Fees1 | | | Tax Fees2 | | | All Other Fees4 | |
| | | 2010 | | | 2009 | | | 2010 | | | 2009 | | | 2010 | | | 2009 | |
Fees billed by E&Y: | | | | | | | | | | | | | | | | | | | | | | | | |
To MFS Strategic Income Fund | | | 0 | | | | 0 | | | | 9,276 | | | | 9,173 | | | | 0 | | | | 0 | |
To MFS and MFS Related Entities of MFS Strategic Income Fund* | | | 0 | | | | 0 | | | | 0 | | | | 0 | | | | 0 | | | | 0 | |
| | | | | | | | |
| | | 2010 | | | 20095 | |
Aggregate fees for non-audit services: | | | | | | | | |
To MFS Strategic Income Fund, MFS and MFS Related Entities# | | | 247,952 | | | | 237,750 | |
| * | This amount reflects the fees billed to MFS and MFS Related Entities for non-audit services relating directly to the operations and financial reporting of the Funds (portions of which services also related to the operations and financial reporting of other funds within the MFS Funds complex). |
| # | This amount reflects the aggregate fees billed by Deloitte or E&Y, as the case may be, for non-audit services rendered to the Funds and for non-audit services rendered to MFS and the MFS Related Entities. |
| 1 | The fees included under “Audit-Related Fees” are fees related to assurance and related services that are reasonably related to the performance of the audit or review of financial statements, but not reported under “Audit Fees,” including accounting consultations, agreed-upon procedure reports, attestation reports, comfort letters and internal control reviews. |
| 2 | The fees included under “Tax Fees” are fees associated with tax compliance, tax advice and tax planning, including services relating to the filing or amendment of federal, state or local income tax returns, regulated investment company qualification reviews and tax distribution and analysis. |
| 3 | The fees included under “All Other Fees” are fees for products and services provided by Deloitte other than those reported under “Audit Fees,” “Audit-Related Fees” and “Tax Fees,” including fees for services related to analysis of certain portfolio holdings and, review of internal controls and review of Rule 38a-1 compliance program. |
| 4 | The fees under “All Other Fees” are fees for products and services provided by E&Y other than those reported under “Audit Fees,” “Audit-Related Fees” and “Tax Fees”. |
| 5 | E&Y fees reported in 2009 have been restated in this filing from those reported in the Registrant’s filing for the reporting period ended October 31, 2009. |
Item 4(e)(1):
Set forth below are the policies and procedures established by the Audit Committee of the Board of Trustees relating to the pre-approval of audit and non-audit related services:
To the extent required by applicable law, pre-approval by the Audit Committee of the Board is needed for all audit and permissible non-audit services rendered to the Funds and all permissible non-audit services rendered to MFS or MFS Related Entities if the services relate directly to the operations and financial reporting of the Registrant. Pre-approval is currently on an engagement-by-engagement basis. In the event pre-approval of such services is necessary between regular meetings of the Audit Committee and it is not practical to wait to seek pre-approval at the next regular meeting of the Audit Committee, pre-approval of such services may be referred to the Chair of the Audit Committee for approval; provided that the Chair may not pre-approve any individual engagement for such services exceeding $50,000 or multiple engagements for such services in the aggregate exceeding $100,000 in each period between regular meetings of the Audit Committee. Any engagement pre-approved by the Chair between regular meetings of the Audit Committee shall be presented for ratification by the entire Audit Committee at its next regularly scheduled meeting.
Item 4(e)(2):
None, or 0%, of the services relating to the Audit-Related Fees, Tax Fees and All Other Fees paid by the Fund and MFS and MFS Related Entities relating directly to the operations and financial reporting of the Registrant disclosed above were approved by the audit committee pursuant to paragraphs (c)(7)(i)(C) of Rule 2-01 of Regulation S-X (which permits audit committee approval after the start of the engagement with respect to services other than audit, review or attest services, if certain conditions are satisfied).
Item 4(f): Not applicable.
Item 4(h): The Registrant’s Audit Committee has considered whether the provision by a Registrant’s independent registered public accounting firm of non-audit services to MFS and MFS Related Entities that were not pre-approved by the Committee (because such services did not relate directly to the operations and financial reporting of the Registrant) was compatible with maintaining the independence of the independent registered public accounting firm as the Registrant’s principal auditors.
| ITEM 5. | AUDIT COMMITTEE OF LISTED REGISTRANTS. |
Not applicable to the Registrant.
A schedule of investments of each series of the Registrant is included as part of the report to shareholders of such series under Item 1 of this Form N-CSR.
| ITEM 7. | DISCLOSURE OF PROXY VOTING POLICIES AND PROCEDURES FOR CLOSED-END MANAGEMENT INVESTMENT COMPANIES. |
Not applicable to the Registrant.
| ITEM 8. | PORTFOLIO MANAGERS OF CLOSED-END MANAGEMENT INVESTMENT COMPANIES. |
Not applicable to the Registrant.
| ITEM 9. | PURCHASES OF EQUITY SECURITIES BY CLOSED-END MANAGEMENT INVESTMENT COMPANY AND AFFILIATED PURCHASERS. |
Not applicable to the Registrant.
| ITEM 10. | SUBMISSION OF MATTERS TO A VOTE OF SECURITY HOLDERS. |
There were no material changes to the procedures by which shareholders may send recommendations to the Board for nominees to the Registrant’s Board since the Registrant last provided disclosure as to such procedures in response to the requirements of Item 407 (c)(2)(iv) of Regulation S-K or this Item.
| ITEM 11. | CONTROLS AND PROCEDURES. |
| (a) | Based upon their evaluation of the effectiveness of the registrant’s disclosure controls and procedures (as defined in Rule 30a-3(c) under the Investment Company Act of 1940 (the “Act”)) as conducted within 90 days of the filing date of this report on Form N-CSR, the registrant’s principal financial officer and principal executive officer have concluded that those disclosure controls and procedures provide reasonable assurance that the material information required to be disclosed by the registrant on this report is recorded, processed, summarized and reported within the time periods specified in the Securities and Exchange Commission’s rules and forms. |
| (b) | There were no changes in the registrant’s internal controls over financial reporting (as defined in Rule 30a-3(d) under the Act) that occurred during the second fiscal quarter of the period covered by the report that have materially affected, or are reasonably likely to materially affect, the registrant’s internal control over financial reporting. |
| (a) | File the exhibits listed below as part of this form. Letter or number the exhibits in the sequence indicated. |
| | (1) | Any code of ethics, or amendment thereto, that is the subject of the disclosure required by Item 2, to the extent that the registrant intends to satisfy the Item 2 requirements through filing of an exhibit: Code of Ethics attached hereto. |
| | (2) | A separate certification for each principal executive officer and principal financial officer of the registrant as required by Rule 30a-2(a) under the Act (17 CFR 270.30a-2): Attached hereto. |
| (b) | If the report is filed under Section 13(a) or 15(d) of the Exchange Act, provide the certifications required by Rule 30a-2(b) under the Act (17 CFR 270.30a-2(b)), Rule 13a-14(b) or Rule 15d-14(b) under the Exchange Act (17 CFR 240.13a-14(b) or 240.15d-14(b)) and Section 1350 of Chapter 63 of Title 18 of the United States Code (18 U.S.C. 1350) as an exhibit. A certification furnished pursuant to this paragraph will not be deemed “filed” for the purposes of Section 18 of the Exchange Act (15 U.S.C. 78r), or otherwise subject to the liability of that section. Such certification will not be deemed to be incorporated by reference into any filing under the Securities Act of 1933 or the Exchange Act, except to the extent that the registrant specifically incorporates it by reference: Attached hereto. |
Notice
A copy of the Amended and Restated Declaration of Trust, as amended, of the Registrant is on file with the Secretary of State of The Commonwealth of Massachusetts and notice is hereby given that this instrument is executed on behalf of the Registrant by an officer of the Registrant as an officer and not individually and the obligations of or arising out of this instrument are not binding upon any of the Trustees or shareholders individually, but are binding only upon the assets and property of the respective constituent series of the Registrant.
SIGNATURES
Pursuant to the requirements of the Securities Exchange Act of 1934 and the Investment Company Act of 1940, the registrant has duly caused this report to be signed on its behalf by the undersigned, thereunto duly authorized.
(Registrant) MFS SERIES TRUST VIII
| | |
| By (Signature and Title)* | | MARIA F. DIORIODWYER |
| | Maria F. DiOrioDwyer, President |
Date: December 16, 2010
Pursuant to the requirements of the Securities Exchange Act of 1934 and the Investment Company Act of 1940, this report has been signed below by the following persons on behalf of the registrant and in the capacities and on the dates indicated.
| | |
| By (Signature and Title)* | | MARIA F. DIORIODWYER |
| | Maria F. DiOrioDwyer, President (Principal Executive Officer) |
Date: December 16, 2010
| | |
| By (Signature and Title)* | | JOHN M. CORCORAN |
| | John M. Corcoran, Treasurer (Principal Financial Officer and Accounting Officer) |
Date: December 16, 2010
| * | Print name and title of each signing officer under his or her signature. |