UNITED STATES
SECURITIES AND EXCHANGE COMMISSION
Washington, D.C. 20549
FORM N-CSR
CERTIFIED SHAREHOLDER REPORT OF
REGISTERED MANAGEMENT INVESTMENT COMPANIES
Investment Company Act file number 811-5262
MFS SERIES TRUST VIII
(Exact name of registrant as specified in charter)
111 Huntington Avenue, Boston, Massachusetts 02199
(Address of principal executive offices) (Zip code)
Susan S. Newton
Massachusetts Financial Services Company
111 Huntington Avenue
Boston, Massachusetts 02199
(Name and address of agents for service)
Registrant’s telephone number, including area code: (617) 954-5000
Date of fiscal year end: October 31
Date of reporting period: October 31, 2012
| ITEM 1. | REPORTS TO STOCKHOLDERS. |
ANNUAL REPORT
October 31, 2012

MFS® GLOBAL GROWTH FUND

WGF-ANN
MFS® GLOBAL GROWTH FUND
CONTENTS
The report is prepared for the general information of shareholders.
It is authorized for distribution to prospective investors only when preceded or accompanied by a current prospectus.
NOT FDIC INSURED Ÿ MAY LOSE VALUE Ÿ NO BANK GUARANTEE

LETTER FROM THE CHAIRMAN AND CEO
Dear Shareholders:
As 2012 winds down, economic uncertainty continues to dominate world financial markets. In the United States, all eyes are riveted to the ongoing budget deal
negotiations and the specter of a “fiscal cliff.” Overseas, we see growth slowing in China and Japan, and the eurozone has entered its second recession in four years against a backdrop of double-digit unemployment and the continuing sovereign debt crisis.
Amidst the instability, there are silver linings — especially in the U.S. where the labor and housing markets have picked up, consumer confidence has risen and industrial output has increased. Additionally, a U.S. budgetary compromise could propel markets, unleashing pent-up spending and investments, which would help to revive both the U.S. and global economies.
As always, managing risk in the face of uncertainty remains a top priority for investors. At MFS®, an emphasis on global research and our disciplined risk management approach anchor our uniquely collaborative investment process. Our global team of more than 200 investment professionals shares ideas and evaluates opportunities across continents, investment disciplines, and asset classes — all with a goal of building better insights, and ultimately better results — for our clients.
We are mindful of the many economic challenges we face locally, nationally and globally. It is more important than ever to maintain a long-term view, employ time-tested principles, such as asset allocation and diversification, and work closely with investment advisors to identify and pursue the most suitable opportunities.
Respectfully,

Robert J. Manning
Chairman and Chief Executive Officer
MFS Investment Management®
December 14, 2012
The opinions expressed in this letter are subject to change, may not be relied upon for investment advice, and no forecasts can be guaranteed.
1
PORTFOLIO COMPOSITION
Portfolio structure

| | | | |
| Top ten holdings | | | | |
| Groupe Danone | | | 2.6% | |
| LVMH Moet Hennessy Louis Vuitton S.A. | | | 2.5% | |
| Pernod Ricard S.A. | | | 2.2% | |
| Compass Group PLC | | | 2.2% | |
| Danaher Corp. | | | 2.2% | |
| Google, Inc., “A” | | | 2.1% | |
| Colgate-Palmolive Co. | | | 2.0% | |
| Apple, Inc. | | | 2.0% | |
| Accenture PLC, “A” | | | 2.0% | |
| United Technologies Corp. | | | 1.9% | |
| |
| Equity sectors | | | | |
| Technology | | | 14.9% | |
| Consumer Staples | | | 14.6% | |
| Industrial Goods & Services | | | 13.3% | |
| Financial Services | | | 11.9% | |
| Health Care | | | 9.7% | |
| Retailing | | | 8.7% | |
| Special Products & Services | | | 8.3% | |
| Basic Materials | | | 5.5% | |
| Leisure | | | 4.1% | |
| Energy | | | 3.8% | |
| Transportation | | | 2.2% | |
| Autos & Housing | | | 1.3% | |
| Utilities & Communications | | | 0.5% | |
| | | | |
| Issuer country weightings (x) | |
| United States | | | 51.6% | |
| France | | | 12.7% | |
| United Kingdom | | | 10.9% | |
| Switzerland | | | 6.4% | |
| Brazil | | | 4.0% | |
| Germany | | | 3.9% | |
| Taiwan | | | 1.6% | |
| Hong Kong | | | 1.3% | |
| Netherlands | | | 1.3% | |
| Other Countries | | | 6.3% | |
|
| Currency exposure weightings (y) | |
| United States Dollar | | | 54.3% | |
| Euro | | | 18.4% | |
| British Pound Sterling | | | 10.9% | |
| Swiss Franc | | | 6.4% | |
| Brazilian Real | | | 4.0% | |
| Taiwan Dollar | | | 1.6% | |
| Hong Kong Dollar | | | 1.3% | |
| South Korean Won | | | 1.0% | |
| Japanese Yen | | | 1.0% | |
| Other Currencies | | | 1.1% | |
2
Portfolio Composition – continued
| (x) | Represents the portfolio’s exposure to issuer countries as a percentage of a portfolio’s total net assets. |
| (y) | Represents the portfolio’s exposure to a particular currency as a percentage of a portfolio’s total net assets. |
Percentages are based on net assets as of 10/31/12.
The portfolio is actively managed and current holdings may be different.
3
MANAGEMENT REVIEW
Summary of Results
For the twelve months ended October 31, 2012, Class A shares of the MFS Global Growth Fund (the “fund”) provided a total return of 7.98%, at net asset value. This compares with a return of 8.77% for the fund’s benchmark, the MSCI All Country World Growth Index.
Market Environment
Just prior to the beginning of the reporting period, markets were roiled by several global concerns. These included the aftermath of the U.S. sovereign debt-ceiling debacle, the path of eurozone integration and the scope of its bailout facilities, and the likelihood of a Chinese hard landing. Amidst this turmoil, global equity markets had declined sharply and credit spreads widened. At the same time, global consumer and producer sentiment indicators had fallen precipitously, while highly-rated sovereign bond yields hit multi-decade lows.
During the first half of the period, however, additional liquidity from the U.S. Federal Reserve (Fed), in the form of “Operation Twist”, and the European Central Bank (ECB), in the form of 3 year, Long Term Refinancing Operations, or LTROs, coupled with healthier global macroeconomic conditions led by moderate but sustained U.S. growth, ushered in improved market dynamics.
During the latter part of the period, market trends were more mixed. Worsening conditions were driven by broadly weaker global macroeconomic indicators, as well as renewed concerns over the eurozone’s capacity and determination to address its ongoing crisis. However, broad market sentiment remained relatively resilient, as equity markets generally maintained gains and credit spreads did not indicate deterioration. A new round of monetary easing by the Fed (QE3) and the ECB (rate cut and a new bond purchase facility) towards the end of the period instilled additional confidence in risk markets. Nonetheless, towards the end of the period, weaker equity earnings reports and declining forward guidance caused market sentiment to soften.
Detractors from Performance
Weak stock selection in the health care sector detracted from performance relative to the MSCI All Country World Growth Index. However, there were no individual stocks within this sector that were among the fund’s top relative detractors for the reporting period.
Stock selection in the retailing sector was another negative factor that hampered relative performance. The fund’s overweight position in supermarkets and convenient stores operator Tesco (h) (United Kingdom) hurt relative returns as the stock significantly underperformed the benchmark. Early in the year, Tesco’s management lowered guidance on profit forecasts after suffering disappointing sales figures during the holiday season which caused the stock to drop significantly.
Stocks in other sectors that weakened relative performance included an underweight position in computer and personal electronics maker Apple, and overweight positions in food and beverage producer Groupe Danone (France), multi-industrial company Johnson Controls, oil and gas exploration and production company Occidental
4
Management Review – continued
Petroleum, and enterprise software products maker Oracle. Shares of Groupe Danone declined during the period as the deteriorating economic climate in southern Europe played a toll on the company’s sales in this region. The fund’s holdings in global financial services firm Credit Suisse (b)(h) (Switzerland), Israeli-headquartered security software provider Check Point Software Technologies (b), and investment market data and analytics provider MSCI (b) also held back relative returns. Shares of Credit Suisse declined as the company reported weak earnings during the period. In addition, the company’s capital position came under scrutiny by the Swiss National Bank (SNB) which further dampened the stock’s performance. Not holding strong-performing cable services provider Comcast also hindered relative returns.
During the reporting period, the fund’s relative currency exposure, resulting primarily from differences between the portfolio’s and the benchmark’s exposures to holdings of securities denominated in foreign currencies, was another detractor from relative performance. All of MFS’ investment decisions are driven by the fundamentals of each individual opportunity and as such, it is common for our portfolios to have different currency exposure than the benchmark.
Contributors to Performance
The combination of an underweight position and stock selection in the basic materials sector was a primary factor that contributed to the fund’s relative performance. The timing of the fund’s ownership in shares of Australian mining giant BHP Billiton (h) strengthened relative returns. The fund benefited from closing out of the position in the middle of the period and missing the stock’s subsequent depreciation as continued labor disputes hampered the stock’s performance. Additionally, it was announced the company decided to halt its plans to spend $80 billion over five years expanding its iron ore, coal, energy and base metals divisions as the company became concerned that demand for these commodities will be softer than expected in the upcoming years.
Stock selection and the fund’s overweight position in the special products & services sector also boosted relative results. The fund’s overweight position in contract foodservice company Compass Group (United Kingdom) helped relative performance. The stock continued to appreciate throughout the period as good organic growth in the US and Emerging Markets divisions offset weakness in Europe.
An underweight position in the energy sector was another factor that supported relative performance. This sector underperformed the broad benchmark over the reporting period.
Elsewhere, the fund’s overweight position in Spanish fashion distributor Inditex supported relative returns. The stock appreciated on solid pre-tax profit during the year due to strong same-store sales growth. Holdings of global payments technology company Visa, British alcoholic beverage producer Diageo, semiconductor manufacturer Taiwan Semiconductor, German healthcare products maker Bayer,
5
Management Review – continued
investment management firm Franklin Resources, diversified consumer products company Colgate-Polmolive, and life sciences supply company Thermo Fisher Scientific also helped bolster the fund’s relative performance.
Respectfully,
| | |
| David Antonelli | | Jeffrey Constantino |
| Portfolio Manager | | Portfolio Manager |
| (b) | Security is not a benchmark constituent. |
| (h) | Security was not held in the fund at period end. |
The views expressed in this report are those of the portfolio managers only through the end of the period of the report as stated on the cover and do not necessarily reflect the views of MFS or any other person in the MFS organization. These views are subject to change at any time based on market or other conditions, and MFS disclaims any responsibility to update such views. These views may not be relied upon as investment advice or an indication of trading intent on behalf of any MFS portfolio. References to specific securities are not recommendations of such securities, and may not be representative of any MFS portfolio’s current or future investments.
6
PERFORMANCE SUMMARY THROUGH 10/31/12
The following chart illustrates a representative class of the fund’s historical performance in comparison to its benchmark(s). Performance results include the deduction of the maximum applicable sales charge and reflect the percentage change in net asset value, including reinvestment of dividends and capital gains distributions. The performance of other share classes will be greater than or less than that of the class depicted below. Benchmarks are unmanaged and may not be invested in directly. Benchmark returns do not reflect sales charges, commissions or expenses. (See Notes to Performance Summary.)
Performance data shown represents past performance and is no guarantee of future results. Investment return and principal value fluctuate so your shares, when sold, may be worth more or less than the original cost; current performance may be lower or higher than quoted. The performance shown does not reflect the deduction of taxes, if any, that a shareholder would pay on fund distributions or the redemption of fund shares.
Growth of a Hypothetical $10,000 Investment

7
Performance Summary – continued
Total Returns as of: 10/31/12
Average annual without sales charge
| | | | | | | | | | | | | | |
| | | Share class | | Class inception date | | 1-yr | | 5-yr | | 10-yr | | Life (t) | | |
| | | A | | 11/18/93 | | 7.98% | | (0.96)% | | 8.26% | | N/A | | |
| | | B | | 11/18/93 | | 7.19% | | (1.69)% | | 7.46% | | N/A | | |
| | | C | | 1/03/94 | | 7.23% | | (1.69)% | | 7.46% | | N/A | | |
| | | I | | 1/02/97 | | 8.29% | | (0.71)% | | 8.54% | | N/A | | |
| | | R1 | | 4/01/05 | | 7.15% | | (1.70)% | | N/A | | 4.41% | | |
| | | R2 | | 10/31/03 | | 7.73% | | (1.27)% | | N/A | | 6.08% | | |
| | | R3 | | 4/01/05 | | 8.00% | | (0.96)% | | N/A | | 5.19% | | |
| | | R4 | | 4/01/05 | | 8.28% | | (0.71)% | | N/A | | 5.47% | | |
| Comparative benchmark | | | | | | | | | | |
| | | MSCI All Country World Growth Index (f) | | 8.77% | | (1.67)% | | 7.71% | | N/A | | |
| Average annual with sales charge | | | | | | | | | | |
| | | A
With Initial Sales Charge (5.75%) | | 1.77% | | (2.13)% | | 7.62% | | N/A | | |
| | | B
With CDSC (Declining over six years from 4% to 0%) (x) | | 3.19% | | (2.09)% | | 7.46% | | N/A | | |
| | | C
With CDSC (1% for 12 months) (x) | | 6.23% | | (1.69)% | | 7.46% | | N/A | | |
Class I, R1, R2, R3, and R4 shares do not have a sales charge.
CDSC – Contingent Deferred Sales Charge.
| (f) | Source: FactSet Research Systems Inc. |
| (t) | For the period from the class inception date through the stated period end (for those share classes with less than 10 years of performance history). No comparative benchmark performance information is provided for “life” periods. (See Notes to Performance Summary.) |
| (x) | Assuming redemption at the end of the applicable period. |
Benchmark Definition
MSCI All Country World Growth Index – a market capitalization-weighted index that is designed to measure equity market performance for growth securities in the global developed and emerging markets.
It is not possible to invest directly in an index.
Notes to Performance Summary
Average annual total return represents the average annual change in value for each share class for the periods presented. Life returns are presented where the share class has less than 10 years of performance history and represent the average annual total return from the class inception date to the stated period end date. As the fund’s share
8
Performance Summary – continued
classes may have different inception dates, the life returns may represent different time periods and may not be comparable. As a result, no comparative benchmark performance information is provided for life periods.
Performance results reflect any applicable expense subsidies and waivers in effect during the periods shown. Without such subsidies and waivers the fund’s performance results would be less favorable. Please see the prospectus and financial statements for complete details.
Performance results do not include adjustments made for financial reporting purposes in accordance with U.S. generally accepted accounting principles and may differ from amounts reported in the financial highlights.
From time to time the fund may receive proceeds from litigation settlements, without which performance would be lower.
9
EXPENSE TABLE
Fund expenses borne by the shareholders during the period, May 1, 2012 through October 31, 2012
As a shareholder of the fund, you incur two types of costs: (1) transaction costs, including sales charges (loads) on certain purchase or redemption payments, and (2) ongoing costs, including management fees; distribution and service (12b-1) fees; and other fund expenses. This example is intended to help you understand your ongoing costs (in dollars) of investing in the fund and to compare these costs with the ongoing costs of investing in other mutual funds.
The example is based on an investment of $1,000 invested at the beginning of the period and held for the entire period May 1, 2012 through October 31, 2012.
Actual Expenses
The first line for each share class in the following table provides information about actual account values and actual expenses. You may use the information in this line, together with the amount you invested, to estimate the expenses that you paid over the period. Simply divide your account value by $1,000 (for example, an $8,600 account value divided by $1,000 = 8.6), then multiply the result by the number in the first line under the heading entitled “Expenses Paid During Period” to estimate the expenses you paid on your account during this period.
Hypothetical Example for Comparison Purposes
The second line for each share class in the following table provides information about hypothetical account values and hypothetical expenses based on the fund’s actual expense ratio and an assumed rate of return of 5% per year before expenses, which is not the fund’s actual return. The hypothetical account values and expenses may not be used to estimate the actual ending account balance or expenses you paid for the period. You may use this information to compare the ongoing costs of investing in the fund and other funds. To do so, compare this 5% hypothetical example with the 5% hypothetical examples that appear in the shareholder reports of the other funds.
Please note that the expenses shown in the table are meant to highlight your ongoing costs only and do not reflect any transactional costs, such as sales charges (loads). Therefore, the second line for each share class in the table is useful in comparing ongoing costs only, and will not help you determine the relative total costs of owning different funds. In addition, if these transactional costs were included, your costs would have been higher.
10
Expense Table – continued
| | | | | | | | | | | | | | | | | | |
Share
Class | | | | Annualized
Expense
Ratio | | | Beginning
Account Value
5/01/12 | | | Ending
Account Value
10/31/12 | | | Expenses
Paid During
Period (p)
5/01/12-10/31/12 | |
| A | | Actual | | | 1.52% | | | | $1,000.00 | | | | $1,001.83 | | | | $7.65 | |
| | Hypothetical (h) | | | 1.52% | | | | $1,000.00 | | | | $1,017.50 | | | | $7.71 | |
| B | | Actual | | | 2.27% | | | | $1,000.00 | | | | $998.41 | | | | $11.40 | |
| | Hypothetical (h) | | | 2.27% | | | | $1,000.00 | | | | $1,013.72 | | | | $11.49 | |
| C | | Actual | | | 2.27% | | | | $1,000.00 | | | | $998.40 | | | | $11.40 | |
| | Hypothetical (h) | | | 2.27% | | | | $1,000.00 | | | | $1,013.72 | | | | $11.49 | |
| I | | Actual | | | 1.27% | | | | $1,000.00 | | | | $1,003.22 | | | | $6.39 | |
| | Hypothetical (h) | | | 1.27% | | | | $1,000.00 | | | | $1,018.75 | | | | $6.44 | |
| R1 | | Actual | | | 2.27% | | | | $1,000.00 | | | | $997.99 | | | | $11.40 | |
| | Hypothetical (h) | | | 2.27% | | | | $1,000.00 | | | | $1,013.72 | | | | $11.49 | |
| R2 | | Actual | | | 1.77% | | | | $1,000.00 | | | | $1,000.37 | | | | $8.90 | |
| | Hypothetical (h) | | | 1.77% | | | | $1,000.00 | | | | $1,016.24 | | | | $8.97 | |
| R3 | | Actual | | | 1.52% | | | | $1,000.00 | | | | $1,002.20 | | | | $7.65 | |
| | Hypothetical (h) | | | 1.52% | | | | $1,000.00 | | | | $1,017.50 | | | | $7.71 | |
| R4 | | Actual | | | 1.27% | | | | $1,000.00 | | | | $1,003.28 | | | | $6.40 | |
| | Hypothetical (h) | | | 1.27% | | | | $1,000.00 | | | | $1,018.75 | | | | $6.44 | |
| (h) | 5% class return per year before expenses. |
| (p) | Expenses paid are equal to each class’ annualized expense ratio, as shown above, multiplied by the average account value over the period, multiplied by the number of days in the period, divided by the number of days in the year. Expenses paid do not include any applicable sales charges (loads). If these transaction costs had been included, your costs would have been higher. |
11
PORTFOLIO OF INVESTMENTS
10/31/12
The Portfolio of Investments is a complete list of all securities owned by your fund. It is categorized by broad-based asset classes.
| | | | | | | | |
| Common Stocks - 98.8% | | | | | | | | |
| Issuer | | Shares/Par | | | Value ($) | |
| Aerospace - 3.4% | | | | | | | | |
| Precision Castparts Corp. | | | 8,500 | | | $ | 1,471,095 | |
| Rolls-Royce Holdings PLC | | | 101,681 | | | | 1,402,130 | |
| Rolls-Royce Holdings PLC, IPS (a) | | | 7,807,252 | | | | 12,599 | |
| United Technologies Corp. | | | 47,010 | | | | 3,674,302 | |
| | | | | | | | |
| | | | | | | $ | 6,560,126 | |
| Alcoholic Beverages - 4.5% | | | | | | | | |
| Diageo PLC | | | 105,767 | | | $ | 3,022,769 | |
| Heineken N.V. | | | 23,572 | | | | 1,453,246 | |
| Pernod Ricard S.A. | | | 40,231 | | | | 4,329,633 | |
| | | | | | | | |
| | | | | | | $ | 8,805,648 | |
| Apparel Manufacturers - 6.0% | | | | | | | | |
| Cia.Hering S.A. | | | 47,400 | | | $ | 1,088,936 | |
| Compagnie Financiere Richemont S.A. | | | 24,889 | | | | 1,614,190 | |
| Li & Fung Ltd. | | | 1,528,400 | | | | 2,563,751 | |
| LVMH Moet Hennessy Louis Vuitton S.A. | | | 29,903 | | | | 4,860,350 | |
| NIKE, Inc., “B” | | | 15,710 | | | | 1,435,580 | |
| | | | | | | | |
| | | | | | | $ | 11,562,807 | |
| Automotive - 1.3% | | | | | | | | |
| Johnson Controls, Inc. | | | 100,150 | | | $ | 2,578,863 | |
| | |
| Broadcasting - 2.9% | | | | | | | | |
| Publicis Groupe | | | 51,017 | | | $ | 2,748,514 | |
| Viacom, Inc., “B” | | | 33,800 | | | | 1,732,926 | |
| Walt Disney Co. | | | 22,800 | | | | 1,118,796 | |
| | | | | | | | |
| | | | | | | $ | 5,600,236 | |
| Brokerage & Asset Managers - 3.7% | | | | | | | | |
| BM&F Bovespa S.A. | | | 325,800 | | | $ | 2,085,325 | |
| Charles Schwab Corp. | | | 86,780 | | | | 1,178,472 | |
| CME Group, Inc. | | | 17,700 | | | | 989,961 | |
| Franklin Resources, Inc. | | | 22,910 | | | | 2,927,898 | |
| | | | | | | | |
| | | | | | | $ | 7,181,656 | |
| Business Services - 8.2% | | | | | | | | |
| Accenture PLC, “A” | | | 56,250 | | | $ | 3,791,813 | |
| Brenntag AG | | | 13,895 | | | | 1,751,293 | |
| Cognizant Technology Solutions Corp., “A” (a) | | | 24,890 | | | | 1,658,919 | |
12
Portfolio of Investments – continued
| | | | | | | | |
| Issuer | | Shares/Par | | | Value ($) | |
| | | | | | | | |
| Common Stocks - continued | | | | | | | | |
| Business Services - continued | | | | | | | | |
| Compass Group PLC | | | 384,380 | | | $ | 4,217,994 | |
| Intertek Group PLC | | | 20,949 | | | | 953,004 | |
| LPS Brasil - Consultoria de Imoveis S.A. | | | 69,900 | | | | 1,201,108 | |
| MSCI, Inc., “A” (a) | | | 50,320 | | | | 1,355,621 | |
| Verisk Analytics, Inc., “A” (a) | | | 20,440 | | | | 1,042,440 | |
| | | | | | | | |
| | | | | | | $ | 15,972,192 | |
| Chemicals - 0.5% | | | | | | | | |
| Monsanto Co. | | | 12,030 | | | $ | 1,035,422 | |
| | |
| Computer Software - 3.9% | | | | | | | | |
| Autodesk, Inc. (a) | | | 35,390 | | | $ | 1,126,818 | |
| Check Point Software Technologies Ltd. (a) | | | 47,870 | | | | 2,131,651 | |
| Dassault Systemes S.A. | | | 11,007 | | | | 1,159,742 | |
| Oracle Corp. | | | 103,400 | | | | 3,210,570 | |
| | | | | | | | |
| | | | | | | $ | 7,628,781 | |
| Computer Software - Systems - 3.5% | | | | | | | | |
| Apple, Inc. | | | 6,520 | | | $ | 3,880,052 | |
| EMC Corp. (a) | | | 47,520 | | | | 1,160,438 | |
| International Business Machines Corp. | | | 9,030 | | | | 1,756,606 | |
| | | | | | | | |
| | | | | | | $ | 6,797,096 | |
| Consumer Products - 5.5% | | | | | | | | |
| Colgate-Palmolive Co. | | | 37,160 | | | $ | 3,900,314 | |
| Procter & Gamble Co. | | | 46,730 | | | | 3,235,585 | |
| Reckitt Benckiser Group PLC | | | 58,193 | | | | 3,521,586 | |
| | | | | | | | |
| | | | | | | $ | 10,657,485 | |
| Electrical Equipment - 8.4% | | | | | | | | |
| Amphenol Corp., “A” | | | 25,900 | | | $ | 1,557,367 | |
| Danaher Corp. | | | 80,740 | | | | 4,176,680 | |
| Legrand S.A. | | | 80,655 | | | | 3,106,958 | |
| Mettler-Toledo International, Inc. (a) | | | 12,600 | | | | 2,134,062 | |
| Schneider Electric S.A. | | | 21,794 | | | | 1,362,556 | |
| Sensata Technologies Holding B.V. (a) | | | 86,590 | | | | 2,439,240 | |
| W.W. Grainger, Inc. | | | 7,300 | | | | 1,470,293 | |
| | | | | | | | |
| | | | | | | $ | 16,247,156 | |
| Electronics - 4.7% | | | | | | | | |
| ASML Holding N.V. | | | 18,820 | | | $ | 1,034,535 | |
| Microchip Technology, Inc. | | | 92,970 | | | | 2,914,610 | |
13
Portfolio of Investments – continued
| | | | | | | | |
| Issuer | | Shares/Par | | | Value ($) | |
| | | | | | | | |
| Common Stocks - continued | | | | | | | | |
| Electronics - continued | | | | | | | | |
| Samsung Electronics Co. Ltd. | | | 1,655 | | | $ | 1,987,942 | |
| Taiwan Semiconductor Manufacturing Co. Ltd., ADR | | | 198,018 | | | | 3,148,486 | |
| | | | | | | | |
| | | | | | | $ | 9,085,573 | |
| Energy - Independent - 1.7% | | | | | | | | |
| Occidental Petroleum Corp. | | | 40,820 | | | $ | 3,223,147 | |
| | |
| Food & Beverages - 4.6% | | | | | | | | |
| Groupe Danone | | | 82,824 | | | $ | 5,091,184 | |
| M Dias Branco S.A Industria e Comercio de Alimentos | | | 400 | | | | 13,431 | |
| Mead Johnson Nutrition Co., “A” | | | 17,350 | | | | 1,069,801 | |
| Nestle S.A. | | | 17,499 | | | | 1,110,481 | |
| PepsiCo, Inc. | | | 22,880 | | | | 1,584,211 | |
| | | | | | | | |
| | | | | | | $ | 8,869,108 | |
| Food & Drug Stores - 0.3% | | | | | | | | |
| Sundrug Co. Ltd. | | | 15,300 | | | $ | 563,281 | |
| | |
| General Merchandise - 1.5% | | | | | | | | |
| Kohl’s Corp. | | | 19,480 | | | $ | 1,037,894 | |
| Lojas Renner S.A. | | | 21,200 | | | | 784,934 | |
| Target Corp. | | | 16,030 | | | | 1,021,913 | |
| | | | | | | | |
| | | | | | | $ | 2,844,741 | |
| Internet - 2.8% | | | | | | | | |
| Google, Inc., “A” (a) | | | 5,930 | | | $ | 4,031,036 | |
| Yahoo Japan Corp. | | | 3,970 | | | | 1,366,102 | |
| | | | | | | | |
| | | | | | | $ | 5,397,138 | |
| Machinery & Tools - 1.4% | | | | | | | | |
| Schindler Holding AG | | | 21,059 | | | $ | 2,774,551 | |
| | |
| Major Banks - 2.0% | | | | | | | | |
| HSBC Holdings PLC | | | 152,098 | | | $ | 1,494,288 | |
| Standard Chartered PLC | | | 102,831 | | | | 2,428,583 | |
| | | | | | | | |
| | | | | | | $ | 3,922,871 | |
| Medical & Health Technology & Services - 1.3% | | | | | | | | |
| Diagnosticos da America S.A. | | | 90,900 | | | $ | 604,195 | |
| Fresenius Medical Care AG & Co. KGaA | | | 13,143 | | | | 923,143 | |
| Patterson Cos., Inc. | | | 27,940 | | | | 933,196 | |
| | | | | | | | |
| | | | | | | $ | 2,460,534 | |
14
Portfolio of Investments – continued
| | | | | | | | |
| Issuer | | Shares/Par | | | Value ($) | |
| | | | | | | | |
| Common Stocks - continued | | | | | | | | |
| Medical Equipment - 6.3% | | | | | | | | |
| DENTSPLY International, Inc. | | | 77,330 | | | $ | 2,848,837 | |
| Essilor International S.A. | | | 11,118 | | | | 1,002,257 | |
| Sonova Holding AG | | | 24,477 | | | | 2,461,367 | |
| St. Jude Medical, Inc. | | | 36,430 | | | | 1,393,812 | |
| Thermo Fisher Scientific, Inc. | | | 47,030 | | | | 2,871,652 | |
| Waters Corp. (a) | | | 20,250 | | | | 1,656,653 | |
| | | | | | | | |
| | | | | | | $ | 12,234,578 | |
| Metals & Mining - 1.7% | | | | | | | | |
| Rio Tinto PLC | | | 65,320 | | | $ | 3,272,458 | |
| | |
| Oil Services - 2.1% | | | | | | | | |
| National Oilwell Varco, Inc. | | | 10,560 | | | $ | 778,272 | |
| Schlumberger Ltd. | | | 48,350 | | | | 3,361,776 | |
| | | | | | | | |
| | | | | | | $ | 4,140,048 | |
| Other Banks & Diversified Financials - 6.1% | | | | | | | | |
| Credicorp Ltd. | | | 15,190 | | | $ | 1,964,675 | |
| HDFC Bank Ltd. | | | 106,527 | | | | 1,255,868 | |
| Itau Unibanco Holding S.A., ADR | | | 118,290 | | | | 1,724,668 | |
| Julius Baer Group Ltd. | | | 70,946 | | | | 2,460,599 | |
| MasterCard, Inc., “A” | | | 3,330 | | | | 1,534,897 | |
| Visa, Inc., “A” | | | 20,080 | | | | 2,786,301 | |
| | | | | | | | |
| | | | | | | $ | 11,727,008 | |
| Pharmaceuticals - 2.1% | | | | | | | | |
| Allergan, Inc. | | | 13,680 | | | $ | 1,230,106 | |
| Bayer AG | | | 21,069 | | | | 1,834,864 | |
| Johnson & Johnson | | | 14,690 | | | | 1,040,346 | |
| | | | | | | | |
| | | | | | | $ | 4,105,316 | |
| Railroad & Shipping - 1.0% | | | | | | | | |
| Kuehne & Nagel International AG | | | 17,140 | | | $ | 2,000,556 | |
| | |
| Real Estate - 0.1% | | | | | | | | |
| Brasil Brokers Participacoes S.A. | | | 79,900 | | | $ | 224,234 | |
| | |
| Restaurants - 1.2% | | | | | | | | |
| McDonald’s Corp. | | | 25,740 | | | $ | 2,234,232 | |
| | |
| Specialty Chemicals - 3.3% | | | | | | | | |
| Croda International PLC | | | 21,510 | | | $ | 764,006 | |
| L’Air Liquide S.A. | | | 8,266 | | | | 974,972 | |
15
Portfolio of Investments – continued
| | | | | | | | |
| Issuer | | Shares/Par | | | Value ($) | |
| | | | | | | | |
| Common Stocks - continued | | | | | | | | |
| Specialty Chemicals - continued | | | | | | | | |
| Linde AG | | | 11,800 | | | $ | 1,984,470 | |
| Praxair, Inc. | | | 16,140 | | | | 1,714,229 | |
| Symrise AG | | | 27,293 | | | | 981,148 | |
| | | | | | | | |
| | | | | | | $ | 6,418,825 | |
| Specialty Stores - 1.1% | | | | | | | | |
| Industria de Diseno Textil S.A. | | | 17,196 | | | $ | 2,194,089 | |
| | |
| Telecommunications - Wireless - 0.5% | | | | | | | | |
| MTN Group Ltd. | | | 50,655 | | | $ | 913,357 | |
| | |
| Trucking - 1.2% | | | | | | | | |
| Expeditors International of Washington, Inc. | | | 61,810 | | | $ | 2,262,864 | |
| Total Common Stocks (Identified Cost, $174,682,690) | | | | | | $ | 191,495,977 | |
| | |
| Money Market Funds - 0.8% | | | | | | | | |
MFS Institutional Money Market Portfolio, 0.16%,
at Cost and Net Asset Value (v) | | | 1,568,106 | | | $ | 1,568,106 | |
| Total Investments (Identified Cost, $176,250,796) | | | | | | $ | 193,064,083 | |
| | |
| Other Assets, Less Liabilities - 0.4% | | | | | | | 869,422 | |
| Net Assets - 100.0% | | | | | | $ | 193,933,505 | |
| (a) | Non-income producing security. |
| (v) | Underlying affiliated fund that is available only to investment companies managed by MFS. The rate quoted for the MFS Institutional Money Market Portfolio is the annualized seven-day yield of the fund at period end. |
The following abbreviations are used in this report and are defined:
| ADR | | American Depositary Receipt |
| IPS | | International Preference Stock |
| PLC | | Public Limited Company |
See Notes to Financial Statements
16
Financial Statements
STATEMENT OF ASSETS AND LIABILITIES
At 10/31/12
This statement represents your fund’s balance sheet, which details the assets and liabilities comprising the total value of the fund.
| | | | |
| Assets | | | | |
Investments- | | | | |
Non-affiliated issuers, at value (identified cost, $174,682,690) | | | $191,495,977 | |
Underlying affiliated funds, at cost and value | | | 1,568,106 | |
Total investments, at value (identified cost, $176,250,796) | | | $193,064,083 | |
Cash | | | 83,582 | |
Receivables for | | | | |
Investments sold | | | 978,055 | |
Fund shares sold | | | 105,249 | |
Interest and dividends | | | 298,792 | |
Total assets | | | $194,529,761 | |
| Liabilities | | | | |
Payables for | | | | |
Investments purchased | | | $102,239 | |
Fund shares reacquired | | | 301,759 | |
Payable to affiliates | | | | |
Investment adviser | | | 14,602 | |
Shareholder servicing costs | | | 101,749 | |
Distribution and service fees | | | 5,108 | |
Payable for independent Trustees’ compensation | | | 25,133 | |
Accrued expenses and other liabilities | | | 45,666 | |
Total liabilities | | | $596,256 | |
Net assets | | | $193,933,505 | |
| Net assets consist of | | | | |
Paid-in capital | | | $180,185,909 | |
Unrealized appreciation (depreciation) on investments and translation of assets and liabilities in foreign currencies | | | 16,819,887 | |
Accumulated net realized gain (loss) on investments and foreign currency | | | (3,506,357 | ) |
Undistributed net investment income | | | 434,066 | |
Net assets | | | $193,933,505 | |
Shares of beneficial interest outstanding | | | 7,133,099 | |
17
Statement of Assets and Liabilities – continued
| | | | | | | | | | | | |
| | | Net assets | | | Shares
outstanding | | | Net asset value
per share (a) | |
Class A | | | $159,904,535 | | | | 5,824,776 | | | | $27.45 | |
Class B | | | 7,965,516 | | | | 316,403 | | | | 25.18 | |
Class C | | | 11,303,825 | | | | 453,491 | | | | 24.93 | |
Class I | | | 7,512,760 | | | | 268,149 | | | | 28.02 | |
Class R1 | | | 763,097 | | | | 30,667 | | | | 24.88 | |
Class R2 | | | 3,250,126 | | | | 121,433 | | | | 26.76 | |
Class R3 | | | 2,942,024 | | | | 107,583 | | | | 27.35 | |
Class R4 | | | 291,622 | | | | 10,597 | | | | 27.52 | |
| (a) | Maximum offering price per share was equal to the net asset value per share for all share classes, except for Class A, for which the maximum offering price per share was $29.12 [100 / 94.25 x $27.45]. On sales of $50,000 or more, the maximum offering price of Class A shares is reduced. A contingent deferred sales charge may be imposed on redemptions of Class A, Class B, and Class C shares. Redemption price per share was equal to the net asset value per share for Classes I, R1, R2, R3, and R4. |
See Notes to Financial Statements
18
Financial Statements
STATEMENT OF OPERATIONS
Year ended 10/31/12
This statement describes how much your fund earned in investment income and accrued in expenses. It also describes any gains and/or losses generated by fund operations.
| | | | |
| Net investment income | | | | |
Income | | | | |
Dividends | | | $3,736,738 | |
Interest | | | 50,548 | |
Dividends from underlying affiliated funds | | | 2,156 | |
Foreign taxes withheld | | | (153,352 | ) |
Total investment income | | | $3,636,090 | |
Expenses | | | | |
Management fee | | | $1,761,935 | |
Distribution and service fees | | | 637,693 | |
Shareholder servicing costs | | | 392,635 | |
Administrative services fee | | | 38,826 | |
Independent Trustees’ compensation | | | 9,693 | |
Custodian fee | | | 90,164 | |
Shareholder communications | | | 24,693 | |
Audit and tax fees | | | 65,774 | |
Legal fees | | | 2,617 | |
Miscellaneous | | | 119,461 | |
Total expenses | | | $3,143,491 | |
Fees paid indirectly | | | (6 | ) |
Reduction of expenses by investment adviser | | | (699 | ) |
Net expenses | | | $3,142,786 | |
Net investment income | | | $493,304 | |
| Realized and unrealized gain (loss) on investments and foreign currency | | | | |
Realized gain (loss) (identified cost basis) | | | | |
Investments | | | $5,283,297 | |
Foreign currency | | | (27,274 | ) |
Net realized gain (loss) on investments and foreign currency | | | $5,256,023 | |
Change in unrealized appreciation (depreciation) | | | | |
Investments | | | $9,108,940 | |
Translation of assets and liabilities in foreign currencies | | | (14,232 | ) |
Net unrealized gain (loss) on investments and foreign currency translation | | | $9,094,708 | |
Net realized and unrealized gain (loss) on investments and foreign currency | | | $14,350,731 | |
Change in net assets from operations | | | $14,844,035 | |
See Notes to Financial Statements
19
Financial Statements
STATEMENTS OF CHANGES IN NET ASSETS
These statements describe the increases and/or decreases in net assets resulting from operations, any distributions, and any shareholder transactions.
| | | | | | | | |
| | | Years ended 10/31 | |
| | | 2012 | | | 2011 | |
| Change in net assets | | | | | | |
| From operations | | | | | | | | |
Net investment income | | | $493,304 | | | | $734,646 | |
Net realized gain (loss) on investments and foreign currency | | | 5,256,023 | | | | 13,222,696 | |
Net unrealized gain (loss) on investments and foreign currency translation | | | 9,094,708 | | | | (7,707,674 | ) |
Change in net assets from operations | | | $14,844,035 | | | | $6,249,668 | |
| Distributions declared to shareholders | | | | | | | | |
From net investment income | | | $(513,017 | ) | | | $(470,013 | ) |
Change in net assets from fund share transactions | | | $(21,012,800 | ) | | | $(32,285,117 | ) |
Total change in net assets | | | $(6,681,782 | ) | | | $(26,505,462 | ) |
| Net assets | | | | | | | | |
At beginning of period | | | 200,615,287 | | | | 227,120,749 | |
At end of period (including undistributed net investment income of $434,066 and $481,053, respectively) | | | $193,933,505 | | | | $200,615,287 | |
See Notes to Financial Statements
20
Financial Statements
FINANCIAL HIGHLIGHTS
The financial highlights table is intended to help you understand the fund’s financial performance for the past 5 years (or life of a particular share class, if shorter). Certain information reflects financial results for a single fund share. The total returns in the table represent the rate by which an investor would have earned (or lost) on an investment in the fund share class (assuming reinvestment of all distributions) held for the entire period.
| | | | | | | | | | | | | | | | | | | | |
| Class A | | Years ended 10/31 | |
| | | 2012 | | | 2011 | | | 2010 | | | 2009 | | | 2008 | |
Net asset value, beginning of period | | | $25.50 | | | | $24.88 | | | | $21.93 | | | | $17.35 | | | | $29.26 | |
| Income (loss) from investment operations | | | | | | | | | | | | | | | | | |
Net investment income (d) | | | $0.09 | | | | $0.11 | | | | $0.08 | | | | $0.11 | | | | $0.08 | |
Net realized and unrealized gain (loss) on
investments and foreign currency | | | 1.93 | | | | 0.57 | | | | 2.96 | | | | 4.47 | | | | (11.82 | ) |
Total from investment operations | | | $2.02 | | | | $0.68 | | | | $3.04 | | | | $4.58 | | | | $(11.74 | ) |
| Less distributions declared to shareholders | | | | | | | | | | | | | | | | | |
From net investment income | | | $(0.07 | ) | | | $(0.06 | ) | | | $(0.09 | ) | | | $(0.00 | )(w) | | | $(0.17 | ) |
Net asset value, end of period (x) | | | $27.45 | | | | $25.50 | | | | $24.88 | | | | $21.93 | | | | $17.35 | |
Total return (%) (r)(s)(t)(x) | | | 7.98 | | | | 2.73 | | | | 13.92 | | | | 26.40 | | | | (40.34 | ) |
Ratios (%) (to average net assets)
and Supplemental data: | | | | | | | | | | | | | | | | | | | | |
Expenses before expense reductions (f) | | | 1.53 | | | | 1.53 | | | | 1.55 | | | | 1.70 | | | | 1.62 | |
Expenses after expense reductions (f) | | | 1.53 | | | | 1.53 | | | | 1.55 | | | | 1.67 | | | | 1.52 | |
Net investment income | | | 0.33 | | | | 0.42 | | | | 0.34 | | | | 0.59 | | | | 0.30 | |
Portfolio turnover | | | 37 | | | | 39 | | | | 63 | | | | 83 | | | | 88 | |
Net assets at end of period (000 omitted) | | | $159,905 | | | | $164,474 | | | | $183,544 | | | | $180,278 | | | | $153,184 | |
See Notes to Financial Statements
21
Financial Highlights – continued
| | | | | | | | | | | | | | | | | | | | |
| Class B | | Years ended 10/31 | |
| | | 2012 | | | 2011 | | | 2010 | | | 2009 | | | 2008 | |
Net asset value, beginning of period | | | $23.49 | | | | $23.03 | | | | $20.37 | | | | $16.24 | | | | $27.42 | |
| Income (loss) from investment operations | | | | | | | | | | | | | | | | | |
Net investment loss (d) | | | $(0.10 | ) | | | $(0.08 | ) | | | $(0.09 | ) | | | $(0.03 | ) | | | $(0.11 | ) |
Net realized and unrealized gain (loss) on
investments and foreign currency | | | 1.79 | | | | 0.54 | | | | 2.75 | | | | 4.16 | | | | (11.07 | ) |
Total from investment operations | | | $1.69 | | | | $0.46 | | | | $2.66 | | | | $4.13 | | | | $(11.18 | ) |
Net asset value, end of period (x) | | | $25.18 | | | | $23.49 | | | | $23.03 | | | | $20.37 | | | | $16.24 | |
Total return (%) (r)(s)(t)(x) | | | 7.19 | | | | 2.00 | | | | 13.06 | | | | 25.43 | | | | (40.77 | ) |
Ratios (%) (to average net assets)
and Supplemental data: | | | | | | | | | | | | | | | | | | | | |
Expenses before expense reductions (f) | | | 2.28 | | | | 2.28 | | | | 2.30 | | | | 2.43 | | | | 2.27 | |
Expenses after expense reductions (f) | | | 2.28 | | | | 2.28 | | | | 2.30 | | | | 2.43 | | | | 2.27 | |
Net investment loss | | | (0.43 | ) | | | (0.35 | ) | | | (0.43 | ) | | | (0.19 | ) | | | (0.47 | ) |
Portfolio turnover | | | 37 | | | | 39 | | | | 63 | | | | 83 | | | | 88 | |
Net assets at end of period (000 omitted) | | | $7,966 | | | | $9,854 | | | | $13,563 | | | | $17,219 | | | | $19,582 | |
| |
| Class C | | Years ended 10/31 | |
| | | 2012 | | | 2011 | | | 2010 | | | 2009 | | | 2008 | |
Net asset value, beginning of period | | | $23.25 | | | | $22.81 | | | | $20.17 | | | | $16.08 | | | | $27.15 | |
| Income (loss) from investment operations | | | | | | | | | | | | | | | | | |
Net investment loss (d) | | | $(0.10 | ) | | | $(0.07 | ) | | | $(0.09 | ) | | | $(0.03 | ) | | | $(0.11 | ) |
Net realized and unrealized gain (loss) on
investments and foreign currency | | | 1.78 | | | | 0.51 | | | | 2.73 | | | | 4.12 | | | | (10.96 | ) |
Total from investment operations | | | $1.68 | | | | $0.44 | | | | $2.64 | | | | $4.09 | | | | $(11.07 | ) |
| Less distributions declared to shareholders | | | | | | | | | | | | | | | | | |
From net investment income | | | $— | | | | $— | | | | $— | | | | $— | | | | $(0.00 | )(w) |
Net asset value, end of period (x) | | | $24.93 | | | | $23.25 | | | | $22.81 | | | | $20.17 | | | | $16.08 | |
Total return (%) (r)(s)(t)(x) | | | 7.23 | | | | 1.93 | | | | 13.09 | | | | 25.44 | | | | (40.77 | ) |
Ratios (%) (to average net assets)
and Supplemental data: | | | | | | | | | | | | | | | | | | | | |
Expenses before expense reductions (f) | | | 2.28 | | | | 2.28 | | | | 2.30 | | | | 2.42 | | | | 2.27 | |
Expenses after expense reductions (f) | | | 2.28 | | | | 2.28 | | | | 2.30 | | | | 2.41 | | | | 2.27 | |
Net investment loss | | | (0.42 | ) | | | (0.31 | ) | | | (0.41 | ) | | | (0.19 | ) | | | (0.45 | ) |
Portfolio turnover | | | 37 | | | | 39 | | | | 63 | | | | 83 | | | | 88 | |
Net assets at end of period (000 omitted) | | | $11,304 | | | | $11,327 | | | | $14,485 | | | | $13,598 | | | | $10,326 | |
See Notes to Financial Statements
22
Financial Highlights – continued
| | | | | | | | | | | | | | | | | | | | |
| Class I | | Years ended 10/31 | |
| | | 2012 | | | 2011 | | | 2010 | | | 2009 | | | 2008 | |
Net asset value, beginning of period | | | $26.03 | | | | $25.39 | | | | $22.37 | | | | $17.73 | | | | $29.87 | |
| Income (loss) from investment operations | | | | | | | | | | | | | | | | | |
Net investment income (d) | | | $0.16 | | | | $0.18 | | | | $0.14 | | | | $0.16 | | | | $0.14 | |
Net realized and unrealized gain (loss) on
investments and foreign currency | | | 1.97 | | | | 0.58 | | | | 3.02 | | | | 4.55 | | | | (12.05 | ) |
Total from investment operations | | | $2.13 | | | | $0.76 | | | | $3.16 | | | | $4.71 | | | | $(11.91 | ) |
| Less distributions declared to shareholders | | | | | | | | | | | | | | | | | |
From net investment income | | | $(0.14 | ) | | | $(0.12 | ) | | | $(0.14 | ) | | | $(0.07 | ) | | | $(0.23 | ) |
Net asset value, end of period (x) | | | $28.02 | | | | $26.03 | | | | $25.39 | | | | $22.37 | | | | $17.73 | |
Total return (%) (r)(s)(x) | | | 8.29 | | | | 2.99 | | | | 14.18 | | | | 26.68 | | | | (40.16 | ) |
Ratios (%) (to average net assets)
and Supplemental data: | | | | | | | | | | | | | | | | | | | | |
Expenses before expense reductions (f) | | | 1.28 | | | | 1.28 | | | | 1.30 | | | | 1.42 | | | | 1.27 | |
Expenses after expense reductions (f) | | | 1.28 | | | | 1.28 | | | | 1.30 | | | | 1.41 | | | | 1.27 | |
Net investment income | | | 0.58 | | | | 0.67 | | | | 0.60 | | | | 0.84 | | | | 0.54 | |
Portfolio turnover | | | 37 | | | | 39 | | | | 63 | | | | 83 | | | | 88 | |
Net assets at end of period (000 omitted) | | | $7,513 | | | | $6,731 | | | | $6,788 | | | | $5,875 | | | | $4,306 | |
| |
| Class R1 | | Years ended 10/31 | |
| | | 2012 | | | 2011 | | | 2010 | | | 2009 | | | 2008 | |
Net asset value, beginning of period | | | $23.22 | | | | $22.77 | | | | $20.14 | | | | $16.05 | | | | $27.29 | |
| Income (loss) from investment operations | | | | | | | | | | | | | | | | | |
Net investment loss (d) | | | $(0.09 | ) | | | $(0.08 | ) | | | $(0.08 | ) | | | $(0.02 | ) | | | $(0.12 | ) |
Net realized and unrealized gain (loss) on
investments and foreign currency | | | 1.75 | | | | 0.53 | | | | 2.71 | | | | 4.11 | | | | (10.95 | ) |
Total from investment operations | | | $1.66 | | | | $0.45 | | | | $2.63 | | | | $4.09 | | | | $(11.07 | ) |
| Less distributions declared to shareholders | | | | | | | | | | | | | | | | | |
From net investment income | | | $— | | | | $— | | | | $— | | | | $— | | | | $(0.17 | ) |
Net asset value, end of period (x) | | | $24.88 | | | | $23.22 | | | | $22.77 | | | | $20.14 | | | | $16.05 | |
Total return (%) (r)(s)(x) | | | 7.15 | | | | 1.98 | | | | 13.06 | | | | 25.48 | | | | (40.80 | ) |
Ratios (%) (to average net assets)
and Supplemental data: | | | | | | | | | | | | | | | | | | | | |
Expenses before expense reductions (f) | | | 2.28 | | | | 2.28 | | | | 2.30 | | | | 2.41 | | | | 2.31 | |
Expenses after expense reductions (f) | | | 2.28 | | | | 2.28 | | | | 2.30 | | | | 2.41 | | | | 2.31 | |
Net investment loss | | | (0.39 | ) | | | (0.33 | ) | | | (0.38 | ) | | | (0.11 | ) | | | (0.53 | ) |
Portfolio turnover | | | 37 | | | | 39 | | | | 63 | | | | 83 | | | | 88 | |
Net assets at end of period (000 omitted) | | | $763 | | | | $775 | | | | $791 | | | | $886 | | | | $632 | |
See Notes to Financial Statements
23
Financial Highlights – continued
| | | | | | | | | | | | | | | | | | | | |
| Class R2 | | Years ended 10/31 | |
| | | 2012 | | | 2011 | | | 2010 | | | 2009 | | | 2008 | |
Net asset value, beginning of period | | | $24.84 | | | | $24.25 | | | | $21.37 | | | | $16.95 | | | | $28.77 | |
| Income (loss) from investment operations | | | | | | | | | | | | | | | | | |
Net investment income (d) | | | $0.02 | | | | $0.04 | | | | $0.02 | | | | $0.06 | | | | $0.02 | |
Net realized and unrealized gain (loss) on
investments and foreign currency | | | 1.90 | | | | 0.55 | | | | 2.90 | | | | 4.36 | | | | (11.66 | ) |
Total from investment operations | | | $1.92 | | | | $0.59 | | | | $2.92 | | | | $4.42 | | | | $(11.64 | ) |
| Less distributions declared to shareholders | | | | | | | | | | | | | | | | | |
From net investment income | | | $— | | | | $(0.00 | )(w) | | | $(0.04 | ) | | | $— | | | | $(0.18 | ) |
Net asset value, end of period (x) | | | $26.76 | | | | $24.84 | | | | $24.25 | | | | $21.37 | | | | $16.95 | |
Total return (%) (r)(s)(x) | | | 7.73 | | | | 2.45 | | | | 13.66 | | | | 26.08 | | | | (40.70 | ) |
Ratios (%) (to average net assets)
and Supplemental data: | | | | | | | | | | | | | | | | | | | | |
Expenses before expense reductions (f) | | | 1.78 | | | | 1.78 | | | | 1.80 | | | | 1.93 | | | | 1.79 | |
Expenses after expense reductions (f) | | | 1.78 | | | | 1.78 | | | | 1.80 | | | | 1.93 | | | | 1.79 | |
Net investment income | | | 0.09 | | | | 0.14 | | | | 0.10 | | | | 0.36 | | | | 0.06 | |
Portfolio turnover | | | 37 | | | | 39 | | | | 63 | | | | 83 | | | | 88 | |
Net assets at end of period (000 omitted) | | | $3,250 | | | | $4,586 | | | | $5,250 | | | | $5,128 | | | | $4,808 | |
| |
| Class R3 | | Years ended 10/31 | |
| | | 2012 | | | 2011 | | | 2010 | | | 2009 | | | 2008 | |
Net asset value, beginning of period | | | $25.41 | | | | $24.80 | | | | $21.86 | | | | $17.29 | | | | $29.16 | |
| Income (loss) from investment operations | | | | | | | | | | | | | | | | | |
Net investment income (d) | | | $0.09 | | | | $0.11 | | | | $0.08 | | | | $0.11 | | | | $0.07 | |
Net realized and unrealized gain (loss) on
investments and foreign currency | | | 1.93 | | | | 0.56 | | | | 2.96 | | | | 4.46 | | | | (11.78 | ) |
Total from investment operations | | | $2.02 | | | | $0.67 | | | | $3.04 | | | | $4.57 | | | | $(11.71 | ) |
| Less distributions declared to shareholders | | | | | | | | | | | | | | | | | |
From net investment income | | | $(0.08 | ) | | | $(0.06 | ) | | | $(0.10 | ) | | | $— | | | | $(0.16 | ) |
Net asset value, end of period (x) | | | $27.35 | | | | $25.41 | | | | $24.80 | | | | $21.86 | | | | $17.29 | |
Total return (%) (r)(s)(x) | | | 8.00 | | | | 2.72 | | | | 13.93 | | | | 26.43 | | | | (40.37 | ) |
Ratios (%) (to average net assets)
and Supplemental data: | | | | | | | | | | | | | | | | | | | | |
Expenses before expense reductions (f) | | | 1.53 | | | | 1.53 | | | | 1.55 | | | | 1.67 | | | | 1.55 | |
Expenses after expense reductions (f) | | | 1.53 | | | | 1.53 | | | | 1.55 | | | | 1.67 | | | | 1.55 | |
Net investment income | | | 0.32 | | | | 0.42 | | | | 0.34 | | | | 0.60 | | | | 0.28 | |
Portfolio turnover | | | 37 | | | | 39 | | | | 63 | | | | 83 | | | | 88 | |
Net assets at end of period (000 omitted) | | | $2,942 | | | | $2,693 | | | | $2,528 | | | | $2,168 | | | | $1,779 | |
See Notes to Financial Statements
24
Financial Highlights – continued
| | | | | | | | | | | | | | | | | | | | |
| Class R4 | | Years ended 10/31 | |
| | | 2012 | | | 2011 | | | 2010 | | | 2009 | | | 2008 | |
Net asset value, beginning of period | | | $25.57 | | | | $24.95 | | | | $21.98 | | | | $17.41 | | | | $29.33 | |
| Income (loss) from investment operations | | | | | | | | | | | | | | | | | |
Net investment income (d) | | | $0.14 | | | | $0.17 | | | | $0.14 | | | | $0.19 | | | | $0.14 | |
Net realized and unrealized gain (loss) on
investments and foreign currency | | | 1.95 | | | | 0.57 | | | | 2.97 | | | | 4.44 | | | | (11.85 | ) |
Total from investment operations | | | $2.09 | | | | $0.74 | | | | $3.11 | | | | $4.63 | | | | $(11.71 | ) |
| Less distributions declared to shareholders | | | | | | | | | | | | | | | | | |
From net investment income | | | $(0.14 | ) | | | $(0.12 | ) | | | $(0.14 | ) | | | $(0.06 | ) | | | $(0.21 | ) |
Net asset value, end of period (x) | | | $27.52 | | | | $25.57 | | | | $24.95 | | | | $21.98 | | | | $17.41 | |
Total return (%) (r)(s)(x) | | | 8.28 | | | | 2.96 | | | | 14.21 | | | | 26.73 | | | | (40.20 | ) |
Ratios (%) (to average net assets)
and Supplemental data: | | | | | | | | | | | | | | | | | | | | |
Expenses before expense reductions (f) | | | 1.28 | | | | 1.28 | | | | 1.30 | | | | 1.38 | | | | 1.29 | |
Expenses after expense reductions (f) | | | 1.28 | | | | 1.28 | | | | 1.30 | | | | 1.38 | | | | 1.29 | |
Net investment income | | | 0.51 | | | | 0.67 | | | | 0.60 | | | | 1.03 | | | | 0.54 | |
Portfolio turnover | | | 37 | | | | 39 | | | | 63 | | | | 83 | | | | 88 | |
Net assets at end of period (000 omitted) | | | $292 | | | | $175 | | | | $171 | | | | $146 | | | | $46 | |
| (d) | Per share data is based on average shares outstanding. |
| (f) | Ratios do not reflect reductions from fees paid indirectly, if applicable. |
| (r) | Certain expenses have been reduced without which performance would have been lower. |
| (s) | From time to time the fund may receive proceeds from litigation settlements, without which performance would be lower. |
| (t) | Total returns do not include any applicable sales charges. |
| (w) | Per share amount was less than $0.01. |
| (x) | The net asset values per share and total returns have been calculated on net assets which include adjustments made in accordance with U.S. generally accepted accounting principles required at period end for financial reporting purposes. |
See Notes to Financial Statements
25
NOTES TO FINANCIAL STATEMENTS
(1) Business and Organization
MFS Global Growth Fund (the fund) is a series of MFS Series Trust VIII (the trust). The trust is organized as a Massachusetts business trust and is registered under the Investment Company Act of 1940, as amended, as an open-end management investment company.
(2) Significant Accounting Policies
General – The preparation of financial statements in conformity with U.S. generally accepted accounting principles requires management to make estimates and assumptions that affect the reported amounts of assets and liabilities, and disclosure of contingent assets and liabilities at the date of the financial statements and the reported amounts of revenues and expenses during the reporting period. Actual results could differ from those estimates. In the preparation of these financial statements, management has evaluated subsequent events occurring after the date of the fund’s Statement of Assets and Liabilities through the date that the financial statements were issued. The fund invests in foreign securities. Investments in foreign securities are vulnerable to the effects of changes in the relative values of the local currency and the U.S. dollar and to the effects of changes in each country’s legal, political, and economic environment.
In this reporting period the fund adopted FASB Accounting Standards Update 2011-04, Fair Value Measurement (Topic 820) – Amendments to Achieve Common Fair Value Measurement and Disclosure Requirements in U.S. GAAP and IFRSs (“ASU 2011-04”). ASU 2011-04 seeks to improve the comparability of fair value measurements as presented and disclosed in financial statements prepared in accordance with U.S. GAAP and International Financial Reporting Standards (IFRS) by providing common requirements for fair value measurement and disclosure.
In December 2011, the Financial Accounting Standards Board issued Accounting Standards Update 2011-11, Balance Sheet (Topic 210) – Disclosures about Offsetting Assets and Liabilities (“ASU 2011-11”). Effective for annual reporting periods beginning on or after January 1, 2013 and interim periods within those annual periods, ASU 2011-11 is intended to enhance disclosure requirements on the offsetting of financial assets and liabilities. Although still evaluating the potential impacts of ASU 2011-11 to the fund, management expects that the impact of the fund’s adoption will be limited to additional financial statement disclosures.
Investment Valuations – Equity securities, including restricted equity securities, are generally valued at the last sale or official closing price as provided by a third-party pricing service on the market or exchange on which they are primarily traded. Equity securities, for which there were no sales reported that day, are generally valued at the last quoted daily bid quotation as provided by a third-party pricing service on the market or exchange on which such securities are primarily traded. Short-term instruments with a maturity at issuance of 60 days or less generally are valued at amortized cost, which approximates market value. Open-end investment companies are generally valued at net asset value per share. Securities and other assets generally valued on the basis of information from a third-party pricing service may also be valued at a broker/dealer bid quotation. Values obtained from third-party pricing services can
26
Notes to Financial Statements – continued
utilize both transaction data and market information such as yield, quality, coupon rate, maturity, type of issue, trading characteristics, and other market data. The values of foreign securities and other assets and liabilities expressed in foreign currencies are converted to U.S. dollars using the mean of bid and asked prices for rates provided by a third-party pricing service.
The Board of Trustees has delegated primary responsibility for determining or causing to be determined the value of the fund’s investments (including any fair valuation) to the adviser pursuant to valuation policies and procedures approved by the Board. If the adviser determines that reliable market quotations are not readily available, investments are valued at fair value as determined in good faith by the adviser in accordance with such procedures under the oversight of the Board of Trustees. Under the fund’s valuation policies and procedures, market quotations are not considered to be readily available for most types of debt instruments and floating rate loans and many types of derivatives. These investments are generally valued at fair value based on information from third-party pricing services. In addition, investments may be valued at fair value if the adviser determines that an investment’s value has been materially affected by events occurring after the close of the exchange or market on which the investment is principally traded (such as foreign exchange or market) and prior to the determination of the fund’s net asset value, or after the halting of trading of a specific security where trading does not resume prior to the close of the exchange or market on which the security is principally traded. Events that occur on a frequent basis after foreign markets close (such as developments in foreign markets and significant movements in the U.S. markets) and prior to the determination of the fund’s net asset value may be deemed to have a material effect on the value of securities traded in foreign markets. Accordingly, the fund’s foreign equity securities may often be valued at fair value. The adviser generally relies on third-party pricing services or other information (such as the correlation with price movements of similar securities in the same or other markets; the type, cost and investment characteristics of the security; the business and financial condition of the issuer; and trading and other market data) to assist in determining whether to fair value and at what value to fair value an investment. The value of an investment for purposes of calculating the fund’s net asset value can differ depending on the source and method used to determine value. When fair valuation is used, the value of an investment used to determine the fund’s net asset value may differ from quoted or published prices for the same investment. There can be no assurance that the fund could obtain the fair value assigned to an investment if it were to sell the investment at the same time at which the fund determines its net asset value per share.
Various inputs are used in determining the value of the fund’s assets or liabilities. These inputs are categorized into three broad levels. In certain cases, the inputs used to measure fair value may fall into different levels of the fair value hierarchy. In such cases, an investment’s level within the fair value hierarchy is based on the lowest level of input that is significant to the fair value measurement. The fund’s assessment of the significance of a particular input to the fair value measurement in its entirety requires judgment, and considers factors specific to the investment. Level 1 includes unadjusted quoted prices in active markets for identical assets or liabilities. Level 2 includes other significant observable market-based inputs (including quoted prices for similar securities, interest rates, prepayment speed, and credit risk). Level 3 includes
27
Notes to Financial Statements – continued
unobservable inputs, which may include the adviser’s own assumptions in determining the fair value of investments. The following is a summary of the levels used as of October 31, 2012 in valuing the fund’s assets or liabilities:
| | | | | | | | | | | | | | | | |
| Investments at Value | | Level 1 | | | Level 2 | | | Level 3 | | | Total | |
| Equity Securities: | | | | | | | | | | | | | | | | |
United States | | | $97,569,915 | | | | $— | | | | $— | | | | $97,569,915 | |
France | | | 24,636,167 | | | | — | | | | — | | | | 24,636,167 | |
United Kingdom | | | 21,076,818 | | | | 12,599 | | | | — | | | | 21,089,417 | |
Switzerland | | | 12,421,745 | | | | — | | | | — | | | | 12,421,745 | |
Brazil | | | 7,726,832 | | | | — | | | | — | | | | 7,726,832 | |
Germany | | | 7,474,918 | | | | — | | | | — | | | | 7,474,918 | |
Taiwan | | | 3,148,486 | | | | — | | | | — | | | | 3,148,486 | |
Hong Kong | | | 2,563,751 | | | | — | | | | — | | | | 2,563,751 | |
Netherlands | | | 2,487,782 | | | | — | | | | — | | | | 2,487,782 | |
Other Countries | | | 12,376,964 | | | | — | | | | — | | | | 12,376,964 | |
| Mutual Funds | | | 1,568,106 | | | | — | | | | — | | | | 1,568,106 | |
| Total Investments | | | $193,051,484 | | | | $12,599 | | | | $— | | | | $193,064,083 | |
For further information regarding security characteristics, see the Portfolio of Investments.
Of the level 1 investments presented above, equity investments amounting to $62,372,327 would have been considered level 2 investments at the beginning of the period. The primary reason for changes in the classifications between levels 1 and 2 occurs when foreign equity securities are fair valued using other observable market-based inputs in place of the closing exchange price due to events occurring after the close of the exchange or market on which the investment is principally traded. The fund’s foreign equity securities may often be valued at fair value. The fund’s policy is to recognize transfers between the levels as of the end of the period.
Repurchase Agreements – The fund entered into repurchase agreements with approved counterparties. Each repurchase agreement is recorded at cost. The fund requires that the securities collateral in a repurchase transaction be transferred to a custodian. The fund monitors, on a daily basis, the value of the collateral to ensure that its value, including accrued interest, is greater than amounts owed to the fund under each such repurchase agreement.
Foreign Currency Translation – Purchases and sales of foreign investments, income, and expenses are converted into U.S. dollars based upon currency exchange rates prevailing on the respective dates of such transactions or on the reporting date for foreign denominated receivables and payables. Gains and losses attributable to foreign currency exchange rates on sales of securities are recorded for financial statement purposes as net realized gains and losses on investments. Gains and losses attributable to foreign exchange rate movements on receivables, payables, income and expenses are recorded for financial statement purposes as foreign currency transaction gains and losses. That portion of both realized and unrealized gains and losses on investments that results from fluctuations in foreign currency exchange rates is not separately disclosed.
28
Notes to Financial Statements – continued
Security Loans – JPMorgan Chase and Co. (“Chase”), as lending agent, loans the securities of the fund to certain qualified institutions (the “Borrowers”) approved by the fund. The loans are collateralized by cash and/or U.S. Treasury and federal agency obligations in an amount typically at least equal to the market value of the securities loaned. The market value of the loaned securities is determined at the close of business of the fund and any additional required collateral is delivered to the fund on the next business day. Chase provides the fund with indemnification against Borrower default. The fund bears the risk of loss with respect to the investment of cash collateral. On loans collateralized by cash, the cash collateral is invested in short-term securities. A portion of the income generated upon investment of the collateral is remitted to the Borrowers, and the remainder is allocated between the fund and the lending agent. On loans collateralized by U.S. Treasury and/or federal agency obligations, a fee is received from the Borrower, and is allocated between the fund and the lending agent. Income from securities lending is included in “Interest” income on the Statement of Operations. The dividend and interest income earned on the securities loaned is accounted for in the same manner as other dividend and interest income.
Indemnifications – Under the fund’s organizational documents, its officers and Trustees may be indemnified against certain liabilities and expenses arising out of the performance of their duties to the fund. Additionally, in the normal course of business, the fund enters into agreements with service providers that may contain indemnification clauses. The fund’s maximum exposure under these agreements is unknown as this would involve future claims that may be made against the fund that have not yet occurred.
Investment Transactions and Income – Investment transactions are recorded on the trade date. Interest income is recorded on the accrual basis. Dividends received in cash are recorded on the ex-dividend date. Certain dividends from foreign securities will be recorded when the fund is informed of the dividend if such information is obtained subsequent to the ex-dividend date. Dividend and interest payments received in additional securities are recorded on the ex-dividend or ex-interest date in an amount equal to the value of the security on such date.
The fund may receive proceeds from litigation settlements. Any proceeds received from litigation involving portfolio holdings are reflected in the Statement of Operations in realized gain/loss if the security has been disposed of by the fund or in unrealized gain/loss if the security is still held by the fund. Any other proceeds from litigation not related to portfolio holdings are reflected as other income in the Statement of Operations.
Fees Paid Indirectly – The fund’s custody fee may be reduced according to an arrangement that measures the value of cash deposited with the custodian by the fund. This amount, for the year ended October 31, 2012, is shown as a reduction of total expenses on the Statement of Operations.
Tax Matters and Distributions – The fund intends to qualify as a regulated investment company, as defined under Subchapter M of the Internal Revenue Code, and to distribute all of its taxable income, including realized capital gains. As a result, no provision for federal income tax is required. The fund’s federal tax returns, when
29
Notes to Financial Statements – continued
filed, will remain subject to examination by the Internal Revenue Service for a three year period. Foreign taxes have been accrued by the fund in the accompanying financial statements.
Distributions to shareholders are recorded on the ex-dividend date. Income and capital gain distributions are determined in accordance with income tax regulations, which may differ from U.S. generally accepted accounting principles. Certain capital accounts in the financial statements are periodically adjusted for permanent differences in order to reflect their tax character. These adjustments have no impact on net assets or net asset value per share. Temporary differences which arise from recognizing certain items of income, expense, gain or loss in different periods for financial statement and tax purposes will reverse at some time in the future. Distributions in excess of net investment income or net realized gains are temporary overdistributions for financial statement purposes resulting from differences in the recognition or classification of income or distributions for financial statement and tax purposes.
Book/tax differences primarily relate to wash sale loss deferrals.
The tax character of distributions declared to shareholders for the last two fiscal years is as follows:
| | | | | | | | |
| | | 10/31/12 | | | 10/31/11 | |
| Ordinary income (including any short-term capital gains) | | | $513,017 | | | | $470,013 | |
The federal tax cost and the tax basis components of distributable earnings were as follows:
| | | | |
| As of 10/31/12 | | | |
| Cost of investments | | | $176,385,063 | |
| Gross appreciation | | | 25,988,934 | |
| Gross depreciation | | | (9,309,914 | ) |
| Net unrealized appreciation (depreciation) | | | $16,679,020 | |
| Undistributed ordinary income | | | 459,188 | |
| Capital loss carryforwards | | | (3,372,090 | ) |
| Other temporary differences | | | (18,522 | ) |
Under the Regulated Investment Company Modernization Act of 2010 (the “Act”), net capital losses recognized after October 31, 2011 may be carried forward indefinitely, and their character is retained as short-term and/or long-term losses. Previously, net capital losses were carried forward for eight years and treated as short-term losses. As a transition rule, the Act requires that post enactment net capital losses be used before pre-enactment net capital losses.
As of October 31, 2012, the fund had capital loss carryforwards available to offset future realized gains. Such losses expire as follows:
| | | | |
| Pre-enactment losses: | | | |
| 10/31/17 | | | $(3,372,090 | ) |
Multiple Classes of Shares of Beneficial Interest – The fund offers multiple classes of shares, which differ in their respective distribution and service fees. The fund’s
30
Notes to Financial Statements – continued
income, realized and unrealized gain (loss), and common expenses are allocated to shareholders based on the daily net assets of each class. Dividends are declared separately for each class. Differences in per share dividend rates are generally due to differences in separate class expenses. Class B shares will convert to Class A shares approximately eight years after purchase. The fund’s distributions declared to shareholders as reported on the Statements of Changes in Net Assets are presented by class as follows:
| | | | | | | | |
| | | From net investment
income | |
| | | Year
ended
10/31/12 | | | Year
ended
10/31/11 | |
| Class A | | | $467,829 | | | | $429,431 | |
| Class I | | | 35,928 | | | | 32,194 | |
| Class R2 | | | — | | | | 907 | |
| Class R3 | | | 8,269 | | | | 6,647 | |
| Class R4 | | | 991 | | | | 834 | |
| Total | | | $513,017 | | | | $470,013 | |
(3) Transactions with Affiliates
Investment Adviser – The fund has an investment advisory agreement with MFS to provide overall investment management and related administrative services and facilities to the fund. The management fee is computed daily and paid monthly at the following annual rates:
| | | | |
| First $1 billion of average daily net assets | | | 0.90 | % |
| Next $1 billion of average daily net assets | | | 0.75 | % |
| Average daily net assets in excess of $2 billion | | | 0.65 | % |
The management fee incurred for the year ended October 31, 2012 was equivalent to an annual effective rate of 0.90% of the fund’s average daily net assets.
Distributor – MFS Fund Distributors, Inc. (MFD), a wholly-owned subsidiary of MFS, as distributor, received $12,703 for the year ended October 31, 2012, as its portion of the initial sales charge on sales of Class A shares of the fund.
The Board of Trustees has adopted a distribution plan for certain class shares pursuant to Rule 12b-1 of the Investment Company Act of 1940.
The fund’s distribution plan provides that the fund will pay MFD for services provided by MFD and financial intermediaries in connection with the distribution and servicing of certain share classes. One component of the plan is a distribution fee paid to MFD and another component of the plan is a service fee paid to MFD. MFD may subsequently pay all, or a portion, of the distribution and/or service fees to financial intermediaries.
31
Notes to Financial Statements – continued
Distribution Plan Fee Table:
| | | | | | | | | | | | | | | | | | | | |
| | | Distribution
Fee Rate (d) | | | Service
Fee Rate (d) | | | Total
Distribution
Plan (d) | | | Annual
Effective
Rate (e) | | | Distribution
and Service
Fee | |
| Class A | | | — | | | | 0.25% | | | | 0.25% | | | | 0.25% | | | | $403,459 | |
| Class B | | | 0.75% | | | | 0.25% | | | | 1.00% | | | | 1.00% | | | | 87,924 | |
| Class C | | | 0.75% | | | | 0.25% | | | | 1.00% | | | | 1.00% | | | | 113,581 | |
| Class R1 | | | 0.75% | | | | 0.25% | | | | 1.00% | | | | 1.00% | | | | 7,906 | |
| Class R2 | | | 0.25% | | | | 0.25% | | | | 0.50% | | | | 0.50% | | | | 17,920 | |
| Class R3 | | | — | | | | 0.25% | | | | 0.25% | | | | 0.25% | | | | 6,903 | |
| Total Distribution and Service Fees | | | | $637,693 | |
| (d) | In accordance with the distribution plan for certain classes, the fund pays distribution and/or service fees equal to these annual percentage rates of each class’ average daily net assets. The distribution and service fee rates disclosed by class represent the current rates in effect at the end of the reporting period. |
| (e) | The annual effective rates represent actual fees incurred under the distribution plan for the year ended October 31, 2012 based on each class’ average daily net assets. |
Certain Class A shares are subject to a contingent deferred sales charge (CDSC) in the event of a shareholder redemption within 18 months of purchase for shares purchased on or after August 1, 2012, and within 24 months of purchase for shares purchased prior to August 1, 2012. Class C shares are subject to a CDSC in the event of a shareholder redemption within 12 months of purchase. Class B shares are subject to a CDSC in the event of a shareholder redemption within six years of purchase. All contingent deferred sales charges are paid to MFD and during the year ended October 31, 2012, were as follows:
| | | | |
| Class A | | | $168 | |
| Class B | | | 9,081 | |
| Class C | | | 901 | |
Shareholder Servicing Agent – MFS Service Center, Inc. (MFSC), a wholly-owned subsidiary of MFS, receives a fee from the fund for its services as shareholder servicing agent calculated as a percentage of the average daily net assets of the fund as determined periodically under the supervision of the fund’s Board of Trustees. For the year ended October 31, 2012, the fee was $165,026, which equated to 0.0843% annually of the fund’s average daily net assets. MFSC also receives payment from the fund for out-of-pocket expenses, sub-accounting and other shareholder servicing costs which may be paid to affiliated and unaffiliated service providers. For the year ended October 31, 2012, these out-of-pocket expenses, sub-accounting and other shareholder servicing costs amounted to $227,609.
Administrator – MFS provides certain financial, legal, shareholder communications, compliance, and other administrative services to the fund. Under an administrative services agreement, the fund partially reimburses MFS the costs incurred to provide these services. The fund is charged an annual fixed amount of $17,500 plus a fee based on average daily net assets. The administrative services fee incurred for the year ended October 31, 2012 was equivalent to an annual effective rate of 0.0198% of the fund’s average daily net assets.
32
Notes to Financial Statements – continued
Trustees’ and Officers’ Compensation – The fund pays compensation to independent Trustees in the form of a retainer, attendance fees, and additional compensation to Board and Committee chairpersons. The fund does not pay compensation directly to Trustees or officers of the fund who are also officers of the investment adviser, all of whom receive remuneration for their services to the fund from MFS. Certain officers and Trustees of the fund are officers or directors of MFS, MFD, and MFSC.
Prior to December 31, 2001, the fund had an unfunded defined benefit plan (“DB plan”) for independent Trustees. As of December 31, 2001, the Board took action to terminate the DB plan with respect to then-current and any future independent Trustees, such that the DB plan covers only certain of those former independent Trustees who retired on or before December 31, 2001. Effective January 1, 2002, accrued benefits under the DB plan for then-current independent Trustees who continued were credited to an unfunded retirement deferral plan (the “Retirement Deferral plan”), which was established for and exists solely with respect to these credited amounts, and is not available for other deferrals by these or other independent Trustees. Although the Retirement Deferral plan is unfunded, amounts deferred under the plan are periodically adjusted for investment experience as if they had been invested in shares of the fund. The DB plan resulted in a pension expense of $527 and the Retirement Deferral plan resulted in an expense of $2,996. Both amounts are included in “independent Trustees’ compensation” for the year ended October 31, 2012. The liability for deferred retirement benefits payable to certain independent Trustees under both plans amounted to $25,073 at October 31, 2012, and is included in “Payable for independent Trustees’ compensation” on the Statement of Assets and Liabilities.
Other – This fund and certain other funds managed by MFS (the funds) have entered into services agreements (the Agreements) which provide for payment of fees by the funds to Tarantino LLC and Griffin Compliance LLC in return for the provision of services of an Independent Chief Compliance Officer (ICCO) and Assistant ICCO, respectively, for the funds. The ICCO and Assistant ICCO are officers of the funds and the sole members of Tarantino LLC and Griffin Compliance LLC, respectively. The funds can terminate the Agreements with Tarantino LLC and Griffin Compliance LLC at any time under the terms of the Agreements. For the year ended October 31, 2012, the aggregate fees paid by the fund to Tarantino LLC and Griffin Compliance LLC were $1,745 and are included in “Miscellaneous” expense on the Statement of Operations. MFS has agreed to reimburse the fund for a portion of the payments made by the fund in the amount of $699, which is shown as a reduction of total expenses in the Statement of Operations. Additionally, MFS has agreed to bear all expenses associated with office space, other administrative support, and supplies provided to the ICCO and Assistant ICCO.
The fund invests in the MFS Institutional Money Market Portfolio which is managed by MFS and seeks a high level of current income consistent with preservation of capital and liquidity. Income earned on this investment is included in “Dividends from underlying affiliated funds” on the Statement of Operations. This money market fund does not pay a management fee to MFS.
At October 31, 2012, MFS held 61% of the outstanding shares of Class R4.
33
Notes to Financial Statements – continued
(4) Portfolio Securities
Purchases and sales of investments, other than U.S. Government securities and short-term obligations, aggregated $71,397,356 and $93,551,743, respectively.
(5) Shares of Beneficial Interest
The fund’s Declaration of Trust permits the Trustees to issue an unlimited number of full and fractional shares of beneficial interest. Transactions in fund shares were as follows:
| | | | | | | | | | | | | | | | |
| | | Year ended
10/31/12 | | | Year ended
10/31/11 | |
| | | Shares | | | Amount | | | Shares | | | Amount | |
| Shares sold | | | | | | | | | | | | | | | | |
Class A | | | 315,156 | | | | $8,265,686 | | | | 397,763 | | | | $10,337,265 | |
Class B | | | 28,776 | | | | 699,415 | | | | 38,754 | | | | 930,719 | |
Class C | | | 56,057 | | | | 1,339,208 | | | | 39,177 | | | | 925,238 | |
Class I | | | 49,658 | | | | 1,359,885 | | | | 34,344 | | | | 902,016 | |
Class R1 | | | 4,603 | | | | 110,551 | | | | 5,011 | | | | 117,591 | |
Class R2 | | | 15,154 | | | | 395,137 | | | | 25,666 | | | | 646,865 | |
Class R3 | | | 17,408 | | | | 456,130 | | | | 18,958 | | | | 489,091 | |
Class R4 | | | 3,697 | | | | 98,157 | | | | 81 | | | | 2,097 | |
| | | 490,509 | | | | $12,724,169 | | | | 559,754 | | | | $14,350,882 | |
| | | | |
| Shares issued to shareholders in reinvestment of distributions | | | | | | | | | | | | | | | | |
Class A | | | 17,944 | | | | $424,920 | | | | 15,241 | | | | $393,069 | |
Class I | | | 1,371 | | | | 33,065 | | | | 1,113 | | | | 29,242 | |
Class R2 | | | — | | | | — | | | | 33 | | | | 834 | |
Class R3 | | | 350 | | | | 8,269 | | | | 259 | | | | 6,647 | |
Class R4 | | | 42 | | | | 991 | | | | 32 | | | | 834 | |
| | | 19,707 | | | | $467,245 | | | | 16,678 | | | | $430,626 | |
| | | | |
| Shares reacquired | | | | | | | | | | | | | | | | |
Class A | | | (958,704 | ) | | | $(25,209,492 | ) | | | (1,340,941 | ) | | | $(34,753,607 | ) |
Class B | | | (131,972 | ) | | | (3,183,439 | ) | | | (207,981 | ) | | | (4,970,316 | ) |
Class C | | | (89,650 | ) | | | (2,167,380 | ) | | | (187,239 | ) | | | (4,147,439 | ) |
Class I | | | (41,454 | ) | | | (1,103,756 | ) | | | (44,205 | ) | | | (1,186,856 | ) |
Class R1 | | | (7,308 | ) | | | (169,996 | ) | | | (6,373 | ) | | | (145,653 | ) |
Class R2 | | | (78,292 | ) | | | (1,952,000 | ) | | | (57,658 | ) | | | (1,467,820 | ) |
Class R3 | | | (16,184 | ) | | | (418,139 | ) | | | (15,166 | ) | | | (391,732 | ) |
Class R4 | | | — | | | | (12 | ) | | | (119 | ) | | | (3,202 | ) |
| | | (1,323,564 | ) | | | $(34,204,214 | ) | | | (1,859,682 | ) | | | $(47,066,625 | ) |
34
Notes to Financial Statements – continued
| | | | | | | | | | | | | | | | |
| | | Year ended
10/31/12 | | | Year ended
10/31/11 | |
| | | Shares | | | Amount | | | Shares | | | Amount | |
| Net change | | | | | | | | | | | | | | | | |
Class A | | | (625,604 | ) | | | $(16,518,886 | ) | | | (927,937 | ) | | | $(24,023,273 | ) |
Class B | | | (103,196 | ) | | | (2,484,024 | ) | | | (169,227 | ) | | | (4,039,597 | ) |
Class C | | | (33,593 | ) | | | (828,172 | ) | | | (148,062 | ) | | | (3,222,201 | ) |
Class I | | | 9,575 | | | | 289,194 | | | | (8,748 | ) | | | (255,598 | ) |
Class R1 | | | (2,705 | ) | | | (59,445 | ) | | | (1,362 | ) | | | (28,062 | ) |
Class R2 | | | (63,138 | ) | | | (1,556,863 | ) | | | (31,959 | ) | | | (820,121 | ) |
Class R3 | | | 1,574 | | | | 46,260 | | | | 4,051 | | | | 104,006 | |
Class R4 | | | 3,739 | | | | 99,136 | | | | (6 | ) | | | (271 | ) |
| | | (813,348 | ) | | | $(21,012,800 | ) | | | (1,283,250 | ) | | | $(32,285,117 | ) |
(6) Line of Credit
The fund and certain other funds managed by MFS participate in a $1.1 billion unsecured committed line of credit, subject to a $1 billion sublimit, provided by a syndication of banks under a credit agreement. Borrowings may be made for temporary financing needs. Interest is charged to each fund, based on its borrowings, generally at a rate equal to the higher of the Federal Reserve funds rate or one month LIBOR plus an agreed upon spread. A commitment fee, based on the average daily, unused portion of the committed line of credit, is allocated among the participating funds at the end of each calendar quarter. In addition, the fund and other funds managed by MFS have established unsecured uncommitted borrowing arrangements with certain banks for temporary financing needs. Interest is charged to each fund, based on its borrowings, at a rate equal to the Federal Reserve funds rate plus an agreed upon spread. For the year ended October 31, 2012, the funds commitment fee and interest expense were $1,316 and $0, respectively, and are included in “Miscellaneous” expense on the Statement of Operations.
(7) Transactions in Underlying Affiliated Funds-Affiliated Issuers
An affiliated issuer may be considered one in which the fund owns 5% or more of the outstanding voting securities, or a company which is under common control. For the purposes of this report, the fund assumes the following to be an affiliated issuer:
| | | | | | | | | | | | | | | | |
| Underlying Affiliated Fund | | Beginning
Shares/Par
Amount | | | Acquisitions
Shares/Par
Amount | | | Dispositions
Shares/Par
Amount | | | Ending
Shares/Par Amount | |
MFS Institutional Money
Market Portfolio | | | 1,002,486 | | | | 33,741,159 | | | | (33,175,539 | ) | | | 1,568,106 | |
| | | | |
| Underlying Affiliated Fund | | Realized
Gain (Loss) | | | Capital Gain
Distributions | | | Dividend
Income | | | Ending Value | |
MFS Institutional Money Market Portfolio | | | $— | | | | $— | | | | $2,156 | | | | $1,568,106 | |
35
REPORT OF INDEPENDENT REGISTERED PUBLIC ACCOUNTING FIRM
To the Board of Trustees of MFS Series Trust VIII and the Shareholders of MFS Global Growth Fund:
We have audited the accompanying statement of assets and liabilities, including the portfolio of investments, of MFS Global Growth Fund (one of the portfolios comprising MFS Series Trust VIII) (the “Fund”) as of October 31, 2012, and the related statement of operations for the year then ended, the statements of changes in net assets for each of the two years in the period then ended, and the financial highlights for each of the five years in the period then ended. These financial statements and financial highlights are the responsibility of the Fund’s management. Our responsibility is to express an opinion on these financial statements and financial highlights based on our audits.
We conducted our audits in accordance with the standards of the Public Company Accounting Oversight Board (United States). Those standards require that we plan and perform the audit to obtain reasonable assurance about whether the financial statements and financial highlights are free of material misstatement. The Fund is not required to have, nor were we engaged to perform, an audit of its internal control over financial reporting. Our audits included consideration of internal control over financial reporting as a basis for designing audit procedures that are appropriate in the circumstances, but not for the purpose of expressing an opinion on the effectiveness of the Fund’s internal control over financial reporting. Accordingly, we express no such opinion. An audit also includes examining, on a test basis, evidence supporting the amounts and disclosures in the financial statements, assessing the accounting principles used and significant estimates made by management, as well as evaluating the overall financial statement presentation. Our procedures included confirmation of securities owned as of October 31, 2012, by correspondence with the custodian and brokers; where replies were not received from brokers, we performed other auditing procedures. We believe that our audits provide a reasonable basis for our opinion.
In our opinion, the financial statements and financial highlights referred to above present fairly, in all material respects, the financial position of MFS Global Growth Fund as of October 31, 2012, the results of its operations for the year then ended, the changes in its net assets for each of the two years in the period then ended, and the financial highlights for each of the five years in the period then ended, in conformity with accounting principles generally accepted in the United States of America.
DELOITTE & TOUCHE LLP
Boston, Massachusetts
December 19, 2012
36
TRUSTEES AND OFFICERS — IDENTIFICATION AND BACKGROUND
The Trustees and officers of the Trust, as of December 1, 2012, are listed below, together with their principal occupations during the past five years. (Their titles may have varied during that period.) The address of each Trustee and officer is 111 Huntington Avenue, Boston, Massachusetts 02199-7618.
| | | | | | | | |
Name, Age | | Position(s) Held with Fund | | Trustee/Officer
Since (h) | | Principal
Occupations During the Past Five Years | | Other Directorships (j) |
| INTERESTED TRUSTEES |
Robert J. Manning (k)
(age 49) | | Trustee | | February 2004 | | Massachusetts Financial Services Company, Chairman, Chief Executive Officer and Director; President (until December 2009); Chief Investment Officer (until July 2010) | | N/A |
| INDEPENDENT TRUSTEES | | | | |
David H. Gunning
(age 70) | | Trustee and Chair of Trustees | | January 2004 | | Retired; Cleveland-Cliffs Inc. (mining products and service provider), Vice Chairman/Director (until 2007) | | Lincoln Electric Holdings, Inc. (welding equipment manufacturer), Director; Development Alternatives, Inc. (consulting), Director/Non-Executive Chairman; Portman Limited (mining), Director (until 2008) |
Robert E. Butler
(age 71) | | Trustee | | January 2006 | | Consultant – investment company industry regulatory and compliance matters | | N/A |
Maureen R. Goldfarb (age 57) | | Trustee | | January 2009 | | Private investor | | N/A |
William R. Gutow
(age 71) | | Trustee | | December 1993 | | Private investor and real estate consultant; Capitol Entertainment Management Company (video franchise), Vice Chairman | | Atlantic Coast Tan (tanning salons), Vice Chairman (until 2007); Texas Donuts (donut franchise), Vice Chairman (until 2010) |
Michael Hegarty
(age 67) | | Trustee | | December 2004 | | Private investor; Rouse Properties Inc. (real estate), Director | | N/A |
37
Trustees and Officers – continued
| | | | | | | | |
Name, Age | | Position(s) Held with Fund | | Trustee/Officer
Since (h) | | Principal
Occupations During the Past Five Years | | Other Directorships (j) |
John P. Kavanaugh
(age 58) | | Trustee | | January 2009 | | Private investor | | N/A |
J. Dale Sherratt
(age 74) | | Trustee | | June 1989 | | Insight Resources, Inc. (acquisition planning specialists), President; Wellfleet Investments (investor in health care companies), Managing General Partner | | N/A |
Laurie J. Thomsen
(age 55) | | Trustee | | March 2005 | | Private investor; New Profit, Inc. (venture philanthropy), Executive Partner (until 2010) | | The Travelers Companies (insurance), Director |
Robert W. Uek
(age 71) | | Trustee | | January 2006 | | Consultant to investment company industry | | N/A |
| OFFICERS |
John M. Corcoran (k) (age 47) | | President | | October 2008 | | Massachusetts Financial Services Company, Senior Vice President (since October 2008); State Street Bank and Trust (financial services provider), Senior Vice President, (until September 2008) | | N/A |
Christopher R. Bohane (k)
(age 38) | | Assistant Secretary and Assistant Clerk | | July 2005 | | Massachusetts Financial Services Company, Vice President and Senior Counsel | | N/A |
Kino Clark (k)
(age 44) | | Assistant Treasurer | | January 2012 | | Massachusetts Financial Services Company, Vice President | | N/A |
Thomas H. Connors (k)
(age 53) | | Assistant Secretary and Assistant Clerk | | September 2012 | | Massachusetts Financial Services Company, Vice President and Senior Counsel; Deutsche Asset Management, Director and Senior Counsel (until 2012) | | N/A |
38
Trustees and Officers – continued
| | | | | | | | |
Name, Age | | Position(s) Held with Fund | | Trustee/Officer
Since (h) | | Principal
Occupations During the Past Five Years | | Other Directorships (j) |
Ethan D. Corey (k)
(age 49) | | Assistant Secretary and Assistant Clerk | | July 2005 | | Massachusetts Financial Services Company, Senior Vice President and Associate General Counsel | | N/A |
David L. DiLorenzo (k)
(age 44) | | Treasurer | | July 2005 | | Massachusetts Financial Services Company, Senior Vice President | | N/A |
Robyn L. Griffin
(age 37) | | Assistant Independent Chief Compliance Officer | | August 2008 | | Griffin Compliance LLC (provider of compliance services), Principal (since August 2008); State Street Corporation (financial services provider), Mutual Fund Administration Assistant Vice President (October 2006 – July 2008); | | N/A |
Brian E. Langenfeld (k)
(age 39) | | Assistant Secretary and Assistant Clerk | | June 2006 | | Massachusetts Financial Services Company, Vice President and Senior Counsel | | N/A |
Susan S. Newton (k)
(age 62) | | Assistant Secretary and Assistant Clerk | | May 2005 | | Massachusetts Financial Services Company, Senior Vice President and Associate General Counsel | | N/A |
Susan A. Pereira (k)
(age 42) | | Assistant Secretary and Assistant Clerk | | July 2005 | | Massachusetts Financial Services Company, Vice President and Senior Counsel | | N/A |
Kasey L. Phillips (k)
(age 41) | | Assistant Treasurer | | September 2012 | | Massachusetts Financial Services Company, Vice President; Wells Fargo Funds Management, LLC, Senior Vice President, Fund Treasurer (until 2012) | | N/A |
39
Trustees and Officers – continued
| | | | | | | | |
Name, Age | | Position(s) Held with Fund | | Trustee/Officer
Since (h) | | Principal
Occupations During the Past Five Years | | Other Directorships (j) |
Mark N. Polebaum (k)
(age 60) | | Secretary and Clerk | | January 2006 | | Massachusetts Financial Services Company, Executive Vice President, General Counsel and Secretary | | N/A |
Frank L. Tarantino
(age 68) | | Independent Chief Compliance Officer | | June 2004 | | Tarantino LLC (provider of compliance services), Principal | | N/A |
Richard S. Weitzel (k)
(age 42) | | Assistant Secretary and Assistant Clerk | | October 2007 | | Massachusetts Financial Services Company, Senior Vice President and Associate General Counsel | | N/A |
James O. Yost (k)
(age 52) | | Deputy Treasurer | | September 1990 | | Massachusetts Financial Services Company, Senior Vice President | | N/A |
| (h) | Date first appointed to serve as Trustee/officer of an MFS fund. Each Trustee has served continuously since appointment unless indicated otherwise. For the period from December 15, 2004 until February 22, 2005, Mr. Manning served as Advisory Trustee. For the period October 2008, until January 2012, Mr. Corcoran served as Treasurer of the Funds. Prior to January 2012, Messrs. DiLorenzo and Yost served as Assistant Treasurers of the Funds. |
| (j) | Directorships or trusteeships of companies required to report to the Securities and Exchange Commission (i.e., “public companies”). |
| (k) | “Interested person” of the Trust within the meaning of the Investment Company Act of 1940 (referred to as the 1940 Act), which is the principal federal law governing investment companies like the fund, as a result of position with MFS. The address of MFS is 111 Huntington Avenue, Boston, Massachusetts 02199-7618. |
Each Trustee has been elected by shareholders and each Trustee and officer holds office until his or her successor is chosen and qualified or until his or her earlier death, resignation, retirement or removal. The Trust does not hold annual meetings for the purpose of electing Trustees, and Trustees are not elected for fixed terms. Messrs. Butler, Kavanaugh, Uek and Ms. Thomsen are members of the Trust’s Audit Committee.
Each of the Fund’s Trustees and officers holds comparable positions with certain other funds of which MFS or a subsidiary is the investment adviser or distributor, and, in the case of the officers, with certain affiliates of MFS. As of January 1, 2012, the Trustees served as board members of 131 funds within the MFS Family of Funds.
40
Trustees and Officers – continued
The Statement of Additional Information for the Fund includes further information about the Trustees and is available without charge upon request by calling 1-800-225-2606.
| | |
| Investment Adviser | | Custodian |
Massachusetts Financial Services Company
111 Huntington Avenue
Boston, MA 02199-7618 | | JPMorgan Chase Bank One Chase Manhattan Plaza New York, NY 10081 |
| Distributor | | Independent Registered Public Accounting Firm |
MFS Fund Distributors, Inc.
111 Huntington Avenue
Boston, MA 02199-7618 | | Deloitte & Touche LLP 200 Berkeley Street Boston, MA 02116 |
| Portfolio Managers | | |
David Antonelli Jeffrey Constantino | | |
41
BOARD REVIEW OF INVESTMENT ADVISORY AGREEMENT
The Investment Company Act of 1940 requires that both the full Board of Trustees and a majority of the non-interested (“independent”) Trustees, voting separately, annually approve the continuation of the Fund’s investment advisory agreement with MFS. The Trustees consider matters bearing on the Fund and its advisory arrangements at their meetings throughout the year, including a review of performance data at each regular meeting. In addition, the independent Trustees met several times over the course of three months beginning in May and ending in July, 2012 (“contract review meetings”) for the specific purpose of considering whether to approve the continuation of the investment advisory agreement for the Fund and the other investment companies that the Board oversees (the “MFS Funds”). The independent Trustees were assisted in their evaluation of the Fund’s investment advisory agreement by independent legal counsel, from whom they received separate legal advice and with whom they met separately from MFS during various contract review meetings. The independent Trustees were also assisted in this process by the MFS Funds’ Independent Chief Compliance Officer, a full-time senior officer appointed by and reporting to the independent Trustees.
In connection with their deliberations regarding the continuation of the investment advisory agreement, the Trustees, including the independent Trustees, considered such information and factors as they believed, in light of the legal advice furnished to them and their own business judgment, to be relevant. The investment advisory agreement for the Fund was considered separately, although the Trustees also took into account the common interests of all MFS Funds in their review. As described below, the Trustees considered the nature, quality, and extent of the various investment advisory, administrative, and shareholder services performed by MFS under the existing investment advisory agreement and other arrangements with the Fund.
In connection with their contract review meetings, the Trustees received and relied upon materials that included, among other items: (i) information provided by Lipper Inc., an independent third party, on the investment performance of the Fund for various time periods ended December 31, 2011 and the investment performance of a group of funds with substantially similar investment classifications/objectives (the “Lipper performance universe”), (ii) information provided by Lipper Inc. on the Fund’s advisory fees and other expenses and the advisory fees and other expenses of comparable funds identified by Lipper Inc. (the “Lipper expense group”), (iii) information provided by MFS on the advisory fees of comparable portfolios of other clients of MFS, including institutional separate accounts and other clients, (iv) information as to whether and to what extent applicable expense waivers, reimbursements or fee “breakpoints” are observed for the Fund, (v) information regarding MFS’ financial results and financial condition, including MFS’ and certain of its affiliates’ estimated profitability from services performed for the Fund and the MFS Funds as a whole, and compared to MFS’ institutional business, (vi) MFS’ views regarding the outlook for the mutual fund industry and the strategic business plans of MFS, (vii) descriptions of various functions performed by MFS for the Funds, such as compliance monitoring and portfolio trading practices, and (viii) information regarding the overall organization of MFS, including information about MFS’ senior management and other personnel providing investment advisory, administrative and other services to the Fund and the other MFS Funds. The comparative performance, fee and expense
42
Board Review of Investment Advisory Agreement – continued
information prepared and provided by Lipper Inc. was not independently verified and the independent Trustees did not independently verify any information provided to them by MFS.
The Trustees’ conclusion as to the continuation of the investment advisory agreement was based on a comprehensive consideration of all information provided to the Trustees and not the result of any single factor. Some of the factors that figured particularly in the Trustees’ deliberations are described below, although individual Trustees may have evaluated the information presented differently from one another, giving different weights to various factors. It is also important to recognize that the fee arrangements for the Fund and other MFS Funds are the result of years of review and discussion between the independent Trustees and MFS, that certain aspects of such arrangements may receive greater scrutiny in some years than in others, and that the Trustees’ conclusions may be based, in part, on their consideration of these same arrangements during the course of the year and in prior years.
Based on information provided by Lipper Inc. and MFS, the Trustees reviewed the Fund’s total return investment performance as well as the performance of peer groups of funds over various time periods. The Trustees placed particular emphasis on the total return performance of the Fund’s Class A shares in comparison to the performance of funds in its Lipper performance universe over the three-year period ended December 31, 2011, which the Trustees believed was a long enough period to reflect differing market conditions. The total return performance of the Fund’s Class A shares was in the 2nd quintile relative to the other funds in the universe for this three-year period (the 1st quintile being the best performers and the 5th quintile being the worst performers). The total return performance of the Fund’s Class A shares was in the 2nd quintile for each of the one- and five-year periods ended December 31, 2011 relative to the Lipper performance universe. Because of the passage of time, these performance results may differ from the performance results for more recent periods, including those shown elsewhere in this report.
In the course of their deliberations, the Trustees took into account information provided by MFS in connection with the contract review meetings, as well as during investment review meetings conducted with portfolio management personnel during the course of the year regarding the Fund’s performance. After reviewing these and related factors, the Trustees concluded, within the context of their overall conclusions regarding the investment advisory agreement, that they were satisfied with MFS’ responses and efforts relating to investment performance.
In assessing the reasonableness of the Fund’s advisory fee, the Trustees considered, among other information, the Fund’s advisory fee and the total expense ratio of the Fund’s Class A shares as a percentage of average daily net assets and the advisory fee and total expense ratios of peer groups of funds based on information provided by Lipper Inc. The Trustees considered that, according to the Lipper data (which takes into account any fee reductions or expense limitations that were in effect during the Fund’s last fiscal year), the Fund’s effective advisory fee rate was higher than the Lipper expense group median, and the Fund’s total expense ratio was approximately at the Lipper expense group median.
43
Board Review of Investment Advisory Agreement – continued
The Trustees also considered the advisory fees charged by MFS to institutional accounts, if any. In comparing these fees, the Trustees considered information provided by MFS as to the generally broader scope of services provided by MFS to the Fund in comparison to institutional accounts, the higher demands placed on MFS’ investment personnel and trading infrastructure as a result of the daily cash in-flows and out-flows of the Fund, and the impact on MFS and expenses associated with the more extensive regulatory regime to which the Fund is subject in comparison to institutional accounts.
The Trustees also considered whether the Fund is likely to benefit from any economies of scale in the management of the Fund in the event of growth in assets of the Fund. They noted that the Fund’s advisory fee rate schedule is subject to contractual breakpoints that reduce the Fund’s advisory fee rate on average daily net assets over $1 billion and $2 billion. The Trustees concluded that the existing breakpoints were sufficient to allow the Fund to benefit from economies of scale as its assets grow.
The Trustees also considered information prepared by MFS relating to MFS’ costs and profits with respect to the Fund, the MFS Funds considered as a group, and other investment companies and accounts advised by MFS, as well as MFS’ methodologies used to determine and allocate its costs to the MFS Funds, the Fund and other accounts and products for purposes of estimating profitability.
After reviewing these and other factors described herein, the Trustees concluded, within the context of their overall conclusions regarding the investment advisory agreement, that the advisory fees charged to the Fund represent reasonable compensation in light of the nature and quality of the services being provided by MFS to the Fund.
In addition, the Trustees considered MFS’ resources and related efforts to continue to retain, attract and motivate capable personnel to serve the Fund. The Trustees also considered current and developing conditions in the financial services industry, including the presence of large and well-capitalized companies which are spending, and appear to be prepared to continue to spend, substantial sums to engage personnel and to provide services to competing investment companies. In this regard, the Trustees also considered the financial resources of MFS and its ultimate parent, Sun Life Financial Inc. The Trustees also considered the advantages and possible disadvantages to the Fund of having an adviser that also serves other investment companies as well as other accounts.
The Trustees also considered the nature, quality, cost, and extent of administrative, transfer agency, and distribution services provided to the Fund by MFS and its affiliates under agreements and plans other than the investment advisory agreement, including any 12b-1 fees the Fund pays to MFS Fund Distributors, Inc., an affiliate of MFS. The Trustees also considered the nature, extent and quality of certain other services MFS performs or arranges for on the Fund’s behalf, which may include securities lending programs, directed expense payment programs, class action recovery programs, and MFS’ interaction with third-party service providers, principally custodians and sub-custodians. The Trustees concluded that the various non-advisory services provided by MFS and its affiliates on behalf of the Fund were satisfactory.
The Trustees also considered benefits to MFS from the use of the Fund’s portfolio brokerage commissions, if applicable, to pay for investment research, and various other
44
Board Review of Investment Advisory Agreement – continued
factors. Additionally, the Trustees considered so-called “fall-out benefits” to MFS such as reputational value derived from serving as investment manager to the Fund.
Based on their evaluation of factors that they deemed to be material, including those factors described above, the Board of Trustees, including the independent Trustees, concluded that the Fund’s investment advisory agreement with MFS should be continued for an additional one-year period, commencing August 1, 2012.
A discussion regarding the Board’s most recent review and renewal of the fund’s Investment Advisory Agreement with MFS is available by clicking on the fund’s name under “Mutual Funds” in the “Products and Performance” section of the MFS Web site (mfs.com).
45
PROXY VOTING POLICIES AND INFORMATION
A general description of the MFS funds’ proxy voting policies and procedures is available without charge, upon request, by calling 1-800-225-2606, by visiting the Proxy Voting section of mfs.com or by visiting the SEC’s Web site at http://www.sec.gov.
Information regarding how the fund voted proxies relating to portfolio securities during the most recent twelve-month period ended June 30 is available without charge by visiting the Proxy Voting section of mfs.com or by visiting the SEC’s Web site at http://www.sec.gov.
QUARTERLY PORTFOLIO DISCLOSURE
The fund will file a complete schedule of portfolio holdings with the Securities and Exchange Commission (the Commission) for the first and third quarters of each fiscal year on Form N-Q. A shareholder can obtain the quarterly portfolio holdings report at mfs.com. The fund’s Form N-Q is also available on the EDGAR database on the Commission’s Internet Web site at http://www.sec.gov, and may be reviewed and copied at the:
Public Reference Room
Securities and Exchange Commission
100 F Street, NE, Room 1580
Washington, D.C. 20549
Information on the operation of the Public Reference Room may be obtained by calling the Commission at 1-800-SEC-0330. Copies of the fund’s Form N-Q also may be obtained, upon payment of a duplicating fee, by electronic request at the following e-mail address: publicinfo@sec.gov or by writing the Public Reference Section at the above address.
FURTHER INFORMATION
From time to time, MFS may post important information about the fund or the MFS funds on the MFS web site (mfs.com). This information is available by visiting the “News & Commentary” section of mfs.com or by clicking on the fund’s name under “Mutual Funds” in the “Products and Performance” section of mfs.com.
FEDERAL TAX INFORMATION (unaudited)
The fund will notify shareholders of amounts for use in preparing 2012 income tax forms in January 2013. The following information is provided pursuant to provisions of the Internal Revenue Code.
The fund designates the maximum amount allowable as qualified dividend income eligible for the 15% tax rate.
For corporate shareholders, 100% of the ordinary income dividends paid during the fiscal year qualify for the corporate dividends received deduction.
Income derived from foreign sources was $1,893,540. The fund intends to pass through foreign tax credits of $81,397 for the fiscal year.
46
rev. 3/11
| | | | |
| | | |
| FACTS | | WHAT DOES MFS DO WITH YOUR PERSONAL INFORMATION? | |  |
| | |
| Why? | | Financial companies choose how they share your personal information. Federal law gives consumers the right to limit some but not all sharing. Federal law also requires us to tell you how we collect, share, and protect your personal information. Please read this notice carefully to understand what we do. |
| | |
| What? | | The types of personal information we collect and share depend on the product or service you have with us. This information can include: • Social Security number and account balances • Account transactions and transaction history • Checking account information and wire transfer instructions When you are no longer our customer, we continue to share your information as described in this notice. |
| | |
| How? | | All financial companies need to share customers’ personal information to run their everyday business. In the section below, we list the reasons financial companies can share their customers’ personal information; the reasons MFS chooses to share; and whether you can limit this sharing. |
| | | | |
Reasons we can share your
personal information | | Does MFS
share? | | Can you limit
this sharing? |
For our everyday business purposes – such as to process your transactions, maintain your account(s), respond to court orders and legal investigations, or report to credit bureaus | | Yes | | No |
For our marketing purposes – to offer our products and services to you | | No | | We don’t share |
| For joint marketing with other financial companies | | No | | We don’t share |
For our affiliates’ everyday business purposes – information about your transactions and experiences | | No | | We don’t share |
For our affiliates’ everyday business purposes – information about your creditworthiness | | No | | We don’t share |
| For nonaffiliates to market to you | | No | | We don’t share |
| | |
| Questions? | | Call 800-225-2606 or go to mfs.com. |
47
| | |
| Who we are |
| Who is providing this notice? | | MFS Funds, MFS Investment Management, MFS Institutional Advisors, Inc., MFS Fund Distributors, Inc., MFS Heritage Trust Company, and MFS Service Center, Inc. |
| | |
| What we do |
| How does MFS protect my personal information? | | To protect your personal information from unauthorized access and use, we use security measures that comply with federal law. These measures include procedural, electronic, and physical safeguards for the protection of the personal information we collect about you. |
| How does MFS collect my personal information? | | We collect your personal information, for example, when you • open an account or provide account information • direct us to buy securities or direct us to sell your securities • make a wire transfer We also collect your personal information from others, such as credit bureaus, affiliates and other companies. |
| Why can’t I limit all sharing? | | Federal law gives you the right to limit only • sharing for affiliates’ everyday business purposes – information about your creditworthiness • affiliates from using your information to market to you • sharing for nonaffiliates to market to you State laws and individual companies may give you additional rights to limit sharing. |
| | |
| Definitions |
| Affiliates | | Companies related by common ownership or control. They can be financial and nonfinancial companies. • MFS does not share personal information with affiliates, except for everyday business purposes as described on page one of this notice. |
| Nonaffiliates | | Companies not related by common ownership or control. They can be financial and nonfinancial companies. • MFS does not share with nonaffiliates so they can market to you. |
| Joint Marketing | | A formal agreement between nonaffiliated financial companies that together market financial products or services to you. • MFS doesn’t jointly market. |
| | |
| Other important information |
| If you own an MFS product or receive an MFS service in the name of a third party such as a bank or broker-dealer, their privacy policy may apply to you instead of ours. |
48
Save paper with eDelivery.

| MFS® will send you prospectuses, |
reports, and proxies directly via e-mail so you will get information faster with less mailbox clutter.
To sign up:
1. Go to mfs.com.
2. Log in via MFS® Access.
3. Select eDelivery.
If you own your MFS fund shares through a financial institution or a retirement plan, MFS® TALK, MFS® Access, or eDelivery may not be available to you.
CONTACT
WEB SITE
mfs.com
MFS TALK
1-800-637-8255
24 hours a day
ACCOUNT SERVICE AND LITERATURE
Shareholders
1-800-225-2606
Financial advisors
1-800-343-2829
Retirement plan services
1-800-637-1255
MAILING ADDRESS
MFS Service Center, Inc.
P.O. Box 55824
Boston, MA 02205-5824
OVERNIGHT MAIL
MFS Service Center, Inc.
c/o Boston Financial Data Services
30 Dan Road
Canton, MA 02021-2809
ANNUAL REPORT
October 31, 2012

MFS® STRATEGIC INCOME FUND

MFO-ANN
MFS® STRATEGIC INCOME FUND
CONTENTS
Note to Shareholders: At a meeting held June 19, 2012, the Board of Trustees of the MFS Strategic Income Fund (the fund) approved investing some or all of the fund’s assets currently invested in high income debt instruments in the MFS High Yield Pooled Portfolio, a mutual fund advised by MFS that normally invests at least 80% of its assets in high income debt instruments (the “High Yield Pooled Portfolio”). The High Yield Pooled Portfolio will not charge a management fee, distribution and/or service fees, or sales charges. The investment in the MFS High Yield Pooled Portfolio is anticipated to occur in early 2013.
The report is prepared for the general information of shareholders.
It is authorized for distribution to prospective investors only when preceded or accompanied by a current prospectus.
NOT FDIC INSURED Ÿ MAY LOSE VALUE Ÿ NO BANK GUARANTEE

LETTER FROM THE CHAIRMAN AND CEO
Dear Shareholders:
As 2012 winds down, economic uncertainty continues to dominate world financial markets. In the United States, all eyes are riveted to the ongoing budget deal
negotiations and the specter of a “fiscal cliff.” Overseas, we see growth slowing in China and Japan, and the eurozone has entered its second recession in four years against a backdrop of double-digit unemployment and the continuing sovereign debt crisis.
Amidst the instability, there are silver linings — especially in the U.S. where the labor and housing markets have picked up, consumer confidence has risen and industrial output has increased. Additionally, a U.S. budgetary compromise could propel markets, unleashing pent-up spending and investments, which would help to revive both the U.S. and global economies.
As always, managing risk in the face of uncertainty remains a top priority for investors. At MFS®, an emphasis on global research and our disciplined risk management approach anchor our uniquely collaborative investment process. Our global team of more than 200 investment professionals shares ideas and evaluates opportunities across continents, investment disciplines, and asset classes — all with a goal of building better insights, and ultimately better results — for our clients.
We are mindful of the many economic challenges we face locally, nationally and globally. It is more important than ever to maintain a long-term view, employ time-tested principles, such as asset allocation and diversification, and work closely with investment advisors to identify and pursue the most suitable opportunities.
Respectfully,

Robert J. Manning
Chairman and Chief Executive Officer
MFS Investment Management®
December 14, 2012
The opinions expressed in this letter are subject to change, may not be relied upon for investment advice, and no forecasts can be guaranteed.
1
PORTFOLIO COMPOSITION
Portfolio structure (i)

| | | | |
| Fixed income sectors (i) | | | | |
| High Grade Corporates | | | 45.9% | |
| High Yield Corporates | | | 29.5% | |
| Non-U.S. Government Bonds | | | 13.0% | |
| Emerging Markets Bonds | | | 5.9% | |
| Mortgage-Backed Securities | | | 1.0% | |
| Commercial Mortgage-Backed Securities | | | 0.9% | |
| Collateralized Debt Obligations | | | 0.5% | |
| Asset-Backed Securities | | | 0.4% | |
| U.S. Government Agencies | | | 0.1% | |
| Floating Rate Loans (o) | | | 0.0% | |
| U.S. Treasury Securities | | | (3.2)% | |
| | | | |
| Composition including fixed income credit quality (a)(i) | |
| AAA | | | 5.9% | |
| AA | | | 4.0% | |
| A | | | 20.6% | |
| BBB | | | 33.3% | |
| BB | | | 13.2% | |
| B | | | 14.0% | |
| CCC | | | 4.8% | |
| CC | | | 0.2% | |
| C | | | 0.1% | |
| Federal Agencies | | | 1.1% | |
| Not Rated | | | (3.2)% | |
| Non-Fixed Income | | | 0.4% | |
| Cash & Other | | | 5.6% | |
|
| Portfolio facts (i) | |
| Average Duration (d) | | | 4.9 | |
| Average Effective Maturity (m) | | | 7.7 yrs. | |
|
| Issuer country weightings (i)(x) | |
| United States | | | 65.1% | |
| United Kingdom | | | 5.9% | |
| Japan | | | 3.0% | |
| France | | | 2.7% | |
| Netherlands | | | 2.6% | |
| Canada | | | 2.1% | |
| Germany | | | 1.9% | |
| Australia | | | 1.9% | |
| Italy | | | 1.7% | |
| Other Countries | | | 13.1% | |
2
Portfolio Composition – continued
| (a) | For all securities other than those specifically described below, ratings are assigned to underlying securities utilizing ratings from Moody’s, Fitch, and Standard & Poor’s rating agencies and applying the following hierarchy: If all three agencies provide a rating, the middle rating (after dropping the highest and lowest ratings) is assigned; if two of the three agencies rate a security, the lower of the two is assigned. Ratings are shown in the S&P and Fitch scale (e.g., AAA). Securities rated BBB or higher are considered investment grade. All ratings are subject to change. Federal Agencies includes rated and unrated U.S. Agency fixed-income securities, U.S. Agency mortgage-backed securities, and collateralized mortgage obligations of U.S. Agency mortgage-backed securities. Not Rated includes fixed income securities, including fixed income futures contracts, which have not been rated by any rating agency. Non-Fixed Income includes equity securities (including convertible bonds and equity derivatives) and commodities. Cash & Other includes cash, other assets less liabilities, offsets to derivative positions, and short-term securities. The fund may not hold all of these instruments. The fund is not rated by these agencies. |
| (d) | Duration is a measure of how much a bond’s price is likely to fluctuate with general changes in interest rates, e.g., if rates rise 1.00%, a bond with a 5-year duration is likely to lose about 5.00% of its value due to the interest rate move. |
| (i) | For purposes of this presentation, the components include the market value of securities, and reflect the impact of the equivalent exposure of derivative positions, if any. These amounts may be negative from time to time. The bond component will include any accrued interest amounts. Equivalent exposure is a calculated amount that translates the derivative position into a reasonable approximation of the amount of the underlying asset that the portfolio would have to hold at a given point in time to have the same price sensitivity that results from the portfolio’s ownership of the derivative contract. When dealing with derivatives, equivalent exposure is a more representative measure of the potential impact of a position on portfolio performance than market value. Where the fund holds convertible bonds, these are treated as part of the equity portion of the portfolio. |
| (m) | In determining an instrument’s effective maturity for purposes of calculating the fund’s dollar-weighted average effective maturity, MFS uses the instrument’s stated maturity or, if applicable, an earlier date on which MFS believes it is probable that a maturity-shortening device (such as a put, pre-refunding or prepayment) will cause the instrument to be repaid. Such an earlier date can be substantially shorter than the instrument’s stated maturity. |
| (x) | Represents the portfolio’s exposure to issuer countries as a percentage of a portfolio’s net assets. |
Percentages are based on net assets as of 10/31/12.
The portfolio is actively managed and current holdings may be different.
3
MANAGEMENT REVIEW
Summary of Results
For the twelve months ended October 31, 2012, Class A shares of the MFS Strategic Income Fund (the “fund”) provided a total return of 9.98%, at net asset value. This compares with a return of 13.58% for the fund’s benchmark, the Barclays U.S. High-Yield Corporate Bond 2% Issuer Capped Index. Effective February 28, 2012 the Barclays U.S. High-Yield Corporate Bond 2% Issuer Capped Index replaced the Barclays U.S. High-Yield Corporate Bond Index as the fund’s primary benchmark. The Barclays U.S. High-Yield Corporate Bond Index generated a return of 13.61% over the reporting period. Over the same period, the fund’s other benchmark, the MFS Strategic Income Blended Index (“Blended Index”), generated a return of 9.21%. The Blended Index reflects the blended returns of various fixed income market indices, with percentage allocations to each index designed to resemble the fixed income allocations of the fund. The market indices and related percentage allocations used to compile the Blended Index are set forth in the Performance Summary.
Market Environment
Just prior to the beginning of the reporting period, markets were roiled by several global concerns. These included the aftermath of the U.S. sovereign debt-ceiling debacle, the path of eurozone integration and the scope of its bailout facilities, and the likelihood of a Chinese hard landing. Amidst this turmoil, global equity markets had declined sharply and credit spreads widened. At the same time, global consumer and producer sentiment indicators had fallen precipitously, while highly-rated sovereign bond yields hit multi-decade lows.
During the first half of the period, however, additional liquidity from the U.S. Federal Reserve (Fed), in the form of “Operation Twist”, and the European Central Bank (ECB), in the form of 3-year, Long Term Refinancing Operations, or LTROs, coupled with healthier global macroeconomic conditions led by moderate but sustained U.S. growth, ushered in improved market dynamics.
During the latter part of the period, market trends were more mixed. Worsening conditions were driven by broadly weaker global macroeconomic indicators, as well as renewed concerns over the eurozone’s capacity and determination to address its ongoing crisis. However, broad market sentiment remained relatively resilient, as equity markets generally maintained gains and credit spreads did not indicate deterioration. A new round of monetary easing by the Fed (QE3) and the ECB (rate cut and a new bond purchase facility) towards the end of the period instilled additional confidence in risk markets. Nonetheless, towards the end of the period, weaker equity earnings reports and declining forward guidance caused market sentiment to soften.
Detractors from performance
Relative to the Blended Index, the fund’s lesser exposure to emerging markets debt, particularly to Venezuela and the Philippines, hindered results as this market segment turned in strong performance over the reporting period.
4
Management Review – continued
Contributors to Performance
Relative to the Blended Index, the fund’s greater exposure to high-grade corporate bonds in the financial and industrial sectors benefited performance as both sectors outperformed the benchmark amidst a resilient economic environment.
Credit quality, particularly the fund’s greater relative exposure to “BBB”(r) and above rated securities, also contributed to performance as these quality segments performed well during the reporting period.
The fund’s return from yield, which was greater than that of the Blended Index, was an additional positive factor for relative performance.
Respectfully,
| | | | | | |
| William Adams | | David Cole | | James Calmas | | Robert Persons |
| Portfolio Manager | | Portfolio Manager | | Portfolio Manager | | Portfolio Manager |
| | | |
| Matthew Ryan | | Erik Weisman | | | | |
| Portfolio Manager | | Portfolio Manager | | | | |
| (r) | Bonds rated “BBB”, “Baa”, or higher are considered investment grade; bonds rated “BB”, “Ba”, or below are considered non-investment grade. The source for bond quality ratings is Moody’s Investors Service, Standard & Poor’s and Fitch, Inc. and are applied using the following hierarchy: If all three agencies provide a rating, the middle rating (after dropping the highest and lowest ratings) is assigned; if two of the three agencies rate a security, the lower of the two is assigned. Ratings are shown in the S&P and Fitch scale (e.g., AAA). For securities which are not rated by any of the three agencies, the security is considered Not Rated. |
The views expressed in this report are those of the portfolio managers only through the end of the period of the report as stated on the cover and do not necessarily reflect the views of MFS or any other person in the MFS organization. These views are subject to change at any time based on market or other conditions, and MFS disclaims any responsibility to update such views. These views may not be relied upon as investment advice or an indication of trading intent on behalf of any MFS portfolio. References to specific securities are not recommendations of such securities, and may not be representative of any MFS portfolio’s current or future investments.
5
PERFORMANCE SUMMARY THROUGH 10/31/12
The following chart illustrates a representative class of the fund’s historical performance in comparison to its benchmark(s). Performance results include the deduction of the maximum applicable sales charge and reflect the percentage change in net asset value, including reinvestment of dividends and capital gains distributions. The performance of other share classes will be greater than or less than that of the class depicted below. Benchmarks are unmanaged and may not be invested in directly. Benchmark returns do not reflect sales charges, commissions or expenses. (See Notes to Performance Summary.)
Performance data shown represents past performance and is no guarantee of future results. Investment return and principal value fluctuate so your shares, when sold, may be worth more or less than the original cost; current performance may be lower or higher than quoted. The performance shown does not reflect the deduction of taxes, if any, that a shareholder would pay on fund distributions or the redemption of fund shares.
Growth of a Hypothetical $10,000 Investment
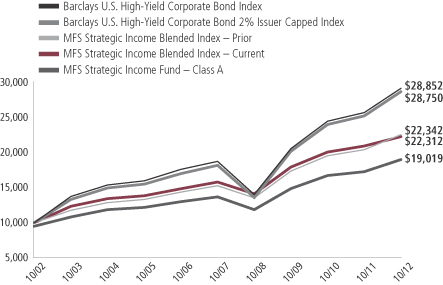
6
Performance Summary – continued
Total Returns through 10/31/12
Average annual without sales charge
| | | | | | | | | | | | |
| | | Share class | | Class inception date | | 1-yr | | 5-yr | | 10-yr | | |
| | | A | | 10/29/87 | | 9.98% | | 6.78% | | 7.16% | | |
| | | B | | 9/07/93 | | 9.22% | | 6.08% | | 6.44% | | |
| | | C | | 9/01/94 | | 9.23% | | 6.12% | | 6.46% | | |
| | | I | | 1/08/97 | | 10.27% | | 7.07% | | 7.46% | | |
| Comparative benchmarks | | | | | | |
| | | Barclays U.S. High-Yield Corporate Bond 2% Issuer Capped Index (f)(z) | | 13.58% | | 9.54% | | 11.14% | | |
| | | Barclays U.S. High-Yield Corporate Bond Index (f)(z) | | 13.61% | | 9.40% | | 11.18% | | |
| | | MFS Strategic Income Blended Index - Current (f)(s)(z) | | 9.21% | | 7.90% | | 8.36% | | |
| | | MFS Strategic Income Blended Index - Prior (f)(y)(z) | | 9.22% | | 7.86% | | 8.37% | | |
| | | Barclays U.S. Government/Mortgage Bond Index (f) | | 3.53% | | 5.97% | | 5.00% | | |
| | | Barclays U.S. Credit Bond Index (f) | | 9.71% | | 7.88% | | 6.69% | | |
| | | Citigroup World Government Bond Non-Dollar Index (f) | | 1.55% | | 6.00% | | 7.20% | | |
| | | Citigroup World Government Bond Non-Dollar Hedged Index (f) | | 5.90% | | 4.50% | | 4.37% | | |
| | | JPMorgan Emerging Markets Bond Index Global (f) | | 16.33% | | 9.98% | | 11.94% | | |
| Average annual with sales charge | | | | | | |
| | | A
With Initial Sales Charge (4.75%) | | 4.76% | | 5.74% | | 6.64% | | |
| | | B
With CDSC (Declining over six years from 4% to 0%) (x) | | 5.22% | | 5.77% | | 6.44% | | |
| | | C
With CDSC (1% for 12 months) (x) | | 8.23% | | 6.12% | | 6.46% | | |
Class I shares do not have a sales charge.
CDSC – Contingent Deferred Sales Charge.
| (f) | Source: FactSet Research Systems Inc. |
| (s) | MFS Strategic Income Blended Index - Current is at a point in time and allocations during the period can change. As of October 31, 2012 the blended index was comprised of 10% Barclays U.S. Credit Bond Index, 26% Barclays U.S. Government/Mortgage Bond Index, 33% Barclays U.S. High-Yield Corporate Bond 2% Issuer Capped Index, 8.5% Citigroup World Government Bond Non-Dollar Hedged Index, 8.5% Citigroup World Government Bond Non-Dollar Index, and 14% JPMorgan Emerging Markets Bond Index Global. |
| (x) | Assuming redemption at the end of the applicable period. |
| (y) | MFS Strategic Income Blended Index - Prior is at a point in time and allocations during the period can change. As of October 31, 2012 the blended index was comprised of 10% Barclays U.S. Credit Bond Index, 26% Barclays U.S. Government/Mortgage Bond Index, 33% Barclays U.S. High-Yield Corporate Bond Index, 8.5% Citigroup World Government Bond Non-Dollar Hedged Index, 8.5% Citigroup World Government Bond Non-Dollar Index, and 14% JPMorgan Emerging Markets Bond Index Global. |
| (z) | Effective February 28, 2012, the Barclays U.S. High-Yield Corporate Bond 2% Issuer Capped Index replaced the Barclays U.S. High-Yield Corporate Bond Index as the fund’s primary |
7
Performance Summary – continued
| | benchmark. Also, MFS Strategic Income Blended Index - Current replaced the MFS Strategic Income Blended Index - Prior as a secondary fund benchmark. The fund’s investment adviser believes the Barclays High-Yield Corporate Bond 2% Issuer Capped Index and the MFS Strategic Income Blended Index - Current better reflect the investment policies and strategies of the fund. |
Benchmark Definitions
Barclays U.S. Credit Bond Index – a market capitalization-weighted index that measures the performance of publicly issued, SEC-registered, U.S. corporate and specified foreign debentures and secured notes that meet specified maturity, liquidity, and quality requirements.
Barclays U.S. Government/Mortgage Bond Index – measures debt issued by the U.S. Government, and its agencies, as well as mortgage-backed pass-through securities of Ginnie Mae (GNMA), Fannie Mae (FNMA), and Freddie Mac (FHLMC).
Barclays U.S. High-Yield Corporate Bond 2% Issuer Capped Index – a component of the Barclays U.S. High-Yield Corporate Bond Index, which measures performance of non-investment grade, fixed rate debt. The index limits the maximum exposure to any one issuer to 2%.
Barclays U.S. High-Yield Corporate Bond Index – a market capitalization-weighted index that measures the performance of non-investment grade, fixed rate debt. Eurobonds and debt issues from countries designated as emerging markets (e.g., Argentina, Brazil, Venezuela, etc.) are excluded.
Citigroup World Government Bond Non-Dollar Hedged Index – a market capitalization-weighted index that is designed to represent the currency-hedged performance of the international developed government bond markets, excluding the United States.
Citigroup World Government Bond Non-Dollar Index – a market capitalization-weighted index that is designed to represent the performance of the international developed government bond markets, excluding the United States.
JPMorgan Emerging Markets Bond Index Global – measures the performance of U.S.-dollar-denominated debt instruments issued by emerging market sovereign and quasi-sovereign entities: Brady bonds, loans, Eurobonds.
It is not possible to invest directly in an index.
Notes to Performance Summary
Average annual total return represents the average annual change in value for each share class for the periods presented.
Performance results reflect any applicable expense subsidies and waivers in effect during the periods shown. Without such subsidies and waivers the fund’s performance results would be less favorable. Please see the prospectus and financial statements for complete details.
Performance results do not include adjustments made for financial reporting purposes in accordance with U.S. generally accepted accounting principles and may differ from amounts reported in the financial highlights.
From time to time the fund may receive proceeds from litigation settlements, without which performance would be lower.
8
EXPENSE TABLE
Fund expenses borne by the shareholders during the period,
May 1, 2012 through October 31, 2012
As a shareholder of the fund, you incur two types of costs: (1) transaction costs, including sales charges (loads) on certain purchase or redemption payments, and (2) ongoing costs, including management fees; distribution and service (12b-1) fees; and other fund expenses. This example is intended to help you understand your ongoing costs (in dollars) of investing in the fund and to compare these costs with the ongoing costs of investing in other mutual funds.
The example is based on an investment of $1,000 invested at the beginning of the period and held for the entire period May 1, 2012 through October 31, 2012.
Actual Expenses
The first line for each share class in the following table provides information about actual account values and actual expenses. You may use the information in this line, together with the amount you invested, to estimate the expenses that you paid over the period. Simply divide your account value by $1,000 (for example, an $8,600 account value divided by $1,000 = 8.6), then multiply the result by the number in the first line under the heading entitled “Expenses Paid During Period” to estimate the expenses you paid on your account during this period.
Hypothetical Example for Comparison Purposes
The second line for each share class in the following table provides information about hypothetical account values and hypothetical expenses based on the fund’s actual expense ratio and an assumed rate of return of 5% per year before expenses, which is not the fund’s actual return. The hypothetical account values and expenses may not be used to estimate the actual ending account balance or expenses you paid for the period. You may use this information to compare the ongoing costs of investing in the fund and other funds. To do so, compare this 5% hypothetical example with the 5% hypothetical examples that appear in the shareholder reports of the other funds.
Please note that the expenses shown in the table are meant to highlight your ongoing costs only and do not reflect any transactional costs, such as sales charges (loads). Therefore, the second line for each share class in the table is useful in comparing ongoing costs only, and will not help you determine the relative total costs of owning different funds. In addition, if these transactional costs were included, your costs would have been higher.
9
Expense Table – continued
| | | | | | | | | | | | | | | | | | |
Share
Class | | | | Annualized
Expense
Ratio | | | Beginning
Account Value
5/01/12 | | | Ending
Account Value
10/31/12 | | | Expenses
Paid During
Period (p)
5/01/12-10/31/12 | |
| A | | Actual | | | 1.05% | | | | $1,000.00 | | | | $1,051.08 | | | | $5.41 | |
| | Hypothetical (h) | | | 1.05% | | | | $1,000.00 | | | | $1,019.86 | | | | $5.33 | |
| B | | Actual | | | 1.80% | | | | $1,000.00 | | | | $1,047.44 | | | | $9.26 | |
| | Hypothetical (h) | | | 1.80% | | | | $1,000.00 | | | | $1,016.09 | | | | $9.12 | |
| C | | Actual | | | 1.80% | | | | $1,000.00 | | | | $1,047.52 | | | | $9.26 | |
| | Hypothetical (h) | | | 1.80% | | | | $1,000.00 | | | | $1,016.09 | | | | $9.12 | |
| I | | Actual | | | 0.80% | | | | $1,000.00 | | | | $1,052.44 | | | | $4.13 | |
| | Hypothetical (h) | | | 0.80% | | | | $1,000.00 | | | | $1,021.11 | | | | $4.06 | |
| (h) | 5% class return per year before expenses. |
| (p) | Expenses paid are equal to each class’ annualized expense ratio, as shown above, multiplied by the average account value over the period, multiplied by the number of days in the period, divided by the number of days in the year. Expenses paid do not include any applicable sales charges (loads). If these transaction costs had been included, your costs would have been higher. |
10
PORTFOLIO OF INVESTMENTS
10/31/12
The Portfolio of Investments is a complete list of all securities owned by your fund. It is categorized by broad-based asset classes.
| | | | | | | | |
| Bonds - 95.8% | | | | | | | | |
| Issuer | | Shares/Par | | | Value ($) | |
| Aerospace - 0.7% | | | | | | | | |
| Bombardier, Inc., 7.5%, 2018 (n) | | $ | 470,000 | | | $ | 537,563 | |
| Bombardier, Inc., 7.75%, 2020 (n) | | | 155,000 | | | | 181,156 | |
| CPI International, Inc., 8%, 2018 | | | 320,000 | | | | 305,600 | |
| Heckler & Koch GmbH, 9.5%, 2018 (z) | | EUR | 100,000 | | | | 111,469 | |
| Huntington Ingalls Industries, Inc., 7.125%, 2021 | | $ | 650,000 | | | | 698,750 | |
| Kratos Defense & Security Solutions, Inc., 10%, 2017 | | | 430,000 | | | | 464,400 | |
| | | | | | | | |
| | | | | | | $ | 2,298,938 | |
| Airlines - 0.3% | | | | | | | | |
| Continental Airlines, Inc., FRN, 0.768%, 2013 | | $ | 929,684 | | | $ | 911,091 | |
| | |
| Apparel Manufacturers - 0.3% | | | | | | | | |
| Hanesbrands, Inc., 8%, 2016 | | $ | 135,000 | | | $ | 149,008 | |
| Hanesbrands, Inc., 6.375%, 2020 | | | 165,000 | | | | 180,056 | |
| Jones Group, Inc., 6.875%, 2019 | | | 270,000 | | | | 279,450 | |
| Levi Strauss & Co., 6.875%, 2022 | | | 45,000 | | | | 46,744 | |
| Phillips-Van Heusen Corp., 7.375%, 2020 | | | 390,000 | | | | 436,800 | |
| | | | | | | | |
| | | | | | | $ | 1,092,058 | |
| Asset-Backed & Securitized - 1.7% | | | | | | | | |
| Anthracite Ltd., “A”, CDO, FRN, 0.57%, 2019 (z) | | $ | 296,151 | | | $ | 288,748 | |
Bayview Financial Revolving Mortgage Loan Trust, FRN, 1.811%, 2040 (z) | | | 444,519 | | | | 288,211 | |
| Capital Trust Realty Ltd., CDO, 5.16%, 2035 (n) | | | 529,724 | | | | 539,682 | |
| Crest Ltd., “A1” CDO, FRN, 0.842%, 2018 (z) | | | 297,117 | | | | 291,175 | |
| Crest Ltd., CDO, 7%, 2040 (a)(p) | | | 475,778 | | | | 23,789 | |
| Falcon Franchise Loan LLC, FRN, 5.51%, 2023 (i)(z) | | | 1,055,758 | | | | 100,297 | |
| Falcon Franchise Loan LLC, FRN, 5.91%, 2025 (i)(z) | | | 851,170 | | | | 133,634 | |
| First Union-Lehman Brothers Bank of America, FRN, 0.452%, 2035 (i) | | | 8,678,864 | | | | 148,244 | |
| GMAC LLC, FRN, 6.02%, 2033 (z) | | | 650,947 | | | | 666,484 | |
| Hertz Global Holdings, Inc., 4.26%, 2014 (n) | | | 641,667 | | | | 647,241 | |
| Hertz Vehicle Financing LLC, 2010-1A, “A1”, 2.6%, 2015 (n) | | | 310,000 | | | | 316,721 | |
| KKR Financial CLO Ltd., “C”, FRN, 1.76%, 2021 (n) | | | 523,730 | | | | 455,645 | |
| Morgan Stanley Capital I, Inc., FRN, 1.381%, 2039 (i)(z) | | | 3,304,962 | | | | 62,794 | |
| Prudential Securities Secured Financing Corp., FRN, 7.166%, 2013 (z) | | | 875,000 | | | | 873,328 | |
| Salomon Brothers Mortgage Securities, Inc., FRN, 7.158%, 2032 (z) | | | 836,199 | | | | 847,370 | |
| | | | | | | | |
| | | | | | | $ | 5,683,363 | |
11
Portfolio of Investments – continued
| | | | | | | | |
| Issuer | | Shares/Par | | | Value ($) | |
| Bonds - continued | | | | | | | | |
| Automotive - 1.9% | | | | | | | | |
| Accuride Corp., 9.5%, 2018 | | $ | 575,000 | | | $ | 567,094 | |
| Allison Transmission, Inc., 7.125%, 2019 (n) | | | 520,000 | | | | 553,150 | |
| Ford Motor Co., 7.45%, 2031 | | | 105,000 | | | | 132,825 | |
| Ford Motor Credit Co. LLC, 12%, 2015 | | | 1,523,000 | | | | 1,877,098 | |
| Ford Motor Credit Co. LLC, 8.125%, 2020 | | | 135,000 | | | | 171,578 | |
| General Motors Financial Co., Inc., 4.75%, 2017 (n) | | | 15,000 | | | | 15,357 | |
| General Motors Financial Co., Inc., 6.75%, 2018 | | | 480,000 | | | | 532,152 | |
| Goodyear Tire & Rubber Co., 8.25%, 2020 | | | 80,000 | | | | 86,900 | |
| Goodyear Tire & Rubber Co., 7%, 2022 | | | 135,000 | | | | 141,581 | |
| Harley-Davidson Financial Services, 3.875%, 2016 (n) | | | 1,130,000 | | | | 1,220,871 | |
| Jaguar Land Rover PLC, 7.75%, 2018 (n) | | | 150,000 | | | | 159,750 | |
| Jaguar Land Rover PLC, 8.125%, 2021 (n) | | | 580,000 | | | | 624,950 | |
| Lear Corp., 8.125%, 2020 | | | 176,000 | | | | 195,580 | |
| | | | | | | | |
| | | | | | | $ | 6,278,886 | |
| Biotechnology - 0.3% | | | | | | | | |
| Life Technologies Corp., 6%, 2020 | | $ | 960,000 | | | $ | 1,148,994 | |
| | |
| Broadcasting - 3.0% | | | | | | | | |
| Allbritton Communications Co., 8%, 2018 | | $ | 160,000 | | | $ | 173,600 | |
| AMC Networks, Inc., 7.75%, 2021 | | | 194,000 | | | | 219,705 | |
| CBS Corp., 5.75%, 2020 | | | 260,000 | | | | 314,399 | |
| CBS Corp., 3.375%, 2022 | | | 911,000 | | | | 957,485 | |
| Clear Channel Communications, Inc., 9%, 2021 | | | 351,000 | | | | 306,248 | |
| Clear Channel Worldwide Holdings, Inc., 7.625%, 2020 | | | 165,000 | | | | 157,163 | |
| Clear Channel Worldwide Holdings, Inc., “A”, 7.625%, 2020 | | | 15,000 | | | | 14,138 | |
| Hughes Network Systems LLC, 7.625%, 2021 | | | 190,000 | | | | 211,375 | |
| Inmarsat Finance PLC, 7.375%, 2017 (n) | | | 275,000 | | | | 296,313 | |
| Intelsat Bermuda Ltd., 11.25%, 2017 | | | 550,000 | | | | 577,500 | |
| Intelsat Bermuda Ltd., 11.5%, 2017 (p) | | | 430,000 | | | | 452,575 | |
| Intelsat Jackson Holdings Ltd., 6.625%, 2022 (n) | | | 270,000 | | | | 267,975 | |
| LBI Media, Inc., 8.5%, 2017 (z) | | | 190,000 | | | | 46,075 | |
| Liberty Media Corp., 8.5%, 2029 | | | 260,000 | | | | 279,500 | |
| Liberty Media Corp., 8.25%, 2030 | | | 175,000 | | | | 187,250 | |
| Local TV Finance LLC, 9.25%, 2015 (p)(z) | | | 254,002 | | | | 258,130 | |
| NBCUniversal Media LLC, 5.95%, 2041 | | | 939,000 | | | | 1,169,396 | |
| Newport Television LLC, 13%, 2017 (n)(p) | | | 283,309 | | | | 304,557 | |
| News America, Inc., 8.5%, 2025 | | | 415,000 | | | | 573,518 | |
| Nexstar Broadcasting Group, Inc., 8.875%, 2017 | | | 130,000 | | | | 141,700 | |
| Nexstar Broadcasting Group, Inc., 6.875%, 2020 (z) | | | 45,000 | | | | 45,113 | |
| Sinclair Broadcast Group, Inc., 9.25%, 2017 (n) | | | 130,000 | | | | 143,975 | |
| Sinclair Broadcast Group, Inc., 8.375%, 2018 | | | 50,000 | | | | 55,750 | |
| SIRIUS XM Radio, Inc., 8.75%, 2015 (n) | | | 180,000 | | | | 204,300 | |
12
Portfolio of Investments – continued
| | | | | | | | |
| Issuer | | Shares/Par | | | Value ($) | |
| Bonds - continued | | | | | | |
| Broadcasting - continued | | | | | | | | |
| SIRIUS XM Radio, Inc., 7.625%, 2018 (n) | | $ | 440,000 | | | $ | 486,200 | |
| SIRIUS XM Radio, Inc., 5.25%, 2022 (n) | | | 45,000 | | | | 45,000 | |
| Starz LLC/Starz Finance Corp., 5%, 2019 (n) | | | 115,000 | | | | 117,588 | |
| Townsquare Radio LLC, 9%, 2019 (z) | | | 120,000 | | | | 129,600 | |
| Univision Communications, Inc., 6.875%, 2019 (n) | | | 390,000 | | | | 398,775 | |
| Univision Communications, Inc., 7.875%, 2020 (n) | | | 135,000 | | | | 143,100 | |
| Univision Communications, Inc., 8.5%, 2021 (n) | | | 225,000 | | | | 226,125 | |
| Vivendi S.A., 4.75%, 2022 (n) | | | 990,000 | | | | 1,031,184 | |
| | | | | | | | |
| | | | | | | $ | 9,935,312 | |
| Brokerage & Asset Managers - 0.9% | | | | | | | | |
| BlackRock, Inc., 3.375%, 2022 | | $ | 325,000 | | | $ | 347,470 | |
| Blackstone Holdings Finance Co. LLC, 4.75%, 2023 (n) | | | 940,000 | | | | 1,008,229 | |
| E*TRADE Financial Corp., 7.875%, 2015 | | | 225,000 | | | | 228,094 | |
| E*TRADE Financial Corp., 12.5%, 2017 | | | 240,000 | | | | 271,800 | |
| TD Ameritrade Holding Corp., 5.6%, 2019 | | | 1,045,000 | | | | 1,224,508 | |
| | | | | | | | |
| | | | | | | $ | 3,080,101 | |
| Building - 1.0% | | | | | | | | |
| Boise Cascade LLC/Finance Corp., 6.375%, 2020 (z) | | $ | 45,000 | | | $ | 45,675 | |
| Building Materials Holding Corp., 6.875%, 2018 (n) | | | 125,000 | | | | 134,063 | |
| Building Materials Holding Corp., 7%, 2020 (n) | | | 290,000 | | | | 314,650 | |
| Building Materials Holding Corp., 6.75%, 2021 (n) | | | 115,000 | | | | 125,350 | |
| CRH PLC, 8.125%, 2018 | | | 590,000 | | | | 707,306 | |
| HD Supply, Inc., 8.125%, 2019 (n) | | | 145,000 | | | | 159,500 | |
| HD Supply, Inc., 11.5%, 2020 (z) | | | 125,000 | | | | 131,563 | |
| Masonite International Corp., 8.25%, 2021 (n) | | | 305,000 | | | | 323,300 | |
| Nortek, Inc., 8.5%, 2021 | | | 435,000 | | | | 467,625 | |
| Owens Corning, Inc., 4.2%, 2022 | | | 385,000 | | | | 389,135 | |
Roofing Supply Group LLC/Roofing Supply Finance, Inc., 10%, 2020 (n) | | | 95,000 | | | | 104,500 | |
| USG Corp., 6.3%, 2016 | | | 303,000 | | | | 308,303 | |
| USG Corp., 7.875%, 2020 (n) | | | 150,000 | | | | 163,500 | |
| | | | | | | | |
| | | | | | | $ | 3,374,470 | |
| Business Services - 0.8% | | | | | | | | |
| Ceridian Corp., 12.25%, 2015 (p) | | $ | 195,000 | | | $ | 191,588 | |
| Ceridian Corp., 8.875%, 2019 (n) | | | 90,000 | | | | 95,400 | |
| Fidelity National Information Services, Inc., 7.625%, 2017 | | | 135,000 | | | | 147,319 | |
| Fidelity National Information Services, Inc., 5%, 2022 | | | 230,000 | | | | 234,600 | |
| iGate Corp., 9%, 2016 | | | 425,000 | | | | 464,313 | |
| Iron Mountain, Inc., 8.375%, 2021 | | | 360,000 | | | | 397,800 | |
| Legend Acquisition Sub, Inc., 10.75%, 2020 (n) | | | 285,000 | | | | 277,875 | |
13
Portfolio of Investments – continued
| | | | | | | | |
| Issuer | | Shares/Par | | | Value ($) | |
| Bonds - continued | | | | | | |
| Business Services - continued | | | | | | | | |
| Lender Processing Services, Inc., 5.75%, 2023 | | $ | 180,000 | | | $ | 190,350 | |
| SunGard Data Systems, Inc., 10.25%, 2015 | | | 43,000 | | | | 43,989 | |
| SunGard Data Systems, Inc., 7.375%, 2018 | | | 120,000 | | | | 129,150 | |
| Tencent Holdings Ltd., 3.375%, 2018 (n) | | | 490,000 | | | | 499,830 | |
| | | | | | | | |
| | | | | | | $ | 2,672,214 | |
| Cable TV - 2.1% | | | | | | | | |
| Bresnan Broadband Holdings LLC, 8%, 2018 (n) | | $ | 70,000 | | | $ | 75,250 | |
| CCH II LLC, 13.5%, 2016 | | | 124,527 | | | | 133,867 | |
| CCO Holdings LLC, 7.875%, 2018 | | | 465,000 | | | | 502,200 | |
| CCO Holdings LLC, 8.125%, 2020 | | | 470,000 | | | | 528,750 | |
| CCO Holdings LLC, 7.375%, 2020 | | | 130,000 | | | | 145,600 | |
| Cequel Communications Holdings, 8.625%, 2017 (n) | | | 160,000 | | | | 171,200 | |
| DIRECTV Holdings LLC, 5.875%, 2019 | | | 370,000 | | | | 442,620 | |
| DIRECTV Holdings LLC, 3.8%, 2022 | | | 1,230,000 | | | | 1,281,562 | |
| DISH DBS Corp., 6.75%, 2021 | | | 170,000 | | | | 189,338 | |
| EchoStar Corp., 7.125%, 2016 | | | 170,000 | | | | 189,975 | |
| Myriad International Holdings B.V., 6.375%, 2017 (n) | | | 271,000 | | | | 306,908 | |
| Time Warner Cable, Inc., 8.25%, 2019 | | | 920,000 | | | | 1,243,881 | |
| UPC Holding B.V., 9.875%, 2018 (n) | | | 215,000 | | | | 241,338 | |
| UPCB Finance III Ltd., 6.625%, 2020 (n) | | | 421,000 | | | | 450,470 | |
| Virgin Media Finance PLC, 8.375%, 2019 | | | 160,000 | | | | 184,000 | |
| Virgin Media Finance PLC, 5.25%, 2022 | | | 310,000 | | | | 323,950 | |
| Ziggo Bond Co. B.V., 8%, 2018 (n) | | EUR | 225,000 | | | | 320,068 | |
| | | | | | | | |
| | | | | | | $ | 6,730,977 | |
| Chemicals - 1.5% | | | | | | | | |
| Celanese U.S. Holdings LLC, 6.625%, 2018 | | $ | 490,000 | | | $ | 534,100 | |
| Dow Chemical Co., 8.55%, 2019 | | | 1,410,000 | | | | 1,912,111 | |
Hexion U.S. Finance Corp./Hexion Nova Scotia Finance, 8.875%, 2018 | | | 360,000 | | | | 363,600 | |
| Hexion U.S. Finance Corp./Hexion Nova Scotia Finance, 9%, 2020 | | | 70,000 | | | | 62,825 | |
| Huntsman International LLC, 8.625%, 2021 | | | 375,000 | | | | 426,563 | |
| INEOS Finance PLC, 8.375%, 2019 (n) | | | 210,000 | | | | 220,500 | |
| INEOS Group Holdings PLC, 8.5%, 2016 (n) | | | 215,000 | | | | 207,475 | |
| LyondellBasell Industries N.V., 6%, 2021 | | | 320,000 | | | | 370,000 | |
| Momentive Performance Materials, Inc., 12.5%, 2014 | | | 200,000 | | | | 207,000 | |
| Momentive Performance Materials, Inc., 11.5%, 2016 | | | 141,000 | | | | 91,650 | |
| Polypore International, Inc., 7.5%, 2017 | | | 155,000 | | | | 167,400 | |
| Sociedad Quimica y Minera de Chile S.A., 5.5%, 2020 (n) | | | 347,000 | | | | 388,930 | |
| | | | | | | | |
| | | | | | | $ | 4,952,154 | |
14
Portfolio of Investments – continued
| | | | | | | | |
| Issuer | | Shares/Par | | | Value ($) | |
| Bonds - continued | | | | | | |
| Computer Software - 0.7% | | | | | | | | |
| Infor U.S., Inc., 11.5%, 2018 | | $ | 345,000 | | | $ | 399,338 | |
| Infor U.S., Inc., 9.375%, 2019 | | | 90,000 | | | | 99,450 | |
| Nuance Communications, Inc., 5.375%, 2020 (n) | | | 240,000 | | | | 244,800 | |
| Oracle Corp., 5.375%, 2040 | | | 607,000 | | | | 790,509 | |
| Seagate HDD Cayman, 6.875%, 2020 | | | 205,000 | | | | 213,713 | |
| Syniverse Holdings, Inc., 9.125%, 2019 | | | 370,000 | | | | 394,050 | |
| TransUnion Holding Co., Inc., 9.625%, 2018 | | | 130,000 | | | | 137,475 | |
| TransUnion LLC/TransUnion Financing Corp., 11.375%, 2018 | | | 65,000 | | | | 75,400 | |
| | | | | | | | |
| | | | | | | $ | 2,354,735 | |
| Computer Software - Systems - 0.3% | | | | | | | | |
| Audatex North America, Inc., 6.75%, 2018 (n) | | $ | 125,000 | | | $ | 134,063 | |
| CDW LLC/CDW Finance Corp., 12.535%, 2017 | | | 255,000 | | | | 273,169 | |
| CDW LLC/CDW Finance Corp., 8.5%, 2019 | | | 365,000 | | | | 389,638 | |
| DuPont Fabros Technology, Inc., REIT, 8.5%, 2017 | | | 255,000 | | | | 280,500 | |
| | | | | | | | |
| | | | | | | $ | 1,077,370 | |
| Conglomerates - 0.5% | | | | | | | | |
| Amsted Industries, Inc., 8.125%, 2018 (n) | | $ | 545,000 | | | $ | 585,875 | |
| Dynacast International LLC, 9.25%, 2019 | | | 215,000 | | | | 225,750 | |
| Griffon Corp., 7.125%, 2018 | | | 425,000 | | | | 448,375 | |
| Ingersoll-Rand Global Holding Co. Ltd., 9.5%, 2014 | | | 375,000 | | | | 419,926 | |
| | | | | | | | |
| | | | | | | $ | 1,679,926 | |
| Consumer Products - 0.7% | | | | | | | | |
| Easton-Bell Sports, Inc., 9.75%, 2016 | | $ | 240,000 | | | $ | 258,602 | |
| Elizabeth Arden, Inc., 7.375%, 2021 | | | 280,000 | | | | 312,550 | |
| FGI Operating Co./FGI Finance, Inc., 7.875%, 2020 (n) | | | 20,000 | | | | 21,700 | |
| Jarden Corp., 7.5%, 2020 | | | 315,000 | | | | 344,925 | |
| Libbey Glass, Inc., 6.875%, 2020 (n) | | | 95,000 | | | | 101,175 | |
| Mattel, Inc., 5.45%, 2041 | | | 478,000 | | | | 564,799 | |
| Newell Rubbermaid, Inc., 4.7%, 2020 | | | 570,000 | | | | 635,244 | |
| | | | | | | | |
| | | | | | | $ | 2,238,995 | |
| Consumer Services - 0.5% | | | | | | | | |
| Experian Finance PLC, 2.375%, 2017 (n) | | $ | 353,000 | | | $ | 361,389 | |
| Service Corp. International, 7%, 2017 | | | 975,000 | | | | 1,116,375 | |
| | | | | | | | |
| | | | | | | $ | 1,477,764 | |
| Containers - 0.7% | | | | | | | | |
| Ardagh Packaging Finance PLC, 7.375%, 2017 (n) | | $ | 260,000 | | | $ | 279,175 | |
| Ardagh Packaging Finance PLC, 9.125%, 2020 (n) | | | 220,000 | | | | 228,800 | |
| Ball Corp., 5%, 2022 | | | 160,000 | | | | 168,800 | |
| Greif, Inc., 6.75%, 2017 | | | 915,000 | | | | 1,008,788 | |
15
Portfolio of Investments – continued
| | | | | | | | |
| Issuer | | Shares/Par | | | Value ($) | |
| Bonds - continued | | | | | | |
| Containers - continued | | | | | | | | |
| Reynolds Group, 7.125%, 2019 | | $ | 180,000 | | | $ | 191,700 | |
| Reynolds Group, 9.875%, 2019 | | | 100,000 | | | | 104,750 | |
| Reynolds Group, 5.75%, 2020 (n) | | | 165,000 | | | | 166,650 | |
| Reynolds Group, 8.25%, 2021 | | | 205,000 | | | | 201,413 | |
| | | | | | | | |
| | | | | | | $ | 2,350,076 | |
| Defense Electronics - 0.8% | | | | | | | | |
| BAE Systems Holdings, Inc., 5.2%, 2015 (n) | | $ | 1,297,000 | | | $ | 1,425,937 | |
| BAE Systems Holdings, Inc., 6.375%, 2019 (n) | | | 380,000 | | | | 457,583 | |
| Ducommun, Inc., 9.75%, 2018 | | | 325,000 | | | | 343,688 | |
| MOOG, Inc., 7.25%, 2018 | | | 255,000 | | | | 270,300 | |
| | | | | | | | |
| | | | | | | $ | 2,497,508 | |
| Electrical Equipment - 0.3% | | | | | | | | |
| Avaya, Inc., 9.75%, 2015 | | $ | 200,000 | | | $ | 178,000 | |
| Avaya, Inc., 7%, 2019 (n) | | | 80,000 | | | | 73,000 | |
| Ericsson, Inc., 4.125%, 2022 | | | 670,000 | | | | 703,340 | |
| | | | | | | | |
| | | | | | | $ | 954,340 | |
| Electronics - 0.4% | | | | | | | | |
| Freescale Semiconductor, Inc., 9.25%, 2018 (n) | | $ | 505,000 | | | $ | 540,350 | |
| Nokia Corp., 5.375%, 2019 | | | 110,000 | | | | 91,025 | |
| Sensata Technologies B.V., 6.5%, 2019 (n) | | | 500,000 | | | | 527,500 | |
| Tyco Electronics Group S.A., 3.5%, 2022 | | | 275,000 | | | | 286,336 | |
| | | | | | | | |
| | | | | | | $ | 1,445,211 | |
| Emerging Market Quasi-Sovereign - 2.8% | | | | | | | | |
| Banco do Nordeste do Brasil (BNB), 4.375%, 2019 (n) | | $ | 254,000 | | | $ | 263,525 | |
| CEZ A.S., 4.25%, 2022 (n) | | | 452,000 | | | | 484,092 | |
| CNOOC Finance (2012) Ltd., 3.875%, 2022 (n) | | | 204,000 | | | | 219,015 | |
| CNPC (HK) Overseas Capital Ltd., 4.5%, 2021 (n) | | | 494,000 | | | | 553,596 | |
| Comision Federal de Electricidad, 5.75%, 2042 (n) | | | 639,000 | | | | 725,265 | |
| Development Bank of Kazakhstan, 5.5%, 2015 (n) | | | 283,000 | | | | 308,810 | |
| Gaz Capital S.A., 9.25%, 2019 | | | 177,000 | | | | 230,985 | |
| Gaz Capital S.A., 5.999%, 2021 (n) | | | 570,000 | | | | 643,530 | |
| Gazprom, 4.375%, 2022 (n) | | | 201,000 | | | | 201,503 | |
| Korea Gas Corp., 2.25%, 2017 (n) | | | 700,000 | | | | 705,158 | |
| Pertamina PT, 6%, 2042 (n) | | | 201,000 | | | | 227,130 | |
| Petrobras International Finance Co., 7.875%, 2019 | | | 494,000 | | | | 625,419 | |
| Petrobras International Finance Co., 6.75%, 2041 | | | 414,000 | | | | 529,347 | |
| Petroleos Mexicanos, 5.5%, 2021 | | | 542,000 | | | | 632,785 | |
| Petroleos Mexicanos, 4.875%, 2022 | | | 344,000 | | | | 385,280 | |
| Petroleos Mexicanos, 6.5%, 2041 | | | 292,000 | | | | 362,445 | |
| PT Perusahaan Listrik Negara, 5.5%, 2021 (n) | | | 200,000 | | | | 225,500 | |
16
Portfolio of Investments – continued
| | | | | | | | |
| Issuer | | Shares/Par | | | Value ($) | |
| Bonds - continued | | | | | | |
| Emerging Market Quasi-Sovereign - continued | | | | | | | | |
| PTT PLC, 3.375%, 2022 (z) | | $ | 331,000 | | | $ | 326,552 | |
| PTT PLC, 4.5%, 2042 (z) | | | 354,000 | | | | 352,033 | |
| Ras Laffan Liquefied Natural Gas Co. Ltd., 5.832%, 2016 (n) | | | 575,296 | | | | 634,839 | |
| Sberbank of Russia, 6.125%, 2022 (n) | | | 285,000 | | | | 318,924 | |
| Sinopec Group Overseas Development (2012) Ltd., 3.9%, 2022 (n) | | | 200,000 | | | | 216,795 | |
| | | | | | | | |
| | | | | | | $ | 9,172,528 | |
| Emerging Market Sovereign - 0.6% | | | | | | | | |
| Republic of Colombia, 6.125%, 2041 | | $ | 210,000 | | | $ | 286,650 | |
| Republic of Indonesia, 4.875%, 2021 (n) | | | 200,000 | | | | 228,000 | |
| Republic of Philippines, 5.5%, 2026 | | | 200,000 | | | | 253,000 | |
| Republic of Philippines, 6.375%, 2034 | | | 300,000 | | | | 417,000 | |
| Republic of Slovakia, 4.375%, 2022 (n) | | | 600,000 | | | | 640,434 | |
| Russian Federation, 5.625%, 2042 (n) | | | 200,000 | | | | 240,260 | |
| | | | | | | | |
| | | | | | | $ | 2,065,344 | |
| Energy - Independent - 3.3% | | | | | | | | |
| BreitBurn Energy Partners LP, 8.625%, 2020 | | $ | 140,000 | | | $ | 151,550 | |
| BreitBurn Energy Partners LP, 7.875%, 2022 (n) | | | 340,000 | | | | 351,900 | |
| Carrizo Oil & Gas, Inc., 8.625%, 2018 | | | 105,000 | | | | 113,138 | |
| Chaparral Energy, Inc., 7.625%, 2022 (n) | | | 340,000 | | | | 359,550 | |
| Chesapeake Energy Corp., 6.875%, 2020 | | | 270,000 | | | | 286,200 | |
| Concho Resources, Inc., 8.625%, 2017 | | | 175,000 | | | | 191,625 | |
| Concho Resources, Inc., 6.5%, 2022 | | | 365,000 | | | | 400,588 | |
| Continental Resources, Inc., 8.25%, 2019 | | | 320,000 | | | | 360,800 | |
| Denbury Resources, Inc., 8.25%, 2020 | | | 460,000 | | | | 520,950 | |
| Energy XXI Gulf Coast, Inc., 9.25%, 2017 | | | 510,000 | | | | 575,025 | |
| EQT Corp., 4.875%, 2021 | | | 431,000 | | | | 466,604 | |
Everest Acquisition LLC/Everest Acquisition Finance, Inc., 9.375%, 2020 (n) | | | 735,000 | | | | 812,175 | |
| EXCO Resources, Inc., 7.5%, 2018 | | | 270,000 | | | | 253,800 | |
| Harvest Operations Corp., 6.875%, 2017 | | | 455,000 | | | | 498,225 | |
| Hess Corp., 8.125%, 2019 | | | 270,000 | | | | 359,829 | |
| Hilcorp Energy I/Hilcorp Finance Co., 8%, 2020 (n) | | | 115,000 | | | | 125,925 | |
| Laredo Petroleum, Inc., 9.5%, 2019 | | | 200,000 | | | | 227,000 | |
| LINN Energy LLC, 6.5%, 2019 | | | 115,000 | | | | 115,863 | |
| LINN Energy LLC, 8.625%, 2020 | | | 220,000 | | | | 240,625 | |
| LINN Energy LLC, 7.75%, 2021 | | | 206,000 | | | | 219,905 | |
| MEG Energy Corp., 6.5%, 2021 (n) | | | 75,000 | | | | 80,438 | |
| Newfield Exploration Co., 6.875%, 2020 | | | 450,000 | | | | 487,125 | |
| OGX Petroleo e Gas Participacoes S.A., 8.5%, 2018 (n) | | | 787,000 | | | | 686,658 | |
| Plains Exploration & Production Co., 8.625%, 2019 | | | 295,000 | | | | 325,238 | |
| Plains Exploration & Production Co., 6.5%, 2020 | | | 110,000 | | | | 110,000 | |
| Plains Exploration & Production Co., 6.75%, 2022 | | | 165,000 | | | | 165,825 | |
17
Portfolio of Investments – continued
| | | | | | | | |
| Issuer | | Shares/Par | | | Value ($) | |
| Bonds - continued | | | | | | |
| Energy - Independent - continued | | | | | | | | |
| QEP Resources, Inc., 6.875%, 2021 | | $ | 525,000 | | | $ | 598,500 | |
| Range Resources Corp., 8%, 2019 | | | 190,000 | | | | 209,950 | |
| Range Resources Corp., 5%, 2022 | | | 105,000 | | | | 109,725 | |
| Samson Investment Co., 9.75%, 2020 (n) | | | 180,000 | | | | 189,900 | |
| SandRidge Energy, Inc., 8%, 2018 (n) | | | 505,000 | | | | 530,250 | |
| SM Energy Co., 6.5%, 2021 | | | 280,000 | | | | 294,700 | |
| Talisman Energy, Inc., 7.75%, 2019 | | | 120,000 | | | | 154,794 | |
| Whiting Petroleum Corp., 6.5%, 2018 | | | 205,000 | | | | 221,144 | |
| | | | | | | | |
| | | | | | | $ | 10,795,524 | |
| Energy - Integrated - 1.0% | | | | | | | | |
| BP Capital Markets PLC, 4.5%, 2020 | | $ | 272,000 | | | $ | 319,405 | |
| BP Capital Markets PLC, 4.742%, 2021 | | | 760,000 | | | | 899,231 | |
| Cenovus Energy, Inc., 4.5%, 2014 | | | 320,000 | | | | 342,721 | |
| Pacific Rubiales Energy Corp., 7.25%, 2021 (n) | | | 534,000 | | | | 632,790 | |
| Petro-Canada Financial Partnership, 5%, 2014 | | | 860,000 | | | | 932,961 | |
| | | | | | | | |
| | | | | | | $ | 3,127,108 | |
| Engineering - Construction - 0.1% | | | | | | | | |
| BakerCorp International, Inc., 8.25%, 2019 | | $ | 230,000 | | | $ | 230,000 | |
| | |
| Entertainment - 0.4% | | | | | | | | |
| AMC Entertainment, Inc., 8.75%, 2019 | | $ | 455,000 | | | $ | 502,775 | |
| AMC Entertainment, Inc., 9.75%, 2020 | | | 295,000 | | | | 331,138 | |
| Cedar Fair LP, 9.125%, 2018 | | | 190,000 | | | | 214,938 | |
| Cinemark USA, Inc., 8.625%, 2019 | | | 385,000 | | | | 426,388 | |
| | | | | | | | |
| | | | | | | $ | 1,475,239 | |
| Financial Institutions - 2.9% | | | | | | | | |
| Ally Financial, Inc., 5.5%, 2017 | | $ | 730,000 | | | $ | 772,467 | |
| CIT Group, Inc., 5.25%, 2014 (n) | | | 400,000 | | | | 415,000 | |
| CIT Group, Inc., 5.25%, 2018 | | | 330,000 | | | | 350,625 | |
| CIT Group, Inc., 6.625%, 2018 (n) | | | 394,000 | | | | 439,310 | |
| CIT Group, Inc., 5.5%, 2019 (n) | | | 335,000 | | | | 357,194 | |
| General Electric Capital Corp., 6%, 2019 | | | 300,000 | | | | 367,473 | |
| General Electric Capital Corp., 5.5%, 2020 | | | 710,000 | | | | 844,669 | |
| General Electric Capital Corp., 3.15%, 2022 | | | 813,000 | | | | 827,056 | |
| GMAC, Inc., 8%, 2031 | | | 60,000 | | | | 71,400 | |
| Icahn Enterprises LP, 8%, 2018 | | | 140,000 | | | | 150,500 | |
| Icahn Enterprises LP, 8%, 2018 (n) | | | 47,000 | | | | 50,525 | |
| International Lease Finance Corp., 4.875%, 2015 | | | 125,000 | | | | 129,375 | |
| International Lease Finance Corp., 8.625%, 2015 | | | 135,000 | | | | 152,010 | |
| International Lease Finance Corp., 7.125%, 2018 (n) | | | 390,000 | | | | 458,250 | |
| LeasePlan Corp. N.V., 3%, 2017 (z) | | | 870,000 | | | | 880,029 | |
18
Portfolio of Investments – continued
| | | | | | | | |
| Issuer | | Shares/Par | | | Value ($) | |
| Bonds - continued | | | | | | |
| Financial Institutions - continued | | | | | | | | |
| Nationstar Mortgage LLC/Capital Corp., 10.875%, 2015 | | $ | 485,000 | | | $ | 524,406 | |
| Nationstar Mortgage LLC/Capital Corp., 9.625%, 2019 (n) | | | 115,000 | | | | 127,075 | |
| Nationstar Mortgage LLC/Capital Corp., 7.875%, 2020 (n) | | | 90,000 | | | | 92,700 | |
| NYSE Euronext, 2%, 2017 | | | 714,000 | | | | 726,938 | |
| PHH Corp., 9.25%, 2016 | | | 270,000 | | | | 311,850 | |
| PHH Corp., 7.375%, 2019 | | | 225,000 | | | | 240,750 | |
| SLM Corp., 8.45%, 2018 | | | 210,000 | | | | 249,570 | |
| SLM Corp., 8%, 2020 | | | 770,000 | | | | 891,752 | |
| SLM Corp., 7.25%, 2022 | | | 55,000 | | | | 60,638 | |
| | | | | | | | |
| | | | | | | $ | 9,491,562 | |
| Food & Beverages - 2.6% | | | | | | | | |
| Anheuser-Busch InBev S.A., 7.75%, 2019 | | $ | 1,100,000 | | | $ | 1,492,292 | |
| ARAMARK Corp., 8.5%, 2015 | | | 240,000 | | | | 243,902 | |
| B&G Foods, Inc., 7.625%, 2018 | | | 480,000 | | | | 517,200 | |
| Campbell Soup Co., 2.5%, 2022 | | | 363,000 | | | | 368,154 | |
| Grupo Bimbo S.A.B. de C.V., 4.5%, 2022 (n) | | | 101,000 | | | | 111,105 | |
| JBS USA LLC/JBS USA Finance, 8.25%, 2020 (n) | | | 80,000 | | | | 82,600 | |
| Kraft Foods Group, Inc., 6.125%, 2018 (n) | | | 720,000 | | | | 892,320 | |
| Mead Johnson Nutrition Co., “A”, 4.9%, 2019 | | | 263,000 | | | | 304,413 | |
| Miller Brewing Co., 5.5%, 2013 (n) | | | 1,370,000 | | | | 1,424,108 | |
| Pernod Ricard S.A., 5.75%, 2021 (n) | | | 594,000 | | | | 719,387 | |
| Pinnacle Foods Finance LLC, 8.25%, 2017 | | | 80,000 | | | | 86,000 | |
| SABMiller Holdings, Inc., 3.75%, 2022 (n) | | | 904,000 | | | | 994,255 | |
| TreeHouse Foods, Inc., 7.75%, 2018 | | | 250,000 | | | | 273,750 | |
| Tyson Foods, Inc., 6.6%, 2016 | | | 560,000 | | | | 645,473 | |
| Tyson Foods, Inc., 4.5%, 2022 | | | 448,000 | | | | 474,880 | |
| | | | | | | | |
| | | | | | | $ | 8,629,839 | |
| Food & Drug Stores - 0.4% | | | | | | | | |
| CVS Caremark Corp., 5.75%, 2041 | | $ | 1,020,000 | | | $ | 1,321,228 | |
| | |
| Forest & Paper Products - 0.3% | | | | | | | | |
| Boise, Inc., 8%, 2020 | | $ | 280,000 | | | $ | 306,600 | |
| Georgia-Pacific Corp., 8%, 2024 | | | 29,000 | | | | 40,715 | |
| Graphic Packaging Holding Co., 7.875%, 2018 | | | 190,000 | | | | 209,950 | |
| Smurfit Kappa Group PLC, 7.75%, 2019 (n) | | EUR | 195,000 | | | | 278,024 | |
| Tembec Industries, Inc., 11.25%, 2018 | | $ | 135,000 | | | | 142,763 | |
| Xerium Technologies, Inc., 8.875%, 2018 | | | 108,000 | | | | 91,260 | |
| | | | | | | | |
| | | | | | | $ | 1,069,312 | |
| Gaming & Lodging - 1.7% | | | | | | | | |
| Caesars Operating Escrow LLC, 8.5%, 2020 (n) | | $ | 270,000 | | | $ | 265,275 | |
| Choice Hotels International, Inc., 5.75%, 2022 | | | 45,000 | | | | 49,275 | |
19
Portfolio of Investments – continued
| | | | | | | | |
| Issuer | | Shares/Par | | | Value ($) | |
| Bonds - continued | | | | | | |
| Gaming & Lodging - continued | | | | | | | | |
| Fontainebleau Las Vegas Holdings LLC, 10.25%, 2015 (a)(d)(n) | | $ | 315,000 | | | $ | 197 | |
| GWR Operating Partnership LLP, 10.875%, 2017 | | | 135,000 | | | | 153,900 | |
| Harrah’s Operating Co., Inc., 11.25%, 2017 | | | 500,000 | | | | 541,250 | |
| Host Hotels & Resorts, Inc., REIT 5.25%, 2022 | | | 175,000 | | | | 193,375 | |
| Isle of Capri Casinos, Inc., 8.875%, 2020 (n) | | | 270,000 | | | | 284,175 | |
| Marriott International, Inc., 5.625%, 2013 | | | 630,000 | | | | 638,005 | |
| MGM Mirage, 10.375%, 2014 | | | 45,000 | | | | 50,569 | |
| MGM Mirage, 6.625%, 2015 | | | 110,000 | | | | 116,875 | |
| MGM Resorts International, 11.375%, 2018 | | | 300,000 | | | | 352,500 | |
| MGM Resorts International, 9%, 2020 | | | 250,000 | | | | 278,750 | |
| Penn National Gaming, Inc., 8.75%, 2019 | | | 445,000 | | | | 497,288 | |
| Pinnacle Entertainment, Inc., 8.75%, 2020 | | | 150,000 | | | | 163,875 | |
| Rivers Pittsburgh Borrower LP/Rivers Pittsburgh Finance Corp., 9.5%, 2019 (n) | | | 45,000 | | | | 48,600 | |
| Seven Seas Cruises S. DE R.L., 9.125%, 2019 | | | 365,000 | | | | 379,144 | |
| Viking Cruises Ltd., 8.5%, 2022 (z) | | | 185,000 | | | | 191,013 | |
| Wyndham Worldwide Corp., 6%, 2016 | | | 4,000 | | | | 4,479 | |
| Wyndham Worldwide Corp., 5.75%, 2018 | | | 760,000 | | | | 850,224 | |
| Wyndham Worldwide Corp., 7.375%, 2020 | | | 170,000 | | | | 203,872 | |
| Wynn Las Vegas LLC, 7.75%, 2020 | | | 290,000 | | | | 325,525 | |
| | | | | | | | |
| | | | | | | $ | 5,588,166 | |
| Industrial - 0.7% | | | | | | | | |
| Altra Holdings, Inc., 8.125%, 2016 | | $ | 170,000 | | | $ | 181,050 | |
| Hyva Global B.V., 8.625%, 2016 (n) | | | 200,000 | | | | 186,500 | |
| Johns Hopkins University, 5.25%, 2019 | | | 1,180,000 | | | | 1,418,655 | |
| Mueller Water Products, Inc., 8.75%, 2020 | | | 219,000 | | | | 251,303 | |
| SPL Logistics Escrow LLC, 8.875%, 2020 (n) | | | 140,000 | | | | 148,750 | |
| | | | | | | | |
| | | | | | | $ | 2,186,258 | |
| Insurance - 2.0% | | | | | | | | |
| Allianz AG, FRN, 5.5%, 2049 | | EUR | 947,000 | | | $ | 1,239,729 | |
| American International Group, Inc., 3%, 2015 | | $ | 20,000 | | | | 20,812 | |
| American International Group, Inc., 8.25%, 2018 | | | 280,000 | | | | 363,733 | |
| American International Group, Inc., 8.175% to 2038, FRN to 2068 | | | 825,000 | | | | 1,029,188 | |
| Metlife, Inc., 1.756%, 2017 | | | 223,000 | | | | 226,632 | |
| MetLife, Inc., 9.25% to 2038, FRN to 2068 (n) | | | 400,000 | | | | 556,000 | |
| Metropolitan Life Global Funding I, 5.125%, 2014 (n) | | | 430,000 | | | | 460,273 | |
| Principal Financial Group, Inc., 8.875%, 2019 | | | 650,000 | | | | 863,669 | |
| Prudential Financial, Inc., 6.2%, 2015 | | | 660,000 | | | | 727,039 | |
| Unum Group, 7.125%, 2016 | | | 945,000 | | | | 1,113,272 | |
| | | | | | | | |
| | | | | | | $ | 6,600,347 | |
20
Portfolio of Investments – continued
| | | | | | | | |
| Issuer | | Shares/Par | | | Value ($) | |
| Bonds - continued | | | | | | |
| Insurance - Health - 0.6% | | | | | | | | |
| AMERIGROUP Corp., 7.5%, 2019 | | $ | 140,000 | | | $ | 163,450 | |
| WellPoint, Inc., 3.3%, 2023 | | | 1,811,000 | | | | 1,873,271 | |
| | | | | | | | |
| | | | | | | $ | 2,036,721 | |
| Insurance - Property & Casualty - 2.8% | | | | | | | | |
| Aon Corp., 3.5%, 2015 | | $ | 760,000 | | | $ | 802,343 | |
| AXIS Capital Holdings Ltd., 5.75%, 2014 | | | 1,035,000 | | | | 1,111,523 | |
| AXIS Capital Holdings Ltd., 5.875%, 2020 | | | 370,000 | | | | 418,382 | |
| CNA Financial Corp., 5.875%, 2020 | | | 990,000 | | | | 1,164,602 | |
| Liberty Mutual Group, Inc., 4.95%, 2022 (n) | | | 757,000 | | | | 826,690 | |
| Liberty Mutual Group, Inc., 10.75% to 2038, FRN to 2058 (n) | | | 365,000 | | | | 543,850 | |
| PartnerRe Ltd., 5.5%, 2020 | | | 583,000 | | | | 644,196 | |
| QBE Capital Funding III Ltd., FRN, 7.25%, 2041 (n) | | | 920,000 | | | | 961,400 | |
| Travelers Cos., Inc., 3.9%, 2020 | | | 1,270,000 | | | | 1,442,721 | |
| ZFS Finance USA Trust V, 6.5% to 2017, FRN to 2067 (n) | | | 1,095,000 | | | | 1,168,913 | |
| | | | | | | | |
| | | | | | | $ | 9,084,620 | |
| International Market Quasi-Sovereign - 2.2% | | | | | | | | |
| EDF Energies Nouvelles S.A., 6.5%, 2019 (n) | | $ | 1,090,000 | | | $ | 1,347,928 | |
| ING Bank N.V., 3.9%, 2014 (n) | | | 1,060,000 | | | | 1,107,033 | |
| Irish Life & Permanent PLC, 3.6%, 2013 (e)(n) | | | 3,000,000 | | | | 3,000,000 | |
| Israel Electric Corp. Ltd., 6.7%, 2017 (n) | | | 553,000 | | | | 605,535 | |
| Vestjysk Bank A/S, FRN, 0.939%, 2013 (n) | | | 710,000 | | | | 711,586 | |
| Westpac Banking Corp., 3.45%, 2014 (n) | | | 520,000 | | | | 546,406 | |
| | | | | | | | |
| | | | | | | $ | 7,318,488 | |
| International Market Sovereign - 10.4% | | | | | | | | |
| Federal Republic of Germany, 3.75%, 2015 | | EUR | 1,675,000 | | | $ | 2,345,278 | |
| Federal Republic of Germany, 4.25%, 2018 | | EUR | 677,000 | | | | 1,052,905 | |
| Federal Republic of Germany, 6.25%, 2030 | | EUR | 564,000 | | | | 1,165,991 | |
| Government of Australia, 5.75%, 2021 | | AUD | 264,000 | | | | 330,910 | |
| Government of Bermuda, 5.603%, 2020 (n) | | $ | 295,000 | | | | 348,100 | |
| Government of Canada, 4.5%, 2015 | | CAD | 546,000 | | | | 593,512 | |
| Government of Canada, 4.25%, 2018 | | CAD | 290,000 | | | | 334,504 | |
| Government of Canada, 5.75%, 2033 | | CAD | 86,000 | | | | 133,817 | |
| Government of Japan, 1.7%, 2017 | | JPY | 231,350,000 | | | | 3,090,715 | |
| Government of Japan, 1.1%, 2020 | | JPY | 121,000,000 | | | | 1,583,330 | |
| Government of Japan, 2.1%, 2024 | | JPY | 56,000,000 | | | | 789,369 | |
| Government of Japan, 2.2%, 2027 | | JPY | 123,300,000 | | | | 1,730,719 | |
| Government of Japan, 2.4%, 2037 | | JPY | 130,200,000 | | | | 1,810,976 | |
| Kingdom of Belgium, 5.5%, 2017 | | EUR | 728,000 | | | | 1,135,959 | |
| Kingdom of Denmark, 3%, 2021 | | DKK | 1,532,000 | | | | 305,895 | |
| Kingdom of Spain, 4.6%, 2019 | | EUR | 1,168,000 | | | | 1,484,443 | |
| Kingdom of Sweden, 5%, 2020 | | SEK | 1,100,000 | | | | 211,416 | |
21
Portfolio of Investments – continued
| | | | | | | | |
| Issuer | | Shares/Par | | | Value ($) | |
| Bonds - continued | | | | | | |
| International Market Sovereign - continued | | | | | | | | |
| Kingdom of the Netherlands, 3.75%, 2014 | | EUR | 1,310,000 | | | $ | 1,803,704 | |
| Kingdom of the Netherlands, 5.5%, 2028 | | EUR | 148,000 | | | | 272,170 | |
| Republic of Austria, 4.65%, 2018 | | EUR | 543,000 | | | | 835,422 | |
| Republic of Finland, 3.875%, 2017 | | EUR | 152,000 | | | | 226,673 | |
| Republic of France, 6%, 2025 | | EUR | 371,000 | | | | 661,968 | |
| Republic of France, 4.75%, 2035 | | EUR | 790,000 | | | | 1,301,158 | |
| Republic of Iceland, 4.875%, 2016 (n) | | $ | 593,000 | | | | 623,391 | |
| Republic of Iceland, 5.875%, 2022 (n) | | | 113,000 | | | | 123,187 | |
| Republic of Italy, 4.25%, 2015 | | EUR | 619,000 | | | | 833,078 | |
| Republic of Italy, 5.25%, 2017 | | EUR | 1,872,000 | | | | 2,586,020 | |
| Republic of Italy, 3.75%, 2021 | | EUR | 709,000 | | | | 874,492 | |
| State of Israel, 4%, 2022 | | $ | 1,496,000 | | | | 1,600,720 | |
| United Kingdom Treasury, 8%, 2015 | | GBP | 746,000 | | | | 1,488,160 | |
| United Kingdom Treasury, 8%, 2021 | | GBP | 552,000 | | | | 1,357,671 | |
| United Kingdom Treasury, 4.25%, 2036 | | GBP | 513,000 | | | | 1,014,055 | |
| | | | | | | | |
| | | | | | | $ | 34,049,708 | |
| Local Authorities - 0.5% | | | | | | | | |
| Louisiana Gas & Fuels Tax Rev. (Build America Bonds), FRN, 3%, 2043 | | $ | 820,000 | | | $ | 823,419 | |
| Province of Ontario, 5.45%, 2016 | | | 745,000 | | | | 864,871 | |
| | | | | | | | |
| | | | | | | $ | 1,688,290 | |
| Machinery & Tools - 1.1% | | | | | | | | |
| Atlas Copco AB, 5.6%, 2017 (n) | | $ | 1,073,000 | | | $ | 1,259,072 | |
| Case Corp., 7.25%, 2016 | | | 145,000 | | | | 162,400 | |
| Case New Holland, Inc., 7.875%, 2017 | | | 775,000 | | | | 910,625 | |
| CNH Capital LLC, 3.875%, 2015 (z) | | | 55,000 | | | | 56,375 | |
| CNH Capital LLC, 6.25%, 2016 (n) | | | 75,000 | | | | 81,000 | |
| H&E Equipment Services LLC, 7%, 2022 (n) | | | 120,000 | | | | 124,800 | |
| NESCO LLC/NESCO Holdings Corp., 11.75%, 2017 (n) | | | 215,000 | | | | 226,825 | |
| RSC Equipment Rental, Inc., 8.25%, 2021 | | | 315,000 | | | | 348,075 | |
| UR Financing Escrow Corp., 5.75%, 2018 (n) | | | 135,000 | | | | 145,125 | |
| UR Financing Escrow Corp., 7.625%, 2022 (n) | | | 139,000 | | | | 152,205 | |
| | | | | | | | |
| | | | | | | $ | 3,466,502 | |
| Major Banks - 7.1% | | | | | | | | |
| ABN AMRO Bank N.V., 4.25%, 2017 (n) | | $ | 913,000 | | | $ | 989,665 | |
| Bank of America Corp., 7.375%, 2014 | | | 460,000 | | | | 502,613 | |
| Bank of America Corp., 6.5%, 2016 | | | 1,305,000 | | | | 1,517,799 | |
| Barclays Bank PLC, 5.125%, 2020 | | | 770,000 | | | | 877,768 | |
| BNP Paribas, 7.195% to 2037, FRN to 2049 (n) | | | 600,000 | | | | 591,000 | |
| BNP Paribas, FRN, 3.129%, 2014 | | | 164,000 | | | | 170,058 | |
| Commonwealth Bank of Australia, 5%, 2019 (n) | | | 760,000 | | | | 881,402 | |
22
Portfolio of Investments – continued
| | | | | | | | |
| Issuer | | Shares/Par | | | Value ($) | |
| Bonds - continued | | | | | | |
| Major Banks - continued | | | | | | | | |
| Credit Suisse New York, 5.5%, 2014 | | $ | 650,000 | | | $ | 693,070 | |
| DBS Bank Ltd., 2.35%, 2017 (n) | | | 980,000 | | | | 1,009,912 | |
| Goldman Sachs Group, Inc., 6%, 2014 | | | 450,000 | | | | 482,508 | |
| Goldman Sachs Group, Inc., 5.75%, 2022 | | | 1,213,000 | | | | 1,408,144 | |
| HSBC Holdings PLC, 4%, 2022 | | | 1,047,000 | | | | 1,146,946 | |
| HSBC USA, Inc., 4.875%, 2020 | | | 930,000 | | | | 1,024,215 | |
| ING Bank N.V., 3.75%, 2017 (n) | | | 1,233,000 | | | | 1,305,613 | |
| Intesa Sanpaolo S.p.A., FRN, 2.831%, 2014 (n) | | | 590,000 | | | | 581,787 | |
| JPMorgan Chase & Co., 2%, 2017 | | | 330,000 | | | | 333,535 | |
| JPMorgan Chase & Co., 4.625%, 2021 | | | 870,000 | | | | 981,379 | |
| Macquarie Bank Ltd., 5%, 2017 (n) | | | 769,000 | | | | 835,234 | |
| Macquarie Group Ltd., 6%, 2020 (n) | | | 428,000 | | | | 466,905 | |
| Merrill Lynch & Co., Inc., 6.4%, 2017 | | | 400,000 | | | | 471,665 | |
| Morgan Stanley, 6%, 2014 | | | 620,000 | | | | 658,683 | |
| Morgan Stanley, 7.3%, 2019 | | | 250,000 | | | | 300,830 | |
| Morgan Stanley, 5.625%, 2019 | | | 420,000 | | | | 466,399 | |
| Royal Bank of Scotland Group PLC, 6.99% to 2017, FRN to 2049 (n) | | | 145,000 | | | | 131,588 | |
| Royal Bank of Scotland Group PLC, 7.648% to 2031, FRN to 2049 | | | 460,000 | | | | 453,100 | |
| Royal Bank of Scotland PLC, 2.55%, 2015 | | | 471,000 | | | | 482,828 | |
| Santander International Debt S.A., 2.991%, 2013 (n) | | | 800,000 | | | | 801,950 | |
| Standard Chartered PLC, 3.85%, 2015 (n) | | | 850,000 | | | | 898,831 | |
| UFJ Finance Aruba AEC, 6.75%, 2013 | | | 648,000 | | | | 674,600 | |
| Wells Fargo & Co., 7.98% to 2018, FRN to 2049 | | | 405,000 | | | | 478,913 | |
| Westpac Banking Corp., 2%, 2017 | | | 1,580,000 | | | | 1,619,568 | |
| | | | | | | | |
| | | | | | | $ | 23,238,508 | |
| Medical & Health Technology & Services - 3.1% | | | | | | | | |
| Aristotle Holding, Inc., 3.9%, 2022 (n) | | $ | 433,000 | | | $ | 473,295 | |
| Biomet, Inc., 6.5%, 2020 (n) | | | 255,000 | | | | 263,288 | |
| Cardinal Health, Inc., 5.8%, 2016 | | | 840,000 | | | | 982,579 | |
| Davita, Inc., 6.375%, 2018 | | | 490,000 | | | | 523,075 | |
| Davita, Inc., 6.625%, 2020 | | | 315,000 | | | | 336,263 | |
| Fresenius Medical Care AG & Co. KGaA, 9%, 2015 (n) | | | 185,000 | | | | 212,288 | |
| Fresenius Medical Care Capital Trust III, 5.625%, 2019 (n) | | | 245,000 | | | | 257,863 | |
| HCA, Inc., 8.5%, 2019 | | | 840,000 | | | | 943,950 | |
| HCA, Inc., 7.5%, 2022 | | | 515,000 | | | | 575,513 | |
| HCA, Inc., 5.875%, 2022 | | | 215,000 | | | | 230,588 | |
| HealthSouth Corp., 8.125%, 2020 | | | 670,000 | | | | 738,675 | |
| Hologic, Inc., 6.25%, 2020 (n) | | | 45,000 | | | | 47,700 | |
| Hospira, Inc., 6.05%, 2017 | | | 490,000 | | | | 575,149 | |
| IASIS Healthcare LLC/IASIS Capital Corp., 8.375%, 2019 | | | 390,000 | | | | 358,800 | |
| McKesson Corp., 5.7%, 2017 | | | 370,000 | | | | 439,661 | |
| Owens & Minor, Inc., 6.35%, 2016 | | | 710,000 | | | | 791,848 | |
23
Portfolio of Investments – continued
| | | | | | | | |
| Issuer | | Shares/Par | | | Value ($) | |
| Bonds - continued | | | | | | |
| Medical & Health Technology & Services - continued | | | | | | | | |
| Physio-Control International, Inc., 9.875%, 2019 (n) | | $ | 185,000 | | | $ | 202,575 | |
| Select Medical Corp., 7.625%, 2015 | | | 45,000 | | | | 45,450 | |
| Tenet Healthcare Corp., 9.25%, 2015 | | | 190,000 | | | | 214,225 | |
| Thermo Fisher Scientific, Inc., 3.15%, 2023 | | | 1,058,000 | | | | 1,101,517 | |
| Truven Health Analytics, Inc., 10.625%, 2020 (z) | | | 140,000 | | | | 150,150 | |
| Universal Health Services, Inc., 7%, 2018 | | | 210,000 | | | | 225,750 | |
| Universal Hospital Services, Inc., 7.625%, 2020 (n) | | | 240,000 | | | | 249,000 | |
| Universal Hospital Services, Inc., FRN, 4.111%, 2015 | | | 90,000 | | | | 88,763 | |
| | | | | | | | |
| | | | | | | $ | 10,027,965 | |
| Metals & Mining - 0.9% | | | | | | | | |
| Arch Coal, Inc., 7.25%, 2020 | | $ | 230,000 | | | $ | 203,550 | |
| Cloud Peak Energy, Inc., 8.25%, 2017 | | | 560,000 | | | | 606,200 | |
| Cloud Peak Energy, Inc., 8.5%, 2019 | | | 60,000 | | | | 66,150 | |
| Consol Energy, Inc., 8%, 2017 | | | 195,000 | | | | 206,213 | |
| Consol Energy, Inc., 8.25%, 2020 | | | 200,000 | | | | 212,000 | |
| First Quantum Minerals Ltd., 7.25%, 2019 (z) | | | 200,000 | | | | 204,000 | |
| Fortescue Metals Group Ltd., 8.25%, 2019 (n) | | | 230,000 | | | | 230,000 | |
| Peabody Energy Corp., 6%, 2018 | | | 125,000 | | | | 129,688 | |
| Peabody Energy Corp., 6.25%, 2021 | | | 125,000 | | | | 129,063 | |
| Southern Copper Corp., 6.75%, 2040 | | | 450,000 | | | | 533,943 | |
| Vale Overseas Ltd., 4.375%, 2022 | | | 421,000 | | | | 448,133 | |
| | | | | | | | |
| | | | | | | $ | 2,968,940 | |
| Mortgage-Backed - 1.0% | | | | | | | | |
| Fannie Mae, 5.5%, 2019 - 2036 | | $ | 1,095,720 | | | $ | 1,195,844 | |
| Fannie Mae, 6.5%, 2031 | | | 86,557 | | | | 99,610 | |
| Fannie Mae, 6%, 2034 (f) | | | 1,006,376 | | | | 1,143,282 | |
| Freddie Mac, 4.224%, 2020 | | | 818,658 | | | | 953,925 | |
| | | | | | | | |
| | | | | | | $ | 3,392,661 | |
| Natural Gas - Distribution - 0.6% | | | | | | | | |
| AmeriGas Finance LLC, 6.75%, 2020 | | $ | 245,000 | | | $ | 263,375 | |
| Ferrellgas LP/Ferrellgas Finance Corp., 6.5%, 2021 | | | 175,000 | | | | 168,875 | |
| GDF Suez, 1.625%, 2017 (n) | | | 1,400,000 | | | | 1,409,520 | |
| | | | | | | | |
| | | | | | | $ | 1,841,770 | |
| Natural Gas - Pipeline - 2.7% | | | | | | | | |
| Atlas Pipeline Partners LP, 8.75%, 2018 | | $ | 465,000 | | | $ | 497,550 | |
| Crosstex Energy, Inc., 8.875%, 2018 | | | 430,000 | | | | 461,175 | |
| El Paso Corp., 7%, 2017 | | | 410,000 | | | | 468,440 | |
| El Paso Corp., 7.75%, 2032 | | | 465,000 | | | | 554,929 | |
| Enbridge Energy Partners LP, 4.2%, 2021 | | | 1,190,000 | | | | 1,313,415 | |
| Energy Transfer Equity LP, 7.5%, 2020 | | | 380,000 | | | | 432,250 | |
24
Portfolio of Investments – continued
| | | | | | | | |
| Issuer | | Shares/Par | | | Value ($) | |
| Bonds - continued | | | | | | |
| Natural Gas - Pipeline - continued | | | | | | | | |
| Energy Transfer Partners LP, 6.5%, 2042 | | $ | 779,000 | | | $ | 979,364 | |
| Enterprise Products Partners LP, 6.3%, 2017 | | | 870,000 | | | | 1,066,655 | |
| Enterprise Products Partners LP, 8.375% to 2016, FRN to 2066 | | | 181,000 | | | | 206,340 | |
| Enterprise Products Partners LP, 7.034% to 2018, FRN to 2068 | | | 113,000 | | | | 129,103 | |
| Kinder Morgan Energy Partners LP, 6.375%, 2041 | | | 1,070,000 | | | | 1,392,638 | |
| MarkWest Energy Partners LP, 5.5%, 2023 | | | 205,000 | | | | 215,250 | |
| Rockies Express Pipeline LLC, 5.625%, 2020 (n) | | | 147,000 | | | | 140,018 | |
| Spectra Energy Capital LLC, 8%, 2019 | | | 679,000 | | | | 907,550 | |
| | | | | | | | |
| | | | | | | $ | 8,764,677 | |
| Network & Telecom - 1.8% | | | | | | | | |
| AT&T, Inc., 5.5%, 2018 | | $ | 660,000 | | | $ | 801,987 | |
| AT&T, Inc., 3.875%, 2021 | | | 670,000 | | | | 762,790 | |
| Centurylink, Inc., 7.65%, 2042 | | | 810,000 | | | | 828,701 | |
| Cincinnati Bell, Inc., 8.25%, 2017 | | | 90,000 | | | | 96,300 | |
| Citizens Communications Co., 9%, 2031 | | | 185,000 | | | | 197,488 | |
| France Telecom, 4.375%, 2014 | | | 640,000 | | | | 677,600 | |
| Frontier Communications Corp., 8.125%, 2018 | | | 220,000 | | | | 249,150 | |
| Qwest Communications International, Inc., 7.125%, 2018 (n) | | | 270,000 | | | | 285,193 | |
| Qwest Corp., 7.5%, 2014 | | | 560,000 | | | | 623,045 | |
| TW Telecom Holdings, Inc., 5.375%, 2022 (n) | | | 120,000 | | | | 123,300 | |
| Verizon Communications, Inc., 8.75%, 2018 | | | 690,000 | | | | 962,769 | |
| Windstream Corp., 8.125%, 2018 | | | 55,000 | | | | 59,538 | |
| Windstream Corp., 7.75%, 2020 | | | 315,000 | | | | 339,413 | |
| | | | | | | | |
| | | | | | | $ | 6,007,274 | |
| Oil Services - 0.8% | | | | | | | | |
| Bristow Group, Inc., 6.25%, 2022 | | $ | 120,000 | | | $ | 125,550 | |
| Chesapeake Energy Corp., 6.625%, 2019 (n) | | | 100,000 | | | | 95,250 | |
| Dresser-Rand Group, Inc., 6.5%, 2021 | | | 130,000 | | | | 136,500 | |
| Edgen Murray Corp., 8.75%, 2020 (z) | | | 260,000 | | | | 258,050 | |
| Pioneer Energy Services Corp., 9.875%, 2018 | | | 285,000 | | | | 308,513 | |
| Shale-Inland Holdings LLC/Finance Co., 8.75%, 2019 (z) | | | 185,000 | | | | 184,538 | |
| Transocean, Inc., 2.5%, 2017 | | | 314,000 | | | | 318,013 | |
| Transocean, Inc., 6%, 2018 | | | 670,000 | | | | 789,344 | |
| Unit Corp., 6.625%, 2021 | | | 190,000 | | | | 193,800 | |
| Unit Corp., 6.625%, 2021 (n) | | | 145,000 | | | | 147,900 | |
| | | | | | | | |
| | | | | | | $ | 2,557,458 | |
| Other Banks & Diversified Financials - 3.1% | | | | | | | | |
| American Express Centurion Bank, 5.5%, 2013 | | $ | 510,000 | | | $ | 521,827 | |
| Bancolombia S.A., 5.95%, 2021 | | | 398,000 | | | | 459,690 | |
| Bancolombia S.A., 5.125%, 2022 | | | 49,000 | | | | 51,205 | |
| BBVA Banco Continental S.A., 5%, 2022 (n) | | | 40,000 | | | | 42,600 | |
25
Portfolio of Investments – continued
| | | | | | | | |
| Issuer | | Shares/Par | | | Value ($) | |
| Bonds - continued | | | | | | |
| Other Banks & Diversified Financials - continued | | | | | | | | |
| Citigroup, Inc., 6.375%, 2014 | | $ | 630,000 | | | $ | 686,489 | |
| Citigroup, Inc., 6.01%, 2015 | | | 530,000 | | | | 583,467 | |
| Citigroup, Inc., 8.5%, 2019 | | | 389,000 | | | | 518,703 | |
| Groupe BPCE S.A., 12.5% to 2019, FRN to 2049 (n) | | | 645,000 | | | | 737,351 | |
| LBG Capital No. 1 PLC, 7.875%, 2020 (n) | | | 265,000 | | | | 272,288 | |
| Lloyds TSB Bank PLC, 5.8%, 2020 (n) | | | 645,000 | | | | 758,877 | |
| PKO Finance AB, 4.63%, 2022 (n) | | | 57,000 | | | | 58,767 | |
| Rabobank Nederland N.V., 3.375%, 2017 | | | 525,000 | | | | 564,633 | |
| Santander Holdings USA, Inc., 4.625%, 2016 | | | 130,000 | | | | 135,901 | |
| Santander UK PLC, 8.963% to 2030, FRN to 2049 | | | 618,000 | | | | 681,345 | |
| SunTrust Banks, Inc., 3.5%, 2017 | | | 622,000 | | | | 668,980 | |
| Svenska Handelsbanken AB, 4.875%, 2014 (n) | | | 910,000 | | | | 960,050 | |
| Swedbank AB, 2.125%, 2017 (n) | | | 615,000 | | | | 621,009 | |
| U.S. Bancorp, 2.95%, 2022 | | | 416,000 | | | | 429,168 | |
| Union Bank, 3%, 2016 | | | 1,250,000 | | | | 1,324,890 | |
| | | | | | | | |
| | | | | | | $ | 10,077,240 | |
| Pharmaceuticals - 1.0% | | | | | | | | |
| Capsugel FinanceCo. SCA, 9.875%, 2019 (n) | | EUR | 145,000 | | | $ | 212,844 | |
| Celgene Corp., 3.95%, 2020 | | $ | 890,000 | | | | 969,988 | |
| Pfizer, Inc., 6.2%, 2019 | | | 860,000 | | | | 1,100,973 | |
| Teva Pharmaceutical Finance LLC, 5.55%, 2016 | | | 359,000 | | | | 408,048 | |
| Valeant Pharmaceuticals International, Inc., 7%, 2020 (n) | | | 315,000 | | | | 339,019 | |
| Valeant Pharmaceuticals International, Inc., 7.25%, 2022 (n) | | | 180,000 | | | | 194,850 | |
| | | | | | | | |
| | | | | | | $ | 3,225,722 | |
| Pollution Control - 0.4% | | | | | | | | |
| Heckmann Corp., 9.875%, 2018 | | $ | 230,000 | | | $ | 230,575 | |
| Republic Services, Inc., 5.25%, 2021 | | | 730,000 | | | | 872,694 | |
| Rough Rider Escrow, Inc., 9.875%, 2018 (z) | | | 75,000 | | | | 75,375 | |
| | | | | | | | |
| | | | | | | $ | 1,178,644 | |
| Precious Metals & Minerals - 0.1% | | | | | | | | |
| IAMGOLD Corp., 6.75%, 2020 (n) | | $ | 213,000 | | | $ | 212,468 | |
| | |
| Printing & Publishing - 0.3% | | | | | | | | |
| American Media, Inc., 13.5%, 2018 (z) | | $ | 28,530 | | | $ | 26,105 | |
| Nielsen Finance LLC, 7.75%, 2018 | | | 270,000 | | | | 303,750 | |
| Nielsen Finance LLC, 4.5%, 2020 (n) | | | 140,000 | | | | 139,300 | |
| Pearson Funding Four PLC, 3.75%, 2022 (n) | | | 437,000 | | | | 459,647 | |
| | | | | | | | |
| | | | | | | $ | 928,802 | |
26
Portfolio of Investments – continued
| | | | | | | | |
| Issuer | | Shares/Par | | | Value ($) | |
| Bonds - continued | | | | | | |
| Railroad & Shipping - 1.0% | | | | | | | | |
| Burlington Northern Santa Fe LLC, 3.05%, 2022 | | $ | 1,290,000 | | | $ | 1,346,029 | |
| CSX Corp., 4.1%, 2044 | | | 1,905,000 | | | | 1,930,495 | |
| Kansas City Southern de Mexico S.A. de C.V., 6.125%, 2021 | | | 125,000 | | | | 139,688 | |
| | | | | | | | |
| | | | | | | $ | 3,416,212 | |
| Real Estate - 2.0% | | | | | | | | |
| Boston Properties LP, REIT, 3.7%, 2018 | | $ | 420,000 | | | $ | 457,705 | |
| Boston Properties LP, REIT, 3.85%, 2023 | | | 916,000 | | | | 988,021 | |
| CNL Lifestyle Properties, Inc., REIT, 7.25%, 2019 | | | 130,000 | | | | 123,175 | |
| Entertainment Properties Trust, REIT, 7.75%, 2020 | | | 250,000 | | | | 290,217 | |
| HCP, Inc., REIT, 5.375%, 2021 | | | 806,000 | | | | 932,924 | |
| Kennedy Wilson, Inc., 8.75%, 2019 | | | 125,000 | | | | 133,125 | |
| Kimco Realty Corp., REIT, 6.875%, 2019 | | | 191,000 | | | | 238,387 | |
| MPT Operating Partnership LP, REIT, 6.875%, 2021 | | | 245,000 | | | | 264,600 | |
| MPT Operating Partnership LP, REIT, 6.375%, 2022 | | | 245,000 | | | | 255,413 | |
| Simon Property Group, Inc., REIT, 6.1%, 2016 | | | 1,790,000 | | | | 2,070,017 | |
| WEA Finance LLC, REIT, 6.75%, 2019 (n) | | | 590,000 | | | | 730,283 | |
| | | | | | | | |
| | | | | | | $ | 6,483,867 | |
| Retailers - 2.8% | | | | | | | | |
| Academy Ltd., 9.25%, 2019 (n) | | $ | 160,000 | | | $ | 175,200 | |
| AutoZone, Inc., 6.5%, 2014 | | | 1,210,000 | | | | 1,287,522 | |
| Burlington Coat Factory Warehouse Corp., 10%, 2019 | | | 290,000 | | | | 320,088 | |
| Dollar General Corp., 4.125%, 2017 | | | 706,000 | | | | 737,770 | |
| Gap, Inc., 5.95%, 2021 | | | 1,118,000 | | | | 1,270,537 | |
| J. Crew Group, Inc., 8.125%, 2019 | | | 250,000 | | | | 259,688 | |
| Kohl’s Corp., 3.25%, 2023 | | | 997,000 | | | | 998,211 | |
| Limited Brands, Inc., 5.25%, 2014 | | | 242,000 | | | | 256,218 | |
| Limited Brands, Inc., 6.9%, 2017 | | | 205,000 | | | | 235,494 | |
| Limited Brands, Inc., 7%, 2020 | | | 135,000 | | | | 154,069 | |
| Limited Brands, Inc., 6.95%, 2033 | | | 115,000 | | | | 116,294 | |
| Macy’s, Inc., 7.875%, 2015 | | | 860,000 | | | | 1,011,478 | |
| Pantry, Inc., 8.375%, 2020 (n) | | | 120,000 | | | | 124,800 | |
| QVC, Inc., 7.375%, 2020 (n) | | | 200,000 | | | | 221,647 | |
| Rite Aid Corp., 9.25%, 2020 | | | 210,000 | | | | 214,725 | |
| Sally Beauty Holdings, Inc., 6.875%, 2019 | | | 125,000 | | | | 138,594 | |
| Staples, Inc., 9.75%, 2014 | | | 690,000 | | | | 757,938 | |
| Toys “R” Us Property Co. II LLC, 8.5%, 2017 | | | 150,000 | | | | 161,063 | |
| Toys “R” Us, Inc., 10.75%, 2017 | | | 415,000 | | | | 448,719 | |
| Yankee Acquisition Corp., 8.5%, 2015 | | | 2,000 | | | | 2,018 | |
| YCC Holdings LLC/Yankee Finance, Inc., 10.25%, 2016 (p) | | | 130,000 | | | | 134,388 | |
| | | | | | | | |
| | | | | | | $ | 9,026,461 | |
27
Portfolio of Investments – continued
| | | | | | | | |
| Issuer | | Shares/Par | | | Value ($) | |
| Bonds - continued | | | | | | |
| Specialty Chemicals - 0.0% | | | | | | | | |
| Koppers, Inc., 7.875%, 2019 | | $ | 115,000 | | | $ | 126,213 | |
| | |
| Specialty Stores - 0.2% | | | | | | | | |
| Gymboree Corp., 9.125%, 2018 | | $ | 135,000 | | | $ | 127,069 | |
| Michaels Stores, Inc., 11.375%, 2016 | | | 210,000 | | | | 219,188 | |
| Michaels Stores, Inc., 7.75%, 2018 | | | 140,000 | | | | 150,325 | |
| | | | | | | | |
| | | | | | | $ | 496,582 | |
| Supermarkets - 0.3% | | | | | | | | |
| Delhaize Group, 5.875%, 2014 | | $ | 740,000 | | | $ | 774,563 | |
| SUPERVALU, Inc., 7.5%, 2014 | | | 98,000 | | | | 94,448 | |
| | | | | | | | |
| | | | | | | $ | 869,011 | |
| Supranational - 0.4% | | �� | | | | | | |
| Corporacion Andina de Fomento, 4.375%, 2022 | | $ | 1,290,000 | | | $ | 1,402,716 | |
| | |
| Telecommunications - Wireless - 2.5% | | | | | | | | |
| America Movil S.A.B. de C.V., 3.125%, 2022 | | $ | 774,000 | | | $ | 798,139 | |
| American Tower Corp., REIT, 4.625%, 2015 | | | 440,000 | | | | 472,578 | |
| American Tower Corp., REIT, 4.7%, 2022 | | | 732,000 | | | | 808,587 | |
| Clearwire Corp., 12%, 2015 (n) | | | 215,000 | | | | 228,975 | |
| Cricket Communications, Inc., 7.75%, 2020 | | | 270,000 | | | | 278,438 | |
| Crown Castle International Corp., 9%, 2015 | | | 175,000 | | | | 187,250 | |
| Crown Castle International Corp., 7.125%, 2019 | | | 800,000 | | | | 878,000 | |
| Crown Castle Towers LLC, 6.113%, 2020 (n) | | | 838,000 | | | | 1,019,568 | |
| Digicel Group Ltd., 12%, 2014 (n) | | | 100,000 | | | | 110,500 | |
| Digicel Group Ltd., 10.5%, 2018 (n) | | | 345,000 | | | | 381,225 | |
Globo Comunicacoes e Participacoes S.A., 6.25% to 2015, 9.375% to 2049 (n) | | | 100,000 | | | | 108,000 | |
| MetroPCS Wireless, Inc., 7.875%, 2018 | | | 245,000 | | | | 268,275 | |
| Rogers Cable, Inc., 5.5%, 2014 | | | 659,000 | | | | 702,375 | |
| Sprint Capital Corp., 6.875%, 2028 | | | 325,000 | | | | 332,313 | |
| Sprint Nextel Corp., 6%, 2016 | | | 425,000 | | | | 456,875 | |
| Sprint Nextel Corp., 8.375%, 2017 | | | 310,000 | | | | 359,600 | |
| Sprint Nextel Corp., 9%, 2018 (n) | | | 75,000 | | | | 92,625 | |
| Wind Acquisition Finance S.A., 11.75%, 2017 (n) | | | 505,000 | | | | 492,375 | |
| Wind Acquisition Finance S.A., 7.25%, 2018 (n) | | | 245,000 | | | | 238,875 | |
| | | | | | | | |
| | | | | | | $ | 8,214,573 | |
| Telephone Services - 0.3% | | | | | | | | |
| Cogent Communications Group, Inc., 8.375%, 2018 (n) | | $ | 120,000 | | | $ | 130,200 | |
| Level 3 Financing, Inc., 9.375%, 2019 | | | 255,000 | | | | 284,325 | |
| Level 3 Financing, Inc., 7%, 2020 (n) | | | 80,000 | | | | 81,400 | |
28
Portfolio of Investments – continued
| | | | | | | | |
| Issuer | | Shares/Par | | | Value ($) | |
| Bonds - continued | | | | | | |
| Telephone Services - continued | | | | | | | | |
| Level 3 Financing, Inc., 8.625%, 2020 | | $ | 135,000 | | | $ | 147,150 | |
| Oi S.A., 5.75%, 2022 (n) | | | 299,000 | | | | 322,920 | |
| | | | | | | | |
| | | | | | | $ | 965,995 | |
| Tobacco - 2.2% | | | | | | | | |
| Altria Group, Inc., 9.25%, 2019 | | $ | 352,000 | | | $ | 496,730 | |
| B.A.T. International Finance PLC, 8.125%, 2013 (n) | | | 810,000 | | | | 867,509 | |
| B.A.T. International Finance PLC, 3.25%, 2022 (n) | | | 1,882,000 | | | | 1,955,008 | |
| Lorillard Tobacco Co., 8.125%, 2019 | | | 640,000 | | | | 823,199 | |
| Lorillard Tobacco Co., 6.875%, 2020 | | | 480,000 | | | | 589,961 | |
| Reynolds American, Inc., 6.75%, 2017 | | | 1,040,000 | | | | 1,256,794 | |
| Reynolds American, Inc., 4.75%, 2042 | | | 1,270,000 | | | | 1,293,736 | |
| | | | | | | | |
| | | | | | | $ | 7,282,937 | |
| Transportation - 0.1% | | | | | | | | |
| Navios South American Logistics, Inc., 9.25%, 2019 | | $ | 248,000 | | | $ | 234,980 | |
| | |
| Transportation - Services - 1.3% | | | | | | | | |
| ACL I Corp., 10.625%, 2016 (p) | | $ | 322,721 | | | $ | 315,774 | |
| Aguila American Resources Ltd., 7.875%, 2018 (n) | | | 230,000 | | | | 243,225 | |
| Avis Budget Car Rental LLC, 8.25%, 2019 | | | 195,000 | | | | 212,794 | |
| Avis Budget Car Rental LLC, 9.75%, 2020 | | | 110,000 | | | | 125,263 | |
| CEVA Group PLC, 8.375%, 2017 (n) | | | 375,000 | | | | 360,938 | |
| Commercial Barge Line Co., 12.5%, 2017 | | | 580,000 | | | | 643,800 | |
| ERAC USA Finance Co., 6.375%, 2017 (n) | | | 930,000 | | | | 1,134,596 | |
| HDTFS, Inc., 5.875%, 2020 (z) | | | 50,000 | | | | 50,500 | |
| Navios Maritime Acquisition Corp., 8.625%, 2017 | | | 360,000 | | | | 339,300 | |
| Navios Maritime Holdings, Inc., 8.875%, 2017 | | | 325,000 | | | | 333,125 | |
| Swift Services Holdings, Inc., 10%, 2018 | | | 505,000 | | | | 541,613 | |
| | | | | | | | |
| | | | | | | $ | 4,300,928 | |
| U.S. Government Agencies and Equivalents - 0.1% | | | | | | | | |
National Credit Union Administration Guaranteed Note, 2.9%, 2020 | | $ | 240,000 | | | $ | 255,788 | |
| | |
| Utilities - Electric Power - 3.9% | | | | | | | | |
| AES Corp., 8%, 2017 | | $ | 485,000 | | | $ | 554,719 | |
| Allegheny Energy, Inc., 5.75%, 2019 (n) | | | 800,000 | | | | 884,852 | |
| Atlantic Power Corp., 9%, 2018 | | | 170,000 | | | | 182,325 | |
| Calpine Corp., 8%, 2016 (n) | | | 280,000 | | | | 298,900 | |
| Calpine Corp., 7.875%, 2020 (n) | | | 355,000 | | | | 388,725 | |
| CMS Energy Corp., 4.25%, 2015 | | | 760,000 | | | | 808,422 | |
| CMS Energy Corp., 5.05%, 2022 | | | 608,000 | | | | 679,166 | |
29
Portfolio of Investments – continued
| | | | | | | | |
| Issuer | | Shares/Par | | | Value ($) | |
| Bonds - continued | | | | | | |
| Utilities - Electric Power - continued | | | | | | | | |
| Covanta Holding Corp., 7.25%, 2020 | | $ | 210,000 | | | $ | 233,118 | |
| Covanta Holding Corp., 6.375%, 2022 | | | 80,000 | | | | 87,062 | |
| DPL, Inc., 7.25%, 2021 | | | 220,000 | | | | 248,050 | |
| Duke Energy Corp., 3.35%, 2015 | | | 1,230,000 | | | | 1,307,004 | |
| Edison Mission Energy, 7%, 2017 | | | 260,000 | | | | 125,450 | |
| Energy Future Holdings Corp., 10%, 2020 | | | 360,000 | | | | 382,500 | |
| Energy Future Holdings Corp., 10%, 2020 | | | 680,000 | | | | 742,900 | |
| Energy Future Holdings Corp., 11.75%, 2022 (n) | | | 245,000 | | | | 239,488 | |
| Exelon Generation Co. LLC, 5.2%, 2019 | | | 360,000 | | | | 414,240 | |
| GenOn Energy, Inc., 9.5%, 2018 | | | 25,000 | | | | 28,500 | |
| GenOn Energy, Inc., 9.875%, 2020 | | | 445,000 | | | | 499,513 | |
| NRG Energy, Inc., 8.25%, 2020 | | | 680,000 | | | | 749,700 | |
| Oncor Electric Delivery Co., 4.1%, 2022 | | | 922,000 | | | | 987,888 | |
| PPL WEM Holdings PLC, 3.9%, 2016 (n) | | | 1,210,000 | | | | 1,273,923 | |
| Progress Energy, Inc., 3.15%, 2022 | | | 1,148,000 | | | | 1,182,347 | |
| Texas Competitive Electric Holdings Co. LLC, 11.5%, 2020 (n) | | | 140,000 | | | | 100,100 | |
| Waterford 3 Funding Corp., 8.09%, 2017 | | | 310,402 | | | | 317,119 | |
| | | | | | | | |
| | | | | | | $ | 12,716,011 | |
| Total Bonds (Identified Cost, $290,233,801) | | | | | | $ | 313,845,670 | |
| | |
| Floating Rate Loans (g)(r) - 0.0% | | | | | | | | |
| Financial Institutions - 0.0% | | | | | | | | |
Springleaf Finance Corp., Term Loan, 5.5%, 2017 (Identified Cost, $129,938) | | $ | 130,430 | | | $ | 128,311 | |
| | |
| Convertible Preferred Stocks - 0.1% | | | | | | | | |
| Automotive - 0.1% | | | | | | | | |
| General Motors Co., 4.75% (Identified Cost, $237,000) | | | 4,740 | | | $ | 192,539 | |
| | |
| Common Stocks - 0.0% | | | | | | | | |
| Automotive - 0.0% | | | | | | | | |
| Accuride Corp. (a) | | | 6,738 | | | $ | 17,990 | |
| | |
| Broadcasting - 0.0% | | | | | | | | |
| New Young Broadcasting Holding Co., Inc. (a) | | | 7 | | | $ | 23,100 | |
| | |
| Printing & Publishing - 0.0% | | | | | | | | |
| American Media Operations, Inc. (a) | | | 7,311 | | | $ | 38,675 | |
| Total Common Stocks (Identified Cost, $188,264) | | | | | | $ | 79,765 | |
30
Portfolio of Investments – continued
| | | | | | | | |
| Preferred Stocks - 0.1% | | | | | | | | |
| Issuer | | Shares/Par | | | Value ($) | |
| Other Banks & Diversified Financials - 0.1% | | | | | | | | |
| Ally Financial, Inc., 7% (z) | | | 160 | | | $ | 154,180 | |
| GMAC Capital Trust I, 8.125% | | | 9,100 | | | | 237,874 | |
| Total Preferred Stocks (Identified Cost, $381,261) | | | | | | $ | 392,054 | |
| | | | | | | | | | | | | | | | |
| | | | |
| | | Strike Price | | | First Exercise | | | | | | | |
| Warrants - 0.1% | | | | | | | | | | | | | | | | |
| New Young Broadcasting Holding Co., Inc. (1 share for 1 warrant) (Identified Cost, $84,629) | | $ | 0.01 | | | | 7/14/10 | | | | 44 | | | $ | 145,200 | |
| | | | | | | | |
| | |
| Convertible Bonds - 0.1% | | | | | | | | |
| Network & Telecom - 0.1% | | | | | | | | |
Nortel Networks Corp., 2.125%, 2014
(Identified Cost, $296,050) (a)(d) | | $ | 300,000 | | | $ | 300,000 | |
| | |
| Money Market Funds - 2.6% | | | | | | | | |
MFS Institutional Money Market Portfolio, 0.16%,
at Cost and Net Asset Value (v) | | | 8,495,868 | | | $ | 8,495,868 | |
| Total Investments (Identified Cost, $300,046,811) | | | | | | $ | 323,579,407 | |
| | |
| Other Assets, Less Liabilities - 1.2% | | | | | | | 3,881,988 | |
| Net Assets - 100.0% | | | | | | $ | 327,461,395 | |
| (a) | Non-income producing security. |
| (d) | In default. Interest and/or scheduled principal payment(s) have been missed. |
| (e) | Guaranteed by Minister for Finance of Ireland. |
| (f) | All or a portion of the security has been segregated as collateral for open futures contracts. |
| (g) | The rate shown represents a weighted average coupon rate on settled positions at period end, unless otherwise indicated. |
| (i) | Interest only security for which the fund receives interest on notional principal (Par amount). Par amount shown is the notional principal and does not reflect the cost of the security. |
| (n) | Securities exempt from registration under Rule 144A of the Securities Act of 1933. These securities may be sold in the ordinary course of business in transactions exempt from registration, normally to qualified institutional buyers. At period end, the aggregate value of these securities was $82,400,146, representing 25.2% of net assets. |
| (p) | Payment-in-kind security. |
| (r) | Remaining maturities of floating rate loans may be less than stated maturities shown as a result of contractual or optional prepayments by the borrower. Such prepayments cannot be predicted with certainty. These loans may be subject to restrictions on resale. Floating rate loans generally have rates of interest which are determined periodically by reference to a base lending rate plus a premium. |
| (v) | Underlying affiliated fund that is available only to investment companies managed by MFS. The rate quoted for the MFS Institutional Money Market Portfolio is the annualized seven-day yield of the fund at period end. |
31
Portfolio of Investments – continued
| (z) | Restricted securities are not registered under the Securities Act of 1933 and are subject to legal restrictions on resale. These securities generally may be resold in transactions exempt from registration or to the public if the securities are subsequently registered. Disposal of these securities may involve time-consuming negotiations and prompt sale at an acceptable price may be difficult. The fund holds the following restricted securities: |
| | | | | | | | | | |
| Restricted Securities | | Acquisition
Date | |
Cost | | | Value | |
| Ally Financial, Inc., 7% (Preferred Stock) | | 4/13/11-4/14/11 | | | $150,000 | | | | $154,180 | |
| American Media, Inc., 13.5%, 2018 | | 12/28/10 | | | 28,910 | | | | 26,105 | |
| Anthracite Ltd., “A”, CDO, FRN, 0.57%, 2019 | | 1/28/10 | | | 231,359 | | | | 288,748 | |
| Bayview Financial Revolving Mortgage Loan Trust, FRN, 1.811%, 2040 | | 3/01/06 | | | 444,519 | | | | 288,211 | |
| Boise Cascade LLC/Finance Corp., 6.375%, 2020 | | 10/17/12 | | | 45,000 | | | | 45,675 | |
| CNH Capital LLC, 3.875%, 2015 | | 10/16/12 | | | 55,000 | | | | 56,375 | |
| Crest Ltd., “A1” CDO, FRN, 0.842%, 2018 | | 1/21/10 | | | 239,625 | | | | 291,175 | |
| Edgen Murray Corp., 8.75%, 2020 | | 10/05/12 | | | 258,148 | | | | 258,050 | |
| Falcon Franchise Loan LLC, FRN, 5.51%, 2023 | | 1/18/02 | | | 38,863 | | | | 100,297 | |
| Falcon Franchise Loan LLC, FRN, 5.91%, 2025 | | 1/29/03 | | | 59,624 | | | | 133,634 | |
| First Quantum Minerals Ltd., 7.25%, 2019 | | 10/04/12 | | | 200,000 | | | | 204,000 | |
| GMAC LLC, FRN, 6.02%, 2033 | | 11/17/00 | | | 650,947 | | | | 666,484 | |
| HD Supply, Inc., 11.5%, 2020 | | 10/09/12-10/11/12 | | | 126,962 | | | | 131,563 | |
| HDTFS, Inc., 5.875%, 2020 | | 10/01/12 | | | 50,000 | | | | 50,500 | |
| Heckler & Koch GmbH, 9.5%, 2018 | | 5/06/11 | | | 142,014 | | | | 111,469 | |
| LBI Media, Inc., 8.5%, 2017 | | 7/18/07 | | | 188,182 | | | | 46,075 | |
| LeasePlan Corp. N.V., 3%, 2017 | | 10/15/12 | | | 869,437 | | | | 880,029 | |
| Local TV Finance LLC, 9.25%, 2015 | | 12/10/07-2/16/11 | | | 251,929 | | | | 258,130 | |
| Morgan Stanley Capital I, Inc., FRN, 1.381%, 2039 | | 7/20/04 | | | 104,667 | | | | 62,794 | |
| Nexstar Broadcasting Group, Inc., 6.875%, 2020 | | 10/24/12 | | | 45,000 | | | | 45,113 | |
| PTT PLC, 3.375%, 2022 | | 10/18/12 | | | 329,695 | | | | 326,552 | |
| PTT PLC, 4.5%, 2042 | | 10/18/12 | | | 349,406 | | | | 352,033 | |
| Prudential Securities Secured Financing Corp., FRN, 7.166%, 2013 | | 12/06/04 | | | 882,148 | | | | 873,328 | |
| Rough Rider Escrow, Inc., 9.875%, 2018 | | 10/26/12 | | | 75,188 | | | | 75,375 | |
| Salomon Brothers Mortgage Securities, Inc., FRN, 7.158%, 2032 | | 1/07/05 | | | 908,708 | | | | 847,370 | |
| Shale-Inland Holdings LLC/Finance Co., 8.75%, 2019 | | 10/26/12 | | | 183,801 | | | | 184,538 | |
| Townsquare Radio LLC, 9%, 2019 | | 3/30/12 | | | 118,873 | | | | 129,600 | |
| Truven Health Analytics, Inc., 10.625%, 2020 | | 5/24/12-6/15/12 | | | 142,151 | | | | 150,150 | |
| Viking Cruises Ltd., 8.5%, 2022 | | 10/12/12-10/25/12 | | | 187,637 | | | | 191,013 | |
| Total Restricted Securities | | | | $7,228,566 | |
| % of Net assets | | | | 2.2% | |
32
Portfolio of Investments – continued
The following abbreviations are used in this report and are defined:
| CDO | | Collateralized Debt Obligation |
| CLO | | Collateralized Loan Obligation |
| FRN | | Floating Rate Note. Interest rate resets periodically and may not be the rate reported at period end. |
| PLC | | Public Limited Company |
| REIT | | Real Estate Investment Trust |
Abbreviations indicate amounts shown in currencies other than the U.S. dollar. All amounts are stated in U.S. dollars unless otherwise indicated. A list of abbreviations is shown below:
Derivative Contracts at 10/31/12
Forward Foreign Currency Exchange Contracts at 10/31/12
| | | | | | | | | | | | | | | | | | | | | | | | |
| Type | | Currency | | Counterparty | | Contracts
to
Deliver/
Receive | | | Settlement
Date Range | | | In
Exchange
For | | | Contracts
at Value | | | Net
Unrealized
Appreciation
(Depreciation) | |
| Asset Derivatives | | | | | | | | | | | | | | | |
| SELL | | CAD | | Merrill Lynch International Bank | | | 1,093,747 | | | | 1/11/13 | | | | $1,115,055 | | | | $1,093,435 | | | | $21,620 | |
| SELL | | DKK | | Citibank N.A. | | | 1,701,041 | | | | 1/11/13 | | | | 298,355 | | | | 295,975 | | | | 2,380 | |
| | | | | | | | | | | | | | | | | | | | | | | | |
| | | | | | | | | | | | | | | | | | | | | | | $24,000 | |
| | | | | | | | | | | | | | | | | | | | | | | | |
| | | | | |
| Liability Derivatives | | | | | | | | | | | | | | | |
| SELL | | AUD | | Wespac Banking Corp. | | | 301,736 | | | | 1/11/13 | | | | $306,060 | | | | $311,417 | | | | $(5,357 | ) |
| SELL | | EUR | | Deutsche Bank AG | | | 2,179,687 | | | | 1/11/13 | | | | 2,808,596 | | | | 2,827,289 | | | | (18,693 | ) |
| SELL | | EUR | | UBS AG | | | 2,179,687 | | | | 1/11/13 | | | | 2,809,268 | | | | 2,827,290 | | | | (18,022 | ) |
| SELL | | GBP | | Barclays Bank PLC | | | 1,233,288 | | | | 1/11/13 | | | | 1,971,663 | | | | 1,989,772 | | | | (18,109 | ) |
| SELL | | GBP | | Deutsche Bank AG | | | 1,233,288 | | | | 1/11/13 | | | | 1,971,299 | | | | 1,989,772 | | | | (18,473 | ) |
| BUY | | JPY | | Credit Suisse Group | | | 65,352,522 | | | | 1/11/13 | | | | 835,999 | | | | 819,283 | | | | (16,716 | ) |
| BUY | | JPY | | Merrill Lynch International Bank | | | 65,352,522 | | | | 1/11/13 | | | | 835,554 | | | | 819,282 | | | | (16,272 | ) |
| SELL | | SEK | | Deutsche Bank AG | | | 1,114,421 | | | | 1/11/13 | | | | 166,794 | | | | 167,664 | | | | (870 | ) |
| | | | | | | | | | | | | | | | | | | | | | | | |
| | | | | | | | | | | | | | | | | | | | | | | $(112,512 | ) |
| | | | | | | | | | | | | | | | | | | | | | | | |
33
Portfolio of Investments – continued
Futures Contracts Outstanding at 10/31/12
| | | | | | | | | | | | | | | | | | |
| Description | | Currency | | | Contracts | | | Value | | Expiration
Date | | | Unrealized
Appreciation
(Depreciation) | |
| Liability Derivatives | | | | | | | | | | | |
| Interest Rate Futures | | | | | | | | | | | |
| U.S. Treasury Note 10 yr (Short) | | | USD | | | | 78 | | | $10,376,438 | | | December - 2012 | | | | $(24,648 | ) |
| | | | | | | | | | | | | | | | | | |
At October 31, 2012, the fund had liquid securities with an aggregate value of $93,743 to cover any commitments for certain derivative contracts.
See Notes to Financial Statements
34
Financial Statements
STATEMENT OF ASSETS AND LIABILITIES
At 10/31/12
This statement represents your fund’s balance sheet, which details the assets and liabilities comprising the total value of the fund.
| | | | |
| Assets | | | | |
Investments- | | | | |
Non-affiliated issuers, at value (identified cost, $291,550,943) | | | $315,083,539 | |
Underlying affiliated funds, at cost and value | | | 8,495,868 | |
Total investments, at value (identified cost, $300,046,811) | | | $323,579,407 | |
Cash | | | 871 | |
Receivables for | | | | |
Forward foreign currency exchange contracts | | | 24,000 | |
Investments sold | | | 540,779 | |
Fund shares sold | | | 608,451 | |
Interest and dividends | | | 4,491,735 | |
Receivable from investment adviser | | | 12,710 | |
Total assets | | | $329,257,953 | |
| Liabilities | | | | |
Payables for | | | | |
Distributions | | | $203,786 | |
Forward foreign currency exchange contracts | | | 112,512 | |
Daily variation margin on open futures contracts | | | 28,031 | |
Investments purchased | | | 304,400 | |
Fund shares reacquired | | | 888,407 | |
Payable to affiliates | | | | |
Shareholder servicing costs | | | 103,751 | |
Distribution and service fees | | | 12,207 | |
Payable for independent Trustees’ compensation | | | 27,049 | |
Accrued expenses and other liabilities | | | 116,415 | |
Total liabilities | | | $1,796,558 | |
Net assets | | | $327,461,395 | |
| Net assets consist of | | | | |
Paid-in capital | | | $319,561,570 | |
Unrealized appreciation (depreciation) on investments and translation of assets and liabilities in foreign currencies | | | 23,425,502 | |
Accumulated net realized gain (loss) on investments and foreign currency | | | (17,151,592 | ) |
Undistributed net investment income | | | 1,625,915 | |
Net assets | | | $327,461,395 | |
Shares of beneficial interest outstanding | | | 47,471,179 | |
| | | | | | | | | | | | |
| | | Net assets | | | Shares
outstanding | | | Net asset value
per share (a) | |
Class A | | | $222,166,284 | | | | 32,115,149 | | | | $6.92 | |
Class B | | | 39,237,926 | | | | 5,716,726 | | | | 6.86 | |
Class C | | | 54,670,674 | | | | 7,992,445 | | | | 6.84 | |
Class I | | | 11,386,511 | | | | 1,646,859 | | | | 6.91 | |
| (a) | Maximum offering price per share was equal to the net asset value per share for all share classes, except for Class A, for which the maximum offering price per share was $7.27 [100 / 95.25 x $6.92]. On sales of $50,000 or more, the maximum offering price of Class A shares is reduced. A contingent deferred sales charge may be imposed on redemptions of Class A, Class B, and Class C shares. Redemption price per share was equal to the net asset value per share for Class I. |
See Notes to Financial Statements
35
Financial Statements
STATEMENT OF OPERATIONS
Year ended 10/31/12
This statement describes how much your fund earned in investment income and accrued in expenses. It also describes any gains and/or losses generated by fund operations.
| | | | |
| Net investment income | | | | |
Income | | | | |
Interest | | | $16,529,160 | |
Dividends | | | 68,205 | |
Dividends from underlying affiliated funds | | | 12,594 | |
Total investment income | | | $16,609,959 | |
Expenses | | | | |
Management fee | | | $1,985,483 | |
Distribution and service fees | | | 1,380,124 | |
Shareholder servicing costs | | | 445,317 | |
Administrative services fee | | | 54,753 | |
Independent Trustees’ compensation | | | 12,926 | |
Custodian fee | | | 79,188 | |
Shareholder communications | | | 67,589 | |
Audit and tax fees | | | 59,651 | |
Legal fees | | | 4,312 | |
Miscellaneous | | | 134,305 | |
Total expenses | | | $4,223,648 | |
Fees paid indirectly | | | (31 | ) |
Reduction of expenses by investment adviser | | | (398,800 | ) |
Net expenses | | | $3,824,817 | |
Net investment income | | | $12,785,142 | |
| Realized and unrealized gain (loss) on investments and foreign currency | |
Realized gain (loss) (identified cost basis) | | | | |
Investments | | | $4,090,810 | |
Futures contracts | | | (306,389 | ) |
Swap agreements | | | 25,153 | |
Foreign currency | | | 398,725 | |
Net realized gain (loss) on investments and foreign currency | | | $4,208,299 | |
Change in unrealized appreciation (depreciation) | | | | |
Investments | | | $11,743,940 | |
Futures contracts | | | (24,648 | ) |
Swap agreements | | | (18,699 | ) |
Translation of assets and liabilities in foreign currencies | | | 190,130 | |
Net unrealized gain (loss) on investments and foreign currency translation | | | $11,890,723 | |
Net realized and unrealized gain (loss) on investments and foreign currency | | | $16,099,022 | |
Change in net assets from operations | | | $28,884,164 | |
See Notes to Financial Statements
36
Financial Statements
STATEMENTS OF CHANGES IN NET ASSETS
These statements describe the increases and/or decreases in net assets resulting from operations, any distributions, and any shareholder transactions.
| | | | | | | | |
| | | Years ended 10/31 | |
| | | 2012 | | | 2011 | |
| Change in net assets | | | | | | |
| From operations | | | | | | | | |
Net investment income | | | $12,785,142 | | | | $13,064,115 | |
Net realized gain (loss) on investments and foreign currency | | | 4,208,299 | | | | 1,847,155 | |
Net unrealized gain (loss) on investments and foreign currency translation | | | 11,890,723 | | | | (6,441,852 | ) |
Change in net assets from operations | | | $28,884,164 | | | | $8,469,418 | |
| Distributions declared to shareholders | | | | | | | | |
From net investment income | | | $(14,036,084 | ) | | | $(14,125,956 | ) |
Change in net assets from fund share transactions | | | $20,506,833 | | | | $(9,516,872 | ) |
Total change in net assets | | | $35,354,913 | | | | $(15,173,410 | ) |
| Net assets | | | | | | | | |
At beginning of period | | | 292,106,482 | | | | 307,279,892 | |
At end of period (including undistributed net investment income of $1,625,915 and $17,727, respectively) | | | $327,461,395 | | | | $292,106,482 | |
See Notes to Financial Statements
37
Financial Statements
FINANCIAL HIGHLIGHTS
The financial highlights table is intended to help you understand the fund’s financial performance for the past 5 years. Certain information reflects financial results for a single fund share. The total returns in the table represent the rate by which an investor would have earned (or lost) on an investment in the fund share class (assuming reinvestment of all distributions) held for the entire period.
| | | | | | | | | | | | | | | | | | | | |
| Class A | | Years ended 10/31 | |
| | | 2012 | | | 2011 | | | 2010 | | | 2009 | | | 2008 | |
Net asset value, beginning of period | | | $6.60 | | | | $6.72 | | | | $6.30 | | | | $5.43 | | | | $6.67 | |
| Income (loss) from investment operations | | | | | | | | | | | | | |
Net investment income (d) | | | $0.29 | | | | $0.31 | | | | $0.33 | | | | $0.33 | | | | $0.37 | |
Net realized and unrealized gain (loss)
on investments and foreign currency | | | 0.35 | | | | (0.10 | ) | | | 0.44 | | | | 0.98 | | | | (1.22 | ) |
Total from investment operations | | | $0.64 | | | | $0.21 | | | | $0.77 | | | | $1.31 | | | | $(0.85 | ) |
| Less distributions declared to shareholders | | | | | | | | | | | | | | | | | |
From net investment income | | | $(0.32 | ) | | | $(0.33 | ) | | | $(0.35 | ) | | | $(0.44 | ) | | | $(0.39 | ) |
Net asset value, end of period (x) | | | $6.92 | | | | $6.60 | | | | $6.72 | | | | $6.30 | | | | $5.43 | |
Total return (%) (r)(s)(t)(x) | | | 9.98 | | | | 3.24 | | | | 12.56 | | | | 25.36 | | | | (13.37 | ) |
Ratios (%) (to average net assets)
and Supplemental data: | | | | | | | | | | | | | |
Expenses before expense reductions (f) | | | 1.18 | | | | 1.16 | | | | 1.18 | | | | 1.28 | | | | 1.28 | |
Expenses after expense reductions (f) | | | 1.05 | | | | 1.05 | | | | 1.02 | | | | 0.92 | | | | 0.83 | |
Net investment income | | | 4.38 | | | | 4.62 | | | | 5.14 | | | | 5.86 | | | | 5.74 | |
Portfolio turnover | | | 42 | | | | 38 | | | | 49 | | | | 53 | | | | 45 | |
Net assets at end of period (000 omitted) | | | $222,166 | | | | $203,155 | | | | $216,200 | | | | $188,786 | | | | $147,255 | |
See Notes to Financial Statements
38
Financial Highlights – continued
| | | | | | | | | | | | | | | | | | | | |
| Class B | | Years ended 10/31 | |
| | | 2012 | | | 2011 | | | 2010 | | | 2009 | | | 2008 | |
Net asset value, beginning of period | | | $6.54 | | | | $6.66 | | | | $6.24 | | | | $5.38 | | | | $6.59 | |
| Income (loss) from investment operations | | | | | | | | | | | | | |
Net investment income (d) | | | $0.24 | | | | $0.26 | | | | $0.28 | | | | $0.29 | | | | $0.33 | |
Net realized and unrealized gain (loss)
on investments and foreign currency | | | 0.35 | | | | (0.10 | ) | | | 0.44 | | | | 0.96 | | | | (1.19 | ) |
Total from investment operations | | | $0.59 | | | | $0.16 | | | | $0.72 | | | | $1.25 | | | | $(0.86 | ) |
| Less distributions declared to shareholders | | | | | | | | | | | | | | | | | |
From net investment income | | | $(0.27 | ) | | | $(0.28 | ) | | | $(0.30 | ) | | | $(0.39 | ) | | | $(0.35 | ) |
Net asset value, end of period (x) | | | $6.86 | | | | $6.54 | | | | $6.66 | | | | $6.24 | | | | $5.38 | |
Total return (%) (r)(s)(t)(x) | | | 9.22 | | | | 2.45 | | | | 11.80 | | | | 24.45 | | | | (13.70 | ) |
Ratios (%) (to average net assets)
and Supplemental data: | | | | | | | | | | | | | |
Expenses before expense reductions (f) | | | 1.94 | | | | 1.92 | | | | 1.94 | | | | 2.01 | | | | 1.94 | |
Expenses after expense reductions (f) | | | 1.80 | | | | 1.80 | | | | 1.77 | | | | 1.63 | | | | 1.48 | |
Net investment income | | | 3.66 | | | | 3.92 | | | | 4.46 | | | | 5.22 | | | | 5.16 | |
Portfolio turnover | | | 42 | | | | 38 | | | | 49 | | | | 53 | | | | 45 | |
Net assets at end of period (000 omitted) | | | $39,238 | | | | $34,112 | | | | $39,468 | | | | $39,976 | | | | $38,838 | |
| |
| Class C | | Years ended 10/31 | |
| | | 2012 | | | 2011 | | | 2010 | | | 2009 | | | 2008 | |
Net asset value, beginning of period | | | $6.52 | | | | $6.64 | | | | $6.22 | | | | $5.35 | | | | $6.56 | |
| Income (loss) from investment operations | | | | | | | | | | | | | |
Net investment income (d) | | | $0.24 | | | | $0.26 | | | | $0.28 | | | | $0.29 | | | | $0.33 | |
Net realized and unrealized gain (loss)
on investments and foreign currency | | | 0.35 | | | | (0.10 | ) | | | 0.44 | | | | 0.97 | | | | (1.19 | ) |
Total from investment operations | | | $0.59 | | | | $0.16 | | | | $0.72 | | | | $1.26 | | | | $(0.86 | ) |
| Less distributions declared to shareholders | | | | | | | | | | | | | | | | | |
From net investment income | | | $(0.27 | ) | | | $(0.28 | ) | | | $(0.30 | ) | | | $(0.39 | ) | | | $(0.35 | ) |
Net asset value, end of period (x) | | | $6.84 | | | | $6.52 | | | | $6.64 | | | | $6.22 | | | | $5.35 | |
Total return (%) (r)(s)(t)(x) | | | 9.23 | | | | 2.45 | | | | 11.82 | | | | 24.74 | | | | (13.79 | ) |
Ratios (%) (to average net assets)
and Supplemental data: | | | | | | | | | | | | | |
Expenses before expense reductions (f) | | | 1.94 | | | | 1.92 | | | | 1.94 | | | | 2.01 | | | | 1.95 | |
Expenses after expense reductions (f) | | | 1.80 | | | | 1.80 | | | | 1.77 | | | | 1.64 | | | | 1.48 | |
Net investment income | | | 3.68 | | | | 3.94 | | | | 4.47 | | | | 5.19 | | | | 5.19 | |
Portfolio turnover | | | 42 | | | | 38 | | | | 49 | | | | 53 | | | | 45 | |
Net assets at end of period (000 omitted) | | | $54,671 | | | | $46,531 | | | | $46,789 | | | | $37,931 | | | | $23,491 | |
See Notes to Financial Statements
39
Financial Highlights – continued
| | | | | | | | | | | | | | | | | | | | |
| Class I | | Years ended 10/31 | |
| | | 2012 | | | 2011 | | | 2010 | | | 2009 | | | 2008 | |
Net asset value, beginning of period | | | $6.59 | | | | $6.72 | | | | $6.30 | | | | $5.43 | | | | $6.66 | |
| Income (loss) from investment operations | | | | | | | | | | | | | |
Net investment income (d) | | | $0.31 | | | | $0.32 | | | | $0.35 | | | | $0.35 | | | | $0.39 | |
Net realized and unrealized gain (loss)
on investments and foreign currency | | | 0.35 | | | | (0.10 | ) | | | 0.43 | | | | 0.97 | | | | (1.20 | ) |
Total from investment operations | | | $0.66 | | | | $0.22 | | | | $0.78 | | | | $1.32 | | | | $(0.81 | ) |
| Less distributions declared to shareholders | | | | | | | | | | | | | | | | | |
From net investment income | | | $(0.34 | ) | | | $(0.35 | ) | | | $(0.36 | ) | | | $(0.45 | ) | | | $(0.42 | ) |
Net asset value, end of period (x) | | | $6.91 | | | | $6.59 | | | | $6.72 | | | | $6.30 | | | | $5.43 | |
Total return (%) (r)(s)(x) | | | 10.27 | | | | 3.34 | | | | 12.84 | | | | 25.71 | | | | (12.93 | ) |
Ratios (%) (to average net assets)
and Supplemental data: | | | | | | | | | | | | | |
Expenses before expense reductions (f) | | | 0.93 | | | | 0.91 | | | | 0.93 | | | | 1.00 | | | | 0.93 | |
Expenses after expense reductions (f) | | | 0.80 | | | | 0.80 | | | | 0.77 | | | | 0.64 | | | | 0.48 | |
Net investment income | | | 4.61 | | | | 4.83 | | | | 5.36 | | | | 6.10 | | | | 6.10 | |
Portfolio turnover | | | 42 | | | | 38 | | | | 49 | | | | 53 | | | | 45 | |
Net assets at end of period (000 omitted) | | | $11,387 | | | | $8,309 | | | | $4,823 | | | | $2,939 | | | | $1,679 | |
| (d) | Per share data is based on average shares outstanding. |
| (f) | Ratios do not reflect reductions from fees paid indirectly, if applicable. |
| (r) | Certain expenses have been reduced without which performance would have been lower. |
| (s) | From time to time the fund may receive proceeds from litigation settlements, without which performance would be lower. |
| (t) | Total returns do not include any applicable sales charges. |
| (x) | The net asset values per share and total returns have been calculated on net assets which include adjustments made in accordance with U.S. generally accepted accounting principles required at period end for financial reporting purposes. |
See Notes to Financial Statements
40
NOTES TO FINANCIAL STATEMENTS
(1) Business and Organization
MFS Strategic Income Fund (the fund) is a series of MFS Series Trust VIII (the trust). The trust is organized as a Massachusetts business trust and is registered under the Investment Company Act of 1940, as amended, as an open-end management investment company.
(2) Significant Accounting Policies
General – The preparation of financial statements in conformity with U.S. generally accepted accounting principles requires management to make estimates and assumptions that affect the reported amounts of assets and liabilities, and disclosure of contingent assets and liabilities at the date of the financial statements and the reported amounts of revenues and expenses during the reporting period. Actual results could differ from those estimates. In the preparation of these financial statements, management has evaluated subsequent events occurring after the date of the fund’s Statement of Assets and Liabilities through the date that the financial statements were issued. The fund invests in high-yield securities rated below investment grade. Investments in high-yield securities involve greater degrees of credit and market risk than investments in higher-rated securities and tend to be more sensitive to economic conditions. The fund invests in foreign securities. Investments in foreign securities are vulnerable to the effects of changes in the relative values of the local currency and the U.S. dollar and to the effects of changes in each country’s legal, political, and economic environment.
In this reporting period the fund adopted FASB Accounting Standards Update 2011-04, Fair Value Measurement (Topic 820) – Amendments to Achieve Common Fair Value Measurement and Disclosure Requirements in U.S. GAAP and IFRSs (“ASU 2011-04”). ASU 2011-04 seeks to improve the comparability of fair value measurements as presented and disclosed in financial statements prepared in accordance with U.S. GAAP and International Financial Reporting Standards (IFRS) by providing common requirements for fair value measurement and disclosure.
In December 2011, the Financial Accounting Standards Board issued Accounting Standards Update 2011-11, Balance Sheet (Topic 210) – Disclosures about Offsetting Assets and Liabilities (“ASU 2011-11”). Effective for annual reporting periods beginning on or after January 1, 2013 and interim periods within those annual periods, ASU 2011-11 is intended to enhance disclosure requirements on the offsetting of financial assets and liabilities. Although still evaluating the potential impacts of ASU 2011-11 to the fund, management expects that the impact of the fund’s adoption will be limited to additional financial statement disclosures.
Investment Valuations – Debt instruments and floating rate loans (other than short-term instruments), including restricted debt instruments, are generally valued at an evaluated or composite bid as provided by a third-party pricing service. Equity securities, including restricted equity securities, are generally valued at the last sale or official closing price as provided by a third-party pricing service on the market or exchange on which they are primarily traded. Equity securities, for which there were no sales reported that day, are generally valued at the last quoted daily bid quotation as
41
Notes to Financial Statements – continued
provided by a third-party pricing service on the market or exchange on which such securities are primarily traded. Short-term instruments with a maturity at issuance of 60 days or less generally are valued at amortized cost, which approximates market value. Futures contracts are generally valued at last posted settlement price as provided by a third-party pricing service on the market on which they are primarily traded. Futures contracts for which there were no trades that day for a particular position are generally valued at the closing bid quotation as provided by a third-party pricing service on the market on which such futures contracts are primarily traded. Forward foreign currency exchange contracts are generally valued at the mean of bid and asked prices for the time period interpolated from rates provided by a third-party pricing service for proximate time periods. Swap agreements are generally valued at valuations provided by a third-party pricing service. Open-end investment companies are generally valued at net asset value per share. Securities and other assets generally valued on the basis of information from a third-party pricing service may also be valued at a broker/dealer bid quotation. Values obtained from third-party pricing services can utilize both transaction data and market information such as yield, quality, coupon rate, maturity, type of issue, trading characteristics, and other market data. The values of foreign securities and other assets and liabilities expressed in foreign currencies are converted to U.S. dollars using the mean of bid and asked prices for rates provided by a third-party pricing service.
The Board of Trustees has delegated primary responsibility for determining or causing to be determined the value of the fund’s investments (including any fair valuation) to the adviser pursuant to valuation policies and procedures approved by the Board. If the adviser determines that reliable market quotations are not readily available, investments are valued at fair value as determined in good faith by the adviser in accordance with such procedures under the oversight of the Board of Trustees. Under the fund’s valuation policies and procedures, market quotations are not considered to be readily available for most types of debt instruments and floating rate loans and many types of derivatives. These investments are generally valued at fair value based on information from third-party pricing services. In addition, investments may be valued at fair value if the adviser determines that an investment’s value has been materially affected by events occurring after the close of the exchange or market on which the investment is principally traded (such as foreign exchange or market) and prior to the determination of the fund’s net asset value, or after the halting of trading of a specific security where trading does not resume prior to the close of the exchange or market on which the security is principally traded. The adviser generally relies on third-party pricing services or other information (such as the correlation with price movements of similar securities in the same or other markets; the type, cost and investment characteristics of the security; the business and financial condition of the issuer; and trading and other market data) to assist in determining whether to fair value and at what value to fair value an investment. The value of an investment for purposes of calculating the fund’s net asset value can differ depending on the source and method used to determine value. When fair valuation is used, the value of an investment used to determine the fund’s net asset value may differ from quoted or published prices for the same investment. There can be no assurance that the fund could obtain the fair value assigned to an investment if it were to sell the investment at the same time at which the fund determines its net asset value per share.
42
Notes to Financial Statements – continued
Various inputs are used in determining the value of the fund’s assets or liabilities. These inputs are categorized into three broad levels. In certain cases, the inputs used to measure fair value may fall into different levels of the fair value hierarchy. In such cases, an investment’s level within the fair value hierarchy is based on the lowest level of input that is significant to the fair value measurement. The fund’s assessment of the significance of a particular input to the fair value measurement in its entirety requires judgment, and considers factors specific to the investment. Level 1 includes unadjusted quoted prices in active markets for identical assets or liabilities. Level 2 includes other significant observable market-based inputs (including quoted prices for similar securities, interest rates, prepayment speed, and credit risk). Level 3 includes unobservable inputs, which may include the adviser’s own assumptions in determining the fair value of investments. Other financial instruments are derivative instruments not reflected in total investments, such as futures contracts and forward foreign currency exchange contracts. The following is a summary of the levels used as of October 31, 2012 in valuing the fund’s assets or liabilities:
| | | | | | | | | | | | | | | | |
| Investments at Value | | Level 1 | | | Level 2 | | | Level 3 | | | Total | |
| Equity Securities | | | $448,403 | | | | $322,480 | | | | $38,675 | | | | $809,558 | |
| U.S. Treasury Bonds & U.S. Government Agency & Equivalents | | | — | | | | 255,788 | | | | — | | | | 255,788 | |
| Non-U.S. Sovereign Debt | | | — | | | | 54,008,782 | | | | — | | | | 54,008,782 | |
| Corporate Bonds | | | — | | | | 192,232,283 | | | | — | | | | 192,232,283 | |
| Residential Mortgage-Backed Securities | | | — | | | | 3,392,662 | | | | — | | | | 3,392,662 | |
| Commercial Mortgage-Backed Securities | | | — | | | | 2,832,150 | | | | — | | | | 2,832,150 | |
| Asset-Backed Securities (including CDOs) | | | — | | | | 2,851,212 | | | | — | | | | 2,851,212 | |
| Foreign Bonds | | | — | | | | 58,572,793 | | | | — | | | | 58,572,793 | |
| Floating Rate Loans | | | — | | | | 128,311 | | | | — | | | | 128,311 | |
| Mutual Funds | | | 8,495,868 | | | | — | | | | — | | | | 8,495,868 | |
| Total Investments | | | $8,944,271 | | | | $314,596,461 | | | | $38,675 | | | | $323,579,407 | |
| | | | |
| Other Financial Instruments | | | | | | | | | | | | |
| Futures Contracts | | | $(24,648 | ) | | | $— | | | | $— | | | | $(24,648 | ) |
| Forward Foreign Currency Exchange Contracts | | | — | | | | (88,512 | ) | | | — | | | | (88,512 | ) |
For further information regarding security characteristics, see the Portfolio of Investments.
43
Notes to Financial Statements – continued
The following is a reconciliation of level 3 assets for which significant unobservable inputs were used to determine fair value. The fund’s policy is to recognize transfers between the levels as of the end of the period. The table presents the activity of level 3 securities held at the beginning and the end of the period.
| | | | |
| | | Equity Securities | |
| Balance as of 10/31/11 | | | $95,993 | |
Change in unrealized appreciation (depreciation) | | | (57,318 | ) |
| Balance as of 10/31/12 | | | $38,675 | |
The net change in unrealized appreciation (depreciation) from investments still held as level 3 at October 31, 2012 is $(57,318).
Foreign Currency Translation – Purchases and sales of foreign investments, income, and expenses are converted into U.S. dollars based upon currency exchange rates prevailing on the respective dates of such transactions or on the reporting date for foreign denominated receivables and payables. Gains and losses attributable to foreign currency exchange rates on sales of securities are recorded for financial statement purposes as net realized gains and losses on investments. Gains and losses attributable to foreign exchange rate movements on receivables, payables, income and expenses are recorded for financial statement purposes as foreign currency transaction gains and losses. That portion of both realized and unrealized gains and losses on investments that results from fluctuations in foreign currency exchange rates is not separately disclosed.
Derivatives – The fund uses derivatives for different purposes, primarily to increase or decrease exposure to a particular market or segment of the market, or security, to increase or decrease interest rate or currency exposure, or as alternatives to direct investments. Derivatives are used for hedging or non-hedging purposes. While hedging can reduce or eliminate losses, it can also reduce or eliminate gains. When the fund uses derivatives as an investment to increase market exposure, or for hedging purposes, gains and losses from derivative instruments may be substantially greater than the derivative’s original cost.
The derivative instruments used by the fund were futures contracts, forward foreign currency exchange contracts, and swap agreements. The fund’s period end derivatives, as presented in the Portfolio of Investments and the associated Derivative Contract Tables, generally are indicative of the volume of its derivative activity during the period.
The following table presents, by major type of derivative contract, the fair value, on a gross basis, of the asset and liability components of derivatives held by the fund at October 31, 2012 as reported in the Statement of Assets and Liabilities:
| | | | | | | | | | |
| | | | | Fair Value (a) | |
| Risk | | Derivative Contracts | | Asset Derivatives | | | Liability Derivatives | |
| Interest Rate | | Interest Rate Futures | | | $— | | | | $(24,648 | ) |
| Foreign Exchange | | Forward Foreign Currency Exchange | | | 24,000 | | | | (112,512 | ) |
| Total | | | | | $24,000 | | | | $(137,160 | ) |
| (a) | The value of futures contracts outstanding includes cumulative appreciation (depreciation) as reported in the fund’s Portfolio of Investments. Only the current day variation margin for futures contracts is separately reported within the fund’s Statement of Assets and Liabilities. |
44
Notes to Financial Statements – continued
The following table presents, by major type of derivative contract, the realized gain (loss) on derivatives held by the fund for the year ended October 31, 2012 as reported in the Statement of Operations:
| | | | | | | | | | | | |
| Risk | | Futures
Contracts | | | Swap
Agreements | | | Foreign
Currency | |
| Interest Rate | | | $(306,389 | ) | | | $— | | | | $— | |
| Foreign Exchange | | | — | | | | — | | | | 453,023 | |
| Credit | | | — | | | | 25,153 | | | | — | |
| Total | | | $(306,389 | ) | | | $25,153 | | | | $453,023 | |
The following table presents, by major type of derivative contract, the change in unrealized appreciation (depreciation) on derivatives held by the fund for the year ended October 31, 2012 as reported in the Statement of Operations:
| | | | | | | | | | | | |
| Risk | | Futures
Contracts | | | Swap
Transactions | | | Translation of Assets
and Liabilities in Foreign
Currencies | |
| Interest Rate | | | $(24,648 | ) | | | $— | | | | $— | |
| Foreign Exchange | | | — | | | | — | | | | 177,082 | |
| Credit | | | — | | | | (18,699 | ) | | | — | |
| Total | | | $(24,648 | ) | | | $(18,699 | ) | | | $177,082 | |
Derivative counterparty credit risk is managed through formal evaluation of the creditworthiness of all potential counterparties. On certain over-the-counter derivatives, the fund attempts to reduce its exposure to counterparty credit risk whenever possible by entering into an International Swaps and Derivatives Association (ISDA) Master Agreement on a bilateral basis with each of the counterparties with whom it undertakes a significant volume of transactions. The ISDA Master Agreement gives each party to the agreement the right to terminate all transactions traded under such agreement if there is a certain deterioration in the credit quality of the other party. The ISDA Master Agreement gives the fund the right, upon an event of default by the applicable counterparty or a termination of the agreement, to close out all transactions traded under such agreement and to net amounts owed under each transaction to one net amount payable by one party to the other. This right to close out and net payments across all transactions traded under the ISDA Master Agreement could result in a reduction of the fund’s credit risk to such counterparty equal to any amounts payable by the fund under the applicable transactions, if any. However, absent an event of default by the counterparty or a termination of the agreement, the ISDA Master Agreement does not result in an offset of reported amounts of assets and liabilities in the Statement of Assets and Liabilities across transactions between the fund and the applicable counterparty.
Collateral requirements differ by type of derivative. Collateral or margin requirements are set by the broker or exchange clearing house for exchange traded derivatives (i.e., futures contracts and exchange-traded options) while collateral terms are contract specific for over-the-counter traded derivatives (i.e., forward foreign currency exchange
45
Notes to Financial Statements – continued
contracts, swap agreements and over-the-counter options). For derivatives traded under an ISDA Master Agreement, the collateral requirements are netted across all transactions traded under such agreement and one amount is posted from one party to the other to collateralize such obligations. Cash collateral that has been pledged to cover obligations of the fund under derivative contracts, if any, will be reported separately on the Statement of Assets and Liabilities as restricted cash. Securities collateral pledged for the same purpose, if any, is noted in the Portfolio of Investments.
Futures Contracts – The fund entered into futures contracts which may be used to hedge against or obtain broad market exposure, interest rate exposure, currency exposure, or to manage duration. A futures contract represents a commitment for the future purchase or sale of an asset at a specified price on a specified date.
Upon entering into a futures contract, the fund is required to deposit with the broker, either in cash or securities, an initial margin in an amount equal to a certain percentage of the notional amount of the contract. Subsequent payments (variation margin) are made or received by the fund each day, depending on the daily fluctuations in the value of the contract, and are recorded for financial statement purposes as unrealized gain or loss by the fund until the contract is closed or expires at which point the gain or loss on futures contracts is realized.
The fund bears the risk of interest rates, exchange rates or securities prices moving unexpectedly, in which case, the fund may not achieve the anticipated benefits of the futures contracts and may realize a loss. While futures contracts may present less counterparty risk to the fund since the contracts are exchange traded and the exchange’s clearinghouse guarantees payments to the broker, there is still counterparty credit risk due to the insolvency of the broker. The fund’s maximum risk of loss due to counterparty credit risk is equal to the margin posted by the fund to the broker plus any gains or minus any losses on the outstanding futures contracts.
Forward Foreign Currency Exchange Contracts – The fund entered into forward foreign currency exchange contracts for the purchase or sale of a specific foreign currency at a fixed price on a future date. These contracts may be used to hedge the fund’s currency risk or for non-hedging purposes. For hedging purposes, the fund may enter into contracts to deliver or receive foreign currency that the fund will receive from or use in its normal investment activities. The fund may also use contracts to hedge against declines in the value of foreign currency denominated securities due to unfavorable exchange rate movements. For non-hedging purposes, the fund may enter into contracts with the intent of changing the relative exposure of the fund’s portfolio of securities to different currencies to take advantage of anticipated exchange rate changes.
Forward foreign currency exchange contracts are adjusted by the daily exchange rate of the underlying currency and any unrealized gains or losses are recorded as a receivable or payable for forward foreign currency exchange contracts until the contract settlement date. On contract settlement date, any gain or loss on the contract is recorded as realized gains or losses on foreign currency.
Risks may arise upon entering into these contracts from unanticipated movements in the value of the contract and from the potential inability of counterparties to meet the terms of their contracts. Generally, the fund’s maximum risk due to counterparty credit
46
Notes to Financial Statements – continued
risk is the unrealized gain on the contract due to the use of Continuous Linked Settlement, an industry accepted settlement system. This risk is mitigated in cases where there is an ISDA Master Agreement between the fund and the counterparty providing for netting as described above and for posting of collateral by the counterparty to the fund to cover the fund’s exposure to the counterparty under such ISDA Master Agreement.
Swap Agreements – The fund entered into swap agreements. A swap agreement is generally an exchange of cash payments, at specified intervals or upon the occurrence of specified events, between the fund and a counterparty. The net cash payments exchanged are recorded as a realized gain or loss on swap agreements in the Statement of Operations. The value of the swap agreement, which is adjusted daily and includes any related interest accruals to be paid or received by the fund, is recorded on the Statement of Assets and Liabilities. The daily change in value, including any related interest accruals to be paid or received, is recorded as unrealized appreciation or depreciation on swap agreements in the Statement of Operations. Amounts paid or received at the inception of the swap agreement are reflected as premiums paid or received on the Statement of Assets and Liabilities and are amortized using the effective interest method over the term of the agreement. A liquidation payment received or made upon early termination is recorded as a realized gain or loss on swap agreements in the Statement of Operations.
Risks related to swap agreements include the possible lack of a liquid market, unfavorable market and interest rate movements of the underlying instrument and the failure of the counterparty to perform under the terms of the agreements. To address counterparty risk, swap agreements are limited to only highly-rated counterparties. The risk is further mitigated by having an ISDA Master Agreement between the fund and the counterparty providing for netting as described above and by the posting of collateral by the counterparty to the fund to cover the fund’s exposure to the counterparty under such ISDA Master Agreement.
The fund entered into credit default swap agreements in order to manage its exposure to the market or certain sectors of the market, to reduce its credit risk exposure to defaults of corporate and sovereign issuers or to create exposure to corporate or sovereign issuers to which it is not otherwise exposed. In a credit default swap agreement, the protection buyer can make an upfront payment and will make a stream of payments based on a fixed percentage applied to the agreement notional amount to the protection seller in exchange for the right to receive a specified return upon the occurrence of a defined credit event on the reference obligation (which may be either a single security or a basket of securities issued by corporate or sovereign issuers) and, with respect to the rare cases where physical settlement applies, the delivery by the buyer to the seller of a defined deliverable obligation. Although agreement-specific, credit events generally consist of a combination of the following: bankruptcy, failure to pay, restructuring, obligation acceleration, obligation default, or repudiation/moratorium, each as defined in the 2003 ISDA Credit Derivatives Definitions as amended by the relevant agreement. Restructuring is generally not applicable when the reference obligation is issued by a North American corporation and obligation acceleration, obligation default, or repudiation/moratorium are generally only applicable when the reference obligation is issued by a sovereign entity or an entity in
47
Notes to Financial Statements – continued
an emerging country. Upon determination of the final price for the deliverable obligation (or upon delivery of the deliverable obligation in the case of physical settlement), the difference between the value of the deliverable obligation and the swap agreement’s notional amount is recorded as realized gain or loss on swap agreements in the Statement of Operations.
The fund’s maximum risk of loss from counterparty risk, either as the protection seller or as the protection buyer, is the fair value of the agreement. This risk is mitigated by having an ISDA Master Agreement between the fund and the counterparty providing for netting as described above and by the posting of collateral by the counterparty to the fund to cover the fund’s exposure to the counterparty under such ISDA Master Agreement.
Loans and Other Direct Debt Instruments – The fund invests in loans and loan participations or other receivables. These investments may include standby financing commitments, including revolving credit facilities, which obligate the fund to supply additional cash to the borrower on demand. Loan participations involve a risk of insolvency of the lending bank or other financial intermediary.
Indemnifications – Under the fund’s organizational documents, its officers and Trustees may be indemnified against certain liabilities and expenses arising out of the performance of their duties to the fund. Additionally, in the normal course of business, the fund enters into agreements with service providers that may contain indemnification clauses. The fund’s maximum exposure under these agreements is unknown as this would involve future claims that may be made against the fund that have not yet occurred.
Investment Transactions and Income – Investment transactions are recorded on the trade date. Interest income is recorded on the accrual basis. All premium and discount is amortized or accreted for financial statement purposes in accordance with U.S. generally accepted accounting principles. The fund earns certain fees in connection with its floating rate loan purchasing activities. These fees are in addition to interest payments earned and may include amendment fees, commitment fees, facility fees, consent fees, and prepayment fees. Commitment fees are recorded on an accrual basis as income in the accompanying financial statements. Dividends received in cash are recorded on the ex-dividend date. Certain dividends from foreign securities will be recorded when the fund is informed of the dividend if such information is obtained subsequent to the ex-dividend date. Dividend and interest payments received in additional securities are recorded on the ex-dividend or ex-interest date in an amount equal to the value of the security on such date. Debt obligations may be placed on non-accrual status or set to accrue at a rate of interest less than the contractual coupon when the collection of all or a portion of interest has become doubtful. Interest income for those debt obligations may be further reduced by the write-off of the related interest receivables when deemed uncollectible.
The fund may receive proceeds from litigation settlements. Any proceeds received from litigation involving portfolio holdings are reflected in the Statement of Operations in realized gain/loss if the security has been disposed of by the fund or in unrealized gain/loss if the security is still held by the fund. Any other proceeds from litigation not related to portfolio holdings are reflected as other income in the Statement of Operations.
48
Notes to Financial Statements – continued
Fees Paid Indirectly – The fund’s custody fee may be reduced according to an arrangement that measures the value of cash deposited with the custodian by the fund. This amount, for the year ended October 31, 2012, is shown as a reduction of total expenses on the Statement of Operations.
Tax Matters and Distributions – The fund intends to qualify as a regulated investment company, as defined under Subchapter M of the Internal Revenue Code, and to distribute all of its taxable income, including realized capital gains. As a result, no provision for federal income tax is required. The fund’s federal tax returns, when filed, will remain subject to examination by the Internal Revenue Service for a three year period.
Distributions to shareholders are recorded on the ex-dividend date. Income and capital gain distributions are determined in accordance with income tax regulations, which may differ from U.S. generally accepted accounting principles. Certain capital accounts in the financial statements are periodically adjusted for permanent differences in order to reflect their tax character. These adjustments have no impact on net assets or net asset value per share. Temporary differences which arise from recognizing certain items of income, expense, gain or loss in different periods for financial statement and tax purposes will reverse at some time in the future. Distributions in excess of net investment income or net realized gains are temporary overdistributions for financial statement purposes resulting from differences in the recognition or classification of income or distributions for financial statement and tax purposes.
Book/tax differences primarily relate to amortization and accretion of debt securities and straddle loss deferrals.
The tax character of distributions declared to shareholders for the last two fiscal years is as follows:
| | | | | | | | |
| | | 10/31/12 | | | 10/31/11 | |
Ordinary income (including any
short-term capital gains) | | | $14,036,084 | | | | $14,125,956 | |
The federal tax cost and the tax basis components of distributable earnings were as follows:
| | | | |
| As of 10/31/12 | | | |
| Cost of investments | | | $302,140,421 | |
| Gross appreciation | | | 24,881,404 | |
| Gross depreciation | | | (3,442,418 | ) |
| Net unrealized appreciation (depreciation) | | | $21,438,986 | |
| Undistributed ordinary income | | | 3,992,066 | |
| Capital loss carryforwards | | | (14,432,711 | ) |
| Other temporary differences | | | (3,098,516 | ) |
Under the Regulated Investment Company Modernization Act of 2010 (the “Act”), net capital losses recognized after October 31, 2011 may be carried forward indefinitely, and their character is retained as short-term and/or long-term losses. Previously, net capital losses were carried forward for eight years and treated as short-term losses. As a transition rule, the Act requires that post-enactment net capital losses be used before pre-enactment net capital losses.
49
Notes to Financial Statements – continued
As of October 31, 2012, the fund had capital loss carryforwards available to offset future realized gains. Such losses expire as follows:
| | | | |
| Pre-enactment losses: | | | |
| 10/31/14 | | | $(1,212,556 | ) |
| 10/31/16 | | | (6,482,036 | ) |
| 10/31/17 | | | (6,738,119 | ) |
| Total | | | $(14,432,711 | ) |
Multiple Classes of Shares of Beneficial Interest – The fund offers multiple classes of shares, which differ in their respective distribution and service fees. The fund’s income and common expenses are allocated to shareholders based on the value of settled shares outstanding of each class. The fund’s realized and unrealized gain (loss) are allocated to shareholders based on the daily net assets of each class. Dividends are declared separately for each class. Differences in per share dividend rates are generally due to differences in separate class expenses. Class B shares will convert to Class A shares approximately eight years after purchase. The fund’s distributions declared to shareholders as reported on the Statements of Changes in Net Assets are presented by class as follows:
| | | | | | | | |
| | | From net investment
income | |
| | | Year
ended
10/31/12 | | | Year
ended
10/31/11 | |
| Class A | | | $10,057,700 | | | | $10,246,663 | |
| Class B | | | 1,440,802 | | | | 1,533,882 | |
| Class C | | | 2,023,171 | | | | 2,012,309 | |
| Class I | | | 514,411 | | | | 333,102 | |
| Total | | | $14,036,084 | | | | $14,125,956 | |
(3) Transactions with Affiliates
Investment Adviser – The fund has an investment advisory agreement with MFS to provide overall investment management and related administrative services and facilities to the fund. The management fee is computed daily and paid monthly at an annual rate of 0.65% of the fund’s average daily net assets.
The investment adviser has agreed in writing to reduce its management fee to 0.60% of average daily net assets. This written agreement will continue until modified by the fund’s Board of Trustees, but such agreement will continue at least until February 28, 2014. For the year ended October 31, 2012, this waiver amounted to $152,728 and is reflected as a reduction of total expenses in the Statement of Operations. The management fee incurred for the year ended October 31, 2012, was equivalent to an annual effective rate of 0.60% of the fund’s average daily net assets.
50
Notes to Financial Statements – continued
The investment adviser has agreed in writing to pay a portion of the fund’s total annual operating expenses, exclusive of interest, taxes, extraordinary expenses, brokerage and transaction costs and investment-related expenses, such that total annual fund operating expenses do not exceed the following rates annually of each class’ average daily net assets:
| | | | | | | | | | | | | | |
| Class A | | | Class B | | | Class C | | | Class I | |
| | 1.05% | | | | 1.80 | % | | | 1.80 | % | | | 0.80 | % |
This written agreement will continue until modified by the fund’s Board of Trustees, but such agreement will continue at least until February 28, 2014. For the year end October 31, 2012, this reduction amounted to $244,990 and is reflected as a reduction of total expenses in the Statement of Operations.
Distributor – MFS Fund Distributors, Inc. (MFD), a wholly-owned subsidiary of MFS, as distributor, received $92,292 for the year ended October 31, 2012, as its portion of the initial sales charge on sales of Class A shares of the fund.
The Board of Trustees has adopted a distribution plan for certain class shares pursuant to Rule 12b-1 of the Investment Company Act of 1940.
The fund’s distribution plan provides that the fund will pay MFD for services provided by MFD and financial intermediaries in connection with the distribution and servicing of certain share classes. One component of the plan is a distribution fee paid to MFD and another component of the plan is a service fee paid to MFD. MFD may subsequently pay all, or a portion, of the distribution and/or service fees to financial intermediaries.
Distribution Plan Fee Table:
| | | | | | | | | | | | | | | | | | | | |
| | | Distribution
Fee Rate (d) | | | Service Fee
Rate (d) | | | Total
Distribution
Plan (d) | | | Annual
Effective
Rate (e) | | | Distribution
and Service
Fee | |
| Class A | | | — | | | | 0.25% | | | | 0.25% | | | | 0.25% | | | | $524,063 | |
| Class B | | | 0.75% | | | | 0.25% | | | | 1.00% | | | | 1.00% | | | | 356,243 | |
| Class C | | | 0.75% | | | | 0.25% | | | | 1.00% | | | | 1.00% | | | | 499,818 | |
| Total Distribution and Service Fees | | | | | | | | | | | | $1,380,124 | |
| (d) | In accordance with the distribution plan for certain classes, the fund pays distribution and/or service fees equal to these annual percentage rates of each class’ average daily net assets. The distribution and service fee rates disclosed by class represent the current rates in effect at the end of the reporting period. |
| (e) | The annual effective rates represent actual fees incurred under the distribution plan for the year ended October 31, 2012 based on each class’ average daily net assets. |
Certain Class A shares are subject to a contingent deferred sales charge (CDSC) in the event of a shareholder redemption within 18 months of purchase for shares purchased on or after August 1, 2012, and within 24 months of purchase for shares purchased prior to August 1, 2012. Class C shares are subject to a CDSC in the event of a shareholder redemption within 12 months of purchase. Class B shares are subject to a
51
Notes to Financial Statements – continued
CDSC in the event of a shareholder redemption within six years of purchase. All contingent deferred sales charges are paid to MFD and during the year ended October 31, 2012, were as follows:
| | | | |
| | | Amount | |
| Class A | | | $2,828 | |
| Class B | | | 29,282 | |
| Class C | | | 6,418 | |
Shareholder Servicing Agent – MFS Service Center, Inc. (MFSC), a wholly-owned subsidiary of MFS, receives a fee from the fund for its services as shareholder servicing agent calculated as a percentage of the average daily net assets of the fund as determined periodically under the supervision of the fund’s Board of Trustees. For the year ended October 31, 2012, the fee was $183,714, which equated to 0.0602% annually of the fund’s average daily net assets. MFSC also receives payment from the fund for out-of-pocket expenses, sub-accounting and other shareholder servicing costs which may be paid to affiliated and unaffiliated service providers. For the year ended October 31, 2012, these out-of-pocket expenses, sub-accounting and other shareholder servicing costs amounted to $261,603.
Administrator – MFS provides certain financial, legal, shareholder communications, compliance, and other administrative services to the fund. Under an administrative services agreement, the fund partially reimburses MFS the costs incurred to provide these services. The fund is charged an annual fixed amount of $17,500 plus a fee based on average daily net assets. The administrative services fee incurred for the year ended October 31, 2012 was equivalent to an annual effective rate of 0.0179% of the fund’s average daily net assets.
Trustees’ and Officers’ Compensation – The fund pays compensation to independent Trustees in the form of a retainer, attendance fees, and additional compensation to Board and Committee chairpersons. The fund does not pay compensation directly to Trustees or officers of the fund who are also officers of the investment adviser, all of whom receive remuneration for their services to the fund from MFS. Certain officers and Trustees of the fund are officers or directors of MFS, MFD, and MFSC.
Prior to December 31, 2001, the fund had an unfunded defined benefit plan (“DB plan”) for independent Trustees. As of December 31, 2001, the Board took action to terminate the DB plan with respect to then-current and any future independent Trustees, such that the DB plan covers only certain of those former independent Trustees who retired on or before December 31, 2001. Effective January 1, 2002, accrued benefits under the DB plan for then-current independent Trustees who continued were credited to an unfunded retirement deferral plan (the “Retirement Deferral plan”), which was established for and exists solely with respect to these credited amounts, and is not available for other deferrals by these or other independent Trustees. Although the Retirement Deferral plan is unfunded, amounts deferred under the plan are periodically adjusted for investment experience as if they had been invested in shares of the fund. The DB plan resulted in a pension expense of $498 and the Retirement Deferral plan resulted in an expense of $1,621. Both amounts are included in independent Trustees’ compensation for the year ended October 31,
52
Notes to Financial Statements – continued
2012. The liability for deferred retirement benefits payable to certain independent Trustees under both plans amounted to $26,973 at October 31, 2012, and is included in “Payable for independent Trustees’ compensation” on the Statement of Assets and Liabilities.
Other – This fund and certain other funds managed by MFS (the funds) have entered into services agreements (the Agreements) which provide for payment of fees by the funds to Tarantino LLC and Griffin Compliance LLC in return for the provision of services of an Independent Chief Compliance Officer (ICCO) and Assistant ICCO, respectively, for the funds. The ICCO and Assistant ICCO are officers of the funds and the sole members of Tarantino LLC and Griffin Compliance LLC, respectively. The funds can terminate the Agreements with Tarantino LLC and Griffin Compliance LLC at any time under the terms of the Agreements. For the year ended October 31, 2012, the aggregate fees paid by the fund to Tarantino LLC and Griffin Compliance LLC were $2,609 and are included in “Miscellaneous” expense on the Statement of Operations MFS has agreed to reimburse the fund for a portion of the payments made by the fund in the amount of $1,082, which is shown as a reduction of total expenses in the Statement of Operations. Additionally, MFS has agreed to bear all expenses associated with office space, other administrative support, and supplies provided to the ICCO and Assistant ICCO.
The fund invests in the MFS Institutional Money Market Portfolio which is managed by MFS and seeks a high level of current income consistent with preservation of capital and liquidity. Income earned on this investment is included in “Dividends from underlying affiliated funds” on the Statement of Operations. This money market fund does not pay a management fee to MFS.
(4) Portfolio Securities
Purchases and sales of investments, other than short-term obligations, were as follows:
| | | | | | | | |
| | | Purchases | | | Sales | |
| U.S. Government securities | | | $11,207,325 | | | | $17,497,580 | |
| Investments (non-U.S. Government securities) | | | $129,832,085 | | | | $106,164,091 | |
(5) Shares of Beneficial Interest
The fund’s Declaration of Trust permits the Trustees to issue an unlimited number of full and fractional shares of beneficial interest. Transactions in fund shares were as follows:
| | | | | | | | | | | | | | | | |
| | | Year ended
10/31/12 | | | Year ended
10/31/11 | |
| | | Shares | | | Amount | | | Shares | | | Amount | |
| Shares sold | | | | | | | | | | | | | | | | |
Class A | | | 5,212,992 | | | | $35,007,449 | | | | 5,619,855 | | | | $37,218,670 | |
Class B | | | 1,586,378 | | | | 10,583,277 | | | | 1,160,822 | | | | 7,620,622 | |
Class C | | | 1,990,942 | | | | 13,218,413 | | | | 1,779,400 | | | | 11,673,078 | |
Class I | | | 948,620 | | | | 6,312,067 | | | | 799,259 | | | | 5,297,189 | |
| | | 9,738,932 | | | | $65,121,206 | | | | 9,359,336 | | | | $61,809,559 | |
53
Notes to Financial Statements – continued
| | | | | | | | | | | | | | | | |
| | | Year ended
10/31/12 | | | Year ended
10/31/11 | |
| | | Shares | | | Amount | | | Shares | | | Amount | |
| Shares issued to shareholders in reinvestment of distributions | | | | | | | | | | | | | | | | |
Class A | | | 1,214,324 | | | | $8,166,624 | | | | 1,174,857 | | | | $7,782,618 | |
Class B | | | 145,321 | | | | 969,483 | | | | 149,130 | | | | 979,483 | |
Class C | | | 218,991 | | | | 1,456,354 | | | | 204,972 | | | | 1,340,523 | |
Class I | | | 61,918 | | | | 416,465 | | | | 39,016 | | | | 258,116 | |
| | | 1,640,554 | | | | $11,008,926 | | | | 1,567,975 | | | | $10,360,740 | |
| | | | |
| Shares reacquired | | | | | | | | | | | | | | | | |
Class A | | | (5,114,592 | ) | | | $(34,279,207 | ) | | | (8,163,561 | ) | | | $(54,102,705 | ) |
Class B | | | (1,230,067 | ) | | | (8,161,335 | ) | | | (2,019,616 | ) | | | (13,269,096 | ) |
Class C | | | (1,357,375 | ) | | | (9,014,642 | ) | | | (1,895,497 | ) | | | (12,363,505 | ) |
Class I | | | (624,299 | ) | | | (4,168,115 | ) | | | (295,674 | ) | | | (1,951,865 | ) |
| | | (8,326,333 | ) | | | $(55,623,299 | ) | | | (12,374,348 | ) | | | $(81,687,171 | ) |
| | | | |
| Net change | | | | | | | | | | | | | | | | |
Class A | | | 1,312,724 | | | | $8,894,866 | | | | (1,368,849 | ) | | | $(9,101,417 | ) |
Class B | | | 501,632 | | | | 3,391,425 | | | | (709,664 | ) | | | (4,668,991 | ) |
Class C | | | 852,558 | | | | 5,660,125 | | | | 88,875 | | | | 650,096 | |
Class I | | | 386,239 | | | | 2,560,417 | | | | 542,601 | | | | 3,603,440 | |
| | | 3,053,153 | | | | $20,506,833 | | | | (1,447,037 | ) | | | $(9,516,872 | ) |
(6) Line of Credit
The fund and certain other funds managed by MFS participate in a $1.1 billion unsecured committed line of credit, subject to a $1 billion sublimit, provided by a syndication of banks under a credit agreement. Borrowings may be made for temporary financing needs. Interest is charged to each fund, based on its borrowings, generally at a rate equal to the higher of the Federal Reserve funds rate or one month LIBOR plus an agreed upon spread. A commitment fee, based on the average daily, unused portion of the committed line of credit, is allocated among the participating funds at the end of each calendar quarter. In addition, the fund and other funds managed by MFS have established unsecured uncommitted borrowing arrangements with certain banks for temporary financing needs. Interest is charged to each fund, based on its borrowings, at a rate equal to the Federal Reserve funds rate plus an agreed upon spread. For the year ended October 31, 2012, the fund’s commitment fee and interest expense were $2,053 and $0, respectively, and are included in “Miscellaneous” expense on the Statement of Operations.
54
Notes to Financial Statements – continued
(7) Transactions in Underlying Affiliated Funds-Affiliated Issuers
An affiliated issuer may be considered one in which the fund owns 5% or more of the outstanding voting securities, or a company which is under common control. For the purposes of this report, the fund assumes the following to be an affiliated issuer:
| | | | | | | | | | | | | | | | |
| Underlying Affiliated Fund | | Beginning
Shares/Par
Amount | | | Acquisitions
Shares/Par
Amount | | | Dispositions
Shares/Par
Amount | | | Ending
Shares/Par
Amount | |
| MFS Institutional Money Market Portfolio | | | 6,055,217 | | | | 78,774,823 | | | | (76,334,172 | ) | | | 8,495,868 | |
| | | | |
| Underlying Affiliated Fund | | Realized
Gain (Loss) | | | Capital Gain
Distributions | | | Dividend
Income | | | Ending
Value | |
| MFS Institutional Money Market Portfolio | | | $— | | | | $— | | | | $12,594 | | | | $8,495,868 | |
55
REPORT OF INDEPENDENT REGISTERED PUBLIC ACCOUNTING FIRM
To the Board of Trustees of MFS Series Trust VIII and Shareholders of MFS Strategic Income Fund:
We have audited the accompanying statement of assets and liabilities of MFS Strategic Income Fund (the Fund) (one of the portfolios comprising MFS Series Trust VIII), including the portfolio of investments, as of October 31, 2012, and the related statement of operations for the year then ended, the statements of changes in net assets for each of the two years in the period then ended, and the financial highlights for each of the five years in the period then ended. These financial statements and financial highlights are the responsibility of the Fund’s management. Our responsibility is to express an opinion on these financial statements and financial highlights based on our audits.
We conducted our audits in accordance with the standards of the Public Company Accounting Oversight Board (United States). Those standards require that we plan and perform the audit to obtain reasonable assurance about whether the financial statements and financial highlights are free of material misstatement. We were not engaged to perform an audit of the Fund’s internal control over financial reporting. Our audits included consideration of internal control over financial reporting as a basis for designing audit procedures that are appropriate in the circumstances, but not for the purpose of expressing an opinion on the effectiveness of the Fund’s internal control over financial reporting. Accordingly, we express no such opinion. An audit also includes examining, on a test basis, evidence supporting the amounts and disclosures in the financial statements and financial highlights, assessing the accounting principles used and significant estimates made by management, and evaluating the overall financial statement presentation. Our procedures included confirmation of securities owned as of October 31, 2012, by correspondence with the custodian and brokers or by other appropriate auditing procedures where replies from brokers were not received. We believe that our audits provide a reasonable basis for our opinion.
In our opinion, the financial statements and financial highlights referred to above present fairly, in all material respects, the financial position of MFS Strategic Income Fund at October 31, 2012, the results of its operations for the year then ended, the changes in its net assets for each of the two years in the period then ended, and its financial highlights for each of the five years in the period then ended, in conformity with U.S. generally accepted accounting principles.

Boston, Massachusetts
December 19, 2012
56
TRUSTEES AND OFFICERS — IDENTIFICATION AND BACKGROUND
The Trustees and officers of the Trust, as of December 1, 2012, are listed below, together with their principal occupations during the past five years. (Their titles may have varied during that period.) The address of each Trustee and officer is 111 Huntington Avenue, Boston, Massachusetts 02199-7618.
| | | | | | | | |
Name, Age | | Position(s) Held with Fund | | Trustee/Officer
Since (h) | | Principal
Occupations During the Past Five Years | | Other Directorships (j) |
| INTERESTED TRUSTEES |
Robert J. Manning (k)
(age 49) | | Trustee | | February 2004 | | Massachusetts Financial Services Company, Chairman, Chief Executive Officer and Director; President (until December 2009); Chief Investment Officer (until July 2010) | | N/A |
| INDEPENDENT TRUSTEES | | | | |
David H. Gunning
(age 70) | | Trustee and Chair of Trustees | | January 2004 | | Retired; Cleveland-Cliffs Inc. (mining products and service provider), Vice Chairman/Director (until 2007) | | Lincoln Electric Holdings, Inc. (welding equipment manufacturer), Director; Development Alternatives, Inc. (consulting), Director/Non-Executive Chairman; Portman Limited (mining), Director (until 2008) |
Robert E. Butler
(age 71) | | Trustee | | January 2006 | | Consultant – investment company industry regulatory and compliance matters | | N/A |
Maureen R. Goldfarb (age 57) | | Trustee | | January 2009 | | Private investor | | N/A |
William R. Gutow
(age 71) | | Trustee | | December 1993 | | Private investor and real estate consultant; Capitol Entertainment Management Company (video franchise), Vice Chairman | | Atlantic Coast Tan (tanning salons), Vice Chairman (until 2007); Texas Donuts (donut franchise), Vice Chairman (until 2010) |
Michael Hegarty
(age 67) | | Trustee | | December
2004 | | Private investor; Rouse Properties Inc. (real estate), Director | | N/A |
57
Trustees and Officers – continued
| | | | | | | | |
Name, Age | | Position(s) Held with Fund | | Trustee/Officer
Since (h) | | Principal
Occupations During the Past Five Years | | Other Directorships (j) |
John P. Kavanaugh
(age 58) | | Trustee | | January 2009 | | Private investor | | N/A |
J. Dale Sherratt
(age 74) | | Trustee | | June 1989 | | Insight Resources, Inc. (acquisition planning specialists), President; Wellfleet Investments (investor in health care companies), Managing General Partner | | N/A |
Laurie J. Thomsen
(age 55) | | Trustee | | March 2005 | | Private investor; New Profit, Inc. (venture philanthropy), Executive Partner (until 2010) | | The Travelers Companies (insurance), Director |
Robert W. Uek
(age 71) | | Trustee | | January 2006 | | Consultant to investment company industry | | N/A |
| OFFICERS |
John M. Corcoran (k) (age 47) | | President | | October 2008 | | Massachusetts Financial Services Company, Senior Vice President (since October 2008); State Street Bank and Trust (financial services provider), Senior Vice President, (until September 2008) | | N/A |
Christopher R. Bohane (k)
(age 38) | | Assistant Secretary and Assistant Clerk | | July 2005 | | Massachusetts Financial Services Company, Vice President and Senior Counsel | | N/A |
Kino Clark (k)
(age 44) | | Assistant Treasurer | | January 2012 | | Massachusetts Financial Services Company, Vice President | | N/A |
Thomas H. Connors (k)
(age 53) | | Assistant Secretary and Assistant Clerk | | September 2012 | | Massachusetts Financial Services Company, Vice President and Senior Counsel; Deutsche Asset Management, Director and Senior Counsel (until 2012) | | N/A |
58
Trustees and Officers – continued
| | | | | | | | |
Name, Age | | Position(s) Held with Fund | | Trustee/Officer
Since (h) | | Principal
Occupations During the Past Five Years | | Other Directorships (j) |
Ethan D. Corey (k)
(age 49) | | Assistant Secretary and Assistant Clerk | | July 2005 | | Massachusetts Financial Services Company, Senior Vice President and Associate General Counsel | | N/A |
David L. DiLorenzo (k)
(age 44) | | Treasurer | | July 2005 | | Massachusetts Financial Services Company, Senior Vice President | | N/A |
Robyn L. Griffin
(age 37) | | Assistant Independent Chief Compliance Officer | | August 2008 | | Griffin Compliance LLC (provider of compliance services), Principal (since August 2008); State Street Corporation (financial services provider), Mutual Fund Administration Assistant Vice President (October 2006 – July 2008); | | N/A |
Brian E. Langenfeld (k)
(age 39) | | Assistant Secretary and Assistant Clerk | | June 2006 | | Massachusetts Financial Services Company, Vice President and Senior Counsel | | N/A |
Susan S. Newton (k)
(age 62) | | Assistant Secretary and Assistant Clerk | | May 2005 | | Massachusetts Financial Services Company, Senior Vice President and Associate General Counsel | | N/A |
Susan A. Pereira (k)
(age 42) | | Assistant Secretary and Assistant Clerk | | July 2005 | | Massachusetts Financial Services Company, Vice President and Senior Counsel | | N/A |
Kasey L. Phillips (k)
(age 41) | | Assistant Treasurer | | September 2012 | | Massachusetts Financial Services Company, Vice President; Wells Fargo Funds Management, LLC, Senior Vice President, Fund Treasurer (until 2012) | | N/A |
59
Trustees and Officers – continued
| | | | | | | | |
Name, Age | | Position(s) Held with Fund | | Trustee/Officer
Since (h) | | Principal
Occupations During the Past Five Years | | Other Directorships (j) |
Mark N. Polebaum (k)
(age 60) | | Secretary and Clerk | | January 2006 | | Massachusetts Financial Services Company, Executive Vice President, General Counsel and Secretary | | N/A |
Frank L. Tarantino
(age 68) | | Independent Chief Compliance Officer | | June 2004 | | Tarantino LLC (provider of compliance services), Principal | | N/A |
Richard S. Weitzel (k)
(age 42) | | Assistant Secretary and Assistant Clerk | | October 2007 | | Massachusetts Financial Services Company, Senior Vice President and Associate General Counsel | | N/A |
James O. Yost (k)
(age 52) | | Deputy Treasurer | | September 1990 | | Massachusetts Financial Services Company, Senior Vice President | | N/A |
| (h) | Date first appointed to serve as Trustee/officer of an MFS fund. Each Trustee has served continuously since appointment unless indicated otherwise. For the period from December 15, 2004 until February 22, 2005, Mr. Manning served as Advisory Trustee. For the period October 2008, until January 2012, Mr. Corcoran served as Treasurer of the Funds. Prior to January 2012, Messrs. DiLorenzo and Yost served as Assistant Treasurers of the Funds. |
| (j) | Directorships or trusteeships of companies required to report to the Securities and Exchange Commission (i.e., “public companies”). |
| (k) | “Interested person” of the Trust within the meaning of the Investment Company Act of 1940 (referred to as the 1940 Act), which is the principal federal law governing investment companies like the fund, as a result of position with MFS. The address of MFS is 111 Huntington Avenue, Boston, Massachusetts 02199-7618. |
Each Trustee has been elected by shareholders and each Trustee and officer holds office until his or her successor is chosen and qualified or until his or her earlier death, resignation, retirement or removal. The Trust does not hold annual meetings for the purpose of electing Trustees, and Trustees are not elected for fixed terms. Messrs. Butler, Kavanaugh, Uek and Ms. Thomsen are members of the Trust’s Audit Committee.
Each of the Fund’s Trustees and officers holds comparable positions with certain other funds of which MFS or a subsidiary is the investment adviser or distributor, and, in the case of the officers, with certain affiliates of MFS. As of January 1, 2012, the Trustees served as board members of 131 funds within the MFS Family of Funds.
60
Trustees and Officers – continued
The Statement of Additional Information for the Fund includes further information about the Trustees and is available without charge upon request by calling 1-800-225-2606.
| | |
| Investment Adviser | | Custodian |
Massachusetts Financial Services Company
111 Huntington Avenue Boston, MA 02199-7618 | | JPMorgan Chase Bank One Chase Manhattan Plaza New York, NY 10081 |
| Distributor | | Independent Registered Public Accounting Firm |
MFS Fund Distributors, Inc.
111 Huntington Avenue
Boston, MA 02199-7618 | | Ernst & Young LLP 200 Clarendon Street
Boston, MA 02116 |
| Portfolio Managers | | |
William Adams David Cole James Calmas Robert Persons Matthew Ryan Erik Weisman | | |
61
BOARD REVIEW OF INVESTMENT ADVISORY AGREEMENT
The Investment Company Act of 1940 requires that both the full Board of Trustees and a majority of the non-interested (“independent”) Trustees, voting separately, annually approve the continuation of the Fund’s investment advisory agreement with MFS. The Trustees consider matters bearing on the Fund and its advisory arrangements at their meetings throughout the year, including a review of performance data at each regular meeting. In addition, the independent Trustees met several times over the course of three months beginning in May and ending in July, 2012 (“contract review meetings”) for the specific purpose of considering whether to approve the continuation of the investment advisory agreement for the Fund and the other investment companies that the Board oversees (the “MFS Funds”). The independent Trustees were assisted in their evaluation of the Fund’s investment advisory agreement by independent legal counsel, from whom they received separate legal advice and with whom they met separately from MFS during various contract review meetings. The independent Trustees were also assisted in this process by the MFS Funds’ Independent Chief Compliance Officer, a full-time senior officer appointed by and reporting to the independent Trustees.
In connection with their deliberations regarding the continuation of the investment advisory agreement, the Trustees, including the independent Trustees, considered such information and factors as they believed, in light of the legal advice furnished to them and their own business judgment, to be relevant. The investment advisory agreement for the Fund was considered separately, although the Trustees also took into account the common interests of all MFS Funds in their review. As described below, the Trustees considered the nature, quality, and extent of the various investment advisory, administrative, and shareholder services performed by MFS under the existing investment advisory agreement and other arrangements with the Fund.
In connection with their contract review meetings, the Trustees received and relied upon materials that included, among other items: (i) information provided by Lipper Inc., an independent third party, on the investment performance of the Fund for various time periods ended December 31, 2011 and the investment performance of a group of funds with substantially similar investment classifications/objectives (the “Lipper performance universe”), (ii) information provided by Lipper Inc. on the Fund’s advisory fees and other expenses and the advisory fees and other expenses of comparable funds identified by Lipper Inc. (the “Lipper expense group”), (iii) information provided by MFS on the advisory fees of comparable portfolios of other clients of MFS, including institutional separate accounts and other clients, (iv) information as to whether and to what extent applicable expense waivers, reimbursements or fee “breakpoints” are observed for the Fund, (v) information regarding MFS’ financial results and financial condition, including MFS’ and certain of its affiliates’ estimated profitability from services performed for the Fund and the MFS Funds as a whole, and compared to MFS’ institutional business, (vi) MFS’ views regarding the outlook for the mutual fund industry and the strategic business plans of MFS, (vii) descriptions of various functions performed by MFS for the Funds, such as compliance monitoring and portfolio trading practices, and (viii) information regarding the overall organization of MFS, including information about MFS’ senior management and other personnel providing investment advisory, administrative and other services to
62
Board Review of Investment Advisory Agreement – continued
the Fund and the other MFS Funds. The comparative performance, fee and expense information prepared and provided by Lipper Inc. was not independently verified and the independent Trustees did not independently verify any information provided to them by MFS.
The Trustees’ conclusion as to the continuation of the investment advisory agreement was based on a comprehensive consideration of all information provided to the Trustees and not the result of any single factor. Some of the factors that figured particularly in the Trustees’ deliberations are described below, although individual Trustees may have evaluated the information presented differently from one another, giving different weights to various factors. It is also important to recognize that the fee arrangements for the Fund and other MFS Funds are the result of years of review and discussion between the independent Trustees and MFS, that certain aspects of such arrangements may receive greater scrutiny in some years than in others, and that the Trustees’ conclusions may be based, in part, on their consideration of these same arrangements during the course of the year and in prior years.
Based on information provided by Lipper Inc. and MFS, the Trustees reviewed the Fund’s total return investment performance as well as the performance of peer groups of funds over various time periods. The Trustees placed particular emphasis on the total return performance of the Fund’s Class A shares in comparison to the performance of funds in its Lipper performance universe over the three-year period ended December 31, 2011, which the Trustees believed was a long enough period to reflect differing market conditions. The total return performance of the Fund’s Class A shares was in the 3rd quintile relative to the other funds in the universe for this three-year period (the 1st quintile being the best performers and the 5th quintile being the worst performers). The total return performance of the Fund’s Class A shares was in the 2nd quintile for the one-year period and the 3rd quintile for the five-year period ended December 31, 2011 relative to the Lipper performance universe. Because of the passage of time, these performance results may differ from the performance results for more recent periods, including those shown elsewhere in this report.
In addition to considering the performance information provided in connection with the contract review meetings, the independent Trustees noted that, in light of the Fund’s substandard relative performance at the time of their contract review meetings in 2011, they had met at each of their regular meetings since then with MFS’ senior investment management personnel to discuss the Fund’s performance and MFS’ efforts to improve the Fund’s performance. The independent Trustees further noted that the Fund’s three-year performance as compared to its Lipper performance universe improved for the period ended December 31, 2011, as compared to the prior year. Taking this information into account, the Trustees concluded, within the context of their overall conclusions regarding the investment advisory agreement, that they were satisfied with MFS’ responses and efforts relating to investment performance.
In assessing the reasonableness of the Fund’s advisory fee, the Trustees considered, among other information, the Fund’s advisory fee and the total expense ratio of the Fund’s Class A shares as a percentage of average daily net assets and the advisory fee and total expense ratios of peer groups of funds based on information provided by Lipper Inc. The Trustees considered that MFS has agreed in writing to reduce its
63
Board Review of Investment Advisory Agreement – continued
advisory fee, and that MFS currently observes an expense limitation for the Fund, each of which may not be changed without the Trustees’ approval. The Trustees also considered that, according to the Lipper data (which takes into account any fee reductions or expense limitations that were in effect during the Fund’s last fiscal year), the Fund’s effective advisory fee rate and total expense ratio were each lower than the Lipper expense group median.
The Trustees also considered the advisory fees charged by MFS to institutional accounts, if any. In comparing these fees, the Trustees considered information provided by MFS as to the generally broader scope of services provided by MFS to the Fund in comparison to institutional accounts, the higher demands placed on MFS’ investment personnel and trading infrastructure as a result of the daily cash in-flows and out-flows of the Fund, and the impact on MFS and expenses associated with the more extensive regulatory regime to which the Fund is subject in comparison to institutional accounts.
The Trustees also considered whether the Fund is likely to benefit from any economies of scale in the management of the Fund in the event of growth in assets of the Fund. They noted that the Fund’s advisory fee rate schedule is not subject to any breakpoints. Taking into account the advisory fee waiver and the expense limitation noted above, the Trustees determined not to recommend any advisory fee breakpoints for the Fund at this time.
The Trustees also considered information prepared by MFS relating to MFS’ costs and profits with respect to the Fund, the MFS Funds considered as a group, and other investment companies and accounts advised by MFS, as well as MFS’ methodologies used to determine and allocate its costs to the MFS Funds, the Fund and other accounts and products for purposes of estimating profitability.
After reviewing these and other factors described herein, the Trustees concluded, within the context of their overall conclusions regarding the investment advisory agreement, that the advisory fees charged to the Fund represent reasonable compensation in light of the services being provided by MFS to the Fund.
In addition, the Trustees considered MFS’ resources and related efforts to continue to retain, attract and motivate capable personnel to serve the Fund. The Trustees also considered current and developing conditions in the financial services industry, including the presence of large and well-capitalized companies which are spending, and appear to be prepared to continue to spend, substantial sums to engage personnel and to provide services to competing investment companies. In this regard, the Trustees also considered the financial resources of MFS and its ultimate parent, Sun Life Financial Inc. The Trustees also considered the advantages and possible disadvantages to the Fund of having an adviser that also serves other investment companies as well as other accounts.
The Trustees also considered the nature, quality, cost, and extent of administrative, transfer agency, and distribution services provided to the Fund by MFS and its affiliates under agreements and plans other than the investment advisory agreement, including any 12b-1 fees the Fund pays to MFS Fund Distributors, Inc., an affiliate of MFS. The Trustees also considered the nature, extent and quality of certain other services MFS performs or arranges for on the Fund’s behalf, which may include securities lending programs, directed expense payment programs, class action recovery programs, and
64
Board Review of Investment Advisory Agreement – continued
MFS’ interaction with third-party service providers, principally custodians and sub-custodians. The Trustees concluded that the various non-advisory services provided by MFS and its affiliates on behalf of the Fund were satisfactory.
The Trustees also considered benefits to MFS from the use of the Fund’s portfolio brokerage commissions, if applicable, to pay for investment research and various other factors. Additionally, the Trustees considered so-called “fall-out benefits” to MFS such as reputational value derived from serving as investment manager to the Fund.
Based on their evaluation of factors that they deemed to be material, including those factors described above, the Board of Trustees, including the independent Trustees, concluded that the Fund’s investment advisory agreement with MFS should be continued for an additional one-year period, commencing August 1, 2012.
A discussion regarding the Board’s most recent review and renewal of the fund’s Investment Advisory Agreement with MFS is available by clicking on the fund’s name under “Mutual Funds” in the “Products and Performance” section of the MFS Web site (mfs.com).
65
PROXY VOTING POLICIES AND INFORMATION
A general description of the MFS funds’ proxy voting policies and procedures is available without charge, upon request, by calling 1-800-225-2606, by visiting the Proxy Voting section of mfs.com or by visiting the SEC’s Web site at http://www.sec.gov.
Information regarding how the fund voted proxies relating to portfolio securities during the most recent twelve-month period ended June 30 is available without charge by visiting the Proxy Voting section of mfs.com or by visiting the SEC’s Web site at http://www.sec.gov.
QUARTERLY PORTFOLIO DISCLOSURE
The fund will file a complete schedule of portfolio holdings with the Securities and Exchange Commission (the Commission) for the first and third quarters of each fiscal year on Form N-Q. A shareholder can obtain the quarterly portfolio holdings report at mfs.com. The fund’s Form N-Q is also available on the EDGAR database on the Commission’s Internet Web site at http://www.sec.gov, and may be reviewed and copied at the:
Public Reference Room
Securities and Exchange Commission
100 F Street, NE, Room 1580
Washington, D.C. 20549
Information on the operation of the Public Reference Room may be obtained by calling the Commission at 1-800-SEC-0330. Copies of the fund’s Form N-Q also may be obtained, upon payment of a duplicating fee, by electronic request at the following e-mail address: publicinfo@sec.gov or by writing the Public Reference Section at the above address.
FURTHER INFORMATION
From time to time, MFS may post important information about the fund or the MFS funds on the MFS web site (mfs.com). This information is available by visiting the “News & Commentary” section of mfs.com or by clicking on the fund’s name under “Mutual Funds” in the “Products and Performance” section of mfs.com.
FEDERAL TAX INFORMATION (unaudited)
The fund will notify shareholders of amounts for use in preparing 2012 income tax forms in January 2013.
66
rev. 3/11
| | | | |
| | | |
FACTS | | WHAT DOES MFS DO WITH YOUR PERSONAL INFORMATION? | |  |
| | |
| Why? | | Financial companies choose how they share your personal information. Federal law gives consumers the right to limit some but not all sharing. Federal law also requires us to tell you how we collect, share, and protect your personal information. Please read this notice carefully to understand what we do. |
| | |
| What? | | The types of personal information we collect and share depend on the product or service you have with us. This information can include: •Social Security number and account balances •Account transactions and transaction history •Checking account information and wire transfer instructions When you are no longer our customer, we continue to share your information as described in this notice. |
| | |
| How? | | All financial companies need to share customers’ personal information to run their everyday business. In the section below, we list the reasons financial companies can share their customers’ personal information; the reasons MFS chooses to share; and whether you can limit this sharing. |
| | | | |
Reasons we can share your
personal information | | Does MFS
share? | | Can you limit
this sharing? |
For our everyday business purposes – such as to process your transactions, maintain your account(s), respond to court orders and legal investigations, or report to credit bureaus | | Yes | | No |
For our marketing purposes – to offer our products and services to you | | No | | We don’t share |
| For joint marketing with other financial companies | | No | | We don’t share |
For our affiliates’ everyday business purposes – information about your transactions and experiences | | No | | We don’t share |
For our affiliates’ everyday business purposes – information about your creditworthiness | | No | | We don’t share |
| For nonaffiliates to market to you | | No | | We don’t share |
| | |
| Questions? | | Call 800-225-2606 or go to mfs.com. |
67
| | |
| Who we are |
| Who is providing this notice? | | MFS Funds, MFS Investment Management, MFS Institutional Advisors, Inc., MFS Fund Distributors, Inc., MFS Heritage Trust Company, and MFS Service Center, Inc. |
| | |
| What we do |
| How does MFS protect my personal information? | | To protect your personal information from unauthorized access and use, we use security measures that comply with federal law. These measures include procedural, electronic, and physical safeguards for the protection of the personal information we collect about you. |
| How does MFS collect my personal information? | | We collect your personal information, for example, when you •open an account or provide account information •direct us to buy securities or direct us to sell your securities •make a wire transfer We also collect your personal information from others, such as credit bureaus, affiliates and other companies. |
| Why can’t I limit all sharing? | | Federal law gives you the right to limit only •sharing for affiliates’ everyday business purposes – information about your creditworthiness •affiliates from using your information to market to you •sharing for nonaffiliates to market to you State laws and individual companies may give you additional rights to limit sharing. |
| | |
| Definitions |
| Affiliates | | Companies related by common ownership or control. They can be financial and nonfinancial companies. •MFS does not share personal information with affiliates, except for everyday business purposes as described on page one of this notice. |
| Nonaffiliates | | Companies not related by common ownership or control. They can be financial and nonfinancial companies. •MFS does not share with nonaffiliates so they can market to you. |
| Joint Marketing | | A formal agreement between nonaffiliated financial companies that together market financial products or services to you. •MFS doesn’t jointly market. |
| | |
| Other important information |
| If you own an MFS product or receive an MFS service in the name of a third party such as a bank or broker-dealer, their privacy policy may apply to you instead of ours. |
68
Save paper with eDelivery.

| MFS® will send you prospectuses, |
reports, and proxies directly via e-mail so you will get information faster with less mailbox clutter.
To sign up:
1. Go to mfs.com.
2. Log in via MFS® Access.
3. Select eDelivery.
If you own your MFS fund shares through a financial institution or a retirement plan, MFS® TALK, MFS® Access, or eDelivery may not be available to you.
CONTACT
WEB SITE
mfs.com
MFS TALK
1-800-637-8255
24 hours a day
ACCOUNT SERVICE AND LITERATURE
Shareholders
1-800-225-2606
Financial advisors
1-800-343-2829
Retirement plan services
1-800-637-1255
MAILING ADDRESS
MFS Service Center, Inc.
P.O. Box 55824
Boston, MA 02205-5824
OVERNIGHT MAIL
MFS Service Center, Inc.
c/o Boston Financial Data Services
30 Dan Road
Canton, MA 02021-2809
The Registrant has adopted a Code of Ethics pursuant to Section 406 of the Sarbanes-Oxley Act and as defined in Form N-CSR that applies to the Registrant’s principal executive officer and principal financial and accounting officer. During the period covered by this report, the Registrant has not amended any provision in its Code of Ethics (the “Code”) that relates to an element of the Code’s definitions enumerated in paragraph (b) of Item 2 of this Form N-CSR. During the period covered by this report, the Registrant did not grant a waiver, including an implicit waiver, from any provision of the Code.
A copy of the Code of Ethics is filed as an exhibit to this Form N-CSR.
| ITEM 3. | AUDIT COMMITTEE FINANCIAL EXPERT. |
Messrs. Robert E. Butler, John P. Kavanaugh and Robert W. Uek and Ms. Laurie J. Thomsen, members of the Audit Committee, have been determined by the Board of Trustees in their reasonable business judgment to meet the definition of “audit committee financial expert” as such term is defined in Form N-CSR. In addition, Messrs. Butler, Kavanaugh and Uek and Ms. Thomsen are “independent” members of the Audit Committee (as such term has been defined by the Securities and Exchange Commission in regulations implementing Section 407 of the Sarbanes-Oxley Act of 2002). The Securities and Exchange Commission has stated that the designation of a person as an audit committee financial expert pursuant to this Item 3 on the Form N-CSR does not impose on such a person any duties, obligations or liability that are greater than the duties, obligations or liability imposed on such person as a member of the Audit Committee and the Board of Trustees in the absence of such designation or identification.
| ITEM 4. | PRINCIPAL ACCOUNTANT FEES AND SERVICES. |
The Board of Trustees has appointed Deloitte & Touche LLP (“Deloitte”) to serve as independent accountants to certain series of the Registrant and Ernst & Young LLP (“E&Y”) to serve in the same capacity to certain other series of the Registrant (the series referred to collectively as the “Funds” and singularly as a “Fund”). The tables below set forth the audit fees billed to the Funds as well as fees for non-audit services provided to the Funds and/or to the Funds’ investment adviser, Massachusetts Financial Services Company (“MFS”) and to various entities either controlling, controlled by, or under common control with MFS that provide ongoing services to the Funds (“MFS Related Entities”).
For the fiscal years ended October 31, 2012 and 2011, audit fees billed to the Funds by Deloitte and E&Y were as follows:
| | | | | | | | |
| | | Audit Fees | |
| Fees billed by Deloitte: | | 2012 | | | 2011 | |
MFS Global Growth Fund | | | 54,384 | | | | 52,373 | |
| |
| | | Audit Fees | |
| Fees billed by E&Y: | | 2012 | | | 2011 | |
MFS Strategic Income Fund | | | 48,544 | | | | 46,752 | |
For the fiscal years ended October 31, 2012 and 2011, fees billed by Deloitte and E&Y for audit-related, tax and other services provided to the Funds and for audit-related, tax and other services provided to MFS and MFS Related Entities were as follows:
| | | | | | | | | | | | | | | | | | | | | | | | |
| | | Audit-Related Fees1 | | | Tax Fees2 | | | All Other Fees3 | |
| Fees billed by Deloitte: | | 2012 | | | 2011 | | | 2012 | | | 2011 | | | 2012 | | | 2011 | |
To MFS Global Growth Fund | | | 0 | | | | 0 | | | | 5,803 | | | | 5,585 | | | | 1,133 | | | | 601 | |
| | | |
| | | Audit-Related Fees1 | | | Tax Fees2 | | | All Other Fees3 | |
| Fees billed by Deloitte: | | 2012 | | | 20115 | | | 2012 | | | 2011 | | | 2012 | | | 20115 | |
To MFS and MFS Related Entities of MFS Global Growth Fund* | | | 1,064,074 | | | | 1,030,504 | | | | 0 | | | | 0 | | | | 0 | | | | 113,100 | |
Aggregate fees for non-audit services:
| | | | | | | | |
| | | 2012 | | | 20115 | |
To MFS Global Growth Fund, MFS and MFS Related Entities# | | | 1,354,850 | | | | 1,558,235 | |
| | | | | | | | | | | | | | | | | | | | | | | | |
| | | Audit-Related Fees1 | | | Tax Fees2 | | | All Other Fees4 | |
| Fees billed by E&Y: | | 2012 | | | 2011 | | | 2012 | | | 2011 | | | 2012 | | | 2011 | |
To MFS Strategic Income Fund | | | 0 | | | | 0 | | | | 9,565 | | | | 9,436 | | | | 0 | | | | 0 | |
| | | |
| | | Audit-Related Fees1 | | | Tax Fees2 | | | All Other Fees4 | |
| Fees billed by E&Y: | | 2012 | | | 2011 | | | 2012 | | | 2011 | | | 2012 | | | 2011 | |
To MFS and MFS Related Entities of MFS Strategic Income Fund* | | | 0 | | | | 0 | | | | 0 | | | | 0 | | | | 0 | | | | 0 | |
Aggregate fees for non-audit services:
| | | | | | | | |
| | | 2012 | | | 20115 | |
To MFS Strategic Income Fund, MFS and MFS Related Entities# | | | 49,565 | | | | 119,436 | |
| * | This amount reflects the fees billed to MFS and MFS Related Entities for non-audit services relating directly to the operations and financial reporting of the Funds (portions of which services also related to the operations and financial reporting of other funds within the MFS Funds complex). |
| # | This amount reflects the aggregate fees billed by Deloitte or E&Y, as the case may be, for non-audit services rendered to the Funds and for non-audit services rendered to MFS and the MFS Related Entities. |
| 1 | The fees included under “Audit-Related Fees” are fees related to assurance and related services that are reasonably related to the performance of the audit or review of financial statements, but not reported under “Audit Fees,” including accounting consultations, agreed-upon procedure reports, attestation reports, comfort letters and internal control reviews. |
| 2 | The fees included under “Tax Fees” are fees associated with tax compliance, tax advice and tax planning, including services relating to the filing or amendment of federal, state or local income tax returns, regulated investment company qualification reviews and tax distribution and analysis. |
| 3 | The fees included under “All Other Fees” are fees for products and services provided by Deloitte other than those reported under “Audit Fees,” “Audit-Related Fees” and “Tax Fees,” including fees for services related to review of internal controls and review of Rule 38a-1 compliance program. |
| 4 | The fees under “All Other Fees” are fees for products and services provided by E&Y other than those reported under “Audit Fees,” “Audit-Related Fees” and “Tax Fees”. |
| 5 | Fees reported in 2011 have been restated in this filing from those reported in the Registrant’s filing for the reporting period ended October 31, 2011. |
Item 4(e)(1):
Set forth below are the policies and procedures established by the Audit Committee of the Board of Trustees relating to the pre-approval of audit and non-audit related services:
To the extent required by applicable law, pre-approval by the Audit Committee of the Board is needed for all audit and permissible non-audit services rendered to the Funds and all permissible non-audit services rendered to MFS or MFS Related Entities if the services relate directly to the operations and financial reporting of the Registrant. Pre-approval is currently on an engagement-by-engagement basis. In the event pre-approval of such services is necessary between regular meetings of the Audit Committee and it is not practical to wait to seek pre-approval at the next regular meeting of the Audit Committee, pre-approval of such services may be referred to the Chair of the Audit Committee for approval; provided that the Chair may not pre-approve any individual engagement for such services exceeding $50,000 or multiple engagements for such services in the aggregate exceeding $100,000 in each period between regular meetings of the Audit Committee. Any engagement pre-approved by the Chair between regular meetings of the Audit Committee shall be presented for ratification by the entire Audit Committee at its next regularly scheduled meeting.
Item 4(e)(2):
None, or 0%, of the services relating to the Audit-Related Fees, Tax Fees and All Other Fees paid by the Fund and MFS and MFS Related Entities relating directly to the operations and financial reporting of the Registrant disclosed above were approved by the audit committee pursuant to paragraphs (c)(7)(i)(C) of Rule 2-01 of Regulation S-X (which permits audit committee approval after the start of the engagement with respect to services other than audit, review or attest services, if certain conditions are satisfied).
Item 4(f): Not applicable.
Item 4(h): The Registrant’s Audit Committee has considered whether the provision by a Registrant’s independent registered public accounting firm of non-audit services to MFS and MFS Related Entities that were not pre-approved by the Committee (because such services did not relate directly to the operations and financial reporting of the Registrant) was compatible with maintaining the independence of the independent registered public accounting firm as the Registrant’s principal auditors.
| ITEM 5. | AUDIT COMMITTEE OF LISTED REGISTRANTS. |
Not applicable to the Registrant.
A schedule of investments of each series of the Registrant is included as part of the report to shareholders of such series under Item 1 of this Form N-CSR.
| ITEM 7. | DISCLOSURE OF PROXY VOTING POLICIES AND PROCEDURES FOR CLOSED-END MANAGEMENT INVESTMENT COMPANIES. |
Not applicable to the Registrant.
| ITEM 8. | PORTFOLIO MANAGERS OF CLOSED-END MANAGEMENT INVESTMENT COMPANIES. |
Not applicable to the Registrant.
| ITEM 9. | PURCHASES OF EQUITY SECURITIES BY CLOSED-END MANAGEMENT INVESTMENT COMPANY AND AFFILIATED PURCHASERS. |
Not applicable to the Registrant.
| ITEM 10. | SUBMISSION OF MATTERS TO A VOTE OF SECURITY HOLDERS. |
There were no material changes to the procedures by which shareholders may send recommendations to the Board for nominees to the Registrant’s Board since the Registrant last provided disclosure as to such procedures in response to the requirements of Item 407 (c)(2)(iv) of Regulation S-K or this Item.
| ITEM 11. | CONTROLS AND PROCEDURES. |
| (a) | Based upon their evaluation of the effectiveness of the registrant’s disclosure controls and procedures (as defined in Rule 30a-3(c) under the Investment Company Act of 1940 (the “Act”)) as conducted within 90 days of the filing date of this report on Form N-CSR, the registrant’s principal financial officer and principal executive officer have concluded that those disclosure controls and procedures provide reasonable assurance that the material information required to be disclosed by the registrant on this report is recorded, processed, summarized and reported within the time periods specified in the Securities and Exchange Commission’s rules and forms. |
| (b) | There were no changes in the registrant’s internal controls over financial reporting (as defined in Rule 30a-3(d) under the Act) that occurred during the second fiscal quarter of the period covered by the report that have materially affected, or are reasonably likely to materially affect, the registrant’s internal control over financial reporting. |
| (a) | File the exhibits listed below as part of this form. Letter or number the exhibits in the sequence indicated. |
| | (1) | Any code of ethics, or amendment thereto, that is the subject of the disclosure required by Item 2, to the extent that the registrant intends to satisfy the Item 2 requirements through filing of an exhibit: Code of Ethics attached hereto. |
| | (2) | A separate certification for each principal executive officer and principal financial officer of the registrant as required by Rule 30a-2(a) under the Act (17 CFR 270.30a-2): Attached hereto. |
| (b) | If the report is filed under Section 13(a) or 15(d) of the Exchange Act, provide the certifications required by Rule 30a-2(b) under the Act (17 CFR 270.30a-2(b)), Rule 13a-14(b) or Rule 15d-14(b) under the Exchange Act (17 CFR 240.13a-14(b) or 240.15d-14(b)) and Section 1350 of Chapter 63 of Title 18 of the United States Code (18 U.S.C. 1350) as an exhibit. A certification furnished pursuant to this paragraph will not be deemed “filed” for the purposes of Section 18 of the Exchange Act (15 U.S.C. 78r), or otherwise subject to the liability of that section. Such certification will not be deemed to be incorporated by reference into any filing under the Securities Act of 1933 or the Exchange Act, except to the extent that the registrant specifically incorporates it by reference: Attached hereto. |
Notice
A copy of the Amended and Restated Declaration of Trust, as amended, of the Registrant is on file with the Secretary of State of The Commonwealth of Massachusetts and notice is hereby given that this instrument is executed on behalf of the Registrant by an officer of the Registrant as an officer and not individually and the obligations of or arising out of this instrument are not binding upon any of the Trustees or shareholders individually, but are binding only upon the assets and property of the respective constituent series of the Registrant.
SIGNATURES
Pursuant to the requirements of the Securities Exchange Act of 1934 and the Investment Company Act of 1940, the registrant has duly caused this report to be signed on its behalf by the undersigned, thereunto duly authorized.
(Registrant) MFS SERIES TRUST VIII
| | |
| By (Signature and Title)* | | JOHN M. CORCORAN |
| | John M. Corcoran, President |
Date: December 19, 2012
Pursuant to the requirements of the Securities Exchange Act of 1934 and the Investment Company Act of 1940, this report has been signed below by the following persons on behalf of the registrant and in the capacities and on the dates indicated.
| | |
| By (Signature and Title)* | | JOHN M. CORCORAN |
| | John M. Corcoran, President (Principal Executive Officer) |
Date: December 19, 2012
| | |
| By (Signature and Title)* | | DAVID L. DILORENZO |
| | David L. DiLorenzo, Treasurer (Principal Financial Officer and Accounting Officer) |
Date: December 19, 2012
| * | Print name and title of each signing officer under his or her signature. |