UNITED STATES
SECURITIES AND EXCHANGE COMMISSION
Washington, D.C. 20549
FORM N-CSR
CERTIFIED SHAREHOLDER REPORT OF
REGISTERED MANAGEMENT INVESTMENT COMPANIES
Investment Company Act file number 811-5262
MFS SERIES TRUST VIII
(Exact name of registrant as specified in charter)
500 Boylston Street, Boston, Massachusetts 02116
(Address of principal executive offices) (Zip code)
Susan S. Newton
Massachusetts Financial Services Company
500 Boylston Street
Boston, Massachusetts 02116
(Name and address of agents for service)
Registrant’s telephone number, including area code: (617) 954-5000
Date of fiscal year end: October 31
Date of reporting period: April 30, 2009
| ITEM 1. | REPORTS TO STOCKHOLDERS. |

MFS® Global Growth Fund
The report is prepared for the general information of shareholders. It is authorized for distribution to prospective investors only when preceded or accompanied by a current prospectus.
NOT FDIC INSURED Ÿ MAY LOSE VALUE Ÿ
NO BANK GUARANTEE
4/30/09
WGF-SEM

LETTER FROM THE CEO
Dear Shareholders:
The market downturns and economic setbacks of late probably rank among the worst financial declines most of us have experienced. Inevitably, people may be questioning their commitment to investing. Still, it is important to remember that downturns are an inescapable part of the business cycle. Such troughs have been seen before, and if we can use history as a guide, market recoveries typically have followed.
Recent events have clearly shown us the value of certain types of investments. In this environment, two of the hallmarks of mutual funds — transparency and liquidity — have become critically important. Unlike some other types of investments, the operations of mutual funds are relatively transparent to their shareholders. With their daily redemption feature, mutual funds also generally provide easy, convenient access to one’s money. Through these recent market upheavals, this level of liquidity enhanced the ability of mutual fund investors to respond and modify their investments as they and their advisors saw fit — a flexibility that those in less liquid investments simply did not have at their disposal.
At MFS® we take particular pride in how well mutual funds can serve investors because we invented the mutual fund in the United States. Established in 1924, Massachusetts Investors Trust was the nation’s first fund. Recent market events only reinforce what we have learned through 85 years — that mutual funds provide unique features that are important to investors in any type of market climate.
Respectfully,

Robert J. Manning
Chief Executive Officer and Chief Investment Officer
MFS Investment Management®
June 15, 2009
The opinions expressed in this letter are subject to change, may not be relied upon for investment advice, and no forecasts can be guaranteed.
Before investing, consider the fund’s investment objectives, risks, charges, and expenses. For a prospectus containing this and other information, contact your investment professional or view online. Read it carefully.
MFS Fund Distributors, Inc., 500 Boylston Street, Boston, MA 02116
1
PORTFOLIO COMPOSITION
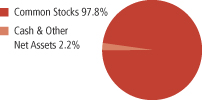
Portfolio structure
| | |
| Top ten holdings | | |
| Nestle S.A. | | 2.1% |
| TOTAL S.A. | | 2.0% |
| INPEX Holdings, Inc. | | 1.8% |
| LVMH Moet Hennessy Louis Vuitton S.A. | | 1.6% |
| Roche Holding AG | | 1.6% |
| Cisco Systems, Inc. | | 1.5% |
| WPP Group PLC | | 1.5% |
| Medtronic, Inc. | | 1.5% |
| Li & Fung Ltd. | | 1.5% |
| Julius Baer Holding Ltd. | | 1.4% |
| | |
| Equity sectors | | |
| Technology | | 15.6% |
| Health Care | | 14.9% |
| Consumer Staples | | 11.4% |
| Financial Services | | 10.0% |
| Retailing | | 9.4% |
| Special Products & Services | | 8.8% |
| Energy | | 7.5% |
| Basic Materials | | 6.0% |
| Industrial Goods & Services | | 5.2% |
| Utilities & Communications | | 4.6% |
| Leisure | | 4.4% |
| |
| Country weightings | | |
| United States | | 37.1% |
| Switzerland | | 9.7% |
| France | | 8.3% |
| United Kingdom | | 7.8% |
| Germany | | 5.7% |
| Japan | | 5.7% |
| Spain | | 2.4% |
| India | | 2.3% |
| Brazil | | 2.1% |
| Other Countries | | 18.9% |
Percentages are based on net assets as of 4/30/09.
The portfolio is actively managed and current holdings may be different.
2
EXPENSE TABLE
Fund expenses borne by the shareholders during the period, November 1, 2008 through April 30, 2009
As a shareholder of the fund, you incur two types of costs: (1) transaction costs, including sales charges (loads) on certain purchase or redemption payments, and (2) ongoing costs, including management fees; distribution and service (12b-1) fees; and other fund expenses. This example is intended to help you understand your ongoing costs (in dollars) of investing in the fund and to compare these costs with the ongoing costs of investing in other mutual funds.
The example is based on an investment of $1,000 invested at the beginning of the period and held for the entire period November 1, 2008 through April 30, 2009.
Actual Expenses
The first line for each share class in the following table provides information about actual account values and actual expenses. You may use the information in this line, together with the amount you invested, to estimate the expenses that you paid over the period. Simply divide your account value by $1,000 (for example, an $8,600 account value divided by $1,000 = 8.6), then multiply the result by the number in the first line under the heading entitled “Expenses Paid During Period” to estimate the expenses you paid on your account during this period.
Hypothetical Example for Comparison Purposes
The second line for each share class in the following table provides information about hypothetical account values and hypothetical expenses based on the fund’s actual expense ratio and an assumed rate of return of 5% per year before expenses, which is not the fund’s actual return. The hypothetical account values and expenses may not be used to estimate the actual ending account balance or expenses you paid for the period. You may use this information to compare the ongoing costs of investing in the fund and other funds. To do so, compare this 5% hypothetical example with the 5% hypothetical examples that appear in the shareholder reports of the other funds.
Please note that the expenses shown in the table are meant to highlight your ongoing costs only and do not reflect any transactional costs, such as sales charges (loads). Therefore, the second line for each share class in the table is useful in comparing ongoing costs only, and will not help you determine the relative total costs of owning different funds. In addition, if these transactional costs were included, your costs would have been higher.
3
Expense Table – continued
| | | | | | | | | | |
Share
Class | | | | Annualized
Expense
Ratio | | Beginning
Account Value
11/01/08 | | Ending Account Value
4/30/09 | | Expenses
Paid During
Period (p)
11/01/08-4/30/09 |
| A | | Actual | | 1.79% | | $1,000.00 | | $991.40 | | $8.84 |
| | Hypothetical (h) | | 1.79% | | $1,000.00 | | $1,015.92 | | $8.95 |
| B | | Actual | | 2.54% | | $1,000.00 | | $987.69 | | $12.52 |
| | Hypothetical (h) | | 2.54% | | $1,000.00 | | $1,012.20 | | $12.67 |
| C | | Actual | | 2.54% | | $1,000.00 | | $987.56 | | $12.52 |
| | Hypothetical (h) | | 2.54% | | $1,000.00 | | $1,012.20 | | $12.67 |
| I | | Actual | | 1.54% | | $1,000.00 | | $992.11 | | $7.61 |
| | Hypothetical (h) | | 1.54% | | $1,000.00 | | $1,017.16 | | $7.70 |
| R1 | | Actual | | 2.54% | | $1,000.00 | | $987.54 | | $12.52 |
| | Hypothetical (h) | | 2.54% | | $1,000.00 | | $1,012.20 | | $12.67 |
| R2 | | Actual | | 2.04% | | $1,000.00 | | $989.97 | | $10.07 |
| | Hypothetical (h) | | 2.04% | | $1,000.00 | | $1,014.68 | | $10.19 |
| R3 | | Actual | | 1.79% | | $1,000.00 | | $991.32 | | $8.84 |
| | Hypothetical (h) | | 1.79% | | $1,000.00 | | $1,015.92 | | $8.95 |
| R4 | | Actual | | 1.53% | | $1,000.00 | | $992.27 | | $7.56 |
| | Hypothetical (h) | | 1.53% | | $1,000.00 | | $1,017.21 | | $7.65 |
| (h) | 5% class return per year before expenses. |
| (p) | Expenses paid is equal to each class’ annualized expense ratio, as shown above, multiplied by the average account value over the period, multiplied by the number of days in the period, divided by the number of days in the year. Expenses paid do not include any applicable sales charges (loads). If these transaction costs had been included, your costs would have been higher. |
4
PORTFOLIO OF INVESTMENTS
4/30/09 (unaudited)
The Portfolio of Investments is a complete list of all securities owned by your fund. It is categorized by broad-based asset classes.
| | | | | |
| Common Stocks - 97.8% | | | | | |
| Issuer | | Shares/Par | | Value ($) |
| | | | | |
| Aerospace - 1.0% | | | | | |
| United Technologies Corp. | | 36,780 | | $ | 1,796,335 |
| | |
| Alcoholic Beverages - 2.3% | | | | | |
| Companhia de Bebidas das Americas, ADR | | 35,880 | | $ | 2,022,914 |
| Pernod Ricard S.A. | | 33,903 | | | 1,999,441 |
| | | | | |
| | | | | $ | 4,022,355 |
| Apparel Manufacturers - 5.6% | | | | | |
| Compagnie Financiere Richemont S.A. | | 95,673 | | $ | 1,713,585 |
| Li & Fung Ltd. | | 922,200 | | | 2,595,898 |
| LVMH Moet Hennessy Louis Vuitton S.A. | | 38,780 | | | 2,931,997 |
| NIKE, Inc., “B” | | 27,740 | | | 1,455,518 |
| Swatch Group Ltd. | | 9,121 | | | 1,265,095 |
| | | | | |
| | | | | $ | 9,962,093 |
| Biotechnology - 1.9% | | | | | |
| Actelion Ltd. (a) | | 30,940 | | $ | 1,412,619 |
| Genzyme Corp. (a) | | 35,750 | | | 1,906,548 |
| | | | | |
| | | | | $ | 3,319,167 |
| Broadcasting - 3.4% | | | | | |
| Grupo Televisa S.A., ADR | | 116,520 | | $ | 1,803,730 |
| Walt Disney Co. | | 70,620 | | | 1,546,578 |
| WPP Group PLC | | 390,444 | | | 2,670,442 |
| | | | | |
| | | | | $ | 6,020,750 |
| Brokerage & Asset Managers - 4.2% | | | | | |
| Charles Schwab Corp. | | 70,310 | | $ | 1,299,329 |
| Deutsche Boerse AG | | 34,260 | | | 2,528,879 |
| Franklin Resources, Inc. | | 19,190 | | | 1,160,611 |
| Julius Baer Holding Ltd. | | 78,529 | | | 2,575,635 |
| | | | | |
| | | | | $ | 7,564,454 |
| Business Services - 6.9% | | | | | |
| Accenture Ltd., “A” | | 79,350 | | $ | 2,335,271 |
| Dun & Bradstreet Corp. | | 16,140 | | | 1,313,796 |
| Infosys Technologies Ltd., ADR | | 75,700 | | | 2,332,317 |
| Intertek Group PLC | | 86,590 | | | 1,298,499 |
| MasterCard, Inc., “A” | | 9,450 | | | 1,733,602 |
5
Portfolio of Investments (unaudited) – continued
| | | | | |
| Issuer | | Shares/Par | | Value ($) |
| | | | | |
| Common Stocks - continued | | | | | |
| Business Services - continued | | | | | |
| Visa, Inc., “A” | | 33,060 | | $ | 2,147,578 |
| Western Union Co. | | 73,760 | | | 1,235,480 |
| | | | | |
| | | | | $ | 12,396,543 |
| Cable TV - 0.5% | | | | | |
| DIRECTV Group, Inc. (a) | | 34,390 | | $ | 850,465 |
| | |
| Chemicals - 1.2% | | | | | |
| 3M Co. | | 37,750 | | $ | 2,174,400 |
| | |
| Computer Software - 2.3% | | | | | |
| Oracle Corp. | | 87,410 | | $ | 1,690,509 |
| SAP AG | | 40,120 | | | 1,534,415 |
| VeriSign, Inc. (a) | | 44,650 | | | 918,897 |
| | | | | |
| | | | | $ | 4,143,821 |
| Computer Software - Systems - 3.6% | | | | | |
| Acer, Inc. | | 567,000 | | $ | 1,085,192 |
| Apple, Inc. (a) | | 16,270 | | | 2,047,254 |
| EMC Corp. (a) | | 127,690 | | | 1,599,956 |
| International Business Machines Corp. | | 17,300 | | | 1,785,533 |
| | | | | |
| | | | | $ | 6,517,935 |
| Conglomerates - 1.9% | | | | | |
| Keppel Corp. NPV | | 535,000 | | $ | 2,139,179 |
| Siemens AG | | 17,620 | | | 1,182,718 |
| | | | | |
| | | | | $ | 3,321,897 |
| Consumer Goods & Services - 5.1% | | | | | |
| Colgate-Palmolive Co. | | 27,210 | | $ | 1,605,390 |
| Hengan International Group Co. Ltd. | | 436,000 | | | 1,825,562 |
| Procter & Gamble Co. | | 44,330 | | | 2,191,675 |
| Reckitt Benckiser Group PLC | | 46,360 | | | 1,825,743 |
| Shiseido Co. Ltd. | | 94,000 | | | 1,649,909 |
| | | | | |
| | | | | $ | 9,098,279 |
| Electrical Equipment - 3.6% | | | | | |
| Danaher Corp. | | 31,020 | | $ | 1,812,809 |
| Keyence Corp. | | 6,200 | | | 1,092,010 |
| Rockwell Automation, Inc. | | 40,930 | | | 1,292,979 |
| Schneider Electric S.A. (l) | | 29,867 | | | 2,252,102 |
| | | | | |
| | | | | $ | 6,449,900 |
6
Portfolio of Investments (unaudited) – continued
| | | | | |
| Issuer | | Shares/Par | | Value ($) |
| | | | | |
| Common Stocks - continued | | | | | |
| Electronics - 4.9% | | | | | |
| Canon, Inc. | | 34,400 | | $ | 1,029,000 |
| Hirose Electric Co. Ltd. | | 8,300 | | | 860,971 |
| Hoya Corp. | | 52,800 | | | 908,554 |
| Intel Corp. | | 93,520 | | | 1,475,746 |
| Samsung Electronics Co. Ltd. | | 4,493 | | | 2,073,154 |
| Taiwan Semiconductor Manufacturing Co. Ltd., ADR | | 223,995 | | | 2,367,627 |
| | | | | |
| | | | | $ | 8,715,052 |
| Energy - Independent - 1.8% | | | | | |
| INPEX Holdings, Inc. | | 513 | | $ | 3,240,712 |
| | |
| Energy - Integrated - 4.7% | | | | | |
| BG Group PLC | | 84,750 | | $ | 1,362,705 |
| OAO Gazprom, ADR | | 100,060 | | | 1,758,040 |
| Petroleo Brasileiro S.A., ADR | | 52,660 | | | 1,767,796 |
| TOTAL S.A. | | 71,980 | | | 3,599,580 |
| | | | | |
| | | | | $ | 8,488,121 |
| Food & Beverages - 4.0% | | | | | |
| Groupe Danone | | 33,726 | | $ | 1,607,628 |
| Nestle S.A. (l) | | 113,634 | | | 3,695,736 |
| PepsiCo, Inc. | | 36,080 | | | 1,795,341 |
| | | | | |
| | | | | $ | 7,098,705 |
| Food & Drug Stores - 2.1% | | | | | |
| CVS Caremark Corp. | | 76,400 | | $ | 2,427,992 |
| Tesco PLC | | 258,999 | | | 1,285,836 |
| | | | | |
| | | | | $ | 3,713,828 |
| Gaming & Lodging - 0.5% | | | | | |
| International Game Technology | | 68,390 | | $ | 844,616 |
| | |
| Insurance - 0.9% | | | | | |
| QBE Insurance Group Ltd. | | 98,350 | | $ | 1,551,271 |
| | |
| Internet - 1.3% | | | | | |
| Google, Inc., “A” (a) | | 5,720 | | $ | 2,264,948 |
| | |
| Machinery & Tools - 0.6% | | | | | |
| Bucyrus International, Inc. | | 50,850 | | $ | 1,103,954 |
| | |
| Major Banks - 2.2% | | | | | |
| Bank of New York Mellon Corp. | | 39,220 | | $ | 999,326 |
7
Portfolio of Investments (unaudited) – continued
| | | | | |
| Issuer | | Shares/Par | | Value ($) |
| | | | | |
| Common Stocks - continued | | | | | |
| Major Banks - continued | | | | | |
| HSBC Holdings PLC | | 252,408 | | $ | 1,794,186 |
| Standard Chartered PLC | | 74,689 | | | 1,148,582 |
| | | | | |
| | | | | $ | 3,942,094 |
| Medical Equipment - 6.6% | | | | | |
| Alcon, Inc. | | 11,870 | | $ | 1,092,159 |
| DENTSPLY International, Inc. | | 46,280 | | | 1,324,534 |
| Essilor International S.A. | | 21,210 | | | 912,897 |
| Medtronic, Inc. | | 81,800 | | | 2,617,600 |
| Sonova Holding AG | | 13,835 | | | 906,090 |
| Synthes, Inc. | | 12,300 | | | 1,250,099 |
| Waters Corp. (a) | | 46,900 | | | 2,071,573 |
| Zimmer Holdings, Inc. (a) | | 37,970 | | | 1,670,300 |
| | | | | |
| | | | | $ | 11,845,252 |
| Metals & Mining - 1.4% | | | | | |
| BHP Billiton PLC | | 118,670 | | $ | 2,499,896 |
| | |
| Network & Telecom - 3.5% | | | | | |
| Cisco Systems, Inc. (a)(s) | | 142,860 | | $ | 2,760,055 |
| Nokia Oyj | | 113,170 | | | 1,612,954 |
| Research in Motion Ltd. (a) | | 26,280 | | | 1,826,460 |
| | | | | |
| | | | | $ | 6,199,469 |
| Oil Services - 1.0% | | | | | |
| Halliburton Co. | | 87,750 | | $ | 1,774,305 |
| | |
| Other Banks & Diversified Financials - 2.7% | | | | | |
| Aeon Credit Service Co. Ltd. | | 120,600 | | $ | 1,369,621 |
| Housing Development Finance Corp. Ltd. | | 52,621 | | | 1,823,032 |
| UBS AG (a) | | 120,325 | | | 1,655,139 |
| | | | | |
| | | | | $ | 4,847,792 |
| Pharmaceuticals - 6.4% | | | | | |
| Abbott Laboratories | | 40,100 | | $ | 1,678,185 |
| Allergan, Inc. | | 32,450 | | | 1,514,117 |
| Bayer AG | | 24,840 | | | 1,232,282 |
| Johnson & Johnson | | 38,350 | | | 2,008,006 |
| Novo Nordisk A/S, “B” | | 46,650 | | | 2,213,479 |
| Roche Holding AG | | 22,600 | | | 2,861,261 |
| | | | | |
| | | | | $ | 11,507,330 |
| Specialty Chemicals - 3.4% | | | | | |
| Akzo Nobel N.V. (l) | | 51,000 | | $ | 2,142,060 |
| L’Air Liquide S.A. | | 17,508 | | | 1,427,893 |
8
Portfolio of Investments (unaudited) – continued
| | | | | | |
| Issuer | | Shares/Par | | Value ($) | |
| | | | | | |
| Common Stocks - continued | | | | | | |
| Specialty Chemicals - continued | | | | | | |
| Linde AG | | 19,220 | | $ | 1,528,278 | |
| Symrise AG | | 71,772 | | | 980,362 | |
| | | | | | |
| | | | | $ | 6,078,593 | |
| Specialty Stores - 1.7% | | | | | | |
| Industria de Diseno Textile S.A. | | 49,610 | | $ | 2,117,037 | |
| Staples, Inc. | | 43,720 | | | 901,506 | |
| | | | | | |
| | | | | $ | 3,018,543 | |
| Telecommunications - Wireless - 1.7% | | | | | | |
| America Movil S.A.B. de C.V., “L”, ADR | | 50,880 | | $ | 1,671,408 | |
| Philippine Long Distance Telephone Co. | | 29,730 | | | 1,353,365 | |
| | | | | | |
| | | | | $ | 3,024,773 | |
| Telephone Services - 2.2% | | | | | | |
| China Unicom Ltd. | | 1,502,000 | | $ | 1,735,603 | |
| Telefonica S.A. | | 118,810 | | | 2,255,931 | |
| | | | | | |
| | | | | $ | 3,991,534 | |
| Utilities - Electric Power - 0.7% | | | | | | |
| E.ON AG (l) | | 36,778 | | $ | 1,242,186 | |
| Total Common Stocks (Identified Cost, $222,198,043) | | | | $ | 174,631,368 | |
| | |
| Money Market Funds (v) - 1.8% | | | | | | |
MFS Institutional Money Market Portfolio, 0.23%,
at Cost and Net Asset Value | | 3,180,168 | | $ | 3,180,168 | |
| | |
| Collateral for Securities Loaned - 3.8% | | | | | | |
| Morgan Stanley Repurchase Agreement, 0.13%, dated 4/30/09, due 5/01/09, total to be received $6,691,724 (secured by U.S. Treasury and Federal Agency obligations and Mortgage Backed securities valued at $6,914,619 in an individually traded account), at Cost and Net Asset Value | | 6,691,700 | | $ | 6,691,700 | |
| Total Investments (Identified Cost, $232,069,911) | | | | $ | 184,503,236 | |
| | |
| Other Assets, Less Liabilities - (3.4)% | | | | | (5,995,516 | ) |
| Net Assets - 100.0% | | | | $ | 178,507,720 | |
| (a) | Non-income producing security. |
| (l) | All or a portion of this security is on loan. |
| (s) | Security or a portion of the security was pledged to cover minimum collateral requirements in brokerage accounts for the purpose of selling securities short. At April 30, 2009, the value of the securities pledged amounted to $1,358,196. At April 30, 2009, the fund had no short sales outstanding. |
| (v) | Underlying fund that is available only to investment companies managed by MFS. The rate quoted is the annualized seven-day yield of the fund at period end. |
The following abbreviations are used in this report and are defined:
| ADR | | American Depository Receipt |
| PLC | | Public Limited Company |
See Notes to Financial Statements
9
Financial Statements
STATEMENT OF ASSETS AND LIABILITIES
At 4/30/09 (unaudited)
This statement represents your fund’s balance sheet, which details the assets and liabilities comprising the total value of the fund.
| | | |
| Assets | | | |
Investments- | | | |
Non-affiliated issuers, at value (identified cost, $228,889,743) | | $181,323,068 | |
Underlying funds, at cost and value | | 3,180,168 | |
Total investments, at value, including $6,431,736 of securities on loan
(identified cost, $232,069,911) | | $184,503,236 | |
Receivables for | | | |
Investments sold | | 814,628 | |
Fund shares sold | | 54,666 | |
Interest and dividends | | 699,682 | |
Other assets | | 2,435 | |
Total assets | | $186,074,647 | |
| Liabilities | | | |
Payable to custodian | | $71,554 | |
Payables for | | | |
Investments purchased | | 374,819 | |
Fund shares reacquired | | 176,210 | |
Collateral for securities loaned, at value | | 6,691,700 | |
Payable to affiliates | | | |
Management fee | | 8,639 | |
Shareholder servicing costs | | 104,973 | |
Distribution and service fees | | 3,419 | |
Administrative services fee | | 230 | |
Payable for independent trustees’ compensation | | 35,642 | |
Accrued expenses and other liabilities | | 99,741 | |
Total liabilities | | $7,566,927 | |
Net assets | | $178,507,720 | |
| Net assets consist of | | | |
Paid-in capital | | $261,740,026 | |
Unrealized appreciation (depreciation) on investments and translation of assets and liabilities in foreign currencies | | (47,567,280 | ) |
Accumulated net realized gain (loss) on investments and foreign currency transactions | | (35,766,065 | ) |
Undistributed net investment income | | 101,039 | |
Net assets | | $178,507,720 | |
Shares of beneficial interest outstanding | | 10,495,535 | |
| | | | | | |
| | | Net assets | | Shares
outstanding | | Net asset value
per share (a) |
Class A | | $142,730,717 | | 8,300,145 | | $17.20 |
Class B | | 15,042,447 | | 938,041 | | 16.04 |
Class C | | 9,502,586 | | 598,553 | | 15.88 |
Class I | | 4,275,776 | | 244,038 | | 17.52 |
Class R1 | | 725,496 | | 45,766 | | 15.85 |
Class R2 | | 4,445,792 | | 264,898 | | 16.78 |
Class R3 | | 1,672,133 | | 97,543 | | 17.14 |
Class R4 | | 112,773 | | 6,551 | | 17.21 |
Shares outstanding are rounded for presentation purposes.
On sales of $50,000 or more, the offering price of Class A shares is reduced. A contingent deferred sales charge may be imposed on redemptions of Class A, Class B, and Class C shares.
| (a) | Maximum offering price and redemption price per share were equal to the net asset value per share for all shares classes, except for Class A, for which the maximum offering price per share was $18.25. |
See Notes to Financial Statements
10
Financial Statements
STATEMENT OF OPERATIONS
Six months ended 4/30/09 (unaudited)
This statement describes how much your fund earned in investment income and accrued in expenses. It also describes any gains and/or losses generated by fund operations.
| | | | | | |
| Net investment income | | | | | | |
Income | | | | | | |
Dividends | | $1,892,825 | | | | |
Interest | | 20,447 | | | | |
Dividends from underlying funds | | 5,466 | | | | |
Foreign taxes withheld | | (146,920 | ) | | | |
Total investment income | | | | | $1,771,818 | |
Expenses | | | | | | |
Management fee | | $765,397 | | | | |
Distribution and service fees | | 354,596 | | | | |
Shareholder servicing costs | | 303,401 | | | | |
Administrative services fee | | 21,344 | | | | |
Independent trustees’ compensation | | 52 | | | | |
Custodian fee | | 95,304 | | | | |
Shareholder communications | | 23,078 | | | | |
Auditing fees | | 28,343 | | | | |
Legal fees | | 4,019 | | | | |
Miscellaneous | | 71,636 | | | | |
Total expenses | | | | | $1,667,170 | |
Fees paid indirectly | | (397 | ) | | | |
Reduction of expenses by investment adviser and distributor | | (45,977 | ) | | | |
Net expenses | | | | | $1,620,796 | |
Net investment income | | | | | $151,022 | |
Realized and unrealized gain (loss) on investments
and foreign currency transactions | | | | | | |
Realized gain (loss) (identified cost basis) | | | | | | |
Investment transactions | | $(29,818,715 | ) | | | |
Foreign currency transactions | | (49,002 | ) | | | |
Net realized gain (loss) on investments
and foreign currency transactions | | | | | $(29,867,717 | ) |
Change in unrealized appreciation (depreciation) | | | | | | |
Investments | | $26,335,417 | | | | |
Translation of assets and liabilities in foreign currencies | | 1,153 | | | | |
Net unrealized gain (loss) on investments
and foreign currency translation | | | | | $26,336,570 | |
Net realized and unrealized gain (loss) on investments
and foreign currency | | | | | $(3,531,147 | ) |
Change in net assets from operations | | | | | $(3,380,125 | ) |
See Notes to Financial Statements
11
Financial Statements
STATEMENTS OF CHANGES IN NET ASSETS
These statements describe the increases and/or decreases in net assets resulting from operations, any distributions, and any shareholder transactions.
| | | | | | |
| Change in net assets | | Six months ended
4/30/09
(unaudited) | | | Year ended
10/31/08 | |
| From operations | | | | | | |
Net investment income | | $151,022 | | | $497,754 | |
Net realized gain (loss) on investments and foreign
currency transactions | | (29,867,717 | ) | | 3,718,777 | |
Net unrealized gain (loss) on investments and foreign
currency translation | | 26,336,570 | | | (148,488,179 | ) |
Change in net assets from operations | | $(3,380,125 | ) | | $(144,271,648 | ) |
| Distributions declared to shareholders | | | | | | |
From net investment income | | $(24,131 | ) | | $(1,850,948 | ) |
Change in net assets from fund share transactions | | $(12,751,286 | ) | | $(61,887,349 | ) |
Total change in net assets | | $(16,155,542 | ) | | $(208,009,945 | ) |
| Net assets | | | | | | |
At beginning of period | | 194,663,262 | | | 402,673,207 | |
At end of period (including undistributed net investment income of $101,039 and accumulated distributions in excess of net investment income of $25,852) | | $178,507,720 | | | $194,663,262 | |
See Notes to Financial Statements
12
Financial Statements
FINANCIAL HIGHLIGHTS
The financial highlights table is intended to help you understand the fund’s financial performance for the semiannual period and the past 5 fiscal years. Certain information reflects financial results for a single fund share. The total returns in the table represent the rate by which an investor would have earned (or lost) on an investment in the fund share class (assuming reinvestment of all distributions) held for the entire period.
| | | | | | | | | | | | | | | | |
| | | Six months
ended
4/30/09
(unaudited) | | | Years ended 10/31 | |
| Class A | | | 2008 | | | 2007 | | | 2006 | | 2005 | | 2004 | |
| | | | | | | | | | | | | | | |
Net asset value, beginning
of period | | $17.35 | | | $29.26 | | | $23.97 | | | $20.10 | | $17.76 | | $15.91 | |
Income (loss) from
investment operations | | | | | | | | | | | | | | | | |
Net investment
income (loss) (d) | | $0.02 | | | $0.08 | | | $0.25 | | | $0.11 | | $0.01 | | $(0.01 | ) |
Net realized and unrealized
gain (loss) on investments
and foreign currency | | (0.17 | ) | | (11.82 | ) | | 5.28 | | | 3.76 | | 2.33 | | 1.86 | |
Total from investment
operations | | $(0.15 | ) | | $(11.74 | ) | | $5.53 | | | $3.87 | | $2.34 | | $1.85 | |
Less distributions declared
to shareholders | | | | | | | | | | | | | | | | |
From net investment income | | $(0.00 | )(w) | | $(0.17 | ) | | $(0.24 | ) | | $— | | $— | | $— | |
Net asset value, end of period | | $17.20 | | | $17.35 | | | $29.26 | | | $23.97 | | $20.10 | | $17.76 | |
Total return (%) (r)(s)(t) | | (0.86 | )(n) | | (40.34 | ) | | 23.24 | | | 19.25 | | 13.18 | | 11.70 | (b)(q) |
Ratios (%) (to average
net assets) and
Supplemental data: | | | | | | | | | | | | | | | | |
Expenses before expense
reductions (f) | | 1.86 | (a) | | 1.62 | | | 1.58 | | | 1.61 | | 1.69 | | 1.70 | |
Expenses after expense
reductions (f) | | 1.79 | (a) | | 1.52 | | | 1.48 | | | 1.51 | | 1.59 | | 1.60 | |
Net investment income (loss) | | 0.30 | (a) | | 0.30 | | | 0.97 | | | 0.49 | | 0.07 | | (0.04 | ) |
Portfolio turnover | | 41 | | | 88 | | | 68 | | | 96 | | 92 | | 163 | |
Net assets at end of period
(000 Omitted) | | $142,731 | | | $153,184 | | | $297,956 | | | $290,952 | | $290,256 | | $304,348 | |
See Notes to Financial Statements
13
Financial Highlights – continued
| | | | | | | | | | | | | | | | | | |
| | | Six months
ended
4/30/09
(unaudited) | | | Years ended 10/31 | |
| Class B | | | 2008 | | | 2007 | | | 2006 | | | 2005 | | | 2004 | |
| | | | | | | | | | | | | | | | | |
Net asset value, beginning
of period | | $16.24 | | | $27.42 | | | $22.46 | | | $18.98 | | | $16.90 | | | $15.25 | |
Income (loss) from
investment operations | | | | | | | | | | | | | | | | | | |
Net investment
income (loss) (d) | | $(0.04 | ) | | $(0.11 | ) | | $0.06 | | | $(0.05 | ) | | $(0.13 | ) | | $(0.13 | ) |
Net realized and unrealized
gain (loss) on investments
and foreign currency | | (0.16 | ) | | (11.07 | ) | | 4.95 | | | 3.53 | | | 2.21 | | | 1.78 | |
Total from investment
operations | | $(0.20 | ) | | $(11.18 | ) | | $5.01 | | | $3.48 | | | $2.08 | | | $1.65 | |
Less distributions declared
to shareholders | | | | | | | | | | | | | | | | | | |
From net investment income | | $— | | | $— | | | $(0.05 | ) | | $— | | | $— | | | $— | |
Net asset value, end of period | | $16.04 | | | $16.24 | | | $27.42 | | | $22.46 | | | $18.98 | | | $16.90 | |
Total return (%) (r)(s)(t) | | (1.23 | )(n) | | (40.77 | ) | | 22.35 | | | 18.34 | | | 12.31 | | | 10.82 | (b)(q) |
Ratios (%) (to average
net assets) and
Supplemental data: | | | | | | | | | | | | | | | | | | |
Expenses before expense
reductions (f) | | 2.54 | (a) | | 2.27 | | | 2.23 | | | 2.26 | | | 2.34 | | | 2.35 | |
Expenses after expense
reductions (f) | | 2.54 | (a) | | 2.27 | | | 2.23 | | | 2.26 | | | 2.34 | | | 2.35 | |
Net investment income (loss) | | (0.51 | )(a) | | (0.47 | ) | | 0.25 | | | (0.26 | ) | | (0.70 | ) | | (0.81 | ) |
Portfolio turnover | | 41 | | | 88 | | | 68 | | | 96 | | | 92 | | | 163 | |
Net assets at end of period
(000 Omitted) | | $15,042 | | | $19,582 | | | $64,416 | | | $75,573 | | | $87,769 | | | $108,750 | |
See Notes to Financial Statements
14
Financial Highlights – continued
| | | | | | | | | | | | | | | | | | |
| | | Six months
ended
4/30/09
(unaudited) | | | Years ended 10/31 | |
| Class C | | | 2008 | | | 2007 | | | 2006 | | | 2005 | | | 2004 | |
| | | | | | | | | | | | | | | | | |
Net asset value, beginning
of period | | $16.08 | | | $27.15 | | | $22.26 | | | $18.80 | | | $16.74 | | | $15.11 | |
Income (loss) from
investment operations | | | | | | | | | | | | | | | | | | |
Net investment
income (loss) (d) | | $(0.03 | ) | | $(0.11 | ) | | $0.05 | | | $(0.06 | ) | | $(0.13 | ) | | $(0.13 | ) |
Net realized and unrealized
gain (loss) on investments
and foreign currency | | (0.17 | ) | | (10.96 | ) | | 4.91 | | | 3.52 | | | 2.19 | | | 1.76 | |
Total from investment
operations | | $(0.20 | ) | | $(11.07 | ) | | $4.96 | | | $3.46 | | | $2.06 | | | $1.63 | |
Less distributions declared
to shareholders | | | | | | | | | | | | | | | | | | |
From net investment income | | $— | | | $(0.00 | )(w) | | $(0.07 | ) | | $— | | | $— | | | $— | |
Net asset value, end of period | | $15.88 | | | $16.08 | | | $27.15 | | | $22.26 | | | $18.80 | | | $16.74 | |
Total return (%) (r)(s)(t) | | (1.24 | )(n) | | (40.77 | ) | | 22.33 | | | 18.40 | | | 12.31 | | | 10.79 | (b)(q) |
Ratios (%) (to average
net assets) and
Supplemental data: | | | | | | | | | | | | | | | | | | |
Expenses before expense
reductions (f) | | 2.54 | (a) | | 2.27 | | | 2.23 | | | 2.26 | | | 2.34 | | | 2.35 | |
Expenses after expense
reductions (f) | | 2.54 | (a) | | 2.27 | | | 2.23 | | | 2.26 | | | 2.34 | | | 2.35 | |
Net investment income (loss) | | (0.47 | )(a) | | (0.45 | ) | | 0.21 | | | (0.27 | ) | | (0.69 | ) | | (0.81 | ) |
Portfolio turnover | | 41 | | | 88 | | | 68 | | | 96 | | | 92 | | | 163 | |
Net assets at end of period
(000 Omitted) | | $9,503 | | | $10,326 | | | $20,249 | | | $20,450 | | | $20,924 | | | $21,945 | |
See Notes to Financial Statements
15
Financial Highlights – continued
| | | | | | | | | | | | | | | | |
| | | Six months
ended
4/30/09
(unaudited) | | | Years ended 10/31 | |
| Class I | | | 2008 | | | 2007 | | | 2006 | | 2005 | | 2004 | |
| | | | | | | | | | | | | | | |
Net asset value, beginning
of period | | $17.73 | | | $29.87 | | | $24.46 | | | $20.46 | | $18.04 | | $16.11 | |
Income (loss) from
investment operations | | | | | | | | | | | | | | | | |
Net investment
income (d) | | $0.05 | | | $0.14 | | | $0.32 | | | $0.17 | | $0.06 | | $0.04 | |
Net realized and unrealized
gain (loss) on investments
and foreign currency | | (0.19 | ) | | (12.05 | ) | | 5.39 | | | 3.83 | | 2.36 | | 1.89 | |
Total from investment
operations | | $(0.14 | ) | | $(11.91 | ) | | $5.71 | | | $4.00 | | $2.42 | | $1.93 | |
Less distributions declared
to shareholders | | | | | | | | | | | | | | | | |
From net investment income | | $(0.07 | ) | | $(0.23 | ) | | $(0.30 | ) | | $— | | $— | | $— | |
Net asset value, end of period | | $17.52 | | | $17.73 | | | $29.87 | | | $24.46 | | $20.46 | | $18.04 | |
Total return (%) (r)(s) | | (0.79 | )(n) | | (40.16 | ) | | 23.57 | | | 19.55 | | 13.41 | | 11.98 | (b)(q) |
Ratios (%) (to average
net assets) and
Supplemental data: | | | | | | | | | | | | | | | | |
Expenses before expense
reductions (f) | | 1.54 | (a) | | 1.27 | | | 1.23 | | | 1.26 | | 1.34 | | 1.34 | |
Expenses after expense
reductions (f) | | 1.54 | (a) | | 1.27 | | | 1.23 | | | 1.26 | | 1.34 | | 1.34 | |
Net investment income | | 0.56 | (a) | | 0.54 | | | 1.22 | | | 0.74 | | 0.31 | | 0.21 | |
Portfolio turnover | | 41 | | | 88 | | | 68 | | | 96 | | 92 | | 163 | |
Net assets at end of period
(000 Omitted) | | $4,276 | | | $4,306 | | | $7,739 | | | $7,368 | | $7,233 | | $7,011 | |
See Notes to Financial Statements
16
Financial Highlights – continued
| | | | | | | | | | | | | | | |
| | | Six months
ended
4/30/09
(unaudited) | | | Years ended 10/31 | |
| Class R1 | | | 2008 | | | 2007 | | | 2006 | | | 2005 (i) | |
| | | | | | | | | | | | | | |
Net asset value, beginning of period | | $16.05 | | | $27.29 | | | $22.42 | | | $18.96 | | | $18.12 | |
| Income (loss) from investment operations | | | | | | | | | | | | | | | |
Net investment loss (d) | | $(0.03 | ) | | $(0.12 | ) | | $(0.10 | ) | | $(0.07 | ) | | $(0.08 | ) |
Net realized and unrealized gain (loss)
on investments and foreign currency | | (0.17 | ) | | (10.95 | ) | | 5.06 | | | 3.53 | | | 0.92 | (g) |
Total from investment operations | | $(0.20 | ) | | $(11.07 | ) | | $4.96 | | | $3.46 | | | $0.84 | |
Less distributions declared
to shareholders | | | | | | | | | | | | | | | |
From net investment income | | $— | | | $(0.17 | ) | | $(0.09 | ) | | $— | | | $— | |
Net asset value, end of period | | $15.85 | | | $16.05 | | | $27.29 | | | $22.42 | | | $18.96 | |
Total return (%) (r)(s) | | (1.25 | )(n) | | (40.80 | ) | | 22.17 | | | 18.25 | | | 4.64 | (n) |
Ratios (%) (to average net assets)
and Supplemental data: | | | | | | | | | | | | | | | |
Expenses before expense reductions (f) | | 2.54 | (a) | | 2.31 | | | 2.35 | | | 2.45 | | | 2.54 | (a) |
Expenses after expense reductions (f) | | 2.54 | (a) | | 2.31 | | | 2.33 | | | 2.35 | | | 2.52 | (a) |
Net investment loss | | (0.40 | )(a) | | (0.53 | ) | | (0.43 | ) | | (0.35 | ) | | (0.77 | )(a) |
Portfolio turnover | | 41 | | | 88 | | | 68 | | | 96 | | | 92 | |
Net assets at end of period (000 Omitted) | | $725 | | | $632 | | | $1,009 | | | $127 | | | $104 | |
See Notes to Financial Statements
17
Financial Highlights – continued
| | | | | | | | | | | | | | | | | |
| | | Six months
ended
4/30/09
(unaudited) | | | Years ended 10/31 | |
| Class R2 | | | 2008 | | | 2007 | | | 2006 | | 2005 | | | 2004 | |
| | | | | | | | | | | | | | | | |
Net asset value, beginning
of period | | $16.95 | | | $28.77 | | | $23.58 | | | $19.85 | | $17.63 | | | $15.87 | |
Income (loss) from
investment operations | | | | | | | | | | | | | | | | | |
Net investment
income (loss) (d) | | $0.00 | (w) | | $0.02 | | | $0.04 | | | $0.03 | | $(0.06 | ) | | $(0.07 | ) |
Net realized and unrealized
gain (loss) on investments
and foreign currency | | (0.17 | ) | | (11.66 | ) | | 5.29 | | | 3.70 | | 2.28 | | | 1.83 | |
Total from investment
operations | | $(0.17 | ) | | $(11.64 | ) | | $5.33 | | | $3.73 | | $2.22 | | | $1.76 | |
Less distributions declared
to shareholders | | | | | | | | | | | | | | | | | |
From net investment income | | $— | | | $(0.18 | ) | | $(0.14 | ) | | $— | | $— | | | $— | |
Net asset value, end of period | | $16.78 | | | $16.95 | | | $28.77 | | | $23.58 | | $19.85 | | | $17.63 | |
Total return (%) (r)(s) | | (1.00 | )(n) | | (40.70 | ) | | 22.73 | | | 18.79 | | 12.59 | | | 11.09 | (b)(q) |
Ratios (%) (to average
net assets) and
Supplemental data: | | | | | | | | | | | | | | | | | |
Expenses before expense
reductions (f) | | 2.04 | (a) | | 1.79 | | | 1.90 | | | 2.00 | | 2.10 | | | 2.08 | |
Expenses after expense
reductions (f) | | 2.04 | (a) | | 1.79 | | | 1.88 | | | 1.90 | | 2.09 | | | 2.08 | |
Net investment income (loss) | | 0.04 | (a) | | 0.06 | | | 0.16 | | | 0.15 | | (0.29 | ) | | (0.45 | ) |
Portfolio turnover | | 41 | | | 88 | | | 68 | | | 96 | | 92 | | | 163 | |
Net assets at end of period
(000 Omitted) | | $4,446 | | | $4,808 | | | $4,168 | | | $619 | | $466 | | | $239 | |
See Notes to Financial Statements
18
Financial Highlights – continued
| | | | | | | | | | | | | | |
| | | Six months
ended
4/30/09
(unaudited) | | | Years ended 10/31 | |
| Class R3 | | | 2008 | | | 2007 | | | 2006 | | 2005 (i) | |
| | | | | | | | | | | | | |
Net asset value, beginning of period | | $17.29 | | | $29.16 | | | $23.91 | | | $20.08 | | $19.10 | |
| Income (loss) from investment operations | | | | | | | | | | | | | | |
Net investment income (d) | | $0.03 | | | $0.07 | | | $0.15 | | | $0.11 | | $0.02 | |
Net realized and unrealized gain (loss)
on investments and foreign currency | | (0.18 | ) | | (11.78 | ) | | 5.33 | | | 3.72 | | 0.96 | (g) |
Total from investment operations | | $(0.15 | ) | | $(11.71 | ) | | $5.48 | | | $3.83 | | $0.98 | |
| Less distributions declared to shareholders | | | | | | | | | | | | | | |
From net investment income | | $— | | | $(0.16 | ) | | $(0.23 | ) | | $— | | $— | |
Net asset value, end of period | | $17.14 | | | $17.29 | | | $29.16 | | | $23.91 | | $20.08 | |
Total return (%) (r)(s) | | (0.87 | )(n) | | (40.37 | ) | | 23.10 | | | 19.07 | | 5.13 | (n) |
Ratios (%) (to average net assets)
and Supplemental data: | | | | | | | | | | | | | | |
Expenses before expense reductions (f) | | 1.79 | (a) | | 1.55 | | | 1.62 | | | 1.64 | | 1.75 | (a) |
Expenses after expense reductions (f) | | 1.79 | (a) | | 1.55 | | | 1.62 | | | 1.64 | | 1.75 | (a) |
Net investment income | | 0.32 | (a) | | 0.28 | | | 0.58 | | | 0.48 | | 0.20 | (a) |
Portfolio turnover | | 41 | | | 88 | | | 68 | | | 96 | | 92 | |
Net assets at end of period (000 Omitted) | | $1,672 | | | $1,779 | | | $3,563 | | | $1,857 | | $53 | |
| | |
| | | Six months
ended
4/30/09
(unaudited) | | | Years ended 10/31 | |
| Class R4 | | | 2008 | | | 2007 | | | 2006 | | 2005 (i) | |
| | | | | | | | | | | | | |
Net asset value, beginning of period | | $17.41 | | | $29.33 | | | $24.02 | | | $20.11 | | $19.10 | |
| Income (loss) from investment operations | | | | | | | | | | | | | | |
Net investment income (d) | | $0.07 | | | $0.14 | | | $0.28 | | | $0.14 | | $0.06 | |
Net realized and unrealized gain (loss)
on investments and foreign currency | | (0.21 | ) | | (11.85 | ) | | 5.31 | | | 3.77 | | 0.95 | (g) |
Total from investment operations | | $(0.14 | ) | | $(11.71 | ) | | $5.59 | | | $3.91 | | $1.01 | |
| Less distributions declared to shareholders | | | | | | | | | | | | | | |
From net investment income | | $(0.06 | ) | | $(0.21 | ) | | $(0.28 | ) | | $— | | $— | |
Net asset value, end of period | | $17.21 | | | $17.41 | | | $29.33 | | | $24.02 | | $20.11 | |
Total return (%) (r)(s) | | (0.77 | )(n) | | (40.20 | ) | | 23.47 | | | 19.44 | | 5.29 | (n) |
Ratios (%) (to average net assets)
and Supplemental data: | | | | | | | | | | | | | | |
Expenses before expense reductions (f) | | 1.53 | (a) | | 1.29 | | | 1.33 | | | 1.35 | | 1.45 | (a) |
Expenses after expense reductions (f) | | 1.53 | (a) | | 1.29 | | | 1.33 | | | 1.35 | | 1.45 | (a) |
Net investment income | | 0.93 | (a) | | 0.54 | | | 1.07 | | | 0.65 | | 0.50 | (a) |
Portfolio turnover | | 41 | | | 88 | | | 68 | | | 96 | | 92 | |
Net assets at end of period (000 Omitted) | | $113 | | | $46 | | | $78 | | | $63 | | $53 | |
See Notes to Financial Statements
19
Financial Highlights – continued
Any redemption fees charged by the fund during the 2005 fiscal year resulted in a per share impact of less than $0.01.
| (b) | The fund’s net asset value and total return calculation include a non-recurring accrual recorded as a result of an administrative proceeding regarding disclosure of brokerage allocation practices in connection with fund sales. The non-recurring accrual did not have a material impact on the net asset value per share based on the shares outstanding on the day the proceeds were recorded. |
| (d) | Per share data are based on average shares outstanding. |
| (f) | Ratios do not reflect reductions from fees paid indirectly, if applicable. |
| (g) | The per share amount is not in accordance with the net realized and unrealized gain/loss for the period because of the timing of sales of fund shares and the per share amount of realized and unrealized gains and losses at such time. |
| (i) | For the period from the class’ inception, April 1, 2005 (Classes R1, R3, and R4) through the stated period end. |
| (q) | The fund’s net asset value and total return calculation include proceeds received on March 19, 2004 for the remaining payment of a non-recurring litigation settlement from Cendant Corporation, recorded as a realized gain on investment transactions. The proceeds resulted in an increase in the net asset value of $0.01 per share based on shares outstanding on the day the proceeds were received. Excluding the effect of this payment from the ending net asset value per share, total return for the year ended October 31, 2004 for Class A, Class B, Class C, Class I, Class R and Class R2 (formerly Class R3) would have been 0.05%, 0.05%, 0.06%, 0.05%, 0.06%, and 0.05% lower, respectively. |
| (r) | Certain expenses have been reduced without which performance would have been lower. |
| (s) | From time to time the fund may receive proceeds from litigation settlements, without which performance would be lower. |
| (t) | Total returns do not include any applicable sales charges. |
| (w) | Per share amount was less than $0.01. |
See Notes to Financial Statements
20
NOTES TO FINANCIAL STATEMENTS
(unaudited)
| (1) | | Business and Organization |
MFS Global Growth Fund (the fund) is a series of MFS Series Trust VIII (the trust). The trust is organized as a Massachusetts business trust and is registered under the Investment Company Act of 1940, as amended, as an open-end management investment company.
| (2) | | Significant Accounting Policies |
General – The preparation of financial statements in conformity with U.S. generally accepted accounting principles requires management to make estimates and assumptions that affect the reported amounts of assets and liabilities, and disclosure of contingent assets and liabilities at the date of the financial statements and the reported amounts of revenues and expenses during the reporting period. Actual results could differ from those estimates. The fund can invest in foreign securities, including securities of emerging market issuers. Investments in foreign securities are vulnerable to the effects of changes in the relative values of the local currency and the U.S. dollar and to the effects of changes in each country’s legal, political, and economic environment. The markets of emerging markets countries are generally more volatile than the markets of developed countries with more mature economies. All of the risks of investing in foreign securities previously described are heightened when investing in emerging markets countries.
In March 2008, FASB Statement No. 161, Disclosures about Derivative Instruments and Hedging Activities (the “Standard”) was issued, and is effective for financial statements issued for fiscal years and interim periods beginning after November 15, 2008. This Standard provides enhanced disclosures about the fund’s use of and accounting for derivative instruments and the effect of derivative instruments on the fund’s results of operations and financial position. Management is evaluating the application of the Standard to the fund, and believes the impact resulting from the adoption of this Standard will be limited to expanded disclosure in the funds’ financial statements.
FASB Staff Position (FSP) 133-1 was implemented during the period. FSP 133-1 amends FAS 133 to require sellers of credit derivatives to make disclosures that will enable financial statement users to assess the potential effects of those credit derivatives on an entity’s financial position, financial performance and cash flows. There was no impact from implementing FSP 133-1 as the fund did not hold any of these credit derivatives at period end.
Investment Valuations – Equity securities, including restricted equity securities, are generally valued at the last sale or official closing price as provided by a third-party pricing service on the market or exchange on which they are primarily traded. For securities for which there were no sales reported
21
Notes to Financial Statements (unaudited) – continued
that day, equity securities are generally valued at the last quoted daily bid quotation as provided by a third-party pricing service on the market or exchange on which such securities are primarily traded. For securities held short for which there were no sales reported for that day, the position is generally valued at the last quoted daily ask quotation as provided by a third-party pricing service on the market or exchange on which such securities are primarily traded. Short-term instruments with a maturity at issuance of 60 days or less generally are valued at amortized cost, which approximates market value. Open-end investment companies are generally valued at net asset value per share. Securities and other assets generally valued on the basis of information from a third-party pricing service may also be valued at a broker/dealer bid quotation. Values obtained from pricing services can utilize both dealer-supplied valuations and electronic data processing techniques, which take into account factors such as institutional-size trading in similar groups of securities, yield, quality, coupon rate, maturity, type of issue, trading characteristics, and other market data. The values of foreign securities and other assets and liabilities expressed in foreign currencies are converted to U.S. dollars using the mean of bid and asked prices for rates provided by a third-party pricing service.
The Board of Trustees has delegated primary responsibility for determining or causing to be determined the value of the fund’s investments (including any fair valuation) to the adviser pursuant to valuation policies and procedures approved by the Board. If the adviser determines that reliable market quotations are not readily available, investments are valued at fair value as determined in good faith by the adviser in accordance with such procedures under the oversight of the Board of Trustees. Under the fund’s valuation policies and procedures, market quotations are not considered to be readily available for most types of debt instruments and floating rate loans and many types of derivatives. These investments are generally valued at fair value based on information from third-party pricing services. In addition, investments may be valued at fair value if the adviser determines that an investment’s value has been materially affected by events occurring after the close of the exchange or market on which the investment is principally traded (such as foreign exchange or market) and prior to the determination of the fund’s net asset value, or after the halting of trading of a specific security where trading does not resume prior to the close of the exchange or market on which the security is principally traded. Events that occur on a frequent basis after foreign markets close (such as developments in foreign markets and significant movements in the U.S. markets) and prior to the determination of the fund’s net asset value may be deemed to have a material affect on the value of securities traded in foreign markets. Accordingly, the fund’s foreign equity securities may often be valued at fair value. The adviser generally relies on
22
Notes to Financial Statements (unaudited) – continued
third-party pricing services or other information (such as the correlation with price movements of similar securities in the same or other markets; the type, cost and investment characteristics of the security; the business and financial condition of the issuer; and trading and other market data) to assist in determining whether to fair value and at what value to fair value an investment. The value of an investment for purposes of calculating the fund’s net asset value can differ depending on the source and method used to determine value. When fair valuation is used, the value of an investment used to determine the fund’s net asset value may differ from quoted or published prices for the same investment. There can be no assurance that the fund could obtain the fair value assigned to an investment if it were to sell the investment at the same time at which the fund determines its net asset value per share.
The fund adopted FASB Statement No. 157, Fair Value Measurements (the “Statement”). This Statement provides a single definition of fair value, a hierarchy for measuring fair value and expanded disclosures about fair value measurements.
Various inputs are used in determining the value of the fund’s assets or liabilities carried at market value. These inputs are categorized into three broad levels. Level 1 includes quoted prices in active markets for identical assets or liabilities. Level 2 includes other significant observable market-based inputs (including quoted prices for similar securities, interest rates, prepayment speed, and credit risk). Level 3 includes unobservable inputs, which may include the adviser’s own assumptions in determining the fair value of investments. Other financial instruments are derivative instruments not reflected in total investments, such as futures, forwards, swap contracts, and written options. The following is a summary of the levels used as of April 30, 2009 in valuing the fund’s assets or liabilities carried at market value:
| | | | | | | | |
| | | Level 1 | | Level 2 | | Level 3 | | Total |
| Investments in Securities | | $107,643,411 | | $76,859,825 | | $— | | $184,503,236 |
| Other Financial Instruments | | $— | | $— | | $— | | $— |
In April 2009, FASB Staff Position (FSP) 157-4 was issued and is effective for financial statements issued for fiscal years and interim periods ending after June 15, 2009. FSP 157-4 clarifies FAS 157 and requires an entity to evaluate certain factors to determine whether there has been a significant decrease in volume and level of activity for the asset or liability such that recent transactions and quoted prices may not be determinative of fair value and further analysis and adjustment may be necessary to estimate fair value. The FSP also requires enhanced disclosure regarding the inputs and valuation techniques used to measure fair value in those instances as well as expanded disclosure of valuation levels for major security types. Management is evaluating the application of the FSP to the fund, and believes the impact
23
Notes to Financial Statements (unaudited) – continued
resulting from the adoption of this FSP will be limited to expanded disclosure in the fund’s financial statements.
Repurchase Agreements – The fund may enter into repurchase agreements with approved counterparties. Each repurchase agreement is recorded at cost. The fund requires that the securities collateral in a repurchase transaction be transferred to a custodian. The fund monitors, on a daily basis, the value of the collateral to ensure that its value, including accrued interest, is greater than amounts owed to the fund under each such repurchase agreement.
Foreign Currency Translation – Purchases and sales of foreign investments, income, and expenses are converted into U.S. dollars based upon currency exchange rates prevailing on the respective dates of such transactions or on the reporting date for foreign denominated receivables and payables. Gains and losses attributable to foreign currency exchange rates on sales of securities are recorded for financial statement purposes as net realized gains and losses on investments. Gains and losses attributable to foreign exchange rate movements on receivables, payables, income and expenses are recorded for financial statement purposes as foreign currency transaction gains and losses. That portion of both realized and unrealized gains and losses on investments that results from fluctuations in foreign currency exchange rates is not separately disclosed.
Short Sales – The fund may enter into short sales whereby it sells a security it does not own in anticipation of a decline in the value of that security. The fund will realize a gain if the security price decreases and a loss if the security price increases between the date of the short sale and the date on which the fund replaces the borrowed security. Losses from short sales can exceed the proceeds of the security sold; and they can also exceed the potential loss from an ordinary buy and sell transaction. The amount of any premium, dividends, or interest the fund may be required to pay in connection with a short sale will be recognized as a fund expense. The fund segregates cash or marketable securities in an amount that, when combined with the amount of proceeds from the short sale deposited with the broker, at least equals the current market value of the security sold short. At April 30, 2009, the fund had no short sales outstanding.
Security Loans – JPMorgan Chase and Co. (“Chase”), as lending agent, may loan the securities of the fund to certain qualified institutions (the “Borrowers”) approved by the fund. The loans are collateralized by cash and/or U.S. Treasury and federal agency obligations in an amount typically at least equal to the market value of the securities loaned. The market value of the loaned securities is determined at the close of business of the fund and any additional required collateral is delivered to the fund on the next business day. Security lending activity through Chase is further collateralized by an
24
Notes to Financial Statements (unaudited) – continued
irrevocable standby letter of credit. Chase provides the fund with indemnification against Borrower default. The fund bears the risk of loss with respect to the investment of cash collateral. On loans collateralized by cash, the cash collateral is invested in short-term securities. A portion of the income generated upon investment of the collateral is remitted to the Borrowers, and the remainder is allocated between the fund and the lending agent. On loans collateralized by U.S. Treasury and/or federal agency obligations, a fee is received from the Borrower, and is allocated between the fund and the lending agent. Income from securities lending is included in interest income on the Statement of Operations. The dividend and interest income earned on the securities loaned is accounted for in the same manner as other dividend and interest income.
Indemnifications – Under the fund’s organizational documents, its officers and trustees may be indemnified against certain liabilities and expenses arising out of the performance of their duties to the fund. Additionally, in the normal course of business, the fund enters into agreements with service providers that may contain indemnification clauses. The fund’s maximum exposure under these agreements is unknown as this would involve future claims that may be made against the fund that have not yet occurred.
Investment Transactions and Income – Investment transactions are recorded on the trade date. Interest income is recorded on the accrual basis. All premium and discount is amortized or accreted for financial statement purposes in accordance with U.S. generally accepted accounting principles. Dividends received in cash are recorded on the ex-dividend date. Certain dividends from foreign securities will be recorded when the fund is informed of the dividend if such information is obtained subsequent to the ex-dividend date. Dividend and interest payments received in additional securities are recorded on the ex-dividend or ex-interest date in an amount equal to the value of the security on such date. The fund may receive proceeds from litigation settlements. Any proceeds received from litigation involving portfolio holdings are reflected in the Statement of Operations in realized gain/loss if the security has been disposed of by the fund or in unrealized gain/loss if the security is still held by the fund. Any other proceeds from litigation not related to portfolio holdings are reflected as other income in the Statement of Operations.
Fees Paid Indirectly – The fund’s custody fee may be reduced according to an arrangement that measures the value of cash deposited with the custodian by the fund. This amount, for the six months ended April 30, 2009, is shown as a reduction of total expenses on the Statement of Operations.
Tax Matters and Distributions – The fund intends to qualify as a regulated investment company, as defined under Subchapter M of the Internal Revenue Code, and to distribute all of its taxable income, including realized capital
25
Notes to Financial Statements (unaudited) – continued
gains. As a result, no provision for federal income taxes is required. The fund’s federal tax returns for the prior three fiscal years remain subject to examination by the Internal Revenue Service. Foreign taxes, if any, have been accrued by the fund in the accompanying financial statements.
Distributions to shareholders are recorded on the ex-dividend date. Income and capital gain distributions are determined in accordance with income tax regulations, which may differ from U.S. generally accepted accounting principles. Certain capital accounts in the financial statements are periodically adjusted for permanent differences in order to reflect their tax character. These adjustments have no impact on net assets or net asset value per share. Temporary differences which arise from recognizing certain items of income, expense, gain or loss in different periods for financial statement and tax purposes will reverse at some time in the future. Distributions in excess of net investment income or net realized gains are temporary overdistributions for financial statement purposes resulting from differences in the recognition or classification of income or distributions for financial statement and tax purposes.
Book/tax differences primarily relate to wash sale loss deferrals, foreign currency transactions, and foreign taxes.
The tax character of distributions made during the current period will be determined at fiscal year end. The tax character of distributions declared to shareholders for the last fiscal year is as follows:
| | |
| | | 10/31/08 |
Ordinary income (including any
short-term capital gains) | | $1,850,948 |
The federal tax cost and the tax basis components of distributable earnings were as follows:
| | | |
| As of 4/30/09 | | | |
| Cost of investments | | $233,015,584 | |
| Gross appreciation | | 6,019,415 | |
| Gross depreciation | | (54,531,763 | ) |
| Net unrealized appreciation (depreciation) | | $(48,512,348 | ) |
| |
| As of 10/31/08 | | | |
| Undistributed ordinary income | | 23,641 | |
| Capital loss carryforwards | | (4,551,465 | ) |
| Other temporary differences | | (452,461 | ) |
| Net unrealized appreciation (depreciation) | | $(74,847,765 | ) |
The aggregate cost above includes prior fiscal year end tax adjustments.
As of October 31, 2008, the fund had capital loss carryforwards available to offset future realized gains. Such losses expire as follows:
26
Notes to Financial Statements (unaudited) – continued
Multiple Classes of Shares of Beneficial Interest – The fund offers multiple classes of shares, which differ in their respective distribution and service fees. The fund’s income, realized and unrealized gain (loss), and common expenses are allocated to shareholders based on the daily net assets of each class. Dividends are declared separately for each class. Differences in per share dividend rates are generally due to differences in separate class expenses. Class B shares will convert to Class A shares approximately eight years after purchase. The fund’s distributions declared to shareholders by class are as follows:
From net investment income
| | | | |
| | | Six months ended
4/30/09
(unaudited) | | Year ended
10/31/08 |
| Class A | | $7,021 | | $1,726,947 |
| Class C | | — | | 2,099 |
| Class I | | 16,937 | | 59,758 |
| Class R1 | | — | | 7,483 |
| Former Class R2 (b) | | — | | 2,230 |
| Class R2 | | — | | 32,323 |
| Class R3 | | — | | 19,553 |
| Class R4 | | 173 | | 555 |
| Total | | $24,131 | | $1,850,948 |
| (b) | At the close of business on April 18, 2008, Class R and Class R2 shares converted into Class R3 shares. Following the conversion, Class R3 shares were renamed Class R2 shares. |
| (3) | | Transactions with Affiliates |
Investment Adviser – The fund has an investment advisory agreement with Massachusetts Financial Services Company (MFS) to provide overall investment management and related administrative services and facilities to the fund. The management fee is computed daily and paid monthly at the following annual rates:
| | | |
| First $1 billion of average daily net assets | | 0.90 | % |
| Next $1 billion of average daily net assets | | 0.75 | % |
| Average daily net assets in excess of $2 billion | | 0.65 | % |
The management fee incurred for the six months ended April 30, 2009 was equivalent to an annual effective rate of 0.90% of the fund’s average daily net assets.
Distributor – MFS Fund Distributors, Inc. (MFD), a wholly-owned subsidiary of MFS, as distributor, received $4,390 for the six months ended April 30, 2009, as its portion of the initial sales charge on sales of Class A shares of the fund.
The Board of Trustees has adopted a distribution plan for certain class shares pursuant to Rule 12b-1 of the Investment Company Act of 1940.
27
Notes to Financial Statements (unaudited) – continued
The fund’s distribution plan provides that the fund will pay MFD for services provided by MFD and financial intermediaries in connection with the distribution and servicing of certain share classes. One component of the plan is a distribution fee paid to MFD and another component of the plan is a service fee paid to MFD. MFD may subsequently pay all, or a portion, of the distribution and/or service fees to financial intermediaries.
Distribution Plan Fee Table:
| | | | | | | | | | |
| | | Distribution
Fee Rate | | Service
Fee Rate | | Total
Distribution
Plan (d) | | Annual
Effective
Rate (e) | | Distribution
and Service
Fee |
| Class A | | — | | 0.25% | | 0.25% | | 0.25% | | $213,839 |
| Class B | | 0.75% | | 0.25% | | 1.00% | | 1.00% | | 79,518 |
| Class C | | 0.75% | | 0.25% | | 1.00% | | 1.00% | | 45,798 |
| Class R1 | | 0.75% | | 0.25% | | 1.00% | | 1.00% | | 3,026 |
| Class R2 | | 0.25% | | 0.25% | | 0.50% | | 0.50% | | 10,518 |
| Class R3 | | — | | 0.25% | | 0.25% | | 0.25% | | 1,897 |
| Total Distribution and Service Fees | | | | | | $354,596 |
| (d) | In accordance with the distribution plan for certain classes, the fund pays distribution and/or service fees up to these annual percentage rates of each class’ average daily net assets. |
| (e) | The annual effective rates represent actual fees incurred under the distribution plan for the six months ended April 30, 2009 based on each class’ average daily net assets. Effective March 1, 2009, the distribution fee for Class A shares was eliminated. Prior to March 1, 2009, 0.10% of the Class A distribution fee was waived under a written waiver arrangement. For the six months ended April 30, 2009, this waiver amounted to $45,480 and is reflected as a reduction of total expenses in the Statement of Operations. |
Certain Class A shares purchased prior to September 1, 2008 are subject to a contingent deferred sales charge (CDSC) in the event of a shareholder redemption within 12 months of purchase. Certain Class A shares purchased on or subsequent to September 1, 2008 are subject to a CDSC in the event of a shareholder redemption within 24 months of purchase. Class C shares are subject to a CDSC in the event of a shareholder redemption within 12 months of purchase. Class B shares are subject to a CDSC in the event of a shareholder redemption within six years of purchase. All contingent deferred sales charges are paid to MFD and during the six months ended April 30, 2009, were as follows:
| | |
| | | Amount |
| Class A | | $14 |
| Class B | | 10,296 |
| Class C | | 382 |
Shareholder Servicing Agent – MFS Service Center, Inc. (MFSC), a wholly-owned subsidiary of MFS, receives a fee from the fund for its services as shareholder servicing agent calculated as a percentage of the average daily net assets of the fund as determined periodically under the supervision of the
28
Notes to Financial Statements (unaudited) – continued
fund’s Board of Trustees. For the six months ended April 30, 2009, the fee was $137,262, which equated to 0.1613% annually of the fund’s average daily net assets. MFSC also receives payment from the fund for out-of-pocket expenses, sub-accounting and other shareholder servicing costs which may be paid to affiliated and unaffiliated service providers. For the six months ended April 30, 2009, these out-of-pocket expenses, sub-accounting and other shareholder servicing costs amounted to $166,139.
Administrator – MFS provides certain financial, legal, shareholder communications, compliance, and other administrative services to the fund. Under an administrative services agreement, the fund partially reimburses MFS the costs incurred to provide these services. The fund is charged an annual fixed amount of $17,500 plus a fee based on average daily net assets.
The administrative services fee incurred for the six months ended April 30, 2009 was equivalent to an annual effective rate of 0.0251% of the fund’s average daily net assets.
Trustees’ and Officers’ Compensation – The fund pays compensation to independent trustees in the form of a retainer, attendance fees, and additional compensation to Board and Committee chairpersons. The fund does not pay compensation directly to trustees or officers of the fund who are also officers of the investment adviser, all of whom receive remuneration for their services to the fund from MFS. Certain officers and trustees of the fund are officers or directors of MFS, MFD, and MFSC.
For certain independent Trustees who retired on or before December 31, 2001, the fund has an unfunded, defined benefit plan which resulted in a pension expense of $831. For certain independent Trustees who served on the Board as of December 31, 2001, the fund also has an unfunded retirement benefit deferral plan which resulted in a net decrease in expense of $6,624. Both amounts are included in independent trustees’ compensation for the six months ended April 30, 2009. The liability for deferred retirement benefits payable to certain independent trustees under both plans amounted to $33,205 at April 30, 2009, and is included in payable for independent trustees’ compensation.
Other – This fund and certain other funds managed by MFS (the funds) have entered into services agreements (the Agreements) which provide for payment of fees by the funds to Tarantino LLC and Griffin Compliance LLC in return for the provision of services of an Independent Chief Compliance Officer (ICCO) and Assistant ICCO, respectively, for the funds. The ICCO and Assistant ICCO are officers of the funds and the sole members of Tarantino LLC and Griffin Compliance LLC, respectively. The funds can terminate the Agreements with Tarantino LLC and Griffin Compliance LLC at any time under the terms of the Agreements. For the six months ended April 30, 2009, the aggregate fees paid
29
Notes to Financial Statements (unaudited) – continued
by the fund to Tarantino LLC and Griffin Compliance LLC were $1,374 and are included in miscellaneous expense on the Statement of Operations. MFS has agreed to reimburse the fund for a portion of the payments made by the fund in the amount of $497, which is shown as a reduction of total expenses in the Statement of Operations. Additionally, MFS has agreed to bear all expenses associated with office space, other administrative support, and supplies provided to the ICCO and Assistant ICCO.
The fund may invest in a money market fund managed by MFS which seeks a high level of current income consistent with preservation of capital and liquidity. Income earned on this investment is included in dividends from underlying funds on the Statement of Operations. This money market fund does not pay a management fee to MFS.
Purchases and sales of investments, other than U.S. Government securities, purchased option transactions, and short-term obligations, aggregated $70,532,197 and $85,887,039, respectively.
| (5) | | Shares of Beneficial Interest |
The fund’s Declaration of Trust permits the Trustees to issue an unlimited number of full and fractional shares of beneficial interest. Transactions in fund shares were as follows:
| | | | | | | | |
| | | Six months ended
4/30/09 | | Year ended
10/31/08 |
| | | Shares | | Amount | | Shares | | Amount |
| Shares sold | | | | | | | | |
Class A | | 515,874 | | $8,166,524 | | 1,789,254 | | $47,308,074 |
Class B | | 51,167 | | 766,413 | | 114,426 | | 2,757,320 |
Class C | | 47,781 | | 711,402 | | 90,910 | | 2,225,010 |
Class I | | 14,776 | | 238,344 | | 30,594 | | 791,240 |
Class R (b) | | — | | — | | 60,868 | | 1,660,911 |
Class R1 | | 9,544 | | 141,636 | | 23,194 | | 575,325 |
Former Class R2 (b) | | — | | — | | 35,692 | | 935,263 |
Class R2 | | 25,393 | | 391,928 | | 334,453 | | 8,938,882 |
Class R3 | | 6,847 | | 107,202 | | 22,620 | | 583,288 |
Class R4 | | 3,874 | | 59,041 | | — | | — |
| | 675,256 | | $10,582,490 | | 2,502,011 | | $65,775,313 |
30
Notes to Financial Statements (unaudited) – continued
| | | | | | | | | | | | |
| | | Six months ended
4/30/09 | | | Year ended
10/31/08 | |
| | | Shares | | | Amount | | | Shares | | | Amount | |
| Shares issued to shareholders in reinvestment of distributions | | | | | | | | | | | | |
Class A | | 370 | | | $6,300 | | | 55,569 | | | $1,565,367 | |
Class C | | — | | | — | | | 65 | | | 1,719 | |
Class I | | 975 | | | 16,937 | | | 2,081 | | | 59,758 | |
Class R1 | | — | | | — | | | 285 | | | 7,483 | |
Former Class R2 (b) | | — | | | — | | | 84 | | | 2,230 | |
Class R2 | | — | | | — | | | 1,167 | | | 32,323 | |
Class R3 | | — | | | — | | | 696 | | | 19,553 | |
Class R4 | | 10 | | | 173 | | | 20 | | | 555 | |
| | 1,355 | | | $23,410 | | | 59,967 | | | $1,688,988 | |
| Shares reacquired | | | | | | | | | | | | |
Class A | | (1,045,355 | ) | | $(16,248,873 | ) | | (3,199,956 | ) | | $(81,615,479 | ) |
Class B | | (319,033 | ) | | (4,649,431 | ) | | (1,257,559 | ) | | (30,606,975 | ) |
Class C | | (91,507 | ) | | (1,329,090 | ) | | (194,505 | ) | | (4,510,502 | ) |
Class I | | (14,642 | ) | | (236,567 | ) | | (48,802 | ) | | (1,245,809 | ) |
Class R (b) | | — | | | — | | | (156,361 | ) | | (4,248,884 | ) |
Class R1 | | (3,131 | ) | | (44,876 | ) | | (21,096 | ) | | (491,139 | ) |
Former Class R2 (b) | | — | | | — | | | (62,264 | ) | | (1,566,393 | ) |
Class R2 | | (44,119 | ) | | (654,839 | ) | | (196,848 | ) | | (4,144,770 | ) |
Class R3 | | (12,142 | ) | | (193,510 | ) | | (42,685 | ) | | (921,699 | ) |
| | (1,529,929 | ) | | $(23,357,186 | ) | | (5,180,076 | ) | | $(129,351,650 | ) |
| Net change | | | | | | | | | | | | |
Class A | | (529,111 | ) | | $(8,076,049 | ) | | (1,355,133 | ) | | $(32,742,038 | ) |
Class B | | (267,866 | ) | | (3,883,018 | ) | | (1,143,133 | ) | | (27,849,655 | ) |
Class C | | (43,726 | ) | | (617,688 | ) | | (103,530 | ) | | (2,283,773 | ) |
Class I | | 1,109 | | | 18,714 | | | (16,127 | ) | | (394,811 | ) |
Class R (b) | | — | | | — | | | (95,493 | ) | | (2,587,973 | ) |
Class R1 | | 6,413 | | | 96,760 | | | 2,383 | | | 91,669 | |
Former Class R2 (b) | | — | | | — | | | (26,488 | ) | | (628,900 | ) |
Class R2 | | (18,726 | ) | | (262,911 | ) | | 138,772 | | | 4,826,435 | |
Class R3 | | (5,295 | ) | | (86,308 | ) | | (19,369 | ) | | (318,858 | ) |
Class R4 | | 3,884 | | | 59,214 | | | 20 | | | 555 | |
| | (853,318 | ) | | $(12,751,286 | ) | | (2,618,098 | ) | | $(61,887,349 | ) |
| (b) | At the close of business on April 18, 2008, Class R and Class R2 shares converted into Class R3 shares. Following the conversion, Class R3 shares were renamed Class R2 shares. |
The fund and certain other funds managed by MFS participate in a $1.1 billion unsecured committed line of credit, subject to a $1 billion sublimit, provided by a syndication of banks under a credit agreement. Borrowings may be made for temporary financing needs. Interest is charged to each fund, based on its
31
Notes to Financial Statements (unaudited) – continued
borrowings, generally at a rate equal to the higher of the Federal Reserve funds rate or one month LIBOR plus 1.25%. A commitment fee, based on the average daily, unused portion of the committed line of credit, is allocated among the participating funds at the end of each calendar quarter. In addition, the fund and other funds managed by MFS have established unsecured uncommitted borrowing arrangements with certain banks for temporary financing needs. Interest is charged to each fund, based on its borrowings, currently at a rate equal to the Federal Reserve funds rate plus 0.30%. For the six months ended April 30, 2009, the fund’s commitment fee and interest expense were $649 and $0, respectively, and are included in miscellaneous expense on the Statement of Operations.
| (7) | | Transactions in Underlying Funds-Affiliated Issuers |
An affiliated issuer may be considered one in which the fund owns 5% or more of the outstanding voting securities, or a company which is under common control. For the purposes of this report, the fund assumes the following to be affiliated issuers:
| | | | | | | | | |
| Underlying Funds | | Beginning
Shares/Par
Amount | | Acquisitions
Shares/Par
Amount | | Dispositions
Shares/Par
Amount | | | Ending
Shares/Par
Amount |
MFS Institutional Money
Market Portfolio | | 2,572,621 | | 36,817,524 | | (36,209,977 | ) | | 3,180,168 |
| | | | |
| Underlying Funds | | Realized
Gain (Loss) | | Capital Gain
Distributions | | Dividend
Income | | | Ending
Value |
MFS Institutional Money
Market Portfolio | | $— | | $— | | $5,466 | | | $3,180,168 |
32
BOARD REVIEW OF INVESTMENT ADVISORY AGREEMENT
A discussion regarding the Board’s most recent review and renewal of the fund’s Investment Advisory Agreement with MFS is available by clicking on the fund’s name under “Mutual Funds” in the “Products and Performance” section of the MFS Web site (mfs.com).
PROXY VOTING POLICIES AND INFORMATION
A general description of the MFS funds’ proxy voting policies and procedures is available without charge, upon request, by calling
1-800-225-2606, by visiting the Proxy Voting section of mfs.com or by visiting the SEC’s Web site at http://www.sec.gov.
Information regarding how the fund voted proxies relating to portfolio securities during the most recent twelve-month period ended June 30 is available without charge by visiting the Proxy Voting section of mfs.com or by visiting the SEC’s Web site at http://www.sec.gov.
QUARTERLY PORTFOLIO DISCLOSURE
The fund will file a complete schedule of portfolio holdings with the Securities and Exchange Commission (the Commission) for the first and third quarters of each fiscal year on Form N-Q. The fund’s Form N-Q may be reviewed and copied at the:
Public Reference Room
Securities and Exchange Commission
100 F Street, NE, Room 1580
Washington, D.C. 20549
Information on the operation of the Public Reference Room may be obtained by calling the Commission at 1-800-SEC-0330. The fund’s Form N-Q is available on the EDGAR database on the Commission’s Internet Web site at http://www.sec.gov, and copies of this information may be obtained, upon payment of a duplicating fee, by electronic request at the following e-mail address: publicinfo@sec.gov or by writing the Public Reference Section at the above address.
A shareholder can also obtain the quarterly portfolio holdings report at mfs.com.
33
CONTACT US
| | |
Web site | | Mailing address |
mfs.com | | MFS Service Center, Inc. |
| | P.O. Box 55824 |
MFS TALK | | Boston, MA 02205-5824 |
1-800-637-8255 | | |
24 hours a day | | Overnight mail |
| | MFS Service Center, Inc. |
Account service and | | c/o Boston Financial Data Services |
literature | | 30 Dan Road |
Shareholders | | Canton, MA 02021-2809 |
1-800-225-2606 | | |
Investment professionals | | |
1-800-343-2829 | | |
Retirement plan services | | |
1-800-637-1255 | | |

Save paper with eDelivery. MFS® will send you prospectuses, reports, and proxies directly via e-mail so you will get information faster with less mailbox clutter. To sign up: 1. go to mfs.com. 2. log in via MFS® Access. 3. select eDelivery. If you own your MFS fund shares through a financial institution or a retirement plan, MFS® TALK, MFS Access, and eDelivery may not be available to you.


MFS® Strategic Income Fund
The report is prepared for the general information of shareholders. It is authorized for distribution to prospective investors only when preceded or accompanied by a current prospectus.
NOT FDIC INSURED Ÿ MAY LOSE VALUE Ÿ
NO BANK GUARANTEE
4/30/09
MFO-SEM

LETTER FROM THE CEO
Dear Shareholders:
The market downturns and economic setbacks of late probably rank among the worst financial declines most of us have experienced. Inevitably, people may be questioning their commitment to investing. Still, it is important to remember that downturns are an inescapable part of the business cycle. Such troughs have been seen before, and if we can use history as a guide, market recoveries typically have followed.
Recent events have clearly shown us the value of certain types of investments. In this environment, two of the hallmarks of mutual funds — transparency and liquidity — have become critically important. Unlike some other types of investments, the operations of mutual funds are relatively transparent to their shareholders. With their daily redemption feature, mutual funds also generally provide easy, convenient access to one’s money. Through these recent market upheavals, this level of liquidity enhanced the ability of mutual fund investors to respond and modify their investments as they and their advisors saw fit — a flexibility that those in less liquid investments simply did not have at their disposal.
At MFS® we take particular pride in how well mutual funds can serve investors because we invented the mutual fund in the United States. Established in 1924, Massachusetts Investors Trust was the nation’s first fund. Recent market events only reinforce what we have learned through 85 years — that mutual funds provide unique features that are important to investors in any type of market climate.
Respectfully,

Robert J. Manning
Chief Executive Officer and Chief Investment Officer
MFS Investment Management®
June 15, 2009
The opinions expressed in this letter are subject to change, may not be relied upon for investment advice, and no forecasts can be guaranteed.
Before investing, consider the fund’s investment objectives, risks, charges, and expenses. For a prospectus containing this and other information, contact your investment professional or view online. Read it carefully.
MFS Fund Distributors, Inc., 500 Boylston Street, Boston, MA 02116
1
PORTFOLIO COMPOSITION
Portfolio structure (i)
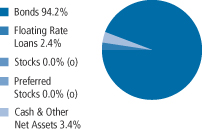
| | |
| Fixed income sectors (i) | | |
| High Grade Corporates | | 27.6% |
| High Yield Corporates | | 24.6% |
| Non-U.S. Government Bonds | | 21.3% |
| Emerging Markets Bonds | | 7.7% |
| Mortgage-Backed Securities | | 5.0% |
| Commercial Mortgage-Backed Securities | | 4.1% |
| U.S. Treasury Securities | | 3.1% |
| Floating Rate Loans | | 2.4% |
| Asset-Backed Securities | | 0.4% |
| U.S. Government Agencies | | 0.3% |
| Collateralized Debt Obligations | | 0.1% |
| | |
| Credit quality of bonds (r) | | |
| AAA | | 21.5% |
| AA | | 11.7% |
| A | | 11.2% |
| BBB | | 20.2% |
| BB | | 13.1% |
| B | | 13.9% |
| CCC | | 4.7% |
| CC | | 0.4% |
| C | | 0.1% |
| D | | 0.7% |
| Not Rated | | 2.5% |
| |
| Portfolio facts | | |
| Average Duration (d)(i) | | 4.4 |
| Effective Maturity (i)(m) | | 6.3 yrs. |
| Average Credit Quality of Rated Securities (long-term) (a) | | BBB+ |
| Average Credit Quality of Rated Securities (short-term) (a) | | A-1 |
| |
| Country weightings (i) | | |
| United States | | 61.1% |
| Japan | | 5.1% |
| Germany | | 4.2% |
| United Kingdom | | 3.2% |
| France | | 3.1% |
| Netherlands | | 2.8% |
| Canada | | 2.7% |
| Italy | | 2.6% |
| Spain | | 2.4% |
| Other Countries | | 12.8% |
2
Portfolio Composition – continued
| (a) | The average credit quality of rated securities is based upon a market weighted average of portfolio holdings that are rated by public rating agencies. |
| (d) | Duration is a measure of how much a bond’s price is likely to fluctuate with general changes in interest rates, e.g., if rates rise 1.00%, a bond with a 5-year duration is likely to lose about 5.00% of its value. |
| (i) | For purposes of this presentation, the bond component includes accrued interest amounts and may be positively or negatively impacted by the equivalent exposure from any derivative holdings, if applicable. |
| (m) | In determining an instrument’s effective maturity for purposes of calculating the fund’s dollar-weighted average effective maturity, MFS uses the instrument’s stated maturity or, if applicable, an earlier date on which MFS believes it is probable that a maturity-shortening device (such as put, pre-refunding or prepayment) will cause the instrument to be repaid. Such an earlier date can be substantially shorter than the instrument’s stated maturity. |
| (r) | Each security is assigned a rating from Moody’s Investors Service. If not rated by Moody’s, the rating will be that assigned by Standard & Poor’s. Likewise, if not assigned a rating by Standard & Poor’s, it will be based on the rating assigned by Fitch, Inc. For those portfolios that hold a security which is not rated by any of the three agencies, the security is considered Not Rated. Holdings in U.S. Treasuries and government agency mortgage-backed securities, if any, are included in the “AAA”-rating category. Percentages are based on the total market value of investments as of 4/30/09. |
Percentages are based on net assets as of 4/30/09, unless otherwise noted.
The portfolio is actively managed and current holdings may be different.
3
EXPENSE TABLE
Fund expenses borne by the shareholders during the period, November 1, 2008 through April 30, 2009
As a shareholder of the fund, you incur two types of costs: (1) transaction costs, including sales charges (loads) on certain purchase or redemption payments, and (2) ongoing costs, including management fees; distribution and service (12b-1) fees; and other fund expenses. This example is intended to help you understand your ongoing costs (in dollars) of investing in the fund and to compare these costs with the ongoing costs of investing in other mutual funds.
The example is based on an investment of $1,000 invested at the beginning of the period and held for the entire period November 1, 2008 through April 30, 2009.
Actual Expenses
The first line for each share class in the following table provides information about actual account values and actual expenses. You may use the information in this line, together with the amount you invested, to estimate the expenses that you paid over the period. Simply divide your account value by $1,000 (for example, an $8,600 account value divided by $1,000 = 8.6), then multiply the result by the number in the first line under the heading entitled “Expenses Paid During Period” to estimate the expenses you paid on your account during this period.
Hypothetical Example for Comparison Purposes
The second line for each share class in the following table provides information about hypothetical account values and hypothetical expenses based on the fund’s actual expense ratio and an assumed rate of return of 5% per year before expenses, which is not the fund’s actual return. The hypothetical account values and expenses may not be used to estimate the actual ending account balance or expenses you paid for the period. You may use this information to compare the ongoing costs of investing in the fund and other funds. To do so, compare this 5% hypothetical example with the 5% hypothetical examples that appear in the shareholder reports of the other funds.
Please note that the expenses shown in the table are meant to highlight your ongoing costs only and do not reflect any transactional costs, such as sales charges (loads). Therefore, the second line for each share class in the table is useful in comparing ongoing costs only, and will not help you determine the relative total costs of owning different funds. In addition, if these transactional costs were included, your costs would have been higher.
4
Expense Table – continued
| | | | | | | | | | |
Share
Class | | | | Annualized
Expense
Ratio | | Beginning
Account Value
11/01/08 | | Ending
Account Value
4/30/09 | | Expenses
Paid During
Period (p)
11/01/08-4/30/09 |
| A | | Actual | | 0.87% | | $1,000.00 | | $1,071.92 | | $4.47 |
| | Hypothetical (h) | | 0.87% | | $1,000.00 | | $1,020.48 | | $4.36 |
| B | | Actual | | 1.55% | | $1,000.00 | | $1,068.54 | | $7.95 |
| | Hypothetical (h) | | 1.55% | | $1,000.00 | | $1,017.11 | | $7.75 |
| C | | Actual | | 1.56% | | $1,000.00 | | $1,070.58 | | $8.01 |
| | Hypothetical (h) | | 1.56% | | $1,000.00 | | $1,017.06 | | $7.80 |
| I | | Actual | | 0.56% | | $1,000.00 | | $1,073.60 | | $2.88 |
| | Hypothetical (h) | | 0.56% | | $1,000.00 | | $1,022.02 | | $2.81 |
| (h) | 5% class return per year before expenses. |
| (p) | Expenses paid is equal to each class’ annualized expense ratio, as shown above, multiplied by the average account value over the period, multiplied by the number of days in the period, divided by the number of days in the year. Expenses paid do not include any applicable sales charges (loads). If these transaction costs had been included, your costs would have been higher. |
Expense Changes Impacting the Table
Changes to the fund’s fee arrangements occurred during the six month period. Had these fee changes been in effect throughout the entire six month period, the annualized expense ratios would have been 0.95% for Class A shares, 1.70% for Class B shares, 1.70% for Class C shares, and 0.70% for Class I shares; the actual expenses paid during the period would have been approximately $4.88 for Class A shares, $8.71 for Class B shares, $8.72 for Class C shares, and $3.60 for Class I shares; and the hypothetical expenses paid during the period would have been approximately $4.76 for Class A shares, $8.50 for Class B shares, $8.50 for Class C shares, and $3.51 for Class I shares. For further information about the fund’s fee arrangements and changes to those fee arrangements, please see Note 3 in the Notes to Financial Statements.
5
PORTFOLIO OF INVESTMENTS
4/30/09 (unaudited)
The Portfolio of Investments is a complete list of all securities owned by your fund. It is categorized by broad-based asset classes.
| | | | | | |
| Bonds - 92.7% | | | | | | |
| Issuer | | Shares/Par | | Value ($) |
| | | | | | |
| Aerospace - 0.3% | | | | | | |
| Bombardier, Inc., 6.3%, 2014 (n) | | $ | 205,000 | | $ | 172,200 |
| Hawker Beechcraft Acquisition Co. LLC, 8.5%, 2015 | | | 210,000 | | | 70,875 |
| TransDigm Group, Inc., 7.75%, 2014 | | | 155,000 | | | 151,513 |
| Vought Aircraft Industries, Inc., 8%, 2011 | | | 625,000 | | | 254,688 |
| | | | | | |
| | | | | | $ | 649,276 |
| Airlines - 0.2% | | | | | | |
| Continental Airlines, Inc., 7.339%, 2014 | | $ | 548,000 | | $ | 345,240 |
| | |
| Asset Backed & Securitized - 4.6% | | | | | | |
| Anthracite Ltd., CDO, 6%, 2037 (z) | | $ | 1,200,000 | | $ | 96,000 |
| ARCap REIT, Inc., CDO, “H”, 6.1%, 2045 (z) | | | 900,000 | | | 54,000 |
| Bayview Financial Revolving Mortgage Loan Trust, FRN, 1.235%, 2040 (z) | | | 674,286 | | | 296,686 |
| Brazilian Merchant Voucher Receivables Ltd., 5.911%, 2011 (z) | | | 670,985 | | | 644,146 |
| Chase Commercial Mortgage Securities Corp., 6.6%, 2029 (z) | | | 1,241,490 | | | 1,256,344 |
| Countrywide Asset-Backed Certificates, FRN, 4.575%, 2035 | | | 12,520 | | | 11,758 |
| Crest Ltd., CDO, 7%, 2040 | | | 400,000 | | | 30,000 |
| Deutsche Mortgage & Asset Receiving Corp., FRN, 7.5%, 2031 | | | 1,050,000 | | | 1,058,341 |
| DLJ Commercial Mortgage Corp., 6.04%, 2031 (z) | | | 550,000 | | | 490,029 |
| Falcon Franchise Loan LLC, 6.5%, 2014 (z) | | | 700,000 | | | 371,000 |
| Falcon Franchise Loan LLC, FRN, 2.713%, 2023 (i)(z) | | | 3,989,792 | | | 220,237 |
| Falcon Franchise Loan LLC, FRN, 3.38%, 2025 (i)(z) | | | 3,257,686 | | | 232,599 |
| First Union-Lehman Brothers Bank of America, FRN, 0.568%, 2035 (i) | | | 14,639,386 | | | 220,314 |
| First Union-Lehman Brothers Commercial Mortgage Trust, 7%, 2029 (n) | | | 404,482 | | | 412,776 |
| GMAC LLC, FRN, 6.02%, 2033 (z) | | | 1,758,000 | | | 1,323,401 |
| JPMorgan Chase Commercial Mortgage Securities Corp., FRN, 5.528%, 2043 (i) | | | 1,789,097 | | | 784,312 |
| KKR Financial CLO Ltd., “C”, CDO, FRN, 2.684%, 2021 (n) | | | 534,418 | | | 24,049 |
| Morgan Stanley Capital I, Inc., FRN, 1.31%, 2039 (i)(z) | | | 10,122,807 | | | 223,512 |
| Prudential Securities Secured Financing Corp., FRN, 7.285%, 2013 (z) | | | 875,000 | | | 716,919 |
| Salomon Brothers Mortgage Securities, Inc., FRN, 7.146%, 2032 (z) | | | 1,800,000 | | | 1,739,593 |
| | | | | | |
| | | | | | $ | 10,206,016 |
6
Portfolio of Investments (unaudited) – continued
| | | | | |
| Issuer | | Shares/Par | | Value ($) |
| | | | | |
| Bonds - continued | | | | | |
| Automotive - 1.0% | | | | | |
| Accuride Corp., 8.5%, 2015 | | $ 150,000 | | $ | 34,500 |
| Allison Transmission, Inc., 11%, 2015 (n) | | 620,000 | | | 372,000 |
| FCE Bank PLC, 7.125%, 2012 | | EUR 900,000 | | | 910,954 |
| Ford Motor Credit Co. LLC, 9.75%, 2010 | | $ 275,000 | | | 247,512 |
| Ford Motor Credit Co. LLC, 12%, 2015 | | 386,000 | | | 326,241 |
| Ford Motor Credit Co. LLC, 8%, 2016 | | 215,000 | | | 164,008 |
| Johnson Controls, Inc., 5.25%, 2011 | | 290,000 | | | 285,390 |
| | | | | |
| | | | | $ | 2,340,605 |
| Broadcasting - 1.0% | | | | | |
| Allbritton Communications Co., 7.75%, 2012 | | $ 485,000 | | $ | 220,675 |
| Canwest Mediaworks, Inc., 9.25%, 2015 (d)(n) | | 305,000 | | | 28,213 |
| Clear Channel Communications, 10.75%, 2016 (n) | | 150,000 | | | 31,500 |
| Intelsat Jackson Holdings Ltd., 9.5%, 2016 (n) | | 270,000 | | | 265,950 |
| Lamar Media Corp., 6.625%, 2015 | | 435,000 | | | 341,475 |
| Lamar Media Corp., “C”, 6.625%, 2015 | | 275,000 | | | 210,375 |
| LBI Media, Inc., 8.5%, 2017 (z) | | 190,000 | | | 58,900 |
| LIN TV Corp., 6.5%, 2013 | | 465,000 | | | 269,700 |
| Local TV Finance LLC, 9.25%, 2015 (p)(z) | | 455,000 | | | 34,631 |
| Newport Television LLC, 13%, 2017 (n)(p) | | 460,000 | | | 6,165 |
| News America, Inc., 6.4%, 2035 | | 890,000 | | | 660,990 |
| Nexstar Broadcasting Group, Inc., 5.125%, 2014 (p)(z) | | 380,579 | | | 107,329 |
| Nexstar Broadcasting Group, Inc., 7%, 2014 | | 126,000 | | | 44,730 |
| Univision Communications, Inc., 10.5%, 2015 (n)(p) | | 285,000 | | | 40,019 |
| | | | | |
| | | | | $ | 2,320,652 |
| Brokerage & Asset Managers - 0.2% | | | | | |
| Janus Capital Group, Inc., 6.95%, 2017 | | $ 375,000 | | $ | 243,187 |
| Nuveen Investments, Inc., 10.5%, 2015 (n) | | 345,000 | | | 174,225 |
| | | | | |
| | | | | $ | 417,412 |
| Building - 1.4% | | | | | |
| Associated Materials, Inc., 11.25%, 2014 | | $ 355,000 | | $ | 127,800 |
| Building Materials Corp. of America, 7.75%, 2014 | | 255,000 | | | 213,563 |
| CRH PLC, 8.125%, 2018 | | 1,430,000 | | | 1,192,626 |
| Lafarge S.A., 6.15%, 2011 | | 1,320,000 | | | 1,283,728 |
| Nortek, Inc., 10%, 2013 | | 225,000 | | | 144,000 |
| Nortek, Inc., 8.5%, 2014 | | 130,000 | | | 28,600 |
| Ply Gem Industries, Inc., 11.75%, 2013 | | 195,000 | | | 113,100 |
| | | | | |
| | | | | $ | 3,103,417 |
7
Portfolio of Investments (unaudited) – continued
| | | | | | |
| Issuer | | Shares/Par | | Value ($) |
| | | | | | |
| Bonds - continued | | | | | | |
| Business Services - 0.3% | | | | | | |
| First Data Corp., 9.875%, 2015 | | $ | 425,000 | | $ | 293,781 |
| SunGard Data Systems, Inc., 10.25%, 2015 | | | 418,000 | | | 363,660 |
| | | | | | |
| | | | | | $ | 657,441 |
| Cable TV - 2.1% | | | | | | |
| CCO Holdings LLC, 8.75%, 2013 | | $ | 705,000 | | $ | 611,588 |
| Charter Communications Holdings LLC, 8.375%, 2014 (n) | | | 240,000 | | | 218,400 |
| Charter Communications Holdings LLC, 10.875%, 2014 (n) | | | 125,000 | | | 124,375 |
| CSC Holdings, Inc., 6.75%, 2012 | | | 365,000 | | | 356,788 |
| CSC Holdings, Inc., 8.5%, 2014 (n) | | | 105,000 | | | 107,100 |
| DirectTV Holdings LLC, 7.625%, 2016 | | | 640,000 | | | 633,600 |
| Mediacom LLC, 9.5%, 2013 | | | 180,000 | | | 176,400 |
| TCI Communications, Inc., 9.8%, 2012 | | | 841,000 | | | 906,636 |
| Time Warner Cable, Inc., 8.25%, 2019 | | | 920,000 | | | 1,016,747 |
| Videotron LTEE, 6.875%, 2014 | | | 115,000 | | | 111,694 |
| Virgin Media, Inc., 9.125%, 2016 | | | 350,000 | | | 344,750 |
| | | | | | |
| | | | | | $ | 4,608,078 |
| Chemicals - 1.0% | | | | | | |
| Innophos Holdings, Inc., 8.875%, 2014 | | $ | 405,000 | | $ | 340,200 |
| Momentive Performance Materials, Inc., 10.125%, 2014 (p) | | | 355,000 | | | 61,585 |
| Momentive Performance Materials, Inc., 11.5%, 2016 | | | 157,000 | | | 35,325 |
| Nalco Co., 7.75%, 2011 | | | 320,000 | | | 323,200 |
| Nalco Finance Holdings, Inc., 9%, 2014 | | | 450,000 | | | 445,500 |
| Yara International A.S.A., 5.25%, 2014 (n) | | | 1,300,000 | | | 1,114,855 |
| | | | | | |
| | | | | | $ | 2,320,665 |
| Construction - 0.5% | | | | | | |
| Lennar Corp., 5.125%, 2010 | | $ | 1,110,000 | | $ | 1,035,075 |
| Lennar Corp., 12.25%, 2017 (z) | | | 140,000 | | | 142,100 |
| | | | | | |
| | | | | | $ | 1,177,175 |
| Consumer Goods & Services - 2.1% | | | | | | |
| Corrections Corp. of America, 6.25%, 2013 | | $ | 200,000 | | $ | 192,500 |
| Fortune Brands, Inc., 5.125%, 2011 | | | 1,025,000 | | | 1,025,379 |
| Jarden Corp., 7.5%, 2017 | | | 130,000 | | | 115,050 |
| KAR Holdings, Inc., 10%, 2015 | | | 310,000 | | | 179,800 |
| KAR Holdings, Inc., FRN, 5.17%, 2014 | | | 170,000 | | | 92,650 |
| Service Corp. International, 7%, 2017 | | | 435,000 | | | 390,413 |
| Service Corp. International, 7.625%, 2018 | | | 425,000 | | | 387,813 |
| Ticketmaster, 10.75%, 2016 (n) | | | 195,000 | | | 133,088 |
8
Portfolio of Investments (unaudited) – continued
| | | | | | |
| Issuer | | Shares/Par | | Value ($) |
| | | | | | |
| Bonds - continued | | | | | | |
| Consumer Goods & Services - continued | | | | | | |
| Western Union Co., 5.4%, 2011 | | $ | 1,610,000 | | $ | 1,632,733 |
| Whirlpool Corp., 8%, 2012 | | | 429,000 | | | 436,460 |
| | | | | | |
| | | | | | $ | 4,585,886 |
| Containers - 1.1% | | | | | | |
| Crown Americas LLC, 7.75%, 2015 | | $ | 250,000 | | $ | 253,750 |
| Graham Packaging Holdings Co., 9.875%, 2014 | | | 450,000 | | | 363,938 |
| Greif, Inc., 6.75%, 2017 | | | 915,000 | | | 846,375 |
| Owens-Brockway Glass Container, Inc., 8.25%, 2013 | | | 1,000,000 | | | 1,015,000 |
| | | | | | |
| | | | | | $ | 2,479,063 |
| Defense Electronics - 1.0% | | | | | | |
| BAE Systems Holdings, Inc., 5.2%, 2015 (n) | | $ | 1,297,000 | | $ | 1,241,521 |
| L-3 Communications Corp., 6.125%, 2014 | | | 700,000 | | | 665,000 |
| L-3 Communications Corp., 5.875%, 2015 | | | 330,000 | | | 301,950 |
| | | | | | |
| | | | | | $ | 2,208,471 |
| Electronics - 0.2% | | | | | | |
| Avago Technologies Ltd., 11.875%, 2015 | | $ | 160,000 | | $ | 139,600 |
| Flextronics International Ltd., 6.25%, 2014 | | | 265,000 | | | 239,825 |
| Freescale Semiconductor, Inc., 8.875%, 2014 | | | 230,000 | | | 78,200 |
| Spansion, Inc., 11.25%, 2016 (d)(n) | | | 375,000 | | | 37,500 |
| | | | | | |
| | | | | | $ | 495,125 |
| Emerging Market Quasi-Sovereign - 3.6% | | | | | | |
| Corporación Nacional del Cobre de Chile, 7.5%, 2019 (n) | | $ | 105,000 | | $ | 111,875 |
| Export-Import Bank of Korea, 8.125%, 2014 | | | 402,000 | | | 421,603 |
| Hana Bank, 6.5%, 2012 (z) | | | 520,000 | | | 529,574 |
| Industrial Bank of Korea, 7.125%, 2014 (z) | | | 602,000 | | | 592,245 |
| KazMunaiGaz Finance B.V., 8.375%, 2013 (n) | | | 109,000 | | | 97,010 |
| KazMunaiGaz Finance B.V., 9.125%, 2018 (n) | | | 352,000 | | | 304,480 |
| Korea Development Bank, 8%, 2014 | | | 263,000 | | | 276,148 |
| Mubadala Development Co., 5.75%, 2014 (z) | | | 1,502,000 | | | 1,487,265 |
| Mubadala Development Co., 7.625%, 2019 (z) | | | 981,000 | | | 973,917 |
| National Power Corp., 5.501%, 2011 | | | 389,000 | | | 386,950 |
| Pemex Project Funding Master Trust, 5.75%, 2018 | | | 778,000 | | | 704,090 |
| Petrobras International Finance Co., 7.875%, 2019 | | | 510,000 | | | 545,700 |
| Petroleos Mexicanos, 8%, 2019 (n) | | | 467,000 | | | 496,787 |
| Petroleum Co. of Trinidad & Tobago Ltd., 6%, 2022 (n) | | | 264,000 | | | 187,387 |
| Ras Laffan Liquefied Natural Gas Co. Ltd., 5.832%, 2016 (n) | | | 890,000 | | | 866,041 |
| | | | | | |
| | | | | | $ | 7,981,072 |
9
Portfolio of Investments (unaudited) – continued
| | | | | | |
| Issuer | | Shares/Par | | Value ($) |
| | | | | | |
| Bonds - continued | | | | | | |
| Emerging Market Sovereign - 2.4% | | | | | | |
| Emirate of Abu Dhabi, 5.5%, 2014 (z) | | $ | 146,000 | | $ | 149,267 |
| Emirate of Abu Dhabi, 6.75%, 2019 (z) | | | 316,000 | | | 320,676 |
| Republic of Argentina, FRN, 3.127%, 2012 | | | 329,550 | | | 172,949 |
| Republic of Colombia, 7.375%, 2017 | | | 704,000 | | | 753,280 |
| Republic of Columbia, 7.375%, 2019 | | | 101,000 | | | 106,161 |
| Republic of Indonesia, 6.875%, 2018 (n) | | | 278,000 | | | 250,200 |
| Republic of Indonesia, 7.75%, 2038 (n) | | | 211,000 | | | 183,570 |
| Republic of Korea, 5.75%, 2014 | | | 828,000 | | | 849,645 |
| Republic of Korea, 7.125%, 2019 | | | 394,000 | | | 402,441 |
| Republic of Panama, 7.25%, 2015 | | | 520,000 | | | 557,700 |
| Republic of Peru, 7.125%, 2019 | | | 103,000 | | | 111,240 |
| Republic of Turkey, 7.5%, 2019 | | | 102,000 | | | 101,271 |
| Republic of Uruguay, 8%, 2022 | | | 535,000 | | | 510,925 |
| State of Qatar, 5.15%, 2014 (z) | | | 538,000 | | | 550,105 |
| State of Qatar, 6.55%, 2019 (z) | | | 363,000 | | | 374,798 |
| | | | | | |
| | | | | | $ | 5,394,228 |
| Energy - Independent - 2.6% | | | | | | |
| Chaparral Energy, Inc., 8.875%, 2017 | | $ | 470,000 | | $ | 190,350 |
| Chesapeake Energy Corp., 6.375%, 2015 | | | 555,000 | | | 489,788 |
| EnCana Corp., 6.5%, 2019 | | | 470,000 | | | 482,375 |
| Forest Oil Corp., 8.5%, 2014 (n) | | | 110,000 | | | 106,700 |
| Forest Oil Corp., 7.25%, 2019 | | | 470,000 | | | 391,275 |
| Hilcorp Energy I LP, 9%, 2016 (n) | | | 475,000 | | | 406,125 |
| Mariner Energy, Inc., 8%, 2017 | | | 540,000 | | | 391,500 |
| McMoRan Exploration Co., 11.875%, 2014 | | | 225,000 | | | 166,500 |
| Newfield Exploration Co., 6.625%, 2014 | | | 255,000 | | | 234,600 |
| Newfield Exploration Co., 6.625%, 2016 | | | 120,000 | | | 108,600 |
| Nexen, Inc., 6.4%, 2037 | | | 1,100,000 | | | 800,361 |
| OPTI Canada, Inc., 8.25%, 2014 | | | 710,000 | | | 390,500 |
| Petrohawk Energy Corp., 10.5%, 2014 (n) | | | 210,000 | | | 211,050 |
| Plains Exploration & Production Co., 7%, 2017 | | | 625,000 | | | 537,500 |
| Quicksilver Resources, Inc., 7.125%, 2016 | | | 690,000 | | | 431,250 |
| SandRidge Energy, Inc., 8%, 2018 (n) | | | 420,000 | | | 367,500 |
| | | | | | |
| | | | | | $ | 5,705,974 |
| Energy - Integrated - 2.1% | | | | | | |
| ConocoPhillips, 5.75%, 2019 | | $ | 1,580,000 | | $ | 1,612,915 |
| Hess Corp., 8.125%, 2019 | | | 270,000 | | | 295,798 |
| Petro-Canada, 5%, 2014 | | | 860,000 | | | 811,111 |
| Shell International Finance, 4%, 2014 | | | 1,870,000 | | | 1,928,391 |
| | | | | | |
| | | | | | $ | 4,648,215 |
10
Portfolio of Investments (unaudited) – continued
| | | | | | |
| Issuer | | Shares/Par | | Value ($) |
| | | | | | |
| Bonds - continued | | | | | | |
| Entertainment - 0.2% | | | | | | |
| AMC Entertainment, Inc., 11%, 2016 | | $ | 285,000 | | $ | 279,300 |
| Marquee Holdings, Inc., 12%, 2014 | | | 225,000 | | | 174,938 |
| Time Warner, Inc., 6.5%, 2036 | | | 110,000 | | | 90,689 |
| | | | | | |
| | | | | | $ | 544,927 |
| Financial Institutions - 1.1% | | | | | | |
| General Electric Capital Corp., FRN, 1.158%, 2012 | | $ | 770,000 | | $ | 653,900 |
| GMAC LLC, 6.875%, 2011 (z) | | | 433,000 | | | 376,710 |
| GMAC LLC, 7%, 2012 (z) | | | 185,000 | | | 151,700 |
| GMAC LLC, 6.75%, 2014 (z) | | | 255,000 | | | 188,700 |
| GMAC LLC, 8%, 2031 (z) | | | 330,000 | | | 231,000 |
| ILFC E-Capital Trust I, 5.9% to 2010, FRN to 2065 (n) | | | 1,400,000 | | | 210,000 |
| ORIX Corp., 5.48%, 2011 | | | 970,000 | | | 754,242 |
| | | | | | |
| | | | | | $ | 2,566,252 |
| Food & Beverages - 2.8% | | | | | | |
| Anheuser-Busch Companies, Inc., 7.75%, 2019 (n) | | $ | 1,100,000 | | $ | 1,151,667 |
| ARAMARK Corp., 8.5%, 2015 | | | 240,000 | | | 229,200 |
| Conagra Foods, Inc., 7.875%, 2010 | | | 746,000 | | | 783,339 |
| Conagra Foods, Inc., 7%, 2019 | | | 50,000 | | | 53,124 |
| Dean Foods Co., 7%, 2016 | | | 455,000 | | | 443,625 |
| Del Monte Corp., 6.75%, 2015 | | | 360,000 | | | 345,600 |
| General Mills, Inc., 5.65%, 2019 | | | 200,000 | | | 204,193 |
| Kraft Foods, Inc., 6.125%, 2018 | | | 720,000 | | | 731,392 |
| Michael Foods, Inc., 8%, 2013 | | | 495,000 | | | 467,775 |
| Miller Brewing Co., 5.5%, 2013 (n) | | | 1,370,000 | | | 1,314,962 |
| Tyson Foods, Inc., 7.85%, 2016 | | | 560,000 | | | 507,889 |
| | | | | | |
| | | | | | $ | 6,232,766 |
| Food & Drug Stores - 0.2% | | | | | | |
| CVS Caremark Corp., 5.75%, 2017 | | $ | 178,000 | | $ | 178,903 |
| CVS Caremark Corp., 6.6%, 2019 | | | 200,000 | | | 211,560 |
| | | | | | |
| | | | | | $ | 390,463 |
| Forest & Paper Products - 1.0% | | | | | | |
| Buckeye Technologies, Inc., 8%, 2010 | | $ | 26,000 | | $ | 24,700 |
| Buckeye Technologies, Inc., 8.5%, 2013 | | | 1,075,000 | | | 935,250 |
| Georgia-Pacific Corp., 7.125%, 2017 (n) | | | 255,000 | | | 240,975 |
| Georgia-Pacific Corp., 8%, 2024 | | | 150,000 | | | 127,500 |
| Graphic Packaging International Corp., 9.5%, 2013 | | | 160,000 | | | 144,400 |
| Jefferson Smurfit Corp., 8.25%, 2012 (d) | | | 195,000 | | | 40,950 |
| Millar Western Forest Products Ltd., 7.75%, 2013 | | | 530,000 | | | 180,200 |
| NewPage Holding Corp., 10%, 2012 | | | 160,000 | | | 75,200 |
11
Portfolio of Investments (unaudited) – continued
| | | | | |
| Issuer | | Shares/Par | | Value ($) |
| | | | | |
| Bonds - continued | | | | | |
| Forest & Paper Products - continued | | | | | |
| Smurfit-Stone Container Corp., 8%, 2017 (d) | | $ 141,000 | | $ | 30,315 |
| Stora Enso Oyj, 6.404%, 2016 (n) | | 690,000 | | | 414,000 |
| | | | | |
| | | | | $ | 2,213,490 |
| Gaming & Lodging - 1.2% | | | | | |
| Boyd Gaming Corp., 6.75%, 2014 | | $ 295,000 | | $ | 224,200 |
| Firekeepers Development Authority, 13.875%, 2015 (z) | | 260,000 | | | 187,200 |
| Fontainebleau Las Vegas Holdings LLC, 10.25%, 2015 (d)(n) | | 315,000 | | | 11,025 |
| Harrah’s Operating Co., Inc., 10%, 2018 (z) | | 786,000 | | | 369,420 |
| Host Hotels & Resorts, Inc., 7.125%, 2013 | | 115,000 | | | 108,100 |
| Host Hotels & Resorts, Inc., 6.75%, 2016 | | 140,000 | | | 122,150 |
| MGM Mirage, 8.375%, 2011 | | 150,000 | | | 61,500 |
| MGM Mirage, 7.5%, 2016 | | 305,000 | | | 170,800 |
| Pinnacle Entertainment, Inc., 7.5%, 2015 | | 635,000 | | | 527,050 |
| Royal Caribbean Cruises Ltd., 7%, 2013 | | 225,000 | | | 174,375 |
| Scientific Games Corp., 6.25%, 2012 | | 335,000 | | | 304,850 |
| Station Casinos, Inc., 6%, 2012 (d) | | 225,000 | | | 78,188 |
| Station Casinos, Inc., 6.5%, 2014 (d) | | 620,000 | | | 21,700 |
| Station Casinos, Inc., 6.875%, 2016 (d) | | 1,060,000 | | | 34,450 |
| Trump Entertainment Resorts, Inc., 8.5%, 2015 (d) | | 825,000 | | | 59,813 |
| Wyndham Worldwide Corp., 6%, 2016 | | 380,000 | | | 250,575 |
| | | | | |
| | | | | $ | 2,705,396 |
| Industrial - 1.3% | | | | | |
| Baldor Electric Co., 8.625%, 2017 | | $ 180,000 | | $ | 159,300 |
| Blount International, Inc., 8.875%, 2012 | | 230,000 | | | 223,100 |
| Johns Hopkins University, 5.25%, 2019 | | 1,180,000 | | | 1,171,669 |
| JohnsonDiversey, Inc., 9.625%, 2012 | | EUR 140,000 | | | 150,040 |
| JohnsonDiversey, Inc., “B”, 9.625%, 2012 | | $ 515,000 | | | 487,963 |
| Steelcase, Inc., 6.5%, 2011 | | 618,000 | | | 610,273 |
| | | | | |
| | | | | $ | 2,802,345 |
| Insurance - 0.7% | | | | | |
| Allianz AG, 5.5%, 2049 | | EUR 947,000 | | $ | 889,613 |
| ING Groep N.V., 5.775% to 2015, FRN to 2049 | | $ 2,010,000 | | | 743,700 |
| | | | | |
| | | | | $ | 1,633,313 |
| Insurance - Property & Casualty - 0.9% | | | | | |
| AXIS Capital Holdings Ltd., 5.75%, 2014 | | $ 1,555,000 | | $ | 1,176,298 |
| USI Holdings Corp., 9.75%, 2015 (z) | | 320,000 | | | 153,600 |
| ZFS Finance USA Trust V, 6.5% to 2017, FRN to 2037 (n) | | 1,080,000 | | | 583,200 |
| | | | | |
| | | | | $ | 1,913,098 |
12
Portfolio of Investments (unaudited) – continued
| | | | | |
| Issuer | | Shares/Par | | Value ($) |
| | | | | |
| Bonds - continued | | | | | |
| International Market Quasi-Sovereign - 3.5% | | | | | |
| Canada Housing Trust, 4.6%, 2011 (n) | | CAD 500,000 | | $ | 450,587 |
| EDF Energies Nouvelles S.A., 6.5%, 2019 (n) | | $ 1,090,000 | | | 1,173,350 |
| ING Bank N.V., 3.9%, 2014 (z) | | 1,060,000 | | | 1,052,531 |
| Landwirtschaftliche Rentenbank, 4.125%, 2013 | | 1,190,000 | | | 1,222,896 |
| LeasePlan Corp. N.V., 3%, 2012 (z) | | 470,000 | | | 469,817 |
| Lloyds TSB Bank PLC, FRN, 2.207%, 2012 (z) | | 1,000,000 | | | 997,504 |
| Province of Ontario, 5.45%, 2016 | | 745,000 | | | 786,562 |
| Societe Financement de l’ Economie, 3.375%, 2014 (z) | | 1,214,000 | �� | | 1,218,109 |
| Swedbank AB, 2.8%, 2012 (z) | | 300,000 | | | 299,249 |
| | | | | |
| | | | | $ | 7,670,605 |
| International Market Sovereign - 17.5% | | | | | |
| Dutch Government, 3.75%, 2014 | | EUR 924,000 | | $ | 1,280,517 |
| Federal Republic of Germany, 5.25%, 2010 | | 1,216,000 | | | 1,685,891 |
| Federal Republic of Germany, 3.75%, 2015 | | 1,556,000 | | | 2,187,168 |
| Federal Republic of Germany, 4.25%, 2018 | | 804,000 | | | 1,158,001 |
| Federal Republic of Germany, 6.25%, 2030 | | 773,000 | | | 1,311,092 |
| Government of Australia, 6.25%, 2015 | | AUD 844,000 | | | 678,199 |
| Government of Canada, 4.5%, 2015 | | CAD 845,000 | | | 796,699 |
| Government of Canada, 5.75%, 2033 | | 218,000 | | | 234,776 |
| Government of Japan, 1.5%, 2012 | | JPY112,000,000 | | | 1,169,251 |
| Government of Japan, 1.3%, 2014 | | 242,000,000 | | | 2,503,404 |
| Government of Japan, 1.7%, 2017 | | 346,000,000 | | | 3,637,512 |
| Government of Japan, 2.2%, 2027 | | 108,000,000 | | | 1,130,853 |
| Government of Japan, 2.4%, 2037 | | 113,000,000 | | | 1,203,243 |
| Kingdom of Belgium, 5.5%, 2017 | | EUR 683,000 | | | 1,021,652 |
| Kingdom of Spain, 5.35%, 2011 | | 2,884,000 | | | 4,127,344 |
| Kingdom of Sweden, 4.5%, 2015 | | SEK 3,365,000 | | | 460,371 |
| Republic of Austria, 4.65%, 2018 | | EUR 935,000 | | | 1,305,860 |
| Republic of France, 4.75%, 2012 | | 753,000 | | | 1,079,395 |
| Republic of France, 6%, 2025 | | 621,000 | | | 1,009,983 |
| Republic of France, 4.75%, 2035 | | 1,041,000 | | | 1,498,306 |
| Republic of Ireland, 4.6%, 2016 | | 981,000 | | | 1,294,677 |
| Republic of Italy, 4.75%, 2013 | | 1,572,000 | | | 2,225,902 |
| Republic of Italy, 5.25%, 2017 | | 1,761,000 | | | 2,568,895 |
| Republic of Portugal, 4.45%, 2018 | | 204,000 | | | 276,048 |
| United Kingdom Treasury, 8%, 2015 | | GBP 801,000 | | | 1,558,684 |
| United Kingdom Treasury, 8%, 2021 | | 394,000 | | | 829,491 |
| United Kingdom Treasury, 4.25%, 2036 | | 480,000 | | | 691,981 |
| | | | | |
| | | | | $ | 38,925,195 |
13
Portfolio of Investments (unaudited) – continued
| | | | | | |
| Issuer | | Shares/Par | | Value ($) |
| | | | | | |
| Bonds - continued | | | | | | |
| Machinery & Tools - 0.6% | | | | | | |
| Atlas Copco AB, 5.6%, 2017 (n) | | $ | 1,073,000 | | $ | 1,018,072 |
| Case New Holland, Inc., 7.125%, 2014 | | | 380,000 | | | 332,500 |
| | | | | | |
| | | | | | $ | 1,350,572 |
| Major Banks - 2.4% | | | | | | |
| BAC Capital Trust XIV, 5.63% to 2012, FRN to 2049 | | $ | 1,840,000 | | $ | 717,311 |
| BNP Paribas, 5.186% to 2015, FRN to 2049 (n) | | | 226,000 | | | 117,369 |
| BNP Paribas, 7.195% to 2037, FRN to 2049 (n) | | | 600,000 | | | 388,950 |
| Credit Suisse New York, 5.5%, 2014 | | | 650,000 | | | 651,668 |
| Goldman Sachs Group, Inc., 6%, 2014 | | | 450,000 | | | 448,268 |
| Goldman Sachs Group, Inc., 7.5%, 2019 | | | 314,000 | | | 322,203 |
| Merrill Lynch & Co., Inc., 6.4%, 2017 | | | 400,000 | | | 325,403 |
| Morgan Stanley, 6.75%, 2011 | | | 780,000 | | | 797,300 |
| Natixis S.A., 10% to 2018, FRN to 2049 (n) | | | 820,000 | | | 336,348 |
| Royal Bank of Scotland Group PLC, 9.118%, 2049 | | | 857,000 | | | 629,895 |
| UniCredito Italiano Capital Trust II, 9.2% to 2010, FRN to 2049 (n) | | | 1,187,000 | | | 558,009 |
| | | | | | |
| | | | | | $ | 5,292,724 |
| Medical & Health Technology & Services - 3.6% | | | | | | |
| Biomet, Inc., 10%, 2017 | | $ | 350,000 | | $ | 364,000 |
| Biomet, Inc., 11.625%, 2017 | | | 290,000 | | | 281,300 |
| Cardinal Health, Inc., 5.8%, 2016 | | | 840,000 | | | 781,832 |
| Community Health Systems, Inc., 8.875%, 2015 | | | 720,000 | | | 716,400 |
| Cooper Cos., Inc., 7.125%, 2015 | | | 265,000 | | | 247,775 |
| DaVita, Inc., 6.625%, 2013 | | | 159,000 | | | 156,218 |
| DaVita, Inc., 7.25%, 2015 | | | 753,000 | | | 736,058 |
| Fresenius Medical Care AG & Co. KGaA, 9%, 2015 (n) | | | 185,000 | | | 196,100 |
| HCA, Inc., 6.375%, 2015 | | | 715,000 | | | 564,850 |
| HCA, Inc., 9.25%, 2016 | | | 855,000 | | | 846,450 |
| HCA, Inc., 8.5%, 2019 (z) | | | 205,000 | | | 206,281 |
| Hospira, Inc., 5.55%, 2012 | | | 450,000 | | | 444,848 |
| Hospira, Inc., 6.05%, 2017 | | | 410,000 | | | 367,438 |
| McKesson Corp., 5.7%, 2017 | | | 370,000 | | | 360,582 |
| Owens & Minor, Inc., 6.35%, 2016 | | | 710,000 | | | 635,776 |
| Psychiatric Solutions, Inc., 7.75%, 2015 | | | 210,000 | | | 192,150 |
| U.S. Oncology, Inc., 10.75%, 2014 | | | 390,000 | | | 361,725 |
| Universal Hospital Services, Inc., 8.5%, 2015 (p) | | | 305,000 | | | 283,650 |
| Universal Hospital Services, Inc., FRN, 5.943%, 2015 | | | 90,000 | | | 69,075 |
| VWR Funding, Inc., 10.25%, 2015 (p) | | | 265,000 | | | 192,788 |
| | | | | | |
| | | | | | $ | 8,005,296 |
14
Portfolio of Investments (unaudited) – continued
| | | | | | |
| Issuer | | Shares/Par | | Value ($) |
| | | | | | |
| Bonds - continued | | | | | | |
| Metals & Mining - 1.3% | | | | | | |
| Arch Western Finance LLC, 6.75%, 2013 | | $ | 345,000 | | $ | 301,013 |
| BHP Billiton Finance Ltd., 6.5%, 2019 | | | 280,000 | | | 304,128 |
| FMG Finance Ltd., 10.625%, 2016 (n) | | | 540,000 | | | 472,500 |
| Freeport-McMoRan Copper & Gold, Inc., 8.375%, 2017 | | | 850,000 | | | 833,000 |
| Freeport-McMoRan Copper & Gold, Inc., FRN, 4.995%, 2015 | | | 160,000 | | | 140,400 |
| Peabody Energy Corp., 7.375%, 2016 | | | 20,000 | | | 19,550 |
| Peabody Energy Corp., “B”, 6.875%, 2013 | | | 665,000 | | | 651,700 |
| Rio Tinto Finance USA Ltd., 5.875%, 2013 | | | 205,000 | | | 193,305 |
| | | | | | |
| | | | | | $ | 2,915,596 |
| Mortgage Backed - 5.0% | | | | | | |
| Fannie Mae, 5.5%, 2019 - 2035 | | $ | 7,579,158 | | $ | 7,894,521 |
| Fannie Mae, 6.5%, 2031 | | | 223,129 | | | 240,563 |
| Fannie Mae, 6%, 2034 (f) | | | 2,755,141 | | | 2,903,497 |
| | | | | | |
| | | | | | $ | 11,038,581 |
| Municipals - 0.3% | | | | | | |
| California Build America, 7.55%, 2039 | | $ | 720,000 | | $ | 750,708 |
| | |
| Natural Gas - Distribution - 0.3% | | | | | | |
| AmeriGas Partners LP, 7.125%, 2016 | | $ | 385,000 | | $ | 372,488 |
| Inergy LP, 6.875%, 2014 | | | 335,000 | | | 314,900 |
| | | | | | |
| | | | | | $ | 687,388 |
| Natural Gas - Pipeline - 2.7% | | | | | | |
| Atlas Pipeline Partners LP, 8.125%, 2015 | | $ | 300,000 | | $ | 181,500 |
| Atlas Pipeline Partners LP, 8.75%, 2018 | | | 270,000 | | | 164,700 |
| CenterPoint Energy, Inc., 7.875%, 2013 | | | 1,096,000 | | | 1,149,411 |
| Deutsche Bank (El Paso Performance-Linked Trust, CLN), 7.75%, 2011 (n) | | | 695,000 | | | 689,729 |
| El Paso Corp., 8.25%, 2016 | | | 275,000 | | | 268,125 |
| El Paso Corp., 7.25%, 2018 | | | 280,000 | | | 255,500 |
| Energy Transfer Partners LP, 8.5%, 2014 | | | 93,000 | | | 100,382 |
| Kinder Morgan Energy Partners LP, 6%, 2017 | | | 830,000 | | | 782,775 |
| Kinder Morgan Finance Corp., 5.35%, 2011 | | | 1,516,000 | | | 1,474,310 |
| Spectra Energy Capital LLC, 8%, 2019 | | | 679,000 | | | 672,310 |
| Williams Partners LP, 7.25%, 2017 | | | 300,000 | | | 271,500 |
| | | | | | |
| | | | | | $ | 6,010,242 |
| Network & Telecom - 3.4% | | | | | | |
| AT&T, Inc., 5.8%, 2019 | | $ | 660,000 | | $ | 671,062 |
| Cincinnati Bell, Inc., 8.375%, 2014 | | | 535,000 | | | 528,313 |
| Citizens Communications Co., 9.25%, 2011 | | | 768,000 | | | 808,320 |
15
Portfolio of Investments (unaudited) – continued
| | | | | | |
| Issuer | | Shares/Par | | Value ($) |
| | | | | | |
| Bonds - continued | | | | | | |
| Network & Telecom - continued | | | | | | |
| Deutsche Telekom International Finance B.V., 8.5%, 2010 | | $ | 543,000 | | $ | 570,802 |
| Nordic Telephone Co. Holdings, 8.875%, 2016 (n) | | | 465,000 | | | 448,725 |
| Qwest Communications International, Inc., 7.25%, 2011 | | | 710,000 | | | 694,025 |
| Qwest Corp., 8.875%, 2012 | | | 290,000 | | | 294,350 |
| Qwest Corp., 7.5%, 2014 | | | 560,000 | | | 540,400 |
| Telecom Italia Capital, 4.875%, 2010 | | | 248,000 | | | 246,330 |
| Telefonica Europe B.V., 7.75%, 2010 | | | 1,090,000 | | | 1,144,656 |
| Telemar Norte Leste S.A., 9.5%, 2019 (z) | | | 532,000 | | | 554,610 |
| Verizon Communications, Inc., 8.75%, 2018 | | | 690,000 | | | 824,441 |
| Windstream Corp., 8.625%, 2016 | | | 300,000 | | | 298,500 |
| | | | | | |
| | | | | | $ | 7,624,534 |
| Oil Services - 0.4% | | | | | | |
| Smith International, Inc., 9.75%, 2019 | | $ | 800,000 | | $ | 845,500 |
| | |
| Oils - 0.4% | | | | | | |
| Premcor Refining Group, Inc., 7.5%, 2015 | | $ | 813,000 | | $ | 808,389 |
| | |
| Other Banks & Diversified Financials - 1.3% | | | | | | |
| American Express Centurion Bank, 5.2%, 2010 | | $ | 840,000 | | $ | 807,657 |
| Bosphorus Financial Services Ltd., FRN, 3.034%, 2012 (z) | | | 600,000 | | | 518,420 |
| Resona Bank Ltd., 5.85% to 2016, FRN to 2049 (n) | | | 246,000 | | | 136,924 |
| Swedbank AB, 9% to 2010, FRN to 2049 (n) | | | 800,000 | | | 308,000 |
| UBS Preferred Funding Trust V, 6.243% to 2016, FRN to 2049 | | | 1,120,000 | | | 459,200 |
| UFJ Finance Aruba AEC, 6.75%, 2013 | | | 648,000 | | | 658,949 |
| | | | | | |
| | | | | | $ | 2,889,150 |
| Pharmaceuticals - 1.5% | | | | | | |
| Pfizer, Inc., 6.2%, 2019 | | $ | 1,280,000 | | $ | 1,375,670 |
| Roche Holdings, Inc., 6%, 2019 (n) | | | 1,590,000 | | | 1,653,209 |
| Teva Pharmaceutical Finance LLC, 5.55%, 2016 | | | 359,000 | | | 368,826 |
| | | | | | |
| | | | | | $ | 3,397,705 |
| Pollution Control - 0.2% | | | | | | |
| Allied Waste North America, Inc., 7.125%, 2016 | | $ | 375,000 | | $ | 367,500 |
| | |
| Precious Metals & Minerals - 0.2% | | | | | | |
| Alrosa Finance S.A., 8.875%, 2014 | | $ | 488,000 | | $ | 357,460 |
| | |
| Printing & Publishing - 0.5% | | | | | | |
| American Media Operations, Inc., 9%, 2013 (p)(z) | | $ | 24,903 | | $ | 11,393 |
| American Media Operations, Inc., 14%, 2013 (p)(z) | | | 260,008 | | | 112,923 |
| Dex Media, Inc., 9.875%, 2013 (d) | | | 849,000 | | | 241,965 |
16
Portfolio of Investments (unaudited) – continued
| | | | | | |
| Issuer | | Shares/Par | | Value ($) |
| | | | | | |
| Bonds - continued | | | | | | |
| Printing & Publishing - continued | | | | | | |
| Idearc, Inc., 8%, 2016 (d) | | $ | 183,000 | | $ | 2,974 |
| Nielsen Finance LLC, 10%, 2014 | | | 330,000 | | | 310,200 |
| Nielsen Finance LLC, 11.5%, 2016 (z) | | | 100,000 | | | 94,500 |
| Nielsen Finance LLC, 0% to 2011, 12.5% to 2016 | | | 533,000 | | | 293,150 |
| Quebecor World, Inc., 6.125%, 2013 (d) | | | 210,000 | | | 3,938 |
| Tribune Co., 5.25%, 2015 (d) | | | 280,000 | | | 11,900 |
| | | | | | |
| | | | | | $ | 1,082,943 |
| Railroad & Shipping - 0.1% | | | | | | |
| Kansas City Southern Railway, 8%, 2015 | | $ | 140,000 | | $ | 121,100 |
| Panama Canal Railway Co., 7%, 2026 (n) | | | 337,000 | | | 192,090 |
| | | | | | |
| | | | | | $ | 313,190 |
| Real Estate - 0.7% | | | | | | |
| Simon Property Group, Inc., REIT, 6.1%, 2016 | | $ | 1,790,000 | | $ | 1,547,369 |
| | |
| Retailers - 1.0% | | | | | | |
| Couche-Tard, Inc., 7.5%, 2013 | | $ | 490,000 | | $ | 485,100 |
| Limited Brands, Inc., 5.25%, 2014 | | | 671,000 | | | 542,573 |
| Macy’s Retail Holdings, Inc., 5.75%, 2014 | | | 200,000 | | | 170,017 |
| Macy’s Retail Holdings, Inc., 7.875%, 2015 | | | 860,000 | | | 809,115 |
| Rite Aid Corp., 7.5%, 2017 | | | 200,000 | | | 148,500 |
| Sally Beauty Holdings, Inc., 10.5%, 2016 | | | 175,000 | | | 168,875 |
| | | | | | |
| | | | | | $ | 2,324,180 |
| Specialty Stores - 0.1% | | | | | | |
| Payless ShoeSource, Inc., 8.25%, 2013 | | $ | 310,000 | | $ | 257,300 |
| | |
| Supermarkets - 0.6% | | | | | | |
| Delhaize Group, 5.875%, 2014 | | $ | 740,000 | | $ | 750,137 |
| Safeway, Inc., 4.95%, 2010 | | | 470,000 | | | 481,531 |
| SUPERVALU, Inc., 8%, 2016 | | | 60,000 | | | 58,200 |
| | | | | | |
| | | | | | $ | 1,289,868 |
| Telecommunications - Wireless - 1.7% | | | | | | |
| Charter Communications, Inc., 7.75%, 2017 (z) | | $ | 125,000 | | $ | 126,250 |
| Crown Castle International Corp., 9%, 2015 | | | 175,000 | | | 178,500 |
| MetroPCS Wireless, Inc., 9.25%, 2014 | | | 345,000 | | | 345,431 |
| Nextel Communications, Inc., 6.875%, 2013 | | | 170,000 | | | 130,475 |
| Rogers Cable, Inc., 5.5%, 2014 | | | 659,000 | | | 662,547 |
| Sprint Nextel Corp., 8.375%, 2012 | | | 610,000 | | | 584,838 |
| Sprint Nextel Corp., 8.75%, 2032 | | | 155,000 | | | 117,800 |
17
Portfolio of Investments (unaudited) – continued
| | | | | | |
| Issuer | | Shares/Par | | Value ($) |
| | | | | | |
| Bonds - continued | | | | | | |
| Telecommunications - Wireless - continued | | | | | | |
| Vodafone Group PLC, 5.375%, 2015 | | $ | 1,080,000 | | $ | 1,079,957 |
| Wind Acquisition Finance S.A., 10.75%, 2015 (z) | | | 442,000 | | | 459,680 |
| | | | | | |
| | | | | | $ | 3,685,478 |
| Telephone Services - 0.1% | | | | | | |
| Frontier Communications Corp., 8.25%, 2014 | | $ | 235,000 | | $ | 230,888 |
| | |
| Tobacco - 1.0% | | | | | | |
| Altria Group, Inc., 9.25%, 2019 | | $ | 1,040,000 | | $ | 1,190,887 |
| Reynolds American, Inc., 6.75%, 2017 | | | 1,040,000 | | | 934,754 |
| | | | | | |
| | | | | | $ | 2,125,641 |
| Transportation - 0.3% | | | | | | |
| IIRSA Norte Finance Ltd., 8.75%, 2024 | | $ | 561,751 | | $ | 421,313 |
| Peru Enhanced Pass-Through Trust, 0%, 2018 (n) | | | 242,200 | | | 146,531 |
| | | | | | |
| | | | | | $ | 567,844 |
| Transportation - Services - 0.1% | | | | | | |
| Hertz Corp., 8.875%, 2014 | | $ | 440,000 | | $ | 341,000 |
| | |
| U.S. Government Agencies and Equivalents - 0.3% | | | | | | |
| Citigroup, Inc., 2.875%, 2011 (m) | | $ | 660,000 | | $ | 678,139 |
| | |
| Utilities - Electric Power - 4.5% | | | | | | |
| AES Corp., 8%, 2017 | | $ | 520,000 | | $ | 475,800 |
| Beaver Valley Funding Corp., 9%, 2017 | | | 1,545,000 | | | 1,518,380 |
| Consumers Energy Co., 6.7%, 2019 | | | 190,000 | | | 200,524 |
| Dynegy Holdings, Inc., 7.5%, 2015 | | | 300,000 | | | 235,500 |
| Dynegy Holdings, Inc., 7.75%, 2019 | | | 170,000 | | | 124,950 |
| Edison Mission Energy, 7%, 2017 | | | 1,420,000 | | | 1,072,100 |
| Enersis S.A., 7.375%, 2014 | | | 191,000 | | | 201,495 |
| FirstEnergy Corp., 6.45%, 2011 | | | 857,000 | | | 870,405 |
| HQI Transelec Chile S.A., 7.875%, 2011 | | | 1,051,000 | | | 1,089,234 |
| Mirant Americas Generation LLC, 8.3%, 2011 | | | 100,000 | | | 100,000 |
| Mirant North America LLC, 7.375%, 2013 | | | 385,000 | | | 370,563 |
| NRG Energy, Inc., 7.375%, 2016 | | | 1,170,000 | | | 1,126,125 |
| Pacific Gas & Electric Co., 4.2%, 2011 | | | 630,000 | | | 646,393 |
| Progress Energy, Inc., 6.05%, 2014 | | | 610,000 | | | 636,200 |
| Texas Competitive Electric Holdings, LLC, 10.25%, 2015 | | | 1,405,000 | | | 797,338 |
| Waterford 3 Funding Corp., 8.09%, 2017 | | | 481,685 | | | 475,567 |
| | | | | | |
| | | | | | $ | 9,940,574 |
| Total Bonds (Identified Cost, $233,359,246) | | | | | $ | 205,967,620 |
18
Portfolio of Investments (unaudited) – continued
| | | | | | |
| Floating Rate Loans (g)(r) - 2.4% | | | | | | |
| Issuer | | Shares/Par | | Value ($) |
| | | | | | |
| Aerospace - 0.1% | | | | | | |
| Hawker Beechcraft Acquisition Co., Letter of Credit, 3.22%, 2014 | | $ | 26,430 | | $ | 13,582 |
| Hawker Beechcraft Acquisition Co., Term Loan B, 2.68%, 2014 | | | 597,059 | | | 306,822 |
| | | | | | |
| | | | | | $ | 320,404 |
| Automotive - 0.6% | | | | | | |
| Accuride Corp., Term Loan B, 6.25%, 2012 | | $ | 49,117 | | $ | 29,378 |
| Allison Transmission, Inc., Term Loan B, 3.21%, 2014 | | | 330,027 | | | 235,419 |
| Federal Mogul Corp., Term Loan B, 2.42%, 2015 | | | 352,979 | | | 197,227 |
| Ford Motor Co., Term Loan B, 3.68%, 2013 | | | 184,401 | | | 115,628 |
| General Motors Corp., Term Loan B, 8%, 2013 | | | 543,125 | | | 351,130 |
| Goodyear Tire & Rubber Co., Second Lien Term Loan, 2.19%, 2014 | | | 573,442 | | | 477,595 |
| | | | | | |
| | | | | | $ | 1,406,377 |
| Broadcasting - 0.1% | | | | | | |
| Gray Television, Inc., Term Loan B, 4%, 2014 (o) | | $ | 185,488 | | $ | 77,441 |
| Young Broadcasting, Inc., Term Loan B, 4.75%, 2012 (d) | | | 249,763 | | | 94,598 |
| Young Broadcasting, Inc., Term Loan B-1, 4.75%, 2012 (d) | | | 133,079 | | | 50,404 |
| | | | | | |
| | | | | | $ | 222,443 |
| Building - 0.0% | | | | | | |
| Building Materials Corp., Term Loan B, 3.25%, 2014 | | $ | 55,813 | | $ | 41,604 |
| | |
| Business Services - 0.2% | | | | | | |
| First Data Corp., Term Loan B-1, 3.18%, 2014 | | $ | 464,147 | | $ | 338,015 |
| | |
| Cable TV - 0.3% | | | | | | |
| Charter Communications Operating LLC, Term Loan B, 5.59%, 2014 | | $ | 246,061 | | $ | 206,760 |
| CSC Holdings, Inc., Term Loan B, 2.19%, 2013 | �� | | 367,087 | | | 338,179 |
| | | | | | |
| | | | | | $ | 544,939 |
| Electronics - 0.0% | | | | | | |
| Freescale Semiconductor, Inc., Term Loan B, 2.25%, 2013 | | $ | 155,531 | | $ | 89,965 |
| | |
| Forest & Paper Products - 0.1% | | | | | | |
| Abitibi-Consolidated, Inc., Term Loan, 11.5%, 2010 (d) | | $ | 130,082 | | $ | 100,597 |
| | |
| Gaming & Lodging - 0.1% | | | | | | |
| Green Valley Ranch Gaming LLC, Second Lien Term Loan, 3.71%, 2014 | | $ | 310,737 | | $ | 18,644 |
| Harrahs Entertainment, Inc., Term Loan B, 2015 (o) | | | 159,291 | | | 112,831 |
| MGM MIRAGE, Term Loan B, 2011 (o) | | | 124,051 | | | 76,369 |
| | | | | | |
| | | | | | $ | 207,844 |
19
Portfolio of Investments (unaudited) – continued
| | | | | | |
| Issuer | | Shares/Par | | Value ($) |
| | | | | | |
| Floating Rate Loans (g)(r) - continued | | | | | | |
| Industrial - 0.0% | | | | | | |
| Oshkosh Truck, Term Loan B, 7.24%, 2013 | | $ | 53,617 | | $ | 43,832 |
| | |
| Medical & Health Technology & Services - 0.0% | | | | | | |
| Community Health Systems, Inc., Term Loan, 2.67%, 2014 | | $ | 74,421 | | $ | 66,987 |
| Community Health Systems, Inc., Term Loan B, 3.44%, 2014 | | | 3,797 | | | 3,417 |
| | | | | | |
| | | | | | $ | 70,404 |
| Printing & Publishing - 0.2% | | | | | | |
| Nielsen Co., Term Loan, 2.46%, 2013 | | $ | 279,038 | | $ | 235,692 |
| Tribune Co., Term Loan B, 5.25%, 2014 | | | 540,238 | | | 134,384 |
| | | | | | |
| | | | | | $ | 370,076 |
| Specialty Chemicals - 0.1% | | | | | | |
LyondellBasell Dutch Tranche Revolving Credit Loan,
5.75%, 2014 (o) | | $ | 5,238 | | $ | 1,737 |
| LyondellBasell Dutch Tranche Term Loan A, 5.75%, 2014 (o) | | | 12,478 | | | 4,139 |
| LyondellBasell German Term Loan B-1, 6%, 2014 (o) | | | 15,037 | | | 4,987 |
| LyondellBasell German Term Loan B-2, 6%, 2014 (o) | | | 15,037 | | | 4,987 |
| LyondellBasell German Term Loan B-3, 6%, 2014 (o) | | | 15,037 | | | 4,987 |
| LyondellBasell Revolving Credit Loan, 5.75%, 2014 (o) | | | 19,642 | | | 6,515 |
| LyondellBasell Second Priority DIP Term Loan, 5.94%, 2009 | | | 61,782 | | | 47,379 |
| LyondellBasell Super Priority DIP Term Loan, 2014 (q) | | | 61,813 | | | 62,500 |
| LyondellBasell Term Loan B-1, 7%, 2014 (o) | | | 65,252 | | | 21,642 |
| LyondellBasell Term Loan B-2, 7%, 2014 (o) | | | 65,252 | | | 21,642 |
| LyondellBasell Term Loan B-3, 7%, 2014 (o) | | | 65,252 | | | 21,642 |
| LyondellBasell U.S. Tranche Term Loan A, 5.75%, 2014 (o) | | | 37,424 | | | 12,412 |
| | | | | | |
| | | | | | $ | 214,569 |
| Specialty Stores - 0.1% | | | | | | |
| Michaels Stores, Inc., Term Loan B, 2.69%, 2013 | | $ | 220,630 | | $ | 151,289 |
| | |
| Utilities - Electric Power - 0.5% | | | | | | |
| Calpine Corp., Term Loan, 4.09%, 2014 | | $ | 392,069 | | $ | 333,013 |
| NRG Energy, Inc., Letter of Credit, 1.12%, 2013 | | | 106,904 | | | 99,198 |
| NRG Energy, Inc., Term Loan B, 2.72%, 2013 | | | 200,627 | | | 186,165 |
| TXU Corp. Term Loan B-3, 3.96%, 2014 | | | 663,470 | | | 446,787 |
| | | | | | |
| | | | | | $ | 1,065,163 |
| Total Floating Rate Loans (Identified Cost, $6,786,519) | | | | | $ | 5,187,521 |
| | |
| Common Stocks - 0.0% | | | | | | |
| Printing & Publishing - 0.0% | | | | | | |
| American Media, Inc., (Identified Cost, $10,199) | | | 4,766 | | $ | 6,387 |
20
Portfolio of Investments (unaudited) – continued
| | | | | | |
| Preferred Stocks - 0.0% | | | | | | |
| Issuer | | Shares/Par | | Value ($) | |
| | | | | | |
| Automotive - 0.0% | | | | | | |
| Preferred Blocker, Inc., 7% (z) (Identified Cost, $128,590) | | 167 | | $ | 50,100 | |
| | |
| Rights - 0.0% | | | | | | |
| Emerging Market Sovereign - 0.0% | | | | | | |
Banco Central del Uruguay, Value Recovery Rights,
Expiring January 2021 (a) (Identified Cost, $0) | | 1,250,000 | | $ | 0 | |
| | |
| Money Market Funds (v) - 6.4% | | | | | | |
MFS Institutional Money Market Portfolio, 0.23%,
at Cost and Net Asset Value | | 14,267,810 | | $ | 14,267,810 | |
| Total Investments (Identified Cost, $254,552,364) | | | | $ | 225,479,438 | |
| | |
| Other Assets, Less Liabilities - (1.5)% | | | | | (3,363,075 | ) |
| Net Assets - 100.0% | | | | $ | 222,116,363 | |
| (a) | Non-income producing security. |
| (d) | Non-income producing security – in default. |
| (f) | All or a portion of the security has been segregated as collateral for open futures contracts. |
| (g) | The rate shown represents a weighted average coupon rate on settled positions at period end, unless otherwise indicated. |
| (i) | Interest only security for which the fund receives interest on notional principal (Par amount). Par amount shown is the notional principal and does not reflect the cost of the security. |
| (m) | The debt is guaranteed under the Federal Deposit Insurance Corporation’s (FDIC) Temporary Liquidity Guarantee Program and is backed by the full faith and credit of the United States. The expiration date of the FDIC’s guarantee is the earlier of the maturity date of the debt or June 30, 2012. |
| (n) | Securities exempt from registration under Rule 144A of the Securities Act of 1933. These securities may be sold in the ordinary course of business in transactions exempt from registration, normally to qualified institutional buyers. At period end, the aggregate value of these securities was $20,304,983, representing 9.1% of net assets. |
| (o) | All or a portion of this position has not settled. Upon settlement date, interest rates for unsettled amounts will be determined. The rate shown represents the weighted average coupon rate for settled amounts. |
| (p) | Payment-in-kind security. |
| (q) | All or a portion of this position represents an unfunded loan commitment. The rate shown represents a weighted average coupon rate on the full position, including the unfunded loan commitment which has no current coupon rate. |
| (r) | Remaining maturities of floating rate loans may be less than stated maturities shown as a result of contractual or optional prepayments by the borrower. Such prepayments cannot be predicted with certainty. These loans may be subject to restrictions on resale. Floating rate loans generally have rates of interest which are determined periodically by reference to a base lending rate plus a premium. |
| (v) | Underlying fund that is available only to investment companies managed by MFS. The rate quoted is the annualized seven-day yield of the fund at period end. |
21
Portfolio of Investments (unaudited) – continued
| (z) | Restricted securities are not registered under the Securities Act of 1933 and are subject to legal restrictions on resale. These securities generally may be resold in transactions exempt from registration or to the public if the securities are subsequently registered. Disposal of these securities may involve time-consuming negotiations and prompt sale at an acceptable price may be difficult. The fund holds the following restricted securities: |
| | | | | | |
| Restricted Securities | | Acquisition
Date | | Cost | | Current
Market
Value |
| ARCap REIT, Inc., CDO, “H”, 6.1%, 2045 | | 9/21/04 | | $787,233 | | $54,000 |
| American Media Operations, Inc., 9%, 2013 | | 1/30/09 | | 14,972 | | 11,393 |
| American Media Operations, Inc., 14%, 2013 | | 1/30/09 | | 128,514 | | 112,923 |
| Anthracite Ltd., CDO, 6%, 2037 | | 5/14/02 | | 1,021,047 | | 96,000 |
| Bayview Financial Revolving Mortgage Loan Trust, FRN, 1.235%, 2040 | | 3/01/06 | | 674,286 | | 296,686 |
| Bosphorus Financial Services Ltd., FRN, 3.034%, 2012 | | 3/08/05 | | 600,000 | | 518,420 |
| Brazilian Merchant Voucher Receivables Ltd., 5.911%, 2011 | | 3/08/07 | | 672,758 | | 644,146 |
| Charter Communications, Inc., 7.75%, 2017 | | 4/15/09 | | 121,366 | | 126,250 |
| Chase Commercial Mortgage Securities Corp., 6.6%, 2029 | | 6/07/00 | | 1,221,983 | | 1,256,344 |
| DLJ Commercial Mortgage Corp., 6.04%, 2031 | | 7/23/04 | | 542,437 | | 490,029 |
| Emirate of Abu Dhabi, 5.5%, 2014 | | 4/01/09 | | 145,056 | | 149,267 |
| Emirate of Abu Dhabi, 6.75%, 2019 | | 4/01/09 | | 315,214 | | 320,676 |
| Falcon Franchise Loan LLC, 6.5%, 2014 | | 7/15/05 | | 647,358 | | 371,000 |
| Falcon Franchise Loan LLC, FRN, 2.713%, 2023 | | 1/18/02 | | 267,684 | | 220,237 |
| Falcon Franchise Loan LLC, FRN, 3.38%, 2025 | | 1/29/03 | | 372,308 | | 232,599 |
| Firekeepers Development Authority, 13.875%, 2015 | | 4/22/08 | | 253,430 | | 187,200 |
| GMAC LLC, 6.875%, 2011 | | 12/29/08 | | 362,758 | | 376,710 |
| GMAC LLC, 7%, 2012 | | 1/23/09 | | 133,972 | | 151,700 |
| GMAC LLC, 6.75%, 2014 | | 2/09/09 | | 169,030 | | 188,700 |
| GMAC LLC, 8%, 2031 | | 12/29/08 | | 212,074 | | 231,000 |
| GMAC LLC, FRN, 6.02%, 2033 | | 11/17/00 | | 1,674,072 | | 1,323,401 |
| HCA, Inc., 8.5%, 2019 | | 4/15/02 | | 198,358 | | 206,281 |
| Hana Bank, 6.5%, 2012 | | 4/02/09 | | 523,905 | | 529,574 |
| Harrah’s Operating Co., Inc., 10%, 2018 | | 2/13/08 | | 863,176 | | 369,420 |
| ING Bank N.V., 3.9%, 2014 | | 3/12/09 | | 1,057,998 | | 1,052,531 |
| Industrial Bank of Korea, 7.125%, 2014 | | 4/16/09 | | 598,632 | | 592,245 |
| LBI Media, Inc., 8.5%, 2017 | | 7/18/07 | | 187,243 | | 58,900 |
| LeasePlan Corp. N.V., 3%, 2012 | | 4/28/09 | | 469,873 | | 469,817 |
| Lennar Corp., 12.25%, 2017 | | 4/23/09 | | 137,338 | | 142,100 |
| Lloyds TSB Bank PLC, FRN, 2.207%, 2012 | | 3/25/09 | | 1,000,000 | | 997,504 |
| Local TV Finance LLC, 9.25%, 2015 | | 11/09/07-12/11/07 | | 439,272 | | 34,631 |
| Morgan Stanley Capital I, Inc., FRN, 1.31%, 2039 | | 7/20/04 | | 357,427 | | 223,512 |
22
Portfolio of Investments (unaudited) – continued
| | | | | | |
| Restricted Securities (continued) | | Acquisition
Date | | Cost | | Current
Market
Value |
| Mubadala Development Co., 5.75%, 2014 | | 4/30/09 | | $1,487,265 | | $1,487,265 |
| Mubadala Development Co., 7.625%, 2019 | | 4/30/09 | | 973,917 | | 973,917 |
| Nexstar Broadcasting Group, Inc., 5.125%, 2014 | | 3/31/09 | | 304,608 | | 107,329 |
| Nielsen Finance LLC, 11.5%, 2016 | | 4/24/09 | | 92,173 | | 94,500 |
| Preferred Blocker, Inc., 7% | | 12/29/08 | | 128,590 | | 50,100 |
| Prudential Securities Secured Financing Corp., FRN, 7.285%, 2013 | | 12/06/04 | | 923,597 | | 716,919 |
| Salomon Brothers Mortgage Securities, Inc., FRN, 7.146%, 2032 | | 1/07/05 | | 1,968,526 | | 1,739,593 |
| Societe Financement de l’ Economie, 3.375%, 2014 | | 4/23/09 | | 1,209,302 | | 1,218,109 |
| State of Qatar, 5.15%, 2014 | | 4/02/09 | | 537,516 | | 550,105 |
| State of Qatar, 6.55%, 2019 | | 4/02/09 | | 361,851 | | 374,798 |
| Swedbank AB, 2.8%, 2012 | | 4/14/09 | | 301,045 | | 299,249 |
| Telemar Norte Leste S.A., 9.5%, 2019 | | 4/16/09 | | 537,914 | | 554,610 |
| USI Holdings Corp., 9.75%, 2015 | | 4/26/07-9/13/07 | | 322,535 | | 153,600 |
| Wind Acquisition Finance S.A., 10.75%, 2015 | | 3/19/08 | | 442,996 | | 459,680 |
| Total Restricted Securities | | | | | | $20,814,970 |
| % of Net Assets | | | | | | 9.4% |
The following abbreviations are used in this report and are defined:
| CDO | | Collateralized Debt Obligation |
| CLO | | Collateralized Loan Obligation |
| FRN | | Floating Rate Note. Interest rate resets periodically and may not be the rate reported at period end. |
| PLC | | Public Limited Company |
| REIT | | Real Estate Investment Trust |
Abbreviations indicate amounts shown in currencies other than the U.S. dollar. All amounts are stated in U.S. dollars unless otherwise indicated. A list of abbreviations is shown below:
23
Portfolio of Investments (unaudited) – continued
Derivative Contracts at 4/30/09
Forward Foreign Currency Exchange Contracts at 4/30/09
| | | | | | | | | | | | | | | |
| Type | | Currency | | Counterparty | | Contracts
to
Deliver/
Receive | | Settlement
Date Range | | In
Exchange
for | | Contracts
at Value | | Net
Unrealized
Appreciation
(Depreciation) | |
| Appreciation—Asset Derivatives | | | | | | | |
| BUY | | AUD | | UBS AG | | 866,158 | | 5/05/09 | | $626,401 | | $629,437 | | $3,036 | |
| BUY | | DKK | | UBS AG | | 1,929,429 | | 5/05/09 | | 337,473 | | 342,703 | | 5,230 | |
| SELL | | DKK | | Citibank N.A. | | 7,334 | | 5/05/09 | | 1,306 | | 1,302 | | 4 | |
| BUY | | EUR | | UBS AG | | 20,893 | | 5/20/09 | | 27,418 | | 27,643 | | 225 | |
| SELL | | EUR | | Goldman Sachs International | | 380,405 | | 5/20/09 | | 505,000 | | 503,294 | | 1,706 | |
| SELL | | JPY | | JPMorgan Chase Bank | | 567,629,213 | | 5/18/09 | | 6,244,546 | | 5,756,918 | | 487,628 | |
| | | | | | | | | | | | | | | |
| | | | | | | | | | | | | | $497,829 | |
| | | | | | | | | | | | | | | |
| | | |
| Depreciation—Liability Derivatives | | | | | | | |
| SELL | | AUD | | UBS AG | | 1,732,315 | | 5/05/09-7/01/09 | | $1,177,689 | | $1,256,486 | | $(78,797 | ) |
| SELL | | CAD | | Citibank N.A. | | 95,842 | | 5/19/09 | | 77,685 | | 80,320 | | (2,635 | ) |
| SELL | | CAD | | UBS AG | | 1,704,823 | | 5/19/09 | | 1,351,334 | | 1,428,722 | | (77,388 | ) |
| SELL | | DKK | | Barclays Bank London | | 1,922,095 | | 5/05/09 | | 323,825 | | 341,400 | | (17,575 | ) |
| BUY | | EUR | | UBS AG | | 396,267 | | 5/20/09 | | 540,453 | | 524,280 | | (16,173 | ) |
| SELL | | EUR | | Barclays Bank London | | 4,249,553 | | 5/20/09 | | 5,477,674 | | 5,622,355 | | (144,681 | ) |
| SELL | | EUR | | Deutsche Bank | | 124,718 | | 5/20/09 | | 157,093 | | 165,008 | | (7,915 | ) |
| SELL | | EUR | | JPMorgan Chase Bank | | 4,249,553 | | 5/20/09 | | 5,477,780 | | 5,622,357 | | (144,577 | ) |
| SELL | | EUR | | UBS AG | | 2,933,747 | | 5/20/09 | | 3,783,306 | | 3,881,484 | | (98,178 | ) |
| SELL | | GBP | | Barclays Bank London | | 945,402 | | 5/18/09 | | 1,347,198 | | 1,398,581 | | (51,383 | ) |
| SELL | | GBP | | Citibank N.A. | | 223,568 | | 5/18/09 | | 330,000 | | 330,736 | | (736 | ) |
| SELL | | GBP | | Deutsche Bank | | 954,402 | | 5/18/09 | | 1,348,063 | | 1,398,581 | | (50,518 | ) |
| BUY | | JPY | | UBS AG | | 635,704,067 | | 5/19/09 | | 6,930,883 | | 6,447,431 | | (483,452 | ) |
| SELL | | JPY | | Goldman Sachs | | 246,688,050 | | 5/19/09 | | 2,450,000 | | 2,501,957 | | (51,957 | ) |
| SELL | | SEK | | UBS AG | | 3,500,909 | | 6/29/09 | | 431,234 | | 435,196 | | (3,962 | ) |
| | | | | | | | | | | | | | | |
| | | | | | | | | | | | | | $(1,229,927 | ) |
| | | | | | | | | | | | | | | |
Futures Contracts Outstanding at 4/30/09
| | | | | | | | | | |
| Description | | Currency | | Contracts | | Value | | Expiration
Date | | Unrealized
Appreciation
(Depreciation) |
| Asset Derivatives | | | | | | | | | | |
| Interest Rate Futures | | | | | | | | | | |
| U.S. Treasury Note 5 yr (Long) | | USD | | 59 | | $6,911,297 | | Jun-09 | | $15,004 |
24
Portfolio of Investments (unaudited) – continued
Swap Agreements at 4/30/09
| | | | | | | | | | | | |
| Expiration | | | | Notional
Amount | | Counterparty | | Cash Flows
to Receive | | Cash Flows
to Pay | | Fair Value |
| Asset Derivatives | | | | | | | | |
| Credit Default Swaps | | | | | | | | |
| 9/20/10 | | USD | | 1,130,000 | | Merrill Lynch International | | (1) | | 0.68% (fixed rate) | | $53,383 |
| 3/20/14 | | USD | | 490,000 | | JPMorgan Chase Bank | | (2) | | 1.75% (fixed rate) | | 4,975 |
| 6/20/13 | | USD | | 6,256,000 | | Morgan Stanley Capital Services, Inc. (a) | | (3) | | 5.00% (fixed rate) | | 1,083,016 |
| | | | | | | | | | | | |
| | | | | | | | | | | | $1,141,374 |
| | | | | | | | | | | | |
| Liability Derivatives | | | | | | | | |
| Credit Default Swaps | | | | | | | | |
| 12/20/13 | | USD | | 620,000 | | JPMorgan Chase Bank | | (4) | | 0.78% (fixed rate) | | $(1,261) |
| (1) | Fund, as protection buyer, to receive notional amount upon a defined credit event by Lennar Corp., 5.95%, 3/01/2013. |
| (2) | Fund, as protection buyer, to receive notional amount upon a defined credit event by Weyerhauser Corp., 7.125%, 7/15/2023. |
| (3) | Fund, as protection buyer, to receive notional amount upon a defined credit event by a reference obligation specified in the CDX High Yield Index. |
| (4) | Fund, as protection buyer, to receive notional amount upon a defined credit event by Arrow Electronics Inc., 6.875%, 6/01/2018. |
| (a) | Net unamortized premiums paid by the fund amounted to $348,078. |
At April 30, 2009, the fund had sufficient cash and/or other liquid securities to cover any commitments under these derivative contracts.
See Notes to Financial Statements
25
Financial Statements
STATEMENT OF ASSETS AND LIABILITIES
At 4/30/09 (unaudited)
This statement represents your fund’s balance sheet, which details the assets and liabilities comprising the total value of the fund.
| | | |
| Assets | | | |
Investments- | | | |
Non-affiliated issuers, at value (identified cost, $240,284,554) | | $211,211,628 | |
Underlying funds, at cost and value | | 14,267,810 | |
Total investments, at value (identified cost, $254,552,364) | | $225,479,438 | |
Cash | | 92,300 | |
Receivables for | | | |
Forward foreign currency exchange contracts | | 497,829 | |
Investments sold | | 862,195 | |
Fund shares sold | | 496,797 | |
Interest and dividends | | 3,825,164 | |
Swaps, at value (net unamortized premiums paid, $348,078) | | 1,141,374 | |
Receivable from investment adviser | | 43,773 | |
Other assets | | 2,842 | |
Total assets | | $232,441,712 | |
| Liabilities | | | |
Payables for | | | |
Distributions | | $312,690 | |
Forward foreign currency exchange contracts | | 1,229,927 | |
Daily variation margin on open futures contracts | | 922 | |
Investments purchased | | 8,138,949 | |
Fund shares reacquired | | 479,303 | |
Swaps, at value | | 1,261 | |
Payable to affiliates | | | |
Management fee | | 7,250 | |
Shareholder servicing costs | | 54,551 | |
Distribution and service fees | | 5,577 | |
Administrative services fee | | 279 | |
Payable for independent trustees’ compensation | | 40,734 | |
Accrued expenses and other liabilities | | 53,906 | |
Total liabilities | | $10,325,349 | |
Net assets | | $222,116,363 | |
| Net assets consist of | | | |
Paid-in capital | | $315,889,000 | |
Unrealized appreciation (depreciation) on investments and translation of assets and liabilities in foreign currencies | | (28,993,193 | ) |
Accumulated net realized gain (loss) on investments and foreign currency transactions | | (63,753,382 | ) |
Accumulated distributions in excess of net investment income | | (1,026,062 | ) |
Net assets | | $222,116,363 | |
Shares of beneficial interest outstanding | | 40,145,237 | |
| | | | | | |
| | | Net assets | | Shares
outstanding | | Net asset value
per share (a) |
Class A | | $156,973,037 | | 28,279,598 | | $5.55 |
Class B | | 36,689,737 | | 6,673,224 | | 5.50 |
Class C | | 26,608,191 | | 4,859,777 | | 5.48 |
Class I | | 1,845,398 | | 332,638 | | 5.55 |
On sales of $50,000 or more, the offering price of Class A shares is reduced. A contingent deferred sales charge may be imposed on redemptions of Class A, Class B, and Class C shares.
| (a) | Maximum offering price and redemption price per share were equal to the net asset value for all shares classes, except for Class A, for which the maximum offering price per share was $5.83. |
See Notes to Financial Statements
26
Financial Statements
STATEMENT OF OPERATIONS
Six months ended 4/30/09 (unaudited)
This statement describes how much your fund earned in investment income and accrued in expenses. It also describes any gains and/or losses generated by fund operations.
| | | | | | |
| Net investment income | | | | | | |
Income | | | | | | |
Interest | | $7,273,941 | | | | |
Dividends | | 4,533 | | | | |
Dividends from underlying funds | | 43,243 | | | | |
Total investment income | | | | | $7,321,717 | |
Expenses | | | | | | |
Management fee | | $675,234 | | | | |
Distribution and service fees | | 533,575 | | | | |
Shareholder servicing costs | | 249,800 | | | | |
Administrative services fee | | 25,234 | | | | |
Independent trustees’ compensation | | 5,446 | | | | |
Custodian fee | | 26,350 | | | | |
Shareholder communications | | 19,105 | | | | |
Auditing fees | | 26,764 | | | | |
Legal fees | | 3,580 | | | | |
Miscellaneous | | 38,894 | | | | |
Total expenses | | | | | $1,603,982 | |
Fees paid indirectly | | (3,764 | ) | | | |
Reduction of expenses by investment adviser | | (492,799 | ) | | | |
Net expenses | | | | | $1,107,419 | |
Net investment income | | | | | $6,214,298 | |
Realized and unrealized gain (loss) on investments
and foreign currency transactions | | | | | | |
Realized gain (loss) (identified cost basis) | | | | | | |
Investment transactions | | $(8,548,160 | ) | | | |
Futures contracts | | 497,908 | | | | |
Swap transactions | | 148,411 | | | | |
Foreign currency transactions | | 1,306,013 | | | | |
Net realized gain (loss) on investments
and foreign currency transactions | | | | | $(6,595,828 | ) |
Change in unrealized appreciation (depreciation) | | | | | | |
Investments | | $17,251,734 | | | | |
Futures contracts | | (53,469 | ) | | | |
Swap transactions | | (58,905 | ) | | | |
Translation of assets and liabilities in foreign currencies | | (2,123,578 | ) | | | |
Net unrealized gain (loss) on investments
and foreign currency translation | | | | | $15,015,782 | |
Net realized and unrealized gain (loss) on investments
and foreign currency | | | | | $8,419,954 | |
Change in net assets from operations | | | | | $14,634,252 | |
See Notes to Financial Statements
27
Financial Statements
STATEMENTS OF CHANGES IN NET ASSETS
These statements describe the increases and/or decreases in net assets resulting from operations, any distributions, and any shareholder transactions.
| | | | | | |
| Change in net assets | | Six months ended
4/30/09
(unaudited) | | | Year ended
10/31/08 | |
| From operations | | | | | | |
Net investment income | | $6,214,298 | | | $14,303,078 | |
Net realized gain (loss) on investments and
foreign currency transactions | | (6,595,828 | ) | | (3,414,349 | ) |
Net unrealized gain (loss) on investments and foreign currency translation | | 15,015,782 | | | (44,693,294 | ) |
Change in net assets from operations | | $14,634,252 | | | $(33,804,565 | ) |
| Distributions declared to shareholders | | | | | | |
From net investment income | | $(9,789,302 | ) | | $(15,352,280 | ) |
Change in net assets from fund share transactions | | $6,008,424 | | | $(17,660,200 | ) |
Total change in net assets | | $10,853,374 | | | $(66,817,045 | ) |
| Net assets | | | | | | |
At beginning of period | | 211,262,989 | | | 278,080,034 | |
At end of period (including accumulated distributions in excess of net investment income of $1,026,062 and undistributed net investment income of $2,548,942, respectively) | | $222,116,363 | | | $211,262,989 | |
See Notes to Financial Statements
28
Financial Statements
FINANCIAL HIGHLIGHTS
The financial highlights table is intended to help you understand the fund’s financial performance for the semiannual period and the past 5 fiscal years. Certain information reflects financial results for a single fund share. The total returns in the table represent the rate by which an investor would have earned (or lost) on an investment in the fund share class (assuming reinvestment of all distributions) held for the entire period.
| | | | | | | | | | | | | | | | | | |
| | | Six months
ended
4/30/09
(unaudited) | | | Years ended 10/31 | |
| Class A | | | 2008 | | | 2007 | | | 2006 | | | 2005 | | | 2004 | |
| | | | | | | | | | | | | | | | | |
Net asset value, beginning
of period | | $5.43 | | | $6.67 | | | $6.70 | | | $6.67 | | | $6.90 | | | $6.69 | |
Income (loss) from
investment operations | | | | | | | | | | | | | | | | | | |
Net investment income (d) | | $0.16 | | | $0.37 | | | $0.39 | | | $0.37 | | | $0.38 | | | $0.40 | |
Net realized and unrealized
gain (loss) on investments
and foreign currency | | 0.22 | | | (1.22 | ) | | (0.04 | ) | | 0.05 | | | (0.20 | ) | | 0.22 | |
Total from investment operations | | $0.38 | | | $(0.85 | ) | | $0.35 | | | $0.42 | | | $0.18 | | | $0.62 | |
Less distributions declared
to shareholders | | | | | | | | | | | | | | | | | | |
From net investment income | | $(0.26 | ) | | $(0.39 | ) | | $(0.38 | ) | | $(0.39 | ) | | $(0.41 | ) | | $(0.41 | ) |
Net asset value, end of period | | $5.55 | | | $5.43 | | | $6.67 | | | $6.70 | | | $6.67 | | | $6.90 | |
Total return (%) (r)(s)(t) | | 7.19 | (n) | | (13.37 | ) | | 5.41 | | | 6.59 | | | 2.68 | | | 9.57 | |
Ratios (%) (to average
net assets) and
Supplemental data: | | | | | | | | | | | | | | | | | | |
Expenses before expense
reductions (f) | | 1.34 | (a) | | 1.28 | | | 1.29 | | | 1.33 | | | 1.34 | | | 1.32 | |
Expenses after expense
reductions (f) | | 0.87 | (a) | | 0.83 | | | 0.83 | | | 0.83 | | | 0.83 | | | 0.87 | |
Net investment income | | 6.15 | (a) | | 5.74 | | | 5.79 | | | 5.55 | | | 5.51 | | | 5.92 | |
Portfolio turnover | | 23 | | | 45 | | | 55 | | | 66 | | | 63 | | | 64 | |
Net assets at end of period
(000 Omitted) | | $156,973 | | | $147,255 | | | $185,193 | | | $194,376 | | | $196,672 | | | $190,165 | |
See Notes to Financial Statements
29
Financial Highlights – continued
| | | | | | | | | | | | | | | | | | |
| | | Six months
ended
4/30/09
(unaudited) | | | Years ended 10/31 | |
| Class B | | | 2008 | | | 2007 | | | 2006 | | | 2005 | | | 2004 | |
| | | | | | | | | | | | | | | | | |
Net asset value, beginning
of period | | $5.38 | | | $6.59 | | | $6.63 | | | $6.59 | | | $6.83 | | | $6.62 | |
Income (loss) from
investment operations | | | | | | | | | | | | | | | | | | |
Net investment income (d) | | $0.15 | | | $0.33 | | | $0.34 | | | $0.32 | | | $0.33 | | | $0.35 | |
Net realized and unrealized
gain (loss) on investments
and foreign currency | | 0.21 | | | (1.19 | ) | | (0.04 | ) | | 0.07 | | | (0.21 | ) | | 0.22 | |
Total from investment operations | | $0.36 | | | $(0.86 | ) | | $0.30 | | | $0.39 | | | $0.12 | | | $0.57 | |
Less distributions declared
to shareholders | | | | | | | | | | | | | | | | | | |
From net investment income | | $(0.24 | ) | | $(0.35 | ) | | $(0.34 | ) | | $(0.35 | ) | | $(0.36 | ) | | $(0.36 | ) |
Net asset value, end of period | | $5.50 | | | $5.38 | | | $6.59 | | | $6.63 | | | $6.59 | | | $6.83 | |
Total return (%) (r)(s)(t) | | 6.85 | (n) | | (13.70 | ) | | 4.57 | | | 6.06 | | | 1.83 | | | 8.90 | |
Ratios (%) (to average
net assets) and
Supplemental data: | | | | | | | | | | | | | | | | | | |
Expenses before expense
reductions (f) | | 2.04 | (a) | | 1.94 | | | 1.94 | | | 1.97 | | | 1.99 | | | 1.97 | |
Expenses after expense
reductions (f) | | 1.55 | (a) | | 1.48 | | | 1.48 | | | 1.48 | | | 1.48 | | | 1.52 | |
Net investment income | | 5.54 | (a) | | 5.16 | | | 5.13 | | | 4.90 | | | 4.89 | | | 5.27 | |
Portfolio turnover | | 23 | | | 45 | | | 55 | | | 66 | | | 63 | | | 64 | |
Net assets at end of period
(000 Omitted) | | $36,690 | | | $38,838 | | | $60,044 | | | $77,822 | | | $105,223 | | | $130,075 | |
See Notes to Financial Statements
30
Financial Highlights – continued
| | | | | | | | | | | | | | | | | | |
| | | Six months
ended
4/30/09
(unaudited) | | | Years ended 10/31 | |
| Class C | | | 2008 | | | 2007 | | | 2006 | | | 2005 | | | 2004 | |
| | | | | | | | | | | | | | | | | |
Net asset value, beginning
of period | | $5.35 | | | $6.56 | | | $6.60 | | | $6.56 | | | $6.80 | | | $6.59 | |
Income (loss) from
investment operations | | | | | | | | | | | | | | | | | | |
Net investment income (d) | | $0.15 | | | $0.33 | | | $0.34 | | | $0.32 | | | $0.33 | | | $0.35 | |
Net realized and unrealized
gain (loss) on investments
and foreign currency | | 0.22 | | | (1.19 | ) | | (0.04 | ) | | 0.07 | | | (0.21 | ) | | 0.22 | |
Total from investment operations | | $0.37 | | | $(0.86 | ) | | $0.30 | | | $0.39 | | | $0.12 | | | $0.57 | |
Less distributions declared
to shareholders | | | | | | | | | | | | | | | | | | |
From net investment income | | $(0.24 | ) | | $(0.35 | ) | | $(0.34 | ) | | $(0.35 | ) | | $(0.36 | ) | | $(0.36 | ) |
Net asset value, end of period | | $5.48 | | | $5.35 | | | $6.56 | | | $6.60 | | | $6.56 | | | $6.80 | |
Total return (%) (r)(s)(t) | | 7.06 | (n) | | (13.79 | ) | | 4.56 | | | 6.07 | | | 1.81 | | | 8.91 | |
Ratios (%) (to average
net assets) and
Supplemental data: | | | | | | | | | | | | | | | | | | |
Expenses before expense
reductions (f) | | 2.04 | (a) | | 1.95 | | | 1.94 | | | 1.98 | | | 1.99 | | | 1.98 | |
Expenses after expense
reductions (f) | | 1.56 | (a) | | 1.48 | | | 1.48 | | | 1.48 | | | 1.48 | | | 1.53 | |
Net investment income
| | 5.55 | (a) | | 5.19 | | | 5.14 | | | 4.90 | | | 4.87 | | | 5.26 | |
Portfolio turnover | | 23 | | | 45 | | | 55 | | | 66 | | | 63 | | | 64 | |
Net assets at end of period
(000 Omitted) | | $26,608 | | | $23,491 | | | $30,385 | | | $29,892 | | | $32,413 | | | $36,537 | |
See Notes to Financial Statements
31
Financial Highlights – continued
| | | | | | | | | | | | | | | | | | |
| | | Six months
ended
4/30/09
(unaudited) | | | Years ended 10/31 | |
| Class I | | | 2008 | | | 2007 | | | 2006 | | | 2005 | | | 2004 | |
| | | | | | | | | | | | | | | | | |
Net asset value, beginning
of period | | $5.43 | | | $6.66 | | | $6.71 | | | $6.67 | | | $6.91 | | | $6.70 | |
Income (loss) from
investment operations | | | | | | | | | | | | | | | | | | |
Net investment income (d) | | $0.17 | | | $0.39 | | | $0.42 | | | $0.39 | | | $0.40 | | | $0.42 | |
Net realized and unrealized
gain (loss) on investments
and foreign currency | | 0.22 | | | (1.20 | ) | | (0.06 | ) | | 0.07 | | | (0.20 | ) | | 0.22 | |
Total from investment operations | | $0.39 | | | $(0.81 | ) | | $0.36 | | | $0.46 | | | $0.20 | | | $0.64 | |
Less distributions declared
to shareholders | | | | | | | | | | | | | | | | | | |
From net investment income | | $(0.27 | ) | | $(0.42 | ) | | $(0.41 | ) | | $(0.42 | ) | | $(0.44 | ) | | $(0.43 | ) |
Net asset value, end of period | | $5.55 | | | $5.43 | | | $6.66 | | | $6.71 | | | $6.67 | | | $6.91 | |
Total return (%) (r)(s) | | 7.36 | (n) | | (12.93 | ) | | 5.46 | | | 7.11 | | | 2.90 | | | 9.95 | |
Ratios (%) (to average
net assets) and
Supplemental data: | | | | | | | | | | | | | | | | | | |
Expenses before expense
reductions (f) | | 1.03 | (a) | | 0.93 | | | 0.95 | | | 0.98 | | | 0.99 | | | 0.97 | |
Expenses after expense
reductions (f) | | 0.56 | (a) | | 0.48 | | | 0.48 | | | 0.48 | | | 0.48 | | | 0.52 | |
Net investment income | | 6.47 | (a) | | 6.10 | | | 6.08 | | | 5.89 | | | 5.86 | | | 6.28 | |
Portfolio turnover | | 23 | | | 45 | | | 55 | | | 66 | | | 63 | | | 64 | |
Net assets at end of period
(000 Omitted) | | $1,845 | | | $1,679 | | | $2,458 | | | $14,437 | | | $12,947 | | | $11,965 | |
Any redemption fees charged by the fund during the 2004 and 2005 fiscal years resulted in a per share impact of less than $0.01.
| (d) | Per share data is based on average shares outstanding. |
| (f) | Ratios do not reflect reductions from fees paid indirectly, if applicable. |
| (r) | Certain expenses have been reduced without which performance would have been lower. |
| (s) | From time to time the fund may receive proceeds from litigation settlements, without which performance would be lower. |
| (t) | Total returns do not include any applicable sales charges. |
See Notes to Financial Statements
32
NOTES TO FINANCIAL STATEMENTS
(unaudited)
| (1) | | Business and Organization |
MFS Strategic Income Fund (the fund) is a series of MFS Series Trust VIII (the trust). The trust is organized as a Massachusetts business trust and is registered under the Investment Company Act of 1940, as amended, as an open-end management investment company.
| (2) | | Significant Accounting Policies |
General – The preparation of financial statements in conformity with U.S. generally accepted accounting principles requires management to make estimates and assumptions that affect the reported amounts of assets and liabilities, and disclosure of contingent assets and liabilities at the date of the financial statements and the reported amounts of revenues and expenses during the reporting period. Actual results could differ from those estimates. The fund can invest up to 100% of its portfolio in high-yield securities rated below investment grade. Investments in high-yield securities involve greater degrees of credit and market risk than investments in higher-rated securities and tend to be more sensitive to economic conditions. The fund can invest in foreign securities, including securities of emerging market issuers. Investments in foreign securities are vulnerable to the effects of changes in the relative values of the local currency and the U.S. dollar and to the effects of changes in each country’s legal, political, and economic environment. The markets of emerging markets countries are generally more volatile than the markets of developed countries with more mature economies. All of the risks of investing in foreign securities previously described are heightened when investing in emerging markets countries.
Investment Valuations – Equity securities, including restricted equity securities, are generally valued at the last sale or official closing price as provided by a third-party pricing service on the market or exchange on which they are primarily traded. For securities for which there were no sales reported that day, equity securities are generally valued at the last quoted daily bid quotation as provided by a third-party pricing service on the market or exchange on which such securities are primarily traded. For securities held short for which there were no sales reported for that day, the position is generally valued at the last quoted daily ask quotation as provided by a third-party pricing service on the market or exchange on which such securities are primarily traded. Debt instruments and floating rate loans (other than short-term instruments), including restricted debt instruments, are generally valued at an evaluated or composite bid as provided by a third-party pricing service. Short-term instruments with a maturity at issuance of 60 days or less generally are valued at amortized cost, which approximates market value.
33
Notes to Financial Statements (unaudited) – continued
Futures contracts are generally valued at last posted settlement price as provided by a third-party pricing service on the market on which they are primarily traded. Futures contracts for which there were no trades that day for a particular position are generally valued at the closing bid quotation as provided by a third-party pricing service on the market on which such futures contracts are primarily traded. Forward foreign currency contracts are generally valued at the mean of bid and asked prices for the time period interpolated from rates provided by a third-party pricing service for proximate time periods. Swaps are generally valued at valuations provided by a third-party pricing service. Open-end investment companies are generally valued at net asset value per share. Securities and other assets generally valued on the basis of information from a third-party pricing service may also be valued at a broker/dealer bid quotation. Values obtained from pricing services can utilize both dealer-supplied valuations and electronic data processing techniques, which take into account factors such as institutional-size trading in similar groups of securities, yield, quality, coupon rate, maturity, type of issue, trading characteristics, and other market data. The values of foreign securities and other assets and liabilities expressed in foreign currencies are converted to U.S. dollars using the mean of bid and asked prices for rates provided by a third-party pricing service.
The Board of Trustees has delegated primary responsibility for determining or causing to be determined the value of the fund’s investments (including any fair valuation) to the adviser pursuant to valuation policies and procedures approved by the Board. If the adviser determines that reliable market quotations are not readily available, investments are valued at fair value as determined in good faith by the adviser in accordance with such procedures under the oversight of the Board of Trustees. Under the fund’s valuation policies and procedures, market quotations are not considered to be readily available for most types of debt instruments and floating rate loans and many types of derivatives. These investments are generally valued at fair value based on information from third-party pricing services. In addition, investments may be valued at fair value if the adviser determines that an investment’s value has been materially affected by events occurring after the close of the exchange or market on which the investment is principally traded (such as foreign exchange or market) and prior to the determination of the fund’s net asset value, or after the halting of trading of a specific security where trading does not resume prior to the close of the exchange or market on which the security is principally traded. Events that occur on a frequent basis after foreign markets close (such as developments in foreign markets and significant movements in the U.S. markets) and prior to the determination of the fund’s net asset value may be deemed to have a material affect on the value of securities traded in foreign markets. Accordingly, the fund’s foreign equity
34
Notes to Financial Statements (unaudited) – continued
securities may often be valued at fair value. The adviser generally relies on third-party pricing services or other information (such as the correlation with price movements of similar securities in the same or other markets; the type, cost and investment characteristics of the security; the business and financial condition of the issuer; and trading and other market data) to assist in determining whether to fair value and at what value to fair value an investment. The value of an investment for purposes of calculating the fund’s net asset value can differ depending on the source and method used to determine value. When fair valuation is used, the value of an investment used to determine the fund’s net asset value may differ from quoted or published prices for the same investment. There can be no assurance that the fund could obtain the fair value assigned to an investment if it were to sell the investment at the same time at which the fund determines its net asset value per share.
The fund adopted FASB Statement No. 157, Fair Value Measurements (the “Statement”). This Statement provides a single definition of fair value, a hierarchy for measuring fair value and expanded disclosures about fair value measurements.
Various inputs are used in determining the value of the fund’s assets or liabilities carried at market value. These inputs are categorized into three broad levels. Level 1 includes quoted prices in active markets for identical assets or liabilities. Level 2 includes other significant observable market-based inputs (including quoted prices for similar securities, interest rates, prepayment speed, and credit risk). Level 3 includes unobservable inputs, which may include the adviser’s own assumptions in determining the fair value of investments. Other financial instruments are derivative instruments not reflected in total investments, such as futures, forwards, swap contracts and written options. The following is a summary of the levels used as of April 30, 2009 in valuing the fund’s assets or liabilities carried at market value:
| | | | | | | | |
| | | Level 1 | | Level 2 | | Level 3 | | Total |
| Investments in Securities | | $14,267,810 | | $211,205,241 | | $6,387 | | $225,479,438 |
| Other Financial Instruments | | $15,004 | | $408,015 | | $— | | $423,019 |
Level 3 Reconciliation Disclosure
Following is a reconciliation of Level 3 assets for which significant unobservable inputs were used to determine fair value. The table presents the activity of Level 3 securities held at the beginning and the end of the period.
| | | | | |
| | | Investments
in Securities | | | Other Financial
Instruments |
| Balance as of 10/31/08 | | $— | | | $— |
Accrued discounts/premiums | | — | | | — |
Realized gain (loss) | | — | | | — |
Change in unrealized appreciation (depreciation) | | (3,812 | ) | | — |
Net purchases (sales) | | 10,199 | | | — |
Transfers in and/or out of Level 3 | | — | | | — |
| Balance as of 4/30/09 | | $6,387 | | | $— |
35
Notes to Financial Statements (unaudited) – continued
In April 2009, FASB Staff Position (FSP) 157-4 was issued and is effective for financial statements issued for fiscal years and interim periods ending after June 15, 2009. FSP 157-4 clarifies FAS 157 and requires an entity to evaluate certain factors to determine whether there has been a significant decrease in volume and level of activity for the asset or liability such that recent transactions and quoted prices may not be determinative of fair value and further analysis and adjustment may be necessary to estimate fair value. The FSP also requires enhanced disclosure regarding the inputs and valuation techniques used to measure fair value in those instances as well as expanded disclosure of valuation levels for major security types. Management is evaluating the application of the FSP to the fund, and believes the impact resulting from the adoption of this FSP will be limited to expanded disclosure in the fund’s financial statements.
Repurchase Agreements – The fund may enter into repurchase agreements with approved counterparties. Each repurchase agreement is recorded at cost. The fund requires that the securities collateral in a repurchase transaction be transferred to a custodian. The fund monitors, on a daily basis, the value of the collateral to ensure that its value, including accrued interest, is greater than amounts owed to the fund under each such repurchase agreement.
Foreign Currency Translation – Purchases and sales of foreign investments, income, and expenses are converted into U.S. dollars based upon currency exchange rates prevailing on the respective dates of such transactions or on the reporting date for foreign denominated receivables and payables. Gains and losses attributable to foreign currency exchange rates on sales of securities are recorded for financial statement purposes as net realized gains and losses on investments. Gains and losses attributable to foreign exchange rate movements on receivables, payables, income and expenses are recorded for financial statement purposes as foreign currency transaction gains and losses. That portion of both realized and unrealized gains and losses on investments that results from fluctuations in foreign currency exchange rates is not separately disclosed.
Derivative Risk – The fund may invest in derivatives for hedging or non-hedging purposes. While hedging can reduce or eliminate losses, it can also reduce or eliminate gains. When the fund uses derivatives as an investment to gain market exposure, or for hedging purposes, gains and losses from derivative instruments may be substantially greater than the derivative’s original cost. Cash that has been segregated on behalf of certain derivative contracts will be reported separately on the Statement of Assets and Liabilities as restricted cash. On some over-the-counter derivatives, the fund attempts to reduce its exposure to counterparty credit risk by entering into an ISDA Master Agreement on a bilateral basis with each of the counterparties with whom it undertakes a significant volume of transactions. The ISDA Master
36
Notes to Financial Statements (unaudited) – continued
Agreement gives the fund the right, upon an event of default by the applicable counterparty, to close out all transactions traded under such agreement and to net amounts owed under each transaction to one net amount payable by one party to the other. This right to close out and net payments across all transactions traded under the ISDA Master Agreement could result in a reduction of the fund’s credit risk to such counterparty equal to any amounts payable by the fund under the applicable transactions, if any. However, absent an event of default by the counterparty, the ISDA Master Agreement does not result in an offset of reported balance sheet assets and liabilities across transactions between the fund and the applicable counterparty. Derivative instruments include futures contracts, forward foreign currency exchange contracts, and swap agreements.
In March 2008, FASB Statement No. 161, Disclosures about Derivative Instruments and Hedging Activities (the “Standard”) was issued, and is effective for financial statements issued for fiscal years and interim periods beginning after November 15, 2008. This Standard provides enhanced disclosures about the fund’s use of and accounting for derivative instruments and the effect of derivative instruments on the fund’s results of operations and financial position. Management is evaluating the application of the Standard to the fund, and believes the impact resulting from the adoption of this Standard will be limited to expanded disclosure in the fund’s financial statements.
FASB Staff Position (FSP) 133-1 was implemented during the period. FSP 133-1 amends FAS 133 to require sellers of credit derivatives to make disclosures that will enable financial statement users to assess the potential effects of those credit derivatives on an entity’s financial position, financial performance and cash flows. Accordingly, appropriate disclosures have been included within the Swap Agreements table in the Portfolio of Investments and Significant Accounting Policies.
Futures Contracts – The fund may enter into futures contracts for the delayed delivery of securities or currency, or contracts based on financial indices at a fixed price on a future date. In entering such contracts, the fund is required to deposit with the broker either in cash or securities an amount equal to a certain percentage of the contract amount. Subsequent payments are made or received by the fund each day, depending on the daily fluctuations in the value of the contract, and are recorded for financial statement purposes as unrealized gains or losses by the fund. Upon entering into such contracts, the fund bears the risk of interest or exchange rates or securities prices moving unexpectedly, in which case, the fund may not achieve the anticipated benefits of the futures contracts and may realize a loss.
Forward Foreign Currency Exchange Contracts – The fund may enter into forward foreign currency exchange contracts for the purchase or sale of a
37
Notes to Financial Statements (unaudited) – continued
specific foreign currency at a fixed price on a future date. Risks may arise upon entering into these contracts from the potential inability of counterparties to meet the terms of their contracts and from unanticipated movements in the value of the contract. The fund may enter into forward foreign currency exchange contracts for hedging purposes as well as for non-hedging purposes. For hedging purposes, the fund may enter into contracts to deliver or receive foreign currency it will receive from or require for its normal investment activities. The fund may also use contracts in a manner intended to protect foreign currency denominated securities from declines in value due to unfavorable exchange rate movements. For non-hedging purposes, the fund may enter into contracts with the intent of changing the relative exposure of the fund’s portfolio of securities to different currencies to take advantage of anticipated changes. The forward foreign currency exchange contracts are adjusted by the daily exchange rate of the underlying currency and any gains or losses are recorded as unrealized until the contract settlement date. On contract settlement date, the gains or losses are recorded as realized gains or losses on foreign currency transactions.
Swap Agreements – The fund may enter into swap agreements. A swap is generally an exchange of cash payments, at specified intervals or upon the occurrence of specified events, between the fund and a counterparty. The net cash payments exchanged are recorded as a realized gain or loss on swap transactions in the Statement of Operations. The value of the swap, which is adjusted daily and includes any related interest accruals to be paid or received by the fund, is recorded on the Statement of Assets and Liabilities. The daily change in value, including any related interest accruals to be paid or received, is recorded as unrealized appreciation or depreciation on swap transactions in the Statement of Operations. Amounts paid or received at the inception of the swap are reflected as premiums paid or received on the Statement of Assets and Liabilities and are amortized using the effective interest method over the term of the agreement. A liquidation payment received or made upon early termination is recorded as a realized gain or loss on swap transactions in the Statement of Operations.
Risks related to swap agreements include the possible lack of a liquid market, unfavorable market and interest rate movements of the underlying instrument and the failure of the counterparty to perform under the terms of the agreements. To address counterparty risk, swap transactions are limited to only highly-rated counterparties and collateral, in the form of cash or securities, may be required to be posted by the counterparty to the fund and held in segregated accounts with the fund’s custodian. Counterparty risk is further mitigated by having ISDA Master Agreements between the fund and its counterparties providing for netting as described above.
38
Notes to Financial Statements (unaudited) – continued
The fund may enter into credit default swaps to manage its exposure to the market or certain sectors of the market, to reduce its credit risk exposure to defaults of corporate and sovereign issuers or to create exposure to corporate or sovereign issuers to which it is not otherwise exposed. In a credit default swap, the protection buyer makes a stream of payments based on a fixed percentage applied to the contract notional amount to the protection seller in exchange for the right to receive a specified return upon the occurrence of a defined credit event on the reference obligation (which may be either a single security or a basket of securities issued by corporate or sovereign issuers) and, with respect to swap transactions where physical settlement applies, the delivery by the buyer to the seller of a deliverable reference obligation as defined by the contract. Although contract-specific, credit events generally consist of a combination of the following: bankruptcy, failure to pay, restructuring, obligation acceleration, obligation default, or repudiation/moratorium, each as defined in the 2003 ISDA Credit Derivatives Definitions as amended by the relevant contract. Obligation acceleration, obligation default, or repudiation/moratorium are generally applicable when the reference obligation is issued by a sovereign entity or an entity in an emerging country. In the event that a defined credit event occurs, the protection buyer, under the terms of the swap contract, designates which security will be delivered to satisfy the reference obligation. Upon designation of the reference security (or upon delivery of the reference security in the case of physical settlement), the difference between the value of the reference obligation and the swap’s notional amount is recorded as realized gain or loss on swap transactions in the Statement of Operations.
Absent any recoveries under recourse or collateral provisions, the maximum amount of future, undiscounted payments that the fund, as protection seller, could be required to make is equal to the swap’s notional amount. The protection seller’s payment obligation would be offset to the extent of the value of the contract’s reference obligation.
Hybrid Instruments – The fund may invest in indexed or hybrid securities on which any combination of interest payments, the principal or stated amount payable at maturity is determined by reference to prices of other securities, currencies, indices, economic factors or other measures, including interest rates, currency exchange rates, or securities indices. The risks of investing in hybrid instruments reflect a combination of the risks of investing in securities, swaps, options, futures and currencies. Hybrid instruments are potentially more volatile and carry greater market risks than traditional debt instruments. Depending on the structure of the particular hybrid instrument, changes in a benchmark, underlying assets or economic indicator may be magnified by the terms of the hybrid instrument and have an even more dramatic and substantial effect upon the value of the hybrid instrument. Also, the prices of
39
Notes to Financial Statements (unaudited) – continued
the hybrid instrument and the benchmark, underlying asset or economic indicator may not move in the same direction or at the same time.
Loans and Other Direct Debt Instruments – The fund may invest in loans and loan participations or other receivables. These investments may include standby financing commitments, including revolving credit facilities, which obligate the fund to supply additional cash to the borrower on demand. At April 30, 2009, the portfolio had unfunded loan commitments of $61,813, which could be extended at the option of the borrower and which are covered by sufficient cash and/or liquid securities held by the fund. The market value and obligation of the fund on these unfunded loan commitments is included in Investments, at value and Payable for investments purchased, respectively, on the Statement of Assets and Liabilities. Loan participations involve a risk of insolvency of the lending bank or other financial intermediary.
Indemnifications – Under the fund’s organizational documents, its officers and trustees may be indemnified against certain liabilities and expenses arising out of the performance of their duties to the fund. Additionally, in the normal course of business, the fund enters into agreements with service providers that may contain indemnification clauses. The fund’s maximum exposure under these agreements is unknown as this would involve future claims that may be made against the fund that have not yet occurred.
Investment Transactions and Income – Investment transactions are recorded on the trade date. Interest income is recorded on the accrual basis. All premium and discount is amortized or accreted for financial statement purposes in accordance with U.S. generally accepted accounting principles. The fund earns certain fees in connection with its floating rate loan purchasing activities. These fees are in addition to interest payments earned and may include amendment fees, commitment fees, facility fees, consent fees, and prepayment fees. Commitment fees are recorded on an accrual basis as income in the accompanying financial statements. Dividends received in cash are recorded on the ex-dividend date. Certain dividends from foreign securities will be recorded when the fund is informed of the dividend if such information is obtained subsequent to the ex-dividend date. Dividend and interest payments received in additional securities are recorded on the ex-dividend or ex-interest date in an amount equal to the value of the security on such date.
The fund may receive proceeds from litigation settlements. Any proceeds received from litigation involving portfolio holdings are reflected in the Statement of Operations in realized gain/loss if the security has been disposed of by the fund or in unrealized gain/loss if the security is still held by the fund. Any other proceeds from litigation not related to portfolio holdings are reflected as other income in the Statement of Operations.
40
Notes to Financial Statements (unaudited) – continued
Fees Paid Indirectly – The fund’s custody fee may be reduced according to an arrangement that measures the value of cash deposited with the custodian by the fund. This amount, for the six months ended April 30, 2009, is shown as a reduction of total expenses on the statement of operations.
Tax Matters and Distributions – The fund intends to qualify as a regulated investment company, as defined under Subchapter M of the Internal Revenue Code, and to distribute all of its taxable income, including realized capital gains. As a result, no provision for federal income taxes is required. The fund’s federal tax returns for the prior three fiscal years remain subject to examination by the Internal Revenue Service. Foreign taxes, if any, have been accrued by the fund in the accompanying financial statements.
Distributions to shareholders are recorded on the ex-dividend date. Income and capital gain distributions are determined in accordance with income tax regulations, which may differ from U.S. generally accepted accounting principles. Certain capital accounts in the financial statements are periodically adjusted for permanent differences in order to reflect their tax character. These adjustments have no impact on net assets or net asset value per share. Temporary differences which arise from recognizing certain items of income, expense, gain or loss in different periods for financial statement and tax purposes will reverse at some time in the future. Distributions in excess of net investment income or net realized gains are temporary overdistributions for financial statement purposes resulting from differences in the recognition or classification of income or distributions for financial statement and tax purposes.
Book/tax differences primarily relate to expiration of capital loss carryforwards, derivative transactions, amortization and accretion of debt securities, straddle loss deferrals, and foreign currency transactions.
The tax character of distributions made during the current period will be determined at fiscal year end. The tax character of distributions declared to shareholders for the last fiscal year is as follows:
| | |
| | | 10/31/08 |
| Ordinary income (including any short-term capital gains) | | $15,352,280 |
The federal tax cost and the tax basis components of distributable earnings were as follows:
| | | |
| As of 4/30/09 | | | |
| Cost of investments | | $254,638,337 | |
| Gross appreciation | | 4,471,880 | |
| Gross depreciation | | (33,630,779 | ) |
| Net unrealized appreciation (depreciation) | | $(29,158,899 | ) |
41
Notes to Financial Statements (unaudited) – continued
| | | |
| As of 10/31/08 | | | |
| Undistributed ordinary income | | $6,928,678 | |
| Capital loss carryforwards | | (55,530,826 | ) |
| Other temporary differences | | (2,116,399 | ) |
| Net realized appreciation (depreciation) | | (47,899,040 | ) |
The aggregate cost above includes prior fiscal year end tax adjustments.
As of October 31, 2008, the fund had capital loss carryforwards available to offset future realized gains. Such losses expire as follows:
| | | |
| 10/31/09 | | $(17,590,678 | ) |
| 10/31/10 | | (28,105,973 | ) |
| 10/31/14 | | (3,352,139 | ) |
| 10/31/16 | | (6,482,036 | ) |
| | $(55,530,826 | ) |
Multiple Classes of Shares of Beneficial Interest – The fund offers multiple classes of shares, which differ in their respective distribution and service fees. The fund’s income and common expenses are allocated to shareholders based on the value of settled shares outstanding of each class. The fund's realized and unrealized gain (loss) are allocated to shareholders based on the daily net assets of each class. Dividends are declared separately for each class. Differences in per share dividend rates are generally due to differences in separate class expenses. Class B shares will convert to Class A shares approximately eight years after purchase. The fund’s distributions declared to shareholders by class are as follows:
From net investment income
| | | | |
| | | Six months ended
4/30/09
(unaudited) | | Year ended
10/31/08 |
| Class A | | $6,976,724 | | $10,816,567 |
| Class B | | 1,688,602 | | 2,799,912 |
| Class C | | 1,039,417 | | 1,589,846 |
| Class I | | 84,559 | | 145,955 |
| Total | | $9,789,302 | | $15,352,280 |
| (3) | | Transactions with Affiliates |
Investment Adviser – The fund has an investment advisory agreement with Massachusetts Financial Services Company (MFS) to provide overall investment management and related administrative services and facilities to the fund. The management fee is computed daily and paid monthly at an annual rate of 0.65% of the fund’s average daily net assets.
As part of a settlement agreement with the New York Attorney General concerning market timing and related matters, MFS has agreed to reduce the management fee to 0.40% of the fund’s average daily net assets for the period March 1, 2004 through February 28, 2009. Effective March 1, 2009, the
42
Notes to Financial Statements (unaudited) – continued
investment adviser has agreed in writing to reduce its management fee to 0.60% of average daily net assets. This written agreement will continue until modified by the fund’s Board of Trustees, but such agreement will continue at least until February 28, 2010. For the six months ended April 30, 2009, these waivers amounted to $188,996 and are reflected as a reduction of total expenses in the Statement of Operations. The management fee incurred for the six months ended April 30, 2009 was equivalent to an annual effective rate of 0.47% of the fund’s average daily net assets.
The investment adviser has agreed in writing to pay a portion of the fund’s operating expenses, exclusive of management fee, distribution and service fees, interest, taxes, extraordinary expenses, brokerage and transaction costs and investment-related expenses, such that operating expenses do not exceed 0.08% annually of the fund’s average daily net assets. This written agreement terminated on February 28, 2009. Effective March 1, 2009, the investment adviser has agreed in writing to pay a portion of the fund’s total annual operating expenses, exclusive of interest, taxes, extraordinary expenses, brokerage and transaction costs, and investment-related expenses, such that total annual fund operating expenses do not exceed the following rates annually of the fund’s average daily net assets:
| | | | | | |
| Class A | | Class B | | Class C | | Class I |
| 0.95% | | 1.70% | | 1.70% | | 0.70% |
This written agreement will continue until modified by the fund’s Board of Trustees, but such agreement will continue at least until February 28, 2010. For the six months ended April 30, 2009, these reductions amounted to $303,180 and are reflected as a reduction of total expenses in the Statement of Operations.
Distributor – MFS Fund Distributors, Inc. (MFD), a wholly-owned subsidiary of MFS, as distributor, received $20,160 for the six months ended April 30, 2009, as its portion of the initial sales charge on sales of Class A shares of the fund.
The Board of Trustees has adopted a distribution plan for certain class shares pursuant to Rule 12b-1 of the Investment Company Act of 1940.
The fund’s distribution plan provides that the fund will pay MFD for services provided by MFD and financial intermediaries in connection with the distribution and servicing of certain share classes. One component of the plan is a distribution fee paid to MFD and another component of the plan is a service fee paid to MFD. MFD may subsequently pay all, or a portion, of the distribution and/or service fees to financial intermediaries.
43
Notes to Financial Statements (unaudited) – continued
Distribution Plan Fee Table:
| | | | | | | | | | |
| | | Distribution
Fee Rate | | Service
Fee Rate | | Total
Distribution
Plan (d) | | Annual
Effective
Rate (e) | | Distribution
and Service
Fee |
| Class A | | — | | 0.25% | | 0.25% | | 0.32% | | $229,177 |
| Class B | | 0.75% | | 0.25% | | 1.00% | | 1.00% | | 187,375 |
| Class C | | 0.75% | | 0.25% | | 1.00% | | 1.00% | | 117,023 |
| Total Distribution and Service Fees | | $533,575 |
| (d) | In accordance with the distribution plan for certain classes, the fund pays distribution and/or service fees up to these annual percentage rates of each class’ average daily net assets. |
| (e) | The annual effective rates represent actual fees incurred under the distribution plan for the six months ended April 30, 2009 based on each class’ average daily net assets. Assets attributable to Class A shares sold prior to May 14, 1991 are subject to a service fee of 0.15% annually. Effective March 1, 2009, the 0.10% Class A annual distribution fee was eliminated. |
Certain Class A shares purchased prior to September 1, 2008 are subject to a contingent deferred sales charge (CDSC) in the event of a shareholder redemption within 12 months of purchase. Certain Class A shares purchased on or subsequent to September 1, 2008 are subject to a CDSC in the event of a shareholder redemption within 24 months of purchase. Class C shares are subject to a CDSC in the event of a shareholder redemption within 12 months of purchase. Class B shares are subject to a CDSC in the event of a shareholder redemption within six years of purchase. All contingent deferred sales charges are paid to MFD and during the six months ended April 30, 2009, were as follows:
| | |
| | | Amount |
| Class A | | $— |
| Class B | | 22,915 |
| Class C | | 2,757 |
Shareholder Servicing Agent – MFS Service Center, Inc. (MFSC), a wholly-owned subsidiary of MFS, receives a fee from the fund for its services as shareholder servicing agent calculated as a percentage of the average daily net assets of the fund as determined periodically under the supervision of the fund’s Board of Trustees. For the six months ended April 30, 2009, the fee was $150,438, which equated to 0.1447% annually of the fund's average daily net assets. MFSC also receives payment from the fund for out-of-pocket expenses, sub-accounting and other shareholder servicing costs which may be paid to affiliated and unaffiliated service providers. For the six months ended April 30, 2009, these out-of-pocket expenses, sub-accounting and other shareholder servicing costs amounted to $99,362.
Administrator – MFS provides certain financial, legal, shareholder communications, compliance, and other administrative services to the fund. Under an administrative services agreement, the fund partially reimburses MFS the costs incurred to provide these services. The fund is charged an annual fixed amount of $17,500 plus a fee based on average daily net assets.
44
Notes to Financial Statements (unaudited) – continued
The administrative services fee incurred for the six months ended April 30, 2009 was equivalent to an annual effective rate of 0.0243% of the fund’s average daily net assets.
Trustees’ and Officers’ Compensation – The fund pays compensation to independent trustees in the form of a retainer, attendance fees, and additional compensation to Board and Committee chairpersons. The fund does not pay compensation directly to trustees or officers of the fund who are also officers of the investment adviser, all of whom receive remuneration for their services to the fund from MFS. Certain officers and trustees of the fund are officers or directors of MFS, MFD, and MFSC.
For certain independent Trustees who retired on or before December 31, 2001, the fund has an unfunded, defined benefit plan which resulted in a pension expense of $834. For certain independent Trustees who served on the Board as of December 31, 2001, the fund also has an unfunded retirement benefit deferral plan which resulted in a net decrease in expense of $1,236. Both amounts are included in independent trustees’ compensation for the six months ended April 30, 2009. The liability for deferred retirement benefits payable to certain independent trustees under both plans amounted to $39,967 at April 30, 2009, and is included in payable for independent trustees’ compensation.
Other – This fund and certain other funds managed by MFS (the funds) have entered into services agreements (the Agreements) which provide for payment of fees by the funds to Tarantino LLC and Griffin Compliance LLC in return for the provision of services of an Independent Chief Compliance Officer (ICCO) and Assistant ICCO, respectively, for the funds. The ICCO and Assistant ICCO are officers of the funds and the sole members of Tarantino LLC and Griffin Compliance LLC, respectively. The funds can terminate the Agreements with Tarantino LLC and Griffin Compliance LLC at any time under the terms of the Agreements. For the six months ended April 30, 2009, the aggregate fees paid by the fund to Tarantino LLC and Griffin Compliance LLC were $1,622 and are included in miscellaneous expense on the Statement of Operations. MFS has agreed to reimburse the fund for a portion of the payments made by the fund in the amount of $623, which is shown as a reduction of total expenses in the Statement of Operations. Additionally, MFS has agreed to bear all expenses associated with office space, other administrative support, and supplies provided to the ICCO and Assistant ICCO.
The fund may invest in a money market fund managed by MFS which seeks a high level of current income consistent with preservation of capital and liquidity. Income earned on this investment is included in dividends from underlying funds on the Statement of Operations. This money market fund does not pay a management fee to MFS.
45
Notes to Financial Statements (unaudited) – continued
Purchases and sales of investments, other than U.S. Government securities, purchased option transactions, and short-term obligations, aggregated $60,917,931 and $44,411,702, respectively.
| (5) | | Shares of Beneficial Interest |
The fund’s Declaration of Trust permits the Trustees to issue an unlimited number of full and fractional shares of beneficial interest. Transactions in fund shares were as follows:
| | | | | | | | | | | | |
| | | Six months ended
4/30/09 | | | Year ended
10/31/08 | |
| | | Shares | | | Amount | | | Shares | | | Amount | |
| Shares sold | | | | | | | | | | | | |
Class A | | 3,822,655 | | | $20,562,770 | | | 5,841,720 | | | $37,206,742 | |
Class B | | 1,319,585 | | | 7,012,723 | | | 1,636,436 | | | 10,305,020 | |
Class C | | 1,080,229 | | | 5,728,690 | | | 1,159,339 | | | 7,264,892 | |
Class I | | 14,248 | | | 76,900 | | | 47,188 | | | 301,734 | |
| | 6,236,717 | | | $33,381,083 | | | 8,684,683 | | | $55,078,388 | |
| Shares issued to shareholders in reinvestment of distributions | | | | | | | | | | | | |
Class A | | 974,206 | | | $5,245,892 | | | 1,294,126 | | | $8,184,249 | |
Class B | | 199,077 | | | 1,061,329 | | | 291,019 | | | 1,825,756 | |
Class C | | 128,073 | | | 680,318 | | | 167,516 | | | 1,043,896 | |
Class I | | 15,628 | | | 84,119 | | | 22,606 | | | 142,928 | |
| | 1,316,984 | | | $7,071,658 | | | 1,775,267 | | | $11,196,829 | |
| Shares reacquired | | | | | | | | | | | | |
Class A | | (3,639,679 | ) | | $(19,525,612 | ) | | (7,794,082 | ) | | $(49,466,698 | ) |
Class B | | (2,069,940 | ) | | (10,979,969 | ) | | (3,808,122 | ) | | (24,017,068 | ) |
Class C | | (737,300 | ) | | (3,903,346 | ) | | (1,567,613 | ) | | (9,652,268 | ) |
Class I | | (6,600 | ) | | (35,390 | ) | | (129,307 | ) | | (799,383 | ) |
| | (6,453,519 | ) | | $(34,444,317 | ) | | (13,299,124 | ) | | $(83,935,417 | ) |
| Net change | | | | | | | | | | | | |
Class A | | 1,157,182 | | | $6,283,050 | | | (658,236 | ) | | $(4,075,707 | ) |
Class B | | (551,278 | ) | | (2,905,917 | ) | | (1,880,667 | ) | | (11,886,292 | ) |
Class C | | 471,002 | | | 2,505,662 | | | (240,758 | ) | | (1,343,480 | ) |
Class I | | 23,276 | | | 125,629 | | | (59,513 | ) | | (354,721 | ) |
| | 1,100,182 | | | $6,008,424 | | | (2,839,174 | ) | | $(17,660,200 | ) |
The fund and certain other funds managed by MFS participate in a $1.1 billion unsecured committed line of credit, subject to a $1 billion sublimit, provided by a syndication of banks under a credit agreement. Borrowings may be made for temporary financing needs. Interest is charged to each fund, based on its borrowings, generally at a rate equal to the higher of the Federal Reserve funds
46
Notes to Financial Statements (unaudited) – continued
rate or one month LIBOR plus 1.25%. A commitment fee, based on the average daily, unused portion of the committed line of credit, is allocated among the participating funds at the end of each calendar quarter. In addition, the fund and other funds managed by MFS have established unsecured uncommitted borrowing arrangements with certain banks for temporary financing needs. Interest is charged to each fund, based on its borrowings, currently at a rate equal to the Federal Reserve funds rate plus 0.30%. For the six months ended April 30, 2009, the fund’s commitment fee and interest expense were $683 and $0, respectively, and are included in miscellaneous expense on the Statement of Operations.
| (7) | | Transactions in Underlying Funds-Affiliated Issuers |
An affiliated issuer may be considered one in which the fund owns 5% or more of the outstanding voting securities, or a company which is under common control. For the purposes of this report, the fund assumes the following to be affiliated issuers:
| | | | | | | | | |
| Underlying Funds | | Beginning
Shares/Par
Amount | | Acquisitions
Shares/Par
Amount | | Dispositions
Shares/Par
Amount | | | Ending
Shares/Par
Amount |
MFS Institutional Money
Market Portfolio | | 19,148,150 | | 27,186,507 | | (32,066,847 | ) | | 14,267,810 |
| | | | |
| Underlying Funds | | Realized
Gain (Loss) | | Capital Gain
Distributions | | Dividend
Income | | | Ending
Value |
MFS Institutional Money
Market Portfolio | | $— | | $— | | $43,243 | | | $14,267,810 |
47
BOARD REVIEW OF INVESTMENT ADVISORY AGREEMENT
A discussion regarding the Board’s most recent review and renewal of the fund’s Investment Advisory Agreement with MFS is available by clicking on the fund’s name under “Mutual Funds” in the “Products and Performance” section of the MFS Web site (mfs.com).
PROXY VOTING POLICIES AND INFORMATION
A general description of the MFS funds’ proxy voting policies and procedures is available without charge, upon request, by calling
1-800-225-2606, by visiting the Proxy Voting section of mfs.com or by visiting the SEC’s Web site at http://www.sec.gov.
Information regarding how the fund voted proxies relating to portfolio securities during the most recent twelve-month period ended June 30 is available without charge by visiting the Proxy Voting section of mfs.com or by visiting the SEC’s Web site at http://www.sec.gov.
QUARTERLY PORTFOLIO DISCLOSURE
The fund will file a complete schedule of portfolio holdings with the Securities and Exchange Commission (the Commission) for the first and third quarters of each fiscal year on Form N-Q. The fund’s Form N-Q may be reviewed and copied at the:
Public Reference Room
Securities and Exchange Commission
100 F Street, NE, Room 1580
Washington, D.C. 20549
Information on the operation of the Public Reference Room may be obtained by calling the Commission at 1-800-SEC-0330. The fund’s Form N-Q is available on the EDGAR database on the Commission’s Internet Web site at http://www.sec.gov, and copies of this information may be obtained, upon payment of a duplicating fee, by electronic request at the following e-mail address: publicinfo@sec.gov or by writing the Public Reference Section at the above address.
A shareholder can also obtain the quarterly portfolio holdings report at mfs.com.
48
CONTACT US
| | |
Web site | | Mailing address |
mfs.com | | MFS Service Center, Inc. |
| | P.O. Box 55824 |
MFS TALK | | Boston, MA 02205-5824 |
1-800-637-8255 | | |
24 hours a day | | Overnight mail |
| | MFS Service Center, Inc. |
Account service and | | c/o Boston Financial Data Services |
literature | | 30 Dan Road |
Shareholders | | Canton, MA 02021-2809 |
1-800-225-2606 | | |
Investment professionals | | |
1-800-343-2829 | | |
Retirement plan services | | |
1-800-637-1255 | | |

Save paper with eDelivery. MFS® will send you prospectuses, reports, and proxies directly via e-mail so you will get information faster with less mailbox clutter. To sign up: 1. go to mfs.com. 2. log in via MFS® Access. 3. select eDelivery. If you own your MFS fund shares through a financial institution or a retirement plan, MFS® TALK, MFS Access, and eDelivery may not be available to you.

The Registrant has not amended any provision in its Code of Ethics (the “Code”) that relates to any element of the Code’s definition enumerated in paragraph (b) of Item 2 of this Form N-CSR.
| ITEM 3. | AUDIT COMMITTEE FINANCIAL EXPERT. |
Not applicable for semi-annual reports.
| ITEM 4. | PRINCIPAL ACCOUNTANT FEES AND SERVICES. |
Not applicable for semi-annual reports.
| ITEM 5. | AUDIT COMMITTEE OF LISTED REGISTRANTS. |
Not applicable to the Registrant.
A schedule of investments for each series of the Registrant is included as part of the report to shareholders of such series under Item 1 of this Form N-CSR.
| ITEM 7. | DISCLOSURE OF PROXY VOTING POLICIES AND PROCEDURES FOR CLOSED-END MANAGEMENT INVESTMENT COMPANIES. |
Not applicable to the Registrant.
| ITEM 8. | PORTFOLIO MANAGERS OF CLOSED-END MANAGEMENT INVESTMENT COMPANIES. |
Not applicable to the Registrant.
| ITEM 9. | PURCHASES OF EQUITY SECURITIES BY CLOSED-END MANAGEMENT INVESTMENT COMPANY AND AFFILIATED PURCHASERS. |
Not applicable to the Registrant.
| ITEM 10. | SUBMISSION OF MATTERS TO A VOTE OF SECURITY HOLDERS. |
There were no material changes to the procedures by which shareholders may send recommendations to the Board for nominees to the Registrant’s Board since the Registrant last provided disclosure as to such procedures in response to the requirements of Item 407 (c)(2)(iv) of Regulation S-K or this Item.
| ITEM 11. | CONTROLS AND PROCEDURES. |
| (a) | Based upon their evaluation of the effectiveness of the registrant’s disclosure controls and procedures (as defined in Rule 30a-3(c) under the Investment Company Act of 1940 (the “Act”)) as conducted within 90 days of the filing date of this report on Form N-CSR, the registrant’s principal financial officer and principal executive officer have concluded that those disclosure controls and procedures provide reasonable assurance that the material information required to be disclosed by the registrant on this report is recorded, processed, summarized and reported within the time periods specified in the Securities and Exchange Commission’s rules and forms. |
| (b) | There were no changes in the registrant’s internal controls over financial reporting (as defined in Rule 30a-3(d) under the Act) that occurred during the second fiscal quarter of the period covered by the report that have materially affected, or are reasonably likely to materially affect, the registrant’s internal control over financial reporting. |
| (a) | File the exhibits listed below as part of this form. Letter or number the exhibits in the sequence indicated. |
| | (1) | Any code of ethics, or amendment thereto, that is the subject of the disclosure required by Item 2, to the extent that the registrant intends to satisfy the Item 2 requirements through filing of an exhibit. |
| | (2) | A separate certification for each principal executive officer and principal financial officer of the registrant as required by Rule 30a-2 under the Act (17 CFR 270.30a-2): Attached hereto. |
| (b) | If the report is filed under Section 13(a) or 15(d) of the Exchange Act, provide the certifications required by Rule 30a-2(b) under the Act (17 CFR 270.30a-2(b)), Rule 13a-14(b) or Rule 15d-14(b) under the Exchange Act (17 CFR 240.13a-14(b) or 240.15d-14(b)) and Section 1350 of Chapter 63 of Title 18 of the United States Code (18 U.S.C. 1350) as an exhibit. A certification furnished pursuant to this paragraph will not be deemed “filed” for the purposes of Section 18 of the Exchange Act (15 U.S.C. 78r), or otherwise subject to the liability of that section. Such certification will not be deemed to be incorporated by reference into any filing under the Securities Act of 1933 or the Exchange Act, except to the extent that the registrant specifically incorporates it by reference: Attached hereto. |
Notice
A copy of the Amended and Restated Declaration of Trust, as amended, of the Registrant is on file with the Secretary of State of The Commonwealth of Massachusetts and notice is hereby given that this instrument is executed on behalf of the Registrant by an officer of the Registrant as an officer and not individually and the obligations of or arising out of this instrument are not binding upon any of the Trustees or shareholders individually, but are binding only upon the assets and property of the respective constituent series of the Registrant.
SIGNATURES
Pursuant to the requirements of the Securities Exchange Act of 1934 and the Investment Company Act of 1940, the registrant has duly caused this report to be signed on its behalf by the undersigned, thereunto duly authorized.
(Registrant) MFS SERIES TRUST VIII
| | |
| By (Signature and Title)* | | MARIA F. DWYER |
| | Maria F. Dwyer, President |
Date: June 17, 2009
Pursuant to the requirements of the Securities Exchange Act of 1934 and the Investment Company Act of 1940, this report has been signed below by the following persons on behalf of the registrant and in the capacities and on the dates indicated.
| | |
| By (Signature and Title)* | | MARIA F. DWYER |
| | Maria F. Dwyer, President (Principal Executive Officer) |
Date: June 17, 2009
| | |
| By (Signature and Title)* | | JOHN M. CORCORAN |
| | John M. Corcoran, Treasurer (Principal Financial Officer and Accounting Officer) |
Date: June 17, 2009
| * | Print name and title of each signing officer under his or her signature. |