Item 1: Report to Shareholders
 |
| Science & Technology Fund | December 31, 2005 |
The views and opinions in this report were current as of December 31, 2005. They are not guarantees of performance or investment results and should not be taken as investment advice. Investment decisions reflect a variety of factors, and the managers reserve the right to change their views about individual stocks, sectors, and the markets at any time. As a result, the views expressed should not be relied upon as a forecast of the fund’s future investment intent. The report is certified under the Sarbanes-Oxley Act of 2002, which requires mutual funds and other public companies to affirm that, to the best of their knowledge, the information in their financial reports is fairly and accurately stated in all material respects.
REPORTS ON THE WEB
Sign up for our E-mail Program, and you can begin to receive updated fund reports and prospectuses online rather than through the mail. Log in to your account at troweprice.com for more information.
Fellow Shareholders
The broad stock market ended 2005 near its highest level of the year. Similar to the past few years, all of the year’s gains were due mainly to a strong rally in the fourth quarter. While the S&P 500 and Nasdaq Composite indexes remained well below their all-time highs set in early 2000, the Russell 2000 Index (a proxy for small- and mid-cap stocks) reached record highs in 2005. Since the October 2002 lows, the Russell 2000 Index has outperformed the S&P 500 Index by almost 50%. Driven by a healthy demand outlook for semiconductor companies, a general improvement in investor sentiment, and the impressive performance of several high-flying stocks such as SanDisk, Apple Computer, and Google, technology stocks registered strong gains after the first-quarter sell-off.
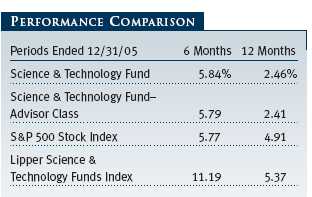
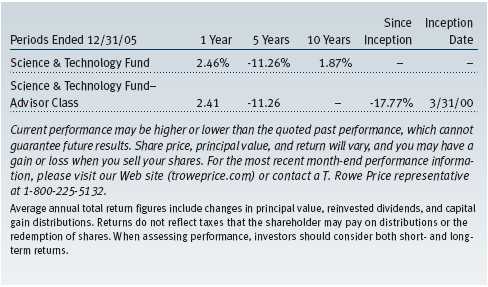
Your fund ended the year marginally higher, with returns of 5.84% for the six-month period and 2.46% for the 12-month period shown in the table. (Advisor Class returns were lower over the year, reflecting higher fees.) Returns were in line with the unmanaged Standard & Poor’s 500 Stock Index but lagged the Lipper Science & Technology Funds Index for the six-month period. Disappointing relative performance versus Lipper for the year was due mainly to stock selection in the hardware sector and an overweight of the software sector. Positive contributions from semiconductor and Internet stocks were offset by the negative impact of hardware and software stocks, specifically Dell and Mercury Interactive. (Please refer to our portfolio of investments for a complete listing of the portfolio’s holdings and the amount each represents in the portfolio.)
MARKET ENVIRONMENT
Oil prices and natural catastrophes dominated the headlines throughout 2005. The daily swings in oil’s price seemed to be the counterbalance to the stock market. As gasoline surged toward, and briefly passed, $3 per gallon, the market fretted over its impact on consumer demand. Small- and mid-cap stocks continued their outperformance relative to their large-cap brethren that began more than six years ago, with the small-cap Russell 2000 returning nearly 80% versus less than 5% for the large-cap S&P 500 since early 1999.
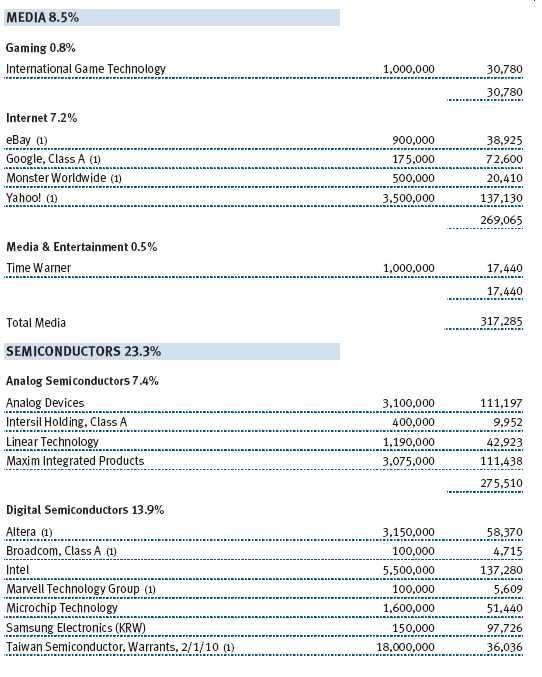
Within the technology segment, investors chased performance and afforded stocks with accelerating growth and rising estimates extreme relative earnings multiples and market capitalizations. A microcosm of the momentum-driven market is the performance of Google—a stock we have owned since its initial public offering. While we have the utmost respect for the management team and recognize the opportunity, Google already is the third largest company (measured by market capitalization) in technology behind only Microsoft and Intel—a lofty level for a company founded in September 1998. Leadership in Internet search has changed in the past, but with its current market capitalization, investors are assuming that Google’s victory is inevitable and that the current operating model of 50% pretax margins is enduring. We were not willing to assume either of these postulates and thus managed our position size accordingly.
Consolidation within the technology segment continued in 2005. Oracle’s acquisition of Siebel Systems and Seagate Technology’s acquisition of Maxtor are among the larger deals announced last year and expected to close in 2006. The healthy cash flows and attractive valuations of technology companies have drawn the attention of leveraged buyout (LBO) firms. While we do not anticipate the hostile bids that were part of the LBO wave in the 1980s, LBO firms will indirectly impose more discipline on technology companies that have not been good stewards of capital.
PORTFOLIO REVIEW
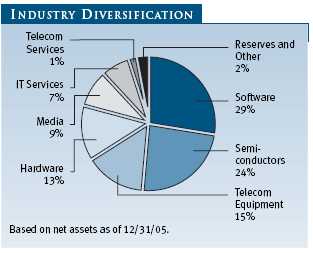
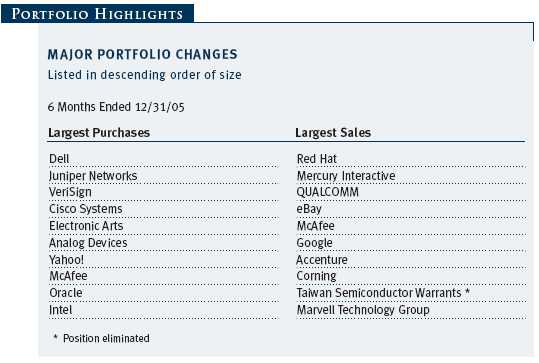
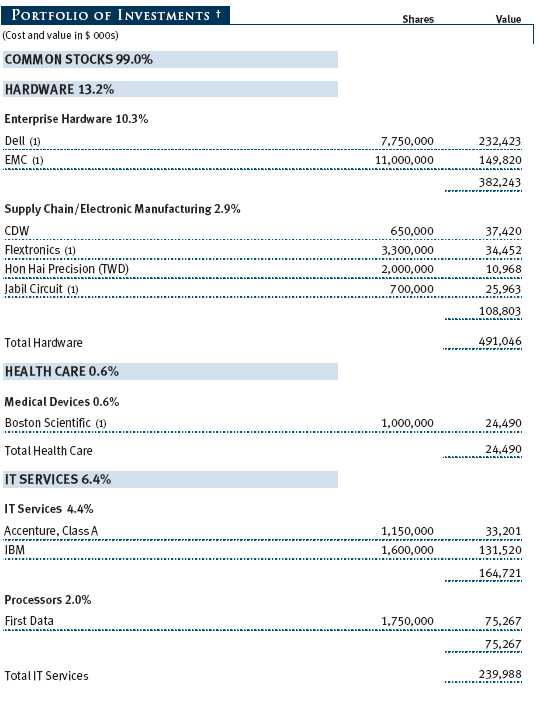
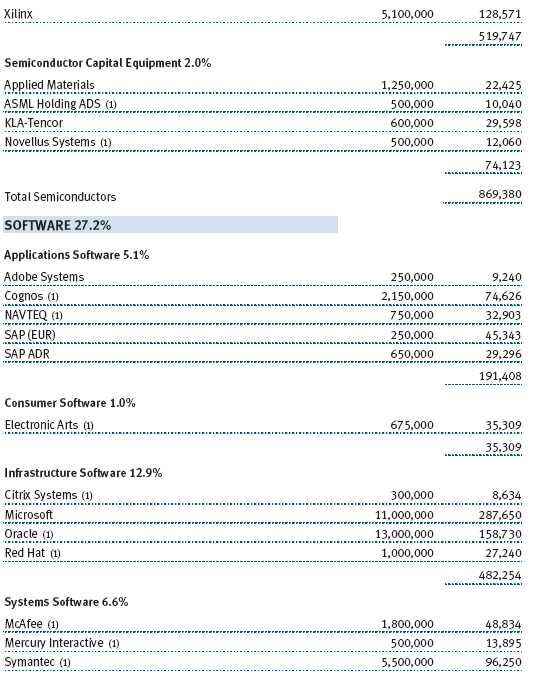
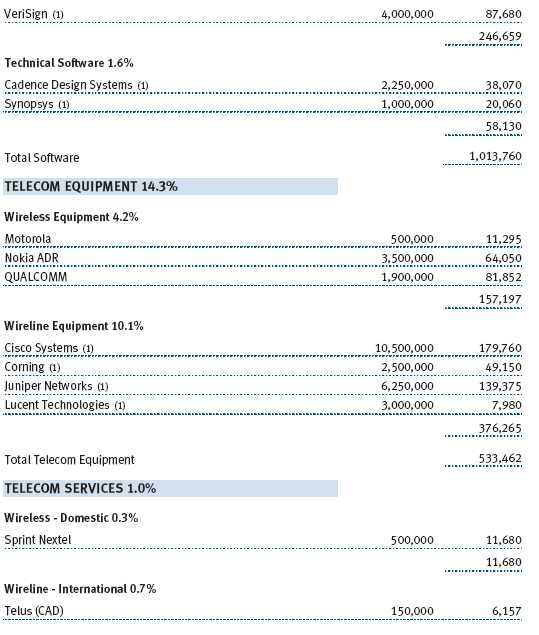
The fund remains broadly diversified across the principal segments of the science and technology sector. Software and semiconductors accounted for more than half the portfolio, and telecom equipment and hardware constituted another quarter, as shown in the Industry Diversification pie chart. During the past six months, we increased our exposure to software, principally through purchases of gaming software vendors such as Electronic Arts, and to hardware through purchases of Dell. With the strong performance of wireless vendors such as QUALCOMM, we reduced our exposure to the sector and purchased wireline vendors Juniper Networks and Cisco Systems. Our largest purchases were Dell, Juniper Networks, Verisign, Cisco Systems, and Electronic Arts, while our largest sales were Red Hat, Mercury Interactive, QUALCOMM, and eBay.
Among portfolio holdings, Red Hat, QUALCOMM, Google, Samsung, and eBay were the fund’s best contributors over the past six months. The laggards included Dell, Mercury Interactive, Cisco Systems, Verisign, and Symantec. Our investment in Red Hat proved quite timely as the market began to recognize the potential for open-source software and Red Hat’s leading position. Despite a stellar long-term record of outperforming the hardware sector, investors punished Dell for two disappointing quarters and slower long-term growth. However, we believe that Dell’s competitive advantages of a superior supply chain and a direct sales model will continue to bear fruit. Cisco Systems also delivered solid financials, but it, too, suffered from slowing revenue growth. Its preeminent position as a broadband networking player continues to b e the crux of our investment thesis.
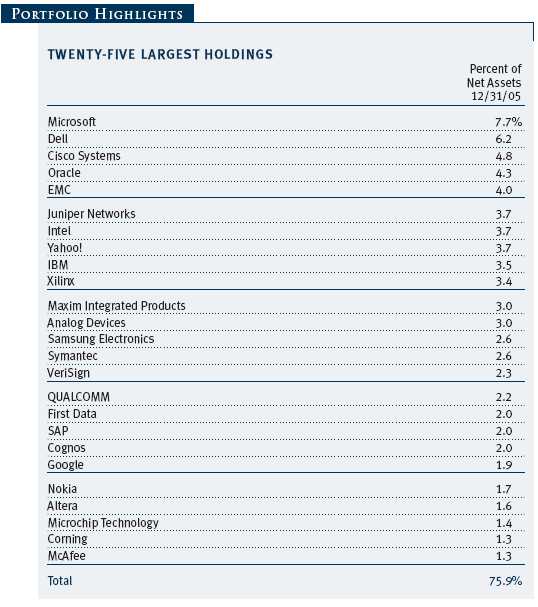
The fund’s 25 largest holdings, which included Microsoft, Dell, and Cisco Systems, represented nearly 76% of net assets compared with 67% at the end of June 2005. We increased concentration because of more attractive valuations for larger capitalization names and the desire to focus on stocks that have not caught the eye of investors, despite an improved demand environment. At the end of December, the average market capitalization for the fund was $32.6 billion compared with $23.6 billion six months ago.
OUTLOOK
The annual Consumer Electronics Show (CES) that is held in Las Vegas each January is the showcase for the future of the digital home. Investors leave Las Vegas with the idea that the technologies presented are on the verge of adoption. However, when the din of CES fades, they awake to the reality that adoption of technology, particularly within the home, is always slower than hoped and hyped. Despite being available for years, the penetration of both high-definition television (HDTV) and flat-panel televisions is still less than 15% of households. Yet, anyone who has watched a sporting event in HDTV can vouch for its superiority over standard analog broadcast. While we believe that the convergence of digital media components in the home is both inevitable and embryonic, the concept of a media device—a personal computer, a set-top box, or a gaming platform—managing all digital media and broadcasting within the home is still years away. Even Apple’s iPod has penetrated less than 10% of U.S. households. The potential winners within the digital home include traditional software player Microsoft, semiconductor manufacturer Intel, personal computer manufacturers Apple and Dell, traditional consumer electronics company Sony, the current Internet players Google and Yahoo!, and, finally, the networking vendor Cisco. All of these competitors have the financial resources and some of the critical components, but none has a complete solution available today. What the long list of players reveals is just how competitive the market is likely to be. Despite the market anointing the perceived winners with, in our opinion, extreme market capitalizations, the ultimate winners are unlikely to be decided for years. (Just remember in the 1980s when investors shunned Microsoft in favor of Lotus because they placed little value on owning the operating system.) In the interim, we have chosen to focus on the one obvious component of the digital home, the need for broadband connectivity both to and within the home.
The myopic focus of some investors presents opportunity. Rather than ask which company is tracking ahead of the current quarter’s expectation; what product is “hot” now?, or what stocks are doing well today, we are asking the main question: What companies are best positioned over the next three to five years? The answer to this question leads us to investments rather than quarterly trades.
As we near the end of the Federal Reserve interest rate tightening, we anticipate a favorable macroeconomic backdrop for information technology spending. Companies’ balance sheets and cash flows are as healthy as they have been in decades, and large enterprises still have not opened their wallets for capital expenditures. Valuations for technology companies, particularly the large-cap stocks, remain attractive. Our concerns center around the record net margins already achieved for technology companies and the impact of currency on growth rates now that the U.S. dollar has strengthened. Technology is still the principal means of improving corporate productivity, and we remain upbeat about long-term prospects for this segment of the equity markets.
As always, we appreciate your continued support.
Respectfully submitted,

Michael F. Sola
President of the fund and chairman of its Investment Advisory Committee
January 14, 2006
The committee chairman has day-to-day responsibility for managing the portfolio and works with committee members in developing and executing the fund’s investment program.
RISKS OF INVESTING IN THE FUND
Funds that invest only in specific industries will experience greater volatility than funds investing in a broad range of industries. Technology stocks, historically, have experienced unusually wide price swings, both up and down. The potential for wide variation in performance reflects the special risks common to companies in the rapidly changing field of technology. For example, products or services that at first appear promising may not prove commercially successful and may become obsolete quickly. Earnings disappointments and intense competition for market share can result in sharp price declines.
GLOSSARY
Lipper index: An index of mutual fund performance returns for specified periods in defined categories as tracked by Lipper Inc.
Nasdaq Composite Index: A market-value weighted index of all common stocks listed on Nasdaq.
Price/earnings ratio: Calculated by dividing a stock’s market value per share by the company’s earnings per share for the past 12 months or by expected earnings for the coming year.
Russell 2000 Index: Consists of the smallest 2,000 companies in the Russell 3000 Index. Performance is reported on a total return basis.
S&P 500 Stock Index: A market cap-weighted index of 500 widely held stocks often used as a proxy for the overall stock market. Performance is reported on a total-return basis.
| GROWTH OF $10,000 |
This chart shows the value of a hypothetical $10,000 investment in the fund over the past 10 fiscal year periods or since inception (for funds lacking 10-year records). The result is compared with benchmarks, which may include a broad-based market index and a peer group average or index. Market indexes do not include expenses, which are deducted from fund returns as well as mutual fund averages and indexes.
| AVERAGE ANNUAL COMPOUND TOTAL RETURN |
This table shows how the fund would have performed each year if its actual (or cumulative) returns for the periods shown had been earned at a constant rate.
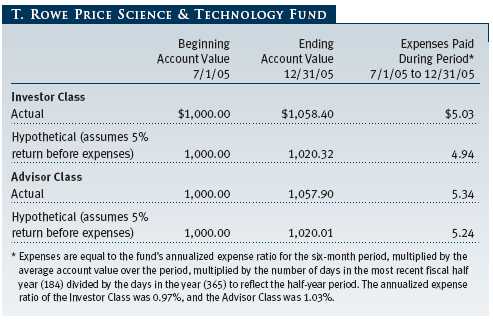
| FUND EXPENSE EXAMPLE |
As a mutual fund shareholder, you may incur two types of costs: (1) transaction costs, such as redemption fees or sales loads, and (2) ongoing costs, including management fees, distribution and service (12b-1) fees, and other fund expenses. The following example is intended to help you understand your ongoing costs (in dollars) of investing in the fund and to compare these costs with the ongoing costs of investing in other mutual funds. The example is based on an investment of $1,000 invested at the beginning of the most recent six-month period and held for the entire period.
Please note that the fund has two share classes: The original share class (“investor class”) charges no distribution and service (12b-1) fees. Advisor Class shares are offered only through unaffiliated brokers and other financial intermediaries and charge a 0.25% 12b-1 fee. Each share class is presented separately in the table.
Actual Expenses
The first line of the following table (“Actual”) provides information about actual account values and expenses based on the fund’s actual returns. You may use the information in this line, together with your account balance, to estimate the expenses that you paid over the period. Simply divide your account value by $1,000 (for example, an $8,600 account value divided by $1,000 = 8.6), then multiply the result by the number in the first line under the heading “Expenses Paid During Period” to estimate the expenses you paid on your account during this period.
Hypothetical Example for Comparison Purposes
The information on the second line of the table (“Hypothetical”) is based on hypothetical account values and expenses derived from the fund’s actual expense ratio and an assumed 5% per year rate of return before expenses (not the fund’s actual return). You may compare the ongoing costs of investing in the fund with other funds by contrasting this 5% hypothetical example and the 5% hypothetical examples that appear in the shareholder reports of the other funds. The hypothetical account values and expenses may not be used to estimate the actual ending account balance or expenses you paid for the period.
Note: T. Rowe Price charges an annual small-account maintenance fee of $10, generally for accounts with less than $2,000 ($500 for UGMA/UTMA). The fee is waived for any investor whose T. Rowe Price mutual fund accounts total $25,000 or more, accounts employing automatic investing, and IRAs and other retirement plan accounts that utilize a prototype plan sponsored by T. Rowe Price (although a separate custodial or administrative fee may apply to such accounts). This fee is not included in the accompanying table. If you are subject to the fee, keep it in mind when you are estimating the ongoing expenses of investing in the fund and when comparing the expenses of this fund with other funds.
You should also be aware that the expenses shown in the table highlight only your ongoing costs and do not reflect any transaction costs, such as redemption fees or sales loads. Therefore, the second line of the table is useful in comparing ongoing costs only and will not help you determine the relative total costs of owning different funds. To the extent a fund charges transaction costs, however, the total cost of owning that fund is higher.
The accompanying notes are an integral part of these financial statements.
The accompanying notes are an integral part of these financial statements.
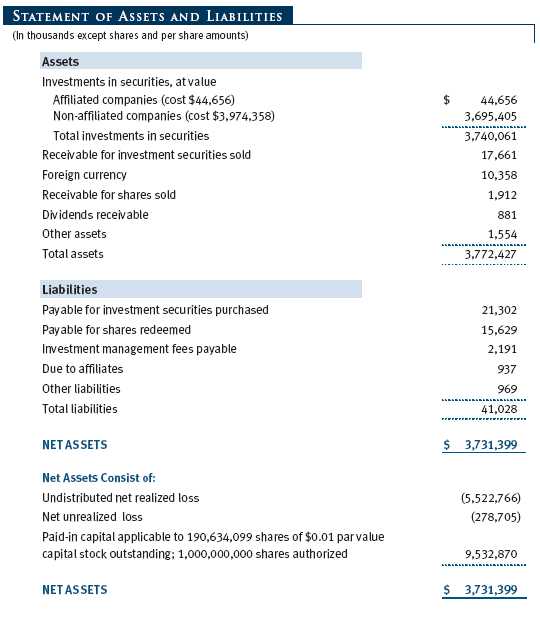
The accompanying notes are an integral part of these financial statements.
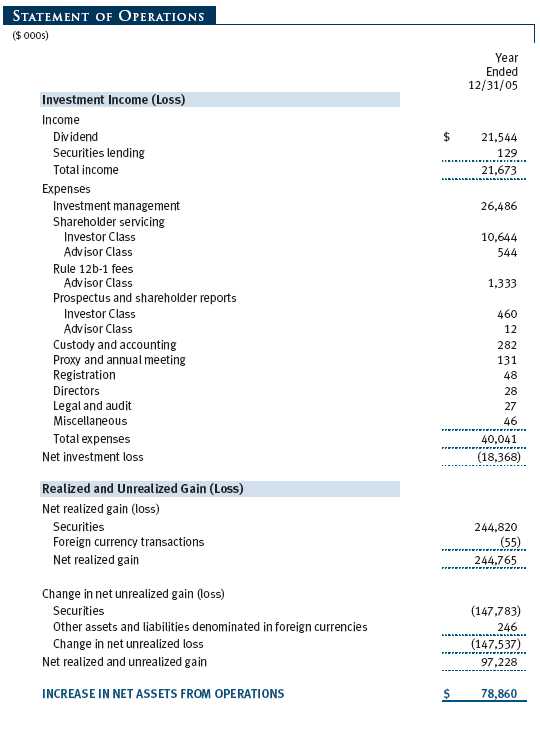
The accompanying notes are an integral part of these financial statements.
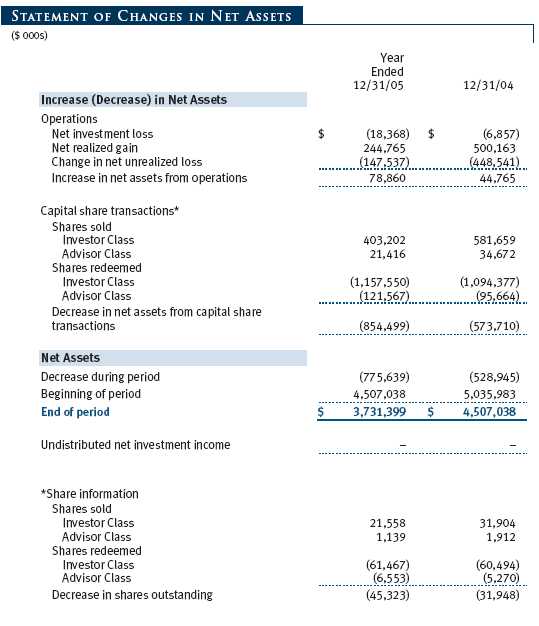
The accompanying notes are an integral part of these financial statements.
| NOTES TO FINANCIAL STATEMENTS |
NOTE 1 - SIGNIFICANT ACCOUNTING POLICIES
T. Rowe Price Science & Technology Fund, Inc. (the fund) is registered under the Investment Company Act of 1940 (the 1940 Act) as a diversified, open-end management investment company. The fund seeks to provide long-term capital appreciation. The fund has two classes of shares: the Science & Technology Fund original share class, referred to in this report as the Investor Class, offered since September 30, 1987, and Science & Technology Fund—Advisor Class (Advisor Class), offered since March 31, 2000. Advisor Class shares are sold only through unaffiliated brokers and other unaffiliated financial intermediaries that are compensated by the class for distribution, shareholder servicing, and/or certain administrative services under a Board-approved Rule 12b-1 plan. Each class has exclusive voting rights on matters related solely to that class, separate voting rights on matters that relate to both classes, and, in all other respects, the same rights and obligations as the other class.
The accompanying financial statements were prepared in accordance with accounting principles generally accepted in the United States of America, which require the use of estimates made by fund management. Fund management believes that estimates and security valuations are appropriate; however actual results may differ from those estimates, and the security valuations reflected in the financial statements may differ from the value the fund ultimately realizes upon sale of the securities.
Valuation The fund values its investments and computes its net asset value per share at the close of the New York Stock Exchange (NYSE), normally 4 p.m. ET, each day that the NYSE is open for business. Equity securities listed or regularly traded on a securities exchange or in the over-the-counter market are valued at the last quoted sale price or, for certain markets, the official closing price at the time the valuations are made, except for OTC Bulletin Board securities, which are valued at the mean of the latest bid and asked prices. A security that is listed or traded on more than one exchange is valued at the quotation on the exchange determined to be the primary market for such security. Listed securities not traded on a particular day are valued at the mean of the latest bid and asked prices for domestic securities and the last quoted sale price for international securities.
Investments in mutual funds are valued at the mutual fund’s closing net asset value per share on the day of valuation.
Other investments, including restricted securities, and those for which the above valuation procedures are inappropriate or are deemed not to reflect fair value are stated at fair value as determined in good faith by the T. Rowe Price Valuation Committee, established by the fund’s Board of Directors.
Most foreign markets close before the close of trading on the NYSE. If the fund determines that developments between the close of a foreign market and the close of the NYSE will, in its judgment, materially affect the value of some or all of its portfolio securities, which in turn will affect the fund’s share price, the fund will adjust the previous closing prices to reflect the fair value of the securities as of the close of the NYSE, as determined in good faith by the T. Rowe Price Valuation Committee, established by the fund’s Board of Directors. A fund may also fair value securities in other situations, such as when a particular foreign market is closed but the fund is open. In deciding whether to make fair value adjustments, the fund reviews a variety of factors, including developments in foreign markets, the performance of U.S. securities markets, and the performance of instruments trading in U.S. markets that represent foreign securities and baskets of foreign securities. The fund uses outside pricing services to provide it with closing market prices and information used for adjusting those prices. The fund cannot predict when and how often it will use closing prices and when it will adjust those prices to reflect fair value. As a means of evaluating its fair value process, the fund routinely compares closing market prices, the next day’s opening prices in the same markets, and adjusted prices.
Currency Translation Assets, including investments, and liabilities denominated in foreign currencies are translated into U.S. dollar values each day at the prevailing exchange rate, using the mean of the bid and asked prices of such currencies against U.S. dollars as quoted by a major bank. Purchases and sales of securities, income, and expenses are translated into U.S. dollars at the prevailing exchange rate on the date of the transaction. The effect of changes in foreign currency exchange rates on realized and unrealized security gains and losses is reflected as a component of security gains and losses.
Class Accounting The Advisor Class pays distribution, shareholder servicing, and/or certain administrative expenses in the form of Rule 12b-1 fees, in an amount not exceeding 0.25% of the class’s average daily net assets. Shareholder servicing, prospectus, and shareholder report expenses incurred by each class are charged directly to the class to which they relate. Expenses common to both classes, investment income, and realized and unrealized gains and losses are allocated to the classes based upon the relative daily net assets of each class.
Rebates and Credits Subject to best execution, the fund may direct certain security trades to brokers who have agreed to rebate a portion of the related brokerage commission to the fund in cash. Commission rebates are reflected as realized gain on securities in the accompanying financial statements and totaled $500,000 for the year ended December 31, 2005. Additionally, the fund earns credits on temporarily uninvested cash balances at the custodian that reduce the fund’s custody charges. Custody expense in the accompanying financial statements is presented before reduction for credits.
Investment Transactions, Investment Income, and Distributions Income and expenses are recorded on the accrual basis. Dividends received from mutual fund investments are reflected as dividend income; capital gain distributions are reflected as realized gain/loss. Dividend income and capital gain distributions are recorded on the ex-dividend date. Investment transactions are accounted for on the trade date. Realized gains and losses are reported on the identified cost basis. Distributions to shareholders are recorded on the ex-dividend date. Income distributions are declared and paid by each class on an annual basis. Capital gain distributions, if any, are declared and paid by the fund, typically on an annual basis.
NOTE 2 - INVESTMENT TRANSACTIONS
Consistent with its investment objective, the fund engages in the following practices to manage exposure to certain risks or enhance performance. The investment objective, policies, program, and risk factors of the fund are described more fully in the fund’s prospectus and Statement of Additional Information.
Securities Lending The fund lends its securities to approved brokers to earn additional income. It receives as collateral cash and U.S. government securities valued at 102% to 105% of the value of the securities on loan. Cash collateral is invested in a money market pooled trust managed by the fund’s lending agent in accordance with investment guidelines approved by fund management. Collateral is maintained over the life of the loan in an amount not less than the value of loaned securities, as determined at the close of fund business each day; any additional collateral required due to changes in security values is delivered to the fund the next business day. Although risk is mitigated by the collateral, the fund could experience a delay in recovering its securities and a possible loss of income or value if the borrower fails to return the securities. Securities lending revenue recognized by the fund consists of earnings on invested collateral and borrowing fees, net of any rebates to the borrower and compensation to the lending agent. At December 31, 2005, there were no securities on loan.
Other Purchases and sales of portfolio securities, other than short-term securities, aggregated $2,340,746,000 and $3,087,084,000, respectively, for the year ended December 31, 2005.
NOTE 3 - FEDERAL INCOME TAXES
No provision for federal income taxes is required since the fund intends to continue to qualify as a regulated investment company under Subchapter M of the Internal Revenue Code and distribute to shareholders all of its taxable income and gains. Federal income tax regulations differ from generally accepted accounting principles; therefore, distributions determined in accordance with tax regulations may differ significantly in amount or character from net investment income and realized gains for financial reporting purposes. Financial reporting records are adjusted for permanent book/tax differences to reflect tax character. Financial records are not adjusted for temporary differences.
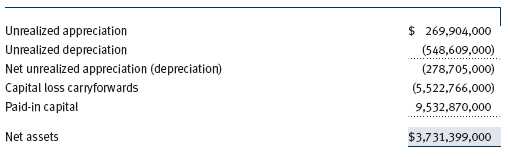
There were no distributions in the year ended December 31, 2005. At December 31, 2005, the tax-basis components of net assets were as follows:
The fund intends to retain realized gains to the extent of available capital loss carryforwards for federal income tax purposes. During the year ended December 31, 2005, the fund utilized $244,820,000 of capital loss carryforwards. As of December 31, 2005, the fund had $3,489,126,000 of capital loss carryforwards that expire in 2009, $1,904,219,000 that expire in 2010, and $129,421,000 that expire in 2011.
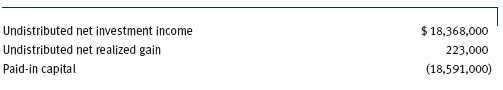
For the year ended December 31, 2005, the fund recorded the following permanent reclassifications to reflect tax character. Reclassifications to paid-in capital relate primarily to the current net operating loss. Results of operations and net assets were not affected by these reclassifications.
At December 31, 2005, the cost of investments for federal income tax purposes was $4,019,014,000.
NOTE 4 - RELATED PARTY TRANSACTIONS
The fund is managed by T. Rowe Price Associates, Inc. (the manager or Price Associates), a wholly owned subsidiary of T. Rowe Price Group, Inc. The investment management agreement between the fund and the manager provides for an annual investment management fee, which is computed daily and paid monthly. The fee consists of an individual fund fee, equal to 0.35% of the fund’s average daily net assets, and a group fee. The group fee rate is calculated based on the combined net assets of certain mutual funds sponsored by Price Associates (the group) applied to a graduated fee schedule, with rates ranging from 0.48% for the first $1 billion of assets to 0.29% for assets in excess of $160 billion. Prior to May 1, 2005, the maximum group fee rate in the graduated fee schedule had been 0.295% for assets in excess of $120 billion. The fund’s group fee is determined by applying the group fee rate to the fund’s average daily net assets. At December 31, 2005, the effective annual group fe e rate was 0.31%.
The Advisor Class is also subject to a contractual expense limitation through April 30, 2006. During the limitation period, the manager is required to waive its management fee and reimburse a class for any expenses, excluding interest, taxes, brokerage commissions, and extraordinary expenses, that would otherwise cause the class’s ratio of total expenses to average net assets (expense ratio) to exceed its expense limitation of 1.15%. The class is required to repay the manager for expenses previously reimbursed and management fees waived to the extent the class’s net assets have grown or expenses have declined sufficiently to allow repayment without causing the class’s expense ratio to exceed its expense limitation. However, no repayment will be made more than three years after the date of any reimbursement or waiver or later than April 30, 2008. Pursuant to this agreement, at December 31, 2005, there were no amounts subject to repayment. For the year ended December 31, 2005, th e Advisor Class operated below its expense limitation.
In addition, the fund has entered into service agreements with Price Associates and two wholly owned subsidiaries of Price Associates (collectively, Price). Price Associates computes the daily share prices and maintains the financial records of the fund. T. Rowe Price Services, Inc., provides shareholder and administrative services in its capacity as the fund’s transfer and dividend disbursing agent. T. Rowe Price Retirement Plan Services, Inc., provides subaccounting and recordkeeping services for certain retirement accounts invested in the Investor Class. For the year ended December 31, 2005, expenses incurred pursuant to these service agreements were $93,000 for Price Associates, $5,139,000 for T. Rowe Price Services, Inc., and $2,831,000 for T. Rowe Price Retirement Plan Services, Inc. The total amount payable at period end pursuant to these service agreements is reflected as Due to Affiliates in the accompanying financial statements.
Additionally, the fund is one of several mutual funds in which certain college savings plans managed by Price Associates may invest. As approved by the fund’s Board of Directors, shareholder servicing costs associated with each college savings plan are borne by the fund in proportion to the average daily value of its shares owned by the college savings plan. For the year ended December 31, 2005, the fund was charged $40,000 for shareholder servicing costs related to the college savings plans, of which $31,000 was for services provided by Price. The amount payable at period end pursuant to this agreement is reflected as Due to Affiliates in the accompanying financial statements. At December 31, 2005, approximately 0.3% of the outstanding shares of the Investor Class were held by college savings plans.
The fund may invest in the T. Rowe Price Reserve Investment Fund and the T. Rowe Price Government Reserve Investment Fund (collectively, the T. Rowe Price Reserve Funds), open-end management investment companies managed by Price Associates and affiliates of the fund. The T. Rowe Price Reserve Funds are offered as cash management options to mutual funds, trusts, and other accounts managed by Price Associates and/or its affiliates, and are not available for direct purchase by members of the public. The T. Rowe Price Reserve Funds pay no investment management fees. During the year ended December 31, 2005, dividend income from the T. Rowe Price Reserve Funds totaled $1,578,000, and the value of shares of the T. Rowe Price Reserve Funds held at December 31, 2005 and December 31, 2004 was $44,656,000 and $158,401,000, respectively.
As of December 31, 2005, T. Rowe Price Group, Inc. and/or its wholly owned subsidiaries owned 271,171 shares of the Investor Class, aggregating less than 1% of the fund’s net assets.
NOTE 5 - INTERFUND BORROWING
Pursuant to its prospectus, the fund may borrow up to 33 1/3% of its total assets. The fund is party to an interfund borrowing agreement between itself and other T. Rowe Price-sponsored mutual funds, which permits it to borrow or lend cash at rates beneficial to both the borrowing and lending funds. Loans totaling 10% or more of a borrowing fund’s total assets are collateralized at 102% of the value of the loan; loans of less than 10% are unsecured. During the year ended December 31, 2005, the fund had outstanding borrowings on three days, in the average amount of $10,100,000, and at an average annual rate of 2.47%. There were no borrowings outstanding at December 31, 2005.
| REPORT OF INDEPENDENT REGISTERED PUBLIC ACCOUNTING FIRM |
To the Board of Directors and Shareholders of T. Rowe Price Science & Technology Fund, Inc.
In our opinion, the accompanying statement of assets and liabilities, including the portfolio of investments, and the related statements of operations and of changes in net assets and the financial highlights present fairly, in all material respects, the financial position of T. Rowe Price Science & Technology Fund, Inc. (the “Fund”) at December 31, 2005, the results of its operations for the year then ended, the changes in its net assets for each of the two years in the period then ended and the financial highlights for each of the five years in the period then ended, in conformity with accounting principles generally accepted in the United States of America. These financial statements and financial highlights (hereafter referred to as “financial statements”) are the responsibility of the Fund’s management; our responsibility is to express an opinion on these financial statements based on our audits. We conducted our audits of these financial statements in accordance with the standards of the Public Company Accounting Oversight Board (United States). Those standards require that we plan and perform the audit to obtain reasonable assurance about whether the financial statements are free of material misstatement. An audit includes examining, on a test basis, evidence supporting the amounts and disclosures in the financial statements, assessing the accounting principles used and significant estimates made by management, and evaluating the overall financial statement presentation. We believe that our audits, which included confirmation of securities at December 31, 2005 by correspondence with the custodian and by agreement to the underlying ownership records for T. Rowe Price Government Reserve Investment Fund, provide a reasonable basis for our opinion.
PricewaterhouseCoopers LLP
Baltimore, Maryland
February 13, 2006
| INFORMATION ON PROXY VOTING POLICIES, PROCEDURES, AND RECORDS |
A description of the policies and procedures used by T. Rowe Price funds and portfolios to determine how to vote proxies relating to portfolio securities is available in each fund’s Statement of Additional Information, which you may request by calling 1-800-225-5132 or by accessing the SEC’s Web site, www.sec.gov. The description of our proxy voting policies and procedures is also available on our Web site, www.troweprice.com. To access it, click on the words “Company Info” at the top of our homepage for individual investors. Then, in the window that appears, click on the “Proxy Voting Policy” navigation button in the top left corner.
Each fund’s most recent annual proxy voting record is available on our Web site and through the SEC’s Web site. To access it through our Web site, follow the directions above, then click on the words “Proxy Voting Record” at the bottom of the Proxy Voting Policy page.
| HOW TO OBTAIN QUARTERLY PORTFOLIO HOLDINGS |
The fund files a complete schedule of portfolio holdings with the Securities and Exchange Commission for the first and third quarters of each fiscal year on Form N-Q. The fund’s Form N-Q is available electronically on the SEC’s Web site (www.sec.gov); hard copies may be reviewed and copied at the SEC’s Public Reference Room, 450 Fifth St. N.W., Washington, DC 20549. For more information on the Public Reference Room, call 1-800-SEC-0330.
| ABOUT THE FUND’S DIRECTORS AND OFFICERS |
Your fund is governed by a Board of Directors that meets regularly to review investments, performance, compliance matters, advisory fees, expenses, and other business affairs, and is responsible for protecting the interests of shareholders. The majority of the fund’s directors are independent of T. Rowe Price Associates, Inc. (T. Rowe Price); “inside” directors are officers of T. Rowe Price. The Board of Directors elects the fund’s officers, who are listed in the final table. The business address of each director and officer is 100 East Pratt Street, Baltimore, MD 21202. The Statement of Additional Information includes additional information about the fund directors and is available without charge by calling a T. Rowe Price representative at 1-800-225-5132.
| Independent Directors | |
| Name | |
| (Year of Birth) | |
| Year Elected * | |
| [Number of T. Rowe Price | Principal Occupation(s) During Past 5 Years and Directorships of |
| Portfolios Overseen] | Other Public Companies |
| Jeremiah E. Casey ** | Director, National Life Insurance (2001 to 8/05); Director, The Rouse |
| (1940) | Company, real estate developers (1990 to 2004) |
| 2005 | |
| [59] | |
| Anthony W. Deering | Chairman, Exeter Capital, LLC, a private investment firm (2004 to pres- |
| (1945) | ent); Director, Chairman of the Board, and Chief Executive Officer, The |
| 2001 | Rouse Company, real estate developers (1997 to 2004); Director, |
| [113] | Mercantile Bank (4/03 to present) |
| Donald W. Dick, Jr. | Principal, EuroCapital Advisors, LLC, an acquisition and management |
| (1943) | advisory firm; Chairman, President, and Chief Executive Officer, The |
| 1994 | Haven Group, a custom manufacturer of modular homes (1/04 |
| [113] | to present) |
| David K. Fagin | Chairman and President, Nye Corporation (6/88 to present); Director, |
| (1938) | Canyon Resources Corp. and Golden Star Resources Ltd. (5/00 to |
| 1994 | present) and Pacific Rim Mining Corp. (2/02 to present) |
| [113] | |
| Karen N. Horn | Managing Director and President, Global Private Client Services, Marsh |
| (1943) | Inc. (1999 to 2003); Managing Director and Head of International Private |
| 2003 | Banking, Bankers Trust (1996 to 1999); Director, Eli Lilly and Company |
| [113] | and Georgia Pacific |
| F. Pierce Linaweaver | President, F. Pierce Linaweaver & Associates, Inc., consulting environ- |
| (1934) | mental and civil engineers |
| 2001 | |
| [113] | |
| Theo C. Rodgers *** | President, A&R Development Corporation |
| (1941) | |
| 2005 | |
| [97] | |
| John G. Schreiber | Owner/President, Centaur Capital Partners, Inc., a real estate investment |
| (1946) | company; Partner, Blackstone Real Estate Advisors, L.P.; Director, AMLI |
| 2001 | Residential Properties Trust |
| [113] | |
| * | Each independent director serves until retirement, resignation, or election of a successor. |
| ** | Elected effective October 19, 2005. |
| *** | Elected effective April 1, 2005. |
| Inside Directors | |
| Name | |
| (Year of Birth) | |
| Year Elected * | |
| [Number of T. Rowe Price | Principal Occupation(s) During Past 5 Years and Directorships of |
| Portfolios Overseen] | Other Public Companies |
| John H. Laporte, CFA | Vice President, T. Rowe Price and T. Rowe Price Group, Inc. |
| (1945) | |
| 1988 | |
| [15] | |
| James S. Riepe | Director and Vice President, T. Rowe Price; Vice Chairman of the Board, |
| (1943) | Director, and Vice President, T. Rowe Price Group, Inc.; Chairman of the |
| 1987 | Board and Director, T. Rowe Price Global Asset Management Limited, |
| [113] | T. Rowe Price Global Investment Services Limited, T. Rowe Price |
| Investment Services, Inc., T. Rowe Price Retirement Plan Services, Inc., | |
| and T. Rowe Price Services, Inc.; Chairman of the Board, Director, | |
| President, and Trust Officer, T. Rowe Price Trust Company; Director, | |
| T. Rowe Price International, Inc.; Chairman of the Board, all funds | |
| * Each inside director serves until retirement, resignation, or election of a successor. | |
| Officers | |
| Name (Year of Birth) | |
| Title and Fund(s) Served | Principal Occupation(s) |
| Kennard W. Allen (1977) | Vice President, T. Rowe Price and T. Rowe Price |
| Vice President, Science & Technology Fund | Group, Inc. |
| Joseph A. Carrier, CPA (1960) | Vice President, T. Rowe Price, T. Rowe Price |
| Treasurer, Science & Technology Fund | Group, Inc., T. Rowe Price Investment Services, |
| Inc., and T. Rowe Price Trust Company | |
| Donald J. Easley, CFA (1971) | Vice President, T. Rowe Price and T. Rowe Price |
| Vice President, Science & Technology Fund | Group, Inc. |
| David J. Eiswert, CFA (1972) | Vice President, T. Rowe Price; formerly Analyst, |
| Vice President, Science & Technology Fund | Mellon Growth Advisors and Fidelity Management |
| and Research (to 2003) | |
| Henry M. Ellenbogen (1971) | Vice President, T. Rowe Price and T. Rowe Price |
| Vice President, Science & Technology Fund | Group, Inc.; formerly Executive Vice President, |
| Business Development, HelloAsia (to 2001) | |
| Roger L. Fiery III, CPA (1959) | Vice President, T. Rowe Price, T. Rowe Price |
| Vice President, Science & Technology Fund | Group, Inc., T. Rowe Price International, Inc., |
| and T. Rowe Price Trust Company | |
| Robert N. Gensler (1957) | Vice President, T. Rowe Price, T. Rowe Price |
| Vice President, Science & Technology Fund | Group, Inc., and T. Rowe Price International, Inc. |
| John R. Gilner (1961) | Chief Compliance Officer and Vice President, |
| Chief Compliance Officer, | T. Rowe Price; Vice President, T. Rowe Price |
| Science & Technology Fund | Group, Inc., and T. Rowe Price Investment |
| Services, Inc. | |
| Gregory S. Golczewski (1966) | Vice President, T. Rowe Price and T. Rowe Price |
| Vice President, Science & Technology Fund | Trust Company |
| Jill L. Hauser (1958) | Vice President, T. Rowe Price and T. Rowe Price |
| Vice President, Science & Technology Fund | Group, Inc. |
| Henry H. Hopkins (1942) | Director and Vice President, T. Rowe Price |
| Vice President, Science & Technology Fund | Investment Services, Inc., T. Rowe Price Services, |
| Inc., and T. Rowe Price Trust Company; Vice | |
| President, T. Rowe Price, T. Rowe Price Group, | |
| Inc., T. Rowe Price International, Inc., and T. Rowe | |
| Price Retirement Plan Services, Inc. | |
| Patricia B. Lippert (1953) | Assistant Vice President, T. Rowe Price and |
| Secretary, Science & Technology Fund | T. Rowe Price Investment Services, Inc. |
| Anh Lu (1968) | Vice President, T. Rowe Price Group, Inc., and |
| Vice President, Science & Technology Fund | T. Rowe Price International, Inc.; formerly Vice |
| President, Salomon Smith Barney Hong Kong | |
| (to 2001) | |
| D. James Prey III (1959) | Vice President, T. Rowe Price and T. Rowe Price |
| Vice President, Science & Technology Fund | Group, Inc. |
| Jeffrey Rottinghaus, CPA (1970) | Vice President, T. Rowe Price and T. Rowe Price |
| Vice President, Science & Technology Fund | Group, Inc.; formerly student, the Wharton |
| School, University of Pennsylvania (to 2001) | |
| Michael F. Sola, CFA (1969) | Vice President, T. Rowe Price and T. Rowe Price |
| President, Science & Technology Fund | Group, Inc. |
| Joshua K. Spencer, CFA (1973) | Vice President, T. Rowe Price and T. Rowe Price |
| Vice President, Science & Technology Fund | Group, Inc.; formerly Research Analyst and Sector |
| Fund Portfolio Manager, Fidelity Investments | |
| (to 2004) | |
| Julie L. Waples (1970) | Vice President, T. Rowe Price |
| Vice President, Science & Technology Fund�� | |
| Wenhua Zhang, CFA, CPA (1970) | Vice President, T. Rowe Price and T. Rowe Price |
| Vice President, Science & Technology Fund | Group, Inc.; formerly student, the Wharton |
| School, University of Pennsylvania (to 2001) | |
| Unless otherwise noted, officers have been employees of T. Rowe Price or T. Rowe Price International for at | |
| least five years. | |
Item 2. Code of Ethics.
The registrant has adopted a code of ethics, as defined in Item 2 of Form N-CSR, applicable to its principal executive officer, principal financial officer, principal accounting officer or controller, or persons performing similar functions. A copy of this code of ethics is filed as an exhibit to this Form N-CSR. No substantive amendments were approved or waivers were granted to this code of ethics during the period covered by this report.
Item 3. Audit Committee Financial Expert.
The registrant’s Board of Directors/Trustees has determined that Mr. Donald W. Dick Jr. qualifies as an audit committee financial expert, as defined in Item 3 of Form N-CSR. Mr. Dick is considered independent for purposes of Item 3 of Form N-CSR.
Item 4. Principal Accountant Fees and Services.
(a) – (d) Aggregate fees billed to the registrant for the last two fiscal years for professional services rendered by the registrant’s principal accountant were as follows:
| 2005 | 2004 | |
| Audit Fees | $15,233 | $15,929 |
| Audit-Related Fees | 979 | 2,190 |
| Tax Fees | 4,327 | 6,440 |
| All Other Fees | 393 | - |
Audit fees include amounts related to the audit of the registrant’s annual financial statements and services normally provided by the accountant in connection with statutory and regulatory filings. Audit-related fees include amounts reasonably related to the performance of the audit of the registrant’s financial statements and specifically include the issuance of a report on internal controls. Tax fees include amounts related to services for tax compliance, tax planning, and tax advice. The nature of these services specifically includes the review of distribution calculations and the preparation of Federal, state, and excise tax returns. All other fees include the registrant’s pro-rata share of amounts for agreed-upon procedures in conjunction with service contract approvals by the registrant’s Board of Directors/Trustees.
(e)(1) The registrant’s audit committee has adopted a policy whereby audit and non-audit services performed by the registrant’s principal accountant for the registrant, its investment adviser, and any entity controlling, controlled by, or under common control with the investment adviser that provides ongoing services to the registrant require pre-approval in advance at regularly scheduled audit committee meetings. If such a service is required between regularly scheduled audit committee meetings, pre-approval may be authorized by one audit committee member with ratification at the next scheduled audit committee meeting. Waiver of pre-approval for audit or non-audit services requiring fees of a de minimis amount is not permitted.
(2) No services included in (b) – (d) above were approved pursuant to paragraph (c)(7)(i)(C) of Rule 2-01 of Regulation S-X.
(f) Less than 50 percent of the hours expended on the principal accountant’s engagement to audit the registrant’s financial statements for the most recent fiscal year were attributed to work performed by persons other than the principal accountant’s full-time, permanent employees.
(g) The aggregate fees billed for the most recent fiscal year and the preceding fiscal year by the registrant’s principal accountant for non-audit services rendered to the registrant, its investment adviser, and any entity controlling, controlled by, or under common control with the investment adviser that provides ongoing services to the registrant were $1,008,000 and $903,000, respectively, and were less than the aggregate fees billed for those same periods by the registrant’s principal accountant for audit services rendered to the T. Rowe Price Funds.
(h) All non-audit services rendered in (g) above were pre-approved by the registrant’s audit committee. Accordingly, these services were considered by the registrant’s audit committee in maintaining the principal accountant’s independence.Item 5. Audit Committee of Listed Registrants.
Not applicable.
Item 6. Schedule of Investments.
Not applicable. The complete schedule of investments is included in Item 1 of this Form N-CSR.
Item 7. Disclosure of Proxy Voting Policies and Procedures for Closed-End Management Investment Companies.
Not applicable.
Item 8. Portfolio Managers of Closed-End Management Investment Companies.
Not applicable.
Item 9. Purchases of Equity Securities by Closed-End Management Investment Company and Affiliated Purchasers.
Not applicable.
Item 10. Submission of Matters to a Vote of Security Holders.
Not applicable.
Item 11. Controls and Procedures.
(a) The registrant’s principal executive officer and principal financial officer have evaluated the registrant’s disclosure controls and procedures within 90 days of this filing and have concluded that the registrant’s disclosure controls and procedures were effective, as of that date, in ensuring that information required to be disclosed by the registrant in this Form N-CSR was recorded, processed, summarized, and reported timely.
(b) The registrant’s principal executive officer and principal financial officer are aware of no change in the registrant’s internal control over financial reporting that occurred during the registrant’s second fiscal quarter covered by this report that has materially affected, or is reasonably likely to materially affect, the registrant’s internal control over financial reporting.
Item 12. Exhibits.
(a)(1) The registrant’s code of ethics pursuant to Item 2 of Form N-CSR is attached.
(2) Separate certifications by the registrant's principal executive officer and principal financial officer, pursuant to Section 302 of the Sarbanes-Oxley Act of 2002 and required by Rule 30a-2(a) under the Investment Company Act of 1940, are attached.
(3) Written solicitation to repurchase securities issued by closed-end companies: not applicable.
(b) A certification by the registrant's principal executive officer and principal financial officer, pursuant to Section 906 of the Sarbanes-Oxley Act of 2002 and required by Rule 30a-2(b) under the Investment Company Act of 1940, is attached.
SIGNATURES | |
| Pursuant to the requirements of the Securities Exchange Act of 1934 and the Investment | |
| Company Act of 1940, the registrant has duly caused this report to be signed on its behalf by the | |
| undersigned, thereunto duly authorized. | |
| T. Rowe Price Science & Technology Fund, Inc. | |
| By | /s/ James S. Riepe |
| James S. Riepe | |
| Principal Executive Officer | |
| Date | February 21, 2006 |
| Pursuant to the requirements of the Securities Exchange Act of 1934 and the Investment | |
| Company Act of 1940, this report has been signed below by the following persons on behalf of | |
| the registrant and in the capacities and on the dates indicated. | |
| By | /s/ James S. Riepe |
| James S. Riepe | |
| Principal Executive Officer | |
| Date | February 21, 2006 |
| By | /s/ Joseph A. Carrier |
| Joseph A. Carrier | |
| Principal Financial Officer | |
| Date | February 21, 2006 |