Item 1: Report to Shareholders
 |
| Science & Technology Fund | December 31, 2006 |
The views and opinions in this report were current as of December 31, 2006. They are not guarantees of performance or investment results and should not be taken as investment advice. Investment decisions reflect a variety of factors, and the managers reserve the right to change their views about individual stocks, sectors, and the markets at any time. As a result, the views expressed should not be relied upon as a forecast of the fund’s future investment intent. The report is certified under the Sarbanes-Oxley Act, which requires mutual funds and other public companies to affirm that, to the best of their knowledge, the information in their financial reports is fairly and accurately stated in all material respects.
REPORTS ON THE WEB
Sign up for our E-mail Program, and you can begin to receive updated fund reports and prospectuses online rather than through the mail. Log in to your account at troweprice.com for more information.
Fellow Shareholders
Technology stocks closed out 2006 with solid gains. The broad stock market, as measured by the S&P 500, ended the year within about 7% of its all-time high set in March 2000. Driven by an improvement in investor sentiment and a stable outlook for the overall economy, technology stocks played out their seasonal pattern—as they have in the past seven out of eight years—of concentrating their gains during the second half of the calendar year. Tech stocks, however, also followed a more unfortunate pattern of underperforming the general market for the fifth of the past six years.
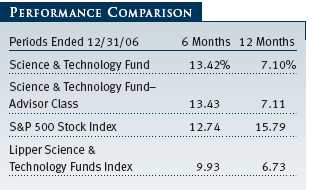
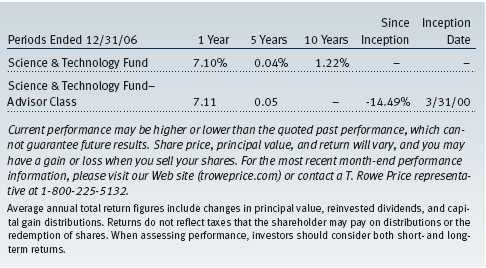
Your fund ended the year higher, with returns of 13.42% for the 6-month period and 7.10% for the 12-month period shown in the table. (Advisor Class returns were lower over the year, reflecting a different fee structure.) The fund outperformed the Standard & Poor’s 500 Stock Index and the Lipper Science & Technology Funds Index for the six-month period. For the year, the fund lagged the broad market index but outperformed the Lipper index, with strong contributions from its software and telecommunications holdings.
HIGHLIGHTS
- Technology stocks performed strongly in the second half of the year after dipping in the spring.
- The fund ended the year with solid gains, outperforming its Lipper peer group and the broad market for the six-month period. For the year, the fund beat its peer group but lagged the market.
- A number of important new product cycles and innovations are under way, and the fund has focused on investing in smaller and faster-growing companies with promising cutting-edge technology products and services.
- We believe favorable economic conditions, the release of significant new products, and deferred capital purchases by businesses will result in increased technology spending in 2007 and an opportunity for technology stocks to outperform the general market.
MARKET ENVIRONMENT
The U.S. economy continued its expansion despite the Federal Reserve’s two-year tightening cycle that likely ended in June after 17 rate hikes. The Fed’s restrictive monetary policy appears to be achieving its goal of containing inflation and gradually decelerating economic growth. However, the Fed’s effort to engineer a “soft landing”—an economy with lower-than-average growth and dropping inflation within the Fed’s comfort zone—always raises the risk that its efforts to cool economic activity could result in a recession. In this uncertain economic environment, consumers faced not only higher interest rates but oil prices that rose for much of the year and the weakening of the housing market. It is no surprise that consumer confidence plunged in the first half of the year and reached a low in August, which nearly coincided with the stock market bottom in July.
Within technology, investors began the year chasing performance by buying stocks that had performed well in 2005, such as Corning, Broadcom, and Marvell Technology Group. These stocks experienced returns in excess of 20% in the first two months of the year, but they surrendered these gains over the next 10 months and finished the year with negative returns. The semiconductor industry endured tepid demand and excess chip inventory that led to a significant midyear correction. Contract manufacturers were the major culprit behind this inventory growth, as their chip inventories, measured by days of supply, have swelled to levels not seen since 2002. Semiconductor unit growth approached 30% in early 2006 but declined to less than 5% in November. As a result, semiconductor companies began to reduce earning expectations in the summer, but chip stocks already reflected the reduced guidance and rallied strongly off the bottom. While semiconductor stoc ks were the laggards in 2006, the winners tended to be the leaders of the previous decade, such as network equipment maker Cisco Systems and software giant Oracle. (Please refer to the fund’s Portfolio of Investments for a complete listing of our holdings and the amount each represents in the portfolio.)
Consolidation within the technology segment continued in 2006. Oracle’s acquisition of Seibel Systems and Seagate Technology’s acquisition of Maxtor are among the larger deals that closed in 2006. Of late, leveraged buyout (LBO) firms have turned their focus on the technology companies’ healthy cash flows and attractive valuations.
The number of LBOs of tech companies reached its highest level since peaking in 2000, but the total value of deals was five times larger and involved well-established firms, such as the $16 billion buyout of Freescale Semiconductor. While we do not anticipate a recurrence of the hostile bids that characterized the 1980s’ LBO buying wave, today’s cash-rich private equity firms will indirectly impose more discipline on technology companies that have not been good stewards of capital.
PORTFOLIO REVIEW
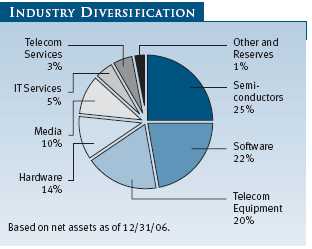
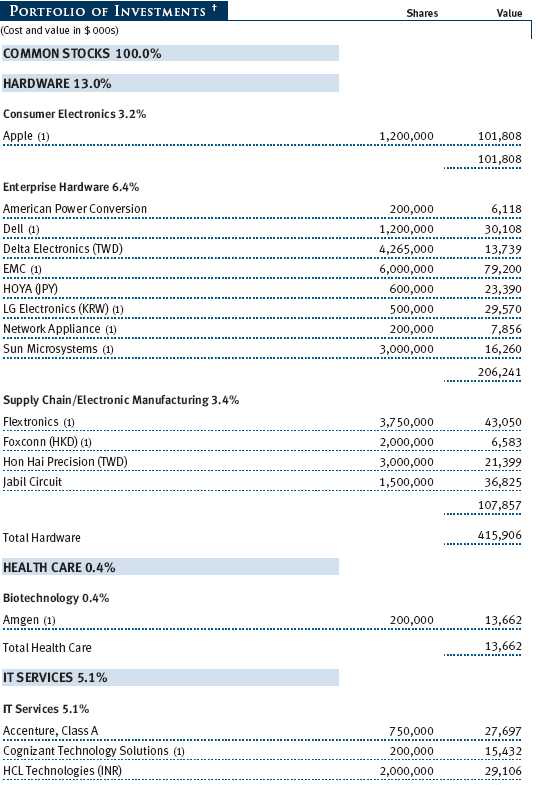
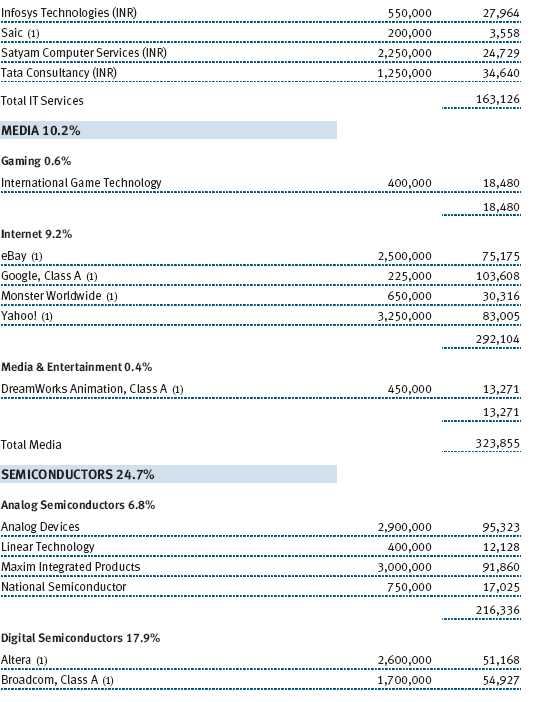
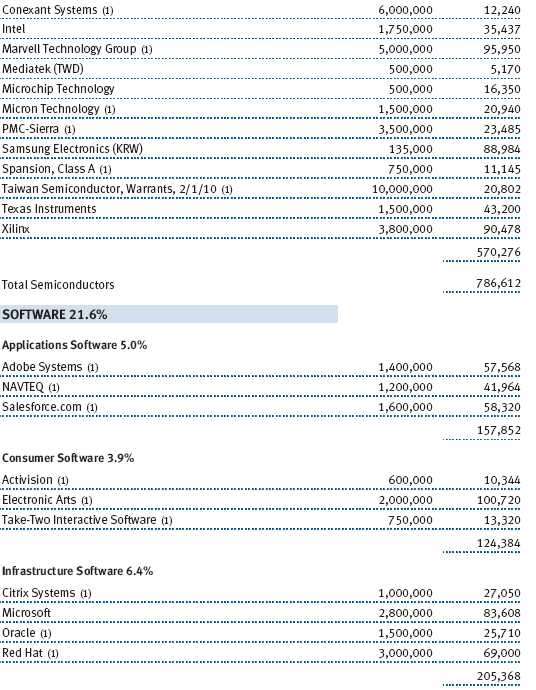
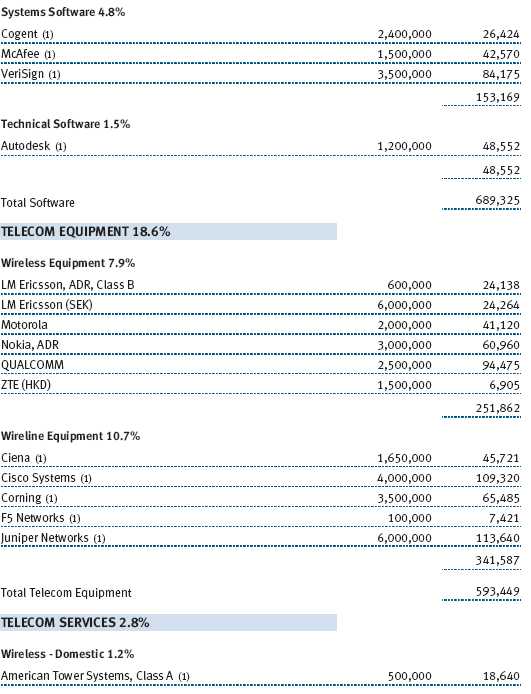
The fund remains broadly diversified across the principal industries of the science and technology sector. Software and semiconductors accounted for about 47% of the holdings, and telecom equipment and hardware constituted another third, as shown in the Industry Diversification pie chart. During the past six months, we increased our exposure to telecom equipment, principally through purchases of wireless vendors Qualcomm and Motorola, and to semiconductors, through purchases of Marvell Technology Group, a provider of chips for hard disk drives and wireless LANs. With the strong performance of networking vendors such as Cisco Systems, we took some profits and reduced our exposure to the sector. Our largest purchases were Marvell, Electronic Arts, Qualcomm, Motorola, and Ciena, while our largest sales were Cognos, Cisco Systems, Yahoo!, Symantec, and Juniper Networks.
Among portfolio holdings, Cisco Systems, Bharti Airtel (a wireless service provider in India), Apple, Juniper Networks, and Adobe Systems were the fund’s best contributors over the past six months. The laggards included Yahoo!, NAVTEQ, Corning, Cogent, and Getty Images. Our investment in Cisco Systems finally paid off as the market recognized the strength and growth potential of the world’s largest networking company. Despite its emergence from the Internet bust and its established position as a leading Web portal, investors punished Yahoo! for slowing growth and its falling share of the Internet search market. While we are concerned about the near-term transition to a new search platform in the first half of 2007, we believe that Yahoo!’s ability to realize revenue from its Internet traffic will show significant improvement in the latter half of the year. In the last six months, the fund benefited from the buyouts of three companies—American Power Conversion, Neomax, and Symbol Technologies—that were acquired for cash at significant premiums.
The fund’s 25 largest holdings, which included Juniper Networks, Cisco Systems, and Google, represented nearly 63% of net assets compared with 66% at the end of June 2006. We modestly decreased concentration, as some of the larger holdings appreciated significantly in the last six months. We are also focusing on smaller tech companies, which tend to be more innovative and faster growing than the large-cap companies. At the end of December, the average market capitalization for the fund was $15.4 billion compared with $16.1 billion six months ago—considerably below the $32.6 billion average a year ago.
OUTLOOK
The myopic focus of some investors presents opportunity for us. They focus on unproductive questions such as: Which company is tracking ahead of the current quarter’s expectations? What product is “hot” now? Or, what stocks are doing well today? Instead, we are asking the more important question: Which companies are best positioned over the next three to five years? The answer to this question leads us to find investments rather than engage in quarterly trades.
We believe there is significant opportunity in technology stocks. Unlike the post-bubble period of the past six years when technology stock performance simply reflected overall economic growth, tech companies have initiated several major product cycles that could differentiate the sector from the general market in 2007 and beyond. First, Microsoft is introducing Vista, a new operating system for personal computers that improves security, enhances the graphical user interface, and eases the transition to a fully digital home. Second, the gaming console market began shipping the new Sony PlayStation 3 and the Nintendo Wii platforms in 2006. Finally, flat-panel televisions will likely hit mainstream adoption now that a 32-inch LCD high-definition TV can be purchased for less than $700. Beyond these specific product cycles, there are several nascent technologies that should have a profound effect on future purchases of information technology. One promising innovation is on-demand software, which refers to software applications that are accessed through the Web rather than reside on a customer’s PC. Unlike the historic software purchases that involved a large purchase upfront, the customer “rents” the software by paying monthly fees per user, thus lowering the cost of deployment. Another promising development is server virtualization, which allows a single physical server to function as multiple logical servers, thus improving utilization and reducing power consumption.
Adoption of digital media beyond simply music will have numerous impacts on the technology food chain. Video over the Internet became a mainstream application in 2006. YouTube video downloads increased a hundredfold in less than a year to more than 100 million downloads per day. By contrast, at its peak, CBS was streaming 25 million videos a day around the world during last year’s college basketball “March Madness” playoffs. Major television networks have begun offering prime time shows with very limited commercials over the Internet. This growth in video will necessitate an overhaul of both cable and telecom networks. The networks built in the 1990s for delivering Web pages and e-mails are woefully inadequate at delivering video. Unlike Web surfing, where a user consumes bandwidth for only a fraction of the time, video over the Internet constantly consumes bandwidth. Broadband penetration has already reached one in five Internet users, but more importantly, the definition of broadband will increase over time from today’s speeds of 1 Mbps to 10 Mbps or more in the next three to five years. In addition to the network upgrades that will enable video, the storage needs for multimedia will increase exponentially. A high-definition movie is 3,000 times larger than the average Web page and 600 times larger than the average MP3 file.
As we near the end of the Federal Reserve’s cycle of interest rate tightening, we anticipate a favorable macroeconomic backdrop for information technology spending. Companies’ balance sheets and cash flows are as healthy as they have been in decades, and large enterprises still have not opened their wallets for capital expenditures. Valuations for technology companies remain attractive. Our concerns center around technology companies’ record net margins, the transition risks posed by the new product cycles as consumers often defer purchases in anticipation of new and improved features, and the pricing pressure in handsets and personal computers. Despite these concerns, we believe technology is still the principal means of improving corporate productivity, and we remain upbeat about long-term prospects for this segment of the equities markets.
As always, we appreciate your continued support.
Respectfully submitted,

Michael F. Sola
President of the fund and chairman of its Investment Advisory Committee
January 14, 2007
The committee chairman has day-to-day responsibility for managing the portfolio and works with committee members in developing and executing the fund’s investment program.
RISKS OF INVESTING IN THE FUND
Funds that invest only in specific industries will experience greater volatility than funds investing in a broad range of industries. Technology stocks, historically, have experienced unusually wide price swings, both up and down. The potential for wide variation in performance reflects the special risks common to companies in the rapidly changing field of technology. For example, products or services that at first appear promising may not prove commercially successful and may become obsolete quickly. Earnings disappointments and intense competition for market share can result in sharp price declines.
GLOSSARY
Lipper Index: An index of mutual fund performance returns for specified periods in defined categories as tracked by Lipper Inc.
S&P 500 Stock Index: A market-cap weighted index of 500 widely held stocks often used as a proxy for the overall stock market. Performance is reported on a total-return basis.
Price/earnings ratio: Calculated by dividing a stock’s market value per share by the company’s earnings per share for the past 12 months or by expected earnings for the coming year.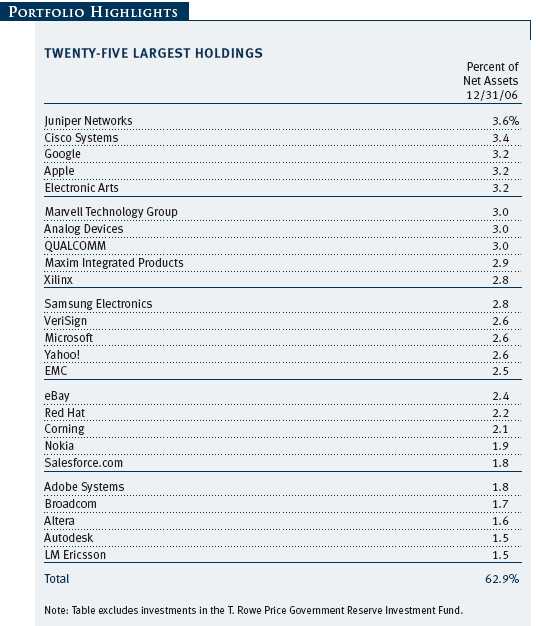
![]()
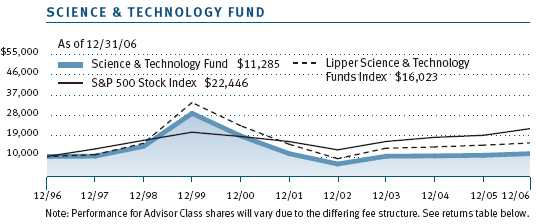
| GROWTH OF $10,000 |
This chart shows the value of a hypothetical $10,000 investment in the fund over the past 10 fiscal year periods or since inception (for funds lacking 10-year records). The result is compared with benchmarks, which may include a broad-based market index and a peer group average or index. Market indexes do not include expenses, which are deducted from fund returns as well as mutual fund averages and indexes.
| AVERAGE ANNUAL COMPOUND TOTAL RETURN |
This table shows how the fund would have performed each year if its actual (or cumulative) returns for the periods shown had been earned at a constant rate.
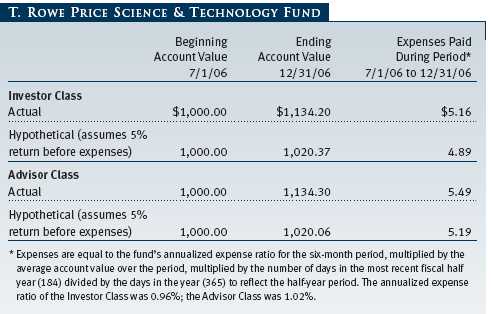
| FUND EXPENSE EXAMPLE |
As a mutual fund shareholder, you may incur two types of costs: (1) transaction costs, such as redemption fees or sales loads, and (2) ongoing costs, including management fees, distribution and service (12b-1) fees, and other fund expenses. The following example is intended to help you understand your ongoing costs (in dollars) of investing in the fund and to compare these costs with the ongoing costs of investing in other mutual funds. The example is based on an investment of $1,000 invested at the beginning of the most recent six-month period and held for the entire period.
Please note that the fund has two share classes: The original share class (“investor class”) charges no distribution and service (12b-1) fee. Advisor Class shares are offered only through unaffiliated brokers and other financial intermediaries and charge a 0.25% 12b-1 fee. Each share class is presented separately in the table.
Actual Expenses
The first line of the following table (“Actual”) provides information about actual account values and expenses based on the fund’s actual returns. You may use the information in this line, together with your account balance, to estimate the expenses that you paid over the period. Simply divide your account value by $1,000 (for example, an $8,600 account value divided by $1,000 = 8.6), then multiply the result by the number in the first line under the heading “Expenses Paid During Period” to estimate the expenses you paid on your account during this period.
Hypothetical Example for Comparison Purposes
The information on the second line of the table (“Hypothetical”) is based on hypothetical account values and expenses derived from the fund’s actual expense ratio and an assumed 5% per year rate of return before expenses (not the fund’s actual return). You may compare the ongoing costs of investing in the fund with other funds by contrasting this 5% hypothetical example and the 5% hypothetical examples that appear in the shareholder reports of the other funds. The hypothetical account values and expenses may not be used to estimate the actual ending account balance or expenses you paid for the period.
Note: T. Rowe Price charges an annual small-account maintenance fee of $10, generally for accounts with less than $2,000 ($500 for UGMA/UTMA). The fee is waived for any investor whose T. Rowe Price mutual fund accounts total $25,000 or more, accounts employing automatic investing, and IRAs and other retirement plan accounts that utilize a prototype plan sponsored by T. Rowe Price (although a separate custodial or administrative fee may apply to such accounts). This fee is not included in the accompanying table. If you are subject to the fee, keep it in mind when you are estimating the ongoing expenses of investing in the fund and when comparing the expenses of this fund with other funds.
You should also be aware that the expenses shown in the table highlight only your ongoing costs and do not reflect any transaction costs, such as redemption fees or sales loads. Therefore, the second line of the table is useful in comparing ongoing costs only and will not help you determine the relative total costs of owning different funds. To the extent a fund charges transaction costs, however, the total cost of owning that fund is higher.
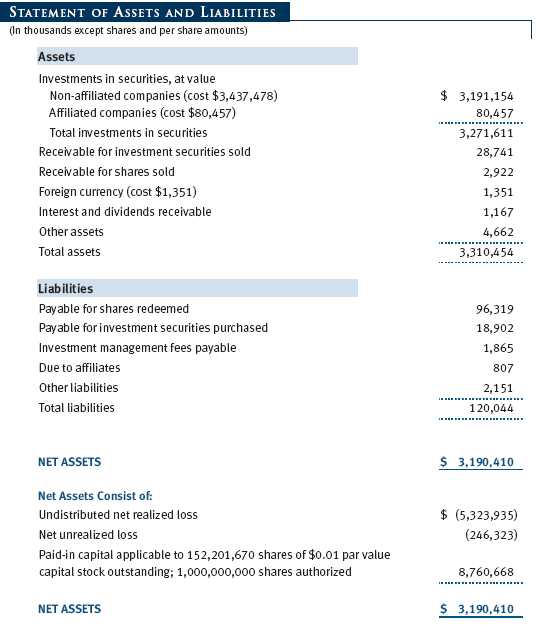
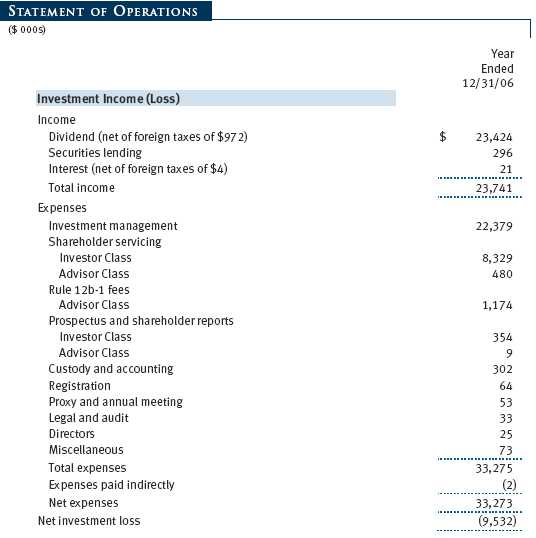
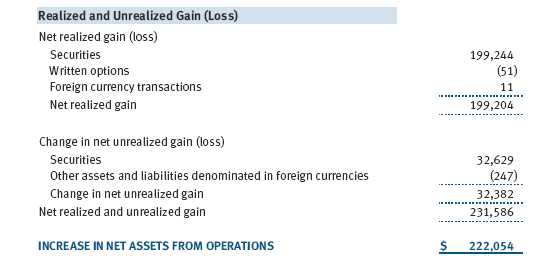
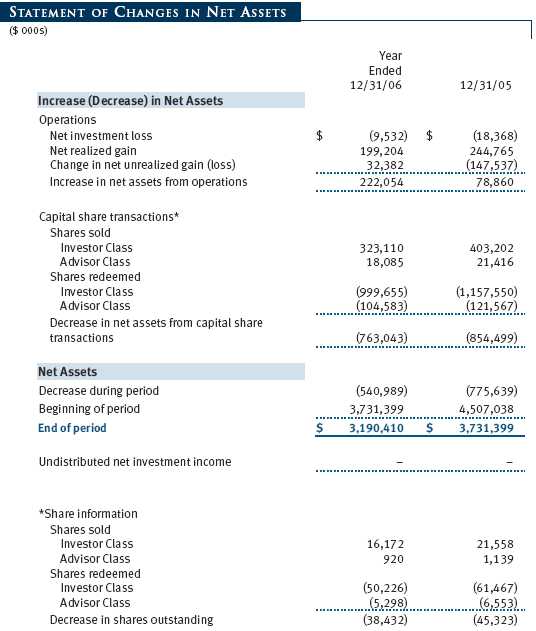
The accompanying notes are an integral part of these financial statements.
The accompanying notes are an integral part of these financial statements.
The accompanying notes are an integral part of these financial statements.
The accompanying notes are an integral part of these financial statements.
The accompanying notes are an integral part of these financial statements.
The accompanying notes are an integral part of these financial statements.
| NOTES TO FINANCIAL STATEMENTS |
NOTE 1 - SIGNIFICANT ACCOUNTING POLICIES
T. Rowe Price Science & Technology Fund, Inc. (the fund), is registered under the Investment Company Act of 1940 (the 1940 Act) as a diversified, open-end management investment company. The fund seeks to provide long-term capital appreciation. The fund has two classes of shares: the Science & Technology Fund original share class, referred to in this report as the Investor Class, offered since September 30, 1987, and Science & Technology Fund—Advisor Class (Advisor Class), offered since March 31, 2000. Advisor Class shares are sold only through unaffiliated brokers and other unaffiliated financial intermediaries that are compensated by the class for distribution, shareholder servicing, and/or certain administrative services under a Board-approved Rule 12b-1 plan. Each class has exclusive voting rights on matters related solely to that class, separate voting rights on matters that relate to both classes, and, in all other respects, the same rights and obligations as the othe r class.
The accompanying financial statements were prepared in accordance with accounting principles generally accepted in the United States of America, which require the use of estimates made by fund management. Fund management believes that estimates and security valuations are appropriate; however, actual results may differ from those estimates, and the security valuations reflected in the financial statements may differ from the value the fund ultimately realizes upon sale of the securities.
Valuation The fund values its investments and computes its net asset value per share at the close of the New York Stock Exchange (NYSE), normally 4 p.m. ET, each day that the NYSE is open for business. Equity securities listed or regularly traded on a securities exchange or in the over-the-counter (OTC) market are valued at the last quoted sale price or, for certain markets, the official closing price at the time the valuations are made, except for OTC Bulletin Board securities, which are valued at the mean of the latest bid and asked prices. A security that is listed or traded on more than one exchange is valued at the quotation on the exchange determined to be the primary market for such security. Listed securities not traded on a particular day are valued at the mean of the latest bid and asked prices for domestic securities and the last quoted sale price for international securities.
Investments in mutual funds are valued at the mutual fund’s closing net asset value per share on the day of valuation. Purchased and written options are valued at the mean of the closing bid and asked prices.
Other investments, including restricted securities, and those for which the above valuation procedures are inappropriate or are deemed not to reflect fair value are stated at fair value as determined in good faith by the T. Rowe Price Valuation Committee, established by the fund’s Board of Directors.
Most foreign markets close before the close of trading on the NYSE. If the fund determines that developments between the close of a foreign market and the close of the NYSE will, in its judgment, materially affect the value of some or all of its portfolio securities, which in turn will affect the fund’s share price, the fund will adjust the previous closing prices to reflect the fair value of the securities as of the close of the NYSE, as determined in good faith by the T. Rowe Price Valuation Committee, established by the fund’s Board of Directors. A fund may also fair value securities in other situations, such as when a particular foreign market is closed but the fund is open. In deciding whether to make fair value adjustments, the fund reviews a variety of factors, including developments in foreign markets, the performance of U.S. securities markets, and the performance of instruments trading in U.S. markets that represent foreign securities and baskets of foreign securities . The fund uses outside pricing services to provide it with closing market prices and information used for adjusting those prices. The fund cannot predict when and how often it will use closing prices and when it will adjust those prices to reflect fair value. As a means of evaluating its fair value process, the fund routinely compares closing market prices, the next day’s opening prices in the same markets, and adjusted prices.
Currency Translation Assets, including investments, and liabilities denominated in foreign currencies are translated into U.S. dollar values each day at the prevailing exchange rate, using the mean of the bid and asked prices of such currencies against U.S. dollars as quoted by a major bank. Purchases and sales of securities, income, and expenses are translated into U.S. dollars at the prevailing exchange rate on the date of the transaction. The effect of changes in foreign currency exchange rates on realized and unrealized security gains and losses is reflected as a component of security gains and losses.
Class Accounting The Advisor Class pays distribution, shareholder servicing, and/or certain administrative expenses in the form of Rule 12b-1 fees, in an amount not exceeding 0.25% of the class’s average daily net assets. Shareholder servicing, prospectus, and shareholder report expenses incurred by each class are charged directly to the class to which they relate. Expenses common to both classes, investment income, and realized and unrealized gains and losses are allocated to the classes based upon the relative daily net assets of each class.
Rebates and Credits Subject to best execution, the fund may direct certain security trades to brokers who have agreed to rebate a portion of the related brokerage commission to the fund in cash. Commission rebates are reflected as realized gain on securities in the accompanying financial statements and totaled $535,000 for the year ended December 31, 2006. Additionally, the fund earns credits on temporarily uninvested cash balances at the custodian that reduce the fund’s custody charges. Custody expense in the accompanying financial statements is presented before reduction for credits, which are reflected as expenses paid indirectly.
Investment Transactions, Investment Income, and Distributions Income and expenses are recorded on the accrual basis. Dividends received from mutual fund investments are reflected as dividend income; capital gain distributions are reflected as realized gain/loss. Dividend income and capital gain distributions are recorded on the ex-dividend date. Investment transactions are accounted for on the trade date. Realized gains and losses are reported on the identified cost basis. Distributions to shareholders are recorded on the ex-dividend date. Income distributions are declared and paid by each class on an annual basis. Capital gain distributions, if any, are declared and paid by the fund, typically on an annual basis.
New Accounting Pronouncements In June 2006, the Financial Accounting Standards Board (“FASB”) issued FASB Interpretation No. 48 (“FIN 48”), Accounting for Uncertainty in Income Taxes, a clarification of FASB Statement No. 109, Accounting for Income Taxes. FIN 48 establishes financial reporting rules regarding recognition and measurement of tax positions taken or expected to be taken on a tax return. Management is evaluating the anticipated impact, if any, that FIN 48 will have on the fund upon adoption, which, pursuant to a delay granted by the U.S. Securities and Exchange Commission, is expected to be on the last business day of the fund’s semi-annual period, June 29, 2007.
In September 2006, the FASB released the Statement of Financial Accounting Standard No. 157 (“FAS 157”), Fair Value Measurements. FAS 157 clarifies the definition of fair value and establishes the framework for measuring fair value, as well as proper disclosure of this methodology in the financial statements. It will be effective for the fund’s fiscal year beginning January 1, 2008. Management is evaluating the effects of FAS 157; however, it is not expected to have a material impact on the fund’s net assets or results of operations.
NOTE 2 - INVESTMENT TRANSACTIONS
Consistent with its investment objective, the fund engages in the following practices to manage exposure to certain risks or to enhance performance. The investment objective, policies, program, and risk factors of the fund are described more fully in the fund’s prospectus and Statement of Additional Information.
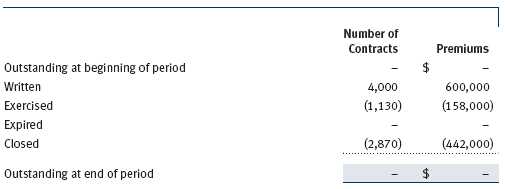
Options Call and put options give the holder the right to purchase or sell, respectively, a security at a specified price on a certain date. Risks arise from possible illiquidity of the options market and from movements in security values. Written options are reflected in the accompanying Statement of Assets and Liabilities at market value. Transactions in options written and related premiums received during the year ended December 31, 2006, were as follows:
Securities Lending The fund lends its securities to approved brokers to earn additional income. It receives as collateral cash and U.S. government securities valued at 102% to 105% of the value of the securities on loan. Cash collateral is invested in a money market pooled trust managed by the fund’s lending agent in accordance with investment guidelines approved by fund management. Collateral is maintained over the life of the loan in an amount not less than the value of loaned securities, as determined at the close of fund business each day; any additional collateral required due to changes in security values is delivered to the fund the next business day. Although risk is mitigated by the collateral, the fund could experience a delay in recovering its securities and a possible loss of income or value if the borrower fails to return the securities. Securities lending revenue recognized by the fund consists of earnings on invested collateral and borrowing fee s, net of any rebates to the borrower and compensation to the lending agent. At December 31, 2006, there were no securities on loan.
Other Purchases and sales of portfolio securities, other than short-term securities, aggregated $3,347,448,000 and $4,080,695,000, respectively, for the year ended December 31, 2006.
NOTE 3 - FEDERAL INCOME TAXES
No provision for federal income taxes is required since the fund intends to continue to qualify as a regulated investment company under Subchapter M of the Internal Revenue Code and distribute to shareholders all of its taxable income and gains. Federal income tax regulations differ from generally accepted accounting principles; therefore, distributions determined in accordance with tax regulations may differ significantly in amount or character from net investment income and realized gains for financial reporting purposes. Financial reporting records are adjusted for permanent book/tax differences to reflect tax character. Financial records are not adjusted for temporary differences.
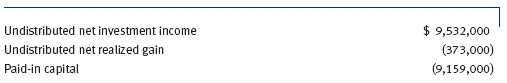
There were no distributions in the year ended December 31, 2006. At December 31, 2006, the tax-basis components of net assets were as follows:
![]()
The fund intends to retain realized gains to the extent of available capital loss carryforwards. During the year ended December 31, 2006, the fund utilized $197,651,000 of capital loss carryforwards. As of December 31, 2006, the fund had $5,323,578,000 of capital loss carryforwards, of which $3,289,937,000 expire in 2009, and $2,033,641,000 expire thereafter through 2011.
For the year ended December 31, 2006, the fund recorded the following permanent reclassifications to reflect tax character. Reclassifications to paid-in capital relate primarily to the current net operating loss. Results of operations and net assets were not affected by these reclassifications.
At December 31, 2006, the cost of investments for federal income tax purposes was $3,518,292,000.
NOTE 4 - FOREIGN TAXES
The fund is subject to foreign income taxes imposed by certain countries in which it invests. Additionally, capital gains realized by the fund upon disposition of securities issued in or by certain foreign countries are subject to capital gains tax imposed by those countries, which is payable prior to repatriation of sale proceeds. Similarly, a tax on net profits, including interest income and realized and unrealized capital gains, is imposed by certain other countries. All taxes are computed in accordance with the applicable foreign tax law, and, to the extent permitted, capital losses are used to offset capital gains. Tax expense attributable to income is accrued by the fund as a reduction of income. Current and deferred tax expense attributable to net capital gains is reflected as a component of realized and/or change in unrealized gain/loss on securities in the accompanying financial statements.
At December 31, 2006, the fund had a tax refund receivable of $221,000 attributable to foreign securities, no deferred tax liability attributable to foreign securities, and $244,000 of foreign capital loss carryforwards that expire in 2015.
NOTE 5 - RELATED PARTY TRANSACTIONS
The fund is managed by T. Rowe Price Associates, Inc. (the manager or Price Associates), a wholly owned subsidiary of T. Rowe Price Group, Inc. The investment management agreement between the fund and the manager provides for an annual investment management fee, which is computed daily and paid monthly. The fee consists of an individual fund fee, equal to 0.35% of the fund’s average daily net assets, and a group fee. The group fee rate is calculated based on the combined net assets of certain mutual funds sponsored by Price Associates (the group) applied to a graduated fee schedule, with rates ranging from 0.48% for the first $1 billion of assets to 0.29% for assets in excess of $160 billion. The fund’s group fee is determined by applying the group fee rate to the fund’s average daily net assets. At December 31, 2006, the effective annual group fee rate was 0.31%.
In addition, the fund has entered into service agreements with Price Associates and two wholly owned subsidiaries of Price Associates (collectively, Price). Price Associates computes the daily share prices and provides certain other administrative services to the fund. T. Rowe Price Services, Inc., provides shareholder and administrative services in its capacity as the fund’s transfer and dividend disbursing agent. T. Rowe Price Retirement Plan Services, Inc., provides subaccounting and recordkeeping services for certain retirement accounts invested in the Investor Class. For the year ended December 31, 2006, expenses incurred pursuant to these service agreements were $95,000 for Price Associates, $4,616,000 for T. Rowe Price Services, Inc., and $1,949,000 for T. Rowe Price Retirement Plan Services, Inc. The total amount payable at period-end pursuant to these service agreements is reflected as Due to Affiliates in the accompanying financial statements.
Additionally, the fund is one of several mutual funds in which certain college savings plans managed by Price Associates may invest. As approved by the fund’s Board of Directors, shareholder servicing costs associated with each college savings plan are borne by the fund in proportion to the average daily value of its shares owned by the college savings plan. For the year ended December 31, 2006, the fund was charged $43,000 for shareholder servicing costs related to the college savings plans, of which $37,000 was for services provided by Price. The amount payable at period-end pursuant to this agreement is reflected as Due to Affiliates in the accompanying financial statements. At December 31, 2006, approximately 1% of the outstanding shares of the Investor Class were held by college savings plans.
The fund may invest in the T. Rowe Price Reserve Investment Fund and the T. Rowe Price Government Reserve Investment Fund (collectively, the T. Rowe Price Reserve Funds), open-end management investment companies managed by Price Associates and affiliates of the fund. The T. Rowe Price Reserve Funds are offered as cash management options to mutual funds, trusts, and other accounts managed by Price Associates and/or its affiliates, and are not available for direct purchase by members of the public. The T. Rowe Price Reserve Funds pay no investment management fees. During the year ended December 31, 2006, dividend income from the T. Rowe Price Reserve Funds totaled $4,684,000, and the value of shares of the T. Rowe Price Reserve Funds held at December 31, 2006 and December 31, 2005 was $80,457,000 and $44,656,000, respectively.
As of December 31, 2006, T. Rowe Price Group, Inc., and/or its wholly owned subsidiaries owned 510,520 shares of the Investor Class, aggregating less than 1% of the fund’s net assets.
| REPORT OF INDEPENDENT REGISTERED PUBLIC ACCOUNTING FIRM |
To the Board of Directors and Shareholders of T. Rowe Price Science & Technology Fund, Inc.
In our opinion, the accompanying statement of assets and liabilities, including the portfolio of investments, and the related statements of operations and of changes in net assets and the financial highlights present fairly, in all material respects, the financial position of T. Rowe Price Science & Technology Fund, Inc. (the “Fund”) at December 31, 2006, the results of its operations for the year then ended, the changes in its net assets for each of the two years in the period then ended and the financial highlights for each of the five years in the period then ended, in conformity with accounting principles generally accepted in the United States of America. These financial statements and financial highlights (hereafter referred to as “financial statements”) are the responsibility of the Fund’s management; our responsibility is to express an opinion on these financial statements based on our audits. We conducted our audits of these financial statements in ac cordance with the auditing standards of the Public Company Accounting Oversight Board (United States). Those standards require that we plan and perform the audit to obtain reasonable assurance about whether the financial statements are free of material misstatement. An audit includes examining, on a test basis, evidence supporting the amounts and disclosures in the financial statements, assessing the accounting principles used and significant estimates made by management, and evaluating the overall financial statement presentation. We believe that our audits, which included confirmation of securities at December 31, 2006 by correspondence with the custodian and by agreement to the underlying ownership records for T. Rowe Price Government Reserve Investment Fund, provide a reasonable basis for our opinion.
PricewaterhouseCoopers LLP
Baltimore, Maryland
February 12, 2007
| INFORMATION ON PROXY VOTING POLICIES, PROCEDURES, AND RECORDS |
A description of the policies and procedures used by T. Rowe Price funds and portfolios to determine how to vote proxies relating to portfolio securities is available in each fund’s Statement of Additional Information, which you may request by calling 1-800-225-5132 or by accessing the SEC’s Web site, www.sec.gov. The description of our proxy voting policies and procedures is also available on our Web site, www.troweprice.com. To access it, click on the words “Company Info” at the top of our homepage for individual investors. Then, in the window that appears, click on the “Proxy Voting Policy” navigation button in the top left corner.
Each fund’s most recent annual proxy voting record is available on our Web site and through the SEC’s Web site. To access it through our Web site, follow the directions above, then click on the words “Proxy Voting Record” at the bottom of the Proxy Voting Policy page.
| HOW TO OBTAIN QUARTERLY PORTFOLIO HOLDINGS |
The fund files a complete schedule of portfolio holdings with the Securities and Exchange Commission for the first and third quarters of each fiscal year on Form N-Q. The fund’s Form N-Q is available electronically on the SEC’s Web site (www.sec.gov); hard copies may be reviewed and copied at the SEC’s Public Reference Room, 450 Fifth St. N.W., Washington, DC 20549. For more information on the Public Reference Room, call 1-800-SEC-0330.
| ABOUT THE FUND’S DIRECTORS AND OFFICERS |
Your fund is governed by a Board of Directors that meets regularly to review a wide variety of matters affecting the fund, including performance, investment programs, compliance matters, advisory fees and expenses, service providers, and other business affairs. The Board of Directors elects the fund’s officers, who are listed in the final table. At least 75% of Board members are independent of T. Rowe Price Associates, Inc. (T. Rowe Price), and T. Rowe Price International, Inc. (T. Rowe Price International); “inside” or “interested” directors are officers of T. Rowe Price. The business address of each director and officer is 100 East Pratt Street, Baltimore, Maryland 21202. The Statement of Additional Information includes additional information about the fund directors and is available without charge by calling a T. Rowe Price representative at 1-800-225-5132.
| Independent Directors | |
| Name | |
| (Year of Birth) | Principal Occupation(s) During Past 5 Years and Directorships of |
| Year Elected * | Other Public Companies |
| Jeremiah E. Casey | Director, Allfirst Financial Inc. (previously First Maryland Bankcorp) |
| (1940) | (1983 to 2002); Director, National Life Insurance (2001 to 2005); |
| 2005 | Director, The Rouse Company, real estate developers (1990 to 2004) |
| Anthony W. Deering | Chairman, Exeter Capital, LLC, a private investment firm (2004 to |
| (1945) | present); Director, Vornado Real Estate Investment Trust (3/04 to |
| 2001 | present); Director, Mercantile Bankshares (4/03 to present); Member, |
| Advisory Board, Deutsche Bank North America (2004 to present); | |
| Director, Chairman of the Board, and Chief Executive Officer, The | |
| Rouse Company, real estate developers (1997 to 2004) | |
| Donald W. Dick, Jr. | Principal, EuroCapital Advisors, LLC, an acquisition and management |
| (1943) | advisory firm; Chairman, President, and Chief Executive Officer, |
| 1994 | The Haven Group, a custom manufacturer of modular homes |
| (1/04 to present) | |
| David K. Fagin | Chairman and President, Nye Corporation (6/88 to present); Director, |
| (1938) | Canyon Resources Corp., Golden Star Resources Ltd. (5/92 to pres- |
| 1994 | ent), and Pacific Rim Mining Corp. (2/02 to present) |
| Karen N. Horn | Director, Federal National Mortgage Association (9/06 to present); |
| (1943) | Managing Director and President, Global Private Client Services, |
| 2003 | Marsh Inc. (1999 to 2003); Director, Georgia Pacific (5/04 to |
| 12/05), Eli Lilly and Company, and Simon Property Group | |
| Theo C. Rodgers | President, A&R Development Corporation |
| (1941) | |
| 2005 | |
| John G. Schreiber | Owner/President, Centaur Capital Partners, Inc., a real estate invest- |
| (1946) | ment company; Partner, Blackstone Real Estate Advisors, L.P. |
| 2001 |
* Each independent director oversees 115 T. Rowe Price portfolios and serves until retirement, resignation, or election of a successor.
| Inside Directors | |
| Name | |
| (Year of Birth) | |
| Year Elected * | |
| [Number of T. Rowe Price | Principal Occupation(s) During Past 5 Years and Directorships of |
| Portfolios Overseen] | Other Public Companies |
| Edward C. Bernard | Director and Vice President, T. Rowe Price and T. Rowe Price Group, |
| (1956) | Inc.; Chairman of the Board, Director, and President, T. Rowe Price |
| 2006 | Investment Services, Inc.; Chairman of the Board and Director, |
| [115] | T. Rowe Price International, Inc., T. Rowe Price Retirement Plan |
| Services, Inc., T. Rowe Price Services, Inc., and T. Rowe Price Savings | |
| Bank; Director, T. Rowe Price Global Asset Management Limited and | |
| T. Rowe Price Global Investment Services Limited; Chief Executive | |
| Officer, Chairman of the Board, Director, and President, T. Rowe Price | |
| Trust Company; Chairman of the Board, all funds | |
| John H. Laporte, CFA | Vice President, T. Rowe Price, T. Rowe Price Group, Inc., and T. Rowe |
| (1945) | Price Trust Company |
| 1988 | |
| [15] | |
* Each inside director serves until retirement, resignation, or election of a successor.
| Officers | |
| Name (Year of Birth) | |
| Title and Fund(s) Served | Principal Occupation(s) |
| Kennard W. Allen (1977) | Vice President, T. Rowe Price and T. Rowe Price |
| Vice President, Science & Technology Fund | Group, Inc. |
| Joseph A. Carrier, CPA (1960) | Vice President, T. Rowe Price, T. Rowe Price |
| Treasurer, Science & Technology Fund | Group, Inc., T. Rowe Price Investment Services, |
| Inc., and T. Rowe Price Trust Company | |
| Donald J. Easley, CFA (1971) | Vice President, T. Rowe Price and T. Rowe Price |
| Vice President, Science & Technology Fund | Group, Inc. |
| David J. Eiswert, CFA (1972) | Vice President, T. Rowe Price and T. Rowe Price |
| Vice President, Science & Technology Fund | Group, Inc.; formerly Analyst, Mellon Growth |
| Advisors and Fidelity Management and | |
| Research (to 2003) | |
| Henry M. Ellenbogen (1971) | Vice President, T. Rowe Price and T. Rowe Price |
| Vice President, Science & Technology Fund | Group, Inc. |
| Roger L. Fiery III, CPA (1959) | Vice President, T. Rowe Price, T. Rowe Price |
| Vice President, Science & Technology Fund | Group, Inc., T. Rowe Price International, Inc., |
| and T. Rowe Price Trust Company | |
| Robert N. Gensler (1957) | Vice President, T. Rowe Price, T. Rowe Price |
| Vice President, Science & Technology Fund | Group, Inc., and T. Rowe Price International, Inc. |
| John R. Gilner (1961) | Chief Compliance Officer and Vice President, |
| Chief Compliance Officer, Science & Technology | T. Rowe Price; Vice President, T. Rowe Price |
| Fund | Group, Inc., and T. Rowe Price Investment |
| Services, Inc. | |
| Gregory S. Golczewski (1966) | Vice President, T. Rowe Price and T. Rowe Price |
| Vice President, Science & Technology Fund | Trust Company |
| Jill L. Hauser (1958) | Vice President, T. Rowe Price and T. Rowe Price |
| Vice President, Science & Technology Fund | Group, Inc. |
| Henry H. Hopkins (1942) | Director and Vice President, T. Rowe Price |
| Vice President, Science & Technology Fund | Investment Services, Inc., T. Rowe Price |
| Services, Inc., and T. Rowe Price Trust | |
| Company; Vice President, T. Rowe Price, | |
| T. Rowe Price Group, Inc., T. Rowe Price | |
| International, Inc., and T. Rowe Price | |
| Retirement Plan Services, Inc. | |
| Patricia B. Lippert (1953) | Assistant Vice President, T. Rowe Price and |
| Secretary, Science & Technology Fund | T. Rowe Price Investment Services, Inc. |
| D. James Prey III (1959) | Vice President, T. Rowe Price and T. Rowe Price |
| Vice President, Science & Technology Fund | Group, Inc. |
| Jeffrey Rottinghaus, CPA (1970) | Vice President, T. Rowe Price and T. Rowe Price |
| Vice President, Science & Technology Fund | Group, Inc. |
| Michael F. Sola, CFA (1969) | Vice President, T. Rowe Price and T. Rowe Price |
| President, Science & Technology Fund | Group, Inc. |
| Joshua K. Spencer, CFA (1973) | Vice President, T. Rowe Price and T. Rowe Price |
| Vice President, Science & Technology Fund | Group, Inc.; formerly Research Analyst and |
| Sector Fund Portfolio Manager, Fidelity | |
| Investments (to 2004) | |
| Chirag Vasavada (1972) | Vice President, T. Rowe Price; formerly Senior |
| Vice President, Science & Technology Fund | Manager in the Corporate Strategy and |
| Development Group, Microsoft Corporation | |
| (to 2005) | |
| Julie L. Waples (1970) | Vice President, T. Rowe Price |
| Vice President, Science & Technology Fund | |
| Wenhua Zhang, CFA, CPA (1970) | Vice President, T. Rowe Price and T. Rowe Price |
| Vice President, Science & Technology Fund | Group, Inc. |
Unless otherwise noted, officers have been employees of T. Rowe Price or T. Rowe Price International for at least five years.
Item 2. Code of Ethics.
The registrant has adopted a code of ethics, as defined in Item 2 of Form N-CSR, applicable to its principal executive officer, principal financial officer, principal accounting officer or controller, or persons performing similar functions. A copy of this code of ethics is filed as an exhibit to this Form N-CSR. No substantive amendments were approved or waivers were granted to this code of ethics during the period covered by this report.
Item 3. Audit Committee Financial Expert.
The registrant’s Board of Directors/Trustees has determined that Mr. Donald W. Dick Jr. qualifies as an audit committee financial expert, as defined in Item 3 of Form N-CSR. Mr. Dick is considered independent for purposes of Item 3 of Form N-CSR.
Item 4. Principal Accountant Fees and Services.
(a) – (d) Aggregate fees billed to the registrant for the last two fiscal years for professional services rendered by the registrant’s principal accountant were as follows:
Audit fees include amounts related to the audit of the registrant’s annual financial statements and services normally provided by the accountant in connection with statutory and regulatory filings. Audit-related fees include amounts reasonably related to the performance of the audit of the registrant’s financial statements and specifically include the issuance of a report on internal controls and, if applicable for 2006, agreed-upon procedures related to fund acquisitions. Tax fees include amounts related to services for tax compliance, tax planning, and tax advice. The nature of these services specifically includes the review of distribution calculations and the preparation of Federal, state, and excise tax returns. Reclassification from tax fees to audit fees of fiscal 2005 amounts related to the auditing of tax disclosures within the registrant’s annual financial statements has been made in order to conform to fiscal 2006 presentation. All other fees include the registrant’s pro-rata share of amounts for agreed-upon procedures in conjunction with service contract approvals by the registrant’s Board of Directors/Trustees.
(e)(1) The registrant’s audit committee has adopted a policy whereby audit and non-audit services performed by the registrant’s principal accountant for the registrant, its investment adviser, and any entity controlling, controlled by, or under common control with the investment adviser that provides ongoing services to the registrant require pre-approval in advance at regularly scheduled audit committee meetings. If such a service is required between regularly scheduled audit committee meetings, pre-approval may be authorized by one audit committee member with ratification at the next scheduled audit committee meeting. Waiver of pre-approval for audit or non-audit services requiring fees of a de minimis amount is not permitted.
(2) No services included in (b) – (d) above were approved pursuant to paragraph (c)(7)(i)(C) of Rule 2-01 of Regulation S-X.
(f) Less than 50 percent of the hours expended on the principal accountant’s engagement to audit the registrant’s financial statements for the most recent fiscal year were attributed to work performed by persons other than the principal accountant’s full-time, permanent employees.
(g) The aggregate fees billed for the most recent fiscal year and the preceding fiscal year by the registrant’s principal accountant for non-audit services rendered to the registrant, its investment adviser, and any entity controlling, controlled by, or under common control with the investment adviser that provides ongoing services to the registrant were $1,401,000 and $883,000, respectively, and were less than the aggregate fees billed for those same periods by the registrant’s principal accountant for audit services rendered to the T. Rowe Price Funds. Preceding fiscal year amount reflects the reclassification of tax fees described in (a) – (d) above.
(h) All non-audit services rendered in (g) above were pre-approved by the registrant’s audit committee. Accordingly, these services were considered by the registrant’s audit committee in maintaining the principal accountant’s independence.Item 5. Audit Committee of Listed Registrants.
Not applicable.
Item 6. Schedule of Investments.
Not applicable. The complete schedule of investments is included in Item 1 of this Form N-CSR.
Item 7. Disclosure of Proxy Voting Policies and Procedures for Closed-End Management Investment Companies.
Not applicable.
Item 8. Portfolio Managers of Closed-End Management Investment Companies.
Not applicable.
Item 9. Purchases of Equity Securities by Closed-End Management Investment Company and Affiliated Purchasers.
Not applicable.
Item 10. Submission of Matters to a Vote of Security Holders.
Not applicable.
Item 11. Controls and Procedures.
(a) The registrant’s principal executive officer and principal financial officer have evaluated the registrant’s disclosure controls and procedures within 90 days of this filing and have concluded that the registrant’s disclosure controls and procedures were effective, as of that date, in ensuring that information required to be disclosed by the registrant in this Form N-CSR was recorded, processed, summarized, and reported timely.
(b) The registrant’s principal executive officer and principal financial officer are aware of no change in the registrant’s internal control over financial reporting that occurred during the registrant’s second fiscal quarter covered by this report that has materially affected, or is reasonably likely to materially affect, the registrant’s internal control over financial reporting.
Item 12. Exhibits.
(a)(1) The registrant’s code of ethics pursuant to Item 2 of Form N-CSR is attached.
(2) Separate certifications by the registrant's principal executive officer and principal financial officer, pursuant to Section 302 of the Sarbanes-Oxley Act of 2002 and required by Rule 30a-2(a) under the Investment Company Act of 1940, are attached.
(3) Written solicitation to repurchase securities issued by closed-end companies: not applicable.
(b) A certification by the registrant's principal executive officer and principal financial officer, pursuant to Section 906 of the Sarbanes-Oxley Act of 2002 and required by Rule 30a-2(b) under the Investment Company Act of 1940, is attached.
SIGNATURES | |
| Pursuant to the requirements of the Securities Exchange Act of 1934 and the Investment | |
| Company Act of 1940, the registrant has duly caused this report to be signed on its behalf by the | |
| undersigned, thereunto duly authorized. | |
| T. Rowe Price Science & Technology Fund, Inc. | |
| By | /s/ Edward C. Bernard |
| Edward C. Bernard | |
| Principal Executive Officer | |
| Date | February 16, 2007 |
| Pursuant to the requirements of the Securities Exchange Act of 1934 and the Investment | |
| Company Act of 1940, this report has been signed below by the following persons on behalf of | |
| the registrant and in the capacities and on the dates indicated. | |
| By | /s/ Edward C. Bernard |
| Edward C. Bernard | |
| Principal Executive Officer | |
| Date | February 16, 2007 |
| By | /s/ Joseph A. Carrier |
| Joseph A. Carrier | |
| Principal Financial Officer | |
| Date | February 16, 2007 |