| UNITED STATES |
| SECURITIES AND EXCHANGE COMMISSION |
| Washington, D.C. 20549 |
FORM N-CSR |
CERTIFIED SHAREHOLDER REPORT OF REGISTERED |
MANAGEMENT INVESTMENT COMPANIES |
| Investment Company Act File Number: 811-5299 |
| T. Rowe Price Science & Technology Fund, Inc. |
| (Exact name of registrant as specified in charter) |
| 100 East Pratt Street, Baltimore, MD 21202 |
| (Address of principal executive offices) |
| David Oestreicher |
| 100 East Pratt Street, Baltimore, MD 21202 |
| (Name and address of agent for service) |
| Registrant’s telephone number, including area code: (410) 345-2000 |
| Date of fiscal year end: December 31 |
| Date of reporting period: December 31, 2009 |
Item 1: Report to Shareholders
 |
| Science & Technology Fund | December 31, 2009 |
The views and opinions in this report were current as of December 31, 2009. They are not guarantees of performance or investment results and should not be taken as investment advice. Investment decisions reflect a variety of factors, and the managers reserve the right to change their views about individual stocks, sectors, and the markets at any time. As a result, the views expressed should not be relied upon as a forecast of the fund’s future investment intent. The report is certified under the Sarbanes-Oxley Act, which requires mutual funds and other public companies to affirm that, to the best of their knowledge, the information in their financial reports is fairly and accurately stated in all material respects.
REPORTS ON THE WEB
Sign up for our E-mail Program, and you can begin to receive updated fund reports and prospectuses online rather than through the mail. Log in to your account at troweprice.com for more information.
Manager’s Letter
Fellow Shareholders
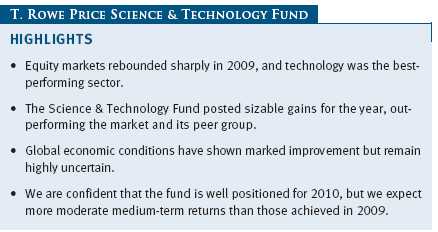
The past year was a favorable period to invest in stocks as they rebounded strongly from the declines suffered in 2008. Since our last letter six months ago, improvement in global economic data and better-than-expected corporate earnings drove a more than 22% gain in the Standard & Poor’s 500 Index. Science and technology stocks continued to outpace the broader market, and for the year technology was the market’s best-performing sector. Your fund posted very strong results.
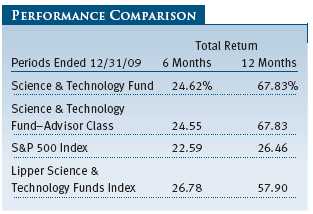
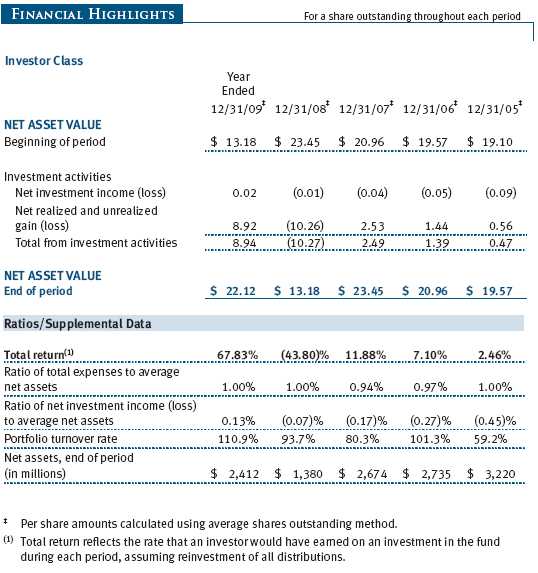
For the year ended December 31, 2009, the fund returned more than 67%, outpacing its Lipper peer group and the unmanaged S&P 500 Index. Performance was driven by effective stock selection, particularly in hardware and telecommunication equipment. Compared with its peer group, the fund’s results were hurt by an overweight in software, which lagged other areas of technology, but benefited from an underweight in health care, the weakest-performing area of science and technology.
MARKET ENVIRONMENT
The past two years were a tale of two stock markets. The painful losses of 2008 and early 2009 gave way to a historic rally that began in March and persisted through year-end. In early 2009, investors’ outlook for corporate earnings and stock prices was extremely bearish. But earnings weren’t nearly as bad as expected due to an improving economy and companies’ aggressive cost reductions, and they drove stock prices higher. The technology sector, among the hardest hit in 2008, held up relatively well early in 2009 and then enjoyed a particularly sharp rebound through year-end.
Entering 2009, technology stocks were coming off a long period of poor performance. Industry revenue and earnings had fallen sharply in the second half of 2008 after growing solidly in the preceding five years, including through the earlier stages of the most recent economic downturn. Amid major global economic turmoil that dominated early 2009, investors expected the downturn in technology earnings would be deep and protracted. Technology valuations at the time were very low relative to their historical levels as well as to the broader market, particularly on cash flow metrics. Early 2009 was a time of tremendous uncertainty, but it ultimately turned out to be a great opportunity for investors in technology stocks.
During the course of 2009, economic conditions progressed from dire to stable to improving, which made for a much healthier backdrop for technology spending and technology stocks. Technology managements aggressively cut costs early in the downturn, which helped bolster earnings and cash flow in a weak revenue environment. Technological innovation continued to spawn appealing products that enabled certain areas of technology to continue growing. Additionally, investor sentiment toward technology stocks shifted dramatically in 2009 from aversion early in the year to considerable optimism by the year’s end. This swing in sentiment resulted in higher valuation multiples for technology stocks in absolute terms and also relative to the broader market and helped extend their powerful rally through the second half of the year.
PORTFOLIO REVIEW
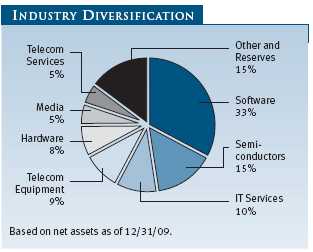
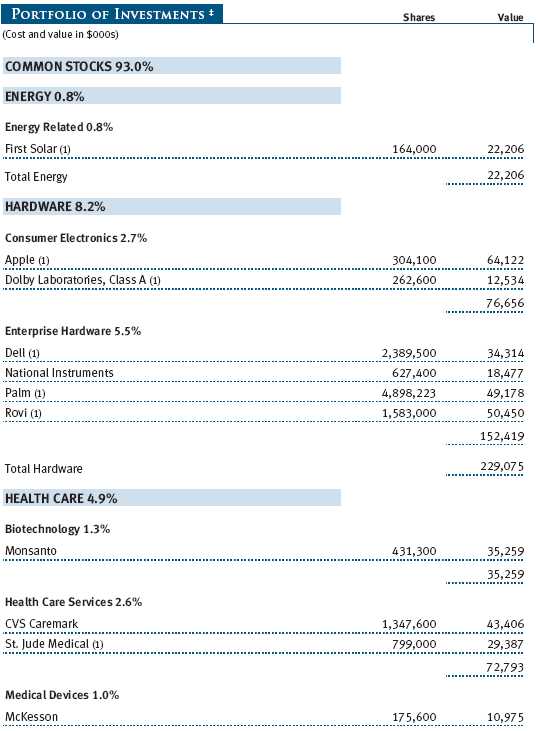
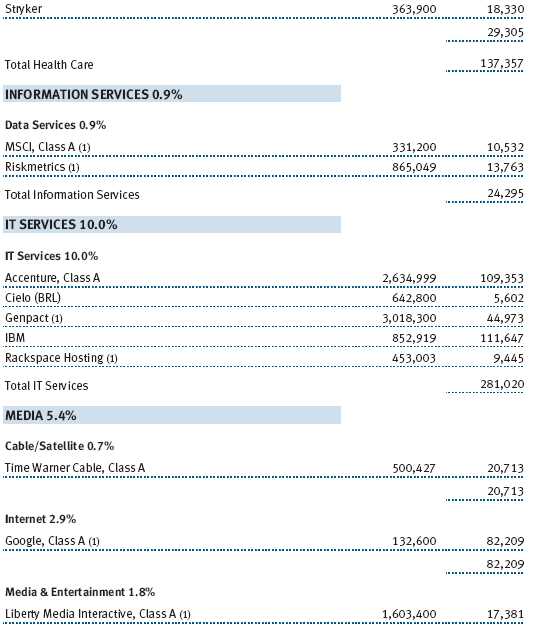
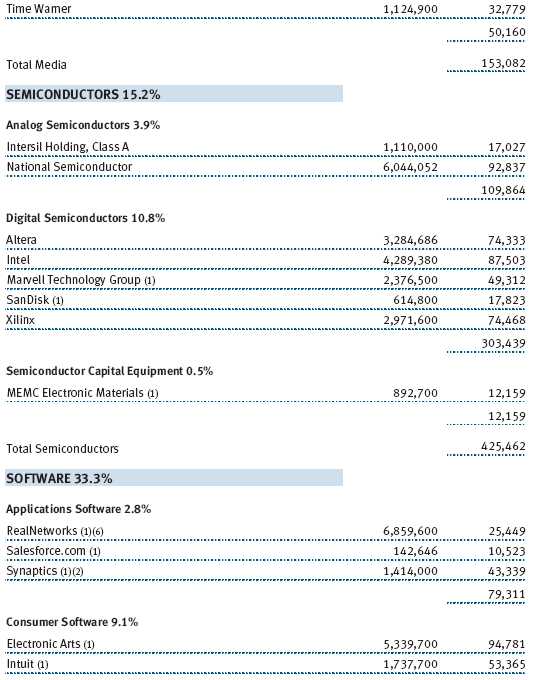
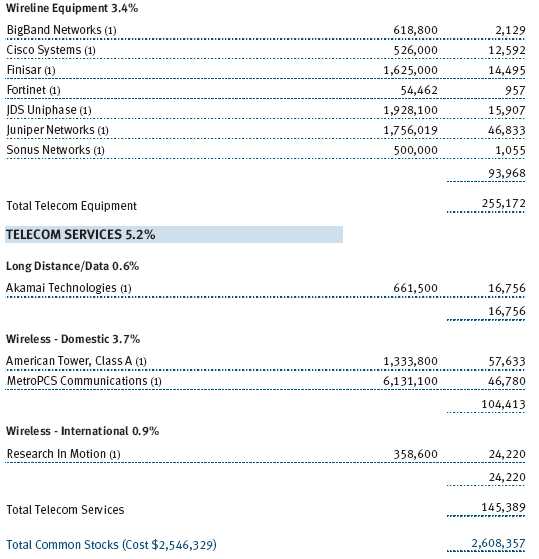
The fund remains broadly diversified across the principal segments of science and technology. At the end of 2009, software accounted for 33% of the portfolio. Other major components included semiconductors at 15%, telecommunication equipment at 9%, and information technology (IT) services at 10%. Since midyear, we have increased our weights in software and IT services and decreased weights in semiconductors and telecommunication equipment. During the year, technology stocks were most of our best performers, but the fund also benefited from favorable stock picking in other sectors including health care and media.
At the beginning of 2009, science and technology stocks’ valuations were attractive and investor expectations were extremely low, and we were optimistic that the group was positioned for favorable performance. Within the technology sector, we believed there were positive dynamics at work that investors were overlooking given their focus on the economic downturn. We believed that these dynamics—including strong balance sheets, aggressive cost-cutting, and strong spending drivers like mobile computing and software-as-a-service—would be key drivers of technology stock performance. In addition, we believed once economic signs became more favorable, investors would be attracted to technology stocks for the cyclical earnings improvement they promised in an economic recovery. As the year unfolded, these dynamics fueled exceptional gains in technology stocks.
Microsoft was our largest holding and a strong contributor. The stock’s weakness early in the year gave us an opportunity to add to our existing holdings at extremely attractive prices and to make it a very large position. Investor anticipation of a successful launch of Windows 7 and strong initial sales of the product drove a sharp rebound in Microsoft through year-end. We continue to believe Microsoft merits a sizable weighting in the fund given our expectations that Windows 7 and the anticipated midyear launch of Office 2010 will generate robust earnings growth. (Please see the portfolio of investments for a complete listing of holdings and the amount each represents in the portfolio.)
Other leading contributors included Red Hat, Salesforce.com, Omniture, and Rackspace. The strength of Red Hat’s business was spotlighted by its continued healthy growth through the difficult economic environment even as most peers saw declines. Red Hat’s low-cost value proposition as the leader in open source software became even more appealing to cost-conscious customers, which drove an acceleration in its market share gains.
The fund benefited from building large positions in Salesforce.com and Omniture in the first half of the year. Both are leading providers of software-as-a-service, which has been one of the fastest growing areas of technology in recent years. Software-as-a-service is attractive to customers because the software is used over the Internet, enabling the customer to avoid much of the cost of installing and managing the software. With its roots in customer relationship management applications, Salesforce.com is the largest provider of software-as-a-service. It also has a large opportunity in providing software development and hosting capabilities to customers and other software vendors. In the latter part of the year as the company’s considerable merits became better reflected in the stock, we significantly reduced our Salesforce.com position. Omniture was acquired by Adobe for a substantial stock price premium because of its strategically valuable market position as the leader in Web analytics.
Rackspace, a provider of managed hosting services, increased more than fourfold, making it the fund’s best-performing stock of 2009. During the year, Rackspace went from an underfollowed newly public company to a favored way to invest in cloud computing, which refers to technology capabilities delivered over the Internet. Cloud computing is an area of rapid innovation that is garnering considerable interest from corporate technology departments; we believe it will be an increasingly important driver of technology spending in the future. We pared our Rackspace holdings in the second half of the year but maintained a position in the stock.
Health care was the weakest-performing group among science and technology sectors, but it composed only a small part of the fund and our stock selection here was favorable. The standouts were distributor and health care information technology provider McKesson and orthopedic device maker Stryker, both of which rode better-than-expected earnings to rebound strongly from historically low valuations.
The fund’s largest negative contributor of 2009 by a wide margin was Nintendo. I wrote at midyear about Nintendo’s poor first-half performance and expressed my confidence that it would have a better second half. The stock’s weakness instead continued due to pronounced weakness in the overall video game market as well as slower-than-expected sales of Nintendo’s Wii gaming console and related games. Nintendo remains a large position. We continue to believe its highly popular games and innovative offerings, including the Wii’s motion control technology, differentiate it from its competitors. We’re encouraged by Nintendo’s sales improvement in December, and we’re optimistic that a strengthened new product lineup will drive appreciation in the stock.
Video game producer Electronic Arts was also hampered by industry weakness in 2009 and was among the fund’s worst performers for the year. In the second half, we added significantly to the position because we believe that, with the stock trading at a historically low multiple of sales, the business is simply undervalued. We expect that improved earnings and continued strong growth in its digital games business in 2010 will help the stock.
Wireless service provider MetroPCS Communications was another sizable detractor to the fund’s performance. Increased unemployment and heightened competition cut into its subscriber growth, pricing, and profits, and investors assigned the stock a deeply discounted valuation multiple. MetroPCS’s growth prospects now appear less favorable than our previous expectations; however, we added to the position as we believe the company’s advantages in the wireless market as a low-cost provider remain intact and that its cash flow streams and asset value are worth much more than the stock’s current valuation.
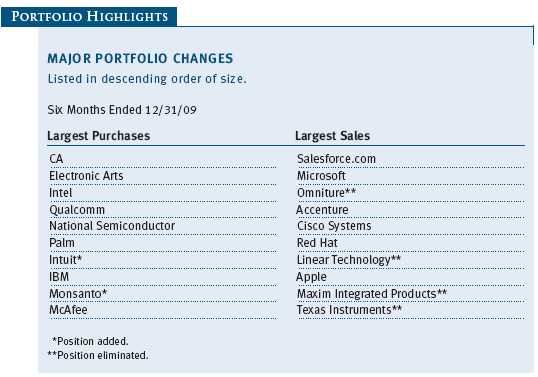
A recent portfolio addition is Intuit, the leading provider of tax preparation and small business accounting software. We view Intuit as one of the more durable growers in the technology industry because of its large and defensible market share in underpenetrated markets. Intuit’s strong market positions enable it to be very profitable while also investing in promising growth opportunities. The stock lagged through much of 2009, providing us an opportunity to buy it at a valuation discount to the technology universe and the broader market. We believe Intuit will be a strong performer as the market better appreciates the consistency and durability of its earnings growth.
Another addition to the fund in the latter part of the year was Dell. Dell became a very inexpensive stock due to the company’s uneven execution in the competitively intense PC and server hardware markets. In the context of its low valuation and our expectation that PC and server market growth will rebound in 2010 after a difficult 2009, we believe Dell is worth owning. Dell’s PC sales are weighted toward the business part of the market, which has been particularly weak but should improve sharply in coming quarters as companies move forward with previously deferred purchasing plans.
Another likely beneficiary of a better PC market is Synaptics, which we took a position in early in the fourth quarter. Synaptics provides touch-pad and touchscreen technologies for computers and devices like smartphones and e-readers. We believe the rapid adoption of touch technologies will fuel strong growth for Synaptics and drive appreciation in the stock.
STRATEGY REVIEW AND OUTLOOK
Despite a challenging year for economies globally, stocks—especially technology stocks—enjoyed a historic rally in 2009. This outcome highlights the importance of valuations and expectations to stock performance. At the start of 2009, valuations and expectations were both extremely low due to investors’ fears that the economy would worsen further and that corporate earnings would plummet. As the economy and earnings stabilized and showed signs of improvement, stocks enjoyed a swift and extended rebound. As we begin 2010, investors are considerably more optimistic about economic conditions and also about the outlook for stocks.
We, too, are encouraged by recent signs of improvement in economic indicators as well as in spending on most areas of science and technology. We expect 2010 to be a better year for revenue and earnings performance than 2009. But we’re cognizant that valuations have increased and stock prices already anticipate some level of fundamental improvement. As a result, equities are not as appealing in aggregate as they were a year ago, and it is unlikely that the fund will appreciate as much in 2010 as it did in 2009.
We’re still finding a large number of stocks with strong appreciation potential and palatable risk. We continue to believe that science and technology stocks hold considerable opportunity for long-term investors. Technological innovation continues at a rapid pace, fueling growth in science and technology products and services that should outpace the broader economy. Additionally, high stock price volatility allows us to invest opportunistically in appealing businesses at attractive prices.
Many of the stocks we find particularly appealing entering 2010 are steady growers trading at modest valuations. These include IBM, technology services provider Accenture, security software maker McAfee, and management software vendor CA. We see particular opportunity in software stocks because we believe the valuations of many of these don’t appropriately reflect their individual merits and the merits of software in general. Successful software businesses offer high competitive barriers, strong cash generation, and durable growth. We believe software will continue to gain share of technology spending, and we expect that many small- and medium-sized software companies will be acquired as larger vendors seek to expand their software businesses.
The past year was a historic period in technology investing. The enormous fear and uncertainty about the economy, the market, and science and technology stocks early in the year created extraordinary opportunity as the year progressed. Throughout 2009—particularly during the extreme turbulence early in the year—the industry expertise and collaborative efforts of our global research team were invaluable to the fund. We believe these capabilities will serve you well in the years ahead. Thank you for your continued trust and support.
Respectfully submitted,

Kennard W. Allen
President of the fund and chairman of its Investment Advisory Committee
January 20, 2010
The committee chairman has day-to-day responsibility for managing the portfolio and works with committee members in developing and executing the fund’s investment program.
RISKS OF INVESTING IN THE FUND
Funds that invest only in specific industries will experience greater volatility than funds investing in a broad range of industries. Technology stocks, historically, have experienced unusually wide price swings, both up and down. The potential for wide variation in performance reflects the special risks common to companies in the rapidly changing field of technology. For example, products or services that at first appear promising may not prove commercially successful and may become obsolete quickly. Earnings disappointments and intense competition for market share can result in sharp price declines.
GLOSSARY
Lipper Science & Technology Funds Index: An index of science and technology mutual fund performance returns for specified periods as tracked by Lipper Inc.
Price/earnings ratio: Calculated by dividing a stock’s market value per share by the company’s earnings per share for the past 12 months or by expected earnings for the coming year.
S&P 500 Index: A market cap-weighted index of 500 widely held stocks often used as a proxy for the overall stock market. Performance is reported on a total return basis.
Performance and Expenses
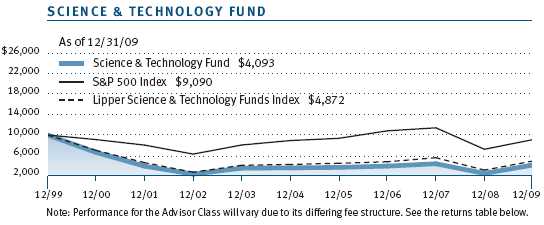
| GROWTH OF $10,000 |
This chart shows the value of a hypothetical $10,000 investment in the fund over the past 10 fiscal year periods or since inception (for funds lacking 10-year records). The result is compared with benchmarks, which may include a broad-based market index and a peer group average or index. Market indexes do not include expenses, which are deducted from fund returns as well as mutual fund averages and indexes.
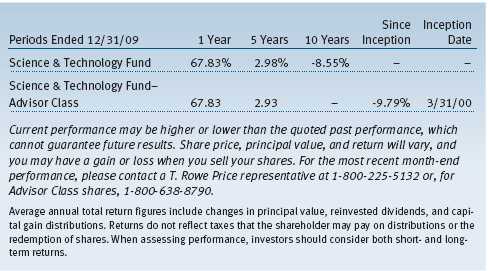
| AVERAGE ANNUAL COMPOUND TOTAL RETURN |
This table shows how the fund would have performed each year if its actual (or cumulative) returns for the periods shown had been earned at a constant rate.
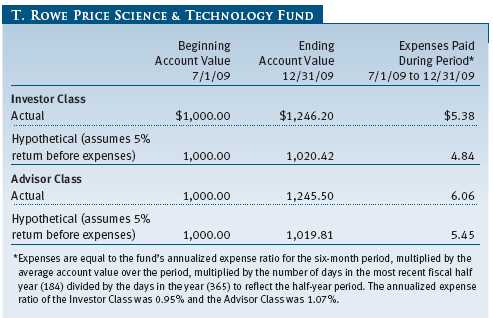
| FUND EXPENSE EXAMPLE |
As a mutual fund shareholder, you may incur two types of costs: (1) transaction costs, such as redemption fees or sales loads, and (2) ongoing costs, including management fees, distribution and service (12b-1) fees, and other fund expenses. The following example is intended to help you understand your ongoing costs (in dollars) of investing in the fund and to compare these costs with the ongoing costs of investing in other mutual funds. The example is based on an investment of $1,000 invested at the beginning of the most recent six-month period and held for the entire period.
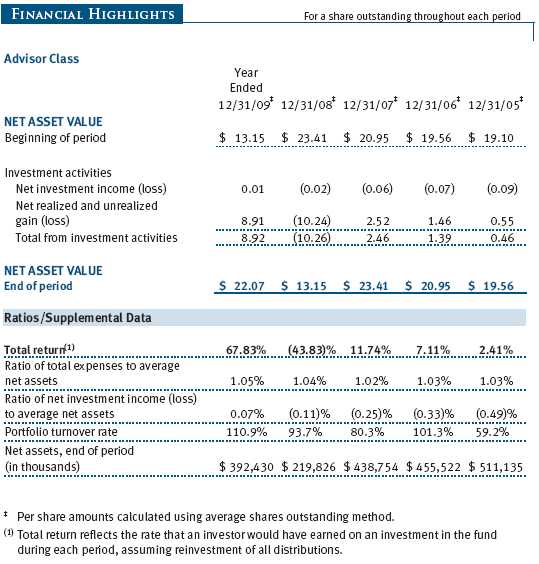
Please note that the fund has two share classes: The original share class (“investor class”) charges no distribution and service (12b-1) fee, and the Advisor Class shares are offered only through unaffiliated brokers and other financial intermediaries and charge a 0.25% 12b-1 fee. Each share class is presented separately in the table.
Actual Expenses
The first line of the following table (“Actual”) provides information about actual account values and expenses based on the fund’s actual returns. You may use the information in this line, together with your account balance, to estimate the expenses that you paid over the period. Simply divide your account value by $1,000 (for example, an $8,600 account value divided by $1,000 = 8.6), then multiply the result by the number in the first line under the heading “Expenses Paid During Period” to estimate the expenses you paid on your account during this period.
Hypothetical Example for Comparison Purposes
The information on the second line of the table (“Hypothetical”) is based on hypothetical account values and expenses derived from the fund’s actual expense ratio and an assumed 5% per year rate of return before expenses (not the fund’s actual return). You may compare the ongoing costs of investing in the fund with other funds by contrasting this 5% hypothetical example and the 5% hypothetical examples that appear in the shareholder reports of the other funds. The hypothetical account values and expenses may not be used to estimate the actual ending account balance or expenses you paid for the period.
Note: T. Rowe Price charges an annual small-account maintenance fee of $10, generally for accounts with less than $2,000 ($500 for UGMA/UTMA). The fee is waived for any investor whose T. Rowe Price mutual fund accounts total $25,000 or more, accounts employing automatic investing, and IRAs and other retirement plan accounts that utilize a prototype plan sponsored by T. Rowe Price (although a separate custodial or administrative fee may apply to such accounts). This fee is not included in the accompanying table. If you are subject to the fee, keep it in mind when you are estimating the ongoing expenses of investing in the fund and when comparing the expenses of this fund with other funds.
You should also be aware that the expenses shown in the table highlight only your ongoing costs and do not reflect any transaction costs, such as redemption fees or sales loads. Therefore, the second line of the table is useful in comparing ongoing costs only and will not help you determine the relative total costs of owning different funds. To the extent a fund charges transaction costs, however, the total cost of owning that fund is higher.
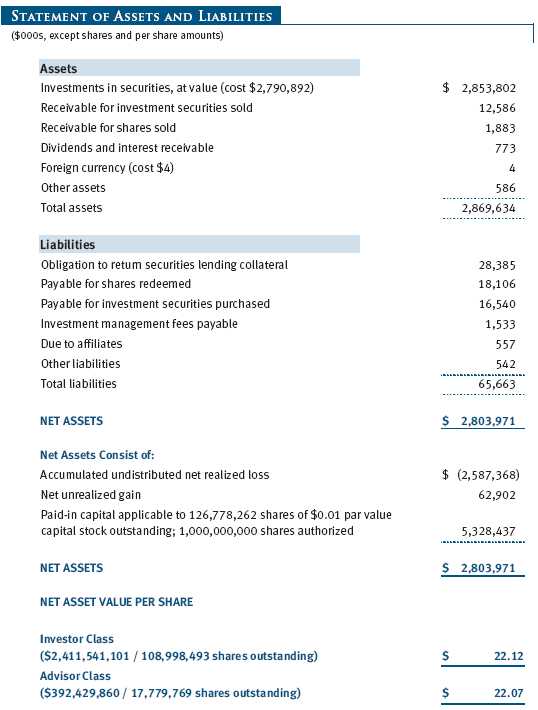
The accompanying notes are an integral part of these financial statements.
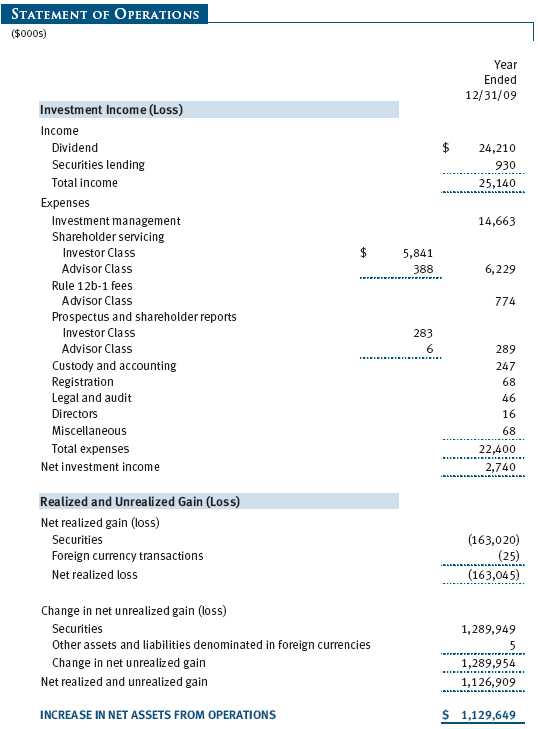
The accompanying notes are an integral part of these financial statements.
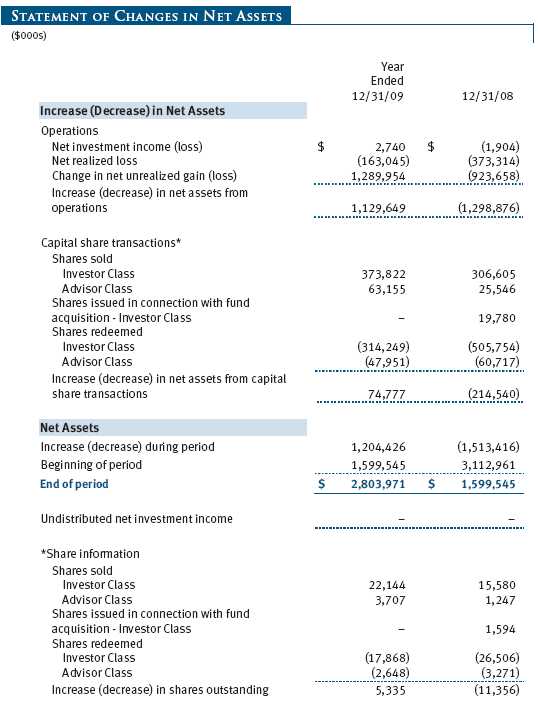
The accompanying notes are an integral part of these financial statements.
The accompanying notes are an integral part of these financial statements.
The accompanying notes are an integral part of these financial statements.
The accompanying notes are an integral part of these financial statements.
| NOTES TO FINANCIAL STATEMENTS |
T. Rowe Price Science & Technology Fund, Inc. (the fund), is registered under the Investment Company Act of 1940 (the 1940 Act) as a diversified, open-end management investment company. The fund seeks to provide long-term capital appreciation. The fund has two classes of shares: the Science & Technology Fund original share class, referred to in this report as the Investor Class, offered since September 30, 1987, and the Science & Technology Fund—Advisor Class (Advisor Class), offered since March 31, 2000. Advisor Class shares are sold only through unaffiliated brokers and other unaffiliated financial intermediaries that are compensated by the class for distribution, shareholder servicing, and/or certain administrative services under a Board-approved Rule 12b-1 plan. Each class has exclusive voting rights on matters related solely to that class; separate voting rights on matters that relate to both classes; and, in all other respects, the same rights and obligations as the other class.
NOTE 1 - SIGNIFICANT ACCOUNTING POLICIES
Basis of Preparation The accompanying financial statements were prepared in accordance with accounting principles generally accepted in the United States of America (GAAP), which require the use of estimates made by fund management. Fund management believes that estimates and security valuations are appropriate; however, actual results may differ from those estimates, and the security valuations reflected in the accompanying financial statements may differ from the value ultimately realized upon sale of the securities. Further, fund management believes that no events have occurred between December 31, 2009, the date of this report, and February 25, 2010, the date of issuance of the financial statements, that require adjustment of, or disclosure in, the accompanying financial statements.
Investment Transactions, Investment Income, and Distributions Income and expenses are recorded on the accrual basis. Dividends received from mutual fund investments are reflected as dividend income; capital gain distributions are reflected as realized gain/loss. Dividend income and capital gain distributions are recorded on the ex-dividend date. Income tax-related interest and penalties, if incurred, would be recorded as income tax expense. Investment transactions are accounted for on the trade date. Realized gains and losses are reported on the identified cost basis. Distributions to shareholders are recorded on the ex-dividend date. Income distributions are declared and paid by each class annually. Capital gain distributions, if any, are generally declared and paid by the fund, annually.
Currency Translation Assets, including investments, and liabilities denominated in foreign currencies are translated into U.S. dollar values each day at the prevailing exchange rate, using the mean of the bid and asked prices of such currencies against U.S. dollars as quoted by a major bank. Purchases and sales of securities, income, and expenses are translated into U.S. dollars at the prevailing exchange rate on the date of the transaction. The effect of changes in foreign currency exchange rates on realized and unrealized security gains and losses is reflected as a component of security gains and losses.
Class Accounting The Advisor Class pays distribution, shareholder servicing, and/or certain administrative expenses in the form of Rule 12b-1 fees, in an amount not exceeding 0.25% of the class’s average daily net assets. Shareholder servicing, prospectus, and shareholder report expenses incurred by each class are charged directly to the class to which they relate. Expenses common to both classes, investment income, and realized and unrealized gains and losses are allocated to the classes based upon the relative daily net assets of each class.
Rebates and Credits Subject to best execution, the fund may direct certain security trades to brokers who have agreed to rebate a portion of the related brokerage commission to the fund in cash. Commission rebates are reflected as realized gain on securities in the accompanying financial statements and totaled $186,000 for the year ended December 31, 2009. Additionally, the fund earns credits on temporarily uninvested cash balances held at the custodian, which reduce the fund’s custody charges. Custody expense in the accompanying financial statements is presented before reduction for credits.
New Accounting Pronouncement On January 1, 2009, the fund adopted new accounting guidance that requires enhanced disclosures about derivative and hedging activities, including how such activities are accounted for and their effect on financial position, performance, and cash flows. Adoption of this guidance had no impact on the fund’s net assets or results of operations.
NOTE 2 - VALUATION
The fund’s investments are reported at fair value as defined under GAAP. The fund determines the values of its assets and liabilities and computes its net asset value per share at the close of the New York Stock Exchange (NYSE), normally 4 p.m. ET, each day that the NYSE is open for business.
Valuation Methods Equity securities listed or regularly traded on a securities exchange or in the over-the-counter (OTC) market are valued at the last quoted sale price or, for certain markets, the official closing price at the time the valuations are made, except for OTC Bulletin Board securities, which are valued at the mean of the latest bid and asked prices. A security that is listed or traded on more than one exchange is valued at the quotation on the exchange determined to be the primary market for such security. Listed securities not traded on a particular day are valued at the mean of the latest bid and asked prices for domestic securities and the last quoted sale price for international securities.
Investments in mutual funds are valued at the mutual fund’s closing net asset value per share on the day of valuation.
Other investments, including restricted securities, and those financial instruments for which the above valuation procedures are inappropriate or are deemed not to reflect fair value are stated at fair value as determined in good faith by the T. Rowe Price Valuation Committee, established by the fund’s Board of Directors.
For valuation purposes, the last quoted prices of non-U.S. equity securities may be adjusted under the circumstances described below. If the fund determines that developments between the close of a foreign market and the close of the NYSE will, in its judgment, materially affect the value of some or all of its portfolio securities, the fund will adjust the previous closing prices to reflect what it believes to be the fair value of the securities as of the close of the NYSE. In deciding whether it is necessary to adjust closing prices to reflect fair value, the fund reviews a variety of factors, including developments in foreign markets, the performance of U.S. securities markets, and the performance of instruments trading in U.S. markets that represent foreign securities and baskets of foreign securities. A fund may also fair value securities in other situations, such as when a particular foreign market is closed but the fund is open. The fund uses outside pricing services to provide it with closing prices and information to evaluate and/or adjust those prices. The fund cannot predict how often it will use closing prices and how often it will determine it necessary to adjust those prices to reflect fair value. As a means of evaluating its security valuation process, the fund routinely compares closing prices, the next day’s opening prices in the same markets, and adjusted prices.
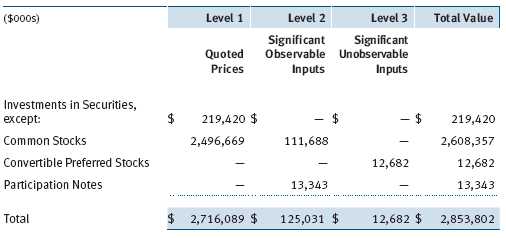
Valuation Inputs Various inputs are used to determine the value of the fund’s financial instruments. These inputs are summarized in the three broad levels listed below:
Level 1 – quoted prices in active markets for identical securities
Level 2 – observable inputs other than Level 1 quoted prices (including, but not limited to, quoted prices for similar securities, interest rates, prepayment speeds, and credit risk)
Level 3 – unobservable inputs
Observable inputs are those based on market data obtained from sources independent of the fund, and unobservable inputs reflect the fund’s own assumptions based on the best information available. The input levels are not necessarily an indication of the risk or liquidity associated with financial instruments at that level. For example, non-U.S. equity securities actively traded in foreign markets generally are reflected in Level 2 despite the availability of closing prices because the fund evaluates and determines whether those closing prices reflect fair value at the close of the NYSE or require adjustment, as described above. The following table summarizes the fund’s financial instruments, based on the inputs used to determine their values on December 31, 2009:
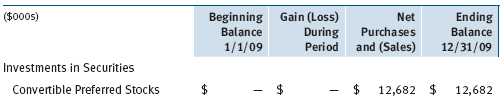
Following is a reconciliation of the fund’s Level 3 holdings for the year ended December 31, 2009. Gain (loss) reflects both realized and change in unrealized gain (loss) on Level 3 holdings during the period, if any, and is included on the accompanying Statement of Operations. The change in unrealized gain/loss on Level 3 instruments held at December 31, 2009, totaled $0 for the year ended December 31, 2009.
NOTE 3 - OTHER INVESTMENT TRANSACTIONS
Consistent with its investment objective, the fund engages in the following practices to manage exposure to certain risks and/or to enhance performance. The investment objective, policies, program, and risk factors of the fund are described more fully in the fund’s prospectus and Statement of Additional Information.
Restricted Securities The fund may invest in securities that are subject to legal or contractual restrictions on resale. Prompt sale of such securities at an acceptable price may be difficult and may involve substantial delays and additional costs.
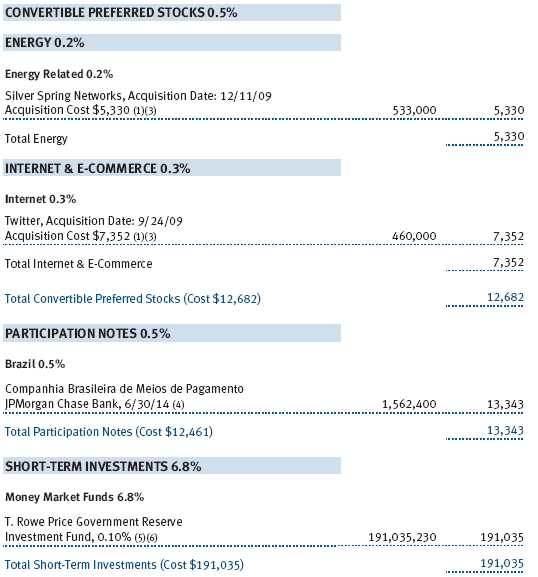
Participation Notes During the year ended December 31, 2009, the fund was a party to participation notes through which it gains exposure to common stock in markets where direct investment by the fund is not possible. Participation notes provide the economic benefit of common stock ownership to the fund, while legal ownership is retained by the counterparty. Although each participation note is structured with a defined maturity date, early redemption may be possible. Risks associated with participation notes include the possible failure of a counterparty to perform in accordance with the terms of the agreement and potential delays or an inability to redeem before maturity under certain market conditions.
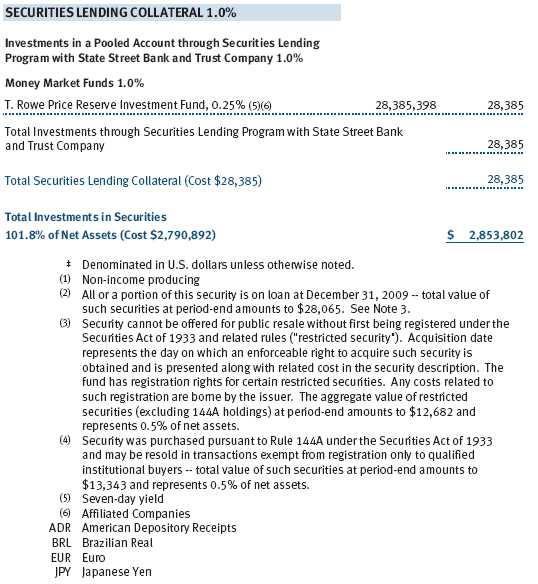
Securities Lending The fund lends its securities to approved brokers to earn additional income. It receives as collateral cash and U.S. government securities valued at 102% to 105% of the value of the securities on loan. Cash collateral is invested by the fund’s lending agent(s) in accordance with investment guidelines approved by fund management. Collateral is maintained over the life of the loan in an amount not less than the value of loaned securities as determined at the close of fund business each day; any additional collateral required due to changes in security values is delivered to the fund the next business day. Although risk is mitigated by the collateral, the fund could experience a delay in recovering its securities and a possible loss of income or value if the borrower fails to return the securities or if collateral investments decline in value. Securities lending revenue recognized by the fund consists of earnings on invested collateral and borrowing fees, net of any rebates to the borrower and compensation to the lending agent. On December 31, 2009, the value of loaned securities was $28,065,000.
Other Purchases and sales of portfolio securities other than short-term securities aggregated $2,316,361,000 and $2,371,761,000, respectively, for the year ended December 31, 2009.
NOTE 4 - FEDERAL INCOME TAXES
No provision for federal income taxes is required since the fund intends to continue to qualify as a regulated investment company under Subchapter M of the Internal Revenue Code and distribute to shareholders all of its taxable income and gains. Distributions determined in accordance with federal income tax regulations may differ in amount or character from net investment income and realized gains for financial reporting purposes. Financial reporting records are adjusted for permanent book/tax differences to reflect tax character but are not adjusted for temporary differences.
The fund files U.S. federal, state, and local tax returns as required. The fund’s tax returns are subject to examination by the relevant tax authorities until expiration of the applicable statute of limitations, which is generally three years after filing of the tax return but could be longer in certain circumstances.
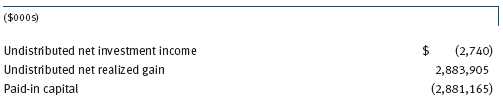
Reclassifications to paid-in capital relate primarily to expiring capital loss carryforwards. For the year ended December 31, 2009, the following reclassifications were recorded to reflect tax character; there was no impact on results of operations or net assets:
There were no distributions in the years ended December 31, 2009 and December 31, 2008. At December 31, 2009, the tax-basis cost of investments and components of net assets were as follows:
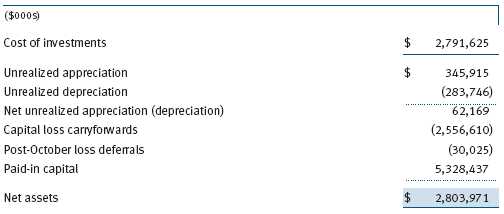
The fund intends to retain realized gains to the extent of available capital loss carryforwards. The fund’s unused capital loss carryforwards as of December 31, 2009, expire: $1,904,219,000 in fiscal 2010, $129,421,000 in fiscal 2011, $7,359,000 in fiscal 2015, $212,386,000 in fiscal 2016 and $303,225,000 in fiscal 2017. Further, $17,404,000 of the fund’s unused capital loss carryforwards acquired through tax-free reorganizations may be subject to certain limitations on amount and/or timing of use. In accordance with federal income tax regulations applicable to investment companies, recognition of capital losses on certain transactions realized between November 1 and the fund’s year end is deferred for tax purposes until the subsequent year (post-October loss deferrals); however, such losses are recognized for financial reporting purposes in the year realized.
NOTE 5 - ACQUISITION
On November 14, 2008, the fund acquired substantially all of the assets of the T. Rowe Price Developing Technologies Fund (the acquired fund), pursuant to the Agreement and Plan of Reorganization dated August 26, 2008, and approved by shareholders of the acquired fund on October 21, 2008. The acquisition was accomplished by a tax-free exchange of 1,593,877 shares of the fund (with a value of $19,780,000) for the 8,382,071 shares of the acquired fund outstanding on November 14, 2008, with the same value. The net assets of the acquired fund at that date included $5,187,000 of unrealized depreciation and $19,733,000 of net realized losses carried forward for tax purposes to offset distributable gains realized by the fund in the future. Net assets of the acquired fund were combined with those of the fund, resulting in aggregate net assets of $1,532,142,000 immediately after the acquisition.
NOTE 6 - RELATED PARTY TRANSACTIONS
The fund is managed by T. Rowe Price Associates, Inc. (the manager or Price Associates), a wholly owned subsidiary of T. Rowe Price Group, Inc. The investment management agreement between the fund and the manager provides for an annual investment management fee, which is computed daily and paid monthly. The fee consists of an individual fund fee, equal to 0.35% of the fund’s average daily net assets, and a group fee. The group fee rate is calculated based on the combined net assets of certain mutual funds sponsored by Price Associates (the group) applied to a graduated fee schedule, with rates ranging from 0.48% for the first $1 billion of assets to 0.285% for assets in excess of $220 billion. The fund’s group fee is determined by applying the group fee rate to the fund’s average daily net assets. At December 31, 2009, the effective annual group fee rate was 0.30%.
In addition, the fund has entered into service agreements with Price Associates and two wholly owned subsidiaries of Price Associates (collectively, Price). Price Associates computes the daily share prices and provides certain other administrative services to the fund. T. Rowe Price Services, Inc., provides shareholder and administrative services in its capacity as the fund’s transfer and dividend disbursing agent. T. Rowe Price Retirement Plan Services, Inc., provides subaccounting and recordkeeping services for certain retirement accounts invested in the Investor Class. For the year ended December 31, 2009, expenses incurred pursuant to these service agreements were $132,000 for Price Associates; $3,139,000 for T. Rowe Price Services, Inc.; and $1,153,000 for T. Rowe Price Retirement Plan Services, Inc. The total amount payable at period-end pursuant to these service agreements is reflected as Due to Affiliates in the accompanying financial statements.
Additionally, the fund is one of several mutual funds in which certain college savings plans managed by Price Associates may invest. As approved by the fund’s Board of Directors, shareholder servicing costs associated with each college savings plan are borne by the fund in proportion to the average daily value of its shares owned by the college savings plan. For the year ended December 31, 2009, the fund was charged $39,000 for shareholder servicing costs related to the college savings plans, of which $27,000 was for services provided by Price. The amount payable at period-end pursuant to this agreement is reflected as Due to Affiliates in the accompanying financial statements. At December 31, 2009, approximately 1% of the outstanding shares of the Investor Class were held by college savings plans.
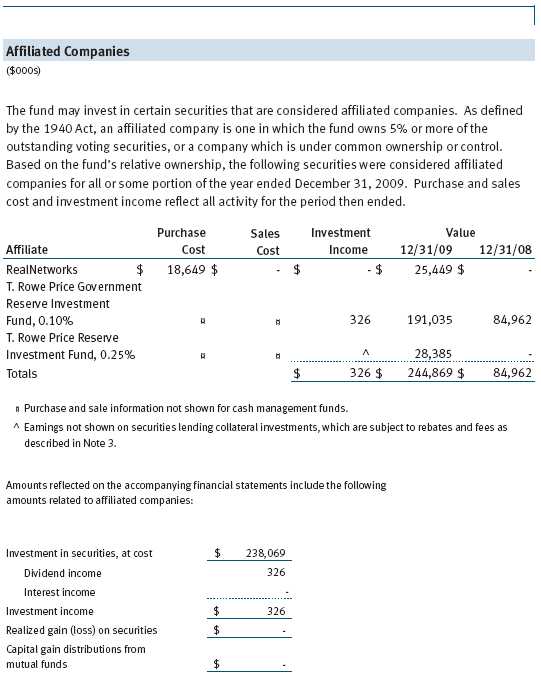
The fund may invest in the T. Rowe Price Reserve Investment Fund and the T. Rowe Price Government Reserve Investment Fund (collectively, the T. Rowe Price Reserve Investment Funds), open-end management investment companies managed by Price Associates and considered affiliates of the fund. The T. Rowe Price Reserve Investment Funds are offered as cash management options to mutual funds, trusts, and other accounts managed by Price Associates and/or its affiliates and are not available for direct purchase by members of the public. The T. Rowe Price Reserve Investment Funds pay no investment management fees.
As of December 31, 2009, T. Rowe Price Group, Inc., and/or its wholly owned subsidiaries owned 637,630 shares of the Investor Class, representing 1% of the fund’s net assets.
| REPORT OF INDEPENDENT REGISTERED PUBLIC ACCOUNTING FIRM |
To the Board of Directors and Shareholders of
T. Rowe Price Science & Technology Fund, Inc.
In our opinion, the accompanying statement of assets and liabilities, including the schedule of investments, and the related statements of operations and of changes in net assets and the financial highlights present fairly, in all material respects, the financial position of T. Rowe Price Science & Technology Fund, Inc. (the “Fund”) at December 31, 2009, the results of its operations for the year then ended, the changes in its net assets for each of the two years in the period then ended and the financial highlights for each of the five years in the period then ended, in conformity with accounting principles generally accepted in the United States of America. These financial statements and financial highlights (hereafter referred to as “financial statements”) are the responsibility of the Fund’s management; our responsibility is to express an opinion on these financial statements based on our audits. We conducted our audits of these financial statements in accordance with the standards of the Public Company Accounting Oversight Board (United States). Those standards require that we plan and perform the audit to obtain reasonable assurance about whether the financial statements are free of material misstatement. An audit includes examining, on a test basis, evidence supporting the amounts and disclosures in the financial statements, assessing the accounting principles used and significant estimates made by management, and evaluating the overall financial statement presentation. We believe that our audits, which included confirmation of securities at December 31, 2009 by correspondence with the custodian, and confirmation of the underlying funds by correspondence with the transfer agent, provide a reasonable basis for our opinion.
PricewaterhouseCoopers LLP
Baltimore, Maryland
February 25, 2010
| INFORMATION ON PROXY VOTING POLICIES, PROCEDURES, AND RECORDS |
A description of the policies and procedures used by T. Rowe Price funds and portfolios to determine how to vote proxies relating to portfolio securities is available in each fund’s Statement of Additional Information, which you may request by calling 1-800-225-5132 or by accessing the SEC’s Web site, www.sec.gov. The description of our proxy voting policies and procedures is also available on our Web site, www.troweprice.com. To access it, click on the words “Our Company” at the top of our corporate homepage. Then, when the next page appears, click on the words “Proxy Voting Policies” on the left side of the page.
Each fund’s most recent annual proxy voting record is available on our Web site and through the SEC’s Web site. To access it through our Web site, follow the directions above, then click on the words “Proxy Voting Records” on the right side of the Proxy Voting Policies page.
| HOW TO OBTAIN QUARTERLY PORTFOLIO HOLDINGS |
The fund files a complete schedule of portfolio holdings with the Securities and Exchange Commission for the first and third quarters of each fiscal year on Form N-Q. The fund’s Form N-Q is available electronically on the SEC’s Web site (www.sec.gov); hard copies may be reviewed and copied at the SEC’s Public Reference Room, 450 Fifth St. N.W., Washington, DC 20549. For more information on the Public Reference Room, call 1-800-SEC-0330.
| ABOUT THE FUND’S DIRECTORS AND OFFICERS |
Your fund is governed by a Board of Directors (Board) that meets regularly to review a wide variety of matters affecting the fund, including performance, investment programs, compliance matters, advisory fees and expenses, service providers, and other business affairs. The Board elects the fund’s officers, who are listed in the final table. At least 75% of Board members are independent of T. Rowe Price Associates, Inc. (T. Rowe Price), and T. Rowe Price International, Inc. (T. Rowe Price International); “inside” or “interested” directors are employees or officers of T. Rowe Price. The business address of each director and officer is 100 East Pratt Street, Baltimore, Maryland 21202. The Statement of Additional Information includes additional information about the directors and is available without charge by calling a T. Rowe Price representative at 1-800-225-5132.
| Independent Directors | |
| Name | |
| (Year of Birth) | Principal Occupation(s) During Past Five Years and Directorships of |
| Year Elected* | Other Public Companies |
| William R. Brody, M.D., Ph.D. | President and Trustee, Salk Institute for Biological Studies (2009 |
| (1944) | to present); Director, Novartis, Inc. (2009 to present); Director, IBM |
| 2009 | (2007 to present); President and Trustee, Johns Hopkins University |
| (1996 to 2009); Chairman of Executive Committee and Trustee, | |
| Johns Hopkins Health System (1996 to 2009) | |
| Jeremiah E. Casey | Director, National Life Insurance (2001 to 2005); Director, The Rouse |
| (1940) | Company, real estate developers (1990 to 2004) |
| 2005 | |
| Anthony W. Deering | Chairman, Exeter Capital, LLC, a private investment firm (2004 to |
| (1945) | present); Director, Under Armour (2008 to present); Director, Vornado |
| 2001 | Real Estate Investment Trust (2004 to present); Director, Mercantile |
| Bankshares (2002 to 2007); Member, Advisory Board, Deutsche Bank | |
| North America (2004 to present); Director, Chairman of the Board, | |
| and Chief Executive Officer, The Rouse Company, real estate develop- | |
| ers (1997 to 2004) | |
| Donald W. Dick, Jr. | Principal, EuroCapital Advisors, LLC, an acquisition and management |
| (1943) | advisory firm (1995 to present) |
| 1994 | |
| Karen N. Horn | Director, Eli Lilly and Company (1987 to present); Director, Simon |
| (1943) | Property Group (2004 to present); Director, Norfolk Southern (2008 |
| 2003 | to present); Director, Georgia Pacific (2004 to 2005) |
| Theo C. Rodgers | President, A&R Development Corporation (1977 to present) |
| (1941) | |
| 2005 | |
| John G. Schreiber | Owner/President, Centaur Capital Partners, Inc., a real estate invest- |
| (1946) | ment company (1991 to present); Partner, Blackstone Real Estate |
| 2001 | Advisors, L.P. (1992 to present) |
| Mark R. Tercek | President and Chief Executive Officer, The Nature Conservancy (2008 |
| (1957) | to present); Managing Director, The Goldman Sachs Group, Inc. |
| 2009 | (1984 to 2008) |
| *Each independent director oversees 124 T. Rowe Price portfolios and serves until retirement, resignation, | |
| or election of a successor. | |
| Inside Directors | |
| Name | |
| (Year of Birth) | |
| Year Elected* | |
| [Number of T. Rowe Price | Principal Occupation(s) During Past Five Years and Directorships of |
| Portfolios Overseen] | Other Public Companies |
| Edward C. Bernard | Director and Vice President, T. Rowe Price; Vice Chairman of the Board, |
| (1956) | Director, and Vice President, T. Rowe Price Group, Inc.; Chairman of |
| 2006 | the Board, Director, and President, T. Rowe Price Investment Services, |
| [124] | Inc.; Chairman of the Board and Director, T. Rowe Price Global Asset |
| Management Limited, T. Rowe Price Global Investment Services | |
| Limited, T. Rowe Price Retirement Plan Services, Inc., T. Rowe Price | |
| Savings Bank, and T. Rowe Price Services, Inc.; Director, T. Rowe Price | |
| International, Inc.; Chief Executive Officer, Chairman of the Board, | |
| Director, and President, T. Rowe Price Trust Company; Chairman of the | |
| Board, all funds | |
| John H. Laporte, CFA | Vice President, T. Rowe Price, T. Rowe Price Group, Inc., and T. Rowe |
| (1945) | Price Trust Company |
| 1988 | |
| [16] | |
| *Each inside director serves until retirement, resignation, or election of a successor. | |
| Officers | |
| Name (Year of Birth) | |
| Position Held With Science & Technology Fund | Principal Occupation(s) |
| Kennard W. Allen (1977) | Vice President, T. Rowe Price and T. Rowe Price |
| President | Group, Inc. |
| Brian W.H. Berghuis, CFA (1958) | Vice President, T. Rowe Price, T. Rowe Price |
| Vice President | Group, Inc., and T. Rowe Price Trust Company |
| David J. Eiswert, CFA (1972) | Vice President, T. Rowe Price, T. Rowe Price |
| Vice President | Global Investment Services Limited, and |
| T. Rowe Price Group, Inc. | |
| Henry M. Ellenbogen (1973) | Vice President, T. Rowe Price and T. Rowe Price |
| Vice President | Group, Inc. |
| Roger L. Fiery III, CPA (1959) | Vice President, T. Rowe Price, T. Rowe Price |
| Vice President | Group, Inc., T. Rowe Price International, Inc., |
| and T. Rowe Price Trust Company | |
| Daniel Flax (1974) | Vice President, T. Rowe Price and T. Rowe |
| Vice President | Price Group, Inc.; formerly student, Columbia |
| Business School (to 2006); Equity Analyst/ | |
| Trader, Madoff Securities International (London) | |
| (to 2004) | |
| John R. Gilner (1961) | Chief Compliance Officer and Vice President, |
| Chief Compliance Officer | T. Rowe Price; Vice President, T. Rowe Price |
| Group, Inc., and T. Rowe Price Investment | |
| Services, Inc. | |
| Gregory S. Golczewski (1966) | Vice President, T. Rowe Price and T. Rowe Price |
| Vice President | Trust Company |
| Gregory K. Hinkle, CPA (1958) | Vice President, T. Rowe Price, T. Rowe Price |
| Treasurer | Group, Inc., and T. Rowe Price Trust Company; |
| formerly Partner, PricewaterhouseCoopers LLP | |
| (to 2007) | |
| Rhett K. Hunter (1977) | Vice President, T. Rowe Price; formerly student, |
| Vice President | MIT Sloan School of Management (to 2007), |
| and Bowdoin College (to 2005) | |
| Patricia B. Lippert (1953) | Assistant Vice President, T. Rowe Price and |
| Secretary | T. Rowe Price Investment Services, Inc. |
| David Oestreicher (1967) | Director and Vice President, T. Rowe Price |
| Vice President | Investment Services, Inc., T. Rowe Price Trust |
| Company, and T. Rowe Price Services, Inc.; Vice | |
| President, T. Rowe Price, T. Rowe Price Global | |
| Asset Management Limited, T. Rowe Price | |
| Global Investment Services Limited, T. Rowe | |
| Price Group, Inc., T. Rowe Price International, | |
| Inc., and T. Rowe Price Retirement Plan | |
| Services, Inc. | |
| Hiroaki Owaki, CFA (1962) | Vice President, T. Rowe Price Global Investment |
| Vice President | Services Limited and T. Rowe Price Group, Inc. |
| Deborah D. Seidel (1962) | Vice President, T. Rowe Price, T. Rowe Price |
| Vice President | Investment Services, Inc., and T. Rowe Price |
| Services, Inc. | |
| Michael F. Sola, CFA (1969) | Vice President, T. Rowe Price and T. Rowe Price |
| Vice President | Group, Inc. |
| Joshua K. Spencer, CFA (1973) | Vice President, T. Rowe Price and T. Rowe Price |
| Vice President | Group, Inc. |
| Julie L. Waples (1970) | Vice President, T. Rowe Price |
| Vice President | |
| Thomas H. Watson (1977) | Vice President, T. Rowe Price; formerly Strategy |
| Vice President | Analyst, Forrester Research (to 2005) |
| Alison Mei Ling Yip (1966) | Vice President, T. Rowe Price Group, Inc., and |
| Vice President | T. Rowe Price International, Inc.; formerly |
| Analyst, Credit Suisse First Boston (to 2006) | |
| Nalin Yogasundram (1975) | Vice President, T. Rowe Price; formerly Equity |
| Vice President | Analyst intern, American Century Investments |
| (to 2006); Project Lead, Ceterus Networks (to | |
| 2005); Project Lead, Mahi Networks (to 2004) | |
| Unless otherwise noted, officers have been employees of T. Rowe Price or T. Rowe Price International for | |
| at least five years. | |
Item 2. Code of Ethics.
The registrant has adopted a code of ethics, as defined in Item 2 of Form N-CSR, applicable to its principal executive officer, principal financial officer, principal accounting officer or controller, or persons performing similar functions. A copy of this code of ethics is filed as an exhibit to this Form N-CSR. No substantive amendments were approved or waivers were granted to this code of ethics during the period covered by this report.
Item 3. Audit Committee Financial Expert.
The registrant’s Board of Directors/Trustees has determined that Mr. Anthony W. Deering qualifies as an audit committee financial expert, as defined in Item 3 of Form N-CSR. Mr. Deering is considered independent for purposes of Item 3 of Form N-CSR.
Item 4. Principal Accountant Fees and Services.
(a) – (d) Aggregate fees billed to the registrant for the last two fiscal years for professional services rendered by the registrant’s principal accountant were as follows:
Audit fees include amounts related to the audit of the registrant’s annual financial statements and services normally provided by the accountant in connection with statutory and regulatory filings. Audit-related fees include amounts reasonably related to the performance of the audit of the registrant’s financial statements and specifically include the issuance of a report on internal controls and, if applicable, agreed-upon procedures related to fund acquisitions. Tax fees include amounts related to services for tax compliance, tax planning, and tax advice. The nature of these services specifically includes the review of distribution calculations and the preparation of Federal, state, and excise tax returns. All other fees include the registrant’s pro-rata share of amounts for agreed-upon procedures in conjunction with service contract approvals by the registrant’s Board of Directors/Trustees.
(e)(1) The registrant’s audit committee has adopted a policy whereby audit and non-audit services performed by the registrant’s principal accountant for the registrant, its investment adviser, and any entity controlling, controlled by, or under common control with the investment adviser that provides ongoing services to the registrant require pre-approval in advance at regularly scheduled audit committee meetings. If such a service is required between regularly scheduled audit committee meetings, pre-approval may be authorized by one audit committee member with ratification at the next scheduled audit committee meeting. Waiver of pre-approval for audit or non-audit services requiring fees of a de minimis amount is not permitted.
(2) No services included in (b) – (d) above were approved pursuant to paragraph (c)(7)(i)(C) of Rule 2-01 of Regulation S-X.
(f) Less than 50 percent of the hours expended on the principal accountant’s engagement to audit the registrant’s financial statements for the most recent fiscal year were attributed to work performed by persons other than the principal accountant’s full-time, permanent employees.
(g) The aggregate fees billed for the most recent fiscal year and the preceding fiscal year by the registrant’s principal accountant for non-audit services rendered to the registrant, its investment adviser, and any entity controlling, controlled by, or under common control with the investment adviser that provides ongoing services to the registrant were $1,879,000 and $1,922,000, respectively.
(h) All non-audit services rendered in (g) above were pre-approved by the registrant’s audit committee. Accordingly, these services were considered by the registrant’s audit committee in maintaining the principal accountant’s independence.
Item 5. Audit Committee of Listed Registrants.
Not applicable.
Item 6. Investments.
(a) Not applicable. The complete schedule of investments is included in Item 1 of this Form N-CSR.
(b) Not applicable.
Item 7. Disclosure of Proxy Voting Policies and Procedures for Closed-End Management Investment Companies.
Not applicable.
Item 8. Portfolio Managers of Closed-End Management Investment Companies.
Not applicable.
Item 9. Purchases of Equity Securities by Closed-End Management Investment Company and Affiliated Purchasers.
Not applicable.
Item 10. Submission of Matters to a Vote of Security Holders.
Not applicable.
Item 11. Controls and Procedures.
(a) The registrant’s principal executive officer and principal financial officer have evaluated the registrant’s disclosure controls and procedures within 90 days of this filing and have concluded that the registrant’s disclosure controls and procedures were effective, as of that date, in ensuring that information required to be disclosed by the registrant in this Form N-CSR was recorded, processed, summarized, and reported timely.
(b) The registrant’s principal executive officer and principal financial officer are aware of no change in the registrant’s internal control over financial reporting that occurred during the registrant’s second fiscal quarter covered by this report that has materially affected, or is reasonably likely to materially affect, the registrant’s internal control over financial reporting.
Item 12. Exhibits.
(a)(1) The registrant’s code of ethics pursuant to Item 2 of Form N-CSR is attached.
(2) Separate certifications by the registrant's principal executive officer and principal financial officer, pursuant to Section 302 of the Sarbanes-Oxley Act of 2002 and required by Rule 30a-2(a) under the Investment Company Act of 1940, are attached.
(3) Written solicitation to repurchase securities issued by closed-end companies: not applicable.
(b) A certification by the registrant's principal executive officer and principal financial officer, pursuant to Section 906 of the Sarbanes-Oxley Act of 2002 and required by Rule 30a-2(b) under the Investment Company Act of 1940, is attached.
SIGNATURES | |
| Pursuant to the requirements of the Securities Exchange Act of 1934 and the Investment | |
| Company Act of 1940, the registrant has duly caused this report to be signed on its behalf by the | |
| undersigned, thereunto duly authorized. | |
| T. Rowe Price Science & Technology Fund, Inc. | |
| By | /s/ Edward C. Bernard |
| Edward C. Bernard | |
| Principal Executive Officer | |
| Date | February 25, 2010 |
| Pursuant to the requirements of the Securities Exchange Act of 1934 and the Investment | |
| Company Act of 1940, this report has been signed below by the following persons on behalf of | |
| the registrant and in the capacities and on the dates indicated. | |
| By | /s/ Edward C. Bernard |
| Edward C. Bernard | |
| Principal Executive Officer | |
| Date | February 25, 2010 |
| By | /s/ Gregory K. Hinkle |
| Gregory K. Hinkle | |
| Principal Financial Officer | |
| Date | February 25, 2010 |