UNITED STATES
SECURITIES AND EXCHANGE COMMISSION
Washington, D.C. 20549
FORM N-CSR
CERTIFIED SHAREHOLDER REPORT OF REGISTERED
MANAGEMENT INVESTMENT COMPANIES
Investment Company Act File Number: 811-5299
| T. Rowe Price Science & Technology Fund, Inc. |
| (Exact name of registrant as specified in charter) |
| 100 East Pratt Street, Baltimore, MD 21202 |
| (Address of principal executive offices) |
| David Oestreicher |
| 100 East Pratt Street, Baltimore, MD 21202 |
| (Name and address of agent for service) |
Registrant’s telephone number, including area code: (410) 345-2000
Date of fiscal year end: December 31
Date of reporting period: December 31, 2011
Item 1. Report to Shareholders
 |
| Science & Technology Fund | December 31, 2011 |
The views and opinions in this report were current as of December 31, 2011. They are not guarantees of performance or investment results and should not be taken as investment advice. Investment decisions reflect a variety of factors, and the managers reserve the right to change their views about individual stocks, sectors, and the markets at any time. As a result, the views expressed should not be relied upon as a forecast of the fund’s future investment intent. The report is certified under the Sarbanes-Oxley Act, which requires mutual funds and other public companies to affirm that, to the best of their knowledge, the information in their financial reports is fairly and accurately stated in all material respects.
REPORTS ON THE WEB
Sign up for our E-mail Program, and you can begin to receive updated fund reports and prospectuses online rather than through the mail. Log in to your account at troweprice.com for more information.
Manager’s Letter
Fellow Shareholders
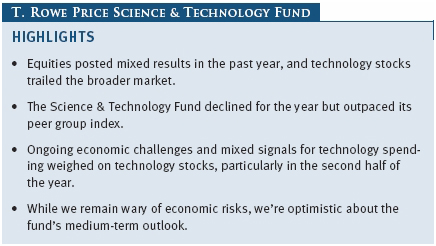
Despite a fourth-quarter rally, equity performance was mixed for the year. Economic turbulence, particularly in Europe, kept global growth fears front and center and weighed on stocks. As a result of economic challenges and pockets of technology spending weakness, technology stocks lagged the broader market. Health care stocks, which did not keep pace with the market rebound in the previous two years, surpassed returns of most sectors in 2011 and achieved solid gains.
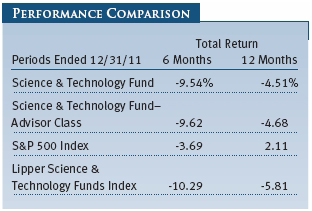
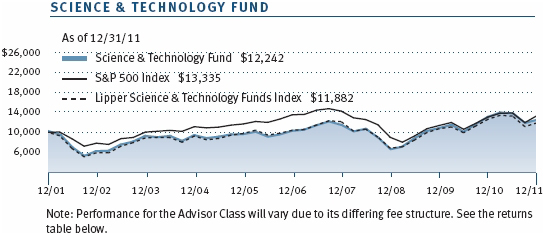
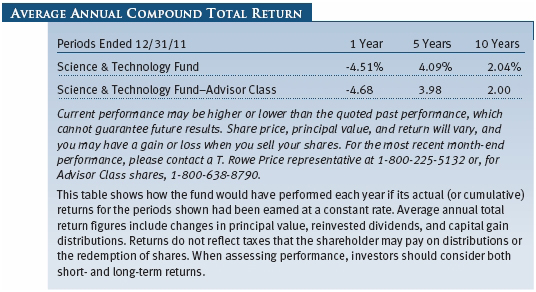
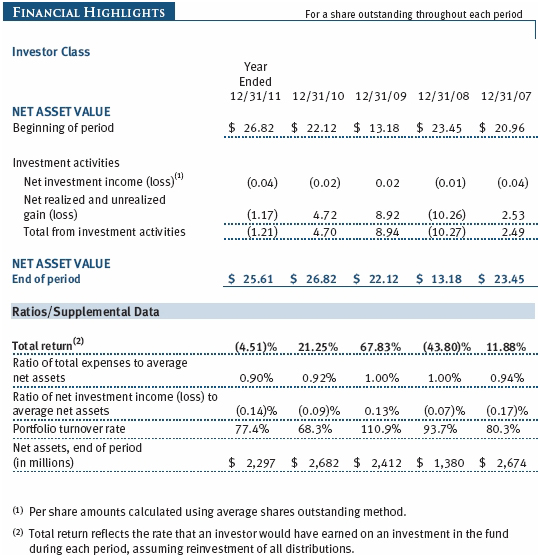
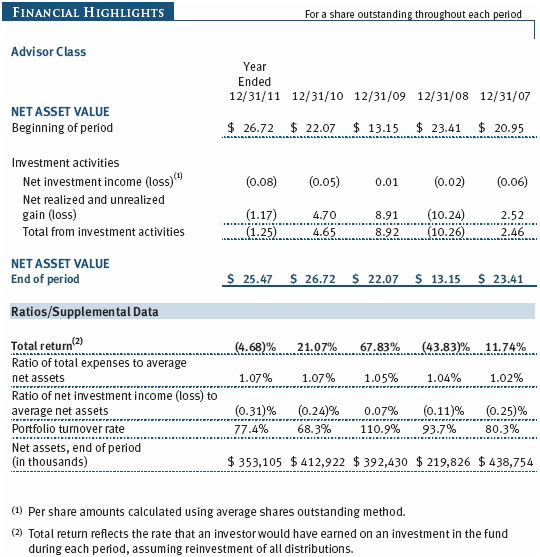
For the year ended December 31, 2011, your fund returned -4.51%, better than its Lipper peer group but behind the unmanaged S&P 500 Index. (Returns for the Advisor Class shares were slightly lower, reflecting their different cost structure.) Relative results benefited from favorable stock selection in telecommunication equipment, telecommunications services, and semiconductors. Returns were hurt by large declines in several software and alternative energy stocks. Many of our weakest performers, particularly in the second half, are economically sensitive and fell due to dampened investor expectations for economic growth.
MARKET ENVIRONMENT
Equity markets were volatile in 2011 and posted mixed results for the year, despite a strong fourth-quarter rally. Global economic challenges were an ever-present headwind for stocks amid the continued sovereign debt problems in Europe and renewed weakness in U.S. economic growth. Higher oil prices resulting from turmoil in the Middle East and North Africa were partly to blame, as were disruptions to global supply chains from the earthquake and tsunami disasters in Japan. Consumer confidence indexes remained at very low levels, and a showdown over raising the federal debt limit, followed by a downgrade of the U.S. government’s long-term credit rating, further weighed on sentiment.
Technology earnings grew solidly in 2011, driven on the consumer side by the continued rapid adoption of smartphones and, among corporations, by the modernization of data centers using virtualization software and related technologies. However, dampened expectations for economic growth caused lower expectations for future technology earnings which drove declines for technology stocks in 2011. This was a reversal of the rising earnings expectations that fueled the powerful rally in technology stocks in the previous two years. The muted sentiment that prevailed in 2011 resulted in lower valuations and offered us opportunities to establish several promising new positions, particularly in the second half of the year.
PORTFOLIO REVIEW
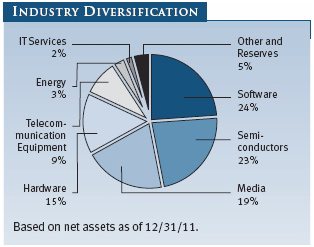
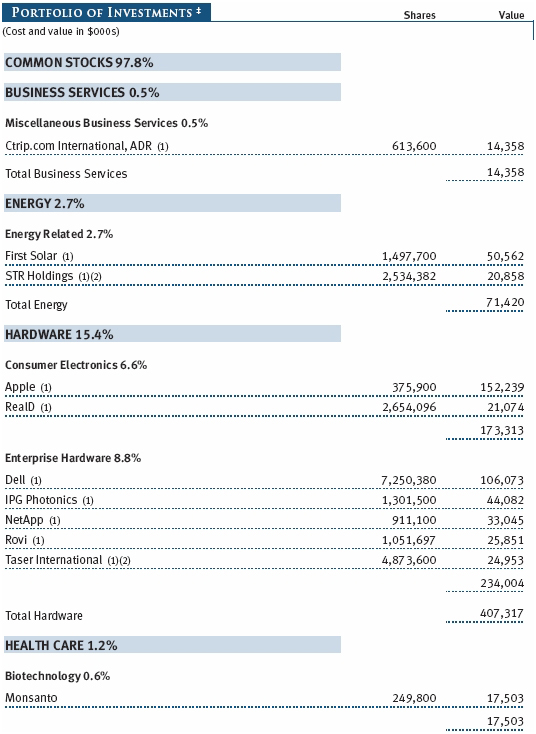
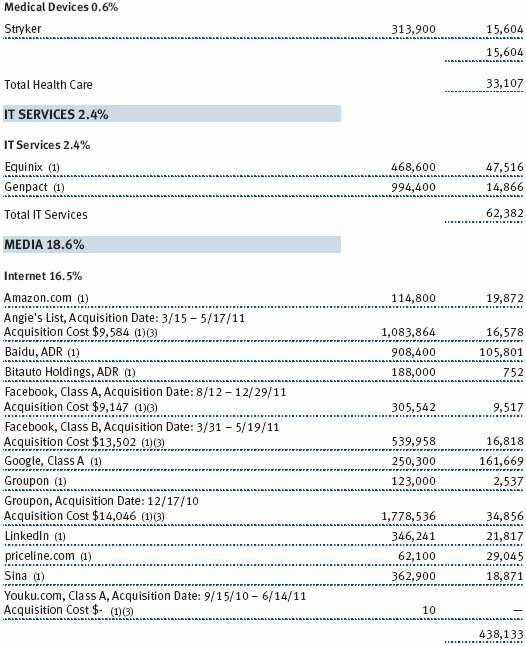
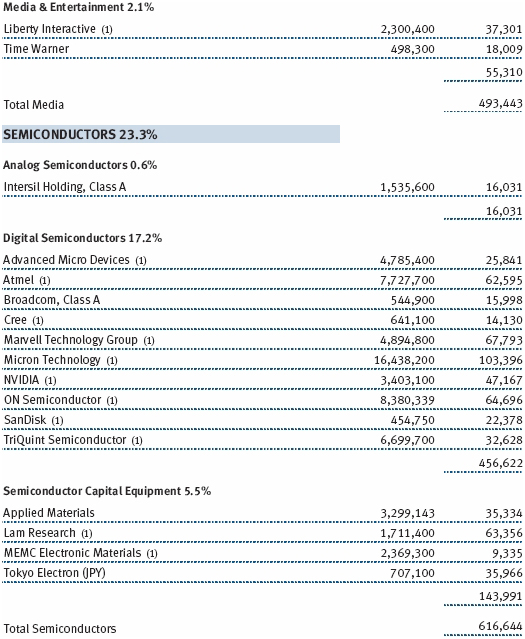
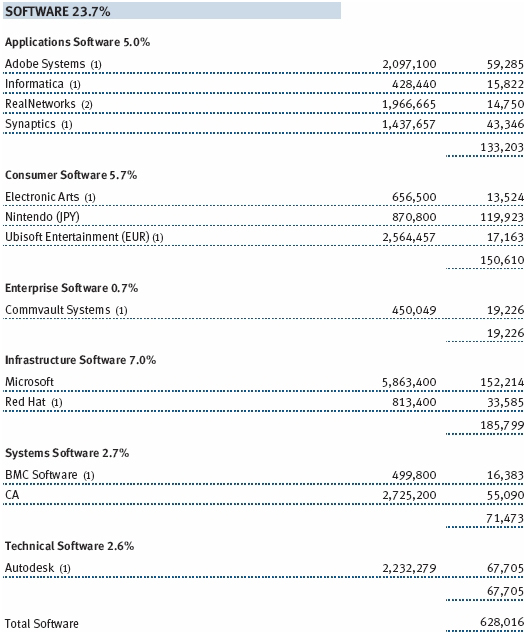
The fund remains diversified across the principal segments of science and technology. At the end of 2011, software accounted for 24% of the portfolio. Other major components included semiconductors at 23%, media at 19%, hardware at 15%, and telecommunication equipment at 9%. For the second half of the year, the telecommunication services and media groups were our biggest gainers, while alternative energy was our weakest performer.
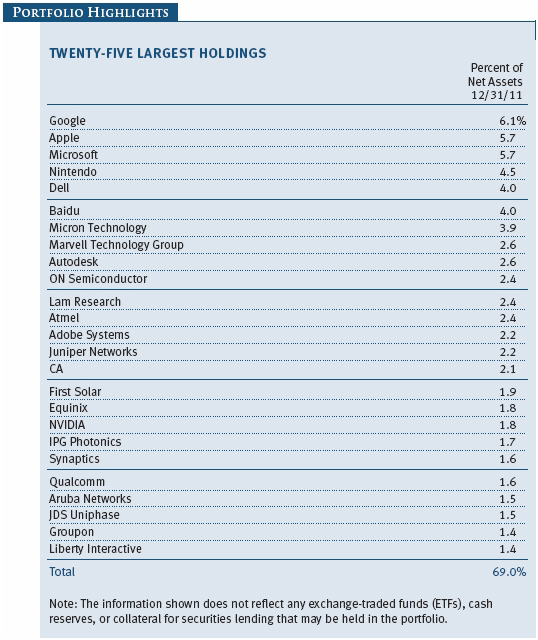
Google, our largest position, was the portfolio’s strongest contributor for the second half as it continued to generate rapid revenue growth driven by its dominant position in Internet search. Mobile search has become a powerful growth driver in the past year due to the widespread adoption of smartphones and rapid increase in Internet usage from these devices. We remain bullish on Google’s search business and are encouraged by its progress in display advertising and online video. That said, we reduced the position late in the year as the higher share price made the potential for appreciation less favorable. Balancing opportunity and risk in our position sizes, particularly our larger ones, continues to be a focus as we seek to achieve favorable returns with appropriate levels of risk. (Please refer to the fund’s portfolio of investments for a complete list of our holdings and the amount each represents in the portfolio.)
UK-based software provider Autonomy was a strong contributor due to its acquisition by Hewlett-Packard for more than $10 billion, a 64% premium above the stock’s trading price. We owned Autonomy because of our confidence in the uniqueness of its software solutions that are used by businesses to manage ever-growing amounts of data. It was among a group of software companies we thought had above-average acquisition potential, but we were pleasantly surprised by the sale and the takeover price.
Nintendo was our largest detractor for the year. We were optimistic that the release of its next-generation gaming consoles, the 3DS handheld and the WiiU home console, would drive better earnings performance than the market anticipated. But sales of the 3DS, released in March and notable for offering three-dimensional gameplay without special 3-D glasses, got off to a very slow start as a result of its high initial price, limited appeal of available games at the launch, and the continued proliferation of alternative media devices. Sales of the 3DS surged during the holidays following a price cut and the release of games for its beloved “Mario” franchise, but investors remained skeptical that this improvement could be sustained and questioned whether the WiiU, expected to be released in the second half of 2012, would be successful. We’re encouraged that the 3DS has built a customer base of more than 12 million users, and we think the WiiU holds promise that, if realized, would be very positive for the stock.
Another disappointing performer was solar power panels and projects company First Solar. The business was buffeted by falling prices, which impeded industry growth and profitability. It was also hampered by slower economic activity and investor concerns about reduced government subsidies for solar companies, particularly in Europe. First Solar experienced elevated personnel turnover in its executive ranks as it grappled with the worsening industry outlook and sought to move beyond its dependence on subsidies. At the same time, the company continues to innovate and lead the industry with a credible multiyear plan to become competitive with traditional power sources. We think the stock is undervalued and merits our continued investment given its potential to drive—and benefit from—a major wave of solar power adoption.
Our largest new position of the year was Chinese Internet search leader Baidu. We believe that search is a very attractive business that offers major scale advantages to leading providers. Online advertising is still a nascent business in China and holds outstanding growth prospects. We expect Baidu to be a prime beneficiary as it follows a path paved by Google in search in the past decade. Baidu’s valuation looks high, but we believe the stock offers potential for large appreciation as we expect its growth to be even better than anticipated by the stock price.
Professional social networking leader LinkedIn is another new position that trades at high valuation multiples but that we find appealing. We believe the company will continue to benefit from its already large base of members and become a leading solutions provider for human resource (HR) departments. LinkedIn has a compelling opportunity to build substantial revenue streams on the strength of the value it offers members, HR departments, and advertisers. We think it could become one of the next large Internet businesses. Like Baidu, LinkedIn appears to have many years of rapid growth ahead, making the current valuation attractive even though it is higher than most in the fund.
Economic concerns weighed on IPG Photonics, creating what we believed was an attractive opportunity to initiate and build a position. IPG is the leading provider of fiber lasers used for welding and cutting for manufactured items, such as cars and ships. We consider IPG to be a long-term share gainer in the commercial laser market given the energy efficiency and other advantages of its fiber lasers over alternative laser technologies and its manufacturing and scale advantages over its competitors. In a healthy economic backdrop, we believe IPG can be one of the fastest growers in the portfolio.
We built flash memory semiconductor provider Micron Technology into one of the fund’s largest positions during the fourth quarter as the stock was pressured by weakness in prices of dynamic random-access memory (DRAM) storage cells and a potentially harmful legal ruling. The stock surged at year-end as the legal ruling was more favorable than the market expected and DRAM prices improved. Micron Technology reflects our view that times of heightened uncertainty can offer substantial opportunity. The company remains a large position, as we continue to believe it is undervalued and foresee improvement later this year in its important personal computer end-market. PC industry challenges have caused a large contraction in the valuations of companies with PC-related businesses, resulting in what we see as several attractively valued stocks. In addition to Micron Technology, our large PC-related holdings include Microsoft, Dell, and Marvell Technology Group. While the high PC penetration in many markets and the proliferation of alternative computing devices, such as tablet computers, will remain headwinds to industry growth, we think the launch of Microsoft’s Windows 8 operating system later this year will stimulate a strong uptick in PC purchases.
Our health care positions were helped by favorable stock selection and a good year for the group. While health care is typically a modest part of the fund, we’re encouraged by our continued positive results in the area. Leading health care contributors included biotechnology giant Amgen, pharmaceutical makers Pfizer and Celgene, and orthopedics provider Zimmer. We exited all of these positions following their strong performances as we saw better opportunities in other stocks. Health care remains a small part of the portfolio, with orthopedic device maker Stryker our largest holding.
STRATEGY REVIEW AND OUTLOOK
In the three years I’ve managed your fund, I’ve often been asked what types of stocks we look for. Are we seeking high growth or low multiple stocks, cyclical or defensive positions? And what trends are we playing? The answer is that we focus on finding the most undervalued stocks within science and technology. This results in a portfolio that is defined by its individual stocks rather than by a shared attribute or theme. Among our largest holdings, for example, we believe Google and Baidu are fast growers, Microsoft and Dell trade at very low multiples, Autodesk is very cyclical, CA is defensive, and Apple and Atmel are leading beneficiaries of the mobile computing trend.
We believe that the increasing prevalence of smartphones and tablets and the ongoing migration of software to the cloud, and advertising and commerce to the Internet, are reshaping the technology landscape, inviting new and appealing investment opportunities. What’s more, these trends are having a fundamental impact on how people use technology—both at home and at work—and how businesses compete, especially in industries in which your fund invests. Industry trends continue to be critical inputs in our stock selection.
In order to consistently identify undervalued stocks—whether they are high or low multiple ones—it is paramount that we have deeply researched and well-vetted views of evolving trends. I am fortunate to work with a team of experienced analysts whose collaborative efforts continually inform and develop my industry views and, thus, my assessment of the prospects for companies and their stocks. We will continue to work to anticipate the science and technology industry’s evolution and to identify the most appealing stocks for inclusion in your fund. I look forward to reporting to you on our progress at midyear.
Thank you for your continued support.
Respectfully submitted,

Kennard W. Allen
President of the fund and chairman of its Investment Advisory Committee
January 23, 2012
The committee chairman has day-to-day responsibility for managing the portfolio and works with committee members in developing and executing the fund’s investment program.
RISKS OF INVESTING IN THE FUND
Funds that invest only in specific industries will experience greater volatility than funds investing in a broad range of industries. Technology stocks, historically, have experienced unusually wide price swings, both up and down. The potential for wide variation in performance reflects the special risks common to companies in the rapidly changing field of technology. For example, products or services that at first appear promising may not prove commercially successful and may become obsolete quickly. Earnings disappointments and intense competition for market share can result in sharp price declines.
GLOSSARY
Lipper Science & Technology Funds Index: An index of science and technology mutual fund performance returns for specified periods as tracked by Lipper Inc.
S&P 500 Index: A market cap-weighted index of 500 widely held stocks often used as a proxy for the overall stock market. Performance is reported on a total-return basis.
Performance and Expenses
| Growth of $10,000 |
This chart shows the value of a hypothetical $10,000 investment in the fund over the past 10 fiscal year periods or since inception (for funds lacking 10-year records). The result is compared with benchmarks, which may include a broad-based market index and a peer group average or index. Market indexes do not include expenses, which are deducted from fund returns as well as mutual fund averages and indexes.
| Fund Expense Example |
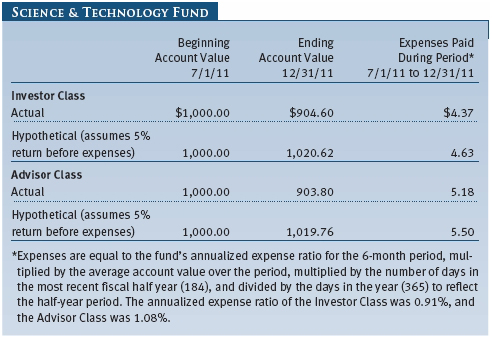
As a mutual fund shareholder, you may incur two types of costs: (1) transaction costs, such as redemption fees or sales loads, and (2) ongoing costs, including management fees, distribution and service (12b-1) fees, and other fund expenses. The following example is intended to help you understand your ongoing costs (in dollars) of investing in the fund and to compare these costs with the ongoing costs of investing in other mutual funds. The example is based on an investment of $1,000 invested at the beginning of the most recent six-month period and held for the entire period.
Please note that the fund has two share classes: The original share class (“Investor Class”) charges no distribution and service (12b-1) fee, and the Advisor Class shares are offered only through unaffiliated brokers and other financial intermediaries and charge a 0.25% 12b-1 fee. Each share class is presented separately in the table.
Actual Expenses
The first line of the following table (“Actual”) provides information about actual account values and expenses based on the fund’s actual returns. You may use the information on this line, together with your account balance, to estimate the expenses that you paid over the period. Simply divide your account value by $1,000 (for example, an $8,600 account value divided by $1,000 = 8.6), then multiply the result by the number on the first line under the heading “Expenses Paid During Period” to estimate the expenses you paid on your account during this period.
Hypothetical Example for Comparison Purposes
The information on the second line of the table (“Hypothetical”) is based on hypothetical account values and expenses derived from the fund’s actual expense ratio and an assumed 5% per year rate of return before expenses (not the fund’s actual return). You may compare the ongoing costs of investing in the fund with other funds by contrasting this 5% hypothetical example and the 5% hypothetical examples that appear in the shareholder reports of the other funds. The hypothetical account values and expenses may not be used to estimate the actual ending account balance or expenses you paid for the period.
Note: T. Rowe Price charges an annual account service fee of $20, generally for accounts with less than $10,000 ($1,000 for UGMA/UTMA). The fee is waived for any investor whose T. Rowe Price mutual fund accounts total $50,000 or more; accounts employing automatic investing; accounts electing to receive electronic delivery of account statements, transaction confirmations, prospectuses, and shareholder reports; accounts of an investor who is a T. Rowe Price Preferred Services, Personal Services, or Enhanced Personal Services client (enrollment in these programs generally requires T. Rowe Price assets of at least $100,000); and IRAs and other retirement plan accounts that utilize a prototype plan sponsored by T. Rowe Price (although a separate custodial or administrative fee may apply to such accounts). This fee is not included in the accompanying table. If you are subject to the fee, keep it in mind when you are estimating the ongoing expenses of investing in the fund and when comparing the expenses of this fund with other funds.
You should also be aware that the expenses shown in the table highlight only your ongoing costs and do not reflect any transaction costs, such as redemption fees or sales loads. Therefore, the second line of the table is useful in comparing ongoing costs only and will not help you determine the relative total costs of owning different funds. To the extent a fund charges transaction costs, however, the total cost of owning that fund is higher.
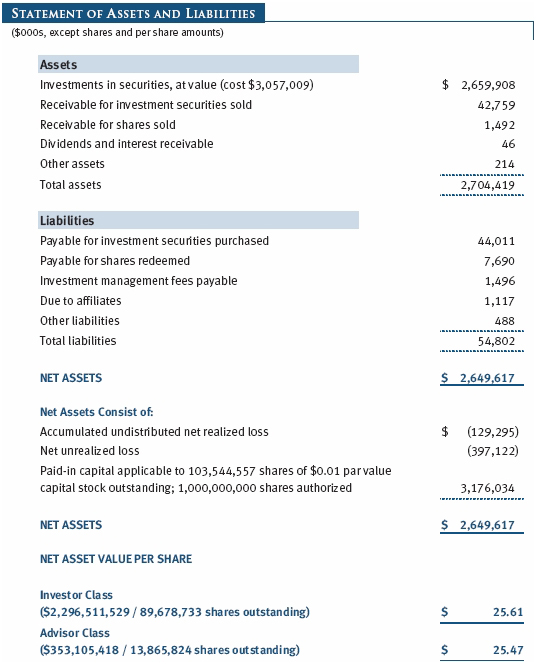
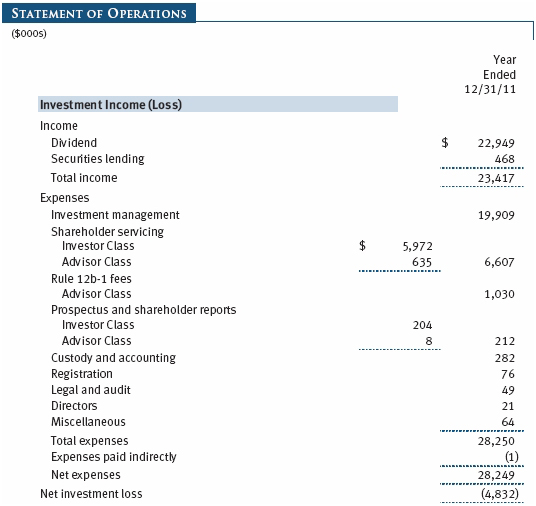
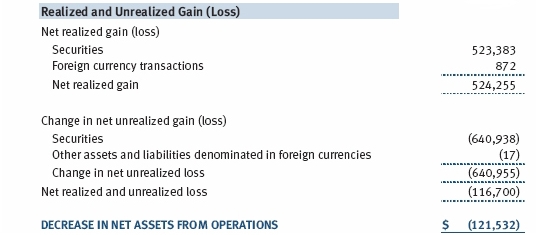
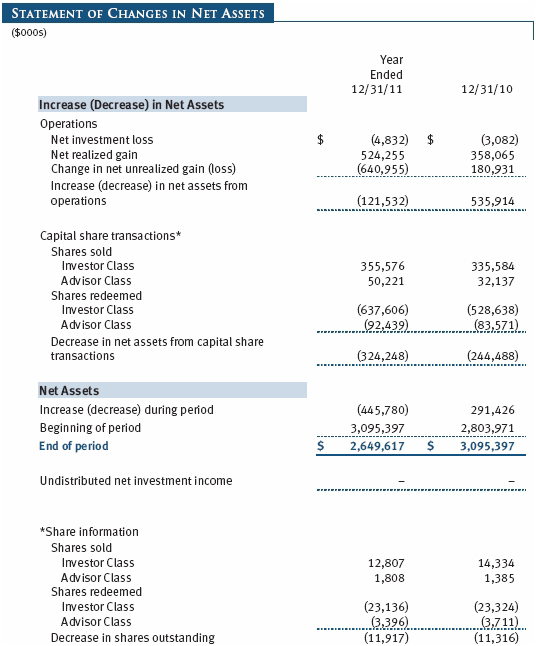
The accompanying notes are an integral part of these financial statements.
The accompanying notes are an integral part of these financial statements.

The accompanying notes are an integral part of these financial statements.
The accompanying notes are an integral part of these financial statements.
The accompanying notes are an integral part of these financial statements.
The accompanying notes are an integral part of these financial statements.
| Notes to Financial Statements |
T. Rowe Price Science & Technology Fund, Inc. (the fund), is registered under the Investment Company Act of 1940 (the 1940 Act) as a diversified, open-end management investment company. The fund seeks to provide long-term capital appreciation. The fund has two classes of shares: the Science & Technology Fund original share class, referred to in this report as the Investor Class, offered since September 30, 1987, and the Science & Technology Fund–Advisor Class (Advisor Class), offered since March 31, 2000. Advisor Class shares are sold only through unaffiliated brokers and other unaffiliated financial intermediaries that are compensated by the class for distribution, shareholder servicing, and/or certain administrative services under a Board-approved Rule 12b-1 plan. Each class has exclusive voting rights on matters related solely to that class; separate voting rights on matters that relate to both classes; and, in all other respects, the same rights and obligations as the other class.
NOTE 1 - SIGNIFICANT ACCOUNTING POLICIES
Basis of Preparation The accompanying financial statements were prepared in accordance with accounting principles generally accepted in the United States of America (GAAP), which require the use of estimates made by management. Management believes that estimates and valuations are appropriate; however, actual results may differ from those estimates, and the valuations reflected in the accompanying financial statements may differ from the value ultimately realized upon sale or maturity.
Investment Transactions, Investment Income, and Distributions Income and expenses are recorded on the accrual basis. Dividends received from mutual fund investments are reflected as dividend income; capital gain distributions are reflected as realized gain/loss. Dividend income and capital gain distributions are recorded on the ex-dividend date. Income tax-related interest and penalties, if incurred, would be recorded as income tax expense. Investment transactions are accounted for on the trade date. Realized gains and losses are reported on the identified cost basis. Distributions to shareholders are recorded on the ex-dividend date. Income distributions are declared and paid by each class annually. Capital gain distributions, if any, are generally declared and paid by the fund annually.
Currency Translation Assets, including investments, and liabilities denominated in foreign currencies are translated into U.S. dollar values each day at the prevailing exchange rate, using the mean of the bid and asked prices of such currencies against U.S. dollars as quoted by a major bank. Purchases and sales of securities, income, and expenses are translated into U.S. dollars at the prevailing exchange rate on the date of the transaction. The effect of changes in foreign currency exchange rates on realized and unrealized security gains and losses is reflected as a component of security gains and losses.
Class Accounting The Advisor Class pays distribution, shareholder servicing, and/or certain administrative expenses in the form of Rule 12b-1 fees, in an amount not exceeding 0.25% of the class’s average daily net assets. Shareholder servicing, prospectus, and shareholder report expenses incurred by each class are charged directly to the class to which they relate. Expenses common to both classes, investment income, and realized and unrealized gains and losses are allocated to the classes based upon the relative daily net assets of each class.
Rebates and Credits Subject to best execution, the fund may direct certain security trades to brokers who have agreed to rebate a portion of the related brokerage commission to the fund in cash. Commission rebates are reflected as realized gain on securities in the accompanying financial statements and totaled $197,000 for the year ended December 31, 2011. Additionally, the fund earns credits on temporarily uninvested cash balances held at the custodian, which reduce the fund’s custody charges. Custody expense in the accompanying financial statements is presented before reduction for credits, which are reflected as expenses paid indirectly.
New Accounting Pronouncements In December 2011, the Financial Accounting Standards Board issued amended guidance to enhance disclosure for offsetting assets and liabilities. The guidance is effective for fiscal years and interim periods beginning on or after January 1, 2013; adoption will have no effect on the fund’s net assets or results of operations.
NOTE 2 - VALUATION
The fund’s financial instruments are reported at fair value as defined by GAAP. The fund determines the values of its assets and liabilities and computes each class’s net asset value per share at the close of the New York Stock Exchange (NYSE), normally 4 p.m. ET, each day that the NYSE is open for business.
Values in the accompanying Portfolio of Investments are as of December 30, 2011, the last business day in the fund’s fiscal year ended December 31, 2011. Some foreign markets were open between December 30 and the close of the fund’s reporting period on December 31, but any differences in values and foreign exchange rates subsequent to December 30 through December 31 were immaterial to the fund’s financial statements.
Valuation Methods Equity securities listed or regularly traded on a securities exchange or in the over-the-counter (OTC) market are valued at the last quoted sale price or, for certain markets, the official closing price at the time the valuations are made, except for OTC Bulletin Board securities, which are valued at the mean of the latest bid and asked prices. A security that is listed or traded on more than one exchange is valued at the quotation on the exchange determined to be the primary market for such security. Listed securities not traded on a particular day are valued at the mean of the latest bid and asked prices for domestic securities and the last quoted sale price for international securities.
Investments in mutual funds are valued at the mutual fund’s closing net asset value per share on the day of valuation.
Other investments, including restricted securities and private placements, and those financial instruments for which the above valuation procedures are inappropriate or are deemed not to reflect fair value, are stated at fair value as determined in good faith by the T. Rowe Price Valuation Committee, established by the fund’s Board of Directors (the Board). Subject to oversight by the Board, the Valuation Committee develops pricing-related policies and procedures and approves all fair-value determinations. The Valuation Committee regularly makes good faith judgments, using a wide variety of sources and information, to establish and adjust valuations of certain securities as events occur and circumstances warrant. For instance, in determining the fair value of private-equity instruments, the Valuation Committee considers a variety of factors, including the company’s business prospects, its financial performance, strategic events impacting the company, relevant valuations of similar companies, new rounds of financing, and any negotiated transactions of significant size between other investors in the company. Because any fair-value determination involves a significant amount of judgment, there is a degree of subjectivity inherent in such pricing decisions.
For valuation purposes, the last quoted prices of non-U.S. equity securities may be adjusted under the circumstances described below. If the fund determines that developments between the close of a foreign market and the close of the NYSE will, in its judgment, materially affect the value of some or all of its portfolio securities, the fund will adjust the previous closing prices to reflect what it believes to be the fair value of the securities as of the close of the NYSE. In deciding whether it is necessary to adjust closing prices to reflect fair value, the fund reviews a variety of factors, including developments in foreign markets, the performance of U.S. securities markets, and the performance of instruments trading in U.S. markets that represent foreign securities and baskets of foreign securities. A fund may also fair value securities in other situations, such as when a particular foreign market is closed but the fund is open. The fund uses outside pricing services to provide it with closing prices and information to evaluate and/or adjust those prices. The fund cannot predict how often it will use closing prices and how often it will determine it necessary to adjust those prices to reflect fair value. As a means of evaluating its security valuation process, the fund routinely compares closing prices, the next day’s opening prices in the same markets, and adjusted prices. Additionally, trading in the underlying securities of the fund may take place in various foreign markets on certain days when the fund is not open for business and does not calculate a net asset value. As a result, net asset values may be significantly affected on days when shareholders cannot make transactions.
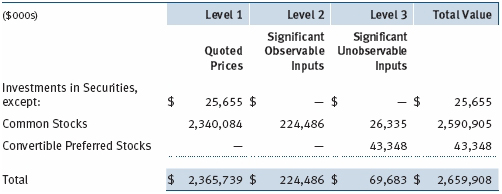
Valuation Inputs Various inputs are used to determine the value of the fund’s financial instruments. These inputs are summarized in the three broad levels listed below:
Level 1 – quoted prices in active markets for identical financial instruments
Level 2 – observable inputs other than Level 1 quoted prices (including, but not limited to, quoted prices for similar financial instruments, interest rates, prepayment speeds, and credit risk)
Level 3 – unobservable inputs
Observable inputs are those based on market data obtained from sources independent of the fund, and unobservable inputs reflect the fund’s own assumptions based on the best information available. The input levels are not necessarily an indication of the risk or liquidity associated with financial instruments at that level. For example, non-U.S. equity securities actively traded in foreign markets generally are reflected in Level 2 despite the availability of closing prices because the fund evaluates and determines whether those closing prices reflect fair value at the close of the NYSE or require adjustment, as described above. The following table summarizes the fund’s financial instruments, based on the inputs used to determine their values on December 31, 2011:
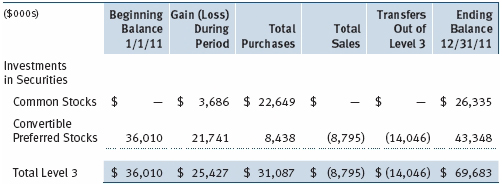
Following is a reconciliation of the fund’s Level 3 holdings for the year ended December 31, 2011. Transfers into and out of Level 3 are reflected at the value of the financial instrument at the beginning of the period. Gain (loss) reflects both realized and change in unrealized gain (loss) on Level 3 holdings during the period, if any, and is included on the accompanying Statement of Operations. The change in unrealized gain (loss) on Level 3 instruments held at December 31, 2011, totaled $18,102,000 for the year ended December 31, 2011.
NOTE 3 - OTHER INVESTMENT TRANSACTIONS
Consistent with its investment objective, the fund engages in the following practices to manage exposure to certain risks and/or to enhance performance. The investment objective, policies, program, and risk factors of the fund are described more fully in the fund’s prospectus and Statement of Additional Information.
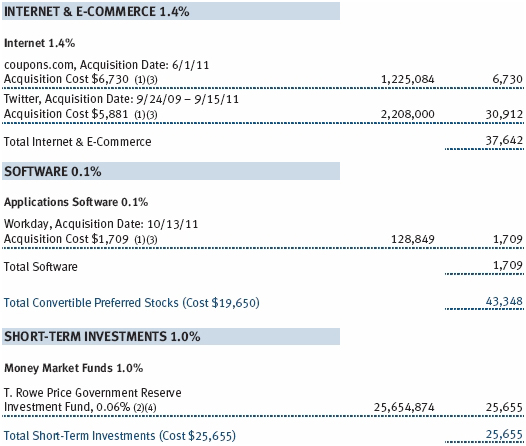
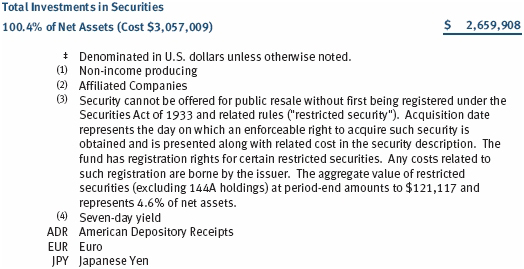
Restricted Securities The fund may invest in securities that are subject to legal or contractual restrictions on resale. Prompt sale of such securities at an acceptable price may be difficult and may involve substantial delays and additional costs.
Securities Lending The fund lends its securities to approved brokers to earn additional income. It receives as collateral cash and U.S. government securities valued at 102% to 105% of the value of the securities on loan. Cash collateral is invested by the fund’s lending agent(s) in accordance with investment guidelines approved by management. Although risk is mitigated by the collateral, the fund could experience a delay in recovering its securities and a possible loss of income or value if the borrower fails to return the securities or if collateral investments decline in value. Securities lending revenue recognized by the fund consists of earnings on invested collateral and borrowing fees, net of any rebates to the borrower and compensation to the lending agent. In accordance with GAAP, investments made with cash collateral are reflected in the accompanying financial statements, but collateral received in the form of securities are not. At December 31, 2011, there were no securities on loan.
Other Purchases and sales of portfolio securities other than short-term securities aggregated $2,319,509,000 and $2,491,478,000, respectively, for the year ended December 31, 2011.
NOTE 4 - FEDERAL INCOME TAXES
No provision for federal income taxes is required since the fund intends to continue to qualify as a regulated investment company under Subchapter M of the Internal Revenue Code and distribute to shareholders all of its taxable income and gains. Distributions determined in accordance with federal income tax regulations may differ in amount or character from net investment income and realized gains for financial reporting purposes. Financial reporting records are adjusted for permanent book/tax differences to reflect tax character but are not adjusted for temporary differences.
The fund files U.S. federal, state, and local tax returns as required. The fund’s tax returns are subject to examination by the relevant tax authorities until expiration of the applicable statute of limitations, which is generally three years after the filing of the tax return but which can be extended to six years in certain circumstances. Tax returns for open years have incorporated no uncertain tax positions that require a provision for income taxes.
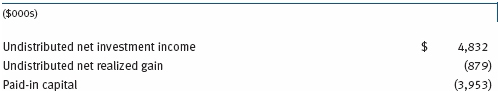
Reclassifications to paid-in capital relate primarily to the current net operating loss. For the year ended December 31, 2011, the following reclassifications were recorded to reflect tax character (there was no impact on results of operations or net assets):
There were no distributions in the years ended December 31, 2011 and December 31, 2010. At December 31, 2011, the tax-basis cost of investments and components of net assets were as follows:
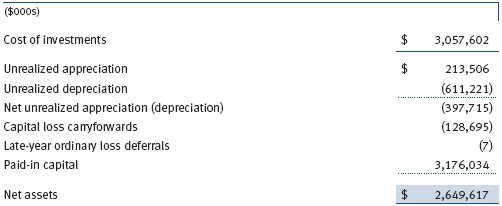
As a result of the Regulated Investment Company Modernization Act of 2010, net capital losses realized on or after January 1, 2011 (effective date) may be carried forward indefinitely to offset future realized capital gains; however, post-effective losses must be used before pre-effective capital loss carryforwards with expiration dates. Accordingly, it is possible that all or a portion of the fund’s pre-effective capital loss carryforwards could expire unused. All or a portion of the fund’s capital loss carryforwards may be from losses realized between November 1 and the fund’s fiscal year-end, which are deferred for tax purposes until the subsequent year but recognized for financial reporting purposes in the year realized. The fund intends to retain realized gains to the extent of available capital loss carryforwards. During the year ended December 31, 2011, the fund utilized $526,823,000 of capital loss carryforwards. The fund’s available capital loss carryforwards as of December 31, 2011, expire as follows: $4,307,000 in fiscal 2015 and $121,261,000 in fiscal 2017; $3,127,000 have no expiration. Further, $20,637,000 of the fund’s available capital loss carryforwards acquired through tax-free reorganizations may be subject to certain limitations on amount and/or timing of use. In accordance with federal tax laws applicable to investment companies, specified net losses realized between November 1 and December 31, are not recognized for tax purposes until the subsequent year (late-year ordinary loss deferrals); however, such losses are recognized for financial reporting purposes in the year realized.
NOTE 5 - RELATED PARTY TRANSACTIONS
The fund is managed by T. Rowe Price Associates, Inc. (Price Associates), a wholly owned subsidiary of T. Rowe Price Group, Inc. (Price Group). The investment management agreement between the fund and Price Associates provides for an annual investment management fee, which is computed daily and paid monthly. The fee consists of an individual fund fee, equal to 0.35% of the fund’s average daily net assets, and a group fee. The group fee rate is calculated based on the combined net assets of certain mutual funds sponsored by Price Associates (the group) applied to a graduated fee schedule, with rates ranging from 0.48% for the first $1 billion of assets to 0.28% for assets in excess of $300 billion. The fund’s group fee is determined by applying the group fee rate to the fund’s average daily net assets. At December 31, 2011, the effective annual group fee rate was 0.30%.
In addition, the fund has entered into service agreements with Price Associates and two wholly owned subsidiaries of Price Associates (collectively, Price). Price Associates computes the daily share prices and provides certain other administrative services to the fund. T. Rowe Price Services, Inc., provides shareholder and administrative services in its capacity as the fund’s transfer and dividend disbursing agent. T. Rowe Price Retirement Plan Services, Inc., provides subaccounting and recordkeeping services for certain retirement accounts invested in the Investor Class. For the year ended December 31, 2011, expenses incurred pursuant to these service agreements were $138,000 for Price Associates; $2,882,000 for T. Rowe Price Services, Inc.; and $1,372,000 for T. Rowe Price Retirement Plan Services, Inc. The total amount payable at period-end pursuant to these service agreements is reflected as Due to Affiliates in the accompanying financial statements.
Additionally, the fund is one of several mutual funds in which certain college savings plans managed by Price Associates may invest. As approved by the fund’s Board of Directors, shareholder servicing costs associated with each college savings plan are borne by the fund in proportion to the average daily value of its shares owned by the college savings plan. For the year ended December 31, 2011, the fund was charged $43,000 for shareholder servicing costs related to the college savings plans, of which $29,000 was for services provided by Price. The amount payable at period-end pursuant to this agreement is reflected as Due to Affiliates in the accompanying financial statements. At December 31, 2011, approximately 1% of the outstanding shares of the Investor Class were held by college savings plans.
The fund may invest in the T. Rowe Price Reserve Investment Fund and the T. Rowe Price Government Reserve Investment Fund (collectively, the T. Rowe Price Reserve Investment Funds), open-end management investment companies managed by Price Associates and considered affiliates of the fund. The T. Rowe Price Reserve Investment Funds are offered as cash management options to mutual funds, trusts, and other accounts managed by Price Associates and/or its affiliates and are not available for direct purchase by members of the public. The T. Rowe Price Reserve Investment Funds pay no investment management fees.
As of December 31, 2011, T. Rowe Price Group, Inc., and/or its wholly owned subsidiaries owned 637,630 shares of the Investor Class, representing 1% of the fund’s net assets.
| Report of Independent Registered Public Accounting Firm |
To the Board of Directors and Shareholders of
T. Rowe Price Science & Technology Fund, Inc.
In our opinion, the accompanying statement of assets and liabilities, including the portfolio of investments, and the related statements of operations and of changes in net assets and the financial highlights present fairly, in all material respects, the financial position of T. Rowe Price Science & Technology Fund, Inc. (the “Fund”) at December 31, 2011, and the results of its operations, the changes in its net assets and the financial highlights for each of the periods indicated therein, in conformity with accounting principles generally accepted in the United States of America. These financial statements and financial highlights (hereafter referred to as “financial statements”) are the responsibility of the Fund’s management; our responsibility is to express an opinion on these financial statements based on our audits. We conducted our audits of these financial statements in accordance with the standards of the Public Company Accounting Oversight Board (United States). Those standards require that we plan and perform the audit to obtain reasonable assurance about whether the financial statements are free of material misstatement. An audit includes examining, on a test basis, evidence supporting the amounts and disclosures in the financial statements, assessing the accounting principles used and significant estimates made by management, and evaluating the overall financial statement presentation. We believe that our audits, which included confirmation of securities at December 31, 2011 by correspondence with the custodian and brokers, and confirmation of the underlying funds by correspondence with the transfer agent, provide a reasonable basis for our opinion.
PricewaterhouseCoopers LLP
Baltimore, Maryland
February 17, 2012
| Information on Proxy Voting Policies, Procedures, and Records |
A description of the policies and procedures used by T. Rowe Price funds and portfolios to determine how to vote proxies relating to portfolio securities is available in each fund’s Statement of Additional Information, which you may request by calling 1-800-225-5132 or by accessing the SEC’s website, sec.gov. The description of our proxy voting policies and procedures is also available on our website, troweprice.com. To access it, click on the words “Our Company” at the top of our corporate homepage. Then, when the next page appears, click on the words “Proxy Voting Policies” on the left side of the page.
Each fund’s most recent annual proxy voting record is available on our website and through the SEC’s website. To access it through our website, follow the directions above, then click on the words “Proxy Voting Records” on the right side of the Proxy Voting Policies page.
| How to Obtain Quarterly Portfolio Holdings |
The fund files a complete schedule of portfolio holdings with the Securities and Exchange Commission for the first and third quarters of each fiscal year on Form N-Q. The fund’s Form N-Q is available electronically on the SEC’s website (sec.gov); hard copies may be reviewed and copied at the SEC’s Public Reference Room, 450 Fifth St. N.W., Washington, DC 20549. For more information on the Public Reference Room, call 1-800-SEC-0330.
| About the Fund’s Directors and Officers |
Your fund is overseen by a Board of Directors (Board) that meets regularly to review a wide variety of matters affecting the fund, including performance, investment programs, compliance matters, advisory fees and expenses, service providers, and other business affairs. The Board elects the fund’s officers, who are listed in the final table. At least 75% of the Board’s members are independent of T. Rowe Price Associates, Inc. (T. Rowe Price), and its affiliates; “inside” or “interested” directors are employees or officers of T. Rowe Price. The business address of each director and officer is 100 East Pratt Street, Baltimore, Maryland 21202. The Statement of Additional Information includes additional information about the fund directors and is available without charge by calling a T. Rowe Price representative at 1-800-638-5660.
| Independent Directors | ||
| Name | ||
| (Year of Birth) | Principal Occupation(s) and Directorships of Public Companies and | |
| Year Elected* | Other Investment Companies During the Past Five Years | |
| William R. Brody, M.D., | President and Trustee, Salk Institute for Biological Studies (2009 | |
| Ph.D. | to present); Director, Novartis, Inc. (2009 to present); Director, IBM | |
| (1944) | (2007 to present); President and Trustee, Johns Hopkins University | |
| 2009 | (1996 to 2009); Chairman of Executive Committee and Trustee, | |
| Johns Hopkins Health System (1996 to 2009) | ||
| Jeremiah E. Casey | Retired | |
| (1940) | ||
| 2005 | ||
| Anthony W. Deering | Chairman, Exeter Capital, LLC, a private investment firm (2004 | |
| (1945) | to present); Director, Under Armour (2008 to present); Director, | |
| 2001 | Vornado Real Estate Investment Trust (2004 to present); Director, | |
| Mercantile Bankshares (2002 to 2007); Director and Member of the | ||
| Advisory Board, Deutsche Bank North America (2004 to present) | ||
| Donald W. Dick, Jr. | Principal, EuroCapital Partners, LLC, an acquisition and management | |
| (1943) | advisory firm (1995 to present) | |
| 1994 | ||
| Karen N. Horn | Senior Managing Director, Brock Capital Group, an advisory and | |
| (1943) | investment banking firm (2004 to present); Director, Eli Lilly and | |
| 2003 | Company (1987 to present); Director, Simon Property Group (2004 | |
| to present); Director, Norfolk Southern (2008 to present); Director, | ||
| Fannie Mae (2006 to 2008) | ||
| Theo C. Rodgers | President, A&R Development Corporation (1977 to present) | |
| (1941) | ||
| 2005 | ||
| John G. Schreiber | Owner/President, Centaur Capital Partners, Inc., a real estate | |
| (1946) | investment company (1991 to present); Cofounder and Partner, | |
| 2001 | Blackstone Real Estate Advisors, L.P. (1992 to present); Director, | |
| General Growth Properties, Inc. (2010 to present) | ||
| Mark R. Tercek | President and Chief Executive Officer, The Nature Conservancy (2008 | |
| (1957) | to present); Managing Director, The Goldman Sachs Group, Inc. | |
| 2009 | (1984 to 2008) | |
| *Each independent director oversees 130 T. Rowe Price portfolios and serves until retirement, resignation, or election of a successor. | ||
| Inside Directors | ||
| Name | ||
| (Year of Birth) | ||
| Year Elected* | ||
| [Number of T. Rowe Price | Principal Occupation(s) and Directorships of Public Companies and | |
| Portfolios Overseen] | Other Investment Companies During the Past Five Years | |
| Edward C. Bernard | Director and Vice President, T. Rowe Price; Vice Chairman of the | |
| (1956) | Board, Director, and Vice President, T. Rowe Price Group, Inc.; | |
| 2006 | Chairman of the Board, Director, and President, T. Rowe Price | |
| [130] | Investment Services, Inc.; Chairman of the Board and Director, | |
| T. Rowe Price Retirement Plan Services, Inc., T. Rowe Price Savings | ||
| Bank, and T. Rowe Price Services, Inc.; Chairman of the Board, Chief | ||
| Executive Officer, and Director, T. Rowe Price International; Chief | ||
| Executive Officer, Chairman of the Board, Director, and President, | ||
| T. Rowe Price Trust Company; Chairman of the Board, all funds | ||
| John H. Laporte, CFA | Vice President, T. Rowe Price, T. Rowe Price Group, Inc., and T. Rowe | |
| (1945) | Price Trust Company | |
| 1988 | ||
| [16] | ||
| *Each inside director serves until retirement, resignation, or election of a successor. | ||
| Officers | ||
| Name (Year of Birth) | ||
| Position Held With Science & Technology Fund | Principal Occupation(s) | |
| Kennard W. Allen (1977) | Vice President, T. Rowe Price and T. Rowe Price | |
| President | Group, Inc. | |
| Brian W.H. Berghuis, CFA (1958) | Vice President, T. Rowe Price, T. Rowe Price | |
| Vice President | Group, Inc., and T. Rowe Price Trust Company | |
| David J. Eiswert, CFA (1972) | Vice President, T. Rowe Price, T. Rowe Price | |
| Vice President | Group, Inc., and T. Rowe Price International | |
| Roger L. Fiery III, CPA (1959) | Vice President, Price Hong Kong, Price | |
| Vice President | Singapore, T. Rowe Price, T. Rowe Price Group, | |
| Inc., T. Rowe Price International, and T. Rowe | ||
| Price Trust Company | ||
| John R. Gilner (1961) | Chief Compliance Officer and Vice President, | |
| Chief Compliance Officer | T. Rowe Price; Vice President, T. Rowe Price | |
| Group, Inc., and T. Rowe Price Investment | ||
| Services, Inc. | ||
| Gregory S. Golczewski (1966) | Vice President, T. Rowe Price and T. Rowe Price | |
| Vice President | Trust Company | |
| Gregory K. Hinkle, CPA (1958) | Vice President, T. Rowe Price, T. Rowe Price | |
| Treasurer | Group, Inc., and T. Rowe Price Trust Company; | |
| formerly Partner, PricewaterhouseCoopers LLP | ||
| (to 2007) | ||
| Rhett K. Hunter (1977) | Vice President, T. Rowe Price and T. Rowe Price | |
| Vice President | Group, Inc.; formerly student, MIT Sloan School | |
| of Management (to 2007) | ||
| Patricia B. Lippert (1953) | Assistant Vice President, T. Rowe Price and | |
| Secretary | T. Rowe Price Investment Services, Inc. | |
| Daniel Martino, CFA (1974) | Vice President, T. Rowe Price and T. Rowe Price | |
| Vice President | Group, Inc. | |
| Shalin Mody (1980) | Employee, T. Rowe Price; formerly student, | |
| Vice President | University of Chicago, Booth School of Business | |
| (to 2009), Associate, FLAG Capital (to 2007) | ||
| David Oestreicher (1967) | Director and Vice President, T. Rowe Price | |
| Vice President | Investment Services, Inc., T. Rowe Price | |
| Retirement Plan Services, Inc., T. Rowe | ||
| Price Services, Inc., and T. Rowe Price Trust | ||
| Company; Vice President, Price Hong Kong, | ||
| Price Singapore, T. Rowe Price, T. Rowe Price | ||
| Group, Inc., and T. Rowe Price International | ||
| Hiroaki Owaki, CFA (1962) | Vice President, T. Rowe Price Group, Inc., and | |
| Vice President | T. Rowe Price International | |
| Deborah D. Seidel (1962) | Vice President, T. Rowe Price, T. Rowe Price | |
| Vice President | Group, Inc., and T. Rowe Price Investment | |
| Services, Inc.; Assistant Treasurer and Vice | ||
| President, T. Rowe Price Services, Inc. | ||
| Michael F. Sola, CFA (1969) | Vice President, T. Rowe Price and T. Rowe Price | |
| Vice President | Group, Inc. | |
| Joshua K. Spencer, CFA (1973) | Vice President, T. Rowe Price and T. Rowe Price | |
| Vice President | Group, Inc. | |
| Julie L. Waples (1970) | Vice President, T. Rowe Price | |
| Vice President | ||
| Thomas H. Watson (1977) | Vice President, T. Rowe Price and T. Rowe Price | |
| Vice President | Group, Inc. | |
| Alison Mei Ling Yip (1966) | Vice President, Price Hong Kong and T. Rowe | |
| Vice President | Price Group, Inc. | |
| Nalin Yogasundram (1975) | Vice President, T. Rowe Price and T. Rowe Price | |
| Vice President | Group, Inc. | |
| Unless otherwise noted, officers have been employees of T. Rowe Price or T. Rowe Price International for at least 5 years. | ||
Item 2. Code of Ethics.
The registrant has adopted a code of ethics, as defined in Item 2 of Form N-CSR, applicable to its principal executive officer, principal financial officer, principal accounting officer or controller, or persons performing similar functions. A copy of this code of ethics is filed as an exhibit to this Form N-CSR. No substantive amendments were approved or waivers were granted to this code of ethics during the period covered by this report.
Item 3. Audit Committee Financial Expert.
The registrant’s Board of Directors/Trustees has determined that Mr. Anthony W. Deering qualifies as an audit committee financial expert, as defined in Item 3 of Form N-CSR. Mr. Deering is considered independent for purposes of Item 3 of Form N-CSR.
Item 4. Principal Accountant Fees and Services.
(a) – (d) Aggregate fees billed to the registrant for the last two fiscal years for professional services rendered by the registrant’s principal accountant were as follows:
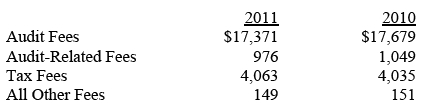
Audit fees include amounts related to the audit of the registrant’s annual financial statements and services normally provided by the accountant in connection with statutory and regulatory filings. Audit-related fees include amounts reasonably related to the performance of the audit of the registrant’s financial statements and specifically include the issuance of a report on internal controls and, if applicable, agreed-upon procedures related to fund acquisitions. Tax fees include amounts related to services for tax compliance, tax planning, and tax advice. The nature of these services specifically includes the review of distribution calculations and the preparation of Federal, state, and excise tax returns. All other fees include the registrant’s pro-rata share of amounts for agreed-upon procedures in conjunction with service contract approvals by the registrant’s Board of Directors/Trustees.
(e)(1) The registrant’s audit committee has adopted a policy whereby audit and non-audit services performed by the registrant’s principal accountant for the registrant, its investment adviser, and any entity controlling, controlled by, or under common control with the investment adviser that provides ongoing services to the registrant require pre-approval in advance at regularly scheduled audit committee meetings. If such a service is required between regularly scheduled audit committee meetings, pre-approval may be authorized by one audit committee member with ratification at the next scheduled audit committee meeting. Waiver of pre-approval for audit or non-audit services requiring fees of a de minimis amount is not permitted.
(2) No services included in (b) – (d) above were approved pursuant to paragraph (c)(7)(i)(C) of Rule 2-01 of Regulation S-X.
(f) Less than 50 percent of the hours expended on the principal accountant’s engagement to audit the registrant’s financial statements for the most recent fiscal year were attributed to work performed by persons other than the principal accountant’s full-time, permanent employees.
(g) The aggregate fees billed for the most recent fiscal year and the preceding fiscal year by the registrant’s principal accountant for non-audit services rendered to the registrant, its investment adviser, and any entity controlling, controlled by, or under common control with the investment adviser that provides ongoing services to the registrant were $1,764,000 and $1,417,000, respectively.
(h) All non-audit services rendered in (g) above were pre-approved by the registrant’s audit committee. Accordingly, these services were considered by the registrant’s audit committee in maintaining the principal accountant’s independence.
Item 5. Audit Committee of Listed Registrants.
Not applicable.
Item 6. Investments.
(a) Not applicable. The complete schedule of investments is included in Item 1 of this Form N-CSR.
(b) Not applicable.
Item 7. Disclosure of Proxy Voting Policies and Procedures for Closed-End Management Investment Companies.
Not applicable.
Item 8. Portfolio Managers of Closed-End Management Investment Companies.
Not applicable.
Item 9. Purchases of Equity Securities by Closed-End Management Investment Company and Affiliated Purchasers.
Not applicable.
Item 10. Submission of Matters to a Vote of Security Holders.
Not applicable.
Item 11. Controls and Procedures.
(a) The registrant’s principal executive officer and principal financial officer have evaluated the registrant’s disclosure controls and procedures within 90 days of this filing and have concluded that the registrant’s disclosure controls and procedures were effective, as of that date, in ensuring that information required to be disclosed by the registrant in this Form N-CSR was recorded, processed, summarized, and reported timely.
(b) The registrant’s principal executive officer and principal financial officer are aware of no change in the registrant’s internal control over financial reporting that occurred during the registrant’s second fiscal quarter covered by this report that has materially affected, or is reasonably likely to materially affect, the registrant’s internal control over financial reporting.
Item 12. Exhibits.
(a)(1) The registrant’s code of ethics pursuant to Item 2 of Form N-CSR is attached.
(b) A certification by the registrant's principal executive officer and principal financial officer, pursuant to Section 906 of the Sarbanes-Oxley Act of 2002 and required by Rule 30a-2(b) under the Investment Company Act of 1940, is attached.
SIGNATURES
Pursuant to the requirements of the Securities Exchange Act of 1934 and the Investment Company Act of 1940, the registrant has duly caused this report to be signed on its behalf by the undersigned, thereunto duly authorized.
T. Rowe Price Science & Technology Fund, Inc.
| By | /s/ Edward C. Bernard | |
| Edward C. Bernard | ||
| Principal Executive Officer | ||
| Date February 17, 2012 | ||
Pursuant to the requirements of the Securities Exchange Act of 1934 and the Investment Company Act of 1940, this report has been signed below by the following persons on behalf of the registrant and in the capacities and on the dates indicated.
| By | /s/ Edward C. Bernard | |
| Edward C. Bernard | ||
| Principal Executive Officer | ||
| Date February 17, 2012 | ||
| By | /s/ Gregory K. Hinkle | |
| Gregory K. Hinkle | ||
| Principal Financial Officer | ||
| Date February 17, 2012 | ||