UNITED STATES
SECURITIES AND EXCHANGE COMMISSION
Washington, D.C. 20549
FORM N-CSR
CERTIFIED SHAREHOLDER REPORT OF REGISTERED
MANAGEMENT INVESTMENT COMPANIES
Investment Company Act File Number: 811-05299
| T. Rowe Price Science & Technology Fund, Inc. |
| (Exact name of registrant as specified in charter) |
| 100 East Pratt Street, Baltimore, MD 21202 |
| (Address of principal executive offices) |
| David Oestreicher |
| 100 East Pratt Street, Baltimore, MD 21202 |
| (Name and address of agent for service) |
Registrant’s telephone number, including area code: (410) 345-2000
Date of fiscal year end: December 31
Date of reporting period: December 31, 2014
Item 1. Report to Shareholders
 |
| Science & Technology Fund | December 31, 2014 |
The views and opinions in this report were current as of December 31, 2014. They are not guarantees of performance or investment results and should not be taken as investment advice. Investment decisions reflect a variety of factors, and the managers reserve the right to change their views about individual stocks, sectors, and the markets at any time. As a result, the views expressed should not be relied upon as a forecast of the fund’s future investment intent. The report is certified under the Sarbanes-Oxley Act, which requires mutual funds and other public companies to affirm that, to the best of their knowledge, the information in their financial reports is fairly and accurately stated in all material respects.
REPORTS ON THE WEB
Sign up for our E-mail Program, and you can begin to receive updated fund reports and prospectuses online rather than through the mail. Log in to your account at troweprice.com for more information.
Manager’s Letter
Fellow Shareholders
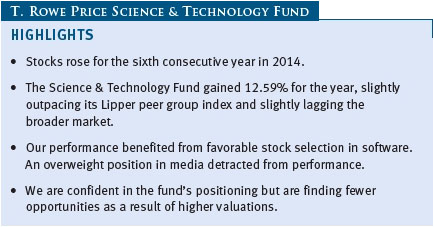
Technology stocks performed well in 2014, as the bull market defied the skeptics and continued into its sixth year. Technology shares experienced periodic bouts of volatility, however, as global economic and political concerns caused investors to seek out more defensive assets. Our broadly diversified approach helped us slightly outpace the returns of our peer group. We continue to look at a range of companies and industries where technology is creating opportunities for firms nimble enough to seize them.
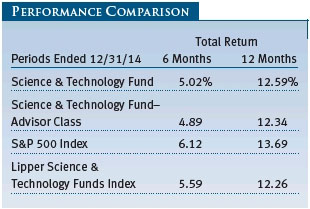
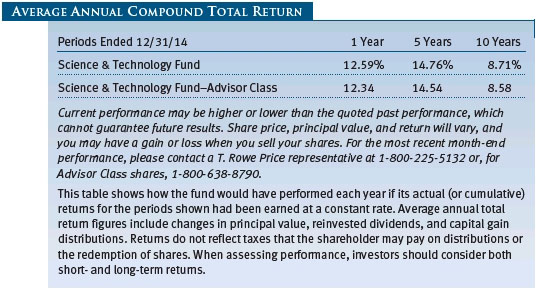
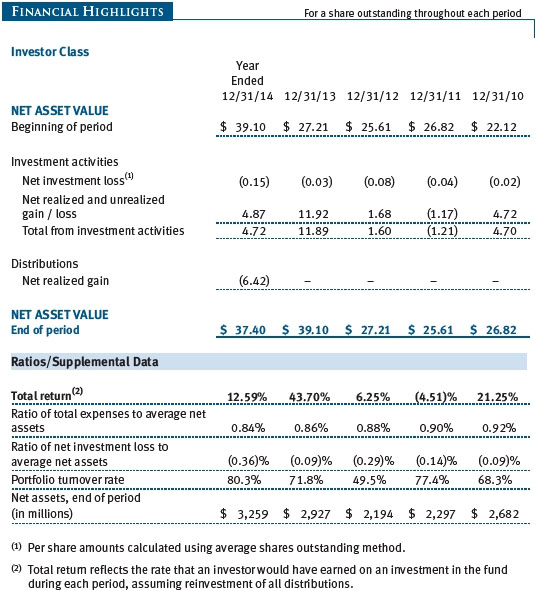
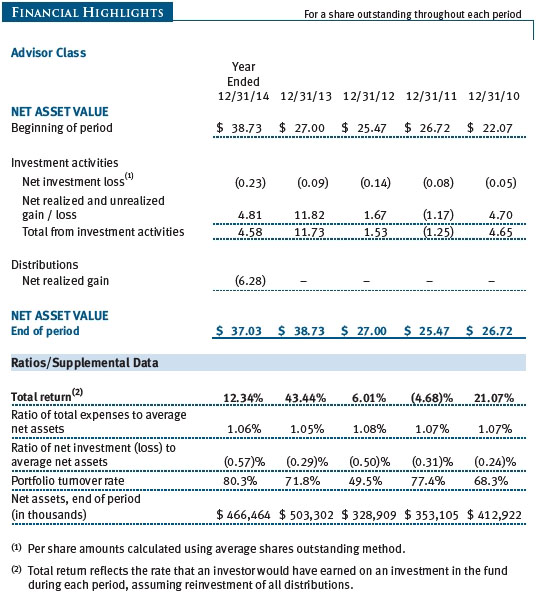
Your fund returned 12.59% for the year ended December 31, 2014, slightly outperforming its Lipper peer group index and slightly underperforming the broad unmanaged S&P 500 Index. (Returns for the Advisor Class shares were slightly lower, reflecting its different cost structure.) Our performance benefited from favorable stock selection in software while a large overweight in media, inclusive of Internet stocks, detracted from results.
MARKET ENVIRONMENT
The major benchmarks established new or multiyear highs in 2014, although markets grew considerably more volatile as the year came to a close. Investors were encouraged that the U.S. economic recovery appeared to gain traction at midyear, and corporate earnings generally surprised on the upside through the fall. The end of the Federal Reserve’s latest quantitative easing program in October did not result in a rise in long-term interest rates as some had feared. Part of the reason for the benign interest rate environment was a much weaker global economic environment, which also fostered a rise in the U.S. dollar against most other major currencies. The falling value of profits earned overseas weighed on the profit outlooks of many U.S. multinational firms, which was one factor in significantly reducing earnings expectations for the final quarter of the year.
Slowing global growth also contributed to an over 50% plunge in oil prices, which began in the summer but also had a large impact on the markets late in the year. After a stretch of superior results, small-caps underperformed substantially during the year, while among large-caps, value generally outperformed.
PORTFOLIO REVIEW
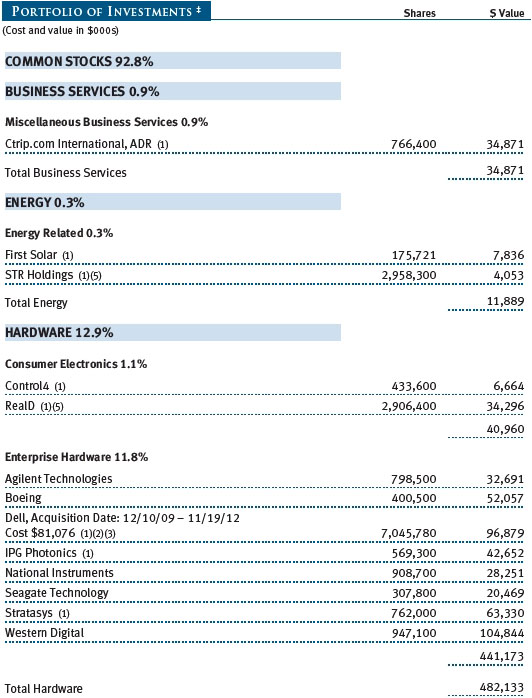
Technology stocks rose solidly in 2014 despite sharp sell-offs in the spring and fall as economic activity and corporate earnings remained supportive. Industry growth continued to be powered by the migrations of commerce and advertising to the Internet and mobile apps and of enterprise technology to cloud computing. Apple reasserted its dominance in the high end of the mobile phone market with strong uptake of its iPhone 6 and 6 Plus and bolstered its market capitalization, which was already the largest in the world. Facebook’s rapid growth, driven by advertising on its mobile app, made its turbulent 2012 initial public offering (IPO) a distant memory, but newly public Twitter experienced reminiscent growing pains. Amazon.com continued pressing its advantage in e-commerce by adding to its already enormous vendor and product selection and further shrinking delivery times. (Please refer to the portfolio of investments for a complete list of holdings and the amount each represents in the portfolio.)
In the cloud computing business, Amazon aggressively expanded its offerings as Microsoft and Google increasingly marketed their clouds, and slower-moving technology giants ratcheted up their investments. Microsoft’s progress with its cloud offerings under its new CEO strengthened its positioning. The company was also one of many large incumbents whose stocks benefited from a rebound in sales of business PCs—which had long been hoped for, but ultimately proved unexpected. Among smaller companies, software-as-a-service, which provides software applications from cloud data centers, saw rapid growth, with several providers, including ServiceNow and Veeva Systems, growing revenue by more than 50%.
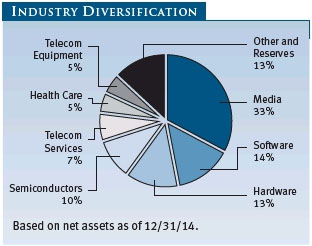
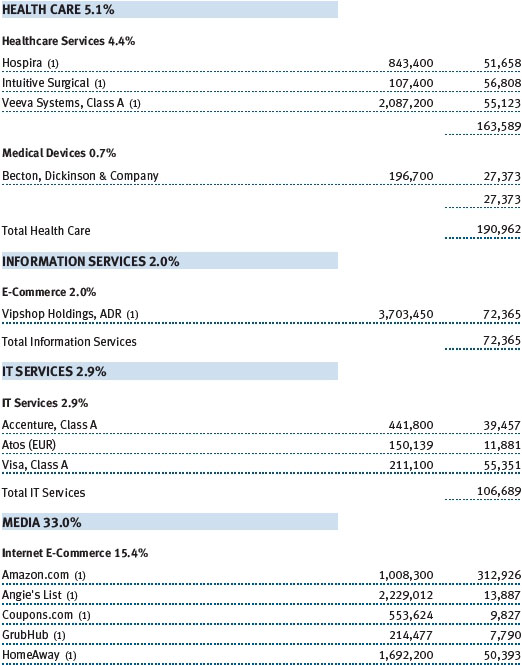
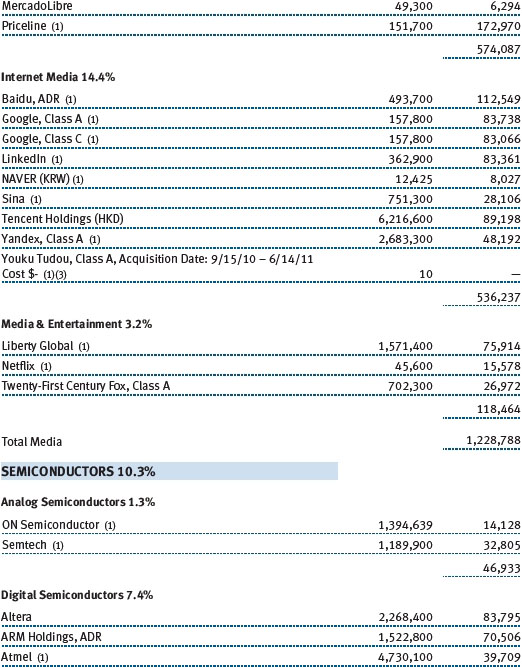
The fund remains diversified across the principal segments of science and technology. At the end of 2014, media, inclusive of Internet stocks, accounted for 33% of the portfolio; software was 14%; and semiconductors was 10%. Other major components included hardware at 13% and telecommunication equipment at 5%. For the second half of the year, software was our biggest contributor, while media and telecommunication services were our weakest performers.
LinkedIn was our biggest contributor in the second half after we built it into one of our largest holdings on pronounced weakness in the spring. We continue to view LinkedIn as one of the most promising businesses anywhere given its dominant professional network, which offers many large growth opportunities. We expect continued strong growth in its core recruiting offerings and are optimistic that two earlier stage offerings, business-to-business advertising and tools for salespeople, will become strong contributors in the coming year. We moderated our position following the stock’s rebound, but LinkedIn remains a sizable position.
Red Hat, the leading provider of Linux and other open source software, was one of our top purchases in 2013 and one of our largest contributors in 2014. As discussed in past letters, we have long felt that Red Hat’s competitive advantage and growth prospects were underappreciated. In addition, we are attracted to Red Hat’s outstanding business model. The large majority of its revenue is annually recurring, and the company generates more than 30 cents of cash flow for every dollar of revenue.
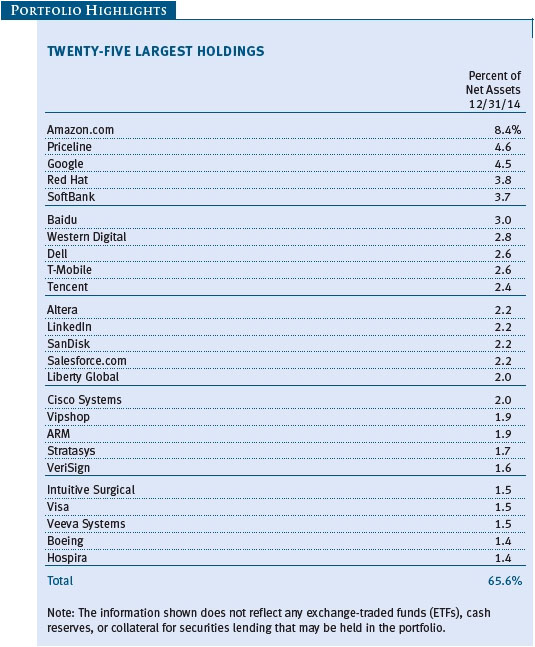
Amazon.com was our biggest holding for much of the year and was, by far, our largest position at year-end. We view Amazon as a compelling opportunity for its combination of leading retail business and highly promising cloud technology business. The stock was a significant detractor as profits remained under pressure due substantially to managements’ aggressive reinvestment of profits from its retail business into newer areas, such as the Fire Phone, streaming video, and cloud computing. There is considerable investor skepticism over Amazon’s profitability prospects, but our work gives us confidence that both its retail and cloud technology leadership are sustainable and will achieve very attractive profits over time.
We find other leading e-commerce businesses appealing as well for the still very early move of commerce online and the combination of digital and physical world advantages they have built. In addition to Amazon, we own a large position in Chinese e-commerce firm Vipshop, which sells primarily discounted apparel online. We believe Vipshop offers differentiated capabilities to its merchant partners as well as customers that will enable it to carve out an increasingly lucrative niche even as Alibaba Group continues to be the dominant broader force in China e-commerce.
Salesforce.com was a new position in the second half, but one that we have owned in the past. For some time, I had viewed the stock as fairly valued as investors rewarded its valuable position as the largest provider of software-as-a-service. In recent months, though, investor expectations moderated at the same time Salesforce.com introduced a promising new offering in the area of analytical software. We are impressed by this new offering and believe over time it will become a sizable contributor both to Salesforce.com’s increasing importance to its customers and to the company’s ability to sustain high rates of growth and expanding profit margins.
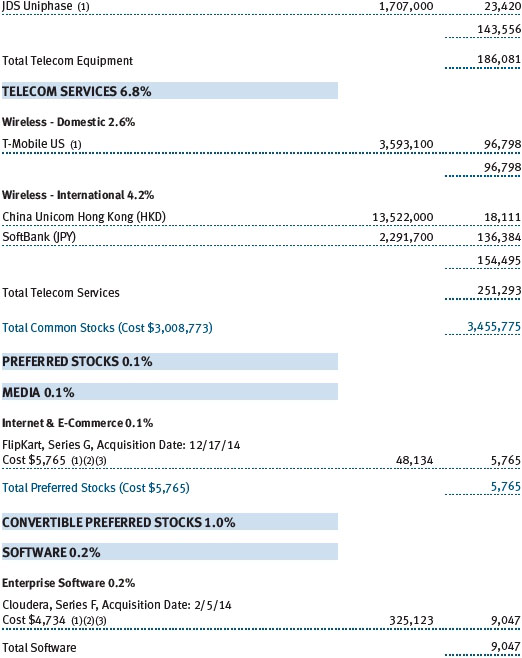
We built Japanese conglomerate SoftBank into one of the fund’s top positions. The stock was weak despite the highly successful IPO of China’s e-commerce leader Alibaba Group, of which it owns nearly one-third. We owned Alibaba but moved out of the position after it appreciated strongly above its IPO price. SoftBank is a combination of its traditional Japanese telecommunication business and large investments in other companies—in addition to Alibaba, U.S. wireless provider Sprint and Yahoo! Japan. We closely follow these businesses and believe the value of SoftBank’s stakes in them is much higher than the current stock price reflects, particularly as the stock further weakened at year-end.
I mentioned a year ago that I was particularly focused on finding opportunities in businesses not necessarily classified as technology but for which technology and innovation are at the heart of their success. We initiated a position in Intuitive Surgical, the maker of robotic systems used to perform surgeries, including prostatectomies and hysterectomies. Another new position was Visa, which I made one of our largest positions on weakness that we viewed as unwarranted. We initiated a position in Boeing, which brings vast technology capabilities to bear in its production of aircraft and defense and other systems. Intuitive and Visa were solid contributors in the second half, while Boeing was a slight detractor.
STRATEGY REVIEW AND OUTLOOK
Entering 2015, it might reasonably be wondered whether stocks can rise for a seventh consecutive year. I wonder about this also, but while opportunities are fewer, I feel confident in the stocks we own and, in particular, the ones highlighted positively in this letter. I continue to carefully consider risk in each of the fund’s holdings while focusing on company-specific merits that may offer opportunity. While it is unlikely the fund will gain if the broader market falls, I think our long-term focus will serve you well over time and across market environments.
In the past decade, technology has become ubiquitous throughout much of the world. A phone offering access to innumerable services is—for more than 1 billion people—almost always within reach. This phenomenon is being further extended by the nascent wave of devices, sensors, and wearables, often collectively called “the Internet of things.” The ability to provide customers countless products and services almost anytime, anywhere offers great opportunity for innovative companies and great risk to unadaptable ones. We remain focused on accurately delineating between these two groups. Industry trends continue to be a key focus of our work, inclusive of envisioning how they will evolve in the coming years and assessing in that broader context the prospects of individual companies and their stocks. In seeking to find the best stocks for your fund, I am fortunate to benefit from the broad research capabilities of the firm and, in particular, the insights and investing acumen of our team of technology analysts. I am pleased to report solid gains for 2014 and look forward to updating you next in six months.
Respectfully submitted,

Kennard W. Allen
President of the fund and chairman of its Investment Advisory Committee
January 23, 2015
The committee chairman has day-to-day responsibility for managing the portfolio and works with committee members in developing and executing the fund’s investment program.
RISKS OF INVESTING IN THE FUND
Funds that invest only in specific industries will experience greater volatility than funds investing in a broad range of industries. Technology stocks, historically, have experienced unusually wide price swings, both up and down. The potential for wide variation in performance reflects the special risks common to companies in the rapidly changing field of technology. For example, products or services that at first appear promising may not prove commercially successful and may become obsolete quickly. Earnings disappointments and intense competition for market share can result in sharp price declines.
GLOSSARY
Lipper index: An index of mutual fund performance returns for specified periods in defined categories as tracked by Lipper Inc.
Price/earnings (P/E) ratio: A valuation measure calculated by dividing the price of a stock by its reported earnings per share. The ratio is a measure of how much investors are willing to pay for the company’s earnings.
S&P 500 Index: A market cap-weighted index of 500 widely held stocks often used as a proxy for the overall stock market. Performance is reported on a total return basis.
Performance and Expenses
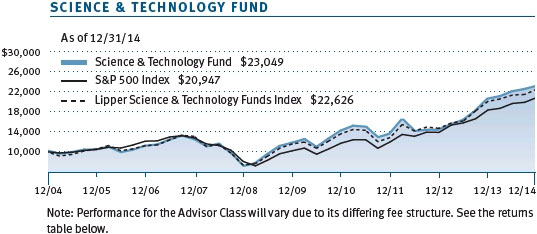
| Growth of $10,000 |
This chart shows the value of a hypothetical $10,000 investment in the fund over the past 10 fiscal year periods or since inception (for funds lacking 10-year records). The result is compared with benchmarks, which may include a broad-based market index and a peer group average or index. Market indexes do not include expenses, which are deducted from fund returns as well as mutual fund averages and indexes.
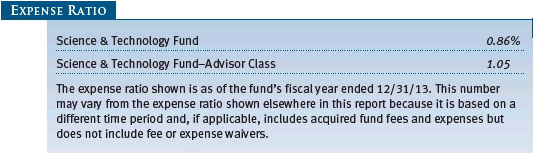
| Fund Expense Example |
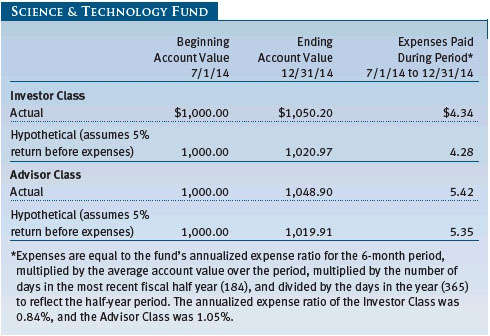
As a mutual fund shareholder, you may incur two types of costs: (1) transaction costs, such as redemption fees or sales loads, and (2) ongoing costs, including management fees, distribution and service (12b-1) fees, and other fund expenses. The following example is intended to help you understand your ongoing costs (in dollars) of investing in the fund and to compare these costs with the ongoing costs of investing in other mutual funds. The example is based on an investment of $1,000 invested at the beginning of the most recent six-month period and held for the entire period.
Please note that the fund has two share classes: The original share class (Investor Class) charges no distribution and service (12b-1) fee, and the Advisor Class shares are offered only through unaffiliated brokers and other financial intermediaries and charge a 0.25% 12b-1 fee. Each share class is presented separately in the table.
Actual Expenses
The first line of the following table (Actual) provides information about actual account values and expenses based on the fund’s actual returns. You may use the information on this line, together with your account balance, to estimate the expenses that you paid over the period. Simply divide your account value by $1,000 (for example, an $8,600 account value divided by $1,000 = 8.6), then multiply the result by the number on the first line under the heading “Expenses Paid During Period” to estimate the expenses you paid on your account during this period.
Hypothetical Example for Comparison Purposes
The information on the second line of the table (Hypothetical) is based on hypothetical account values and expenses derived from the fund’s actual expense ratio and an assumed 5% per year rate of return before expenses (not the fund’s actual return). You may compare the ongoing costs of investing in the fund with other funds by contrasting this 5% hypothetical example and the 5% hypothetical examples that appear in the shareholder reports of the other funds. The hypothetical account values and expenses may not be used to estimate the actual ending account balance or expenses you paid for the period.
Note: T. Rowe Price charges an annual account service fee of $20, generally for accounts with less than $10,000. The fee is waived for any investor whose T. Rowe Price mutual fund accounts total $50,000 or more; accounts electing to receive electronic delivery of account statements, transaction confirmations, prospectuses, and shareholder reports; or accounts of an investor who is a T. Rowe Price Preferred Services, Personal Services, or Enhanced Personal Services client (enrollment in these programs generally requires T. Rowe Price assets of at least $100,000). This fee is not included in the accompanying table. If you are subject to the fee, keep it in mind when you are estimating the ongoing expenses of investing in the fund and when comparing the expenses of this fund with other funds.
You should also be aware that the expenses shown in the table highlight only your ongoing costs and do not reflect any transaction costs, such as redemption fees or sales loads. Therefore, the second line of the table is useful in comparing ongoing costs only and will not help you determine the relative total costs of owning different funds. To the extent a fund charges transaction costs, however, the total cost of owning that fund is higher.
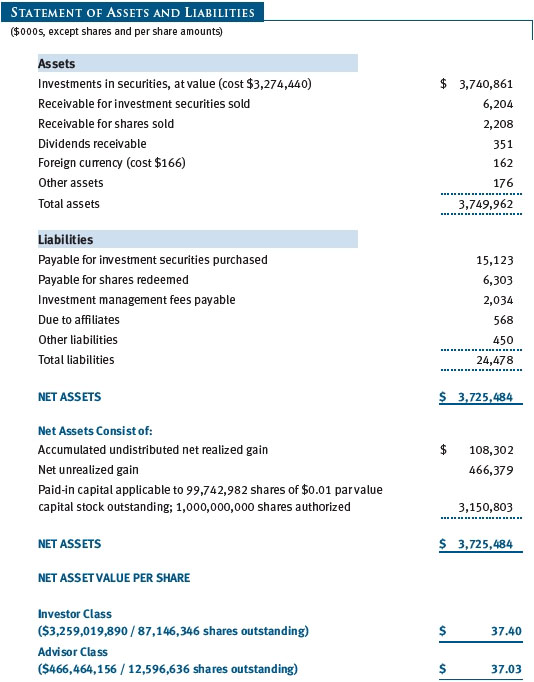
The accompanying notes are an integral part of these financial statements.
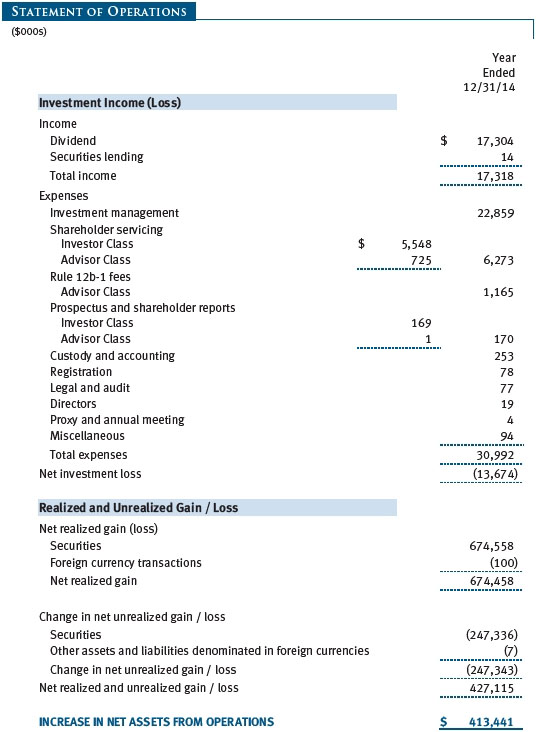
The accompanying notes are an integral part of these financial statements.

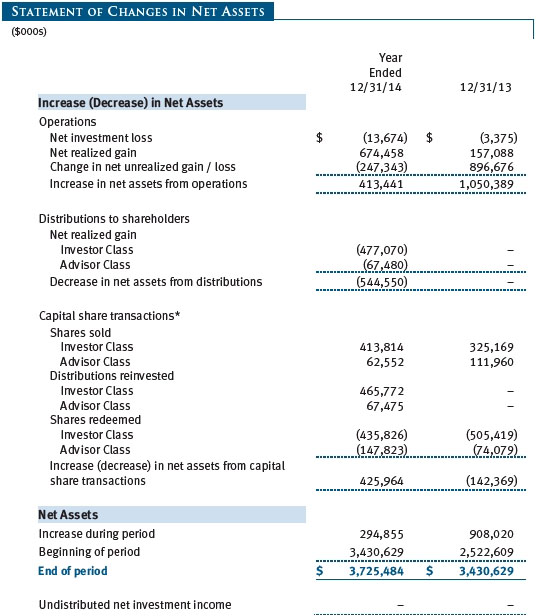
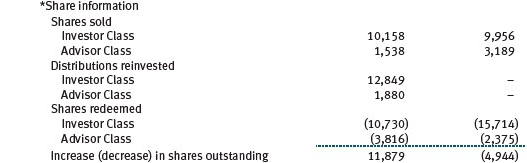
The accompanying notes are an integral part of these financial statements.
The accompanying notes are an integral part of these financial statements.
The accompanying notes are an integral part of these financial statements.
The accompanying notes are an integral part of these financial statements.
| Notes to Financial Statements |
T. Rowe Price Science & Technology Fund, Inc. (the fund), is registered under the Investment Company Act of 1940 (the 1940 Act) as a diversified, open-end management investment company. The fund seeks to provide long-term capital appreciation. The fund has two classes of shares: the Science & Technology Fund original share class, referred to in this report as the Investor Class, offered since September 30, 1987, and the Science & Technology Fund–Advisor Class (Advisor Class), offered since March 31, 2000. Advisor Class shares are sold only through unaffiliated brokers and other unaffiliated financial intermediaries that are compensated by the class for distribution, shareholder servicing, and/or certain administrative services under a Board-approved Rule 12b-1 plan. Each class has exclusive voting rights on matters related solely to that class; separate voting rights on matters that relate to both classes; and, in all other respects, the same rights and obligations as the other class.
NOTE 1 - SIGNIFICANT ACCOUNTING POLICIES
Basis of Preparation The fund is an investment company and follows accounting and reporting guidance in the Financial Accounting Standards Board (FASB) Accounting Standards Codification Topic 946 (ASC 946). The accompanying financial statements were prepared in accordance with accounting principles generally accepted in the United States of America (GAAP), including but not limited to ASC 946. GAAP requires the use of estimates made by management. Management believes that estimates and valuations are appropriate; however, actual results may differ from those estimates, and the valuations reflected in the accompanying financial statements may differ from the value ultimately realized upon sale or maturity.
Investment Transactions, Investment Income, and Distributions Income and expenses are recorded on the accrual basis. Dividends received from mutual fund investments are reflected as dividend income; capital gain distributions are reflected as realized gain/loss. Dividend income and capital gain distributions are recorded on the ex-dividend date. Income tax-related interest and penalties, if incurred, would be recorded as income tax expense. Investment transactions are accounted for on the trade date. Realized gains and losses are reported on the identified cost basis. Distributions to shareholders are recorded on the ex-dividend date. Income distributions are declared and paid by each class annually. Capital gain distributions, if any, are generally declared and paid by the fund annually.
Currency Translation Assets, including investments, and liabilities denominated in foreign currencies are translated into U.S. dollar values each day at the prevailing exchange rate, using the mean of the bid and asked prices of such currencies against U.S. dollars as quoted by a major bank. Purchases and sales of securities, income, and expenses are translated into U.S. dollars at the prevailing exchange rate on the date of the transaction. The effect of changes in foreign currency exchange rates on realized and unrealized security gains and losses is reflected as a component of security gains and losses.
Class Accounting The Advisor Class pays distribution, shareholder servicing, and/or certain administrative expenses in the form of Rule 12b-1 fees, in an amount not exceeding 0.25% of the class’s average daily net assets. Shareholder servicing, prospectus, and shareholder report expenses incurred by each class are charged directly to the class to which they relate. Expenses common to both classes, investment income, and realized and unrealized gains and losses are allocated to the classes based upon the relative daily net assets of each class.
Rebates Subject to best execution, the fund may direct certain security trades to brokers who have agreed to rebate a portion of the related brokerage commission to the fund in cash. Commission rebates are reflected as realized gain on securities in the accompanying financial statements and totaled $91,000 for the year ended December 31, 2014.
New Accounting Guidance In June 2014, FASB issued Accounting Standards Update (ASU) No. 2014-11, Transfers and Servicing (Topic 860), Repurchase-to-Maturity Transactions, Repurchase Financings, and Disclosures. The ASU changes the accounting for certain repurchase agreements and expands disclosure requirements related to repurchase agreements, securities lending, repurchase-to-maturity and similar transactions. The ASU is effective for interim and annual reporting periods beginning after December 15, 2014. Adoption will have no effect on the fund’s net assets or results of operations.
NOTE 2 - VALUATION
The fund’s financial instruments are valued and each class’s net asset value (NAV) per share is computed at the close of the New York Stock Exchange (NYSE), normally 4 p.m. ET, each day the NYSE is open for business.
Fair Value The fund’s financial instruments are reported at fair value, which GAAP defines as the price that would be received to sell an asset or paid to transfer a liability in an orderly transaction between market participants at the measurement date. The T. Rowe Price Valuation Committee (the Valuation Committee) has been established by the fund’s Board of Directors (the Board) to ensure that financial instruments are appropriately priced at fair value in accordance with GAAP and the 1940 Act. Subject to oversight by the Board, the Valuation Committee develops and oversees pricing-related policies and procedures and approves all fair value determinations. Specifically, the Valuation Committee establishes procedures to value securities; determines pricing techniques, sources, and persons eligible to effect fair value pricing actions; oversees the selection, services, and performance of pricing vendors; oversees valuation-related business continuity practices; and provides guidance on internal controls and valuation-related matters. The Valuation Committee reports to the Board; is chaired by the fund’s treasurer; and has representation from legal, portfolio management and trading, operations, and risk management.
Various valuation techniques and inputs are used to determine the fair value of financial instruments. GAAP establishes the following fair value hierarchy that categorizes the inputs used to measure fair value:
Level 1 – quoted prices (unadjusted) in active markets for identical financial instruments that the fund can access at the reporting date
Level 2 – inputs other than Level 1 quoted prices that are observable, either directly or indirectly (including, but not limited to, quoted prices for similar financial instruments in active markets, quoted prices for identical or similar financial instruments in inactive markets, interest rates and yield curves, implied volatilities, and credit spreads)
Level 3 – unobservable inputs
Observable inputs are developed using market data, such as publicly available information about actual events or transactions, and reflect the assumptions that market participants would use to price the financial instrument. Unobservable inputs are those for which market data are not available and are developed using the best information available about the assumptions that market participants would use to price the financial instrument. GAAP requires valuation techniques to maximize the use of relevant observable inputs and minimize the use of unobservable inputs. When multiple inputs are used to derive fair value, the financial instrument is assigned to the level within the fair value hierarchy based on the lowest-level input that is significant to the fair value of the financial instrument. Input levels are not necessarily an indication of the risk or liquidity associated with financial instruments at that level but rather the degree of judgment used in determining those values.
Valuation Techniques Equity securities listed or regularly traded on a securities exchange or in the over-the-counter (OTC) market are valued at the last quoted sale price or, for certain markets, the official closing price at the time the valuations are made. OTC Bulletin Board securities are valued at the mean of the closing bid and asked prices. A security that is listed or traded on more than one exchange is valued at the quotation on the exchange determined to be the primary market for such security. Listed securities not traded on a particular day are valued at the mean of the closing bid and asked prices for domestic securities and the last quoted sale or closing price for international securities.
For valuation purposes, the last quoted prices of non-U.S. equity securities may be adjusted to reflect the fair value of such securities at the close of the NYSE. If the fund determines that developments between the close of a foreign market and the close of the NYSE will, in its judgment, materially affect the value of some or all of its portfolio securities, the fund will adjust the previous quoted prices to reflect what it believes to be the fair value of the securities as of the close of the NYSE. In deciding whether it is necessary to adjust quoted prices to reflect fair value, the fund reviews a variety of factors, including developments in foreign markets, the performance of U.S. securities markets, and the performance of instruments trading in U.S. markets that represent foreign securities and baskets of foreign securities. The fund may also fair value securities in other situations, such as when a particular foreign market is closed but the fund is open. The fund uses outside pricing services to provide it with quoted prices and information to evaluate or adjust those prices. The fund cannot predict how often it will use quoted prices and how often it will determine it necessary to adjust those prices to reflect fair value. As a means of evaluating its security valuation process, the fund routinely compares quoted prices, the next day’s opening prices in the same markets, and adjusted prices.
Actively traded domestic equity securities generally are categorized in Level 1 of the fair value hierarchy. Non-U.S. equity securities generally are categorized in Level 2 of the fair value hierarchy despite the availability of quoted prices because, as described above, the fund evaluates and determines whether those quoted prices reflect fair value at the close of the NYSE or require adjustment. OTC Bulletin Board securities, certain preferred securities, and equity securities traded in inactive markets generally are categorized in Level 2 of the fair value hierarchy.
Investments in mutual funds are valued at the mutual fund’s closing NAV per share on the day of valuation and are categorized in Level 1 of the fair value hierarchy. Assets and liabilities other than financial instruments, including short-term receivables and payables, are carried at cost, or estimated realizable value, if less, which approximates fair value.
Thinly traded financial instruments and those for which the above valuation procedures are inappropriate or are deemed not to reflect fair value are stated at fair value as determined in good faith by the Valuation Committee. The objective of any fair value pricing determination is to arrive at a price that could reasonably be expected from a current sale. Financial instruments fair valued by the Valuation Committee are primarily private placements, restricted securities, warrants, rights, and other securities that are not publicly traded.
Subject to oversight by the Board, the Valuation Committee regularly makes good faith judgments to establish and adjust the fair valuations of certain securities as events occur and circumstances warrant. For instance, in determining the fair value of an equity investment with limited market activity, such as a private placement or a thinly traded public company stock, the Valuation Committee considers a variety of factors, which may include, but are not limited to, the issuer’s business prospects, its financial standing and performance, recent investment transactions in the issuer, new rounds of financing, negotiated transactions of significant size between other investors in the company, relevant market valuations of peer companies, strategic events affecting the company, market liquidity for the issuer, and general economic conditions and events. In consultation with the investment and pricing teams, the Valuation Committee will determine an appropriate valuation technique based on available information, which may include both observable and unobservable inputs. The Valuation Committee typically will afford greatest weight to actual prices in arm’s length transactions, to the extent they represent orderly transactions between market participants; transaction information can be reliably obtained; and prices are deemed representative of fair value. However, the Valuation Committee may also consider other valuation methods such as market-based valuation multiples; a discount or premium from market value of a similar, freely traded security of the same issuer; or some combination. Fair value determinations are reviewed on a regular basis and updated as information becomes available, including actual purchase and sale transactions of the issue. Because any fair value determination involves a significant amount of judgment, there is a degree of subjectivity inherent in such pricing decisions, and fair value prices determined by the Valuation Committee could differ from those of other market participants. Depending on the relative significance of unobservable inputs, including the valuation technique(s) used, fair valued securities may be categorized in Level 2 or 3 of the fair value hierarchy.
Valuation Inputs The following table summarizes the fund’s financial instruments, based on the inputs used to determine their fair values on December 31, 2014:
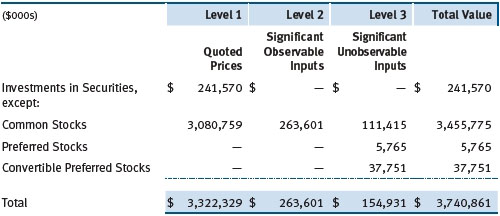
There were no material transfers between Levels 1 and 2 during the year ended December 31, 2014.
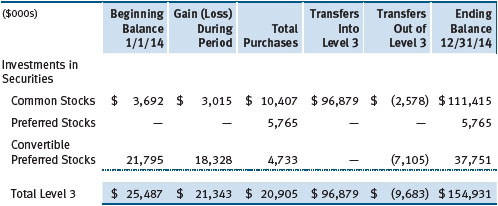
Following is a reconciliation of the fund’s Level 3 holdings for the year ended December 31, 2014. Gain (loss) reflects both realized and change in unrealized gain/loss on Level 3 holdings during the period, if any, and is included on the accompanying Statement of Operations. The change in unrealized gain/loss on Level 3 instruments held at December 31, 2014, totaled $21,343,000 for the year ended December 31, 2014. Transfers into and out of Level 3 are reflected at the value of the financial instrument at the beginning of the period. During the year, transfers into Level 3 were because the fair values of these instruments at the reporting date were determined by the Valuation Committee and transfers out of Level 3 were because observable market data became available for the security.
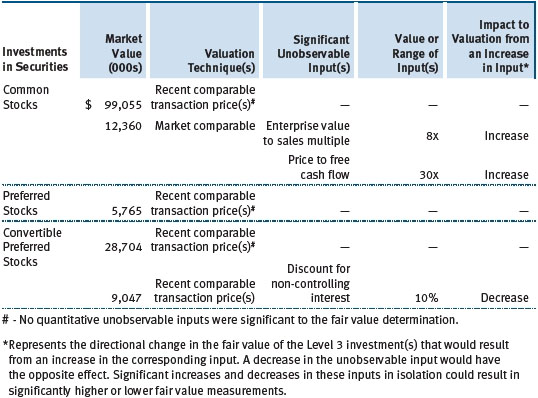
In accordance with GAAP, the following table provides quantitative information about significant unobservable inputs used to determine the fair valuations of the fund’s Level 3 assets, by class of financial instrument; it also indicates the sensitivity of the Level 3 valuations to changes in those significant unobservable inputs. Because the Valuation Committee considers a wide variety of factors and inputs, both observable and unobservable, in determining fair values, the unobservable inputs presented do not reflect all inputs significant to the fair value determination.
NOTE 3 - OTHER INVESTMENT TRANSACTIONS
Consistent with its investment objective, the fund engages in the following practices to manage exposure to certain risks and/or to enhance performance. The investment objective, policies, program, and risk factors of the fund are described more fully in the fund’s prospectus and Statement of Additional Information.
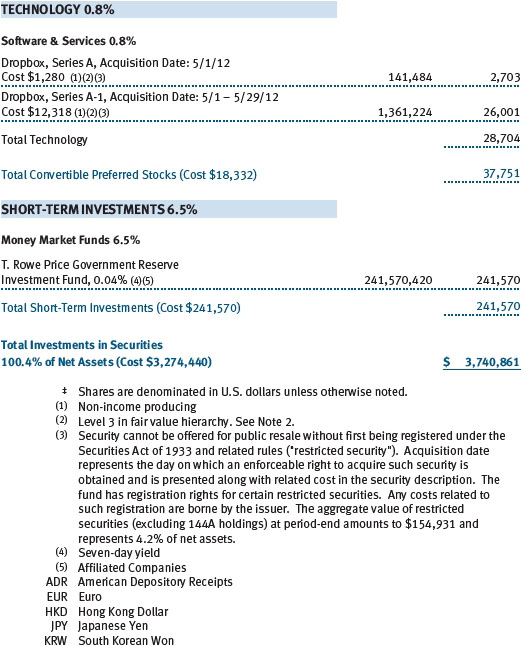
Restricted Securities The fund may invest in securities that are subject to legal or contractual restrictions on resale. Prompt sale of such securities at an acceptable price may be difficult and may involve substantial delays and additional costs.
Securities Lending The fund may lend its securities to approved brokers to earn additional income. Its securities lending activities are administered by a lending agent in accordance with a securities lending agreement. Security loans generally do not have stated maturity dates and the fund may recall a security at any time. The fund receives collateral in the form of cash or U.S. government securities, valued at 102% to 105% of the value of the securities on loan. Collateral is maintained over the life of the loan in an amount not less than the value of loaned securities; any additional collateral required due to changes in security values is delivered to the fund the next business day. Cash collateral is invested by the lending agent(s) in accordance with investment guidelines approved by fund management. Additionally, the lending agent indemnifies the fund against losses resulting from borrower default. Although risk is mitigated by the collateral and indemnification, the fund could experience a delay in recovering its securities and a possible loss of income or value if the borrower fails to return the securities, collateral investments decline in value and the lending agent fails to perform. Securities lending revenue consists of earnings on invested collateral and borrowing fees, net of any rebates to the borrower, compensation to the lending agent, and other administrative costs. In accordance with GAAP, investments made with cash collateral are reflected in the accompanying financial statements, but collateral received in the form of securities is not. At December 31, 2014, there were no securities on loan.
Other Purchases and sales of portfolio securities other than short-term securities aggregated $2,685,203,000 and $2,674,674,000, respectively, for the year ended December 31, 2014.
NOTE 4 - FEDERAL INCOME TAXES
No provision for federal income taxes is required since the fund intends to continue to qualify as a regulated investment company under Subchapter M of the Internal Revenue Code and distribute to shareholders all of its taxable income and gains. Distributions determined in accordance with federal income tax regulations may differ in amount or character from net investment income and realized gains for financial reporting purposes. Financial reporting records are adjusted for permanent book/tax differences to reflect tax character but are not adjusted for temporary differences.
The fund files U.S. federal, state, and local tax returns as required. The fund’s tax returns are subject to examination by the relevant tax authorities until expiration of the applicable statute of limitations, which is generally three years after the filing of the tax return but which can be extended to six years in certain circumstances. Tax returns for open years have incorporated no uncertain tax positions that require a provision for income taxes.
Reclassifications between income and gain relate primarily to the offset of the current net operating loss against realized gains. For the year ended December 31, 2014, the following reclassifications were recorded to reflect tax character (there was no impact on results of operations or net assets):
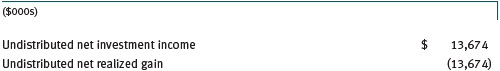
Distributions during the year ended December 31, 2014 were characterized for tax purposes as $229,845,000 of ordinary income and $314,705,000, of long-term capital gain. There were no distributions in the year ended December 31, 2013. At December 31, 2014, the tax-basis cost of investments and components of net assets were as follows:
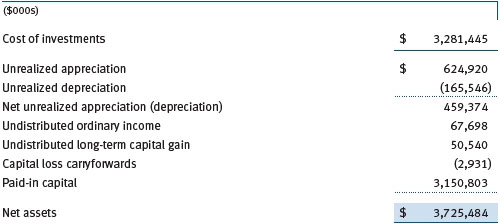
The difference between book-basis and tax-basis net unrealized appreciation (depreciation) is attributable to the deferral of losses from wash sales for tax purposes. The fund intends to retain realized gains to the extent of available capital loss carryforwards. Because the fund is required to use capital loss carryforwards that do not expire before those with expiration dates, all or a portion of its capital loss carryforwards subject to expiration could ultimately go unused. During the year ended December 31, 2014, the fund utilized $977,000 of capital loss carryforwards. The fund’s available capital loss carryforwards as of December 31, 2014, all expire in fiscal 2017. Further, $1,954,000 of the fund’s available capital loss carryforwards acquired through tax-free reorganization may be subject to certain limitations on amount or timing of use.
NOTE 5 - RELATED PARTY TRANSACTIONS
The fund is managed by T. Rowe Price Associates, Inc. (Price Associates), a wholly owned subsidiary of T. Rowe Price Group, Inc. (Price Group). The investment management agreement between the fund and Price Associates provides for an annual investment management fee, which is computed daily and paid monthly. The fee consists of an individual fund fee, equal to 0.35% of the fund’s average daily net assets, and a group fee. The group fee rate is calculated based on the combined net assets of certain mutual funds sponsored by Price Associates (the group) applied to a graduated fee schedule, with rates ranging from 0.48% for the first $1 billion of assets to 0.275% for assets in excess of $400 billion. The fund’s group fee is determined by applying the group fee rate to the fund’s average daily net assets. At December 31, 2014, the effective annual group fee rate was 0.29%.
In addition, the fund has entered into service agreements with Price Associates and two wholly owned subsidiaries of Price Associates (collectively, Price). Price Associates computes the daily share prices and provides certain other administrative services to the fund. T. Rowe Price Services, Inc., provides shareholder and administrative services in its capacity as the fund’s transfer and dividend-disbursing agent. T. Rowe Price Retirement Plan Services, Inc., provides subaccounting and recordkeeping services for certain retirement accounts invested in the Investor Class. For the year ended December 31, 2014, expenses incurred pursuant to these service agreements were $145,000 for Price Associates; $2,536,000 for T. Rowe Price Services, Inc.; and $1,359,000 for T. Rowe Price Retirement Plan Services, Inc. The total amount payable at period-end pursuant to these service agreements is reflected as Due to Affiliates in the accompanying financial statements.
Additionally, the fund is one of several mutual funds in which certain college savings plans managed by Price Associates may invest. As approved by the fund’s Board of Directors, shareholder servicing costs associated with each college savings plan are borne by the fund in proportion to the average daily value of its shares owned by the college savings plan. For the year ended December 31, 2014, the fund was charged $49,000 for shareholder servicing costs related to the college savings plans, of which $30,000 was for services provided by Price. The amount payable at period-end pursuant to this agreement is reflected as Due to Affiliates in the accompanying financial statements. At December 31, 2014, approximately 1% of the outstanding shares of the Investor Class were held by college savings plans.
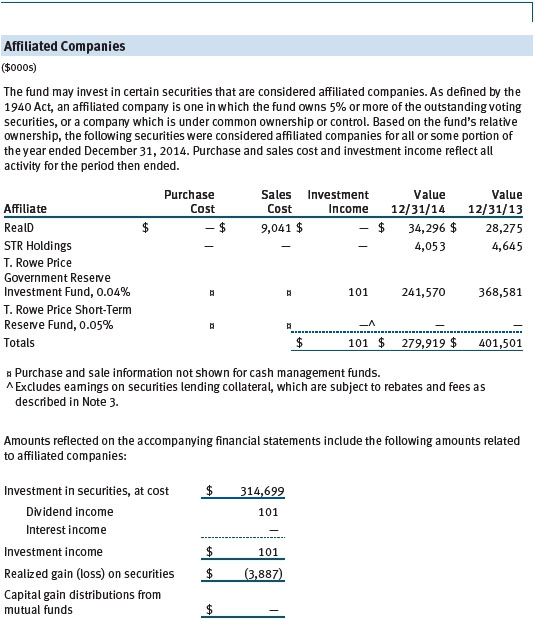
The fund may invest in the T. Rowe Price Reserve Investment Fund, the T. Rowe Price Government Reserve Investment Fund, or the T. Rowe Price Short-Term Reserve Fund (collectively, the Price Reserve Investment Funds), open-end management investment companies managed by Price Associates and considered affiliates of the fund. The Price Reserve Investment Funds are offered as short-term investment options to mutual funds, trusts, and other accounts managed by Price Associates or its affiliates and are not available for direct purchase by members of the public. The Price Reserve Investment Funds pay no investment management fees.
| Report of Independent Registered Public Accounting Firm |
To the Board of Directors and Shareholders of
T. Rowe Price Science & Technology Fund, Inc.
In our opinion, the accompanying statement of assets and liabilities, including the portfolio of investments, and the related statements of operations and of changes in net assets and the financial highlights present fairly, in all material respects, the financial position of T. Rowe Price Science & Technology Fund, Inc. (the “Fund”) at December 31, 2014, the results of its operations, the changes in its net assets and the financial highlights for each of the periods indicated therein, in conformity with accounting principles generally accepted in the United States of America. These financial statements and financial highlights (hereafter referred to as “financial statements”) are the responsibility of the Fund’s management. Our responsibility is to express an opinion on these financial statements based on our audits. We conducted our audits of these financial statements in accordance with the standards of the Public Company Accounting Oversight Board (United States). Those standards require that we plan and perform the audit to obtain reasonable assurance about whether the financial statements are free of material misstatement. An audit includes examining, on a test basis, evidence supporting the amounts and disclosures in the financial statements, assessing the accounting principles used and significant estimates made by management, and evaluating the overall financial statement presentation. We believe that our audits, which included confirmation of securities at December 31, 2014 by correspondence with the custodian and brokers, and confirmation of the underlying fund by correspondence with the transfer agent, provide a reasonable basis for our opinion.
PricewaterhouseCoopers LLP
Baltimore, Maryland
February 13, 2015
| Tax Information (Unaudited) for the Tax Year Ended 12/31/14 |
We are providing this information as required by the Internal Revenue Code. The amounts shown may differ from those elsewhere in this report because of differences between tax and financial reporting requirements.
The fund’s distributions to shareholders included:
| ● | $229,845,000 from short-term capital gains, |
| ● | $314,705,000 from long-term capital gains, subject to a long-term capital gains tax rate of not greater than 20%. |
For taxable non-corporate shareholders, $17,345,000 of the fund’s income represents qualified dividend income subject to a long-term capital gains tax rate of not greater than 20%.
For corporate shareholders, $13,621,000 of the fund’s income qualifies for the dividends-received deduction.
| Information on Proxy Voting Policies, Procedures, and Records |
A description of the policies and procedures used by T. Rowe Price funds and portfolios to determine how to vote proxies relating to portfolio securities is available in each fund’s Statement of Additional Information. You may request this document by calling 1-800-225-5132 or by accessing the SEC’s website, sec.gov.
The description of our proxy voting policies and procedures is also available on our website, troweprice.com. To access it, click on the words “Social Responsibility” at the top of our corporate homepage. Next, click on the words “Conducting Business Responsibly” on the left side of the page that appears. Finally, click on the words “Proxy Voting Policies” on the left side of the page that appears.
Each fund’s most recent annual proxy voting record is available on our website and through the SEC’s website. To access it through our website, follow the above directions to reach the “Conducting Business Responsibly” page. Click on the words “Proxy Voting Records” on the left side of that page, and then click on the “View Proxy Voting Records” link at the bottom of the page that appears.
| How to Obtain Quarterly Portfolio Holdings |
The fund files a complete schedule of portfolio holdings with the Securities and Exchange Commission for the first and third quarters of each fiscal year on Form N-Q. The fund’s Form N-Q is available electronically on the SEC’s website (sec.gov); hard copies may be reviewed and copied at the SEC’s Public Reference Room, 100 F St. N.E., Washington, DC 20549. For more information on the Public Reference Room, call 1-800-SEC-0330.
| About the Fund’s Directors and Officers |
Your fund is overseen by a Board of Directors (Board) that meets regularly to review a wide variety of matters affecting or potentially affecting the fund, including performance, investment programs, compliance matters, advisory fees and expenses, service providers, and business and regulatory affairs. The Board elects the fund’s officers, who are listed in the final table. At least 75% of the Board’s members are independent of T. Rowe Price Associates, Inc. (T. Rowe Price), and its affiliates; “inside” or “interested” directors are employees or officers of T. Rowe Price. The business address of each director and officer is 100 East Pratt Street, Baltimore, Maryland 21202. The Statement of Additional Information includes additional information about the fund directors and is available without charge by calling a T. Rowe Price representative at 1-800-638-5660.
| Independent Directors | ||
| Name | ||
| (Year of Birth) | ||
| Year Elected* | ||
| [Number of T. Rowe Price | Principal Occupation(s) and Directorships of Public Companies and | |
| Portfolios Overseen] | Other Investment Companies During the Past Five Years | |
| William R. Brody, M.D., Ph.D. | President and Trustee, Salk Institute for Biological Studies (2009 to | |
| (1944) | present); Director, BioMed Realty Trust (2013 to present); Director, | |
| 2009 | Novartis, Inc. (2009 to present); Director, IBM (2007 to present) | |
| [165] | ||
| Anthony W. Deering | Chairman, Exeter Capital, LLC, a private investment firm (2004 to | |
| (1945) | present); Director, Brixmor Real Estate Investment Trust (2012 to | |
| 2001 | present); Director and Member of the Advisory Board, Deutsche | |
| [165] | Bank North America (2004 to present); Director, Under Armour | |
| (2008 to present); Director, Vornado Real Estate Investment Trust | ||
| (2004 to 2012) | ||
| Donald W. Dick, Jr. | Principal, EuroCapital Partners, LLC, an acquisition and management | |
| (1943) | advisory firm (1995 to present) | |
| 1994 | ||
| [165] | ||
| Bruce W. Duncan | President, Chief Executive Officer, and Director, First Industrial Realty | |
| (1951) | Trust, owner and operator of industrial properties (2009 to present); | |
| 2013 | Chairman of the Board (2005 to present), Interim Chief Executive | |
| [165] | Officer (2007), and Director, Starwood Hotels & Resorts, a hotel and | |
| leisure company (1999 to present) | ||
| Robert J. Gerrard, Jr. | Advisory Board Member, Pipeline Crisis/Winning Strategies, a | |
| (1952) | collaborative working to improve opportunities for young African | |
| 2012 | Americans (1997 to present); Chairman of Compensation Committee | |
| [165] | and Director, Syniverse Holdings, Inc., a provider of wireless voice | |
| and data services for telecommunications companies (2008 to 2011) | ||
| Karen N. Horn | Limited Partner and Senior Managing Director, Brock Capital Group, | |
| (1943) | an advisory and investment banking firm (2004 to present); Director, | |
| 2003 | Eli Lilly and Company (1987 to present); Director, Simon Property | |
| [165] | Group (2004 to present); Director, Norfolk Southern (2008 to present) | |
| Paul F. McBride | Former Company Officer and Senior Vice President, Human | |
| (1956) | Resources and Corporate Initiatives, Black & Decker Corporation | |
| 2013 | (2004 to 2010) | |
| [165] | ||
| Cecilia E. Rouse, Ph.D. | Dean, Woodrow Wilson School (2012 to present); Professor and | |
| (1963) | Researcher, Princeton University (1992 to present); Director, MDRC, | |
| 2012 | a nonprofit education and social policy research organization | |
| [165] | (2011 to present); Member, National Academy of Education (2010 | |
| to present); Research Associate, National Bureau of Economic | ||
| Research’s Labor Studies Program (2011 to present); Member, | ||
| President’s Council of Economic Advisors (2009 to 2011); Chair | ||
| of Committee on the Status of Minority Groups in the Economic | ||
| Profession, American Economic Association (2012 to present) | ||
| John G. Schreiber | Owner/President, Centaur Capital Partners, Inc., a real estate | |
| (1946) | investment company (1991 to present); Cofounder and Partner, | |
| 2001 | Blackstone Real Estate Advisors, L.P. (1992 to present); Director, | |
| [165] | General Growth Properties, Inc. (2010 to 2013); Director, BXMT | |
| (formerly Capital Trust, Inc.), a real estate investment company | ||
| (2012 to present); Director and Chairman of the Board, Brixmor | ||
| Property Group, Inc. (2013 to present); Director, Hilton Worldwide | ||
| (2013 to present) | ||
| Mark R. Tercek | President and Chief Executive Officer, The Nature Conservancy (2008 | |
| (1957) | to present); Managing Director, The Goldman Sachs Group, Inc. | |
| 2009 | (1984 to 2008) | |
| [165] | ||
| *Each independent director serves until retirement, resignation, or election of a successor. | ||
| Inside Directors | ||
| Name | ||
| (Year of Birth) | ||
| Year Elected* | ||
| [Number of T. Rowe Price | Principal Occupation(s) and Directorships of Public Companies and | |
| Portfolios Overseen] | Other Investment Companies During the Past Five Years | |
| Edward C. Bernard | Director and Vice President, T. Rowe Price; Vice Chairman of the | |
| (1956) | Board, Director, and Vice President, T. Rowe Price Group, Inc.; | |
| 2006 | Chairman of the Board, Director, and President, T. Rowe Price | |
| [165] | Investment Services, Inc.; Chairman of the Board and Director, | |
| T. Rowe Price Retirement Plan Services, Inc., and T. Rowe Price | ||
| Services, Inc.; Chairman of the Board, Chief Executive Officer, | ||
| and Director, T. Rowe Price International; Chairman of the Board, | ||
| Chief Executive Officer, Director, and President, T. Rowe Price Trust | ||
| Company; Chairman of the Board, all funds | ||
| Brian C. Rogers, CFA, CIC | Chief Investment Officer, Director, and Vice President, T. Rowe Price; | |
| (1955) | Chairman of the Board, Chief Investment Officer, Director, and Vice | |
| 2013 | President, T. Rowe Price Group, Inc.; Vice President, T. Rowe Price | |
| [111] | Trust Company | |
| *Each inside director serves until retirement, resignation, or election of a successor. | ||
| Officers | ||
| Name (Year of Birth) | ||
| Position Held With Science & Technology Fund | Principal Occupation(s) | |
| Kennard W. Allen (1977) | Vice President, T. Rowe Price and T. Rowe Price | |
| President | Group, Inc. | |
| Brian W.H. Berghuis, CFA (1958) | Vice President, T. Rowe Price, T. Rowe Price | |
| Vice President | Group, Inc., and T. Rowe Price Trust Company | |
| Darrell N. Braman (1963) | Vice President, Price Hong Kong, Price | |
| Vice President | Singapore, T. Rowe Price, T. Rowe Price Group, | |
| Inc., T. Rowe Price International, T. Rowe Price | ||
| Investment Services, Inc., and T. Rowe Price | ||
| Services, Inc. | ||
| David J. Eiswert, CFA (1972) | Vice President, T. Rowe Price, T. Rowe Price | |
| Vice President | Group, Inc., and T. Rowe Price International | |
| Roger L. Fiery III, CPA (1959) | Vice President, Price Hong Kong, Price | |
| Vice President | Singapore, T. Rowe Price, T. Rowe Price Group, | |
| Inc., T. Rowe Price International, and T. Rowe | ||
| Price Trust Company | ||
| John R. Gilner (1961) | Chief Compliance Officer and Vice President, | |
| Chief Compliance Officer | T. Rowe Price; Vice President, T. Rowe Price | |
| Group, Inc., and T. Rowe Price Investment | ||
| Services, Inc. | ||
| Gregory S. Golczewski (1966) | Vice President, T. Rowe Price and T. Rowe Price | |
| Vice President | Trust Company | |
| Paul D. Greene II (1978) | Vice President, T. Rowe Price and T. Rowe Price | |
| Vice President | Group, Inc. | |
| Gregory K. Hinkle, CPA (1958) | Vice President, T. Rowe Price, T. Rowe Price | |
| Treasurer | Group, Inc., and T. Rowe Price Trust Company | |
| Rhett K. Hunter (1977) | Vice President, T. Rowe Price and T. Rowe Price | |
| Vice President | Group, Inc. | |
| Patricia B. Lippert (1953) | Assistant Vice President, T. Rowe Price and | |
| Secretary | T. Rowe Price Investment Services, Inc. | |
| Daniel Martino, CFA (1974) | Vice President, T. Rowe Price and T. Rowe Price | |
| Vice President | Group, Inc. | |
| Tobias F. Mueller (1980) | Vice President, T. Rowe Price Group, Inc., and | |
| Vice President | T. Rowe Price International; formerly intern, | |
| T. Rowe Price (to 2011) | ||
| David Oestreicher (1967) | Director, Vice President, and Secretary, T. Rowe | |
| Vice President | Price Investment Services, Inc., T. Rowe Price | |
| Retirement Plan Services, Inc., T. Rowe | ||
| Price Services, Inc., and T. Rowe Price Trust | ||
| Company; Chief Legal Officer, Vice President, | ||
| and Secretary, T. Rowe Price Group, Inc.; Vice | ||
| President and Secretary, T. Rowe Price and | ||
| T. Rowe Price International; Vice President, | ||
| Price Hong Kong and Price Singapore | ||
| Deborah D. Seidel (1962) | Vice President, T. Rowe Price, T. Rowe Price | |
| Vice President | Group, Inc., T. Rowe Price Investment Services, | |
| Inc., and T. Rowe Price Services, Inc. | ||
| Michael F. Sola, CFA (1969) | Vice President, T. Rowe Price and T. Rowe Price | |
| Vice President | Group, Inc. | |
| Joshua K. Spencer, CFA (1973) | Vice President, T. Rowe Price and T. Rowe Price | |
| Vice President | Group, Inc. | |
| Julie L. Waples (1970) | Vice President, T. Rowe Price | |
| Vice President | ||
| Thomas H. Watson (1977) | Vice President, T. Rowe Price and T. Rowe Price | |
| Vice President | Group, Inc. | |
| Justin P. White (1981) | Vice President, T. Rowe Price and T. Rowe Price | |
| Vice President | Group, Inc. | |
| Alison Mei Ling Yip (1966) | Vice President, Price Hong Kong and T. Rowe | |
| Vice President | Price Group, Inc. | |
| Unless otherwise noted, officers have been employees of T. Rowe Price or T. Rowe Price International for at least 5 years. | ||
Item 2. Code of Ethics.
The registrant has adopted a code of ethics, as defined in Item 2 of Form N-CSR, applicable to its principal executive officer, principal financial officer, principal accounting officer or controller, or persons performing similar functions. A copy of this code of ethics is filed as an exhibit to this Form N-CSR. No substantive amendments were approved or waivers were granted to this code of ethics during the period covered by this report.
Item 3. Audit Committee Financial Expert.
The registrant’s Board of Directors/Trustees has determined that Mr. Anthony W. Deering qualifies as an audit committee financial expert, as defined in Item 3 of Form N-CSR. Mr. Deering is considered independent for purposes of Item 3 of Form N-CSR.
Item 4. Principal Accountant Fees and Services.
(a) – (d) Aggregate fees billed for the last two fiscal years for professional services rendered to, or on behalf of, the registrant by the registrant’s principal accountant were as follows:
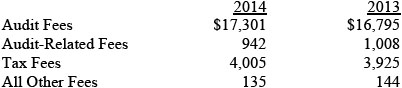
Audit fees include amounts related to the audit of the registrant’s annual financial statements and services normally provided by the accountant in connection with statutory and regulatory filings. Audit-related fees include amounts reasonably related to the performance of the audit of the registrant’s financial statements and specifically include the issuance of a report on internal controls and, if applicable, agreed-upon procedures related to fund acquisitions. Tax fees include amounts related to services for tax compliance, tax planning, and tax advice. The nature of these services specifically includes the review of distribution calculations and the preparation of Federal, state, and excise tax returns. All other fees include the registrant’s pro-rata share of amounts for agreed-upon procedures in conjunction with service contract approvals by the registrant’s Board of Directors/Trustees.
(e)(1) The registrant’s audit committee has adopted a policy whereby audit and non-audit services performed by the registrant’s principal accountant for the registrant, its investment adviser, and any entity controlling, controlled by, or under common control with the investment adviser that provides ongoing services to the registrant require pre-approval in advance at regularly scheduled audit committee meetings. If such a service is required between regularly scheduled audit committee meetings, pre-approval may be authorized by one audit committee member with ratification at the next scheduled audit committee meeting. Waiver of pre-approval for audit or non-audit services requiring fees of a de minimis amount is not permitted.
(2) No services included in (b) – (d) above were approved pursuant to paragraph (c)(7)(i)(C) of Rule 2-01 of Regulation S-X.
(f) Less than 50 percent of the hours expended on the principal accountant’s engagement to audit the registrant’s financial statements for the most recent fiscal year were attributed to work performed by persons other than the principal accountant’s full-time, permanent employees.
(g) The aggregate fees billed for the most recent fiscal year and the preceding fiscal year by the registrant’s principal accountant for non-audit services rendered to the registrant, its investment adviser, and any entity controlling, controlled by, or under common control with the investment adviser that provides ongoing services to the registrant were $2,283,000 and $1,691,000, respectively.
(h) All non-audit services rendered in (g) above were pre-approved by the registrant’s audit committee. Accordingly, these services were considered by the registrant’s audit committee in maintaining the principal accountant’s independence.
Item 5. Audit Committee of Listed Registrants.
Not applicable.
Item 6. Investments.
(a) Not applicable. The complete schedule of investments is included in Item 1 of this Form N-CSR.
(b) Not applicable.
Item 7. Disclosure of Proxy Voting Policies and Procedures for Closed-End Management Investment Companies.
Not applicable.
Item 8. Portfolio Managers of Closed-End Management Investment Companies.
Not applicable.
Item 9. Purchases of Equity Securities by Closed-End Management Investment Company and Affiliated Purchasers.
Not applicable.
Item 10. Submission of Matters to a Vote of Security Holders.
Not applicable.
Item 11. Controls and Procedures.
(a) The registrant’s principal executive officer and principal financial officer have evaluated the registrant’s disclosure controls and procedures within 90 days of this filing and have concluded that the registrant’s disclosure controls and procedures were effective, as of that date, in ensuring that information required to be disclosed by the registrant in this Form N-CSR was recorded, processed, summarized, and reported timely.
(b) The registrant’s principal executive officer and principal financial officer are aware of no change in the registrant’s internal control over financial reporting that occurred during the registrant’s second fiscal quarter covered by this report that has materially affected, or is reasonably likely to materially affect, the registrant’s internal control over financial reporting.
Item 12. Exhibits.
(a)(1) The registrant’s code of ethics pursuant to Item 2 of Form N-CSR is attached.
(3) Written solicitation to repurchase securities issued by closed-end companies: not applicable.
(b) A certification by the registrant's principal executive officer and principal financial officer, pursuant to Section 906 of the Sarbanes-Oxley Act of 2002 and required by Rule 30a-2(b) under the Investment Company Act of 1940, is attached.
SIGNATURES
Pursuant to the requirements of the Securities Exchange Act of 1934 and the Investment Company Act of 1940, the registrant has duly caused this report to be signed on its behalf by the undersigned, thereunto duly authorized.
T. Rowe Price Science & Technology Fund, Inc.
| By | /s/ Edward C. Bernard | |
| Edward C. Bernard | ||
| Principal Executive Officer | ||
| Date February 13, 2015 | ||
Pursuant to the requirements of the Securities Exchange Act of 1934 and the Investment Company Act of 1940, this report has been signed below by the following persons on behalf of the registrant and in the capacities and on the dates indicated.
| By | /s/ Edward C. Bernard | |
| Edward C. Bernard | ||
| Principal Executive Officer | ||
| Date February 13, 2015 | ||
| By | /s/ Gregory K. Hinkle | |
| Gregory K. Hinkle | ||
| Principal Financial Officer | ||
| Date February 13, 2015 | ||