UNITED STATES
SECURITIES AND EXCHANGE COMMISSION
Washington, D.C. 20549
FORM N-CSR
CERTIFIED SHAREHOLDER REPORT OF REGISTERED
MANAGEMENT INVESTMENT COMPANIES
Investment Company Act File Number: 811-05299
| T. Rowe Price Science & Technology Fund, Inc. |
| (Exact name of registrant as specified in charter) |
| 100 East Pratt Street, Baltimore, MD 21202 |
| (Address of principal executive offices) |
| David Oestreicher |
| 100 East Pratt Street, Baltimore, MD 21202 |
| (Name and address of agent for service) |
Registrant’s telephone number, including area code: (410) 345-2000
Date of fiscal year end: December 31
Date of reporting period: December 31, 2016
Item 1. Report to Shareholders
 |
| Science & Technology Fund | December 31, 2016 |

The views and opinions in this report were current as of December 31, 2016. They are not guarantees of performance or investment results and should not be taken as investment advice. Investment decisions reflect a variety of factors, and the managers reserve the right to change their views about individual stocks, sectors, and the markets at any time. As a result, the views expressed should not be relied upon as a forecast of the fund’s future investment intent. The report is certified under the Sarbanes-Oxley Act, which requires mutual funds and other public companies to affirm that, to the best of their knowledge, the information in their financial reports is fairly and accurately stated in all material respects.
REPORTS ON THE WEB
Sign up for our Email Program, and you can begin to receive updated fund reports and prospectuses online rather than through the mail. Log in to your account at troweprice.com for more information.
Manager’s Letter
Fellow Shareholders
Stocks achieved solid gains in 2016, but technology lagged the broader market. Within technology, value stocks—ones with relatively low growth and low valuations and, in many cases, with greater sensitivity to economic conditions—handily outperformed growth stocks. As high-growth stocks fell sharply early in the year, we added to those holdings, a move that was quickly rewarded with rebounds in large positions, including Amazon.com and LinkedIn. Because we found relatively few value stocks attractive, our holdings for most of the year skewed toward growth stocks, and we held a relatively high cash balance. These factors hurt our returns, although we posted healthy gains that exceeded our peer group benchmark. We continue to take a long-term view in an effort to capture outsized value creation—and avoid value destruction—that is driven by the fast pace of technological innovation. (Please refer to the fund’s portfolio of investments for a complete list of our holdings and the amount each represents in the portfolio.)
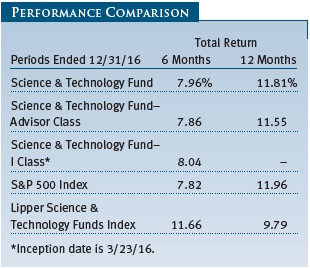
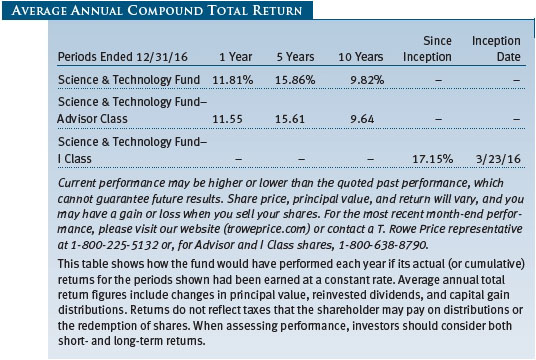
Your fund returned 11.81% for the year ended December 31, 2016, outperforming its Lipper peer group index and slightly lagging the broad S&P 500 Index. (Returns for the Advisor and I Class shares vary, reflecting different cost structures.) Our performance benefited from favorable stock picking in software and semiconductors. Performance was hurt by stock picking in media and Internet and a large underweight in semiconductors.
MARKET ENVIRONMENT
Stocks recorded solid gains in the six months since our last report, helped by improved earnings and economic data and hopes that even stronger results lay ahead. U.S. economic growth picked up in the second half of the year, with a healthy labor market driving wage gains and boosting retail sales and consumer confidence. The housing market also continued to improve, evidenced by the highest pace of new and existing home sales since the collapse of the housing market in 2008 and 2009. Global economic signals also improved, as stimulus measures put in place early in the year in China took hold, while further monetary stimulus in Europe helped the Continent overcome volatility set off by the Brexit vote in late June. Better-than-expected U.S. corporate earnings also boosted stocks. The S&P 500 recorded a year-over-year increase in overall earnings of roughly 3% in the third quarter—a moderate gain, but the first since the start of 2015.
Donald Trump’s election in November and the promise of unified action in Washington under a Republican Congress spurred a further advance in the markets, bringing all of the major indexes to new highs by mid-December. The gains were uneven, however, with investors favoring value-oriented stocks that appeared poised to benefit from possible deregulation (particularly in the financials sector) and increased infrastructure and defense spending under the incoming administration. Fast-growing technology and Internet-related shares lagged as investors may have worried about how changes in trade policy might weigh on supply chains and earnings generated outside the United States. Investors may also have simply harvested strong recent gains in these shares to increase investment elsewhere.
PORTFOLIO REVIEW
Technology stocks rose modestly in 2016 with most of the gains coming in the second half. Earnings remained generally favorable supported by modest economic growth and the long-term trend of technology becoming ever more central to our professional and personal lives.
Personal purchases of PCs and tablets continued to fall, and smartphones—once a dominant technology growth driver—saw faltering growth, driving Apple’s first annual sales decline in more than 15 years. E-commerce continued to rapidly gain share of retail purchases. Amazon’s remarkable growth trajectory persisted, in particular, with its “Echo” line of digital-assistant-enabled wireless speakers emerging as a big winner of the holiday selling season. The broader Internet economy continued growing at the expense of physical stores and offline advertising—but after a very strong 2015, the Internet group saw mixed returns, with a few of our China Internet holdings falling sharply.
Businesses continued to spend more on technology driven by outsized growth in cloud computing, including public cloud offerings from such providers as Amazon and Microsoft, and software-as-a-service wares from the likes of salesforce.com, Microsoft’s Office 365, and ServiceNow. Many large areas of spending such as server and storage systems saw weakness as corporations increasingly shifted technology processes and systems to the cloud. We have long been big believers in cloud computing, a view that in combination with our bottom-up research has identified key winners such as Amazon, Microsoft, salesforce.com, and Veeva Systems. Likewise, we have tended to avoid companies we believe will fail to successfully evolve to the cloud computing era. This positioning hurt performance during the year as many of these stocks rebounded strongly from the weakness experienced in prior years as investors grew more optimistic about economic growth and incumbent firms’ ability to adapt to the changing landscape.
Semiconductor stocks enjoyed outstanding returns fueled by continued industry consolidation, which provided large acquisition premiums to the acquired companies and substantial earnings accretion for the acquirers. We were underexposed to semiconductors overall but did own several big gainers, most notably memory semiconductors SK Hynix and Micron Technology and analog and mixed-signal solutions provider Microsemi.
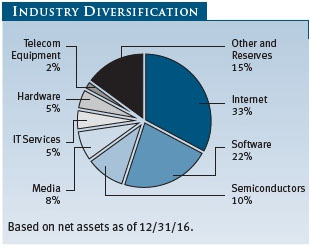
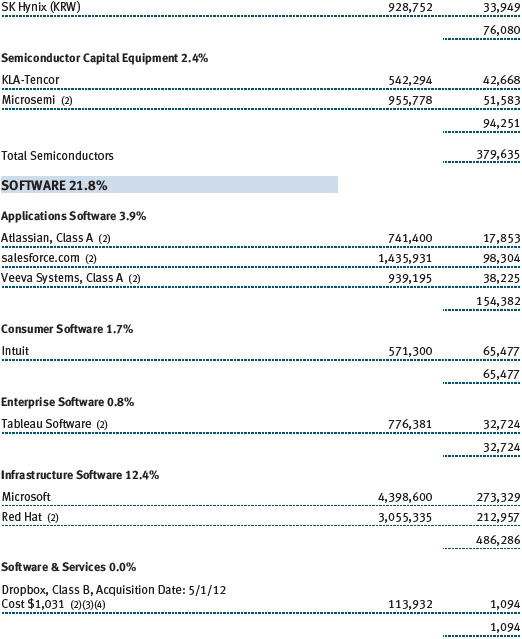
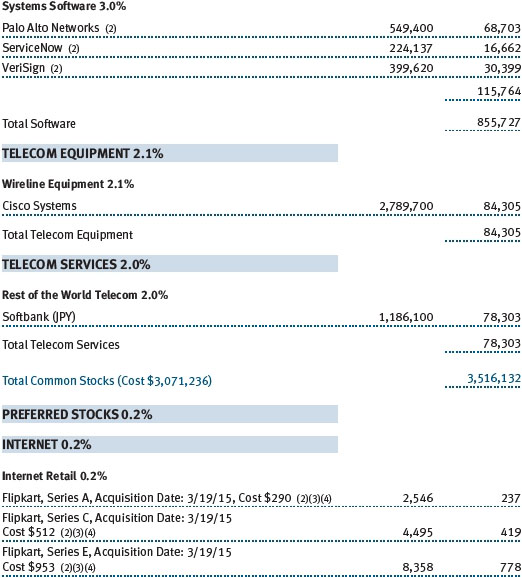
The fund remains diversified across the principal segments of science and technology. As shown in the Industry Diversification chart, at the end of December, Internet accounted for 33% of the portfolio, software was 22%, semiconductors was 10%, and media was 8%, with smaller representation in IT services (5%), hardware (5%), and telecommunications equipment (2%). For the year, we saw our strongest returns in semiconductors but were hurt by an underweight in that group. Our software, telecommunication services, and telecommunications equipment holdings performed well, while our Internet holdings, specifically in China, detracted from results. Performance was hurt by not owning more highly cyclical and lower-valuation businesses as many of these performed strongly, particularly after the U.S. elections.
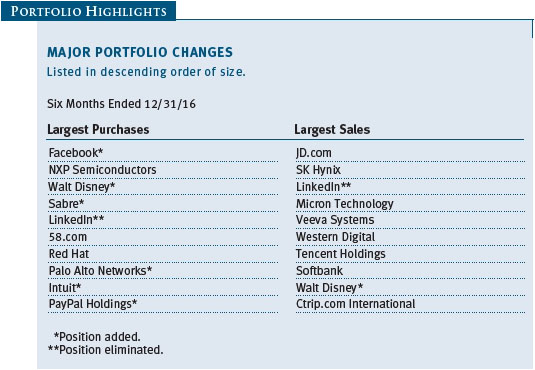
LinkedIn was our biggest contributor for the year as it was acquired by Microsoft for a 50% premium to its prior trading price. We have long viewed LinkedIn as unique and valuable for its combination of dominant professional network and leading cloud software business. We aggressively added to our position on sharp early-year weakness and were rewarded by its sale to Microsoft.
Microsoft itself enjoyed a strong second half as growth in its cloud computing offerings, Office 365 and Azure, was better than expected and investors increasingly viewed it as a likely winner in the forthcoming cloud technology era. The stock has enjoyed dramatic expansion in its valuation multiples in recent years, and its higher valuation gives us some pause. Nevertheless, we continue to think its leadership position in cloud computing will enable better and more durable growth than the stock price anticipates.
We benefited from a dramatic turnaround in the performance of memory semiconductor stocks SK Hynix and Micron. Having been punished in 2015 by a weak pricing environment for their key offering, DRAM chips, both stocks surged on a pricing recovery that was driven by constrained supply and demand growth in smartphones. We were rewarded for buying more of these stocks when they were severely out of favor. We lowered our weightings in the second half in light of the much higher valuations.
Latin America e-commerce marketplace MercadoLibre was a large gainer as it continued driving the adoption of e-commerce in the region by expanding its set of offerings for consumers and merchants. Following the path that Amazon has taken in the U.S. and many other countries, MercadoLibre has provided a shopping destination in Latin America offering vast selection and has systematically lowered the friction to transacting online for both vendors and consumers. Similar to eBay when it acquired PayPal, MercadoLibre also boasts a potentially valuable payments business in MercadoPago, which it offers for payments on its marketplace and beyond.
Facebook was our largest purchase for the year as the stock faltered after a big multiyear run. This was an instance of changing my mind about a stock after considering the latest information and conducting additional analysis. My view had been that the explosive growth of online advertising and Facebook’s market share gains would slow such that Facebook would not exceed investors’ growth expectations. But after incorporating new insights on Facebook’s addressable market and market share prospects, I became much more optimistic about the durability of its growth.
Online travel agency leader Priceline was one of our largest purchases in the first half on its pronounced weakness. Priceline rallied strongly on quarterly earnings that were much better than expected, supporting our view that its competitive advantage and the future growth in online travel are both stronger than the stock had reflected.
We initiated a position in cybersecurity vendor Palo Alto Networks in the fourth quarter. Palo Alto’s growth has recently slowed from a prior torrid pace, and investors have punished the stock as a result. We viewed this as a buying opportunity given cybersecurity is an area of likely consistently increasing importance for businesses and governments, and Palo Alto has differentiated capabilities in this space. While the weaker recent results are cause for concern, a coming upgrade cycle for its primary product, network firewalls, should provide attractive growth for the foreseeable future. Meanwhile, growth in newer products, such as endpoint security, plus an increasing mix of recurring revenue, should support the business longer term.
Our largest detractor for the year was 58.com, China’s online classifieds leader. Entering the year, we were optimistic 58.com’s acquisition of previously intense rival Ganji would facilitate a much more favorable competitive landscape and profitability picture. While it did benefit margins, Ganji proved difficult to integrate, which resulted in weaker-than-expected results and a lack of near-term earnings support for the stock. In addition, late in the year, China’s implementation of new restrictions on the housing market marred the outlook for 58.com’s business in that advertising segment—its second largest, behind postings for blue-collar jobs. We remain optimistic that 58.com’s competitive position is secure and that it will benefit a rapid shift to online classified ads in China. Given that we believe the company should eventually realize the attractive profitability enjoyed by online classifieds leaders in many other countries, we added to our position.
Open source software leader Red Hat, which distributes the Linux operating system, had a disappointing year as investors became skeptical of its ability to participate in the growth of cloud computing. While Red Hat’s opportunities in the cloud are less obvious than companies such as Amazon and salesforce.com, whose businesses are entirely cloud-based, we think its future is bright. In particular, open source software is likely to remain much more prominent in the cloud than it is corporate data centers, and the vast majority of cloud computing is already done in Linux—albeit mostly in free Linux alternatives, against which Red Hat has always competed. We anticipate that Red Hat’s differentiated capabilities will become clear, however, as companies increasingly run more critical computing processes in the cloud. We made the company one of our largest positions on its second-half weakness.
STRATEGY REVIEW AND OUTLOOK
Technology stocks enjoyed another year of gains, recovering strongly from early-year weakness. We outperformed solidly in the first half but did not keep up with the second-half rally as we were underexposed to value stocks as well as highly cyclical stocks, such as semiconductors, that benefited from investors’ increased optimism in economic growth.
Despite the disappointing second half, we generated solid gains and outperformed our peer group for the year. I continue to think it is critical to cast a wide net in order to find the best investments for the fund. I am encouraged by the breadth of our top contributors—from LinkedIn to memory semiconductors SK Hynix and Micron to cloud software provider Veeva to Japanese conglomerate and Alibaba stakeholder Softbank.
Looking to 2017, with stocks at all-time highs and valuation multiples having risen substantially, I am finding relatively few attractive stocks. As such, I have exited many positions and have been especially rigorous in trying to ensure our holdings are concentrated in our highest-conviction stocks. Several of our favorite businesses, including Amazon, Red Hat, Facebook, Priceline, Tencent Holdings, and Salesforce.com, have not recently seen their stocks keep up with the strong growth of their businesses. We are confident in continued strong results from these companies and are optimistic their stocks will benefit over time.
In managing your fund, I continue to benefit from the research, insights, and collaboration of our team. While I worry about various risks that could inhibit further gains for stocks, I believe our teamwork, rigorous analysis, and long-term approach will serve you well across market environments. Thank you for your continued trust.
Respectfully submitted,

Kennard W. Allen
President of the fund and Chairman of its Investment Advisory Committee
January 20, 2017
The committee chairman has day-to-day responsibility for managing the portfolio and works with committee members in developing and executing the fund’s investment program.
RISKS OF INVESTING IN THE FUND
Funds that invest only in specific industries will experience greater volatility than funds investing in a broad range of industries. Technology stocks, historically, have experienced unusually wide price swings, both up and down. The potential for wide variation in performance reflects the special risks common to companies in the rapidly changing field of technology. For example, products or services that at first appear promising may not prove commercially successful and may become obsolete quickly. Earnings disappointments and intense competition for market share can result in sharp price declines.
GLOSSARY
Lipper Science & Technology Funds Index: An index of science and technology mutual fund performance returns for specified periods as tracked by Lipper Inc.
S&P 500 Index: A market cap-weighted index of 500 widely held stocks often used as a proxy for the overall stock market. Performance is reported on a total return basis.
Performance and Expenses
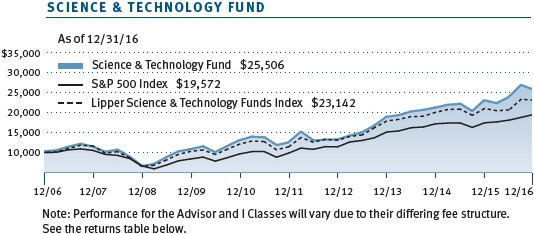
| Growth of $10,000 |
This chart shows the value of a hypothetical $10,000 investment in the fund over the past 10 fiscal year periods or since inception (for funds lacking 10-year records). The result is compared with benchmarks, which may include a broad-based market index and a peer group average or index. Market indexes do not include expenses, which are deducted from fund returns as well as mutual fund averages and indexes.
| Fund Expense Example |
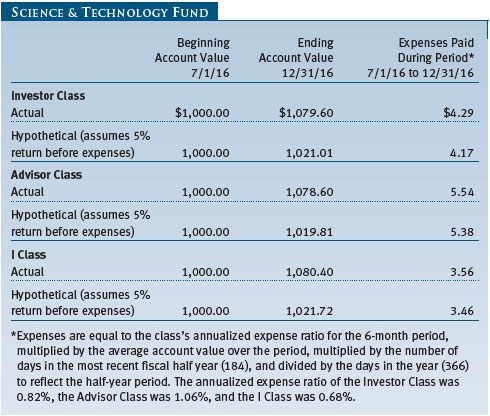
As a mutual fund shareholder, you may incur two types of costs: (1) transaction costs, such as redemption fees or sales loads, and (2) ongoing costs, including management fees, distribution and service (12b-1) fees, and other fund expenses. The following example is intended to help you understand your ongoing costs (in dollars) of investing in the fund and to compare these costs with the ongoing costs of investing in other mutual funds. The example is based on an investment of $1,000 invested at the beginning of the most recent six-month period and held for the entire period.
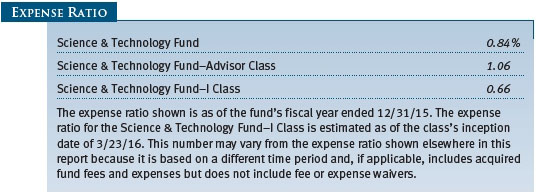
Please note that the fund has three share classes: The original share class (Investor Class) charges no distribution and service (12b-1) fee, the Advisor Class shares are offered only through unaffiliated brokers and other financial intermediaries and charge a 0.25% 12b-1 fee, and I Class shares are available to institutionally oriented clients and impose no 12b-1 or administrative fee payment. Each share class is presented separately in the table.
Actual Expenses
The first line of the following table (Actual) provides information about actual account values and expenses based on the fund’s actual returns. You may use the information on this line, together with your account balance, to estimate the expenses that you paid over the period. Simply divide your account value by $1,000 (for example, an $8,600 account value divided by $1,000 = 8.6), then multiply the result by the number on the first line under the heading “Expenses Paid During Period” to estimate the expenses you paid on your account during this period.
Hypothetical Example for Comparison Purposes
The information on the second line of the table (Hypothetical) is based on hypothetical account values and expenses derived from the fund’s actual expense ratio and an assumed 5% per year rate of return before expenses (not the fund’s actual return). You may compare the ongoing costs of investing in the fund with other funds by contrasting this 5% hypothetical example and the 5% hypothetical examples that appear in the shareholder reports of the other funds. The hypothetical account values and expenses may not be used to estimate the actual ending account balance or expenses you paid for the period.
Note: T. Rowe Price charges an annual account service fee of $20, generally for accounts with less than $10,000. The fee is waived for any investor whose T. Rowe Price mutual fund accounts total $50,000 or more; accounts electing to receive electronic delivery of account statements, transaction confirmations, prospectuses, and shareholder reports; or accounts of an investor who is a T. Rowe Price Preferred Services, Personal Services, or Enhanced Personal Services client (enrollment in these programs generally requires T. Rowe Price assets of at least $100,000). This fee is not included in the accompanying table. If you are subject to the fee, keep it in mind when you are estimating the ongoing expenses of investing in the fund and when comparing the expenses of this fund with other funds.
You should also be aware that the expenses shown in the table highlight only your ongoing costs and do not reflect any transaction costs, such as redemption fees or sales loads. Therefore, the second line of the table is useful in comparing ongoing costs only and will not help you determine the relative total costs of owning different funds. To the extent a fund charges transaction costs, however, the total cost of owning that fund is higher.

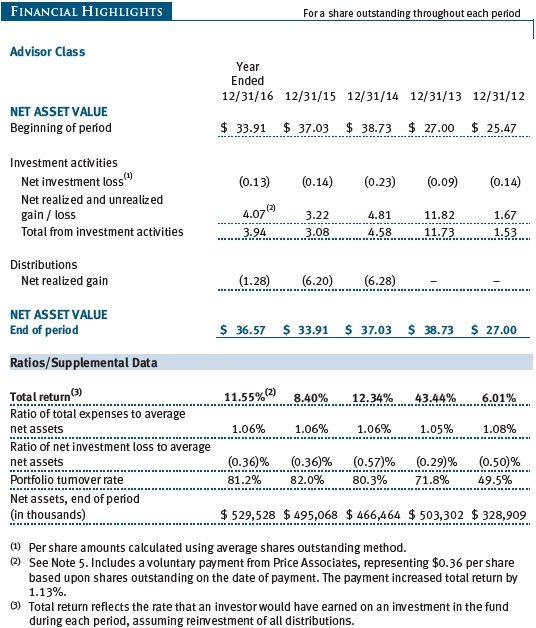
The accompanying notes are an integral part of these financial statements.
The accompanying notes are an integral part of these financial statements.
The accompanying notes are an integral part of these financial statements.


The accompanying notes are an integral part of these financial statements.
The accompanying notes are an integral part of these financial statements.
The accompanying notes are an integral part of these financial statements.
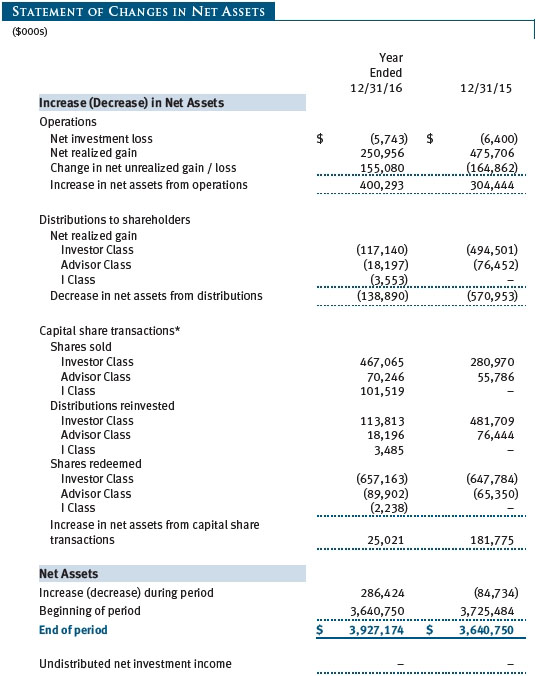
The accompanying notes are an integral part of these financial statements.
| Notes to Financial Statements |
T. Rowe Price Science & Technology Fund, Inc. (the fund), is registered under the Investment Company Act of 1940 (the 1940 Act) as a diversified, open-end management investment company. The fund seeks to provide long-term capital appreciation. The fund has three classes of shares: the Science & Technology Fund (Investor Class), the Science & Technology Fund–Advisor Class (Advisor Class), and the Science & Technology Fund–I Class (I Class). Advisor Class shares are sold only through unaffiliated brokers and other unaffiliated financial intermediaries. I Class shares generally are available only to investors meeting a $1,000,000 minimum investment or certain other criteria. The Advisor Class operates under a Board-approved Rule 12b-1 plan pursuant to which the class compensates financial intermediaries for distribution, shareholder servicing, and/or certain administrative services; the Investor and I Classes do not pay Rule 12b-1 fees. Each class has exclusive voting rights on matters related solely to that class; separate voting rights on matters that relate to all classes; and, in all other respects, the same rights and obligations as the other classes.
NOTE 1 - SIGNIFICANT ACCOUNTING POLICIES
Basis of Preparation The fund is an investment company and follows accounting and reporting guidance in the Financial Accounting Standards Board (FASB) Accounting Standards Codification Topic 946 (ASC 946). The accompanying financial statements were prepared in accordance with accounting principles generally accepted in the United States of America (GAAP), including, but not limited to, ASC 946. GAAP requires the use of estimates made by management. Management believes that estimates and valuations are appropriate; however, actual results may differ from those estimates, and the valuations reflected in the accompanying financial statements may differ from the value ultimately realized upon sale or maturity.
Investment Transactions, Investment Income, and Distributions Income and expenses are recorded on the accrual basis. Premiums and discounts on debt securities are amortized for financial reporting purposes. Dividends received from mutual fund investments are reflected as dividend income; capital gain distributions are reflected as realized gain/loss. Dividend income and capital gain distributions are recorded on the ex-dividend date. Income tax-related interest and penalties, if incurred, would be recorded as income tax expense. Investment transactions are accounted for on the trade date. Realized gains and losses are reported on the identified cost basis. Distributions from REITs are initially recorded as dividend income and, to the extent such represent a return of capital or capital gain for tax purposes, are reclassified when such information becomes available. Income distributions are declared and paid by each class annually. Distributions to shareholders are recorded on the ex-dividend date. Capital gain distributions are generally declared and paid by the fund annually.
Currency Translation Assets, including investments, and liabilities denominated in foreign currencies are translated into U.S. dollar values each day at the prevailing exchange rate, using the mean of the bid and asked prices of such currencies against U.S. dollars as quoted by a major bank. Purchases and sales of securities, income, and expenses are translated into U.S. dollars at the prevailing exchange rate on the date of the transaction. The effect of changes in foreign currency exchange rates on realized and unrealized security gains and losses is reflected as a component of security gains and losses.
Class Accounting Shareholder servicing, prospectus, and shareholder report expenses incurred by each class are charged directly to the class to which they relate. Expenses common to all classes, investment income, and realized and unrealized gains and losses are allocated to the classes based upon the relative daily net assets of each class. The Advisor Class pays Rule 12b-1 fees, in an amount not exceeding 0.25% of the class’s average daily net assets.
Rebates Subject to best execution, the fund may direct certain security trades to brokers who have agreed to rebate a portion of the related brokerage commission to the fund in cash. Commission rebates are reflected as realized gain on securities in the accompanying financial statements and totaled $121,000 for the year ended December 31, 2016.
New Accounting Guidance In October 2016, the Securities and Exchange Commission (SEC) issued a new rule, Investment Company Reporting Modernization, which, among other provisions, amends Regulation S-X to require standardized, enhanced disclosures, particularly related to derivatives, in investment company financial statements. Compliance with the guidance is effective for financial statements filed with the SEC on or after August 1, 2017; adoption will have no effect on the fund’s net assets or results of operations.
NOTE 2 - VALUATION
The fund’s financial instruments are valued and each class’s net asset value (NAV) per share is computed at the close of the New York Stock Exchange (NYSE), normally 4 p.m. ET, each day the NYSE is open for business. However, the NAV per share may be calculated at a time other than the normal close of the NYSE if trading on the NYSE is restricted, if the NYSE closes earlier, or as may be permitted by the SEC.
Fair Value The fund’s financial instruments are reported at fair value, which GAAP defines as the price that would be received to sell an asset or paid to transfer a liability in an orderly transaction between market participants at the measurement date. The T. Rowe Price Valuation Committee (the Valuation Committee) is an internal committee that has been delegated certain responsibilities by the fund’s Board of Directors (the Board) to ensure that financial instruments are appropriately priced at fair value in accordance with GAAP and the 1940 Act. Subject to oversight by the Board, the Valuation Committee develops and oversees pricing-related policies and procedures and approves all fair value determinations. Specifically, the Valuation Committee establishes procedures to value securities; determines pricing techniques, sources, and persons eligible to effect fair value pricing actions; oversees the selection, services, and performance of pricing vendors; oversees valuation-related business continuity practices; and provides guidance on internal controls and valuation-related matters. The Valuation Committee reports to the Board and has representation from legal, portfolio management and trading, operations, risk management, and the fund’s treasurer.
Various valuation techniques and inputs are used to determine the fair value of financial instruments. GAAP establishes the following fair value hierarchy that categorizes the inputs used to measure fair value:
Level 1 – quoted prices (unadjusted) in active markets for identical financial instruments that the fund can access at the reporting date
Level 2 – inputs other than Level 1 quoted prices that are observable, either directly or indirectly (including, but not limited to, quoted prices for similar financial instruments in active markets, quoted prices for identical or similar financial instruments in inactive markets, interest rates and yield curves, implied volatilities, and credit spreads)
Level 3 – unobservable inputs
Observable inputs are developed using market data, such as publicly available information about actual events or transactions, and reflect the assumptions that market participants would use to price the financial instrument. Unobservable inputs are those for which market data are not available and are developed using the best information available about the assumptions that market participants would use to price the financial instrument. GAAP requires valuation techniques to maximize the use of relevant observable inputs and minimize the use of unobservable inputs. When multiple inputs are used to derive fair value, the financial instrument is assigned to the level within the fair value hierarchy based on the lowest-level input that is significant to the fair value of the financial instrument. Input levels are not necessarily an indication of the risk or liquidity associated with financial instruments at that level but rather the degree of judgment used in determining those values.
Valuation Techniques Equity securities listed or regularly traded on a securities exchange or in the over-the-counter (OTC) market are valued at the last quoted sale price or, for certain markets, the official closing price at the time the valuations are made. OTC Bulletin Board securities are valued at the mean of the closing bid and asked prices. A security that is listed or traded on more than one exchange is valued at the quotation on the exchange determined to be the primary market for such security. Listed securities not traded on a particular day are valued at the mean of the closing bid and asked prices for domestic securities and the last quoted sale or closing price for international securities.
For valuation purposes, the last quoted prices of non-U.S. equity securities may be adjusted to reflect the fair value of such securities at the close of the NYSE. If the fund determines that developments between the close of a foreign market and the close of the NYSE will, in its judgment, materially affect the value of some or all of its portfolio securities, the fund will adjust the previous quoted prices to reflect what it believes to be the fair value of the securities as of the close of the NYSE. In deciding whether it is necessary to adjust quoted prices to reflect fair value, the fund reviews a variety of factors, including developments in foreign markets, the performance of U.S. securities markets, and the performance of instruments trading in U.S. markets that represent foreign securities and baskets of foreign securities. The fund may also fair value securities in other situations, such as when a particular foreign market is closed but the fund is open. The fund uses outside pricing services to provide it with quoted prices and information to evaluate or adjust those prices. The fund cannot predict how often it will use quoted prices and how often it will determine it necessary to adjust those prices to reflect fair value. As a means of evaluating its security valuation process, the fund routinely compares quoted prices, the next day’s opening prices in the same markets, and adjusted prices.
Actively traded equity securities listed on a domestic exchange generally are categorized in Level 1 of the fair value hierarchy. Non-U.S. equity securities generally are categorized in Level 2 of the fair value hierarchy despite the availability of quoted prices because, as described above, the fund evaluates and determines whether those quoted prices reflect fair value at the close of the NYSE or require adjustment. OTC Bulletin Board securities, certain preferred securities, and equity securities traded in inactive markets generally are categorized in Level 2 of the fair value hierarchy.
Debt securities generally are traded in the OTC market. Securities with remaining maturities of one year or more at the time of acquisition are valued at prices furnished by dealers who make markets in such securities or by an independent pricing service, which considers the yield or price of bonds of comparable quality, coupon, maturity, and type, as well as prices quoted by dealers who make markets in such securities. Generally, debt securities are categorized in Level 2 of the fair value hierarchy.
Investments in mutual funds are valued at the mutual fund’s closing NAV per share on the day of valuation and are categorized in Level 1 of the fair value hierarchy. Assets and liabilities other than financial instruments, including short-term receivables and payables, are carried at cost, or estimated realizable value, if less, which approximates fair value.
Thinly traded financial instruments and those for which the above valuation procedures are inappropriate or are deemed not to reflect fair value are stated at fair value as determined in good faith by the Valuation Committee. The objective of any fair value pricing determination is to arrive at a price that could reasonably be expected from a current sale. Financial instruments fair valued by the Valuation Committee are primarily private placements, restricted securities, warrants, rights, and other securities that are not publicly traded.
Subject to oversight by the Board, the Valuation Committee regularly makes good faith judgments to establish and adjust the fair valuations of certain securities as events occur and circumstances warrant. For instance, in determining the fair value of an equity investment with limited market activity, such as a private placement or a thinly traded public company stock, the Valuation Committee considers a variety of factors, which may include, but are not limited to, the issuer’s business prospects, its financial standing and performance, recent investment transactions in the issuer, new rounds of financing, negotiated transactions of significant size between other investors in the company, relevant market valuations of peer companies, strategic events affecting the company, market liquidity for the issuer, and general economic conditions and events. In consultation with the investment and pricing teams, the Valuation Committee will determine an appropriate valuation technique based on available information, which may include both observable and unobservable inputs. The Valuation Committee typically will afford greatest weight to actual prices in arm’s length transactions, to the extent they represent orderly transactions between market participants, transaction information can be reliably obtained, and prices are deemed representative of fair value. However, the Valuation Committee may also consider other valuation methods such as market-based valuation multiples; a discount or premium from market value of a similar, freely traded security of the same issuer; or some combination. Fair value determinations are reviewed on a regular basis and updated as information becomes available, including actual purchase and sale transactions of the issue. Because any fair value determination involves a significant amount of judgment, there is a degree of subjectivity inherent in such pricing decisions, and fair value prices determined by the Valuation Committee could differ from those of other market participants. Depending on the relative significance of unobservable inputs, including the valuation technique(s) used, fair valued securities may be categorized in Level 2 or 3 of the fair value hierarchy.
Valuation Inputs The following table summarizes the fund’s financial instruments, based on the inputs used to determine their fair values on December 31, 2016:
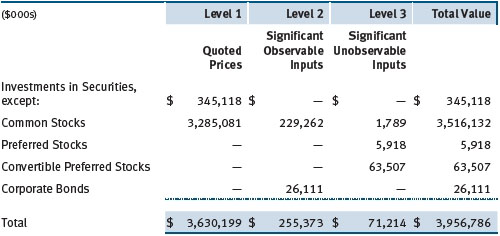
There were no material transfers between Levels 1 and 2 during the year ended December 31, 2016.
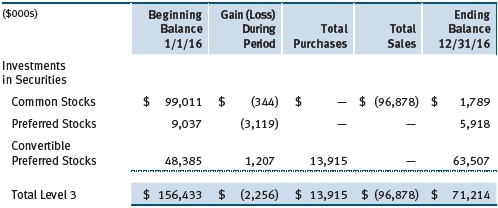
Following is a reconciliation of the fund’s Level 3 holdings for the year ended December 31, 2016. Gain (loss) reflects both realized and change in unrealized gain/loss on Level 3 holdings during the period, if any, and is included on the accompanying Statement of Operations. The change in unrealized gain/loss on Level 3 instruments held at December 31, 2016, totaled $(2,255,000) for the year ended December 31, 2016.
NOTE 3 - OTHER INVESTMENT TRANSACTIONS
Consistent with its investment objective, the fund engages in the following practices to manage exposure to certain risks and/or to enhance performance. The investment objective, policies, program, and risk factors of the fund are described more fully in the fund’s prospectus and Statement of Additional Information.
Emerging and Frontier Markets The fund may invest, either directly or through investments in T. Rowe Price institutional funds, in securities of companies located in, issued by governments of, or denominated in or linked to the currencies of emerging and frontier market countries; at period-end, approximately 10% of the fund’s net assets were invested in emerging markets and 2% in frontier markets. Emerging markets, and to a greater extent frontier markets, generally have economic structures that are less diverse and mature, and political systems that are less stable, than developed countries. These markets may be subject to greater political, economic, and social uncertainty and differing regulatory environments that may potentially impact the fund’s ability to buy or sell certain securities or repatriate proceeds to U.S. dollars. Such securities are often subject to greater price volatility, less liquidity, and higher rates of inflation than U.S. securities. Investing in frontier markets is significantly riskier than investing in other countries, including emerging markets.
Restricted Securities The fund may invest in securities that are subject to legal or contractual restrictions on resale. Prompt sale of such securities at an acceptable price may be difficult and may involve substantial delays and additional costs.
Securities Lending The fund may lend its securities to approved brokers to earn additional income. Its securities lending activities are administered by a lending agent in accordance with a securities lending agreement. Security loans generally do not have stated maturity dates, and the fund may recall a security at any time. The fund receives collateral in the form of cash or U.S. government securities, valued at 102% to 105% of the value of the securities on loan. Collateral is maintained over the life of the loan in an amount not less than the value of loaned securities; any additional collateral required due to changes in security values is delivered to the fund the next business day. Cash collateral is invested by the lending agent(s) in accordance with investment guidelines approved by fund management. Additionally, the lending agent indemnifies the fund against losses resulting from borrower default. Although risk is mitigated by the collateral and indemnification, the fund could experience a delay in recovering its securities and a possible loss of income or value if the borrower fails to return the securities, collateral investments decline in value, and the lending agent fails to perform. Securities lending revenue consists of earnings on invested collateral and borrowing fees, net of any rebates to the borrower, compensation to the lending agent, and other administrative costs. In accordance with GAAP, investments made with cash collateral are reflected in the accompanying financial statements, but collateral received in the form of securities is not. At December 31, 2016, there were no securities on loan.
Other Purchases and sales of portfolio securities other than short-term securities aggregated $2,760,569,000 and $3,030,681,000, respectively, for the year ended December 31, 2016.
NOTE 4 - FEDERAL INCOME TAXES
No provision for federal income taxes is required since the fund intends to continue to qualify as a regulated investment company under Subchapter M of the Internal Revenue Code and distribute to shareholders all of its taxable income and gains. Distributions determined in accordance with federal income tax regulations may differ in amount or character from net investment income and realized gains for financial reporting purposes. Financial reporting records are adjusted for permanent book/tax differences to reflect tax character but are not adjusted for temporary differences.
The fund files U.S. federal, state, and local tax returns as required. The fund’s tax returns are subject to examination by the relevant tax authorities until expiration of the applicable statute of limitations, which is generally three years after the filing of the tax return but which can be extended to six years in certain circumstances. Tax returns for open years have incorporated no uncertain tax positions that require a provision for income taxes.
Reclassifications between income and gain relate primarily to the offset of the current net operating loss against realized gains. For the year ended December 31, 2016, the following reclassifications were recorded to reflect tax character (there was no impact on results of operations or net assets):

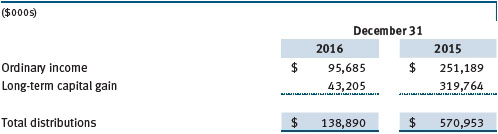
Distributions during the years ended December 31, 2016 and December 31, 2015, were characterized for tax purposes as follows:
At December 31, 2016, the tax-basis cost of investments and components of net assets were as follows:
The difference between book-basis and tax-basis net unrealized appreciation (depreciation) is attributable to the deferral of losses from wash sales for tax purposes. The fund intends to retain realized gains to the extent of available capital loss carryforwards. Because the fund is required to use capital loss carryforwards that do not expire before those with expiration dates, all or a portion of its capital loss carryforwards subject to expiration could ultimately go unused. During the year ended December 31, 2016, the fund utilized $977,000 of capital loss carryforwards. The fund’s available capital loss carryforwards as of December 31, 2016, all expire in fiscal 2017.
NOTE 5 - RELATED PARTY TRANSACTIONS
The fund is managed by T. Rowe Price Associates, Inc. (Price Associates), a wholly owned subsidiary of T. Rowe Price Group, Inc. (Price Group). The investment management agreement between the fund and Price Associates provides for an annual investment management fee, which is computed daily and paid monthly. The fee consists of an individual fund fee, equal to 0.35% of the fund’s average daily net assets, and a group fee. The group fee rate is calculated based on the combined net assets of certain mutual funds sponsored by Price Associates (the group) applied to a graduated fee schedule, with rates ranging from 0.48% for the first $1 billion of assets to 0.270% for assets in excess of $500 billion. The fund’s group fee is determined by applying the group fee rate to the fund’s average daily net assets. At December 31, 2016, the effective annual group fee rate was 0.29%.
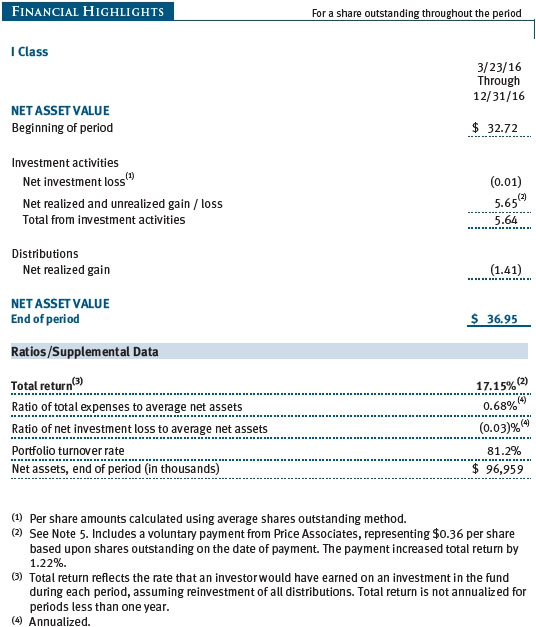
The I Class is subject to an operating expense limitation (I Class limit) pursuant to which Price Associates is contractually required to pay all operating expenses of the I Class, excluding management fees, interest, expenses related to borrowings, taxes, and brokerage, and other non-recurring expenses permitted by the investment management agreement, to the extent such operating expenses, on an annualized basis, exceed 0.05% of average net assets. This agreement will continue until April 30, 2018, and may be renewed, revised, or revoked only with approval of the fund’s Board. The I Class is required to repay Price Associates for expenses previously paid to the extent the class’s net assets grow or expenses decline sufficiently to allow repayment without causing the class’s operating expenses to exceed the I Class limit in effect at the time of the waiver. However, no repayment will be made more than three years after the date of a payment or waiver. For the year ended December 31, 2016, the I Class operated below its expense limitation.
In addition, the fund has entered into service agreements with Price Associates and two wholly owned subsidiaries of Price Associates (collectively, Price). Price Associates provides certain accounting and administrative services to the fund. T. Rowe Price Services, Inc., provides shareholder and administrative services in its capacity as the fund’s transfer and dividend-disbursing agent. T. Rowe Price Retirement Plan Services, Inc., provides subaccounting and recordkeeping services for certain retirement accounts invested in the Investor Class and I Class. For the year ended December 31, 2016, expenses incurred pursuant to these service agreements were $67,000 for Price Associates; $2,639,000 for T. Rowe Price Services, Inc.; and $1,253,000 for T. Rowe Price Retirement Plan Services, Inc. The total amount payable at period-end pursuant to these service agreements is reflected as Due to Affiliates in the accompanying financial statements.
Additionally, the fund is one of several mutual funds in which certain college savings plans managed by Price Associates may invest. As approved by the fund’s Board of Directors, shareholder servicing costs associated with each college savings plan are borne by the fund in proportion to the average daily value of its shares owned by the college savings plan. For the year ended December 31, 2016, the fund was charged $62,000 for shareholder servicing costs related to the college savings plans, of which $31,000 was for services provided by Price. The amount payable at period-end pursuant to this agreement is reflected as Due to Affiliates in the accompanying financial statements. At December 31, 2016, approximately 1% of the outstanding shares of the Investor Class were held by college savings plans.
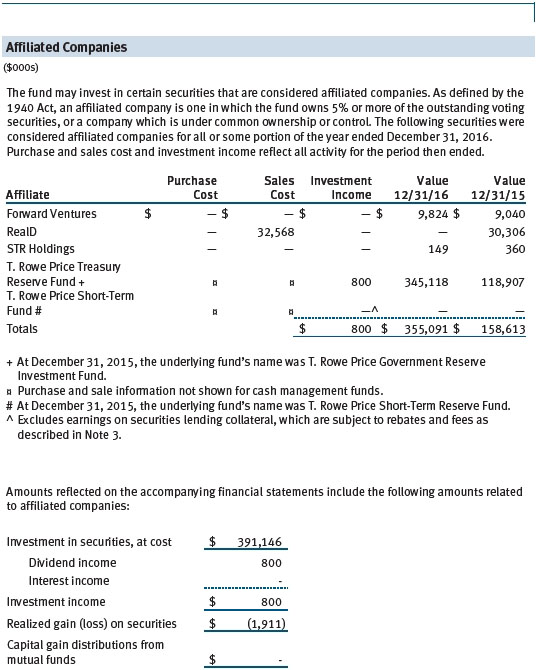
The fund may invest in the T. Rowe Price Government Reserve Fund, the T. Rowe Price Treasury Reserve Fund, or the T. Rowe Price Short-Term Fund (collectively, the Price Reserve Funds), open-end management investment companies managed by Price Associates and considered affiliates of the fund. The Price Reserve Funds are offered as short-term investment options to mutual funds, trusts, and other accounts managed by Price Associates or its affiliates and are not available for direct purchase by members of the public. The Price Reserve Funds pay no investment management fees.
As of December 31, 2016, T. Rowe Price Group, Inc., or its wholly owned subsidiaries owned 7,641 shares of the I Class, representing less than 1% of the I Class’s net assets.
The fund may participate in securities purchase and sale transactions with other funds or accounts advised by Price Associates (cross trades), in accordance with procedures adopted by the fund’s Board and Securities and Exchange Commission rules, which require, among other things, that such purchase and sale cross trades be effected at the independent current market price of the security. During the year ended December 31, 2016, the fund had no purchases or sales cross trades with other funds or accounts advised by Price Associates.
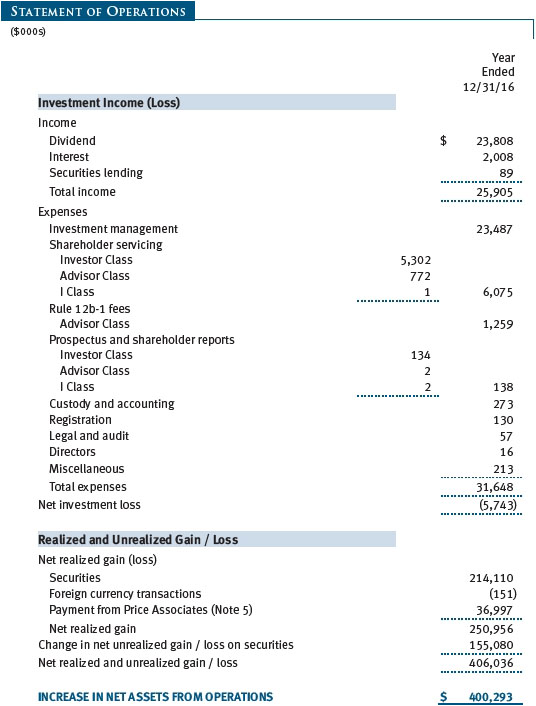
On June 6, 2016, Price Associates offered, and the fund’s Board of Directors accepted, a voluntary payment to compensate the fund for a loss of value on its investment in Dell as a result of the fund’s ineligibility to pursue an appraisal action in Delaware court due to a proxy voting error in 2013 (the Offer). The payment from Price Associates was received in cash on June 10, 2016. Subsequently, a final settlement to the appraisal action was negotiated with Dell, pursuant to which the fund received the original merger consideration plus negotiated interest. The negotiated interest, net of contingent legal fees, approximated $0.75 per Dell share and was received by the fund on June 30; the original merger consideration was received on July 1. The settlement from Dell is reflected as realized gain/loss on securities in the accompanying financial statements. The payment from Price Associates, reduced by the settlement from Dell in accordance with the terms of the Offer, was $36,997,000 and increased the total return by 1.16%, 1.13%, and 1.22% for the Investor Class, Advisor Class, and I Class, respectively for the year ended December 31, 2016. An appeal is currently pending; the amount paid by Price Associates may be further increased or decreased in the future, in the event there is a court-determined change in the fair valuation of Dell shares on appeal, or payment is received by the fund from any other source to compensate for the loss of value on its Dell shares.
| Report of Independent Registered Public Accounting Firm |
To the Board of Directors and Shareholders of
T. Rowe Price Science & Technology Fund, Inc.
In our opinion, the accompanying statement of assets and liabilities, including the portfolio of investments, and the related statements of operations and of changes in net assets and the financial highlights present fairly, in all material respects, the financial position of T. Rowe Price Science & Technology Fund, Inc. (the “Fund”) as of December 31, 2016, the results of its operations, the changes in its net assets and the financial highlights for each of the periods indicated therein, in conformity with accounting principles generally accepted in the United States of America. These financial statements and financial highlights (hereafter referred to as “financial statements”) are the responsibility of the Fund’s management. Our responsibility is to express an opinion on these financial statements based on our audits. We conducted our audits of these financial statements in accordance with the standards of the Public Company Accounting Oversight Board (United States). Those standards require that we plan and perform the audit to obtain reasonable assurance about whether the financial statements are free of material misstatement. An audit includes examining, on a test basis, evidence supporting the amounts and disclosures in the financial statements, assessing the accounting principles used and significant estimates made by management, and evaluating the overall financial statement presentation. We believe that our audits, which included confirmation of securities as of December 31, 2016 by correspondence with the custodian and brokers, and confirmation of the underlying fund by correspondence with the transfer agent, provide a reasonable basis for our opinion.
PricewaterhouseCoopers LLP
Baltimore, Maryland
February 16, 2017
| Tax Information (Unaudited) for the Tax Year Ended 12/31/16 |
We are providing this information as required by the Internal Revenue Code. The amounts shown may differ from those elsewhere in this report because of differences between tax and financial reporting requirements.
The fund’s distributions to shareholders included:
| ● | $95,686,000 from short-term capital gains, |
| ● | $43,205,000 from long-term capital gains, subject to a long-term capital gains tax rate of not greater than 20%. |
For taxable non-corporate shareholders, $21,612,000 of the fund’s income represents qualified dividend income subject to a long-term capital gains tax rate of not greater than 20%.
For corporate shareholders, $16,123,000 of the fund’s income qualifies for the dividends-received deduction.
| Information on Proxy Voting Policies, Procedures, and Records |
A description of the policies and procedures used by T. Rowe Price funds and portfolios to determine how to vote proxies relating to portfolio securities is available in each fund’s Statement of Additional Information. You may request this document by calling 1-800-225-5132 or by accessing the SEC’s website, sec.gov.
The description of our proxy voting policies and procedures is also available on our corporate website. To access it, please visit the following Web page:
https://www3.troweprice.com/usis/corporate/en/utility/policies.html
Scroll down to the section near the bottom of the page that says, “Proxy Voting Policies.” Click on the Proxy Voting Policies link in the shaded box.
Each fund’s most recent annual proxy voting record is available on our website and through the SEC’s website. To access it through T. Rowe Price, visit the website location shown above, and scroll down to the section near the bottom of the page that says, “Proxy Voting Records.” Click on the Proxy Voting Records link in the shaded box.
| How to Obtain Quarterly Portfolio Holdings |
The fund files a complete schedule of portfolio holdings with the Securities and Exchange Commission for the first and third quarters of each fiscal year on Form N-Q. The fund’s Form N-Q is available electronically on the SEC’s website (sec.gov); hard copies may be reviewed and copied at the SEC’s Public Reference Room, 100 F St. N.E., Washington, DC 20549. For more information on the Public Reference Room, call 1-800-SEC-0330.
| About the Fund’s Directors and Officers |
Your fund is overseen by a Board of Directors (Board) that meets regularly to review a wide variety of matters affecting or potentially affecting the fund, including performance, investment programs, compliance matters, advisory fees and expenses, service providers, and business and regulatory affairs. The Board elects the fund’s officers, who are listed in the final table. At least 75% of the Board’s members are independent of T. Rowe Price Associates, Inc. (T. Rowe Price), and its affiliates; “inside” or “interested” directors are employees or officers of T. Rowe Price. The business address of each director and officer is 100 East Pratt Street, Baltimore, Maryland 21202. The Statement of Additional Information includes additional information about the fund directors and is available without charge by calling a T. Rowe Price representative at 1-800-638-5660.
Independent Directors
| Name | ||
| (Year of Birth) | ||
| Year Elected* | ||
| [Number of T. Rowe Price | Principal Occupation(s) and Directorships of Public Companies and | |
| Portfolios Overseen] | Other Investment Companies During the Past Five Years | |
| William R. Brody, M.D., Ph.D. | President and Trustee, Salk Institute for Biological Studies (2009 to | |
| (1944) | present); Director, BioMed Realty Trust (2013 to 2016); Chairman | |
| 2009 | of the Board, Mesa Biotech, a molecular diagnostic company | |
| [187] | (March 2016 to present); Director, Radiology Partners, an integrated | |
| radiology practice management company (June 2016 to present); | ||
| Director, Novartis, Inc. (2009 to 2014); Director, IBM (2007 | ||
| to present) | ||
| Anthony W. Deering | Chairman, Exeter Capital, LLC, a private investment firm (2004 | |
| (1945) | to present); Director, Brixmor Real Estate Investment Trust (2012 | |
| 2001 | to present); Director and Advisory Board Member, Deutsche | |
| [187] | Bank North America (2004 to present); Director, Under Armour | |
| (2008 to present); Director, Vornado Real Estate Investment Trust | ||
| (2004 to 2012) | ||
| Bruce W. Duncan | Chief Executive Officer and Director (2009 to present), Chairman | |
| (1951) | of the Board (January 2016 to present), and President (2009 | |
| 2013 | to September 2016), First Industrial Realty Trust, an owner and | |
| [187] | operator of industrial properties; Chairman of the Board (2005 to | |
| May 2016) and Director (1999 to May 2016), Starwood Hotels & | ||
| Resorts, a hotel and leisure company; Director, Boston Properties | ||
| (May 2016 to present) | ||
| Robert J. Gerrard, Jr. | Advisory Board Member, Pipeline Crisis/Winning Strategies, a | |
| (1952) | collaborative working to improve opportunities for young African | |
| 2012 | Americans (1997 to present) | |
| [187] | ||
| Paul F. McBride | Advisory Board Member, Vizzia Technologies (2015 to present) | |
| (1956) | ||
| 2013 | ||
| [187] | ||
| Cecilia E. Rouse, Ph.D. | Dean, Woodrow Wilson School (2012 to present); Professor and | |
| (1963) | Researcher, Princeton University (1992 to present); Director, MDRC, | |
| 2012 | a nonprofit education and social policy research organization (2011 | |
| [187] | to present); Member of National Academy of Education (2010 to | |
| present); Research Associate of Labor Program (2011 to present) | ||
| and Board Member (2015 to present), National Bureau of Economic | ||
| Research (2011 to present); Chair of Committee on the Status of | ||
| Minority Groups in the Economic Profession (2012 to present) and | ||
| Vice President (2015 to present), American Economic Association | ||
| John G. Schreiber | Owner/President, Centaur Capital Partners, Inc., a real estate | |
| (1946) | investment company (1991 to present); Cofounder, Partner, and | |
| 2001 | Cochairman of the Investment Committee, Blackstone Real Estate | |
| [187] | Advisors, L.P. (1992 to 2015); Director, General Growth Properties, | |
| Inc. (2010 to 2013); Director, Blackstone Mortgage Trust, a real | ||
| estate finance company (2012 to 2016); Director and Chairman of | ||
| the Board, Brixmor Property Group, Inc. (2013 to present); Director, | ||
| Hilton Worldwide (2013 to present); Director, Hudson Pacific | ||
| Properties (2014 to 2016) | ||
| Mark R. Tercek | President and Chief Executive Officer, The Nature Conservancy | |
| (1957) | (2008 to present) | |
| 2009 | ||
| [187] | ||
| *Each independent director serves until retirement, resignation, or election of a successor. | ||
Inside Directors
| Name | ||
| (Year of Birth) | ||
| Year Elected* | ||
| [Number of T. Rowe Price | Principal Occupation(s) and Directorships of Public Companies and | |
| Portfolios Overseen] | Other Investment Companies During the Past Five Years | |
| Edward C. Bernard | Director and Vice President, T. Rowe Price; Vice Chairman of the | |
| (1956) | Board, Director, and Vice President, T. Rowe Price Group, Inc.; | |
| 2006 | Chairman of the Board, Director, and President, T. Rowe Price | |
| [187] | Investment Services, Inc.; Chairman of the Board and Director, | |
| T. Rowe Price Retirement Plan Services, Inc., and T. Rowe Price | ||
| Services, Inc.; Chairman of the Board, Chief Executive Officer, | ||
| Director, and President, T. Rowe Price International and T. Rowe | ||
| Price Trust Company; Chairman of the Board, all funds | ||
| Brian C. Rogers, CFA, CIC | Chief Investment Officer, Director, and Vice President, T. Rowe | |
| (1955) | Price; Chairman of the Board, Chief Investment Officer, Director, and | |
| 2013 | Vice President, T. Rowe Price Group, Inc.; Vice President, T. Rowe | |
| [131] | Price Trust Company; Director, United Technologies (January 2016 | |
| to present) | ||
| *Each inside director serves until retirement, resignation, or election of a successor. | ||
Officers
| Name (Year of Birth) | ||
| Position Held With Science & Technology Fund | Principal Occupation(s) | |
| Kennard W. Allen (1977) | Vice President, T. Rowe Price and T. Rowe Price | |
| President | Group, Inc. | |
| Brian W.H. Berghuis, CFA (1958) | Vice President, T. Rowe Price, T. Rowe Price | |
| Vice President | Group, Inc., and T. Rowe Price Trust Company | |
| Darrell N. Braman (1963) | Vice President, Price Hong Kong, Price | |
| Vice President and Secretary | Singapore, T. Rowe Price, T. Rowe Price Group, | |
| Inc., T. Rowe Price International, T. Rowe Price | ||
| Investment Services, Inc., and T. Rowe Price | ||
| Services, Inc. | ||
| Gregory Dunham, CFA (1974) | Vice President, T. Rowe Price and T. Rowe Price | |
| Vice President | Group, Inc.; formerly, Analyst, Goldman Sachs | |
| (to 2015) | ||
| David J. Eiswert, CFA (1972) | Vice President, T. Rowe Price, T. Rowe Price | |
| Vice President | Group, Inc., and T. Rowe Price International | |
| John R. Gilner (1961) | Chief Compliance Officer and Vice President, | |
| Chief Compliance Officer | T. Rowe Price; Vice President, T. Rowe Price | |
| Group, Inc., and T. Rowe Price Investment | ||
| Services, Inc. | ||
| Paul D. Greene II (1978) | Vice President, T. Rowe Price and T. Rowe Price | |
| Vice President | Group, Inc. | |
| Paul J. Krug, CPA (1964) | Vice President, T. Rowe Price, T. Rowe Price | |
| Vice President | Group, Inc., and T. Rowe Price Trust Company | |
| Catherine D. Mathews (1963) | Vice President, T. Rowe Price, T. Rowe Price | |
| Treasurer and Vice President | Group, Inc., and T. Rowe Price Trust Company | |
| Tobias F. Mueller (1980) | Vice President, T. Rowe Price Group, Inc., and | |
| Vice President | T. Rowe Price International | |
| David Oestreicher (1967) | Director, Vice President, and Secretary, | |
| Vice President | T. Rowe Price Investment Services, Inc., T. Rowe | |
| Price Retirement Plan Services, Inc., T. Rowe | ||
| Price Services, Inc., and T. Rowe Price Trust | ||
| Company; Chief Legal Officer, Vice President, | ||
| and Secretary, T. Rowe Price Group, Inc.; Vice | ||
| President and Secretary, T. Rowe Price and | ||
| T. Rowe Price International; Vice President, | ||
| Price Hong Kong and Price Singapore | ||
| John W. Ratzesberger (1975) | Vice President, T. Rowe Price, T. Rowe Price | |
| Vice President | Group, Inc., and T. Rowe Price Trust Company; | |
| formerly, North American Head of Listed | ||
| Derivatives Operation, Morgan Stanley | ||
| (to 2013) | ||
| Shannon H. Rauser (1987) | Employee, T. Rowe Price | |
| Assistant Secretary | ||
| Emily C. Scudder, CFA, CPA (1985) | Employee, T. Rowe Price; formerly, student, The | |
| Vice President | Wharton School, University of Pennsylvania (to | |
| 2015); Equity Research Associate, BMO Capital | ||
| Markets (to 2013) | ||
| Deborah D. Seidel (1962) | Vice President, T. Rowe Price, T. Rowe Price | |
| Vice President | Group, Inc., T. Rowe Price Investment Services, | |
| Inc., and T. Rowe Price Services, Inc. | ||
| Joshua K. Spencer, CFA (1973) | Vice President, T. Rowe Price and T. Rowe Price | |
| Vice President | Group, Inc. | |
| Alan Tu (1985) | Vice President, T. Rowe Price; formerly, summer | |
| Vice President | intern, T. Rowe Price (to 2013); student, | |
| University of Chicago Booth School of Business | ||
| (to 2014); Analyst, Ananda Capital Management | ||
| (to 2012) | ||
| Thomas H. Watson (1977) | Vice President, T. Rowe Price and T. Rowe Price | |
| Vice President | Group, Inc. | |
| Alison Mei Ling Yip (1966) | Vice President, Price Hong Kong and T. Rowe | |
| Vice President | Price Group, Inc. | |
| Unless otherwise noted, officers have been employees of T. Rowe Price or T. Rowe Price International for at least 5 years. | ||
Item 2. Code of Ethics.
The registrant has adopted a code of ethics, as defined in Item 2 of Form N-CSR, applicable to its principal executive officer, principal financial officer, principal accounting officer or controller, or persons performing similar functions. A copy of this code of ethics is filed as an exhibit to this Form N-CSR. No substantive amendments were approved or waivers were granted to this code of ethics during the period covered by this report.
Item 3. Audit Committee Financial Expert.
The registrant’s Board of Directors/Trustees has determined that Mr. Bruce W. Duncan qualifies as an audit committee financial expert, as defined in Item 3 of Form N-CSR. Mr. Duncan is considered independent for purposes of Item 3 of Form N-CSR.
Item 4. Principal Accountant Fees and Services.
(a) – (d) Aggregate fees billed for the last two fiscal years for professional services rendered to, or on behalf of, the registrant by the registrant’s principal accountant were as follows:
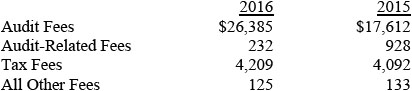
Audit fees include amounts related to the audit of the registrant’s annual financial statements and services normally provided by the accountant in connection with statutory and regulatory filings. Audit-related fees include amounts reasonably related to the performance of the audit of the registrant’s financial statements and specifically include the issuance of a report on internal controls and, if applicable, agreed-upon procedures related to fund acquisitions. Tax fees include amounts related to services for tax compliance, tax planning, and tax advice. The nature of these services specifically includes the review of distribution calculations and the preparation of Federal, state, and excise tax returns. All other fees include the registrant’s pro-rata share of amounts for agreed-upon procedures in conjunction with service contract approvals by the registrant’s Board of Directors/Trustees.
(e)(1) The registrant’s audit committee has adopted a policy whereby audit and non-audit services performed by the registrant’s principal accountant for the registrant, its investment adviser, and any entity controlling, controlled by, or under common control with the investment adviser that provides ongoing services to the registrant require pre-approval in advance at regularly scheduled audit committee meetings. If such a service is required between regularly scheduled audit committee meetings, pre-approval may be authorized by one audit committee member with ratification at the next scheduled audit committee meeting. Waiver of pre-approval for audit or non-audit services requiring fees of a de minimis amount is not permitted.
(2) No services included in (b) – (d) above were approved pursuant to paragraph (c)(7)(i)(C) of Rule 2-01 of Regulation S-X.
(f) Less than 50 percent of the hours expended on the principal accountant’s engagement to audit the registrant’s financial statements for the most recent fiscal year were attributed to work performed by persons other than the principal accountant’s full-time, permanent employees.
(g) The aggregate fees billed for the most recent fiscal year and the preceding fiscal year by the registrant’s principal accountant for non-audit services rendered to the registrant, its investment adviser, and any entity controlling, controlled by, or under common control with the investment adviser that provides ongoing services to the registrant were $2,146,000 and $2,158,000, respectively.
(h) All non-audit services rendered in (g) above were pre-approved by the registrant’s audit committee. Accordingly, these services were considered by the registrant’s audit committee in maintaining the principal accountant’s independence.
Item 5. Audit Committee of Listed Registrants.
Not applicable.
Item 6. Investments.
(a) Not applicable. The complete schedule of investments is included in Item 1 of this Form N-CSR.
(b) Not applicable.
Item 7. Disclosure of Proxy Voting Policies and Procedures for Closed-End Management Investment Companies.
Not applicable.
Item 8. Portfolio Managers of Closed-End Management Investment Companies.
Not applicable.
Item 9. Purchases of Equity Securities by Closed-End Management Investment Company and Affiliated Purchasers.
Not applicable.
Item 10. Submission of Matters to a Vote of Security Holders.
Not applicable.
Item 11. Controls and Procedures.
(a) The registrant’s principal executive officer and principal financial officer have evaluated the registrant’s disclosure controls and procedures within 90 days of this filing and have concluded that the registrant’s disclosure controls and procedures were effective, as of that date, in ensuring that information required to be disclosed by the registrant in this Form N-CSR was recorded, processed, summarized, and reported timely.
(b) The registrant’s principal executive officer and principal financial officer are aware of no change in the registrant’s internal control over financial reporting that occurred during the registrant’s second fiscal quarter covered by this report that has materially affected, or is reasonably likely to materially affect, the registrant’s internal control over financial reporting.
Item 12. Exhibits.
(a)(1) The registrant’s code of ethics pursuant to Item 2 of Form N-CSR is attached.
(2) Separate certifications by the registrant's principal executive officer and principal financial officer, pursuant to Section 302 of the Sarbanes-Oxley Act of 2002 and required by Rule 30a-2(a) under the Investment Company Act of 1940, are attached.
(3) Written solicitation to repurchase securities issued by closed-end companies: not applicable.
(b) A certification by the registrant's principal executive officer and principal financial officer, pursuant to Section 906 of the Sarbanes-Oxley Act of 2002 and required by Rule 30a-2(b) under the Investment Company Act of 1940, is attached.
SIGNATURES
Pursuant to the requirements of the Securities Exchange Act of 1934 and the Investment Company Act of 1940, the registrant has duly caused this report to be signed on its behalf by the undersigned, thereunto duly authorized.
T. Rowe Price Science & Technology Fund, Inc.
| By | /s/ Edward C. Bernard | |
| Edward C. Bernard | ||
| Principal Executive Officer | ||
| Date February 16, 2017 | ||
Pursuant to the requirements of the Securities Exchange Act of 1934 and the Investment Company Act of 1940, this report has been signed below by the following persons on behalf of the registrant and in the capacities and on the dates indicated.
| By | /s/ Edward C. Bernard | |
| Edward C. Bernard | ||
| Principal Executive Officer | ||
| Date February 16, 2017 | ||
| By | /s/ Catherine D. Mathews | |
| Catherine D. Mathews | ||
| Principal Financial Officer | ||
| Date February 16, 2017 | ||