UNITED STATES
SECURITIES AND EXCHANGE COMMISSION
Washington, D.C. 20549
FORM N-CSR
CERTIFIED SHAREHOLDER REPORT OF REGISTERED
MANAGEMENT INVESTMENT COMPANIES
Investment Company Act File Number: 811-05299
| T. Rowe Price Science & Technology Fund, Inc. |
| (Exact name of registrant as specified in charter) |
| 100 East Pratt Street, Baltimore, MD 21202 |
| (Address of principal executive offices) |
| David Oestreicher |
| 100 East Pratt Street, Baltimore, MD 21202 |
| (Name and address of agent for service) |
Registrant’s telephone number, including area code: (410) 345-2000
Date of fiscal year end: December 31
Date of reporting period: June 30, 2016
Item 1. Report to Shareholders
 |
| Science & Technology Fund | June 30, 2016 |
The views and opinions in this report were current as of June 30, 2016. They are not guarantees of performance or investment results and should not be taken as investment advice. Investment decisions reflect a variety of factors, and the managers reserve the right to change their views about individual stocks, sectors, and the markets at any time. As a result, the views expressed should not be relied upon as a forecast of the fund’s future investment intent. The report is certified under the Sarbanes-Oxley Act, which requires mutual funds and other public companies to affirm that, to the best of their knowledge, the information in their financial reports is fairly and accurately stated in all material respects.
REPORTS ON THE WEB
Sign up for our Email Program, and you can begin to receive updated fund reports and prospectuses online rather than through the mail. Log in to your account at troweprice.com for more information.
Manager’s Letter
Fellow Shareholders
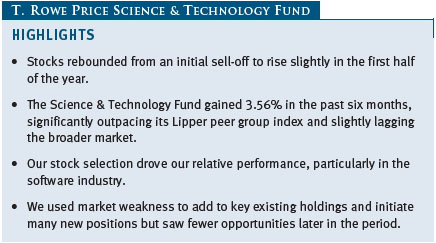
Technology stocks rebounded from a sharp sell-off to end the first half of 2016 about flat with where they entered the year. In this environment, your fund fared well, generating gains on the back of a handful of standout performers. Entering the year, we were finding it challenging to identify many stocks, particularly prospective new positions, we felt offered outstanding opportunities. With markets falling sharply early in the year, though, we added greatly to holdings in many quality growth companies whose lower stock prices offered opportunities. I think market downdrafts are often the best test of investors, and I am pleased with the rigorous and insightful work our team did to continue vetting existing holdings and unearthing especially attractive new ones. These efforts were rewarded by strong performance in the market rebound.
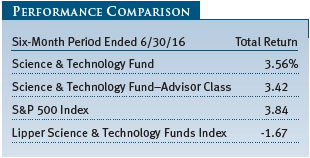
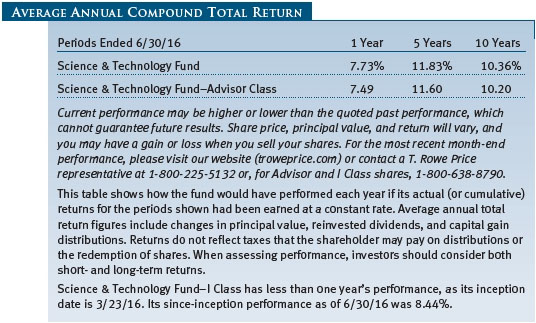
Your fund returned 3.56% in the six months ended June 30, 2016, outperforming its Lipper peer group index and slightly lagging the broad S&P 500 Index. (Returns for the Advisor Class shares were slightly lower, reflecting a different cost structure.) Our performance benefited from favorable stock picking in software, semiconductors, and U.S.-based Internet. Performance was hurt by the weak performance of several China-based Internet holdings. The fund’s performance compared highly favorable with its peers. (Based on cumulative total return, Lipper ranked the Science & Technology Fund 9 of 157, 16 of 146, 31 of 139, and 17 of 117 science & technology funds for the 1-, 3-, 5-, and 10-year periods ended June 30, 2016, respectively. Past performance cannot guarantee future results.)
MARKET ENVIRONMENT
Stocks were resilient in the first half, recovering from an early-year swoon to generate modest gains. The poor start to the year was due to many of the same concerns that brought the market off of its highs in late 2015: Worries about the challenges of the Chinese economy as it transitions from an export focus to domestic sources of growth, a further plunge in oil prices, and fears that the strong U.S. dollar and weak export markets would derail the U.S. economy. Some reassuring news on all three counts later in the spring helped the markets regain their momentum, however, and most of the major benchmarks reached their highest levels in roughly a year by early June. Britain’s surprising vote to leave the European Union caused a brief market decline at the end of our reporting period, but most stocks quickly regained their footing.
Technology stocks lagged the broader market as they were unable to recover the entirety of their lost ground; indeed, the technology-heavy Nasdaq Composite ended June as the sole index in negative territory for the year to date. Acquisition activity remained substantial, driving large gains for many acquired companies and providing technology stocks somewhat of a ballast of valuation support that helped offset the dampening effect of economic headwinds. Among the significant industry segments in our Lipper benchmark, semiconductor and telecom-oriented shares performed best, while stocks related to health care technology and hardware shares suffered the biggest losses.
PORTFOLIO REVIEW
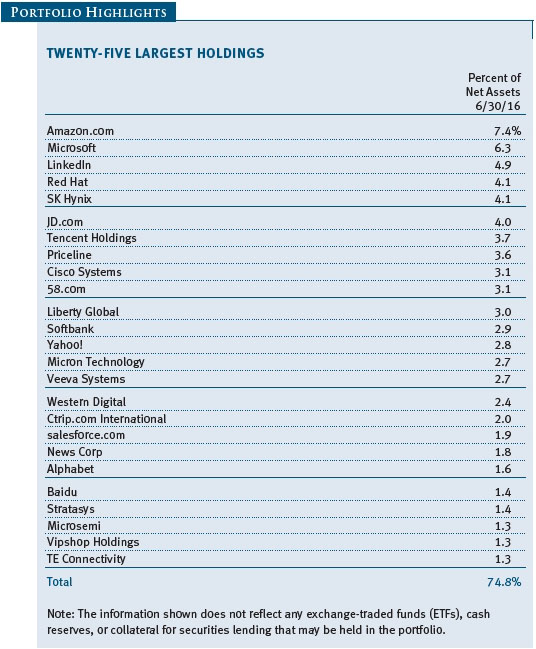
Technology is a fast-changing industry that, in recent years, has accelerated to a new level of velocity. This has been driven by the global and continuous availability of the Internet and all it provides, including via mobile devices. Countless websites, mobile applications, and other online services are available almost instantaneously to billions of people. This explosive growth has given rise to many of the most valuable and innovative companies in the world, including Google (now Alphabet), Amazon.com, and Facebook. (Please refer to the portfolio of investments for a complete list of holdings and the amount each represents in the portfolio.)
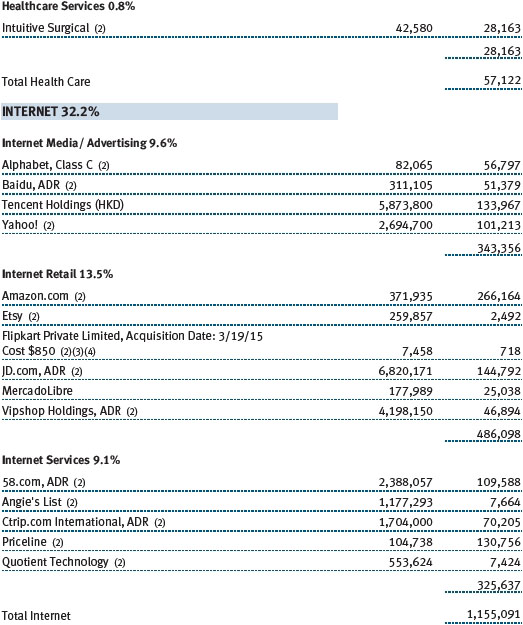
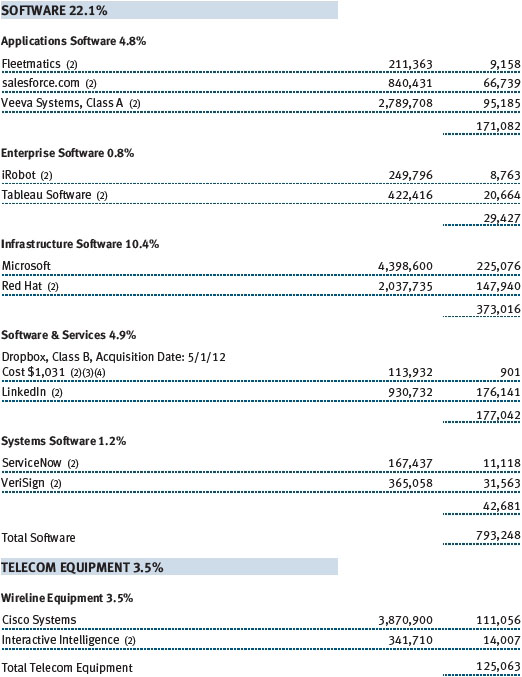
Inside companies in all industries, information technology leaders have begun to reimagine how they use technology in response to the innovations and promise of cloud computing offerings, such as Amazon Web Services, Microsoft Azure, and salesforce.com. As the next era of technology, cloud computing offers great potential rewards for nimble and innovative companies while posing great risks for slow-moving incumbents, even longstanding industry leaders. We continue to own many Internet and cloud computing leaders, although we remain selective in focusing on those that we believe offer attractive valuations. This has led us to emphasize Amazon and Microsoft in cloud computing and, in Internet, several China-based companies, including Tencent Holdings and JD.com.
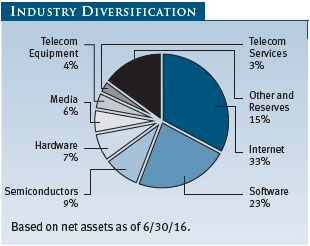
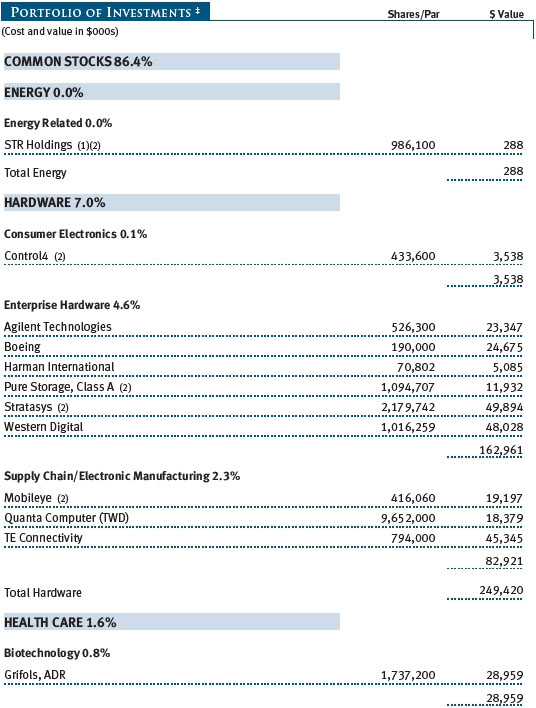
The fund remains diversified across the principal segments of science and technology. At the end of June, Internet accounted for 33% of the portfolio, software was 23%, semiconductors were 9%, and hardware was 7%. We had smaller positions in telecom equipment (4%) and telecom services (3%). For the six-month period, we saw our strongest returns from software and semiconductors, while our Internet holdings declined due to weakness in China holdings.
Our biggest contributor to performance in the first half was LinkedIn, which was one of our largest purchases following its pronounced decline early in the year. LinkedIn announced an agreement to be acquired by Microsoft for a 50% premium to its prior closing price. We have had a high regard for LinkedIn’s combination of leading network for professionals and leading software-as-a-service business, and while we did not expect an acquisition, we were not surprised that Microsoft and another bidder—according to regulatory filings—were eager to combine it with their businesses.
After an extraordinary 2015, Amazon was again a top contributor. As we have frequently discussed, Amazon is unique among the large universe of stocks within which we invest. Its retail business is rapidly gaining share of a market sized in the multi-trillions of dollars while Amazon Web Services, which boasts a notably large share of the cloud market, has the potential to become its most valuable business. Amazon’s chief rival in cloud computing is Microsoft, which is leveraging its vast software capabilities and large customer base into early success with its Azure public cloud offerings. Amazon, being our top position, and Microsoft, our number two, are reflective of our view that they will be outsized beneficiaries in the cloud computing era as customers concentrate their spending with a small number of massive, heavily resourced providers. Accordingly, we remain comfortable not owning most traditional technology leaders.
Veeva Systems, which provides customer relationship management and content management software to life sciences companies, performed notably well on the back of impressive quarterly results. Our large position in Veeva is indicative of my approach to investing in high-growth companies. I am focused on owning those growth companies I believe have both lasting competitive advantage and attractive stock prices. For various reasons, Veeva had not, until recently, been anointed by the stock market as a winning growth stock. When the consensus view changed, we earned strong returns even as many of its peers struggled under the weight of very high valuations. Among these was ServiceNow, which we had recently avoided based on our view that it was fully valued. After the stock declined following a disappointing earnings report, we initiated a position.
Our holding that appreciated the most was automotive safety technology provider Mobileye, which rose more than 60% after we initiated a position. As the dream of cars that can drive themselves—so-called autonomous driving—and do so more safely than human drivers moves briskly toward reality, Mobileye’s vision-based technology and impressive roster of automaker customers positions it as a potential key beneficiary. We moderated the position given a fuller valuation after its strong performance. Tesla Motors is arguably the prime mover within the pursuit of autonomous driving. Given our optimism in its autonomous potential within its broader propagation of electric vehicles, we maintain a position in Tesla, although we moderated the position late in the period.
Chinese Internet stocks have continued to be an important part of the portfolio but have been disappointing, with online retailer JD.com, online apparel retailer Vipshop Holdings, and online classifieds leader 58.com our three biggest detractors. A notable bright spot was messaging and social networking platform provider Tencent, until recently our largest holding in the area. While there are various dynamics at play, both economic and company-specific, we remain confident that online commerce and advertising in China will continue growing rapidly given that their share of the market is still fairly low versus physical alternatives. We also believe that our holdings will maintain their leading competitive positions, grow faster, and become more profitable than their valuations—which are well below those of comparable companies outside of China—currently reflect. I look forward to reporting hopefully better news on these stocks in future letters.
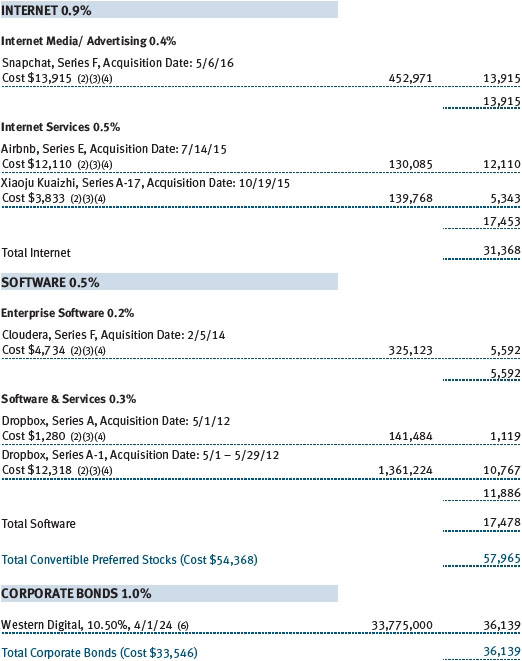
In our pursuit of the best investments at a time when I view opportunities as less abundant than in recent years, I am casting a wide net to find new ideas. One new position particularly reflective of my broadened search is a Western Digital 10.5% coupon bond issued to finance its acquisition of SanDisk. In assessing this opportunity, we augmented our view of Western Digital as an existing equity position with the expertise of our fixed income investment colleagues to conclude that the company’s credit quality was better than the bond reflected. The price of the bond has appreciated nearly 10% in three months, an unusually strong appreciation for an investment that carried lower risk than a typical equity investment.
STRATEGY REVIEW AND OUTLOOK
Despite technology stocks’ lackluster performance in the first half of 2016, many stocks enjoyed strong gains, including some of our key holdings. Our performance benefited from opportunistic additions to existing holdings in the early-year market decline. Many of these, including LinkedIn, Amazon, Micron Technology, salesforce.com, Veeva, and Yahoo! recovered more than 30% from their lows. As discussed, we are recently finding fewer compelling opportunities. Nevertheless, I am particularly optimistic about our large positions in Amazon, Microsoft, JD.com, Red Hat, SK Hynix, and 58.com, and I see promise in new positions NXP Semiconductors and Harman.
As I have discussed in past letters, we are dually focused on successfully evaluating industry trends and companies’ particular attributes with a multiyear view. In that effort, our analysts are chartered with being experts on their industries and companies. Our consistent collaboration on key trends bolsters the knowledge of each of us and makes us better able to effectively ascertain the implications of the key trends on our companies. The combination of high-level and company-specific insights our team provides is invaluable to my efforts to identify the best stocks to own.
While it gives me pause to currently be seeing limited opportunities, the strength of our team and longer-term approach continue to make me confident we will serve you well over time. Thank you for your support.
Respectfully submitted,
Kennard W. Allen
President of the fund and chairman of its Investment Advisory Committee
July 25, 2016
The committee chairman has day-to-day responsibility for managing the portfolio and works with committee members in developing and executing the fund’s investment program.
RISKS OF INVESTING IN THE FUND
Funds that invest only in specific industries will experience greater volatility than funds investing in a broad range of industries. Technology stocks, historically, have experienced unusually wide price swings, both up and down. The potential for wide variation in performance reflects the special risks common to companies in the rapidly changing field of technology. For example, products or services that at first appear promising may not prove commercially successful and may become obsolete quickly. Earnings disappointments and intense competition for market share can result in sharp price declines.
GLOSSARY
Lipper Index: An index of mutual fund performance returns for specified periods in categories defined by Lipper Inc.
Lipper Science & Technology Funds Index: An index of science and technology mutual fund performance returns for specified periods as tracked by Lipper Inc.
Nasdaq Composite Index: A market value-weighted index of all common stocks listed on Nasdaq.
Price/earnings (P/E) ratio: A valuation measure calculated by dividing the price of a stock by its reported earnings per share. The ratio is a measure of how much investors are willing to pay for the company’s earnings.
S&P 500 Index: A market cap-weighted index of 500 widely held stocks often used as a proxy for the overall stock market. Performance is reported on a total return basis.
Performance and Expenses
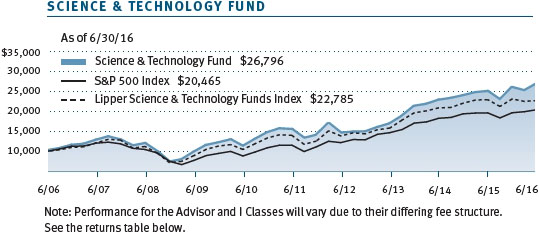
| Growth of $10,000 |
This chart shows the value of a hypothetical $10,000 investment in the fund over the past 10 fiscal year periods or since inception (for funds lacking 10-year records). The result is compared with benchmarks, which may include a broad-based market index and a peer group average or index. Market indexes do not include expenses, which are deducted from fund returns as well as mutual fund averages and indexes.
| Fund Expense Example |
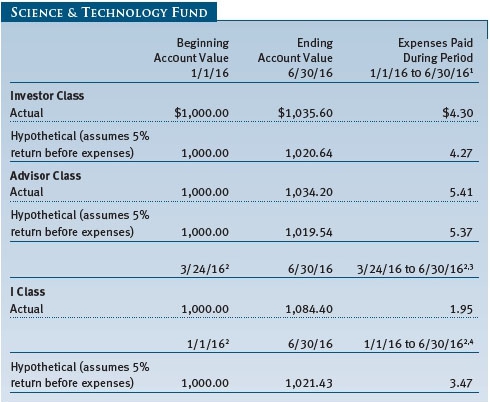
As a mutual fund shareholder, you may incur two types of costs: (1) transaction costs, such as redemption fees or sales loads, and (2) ongoing costs, including management fees, distribution and service (12b-1) fees, and other fund expenses. The following example is intended to help you understand your ongoing costs (in dollars) of investing in the fund and to compare these costs with the ongoing costs of investing in other mutual funds. The example is based on an investment of $1,000 invested at the beginning of the most recent six-month period and held for the entire period.
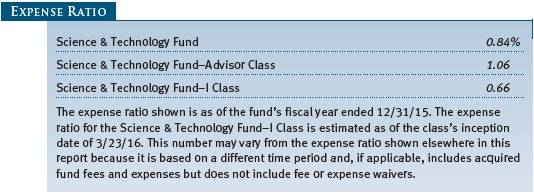
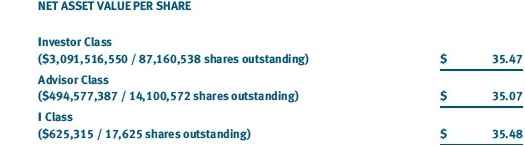
Please note that the fund has three share classes: The original share class (Investor Class) charges no distribution and service (12b-1) fee, the Advisor Class shares are offered only through unaffiliated brokers and other financial intermediaries and charge a 0.25% 12b-1 fee, and I Class shares are available to institutionally oriented clients and impose no 12b-1 or administrative fee payment. Each share class is presented separately in the table.
Actual Expenses
The first line of the following table (Actual) provides information about actual account values and expenses based on the fund’s actual returns. You may use the information on this line, together with your account balance, to estimate the expenses that you paid over the period. Simply divide your account value by $1,000 (for example, an $8,600 account value divided by $1,000 = 8.6), then multiply the result by the number on the first line under the heading “Expenses Paid During Period” to estimate the expenses you paid on your account during this period.
Hypothetical Example for Comparison Purposes
The information on the second line of the table (Hypothetical) is based on hypothetical account values and expenses derived from the fund’s actual expense ratio and an assumed 5% per year rate of return before expenses (not the fund’s actual return). You may compare the ongoing costs of investing in the fund with other funds by contrasting this 5% hypothetical example and the 5% hypothetical examples that appear in the shareholder reports of the other funds. The hypothetical account values and expenses may not be used to estimate the actual ending account balance or expenses you paid for the period.
Note: T. Rowe Price charges an annual account service fee of $20, generally for accounts with less than $10,000. The fee is waived for any investor whose T. Rowe Price mutual fund accounts total $50,000 or more; accounts electing to receive electronic delivery of account statements, transaction confirmations, prospectuses, and shareholder reports; or accounts of an investor who is a T. Rowe Price Preferred Services, Personal Services, or Enhanced Personal Services client (enrollment in these programs generally requires T. Rowe Price assets of at least $100,000). This fee is not included in the accompanying table. If you are subject to the fee, keep it in mind when you are estimating the ongoing expenses of investing in the fund and when comparing the expenses of this fund with other funds.
You should also be aware that the expenses shown in the table highlight only your ongoing costs and do not reflect any transaction costs, such as redemption fees or sales loads. Therefore, the second line of the table is useful in comparing ongoing costs only and will not help you determine the relative total costs of owning different funds. To the extent a fund charges transaction costs, however, the total cost of owning that fund is higher.
Unaudited
The accompanying notes are an integral part of these financial statements.
Unaudited
The accompanying notes are an integral part of these financial statements.
Unaudited
The accompanying notes are an integral part of these financial statements.
Unaudited
The accompanying notes are an integral part of these financial statements.
Unaudited
The accompanying notes are an integral part of these financial statements.
Unaudited
The accompanying notes are an integral part of these financial statements.
Unaudited
The accompanying notes are an integral part of these financial statements.
Unaudited
| Notes to Financial Statements |
T. Rowe Price Science & Technology Fund, Inc. (the fund), is registered under the Investment Company Act of 1940 (the 1940 Act) as a diversified, open-end management investment company. The fund seeks to provide long-term capital appreciation. The fund has three classes of shares: the Science & Technology Fund original share class, referred to in this report as the Investor Class, incepted on September 30, 1987; the Science & Technology Fund–Advisor Class (Advisor Class), incepted on March 31, 2000; and the Science & Technology Fund–I Class (I Class), incepted on March 23, 2016. Advisor Class shares are sold only through unaffiliated brokers and other unaffiliated financial intermediaries. I Class shares generally are available only to investors meeting a $1,000,000 minimum investment or certain other criteria. The Advisor Class operates under a Board-approved Rule 12b-1 plan pursuant to which the class compensates financial intermediaries for distribution, shareholder servicing, and/or certain administrative services; the Investor and I Classes do not pay Rule 12b-1 fees. Each class has exclusive voting rights on matters related solely to that class; separate voting rights on matters that relate to all classes; and, in all other respects, the same rights and obligations as the other classes.
NOTE 1 - SIGNIFICANT ACCOUNTING POLICIES
Basis of Preparation The fund is an investment company and follows accounting and reporting guidance in the Financial Accounting Standards Board (FASB) Accounting Standards Codification Topic 946 (ASC 946). The accompanying financial statements were prepared in accordance with accounting principles generally accepted in the United States of America (GAAP), including, but not limited to, ASC 946. GAAP requires the use of estimates made by management. Management believes that estimates and valuations are appropriate; however, actual results may differ from those estimates, and the valuations reflected in the accompanying financial statements may differ from the value ultimately realized upon sale or maturity.
Investment Transactions, Investment Income, and Distributions Income and expenses are recorded on the accrual basis. Premiums and discounts on debt securities are amortized for financial reporting purposes. Dividends received from mutual fund investments are reflected as dividend income; capital gain distributions, if any, are reflected as realized gain/loss. Dividend income and capital gain distributions are recorded on the ex-dividend date. Income tax-related interest and penalties, if incurred, would be recorded as income tax expense. Investment transactions are accounted for on the trade date. Realized gains and losses are reported on the identified cost basis. Distributions from REITs are initially recorded as dividend income and, to the extent such represent a return of capital or capital gain for tax purposes, are reclassified when such information becomes available. Income distributions are declared and paid by each class annually. Distributions to shareholders are recorded on the ex-dividend date. Capital gain distributions, if any, are generally declared and paid by the fund annually.
Currency Translation Assets, including investments, and liabilities denominated in foreign currencies are translated into U.S. dollar values each day at the prevailing exchange rate, using the mean of the bid and asked prices of such currencies against U.S. dollars as quoted by a major bank. Purchases and sales of securities, income, and expenses are translated into U.S. dollars at the prevailing exchange rate on the date of the transaction. The effect of changes in foreign currency exchange rates on realized and unrealized security gains and losses is reflected as a component of security gains and losses.
Class Accounting Shareholder servicing, prospectus, and shareholder report expenses incurred by each class are charged directly to the class to which they relate. Expenses common to all classes, investment income, and realized and unrealized gains and losses are allocated to the classes based upon the relative daily net assets of each class. The Advisor Class pays Rule 12b-1 fees, in an amount not exceeding 0.25% of the class’s average daily net assets.
Rebates Subject to best execution, the fund may direct certain security trades to brokers who have agreed to rebate a portion of the related brokerage commission to the fund in cash. Commission rebates are reflected as realized gain on securities in the accompanying financial statements and totaled $48,000 for the six months ended June 30, 2016.
NOTE 2 - VALUATION
The fund’s financial instruments are valued and each class’s net asset value (NAV) per share is computed at the close of the New York Stock Exchange (NYSE), normally 4 p.m. ET, each day the NYSE is open for business.
Fair Value The fund’s financial instruments are reported at fair value, which GAAP defines as the price that would be received to sell an asset or paid to transfer a liability in an orderly transaction between market participants at the measurement date. The T. Rowe Price Valuation Committee (the Valuation Committee) has been established by the fund’s Board of Directors (the Board) to ensure that financial instruments are appropriately priced at fair value in accordance with GAAP and the 1940 Act. Subject to oversight by the Board, the Valuation Committee develops and oversees pricing-related policies and procedures and approves all fair value determinations. Specifically, the Valuation Committee establishes procedures to value securities; determines pricing techniques, sources, and persons eligible to effect fair value pricing actions; oversees the selection, services, and performance of pricing vendors; oversees valuation-related business continuity practices; and provides guidance on internal controls and valuation-related matters. The Valuation Committee reports to the Board and has representation from legal, portfolio management and trading, operations, risk management, and the fund’s treasurer.
Various valuation techniques and inputs are used to determine the fair value of financial instruments. GAAP establishes the following fair value hierarchy that categorizes the inputs used to measure fair value:
Level 1 – quoted prices (unadjusted) in active markets for identical financial instruments that the fund can access at the reporting date
Level 2 – inputs other than Level 1 quoted prices that are observable, either directly or indirectly (including, but not limited to, quoted prices for similar financial instruments in active markets, quoted prices for identical or similar financial instruments in inactive markets, interest rates and yield curves, implied volatilities, and credit spreads)
Level 3 – unobservable inputs
Observable inputs are developed using market data, such as publicly available information about actual events or transactions, and reflect the assumptions that market participants would use to price the financial instrument. Unobservable inputs are those for which market data are not available and are developed using the best information available about the assumptions that market participants would use to price the financial instrument. GAAP requires valuation techniques to maximize the use of relevant observable inputs and minimize the use of unobservable inputs. When multiple inputs are used to derive fair value, the financial instrument is assigned to the level within the fair value hierarchy based on the lowest-level input that is significant to the fair value of the financial instrument. Input levels are not necessarily an indication of the risk or liquidity associated with financial instruments at that level but rather the degree of judgment used in determining those values.
Valuation Techniques Equity securities listed or regularly traded on a securities exchange or in the over-the-counter (OTC) market are valued at the last quoted sale price or, for certain markets, the official closing price at the time the valuations are made. OTC Bulletin Board securities are valued at the mean of the closing bid and asked prices. A security that is listed or traded on more than one exchange is valued at the quotation on the exchange determined to be the primary market for such security. Listed securities not traded on a particular day are valued at the mean of the closing bid and asked prices for domestic securities and the last quoted sale or closing price for international securities.
For valuation purposes, the last quoted prices of non-U.S. equity securities may be adjusted to reflect the fair value of such securities at the close of the NYSE. If the fund determines that developments between the close of a foreign market and the close of the NYSE will, in its judgment, materially affect the value of some or all of its portfolio securities, the fund will adjust the previous quoted prices to reflect what it believes to be the fair value of the securities as of the close of the NYSE. In deciding whether it is necessary to adjust quoted prices to reflect fair value, the fund reviews a variety of factors, including developments in foreign markets, the performance of U.S. securities markets, and the performance of instruments trading in U.S. markets that represent foreign securities and baskets of foreign securities. The fund may also fair value securities in other situations, such as when a particular foreign market is closed but the fund is open. The fund uses outside pricing services to provide it with quoted prices and information to evaluate or adjust those prices. The fund cannot predict how often it will use quoted prices and how often it will determine it necessary to adjust those prices to reflect fair value. As a means of evaluating its security valuation process, the fund routinely compares quoted prices, the next day’s opening prices in the same markets, and adjusted prices.
Actively traded equity securities listed on a domestic exchange generally are categorized in Level 1 of the fair value hierarchy. Non-U.S. equity securities generally are categorized in Level 2 of the fair value hierarchy despite the availability of quoted prices because, as described above, the fund evaluates and determines whether those quoted prices reflect fair value at the close of the NYSE or require adjustment. OTC Bulletin Board securities, certain preferred securities, and equity securities traded in inactive markets generally are categorized in Level 2 of the fair value hierarchy.
Debt securities generally are traded in the OTC market. Securities with remaining maturities of one year or more at the time of acquisition are valued at prices furnished by dealers who make markets in such securities or by an independent pricing service, which considers the yield or price of bonds of comparable quality, coupon, maturity, and type, as well as prices quoted by dealers who make markets in such securities. Generally, debt securities are categorized in Level 2 of the fair value hierarchy.
Investments in mutual funds are valued at the mutual fund’s closing NAV per share on the day of valuation and are categorized in Level 1 of the fair value hierarchy. Assets and liabilities other than financial instruments, including short-term receivables and payables, are carried at cost, or estimated realizable value, if less, which approximates fair value.
Thinly traded financial instruments and those for which the above valuation procedures are inappropriate or are deemed not to reflect fair value are stated at fair value as determined in good faith by the Valuation Committee. The objective of any fair value pricing determination is to arrive at a price that could reasonably be expected from a current sale. Financial instruments fair valued by the Valuation Committee are primarily private placements, restricted securities, warrants, rights, and other securities that are not publicly traded.
Subject to oversight by the Board, the Valuation Committee regularly makes good faith judgments to establish and adjust the fair valuations of certain securities as events occur and circumstances warrant. For instance, in determining the fair value of an equity investment with limited market activity, such as a private placement or a thinly traded public company stock, the Valuation Committee considers a variety of factors, which may include, but are not limited to, the issuer’s business prospects, its financial standing and performance, recent investment transactions in the issuer, new rounds of financing, negotiated transactions of significant size between other investors in the company, relevant market valuations of peer companies, strategic events affecting the company, market liquidity for the issuer, and general economic conditions and events. In consultation with the investment and pricing teams, the Valuation Committee will determine an appropriate valuation technique based on available information, which may include both observable and unobservable inputs. The Valuation Committee typically will afford greatest weight to actual prices in arm’s length transactions, to the extent they represent orderly transactions between market participants, transaction information can be reliably obtained, and prices are deemed representative of fair value. However, the Valuation Committee may also consider other valuation methods such as market-based valuation multiples; a discount or premium from market value of a similar, freely traded security of the same issuer; or some combination. Fair value determinations are reviewed on a regular basis and updated as information becomes available, including actual purchase and sale transactions of the issue. Because any fair value determination involves a significant amount of judgment, there is a degree of subjectivity inherent in such pricing decisions, and fair value prices determined by the Valuation Committee could differ from those of other market participants. Depending on the relative significance of unobservable inputs, including the valuation technique(s) used, fair valued securities may be categorized in Level 2 or 3 of the fair value hierarchy.
Valuation Inputs The following table summarizes the fund’s financial instruments, based on the inputs used to determine their fair values on June 30, 2016:
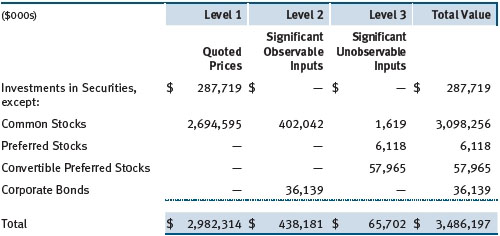
There were no material transfers between Levels 1 and 2 during the six months ended June 30, 2016.
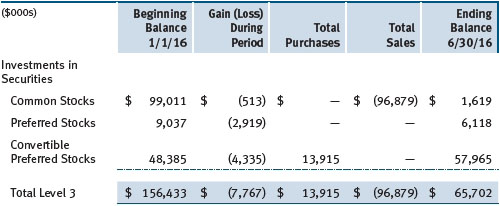
Following is a reconciliation of the fund’s Level 3 holdings for the six months ended June 30, 2016. Gain (loss) reflects both realized and change in unrealized gain/loss on Level 3 holdings during the period, if any, and is included on the accompanying Statement of Operations. The change in unrealized gain/loss on Level 3 instruments held at June 30, 2016, totaled $(23,570,000) for the six months ended June 30, 2016.
NOTE 3 - OTHER INVESTMENT TRANSACTIONS
Consistent with its investment objective, the fund engages in the following practices to manage exposure to certain risks and/or to enhance performance. The investment objective, policies, program, and risk factors of the fund are described more fully in the fund’s prospectus and Statement of Additional Information.
Emerging Markets The fund may invest, either directly or through investments in T. Rowe Price institutional funds, in securities of companies located in, issued by governments of, or denominated in or linked to the currencies of emerging market countries; at period-end, approximately 20% of the fund’s net assets were invested in emerging markets. Emerging markets generally have economic structures that are less diverse and mature, and political systems that are less stable, than developed countries. These markets may be subject to greater political, economic, and social uncertainty and differing regulatory environments that may potentially impact the fund’s ability to buy or sell certain securities or repatriate proceeds to U.S. dollars. Such securities are often subject to greater price volatility, less liquidity, and higher rates of inflation than U.S. securities.
Restricted Securities The fund may invest in securities that are subject to legal or contractual restrictions on resale. Prompt sale of such securities at an acceptable price may be difficult and may involve substantial delays and additional costs.
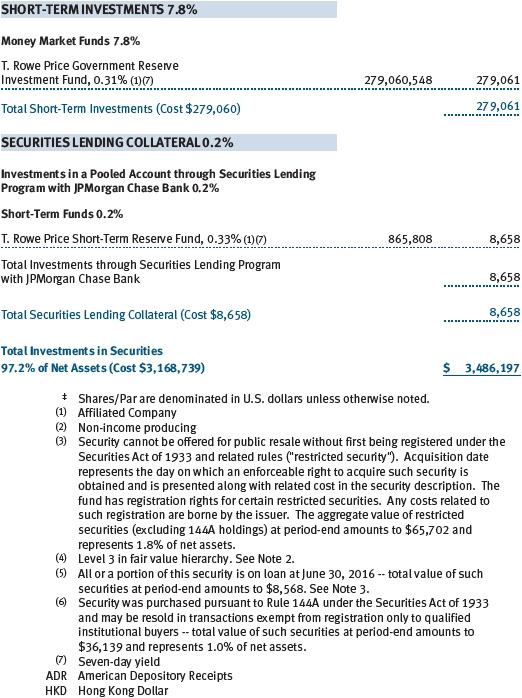
Securities Lending The fund may lend its securities to approved brokers to earn additional income. Its securities lending activities are administered by a lending agent in accordance with a securities lending agreement. Security loans generally do not have stated maturity dates, and the fund may recall a security at any time. The fund receives collateral in the form of cash or U.S. government securities, valued at 102% to 105% of the value of the securities on loan. Collateral is maintained over the life of the loan in an amount not less than the value of loaned securities; any additional collateral required due to changes in security values is delivered to the fund the next business day. Cash collateral is invested by the lending agent(s) in accordance with investment guidelines approved by fund management. Additionally, the lending agent indemnifies the fund against losses resulting from borrower default. Although risk is mitigated by the collateral and indemnification, the fund could experience a delay in recovering its securities and a possible loss of income or value if the borrower fails to return the securities, collateral investments decline in value, and the lending agent fails to perform. Securities lending revenue consists of earnings on invested collateral and borrowing fees, net of any rebates to the borrower, compensation to the lending agent, and other administrative costs. In accordance with GAAP, investments made with cash collateral are reflected in the accompanying financial statements, but collateral received in the form of securities is not. At June 30, 2016, the value of loaned securities was $8,568,000; the value of cash collateral and related investments was $8,658,000.
Other Purchases and sales of portfolio securities other than short-term securities aggregated $1,246,978,000 and $1,644,559,000, respectively, for the six months ended June 30, 2016.
NOTE 4 - FEDERAL INCOME TAXES
No provision for federal income taxes is required since the fund intends to continue to qualify as a regulated investment company under Subchapter M of the Internal Revenue Code and distribute to shareholders all of its taxable income and gains. Distributions determined in accordance with federal income tax regulations may differ in amount or character from net investment income and realized gains for financial reporting purposes. Financial reporting records are adjusted for permanent book/tax differences to reflect tax character but are not adjusted for temporary differences. The amount and character of tax-basis distributions and composition of net assets are finalized at fiscal year-end; accordingly, tax-basis balances have not been determined as of the date of this report.
The fund intends to retain realized gains to the extent of available capital loss carryforwards. Because the fund is required to use capital loss carryforwards that do not expire before those with expiration dates, all or a portion of its capital loss carryforwards subject to expiration could ultimately go unused. As of December 31, 2015, the fund had $1,954,000 of available capital loss carryforwards, which all expire in fiscal 2017. Further, $977,000 of the fund’s available capital loss carryforwards acquired through tax-free reorganizations may be subject to certain limitations on amount or timing of use.
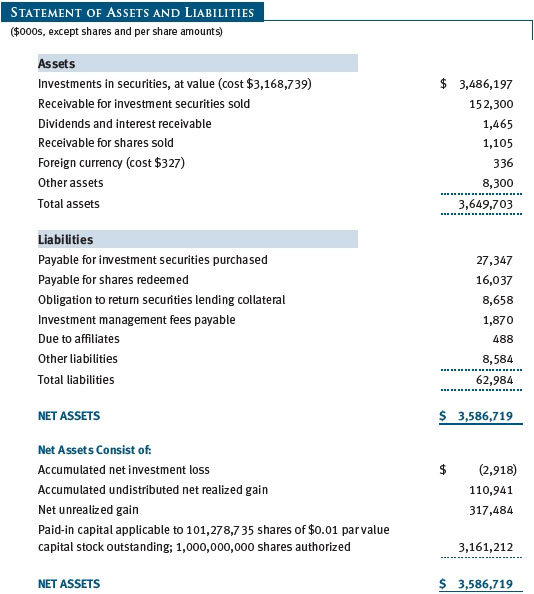
At June 30, 2016, the cost of investments for federal income tax purposes was $3,215,227,000. Net unrealized gain aggregated $270,996,000 at period-end, of which $605,529,000 related to appreciated investments and $334,533,000 related to depreciated investments.
NOTE 5 - RELATED PARTY TRANSACTIONS
The fund is managed by T. Rowe Price Associates, Inc. (Price Associates), a wholly owned subsidiary of T. Rowe Price Group, Inc. (Price Group). The investment management agreement between the fund and Price Associates provides for an annual investment management fee, which is computed daily and paid monthly. The fee consists of an individual fund fee, equal 0.35% of the fund’s average daily net assets, and a group fee. The group fee rate is calculated based on the combined net assets of certain mutual funds sponsored by Price Associates (the group) applied to a graduated fee schedule, with rates ranging from 0.48% for the first $1 billion of assets to 0.270% for assets in excess of $500 billion. The fund’s group fee is determined by applying the group fee rate to the fund’s average daily net assets. At June 30, 2016, the effective annual group fee rate was 0.29%.
The I Class is subject to an operating expense limitation (I Class limit) pursuant to which Price Associates is contractually required to pay all operating expenses of the I Class, excluding management fees, interest, borrowing-related expenses, taxes, brokerage commissions, and extraordinary expenses, to the extent such operating expenses, on an annualized basis, exceed 0.05% of average net assets. This agreement will continue until April 30, 2018, and may be renewed, revised or revoked only with approval of the fund’s Board. The I Class is required to repay Price Associates for expenses previously paid to the extent the class’s net assets grow or expenses decline sufficiently to allow repayment without causing the class’s operating expenses to exceed the I Class limit. However, no repayment will be made more than three years after the date of a payment or waiver. Pursuant to this agreement, less than $1,000 of expenses were waived/paid by Price Associates during the six months ended June 30, 2016 and remain subject to repayment by the fund.
In addition, the fund has entered into service agreements with Price Associates and two wholly owned subsidiaries of Price Associates (collectively, Price). Price Associates provides certain accounting and administrative services to the fund. T. Rowe Price Services, Inc., provides shareholder and administrative services in its capacity as the fund’s transfer and dividend-disbursing agent. T. Rowe Price Retirement Plan Services, Inc., provides subaccounting and recordkeeping services for certain retirement accounts invested in the Investor Class and I Class. For the six months ended June 30, 2016, expenses incurred pursuant to these service agreements were $23,000 for Price Associates; $1,321,000 for T. Rowe Price Services, Inc.; and $698,000 for T. Rowe Price Retirement Plan Services, Inc. The total amount payable at period-end pursuant to these service agreements is reflected as Due to Affiliates in the accompanying financial statements, if any.
Additionally, the fund is one of several mutual funds in which certain college savings plans managed by Price Associates may invest. As approved by the fund’s Board of Directors, shareholder servicing costs associated with each college savings plan are borne by the fund in proportion to the average daily value of its shares owned by the college savings plan. For the six months ended June 30, 2016, the fund was charged $30,000 for shareholder servicing costs related to the college savings plans, of which $16,000 was for services provided by Price. The amount payable at period-end pursuant to this agreement is reflected as Due to Affiliates in the accompanying financial statements. At June 30, 2016, approximately 1% of the outstanding shares of the Investor Class were held by college savings plans.
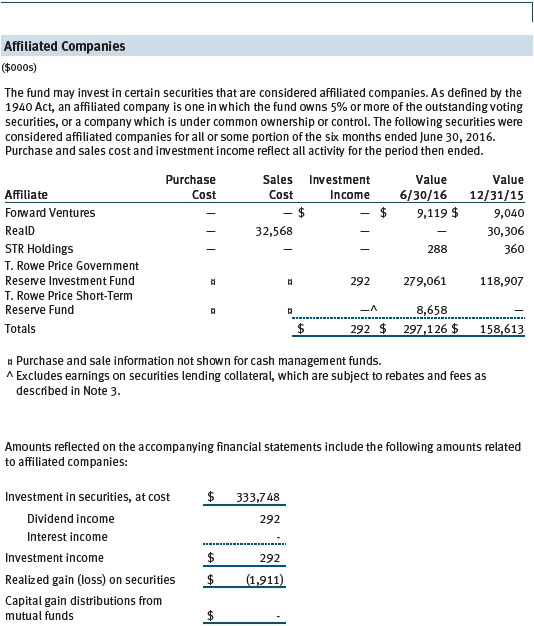
The fund may invest in the T. Rowe Price Reserve Investment Fund, the T. Rowe Price Government Reserve Investment Fund, or the T. Rowe Price Short-Term Reserve Fund (collectively, the Price Reserve Investment Funds), open-end management investment companies managed by Price Associates and considered affiliates of the fund. The Price Reserve Investment Funds are offered as short-term investment options to mutual funds, trusts, and other accounts managed by Price Associates or its affiliates and are not available for direct purchase by members of the public. The Price Reserve Investment Funds pay no investment management fees.
As of June 30, 2016, T. Rowe Price Group, Inc., or its wholly owned subsidiaries owned 7,641 shares of the I Class, representing 43% of the I Class’s net assets.
The fund may participate in securities purchase and sale transactions with other funds or accounts advised by Price Associates (cross trades), in accordance with procedures adopted by the fund’s Board and Securities and Exchange Commission rules, which require, among other things, that such purchase and sale cross trades be effected at the independent current market price of the security. During the six months ended June 30, 2016, the fund had no purchases or sales cross trades with other funds or accounts advised by Price Associates.
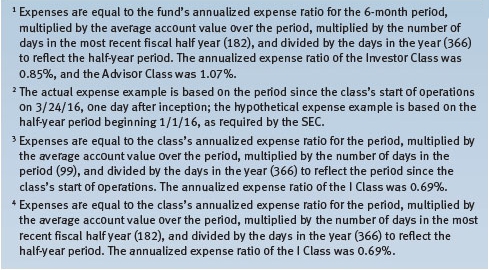
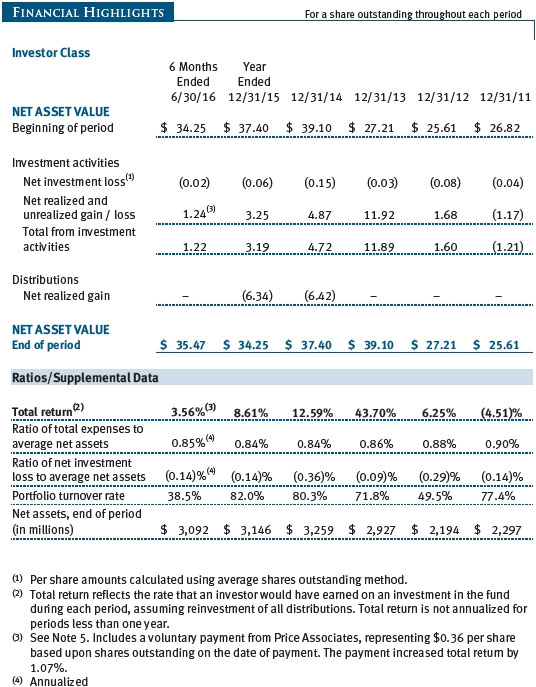
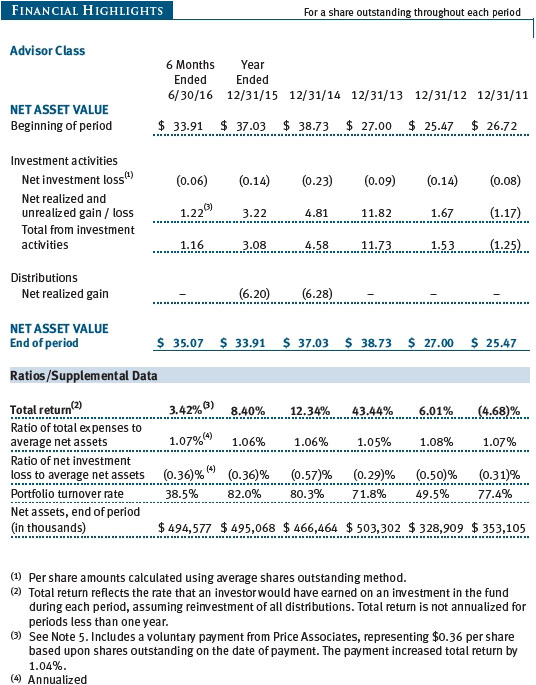
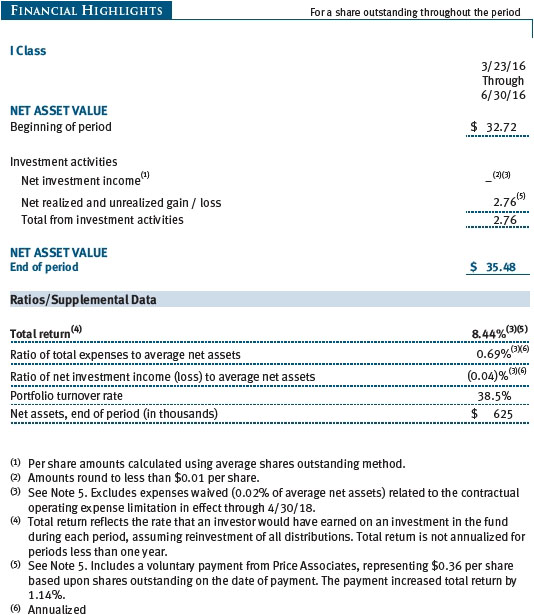
On June 6, 2016, Price Associates offered, and the fund’s Board of Directors accepted, a voluntary payment to compensate the fund for a loss of value on its investment in Dell as a result of the fund’s ineligibility to pursue an appraisal action in Delaware court due to a proxy voting error in 2013 (the Offer). The payment from Price Associates was received in cash on June 10, 2016. Subsequently, a final settlement to the appraisal action was negotiated with Dell, pursuant to which the fund received the original merger consideration plus negotiated interest. The negotiated interest, net of contingent legal fees, approximated $0.75 per Dell share and was received by the fund on June 30; the original merger consideration was received on July 1. The settlement from Dell is reflected as realized gain/loss on securities in the accompanying financial statements. The payment from Price Associates, reduced by the settlement from Dell in accordance with the terms of the Offer, was $36,998,000 and increased the total return by 1.07%, 1.04%, and 1.14% for the Investor Class, Advisor Class, and I Class, respectively for the six months ended June 30, 2016. The amount paid by Price Associates may be further increased or decreased in the future, in the event there is a court-determined change in the fair valuation of Dell shares on appeal, or payment is received by the fund from any other source to compensate for the loss of value on its Dell shares.
| Information on Proxy Voting Policies, Procedures, and Records |
A description of the policies and procedures used by T. Rowe Price funds and portfolios to determine how to vote proxies relating to portfolio securities is available in each fund’s Statement of Additional Information. You may request this document by calling 1-800-225-5132 or by accessing the SEC’s website, sec.gov.
The description of our proxy voting policies and procedures is also available on our corporate website. To access it, please visit the following Web page
https://www3.troweprice.com/usis/corporate/en/utility/policies.html
and scroll down to the section near the bottom of the page that says, “Proxy Voting Policies.” Click on the Proxy Voting Policies link in the shaded box.
Each fund’s most recent annual proxy voting record is available on our website and through the SEC’s website. To access it through T. Rowe Price, visit the website location shown above, and scroll down to the section near the bottom of the page that says, “Proxy Voting Records.” Click on the Proxy Voting Records link in the shaded box.
| How to Obtain Quarterly Portfolio Holdings |
The fund files a complete schedule of portfolio holdings with the Securities and Exchange Commission for the first and third quarters of each fiscal year on Form N-Q. The fund’s Form N-Q is available electronically on the SEC’s website (sec.gov); hard copies may be reviewed and copied at the SEC’s Public Reference Room, 100 F St. N.E., Washington, DC 20549. For more information on the Public Reference Room, call 1-800-SEC-0330.
| Approval of Investment Management Agreement |
On March 11, 2016, the fund’s Board of Directors (Board), including a majority of the fund’s independent directors, approved the continuation of the investment management agreement (Advisory Contract) between the fund and its investment advisor, T. Rowe Price Associates, Inc. (Advisor). In connection with its deliberations, the Board requested, and the Advisor provided, such information as the Board (with advice from independent legal counsel) deemed reasonably necessary. The Board considered a variety of factors in connection with its review of the Advisory Contract, also taking into account information provided by the Advisor during the course of the year, as discussed below:
Services Provided by the Advisor
The Board considered the nature, quality, and extent of the services provided to the fund by the Advisor. These services included, but were not limited to, directing the fund’s investments in accordance with its investment program and the overall management of the fund’s portfolio, as well as a variety of related activities such as financial, investment operations, and administrative services; compliance; maintaining the fund’s records and registrations; and shareholder communications. The Board also reviewed the background and experience of the Advisor’s senior management team and investment personnel involved in the management of the fund, as well as the Advisor’s compliance record. The Board concluded that it was satisfied with the nature, quality, and extent of the services provided by the Advisor.
Investment Performance of the Fund
The Board reviewed the fund’s three-month, one-year, and year-by-year returns, as well as the fund’s average annualized total returns over the 3-, 5-, and 10-year periods, and compared these returns with a wide variety of comparable performance measures and market data, including those supplied by Lipper and Morningstar, which are independent providers of mutual fund data.
On the basis of this evaluation and the Board’s ongoing review of investment results and factoring in the relative market conditions during certain of the performance periods, the Board concluded that the fund’s performance was satisfactory.
Costs, Benefits, Profits, and Economies of Scale
The Board reviewed detailed information regarding the revenues received by the Advisor under the Advisory Contract and other benefits that the Advisor (and its affiliates) may have realized from its relationship with the fund, including any research received under “soft dollar” agreements and commission-sharing arrangements with broker-dealers. The Board considered that the Advisor may receive some benefit from soft-dollar arrangements pursuant to which research is received from broker-dealers that execute the applicable fund’s portfolio transactions. The Board received information on the estimated costs incurred and profits realized by the Advisor from managing T. Rowe Price mutual funds. The Board also reviewed estimates of the profits realized from managing the fund in particular, and the Board concluded that the Advisor’s profits were reasonable in light of the services provided to the fund.
The Board also considered whether the fund benefits under the fee levels set forth in the Advisory Contract from any economies of scale realized by the Advisor. Under the Advisory Contract, the fund pays a fee to the Advisor for investment management services composed of two components—a group fee rate based on the combined average net assets of most of the T. Rowe Price mutual funds (including the fund) that declines at certain asset levels and an individual fund fee rate based on the fund’s average daily net assets—and the fund pays its own expenses of operations. The Board concluded that the advisory fee structure for the fund continued to provide for a reasonable sharing of benefits from any economies of scale with the fund’s investors.
Fees
The Board was provided with information regarding industry trends in management fees and expenses, and the Board reviewed the fund’s management fee rate, operating expenses, and total expense ratio for the Investor Class and Advisor Class in comparison with fees and expenses of other comparable funds based on information and data supplied by Lipper. The information provided to the Board indicated that the fund’s management fee rate was above the median for certain groups of comparable funds and at or below the median for other groups of comparable funds. The information also indicated that the total expense ratio for the Investor Class was above the median for certain groups of comparable funds and at or below the median for other groups of comparable funds, and the total expense ratio for the Advisor Class was below the median for comparable funds.
The Board also reviewed the fee schedules for institutional accounts (including subadvised mutual funds) and private accounts with similar mandates that are advised or subadvised by the Advisor and its affiliates. Management provided the Board with information about the Advisor’s responsibilities and services provided to subadvisory and other institutional account clients, including information about how the requirements and economics of the institutional business differ from those of the Advisor’s proprietary mutual fund business. The Board considered information showing that the Advisor’s proprietary mutual fund business is generally more complex from a business and compliance perspective than its institutional account business and considered various other relevant factors, including the broader scope of operations and oversight, more extensive shareholder communication infrastructure, greater asset flows, heightened business risks, and differences in applicable laws and regulations associated with the Advisor’s proprietary mutual fund business. In assessing the reasonableness of the fund’s management fee rate, the Board considered the differences in the nature of the services required for the Advisor to manage its proprietary mutual fund business versus managing a discrete pool of assets as a subadvisor to another institution’s mutual fund or for another institutional account and the degree to which the Advisor performs significant additional services and assumes greater risk in managing the fund and other T. Rowe Price mutual funds than it does for institutional account clients.
On the basis of the information provided and the factors considered, the Board concluded that the fees paid by the fund under the Advisory Contract are reasonable.
Approval of the Advisory Contract
As noted, the Board approved the continuation of the Advisory Contract. No single factor was considered in isolation or to be determinative to the decision. Rather, the Board concluded, in light of a weighting and balancing of all factors considered, that it was in the best interests of the fund and its shareholders for the Board to approve the continuation of the Advisory Contract (including the fees to be charged for services thereunder). The independent directors were advised throughout the process by independent legal counsel.
Item 2. Code of Ethics.
A code of ethics, as defined in Item 2 of Form N-CSR, applicable to its principal executive officer, principal financial officer, principal accounting officer or controller, or persons performing similar functions is filed as an exhibit to the registrant’s annual Form N-CSR. No substantive amendments were approved or waivers were granted to this code of ethics during the registrant’s most recent fiscal half-year.
Item 3. Audit Committee Financial Expert.
Disclosure required in registrant’s annual Form N-CSR.
Item 4. Principal Accountant Fees and Services.
Disclosure required in registrant’s annual Form N-CSR.
Item 5. Audit Committee of Listed Registrants.
Not applicable.
Item 6. Investments.
(a) Not applicable. The complete schedule of investments is included in Item 1 of this Form N-CSR.
(b) Not applicable.
Item 7. Disclosure of Proxy Voting Policies and Procedures for Closed-End Management Investment Companies.
Not applicable.
Item 8. Portfolio Managers of Closed-End Management Investment Companies.
Not applicable.
Item 9. Purchases of Equity Securities by Closed-End Management Investment Company and Affiliated Purchasers.
Not applicable.
Item 10. Submission of Matters to a Vote of Security Holders.
Not applicable.
Item 11. Controls and Procedures.
(a) The registrant’s principal executive officer and principal financial officer have evaluated the registrant’s disclosure controls and procedures within 90 days of this filing and have concluded that the registrant’s disclosure controls and procedures were effective, as of that date, in ensuring that information required to be disclosed by the registrant in this Form N-CSR was recorded, processed, summarized, and reported timely.
(b) The registrant’s principal executive officer and principal financial officer are aware of no change in the registrant’s internal control over financial reporting that occurred during the registrant’s second fiscal quarter covered by this report that has materially affected, or is reasonably likely to materially affect, the registrant’s internal control over financial reporting.
Item 12. Exhibits.
(a)(1) The registrant’s code of ethics pursuant to Item 2 of Form N-CSR is filed with the registrant’s annual Form N-CSR.
(2) Separate certifications by the registrant's principal executive officer and principal financial officer, pursuant to Section 302 of the Sarbanes-Oxley Act of 2002 and required by Rule 30a-2(a) under the Investment Company Act of 1940, are attached.
(3) Written solicitation to repurchase securities issued by closed-end companies: not applicable.
(b) A certification by the registrant's principal executive officer and principal financial officer, pursuant to Section 906 of the Sarbanes-Oxley Act of 2002 and required by Rule 30a-2(b) under the Investment Company Act of 1940, is attached.
SIGNATURES
Pursuant to the requirements of the Securities Exchange Act of 1934 and the Investment Company Act of 1940, the registrant has duly caused this report to be signed on its behalf by the undersigned, thereunto duly authorized.
T. Rowe Price Science & Technology Fund, Inc.
| By | /s/ Edward C. Bernard | |
| Edward C. Bernard | ||
| Principal Executive Officer | ||
| Date August 17, 2016 | ||
Pursuant to the requirements of the Securities Exchange Act of 1934 and the Investment Company Act of 1940, this report has been signed below by the following persons on behalf of the registrant and in the capacities and on the dates indicated.
| By | /s/ Edward C. Bernard | |
| Edward C. Bernard | ||
| Principal Executive Officer | ||
| Date August 17, 2016 | ||
| By | /s/ Catherine D. Mathews | |
| Catherine D. Mathews | ||
| Principal Financial Officer | ||
| Date August 17, 2016 | ||