UNITED STATES
SECURITIES AND EXCHANGE COMMISSION
Washington, D.C. 20549
FORM N-CSR
CERTIFIED SHAREHOLDER REPORT OF REGISTERED
MANAGEMENT INVESTMENT COMPANIES
Investment Company Act File Number: 811-05299
| T. Rowe Price Science & Technology Fund, Inc. |
|
| (Exact name of registrant as specified in charter) |
| |
| 100 East Pratt Street, Baltimore, MD 21202 |
|
| (Address of principal executive offices) |
| |
| David Oestreicher |
| 100 East Pratt Street, Baltimore, MD 21202 |
|
| (Name and address of agent for service) |
Registrant’s telephone number, including area code: (410) 345-2000
Date of fiscal year end: December 31
Date of reporting period: June 30, 2019
Item 1. Reports to Shareholders
(a) Report pursuant to Rule 30e-1.
| Science & Technology Fund | June 30, 2019 |
| PRSCX | Investor Class |
| PASTX | Advisor Class |
| TSNIX | I Class |
Beginning on January 1, 2021, as permitted by SEC regulations, paper copies of the T. Rowe Price funds’ annual and semiannual shareholder reports will no longer be mailed, unless you specifically request them. Instead, shareholder reports will be made available on the funds’ website (troweprice.com/prospectus), and you will be notified by mail with a website link to access the reports each time a report is posted to the site.
If you already elected to receive reports electronically, you will not be affected by this change and need not take any action. At any time, shareholders who invest directly in T. Rowe Price funds may generally elect to receive reports or other communications electronically by enrolling attroweprice.com/paperlessor, if you are a retirement plan sponsor or invest in the funds through a financial intermediary (such as an investment advisor, broker-dealer, insurance company, or bank), by contacting your representative or your financial intermediary.
You may elect to continue receiving paper copies of future shareholder reports free of charge. To do so, if you invest directly with T. Rowe Price, please call T. Rowe Price as follows: IRA, nonretirement account holders, and institutional investors,1-800-225-5132; small business retirement accounts,1-800-492-7670. If you are a retirement plan sponsor or invest in the T. Rowe Price funds through a financial intermediary, please contact your representative or financial intermediary or follow additional instructions if included with this document. Your election to receive paper copies of reports will apply to all funds held in your account with your financial intermediary or, if you invest directly in the T. Rowe Price funds, with T. Rowe Price. Your election can be changed at any time in the future.
| T. ROWE PRICE SCIENCE & TECHNOLOGY FUND |
|
HIGHLIGHTS
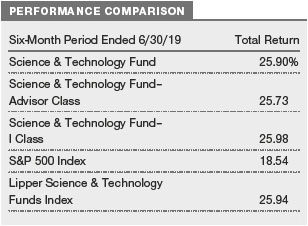
| ■ | The Science & Technology Fund posted sizable gains in the first half of 2019, performing roughly in line with its peer group, as represented by the Lipper Science & Technology Funds Index, and better than the S&P 500 Index, a proxy for the broader market. |
| | |
| ■ | Many of our top performers were internet companies that we added to in late 2018. |
| | |
| ■ | We continue to focus on companies with attractive markets and enduring competitive strengths. |
| | |
| ■ | We remain disciplined in our valuation analysis, which we think is important for identifying opportunities and managing risk. |
Log in to your account attroweprice.comfor more information.
*Certain mutual fund accounts that are assessed an annual account service fee can also save money by switching to e-delivery.
CIO Market Commentary
Dear Shareholder
Markets overcame a bout of volatility in May and recorded exceptional returns in the six months ended June 30, 2019. The large-cap S&P 500 Index reached record highs and notched its best start to a year in over two decades. Overseas equity markets were also strong, while bond prices rose as longer-term interest rates fell to their lowest levels since late 2016.
Markets rebounded to start the year, as many of the worries behind the sell-off in late 2018 receded. Investors seemed most relieved by a dovish pivot in monetary policy. The S&P 500 scored its best daily gain for the period on January 4, after Federal Reserve Chair Jerome Powell pledged that the central bank would respond with all the tools at its disposal to counteract an economic downturn or financial turmoil. The Fed soon paused and kept rates steady following a series of quarterly hikes stretching back to late 2017.
Investors also seemed comforted by progress in U.S.-China trade relations. In March, President Donald Trump postponed a threatened tariff increase on Chinese goods and remarked that the two sides were “getting very close” to a deal. Encouraging statements continued to flow from the White House, and speculation grew that Chinese President Xi Jinping would soon visit Washington to sign an agreement.
Hopes for a deal were dashed in early May, however, sending stocks sharply lower. With negotiations at a standstill, on May 10, the administration increased the tariff rate to 25% from 10% on $200 billion in Chinese goods, as the president had long threatened. China soon retaliated with its own tariffs.A technological “cold war” also seemed to be developing, with both sides taking measures to cut off the other’s access to key components and raw materials. Stocks fell sharply in response, and the small- and mid-cap indexes moved back into correction territory, or down more than 10% from the highs they established late in the previous summer.
Another turn in trade policy in June helped stocks recover their losses. The White House abandoned an earlier threat to put tariffs on Mexican imports in response to immigration issues, and President Trump again softened his stance on China. Markets were closed on the final weekend of the month, when the president announced that he and President Xi had agreed to resume trade negotiations and arranged a truce that would at least temporarily prevent the imposition of further tariffs.
An even bigger factor in the June rebound appeared to be growing confidence that the Fed would cut interest rates rather than merely keep them steady. Fed Chair Powell pledged that policymakers were paying close attention to the impact of trade tensions on the economy and would “act as appropriate to sustain the expansion.” Policymakers also dropped references to being “patient” in adjusting monetary policy. By the end of the month, futures markets were pricing in 75 basis points (0.75 percentage point) of cuts in the second half of the year, with a reasonable chance of more to come in 2020.
The dovish shift in Fed policy has been driven by accumulating evidence of slowing global growth. Rising trade barriers have taken a heavy toll on the global manufacturing sector, and business investment has pulled back as managers confront additional sources of uncertainty, such as the possibility of a disorderly Brexit this October. As a result, corporate earnings growth has stalled in the U.S. and turned negative in other major markets. On the positive side, consumers remain in much better shape, particularly domestically.
We see little evidence to suggest a recession is on the horizon. Indeed, with markets at all-time highs, investors seem willing to bet that this decade-long economic recovery still has legs. We will keep a close eye on developments and rely on our careful fundamental research to avoid pitfalls; I am confident our strategic investing approach will continue to serve our shareholders well.
Thank you for your continued confidence in T. Rowe Price.
Sincerely,

Robert Sharps
Group Chief Investment Officer
Management’s Discussion of Fund Performance
INVESTMENT OBJECTIVE
The fund seeks to provide long-term capital appreciation.
FUND COMMENTARY
How did the fund perform in the past six months?
The Science & Technology Fund returned 25.90% in the first half of 2019. The fund performed roughly in line with the Lipper Science & Technology Funds Index and outperformed the broader market by a wide margin. (Returns for the fund’s Advisor and I Class shares varied slightly, reflecting their different fee structures.Past performance cannot guarantee future results.)
What factors influenced the fund’s performance?
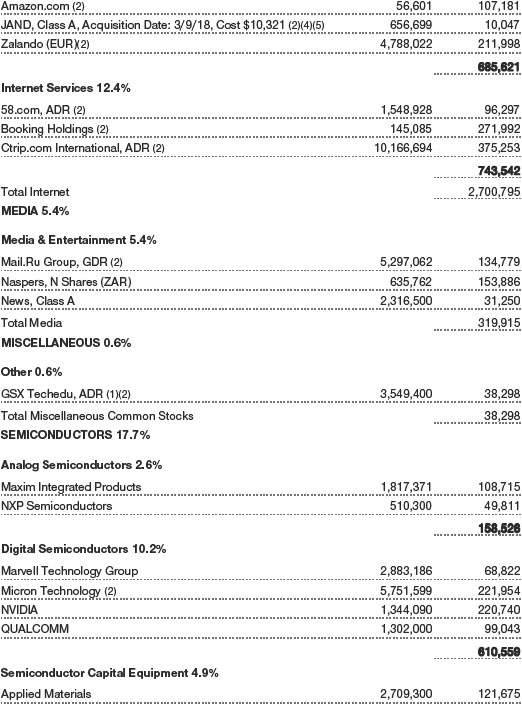
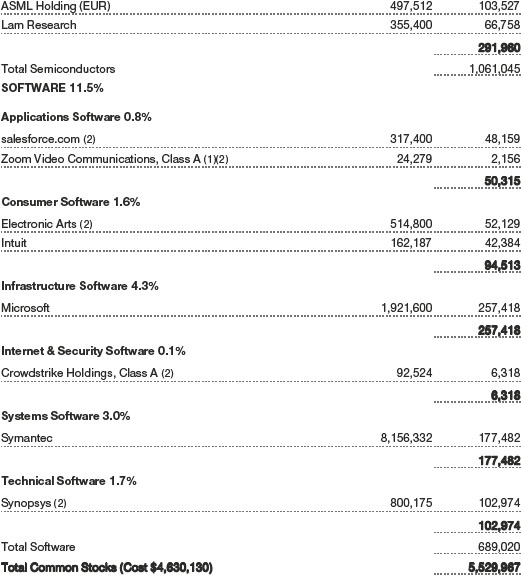
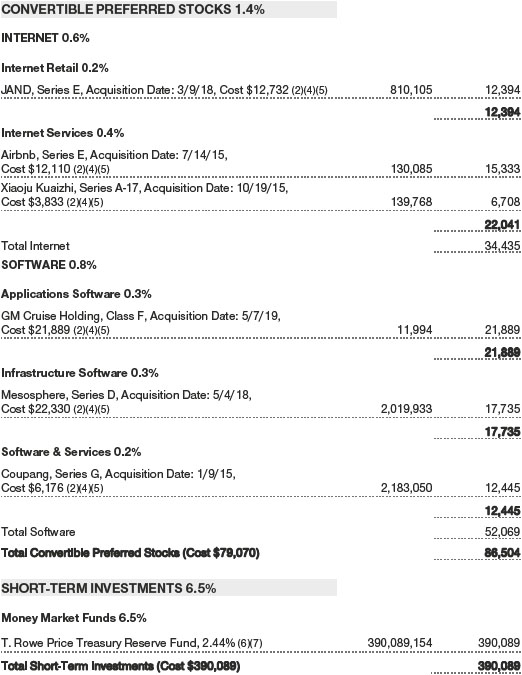
Technology stocks rebounded sharply in the first half of 2019. Since the 2008–2009 financial crisis, investors have flocked to high-growth companies, particularly in the software subsector, where stocks now trade forastoundingly high valuations. Consider that during that crisis,Salesforce.com, then an emerging software leader, traded at afree cash flow multiple of less than 25. Today, many emerging software companies boastsales multiples of more than 25. Other than a few key holdings, such asMicrosoftandSynopsys, we’ve recently found valuations of growing software companies to be prohibitively high. Our limited exposure to that area in the past year has hampered performance. (Please refer to the portfolio of investments for a complete list of holdings and the amount each represents in the portfolio.)
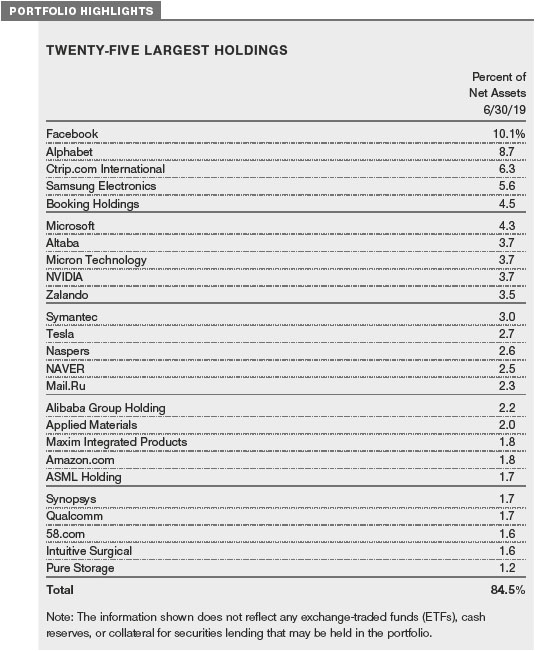
In the first half of 2019, the portfolio benefited from outsized absolute returns in many stocks that were among our largest purchases in the second half of 2018. These includeFacebook, the portfolio’s biggest position at the end of the period, and other internet leaders, such asZalando, which operates Europe’s leading online marketplace for apparel, andCtrip.com International, the dominant online provider of travel services in China. Semiconductor companyMarvell Technology Groupand related technology providerLam Researchwere other sizable contributors that we added in the back half of last year.
Geopolitical tensions between the U.S. and China again threatened the health of technology-oriented supply chains and economies. This situation weighed on many technology stocks, especially Chinese internet companies and technology component providers whose customers include Huawei and other China-based firms that could be at risk of supply restrictions from the U.S. We were particularly active in stocks affected by the wild swings in investor expectations around the trade conflict, buying on weakness and trimming on strength as we sought to balance opportunity and risk. Some opportunistic additions to the portfolio included58.com, the leading online classifieds platform in China;ASML Holding, an innovator in lithography systems used to build advanced semiconductors; andQualcomm, the leader in intellectual property and related technologies used in smartphones.
The world’s largest technology companies were buffeted by news of increasing regulatory scrutiny. However, in an indication that technology company fundamentals are usually at least as important to stocks’ performance as geopolitics, Facebook surged on better-than-expected earnings, whileAlphabet, Google’s parent company, lagged on modestly disappointing results. We added aggressively to our position in Alphabet on weakness.Microsoft largely stayed out of the regulatory news flow. The shares soared on continued stellar results, giving Microsoft the world’s largest market capitalization and the only one exceeding $1 trillion.
Our poorest absolute performer wasTesla, which fell on weaker-than-expected earnings and demand fears that we viewed as overblown. While Tesla carries above-average risk, we think itsfuture is bright as the dominant and innovative leader in electric vehicles. Three key internet holdings—South Korean search portal and e-commerce marketplaceNAVER, Russian social media playerMail.Ru, and global online travel leaderBooking Holdings—lagged on lukewarm investor sentiment. In our view, each offers differentiated services to its customers while offering investors attractive growth prospects at a low valuation.
How is the fund positioned?
The stock market has enjoyed record gains in the more than 10 years I’ve managed your fund. Technology led the way, driven by the ascendance of Big Tech—Microsoft,Amazon.com, Apple, Alphabet, and Facebook—whose collective market cap now exceeds $4 trillion. Over the 10 years ended December 31, 2018, the S&P 500 gained more than 240%, our benchmark returned more than 370%, and the fund gained more than 470%. Technology stocks’ strong performance continued in the first half of 2019.
As always, instead of trying to predict or time the market, we’re focusing on company fundamentals and industry trends to help us identify the most attractive technology stocks while maintaining an appropriate regard for risk. That said, we also continuously contemplate a range of economic, geopolitical, and stock market scenarios as part of assessing the reward and risk of our holdings and our overall portfolio positioning. In recent years, we’ve most often been conservatively positioned for a lower-return stock market environment than what has come to pass and typically have not had large exposure to the most expensive and highest-momentum stocks that have propelled the gains. We’ve tended to have an all-weather portfolio in a world of tech stocks that, despite some passing dark clouds, has enjoyed largely sunny skies. The fund participated in technology’s strong gains, but our relative performance has fallen short of our expectations.
We don’t know if this nearly unprecedented strength will continue, but as we enter the second half, we’re confident in our positioning because we see a lot more opportunity in the stocks we own than the ones we don’t. We’re especially optimistic about Alphabet, given its low valuation relative to its growth prospects, and several internet holdings outside the U.S.—Ctrip.com,Alibaba Group Holding, Zalando, NAVER, Mail.Ru, and 58.com—which are high-quality businesses that should be rewarded over time. In addition, we see opportunity in memory chipmakersSamsung ElectronicsandMicron Technology. This segment of the semiconductor market is experiencing short-term weakness that we believe will give way to benefits from powerful cross-cycle growth in the use of memory-intensive technologies, such as artificial intelligence.
What is portfolio management’s outlook?
In the past year or so, geopolitical dynamics have become a persistent factor in technology stock performance. In the U.S., there is unprecedented focus on what, if anything, regulators might do about concerns that the biggest technology companies have become too big and too powerful. The ongoingtensions between the U.S. and China remain particularly risky and continue to cause uncertainty for technology investors, given China’s importance to technology manufacturing and the size of its economy. That said, a substantial trade agreement may alleviate the apparent discount at which many technology supply chain stocks trade. In part because of their lower sensitivity to geopolitical tensions, many high-growth and high-momentum stocks seem to have gained even greater favor among investors; however, many of these seem priced to perfection and thus risky and best avoided for now.
We attach the most weight to our analysis of company fundamentals while also trying to appropriately account for economic and geopolitical scenarios. We see the most opportunity in our internet holdings, many of which have established strong competitive advantages in markets that are large and relatively early in their life cycles—dynamics that should support durable and attractive growth rates.
While the elevated geopolitical uncertainty warrants an extra degree of rigor and, in many cases, caution, we believe uncertainty often creates opportunity in individual stocks, and we remain on the lookout for good prices in high-growth as well as mature but durable businesses. Against this dynamic backdrop, a detailed understanding of companies’ particular strengths, weaknesses, and market positioning goes a long way in identifying the best stocks. In this pursuit, my partnership with our experienced and collaborative team of technology analysts remains invaluable. Thank you for your trust and support.
The views expressed reflect the opinions of T. Rowe Price as of the date of this report and are subject to change based on changes in market, economic, or other conditions. These views are not intended to be a forecast of future events and are no guarantee of future results.
RISKS OF INVESTING IN THE FUND
A fund that focuses its investments in specific industries or sectors is more susceptible to developments affecting those industries and sectors than a more broadly diversified fund. Because the fund invests significantly in science and technology companies, the fund may perform poorly during a downturn in those industries. Science and technology companies can be adversely affected by, among other things, intense competition, government regulation, earnings disappointments, dependency on patent protection, and rapid obsolescence of products and services due to technological innovations or changing consumer preferences.
GROWTH OF $10,000
This chart shows the value of a hypothetical $10,000 investment in the fund over the past 10 fiscal year periods or since inception (for funds lacking 10-year records). The result is compared with benchmarks, which include a broad-based market index and may also include a peer group average or index. Market indexes do not include expenses, which are deducted from fund returns as well as mutual fund averages and indexes.

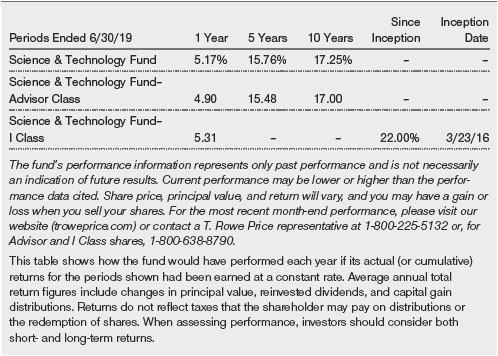
AVERAGE ANNUAL COMPOUND TOTAL RETURN
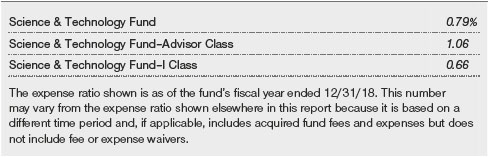
EXPENSE RATIO
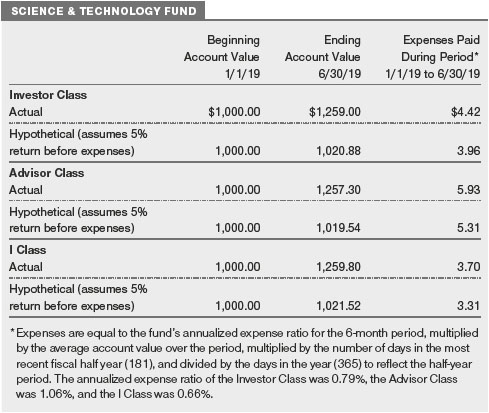
FUND EXPENSE EXAMPLE
As a mutual fund shareholder, you may incur two types of costs: (1) transaction costs, such as redemption fees or sales loads, and (2) ongoing costs, including management fees, distribution and service (12b-1) fees, and other fund expenses. The following example is intended to help you understand your ongoing costs (in dollars) of investing in the fund and to compare these costs with the ongoing costs of investing in other mutual funds. The example is based on an investment of $1,000 invested at the beginning of the most recent six-month period and held for the entire period.
Please note that the fund has three share classes: The original share class (Investor Class) charges no distribution and service (12b-1) fee, the Advisor Class shares are offered only through unaffiliated brokers and other financial intermediaries and charge a 0.25% 12b-1 fee, and I Class shares are available to institutionally oriented clients and impose no 12b-1 or administrative fee payment. Each share class is presented separately in the table.
Actual Expenses
The first line of the following table (Actual) provides information about actual account values and expenses based on the fund’s actual returns. You may use the information on this line, together with your account balance, to estimate the expenses that you paid over the period. Simply divide your account value by $1,000 (for example, an $8,600 account value divided by $1,000 = 8.6), then multiply the result by the number on the first line under the heading “Expenses Paid During Period” to estimate the expenses you paid on your account during this period.
Hypothetical Example for Comparison Purposes
The information on the second line of the table (Hypothetical) is based on hypothetical account values and expenses derived from the fund’s actual expense ratio and an assumed 5% per year rate of return before expenses (not the fund’s actual return). You may compare the ongoing costs of investing in the fund with other funds by contrasting this 5% hypothetical example and the 5% hypothetical examples that appear in the shareholder reports of the other funds. The hypothetical account values and expenses may not be used to estimate the actual ending account balance or expenses you paid for the period.
Note:T. Rowe Price charges an annual account service fee of $20, generally for accounts with less than $10,000. The fee is waived for any investor whose T. Rowe Price mutual fund accounts total $50,000 or more; accounts electing to receive electronic delivery of account statements, transaction confirmations, prospectuses, and shareholder reports; or accounts of an investor who is a T. Rowe Price Personal Services or Enhanced Personal Services client (enrollment in these programs generally requires T. Rowe Price assets of at least $250,000). This fee is not included in the accompanying table. If you are subject to the fee, keep it in mind when you are estimating the ongoing expenses of investing in the fund and when comparing the expenses of this fund with other funds.
You should also be aware that the expenses shown in the table highlight only your ongoing costs and do not reflect any transaction costs, such as redemption fees or sales loads. Therefore, the second line of the table is useful in comparing ongoing costs only and will not help you determine the relative total costs of owning different funds. To the extent a fund charges transaction costs, however, the total cost of owning that fund is higher.
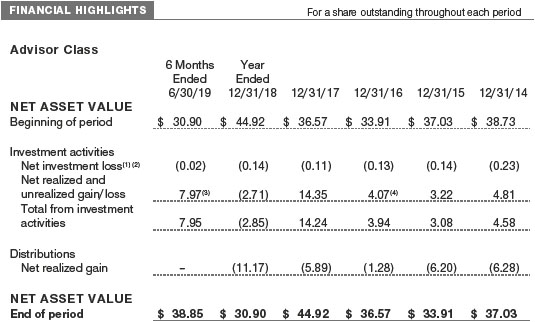
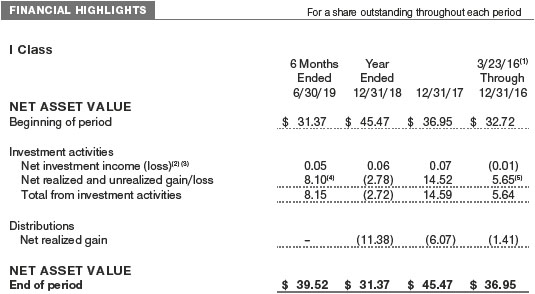
Unaudited
The accompanying notes are an integral part of these financial statements.
Unaudited
The accompanying notes are an integral part of these financial statements.
Unaudited
The accompanying notes are an integral part of these financial statements.
Unaudited


The accompanying notes are an integral part of these financial statements.
Unaudited
The accompanying notes are an integral part of these financial statements.
Unaudited
The accompanying notes are an integral part of these financial statements.
Unaudited
The accompanying notes are an integral part of these financial statements.
Unaudited
| NOTES TO FINANCIAL STATEMENTS |
T. Rowe Price Science & Technology Fund, Inc. (the fund) is registered under the Investment Company Act of 1940 (the 1940 Act) as a nondiversified, open-end management investment company. The fund seeks to provide long-term capital appreciation. The fund has three classes of shares: the Science & Technology Fund (Investor Class), the Science & Technology Fund–Advisor Class (Advisor Class), and the Science & Technology Fund–I Class (I Class). Advisor Class shares are sold only through unaffiliated brokers and other unaffiliated financial intermediaries. I Class shares require a $1 million initial investment minimum, although the minimum generally is waived for retirement plans, financial intermediaries, and certain other accounts. The Advisor Class operates under a Board-approved Rule 12b-1 plan pursuant to which the class compensates financial intermediaries for distribution, shareholder servicing, and/or certain administrative services; the Investor and I Classes do not pay Rule 12b-1 fees. Each class has exclusive voting rights on matters related solely to that class; separate voting rights on matters that relate to all classes; and, in all other respects, the same rights and obligations as the other classes.
NOTE 1 - SIGNIFICANT ACCOUNTING POLICIES
Basis of PreparationThe fund is an investment company and follows accounting and reporting guidance in the Financial Accounting Standards Board (FASB)Accounting Standards CodificationTopic 946 (ASC 946). The accompanying financial statements were prepared in accordance with accounting principles generally accepted in the United States of America (GAAP), including, but not limited to, ASC 946. GAAP requires the use of estimates made by management. Management believes that estimates and valuations are appropriate; however, actual results may differ from those estimates, and the valuations reflected in the accompanying financial statements may differ from the value ultimately realized upon sale or maturity. Certain prior year amounts in the accompanying financial statements and financial highlights have been restated to conform to current year presentation.
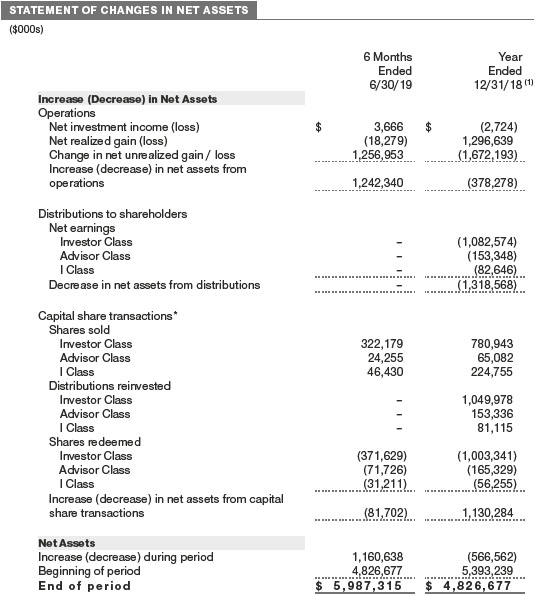
Investment Transactions, Investment Income, and DistributionsInvestment transactions are accounted for on the trade date basis. Income and expenses are recorded on the accrual basis. Realized gains and losses are reported on the identified cost basis. Income tax-related interest and penalties, if incurred, are recorded as income tax expense. Dividends received from mutual fund investments are reflected as dividend income; capital gain distributions are reflected as realized gain/loss. Dividend income and capital gain distributions are recorded on the ex-dividend date. Distributions to shareholdersare recorded on the ex-dividend date. Income distributions, if any, are declared and paid by each class annually. A capital gain distribution may also be declared and paid by the fund annually.
Currency TranslationAssets, including investments, and liabilities denominated in foreign currencies are translated into U.S. dollar values each day at the prevailing exchange rate, using the mean of the bid and asked prices of such currencies against U.S. dollars as quoted by a major bank. Purchases and sales of securities, income, and expenses are translated into U.S. dollars at the prevailing exchange rate on the respective date of such transaction. The effect of changes in foreign currency exchange rates on realized and unrealized security gains and losses is not bifurcated from the portion attributable to changes in market prices.
Class AccountingShareholder servicing, prospectus, and shareholder report expenses incurred by each class are charged directly to the class to which they relate. Expenses common to all classes, investment income, and realized and unrealized gains and losses are allocated to the classes based upon the relative daily net assets of each class. The Advisor Class pays Rule 12b-1 fees, in an amount not exceeding 0.25% of the class’s average daily net assets.
New Accounting GuidanceIn March 2017, the FASB issued amended guidance to shorten the amortization period for certain callable debt securities held at a premium. The guidance is effective for fiscal years and interim periods beginning after December 15, 2018. Adoption will have no effect on the fund’s net assets or results of operations.
IndemnificationIn the normal course of business, the fund may provide indemnification in connection with its officers and directors, service providers, and/or private company investments. The fund’s maximum exposure under these arrangements is unknown; however, the risk of material loss is currently considered to be remote.
NOTE 2 - VALUATION
The fund’s financial instruments are valued and each class’s net asset value (NAV) per share is computed at the close of the New York Stock Exchange (NYSE), normally 4 p.m. ET, each day the NYSE is open for business. However, the NAV per share may be calculated at a time other than the normal close of the NYSE if trading on the NYSE is restricted, if the NYSE closes earlier, or as may be permitted by the SEC.
Fair ValueThe fund’s financial instruments are reported at fair value, which GAAP defines as the price that would be received to sell an asset or paid to transfer a liability in an orderly transaction between market participants at the measurement date. TheT. Rowe Price Valuation Committee (the Valuation Committee) is an internal committee that has been delegated certain responsibilities by the fund’s Board of Directors (the Board) to ensure that financial instruments are appropriately priced at fair value in accordance with GAAP and the 1940 Act. Subject to oversight by the Board, the Valuation Committee develops and oversees pricing-related policies and procedures and approves all fair value determinations. Specifically, the Valuation Committee establishes procedures to value securities; determines pricing techniques, sources, and persons eligible to effect fair value pricing actions; oversees the selection, services, and performance of pricing vendors; oversees valuation-related business continuity practices; and provides guidance on internal controls and valuation-related matters. The Valuation Committee reports to the Board and has representation from legal, portfolio management and trading, operations, risk management, and the fund’s treasurer.
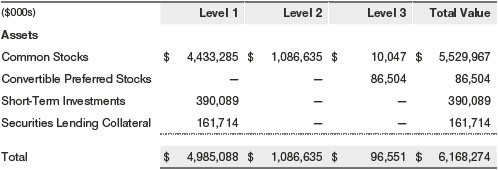
Various valuation techniques and inputs are used to determine the fair value of financial instruments. GAAP establishes the following fair value hierarchy that categorizes the inputs used to measure fair value:
Level 1 – quoted prices (unadjusted) in active markets for identical financial instruments that the fund can access at the reporting date
Level 2 – inputs other than Level 1 quoted prices that are observable, either directly or indirectly (including, but not limited to, quoted prices for similar financial instruments in active markets, quoted prices for identical or similar financial instruments in inactive markets, interest rates and yield curves, implied volatilities, and credit spreads)
Level 3 – unobservable inputs
Observable inputs are developed using market data, such as publicly available information about actual events or transactions, and reflect the assumptions that market participants would use to price the financial instrument. Unobservable inputs are those for which market data are not available and are developed using the best information available about the assumptions that market participants would use to price the financial instrument. GAAP requires valuation techniques to maximize the use of relevant observable inputs and minimize the use of unobservable inputs. When multiple inputs are used to derive fair value, the financial instrument is assigned to the level within the fair value hierarchy based on the lowest-level input that is significant to the fair value of the financial instrument. Input levels are not necessarily an indication of the risk or liquidity associated with financial instruments at that level but rather the degree of judgment used in determining those values.
Valuation TechniquesEquity securities listed or regularly traded on a securities exchange or in the over-the-counter (OTC) market are valued at the last quoted sale price or, for certain markets, the official closing price at the time the valuations are made. OTC Bulletin Board securities are valued at the mean of the closing bid and asked prices. A security that is listed or traded on more than one exchange is valued at the quotation on the exchange determined to be the primary market for such security. Listed securities not traded on a particular day are valued at the mean of the closing bid and asked prices for domestic securities and the last quoted sale or closing price for international securities.
For valuation purposes, the last quoted prices of non-U.S. equity securities may be adjusted to reflect the fair value of such securities at the close of the NYSE. If the fund determines that developments between the close of a foreign market and the close of the NYSE will affect the value of some or all of its portfolio securities, the fund will adjust the previous quoted prices to reflect what it believes to be the fair value of the securities as of the close of the NYSE. In deciding whether it is necessary to adjust quoted prices to reflect fair value, the fund reviews a variety of factors, including developments in foreign markets, the performance of U.S. securities markets, and the performance of instruments trading in U.S. markets that represent foreign securities and baskets of foreign securities. The fund may also fair value securities in other situations, such as when a particular foreign market is closed but the fund is open. The fund uses outside pricing services to provide it with quoted prices and information to evaluate or adjust those prices. The fund cannot predict how often it will use quoted prices and how often it will determine it necessary to adjust those prices to reflect fair value. As a means of evaluating its security valuation process, the fund routinely compares quoted prices, the next day’s opening prices in the same markets, and adjusted prices.
Actively traded equity securities listed on a domestic exchange generally are categorized in Level 1 of the fair value hierarchy. Non-U.S. equity securities generally are categorized in Level 2 of the fair value hierarchy despite the availability of quoted prices because, as described above, the fund evaluates and determines whether those quoted prices reflect fair value at the close of the NYSE or require adjustment. OTC Bulletin Board securities, certain preferred securities, and equity securities traded in inactive markets generally are categorized in Level 2 of the fair value hierarchy.
Investments in mutual funds are valued at the mutual fund’s closing NAV per share on the day of valuation and are categorized in Level 1 of the fair value hierarchy. Assets and liabilities other than financial instruments, including short-term receivables and payables, are carried at cost, or estimated realizable value, if less, which approximates fair value.
Thinly traded financial instruments and those for which the above valuation procedures are inappropriate or are deemed not to reflect fair value are stated at fair value as determined in good faith by the Valuation Committee. The objective of any fair value pricing determination is to arrive at a price that could reasonably be expected from a current sale. Financial instruments fair valued by the Valuation Committee are primarily private placements, restricted securities, warrants, rights, and other securities that are not publicly traded.
Subject to oversight by the Board, the Valuation Committee regularly makes good faith judgments to establish and adjust the fair valuations of certain securities as events occur and circumstances warrant. For instance, in determining the fair value of an equity investment with limited market activity, such as a private placement or a thinly traded public company stock, the Valuation Committee considers a variety of factors, which may include, but are not limited to, the issuer’s business prospects, its financial standing and performance, recent investment transactions in the issuer, new rounds of financing, negotiated transactions of significant size between other investors in the company, relevant market valuations of peer companies, strategic events affecting the company, market liquidity for the issuer, and general economic conditions and events. In consultation with the investment and pricing teams, the Valuation Committee will determine an appropriate valuation technique based on available information, which may include both observable and unobservable inputs. The Valuation Committee typically will afford greatest weight to actual prices in arm’s length transactions, to the extent they represent orderly transactions between market participants, transaction information can be reliably obtained, and prices are deemed representative of fair value. However, the Valuation Committee may also consider other valuation methods such as market-based valuation multiples; a discount or premium from market value of a similar, freely traded security of the same issuer; or some combination. Fair value determinations are reviewed on a regular basis and updated as information becomes available, including actual purchase and sale transactions of the issue. Because any fair value determination involves a significant amount of judgment, there is a degree of subjectivity inherent in such pricing decisions, and fair value prices determined by the Valuation Committee could differ from those of other market participants. Depending on the relative significance of unobservable inputs, including the valuation technique(s) used, fair valued securities may be categorized in Level 2 or 3 of the fair value hierarchy.
Valuation InputsThe following table summarizes the fund’s financial instruments, based on the inputs used to determine their fair values on June 30, 2019 (for further detail by category, please refer to the accompanying Portfolio of Investments):
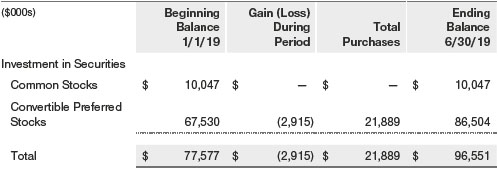
Following is a reconciliation of the fund’s Level 3 holdings for the six months ended June 30, 2019. Gain (loss) reflects both realized and change in unrealized gain/loss on Level 3 holdings during the period, if any, and is included on the accompanying Statement of Operations. The change in unrealized gain/loss on Level 3 instruments held at June 30, 2019, totaled $(2,915,000) for the six months ended June 30, 2019.
NOTE 3 - OTHER INVESTMENT TRANSACTIONS
Consistent with its investment objective, the fund engages in the following practices to manage exposure to certain risks and/or to enhance performance. The investment objective, policies, program, and risk factors of the fund are described more fully in the fund’s prospectus and Statement of Additional Information.
Emerging MarketsThe fund may invest, either directly or through investments in T. Rowe Price institutional funds, in securities of companies located in, issued by governments of, or denominated in or linked to the currencies of emerging market countries; at period-end, approximately 24% of the fund’s net assets were invested in emerging markets. Emerging markets generally have economic structures that are less diverse and mature, and political systems that are less stable, than developed countries. These markets may be subject to greater political, economic, and social uncertainty and differing regulatory environments that may potentially impact the fund’s ability to buy or sell certain securities or repatriate proceeds to U.S. dollars. Such securities are often subject to greater price volatility, less liquidity, and higher rates of inflation than U.S. securities.
Restricted SecuritiesThe fund may invest in securities that are subject to legal or contractual restrictions on resale. Prompt sale of such securities at an acceptable price may be difficult and may involve substantial delays and additional costs.
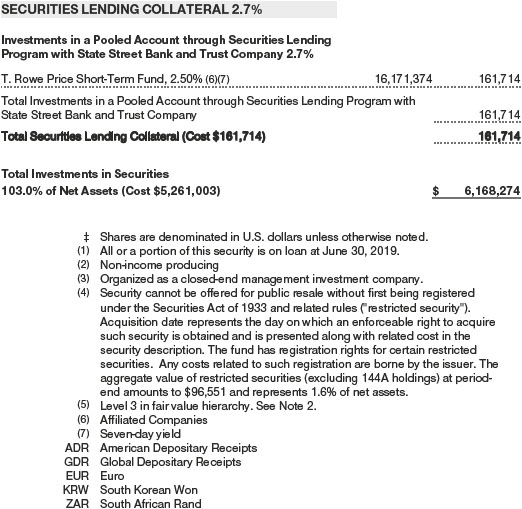
Securities LendingThe fund may lend its securities to approved borrowers to earn additional income. Its securities lending activities are administered by a lending agent in accordance with a securities lending agreement. Security loans generally do not have stated maturity dates, and the fund may recall a security at any time. The fund receives collateral in the form of cash or U.S. government securities. Collateral is maintained over the life of the loan in an amount not less than the value of loaned securities; any additional collateral required due to changes in security values is delivered to the fund the next business day. Cash collateral is invested in accordance with investment guidelines approved by fund management. Additionally, the lending agent indemnifies the fund against losses resulting from borrower default. Although risk is mitigated by the collateral and indemnification, the fund could experience a delay in recovering its securities and a possible loss of income or value if the borrower fails to return the securities, collateral investments decline in value, and the lending agent fails to perform. Securities lending revenue consists of earnings on invested collateral and borrowing fees, net of any rebates to the borrower, compensation to the lending agent, and other administrative costs. In accordance with GAAP, investments made with cash collateral are reflected in the accompanying financial statements, but collateral received in the form of securities is not. At June 30, 2019, the value of loaned securities was $159,686,000, including securities sold but not yet settled, which are not reflected in the accompanying Portfolio of Investments; the value of cash collateral and related investments was $161,846,000.
OtherPurchases and sales of portfolio securities other than short-term securities aggregated $1,667,280,000 and $2,052,744,000, respectively, for the six months ended June 30, 2019.
NOTE 4 - FEDERAL INCOME TAXES
No provision for federal income taxes is required since the fund intends to continue to qualify as a regulated investment company under Subchapter M of the Internal Revenue Code and distribute to shareholders all of its taxable income and gains. Distributions determined in accordance with federal income tax regulations may differ in amount or character from net investment income and realized gains for financial reporting purposes. Financial reporting records are adjusted for permanent book/tax differences to reflect tax character but are not adjusted for temporary differences. The amount and character of tax-basis distributions and composition of net assets are finalized at fiscal year-end; accordingly, tax-basis balances have not been determined as of the date of this report.
At June 30, 2019, the cost of investments for federal income tax purposes was $5,285,507,000. Net unrealized gain aggregated $882,704,000 at period-end, of which $1,034,231,000 related to appreciated investments and $151,527,000 related to depreciated investments.
NOTE 5 - FOREIGN TAXES
The fund is subject to foreign income taxes imposed by certain countries in which it invests. Additionally, certain foreign currency transactions are subject to tax, and capital gains realized upon disposition of securities issued in or by certain foreign countries are subject to capital gains tax imposed by those countries. All taxes are computed in accordance with the applicable foreign tax law, and, to the extent permitted, capital losses are used to offset capital gains. Taxes attributable to income are accrued by the fund as a reduction of income. Taxes incurred on the purchase of foreign currencies are recorded as realized loss on foreign currency transactions. Current and deferred tax expense attributable to capital gains is reflected as a component of realized or change in unrealized gain/loss on securities in the accompanying financial statements. At June 30, 2019, the fund had no deferred tax liability attributable to foreign securities and no foreign capital loss carryforwards.
NOTE 6 - RELATED PARTY TRANSACTIONS
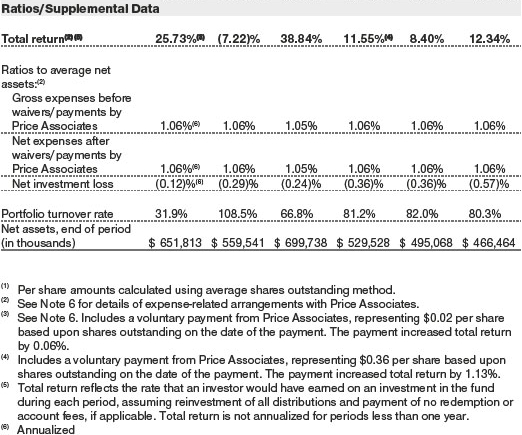
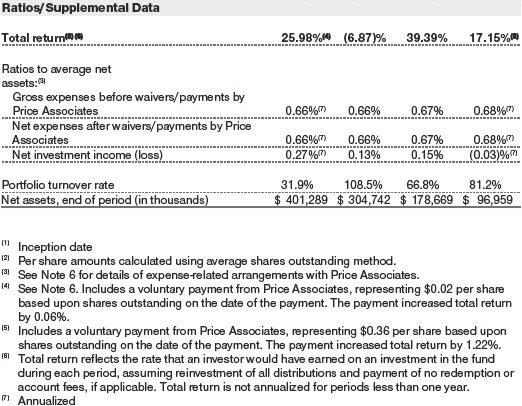
The fund is managed by T. Rowe Price Associates, Inc. (Price Associates), a wholly owned subsidiary of T. Rowe Price Group, Inc. (Price Group). The investment management agreement between the fund and Price Associates provides for an annual investment management fee, which is computed daily and paid monthly. The fee consists of an individual fund fee, equal to 0.35% of the fund’s average daily net assets, and a groupfee. The group fee rate is calculated based on the combined net assets of certain mutual funds sponsored by Price Associates (the group) applied to a graduated fee schedule, with rates ranging from 0.48% for the first $1 billion of assets to 0.265% for assets in excess of $650 billion. The fund’s group fee is determined by applying the group fee rate to the fund’s average daily net assets. At June 30, 2019, the effective annual group fee rate was 0.29%.
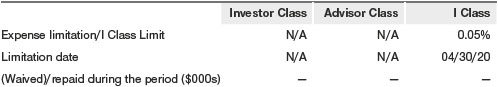
The I Class is subject to an operating expense limitation (I Class Limit) pursuant to which Price Associates is contractually required to pay all operating expenses of the I Class, excluding management fees; interest; expenses related to borrowings, taxes, and brokerage; and other non-recurring expenses permitted by the investment management agreement, to the extent such operating expenses, on an annualized basis, exceed the I Class Limit. This agreement will continue through the limitation date indicated in the table below, and may be renewed, revised, or revoked only with approval of the fund’s Board. The I Class is required to repay Price Associates for expenses previously paid to the extent the class’s net assets grow or expenses decline sufficiently to allow repayment without causing the class’s operating expenses (after the repayment is taken into account) to exceed the lesser of: (1) the I Class Limit in place at the time such amounts were paid; or (2) the current I Class Limit. However, no repayment will be made more than three years after the date of a payment or waiver.
In addition, the fund has entered into service agreements with Price Associates and two wholly owned subsidiaries of Price Associates, each an affiliate of the fund (collectively, Price). Price Associates provides certain accounting and administrative services to the fund. T. Rowe Price Services, Inc. provides shareholder and administrative services in its capacity as the fund’s transfer and dividend-disbursing agent. T. Rowe Price Retirement Plan Services, Inc. provides subaccounting and recordkeeping services for certain retirement accounts invested in the Investor Class and Advisor Class. For the six months ended June 30, 2019, expenses incurred pursuant to these service agreements were $34,000 for Price Associates; $1,411,000 for T. Rowe Price Services, Inc.; and $482,000 for T. Rowe Price Retirement Plan Services, Inc. All amounts due to and due from Price, exclusive of investment management fees payable, are presented net on the accompanying Statement of Assets and Liabilities.
Additionally, the fund is one of several mutual funds in which certain college savings plans managed by Price Associates may invest. As approved by the fund’s Board of Directors, shareholder servicing costs associated with each college savings plan are borne by the fund in proportion to the average daily value of its shares owned by the college savings plan. For the six months ended June 30, 2019, the fund was charged $41,000 for shareholder servicing costs related to the college savings plans, of which $25,000 was for services provided by Price. All amounts due to and due from Price, exclusive of investment management fees payable, are presented net on the accompanying Statement of Assets and Liabilities. At June 30, 2019, approximately 1% of the outstanding shares of the Investor Class were held by college savings plans.
The fund may invest its cash reserves in certain open-end management investment companies managed by Price Associates and considered affiliates of the fund: the T. Rowe Price Government Reserve Fund or the T. Rowe Price Treasury Reserve Fund, organized as money market funds, or the T. Rowe Price Short-Term Fund, a short-term bond fund (collectively, the Price Reserve Funds). The Price Reserve Funds are offered as short-term investment options to mutual funds, trusts, and other accounts managed by Price Associates or its affiliates and are not available for direct purchase by members of the public. Cash collateral from securities lending is invested in the T. Rowe Price Short-Term Fund. The Price Reserve Funds pay no investment management fees.
On April 2, 2019, Price Associates reimbursed the fund $3,117,000 (0.1% of net assets) for the estimated effect of an under-reported cash balance available for investment.
The fund may participate in securities purchase and sale transactions with other funds or accounts advised by Price Associates (cross trades), in accordance with procedures adopted by the fund’s Board and Securities and Exchange Commission rules, which require, among other things, that such purchase and sale cross trades be effected at the independent current market price of the security. During the six months ended June 30, 2019, the fund had no purchases or sales cross trades with other funds or accounts advised by Price Associates.
INFORMATION ON PROXY VOTING POLICIES, PROCEDURES, AND RECORDS
A description of the policies and procedures used by T. Rowe Price funds and portfolios to determine how to vote proxies relating to portfolio securities is available in each fund’s Statement of Additional Information. You may request this document by calling 1-800-225-5132 or by accessing the SEC’s website, sec.gov.
The description of our proxy voting policies and procedures is also available on our corporate website. To access it, please visit the following Web page:
https://www3.troweprice.com/usis/corporate/en/utility/policies.html
Scroll down to the section near the bottom of the page that says, “Proxy Voting Policies.” Click on the Proxy Voting Policies link in the shaded box.
Each fund’s most recent annual proxy voting record is available on our website and through the SEC’s website. To access it through T. Rowe Price, visit the website location shown above, and scroll down to the section near the bottom of the page that says, “Proxy Voting Records.” Click on the Proxy Voting Records link in the shaded box.
HOW TO OBTAIN QUARTERLY PORTFOLIO HOLDINGS
Effective for reporting periods on or after March 1, 2019, a fund, except a money market fund, files a complete schedule of portfolio holdings with the Securities and Exchange Commission (SEC) for the first and third quarters of each fiscal year as an exhibit to its reports on Form N-PORT. Prior to March 1, 2019, a fund, including a money market fund, filed a complete schedule of portfolio holdings with the SEC for the first and third quarters of each fiscal year on Form N-Q. A money market fund files detailed month-end portfolio holdings information on Form N-MFP with the SEC each month and posts a complete schedule of portfolio holdings on its website (troweprice.com) as of each month-end for the previous six months. A fund’s Forms N-PORT, N-MFP and N-Q are available electronically on the SEC’s website (sec.gov).
APPROVAL OF INVESTMENT MANAGEMENT AGREEMENT
Each year, the fund’s Board of Directors (Board) considers the continuation of the investment management agreement (Advisory Contract) between the fund and its investment advisor, T. Rowe Price Associates, Inc. (Advisor), on behalf of the fund. In that regard, at an in-person meeting held on March 11–12, 2019 (Meeting), the Board, including a majority of the fund’s independent directors, approved the continuation of the fund’s Advisory Contract. At the Meeting, the Board considered the factors and reached the conclusions described below relating to the selection of the Advisor and the approval of the Advisory Contract. The independent directors were assisted in their evaluation of the Advisory Contract by independent legal counsel from whom they received separate legal advice and with whom they met separately.
In providing information to the Board, the Advisor was guided by a detailed set of requests for information submitted by independent legal counsel on behalf of the independent directors. In considering and approving the Advisory Contract, the Board considered the information it believed was relevant, including, but not limited to, the information discussed below. The Board considered not only the specific information presented in connection with the Meeting but also the knowledge gained over time through interaction with the Advisor about various topics. The Board meets regularly and, at each of its meetings, covers an extensive agenda of topics and materials and considers factors that are relevant to its annual consideration of the renewal of the T. Rowe Price funds’ advisory contracts, including performance and the services and support provided to the funds and their shareholders.
Services Provided by the Advisor
The Board considered the nature, quality, and extent of the services provided to the fund by the Advisor. These services included, but were not limited to, directing the fund’s investments in accordance with its investment program and the overall management of the fund’s portfolio, as well as a variety of related activities such as financial, investment operations, and administrative services; compliance; maintaining the fund’s records and registrations; and shareholder communications. The Board also reviewed the background and experience of the Advisor’s senior management team and investment personnel involved in the management of the fund, as well as the Advisor’s compliance record. The Board concluded that it was satisfied with the nature, quality, and extent of the services provided by the Advisor.
Investment Performance of the Fund
The Board took into account discussions with the Advisor and reports that it receives throughout the year relating to fund performance. In connection with the Meeting, the Board reviewed the fund’s net annualized total returns for the 1-, 2-, 3-, 4-, 5-, and 10-year periods as of September 30, 2018, and compared these returns with the performance of a peer group of funds with similar investment programs and a wide variety of other previously agreed-upon comparable performance measures and market data, including those supplied by Broadridge, which is an independent provider of mutual fund data.
On the basis of this evaluation and the Board’s ongoing review of investment results, and factoring in the relative market conditions during certain of the performance periods, the Board concluded that the fund’s performance was satisfactory.
Costs, Benefits, Profits, and Economies of Scale
The Board reviewed detailed information regarding the revenues received by the Advisor under the Advisory Contract and other benefits that the Advisor (and its affiliates) may have realized from its relationship with the fund, including any research received under “soft dollar” agreements and commission-sharing arrangements with broker-dealers. The Board considered that the Advisor may receive some benefit from soft-dollar arrangements pursuant to which research is received from broker-dealers that execute the fund’s portfolio transactions. The Board received information on the estimated costs incurred and profits realized by the Advisor from managing the T. Rowe Price funds. The Board also reviewed estimates of the profits realized from managing the fund in particular, and the Board concluded that the Advisor’s profits were reasonable in light of the services provided to the fund.
The Board also considered whether the fund benefits under the fee levels set forth in the Advisory Contract from any economies of scale realized by the Advisor. Under the Advisory Contract, the fund pays a fee to the Advisor for investment management services composed of two components—a group fee rate based on the combined average net assets of most of the T. Rowe Price funds (including the fund) that declines at certain asset levels and an individual fund fee rate based on the fund’s average daily net assets—and the fund pays its own expenses of operations. The Board concluded that the advisory fee structure for the fund continued to provide for a reasonable sharing of benefits from any economies of scale with the fund’s investors.
Fees and Expenses
The Board was provided with information regarding industry trends in management fees and expenses. Among other things, the Board reviewed data for peer groups that were compiled by Broadridge, which compared: (i) contractual management fees, total expenses, actual management fees, and nonmanagement expenses of the Investor Class of the fund with a group of competitor funds selected by Broadridge (Investor Class Expense Group); (ii) total expenses and actual management fees of the Advisor Class of the fund with a group of competitor funds selected by Broadridge (Advisor Class Expense Group); and (iii) total expenses, actual management fees, and nonmanagement expenses of the Investor Class of the fund with a broader set of funds within the Lipper investment classification (Expense Universe). The Board considered the fund’s contractual management fee rate, actual management fee rate (which reflects the management fees actually received from the fund by the Advisor after any applicable waivers, reductions, or reimbursements), operating expenses, and total expenses (which reflect the net total expense ratio of the fund after any waivers, reductions, or reimbursements) in comparison with the information for the Broadridge peer groups. Broadridge generally constructed the peer groups by seeking the most comparable funds based on similar investmentclassifications and objectives, expense structure, asset size, and operating components and attributes and ranked funds into quintiles, with the first quintile representing the funds with the lowest relative expenses and the fifth quintile representing the funds with the highest relative expenses. The information provided to the Board indicated that the fund’s contractual management fee ranked in the second quintile (Investor Class Expense Group), the fund’s actual management fee rate ranked in the first quintile (Investor Class Expense Group) and second quintile (Advisor Class Expense Group and Expense Universe), and the fund’s total expenses ranked in the first quintile (Investor Class Expense Group, Advisor Class Expense Group, and Expense Universe).
The Board also reviewed the fee schedules for institutional accounts and private accounts with similar mandates that are advised or subadvised by the Advisor and its affiliates. Management provided the Board with information about the Advisor’s responsibilities and services provided to subadvisory and other institutional account clients, including information about how the requirements and economics of the institutional business are fundamentally different from those of the mutual fund business. The Board considered information showing that the Advisor’s mutual fund business is generally more complex from a business and compliance perspective than its institutional account business and considered various relevant factors, such as the broader scope of operations and oversight, more extensive shareholder communication infrastructure, greater asset flows, heightened business risks, and differences in applicable laws and regulations associated with the Advisor’s proprietary mutual fund business. In assessing the reasonableness of the fund’s management fee rate, the Board considered the differences in the nature of the services required for the Advisor to manage its mutual fund business versus managing a discrete pool of assets as a subadvisor to another institution’s mutual fund or for an institutional account and that the Advisor generally performs significant additional services and assumes greater risk in managing the fund and other T. Rowe Price funds than it does for institutional account clients.
On the basis of the information provided and the factors considered, the Board concluded that the fees paid by the fund under the Advisory Contract are reasonable.
Approval of the Advisory Contract
As noted, the Board approved the continuation of the Advisory Contract. No single factor was considered in isolation or to be determinative to the decision. Rather, the Board concluded, in light of a weighting and balancing of all factors considered, that it was in the best interests of the fund and its shareholders for the Board to approve the continuation of the Advisory Contract (including the fees to be charged for services thereunder).
Item 1. (b) Notice pursuant to Rule 30e-3.
Not applicable.
Item 2. Code of Ethics.
A code of ethics, as defined in Item 2 of Form N-CSR, applicable to its principal executive officer, principal financial officer, principal accounting officer or controller, or persons performing similar functions is filed as an exhibit to the registrant’s annual Form N-CSR. No substantive amendments were approved or waivers were granted to this code of ethics during the registrant’s most recent fiscal half-year.
Item 3. Audit Committee Financial Expert.
Disclosure required in registrant’s annual Form N-CSR.
Item 4. Principal Accountant Fees and Services.
Disclosure required in registrant’s annual Form N-CSR.
Item 5. Audit Committee of Listed Registrants.
Not applicable.
Item 6. Investments.
(a) Not applicable. The complete schedule of investments is included in Item 1 of this Form N-CSR.
(b) Not applicable.
Item 7. Disclosure of Proxy Voting Policies and Procedures for Closed-End Management Investment Companies.
Not applicable.
Item 8. Portfolio Managers of Closed-End Management Investment Companies.
Not applicable.
Item 9. Purchases of Equity Securities by Closed-End Management Investment Company and Affiliated Purchasers.
Not applicable.
Item 10. Submission of Matters to a Vote of Security Holders.
Not applicable.
Item 11. Controls and Procedures.
(a) The registrant’s principal executive officer and principal financial officer have evaluated the registrant’s disclosure controls and procedures within 90 days of this filing and have concluded that the registrant’s disclosure controls and procedures were effective, as of that date, in ensuring that information required to be disclosed by the registrant in this Form N-CSR was recorded, processed, summarized, and reported timely.
(b) The registrant’s principal executive officer and principal financial officer are aware of no change in the registrant’s internal control over financial reporting that occurred during the period covered by this report that has materially affected, or is reasonably likely to materially affect, the registrant’s internal control over financial reporting.
Item 12. Disclosure of Securities Lending Activities for Closed-End Management Investment Companies.
Not applicable.
Item 13. Exhibits.
(a)(1) The registrant’s code of ethics pursuant to Item 2 of Form N-CSR is filed with the registrant’s annual Form N-CSR.
(2) Separate certifications by the registrant's principal executive officer and principal financial officer, pursuant to Section 302 of the Sarbanes-Oxley Act of 2002 and required by Rule 30a-2(a) under the Investment Company Act of 1940, are attached.
(3) Written solicitation to repurchase securities issued by closed-end companies: not applicable.
(b) A certification by the registrant's principal executive officer and principal financial officer, pursuant to Section 906 of the Sarbanes-Oxley Act of 2002 and required by Rule 30a-2(b) under the Investment Company Act of 1940, is attached.
SIGNATURES
Pursuant to the requirements of the Securities Exchange Act of 1934 and the Investment Company Act of 1940, the registrant has duly caused this report to be signed on its behalf by the undersigned, thereunto duly authorized.
T. Rowe Price Science & Technology Fund, Inc.
| By | | /s/ David Oestreicher |
| | | David Oestreicher |
| | | Principal Executive Officer |
| |
| Date | | August 16, 2019 | | | | |
Pursuant to the requirements of the Securities Exchange Act of 1934 and the Investment Company Act of 1940, this report has been signed below by the following persons on behalf of the registrant and in the capacities and on the dates indicated.
| By | | /s/ David Oestreicher |
| | | David Oestreicher |
| | | Principal Executive Officer |
| |
| Date | | August 16, 2019 | | | | |
| |
| |
| By | | /s/ Catherine D. Mathews |
| | | Catherine D. Mathews |
| | | Principal Financial Officer |
| |
| Date | | August 16, 2019 | | | | |