| UNITED STATES |
| SECURITIES AND EXCHANGE COMMISSION |
| Washington, D.C. 20549 |
| CERTIFIED SHAREHOLDER REPORT OF REGISTERED MANAGEMENT |
| INVESTMENT COMPANIES |
Investment Company Act file number 811-05202
| The Dreyfus/Laurel Funds, Inc. |
| (Exact name of Registrant as specified in charter) |
| c/o The Dreyfus Corporation |
| 200 Park Avenue |
| New York, New York 10166 |
| (Address of principal executive offices) | | (Zip code) |
| Michael A. Rosenberg, Esq. |
| 200 Park Avenue |
| New York, New York 10166 |
| (Name and address of agent for service) |
| Registrant's telephone number, including area code: | | (212) 922-6000 |
| Date of fiscal year end: | | 08/31 | | |
| Date of reporting period: | | 08/31/2008 | | |
The following Form N-CSR relates only to Dreyfus Premier Core Equity Fund, a series of the Registrant, and does not affect the other series of the Registrant, which have a different fiscal year end and, therefore, different Form N-CSR reporting requirements. A separate Form N-CSR will be filed for those series, as appropriate.
| Item 1. Reports to Stockholders. |
Dreyfus Premier Core Equity Fund
| | ANNUAL REPORT August 31, 2008 |

Save time. Save paper. View your next shareholder report online as soon as it’s available. Log into www.dreyfus.com and sign up for Dreyfus eCommunications. It’s simple and only takes a few minutes.
The views expressed in this report reflect those of the portfolio manager only through the end of the period covered and do not necessarily represent the views of Dreyfus or any other person in the Dreyfus organization. Any such views are subject to change at any time based upon market or other conditions and Dreyfus disclaims any responsibility to update such views.These views may not be relied on as investment advice and, because investment decisions for a Dreyfus fund are based on numerous factors, may not be relied on as an indication of trading intent on behalf of any Dreyfus fund.
Not FDIC-Insured Not Bank-Guaranteed May Lose Value
| | Contents |
| |
| | THE FUND |
| |
| 2 | A Letter from the CEO |
| |
| 3 | Discussion of Fund Performance |
| |
| 6 | Fund Performance |
| |
| 8 | Understanding Your Fund’s Expenses |
| |
| 8 | Comparing Your Fund’s Expenses With Those of Other Funds |
| |
| 9 | Statement of Investments |
| |
| 12 | Statement of Assets and Liabilities |
| |
| 13 | Statement of Operations |
| |
| 14 | Statement of Changes in Net Assets |
| |
| 17 | Financial Highlights |
| |
| 22 | Notes to Financial Statements |
| |
| 31 | Report of Independent Registered Public Accounting Firm |
| |
| 32 | Important Tax Information |
| |
| 33 | Board Members Information |
| |
| 35 | Officers of the Fund |
| |
| | FOR MORE INFORMATION |
| |
| | Back Cover |
| |
Dreyfus Premier
Core Equity Fund |

A LETTER FROM THE CEO
Dear Shareholder: |
We present to you this annual report for Dreyfus Premier Core Equity Fund, covering the 12-month period from September 1, 2007, through August 31, 2008.
Economic and market conditions generally remained unsettled throughout the reporting period. A persistent credit crisis, downturns in the U.S. and global economies and resurgent inflationary pressures produced heightened market volatility. However, a look at the returns of various stock market indices over the 12-month reporting period reveals a counter-historical trend: Smaller, growth-oriented stocks declined less sharply, on average, than larger value stocks.These results reinforce two important principles of investing: the short-term movements of financial markets are difficult to predict; and diversification across asset classes and investment styles can help cushion the volatility of individual securities and markets.
We believe that monetary and other recent government policy actions should contribute to the recuperation of the ongoing credit crisis, and that credit availability is likely to improve slowly as financial institutions remain cautious. Global energy demand has begun to weaken, potentially alleviating inflationary pressures.The housing market may bottom later this year, with relatively little potential for either sharp subsequent declines or a strong rebound. Consequently, we expect the U.S. economy to slow to sub-par levels for a prolonged period, rather than entering either a sustained rebound or a severe recession.As always, your financial advisor can help you position your investments accordingly.
For information about how the fund performed during the reporting period, as well as market perspectives, we have provided a Discussion of Fund Performance given by the fund’s Portfolio Manager.
Thank you for your continued confidence and support.
Jonathan R. Baum
Chief Executive Officer
The Dreyfus Corporation |

DISCUSSION OF FUND PERFORMANCE
For the period of September 1, 2007, through August 31, 2008, as provided by Fayez Sarofim, of Fayez Sarofim & Co., Sub-Investment Adviser
Fund and Market Performance
For the 12-month period ended August 31, 2008, Dreyfus Premier Core Equity Fund’s Class A shares produced a total return of –7.86%, Class B shares returned –8.60%, Class C shares returned –8.59%, Class I shares returned –7.63% and Class T shares returned –8.07% .1 For the same period, the fund’s benchmark, the Standard & Poor’s 500 Composite Stock Price Index (“S&P 500 Index”),produced a –11.13% total return.2
Stocks generally declined as an intensifying credit crisis produced massive losses among financial institutions, and the U.S. economy weakened along with home prices, the job market and consumer spending. The fund produced higher returns than its benchmark, primarily due to its focus on industry leaders with strong balance sheets, positive cash flows and global market positions.
The Fund’s Investment Approach
The fund seeks long-term capital appreciation.To pursue its goal, the fund normally invests at least 80% of its assets in common stocks of U.S. and foreign companies with market capitalizations exceeding $5 billion at the time of purchase, including multinational companies.
In choosing stocks, the fund first identifies economic sectors that it believes will expand over the next three to five years or longer.Using fundamental analysis, the fund then seeks companies within these sectors that have dominant positions in their industries and that have demonstrated sustained patterns of profitability, strong balance sheets, and expanding global presence and the potential to achieve predictable, above-average earnings growth.The fund is also alert to companies which it considers undervalued in terms of current earnings, assets or growth prospects.
The fund employs a “buy-and-hold” investment strategy, which generally has resulted in an annual portfolio turnover of below 15%.3 As a result, the fund invests for long-term growth rather than short-term profits.
| DISCUSSION OF FUND PERFORMANCE (continued) |
Stocks Struggled in a Weaker Economy
U.S. stocks generally produced disappointing results over the reporting period amid an onslaught of negative economic news.As housing values plummeted and unemployment rates climbed, mortgage delinquencies and foreclosures rose sharply, fueling ongoing turmoil in the mortgage market. Meanwhile, escalating commodity prices over much of the reporting period burdened consumers with soaring oil, gas and home heating expenditures and rising food costs.These factors caused consumers to cut back on spending in other, more discretionary areas. In addition, with banks increasingly reluctant to lend, many businesses reduced capital spending in anticipation of a more difficult business environment.
At the same time, a credit crisis that began in the sub-prime mortgage market continued to batter commercial banks, investment banks, bond insurers and mortgage agencies.A number of the world’s major financial institutions announced additional write-downs and write-offs over the reporting period, sparking steep declines in their stock prices. Most other market sectors also posted losses in this challenging environment.
A Focus on Quality Helped Limit Losses
The fund’s unwavering focus on financially strong, globally positioned blue-chip companies helped protect it from the full brunt of the U.S. equity market’s slump. In fact, the fund’s relatively light exposure to troubled financial services companies proved to be one of the reporting period’s greater contributors to the fund’s relative performance, as we avoided some of the companies most severely embroiled in the sub-prime mortgage meltdown. Conversely, an overweighted position in the better-performing consumer staples sector enabled the fund to participate more fully in companies that historically have been relatively insensitive to economic cycles. Winners included brewery Anheuser-Busch, which gained value when it received an acquisition offer, as well as Procter & Gamble, McDonald’s and Wal-Mart Stores.
An overweighted position in the better-performing energy sector helped the fund participate more fully in gains among oil and gas producers, such as Occidental Petroleum; energy services companies, such as Halliburton; and coal producers, such as Peabody Energy.
4
On the other hand, the fund’s lack of exposure to utilities undermined relative performance, as did underweighted positions in the materials and industrials areas.Among individual stocks, financial giant Citigroup was the greatest detractor from relative performance over the reporting period as the credit crisis took its toll, and we reduced our exposure. Other financials holdings, such as American International Group and Merrill Lynch & Co., also fared poorly.We completely eliminated the fund’s positions in the latter two companies as of August 20 and June 18, respectively, which allowed us to avoid the full impact of the crisis in September. Finally, industrial conglomerate General Electric stumbled due in part to losses in its consumer finance business.
Finding Opportunities in a Distressed Market
As of the reporting period’s end, we have identified a number of fundamentally strong companies selling at attractive valuations compared to historical averages.As might be expected during a period of heightened volatility, we took advantage of some of these opportunities to upgrade the fund’s portfolio. For example, we redeployed assets from the troubled financials sector to the industrials group, where we identified several financially strong companies that appear well positioned for growth in overseas markets.
September 15, 2008
| 1 | Total return includes reinvestment of dividends and any capital gains paid, and does not take into consideration the maximum initial sales charges in the case of Class A and Class T shares, or the applicable contingent deferred sales charges imposed on redemptions in the case of Class B and Class C shares. Had these charges been reflected, returns would have been lower. Past performance is no guarantee of future results. Share price and investment return fluctuate such that upon redemption, fund shares may be worth more or less than their original cost. Return figures provided reflect the absorption of certain fund expenses by Fayez Sarofim & Co., the fund’s sub- investment adviser, pursuant to an undertaking in effect through April 4, 2009. Had these expenses not been absorbed, the fund’s returns would have been lower. |
| |
| 2 | SOURCE: LIPPER INC. — Reflects monthly reinvestment of dividends and, where applicable, capital gain distributions.The Standard & Poor’s 500 Composite Stock Price Index is a widely accepted, unmanaged index of U.S. stock market performance. |
| |
| 3 | Portfolio turnover rates are subject to change. Portfolio turnover rates alone do not automatically result in high or low distribution levels.There can be no guarantee that the fund will generate any specific level of distributions annually. |
| |

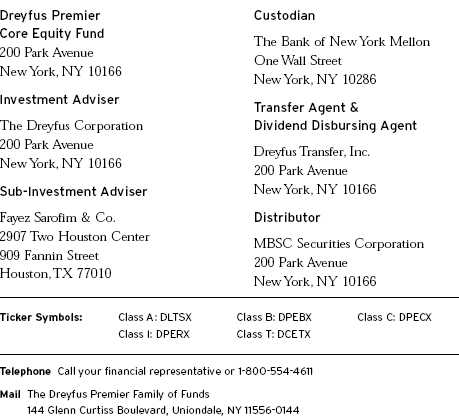
Comparison of change in value of $10,000 investment in Dreyfus Premier Core Equity Fund Class A shares and the Standard & Poor’s 500 Composite Stock Price Index
† Source: Lipper Inc.
Past performance is not predictive of future performance.
The above graph compares a $10,000 investment made in Class A shares of Dreyfus Premier Core Equity Fund on 9/30/98 (inception date) to a $10,000 investment made in the Standard & Poor’s 500 Composite Stock Price Index (the “Index”) on that date. Performance for Class B, Class C, Class I and Class T shares will vary from the performance of Class A shares shown above due to differences in charges and expenses. All dividends and capital gain distributions are reinvested.
The fund’s performance shown in the line graph takes into account the maximum initial sales charge on Class A shares and all applicable fees and expenses.The Index is a widely accepted, unmanaged index of U.S. stock market performance. Unlike a mutual fund, the Index is not subject to charges, fees and other expenses. Investors cannot invest directly in any index. Further information relating to fund performance, including expense reimbursements, if applicable, is contained in the Financial Highlights section of the prospectus and elsewhere in this report.
6
| Average Annual Total Returns as of 8/31/08 | | | | | | |
| |
| | | Inception | | | | | | From |
| | | Date | | 1 Year | | 5 Years | | Inception |
| |
| |
| |
| |
|
| Class A shares | | | | | | | | |
| with maximum sales charge (5.75%) | | 9/30/98 | | (13.15)% | | 4.12% | | 2.60% |
| without sales charge | | 9/30/98 | | (7.86)% | | 5.36% | | 3.21% |
| Class B shares | | | | | | | | |
| with applicable redemption charge † | | 4/15/02 | | (12.20)% | | 4.23% | | 3.02%†††,†††† |
| without redemption | | 4/15/02 | | (8.60)% | | 4.57% | | 3.02%†††,†††† |
| Class C shares | | | | | | | | |
| with applicable redemption charge †† | | 4/15/02 | | (9.49)% | | 4.58% | | 2.71%††† |
| without redemption | | 4/15/02 | | (8.59)% | | 4.58% | | 2.71%††† |
| Class I shares | | 4/15/02 | | (7.63)% | | 5.99% | | 3.54%††† |
| Class T shares | | | | | | | | |
| with applicable sales charge (4.5%) | | 4/15/02 | | (12.21)% | | 4.13% | | 2.56%††† |
| without sales charge | | 4/15/02 | | (8.07)% | | 5.10% | | 3.04%††† |
| Past performance is not predictive of future performance.The fund’s performance shown in the graph and table does not |
| reflect the deduction of taxes that a shareholder would pay on fund distributions or the redemption of fund shares. |
| † | | The maximum contingent deferred sales charge for Class B shares is 4%. After six years Class B shares convert to |
| | | Class A shares. |
| †† | | The maximum contingent deferred sales charge for Class C shares is 1% for shares redeemed within one year of |
| | | the date of purchase. |
| ††† | | The total return performance figures presented for Class B, C, I and T shares of the fund represent the performance |
| | | of the fund’s Class A shares for periods prior to April 15, 2002 (the inception date for Class B, C, I and T shares), |
| | | adjusted to reflect the applicable sales load for that class and the applicable distribution/servicing fees thereafter. |
| †††† | | Assumes the conversion of Class B shares to Class A shares at the end of the sixth year following the date |
| | | of purchase. |
UNDERSTANDING YOUR FUND’S EXPENSES (Unaudited)
As a mutual fund investor, you pay ongoing expenses, such as management fees and other expenses. Using the information below, you can estimate how these expenses affect your investment and compare them with the expenses of other funds.You also may pay one-time transaction expenses, including sales charges (loads) and redemption fees, which are not shown in this section and would have resulted in higher total expenses. For more information, see your fund’s prospectus or talk to your financial adviser.
Review your fund’s expenses
The table below shows the expenses you would have paid on a $1,000 investment in Dreyfus Premier Core Equity Fund from March 1, 2008 to August 31, 2008. It also shows how much a $1,000 investment would be worth at the close of the period, assuming actual returns and expenses.
Expenses and Value of a $1,000 Investment assuming actual returns for the six months ended August 31, 2008
| | | Class A | | Class B | | Class C | | Class I | | Class T |
| |
| |
| |
| |
| |
|
| Expenses paid per $1,000† | | $ 6.24 | | $ 9.97 | | $ 9.97 | | $ 5.00 | | $ 7.48 |
| Ending value (after expenses) | | $986.30 | | $982.30 | | $982.90 | | $987.70 | | $984.90 |
COMPARING YOUR FUND’S EXPENSES WITH THOSE OF OTHER FUNDS (Unaudited)
Using the SEC’s method to compare expenses
The Securities and Exchange Commission (SEC) has established guidelines to help investors assess fund expenses. Per these guidelines, the table below shows your fund’s expenses based on a $1,000 investment, assuming a hypothetical 5% annualized return. You can use this information to compare the ongoing expenses (but not transaction expenses or total cost) of investing in the fund with those of other funds.All mutual fund shareholder reports will provide this information to help you make this comparison. Please note that you cannot use this information to estimate your actual ending account balance and expenses paid during the period.
Expenses and Value of a $1,000 Investment assuming a hypothetical 5% annualized return for the six months ended August 31, 2008
| | | Class A | | Class B | | Class C | | Class I | | Class T |
| |
| |
| |
| |
| |
|
| Expenses paid per $1,000† | | $ 6.34 | | $ 10.13 | | $ 10.13 | | $ 5.08 | | $ 7.61 |
| Ending value (after expenses) | | $1,018.85 | | $1,015.08 | | $1,015.08 | | $1,020.11 | | $1,017.60 |
| † Expenses are equal to the fund’s annualized expense ratio of 1.25% for Class A, 2.00% for Class B, 2.00% for |
| Class C, 1.00% for Class I and 1.50% from Class T Shares, multiplied by the average account value over the |
| period, multiplied by 184/366 (to reflect the one-half year period). |
8
STATEMENT OF INVESTMENTS
August 31, 2008 |
| Common Stocks—99.4% | | Shares | | Value ($) |
| |
| |
|
| Consumer Discretionary—14.9% | | | | |
| McDonald’s | | 40,000 | | 2,482,000 |
| McGraw-Hill | | 78,500 | | 3,362,940 |
| News, Cl. A | | 185,200 | | 2,622,432 |
| Procter & Gamble | | 110,000 | | 7,674,700 |
| Target | | 45,000 | | 2,385,900 |
| Walgreen | | 152,000 | | 5,537,360 |
| | | | | 24,065,332 |
| Consumer Staples—22.7% | | | | |
| Altria Group | | 160,000 | | 3,364,800 |
| Anheuser-Busch | | 12,000 | | 814,320 |
| Coca-Cola | | 150,000 | | 7,810,500 |
| Estee Lauder, Cl. A | | 29,000 | | 1,443,330 |
| Nestle, ADR | | 150,125 | | 6,626,517 |
| PepsiCo | | 80,000 | | 5,478,400 |
| Philip Morris International | | 160,000 | | 8,592,000 |
| Wal-Mart Stores | | 35,000 | | 2,067,450 |
| Whole Foods Market | | 25,000 a | | 457,750 |
| | | | | 36,655,067 |
| Energy—23.1% | | | | |
| Chevron | | 84,000 | | 7,250,880 |
| ConocoPhillips | | 70,000 | | 5,775,700 |
| Exxon Mobil | | 151,560 | | 12,126,316 |
| Halliburton | | 50,000 | | 2,197,000 |
| Occidental Petroleum | | 40,000 | | 3,174,400 |
| Patriot Coal�� | | 2,400 b | | 143,904 |
| Peabody Energy | | 12,000 | | 755,400 |
| Royal Dutch Shell, ADR | | 50,000 | | 3,476,000 |
| Total, ADR | | 12,000 | | 862,560 |
| Transocean | | 12,243 b | | 1,557,309 |
| | | | | 37,319,469 |
| Financial—6.2% | | | | |
| American Express | | 32,500 | | 1,289,600 |
| Ameriprise Financial | | 16,000 | | 719,200 |
| Bank of America | | 95,000 | | 2,958,300 |
| STATEMENT OF INVESTMENTS (continued) |
| Common Stocks (continued) | | Shares | | Value ($) |
| |
| |
|
| Financial (continued) | | | | |
| Citigroup | | 35,233 | | 669,075 |
| HSBC Holdings, ADR | | 35,000 a | | 2,754,850 |
| JPMorgan Chase & Co. | | 40,500 | | 1,558,845 |
| | | | | 9,949,870 |
| Health Care—8.3% | | | | |
| Abbott Laboratories | | 70,000 | | 4,020,100 |
| Eli Lilly & Co. | | 18,000 | | 839,700 |
| Johnson & Johnson | | 90,000 | | 6,338,700 |
| Medtronic | | 20,000 | | 1,092,000 |
| Merck & Co. | | 30,000 | | 1,070,100 |
| | | | | 13,360,600 |
| Industrials—9.3% | | | | |
| Caterpillar | | 27,000 | | 1,909,710 |
| Emerson Electric | | 100,000 | | 4,680,000 |
| General Dynamics | | 11,000 | | 1,015,300 |
| General Electric | | 204,000 | | 5,732,400 |
| United Technologies | | 27,000 | | 1,770,930 |
| | | | | 15,108,340 |
| Information Technology—12.5% | | | | |
| Apple | | 14,000 b | | 2,373,420 |
| Automatic Data Processing | | 30,000 | | 1,331,400 |
| Cisco Systems | | 100,000 b | | 2,405,000 |
| Intel | | 325,000 | | 7,432,750 |
| Microsoft | | 130,000 | | 3,547,700 |
| QUALCOMM | | 25,000 | | 1,316,250 |
| Texas Instruments | | 75,000 | | 1,838,250 |
| | | | | 20,244,770 |
| Materials—2.4% | | | | |
| Freeport-McMoRan Copper & Gold | | 14,000 | | 1,250,480 |
| Praxair | | 25,000 | | 2,246,000 |
| Rio Tinto, ADR | | 1,000 a | | 379,720 |
| | | | | 3,876,200 |
| Total Common Stocks | | | | |
| (cost $120,568,337) | | | | 160,579,648 |
10
| Other Investment—.3% | | Shares | | Value ($) |
| |
| |
|
| Registered Investment Company; | | | | |
| Dreyfus Institutional Preferred | | | | |
| Plus Money Market Fund | | | | |
| (cost $456,000) | | 456,000 c | | 456,000 |
| |
| |
|
| |
| Investment of Cash Collateral | | | | |
| for Securities Loaned—2.1% | | | | |
| |
| |
|
| Registered Investment Company; | | | | |
| Dreyfus Institutional Cash | | | | |
| Advantage Plus Fund | | | | |
| (cost $3,335,400) | | 3,335,400 c | | 3,335,400 |
| |
| |
|
| Total Investments (cost $124,359,737) | | 101.8% | | 164,371,048 |
| Liabilities, Less Cash and Receivables | | (1.8%) | | (2,838,607) |
| Net Assets | | 100.0% | | 161,532,441 |
| ADR—American Depository Receipts |
| a | All or a portion of these securities are on loan. At August 31, 2008, the total market value of the fund’s securities on loan is $3,233,088 and the total market value of the collateral held by the fund is $3,335,400. |
| |
| b | Non-income producing security. |
| |
| c | Investment in affiliated money market mutual fund. |
| |
| Portfolio Summary (Unaudited)† | | | | |
| |
| | | Value (%) | | | | Value (%) |
| |
| |
| |
|
| Consumer Staples | | 22.7 | | Health Care | | 8.3 |
| Energy | | 23.1 | | Financial | | 6.2 |
| Consumer Discretionary | | 14.9 | | Materials | | 2.4 |
| Information Technology | | 12.5 | | Money Market Investments | | 2.4 |
| Industrials | | 9.3 | | | | 101.8 |
| |
| † Based on net assets. | | | | | | |
| See notes to financial statements. | | | | | | |
STATEMENT OF ASSETS AND LIABILITIES
August 31, 2008
| | | | | | | | | Cost | | Value |
| |
| |
| |
| |
| |
|
| Assets ($): | | | | | | | | | | |
| Investments in securities—See Statement of | | | | | | | | |
| Investments (including securities on loan, | | | | | | | | |
| valued at $3,233,088)—Note 1(b): | | | | | | | | |
| Unaffiliated issuers | | | | | | 120,568,337 | | 160,579,648 |
| Affiliated issuers | | | | | | 3,791,400 | | 3,791,400 |
| Cash | | | | | | | | | | 11,150 |
| Dividends and interest receivable | | | | | | | | 447,925 |
| Receivable for investment securities sold | | | | | | | | 271,309 |
| Receivable for shares of Capital Stock subscribed | | | | | | 55,306 |
| | | | | | | | | | | 165,156,738 |
| |
| |
| |
| |
| |
|
| Liabilities ($): | | | | | | | | | | |
| Due to The Dreyfus Corporation and affiliates—Note 3(b) | | | | | | 228,284 |
| Liability for securities on loan—Note 1(b) | | | | | | | | 3,335,400 |
| Payable for shares of Capital Stock redeemed | | | | | | 59,583 |
| Payable for loan commitment fees—Note 2 | | | | | | | | 1,030 |
| | | | | | | | | | | 3,624,297 |
| |
| |
| |
| |
| |
|
| Net Assets ($) | | | | | | | | | | 161,532,441 |
| |
| |
| |
| |
| |
|
| Composition of Net Assets ($): | | | | | | | | |
| Paid-in capital | | | | | | | | | | 121,943,461 |
| Accumulated undistributed investment income—net | | | | | | 916,444 |
| Accumulated net realized gain (loss) on investments | | | | | | (1,338,775) |
| Accumulated net unrealized appreciation | | | | | | | | |
| (depreciation) on investments | | | | | | | | 40,011,311 |
| |
| |
| |
| |
|
| Net Assets ($) | | | | | | | | | | 161,532,441 |
| |
| |
| |
| |
| |
|
| |
| |
| Net Asset Value Per Share | | | | | | | | |
| | | Class A | | Class B | | Class C | | Class I | | Class T |
| |
| |
| |
| |
| |
|
| Net Assets ($) | | 73,223,432 | | 23,103,548 | | 63,331,604 | | 141,962 | | 1,731,895 |
| Shares Outstanding | | 4,631,603 | | 1,488,320 | | 4,088,485 | | 8,809 | | 110,593 |
| |
| |
| |
| |
| |
|
| Net Asset Value | | | | | | | | | | |
| Per Share ($) | | 15.81 | | 15.52 | | 15.49 | | 16.12 | | 15.66 |
| |
| See notes to financial statements. | | | | | | | | |
12
STATEMENT OF OPERATIONS
Year Ended August 31, 2008 |
| Investment Income ($): | | |
| Income: | | |
| Cash dividends (net of $53,827 foreign taxes withheld at source): | | |
| Unaffiliated issuers | | 4,465,978 |
| Affiliated issuers | | 23,493 |
| Income from securities lending | | 27,983 |
| Total Income | | 4,517,454 |
| Expenses: | | |
| Management fee—Note 3(a) | | 2,029,557 |
| Distribution and service fees—Note 3(b) | | 1,227,639 |
| Directors’ fees and expenses—Note 3(a) | | 12,761 |
| Loan commitment fees—Note 2 | | 520 |
| Total Expenses | | 3,270,477 |
| Less—reduction in management fee | | |
| due to undertaking—Note 3(a) | | (184,551) |
| Less—Directors’ fees reimbursed | | |
| by the Manager—Note 3(a) | | (12,761) |
| Net Expenses | | 3,073,165 |
| Investment Income—Net | | 1,444,289 |
| |
|
| Realized and Unrealized Gain (Loss) on Investments—Note 4 ($): | | |
| Net realized gain (loss) on investments | | 1,690,372 |
| Net unrealized appreciation (depreciation) on investments | | (18,613,915) |
| Net Realized and Unrealized Gain (Loss) on Investments | | (16,923,543) |
| Net (Decrease) in Net Assets Resulting from Operations | | (15,479,254) |
| |
| See notes to financial statements. | | |
STATEMENT OF CHANGES IN NET ASSETS
| | | Year Ended August 31, |
| | |
|
| | | 2008 | | 2007a |
| |
| |
|
| Operations ($): | | | | |
| Investment income—net | | 1,444,289 | | 1,359,171 |
| Net realized gain (loss) on investments | | 1,690,372 | | 5,171,644 |
| Net unrealized appreciation | | | | |
| (depreciation) on investments | | (18,613,915) | | 14,892,924 |
| Net Increase (Decrease) in Net Assets | | | | |
| Resulting from Operations | | (15,479,254) | | 21,423,739 |
| |
| |
|
| Dividends to Shareholders from ($): | | | | |
| Investment income—net: | | | | |
| Class A Shares | | (981,299) | | (999,464) |
| Class B Shares | | (126,290) | | (145,632) |
| Class C Shares | | (335,591) | | (321,984) |
| Class I Shares | | (1,529) | | (1,722) |
| Class T Shares | | (29,606) | | (30,069) |
| Net realized gain on investments: | | | | |
| Class A Shares | | (944,029) | | — |
| Class B Shares | | (392,880) | | — |
| Class C Shares | | (856,619) | | — |
| Class I Shares | | (1,199) | | — |
| Class T Shares | | (36,840) | | — |
| Total Dividends | | (3,705,882) | | (1,498,871) |
| |
| |
|
| Capital Stock Transactions ($): | | | | |
| Net proceeds from shares sold: | | | | |
| Class A Shares | | 12,941,924 | | 14,725,226 |
| Class B Shares | | 569,932 | | 562,305 |
| Class C Shares | | 11,366,945 | | 17,883,104 |
| Class I Shares | | 53,009 | | 12,832 |
| Class T Shares | | 115,040 | | 176,489 |
14
| | | Year Ended August 31, |
| | |
|
| | | 2008 | | 2007a |
| |
| |
|
| Capital Stock Transactions ($) (continued): | | | | |
| Dividends reinvested: | | | | |
| Class A Shares | | 1,462,847 | | 710,465 |
| Class B Shares | | 384,578 | | 106,842 |
| Class C Shares | | 554,976 | | 160,658 |
| Class I Shares | | 2,728 | | 1,426 |
| Class T Shares | | 57,889 | | 26,901 |
| Cost of shares redeemed: | | | | |
| Class A Shares | | (20,100,069) | | (21,975,531) |
| Class B Shares | | (11,246,874) | | (8,242,525) |
| Class C Shares | | (16,803,154) | | (13,518,342) |
| Class I Shares | | (27,280) | | (22,609) |
| Class T Shares | | (1,562,665) | | (539,596) |
| Increase (Decrease) in Net Assets | | | | |
| from Capital Stock Transactions | | (22,230,174) | | (9,932,355) |
| Total Increase (Decrease) in Net Assets | | (41,415,310) | | 9,992,513 |
| |
| |
|
| Net Assets ($): | | | | |
| Beginning of Period | | 202,947,751 | | 192,955,238 |
| End of Period | | 161,532,441 | | 202,947,751 |
| Undistributed investment income—net | | 916,444 | | 946,916 |
STATEMENT OF CHANGES IN NET ASSETS (continued)
| | | Year Ended August 31, |
| | |
|
| | | 2008 | | 2007a |
| |
| |
|
| Capital Share Transactions: | | | | |
| Class Ab | | | | |
| Shares sold | | 773,885 | | 880,230 |
| Shares issued for dividends reinvested | | 84,276 | | 42,696 |
| Shares redeemed | | (1,200,427) | | (1,285,711) |
| Net Increase (Decrease) in Shares Outstanding | | (342,266) | | (362,785) |
| |
| |
|
| Class Bb | | | | |
| Shares sold | | 34,254 | | 33,994 |
| Shares issued for dividends reinvested | | 22,438 | | 6,503 |
| Shares redeemed | | (686,273) | | (493,327) |
| Net Increase (Decrease) in Shares Outstanding | | (629,581) | | (452,830) |
| |
| |
|
| Class C | | | | |
| Shares sold | | 687,579 | | 1,085,309 |
| Shares issued for dividends reinvested | | 32,455 | | 9,796 |
| Shares redeemed | | (1,025,733) | | (807,900) |
| Net Increase (Decrease) in Shares Outstanding | | (305,699) | | 287,205 |
| |
| |
|
| Class I | | | | |
| Shares sold | | 3,217 | | 742 |
| Shares issued for dividends reinvested | | 155 | | 84 |
| Shares redeemed | | (1,541) | | (1,349) |
| Net Increase (Decrease) in Shares Outstanding | | 1,831 | | (523) |
| |
| |
|
| Class T | | | | |
| Shares sold | | 7,005 | | 10,559 |
| Shares issued for dividends reinvested | | 3,362 | | 1,628 |
| Shares redeemed | | (90,990) | | (31,625) |
| Net Increase (Decrease) in Shares Outstanding | | (80,623) | | (19,438) |
| a | Effective June 1, 2007, Class R shares were redesignated as Class I shares. |
| |
| b | During the period ended August 31, 2008, 100,671 Class B shares representing $1,610,683 were automatically converted to 99,003 Class A shares and during the period ended August 31, 2007, 85,477 Class B shares representing $1,428,525 were automatically converted to 84,193 Class A shares. |
| |
| See notes to financial statements. |
16
FINANCIAL HIGHLIGHTS
The following tables describe the performance for each share class for the fiscal periods indicated.All information (except portfolio turnover rate) reflects financial results for a single fund share.Total return shows how much your investment in the fund would have increased (or decreased) during each period, assuming you had reinvested all dividends and distributions.These figures have been derived from the fund’s financial statements.
| | | | | Year Ended August 31, | | |
| | |
| |
| |
|
| Class A Shares | | 2008 | | 2007 | | 2006 | | 2005 | | 2004 |
| |
| |
| |
| |
| |
|
| Per Share Data ($): | | | | | | | | | | |
| Net asset value, beginning of period | | 17.56 | | 15.94 | | 14.81 | | 13.95 | | 12.91 |
| Investment Operations: | | | | | | | | | | |
| Investment income—neta | | .20 | | .18 | | .17 | | .20 | | .10 |
| Net realized and unrealized | | | | | | | | | | |
| gain (loss) on investments | | (1.54) | | 1.63 | | 1.08 | | .82 | | 1.02 |
| Total from Investment Operations | | (1.34) | | 1.81 | | 1.25 | | 1.02 | | 1.12 |
| Distributions: | | | | | | | | | | |
| Dividends from investment income—net | | (.21) | | (.19) | | (.12) | | (.16) | | (.08) |
| Dividends from net realized | | | | | | | | | | |
| gain on investments | | (.20) | | — | | — | | — | | — |
| Total Distributions | | (.41) | | (.19) | | (.12) | | (.16) | | (.08) |
| Net asset value, end of period | | 15.81 | | 17.56 | | 15.94 | | 14.81 | | 13.95 |
| |
| |
| |
| |
| |
|
| Total Return (%)b | | (7.86) | | 11.39 | | 8.45 | | 7.35 | | 8.67 |
| |
| |
| |
| |
| |
|
| Ratios/Supplemental Data (%): | | | | | | | | | | |
| Ratio of total expenses | | | | | | | | | | |
| to average net assets | | 1.36 | | 1.35 | | 1.36 | | 1.35 | | 1.35 |
| Ratio of net expenses | | | | | | | | | | |
| to average net assets | | 1.25 | | 1.25 | | 1.30 | | 1.35 | | 1.35 |
| Ratio of net investment income | | | | | | | | | | |
| to average net assets | | 1.19 | | 1.07 | | 1.13 | | 1.39 | | .72 |
| Portfolio Turnover Rate | | 8.27 | | 5.10 | | .88 | | 3.89 | | 2.21 |
| |
| |
| |
| |
| |
|
| Net Assets, end of period ($ x 1,000) | | 73,223 | | 87,341 | | 85,054 | | 95,660 | | 102,518 |
| a | Based on average shares outstanding at each month end. |
| |
| b | Exclusive of sales charge. |
| |
| See notes to financial statements. |
| FINANCIAL HIGHLIGHTS (continued) |
| | | | | Year Ended August 31, | | |
| | |
| |
| |
|
| Class B Shares | | 2008 | | 2007 | | 2006 | | 2005 | | 2004 |
| |
| |
| |
| |
| |
|
| Per Share Data ($): | | | | | | | | | | |
| Net asset value, beginning of period | | 17.24 | | 15.65 | | 14.62 | | 13.76 | | 12.77 |
| Investment Operations: | | | | | | | | | | |
| Investment income (loss)—neta | | .07 | | .05 | | .06 | | .09 | | (.00)b |
| Net realized and unrealized | | | | | | | | | | |
| gain (loss) on investments | | (1.53) | | 1.60 | | 1.05 | | .82 | | 1.00 |
| Total from Investment Operations | | (1.46) | | 1.65 | | 1.11 | | .91 | | 1.00 |
| Distributions: | | | | | | | | | | |
| Dividends from investment income—net | | (.06) | | (.06) | | (.08) | | (.05) | | (.01) |
| Dividends from net realized | | | | | | | | | | |
| gain on investments | | (.20) | | — | | — | | — | | — |
| Total Distributions | | (.26) | | (.06) | | (.08) | | (.05) | | (.01) |
| Net asset value, end of period | | 15.52 | | 17.24 | | 15.65 | | 14.62 | | 13.76 |
| |
| |
| |
| |
| |
|
| Total Return (%)c | | (8.60) | | 10.56 | | 7.60 | | 6.65 | | 7.81 |
| |
| |
| |
| |
| |
|
| Ratios/Supplemental Data (%): | | | | | | | | | | |
| Ratio of total expenses | | | | | | | | | | |
| to average net assets | | 2.11 | | 2.10 | | 2.11 | | 2.10 | | 2.10 |
| Ratio of net expenses | | | | | | | | | | |
| to average net assets | | 2.00 | | 2.00 | | 2.05 | | 2.10 | | 2.10 |
| Ratio of net investment income | | | | | | | | | | |
| (loss) to average net assets | | .45 | | .32 | | .38 | | .64 | | (.03) |
| Portfolio Turnover Rate | | 8.27 | | 5.10 | | .88 | | 3.89 | | 2.21 |
| |
| |
| |
| |
| |
|
| Net Assets, end of period ($ x 1,000) | | 23,104 | | 36,510 | | 40,222 | | 47,455 | | 50,172 |
| a | Based on average shares outstanding at each month end. |
| |
| b | Amount represents less than $.01 per share. |
| |
| c | Exclusive of sales charge. |
| |
| See notes to financial statements. |
18
| | | | | Year Ended August 31, | | |
| | |
| |
| |
|
| Class C Shares | | 2008 | | 2007 | | 2006 | | 2005 | | 2004 |
| |
| |
| |
| |
| |
|
| Per Share Data ($): | | | | | | | | | | |
| Net asset value, beginning of period | | 17.21 | | 15.64 | | 14.61 | | 13.76 | | 12.77 |
| Investment Operations: | | | | | | | | | | |
| Investment income (loss)—neta | | .07 | | .05 | | .06 | | .09 | | (.00)b |
| Net realized and unrealized | | | | | | | | | | |
| gain (loss) on investments | | (1.51) | | 1.59 | | 1.05 | | .81 | | 1.01 |
| Total from Investment Operations | | (1.44) | | 1.64 | | 1.11 | | .90 | | 1.01 |
| Distributions: | | | | | | | | | | |
| Dividends from investment income—net | | (.08) | | (.07) | | (.08) | | (.05) | | (.02) |
| Dividends from net realized | | | | | | | | | | |
| gain on investments | | (.20) | | — | | — | | — | | — |
| Total Distributions | | (.28) | | (.07) | | (.08) | | (.05) | | (.02) |
| Net asset value, end of period | | 15.49 | | 17.21 | | 15.64 | | 14.61 | | 13.76 |
| |
| |
| |
| |
| |
|
| Total Return (%)c | | (8.59) | | 10.60 | | 7.60 | | 6.58 | | 7.88 |
| |
| |
| |
| |
| |
|
| Ratios/Supplemental Data (%): | | | | | | | | | | |
| Ratio of total expenses | | | | | | | | | | |
| to average net assets | | 2.11 | | 2.10 | | 2.11 | | 2.10 | | 2.10 |
| Ratio of net expenses | | | | | | | | | | |
| to average net assets | | 2.00 | | 2.00 | | 2.05 | | 2.10 | | 2.10 |
| Ratio of net investment income | | | | | | | | | | |
| (loss) to average net assets | | .45 | | .32 | | .38 | | .63 | | (.03) |
| Portfolio Turnover Rate | | 8.27 | | 5.10 | | .88 | | 3.89 | | 2.21 |
| |
| |
| |
| |
| |
|
| Net Assets, end of period ($ x 1,000) | | 63,332 | | 75,646 | | 64,230 | | 72,062 | | 73,690 |
| a | Based on average shares outstanding at each month end. |
| |
| b | Amount represents less than $.01 per share. |
| |
| c | Exclusive of sales charge. |
| |
| See notes to financial statements. |
| FINANCIAL HIGHLIGHTS (continued) |
| | | | | Year Ended August 31, | | |
| | |
| |
| |
|
| Class I Shares | | 2008 | | 2007a | | 2006 | | 2005 | | 2004 |
| |
| |
| |
| |
| |
|
| Per Share Data ($): | | | | | | | | | | |
| Net asset value, beginning of period | | 17.90 | | 16.24 | | 15.06 | | 13.97 | | 12.90 |
| Investment Operations: | | | | | | | | | | |
| Investment income—netb | | .25 | | .23 | | .22 | | .26 | | .13 |
| Net realized and unrealized | | | | | | | | | | |
| gain (loss) on investments | | (1.58) | | 1.66 | | 1.09 | | 1.03 | | 1.04 |
| Total from Investment Operations | | (1.33) | | 1.89 | | 1.31 | | 1.29 | | 1.17 |
| Distributions: | | | | | | | | | | |
| Dividends from investment income—net | | (.25) | | (.23) | | (.13) | | (.20) | | (.10) |
| Dividends from net realized | | | | | | | | | | |
| gain on investments | | (.20) | | — | | — | | — | | — |
| Total Distributions | | (.45) | | (.23) | | (.13) | | (.20) | | (.10) |
| Net asset value, end of period | | 16.12 | | 17.90 | | 16.24 | | 15.06 | | 13.97 |
| |
| |
| |
| |
| |
|
| Total Return (%) | | (7.63) | | 11.69 | | 8.72 | | 9.29 | | 9.13 |
| |
| |
| |
| |
| |
|
| Ratios/Supplemental Data (%): | | | | | | | | | | |
| Ratio of total expenses | | | | | | | | | | |
| to average net assets | | 1.11 | | 1.10 | | 1.11 | | 1.10 | | 1.10 |
| Ratio of net expenses | | | | | | | | | | |
| to average net assets | | 1.00 | | 1.00 | | 1.05 | | 1.10 | | 1.10 |
| Ratio of net investment income | | | | | | | | | | |
| to average net assets | | 1.46 | | 1.33 | | 1.41 | | 1.79 | | 1.01 |
| Portfolio Turnover Rate | | 8.27 | | 5.10 | | .88 | | 3.89 | | 2.21 |
| |
| |
| |
| |
| |
|
| Net Assets, end of period ($ x 1,000) | | 142 | | 125 | | 122 | | 103 | | 596 |
| a | Effective June 1, 2007, Class R shares were redesignated as Class I shares. |
| |
| b | Based on average shares outstanding at each month end. |
| |
| See notes to financial statements. |
20
| | | | | Year Ended August 31, | | |
| | |
| |
| |
|
| Class T Shares | | 2008 | | 2007 | | 2006 | | 2005 | | 2004 |
| |
| |
| |
| |
| |
|
| Per Share Data ($): | | | | | | | | | | |
| Net asset value, beginning of period | | 17.39 | | 15.79 | | 14.70 | | 13.86 | | 12.84 |
| Investment Operations: | | | | | | | | | | |
| Investment income—neta | | .18 | | .14 | | .13 | | .16 | | .07 |
| Net realized and unrealized | | | | | | | | | | |
| gain (loss) on investments | | (1.55) | | 1.61 | | 1.06 | | .82 | | 1.01 |
| Total from Investment Operations | | (1.37) | | 1.75 | | 1.19 | | .98 | | 1.08 |
| Distributions: | | | | | | | | | | |
| Dividends from investment income—net | | (.16) | | (.15) | | (.10) | | (.14) | | (.06) |
| Dividends from net realized | | | | | | | | | | |
| gain on investments | | (.20) | | — | | — | | — | | — |
| Total Distributions | | (.36) | | (.15) | | (.10) | | (.14) | | (.06) |
| Net asset value, end of period | | 15.66 | | 17.39 | | 15.79 | | 14.70 | | 13.86 |
| |
| |
| |
| |
| |
|
| Total Return (%)b | | (8.07) | | 11.11 | | 8.14 | | 7.14 | | 8.39 |
| |
| |
| |
| |
| |
|
| Ratios/Supplemental Data (%): | | | | | | | | | | |
| Ratio of total expenses | | | | | | | | | | |
| to average net assets | | 1.61 | | 1.60 | | 1.61 | | 1.60 | | 1.60 |
| Ratio of net expenses | | | | | | | | | | |
| to average net assets | | 1.50 | | 1.50 | | 1.55 | | 1.60 | | 1.60 |
| Ratio of net investment income | | | | | | | | | | |
| to average net assets | | 1.10 | | .82 | | .89 | | 1.12 | | .51 |
| Portfolio Turnover Rate | | 8.27 | | 5.10 | | .88 | | 3.89 | | 2.21 |
| |
| |
| |
| |
| |
|
| Net Assets, end of period ($ x 1,000) | | 1,732 | | 3,326 | | 3,327 | | 3,050 | | 2,527 |
| a | Based on average shares outstanding at each month end. |
| |
| b | Exclusive of sales charge. |
| |
| See notes to financial statements. |
NOTES TO FINANCIAL STATEMENTS
NOTE 1—Significant Accounting Policies:
Dreyfus Premier Core Equity Fund (the “fund”) is a separate diversified series of The Dreyfus/Laurel Funds, Inc. (the “Company”) which is registered under the Investment Company Act of 1940, as amended (the “Act”), as an open-end management investment company and operates as a series company currently offering fourteen series, including the fund.The fund’s investment objective is to achieve long-term capital appreciation. The Dreyfus Corporation (the “Manager” or “Dreyfus”), a wholly-owned subsidiary of The Bank of New York Mellon Corporation (“BNY Mellon”), serves as the fund’s investment adviser. Fayez Sarofim & Co. (“Sarofim & Co.”) serves as the fund’s sub-investment adviser.
Effective July 1, 2008, BNY Mellon has reorganized and consolidated a number of its banking and trust company subsidiaries. As a result of the reorganization, any services previously provided to the fund by Mellon Bank, N.A. or Mellon Trust of New England, N.A. are now provided by The Bank of New York, which has changed its name to The Bank of New York Mellon.
MBSC Securities Corporation (the “Distributor”), a wholly-owned subsidiary of Dreyfus, is the distributor of the fund’s shares.The fund is authorized to issue 100 million shares of $.001 par value Capital Stock in each of the following classes of shares: Class A, Class B, Class C, Class I and Class T. Class A, Class B, Class C and Class T shares are sold primarily to retail investors through financial intermediaries and bear a distribution fee and/or service fee. Class A and Class T shares are sold with a front-end sales charge. Class B and Class C shares are subject to a contingent deferred sales charge (“CDSC”). Class B shares automatically convert to Class A shares after six years.The fund does not offer Class B shares, except in connection with dividend reinvestment and permitted exchanges of Class B shares. Class I shares are sold primarily to bank trust departments and other financial service providers, including The Bank of New York Mellon, a subsidiary of
22
BNY Mellon and an affiliate of Dreyfus, acting on behalf of customers having a qualified trust or investment account or relationship at such institution and bear no distribution or service fees. Class I shares are offered without a front end sales charge or CDSC. Each class of shares has identical rights and privileges, except with respect to distribution and service fees and voting rights on matters affecting a single class. Income, expenses (other than expenses attributable to a specific class), and realized and unrealized gains or losses on investments are allocated to each class of shares based on its relative net assets.
The fund’s financial statements are prepared in accordance with U.S. generally accepted accounting principles, which may require the use of management estimates and assumptions. Actual results could differ from those estimates.
(a) Portfolio valuation: Investments in securities are valued at the last sales price on the securities exchange or national securities market on which such securities are primarily traded. Securities listed on the National Market System for which market quotations are available are valued at the official closing price or, if there is no official closing price that day, at the last sales price. Securities not listed on an exchange or the national securities market, or securities for which there were no transactions, are valued at the average of the most recent bid and asked prices, except for open short positions, where the asked price is used for valuation purposes. Bid price is used when no asked price is available. Registered investment companies that are not traded on an exchange are valued at their net asset value.When market quotations or official closing prices are not readily available, or are determined not to reflect accurately fair value, such as when the value of a security has been significantly affected by events after the close of the exchange or market on which the security is principally traded (for example, a foreign exchange or market), but before the fund calculates its net asset value, the fund may value these investments at fair value as determined in accordance with the procedures approved by the Board of
| NOTES TO FINANCIAL STATEMENTS (continued) |
Directors. Fair valuing of securities may be determined with the assistance of a pricing service using calculations based on indices of domestic securities and other appropriate indicators, such as prices of relevant ADRs and futures contracts. For other securities that are fair valued by the Board of Directors, certain factors may be considered such as: fundamental analytical data, the nature and duration of restrictions on disposition, an evaluation of the forces that influence the market in which the securities are purchased and sold, and public trading in similar securities of the issuer or comparable issuers. Financial futures are valued at the last sales price.
The Financial Accounting Standards Board (“FASB”) released Statement of Financial Accounting Standards No. 157 “Fair Value Measurements” (“FAS 157”). FAS 157 establishes an authoritative definition of fair value, sets out a framework for measuring fair value, and requires additional disclosures about fair-value measurements. The application of FAS 157 is required for fiscal years beginning after November 15, 2007 and interim periods within those fiscal years. Management does not believe that the application of this standard will have a material impact on the financial statements of the fund.
(b) Securities transactions and investment income: Securities transactions are recorded on a trade date basis. Realized gains and losses from securities transactions are recorded on the identified cost basis. Dividend income is recognized on the ex-dividend date and interest income, including, where applicable, accretion of discount and amortization of premium on investments is recognized on the accrual basis.
The fund has arrangements with the custodian and cash management banks whereby the fund may receive earnings credits when positive cash balances are maintained, which are used to offset custody and cash management fees. For financial reporting purposes, the fund includes net earnings credits as an expense offset in the Statement of Operations.
Pursuant to a securities lending agreement withThe Bank of NewYork Mellon, the fund may lend securities to qualified institutions. It is the
24
fund’s policy that, at origination, all loans are secured by collateral of at least 102% of the value of U.S. securities loaned and 105% of the value of foreign securities loaned. Collateral equivalent to at least 100% of the market value of securities on loan is maintained at all times. Collateral is either in the form of cash, which can be invested in certain money market mutual funds managed by Dreyfus, U.S. Government and Agency securities or letters of credit.The fund is entitled to receive all income on securities loaned, in addition to income earned as a result of the lending transaction.Although each security loaned is fully collateralized, the fund bears the risk of delay in recovery of, or loss of rights in, the securities loaned should a borrower fail to return the securities in a timely manner. During the period ended August 31, 2008, The Bank of NewYork Mellon earned $11,993, from lending fund portfolio securities, pursuant to the securities lending agreement.
(c) Affiliated issuers: Investments in other investment companies advised by Dreyfus are defined as “affiliated” in the Act.
(d) Dividends to shareholders: Dividends are recorded on the ex-dividend date. Dividends from investment income-net and dividends from net realized capital gains, if any, are normally declared and paid annually, but the fund may make distributions on a more frequent basis to comply with the distribution requirements of the Internal Revenue Code of 1986, as amended (the “Code”).To the extent that net realized capital gains can be offset by capital loss carryovers, it is the policy of the fund not to distribute such gains. Income and capital gain distributions are determined in accordance with income tax regulations, which may differ from U.S. generally accepted accounting principles.
(e) Federal income taxes: It is the policy of the fund to continue to qualify as a regulated investment company, if such qualification is in the best interests of its shareholders, by complying with the applicable provisions of the Code, and to make distributions of taxable income sufficient to relieve it from substantially all federal income and excise taxes.
| NOTES TO FINANCIAL STATEMENTS (continued) |
The fund adopted FASB Interpretation No. 48 “Accounting for Uncertainty in Income Taxes” (“FIN 48”). FIN 48 provides guidance for how uncertain tax positions should be recognized, measured, presented and disclosed in the financial statements. FIN 48 requires the evaluation of tax positions taken or expected to be taken in the course of preparing the fund’s tax returns to determine whether the tax positions are “more-likely-than-not” of being sustained by the applicable tax authority.Tax positions not deemed to meet the more likely-than-not threshold would be recorded as a tax expense in the current year. The adoption of FIN 48 had no impact on the operations of the fund for the period ended August 31, 2008.
As of and during the period ended August 31, 2008, the fund did not have any liabilities for any unrecognized tax benefits.The fund recognizes interest and penalties, if any, related to unrecognized tax benefits as income tax expense in the Statement of Operations. During the period, the fund did not incur any interest or penalties.
Each of the tax years in the four-year period ended August 31, 2008, remains subject to examination by the Internal Revenue Service and state taxing authorities.
At August 31, 2008, the components of accumulated earnings on a tax basis were as follows:undistributed ordinary income $916,444 and unrealized appreciation $40,011,311. In addition, the fund had $1,338,775 of capital losses realized after October 31, 2007, which were deferred for tax purposes to the first day of the following fiscal year.
The tax character of distributions paid to shareholders during the fiscal periods ended August 31, 2008 and August 31, 2007 were as follows: ordinary income $1,474,761 and $1,498,871 and long-term capital gains $2,231,121 and $0, respectively.
During the period ended August 31, 2008, as a result of permanent book to tax differences, primarily due to dividend reclassification, the fund decreased accumulated undistributed investment income-net by $446 and increased accumulated net realized gain (loss) on invest-
26
ments by the same amount. Net assets and net asset value per share were not affected by this reclassification.
NOTE 2—Bank Line of Credit:
The fund participates with other Dreyfus-managed funds in a $350 million redemption credit facility (the “Facility”) to be utilized for temporary or emergency purposes, including the financing of redemptions. In connection therewith, the fund has agreed to pay commitment fees on its pro rata portion of the Facility. Interest is charged to the fund based on prevailing market rates in effect at the time of borrowing. During the period ended August 31, 2008, the fund did not borrow under the Facility.
NOTE 3—Investment Management Fee and Other Transactions With Affiliates:
(a) Pursuant to an Investment Management Agreement with Dreyfus, Dreyfus provides or arranges for one or more third parties and/or affiliates to provide investment advisory, administrative, custody, fund accounting and transfer agency services to the fund. Dreyfus also directs the investments of the fund in accordance with its investment objective, policies and limitations. For these services, the fund is contractually obligated to pay Dreyfus a fee, calculated daily and paid monthly, at the annual rate of 1.10% of the value of the fund’s average daily net assets.A portion of the fund’s management fee, in the amount of .10% of the fund’s average daily net assets, is being waived from September 1, 2008 until April 4, 2009. Sarofim & Co. has agreed to waive receipt of that portion of its sub-investment advisory fee, which is paid by Dreyfus out of its management fee received from the fund. Dreyfus will, in turn, pass that waiver onto the fund.The reduction in management fee, pursuant to the undertakings, amounted to $184,551 during the period ended August 31, 2008. Out of its fee, Dreyfus pays all of the expenses of the fund except brokerage fees, taxes, interest, commitment fees, Rule 12b-1 distribution fees and expenses, fees and
| NOTES TO FINANCIAL STATEMENTS (continued) |
expenses of non-interested Directors (including counsel fees) and extraordinary expenses. In addition, Dreyfus is required to reduce its fee in an amount equal to the fund’s allocable portion of fees and expenses of the non-interested Directors (including counsel fees). Each Director receives $45,000 per year, plus $6,000 for each joint Board meeting of the Company, The Dreyfus/Laurel Tax-Free Municipal Funds and The Dreyfus/Laurel Funds Trust (collectively, the “Dreyfus/Laurel Funds”) attended, $2,000 for separate in-person committee meetings attended which are not held in conjunction with a regularly scheduled Board meeting and $1,500 for Board meetings and separate committee meetings attended that are conducted by telephone and are reimbursed for travel and out of-pocket expenses. With respect to Board meetings, the Chairman of the Board receives an additional 25% of such compensation (with the exception of reimbursable amounts).With respect to compensation committee meetings, the Chair of the compensation committee receives $900 per meeting and, with respect to audit committee meetings prior to April 12, 2008, the Chair of the audit committee received $1,350 per meeting. In the event that there is an in-person joint committee meeting or a joint telephone meeting of the Dreyfus/Laurel Funds and Dreyfus High Yield Strategies Fund, the $2,000 or $1,500 fee, as applicable, will be allocated between the Dreyfus/Laurel Funds and Dreyfus High Yield Strategies Fund.These fees and expenses are charged and allocated to each series based on net assets. Amounts required to be paid by the Company directly to the non-interested Directors, that would be applied to offset a portion of the management fee payable to Dreyfus, are in fact paid directly by Dreyfus to the non-interested Directors.
Pursuant to a Sub-Investment Advisory Agreement between Dreyfus and Sarofim & Co., Dreyfus has agreed to pay Sarofim & Co. an annual fee of .30% of the value of the fund’s average daily net assets, payable monthly. Sarofim & Co. has agreed to waive receipt of that portion of its sub-investment advisory fee, which is paid by Dreyfus out of its Management fee received from the fund.
28
During the period ended August 31, 2008, the Distributor retained $13,885 and $110 from commissions earned on sales of the fund’s Class A and ClassT shares,respectively,and $99,952 and $11,285 from CDSCs on redemptions of the fund’s Class B and Class C shares, respectively.
(b) Under separate Distribution Plans (the “Plans”) adopted pursuant to Rule 12b-1 under the Act, Class A shares may pay annually up to .25% of the value of its average daily net assets to compensate the Distributor for shareholder servicing activities and expenses primarily intended to result in the sale of Class A shares. Class B, Class C and ClassT shares pay the Distributor for distributing their shares at an aggregate annual rate of .75% of the value of the average daily net assets of Class B and Class C shares and .25% of the value of the average daily net assets of Class T shares.The Distributor may pay one or more agents in respect of advertising, marketing and other distribution services for Class T shares and determines the amounts, if any, to be paid to agents and the basis on which such payments are made. Class B, Class C and Class T shares are also subject to a service plan adopted pursuant to Rule 12b-1 (the “Service Plan”), under which Class B, Class C and ClassT shares pay the Distributor for providing certain services to the holders of their shares a fee at the annual rate of .25% of the value of the average daily net assets of Class B, Class C and Class T shares. During the period ended August 31, 2008, Class A, Class B, Class C and Class T shares were charged $201,465, $229,296, $531,521 and $5,876, respectively, pursuant to their respective Plans. During the period ended August 31, 2008, Class B, Class C and Class T shares were charged $76,432, $177,173 and $5,876, respectively, pursuant to the Service Plan.
Under their terms, the Plans and Service Plan shall remain in effect from year to year, provided such continuance is approved annually by a vote of majority of those Directors who are not “interested persons” of the Company and who have no direct or indirect financial interest in the operation of or in any agreement related to the Plans or Service Plan.
| NOTES TO FINANCIAL STATEMENTS (continued) |
The components of “Due to The Dreyfus Corporation and affiliates” in the Statement of Assets and Liabilities consist of: management fees $151,859, Rule 12b-1 distribution plan fees $71,401 and shareholder services plan fees $18,829, which are offset against an expense reimbursement currently in effect in the amount of $13,805.
NOTE 4—Securities Transactions:
The aggregate amount of purchases and sales of investment securities, excluding short-term securities, during the period ended August 31, 2008, amounted to $15,230,608 and $39,569,435, respectively.
At August 31, 2008, the cost of investments for federal income tax purposes was $124,359,737; accordingly, accumulated net unrealized appreciation on investments was $40,011,311, consisting of $47,009,497 gross unrealized appreciation and $6,998,186 gross unrealized depreciation.
In March 2008, the FASB released Statement of Financial Accounting Standards No. 161 “Disclosures about Derivative Instruments and Hedging Activities” (“FAS 161”). FAS 161 requires qualitative disclosures about objectives and strategies for using derivatives, quantitative disclosures about fair value amounts of gains and losses on derivative instruments and disclosures about credit-risk-related contingent features in derivative agreements.The application of FAS 161 is required for fiscal years and interim periods beginning after November 15, 2008. At this time, management is evaluating the implications of FAS 161 and its impact on the financial statements and the accompanying notes has not yet been determined.
30
REPORT OF INDEPENDENT REGISTERED PUBLIC ACCOUNTING FIRM
The Board of Directors and Shareholders of The Dreyfus/Laurel Funds, Inc.:
We have audited the accompanying statement of assets and liabilities of Dreyfus Premier Core Equity Fund, a series of The Dreyfus/Laurel Funds, Inc. (the “Fund”), including the statement of investments, as of August 31, 2008, and the related statement of operations for the year then ended, the statement of changes in net assets for each of the years in the two-year period then ended, and the financial highlights for each of the years in the five-year period then ended.These financial statements and financial highlights are the responsibility of the Fund’s management. Our responsibility is to express an opinion on these financial statements and financial highlights based on our audits.
We conducted our audits in accordance with the standards of the Public Company Accounting Oversight Board (United States).Those standards require that we plan and perform the audit to obtain reasonable assurance about whether the financial statements and financial highlights are free of material misstatement. An audit includes examining, on a test basis, evidence supporting the amounts and disclosures in the financial statements. Our procedures included confirmation of securities owned as of August 31, 2008, by correspondence with the custodian. An audit also includes assessing the accounting principles used and significant estimates made by management, as well as evaluating the overall financial statement presentation.We believe that our audits provide a reasonable basis for our opinion.
In our opinion, the financial statements and financial highlights referred to above present fairly, in all material respects, the financial position of Dreyfus Premier Core Equity Fund as of August 31,2008,and the results of its operations for the year then ended, the changes in its net assets for each of the years in the two-year period then ended, and the financial highlights for each of the years in the five-year period then ended, in conformity with U.S. generally accepted accounting principles.

| | New York, New York
October 24, 2008 |
IMPORTANT TAX INFORMATION (Unaudited)
For federal tax purposes, the fund hereby designates $.1991 per share as a long-term capital gain distribution per share paid on December 4, 2007.Also the fund hereby designates 100% of the ordinary dividends paid during the fiscal year ended August 31, 2008 as qualifying for the corporate dividends received deduction.Also certain dividends paid by the fund may be subject to a maximum tax rate of 15%, as provided for by the Jobs and Growth Tax Relief Reconciliation Act of 2003. Of the distributions paid during the fiscal year, $1,474,761 represents the maximum amount that may be considered qualified dividend income. Shareholders will receive notification in January 2009 of the percentage applicable to the preparation of their 2008 income tax returns.
32
BOARD MEMBERS INFORMATION (Unaudited)
Joseph S. DiMartino (64)
Chairman of the Board (1995)
Principal Occupation During Past 5Years:
Corporate Director and Trustee
Other Board Memberships and Affiliations: |
- The Muscular Dystrophy Association, Director
- Century Business Services, Inc., a provider of outsourcing functions for small and medium size companies, Director
- The Newark Group, a provider of a national market of paper recovery facilities, paperboard mills and paperboard converting plants, Director
- Sunair Services Corporation, a provider of certain outdoor-related services to homes and businesses, Director
No. of Portfolios for which Board Member Serves: 157
James M. Fitzgibbons (73)
Board Member (1994)
Principal Occupation During Past 5Years:
Corporate Director and Trustee |
Other Board Memberships and Affiliations:
Bill Barrett Company, an oil and gas exploration company, Director
No. of Portfolios for which Board Member Serves: 25
Kenneth A. Himmel (62)
Board Member (1994)
Principal Occupation During Past 5Years: |
- President and CEO,Related Urban Development,a real estate development company (1996-present)
- President and CEO, Himmel & Company, a real estate development company (1980-present)
- CEO, American Food Management, a restaurant company (1983-present)
| No. of Portfolios for which Board Member Serves: 25 |
Stephen J. Lockwood (61)
Board Member (1994)
Principal Occupation During Past 5Years: |
- Chairman of the Board, Stephen J. Lockwood and Company LLC, an investment company (2000-present)
| No. of Portfolios for which Board Member Serves: 25 |
BOARD MEMBERS INFORMATION (Unaudited) (continued)
Roslyn M. Watson (58)
Board Member (1994) |
Principal Occupation During Past 5Years:
Principal,Watson Ventures, Inc., a real estate investment company (1993-present)
Other Board Memberships and Affiliations:
- American Express Bank, Director
- The Hyams Foundation Inc., a Massachusetts Charitable Foundation,Trustee
- National Osteoporosis Foundation,Trustee
- SBLI-USA, Director
| No. of Portfolios for which Board Member Serves: 25 |
Benaree Pratt Wiley (62)
Board Member (1998)
Principal Occupation During Past 5Years: |
- Principal,The Wiley Group, a firm specializing in strategy and business development (2005-present)
- President and CEO,The Partnership, an organization dedicated to increasing the representation of African Americans in positions of leadership, influence and decision-making in Boston, MA (1991-2005)
| Other Board Memberships and Affiliations: |
- Boston College,Trustee Associate
- Blue Cross Blue Shield of Massachusetts, Director
- CBIZ, professional support consultants and service providers for small, midsized and corporate business, Director
- Commonwealth Institute, Director
- Efficacy Institute, Director
- PepsiCo African-American, Chair of Advisory Board
- The Boston Foundation, Director
- Century Business Services, Inc., a provider of outsourcing functions for small and medium size companies, Director
| No. of Portfolios for which Board Member Serves: 35 |
Once elected all Board Members serve for an indefinite term, but achieve Emeritus status upon reaching age 80.The address of the Board Members and Officers is in c/o The Dreyfus Corporation, 200 Park Avenue, NewYork, NewYork 10166. Additional information about the Board Members is available in the fund’s Statement of Additional Information which can be obtained from Dreyfus free of charge by calling this toll free number: 1-800-554-4611.
Francis P. Brennan, Emeritus Board Member
J.Tomlinson Fort, Emeritus Board Member |
34
OFFICERS OF THE FUND (Unaudited)
J. DAVID OFFICER, President since December 2006.
Chief Operating Officer,Vice Chairman and a Director of the Manager, and an officer of 76 investment companies (comprised of 157 portfolios) managed by the Manager. He is 60 years old and has been an employee of the Manager since April 1998.
PHILLIP N. MAISANO, Executive Vice President since July 2007.
Chief Investment Officer,Vice Chair and a director of the Manager, and an officer of 76 investment companies (comprised of 157 portfolios) managed by the Manager. Mr. Maisano also is an officer and/or Board member of certain other investment management subsidiaries of The Bank of New York Mellon Corporation, each of which is an affiliate of the Manager. He is 61 years old and has been an employee of the Manager since November 2006. Prior to joining the Manager, Mr. Maisano served as Chairman and Chief Executive Officer of EACM Advisors, an affiliate of the Manager, since August 2004, and served as Chief Executive Officer of Evaluation Associates, a leading institutional investment consulting firm, from 1988 until 2004.
MICHAEL A. ROSENBERG, Vice President and Secretary since August 2005.
Assistant General Counsel of BNY Mellon, and an officer of 77 investment companies (comprised of 174 portfolios) managed by the Manager. He is 48 years old and has been an employee of the Manager since October 1991.
JAMES BITETTO, Vice President and Assistant Secretary since August 2005.
Senior Counsel of BNY Mellon and Secretary of the Manager, and an officer of 77 investment companies (comprised of 174 portfolios) managed by the Manager. He is 42 years old and has been an employee of the Manager since December 1996.
JONI LACKS CHARATAN, Vice President and Assistant Secretary since August 2005.
Senior Counsel of BNY Mellon, and an officer of 77 investment companies (comprised of 174 portfolios) managed by the Manager. She is 52 years old and has been an employee of the Manager since October 1988.
JOSEPH M. CHIOFFI, Vice President and Assistant Secretary since August 2005.
Senior Counsel of BNY Mellon, and an officer of 77 investment companies (comprised of 174 portfolios) managed by the Manager. He is 46 years old and has been an employee of the Manager since June 2000.
JANETTE E. FARRAGHER, Vice President and Assistant Secretary since August 2005.
Assistant General Counsel of BNY Mellon, and an officer of 77 investment companies (comprised of 174 portfolios) managed by the Manager. She is 45 years old and has been an employee of the Manager since February 1984.
JOHN B. HAMMALIAN, Vice President and Assistant Secretary since August 2005.
Managing Counsel of BNY Mellon, and an officer of 77 investment companies (comprised of 174 portfolios) managed by the Manager. He is 45 years old and has been an employee of the Manager since February 1991.
ROBERT R. MULLERY, Vice President and Assistant Secretary since August 2005.
Managing Counsel of BNY Mellon, and an officer of 77 investment companies (comprised of 174 portfolios) managed by the Manager. He is 56 years old and has been an employee of the Manager since May 1986.
OFFICERS OF THE FUND (Unaudited) (continued)
| JEFF PRUSNOFSKY, Vice President and | | ROBERT SALVIOLO, Assistant Treasurer |
| Assistant Secretary since August 2005. | | since July 2007. |
| Managing Counsel of BNY Mellon, and an | | Senior Accounting Manager – Equity Funds of |
| officer of 77 investment companies (comprised | | the Manager, and an officer of 77 investment |
| of 174 portfolios) managed by the Manager. | | companies (comprised of 174 portfolios) |
| He is 43 years old and has been an employee | | managed by the Manager. He is 41 years old |
| of the Manager since October 1990. | | and has been an employee of the Manager |
| | | since June 1989. |
| JAMES WINDELS, Treasurer since | | |
| November 2001. | | ROBERT SVAGNA, Assistant Treasurer |
| Director – Mutual Fund Accounting of the | | since December 2002. |
| Manager, and an officer of 77 investment | | Senior Accounting Manager – Equity Funds of |
| companies (comprised of 174 portfolios) | | the Manager, and an officer of 77 investment |
| managed by the Manager. He is 49 years old | | companies (comprised of 174 portfolios) |
| and has been an employee of the Manager | | managed by the Manager. He is 41 years old |
| since April 1985. | | and has been an employee of the Manager |
| | | since November 1990. |
| RICHARD CASSARO, Assistant Treasurer | | |
| since September 2007. | | JOSEPH W. CONNOLLY, Chief Compliance |
| Senior Accounting Manager – Money Market | | Officer since October 2004. |
| and Municipal Bond Funds of the Manager, | | Chief Compliance Officer of the Manager and |
| and an officer of 77 investment companies | | The Dreyfus Family of Funds (77 investment |
| (comprised of 174 portfolios) managed by | | companies, comprised of 174 portfolios). From |
| the Manager. He is 49 years old and has | | November 2001 through March 2004, Mr. |
| been an employee of the Manager since | | Connolly was first Vice-President, Mutual |
| September 1982. | | Fund Servicing for Mellon Global Securities |
| | | Services. In that capacity, Mr. Connolly was |
| GAVIN C. REILLY, Assistant Treasurer | | |
| | | responsible for managing Mellon’s Custody, |
| since December 2005. | | |
| | | Fund Accounting and Fund Administration |
| Tax Manager of the Investment Accounting | | services to third-party mutual fund clients. He |
| and Support Department of the Manager, and | | is 51 years old and has served in various |
| an officer of 77 investment companies | | capacities with the Manager since 1980, |
| (comprised of 174 portfolios) managed by the | | including manager of the firm’s Fund |
| Manager. He is 40 years old and has been an | | Accounting Department from 1997 through |
| employee of the Manager since April 1991. | | October 2001. |
| |
| ROBERT ROBOL, Assistant Treasurer | | WILLIAM GERMENIS, Anti-Money |
| since December 2002. | | Laundering Compliance Officer since |
| Senior Accounting Manager – Fixed Income | | July 2002. |
| Funds of the Manager, and an officer of 77 | | Vice President and Anti-Money Laundering |
| investment companies (comprised of 174 | | Compliance Officer of the Distributor, and the |
| portfolios) managed by the Manager. He is 44 | | Anti-Money Laundering Compliance Officer |
| years old and has been an employee of the | | of 73 investment companies (comprised of 170 |
| Manager since October 1988. | | portfolios) managed by the Manager. He is 37 |
| | | years old and has been an employee of the |
| | | Distributor since October 1998. |
36
For More Information
The fund files its complete schedule of portfolio holdings with the Securities and Exchange Commission (“SEC”) for the first and third quarters of each fiscal year on Form N-Q. The fund’s Forms N-Q are available on the SEC’s website at http://www.sec.gov and may be reviewed and copied at the SEC’s Public Reference Room in Washington, DC. Information on the operation of the Public Reference Room may be obtained by calling 1-800-SEC-0330.
A description of the policies and procedures that the fund uses to determine how to vote proxies relating to portfolio securities, and information regarding how the fund voted these proxies for the 12-month period ended June 30, 2008, is available at http://www.dreyfus.com and on the SEC’s website at http://www.sec.gov. The description of the policies and procedures is also available without charge, upon request, by calling 1-800-645-6561.

| | | ® |
| © 2008 MBSC Securities Corporation | | 0047AR0808 |
Item 2. Code of Ethics.
The Registrant has adopted a code of ethics that applies to the Registrant's principal executive officer, principal financial officer, principal accounting officer or controller, or persons performing similar functions. There have been no amendments to, or waivers in connection with, the Code of Ethics during the period covered by this Report.
Item 3. Audit Committee Financial Expert.
The Registrant's Board has determined that Joseph S. DiMartino, a member of the Audit Committee of the Board, is an audit committee financial expert as defined by the Securities and Exchange Commission (the "SEC"). Joseph S. DiMartino is "independent" as defined by the SEC for purposes of audit committee financial expert determinations.
Item 4. Principal Accountant Fees and Services.
(a) Audit Fees. The aggregate fees billed for each of the last two fiscal years (the "Reporting Periods") for professional services rendered by the Registrant's principal accountant (the "Auditor") for the audit of the Registrant's annual financial statements, or services that are normally provided by the Auditor in connection with the statutory and regulatory filings or engagements for the Reporting Periods, were $27,200 in 2007 and $28,020 in 2008.
(b) Audit-Related Fees. The aggregate fees billed in the Reporting Periods for assurance and related services by the Auditor that are reasonably related to the performance of the audit of the Registrant's financial statements and are not reported under paragraph (a) of this Item 4 were $4,090 in 2007 and $4,210 in 2008. These services consisted of security counts required by Rule 17f-2 under the Investment Company Act of 1940, as amended.
The aggregate fees billed in the Reporting Periods for non-audit assurance and related services by the Auditor to the Registrant's investment adviser (not including any sub-investment adviser whose role is primarily portfolio management and is subcontracted with or overseen by another investment adviser), and any entity controlling, controlled by or under common control with the investment adviser that provides ongoing services to the Registrant ("Service Affiliates"), that were reasonably related to the performance of the annual audit of the Service Affiliate, which required pre-approval by the Audit Committee were $0 in 2007 and $0 in 2008.
Note: For the second paragraph in each of (b) through (d) of this Item 4, certain of such services were not pre-approved prior to May 6, 2003, when such services were required to be pre-approved. On and after May 6, 2003, 100% of all services provided by the Auditor were pre-approved as required. For comparative purposes, the fees shown assume that all such services were pre-approved, including services that were not pre-approved prior to the compliance date of the pre-approval requirement.
(c) Tax Fees. The aggregate fees billed in the Reporting Periods for professional services rendered by the Auditor for tax compliance, tax advice and tax planning ("Tax Services") were $2,090 in 2007 and $2,235 in 2008. These services consisted of review or preparation of U.S. federal, state, local and excise tax returns. The aggregate fees billed in the Reporting Periods for Tax Services by the Auditor to Service Affiliates which required pre-approval by the Audit Committee were $0 in 2007 and $0 in 2008.
(d) All Other Fees. The aggregate fees billed in the Reporting Periods for products and services provided by the Auditor, other than the services reported in paragraphs (a) through (c) of this Item, were $0 in 2007 and $0 in 2008.
The aggregate fees billed in the Reporting Periods for Non-Audit Services by the Auditor to Service Affiliates, other than the services reported in paragraphs (b) through (c) of this Item, which required pre-approval by the Audit Committee were $0 in 2007 and $0 in 2008.
Audit Committee Pre-Approval Policies and Procedures. The Registrant's Audit Committee has established policies and procedures (the "Policy") for pre-approval (within specified fee limits) of the Auditor's engagements for non-audit services to the Registrant and Service Affiliates without specific case-by-case consideration. Pre-approval considerations include whether the proposed services are compatible with maintaining the Auditor's independence. Pre-approvals pursuant to the Policy are considered annually.
Non-Audit Fees. The aggregate non-audit fees billed by the Auditor for services rendered to the Registrant, and rendered to Service Affiliates, for the Reporting Periods were $2,455,000 in 2007 and $2,532,612 in 2008.
Auditor Independence. The Registrant's Audit Committee has considered whether the provision of non-audit services that were rendered to Service Affiliates which were not pre-approved (not requiring pre-approval) is compatible with maintaining the Auditor's independence.
| Item 5. | | Audit Committee of Listed Registrants. |
| | | Not applicable. |
| Item 6. | | Schedule of Investments. |
| (a) | | Not applicable. |
| Item 7. | | Disclosure of Proxy Voting Policies and Procedures for Closed-End Management |
| | | Investment Companies. |
| | | Not applicable. |
| Item 8. | | Portfolio Managers of Closed-End Management Investment Companies. |
| | | Not applicable. |
| Item 9. | | Purchases of Equity Securities by Closed-End Management Investment Companies and |
| | | Affiliated Purchasers. |
| | | Not applicable. |
| Item 10. | | Submission of Matters to a Vote of Security Holders. |
The Registrant has a Nominating Committee (the "Committee"), which is responsible for selecting and nominating persons for election or appointment by the Registrant's Board as Board members. The Committee has adopted a Nominating Committee Charter (the "Charter"). Pursuant to the Charter, the Committee will consider recommendations for nominees from shareholders submitted to the Secretary of the Registrant, c/o The Dreyfus Corporation Legal Department, 200 Park Avenue, 8th Floor East, New York, New York 10166. A nomination submission must include information regarding the recommended nominee as specified in the Charter. This information includes all information relating to a recommended nominee that is required to be disclosed in solicitations or proxy statements for the election of Board members, as well as information sufficient to evaluate the factors to be considered by the Committee, including character and integrity, business and professional experience, and whether the person has the ability to apply sound and
independent business judgment and would act in the interests of the Registrant and its shareholders. Nomination submissions are required to be accompanied by a written consent of the individual to stand for election if nominated by the Board and to serve if elected by the shareholders, and such additional information must be provided regarding the recommended nominee as reasonably requested by the Committee.
(a) The Registrant's principal executive and principal financial officers have concluded, based on their evaluation of the Registrant's disclosure controls and procedures as of a date within 90 days of the filing date of this report, that the Registrant's disclosure controls and procedures are reasonably designed to ensure that information required to be disclosed by the Registrant on Form N-CSR is recorded, processed, summarized and reported within the required time periods and that information required to be disclosed by the Registrant in the reports that it files or submits on Form N-CSR is accumulated and communicated to the Registrant's management, including its principal executive and principal financial officers, as appropriate to allow timely decisions regarding required disclosure.
(b) There were no changes to the Registrant's internal control over financial reporting that occurred during the second fiscal quarter of the period covered by this report that have materially affected, or are reasonably likely to materially affect, the Registrant's internal control over financial reporting.
| Item 12. Exhibits. |
| (a)(1) | | Code of ethics referred to in Item 2. |
| (a)(2) | | Certifications of principal executive and principal financial officers as required by Rule 30a-2(a) |
under the Investment Company Act of 1940.
(a)(3) Not applicable.
(b) Certification of principal executive and principal financial officers as required by Rule 30a-2(b) under the Investment Company Act of 1940.
Pursuant to the requirements of the Securities Exchange Act of 1934 and the Investment Company Act of 1940, the Registrant has duly caused this Report to be signed on its behalf by the undersigned, thereunto duly authorized.
The Dreyfus/Laurel Funds, Inc.
| By: | | /s/ J. David Officer |
| | | J. David Officer |
| | President |
| |
| Date: | | October 27, 2008 |
Pursuant to the requirements of the Securities Exchange Act of 1934 and the Investment Company Act of 1940, this Report has been signed below by the following persons on behalf of the Registrant and in the capacities and on the dates indicated.
| By: | | /s/ J. David Officer |
| | | J. David Officer |
| | | President |
| Date: | | October 27, 2008 |
| | | |
| | |
| By: | | /s/ James Windels |
| | | James Windels |
| | | Treasurer |
| Date: | | October 27, 2008 |
| EXHIBIT INDEX |
| | | (a)(1) | | Code of ethics referred to in Item 2. |
| | | (a)(2) | | Certifications of principal executive and principal financial officers as required by Rule 30a- |
| | | 2(a) under the Investment Company Act of 1940. (EX-99.CERT) |
| | | (b) | | Certification of principal executive and principal financial officers as required by Rule 30a- |
| | | 2(b) under the Investment Company Act of 1940. (EX-99.906CERT) |