UNITED STATES
SECURITIES AND EXCHANGE COMMISSION
Washington, D.C. 20549 |
CERTIFIED SHAREHOLDER REPORT OF REGISTERED MANAGEMENT
INVESTMENT COMPANIES |
The Dreyfus/Laurel Funds, Inc.
(Exact name of Registrant as specified in charter) |
c/o The Dreyfus Corporation
200 Park Avenue
New York, New York 10166
(Address of principal executive offices) (Zip code) |
Michael A. Rosenberg, Esq.
200 Park Avenue
New York, New York 10166
(Name and address of agent for service) |
| Registrant's telephone number, including area code: | | (212) 922-6000 |
| Date of fiscal year end: | | 10/31 | | |
| Date of reporting period: | | 10/31/2008 | | |
The following N-CSR relates only to the Registrant’s series listed below and does not affect Dreyfus Core Equity Fund, a series of the Registrant with a fiscal year end of August 31. A separate N-CSR will be filed for that series as appropriate.
Dreyfus Bond Market Index Fund
Dreyfus Midcap Stock Fund
Dreyfus Disciplined Stock Fund
Dreyfus Large Company Stock Fund
Dreyfus Money Market Reserves
Dreyfus AMT-Free Municipal Reserves
Dreyfus Tax Managed Growth Fund
Dreyfus BASIC S&P 500 Stock Index Fund
Dreyfus U.S. Treasury Reserves
Dreyfus Balanced Fund
Dreyfus Limited Term Income Fund
Dreyfus Small Cap Value Fund
Dreyfus Strategic Income Fund |
Investment Company Act file number 811-05202
Item 1. Reports to Stockholders.

Save time. Save paper. View your next shareholder report online as soon as it’s available. Log into www.dreyfus.com and sign up for Dreyfus eCommunications. It’s simple and only takes a few minutes.
The views expressed in this report reflect those of the portfolio manager only through the end of the period covered and do not necessarily represent the views of Dreyfus or any other person in the Dreyfus organization. Any such views are subject to change at any time based upon market or other conditions and Dreyfus disclaims any responsibility to update such views.These views may not be relied on as investment advice and, because investment decisions for a Dreyfus fund are based on numerous factors, may not be relied on as an indication of trading intent on behalf of any Dreyfus fund.
Not FDIC-Insured Not Bank-Guaranteed May Lose Value
| | Contents |
| |
| | THE FUND |
| |
| 2 | A Letter from the CEO |
| |
| 3 | Discussion of Fund Performance |
| |
| 6 | Fund Performance |
| |
| 7 | Understanding Your Fund’s Expenses |
| |
| 7 | Comparing Your Fund’s Expenses With Those of Other Funds |
| |
| 8 | Statement of Investments |
| |
| 47 | Statement of Assets and Liabilities |
| |
| 48 | Statement of Operations |
| |
| 49 | Statement of Changes in Net Assets |
| |
| 51 | Financial Highlights |
| |
| 53 | Notes to Financial Statements |
| |
| 61 | Report of Independent Registered Public Accounting Firm |
| |
| 62 | Important Tax Information |
| |
| 63 | Board Members Information |
| |
| 65 | Officers of the Fund |
| |
| | FOR MORE INFORMATION |
| |
| | Back Cover |
| |
The Fund

A LETTER FROM THE CEO
Dear Shareholder: |
We present to you this annual report for Dreyfus Bond Market Index Fund, covering the 12-month period from November 1, 2007, through October 31, 2008.
These are difficult times for fixed-income investors.A credit crunch that began in 2007 has developed into a full-blown global financial crisis, recently resulting in the failure of several major financial institutions and prompting a massive government rescue effort.The U.S. economic slowdown also has gathered momentum, depressing investor sentiment and consumer confidence. These factors undermined returns in the bond market’s higher-yielding sectors, including high yield corporate and municipal securities, and even the traditional safe haven of U.S. government securities has encountered heightened yield volatility. The depth and duration of the economic downturn will depend on how quickly the financial system can be stabilized.We believe that the Temporary Guarantee Program for Money Market Funds and the $700 billion rescue package intended to promote greater liquidity in the financial markets meet several critical requirements for addressing today’s financial stresses, and we expect these measures to contribute to a more orderly deleveraging process. However, recuperation from the financial crisis is likely to take time. In the meantime, we encourage you to keep in touch with your financial advisor and maintain a long-term and disciplined perspective to investing. Indeed, we already are seeing some positive signs, including a likely peak in global inflationary pressures, a bottoming of the U.S. dollar and a large pool of worldwide financial liquidity that could be deployed gradually to riskier assets as the economic cycle turns.
For information about how the fund performed during the reporting period, as well as market perspectives, we have provided a Discussion of Fund Performance given by the fund’s Portfolio Manager.
Thank you for your continued confidence and support.

Jonathan R. Baum
Chief Executive Officer
The Dreyfus Corporation
November 17, 2008 |
2
| Dreyfus |
| Bond Market Index Fund |

DISCUSSION OF FUND PERFORMANCE
For the period of November 1, 2007, through October 31, 2008, as provided by Laurie Carroll, Portfolio Manager
Fund and Market Performance Overview
For the 12-month period ended October 31, 2008, Dreyfus Bond Market Index Fund’s Investor shares produced a total return of 0.51%, and BASIC shares produced a total return of 0.67% ..1 In comparison, the Barclays Capital U.S. Aggregate Index (the “Index”) achieved a total return of 0.30% for the same period.2
The U.S. bond market produced modestly positive absolute returns during an especially challenging reporting period. Concerns regarding a slowing economy, turmoil in global credit markets and the near collapse of the global banking system fueled a “flight to quality” among investors, causing U.S.Treasuries securities and U.S. government agency securities to produce some of the bond market’s better results. Conversely, the corporate-backed sector produced less attractive returns.
The Fund’s Investment Approach
The fund seeks to match the total return of the Index.To pursue this goal, the fund normally invests at least 80% of its assets in bonds that are included in the Index. To maintain liquidity, the fund may invest up to 20% of its assets in various short-term, fixed-income securities and money market instruments.
While the fund seeks to mirror the returns of the Index, it does not hold the same number of bonds. Instead, the fund holds approximately 1,300 securities as compared to 9,500 securities in the Index. The fund’s average duration — a measure of sensitivity to changing interest rates — generally remains neutral to the Index. As of October 31, 2008, the average duration of the fund was approximately 4.74 years.
Volatility Increases as Financial Crisis Intensifies
A credit crisis that dominated much of the reporting period later developed into a full-blown global financial crisis, resulting in the failure of
| DISCUSSION OF FUND PERFORMANCE (continued) |
several major financial institutions. As lenders grew increasingly risk-averse, virtually all investment sectors scrambled to obtain funding from a rapidly shrinking supply of available credit. Investors responded by flocking to the relative safety of U.S. government securities, and support for most other sectors of the bond market waned.
While the impact of the credit crisis was particularly severe in higher-yielding bond market sectors, even money market funds were not immune, as interbank lending rates spiked to abnormally high levels and the commercial paper market suffered bouts of challenged liquid-ity.A barrage of negative economic news put further downward pressure on the bond market, including a slowing global economy, and, in the United States, falling home prices, growing unemployment and sluggish consumer spending. As the slowdown intensified, previously high-flying commodity prices retreated sharply from their peaks.
The Federal Reserve Board (the “Fed”) responded aggressively to these developments, reducing short-term interest rates and, in March 2008, participating in the rescue of investment bank Bear Stearns in an effort to limit damage to the capital markets.While the fixed-income markets subsequently rallied, the recovery proved to be short-lived. Over the summer, additional government rescues were announced for insurer American International Group and mortgage agencies Freddie Mac and Fannie Mae. Meanwhile, investment bank Lehman Brothers filed for bankruptcy, Merrill Lynch and Wachovia were acquired by competitors, Washington Mutual was seized by regulators, and Goldman Sachs and Morgan Stanley re-registered as bank holding companies to enable them to tap government funds.With the nation’s major financial institutions realigned or eliminated, fixed-income liquidity became increasingly limited. By September, the financial crisis threatened to spin out of control, and the global banking system came close to collapse.
The U.S. Congress responded to the crisis by making $700 billion available to banks through the controversial Troubled Asset Relief Program. In addition, the Fed and several of the world’s major central banks announced unprecedented, coordinated reductions in short-term inter-
4
est rates to help strengthen the world’s financial systems. By the reporting period’s end, the overnight federal funds rate had declined to 1.00% .
“Flight to Quality” Benefited U.S. Government Securities
The fund benefited from its relatively heavy exposure to U.S.Treasury securities and U.S. government agency securities, which produced some of the Index’s stronger returns. Mortgage-backed securities also fared well, especially after the U.S. government took conservatorship of Freddie Mac and Fannie Mae.
On the other hand, corporate bonds declined sharply due to credit concerns, a slowing global economy and anemic investor demand. Commercial mortgage-backed securities also declined, but, because this asset class represents only a small portion of the Index’s composition, the overall effect was muted.
Mirroring the Index’s Composition
As an index fund, we attempt to replicate the returns of the Index by closely approximating its composition. As of October 31, 2008, approximately 41% of the fund’s assets were invested in mortgage-backed securities, 4% in commercial mortgage-backed securities, 17% in corporate bonds and asset-backed securities, 25% in U.S. Treasury securities and 13% in U.S. government agency bonds. In addition, all of the fund’s corporate securities were at least BBB-rated or better at the end of the reporting period, and the fund has maintained an overall credit quality that is closely aligned with that of the Index.
November 17, 2008
| 1 | | Total return includes reinvestment of dividends and any capital gains paid. Past performance is no |
| | | guarantee of future results. Share price, yield and investment return fluctuate such that upon |
| | | redemption, fund shares may be worth more or less than their original cost. |
| 2 | | SOURCE: LIPPER INC. — Reflects reinvestment of dividends and, where applicable, capital |
| | | gain distributions.The Barclays Capital U.S. Aggregate Index is a widely accepted, unmanaged |
| | | total return index of corporate, U.S. government and U.S. government agency debt instruments, |
| | | mortgage-backed securities and asset-backed securities with an average maturity of 1-10 years. |
| | | Index returns do not reflect fees and expenses associated with operating a mutual fund. |

| Average Annual Total Returns as of 10/31/08 | | | | | | |
| | | 1 Year | | 5 Years | | 10 Years |
| |
| |
| |
|
| BASIC shares | | 0.67% | | 3.43% | | 4.80% |
| Investor shares | | 0.51% | | 3.19% | | 4.55% |
| † Source: Lipper Inc. |
| Past performance is not predictive of future performance.The fund’s performance shown in the graph and table does not |
| reflect the deduction of taxes that a shareholder would pay on fund distributions or the redemption of fund shares. |
| The above graph compares a $10,000 investment made in both the BASIC shares and Investor shares of Dreyfus Bond |
| Market Index Fund on 10/31/98 to a $10,000 investment made in the Barclays Capital U.S. Aggregate Index (the |
| “Index”) on that date. All dividends and capital gain distributions are reinvested. |
| The fund’s performance shown in the line graph takes into account all applicable fees and expenses on both BASIC and |
| Investor shares.The Index is a widely accepted, unmanaged index of corporate, U.S. government and U.S. government |
| agency debt instruments, mortgage-backed securities, and asset-backed securities. Unlike a mutual fund, the Index is not |
| subject to charges, fees and other expenses. Investors cannot invest directly in any index. Further information relating to |
| fund performance, including expense reimbursements, if applicable, is contained in the Financial Highlights section of the |
| prospectus and elsewhere in this report. |
6
UNDERSTANDING YOUR FUND’S EXPENSES (Unaudited)
As a mutual fund investor, you pay ongoing expenses, such as management fees and other expenses. Using the information below, you can estimate how these expenses affect your investment and compare them with the expenses of other funds.You also may pay one-time transaction expenses, including sales charges (loads) and redemption fees, which are not shown in this section and would have resulted in higher total expenses. For more information, see your fund’s prospectus or talk to your financial adviser.
Review your fund’s expenses
The table below shows the expenses you would have paid on a $1,000 investment in Dreyfus Bond Market Index Fund from May 1, 2008 to October 31, 2008. It also shows how much a $1,000 investment would be worth at the close of the period, assuming actual returns and expenses.
Expenses and Value of a $1,000 Investment assuming actual returns for the six months ended October 31, 2008
| | | Investor Shares | | BASIC Shares |
| |
| |
|
| Expenses paid per $1,000† | | $ 1.98 | | $ .74 |
| Ending value (after expenses) | | $965.50 | | $966.70 |
COMPARING YOUR FUND’S EXPENSES WITH THOSE OF OTHER FUNDS (Unaudited)
Using the SEC’s method to compare expenses
The Securities and Exchange Commission (SEC) has established guidelines to help investors assess fund expenses. Per these guidelines, the table below shows your fund’s expenses based on a $1,000 investment, assuming a hypothetical 5% annualized return. You can use this information to compare the ongoing expenses (but not transaction expenses or total cost) of investing in the fund with those of other funds.All mutual fund shareholder reports will provide this information to help you make this comparison. Please note that you cannot use this information to estimate your actual ending account balance and expenses paid during the period.
Expenses and Value of a $1,000 Investment assuming a hypothetical 5% annualized return for the six months ended October 31, 2008
| | | Investor Shares | | BASIC Shares |
| |
| |
|
| Expenses paid per $1,000† | | $ 2.03 | | $ .76 |
| Ending value (after expenses) | | $1,022.13 | | $1,024.38 |
| † Expenses are equal to the fund’s annualized expense ratio of .40% for Investor shares and .15% for Basic shares, |
| multiplied by the average account value over the period, multiplied by 184/366 (to reflect the one-half year period). |
| STATEMENT OF INVESTMENTS | | | | | | |
| October 31, 2008 | | | | | | | | |
| |
| |
| |
| |
|
| |
| |
| |
| | | Coupon | | Maturity | | Principal | | |
| Bonds and Notes—96.7% | | Rate (%) | | Date | | Amount ($) | | Value ($) |
| |
| |
| |
| |
|
| Aerospace & Defense—.2% | | | | | | | | |
| Boeing, | | | | | | | | |
| Sr. Unscd. Bonds | | 7.25 | | 6/15/25 | | 150,000 | | 143,647 |
| General Dynamics, | | | | | | | | |
| Gtd. Notes | | 4.25 | | 5/15/13 | | 125,000 | | 117,166 |
| Lockheed Martin, | | | | | | | | |
| Sr. Unscd. Notes, Ser. B | | 6.15 | | 9/1/36 | | 455,000 | | 391,341 |
| Northrop Grumman, | | | | | | | | |
| Gtd. Debs. | | 7.75 | | 3/1/16 | | 540,000 | | 535,530 |
| Raytheon, | | | | | | | | |
| Sr. Unscd. Notes | | 4.85 | | 1/15/11 | | 125,000 | | 121,387 |
| Raytheon, | | | | | | | | |
| Sr. Unscd. Debs. | | 7.20 | | 8/15/27 | | 150,000 | | 140,360 |
| United Technologies, | | | | | | | | |
| Sr. Unscd. Notes | | 4.88 | | 5/1/15 | | 500,000 | | 456,232 |
| United Technologies, | | | | | | | | |
| Sr. Unscd. Notes | | 6.70 | | 8/1/28 | | 50,000 | | 50,609 |
| United Technologies, | | | | | | | | |
| Sr. Unscd. Debs. | | 8.75 | | 3/1/21 | | 50,000 | | 60,327 |
| | | | | | | | | 2,016,599 |
| Agricultural—.1% | | | | | | | | |
| Philip Morris International, | | | | | | | | |
| Sr. Unscd Notes | | 5.65 | | 5/16/18 | | 760,000 | | 651,290 |
| Reynolds American, | | | | | | | | |
| Sr. Scd. Notes | | 7.63 | | 6/1/16 | | 170,000 | | 139,652 |
| | | | | | | | | 790,942 |
| Asset-Backed Ctfs./ | | | | | | | | |
| Auto Receivables—.1% | | | | | | | | |
| Americredit Automobile Receivables | | | | | | | | |
| Trust, Ser. 2006-RM, Cl. A2 | | 5.42 | | 8/8/11 | | 379,974 | | 365,683 |
| Chase Manhattan Auto Owner Trust, | | | | | | | | |
| Ser. 2006-A, Cl. A4 | | 5.36 | | 1/15/13 | | 90,000 | | 89,080 |
| Honda Auto Receivables Owner | | | | | | | | |
| Trust, Ser. 2006-1, Cl. A3 | | 5.07 | | 2/18/10 | | 57,901 | | 57,950 |
| Honda Auto Receivables Owner | | | | | | | | |
| Trust, Ser. 2007-1, Cl. A4 | | 5.09 | | 7/18/13 | | 700,000 | | 675,471 |
| | | | | | | | | 1,188,184 |
| Asset-Backed Ctfs./Credit Cards—.2% | | | | | | | | |
| Bank One Issuance Trust, | | | | | | | | |
| Ser. 2004-A1, Cl. A1 | | 3.45 | | 10/17/11 | | 950,000 | | 940,720 |
8
| | | Coupon | | Maturity | | Principal | | | | |
| Bonds and Notes (continued) | | Rate (%) | | Date | | Amount ($) | | | | Value ($) |
| |
| |
| |
| |
| |
|
| Asset-Backed Ctfs./ | | | | | | | | | | |
| Credit Cards (continued) | | | | | | | | | | |
| Bank One Issuance Trust, | | | | | | | | | | |
| Ser. 2003-C3, Cl. C3 | | 4.77 | | 2/16/16 | | 200,000 | | | | 138,208 |
| Citibank Credit Card Issuance | | | | | | | | | | |
| Trust, Ser. 2005-A4, Cl. A4 | | 4.40 | | 6/20/14 | | 500,000 | | | | 433,214 |
| | | | | | | | | | | 1,512,142 |
| Asset-Backed Ctfs./ | | | | | | | | | | |
| Home Equity Loans—.1% | | | | | | | | | | |
| Centex Home Equity, | | | | | | | | | | |
| Ser. 2005-C, Cl. AF5 | | 5.05 | | 6/25/35 | | 200,000 | | a | | 161,208 |
| Countrywide Asset-Backed | | | | | | | | | | |
| Certificates, Ser. 2006-11, | | | | | | | | | | |
| Cl. 1AF4 | | 6.30 | | 9/25/46 | | 1,030,000 | | a | | 426,671 |
| CPL Transition Funding, | | | | | | | | | | |
| Ser. 2002-1, Cl. A4 | | 5.96 | | 7/15/15 | | 550,000 | | | | 547,326 |
| | | | | | | | | | | 1,135,205 |
| Automobile Manufacturers—.1% | | | | | | | | | | |
| Daimler Finance North America, | | | | | | | | | | |
| Gtd. Notes | | 6.50 | | 11/15/13 | | 225,000 | | | | 168,824 |
| Daimler Finance North America, | | | | | | | | | | |
| Gtd. Notes | | 7.30 | | 1/15/12 | | 400,000 | | | | 326,243 |
| Daimler Finance North America, | | | | | | | | | | |
| Gtd. Notes | | 8.50 | | 1/18/31 | | 200,000 | | | | 157,421 |
| | | | | | | | | | | 652,488 |
| Banks—2.9% | | | | | | | | | | |
| Abbey National, | | | | | | | | | | |
| Sub. Debs | | 7.95 | | 10/26/29 | | 350,000 | | | | 271,984 |
| BAC Capital Trust XI, | | | | | | | | | | |
| Bank Gtd. Cap. Secs. | | 6.63 | | 5/23/36 | | 125,000 | | | | 87,995 |
| Bank of America, | | | | | | | | | | |
| Sr. Unscd. Notes | | 5.13 | | 11/15/14 | | 350,000 | | | | 308,660 |
| Bank of America, | | | | | | | | | | |
| Sr. Unscd. Notes | | 5.38 | | 6/15/14 | | 275,000 | | | | 248,223 |
| Bank of America, | | | | | | | | | | |
| Sr. Unscd. Notes | | 5.63 | | 10/14/16 | | 575,000 | | | | 494,216 |
| Bank of America, | | | | | | | | | | |
| Sr. Unscd. Notes | | 5.65 | | 5/1/18 | | 965,000 | | | | 830,904 |
| Bank of America, | | | | | | | | | | |
| Sr. Unscd. Notes | | 5.75 | | 12/1/17 | | 750,000 | | | | 647,040 |
| STATEMENT OF INVESTMENTS (continued) |
| | | Coupon | | Maturity | | Principal | | | | |
| Bonds and Notes (continued) | | Rate (%) | | Date | | Amount ($) | | | | Value ($) |
| |
| |
| |
| |
| |
|
| Banks (continued) | | | | | | | | | | |
| Bank of America, | | | | | | | | | | |
| Sub. Notes | | 7.80 | | 2/15/10 | | 500,000 | | | | 504,788 |
| Bank One, | | | | | | | | | | |
| Sub. Notes | | 5.90 | | 11/15/11 | | 500,000 | | | | 490,236 |
| Bayerische Landesbank, | | | | | | | | | | |
| Sub. Notes | | 5.88 | | 12/1/08 | | 300,000 | | | | 301,071 |
| BB & T, | | | | | | | | | | |
| Sub. Notes | | 4.75 | | 10/1/12 | | 325,000 | | | | 295,100 |
| BB & T, | | | | | | | | | | |
| Sub. Notes | | 4.90 | | 6/30/17 | | 150,000 | | | | 120,150 |
| Capital One Bank, | | | | | | | | | | |
| Sr. Unscd. Notes | | 5.13 | | 2/15/14 | | 200,000 | | b | | 170,126 |
| Credit Suisse USA, | | | | | | | | | | |
| Gtd. Notes | | 5.38 | | 3/2/16 | | 200,000 | | | | 159,007 |
| Deutsche Bank London, | | | | | | | | | | |
| Sr. Unscd. Notes | | 6.00 | | 9/1/17 | | 845,000 | | | | 751,225 |
| Dresdner Bank, | | | | | | | | | | |
| Sr. Sub. Notes | | 7.25 | | 9/15/15 | | 145,000 | | | | 122,307 |
| Fifth Third Bank, | | | | | | | | | | |
| Notes | | 4.20 | | 2/23/10 | | 200,000 | | | | 186,598 |
| First Tennessee Bank, | | | | | | | | | | |
| Sub. Notes | | 5.65 | | 4/1/16 | | 250,000 | | | | 126,193 |
| Fleet Financial Group, | | | | | | | | | | |
| Sr. Sub. Notes | | 7.38 | | 12/1/09 | | 175,000 | | | | 176,775 |
| Golden West Financial, | | | | | | | | | | |
| Sr. Unscd. Notes | | 4.75 | | 10/1/12 | | 1,000,000 | | | | 837,287 |
| HSBC Holdings, | | | | | | | | | | |
| Sub. Notes | | 6.50 | | 5/2/36 | | 250,000 | | | | 198,344 |
| HSBC Holdings, | | | | | | | | | | |
| Sub. Notes | | 6.50 | | 9/15/37 | | 555,000 | | | | 438,846 |
| HSBC Holdings, | | | | | | | | | | |
| Sub. Notes | | 7.50 | | 7/15/09 | | 200,000 | | | | 198,860 |
| JP Morgan Chase, | | | | | | | | | | |
| Sub. Notes | | 6.00 | | 10/1/17 | | 150,000 | | | | 131,526 |
| KeyBank, | | | | | | | | | | |
| Sub. Notes | | 6.95 | | 2/1/28 | | 100,000 | | | | 65,041 |
| KFW, | | | | | | | | | | |
| Gov’t Gtd. Notes | | 3.25 | | 3/30/09 | | 1,250,000 | | | | 1,247,397 |
| KFW, | | | | | | | | | | |
| Govt Gtd. Bonds | | 4.00 | | 10/15/13 | | 1,400,000 | | b | | 1,425,578 |
10
| | | Coupon | | Maturity | | Principal | | | | |
| Bonds and Notes (continued) | | Rate (%) | | Date | | Amount ($) | | | | Value ($) |
| |
| |
| |
| |
| |
|
| Banks (continued) | | | | | | | | | | |
| KFW, | | | | | | | | | | |
| Gov’t Gtd. Bonds | | 4.13 | | 10/15/14 | | 1,200,000 | | b | | 1,222,300 |
| KFW, | | | | | | | | | | |
| Gov’t Gtd. Notes | | 4.88 | | 1/17/17 | | 1,240,000 | | | | 1,276,829 |
| KFW, | | | | | | | | | | |
| Gov’t Gtd. Bonds | | 5.13 | | 3/14/16 | | 625,000 | | b | | 618,063 |
| KFW, | | | | | | | | | | |
| Gov’t Gtd. Notes | | 8.00 | | 2/15/10 | | 35,000 | | | | 37,056 |
| Korea Development Bank, | | | | | | | | | | |
| Sr. Unscd. Notes | | 5.50 | | 11/13/12 | | 350,000 | | | | 296,621 |
| Mercantile Bankshares, | | | | | | | | | | |
| Sub. Notes, Ser. B | | 4.63 | | 4/15/13 | | 200,000 | | | | 193,994 |
| National City Bank, | | | | | | | | | | |
| Sr. Unscd. Notes | | 4.50 | | 3/15/10 | | 1,275,000 | | b | | 1,179,360 |
| NationsBank, | | | | | | | | | | |
| Sub. Notes | | 7.80 | | 9/15/16 | | 235,000 | | | | 220,661 |
| NB Capital Trust IV, | | | | | | | | | | |
| Bank Gtd. Cap. Secs. | | 8.25 | | 4/15/27 | | 55,000 | | | | 45,620 |
| Oesterreichische Kontrollbank, | | | | | | | | | | |
| Govt. Gtd. Notes | | 4.88 | | 2/16/16 | | 1,500,000 | | b | | 1,547,841 |
| Pemex Project Funding Master | | | | | | | | | | |
| Trust, Gtd. Bonds | | 6.63 | | 6/15/35 | | 60,000 | | | | 44,999 |
| PNC Funding, | | | | | | | | | | |
| Bank Gtd. Notes | | 5.25 | | 11/15/15 | | 225,000 | | | | 190,379 |
| Royal Bank of Scotland Group, | | | | | | | | | | |
| Sr. Sub. Notes | | 6.38 | | 2/1/11 | | 410,000 | | | | 394,641 |
| Royal Bank of Scotland Group, | | | | | | | | | | |
| Jr. Sub. Bonds | | 7.65 | | 8/29/49 | | 550,000 | | a | | 303,678 |
| Royal Bank of Scotland, | | | | | | | | | | |
| Sr. Sub. Notes | | 5.00 | | 10/1/14 | | 175,000 | | | | 134,167 |
| Sanwa Finance Aruba, | | | | | | | | | | |
| Bank Gtd. Notes | | 8.35 | | 7/15/09 | | 150,000 | | | | 151,889 |
| SouthTrust, | | | | | | | | | | |
| Sub. Notes | | 5.80 | | 6/15/14 | | 500,000 | | | | 413,537 |
| Sovereign Bancorp, | | | | | | | | | | |
| Sr. Unscd. Notes | | 4.80 | | 9/1/10 | | 500,000 | | | | 444,977 |
| State Street Bank & Trust, | | | | | | | | | | |
| Sub. Notes | | 5.25 | | 10/15/18 | | 200,000 | | | | 163,529 |
| Suntrust Capital VIII, | | | | | | | | | | |
| Bank Gtd. Secs. | | 6.10 | | 12/15/36 | | 335,000 | | a | | 172,429 |
| | STATEMENT OF INVESTMENTS (continued) |
| | | Coupon | | Maturity | | Principal | | |
| Bonds and Notes (continued) | | Rate (%) | | Date | | Amount ($) | | Value ($) |
| |
| |
| |
| |
|
| Banks (continued) | | | | | | | | |
| U.S. Bank, | | | | | | | | |
| Sub. Notes | | 4.95 | | 10/30/14 | | 45,000 | | 42,623 |
| U.S. Bank, | | | | | | | | |
| Sub. Notes | | 6.38 | | 8/1/11 | | 100,000 | | 99,053 |
| UBS, | | | | | | | | |
| Sr. Sub. Notes | | 5.88 | | 7/15/16 | | 75,000 | | 63,385 |
| UBS, | | | | | | | | |
| Sr. Unscd. Notes | | 5.88 | | 12/20/17 | | 760,000 | | 607,629 |
| Union Planters, | | | | | | | | |
| Sr. Unscd. Notes | | 4.38 | | 12/1/10 | | 400,000 | | 368,207 |
| Wachovia Bank, | | | | | | | | |
| Sub. Notes | | 5.00 | | 8/15/15 | | 250,000 | | 199,171 |
| Wachovia Bank, | | | | | | | | |
| Sub. Notes | | 6.60 | | 1/15/38 | | 415,000 | | 329,046 |
| Wachovia, | | | | | | | | |
| Sub. Notes | | 5.25 | | 8/1/14 | | 200,000 | | 166,900 |
| Wells Fargo & Co., | | | | | | | | |
| Sr. Unscd. Notes | | 5.63 | | 12/11/17 | | 1,140,000 | | 1,007,423 |
| Wells Fargo & Co., | | | | | | | | |
| Sub. Notes | | 6.38 | | 8/1/11 | | 420,000 | | 429,248 |
| Wells Fargo Bank, | | | | | | | | |
| Sub. Notes | | 5.75 | | 5/16/16 | | 875,000 | | 785,152 |
| Westpac Banking, | | | | | | | | |
| Sub. Notes | | 4.63 | | 6/1/18 | | 500,000 | | 428,961 |
| Zions Bancorporation, | | | | | | | | |
| Sub. Notes | | 6.00 | | 9/15/15 | | 250,000 | | 167,415 |
| | | | | | | | | 24,582,260 |
| Building & Construction—.1% | | | | | | | | |
| CRH America, | | | | | | | | |
| Gtd. Notes | | 5.30 | | 10/15/13 | | 500,000 | | 402,550 |
| Masco, | | | | | | | | |
| Sr. Unscd. Bonds | | 4.80 | | 6/15/15 | | 375,000 | | 283,497 |
| | | | | | | | | 686,047 |
| Chemicals—.2% | | | | | | | | |
| Archer Daniels, | | | | | | | | |
| Sr. Unscd. Notes | | 5.45 | | 3/15/18 | | 130,000 | | 110,688 |
| E.I. Du Pont De Nemours, | | | | | | | | |
| Sr. Unscd. Notes | | 5.25 | | 12/15/16 | | 500,000 | | 440,699 |
12
| | | Coupon | | Maturity | | Principal | | | | |
| Bonds and Notes (continued) | | Rate (%) | | Date | | Amount ($) | | | | Value ($) |
| |
| |
| |
| |
| |
|
| Building & Construction (continued) | | | | | | | | | | |
| E.I. Du Pont De Nemours, | | | | | | | | | | |
| Sr. Unscd. Notes | | 6.00 | | 7/15/18 | | 560,000 | | | | 513,444 |
| Lubrizol, | | | | | | | | | | |
| Gtd. Notes | | 5.50 | | 10/1/14 | | 150,000 | | | | 124,536 |
| Potash of Saskatchewan, | | | | | | | | | | |
| Sr. Unscd. Notes | | 7.75 | | 5/31/11 | | 200,000 | | | | 203,302 |
| Praxair, | | | | | | | | | | |
| Sr. Unscd. Notes | | 6.38 | | 4/1/12 | | 100,000 | | | | 102,501 |
| Rohm & Haas, | | | | | | | | | | |
| Sr. Unscd. Notes | | 7.85 | | 7/15/29 | | 430,000 | | | | 368,390 |
| | | | | | | | | | | 1,863,560 |
| Commercial & Professional Services—.1% | | | | | | | | |
| R.R. Donnelley & Sons, | | | | | | | | | | |
| Sr. Unscd. Notes | | 4.95 | | 5/15/10 | | 750,000 | | | | 683,043 |
| Commercial Mortgage | | | | | | | | | | |
| Pass-Through Ctfs.—4.0% | | | | | | | | | | |
| Asset Securitization, | | | | | | | | | | |
| Ser. 1995-D1, Cl. A2 | | 7.59 | | 7/11/27 | | 14,264 | | | | 14,255 |
| Banc of America Commercial | | | | | | | | | | |
| Mortgage, Ser. 2005-3, Cl. A4 | | 4.67 | | 7/10/43 | | 1,000,000 | | | | 792,207 |
| Banc of America Commercial | | | | | | | | | | |
| Mortgage, Ser. 2007-1, Cl. A4 | | 5.45 | | 1/15/49 | | 1,000,000 | | | | 742,344 |
| Banc of America Commercial | | | | | | | | | | |
| Mortgage, Ser. 2000-2, Cl. A2 | | 7.20 | | 9/15/32 | | 600,000 | | a | | 597,362 |
| Bank of America, | | | | | | | | | | |
| Ser. 2007-4, Cl. A4 | | 5.94 | | 2/10/51 | | 300,000 | | a | | 226,117 |
| Bear Stearns Commercial Mortgage | | | | | | | | | | |
| Securities, Ser. 2003-T12, | | | | | | | | | | |
| Cl. A4 | | 4.68 | | 8/13/39 | | 350,000 | | a | | 301,280 |
| Bear Stearns Commercial Mortgage | | | | | | | | | | |
| Securities, Ser. 2003-T10, | | | | | | | | | | |
| Cl. A2 | | 4.74 | | 3/13/40 | | 400,000 | | | | 350,095 |
| Bear Stearns Commercial Mortgage | | | | | | | | | | |
| Securities, Ser. 2005-PWR9, | | | | | | | | | | |
| Cl. A4A | | 4.87 | | 9/11/42 | | 900,000 | | | | 716,946 |
| Bear Stearns Commercial Mortgage | | | | | | | | | | |
| Securities, Ser. 2006-PW12, | | | | | | | | | | |
| Cl. A4 | | 5.72 | | 9/11/38 | | 850,000 | | a | | 678,823 |
| STATEMENT OF INVESTMENTS (continued) |
| | | Coupon | | Maturity | | Principal | | | | |
| Bonds and Notes (continued) | | Rate (%) | | Date | | Amount ($) | | | | Value ($) |
| |
| |
| |
| |
| |
|
| Commercial Mortgage | | | | | | | | | | |
| Pass-Through Ctfs. (continued) | | | | | | | | | | |
| Bear Stearns Commercial Mortgage | | | | | | | | | | |
| Securities, Ser. 2002-TOP6, | | | | | | | | | | |
| Cl. A2 | | 6.46 | | 10/15/36 | | 175,000 | | | | 166,581 |
| Bear Stearns Commercial Mortgage | | | | | | | | | | |
| Securities, Ser. 2001-TOP2, | | | | | | | | | | |
| Cl. A2 | | 6.48 | | 2/15/35 | | 230,000 | | | | 223,647 |
| Bear Stearns Commercial Mortgage | | | | | | | | | | |
| Securities, Ser. 1999-WF2, | | | | | | | | | | |
| Cl. A2 | | 7.08 | | 7/15/31 | | 154,710 | | | | 154,125 |
| Chase Commercial Mortgage | | | | | | | | | | |
| Securities, Ser. 2000-3, Cl. A2 | | 7.32 | | 10/15/32 | | 400,989 | | | | 398,115 |
| Chase Commercial Mortgage | | | | | | | | | | |
| Securities, Ser. 2000-2, Cl. A2 | | 7.63 | | 7/15/32 | | 250,000 | | | | 249,493 |
| Citigroup Commercial Mortgage | | | | | | | | | | |
| Trust, Ser. 2006-C4, Cl. A3 | | 5.72 | | 3/15/49 | | 225,000 | | a | | 179,425 |
| Citigroup Commercial Mortgage | | | | | | | | | | |
| Trust, Ser. 2008-C7, Cl. A4 | | 6.10 | | 12/10/49 | | 1,100,000 | | a | | 852,142 |
| Citigroup/Deutsche Bank Commercial | | | | | | | | | | |
| Mortgage Trust, Ser. 2005-CD1, | | | | | | | | | | |
| Cl. A4 | | 5.23 | | 7/15/44 | | 1,900,000 | | a | | 1,550,200 |
| Citigroup/Deutsche Bank Commercial | | | | | | | | | | |
| Mortgage Trust, Ser. 2006-CD2, | | | | | | | | | | |
| Cl. A4 | | 5.36 | | 1/15/46 | | 85,000 | | a | | 66,599 |
| Commercial Mortgage Pass-Through | | | | | | | | | | |
| Certificates, Ser. 2005-LP5, | | | | | | | | | | |
| Cl. A2 | | 4.63 | | 5/10/43 | | 1,459,259 | | | | 1,397,035 |
| Credit Suisse Mortgage Capital | | | | | | | | | | |
| Certificates, Ser. 2006-C3, | | | | | | | | | | |
| Cl. A3 | | 5.83 | | 6/15/38 | | 1,500,000 | | a | | 1,200,367 |
| CS First Boston Mortgage | | | | | | | | | | |
| Securities, Ser. 2004-C3, Cl. A5 | | 5.11 | | 7/15/36 | | 1,245,000 | | a | | 1,041,218 |
| CS First Boston Mortgage | | | | | | | | | | |
| Securities, Ser. 2002-CKP1, Cl. A3 | | 6.44 | | 12/15/35 | | 675,000 | | | | 647,580 |
| CS First Boston Mortgage | | | | | | | | | | |
| Securities, Ser. 2001-CK3, Cl. A4 | | 6.53 | | 6/15/34 | | 375,000 | | | | 365,060 |
| CS First Boston Mortgage | | | | | | | | | | |
| Securities, Ser. 1999-C1, Cl. A2 | | 7.29 | | 9/15/41 | | 630,970 | | | | 630,560 |
| CS First Boston Mortgage | | | | | | | | | | |
| Securities, Ser. 2000-C1, Cl. A2 | | 7.55 | | 4/15/62 | | 278,055 | | | | 278,492 |
14
| | | Coupon | | Maturity | | Principal | | | | |
| Bonds and Notes (continued) | | Rate (%) | | Date | | Amount ($) | | | | Value ($) |
| |
| |
| |
| |
| |
|
| Commercial Mortgage | | | | | | | | | | |
| Pass-Through Ctfs. (continued) | | | | | | | | | | |
| CWCapital Cobalt, | | | | | | | | | | |
| Ser. 2007-C3, Cl. A4 | | 5.82 | | 5/15/46 | | 1,000,000 | | a | | 751,762 |
| DLJ Commercial Mortgage, | | | | | | | | | | |
| Ser. 2000-CKP1, Cl. A1B | | 7.18 | | 11/10/33 | | 435,288 | | | | 432,632 |
| GE Capital Commercial Mortgage, | | | | | | | | | | |
| Ser. 2002-1A, Cl. A3 | | 6.27 | | 12/10/35 | | 1,250,000 | | | | 1,185,367 |
| Greenwich Capital Commercial | | | | | | | | | | |
| Funding, Ser. 2005-GG5, Cl. A5 | | 5.22 | | 4/10/37 | | 1,000,000 | | a | | 808,308 |
| GS Mortgage Securities II, | | | | | | | | | | |
| Ser. 2005-GG4, Cl. A3 | | 4.61 | | 7/10/39 | | 775,000 | | | | 674,217 |
| GS Mortgage Securities II, | | | | | | | | | | |
| Ser. 2007-GG10, Cl. A4 | | 5.80 | | 8/10/45 | | 1,000,000 | | a | | 754,900 |
| Heller Financial Commercial | | | | | | | | | | |
| Mortgage Asset, Ser. 1999-PH1, | | | | | | | | | | |
| Cl. A2 | | 6.85 | | 5/15/31 | | 155,219 | | a | | 154,719 |
| J. P. Morgan Chase Commercial | | | | | | | | | | |
| Mortgage Securities, | | | | | | | | | | |
| Ser. 2007-CB20, Cl. A4 | | 5.79 | | 2/12/51 | | 1,000,000 | | a | | 745,503 |
| J.P. Morgan Chase Commercial | | | | | | | | | | |
| Mortgage Securities, | | | | | | | | | | |
| Ser. 2004-CB8, Cl. A4 | | 4.40 | | 1/12/39 | | 1,000,000 | | | | 810,374 |
| J.P. Morgan Chase Commercial | | | | | | | | | | |
| Mortgage Securities, | | | | | | | | | | |
| Ser. 2005-LDP3, Cl. A4A | | 4.94 | | 8/15/42 | | 600,000 | | a | | 474,633 |
| J.P. Morgan Chase Commercial | | | | | | | | | | |
| Mortgage Securities, | | | | | | | | | | |
| Ser. 2004-LN2, Cl. A2 | | 5.11 | | 7/15/41 | | 150,000 | | | | 124,778 |
| J.P. Morgan Chase Commercial | | | | | | | | | | |
| Mortgage Securities, | | | | | | | | | | |
| Ser. 2007-LDPX, Cl. A3 | | 5.42 | | 1/15/49 | | 1,200,000 | | | | 887,536 |
| J.P. Morgan Chase Commercial | | | | | | | | | | |
| Mortgage Securities, | | | | | | | | | | |
| Ser. 2007-CB18, Cl. A4 | | 5.44 | | 6/12/47 | | 350,000 | | | | 258,695 |
| J.P. Morgan Chase Commercial | | | | | | | | | | |
| Mortgage Securities, | | | | | | | | | | |
| Ser. 2006-LDP8, Cl. A3B | | 5.45 | | 5/15/45 | | 225,000 | | | | 185,862 |
| J.P. Morgan Chase Commercial | | | | | | | | | | |
| Mortgage Securities, | | | | | | | | | | |
| Ser. 2006-CB14, Cl. A4 | | 5.48 | | 12/12/44 | | 500,000 | | a | | 390,491 |
| STATEMENT OF INVESTMENTS (continued) |
| | | Coupon | | Maturity | | Principal | | | | |
| Bonds and Notes (continued) | | Rate (%) | | Date | | Amount ($) | | | | Value ($) |
| |
| |
| |
| |
| |
|
| Commercial Mortgage | | | | | | | | | | |
| Pass-Through Ctfs. (continued) | | | | | | | | | | |
| LB Commercial Conduit Mortgage | | | | | | | | | | |
| Trust, Ser. 1999-C2, Cl. A2 | | 7.32 | | 10/15/32 | | 136,695 | | | | 136,290 |
| LB-UBS Commercial Mortgage Trust, | | | | | | | | | | |
| Ser. 2003-C3, Cl. A4 | | 4.17 | | 5/15/32 | | 475,000 | | | | 399,472 |
| LB-UBS Commercial Mortgage Trust, | | | | | | | | | | |
| Ser. 2004-C7, Cl. A6 | | 4.79 | | 10/15/29 | | 700,000 | | a | | 571,765 |
| LB-UBS Commercial Mortgage Trust, | | | | | | | | | | |
| Ser. 2005-C3, Cl. AJ | | 4.84 | | 7/15/40 | | 500,000 | | | | 334,154 |
| LB-UBS Commercial Mortgage Trust, | | | | | | | | | | |
| Ser. 2004-C6, Cl. A6 | | 5.02 | | 8/15/29 | | 275,000 | | a | | 229,307 |
| LB-UBS Commercial Mortgage Trust, | | | | | | | | | | |
| Ser. 2007-C2, Cl. A3 | | 5.43 | | 2/15/40 | | 1,200,000 | | | | 890,175 |
| LB-UBS Commercial Mortgage Trust, | | | | | | | | | | |
| Ser. 2000-C3, Cl. A2 | | 7.95 | | 5/15/25 | | 1,057,384 | | a | | 1,063,012 |
| Merrill Lynch Mortgage Trust, | | | | | | | | | | |
| Ser. 2003-KEY1, Cl. A4 | | 5.24 | | 11/12/35 | | 500,000 | | a | | 433,208 |
| Merrill Lynch Mortgage Trust, | | | | | | | | | | |
| Ser. 2005-CKI1, Cl. A6 | | 5.42 | | 11/12/37 | | 375,000 | | a | | 304,388 |
| Merrill Lynch Mortgage Trust, | | | | | | | | | | |
| Ser. 2007-C1, Cl. A4 | | 5.83 | | 6/12/50 | | 1,000,000 | | a | | 760,137 |
| Merrill Lynch/Countrywide | | | | | | | | | | |
| Commercial Mortgage, | | | | | | | | | | |
| Ser. 2007-7, Cl. A4 | | 5.75 | | 6/12/50 | | 1,200,000 | | a | | 905,220 |
| Morgan Stanley Capital I, | | | | | | | | | | |
| Ser. 2004-T13, Cl. A4 | | 4.66 | | 9/13/45 | | 1,000,000 | | | | 845,277 |
| Morgan Stanley Capital I, | | | | | | | | | | |
| Ser. 2007-IQ14, Cl. A4 | | 5.69 | | 4/15/49 | | 1,300,000 | | a | | 976,687 |
| Morgan Stanley Capital I, | | | | | | | | | | |
| Ser. 2006-HQ9, Cl. A4 | | 5.73 | | 7/12/44 | | 500,000 | | a | | 393,864 |
| Morgan Stanley Dean Witter Capital | | | | | | | | | | |
| I, Ser. 2003-HQ2, Cl. A2 | | 4.92 | | 3/12/35 | | 500,000 | | | | 438,741 |
| Morgan Stanley Dean Witter Capital | | | | | | | | | | |
| I, Ser. 2001-TOP1, Cl. A4 | | 6.66 | | 2/15/33 | | 112,662 | | | | 110,562 |
| Wachovia Bank Commercial Mortgage | | | | | | | | | | |
| Trust, Ser. 2005-C20, Cl. A7 | | 5.12 | | 7/15/42 | | 800,000 | | a | | 639,431 |
| Wachovia Bank Commercial Mortgage | | | | | | | | | | |
| Trust, Ser. 2004-C11, Cl. A5 | | 5.22 | | 1/15/41 | | 800,000 | | a | | 673,225 |
| Wachovia Bank Commercial Mortgage | | | | | | | | | | |
| Trust, Ser. 2006-C28, Cl. A3 | | 5.68 | | 10/15/48 | | 150,000 | | | | 112,745 |
16
| | | Coupon | | Maturity | | Principal | | | | |
| Bonds and Notes (continued) | | Rate (%) | | Date | | Amount ($) | | | | Value ($) |
| |
| |
| |
| |
| |
|
| Commercial Mortgage | | | | | | | | | | |
| Pass-Through Ctfs. (continued) | | | | | | | | | | |
| Wachovia Bank Commercial Mortgage | | | | | | | | | | |
| Trust, Ser. 2006-C27, Cl. A3 | | 5.76 | | 7/15/45 | | 1,150,000 | | a | | 868,935 |
| | | | | | | | | | | 33,546,440 |
| Consumer Products—.1% | | | | | | | | | | |
| Avon Products, | | | | | | | | | | |
| Sr. Unscd. Notes | | 4.20 | | 7/15/18 | | 250,000 | | | | 176,581 |
| Procter & Gamble, | | | | | | | | | | |
| Sr. Unscd. Notes | | 4.95 | | 8/15/14 | | 125,000 | | | | 123,393 |
| Procter & Gamble, | | | | | | | | | | |
| Sr. Unscd. Notes | | 5.55 | | 3/5/37 | | 300,000 | | | | 260,339 |
| Procter & Gamble, | | | | | | | | | | |
| Sr. Unscd. Notes | | 6.88 | | 9/15/09 | | 750,000 | | b | | 771,217 |
| | | | | | | | | | | 1,331,530 |
| Diversified Financial Services—3.9% | | | | | | | | | | |
| AEP Texas Central Transition | | | | | | | | | | |
| Funding, Sr. Scd. Bonds, | | | | | | | | | | |
| Ser. A-4 | | 5.17 | | 1/1/20 | | 250,000 | | | | 213,420 |
| AEP Texas Central Transition | | | | | | | | | | |
| Funding, Sr. Scd. Bonds, | | | | | | | | | | |
| Ser. A-5 | | 5.31 | | 7/1/21 | | 45,000 | | | | 36,413 |
| American Express, | | | | | | | | | | |
| Sr. Unscd. Notes | | 6.15 | | 8/28/17 | | 700,000 | | | | 501,674 |
| American Express, | | | | | | | | | | |
| Sr. Unscd. Notes | | 7.00 | | 3/19/18 | | 1,000,000 | | | | 771,532 |
| American General Finance, | | | | | | | | | | |
| Sr. Unscd. Notes | | 6.90 | | 12/15/17 | | 900,000 | | | | 326,091 |
| BA Master Credit Card Trust, | | | | | | | | | | |
| Asset Backed Notes, Ser. 99-J | | 7.00 | | 2/15/12 | | 875,000 | | | | 876,584 |
| Bear Stearns, | | | | | | | | | | |
| Sr. Unscd. Notes | | 5.30 | | 10/30/15 | | 100,000 | | | | 85,276 |
| Bear Stearns, | | | | | | | | | | |
| Sub. Notes | | 5.55 | | 1/22/17 | | 500,000 | | b | | 424,384 |
| Bear Stearns, | | | | | | | | | | |
| Sr. Unscd. Notes | | 6.40 | | 10/2/17 | | 540,000 | | | | 480,755 |
| Bear Stearns, | | | | | | | | | | |
| Sr. Unscd. Notes | | 7.25 | | 2/1/18 | | 270,000 | | | | 254,596 |
| Capital One Bank, | | | | | | | | | | |
| Sr. Unscd. Notes | | 4.25 | | 12/1/08 | | 275,000 | | | | 273,007 |
| STATEMENT OF INVESTMENTS (continued) |
| | | Coupon | | Maturity | | Principal | | | | |
| Bonds and Notes (continued) | | Rate (%) | | Date | | Amount ($) | | | | Value ($) |
| |
| |
| |
| |
| |
|
| Diversified Financial | | | | | | | | | | |
| Services (continued) | | | | | | | | | | |
| Capital One Capital III, | | | | | | | | | | |
| Gtd. Cap. Secs. | | 7.69 | | 8/15/36 | | 200,000 | | | | 95,458 |
| CIT Group Funding, | | | | | | | | | | |
| Gtd. Notes | | 4.65 | | 7/1/10 | | 1,375,000 | | a | | 950,359 |
| Citigroup Capital XXI, | | | | | | | | | | |
| Gtd. Bonds | | 8.30 | | 12/21/77 | | 835,000 | | a | | 574,371 |
| Citigroup, | | | | | | | | | | |
| Sub. Notes | | 5.00 | | 9/15/14 | | 730,000 | | | | 577,733 |
| Citigroup, | | | | | | | | | | |
| Sr. Unscd. Notes | | 6.00 | | 2/21/12 | | 1,075,000 | | | | 1,019,270 |
| Citigroup, | | | | | | | | | | |
| Sr. Unscd. Notes | | 6.13 | | 11/21/17 | | 885,000 | | | | 762,131 |
| Citigroup, | | | | | | | | | | |
| Sub. Notes | | 6.13 | | 8/25/36 | | 575,000 | | | | 388,722 |
| Citigroup, | | | | | | | | | | |
| Sr. Unscd. Notes | | 6.63 | | 1/15/28 | | 100,000 | | | | 82,985 |
| Countrywide Home Loans, | | | | | | | | | | |
| Gtd. Notes, Ser. L | | 4.00 | | 3/22/11 | | 750,000 | | | | 692,041 |
| Countrywide Home Loans, | | | | | | | | | | |
| Gtd. Notes | | 4.13 | | 9/15/09 | | 200,000 | | | | 191,838 |
| Credit Suisse USA, | | | | | | | | | | |
| Gtd. Notes | | 5.50 | | 8/15/13 | | 1,000,000 | | b | | 894,704 |
| Credit Suisse USA, | | | | | | | | | | |
| Gtd. Notes | | 6.50 | | 1/15/12 | | 1,300,000 | | | | 1,267,348 |
| General Electric Capital, | | | | | | | | | | |
| Sr. Unscd. Notes | | 5.00 | | 1/8/16 | | 375,000 | | | | 301,437 |
| General Electric Capital, | | | | | | | | | | |
| Sr. Unscd. Notes, Ser. A | | 5.45 | | 1/15/13 | | 650,000 | | | | 601,290 |
| General Electric Capital, | | | | | | | | | | |
| Sr. Unscd. Notes | | 5.63 | | 9/15/17 | | 1,000,000 | | | | 818,890 |
| General Electric Capital, | | | | | | | | | | |
| Sr. Unscd. Notes | | 5.63 | | 5/1/18 | | 135,000 | | | | 111,330 |
| General Electric Capital, | | | | | | | | | | |
| Sr. Unscd. Notes | | 5.88 | | 1/14/38 | | 500,000 | | | | 357,683 |
| General Electric Capital, | | | | | | | | | | |
| Sr. Unscd. Notes, Ser. A | | 6.75 | | 3/15/32 | | 1,445,000 | | | | 1,175,583 |
| General Electric Capital, | | | | | | | | | | |
| Sr. Unscd. Debs. | | 8.30 | | 9/20/09 | | 15,000 | | | | 15,217 |
18
| | | Coupon | | Maturity | | Principal | | | | |
| Bonds and Notes (continued) | | Rate (%) | | Date | | Amount ($) | | | | Value ($) |
| |
| |
| |
| |
| |
|
| Diversified Financial | | | | | | | | | | |
| Services (continued) | | | | | | | | | | |
| Goldman Sachs Capital I, | | | | | | | | | | |
| Gtd. Cap. Secs. | | 6.35 | | 2/15/34 | | 350,000 | | b | | 216,514 |
| Goldman Sachs Group, | | | | | | | | | | |
| Sr. Unscd. Notes | | 5.95 | | 1/18/18 | | 15,000 | | | | 12,253 |
| Goldman Sachs Group, | | | | | | | | | | |
| Sr. Unscd. Notes | | 6.13 | | 2/15/33 | | 475,000 | | | | 352,686 |
| Goldman Sachs Group, | | | | | | | | | | |
| Sr. Unscd. Notes | | 6.15 | | 4/1/18 | | 680,000 | | | | 564,257 |
| Goldman Sachs Group, | | | | | | | | | | |
| Sr. Unscd. Notes | | 6.25 | | 9/1/17 | | 190,000 | | | | 159,041 |
| Goldman Sachs Group, | | | | | | | | | | |
| Sr. Unscd. Notes | | 6.60 | | 1/15/12 | | 2,725,000 | | | | 2,577,444 |
| Goldman Sachs Group, | | | | | | | | | | |
| Sub. Notes | | 6.75 | | 10/1/37 | | 630,000 | | | | 411,289 |
| Goldman Sachs Group, | | | | | | | | | | |
| Sr. Unscd. Notes | | 7.35 | | 10/1/09 | | 100,000 | | | | 99,977 |
| Household Finance, | | | | | | | | | | |
| Sr. Unscd. Notes | | 4.75 | | 7/15/13 | | 700,000 | | | | 616,930 |
| Household Finance, | | | | | | | | | | |
| Sr. Unscd. Notes | | 8.00 | | 7/15/10 | | 630,000 | | | | 613,261 |
| HSBC Finance, | | | | | | | | | | |
| Sr. Unscd. Notes | | 5.50 | | 1/19/16 | | 325,000 | | | | 268,425 |
| International Lease Finance, | | | | | | | | | | |
| Sr. Unscd. Notes | | 4.75 | | 1/13/12 | | 250,000 | | | | 164,081 |
| International Lease Finance, | | | | | | | | | | |
| Sr. Unscd. Notes | | 5.00 | | 4/15/10 | | 1,200,000 | | | | 890,528 |
| International Lease Finance, | | | | | | | | | | |
| Sr. Unscd. Notes | | 5.65 | | 6/1/14 | | 350,000 | | b | | 223,659 |
| J.P. Morgan Chase Capital XX, | | | | | | | | | | |
| Gtd. Notes, Ser. T | | 6.55 | | 9/29/36 | | 50,000 | | | | 35,117 |
| Janus Capital Group, | | | | | | | | | | |
| Sr. Unscd. Notes | | 6.25 | | 6/15/12 | | 75,000 | | | | 59,160 |
| Jefferies Group, | | | | | | | | | | |
| Sr. Unscd. Debs. | | 6.25 | | 1/15/36 | | 200,000 | | | | 132,417 |
| Jefferies Group, | | | | | | | | | | |
| Sr. Unscd. Debs. | | 6.45 | | 6/8/27 | | 35,000 | | | �� | 24,971 |
| JP Morgan Chase XVII, | | | | | | | | | | |
| Gtd. Debs., Ser. Q | | 5.85 | | 8/1/35 | | 310,000 | | | | 195,032 |
| STATEMENT OF INVESTMENTS (continued) |
| | | Coupon | | Maturity | | Principal | | |
| Bonds and Notes (continued) | | Rate (%) | | Date | | Amount ($) | | Value ($) |
| |
| |
| |
| |
|
| Diversified Financial | | | | | | | | |
| Services (continued) | | | | | | | | |
| JPMorgan Chase & Co., | | | | | | | | |
| Sub. Notes | | 5.13 | | 9/15/14 | | 2,525,000 | | 2,250,171 |
| JPMorgan Chase & Co., | | | | | | | | |
| Sub. Notes | | 5.15 | | 10/1/15 | | 250,000 | | 217,964 |
| JPMorgan Chase & Co., | | | | | | | | |
| Sr. Sub. Notes | | 6.75 | | 2/1/11 | | 1,000,000 | | 993,551 |
| Merrill Lynch & Co., | | | | | | | | |
| Sr. Unscd. Notes | | 5.45 | | 7/15/14 | | 565,000 | | 492,677 |
| Merrill Lynch & Co., | | | | | | | | |
| Sr. Unscd. Notes | | 6.05 | | 8/15/12 | | 1,235,000 | | 1,125,085 |
| Merrill Lynch & Co., | | | | | | | | |
| Sub. Notes | | 6.05 | | 5/16/16 | | 575,000 | | 466,013 |
| Merrill Lynch & Co., | | | | | | | | |
| Sr. Unscd. Notes | | 6.40 | | 8/28/17 | | 65,000 | | 55,010 |
| Merrill Lynch & Co., | | | | | | | | |
| Notes | | 6.88 | | 4/25/18 | | 150,000 | | 133,451 |
| Merrill Lynch & Co., | | | | | | | | |
| Sr. Unscd. Notes | | 6.88 | | 11/15/18 | | 150,000 | | 132,793 |
| Morgan Stanley, | | | | | | | | |
| Sub. Notes | | 4.75 | | 4/1/14 | | 1,580,000 | | 1,124,998 |
| Morgan Stanley, | | | | | | | | |
| Sr. Unscd. Notes | | 5.45 | | 1/9/17 | | 1,100,000 | | 880,433 |
| Morgan Stanley, | | | | | | | | |
| Sr. Unscd. Notes | | 5.75 | | 10/18/16 | | 175,000 | | 136,699 |
| Morgan Stanley, | | | | | | | | |
| Sr. Unscd. Notes | | 7.25 | | 4/1/32 | | 300,000 | | 229,444 |
| National Rural Utilities | | | | | | | | |
| Cooperative Finance, Coll. | | | | | | | | |
| Trust Notes | | 4.38 | | 10/1/10 | | 600,000 | | 570,503 |
| SLM, | | | | | | | | |
| Sr. Unscd. Notes, Ser. A | | 5.00 | | 10/1/13 | | 100,000 | | 60,808 |
| SLM, | | | | | | | | |
| Sr. Unscd. Notes, Ser. A | | 5.00 | | 4/15/15 | | 450,000 | | 253,615 |
| Toyota Motor Credit, | | | | | | | | |
| Unscd. Notes | | 4.35 | | 12/15/10 | | 150,000 b | | 150,511 |
| Toyota Motor Credit, | | | | | | | | |
| Unscd. Notes | | 5.50 | | 12/15/08 | | 225,000 | | 224,444 |
| | | | | | | | | 32,237,334 |
20
| | | Coupon | | Maturity | | Principal | | |
| Bonds and Notes (continued) | | Rate (%) | | Date | | Amount ($) | | Value ($) |
| |
| |
| |
| |
|
| Diversified Metals & Mining—.4% | | | | | | | | |
| Alcan, | | | | | | | | |
| Sr. Unscd. Debs. | | 7.25 | | 3/15/31 | | 350,000 | | 272,040 |
| Alcoa, | | | | | | | | |
| Sr. Unscd. Notes | | 5.72 | | 2/23/19 | | 612,000 | | 415,481 |
| Alcoa, | | | | | | | | |
| Sr. Unscd. Notes | | 6.00 | | 1/15/12 | | 250,000 | | 229,789 |
| BHP Finance USA, | | | | | | | | |
| Gtd. Notes | | 4.80 | | 4/15/13 | | 1,175,000 | | 1,078,903 |
| Freeport-McMoran C&G, | | | | | | | | |
| Sr. Unscd. Notes | | 8.38 | | 4/1/17 | | 895,000 | | 703,547 |
| Inco, | | | | | | | | |
| Unsub. Bonds | | 7.20 | | 9/15/32 | | 100,000 | | 67,007 |
| Noranda, | | | | | | | | |
| Notes | | 5.50 | | 6/15/17 | | 165,000 | | 125,077 |
| Rio Tinto Finance USA, | | | | | | | | |
| Gtd. Notes | | 6.50 | | 7/15/18 | | 120,000 | | 93,238 |
| Vale Overseas, | | | | | | | | |
| Gtd. Notes | | 6.25 | | 1/23/17 | | 510,000 | | 416,028 |
| Wellpoint, | | | | | | | | |
| Sr. Unscd. Notes | | 5.88 | | 6/15/17 | | 65,000 | | 53,219 |
| | | | | | | | | 3,454,329 |
| Electric Utilities—1.3% | | | | | | | | |
| Cincinnati Gas & Electric, | | | | | | | | |
| Sr. Unscd. Bonds | | 5.70 | | 9/15/12 | | 185,000 | | 180,473 |
| Cleveland Electric Illumination, | | | | | | | | |
| Sr. Unscd. Notes | | 5.70 | | 4/1/17 | | 150,000 | | 119,653 |
| Consolidated Edison of New York, | | | | | | | | |
| Sr. Unscd. Debs., Ser. 05-A | | 5.30 | | 3/1/35 | | 175,000 | | 116,037 |
| Consolidated Edison of New York, | | | | | | | | |
| Sr. Unscd. Debs., Ser. 08-A | | 5.85 | | 4/1/18 | | 600,000 | | 511,976 |
| Consolidated Edison of New York, | | | | | | | | |
| Sr. Unscd. Debs., Ser. 06-B | | 6.20 | | 6/15/36 | | 200,000 | | 150,756 |
| Constellation Energy Group, | | | | | | | | |
| Sr. Unscd. Notes | | 7.00 | | 4/1/12 | | 225,000 | | 207,442 |
| Constellation Energy Group, | | | | | | | | |
| Sr. Unscd. Notes | | 7.60 | | 4/1/32 | | 250,000 | | 197,337 |
| Consumers Energy, | | | | | | | | |
| First Mortgage Bonds, Ser. P | | 5.50 | | 8/15/16 | | 200,000 | | 163,278 |
| STATEMENT OF INVESTMENTS (continued) |
| | | Coupon | | Maturity | | Principal | | |
| Bonds and Notes (continued) | | Rate (%) | | Date | | Amount ($) | | Value ($) |
| |
| |
| |
| |
|
| Electric Utilities (continued) | | | | | | | | |
| Dominion Resources, | | | | | | | | |
| Sr. Unscd. Notes, Ser. C | | 5.15 | | 7/15/15 | | 175,000 | | 144,275 |
| Dominion Resources, | | | | | | | | |
| Sr. Unscd. Notes, Ser. E | | 6.30 | | 3/15/33 | | 100,000 | | 70,655 |
| Duke Energy Carolinas, | | | | | | | | |
| First Mortgage Bonds | | 6.00 | | 1/15/38 | | 710,000 | | 596,683 |
| Duke Energy Carolinas, | | | | | | | | |
| Sr. Unscd. Notes | | 6.25 | | 1/15/12 | | 75,000 | | 74,579 |
| Exelon, | | | | | | | | |
| Sr. Unscd. Notes | | 4.90 | | 6/15/15 | | 600,000 | | 449,490 |
| FirstEnergy, | | | | | | | | |
| Sr. Unscd. Notes, Ser. B | | 6.45 | | 11/15/11 | | 135,000 | | 127,254 |
| FirstEnergy, | | | | | | | | |
| Sr. Unscd. Notes, Ser. C | | 7.38 | | 11/15/31 | | 460,000 | | 357,632 |
| Florida Power & Light, | | | | | | | | |
| First Mortgage Bonds | | 5.63 | | 4/1/34 | | 250,000 | | 207,326 |
| Florida Power & Light, | | | | | | | | |
| First Mortgage Debs | | 5.65 | | 2/1/35 | | 25,000 | | 20,756 |
| Hydro-Quebec, | | | | | | | | |
| Gov’t Gtd. Debs., Ser. HH | | 8.50 | | 12/1/29 | | 200,000 | | 279,930 |
| Hydro-Quebec, | | | | | | | | |
| Gov’t Gtd. Debs., Ser. HK | | 9.38 | | 4/15/30 | | 20,000 | | 30,257 |
| MidAmerican Energy Holdings, | | | | | | | | |
| Sr. Unscd. Notes | | 5.88 | | 10/1/12 | | 950,000 | | 900,230 |
| NiSource Finance, | | | | | | | | |
| Gtd. Notes | | 5.40 | | 7/15/14 | | 150,000 | | 115,689 |
| NiSource Finance, | | | | | | | | |
| Gtd. Notes | | 7.88 | | 11/15/10 | | 100,000 | | 90,331 |
| Ohio Power, | | | | | | | | |
| Sr. Unscd. Notes, Ser. F | | 5.50 | | 2/15/13 | | 1,500,000 | | 1,369,065 |
| Oncor Electric Delivery, | | | | | | | | |
| Sr. Scd. Debs. | | 7.00 | | 9/1/22 | | 170,000 | | 136,171 |
| Oncor Electric Delivery, | | | | | | | | |
| Sr. Unscd. Notes | | 7.00 | | 5/1/32 | | 250,000 | | 187,346 |
| Pacific Gas & Electric, | | | | | | | | |
| Sr. Unscd. Bonds | | 4.80 | | 3/1/14 | | 100,000 | | 88,689 |
| Pacific Gas & Electric, | | | | | | | | |
| Sr. Unscd. Bonds | | 6.05 | | 3/1/34 | | 465,000 | | 355,671 |
| Pacificorp, | | | | | | | | |
| First Mortgage Bonds | | 5.75 | | 4/1/37 | | 335,000 | | 255,046 |
22
| | | Coupon | | Maturity | | Principal | | |
| Bonds and Notes (continued) | | Rate (%) | | Date | | Amount ($) | | Value ($) |
| |
| |
| |
| |
|
| Electric Utilities (continued) | | | | | | | | |
| PPL Electric Utilities, | | | | | | | | |
| Sr. Scd. Bonds | | 6.25 | | 8/15/09 | | 300,000 | | 298,669 |
| Progress Energy, | | | | | | | | |
| Sr. Unscd. Notes | | 7.10 | | 3/1/11 | | 500,000 | | 495,808 |
| Progress Energy, | | | | | | | | |
| Sr. Unscd. Notes | | 7.75 | | 3/1/31 | | 480,000 | | 403,310 |
| Public Service Company of | | | | | | | | |
| Colorado, First Mortgage | | | | | | | | |
| Bonds, Ser. 10 | | 7.88 | | 10/1/12 | | 350,000 | | 351,491 |
| Public Service Electric El & Gas, | | | | | | | | |
| Scd. Notes, Ser. D | | 5.25 | | 7/1/35 | | 230,000 | | 157,275 |
| South Carolina Electric & Gas, | | | | | | | | |
| First Mortgage Bonds | | 6.63 | | 2/1/32 | | 200,000 | | 184,304 |
| Southern California Edison, | | | | | | | | |
| First Mortgage Bonds, Ser. 08-A | | 5.95 | | 2/1/38 | | 70,000 | | 58,042 |
| Southern California Edison, | | | | | | | | |
| Sr. Unscd. Notes | | 6.65 | | 4/1/29 | | 450,000 b | | 378,208 |
| Southern California Gas, | | | | | | | | |
| First Mortgage Bonds, Ser. HH | | 5.45 | | 4/15/18 | | 100,000 | | 89,363 |
| Southern Power, | | | | | | | | |
| Sr. Unscd. Notes, Ser. D | | 4.88 | | 7/15/15 | | 300,000 | | 247,884 |
| SouthWestern Electric Power, | | | | | | | | |
| Sr. Unscd. Notes, Ser. F | | 5.88 | | 3/1/18 | | 150,000 | | 123,224 |
| Virginia Electric & Power, | | | | | | | | |
| Sr. Unscd. Notes, Ser. A | | 5.40 | | 1/15/16 | | 500,000 | | 427,210 |
| | | | | | | | | 10,718,815 |
| Food & Beverages—.8% | | | | | | | | |
| Anheuser-Busch Cos., | | | | | | | | |
| Sr. Unscd. Bonds | | 5.00 | | 1/15/15 | | 1,000,000 | | 822,353 |
| Anheuser-Busch Cos., | | | | | | | | |
| Sr. Unscd. Notes | | 5.50 | | 1/15/18 | | 145,000 | | 112,736 |
| Bottling Group, | | | | | | | | |
| Gtd. Notes | | 4.63 | | 11/15/12 | | 350,000 | | 336,076 |
| Coca-Cola Enterprises, | | | | | | | | |
| Sr. Unscd. Debs. | | 6.70 | | 10/15/36 | | 250,000 | | 205,490 |
| Coca-Cola Enterprises, | | | | | | | | |
| Sr. Unscd. Debs. | | 6.95 | | 11/15/26 | | 175,000 | | 155,256 |
| Coca-Cola Enterprises, | | | | | | | | |
| Sr. Unscd. Debs. | | 8.50 | | 2/1/22 | | 100,000 | | 105,653 |
| | STATEMENT OF INVESTMENTS (continued) |
| | | Coupon | | Maturity | | Principal | | | | |
| Bonds and Notes (continued) | | Rate (%) | | Date | | Amount ($) | | | | Value ($) |
| |
| |
| |
| |
| |
|
| Food & Beverages (continued) | | | | | | | | | | |
| ConAgra Foods, | | | | | | | | | | |
| Sr. Unscd. Notes | | 7.00 | | 10/1/28 | | 350,000 | | | | 274,562 |
| Diageo Capital, | | | | | | | | | | |
| Gtd. Notes | | 5.75 | | 10/23/17 | | 720,000 | | | | 620,011 |
| Diageo Finance, | | | | | | | | | | |
| Gtd. Notes | | 5.30 | | 10/28/15 | | 125,000 | | | | 108,802 |
| General Mills, | | | | | | | | | | |
| Sr. Unscd. Notes | | 6.00 | | 2/15/12 | | 125,000 | | | | 122,706 |
| H.J. Heinz, | | | | | | | | | | |
| Sr. Unscd. Debs. | | 6.38 | | 7/15/28 | | 100,000 | | b | | 77,982 |
| Hershey, | | | | | | | | | | |
| Sr. Unscd. Notes | | 5.30 | | 9/1/11 | | 750,000 | | | | 740,073 |
| Hershey, | | | | | | | | | | |
| Sr. Unscd. Debs. | | 8.80 | | 2/15/21 | | 30,000 | | | | 34,786 |
| Kellogg, | | | | | | | | | | |
| Sr. Unscd. Debs., Ser. B | | 7.45 | | 4/1/31 | | 340,000 | | | | 340,517 |
| Kraft Foods, | | | | | | | | | | |
| Sr. Unscd. Notes | | 6.13 | | 2/1/18 | | 775,000 | | | | 665,131 |
| Kraft Foods, | | | | | | | | | | |
| Sr. Unscd. Notes | | 6.25 | | 6/1/12 | | 225,000 | | | | 215,495 |
| Kroger, | | | | | | | | | | |
| Gtd. Notes | | 7.25 | | 6/1/09 | | 550,000 | | | | 554,036 |
| Kroger, | | | | | | | | | | |
| Gtd. Notes | | 7.50 | | 4/1/31 | | 100,000 | | b | | 85,766 |
| Nabisco, | | | | | | | | | | |
| Sr. Unscd. Debs. | | 7.55 | | 6/15/15 | | 640,000 | | | | 609,400 |
| Safeway, | | | | | | | | | | |
| Sr. Unscd. Notes | | 4.95 | | 8/16/10 | | 125,000 | | | | 123,383 |
| Safeway, | | | | | | | | | | |
| Sr. Unscd. Notes | | 5.80 | | 8/15/12 | | 210,000 | | | | 196,595 |
| Sara Lee, | | | | | | | | | | |
| Sr. Unscd. Notes | | 6.25 | | 9/15/11 | | 300,000 | | | | 288,354 |
| SYSCO, | | | | | | | | | | |
| Sr. Unscd. Notes | | 5.38 | | 9/21/35 | | 350,000 | | | | 252,190 |
| | | | | | | | | | | 7,047,353 |
| Foreign/Governmental—2.7% | | | | | | | | | | |
| Asian Development Bank, | | | | | | | | | | |
| Sr. Unsub. Notes | | 4.50 | | 9/4/12 | | 750,000 | | | | 783,674 |
| European Investment Bank, | | | | | | | | | | |
| Sr. Unscd. Notes | | 3.25 | | 2/15/11 | | 2,000,000 | | | | 2,029,496 |
24
| | | Coupon | | Maturity | | Principal | | | | |
| Bonds and Notes (continued) | | Rate (%) | | Date | | Amount ($) | | | | Value ($) |
| |
| |
| |
| |
| |
|
| Foreign/Governmental (continued) | | | | | | | | | | |
| European Investment Bank, | | | | | | | | | | |
| Sr. Unscd. Notes | | 4.63 | | 5/15/14 | | 500,000 | | | | 518,040 |
| European Investment Bank, | | | | | | | | | | |
| Sr. Unscd. Bonds | | 4.63 | | 10/20/15 | | 350,000 | | | | 361,170 |
| European Investment Bank, | | | | | | | | | | |
| Sr. Unscd. Bonds | | 4.88 | | 1/17/17 | | 850,000 | | | | 877,016 |
| European Investment Bank, | | | | | | | | | | |
| Sr. Unscd. Bonds | | 5.13 | | 5/30/17 | | 250,000 | | | | 261,399 |
| Federal Republic of Brazil, | | | | | | | | | | |
| Sr. Unscd. Bonds | | 6.00 | | 1/17/17 | | 2,270,000 | | | | 2,060,025 |
| Federal Republic of Brazil, | | | | | | | | | | |
| Unscd. Bonds | | 10.13 | | 5/15/27 | | 500,000 | | | | 558,000 |
| Inter-American Development Bank, | | | | | | | | | | |
| Sr. Unscd. Notes | | 4.38 | | 9/20/12 | | 1,530,000 | | | | 1,552,782 |
| Inter-American Development Bank, | | | | | | | | | | |
| Sr. Unscd. Notes | | 5.13 | | 9/13/16 | | 150,000 | | | | 154,250 |
| International Bank for | | | | | | | | | | |
| Reconstruction & Development, | | | | | | | | | | |
| Notes | | 5.00 | | 4/1/16 | | 700,000 | | | | 726,698 |
| International Bank for | | | | | | | | | | |
| Reconstruction & Development, | | | | | | | | | | |
| Unsub. Bonds | | 7.63 | | 1/19/23 | | 250,000 | | | | 309,853 |
| Malaysia Government, | | | | | | | | | | |
| Sr. Unsub. Notes | | 8.75 | | 6/1/09 | | 330,000 | | | | 333,241 |
| Province of British Columbia | | | | | | | | | | |
| Canada, Bonds, Ser. USD-2 | | 6.50 | | 1/15/26 | | 25,000 | | | | 29,507 |
| Province of Manitoba Canada, | | | | | | | | | | |
| Debs., Ser. CB | | 8.80 | | 1/15/20 | | 10,000 | | | | 13,444 |
| Province of Ontario Canada, | | | | | | | | | | |
| Sr. Unscd. Bonds | | 3.63 | | 10/21/09 | | 1,200,000 | | b | | 1,217,567 |
| Province of Ontario Canada, | | | | | | | | | | |
| Sr. Unscd. Notes | | 4.95 | | 11/28/16 | | 1,000,000 | | b | | 1,019,412 |
| Province of Quebec Canada, | | | | | | | | | | |
| Unscd. Notes | | 4.60 | | 5/26/15 | | 700,000 | | | | 716,575 |
| Province of Quebec Canada, | | | | | | | | | | |
| Bonds | | 5.13 | | 11/14/16 | | 125,000 | | | | 127,028 |
| Province of Quebec Canada, | | | | | | | | | | |
| Sr. Unscd. Debs., Ser. PA | | 5.75 | | 2/15/09 | | 175,000 | | | | 176,948 |
| Province of Quebec Canada, | | | | | | | | | | |
| Debs., Ser. NJ | | 7.50 | | 7/15/23 | | 200,000 | | | | 246,085 |
| STATEMENT OF INVESTMENTS (continued) |
| | | Coupon | | Maturity | | Principal | | | | |
| Bonds and Notes (continued) | | Rate (%) | | Date | | Amount ($) | | | | Value ($) |
| |
| |
| |
| |
| |
|
| Foreign/Governmental (continued) | | | | | | | | | | |
| Province of Saskatchewan Canada, | | | | | | | | | | |
| Debs. | | 7.38 | | 7/15/13 | | 500,000 | | | | 582,158 |
| Republic of Chile, | | | | | | | | | | |
| Sr. Unsub. Bonds | | 5.50 | | 1/15/13 | | 625,000 | | | | 643,000 |
| Republic of Finland, | | | | | | | | | | |
| Bonds | | 6.95 | | 2/15/26 | | 25,000 | | | | 30,686 |
| Republic of Hungary, | | | | | | | | | | |
| Unsub. Notes | | 4.75 | | 2/3/15 | | 125,000 | | | | 93,825 |
| Republic of Italy, | | | | | | | | | | |
| Sr. Unscd. Notes | | 4.50 | | 1/21/15 | | 50,000 | | | | 51,937 |
| Republic of Italy, | | | | | | | | | | |
| Sr. Unsub. Notes | | 5.25 | | 9/20/16 | | 155,000 | | | | 162,022 |
| Republic of Italy, | | | | | | | | | | |
| Sr. Unscd. Notes | | 5.38 | | 6/15/33 | | 550,000 | | | | 559,252 |
| Republic of Italy, | | | | | | | | | | |
| Sr. Unscd. Notes | | 6.00 | | 2/22/11 | | 1,725,000 | | | | 1,875,004 |
| Republic of Italy, | | | | | | | | | | |
| Sr. Unscd. Notes | | 6.88 | | 9/27/23 | | 610,000 | | | | 710,953 |
| Republic of Korea, | | | | | | | | | | |
| Unscd. Notes | | 4.88 | | 9/22/14 | | 200,000 | | b | | 169,290 |
| Republic of Peru, | | | | | | | | | | |
| Sr. Unscd. Bonds | | 6.55 | | 3/14/37 | | 540,000 | | b | | 375,300 |
| Republic of Poland, | | | | | | | | | | |
| Sr. Unsub. Notes | | 5.25 | | 1/15/14 | | 250,000 | | | | 226,479 |
| Republic of South Africa, | | | | | | | | | | |
| Sr. Unscd. Notes | | 6.50 | | 6/2/14 | | 170,000 | | | | 141,950 |
| United Mexican States, | | | | | | | | | | |
| Sr. Unscd. Notes | | 5.63 | | 1/15/17 | | 791,000 | | b | | 707,945 |
| United Mexican States, | | | | | | | | | | |
| Sr. Unscd. Notes, Ser. A | | 6.75 | | 9/27/34 | | 640,000 | | | | 534,400 |
| United Mexican States, | | | | | | | | | | |
| Notes | | 9.88 | | 2/1/10 | | 1,525,000 | | | | 1,647,000 |
| | | | | | | | | | | 22,583,411 |
| Health Care—.8% | | | | | | | | | | |
| Abbott Laboratories, | | | | | | | | | | |
| Sr. Unscd. Notes | | 5.88 | | 5/15/16 | | 170,000 | | | | 162,679 |
| Amgen, | | | | | | | | | | |
| Sr. Unscd. Notes | | 5.85 | | 6/1/17 | | 400,000 | | | | 355,653 |
26
| | | Coupon | | Maturity | | Principal | | |
| Bonds and Notes (continued) | | Rate (%) | | Date | | Amount ($) | | Value ($) |
| |
| |
| |
| |
|
| Health Care (continued) | | | | | | | | |
| Astrazeneca, | | | | | | | | |
| Sr. Unscd. Notes | | 6.45 | | 9/15/37 | | 520,000 | | 446,541 |
| Bristol-Myers Squibb, | | | | | | | | |
| Sr. Unscd. Notes | | 5.88 | | 11/15/36 | | 425,000 | | 349,473 |
| Covidien International Finance, | | | | | | | | |
| Gtd. Notes | | 6.00 | | 10/15/17 | | 590,000 | | 515,321 |
| Eli Lilly & Co., | | | | | | | | |
| Sr. Unscd. Notes | | 7.13 | | 6/1/25 | | 200,000 | | 194,163 |
| GlaxoSmithKline Capital, | | | | | | | | |
| Gtd. Notes | | 4.38 | | 4/15/14 | | 500,000 | | 455,523 |
| GlaxoSmithKline Capital, | | | | | | | | |
| Gtd. Notes | | 5.65 | | 5/15/18 | | 740,000 | | 656,958 |
| Johnson & Johnson, | | | | | | | | |
| Unscd. Debs. | | 4.95 | | 5/15/33 | | 170,000 | | 137,635 |
| Johnson & Johnson, | | | | | | | | |
| Unscd. Notes | | 5.95 | | 8/15/37 | | 470,000 | | 435,626 |
| Merck & Co., | | | | | | | | |
| Sr. Unscd. Debs. | | 6.40 | | 3/1/28 | | 150,000 | | 135,710 |
| Quest Diagnostic, | | | | | | | | |
| Gtd. Notes | | 6.95 | | 7/1/37 | | 50,000 | | 35,937 |
| Quest Diagnostics, | | | | | | | | |
| Gtd. Notes | | 5.45 | | 11/1/15 | | 500,000 | | 405,211 |
| Schering-Plough, | | | | | | | | |
| Sr. Unscd. Notes | | 5.55 | | 12/1/13 | | 1,000,000 | | 949,405 |
| Teva Pharmaceutical Finance, | | | | | | | | |
| Gtd. Notes | | 6.15 | | 2/1/36 | | 85,000 | | 61,626 |
| UnitedHealth Group, | | | | | | | | |
| Sr. Unscd. Notes | | 5.00 | | 8/15/14 | | 300,000 | | 235,333 |
| UnitedHealth Group, | | | | | | | | |
| Sr. Unscd. Notes | | 6.88 | | 2/15/38 | | 60,000 | | 42,930 |
| WellPoint, | | | | | | | | |
| Sr. Unscd. Bonds | | 5.25 | | 1/15/16 | | 375,000 | | 299,296 |
| Wellpoint, | | | | | | | | |
| Sr. Unscd. Notes | | 6.80 | | 8/1/12 | | 300,000 | | 319,217 |
| Wyeth, | | | | | | | | |
| Sr. Unscd. Notes | | 5.50 | | 2/1/14 | | 150,000 | | 140,721 |
| Wyeth, | | | | | | | | |
| Sr. Unscd. Notes | | 5.95 | | 4/1/37 | | 200,000 | | 162,862 |
| STATEMENT OF INVESTMENTS (continued) |
| | | Coupon | | Maturity | | Principal | | |
| Bonds and Notes (continued) | | Rate (%) | | Date | | Amount ($) | | Value ($) |
| |
| |
| |
| |
|
| Health Care (continued) | | | | | | | | |
| Wyeth, | | | | | | | | |
| Sr. Unscd. Notes | | 6.50 | | 2/1/34 | | 200,000 | | 163,868 |
| | | | | | | | | 6,661,688 |
| Industrial—.1% | | | | | | | | |
| Continental Airlines, | | | | | | | | |
| Pass-Through Certificates, | | | | | | | | |
| Ser. 974A | | 6.90 | | 1/2/18 | | 193,066 | | 139,007 |
| Mohawk Industries, | | | | | | | | |
| Sr. Unscd. Notes | | 6.13 | | 1/15/16 | | 70,000 | | 61,494 |
| Pemex Project Funding Master | | | | | | | | |
| Trust, Gtd. Notes | | 7.88 | | 2/1/09 | | 244,000 a | | 243,522 |
| US Steel, | | | | | | | | |
| Sr. Unscd. Notes | | 5.65 | | 6/1/13 | | 250,000 | | 197,979 |
| USA Waste Services, | | | | | | | | |
| Sr. Unscd. Notes | | 7.00 | | 7/15/28 | | 150,000 | | 105,640 |
| | | | | | | | | 747,642 |
| Machinery—.1% | | | | | | | | |
| Caterpillar, | | | | | | | | |
| Sr. Unscd. Debs. | | 6.05 | | 8/15/36 | | 375,000 | | 298,911 |
| Caterpillar, | | | | | | | | |
| Sr. Unscd. Debs. | | 7.30 | | 5/1/31 | | 125,000 | | 114,662 |
| Deere & Co., | | | | | | | | |
| Sr. Unscd. Notes | | 6.95 | | 4/25/14 | | 775,000 | | 786,082 |
| | | | | | | | | 1,199,655 |
| Manufacturing—.3% | | | | | | | | |
| General Electric, | | | | | | | | |
| Sr. Unscd. Notes | | 5.00 | | 2/1/13 | | 500,000 | | 472,086 |
| General Electric, | | | | | | | | |
| Sr. Unscd. Notes | | 5.25 | | 12/6/17 | | 1,000,000 | | 838,491 |
| Honeywell International, | | | | | | | | |
| Sr. Unscd. Notes | | 4.25 | | 3/1/13 | | 1,300,000 | | 1,196,032 |
| Honeywell International, | | | | | | | | |
| Sr. Unscd. Notes | | 6.13 | | 11/1/11 | | 175,000 | | 175,753 |
| Tyco International Finance, | | | | | | | | |
| Gtd. Bonds | | 6.88 | | 1/15/21 | | 235,000 | | 176,169 |
| | | | | | | | | 2,858,531 |
| Media—.7% | | | | | | | | |
| AOL Time Warner, | | | | | | | | |
| Gtd. Notes | | 6.88 | | 5/1/12 | | 250,000 | | 224,797 |
28
| | | Coupon | | Maturity | | Principal | | |
| Bonds and Notes (continued) | | Rate (%) | | Date | | Amount ($) | | Value ($) |
| |
| |
| |
| |
|
| Media (continued) | | | | | | | | |
| AOL Time Warner, | | | | | | | | |
| Gtd. Notes | | 7.63 | | 4/15/31 | | 300,000 | | 240,443 |
| AT & T Broadband, | | | | | | | | |
| Gtd. Notes | | 9.46 | | 11/15/22 | | 304,000 | | 292,687 |
| Comcast Cable Communications, | | | | | | | | |
| Gtd. Notes | | 6.75 | | 1/30/11 | | 600,000 | | 589,681 |
| Comcast Cable Communications, | | | | | | | | |
| Gtd. Notes | | 7.13 | | 6/15/13 | | 300,000 | | 285,661 |
| Comcast, | | | | | | | | |
| Gtd. Notes | | 6.45 | | 3/15/37 | | 200,000 | | 154,018 |
| Comcast, | | | | | | | | |
| Gtd. Notes | | 6.95 | | 8/15/37 | | 365,000 | | 298,428 |
| COX Communications, | | | | | | | | |
| Sr. Unscd. Bonds | | 5.50 | | 10/1/15 | | 450,000 | | 370,981 |
| COX Communications, | | | | | | | | |
| Unscd. Notes | | 7.13 | | 10/1/12 | | 275,000 | | 262,868 |
| News America Holdings, | | | | | | | | |
| Gtd. Debs. | | 7.75 | | 12/1/45 | | 100,000 | | 83,696 |
| News America Holdings, | | | | | | | | |
| Gtd. Debs. | | 8.25 | | 8/10/18 | | 150,000 | | 132,607 |
| News America, | | | | | | | | |
| Gtd. Notes | | 6.20 | | 12/15/34 | | 250,000 | | 189,290 |
| News America, | | | | | | | | |
| Gtd. Notes | | 6.65 | | 11/15/37 | | 360,000 | | 285,930 |
| Thomson Reuters, | | | | | | | | |
| Gtd. Notes | | 6.50 | | 7/15/18 | | 800,000 | | 673,760 |
| Time Warner Cable, | | | | | | | | |
| Gtd. Debs. | | 6.55 | | 5/1/37 | | 350,000 | | 267,272 |
| Time Warner Cable, | | | | | | | | |
| Gtd. Debs. | | 7.30 | | 7/1/38 | | 495,000 | | 415,270 |
| Time Warner, | | | | | | | | |
| Gtd. Debs. | | 6.50 | | 11/15/36 | | 200,000 | | 142,517 |
| Time Warner, | | | | | | | | |
| Gtd. Debs. | | 6.95 | | 1/15/28 | | 325,000 | | 251,640 |
| Viacom, | | | | | | | | |
| Gtd. Notes | | 5.50 | | 5/15/33 | | 250,000 | | 151,489 |
| Viacom, | | | | | | | | |
| Sr. Unscd. Notes | | 6.88 | | 4/30/36 | | 235,000 | | 164,446 |
| Viacom, | | | | | | | | |
| Gtd. Debs | | 7.88 | | 7/30/30 | | 80,000 | | 57,683 |
| STATEMENT OF INVESTMENTS (continued) |
| | | Coupon | | Maturity | | Principal | | |
| Bonds and Notes (continued) | | Rate (%) | | Date | | Amount ($) | | Value ($) |
| |
| |
| |
| |
|
| Media (continued) | | | | | | | | |
| Walt Disney, | | | | | | | | |
| Sr. Unscd. Notes, Ser. B | | 6.38 | | 3/1/12 | | 100,000 | | 101,471 |
| Walt Disney, | | | | | | | | |
| Sr. Unscd. Notes, Ser. B | | 7.00 | | 3/1/32 | | 150,000 | | 141,225 |
| Walt Disney, | | | | | | | | |
| Sr. Unscd. Debs. | | 7.55 | | 7/15/93 | | 100,000 | | 97,193 |
| | | | | | | | | 5,875,053 |
| Oil & Gas—1.3% | | | | | | | | |
| Amerada Hess, | | | | | | | | |
| Sr. Unscd. Bonds | | 7.88 | | 10/1/29 | | 175,000 | | 149,551 |
| Anadarko Finance, | | | | | | | | |
| Gtd. Notes, Ser. B | | 6.75 | | 5/1/11 | | 300,000 | | 299,149 |
| Anadarko Petroleum, | | | | | | | | |
| Sr. Unscd. Notes | | 5.95 | | 9/15/16 | | 350,000 | | 292,371 |
| Anadarko Petroleum, | | | | | | | | |
| Sr. Unscd. Notes | | 6.45 | | 9/15/36 | | 150,000 | | 107,269 |
| Apache, | | | | | | | | |
| Sr. Unscd. Notes | | 6.00 | | 1/15/37 | | 380,000 | | 290,747 |
| Canadian National Resources, | | | | | | | | |
| Sr. Unscd. Notes | | 6.25 | | 3/15/38 | | 80,000 | | 55,974 |
| Canadian Natural Resources, | | | | | | | | |
| Sr. Unscd. Notes | | 4.90 | | 12/1/14 | | 350,000 | | 298,541 |
| Conoco, | | | | | | | | |
| Sr. Unscd. Notes | | 6.95 | | 4/15/29 | | 125,000 | | 109,233 |
| ConocoPhillips, | | | | | | | | |
| Gtd. Notes | | 5.90 | | 10/15/32 | | 500,000 | | 389,003 |
| ConocoPhillips, | | | | | | | | |
| Sr. Unscd. Notes | | 8.75 | | 5/25/10 | | 200,000 | | 208,391 |
| Devon Financing, | | | | | | | | |
| Gtd. Debs. | | 7.88 | | 9/30/31 | | 275,000 | | 247,972 |
| EnCana, | | | | | | | | |
| Sr. Unscd. Bonds | | 7.20 | | 11/1/31 | | 625,000 | | 479,756 |
| Energy Transfer Partners, | | | | | | | | |
| Sr. Unscd. Bonds | | 7.50 | | 7/1/38 | | 375,000 | | 285,388 |
| Enterprise Products Operating, | | | | | | | | |
| Gtd. Notes, Ser. B | | 5.60 | | 10/15/14 | | 995,000 | | 834,844 |
| Enterprise Products Operating, | | | | | | | | |
| Gtd. Bonds | | 6.30 | | 9/15/17 | | 75,000 | | 61,391 |
30
| | | Coupon | | Maturity | | Principal | | |
| Bonds and Notes (continued) | | Rate (%) | | Date | | Amount ($) | | Value ($) |
| |
| |
| |
| |
|
| Oil & Gas (continued) | | | | | | | | |
| Exxon Mobil, | | | | | | | | |
| Sr. Unscd. Bonds | | 8.63 | | 8/15/21 | | 15,000 | | 17,821 |
| Kerr-McGee, | | | | | | | | |
| Gtd. Notes | | 6.95 | | 7/1/24 | | 600,000 | | 476,860 |
| Kinder Morgan Energy Partners, | | | | | | | | |
| Sr. Unscd. Notes | | 6.95 | | 1/15/38 | | 75,000 | | 55,145 |
| Kinder Morgan Energy Partners, | | | | | | | | |
| Sr. Unscd. Notes | | 7.40 | | 3/15/31 | | 350,000 | | 266,829 |
| Marathon Oil, | | | | | | | | |
| Sr. Unscd. Notes | | 6.60 | | 10/1/37 | | 350,000 | | 248,240 |
| Nexen, | | | | | | | | |
| Sr. Unscd. Notes | | 5.20 | | 3/10/15 | | 150,000 | | 123,453 |
| Nexen, | | | | | | | | |
| Sr. Unscd. Notes | | 5.88 | | 3/10/35 | | 125,000 | | 82,430 |
| ONEOK Partners, | | | | | | | | |
| Gtd. Notes | | 6.15 | | 10/1/16 | | 545,000 | | 440,900 |
| ONEOK Partners, | | | | | | | | |
| Gtd. Notes | | 6.85 | | 10/15/37 | | 60,000 | | 40,869 |
| Oneok, | | | | | | | | |
| Sr. Unscd. Notes | | 5.20 | | 6/15/15 | | 200,000 | | 156,732 |
| Pemex Project Funding Master | | | | | | | | |
| Trust, Gtd. Notes | | 7.38 | | 12/15/14 | | 400,000 | | 357,564 |
| Petrobras International Finance, | | | | | | | | |
| Gtd. Notes | | 5.88 | | 3/1/18 | | 625,000 | | 493,756 |
| Petro-Canada, | | | | | | | | |
| Sr. Unscd. Notes | | 4.00 | | 7/15/13 | | 450,000 | | 383,121 |
| Plains All America Pipeline, | | | | | | | | |
| Gtd. Notes | | 6.13 | | 1/15/17 | | 525,000 | | 391,176 |
| Schering-Plough, | | | | | | | | |
| Sr. Unscd. Bonds | | 6.75 | | 12/1/33 | | 80,000 a | | 66,405 |
| Sempra Energy, | | | | | | | | |
| Sr. Unscd. Notes | | 7.95 | | 3/1/10 | | 500,000 | | 502,836 |
| Shell International Finance, | | | | | | | | |
| Gtd. Notes | | 5.63 | | 6/27/11 | | 500,000 | | 518,287 |
| Spectra Energy Capital, | | | | | | | | |
| Sr. Unscd. Notes | | 8.00 | | 10/1/19 | | 225,000 | | 203,270 |
| Suncor Energy, | | | | | | | | |
| Sr. Unscd. Notes | | 6.50 | | 6/15/38 | | 100,000 | | 68,419 |
| STATEMENT OF INVESTMENTS (continued) |
| | | Coupon | | Maturity | | Principal | | |
| Bonds and Notes (continued) | | Rate (%) | | Date | | Amount ($) | | Value ($) |
| |
| |
| |
| |
|
| Oil & Gas (continued) | | | | | | | | |
| Talisman Energy, | | | | | | | | |
| Sr. Unscd. Notes | | 6.25 | | 2/1/38 | | 200,000 | | 128,872 |
| Tennessee Gas Pipeline, | | | | | | | | |
| Sr. Unscd. Debs. | | 7.00 | | 10/15/28 | | 390,000 b | | 282,377 |
| Tennessee Gas Pipeline, | | | | | | | | |
| Sr. Unscd Debs. | | 7.63 | | 4/1/37 | | 70,000 | | 51,705 |
| Texas Eastern Transmission, | | | | | | | | |
| Sr. Unscd. Notes | | 7.30 | | 12/1/10 | | 140,000 | | 138,193 |
| Trans-Canada Pipelines, | | | | | | | | |
| Sr. Unscd. Notes | | 5.85 | | 3/15/36 | | 200,000 | | 130,807 |
| Trans-Canada Pipelines, | | | | | | | | |
| Sr. Unscd. Notes | | 6.20 | | 10/15/37 | | 75,000 | | 51,348 |
| Transocean, | | | | | | | | |
| Sr. Unscd. Notes | | 7.50 | | 4/15/31 | | 150,000 | | 127,381 |
| Valero Energy, | | | | | | | | |
| Sr. Unscd. Notes | | 6.63 | | 6/15/37 | | 115,000 | | 81,909 |
| Valero Energy, | | | | | | | | |
| Sr. Unscd. Notes | | 7.50 | | 4/15/32 | | 170,000 | | 130,139 |
| XTO Energy, | | | | | | | | |
| Sr. Unscd. Notes | | 4.90 | | 2/1/14 | | 800,000 | | 654,886 |
| | | | | | | | | 10,781,310 |
| Paper & Forest Products—.1% | | | | | | | | |
| International Paper, | | | | | | | | |
| Sr. Unscd. Notes | | 6.75 | | 9/1/11 | | 200,000 | | 188,769 |
| Weyerhaeuser, | | | | | | | | |
| Sr. Unscd. Debs. | | 7.38 | | 3/15/32 | | 400,000 | | 275,020 |
| | | | | | | | | 463,789 |
| Property & Casualty Insurance—.7% | | | | | | | | |
| Aegon, | | | | | | | | |
| Sr. Unscd. Notes | | 4.75 | | 6/1/13 | | 375,000 | | 332,815 |
| Aetna, | | | | | | | | |
| Sr. Unscd. Notes | | 6.63 | | 6/15/36 | | 300,000 | | 211,306 |
| Aetna, | | | | | | | | |
| Gtd. Debs | | 7.63 | | 8/15/26 | | 50,000 | | 44,318 |
| Allstate, | | | | | | | | |
| Sr. Unscd. Notes | | 5.00 | | 8/15/14 | | 125,000 | | 111,030 |
| Allstate, | | | | | | | | |
| Sr. Unscd. Notes | | 5.55 | | 5/9/35 | | 175,000 | | 113,976 |
32
| | | Coupon | | Maturity | | Principal | | | | |
| Bonds and Notes (continued) | | Rate (%) | | Date | | Amount ($) | | | | Value ($) |
| |
| |
| |
| |
| |
|
| Property & Casualty | | | | | | | | | | |
| Insurance (continued) | | | | | | | | | | |
| Allstate, | | | | | | | | | | |
| Sr. Unscd. Debs. | | 6.75 | | 5/15/18 | | 350,000 | | | | 307,401 |
| American International Group, | | | | | | | | | | |
| Sr. Unscd. Notes | | 5.60 | | 10/18/16 | | 600,000 | | | | 217,010 |
| American International Group, | | | | | | | | | | |
| Sr. Unscd. Notes | | 5.85 | | 1/16/18 | | 1,000,000 | | | | 363,331 |
| American International Group, | | | | | | | | | | |
| Jr. Sub. Bonds | | 6.25 | | 3/15/37 | | 85,000 | | | | 11,467 |
| AON Capital Trust A, | | | | | | | | | | |
| Gtd. Cap. Secs. | | 8.21 | | 1/1/27 | | 70,000 | | | | 48,509 |
| AXA, | | | | | | | | | | |
| Sub. Bonds | | 8.60 | | 12/15/30 | | 165,000 | | | | 92,176 |
| Berkshire Hathaway Finance, | | | | | | | | | | |
| Gtd. Notes | | 4.85 | | 1/15/15 | | 200,000 | | | | 188,941 |
| CNA Financial, | | | | | | | | | | |
| Sr. Unscd. Notes | | 6.50 | | 8/15/16 | | 100,000 | | | | 74,875 |
| GE Global Insurance Holdings, | | | | | | | | | | |
| Sr. Unscd. Notes | | 7.00 | | 2/15/26 | | 150,000 | | | | 126,292 |
| Hartford Financial Services Group, | | | | | | | | | | |
| Sr. Unscd. Notes | | 6.30 | | 3/15/18 | | 580,000 | | b | | 413,810 |
| Marsh & McLennan Cos., | | | | | | | | | | |
| Sr. Unscd. Bonds | | 5.88 | | 8/1/33 | | 275,000 | | b | | 226,744 |
| Metlife, | | | | | | | | | | |
| Sr. Unscd. Notes | | 5.00 | | 11/24/13 | | 225,000 | | | | 196,974 |
| MetLife, | | | | | | | | | | |
| Sr. Unscd. Notes | | 6.13 | | 12/1/11 | | 260,000 | | | | 252,001 |
| MetLife, | | | | | | | | | | |
| Sr. Unscd. Notes | | 6.38 | | 6/15/34 | | 200,000 | | | | 147,239 |
| Nationwide Financial Services, | | | | | | | | | | |
| Sr. Notes | | 6.25 | | 11/15/11 | | 350,000 | | | | 369,333 |
| Principal Financial Group, | | | | | | | | | | |
| Gtd. Notes | | 6.05 | | 10/15/36 | | 225,000 | | | | 134,631 |
| Progressive, | | | | | | | | | | |
| Sr. Unscd. Notes | | 6.63 | | 3/1/29 | | 100,000 | | | | 79,365 |
| Prudential Financial, | | | | | | | | | | |
| Sr. Unscd. Notes, Ser. B | | 4.75 | | 4/1/14 | | 350,000 | | | | 271,551 |
| STATEMENT OF INVESTMENTS (continued) |
| | | Coupon | | Maturity | | Principal | | |
| Bonds and Notes (continued) | | Rate (%) | | Date | | Amount ($) | | Value ($) |
| |
| |
| |
| |
|
| Property & Casualty | | | | | | | | |
| Insurance (continued) | | | | | | | | |
| Prudential Financial, | | | | | | | | |
| Sr. Unscd. Notes, Ser. B | | 5.10 | | 9/20/14 | | 250,000 | | 189,357 |
| St. Paul Travelers Cos., | | | | | | | | |
| Sr. Unscd. Notes | | 5.50 | | 12/1/15 | | 960,000 | | 850,490 |
| Torchmark, | | | | | | | | |
| Sr. Unscd. Bonds | | 8.25 | | 8/15/09 | | 150,000 | | 148,669 |
| Travelers Property & Casualty, | | | | | | | | |
| Gtd. Notes | | 5.00 | | 3/15/13 | | 250,000 | | 219,382 |
| Willis North America, | | | | | | | | |
| Gtd. Notes | | 6.20 | | 3/28/17 | | 335,000 | | 244,487 |
| | | | | | | | | 5,987,480 |
| Real Estate Investment Trusts—.2% | | | | | | | | |
| Boston Properties, | | | | | | | | |
| Sr. Unscd. Notes | | 5.00 | | 6/1/15 | | 500,000 | | 374,328 |
| Brandywine Operating Partnership, | | | | | | | | |
| Gtd. Notes | | 5.75 | | 4/1/12 | | 130,000 | | 104,182 |
| ERP Operating, | | | | | | | | |
| Sr. Unscd. Notes | | 5.20 | | 4/1/13 | | 600,000 | | 485,996 |
| ERP Operating, | | | | | | | | |
| Sr. Unscd. Notes | | 5.38 | | 8/1/16 | | 95,000 b | | 65,105 |
| iStar Financial, | | | | | | | | |
| Sr. Unscd. Notes, Ser. 1 | | 5.88 | | 3/15/16 | | 185,000 | | 70,380 |
| Realty Income, | | | | | | | | |
| Sr. Unscd. Notes | | 5.95 | | 9/15/16 | | 100,000 | | 77,456 |
| Regency Centers, | | | | | | | | |
| Gtd. Notes | | 5.88 | | 6/15/17 | | 200,000 | | 152,604 |
| Simon Property Group, | | | | | | | | |
| Sr. Unscd. Notes | | 5.25 | | 12/1/16 | | 150,000 | | 102,101 |
| Simon Property Group, | | | | | | | | |
| Sr. Unscd. Notes | | 6.35 | | 8/28/12 | | 400,000 | | 347,191 |
| | | | | | | | | 1,779,343 |
| Retail—.7% | | | | | | | | |
| Costco Wholesale, | | | | | | | | |
| Sr. Unscd. Notes | | 5.50 | | 3/15/17 | | 500,000 | | 460,363 |
| CVS Caremark, | | | | | | | | |
| Sr. Unscd. Notes | | 5.75 | | 6/1/17 | | 100,000 | | 80,834 |
| CVS Caremark, | | | | | | | | |
| Sr. Unscd. Notes | | 6.25 | | 6/1/27 | | 500,000 | | 363,344 |
34
| | | Coupon | | Maturity | | Principal | | | | |
| Bonds and Notes (continued) | | Rate (%) | | Date | | Amount ($) | | | | Value ($) |
| |
| |
| |
| |
| |
|
| Retail (continued) | | | | | | | | | | |
| Home Depot, | | | | | | | | | | |
| Sr. Unscd. Notes | | 3.75 | | 9/15/09 | | 1,000,000 | | | | 954,281 |
| Home Depot, | | | | | | | | | | |
| Sr. Unscd. Notes | | 5.40 | | 3/1/16 | | 650,000 | | | | 498,997 |
| J.C. Penney, | | | | | | | | | | |
| Sr. Unscd. Notes | | 8.00 | | 3/1/10 | | 350,000 | | | | 333,055 |
| Macy’s Retail Holdings, | | | | | | | | | | |
| Gtd. Notes | | 6.70 | | 7/15/34 | | 200,000 | | | | 105,695 |
| Macy’s Retail Holdings, | | | | | | | | | | |
| Gtd. Debs | | 7.00 | | 2/15/28 | | 200,000 | | | | 109,447 |
| Macy’s Retail Holdings, | | | | | | | | | | |
| Gtd. Debs | | 7.45 | | 7/15/17 | | 350,000 | | | | 232,624 |
| Starbucks, | | | | | | | | | | |
| Sr. Unscd. Bonds | | 6.25 | | 8/15/17 | | 750,000 | | | | 658,979 |
| Target, | | | | | | | | | | |
| Sr. Unscd. Notes | | 5.38 | | 5/1/17 | | 400,000 | | | | 321,212 |
| Target, | | | | | | | | | | |
| Sr. Unscd. Notes | | 5.88 | | 3/1/12 | | 100,000 | | | | 99,084 |
| Target, | | | | | | | | | | |
| Sr. Unscd. Debs. | | 7.00 | | 7/15/31 | | 125,000 | | | | 98,584 |
| Target, | | | | | | | | | | |
| Sr. Unscd. Notes | | 7.00 | | 1/15/38 | | 380,000 | | | | 291,501 |
| Wal-Mart Stores, | | | | | | | | | | |
| Sr. Unscd. Notes | | 4.13 | | 2/15/11 | | 75,000 | | b | | 75,205 |
| Wal-Mart Stores, | | | | | | | | | | |
| Sr. Unscd. Notes | | 5.25 | | 9/1/35 | | 600,000 | | | | 451,274 |
| Wal-Mart Stores, | | | | | | | | | | |
| Sr. Unscd. Notes | | 6.50 | | 8/15/37 | | 400,000 | | | | 360,136 |
| Xerox, | | | | | | | | | | |
| Sr. Unscd. Notes | | 6.75 | | 2/1/17 | | 750,000 | | | | 551,803 |
| | | | | | | | | | | 6,046,418 |
| State/Territory General Obligation—.1% | | | | | | | | |
| State of Illinois Taxable Pension | | | | | | | | | | |
| Funding, Bonds | | 5.10 | | 6/1/33 | | 655,000 | | | | 545,753 |
| Technology—.3% | | | | | | | | | | |
| Electronic Data Systems, | | | | | | | | | | |
| Sr. Unscd. Notes, Ser. B | | 6.00 | | 8/1/13 | | 125,000 | | a | | 118,117 |
| Hewlett Packard, | | | | | | | | | | |
| Sr. Unscd. Notes | | 5.50 | | 3/1/18 | | 560,000 | | b | | 482,227 |
| STATEMENT OF INVESTMENTS (continued) |
| | | Coupon | | Maturity | | Principal | | | | |
| Bonds and Notes (continued) | | Rate (%) | | Date | | Amount ($) | | | | Value ($) |
| |
| |
| |
| |
| |
|
| Technology (continued) | | | | | | | | | | |
| International Business Machines, | | | | | | | | | | |
| Sr. Unscd. Notes | | 4.38 | | 6/1/09 | | 100,000 | | b | | 99,690 |
| International Business Machines, | | | | | | | | | | |
| Sr. Unscd. Notes | | 5.70 | | 9/14/17 | | 600,000 | | | | 545,950 |
| International Business Machines, | | | | | | | | | | |
| Sr. Unscd. Debs. | | 7.00 | | 10/30/25 | | 225,000 | | | | 213,363 |
| International Business Machines, | | | | | | | | | | |
| Sr. Unscd. Debs., Ser. A | | 7.50 | | 6/15/13 | | 75,000 | | | | 79,637 |
| International Business Machines, | | | | | | | | | | |
| Sr. Unscd. Notes | | 8.38 | | 11/1/19 | | 300,000 | | | | 322,085 |
| Oracle, | | | | | | | | | | |
| Sr. Unscd. Notes | | 5.00 | | 1/15/11 | | 1,000,000 | | | | 992,234 |
| Oracle, | | | | | | | | | | |
| Sr. Unscd. Notes | | 5.75 | | 4/15/18 | | 150,000 | | | | 131,484 |
| | | | | | | | | | | 2,984,787 |
| Telecommunications—1.3% | | | | | | | | | | |
| America Movil, | | | | | | | | | | |
| Gtd. Notes | | 6.38 | | 3/1/35 | | 100,000 | | | | 70,254 |
| AT & T Wireless, | | | | | | | | | | |
| Sr. Unscd. Notes | | 7.88 | | 3/1/11 | | 1,225,000 | | | | 1,223,050 |
| AT & T Wireless, | | | | | | | | | | |
| Sr. Unscd. Notes | | 8.13 | | 5/1/12 | | 250,000 | | | | 248,005 |
| AT&T, | | | | | | | | | | |
| Sr. Unscd. Notes | | 6.30 | | 1/15/38 | | 400,000 | | | | 316,786 |
| AT&T, | | | | | | | | | | |
| Gtd. Notes | | 8.00 | | 11/15/31 | | 470,000 | | a | | 434,778 |
| BellSouth Telecommunications, | | | | | | | | | | |
| Unscd. Debs. | | 6.38 | | 6/1/28 | | 550,000 | | | | 440,209 |
| BellSouth, | | | | | | | | | | |
| Sr. Unscd. Bonds | | 6.55 | | 6/15/34 | | 100,000 | | | | 78,638 |
| British Telecommunications, | | | | | | | | | | |
| Sr. Unscd. Notes | | 5.95 | | 1/15/18 | | 580,000 | | | | 460,093 |
| British Telecommunications, | | | | | | | | | | |
| Sr. Unscd. Notes | | 9.13 | | 12/15/30 | | 175,000 | | a | | 158,820 |
| Cisco Systems, | | | | | | | | | | |
| Sr. Unscd. Notes | | 5.50 | | 2/22/16 | | 500,000 | | | | 464,148 |
| Deutsche Telekom International | | | | | | | | | | |
| Finance, Gtd. Bonds | | 8.50 | | 6/15/10 | | 215,000 | | a | | 211,837 |
36
| | | Coupon | | Maturity | | Principal | | | | |
| Bonds and Notes (continued) | | Rate (%) | | Date | | Amount ($) | | | | Value ($) |
| |
| |
| |
| |
| |
|
| Telecommunications (continued) | | | | | | | | | | |
| Deutsche Telekom International | | | | | | | | | | |
| Finance, Gtd. Bonds | | 8.75 | | 6/15/30 | | 300,000 | | a | | 266,230 |
| Embarq, | | | | | | | | | | |
| Sr. Unscd. Notes | | 8.00 | | 6/1/36 | | 150,000 | | | | 99,202 |
| France Telecom, | | | | | | | | | | |
| Sr. Unscd. Notes | | 8.50 | | 3/1/31 | | 220,000 | | a | | 207,796 |
| GTE, | | | | | | | | | | |
| Gtd. Bonds | | 6.94 | | 4/15/28 | | 100,000 | | | | 77,247 |
| Koninklijke, | | | | | | | | | | |
| Sr. Unscd. Notes | | 8.00 | | 10/1/10 | | 250,000 | | | | 239,506 |
| Koninklijke, | | | | | | | | | | |
| Sr. Unscd. Bonds | | 8.38 | | 10/1/30 | | 250,000 | | | | 203,266 |
| Motorola, | | | | | | | | | | |
| Sr. Unscd. Debs. | | 7.50 | | 5/15/25 | | 150,000 | | | | 117,146 |
| New Jersey Bell Telephone, | | | | | | | | | | |
| Sr. Unscd. Bonds | | 8.00 | | 6/1/22 | | 25,000 | | | | 22,201 |
| Pacific-Bell, | | | | | | | | | | |
| Gtd. Bonds | | 7.13 | | 3/15/26 | | 310,000 | | | | 260,992 |
| SBC Communications, | | | | | | | | | | |
| Sr. Unscd. Notes | | 5.10 | | 9/15/14 | | 250,000 | | | | 218,615 |
| SBC Communications, | | | | | | | | | | |
| Sr. Unscd. Notes | | 5.88 | | 8/15/12 | | 775,000 | | | | 744,093 |
| Telecom Italia Capital, | | | | | | | | | | |
| Gtd. Notes | | 5.25 | | 11/15/13 | | 900,000 | | | | 683,841 |
| Telecom Italia Capital, | | | | | | | | | | |
| Gtd. Notes | | 5.25 | | 10/1/15 | | 100,000 | | | | 68,681 |
| Telecom Italia Capital, | | | | | | | | | | |
| Gtd. Notes | | 6.38 | | 11/15/33 | | 200,000 | | | | 120,534 |
| Telefonica Emisiones, | | | | | | | | | | |
| Gtd. Notes | | 7.05 | | 6/20/36 | | 275,000 | | | | 218,584 |
| Telefonica Europe, | | | | | | | | | | |
| Gtd. Notes | | 7.75 | | 9/15/10 | | 200,000 | | b | | 193,700 |
| U.S. West Communications, | | | | | | | | | | |
| Sr. Unscd. Debs. | | 6.88 | | 9/15/33 | | 330,000 | | | | 206,250 |
| Verizon Communications, | | | | | | | | | | |
| Sr. Unscd. Notes | | 5.85 | | 9/15/35 | | 560,000 | | | | 411,736 |
| Verizon Global Funding, | | | | | | | | | | |
| Sr. Unscd. Notes | | 7.25 | | 12/1/10 | | 500,000 | | | | 498,750 |
| STATEMENT OF INVESTMENTS (continued) |
| | | Coupon | | Maturity | | Principal | | | | |
| Bonds and Notes (continued) | | Rate (%) | | Date | | Amount ($) | | | | Value ($) |
| |
| |
| |
| |
| |
|
| Telecommunications (continued) | | | | | | | | | | |
| Verizon Global Funding, | | | | | | | | | | |
| Sr. Unscd. Notes | | 7.38 | | 9/1/12 | | 500,000 | | | | 489,910 |
| Verizon Global Funding, | | | | | | | | | | |
| Sr. Unscd. Notes | | 7.75 | | 12/1/30 | | 690,000 | | | | 617,943 |
| Vodafone Group, | | | | | | | | | | |
| Sr. Unscd. Notes | | 5.63 | | 2/27/17 | | 555,000 | | | | 453,759 |
| Vodafone Group, | | | | | | | | | | |
| Sr. Unscd. Notes | | 7.75 | | 2/15/10 | | 580,000 | | | | 564,046 |
| Vodafone Group, | | | | | | | | | | |
| Sr. Unscd. Notes | | 7.88 | | 2/15/30 | | 125,000 | | | | 111,943 |
| | | | | | | | | | | 11,202,589 |
| Transportation—.2% | | | | | | | | | | |
| Burlington Northern Santa Fe, | | | | | | | | | | |
| Sr. Unscd. Debs. | | 7.00 | | 12/15/25 | | 100,000 | | | | 88,179 |
| Burlington Northern Santa Fe, | | | | | | | | | | |
| Sr. Unscd. Debs. | | 7.95 | | 8/15/30 | | 100,000 | | | | 94,991 |
| Canadian National Railway, | | | | | | | | | | |
| Sr. Unscd. Notes | | 6.90 | | 7/15/28 | | 100,000 | | | | 87,986 |
| CSX, | | | | | | | | | | |
| Sr. Unscd. Bonds | | 6.15 | | 5/1/37 | | 200,000 | | b | | 130,586 |
| Federal Express, | | | | | | | | | | |
| Sr. Unscd. Notes | | 9.65 | | 6/15/12 | | 225,000 | | | | 235,138 |
| Norfolk Southern, | | | | | | | | | | |
| Sr. Unscd. Notes | | 5.59 | | 5/17/25 | | 10,000 | | | | 7,673 |
| Norfolk Southern, | | | | | | | | | | |
| Sr. Unscd. Notes | | 7.05 | | 5/1/37 | | 50,000 | | | | 43,298 |
| Norfolk Southern, | | | | | | | | | | |
| Sr. Unscd. Notes | | 7.80 | | 5/15/27 | | 250,000 | | | | 231,945 |
| Union Pacific, | | | | | | | | | | |
| Sr. Unscd. Debs. | | 6.63 | | 2/1/29 | | 325,000 | | | | 264,751 |
| United Parcel Service of America, | | | | | | | | | | |
| Sr. Unscd. Debs. | | 8.38 | | 4/1/30 | | 10,000 | | a | | 10,769 |
| United Parcel Service, | | | | | | | | | | |
| Sr. Unscd. Notes | | 6.20 | | 1/15/38 | | 425,000 | | | | 368,571 |
| | | | | | | | | | | 1,563,887 |
| U.S. Government Agencies—9.4% | | | | | | | | | | |
| Federal Farm Credit Banks, | | | | | | | | | | |
| Bonds | | 3.75 | | 12/6/10 | | 2,750,000 | | | | 2,774,428 |
38
| | | Coupon | | Maturity | | Principal | | | | |
| Bonds and Notes (continued) | | Rate (%) | | Date | | Amount ($) | | | | Value ($) |
| |
| |
| |
| |
| |
|
| U.S. Government Agencies (continued) | | | | | | | | | | |
| Federal Farm Credit Banks, | | | | | | | | | | |
| Bonds | | 5.13 | | 8/25/16 | | 350,000 | | | | 347,623 |
| Federal Home Loan Banks, | | | | | | | | | | |
| Bonds, Ser. 455 | | 3.00 | | 4/15/09 | | 5,675,000 | | | | 5,688,790 |
| Federal Home Loan Banks, | | | | | | | | | | |
| Bonds, Ser. 498 | | 3.88 | | 1/15/10 | | 4,625,000 | | | | 4,663,078 |
| Federal Home Loan Banks, | | | | | | | | | | |
| Bonds, Ser. 567 | | 4.38 | | 9/17/10 | | 2,800,000 | | | | 2,857,196 |
| Federal Home Loan Banks, | | | | | | | | | | |
| Bonds, Ser. 616 | | 4.63 | | 2/18/11 | | 1,000,000 | | | | 1,028,948 |
| Federal Home Loan Banks, | | | | | | | | | | |
| Bonds | | 4.75 | | 12/16/16 | | 1,000,000 | | | | 964,271 |
| Federal Home Loan Banks, | | | | | | | | | | |
| Bonds | | 4.88 | | 11/18/11 | | 3,000,000 | | | | 3,115,815 |
| Federal Home Loan Banks, | | | | | | | | | | |
| Bonds, Ser. 1 | | 4.88 | | 5/17/17 | | 2,000,000 | | | | 1,942,122 |
| Federal Home Loan Banks, | | | | | | | | | | |
| Bonds | | 5.00 | | 11/17/17 | | 1,000,000 | | | | 978,267 |
| Federal Home Loan Banks, | | | | | | | | | | |
| Bonds | | 5.13 | | 8/14/13 | | 1,260,000 | | | | 1,301,734 |
| Federal Home Loan Banks, | | | | | | | | | | |
| Bonds, Ser. 656 | | 5.38 | | 5/18/16 | | 320,000 | | | | 324,725 |
| Federal Home Loan Banks, | | | | | | | | | | |
| Bonds | | 5.50 | | 8/13/14 | | 300,000 | | | | 311,688 |
| Federal Home Loan Banks, | | | | | | | | | | |
| Bonds | | 5.50 | | 7/15/36 | | 180,000 | | | | 174,633 |
| Federal Home Loan Mortgage Corp., | | | | | | | | | | |
| Notes | | 4.00 | | 12/15/09 | | 2,350,000 | | c | | 2,375,178 |
| Federal Home Loan Mortgage Corp., | | | | | | | | | | |
| Notes | | 4.38 | | 7/17/15 | | 1,985,000 | | c | | 1,950,487 |
| Federal Home Loan Mortgage Corp., | | | | | | | | | | |
| Notes | | 4.50 | | 1/15/13 | | 3,200,000 | | c | | 3,245,056 |
| Federal Home Loan Mortgage Corp., | | | | | | | | | | |
| Notes | | 4.50 | | 1/15/14 | | 1,400,000 | | c | | 1,414,078 |
| Federal Home Loan Mortgage Corp., | | | | | | | | | | |
| Notes | | 4.75 | | 1/18/11 | | 1,250,000 | | c | | 1,295,360 |
| Federal Home Loan Mortgage Corp., | | | | | | | | | | |
| Notes | | 4.88 | | 11/15/13 | | 1,000,000 | | | | 1,028,682 |
| STATEMENT OF INVESTMENTS (continued) |
| | | Coupon | | Maturity | | Principal | | | | |
| Bonds and Notes (continued) | | Rate (%) | | Date | | Amount ($) | | | | Value ($) |
| |
| |
| |
| |
| |
|
| U.S. Government Agencies (continued) | | | | | | | | | | |
| Federal Home Loan Mortgage Corp., | | | | | | | | | | |
| Notes | | 5.00 | | 2/16/17 | | 825,000 | | | | 815,145 |
| Federal Home Loan Mortgage Corp., | | | | | | | | | | |
| Notes | | 5.13 | | 7/15/12 | | 1,125,000 | | | | 1,176,738 |
| Federal Home Loan Mortgage Corp., | | | | | | | | | | |
| Notes | | 5.13 | | 10/18/16 | | 750,000 | | | | 748,283 |
| Federal Home Loan Mortgage Corp., | | | | | | | | | | |
| Notes | | 5.13 | | 11/17/17 | | 650,000 | | | | 645,789 |
| Federal Home Loan Mortgage Corp., | | | | | | | | | | |
| Notes | | 5.50 | | 9/15/11 | | 500,000 | | | | 531,321 |
| Federal Home Loan Mortgage Corp., | | | | | | | | | | |
| Notes | | 5.75 | | 1/15/12 | | 2,500,000 | | | | 2,660,868 |
| Federal Home Loan Mortgage Corp., | | | | | | | | | | |
| Sub. Notes | | 5.88 | | 3/21/11 | | 650,000 | | | | 669,544 |
| Federal Home Loan Mortgage Corp., | | | | | | | | | | |
| Notes | | 6.25 | | 7/15/32 | | 1,000,000 | | | | 1,089,217 |
| Federal Home Loan Mortgage Corp., | | | | | | | | | | |
| Bonds | | 6.75 | | 9/15/29 | | 400,000 | | | | 452,760 |
| Federal Home Loan Mortgage Corp., | | | | | | | | | | |
| Notes | | 6.88 | | 9/15/10 | | 2,500,000 | | | | 2,668,450 |
| Federal National Mortgage | | | | | | | | | | |
| Association, Notes | | 3.25 | | 2/15/09 | | 875,000 | | c | | 876,642 |
| Federal National Mortgage | | | | | �� | | | | | |
| Association, Notes | | 3.88 | | 2/15/10 | | 1,025,000 | | c | | 1,034,623 |
| Federal National Mortgage | | | | | | | | | | |
| Association, Bonds | | 4.38 | | 3/15/13 | | 2,605,000 | | c | | 2,632,790 |
| Federal National Mortgage | | | | | | | | | | |
| Association, Notes | | 4.38 | | 10/15/15 | | 850,000 | | c | | 831,707 |
| Federal National Mortgage | | | | | | | | | | |
| Association, Notes | | 4.63 | | 10/15/13 | | 1,400,000 | | c | | 1,429,362 |
| Federal National Mortgage | | | | | | | | | | |
| Association, Notes | | 4.63 | | 10/15/14 | | 1,500,000 | | c | | 1,513,479 |
| Federal National Mortgage | | | | | | | | | | |
| Association, Notes | | 5.00 | | 4/15/15 | | 200,000 | | c | | 204,457 |
| Federal National Mortgage | | | | | | | | | | |
| Association, Notes | | 5.00 | | 3/15/16 | | 240,000 | | c | | 239,101 |
| Federal National Mortgage | | | | | | | | | | |
| Association, Notes | | 5.00 | | 5/11/17 | | 1,200,000 | | | | 1,181,178 |
| Federal National Mortgage | | | | | | | | | | |
| Association, Notes | | 5.13 | | 4/15/11 | | 2,500,000 | | | | 2,599,688 |
40
| | | Coupon | | Maturity | | Principal | | |
| Bonds and Notes (continued) | | Rate (%) | | Date | | Amount ($) | | Value ($) |
| |
| |
| |
| |
|
| U.S. Government Agencies (continued) | | | | | | | | |
| Federal National Mortgage | | | | | | | | |
| Association, Sub. Notes | | 5.13 | | 1/2/14 | | 365,000 | | 357,030 |
| Federal National Mortgage | | | | | | | | |
| Association, Sub. Notes | | 5.25 | | 8/1/12 | | 1,000,000 | | 1,000,370 |
| Federal National Mortgage | | | | | | | | |
| Association, Notes | | 5.25 | | 9/15/16 | | 1,225,000 | | 1,234,960 |
| Federal National Mortgage | | | | | | | | |
| Association, Notes | | 5.38 | | 11/15/11 | | 1,250,000 | | 1,318,440 |
| Federal National Mortgage | | | | | | | | |
| Association, Notes | | 5.38 | | 6/12/17 | | 360,000 | | 364,527 |
| Federal National Mortgage | | | | | | | | |
| Association, Notes | | 5.50 | | 3/15/11 | | 1,200,000 | | 1,264,808 |
| Federal National Mortgage | | | | | | | | |
| Association, Bonds | | 6.00 | | 5/15/11 | | 2,450,000 | | 2,602,468 |
| Federal National Mortgage | | | | | | | | |
| Association, Bonds | | 6.25 | | 5/15/29 | | 1,340,000 | | 1,442,771 |
| Federal National Mortgage | | | | | | | | |
| Association, Notes | | 6.63 | | 11/15/10 | | 3,350,000 | | 3,585,398 |
| Federal National Mortgage | | | | | | | | |
| Association, Notes | | 7.25 | | 1/15/10 | | 1,550,000 | | 1,624,912 |
| Financing (FICO), | | | | | | | | |
| Bonds | | 8.60 | | 9/26/19 | | 40,000 | | 50,726 |
| Financing (FICO), | | | | | | | | |
| Bonds, Ser. E | | 9.65 | | 11/2/18 | | 510,000 | | 679,750 |
| Tennessee Valley Authority, | | | | | | | | |
| Notes, Ser. C | | 4.75 | | 8/1/13 | | 750,000 | | 758,415 |
| Tennessee Valley Authority, | | | | | | | | |
| Bonds, Ser. C | | 6.00 | | 3/15/13 | | 1,750,000 | | 1,867,553 |
| Tennessee Valley Authority, | | | | | | | | |
| Bonds | | 6.15 | | 1/15/38 | | 165,000 | | 173,496 |
| | | | | | | | | 80,108,925 |
| U.S. Government Agencies/ | | | | | | | | |
| Mortgage-Backed—38.7% | | | | | | | | |
| Federal Home Loan Mortgage Corp.: | | | | | | | | |
| 6.00% | | | | | | 1,500,000 d | | 1,497,422 |
| 3.50%, 6/1/19 | | | | | | 45,151 | | 41,521 |
| 4.00%, 8/1/18—9/1/35 | | | | | | 1,082,231 | | 1,011,464 |
| 4.47%, 12/1/34 | | | | | | 60,578 a | | 61,067 |
| 4.50%, 5/1/10—1/1/37 | | | | | | 9,011,482 | | 8,497,105 |
| 5.00%, 12/1/17—6/1/38 | | | | | | 35,053,047 | | 33,506,701 |
| STATEMENT OF INVESTMENTS (continued) |
| | | Principal | | |
| Bonds and Notes (continued) | | Amount ($) | | Value ($) |
| |
| |
|
| U.S. Government Agencies/ | | | | |
| Mortgage-Backed (continued) | | | | |
| Federal Home Loan Mortgage Corp. (continued): | | | | |
| 4.72%, 6/1/34 | | 61,868 a | | 61,128 |
| 4.75%, 4/1/33 | | 38,113 a | | 38,176 |
| 4.98%, 6/1/35 | | 26,223 a | | 26,815 |
| 5.03%, 12/1/34 | | 121,160 a | | 121,176 |
| 5.14%, 8/1/34 | | 43,061 a | | 43,632 |
| 5.18%, 11/1/33 | | 46,816 a | | 46,737 |
| 5.47%, 3/1/36 | | 43,911 a | | 44,353 |
| 5.49%, 10/1/32 | | 59,142 a | | 59,869 |
| 5.50%, 9/1/09—8/1/38 | | 40,737,005 | | 39,848,750 |
| 5.62%, 8/1/37 | | 367,497 a | | 371,602 |
| 6.00%, 12/1/13—7/1/38 | | 23,059,853 | | 23,057,681 |
| 6.20%, 6/1/36 | | 33,768 a | | 34,115 |
| 6.50%, 12/1/12—11/1/37 | | 6,370,867 | | 6,476,875 |
| 7.00%, 9/1/11—7/1/37 | | 662,065 | | 679,031 |
| 7.50%, 7/1/10—11/1/33 | | 256,578 | | 270,793 |
| 8.00%, 2/1/17—10/1/31 | | 113,166 | | 119,844 |
| 8.50%, 10/1/18—6/1/30 | | 4,463 | | 4,787 |
| Federal National Mortgage Association: | | | | |
| 5.00% | | 1,600,000 d | | 1,515,750 |
| 5.50% | | 2,300,000 d | | 2,247,171 |
| 6.00% | | 2,300,000 d | | 2,298,921 |
| 3.82%, 6/1/34 | | 589,431 a | | 590,321 |
| 4.00%, 9/1/18—10/1/20 | | 1,607,286 | | 1,501,456 |
| 4.01%, 9/1/33 | | 38,708 a | | 38,395 |
| 4.11%, 9/1/33 | | 85,911 a | | 85,449 |
| 4.13%, 2/1/35 | | 1,007,843 a | | 1,016,784 |
| 4.30%, 6/1/34 | | 209,840 a | | 207,912 |
| 4.33%, 1/1/35 | | 826,650 a | | 854,284 |
| 4.50%, 4/1/18—4/1/38 | | 10,395,601 | | 9,819,535 |
| 4.59%, 3/1/34 | | 909,750 a | | 904,378 |
| 4.64%, 2/1/34 | | 999,714 a | | 1,011,070 |
| 4.67%, 8/1/35 | | 673,448 a | | 677,108 |
| 4.79%, 10/1/34 | | 45,191 a | | 45,539 |
| 4.86%, 8/1/35 | | 189,220 a | | 189,350 |
| 4.86%, 9/1/35 | | 1,578,922 a | | 1,579,470 |
| 4.93%, 5/1/33 | | 39,820 a | | 40,099 |
| 4.94%, 11/1/32 | | 44,763 a | | 45,072 |
| 5.00%, 5/1/10—7/1/38 | | 38,237,328 | | 36,567,059 |
| 5.05%, 1/1/35 | | 47,937 a | | 47,654 |
| 5.10%, 8/1/34 | | 46,996 a | | 48,146 |
42
| | | Principal | | |
| Bonds and Notes (continued) | | Amount ($) | | Value ($) |
| |
| |
|
| U.S. Government Agencies/ | | | | |
| Mortgage-Backed (continued) | | | | |
| Federal National Mortgage Association (continued): | | | | |
| 5.10%, 12/1/35 | | 64,714 a | | 66,682 |
| 5.20%, 11/1/36 | | 744,647 a | | 755,649 |
| 5.23%, 6/1/35 | | 144,779 a | | 141,965 |
| 5.27%, 11/1/35 | | 28,894 a | | 28,456 |
| 5.32%, 3/1/37 | | 525,272 a | | 532,463 |
| 5.47%, 2/1/37 | | 1,280,837 a | | 1,300,133 |
| 5.50%, 2/1/14—8/1/38 | | 52,424,764 | | 51,353,327 |
| 5.50%, 2/1/37 | | 1,646,162 a | | 1,669,257 |
| 5.65%, 4/1/36 | | 991,693 a | | 1,001,326 |
| 5.68%, 3/1/37 | | 271,408 a | | 275,096 |
| 5.85%, 12/1/36 | | 158,382 a | | 164,606 |
| 5.91%, 11/1/36 | | 89,099 a | | 92,199 |
| 5.93%, 2/1/37 | | 25,162 a | | 25,481 |
| 6.00%, 6/1/11—1/1/38 | | 34,278,183 | | 34,318,402 |
| 6.50%, 1/1/11—12/1/37 | | 11,902,569 | | 12,094,673 |
| 7.00%, 3/1/14—3/1/38 | | 3,379,529 | | 3,498,600 |
| 7.50%, 8/1/15—3/1/32 | | 294,223 | | 310,067 |
| 8.00%, 2/1/13—8/1/30 | | 84,320 | | 89,285 |
| 8.50%, 9/1/15—7/1/30 | | 33,496 | | 36,140 |
| 9.00%, 4/1/16—10/1/30 | | 5,763 | | 6,144 |
| Government National Mortgage Association I: | | | | |
| 5.50% | | 4,000,000 d | | 3,923,124 |
| 6.50% | | 5,000,000 d | | 5,053,905 |
| 4.50%, 1/15/19—8/15/33 | | 933,553 | | 887,742 |
| 5.00%, 1/15/17—7/15/38 | | 6,015,641 | | 5,783,821 |
| 5.50%, 9/15/20—6/15/38 | | 12,309,813 | | 12,097,633 |
| 6.00%, 10/15/13—8/15/38 | | 14,276,310 | | 14,299,358 |
| 6.50%, 2/15/24—10/15/37 | | 2,367,613 | | 2,398,248 |
| 7.00%, 4/1/11—8/15/32 | | 285,729 | | 293,362 |
| 7.50%, 9/15/11—10/15/32 | | 210,530 | | 222,186 |
| 8.00%, 2/15/17—3/15/32 | | 57,577 | | 61,613 |
| 8.25%, 10/15/26—6/15/27 | | 10,944 | | 11,650 |
| 8.50%, 10/15/26 | | 19,121 | | 20,515 |
| 9.00%, 2/15/22—2/15/23 | | 13,160 | | 14,346 |
| Government National Mortgage Association II: | | | | |
| 3.50%, 5/20/34 | | 58,440 | | 49,918 |
| 6.50%, 2/20/28 | | 2,842 | | 2,883 |
| 8.50%, 7/20/25 | | 1,812 | | 1,960 |
| | | | | 330,133,782 |
| STATEMENT OF INVESTMENTS (continued) |
| | | Principal | | |
| Bonds and Notes (continued) | | Amount ($) | | Value ($) |
| |
| |
|
| U.S. Government Securities—24.3% | | | | |
| U.S. Treasury Bonds: | | | | |
| 4.38%, 2/15/38 | | 1,180,000 b | | 1,183,873 |
| 4.50%, 2/15/36 | | 2,200,000 b | | 2,241,424 |
| 4.75%, 2/15/37 | | 800,000 b | | 848,438 |
| 5.00%, 5/15/37 | | 2,555,000 b | | 2,814,892 |
| 5.25%, 11/15/28 | | 1,440,000 b | | 1,531,801 |
| 5.25%, 2/15/29 | | 1,200,000 b | | 1,276,969 |
| 5.38%, 2/15/31 | | 1,405,000 b | | 1,537,708 |
| 5.50%, 8/15/28 | | 2,000,000 b | | 2,184,688 |
| 6.13%, 11/15/27 | | 1,605,000 b | | 1,874,842 |
| 6.13%, 8/15/29 | | 1,400,000 b | | 1,660,970 |
| 6.25%, 8/15/23 | | 2,610,000 b | | 2,988,860 |
| 6.25%, 5/15/30 | | 660,000 b | | 797,982 |
| 6.50%, 11/15/26 | | 770,000 b | | 928,572 |
| 7.13%, 2/15/23 | | 1,575,000 b | | 1,939,343 |
| 7.25%, 5/15/16 | | 2,300,000 b | | 2,750,299 |
| 7.25%, 8/15/22 | | 870,000 b | | 1,074,722 |
| 7.63%, 2/15/25 | | 660,000 b | | 879,038 |
| 7.88%, 2/15/21 | | 3,405,000 b | | 4,359,731 |
| 8.00%, 11/15/21 | | 2,670,000 b | | 3,472,669 |
| 8.13%, 8/15/19 | | 2,050,000 b | | 2,644,982 |
| 8.75%, 5/15/17 | | 775,000 b | | 1,015,553 |
| 8.75%, 5/15/20 | | 775,000 b | | 1,049,762 |
| 8.88%, 8/15/17 | | 2,725,000 b | | 3,611,053 |
| 8.88%, 2/15/19 | | 1,000,000 b | | 1,347,422 |
| 9.00%, 11/15/18 | | 660,000 b | | 898,941 |
| 12.50%, 8/15/14 | | 40,000 | | 43,381 |
| U.S. Treasury Notes: | | | | |
| 2.00%, 9/30/10 | | 4,400,000 b | | 4,442,284 |
| 2.13%, 4/30/10 | | 4,675,000 b | | 4,728,328 |
| 2.50%, 3/31/13 | | 2,600,000 b | | 2,599,797 |
| 2.88%, 1/31/13 | | 3,495,000 b | | 3,567,906 |
| 3.25%, 12/31/09 | | 5,500,000 b | | 5,611,722 |
| 3.38%, 11/30/12 | | 790,000 b | | 826,662 |
| 3.38%, 6/30/13 | | 3,425,000 b | | 3,528,555 |
| 3.38%, 7/31/13 | | 1,200,000 b | | 1,235,626 |
| 3.50%, 5/31/13 | | 2,370,000 b | | 2,460,171 |
| 3.50%, 2/15/18 | | 2,470,000 b | | 2,403,426 |
| 3.63%, 5/15/13 | | 2,700,000 b | | 2,816,861 |
| 3.88%, 10/31/12 | | 9,100,000 b | | 9,709,281 |
| 3.88%, 2/15/13 | | 1,150,000 b | | 1,215,407 |
| 3.88%, 5/15/18 | | 3,100,000 b | | 3,095,883 |
44
| | | Coupon | | Maturity | | Principal | | |
| Bonds and Notes (continued) | | Rate (%) | | Date | | Amount ($) | | Value ($) |
| |
| |
| |
| |
|
| U.S. Government Securities (continued) | | | | | | |
| U.S. Treasury Notes (continued): | | | | | | | | |
| 4.00%, 11/15/12 | | | | | | 7,700,000 b | | 8,243,212 |
| 4.00%, 2/15/15 | | | | | | 300,000 b | | 313,594 |
| 4.13%, 8/31/12 | | | | | | 1,200,000 b | | 1,290,938 |
| 4.25%, 9/30/12 | | | | | | 800,000 b | | 865,438 |
| 4.25%, 8/15/13 | | | | | | 2,800,000 b | | 2,998,408 |
| 4.25%, 11/15/13 | | | | | | 3,921,000 b | | 4,204,355 |
| 4.25%, 8/15/15 | | | | | | 805,000 b | | 837,640 |
| 4.25%, 11/15/17 | | | | | | 2,530,000 b | | 2,602,937 |
| 4.38%, 8/15/12 | | | | | | 225,000 b | | 244,037 |
| 4.50%, 2/28/11 | | | | | | 3,500,000 b | | 3,747,737 |
| 4.50%, 9/30/11 | | | | | | 676,000 b | | 727,809 |
| 4.50%, 11/30/11 | | | | | | 3,500,000 b | | 3,780,823 |
| 4.50%, 3/31/12 | | | | | | 2,950,000 b | | 3,190,841 |
| 4.50%, 11/15/15 | | | | | | 3,800,000 b | | 4,021,175 |
| 4.50%, 2/15/16 | | | | | | 425,000 b | | 448,342 |
| 4.50%, 5/15/17 | | | | | | 1,800,000 b | | 1,875,938 |
| 4.63%, 8/31/11 | | | | | | 700,000 b | | 755,782 |
| 4.63%, 10/31/11 | | | | | | 4,300,000 b | | 4,653,408 |
| 4.63%, 11/15/16 | | | | | | 2,000,000 b | | 2,096,876 |
| 4.63%, 2/15/17 | | | | | | 2,415,000 b | | 2,539,336 |
| 4.75%, 3/31/11 | | | | | | 1,800,000 b | | 1,941,329 |
| 4.75%, 5/15/14 | | | | | | 2,400,000 b | | 2,634,190 |
| 4.75%, 8/15/17 | | | | | | 2,300,000 b | | 2,435,127 |
| 4.88%, 4/30/11 | | | | | | 3,800,000 b | | 4,109,347 |
| 4.88%, 5/31/11 | | | | | | 3,200,000 b | | 3,467,002 |
| 4.88%, 7/31/11 | | | | | | 4,500,000 b | | 4,882,149 |
| 4.88%, 2/15/12 | | | | | | 3,600,000 b | | 3,941,719 |
| 4.88%, 8/15/16 | | | | | | 2,530,000 b | | 2,697,020 |
| 5.00%, 2/15/11 | | | | | | 3,400,000 b | | 3,677,579 |
| 5.00%, 8/15/11 | | | | | | 4,125,000 b | | 4,511,397 |
| 5.13%, 5/15/16 | | | | | | 1,350,000 b | | 1,463,801 |
| 5.75%, 8/15/10 | | | | | | 5,875,000 b | | 6,328,480 |
| 6.00%, 8/15/09 | | | | | | 14,650,000 b | | 15,181,077 |
| 6.50%, 2/15/10 | | | | | | 5,100,000 b | | 5,421,142 |
| | | | | | | | | 207,329,809 |
| Wireless Communications—.1% | | | | | | | | |
| Rogers Wireless Communications, | | | | | | | | |
| Scd. Bonds | | 6.38 | | 3/1/14 | | 760,000 | | 679,377 |
| Total Bonds and Notes | | | | | | | | |
| (cost $861,690,398) | | | | | | | | 822,979,500 |
| STATEMENT OF INVESTMENTS (continued) |
| Other Investment—3.5% | | Shares | | Value ($) |
| |
| |
|
| Registered Investment Company; | | | | |
| Dreyfus Institutional Preferred | | | | |
| Plus Money Market Fund | | | | |
| (cost $29,841,000) | | 29,841,000 e | | 29,841,000 |
| |
| |
|
| |
| Investment of Cash Collateral | | | | |
| for Securities Loaned—23.7% | | | | |
| |
| |
|
| Registered Investment Company; | | | | |
| Dreyfus Institutional Cash | | | | |
| Advantage Plus Fund | | | | |
| (cost $201,919,961) | | 201,919,961 e | | 201,919,961 |
| |
| |
|
| |
| Total Investments (cost $1,093,451,359) | | 123.9% | | 1,054,740,461 |
| Liabilities, Less Cash and Receivables | | (23.9%) | | (203,653,404) |
| Net Assets | | 100.0% | | 851,087,057 |
| a Variable rate security—interest rate subject to periodic change. |
| b All or a portion of these securities are on loan. At October 31, 2008, the total market value of the fund’s securities |
| on loan is $214,892,462 and the total market value of the collateral held by the fund is $222,211,424, consisting |
| of cash collateral of $201,919,961, U.S. Government and Agency securities valued at $12,833,366, and letters of |
| credit valued at $7,458,097. |
| c On September 7, 2008, the Federal Housing Finance Agency (FHFA) placed Federal National Mortgage |
| Association and Federal Home Loan Mortgage Corporation into conservatorship with FHFA as the conservator. As |
| such, the FHFA will oversee the continuing affairs of these companies. |
| d Purchased on a forward commitment basis. |
| e Investment in affiliated money market mutual fund. |
| Portfolio Summary (Unaudited)† | | | | |
| |
| | | Value (%) | | | | Value (%) |
| |
| |
| |
|
| U.S. Government & Agencies | | 72.4 | | Foreign/Governmental | | 2.7 |
| Money Market Investments | | 27.2 | | State/Government | | |
| Corporate Bonds | | 17.1 | | General Obligations | | .1 |
| Asset/Mortgage-Backed | | 4.4 | | | | 123.9 |
| |
| † Based on net assets. | | | | | | |
| See notes to financial statements. | | | | | | |
46
STATEMENT OF ASSETS AND LIABILITIES
October 31, 2008
| | | Cost | | Value |
| |
| |
|
| Assets ($): | | | | |
| Investments in securities—See Statement | | | | |
| of Investments (including securities on loan, | | | | |
| valued at $214,892,462)—Note 1(b): | | | | |
| Unaffiliated issuers | | 861,690,398 | | 822,979,500 |
| Affiliated issuers | | 231,760,961 | | 231,760,961 |
| Cash | | | | 4,451,631 |
| Dividends and Interest receivable | | | | 8,407,523 |
| Receivable for shares of Capital Stock subscribed | | | | 3,042,268 |
| Other Assets | | | | 11,097 |
| | | | | 1,070,652,980 |
| |
| |
|
| Liabilities ($): | | | | |
| Due to The Dreyfus Corporation and affiliates—Note 3(b) | | | | 194,779 |
| Liability for securities on loan—Note 1(b) | | | | 201,919,961 |
| Payable for investment securities purchased | | | | 16,681,417 |
| Payable for shares of Capital Stock redeemed | | | | 769,766 |
| | | | | 219,565,923 |
| |
| |
|
| Net Assets ($) | | | | 851,087,057 |
| |
| |
|
| Composition of Net Assets ($): | | | | |
| Paid-in capital | | | | 896,479,751 |
| Accumulated undistributed investment income—net | | | | 14,018 |
| Accumulated net realized gain (loss) on investments | | | | (6,695,814) |
| Accumulated net unrealized appreciation | | | | |
| (depreciation) on investments | | | | (38,710,898) |
| |
| |
|
| Net Assets ($) | | | | 851,087,057 |
| |
| |
|
| |
| |
| Net Asset Value Per Share | | | | |
| | | Investor Shares | | BASIC Shares |
| |
| |
|
| Net Assets ($) | | 428,767,753 | | 422,319,304 |
| Shares Outstanding | | 44,586,739 | | 43,891,148 |
| |
| |
|
| Net Asset Value Per Share ($) | | 9.62 | | 9.62 |
| |
| See notes to financial statements. | | | | |
STATEMENT OF OPERATIONS
Year Ended October 31, 2008 |
| Investment Income ($): | | |
| Income: | | |
| Interest | | 31,449,487 |
| Income from securities lending | | 977,071 |
| Cash dividends; | | |
| Affiliated issuers | | 366,305 |
| Total Income | | 32,792,863 |
| Expenses: | | |
| Management fee—Note 3(a) | | 975,521 |
| Distribution fees (Investor Shares)—Note 3(b) | | 922,665 |
| Directors’ fees—Note 3(a) | | 72,381 |
| Loan commitment fees—Note 2 | | 12,905 |
| Total Expenses | | 1,983,472 |
| Less—Directors’ fees reimbursed by the Manager—Note 3(a) | | (72,381) |
| Net Expenses | | 1,911,091 |
| Investment Income—Net | | 30,881,772 |
| |
|
| Realized and Unrealized Gain (Loss) on Investments—Note 4 ($): | | |
| Net realized gain (loss) on investments | | (726,552) |
| Net unrealized appreciation (depreciation) on investments | | (37,634,162) |
| Net Realized and Unrealized Gain (Loss) on Investments | | (38,360,714) |
| Net (Decrease) in Net Assets Resulting from Operations | | (7,478,942) |
| |
| See notes to financial statements. | | |
48
STATEMENT OF CHANGES IN NET ASSETS
| | | Year Ended October 31, |
| | |
|
| | | 2008 | | 2007 |
| |
| |
|
| Operations ($): | | | | |
| Investment income—net | | 30,881,772 | | 22,653,325 |
| Net realized gain (loss) on investments | | (726,552) | | (157,819) |
| Net unrealized appreciation | | | | |
| (depreciation) on investments | | (37,634,162) | | 1,534,763 |
| Net Increase (Decrease) in Net Assets | | | | |
| Resulting from Operations | | (7,478,942) | | 24,030,269 |
| |
| |
|
| Dividends to Shareholders from ($): | | | | |
| Investment income—net: | | | | |
| Investor Shares | | (17,255,387) | | (11,482,656) |
| BASIC Shares | | (13,875,820) | | (11,353,172) |
| Total Dividends | | (31,131,207) | | (22,835,828) |
| |
| |
|
| Capital Stock Transactions ($): | | | | |
| Net proceeds from shares sold: | | | | |
| Investor Shares | | 275,212,660 | | 170,848,549 |
| BASIC Shares | | 197,835,399 | | 117,425,056 |
| Net assets received in connection | | | | |
| with reorganization—Note 1 | | 108,314,039 | | — |
| Dividends reinvested: | | | | |
| Investor Shares | | 16,741,220 | | 11,189,881 |
| BASIC Shares | | 7,770,384 | | 5,714,132 |
| Cost of shares redeemed: | | | | |
| Investor Shares | | (141,747,478) | | (110,003,537) |
| BASIC Shares | | (119,150,782) | | (74,885,473) |
| Increase (Decrease) in Net Assets | | | | |
| from Capital Stock Transactions | | 344,975,442 | | 120,288,608 |
| Total Increase (Decrease) in Net Assets | | 306,365,293 | | 121,483,049 |
| |
| |
|
| Net Assets ($): | | | | |
| Beginning of Period | | 544,721,764 | | 423,238,715 |
| End of Period | | 851,087,057 | | 544,721,764 |
| Undistributed investment income—net | | 14,018 | | 17,698 |
STATEMENT OF CHANGES IN NET ASSETS (continued)
| | | Year Ended October 31, |
| | |
|
| | | 2008 | | 2007 |
| |
| |
|
| Capital Share Transactions: | | | | |
| Investor Shares | | | | |
| Shares sold | | 27,289,993 | | 17,120,327 |
| Shares issued in connection | | | | |
| with reorganization—Note 1 | | 12,266 | | |
| Shares issued for dividends reinvested | | 1,663,862 | | 1,121,581 |
| Shares redeemed | | (14,081,166) | | (11,045,132) |
| Net Increase (Decrease) in Shares Outstanding | | 14,884,955 | | 7,196,776 |
| |
| |
|
| BASIC Shares | | | | |
| Shares sold | | 19,684,157 | | 11,789,633 |
| Shares issued in connection | | | | |
| with reorganization—Note 1 | | 10,707,749 | | — |
| Shares issued for dividends reinvested | | 774,442 | | 572,731 |
| Shares redeemed | | (11,853,674) | | (7,507,754) |
| Net Increase (Decrease) in Shares Outstanding | | 19,312,674 | | 4,854,610 |
| |
| See notes to financial statements. | | | | |
50
FINANCIAL HIGHLIGHTS
The following tables describe the performance for each share class for the fiscal periods indicated.All information (except portfolio turnover rate) reflects financial results for a single fund share.Total return shows how much your investment in the fund would have increased (or decreased) during each period, assuming you had reinvested all dividends and distributions.These figures have been derived from the fund’s financial statements.
| | | | | Year Ended October 31, | | |
| | |
| |
| |
|
| Investor Shares | | 2008 | | 2007 | | 2006 | | 2005 | | 2004 |
| |
| |
| |
| |
| |
|
| Per Share Data ($): | | | | | | | | | | |
| Net asset value, beginning of period | | 10.03 | | 10.02 | | 10.01 | | 10.38 | | 10.35 |
| Investment Operations: | | | | | | | | | | |
| Investment income—neta | | .47 | | .47 | | .45 | | .41 | | .41 |
| Net realized and unrealized | | | | | | | | | | |
| gain (loss) on investments | | (.41) | | .02 | | .02 | | (.34) | | .10 |
| Total from Investment Operations | | .06 | | .49 | | .47 | | .07 | | .51 |
| Distributions: | | | | | | | | | | |
| Dividends from investment income—net | | (.47) | | (.48) | | (.46) | | (.43) | | (.43) |
| Dividends from net realized | | | | | | | | | | |
| gain on investments | | — | | — | | — | | (.01) | | (.05) |
| Total Distributions | | (.47) | | (.48) | | (.46) | | (.44) | | (.48) |
| Net asset value, end of period | | 9.62 | | 10.03 | | 10.02 | | 10.01 | | 10.38 |
| |
| |
| |
| |
| |
|
| Total Return (%) | | .51 | | 4.99 | | 4.79 | | .72 | | 5.02 |
| |
| |
| |
| |
| |
|
| Ratios/Supplemental Data (%): | | | | | | | | | | |
| Ratio of total expenses | | | | | | | | | | |
| to average net assets | | .41 | | .41 | | .40 | | .40 | | .40 |
| Ratio of net expenses | | | | | | | | | | |
| to average net assets | | .40 | | .40 | | .40 | | .40 | | .40 |
| Ratio of net investment income | | | | | | | | | | |
| to average net assets | | 4.64 | | 4.73 | | 4.53 | | 4.06 | | 3.94 |
| Portfolio Turnover Rate | | 25.41 | | 42.83b | | 31.05 | | 46.96 | | 44.84 |
| |
| |
| |
| |
| |
|
| Net Assets, end of period ($ x 1,000) | | 428,768 | | 297,998 | | 225,507 | | 211,701 | | 208,234 |
| a | | Based on average shares outstanding at each month end. |
| b | | The portfolio turnover rate excluding mortgage dollar roll transactions for the period ended October 31, 2007 was |
| | | 41.80%. |
| See notes to financial statements. |
| | FINANCIAL HIGHLIGHTS (continued) |
| | | | | Year Ended October 31, | | |
| | |
| |
| |
|
| BASIC Shares | | 2008 | | 2007 | | 2006 | | 2005 | | 2004 |
| |
| |
| |
| |
| |
|
| Per Share Data ($): | | | | | | | | | | |
| Net asset value, beginning of period | | 10.04 | | 10.03 | | 10.02 | | 10.39 | | 10.36 |
| Investment Operations: | | | | | | | | | | |
| Investment income—neta | | .48 | | .50 | | .47 | | .44 | | .43 |
| Net realized and unrealized | | | | | | | | | | |
| gain (loss) on investments | | (.40) | | .01 | | .02 | | (.34) | | .11 |
| Total from Investment Operations | | .08 | | .51 | | .49 | | .10 | | .54 |
| Distributions: | | | | | | | | | | |
| Dividends from investment income—net | | (.50) | | (.50) | | (.48) | | (.46) | | (.46) |
| Dividends from net realized | | | | | | | | | | |
| gain on investments | | — | | — | | — | | (.01) | | (.05) |
| Total Distributions | | (.50) | | (.50) | | (.48) | | (.47) | | (.51) |
| Net asset value, end of period | | 9.62 | | 10.04 | | 10.03 | | 10.02 | | 10.39 |
| |
| |
| |
| |
| |
|
| Total Return (%) | | .67 | | 5.25 | | 5.06 | | .97 | | 5.29 |
| |
| |
| |
| |
| |
|
| Ratios/Supplemental Data (%): | | | | | | | | | | |
| Ratio of total expenses | | | | | | | | | | |
| to average net assets | | .16 | | .16 | | .15 | | .15 | | .15 |
| Ratio of net expenses | | | | | | | | | | |
| to average net assets | | .15 | | .15 | | .15 | | .15 | | .15 |
| Ratio of net investment income | | | | | | | | | | |
| to average net assets | | 4.89 | | 4.99 | | 4.78 | | 4.31 | | 4.19 |
| Portfolio Turnover Rate | | 25.41 | | 42.83b | | 31.05 | | 46.96 | | 44.84 |
| |
| |
| |
| |
| |
|
| Net Assets, end of period ($ x 1,000) | | 422,319 | | 246,724 | | 197,732 | | 187,827 | | 171,827 |
| a | | Based on average shares outstanding at each month end. |
| b | | The portfolio turnover rate excluding mortgage dollar roll transactions for the period ended October 31, 2007 was |
| | | 41.80%. |
| See notes to financial statements. |
52
NOTES TO FINANCIAL STATEMENTS
NOTE 1—Significant Accounting Policies:
Dreyfus Bond Market Index Fund (the “fund”) is a separate diversified series of The Dreyfus/Laurel Funds, Inc. (the “Company”) which is registered under the Investment Company Act of 1940, as amended (the “Act”), as an open-end management investment company and operates as a series company currently offering fourteen series, including the fund.The fund’s investment objective is to seek to replicate the total return of the Barclays Capital U.S.Aggregate Index.The Dreyfus Corporation (the “Manager” or “Dreyfus”), a wholly-owned subsidiary of The Bank of New York Mellon Corporation (“BNY Mellon”), serves as the fund’s investment adviser.
Effective July 1, 2008, BNY Mellon has reorganized and consolidated a number of its banking and trust company subsidiaries. As a result of the reorganization, any services previously provided to the fund by Mellon Bank, N.A. or Mellon Trust of New England, N.A. are now provided by The Bank of New York, which has changed its name to The Bank of New York Mellon.
As of the close of business on September 12, 2008, pursuant to an Agreement and Plan of Reorganization previously approved by the fund’s Board of Directors, all of the assets, subject to liabilities, of BNY Hamilton U.S. Bond Market Index Fund (“BNY U.S Bond”) were transferred to the fund in exchange for the shares of Capital Stock of the fund of equal value. Shareholders of BNY U.S. Bond received shares of the fund, in an amount equal to the aggregate net asset value of their investment in BNY U.S. Bond at the time of the exchange.The fund’s net asset value per share on the close of business on September 12, 2008 after the reorganization was $10.10 and a total of 12,266 Investor shares and 10,707,749 Basic shares representing net assets of $108,314,039 (including $108,391 net unrealized depreciation on investments) were issued to shareholders of BNY U.S. Bond in the exchange. The exchange was a tax-free event to BNY U.S. Bond shareholders.
MBSC Securities Corporation (the “Distributor”), a wholly-owned subsidiary of the Manager, is the distributor of the fund’s shares. The
| NOTES TO FINANCIAL STATEMENTS (continued) |
fund is authorized to issue 150 million shares of $.001 par value Capital Stock.The fund is currently authorized to issue two classes of shares: Investor (75 million shares authorized) and BASIC (75 million shares authorized). BASIC shares and Investor shares are offered to any investor. Differences between the two classes include the services offered to and the expenses borne by each class, as well as their minimum purchase and account balance requirements. Income, expenses (other than expenses attributable to a specific class), and realized and unrealized gains or losses on investments are allocated to each class of shares based on its relative net assets.
The fund’s financial statements are prepared in accordance with U.S. generally accepted accounting principles, which may require the use of management estimates and assumptions. Actual results could differ from those estimates.
(a) Portfolio valuation: Investments in securities excluding short-term investments (other than U.S. Treasury Bills), are valued each business day by an independent pricing service (the “Service”) approved by the Board of Directors. Investments for which quoted bid prices are readily available and are representative of the bid side of the market in the judgment of the Service are valued at the mean between the quoted bid prices (as obtained by the Service from dealers in such securities) and asked prices (as calculated by the Service based upon its evaluation of the market for such securities). Other investments (which constitute a majority of the portfolio securities) are valued as determined by the Service, based on methods which include consideration of: yields or prices of securities of comparable quality, coupon, maturity and type; indications as to values from dealers; and general market conditions. Restricted securities, as well as securities or other assets for which recent market quotations are not readily available, that are not valued by a pricing service approved by the Board of Directors, or are determined by the fund not to reflect accurately fair value, are valued at fair value as determined in good faith under the direction of the Board of Directors.The factors that may be considered when fair valuing a secu-
54
rity include fundamental analytical data, the nature and duration of restrictions on disposition, an evaluation of the forces that influence the market in which the securities are purchased and sold, and public trading in similar securities of the issuer or comparable issuers. Short-term investments, excluding U.S.Treasury Bills, are carried at amortized cost, which approximates fair value. Registered investment companies that are not traded on an exchange are valued at their net asset value.
The Financial Accounting Standards Board (“FASB”) released Statement of Financial Accounting Standards No. 157 “Fair Value Measurements” (“FAS 157”). FAS 157 establishes an authoritative definition of fair value, sets out a framework for measuring fair value, and requires additional disclosures about fair-value measurements. The application of FAS 157 is required for fiscal years beginning after November 15, 2007 and interim periods within those fiscal years. Management does not believe that the application of this standard will have a material impact on the financial statements of the fund.
(b) Securities transactions and investment income: Securities transactions are recorded on a trade date basis. Realized gains and losses from securities transactions are recorded on the identified cost basis. Interest income, including where applicable, accretion of discount and amortization of premium on investments, is recognized on the accrual basis.
Pursuant to a securities lending agreement withThe Bank of NewYork Mellon, a subsidiary of BNY Mellon and an affiliate of Dreyfus, the fund may lend securities to qualified institutions. It is the fund’s policy that, at origination, all loans are secured by collateral of at least 102% of the value of U.S. securities loaned and 105% of the value of foreign securities loaned. Collateral equivalent to at least 100% of the market value of securities on loan is maintained at all times. Collateral is either in the form of cash, which can be invested in certain money market mutual funds managed by the Manager, U.S. Government and Agency securities or letters of credit.The fund is entitled to receive all income on securities loaned, in addition to income earned as a result of the
| NOTES TO FINANCIAL STATEMENTS (continued) |
lending transaction. Although each security loaned is fully collateralized, the fund bears the risk of delay in recovery of, or loss of rights in, the securities loaned should a borrower fail to return the securities in a timely manner. During the period ended October 31,2008,The Bank of New York Mellon earned $526,115 from lending fund portfolio securities, pursuant to the securities lending agreement.
(c) Affiliated issuers: Investments in other investment companies advised by the Manager are defined as “affiliated” in the Act.
(d) Dividends to shareholders: It is the policy of the fund to declare dividends daily from investment income-net; such dividends are paid monthly. Dividends from net realized capital gains, if any, are normally declared and paid annually, but the fund may make distributions on a more frequent basis to comply with the distribution requirements of the Internal Revenue Code of 1986, as amended (the “Code”).To the extent that net realized capital gains can be offset by capital loss carryovers, it is the policy of the fund not to distribute such gains. Income and capital gain distributions are determined in accordance with income tax regulations, which may differ from U.S. generally accepted accounting principles.
(e) Federal income taxes: It is the policy of the fund to continue to qualify as a regulated investment company, if such qualification is in the best interests of its shareholders, by complying with the applicable provisions of the Code, and to make distributions of taxable income sufficient to relieve it from substantially all federal income and excise taxes.
The fund adopted FASB Interpretation No. 48 “Accounting for Uncertainty in Income Taxes” (“FIN 48”). FIN 48 provides guidance for how uncertain tax positions should be recognized, measured, presented and disclosed in the financial statements. FIN 48 requires the evaluation of tax positions taken or expected to be taken in the course of preparing the fund’s tax returns to determine whether the tax positions are “more-likely-than-not” of being sustained by the applicable tax authority. Liability for tax positions not deemed to meet the more-likely-than-not threshold would be recorded as a tax expense in the
56
current year.The adoption of FIN 48 had no impact on the operations of the fund for the period ended October 31, 2008.
As of and during the period ended October 31, 2008, the fund did not have any liabilities for any unrecognized tax positions. The fund recognizes interest and penalties, if any, related to unrecognized tax positions as income tax expense in the Statement of Operations. During the period, the fund did not incur any interest or penalties.
Each of the tax years in the four-year period ended October 31, 2008 remains subject to examination by the Internal Revenue Service and state taxing authorities.
At October 31, 2008, the components of accumulated earnings on a tax basis were as follows: undistributed ordinary income $14,018, accumulated capital losses $6,694,656 and unrealized depreciation $38,712,056.
The accumulated capital loss carryover is available for federal income tax purposes to be applied against future net securities profits, if any, realized subsequent to October 31, 2008. If not applied, $200,657 of the carryover expires in fiscal 2012, $1,287,894 expires in fiscal 2013, $3,695,859 expires in fiscal 2014, $536,637 expires in fiscal 2015 and $973,609 expires in fiscal 2016.
The tax character of distributions paid to shareholders during the fiscal periods ended October 31, 2008 and October 31, 2007 were as follows: ordinary income $31,131,207 and $22,835,828, respectively.
During the period ended October 31, 2008, as a result of permanent book to tax differences, primarily due to the tax treatment for pay-down gains and losses on mortgage backed securities, amortization of premiums, consent fees and capital loss carryover and wash sales from fund merger, the fund increased accumulated undistributed investment income-net by $245,755, decreased accumulated net realized gain (loss) on investments by $2,351,942 and increased paid-in capital by $2,106,187. Net assets and net asset value per share were not affected by this reclassification.
| NOTES TO FINANCIAL STATEMENTS (continued) |
NOTE 2—Bank Lines of Credit:
Prior to October 15, 2008, the fund participated with other Dreyfus-managed funds in a $350 million redemption credit facility. Effective October 15, 2008, the fund participates with other Dreyfus-managed funds in a $145 million redemption credit facility (the “Facility”) to be utilized for temporary or emergency purposes, including the financing of redemptions. In connection therewith, the fund has agreed to pay commitment fees on its pro rata portion of the Facility. Interest is charged to the fund based on prevailing market rates in effect at the time of borrowing. During the period ended October 31, 2008, the fund did not borrow under either Facility.
NOTE 3—Investment Management Fee and Other Transactions With Affiliates:
(a) Pursuant to an Investment Management Agreement with the Manager, the Manager provides or arranges for one or more third parties and/or affiliates to provide investment advisory, administrative, custody, fund accounting and transfer agency services to the fund. The Manager also directs the investments of the fund in accordance with its investment objective, policies and limitations. For these services, the fund is contractually obligated to pay the Manager a fee, calculated daily and paid monthly, at the annual rate of .15% of the value of the fund’s average daily net assets. Out of its fee, the Manager pays all of the expenses of the fund except brokerage fees, taxes, interest, commitment fees, Rule 12b-1 distribution fees and expenses, service fees, fees and expenses of non-interested Directors (including counsel fees) and extraordinary expenses. In addition, the Manager is required to reduce its fee in an amount equal to the fund’s allocable portion of fees and expenses of the non-interested Directors (including counsel fees). Each Director receives $45,000 per year, plus $6,000 for each joint Board meeting of the Company, The Dreyfus/Laurel Tax-Free Municipal Funds and The Dreyfus/Laurel Funds Trust (collectively, the “Dreyfus/Laurel Funds”) attended, $2,000 for separate in-person committee meetings attended which are not held in conjunction with a
58
regularly scheduled Board meeting and $1,500 for Board meetings and separate committee meetings attended that are conducted by telephone and is reimbursed for travel and out-of-pocket expenses.With respect to the Board meetings, the Chairman of the Board receives an additional 25% of such compensation (with the exception of reimbursable amounts). With respect to compensation committee meetings, the Chair of the compensation committee receives $900 per meeting and, prior to April 12, 2008 with respect to audit committee meetings, the Chair of the audit committee received $1,350 per meeting. In the event that there is an in-person joint committee meeting or a joint telephone meeting of the Dreyfus/Laurel Funds and Dreyfus HighYield Strategies Fund, the $2,000 or $1,500 fee, as applicable, will be allocated between the Dreyfus/Laurel Funds and Dreyfus High Yield Strategies Fund. These fees and expenses are charged and allocated to each series based on net assets.Amounts required to be paid by the Company directly to the non-interested Directors, that would be applied to offset a portion of the management fee payable to the Manager, are in fact paid directly by the Manager to the non-interested Directors.
(b) Under the fund’s Distribution Plan (the “Plan”) adopted pursuant to Rule 12b-1 under the Act, Investor shares may pay annually up to .25% of the value of the average daily net assets to compensate the Distributor for shareholder servicing activities primarily intended to result in the sale of Investor shares.The BASIC shares bear no distribution fee. During the period ended October 31, 2008, Investor shares were charged $922,665 pursuant to the Plan.
Under its terms, the Plan shall remain in effect from year to year, provided such continuance is approved annually by a vote of majority of those Directors who are not “interested persons” of the Company and who have no direct or indirect financial interest in the operation or in any agreement related to the Plan.
The components of “Due to The Dreyfus Corporation and affiliates” in the Statement of Assets and Liabilities consist of: management fees $103,289 and Rule 12b-1 distribution plan fees $91,490.
| NOTES TO FINANCIAL STATEMENTS (continued) |
NOTE 4—Securities Transactions:
The aggregate amount of purchases and sales (including paydowns) of investment securities, excluding short-term securities, during the period ended October 31, 2008, amounted to $393,484,152 and $162,359,351, respectively.
At October 31, 2008, the cost of investments for federal income tax purposes was $1,093,452,517; accordingly, accumulated net unrealized depreciation on investments was $38,712,056, consisting of $6,742,554 gross unrealized appreciation and $45,454,610 gross unrealized depreciation.
In March 2008, the FASB released Statement of Financial Accounting Standards No. 161, Disclosures about Derivative Instruments and Hedging Activities (“FAS 161”). FAS 161 requires qualitative disclosures about objectives and strategies for using derivatives, quantitative disclosures about fair value amounts of gains and losses on derivative instruments, and disclosures about credit-risk-related contingent features in derivative agreements.The application of FAS 161 is required for fiscal years and interim periods beginning after November 15, 2008. At this time, management is evaluating the implications of FAS 161 and its impact on the financial statements and the accompanying notes has not yet been determined.
60
REPORT OF INDEPENDENT REGISTERED PUBLIC ACCOUNTING FIRM
The Board of Directors and Shareholders The Dreyfus/Laurel Funds, Inc.:
We have audited the accompanying statement of assets and liabilities of Dreyfus Bond Market Index Fund, a series of The Dreyfus/Laurel Funds, Inc. (the “Fund”), including the statement of investments, as of October 31, 2008, and the related statement of operations for the year then ended, the statements of changes in net assets for each of the years in the two-year period then ended, and the financial highlights for each of the years in the five-year period then ended. These financial statements and financial highlights are the responsibility of the Fund’s management. Our responsibility is to express an opinion on these financial statements and financial highlights based on our audits.
We conducted our audits in accordance with the standards of the Public Company Accounting Oversight Board (United States).Those standards require that we plan and perform the audit to obtain reasonable assurance about whether the financial statements and financial highlights are free of material misstatement. An audit includes examining, on a test basis, evidence supporting the amounts and disclosures in the financial statements. Our procedures included confirmation of securities owned as of October 31, 2008, by correspondence with the custodian and brokers or by other appropriate auditing procedures where replies from brokers were not received.An audit also includes assessing the accounting principles used and significant estimates made by management, as well as evaluating the overall financial statement presentation.We believe that our audits provide a reasonable basis for our opinion.
In our opinion, the financial statements and financial highlights referred to above present fairly, in all material respects, the financial position of Dreyfus Bond Market Index Fund as of October 31, 2008, the results of its operations for the year then ended, the changes in its net assets for each of the years in the two-year period then ended, and the financial highlights for each of the years in the five-year period then ended, in conformity with U.S. generally accepted accounting principles.

| | New York, New York
December 23, 2008 |
IMPORTANT TAX INFORMATION ( U n a u d i t e d )
For federal tax purposes the fund hereby designates 99.96% of ordinary income dividends paid during the fiscal year ended October 31, 2008 as qualifying “interest related dividends.”
62
BOARD MEMBERS INFORMATION ( U n a u d i t e d )
Joseph S. DiMartino (65)
Chairman of the Board (1999)
Principal Occupation During Past 5Years:
Corporate Director and Trustee
Other Board Memberships and Affiliations: |
- The Muscular Dystrophy Association, Director
- Century Business Services, Inc., a provider of outsourcing functions for small and medium size companies, Director
- The Newark Group, a provider of a national market of paper recovery facilities, paperboard mills and paperboard converting plants, Director
- Sunair Services Corporation, a provider of certain outdoor-related services to homes and businesses, Director
No. of Portfolios for which Board Member Serves: 167
James M. Fitzgibbons (74)
Board Member (1994)
Principal Occupation During Past 5Years:
Corporate Director and Trustee |
Other Board Memberships and Affiliations:
Bill Barrett Company, an oil and gas exploration company, Director
No. of Portfolios for which Board Member Serves: 25
Kenneth A. Himmel (62)
Board Member (1994)
Principal Occupation During Past 5Years: |
- President and CEO,Related Urban Development,a real estate development company (1996-present)
- President and CEO, Himmel & Company, a real estate development company (1980-present)
- CEO, American Food Management, a restaurant company (1983-present)
| No. of Portfolios for which Board Member Serves: 25 |
Stephen J. Lockwood (61)
Board Member (1994)
Principal Occupation During Past 5Years: |
- Chairman of the Board, Stephen J. Lockwood and Company LLC, an investment company (2000-present)
| No. of Portfolios for which Board Member Serves: 25 |
BOARD MEMBERS INFORMATION (Unaudited) (continued)
Roslyn M. Watson (59)
Board Member (1994) |
Principal Occupation During Past 5Years:
Principal,Watson Ventures, Inc., a real estate investment company (1993-present)
Other Board Memberships and Affiliations:
- American Express Bank, Director
- The Hyams Foundation Inc., a Massachusetts Charitable Foundation,Trustee
- National Osteoporosis Foundation,Trustee
- SBLI-USA, Director
| No. of Portfolios for which Board Member Serves: 25 |
Benaree Pratt Wiley (62)
Board Member (1998)
Principal Occupation During Past 5Years: |
- Principal,The Wiley Group, a firm specializing in strategy and business development (2005-present)
- President and CEO,The Partnership, an organization dedicated to increasing the representation of African Americans in positions of leadership, influence and decision-making in Boston, MA (1991-2005)
| Other Board Memberships and Affiliations: |
- Boston College,Trustee Associate
- Blue Cross Blue Shield of Massachusetts, Director
- CBIZ, professional support consultants and service providers for small, midsized and corporate business, Director
- Commonwealth Institute, Director
- Efficacy Institute, Director
- PepsiCo African-American, Chair of Advisory Board
- The Boston Foundation, Director
- Century Business Services, Inc., a provider of outsourcing functions for small and medium size companies, Director
| No. of Portfolios for which Board Member Serves: 36 |
Once elected all Board Members serve for an indefinite term, but achieve Emeritus status upon reaching age 80.The address of the Board Members and Officers is in c/o The Dreyfus Corporation, 200 Park Avenue, NewYork, NewYork 10166. Additional information about the Board Members is available in the fund’s Statement of Additional Information which can be obtained from Dreyfus free of charge by calling this toll free number: 1-800-554-4611.
Francis P. Brennan, Emeritus Board Member
J.Tomlinson Fort, Emeritus Board Member |
64
OFFICERS OF THE FUND (Unaudited)
| J. DAVID OFFICER, President since | | JONI LACKS CHARATAN, Vice President |
| December 2006. | | and Assistant Secretary since |
| Chief Operating Officer,Vice Chairman and a | | August 2005. |
| Director of the Manager, and an officer of 77 | | Senior Counsel of BNY Mellon, and an officer |
| investment companies (comprised of 167 | | of 78 investment companies (comprised of 188 |
| portfolios) managed by the Manager. He is 60 | | portfolios) managed by the Manager. She is 53 |
| years old and has been an employee of the | | years old and has been an employee of the |
| Manager since April 1998. | | Manager since October 1988. |
| |
| PHILLIP N. MAISANO, Executive Vice | | JOSEPH M. CHIOFFI, Vice President and |
| President since July 2007. | | Assistant Secretary since August 2005. |
| Chief Investment Officer,Vice Chair and a | | Senior Counsel of BNY Mellon, and an officer |
| director of the Manager, and an officer of 77 | | of 78 investment companies (comprised of 188 |
| investment companies (comprised of 167 | | portfolios) managed by the Manager. He is 47 |
| portfolios) managed by the Manager. Mr. | | years old and has been an employee of the |
| Maisano also is an officer and/or Board | | Manager since June 2000. |
| member of certain other investment | | |
| | | JANETTE E. FARRAGHER, Vice President |
| management subsidiaries of The Bank of New | | |
| | | and Assistant Secretary since |
| York Mellon Corporation, each of which is an | | |
| | | August 2005. |
| affiliate of the Manager. He is 61 years old and | | |
| has been an employee of the Manager since | | Assistant General Counsel of BNY Mellon, |
| November 2006. Prior to joining the Manager, | | and an officer of 78 investment companies |
| Mr. Maisano served as Chairman and Chief | | (comprised of 188 portfolios) managed by the |
| Executive Officer of EACM Advisors, an | | Manager. She is 45 years old and has been an |
| affiliate of the Manager, since August 2004, and | | employee of the Manager since February 1984. |
| served as Chief Executive Officer of Evaluation | | JOHN B. HAMMALIAN, Vice President and |
| Associates, a leading institutional investment | | Assistant Secretary since August 2005. |
| consulting firm, from 1988 until 2004. | | |
| | | Managing Counsel of BNY Mellon, and an |
| MICHAEL A. ROSENBERG, Vice President | | officer of 78 investment companies (comprised |
| and Secretary since August 2005. | | of 188 portfolios) managed by the Manager. |
| Assistant General Counsel of BNY Mellon, | | He is 45 years old and has been an employee |
| and an officer of 78 investment companies | | of the Manager since February 1991. |
| (comprised of 188 portfolios) managed by the | | ROBERT R. MULLERY, Vice President and |
| Manager. He is 48 years old and has been an | | Assistant Secretary since August 2005. |
| employee of the Manager since October 1991. | | |
| | | Managing Counsel of BNY Mellon, and an |
| JAMES BITETTO, Vice President and | | officer of 78 investment companies (comprised |
| Assistant Secretary since August 2005. | | of 188 portfolios) managed by the Manager. |
| Senior Counsel of BNY Mellon and Secretary | | He is 56 years old and has been an employee |
| of the Manager, and an officer of 78 | | of the Manager since May 1986. |
| investment companies (comprised of 188 | | |
| portfolios) managed by the Manager. He is 42 | | |
| years old and has been an employee of the | | |
| Manager since December 1996. | | |
OFFICERS OF THE FUND (Unaudited) (continued)
| JEFF PRUSNOFSKY, Vice President and | | ROBERT SALVIOLO, Assistant Treasurer |
| Assistant Secretary since August 2005. | | since July 2007. |
| Managing Counsel of BNY Mellon, and an | | Senior Accounting Manager – Equity Funds of |
| officer of 78 investment companies (comprised | | the Manager, and an officer of 78 investment |
| of 188 portfolios) managed by the Manager. | | companies (comprised of 188 portfolios) |
| He is 43 years old and has been an employee | | managed by the Manager. He is 41 years old |
| of the Manager since October 1990. | | and has been an employee of the Manager |
| | | since June 1989. |
| JAMES WINDELS, Treasurer since | | |
| November 2001. | | ROBERT SVAGNA, Assistant Treasurer |
| Director – Mutual Fund Accounting of the | | since December 2002. |
| Manager, and an officer of 78 investment | | Senior Accounting Manager – Equity Funds of |
| companies (comprised of 188 portfolios) | | the Manager, and an officer of 78 investment |
| managed by the Manager. He is 49 years old | | companies (comprised of 188 portfolios) |
| and has been an employee of the Manager | | managed by the Manager. He is 41 years old |
| since April 1985. | | and has been an employee of the Manager |
| | | since November 1990. |
| RICHARD CASSARO, Assistant Treasurer | | |
| since January 2008. | | JOSEPH W. CONNOLLY, Chief Compliance |
| Senior Accounting Manager – Money Market | | Officer since October 2004. |
| and Municipal Bond Funds of the Manager, | | Chief Compliance Officer of the Manager and |
| and an officer of 78 investment companies | | The Dreyfus Family of Funds (78 investment |
| (comprised of 188 portfolios) managed by | | companies, comprised of 188 portfolios). From |
| the Manager. He is 49 years old and has | | November 2001 through March 2004, Mr. |
| been an employee of the Manager since | | Connolly was first Vice-President, Mutual |
| September 1982. | | Fund Servicing for Mellon Global Securities |
| | | Services. In that capacity, Mr. Connolly was |
| GAVIN C. REILLY, Assistant Treasurer | | |
| | | responsible for managing Mellon’s Custody, |
| since December 2005. | | |
| | | Fund Accounting and Fund Administration |
| Tax Manager of the Investment Accounting | | services to third-party mutual fund clients. He |
| and Support Department of the Manager, and | | is 51 years old and has served in various |
| an officer of 78 investment companies | | capacities with the Manager since 1980, |
| (comprised of 188 portfolios) managed by the | | including manager of the firm’s Fund |
| Manager. He is 40 years old and has been an | | Accounting Department from 1997 through |
| employee of the Manager since April 1991. | | October 2001. |
| |
| ROBERT ROBOL, Assistant Treasurer | | WILLIAM GERMENIS, Anti-Money |
| since December 2002. | | Laundering Compliance Officer since |
| Senior Accounting Manager – Fixed Income | | July 2002. |
| Funds of the Manager, and an officer of 78 | | Vice President and Anti-Money Laundering |
| investment companies (comprised of 188 | | Compliance Officer of the Distributor, and the |
| portfolios) managed by the Manager. He is 44 | | Anti-Money Laundering Compliance Officer |
| years old and has been an employee of the | | of 74 investment companies (comprised of 184 |
| Manager since October 1988. | | portfolios) managed by the Manager. He is 38 |
| | | years old and has been an employee of the |
| | | Distributor since October 1998. |
66
NOTES


Save time. Save paper. View your next shareholder report online as soon as it’s available. Log into www.dreyfus.com and sign up for Dreyfus eCommunications. It’s simple and only takes a few minutes.
The views expressed in this report reflect those of the portfolio manager only through the end of the period covered and do not necessarily represent the views of Dreyfus or any other person in the Dreyfus organization. Any such views are subject to change at any time based upon market or other conditions and Dreyfus disclaims any responsibility to update such views.These views may not be relied on as investment advice and, because investment decisions for a Dreyfus fund are based on numerous factors, may not be relied on as an indication of trading intent on behalf of any Dreyfus fund.
Not FDIC-Insured Not Bank-Guaranteed May Lose Value
| | Contents |
| |
| | THE FUND |
| |
| 2 | A Letter from the CEO |
| |
| 3 | Discussion of Fund Performance |
| |
| 6 | Fund Performance |
| |
| 8 | Understanding Your Fund’s Expenses |
| |
| 8 | Comparing Your Fund’s Expenses With Those of Other Funds |
| |
| 9 | Statement of Investments |
| |
| 15 | Statement of Assets and Liabilities |
| |
| 16 | Statement of Operations |
| |
| 17 | Statement of Changes in Net Assets |
| |
| 19 | Financial Highlights |
| |
| 24 | Notes to Financial Statements |
| |
| 33 | Report of Independent Registered Public Accounting Firm |
| |
| 34 | Important Tax Information |
| |
| 34 | Proxy Results |
| |
| 35 | Board Members Information |
| |
| 37 | Officers of the Fund |
| |
| | FOR MORE INFORMATION |
| |
| | Back Cover |
| |

A LETTER FROM THE CEO
Dear Shareholder: |
We present to you this annual report for Dreyfus Midcap Stock Fund, covering the 12-month period from November 1, 2007, through October 31, 2008.
These are difficult times for equity investors. A credit crunch that began in early 2007 has developed into a full-blown global financial crisis, recently resulting in the failure of several major financial institutions and prompting a massive government rescue effort. Meanwhile, the U.S. economic slowdown has gathered momentum,depressing investor sentiment, consumer confidence and business investment.These factors undermined returns in most stock market sectors, particularly financial companies and businesses that tend to be more sensitive to economic trends.
The depth and duration of the economic downturn will depend on how quickly the financial system can be stabilized.We believe that the Temporary Guarantee Program for Money Market Funds and the $700 billion rescue package intended to promote greater liquidity in the financial markets meet several critical requirements for addressing today’s financial stresses, and we expect these measures to contribute to a more orderly deleveraging process. However, recuperation from the financial crisis is likely to take time. In the meantime, we encourage you to keep in touch with your financial advisor and maintain a long-term and disciplined perspective to investing. Indeed, we already are seeing some positive signs, including a likely peak in global inflationary pressures, a bottoming of the U.S. dollar, attractive valuations among fundamentally sound companies and a large pool of worldwide financial liquidity that could be deployed gradually as the economic cycle turns.
For information about how the fund performed during the reporting period, as well as market perspectives, we have provided a Discussion of Fund Performance given by the fund’s Portfolio Managers.
Thank you for your continued confidence and support.

| | Jonathan R. Baum
Chief Executive Officer
The Dreyfus Corporation |

DISCUSSION OF FUND PERFORMANCE
For the reporting period of November 1, 2007, through October 31, 2008, as provided by Michael Dunn, Oliver Buckley and Patrick Slattery, Portfolio Managers
Fund and Market Performance Overview
For the 12-month period ended October 31, 2008, Dreyfus Midcap Stock Fund’s Class A shares produced a total return of –39.72%, Class B shares returned –40.19%, Class C shares returned –40.18%, Class I shares returned –39.53% and Class T shares returned –39.85% .1 This compares with the fund’s benchmark, the Standard & Poor’s MidCap 400 Index (“S&P 400 Index”), which produced a total return of –36.46% for the same period.2
Slowing U.S. economic growth, falling housing prices and an expanding credit crisis sharply undercut stocks during the reporting period.These declines affected all market capitalization sectors to roughly the same degree, with midcap stocks experiencing a downturn similar in severity to both large-cap and small-cap stocks.The fund produced lower returns than the S&P 400 Index,primarily due to relatively weak stock selections in several sectors, including consumer staples and industrials.
On a separate note, effective on or about December 17, 2008, the fund will merge into Dreyfus S&P STARS Opportunities Fund.
The Fund’s Investment Approach
The fund typically seeks capital appreciation. To pursue its goal, the fund normally invests at least 80% of its assets in growth and value stocks of mid-capitalization companies. A proprietary quantitative model considers more than 40 factors to identify and rank stocks based on fundamental momentum, relative value, future value, long-term growth and other factors.We then focus on “bottom-up” stock selection to construct a portfolio with exposure to industries and market capitalizations that are similar to the benchmark’s composition. We seek to overweight more attractive stocks and underweight or not hold stocks that have been ranked as less attractive.
The Fund 3
| DISCUSSION OF FUND PERFORMANCE (continued) |
Negative Economic News Drove Markets Lower
U.S. economic growth slowed during the reporting period, triggering bouts of heightened stock market volatility. By September 2008, a credit crisis that began in 2007 in the sub-prime mortgage market had mushroomed into a global financial crisis, threatening to undermine the stability of the global banking system. Meanwhile, plunging housing values and rising unemployment led consumers to curtail discretionary spending. In addition, many businesses reduced capital spending in anticipation of reduced credit availability and a more challenging business environment. These developments produced historically steep declines in stock prices during the final months of the reporting period.
Disappointments in Consumer Staples and Industrials
While the fund’s quantitative stock selection process identified relatively strong performers in several market sectors, the fund’s underperformance in a handful of market sectors caused its overall returns to lag the benchmark. Among consumer staples holdings, two notably weak performers included agricultural processor Bunge Limited and alcoholic beverage distributor Central European Distribution. In the industrials sector, construction engineering firms Dycom Industries and Jacobs Engineering Group suffered as a result of their exposure to industries hurt by the economic downturn. In addition, truck manufacturer Oshkosh encountered financial setbacks in connection with a recent European acquisition. Finally, in the basic materials sector, steel fabricator AK Steel Holding was negatively affected by falling commodity prices.
Other Stock Selections Fared Better
The fund achieved above-average results in some key areas due to strong selections of individual stocks. Among financial companies, for example, property and casualty insurer Philadelphia Consolidated Holding rose after receiving a buyout offer. Securities trading services provider NASDAQ OMX Group outperformed during the period it
4
was held in the fund due to the company’s expanding European presence and its success in controlling costs. However, the fund also held some of the financial sector’s weaker performers, including the real estate investment trusts ProLogis and Hospitality Properties Trust.
The retail industry proved to be a relatively strong area for the fund. Although some holdings, such as entertainment software seller GameStop, were sharply penalized by the market, others, including discount merchandisers Family Dollar Stores and Dollar Tree held up relatively well. Relatively strong holdings in the energy sector, such as natural gas producer Southwestern Energy, more than made up for weaker holdings, such as independent oil and gas company Denbury Resources.The fund also held several stronger performers in the health care sector, including cardiovascular equipment maker Edwards Lifesciences and infection control specialist STERIS.
November 17, 2008
| 1 | | Total return includes reinvestment of dividends and any capital gains paid and does not take into |
| | | consideration the maximum initial sales charges in the case of Class A and Class T shares or the |
| | | applicable contingent deferred sales charges imposed on redemptions in the case of Class B and |
| | | Class C shares. Had these charges been reflected, returns would have been lower. Past performance |
| | | is no guarantee of future results. Share price and investment return fluctuate such that upon |
| | | redemption, fund shares may be worth more or less than their original cost. Return figures |
| | | provided reflect the absorption of certain fund expenses by The Dreyfus Corporation pursuant to |
| | | an agreement in effect through April 4, 2009, at which time it may be extended, terminated or |
| | | modified. Had these expenses not been absorbed, the fund’s returns would have been lower. |
| 2 | | SOURCE: LIPPER INC. — Reflects reinvestment of dividends and, where applicable, capital |
| | | gain distributions.The Standard & Poor’s MidCap 400 Index is a widely accepted, unmanaged |
| | | total return index measuring the performance of the midsize-company segment of the U.S. market. |
| | | Franklin Portfolio Associates is a wholly-owned subsidiary of The Bank of NewYork Mellon |
| | | Corporation. Franklin Portfolio Associates has no affiliation to the Franklin Templeton Group of |
| | | Funds or Franklin Resources, Inc.The portfolio managers are dual employees of Franklin Portfolio |
| | | Associates and Dreyfus. |
The Fund 5
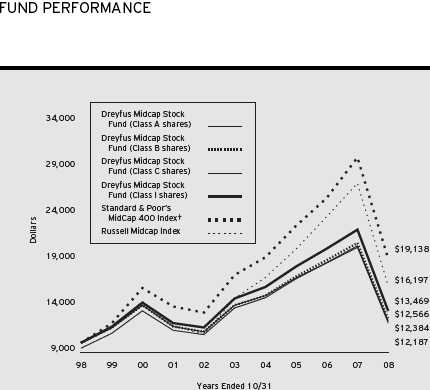
| Comparison of change in value of $10,000 investment in Dreyfus Midcap Stock Fund Class A |
| shares, Class B shares, Class C shares and Class I shares with the Standard & Poor’s MidCap 400 |
| Index and the Russell Midcap Index |
| |
| † Source: Lipper Inc. |
| Past performance is not predictive of future performance. |
| The above graph compares a $10,000 investment made in Class A, Class B, Class C and Class I shares of Dreyfus |
| Midcap Stock Fund on 10/31/98 to a $10,000 investment made in the Standard & Poor’s MidCap 400 Index (the |
| “S&P 400 Index”) and the Russell Midcap Index on that date. All dividends and capital gain distributions are |
| reinvested. Performance for Class T shares will vary from the performance of Class A, Class B, Class C and Class I |
| shares shown above due to differences in charges and expenses. |
| The fund’s performance shown in the line graph takes into account the maximum initial sales charge on Class A shares |
| and all other applicable fees and expenses.The S&P 400 Index is a widely accepted, unmanaged total return index |
| measuring the performance of the midsize company segment of the U.S. stock market.The Russell Midcap Index is a |
| widely accepted, unmanaged index of medium-cap stock market performance. Unlike a mutual fund, the indices are not |
| subject to charges, fees and other expenses. Investors cannot invest directly in any index. Further information relating to |
| fund performance, including expense reimbursements, if applicable, is contained in the Financial Highlights section of the |
| prospectus and elsewhere in this report. |
6
| Average Annual Total Returns as of 10/31/08 | | | | | | |
| |
| Inception |
| | | Date | | 1 Year | | 5 Years | | 10 Years |
| |
| |
| |
| |
|
| Class A shares | | | | | | | | |
| with maximum sales charge (5.75%) | | | | (43.18)% | | (3.29)% | | 2.16% |
| without sales charge | | | | (39.72)% | | (2.13)% | | 2.77% |
| Class B shares | | | | | | | | |
| with applicable redemption charge † | | | | (42.17)% | | (3.05)% | | 2.31% |
| without redemption | | | | (40.19)% | | (2.86)% | | 2.31% |
| Class C shares | | | | | | | | |
| with applicable redemption charge †† | | | | (40.67)% | | (2.87)% | | 2.00% |
| without redemption | | | | (40.18)% | | (2.87)% | | 2.00% |
| Class I shares | | | | (39.53)% | | (1.88)% | | 3.02% |
| Class T shares | | | | | | | | |
| with applicable sales charge (4.5%) | | 8/16/99 | | (42.56)% | | (3.27)% | | 2.04%††† |
| without sales charge | | 8/16/99 | | (39.85)% | | (2.37)% | | 2.50%††† |
| Past performance is not predictive of future performance.The fund’s performance shown in the graph and table does not |
| reflect the deduction of taxes that a shareholder would pay on fund distributions or the redemption of fund shares. |
| Performance for Class B shares assumes the conversion of Class B shares to Class A shares at the end of the sixth year |
| following the date of purchase. |
| † | | The maximum contingent deferred sales charge for Class B shares is 4%. After six years Class B shares convert to |
| | | Class A shares. |
| †† | | The maximum contingent deferred sales charge for Class C shares is 1% for shares redeemed within one year of the |
| | | date of purchase. |
| ††† | | The total return performance figures presented for Class T shares of the fund reflect the performance of the fund’s |
| | | Class A shares for periods prior to 8/16/99 (the inception date for Class T shares), adjusted to reflect the applicable |
| | | sales load for that class and the applicable distribution/servicing fees thereafter. |
The Fund 7
UNDERSTANDING YOUR FUND’S EXPENSES (Unaudited)
As a mutual fund investor, you pay ongoing expenses, such as management fees and other expenses. Using the information below, you can estimate how these expenses affect your investment and compare them with the expenses of other funds.You also may pay one-time transaction expenses, including sales charges (loads) and redemption fees, which are not shown in this section and would have resulted in higher total expenses. For more information, see your fund’s prospectus or talk to your financial adviser.
Review your fund’s expenses
The table below shows the expenses you would have paid on a $1,000 investment in Dreyfus Midcap Stock Fund from May 1, 2008 to October 31, 2008. It also shows how much a $1,000 investment would be worth at the close of the period, assuming actual returns and expenses.
Expenses and Value of a $1,000 Investment assuming actual returns for the six months ended October 31, 2008
| | | Class A | | Class B | | Class C | | Class I | | Class T |
| |
| |
| |
| |
| |
|
| Expenses paid per $1,000† | | $ 5.42 | | $ 8.53 | | $ 8.53 | | $ 4.38 | | $ 6.46 |
| Ending value (after expenses) | | $657.60 | | $654.80 | | $655.40 | | $658.60 | | $656.90 |
COMPARING YOUR FUND’S EXPENSES WITH THOSE OF OTHER FUNDS (Unaudited)
Using the SEC’s method to compare expenses
The Securities and Exchange Commission (SEC) has established guidelines to help investors assess fund expenses. Per these guidelines, the table below shows your fund’s expenses based on a $1,000 investment, assuming a hypothetical 5% annualized return. You can use this information to compare the ongoing expenses (but not transaction expenses or total cost) of investing in the fund with those of other funds.All mutual fund shareholder reports will provide this information to help you make this comparison. Please note that you cannot use this information to estimate your actual ending account balance and expenses paid during the period.
Expenses and Value of a $1,000 Investment assuming a hypothetical 5% annualized return for the six months ended October 31, 2008
| | | Class A | | Class B | | Class C | | Class I | | Class T |
| |
| |
| |
| |
| |
|
| Expenses paid per $1,000† | | $ 6.60 | | $ 10.38 | | $ 10.38 | | $ 5.33 | | $ 7.86 |
| Ending value (after expenses) | | $1,018.60 | | $1,014.83 | | $1,014.83 | | $1,019.86 | | $1,017.34 |
| † Expenses are equal to the fund’s annualized expense ratio of 1.30% for Class A, 2.05% for Class B, 2.05% for |
| Class C, 1.05% for Class I and 1.55% for Class T, multiplied by the average account value over the period, |
| multiplied by 184/366 (to reflect the one-half year period). |
8
STATEMENT OF INVESTMENTS
October 31, 2008 |
| Common Stocks—98.8% | | Shares | | Value ($) |
| |
| |
|
| Commercial & Consumer Services—5.8% | | | | |
| Avnet | | 12,700 a | | 212,598 |
| Brink’s | | 8,600 | | 417,014 |
| Copart | | 5,400 a | | 188,460 |
| Dun & Bradstreet | | 10,600 | | 781,114 |
| Gartner | | 16,000 a | | 294,400 |
| Ingram Micro, Cl. A | | 12,700 a | | 169,291 |
| Manpower | | 11,100 | | 345,543 |
| MPS Group | | 28,000 a | | 218,120 |
| Tech Data | | 19,200 a | | 411,840 |
| | | | | 3,038,380 |
| Consumer Durables—1.5% | | | | |
| Activision Blizzard | | 18,400 a | | 229,264 |
| Callaway Golf | | 26,500 b | | 277,190 |
| Hasbro | | 10,150 | | 295,060 |
| | | | | 801,514 |
| Consumer Non-Durables—6.6% | | | | |
| American Greetings, Cl. A | | 14,900 | | 174,032 |
| Blyth | | 14,900 | | 128,140 |
| Central European Distribution | | 14,100 a,b | | 405,939 |
| Church & Dwight | | 7,900 | | 466,811 |
| Hormel Foods | | 7,650 | | 216,189 |
| PepsiAmericas | | 13,400 | | 253,662 |
| Ralcorp Holdings | | 6,700 a | | 453,456 |
| Tupperware Brands | | 9,800 | | 247,940 |
| Universal | | 13,100 b | | 518,629 |
| Warnaco Group | | 19,000 a | | 566,390 |
| | | | | 3,431,188 |
| Consumer Services—2.3% | | | | |
| Brinker International | | 32,075 | | 298,297 |
| ITT Educational Services | | 6,400 a | | 560,960 |
| John Wiley & Sons, Cl. A | | 5,300 | | 184,334 |
| Service Corporation International | | 19,600 | | 135,240 |
| | | | | 1,178,831 |
| Electronic Technology—6.4% | | | | |
| CommScope | | 20,800 a,b | | 305,968 |
| Harris | | 7,100 | | 255,245 |
The Fund 9
| STATEMENT OF INVESTMENTS (continued) |
| Common Stocks (continued) | | Shares | | Value ($) |
| |
| |
|
| Electronic Technology (continued) | | | | |
| Integrated Device Technology | | 52,500 a | | 333,900 |
| Intersil, Cl. A | | 29,750 | | 407,278 |
| Jabil Circuit | | 28,900 | | 243,049 |
| L-3 Communications Holdings | | 1,600 | | 129,872 |
| Rockwell Automation | | 5,500 | | 152,185 |
| Semtech | | 41,800 a,b | | 506,616 |
| Synopsys | | 10,200 a | | 186,456 |
| Western Digital | | 34,700 a | | 572,550 |
| Zebra Technologies, Cl. A | | 12,900 a | | 261,096 |
| | | | | 3,354,215 |
| Energy Minerals—3.4% | | | | |
| Cimarex Energy | | 21,600 | | 873,936 |
| Denbury Resources | | 11,800 a | | 149,978 |
| Southwestern Energy | | 20,700 a | | 737,334 |
| | | | | 1,761,248 |
| Finance—19.4% | | | | |
| AMB Property | | 14,000 b | | 336,420 |
| American Financial Group | | 19,950 | | 453,463 |
| Cincinnati Financial | | 13,800 | | 358,662 |
| FirstMerit | | 26,800 | | 624,976 |
| GATX | | 11,250 | | 321,187 |
| HCC Insurance Holdings | | 33,600 | | 741,216 |
| Hospitality Properties Trust | | 39,750 b | | 403,462 |
| Host Hotels & Resorts | | 21,500 b | | 222,310 |
| Hudson City Bancorp | | 39,500 | | 742,995 |
| Jones Lang LaSalle | | 13,800 | | 454,296 |
| Macerich | | 9,600 | | 282,432 |
| Nasdaq OMX Group | | 6,700 a,b | | 217,482 |
| Nationwide Health Properties | | 7,200 | | 214,848 |
| Philadelphia Consolidated Holding | | 4,500 a | | 263,205 |
| Potlatch | | 6,600 | | 219,186 |
| ProLogis | | 12,050 | | 168,700 |
| Raymond James Financial | | 26,700 b | | 621,843 |
| Reinsurance Group of America, Cl. A | | 6,800 b | | 253,912 |
| StanCorp Financial Group | | 21,600 | | 736,128 |
| SVB Financial Group | | 11,600 a,b | | 596,820 |
10
| Common Stocks (continued) | | Shares | | Value ($) |
| |
| |
|
| Finance (continued) | | | | |
| Synovus Financial | | 25,100 b | | 259,283 |
| Transatlantic Holdings | | 2,800 | | 119,980 |
| UDR | | 13,300 | | 262,808 |
| Weingarten Realty Investors | | 23,800 b | | 486,710 |
| Westamerica Bancorporation | | 12,600 b | | 721,350 |
| | | | | 10,083,674 |
| Health Care Technology—9.8% | | | | |
| Dentsply International | | 29,200 | | 887,096 |
| Edwards Lifesciences | | 6,100 a,b | | 322,324 |
| IDEXX Laboratories | | 6,900 a | | 242,811 |
| Invitrogen | | 34,100 a,b | | 981,739 |
| Medicis Pharmaceutical, Cl. A | | 12,550 b | | 179,089 |
| Perrigo | | 17,600 b | | 598,400 |
| STERIS | | 13,300 | | 452,732 |
| Techne | | 4,800 | | 331,296 |
| Varian Medical Systems | | 4,500 a | | 204,795 |
| Vertex Pharmaceuticals | | 21,100 a | | 553,031 |
| Warner Chilcott, Cl. A | | 23,800 a | | 330,106 |
| | | | | 5,083,419 |
| Industrial Services—4.2% | | | | |
| Cameron International | | 11,400 a | | 276,564 |
| Dycom Industries | | 19,800 a | | 175,824 |
| Fluor | | 5,400 | | 215,622 |
| FMC Technologies | | 12,700 a | | 444,373 |
| Helmerich & Payne | | 5,700 | | 195,567 |
| Jacobs Engineering Group | | 7,400 a | | 269,582 |
| KBR | | 11,500 | | 170,660 |
| Murphy Oil | | 2,900 | | 146,856 |
| Oil States International | | 5,200 a | | 120,276 |
| Patterson-UTI Energy | | 13,150 | | 174,501 |
| | | | | 2,189,825 |
| Non-Energy Minerals—1.7% | | | | |
| AK Steel Holding | | 18,600 | | 258,912 |
| Reliance Steel & Aluminum | | 5,700 | | 142,728 |
| Worthington Industries | | 39,600 b | | 477,972 |
| | | | | 879,612 |
The Fund 11
| STATEMENT OF INVESTMENTS (continued) |
| Common Stocks (continued) | | Shares | | Value ($) |
| |
| |
|
| Process Industries—5.1% | | | | |
| Bunge | | 4,200 | | 161,322 |
| Crown Holdings | | 18,500 a | | 373,330 |
| Lubrizol | | 6,100 | | 229,238 |
| Minerals Technologies | | 13,700 | | 777,612 |
| Olin | | 14,100 | | 256,056 |
| Owens-Illinois | | 17,000 a | | 388,960 |
| Terra Industries | | 21,100 | | 463,989 |
| | | | | 2,650,507 |
| Producer Manufacturing—7.3% | | | | |
| AGCO | | 14,850 a | | 468,072 |
| ArvinMeritor | | 9,800 | | 58,016 |
| Gardner Denver | | 17,100 a | | 438,102 |
| Gentex | | 13,500 | | 129,465 |
| Hubbell, Cl. B | | 17,500 | | 627,725 |
| Ingersoll-Rand, Cl. A | | 9,100 | | 167,895 |
| Kennametal | | 7,300 | | 154,906 |
| Manitowoc | | 17,200 | | 169,248 |
| Mettler-Toledo International | | 4,500 a | | 344,430 |
| Nordson | | 10,600 b | | 391,458 |
| Oshkosh | | 18,100 | | 138,646 |
| SPX | | 11,850 | | 459,069 |
| Toro | | 7,200 b | | 242,208 |
| | | | | 3,789,240 |
| Retail Trade—7.2% | | | | |
| Advance Auto Parts | | 12,300 | | 383,760 |
| Aeropostale | | 26,575 a,b | | 643,381 |
| BJ’s Wholesale Club | | 14,000 a,b | | 492,800 |
| Dollar Tree | | 16,900 a | | 642,538 |
| Family Dollar Stores | | 11,450 | | 308,119 |
| GameStop, Cl. A | | 8,500 a | | 232,815 |
| Tiffany & Co. | | 6,900 | | 189,405 |
| Urban Outfitters | | 40,300 a | | 876,122 |
| | | | | 3,768,940 |
| Technology Services—6.7% | | | | |
| ANSYS | | 7,500 a | | 214,725 |
12
| Common Stocks (continued) | | Shares | | Value ($) |
| |
| |
|
| Technology Services (continued) | | | | |
| Computer Sciences | | 9,800 a | | 295,568 |
| DST Systems | | 3,700 a,b | | 150,146 |
| Express Scripts | | 3,900 a | | 236,379 |
| LifePoint Hospitals | | 14,700 a,b | | 352,359 |
| Lincare Holdings | | 24,400 a | | 642,940 |
| Parametric Technology | | 27,350 a | | 355,277 |
| Sohu.com | | 3,300 a,b | | 181,302 |
| Sybase | | 24,700 a | | 657,761 |
| Universal Health Services, Cl. B | | 9,700 | | 407,788 |
| | | | | 3,494,245 |
| Telecommunications—1.1% | | | | |
| Telephone & Data Systems | | 22,100 | | 593,385 |
| Transportation—1.2% | | | | |
| Frontline | | 9,200 b | | 292,560 |
| Kansas City Southern | | 6,200 a | | 191,394 |
| Southwest Airlines | | 13,500 | | 159,030 |
| | | | | 642,984 |
| Utilities—9.1% | | | | |
| Alliant Energy | | 18,850 | | 553,813 |
| CenterPoint Energy | | 48,300 | | 556,416 |
| Hawaiian Electric Industries | | 31,100 | | 827,882 |
| Integrys Energy | | 7,900 | | 376,593 |
| Pepco Holdings | | 21,550 | | 445,008 |
| Sierra Pacific Resources | | 79,600 | | 659,884 |
| Southern Union | | 23,200 b | | 399,504 |
| UGI | | 19,700 | | 470,239 |
| WGL Holdings | | 14,300 | | 460,317 |
| | | | | 4,749,656 |
| Total Common Stocks | | | | |
| (cost $74,113,893) | | | | 51,490,863 |
| |
| |
|
| |
| Other Investment—.3% | | | | |
| |
| |
|
| Registered Investment Company; | | | | |
| Dreyfus Institutional Preferred Plus Money Market Fund | | | | |
| (cost $173,000) | | 173,000 c | | 173,000 |
The Fund 13
| STATEMENT OF INVESTMENTS (continued) |
| Investment of Cash Collateral | | | | |
| for Securities Loaned—15.0% | | Shares | | Value ($) |
| |
| |
|
| Registered Investment Company; | | | | |
| Dreyfus Institutional Cash Advantage Fund | | | | |
| (cost $7,821,581) | | 7,821,581 c | | 7,821,581 |
| |
| |
|
| Total Investments (cost $82,108,474) | | 114.1% | | 59,485,444 |
| Liabilities, Less Cash and Receivables | | (14.1%) | | (7,347,583) |
| Net Assets | | 100.0% | | 52,137,861 |
| a Non-income producing security. |
| b All or a portion of these securities are on loan. At October 31, 2008, the total market value of the fund’s securities |
| on loan is $7,934,908 and the total market value of the collateral held by the fund is $8,068,384, consisting of |
| cash collateral of $7,821,581 and U.S. Government and Agency securities valued at $246,803. |
| c Investment in affiliated money market mutual fund. |
| Portfolio Summary (Unaudited)† | | | | |
| |
| | | Value (%) | | | | Value (%) |
| |
| |
| |
|
| Finance | | 19.4 | | Process Industries | | 5.1 |
| Money Market Investments | | 15.3 | | Industrial Services | | 4.2 |
| Health Care Technology | | 9.8 | | Energy Minerals | | 3.4 |
| Utilities | | 9.1 | | Consumer Services | | 2.3 |
| Producer Manufacturing | | 7.3 | | Non-Energy Minerals | | 1.7 |
| Retail Trade | | 7.2 | | Consumer Durables | | 1.5 |
| Technology Services | | 6.7 | | Transportation | | 1.2 |
| Consumer Non-Durables | | 6.6 | | Telecommunications | | 1.1 |
| Electronic Technology | | 6.4 | | | | |
| Commercial & Consumer Services | | 5.8 | | | | 114.1 |
| |
| † Based on net assets. | | | | | | |
| See notes to financial statements. | | | | | | |
14
STATEMENT OF ASSETS AND LIABILITIES
October 31, 2008
| | | | | | | | | Cost | | Value |
| |
| |
| |
| |
| |
|
| Assets ($): | | | | | | | | | | |
| Investments in securities-See Statement of Investments (including | | | | |
| securities on loan, valued at $7,934,908)—Note 1(b): | | | | | | |
| Unaffiliated issuers | | | | | | 74,113,893 | | 51,490,863 |
| Affiliated issuers | | | | | | | | 7,994,581 | | 7,994,581 |
| Cash | | | | | | | | | | 13,420 |
| Receivable for investment securities sold | | | | | | 1,421,483 |
| Dividends and interest receivable | | | | | | | | 71,216 |
| Receivable for shares of Capital Stock subscribed | | | | | | 29,511 |
| | | | | | | | | | | 61,021,074 |
| |
| |
| |
| |
| |
|
| Liabilities ($): | | | | | | | | | | |
| Due to The Dreyfus Corporation and affiliates—Note 3(b) | | | | | | 62,466 |
| Liability for securities on loan—Note 1(b) | | | | | | | | 7,821,581 |
| Payable for investment securities purchased | | | | | | 876,325 |
| Payable for shares of Capital Stock redeemed | | | | | | 122,221 |
| Interest payable—Note 2 | | | | | | | | 620 |
| | | | | | | | | | | 8,883,213 |
| |
| |
| |
| |
| |
|
| Net Assets ($) | | | | | | | | | | 52,137,861 |
| |
| |
| |
| |
| |
|
| Composition of Net Assets ($): | | | | | | | | |
| Paid-in capital | | | | | | | | | | 82,731,434 |
| Accumulated undistributed investment income—net | | | | | | 265,453 |
| Accumulated net realized gain (loss) on investments | | | | | | (8,235,996) |
| Accumulated net unrealized appreciation | | | | | | |
| (depreciation) on investments | | | | | | | | (22,623,030) |
| |
| |
| |
| |
|
| Net Assets ($) | | | | | | | | | | 52,137,861 |
| |
| |
| |
| |
| |
|
| |
| |
| Net Asset Value Per Share | | | | | | | | |
| | | Class A | | Class B | | Class C | | Class I | | Class T |
| |
| |
| |
| |
| |
|
| Net Assets ($) | | 35,357,985 | | 3,974,939 | | 4,805,016 | | 7,620,628 | | 379,293 |
| Shares Outstanding | | 4,578,763 | | 601,788 | | 725,531 | | 938,535 | | 51,174 |
| |
| |
| |
| |
| |
|
| Net Asset Value | | | | | | | | | | |
| Per Share ($) | | 7.72 | | 6.61 | | 6.62 | | 8.12 | | 7.41 |
| |
| See notes to financial statements. | | | | | | | | |
The Fund 15
| STATEMENT OF OPERATIONS | | |
| Year Ended October 31, 2008 | | |
| |
|
| |
| |
| |
| |
| Investment Income ($): | | |
| Income: | | |
| Cash dividends (net of $240 foreign taxes withheld at source): | | |
| Unaffiliated issuers | | 1,438,704 |
| Affiliated issuers | | 18,871 |
| Income on securities lending | | 89,565 |
| Total Income | | 1,547,140 |
| Expenses: | | |
| Management fee—Note 3(a) | | 979,472 |
| Distribution and service plan fees—Note 3(b) | | 321,748 |
| Directors’ fees—Note 3(a) | | 4,486 |
| Loan commitment fees—Note 2 | | 1,478 |
| Interest expense—Note 2 | | 173 |
| Total Expenses | | 1,307,357 |
| Less—reduction in management fee | | |
| due to undertaking—Note 3(a) | | (44,521) |
| Less—Directors’ fees reimbursed | | |
| by the Manager—Note 3(a) | | (4,486) |
| Net Expenses | | 1,258,350 |
| Investment Income—Net | | 288,790 |
| |
|
| Realized and Unrealized Gain (Loss) on Investments—Note 4 ($): | | |
| Net realized gain (loss) on investments | | (8,252,131) |
| Net unrealized appreciation (depreciation) on investments | | (31,230,748) |
| Net Realized and Unrealized Gain (Loss) on Investments | | (39,482,879) |
| Net (Decrease) in Net Assets Resulting from Operations | | (39,194,089) |
| |
| See notes to financial statements. | | |
16
STATEMENT OF CHANGES IN NET ASSETS
| | | Year Ended October 31, |
| | |
|
| | | 2008 | | 2007a |
| |
| |
|
| Operations ($): | | | | |
| Investment income—net | | 288,790 | | (12,823) |
| Net realized gain (loss) on investments | | (8,252,131) | | 16,309,602 |
| Net unrealized appreciation | | | | |
| (depreciation) on investments | | (31,230,748) | | (2,561,573) |
| Net Increase (Decrease) in Net Assets | | | | |
| Resulting from Operations | | (39,194,089) | | 13,735,206 |
| |
| |
|
| Dividends to Shareholders from ($): | | | | |
| Net realized gain on investments: | | | | |
| Class A Shares | | (10,073,140) | | (12,838,128) |
| Class B Shares | | (2,334,879) | | (4,141,897) |
| Class C Shares | | (1,608,612) | | (2,112,366) |
| Class I Shares | | (1,988,588) | | (4,818,062) |
| Class T Shares | | (200,710) | | (227,086) |
| Total Dividends | | (16,205,929) | | (24,137,539) |
| |
| |
|
| Capital Stock Transactions ($): | | | | |
| Net proceeds from shares sold: | | | | |
| Class A Shares | | 10,127,049 | | 15,768,053 |
| Class B Shares | | 96,180 | | 226,811 |
| Class C Shares | | 593,566 | | 1,262,988 |
| Class I Shares | | 530,323 | | 2,410,723 |
| Class T Shares | | 252,551 | | 462,004 |
| Dividends reinvested: | | | | |
| Class A Shares | | 9,432,644 | | 12,001,307 |
| Class B Shares | | 2,226,328 | | 3,903,700 |
| Class C Shares | | 1,284,633 | | 1,501,962 |
| Class I Shares | | 1,881,081 | | 4,651,436 |
| Class T Shares | | 188,687 | | 216,678 |
| Cost of shares redeemed: | | | | |
| Class A Shares | | (22,499,834) | | (31,178,371) |
| Class B Shares | | (7,997,882) | | (11,726,726) |
| Class C Shares | | (2,363,746) | | (4,279,484) |
| Class I Shares | | (13,032,289) | | (10,515,413) |
| Class T Shares | | (878,401) | | (720,575) |
| Increase (Decrease) in Net Assets | | | | |
| from Capital Stock Transactions | | (20,159,110) | | (16,014,907) |
| Total Increase (Decrease) in Net Assets | | (75,559,128) | | (26,417,240) |
| |
| |
|
| Net Assets ($): | | | | |
| Beginning of Period | | 127,696,989 | | 154,114,229 |
| End of Period | | 52,137,861 | | 127,696,989 |
| Undistributed investment income—net | | 265,453 | | 52,800 |
The Fund 17
STATEMENT OF CHANGES IN NET ASSETS (continued)
| | | Year Ended October 31, |
| | |
|
| | | 2008 | | 2007a |
| |
| |
|
| Capital Share Transactions: | | | | |
| Class Ab | | | | |
| Shares sold | | 879,864 | | 1,050,729 |
| Shares issued for dividends reinvested | | 795,118 | | 848,997 |
| Shares redeemed | | (1,988,287) | | (2,081,757) |
| Net Increase (Decrease) in Shares Outstanding | | (313,305) | | (182,031) |
| |
| |
|
| Class Bb | | | | |
| Shares sold | | 9,804 | | 17,328 |
| Shares issued for dividends reinvested | | 217,945 | | 310,601 |
| Shares redeemed | | (803,695) | | (872,354) |
| Net Increase (Decrease) in Shares Outstanding | | (575,946) | | (544,425) |
| |
| |
|
| Class C | | | | |
| Shares sold | | 59,636 | | 96,400 |
| Shares issued for dividends reinvested | | 125,399 | | 119,245 |
| Shares redeemed | | (242,931) | | (315,584) |
| Net Increase (Decrease) in Shares Outstanding | | (57,896) | | (99,939) |
| |
| |
|
| Class I | | | | |
| Shares sold | | 45,213 | | 154,820 |
| Shares issued for dividends reinvested | | 151,141 | | 316,482 |
| Shares redeemed | | (924,942) | | (673,658) |
| Net Increase (Decrease) in Shares Outstanding | | (728,588) | | (202,356) |
| |
| |
|
| Class T | | | | |
| Shares sold | | 22,683 | | 32,036 |
| Shares issued for dividends reinvested | | 16,532 | | 15,797 |
| Shares redeemed | | (82,923) | | (48,608) |
| Net Increase (Decrease) in Shares Outstanding | | (43,708) | | (775) |
| a | | Effective June 1, 2007, Class R shares were redesignated as Class I shares. |
| b | | During the period ended October 31, 2008, 413,881 Class B shares representing $4,190,233, were automatically |
| | | converted to 356,376 Class A shares and during the period ended October 31, 2007, 487,720 Class B shares |
| | | representing $6,589,514 were automatically converted to 433,658 Class A shares. |
| See notes to financial statements. |
18
FINANCIAL HIGHLIGHTS
The following tables describe the performance for each share class for the fiscal periods indicated.All information (except portfolio turnover rate) reflects financial results for a single fund share.Total return shows how much your investment in the fund would have increased (or decreased) during each period, assuming you had reinvested all dividends and distributions.These figures have been derived from the fund’s financial statements.
| | | | | Year Ended October 31, | | |
| | |
| |
| |
|
| Class A Shares | | 2008 | | 2007 | | 2006 | | 2005 | | 2004 |
| |
| |
| |
| |
| |
|
| Per Share Data ($): | | | | | | | | | | |
| Net asset value, beginning of period | | 15.11 | | 16.29 | | 20.14 | | 18.02 | | 16.68 |
| Investment Operations: | | | | | | | | | | |
| Investment income (loss)—neta | | .05 | | .02 | | (.02) | | (.03) | | (.03) |
| Net realized and unrealized | | | | | | | | | | |
| gain (loss) on investments | | (5.31) | | 1.40 | | 1.80 | | 2.48 | | 1.37 |
| Total from Investment Operations | | (5.26) | | 1.42 | | 1.78 | | 2.45 | | 1.34 |
| Distributions: | | | | | | | | | | |
| Dividends from net realized | | | | | | | | | | |
| gain on investments | | (2.13) | | (2.60) | | (5.63) | | (.33) | | — |
| Net asset value, end of period | | 7.72 | | 15.11 | | 16.29 | | 20.14 | | 18.02 |
| |
| |
| |
| |
| |
|
| Total Return (%)b | | (39.72) | | 9.85 | | 10.34 | | 13.70 | | 8.10 |
| |
| |
| |
| |
| |
|
| Ratios/Supplemental Data (%): | | | | | | | | | | |
| Ratio of total expenses | | | | | | | | | | |
| to average net assets | | 1.36 | | 1.35 | | 1.35 | | 1.35 | | 1.35 |
| Ratio of net expenses | | | | | | | | | | |
| to average net assets | | 1.30 | | 1.32 | | 1.35 | | 1.35 | | 1.35 |
| Ratio of net investment income | | | | | | | | | | |
| (loss) to average net assets | | .44 | | .11 | | (.10) | | (.14) | | (.17) |
| Portfolio Turnover Rate | | 81.79 | | 123.26 | | 144.49 | | 87.40 | | 77.47 |
| |
| |
| |
| |
| |
|
| Net Assets, end of period ($ x 1,000) | | 35,358 | | 73,901 | | 82,641 | | 93,533 | | 157,483 |
| a | | Based on average shares outstanding at each month end. |
| b | | Exclusive of sales charge. |
| See notes to financial statements. |
The Fund 19
| | FINANCIAL HIGHLIGHTS (continued) |
| | | | | Year Ended October 31, | | |
| | |
| |
| |
|
| Class B Shares | | 2008 | | 2007 | | 2006 | | 2005 | | 2004 |
| |
| |
| |
| |
| |
|
| Per Share Data ($): | | | | | | | | | | |
| Net asset value, beginning of period | | 13.34 | | 14.77 | | 18.87 | | 17.03 | | 15.87 |
| Investment Operations: | | | | | | | | | | |
| Investment (loss)—neta | | (.03) | | (.09) | | (.13) | | (.17) | | (.15) |
| Net realized and unrealized | | | | | | | | | | |
| gain (loss) on investments | | (4.57) | | 1.26 | | 1.66 | | 2.34 | | 1.31 |
| Total from Investment Operations | | (4.60) | | 1.17 | | 1.53 | | 2.17 | | 1.16 |
| Distributions: | | | | | | | | | | |
| Dividends from net realized | | | | | | | | | | |
| gain on investments | | (2.13) | | (2.60) | | (5.63) | | (.33) | | — |
| Net asset value, end of period | | 6.61 | | 13.34 | | 14.77 | | 18.87 | | 17.03 |
| |
| |
| |
| |
| |
|
| Total Return (%)b | | (40.19) | | 9.06 | | 9.51 | | 12.84 | | 7.31 |
| |
| |
| |
| |
| |
|
| Ratios/Supplemental Data (%): | | | | | | | | | | |
| Ratio of total expenses | | | | | | | | | | |
| to average net assets | | 2.11 | | 2.10 | | 2.10 | | 2.10 | | 2.10 |
| Ratio of net expenses | | | | | | | | | | |
| to average net assets | | 2.05 | | 2.07 | | 2.10 | | 2.10 | | 2.10 |
| Ratio of net investment (loss) | | | | | | | | | | |
| to average net assets | | (.30) | | (.65) | | (.85) | | (.92) | | (.91) |
| Portfolio Turnover Rate | | 81.79 | | 123.26 | | 144.49 | | 87.40 | | 77.47 |
| |
| |
| |
| |
| |
|
| Net Assets, end of period ($ x 1,000) | | 3,975 | | 15,708 | | 25,435 | | 33,992 | | 40,755 |
| a | | Based on average shares outstanding at each month end. |
| b | | Exclusive of sales charge. |
| See notes to financial statements. |
20
| | | | | Year Ended October 31, | | |
| | |
| |
| |
|
| Class C Shares | | 2008 | | 2007 | | 2006 | | 2005 | | 2004 |
| |
| |
| |
| |
| |
|
| Per Share Data ($): | | | | | | | | | | |
| Net asset value, beginning of period | | 13.37 | | 14.80 | | 18.90 | | 17.06 | | 15.90 |
| Investment Operations: | | | | | | | | | | |
| Investment (loss)—neta | | (.03) | | (.09) | | (.13) | | (.17) | | (.15) |
| Net realized and unrealized | | | | | | | | | | |
| gain (loss) on investments | | (4.59) | | 1.26 | | 1.66 | | 2.34 | | 1.31 |
| Total from Investment Operations | | (4.62) | | 1.17 | | 1.53 | | 2.17 | | 1.16 |
| Distributions: | | | | | | | | | | |
| Dividends from net realized | | | | | | | | | | |
| gain on investments | | (2.13) | | (2.60) | | (5.63) | | (.33) | | — |
| Net asset value, end of period | | 6.62 | | 13.37 | | 14.80 | | 18.90 | | 17.06 |
| |
| |
| |
| |
| |
|
| Total Return (%)b | | (40.18) | | 9.03 | | 9.43 | | 12.88 | | 7.30 |
| |
| |
| |
| |
| |
|
| Ratios/Supplemental Data (%): | | | | | | | | | | |
| Ratio of total expenses | | | | | | | | | | |
| to average net assets | | 2.11 | | 2.10 | | 2.10 | | 2.10 | | 2.10 |
| Ratio of net expenses | | | | | | | | | | |
| to average net assets | | 2.05 | | 2.07 | | 2.10 | | 2.10 | | 2.10 |
| Ratio of net investment (loss) | | | | | | | | | | |
| to average net assets | | (.31) | | (.64) | | (.85) | | (.93) | | (.92) |
| Portfolio Turnover Rate | | 81.79 | | 123.26 | | 144.49 | | 87.40 | | 77.47 |
| |
| |
| |
| |
| |
|
| Net Assets, end of period ($ x 1,000) | | 4,805 | | 10,473 | | 13,072 | | 16,563 | | 16,041 |
| a | | Based on average shares outstanding at each month end. |
| b | | Exclusive of sales charge. |
| See notes to financial statements. |
The Fund 21
| FINANCIAL HIGHLIGHTS (continued) |
| | | | | Year Ended October 31, | | |
| | |
| |
| |
|
| Class I Shares | | 2008 | | 2007a | | 2006 | | 2005 | | 2004 |
| |
| |
| |
| |
| |
|
| Per Share Data ($): | | | | | | | | | | |
| Net asset value, beginning of period | | 15.73 | | 16.82 | | 20.59 | | 18.37 | | 16.95 |
| Investment Operations: | | | | | | | | | | |
| Investment income—netb | | .08 | | .06 | | .03 | | .02 | | .02 |
| Net realized and unrealized | | | | | | | | | | |
| gain (loss) on investments | | (5.56) | | 1.45 | | 1.83 | | 2.53 | | 1.40 |
| Total from Investment Operations | | (5.48) | | 1.51 | | 1.86 | | 2.55 | | 1.42 |
| Distributions: | | | | | | | | | | |
| Dividends from net realized | | | | | | | | | | |
| gain on investments | | (2.13) | | (2.60) | | (5.63) | | (.33) | | — |
| Net asset value, end of period | | 8.12 | | 15.73 | | 16.82 | | 20.59 | | 18.37 |
| |
| |
| |
| |
| |
|
| Total Return (%) | | (39.53) | | 10.11 | | 10.56 | | 13.99 | | 8.38 |
| |
| |
| |
| |
| |
|
| Ratios/Supplemental Data (%): | | | | | | | | | | |
| Ratio of total expenses | | | | | | | | | | |
| to average net assets | | 1.11 | | 1.10 | | 1.10 | | 1.10 | | 1.10 |
| Ratio of net expenses | | | | | | | | | | |
| to average net assets | | 1.05 | | 1.06 | | 1.10 | | 1.10 | | 1.10 |
| Ratio of net investment income | | | | | | | | | | |
| to average net assets | | .68 | | .36 | | .15 | | .08 | | .09 |
| Portfolio Turnover Rate | | 81.79 | | 123.26 | | 144.49 | | 87.40 | | 77.47 |
| |
| |
| |
| |
| |
|
| Net Assets, end of period ($ x 1,000) | | 7,621 | | 26,228 | | 31,446 | | 31,738 | | 39,215 |
| a | | Effective June 1, 2007, the fund redesignated Class R shares to Class I shares |
| b | | Based on average shares outstanding at each month end. |
| See notes to financial statements. |
22
| | | | | Year Ended October 31, | | |
| | |
| |
| |
|
| Class T Shares | | 2008 | | 2007 | | 2006 | | 2005 | | 2004 |
| |
| |
| |
| |
| |
|
| Per Share Data ($): | | | | | | | | | | |
| Net asset value, beginning of period | | 14.62 | | 15.88 | | 19.81 | | 17.77 | | 16.49 |
| Investment Operations: | | | | | | | | | | |
| Investment income (loss)—neta | | .02 | | (.02) | | (.06) | | (.08) | | (.07) |
| Net realized and unrealized | | | | | | | | | | |
| gain (loss) on investments | | (5.10) | | 1.36 | | 1.76 | | 2.45 | | 1.35 |
| Total from Investment Operations | | (5.08) | | 1.34 | | 1.70 | | 2.37 | | 1.28 |
| Distributions: | | | | | | | | | | |
| Dividends from net realized | | | | | | | | | | |
| gain on investments | | (2.13) | | (2.60) | | (5.63) | | (.33) | | — |
| Net asset value, end of period | | 7.41 | | 14.62 | | 15.88 | | 19.81 | | 17.77 |
| |
| |
| |
| |
| |
|
| Total Return (%)b | | (39.85) | | 9.56 | | 10.03 | | 13.44 | | 7.83 |
| |
| |
| |
| |
| |
|
| Ratios/Supplemental Data (%): | | | | | | | | | | |
| Ratio of total expenses | | | | | | | | | | |
| to average net assets | | 1.61 | | 1.60 | | 1.60 | | 1.60 | | 1.60 |
| Ratio of net expenses | | | | | | | | | | |
| to average net assets | | 1.55 | | 1.57 | | 1.60 | | 1.60 | | 1.60 |
| Ratio of net investment income | | | | | | | | | | |
| (loss) to average net assets | | .17 | | (.14) | | (.36) | | (.43) | | (.42) |
| Portfolio Turnover Rate | | 81.79 | | 123.26 | | 144.49 | | 87.40 | | 77.47 |
| |
| |
| |
| |
| |
|
| Net Assets, end of period ($ x 1,000) | | 379 | | 1,388 | | 1,519 | | 1,388 | | 1,570 |
| a | | Based on average shares outstanding at each month end. |
| b | | Exclusive of sales charge. |
| See notes to financial statements. |
The Fund 23
NOTES TO FINANCIAL STATEMENTS
NOTE 1—Significant Accounting Policies:
Dreyfus Midcap Stock Fund (the “fund”) is a separate diversified series ofThe Dreyfus/Laurel Funds, Inc. (the “Company”) which is registered under the Investment Company Act of 1940, as amended (the “Act”), as an open-end management investment company and operates as a series company currently offering fourteen series, including the fund. The fund’s investment objective is to seek capital appreciation. The Dreyfus Corporation (the “Manager” or “Dreyfus”), a wholly-owned subsidiary of The Bank of New York Mellon Corporation (“BNY Mellon”), serves as the fund’s investment adviser.
At a meeting of the fund’s Board of Directors held on July 24, 2008, the Board approved, effective December 1, 2008, a proposal to change the name of the fund from “Dreyfus Premier Midcap Stock Fund” to “Dreyfus Midcap Stock Fund”.
Effective July 1, 2008, BNY Mellon has reorganized and consolidated a number of its banking and trust company subsidiaries. As a result of the reorganization, any services previously provided to the fund by Mellon Bank, N.A. or Mellon Trust of New England, N.A. are now provided by The Bank of New York, which has changed its name to The Bank of New York Mellon.
MBSC Securities Corporation (the “Distributor”), a wholly-owned subsidiary of the Manager, is the distributor of the fund’s shares. The fund is authorized to issue 488 million shares of $.001 par value Capital Stock.The fund currently offers five classes of shares: Class A (22 million shares authorized), Class B (100 million shares authorized), Class C (100 million shares authorized), Class I (66 million shares authorized) and ClassT shares (200 million shares authorized). Class A, Class B, Class C and Class T shares are sold primarily to retail investors through financial intermediaries and bear a distribution fee and/or service fee. Class A and Class T shares are sold with a front-end sales charge, while Class B and Class C shares are subject to a contingent deferred sales charge (“CDSC”). Class B shares automatically convert to Class A shares after six years.The fund does not offer Class B shares,
24
except in connection with dividend reinvestment and permitted exchanges of Class B shares. Class I shares are sold primarily to bank trust departments and other financial service providers (including The Bank of NewYork Mellon and/or any of its affiliates) acting on behalf of customers having a qualified trust or an investment account or relationship at such institution and bear no distribution or service fees. Class I shares are offered without a front end sales charge or CDSC. Each class of shares has identical rights and privileges, except with respect to distribution and service fees, the allocation of certain transfer agency costs and voting rights on matters affecting a single class. Income, expenses (other than expenses attributable to a specific class), and realized and unrealized gains or losses on investments are allocated to each class of shares based on its relative net assets.
The fund’s financial statements are prepared in accordance with U.S. generally accepted accounting principles, which may require the use of management estimates and assumptions. Actual results could differ from those estimates.
(a) Portfolio valuation: Investments in securities are valued at the last sales price on the securities exchange or national securities market on which such securities are primarily traded. Securities listed on the National Market System for which market quotations are available, are valued at the official closing price or, if there is no official closing price that day, at the last sale price. Securities not listed on an exchange or the national securities market, or securities for which there were no transactions, are valued at the average of the most recent bid and asked prices, except for open short positions, where the asked price is used for valuation purposes. Bid price is used when no asked price is available. Registered investment companies that are not traded on an exchange are valued at their net asset value. When market quotations or official closing prices are not readily available, or are determined not to reflect accurately fair value, such as when the value of a security has been significantly affected by events after the close of the exchange or market on which the security is principally
The Fund 25
| NOTES TO FINANCIAL STATEMENTS (continued) |
traded (for example, a foreign exchange or market), but before the fund calculates its net asset value, the fund may value these investments at fair value as determined in accordance with the procedures approved by the Board of Directors. Fair valuing of securities may be determined with the assistance of a pricing service using calculations based on indices of domestic securities and other appropriate indicators, such as prices of relevant ADRs and futures contracts. For other securities that are fair valued by the Board of Directors, certain factors may be considered such as: fundamental analytical data, the nature and duration of restrictions on disposition, an evaluation of the forces that influence the market in which the securities are purchased and sold, and public trading in similar securities of the issuer or comparable issuers. Financial futures are valued at the last sales price.
The Financial Accounting Standards Board (“FASB”) released Statement of Financial Accounting Standards No. 157 “Fair Value Measurements” (“FAS 157”). FAS 157 establishes an authoritative definition of fair value, sets out a framework for measuring fair value, and requires additional disclosures about fair-value measurements. The application of FAS 157 is required for fiscal years beginning after November 15, 2007 and interim periods within those fiscal years. Management does not believe that the application of this standard will have a material impact on the financial statements of the fund.
(b) Securities transactions and investment income: Securities transactions are recorded on a trade date basis. Realized gains and losses from securities transactions are recorded on the identified cost basis. Dividend income is recognized on the ex-dividend date and interest income, including, where applicable, accretion of discount and amortization premium on investments, is recognized on the accrual basis.
Pursuant to a securities lending agreement with The Bank of New York Mellon, a subsidiary of BNY Mellon and a Dreyfus affiliate, the fund may lend securities to qualified institutions. It is the fund’s policy that, at origination, all loans are secured by collateral of at least 102% of the value of U.S. securities loaned and 105% of the value of foreign
26
securities loaned. Collateral equivalent to at least 100% of the market value of securities on loan will be maintained at all times. Collateral is either in the form of cash, which can be invested in certain money market mutual funds managed by the Manager, U.S. Government and Agency securities or Letters of Credit.The fund is entitled to receive all income on securities loaned, in addition to income earned as a result of the lending transaction.Although each security loaned is fully collateralized, the fund bears the risk of delay in recovery of, or loss of rights in, the securities loaned should a borrower fail to return the securities in a timely manner. During the period ended October 31, 2008, The Bank of New York Mellon earned $29,855 from lending fund portfolio securities, pursuant to the securities lending agreement.
(c) Affiliated issuers: Investments in other investment companies advised by the Manager are defined as “affiliated” in the Act.
(d) Dividends to shareholders: Dividends are recorded on the ex-dividend date. Dividends from investment income-net and dividends from net realized capital gains, if any, are normally declared and paid annually, but the fund may make distributions on a more frequent basis to comply with the distribution requirements of the Internal Revenue Code of 1986, as amended (the “Code”).To the extent that net realized capital gains can be offset by capital loss carryovers, it is the policy of the fund not to distribute such gains. Income and capital gain distributions are determined in accordance with income tax regulations, which may differ from U.S. generally accepted accounting principles.
(e) Federal income taxes: It is the policy of the fund to continue to qualify as a regulated investment company, if such qualification is in the best interests of its shareholders, by complying with the applicable provisions of the Code, and to make distributions of taxable income sufficient to relieve it from substantially all federal income and excise taxes.
The fund adopted FASB Interpretation No. 48 “Accounting for Uncertainty in Income Taxes” (“FIN 48”). FIN 48 provides guidance for how uncertain tax positions should be recognized, measured, pre-
The Fund 27
| NOTES TO FINANCIAL STATEMENTS (continued) |
sented and disclosed in the financial statements. FIN 48 requires the evaluation of tax positions taken or expected to be taken in the course of preparing the fund’s tax returns to determine whether the tax positions are “more-likely-than-not” of being sustained by the applicable tax authority. Liability for tax positions not deemed to meet the more-likely-than-not threshold would be recorded as a tax expense in the current year.The adoption of FIN 48 had no impact on the operations of the fund for the period ending October 31, 2008.
As of and during the period ended October 31, 2008, the fund did not have any liabilities for any unrecognized tax positions. The fund recognizes interest and penalties, if any, related to unrecognized tax positions as income tax expense in the Statement of Operations. During the period, the fund did not incur any interest or penalties.
Each of the tax years in the four-year period ended October 31, 2008 remains subject to examination by the Internal Revenue Service and state taxing authorities.
At October 31, 2008, the components of accumulated earnings on a tax basis were as follows: undistributed ordinary income $169,467, accumulated capital losses $8,224,360 and unrealized depreciation $22,538,680.
The accumulated capital loss carryover is available to be applied against future net securities profits, if any, realized subsequent to October 31, 2008. If not applied the carryover expires in fiscal 2016.
The tax character of distributions paid to shareholders during the fiscal periods ended October 31, 2008 and October 31, 2007, were as follows: ordinary income $6,564,078 and $3,377,039 and long term capital gains $9,641,851 and $20,760,500, respectively.
During the period ended October 31, 2008, as a result of permanent book to tax differences, primarily due to the tax treatment for real estate investment trusts, the fund decreased accumulated undistributed investment income-net by $76,137 and increased accumulated net realized gain (loss) on investments by the same amount. Net assets and net asset value per share were not affected by this reclassification.
28
NOTE 2—Bank Lines of Credit:
Prior to October 15, 2008, the fund participated with other Dreyfus-managed funds in a $350 million redemption credit facility. Effective October 15, 2008, the fund participates with other Dreyfus-managed funds in a $145 million redemption credit facility (the “Facility”) to be utilized for temporary or emergency purposes, including the financing of redemptions. In connection therewith, the fund has agreed to pay commitment fees on its pro rata portion of the Facility. Interest is charged to the fund at rates based on prevailing market rates in effect at the time of borrowing.
The average daily amount of borrowings outstanding under the Facilities during the period ended October 31, 2008, was approximately $6,700, with a related weighted average annualized interest rate of 2.60% .
NOTE 3—Investment Management Fee And Other Transactions With Affiliates:
(a) Pursuant to an Investment Management Agreement with the Manager, the Manager provides or arranges for one or more third parties and/or affiliates to provide investment advisory, administrative, custody, fund accounting and transfer agency services to the fund.The Manager also directs the investments of the fund in accordance with its investment objective, policies and limitations. For these services, the fund is contractually obligated to pay the Manager a fee, calculated daily and paid monthly, at the annual rate of 1.10% of the value of the fund’s average daily net assets. Out of its fee, the Manager pays all of the expenses of the fund except brokerage fees, taxes, interest, commitment fees, Rule 12b-1 distribution fees and expenses, service fees, fees and expenses of non-interested Directors (including counsel fees) and extraordinary expenses. In addition, the Manager is required to reduce its fee in an amount equal to the fund’s allocable portion of fees and expenses of the non-interested Directors (including counsel fees). Each Director receives $45,000 per year, plus $6,000 for each joint
The Fund 29
| NOTES TO FINANCIAL STATEMENTS (continued) |
Board meeting of the Company, The Dreyfus/Laurel Tax-Free Municipal Funds andThe Dreyfus/Laurel FundsTrust (collectively, the “Dreyfus/Laurel Funds”) attended, $2,000 for separate in-person committee meetings attended which are not held in conjunction with a regularly scheduled Board meeting and $1,500 for Board meetings and separate committee meetings attended that are conducted by telephone and is reimbursed for travel and out-of-pocket expenses.With respect to Board Meetings, the Chairman of the Board receives an additional 25% of such compensation (with the exception of reimbursable amounts). With respect to compensation committee meetings, the Chair of the compensation committee receives $900 per meeting and, prior to April 12, 2008 with respect to audit committee meetings, the Chair of the audit committee received $1,350 per meeting. In the event that there is an in-person joint committee meeting or a joint telephone meeting of the Dreyfus/Laurel Funds and Dreyfus HighYield Strategies Fund, the $2,000 or $1,500 fee, as applicable, will be allocated between the Dreyfus/Laurel Funds and Dreyfus High Yield Strategies Fund. These fees and expenses are charged and allocated to each series based on net assets. Amounts required to be paid by the Company directly to the non-interested Directors, that would be applied to offset a portion of the management fee payable to the Manager, are in fact paid directly by the Manager to the non-interested Directors.
The Manager has agreed from November 1, 2007 through April 4, 2009 to waive receipt of a portion of the fund’s management fee, in the amount of .05% of the value of the fund’s average daily net assets. The reduction in management fee pursuant to the undertaking, amounted to $44,521 during the period ended October 31, 2008.
During the period ended October 31, 2008, the Distributor retained $2,271 and $9 from commissions earned on sales of the fund’s Class A and Class T shares, respectively, and $20,562 and $1,343 from CDSCs on redemptions of the fund’s Class B and Class C shares, respectively.
30
(b) Under separate Distribution Plans (the “Plans”) adopted pursuant to Rule 12b-1 under the Act, Class A shares may pay annually up to .25% of the value of their average daily net assets to compensate the Distributor for shareholder servicing activities and expenses primarily intended to result in the sale of Class A shares. Class B, Class C and Class T shares may pay the Distributor for distributing their shares at an aggregate annual rate of .75% of the value of the average daily net assets of Class B and Class C shares and .25% of the value of the average daily net assets of Class T shares.The Distributor may pay one or more agents in respect of advertising, marketing and other distribution services for Class T shares and determines the amounts, if any, to be paid to agents and the basis on which such payments are made. Class B, Class C and Class T shares are also subject to a service plan adopted pursuant to Rule 12b-1, (the “Service Plan”) under which Class B, Class C and Class T shares pay the Distributor for providing services to the holders of their shares a fee at the annual rate of .25% of the value of the average daily net assets of Class B, Class C and Class T shares. During the period ended October 31, 2008, Class A, Class B, Class C and Class T shares were charged $145,033, $69,069, $59,684 and $2,522, respectively, pursuant to their respective Plans, and Class B, Class C and Class T shares were charged $23,023, $19,895 and $2,522, respectively, pursuant to the Service Plan.
Under its terms, the Plans and Service Plan shall remain in effect from year to year, provided such continuance is approved annually by a vote of majority of those Directors who are not “interested persons” of the Company and who have no direct or indirect financial interest in the operation of or in any agreement related to the Plans or Service Plan.
The components of “Due to The Dreyfus Corporation and affiliates” in the Statement of Assets and Liabilities consist of: management fees $49,406, Rule 12b-1 distribution plans fees $13,417 and shareholder services plan fees $1,993, which are offset against an expense reimbursement currently in effect in the amount of $2,350.
The Fund 31
| NOTES TO FINANCIAL STATEMENTS (continued) |
NOTE 4—Securities Transactions:
The aggregate amount of purchases and sales of investment securities, excluding short-term securities, during the period ended October 31, 2008, amounted to $73,100,267 and $109,472,142, respectively.
At October 31, 2008, the cost of investments for federal income tax purposes was $82,024,124; accordingly, accumulated net unrealized depreciation on investments was $22,538,680, consisting of $978,031 gross unrealized appreciation and $23,516,711 gross unrealized depreciation.
In March 2008, the FASB released Statement of Financial Accounting Standards No. 161 “Disclosures about Derivative Instruments and Hedging Activities” (“FAS 161”). FAS 161 requires qualitative disclosures about objectives and strategies for using derivatives, quantitative disclosures about fair value amounts of gains and losses on derivative instruments and disclosures about credit-risk-related contingent features in derivative agreements.The application of FAS 161 is required for fiscal years and interim periods beginning after November 15, 2008. At this time, management is evaluating the implications of FAS 161 and its impact on the financial statements and the accompanying notes has not yet been determined.
NOTE 5—Plan of Reorganization:
On August 5, 2008, the Board of Directors of the Company, and on October 15, 2008, the shareholders of the fund, approved an Agreement and Plan of Reorganization between the Company, on behalf of the fund, and Dreyfus Premier Manager Funds I, on behalf of Dreyfus S&P STARS Opportunities Fund (the “Acquiring Fund”). The merger provides for the transfer of the fund’s assets to the Acquiring Fund in a tax-free exchange for shares of the Acquiring Fund and the assumption by the Acquiring Fund to the fund’s shareholders and the subsequent termination of the fund (the “Reorganization”). The Reorganization took place on December 17, 2008. In anticipation of the Reorganization, effective August 29, 2008, the fund was closed to any investments for new accounts.
32
REPORT OF INDEPENDENT REGISTERED PUBLIC ACCOUNTING FIRM
The Board of Directors and Shareholders The Dreyfus/Laurel Funds, Inc.:
We have audited the accompanying statement of assets and liabilities of Dreyfus Midcap Stock Fund (formerly Dreyfus Premier Midcap Stock Fund) as series of The Dreyfus/Laurel Funds, Inc., (the “Fund”), including the statement of investments, as of October 31, 2008, and the related statement of operations for the year then ended, the statement of changes in net assets for each of the years in the two-year period then ended, and the financial highlights for each of the years in the five-year period then ended. These financial statements and financial highlights are the responsibility of the Fund’s management. Our responsibility is to express an opinion on these financial statements and financial highlights based on our audits.
We conducted our audits in accordance with the standards of the Public Company Accounting Oversight Board (United States).Those standards require that we plan and perform the audit to obtain reasonable assurance about whether the financial statements and financial highlights are free of material misstatement.An audit includes examining, on a test basis, evidence supporting the amounts and disclosures in the financial statements. Our procedures included confirmation of securities owned as of October 31, 2008, by correspondence with the custodian and brokers or by other appropriate auditing procedures where replies from brokers were not received. An audit also includes assessing the accounting principles used and significant estimates made by management, as well as evaluating the overall financial statement presentation. We believe that our audits provide a reasonable basis for our opinion.
In our opinion, the financial statements and financial highlights referred to above present fairly, in all material respects, the financial position of Dreyfus Midcap Stock Fund as of October 31, 2008, and the results of its operations for the year then ended, the changes in its net assets for each of the years in the two-year period then ended, and the financial highlights for each of the years in the five-year period then ended, in conformity with U.S. generally accepted accounting principles.

New York, New York
December 19, 2008 |
The Fund 33
IMPORTANT TAX INFORMATION (Unaudited)
For federal tax purposes, the fund hereby designates 28.20% of the ordinary dividends paid during the fiscal year ended October 31, 2008 as qualifying for the corporate dividends received deduction. For the fiscal year ended October 31, 2008, certain dividends paid by the fund may be subject to a maximum tax rate of 15%, as provided for by the Jobs and Growth Tax Relief Reconciliation Act of 2003. Of the distributions paid during the fiscal year, $4,902 represents the maximum amount that may be considered qualified dividend income. Shareholders will receive notification in January 2009 of the percentage applicable to the preparation of their 2008 income tax returns.Also the fund hereby designates $1.2588 per share as a long-term capital gain distribution and $.8582 per share as a short-term capital gain distribution of the $2.1170 per share paid on December 18, 2007 and also the fund hereby designates $.0083 per share as a long-term capital gain distribution and $.0047 per share as a short-term capital gain distribution of the $.0130 per share paid on March 27, 2008.
| PROXY RESULTS (Unaudited) |
The Dreyful/Laurel Funds,Inc.,held a special meeting of shareholders on October 15, 2008.The proposal considered at the meeting, and the results, are as follows:
| | | | | Shares | | |
| | |
| |
| |
|
| | | Votes for | | Authority Withheld | | Abstain |
| | |
| |
| |
|
| To approve an Agreement and Plan of | | | | | | |
| Reorganization providing for the | | | | | | |
| transfer of all of the assets of the | | | | | | |
| fund to Dreyfus S&P STARS Opportunity | | | | | | |
| Fund (the “Acquiring Fund”) | | 3,817,371 | | 234,154 | | 201,923 |
34
BOARD MEMBERS INFORMATION (Unaudited)
Joseph S. DiMartino (65)
Chairman of the Board (1999)
Principal Occupation During Past 5Years:
Corporate Director and Trustee
Other Board Memberships and Affiliations: |
- The Muscular Dystrophy Association, Director
- Century Business Services, Inc., a provider of outsourcing functions for small and medium size companies, Director
- The Newark Group, a provider of a national market of paper recovery facilities, paperboard mills and paperboard converting plants, Director
- Sunair Services Corporation, a provider of certain outdoor-related services to homes and businesses, Director
No. of Portfolios for which Board Member Serves: 167
James M. Fitzgibbons (74)
Board Member (1994)
Principal Occupation During Past 5Years:
Corporate Director and Trustee |
Other Board Memberships and Affiliations:
Bill Barrett Company, an oil and gas exploration company, Director
No. of Portfolios for which Board Member Serves: 25
Kenneth A. Himmel (62)
Board Member (1994)
Principal Occupation During Past 5Years: |
- President and CEO,Related Urban Development,a real estate development company (1996-present)
- President and CEO, Himmel & Company, a real estate development company (1980-present)
- CEO, American Food Management, a restaurant company (1983-present)
| No. of Portfolios for which Board Member Serves: 25 |
Stephen J. Lockwood (61)
Board Member (1994)
Principal Occupation During Past 5Years: |
- Chairman of the Board, Stephen J. Lockwood and Company LLC, an investment company (2000-present)
| No. of Portfolios for which Board Member Serves: 25 |
The Fund 35
BOARD MEMBERS INFORMATION (Unaudited) (continued)
Roslyn M. Watson (59)
Board Member (1994) |
Principal Occupation During Past 5Years:
Principal,Watson Ventures, Inc., a real estate investment company (1993-present)
Other Board Memberships and Affiliations:
- American Express Bank, Director
- The Hyams Foundation Inc., a Massachusetts Charitable Foundation,Trustee
- National Osteoporosis Foundation,Trustee
- SBLI-USA, Director
| No. of Portfolios for which Board Member Serves: 25 |
Benaree Pratt Wiley (62)
Board Member (1998)
Principal Occupation During Past 5Years: |
- Principal,The Wiley Group, a firm specializing in strategy and business development (2005-present)
- President and CEO,The Partnership, an organization dedicated to increasing the representation of African Americans in positions of leadership, influence and decision-making in Boston, MA (1991-2005)
| Other Board Memberships and Affiliations: |
- Boston College,Trustee Associate
- Blue Cross Blue Shield of Massachusetts, Director
- CBIZ, professional support consultants and service providers for small, midsized and corporate business, Director
- Commonwealth Institute, Director
- Efficacy Institute, Director
- PepsiCo African-American, Chair of Advisory Board
- The Boston Foundation, Director
- Century Business Services, Inc., a provider of outsourcing functions for small and medium size companies, Director
| No. of Portfolios for which Board Member Serves: 36 |
Once elected all Board Members serve for an indefinite term, but achieve Emeritus status upon reaching age 80.The address of the Board Members and Officers is in c/o The Dreyfus Corporation, 200 Park Avenue, NewYork, NewYork 10166. Additional information about the Board Members is available in the fund’s Statement of Additional Information which can be obtained from Dreyfus free of charge by calling this toll free number: 1-800-554-4611.
Francis P. Brennan, Emeritus Board Member
J.Tomlinson Fort, Emeritus Board Member |
36
OFFICERS OF THE FUND (Unaudited)
| J. DAVID OFFICER, President since | | JONI LACKS CHARATAN, Vice President |
| December 2006. | | and Assistant Secretary since |
| Chief Operating Officer,Vice Chairman and a | | August 2005. |
| Director of the Manager, and an officer of 77 | | Senior Counsel of BNY Mellon, and an officer |
| investment companies (comprised of 167 | | of 78 investment companies (comprised of 188 |
| portfolios) managed by the Manager. He is 60 | | portfolios) managed by the Manager. She is 53 |
| years old and has been an employee of the | | years old and has been an employee of the |
| Manager since April 1998. | | Manager since October 1988. |
| |
| PHILLIP N. MAISANO, Executive Vice | | JOSEPH M. CHIOFFI, Vice President and |
| President since July 2007. | | Assistant Secretary since August 2005. |
| Chief Investment Officer,Vice Chair and a | | Senior Counsel of BNY Mellon, and an officer |
| director of the Manager, and an officer of 77 | | of 78 investment companies (comprised of 188 |
| investment companies (comprised of 167 | | portfolios) managed by the Manager. He is 47 |
| portfolios) managed by the Manager. Mr. | | years old and has been an employee of the |
| Maisano also is an officer and/or Board | | Manager since June 2000. |
| member of certain other investment | | |
| | | JANETTE E. FARRAGHER, Vice President |
| management subsidiaries of The Bank of New | | |
| | | and Assistant Secretary since |
| York Mellon Corporation, each of which is an | | |
| | | August 2005. |
| affiliate of the Manager. He is 61 years old and | | |
| has been an employee of the Manager since | | Assistant General Counsel of BNY Mellon, |
| November 2006. Prior to joining the Manager, | | and an officer of 78 investment companies |
| Mr. Maisano served as Chairman and Chief | | (comprised of 188 portfolios) managed by the |
| Executive Officer of EACM Advisors, an | | Manager. She is 45 years old and has been an |
| affiliate of the Manager, since August 2004, and | | employee of the Manager since February 1984. |
| served as Chief Executive Officer of Evaluation | | JOHN B. HAMMALIAN, Vice President and |
| Associates, a leading institutional investment | | Assistant Secretary since August 2005. |
| consulting firm, from 1988 until 2004. | | |
| | | Managing Counsel of BNY Mellon, and an |
| MICHAEL A. ROSENBERG, Vice President | | officer of 78 investment companies (comprised |
| and Secretary since August 2005. | | of 188 portfolios) managed by the Manager. |
| Assistant General Counsel of BNY Mellon, | | He is 45 years old and has been an employee |
| and an officer of 78 investment companies | | of the Manager since February 1991. |
| (comprised of 188 portfolios) managed by the | | ROBERT R. MULLERY, Vice President and |
| Manager. He is 48 years old and has been an | | Assistant Secretary since August 2005. |
| employee of the Manager since October 1991. | | |
| | | Managing Counsel of BNY Mellon, and an |
| JAMES BITETTO, Vice President and | | officer of 78 investment companies (comprised |
| Assistant Secretary since August 2005. | | of 188 portfolios) managed by the Manager. |
| Senior Counsel of BNY Mellon and Secretary | | He is 56 years old and has been an employee |
| of the Manager, and an officer of 78 | | of the Manager since May 1986. |
| investment companies (comprised of 188 | | |
| portfolios) managed by the Manager. He is 42 | | |
| years old and has been an employee of the | | |
| Manager since December 1996. | | |
The Fund 37
OFFICERS OF THE FUND (Unaudited) (continued)
| JEFF PRUSNOFSKY, Vice President and | | ROBERT SALVIOLO, Assistant Treasurer |
| Assistant Secretary since August 2005. | | since July 2007. |
| Managing Counsel of BNY Mellon, and an | | Senior Accounting Manager – Equity Funds of |
| officer of 78 investment companies (comprised | | the Manager, and an officer of 78 investment |
| of 188 portfolios) managed by the Manager. | | companies (comprised of 188 portfolios) |
| He is 43 years old and has been an employee | | managed by the Manager. He is 41 years old |
| of the Manager since October 1990. | | and has been an employee of the Manager |
| | | since June 1989. |
| JAMES WINDELS, Treasurer since | | |
| November 2001. | | ROBERT SVAGNA, Assistant Treasurer |
| Director – Mutual Fund Accounting of the | | since December 2002. |
| Manager, and an officer of 78 investment | | Senior Accounting Manager – Equity Funds of |
| companies (comprised of 188 portfolios) | | the Manager, and an officer of 78 investment |
| managed by the Manager. He is 49 years old | | companies (comprised of 188 portfolios) |
| and has been an employee of the Manager | | managed by the Manager. He is 41 years old |
| since April 1985. | | and has been an employee of the Manager |
| | | since November 1990. |
| RICHARD CASSARO, Assistant Treasurer | | |
| since January 2008. | | JOSEPH W. CONNOLLY, Chief Compliance |
| Senior Accounting Manager – Money Market | | Officer since October 2004. |
| and Municipal Bond Funds of the Manager, | | Chief Compliance Officer of the Manager and |
| and an officer of 78 investment companies | | The Dreyfus Family of Funds (78 investment |
| (comprised of 188 portfolios) managed by | | companies, comprised of 188 portfolios). From |
| the Manager. He is 49 years old and has | | November 2001 through March 2004, Mr. |
| been an employee of the Manager since | | Connolly was first Vice-President, Mutual |
| September 1982. | | Fund Servicing for Mellon Global Securities |
| | | Services. In that capacity, Mr. Connolly was |
| GAVIN C. REILLY, Assistant Treasurer | | |
| | | responsible for managing Mellon’s Custody, |
| since December 2005. | | |
| | | Fund Accounting and Fund Administration |
| Tax Manager of the Investment Accounting | | services to third-party mutual fund clients. He |
| and Support Department of the Manager, and | | is 51 years old and has served in various |
| an officer of 78 investment companies | | capacities with the Manager since 1980, |
| (comprised of 188 portfolios) managed by the | | including manager of the firm’s Fund |
| Manager. He is 40 years old and has been an | | Accounting Department from 1997 through |
| employee of the Manager since April 1991. | | October 2001. |
| |
| ROBERT ROBOL, Assistant Treasurer | | WILLIAM GERMENIS, Anti-Money |
| since December 2002. | | Laundering Compliance Officer since |
| Senior Accounting Manager – Fixed Income | | July 2002. |
| Funds of the Manager, and an officer of 78 | | Vice President and Anti-Money Laundering |
| investment companies (comprised of 188 | | Compliance Officer of the Distributor, and the |
| portfolios) managed by the Manager. He is 44 | | Anti-Money Laundering Compliance Officer |
| years old and has been an employee of the | | of 74 investment companies (comprised of 184 |
| Manager since October 1988. | | portfolios) managed by the Manager. He is 38 |
| | | years old and has been an employee of the |
| | | Distributor since October 1998. |
38

NOTES


Save time. Save paper. View your next shareholder report online as soon as it’s available. Log into www.dreyfus.com and sign up for Dreyfus eCommunications. It’s simple and only takes a few minutes.
The views expressed in this report reflect those of the portfolio manager only through the end of the period covered and do not necessarily represent the views of Dreyfus or any other person in the Dreyfus organization. Any such views are subject to change at any time based upon market or other conditions and Dreyfus disclaims any responsibility to update such views.These views may not be relied on as investment advice and, because investment decisions for a Dreyfus fund are based on numerous factors, may not be relied on as an indication of trading intent on behalf of any Dreyfus fund.
Not FDIC-Insured Not Bank-Guaranteed May Lose Value
| | Contents |
| |
| | THE FUND |
| |
| 2 | A Letter from the CEO |
| |
| 3 | Discussion of Fund Performance |
| |
| 6 | Fund Performance |
| |
| 7 | Understanding Your Fund’s Expenses |
| |
| 7 | Comparing Your Fund’s Expenses With Those of Other Funds |
| |
| 8 | Statement of Investments |
| |
| 12 | Statement of Assets and Liabilities |
| |
| 13 | Statement of Operations |
| |
| 14 | Statement of Changes in Net Assets |
| |
| 15 | Financial Highlights |
| |
| 16 | Notes to Financial Statements |
| |
| 23 | Report of Independent Registered Public Accounting Firm |
| |
| 24 | Important Tax Information |
| |
| 25 | Board Members Information |
| |
| 27 | Officers of the Fund |
| |
| | FOR MORE INFORMATION |
| |
| | Back Cover |
| |
Dreyfus
Disciplined Stock Fund |

A LETTER FROM THE CEO
Dear Shareholder: |
We present to you this annual report for Dreyfus Disciplined Stock Fund, covering the 12-month period from November 1, 2007, through October 31, 2008.
These are difficult times for equity investors. A credit crunch that began in early 2007 has developed into a full-blown global financial crisis, recently resulting in the failure of several major financial institutions and prompting a massive government rescue effort. Meanwhile, the U.S. economic slowdown has gathered momentum,depressing investor sentiment, consumer confidence and business investment.These factors undermined returns in most stock market sectors, particularly financial companies and businesses that tend to be more sensitive to economic trends.
The depth and duration of the economic downturn will depend on how quickly the financial system can be stabilized.We believe that the Temporary Guarantee Program for Money Market Funds and the $700 billion rescue package intended to promote greater liquidity in the financial markets meet several critical requirements for addressing today’s financial stresses, and we expect these measures to contribute to a more orderly deleveraging process. However, recuperation from the financial crisis is likely to take time. In the meantime, we encourage you to keep in touch with your financial advisor and maintain a long-term and disciplined perspective to investing. Indeed, we already are seeing some positive signs, including a likely peak in global inflationary pressures, a bottoming of the U.S. dollar, attractive valuations among fundamentally sound companies and a large pool of worldwide financial liquidity that could be deployed gradually as the economic cycle turns.
For information about how the fund performed during the reporting period, as well as market perspectives, we have provided a Discussion of Fund Performance given by the fund’s Portfolio Manager.
Thank you for your continued confidence and support.

| | Jonathan R. Baum
Chief Executive Officer
The Dreyfus Corporation |

DISCUSSION OF FUND PERFORMANCE
For the reporting period of November 1, 2007, through October 31, 2008, as provided by Sean P. Fitzgibbon, Portfolio Manager
Fund and Market Performance Overview
For the 12-month period ended October 31, 2008, Dreyfus Disciplined Stock Fund produced a total return of –36.51% .1 In comparison, the total return of the Standard & Poor’s 500 Composite Stock Price Index (“S&P 500 Index”), the fund’s benchmark, was –36.08% for the same period.2
Slowing U.S. economic growth and an intensifying financial crisis fueled steep stock market declines, especially during the final months of the reporting period. While financial stocks bore the brunt of the downturn, all 10 sectors of the S&P 500 Index encountered severe declines.The fund managed to limit its losses in the especially hard-hit financial and consumer discretionary areas, but these relatively favorable results were balanced by disappointing returns in the materials, technology and energy sectors. As a result, the fund’s total return roughly matched that of the benchmark, which is not subject to fees and expenses like a mutual fund.
The Fund’s Investment Approach
The fund seeks capital appreciation. To pursue its goal, the fund normally invests at least 80% of its assets in stocks of large-cap companies. The fund invests in a diversified portfolio of growth and value stocks, remaining fully invested and industry and sector neutral in relation to the S&P 500 Index.We choose stocks through a disciplined investment process that combines computer modeling techniques, fundamental analysis and risk management.The result is a broadly diversified portfolio of carefully selected stocks, with overall performance determined by a large number of securities.At the end of the reporting period, the fund held positions in approximately 85 stocks across 11 economic sectors.
The Fund 3
| DISCUSSION OF FUND PERFORMANCE (continued) |
Markets Driven Lower By Negative Economic News
The reporting period was characterized by dramatic deterioration of economic trends and unprecedented levels of market volatility. Over the reporting period’s first half, commodity prices soared, and rising unemployment and plunging housing values prompted consumers to reduce spending and businesses to curtail capital investment. Meanwhile, a credit crisis that began in 2007 in the U.S. sub-prime mortgage market mushroomed into a global financial crisis later in the reporting period, pushing the world’s banking system to the brink of collapse and requiring massive intervention by governments and central banks. Stock prices staged a broad-based decline in response to these adverse developments.
Mitigating the Decline in Key Sectors
The burgeoning credit crisis overwhelmed the financial sector, leading to a wave of steep stock declines, bankruptcies and government bailouts.The fund limited its losses with timely positioning in several of the financial sector’s industry groups. Returns among insurance holdings benefited from overweighted exposure toThe Chubb Corporation as well as the sale of American International Group before the stock collapsed in September. In the mortgage industry, the fund avoided several poor performers, including Fannie Mae and Freddie Mac. Among banks, the fund focused on well-capitalized companies, such as Bank of America and JPMorgan Chase & Co., that took advantage of their strong capital positions to make opportunistic acquisitions.Within the troubled capital markets industry, the fund successfully sidestepped the failures of Bear Stearns, Lehman Brothers and Merrill Lynch.
The consumer discretionary sector proved another area of relative outperformance, led by holdings of off-price and discount retailers, such as Ross Stores, Family Dollar Stores and The TJX Companies, Inc., which benefited from tightening consumer spending patterns.A relatively large position in McDonald’s also bolstered returns as the fast food giant delivered strong performance despite the tough economic environment.
4
Disappointments in Other Sectors
Unfortunately, relatively strong performance in these areas was offset by disappointing performance in a handful of market sectors. In the materials sector, fertilizer manufacturer Mosaic and metals-and-mining companies Freeport-McMoRan Copper & Gold and Allegheny Technologies fell due to retreating commodity prices. In the technology sector, slightly overweighted exposure to Apple hurt the fund when consumer spending slowed. In the energy sector, returns suffered due to the fund’s emphasis on exploration-and-production companies leveraged to the price of natural gas, which fell sharply. Consumer staples holdings lagged because of the fund’s lack of exposure to household goods maker Procter & Gamble. Finally, among industrial stocks, Textron, Terex and Eaton struggled in the face of widespread fears of a global recession.
Cautiously Positioned for Recovery
While we do not know how long the current economic downturn will last, we believe that equity valuations already reflect the potential for a severe recession, offering attractive opportunities for appreciation during an eventual recovery.Therefore, we have cautiously positioned the fund for better economic and market conditions, emphasizing beaten-down consumer discretionary stocks such as specialty retailers that have maintained their profit margins.The fund also holds overweighted exposure to health care equipment and supply providers that we believe are largely insulated from economic turmoil. Conversely, the fund holds underweighted exposure to energy, telecommunications and consumer staples stocks, which we expect to remain under pressure.
November 17, 2008
| 1 | | Total return includes reinvestment of dividends and any capital gains paid. Past performance is no |
| | | guarantee of future results. Share price and investment return fluctuate such that upon redemption, |
| | | fund shares may be worth more or less than their original cost. |
| 2 | | SOURCE: LIPPER INC. — Reflects the monthly reinvestment of dividends and, where |
| | | applicable, capital gain distributions.The Standard & Poor’s 500 Composite Stock Price Index is |
| | | a widely accepted, unmanaged index of U.S. stock market performance. |
The Fund 5
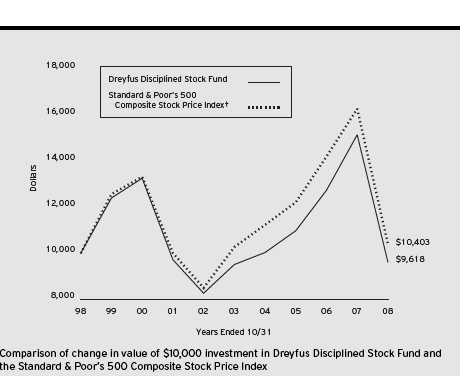
| Average Annual Total Returns as of 10/31/08 | | | | |
| | | 1 Year | | 5 Years | | 10 Years |
| |
| |
| |
|
| Fund | | (36.51)% | | 0.23% | | (0.39)% |
| † Source: Lipper Inc. |
| Past performance is not predictive of future performance.The fund’s performance shown in the graph and table does not |
| reflect the deduction of taxes that a shareholder would pay on fund distributions or the redemption of fund shares. |
| The above graph compares a $10,000 investment made in Dreyfus Disciplined Stock Fund on 10/31/98 to a |
| $10,000 investment made in the Standard & Poor’s 500 Composite Stock Price Index (the “Index”) on that date. All |
| dividends and capital gain distributions are reinvested. |
| The fund’s performance shown in the line graph takes into account all applicable fees and expenses.The Index is a widely |
| accepted, unmanaged index of U.S. stock market performance. Unlike a mutual fund, the Index is not subject to charges, |
| fees and other expenses. Investors cannot invest directly in any index. Further information relating to fund performance, |
| including expense reimbursements, if applicable, is contained in the Financial Highlights section of the prospectus and |
| elsewhere in this report. |
6
UNDERSTANDING YOUR FUND’S EXPENSES (Unaudited)
As a mutual fund investor, you pay ongoing expenses, such as management fees and other expenses. Using the information below, you can estimate how these expenses affect your investment and compare them with the expenses of other funds.You also may pay one-time transaction expenses, including sales charges (loads) and redemption fees, which are not shown in this section and would have resulted in higher total expenses. For more information, see your fund’s prospectus or talk to your financial adviser.
Review your fund’s expenses
The table below shows the expenses you would have paid on a $1,000 investment in Dreyfus Disciplined Stock Fund from May 1, 2008 to October 31, 2008. It also shows how much a $1,000 investment would be worth at the close of the period, assuming actual returns and expenses.
Expenses and Value of a $1,000 Investment assuming actual returns for the six months ended October 31, 2008
| Expenses paid per $1,000† | | $ 4.28 |
| Ending value (after expenses) | | $701.90 |
COMPARING YOUR FUND’S EXPENSES WITH THOSE OF OTHER FUNDS (Unaudited)
Using the SEC’s method to compare expenses
The Securities and Exchange Commission (SEC) has established guidelines to help investors assess fund expenses. Per these guidelines, the table below shows your fund’s expenses based on a $1,000 investment, assuming a hypothetical 5% annualized return. You can use this information to compare the ongoing expenses (but not transaction expenses or total cost) of investing in the fund with those of other funds.All mutual fund shareholder reports will provide this information to help you make this comparison. Please note that you cannot use this information to estimate your actual ending account balance and expenses paid during the period.
Expenses and Value of a $1,000 Investment assuming a hypothetical 5% annualized return for the six months ended October 31, 2008
| Expenses paid per $1,000† | | $ 5.08 |
| Ending value (after expenses) | | $1,020.11 |
| † Expenses are equal to the fund’s annualized expense ratio of 1.00%; multiplied by the average account value over the |
| period, multiplied by 184/366 (to reflect the one-half year period). |
The Fund 7
STATEMENT OF INVESTMENTS
October 31, 2008 |
| Common Stocks—96.9% | | Shares | | Value ($) |
| |
| |
|
| Consumer Discretionary—9.5% | | | | |
| Coach | | 159,110 a | | 3,277,666 |
| Darden Restaurants | | 129,010 | | 2,860,152 |
| Family Dollar Stores | | 188,570 b | | 5,074,419 |
| Gap | | 344,830 | | 4,462,100 |
| McDonald’s | | 154,504 | | 8,950,417 |
| Newell Rubbermaid | | 340,070 | | 4,675,963 |
| News, Cl. A | | 480,290 | | 5,110,286 |
| OfficeMax | | 259,670 | | 2,090,344 |
| Omnicom Group | | 159,350 | | 4,707,199 |
| Ross Stores | | 187,040 | | 6,114,338 |
| TJX Cos | | 117,370 b | | 3,140,821 |
| | | | | 50,463,705 |
| Consumer Staples—11.3% | | | | |
| Cadbury, ADR | | 75,897 | | 2,806,671 |
| Coca-Cola Enterprises | | 144,110 | | 1,448,305 |
| Colgate-Palmolive | | 139,830 | | 8,775,731 |
| CVS Caremark | | 317,030 | | 9,716,969 |
| Dr. Pepper Snapple Group | | 149,770 a | | 3,429,733 |
| Estee Lauder, Cl. A | | 156,500 | | 5,640,260 |
| Kroger | | 218,580 | | 6,002,207 |
| Molson Coors Brewing, Cl. B | | 81,020 | | 3,026,907 |
| Philip Morris International | | 221,720 | | 9,638,168 |
| Wal-Mart Stores | | 175,180 | | 9,776,796 |
| | | | | 60,261,747 |
| Energy—10.3% | | | | |
| Anadarko Petroleum | | 86,130 | | 3,040,389 |
| Chevron | | 208,410 | | 15,547,386 |
| ConocoPhillips | | 285,950 | | 14,875,119 |
| ENSCO International | | 43,160 | | 1,640,512 |
| Marathon Oil | | 147,730 | | 4,298,943 |
| Nabors Industries | | 158,740 a | | 2,282,681 |
| National Oilwell Varco | | 59,820 a | | 1,788,020 |
| Valero Energy | | 59,160 | | 1,217,513 |
| Williams | | 162,130 | | 3,399,866 |
| XTO Energy | | 187,197 | | 6,729,732 |
| | | | | 54,820,161 |
8
| Common Stocks (continued) | | Shares | | Value ($) |
| |
| |
|
| Exchange Traded Funds—2.4% | | | | |
| Standard & Poor’s Depository | | | | |
| Receipts (Tr. Ser. 1) | | 132,070 | | 12,788,338 |
| Financial—14.6% | | | | |
| Bank of America | | 533,730 | | 12,900,254 |
| Chubb | | 197,840 | | 10,252,069 |
| Citigroup | | 745,590 | | 10,177,304 |
| Discover Financial Services | | 219,910 | | 2,693,897 |
| Fifth Third Bancorp | | 380,980 | | 4,133,633 |
| First Horizon National | | 345,800 b | | 4,118,478 |
| JPMorgan Chase & Co. | | 301,190 | | 12,424,087 |
| KeyCorp | | 359,830 | | 4,400,721 |
| U.S. Bancorp | | 157,390 | | 4,691,796 |
| Wells Fargo & Co. | | 348,000 | | 11,849,400 |
| | | | | 77,641,639 |
| Health Care—15.7% | | | | |
| Aetna | | 181,560 | | 4,515,397 |
| Amgen | | 109,280 a | | 6,544,779 |
| Baxter International | | 236,900 | | 14,330,081 |
| Becton, Dickinson & Co. | | 40,070 | | 2,780,858 |
| Covidien | | 93,660 | | 4,148,201 |
| Hospira | | 159,670 a | | 4,442,019 |
| Invitrogen | | 96,830 a | | 2,787,736 |
| Johnson & Johnson | | 124,630 | | 7,644,804 |
| Laboratory Corp. of America Holdings | | 60,550 a,b | | 3,723,219 |
| Novartis, ADR | | 114,850 | | 5,856,202 |
| Pfizer | | 512,634 | | 9,078,748 |
| Schering-Plough | | 282,880 | | 4,098,931 |
| St. Jude Medical | | 106,280 a | | 4,041,828 |
| Thermo Fisher Scientific | | 154,660 a,b | | 6,279,196 |
| Vertex Pharmaceuticals | | 122,470 a | | 3,209,939 |
| | | | | 83,481,938 |
| Industrial—10.3% | | | | |
| Allied Waste Industries | | 360,140 a | | 3,752,659 |
| Delta Air Lines | | 323,120 a | | 3,547,858 |
| Dover | | 116,890 | | 3,713,595 |
| Emerson Electric | | 166,520 | | 5,450,200 |
The Fund 9
| STATEMENT OF INVESTMENTS (continued) |
| Common Stocks (continued) | | Shares | | Value ($) |
| |
| |
|
| Industrial (continued) | | | | |
| FedEx | | 54,840 | | 3,584,891 |
| General Electric | | 457,320 | | 8,922,313 |
| Goodrich | | 102,080 | | 3,732,045 |
| L-3 Communications Holdings | | 57,380 | | 4,657,535 |
| Lockheed Martin | | 76,790 | | 6,530,989 |
| Raytheon | | 67,080 | | 3,428,459 |
| Textron | | 115,640 | | 2,046,828 |
| Tyco International | | 221,310 | | 5,594,717 |
| | | | | 54,962,089 |
| Information Technology—15.8% | | | | |
| Accenture, Cl. A | | 107,890 | | 3,565,764 |
| Adobe Systems | | 154,620 a | | 4,119,077 |
| Alliance Data Systems | | 115,990 a,b | | 5,818,058 |
| Amphenol, Cl. A | | 94,200 | | 2,698,830 |
| Apple | | 90,970 a | | 9,787,462 |
| Cisco Systems | | 693,610 a | | 12,325,450 |
| Global Payments | | 88,080 | | 3,568,121 |
| Intel | | 329,000 | | 5,264,000 |
| Juniper Networks | | 214,610 a,b | | 4,021,791 |
| McAfee | | 58,040 a | | 1,889,202 |
| Microsoft | | 619,100 | | 13,824,503 |
| Nokia, ADR | | 102,160 | | 1,550,789 |
| Oracle | | 386,670 a | | 7,072,194 |
| QUALCOMM | | 118,380 | | 4,529,219 |
| Visa, Cl. A | | 76,220 | | 4,218,777 |
| | | | | 84,253,237 |
| Materials—1.7% | | | | |
| Freeport-McMoRan Copper & Gold | | 55,540 | | 1,616,214 |
| International Paper | | 165,300 b | | 2,846,466 |
| Mosaic | | 37,100 | | 1,462,111 |
| Pactiv | | 131,850 a | | 3,106,386 |
| | | | | 9,031,177 |
| Telecommunication Services—1.8% | | | | |
| AT & T | | 371,330 | | 9,940,504 |
| Utilities—3.5% | | | | |
| American Electric Power | | 228,280 | | 7,448,776 |
| PG & E | | 136,270 b | | 4,997,021 |
10
| Common Stocks (continued) | | Shares | | Value ($) |
| |
| |
|
| Utilities (continued) | | | | |
| Sempra Energy | | 143,330 | | 6,104,425 |
| | | | | 18,550,222 |
| Total Common Stocks | | | | |
| (cost $591,770,104) | | | | 516,194,757 |
| |
| |
|
| |
| Other Investment—2.4% | | | | |
| |
| |
|
| Registered Investment Company; | | | | |
| Dreyfus Institutional Preferred | | | | |
| Plus Money Market Fund | | | | |
| (cost $12,794,000) | | 12,794,000 c | | 12,794,000 |
| |
| |
|
| |
| Investment of Cash Collateral | | | | |
| for Securities Loaned—4.7% | | | | |
| |
| |
|
| Registered Investment Company; | | | | |
| Dreyfus Institutional Cash Advantage Fund | | | | |
| (cost $25,243,017) | | 25,243,017 c | | 25,243,017 |
| |
| |
|
| Total Investments (cost $629,807,121) | | 104.0% | | 554,231,774 |
| Liabilities, Less Cash and Receivables | | (4.0%) | | (21,534,815) |
| Net Assets | | 100.0% | | 532,696,959 |
| ADR—American Depository Receipts |
| a Non-income producing security. |
| b All or a portion of these securities are on loan. At October 31, 2008, the total market value of the fund’s securities |
| on loan is $24,323,835 and the total market value of the collateral held by the fund is $25,243,017. |
| c Investment in affiliated money market mutual fund. |
| Portfolio Summary (Unaudited)† | | | | |
| |
| | | Value (%) | | | | Value (%) |
| |
| |
| |
|
| Information Technology | | 15.8 | | Money Market Investments | | 7.1 |
| Health Care | | 15.7 | | Utilities | | 3.5 |
| Financial | | 14.6 | | Exchange Traded Funds | | 2.4 |
| Consumer Staples | | 11.3 | | Telecommunication Services | | 1.8 |
| Industrial | | 10.3 | | Materials | | 1.7 |
| Energy | | 10.3 | | | | |
| Consumer Discretionary | | 9.5 | | | | 104.0 |
| |
| † Based on net assets. | | | | | | |
| See notes to financial statements. | | | | | | |
The Fund 11
STATEMENT OF ASSETS AND LIABILITIES
October 31, 2008
| | | Cost | | Value |
| |
| |
|
| Assets ($): | | | | |
| Investments in securities���See Statement of Investments (including | | | | |
| securities on loan, valued at $24,323,835)—Note 1(b): | | | | |
| Unaffiliated issuers | | 591,770,104 | | 516,194,757 |
| Affiliated issuers | | 38,037,017 | | 38,037,017 |
| Cash | | | | 333,811 |
| Receivable for investment securities sold | | | | 12,061,278 |
| Dividends and interest receivable | | | | 798,260 |
| Receivable for shares of Capital Stock subscribed | | | | 56,714 |
| | | | | 567,481,837 |
| |
| |
|
| Liabilities ($): | | | | |
| Due to The Dreyfus Corporation and affiliates—Note 3(b) | | | | 451,561 |
| Liability for securities on loan—Note 1(b) | | | | 25,243,017 |
| Payable for investment securities purchased | | | | 8,837,257 |
| Payable for shares of Capital Stock redeemed | | | | 248,772 |
| Interest payable—Note 2 | | | | 4,271 |
| | | | | 34,784,878 |
| |
| |
|
| Net Assets ($) | | | | 532,696,959 |
| |
| |
|
| Composition of Net Assets ($): | | | | |
| Paid-in capital | | | | 641,568,519 |
| Accumulated undistributed investment income—net | | | | 2,917,523 |
| Accumulated net realized gain (loss) on investments | | | | (36,213,736) |
| Accumulated net unrealized appreciation | | | | |
| (depreciation) on investments | | | | (75,575,347) |
| |
| |
|
| Net Assets ($) | | | | 532,696,959 |
| |
| |
|
| Shares Outstanding | | | | |
| (165 million shares of $.001 par value Capital Stock authorized) | | | | 23,394,732 |
| Net Asset Value, offering and redemption price per share ($) | | | | 22.77 |
| |
| See notes to financial statements. | | | | |
12
STATEMENT OF OPERATIONS
Year Ended October 31, 2008 |
| Investment Income ($): | | |
| Income: | | |
| Cash dividends: | | |
| Unaffiliated issuers | | 15,694,961 |
| Affiliated issuers | | 189,077 |
| Income from securities lending | | 191,065 |
| Total Income | | 16,075,103 |
| Expenses: | | |
| Management fee—Note 3(a) | | 6,829,670 |
| Distribution fees—Note 3(b) | | 758,852 |
| Directors’ fees—Note 3(a) | | 45,771 |
| Loan commitment fees—Note 2 | | 12,623 |
| Interest expense—Note 2 | | 8,820 |
| Total Expenses | | 7,655,736 |
| Less—Directors’ fees reimbursed | | |
| by the Manager—Note 3(a) | | (45,771) |
| Net Expenses | | 7,609,965 |
| Investment Income—Net | | 8,465,138 |
| |
|
| Realized and Unrealized Gain (Loss) on Investments—Note 4 ($): | | |
| Net realized gain (loss) on investments | | (34,934,480) |
| Net unrealized appreciation (depreciation) on investments | | (292,073,821) |
| Net Realized and Unrealized Gain (Loss) on Investments | | (327,008,301) |
| Net (Decrease) in Net Assets Resulting from Operations | | (318,543,163) |
| See notes to financial statements. | | |
The Fund 13
STATEMENT OF CHANGES IN NET ASSETS
| | | Year Ended October 31, |
| | |
|
| | | 2008 | | 2007 |
| |
| |
|
| Operations ($): | | | | |
| Investment income—net | | 8,465,138 | | 6,488,436 |
| Net realized gain (loss) on investments | | (34,934,480) | | 91,771,057 |
| Net unrealized appreciation | | | | |
| (depreciation) on investments | | (292,073,821) | | 64,495,488 |
| Net Increase (Decrease) in Net Assets | | | | |
| Resulting from Operations | | (318,543,163) | | 162,754,981 |
| |
| |
|
| Dividends to Shareholders from ($): | | | | |
| Investment income—net | | (8,002,778) | | (5,603,181) |
| Net realized gain on investments | | (91,047,656) | | (85,750,982) |
| Total Dividends | | (99,050,434) | | (91,354,163) |
| |
| |
|
| Capital Stock Transactions ($): | | | | |
| Net proceeds from shares sold | | 31,693,253 | | 58,169,240 |
| Dividends reinvested | | 93,755,211 | | 86,774,362 |
| Cost of shares redeemed | | (120,977,310) | | (211,615,674) |
| Increase (Decrease) in Net Assets | | | | |
| from Capital Stock Transactions | | 4,471,154 | | (66,672,072) |
| Total Increase (Decrease) in Net Assets | | (413,122,443) | | 4,728,746 |
| |
| |
|
| Net Assets ($): | | | | |
| Beginning of Period | | 945,819,402 | | 941,090,656 |
| End of Period | | 532,696,959 | | 945,819,402 |
| Undistributed investment income—net | | 2,917,523 | | 2,461,535 |
| |
| |
|
| Capital Share Transactions (Shares): | | | | |
| Shares sold | | 1,060,519 | | 1,561,278 |
| Shares issued for dividends reinvested | | 2,672,520 | | 2,462,017 |
| Shares redeemed | | (3,843,888) | | (5,710,881) |
| Net Increase (Decrease) in Shares Outstanding | | (110,849) | | (1,687,586) |
| |
| See notes to financial statements. | | | | |
14
FINANCIAL HIGHLIGHTS
The following table describes the performance for the fiscal periods indicated. Total return shows how much your investment in the fund would have increased (or decreased) during each period, assuming you had reinvested all dividends and distributions.These figures have been derived from the fund’s financial statements.
| | | | | Year Ended October 31, | | |
| | |
| |
| |
|
| | | 2008 | | 2007 | | 2006 | | 2005 | | 2004 |
| |
| |
| |
| |
| |
|
| Per Share Data ($): | | | | | | | | | | |
| Net asset value, beginning of period | | 40.24 | | 37.35 | | 32.52 | | 30.02 | | 28.64 |
| Investment Operations: | | | | | | | | | | |
| Investment income—neta | | .35 | | .26 | | .29 | | .34 | | .19 |
| Net realized and unrealized | | | | | | | | | | |
| gain (loss) on investments | | (13.57) | | 6.31 | | 4.88 | | 2.46 | | 1.38 |
| Total from Investment Operations | | (13.22) | | 6.57 | | 5.17 | | 2.80 | | 1.57 |
| Distributions: | | | | | | | | | | |
| Dividends from investment income—net | | (.34) | | (.23) | | (.34) | | (.30) | | (.19) |
| Dividends from net realized | | | | | | | | | | |
| gain on investments | | (3.91) | | (3.45) | | — | | — | | — |
| Total Distributions | | (4.25) | | (3.68) | | (.34) | | (.30) | | (.19) |
| Net asset value, end of period | | 22.77 | | 40.24 | | 37.35 | | 32.52 | | 30.02 |
| |
| |
| |
| |
| |
|
| Total Return (%) | | (36.51) | | 18.98 | | 16.01 | | 9.37 | | 5.54 |
| |
| |
| |
| |
| |
|
| Ratios/Supplemental Data (%): | | | | | | | | | | |
| Ratio of total expenses | | | | | | | | | | |
| to average net assets | | 1.01 | | 1.01 | | 1.00 | | 1.00 | | 1.00 |
| Ratio of net expenses | | | | | | | | | | |
| to average net assets | | 1.00 | | .98 | | .93 | | .90 | | .93 |
| Ratio of net investment income | | | | | | | | | | |
| to average net assets | | 1.12 | | .69 | | .86 | | 1.06 | | .66 |
| Portfolio Turnover Rate | | 70.11 | | 49.43 | | 96.40 | | 68.42 | | 79.49 |
| |
| |
| |
| |
| |
|
| Net Assets, end of period ($ x 1,000) | | 532,697 | | 945,819 | | 941,091 | | 1,075,938 | | 1,245,344 |
| |
| a Based on average shares outstanding at each month end. | | | | | | | | |
| See notes to financial statements. | | | | | | | | | | |
The Fund 15
NOTES TO FINANCIAL STATEMENTS
NOTE 1—Significant Accounting Policies:
Dreyfus Disciplined Stock Fund (the “fund”) is a separate diversified series of The Dreyfus/Laurel Funds, Inc. (the “Company”) which is registered under the Investment Company Act of 1940, as amended (the “Act”), as an open-end management investment company and operates as a series company currently offering fourteen series, including the fund.The fund’s investment objective is to seek capital appreciation. The Dreyfus Corporation (the “Manager” or “Dreyfus”), a wholly-owned subsidiary of The Bank of New York Mellon Corporation (“BNY Mellon”), serves as investment adviser. MBSC Securities Corporation (the “Distributor”), a wholly-owned subsidiary of the Manager, is the distributor of the fund’s shares, which are sold to the public without a sales charge.
Effective July 1, 2008, BNY Mellon has reorganized and consolidated a number of its banking and trust company subsidiaries. As a result of the reorganization, any services previously provided to the fund by Mellon Bank, N.A. or Mellon Trust of New England, N.A. are now provided by The Bank of New York, which has changed its name to The Bank of New York Mellon.
The fund’s financial statements are prepared in accordance with U.S. generally accepted accounting principles, which may require the use of management estimates and assumptions. Actual results could differ from those estimates.
(a) Portfolio valuation: Investments in securities are valued at the last sales price on the securities exchange or national securities market on which such securities are primarily traded. Securities listed on the National Market System for which market quotations are available are valued at the official closing price or, if there is no official closing price that day, at the last sale price. Securities not listed on an exchange or the national securities market, or securities for which there were no transactions, are valued at the average of the most recent bid and asked prices, except for open short positions, where the asked price is used for valuation purposes. Bid price is used when no asked price is available.
16
Registered investment companies that are not traded on an exchange, are valued at their net asset value. When market quotations or official closing prices are not readily available, or are determined not to reflect accurately fair value, such as when the value of a security has been significantly affected by events after the close of the exchange or market on which the security is principally traded (for example, a foreign exchange or market),but before the fund calculates its net asset value,the fund may value these investments at fair value as determined in accordance with the procedures approved by the Board of Directors. Fair valuing of securities may be determined with the assistance of a pricing service using calculations based on indices of domestic securities and other appropriate indicators, such as prices of relevant ADRs and futures contracts. For other securities that are fair valued by the Board of Directors, certain factors may be considered such as: fundamental analytical data, the nature and duration of restrictions on disposition, an evaluation of the forces that influence the market in which the securities are purchased and sold, and public trading in similar securities of the issuer or comparable issuers. Financial futures are valued at the last sales price.
The Financial Accounting Standards Board (“FASB”) released Statement of Financial Accounting Standards No. 157 “Fair Value Measurements” (“FAS 157”). FAS 157 establishes an authoritative definition of fair value, sets out a framework for measuring fair value, and requires additional disclosures about fair-value measurements. The application of FAS 157 is required for fiscal years beginning after November 15, 2007 and interim periods within those fiscal years. Management does not believe that the application of this standard will have a material impact on the financial statements of the fund.
(b) Securities transactions and investment income: Securities transactions are recorded on a trade date basis. Realized gains and losses from securities transactions are recorded on the identified cost basis. Dividend income is recognized on the ex-dividend date and interest income, including, where applicable, accretion of discount and amortization of premium on investments is recognized on the accrual basis.
The Fund 17
| NOTES TO FINANCIAL STATEMENTS (continued) |
Pursuant to a securities lending agreement with The Bank of New York Mellon, a subsidiary of BNY Mellon and an affiliate of Dreyfus, the fund may lend securities to qualified institutions. It is the fund’s policy that, at origination, all loans are secured by collateral of at least 102% of the value of U.S. securities loaned and 105% of the value of foreign securities loaned. It is the fund’s policy that collateral equivalent to at least 100% of the market value of securities on loan is maintained at all times. Collateral is either in the form of cash, which can be invested in certain money market mutual funds managed by the Manager, U.S. Government and Agency securities or letters of credit. The fund is entitled to receive all income on securities loaned, in addition to income earned as a result of the lending transaction.Although each security loaned is fully collateralized, the fund bears the risk of delay in recovery of, or loss of rights in, the securities loaned should a borrower fail to return the securities in a timely manner. During the period ended October 31, 2008, The Bank of New York Mellon earned $81,885, pursuant to the securities lending agreement.
(c) Affiliated issuers: Investments in other investment companies advised by the Manager are defined as “affiliated” in the Act.
(d) Dividends to shareholders: Dividends are recorded on the ex-dividend date. Dividends from investment income-net and dividends from net realized capital gains, if any, are normally declared and paid annually, but the fund may make distributions on a more frequent basis to comply with the distribution requirements of the Internal Revenue Code of 1986, as amended (the “Code”).To the extent that net realized capital gains can be offset by capital loss carryovers, it is the policy of the fund not to distribute such gains. Income and capital gain distributions are determined in accordance with income tax regulations, which may differ from U.S. generally accepted accounting principles.
(e) Federal income taxes: It is the policy of the fund to continue to qualify as a regulated investment company, if such qualification is in the best interests of its shareholders, by complying with the applicable provisions of the Code, and to make distributions of taxable income sufficient to relieve it from substantially all federal income and excise taxes.
18
The fund adopted FASB Interpretation No. 48 “Accounting for Uncertainty in Income Taxes” (“FIN 48”). FIN 48 provides guidance for how uncertain tax positions should be recognized, measured, presented and disclosed in the financial statements. FIN 48 requires the evaluation of tax positions taken or expected to be taken in the course of preparing the fund’s tax returns to determine whether the tax positions are “more-likely-than-not” of being sustained by the applicable tax authority. Liability for tax positions not deemed to meet the more-likely-than-not threshold would be recorded as a tax expense in the current year.The adoption of FIN 48 had no impact on the operations of the fund for the period ended October 31, 2008.
As of and during the period ended October 31, 2008, the fund did not have any liabilities for any unrecognized tax positions. The fund recognizes interest and penalties, if any, related to unrecognized tax positions as income tax expense in the Statement of Operations. During the period, the fund did not incur any interest or penalties.
Each of the tax years in the four-year period ended October 31, 2008 remains subject to examination by the Internal Revenue Service and state taxing authorities.
At October 31, 2008, the components of accumulated earnings on a tax basis were as follows: undistributed ordinary income $2,917,523, accumulated capital losses $34,548,052 and unrealized depreciation $77,241,031.
The accumulated capital loss carryover is available for federal income tax purposes to be applied against future net securities profits, if any, realized subsequent to October 31, 2008. If not applied, the carryover expires in fiscal 2016.
The tax character of distributions paid to shareholders during the fiscal periods ended October 31, 2008 and October 31, 2007 were as follows: ordinary income $35,193,440 and $5,603,181, and long-term capital gains $63,856,994 and $85,750,982, respectively.
The Fund 19
| NOTES TO FINANCIAL STATEMENTS (continued) |
During the period ended October 31, 2008, as a result of permanent book to tax differences, primarily due to dividend reclassification, the fund decreased undistributed investment income-net by $6,372 and increased accumulated net realized gain (loss) on investments by the same amount. Net assets and net asset per share were not affected by this reclassification.
NOTE 2—Bank Lines of Credit:
Prior to October 15, 2008, the fund participated with other Dreyfus-managed funds in a $350 million redemption credit facility. Effective October 15, 2008, the fund participates with other Dreyfus-managed funds in a $145 million redemption credit facility (the “Facility”) to be utilized for temporary or emergency purposes, including the financing of redemptions. In connection therewith, the fund has agreed to pay commitment fees on its pro rata portion of the Facility. Interest is charged to the fund based on prevailing market rates in effect at the time of borrowing.
The average daily amount of borrowings outstanding under the Facilities during the period ended October 31, 2008, was $211,000 with a related weighted average annualized interest rate of 4.18% .
NOTE 3—Investment Management Fee and Other Transactions With Affiliates:
(a) Pursuant to an Investment Management Agreement with the Manager, the Manager provides or arranges for one or more third parties and/or affiliates to provide investment advisory, administrative, custody, fund accounting and transfer agency services to the fund. The Manager also directs the investments of the fund in accordance with its investment objective, policies and limitations. For these services, the fund is contractually obligated to pay the Manager a fee, calculated daily and paid monthly, at the annual rate of .90% of the value of the fund’s average daily net assets. Out of its fee, the Manager pays all of the expenses of the fund except brokerage fees, taxes, interest, commitment fees, Rule 12b-1 distribution fees and expenses, fees and expenses of non-interested Directors (including counsel fees) and extraordinary
20
expenses. In addition, the Manager is required to reduce its fee in an amount equal to the fund’s allocable portion of fees and expenses of the non-interested Directors (including counsel fees). Each Director receives $45,000 per year, plus $6,000 for each joint Board meeting of the Company,The Dreyfus/Laurel Tax-Free Municipal Funds and The Dreyfus/Laurel Funds Trust (collectively, the “Dreyfus/Laurel Funds”) attended, $2,000 for separate in-person committee meetings attended which are not held in conjunction with a regularly scheduled Board meeting and $1,500 for Board meetings and separate committee meetings attended that are conducted by telephone and is reimbursed for travel and out-of-pocket expenses.With respect to Board meetings, the Chairman of the Board receives an additional 25% of such compensation (with the exception of reimbursable amounts). With respect to compensation committee meetings, the Chair of the compensation committee receives $900 per meeting and, prior to April 12, 2008 with respect to audit committee meetings, the Chair of the audit committee received $1,350 per meeting. In the event that there is an in-person joint committee meeting or a joint telephone meeting of the Dreyfus/Laurel Funds and Dreyfus High Yield Strategies Fund, the $2,000 or $1,500 fee, as applicable, will be allocated between the Dreyfus/Laurel Funds and Dreyfus High Yield Strategies Fund. These fees and expenses are charged and allocated to each series based on net assets. Amounts required to be paid by the Company directly to the non-interested Directors, that would be applied to offset a portion of the management fee payable to the Manager, are in fact paid directly by the Manager to the non-interested Directors.
(b) Under the Distribution Plan (the “Plan”) adopted pursuant to Rule 12b-1 under the Act, the fund may pay annually up to .10% of the value of the fund’s average daily net assets to compensateThe Bank of NewYork Mellon and/or any of its affialites for shareholder servicing activities and the Distributor for shareholder servicing activities and expenses primarily intended to result in the sale of fund shares. During the period ended October 31, 2008, the fund was charged $758,852 pursuant to the Plan.
The Fund 21
| NOTES TO FINANCIAL STATEMENTS (continued) |
Under its terms, the Plan shall remain in effect from year to year, provided such continuance is approved annually by a vote of a majority of those Directors who are not “interested persons” of the Company and who have no direct or indirect financial interest in the operation of or in any agreement related to the Plan.
The components of “Due to The Dreyfus Corporation and affiliates” in the Statement of Assets and Liabilities consist of: management fees $406,508 and Rule 12b-1 distribution plan fees $45,053.
NOTE 4—Securities Transactions:
The aggregate amount of purchases and sales of investment securities, excluding short-term securities, during the period ended October 31, 2008, amounted to $504,969,772 and $596,665,164, respectively.
At October 31, 2008, the cost of investments for federal income tax purposes was $631,472,805; accordingly, accumulated net unrealized depreciation on investments was $77,241,031, consisting of $31,796,495 gross unrealized appreciation and $109,037,526 gross unrealized depreciation.
In March 2008, the FASB released Statement of Financial Accounting Standards No. 161, Disclosures about Derivative Instruments and Hedging Activities (“FAS 161”). FAS 161 requires qualitative disclosures about objectives and strategies for using derivatives, quantitative disclosures about fair value amounts of gains and losses on derivative instruments, and disclosures about credit-risk-related contingent features in derivative agreements.The application of FAS 161 is required for fiscal years and interim periods beginning after November 15, 2008. At this time, management is evaluating the implications of FAS 161 and its impact on the financial statements and the accompanying notes has not yet been determined.
22
REPORT OF INDEPENDENT REGISTERED PUBLIC ACCOUNTING FIRM
The Board of Directors and Shareholders The Dreyfus/Laurel Funds, Inc.:
We have audited the accompanying statement of assets and liabilities of Dreyfus Disciplined Stock Fund, a series of The Dreyfus/Laurel Funds, Inc. (the “Fund”), including the statement of investments, as of October 31, 2008, and the related statement of operations for the year then ended, the statement of changes in net assets for each of the years in the two-year period then ended, and the financial highlights for each of the years in the five-year period then ended. These financial statements and financial highlights are the responsibility of the Fund’s management. Our responsibility is to express an opinion on these financial statements and financial highlights based on our audits.
We conducted our audits in accordance with the standards of the Public Company Accounting Oversight Board (United States).Those standards require that we plan and perform the audit to obtain reasonable assurance about whether the financial statements and financial highlights are free of material misstatement. An audit includes examining, on a test basis, evidence supporting the amounts and disclosures in the financial statements. Our procedures included confirmation of securities owned as of October 31, 2008, by correspondence with the custodian and brokers or by other appropriate auditing procedures where replies from brokers were not received.An audit also includes assessing the accounting principles used and significant estimates made by management, as well as evaluating the overall financial statement presentation.We believe that our audits provide a reasonable basis for our opinion.
In our opinion, the financial statements and financial highlights referred to above present fairly, in all material respects, the financial position of Dreyfus Disciplined Stock Fund as of October 31, 2008, and the results of its operations for the year then ended, the changes in its net assets for each of the years in the two-year period then ended, and the financial highlights for each of the years in the five-year period then ended, in conformity with U.S. generally accepted accounting principles.

| | New York, New York
December 19, 2008 |
The Fund 23
IMPORTANT TAX INFORMATION ( U n a u d i t e d )
In accordance with federal tax law, the fund hereby designates 53.34% of the ordinary dividends paid during the fiscal year ended October 31, 2008 as qualifying for the corporate dividends received deduction. For the fiscal year ended October 31, 2008, certain dividends paid by the fund may be subject to a maximum tax rate of 15%, as provided for by the Jobs and Growth Tax Relief Reconciliation Act of 2003. Of the distributions paid during the fiscal year, $15,236,850 represents the maximum amount that may be considered qualified dividend income. Shareholders will receive notification in January 2009 of the percentage applicable to the preparation of their 2008 income tax returns. Also, the fund hereby designates $2.7445 per share as a long-term capital gain distribution and $1.1685 per share as a short-term capital gain distribution of the $4.0190 per share paid on December 6, 2007.
24
BOARD MEMBERS INFORMATION ( U n a u d i t e d )
Joseph S. DiMartino (65)
Chairman of the Board (1999)
Principal Occupation During Past 5Years:
Corporate Director and Trustee
Other Board Memberships and Affiliations: |
- The Muscular Dystrophy Association, Director
- Century Business Services, Inc., a provider of outsourcing functions for small and medium size companies, Director
- The Newark Group, a provider of a national market of paper recovery facilities, paperboard mills and paperboard converting plants, Director
- Sunair Services Corporation, a provider of certain outdoor-related services to homes and businesses, Director
No. of Portfolios for which Board Member Serves: 167
James M. Fitzgibbons (74)
Board Member (1994)
Principal Occupation During Past 5Years:
Corporate Director and Trustee |
Other Board Memberships and Affiliations:
Bill Barrett Company, an oil and gas exploration company, Director
No. of Portfolios for which Board Member Serves: 25
Kenneth A. Himmel (62)
Board Member (1994)
Principal Occupation During Past 5Years: |
- President and CEO,Related Urban Development,a real estate development company (1996-present)
- President and CEO, Himmel & Company, a real estate development company (1980-present)
- CEO, American Food Management, a restaurant company (1983-present)
| No. of Portfolios for which Board Member Serves: 25 |
Stephen J. Lockwood (61)
Board Member (1994)
Principal Occupation During Past 5Years: |
- Chairman of the Board, Stephen J. Lockwood and Company LLC, an investment company (2000-present)
| No. of Portfolios for which Board Member Serves: 25 |
The Fund 25
BOARD MEMBERS INFORMATION ( U n a u d i t e d ) (continued)
Roslyn M. Watson (59)
Board Member (1994) |
Principal Occupation During Past 5Years:
Principal,Watson Ventures, Inc., a real estate investment company (1993-present)
Other Board Memberships and Affiliations:
- American Express Bank, Director
- The Hyams Foundation Inc., a Massachusetts Charitable Foundation,Trustee
- National Osteoporosis Foundation,Trustee
- SBLI-USA, Director
| No. of Portfolios for which Board Member Serves: 25 |
Benaree Pratt Wiley (62)
Board Member (1998)
Principal Occupation During Past 5Years: |
- Principal,The Wiley Group, a firm specializing in strategy and business development (2005-present)
- President and CEO,The Partnership, an organization dedicated to increasing the representation of African Americans in positions of leadership, influence and decision-making in Boston, MA (1991-2005)
| Other Board Memberships and Affiliations: |
- Boston College,Trustee Associate
- Blue Cross Blue Shield of Massachusetts, Director
- CBIZ, professional support consultants and service providers for small, midsized and corporate business, Director
- Commonwealth Institute, Director
- Efficacy Institute, Director
- PepsiCo African-American, Chair of Advisory Board
- The Boston Foundation, Director
- Century Business Services, Inc., a provider of outsourcing functions for small and medium size companies, Director
| No. of Portfolios for which Board Member Serves: 36 |
Once elected all Board Members serve for an indefinite term, but achieve Emeritus status upon reaching age 80.The address of the Board Members and Officers is in c/o The Dreyfus Corporation, 200 Park Avenue, NewYork, NewYork 10166. Additional information about the Board Members is available in the fund’s Statement of Additional Information which can be obtained from Dreyfus free of charge by calling this toll free number: 1-800-554-4611.
Francis P. Brennan, Emeritus Board Member
J.Tomlinson Fort, Emeritus Board Member |
26
OFFICERS OF THE FUND ( U n a u d i t e d )
| J. DAVID OFFICER, President since | | JONI LACKS CHARATAN, Vice President |
| December 2006. | | and Assistant Secretary since |
| Chief Operating Officer,Vice Chairman and a | | August 2005. |
| Director of the Manager, and an officer of 77 | | Senior Counsel of BNY Mellon, and an officer |
| investment companies (comprised of 167 | | of 78 investment companies (comprised of 188 |
| portfolios) managed by the Manager. He is 60 | | portfolios) managed by the Manager. She is 53 |
| years old and has been an employee of the | | years old and has been an employee of the |
| Manager since April 1998. | | Manager since October 1988. |
| |
| PHILLIP N. MAISANO, Executive Vice | | JOSEPH M. CHIOFFI, Vice President and |
| President since July 2007. | | Assistant Secretary since August 2005. |
| Chief Investment Officer,Vice Chair and a | | Senior Counsel of BNY Mellon, and an officer |
| director of the Manager, and an officer of 77 | | of 78 investment companies (comprised of 188 |
| investment companies (comprised of 167 | | portfolios) managed by the Manager. He is 47 |
| portfolios) managed by the Manager. Mr. | | years old and has been an employee of the |
| Maisano also is an officer and/or Board | | Manager since June 2000. |
| member of certain other investment | | |
| | | JANETTE E. FARRAGHER, Vice President |
| management subsidiaries of The Bank of New | | |
| | | and Assistant Secretary since |
| York Mellon Corporation, each of which is an | | |
| | | August 2005. |
| affiliate of the Manager. He is 61 years old and | | |
| has been an employee of the Manager since | | Assistant General Counsel of BNY Mellon, |
| November 2006. Prior to joining the Manager, | | and an officer of 78 investment companies |
| Mr. Maisano served as Chairman and Chief | | (comprised of 188 portfolios) managed by the |
| Executive Officer of EACM Advisors, an | | Manager. She is 45 years old and has been an |
| affiliate of the Manager, since August 2004, and | | employee of the Manager since February 1984. |
| served as Chief Executive Officer of Evaluation | | JOHN B. HAMMALIAN, Vice President and |
| Associates, a leading institutional investment | | Assistant Secretary since August 2005. |
| consulting firm, from 1988 until 2004. | | |
| | | Managing Counsel of BNY Mellon, and an |
| MICHAEL A. ROSENBERG, Vice President | | officer of 78 investment companies (comprised |
| and Secretary since August 2005. | | of 188 portfolios) managed by the Manager. |
| Assistant General Counsel of BNY Mellon, | | He is 45 years old and has been an employee |
| and an officer of 78 investment companies | | of the Manager since February 1991. |
| (comprised of 188 portfolios) managed by the | | ROBERT R. MULLERY, Vice President and |
| Manager. He is 48 years old and has been an | | Assistant Secretary since August 2005. |
| employee of the Manager since October 1991. | | |
| | | Managing Counsel of BNY Mellon, and an |
| JAMES BITETTO, Vice President and | | officer of 78 investment companies (comprised |
| Assistant Secretary since August 2005. | | of 188 portfolios) managed by the Manager. |
| Senior Counsel of BNY Mellon and Secretary | | He is 56 years old and has been an employee |
| of the Manager, and an officer of 78 | | of the Manager since May 1986. |
| investment companies (comprised of 188 | | |
| portfolios) managed by the Manager. He is 42 | | |
| years old and has been an employee of the | | |
| Manager since December 1996. | | |
The Fund 27
OFFICERS OF THE FUND (Unaudited) (continued)
| JEFF PRUSNOFSKY, Vice President and | | ROBERT SALVIOLO, Assistant Treasurer |
| Assistant Secretary since August 2005. | | since July 2007. |
| Managing Counsel of BNY Mellon, and an | | Senior Accounting Manager – Equity Funds of |
| officer of 78 investment companies (comprised | | the Manager, and an officer of 78 investment |
| of 188 portfolios) managed by the Manager. | | companies (comprised of 188 portfolios) |
| He is 43 years old and has been an employee | | managed by the Manager. He is 41 years old |
| of the Manager since October 1990. | | and has been an employee of the Manager |
| | | since June 1989. |
| JAMES WINDELS, Treasurer since | | |
| November 2001. | | ROBERT SVAGNA, Assistant Treasurer |
| Director – Mutual Fund Accounting of the | | since December 2002. |
| Manager, and an officer of 78 investment | | Senior Accounting Manager – Equity Funds of |
| companies (comprised of 188 portfolios) | | the Manager, and an officer of 78 investment |
| managed by the Manager. He is 49 years old | | companies (comprised of 188 portfolios) |
| and has been an employee of the Manager | | managed by the Manager. He is 41 years old |
| since April 1985. | | and has been an employee of the Manager |
| | | since November 1990. |
| RICHARD CASSARO, Assistant Treasurer | | |
| since January 2008. | | JOSEPH W. CONNOLLY, Chief Compliance |
| Senior Accounting Manager – Money Market | | Officer since October 2004. |
| and Municipal Bond Funds of the Manager, | | Chief Compliance Officer of the Manager and |
| and an officer of 78 investment companies | | The Dreyfus Family of Funds (78 investment |
| (comprised of 188 portfolios) managed by | | companies, comprised of 188 portfolios). From |
| the Manager. He is 49 years old and has | | November 2001 through March 2004, Mr. |
| been an employee of the Manager since | | Connolly was first Vice-President, Mutual |
| September 1982. | | Fund Servicing for Mellon Global Securities |
| | | Services. In that capacity, Mr. Connolly was |
| GAVIN C. REILLY, Assistant Treasurer | | |
| | | responsible for managing Mellon’s Custody, |
| since December 2005. | | |
| | | Fund Accounting and Fund Administration |
| Tax Manager of the Investment Accounting | | services to third-party mutual fund clients. He |
| and Support Department of the Manager, and | | is 51 years old and has served in various |
| an officer of 78 investment companies | | capacities with the Manager since 1980, |
| (comprised of 188 portfolios) managed by the | | including manager of the firm’s Fund |
| Manager. He is 40 years old and has been an | | Accounting Department from 1997 through |
| employee of the Manager since April 1991. | | October 2001. |
| |
| ROBERT ROBOL, Assistant Treasurer | | WILLIAM GERMENIS, Anti-Money |
| since December 2002. | | Laundering Compliance Officer since |
| Senior Accounting Manager – Fixed Income | | July 2002. |
| Funds of the Manager, and an officer of 78 | | Vice President and Anti-Money Laundering |
| investment companies (comprised of 188 | | Compliance Officer of the Distributor, and the |
| portfolios) managed by the Manager. He is 44 | | Anti-Money Laundering Compliance Officer |
| years old and has been an employee of the | | of 74 investment companies (comprised of 184 |
| Manager since October 1988. | | portfolios) managed by the Manager. He is 38 |
| | | years old and has been an employee of the |
| | | Distributor since October 1998. |
28

Save time. Save paper. View your next shareholder report online as soon as it’s available. Log into www.dreyfus.com and sign up for Dreyfus eCommunications. It’s simple and only takes a few minutes.
The views expressed in this report reflect those of the portfolio manager only through the end of the period covered and do not necessarily represent the views of Dreyfus or any other person in the Dreyfus organization. Any such views are subject to change at any time based upon market or other conditions and Dreyfus disclaims any responsibility to update such views.These views may not be relied on as investment advice and, because investment decisions for a Dreyfus fund are based on numerous factors, may not be relied on as an indication of trading intent on behalf of any Dreyfus fund.
Not FDIC-Insured Not Bank-Guaranteed May Lose Value
| | Contents |
| |
| | THE FUND |
| |
| 2 | A Letter from the CEO |
| |
| 3 | Discussion of Fund Performance |
| |
| 6 | Fund Performance |
| |
| 8 | Understanding Your Fund’s Expenses |
| |
| 8 | Comparing Your Fund’s Expenses With Those of Other Funds |
| |
| 9 | Statement of Investments |
| |
| 13 | Statement of Assets and Liabilities |
| |
| 14 | Statement of Operations |
| |
| 15 | Statement of Changes in Net Assets |
| |
| 17 | Financial Highlights |
| |
| 22 | Notes to Financial Statements |
| |
| 31 | Report of Independent Registered Public Accounting Firm |
| |
| 32 | Important Tax Information |
| |
| 33 | Board Members Information |
| |
| 35 | Officers of the Fund |
| |
| | FOR MORE INFORMATION |
| |
| | Back Cover |
| |
| Dreyfus |
| Large Company |
| Stock Fund |

A LETTER FROM THE CEO
Dear Shareholder:
We present to you this annual report for Dreyfus Large Company Stock Fund, covering the 12-month period from November 1, 2007, through October 31, 2008.
These are difficult times for equity investors. A credit crunch that began in early 2007 has developed into a full-blown global financial crisis, recently resulting in the failure of several major financial institutions and prompting a massive government rescue effort. Meanwhile, the U.S. economic slowdown has gathered momentum,depressing investor sentiment, consumer confidence and business investment.These factors undermined returns in most stock market sectors, particularly financial companies and businesses that tend to be more sensitive to economic trends.
The depth and duration of the economic downturn will depend on how quickly the financial system can be stabilized.We believe that the Temporary Guarantee Program for Money Market Funds and the $700 billion rescue package intended to promote greater liquidity in the financial markets meet several critical requirements for addressing today’s financial stresses, and we expect these measures to contribute to a more orderly deleveraging process. However, recuperation from the financial crisis is likely to take time. In the meantime, we encourage you to keep in touch with your financial advisor and maintain a long-term and disciplined perspective to investing. Indeed, we already are seeing some positive signs, including a likely peak in global inflationary pressures, a bottoming of the U.S. dollar, attractive valuations among fundamentally sound companies and a large pool of worldwide financial liquidity that could be deployed gradually as the economic cycle turns.
For information about how the fund performed during the reporting period, as well as market perspectives, we have provided a Discussion of Fund Performance given by the fund’s Portfolio Manager.
Thank you for your continued confidence and support.

Jonathan R. Baum
Chief Executive Officer
The Dreyfus Corporation
November 17, 2008 |
2

DISCUSSION OF FUND PERFORMANCE
For the reporting period of November 1, 2007, through October 31, 2008, as provided by Sean P. Fitzgibbon, Portfolio Manager
Fund and Market Performance Overview
For the 12-month period ended October 31, 2008, Dreyfus Large Company Stock Fund’s Class A shares produced a total return of –36.71%, Class B shares returned –37.19%, Class C shares returned –37.17%, Class I shares returned –36.52% and Class T shares returned –36.85% .1 In comparison, the total return of the Standard & Poor’s 500 Composite Stock Price Index (“S&P 500 Index”), the fund’s benchmark, was –36.08% for the same period.2
An intensifying credit crisis and slowing economic growth precipitated a sharp downturn in stock prices, especially during the reporting period’s final months, in which all 10 sectors of the S&P 500 Index experienced severe declines. Relatively strong results in the hard-hit financial and consumer discretionary areas were offset by disappointments in several other sectors. As a result, the fund produced returns that were roughly in line with the benchmark, which is not subject to fees and expenses like a mutual fund.
The Fund’s Investment Approach
The fund seeks capital appreciation.To pursue its goal, the fund normally invests at least 80% of its assets in stocks of large-cap companies.The fund invests in a diversified portfolio of growth and value stocks, remaining fully invested and industry and sector neutral in relation to the S&P 500 Index. Stocks are chosen through a disciplined investment process that combines computer-modeling techniques, fundamental analysis and risk management. The result is a broadly diversified portfolio of carefully selected stocks, with performance determined by a large number of securities. At the end of the reporting period, the fund held positions in approximately 85 stocks across 11 economic sectors.
The Fund 3
| DISCUSSION OF FUND PERFORMANCE (continued) |
Economic Developments Drove Markets Lower
The reporting period was characterized by dramatic deterioration of economic trends and unprecedented levels of market volatility. Over the reporting period’s first half, commodity prices soared, and rising unemployment and plunging housing values prompted consumers to reduce spending and businesses to curtail capital investment. Meanwhile, a credit crisis that began in 2007 in the U.S. sub-prime mortgage market mushroomed into a global financial crisis later in the reporting period, pushing the world’s banking system to the brink of collapse and requiring massive intervention by governments and central banks. Stock prices staged a broad-based decline in response to these adverse developments.
Losses Were Limited in Key Sectors
The financial sector was hit especially hard, as widespread exposure to troubled mortgages produced severe losses among a number of financial institutions, leading to a wave of bankruptcies, mergers and government bailouts. However, effective positioning in the financials sector enabled the fund to limit its losses. Among insurance holdings, the fund benefited from the sale of American International Group before the stock collapsed in September, and from overweighted exposure toThe Chubb Corporation, which maintained its value.The fund avoided many of the worst performers in the mortgage and capital markets industries, including the highly publicized failures of Washington Mutual, Fannie Mae, Freddie Mac, Bear Stearns and Lehman Brothers. Among banks, the fund emphasized well-capitalized companies, such as JPMorgan Chase & Co. and Bank of America, which put their strong capital positions to work making opportunistic acquisitions.
Relatively strong returns in the consumer discretionary sector further bolstered performance. Top holdings included off-price and discount retailers that benefited from tightening consumer spending patterns, such as The TJX Companies, Family Dollar Stores and Ross Stores. The fund’s relatively large position in casual restaurant chain McDonald’s also enhanced relative returns when the company reported strong sales despite the economic turmoil.
4
Other Sectors Delivered Disappointing Results
The fund’s relatively strong performance among financials and consumer discretionary stocks was balanced by disappointments in several other sectors. Basic materials holdings—such as fertilizer manufacturer Mosaic and mining companies Freeport-McMoRan Copper & Gold and Allegheny Technologies—were hurt when commodity prices retreated from their previous peaks.Technology holding Apple fell in response to slowing consumer spending. Industrial holdings Eaton, Terex and Textron lost ground due to fears of a global recession. Finally, the fund’s lack of exposure to household goods maker Procter & Gamble undermined returns in the consumer staples sector.
Finding Opportunities for Future Gains
While no one can predict with certainty the depth or duration of the current downturn, we believe that equity valuations already reflect the potential for a severe recession.Indeed,we have identified what we regard as attractive opportunities for future appreciation, and we have cautiously positioned the fund for an eventual recovery. For example, we recently have emphasized beaten-down specialty retailers that have maintained profit margins despite today’s difficult environment.We also have allocated a relatively large percentage of the fund’s assets to health care equipment and supply providers that we believe are largely insulated from the economic downturn. Conversely, we have established underweighted positions in areas where we see less potential for rapid recovery, such as the energy, telecommunications and consumer staples sectors.
November 17, 2008
| 1 | | Total return includes reinvestment of dividends and any capital gains paid, and does not take into |
| | | consideration the maximum initial sales charges in the case of Class A and Class T shares, or the |
| | | applicable contingent deferred sales charges imposed on redemptions in the case of Class B and |
| | | Class C shares. Had these charges been reflected, returns would have been lower. Past performance |
| | | is no guarantee of future results. Share price and investment return fluctuate such that upon |
| | | redemption, fund shares may be worth more or less than their original cost. |
| 2 | | SOURCE: LIPPER INC. — Reflects the monthly reinvestment of dividends and, where |
| | | applicable, capital gain distributions.The Standard & Poor’s 500 Composite Stock Price Index is |
| | | a widely accepted, unmanaged index of U.S. stock market performance. |
The Fund 5
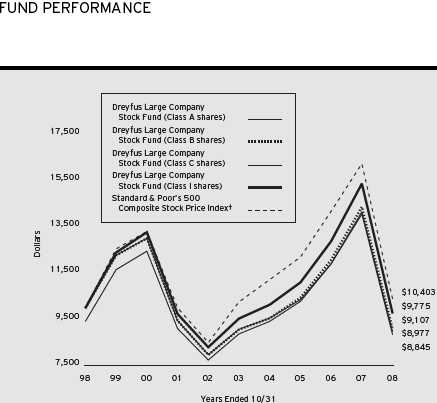
| Comparison of change in value of $10,000 investment in Dreyfus Large Company Stock Fund |
| Class A shares, Class B shares, Class C shares and Class I shares and the Standard & Poor’s 500 |
| Composite Stock Price Index |
| |
| † Source: Lipper Inc. |
| Past performance is not predictive of future performance. |
| The above graph compares a $10,000 investment made in Class A, Class B, Class C and Class I shares of Dreyfus |
| Large Company Stock Fund on 10/31/98 to a $10,000 investment made in the Standard & Poor’s 500 Composite |
| Stock Price Index (the “Index”) on that date. All dividends and capital gain distributions are reinvested. Performance for |
| Class T shares will vary from the performance of Class A, Class B, Class C and Class I shares shown above due to |
| differences in charges and expenses. |
| The fund’s performance shown in the line graph takes into account the maximum initial sales charge on Class A shares |
| and all other applicable fees and expenses.The Index is a widely accepted, unmanaged index of U.S. stock market |
| performance. Unlike a mutual fund, the Index is not subject to charges, fees and other expenses. Investors cannot invest |
| directly in any index. Further information relating to fund performance, including expense reimbursements, if applicable, is |
| contained in the Financial Highlights section of the prospectus and elsewhere in this report. |
6
| Average Annual Total Returns as of 10/31/08 | | | | | | |
| |
| Inception |
| | | Date | | 1 Year | | 5 Years | | 10 Years |
| |
| |
| |
| |
|
| Class A shares | | | | | | | | |
| with maximum sales charge (5.75%) | | | | (40.35)% | | (0.97)% | | (1.07)% |
| without sales charge | | | | (36.71)% | | 0.21% | | (0.49)% |
| Class B shares | | | | | | | | |
| with applicable redemption charge † | | | | (39.69)% | | (0.92)% | | (0.93)% |
| without redemption | | | | (37.19)% | | (0.52)% | | (0.93)% |
| Class C shares | | | | | | | | |
| with applicable redemption charge †† | | | | (37.79)% | | (0.54)% | | (1.22)% |
| without redemption | | | | (37.17)% | | (0.54)% | | (1.22)% |
| Class I shares | | | | (36.52)% | | 0.48% | | (0.23)% |
| Class T shares | | | | | | | | |
| with applicable sales charge (4.5%) | | 8/16/99 | | (39.69)% | | (0.95)% | | (1.14)%††† |
| without sales charge | | 8/16/99 | | (36.85)% | | (0.03)% | | (0.69)%††† |
| Past performance is not predictive of future performance.The fund’s performance shown in the graph and table does not |
| reflect the deduction of taxes that a shareholder would pay on fund distributions or the redemption of fund shares. |
| Performance for Class B shares assumes the conversion of Class B shares to Class A shares at the end of the sixth year |
| following the date of purchase. |
| † | | The maximum contingent deferred sales charge for Class B shares is 4%. After six years Class B shares convert to |
| | | Class A shares. |
| †† | | The maximum contingent deferred sales charge for Class C shares is 1% for shares redeemed within one year of the |
| | | date of purchase. |
| ††† | | The total return performance figures presented for Class T shares of the fund reflect the performance of the fund’s |
| | | Class A shares for periods prior 8/16/99 (the inception date for Class T shares), adjusted to reflect the applicable |
| | | sales load for that class and the applicable distribution/servicing fees thereafter. |
The Fund 7
UNDERSTANDING YOUR FUND’S EXPENSES (Unaudited)
As a mutual fund investor, you pay ongoing expenses, such as management fees and other expenses. Using the information below, you can estimate how these expenses affect your investment and compare them with the expenses of other funds.You also may pay one-time transaction expenses, including sales charges (loads) and redemption fees, which are not shown in this section and would have resulted in higher total expenses. For more information, see your fund’s prospectus or talk to your financial adviser.
Review your fund’s expenses
The table below shows the expenses you would have paid on a $1,000 investment in Dreyfus Large Company Stock Fund from May 1, 2008 to October 31, 2008. It also shows how much a $1,000 investment would be worth at the close of the period, assuming actual returns and expenses.
Expenses and Value of a $1,000 Investment assuming actual returns for the six months ended October 31, 2008
| | | Class A | | Class B | | Class C | | Class I | | Class T |
| |
| |
| |
| |
| |
|
| Expenses paid per $1,000† | | $ 4.91 | | $ 8.11 | | $ 8.11 | | $ 3.85 | | $ 5.98 |
| Ending value (after expenses) | | $700.00 | | $697.30 | | $697.60 | | $701.40 | | $699.20 |
COMPARING YOUR FUND’S EXPENSES WITH THOSE OF OTHER FUNDS (Unaudited)
Using the SEC’s method to compare expenses
The Securities and Exchange Commission (SEC) has established guidelines to help investors assess fund expenses. Per these guidelines, the table below shows your fund’s expenses based on a $1,000 investment, assuming a hypothetical 5% annualized return. You can use this information to compare the ongoing expenses (but not transaction expenses or total cost) of investing in the fund with those of other funds.All mutual fund shareholder reports will provide this information to help you make this comparison. Please note that you cannot use this information to estimate your actual ending account balance and expenses paid during the period.
Expenses and Value of a $1,000 Investment assuming a hypothetical 5% annualized return for the six months ended October 31, 2008
| | | Class A | | Class B | | Class C�� | | Class I | | Class T |
| |
| |
| |
| |
| |
|
| Expenses paid per $1,000† | | $ 5.84 | | $ 9.63 | | $ 9.63 | | $ 4.57 | | $ 7.10 |
| Ending value (after expenses) | | $1,019.36 | | $1,015.58 | | $1,015.58 | | $1,020.61 | | $1,018.10 |
| † Expenses are equal to the fund’s annualized expense ratio of 1.15% for Class A, 1.90% for Class B, 1.90% for |
| Class C, .90% for Class I and 1.40% for Class T, multiplied by the average account value over the period, |
| multiplied by 184/366 (to reflect the one-half year period). |
8
STATEMENT OF INVESTMENTS
October 31, 2008 |
| Common Stocks—97.0% | | Shares | | Value ($) |
| |
| |
|
| Consumer Discretionary—9.7% | | | | |
| Coach | | 12,880 a | | 265,328 |
| Darden Restaurants | | 10,692 | | 237,042 |
| Family Dollar Stores | | 15,590 | | 419,527 |
| Gap | | 28,630 b | | 370,472 |
| McDonald’s | | 12,865 | | 745,269 |
| Newell Rubbermaid | | 28,310 | | 389,263 |
| News, Cl. A | | 38,930 | | 414,215 |
| OfficeMax | | 21,600 | | 173,880 |
| Omnicom Group | | 13,310 | | 393,177 |
| Ross Stores | | 15,730 | | 514,214 |
| TJX Cos. | | 9,530 | | 255,023 |
| | | | | 4,177,410 |
| Consumer Staples—11.7% | | | | |
| Cadbury, ADR | | 6,368 | | 235,488 |
| Coca-Cola Enterprises | | 12,000 | | 120,600 |
| Colgate-Palmolive | | 11,670 | | 732,409 |
| CVS Caremark | | 25,910 | | 794,141 |
| Dr. Pepper Snapple Group | | 12,451 a | | 285,128 |
| Estee Lauder, Cl. A | | 13,070 | | 471,043 |
| Kroger | | 18,120 | | 497,575 |
| Molson Coors Brewing, Cl. B | | 6,730 | | 251,433 |
| Philip Morris International | | 18,750 | | 815,063 |
| Wal-Mart Stores | | 14,630 | | 816,500 |
| | | | | 5,019,380 |
| Energy—10.6% | | | | |
| Anadarko Petroleum | | 7,170 | | 253,101 |
| Chevron | | 17,270 | | 1,288,342 |
| ConocoPhillips | | 23,940 | | 1,245,359 |
| ENSCO International | | 3,610 | | 137,216 |
| Marathon Oil | | 12,240 | | 356,184 |
| Nabors Industries | | 13,290 a | | 191,110 |
| National Oilwell Varco | | 5,000 a | | 149,450 |
| Valero Energy | | 4,890 | | 100,636 |
| Williams | | 13,580 | | 284,773 |
| XTO Energy | | 15,545 | | 558,843 |
| | | | | 4,565,014 |
The Fund 9
| STATEMENT OF INVESTMENTS (continued) |
| Common Stocks (continued) | | Shares | | Value ($) |
| |
| |
|
| Exchange Traded Funds—.8% | | | | |
| Standard & Poor’s Depository | | | | |
| Receipts (Tr. Ser. 1) | | 3,420 | | 331,159 |
| Financial—14.8% | | | | |
| Bank of America | | 43,310 | | 1,046,802 |
| Chubb | | 16,490 | | 854,512 |
| Citigroup | | 60,500 | | 825,825 |
| Discover Financial Services | | 18,250 | | 223,563 |
| Fifth Third Bancorp | | 30,830 | | 334,506 |
| First Horizon National | | 28,000 | | 333,480 |
| JPMorgan Chase & Co. | | 24,440 | | 1,008,150 |
| KeyCorp | | 29,200 | | 357,116 |
| U.S. Bancorp | | 12,770 | | 380,674 |
| Wells Fargo & Co. | | 28,840 | | 982,002 |
| | | | | 6,346,630 |
| Health Care—15.2% | | | | |
| Aetna | | 15,230 | | 378,770 |
| Amgen | | 8,860 a | | 530,625 |
| Baxter International | | 19,620 | | 1,186,814 |
| Becton, Dickinson & Co. | | 2,130 | | 147,822 |
| Covidien | | 7,652 | | 338,907 |
| Hospira | | 13,200 a | | 367,224 |
| Invitrogen | | 7,830 a | | 225,426 |
| Johnson & Johnson | | 10,080 | | 618,307 |
| Laboratory Corp. of America Holdings | | 5,050 a | | 310,525 |
| Novartis, ADR | | 9,450 | | 481,856 |
| Pfizer | | 27,623 | | 489,203 |
| Schering-Plough | | 23,440 | | 339,646 |
| St. Jude Medical | | 8,800 a | | 334,664 |
| Thermo Fisher Scientific | | 12,790 a | | 519,274 |
| Vertex Pharmaceuticals | | 9,900 a | | 259,479 |
| | | | | 6,528,542 |
| Industrial—10.5% | | | | |
| Allied Waste Industries | | 29,780 a | | 310,307 |
| Delta Air Lines | | 26,220 a | | 287,896 |
| Dover | | 9,650 | | 306,581 |
| Emerson Electric | | 13,770 | | 450,692 |
| FedEx | | 4,440 | | 290,243 |
10
| Common Stocks (continued) | | Shares | | Value ($) |
| |
| |
|
| Industrial (continued) | | | | |
| General Electric | | 37,920 | | 739,819 |
| Goodrich | | 8,420 | | 307,835 |
| L-3 Communications Holdings | | 4,810 | | 390,428 |
| Lockheed Martin | | 6,260 | | 532,413 |
| Raytheon | | 5,610 | | 286,727 |
| Textron | | 9,470 | | 167,619 |
| Tyco International | | 18,522 | | 468,236 |
| | | | | 4,538,796 |
| Information Technology—16.1% | | | | |
| Accenture, Cl. A | | 9,000 | | 297,450 |
| Adobe Systems | | 12,780 a | | 340,459 |
| Alliance Data Systems | | 9,720 a | | 487,555 |
| Amphenol, Cl. A | | 7,830 | | 224,329 |
| Apple | | 7,560 a | | 813,380 |
| Cisco Systems | | 58,170 a | | 1,033,681 |
| Global Payments | | 7,290 | | 295,318 |
| Intel | | 26,690 | | 427,040 |
| Juniper Networks | | 17,420 a | | 326,451 |
| McAfee | | 4,690 a | | 152,660 |
| Microsoft | | 51,320 | | 1,145,976 |
| Nokia, ADR | | 8,280 | | 125,690 |
| Oracle | | 32,070 a | | 586,560 |
| QUALCOMM | | 9,610 | | 367,679 |
| Visa, Cl. A | | 6,295 | | 348,428 |
| | | | | 6,972,656 |
| Materials—1.7% | | | | |
| Freeport-McMoRan Copper & Gold | | 4,600 | | 133,860 |
| International Paper | | 13,680 | | 235,570 |
| Mosaic | | 3,100 | | 122,171 |
| Pactiv | | 10,920 a | | 257,275 |
| | | | | 748,876 |
| Telecommunication Services—1.9% | | | | |
| AT & T | | 30,030 | | 803,903 |
| Utilities—4.0% | | | | |
| American Electric Power | | 18,520 | | 604,307 |
| PG & E | | 16,600 | | 608,722 |
The Fund 11
| | STATEMENT OF INVESTMENTS (continued) |
| Common Stocks (continued) | | Shares | | Value ($) |
| |
| |
|
| Utilities (continued) | | | | |
| Sempra Energy | | 11,660 | | 496,599 |
| | | | | 1,709,628 |
| Total Common Stocks | | | | |
| (cost $50,603,960) | | | | 41,741,994 |
| |
| |
|
| |
| Other Investment—2.3% | | | | |
| |
| |
|
| Registered Investment Company; | | | | |
| Dreyfus Institutional Preferred | | | | |
| Plus Money Market Fund | | | | |
| (cost $988,000) | | 988,000 c | | 988,000 |
| |
| |
|
| |
| Investment of Cash Collateral | | | | |
| for Securities Loaned—.8% | | | | |
| |
| |
|
| Registered Investment Company; | | | | |
| Dreyfus Institutional Cash | | | | |
| Advantage Plus Fund | | | | |
| (cost $334,971) | | 334,971 c | | 334,971 |
| |
| |
|
| Total Investments (cost $51,926,931) | | 100.1% | | 43,064,965 |
| Liabilities, Less Cash and Receivables | | (.1%) | | (42,242) |
| Net Assets | | 100.0% | | 43,022,723 |
| ADR—American Depository Receipts |
| a Non-income producing security. |
| b All or a portion of this security is on loan. At October 31, 2008, the total market value of the fund’s securities on |
| loan is $333,425 and the total market value of the collateral held by the fund is $334,971. |
| c Investment in affiliated money market mutual fund. |
| Portfolio Summary (Unaudited)† | | | | |
| |
| | | Value (%) | | | | Value (%) |
| |
| |
| |
|
| Information Technology | | 16.1 | | Utilities | | 4.0 |
| Health Care | | 15.2 | | Money Market Investments | | 3.1 |
| Financial | | 14.8 | | Telecommunication Services | | 1.9 |
| Consumer Staples | | 11.7 | | Materials | | 1.7 |
| Energy | | 10.6 | | Exchange Traded Funds | | .8 |
| Industrial | | 10.5 | | | | |
| Consumer Discretionary | | 9.7 | | | | 100.1 |
| |
| † Based on net assets. | | | | | | |
| See notes to financial statements. | | | | | | |
12
STATEMENT OF ASSETS AND LIABILITIES
October 31, 2008
| | | | | | | | | Cost | | Value |
| |
| |
| |
| |
| |
|
| Assets ($): | | | | | | | | | | |
| Investments in securities—See Statement of Investments (including | | | | |
| securities on loan, valued at $333,425)—Note 1(b): | | | | | | |
| Unaffiliated issuers | | | | | | 50,603,960 | | 41,741,994 |
| Affiliated issuers | | | | | | | | 1,322,971 | | 1,322,971 |
| Receivable for investment securities sold | | | | | | 1,019,888 |
| Dividends and interest receivable | | | | | | | | 64,856 |
| Receivable for shares of Capital Stock subscribed | | | | | | 38,783 |
| Prepaid expenses | | | | | | | | | | 1,119 |
| | | | | | | | | | | 44,189,611 |
| |
| |
| |
| |
| |
|
| Liabilities ($): | | | | | | | | | | |
| Due to The Dreyfus Corporation and affiliates—Note 3(b) | | | | | | 45,267 |
| Cash overdraft due to Custodian | | | | | | | | 19,129 |
| Payable for investment securities purchased | | | | | | 714,880 |
| Liability for securities on loan—Note 1(b) | | | | | | | | 334,971 |
| Payable for shares of Capital Stock redeemed | | | | | | 52,565 |
| Accrued expenses | | | | | | | | | | 76 |
| | | | | | | | | | | 1,166,888 |
| |
| |
| |
| |
| |
|
| Net Assets ($) | | | | | | | | | | 43,022,723 |
| |
| |
| |
| |
| |
|
| Composition of Net Assets ($): | | | | | | | | |
| Paid-in capital | | | | | | | | | | 86,623,439 |
| Accumulated undistributed investment income—net | | | | | | 255,780 |
| Accumulated net realized gain (loss) on investments | | | | | | (34,994,530) |
| Accumulated net unrealized appreciation | | | | | | |
| (depreciation) on investments | | | | | | | | (8,861,966) |
| |
| |
| |
| |
|
| Net Assets ($) | | | | | | | | | | 43,022,723 |
| |
| |
| |
| |
| |
|
| |
| |
| Net Asset Value Per Share | | | | | | | | |
| | | Class A | | Class B | | Class C | | Class I | | Class T |
| |
| |
| |
| |
| |
|
| Net Assets ($) | | 30,616,062 | | 2,881,346 | | 3,888,130 | | 5,369,032 | | 268,153 |
| Shares Outstanding | | 1,712,737 | | 171,038 | | 230,815 | | 295,997 | | 15,250 |
| |
| |
| |
| |
| |
|
| Net Asset Value | | | | | | | | | | |
| Per Share ($) | | 17.88 | | 16.85 | | 16.85 | | 18.14 | | 17.58 |
| |
| See notes to financial statements. | | | | | | | | |
The Fund 13
STATEMENT OF OPERATIONS
Year Ended October 31, 2008 |
| Investment Income ($): | | |
| Income: | | |
| Cash dividends: | | |
| Unaffiliated issuers | | 1,318,546 |
| Affiliated issuers | | 15,267 |
| Income from securities lending | | 6,417 |
| Total Income | | 1,340,230 |
| Expenses: | | |
| Management fee—Note 3(a) | | 576,119 |
| Distribution and service fees—Note 3(b) | | 226,448 |
| Directors’ fees—Note 3(a) | | 3,698 |
| Loan commitment fees—Note 2 | | 1,047 |
| Total Expenses | | 807,312 |
| Less—Directors’ fees reimbursed by | | |
| the Manager—Note 3(a) | | (3,698) |
| Net Expenses | | 803,614 |
| Investment Income—Net | | 536,616 |
| |
|
| Realized and Unrealized Gain (Loss) on Investments—Note 4 ($): | | |
| Net realized gain (loss) on investments | | (2,962,803) |
| Net unrealized appreciation (depreciation) on investments | | (24,357,824) |
| Net Realized and Unrealized Gain (Loss) on Investments | | (27,320,627) |
| Net (Decrease) in Net Assets Resulting from Operations | | (26,784,011) |
| |
| See notes to financial statements. | | |
14
STATEMENT OF CHANGES IN NET ASSETS
| | | Year Ended October 31, |
| | |
|
| | | 2008 | | 2007a |
| |
| |
|
| Operations ($): | | | | |
| Investment income—net | | 536,616 | | 370,881 |
| Net realized gain (loss) on investments | | (2,962,803) | | 8,205,044 |
| Net unrealized appreciation | | | | |
| (depreciation) on investments | | (24,357,824) | | 4,902,331 |
| Net Increase (Decrease) in Net Assets | | | | |
| Resulting from Operations | | (26,784,011) | | 13,478,256 |
| |
| |
|
| Dividends to Shareholders from ($): | | | | |
| Investment income—net: | | | | |
| Class A Shares | | (432,848) | | (193,474) |
| Class B Shares | | (25,071) | | (26,457) |
| Class C Shares | | (26,534) | | (14,730) |
| Class I Shares | | (88,120) | | (39,345) |
| Class T Shares | | (2,918) | | (1,445) |
| Total Dividends | | (575,491) | | (275,451) |
| |
| |
|
| Capital Stock Transactions ($): | | | | |
| Net proceeds from shares sold: | | | | |
| Class A Shares | | 5,439,982 | | 10,062,628 |
| Class B Shares | | 1,199,484 | | 570,623 |
| Class C Shares | | 473,194 | | 326,874 |
| Class I Shares | | 57,853 | | 62,848 |
| Class T Shares | | 222,838 | | 79,797 |
| Dividends reinvested: | | | | |
| Class A Shares | | 390,170 | | 172,403 |
| Class B Shares | | 23,128 | | 25,141 |
| Class C Shares | | 11,352 | | 6,494 |
| Class I Shares | | 70,854 | | 32,131 |
| Class T Shares | | 2,617 | | 1,312 |
| Cost of shares redeemed: | | | | |
| Class A Shares | | (10,117,362) | | (12,791,058) |
| Class B Shares | | (3,861,855) | | (9,117,910) |
| Class C Shares | | (1,537,138) | | (1,128,116) |
| Class I Shares | | (878,424) | | (864,930) |
| Class T Shares | | (243,921) | | (156,539) |
| Increase (Decrease) in Net Assets | | | | |
| from Capital Stock Transactions | | (8,747,228) | | (12,718,302) |
| Total Increase (Decrease) in Net Assets | | (36,106,730) | | 484,503 |
| |
| |
|
| Net Assets ($): | | | | |
| Beginning of Period | | 79,129,453 | | 78,644,950 |
| End of Period | | 43,022,723 | | 79,129,453 |
| Undistributed investment income—net | | 255,780 | | 294,655 |
The Fund 15
STATEMENT OF CHANGES IN NET ASSETS (continued)
| | | Year Ended October 31, |
| | |
|
| | | 2008 | | 2007a |
| |
| |
|
| Capital Share Transactions: | | | | |
| Class Ab | | | | |
| Shares sold | | 217,074 | | 391,279 |
| Shares issued for dividends reinvested | | 14,705 | | 6,943 |
| Shares redeemed | | (418,717) | | (492,696) |
| Net Increase (Decrease) in Shares Outstanding | | (186,938) | | (94,474) |
| |
| |
|
| Class Bb | | | | |
| Shares sold | | 49,904 | | 23,466 |
| Shares issued for dividends reinvested | | 885 | | 1,064 |
| Shares redeemed | | (165,665) | | (376,427) |
| Net Increase (Decrease) in Shares Outstanding | | (114,876) | | (351,897) |
| |
| |
|
| Class C | | | | |
| Shares sold | | 20,355 | | 12,998 |
| Shares issued for dividends reinvested | | 435 | | 275 |
| Shares redeemed | | (67,685) | | (45,265) |
| Net Increase (Decrease) in Shares Outstanding | | (46,895) | | (31,992) |
| |
| |
|
| Class I | | | | |
| Shares sold | | 2,406 | | 2,391 |
| Shares issued for dividends reinvested | | 2,650 | | 1,279 |
| Shares redeemed | | (34,812) | | (33,375) |
| Net Increase (Decrease) in Shares Outstanding | | (29,756) | | (29,705) |
| |
| |
|
| Class T | | | | |
| Shares sold | | 9,208 | | 3,086 |
| Shares issued for dividends reinvested | | 100 | | 54 |
| Shares redeemed | | (10,187) | | (5,802) |
| Net Increase (Decrease) in Shares Outstanding | | (879) | | (2,662) |
| a | | Effective June 1, 2007, Class R shares were redesignated as Class I shares. |
| b | | During the period ended October 31, 2008, 87,530 Class B shares representing $2,090,325 were automatically |
| | | converted to 82,646 Class A shares and during the period ended October 31, 2007, 275,310 Class B shares |
| | | representing $6,682,777 were automatically converted to 261,244 Class A shares. |
| See notes to financial statements. |
16
FINANCIAL HIGHLIGHTS
The following tables describe the performance for each share class for the fiscal periods indicated.All information (except portfolio turnover rate) reflects financial results for a single fund share.Total return shows how much your investment in the fund would have increased (or decreased) during each period, assuming you had reinvested all dividends and distributions.These figures have been derived from the fund’s financial statements.
| | | | | Year Ended October 31, | | |
| | |
| |
| |
|
| Class A Shares | | 2008 | | 2007 | | 2006 | | 2005 | | 2004 |
| |
| |
| |
| |
| |
|
| Per Share Data ($): | | | | | | | | | | |
| Net asset value, beginning of period | | 28.48 | | 24.03 | | 20.81 | | 19.27 | | 18.23 |
| Investment Operations: | | | | | | | | | | |
| Investment income—neta | | .23 | | .16 | | .16 | | .17 | | .10 |
| Net realized and unrealized | | | | | | | | | | |
| gain (loss) on investments | | (10.60) | | 4.39 | | 3.14 | | 1.59 | | 1.00 |
| Total from Investment Operations | | (10.37) | | 4.55 | | 3.30 | | 1.76 | | 1.10 |
| Distributions: | | | | | | | | | | |
| Dividends from investment income—net | | (.23) | | (.10) | | (.08) | | (.22) | | (.06) |
| Net asset value, end of period | | 17.88 | | 28.48 | | 24.03 | | 20.81 | | 19.27 |
| |
| |
| |
| |
| |
|
| Total Return (%)b | | (36.71) | | 18.98 | | 15.81 | | 9.23 | | 6.05 |
| |
| |
| |
| |
| |
|
| Ratios/Supplemental Data (%): | | | | | | | | | | |
| Ratio of total expenses | | | | | | | | | | |
| to average net assets | | 1.16 | | 1.15 | | 1.15 | | 1.15 | | 1.15 |
| Ratio of net expenses | | | | | | | | | | |
| to average net assets | | 1.15 | | 1.11 | | 1.05 | | 1.05 | | 1.08 |
| Ratio of net investment income | | | | | | | | | | |
| to average net assets | | .94 | | .61 | | .71 | | .84 | | .51 |
| Portfolio Turnover Rate | | 65.62 | | 50.62 | | 97.90 | | 70.09 | | 65.83 |
| |
| |
| |
| |
| |
|
| Net Assets, end of period ($ x 1,000) | | 30,616 | | 54,103 | | 47,928 | | 39,665 | | 33,185 |
| a | | Based on average shares outstanding at each month end |
| b | | Exclusive of sales charge. |
| See notes to financial statements. |
The Fund 17
| | FINANCIAL HIGHLIGHTS (continued) |
| | | | | Year Ended October 31, | | |
| | |
| |
| |
|
| Class B Shares | | 2008 | | 2007 | | 2006 | | 2005 | | 2004 |
| |
| |
| |
| |
| |
|
| Per Share Data ($): | | | | | | | | | | |
| Net asset value, beginning of period | | 26.91 | | 22.83 | | 19.85 | | 18.45 | | 17.54 |
| Investment Operations: | | | | | | | | | | |
| Investment income (loss)—neta | | .04 | | (.02) | | .00b | | .04 | | (.05) |
| Net realized and unrealized | | | | | | | | | | |
| gain (loss) on investments | | (10.00) | | 4.15 | | 2.98 | | 1.50 | | .98 |
| Total from Investment Operations | | (9.96) | | 4.13 | | 2.98 | | 1.54 | | .93 |
| Distributions: | | | | | | | | | | |
| Dividends from investment income—net | | (.10) | | (.05) | | (.00)b | | (.14) | | (.02) |
| Net asset value, end of period | | 16.85 | | 26.91 | | 22.83 | | 19.85 | | 18.45 |
| |
| |
| |
| |
| |
|
| Total Return (%)c | | (37.19) | | 18.11 | | 14.97 | | 8.42 | | 5.34 |
| |
| |
| |
| |
| |
|
| Ratios/Supplemental Data (%): | | | | | | | | | | |
| Ratio of total expenses | | | | | | | | | | |
| to average net assets | | 1.91 | | 1.90 | | 1.90 | | 1.90 | | 1.90 |
| Ratio of net expenses | | | | | | | | | | |
| to average net assets | | 1.90 | | 1.86 | | 1.80 | | 1.80 | | 1.83 |
| Ratio of net investment income | | | | | | | | | | |
| (loss) to average net assets | | .20 | | (.10) | | .02 | | .21 | | (.25) |
| Portfolio Turnover Rate | | 65.62 | | 50.62 | | 97.90 | | 70.09 | | 65.83 |
| |
| |
| |
| |
| |
|
| Net Assets, end of period ($ x 1,000) | | 2,881 | | 7,695 | | 14,558 | | 29,078 | | 45,297 |
| a | | Based on average shares outstanding at each month end. |
| b | | Amount represents less than $.01 per share. |
| c | | Exclusive of sales charge. |
| See notes to financial statements. |
18
| | | | | Year Ended October 31, | | |
| | |
| |
| |
|
| Class C Shares | | 2008 | | 2007 | | 2006 | | 2005 | | 2004 |
| |
| |
| |
| |
| |
|
| Per Share Data ($): | | | | | | | | | | |
| Net asset value, beginning of period | | 26.90 | | 22.82 | | 19.86 | | 18.45 | | 17.54 |
| Investment Operations: | | | | | | | | | | |
| Investment income (loss)—neta | | .04 | | (.03) | | .00b | | .03 | | (.05) |
| Net realized and unrealized | | | | | | | | | | |
| gain (loss) on investments | | (9.99) | | 4.16 | | 2.96 | | 1.52 | | .98 |
| Total from Investment Operations | | (9.95) | | 4.13 | | 2.96 | | 1.55 | | .93 |
| Distributions: | | | | | | | | | | |
| Dividends from investment income—net | | (.10) | | (.05) | | (.00)b | | (.14) | | (.02) |
| Net asset value, end of period | | 16.85 | | 26.90 | | 22.82 | | 19.86 | | 18.45 |
| |
| |
| |
| |
| |
|
| Total Return (%)c | | (37.17) | | 18.07 | | 14.97 | | 8.42 | | 5.28 |
| |
| |
| |
| |
| |
|
| Ratios/Supplemental Data (%): | | | | | | | | | | |
| Ratio of total expenses | | | | | | | | | | |
| to average net assets | | 1.91 | | 1.90 | | 1.90 | | 1.90 | | 1.90 |
| Ratio of net expenses | | | | | | | | | | |
| to average net assets | | 1.90 | | 1.86 | | 1.80 | | 1.80 | | 1.83 |
| Ratio of net investment income | | | | | | | | | | |
| (loss) to average net assets | | .19 | | (.14) | | (.01) | | .17 | | (.25) |
| Portfolio Turnover Rate | | 65.62 | | 50.62 | | 97.90 | | 70.09 | | 65.83 |
| |
| |
| |
| |
| |
|
| Net Assets, end of period ($ x 1,000) | | 3,888 | | 7,471 | | 7,069 | | 8,380 | | 10,271 |
| a | | Based on average shares outstanding at each month end. |
| b | | Amount represents less than $.01 per share. |
| c | | Exclusive of sales charge. |
| See notes to financial statements. |
The Fund 19
| | FINANCIAL HIGHLIGHTS (continued) |
| | | | | Year Ended October 31, | | |
| | |
| |
| |
|
| Class I Shares | | 2008 | | 2007a | | 2006 | | 2005 | | 2004 |
| |
| |
| |
| |
| |
|
| Per Share Data ($): | | | | | | | | | | |
| Net asset value, beginning of period | | 28.88 | | 24.32 | | 21.06 | | 19.47 | | 18.40 |
| Investment Operations: | | | | | | | | | | |
| Investment income—netb | | .29 | | .23 | | .22 | | .24 | | .14 |
| Net realized and unrealized | | | | | | | | | | |
| gain (loss) on investments | | (10.75) | | 4.44 | | 3.17 | | 1.60 | | 1.02 |
| Total from Investment Operations | | (10.46) | | 4.67 | | 3.39 | | 1.84 | | 1.16 |
| Distributions: | | | | | | | | | | |
| Dividends from investment income—net | | (.28) | | (.11) | | (.13) | | (.25) | | (.09) |
| Net asset value, end of period | | 18.14 | | 28.88 | | 24.32 | | 21.06 | | 19.47 |
| |
| |
| |
| |
| |
|
| Total Return (%) | | (36.52) | | 19.29 | | 16.14 | | 9.50 | | 6.35 |
| |
| |
| |
| |
| |
|
| Ratios/Supplemental Data (%): | | | | | | | | | | |
| Ratio of total expenses | | | | | | | | | | |
| to average net assets | | .91 | | .90 | | .90 | | .90 | | .90 |
| Ratio of net expenses | | | | | | | | | | |
| to average net assets | | .90 | | .86 | | .80 | | .80 | | .83 |
| Ratio of net investment income | | | | | | | | | | |
| to average net assets | | 1.19 | | .86 | | .97 | | 1.17 | | .75 |
| Portfolio Turnover Rate | | 65.62 | | 50.62 | | 97.90 | | 70.09 | | 65.83 |
| |
| |
| |
| |
| |
|
| Net Assets, end of period ($ x 1,000) | | 5,369 | | 9,409 | | 8,645 | | 8,713 | | 10,019 |
| a | | Effective June 1, 2007, Class R shares were redesignated as Class I shares. |
| b | | Based on average shares outstanding at each month end. |
| See notes to financial statements. |
20
| | | | | Year Ended October 31, | | |
| | |
| |
| |
|
| Class T Shares | | 2008 | | 2007 | | 2006 | | 2005 | | 2004 |
| |
| |
| |
| |
| |
|
| Per Share Data ($): | | | | | | | | | | |
| Net asset value, beginning of period | | 28.03 | | 23.69 | | 20.54 | | 19.04 | | 18.04 |
| Investment Operations: | | | | | | | | | | |
| Investment income—neta | | .16 | | .09 | | .11 | | .13 | | .05 |
| Net realized and unrealized | | | | | | | | | | |
| gain (loss) on investments | | (10.43) | | 4.33 | | 3.08 | | 1.56 | | 1.00 |
| Total from Investment Operations | | (10.27) | | 4.42 | | 3.19 | | 1.69 | | 1.05 |
| Distributions: | | | | | | | | | | |
| Dividends from investment income—net | | (.18) | | (.08) | | (.04) | | (.19) | | (.05) |
| Net asset value, end of period | | 17.58 | | 28.03 | | 23.69 | | 20.54 | | 19.04 |
| |
| |
| |
| |
| |
|
| Total Return (%)b | | (36.85) | | 18.71 | | 15.54 | | 8.93 | | 5.82 |
| |
| |
| |
| |
| |
|
| Ratios/Supplemental Data (%): | | | | | | | | | | |
| Ratio of total expenses | | | | | | | | | | |
| to average net assets | | 1.41 | | 1.40 | | 1.40 | | 1.40 | | 1.40 |
| Ratio of net expenses | | | | | | | | | | |
| to average net assets | | 1.40 | | 1.36 | | 1.30 | | 1.30 | | 1.33 |
| Ratio of net investment income | | | | | | | | | | |
| to average net assets | | .68 | | .35 | | .49 | | .64 | | .25 |
| Portfolio Turnover Rate | | 65.62 | | 50.62 | | 97.90 | | 70.09 | | 65.83 |
| |
| |
| |
| |
| |
|
| Net Assets, end of period ($ x 1,000) | | 268 | | 452 | | 445 | | 609 | | 660 |
| a | | Based on average shares outstanding at each month end. |
| b | | Exclusive of sales charge. |
| See notes to financial statements. |
The Fund 21
NOTES TO FINANCIAL STATEMENTS
NOTE 1—Significant Accounting Policies:
Dreyfus Large Company Stock Fund (the “fund”) is a separate diversified series of The Dreyfus/Laurel Funds, Inc. (the “Company”) which is registered under the Investment Company Act of 1940, as amended (the “Act”), as an open-end management investment company and operates as a series company currently offering fourteen series, including the fund.The fund’s investment objective is to seek capital appreciation.The Dreyfus Corporation (the “Manager” or “Dreyfus”), a wholly-owned subsidiary of The Bank of New York Mellon Corporation (“BNY Mellon”), serves as the fund’s investment adviser.
At a meeting of the fund’s Board of Directors held on July 24, 2008, the Board approved, effective December 1, 2008, a proposal to change the name of the fund from “Dreyfus Premier Large Company Stock Fund” to “Dreyfus Large Company Stock Fund”.
Effective July 1, 2008, BNY Mellon has reorganized and consolidated a number of its banking and trust company subsidiaries. As a result of the reorganization, any services previously provided to the fund by Mellon Bank, N.A. or Mellon Trust of New England, N.A. are now provided by The Bank of New York, which has changed its name to The Bank of New York Mellon.
MBSC Securities Corporation (the “Distributor”), a wholly-owned subsidiary of the Manager, is the distributor of the fund’s shares. The fund is authorized to issue 450 million shares of $.001 par value Capital Stock.The fund currently offers five classes of shares: Class A (20 million shares authorized), Class B (100 million shares authorized), Class C (100 million shares authorized), Class I (30 million shares authorized) and Class T (200 million shares authorized). Class A, Class B, Class C and Class T shares are sold primarily to retail investors through financial intermediaries and bear a distribution fee and/or service fee. Class A and Class T shares are sold with a front-end sales charge, while Class B and Class C shares are subject to a contingent deferred sales charge (“CDSC”). Class B shares automatically convert to Class A shares after six years.The fund does not offer Class B shares,
22
except in connection with dividend reinvestment and permitted exchanges of Class B shares. Class I shares are sold primarily to bank trust departments and other financial service providers including The Bank of New York Mellon, a subsidiary of BNY Mellon and an affiliate of Dreyfus, acting on behalf of customers having a qualified trust or an investment account or relationship at such institution and bear no distribution or service fees. Class I shares are offered without a front-end sales charge or CDSC. Each class of shares has identical rights and privileges, except with respect to distribution and service fees and voting rights on matters affecting a single class. Income, expenses (other than expenses attributable to a specific class), and realized and unrealized gains or losses on investments are allocated to each class of shares based on its relative net assets.
The fund’s financial statements are prepared in accordance with U.S. generally accepted accounting principles, which may require the use of management estimates and assumptions. Actual results could differ from those estimates.
(a) Portfolio valuation: Investments in securities are valued at the last sales price on the securities exchange or national securities market on which such securities are primarily traded. Securities listed on the National Market System for which market quotations are available are valued at the official closing price or, if there is no official closing price that day, at the last sales price. Securities not listed on an exchange or the national securities market, or securities for which there were no transactions, are valued at the average of the most recent bid and asked prices, except for open short positions, where the asked price is used for valuation purposes. Bid price is used when no asked price is available. Registered investment companies that are not traded on an exchange are valued at their net asset value.When market quotations or official closing prices are not readily available, or are determined not to reflect accurately fair value, such as when the value of a security has been significantly affected by events after the close of the exchange or market on which the security is principally traded (for example, a for-
The Fund 23
| NOTES TO FINANCIAL STATEMENTS (continued) |
eign exchange or market), but before the fund calculates its net asset value, the fund may value these investments at fair value as determined in accordance with the procedures approved by the Board of Directors. Fair valuing of securities may be determined with the assistance of a pricing service using calculations based on indices of domestic securities and other appropriate indicators, such as prices of relevant ADRs and futures contracts. For other securities that are fair valued by the Board of Directors, certain factors may be considered such as: fundamental analytical data, the nature and duration of restrictions on disposition, an evaluation of the forces that influence the market in which the securities are purchased and sold, and public trading in similar securities of the issuer or comparable issuers. Financial futures are valued at the last sales price.
The Financial Accounting Standards Board (“FASB”) released Statement of Financial Accounting Standards No. 157 “Fair Value Measurements” (“FAS 157”). FAS 157 establishes an authoritative definition of fair value, sets out a framework for measuring fair value, and requires additional disclosures about fair-value measurements. The application of FAS 157 is required for fiscal years beginning after November 15, 2007 and interim periods within those fiscal years. Management does not believe that the application of this standard will have a material impact on the financial statements of the fund.
(b) Securities transactions and investment income: Securities transactions are recorded on a trade date basis. Realized gains and losses from securities transactions are recorded on the identified cost basis. Dividend income is recognized on the ex-dividend date and interest income, including, where applicable, accretion of discount and amortization of premium on investments, is recognized on the accrual basis.
Pursuant to a securities lending agreement with The Bank of New York Mellon, the fund may lend securities to qualified institutions. It is the fund’s policy that, at origination, all loans are secured by collateral of at least 102% of the value of U.S. securities loaned and 105% of
24
the value of foreign securities loaned. Collateral equivalent to at least 100% of the market value of securities on loan is maintained at all times. Collateral is either in the form of cash, which can be invested in certain money market mutual funds managed by the Manager, U.S. Government and Agency securities or letters of credit. The fund is entitled to receive all income on securities loaned, in addition to income earned as a result of the lending transaction. Although each security loaned is fully collateralized, the fund bears the risk of delay in recovery of, or loss of rights in, the securities loaned should a borrower fail to return the securities in a timely manner. During the period ended October 31, 2008, The Bank of New York Mellon earned $2,750 from lending fund portfolio securities, pursuant to the securities lending agreement.
(c) Affiliated issuers: Investments in other investment companies advised by the Manager are defined as “affiliated” in the Act.
(d) Dividends to shareholders: Dividends are recorded on the ex-dividend date. Dividends from investment income-net are declared and paid on a quarterly basis. Dividends from net realized capital gains, if any, are normally declared and paid annually, but the fund may make distributions on a more frequent basis to comply with the distribution requirements of the Internal Revenue Code of 1986, as amended (the “Code”).To the extent that net realized capital gains can be offset by capital loss carryovers, it is the policy of the fund not to distribute such gains. Income and capital gain distributions are determined in accordance with income tax regulations, which may differ from U.S. generally accepted accounting principles.
(e) Federal income taxes: It is the policy of the fund to continue to qualify as a regulated investment company, if such qualification is in the best interests of its shareholders, by complying with the applicable provisions of the Code, and to make distributions of taxable income sufficient to relieve it from substantially all federal income and excise taxes.
The Fund 25
| NOTES TO FINANCIAL STATEMENTS (continued) |
The fund adopted FASB Interpretation No. 48 “Accounting for Uncertainty in Income Taxes” (“FIN 48”). FIN 48 provides guidance for how uncertain tax positions should be recognized, measured, presented and disclosed in the financial statements. FIN 48 requires the evaluation of tax positions taken or expected to be taken in the course of preparing the fund’s tax returns to determine whether the tax positions are “more-likely-than not” of being sustained by the applicable tax authority. Liability for tax positions not deemed to meet the more likely-than-not threshold would be recorded as a tax expense in the current year.The adoption of FIN 48 had no impact on the operations of the fund for the period ended October 31, 2008.
As of and during the period ended October 31, 2008, the fund did not have any liabilities for any unrecognized tax positions. The fund recognizes interest and penalties, if any, related to unrecognized tax positions as income tax expense in the Statement of Operations. During the period, the fund did not incur any interest or penalties.
Each of the tax years in the four-year period ended October 31, 2008 remains subject to examination by the Internal Revenue Service and state taxing authorities.
At October 31, 2008, the components of accumulated earnings on a tax basis were as follows: undistributed ordinary income $255,780, accumulated capital losses $34,826,984 and unrealized depreciation $9,029,512.
The accumulated capital loss carryover is available for federal income tax purposes to be applied against future net securities profits, if any, realized subsequent to October 31, 2008. If not applied, $20,424,644 of the carryover expires in fiscal 2010, $11,543,806 expires in fiscal 2011 and $2,858,534 expires in fiscal 2016.
The tax character of distributions paid to shareholders during the fiscal periods ended October 31, 2008 and October 31, 2007 were as follows: ordinary income $575,491 and $275,451, respectively.
26
NOTE 2—Bank Lines of Credit:
Prior to October 15, 2008, the fund participated with other Dreyfus-managed funds in a $350 million redemption credit facility. Effective October 15, 2008, the fund participates with other Dreyfus-managed funds in a $145 million redemption credit facility (the “Facility”) to be utilized for temporary or emergency purposes, including the financing of redemptions. In connection therewith, the fund has agreed to pay commitment fees on its pro rata portion of the Facility. Interest is charged to the fund based on prevailing market rates in effect at the time of borrowing. During the period ended October 31, 2008, the fund did not borrow under either Facility.
NOTE 3—Investment Management Fee And Other Transactions With Affiliates:
(a) Pursuant to an Investment Management Agreement with the Manager, the Manager provides or arranges for one or more third parties and/or affiliates to provide investment advisory, administrative, custody, fund accounting and transfer agency services to the fund.The Manager also directs the investments of the fund in accordance with its investment objective, policies and limitations. For these services, the fund is contractually obligated to pay the Manager a fee, calculated daily and paid monthly, at the annual rate of .90% of the value of the fund’s average daily net assets. Out of its fee, the Manager pays all of the expenses of the fund except brokerage fees, taxes, interest, commitment fees, Rule 12b-1 distribution fees and expenses, service fees, fees and expenses of non-interested Directors (including counsel fees) and extraordinary expenses. In addition, the Manager is required to reduce its fee in an amount equal to the fund’s allocable portion of fees and expenses of the non-interested Directors (including counsel fees). Each director receives $45,000 per year, plus $6,000 for each joint Board meeting of the Company, The Dreyfus/Laurel Tax-Free Municipal Funds and The Dreyfus/Laurel Funds Trust (collectively, the
The Fund 27
| NOTES TO FINANCIAL STATEMENTS (continued) |
“Dreyfus/Laurel Funds”) attended, $2,000 for separate in-person committee meetings attended which are not held in conjunction with a regularly scheduled Board meeting and $1,500 for Board meetings and separate committee meetings attended that are conducted by telephone and is reimbursed for travel and out-of-pocket expenses.With respect to Board meetings, the Chairman of the Board receives an additional 25% of such compensation (with the exception of reimbursable amounts). With respect to compensation committee meetings, the Chair of the compensation committee receives $900 per meeting and, prior to April 12, 2008 with respect to audit committee meetings, the Chair of the audit committee received $1,350 per meeting. In the event that there is an in-person joint committee meeting or a joint telephone meeting of the Dreyfus/Laurel Funds and Dreyfus HighYield Strategies Fund, the $2,000 or $1,500 fee, as applicable, will be allocated between the Dreyfus/Laurel Funds and Dreyfus High Yield Strategies Fund. These fees and expenses are charged and allocated to each series based on net assets.Amounts required to be paid by the Company directly to the non-interested Directors, that would be applied to offset a portion of the management fee payable to the Manager, are in fact paid directly by the Manager to the non-interested Directors.
During the period ended October 31, 2008, the Distributor retained $3,540 and $31 from commissions earned on sales of the fund’s Class A and Class T shares, respectively, and $14,308 and $819 from CDSCs on redemptions of the fund’s Class B and Class C shares, respectively.
(b) Under separate Distribution Plans (the “Plans”) adopted pursuant to Rule 12b-1 under the Act, Class A shares may pay annually up to .25% of their average daily net assets to compensate the Distributor for shareholder servicing activities and expenses primarily intended to result in the sale of Class A shares. Class B, Class C and Class T shares may pay the Distributor for distributing their shares at an aggregate annual rate of .75% of the value of the average daily net assets of Class B and Class C shares and .25% of the average daily net assets of Class T shares.The Distributor may pay one or more agents in respect of advertising, marketing and other distribution services for Class T shares and determines
28
the amounts, if any, to be paid to agents and the basis on which such payments are made. Class B, Class C and Class T shares are also subject to a service plan adopted pursuant to Rule 12b-1 (the “Service Plan”) under which Class B, Class C and Class T shares pay the Distributor for providing services to the holders of their shares, a fee at the annual rate of .25% of the value of the average daily net assets of Class B, Class C and Class T shares. During the period ended October 31, 2008, Class A, Class B, Class C and Class T shares were charged $111,898, $39,964, $44,413 and $1,024, respectively, pursuant to their respective Plans. Class B, Class C and Class T shares were charged $13,321, $14,804 and $1,024, respectively, pursuant to the Service Plan.
Under its terms, the Plans and Service Plan shall remain in effect from year to year, provided such continuance is approved annually by a vote of a majority of those directors who are not “interested persons” of the Company and who had no direct or indirect financial interest in the operation of or in any agreement related to the Plans or Service Plan.
The components of “Due to The Dreyfus Corporation and affiliates” in the Statement of Assets and Liabilities consist of: management fees $32,893, Rule 12b-1 distribution plan fees $10,877 and services plan fees $1,497.
NOTE 4—Securities Transactions:
The aggregate amount of purchases and sales of investment securities, excluding short-term securities, during the period ended October 31, 2008, amounted to $42,046,178 and $51,464,033, respectively.
At October 31, 2008, the cost of investments for federal income tax purposes was $52,094,477; accordingly, accumulated net unrealized depreciation on investments was $9,029,512, consisting of $1,624,805 gross unrealized appreciation and $10,654,317 gross unrealized depreciation.
In March 2008, the FASB released Statement of Financial Accounting Standards No. 161 “Disclosures about Derivative Instruments and Hedging Activities” (“FAS 161”). FAS 161 requires qualitative disclo-
The Fund 29
| NOTES TO FINANCIAL STATEMENTS (continued) |
sures about objectives and strategies for using derivatives, quantitative disclosures about fair value amounts of gains and losses on derivative instruments and disclosures about credit-risk-related contingent features in derivative agreements.The application of FAS 161 is required for fiscal years and interim periods beginning after November 15, 2008. At this time, management is evaluating the implications of FAS 161 and its impact on the financial statements and the accompanying notes has not yet been determined.
NOTE 5—Subsequent Event:
Effective on or about February 4, 2009 (the “Effective Date”), the fund will issue to each holder of its Class T shares, in exchange for said shares, Class A shares of the fund having an aggregate net asset value equal to the aggregate net asset value of the shareholder’s Class T shares.Thereafter, the fund will no longer offer Class T shares.
Effective on or about December 3, 2008, no investments for new accounts are permitted in Class T of the fund, except that participants in certain group retirement plans are able to open a new account in Class T of the fund, provided that the fund was established as an investment option under the plans before December 3, 2008. After the Effective Date, subsequent investments in the fund’s Class A shares made by holders of the fund’s Class T shares who received Class A shares of the fund in exchange for their Class T shares will be subject to the front-end sales load schedule currently in effect for Class T shares. Otherwise, all other Class A share attributes will be in effect.
30
REPORT OF INDEPENDENT REGISTERED PUBLIC ACCOUNTING FIRM
The Board of Directors and Shareholders The Dreyfus/Laurel Funds, Inc.:
We have audited the accompanying statement of assets and liabilities of Dreyfus Large Company Stock Fund (formerly Dreyfus Premier Large Company Stock Fund), a series of The Dreyfus/Laurel Funds, Inc. (the “Fund”),including the statement of investments,as of October 31,2008, and the related statement of operations for the year then ended, the statement of changes in net assets for each of the years in the two-year period then ended, and the financial highlights for each of the years in the five-year period then ended.These financial statements and financial highlights are the responsibility of the Fund’s management. Our responsibility is to express an opinion on these financial statements and financial highlights based on our audits.
We conducted our audits in accordance with the standards of the Public Company Accounting Oversight Board (United States).Those standards require that we plan and perform the audit to obtain reasonable assurance about whether the financial statements and financial highlights are free of material misstatement. An audit includes examining, on a test basis, evidence supporting the amounts and disclosures in the financial statements. Our procedures included confirmation of securities owned as of October 31, 2008, by correspondence with the custodian and brokers or by other appropriate auditing procedures where replies from brokers were not received. An audit also includes assessing the accounting principles used and significant estimates made by management, as well as evaluating the overall financial statement presentation. We believe that our audits provide a reasonable basis for our opinion.
In our opinion, the financial statements and financial highlights referred to above present fairly, in all material respects, the financial position of Dreyfus Large Company Stock Fund as of October 31, 2008, and the results of its operations for the year then ended, the changes in its net assets for each of the years in the two-year period then ended, and the financial highlights for each of the years in the five-year period then ended, in conformity with U.S. generally accepted accounting principles.

New York, New York
December 19, 2008 |
The Fund 31
IMPORTANT TAX INFORMATION (Unaudited)
In accordance with federal tax law, the fund hereby designates 100% of the ordinary dividends paid during the fiscal year ended October 31, 2008 as qualifying for the corporate dividends received deduction. For the fiscal year ended October 31,2008,certain dividends paid by the fund may be subject to a maximum tax rate of 15%,as provided for by the Jobs and Growth Tax Relief Reconciliation Act of 2003. Of the distributions paid during the fiscal year, $575,491 represents the maximum amount that may be considered qualified dividend income. Shareholders will receive notification in January 2009 of the percentage applicable to the preparation of their 2008 income tax returns.
32
BOARD MEMBERS INFORMATION (Unaudited)
Joseph S. DiMartino (65)
Chairman of the Board (1999)
Principal Occupation During Past 5Years:
Corporate Director and Trustee
Other Board Memberships and Affiliations: |
- The Muscular Dystrophy Association, Director
- Century Business Services, Inc., a provider of outsourcing functions for small and medium size companies, Director
- The Newark Group, a provider of a national market of paper recovery facilities, paperboard mills and paperboard converting plants, Director
- Sunair Services Corporation, a provider of certain outdoor-related services to homes and businesses, Director
No. of Portfolios for which Board Member Serves: 167
James M. Fitzgibbons (74)
Board Member (1994)
Principal Occupation During Past 5Years:
Corporate Director and Trustee |
Other Board Memberships and Affiliations:
Bill Barrett Company, an oil and gas exploration company, Director
No. of Portfolios for which Board Member Serves: 25
Kenneth A. Himmel (62)
Board Member (1994)
Principal Occupation During Past 5Years: |
- President and CEO,Related Urban Development,a real estate development company (1996-present)
- President and CEO, Himmel & Company, a real estate development company (1980-present)
- CEO, American Food Management, a restaurant company (1983-present)
| No. of Portfolios for which Board Member Serves: 25 |
Stephen J. Lockwood (61)
Board Member (1994)
Principal Occupation During Past 5Years: |
- Chairman of the Board, Stephen J. Lockwood and Company LLC, an investment company (2000-present)
| No. of Portfolios for which Board Member Serves: 25 |
The Fund 33
BOARD MEMBERS INFORMATION (Unaudited) (continued)
Roslyn M. Watson (59)
Board Member (1994) |
Principal Occupation During Past 5Years:
Principal,Watson Ventures, Inc., a real estate investment company (1993-present)
Other Board Memberships and Affiliations:
- American Express Bank, Director
- The Hyams Foundation Inc., a Massachusetts Charitable Foundation,Trustee
- National Osteoporosis Foundation,Trustee
- SBLI-USA, Director
| No. of Portfolios for which Board Member Serves: 25 |
Benaree Pratt Wiley (62)
Board Member (1998)
Principal Occupation During Past 5Years: |
- Principal,The Wiley Group, a firm specializing in strategy and business development (2005-present)
- President and CEO,The Partnership, an organization dedicated to increasing the representation of African Americans in positions of leadership, influence and decision-making in Boston, MA (1991-2005)
| Other Board Memberships and Affiliations: |
- Boston College,Trustee Associate
- Blue Cross Blue Shield of Massachusetts, Director
- CBIZ, professional support consultants and service providers for small, midsized and corporate business, Director
- Commonwealth Institute, Director
- Efficacy Institute, Director
- PepsiCo African-American, Chair of Advisory Board
- The Boston Foundation, Director
- Century Business Services, Inc., a provider of outsourcing functions for small and medium size companies, Director
| No. of Portfolios for which Board Member Serves: 36 |
Once elected all Board Members serve for an indefinite term, but achieve Emeritus status upon reaching age 80.The address of the Board Members and Officers is in c/o The Dreyfus Corporation, 200 Park Avenue, NewYork, NewYork 10166. Additional information about the Board Members is available in the fund’s Statement of Additional Information which can be obtained from Dreyfus free of charge by calling this toll free number: 1-800-554-4611.
Francis P. Brennan, Emeritus Board Member
J.Tomlinson Fort, Emeritus Board Member |
34
OFFICERS OF THE FUND (Unaudited)
| J. DAVID OFFICER, President since | | JONI LACKS CHARATAN, Vice President |
| December 2006. | | and Assistant Secretary since |
| Chief Operating Officer,Vice Chairman and a | | August 2005. |
| Director of the Manager, and an officer of 77 | | Senior Counsel of BNY Mellon, and an officer |
| investment companies (comprised of 167 | | of 78 investment companies (comprised of 188 |
| portfolios) managed by the Manager. He is 60 | | portfolios) managed by the Manager. She is 53 |
| years old and has been an employee of the | | years old and has been an employee of the |
| Manager since April 1998. | | Manager since October 1988. |
| |
| PHILLIP N. MAISANO, Executive Vice | | JOSEPH M. CHIOFFI, Vice President and |
| President since July 2007. | | Assistant Secretary since August 2005. |
| Chief Investment Officer,Vice Chair and a | | Senior Counsel of BNY Mellon, and an officer |
| director of the Manager, and an officer of 77 | | of 78 investment companies (comprised of 188 |
| investment companies (comprised of 167 | | portfolios) managed by the Manager. He is 47 |
| portfolios) managed by the Manager. Mr. | | years old and has been an employee of the |
| Maisano also is an officer and/or Board | | Manager since June 2000. |
| member of certain other investment | | |
| | | JANETTE E. FARRAGHER, Vice President |
| management subsidiaries of The Bank of New | | |
| | | and Assistant Secretary since |
| York Mellon Corporation, each of which is an | | |
| | | August 2005. |
| affiliate of the Manager. He is 61 years old and | | |
| has been an employee of the Manager since | | Assistant General Counsel of BNY Mellon, |
| November 2006. Prior to joining the Manager, | | and an officer of 78 investment companies |
| Mr. Maisano served as Chairman and Chief | | (comprised of 188 portfolios) managed by the |
| Executive Officer of EACM Advisors, an | | Manager. She is 45 years old and has been an |
| affiliate of the Manager, since August 2004, and | | employee of the Manager since February 1984. |
| served as Chief Executive Officer of Evaluation | | JOHN B. HAMMALIAN, Vice President and |
| Associates, a leading institutional investment | | Assistant Secretary since August 2005. |
| consulting firm, from 1988 until 2004. | | |
| | | Managing Counsel of BNY Mellon, and an |
| MICHAEL A. ROSENBERG, Vice President | | officer of 78 investment companies (comprised |
| and Secretary since August 2005. | | of 188 portfolios) managed by the Manager. |
| Assistant General Counsel of BNY Mellon, | | He is 45 years old and has been an employee |
| and an officer of 78 investment companies | | of the Manager since February 1991. |
| (comprised of 188 portfolios) managed by the | | ROBERT R. MULLERY, Vice President and |
| Manager. He is 48 years old and has been an | | Assistant Secretary since August 2005. |
| employee of the Manager since October 1991. | | |
| | | Managing Counsel of BNY Mellon, and an |
| JAMES BITETTO, Vice President and | | officer of 78 investment companies (comprised |
| Assistant Secretary since August 2005. | | of 188 portfolios) managed by the Manager. |
| Senior Counsel of BNY Mellon and Secretary | | He is 56 years old and has been an employee |
| of the Manager, and an officer of 78 | | of the Manager since May 1986. |
| investment companies (comprised of 188 | | |
| portfolios) managed by the Manager. He is 42 | | |
| years old and has been an employee of the | | |
| Manager since December 1996. | | |
The Fund 35
OFFICERS OF THE FUND (Unaudited) (continued)
| JEFF PRUSNOFSKY, Vice President and | | ROBERT SALVIOLO, Assistant Treasurer |
| Assistant Secretary since August 2005. | | since July 2007. |
| Managing Counsel of BNY Mellon, and an | | Senior Accounting Manager – Equity Funds of |
| officer of 78 investment companies (comprised | | the Manager, and an officer of 78 investment |
| of 188 portfolios) managed by the Manager. | | companies (comprised of 188 portfolios) |
| He is 43 years old and has been an employee | | managed by the Manager. He is 41 years old |
| of the Manager since October 1990. | | and has been an employee of the Manager |
| | | since June 1989. |
| JAMES WINDELS, Treasurer since | | |
| November 2001. | | ROBERT SVAGNA, Assistant Treasurer |
| Director – Mutual Fund Accounting of the | | since December 2002. |
| Manager, and an officer of 78 investment | | Senior Accounting Manager – Equity Funds of |
| companies (comprised of 188 portfolios) | | the Manager, and an officer of 78 investment |
| managed by the Manager. He is 49 years old | | companies (comprised of 188 portfolios) |
| and has been an employee of the Manager | | managed by the Manager. He is 41 years old |
| since April 1985. | | and has been an employee of the Manager |
| | | since November 1990. |
| RICHARD CASSARO, Assistant Treasurer | | |
| since January 2008. | | JOSEPH W. CONNOLLY, Chief Compliance |
| Senior Accounting Manager – Money Market | | Officer since October 2004. |
| and Municipal Bond Funds of the Manager, | | Chief Compliance Officer of the Manager and |
| and an officer of 78 investment companies | | The Dreyfus Family of Funds (78 investment |
| (comprised of 188 portfolios) managed by | | companies, comprised of 188 portfolios). From |
| the Manager. He is 49 years old and has | | November 2001 through March 2004, Mr. |
| been an employee of the Manager since | | Connolly was first Vice-President, Mutual |
| September 1982. | | Fund Servicing for Mellon Global Securities |
| | | Services. In that capacity, Mr. Connolly was |
| GAVIN C. REILLY, Assistant Treasurer | | |
| | | responsible for managing Mellon’s Custody, |
| since December 2005. | | |
| | | Fund Accounting and Fund Administration |
| Tax Manager of the Investment Accounting | | services to third-party mutual fund clients. He |
| and Support Department of the Manager, and | | is 51 years old and has served in various |
| an officer of 78 investment companies | | capacities with the Manager since 1980, |
| (comprised of 188 portfolios) managed by the | | including manager of the firm’s Fund |
| Manager. He is 40 years old and has been an | | Accounting Department from 1997 through |
| employee of the Manager since April 1991. | | October 2001. |
| |
| ROBERT ROBOL, Assistant Treasurer | | WILLIAM GERMENIS, Anti-Money |
| since December 2002. | | Laundering Compliance Officer since |
| Senior Accounting Manager – Fixed Income | | July 2002. |
| Funds of the Manager, and an officer of 78 | | Vice President and Anti-Money Laundering |
| investment companies (comprised of 188 | | Compliance Officer of the Distributor, and the |
| portfolios) managed by the Manager. He is 44 | | Anti-Money Laundering Compliance Officer |
| years old and has been an employee of the | | of 74 investment companies (comprised of 184 |
| Manager since October 1988. | | portfolios) managed by the Manager. He is 38 |
| | | years old and has been an employee of the |
| | | Distributor since October 1998. |
36

| | Dreyfus
Money Market
Reserves |
| | ANNUAL REPORT October 31, 2008 |

Save time. Save paper. View your next shareholder report online as soon as it’s available. Log into www.dreyfus.com and sign up for Dreyfus eCommunications. It’s simple and only takes a few minutes.
The views expressed in this report reflect those of the portfolio manager only through the end of the period covered and do not necessarily represent the views of Dreyfus or any other person in the Dreyfus organization. Any such views are subject to change at any time based upon market or other conditions and Dreyfus disclaims any responsibility to update such views.These views may not be relied on as investment advice and, because investment decisions for a Dreyfus fund are based on numerous factors, may not be relied on as an indication of trading intent on behalf of any Dreyfus fund.
Not FDIC-Insured Not Bank-Guaranteed May Lose Value
| Contents |
| |
| | | THE FUND |
| |
|
| 2 | | A Letter from the CEO |
| 3 | | Discussion of Fund Performance |
| 6 | | Understanding Your Fund’s Expenses |
| 6 | | Comparing Your Fund’s Expenses |
| With Those of Other Funds |
| 7 | | Statement of Investments |
| 10 | | Statement of Assets and Liabilities |
| 11 | | Statement of Operations |
| 12 | | Statement of Changes in Net Assets |
| 13 | | Financial Highlights |
| 15 | | Notes to Financial Statements |
| 23 | | Report of Independent Registered |
| | | Public Accounting Firm |
| 24 | | Important Tax Information |
| 25 | | Board Members Information |
| 27 | | Officers of the Fund |
| FOR MORE INFORMATION |
|
| | | Back Cover |
Dreyfus
Money Market Reserves |

A LETTER FROM THE CEO
Dear Shareholder: |
We are pleased to present this annual report for Dreyfus Money Market Reserves, covering the 12-month period from November 1, 2007, through October 31, 2008.
These are difficult times for investors. A credit crunch that began in 2007 has developed into a full-blown global financial crisis, recently resulting in the failure of several major financial institutions. Making matters worse, the U.S. economic slowdown has gathered momentum, depressing investor sentiment.
Money market funds have not been immune to the downturn, as banks’ reluctance to lend even to financially sound companies produced challenging liquidity conditions in the commercial paper market, and resulted to date in at least one U.S. money market fund family having to close and liquidate certain of its money funds’ portfolios. The federal government subsequently stepped in with a number of measures, including a Temporary Guarantee Program for Money Market Funds and a $700 billion rescue package intended to promote greater liquidity in the financial markets. In our view, the government’s efforts to stabilize the fixed income markets are critical to a broader recovery in the credit markets, as funding for America’s leading corporations must improve before a more widespread easing of credit availability is possible.
The depth and duration of the financial crisis will depend on how quickly the banking system can be stabilized. In the meantime, we encourage you to maintain a long-term perspective and a disciplined approach to investing. Indeed, we already are seeing some positive signs, including a likely peak in global inflationary pressures, a bottoming of the U.S. dollar and a large pool of worldwide financial liquidity that could be deployed gradually as the economic cycle turns.
For information about how the fund performed during the reporting period, as well as market perspectives, we have provided a Discussion of Fund Performance given by the fund’s Portfolio Manager.
Thank you for your continued confidence and support.

Jonathan R. Baum
Chief Executive Officer
The Dreyfus Corporation |

DISCUSSION OF FUND PERFORMANCE
For the period of November 1, 2007, through October 31, 2008, as provided by Patricia A. Larkin, Senior Portfolio Manager
Fund and Market Performance Overview
For the 12-month period ended October 31, 2008, Dreyfus Money Market Reserves’ Investor shares produced a yield of 2.82%, and Class R shares produced a yield of 3.02% . Taking into account the effects of compounding, the fund’s Investor shares and Class R shares also produced effective yields of 2.86% and 3.06%, respectively.1
Money market yields declined over much of the reporting period along with short-term interest rates, while a burgeoning financial crisis produced turmoil in the commercial paper market later in the reporting period.
The Fund’s Investment Approach
The fund seeks a high level of current income consistent with stability of principal.To pursue its goal, the fund invests in a diversified portfolio of high-quality, short-term debt securities, including: securities issued or guaranteed by the U.S. government or its agencies and instrumentalities; certificates of deposit, time deposits, bankers’ acceptances and other short-term securities issued by domestic or foreign banks or their subsidiaries or branches; repurchase agreements; asset-backed securities; domestic and dollar-denominated foreign commercial paper and other short-term corporate obligations, including those with floating or variable rates of interest.
Interest Rates Fell as U.S. Economy Struggled
Slumping U.S. housing markets, sluggish consumer spending and resurgent energy prices already had produced a weaker U.S. economy by the start of the reporting period. As a result, the Federal Reserve Board (the “Fed”) reduced short-term interest rates, which began the reporting period with an overnight federal funds rate of 4.5% .
T h e F u n d 3
| DISCUSSION OF FUND PERFORMANCE (continued) |
Evidence of economic weakness continued to mount through the first quarter of 2008, and an ongoing credit crisis intensified as institutional investors sought to de-lever their portfolios to raise cash. Despite aggressive interest-rate reductions by the Fed and an economic stimulus package from Congress, job losses and deleveraging pressures intensified. In March, the Fed participated in the rescue of investment bank Bear Stearns and made funds available to Wall Street firms in an unprecedented program allowing the use of mortgage-backed securities as collateral. Nonetheless, the unemployment rate continued to rise, and inflation appeared to accelerate along with commodity prices.
Reports of additional write-downs by major banks in June and greater-than-expected losses by mortgage agencies Fannie Mae and Freddie Mac in July sparked renewed volatility in the stock and bond markets. The bad news continued to mount in August, including a jump in the unemployment rate to its highest level in five years and a surge in mortgage delinquencies. However, inflationary pressures appeared to ebb when commodity prices retreated from their peaks.
September ranked as one of the most challenging months in memory for the U.S. economy and global financial markets. In a financial crisis that former Fed Chairman Alan Greenspan called a “global tsunami,” major financial institutions found themselves unable to obtain short-term funding for their operations. In the ensuing tumult, the U.S. government effectively nationalized Fannie Mae, Freddie Mac and insurer AIG. In addition, Lehman Brothers filed for bankruptcy,Washington Mutual was seized by regulators, and Merrill Lynch and Wachovia were sold to former rivals.The U.S.Treasury Department proposed a $700 billion rescue package for the nation’s banking system, which initially was rejected by Congress but after some adjustments was enacted into law. It later was estimated that U.S. GDP contracted by a 0.3% annualized rate in the third quarter, stoking recession fears.
Money Markets Suffered in the Financial Crisis
The money markets were not immune to the financial crisis, as evidenced by several high-profile money funds “breaking the buck.”The
4
Lehman Brothers bankruptcy led to challenging liquidity conditions in the commercial paper market and concerned money market fund investors began a rash of redemptions from such funds. In an attempt to curtail diminishing investor confidence and help restore liquidity and stability to the financial system, the Department of Treasury initiated several measures, including the Temporary Guarantee Program specifically for money market funds.
In October, the Fed and other central banks implemented an unprece-dented,coordinated rate cut to combat spreading global economic weak-ness.The Fed followed up with another reduction later in the month,and the federal funds rate ended the reporting period at just 1%. In addition, signs of recovery in the commercial paper market had appeared by the reporting period’s end, as evidenced by rising trading activity.
Maintaining a Cautious Posture
For most of the reporting period, we maintained the fund’s weighted average maturity in a position we considered longer than industry averages. However, September’s developments constrained our ability to find longer-dated money market instruments at reasonable prices, and we focused on instruments with overnight maturities.
We currently expect investors’ focus to turn to the outlook for the underlying economy, as reduced liquidity and tighter loan standards are likely to dampen economic growth into 2009. However, the Fed has left little room to ease monetary policy further. Therefore, we currently intend to maintain the fund’s conservative credit posture and a focus on liquidity.
November 17, 2008
An investment in the fund is not insured or guaranteed by the FDIC or any other government agency. Although the fund seeks to preserve the value of your investment at $1.00 per share, it is possible to lose money by investing in the fund.
1 Effective yield is based upon dividends declared daily and reinvested monthly. Past performance is
no guarantee of future results.Yields fluctuate. |
T h e F u n d 5
UNDERSTANDING YOUR FUND’S EXPENSES (Unaudited)
As a mutual fund investor, you pay ongoing expenses, such as management fees and other expenses. Using the information below, you can estimate how these expenses affect your investment and compare them with the expenses of other funds.You also may pay one-time transaction expenses, including sales charges (loads) and redemption fees, which are not shown in this section and would have resulted in higher total expenses. For more information, see your fund’s prospectus or talk to your financial adviser.
Review your fund’s expenses
The table below shows the expenses you would have paid on a $1,000 investment in Dreyfus Money Market Reserves from May 1, 2008 to October 31, 2008. It also shows how much a $1,000 investment would be worth at the close of the period, assuming actual returns and expenses.
| | Expenses and Value of a $1,000 Investment
assuming actual returns for the six months ended October 31, 2008 |
| | | Investor Shares | | Class R Shares |
| |
| |
|
| Expenses paid per $1,000† | | $ 3.54 | | $ 2.53 |
| Ending value (after expenses) | | $1,010.30 | | $1,011.30 |
COMPARING YOUR FUND’S EXPENSES
WITH THOSE OF OTHER FUNDS (Unaudited) |
Using the SEC’s method to compare expenses
The Securities and Exchange Commission (SEC) has established guidelines to help investors assess fund expenses. Per these guidelines, the table below shows your fund’s expenses based on a $1,000 investment, assuming a hypothetical 5% annualized return. You can use this information to compare the ongoing expenses (but not transaction expenses or total cost) of investing in the fund with those of other funds.All mutual fund shareholder reports will provide this information to help you make this comparison. Please note that you cannot use this information to estimate your actual ending account balance and expenses paid during the period.
| | Expenses and Value of a $1,000 Investment
assuming a hypothetical 5% annualized return for the six months ended October 31, 2008 |
| | | Investor Shares | | Class R Shares |
| |
| |
|
| Expenses paid per $1,000† | | $ 3.56 | | $ 2.54 |
| Ending value (after expenses) | | $1,021.62 | | $1,022.62 |
| † Expenses are equal to the fund’s annualized expense ratio of .70% for Investor shares and .50% for Class R shares, |
| multiplied by the average account value over the period, multiplied by 184/366 (to reflect the one-half year period). |
6
| STATEMENT OF INVESTMENTS | | | | |
| October 31, 2008 | | | | |
| |
| |
|
| |
| |
| |
| | | Principal | | |
| Negotiable Bank Certificates of Deposit—15.1% | | Amount ($) | | Value ($) |
| |
| |
|
| Fifth Third Bank | | | | |
| 2.86%, 12/11/08 | | 20,000,000 | | 20,000,000 |
| Natixis (Yankee) | | | | |
| 3.20%, 12/29/08 | | 25,000,000 | | 25,000,000 |
| SunTrust Bank | | | | |
| 3.00%, 12/16/08 | | 20,000,000 | | 20,000,000 |
| Wilmington Trust Co., DE | | | | |
| 2.89%, 11/25/08 | | 25,000,000 | | 25,000,000 |
| Total Negotiable Bank Certificates of Deposit | | | | |
| (cost $90,000,000) | | | | 90,000,000 |
| |
| |
|
| |
| Commercial Paper—54.4% | | | | |
| |
| |
|
| Alpine Securitization Corp. | | | | |
| 3.61%, 11/20/08 | | 25,000,000 a | | 24,952,500 |
| Barclays U.S. Funding Corp. | | | | |
| 3.18%, 2/20/09 | | 20,000,000 | | 19,807,045 |
| Bryant Park Funding LLC | | | | |
| 3.56%, 11/20/08 | | 25,000,000 a | | 24,953,160 |
| CAFCO LLC | | | | |
| 3.02%, 1/20/09 | | 25,000,000 a | | 24,833,333 |
| Cancara Asset Securitisation Ltd. | | | | |
| 4.04%, 1/13/09 | | 25,000,000 a | | 24,797,222 |
| Citigroup Funding Inc. | | | | |
| 2.92%, 11/18/08 | | 10,000,000 | | 9,986,258 |
| Gemini Securitization Corp., LLC | | | | |
| 0.30%, 11/3/08 | | 25,000,000 a | | 24,999,583 |
| General Electric Capital Corp. | | | | |
| 0.25%, 11/3/08 | | 25,000,000 | | 24,999,653 |
| Gotham Funding Corp. | | | | |
| 4.17%, 11/18/08 | | 25,000,000 a | | 24,951,007 |
| ING (US) Funding LLC | | | | |
| 2.80%, 11/5/08 | | 20,000,000 | | 19,993,867 |
T h e F u n d 7
| STATEMENT OF INVESTMENTS (continued) |
| | | Principal | | |
| Commercial Paper (continued) | | Amount ($) | | Value ($) |
| |
| |
|
| Mont Blanc Capital Corp. | | | | |
| 3.79%, 1/20/09 | | 25,000,000 a | | 24,791,667 |
| Sanpaolo IMI U.S. Financial Co. | | | | |
| 2.84%, 12/1/08 | | 25,000,000 | | 24,941,667 |
| Societe Generale N.A. Inc. | | | | |
| 2.80%, 11/26/08 | | 25,000,000 | | 24,951,736 |
| Working Capital Management Co. L.P. | | | | |
| 4.52%, 11/17/08 | | 25,000,000 | | 24,950,000 |
| Total Commercial Paper | | | | |
| (cost $323,908,698) | | | | 323,908,698 |
| |
| |
|
| |
| U.S. Government Agency—8.4% | | | | |
| |
| |
|
| Federal Home Loan Bank | | | | |
| 2.82%, 12/10/08 | | | | |
| (cost $50,000,000) | | 50,000,000 | | 50,000,000 |
| |
| |
|
| |
| Time Deposit—4.9% | | | | |
| |
| |
|
| Bank of America N.A. (Grand Cayman) | | | | |
| 0.12%, 11/3/08 | | | | |
| (cost $29,000,000) | | 29,000,000 | | 29,000,000 |
| |
| |
|
| |
| Repurchase Agreements—16.8% | | | | |
| |
| |
|
| Goldman, Sachs & Co. | | | | |
| 0.10%, dated 10/31/08, due 11/3/08 | | | | |
| in the amount of $50,000,417 (fully | | | | |
| collateralized by $50,582,000 | | | | |
| Federal National Mortgage Association, | | | | |
| 2.50%-3.125%, due 4/9/10-6/4/10, | | | | |
| value $51,000,880) | | 50,000,000 | | 50,000,000 |
8
| | | Principal | | |
| Repurchase Agreements (continued) | | Amount ($) | | Value ($) |
| |
| |
|
| Greenwich Capital Markets | | | | |
| 0.20%, dated 10/31/08, due 11/3/08 | | | | |
| in the amount of $50,000,833 (fully | | | | |
| collateralized by $47,900,000 U.S. | | | | |
| Treasury Notes, 4.50%, due 5/15/17, | | | | |
| value $51,004,195) | | 50,000,000 | | 50,000,000 |
| Total Repurchase Agreements | | | | |
| (cost $100,000,000) | | | | 100,000,000 |
| |
| |
|
| |
| Total Investments (cost $592,908,698) | | 99.6% | | 592,908,698 |
| |
| Cash and Receivables (Net) | | .4% | | 2,610,702 |
| |
| Net Assets | | 100.0% | | 595,519,400 |
| a Securities exempt from registration under Rule 144A of the Securities Act of 1933.These securities may be resold in |
| transactions exempt from registration, normally to qualified institutional buyers. At October 31, 2008, these securities |
| amounted to $174,278,472 or 29.3% of net assets. |
| Portfolio Summary (Unaudited)† | | | | |
| |
| | | Value (%) | | | | Value (%) |
| |
| |
| |
|
| Banking | | 45.1 | | U.S. Government Agency | | 8.4 |
| Asset-Backed/Multi-Seller Programs | | 25.1 | | Finance | | 4.2 |
| Repurchase Agreements | | 16.8 | | | | 99.6 |
| |
| † Based on net assets. | | | | | | |
| See notes to financial statements. | | | | | | |
T h e F u n d 9
STATEMENT OF ASSETS AND LIABILITIES
October 31, 2008
| | | Cost | | Value |
| |
| |
|
| Assets ($): | | | | |
| Investments in securities—See Statement of | | | | |
| Investments (including Repurchase Agreements | | | | |
| of $100,000,000)—Note 1(b) | | 592,908,698 | | 592,908,698 |
| Receivable from securities matured | | | | 7,000,024 |
| Interest receivable | | | | 812,799 |
| Prepaid expenses | | | | 48,328 |
| | | | | 600,769,849 |
| |
| |
|
| Liabilities ($): | | | | |
| Due to The Dreyfus Corporation and affiliates—Note 3(b) | | | | 320,160 |
| Cash overdraft due to Custodian | | | | 3,539,774 |
| Payable for shares of Capital Stock redeemed | | | | 620,998 |
| Dividend Payable | | | | 769,517 |
| | | | | 5,250,449 |
| |
| |
|
| Net Assets ($) | | | | 595,519,400 |
| |
| |
|
| Composition of Net Assets ($): | | | | |
| Paid-in capital | | | | 595,519,400 |
| |
| |
|
| Net Assets ($) | | | | 595,519,400 |
| |
| |
|
| |
| |
| Net Asset Value Per Share | | | | |
| | | Investor Shares | | Class R Shares |
| |
| |
|
| Net Assets ($) | | 408,547,286 | | 186,972,114 |
| Shares Outstanding | | 408,547,286 | | 186,972,114 |
| |
| |
|
| Net Asset Value Per Share ($) | | 1.00 | | 1.00 |
| |
| See notes to financial statements. | | | | |
10
STATEMENT OF OPERATIONS
Year Ended October 31, 2008 |
| Investment Income ($): | | |
| Interest Income | | 21,676,448 |
| Expenses: | | |
| Management fee—Note 3(a) | | 3,087,842 |
| Distribution fees (Investor Shares)—Note 3(b) | | 878,042 |
| Directors’ fees—Note 3(a) | | 51,151 |
| Treasury insurance expense—Note 1(e) | | 12,456 |
| Total Expenses | | 4,029,491 |
| Less—Directors’ fees reimbursed by | | |
| the Manager—Note 3(a) | | (51,151) |
| Net Expenses | | 3,978,340 |
| Investment Income—Net | | 17,698,108 |
| |
|
| Net Realized Gain (Loss) on Investments—Note 1(b) ($) | | 647 |
| Net Increase in Net Assets Resulting from Operations | | 17,698,755 |
| |
| See notes to financial statements. | | |
T h e F u n d 11
STATEMENT OF CHANGES IN NET ASSETS
| | | Year Ended October 31, |
| | |
|
| | | 2008 | | 2007 |
| |
| |
|
| Operations ($): | | | | |
| Investment income—net | | 17,698,108 | | 24,537,218 |
| Net realized gain (loss) on investments | | 647 | | — |
| Net Increase (Decrease) in Net Assets | | | | |
| Resulting from Operations | | 17,698,755 | | 24,537,218 |
| |
| |
|
| Dividends to Shareholders from ($): | | | | |
| Investment income—net: | | | | |
| Investors Shares | | (12,286,887) | | (15,807,528) |
| Class R Shares | | (5,411,221) | | (8,729,690) |
| Total Dividends | | (17,698,108) | | (24,537,218) |
| |
| |
|
| Capital Stock Transactions ($1.00 per share): | | | | |
| Net proceeds from shares sold: | | | | |
| Investors Shares | | 746,356,237 | | 610,414,325 |
| Class R Shares | | 901,970,524 | | 664,404,597 |
| Dividends reinvested: | | | | |
| Investors Shares | | 12,125,869 | | 15,760,739 |
| Class R Shares | | 3,229,845 | | 4,285,515 |
| Cost of shares redeemed: | | | | |
| Investors Shares | | (702,041,507) | | (558,689,316) |
| Class R Shares | | (880,305,485) | | (692,387,059) |
| Increase (Decrease) in Net Assets | | | | |
| from Capital Stock Transactions | | 81,335,483 | | 43,788,801 |
| Total Increase (Decrease) in Net Assets | | 81,336,130 | | 43,788,801 |
| |
| |
|
| Net Assets ($): | | | | |
| Beginning of Period | | 514,183,270 | | 470,394,469 |
| End of Period | | 595,519,400 | | 514,183,270 |
| |
| See notes to financial statements. | | | | |
12
FINANCIAL HIGHLIGHTS
The following tables describe the performance for each share class for the fiscal periods indicated. All information reflects financial results for a single fund share. Total return shows how much your investment in the fund would have increased (or decreased) during each period, assuming you had reinvested all dividends and distributions.These figures have been derived from the fund’s financial statements.
| | | | | Year Ended October 31, | | |
| | |
| |
| |
|
| Investor Shares | | 2008 | | 2007 | | 2006 | | 2005 | | 2004 |
| |
| |
| |
| |
| |
|
| Per Share Data ($): | | | | | | | | | | |
| Net asset value, beginning of period | | 1.00 | | 1.00 | | 1.00 | | 1.00 | | 1.00 |
| Investment Operations: | | | | | | | | | | |
| Investment income—net | | .028 | | .046 | | .042 | | .022 | | .005 |
| Distributions: | | | | | | | | | | |
| Dividends from | | | | | | | | | | |
| investment income—net | | (.028) | | (.046) | | (.042) | | (.022) | | (.005) |
| Net asset value, end of period | | 1.00 | | 1.00 | | 1.00 | | 1.00 | | 1.00 |
| |
| |
| |
| |
| |
|
| Total Return (%) | | 2.87 | | 4.75 | | 4.24 | | 2.23 | | .54 |
| |
| |
| |
| |
| |
|
| Ratios/Supplemental Data (%): | | | | | | | | | | |
| Ratio of total expenses | | | | | | | | | | |
| to average net assets | | .71 | | .71 | | .70 | | .70 | | .70 |
| Ratio of net expenses | | | | | | | | | | |
| to average net assets | | .70 | | .70 | | .70 | | .70 | | .70 |
| Ratio of net investment income | | | | | | | | | | |
| to average net assets | | 2.80 | | 4.65 | | 4.15 | | 2.19 | | .53 |
| |
| |
| |
| |
| |
|
| Net Assets, end of period ($ x 1,000) | | 408,547 | | 352,108 | | 284,623 | | 308,202 | | 357,163 |
| |
| See notes to financial statements. | | | | | | | | | | |
T h e F u n d 13
| FINANCIAL HIGHLIGHTS (continued) |
| | | | | Year Ended October 31, | | |
| | |
| |
| |
|
| Class R Shares | | 2008 | | 2007 | | 2006 | | 2005 | | 2004 |
| |
| |
| |
| |
| |
|
| Per Share Data ($): | | | | | | | | | | |
| Net asset value, beginning of period | | 1.00 | | 1.00 | | 1.00 | | 1.00 | | 1.00 |
| Investment Operations: | | | | | | | | | | |
| Investment income—net | | .030 | | .048 | | .044 | | .024 | | .007 |
| Distributions: | | | | | | | | | | |
| Dividends from | | | | | | | | | | |
| investment income—net | | (.030) | | (.048) | | (.044) | | (.024) | | (.007) |
| Net asset value, end of period | | 1.00 | | 1.00 | | 1.00 | | 1.00 | | 1.00 |
| |
| |
| |
| |
| |
|
| Total Return (%) | | 3.07 | | 4.96 | | 4.45 | | 2.43 | | .74 |
| |
| |
| |
| |
| |
|
| Ratios/Supplemental Data (%): | | | | | | | | | | |
| Ratio of total expenses | | | | | | | | | | |
| to average net assets | | .51 | | .51 | | .50 | | .50 | | .50 |
| Ratio of net expenses | | | | | | | | | | |
| to average net assets | | .50 | | .50 | | .50 | | .50 | | .50 |
| Ratio of net investment income | | | | | | | | | | |
| to average net assets | | 3.03 | | 4.85 | | 4.40 | | 2.38 | | .72 |
| |
| |
| |
| |
| |
|
| Net Assets, end of period ($ x 1,000) | | 186,972 | | 162,075 | | 185,772 | | 115,384 | | 179,552 |
| |
| See notes to financial statements. | | | | | | | | | | |
14
NOTES TO FINANCIAL STATEMENTS
NOTE 1—Significant Accounting Policies:
Dreyfus Money Market Reserves (the “fund”) is a separate diversified series of The Dreyfus/Laurel Funds, Inc. (the “Company”) which is registered under the Investment Company Act of 1940, as amended (the “Act”), as an open-end management investment company and operates as a series company currently offering fourteen series including the fund.The fund’s investment objective is to seek a high level of current income consistent with stability of principal by investing in a diversified portfolio of high-quality, short-term debt securities. The Dreyfus Corporation (the “Manager” or “Dreyfus”), a wholly-owned subsidiary of The Bank of New York Mellon Corporation (“BNY Mellon”), serves as the fund’s investment adviser.
Effective July 1, 2008, BNY Mellon has reorganized and consolidated a number of its banking and trust company subsidiaries. As a result of the reorganization, any services previously provided to the fund by Mellon Bank, N.A. or Mellon Trust of New England, N.A. are now provided by The Bank of New York, which has changed its name to The Bank of New York Mellon.
MBSC Securities Corporation (the “Distributor”), a wholly-owned subsidiary of the Manager, is the distributor of the fund’s shares, which are sold without a sales charge.The fund is authorized to issue 2 billion shares of $.001 par value Capital Stock in each of the following classes of shares: Investor and Class R. Investor shares are sold primarily to retail investors and bear a distribution fee. Class R shares are sold primarily to bank trust departments and other financial service providers (including The Bank of New York Mellon, a subsidiary of BNY Mellon and an affiliate of Dreyfus) acting on behalf of customers having a qualified trust or investment account or relationship at such institution, and bear no distribution fee. Each class of shares has identical rights and privileges, except with respect to the distribution fee and voting rights on matters affecting a single class. Income, expenses (other than expenses attributable to a specific class), and realized and
T h e F u n d 15
| NOTES TO FINANCIAL STATEMENTS (continued) |
unrealized gains or losses on investments are allocated to each class of shares based on its relative net assets.
It is the fund’s policy to maintain a continuous net asset value per share of $1.00 for the fund; the fund has adopted certain investment, portfolio valuation and dividend and distribution policies to enable it to do so. There is no assurance, however, that the fund will be able to maintain a stable net asset value per share of $1.00.
The fund’s financial statements are prepared in accordance with U.S. generally accepted accounting principles, which may require the use of management estimates and assumptions. Actual results could differ from those estimates.
(a) Portfolio valuation: Investments in securities are valued at amortized cost in accordance with Rule 2a-7 of the Act, which has been determined by the Board of Directors to represent the fair value of the fund’s investments.
The Financial Accounting Standards Board (“FASB”) released Statement of Financial Accounting Standards No. 157 “Fair Value Measurements” (“FAS 157”). FAS 157 establishes an authoritative definition of fair value, sets out a framework for measuring fair value, and requires additional disclosures about fair-value measurements. The application of FAS 157 is required for fiscal years beginning after November 15, 2007 and interim periods within those fiscal years. Management does not believe that the application of this standard will have a material impact on the financial statements of the fund.
(b) Securities transactions and investment income: Securities transactions are recorded on a trade date basis. Realized gains and losses from securities transactions are recorded on the identified cost basis. Interest income, adjusted for accretion of discount and amortization of premium on investments, is earned from settlement date and recognized on the accrual basis. Cost of investments represents amortized cost.
16
The fund may engage in repurchase agreement transactions. Under the terms of a typical repurchase agreement, the fund, through its custodian and sub-custodian, takes possession of an underlying debt obligation subject to an obligation of the seller to repurchase, and the fund to resell, the obligation at an agreed-upon price and time, thereby determining the yield during the fund’s holding period. This arrangement results in a fixed rate of return that is not subject to market fluctuations during the fund’s holding period.The value of the collateral is at least equal, at all times, to the total amount of the repurchase obligation, including interest. In the event of a counter party default, the fund has the right to use the collateral to offset losses incurred.There is potential loss to the fund in the event the fund is delayed or prevented from exercising its rights to dispose of the collateral securities, including the risk of a possible decline in the value of the underlying securities during the period while the fund seeks to assert its rights. The Manager, acting under the supervision of the Board of Directors, reviews the value of the collateral and the creditworthiness of those banks and dealers with which the fund enters into repurchase agreements to evaluate potential risks.
In March 2008, the FASB released Statement of Financial Accounting Standards No. 161 “Disclosures about Derivative Instruments and Hedging Activities” (“FAS 161”). FAS 161 requires qualitative disclosures about objectives and strategies for using derivatives, quantitative disclosures about fair value amounts of gains and losses on derivative instruments and disclosures about credit-risk-related contingent features in derivative agreements.The application of FAS 161 is required for fiscal years and interim periods beginning after November 15, 2008. At this time, management is evaluating the implications of FAS 161 and its impact on the financial statements and the accompanying notes has not yet been determined.
T h e F u n d 17
| NOTES TO FINANCIAL STATEMENTS (continued) |
(c) Dividends to shareholders: It is the policy of the fund to declare dividends daily from investment income-net; such dividends are paid monthly. Dividends from net realized capital gains, if any, are normally declared and paid annually, but the fund may make distributions on a more frequent basis to comply with the distribution requirements of the Internal Revenue Code of 1986, as amended (the “Code”).To the extent that net realized capital gains can be offset by capital loss carryovers, it is the policy of the fund not to distribute such gains.
(d) Federal income taxes: It is the policy of the fund to continue to qualify as a regulated investment company, if such qualifications is in the best interest of its shareholders, by complying with the applicable provisions of the Code, and to make distributions of taxable income sufficient to relieve it from substantially all federal income and excise taxes.
The fund adopted FASB Interpretation No. 48 “Accounting for Uncertainty in Income Taxes” (“FIN 48”). FIN 48 provides guidance for how uncertain tax positions should be recognized, measured, presented and disclosed in the financial statements. FIN 48 requires the evaluation of tax positions taken or expected to be taken in the course of preparing the fund’s tax returns to determine whether the tax positions are “more-likely-than-not” of being sustained by the applicable tax authority. Liability for tax positions not deemed to meet the more-likely-than-not threshold would be recorded as a tax expense in the current year.The adoption of FIN 48 had no impact on the operations of the fund for the period ended October 31, 2008.
As of and during the period ended October 31, 2008, the fund did not have any liabilities for any unrecognized tax positions. The fund recognizes interest and penalties, if any, related to unrecognized tax positions as income tax expense in the Statement of Operations. During the period, the fund did not incur any interest or penalties.
Each of the tax years in the four-year period ended October 31, 2008 remains subject to examination by the Internal Revenue Service and state taxing authorities.
18
At October 31, 2008, the components of accumulated earnings on a tax basis were substantially the same as for financial reporting purposes.
The tax character of distributions paid to shareholders during the fiscal periods ended October 31, 2008 and October 31, 2007 were all ordinary income.
At October 31, 2008, the cost of investments for federal income tax purposes was substantially the same as the cost for financial reporting purposes (see the Statement of Investments).
(e) Treasury’s Temporary Guarantee Program: The fund has entered into a Guarantee Agreement with the United States Department of the Treasury (the “Treasury”) to participate in the Treasury’s Temporary Guarantee Program for Money Market Funds (the “Program”).
Under the Program, the Treasury guarantees the share price of shares of the fund held by shareholders as of September 19, 2008 at $1.00 per share if the fund’s net asset value per share falls below $0.995 (a “Guarantee Event”) and the fund liquidates. Recovery under the Program is subject to certain conditions and limitations.
Fund shares acquired by investors after September 19, 2008 that increase the number of fund shares the investor held at the close of business on September 19, 2008 are not eligible for protection under the Program. In addition, fund shares acquired by investors who did not hold fund shares at the close of business on September 19, 2008 are not eligible for protection under the Program.
The Program, which was originally set to expire on December 18, 2008, has been extended by the Treasury until April 30, 2009, after which the Secretary of theTreasury will review the need for, and terms of, the Program. Participation in the initial term and the extended period of the Program required a payment to the Treasury in the amount of .01% and .015%, respectively, of the fund’s shares outstanding as of September 19, 2008.This expense is being borne by the fund without regard to any expense limitation currently in effect.
T h e F u n d 19
| NOTES TO FINANCIAL STATEMENTS (continued) |
NOTE 2—Bank Line of Credit:
Prior to May 1, 2008, the fund participated with other Dreyfus managed funds in a $100 million unsecured line of credit. Effective May 1, 2008, the fund participates with other Dreyfus-managed funds in a $300 million unsecured line of credit primarily to be utilized for temporary or emergency purposes, including the financing of redemptions. The terms of the line of credit agreement limit the amount of individual fund borrowings. Interest is charged to the fund based on prevailing market rates in effect at the time of borrowing. Effective October 15, 2008, the $300 million unsecured line of credit was terminated. During the period ended October 31, 2008, the fund did not borrow under the lines of credit.
NOTE 3—Investment Management Fee and Other Transactions With Affiliates:
(a) Pursuant to an Investment Management Agreement with the Manager, the Manager provides or arranges for one or more third parties and/or affiliates to provide investment advisory, administrative, custody, fund accounting and transfer agency services to the fund. The Manager also directs the investments of the fund in accordance with its investment objective, policies and limitations. For these services, the fund is contractually obligated to pay the Manager a fee, calculated daily and paid monthly, at the annual rate of .50% of the value of the fund’s average daily net assets. Out of its fee, the Manager pays all of the expenses of the fund except brokerage fees, taxes, interest, Rule 12b-1 distribution fees, servicing fees and expenses, fees and expenses of non-interested Directors (including counsel fees) and extraordinary expenses. In addition, the Manager is required to reduce its fee in an amount equal to the fund’s allocable portion of fees and expenses of the non-interested Directors (including counsel fees). Each Director receives $45,000 per year, plus $6,000 for each joint Board meeting of the Company, The
20
Dreyfus/Laurel Tax-Free Municipal Funds and The Dreyfus/Laurel Funds Trust (collectively, the “Dreyfus/Laurel Funds”) attended, $2,000 for separate in-person committee meetings attended which are not held in conjunction with a regularly scheduled Board meeting and $1,500 for Board meetings and separate committee meetings attended that are conducted by telephone and is reimbursed for travel and out-of-pocket expenses.With respect to Board meetings, the Chairman of the Board receives an additional 25% of such compensation (with the exception of reimbursable amounts). With respect to compensation committee meetings, the Chair of the compensation committee receives $900 per meeting and prior to April 12, 2008, with respect to audit committee meetings, the Chair of the audit committee received $1,350 per meeting. In the event that there is an in-person joint committee meeting or a joint telephone meeting of the Dreyfus/Laurel Funds and Dreyfus HighYield Strategies Fund, the $2,000 or $1,500 fee, as applicable, will be allocated between the Dreyfus/Laurel Funds and Dreyfus HighYield Strategies Fund. These fees and expenses are allocated to each series based on net assets. Amounts required to be paid by the Company directly to the non-interested Directors, that would be applied to offset a portion of the management fee payable to the Manager, are in fact paid directly by the Manager to the non-interested Directors.
(b) Under the fund’s Distribution Plan (the “Plan”) adopted pursuant to Rule 12b-1 under the Act, Investor shares may pay annually up to .25% (currently limited by the Company’s Board of Directors to .20%) of the value of the average daily net assets attributable to its Investor shares to compensate the Distributor for shareholder servicing activities and expenses primarily intended to result in the sale of Investor shares. During the period ended October 31, 2008, Investor shares were charged $878,042 pursuant to the Plan.
T h e F u n d 21
| NOTES TO FINANCIAL STATEMENTS (continued) |
Under its terms, the Plan shall remain in effect from year to year, provided such continuance is approved annually by a vote of a majority of those Directors who are not “interested persons” of the Company and who have no direct or indirect financial interest in the operation of or in any agreement related to the Plan.
The components of “Due to The Dreyfus Corporation and affiliates” in the Statement of Assets and Liabilities consist of: management fees $249,997 and Rule 12b-1 distribution plan fees $70,163.
22
REPORT OF INDEPENDENT REGISTERED
PUBLIC ACCOUNTING FIRM |
The Board of Directors and Shareholders The Dreyfus/Laurel Funds, Inc.:
We have audited the accompanying statement of assets and liabilities of Dreyfus Money Market Reserves, a series of The Dreyfus/Laurel Funds, Inc. (the “Fund”), including the statement of investments, as of October 31, 2008, and the related statement of operations for the year then ended, the statement of changes in net assets for each of the years in the two-year period then ended, and the financial highlights for each of the years in the five-year period then ended. These financial statements and financial highlights are the responsibility of the Fund’s management. Our responsibility is to express an opinion on these financial statements and financial highlights based on our audits.
We conducted our audits in accordance with the standards of the Public Company Accounting Oversight Board (United States).Those standards require that we plan and perform the audit to obtain reasonable assurance about whether the financial statements and financial highlights are free of material misstatement. An audit also includes examining, on a test basis, evidence supporting the amounts and disclosures in the financial statements. Our procedures included confirmation of securities owned as of October 31, 2008, by correspondence with the custodian.An audit includes assessing the accounting principles used and significant estimates made by management, as well as evaluating the overall financial statement presentation.We believe that our audits provide a reasonable basis for our opinion.
In our opinion, the financial statements and financial highlights referred to above present fairly, in all material respects, the financial position of Dreyfus Money Market Reserves as of October 31, 2008, the results of its operations for the year then ended, the changes in its net assets for each of the years in the two-year period then ended, and the financial highlights for each of the years in the five-year period then ended, in conformity with U.S. generally accepted accounting principles.

| | New York, New York
December 19, 2008 |
T h e F u n d 23
IMPORTANT TAX INFORMATION (Unaudited)
For federal tax purposes, the fund hereby designates 96.72% of ordinary income dividends paid during the fiscal year ended October 31, 2008 as qualifying “interest related dividends”.
24
BOARD MEMBERS INFORMATION (Unaudited)
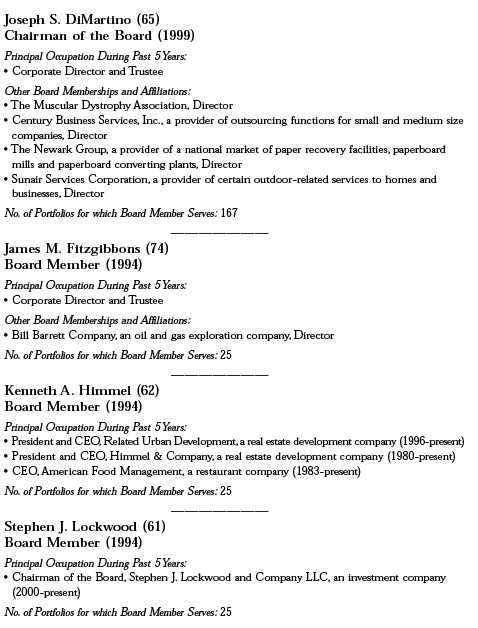
T h e F u n d 25
BOARD MEMBERS INFORMATION (Unaudited) (continued)

26
OFFICERS OF THE FUND (Unaudited)

T h e F u n d 27
OFFICERS OF THE FUND (Unaudited) (continued)

28
For More Information
| Dreyfus | | | | Transfer Agent & |
| Money Market Reserves | | Dividend Disbursing Agent |
| 200 Park Avenue | | | | Dreyfus Transfer, Inc. |
| New York, NY 10166 | | 200 Park Avenue |
| Manager | | | | New York, NY 10166 |
| The Dreyfus Corporation | | Distributor |
| 200 Park Avenue | | | | MBSC Securities Corporation |
| New York, NY 10166 | | 200 Park Avenue |
| Custodian | | | | New York, NY 10166 |
| The Bank of New York Mellon | | |
| One Wall Street | | | | |
| New York, NY 10286 | | |
| |
|
| |
| Ticker Symbols: | | Investor: DPIXX | | Class R: DPOXX |
Telephone 1-800-645-6561
Mail The Dreyfus Family of Funds, 144 Glenn Curtiss Boulevard, Uniondale, NY 11556-0144 E-mail Send your request to info@dreyfus.com Internet Information can be viewed online or downloaded at: http://www.dreyfus.com
The fund will disclose daily, on www.dreyfus.com, the fund’s complete schedule of holdings as of the end of the previous business day. The schedule of holdings will remain on the website until the fund files its Form N-Q or Form N-CSR for the period that includes the date of the posted holdings.
The fund files its complete schedule of portfolio holdings with the Securities and Exchange Commission (“SEC”) for the first and third quarters of each fiscal year on Form N-Q. The fund's Forms N-Q are available on the SEC’s website at http://www.sec.gov and may be reviewed and copied at the SEC’s Public Reference Room in Washington, DC. Information on the operation of the Public Reference Room may be obtained by calling 1-800-SEC-0330.
Information regarding how the fund voted proxies relating to portfolio securities for the 12-month period ended June 30, 2008, is available on the SEC’s website at http://www.sec.gov and without charge, upon request, by calling 1-800-645-6561.

| © 2008 MBSC Securities Corporation |
| | Dreyfus
AMT-Free
Municipal Reserves |
| | ANNUAL REPORT October 31, 2008 |

Save time. Save paper. View your next shareholder report online as soon as it’s available. Log into www.dreyfus.com and sign up for Dreyfus eCommunications. It’s simple and only takes a few minutes.
The views expressed in this report reflect those of the portfolio manager only through the end of the period covered and do not necessarily represent the views of Dreyfus or any other person in the Dreyfus organization. Any such views are subject to change at any time based upon market or other conditions and Dreyfus disclaims any responsibility to update such views.These views may not be relied on as investment advice and, because investment decisions for a Dreyfus fund are based on numerous factors, may not be relied on as an indication of trading intent on behalf of any Dreyfus fund.
Not FDIC-Insured Not Bank-Guaranteed May Lose Value
| Contents |
| |
| | | THE FUND |
| |
|
| 2 | | A Letter from the CEO |
| 3 | | Discussion of Fund Performance |
| 6 | | Understanding Your Fund’s Expenses |
| 6 | | Comparing Your Fund’s Expenses |
| With Those of Other Funds |
| 7 | | Statement of Investments |
| 17 | | Statement of Assets and Liabilities |
| 18 | | Statement of Operations |
| 19 | | Statement of Changes in Net Assets |
| 20 | | Financial Highlights |
| 23 | | Notes to Financial Statements |
| 31 | | Report of Independent Registered |
| | | Public Accounting Firm |
| 32 | | Important Tax Information |
| 33 | | Board Members Information |
| 35 | | Officers of the Fund |
| FOR MORE INFORMATION |
|
| | | Back Cover |
| Dreyfus |
| AMT-Free |
| Municipal Reserves |
The Fund

A LETTER FROM THE CEO
Dear Shareholder:
We are pleased to present this annual report for Dreyfus AMT-Free Municipal Reserves, covering the 12-month period from November 1, 2007, through October 31, 2008.
These are difficult times for investors. A credit crunch that began in 2007 has developed into a full-blown global financial crisis, recently resulting in the failure of several major financial institutions. Making matters worse, the U.S. economic slowdown has gathered momentum, depressing investor sentiment.
Money market funds have not been immune to the downturn, as banks’ reluctance to lend even to financially sound companies produced challenging liquidity conditions in the commercial paper market, and resulted to date in at least one U.S. money market fund family having to close and liquidate certain of its money funds’ portfolios. The federal government subsequently stepped in with a number of measures, including a Temporary Guarantee Program for Money Market Funds and a $700 billion rescue package intended to promote greater liquidity in the financial markets. In our view, the government’s efforts to stabilize the fixed income markets are critical to a broader recovery in the credit markets, as funding for America’s leading corporations must improve before a more widespread easing of credit availability is possible.
The depth and duration of the financial crisis will depend on how quickly the banking system can be stabilized. In the meantime, we encourage you to maintain a long-term perspective and a disciplined approach to investing. Indeed, we already are seeing some positive signs, including a likely peak in global inflationary pressures, a bottoming of the U.S. dollar and a large pool of worldwide financial liquidity that could be deployed gradually as the economic cycle turns.
For information about how the fund performed during the reporting period, as well as market perspectives, we have provided a Discussion of Fund Performance given by the fund’s Portfolio Manager.
Thank you for your continued confidence and support.
Jonathan R. Baum
Chief Executive Officer
The Dreyfus Corporation
November 17, 2008 |
2

DISCUSSION OF FUND PERFORMANCE
For the period of November 1, 2007, through October 31, 2008, as provided by Joseph Irace, Senior Portfolio Manager
Fund and Market Performance Overview
For the 12-month period ended October 31, 2008, Dreyfus AMT-Free Municipal Reserves BASIC shares, Class B shares, Class R shares and Investor shares produced yields of 2.52%, 2.02%, 2.52% and 2.32%, respectively.Taking into account the effects of compounding, the fund’s BASIC shares, Class B shares, Class R shares and Investor shares produced effective yields of 2.55%, 2.04%, 2.55% and 2.35%, respectively.1
Tax-exempt money market instruments were influenced by declining short-term interest rates in a faltering U.S. economy over much of the reporting period and the effects of an intensifying global financial crisis, which were particularly severe in September and October 2008.
The Fund’s Investment Approach
The fund seeks a high level of current income, consistent with stability of principal, that is exempt from federal income tax.The fund also seeks to provide income exempt from the federal alternative minimum tax. To pursue its goal, the fund normally invests substantially all of its assets in tax-exempt municipal obligations, including short-term municipal debt securities, that do not pay interest that is subject to the federal alternative minimum tax.Among these are municipal notes, short-term municipal bonds, tax-exempt commercial paper and municipal leases.
The fund also may invest in high-quality short-term structured notes, which are derivative instruments whose value is tied to underlying municipal obligations.
Economic Slump and Financial Crisis Roiled Money Markets
Economic conditions deteriorated early in the reporting period as a result of weakness in U.S. housing markets, rising energy prices and declining consumer confidence.The Federal Reserve Board (the “Fed”) attempted to address the economic downturn by reducing the overnight
The Fund 3
| DISCUSSION OF FUND PERFORMANCE (continued) |
federal funds rate, which began the reporting period at 4.5% . However, news of massive sub-prime related losses among major financial institutions, additional evidence of a slowing economy and, at the time, mounting inflationary pressures led to renewed market turbulence, and the Fed responded with additional rate cuts through the spring of 2008.
Meanwhile, a credit crisis that originated in the sub-prime mortgage market intensified in early 2008 as mortgage foreclosure rates surged and institutional investors continued to de-lever their portfolios, selling their more liquid and creditworthy holdings to meet margin calls resulting from losses in mortgage- and asset-backed securities. In March, the credit crisis led to the collapse of investment bank Bear Stearns. In an attempt to prevent the bank’s failure from cascading throughout the financial services industry, the Fed participated in a rescue of the troubled institution. A rebound in fixed-income and equity markets ensued as investors reacted positively to this demonstration of the Fed’s resolve.
However, the rally proved to be short-lived when, over the summer of 2008, the credit crisis mushroomed into a global financial crisis, resulting in the failures and government bailouts of several major financial institu-tions.The money markets were not immune to the financial crisis. So in an attempt to curtail diminishing investor confidence and help restore liquidity and stability to the financial system, the Department of Treasury initiated several measures, including the Temporary Guarantee Program specifically for money market funds.
With the Fed and U.S.Treasury fully supporting banks and short-term lending, the stress in the system appeared to have been mitigated by the reporting period’s end. Although liquidity concerns regarding variable-rate demand notes (“VRDNs”) pushed their yields higher in September, the VRDN market recently has stabilized, with liquidity and yields returning to normalized levels and tax-exempt money market funds seeing positive cash flows.
Independent Research Helps Avoid Credit Problems
As always, we have invested exclusively in direct, high-quality municipal obligations that have been independently approved by our credit
4
analysts. In light of the issues confronting the market, we maintained a conservative credit selection strategy, including increased credit surveillance of the fund’s holdings.
Over much of the reporting period, we set the fund’s weighted average maturity in a range that was longer than industry averages to capture higher yields for as long as we deemed practical while interest rates fell. However, we recently moved to shorten our weighted average maturity to weather the dislocations caused by the financial crisis.This enabled us to take greater advantage of the outsized yields offered by VRDNs at the time.
Maintaining a Conservative Investment Posture
As the financial crisis intensified, the Fed implemented additional reductions in short-term interest rates, including an unprecedented, coordinated rate cut with other central banks. Consequently, the federal funds rate ended the reporting period at just 1%. Despite the U.S. government’s current guarantee of money market instruments,we intend to maintain the fund’s conservative credit selection strategy and weighted average maturity until we are confident that the crisis and volatility that typically affects the tax-exempt money markets at year-end have passed.
November 17, 2008
An investment in the fund is not insured or guaranteed by the FDIC or any other government agency. Although the fund seeks to preserve the value of your investment at $1.00 per share, it is possible to lose money by investing in the fund.
| 1 | Effective yield is based upon dividends declared daily and reinvested monthly. Past performance is no guarantee of future results.Yields fluctuate. Income may be subject to state and local taxes. |
| |
| | Yields provided reflect the absorption of certain fund expenses by The Dreyfus Corporation pursuant to an undertaking in effect that may be extended, terminated or modified at any time. Had these expenses not been absorbed, yields of the fund’s BASIC shares, Class B shares, Class R shares and Investor shares would have been 2.51%, 2.01%, 2.51% and 2.31%, respectively, and the effective yields would have been 2.54%, 2.03%, 2.54% and 2.34%, respectively. |
| |
The Fund 5
UNDERSTANDING YOUR FUND’S EXPENSES (Unaudited)
As a mutual fund investor, you pay ongoing expenses, such as management fees and other expenses. Using the information below, you can estimate how these expenses affect your investment and compare them with the expenses of other funds.You also may pay one-time transaction expenses, including sales charges (loads) and redemption fees, which are not shown in this section and would have resulted in higher total expenses. For more information, see your fund’s prospectus or talk to your financial adviser.
Review your fund’s expenses
The table below shows the expenses you would have paid on a $1,000 investment in Dreyfus AMT-Free Municipal Reserves from May 1, 2008 to October 31, 2008. It also shows how much a $1,000 investment would be worth at the close of the period, assuming actual returns and expenses.
Expenses and Value of a $1,000 Investment
assuming actual returns for the six months ended October 31, 2008 |
| | | Investor Shares | | Class R Shares | | BASIC Shares | | Class B Shares |
| |
| |
| |
| |
|
| Expenses paid per $1,000† | | $ 3.54 | | $ 2.53 | | $ 2.53 | | $ 5.05 |
| Ending value (after expenses) | | $1,010.20 | | $1,011.30 | | $1,011.30 | | $1,008.70 |
COMPARING YOUR FUND’S EXPENSES
WITH THOSE OF OTHER FUNDS (Unaudited) |
Using the SEC’s method to compare expenses
The Securities and Exchange Commission (SEC) has established guidelines to help investors assess fund expenses. Per these guidelines, the table below shows your fund’s expenses based on a $1,000 investment, assuming a hypothetical 5% annualized return. You can use this information to compare the ongoing expenses (but not transaction expenses or total cost) of investing in the fund with those of other funds.All mutual fund shareholder reports will provide this information to help you make this comparison. Please note that you cannot use this information to estimate your actual ending account balance and expenses paid during the period.
Expenses and Value of a $1,000 Investment
assuming a hypothetical 5% annualized return for the six months ended October 31, 2008 |
| | | Investor Shares | | Class R Shares | | BASIC Shares | | Class B Shares |
| |
| |
| |
| |
|
| Expenses paid per $1,000† | | $ 3.56 | | $ 2.54 | | $ 2.54 | | $ 5.08 |
| Ending value (after expenses) | | $1,021.62 | | $1,022.62 | | $1,022.62 | | $1,020.11 |
| † Expenses are equal to the fund’s annualized expense ratio of .70% for Investor Shares, .50% for Class R, .50% for |
| BASIC Shares and 1.00% for Class B, multiplied by the average account value over the period, multiplied by |
| 184/366 (to reflect the one-half year period). |
6
| STATEMENT OF INVESTMENTS | | | | | | | | |
| October 31, 2008 | | | | | | | | | | |
| |
| |
| |
| |
| |
|
| |
| |
| |
| |
| Short-Term | | Coupon | | Maturity | | Principal | | | | |
| Investments—98.7% | | Rate (%) | | Date | | Amount ($) | | | | Value ($) |
| |
| |
| |
| |
| |
|
| Alabama—2.0% | | | | | | | | | | |
| Macon Trust Various Certificates | | | | | | | | | | |
| (Spanish Fort Redevelopment | | | | | | | | | | |
| Authority—Spanish Fort Town | | | | | | | | | | |
| Center) (Liquidity Facility; | | | | | | | | | | |
| Bank of America and LOC; Bank | | | | | | | | | | |
| of America) | | 1.87 | | 11/7/08 | | 5,000,000 | | a,b | | 5,000,000 |
| Colorado—3.0% | | | | | | | | | | |
| Centerra Metropolitan District, | | | | | | | | | | |
| Improvement Revenue, Refunding | | | | | | | | | | |
| (LOC; Compass Bank) | | 1.80 | | 11/7/08 | | 3,000,000 | | a | | 3,000,000 |
| Central Platte Valley Metropolitan | | | | | | | | | | |
| District, GO (Liquidity | | | | | | | | | | |
| Facility; BNP Paribas) | | 3.50 | | 12/1/08 | | 500,000 | | | | 500,000 |
| Central Platte Valley Metropolitan | | | | | | | | | | |
| District, GO (LOC; U.S. Bank NA) | | 3.50 | | 12/1/08 | | 1,000,000 | | | | 1,000,000 |
| Solaris Metropolitan District | | | | | | | | | | |
| Number 1, Property Tax Revenue | | | | | | | | | | |
| (LOC; Key Bank) | | 2.52 | | 11/7/08 | | 3,000,000 | | a | | 3,000,000 |
| Florida—11.0% | | | | | | | | | | |
| Bay Medical Center Board of | | | | | | | | | | |
| Trustees, HR (Bay Medical Center | | | | | | | | | | |
| Project) (LOC; Regions Bank) | | 3.75 | | 11/7/08 | | 4,945,000 | | a | | 4,945,000 |
| Citizens Property Insurance | | | | | | | | | | |
| Corporation, High-Risk Account | | | | | | | | | | |
| Senior Secured Revenue | | 4.50 | | 6/1/09 | | 11,000,000 | | | | 11,063,117 |
| Florida, State Board of Education, | | | | | | | | | | |
| Public Education Capital | | | | | | | | | | |
| Outlay GO Notes | | 5.00 | | 6/1/09 | | 100,000 | | | | 101,537 |
| Florida, State Board of Education, | | | | | | | | | | |
| Public Education Capital | | | | | | | | | | |
| Outlay GO Notes, Refunding | | 4.00 | | 6/1/09 | | 1,000,000 | | | | 1,011,148 |
| Hillsborough County Industrial | | | | | | | | | | |
| Development Authority, IDR, | | | | | | | | | | |
| Refunding (Leslie Controls, Inc. | | | | | | | | | | |
| Project) (LOC; SunTrust Bank) | | 1.95 | | 11/7/08 | | 3,535,000 | | a | | 3,535,000 |
| Lee County Educational Facilities | | | | | | | | | | |
| Authority, Educational Facilities | | | | | | | | | | |
| Revenue (International College | | | | | | | | | | |
| Foundation, Inc. Project) (LOC; | | | | | | | | | | |
| SunTrust Bank) | | 1.95 | | 11/7/08 | | 1,625,000 | | a | | 1,625,000 |
The Fund 7
| | STATEMENT OF INVESTMENTS (continued) |
| Short-Term | | Coupon | | Maturity | | Principal | | | | |
| Investments (continued) | | Rate (%) | | Date | | Amount ($) | | | | Value ($) |
| |
| |
| |
| |
| |
|
| Florida (continued) | | | | | | | | | | |
| Pasco County Educational | | | | | | | | | | |
| Facilities Authority, Revenue | | | | | | | | | | |
| (Saint Leo University Project) | | | | | | | | | | |
| (LOC; Amsouth Bank) | | 2.42 | | 11/7/08 | | 995,000 | | a | | 995,000 |
| South Broward Hospital District, | | | | | | | | | | |
| HR, Refunding (South Broward | | | | | | | | | | |
| Hospital District Obligated Group) | | 4.00 | | 5/1/09 | | 1,580,000 | | | | 1,593,072 |
| Volusia County Industrial | | | | | | | | | | |
| Development Authority, | | | | | | | | | | |
| Revenue, Refunding (Retirement | | | | | | | | | | |
| Housing Foundation Obligated | | | | | | | | | | |
| Group—Bishop’s Glen) (LOC; | | | | | | | | | | |
| KBC Bank) | | 1.70 | | 11/7/08 | | 2,790,000 | | a | | 2,790,000 |
| Illinois—1.8% | | | | | | | | | | |
| Chicago O’Hare International | | | | | | | | | | |
| Airport, Revenue (Insured; | | | | | | | | | | |
| Assured Guaranty and Liquidity | | | | | | | | | | |
| Facility; Citibank NA) | | 2.14 | | 11/7/08 | | 3,435,000 | | a,b | | 3,435,000 |
| Illinois, | | | | | | | | | | |
| GO Notes | | 5.25 | | 6/1/09 | | 125,000 | | | | 127,136 |
| Illinois Finance Authority, | | | | | | | | | | |
| Revenue, Refunding (Bradley | | | | | | | | | | |
| University) (LOC; Northern | | | | | | | | | | |
| Trust Company) | | 2.00 | | 4/1/09 | | 1,000,000 | | | | 1,000,000 |
| Kansas—3.9% | | | | | | | | | | |
| Junction City, | | | | | | | | | | |
| GO Temporary Notes | | 4.50 | | 6/1/09 | | 9,870,000 | | | | 9,911,679 |
| Kentucky—3.2% | | | | | | | | | | |
| Jefferson County, | | | | | | | | | | |
| Retirement Home Revenue | | | | | | | | | | |
| (Nazareth Literary and | | | | | | | | | | |
| Benevolent Institution Project) | | | | | | | | | | |
| (LOC; Fifth Third Bank) | | 2.31 | | 11/7/08 | | 3,185,000 | | a | | 3,185,000 |
| Kentucky Area Development | | | | | | | | | | |
| Districts Financing Trust, | | | | | | | | | | |
| Lease Program Revenue (Lyon | | | | | | | | | | |
| County Emergency Ambulance | | | | | | | | | | |
| District) (LOC; Fifth Third Bank) | | 3.60 | | 11/7/08 | | 390,000 | | a | | 390,000 |
8
| Short-Term | | Coupon | | Maturity | | Principal | | | | |
| Investments (continued) | | Rate (%) | | Date | | Amount ($) | | | | Value ($) |
| |
| |
| |
| |
| |
|
| Kentucky (continued) | | | | | | | | | | |
| Lexington-Fayette Urban County | | | | | | | | | | |
| Government, Industrial | | | | | | | | | | |
| Building Revenue (Northeast | | | | | | | | | | |
| Christian Project) (LOC; Fifth | | | | | | | | | | |
| Third Bank) | | 2.10 | | 11/7/08 | | 4,430,000 | | a | | 4,430,000 |
| Louisiana—1.6% | | | | | | | | | | |
| Louisiana Local Government | | | | | | | | | | |
| Environmental Facilities and | | | | | | | | | | |
| Community Development Authority, | | | | | | | | | | |
| Revenue (Price LeBlanc Facility, | | | | | | | | | | |
| L.C. Project) (LOC; Regions Bank) | | 2.37 | | 11/7/08 | | 4,000,000 | | a | | 4,000,000 |
| Maine—.2% | | | | | | | | | | |
| Maine, | | | | | | | | | | |
| GO Notes | | 5.00 | | 1/15/09 | | 100,000 | | | | 100,596 |
| Maine Municipal Bond Bank, | | | | | | | | | | |
| Revenue | | 5.00 | | 11/1/08 | | 500,000 | | | | 500,000 |
| Maryland—7.6% | | | | | | | | | | |
| Frederick County, | | | | | | | | | | |
| Revenue (Homewood Inc. | | | | | | | | | | |
| Facility) (LOC; M&T Bank) | | 2.28 | | 11/7/08 | | 8,300,000 | | a | | 8,300,000 |
| Maryland Health and Higher | | | | | | | | | | |
| Educational Facilities | | | | | | | | | | |
| Authority, Revenue (Dematha | | | | | | | | | | |
| Catholic High School) (LOC; | | | | | | | | | | |
| Branch Banking and Trust Co.) | | 1.78 | | 11/7/08 | | 9,865,000 | | a | | 9,865,000 |
| Ocean City, | | | | | | | | | | |
| GO Notes, Refunding (Insured; FSA) | | 4.00 | | 12/1/08 | | 1,005,000 | | | | 1,006,336 |
| Massachusetts—5.8% | | | | | | | | | | |
| Massachusetts Development Finance | | | | | | | | | | |
| Agency, Revenue (Suffolk | | | | | | | | | | |
| University Issue) (Insured; | | | | | | | | | | |
| Assured Guaranty and Liquidity | | | | | | | | | | |
| Facility; JPMorgan Chase Bank) | | 2.00 | | 11/7/08 | | 3,645,000 | | a | | 3,645,000 |
| Massachusetts Health and | | | | | | | | | | |
| Educational Facilities | | | | | | | | | | |
| Authority, Revenue | | | | | | | | | | |
| (Northeastern University Issue) | | 2.25 | | 5/14/09 | | 10,000,000 | | | | 10,000,000 |
The Fund 9
| | STATEMENT OF INVESTMENTS (continued) |
| Short-Term | | Coupon | | Maturity | | Principal | | | | |
| Investments (continued) | | Rate (%) | | Date | | Amount ($) | | | | Value ($) |
| |
| |
| |
| |
| |
|
| Massachusetts (continued) | | | | | | | | | | |
| Woods Hole Martha’s Vineyard and | | | | | | | | | | |
| Nantucket Steamship Authority, | | | | | | | | | | |
| Steamship Revenue | | 4.00 | | 3/1/09 | | 1,020,000 | | | | 1,026,607 |
| Michigan—.2% | | | | | | | | | | |
| Kalamazoo Hospital Finance | | | | | | | | | | |
| Authority, HR, Refunding | | | | | | | | | | |
| (Bronson Methodist Hospital) | | | | | | | | | | |
| (Insured; FSA) | | 2.65 | | 5/15/09 | | 600,000 | | | | 600,000 |
| Minnesota—1.6% | | | | | | | | | | |
| Puttable Floating Option Tax | | | | | | | | | | |
| Exempt Receipts (Saint Paul | | | | | | | | | | |
| Port Authority, MFHR | | | | | | | | | | |
| (Burlington Apartments | | | | | | | | | | |
| Project)) (Liquidity Facility; | | | | | | | | | | |
| FHLMC and LOC; FHLMC) | | 2.04 | | 11/7/08 | | 4,080,000 | | a,b | | 4,080,000 |
| Missouri—.4% | | | | | | | | | | |
| Missouri Health and Educational | | | | | | | | | | |
| Facilities Authority, School | | | | | | | | | | |
| District Advance Program Notes | | | | | | | | | | |
| (Fayette R-III School District) | | 4.25 | | 11/3/08 | | 920,000 | | | | 920,036 |
| New Hampshire—1.2% | | | | | | | | | | |
| New Hampshire Health and Education | | | | | | | | | | |
| Facilities Authority, Revenue | | | | | | | | | | |
| (University System of New | | | | | | | | | | |
| Hampshire Issue) | | 3.00 | | 3/26/09 | | 1,150,000 | | | | 1,150,000 |
| New Hampshire Higher Educational | | | | | | | | | | |
| and Health Facilities Authority, | | | | | | | | | | |
| Revenue (Hunt Community Issue) | | | | | | | | | | |
| (LOC; Bank of America) | | 2.05 | | 11/7/08 | | 1,900,000 | | a | | 1,900,000 |
| New Jersey—14.7% | | | | | | | | | | |
| New Jersey Economic Development | | | | | | | | | | |
| Authority, School Facilities | | | | | | | | | | |
| Construction Revenue, Refunding | | | | | | | | | | |
| (LOC; Dexia Credit Locale) | | 6.00 | | 11/7/08 | | 10,000,000 | | a | | 10,000,000 |
| New Jersey Health Care Facilities | | | | | | | | | | |
| Financing Authority, Revenue | | | | | | | | | | |
| (AtlantiCare Regional Medical | | | | | | | | | | |
| Center) (LOC; Wachovia Bank) | | 3.48 | | 11/7/08 | | 4,235,000 | | a | | 4,235,000 |
10
| Short-Term | | Coupon | | Maturity | | Principal | | | | |
| Investments (continued) | | Rate (%) | | Date | | Amount ($) | | | | Value ($) |
| |
| |
| |
| |
| |
|
| New Jersey (continued) | | | | | | | | | | |
| New Jersey Health Care Facilities | | | | | | | | | | |
| Financing Authority, Revenue | | | | | | | | | | |
| (Meridian Health System | | | | | | | | | | |
| Obligated Group Issue) (Insured; | | | | | | | | | | |
| Assured Guaranty and Liquidity | | | | | | | | | | |
| Facility; Wachovia Bank) | | 2.28 | | 11/7/08 | | 11,400,000 | | a | | 11,400,000 |
| New Jersey Turnpike Authority, | | | | | | | | | | |
| Turnpike Revenue (Insured; FSA | | | | | | | | | | |
| and Liquidity Facility; Dexia | | | | | | | | | | |
| Credit Locale) | | 6.00 | | 11/7/08 | | 3,000,000 | | a | | 3,000,000 |
| New Jersey Turnpike Authority, | | | | | | | | | | |
| Turnpike Revenue (Insured; FSA | | | | | | | | | | |
| and Liquidity Facility; Dexia | | | | | | | | | | |
| Credit Locale) | | 6.00 | | 11/7/08 | | 1,000,000 | | a | | 1,000,000 |
| Puttable Floating Option Tax | | | | | | | | | | |
| Exempt Receipts (Tobacco | | | | | | | | | | |
| Settlement Financing Corporation | | | | | | | | | | |
| of New Jersey, Tobacco Settlement | | | | | | | | | | |
| Asset-Backed Bonds) (Liquidity | | | | | | | | | | |
| Facility; Merrill Lynch | | | | | | | | | | |
| Capital Services and LOC; | | | | | | | | | | |
| Merrill Lynch Capital Sevices) | | 2.64 | | 11/7/08 | | 7,400,000 | | a,b | | 7,400,000 |
| North Carolina—1.9% | | | | | | | | | | |
| North Carolina, | | | | | | | | | | |
| Public Improvement GO Notes | | 5.25 | | 3/1/09 | | 105,000 | | | | 106,106 |
| Wake County, | | | | | | | | | | |
| GO (Liquidity Facility; | | | | | | | | | | |
| Landesbank Hessen-Thuringen | | | | | | | | | | |
| Girozentrale) | | 2.80 | | 11/7/08 | | 4,795,000 | | a | | 4,795,000 |
| Ohio—2.0% | | | | | | | | | | |
| Blue Ash, | | | | | | | | | | |
| EDR (Ursuline Academy of | | | | | | | | | | |
| Cincinnati Project) (LOC; | | | | | | | | | | |
| Fifth Third Bank) | | 2.10 | | 11/7/08 | | 5,100,000 | | a | | 5,100,000 |
| Oklahoma—2.0% | | | | | | | | | | |
| Tulsa County Industrial Authority, | | | | | | | | | | |
| Capital Improvements Revenue | | | | | | | | | | |
| (Liquidity Facility; Bank of America) | | 2.00 | | 11/15/08 | | 5,140,000 | | | | 5,140,000 |
The Fund 11
| STATEMENT OF INVESTMENTS (continued) |
| Short-Term | | Coupon | | Maturity | | Principal | | | | |
| Investments (continued) | | Rate (%) | | Date | | Amount ($) | | | | Value ($) |
| |
| |
| |
| |
| |
|
| Pennsylvania—21.5% | | | | | | | | | | |
| Chester County Industrial | | | | | | | | | | |
| Development Authority, Revenue | | | | | | | | | | |
| (YMCA of the Brandywine Valley | | | | | | | | | | |
| Project) (LOC; Fulton Bank) | | 1.81 | | 11/7/08 | | 5,800,000 | | a | | 5,800,000 |
| Delaware County Industrial | | | | | | | | | | |
| Development Authority, Revenue | | | | | | | | | | |
| (Melmark Inc. Project) (LOC; | | | | | | | | | | |
| Commerce Bank) | | 1.92 | | 11/7/08 | | 2,900,000 | | a | | 2,900,000 |
| Harrisburg Authority, | | | | | | | | | | |
| Revenue (Haverford Township | | | | | | | | | | |
| School District Project) | | | | | | | | | | |
| (Insured; FSA and Liquidity | | | | | | | | | | |
| Facility; Dexia Credit Locale) | | 2.82 | | 11/7/08 | | 3,290,000 | | a | | 3,290,000 |
| Horizon Hospital System Authority, | | | | | | | | | | |
| Senior Health and Housing | | | | | | | | | | |
| Facilities Revenue (Saint Paul | | | | | | | | | | |
| Homes Project) (LOC; M&T Bank) | | 1.87 | | 11/7/08 | | 7,160,000 | | a | | 7,160,000 |
| Lancaster Industrial Development | | | | | | | | | | |
| Authority, Revenue (Student | | | | | | | | | | |
| Lodging, Inc. Project) (LOC; | | | | | | | | | | |
| Fulton Bank) | | 1.90 | | 11/7/08 | | 5,410,000 | | a | | 5,410,000 |
| Lancaster Municipal Authority, | | | | | | | | | | |
| Revenue (Garden Spot Village | | | | | | | | | | �� |
| Project) (LOC; Fulton Bank) | | 2.05 | | 11/7/08 | | 950,000 | | a | | 950,000 |
| Lebanon County Health Facilities | | | | | | | | | | |
| Authority, Revenue (E.C.C. | | | | | | | | | | |
| Retirement Village Project) | | | | | | | | | | |
| (LOC; PNC Bank NA) | | 1.77 | | 11/7/08 | | 4,315,000 | | a | | 4,315,000 |
| Pennsylvania Economic Development | | | | | | | | | | |
| Financing Authority, EDR | | | | | | | | | | |
| (Homewood Retirement Centers | | | | | | | | | | |
| Project) (LOC; M&T Bank) | | 2.33 | | 11/7/08 | | 3,925,000 | | a | | 3,925,000 |
| Pennsylvania Higher Educational | | | | | | | | | | |
| Facilities Authority, Revenue | | | | | | | | | | |
| (Drexel University) (LOC; | | | | | | | | | | |
| Allied Irish Banks) | | 2.02 | | 11/7/08 | | 190,000 | | a | | 190,000 |
| Philadelphia School District, | | | | | | | | | | |
| GO Notes, Refunding (LOC; | | | | | | | | | | |
| Wachovia Bank) | | 2.30 | | 11/7/08 | | 10,000,000 | | a | | 10,000,000 |
12
| Short-Term | | Coupon | | Maturity | | Principal | | | | |
| Investments (continued) | | Rate (%) | | Date | | Amount ($) | | | | Value ($) |
| |
| |
| |
| |
| |
|
| Pennsylvania (continued) | | | | | | | | | | |
| Puttable Floating Option Tax | | | | | | | | | | |
| Exempt Receipts (Montgomery | | | | | | | | | | |
| County Redevelopment | | | | | | | | | | |
| Authority, MFHR (Hunt Club | | | | | | | | | | |
| Apartments)) (Liquidity | | | | | | | | | | |
| Facility; FHLMC and LOC; FHLMC) | | 2.04 | | 11/7/08 | | 7,000,000 | | a,b | | 7,000,000 |
| Southcentral Pennsylvania General | | | | | | | | | | |
| Authority, Revenue (York | | | | | | | | | | |
| County Cerebral Palsy Home, Inc. | | | | | | | | | | |
| Project) (LOC; Fulton Bank) | | 1.90 | | 11/7/08 | | 3,200,000 | | a | | 3,200,000 |
| South Carolina—.1% | | | | | | | | | | |
| Hilton Head Island, | | | | | | | | | | |
| GO Notes, Refunding | | 4.00 | | 12/1/08 | | 185,000 | | | | 185,148 |
| Texas—3.1% | | | | | | | | | | |
| Collin County Housing Finance | | | | | | | | | | |
| Corporation, Multifamily | | | | | | | | | | |
| Revenue (Carpenter-Oxford | | | | | | | | | | |
| Development Housing) | | | | | | | | | | |
| (Liquidity Facility; FHLMC and | | | | | | | | | | |
| LOC; FHLMC) | | 2.04 | | 11/7/08 | | 5,000,000 | | a,b | | 5,000,000 |
| North Texas Tollway Authority, | | | | | | | | | | |
| BAN | | 4.13 | | 11/19/08 | | 905,000 | | | | 905,128 |
| Texas Transportation Commission, | | | | | | | | | | |
| GO Mobility Fund Bonds | | | | | | | | | | |
| (Liquidity Facility; JPMorgan | | | | | | | | | | |
| Chase Bank) | | 1.83 | | 11/7/08 | | 1,500,000 | | a,b | | 1,500,000 |
| Travis County Health Facilities | | | | | | | | | | |
| Development Corporation, | | | | | | | | | | |
| Revenue (Ascension Health | | | | | | | | | | |
| Credit Group) (Insured; MBIA, Inc.) | | 5.75 | | 11/15/08 | | 500,000 | | | | 500,454 |
| Virginia—1.7% | | | | | | | | | | |
| Spotsylvania County Economic | | | | | | | | | | |
| Development Authority, Revenue | | | | | | | | | | |
| (Civil War Preservation Trust | | | | | | | | | | |
| Project) (LOC; SunTrust Bank) | | 1.85 | | 11/7/08 | | 4,300,000 | | a | | 4,300,000 |
| Washington—1.6% | | | | | | | | | | |
| Washington, | | | | | | | | | | |
| GO Notes (Various Purpose) | | 5.00 | | 1/1/09 | | 200,000 | | | | 200,983 |
The Fund 13
| STATEMENT OF INVESTMENTS (continued) |
| Short-Term | | Coupon | | Maturity | | Principal | | | | |
| Investments (continued) | | Rate (%) | | Date | | Amount ($) | | | | Value ($) |
| |
| |
| |
| |
| |
|
| Washington (continued) | | | | | | | | | | |
| Washington, | | | | | | | | | | |
| GO Notes (Various Purpose) | | 6.00 | | 1/1/09 | | 130,000 | | | | 130,766 |
| Washington Housing Finance | | | | | | | | | | |
| Commission, Nonprofit Housing | | | | | | | | | | |
| Revenue (Mirabella Project) | | | | | | | | | | |
| (LOC; HSH Nordbank) | | 2.50 | | 11/1/08 | | 3,800,000 | | a | | 3,800,000 |
| Wisconsin—3.5% | | | | | | | | | | |
| Green Bay/Brown County Professional | | | | | | | | | | |
| Football Stadium District, Sales | | | | | | | | | | |
| Tax Revenue (Lambeau | | | | | | | | | | |
| Field Renovation Project) | | 4.25 | | 2/1/09 | | 200,000 | | | | 200,960 |
| Wisconsin Health and Educational | | | | | | | | | | |
| Facilities Authority, | | | | | | | | | | |
| Revenue (Amery Regional | | | | | | | | | | |
| Medical Center, Inc.) | | | | | | | | | | |
| (LOC; Fifth Third Bank) | | 2.15 | | 11/7/08 | | 8,630,000 | | a | | 8,630,000 |
| Wyoming—3.1% | | | | | | | | | | |
| Sweetwater County, | | | | | | | | | | |
| HR (Memorial Hospital Project) | | | | | | | | | | |
| (LOC; Key Bank) | | 2.35 | | 11/7/08 | | 7,750,000 | | a | | 7,750,000 |
| |
| |
| |
| |
| |
|
| |
| Total Investments (cost $249,150,809) | | | | | | 98.7% | | | | 249,150,809 |
| Cash and Receivables (Net) | | | | | | 1.3% | | | | 3,303,145 |
| Net Assets | | | | | | 100.0% | | | | 252,453,954 |
| a | Variable rate demand note—rate shown is the interest rate in effect at October 31, 2008. Maturity date represents the next demand date, or the ultimate maturity date if earlier. |
| |
| b | Securities exempt from registration under Rule 144A of the Securities Act of 1933.These securities may be resold in transactions exempt from registration, normally to qualified institutional buyers. At October 31, 2008, these securities amounted to $33,415,000 or 13.2% of net assets. |
| |
14
| Summary of Abbreviations | | | | |
| |
| ABAG | | Association of Bay Area Governments | | ACA | | American Capital Access |
| AGC | | ACE Guaranty Corporation | | AGIC | | Asset Guaranty Insurance Company |
| AMBAC | | American Municipal Bond | | | | |
| | | Assurance Corporation | | ARRN | | Adjustable Rate Receipt Notes |
| BAN | | Bond Anticipation Notes | | BIGI | | Bond Investors Guaranty Insurance |
| BPA | | Bond Purchase Agreement | | CGIC | | Capital Guaranty Insurance Company |
| CIC | | Continental Insurance Company | | CIFG | | CDC Ixis Financial Guaranty |
| CMAC | | Capital Market Assurance Corporation | | COP | | Certificate of Participation |
| CP | | Commercial Paper | | EDR | | Economic Development Revenue |
| EIR | | Environmental Improvement Revenue | | FGIC | | Financial Guaranty Insurance |
| | | | | | | Company |
| FHA | | Federal Housing Administration | | FHLB | | Federal Home Loan Bank |
| FHLMC | | Federal Home Loan Mortgage | | FNMA | | Federal National |
| | | Corporation | | | | Mortgage Association |
| FSA | | Financial Security Assurance | | GAN | | Grant Anticipation Notes |
| GIC | | Guaranteed Investment Contract | | GNMA | | Government National |
| | | | | | | Mortgage Association |
| GO | | General Obligation | | HR | | Hospital Revenue |
| IDB | | Industrial Development Board | | IDC | | Industrial Development Corporation |
| IDR | | Industrial Development Revenue | | LOC | | Letter of Credit |
| LOR | | Limited Obligation Revenue | | LR | | Lease Revenue |
| MFHR | | Multi-Family Housing Revenue | | MFMR | | Multi-Family Mortgage Revenue |
| PCR | | Pollution Control Revenue | | PILOT | | Payment in Lieu of Taxes |
| RAC | | Revenue Anticipation Certificates | | RAN | | Revenue Anticipation Notes |
| RAW | | Revenue Anticipation Warrants | | RRR | | Resources Recovery Revenue |
| SAAN | | State Aid Anticipation Notes | | SBPA | | Standby Bond Purchase Agreement |
| SFHR | | Single Family Housing Revenue | | SFMR | | Single Family Mortgage Revenue |
| SONYMA | | State of New York Mortgage Agency | | SWDR | | Solid Waste Disposal Revenue |
| TAN | | Tax Anticipation Notes | | TAW | | Tax Anticipation Warrants |
| TRAN | | Tax and Revenue Anticipation Notes | | XLCA | | XL Capital Assurance |
The Fund 15
| | STATEMENT OF INVESTMENTS (continued) |
| Summary of Combined Ratings (Unaudited) | | |
| |
| Fitch | | or | | Moody’s | | or | | Standard & Poor’s | | Value (%)† |
| |
| |
| |
| |
| |
|
| F1+,F1 | | | | VMIG1,MIG1,P1 | | | | SP1+,SP1,A1+,A1 | | 85.3 |
| AAA,AA,Ac | | | | Aaa,Aa,Ac | | | | AAA,AA,Ac | | 4.3 |
| Not Ratedd | | | | Not Ratedd | | | | Not Ratedd | | 10.4 |
| | | | | | | | | | | 100.0 |
| † | | Based on total investments. |
| c | | Notes which are not F, MIG and SP rated are represented by bond ratings of the issuers. |
| d | | Securities which, while not rated by Fitch, Moody’s and Standard & Poor’s, have been determined by the Manager to |
| | | be of comparable quality to those rated securities in which the fund may invest. |
| See notes to financial statements. |
16
STATEMENT OF ASSETS AND LIABILITIES
October 31, 2008
| | | | | | | Cost | | Value |
| |
| |
| |
| |
|
| Assets ($): | | | | | | | | |
| Investments in securities—See Statement of Investments | | 249,150,809 | | 249,150,809 |
| Cash | | | | | | | | 2,503,636 |
| Interest receivable | | | | | | | | 1,605,891 |
| Prepaid expenses | | | | | | | | 16,169 |
| | | | | | | | | 253,276,505 |
| |
| |
| |
| |
|
| Liabilities ($): | | | | | | | | |
| Due to The Dreyfus Corporation and affiliates—Note 3(c) | | | | 162,675 |
| Dividend payable | | | | | | | | 645,427 |
| Payable for shares of Capital Stock redeemed | | | | | | 14,449 |
| | | | | | | | | 822,551 |
| |
| |
| |
| |
|
| Net Assets ($) | | | | | | | | 252,453,954 |
| |
| |
| |
| |
|
| Composition of Net Assets ($): | | | | | | | | |
| Paid-in capital | | | | | | | | 252,457,840 |
| Accumulated net realized gain (loss) on investments | | | | | | (3,886) |
| |
| |
| |
|
| Net Assets ($) | | | | | | | | 252,453,954 |
| |
| |
| |
| |
|
| |
| |
| Net Asset Value Per Share | | | | | | | | |
| | | Investor | | Class R | | BASIC | | Class B |
| | | Shares | | Shares | | Shares | | Shares |
| |
| |
| |
| |
|
| Net Assets ($) | | 54,469,250 | | 56,858,758 | | 29,900,132 | | 111,225,814 |
| Shares Outstanding | | 54,470,479 | | 56,860,158 | | 29,900,783 | | 111,228,133 |
| |
| |
| |
| |
|
| Net Asset Value | | | | | | | | |
| Per Share ($) | | 1.00 | | 1.00 | | 1.00 | | 1.00 |
| |
| See notes to financial statements. | | | | | | | | |
The Fund 17
STATEMENT OF OPERATIONS
Year Ended October 31, 2008 |
| Investment Income ($): | | |
| Interest Income | | 5,253,945 |
| Expenses: | | |
| Management fee—Note 3(a) | | 902,146 |
| Distribution fees (Investor Shares and Class B Shares)—Note 3(b) | | 183,507 |
| Shareholder servicing costs (Class B Shares)—Note 3(c) | | 103,510 |
| Directors’ fees—Note 3(a) | | 21,561 |
| Treasury insurance expense—Note 1(e) | | 4,172 |
| Total Expenses | | 1,214,896 |
| Less—Directors’ fees reimbursed by the Manager—Note 3(a) | | (21,561) |
| Net Expenses | | 1,193,335 |
| Investment Income—Net | | 4,060,610 |
| |
|
| Net Realized Gain (Loss) on Investments—Note 1(b) ($) | | (666) |
| Net Increase in Net Assets Resulting from Operations | | 4,059,944 |
| |
| See notes to financial statements. | | |
18
STATEMENT OF CHANGES IN NET ASSETS
| | | Year Ended October 31, |
| | |
|
| | | 2008 | | 2007a |
| |
| |
|
| Operations ($): | | | | |
| Investment income—net | | 4,060,610 | | 3,219,159 |
| Net realized gain (loss) on investments | | (666) | | (2,343) |
| Net Increase (Decrease) in Net Assets | | | | |
| Resulting from Operations | | 4,059,944 | | 3,216,816 |
| |
| |
|
| Dividends to Shareholders from ($): | | | | |
| Investment income—net: | | | | |
| Investors Shares | | (872,372) | | (707,448) |
| Class R Shares | | (1,973,796) | | (2,423,865) |
| BASIC Shares | | (466,585) | | (87,837) |
| Class B Shares | | (747,857) | | (9) |
| Total Dividends | | (4,060,610) | | (3,219,159) |
| |
| |
|
| Capital Stock Transactions ($1.00 per share): | | | | |
| Net proceeds from shares sold: | | | | |
| Investors Shares | | 132,309,154 | | 49,122,142 |
| Class R Shares | | 252,137,767 | | 249,806,941 |
| BASIC Shares | | 38,714,314 | | 10,947,389 |
| Class B Shares | | 289,043,000 | | 1,001 |
| Dividends reinvested: | | | | |
| Investors Shares | | 834,240 | | 704,513 |
| Class R Shares | | 439,833 | | 588,037 |
| BASIC Shares | | 441,192 | | 87,668 |
| Class B Shares | | 725,087 | | 9 |
| Cost of shares redeemed: | | | | |
| Investors Shares | | (98,560,412) | | (55,836,828) |
| Class R Shares | | (271,775,888) | | (257,750,884) |
| BASIC Shares | | (18,106,554) | | (2,183,226) |
| Class B Shares | | (178,540,963) | | (1) |
| Increase (Decrease) in Net Assets | | | | |
| from Capital Stock Transactions | | 147,660,770 | | (4,513,239) |
| Total Increase (Decrease) in Net Assets | | 147,660,104 | | (4,515,582) |
| |
| |
|
| Net Assets ($): | | | | |
| Beginning of Period | | 104,793,850 | | 109,309,432 |
| End of Period | | 252,453,954 | | 104,793,850 |
| a From July 2, 2007 (commencement of operations) to October 31, 2007 for BASIC Shares and Class B Shares. |
| See notes to financial statements. |
The Fund 19
FINANCIAL HIGHLIGHTS
The following tables describe the performance for each share class for the fiscal periods indicated. All information reflects financial results for a single fund share. Total return shows how much your investment in the fund would have increased (or decreased) during each period, assuming you had reinvested all dividends and distributions.These figures have been derived from the fund’s financial statements.
| | | | | Year Ended October 31, | | |
| | |
| |
| |
|
| Investor Shares | | 2008 | | 2007 | | 2006 | | 2005 | | 2004 |
| |
| |
| |
| |
| |
|
| Per Share Data ($): | | | | | | | | | | |
| Net asset value, beginning of period | | 1.00 | | 1.00 | | 1.00 | | 1.00 | | 1.00 |
| Investment Operations: | | | | | | | | | | |
| Investment income—net | | .023 | | .030 | | .026 | | .015 | | .004 |
| Distributions: | | | | | | | | | | |
| Dividends from investment income—net | | (.023) | | (.030) | | (.026) | | (.015) | | (.004) |
| Net asset value, end of period | | 1.00 | | 1.00 | | 1.00 | | 1.00 | | 1.00 |
| |
| |
| |
| |
| |
|
| Total Return (%) | | 2.35 | | 3.05 | | 2.65 | | 1.48 | | .44 |
| |
| |
| |
| |
| |
|
| Ratios/Supplemental Data (%): | | | | | | | | | | |
| Ratio of total expenses | | | | | | | | | | |
| to average net assets | | .71 | | .71 | | .71 | | .71 | | .71 |
| Ratio of net expenses | | | | | | | | | | |
| to average net assets | | .70 | | .70 | | .71 | | .71 | | .71 |
| Ratio of net investment income | | | | | | | | | | |
| to average net assets | | 2.18 | | 3.01 | | 2.65 | | 1.44 | | .43 |
| |
| |
| |
| |
| |
|
| Net Assets, end of period ($ x 1,000) | | 54,469 | | 19,885 | | 25,896 | | 22,170 | | 26,380 |
| |
| See notes to financial statements. | | | | | | | | | | |
20
| | | | | Year Ended October 31, | | |
| | |
| |
| |
|
| Class R Shares | | 2008 | | 2007 | | 2006 | | 2005 | | 2004 |
| |
| |
| |
| |
| |
|
| Per Share Data ($): | | | | | | | | | | |
| Net asset value, beginning of period | | 1.00 | | 1.00 | | 1.00 | | 1.00 | | 1.00 |
| Investment Operations: | | | | | | | | | | |
| Investment income—net | | .025 | | .032 | | .028 | | .017 | | .006 |
| Distributions: | | | | | | | | | | |
| Dividends from investment income—net | | (.025) | | (.032) | | (.028) | | (.017) | | (.006) |
| Net asset value, end of period | | 1.00 | | 1.00 | | 1.00 | | 1.00 | | 1.00 |
| |
| |
| |
| |
| |
|
| Total Return (%) | | 2.56 | | 3.26 | | 2.86 | | 1.69 | | .64 |
| |
| |
| |
| |
| |
|
| Ratios/Supplemental Data (%): | | | | | | | | | | |
| Ratio of total expenses | | | | | | | | | | |
| to average net assets | | .51 | | .51 | | .51 | | .51 | | .51 |
| Ratio of net expenses | | | | | | | | | | |
| to average net assets | | .50 | | .50 | | .51 | | .51 | | .51 |
| Ratio of net investment income | | | | | | | | | | |
| to average net assets | | 2.48 | | 3.20 | | 2.84 | | 1.60 | | .60 |
| |
| |
| |
| |
| |
|
| Net Assets, end of period ($ x 1,000) | | 56,859 | | 76,056 | | 83,413 | | 65,188 | | 124,838 |
| |
| See notes to financial statements. | | | | | | | | | | |
The Fund 21
| FINANCIAL HIGHLIGHTS (continued) |
| | | BASIC Shares | | BASIC Shares | | Class B Shares | | Class B Shares |
| | | Year Ended | | Period Ended | | Year Ended | | Period Ended |
| October 31, 2008 | | October 31, 2007a | | October 31, 2008 | | October 31, 2007a |
| |
| |
| |
|
| Per Share Data ($): | | | | | | | | |
| Net asset value, | | | | | | | | |
| beginning of period | | 1.00 | | 1.00 | | 1.00 | | 1.00 |
| Investment Operations: | | | | | | | | |
| Investment income—net | | .025 | | .011 | | .020 | | .009 |
| Distributions: | | | | | | | | |
| Dividends from | | | | | | | | |
| investment income—net | | (.025) | | (.011) | | (.020) | | (.009) |
| Net asset value, end of period | | 1.00 | | 1.00 | | 1.00 | | 1.00 |
| |
| |
| |
| |
|
| Total Return (%) | | 2.56 | | 3.26b | | 2.05 | | 2.75b |
| |
| |
| |
| |
|
| Ratios/Supplemental | | | | | | | | |
| Data (%): | | | | | | | | |
| Ratio of total expenses | | | | | | | | |
| to average net assets | | .51 | | .52b | | 1.02 | | 1.03b |
| Ratio of net expenses | | | | | | | | |
| to average net assets | | .50 | | .50b | | 1.00 | | 1.00b |
| Ratio of net investment income | | | | | | | | |
| to average net assets | | 2.40 | | 3.26b | | 1.81 | | 2.69b |
| |
| |
| |
| |
|
| Net Assets, end of period | | | | | | | | |
| ($ x 1,000) | | 29,900 | | 8,852 | | 111,226 | | 1 |
| a | From July 2, 2007 (commencement of operations) to October 31, 2007. |
| |
| b | Annualized. |
| |
| See notes to financial statements. |
22
NOTES TO FINANCIAL STATEMENTS
NOTE 1—Significant Accounting Policies:
Dreyfus AMT-Free Municipal Reserves (the “fund”) is a separate diversified series of The Dreyfus/Laurel Funds, Inc. (the “Company”) which is registered under the Investment Company Act of 1940, as amended (the “Act”), as an open-end management investment company and operates as a series company currently offering fourteen series including the fund.The fund’s investment objective is to seek income, consistent with stability of principal, that is exempt from federal income tax.The fund also seeks to provide income exempt from the federal alternative minimum tax. Effective January 1, 2008, the fund changed its name from “Dreyfus Municipal Reserves” to “Dreyfus AMT-Free Municipal Reserves.” The Dreyfus Corporation (the “Manager” or “Dreyfus”), a wholly-owned subsidiary of The Bank of New York Mellon Corporation (“BNY Mellon”), serves as the fund’s investment adviser.
Effective July 1, 2008, BNY Mellon has reorganized and consolidated a number of its banking and trust company subsidiaries. As a result of the reorganization, any services previously provided to the fund by Mellon Bank, N.A. or Mellon Trust of New England, N.A. are now provided by The Bank of New York, which has changed its name to The Bank of New York Mellon.
MBSC Securities Corporation (the “Distributor”), a wholly-owned subsidiary of the Manager, is the distributor of the fund’s shares, which are sold without a sales charge.The fund is authorized to issue 1 billion shares of $.001 par value Capital Stock in each of the following classes of shares: Investor, Class R, Class B and BASIC. Investor shares and Class B shares are offered primarily to clients of financial institutions that have entered into selling agreements with the Distributor, and bear a distribution fee. Class B shares also bear a shareholder services fee. BASIC shares are offered to any investor and bear no distribution or shareholder services fee. Class R shares are sold primarily to bank trust departments and other financial service providers (including The Bank of New York Mellon, a subsidiary of BNY Mellon and an affiliate of Dreyfus) acting on behalf of customers having a qualified trust or
The Fund 23
| NOTES TO FINANCIAL STATEMENTS (continued) |
investment account or relationship at such institution, and bear no distribution or shareholder services fee. Each class of shares has identical rights and privileges, except with respect to the distribution fee, shareholder services fee and voting rights on matters affecting a single class. Income, expenses (other than expense attributable to a specific class), and realized and unrealized gains or losses on investments are allocated to each class of shares based on its relative net assets.
It is the fund’s policy to maintain a continuous net asset value per share of $1.00 for the fund; the fund has adopted certain investment, portfolio valuation and dividend and distribution policies to enable it to do so. There is no assurance, however, that the fund will be able to maintain a stable net asset value per share of $1.00.
The fund’s financial statements are prepared in accordance with U.S. generally accepted accounting principles, which may require the use of management estimates and assumptions. Actual results could differ from those estimates.
(a) Portfolio valuation: Investments in securities are valued at amortized cost in accordance with Rule 2a-7 of the Act, which has been determined by the Board of Directors to represent the fair value of the fund’s investments.
The Financial Accounting Standards Board (“FASB”) released Statement of Financial Accounting Standards No. 157 “Fair Value Measurements” (“FAS 157”). FAS 157 establishes an authoritative definition of fair value, sets out a framework for measuring fair value, and requires additional disclosures about fair-value measurements.The application of FAS 157 is required for fiscal years beginning after November 15, 2007 and interim periods within those fiscal years. Management does not believe that the application of this standard will have a material impact on the financial statements of the fund.
(b) Securities transactions and investment income: Securities transactions are recorded on a trade date basis. Realized gains and losses from securities transactions are recorded on the identified cost basis. Interest
24
income, adjusted for accretion of discount and amortization of premium on investments, is earned from settlement date and is recognized on the accrual basis. Cost of investments represents amortized cost.
In March 2008, the FASB released Statement of Financial Accounting Standards No. 161 “Disclosures about Derivative Instruments and Hedging Activities” (“FAS 161”). FAS 161 requires qualitative disclosures about objectives and strategies for using derivatives, quantitative disclosures about fair value amounts of gains and losses on derivative instruments and disclosures about credit-risk-related contingent features in derivative agreements.The application of FAS 161 is required for fiscal years and interim periods beginning after November 15, 2008. At this time, management is evaluating the implications of FAS 161 and its impact on the financial statements and the accompanying notes has not yet been determined.
(c) Dividends to shareholders: It is the policy of the fund to declare dividends daily from investment income-net; such dividends are paid monthly. Dividends from net realized capital gains, if any, are normally declared and paid annually, but the fund may make distributions on a more frequent basis to comply with the distribution requirements of the Internal Revenue Code of 1986, as amended (the “Code”).To the extent that net realized capital gains can be offset by capital loss carryovers, it is the policy of the fund not to distribute such gains.
(d) Federal income taxes: It is the policy of the fund to continue to qualify as a regulated investment company, which can distribute tax exempt dividends, by complying with the applicable provisions of the Code, and to make distributions of income and net realized capital gain sufficient to relieve it from substantially all federal income and excise taxes.
The fund adopted FASB Interpretation No. 48 “Accounting for Uncertainty in Income Taxes” (“FIN 48”). FIN 48 provides guidance for how uncertain tax positions should be recognized, measured, presented and disclosed in the financial statements. FIN 48 requires the
The Fund 25
| NOTES TO FINANCIAL STATEMENTS (continued) |
evaluation of tax positions taken or expected to be taken in the course of preparing the fund’s tax returns to determine whether the tax positions are “more-likely-than-not” of being sustained by the applicable tax authority. Liability for tax positions not deemed to meet the more-likely-than-not threshold would be recorded as a tax expense in the current year.The adoption of FIN 48 had no impact on the operations of the fund for the period ended October 31, 2008.
As of and during the period ended October 31, 2008, the fund did not have any liabilities for any unrecognized tax positions. The fund recognizes interest and penalties, if any, related to unrecognized tax positions as income tax expense in the Statement of Operations. During the period, the fund did not incur any interest or penalties.
Each of the tax years in the four-year period ended October 31, 2008 remains subject to examination by the Internal Revenue Service and state taxing authorities.
At October 31, 2008, the components of accumulated earnings on a tax basis were substantially the same as for financial reporting purposes.
The accumulated capital loss carryover of $3,886 is available to be applied against future net securities profit, if any, realized subsequent to October 31, 2008. If not applied, $877 of the carryover expires in fiscal 2011, $2,343 expires in fiscal 2015 and $666 expires in fiscal 2016.
The tax character of distributions paid to shareholders during the fiscal periods ended October 31, 2008 and October 31, 2007 were all tax-exempt income.
At October 31, 2008, the cost of investments for federal income tax purposes was substantially the same as the cost for financial reporting purposes (see the Statement of Investments).
(e) Treasury’s Temporary Guarantee Program: The fund has entered into a Guarantee Agreement with the United States Department of the Treasury (the “Treasury”) to participate in the Treasury’s Temporary Guarantee Program for Money Market Funds (the “Program”).
26
Under the Program, the Treasury guarantees the share price of shares of the fund held by shareholders as of September 19, 2008 at $1.00 per share if the fund’s net asset value per share falls below $0.995 (a “Guarantee Event”) and the fund liquidates. Recovery under the Program is subject to certain conditions and limitations.
Fund shares acquired by investors after September 19, 2008 that increase the number of fund shares the investor held at the close of business on September 19, 2008 are not eligible for protection under the Program. In addition, fund shares acquired by investors who did not hold fund shares at the close of business on September 19, 2008 are not eligible for protection under the Program.
The Program, which was originally set to expire on December 18, 2008, has been extended by the Treasury until April 30, 2009, after which the Secretary of theTreasury will review the need for, and terms of, the Program. Participation in the initial term and the extended period of the Program required a payment to the Treasury in the amount of .01% and .015%, respectively, of the fund’s shares outstanding as of September 19, 2008.This expense is being borne by the fund without regard to any expense limitation currently in effect.
NOTE 2—Bank Line of Credit:
Prior to May 1, 2008, the fund participated with other Dreyfus managed funds in a $100 million unsecured line of credit. Effective May 1, 2008, the fund participates with other Dreyfus-managed funds in a $300 million unsecured line of credit primarily to be utilized for temporary or emergency purposes, including the financing of redemp-tions.The terms of the line of credit agreement limit the amount of individual fund borrowings. Interest is charged to the fund based on prevailing market rates in effect at the time of borrowing. Effective October 15, 2008, the $300 million unsecured line of credit was terminated. During the period ended October 31, 2008, the fund did not borrow under the lines of credit.
The Fund 27
| NOTES TO FINANCIAL STATEMENTS (continued) |
NOTE 3—Investment Management Fee and Other Transactions With Affiliates:
(a) Pursuant to an Investment Management Agreement with the Manager, the Manager provides or arranges for one or more third parties and/or affiliates to provide investment advisory, administrative, custody, fund accounting and transfer agency services to the fund.The Manager also directs the investments of the fund in accordance with its investment objective, policies and limitations. For these services, the fund is contractually obligated to pay the Manager a fee, calculated daily and paid monthly, at the annual rate of .50% of the value of the fund’s average daily net assets. Out of its fee, the Manager pays all of the expenses of the fund except brokerage fees, taxes, interest, Rule 12b-1 distribution fees, service fees and expenses, fees and expenses of non-interested Directors (including counsel fees) and extraordinary expenses. In addition, the Manager is required to reduce its fee in an amount equal to the fund’s allocable portion of fees and expenses of the non-interested Directors (including counsel fees). Each Director receives $45,000 per year, plus $6,000 for each joint Board meeting of the Company,The Dreyfus/Laurel Tax-Free Municipal Funds and The Dreyfus/Laurel Funds Trust (collectively, the “Dreyfus/Laurel Funds”) attended, $2,000 for separate in-person committee meetings attended which are not held in conjunction with a regularly scheduled Board meeting and $1,500 for Board meetings and separate committee meetings attended that are conducted by telephone and is reimbursed for travel and out-of-pocket expenses.With respect to Board meetings, the Chairman of the Board receives an additional 25% of such compensation (with the exception of reimbursable amounts). With respect to compensation committee meetings, the Chair of the compensation committee receives $900 per meeting and, prior to April 12, 2008 with respect to audit committee meetings, the Chair of the audit committee received $1,350 per meeting. In the event that there is an in-person joint committee meeting or a joint telephone meeting of the
28
Dreyfus/Laurel Funds and Dreyfus High Yield Strategies Fund, the $2,000 or $1,500 fee, as applicable, will be allocated between the Dreyfus/Laurel Funds and Dreyfus High Yield Strategies Fund.These fees and expenses are charged and allocated to each series based on net assets. Amounts required to be paid by the Company directly to the non-interested Directors, that would be applied to offset a portion of the management fee payable to the Manager, are in fact paid directly by the Manager to the non-interested Directors.
(b) Under the Distribution Plan (the “Plan”) adopted pursuant to Rule 12b-1 under the Act, Investor shares and Class B shares may pay annually up to .25% of the value of the average daily net assets (Investor shares are currently limited by the Company’s Board of Directors to .20%) attributable to its Investor shares and Class B shares to compensate the Distributor for shareholder servicing activities and activities primarily intended to result in the sale of Investor shares and Class B shares. During the period ended October 31, 2008, Investor shares and Class B shares were charged $79,997 and $103,510, respectively, pursuant to the Plan.
(c) Under the Shareholder Services Plan (the “Service Plan”) subject to the Rule, pursuant to which the Fund pays the Distributor for the provision of certain services to the holders of its Class B shares a fee at an annual rate of .25% of the value of the fund’s average daily net assets attributable to Class B shares.The services provided may include personal services relating to shareholder accounts, such as answering shareholder inquiries regarding the fund and providing reports and other information, and services related to the maintenance of such shareholder accounts. Under the Service Plan, the Distributor may enter into Shareholder Services Agreements with Service Agents and make payments to Service Agents in respect of these services. During the period ended October 31, 2008, Class B shares were charged $103,510, pursuant to the Service Plan.
The Fund 29
| NOTES TO FINANCIAL STATEMENTS (continued) |
The Company and the Distributor may suspend or reduce payments under the Service Plan at any time, and payments are subject to the continuation of the Service Plan and the Agreements described above. From time to time, the Service Agents, the Distributor and the Company may agree to voluntarily reduce the maximum fees payable under the Service Plan.
Under its terms, the Service Plan shall remain in effect from year to year, provided such continuance is approved annually by a vote of a majority of those Directors who are not interested persons of the Company and who have no direct or indirect financial interest in the operation of or in any agreement related to the Service Plan.
The components of “Due to The Dreyfus Corporation and affiliates” in the Statement of Assets and Liabilities consist of: management fees $110,309, Rule 12b-1 distribution plan fees $30,333 and shareholder services plan fees $22,033.
30
REPORT OF INDEPENDENT REGISTERED
PUBLIC ACCOUNTING FIRM |
The Board of Directors and Shareholders The Dreyfus/Laurel Funds, Inc.:
We have audited the accompanying statement of assets and liabilities of Dreyfus AMT-Free Municipal Reserves (formerly Dreyfus Municipal Reserves), a series of The Dreyfus/Laurel Funds, Inc. (the “Fund”), including the statement of investments, as of October 31, 2008, and the related statement of operations for the year then ended, the statement of changes in net assets for each of the years in the two-year period then ended, and the financial highlights for each of the years or periods indicated therein. These financial statements and financial highlights are the responsibility of the Fund’s management. Our responsibility is to express an opinion on these financial statements and financial highlights based on our audits.
We conducted our audits in accordance with the standards of the Public Company Accounting Oversight Board (United States).Those standards require that we plan and perform the audit to obtain reasonable assurance about whether the financial statements and financial highlights are free of material misstatement. An audit includes examining, on a test basis, evidence supporting the amounts and disclosures in the financial statements. Our procedures included confirmation of securities owned as of October 31, 2008, by correspondence with the custodian. An audit also includes assessing the accounting principles used and significant estimates made by management, as well as evaluating the overall financial statement presentation.We believe that our audits provide a reasonable basis for our opinion.
In our opinion, the financial statements and financial highlights referred to above present fairly, in all material respects, the financial position of Dreyfus AMT-Free Municipal Reserves as of October 31, 2008, the results of its operations for the year then ended, the changes in its net assets for each of the years in the two-year period then ended, and the financial highlights for each of the years or periods indicated therein, in conformity with U.S. generally accepted accounting principles.

New York, New York
December 19, 2008 |
The Fund 31
IMPORTANT TAX INFORMATION (Unaudited)
In accordance with federal tax law, the fund hereby designates all the dividends paid from investment income-net during its fiscal year ended October 31, 2008 as “exempt-interest dividends” (not generally subject to regular federal income tax). As required by federal tax law rules, shareholders will receive notification of their portion of the fund’s tax-exempt dividends paid for the 2008 calendar year on Form 1099-INT, which will be mailed by January 31, 2009.
32
BOARD MEMBERS INFORMATION (Unaudited)

The Fund 33
BOARD MEMBERS INFORMATION (Unaudited) (continued)
34
OFFICERS OF THE FUND (Unaudited)
The Fund 35
OFFICERS OF THE FUND (Unaudited)

36
For More Information
| Dreyfus | | | | Transfer Agent & |
| AMT-Free | | | | Dividend Disbursing Agent |
| Municipal Reserves | | Dreyfus Transfer, Inc. |
| 200 Park Avenue | | 200 Park Avenue |
| New York, NY 10166 | | New York, NY 10166 |
| |
| Investment Adviser | | Distributor |
| The Dreyfus Corporation | | MBSC Securities Corporation |
| 200 Park Avenue | | 200 Park Avenue |
| New York, NY 10166 | | New York, NY 10166 |
| Custodian | | | | |
| The Bank of New York Mellon | | |
| One Wall Street | | |
| New York, NY 10286 | | |
| |
|
| |
| Ticker Symbols: | | BASIC: DLRXX | | Class B: DMBXX Class R: DTMXX Investor: DLTXX |
Telephone 1-800-645-6561
Mail The Dreyfus Family of Funds, 144 Glenn Curtiss Boulevard, Uniondale, NY 11556-0144 E-mail Send your request to info@dreyfus.com Internet Information can be viewed online or downloaded at: http://www.dreyfus.com
The fund will disclose daily, on www.dreyfus.com, the fund’s complete schedule of holdings as of the end of the previous business day. The schedule of holdings will remain on the website until the fund files its Form N-Q or Form N-CSR for the period that includes the date of the posted holdings.
The fund files its complete schedule of portfolio holdings with the Securities and Exchange Commission (“SEC”) for the first and third quarters of each fiscal year on Form N-Q. The fund's Forms N-Q are available on the SEC’s website at http://www.sec.gov and may be reviewed and copied at the SEC’s Public Reference Room in Washington, DC. Information on the operation of the Public Reference Room may be obtained by calling 1-800-SEC-0330.
Information regarding how the fund voted proxies relating to portfolio securities for the 12-month period ended June 30, 2008, is available on the SEC’s website at http://www.sec.gov and without charge, upon request, by calling 1-800-645-6561.
| © 2008 MBSC Securities Corporation |

Save time. Save paper. View your next shareholder report online as soon as it’s available. Log into www.dreyfus.com and sign up for Dreyfus eCommunications. It’s simple and only takes a few minutes.
The views expressed in this report reflect those of the portfolio manager only through the end of the period covered and do not necessarily represent the views of Dreyfus or any other person in the Dreyfus organization. Any such views are subject to change at any time based upon market or other conditions and Dreyfus disclaims any responsibility to update such views.These views may not be relied on as investment advice and, because investment decisions for a Dreyfus fund are based on numerous factors, may not be relied on as an indication of trading intent on behalf of any Dreyfus fund.
Not FDIC-Insured Not Bank-Guaranteed May Lose Value
| | Contents |
| |
| | THE FUND |
| |
| 2 | A Letter from the CEO |
| |
| 3 | Discussion of Fund Performance |
| |
| 6 | Fund Performance |
| |
| 8 | Understanding Your Fund’s Expenses |
| |
| 8 | Comparing Your Fund’s Expenses With Those of Other Funds |
| |
| 9 | Statement of Investments |
| |
| 12 | Statement of Assets and Liabilities |
| |
| 13 | Statement of Operations |
| |
| 14 | Statement of Changes in Net Assets |
| |
| 16 | Financial Highlights |
| |
| 21 | Notes to Financial Statements |
| |
| 30 | Report of Independent Registered Public Accounting Firm |
| |
| 31 | Important Tax Information |
| |
| 32 | Board Members Information |
| |
| 34 | Officers of the Fund |
| |
| | FOR MORE INFORMATION |
| |
| | Back Cover |
| |
| Dreyfus |
| Tax Managed |
| Growth Fund |

A LETTER FROM THE CEO
Dear Shareholder:
We present to you this annual report for Dreyfus Tax Managed Growth Fund, covering the 12-month period from November 1, 2007, through October 31, 2008.
These are difficult times for equity investors. A credit crunch that began in early 2007 has developed into a full-blown global financial crisis, recently resulting in the failure of several major financial institutions and prompting a massive government rescue effort. Meanwhile, the U.S. economic slowdown has gathered momentum, depressing investor sentiment, consumer confidence and business investment. These factors undermined returns in most stock market sectors, particularly financial companies and businesses that tend to be more sensitive to economic trends.
The depth and duration of the economic downturn will depend on how quickly the financial system can be stabilized.We believe that the Temporary Guarantee Program for Money Market Funds and the $700 billion rescue package intended to promote greater liquidity in the financial markets meet several critical requirements for addressing today’s financial stresses, and we expect these measures to contribute to a more orderly deleveraging process. However, recuperation from the financial crisis is likely to take time. In the meantime, we encourage you to keep in touch with your financial advisor and maintain a long-term and disciplined perspective to investing. Indeed, we already are seeing some positive signs, including a likely peak in global inflationary pressures, a bottoming of the U.S. dollar, attractive valuations among fundamentally sound companies and a large pool of worldwide financial liquidity that could be deployed gradually as the economic cycle turns.
For information about how the fund performed during the reporting period, as well as market perspectives, we have provided a Discussion of Fund Performance given by the fund’s Portfolio Manager.
Thank you for your continued confidence and support.

| | Jonathan R. Baum
Chief Executive Officer
The Dreyfus Corporation
November 17, 2008 |
2

DISCUSSION OF FUND PERFORMANCE
For the period of November 1, 2007, through October 31, 2008, as provided by Fayez Sarofim, Portfolio Manager of Fayez Sarofim & Co., Sub-Investment Adviser
Fund and Market Performance Overview
For the 12-month period ended October 31, 2008, Dreyfus Tax Managed Growth Fund’s Class A shares produced a total return of –29.22%, Class B shares returned –29.72%, Class C shares returned –29.71%, Class I shares returned –28.99% and Class T shares returned –29.39% .1 For the same period, the fund’s benchmark, the Standard & Poor’s 500 Composite Stock Price Index (“S&P 500 Index”), produced a –36.08% total return.2 U.S.stocks declined sharply during the reporting period as a global financial crisis and U.S. economic downturn intensified.The fund produced higher returns than its benchmark, due primarily to our emphasis on large, high-quality companies in recession-resistant industries.
The Fund’s Investment Approach
The fund invests primarily in well-established, multinational companies that we believe are well positioned to weather difficult economic climates and thrive during favorable times. We focus on purchasing large-cap,“blue-chip” stocks at a price we consider to be justified by a company’s fundamentals.The result is a portfolio of stocks selected for what we consider to be sustained patterns of profitability, strong balance sheets, expanding global presence and above-average earnings growth potential.At the same time, we manage the fund in a manner cognizant of the concerns of tax-conscious investors.We typically buy and sell relatively few stocks during the course of the year, which may help reduce investors’ tax liabilities.
Global Financial Crisis Sparked Broad Declines
Slumping housing markets, rising unemployment and sharply lower consumer confidence exacerbated a downturn in the U.S. economy, giving rise to fears regarding a potentially deep and prolonged recession. Many commodity prices that had soared over the reporting period’s first half plummeted over the second half when demand abated for energy and construction materials worldwide.
Meanwhile, a credit crunch that began in 2007 developed into a full-blown global financial crisis, and very difficult liquidity conditions
The Fund 3
| DISCUSSION OF FUND PERFORMANCE (continued) |
in some credit markets nearly led to the collapse of the global banking system in September 2008. Government authorities intervened, pumping billion of dollars of liquidity into the system to restore a degree of investor confidence.These efforts included the passage of the Troubled Asset Relief Program by the U.S. Congress and coordinated reductions of short-term interest rates by central banks, including the Federal Reserve Board.
As market conditions deteriorated, many highly leveraged institutional investors were forced to de-lever their portfolios, selling their more liquid investments to raise cash for margin calls and redemption requests, leading to broadly lower prices even among fundamentally sound stocks. The financials sector was particularly hard-hit, while the consumer staples and utilities sectors fared better as risk-averse investors flocked to companies selling products and services that typically remain in demand regardless of economic conditions.
Security Selection Strategy Bolstered Relative Performance
In this challenging environment, we remained focused on dividend-paying companies with healthy balance sheets and dominant industry positions. Companies with these characteristics held up better, on average, than their more speculative counterparts, helping to protect the fund somewhat from the full brunt of the market’s steep decline. An overweighted position in the consumer staples sector proved particularly advantageous, as this traditionally defensive area provided some insulation from recessionary concerns.These consumer staples companies generally produce large cash flows and require low levels of debt, which effectively reduced their dependence on troubled credit markets to fund their operations.Winners in the consumer staples sector included brewer Anheuser-Busch, which received an acquisition offer from In Bev; Wal-Mart Stores, which benefited from rising consumer demand for low-priced goods; and McDonald’s, which attracted customers with inexpensive menu items.
The fund also achieved relatively attractive results from the energy sector, as strong performance over the first nine months of the reporting period helped offset some of the sharp declines when commodity prices later plummeted.An underweighted allocation to the troubled financials sector also boosted relative returns, as we eliminated several stocks that later fell steeply. Finally, health care company Abbott Laboratories fared well as earnings were supported by successful new pharmaceutical products. Detractors from relative performance included the materials and industrials sectors, which suffered from commodity price pullbacks and
4
fears of waning demand in the economic downturn.Among individual stocks, General Electric ranked among the reporting period’s greater disappointments due to its exposure to the financial crisis and sluggish industrial demand. Energy giants ExxonMobil and ConocoPhillips declined along with oil prices,and financial conglomerate Citigroup was hurt by the financial crisis.
Finding Opportunities in Distressed Markets
Although the financial crisis and economic slowdown are expected to persist, we are encouraged by the government’s attempts to shore up troubled industries and restore liquidity to the credit markets. However, in an environment where credit is less available and more expensive and demand is stagnant or declining, even the healthiest companies will face challenges.Such an environment highlights the necessity of a longer term investment perspective and underscores the importance of a focus on the highest quality industry leaders. The multinationals in the portfolio are distinguished by strong balance sheets and sustainable operating cash flows. These well-capitalized companies have the financial flexibility to exploit the opportunities presented by this crisis to augment their existing strengths and gain share from weakened competitors both here and abroad. Furthermore, the above-market yield and faster dividend growth of portfolio issues are also expected to have added appeal for investors in this economic downturn. Despite their considerable fundamental strengths, certain companies in the portfolio have not traded at valuations this low since the early 1980s.As investors gain greater clarity about the impact of policy actions and the ramifications of the recent election, valuations of these high quality large caps are projected to expand against a backdrop of low interest rates and low inflation.
November 17, 2008
| 1 | | Total return includes reinvestment of dividends and any capital gains paid, and does not take into |
| | | consideration the maximum initial sales charges in the case of Class A and Class T shares, or the |
| | | applicable contingent deferred sales charges imposed on redemptions in the case of Class B and |
| | | Class C shares. Had these charges been reflected, returns would have been lower. Past performance |
| | | is no guarantee of future results. Share price and investment return fluctuate such that upon |
| | | redemption, fund shares may be worth more or less than their original cost. Return figures |
| | | provided reflect the absorption of certain fund expenses by Fayez Sarofim & Co. pursuant to an |
| | | agreement in effect until April 4, 2009. Had these expenses not been absorbed, the fund’s returns |
| | | would have been lower. |
| 2 | | SOURCE: LIPPER INC. — Reflects monthly reinvestment of dividends and, where |
| | | applicable, capital gain distributions.The Standard & Poor’s 500 Composite Stock Price Index is |
| | | a widely accepted, unmanaged index of U.S. stock market performance. |
The Fund 5
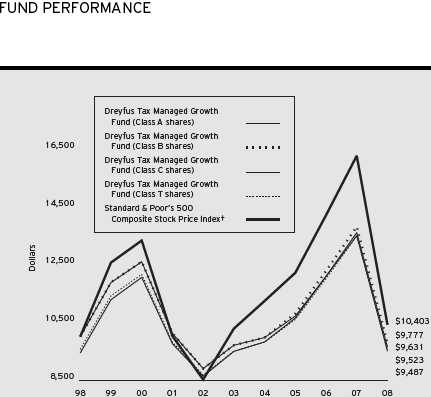
| Comparison of change in value of $10,000 investment in Dreyfus Tax Managed Growth Fund Class |
| A shares, Class B shares, Class C shares and Class T shares and the Standard & Poor’s 500 |
| Composite Stock Price Index |
| † Source: Lipper Inc. |
| Past performance is not predictive of future performance. |
| The above graph compares a $10,000 investment made in each of the Class A, Class B, Class C and Class T shares of |
| Dreyfus Tax Managed Growth Fund on 10/31/98 to a $10,000 investment made in the Standard & Poor’s 500 |
| Composite Stock Price Index (the “Index”) on that date. All dividends and capital gain distributions are reinvested. |
| Performance for Class I shares will vary from the performance of Class A, Class B, Class C and Class T shares shown |
| above due to differences in charges and expenses. |
| The fund’s performance shown in the line graph takes into account the maximum initial sales charges on Class A and |
| Class T shares and all other applicable fees and expenses on all classes.The Index is a widely accepted, unmanaged index |
| of U.S. stock market performance. Unlike a mutual fund, the Index is not subject to charges, fees and other expenses. |
| Investors cannot invest directly in any index. Further information relating to fund performance, including expense |
| reimbursements, if applicable, is contained in the Financial Highlights section of the prospectus and elsewhere in this report. |
6
| Average Annual Total Returns as of 10/31/08 | | | | | | |
| |
| | | Inception | | | | | | |
| | | Date | | 1 Year | | 5 Years | | 10 Years |
| |
| |
| |
| |
|
| Class A shares | | | | | | | | |
| with maximum sales charge (5.75%) | | | | (33.28)% | | (0.88)% | | (0.38)% |
| without sales charge | | | | (29.22)% | | 0.31% | | 0.22% |
| Class B shares | | | | | | | | |
| with applicable redemption charge † | | | | (32.52)% | | (0.81)% | | (0.23)% |
| without redemption | | | | (29.72)% | | (0.42)% | | (0.23)% |
| Class C shares | | | | | | | | |
| with applicable redemption charge †† | | | | (30.41)% | | (0.43)% | | (0.53)% |
| without redemption | | | | (29.71)% | | (0.43)% | | (0.53)% |
| Class T shares | | | | | | | | |
| with applicable sales charge (4.5%) | | | | (32.56)% | | (0.84)% | | (0.49)% |
| without sales charge | | | | (29.39)% | | 0.07% | | (0.03)% |
| Class I shares | | 5/14/04 | | (28.99)% | | 0.55%††† | | 0.34%††† |
| Past performance is not predictive of future performance.The fund’s performance shown in the graph and table does not |
| reflect the deduction of taxes that a shareholder would pay on fund distributions or the redemption of fund shares. |
| Performance for Class B shares assumes the conversion of Class B shares to Class A shares at the end of the sixth year |
| following the date of purchase. |
| † | | The maximum contingent deferred sales charge for Class B shares is 4%. After six years Class B shares convert to |
| | | Class A shares. |
| †† | | The maximum contingent deferred sales charge for Class C shares is 1% for shares redeemed within one year of the |
| | | date of purchase. |
| ††† | | The total return performance figures presented for Class I shares of the fund reflect the performance of the fund’s |
| | | Class A shares for periods prior to 5/14/04 (the inception date for Class I shares), adjusted to reflect the applicable |
| | | sales load for that class and the applicable distribution/servicing fees thereafter. |
The Fund 7
UNDERSTANDING YOUR FUND’S EXPENSES (Unaudited)
As a mutual fund investor, you pay ongoing expenses, such as management fees and other expenses. Using the information below, you can estimate how these expenses affect your investment and compare them with the expenses of other funds.You also may pay one-time transaction expenses, including sales charges (loads) and redemption fees, which are not shown in this section and would have resulted in higher total expenses. For more information, see your fund’s prospectus or talk to your financial adviser.
Review your fund’s expenses
The table below shows the expenses you would have paid on a $1,000 investment in Dreyfus Tax Managed Growth Fund from May 1, 2008 to October 31, 2008. It also shows how much a $1,000 investment would be worth at the close of the period, assuming actual returns and expenses.
Expenses and Value of a $1,000 Investment assuming actual returns for the six months ended October 31, 2008
| | | Class A | | Class B | | Class C | | Class I | | Class T |
| |
| |
| |
| |
| |
|
| Expenses paid per $1,000† | | $ 5.53 | | $ 8.83 | | $ 8.83 | | $ 4.43 | | $ 6.63 |
| Ending value (after expenses) | | $759.30 | | $756.70 | | $756.80 | | $760.80 | | $758.30 |
COMPARING YOUR FUND’S EXPENSES WITH THOSE OF OTHER FUNDS (Unaudited)
Using the SEC’s method to compare expenses
The Securities and Exchange Commission (SEC) has established guidelines to help investors assess fund expenses. Per these guidelines, the table below shows your fund’s expenses based on a $1,000 investment, assuming a hypothetical 5% annualized return. You can use this information to compare the ongoing expenses (but not transaction expenses or total cost) of investing in the fund with those of other funds.All mutual fund shareholder reports will provide this information to help you make this comparison. Please note that you cannot use this information to estimate your actual ending account balance and expenses paid during the period.
Expenses and Value of a $1,000 Investment assuming a hypothetical 5% annualized return for the six months ended October 31, 2008
| | | Class A | | Class B | | Class C | | Class I | | Class T |
| |
| |
| |
| |
| |
|
| Expenses paid per $1,000† | | $ 6.34 | | $ 10.13 | | $ 10.13 | | $ 5.08 | | $ 7.61 |
| Ending value (after expenses) | | $1,018.85 | | $1,015.08 | | $1,015.08 | | $1,020.11 | | $1,017.60 |
| † Expenses are equal to the fund’s annualized expense ratio of 1.25% for Class A, 2.00% for Class B, 2.00% for |
| Class C, 1.00% for Class I and 1.50% for ClassT, multiplied by the average account value over the period, multiplied |
| by 184/366 (to reflect the one-half year period). |
8
STATEMENT OF INVESTMENTS
October 31, 2008 |
| Common Stocks—98.7% | | Shares | | Value ($) |
| |
| |
|
| Consumer Discretionary—18.9% | | | | |
| McDonald’s | | 62,000 | | 3,591,660 |
| McGraw-Hill | | 57,000 | | 1,529,880 |
| News, Cl. A | | 138,000 | | 1,468,320 |
| Philip Morris International | | 129,000 | | 5,607,630 |
| Procter & Gamble | | 77,000 | | 4,969,580 |
| | | | | 17,167,070 |
| Consumer Staples—23.8% | | | | |
| Altria Group | | 129,000 | | 2,475,510 |
| Coca-Cola | | 114,000 | | 5,022,840 |
| Estee Lauder, Cl. A | | 20,500 | | 738,820 |
| Kraft Foods, Cl. A | | 15,271 | | 444,997 |
| Nestle, ADR | | 115,750 | | 4,450,588 |
| PepsiCo | | 61,400 | | 3,500,414 |
| Wal-Mart Stores | | 27,000 | | 1,506,870 |
| Walgreen | | 129,000 | | 3,284,340 |
| Whole Foods Market | | 19,000 a | | 203,680 |
| | | | | 21,628,059 |
| Energy—19.2% | | | | |
| Chevron | | 63,000 | | 4,699,800 |
| ConocoPhillips | | 67,000 | | 3,485,340 |
| Exxon Mobil | | 90,012 | | 6,671,689 |
| Patriot Coal | | 2,400 b | | 37,992 |
| Peabody Energy | | 12,000 | | 414,120 |
| Total, ADR | | 24,000 | | 1,330,560 |
| Transocean | | 9,444 b | | 777,525 |
| | | | | 17,417,026 |
| Financial—4.4% | | | | |
| American Express | | 20,000 | | 550,000 |
| Ameriprise Financial | | 15,000 | | 324,000 |
| Bank of America | | 78,896 | | 1,906,916 |
| JPMorgan Chase & Co | | 30,000 | | 1,237,500 |
| | | | | 4,018,416 |
| STATEMENT OF INVESTMENTS (continued) |
| Common Stocks (continued) | | Shares | | Value ($) |
| |
| |
|
| Health Care—10.3% | | | | |
| Abbott Laboratories | | 70,000 | | 3,860,500 |
| Johnson & Johnson | | 74,500 | | 4,569,830 |
| Merck & Co | | 18,000 | | 557,100 |
| Novo Nordisk, ADR | | 7,000 | | 374,570 |
| | | | | 9,362,000 |
| Industrial—7.5% | | | | |
| Caterpillar | | 20,000 | | 763,400 |
| Emerson Electric | | 60,000 | | 1,963,800 |
| General Dynamics | | 10,000 | | 603,200 |
| General Electric | | 120,000 | | 2,341,200 |
| United Technologies | | 20,000 | | 1,099,200 |
| | | | | 6,770,800 |
| Information Technology—12.6% | | | | |
| Apple | | 15,000 b | | 1,613,850 |
| Automatic Data Processing | | 25,000 | | 873,750 |
| Cisco Systems | | 75,000 b | | 1,332,750 |
| Intel | | 220,000 | | 3,520,000 |
| Microsoft | | 107,000 | | 2,389,310 |
| QUALCOMM | | 20,500 | | 784,330 |
| Texas Instruments | | 45,000 | | 880,200 |
| | | | | 11,394,190 |
| Materials—2.0% | | | | |
| Freeport-McMoRan Copper & Gold | | 10,000 | | 291,000 |
| Praxair | | 15,000 | | 977,250 |
| Rio Tinto, ADR | | 3,000 a | | 557,610 |
| | | | | 1,825,860 |
| Total Common Stocks | | | | |
| (cost $82,612,125) | | | | 89,583,421 |
| |
| |
|
| |
| Other Investment—.5% | | | | |
| |
| |
|
| Registered Investment Company; | | | | |
| Dreyfus Institutional Preferred | | | | |
| Plus Money Market Fund | | | | |
| (cost $480,000) | | 480,000 c | | 480,000 |
10
| Investment of Cash Collateral | | | | |
| for Securities Loaned—.8% | | Shares | | Value ($) |
| |
| |
|
| Registered Investment Company; | | | | |
| Dreyfus Institutional Cash | | | | |
| Advantage Plus Fund | | | | |
| (cost $695,700) | | 695,700 c | | 695,700 |
| |
| |
|
| |
| Total Investments (cost $83,787,825) | | 100.0% | | 90,759,121 |
| Liabilities, Less Cash and Receivables | | (.0%) | | (733) |
| Net Assets | | 100.0% | | 90,758,388 |
| ADR—American Depository Receipts |
| a | All or a portion of these securities are on loan. At October 31, 2008, the total market value of the fund’s securities on loan is $685,161 and the total market value of the collateral held by the fund is $695,700. |
| |
| b | Non-income producing security. |
| |
| c | Investment in affiliated money market mutual fund. |
| |
| Portfolio Summary (Unaudited)† | | | | |
| |
| | | Value (%) | | | | Value (%) |
| |
| |
| |
|
| Consumer Staples | | 23.8 | | Industrial | | 7.5 |
| Energy | | 19.2 | | Financial | | 4.4 |
| Consumer Discretionary | | 18.9 | | Materials | | 2.0 |
| Information Technology | | 12.6 | | Money Market Investments | | 1.3 |
| Health Care | | 10.3 | | | | 100.0 |
| |
| † Based on net assets. | | | | | | |
| See notes to financial statements. | | | | | | |
STATEMENT OF ASSETS AND LIABILITIES
October 31, 2008
| | | | | | | | | Cost | | Value |
| |
| |
| |
| |
| |
|
| Assets ($): | | | | | | | | | | |
| Investments in securities—See Statement | | | | | | | | |
| of Investments (including securities on loan, | | | | | | | | |
| valued at $685,161)—Note 1(b): | | | | | | | | |
| Unaffiliated issuers | | | | | | 82,612,125 | | 89,583,421 |
| Affiliated issuers | | | | | | 1,175,700 | | 1,175,700 |
| Receivable for investment securities sold | | | | | | | | 794,084 |
| Dividends and interest receivable | | | | | | | | 114,307 |
| Receivable for shares of Capital Stock subscribed | | | | | | 32,639 |
| | | | | | | | | | | 91,700,151 |
| |
| |
| |
| |
| |
|
| Liabilities ($): | | | | | | | | | | |
| Due to The Dreyfus Corporation and affiliates—Note 3(b) | | | | | | 115,395 |
| Cash overdraft due to Custodian | | | | | | | | 26,551 |
| Liability for securities on loan—Note 1(b) | | | | | | | | 695,700 |
| Payable for shares of Capital Stock redeemed | | | | | | | | 104,117 |
| | | | | | | | | | | 941,763 |
| |
| |
| |
| |
| |
|
| Net Assets ($) | | | | | | | | | | 90,758,388 |
| |
| |
| |
| |
| |
|
| Composition of Net Assets ($): | | | | | | | | |
| Paid-in capital | | | | | | | | | | 97,714,727 |
| Accumulated undistributed investment income—net | | | | | | 1,101,431 |
| Accumulated net realized gain (loss) on investments | | | | | | (15,029,066) |
| Accumulated net unrealized appreciation | | | | | | | | |
| (depreciation) on investments | | | | | | | | | | 6,971,296 |
| |
| |
| |
| |
| |
|
| Net Assets ($) | | | | | | | | | | 90,758,388 |
| |
| |
| |
| |
| |
|
| |
| |
| Net Asset Value Per Share | | | | | | | | |
| | | Class A | | Class B | | Class C | | Class I | | Class T |
| |
| |
| |
| |
| |
|
| Net Assets ($) | | 60,206,870 | | 8,518,770 | | 20,247,418 | | 10,479 | | 1,774,851 |
| Shares Outstanding | | 4,194,457 | | 621,019 | | 1,485,989 | | 727 | | 125,684 |
| |
| |
| |
| |
| |
|
| Net Asset Value | | | | | | | | | | |
| Per Share ($) | | 14.35 | | 13.72 | | 13.63 | | 14.41 | | 14.12 |
| |
| See notes to financial statements. | | | | | | | | | | |
12
STATEMENT OF OPERATIONS
Year Ended October 31, 2008 |
| Investment Income ($): | | |
| Income: | | |
| Cash dividends: | | |
| Unaffiliated issuers (net of $35,263 foreign taxes withheld at source) | | 3,373,121 |
| Affiliated issuers | | 17,223 |
| Income from securities lending | | 14,166 |
| Total Income | | 3,404,510 |
| Expenses: | | |
| Management fee—Note 3(a) | | 1,433,525 |
| Distribution and service plan fees—Note 3(b) | | 659,930 |
| Directors’ fees and expenses—Note 3(a) | | 7,803 |
| Loan commitment fees—Note 2 | | 1,351 |
| Total Expenses | | 2,102,609 |
| Less—reduction in management fee due to undertaking—Note 3(a) | | (130,320) |
| Less—Directors’ fees reimbursed by the Manager—Note 3(a) | | (7,803) |
| Net Expenses | | 1,964,486 |
| Investment Income—Net | | 1,440,024 |
| |
|
| Realized and Unrealized Gain (Loss) on Investments—Note 4 ($): | | |
| Net realized gain (loss) on investments | | 3,522,299 |
| Net unrealized appreciation (depreciation) on investments | | (46,291,469) |
| Net Realized and Unrealized Gain (Loss) on Investments | | (42,769,170) |
| Net (Decrease) in Net Assets Resulting from Operations | | (41,329,146) |
| |
| See notes to financial statements. | | |
The Fund 13
STATEMENT OF CHANGES IN NET ASSETS
| | | Year Ended October 31, |
| | |
|
| | | 2008 | | 2007a |
| |
| |
|
| Operations ($): | | | | |
| Investment income—net | | 1,440,024 | | 1,361,263 |
| Net realized gain (loss) on investments | | 3,522,299 | | 6,372,423 |
| Net unrealized appreciation | | | | |
| (depreciation) on investments | | (46,291,469) | | 11,140,545 |
| Net Increase (Decrease) in Net Assets | | | | |
| Resulting from Operations | | (41,329,146) | | 18,874,231 |
| |
| |
|
| Dividends to Shareholders from ($): | | | | |
| Investment income—net: | | | | |
| Class A Shares | | (1,124,892) | | (1,141,289) |
| Class B Shares | | (42,505) | | (135,137) |
| Class C Shares | | (156,430) | | (194,703) |
| Class I Shares | | (91) | | (18) |
| Class T Shares | | (25,983) | | (28,892) |
| Total Dividends | | (1,349,901) | | (1,500,039) |
| |
| |
|
| Capital Stock Transactions ($): | | | | |
| Net proceeds from shares sold: | | | | |
| Class A Shares | | 10,749,835 | | 15,394,909 |
| Class B Shares | | 128,173 | | 51,912 |
| Class C Shares | | 994,877 | | 2,369,543 |
| Class I Shares | | 7,750 | | 10,000 |
| Class T Shares | | 14,993 | | 51,442 |
| Dividends reinvested: | | | | |
| Class A Shares | | 899,235 | | 906,748 |
| Class B Shares | | 27,740 | | 90,149 |
| Class C Shares | | 98,741 | | 126,573 |
| Class I Shares | | 19 | | 18 |
| Class T Shares | | 24,184 | | 27,067 |
| Cost of shares redeemed: | | | | |
| Class A Shares | | (20,099,201) | | (22,571,260) |
| Class B Shares | | (10,701,354) | | (15,999,566) |
| Class C Shares | | (6,359,822) | | (6,871,014) |
| Class I Shares | | (5,030) | | — |
| Class T Shares | | (397,029) | | (364,359) |
| Increase (Decrease) in Net Assets | | | | |
| from Capital Stock Transactions | | (24,616,889) | | (26,777,838) |
| Total Increase (Decrease) in Net Assets | | (67,295,936) | | (9,403,646) |
| |
| |
|
| Net Assets ($): | | | | |
| Beginning of Period | | 158,054,324 | | 167,457,970 |
| End of Period | | 90,758,388 | | 158,054,324 |
| Undistributed investment income—net | | 1,101,431 | | 1,011,308 |
14
| | | Year Ended October 31, |
| | |
|
| | | 2008 | | 2007a |
| |
| |
|
| Capital Share Transactions: | | | | |
| Class Ab | | | | |
| Shares sold | | 571,370 | | 797,423 |
| Shares issued for dividends reinvested | | 44,161 | | 48,723 |
| Shares redeemed | | (1,126,385) | | (1,163,074) |
| Net Increase (Decrease) in Shares Outstanding | | (510,854) | | (316,928) |
| |
| |
|
| Class Bb | | | | |
| Shares sold | | 7,021 | | 2,894 |
| Shares issued for dividends reinvested | | 1,418 | | 5,043 |
| Shares redeemed | | (595,086) | | (867,693) |
| Net Increase (Decrease) in Shares Outstanding | | (586,647) | | (859,756) |
| |
| |
|
| Class C | | | | |
| Shares sold | | 55,701 | | 129,143 |
| Shares issued for dividends reinvested | | 5,074 | | 7,111 |
| Shares redeemed | | (369,488) | | (372,901) |
| Net Increase (Decrease) in Shares Outstanding | | (308,713) | | (236,647) |
| |
| |
|
| Class I | | | | |
| Shares sold | | 410 | | 500 |
| Shares issued for dividends reinvested | | 1 | | 1 |
| Shares redeemed | | (251) | | — |
| Net Increase (Decrease) in Shares Outstanding | | 160 | | 501 |
| |
| |
|
| Class T | | | | |
| Shares sold | | 801 | | 2,728 |
| Shares issued for dividends reinvested | | 1,205 | | 1,475 |
| Shares redeemed | | (22,660) | | (19,194) |
| Net Increase (Decrease) in Shares Outstanding | | (20,654) | | (14,991) |
| a | | Effective June 1, 2007, Class R shares were redesignated as Class I shares. |
| b | | During the period ended October 31, 2008, 285,926 Class B shares representing $5,190,502 were automatically |
| | | converted to 273,933 Class A shares and during the period ended October 31, 2007, 425,402 Class B shares |
| | | representing $7,862,203 were automatically converted to 407,004 Class A shares. |
| See notes to financial statements. |
The Fund 15
FINANCIAL HIGHLIGHTS
The following tables describe the performance for each share class for the fiscal periods indicated.All information (except portfolio turnover rate) reflects financial results for a single fund share.Total return shows how much your investment in the fund would have increased (or decreased) during each period, assuming you had reinvested all dividends and distributions.These figures have been derived from the fund’s financial statements.
| | | | | Year Ended October 31, | | |
| | |
| |
| |
|
| Class A Shares | | 2008 | | 2007 | | 2006 | | 2005 | | 2004 |
| |
| |
| |
| |
| |
|
| Per Share Data ($): | | | | | | | | | | |
| Net asset value, beginning of period | | 20.51 | | 18.44 | | 16.35 | | 15.26 | | 14.86 |
| Investment Operations: | | | | | | | | | | |
| Investment income—neta | | .25 | | .22 | | .21 | | .20 | | .12 |
| Net realized and unrealized gain | | | | | | | | | | |
| (loss) on investments | | (6.17) | | 2.08 | | 2.00 | | 1.08 | | .40 |
| Total from Investment Operations | | (5.92) | | 2.30 | | 2.21 | | 1.28 | | .52 |
| Distributions: | | | | | | | | | | |
| Dividends from investment income—net | | (.24) | | (.23) | | (.12) | | (.19) | | (.12) |
| Net asset value, end of period | | 14.35 | | 20.51 | | 18.44 | | 16.35 | | 15.26 |
| |
| |
| |
| |
| |
|
| Total Return (%)b | | (29.22) | | 12.58 | | 13.61 | | 8.41 | | 3.48 |
| |
| |
| |
| |
| |
|
| Ratios/Supplemental Data (%): | | | | | | | | | | |
| Ratio of total expenses | | | | | | | | | | |
| to average net assets | | 1.36 | | 1.36 | | 1.36 | | 1.36 | | 1.35 |
| Ratio of net expenses | | | | | | | | | | |
| to average net assets | | 1.25 | | 1.25 | | 1.29 | | 1.36 | | 1.35 |
| Ratio of net investment income | | | | | | | | | | |
| to average net assets | | 1.35 | | 1.13 | | 1.20 | | 1.22 | | .77 |
| Portfolio Turnover Rate | | 5.91 | | 8.09 | | — | | 1.06 | | .72 |
| |
| |
| |
| |
| |
|
| Net Assets, end of period ($ x 1,000) | | 60,207 | | 96,507 | | 92,601 | | 104,506 | | 91,759 |
| a | | Based on average shares outstanding at each month end. |
| b | | Exclusive of sales charge. |
| See notes to financial statements. |
16
| | | | | Year Ended October 31, | | |
| | |
| |
| |
|
| Class B Shares | | 2008 | | 2007 | | 2006 | | 2005 | | 2004 |
| |
| |
| |
| |
| |
|
| Per Share Data ($): | | | | | | | | | | |
| Net asset value, beginning of period | | 19.56 | | 17.57 | | 15.68 | | 14.60 | | 14.22 |
| Investment Operations: | | | | | | | | | | |
| Investment income—neta | | .11 | | .08 | | .08 | | .09 | | .00b |
| Net realized and unrealized | | | | | | | | | | |
| gain (loss) on investments | | (5.91) | | 1.98 | | 1.91 | | 1.03 | | .38 |
| Total from Investment Operations | | (5.80) | | 2.06 | | 1.99 | | 1.12 | | .38 |
| Distributions: | | | | | | | | | | |
| Dividends from investment income—net | | (.04) | | (.07) | | (.10) | | (.04) | | (.00)b |
| Net asset value, end of period | | 13.72 | | 19.56 | | 17.57 | | 15.68 | | 14.60 |
| |
| |
| |
| |
| |
|
| Total Return (%)c | | (29.72) | | 11.76 | | 12.76 | | 7.60 | | 2.77 |
| |
| |
| |
| |
| |
|
| Ratios/Supplemental Data (%): | | | | | | | | | | |
| Ratio of total expenses | | | | | | | | | | |
| to average net assets | | 2.11 | | 2.11 | | 2.11 | | 2.11 | | 2.10 |
| Ratio of net expenses | | | | | | | | | | |
| to average net assets | | 2.00 | | 2.00 | | 2.04 | | 2.11 | | 2.10 |
| Ratio of net investment income | | | | | | | | | | |
| to average net assets | | .65 | | .42 | | .47 | | .60 | | .02 |
| Portfolio Turnover Rate | | 5.91 | | 8.09 | | — | | 1.06 | | .72 |
| |
| |
| |
| |
| |
|
| Net Assets, end of period ($ x 1,000) | | 8,519 | | 23,622 | | 36,326 | | 57,804 | | 102,007 |
| a | | Based on average shares outstanding at each month end. |
| b | | Amount represents less than $.01 per share. |
| c | | Exclusive of sales charge. |
| See notes to financial statements. |
The Fund 17
| | FINANCIAL HIGHLIGHTS (continued) |
| | | | | Year Ended October 31, | | |
| | |
| |
| |
|
| Class C Shares | | 2008 | | 2007 | | 2006 | | 2005 | | 2004 |
| |
| |
| |
| |
| |
|
| Per Share Data ($): | | | | | | | | | | |
| Net asset value, beginning of period | | 19.48 | | 17.53 | | 15.64 | | 14.59 | | 14.22 |
| Investment Operations: | | | | | | | | | | |
| Investment income—neta | | .11 | | .07 | | .07 | | .08 | | .00b |
| Net realized and unrealized | | | | | | | | | | |
| gain (loss) on investments | | (5.87) | | 1.98 | | 1.92 | | 1.03 | | .38 |
| Total from Investment Operations | | (5.76) | | 2.05 | | 1.99 | | 1.11 | | .38 |
| Distributions: | | | | | | | | | | |
| Dividends from investment income—net | | (.09) | | (.10) | | (.10) | | (.06) | | (.01) |
| Net asset value, end of period | | 13.63 | | 19.48 | | 17.53 | | 15.64 | | 14.59 |
| |
| |
| |
| |
| |
|
| Total Return (%)c | | (29.71) | | 11.73 | | 12.80 | | 7.54 | | 2.73 |
| |
| |
| |
| |
| |
|
| Ratios/Supplemental Data (%): | | | | | | | | | | |
| Ratio of total expenses | | | | | | | | | | |
| to average net assets | | 2.11 | | 2.11 | | 2.11 | | 2.11 | | 2.10 |
| Ratio of net expenses | | | | | | | | | | |
| to average net assets | | 2.00 | | 2.00 | | 2.04 | | 2.11 | | 2.10 |
| Ratio of net investment income | | | | | | | | | | |
| to average net assets | | .61 | | .39 | | .44 | | .53 | | .02 |
| Portfolio Turnover Rate | | 5.91 | | 8.09 | | — | | 1.06 | | .72 |
| |
| |
| |
| |
| |
|
| Net Assets, end of period ($ x 1,000) | | 20,247 | | 34,961 | | 35,603 | | 41,677 | | 51,391 |
| a | | Based on average shares outstanding at each month end. |
| b | | Amount represents less than $.01 per share. |
| c | | Exclusive of sales charge. |
| See notes to financial statements. |
18
| | | | | Year Ended October 31, | | |
| | |
| |
| |
|
| Class I Shares | | 2008 | | 2007a | | 2006 | | 2005 | | 2004b |
| |
| |
| |
| |
| |
|
| Per Share Data ($): | | | | | | | | | | |
| Net asset value, beginning of period | | 20.58 | | 18.52 | | 16.38 | | 15.28 | | 15.56 |
| Investment Operations: | | | | | | | | | | |
| Investment income—netc | | .28 | | .20 | | .24 | | .25 | | .06 |
| Net realized and unrealized | | | | | | | | | | |
| gain (loss) on investments | | (6.16) | | 2.14 | | 2.03 | | 1.07 | | (.34) |
| Total from Investment Operations | | (5.88) | | 2.34 | | 2.27 | | 1.32 | | (.28) |
| Distributions: | | | | | | | | | | |
| Dividends from investment income—net | | (.29) | | (.28) | | (.13) | | (.22) | | — |
| Net asset value, end of period | | 14.41 | | 20.58 | | 18.52 | | 16.38 | | 15.28 |
| |
| |
| |
| |
| |
|
| Total Return (%) | | (28.99) | | 12.76 | | 13.94 | | 8.73 | | (1.80)d |
| |
| |
| |
| |
| |
|
| Ratios/Supplemental Data (%): | | | | | | | | | | |
| Ratio of total expenses | | | | | | | | | | |
| to average net assets | | 1.11 | | 1.12 | | 1.10 | | 1.10 | | .51d |
| Ratio of net expenses | | | | | | | | | | |
| to average net assets | | 1.00 | | 1.01 | | 1.04 | | 1.10 | | .51d |
| Ratio of net investment income | | | | | | | | | | |
| to average net assets | | 1.57 | | 1.01 | | 1.41 | | 1.48 | | .41d |
| Portfolio Turnover Rate | | 5.91 | | 8.09 | | — | | 1.06 | | .72 |
| |
| |
| |
| |
| |
|
| Net Assets, end of period ($ x 1,000) | | 10 | | 12 | | 1 | | 1 | | 1 |
| a | | Effective June 1, 2007, Class R shares were redesignated as to Class I shares. |
| b | | From May 14, 2004 (commencement of initial offering) to October 31, 2004. |
| c | | Based on average shares outstanding at each month end. |
| d | | Not annualized. |
| See notes to financial statements. |
The Fund 19
| FINANCIAL HIGHLIGHTS (continued) |
| | | | | Year Ended October 31, | | |
| | |
| |
| |
|
| Class T Shares | | 2008 | | 2007 | | 2006 | | 2005 | | 2004 |
| |
| |
| |
| |
| |
|
| Per Share Data ($): | | | | | | | | | | |
| Net asset value, beginning of period | | 20.18 | | 18.14 | | 16.12 | | 15.04 | | 14.64 |
| Investment Operations: | | | | | | | | | | |
| Investment income—neta | | .20 | | .17 | | .16 | | .17 | | .08 |
| Net realized and unrealized | | | | | | | | | | |
| gain (loss) on investments | | (6.08) | | 2.05 | | 1.98 | | 1.05 | | .39 |
| Total from Investment Operations | | (5.88) | | 2.22 | | 2.14 | | 1.22 | | .47 |
| Distributions: | | | | | | | | | | |
| Dividends from investment income—net | | (.18) | | (.18) | | (.12) | | (.14) | | (.07) |
| Net asset value, end of period | | 14.12 | | 20.18 | | 18.14 | | 16.12 | | 15.04 |
| |
| |
| |
| |
| |
|
| Total Return (%)b | | (29.39) | | 12.34 | | 13.34 | | 8.12 | | 3.25 |
| |
| |
| |
| |
| |
|
| Ratios/Supplemental Data (%): | | | | | | | | | | |
| Ratio of total expenses | | | | | | | | | | |
| to average net assets | | 1.61 | | 1.61 | | 1.61 | | 1.61 | | 1.60 |
| Ratio of net expenses | | | | | | | | | | |
| to average net assets | | 1.50 | | 1.50 | | 1.54 | | 1.61 | | 1.60 |
| Ratio of net investment income | | | | | | | | | | |
| to average net assets | | 1.10 | | .88 | | .95 | | 1.04 | | .52 |
| Portfolio Turnover Rate | | 5.91 | | 8.09 | | — | | 1.06 | | .72 |
| |
| |
| |
| |
| |
|
| Net Assets, end of period ($ x 1,000) | | 1,775 | | 2,953 | | 2,927 | | 3,857 | | 4,641 |
| a | | Based on average shares outstanding at each month end. |
| b | | Exclusive of sales charge. |
| See notes to financial statements. |
20
NOTES TO FINANCIAL STATEMENTS
NOTE 1—Significant Accounting Policies:
Dreyfus Tax Managed Growth Fund (the “fund”) is a separate diversified series of The Dreyfus/Laurel Funds, Inc. (the “Company”) which is registered under the Investment Company Act of 1940, as amended (the “Act”), as an open-end management investment company and operates as a series company currently offering fourteen series, including the fund. The fund’s investment objective is to provide investors with long-term capital appreciation consistent with minimizing realized capital gains and taxable current income. The Dreyfus Corporation (the “Manager” or “Dreyfus”), a wholly-owned subsidiary of The Bank of New York Mellon Corporation (“BNY Mellon”), serves as the fund’s investment adviser
At a meeting of the fund’s Board of Directors held on July 24, 2008, the Board approved, effective December 1, 2008, a proposal to change the name of the fund from “Dreyfus Premier Tax Managed Growth Fund” to “Dreyfus Tax Managed Growth Fund.”
Effective July 1, 2008, BNY Mellon has reorganized and consolidated a number of its banking and trust company subsidiaries. As a result of the reorganization, any services previously provided to the fund by Mellon Bank, N.A. or Mellon Trust of New England, N.A. are now provided by The Bank of New York, which has changed its name to The Bank of New York Mellon.
MBSC Securities Corporation (the “Distributor”), a wholly-owned subsidiary of Dreyfus, is the distributor of the fund’s shares.The fund is authorized to issue 100 million shares of $.001 par value Capital Stock in each of the following classes of shares: Class A, Class B, Class C, Class I and Class T. Class A, Class B, Class C and Class T shares are sold primarily to retail investors through financial intermediaries and bear a distribution fee and/or service fee. Class A and Class T shares are sold with a front-end sales charge, while Class B and Class C shares are subject to a contingent deferred sales charge (“CDSC”). Class B shares automatically convert to Class A shares after six years. The fund does not offer Class B shares, except in connection with div-
The Fund 21
| NOTES TO FINANCIAL STATEMENTS (continued) |
idend re-investment and permitted exchanges of Class B shares. Class I shares are sold primarily to bank trust departments and other financial service providers (including The Bank of New York Mellon, a subsidiary of BNY Mellon and an affiliate of Dreyfus) acting on behalf of customers having a qualified trust or investment account or relationship at such institution, and bear no distribution or service fees. Class I shares are offered without a front-end sales charge or CDSC. Each class of shares has identical rights and privileges, except with respect to distribution and service fees, the allocation of certain transfer agency costs and voting rights on matters affecting a single class. Income, expenses (other than expenses attributable to a specific class), and realized and unrealized gains or losses on investments are allocated to each class of shares based on its relative net assets.
The fund’s financial statements are prepared in accordance with U.S. generally accepted accounting principles, which may require the use of management estimates and assumptions. Actual results could differ from those estimates.
(a) Portfolio valuation: Investments in securities are valued at the last sales price on the securities exchange or national securities market on which such securities are primarily traded. Securities listed on the National Market System for which market quotations are available, are valued at the official closing price or, if there is no official closing price that day, at the last sales price. Securities not listed on an exchange or the national securities market, or securities for which there were no transactions, are valued at the average of the most recent bid and asked prices, except for open short positions, where the asked price is used for valuation purposes. Bid price is used when no asked price is available. Registered investment companies that are not traded on an exchange are valued at their net asset value.When market quotations or official closing prices are not readily available, or are determined not to reflect accurately fair value, such as when the value of the security has been significantly affected by events after the close of the exchange or market on which the security is principally traded (for example, a foreign exchange or market), but before the fund calculates its net asset
22
value, the fund may value these investments at fair value as determined in accordance with the procedures approved by the Board of Directors. Fair valuing of securities may be determined with the assistance of a pricing service using calculations based on indices of domestic securities and other appropriate indicators, such as prices of relevant ADRs and futures contracts. For other securities that are fair valued by the Board of Directors, certain factors may be considered such as: fundamental analytical data, the nature and duration of restrictions on disposition, an evaluation of the forces that influence the market in which securities are purchased and sold and public trading in similar securities of the issuer or comparable issuers.
The Financial Accounting Standards Board (FASB) released Statement of Financial Accounting Standards No. 157 “FairValue Measurements” (“FAS 157”). FAS 157 establishes an authoritative definition of fair value, sets out a framework for measuring fair value, and requires additional disclosures about fair-value measurements. The application of FAS 157 is required for fiscal years beginning after November 15, 2007 and interim periods within those fiscal years. Management does not believe that the application of this standard will have a material impact on the financial statements of the fund.
(b) Securities transactions and investment income: Securities transactions are recorded on a trade date basis. Realized gains and losses from securities transactions are recorded on the identified cost basis. Dividend income is recognized on the ex-dividend date and interest income, including, where applicable, accretion of discount and amortization of premium on investments, is recognized on the accrual basis.
Pursuant to a securities lending agreement withThe Bank of NewYork Mellon, the fund may lend securities to qualified institutions. It is the fund’s policy that, at origination, all loans are secured by collateral of at least 102% of the value of U.S. securities loaned and 105% of the value of foreign securities loaned. Collateral equivalent to at least 100% of the market value of securities on loan is maintained at all times. Collateral is either in the form of cash, which can be invested in certain money
The Fund 23
| NOTES TO FINANCIAL STATEMENTS (continued) |
market mutual funds managed by the Manager, U.S. Government and Agency securities or letters of credit.The fund is entitled to receive all income on securities loaned, in addition to income earned as a result of the lending transaction.Although each security loaned is fully collateralized, the fund bears the risk of delay in recovery of, or loss of rights in, the securities loaned should a borrower fail to return the securities in a timely manner. During the period ended October 31, 2008,The Bank of New York Mellon earned $6,071 pursuant to the securities lending agreement.
(c) Affiliated issuers: Investments in other investment companies advised by Dreyfus are defined as “affiliated” in the Act.
(d) Dividends to shareholders: Dividends are recorded on the ex-dividend date. Dividends from investment income-net and dividends from net realized capital gains, if any, are normally declared and paid annually, but the fund may make distributions on a more frequent basis to comply with the distribution requirements of the Internal Revenue Code of 1986, as amended (the “Code”).To the extent that net realized capital gains can be offset by capital loss carryovers, it is the policy of the fund not to distribute such gains. Income and capital gain distributions are determined in accordance with income tax regulations, which may differ from U.S. generally accepted accounting principles.
(e) Federal income taxes: It is the policy of the fund to continue to qualify as a regulated investment company, if such qualification is in the best interests of its shareholders, by complying with the applicable provisions of the Code, and to make distributions of taxable income sufficient to relieve it from substantially all federal income and excise taxes.
The fund adopted FASB Interpretation No. 48 “Accounting for Uncertainty in Income Taxes” (“FIN 48”). FIN 48 provides guidance for how uncertain tax positions should be recognized, measured, presented and disclosed in the financial statements. FIN 48 requires the evaluation of tax positions taken or expected to be taken in the course of preparing the fund’s tax returns to determine whether the tax positions are “more-likely-than-not” of being sustained by the applicable
24
tax authority. Liability for tax positions not deemed to meet the more-likely-than-not threshold would be recorded as a tax expense in the current year.The adoption of FIN 48 had no impact on the operations of the fund for the period ended October 31, 2008.
As of and during the period ended October 31, 2008, the fund did not have any liabilities for any unrecognized tax positions. The fund recognizes interest and penalties, if any, related to unrecognized tax positions as income tax expense in the Statement of Operations. During the period, the fund did not incur any interest or penalties.
Each of the tax years in the four-year period ended October 31, 2008 remains subject to examination by the Internal Revenue Service and state taxing authorities.
At October 31, 2008, the components of accumulated earnings on a tax basis were as follows: undistributed ordinary income $1,101,431, accumulated capital losses $15,029,066 and unrealized appreciation $6,971,296.
The accumulated capital loss carryover is available for federal income tax purposes to be applied against future net securities profits, if any, realized subsequent to October 31, 2008. If not applied, $7,169,147 of the carryover expires in fiscal 2011 and $7,859,919 expires in fiscal 2012.
The tax character of distributions paid to shareholders during the fiscal periods ended October 31, 2008 and October 31, 2007 were as follows: ordinary income $1,349,901 and $1,500,039, respectively.
NOTE 2—Bank Lines of Credit:
Prior to October 15, 2008, the fund participated with other Dreyfus-managed funds in a $350 million redemption credit facility. Effective October 15, 2008, the fund participates with other Dreyfus-managed funds in a $145 million redemption credit facility (the “Facility”) to be utilized for temporary or emergency purposes, including the financing of redemptions. In connection therewith, the fund has agreed to pay commitment fees on its pro rata portion of the Facility. Interest is
The Fund 25
| NOTES TO FINANCIAL STATEMENTS (continued) |
charged to the fund based on prevailing market rates in effect at the time of borrowing. During the period ended October 31, 2008, the fund did not borrow under either Facility.
NOTE 3—Investment Management Fee and Other Transactions With Affiliates:
(a) Pursuant to an Investment Management Agreement with Dreyfus, Dreyfus provides or arranges for one or more third parties and/or affiliates to provide investment advisory, administrative, custody, fund accounting and transfer agency services to the fund. Dreyfus also directs the investments of the fund in accordance with its investment objective, policies and limitations. For these services, the fund is contractually obligated to pay Dreyfus a fee, calculated daily and paid monthly, at the annual rate of 1.10% of the value of the fund’s average daily net assets. Out of its fee, Dreyfus pays all of the expenses of the fund except brokerage fees, taxes, interest, commitment fees, Rule 12b-1 distribution fees and expenses, service fees, expenses of non-interested Directors (including counsel fees) and extraordinary expenses. In addition, Dreyfus is required to reduce its fee in an amount equal to the fund’s allocable portion of fees and expenses of the non-interested Directors (including counsel fees). Each Director receives $45,000 per year, plus $6,000 for each joint Board meeting of the Company,The Dreyfus/Laurel Tax-Free Municipal Funds and The Dreyfus/Laurel Funds Trust (collectively, the “Dreyfus/Laurel Funds”) attended, $2,000 for separate in-person committee meetings attended which are not held in conjunction with a regularly scheduled Board meeting and $1,500 for Board meetings and separate committee meetings attended that are conducted by telephone and is reimbursed for travel and out-of-pocket expenses.With respect to Board meetings, the Chairman of the Board receives an additional 25% of such compensation (with the exception of reimbursable amounts). With respect to compensation committee meetings, the Chair of the compensation committee receives $900 per meeting and, prior to April 12, 2008 with respect to audit committee meetings, the Chair of the audit committee received $1,350 per meeting. In the event that there is an in-per-
26
son joint committee meeting or a joint telephone meeting of the Dreyfus/Laurel Funds and Dreyfus High Yield Strategies Fund, the $2,000 or $1,500 fee, as applicable, will be allocated between the Dreyfus/Laurel Funds and Dreyfus High Yield Strategies Fund.These fees and expenses are charged and allocated to each series based on net assets. Amounts required to be paid by the Company directly to the non-interested Directors, that would be applied to offset a portion of the management fee payable to Dreyfus, are in fact paid directly by Dreyfus to the non-interested Directors.
Pursuant to a Sub-Investment Advisory Agreement between Dreyfus and Sarofim & Co., Dreyfus pays Sarofim & Co. an annual fee of .30% of the value of the fund’s average daily net assets, payable monthly. From November 1, 2007 through April 4, 2009, Sarofim & Co. has agreed to waive receipt of a portion of its sub-investment advisory fee in the amount of .10% of the fund’s average daily net assets. The sub-investment advisory fee is paid by Dreyfus out of the management fee Dreyfus receives from the fund. Dreyfus is, in turn, passing the waiver by Sarofim & Co.onto the fund by waiving a portion of the management fee in that amount, .10% of the fund’s average daily net assets. The reduction in management fee, pursuant to the undertaking by Sarofim & Co., amounted to $130,320 during the period ended October 31, 2008.
During the period ended October 31, 2008, the Distributor retained $5,398 and $79 from commissions earned on sales of the fund’s Class A and Class T shares, respectively, and $32,423 and $4,455 from CDSCs on redemptions of the fund’s Class B and Class C shares, respectively.
(b) Under separate Distribution Plans (the “Plans”) adopted pursuant to Rule 12b-1 under the Act, Class A shares may pay annually up to .25% of the value of its average daily net assets to compensate the Distributor for shareholder servicing activities and expenses primarily intended to result in the sale of Class A shares. Class B, Class C and ClassT shares pay the Distributor for distributing their shares at an aggregate annual rate of .75% of the value of the average daily net assets of Class B and Class C shares and .25% of the value of the average daily net assets of Class T
The Fund 27
| NOTES TO FINANCIAL STATEMENTS (continued) |
shares.The Distributor may pay one or more agents in respect of advertising, marketing and other distribution services for Class T shares and determines the amounts, if any, to be paid to agents and the basis on which such payments are made. Class B, Class C and Class T shares are also subject to a service plan adopted pursuant to Rule 12b-1 (the “Service Plan”), under which Class B, Class C and ClassT shares pay the Distributor for providing certain services to the holders of their shares a fee at the annual rate of .25% of the value of the average daily net assets of Class B, Class C and Class T shares. During the period ended October 31, 2008, Class A, Class B, Class C and Class T shares were charged $210,298,$112,104,$215,919 and $6,134,respectively,pursuant to their respective Plans. During the period ended October 31, 2008, Class B, Class C and Class T shares were charged $37,368, $71,973 and $6,134, respectively, pursuant to the Service Plan.
Under its terms, the Plans and Service Plan shall remain in effect from year to year, provided such continuance is approved annually by a vote of majority of those Directors who are not “interested persons” of the Company and who have no direct or indirect financial interest in the operation of or in any agreement related to the Plans or Service Plan.
The components of “Due to The Dreyfus Corporation and affiliates” in the Statement of Assets and Liabilities consist of: management fees $85,064, Rule 12b-1 distribution plan fees $31,566 and service plan fees $6,498, which are offset against an expense reimbursement currently in effect in the amount of $7,733.
NOTE 4—Securities Transactions:
The aggregate amount of purchases and sales of investment securities, excluding short-term securities, during the period ended October 31, 2008, amounted to $7,700,663 and $32,748,838, respectively.
At October 31, 2008, the cost of investments for federal income tax purposes was $83,787,825; accordingly, accumulated net unrealized appreciation on investments was $6,971,296, consisting of $21,437,302 gross unrealized appreciation and $14,466,006 gross unrealized depreciation.
28
In March 2008, the FASB released Statement of Financial Accounting Standards No. 161 “Disclosures about Derivative Instruments and Hedging Activities” (“FAS 161”). FAS 161 requires qualitative disclosures about objectives and strategies for using derivatives, quantitative disclosures about fair value amounts of gains and losses on derivative instruments and disclosures about credit-risk-related contingent features in derivative agreements.The application of FAS 161 is required for fiscal years and interim periods beginning after November 15, 2008. At this time, management is evaluating the implications of FAS 161 and its impact on the financial statements and the accompanying notes has not yet been determined.
NOTE 5—Subsequent Event:
Effective on or about February 4, 2009 (the “Effective Date”), the fund will issue to each holder of its Class T shares, in exchange for said shares, Class A shares of the fund having an aggregate net asset value equal to the aggregate net asset value of the shareholder’s Class T shares.Thereafter, the fund will no longer offer Class T shares.
Effective on or about December 3, 2008, no investments for new accounts were permitted in Class T of the fund, except that participants in certain group retirement plans were able to open a new account in Class T of the fund, provided that the fund was established as an investment option under the plans before December 3, 2008. After the Effective Date, subsequent investments in the fund’s Class A shares made by holders of the fund’s Class T shares who received Class A shares of the fund in exchange for their Class T shares will be subject to the front-end sales load schedule currently in effect for Class T shares. Otherwise, all other Class A share attributes will be in effect.
The Fund 29
REPORT OF INDEPENDENT REGISTERED PUBLIC ACCOUNTING FIRM
The Board of Directors and Shareholders The Dreyfus/Laurel Funds, Inc.:
We have audited the accompanying statement of assets and liabilities of Dreyfus Tax Managed Growth Fund (formerly Dreyfus Premier Tax Managed Growth Fund), a series of The Dreyfus/Laurel Funds, Inc. (the “Fund”), including the statement of investments, as of October 31, 2008, and the related statement of operations for the year then ended, the statement of changes in net assets for each of the years in the two-year period then ended, and the financial highlights for each of the years or periods in the five-year period then ended.These financial statements and financial highlights are the responsibility of the Fund’s management. Our responsibility is to express an opinion on these financial statements and financial highlights based on our audits.
We conducted our audits in accordance with the standards of the Public Company Accounting Oversight Board (United States).Those standards require that we plan and perform the audit to obtain reasonable assurance about whether the financial statements and financial highlights are free of material misstatement. An audit includes examining, on a test basis, evidence supporting the amounts and disclosures in the financial statements. Our procedures included confirmation of securities owned as of October 31, 2008, by correspondence with the custodian. An audit also includes assessing the accounting principles used and significant estimates made by management, as well as evaluating the overall financial statement presentation.We believe that our audits provide a reasonable basis for our opinion.
In our opinion, the financial statements and financial highlights referred to above present fairly, in all material respects, the financial position of Dreyfus Tax Managed Growth Fund as of October 31, 2008, and the results of its operations for the year then ended, the changes in its net assets for each of the years in the two-year period then ended, and the financial highlights for each of the years or periods in the five-year period then ended, in conformity with U.S. generally accepted accounting principles.

| | New York, New York
December 19, 2008 |
30
IMPORTANT TAX INFORMATION ( U n a u d i t e d )
In accordance with federal tax law, the fund hereby designates 100% of the ordinary dividends paid during the fiscal year ended October 31, 2008 as qualifying for the corporate dividends received deduction. For the fiscal year ended October 31, 2008, certain dividends paid by the fund may be subject to a maximum tax rate of 15%, as provided for by the Jobs and Growth Tax Relief Reconciliation Act of 2003. Of the distributions paid during the fiscal year, $1,349,901 represents the maximum amount that may be considered qualified dividend income. Shareholders will receive notification in January 2009 of the percentage applicable to the preparation of their 2008 income tax returns.
The Fund 31
BOARD MEMBERS INFORMATION ( U n a u d i t e d )
Joseph S. DiMartino (65)
Chairman of the Board (1995)
Principal Occupation During Past 5Years:
Corporate Director and Trustee
Other Board Memberships and Affiliations: |
- The Muscular Dystrophy Association, Director
- Century Business Services, Inc., a provider of outsourcing functions for small and medium size companies, Director
- The Newark Group, a provider of a national market of paper recovery facilities, paperboard mills and paperboard converting plants, Director
- Sunair Services Corporation, a provider of certain outdoor-related services to homes and businesses, Director
No. of Portfolios for which Board Member Serves: 167
James M. Fitzgibbons (74)
Board Member (1994)
Principal Occupation During Past 5Years:
Corporate Director and Trustee |
Other Board Memberships and Affiliations:
Bill Barrett Company, an oil and gas exploration company, Director
No. of Portfolios for which Board Member Serves: 25
Kenneth A. Himmel (62)
Board Member (1994)
Principal Occupation During Past 5Years: |
- President and CEO, Related Urban Development, a real estate development company (1996-present)
- President and CEO, Himmel & Company, a real estate development company (1980-present)
- CEO, American Food Management, a restaurant company (1983-present)
| No. of Portfolios for which Board Member Serves: 25 |
Stephen J. Lockwood (61)
Board Member (1994)
Principal Occupation During Past 5Years: |
- Chairman of the Board, Stephen J. Lockwood and Company LLC, an investment company (2000-present)
| No. of Portfolios for which Board Member Serves: 25 |
32
Roslyn M. Watson (59)
Board Member (1994) |
Principal Occupation During Past 5Years:
Principal,Watson Ventures, Inc., a real estate investment company (1993-present)
Other Board Memberships and Affiliations:
- American Express Bank, Director
- The Hyams Foundation Inc., a Massachusetts Charitable Foundation,Trustee
- National Osteoporosis Foundation,Trustee
- SBLI-USA, Director
| No. of Portfolios for which Board Member Serves: 25 |
Benaree Pratt Wiley (62)
Board Member (1998)
Principal Occupation During Past 5Years: |
- Principal, The Wiley Group, a firm specializing in strategy and business development (2005-present)
- President and CEO,The Partnership, an organization dedicated to increasing the representation of African Americans in positions of leadership, influence and decision-making in Boston, MA
(1991-2005)
| Other Board Memberships and Affiliations: |
- Boston College,Trustee Associate
- Blue Cross Blue Shield of Massachusetts, Director
- CBIZ, professional support consultants and service providers for small, midsized and corporate business, Director
- Commonwealth Institute, Director
- Efficacy Institute, Director
- PepsiCo African-American, Chair of Advisory Board
- The Boston Foundation, Director
- Century Business Services, Inc., a provider of outsourcing functions for small and medium size companies, Director
| No. of Portfolios for which Board Member Serves: 36 |
Once elected all Board Members serve for an indefinite term, but achieve Emeritus status upon reaching age 80.The address of the Board Members and Officers is in c/o The Dreyfus Corporation, 200 Park Avenue, NewYork, NewYork 10166. Additional information about the Board Members is available in the fund’s Statement of Additional Information which can be obtained from Dreyfus free of charge by calling this toll free number: 1-800-554-4611.
Francis P. Brennan, Emeritus Board Member
J.Tomlinson Fort, Emeritus Board Member |
The Fund 33
OFFICERS OF THE FUND ( U n a u d i t e d )
| J. DAVID OFFICER, President since | | JONI LACKS CHARATAN, Vice President |
| December 2006. | | and Assistant Secretary since |
| Chief Operating Officer,Vice Chairman and a | | August 2005. |
| Director of the Manager, and an officer of 77 | | Senior Counsel of BNY Mellon, and an officer |
| investment companies (comprised of 167 | | of 78 investment companies (comprised of 188 |
| portfolios) managed by the Manager. He is 60 | | portfolios) managed by the Manager. She is 53 |
| years old and has been an employee of the | | years old and has been an employee of the |
| Manager since April 1998. | | Manager since October 1988. |
| |
| PHILLIP N. MAISANO, Executive Vice | | JOSEPH M. CHIOFFI, Vice President and |
| President since July 2007. | | Assistant Secretary since August 2005. |
| Chief Investment Officer,Vice Chair and a | | Senior Counsel of BNY Mellon, and an officer |
| director of the Manager, and an officer of 77 | | of 78 investment companies (comprised of 188 |
| investment companies (comprised of 167 | | portfolios) managed by the Manager. He is 47 |
| portfolios) managed by the Manager. Mr. | | years old and has been an employee of the |
| Maisano also is an officer and/or Board | | Manager since June 2000. |
| member of certain other investment | | |
| | | JANETTE E. FARRAGHER, Vice President |
| management subsidiaries of The Bank of New | | |
| | | and Assistant Secretary since |
| York Mellon Corporation, each of which is an | | |
| | | August 2005. |
| affiliate of the Manager. He is 61 years old and | | |
| has been an employee of the Manager since | | Assistant General Counsel of BNY Mellon, |
| November 2006. Prior to joining the Manager, | | and an officer of 78 investment companies |
| Mr. Maisano served as Chairman and Chief | | (comprised of 188 portfolios) managed by the |
| Executive Officer of EACM Advisors, an | | Manager. She is 45 years old and has been an |
| affiliate of the Manager, since August 2004, and | | employee of the Manager since February 1984. |
| served as Chief Executive Officer of Evaluation | | JOHN B. HAMMALIAN, Vice President and |
| Associates, a leading institutional investment | | Assistant Secretary since August 2005. |
| consulting firm, from 1988 until 2004. | | |
| | | Managing Counsel of BNY Mellon, and an |
| MICHAEL A. ROSENBERG, Vice President | | officer of 78 investment companies (comprised |
| and Secretary since August 2005. | | of 188 portfolios) managed by the Manager. |
| Assistant General Counsel of BNY Mellon, | | He is 45 years old and has been an employee |
| and an officer of 78 investment companies | | of the Manager since February 1991. |
| (comprised of 188 portfolios) managed by the | | ROBERT R. MULLERY, Vice President and |
| Manager. He is 48 years old and has been an | | Assistant Secretary since August 2005. |
| employee of the Manager since October 1991. | | |
| | | Managing Counsel of BNY Mellon, and an |
| JAMES BITETTO, Vice President and | | officer of 78 investment companies (comprised |
| Assistant Secretary since August 2005. | | of 188 portfolios) managed by the Manager. |
| Senior Counsel of BNY Mellon and Secretary | | He is 56 years old and has been an employee |
| of the Manager, and an officer of 78 | | of the Manager since May 1986. |
| investment companies (comprised of 188 | | |
| portfolios) managed by the Manager. He is 42 | | |
| years old and has been an employee of the | | |
| Manager since December 1996. | | |
34
| JEFF PRUSNOFSKY, Vice President and | | ROBERT SALVIOLO, Assistant Treasurer |
| Assistant Secretary since August 2005. | | since July 2007. |
| Managing Counsel of BNY Mellon, and an | | Senior Accounting Manager – Equity Funds of |
| officer of 78 investment companies (comprised | | the Manager, and an officer of 78 investment |
| of 188 portfolios) managed by the Manager. | | companies (comprised of 188 portfolios) |
| He is 43 years old and has been an employee | | managed by the Manager. He is 41 years old |
| of the Manager since October 1990. | | and has been an employee of the Manager |
| | | since June 1989. |
| JAMES WINDELS, Treasurer since | | |
| November 2001. | | ROBERT SVAGNA, Assistant Treasurer |
| Director – Mutual Fund Accounting of the | | since December 2002. |
| Manager, and an officer of 78 investment | | Senior Accounting Manager – Equity Funds of |
| companies (comprised of 188 portfolios) | | the Manager, and an officer of 78 investment |
| managed by the Manager. He is 49 years old | | companies (comprised of 188 portfolios) |
| and has been an employee of the Manager | | managed by the Manager. He is 41 years old |
| since April 1985. | | and has been an employee of the Manager |
| | | since November 1990. |
| RICHARD CASSARO, Assistant Treasurer | | |
| since January 2008. | | JOSEPH W. CONNOLLY, Chief Compliance |
| Senior Accounting Manager – Money Market | | Officer since October 2004. |
| and Municipal Bond Funds of the Manager, | | Chief Compliance Officer of the Manager and |
| and an officer of 78 investment companies | | The Dreyfus Family of Funds (78 investment |
| (comprised of 188 portfolios) managed by | | companies, comprised of 188 portfolios). From |
| the Manager. He is 49 years old and has | | November 2001 through March 2004, Mr. |
| been an employee of the Manager since | | Connolly was first Vice-President, Mutual |
| September 1982. | | Fund Servicing for Mellon Global Securities |
| | | Services. In that capacity, Mr. Connolly was |
| GAVIN C. REILLY, Assistant Treasurer | | |
| | | responsible for managing Mellon’s Custody, |
| since December 2005. | | |
| | | Fund Accounting and Fund Administration |
| Tax Manager of the Investment Accounting | | services to third-party mutual fund clients. He |
| and Support Department of the Manager, and | | is 51 years old and has served in various |
| an officer of 78 investment companies | | capacities with the Manager since 1980, |
| (comprised of 188 portfolios) managed by the | | including manager of the firm’s Fund |
| Manager. He is 40 years old and has been an | | Accounting Department from 1997 through |
| employee of the Manager since April 1991. | | October 2001. |
| |
| ROBERT ROBOL, Assistant Treasurer | | WILLIAM GERMENIS, Anti-Money |
| since December 2002. | | Laundering Compliance Officer since |
| Senior Accounting Manager – Fixed Income | | July 2002. |
| Funds of the Manager, and an officer of 78 | | Vice President and Anti-Money Laundering |
| investment companies (comprised of 188 | | Compliance Officer of the Distributor, and the |
| portfolios) managed by the Manager. He is 44 | | Anti-Money Laundering Compliance Officer |
| years old and has been an employee of the | | of 74 investment companies (comprised of 184 |
| Manager since October 1988. | | portfolios) managed by the Manager. He is 38 |
| | | years old and has been an employee of the |
| | | Distributor since October 1998. |
The Fund 35
NOTES


Save time. Save paper. View your next shareholder report online as soon as it’s available. Log into www.dreyfus.com and sign up for Dreyfus eCommunications. It’s simple and only takes a few minutes.
The views expressed in this report reflect those of the portfolio manager only through the end of the period covered and do not necessarily represent the views of Dreyfus or any other person in the Dreyfus organization. Any such views are subject to change at any time based upon market or other conditions and Dreyfus disclaims any responsibility to update such views.These views may not be relied on as investment advice and, because investment decisions for a Dreyfus fund are based on numerous factors, may not be relied on as an indication of trading intent on behalf of any Dreyfus fund.
Not FDIC-Insured Not Bank-Guaranteed May Lose Value
| | Contents |
| |
| | THE FUND |
| |
| 2 | A Letter from the CEO |
| |
| 3 | Discussion of Fund Performance |
| |
| 6 | Fund Performance |
| |
| 7 | Understanding Your Fund’s Expenses |
| |
| 7 | Comparing Your Fund’s Expenses With Those of Other Funds |
| |
| 8 | Statement of Investments |
| |
| 24 | Statement of Financial Futures |
| |
| 25 | Statement of Assets and Liabilities |
| |
| 26 | Statement of Operations |
| |
| 27 | Statement of Changes in Net Assets |
| |
| 28 | Financial Highlights |
| |
| 29 | Notes to Financial Statements |
| |
| 37 | Report of Independent Registered Public Accounting Firm |
| |
| 38 | Important Tax Information |
| |
| 39 | Board Members Information |
| |
| 41 | Officers of the Fund |
| |
| | FOR MORE INFORMATION |
| |
| | Back Cover |
| |
The Fund
| Dreyfus BASIC |
| S&P 500 Stock Index Fund |

A LETTER FROM THE CEO
Dear Shareholder: |
We present to you this annual report for Dreyfus BASIC S&P 500 Stock Index Fund, covering the 12-month period from November 1, 2007, through October 31, 2008.
These are difficult times for equity investors. A credit crunch that began in early 2007 has developed into a full-blown global financial crisis, recently resulting in the failure of several major financial institutions and prompting a massive government rescue effort. Meanwhile, the U.S. economic slowdown has gathered momentum,depressing investor sentiment, consumer confidence and business investment.These factors undermined returns in most stock market sectors, particularly financial companies and businesses that tend to be more sensitive to economic trends.
The depth and duration of the economic downturn will depend on how quickly the financial system can be stabilized.We believe that the Temporary Guarantee Program for Money Market Funds and the $700 billion rescue package intended to promote greater liquidity in the financial markets meet several critical requirements for addressing today’s financial stresses, and we expect these measures to contribute to a more orderly deleveraging process. However, recuperation from the financial crisis is likely to take time. In the meantime, we encourage you to keep in touch with your financial advisor and maintain a long-term and disciplined perspective to investing. Indeed, we already are seeing some positive signs, including a likely peak in global inflationary pressures, a bottoming of the U.S. dollar, attractive valuations among fundamentally sound companies and a large pool of worldwide financial liquidity that could be deployed gradually as the economic cycle turns.
For information about how the fund performed during the reporting period, as well as market perspectives, we have provided a Discussion of Fund Performance given by the fund’s Portfolio Manager.
Thank you for your continued confidence and support.

| | Jonathan R. Baum
Chief Executive Officer
The Dreyfus Corporation |

DISCUSSION OF FUND PERFORMANCE
For the period of November 1, 2007, through October 31, 2008, as provided by Thomas Durante, CFA, Portfolio Manager
Fund and Market Performance Overview
For the 12-month period ended October 31, 2008, Dreyfus BASIC S&P 500 Stock Index Fund produced a total return of –36.23% .1 In comparison, the Standard & Poor’s 500 Composite Stock Price Index (the “S&P 500 Index”), the fund’s benchmark, produced a –36.08% return for the same period.2,3
Large-cap stocks produced disappointing absolute returns during an especially challenging reporting period. Concerns regarding slowing U.S. and overseas economies, turmoil in world credit markets, the near collapse of the global banking system and, later in the reporting period, slumping commodity prices caused stock prices across most market sectors to fall sharply. The difference in returns between the fund and the S&P 500 Index was primarily the result of transaction costs and operating expenses.
The Fund’s Investment Approach
The fund seeks to match the total return of the S&P 500 Index by generally investing in all 500 stocks in the S&P 500 Index in proportion to their respective weighting. Often considered a barometer for the stock market in general, the S&P 500 Index is made up of 500 widely held common stocks across 10 economic sectors. Each stock is weighted by its market capitalization; that is, larger companies have greater representation in the S&P 500 Index than smaller ones. The S&P 500 Index is dominated by large-cap, blue-chip stocks that comprise nearly 75% of total U.S. market capitalization.
Volatility Increases as Financial Crisis Intensifies
A credit crisis that dominated much of the reporting period developed into a full-blown global financial crisis, resulting in the failure of several major financial institutions. As lenders grew increasingly risk-averse,
| DISCUSSION OF FUND PERFORMANCE (continued) |
companies across virtually all industry groups scrambled to obtain funding from a rapidly shrinking supply of available credit. Also contributing to the downturn was a barrage of negative economic news, including slowing U.S. and global economies, falling home prices, growing unemployment and sluggish consumer spending.As the slowdown intensified, previously high-flying commodity prices retreated sharply from their highs.These factors caused investors to become more averse to risks, sparking broad-based declines in the stock market.
The Federal Reserve Board (the “Fed”) responded aggressively to the economic slowdown and financial crisis by reducing short-term interest rates and, in March 2008, participating in the rescue of investment bank Bear Stearns.Although the market rallied briefly in the spring, the rebound proved to be short-lived. Over the summer, additional government rescues were announced for insurer American International Group and mortgage agencies Freddie Mac and Fannie Mae. Meanwhile, investment bank Lehman Brothers filed for bankruptcy, Merrill Lynch andWachovia were acquired by competitors,Washington Mutual was seized by regulators, and Goldman Sachs and Morgan Stanley re-registered as bank holding companies to enable them to tap government funds. By September, the financial crisis threatened to spin out of control, and the global banking system came close to collapse.
The U.S. Congress responded to the crisis by making $700 billion available to banks through the controversial Troubled Asset Relief Program. In addition, the Fed and several of the world’s major central banks announced unprecedented, coordinated reductions in short-term interest rates to help strengthen the world’s financial systems.The reporting period ended with all major stock market indices reporting negative double-digit returns.
No Winners in this Turbulent Market Environment
For the 12-month reporting period, none of the 10 sectors in the S&P 500 Index posted a positive absolute return. Declines were most severe among the S&P 500 Index’s financials, technology, energy and industrials areas. A host of diversified financial conglomerates, banks, and insurance
4
companies were hurt by massive sub-prime related losses. Technology stocks retracted amid a slowdown in spending by consumers and corporations, and a slowdown in exports hurt many hardware producers that rely heavily on overseas sales. Semiconductor stocks fell along with hardware sales, while Internet companies were hurt by lower advertising revenues, troubled product launches and reduced consumer spending.
Energy stocks gave back many of their previous gains when crude oil prices dropped from their highs of $141 per barrel in July to $61 per barrel by the reporting period’s end. Refiners, integrated energy producers, drillers, oil field services firms and equipment services companies were particularly hard-hit. Finally, the industrials sector suffered from a sharply reduced number of infrastructure construction projects worldwide, which drove down the stock prices of large industrial conglomerates as well as construction and industrial machinery and equipment stocks.
Index Funds Offer Diversification
As an index fund, we attempt to replicate the returns of the S&P 500 Index by closely approximating its composition. In our view, one of the greatest benefits of an index fund is that it offers a broadly diversified investment vehicle that can help investors manage risks by limiting the impact on the overall portfolio of unexpected losses in any single industry group or holding.
November 17, 2008
| 1 | | Total return includes reinvestment of dividends and any capital gains paid. Past performance is no |
| | | guarantee of future results. Share price and investment return fluctuate such that upon redemption, |
| | | fund shares may be worth more or less than their original cost. Return figure provided reflects the |
| | | absorption of certain fund expenses by The Dreyfus Corporation pursuant to an agreement in |
| | | effect that may be extended, terminated or modified. Had these expenses not been absorbed, the |
| | | fund’s return would have been lower. |
| 2 | | SOURCE: LIPPER INC. — Reflects reinvestment of dividends daily and, where applicable, |
| | | capital gain distributions.The Standard & Poor’s 500 Composite Stock Price Index is a widely |
| | | accepted, unmanaged index of U.S. stock market performance. |
| 3 | | “Standard & Poor’s®,”“S&P®,”“Standard & Poor’s® 500” and “S&P 500®” are trademarks |
| | | of The McGraw-Hill Companies, Inc., and have been licensed for use by the fund.The fund is |
| | | not sponsored, endorsed, sold or promoted by Standard & Poor’s and Standard & Poor’s makes no |
| | | representation regarding the advisability of investing in the fund. |
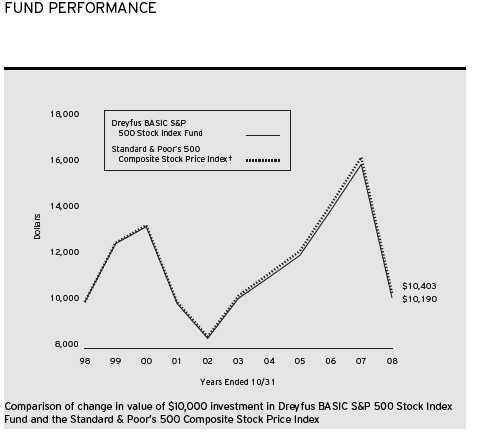
| Average Annual Total Returns as of 10/31/08 | | | | |
| | | 1 Year | | 5 Years | | 10 Years |
| |
| |
| |
|
| Fund | | (36.23)% | | 0.07% | | 0.19% |
| † Source: Lipper Inc. |
| Past performance is not predictive of future performance.The fund’s performance shown in the graph and table does not |
| reflect the deduction of taxes that a shareholder would pay on fund distributions or the redemption of fund shares. |
| The above graph compares a $10,000 investment made in Dreyfus BASIC S&P 500 Stock Index Fund on |
| 10/31/98 to a $10,000 investment made in the Standard & Poor’s 500 Composite Stock Price Index (the “Index”) |
| on that date. All dividends and capital gain distributions are reinvested. |
| The fund’s performance shown in the line graph takes into account all applicable fees and expenses.The Index is a widely |
| accepted, unmanaged index of U.S. stock market performance and reflects the reinvestment of dividends daily. Unlike a |
| mutual fund, the Index is not subject to charges, fees and other expenses. Investors cannot invest directly in any index. |
| Further information relating to fund performance, including expense reimbursements, if applicable, is contained in the |
| Financial Highlights section of the prospectus and elsewhere in this report. |
6
UNDERSTANDING YOUR FUND’S EXPENSES (Unaudited)
As a mutual fund investor, you pay ongoing expenses, such as management fees and other expenses. Using the information below, you can estimate how these expenses affect your investment and compare them with the expenses of other funds.You also may pay one-time transaction expenses, including sales charges (loads) and redemption fees, which are not shown in this section and would have resulted in higher total expenses. For more information, see your fund’s prospectus or talk to your financial adviser.
Review your fund’s expenses
The table below shows the expenses you would have paid on a $1,000 investment in Dreyfus BASIC S&P 500 Stock Index Fund from May 1, 2008 to October 31, 2008. It also shows how much a $1,000 investment would be worth at the close of the period, assuming actual returns and expenses.
Expenses and Value of a $1,000 Investment assuming actual returns for the six months ended October 31, 2008
| Expenses paid per $1,000† | | $ .86 |
| Ending value (after expenses) | | $706.30 |
COMPARING YOUR FUND’S EXPENSES WITH THOSE OF OTHER FUNDS (Unaudited)
Using the SEC’s method to compare expenses
The Securities and Exchange Commission (SEC) has established guidelines to help investors assess fund expenses. Per these guidelines, the table below shows your fund’s expenses based on a $1,000 investment, assuming a hypothetical 5% annualized return. You can use this information to compare the ongoing expenses (but not transaction expenses or total cost) of investing in the fund with those of other funds.All mutual fund shareholder reports will provide this information to help you make this comparison. Please note that you cannot use this information to estimate your actual ending account balance and expenses paid during the period.
Expenses and Value of a $1,000 Investment assuming a hypothetical 5% annualized return for the six months ended October 31, 2008
| Expenses paid per $1,000† | | $ 1.02 |
| Ending value (after expenses) | | $1,024.13 |
| † Expenses are equal to the fund’s annualized expense ratio of .20%; multiplied by the average account value over the |
| period, multiplied by 184/366 (to reflect the one-half year period). |
STATEMENT OF INVESTMENTS
October 31, 2008 |
| Common Stocks—93.8% | | Shares | | Value ($) |
| |
| |
|
| Consumer Discretionary—8.1% | | | | |
| Abercrombie & Fitch, Cl. A | | 8,367 | | 242,308 |
| Amazon.com | | 30,570 a | | 1,749,827 |
| Apollo Group, Cl. A | | 10,399 a | | 722,834 |
| AutoNation | | 13,403 a,b | | 92,079 |
| AutoZone | | 4,128 a | | 525,453 |
| Bed Bath & Beyond | | 24,751 a,b | | 637,833 |
| Best Buy | | 33,021 b | | 885,293 |
| Big Lots | | 7,809 a,b | | 190,774 |
| Black & Decker | | 5,856 | | 296,431 |
| Carnival | | 41,699 | | 1,059,155 |
| CBS, Cl. B | | 65,058 | | 631,713 |
| Centex | | 11,525 | | 141,181 |
| Coach | | 32,851 a | | 676,731 |
| Colgate-Palmolive | | 48,513 | | 3,044,676 |
| Comcast, Cl. A | | 282,830 | | 4,457,401 |
| D.R. Horton | | 21,081 b | | 155,578 |
| Darden Restaurants | | 13,390 | | 296,856 |
| DIRECTV Group | | 55,942 a,b | | 1,224,570 |
| Eastman Kodak | | 27,492 b | | 252,377 |
| Expedia | | 19,949 a | | 189,715 |
| Family Dollar Stores | | 13,358 | | 359,464 |
| Ford Motor | | 197,742 a,b | | 433,055 |
| Fortune Brands | | 14,704 | | 560,811 |
| GameStop, Cl. A | | 15,607 a | | 427,476 |
| Gannett | | 22,201 b | | 244,211 |
| Gap | | 42,870 | | 554,738 |
| General Motors | | 54,312 b | | 313,923 |
| Genuine Parts | | 15,655 | | 616,024 |
| Goodyear Tire & Rubber | | 23,265 a | | 207,524 |
| H & R Block | | 31,312 | | 617,473 |
| Harley-Davidson | | 22,578 b | | 552,709 |
| Harman International Industries | | 5,777 b | | 106,123 |
| Hasbro | | 13,334 b | | 387,619 |
| Home Depot | | 162,108 | | 3,824,128 |
| International Game Technology | | 29,558 | | 413,812 |
8
| Common Stocks (continued) | | Shares | | Value ($) |
| |
| |
|
| Consumer Discretionary (continued) | | | | |
| Interpublic Group of Cos. | | 44,953 a | | 233,306 |
| J.C. Penney | | 21,191 | | 506,889 |
| Johnson Controls | | 56,681 | | 1,004,954 |
| Jones Apparel Group | | 8,231 b | | 91,446 |
| KB Home | | 7,436 b | | 124,107 |
| Kohl’s | | 29,286 a | | 1,028,817 |
| Leggett & Platt | | 15,877 b | | 275,625 |
| Lennar, Cl. A | | 13,364 b | | 103,437 |
| Limited Brands | | 28,607 | | 342,712 |
| Liz Claiborne | | 9,519 | | 77,580 |
| Lowe’s Cos. | | 139,808 | | 3,033,834 |
| Macy’s | | 40,143 | | 493,357 |
| Marriott International, Cl. A | | 28,969 b | | 604,583 |
| Mattel | | 34,705 | | 521,269 |
| McDonald’s | | 108,305 | | 6,274,109 |
| McGraw-Hill | | 30,677 b | | 823,371 |
| Meredith | | 3,505 b | | 67,892 |
| New York Times, Cl. A | | 13,786 b | | 137,860 |
| Newell Rubbermaid | | 26,456 | | 363,770 |
| News, Cl. A | | 219,995 | | 2,340,747 |
| NIKE, Cl. B | | 37,548 b | | 2,163,891 |
| Nordstrom | | 16,771 b | | 303,387 |
| Office Depot | | 11,341 a | | 40,828 |
| Omnicom Group | | 30,615 | | 904,367 |
| Polo Ralph Lauren | | 5,526 b | | 260,661 |
| Pulte Homes | | 20,593 b | | 229,406 |
| RadioShack | | 12,526 | | 158,579 |
| Scripps Networks Interactive, Cl. A | | 8,596 b | | 244,126 |
| Sears Holdings | | 5,592 a,b | | 322,882 |
| Sherwin-Williams | | 9,439 b | | 537,173 |
| Snap-On | | 5,529 | | 204,297 |
| Stanley Works | | 7,511 | | 245,910 |
| Staples | | 67,070 | | 1,303,170 |
| Starbucks | | 69,873 a,b | | 917,432 |
| Starwood Hotels & Resorts Worldwide | | 17,834 b | | 401,978 |
| STATEMENT OF INVESTMENTS (continued) |
| Common Stocks (continued) | | Shares | | Value ($) |
| |
| |
|
| Consumer Discretionary (continued) | | | | |
| Target | | 71,377 | | 2,863,645 |
| Tiffany & Co. | | 12,034 b | | 330,333 |
| Time Warner | | 343,703 | | 3,467,963 |
| TJX Cos. | | 40,533 | | 1,084,663 |
| VF | | 8,373 | | 461,352 |
| Viacom, Cl. B | | 60,432 a | | 1,221,935 |
| Walt Disney | | 178,278 | | 4,617,400 |
| Washington Post, Cl. B | | 538 | | 229,618 |
| Whirlpool | | 7,184 b | | 335,134 |
| Wyndham Worldwide | | 16,898 b | | 138,395 |
| Yum! Brands | | 45,236 | | 1,312,296 |
| | | | | 69,842,361 |
| Consumer Staples—11.8% | | | | |
| Altria Group | | 200,014 | | 3,838,269 |
| Anheuser-Busch | | 68,978 | | 4,278,705 |
| Archer-Daniels-Midland | | 61,474 | | 1,274,356 |
| Avon Products | | 40,774 | | 1,012,418 |
| Brown-Forman, Cl. B | | 10,049 | | 456,213 |
| Campbell Soup | | 20,566 | | 780,480 |
| Clorox | | 13,102 | | 796,733 |
| Coca-Cola | | 190,838 | | 8,408,322 |
| Coca-Cola Enterprises | | 27,486 | | 276,234 |
| ConAgra Foods | | 43,463 | | 757,125 |
| Constellation Brands, Cl. A | | 18,621 a | | 233,507 |
| Costco Wholesale | | 41,391 | | 2,359,701 |
| CVS Caremark | | 136,513 | | 4,184,123 |
| Dean Foods | | 14,386 a,b | | 314,478 |
| Dr. Pepper Snapple Group | | 24,365 a | | 557,958 |
| Estee Lauder, Cl. A | | 10,841 | | 390,710 |
| General Mills | | 32,011 | | 2,168,425 |
| H.J. Heinz | | 30,121 | | 1,319,902 |
| Hershey | | 16,169 b | | 602,134 |
| Kellogg | | 24,258 | | 1,223,088 |
| Kimberly-Clark | | 39,997 | | 2,451,416 |
| Kraft Foods, Cl. A | | 144,777 | | 4,218,802 |
| Kroger | | 63,168 | | 1,734,593 |
10
| Common Stocks (continued) | | Shares | | Value ($) |
| |
| |
|
| Consumer Staples (continued) | | | | |
| Lorillard | | 16,623 | | 1,094,791 |
| McCormick & Co. | | 12,253 | | 412,436 |
| Molson Coors Brewing, Cl. B | | 14,451 | | 539,889 |
| Pepsi Bottling Group | | 12,925 | | 298,826 |
| PepsiCo | | 149,428 | | 8,518,890 |
| Philip Morris International | | 198,208 | | 8,616,102 |
| Procter & Gamble | | 291,630 | | 18,821,800 |
| Reynolds American | | 16,342 | | 800,104 |
| Safeway | | 41,815 | | 889,405 |
| Sara Lee | | 67,461 | | 754,214 |
| SUPERVALU | | 20,272 | | 288,673 |
| SYSCO | | 57,394 | | 1,503,723 |
| Tyson Foods, Cl. A | | 26,299 | | 229,853 |
| UST | | 14,122 | | 954,506 |
| Wal-Mart Stores | | 215,559 | | 12,030,348 |
| Walgreen | | 94,620 | | 2,409,025 |
| Whole Foods Market | | 13,368 b | | 143,305 |
| | | | | 101,943,582 |
| Energy—12.3% | | | | |
| Anadarko Petroleum | | 44,724 | | 1,578,757 |
| Apache | | 31,880 | | 2,624,680 |
| Baker Hughes | | 29,419 | | 1,028,194 |
| BJ Services | | 28,049 | | 360,430 |
| Cabot Oil & Gas | | 9,225 | | 258,946 |
| Cameron International | | 20,687 a,b | | 501,867 |
| Chesapeake Energy | | 49,260 b | | 1,082,242 |
| Chevron | | 197,604 | | 14,741,258 |
| ConocoPhillips | | 144,970 | | 7,541,339 |
| Consol Energy | | 17,451 | | 547,787 |
| Devon Energy | | 42,602 | | 3,444,798 |
| El Paso | | 67,267 b | | 652,490 |
| ENSCO International | | 13,817 | | 525,184 |
| EOG Resources | | 23,708 | | 1,918,451 |
| Exxon Mobil | | 498,486 | | 36,947,782 |
| Halliburton | | 83,318 | | 1,648,863 |
| Hess | | 26,826 | | 1,615,193 |
| STATEMENT OF INVESTMENTS (continued) |
| Common Stocks (continued) | | Shares | | Value ($) |
| |
| |
|
| Energy (continued) | | | | |
| Marathon Oil | | 67,600 | | 1,967,160 |
| Massey Energy | | 7,800 | | 180,102 |
| Murphy Oil | | 18,123 | | 917,749 |
| Nabors Industries | | 26,878 a | | 386,506 |
| National Oilwell Varco | | 39,662 a | | 1,185,497 |
| Noble | | 25,658 | | 826,444 |
| Noble Energy | | 16,445 | | 852,180 |
| Occidental Petroleum | | 78,407 | | 4,354,725 |
| Peabody Energy | | 25,937 | | 895,086 |
| Pioneer Natural Resources | | 11,476 b | | 319,377 |
| Range Resources | | 14,917 | | 629,796 |
| Rowan | | 10,757 b | | 195,132 |
| Schlumberger | | 115,137 | | 5,946,826 |
| Smith International | | 20,633 | | 711,426 |
| Southwestern Energy | | 32,685 a | | 1,164,240 |
| Spectra Energy | | 60,444 | | 1,168,383 |
| Sunoco | | 11,151 | | 340,105 |
| Tesoro | | 13,139 b | | 127,054 |
| Transocean | | 30,447 a | | 2,506,702 |
| Valero Energy | | 50,465 | | 1,038,570 |
| Weatherford International | | 64,922 a | | 1,095,883 |
| Williams | | 55,826 | | 1,170,671 |
| XTO Energy | | 52,730 | | 1,895,644 |
| | | | | 106,893,519 |
| Financial—13.9% | | | | |
| Aflac | | 45,394 | | 2,010,046 |
| Allstate | | 52,592 | | 1,387,903 |
| American Capital | | 19,591 b | | 275,254 |
| American Express | | 110,644 | | 3,042,710 |
| American International Group | | 237,205 b | | 453,062 |
| Ameriprise Financial | | 21,223 | | 458,417 |
| AON | | 25,558 | | 1,081,103 |
| Apartment Investment & Management, Cl. A | | 9,194 b | | 134,508 |
| Assurant | | 11,391 | | 290,243 |
| AvalonBay Communities | | 7,365 b | | 523,062 |
12
| Common Stocks (continued) | | Shares | | Value ($) |
| |
| |
|
| Financial (continued) | | | | |
| Bank of America | | 480,556 | | 11,615,039 |
| Bank of New York Mellon | | 109,281 | | 3,562,561 |
| BB & T | | 52,250 b | | 1,873,162 |
| Boston Properties | | 11,449 | | 811,505 |
| Capital One Financial | | 35,866 b | | 1,403,078 |
| CB Richard Ellis Group, Cl. A | | 16,899 a,b | | 118,462 |
| Charles Schwab | | 88,722 | | 1,696,365 |
| Chubb | | 34,919 | | 1,809,503 |
| Cincinnati Financial | | 15,583 | | 405,002 |
| CIT Group | | 26,987 b | | 111,726 |
| Citigroup | | 521,002 | | 7,111,677 |
| CME Group | | 6,428 | | 1,813,660 |
| Comerica | | 14,468 b | | 399,172 |
| Developers Diversified Realty | | 11,418 b | | 150,375 |
| Discover Financial Services | | 45,752 | | 560,462 |
| E*TRADE FINANCIAL | | 44,762 a,b | | 81,467 |
| Equity Residential | | 25,818 | | 901,823 |
| Federated Investors, Cl. B | | 8,490 | | 205,458 |
| Fifth Third Bancorp | | 54,917 | | 595,849 |
| First Horizon National | | 18,578 b | | 221,264 |
| Franklin Resources | | 14,905 | | 1,013,540 |
| General Growth Properties | | 14,091 b | | 58,337 |
| Genworth Financial, Cl. A | | 31,417 | | 152,058 |
| Goldman Sachs Group | | 41,674 | | 3,854,845 |
| Hartford Financial Services Group | | 30,065 | | 310,271 |
| HCP | | 24,140 | | 722,510 |
| Host Hotels & Resorts | | 50,054 b | | 517,558 |
| Hudson City Bancorp | | 49,923 b | | 939,052 |
| Huntington Bancshares | | 35,070 b | | 331,411 |
| IntercontinentalExchange | | 6,758 a | | 578,214 |
| Invesco | | 36,900 | | 550,179 |
| Janus Capital Group | | 13,979 b | | 164,113 |
| JPMorgan Chase & Co. | | 353,193 | | 14,569,211 |
| KeyCorp | | 46,637 | | 570,371 |
| Kimco Realty | | 19,788 | | 446,813 |
| STATEMENT OF INVESTMENTS (continued) |
| Common Stocks (continued) | | Shares | | Value ($) |
| |
| |
|
| Financial (continued) | | | | |
| Legg Mason | | 11,148 b | | 247,374 |
| Leucadia National | | 16,908 b | | 453,811 |
| Lincoln National | | 24,758 | | 426,828 |
| Loews | | 34,567 | | 1,147,970 |
| M & T Bank | | 7,362 b | | 597,058 |
| Marsh & McLennan Cos. | | 48,849 | | 1,432,253 |
| Marshall & Ilsley | | 25,198 b | | 454,320 |
| MBIA | | 20,686 b | | 203,343 |
| Merrill Lynch & Co. | | 146,223 | | 2,718,286 |
| MetLife | | 73,057 b | | 2,426,954 |
| Moody’s | | 19,401 b | | 496,666 |
| Morgan Stanley | | 105,741 | | 1,847,295 |
| Nasdaq OMX Group | | 13,036 a,b | | 423,149 |
| National City | | 200,791 | | 542,136 |
| Northern Trust | | 21,222 | | 1,195,011 |
| NYSE Euronext | | 25,517 | | 770,103 |
| Plum Creek Timber | | 16,483 b | | 614,486 |
| PNC Financial Services Group | | 33,021 | | 2,201,510 |
| Principal Financial Group | | 24,706 | | 469,167 |
| Progressive | | 64,742 | | 923,868 |
| ProLogis | | 25,039 | | 350,546 |
| Prudential Financial | | 41,673 | | 1,250,190 |
| Public Storage | | 11,779 | | 959,989 |
| Regions Financial | | 67,048 b | | 743,562 |
| Simon Property Group | | 21,470 | | 1,439,134 |
| SLM | | 44,947 a | | 479,584 |
| Sovereign Bancorp | | 45,760 a,b | | 132,704 |
| State Street | | 40,776 | | 1,767,640 |
| SunTrust Banks | | 33,636 | | 1,350,149 |
| T. Rowe Price Group | | 24,810 b | | 980,987 |
| Torchmark | | 8,561 | | 357,593 |
| Travelers Cos. | | 57,750 | | 2,457,263 |
| U.S. Bancorp | | 166,254 | | 4,956,032 |
| Unum Group | | 33,174 b | | 522,491 |
| Vornado Realty Trust | | 12,953 b | | 913,834 |
| Wachovia | | 204,214 b | | 1,309,012 |
14
| Common Stocks (continued) | | Shares | | Value ($) |
| |
| |
|
| Financial (continued) | | | | |
| Wells Fargo & Co. | | 317,592 b | | 10,814,008 |
| XL Capital, Cl. A | | 29,936 | | 290,379 |
| Zions Bancorporation | | 10,246 b | | 390,475 |
| | | | | 120,939,561 |
| Health Care—13.0% | | | | |
| Abbott Laboratories | | 147,456 | | 8,132,198 |
| Aetna | | 46,294 | | 1,151,332 |
| Allergan | | 29,388 | | 1,165,822 |
| AmerisourceBergen | | 15,378 | | 480,870 |
| Amgen | | 101,814 a | | 6,097,640 |
| Applied Biosystems | | 15,855 | | 488,810 |
| Barr Pharmaceuticals | | 10,279 a | | 660,529 |
| Baxter International | | 59,958 | | 3,626,859 |
| Becton, Dickinson & Co. | | 23,309 | | 1,617,645 |
| Biogen Idec | | 27,983 a | | 1,190,677 |
| Boston Scientific | | 143,958 a | | 1,299,941 |
| Bristol-Myers Squibb | | 189,101 | | 3,886,026 |
| C.R. Bard | | 9,489 | | 837,404 |
| Cardinal Health | | 34,083 | | 1,301,971 |
| Celgene | | 43,566 a | | 2,799,551 |
| CIGNA | | 26,822 | | 437,199 |
| Coventry Health Care | | 14,504 a | | 191,308 |
| Covidien | | 47,723 | | 2,113,652 |
| DaVita | | 10,125 a | | 574,594 |
| Eli Lilly & Co. | | 95,910 | | 3,243,676 |
| Express Scripts | | 23,976 a | | 1,453,185 |
| Forest Laboratories | | 29,113 a | | 676,295 |
| Genzyme | | 25,543 a | | 1,861,574 |
| Gilead Sciences | | 88,123 a | | 4,040,440 |
| Hospira | | 15,304 a | | 425,757 |
| Humana | | 16,313 a | | 482,702 |
| IMS Health | | 17,374 | | 249,143 |
| Intuitive Surgical | | 3,683 a | | 636,386 |
| Johnson & Johnson | | 267,405 | | 16,402,623 |
| King Pharmaceuticals | | 23,646 a,b | | 207,848 |
| Laboratory Corp. of America Holdings | | 10,610 a,b | | 652,409 |
| STATEMENT OF INVESTMENTS (continued) |
| Common Stocks (continued) | | Shares | | Value ($) |
| |
| |
|
| Health Care (continued) | | | | |
| McKesson | | 26,489 | | 974,530 |
| Medco Health Solutions | | 48,386 a | | 1,836,249 |
| Medtronic | | 108,239 | | 4,365,279 |
| Merck & Co. | | 205,051 | | 6,346,328 |
| Millipore | | 5,248 a | | 272,319 |
| Mylan | | 23,271 a,b | | 199,432 |
| Patterson Cos. | | 6,920 a | | 175,284 |
| PerkinElmer | | 11,332 | | 203,296 |
| Pfizer | | 646,216 | | 11,444,485 |
| Quest Diagnostics | | 14,870 | | 695,916 |
| Schering-Plough | | 154,855 | | 2,243,849 |
| St. Jude Medical | | 32,348 a | | 1,230,194 |
| Stryker | | 23,732 | | 1,268,713 |
| Tenet Healthcare | | 45,575 a | | 199,618 |
| Thermo Fisher Scientific | | 39,945 a | | 1,621,767 |
| UnitedHealth Group | | 117,372 | | 2,785,238 |
| Varian Medical Systems | | 12,056 a | | 548,669 |
| Waters | | 9,545 a | | 418,071 |
| Watson Pharmaceuticals | | 9,961 a | | 260,679 |
| WellPoint | | 50,248 a | | 1,953,140 |
| Wyeth | | 127,364 | | 4,098,574 |
| Zimmer Holdings | | 22,101 a | | 1,026,149 |
| | | | | 112,553,845 |
| Industrial—10.3% | | | | |
| 3M | | 67,267 | | 4,325,268 |
| Allied Waste Industries | | 32,330 a | | 336,879 |
| Avery Dennison | | 10,232 | | 358,325 |
| Boeing | | 71,765 | | 3,751,157 |
| Burlington Northern Santa Fe | | 26,605 | | 2,369,441 |
| C.H. Robinson Worldwide | | 16,280 b | | 842,978 |
| Caterpillar | | 58,734 | | 2,241,877 |
| Cintas | | 12,494 | | 296,108 |
| Cooper Industries, Cl. A | | 16,629 | | 514,668 |
| CSX | | 38,709 | | 1,769,775 |
| Cummins | | 19,295 | | 498,776 |
16
| Common Stocks (continued) | | Shares | | Value ($) |
| |
| |
|
| Industrial (continued) | | | | |
| Danaher | | 24,814 b | | 1,469,981 |
| Deere & Co. | | 41,149 | | 1,586,705 |
| Dover | | 18,060 | | 573,766 |
| Eaton | | 15,710 | | 700,666 |
| Emerson Electric | | 74,559 | | 2,440,316 |
| Equifax | | 12,385 | | 323,001 |
| Expeditors International Washington | | 20,346 | | 664,297 |
| Fastenal | | 12,267 b | | 493,869 |
| FedEx | | 29,612 | | 1,935,736 |
| Flowserve | | 5,503 | | 313,231 |
| Fluor | | 16,937 b | | 676,294 |
| General Dynamics | | 38,110 | | 2,298,795 |
| General Electric | | 1,005,663 | | 19,620,485 |
| Goodrich | | 12,045 | | 440,365 |
| Honeywell International | | 70,817 | | 2,156,378 |
| Illinois Tool Works | | 37,985 | | 1,268,319 |
| Ingersoll-Rand, Cl. A | | 30,352 | | 559,994 |
| ITT | | 17,337 | | 771,497 |
| Jacobs Engineering Group | | 11,668 a | | 425,065 |
| L-3 Communications Holdings | | 11,728 | | 951,962 |
| Lockheed Martin | | 32,292 | | 2,746,435 |
| Manitowoc | | 12,372 | | 121,740 |
| Masco | | 34,767 b | | 352,885 |
| Monster Worldwide | | 11,893 a | | 169,356 |
| Norfolk Southern | | 35,925 | | 2,153,345 |
| Northrop Grumman | | 32,695 | | 1,533,069 |
| Paccar | | 34,905 b | | 1,020,622 |
| Pall | | 11,423 | | 301,681 |
| Parker Hannifin | | 16,037 | | 621,754 |
| Pitney Bowes | | 19,701 | | 488,191 |
| Precision Castparts | | 13,343 | | 864,760 |
| R.R. Donnelley & Sons | | 20,293 | | 336,255 |
| Raytheon | | 40,438 | | 2,066,786 |
| Robert Half International | | 15,150 | | 285,881 |
| Rockwell Automation | | 14,011 | | 387,684 |
| STATEMENT OF INVESTMENTS (continued) |
| Common Stocks (continued) | | Shares | | Value ($) |
| |
| |
|
| Industrial (continued) | | | | |
| Rockwell Collins | | 15,331 | | 570,773 |
| Ryder System | | 5,478 b | | 217,038 |
| Southwest Airlines | | 69,908 | | 823,516 |
| Terex | | 9,601 a | | 160,241 |
| Textron | | 23,805 | | 421,349 |
| Tyco International | | 46,046 | | 1,164,043 |
| Union Pacific | | 49,348 | | 3,294,966 |
| United Parcel Service, Cl. B | | 97,528 | | 5,147,528 |
| United Technologies | | 92,978 | | 5,110,071 |
| W.W. Grainger | | 6,198 | | 486,977 |
| Waste Management | | 46,886 | | 1,464,250 |
| | | | | 89,287,170 |
| Information Technology—14.8% | | | | |
| Adobe Systems | | 50,801 a | | 1,353,339 |
| Advanced Micro Devices | | 57,790 a,b | | 202,265 |
| Affiliated Computer Services, Cl. A | | 9,210 a | | 377,610 |
| Agilent Technologies | | 35,250 a | | 782,198 |
| Akamai Technologies | | 16,224 a | | 233,301 |
| Altera | | 28,637 | | 496,852 |
| Amphenol, Cl. A | | 16,955 | | 485,761 |
| Analog Devices | | 27,719 | | 592,078 |
| Apple | | 85,015 a | | 9,146,764 |
| Applied Materials | | 129,479 | | 1,671,574 |
| Autodesk | | 21,402 a | | 456,077 |
| Automatic Data Processing | | 49,517 | | 1,730,619 |
| BMC Software | | 18,232 a | | 470,750 |
| Broadcom, Cl. A | | 39,888 a | | 681,287 |
| CA | | 37,281 | | 663,602 |
| Ciena | | 4,012 a,b | | 38,555 |
| Cisco Systems | | 566,944 a | | 10,074,595 |
| Citrix Systems | | 17,504 a | | 451,078 |
| Cognizant Technology Solutions, Cl. A | | 27,854 a | | 534,797 |
| Computer Sciences | | 14,453 a | | 435,902 |
| Compuware | | 24,452 a | | 156,004 |
| Convergys | | 11,801 a | | 90,750 |
18
| Common Stocks (continued) | | Shares | | Value ($) |
| |
| |
|
| Information Technology (continued) | | | | |
| Corning | | 150,446 | | 1,629,330 |
| Dell | | 167,201 a | | 2,031,492 |
| eBay | | 105,559 a | | 1,611,886 |
| Electronic Arts | | 30,397 a | | 692,444 |
| EMC | | 197,447 a,b | | 2,325,926 |
| Fidelity National Information Services | | 16,483 | | 248,728 |
| Fiserv | | 15,781 a | | 526,454 |
| Google, Cl. A | | 22,932 a | | 8,240,844 |
| Harris | | 12,879 | | 463,000 |
| Hewlett-Packard | | 235,566 | | 9,017,466 |
| Intel | | 540,593 | | 8,649,488 |
| International Business Machines | | 130,227 | | 12,107,204 |
| Intuit | | 30,676 a | | 768,741 |
| Jabil Circuit | | 19,955 | | 167,822 |
| JDS Uniphase | | 13,656 a,b | | 74,562 |
| Juniper Networks | | 52,142 a | | 977,141 |
| KLA-Tencor | | 16,221 | | 377,138 |
| Lexmark International, Cl. A | | 6,829 a,b | | 176,393 |
| Linear Technology | | 21,383 b | | 484,966 |
| LSI | | 61,305 a,b | | 236,024 |
| MasterCard, Cl. A | | 6,970 b | | 1,030,305 |
| MEMC Electronic Materials | | 21,843 a | | 401,474 |
| Microchip Technology | | 17,669 b | | 435,187 |
| Micron Technology | | 72,851 a,b | | 343,128 |
| Microsoft | | 754,593 | | 16,850,062 |
| Molex | | 13,584 | | 195,745 |
| Motorola | | 215,422 | | 1,156,816 |
| National Semiconductor | | 20,822 | | 274,226 |
| NetApp | | 33,043 a | | 447,072 |
| Novell | | 33,473 a | | 155,984 |
| Novellus Systems | | 9,814 a | | 155,061 |
| NVIDIA | | 53,123 a | | 465,357 |
| Oracle | | 373,555 a | | 6,832,321 |
| Paychex | | 30,640 b | | 874,466 |
| QLogic | | 12,996 a,b | | 156,212 |
| STATEMENT OF INVESTMENTS (continued) |
| Common Stocks (continued) | | Shares | | Value ($) |
| |
| |
|
| Information Technology (continued) | | | | |
| QUALCOMM | | 157,420 | | 6,022,889 |
| Salesforce.com | | 9,983 a,b | | 309,074 |
| SanDisk | | 21,814 a,b | | 193,926 |
| Sun Microsystems | | 74,663 a | | 343,450 |
| Symantec | | 77,706 a | | 977,541 |
| Tellabs | | 37,952 a | | 160,916 |
| Teradata | | 17,357 a | | 267,124 |
| Teradyne | | 16,198 a | | 82,610 |
| Texas Instruments | | 126,357 | | 2,471,543 |
| Total System Services | | 18,948 | | 260,346 |
| Tyco Electronics | | 45,660 | | 887,630 |
| Unisys | | 33,396 a | | 50,762 |
| VeriSign | | 18,613 a,b | | 394,596 |
| Western Union | | 70,666 | | 1,078,363 |
| Xerox | | 85,878 | | 688,742 |
| Xilinx | | 26,954 b | | 496,493 |
| Yahoo! | | 132,675 a | | 1,700,894 |
| | | | | 128,093,122 |
| Materials—2.9% | | | | |
| Air Products & Chemicals | | 20,149 | | 1,171,261 |
| AK Steel Holding | | 10,800 b | | 150,336 |
| Alcoa | | 77,831 | | 895,835 |
| Allegheny Technologies | | 9,688 | | 257,120 |
| Ashland | | 5,362 | | 121,128 |
| Ball | | 9,476 | | 324,079 |
| Bemis | | 9,786 | | 243,084 |
| CF Industries Holdings | | 5,382 | | 345,471 |
| Dow Chemical | | 88,838 | | 2,369,309 |
| E.I. du Pont de Nemours & Co. | | 86,043 | | 2,753,376 |
| Eastman Chemical | | 7,290 b | | 294,443 |
| Ecolab | | 16,876 | | 628,800 |
| Freeport-McMoRan Copper & Gold | | 36,627 | | 1,065,846 |
| Hercules | | 11,149 | | 187,415 |
| International Flavors & Fragrances | | 7,701 | | 245,508 |
| International Paper | | 40,949 b | | 705,142 |
20
| Common Stocks (continued) | | Shares | | Value ($) |
| |
| |
|
| Materials (continued) | | | | |
| MeadWestvaco | | 16,596 | | 232,842 |
| Monsanto | | 52,399 | | 4,662,463 |
| Newmont Mining | | 43,350 | | 1,141,839 |
| Nucor | | 29,947 | | 1,213,153 |
| Pactiv | | 12,627 a | | 297,492 |
| PPG Industries | | 15,536 | | 770,275 |
| Praxair | | 29,897 | | 1,947,790 |
| Rohm & Haas | | 12,008 | | 844,763 |
| Sealed Air | | 15,280 | | 258,538 |
| Sigma-Aldrich | | 12,338 | | 541,145 |
| Titanium Metals | | 9,443 b | | 87,914 |
| United States Steel | | 11,272 b | | 415,711 |
| Vulcan Materials | | 10,439 b | | 566,629 |
| Weyerhaeuser | | 20,185 | | 771,471 |
| | | | | 25,510,178 |
| Telecommunication Services—3.1% | | | | |
| American Tower, Cl. A | | 37,877 a | | 1,223,806 |
| AT & T | | 563,781 | | 15,092,417 |
| CenturyTel | | 10,096 | | 253,511 |
| Embarq | | 14,106 | | 423,180 |
| Frontier Communications | | 31,281 b | | 238,048 |
| Qwest Communications International | | 124,599 b | | 356,353 |
| Sprint Nextel | | 272,292 | | 852,274 |
| Verizon Communications | | 272,305 | | 8,079,289 |
| Windstream | | 42,702 | | 320,692 |
| | | | | 26,839,570 |
| Utilities—3.6% | | | | |
| AES | | 64,164 a | | 511,387 |
| Allegheny Energy | | 16,054 b | | 484,028 |
| Ameren | | 20,012 b | | 649,389 |
| American Electric Power | | 38,344 | | 1,251,165 |
| CenterPoint Energy | | 31,786 | | 366,175 |
| CMS Energy | | 17,536 | | 179,744 |
| Consolidated Edison | | 26,043 b | | 1,128,183 |
| Constellation Energy Group | | 17,056 | | 412,926 |
| STATEMENT OF INVESTMENTS (continued) |
| Common Stocks (continued) | | Shares | | Value ($) |
| |
| |
|
| Utilities (continued) | | | | |
| Dominion Resources | | 55,233 b | | 2,003,853 |
| DTE Energy | | 15,554 | | 549,056 |
| Duke Energy | | 120,806 b | | 1,978,802 |
| Dynergy, Cl. A | | 48,495 a | | 176,522 |
| Edison International | | 31,127 | | 1,107,810 |
| Entergy | | 18,288 b | | 1,427,378 |
| Exelon | | 62,669 | | 3,399,167 |
| FirstEnergy | | 29,144 | | 1,520,151 |
| FPL Group | | 38,974 | | 1,841,132 |
| Integrys Energy | | 7,311 | | 348,515 |
| Nicor | | 4,304 b | | 198,888 |
| NiSource | | 26,553 | | 344,127 |
| Pepco Holdings | | 19,181 | | 396,088 |
| PG & E | | 33,835 b | | 1,240,729 |
| Pinnacle West Capital | | 9,580 | | 303,207 |
| PPL | | 35,640 | | 1,169,705 |
| Progress Energy | | 24,957 | | 982,557 |
| Public Service Enterprise Group | | 48,564 | | 1,367,077 |
| Questar | | 16,555 | | 570,485 |
| Sempra Energy | | 23,912 | | 1,018,412 |
| Southern | | 73,274 b | | 2,516,229 |
| TECO Energy | | 20,473 b | | 236,258 |
| Wisconsin Energy | | 11,211 | | 487,679 |
| Xcel Energy | | 41,115 b | | 716,223 |
| | | | | 30,883,047 |
| Total Common Stocks | | | | |
| (cost $892,375,471) | | | | 812,785,955 |
| |
| |
|
| | | Principal | | |
| Short-Term Investments—.6% | | Amount ($) | | Value ($) |
| |
| |
|
| U.S. Treasury Bills: | | | | |
| 0.57%, 12/18/08 | | 3,700,000 c | | 3,698,043 |
| 1.63%, 11/6/08 | | 2,000,000 c | | 1,999,988 |
| Total Short-Term Investments | | | | |
| (cost $5,697,075) | | | | 5,698,031 |
22
| Other Investment—5.2% | | Shares | | Value ($) |
| |
| |
|
| Registered Investment Company; | | | | |
| Dreyfus Institutional Preferred | | | | |
| Plus Money Market Fund | | | | |
| (cost $44,810,000) | | 44,810,000 d | | 44,810,000 |
| |
| |
|
| |
| Investment of Cash Collateral | | | | |
| for Securities Loaned—6.0% | | | | |
| |
| |
|
| Registered Investment Company; | | | | |
| Dreyfus Institutional Cash | | | | |
| Advantage Fund | | | | |
| (cost $52,284,556) | | 52,284,556 d | | 52,284,556 |
| |
| |
|
| |
| Total Investments (cost $995,167,102) | | 105.6% | | 915,578,542 |
| Liabilities, Less Cash and Receivables | | (5.6%) | | (48,763,362) |
| Net Assets | | 100.0% | | 866,815,180 |
| a Non-income producing security. |
| b All or a portion of these securities are on loan. At October 31, 2008, the total market value of the fund’s securities |
| on loan is $51,753,753 and the total market value of the collateral held by the fund is $53,142,559, consisting of |
| $52,284,556 of cash collateral and U.S. Government and agencies securities valued at $858,003. |
| c Partially held by a broker as collateral for open financial futures positions. |
| d Investment in affiliated money market mutual fund. |
| Portfolio Summary (Unaudited)† | | | | |
| |
| | | Value (%) | | | | Value (%) |
| |
| |
| |
|
| Information Technology | | 14.8 | | Industrial | | 10.3 |
| Financial | | 13.9 | | Consumer Discretionary | | 8.1 |
| Health Care | | 13.0 | | Utilities | | 3.6 |
| Energy | | 12.3 | | Telecommunication Services | | 3.1 |
| Short-Term/Money | | | | Materials | | 2.9 |
| Market Investments | | 11.8 | | | | |
| Consumer Staples | | 11.8 | | | | 105.6 |
| |
| † Based on net assets. | | | | | | |
| See notes to financial statements. | | | | | | |
STATEMENT OF FINANCIAL FUTURES
October 31, 2008
| | | | | Market Value | | | | Unrealized |
| | | | | Covered by | | | | (Depreciation) |
| | | Contracts | | Contracts ($) | | Expiration | | at 10/31/2008 ($) |
| |
| |
| |
| |
|
| Financial Futures Long | | | | | | | | |
| Standard & Poor’s | | | | | | | | |
| 500 E-mini | | 1,096 | | 53,008,040 | | December 2008 | | (9,719,370) |
| |
| See notes to financial statements. | | | | | | | | |
24
STATEMENT OF ASSETS AND LIABILITIES
October 31, 2008
| | | Cost | | Value |
| |
| |
|
| Assets ($): | | | | |
| Investments in securities—See Statement of Investments (including | | | | |
| securities on loan, valued at $51,753,753)—Note 1(b): | | | | |
| Unaffiliated issuers | | 898,072,546 | | 818,483,986 |
| Affiliated issuers | | 97,094,556 | | 97,094,556 |
| Cash | | | | 902,238 |
| Receivable for investment securities sold | | | | 2,699,073 |
| Dividends and interest receivable | | | | 1,302,915 |
| Receivable for shares of Capital Stock subscribed | | | | 851,244 |
| Receivable for futures variation margin—Note 4 | | | | 306,828 |
| | | | | 921,640,840 |
| |
| |
|
| Liabilities ($): | | | | |
| Due to The Dreyfus Corporation and affiliates—Note 3(a) | | | | 154,686 |
| Liability for securities on loan—Note 1(b) | | | | 52,284,556 |
| Payable for investment securities purchased | | | | 2,207,962 |
| Payable for shares of Capital Stock redeemed | | | | 178,456 |
| | | | | 54,825,660 |
| |
| |
|
| Net Assets ($) | | | | 866,815,180 |
| |
| |
|
| Composition of Net Assets ($): | | | | |
| Paid-in capital | | | | 947,172,116 |
| Accumulated undistributed investment income—net | | | | 6,725,991 |
| Accumulated net realized gain (loss) on investments | | | | 2,225,003 |
| Accumulated net unrealized appreciation (depreciation) | | | | |
| on investments [including ($9,719,370) net unrealized | | | | |
| (depreciation) on financial futures] | | | | (89,307,930) |
| |
| |
|
| Net Assets ($) | | | | 866,815,180 |
| |
| |
|
| Shares Outstanding | | | | |
| (150 million shares of $.001par value of Capital Stock authorized) | | | | 42,944,561 |
| Net Asset Value, offering and redemption price per share ($) | | | | 20.18 |
| |
| See notes to financial statements. | | | | |
| | STATEMENT OF OPERATIONS
Year Ended October 31, 2008 |
| Investment Income ($): | | |
| Income: | | |
| Cash dividends: | | |
| Unaffiliated issuers | | 25,697,447 |
| Affiliated issuers | | 1,086,250 |
| Income from securities lending | | 472,018 |
| Interest | | 77,334 |
| Total Income | | 27,333,049 |
| Expenses: | | |
| Management fee—Note 3(a) | | 2,411,995 |
| Directors’ fees—Note 3(a) | | 74,431 |
| Loan commitment fees—Note 2 | | 20,454 |
| Interest expense—Note 2 | | 1,121 |
| Total Expenses | | 2,508,001 |
| Less—Directors’ fees reimbursed by | | |
| the manager—Note 3(a) | | (74,431) |
| Net Expenses | | 2,433,570 |
| Investment Income—Net | | 24,899,479 |
| |
|
| Realized and Unrealized Gain (Loss) on Investments—Note 4 ($): | | |
| Net realized gain (loss) on investments | | 109,843,132a |
| Net realized gain (loss) on financial futures | | (8,901,505) |
| Net Realized Gain (Loss) | | 100,941,627 |
| Net unrealized appreciation (depreciation) on investments [including | | |
| ($10,579,945) net unrealized (depreciation) on financial futures] | | (634,402,450) |
| Net Realized and Unrealized Gain (Loss) on Investments | | (533,460,823) |
| Net (Decrease) in Net Assets Resulting from Operations | | (508,561,344) |
| a | | On June 30, 2008, the fund had a redemption-in-kind with total proceeds in the amount of $160,282,886.The |
| | | net realized gain of the transaction of $19,815,047 will not be realized for tax purposes. |
| See notes to financial statements. |
26
STATEMENT OF CHANGES IN NET ASSETS
| | | Year Ended October 31, |
| | |
|
| | | 2008 | | 2007 |
| |
| |
|
| Operations ($): | | | | |
| Investment income—net | | 24,899,479 | | 28,558,838 |
| Net realized gain (loss) on investments | | 100,941,627 | | 50,750,743 |
| Net unrealized appreciation | | | | |
| (depreciation) on investments | | (634,402,450) | | 129,795,092 |
| Net Increase (Decrease) in Net Assets | | | | |
| Resulting from Operations | | (508,561,344) | | 209,104,673 |
| |
| |
|
| Dividends to Shareholders from ($): | | | | |
| Investment income—net | | (26,911,293) | | (26,858,395) |
| |
| |
|
| Capital Stock Transactions ($): | | | | |
| Net proceeds from shares sold | | 254,397,187 | | 374,141,916 |
| Net assets received in connection | | | | |
| with reorganization—Note 1 | | 110,283,460 | | — |
| Dividends reinvested | | 21,920,453 | | 21,910,104 |
| Cost of shares redeemed | | (648,740,960) | | (369,357,604) |
| Increase (Decrease) in Net Assets | | | | |
| from Capital Stock Transactions | | (262,139,860) | | 26,694,416 |
| Total Increase (Decrease) in Net Assets | | (797,612,497) | | 208,940,694 |
| |
| |
|
| Net Assets ($): | | | | |
| Beginning of Period | | 1,664,427,677 | | 1,455,486,983 |
| End of Period | | 866,815,180 | | 1,664,427,677 |
| Undistributed investment income—net | | 6,725,991 | | 9,015,217 |
| |
| |
|
| Capital Share Transactions (Shares): | | | | |
| Shares sold | | 9,693,208 | | 12,320,080 |
| Shares issued in connection | | | | |
| with reorganization—Note 1 | | 4,239,223 | | — |
| Shares issued for dividends reinvested | | 747,863 | | 733,321 |
| Shares redeemed | | (23,272,151) | | (12,171,977) |
| Net Increase (Decrease) in Shares Outstanding | | (8,591,857) | | 881,424 |
| |
| See notes to financial statements. | | | | |
FINANCIAL HIGHLIGHTS
The following table describes the performance for the fiscal periods indicated. Total return shows how much your investment in the fund would have increased (or decreased) during each period, assuming you had reinvested all dividends and distributions.These figures have been derived from the fund’s financial statements.
| | | | | Year Ended October 31, | | |
| | |
| |
| |
|
| | | 2008 | | 2007 | | 2006 | | 2005 | | 2004 |
| |
| |
| |
| |
| |
|
| Per Share Data ($): | | | | | | | | | | |
| Net asset value, | | | | | | | | | | |
| beginning of period | | 32.30 | | 28.73 | | 25.18 | | 23.66 | | 21.99 |
| Investment Operations: | | | | | | | | | | |
| Investment income—neta | | .56 | | .55 | | .47 | | .48 | | .35 |
| Net realized and unrealized | | | | | | | | | | |
| gain (loss) on investments | | (12.08) | | 3.54 | | 3.54 | | 1.52 | | 1.65 |
| Total from Investment Operations | | (11.52) | | 4.09 | | 4.01 | | 2.00 | | 2.00 |
| Distributions: | | | | | | | | | | |
| Dividends from | | | | | | | | | | |
| investment income—net | | (.60) | | (.52) | | (.46) | | (.48) | | (.33) |
| Net asset value, end of period | | 20.18 | | 32.30 | | 28.73 | | 25.18 | | 23.66 |
| |
| |
| |
| |
| |
|
| Total Return (%) | | (36.23) | | 14.41 | | 16.13 | | 8.48 | | 9.19 |
| |
| |
| |
| |
| |
|
| Ratios/Supplemental Data (%): | | | | | | | | | | |
| Ratio of total expenses | | | | | | | | | | |
| to average net assets | | .21 | | .21 | | .20 | | .20 | | .20 |
| Ratio of net expenses | | | | | | | | | | |
| to average net assets | | .20 | | .20 | | .20 | | .20 | | .20 |
| Ratio of net investment income | | | | | | | | | | |
| to average net assets | | 2.07 | | 1.82 | | 1.77 | | 1.91 | | 1.51 |
| Portfolio Turnover Rate | | 4.84 | | 8.00 | | 5.12 | | 9.01 | | 4.21 |
| |
| |
| |
| |
| |
|
| Net Assets, end of period | | | | | | | | | | |
| ($ x 1,000) | | 866,815 | | 1,664,428 | | 1,455,487 | | 1,433,403 | | 1,338,323 |
| |
| a Based on average shares outstanding at each month end. | | | | | | |
| See notes to financial statements. | | | | | | | | | | |
28
NOTES TO FINANCIAL STATEMENTS
NOTE 1—Significant Accounting Policies:
Dreyfus BASIC S&P 500 Stock Index Fund (the “fund”) is a separate diversified series of The Dreyfus/Laurel Funds, Inc. (the “Company”) which is registered under the Investment Company Act of 1940, as amended (the “Act”), as an open-end management investment company and operates as a series company currently offering fourteen series including the fund.The fund’s investment objective is to replicate the total return of the Standard & Poor’s 500 Composite Stock Price Index primarily through investments in equity securities. The Dreyfus Corporation (the “Manager” or “Dreyfus”), a wholly-owned subsidiary of The Bank of New York Mellon Corporation (“BNY Mellon”), serves as the fund’s investment adviser. MBSC Securities Corporation (the “Distributor”), a wholly-owned subsidiary of the Manager, is the distributor of the fund’s shares, which are sold to the public without a sales charge.
Effective July 1, 2008, BNY Mellon has reorganized and consolidated a number of its banking and trust company subsidiaries. As a result of the reorganization, any services previously provided to the fund by Mellon Bank, N.A. or Mellon Trust of New England, N.A. are now provided by The Bank of New York, which has changed its name to The Bank of New York Mellon.
As of the close of business on September 12, 2008, pursuant to an Agreement and Plan of Reorganization previously approved by the fund’s Board of Directors, all of the assets, subject to liabilities, of BNY Hamilton S&P 500 Index Fund (“BNY S&P 500”) were transferred to the fund in exchange for the shares of Capital Stock on the fund of equal value. Shareholders of BNY S&P 500 received shares of the fund, in an amount equal to the aggregate net asset value of their investment in BNY S&P 500 at the time of the exchange.The fund’s net asset value on the close of business on September 12, 2008 after the reorganization was $26.03 per share and a total of 4,196,848 Institutional and 42,375 Investor shares representing net assets of $110,283,460 (including $2,136,568
| NOTES TO FINANCIAL STATEMENTS (continued) |
net unrealized appreciation on investments) were issued to shareholders of BNY S&P 500 in the exchange. The exchange was a tax-free event to BNY S&P 500 shareholders.
The fund’s financial statements are prepared in accordance with U.S. generally accepted accounting principles, which may require the use of management estimates and assumptions. Actual results could differ from those estimates.
(a) Portfolio valuation: Investments in securities are valued at the last sales price on the securities exchange or national securities market on which such securities are primarily traded. Securities listed on the National Market System for which market quotations are available are valued at the official closing price or, if there is no official closing price that day, at the last sales price. Securities not listed on an exchange or the national securities market, or securities for which there were no transactions, are valued at the average of the most recent bid and asked prices, except for open short positions, where the asked price is used for valuation purposes. Bid price is used when no asked price is available. Registered investment companies that are not traded on an exchange, are valued at their net asset value. When market quotations or official closing prices are not readily available, or are determined not to reflect accurately fair value, such as when the value of a security has been significantly affected by events after the close of the exchange or market on which the security is principally traded (for example, a foreign exchange or market),but before the fund calculates its net asset value,the fund may value these investments at fair value as determined in accordance with the procedures approved by the Board of Directors. Fair valuing of securities may be determined with the assistance of a pricing service using calculations based on indices of domestic securities and other appropriate indicators, such as prices of relevant ADRs and futures contracts. For other securities that are fair valued by the Board of Directors, certain factors may be considered such as: fundamental analytical data, the nature and duration of restrictions on disposition, an evaluation of the forces that influence the market in which the securities are purchased
30
and sold, and public trading in similar securities of the issuer or comparable issuers. Financial futures are valued at the last sales price.
The Financial Accounting Standards Board (“FASB”) released Statement of Financial Accounting Standards No. 157 “Fair Value Measurements” (“FAS 157”). FAS 157 establishes an authoritative definition of fair value, sets out a framework for measuring fair value, and requires additional disclosures about fair-value measurements. The application of FAS 157 is required for fiscal years beginning after November 15, 2007 and interim periods within those fiscal years. Management does not believe that the application of this standard will have a material impact on the financial statements of the fund.
(b) Securities transactions and investment income: Securities transactions are recorded on a trade date basis. Realized gains and losses from securities transactions are recorded on the identified cost basis. Dividend income is recognized on the ex-dividend date and interest income, including, where applicable, accretion of discount and amortization of premium on investments is recognized on the accrual basis.
Pursuant to a securities lending agreement with The Bank of New York Mellon, a subsidiary of BNY Mellon and an affiliate of Dreyfus, the fund may lend securities to qualified institutions. It is the fund’s policy that, at origination, all loans are secured by collateral of at least 102% of the value of U.S. securities loaned and 105% of the value of foreign securities loaned. Collateral equivalent to at least 100% of the market value of securities on loan is maintained at all times. Collateral is either in the form of cash, which can be invested in certain money market mutual funds managed by the Manager, U.S. Government and Agency securities or letters of credit.The fund is entitled to receive all income on securities loaned, in addition to income earned as a result of the lending transaction. Although each security loaned is fully collateralized, the fund bears the risk of delay in recovery of, or loss of rights in, the securities loaned should a borrower fail to return the securities in a timely manner. During the period ended October 31,
| NOTES TO FINANCIAL STATEMENTS (continued) |
2008,The Bank of New York Mellon earned $202,293 from lending fund portfolio securities, pursuant to the securities lending agreement.
(c) Affiliated issuers: Investments in other investment companies advised by the Manager are defined as “affiliated” in the Act.
(d) Dividends to shareholders: Dividends are recorded on the ex-dividend date. Dividends from investment income-net are declared and paid on a quarterly basis. Dividends from net realized capital gains, if any, are normally declared and paid annually, but the fund may make distributions on a more frequent basis to comply with the distribution requirements of the Internal Revenue Code of 1986, as amended (the “Code”). To the extent that net realized capital gains can be offset by capital loss carryovers, it is the policy of the fund not to distribute such gains. Income and capital gain distributions are determined in accordance with income tax regulations, which may differ from U.S. generally accepted accounting principles.
(e) Federal income taxes: It is the policy of the fund to continue to qualify as a regulated investment company, if such qualification is in the best interests of its shareholders, by complying with the applicable provisions of the Code, and to make distributions of taxable income sufficient to relieve it from substantially all federal income and excise taxes.
The fund adopted FASB Interpretation No. 48 “Accounting for Uncertainty in Income Taxes” (“FIN 48”). FIN 48 provides guidance for how uncertain tax positions should be recognized, measured, presented and disclosed in the financial statements. FIN 48 requires the evaluation of tax positions taken or expected to be taken in the course of preparing the fund’s tax returns to determine whether the tax positions are “more-likely-than-not” of being sustained by the applicable tax authority. Liability for tax positions not deemed to meet the more-likely-than-not threshold would be recorded as a tax expense in the current year.The adoption of FIN 48 had no impact on the operations of the fund for the period ended October 31, 2008.
32
As of and during the period ended October 31, 2008, the fund did not have any liabilities for any unrecognized tax positions. The fund recognizes interest and penalties, if any, related to unrecognized tax positions as income tax expense in the Statement of Operations. During the period, the fund did not incur any interest or penalties.
Each of the tax years in the four-year period ended October 31, 2008 remains subject to examination by the Internal Revenue Service and state taxing authorities.
At October 31, 2008, the components of accumulated earnings on a tax basis were as follows: undistributed ordinary income $6,644,996, undistributed capital gains $13,756,567 and unrealized depreciation $100,758,499.
The tax character of distributions paid to shareholders during the fiscal periods ended October 31, 2008 and October 31, 2007 were as follows: ordinary income $26,911,293 and $26,858,395, respectively.
During the period ended Ocotber 31, 2008, as a result of permanent book to tax differences, primarily due to the tax treatment for real estate investment trusts, wash sales from the fund merger, net realized gains from redemption-in-kind and distributions paid with redemptions, the fund decreased accumulated undistributed investment income-net by $277,412, decreased accumulated net realized gain (loss) on investments by $53,124,083 and increased paid-in-capital by $53,401,495. Net assets and net asset value per share were not affected by this reclassification.
NOTE 2—Bank Lines of Credit:
Prior to October 15, 2008, the fund participated with other Dreyfus-managed funds in a $350 million redemption credit facility. Effective October 15, 2008, the fund participates with other Dreyfus-managed funds in a $145 million redemption credit facility (the “Facility”) to be utilized for temporary or emergency purposes, including the financing of redemptions. In connection therewith, the fund has agreed to pay
| NOTES TO FINANCIAL STATEMENTS (continued) |
commitment fees on its pro rata portion of the Facility. Interest is charged to the fund based on prevailing market rates in effect at the time of borrowing.
The average daily amount of borrowings outstanding under the Facilities during the period ended October 31, 2008, was approximately $24,800 with a related weighted average annualized interest rate of 4.52% .
NOTE 3—Investment Management Fee And Other Transactions with Affiliates:
(a) Pursuant to an Investment Management agreement with the Manager, the Manager provides or arranges for one or more third and/or affiliated parties to provide investment advisory, administrative, custody, fund accounting and transfer agency services to the fund.The Manager also directs the investments of the fund in accordance with its investment objective, policies and limitations. For these services, the fund is contractually obligated to pay the Manager a fee, calculated daily and paid monthly, at the annual rate of .20% of the value of the fund’s average daily net assets. Out of its fee, the Manager pays all of the expenses of the fund except brokerage fees, taxes, interest, commitment fees, fees and expenses of non-interested Directors (including counsel fees) and extraordinary expenses. In addition, the Manager is required to reduce its fee in an amount equal to the fund’s allocable portion of fees and expenses of the non-interested Directors (including counsel fees). Each Director receives $45,000 per year, plus $6,000 for each joint Board meeting of the Company, The Dreyfus/Laurel Tax-Free Municipal Funds, and The Dreyfus/Laurel Funds Trust (collectively, the “Dreyfus/Laurel Funds”) attended, $2,000 for separate in-person committee meetings attended which are not held in conjunction with a regularly scheduled Board meeting and $1,500 for Board meetings and separate committee meetings attended that are conducted by telephone and is reimbursed for travel and out-of-pocket expenses.With respect to Board meetings, the Chairman of the Board receives an additional 25% of such compensation (with the exception of reimbursable
34
amounts). With respect to compensation committee meetings, the Chair of the compensation committee receives $900 per meeting and, prior to April 12, 2008 with respect to audit committee meetings, the Chair of the audit committee received $1,350 per meeting. In the event that there is an in-person joint committee meeting or a joint telephone meeting of the Dreyfus/Laurel Funds and Dreyfus HighYield Strategies Fund, the $2,000 or $1,500 fee, as applicable, will be allocated between the Dreyfus/Laurel Funds and Dreyfus High Yield Strategies Fund. These fees and expenses are charged and allocated to each series based on net assets.Amounts required to be paid by the Company directly to the non-interested Directors, that would be applied to offset a portion of the management fee payable to the Manager, are in fact paid directly by the Manager to the non-interested Directors.
The component of “Due to The Dreyfus Corporation and affiliates” in the Statement of Assets and Liabilities consist of: management fees $154,686.
NOTE 4—Securities Transactions:
The aggregate amount of purchases and sales of investment securities, excluding short-term securities and financial futures, during the period ended October 31, 2008, amounted to $162,768,166 and $455,947,153, respectively.
The fund may invest in financial futures contracts in order to gain exposure to or protect against changes in the market. The fund is exposed to market risk as a result of changes in the value of the underlying financial instruments. Investments in financial futures require the fund to “mark to market” on a daily basis, which reflects the change in the market value of the contract at the close of each day’s trading. Typically, variation margin payments are received or made to reflect daily unrealized gains or losses.When the contracts are closed, the fund recognizes a realized gain or loss.These investments require initial margin deposits with a broker, which consist of cash or
| NOTES TO FINANCIAL STATEMENTS (continued) |
cash equivalents. The amount of these deposits is determined by the exchange or Board of Trade on which the contract is traded and is subject to change. Contracts open at October 31, 2008, are set forth in the Statement of Financial Futures.
At October 31, 2008, the cost of investments for federal income tax purposes was $1,016,337,041; accordingly, accumulated net unrealized depreciation on investments was $100,758,499 consisting of $154,601,621 gross unrealized appreciation and $255,360,120 gross unrealized depreciation.
In March 2008, the FASB released Statement of Financial Accounting Standards No. 161, Disclosures about Derivative Instruments and Hedging Activities (“FAS 161”). FAS 161 requires qualitative disclosures about objectives and strategies for using derivatives, quantitative disclosures about fair value amounts of gains and losses on derivative instruments, and disclosures about credit-risk-related contingent features in derivative agreements.The application of FAS 161 is required for fiscal years and interim periods beginning after November 15, 2008. At this time, management is evaluating the implications of FAS 161 and its impact on the financial statements and the accompanying notes has not yet been determined.
36
REPORT OF INDEPENDENT REGISTERED PUBLIC ACCOUNTING FIRM
The Board of Directors and Shareholders The Dreyfus/Laurel Funds, Inc.:
We have audited the accompanying statement of assets and liabilities of Dreyfus BASIC S&P 500 Stock Index Fund, a series of The Dreyfus/Laurel Funds, Inc. (the “Fund”), including the statements of investments and financial futures, as of October 31, 2008, and the related statement of operations for the year then ended, the statement of changes in net assets for each of the years in the two-year period then ended, and the financial highlights for each of the years in the five-year period then ended. These financial statements and financial highlights are the responsibility of the Fund’s management. Our responsibility is to express an opinion on these financial statements and financial highlights based on our audits.
We conducted our audits in accordance with standards of the Public Company Accounting Oversight Board (United States).Those standards require that we plan and perform the audit to obtain reasonable assurance about whether the financial statements and financial highlights are free of material misstatement. An audit also includes examining, on a test basis, evidence supporting the amounts and disclosures in the financial statements. Our procedures included confirmation of securities owned as of October 31, 2008, by correspondence with the custodian and brokers or by other appropriate auditing procedures where replies from brokers were not received. An audit also includes assessing the accounting principles used and significant estimates made by management, as well as evaluating the overall financial statement presentation.We believe that our audits provide a reasonable basis for our opinion.
In our opinion, the financial statements and financial highlights referred to above present fairly, in all material respects, the financial position of Dreyfus BASIC S&P 500 Stock Index Fund as of October 31, 2008, and the results of its operations for the year then ended, the changes in its net assets for each of the years in the two-year period then ended, and the financial highlights for each of the years in the five-year period then ended, in conformity with U.S. generally accepted accounting principles.

| | New York, New York
December 23, 2008 |
IMPORTANT TAX INFORMATION (Unaudited)
For federal income tax purposes, the fund hereby designates $32,880,128 as a long-term capital gain dividend for the fiscal year ended October 31, 2008.The fund also designates 97% of the ordinary dividends paid during the fiscal year ended October 31, 2008 as qualifying for the corporate dividends received deduction. For the fiscal year ended October 31, 2008, certain dividends paid by the fund may be subject to a maximum tax rate of 15%, as provided for by the Jobs and Growth Tax Relief Reconciliation Act of 2003. Of the distributions paid during the fiscal year, $18,833,681 represents the maximum amount that may be considered qualified dividend income. Shareholders will receive notification in January 2009 of the percentage applicable to the preparation of their 2008 income tax returns.
38
BOARD MEMBERS INFORMATION (Unaudited)
Joseph S. DiMartino (65)
Chairman of the Board (1999)
Principal Occupation During Past 5Years:
Corporate Director and Trustee
Other Board Memberships and Affiliations: |
- The Muscular Dystrophy Association, Director
- Century Business Services, Inc., a provider of outsourcing functions for small and medium size companies, Director
- The Newark Group, a provider of a national market of paper recovery facilities, paperboard mills and paperboard converting plants, Director
- Sunair Services Corporation, a provider of certain outdoor-related services to homes and businesses, Director
No. of Portfolios for which Board Member Serves: 167
James M. Fitzgibbons (74)
Board Member (1994)
Principal Occupation During Past 5Years:
Corporate Director and Trustee |
Other Board Memberships and Affiliations:
Bill Barrett Company, an oil and gas exploration company, Director
No. of Portfolios for which Board Member Serves: 25
Kenneth A. Himmel (62)
Board Member (1994)
Principal Occupation During Past 5Years: |
- President and CEO,Related Urban Development,a real estate development company (1996-present)
- President and CEO, Himmel & Company, a real estate development company (1980-present)
- CEO, American Food Management, a restaurant company (1983-present)
| No. of Portfolios for which Board Member Serves: 25 |
Stephen J. Lockwood (61)
Board Member (1994)
Principal Occupation During Past 5Years: |
- Chairman of the Board, Stephen J. Lockwood and Company LLC, an investment company (2000-present)
| No. of Portfolios for which Board Member Serves: 25 |
BOARD MEMBERS INFORMATION (Unaudited) (continued)
Roslyn M. Watson (59)
Board Member (1994) |
Principal Occupation During Past 5Years:
Principal,Watson Ventures, Inc., a real estate investment company (1993-present)
Other Board Memberships and Affiliations:
- American Express Bank, Director
- The Hyams Foundation Inc., a Massachusetts Charitable Foundation,Trustee
- National Osteoporosis Foundation,Trustee
- SBLI-USA, Director
| No. of Portfolios for which Board Member Serves: 25 |
Benaree Pratt Wiley (62)
Board Member (1998)
Principal Occupation During Past 5Years: |
- Principal,The Wiley Group, a firm specializing in strategy and business development (2005-present)
- President and CEO,The Partnership, an organization dedicated to increasing the representation of African Americans in positions of leadership, influence and decision-making in Boston, MA (1991-2005)
| Other Board Memberships and Affiliations: |
- Boston College,Trustee Associate
- Blue Cross Blue Shield of Massachusetts, Director
- CBIZ, professional support consultants and service providers for small, midsized and corporate business, Director
- Commonwealth Institute, Director
- Efficacy Institute, Director
- PepsiCo African-American, Chair of Advisory Board
- The Boston Foundation, Director
- Century Business Services, Inc., a provider of outsourcing functions for small and medium size companies, Director
| No. of Portfolios for which Board Member Serves: 36 |
Once elected all Board Members serve for an indefinite term, but achieve Emeritus status upon reaching age 80.The address of the Board Members and Officers is in c/o The Dreyfus Corporation, 200 Park Avenue, NewYork, NewYork 10166. Additional information about the Board Members is available in the fund’s Statement of Additional Information which can be obtained from Dreyfus free of charge by calling this toll free number: 1-800-554-4611.
Francis P. Brennan, Emeritus Board Member
J.Tomlinson Fort, Emeritus Board Member |
40
OFFICERS OF THE FUND (Unaudited)
| J. DAVID OFFICER, President since | | JONI LACKS CHARATAN, Vice President |
| December 2006. | | and Assistant Secretary since |
| Chief Operating Officer,Vice Chairman and a | | August 2005. |
| Director of the Manager, and an officer of 77 | | Senior Counsel of BNY Mellon, and an officer |
| investment companies (comprised of 167 | | of 78 investment companies (comprised of 188 |
| portfolios) managed by the Manager. He is 60 | | portfolios) managed by the Manager. She is 53 |
| years old and has been an employee of the | | years old and has been an employee of the |
| Manager since April 1998. | | Manager since October 1988. |
| |
| PHILLIP N. MAISANO, Executive Vice | | JOSEPH M. CHIOFFI, Vice President and |
| President since July 2007. | | Assistant Secretary since August 2005. |
| Chief Investment Officer,Vice Chair and a | | Senior Counsel of BNY Mellon, and an officer |
| director of the Manager, and an officer of 77 | | of 78 investment companies (comprised of 188 |
| investment companies (comprised of 167 | | portfolios) managed by the Manager. He is 47 |
| portfolios) managed by the Manager. Mr. | | years old and has been an employee of the |
| Maisano also is an officer and/or Board | | Manager since June 2000. |
| member of certain other investment | | |
| | | JANETTE E. FARRAGHER, Vice President |
| management subsidiaries of The Bank of New | | |
| | | and Assistant Secretary since |
| York Mellon Corporation, each of which is an | | |
| | | August 2005. |
| affiliate of the Manager. He is 61 years old and | | |
| has been an employee of the Manager since | | Assistant General Counsel of BNY Mellon, |
| November 2006. Prior to joining the Manager, | | and an officer of 78 investment companies |
| Mr. Maisano served as Chairman and Chief | | (comprised of 188 portfolios) managed by the |
| Executive Officer of EACM Advisors, an | | Manager. She is 45 years old and has been an |
| affiliate of the Manager, since August 2004, and | | employee of the Manager since February 1984. |
| served as Chief Executive Officer of Evaluation | | JOHN B. HAMMALIAN, Vice President and |
| Associates, a leading institutional investment | | Assistant Secretary since August 2005. |
| consulting firm, from 1988 until 2004. | | |
| | | Managing Counsel of BNY Mellon, and an |
| MICHAEL A. ROSENBERG, Vice President | | officer of 78 investment companies (comprised |
| and Secretary since August 2005. | | of 188 portfolios) managed by the Manager. |
| Assistant General Counsel of BNY Mellon, | | He is 45 years old and has been an employee |
| and an officer of 78 investment companies | | of the Manager since February 1991. |
| (comprised of 188 portfolios) managed by the | | ROBERT R. MULLERY, Vice President and |
| Manager. He is 48 years old and has been an | | Assistant Secretary since August 2005. |
| employee of the Manager since October 1991. | | |
| | | Managing Counsel of BNY Mellon, and an |
| JAMES BITETTO, Vice President and | | officer of 78 investment companies (comprised |
| Assistant Secretary since August 2005. | | of 188 portfolios) managed by the Manager. |
| Senior Counsel of BNY Mellon and Secretary | | He is 56 years old and has been an employee |
| of the Manager, and an officer of 78 | | of the Manager since May 1986. |
| investment companies (comprised of 188 | | |
| portfolios) managed by the Manager. He is 42 | | |
| years old and has been an employee of the | | |
| Manager since December 1996. | | |
OFFICERS OF THE FUND (Unaudited) (continued)
| JEFF PRUSNOFSKY, Vice President and | | ROBERT SALVIOLO, Assistant Treasurer |
| Assistant Secretary since August 2005. | | since July 2007. |
| Managing Counsel of BNY Mellon, and an | | Senior Accounting Manager – Equity Funds of |
| officer of 78 investment companies (comprised | | the Manager, and an officer of 78 investment |
| of 188 portfolios) managed by the Manager. | | companies (comprised of 188 portfolios) |
| He is 43 years old and has been an employee | | managed by the Manager. He is 41 years old |
| of the Manager since October 1990. | | and has been an employee of the Manager |
| | | since June 1989. |
| JAMES WINDELS, Treasurer since | | |
| November 2001. | | ROBERT SVAGNA, Assistant Treasurer |
| Director – Mutual Fund Accounting of the | | since December 2002. |
| Manager, and an officer of 78 investment | | Senior Accounting Manager – Equity Funds of |
| companies (comprised of 188 portfolios) | | the Manager, and an officer of 78 investment |
| managed by the Manager. He is 49 years old | | companies (comprised of 188 portfolios) |
| and has been an employee of the Manager | | managed by the Manager. He is 41 years old |
| since April 1985. | | and has been an employee of the Manager |
| | | since November 1990. |
| RICHARD CASSARO, Assistant Treasurer | | |
| since January 2008. | | JOSEPH W. CONNOLLY, Chief Compliance |
| Senior Accounting Manager – Money Market | | Officer since October 2004. |
| and Municipal Bond Funds of the Manager, | | Chief Compliance Officer of the Manager and |
| and an officer of 78 investment companies | | The Dreyfus Family of Funds (78 investment |
| (comprised of 188 portfolios) managed by | | companies, comprised of 188 portfolios). From |
| the Manager. He is 49 years old and has | | November 2001 through March 2004, Mr. |
| been an employee of the Manager since | | Connolly was first Vice-President, Mutual |
| September 1982. | | Fund Servicing for Mellon Global Securities |
| | | Services. In that capacity, Mr. Connolly was |
| GAVIN C. REILLY, Assistant Treasurer | | |
| | | responsible for managing Mellon’s Custody, |
| since December 2005. | | |
| | | Fund Accounting and Fund Administration |
| Tax Manager of the Investment Accounting | | services to third-party mutual fund clients. He |
| and Support Department of the Manager, and | | is 51 years old and has served in various |
| an officer of 78 investment companies | | capacities with the Manager since 1980, |
| (comprised of 188 portfolios) managed by the | | including manager of the firm’s Fund |
| Manager. He is 40 years old and has been an | | Accounting Department from 1997 through |
| employee of the Manager since April 1991. | | October 2001. |
| |
| ROBERT ROBOL, Assistant Treasurer | | WILLIAM GERMENIS, Anti-Money |
| since December 2002. | | Laundering Compliance Officer since |
| Senior Accounting Manager – Fixed Income | | July 2002. |
| Funds of the Manager, and an officer of 78 | | Vice President and Anti-Money Laundering |
| investment companies (comprised of 188 | | Compliance Officer of the Distributor, and the |
| portfolios) managed by the Manager. He is 44 | | Anti-Money Laundering Compliance Officer |
| years old and has been an employee of the | | of 74 investment companies (comprised of 184 |
| Manager since October 1988. | | portfolios) managed by the Manager. He is 38 |
| | | years old and has been an employee of the |
| | | Distributor since October 1998. |
42
NOTES
| | Dreyfus
U.S. Treasury
Reserves |
| | ANNUAL REPORT October 31, 2008 |

Save time. Save paper. View your next shareholder report online as soon as it’s available. Log into www.dreyfus.com and sign up for Dreyfus eCommunications. It’s simple and only takes a few minutes.
The views expressed in this report reflect those of the portfolio manager only through the end of the period covered and do not necessarily represent the views of Dreyfus or any other person in the Dreyfus organization. Any such views are subject to change at any time based upon market or other conditions and Dreyfus disclaims any responsibility to update such views.These views may not be relied on as investment advice and, because investment decisions for a Dreyfus fund are based on numerous factors, may not be relied on as an indication of trading intent on behalf of any Dreyfus fund.
Not FDIC-Insured Not Bank-Guaranteed May Lose Value
| Contents |
| |
| | | THE FUND |
| |
|
| 2 | | A Letter from the CEO |
| 3 | | Discussion of Fund Performance |
| 6 | | Understanding Your Fund’s Expenses |
| 6 | | Comparing Your Fund’s Expenses |
| With Those of Other Funds |
| 7 | | Statement of Investments |
| 9 | | Statement of Assets and Liabilities |
| 10 | | Statement of Operations |
| 11 | | Statement of Changes in Net Assets |
| 12 | | Financial Highlights |
| 14 | | Notes to Financial Statements |
| 21 | | Report of Independent Registered |
| | | Public Accounting Firm |
| 22 | | Important Tax Information |
| 23 | | Board Members Information |
| 25 | | Officers of the Fund |
| FOR MORE INFORMATION |
|
| | | Back Cover |
Dreyfus
U.S. Treasury Reserves |

A LETTER FROM THE CEO
Dear Shareholder: |
We are pleased to present this annual report for Dreyfus U.S.Treasury Reserves, covering the 12-month period from November 1, 2007, through October 31, 2008.
These are difficult times for investors. A credit crunch that began in 2007 has developed into a full-blown global financial crisis, recently resulting in the failure of several major financial institutions. Making matters worse, the U.S. economic slowdown has gathered momentum, depressing investor sentiment.
Money market funds have not been immune to the downturn, as banks’ reluctance to lend even to financially sound companies produced challenging liquidity conditions in the commercial paper market,and resulted to date in at least one U.S. money market fund family having to close and liquidate certain of its money funds’ portfolios.The federal government subsequently stepped in with a number of measures, including a Temporary Guarantee Program for Money Market Funds and a $700 billion rescue package intended to promote greater liquidity in the financial markets. In our view, the government’s efforts to stabilize the fixed income markets are critical to a broader recovery in the credit markets, as funding for America’s leading corporations must improve before a more widespread easing of credit availability is possible.
The depth and duration of the financial crisis will depend on how quickly the banking system can be stabilized. In the meantime, we encourage you to maintain a long-term perspective and a disciplined approach to investing. Indeed, we already are seeing some positive signs, including a likely peak in global inflationary pressures, a bottoming of the U.S. dollar and a large pool of worldwide financial liquidity that could be deployed gradually as the economic cycle turns.
For information about how the fund performed during the reporting period, as well as market perspectives, we have provided a Discussion of Fund Performance given by the fund’s Portfolio Manager.
Thank you for your continued confidence and support.

Jonathan R. Baum
Chief Executive Officer
The Dreyfus Corporation |

DISCUSSION OF FUND PERFORMANCE
For the period of November 1, 2007, through October 31, 2008, as provided by Patricia A. Larkin, Senior Portfolio Manager
Fund and Market Performance Overview
For the 12-month period ended October 31, 2008, Dreyfus U.S. Treasury Reserves’ Investor shares produced a yield of 1.60%, and Class R shares produced a yield of 1.79% . Taking into account the effects of compounding, the fund’s Investor shares and Class R shares also produced effective yields of 1.62% and 1.80%, respectively.1
Yields of short-term U.S. Treasury securities declined over much of the reporting period along with short-term interest rates.
The Fund’s Investment Approach
The fund seeks a high level of current income consistent with stability of principal. As a U.S.Treasury money market fund, we attempt to provide shareholders with an investment vehicle that is made up of Treasury bills and notes with remaining maturities of 13 months or less issued by the U.S. government as well as repurchase agreements with securities dealers, which are backed by U.S. Treasuries. To pursue its goal, the fund invests exclusively in direct obligations of the U.S. Treasury and in repurchase agreements secured by these obligations.
Interest Rates Fell as U.S. Economy Struggled
Slumping U.S. housing markets, sluggish consumer spending and resurgent energy prices already had produced a weaker U.S. economy by the start of the reporting period. As a result, the Federal Reserve Board (the “Fed”) reduced short-term interest rates, which began the reporting period with an overnight federal funds rate of 4.5% .
Evidence of economic weakness continued to mount through the end of 2007 and first quarter of 2008, and an ongoing credit crisis intensified as institutional investors sought to de-lever their portfolios to raise cash. Despite aggressive interest-rate reductions by the Fed and an economic
| DISCUSSION OF FUND PERFORMANCE (continued) |
stimulus package from Congress, job losses and deleveraging pressures intensified. In March, the Fed participated in the rescue of investment bank Bear Stearns and made funds available to Wall Street firms in an unprecedented program allowing the use of mortgage-backed securities as collateral. Nonetheless, the unemployment rate continued to rise, and inflation appeared to accelerate along with commodity prices.
Reports of additional write-downs by major banks in June and greater-than-expected losses by mortgage agencies Fannie Mae and Freddie Mac in July sparked renewed volatility in the stock and bond markets. The bad news continued to mount in August, including a jump in the unemployment rate to its highest level in five years and a surge in mortgage delinquencies. However, inflationary pressures appeared to ebb when commodity prices retreated from their peaks.
September ranked as one of the most challenging months in memory for the U.S. economy and global financial markets. In a financial crisis that former Fed Chairman Alan Greenspan called a “global tsunami,” major financial institutions found themselves unable to obtain short-term funding for their operations. As a result, the U.S. government effectively nationalized Fannie Mae, Freddie Mac and insurer AIG. In addition, Lehman Brothers filed for bankruptcy, Washington Mutual was seized by regulators, and Merrill Lynch and Wachovia were sold to former rivals. The U.S. Treasury Department proposed a $700 billion rescue package for the nation’s banking system, which initially was rejected by Congress but after some adjustments was enacted into law. It later was estimated that U.S. GDP contracted by a –0.3% annualized rate in the third quarter, stoking recession fears.
Money Markets Suffered in the Financial Crisis
The money markets were not immune to the financial crisis, as evidenced by several high-profile money funds “breaking the buck.”The Lehman Brothers bankruptcy led to challenging liquidity conditions in the commercial paper market and concerned money market fund investors began a rash of redemptions from such funds. In an attempt
4
to curtail diminishing investor confidence and help restore liquidity and stability to the financial system, the Department of Treasury initiated several measures, including the Temporary Guarantee Program specifically for money market funds.
In October, the Fed and other central banks implemented an unprece-dented,coordinated rate cut to combat spreading global economic weak-ness.The Fed followed up with another reduction later in the month,and the federal funds rate ended the reporting period at just 1%. In addition, signs of recovery in the commercial paper market had appeared by the reporting period’s end, as evidenced by rising trading activity.
Maintaining a Cautious Posture
The fund’s portfolio of U.S.Treasury securities and repurchase agreements sheltered shareholders from the turmoil in the commercial paper market. In addition, we maintained the fund’s weighted average maturity in a position we considered shorter than industry averages.
We currently expect investors’ focus to turn to the outlook for the underlying economy, as reduced liquidity and tighter loan standards are likely to dampen economic growth into 2009. However, the Fed has left little room to ease monetary policy further.Therefore, we currently intend to maintain the fund’s focus on liquidity.
November 17, 2008
| | An investment in the fund is not insured or guaranteed by the FDIC or any other government
agency. Although the fund seeks to preserve the value of your investment at $1.00 per share, it is
possible to lose money by investing in the fund. |
1 Effective yield is based upon dividends declared daily and reinvested monthly. Past performance is
no guarantee of future results.Yields fluctuate.Yields provided reflect the absorption of certain fund
expenses by The Dreyfus Corporation pursuant to an undertaking in effect that may be extended,
terminated or modified at any time. Had these expenses not been absorbed, yields of the fund’s
Class R shares and Investor shares would have been 1.76% and 1.56%, respectively, and the
effective yields would have been 1.77% and 1.58%, respectively. |
UNDERSTANDING YOUR FUND’S EXPENSES (Unaudited)
As a mutual fund investor, you pay ongoing expenses, such as management fees and other expenses. Using the information below, you can estimate how these expenses affect your investment and compare them with the expenses of other funds.You also may pay one-time transaction expenses, including sales charges (loads) and redemption fees, which are not shown in this section and would have resulted in higher total expenses. For more information, see your fund’s prospectus or talk to your financial adviser.
Review your fund’s expenses
The table below shows the expenses you would have paid on a $1,000 investment in Dreyfus U.S.Treasury Reserves from May 1, 2008 to October 31, 2008. It also shows how much a $1,000 investment would be worth at the close of the period, assuming actual returns and expenses.
Expenses and Value of a $1,000 Investment assuming actual returns for the six months ended October 31, 2008
| | | Investor Shares | | Class R Shares |
| |
| |
|
| Expenses paid per $1,000† | | $ 3.33 | | $ 2.47 |
| Ending value (after expenses) | | $1,004.90 | | $1,005.70 |
COMPARING YOUR FUND’S EXPENSES WITH THOSE OF OTHER FUNDS (Unaudited)
Using the SEC’s method to compare expenses
The Securities and Exchange Commission (SEC) has established guidelines to help investors assess fund expenses. Per these guidelines, the table below shows your fund’s expenses based on a $1,000 investment, assuming a hypothetical 5% annualized return. You can use this information to compare the ongoing expenses (but not transaction expenses or total cost) of investing in the fund with those of other funds.All mutual fund shareholder reports will provide this information to help you make this comparison. Please note that you cannot use this information to estimate your actual ending account balance and expenses paid during the period.
Expenses and Value of a $1,000 Investment assuming a hypothetical 5% annualized return for the six months ended October 31, 2008
| | | Investor Shares | | Class R Shares |
| |
| |
|
| Expenses paid per $1,000† | | $ 3.35 | | $ 2.49 |
| Ending value (after expenses) | | $1,021.82 | | $1,022.67 |
† Expenses are equal to the fund’s annualized expense ratio of .66% for Investor shares and .49% for Class R shares,
multiplied by the average account value over the period, multiplied by 184/366 (to reflect the one-half year period). |
6
STATEMENT OF INVESTMENTS
October 31, 2008 |
| | | Annualized | | | | |
| | | Yield on | | | | |
| | | Date of | | Principal | | |
| U.S. Treasury Bills—26.5% | | Purchase (%) | | Amount ($) | | Value ($) |
| |
| |
| |
|
| 1/22/09 | | 1.88 | | 50,000,000 | | 49,788,167 |
| 1/29/09 | | 1.10 | | 50,000,000 | | 49,864,028 |
| 3/5/09 | | 1.87 | | 75,000,000 | | 74,521,566 |
| Total U.S. Treasury Bills | | | | | | |
| (cost $174,173,761) | | | | | | 174,173,761 |
| |
| |
| |
|
| |
| |
| Repurchase Agreements—73.5% | | | | | | |
| |
| |
| |
|
| Citigroup Global Markets Holdings Inc. | | | | | | |
| dated 10/31/08, due 11/3/08 in the | | | | | | |
| amount of $120,000,500 (fully | | | | | | |
| collateralized by $97,725,500 | | | | | | |
| U.S. Treasury Bonds, 7.125%, | | | | | | |
| due 2/15/23, value $122,400,044) | | 0.05 | | 120,000,000 | | 120,000,000 |
| Goldman, Sachs & Co. | | | | | | |
| dated 10/31/08, due 11/3/08 in the | | | | | | |
| amount of $113,000,094 (fully | | | | | | |
| collateralized by $217,317,358 | | | | | | |
| U.S. Treasury Strips, due 5/15/14-2/15/25, | | | | | | |
| value $115,260,023) | | 0.01 | | 113,000,000 | | 113,000,000 |
| Greenwich Capital Markets | | | | | | |
| dated 10/31/08, due 11/3/08 in the | | | | | | |
| amount of $120,001,500 (fully | | | | | | |
| collateralized by $121,745,000 | | | | | | |
| U.S. Treasury Notes, 1.75%, | | | | | | |
| due 3/31/10, value $122,402,474) | | 0.15 | | 120,000,000 | | 120,000,000 |
| STATEMENT OF INVESTMENTS (continued) |
| | | Annualized | | | | |
| | | Yield on | | | | |
| | | Date of | | Principal | | |
| Repurchase Agreements (continued) | | Purchase (%) | | Amount ($) | | Value ($) |
| |
| |
| |
|
| JP Morgan Chase & Co. | | | | | | |
| dated 10/31/08, due 11/3/08 in the | | | | | | |
| amount of $130,001,083 (fully | | | | | | |
| collateralized by $128,079,800 | | | | | | |
| Treasury Inflation Protected Securities, | | | | | | |
| 1.625%-3.50%, due 1/15/11-1/15/18, | | | | | | |
| value $132,604,356) | | 0.10 | | 130,000,000 | | 130,000,000 |
| Total Repurchase Agreements | | | | | | |
| (cost $483,000,000) | | | | | | 483,000,000 |
| |
| |
| |
|
| |
| Total Investments (cost $657,173,761) | | | | 100.0% | | 657,173,761 |
| |
| Liabilities, Less Cash and Receivables | | | | (.0%) | | (266,092) |
| |
| Net Assets | | | | 100.0% | | 656,907,669 |
| Portfolio Summary (Unaudited)† | | | | |
| | | Value (%) | | | | Value (%) |
| |
| |
| |
|
| Repurchase Agreements | | 73.5 | | U.S. Treasury Bills | | 26.5 |
| | | | | | | 100.0 |
| † Based on net assets. | | | | | | |
| See notes to financial statements. | | | | | | |
8
STATEMENT OF ASSETS AND LIABILITIES
October 31, 2008
| | | Cost | | Value |
| |
| |
|
| Assets ($): | | | | |
| Investments in securities—See Statement of | | | | |
| Investments (including Repurchase Agreements | | | | |
| of $483,000,000)—Note 1(b) | | 657,173,761 | | 657,173,761 |
| Receivable for investment securities sold | | | | 10,000,819 |
| Interest receivable | | | | 1,059 |
| Prepaid expenses | | | | 45,419 |
| | | | | 667,221,058 |
| |
| |
|
| Liabilities ($): | | | | |
| Due to The Dreyfus Corporation and affiliates—Note 3(b) | | | | 217,381 |
| Cash overdraft due to Custodian | | | | 10,022,598 |
| Dividend payable | | | | 73,171 |
| Payable for shares of Capital Stock redeemed | | | | 239 |
| | | | | 10,313,389 |
| |
| |
|
| Net Assets ($) | | | | 656,907,669 |
| |
| |
|
| Composition of Net Assets ($): | | | | |
| Paid-in capital | | | | 656,907,669 |
| |
| |
|
| Net Assets ($) | | | | 656,907,669 |
| |
| |
|
| |
| |
| Net Asset Value Per Share | | | | |
| | | Investor Shares | | Class R Shares |
| |
| |
|
| Net Assets ($) | | 154,822,527 | | 502,085,142 |
| Shares Outstanding | | 154,822,527 | | 502,085,142 |
| |
| |
|
| Net Asset Value Per Share ($) | | 1.00 | | 1.00 |
| |
| See notes to financial statements. | | | | |
| STATEMENT OF OPERATIONS | | |
| Year Ended October 31, 2008 | | |
| |
|
| |
| |
| |
| |
| Investment Income ($): | | |
| Interest Income | | 7,195,623 |
| Expenses: | | |
| Management fee—Note 3(a) | | 1,825,585 |
| Distribution fees (Investor Shares)—Note 3(b) | | 269,394 |
| Directors’ fees—Note 3(a) | | 56,459 |
| Treasury insurance expense—Note 1(e) | | 11,708 |
| Total Expenses | | 2,163,146 |
| Less—reduction in expenses due to undertaking—Note 3(a) | | (54,808) |
| Less—Directors’ fees reimbursed by the Manager—Note 3(a) | | (56,459) |
| Net Expenses | | 2,051,879 |
| Investment Income—Net, representing net increase | | |
| in net assets resulting from operations | | 5,143,744 |
| |
| See notes to financial statements. | | |
10
STATEMENT OF CHANGES IN NET ASSETS
| | | Year Ended October 31, |
| | |
|
| | | 2008 | | 2007 |
| |
| |
|
| Operations ($): | | | | |
| Investment Income—net, representing net increase | | | | |
| in net assets resulting from operations | | 5,143,744 | | 5,706,123 |
| |
| |
|
| Dividends to Shareholders from ($): | | | | |
| Investment income—net: | | | | |
| Investors Shares | | (2,027,963) | | (4,318,586) |
| Class R Shares | | (3,115,781) | | (1,387,537) |
| Total Dividends | | (5,143,744) | | (5,706,123) |
| |
| |
|
| Capital Stock Transactions ($1.00 per share): | | | | |
| Net proceeds from shares sold: | | | | |
| Investors Shares | | 235,086,111 | | 149,224,575 |
| Class R Shares | | 1,130,142,244 | | 187,470,868 |
| Dividends reinvested: | | | | |
| Investors Shares | | 1,974,354 | | 4,199,556 |
| Class R Shares | | 240,155 | | 546,823 |
| Cost of shares redeemed: | | | | |
| Investors Shares | | (190,389,091) | | (138,364,250) |
| Class R Shares | | (692,238,469) | | (141,716,881) |
| Increase (Decrease) in Net Assets | | | | |
| from Capital Stock Transactions | | 484,815,304 | | 61,360,691 |
| Total Increase (Decrease) in Net Assets | | 484,815,304 | | 61,360,691 |
| |
| |
|
| Net Assets ($): | | | | |
| Beginning of Period | | 172,092,365 | | 110,731,674 |
| End of Period | | 656,907,669 | | 172,092,365 |
| |
| See notes to financial statements. | | | | |
FINANCIAL HIGHLIGHTS
The following tables describe the performance for each share class for the fiscal periods indicated. All information reflects financial results for a single fund share. Total return shows how much your investment in the fund would have increased (or decreased) during each period, assuming you had reinvested all dividends and distributions.These figures have been derived from the fund’s financial statements.
| | | | | Year Ended October 31, | | |
| | |
| |
| |
|
| Investor Shares | | 2008 | | 2007 | | 2006 | | 2005 | | 2004 |
| |
| |
| |
| |
| |
|
| Per Share Data ($): | | | | | | | | | | |
| Net asset value, beginning of period | | 1.00 | | 1.00 | | 1.00 | | 1.00 | | 1.00 |
| Investment Operations: | | | | | | | | | | |
| Investment income—net | | .016 | | .043 | | .039 | | .020 | | .004 |
| Distributions: | | | | | | | | | | |
| Dividends from investment income—net | | (.016) | | (.043) | | (.039) | | (.020) | | (.004) |
| Net asset value, end of period | | 1.00 | | 1.00 | | 1.00 | | 1.00 | | 1.00 |
| |
| |
| |
| |
| |
|
| Total Return (%) | | 1.62 | | 4.41 | | 3.96 | | 2.03 | | .42 |
| |
| |
| |
| |
| |
|
| Ratios/Supplemental Data (%): | | | | | | | | | | |
| Ratio of total expenses | | | | | | | | | | |
| to average net assets | | .72 | | .71 | | .70 | | .70 | | .70 |
| Ratio of net expenses | | | | | | | | | | |
| to average net assets | | .68 | | .70 | | .70 | | .70 | | .70 |
| Ratio of net investment income | | | | | | | | | | |
| to average net assets | | 1.51 | | 4.31 | | 3.89 | | 2.01 | | .42 |
| |
| |
| |
| |
| |
|
| Net Assets, end of period ($ x 1,000) | | 154,823 | | 108,151 | | 93,091 | | 93,973 | | 77,043 |
| |
| See notes to financial statements. | | | | | | | | | | |
12
| | | | | Year Ended October 31, | | |
| | |
| |
| |
|
| Class R Shares | | 2008 | | 2007 | | 2006 | | 2005 | | 2004 |
| |
| |
| |
| |
| |
|
| Per Share Data ($): | | | | | | | | | | |
| Net asset value, beginning of period | | 1.00 | | 1.00 | | 1.00 | | 1.00 | | 1.00 |
| Investment Operations: | | | | | | | | | | |
| Investment income—net | | .018 | | .045 | | .041 | | .022 | | .006 |
| Distributions: | | | | | | | | | | |
| Dividends from investment income—net | | (.018) | | (.045) | | (.041) | | (.022) | | (.006) |
| Net asset value, end of period | | 1.00 | | 1.00 | | 1.00 | | 1.00 | | 1.00 |
| |
| |
| |
| |
| |
|
| Total Return (%) | | 1.81 | | 4.62 | | 4.17 | | 2.23 | | .62 |
| |
| |
| |
| |
| |
|
| Ratios/Supplemental Data (%): | | | | | | | | | | |
| Ratio of total expenses | | | | | | | | | | |
| to average net assets | | .52 | | .51 | | .50 | | .50 | | .50 |
| Ratio of net expenses | | | | | | | | | | |
| to average net assets | | .49 | | .50 | | .50 | | .50 | | .50 |
| Ratio of net investment income | | | | | | | | | | |
| to average net assets | | 1.35 | | 4.40 | | 4.05 | | 2.10 | | .63 |
| |
| |
| |
| |
| |
|
| Net Assets, end of period ($ x 1,000) | | 502,085 | | 63,941 | | 17,640 | | 25,243 | | 82,911 |
| |
| See notes to financial statements. | | | | | | | | | | |
NOTES TO FINANCIAL STATEMENTS
NOTE 1—Significant Accounting Policies:
Dreyfus U.S. Treasury Reserves (the “fund”) is a separate diversified series of The Dreyfus/Laurel Funds, Inc. (the “Company”) which is registered under the Investment Company Act of 1940, as amended (the “Act”), as an open-end management investment company and operates as a series company currently offering fourteen series including the fund.The fund’s investment objective is to seek a high level of current income consistent with stability of principal by investing in direct obligations of U.S. Treasury and repurchase agreements secured by these obligations.The Dreyfus Corporation (the “Manager” or “Dreyfus”), a wholly-owned subsidiary of The Bank of New York Mellon Corporation (“BNY Mellon”), serves as the fund’s investment adviser.
Effective July 1, 2008, BNY Mellon has reorganized and consolidated a number of its banking and trust company subsidiaries. As a result of the reorganization, any services previously provided to the fund by Mellon Bank, N.A. or Mellon Trust of New England, N.A. are now provided by The Bank of New York, which has changed its name to The Bank of New York Mellon.
MBSC Securities Corporation (the “Distributor”), a wholly-owned subsidiary of the Manager, is the distributor of the fund’s shares, which are sold without a sales charge.The fund is authorized to issue 1 billion shares of $.001 par value Capital Stock in each of the following classes of shares: Investor and Class R. Investor shares are sold primarily to retail investors and bear a distribution fee. Class R shares are sold primarily to bank trust departments and other financial service providers (including The Bank of New York Mellon, a subsidiary of BNY Mellon and an affiliate of Dreyfus) acting on behalf of customers having a qualified trust or investment account or relationship at such institution, and bear no distribution fee. Each class of shares has identical rights and privileges, except with respect to the distribution fee and voting rights on matters affecting a single class. Income, expenses (other than expenses attributable to a specific class), and realized and unrealized gains or losses on investments are allocated to each class of shares based on its relative net assets.
14
It is the fund’s policy to maintain a continuous net asset value per share of $1.00 for the fund; the fund has adopted certain investment, portfolio valuation and dividend and distribution policies to enable it to do so. There is no assurance, however, that the fund will be able to maintain a stable net asset value per share of $1.00.
The fund’s financial statements are prepared in accordance with U.S. generally accepted accounting principles, which may require the use of management estimates and assumptions. Actual results could differ from those estimates.
(a) Portfolio valuation: Investments in securities are valued at amortized cost in accordance with Rule 2a-7 of the Act, which has been determined by the Board of Directors to represent the fair value of the fund’s investments.
The Financial Accounting Standards Board (“FASB”) released Statement of Financial Accounting Standards No. 157 “Fair Value Measurements” (“FAS 157”). FAS 157 establishes an authoritative definition of fair value, sets out a framework for measuring fair value, and requires additional disclosures about fair-value measurements. The application of FAS 157 is required for fiscal years beginning after November 15, 2007 and interim periods within those fiscal years. Management does not believe that the application of this standard will have a material impact on the financial statements of the fund.
(b) Securities transactions and investment income: Securities transactions are recorded on a trade date basis. Realized gains and losses from securities transactions are recorded on the identified cost basis. Interest income, adjusted for accretion of discount and amortization of premium on investments, is earned from settlement date and recognized on the accrual basis. Cost of investments represents amortized cost.
The fund may engage in repurchase agreement transactions. Under the terms of a typical repurchase agreement, the fund, through its custodian and sub-custodian, takes possession of an underlying debt obligation subject to an obligation of the seller to repurchase, and the fund to
| NOTES TO FINANCIAL STATEMENTS (continued) |
resell, the obligation at an agreed-upon price and time, thereby determining the yield during the fund’s holding period. This arrangement results in a fixed rate of return that is not subject to market fluctuations during the fund’s holding period.The value of the collateral is at least equal, at all times, to the total amount of the repurchase obligation, including interest. In the event of a counter party default, the fund has the right to use the collateral to offset losses incurred.There is potential loss to the fund in the event the fund is delayed or prevented from exercising its rights to dispose of the collateral securities, including the risk of a possible decline in the value of the underlying securities during the period while the fund seeks to assert its rights. The Manager, acting under the supervision of the Board of Directors, reviews the value of the collateral and the creditworthiness of those banks and dealers with which the fund enters into repurchase agreements to evaluate potential risks.
In March 2008, the FASB released Statement of Financial Accounting Standards No. 161 “Disclosures about Derivative Instruments and Hedging Activities” (“FAS 161”). FAS 161 requires qualitative disclosures about objectives and strategies for using derivatives, quantitative disclosures about fair value amounts of gains and losses on derivative instruments and disclosures about credit-risk-related contingent features in derivative agreements.The application of FAS 161 is required for fiscal years and interim periods beginning after November 15, 2008. At this time, management is evaluating the implications of FAS 161 and its impact on the financial statements and the accompanying notes has not yet been determined.
(c) Dividends to shareholders: It is the policy of the fund to declare dividends daily from investment income-net; such dividends are paid monthly. Dividends from net realized capital gains, if any, are normally declared and paid annually, but the fund may make distributions on a more frequent basis to comply with the distribution requirements of the Internal Revenue Code of 1986, as amended (the “Code”).To the extent that net realized capital gains can be offset by capital loss carryovers, it is the policy of the fund not to distribute such gains.
16
(d) Federal income taxes: It is the policy of the fund to continue to qualify as a regulated investment company, if such qualification is in the best interests of its shareholders, by complying with the applicable provisions of the Code, and to make distributions of taxable income sufficient to relieve it from substantially all federal income and excise taxes.
The fund adopted FASB Interpretation No. 48 “Accounting for Uncertainty in IncomeTaxes” (“FIN 48”). FIN 48 provides guidance for how uncertain tax positions should be recognized, measured, presented and disclosed in the financial statements. FIN 48 requires the evaluation of tax positions taken or expected to be taken in the course of preparing the fund’s tax returns to determine whether the tax positions are “more-likely-than-not” of being sustained by the applicable tax authority. Liability for tax positions not deemed to meet the more-likely-than-not threshold would be recorded as a tax expense in the current year. The adoption of FIN 48 had no impact on the operations of the fund for the period ended October 31, 2008.
As of and during the period ended October 31, 2008, the fund did not have any liabilities for any unrecognized tax positions. The fund recognizes interest and penalties, if any, related to unrecognized tax positions as income tax expense in the Statement of Operations. During the period, the fund did not incur any interest or penalties.
Each of the tax years in the four-year period ended October 31, 2008 remains subject to examination by the Internal Revenue Service and state taxing authorities.
At October 31, 2008, the components of accumulated earnings on a tax basis were substantially the same as for financial reporting purposes.
The tax character of distributions paid to shareholders during the fiscal periods ended October 31, 2008 and October 31, 2007 were all ordinary income.
At October 31, 2008, the cost of investments for federal income tax purposes was substantially the same as the cost for financial reporting purposes (see the Statement of Investments).
| NOTES TO FINANCIAL STATEMENTS (continued) |
(e) Treasury's Temporary Guarantee Program: The fund has entered into a Guarantee Agreement with the United States Department of the Treasury (the “Treasury”) to participate in the Treasury’s Temporary Guarantee Program for Money Market Funds (the “Program”).
Under the Program, the Treasury guarantees the share price of shares of the fund held by shareholders as of September 19, 2008 at $1.00 per share if the fund’s net asset value per share falls below $0.995 (a “Guarantee Event”) and the fund liquidates. Recovery under the Program is subject to certain conditions and limitations.
Fund shares acquired by investors after September 19, 2008 that increase the number of fund shares the investor held at the close of business on September 19, 2008 are not eligible for protection under the Program. In addition, fund shares acquired by investors who did not hold fund shares at the close of business on September 19, 2008 are not eligible for protection under the Program.
The Program, which was originally set to expire on December 18, 2008, has been extended by the Treasury until April 30, 2009, after which the Secretary of theTreasury will review the need for, and terms of, the Program. Participation in the initial term and the extended period of the Program required a payment to the Treasury in the amount of .01% and .015%, respectively, of the fund’s shares outstanding as of September 19, 2008.This expense is being borne by the fund without regard to any expense limitation currently in effect.
NOTE 2—Bank Line of Credit:
Prior to May 1, 2008, the fund participated with other Dreyfus managed funds in a $100 million unsecured line of credit. Effective May 1, 2008, the fund participates with other Dreyfus-managed funds in a $300 million unsecured line of credit primarily to be utilized for temporary or emergency purposes, including the financing of redemptions. The terms of the line of credit agreement limit the amount of individual fund borrowings. Interest is charged to the fund based on prevailing market rates in effect at the time of borrowing. Effective October 15,
18
2008, the $300 million unsecured line of credit was terminated. During the period ended October 31, 2008, the fund did not borrow under the lines of credit.
NOTE 3—Investment Management Fee and Other Transactions with Affiliates:
(a) Pursuant to an Investment Management Agreement with the Manager, the Manager provides or arranges for one or more third parties and/or affiliates to provide investment advisory, administrative, custody, fund accounting and transfer agency services to the fund.The Manager also directs the investments of the fund in accordance with its investment objective, policies and limitations. For these services, the fund is contractually obligated to pay the Manager a fee, calculated daily and paid monthly, at the annual rate of .50% of the value of the fund’s average daily net assets. Out of its fee, the Manager pays all of the expenses of the fund except brokerage fees, taxes, interest, Rule 12b-1 distribution fees, service fees and expenses, fees and expenses of non-interested Directors (including counsel fees) and extraordinary expenses. In addition, the Manager is required to reduce its fee in an amount equal to the fund’s allocable portion of fees and expenses of the non-interested Directors (including counsel fees). Each Director receives $45,000 per year, plus $6,000 for each joint Board meeting of the Company, The Dreyfus/Laurel Tax-Free Municipal Funds and The Dreyfus/Laurel Funds Trust (collectively, the “Dreyfus/Laurel Funds”) attended, $2,000 for separate in-person committee meetings attended which are not held in conjunction with a regularly scheduled Board meeting and $1,500 for Board meetings and separate committee meetings attended that are conducted by telephone and is reimbursed for travel and out-of-pocket expenses.With respect to Board meetings, the Chairman of the Board receives an additional 25% of such compensation (with the exception of reimbursable amounts). With respect to compensation committee meetings, the Chair of the compensation committee receives $900 per meeting and, prior to April 12, 2008 with respect to audit committee meetings, the Chair of the audit committee received $1,350 per meet-
| NOTES TO FINANCIAL STATEMENTS (continued) |
ing. In the event that there is an in-person joint committee meeting or a joint telephone meeting of the Dreyfus/Laurel Funds and Dreyfus High Yield Strategies Fund, the $2,000 or $1,500 fee, as applicable, will be allocated between the Dreyfus/Laurel Funds and Dreyfus HighYield Strategies Fund. These fees and expenses are charged and allocated to each series based on net assets. Amounts required to be paid by the Company directly to the non-interested Directors, that would be applied to offset a portion of the management fee payable to the Manager, are in fact paid directly by the Manager to the non-interested Directors.
The Manager has undertaken to limit fund expenses to maintain a minimum yield floor limit of .05%. Such expense limitations may fluctuate daily, and are voluntary and temporary, not contractual, and may be terminated by Dreyfus at any time without notice. The reduction in expenses, pursuant to the undertaking, amounted to $54,808 during the period ended October 31, 2008.
(b) Under the fund’s Distribution Plan (the “Plan”) adopted pursuant to Rule 12b-1 under the Act, Investor shares may pay annually up to .25% (currently limited by the Company’s Board of Directors to .20%) of the value of the average daily net assets attributable to its Investor shares to compensate the Distributor for shareholder servicing activities and expenses primarily intended to result in the sale of Investor shares. During the period ended October 31, 2008, Investor shares were charged $269,394 pursuant to the Plan.
Under its terms, the Plan shall remain in effect from year to year, provided such continuance is approved annually by a vote of a majority of those Directors who are not “interested persons” of the Company and who have no direct or indirect financial interest in the operation of or in any agreement related to the Plan.
The components of “Due to The Dreyfus Corporation and affiliates” in the Statement of Assets and Liabilities consist of: management fees $240,706 and Rule 12b-1 distribution plan fees $27,530, which are offset against an expense reimbursement currently in effect in the amount of $50,855.
20
REPORT OF INDEPENDENT REGISTERED PUBLIC ACCOUNTING FIRM
The Board of Directors and Shareholders The Dreyfus/Laurel Funds, Inc.:
We have audited the accompanying statement of assets and liabilities of Dreyfus U.S.Treasury Reserves, a series of The Dreyfus/Laurel Funds, Inc. (the “Fund”), including the statement of investments, as of October 31, 2008, and the related statement of operations for the year then ended, the statement of changes in net assets for each of the years in the two-year period then ended, and the financial highlights for each of the years in the five-year period then ended.These financial statements and financial highlights are the responsibility of the Fund’s management. Our responsibility is to express an opinion on these financial statements and financial highlights based on our audits.
We conducted our audits in accordance with the standards of the Public Company Accounting Oversight Board (United States). Those standards require that we plan and perform the audit to obtain reasonable assurance about whether the financial statements and financial highlights are free of material misstatement.An audit includes examining, on a test basis, evidence supporting the amounts and disclosures in the financial statements. Our procedures included confirmation of securities owned as of October 31, 2008, by correspondence with the custodian. An audit also includes assessing the accounting principles used and significant estimates made by management, as well as evaluating the overall financial statement presentation. We believe that our audits provide a reasonable basis for our opinion.
In our opinion, the financial statements and financial highlights referred to above present fairly, in all material respects, the financial position of Dreyfus U.S.Treasury Reserves as of October 31, 2008, and the results of its operations for the year then ended, the changes in its net assets for each of the years in the two-year period then ended, and the financial highlights for each of the years in the five-year period then ended, in conformity with U.S. generally accepted accounting principles.

| | New York, New York
December 19, 2008 |
IMPORTANT TAX INFORMATION (Unaudited)
For federal tax purposes the fund hereby designates 100% of ordinary income dividends paid during the fiscal year ended October 31, 2008 as qualifying “interest related dividends”.
22

24
OFFICERS OF THE FUND (Unaudited)

OFFICERS OF THE FUND (Unaudited) (continued)

26
NOTES
For More Information
| Dreyfus | | | | Transfer Agent & |
| U.S. Treasury Reserves | | Dividend Disbursing Agent |
| 200 Park Avenue | | | | Dreyfus Transfer, Inc. |
| New York, NY 10166 | | 200 Park Avenue |
| Manager | | | | New York, NY 10166 |
| The Dreyfus Corporation | | Distributor |
| 200 Park Avenue | | | | MBSC Securities Corporation |
| New York, NY 10166 | | 200 Park Avenue |
| Custodian | | | | New York, NY 10166 |
| The Bank of New York Mellon | | |
| One Wall Street | | | | |
| New York, NY 10286 | | |
| |
|
| |
| Ticker Symbols: | | Investor: DUIXX | | Class R: DUTXX |
Telephone 1-800-645-6561
Mail The Dreyfus Family of Funds, 144 Glenn Curtiss Boulevard, Uniondale, NY 11556-0144 E-mail Send your request to info@dreyfus.com Internet Information can be viewed online or downloaded at: http://www.dreyfus.com
The fund will disclose daily, on www.dreyfus.com, the fund’s complete schedule of holdings as of the end of the previous business day. The schedule of holdings will remain on the website until the fund files its Form N-Q or Form N-CSR for the period that includes the date of the posted holdings.
The fund files its complete schedule of portfolio holdings with the Securities and Exchange Commission (“SEC”) for the first and third quarters of each fiscal year on Form N-Q. The fund's Forms N-Q are available on the SEC’s website at http://www.sec.gov and may be reviewed and copied at the SEC’s Public Reference Room in Washington, DC. Information on the operation of the Public Reference Room may be obtained by calling 1-800-SEC-0330.
Information regarding how the fund voted proxies relating to portfolio securities for the 12-month period ended June 30, 2008, is available on the SEC’s website at http://www.sec.gov and without charge, upon request, by calling 1-800-645-6561.
© 2008 MBSC Securities Corporation

Save time. Save paper. View your next shareholder report online as soon as it’s available. Log into www.dreyfus.com and sign up for Dreyfus eCommunications. It’s simple and only takes a few minutes.
The views expressed in this report reflect those of the portfolio manager only through the end of the period covered and do not necessarily represent the views of Dreyfus or any other person in the Dreyfus organization. Any such views are subject to change at any time based upon market or other conditions and Dreyfus disclaims any responsibility to update such views.These views may not be relied on as investment advice and, because investment decisions for a Dreyfus fund are based on numerous factors, may not be relied on as an indication of trading intent on behalf of any Dreyfus fund.
Not FDIC-Insured Not Bank-Guaranteed May Lose Value
| | Contents |
| |
| | THE FUND |
| |
| 2 | A Letter from the CEO |
| |
| 3 | Discussion of Fund Performance |
| |
| 6 | Fund Performance |
| |
| 8 | Understanding Your Fund’s Expenses |
| |
| 8 | Comparing Your Fund’s Expenses With Those of Other Funds |
| |
| 9 | Statement of Investments |
| |
| 24 | Statement of Financial Futures |
| |
| 24 | Statement of Options Written |
| |
| 25 | Statement of Assets and Liabilities |
| |
| 26 | Statement of Operations |
| |
| 27 | Statement of Changes in Net Assets |
| |
| 29 | Financial Highlights |
| |
| 34 | Notes to Financial Statements |
| |
| 47 | Report of Independent Registered Public Accounting Firm |
| |
| 48 | Important Tax Information |
| |
| 48 | Proxy Results |
| |
| 49 | Board Members Information |
| |
| 51 | Officers of the Fund |
| |
| | FOR MORE INFORMATION |
| |
| | Back Cover |
| |
The Fund

A LETTER FROM THE CEO
Dear Shareholder: |
We present to you this annual report for Dreyfus Balanced Fund, covering the 12-month period from November 1, 2007, through October 31, 2008.
These are difficult times for investors. A credit crunch that began in early 2007 has developed into a full-blown global financial crisis, recently resulting in the failure of several major financial institutions and prompting a massive government rescue effort. Meanwhile, the U.S. economic slowdown has gathered momentum, depressing investor sentiment, consumer confidence and business investment.These factors undermined returns in most stock market sectors, particularly financial companies and businesses that tend to be more sensitive to economic trends. While in the bond market, higher-yielding sectors, including high yield corporate and municipal securities, as well as the traditional safe haven of U.S. government securities, to some extent, also have encountered heightened yield volatility.
The depth and duration of the economic downturn will depend on how quickly the financial system can be stabilized.We believe that the Temporary Guarantee Program for Money Market Funds and the $700 billion rescue package intended to promote greater liquidity in the financial markets meet several critical requirements for addressing today’s financial stresses, and we expect these measures to contribute to a more orderly deleveraging process. However, recuperation from the financial crisis is likely to take time. In the meantime, we encourage you to keep in touch with your financial advisor and maintain a long-term and disciplined perspective to investing. Indeed, we already are seeing some positive signs, including a likely peak in global inflationary pressures, a bottoming of the U.S. dollar, attractive valuations among fundamentally sound companies and a large pool of worldwide financial liquidity that could be deployed gradually as the economic cycle turns.
For information about how the fund performed during the reporting period, as well as market perspectives, we have provided a Discussion of Fund Performance given by the fund’s Portfolio Managers.
Thank you for your continued confidence and support.

Jonathan R. Baum
Chief Executive Officer
The Dreyfus Corporation
November 17, 2008 |
2

DISCUSSION OF FUND PERFORMANCE
For the period of November 1, 2007, through October 31, 2008, as provided by John Jares, David Bowser and Peter Vaream, Portfolio Managers
Fund and Market Performance Overview
For the 12-month period ended October 31, 2008, Dreyfus Balanced Fund’s Class A, Class B, Class C, Class I and ClassT shares produced total returns of –30.27%, –30.81%, –30.84%, –30.12% and –30.50%, respectively.1 In comparison, the fund’s benchmark, a hybrid index composed of 60% Standard & Poor’s 500 Composite Stock Price Index (“S&P 500 Index”) and 40% Barclays Capital U.S. Aggregate Index (“Barclays Capital Aggregate Index”), provided a total return of –21.53% for the same period. Separately, the S&P 500 Index and the Barclays Capital Aggregate Index returned –36.08% and 0.30%, respectively.2
Stocks and bonds suffered amid a global economic slowdown and an intensifying financial crisis.The fund underperformed its benchmark, mainly due to disappointing results from our security selection and sector allocation strategies in the information technology and energy sectors of the fund’s equity portfolio, and underweighted exposure to U.S.Treasury securities in the fixed-income portfolio.
On a separate note, effective on or about January 8, 2009, the fund will merge into Dreyfus Balanced Opportunity Fund.
The Fund’s Investment Approach
Seeking total return, the fund has a normal allocation of approximately 60% stocks and 40% bonds, corresponding to the fund’s benchmark. However, the fund is permitted to invest from 40% to 75% of its total assets in stocks and 25% to 60% in bonds.
In choosing stocks, we use a “growth style” of investing with a consis-tent,“bottom-up” approach that emphasizes individual stock selection through in-house qualitative and quantitative research.
In choosing bonds, we review economic, market and other factors, leading to valuations by sector, maturity and quality. The fund primarily invests in U.S. government securities, corporate bonds, mortgage-backed and asset-backed securities.
| DISCUSSION OF FUND PERFORMANCE (continued) |
Global Financial Crisis Sparked Broad Declines
A severe credit crunch developed into a full-blown financial crisis during the reporting period. As the crisis came close to spinning out of control in September 2008, very difficult liquidity conditions in global credit markets nearly led to the collapse of the global banking system. Unprecedented intervention by government authorities helped to thaw frozen credit markets by the reporting period’s end.These efforts included the passage of the Troubled Asset Relief Program by the U.S. Congress and coordinated reductions of short-term interest rates by central banks, including the Federal Reserve Board which lowered the federal funds rate to 1%.
Meanwhile,slumping housing markets,rising unemployment and sharply lower consumer confidence exacerbated a U.S. economic downturn, giving rise to fears regarding a potentially deep and prolonged recession. Commodity prices that had soared over the reporting period’s first half plummeted over the second half when global demand abated for energy and construction materials.
As market conditions deteriorated, many highly leveraged institutional investors were forced to sell their more liquid investments to raise cash for margin calls and redemption requests. As a result, selling pressure intensified even among fundamentally sound securities, leading to broadly lower prices for stocks and most bonds.
Technology and Energy Equities Detracted
These developments sparked declines among the fund’s information technology stocks, including industry giants Microsoft, Apple and Cisco Systems. Silicon wafer producer MEMC Electronic Materials suffered from on-going operating problems and concerns surrounding customer financing, and video game developer Electronic Arts was hurt by restructuring efforts, new product delays and currency devaluation. Overweighted exposure to the technology sector also hindered performance. Unfortunate timing in increasing the fund’s allocation to the energy sector hampered results, as did positions in integrated oil producers Exxon Mobil and Chevron, and natural-gas producer Chesapeake Energy.
4
In the health care sector, contract research organization Pharmaceutical Product Development fared poorly due to reduced earnings guidance and questions regarding future clinical trials. Amylin Pharmaceuticals’ diabetes drug Byetta suffered sluggish sales trends.
On the other hand, underweighted exposure to the hard-hit financials sector boosted relative performance. Consumer discretionary companies Retailers Wal-Mart Stores and Family Dollar Stores bolstered returns as cost-conscious consumers turned to less expensive goods. Education stocks Apollo Group and DeVry University also held up relatively well when concerns regarding the availability of student loans failed to materialize.
In the fund’s bond portfolio, relatively light exposure to U.S. Treasury securities undermined relative results. Conversely, overweighted positions in corporate bonds, commercial mortgage-backed securities and asset-backed securities weighed on performance despite sound credit fundamentals underlying most holdings. However, the fund’s interest-rate strategies contributed positively to relative performance, as the fund benefited from widening yield differences along the market’s maturity range. Similarly, a modestly long average duration helped the fund participate more fully in the benefits of falling U.S. interest rates.
November 17, 2008
| 1 | | Total return includes reinvestment of dividends and any capital gains paid and does not take |
| | | into consideration the maximum initial sales charges in the case of Class A and Class T shares |
| | | or the applicable contingent deferred sales charges imposed on redemptions in the case of Class B |
| | | and Class C shares. Had these charges been reflected, returns would have been lower. Past |
| | | performance is no guarantee of future results. Share price and investment return fluctuate such |
| | | that upon redemption, fund shares may be worth more or less than their original cost. Return |
| | | figures provided reflect the absorption of certain fund expenses by The Dreyfus Corporation |
| | | through April 4, 2009, at which time it may be extended, terminated or modified. Had these |
| | | expenses not been absorbed, the fund’s returns would have been lower. |
| 2 | | SOURCE: LIPPER INC. – Reflects reinvestment of dividends and, where applicable, capital |
| | | gain distributions.The Standard & Poor’s 500 Composite Stock Price Index is a widely accepted, |
| | | unmanaged index of U.S. stock market performance.The Barclays Capital U.S. Aggregate Index |
| | | is a widely accepted, unmanaged total return index of corporate, U.S. government and U.S. |
| | | government agency debt instruments, mortgage-backed securities and asset-backed securities with an |
| | | average maturity of 1-10 years. |

| Comparison of change in value of $10,000 investment in Dreyfus Balanced Fund Class A shares, |
| Class B shares, Class C shares and Class I shares with the Standard & Poor’s 500 Composite |
| Stock Price Index, the Barclays Capital U.S. Aggregate Index and the Hybrid Index |
| |
| † Source: Lipper Inc. |
| Past performance is not predictive of future performance. |
| The above graph compares a $10,000 investment made in Class A, Class B, Class C and Class I shares of Dreyfus |
| Balanced Fund on 10/31/98 to a $10,000 investment made on that date in each of the following: the Standard & |
| Poor’s 500 Composite Stock Price Index (the “S&P 500 Index”); the Barclays Capital U.S. Aggregate Index (the |
| “Barclays Index”); and an unmanaged hybrid index composed of 60% S&P 500 Index and 40% Barclays Index (the |
| “Hybrid Index”). All dividends and capital gain distributions are reinvested.The Hybrid Index is calculated on a year- |
| to-year basis. Performance for Class T shares will vary from the performance of Class A, Class B, Class C and Class I |
| shares shown above due to differences in charges and expenses. |
| The fund’s performance shown in the line graph takes into account the maximum initial sales charge on Class A shares |
| and all other applicable fees and expenses.The S&P 500 Index is a widely accepted, unmanaged index of U.S. stock |
| market performance.The Barclays Index is a widely accepted, unmanaged index of corporate, U.S. government and U.S. |
| government agency debt instruments, mortgage-backed securities, and asset-backed securities with an average maturity of |
| 1-10 years. Unlike a mutual fund, the indices are not subject to charges, fees and other expenses. Investors cannot invest |
| directly in any index. Further information relating to fund performance, including expense reimbursements, if applicable, is |
| contained in the Financial Highlights section of the prospectus and elsewhere in this report. |
6
| Average Annual Total Returns as of 10/31/08 | | | | | | |
| |
| | | Inception | | | | | | |
| | | Date | | 1 Year | | 5 Years | | 10 Years |
| |
| |
| |
| |
|
| Class A shares | | | | | | | | |
| with maximum sales charge (5.75%) | | | | (34.30)% | | (1.98)% | | (1.51)% |
| without sales charge | | | | (30.27)% | | (0.80)% | | (0.92)% |
| Class B shares | | | | | | | | |
| with applicable redemption charge † | | | | (33.56)% | | (1.91)% | | (1.36)% |
| without redemption | | | | (30.81)% | | (1.53)% | | (1.36)% |
| Class C shares | | | | | | | | |
| with applicable redemption charge †† | | | | (31.52)% | | (1.54)% | | (1.66)% |
| without redemption | | | | (30.84)% | | (1.54)% | | (1.66)% |
| Class I shares | | | | (30.12)% | | (0.54)% | | (0.67)% |
| Class T shares | | | | | | | | |
| with applicable sales charge (4.5%) | | 8/16/99 | | (33.64)% | | (1.95)% | | (1.59)%††† |
| without sales charge | | 8/16/99 | | (30.50)% | | (1.04)% | | (1.14)%††† |
| Past performance is not predictive of future performance.The fund’s performance shown in the graph and table does not |
| reflect the deduction of taxes that a shareholder would pay on fund distributions or the redemption of fund shares. |
| Performance for Class B shares assumes the conversion of Class B shares to Class A shares at the end of the sixth year |
| following the date of purchase. |
| † | | The maximum contingent deferred sales charge for Class B shares is 4%. After six years Class B shares convert to |
| | | Class A shares. |
| †† | | The maximum contingent deferred sales charge for Class C shares is 1% for shares redeemed within one year of the |
| | | purchase date. |
| ††† | | The total return performance figures presented for Class T shares of the fund reflect the performance of the fund’s |
| | | Class A shares for periods prior to 8/16/99 (the inception date for Class T shares), adjusted to reflect the |
| | | applicable sales load for that class and the applicable distribution/servicing fees thereafter. |
UNDERSTANDING YOUR FUND’S EXPENSES (Unaudited)
As a mutual fund investor, you pay ongoing expenses, such as management fees and other expenses. Using the information below, you can estimate how these expenses affect your investment and compare them with the expenses of other funds.You also may pay one-time transaction expenses, including sales charges (loads) and redemption fees, which are not shown in this section and would have resulted in higher total expenses. For more information, see your fund’s prospectus or talk to your financial adviser.
Review your fund’s expenses
The table below shows the expenses you would have paid on a $1,000 investment in Dreyfus Balanced Fund from May 1, 2008 to October 31, 2008. It also shows how much a $1,000 investment would be worth at the close of the period, assuming actual returns and expenses.
Expenses and Value of a $1,000 Investment assuming actual returns for the six months ended October 31, 2008
| | | Class A | | Class B | | Class C | | Class I | | Class T |
| |
| |
| |
| |
| |
|
| Expenses paid per $1,000† | | $ 4.84 | | $ 8.12 | | $ 8.12 | | $ 3.74 | | $ 5.94 |
| Ending value (after expenses) | | $750.00 | | $747.20 | | $747.20 | | $750.80 | | $749.10 |
COMPARING YOUR FUND’S EXPENSES WITH THOSE OF OTHER FUNDS (Unaudited)
Using the SEC’s method to compare expenses
The Securities and Exchange Commission (SEC) has established guidelines to help investors assess fund expenses. Per these guidelines, the table below shows your fund’s expenses based on a $1,000 investment, assuming a hypothetical 5% annualized return. You can use this information to compare the ongoing expenses (but not transaction expenses or total cost) of investing in the fund with those of other funds.All mutual fund shareholder reports will provide this information to help you make this comparison. Please note that you cannot use this information to estimate your actual ending account balance and expenses paid during the period.
Expenses and Value of a $1,000 Investment assuming a hypothetical 5% annualized return for the six months ended October 31, 2008
| | | Class A | | Class B | | Class C | | Class I | | Class T |
| |
| |
| |
| |
| |
|
| Expenses paid per $1,000† | | $ 5.58 | | $ 9.37 | | $ 9.37 | | $ 4.32 | | $ 6.85 |
| Ending value (after expenses) | | $1,019.61 | | $1,015.84 | | $1,015.84 | | $1,020.86 | | $1,018.35 |
| † Expenses are equal to the fund’s annualized expense ratio of 1.10% for Class A, 1.85% for Class B, 1.85% for |
| Class C, .85% for Class I and 1.35% for Class T, multiplied by the average account value over the period, multiplied |
| by 184/366 (to reflect the one-half year period). |
8
STATEMENT OF INVESTMENTS
October 31, 2008 |
| Common Stocks—63.8% | | Shares | | Value ($) |
| |
| |
|
| Consumer Discretionary—7.7% | | | | |
| Amazon.com | | 6,216 a | | 355,805 |
| Apollo Group, Cl. A | | 10,994 a | | 764,193 |
| Best Buy | | 15,139 | | 405,877 |
| Carnival | | 7,522 | | 191,059 |
| CVS Caremark | | 17,605 | | 539,593 |
| DeVry | | 4,467 | | 253,234 |
| GameStop, Cl. A | | 10,458 a | | 286,445 |
| Gap | | 34,092 b | | 441,150 |
| Home Depot | | 22,167 | | 522,920 |
| Limited Brands | | 27,312 | | 327,198 |
| Nordstrom | | 7,394 | | 133,757 |
| Walt Disney | | 13,475 | | 349,003 |
| | | | | 4,570,234 |
| Consumer Staples—8.8% | | | | |
| Avon Products | | 20,643 | | 512,566 |
| Clorox | | 5,359 | | 325,881 |
| Dean Foods | | 23,715 | | 518,410 |
| Estee Lauder, Cl. A | | 7,507 | | 270,552 |
| Kraft Foods, Cl. A | | 24,644 | | 718,126 |
| PepsiCo | | 8,035 | | 458,075 |
| Philip Morris International | | 7,570 | | 329,068 |
| Procter & Gamble | | 7,756 | | 500,572 |
| Safeway | | 18,315 | | 389,560 |
| Wal-Mart Stores | | 21,849 | | 1,219,393 |
| | | | | 5,242,203 |
| Energy—5.4% | | | | |
| Apache | | 2,455 | | 202,120 |
| Chevron | | 7,180 | | 535,628 |
| Exxon Mobil | | 12,130 | | 899,076 |
| Hess | | 2,444 | | 147,153 |
| National Oilwell Varco | | 7,703 a | | 230,243 |
| Schlumberger | | 6,994 | | 361,240 |
| Transocean | | 3,378 a | | 278,111 |
| Ultra Petroleum | | 11,680 a | | 543,704 |
| | | | | 3,197,275 |
| STATEMENT OF INVESTMENTS (continued) |
| Common Stocks (continued) | | Shares | | Value ($) |
| |
| |
|
| Exchange Traded Funds—1.3% | | | | |
| iShares Russell 1000 Growth Index Fund | | 4,196 | | 167,588 |
| Standard & Poor’s | | | | |
| Depository Receipts (Tr. Ser. 1) | | 6,151 b | | 595,601 |
| | | | | 763,189 |
| Financial—3.3% | | | | |
| Assurant | | 7,630 | | 194,412 |
| Charles Schwab | | 34,128 | | 652,527 |
| Janus Capital Group | | 25,573 | | 300,227 |
| JPMorgan Chase & Co. | | 9,964 | | 411,015 |
| Unum Group | | 27,396 | | 431,487 |
| | | | | 1,989,668 |
| Health Care—9.3% | | | | |
| Abbott Laboratories | | 16,732 | | 922,770 |
| Allergan | | 10,993 | | 436,092 |
| BioMarin Pharmaceutical | | 28,339 a,b | | 519,170 |
| Covidien | | 13,333 | | 590,519 |
| Gilead Sciences | | 13,703 a | | 628,283 |
| Invitrogen | | 13,393 a | | 385,584 |
| Johnson & Johnson | | 7,362 | | 451,585 |
| Pharmaceutical Product Development | | 33,381 | | 1,034,143 |
| Thermo Fisher Scientific | | 9,974 a | | 404,944 |
| Wyeth | | 5,051 | | 162,541 |
| | | | | 5,535,631 |
| Industrial—5.3% | | | | |
| Deere & Co. | | 6,225 | | 240,036 |
| Dover | | 20,148 | | 640,102 |
| Energy Conversion Devices | | 6,391 a,b | | 218,189 |
| FedEx | | 4,221 | | 275,927 |
| Precision Castparts | | 2,018 | | 130,787 |
| Union Pacific | | 12,005 | | 801,574 |
| Waste Management | | 27,072 | | 845,459 |
| | | | | 3,152,074 |
10
| Common Stocks (continued) | | Shares | | Value ($) |
| |
| |
|
| Information Technology—20.4% | | | | |
| Activision Blizzard | | 27,470 a | | 342,276 |
| Adobe Systems | | 12,554 a | | 334,439 |
| Agilent Technologies | | 16,307 a | | 361,852 |
| Akamai Technologies | | 26,331 a | | 378,640 |
| Altera | | 29,947 | | 519,580 |
| Apple | | 12,839 a | | 1,381,348 |
| Autodesk | | 5,820 a | | 124,024 |
| Broadcom, Cl. A | | 18,440 a | | 314,955 |
| Cisco Systems | | 55,208 a | | 981,046 |
| Electronic Arts | | 18,558 a | | 422,751 |
| EMC | | 45,217 a | | 532,656 |
| Google, Cl. A | | 2,019 a | | 725,548 |
| Hewlett-Packard | | 22,535 | | 862,640 |
| Intel | | 46,662 | | 746,592 |
| Juniper Networks | | 11,598 a | | 217,347 |
| KLA-Tencor | | 8,431 | | 196,021 |
| MEMC Electronic Materials | | 19,047 a | | 350,084 |
| Microsoft | | 89,910 | | 2,007,690 |
| Oracle | | 30,007 a | | 548,828 |
| QUALCOMM | | 12,081 | | 462,219 |
| Visa, Cl. A | | 5,679 | | 314,333 |
| | | | | 12,124,869 |
| Materials—1.5% | | | | |
| Cliffs Natural Resources | | 2,352 | | 63,480 |
| Freeport-McMoRan Copper & Gold | | 2,461 | | 71,615 |
| Monsanto | | 4,694 | | 417,672 |
| Praxair | | 5,123 | | 333,763 |
| | | | | 886,530 |
| Telecommunication Services—.8% | | | | |
| AT & T | | 18,568 | | 497,065 |
| Total Common Stocks | | | | |
| (cost $49,740,907) | | | | 37,958,738 |
| STATEMENT OF INVESTMENTS (continued) |
| | | Coupon | | Maturity | | Principal | | | | |
| Bonds and Notes—35.4% | | Rate (%) | | Date | | Amount ($) | | | | Value ($) |
| |
| |
| |
| |
| |
|
| Asset-Backed Ctfs./ | | | | | | | | | | |
| Auto Receivables—2.2% | | | | | | | | | | |
| Americredit Automobile Receivables | | | | | | | | | | |
| Trust, Ser. 2008-AF, Cl. A2A | | 4.47 | | 1/12/12 | | 85,000 | | | | 81,122 |
| AmeriCredit Automobile Receivables | | | | | | | | | | |
| Trust, Ser. 2005-DA, Cl. A3 | | 4.87 | | 12/6/10 | | 50,443 | | | | 49,675 |
| AmeriCredit Automobile Receivables | | | | | | | | | | |
| Trust, Ser. 2006-BG, Cl. A3 | | 5.21 | | 10/6/11 | | 93,857 | | | | 91,715 |
| Americredit Prime Automobile | | | | | | | | | | |
| Receivables Trust, | | | | | | | | | | |
| Ser. 2007-1, Cl. E | | 6.96 | | 3/8/16 | | 95,400 | | c | | 56,286 |
| Americredit Prime Automobile | | | | | | | | | | |
| Receivables, Ser. 2007-2M, | | | | | | | | | | |
| Cl. A2B | | 4.47 | | 11/8/10 | | 23,843 | | d | | 23,602 |
| Capital One Auto Finance Trust, | | | | | | | | | | |
| Ser. 2007-A, Cl. A3B | | 4.56 | | 8/15/11 | | 84,789 | | d | | 81,701 |
| Capital One Auto Finance Trust, | | | | | | | | | | |
| Ser. 2006-C, Cl. A3A | | 5.07 | | 7/15/11 | | 75,454 | | | | 73,483 |
| Capital One Auto Finance Trust, | | | | | | | | | | |
| Ser. 2007-C, Cl. A3A | | 5.13 | | 4/16/12 | | 185,000 | | | | 173,354 |
| Capital One Auto Finance Trust, | | | | | | | | | | |
| Ser. 2006-A, Cl. A3 | | 5.33 | | 11/15/10 | | 8,895 | | | | 8,864 |
| Ford Credit Auto Owner Trust, | | | | | | | | | | |
| Ser. 2005-B, Cl. B | | 4.64 | | 4/15/10 | | 195,000 | | | | 191,743 |
| Ford Credit Auto Owner Trust, | | | | | | | | | | |
| Ser. 2006-C, Cl. C | | 5.47 | | 9/15/12 | | 100,000 | | | | 73,940 |
| Ford Credit Auto Owner Trust, | | | | | | | | | | |
| Ser. 2007-A, Cl. C | | 5.80 | | 2/15/13 | | 100,000 | | | | 71,782 |
| Honda Auto Receivables Owner | | | | | | | | | | |
| Trust, Ser. 2008-1, Cl. A2 | | 3.77 | | 9/20/10 | | 35,000 | | | | 34,462 |
| Honda Auto Receivables Owner | | | | | | | | | | |
| Trust, Ser. 2006-1, Cl. A3 | | 5.07 | | 2/18/10 | | 18,197 | | | | 18,213 |
| Hyundai Auto Receivables Trust, | | | | | | | | | | |
| Ser. 2007-A, Cl. A3A | | 5.04 | | 1/17/12 | | 55,000 | | | | 54,171 |
| Triad Auto Receivables Owner | | | | | | | | | | |
| Trust, Ser. 2006-A, Cl. A3 | | 4.77 | | 1/12/11 | | 47,164 | | | | 46,720 |
| Wachovia Auto Loan Owner Trust, | | | | | | | | | | |
| Ser. 2007-1, Cl. D | | 5.65 | | 2/20/13 | | 125,000 | | | | 64,959 |
| WFS Financial Owner Trust, | | | | | | | | | | |
| Ser. 2005-2, Cl. B | | 4.57 | | 11/19/12 | | 105,000 | | | | 102,764 |
| | | | | | | | | | | 1,298,556 |
12
| | | | | Coupon | | Maturity | | Principal | | | | |
| Bonds and Notes (continued) | | Rate (%) | | Date | | Amount ($) | | | | Value ($) |
| |
| |
| |
| |
| |
|
| Asset-Backed Ctfs./ | | | | | | | | | | | | |
| Home Equity Loans—1.2% | | | | | | | | | | |
| Ameriquest Mortgage Securities, | | | | | | | | | | |
| Ser. 2003-11, Cl. AF6 | | | | 5.14 | | 1/25/34 | | 168,107 | | d | | 148,425 |
| Citicorp Residential Mortgage | | | | | | | | | | |
| Securities, Ser. 2006-2, Cl. A2 | | 5.56 | | 9/25/36 | | 225,000 | | d | | 223,145 |
| Citigroup Mortgage Loan Trust, | | | | | | | | | | |
| Ser. 2005-WF2, Cl. AF7 | | 5.25 | | 8/25/35 | | 268,488 | | d | | 215,656 |
| Master Asset Backed Securities | | | | | | | | | | |
| Trust, Ser. 2006-AM1, Cl. A2 | | 3.39 | | 1/25/36 | | 31,277 | | d | | 30,128 |
| Residential Asset Securities, | | | | | | | | | | |
| Ser. 2005-EMX4, Cl. A2 | | 3.52 | | 11/25/35 | | 98,084 | | d | | 92,679 |
| Sovereign Commercial Mortgage | | | | | | | | | | |
| Securities Trust, | | | | | | | | | | | | |
| Ser. 2007-C1, Cl. D | | | | 5.78 | | 7/22/30 | | 55,000 | | c,d | | 16,748 |
| | | | | | | | | | | | | 726,781 |
| Asset-Backed Ctfs./ | | | | | | | | | | | | |
| Manufactured Housing—.1% | | | | | | | | | | |
| Green Tree Financial, | | | | | | | | | | | | |
| Ser. 1994-7, Cl. M1 | | | | 9.25 | | 3/15/20 | | 59,493 | | | | 54,677 |
| Banks—1.8% | | | | | | | | | | | | |
| Bank of America, | | | | | | | | | | | | |
| Jr. Sub. Bonds | | | | 8.00 | | 12/29/49 | | 155,000 | | d | | 116,221 |
| Barclays Bank, | | | | | | | | | | | | |
| Jr. Sub. Bonds | | | | 5.93 | | 9/29/49 | | 200,000 | | c,d | | 107,511 |
| Chevy Chase Bank, | | | | | | | | | | | | |
| Sub. Notes | | | | 6.88 | | 12/1/13 | | 105,000 | | | | 63,525 |
| Chuo Mitsui Trust & Banking, | | | | | | | | | | |
| Jr. Sub. Notes | | | | 5.51 | | 12/29/49 | | 100,000 | | c,d | | 65,296 |
| Citigroup, | | | | | | | | | | | | |
| Sr. Sub. Bonds | | | | 6.00 | | 10/31/33 | | 10,000 | | | | 6,793 |
| M&T Bank, | | | | | | | | | | | | |
| Sr. Unscd. Bonds | | | | 5.38 | | 5/24/12 | | 105,000 | | | | 87,930 |
| Marshall & Ilsley, | | | | | | | | | | | | |
| Sr. Unscd. Notes | | | | 5.63 | | 8/17/09 | | 180,000 | | | | 164,992 |
| Royal Bank of Scotland Group, | | | | | | | | | | |
| Jr. Sub. Bonds | | | | 6.99 | | 10/29/49 | | 110,000 | | c,d | | 59,037 |
| Sovereign Bancorp, | | | | | | | | | | | | |
| Sr. Unscd. Notes | | | | 4.80 | | 9/1/10 | | 140,000 | | d | | 124,594 |
| Sumitomo Mitsui Banking, | | | | | | | | | | |
| Sub. Notes | | EUR | | 4.38 | | 7/29/49 | | 50,000 | | d,e | | 35,643 |
| STATEMENT OF INVESTMENTS (continued) |
| | | Coupon | | Maturity | | Principal | | | | |
| Bonds and Notes (continued) | | Rate (%) | | Date | | Amount ($) | | | | Value ($) |
| |
| |
| |
| |
| |
|
| Banks (continued) | | | | | | | | | | |
| SunTrust Preferred Capital I, | | | | | | | | | | |
| Bank Gtd. Notes | | 5.85 | | 12/31/49 | | 105,000 | | d | | 57,917 |
| Wells Fargo Capital XIII, | | | | | | | | | | |
| Bank Gtd. Notes | | 7.70 | | 12/29/49 | | 245,000 | | d | | 200,472 |
| | | | | | | | | | | 1,089,931 |
| Commercial & | | | | | | | | | | |
| Professional Services—.3% | | | | | | | | | | |
| ERAC USA Finance, | | | | | | | | | | |
| Bonds | | 5.60 | | 5/1/15 | | 90,000 | | c | | 63,580 |
| ERAC USA Finance, | | | | | | | | | | |
| Gtd. Notes | | 6.38 | | 10/15/17 | | 90,000 | | c | | 55,281 |
| ERAC USA Finance, | | | | | | | | | | |
| Notes | | 7.95 | | 12/15/09 | | 50,000 | | c | | 47,477 |
| | | | | | | | | | | 166,338 |
| Commercial Mortgage | | | | | | | | | | |
| Pass-Through Ctfs.—3.6% | | | | | | | | | | |
| Banc of America Commercial | | | | | | | | | | |
| Mortgage, Ser. 2002-2, Cl. A3 | | 5.12 | | 7/11/43 | | 40,000 | | | | 36,737 |
| Bear Stearns Commercial Mortgage | | | | | | | | | | |
| Securities, Ser. 2005-PWR8, | | | | | | | | | | |
| Cl. A2 | | 4.48 | | 6/11/41 | | 100,000 | | | | 94,434 |
| Bear Stearns Commercial Mortgage | | | | | | | | | | |
| Securities, Ser. 2006-PW12, | | | | | | | | | | |
| Cl. AAB | | 5.88 | | 9/11/38 | | 100,000 | | d | | 82,943 |
| Crown Castle Towers, | | | | | | | | | | |
| Ser. 2006-1A, Cl. AFX | | 5.24 | | 11/15/36 | | 175,000 | | c | | 168,040 |
| Crown Castle Towers, | | | | | | | | | | |
| Ser. 2005-1A, Cl. D | | 5.61 | | 6/15/35 | | 70,000 | | c | | 63,655 |
| Crown Castle Towers, | | | | | | | | | | |
| Ser. 2006-1A, Cl. D | | 5.77 | | 11/15/36 | | 85,000 | | c | | 73,798 |
| CS First Boston Mortgage | | | | | | | | | | |
| Securities, Ser. 2005-C3, | | | | | | | | | | |
| Cl. A2 | | 4.51 | | 7/15/37 | | 250,000 | | | | 236,712 |
| CS First Boston Mortgage | | | | | | | | | | |
| Securities, Ser. 2001-CKN5, | | | | | | | | | | |
| Cl. A4 | | 5.44 | | 9/15/34 | | 115,466 | | | | 109,163 |
| Global Signal Trust, | | | | | | | | | | |
| Ser. 2006-1, Cl. C | | 5.71 | | 2/15/36 | | 75,000 | | c | | 68,864 |
14
| | | Coupon | | Maturity | | Principal | | | | |
| Bonds and Notes (continued) | | Rate (%) | | Date | | Amount ($) | | | | Value ($) |
| |
| |
| |
| |
| |
|
| Commercial Mortgage | | | | | | | | | | |
| Pass-Through Ctfs. (continued) | | | | | | | | | | |
| Global Signal Trust, | | | | | | | | | | |
| Ser. 2006-1, Cl. D | | 6.05 | | 2/15/36 | | 90,000 | | c | | 79,915 |
| Global Signal Trust, | | | | | | | | | | |
| Ser. 2006-1, Cl. E | | 6.50 | | 2/15/36 | | 35,000 | | c | | 30,447 |
| Goldman Sachs Mortgage Securities | | | | | | | | | | |
| Corporation II, Ser. 2007-EOP, Cl. E | | 4.49 | | 3/6/20 | | 85,000 | | c,d | | 72,012 |
| Goldman Sachs Mortgage Securities | | | | | | | | | | |
| Corporation II, Ser. 2007-EOP, Cl. K | | 5.09 | | 3/6/20 | | 50,000 | | c,d | | 37,195 |
| JP Morgan Chase Commercial | | | | | | | | | | |
| Mortgage Securities, | | | | | | | | | | |
| Ser. 2004-C1, Cl. A2 | | 4.30 | | 1/15/38 | | 85,000 | | | | 77,950 |
| JP Morgan Chase Commercial | | | | | | | | | | |
| Mortgage Securities, | | | | | | | | | | |
| Ser. 2005-LDP5, Cl. A2 | | 5.20 | | 12/15/44 | | 200,000 | | | | 187,450 |
| LB-UBS Commercial Mortgage Trust, | | | | | | | | | | |
| Ser. 2001-C3, Cl. A2 | | 6.37 | | 12/15/28 | | 150,000 | | | | 145,231 |
| Merrill Lynch Mortgage Trust, | | | | | | | | | | |
| Ser. 2005-CKI1, Cl. A2 | | 5.39 | | 11/12/37 | | 45,000 | | d | | 42,416 |
| Morgan Stanley Capital I, | | | | | | | | | | |
| Ser. 2006-T21, Cl. A2 | | 5.09 | | 10/12/52 | | 150,000 | | | | 138,890 |
| SBA CMBS Trust, | | | | | | | | | | |
| Ser. 2005-1A, Cl. C | | 5.73 | | 11/15/35 | | 35,000 | | c | | 29,679 |
| SBA CMBS Trust, | | | | | | | | | | |
| Ser. 2006-1A, Cl. D | | 5.85 | | 11/15/36 | | 30,000 | | c | | 25,974 |
| TIAA Seasoned Commercial Mortgage | | | | | | | | | | |
| Trust, Ser. 2007-C4, Cl. A3 | | 6.09 | | 8/15/39 | | 65,000 | | d | | 55,080 |
| Wachovia Bank Commercial Mortgage | | | | | | | | | | |
| Trust, Ser. 2005-C16, Cl. A2 | | 4.38 | | 10/15/41 | | 70,136 | | | | 67,524 |
| Wachovia Bank Commercial Mortgage | | | | | | | | | | |
| Trust, Ser. 2005-C19, Cl. A5 | | 4.66 | | 5/15/44 | | 55,000 | | | | 48,293 |
| WAMU Commercial Mortgage | | | | | | | | | | |
| Securities Trust, | | | | | | | | | | |
| Ser. 2003-C1A, Cl. A | | 3.83 | | 1/25/35 | | 164,074 | | c | | 154,860 |
| | | | | | | | | | | 2,127,262 |
| Diversified Financial Services—3.5% | | | | | | | | | | |
| Ameriprise Financial, | | | | | | | | | | |
| Jr. Sub. Notes | | 7.52 | | 6/1/66 | | 50,000 | | d | | 24,990 |
| STATEMENT OF INVESTMENTS (continued) |
| | | Coupon | | Maturity | | Principal | | | | |
| Bonds and Notes (continued) | | Rate (%) | | Date | | Amount ($) | | | | Value ($) |
| |
| |
| |
| |
| |
|
| Diversified Financial | | | | | | | | | | |
| Services (continued) | | | | | | | | | | |
| Amvescap, | | | | | | | | | | |
| Gtd. Notes | | 5.38 | | 2/27/13 | | 50,000 | | | | 46,491 |
| BTM Curacao Holdings, | | | | | | | | | | |
| Bank Gtd. Notes | | 4.76 | | 7/21/15 | | 225,000 | | c,d | | 213,553 |
| Capmark Financial Group, | | | | | | | | | | |
| Gtd. Notes | | 5.88 | | 5/10/12 | | 130,000 | | | | 32,513 |
| CIT Group, | | | | | | | | | | |
| Sr. Unscd. Notes | | 3.35 | | 12/22/08 | | 133,000 | | d | | 131,973 |
| Citigroup, | | | | | | | | | | |
| Sr. Unscd. Notes | | 5.50 | | 4/11/13 | | 425,000 | | | | 389,132 |
| Citigroup, | | | | | | | | | | |
| Sr. Unscd. Notes | | 6.13 | | 5/15/18 | | 110,000 | | | | 94,397 |
| Countrywide Home Loans, | | | | | | | | | | |
| Gtd. Notes | | 4.13 | | 9/15/09 | | 40,000 | | | | 38,368 |
| Credit Suisse Guernsey, | | | | | | | | | | |
| Jr. Sub. Notes | | 5.86 | | 5/29/49 | | 110,000 | | d | | 62,917 |
| Credit Suisse USA, | | | | | | | | | | |
| Gtd. Notes | | 5.50 | | 8/16/11 | | 170,000 | | | | 162,013 |
| General Electric Capital, | | | | | | | | | | |
| Sr. Unscd. Notes | | 5.25 | | 10/19/12 | | 180,000 | | | | 166,159 |
| Goldman Sachs Capital II, | | | | | | | | | | |
| Gtd. Bonds | | 5.79 | | 12/29/49 | | 65,000 | | d | | 29,870 |
| Goldman Sachs Group, | | | | | | | | | | |
| Sub. Notes | | 6.75 | | 10/1/37 | | 70,000 | | | | 45,699 |
| HSBC Finance Capital Trust IX, | | | | | | | | | | |
| Gtd. Notes | | 5.91 | | 11/30/35 | | 410,000 | | d | | 224,234 |
| International Lease Finance, | | | | | | | | | | |
| Sr. Unscd. Notes | | 6.38 | | 3/25/13 | | 55,000 | | | | 35,998 |
| Janus Capital Group, | | | | | | | | | | |
| Sr. Unscd. Notes | | 6.25 | | 6/15/12 | | 75,000 | | | | 59,160 |
| Jefferies Group, | | | | | | | | | | |
| Sr. Unscd. Debs. | | 6.25 | | 1/15/36 | | 130,000 | | | | 86,071 |
| Merrill Lynch & Co., | | | | | | | | | | |
| Notes | | 6.88 | | 4/25/18 | | 155,000 | | | | 137,899 |
| Morgan Stanley, | | | | | | | | | | |
| Sub. Notes | | 4.75 | | 4/1/14 | | 35,000 | | | | 24,921 |
| Morgan Stanley, | | | | | | | | | | |
| Sr. Unscd. Notes | | 6.60 | | 4/1/12 | | 95,000 | | | | 85,148 |
| | | | | | | | | | | 2,091,506 |
16
| | | Coupon | | Maturity | | Principal | | | | |
| Bonds and Notes (continued) | | Rate (%) | | Date | | Amount ($) | | | | Value ($) |
| |
| |
| |
| |
| |
|
| Diversified Manufacturing—.1% | | | | | | | | | | |
| Siemens Financieringsmaatschappij, | | | | | | | | | | |
| Gtd. Notes | | 6.13 | | 8/17/26 | | 100,000 | | c | | 81,285 |
| Electric Utilities—2.0% | | | | | | | | | | |
| AES, | | | | | | | | | | |
| Sr. Unscd. Notes | | 7.75 | | 10/15/15 | | 50,000 | | | | 39,437 |
| Cleveland Electric Illumination, | | | | | | | | | | |
| Sr. Unscd. Notes | | 5.70 | | 4/1/17 | | 120,000 | | | | 95,721 |
| Consolidated Edison of NY, | | | | | | | | | | |
| Sr. Unscd. Debs., Ser. 06-D | | 5.30 | | 12/1/16 | | 95,000 | | | | 80,416 |
| Consolidated Edison of NY, | | | | | | | | | | |
| Sr. Unscd. Debs., Ser. 08-A | | 5.85 | | 4/1/18 | | 25,000 | | | | 21,332 |
| Consumers Energy, | | | | | | | | | | |
| First Mortgage Bonds, Ser. O | | 5.00 | | 2/15/12 | | 235,000 | | | | 216,940 |
| Enel Finance International, | | | | | | | | | | |
| Gtd. Bonds | | 6.25 | | 9/15/17 | | 160,000 | | c | | 132,575 |
| FirstEnergy, | | | | | | | | | | |
| Sr. Unscd. Notes, Ser. B | | 6.45 | | 11/15/11 | | 40,000 | | | | 37,705 |
| National Grid, | | | | | | | | | | |
| Sr. Unscd. Notes | | 6.30 | | 8/1/16 | | 140,000 | | | | 117,790 |
| Nevada Power, | | | | | | | | | | |
| Mortgage Notes | | 6.50 | | 8/1/18 | | 55,000 | | | | 46,523 |
| Nevada Power, | | | | | | | | | | |
| Mortgage Notes, Ser. R | | 6.75 | | 7/1/37 | | 55,000 | | | | 41,920 |
| NiSource Finance, | | | | | | | | | | |
| Gtd. Notes | | 5.25 | | 9/15/17 | | 100,000 | | | | 68,171 |
| Ohio Power, | | | | | | | | | | |
| Sr. Unscd. Notes | | 4.39 | | 4/5/10 | | 170,000 | | d | | 167,317 |
| Pacific Gas & Electric, | | | | | | | | | | |
| Sr. Unscd. Notes | | 6.35 | | 2/15/38 | | 50,000 | | | | 39,412 |
| Sierra Pacific Power, | | | | | | | | | | |
| Mortgage Notes, Ser. P | | 6.75 | | 7/1/37 | | 25,000 | | | | 19,055 |
| Southern, | | | | | | | | | | |
| Sr. Unscd. Notes, Ser. A | | 5.30 | | 1/15/12 | | 70,000 | | | | 67,618 |
| | | | | | | | | | | 1,191,932 |
| Environmental Control—.2% | | | | | | | | | | |
| Republic Services, | | | | | | | | | | |
| Sr. Unscd. Notes | | 6.75 | | 8/15/11 | | 85,000 | | | | 82,769 |
| USA Waste Services, | | | | | | | | | | |
| Sr. Unscd. Notes | | 7.00 | | 7/15/28 | | 45,000 | | | | 31,692 |
| | | | | | | | | | | 114,461 |
| STATEMENT OF INVESTMENTS (continued) |
| | | Coupon | | Maturity | | Principal | | |
| Bonds and Notes (continued) | | Rate (%) | | Date | | Amount ($) | | Value ($) |
| |
| |
| |
| |
|
| H.J. Heinz, | | | | | | | | |
| Sr. Unscd. Secs. | | 6.43 | | 12/1/20 | | 60,000 c | | 60,190 |
| Kraft Foods, | | | | | | | | | | |
| Sr. Unscd. Notes | | 6.00 | | 2/11/13 | | 20,000 | | | | 18,708 |
| Kroger, | | | | | | | | | | |
| Gtd. Notes | | 6.15 | | 1/15/20 | | 75,000 | | | | 61,689 |
| | | | | | | | | | | 140,587 |
| Foreign/Governmental—.3% | | | | | | | | | | |
| Export-Import Bank of Korea, | | | | | | | | | | |
| Unsub. Notes | | 4.50 | | 8/12/09 | | 175,000 | | | | 169,306 |
| Health Care—.4% | | | | | | | | | | |
| Community Health Systems, | | | | | | | | | | |
| Gtd. Notes | | 8.88 | | 7/15/15 | | 45,000 | | | | 37,912 |
| Coventry Health Care, | | | | | | | | | | |
| Sr. Unscd. Notes | | 5.88 | | 1/15/12 | | 85,000 | | | | 68,865 |
| Coventry Health Care, | | | | | | | | | | |
| Sr. Unscd. Notes | | 5.95 | | 3/15/17 | | 60,000 | | | | 38,768 |
| Medco Health Solutions, | | | | | | | | | | |
| Sr. Unscd. Notes | | 7.25 | | 8/15/13 | | 50,000 | | | | 47,869 |
| Wellpoint, | | | | | | | | | | |
| Sr. Unscd. Notes | | 5.88 | | 6/15/17 | | 50,000 | | | | 40,937 |
| | | | | | | | | | | 234,351 |
| Machinery—.1% | | | | | | | | | | |
| Atlas Copco, | | | | | | | | | | |
| Sr. Unscd. Bonds | | 5.60 | | 5/22/17 | | 45,000 | | c | | 40,440 |
| Media—.3% | | | | | | | | | | |
| Comcast, | | | | | | | | | | |
| Gtd. Notes | | 6.30 | | 11/15/17 | | 80,000 | | | | 69,248 |
| News America Holdings, | | | | | | | | | | |
| Gtd. Notes | | 7.70 | | 10/30/25 | | 130,000 | | | | 109,832 |
| | | | | | | | | | | 179,080 |
| Municipal Obligations—.2% | | | | | | | | | | |
| Clark County School District, | | | | | | | | | | |
| GO, Ser. F (Insured; FSA) | | 5.50 | | 6/15/17 | | 20,000 | | f | | 21,598 |
| Clark County School District, | | | | | | | | | | |
| GO, Ser. F (Insured; FSA) | | 5.50 | | 6/15/18 | | 15,000 | | f | | 16,198 |
| Clark County, | | | | | | | | | | |
| GO (Bond Bank) (Insured; MBIA) | | 5.25 | | 6/1/20 | | 20,000 | | f | | 21,577 |
18
| | | Coupon | | Maturity | | Principal | | | | |
| Bonds and Notes (continued) | | Rate (%) | | Date | | Amount ($) | | | | Value ($) |
| |
| |
| |
| |
| |
|
| Municipal Obligations (continued) | | | | | | | | | | |
| Cypress-Fairbanks Independent | | | | | | | | | | |
| School District, GO, Ser. A | | | | | | | | | | |
| (Schoolhouse) (Insured; | | | | | | | | | | |
| PSF-GTD) | | 5.25 | | 2/15/22 | | 15,000 | | f | | 15,586 |
| Wisconsin, | | | | | | | | | | |
| GO, Ser. G (Insured; MBIA) | | 5.00 | | 5/1/15 | | 25,000 | | f | | 26,771 |
| | | | | | | | | | | 101,730 |
| Office And Business Equipment—.1% | | | | | | | | | | |
| Xerox, | | | | | | | | | | |
| Sr. Unscd. Notes | | 5.50 | | 5/15/12 | | 15,000 | | | | 11,667 |
| Xerox, | | | | | | | | | | |
| Sr. Unscd. Notes | | 5.65 | | 5/15/13 | | 25,000 | | | | 19,750 |
| | | | | | | | | | | 31,417 |
| Oil & Gas—.0% | | | | | | | | | | |
| Chesapeake Energy, | | | | | | | | | | |
| Gtd. Notes | | 7.50 | | 6/15/14 | | 20,000 | | | | 16,550 |
| Packaging & Containers—.2% | | | | | | | | | | |
| Ball, | | | | | | | | | | |
| Gtd. Notes | | 6.88 | | 12/15/12 | | 25,000 | | | | 23,125 |
| Crown Americas, | | | | | | | | | | |
| Gtd. Notes | | 7.63 | | 11/15/13 | | 90,000 | | | | 79,650 |
| | | | | | | | | | | 102,775 |
| Property & Casualty Insurance—.5% | | | | | | | | | | |
| Ace INA Holdings, | | | | | | | | | | |
| Gtd. Notes | | 5.80 | | 3/15/18 | | 45,000 | | | | 36,191 |
| Allstate, | | | | | | | | | | |
| Jr. Sub. Debs. | | 6.50 | | 5/15/67 | | 40,000 | | d | | 21,924 |
| Jackson National Life Global, | | | | | | | | | | |
| Sr. Scd. Notes | | 5.38 | | 5/8/13 | | 50,000 | | c | | 44,520 |
| Leucadia National, | | | | | | | | | | |
| Sr. Unscd. Notes | | 7.13 | | 3/15/17 | | 55,000 | | | | 47,300 |
| Lincoln National, | | | | | | | | | | |
| Jr. Sub. Bonds | | 6.05 | | 4/20/67 | | 185,000 | | d | | 85,212 |
| Pacific Life Global Funding, | | | | | | | | | | |
| Notes | | 5.15 | | 4/15/13 | | 80,000 | | c | | 67,110 |
| Willis North America, | | | | | | | | | | |
| Gtd. Notes | | 6.20 | | 3/28/17 | | 25,000 | | | | 18,245 |
| | | | | | | | | | | 320,502 |
| STATEMENT OF INVESTMENTS (continued) |
| | | Coupon | | Maturity | | Principal | | | | |
| Bonds and Notes (continued) | | Rate (%) | | Date | | Amount ($) | | | | Value ($) |
| |
| |
| |
| |
| |
|
| Real Estate Investment Trusts—1.8% | | | | | | | | | | |
| Arden Realty, | | | | | | | | | | |
| Sr. Unscd. Notes | | 5.25 | | 3/1/15 | | 125,000 | | | | 104,139 |
| Avalonbay Communities, | | | | | | | | | | |
| Sr. Unscd. Notes | | 6.63 | | 9/15/11 | | 50,000 | | | | 46,332 |
| Duke Realty, | | | | | | | | | | |
| Sr. Unscd. Notes | | 5.88 | | 8/15/12 | | 80,000 | | | | 66,729 |
| Federal Realty Investment Trust, | | | | | | | | | | |
| Sr. Unscd. Bonds | | 5.65 | | 6/1/16 | | 75,000 | | | | 60,616 |
| Federal Realty Investment Trust, | | | | | | | | | | |
| Sr. Unscd. Notes | | 6.00 | | 7/15/12 | | 25,000 | | | | 23,030 |
| Healthcare Realty Trust, | | | | | | | | | | |
| Sr. Unscd. Notes | | 5.13 | | 4/1/14 | | 155,000 | | | | 131,753 |
| Mack-Cali Realty, | | | | | | | | | | |
| Sr. Unscd. Notes | | 5.05 | | 4/15/10 | | 70,000 | | | | 70,173 |
| Mack-Cali Realty, | | | | | | | | | | |
| Notes | | 5.25 | | 1/15/12 | | 100,000 | | | | 100,191 |
| Mack-Cali Realty, | | | | | | | | | | |
| Sr. Unscd. Notes | | 5.80 | | 1/15/16 | | 110,000 | | b | | 101,447 |
| National Retail Properties, | | | | | | | | | | |
| Sr. Unscd. Notes | | 6.15 | | 12/15/15 | | 50,000 | | | | 42,108 |
| Prologis, | | | | | | | | | | |
| Sr. Unscd. Notes | | 6.63 | | 5/15/18 | | 70,000 | | | | 40,351 |
| Regency Centers, | | | | | | | | | | |
| Gtd. Notes | | 5.25 | | 8/1/15 | | 45,000 | | | | 35,860 |
| Regency Centers, | | | | | | | | | | |
| Gtd. Notes | | 5.88 | | 6/15/17 | | 15,000 | | | | 11,445 |
| Simon Property Group, | | | | | | | | | | |
| Sr. Unscd. Notes | | 5.00 | | 3/1/12 | | 175,000 | | | | 148,709 |
| Simon Property Group, | | | | | | | | | | |
| Sr. Unscd. Notes | | 5.75 | | 5/1/12 | | 8,000 | | | | 6,906 |
| WEA Finance, | | | | | | | | | | |
| Sr. Notes | | 7.13 | | 4/15/18 | | 80,000 | | c | | 62,899 |
| | | | | | | | | | | 1,052,688 |
| Residential Mortgage | | | | | | | | | | |
| Pass-Through Ctfs.—.5% | | | | | | | | | | |
| ChaseFlex Trust, | | | | | | | | | | |
| Ser. 2006-2, Cl. A1A | | 5.59 | | 9/25/36 | | 17,680 | | d | | 17,564 |
| Nomura Asset Acceptance, | | | | | | | | | | |
| Ser. 2005-WF1, Cl. 2A5 | | 5.16 | | 3/25/35 | | 146,468 | | d | | 102,001 |
20
| | | Coupon | | Maturity | | Principal | | | | |
| Bonds and Notes (continued) | | Rate (%) | | Date | | Amount ($) | | | | Value ($) |
| |
| |
| |
| |
| |
|
| Residential Mortgage | | | | | | | | | | |
| Pass-Through Ctfs. (continued) | | | | | | | | | | |
| WaMu Pass-Through Certificates, | | | | | | | | | | |
| Ser. 2005-AR4, Cl. A4B | | 4.67 | | 4/25/35 | | 200,000 | | d | | 193,381 |
| | | | | | | | | | | 312,946 |
| Retail—.3% | | | | | | | | | | |
| CVS Caremark, | | | | | | | | | | |
| Sr. Unscd. Notes | | 5.75 | | 8/15/11 | | 35,000 | | | | 33,041 |
| Delhaize Group, | | | | | | | | | | |
| Sr. Unscd. Notes | | 6.50 | | 6/15/17 | | 70,000 | | | | 56,919 |
| Home Depot, | | | | | | | | | | |
| Sr. Unscd. Notes | | 5.88 | | 12/16/36 | | 100,000 | | | | 59,962 |
| Lowe’s Companies, | | | | | | | | | | |
| Sr. Unscd. Notes | | 5.60 | | 9/15/12 | | 25,000 | | | | 24,767 |
| Macys Retail Holdings, | | | | | | | | | | |
| Gtd. Notes | | 5.90 | | 12/1/16 | | 25,000 | | | | 15,123 |
| | | | | | | | | | | 189,812 |
| Telecommunications—.9% | | | | | | | | | | |
| AT & T, | | | | | | | | | | |
| Sr. Unscd. Notes | | 5.60 | | 5/15/18 | | 80,000 | | | | 68,376 |
| KONINKLIJKE KPN, | | | | | | | | | | |
| Sr. Unsub. Notes | | 8.00 | | 10/1/10 | | 20,000 | | | | 19,160 |
| Qwest, | | | | | | | | | | |
| Sr. Unscd. Notes | | 8.88 | | 3/15/12 | | 10,000 | | d | | 8,800 |
| Sprint Capital, | | | | | | | | | | |
| Gtd. Notes | | 6.88 | | 11/15/28 | | 60,000 | | | | 35,171 |
| Sprint Capital, | | | | | | | | | | |
| Gtd. Notes | | 8.38 | | 3/15/12 | | 145,000 | | | | 116,805 |
| Telecom Italia Capital, | | | | | | | | | | |
| Gtd. Notes | | 5.25 | | 11/15/13 | | 35,000 | | | | 26,594 |
| Telefonica Emisiones, | | | | | | | | | | |
| Gtd. Notes | | 5.98 | | 6/20/11 | | 90,000 | | | | 85,988 |
| Time Warner Cable, | | | | | | | | | | |
| Gtd. Notes | | 5.85 | | 5/1/17 | | 80,000 | | | | 65,641 |
| Time Warner, | | | | | | | | | | |
| Gtd. Notes | | 5.88 | | 11/15/16 | | 160,000 | | | | 128,247 |
| | | | | | | | | | | 554,782 |
| Textiles & Apparel—.2% | | | | | | | | | | |
| Mohawk Industries, | | | | | | | | | | |
| Sr. Unscd. Notes | | 5.75 | | 1/15/11 | | 105,000 | | | | 95,568 |
| STATEMENT OF INVESTMENTS (continued) |
| | | Coupon | | Maturity | | Principal | | |
| Bonds and Notes (continued) | | Rate (%) | | Date | | Amount ($) | | Value ($) |
| |
| |
| |
| |
|
| U.S. Government Agencies/ | | | | | | | | |
| Mortgage-Backed—14.4% | | | | | | | | |
| Federal Home Loan Mortgage Corp.: | | | | | | | | |
| 3.50%, 9/1/10 | | | | | | 37,137 g | | 36,755 |
| 5.00%, 7/1/35 | | | | | | 89,015 g,h | | 84,341 |
| 5.00%, 12/1/35—6/1/37 | | | | | | 612,891 g | | 580,706 |
| 5.50%, 4/1/22—11/1/36 | | | | | | 2,280,527 g | | 2,229,085 |
| 6.00%, 9/1/37 | | | | | | 772,616 g | | 771,819 |
| Federal National Mortgage Association: | | | | | | |
| 4.00%, 5/1/10 | | | | | | 184,490 g | | 183,885 |
| 5.00%, 8/1/20—3/1/36 | | | | | | 1,902,525 g | | 1,826,518 |
| 5.50%, 4/1/36 | | | | | | 1,302,731 g | | 1,273,759 |
| 6.00%, 5/1/22—10/1/37 | | | | | | 793,439 g | | 794,137 |
| Government National Mortgage Association I: | | | | | | |
| 5.50%, 4/15/33 | | | | | | 169,267 | | 166,450 |
| Ser. 2005-90, Cl. A, 3.76%, 9/16/28 | | | | 174,999 | | 172,904 |
| Ser. 2005-29, Cl. A, 4.02%, 7/16/27 | | | | 146,274 | | 144,842 |
| Ser. 2006-6, Cl. A, 4.05%, 10/16/23 | | | | 22,965 | | 22,885 |
| Ser. 2006-5, Cl. A, 4.24%, 7/16/29 | | | | 168,450 | | 167,593 |
| Ser. 2005-87, Cl. A, 4.45%, 3/16/25 | | | | 124,177 | | 124,025 |
| | | | | | | | | 8,579,704 |
| Total Bonds and Notes | | | | | | | | |
| (cost $23,595,042) | | | | | | | | 21,064,967 |
| |
| |
| |
| |
|
| |
| | | | | | | Principal | | |
| Short-Term Investments—.4% | | | | | | Amount ($) | | Value ($) |
| |
| |
| |
| |
|
| U.S. Government Agencies—.1% | | | | | | | | |
| Federal National Mortgage | | | | | | | | |
| Association, Notes, 1.50%, 11/13/08 | | | | 40,000 g | | 39,983 |
| U.S. Treasury Bills—.3% | | | | | | | | |
| 0.61%, 1/2/09 | | | | | | 175,000 i | | 174,878 |
| Total Short-Term Investments | | | | | | | | |
| (cost $214,804) | | | | | | | | 214,861 |
22
| Investment of Cash Collateral | | | | |
| for Securities Loaned—3.1% | | Shares | | Value ($) |
| |
| |
|
| Registered Investment Company; | | | | |
| Dreyfus Institutional Cash | | | | |
| Advantage Fund | | | | |
| (cost $1,832,344) | | 1,832,344 j | | 1,832,344 |
| |
| |
|
| |
| Total Investments (cost $75,383,097) | | 102.7% | | 61,070,910 |
| Liabilities, Less Cash and Receivables | | (2.7%) | | (1,590,335) |
| Net Assets | | 100.0% | | 59,480,575 |
| FSA—Financial Security Assurance |
| GO—General Obligation |
| MBIA—Municipal Bond Investors Assurance Insurance Corporation |
| PSF-GTD—Permanent School Fund Guaranteed |
| a | | Non-income producing security. |
| b | | All or a portion of these securities are on loan. At October 31, 2008, the total market value of the fund’s securities |
| | | on loan is $1,757,664 and the total market value of the collateral held by the fund is $1,832,344. |
| c | | Securities exempt from registration under Rule 144A of the Securities Act of 1933.These securities may be resold in |
| | | transactions exempt from registration, normally to qualified institutional buyers. At October 31, 2008, these securities |
| | | amounted to $1,978,227 or 3.3% of net assets. |
| d | | Variable rate security—interest rate subject to periodic change. |
| e | | Principal amount stated in U.S. Dollars unless otherwise noted. |
| | | EUR—Euro |
| f | | These securities are prerefunded; the date shown represents the prerefunded date. Bonds which are prerefunded are |
| | | collateralized by U.S. Government securities which are held in escrow and are used to pay principal and interest on |
| | | the municipal issue and to retire the bonds in full at the earliest refunding date. |
| g | | On September 7, 2008, the Federal Housing Finance Agency (FHFA) placed Federal National Mortgage |
| | | Association and Federal Home Loan Mortgage Corporation into conservatorship with FHFA as the conservator. As |
| | | such, the FHFA will oversee the continuing affairs of the companies. |
| h | | Purchased on a delayed delivery basis. |
| i | | All or partially held by a broker as collateral for open financial futures positions. |
| j | | Investment in affiliated money market mutual fund. |
| Portfolio Summary (Unaudited)† | | | | |
| |
| | | Value (%) | | Value (%) |
| |
| |
|
| Information Technology | | 20.4 | | Industrial | | 5.3 |
| U.S. Government & Agencies | | 14.4 | | Short-Term/Money Market Investments | | 3.5 |
| Corporate Bonds | | 13.1 | | Financial | | 3.3 |
| Health Care | | 9.3 | | Materials | | 1.5 |
| Consumer Staples | | 8.8 | | Exchange Traded Funds | | 1.3 |
| Consumer Discretionary | | 7.7 | | Telecommunication Services | | .8 |
| Asset/Mortgage-Backed | | 7.6 | | Foreign/Governmental | | .3 |
| Energy | | 5.4 | | | | 102.7 |
| |
| † Based on net assets. | | | | | | |
| See notes to financial statements. | | | | | | |
| | | | | The Fund | | 23 |
STATEMENT OF FINANCIAL FUTURES
October 31, 2008
| | | | | | | | | Unrealized |
| | | | | Market Value | | | | Appreciation |
| | | | | Covered by | | | | (Depreciation) |
| | | Contracts | | Contracts ($) | | Expiration | | at 10/31/2008 ($) |
| |
| |
| |
| |
|
| Financial Futures Short | | | | | | | | |
| U.S. Treasury 2 Year Notes | | 1 | | (214,828) | | December 2008 | | (2,737) |
| Financial Futures Long | | | | | | | | |
| Long GILT | | 11 | | 1,970,147 | | December 2008 | | (22,531) |
| U.S. Treasury 5 Year Notes | | 12 | | 1,359,094 | | December 2008 | | 14,790 |
| U.S. Treasury 10 Year Notes | | 3 | | 339,234 | | December 2008 | | (6,896) |
| U.S. Long Bonds | | 13 | | 1,470,625 | | December 2008 | | (48,607) |
| | | | | | | | | (65,981) |
| See notes to financial statements. |
STATEMENT OF OPTIONS WRITTEN
October 31, 2008
| | | Face Amount | | |
| | | Covered by | | |
| | | Contracts ($) | | Value ($) |
| |
| |
|
| Call Options: | | | | |
| 5-Year USD Libor-BBA, Swaption | | 482,000 a | | (3,576) |
| 5-Year USD Libor-BBA, Swaption | | 1,206,000 a | | (12,312) |
| 10-Year USD Libor-BBA, Swaption | | 286,000 a | | (3,334) |
| 10-Year USD Libor-BBA, Swaption | | 312,000 a | | (190) |
| Put Options: | | | | |
| 5-Year USD Libor-BBA, Swaption | | 482,000 a | | (6,357) |
| 5-Year USD Libor-BBA, Swaption | | 1,206,000 a | | (5,770) |
| 10-Year USD Libor-BBA, Swaption | | 286,000 a | | (4,781) |
| 10-Year USD Libor-BBA, Swaption | | 312,000 a | | (8,719) |
| (Premiums received $61,345) | | | | (45,039) |
| |
| LIBOR-BBA—London Interbank Offered Rate British Bankers’ Association | | | | |
| a Non-income producing security. | | | | |
| See notes to financial statements. | | | | |
24
STATEMENT OF ASSETS AND LIABILITIES
October 31, 2008
| | | | | | | | | Cost | | | | Value |
| |
| |
| |
| |
| |
| |
|
| Assets ($): | | | | | | | | | | | | |
| Investments in securities—See Statement of Investments | | | | | | | | |
| (including securities on loan, valued at $1,757,664)—Note 1(c): | | | | | | |
| Unaffiliated issuers | | | | | | 73,550,753 59,238,566 |
| Affiliated issuers | | | | | | 1,832,344 | | 1,832,344 |
| Cash on Initial Margin | | | | | | | | | | | | 95,000 |
| Cash denominated in foreign currencies | | | | | | 1 | | | | 1 |
| Receivable for investment securities sold | | | | | | | | | | 7,354,657 |
| Dividends and interest receivable | | | | | | | | | | | | 244,452 |
| Receivable for shares of Capital Stock subscribed | | | | | | | | | | 81,740 |
| Unrealized appreciation on forward | | | | | | | | | | |
| currency exchange contracts—Note 4 | | | | | | | | | | 16,559 |
| | | | | | | | | | | 68,863,319 |
| |
| |
| |
| |
| |
|
| Liabilities ($): | | | | | | | | | | | | |
| Due to The Dreyfus Corporation and affiliates—Note 3(b) | | | | | | | | 60,820 |
| Cash overdraft due to Custodian | | | | | | | | | | | | 91,241 |
| Payable for investment securities purchased | | | | | | | | | | 6,561,400 |
| Liability for securities on loan—Note 1(c) | | | | | | | | | | 1,832,344 |
| Bank note payable—Note 2 | | | | | | | | | | | | 670,000 |
| Payable for shares of Capital Stock redeemed | | | | | | | | | | 66,093 |
| Outstanding options written, at value (premiums received | | | | | | | | |
| $61,345)—See Statement of Options Written—Note 4 | | | | | | | | 45,039 |
| Payable for futures variation margin—Note 4 | | | | | | | | | | 32,881 |
| Unrealized depreciation on forward | | | | | | | | | | |
| currency exchange contracts—Note 4 | | | | | | | | | | 15,283 |
| Interest payable—Note 2 | | | | | | | | | | | | 5,299 |
| Due to broker | | | | | | | | | | | | 2,344 |
| | | | | | | | | | | | | 9,382,744 |
| |
| |
| |
| |
| |
| |
|
| Net Assets ($) | | | | | | | | | | 59,480,575 |
| |
| |
| |
| |
| |
|
| Composition of Net Assets ($): | | | | | | | | | | | | |
| Paid-in capital | | | | | | | | | | 256,186,095 |
| Accumulated undistributed investment income—net | | | | | | | | 212,613 |
| Accumulated net realized gain (loss) on investments | | | | | | (182,557,004) |
| Accumulated net unrealized appreciation (depreciation) on | | | | | | | | |
| investments, foreign currency transactions and options transactions | | | | | | |
| [including ($65,981) net unrealized (depreciation) on financial futures] | | | | (14,361,129) |
| |
| |
|
| Net Assets ($) | | | | | | | | | | 59,480,575 |
| |
| |
| |
| |
| |
|
| |
| |
| |
| Net Asset Value Per Share | | | | | | | | | | | | |
| | | Class A | | Class B | | Class C | | | | Class I | | Class T |
| |
| |
| |
| |
| |
| |
|
| Net Assets ($) | | 43,399,228 | | 2,951,842 | | 5,164,113 | | 7,813,484 | | 151,908 |
| Shares Outstanding | | 4,164,308 | | 284,048 | | 495,288 | | 750,198 | | 14,570 |
| |
| |
| |
| |
| |
|
| Net Asset Value Per Share ($) | | 10.42 | | 10.39 | | 10.43 | | 10.42 | | 10.43 |
| See notes to financial statements. | | | | | | | | | | | | |
| | | | | | | | | The Fund | | 25 |
STATEMENT OF OPERATIONS
Year Ended October 31, 2008 |
| Investment Income ($): | | |
| Income: | | |
| Cash dividends (net of $685 foreign taxes withheld at source): | | |
| Unaffiliated issuers | | 693,502 |
| Affiliated issuers | | 69,923 |
| Interest | | 1,633,473 |
| Income from securities lending | | 22,062 |
| Total Income | | 2,418,960 |
| Expenses: | | |
| Management fee—Note 3(a) | | 860,115 |
| Distribution and service plan fees—Note 3(b) | | 285,328 |
| Interest expense—Note 2 | | 5,551 |
| Directors’ fees and expenses—Note 3(a) | | 5,107 |
| Loan commitment fees—Note 2 | | 784 |
| Total Expenses | | 1,156,885 |
| Less—reduction in management fee due to undertaking—Note 3(a) | | (129,017) |
| Less—Directors’ fees reimbursed by the Manager—Note 3(a) | | (5,107) |
| Net Expenses | | 1,022,761 |
| Investment Income-Net | | 1,396,199 |
| |
|
| Realized and Unrealized Gain (Loss) on Investments—Note 4 ($): | | |
| Net realized gain (loss) on investments and foreign currency transactions | | (5,342,177) |
| Net realized gain (loss) on options transactions | | 108,125 |
| Net realized gain (loss) on financial futures | | 170,663 |
| Net realized gain (loss) on forward currency exchange contracts | | 5,338 |
| Net Realized Gain (Loss) | | (5,058,051) |
| Net unrealized appreciation (depreciation) on investments, | | |
| foreign currency transactions and options transactions | | |
| [including ($88,173) net unrealized (depreciation) on financial futures] | | (24,391,334) |
| Net Realized and Unrealized Gain (Loss) on Investments | | (29,449,385) |
| Net (Decrease) in Net Assets Resulting from Operations | | (28,053,186) |
| |
| See notes to financial statements. | | |
26
STATEMENT OF CHANGES IN NET ASSETS
| | | Year Ended October 31, |
| | |
|
| | | 2008 | | 2007a |
| |
| |
|
| Operations ($): | | | | |
| Investment income—net | | 1,396,199 | | 2,017,306 |
| Net realized gain (loss) on investments | | (5,058,051) | | 9,644,192 |
| Net unrealized appreciation | | | | |
| (depreciation) on investments | | (24,391,334) | | 2,393,059 |
| Net Increase (Decrease) in Net Assets | | | | |
| Resulting from Operations | | (28,053,186) | | 14,054,557 |
| |
| |
|
| Dividends to Shareholders from ($): | | | | |
| Investment income—net: | | | | |
| Class A Shares | | (1,066,483) | | (1,674,010) |
| Class B Shares | | (51,915) | | (172,320) |
| Class C Shares | | (64,138) | | (121,088) |
| Class I Shares | | (222,944) | | (430,033) |
| Class T Shares | | (2,253) | | (3,344) |
| Total Dividends | | (1,407,733) | | (2,400,795) |
| |
| |
|
| Capital Stock Transactions ($): | | | | |
| Net proceeds from shares sold: | | | | |
| Class A Shares | | 5,395,250 | | 11,663,677 |
| Class B Shares | | 415,437 | | 454,668 |
| Class C Shares | | 582,513 | | 481,539 |
| Class I Shares | | 3,307,500 | | 7,772,789 |
| Class T Shares | | 135,047 | | 3,835 |
| Dividends reinvested: | | | | |
| Class A Shares | | 899,539 | | 1,350,065 |
| Class B Shares | | 41,117 | | 139,145 |
| Class C Shares | | 38,090 | | 70,627 |
| Class I Shares | | 176,673 | | 356,700 |
| Class T Shares | | 2,253 | | 3,344 |
| Cost of shares redeemed: | | | | |
| Class A Shares | | (18,827,054) | | (26,846,646) |
| Class B Shares | | (4,054,531) | | (10,318,883) |
| Class C Shares | | (1,604,447) | | (2,339,429) |
| Class I Shares | | (6,683,962) | | (17,877,077) |
| Class T Shares | | (49,680) | | (94,149) |
| Increase (Decrease) in Net Assets | | | | |
| from Capital Stock Transactions | | (20,226,255) | | (35,179,795) |
| Total Increase (Decrease) in Net Assets | | (49,687,174) | | (23,526,033) |
| |
| |
|
| Net Assets ($): | | | | |
| Beginning of Period | | 109,167,749 | | 132,693,782 |
| End of Period | | 59,480,575 | | 109,167,749 |
| Undistributed investment income—net | | 212,613 | | 311,799 |
STATEMENT OF CHANGES IN NET ASSETS (continued)
| | | Year Ended October 31, |
| | |
|
| | | 2008 | | 2007a |
| |
| |
|
| Capital Share Transactions: | | | | |
| Class Ab | | | | |
| Shares sold | | 390,539 | | 822,354 |
| Shares issued for dividends reinvested | | 63,190 | | 95,816 |
| Shares redeemed | | (1,388,382) | | (1,883,701) |
| Net Increase (Decrease) in Shares Outstanding | | (934,653) | | (965,531) |
| |
| |
|
| Class Bb | | | | |
| Shares sold | | 29,615 | | 32,271 |
| Shares issued for dividends reinvested | | 2,869 | | 9,918 |
| Shares redeemed | | (295,030) | | (728,633) |
| Net Increase (Decrease) in Shares Outstanding | | (262,546) | | (686,444) |
| |
| |
|
| Class C | | | | |
| Shares sold | | 41,433 | | 33,474 |
| Shares issued for dividends reinvested | | 2,674 | | 5,000 |
| Shares redeemed | | (121,904) | | (163,633) |
| Net Increase (Decrease) in Shares Outstanding | | (77,797) | | (125,159) |
| |
| |
|
| Class I | | | | |
| Shares sold | | 239,085 | | 550,568 |
| Shares issued for dividends reinvested | | 12,518 | | 25,544 |
| Shares redeemed | | (466,297) | | (1,251,603) |
| Net Increase (Decrease) in Shares Outstanding | | (214,694) | | (675,491) |
| |
| |
|
| Class T | | | | |
| Shares sold | | 9,476 | | 263 |
| Shares issued for dividends reinvested | | 161 | | 237 |
| Shares redeemed | | (3,769) | | (6,545) |
| Net Increase (Decrease) in Shares Outstanding | | 5,868 | | (6,045) |
| a | | Effective June 1, 2007, Class R shares were redesignated as Class I shares. |
| b | | During the period ended October 31, 2008, 178,876 Class B shares representing $2,486,294 were automatically |
| | | converted to 178,632 Class A shares and during the period ended October 31, 2007, 473,958 Class B shares |
| | | representing $6,715,969 were automatically converted to 473,261 Class A shares. |
| See notes to financial statements. |
28
FINANCIAL HIGHLIGHTS
The following tables describe the performance for each share class for the fiscal periods indicated.All information (except portfolio turnover rate) reflects financial results for a single fund share.Total return shows how much your investment in the fund would have increased (or decreased) during each period, assuming you had reinvested all dividends and distributions.These figures have been derived from the fund’s financial statements.
| | | | | Year Ended October 31, | | |
| | |
| |
| |
|
| Class A Shares | | 2008 | | 2007 | | 2006 | | 2005 | | 2004 |
| |
| |
| |
| |
| |
|
| Per Share Data ($): | | | | | | | | | | |
| Net asset value, beginning of period | | 15.18 | | 13.76 | | 12.58 | | 12.31 | | 11.90 |
| Investment Operations: | | | | | | | | | | |
| Investment income—neta | | .23 | | .25 | | .23 | | .24 | | .15 |
| Net realized and unrealized | | | | | | | | | | |
| gain (loss) on investments | | (4.77) | | 1.46 | | 1.22 | | .29 | | .43 |
| Total from Investment Operations | | (4.54) | | 1.71 | | 1.45 | | .53 | | .58 |
| Distributions: | | | | | | | | | | |
| Dividends from investment income—net | | (.22) | | (.29) | | (.27) | | (.26) | | (.17) |
| Net asset value, end of period | | 10.42 | | 15.18 | | 13.76 | | 12.58 | | 12.31 |
| |
| |
| |
| |
| |
|
| Total Return (%)b | | (30.27) | | 12.64 | | 11.72 | | 4.36 | | 4.90 |
| |
| |
| |
| |
| |
|
| Ratios/Supplemental Data (%): | | | | | | | | | | |
| Ratio of total expenses | | | | | | | | | | |
| to average net assets | | 1.26 | | 1.26 | | 1.25 | | 1.25 | | 1.25 |
| Ratio of net expenses | | | | | | | | | | |
| to average net assets | | 1.11 | | 1.11 | | 1.10 | | 1.12 | | 1.18 |
| Ratio of net investment income | | | | | | | | | | |
| to average net assets | | 1.70 | | 1.77 | | 1.79 | | 1.88 | | 1.20 |
| Portfolio Turnover Rate | | 159.04 | | 226.73c | | 229.90c | | 246.46c | | 215.48 |
| |
| |
| |
| |
| |
|
| Net Assets, end of period ($ x 1,000) | | 43,399 | | 77,416 | | 83,422 | | 87,328 | | 98,546 |
| a | | Based on average shares outstanding at each month end. |
| b | | Exclusive of sales charge. |
| c | | The portfolio turnover rates excluding mortgage dollar roll transactions for the periods ended October 31, 2007, |
| | | October 31, 2006 and Ocotber 31, 2005 were 162.96%, 121.54% and 197.43%, respectively. |
| See notes to financial statements. |
| | FINANCIAL HIGHLIGHTS (continued) |
| | | | | Year Ended October 31, | | |
| | |
| |
| |
|
| Class B Shares | | 2008 | | 2007 | | 2006 | | 2005 | | 2004 |
| |
| |
| |
| |
| |
|
| Per Share Data ($): | | | | | | | | | | |
| Net asset value, beginning of period | | 15.14 | | 13.72 | | 12.53 | | 12.26 | | 11.85 |
| Investment Operations: | | | | | | | | | | |
| Investment income—neta | | .13 | | .14 | | .13 | | .14 | | .05 |
| Net realized and unrealized | | | | | | | | | | |
| gain (loss) on investments | | (4.76) | | 1.47 | | 1.23 | | .30 | | .44 |
| Total from Investment Operations | | (4.63) | | 1.61 | | 1.36 | | .44 | | .49 |
| Distributions: | | | | | | | | | | |
| Dividends from investment income—net | | (.12) | | (.19) | | (.17) | | (.17) | | (.08) |
| Net asset value, end of period | | 10.39 | | 15.14 | | 13.72 | | 12.53 | | 12.26 |
| |
| |
| |
| |
| |
|
| Total Return (%)b | | (30.81) | | 11.83 | | 10.93 | | 3.58 | | 4.13 |
| |
| |
| |
| |
| |
|
| Ratios/Supplemental Data (%): | | | | | | | | | | |
| Ratio of total expenses | | | | | | | | | | |
| to average net assets | | 2.01 | | 2.01 | | 2.00 | | 2.00 | | 2.00 |
| Ratio of net expenses | | | | | | | | | | |
| to average net assets | | 1.86 | | 1.86 | | 1.85 | | 1.88 | | 1.93 |
| Ratio of net investment income | | | | | | | | | | |
| to average net assets | | .95 | | 1.04 | | 1.05 | | 1.18 | | .44 |
| Portfolio Turnover Rate | | 159.04 | | 226.73c | | 229.90c | | 246.46c | | 215.48 |
| |
| |
| |
| |
| |
|
| Net Assets, end of period ($ x 1,000) | | 2,952 | | 8,275 | | 16,913 | | 34,655 | | 78,262 |
| a | | Based on average shares outstanding at each month end. |
| b | | Exclusive of sales charge. |
| c | | The portfolio turnover rates excluding mortgage dollar roll transactions for the periods ended October 31, 2007, |
| | | October 31, 2006 and Ocotber 31, 2005 were 162.96%, 121.54% and 197.43%, respectively. |
| See notes to financial statements. |
30
| | | | | Year Ended October 31, | | |
| | |
| |
| |
|
| Class C Shares | | 2008 | | 2007 | | 2006 | | 2005 | | 2004 |
| |
| |
| |
| |
| |
|
| Per Share Data ($): | | | | | | | | | | |
| Net asset value, beginning of period | | 15.19 | | 13.76 | | 12.58 | | 12.30 | | 11.89 |
| Investment Operations: | | | | | | | | | | |
| Investment income—neta | | .13 | | .15 | | .14 | | .14 | | .05 |
| Net realized and unrealized | | | | | | | | | | |
| gain (loss) on investments | | (4.77) | | 1.47 | | 1.21 | | .31 | | .44 |
| Total from Investment Operations | | (4.64) | | 1.62 | | 1.35 | | .45 | | .49 |
| Distributions: | | | | | | | | | | |
| Dividends from investment income—net | | (.12) | | (.19) | | (.17) | | (.17) | | (.08) |
| Net asset value, end of period | | 10.43 | | 15.19 | | 13.76 | | 12.58 | | 12.30 |
| |
| |
| |
| |
| |
|
| Total Return (%)b | | (30.84) | | 11.87 | | 10.81 | | 3.57 | | 4.20 |
| |
| |
| |
| |
| |
|
| Ratios/Supplemental Data (%): | | | | | | | | | | |
| Ratio of total expenses | | | | | | | | | | |
| to average net assets | | 2.01 | | 2.01 | | 2.00 | | 2.00 | | 2.00 |
| Ratio of net expenses | | | | | | | | | | |
| to average net assets | | 1.86 | | 1.86 | | 1.85 | | 1.87 | | 1.93 |
| Ratio of net investment income | | | | | | | | | | |
| to average net assets | | .95 | | 1.02 | | 1.04 | | 1.15 | | .45 |
| Portfolio Turnover Rate | | 159.04 | | 226.73c 229.90c | | 246.46c | | 215.48 |
| |
| |
| |
| |
|
| Net Assets, end of period ($ x 1,000) | | 5,164 | | 8,705 | | 9,609 | | 11,735 | | 16,426 |
| a | | Based on average shares outstanding at each month end. |
| b | | Exclusive of sales charge. |
| c | | The portfolio turnover rates excluding mortgage dollar roll transactions for the periods ended October 31, 2007, |
| | | October 31, 2006 and Ocotber 31, 2005 were 162.96%, 121.54% and 197.43%, respectively. |
| See notes to financial statements. |
| FINANCIAL HIGHLIGHTS (continued) |
| | | | | Year Ended October 31, | | |
| | |
| |
| |
|
| Class I Shares | | 2008 | | 2007a | | 2006 | | 2005 | | 2004 |
| |
| |
| |
| |
| |
|
| Per Share Data ($): | | | | | | | | | | |
| Net asset value, beginning of period | | 15.17 | | 13.74 | | 12.59 | | 12.32 | | 11.91 |
| Investment Operations: | | | | | | | | | | |
| Investment income—netb | | .26 | | .30 | | .26 | | .27 | | .18 |
| Net realized and unrealized | | | | | | | | | | |
| gain (loss) on investments | | (4.75) | | 1.46 | | 1.21 | | .29 | | .43 |
| Total from Investment Operations | | (4.49) | | 1.76 | | 1.47 | | .56 | | .61 |
| Distributions: | | | | | | | | | | |
| Dividends from investment income—net | | (.26) | | (.33) | | (.32) | | (.29) | | (.20) |
| Net asset value, end of period | | 10.42 | | 15.17 | | 13.74 | | 12.59 | | 12.32 |
| |
| |
| |
| |
| |
|
| Total Return (%) | | (30.12) | | 13.02 | | 11.93 | | 4.61 | | 5.25 |
| |
| |
| |
| |
| |
|
| Ratios/Supplemental Data (%): | | | | | | | | | | |
| Ratio of total expenses | | | | | | | | | | |
| to average net assets | | 1.01 | | 1.01 | | 1.00 | | 1.00 | | 1.00 |
| Ratio of net expenses | | | | | | | | | | |
| to average net assets | | .86 | | .85 | | .85 | | .87 | | .93 |
| Ratio of net investment income | | | | | | | | | | |
| to average net assets | | 1.96 | | 2.08 | | 2.05 | | 2.22 | | 1.46 |
| Portfolio Turnover Rate | | 159.04 | | 226.73c | | 229.90c | | 246.46c | | 215.48 |
| |
| |
| |
| |
| |
|
| Net Assets, end of period ($ x 1,000) | | 7,813 | | 14,640 | | 22,547 | | 32,390 | | 54,429 |
| a | | Effective June 1, 2007, the fund redesignated Class R shares to Class I shares. |
| b | | Based on average shares outstanding at each month end. |
| c | | The portfolio turnover rates excluding mortgage dollar roll transactions for the periods ended October 31, 2007, |
| | | October 31, 2006 and Ocotber 31, 2005 were 162.96%, 121.54% and 197.43%, respectively. |
| See notes to financial statements. |
32
| | | | | Year Ended October 31, | | |
| | |
| |
| |
|
| Class T Shares | | 2008 | | 2007 | | 2006 | | 2005 | | 2004 |
| |
| |
| |
| |
| |
|
| Per Share Data ($): | | | | | | | | | | |
| Net asset value, beginning of period | | 15.19 | | 13.76 | | 12.57 | | 12.30 | | 11.88 |
| Investment Operations: | | | | | | | | | | |
| Investment income—neta | | .19 | | .22 | | .20 | | .21 | | .12 |
| Net realized and unrealized | | | | | | | | | | |
| gain (loss) on investments | | (4.76) | | 1.47 | | 1.21 | | .29 | | .44 |
| Total from Investment Operations | | (4.57) | | 1.69 | | 1.41 | | .50 | | .56 |
| Distributions: | | | | | | | | | | |
| Dividends from investment income—net | | (.19) | | (.26) | | (.22) | | (.23) | | (.14) |
| Net asset value, end of period | | 10.43 | | 15.19 | | 13.76 | | 12.57 | | 12.30 |
| |
| |
| |
| |
| |
|
| Total Return (%)b | | (30.50) | | 12.44 | | 11.38 | | 4.10 | | 4.73 |
| |
| |
| |
| |
| |
|
| Ratios/Supplemental Data (%): | | | | | | | | | | |
| Ratio of total expenses | | | | | | | | | | |
| to average net assets | | 1.51 | | 1.51 | | 1.50 | | 1.50 | | 1.50 |
| Ratio of net expenses | | | | | | | | | | |
| to average net assets | | 1.35 | | 1.36 | | 1.35 | | 1.37 | | 1.43 |
| Ratio of net investment income | | | | | | | | | | |
| to average net assets | | 1.44 | | 1.55 | | 1.53 | | 1.66 | | .95 |
| Portfolio Turnover Rate | | 159.04 | | 226.73c 229.90c 246.46c | | 215.48 |
| |
| |
| |
|
| Net Assets, end of period ($ x 1,000) | | 152 | | 132 | | 203 | | 193 | | 249 |
| a | | Based on average shares outstanding at each month end. |
| b | | Exclusive of sales charge. |
| c | | The portfolio turnover rates excluding mortgage dollar roll transactions for the periods ended October 31, 2007, |
| | | October 31, 2006 and Ocotber 31, 2005 were 162.96%, 121.54% and 197.43%, respectively. |
| See notes to financial statements. |
NOTES TO FINANCIAL STATEMENTS
NOTE 1 - Significant Accounting Policies:
Dreyfus Balanced Fund (the “fund”) is a separate diversified series of The Dreyfus/Laurel Funds, Inc. (the “Company”) which is registered under the Investment Company Act of 1940, as amended (the “Act”), as an open-end management investment company and operates as a series company currently offering fourteen series, including the fund. The fund’s investment objective is to seek total return (consisting of capital appreciation and income). The Dreyfus Corporation (the “Manager” or “Dreyfus”), a wholly-owned subsidiary of The Bank of New York Mellon Corporation (“BNY Mellon”), serves as the fund’s investment adviser.
At a meeting of the fund’s Board of Directors held on July 24, 2008, the Board approved, effective December 1, 2008, a proposal to change the name of the fund from “Dreyfus Premier Balanced Fund” to “Dreyfus Balanced Fund”.
Effective July 1, 2008, BNY Mellon has reorganized and consolidated a number of its banking and trust company subsidiaries. As a result of the reorganization, any services previously provided to the fund by Mellon Bank, N.A. or Mellon Trust of New England, N.A. are now provided by The Bank of New York, which has changed its name to The Bank of New York Mellon.
MBSC Securities Corporation (the “Distributor”), a wholly-owned subsidiary of the Manager, is the distributor of the fund’s shares. The fund is authorized to issue 50 million shares of $.001 par value Capital Stock in each of the following classes of shares: Class A, Class B, Class C and Class I and 200 million shares of $.001 par value Capital Stock of Class T shares. Class A, Class B, Class C and Class T shares are sold primarily to retail investors through financial intermediaries and bear a distribution fee and/or service fee. Class A and Class T shares are subject to a contingent deferred sales charge (“CDSC”). Class B shares automatically convert to Class A shares after six years.The fund does not offer Class B shares, except in connection with dividend reinvestment and permitted exchanges of Class B shares. Class I shares are sold pri-
34
marily to bank trust departments and other financial services providers (includingThe Bank of NewYork Mellon, a subsidiary of BNY Mellon and an affiliate of Dreyfus, and its affiliates) acting on behalf of customers having a qualified or investment account or relationship at such institution, and bear no distribution or service fee. Class I shares are offered without a front-end sales charge or CDSC. Each class of shares has identical rights and privileges, except with respect to distribution and service fees and voting rights on matters affecting a single class. Income, expenses (other than expenses attributable to a specific class), and realized and unrealized gains or losses on investments are allocated to each class of shares based on its relative net assets.
The fund’s financial statements are prepared in accordance with U.S. generally accepted accounting principles, which may require the use of management estimates and assumptions. Actual results could differ from those estimates.
(a) Portfolio valuation: Investments in securities are valued at the last sales price on the securities exchange or national securities market on which such securities are primarily traded. Securities listed on the National Market System for which market quotations are available, are valued at the official closing price or, if there is no official closing price that day, at the last sales price. Securities not listed on an exchange or the national securities market, or securities for which there were no transactions, are valued at the average of the most recent bid and asked prices, except for open short positions, where the asked price is used for valuation purposes. Bid price is used when no asked price is available. Registered investment companies that are not traded on an exchange are valued at their net asset value.When market quotations or official closing prices are not readily available, or are determined not to reflect accurately fair value, such as when the value of a security has been significantly affected by events after the close of the exchange or market on which the security is principally traded (for example, a foreign exchange or market), but before the fund calculates its net asset value, the fund may value these investments at fair value as determined
| NOTES TO FINANCIAL STATEMENTS (continued) |
in accordance with the procedures approved by the Board of Directors. Fair valuing of securities may be determined with the assistance of a pricing service using calculations based on indices of domestic securities and other appropriate indicators, such as prices of relevant ADRs and futures contracts. For other securities that are fair valued by the Board of Directors, certain factors may be considered such as: fundamental analytical data, the nature and duration of restrictions on disposition, an evaluation of the forces that influence the market in which the securities are purchased and sold and public trading in similar securities of the issuer or comparable issuers.
Debt securities excluding short-term investments (other than U.S. Treasury Bills), financial futures, options transactions and forward currency exchange contracts are valued each business day by an independent pricing service (the “Service”) approved by the Board of Directors. Investments for which quoted bid prices are readily available and are representative of the bid side of the market in the judgment of the Service are valued at the mean between the quoted bid prices (as obtained by the Service from dealers in such securities) and asked prices (as calculated by the Service based upon its evaluation of the market for such securities). Other investments are valued as determined by the Service, based on methods which include consideration of: yields or prices of securities of comparable quality, coupon, maturity and type; indications as to values from dealers; and general market conditions. Restricted securities, as well as securities or other assets for which recent market quotations are not readily available, that are not valued by a pricing service approved by the Board of Directors, or are determined by the fund not to reflect accurately fair value are valued at fair value as determined in good faith under the direction of the Board of Directors.The factors that may be considered when fair valuing a security include fundamental analytical data, the nature and duration of restrictions on disposition, an evaluation of the forces that influence the market in which the securities are purchased and sold and public trading in similar securities of the issuer or comparable issuers. Short-term investments, excluding U.S.Treasury Bills, are carried at amortized cost,
36
which approximates value. Financial futures and options, which are traded on an exchange, are valued at the last sales price on the securities exchange on which such securities are primarily traded or at the last sales price on the national securities market on each business day. Options traded over-the-counter are priced at the mean between the bid and asked price. Investments denominated in foreign currencies are translated to U.S. dollars at the prevailing rates of exchange. Forward currency exchange contracts are valued at the forward rate.
The Financial Accounting Standards Board (“FASB”) released Statement of Financial Accounting Standards No. 157 “Fair Value Measurements” (“FAS 157”). FAS 157 establishes an authoritative definition of fair value, sets out a framework for measuring fair value, and requires additional disclosures about fair-value measurements. The application of FAS 157 is required for fiscal years beginning after November 15, 2007 and interim periods within those fiscal years. Management does not believe that the application of this standard will have a material impact on the financial statements of the fund.
(b) Foreign currency transactions: The fund does not isolate that portion of the results of operations resulting from changes in foreign exchange rates on investments from the fluctuations arising from changes in the market prices of securities held. Such fluctuations are included with the net realized and unrealized gain or loss on investments.
Net realized foreign exchange gains or losses arise from sales and maturities of short-term securities, sales of foreign currencies, currency gains or losses realized on securities transactions and the difference between the amounts of dividends, interest and foreign withholding taxes recorded on the fund’s books and the U.S. dollar equivalent of the amounts actually received or paid. Net unrealized foreign exchange gains and losses arise from changes in the value of assets and liabilities other than investments in securities, resulting from changes in exchange rates. Such gains and losses are included with net realized and unrealized gain or loss on investments.
| NOTES TO FINANCIAL STATEMENTS (continued) |
(c) Securities transactions and investment income: Securities transactions are recorded on a trade date basis. Realized gains and losses from securities transactions are recorded on the identified cost basis. Dividend income is recognized on the ex-dividend date and interest income, including, where applicable, accretion of discount and amortization of premium on investments is recognized on the accrual basis.
Pursuant to a securities lending agreement with The Bank of New York Mellon, the fund may lend securities to qualified institutions. It is the fund’s policy that, at origination, all loans are secured by collateral of at least 102% of the value of U.S. securities loaned and 105% of the value of foreign securities loaned. Collateral equivalent to at least 100% of the market value of securities on loan is maintained at all times. Collateral is either in the form of cash, which can be invested in certain money market mutual funds managed by the Manager, U.S. Government and Agency securities or letters of credit. The fund is entitled to receive all income on securities loaned, in addition to income earned as a result of the lending transaction. Although each security loaned is fully collateralized, the fund bears the risk of delay in recovery of, or loss of rights in, the securities loaned should a borrower fail to return the securities in a timely manner. During the period ended October 31, 2008, The Bank of New York Mellon earned $9,455, from lending fund portfolio securities pursuant to the securities lending agreement.
(d) Affiliated issuers: Investments in other investment companies advised by the Manager are defined as “affiliated” in the Act.
(e) Dividends to shareholders: Dividends are recorded on the ex-dividend date. Dividends from investment income-net are declared and paid on a quarterly basis. Dividends from net realized capital gains, if any, are normally declared and paid annually, but the fund may make distributions on a more frequent basis to comply with the distribution requirements of the Internal Revenue Code of 1986, as amended (the
38
“Code”).To the extent that net realized capital gains can be offset by capital loss carryovers, it is the policy of the fund not to distribute such gains Income and capital gain distributions are determined in accordance with income tax regulations, which may differ from U.S. generally accepted accounting principles.
(f) Federal income taxes: It is the policy of the fund to continue to qualify as a regulated investment company, if such qualification is in the best interests of its shareholders, by complying with the applicable provisions of the Code, and to make distributions of taxable income sufficient to relieve it from substantially all federal income and excise taxes.
The fund adopted FASB Interpretation No. 48 “Accounting for Uncertainty in Income Taxes” (“FIN 48”). FIN 48 provides guidance for how uncertain tax positions should be recognized, measured, presented and disclosed in the financial statements. FIN 48 requires the evaluation of tax positions taken or expected to be taken in the course of preparing the fund’s tax returns to determine whether the tax positions are “more-likely-than-not” of being sustained by the applicable tax authority. Liability for tax positions not deemed to meet the more-likely-than-not threshold would be recorded as a tax expense in the current year.The adoption of FIN 48 had no impact on the operations of the fund for the period ended October 31, 2008.
As of and during the period ended October 31, 2008, the fund did not have any liabilities for any unrecognized tax positions. The fund recognizes interest and penalties, if any, related to unrecognized tax positions as income tax expense in the Statement of Operations. During the period, the fund did not incur any interest or penalties.
Each of the tax years in the four-year period ended October 31, 2008 remains subject to examination by the Internal Revenue Service and state taxing authorities.
| NOTES TO FINANCIAL STATEMENTS (continued) |
At October 31, 2008, the components of accumulated earnings on a tax basis were as follows: undistributed ordinary income $213,889, accumulated capital losses $182,578,932 and unrealized depreciation $14,340,477.
The accumulated capital loss carryover is available for federal income tax purposes to be applied against future net securities profits, if any, realized subsequent to October 31, 2008. If not applied, $61,135,096 of the carryover expires in fiscal 2009, $72,687,006 expires in fiscal 2010, $43,722,308 expires in fiscal 2011 and $5,034,522 expires in fiscal 2016.
The tax character of distributions paid to shareholders during the fiscal periods ended October 31, 2008 and October 31, 2007, were as follows: ordinary income $1,407,733 and $2,400,795, respectively.
During the period ended October 31, 2008, as a result of permanent book to tax differences, primarily due to the tax treatment of paydown gains and losses, consent fees and foreign exchange gains and losses, the fund decreased accumulated undistributed investment income-net by $87,652 and increased accumulated net realized gain (loss) on investments by the same amount. Net assets and net asset value per share were not affected by this reclassification.
NOTE 2—Bank Lines of Credit:
Prior to October 15, 2008, the fund participated with other Dreyfus-managed funds in a $350 million redemption credit facility. Effective October 15, 2008, the fund participates with other Dreyfus-managed funds in a $145 million redemption credit facility (the “Facility”) to be utilized for temporary or emergency purposes, including the financing of redemptions. In connection therewith, the fund has agreed to pay commitment fees on its pro rata portion of the Facility. Interest is charged to the fund based on prevailing market rates in effect at the time of borrowing.
The average daily amount of borrowings outstanding under the Facilities during the period ended October 31, 2008, was approximately $125,800 with a related weighted average annualized interest rate of 4.41% .
40
NOTE 3—Investment Management Fee And Other Transactions With Affiliates:
(a) Pursuant to an Investment Management Agreement with the Manager, the Manager provides for one or more third parties and/or affiliates to provide investment advisory, administrative, custody, fund accounting and transfer agency services to the fund.The Manager also directs the investments of the fund in accordance with its investment objective, policies and limitations. For these services, the fund is contractually obligated to pay the Manager a fee, calculated daily and paid monthly, at the annual rate of 1% of the value of the fund’s average daily net assets. Out of its fee, the Manager pays all of the expenses of the fund except brokerage fees, taxes, interest, commitment fees, Rule 12b-1 distribution fees and expenses, service fees, fees and expenses of non-interested Directors (including counsel fees) and extraordinary expenses. In addition, the Manager is required to reduce its fee in an amount equal to the fund’s allocable portion of fees and expenses of the non-interested Directors (including counsel fees). Each Director receives $45,000 per year, plus $6,000 for each joint Board meeting of the Company,The Dreyfus/Laurel Tax-Free Municipal Funds, and The Dreyfus/Laurel Funds Trust (collectively, the “Dreyfus/Laurel Funds”) attended, $2,000 for separate in-person committee meetings attended which are not held in conjunction with a regularly scheduled Board meeting and $1,500 for Board meetings and separate committee meetings attended that are conducted by telephone and is reimbursed for travel and out-of-pocket expenses.With respect to Board meetings, the Chairman of the Board receives an additional 25% of such compensation (with the exception of reimbursable amounts). With respect to compensation committee meetings, the Chair of the compensation committee receives $900 per meeting and, prior to April 12, 2008, with respect to audit committee meetings, the Chair of the audit committee received $1,350 per meeting. In the event that, there is an in-person joint committee meeting or a joint telephone meeting of the Dreyfus/Laurel Funds and Dreyfus High Yield Strategies Fund, the
| NOTES TO FINANCIAL STATEMENTS (continued) |
$2,000 or $1,500 fee, as applicable, will be allocated between the Dreyfus/Laurel Funds and Dreyfus High Yield Strategies Fund.These fees and expenses are charged and allocated to each series based on net assets. Amounts required to be paid by the Company directly to the non-interested Directors, that would be applied to offset a portion of the management fee payable to the Manager, are in fact paid directly by the Manager to the non-interested Directors.
The Manager has agreed from November 1, 2007 through April 4, 2009 to waive receipt of a portion of the fund’s management fee, in the amount of .15% of the value of the fund’s average daily net assets. The reduction in management fee, pursuant to the undertaking, amounted to $129,017 during the period ended October 31, 2008.
During the period ended October 31, 2008, the Distributor retained $3,942 and $10 from commissions earned on sales of the fund’s Class A and Class T shares, respectively, and $11,930 and $826 from CDSCs on redemptions of the fund’s Class B and Class C shares, respectively.
(b) Under separate Distribution Plans (the “Plans”) adopted pursuant to Rule 12b-1 under the Act, Class A shares may pay annually up to .25% of the value of their average daily net assets to compensate the Distributor for shareholder servicing activities and expenses primarily intended to result in the sale of Class A shares. Class B, Class C and Class T shares may pay the Distributor for distributing their shares at an aggregate annual rate of .75% of the value of the average daily net assets of Class B and Class C shares and .25% of the value of the average daily net assets of ClassT shares.The Distributor may pay one or more agents in respect of advertising, marketing and other distribution services for Class T shares and determines the amounts, if any, to be paid to agents and the basis on which such payments are made. Class B, Class C and Class T shares are also subject to a service plan adopted pursuant to Rule 12b-1 (the “Service Plan”), under which Class B, Class C and Class T shares pay the Distributor for providing certain services to the holders of their shares a fee at the annual rate of .25% of the value of the average daily net assets of Class B, Class C and Class T shares.
42
During the period ended October 31, 2008, Class A, Class B, Class C and Class T shares were charged $156,474, $40,692, $55,202 and $498, respectively, pursuant to their respective Plans. During the period ended October 31, 2008, Class B, Class C and Class T shares were charged $13,564, $18,400 and $498, respectively, pursuant to the Service Plan.
Under its terms, the Plans and Service Plan shall remain in effect from year to year, provided such continuance is approved annually by a vote of a majority of those Directors who are not “interested persons” of the Company and who had no direct or indirect financial interest in the operation of or in any agreement related to the Plans or Service Plan.
The components of “Due to The Dreyfus Corporation and affiliates” in the statement of Assets and Liabilities consist of: management fees $51,890, Rule 12b-1 distribution plan fees $14,890 and shareholder services plan fees $1,824, which are offset against an expense reimbursement currently in effect in the amount of $7,784.
NOTE 4—Securities Transactions:
The aggregate amount of purchases and sales (including paydowns) of investment securities, excluding short-term securities, financial futures, forward currency exchange contracts and options transactions during the period ended October 31, 2008, amounted to $138,797,145 and $157,767,971, respectively.
The fund may invest in financial futures contracts in order to gain exposure to or protect against changes in the market.The fund is exposed to market risk as a result of changes in the value of the underlying financial instruments. Investments in financial futures require the fund to “mark to market” on a daily basis, which reflects the change in market value of the contracts at the close of each day’s trading.Accordingly, variation margin payments are received or made to reflect daily unrealized gains or losses.When the contracts are closed, the fund recognizes a realized gain or loss.These investments require initial margin deposits with a broker, which consist of cash or cash equivalents.The amount of these
| NOTES TO FINANCIAL STATEMENTS (continued) |
deposits is determined by the exchange or Board of Trade on which the contract is traded and is subject to change. Contracts open at October 31, 2008, are set forth in the Statement of Financial Futures.
The fund may purchase and write (sell) put and call options in order to gain exposure to or to protect against changes in the market.
As a writer of call options, the fund receives a premium at the outset and then bears the market risk of unfavorable changes in the price of the financial instrument underlying the option. Generally, the fund would incur a gain, to the extent of the premium, if the price of the underlying financial instrument decreases between the date the option is written and the date on which the option is terminated. Generally, the fund would realize a loss, if the price of the financial instrument increases between those dates.
As a writer of put options, the fund receives a premium at the outset and then bears the market risk of unfavorable changes in the price of the financial instrument underlying the option. Generally, the fund would incur a gain, to the extent of the premium, if the price of the underlying financial instrument increases between the date the option is written and the date on which the option is terminated. Generally, the fund would realize a loss, if the price of the financial instrument decreases between those dates.
The following summarizes the fund’s call/put options written for the period ended October 31, 2008:
| | | Face Amount | | | | Options Terminated |
| | | | | | |
|
| | | Covered by | | Premiums | | | | Net Realized |
| Options Written: | | Contracts ($) | | Received ($) | | Cost ($) | | Gain (Loss) ($) |
| |
| |
| |
| |
|
| Contracts outstanding | | | | | | | | |
| October 31, 2007 | | — | | — | | | | |
| Contracts written | | 34,048,000 | | 345,528 | | — | | — |
| Contracts terminated: | | | | | | | | |
| Closed | | 21,958,000 | | 209,569 | | 229,507 | | (19,938) |
| Expired | | 7,518,000 | | 74,614 | | — | | 74,614 |
| Total contracts | | | | | | | | |
| terminated | | 29,476,000 | | 284,183 | | 229,507 | | 54,676 |
| Contracts outstanding | | | | | | | | |
| October 31, 2008 | | 4,572,000 | | 61,345 | | | | |
44
The fund enters into forward currency exchange contracts in order to hedge its exposure to changes in foreign currency exchange rates on its foreign portfolio holdings and to settle foreign currency transac-tions.When executing forward currency exchange contracts, the fund is obligated to buy or sell a foreign currency at a specified rate on a certain date in the future. With respect to sales of forward currency exchange contracts, the fund would incur a loss if the value of the contract increases between the date the forward contract is opened and the date the forward contract is closed.The fund realizes a gain if the value of the contract decreases between those dates. With respect to purchases of forward currency exchange contracts, the fund would incur a loss if the value of the contract decreases between the date the forward contract is opened and the date the forward contract is closed. The fund realizes a gain if the value of the contract increases between those dates. The fund is also exposed to credit risk associated with counterparty nonperformance on these forward currency exchange contracts, which is typically limited to the unrealized gain on each open contract. The following summarizes open forward currency exchange contracts at October 31, 2008:
| | | Foreign | | | | | | Unrealized |
| Forward Currency | | Currency | | | | | | Appreciation |
| Sales Contracts | | Amounts | | Cost ($) | | Value ($) | | (Depreciation) ($) |
| |
| |
| |
| |
|
| Purchases: | | | | | | | | |
| Brazil, | | | | | | | | |
| expiring 12/17/2008 | | 220,000 | | 91,973 | | 99,975 | | 8,002 |
| Sales: | | | | Proceeds ($) | | | | |
| Brazil, | | | | | | | | |
| expiring 11/14/2008 | | 290,000 | | 117,767 | | 133,050 | | (15,283) |
| Euro, | | | | | | | | |
| expiring 12/17/2008 | | 10,000 | | 14,638 | | 12,728 | | 1,910 |
| Euro, | | | | | | | | |
| expiring 12/17/2008 | | 50,000 | | 70,287 | | 63,640 | | 6,647 |
| Total | | | | | | | | 1,276 |
At October 31, 2008, the cost of investments for federal income tax purposes was $75,404,617; accordingly, accumulated net unrealized depreciation on investments was $14,333,707, consisting of $780,604 gross unrealized appreciation and $15,114,311 gross unrealized depreciation.
| NOTES TO FINANCIAL STATEMENTS (continued) |
In March 2008, the FASB released Statement of Financial Accounting Standards No. 161, Disclosures about Derivative Instruments and Hedging Activities (“FAS 161”). FAS 161 requires qualitative disclosures about objectives and strategies for using derivatives, quantitative disclosures about fair value amounts of gains and losses on derivative instruments, and disclosures about credit-risk-related contingent features in derivative agreements.The application of FAS 161 is required for fiscal years and interim periods beginning after November 15, 2008. At this time, management is evaluating the implications of FAS 161 and its impact on the financial statements and the accompanying notes has not yet been determined.
NOTE 5—Plan of Reorganization:
On July 24, 2008, the Board of Directors’ of the Company approved, and on October 15, 2008 the shareholders of the fund approved, an agreement and Plan of Reorganization between the Company on behalf of the Fund and Dreyfus Premier Manager Funds II, on behalf of Dreyfus Balanced Opportunity Fund (the “Acquiring Fund”). The merger provides for the transfer of the fund’s assets to the Acquiring Fund in a tax-free exchange for shares of the Acquiring Fund and the assumption by the Acquiring Fund to the fund’s shareholders and the subsequent termination of the fund (the “Reorganization”). The Reorganization is expected to take place on January 8, 2009. In anticipation of the Reorganization, effective August 29, 2008, the fund was closed to any investments for new accounts.
46
REPORT OF INDEPENDENT REGISTERED PUBLIC ACCOUNTING FIRM
The Board of Directors and Shareholders The Dreyfus/Laurel Funds, Inc.:
We have audited the accompanying statement of assets and liabilities, including the statements of investments, financial futures and options written of Dreyfus Balanced Fund (formerly Dreyfus Premier Balanced Fund) a series of The Dreyfus/Laurel Funds, Inc. (the “Fund”), as of October 31, 2008, and the related statement of operations for the year then ended, the statement of changes in net assets for each of the years in the two-year period then ended, and the financial highlights for each of the years in the five-year period then ended. These financial statements and financial highlights are the responsibility of the Fund’s management. Our responsibility is to express an opinion on these financial statements and financial highlights based on our audits.
We conducted our audits in accordance with the standards of the Public Company Accounting Oversight Board (United States).Those standards require that we plan and perform the audit to obtain reasonable assurance about whether the financial statements and financial highlights are free of material misstatement. An audit includes examining, on a test basis, evidence supporting the amounts and disclosures in the financial statements. Our procedures included confirmation of securities owned as of October 31, 2008, by correspondence with the custodian and brokers or by other appropriate auditing procedures where replies from brokers were not received.An audit also includes assessing the accounting principles used and significant estimates made by management, as well as evaluating the overall financial statement presentation.We believe that our audits provide a reasonable basis for our opinion.
In our opinion, the financial statements and financial highlights referred to above present fairly, in all material respects, the financial position of Dreyfus Balanced Fund as of October 31, 2008, and the results of its operations for the year then ended, the changes in its net assets for each of the years in the two-year period then ended, and the financial highlights for each of the years in the five-year period then ended, in conformity with U.S. generally accepted accounting principles.

| | New York, New York
December 23, 2008 |
IMPORTANT TAX INFORMATION ( U n a u d i t e d )
In accordance with federal tax law, the fund hereby designates 49.68% of the ordinary dividends paid during the fiscal year ended October 31, 2008 as qualifying for the corporate dividends received deduction. For the fiscal year ended October 31, 2008, certain dividends paid by the Fund may be subject to a maximum tax rate of 15%, as provided for by the Jobs and GrowthTax Relief Reconciliation Act of 2003. Of the distributions paid during the fiscal year, $640,093 represents the maximum amount that may be considered qualified dividend income. Shareholders will receive notification in January 2009 of the percentage applicable to the preparation of their 2008 income tax returns.
| PROXY RESULTS (Unaudited) |
The Dreyful/Laurel Funds,Inc.,held a special meeting of shareholders on October 15, 2008.The proposal considered at the meeting, and the results, are as follows:
| | | | | Shares | | |
| | |
| |
| |
|
| | | Votes for | | Authority Withheld | | Abstain |
| | |
| |
| |
|
| To approve an Agreement and Plan of | | | | | | |
| Reorganization providing for the | | | | | | |
| transfer of all of the assets of the | | | | | | |
| fund to Dreyfus Balanced Opportunity | | | | | | |
| Fund (the “Acquiring Fund”) | | 3,037,320 | | 128,189 | | 222,516 |
48
BOARD MEMBERS INFORMATION ( U n a u d i t e d )
Joseph S. DiMartino (65)
Chairman of the Board (1999)
Principal Occupation During Past 5Years:
Corporate Director and Trustee
Other Board Memberships and Affiliations: |
- The Muscular Dystrophy Association, Director
- Century Business Services, Inc., a provider of outsourcing functions for small and medium size companies, Director
- The Newark Group, a provider of a national market of paper recovery facilities, paperboard mills and paperboard converting plants, Director
- Sunair Services Corporation, a provider of certain outdoor-related services to homes and businesses, Director
No. of Portfolios for which Board Member Serves: 167
James M. Fitzgibbons (74)
Board Member (1994)
Principal Occupation During Past 5Years:
Corporate Director and Trustee |
Other Board Memberships and Affiliations:
Bill Barrett Company, an oil and gas exploration company, Director
No. of Portfolios for which Board Member Serves: 25
Kenneth A. Himmel (62)
Board Member (1994)
Principal Occupation During Past 5Years: |
- President and CEO,Related Urban Development,a real estate development company (1996-present)
- President and CEO, Himmel & Company, a real estate development company (1980-present)
- CEO, American Food Management, a restaurant company (1983-present)
| No. of Portfolios for which Board Member Serves: 25 |
Stephen J. Lockwood (61)
Board Member (1994)
Principal Occupation During Past 5Years: |
- Chairman of the Board, Stephen J. Lockwood and Company LLC, an investment company (2000-present)
| No. of Portfolios for which Board Member Serves: 25 |
BOARD MEMBERS INFORMATION ( U n a u d i t e d ) (continued)
Roslyn M. Watson (59)
Board Member (1994) |
Principal Occupation During Past 5Years:
Principal,Watson Ventures, Inc., a real estate investment company (1993-present)
Other Board Memberships and Affiliations:
- American Express Bank, Director
- The Hyams Foundation Inc., a Massachusetts Charitable Foundation,Trustee
- National Osteoporosis Foundation,Trustee
- SBLI-USA, Director
| No. of Portfolios for which Board Member Serves: 25 |
Benaree Pratt Wiley (62)
Board Member (1998)
Principal Occupation During Past 5Years: |
- Principal,The Wiley Group, a firm specializing in strategy and business development (2005-present)
- President and CEO,The Partnership, an organization dedicated to increasing the representation of African Americans in positions of leadership, influence and decision-making in Boston, MA (1991-2005)
| Other Board Memberships and Affiliations: |
- Boston College,Trustee Associate
- Blue Cross Blue Shield of Massachusetts, Director
- CBIZ, professional support consultants and service providers for small, midsized and corporate business, Director
- Commonwealth Institute, Director
- Efficacy Institute, Director
- PepsiCo African-American, Chair of Advisory Board
- The Boston Foundation, Director
- Century Business Services, Inc., a provider of outsourcing functions for small and medium size companies, Director
| No. of Portfolios for which Board Member Serves: 36 |
Once elected all Board Members serve for an indefinite term, but achieve Emeritus status upon reaching age 80.The address of the Board Members and Officers is in c/o The Dreyfus Corporation, 200 Park Avenue, NewYork, NewYork 10166. Additional information about the Board Members is available in the fund’s Statement of Additional Information which can be obtained from Dreyfus free of charge by calling this toll free number: 1-800-554-4611.
Francis P. Brennan, Emeritus Board Member
J.Tomlinson Fort, Emeritus Board Member |
50
OFFICERS OF THE FUND (Unaudited)
| J. DAVID OFFICER, President since | | JONI LACKS CHARATAN, Vice President |
| December 2006. | | and Assistant Secretary since |
| Chief Operating Officer,Vice Chairman and a | | August 2005. |
| Director of the Manager, and an officer of 77 | | Senior Counsel of BNY Mellon, and an officer |
| investment companies (comprised of 167 | | of 78 investment companies (comprised of 188 |
| portfolios) managed by the Manager. He is 60 | | portfolios) managed by the Manager. She is 53 |
| years old and has been an employee of the | | years old and has been an employee of the |
| Manager since April 1998. | | Manager since October 1988. |
| |
| PHILLIP N. MAISANO, Executive Vice | | JOSEPH M. CHIOFFI, Vice President and |
| President since July 2007. | | Assistant Secretary since August 2005. |
| Chief Investment Officer,Vice Chair and a | | Senior Counsel of BNY Mellon, and an officer |
| director of the Manager, and an officer of 77 | | of 78 investment companies (comprised of 188 |
| investment companies (comprised of 167 | | portfolios) managed by the Manager. He is 47 |
| portfolios) managed by the Manager. Mr. | | years old and has been an employee of the |
| Maisano also is an officer and/or Board | | Manager since June 2000. |
| member of certain other investment | | |
| | | JANETTE E. FARRAGHER, Vice President |
| management subsidiaries of The Bank of New | | |
| | | and Assistant Secretary since |
| York Mellon Corporation, each of which is an | | |
| | | August 2005. |
| affiliate of the Manager. He is 61 years old and | | |
| has been an employee of the Manager since | | Assistant General Counsel of BNY Mellon, |
| November 2006. Prior to joining the Manager, | | and an officer of 78 investment companies |
| Mr. Maisano served as Chairman and Chief | | (comprised of 188 portfolios) managed by the |
| Executive Officer of EACM Advisors, an | | Manager. She is 45 years old and has been an |
| affiliate of the Manager, since August 2004, and | | employee of the Manager since February 1984. |
| served as Chief Executive Officer of Evaluation | | JOHN B. HAMMALIAN, Vice President and |
| Associates, a leading institutional investment | | Assistant Secretary since August 2005. |
| consulting firm, from 1988 until 2004. | | |
| | | Managing Counsel of BNY Mellon, and an |
| MICHAEL A. ROSENBERG, Vice President | | officer of 78 investment companies (comprised |
| and Secretary since August 2005. | | of 188 portfolios) managed by the Manager. |
| Assistant General Counsel of BNY Mellon, | | He is 45 years old and has been an employee |
| and an officer of 78 investment companies | | of the Manager since February 1991. |
| (comprised of 188 portfolios) managed by the | | ROBERT R. MULLERY, Vice President and |
| Manager. He is 48 years old and has been an | | Assistant Secretary since August 2005. |
| employee of the Manager since October 1991. | | |
| | | Managing Counsel of BNY Mellon, and an |
| JAMES BITETTO, Vice President and | | officer of 78 investment companies (comprised |
| Assistant Secretary since August 2005. | | of 188 portfolios) managed by the Manager. |
| Senior Counsel of BNY Mellon and Secretary | | He is 56 years old and has been an employee |
| of the Manager, and an officer of 78 | | of the Manager since May 1986. |
| investment companies (comprised of 188 | | |
| portfolios) managed by the Manager. He is 42 | | |
| years old and has been an employee of the | | |
| Manager since December 1996. | | |
OFFICERS OF THE FUND (Unaudited) (continued)
| JEFF PRUSNOFSKY, Vice President and | | ROBERT SALVIOLO, Assistant Treasurer |
| Assistant Secretary since August 2005. | | since July 2007. |
| Managing Counsel of BNY Mellon, and an | | Senior Accounting Manager – Equity Funds of |
| officer of 78 investment companies (comprised | | the Manager, and an officer of 78 investment |
| of 188 portfolios) managed by the Manager. | | companies (comprised of 188 portfolios) |
| He is 43 years old and has been an employee | | managed by the Manager. He is 41 years old |
| of the Manager since October 1990. | | and has been an employee of the Manager |
| | | since June 1989. |
| JAMES WINDELS, Treasurer since | | |
| November 2001. | | ROBERT SVAGNA, Assistant Treasurer |
| Director – Mutual Fund Accounting of the | | since December 2002. |
| Manager, and an officer of 78 investment | | Senior Accounting Manager – Equity Funds of |
| companies (comprised of 188 portfolios) | | the Manager, and an officer of 78 investment |
| managed by the Manager. He is 49 years old | | companies (comprised of 188 portfolios) |
| and has been an employee of the Manager | | managed by the Manager. He is 41 years old |
| since April 1985. | | and has been an employee of the Manager |
| | | since November 1990. |
| RICHARD CASSARO, Assistant Treasurer | | |
| since January 2008. | | JOSEPH W. CONNOLLY, Chief Compliance |
| Senior Accounting Manager – Money Market | | Officer since October 2004. |
| and Municipal Bond Funds of the Manager, | | Chief Compliance Officer of the Manager and |
| and an officer of 78 investment companies | | The Dreyfus Family of Funds (78 investment |
| (comprised of 188 portfolios) managed by | | companies, comprised of 188 portfolios). From |
| the Manager. He is 49 years old and has | | November 2001 through March 2004, Mr. |
| been an employee of the Manager since | | Connolly was first Vice-President, Mutual |
| September 1982. | | Fund Servicing for Mellon Global Securities |
| | | Services. In that capacity, Mr. Connolly was |
| GAVIN C. REILLY, Assistant Treasurer | | |
| | | responsible for managing Mellon’s Custody, |
| since December 2005. | | |
| | | Fund Accounting and Fund Administration |
| Tax Manager of the Investment Accounting | | services to third-party mutual fund clients. He |
| and Support Department of the Manager, and | | is 51 years old and has served in various |
| an officer of 78 investment companies | | capacities with the Manager since 1980, |
| (comprised of 188 portfolios) managed by the | | including manager of the firm’s Fund |
| Manager. He is 40 years old and has been an | | Accounting Department from 1997 through |
| employee of the Manager since April 1991. | | October 2001. |
| |
| ROBERT ROBOL, Assistant Treasurer | | WILLIAM GERMENIS, Anti-Money |
| since December 2002. | | Laundering Compliance Officer since |
| Senior Accounting Manager – Fixed Income | | July 2002. |
| Funds of the Manager, and an officer of 78 | | Vice President and Anti-Money Laundering |
| investment companies (comprised of 188 | | Compliance Officer of the Distributor, and the |
| portfolios) managed by the Manager. He is 44 | | Anti-Money Laundering Compliance Officer |
| years old and has been an employee of the | | of 74 investment companies (comprised of 184 |
| Manager since October 1988. | | portfolios) managed by the Manager. He is 38 |
| | | years old and has been an employee of the |
| | | Distributor since October 1998.24p1.8 |
52


Save time. Save paper. View your next shareholder report online as soon as it’s available. Log into www.dreyfus.com and sign up for Dreyfus eCommunications. It’s simple and only takes a few minutes.
The views expressed in this report reflect those of the portfolio manager only through the end of the period covered and do not necessarily represent the views of Dreyfus or any other person in the Dreyfus organization. Any such views are subject to change at any time based upon market or other conditions and Dreyfus disclaims any responsibility to update such views.These views may not be relied on as investment advice and, because investment decisions for a Dreyfus fund are based on numerous factors, may not be relied on as an indication of trading intent on behalf of any Dreyfus fund.
Not FDIC-Insured Not Bank-Guaranteed May Lose Value
| | Contents |
| |
| | THE FUND |
| |
| 2 | A Letter from the CEO |
| |
| 3 | Discussion of Fund Performance |
| |
| 4 | Fund Performance |
| |
| 6 | Understanding Your Fund’s Expenses |
| |
| 6 | Comparing Your Fund’s Expenses With Those of Other Funds |
| |
| 7 | Statement of Investments |
| |
| 23 | Statement of Financial Futures |
| |
| 24 | Statement of Options Written |
| |
| 25 | Statement of Assets and Liabilities |
| |
| 26 | Statement of Operations |
| |
| 27 | Statement of Changes in Net Assets |
| |
| 29 | Financial Highlights |
| |
| 33 | Notes to Financial Statements |
| |
| 47 | Report of Independent Registered Public Accounting Firm |
| |
| 48 | Important Tax Information |
| |
| 48 | Proxy Results |
| |
| 49 | Board Members Information |
| |
| 51 | Officers of the Fund |
| |
| | FOR MORE INFORMATION |
| |
| | Back Cover |
| |
The Fund
| Dreyfus |
| Limited Term |
| Income Fund |

A LETTER FROM THE CEO
Dear Shareholder:
We present to you this last report for Dreyfus Limited Term Income Fund, covering the 12-month period from November 1, 2007, through October 31, 2008.
These are difficult times for fixed-income investors. A credit crunch that began in 2007 has developed into a full-blown global financial crisis, recently resulting in the failure of several major financial institutions and prompting a massive government rescue effort.The U.S. economic slowdown also has gathered momentum, depressing investor sentiment and consumer confidence. These factors undermined returns in the bond market’s higher-yielding sectors, including high yield corporate and municipal securities, and even the traditional safe haven of U.S. government securities has encountered heightened yield volatility. The depth and duration of the economic downturn will depend on how quickly the financial system can be stabilized.We believe that the Temporary Guarantee Program for Money Market Funds and the $700 billion rescue package intended to promote greater liquidity in the financial markets meet several critical requirements for addressing today’s financial stresses, and we expect these measures to contribute to a more orderly deleveraging process. However, recuperation from the financial crisis is likely to take time. In the meantime, we encourage you to keep in touch with your financial advisor and maintain a long-term and disciplined perspective to investing. Indeed, we already are seeing some positive signs, including a likely peak in global inflationary pressures, a bottoming of the U.S. dollar and a large pool of worldwide financial liquidity that could be deployed gradually to riskier assets as the economic cycle turns.
Thank you for your continued confidence and support.
Jonathan R. Baum
Chief Executive Officer
The Dreyfus Corporation
November 17, 2008 |
2

DISCUSSION OF FUND PERFORMANCE
For the period of November 1, 2007, through October 31, 2008, as provided by David Bowser and Peter Vaream, Portfolio Managers
Fund Performance Overview
For the 12-month period ended October 31, 2008, Class A, Class B, Class C and Class I shares of Dreyfus Limited Term Income Fund achieved total returns of –7.91%, –8.34%, –8.32% and –7.68%, respectively.1 In comparison, the fund’s benchmark, the Barclays Capital U.S.Aggregate Index (the “Index”), achieved a total return of 0.30% for the same period.2 A credit crisis that began over the summer of 2007 in the sub-prime mortgage market continued to dampen investor sentiment throughout the reporting period, causing yield volatility throughout most of the reporting period. The impact of the credit crunch was particularly severe in corporate bond and mortgage-backed sectors—to which the fund had significant exposure relative to the benchmark Index. In addition, a “flight to quality” supported prices of U.S. Treasury securities throughout most of 2008. Despite the fund’s investment-grade posture and defensive yield-curve strategy, a series of desperate rate cuts by the Fed along with a precipitous drop in investor sentiment resulted in one of the worst three-month periods (August 2008 through October 2008) in bond-market history, and the fund’s overall performance was nonetheless deeply affected.
On or about December 17, 2008 (the “Closing Date”), in accordance with an Agreement and Plan of Reorganization that was approved by shareholders at a special shareholder meeting held on October 15, 2008, you will receive Class A shares of Dreyfus Intermediate Term Income Fund (formerly, Dreyfus Premier Intermediate Term Income Fund, the “Acquiring Fund”) for Class A, Class B or Class C shares of the fund or Class I shares of the Acquiring Fund for Class I shares of the fund with a value equal to the value of your investment in the fund as of the Closing Date. The fund will then cease operations and you will be a shareholder of the Acquiring Fund.
November 17, 2008
| 1 | | Total return includes reinvestment of dividends and any capital gains paid, and does not take into |
| | | consideration the maximum initial sales charge in the case of Class A shares, or the applicable |
| | | contingent deferred sales charges imposed on redemptions in the case of Class B and Class C |
| | | shares. Had these charges been reflected, returns would have been lower. Past performance is no |
| | | guarantee of future results. Share price, yield and investment return fluctuate such that upon |
| | | redemption, fund shares may be worth more or less than their original cost. |
| 2 | | SOURCE: LIPPER INC. — Reflects reinvestment of dividends and, where applicable, capital |
| | | gain distributions.The Barclays Capital U.S. Aggregate Index is a widely accepted, unmanaged |
| | | total return index of corporate, U.S. government and U.S. government agency debt instruments, |
| | | mortgage-backed securities and asset-backed securities with an average maturity of 1-10 years. |
| | | Index returns do not reflect fees and expenses associated with operating a mutual fund. |
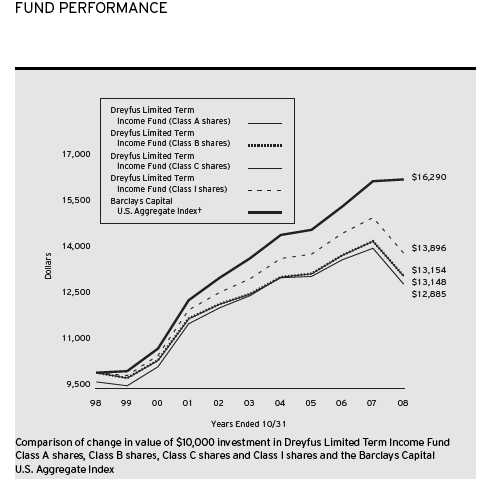
| † Source: Lipper Inc. |
| Past performance is not predictive of future performance. |
| The above graph compares a $10,000 investment made in Class A, Class B, Class C and Class I shares of Dreyfus |
| Limited Term Income Fund on 10/31/98 to a $10,000 investment made in the Barclays Capital U.S. Aggregate |
| Index (the “Index”) on that date. All dividends and capital gain distributions are reinvested. |
| The fund’s performance shown in the line graph takes into account the maximum initial sales charge on Class A shares |
| and all other applicable fees and expenses on all share classes.The Index is a widely accepted, unmanaged index of |
| corporate, U.S. government and U.S. government agency debt instruments, mortgage-backed securities, and asset-backed |
| securities. Unlike a mutual fund, the Index is not subject to charges, fees and other expenses. Investors cannot invest |
| directly in any index. Further information relating to fund performance, including expense reimbursements, if applicable, is |
| contained in the Financial Highlights section of the prospectus and elsewhere in this report. |
4
| Average Annual Total Returns as of 10/31/08 | | | | |
| | | 1 Year | | 5 Years | | 10 Years |
| |
| |
| |
|
| Class A shares | | | | | | |
| with maximum sales charge (3.0%) | | (10.71)% | | 0.39% | | 2.78% |
| without sales charge | | (7.91)% | | 0.99% | | 3.09% |
| Class B shares | | | | | | |
| with applicable redemption charge † | | (10.98)% | | 0.34% | | 2.78% |
| without redemption | | (8.34)% | | 0.50% | | 2.78% |
| Class C shares | | | | | | |
| with applicable redemption charge †† | | (8.98)% | | 0.52% | | 2.57% |
| without redemption | | (8.32)% | | 0.52% | | 2.57% |
| Class I shares | | (7.68)% | | 1.25% | | 3.35% |
| Past performance is not predictive of future performance.The fund’s performance shown in the graph and table does not |
| reflect the deduction of taxes that a shareholder would pay on fund distributions or the redemption of fund shares. |
| Performance for Class B shares assumes the conversion of Class B shares to Class A shares at the end of the sixth year |
| following the date of purchase. |
| † | | The maximum contingent deferred sales charge for Class B shares is 3%. After six years Class B shares convert to |
| | | Class A shares. |
| †† | | The maximum contingent deferred sales charge for Class C shares is .75% for shares redeemed within one year of |
| | | the date of purchase. |
UNDERSTANDING YOUR FUND’S EXPENSES (Unaudited)
As a mutual fund investor, you pay ongoing expenses, such as management fees and other expenses. Using the information below, you can estimate how these expenses affect your investment and compare them with the expenses of other funds.You also may pay one-time transaction expenses, including sales charges (loads) and redemption fees, which are not shown in this section and would have resulted in higher total expenses. For more information, see your fund’s prospectus or talk to your financial adviser.
Review your fund’s expenses
The table below shows the expenses you would have paid on a $1,000 investment in Dreyfus Limited Term Income Fund from May 1, 2008 to October 31, 2008. It also shows how much a $1,000 investment would be worth at the close of the period, assuming actual returns and expenses.
Expenses and Value of a $1,000 Investment assuming actual returns for the six months ended October 31, 2008
| | | Class A | | Class B | | Class C | | Class I |
| |
| |
| |
| |
|
| Expenses paid per $1,000† | | $ 4.09 | | $ 6.49 | | $ 6.49 | | $ 2.89 |
| Ending value (after expenses) | | $914.90 | | $912.00 | | $913.30 | | $916.10 |
COMPARING YOUR FUND’S EXPENSES WITH THOSE OF OTHER FUNDS (Unaudited)
Using the SEC’s method to compare expenses
The Securities and Exchange Commission (SEC) has established guidelines to help investors assess fund expenses. Per these guidelines, the table below shows your fund’s expenses based on a $1,000 investment, assuming a hypothetical 5% annualized return. You can use this information to compare the ongoing expenses (but not transaction expenses or total cost) of investing in the fund with those of other funds.All mutual fund shareholder reports will provide this information to help you make this comparison. Please note that you cannot use this information to estimate your actual ending account balance and expenses paid during the period.
Expenses and Value of a $1,000 Investment assuming a hypothetical 5% annualized return for the six months ended October 31, 2008
| | | Class A | | Class B | | Class C | | Class I |
| |
| |
| |
| |
|
| Expenses paid per $1,000† | | $ 4.32 | | $ 6.85 | | $ 6.85 | | $ 3.05 |
| Ending value (after expenses) | | $1,020.86 | | $1,018.35 | | $1,018.35 | | $1,022.12 |
| † Expenses are equal to the fund’s annualized expense ratio of .85% for Class A, 1.35% for Class B, 1.35% for |
| Class C and .60% for Class I, multiplied by the average account value over the period, multiplied by 184/366 (to |
| reflect the one-half year period). |
6
| STATEMENT OF INVESTMENTS | | | | | | |
| October 31, 2008 | | | | | | | | |
| |
| |
| |
| |
|
| |
| |
| |
| | | Coupon | | Maturity | | Principal | | |
| Bonds and Notes—124.6% | | Rate (%) | | Date | | Amount ($) | | Value ($) |
| |
| |
| |
| |
|
| Agricultural—.4% | | | | | | | | |
| Philip Morris International, | | | | | | | | |
| Sr. Unscd Notes | | 5.65 | | 5/16/18 | | 110,000 | | 94,266 |
| Asset-Backed Ctfs./ | | | | | | | | |
| Auto Receivables—4.7% | | | | | | | | |
| Americredit Automobile Receivables | | | | | | | | |
| Trust, Ser. 2008-AF, Cl. A2A | | 4.47 | | 1/12/12 | | 65,000 | | 62,034 |
| AmeriCredit Automobile Receivables | | | | | | | | |
| Trust, Ser. 2005-DA, Cl. A3 | | 4.87 | | 12/6/10 | | 13,793 | | 13,583 |
| Americredit Prime Automobile | | | | | | | | |
| Receivables, Ser. 2007-1, Cl. A2 | | 5.34 | | 8/9/10 | | 17,059 | | 17,059 |
| Americredit Prime Automobile | | | | | | | | |
| Receivables, Ser. 2007-1, Cl. B | | 5.35 | | 9/9/13 | | 70,000 | | 58,640 |
| Americredit Prime Automobile | | | | | | | | |
| Receivables, Ser. 2007-1, Cl. C | | 5.43 | | 2/10/14 | | 70,000 | | 54,433 |
| Capital One Auto Finance Trust, | | | | | | | | |
| Ser. 2006-C, Cl. A3A | | 5.07 | | 7/15/11 | | 34,176 | | 33,284 |
| Capital One Auto Finance Trust, | | | | | | | | |
| Ser. 2007-C, Cl. A3A | | 5.13 | | 4/16/12 | | 150,000 | | 140,557 |
| Capital One Auto Finance Trust, | | | | | | | | |
| Ser. 2007-C, Cl. A2A | | 5.29 | | 5/17/10 | | 56,777 | | 56,573 |
| Capital One Auto Finance Trust, | | | | | | | | |
| Ser. 2006-A, Cl. A3 | | 5.33 | | 11/15/10 | | 18,532 | | 18,466 |
| Ford Credit Auto Owner Trust, | | | | | | | | |
| Ser. 2005-B, Cl. B | | 4.64 | | 4/15/10 | | 225,000 | | 221,242 |
| Ford Credit Auto Owner Trust, | | | | | | | | |
| Ser. 2005-C, Cl. C | | 4.72 | | 2/15/11 | | 40,000 | | 37,867 |
| Hyundai Auto Receivables Trust, | | | | | | | | |
| Ser. 2004-A, Cl. B | | 3.46 | | 8/15/11 | | 16,923 | | 16,865 |
| Hyundai Auto Receivables Trust, | | | | | | | | |
| Ser. 2007-A, Cl. A3A | | 5.04 | | 1/17/12 | | 55,000 | | 54,171 |
| Hyundai Auto Receivables Trust, | | | | | | | | |
| Ser. 2006-B, Cl. C | | 5.25 | | 5/15/13 | | 35,000 | | 32,222 |
| Wachovia Auto Loan Owner Trust, | | | | | | | | |
| Ser. 2007-1, Cl. D | | 5.65 | | 2/20/13 | | 215,000 | | 111,729 |
| Wachovia Automobile Loan Owner | | | | | | | | |
| Trust, Ser. 2007-1, Cl. C | | 5.45 | | 10/22/12 | | 285,000 | | 240,128 |
| WFS Financial Owner Trust, | | | | | | | | |
| Ser. 2004-4, Cl. C | | 3.21 | | 5/17/12 | | 11,301 | | 11,254 |
| | | | | | | | | 1,180,107 |
| STATEMENT OF INVESTMENTS (continued) |
| | | Coupon | | Maturity | | Principal | | | | |
| Bonds and Notes (continued) | | Rate (%) | | Date | | Amount ($) | | | | Value ($) |
| |
| |
| |
| |
| |
|
| Asset-Backed Ctfs./Credit Cards—1.2% | | | | | | | | |
| Bank of America Credit Card Trust, | | | | | | | | | | |
| Ser. 2007-B1, Cl. B1 | | 4.67 | | 6/15/12 | | 160,000 | | a | | 146,466 |
| Citibank Credit Card Issuance | | | | | | | | | | |
| Trust, Ser. 2006-C4, Cl. C4 | | 4.33 | | 1/9/12 | | 175,000 | | a | | 156,952 |
| | | | | | | | | | | 303,418 |
| Asset-Backed Ctfs./ | | | | | | | | | | |
| Home Equity Loans—2.6% | | | | | | | | | | |
| Ameriquest Mortgage Securities, | | | | | | | | | | |
| Ser. 2003-11, Cl. AF6 | | 5.14 | | 1/25/34 | | 52,834 | | a | | 46,648 |
| Citigroup Mortgage Loan Trust, | | | | | | | | | | |
| Ser. 2005-WF1, Cl. A5 | | 5.01 | | 2/25/35 | | 108,645 | | a | | 85,951 |
| CS First Boston Mortgage | | | | | | | | | | |
| Securities, Ser. 2005-FIX1, Cl. A5 | | 4.90 | | 5/25/35 | | 280,336 | | a | | 228,144 |
| JP Morgan Mortgage Acquisition, | | | | | | | | | | |
| Ser. 2005-FRE1, Cl. A2F2 | | 5.22 | | 10/25/35 | | 25,969 | | a | | 25,768 |
| JP Morgan Mortgage Acquisition, | | | | | | | | | | |
| Ser. 2007-CH1, Cl. AF1B | | 5.94 | | 11/25/36 | | 86,770 | | a | | 83,802 |
| Residential Asset Mortgage | | | | | | | | | | |
| Products, Ser. 2003-RS9, Cl. MI1 | | 5.80 | | 10/25/33 | | 55,029 | | a | | 40,894 |
| Residential Asset Securities, | | | | | | | | | | |
| Ser. 2002-KS4, Cl. AIIB | | 3.76 | | 7/25/32 | | 63,039 | | a | | 48,743 |
| Soundview Home Equity Loan Trust, | | | | | | | | | | |
| Ser. 2005-A, Cl. M5 | | 4.06 | | 4/25/35 | | 66,869 | | a | | 16,760 |
| Sovereign Commercial Mortgage | | | | | | | | | | |
| Securities Trust, | | | | | | | | | | |
| Ser. 2007-C1, Cl. D | | 5.78 | | 7/22/30 | | 70,000 | | a,b | | 21,315 |
| Sovereign Commercial Mortgage | | | | | | | | | | |
| Securities Trust, | | | | | | | | | | |
| Ser. 2007-C1, Cl. B | | 5.78 | | 7/22/30 | | 100,000 | | a,b | | 57,512 |
| | | | | | | | | | | 655,537 |
| Asset-Backed Ctfs./ | | | | | | | | | | |
| Manufactured Housing—.6% | | | | | | | | | | |
| Green Tree Financial, | | | | | | | | | | |
| Ser. 1994-7, Cl. M1 | | 9.25 | | 3/15/20 | | 59,493 | | | | 54,677 |
| Origen Manufactured Housing, | | | | | | | | | | |
| Ser. 2005-B, Cl. A2 | | 5.25 | | 12/15/18 | | 95,750 | | | | 95,719 |
| | | | | | | | | | | 150,396 |
8
| | | Coupon | | Maturity | | Principal | | | | |
| Bonds and Notes (continued) | | Rate (%) | | Date | | Amount ($) | | | | Value ($) |
| |
| |
| |
| |
| |
|
| Banks—6.6% | | | | | | | | | | |
| Bank of America, | | | | | | | | | | |
| Jr. Sub. Bonds | | 8.00 | | 12/29/49 | | 155,000 | | a | | 116,221 |
| Barclays Bank, | | | | | | | | | | |
| Jr. Sub. Bonds | | 5.93 | | 9/29/49 | | 200,000 | | a,b | | 107,511 |
| Capital One Financial, | | | | | | | | | | |
| Sr. Unscd. Notes | | 3.10 | | 9/10/09 | | 100,000 | | a | | 92,751 |
| Chuo Mitsui Trust & Banking, | | | | | | | | | | |
| Jr. Sub. Notes | | 5.51 | | 12/29/49 | | 100,000 | | a,b | | 65,296 |
| Industrial Bank of Korea, | | | | | | | | | | |
| Sub. Notes | | 4.00 | | 5/19/14 | | 120,000 | | a,b | | 111,616 |
| M & I Marshall & Ilsley Bank, | | | | | | | | | | |
| Sr. Unscd. Notes | | 5.30 | | 9/8/11 | | 90,000 | | | | 77,491 |
| Marshall & Ilsley, | | | | | | | | | | |
| Sr. Unscd. Notes | | 5.63 | | 8/17/09 | | 80,000 | | | | 73,330 |
| NB Capital Trust IV, | | | | | | | | | | |
| Bank Gtd. Cap. Secs. | | 8.25 | | 4/15/27 | | 110,000 | | | | 91,239 |
| Northern Trust, | | | | | | | | | | |
| Sr. Unscd. Notes | | 5.30 | | 8/29/11 | | 65,000 | | | | 64,820 |
| PNC Funding, | | | | | | | | | | |
| Bank Gtd. Notes | | 3.56 | | 1/31/12 | | 85,000 | | a | | 68,942 |
| Resona Bank, | | | | | | | | | | |
| Notes | | 5.85 | | 9/29/49 | | 125,000 | | a,b | | 79,095 |
| Royal Bank of Scotland Group, | | | | | | | | | | |
| Jr. Sub. Bonds | | 6.99 | | 10/29/49 | | 200,000 | | a,b | | 107,341 |
| Shinsei Finance II, | | | | | | | | | | |
| Unscd. Bonds | | 7.16 | | 7/29/49 | | 110,000 | | a,b | | 44,859 |
| Sovereign Bancorp, | | | | | | | | | | |
| Sr. Unscd. Notes | | 3.09 | | 3/1/09 | | 8,000 | | a | | 7,672 |
| Sovereign Bancorp, | | | | | | | | | | |
| Sr. Unscd. Notes | | 4.80 | | 9/1/10 | | 145,000 | | a | | 129,043 |
| SunTrust Preferred Capital I, | | | | | | | | | | |
| Bank Gtd. Notes | | 5.85 | | 12/29/49 | | 35,000 | | a | | 19,306 |
| Wachovia, | | | | | | | | | | |
| Sub. Notes | | 6.38 | | 1/15/09 | | 75,000 | | | | 74,150 |
| Wells Fargo Capital XIII, | | | | | | | | | | |
| Bank Gtd. Notes | | 7.70 | | 12/29/49 | | 240,000 | | a | | 196,381 |
| STATEMENT OF INVESTMENTS (continued) |
| | | Coupon | | Maturity | | Principal | | | | |
| Bonds and Notes (continued) | | Rate (%) | | Date | | Amount ($) | | | | Value ($) |
| |
| |
| |
| |
| |
|
| Banks (continued) | | | | | | | | | | |
| Western Financial Bank, | | | | | | | | | | |
| Sub. Debs. | | 9.63 | | 5/15/12 | | 155,000 | | | | 146,781 |
| | | | | | | | | | | 1,673,845 |
| Building & Construction—.4% | | | | | | | | | | |
| Home Depot, | | | | | | | | | | |
| Sr. Unscd. Notes | | 5.88 | | 12/16/36 | | 98,000 | | | | 58,763 |
| Masco, | | | | | | | | | | |
| Sr. Unscd. Notes | | 3.12 | | 3/12/10 | | 45,000 | | a | | 42,396 |
| | | | | | | | | | | 101,159 |
| Chemicals—.4% | | | | | | | | | | |
| Lubrizol, | | | | | | | | | | |
| Gtd. Notes | | 4.63 | | 10/1/09 | | 50,000 | | | | 48,177 |
| Praxair, | | | | | | | | | | |
| Sr. Unscd. Notes | | 5.38 | | 11/1/16 | | 45,000 | | | | 40,800 |
| | | | | | | | | | | 88,977 |
| Commercial & | | | | | | | | | | |
| Professional Services—.2% | | | | | | | | | | |
| ERAC USA Finance, | | | | | | | | | | |
| Notes | | 3.72 | | 4/30/09 | | 25,000 | | a,b | | 23,132 |
| ERAC USA Finance, | | | | | | | | | | |
| Gtd. Notes | | 7.00 | | 10/15/37 | | 50,000 | | b | | 29,317 |
| | | | | | | | | | | 52,449 |
| Commercial Mortgage | | | | | | | | | | |
| Pass-Through Ctfs.—8.7% | | | | | | | | | | |
| Banc of America Commercial | | | | | | | | | | |
| Mortgage, Ser. 2002-2, Cl. A3 | | 5.12 | | 7/11/43 | | 65,000 | | | | 59,697 |
| Bayview Commercial Asset Trust, | | | | | | | | | | |
| Ser. 2004-1, Cl. A | | 3.62 | | 4/25/34 | | 29,203 | | a,b | | 26,129 |
| Bayview Commercial Asset Trust, | | | | | | | | | | |
| Ser. 2006-1A, Cl. M6 | | 3.90 | | 4/25/36 | | 85,088 | | a,b | | 71,048 |
| Bear Stearns Commercial Mortgage | | | | | | | | | | |
| Securities, Ser. 2005-PWR8, Cl. A2 | | 4.48 | | 6/11/41 | | 45,000 | | | | 42,495 |
| Bear Stearns Commercial Mortgage | | | | | | | | | | |
| Securities, Ser. 2005-T18, Cl. A2 | | 4.56 | | 2/13/42 | | 85,000 | | a | | 81,778 |
| Bear Stearns Commercial Mortgage | | | | | | | | | | |
| Securities, Ser. 2004-PWR5, Cl. A3 | | 4.57 | | 7/11/42 | | 110,000 | | | | 101,395 |
| Bear Stearns Commercial Mortgage | | | | | | | | | | |
| Securities, Ser. 2006-PW13, Cl. A3 | | 5.52 | | 9/11/41 | | 35,000 | | | | 29,133 |
10
| | | Coupon | | Maturity | | Principal | | | | |
| Bonds and Notes (continued) | | Rate (%) | | Date | | Amount ($) | | | | Value ($) |
| |
| |
| |
| |
| |
|
| Commercial Mortgage | | | | | | | | | | |
| Pass-Through Ctfs. (continued) | | | | | | | | | | |
| Credit Suisse/Morgan Stanley | | | | | | | | | | |
| Commercial Mortgage Certificates, | | | | | | | | | | |
| Ser. 2006-HC1A, Cl. A1 | | 4.75 | | 5/15/23 | | 88,764 | | a,b | | 78,419 |
| Crown Castle Towers, | | | | | | | | | | |
| Ser. 2006-1A, Cl. AFX | | 5.24 | | 11/15/36 | | 185,000 | | b | | 177,643 |
| Crown Castle Towers, | | | | | | | | | | |
| Ser. 2006-1A, Cl. B | | 5.36 | | 11/15/36 | | 50,000 | | b | | 46,881 |
| Crown Castle Towers, | | | | | | | | | | |
| Ser. 2006-1A, Cl. C | | 5.47 | | 11/15/36 | | 125,000 | | b | | 113,441 |
| Crown Castle Towers, | | | | | | | | | | |
| Ser. 2005-1A, Cl. D | | 5.61 | | 6/15/35 | | 65,000 | | b | | 59,108 |
| Crown Castle Towers, | | | | | | | | | | |
| Ser. 2006-1A, Cl. D | | 5.77 | | 11/15/36 | | 90,000 | | b | | 78,139 |
| CS First Boston Mortgage | | | | | | | | | | |
| Securities, Ser. 2005-C4, Cl. A2 | | 5.02 | | 8/15/38 | | 50,000 | | | | 47,484 |
| CS First Boston Mortgage | | | | | | | | | | |
| Securities, Ser. 2001-CKN5, | | | | | | | | | | |
| Cl. A4 | | 5.44 | | 9/15/34 | | 110,847 | | | | 104,796 |
| CS First Boston Mortgage | | | | | | | | | | |
| Securities, Ser. 2001-CF2, Cl. G | | 6.93 | | 2/15/34 | | 130,000 | | b | | 116,006 |
| Global Signal Trust, | | | | | | | | | | |
| Ser. 2006-1, Cl. C | | 5.71 | | 2/15/36 | | 45,000 | | b | | 41,319 |
| Global Signal Trust, | | | | | | | | | | |
| Ser. 2006-1, Cl. D | | 6.05 | | 2/15/36 | | 125,000 | | b | | 110,993 |
| Global Signal Trust, | | | | | | | | | | |
| Ser. 2006-1, Cl. E | | 6.50 | | 2/15/36 | | 45,000 | | b | | 39,146 |
| Goldman Sachs Mortgage | | | | | | | | | | |
| Securities Corporation II, | | | | | | | | | | |
| Ser. 2007-EOP, Cl. H | | 4.70 | | 3/6/20 | | 25,000 | | a,b | | 19,337 |
| JP Morgan Chase Commercial | | | | | | | | | | |
| Mortgage Securities, | | | | | | | | | | |
| Ser. 2004-C1, Cl. A2 | | 4.30 | | 1/15/38 | | 110,000 | | | | 100,877 |
| LB Commercial Conduit Mortgage | | | | | | | | | | |
| Trust, Ser. 1999-C1, Cl. B | | 6.93 | | 6/15/31 | | 150,000 | | | | 149,341 |
| LB-UBS Commercial Mortgage Trust, | | | | | | | | | | |
| Ser. 2001-C3, Cl. A2 | | 6.37 | | 12/15/28 | | 110,000 | | | | 106,503 |
| Merrill Lynch Mortgage Trust, | | | | | | | | | | |
| Ser. 2005-CKI1, Cl. A6 | | 5.42 | | 11/12/37 | | 180,000 | | a | | 146,106 |
| STATEMENT OF INVESTMENTS (continued) |
| | | Coupon | | Maturity | | Principal | | | | |
| Bonds and Notes (continued) | | Rate (%) | | Date | | Amount ($) | | | | Value ($) |
| |
| |
| |
| |
| |
|
| Commercial Mortgage | | | | | | | | | | |
| Pass-Through Ctfs. (continued) | | | | | | | | | | |
| Morgan Stanley Capital I, | | | | | | | | | | |
| Ser. 2006-T21, Cl. A2 | | 5.09 | | 10/12/52 | | 45,000 | | | | 41,667 |
| Morgan Stanley Capital I, | | | | | | | | | | |
| Ser. 2006-IQ12, Cl. AAB | | 5.33 | | 12/15/43 | | 100,000 | | | | 79,810 |
| Morgan Stanley Dean Witter Capital I, | | | | | | | | | | |
| Ser. 2001-TOP3, Cl. A4 | | 6.39 | | 7/15/33 | | 61,994 | | | | 59,901 |
| SBA CMBS Trust, | | | | | | | | | | |
| Ser. 2006-1A, Cl. D | | 5.85 | | 11/15/36 | | 35,000 | | b | | 30,303 |
| Wachovia Bank Commercial Mortgage | | | | | | | | | | |
| Trust, Ser. 2005-C19, Cl. A5 | | 4.66 | | 5/15/44 | | 50,000 | | | | 43,902 |
| | | | | | | | | | | 2,202,797 |
| Computers—.5% | | | | | | | | | | |
| International Business Machines, | | | | | | | | | | |
| Sr. Unscd. Notes | | 5.70 | | 9/14/17 | | 135,000 | | | | 122,839 |
| Diversified Financial Services—7.8% | | | | | | | | | | |
| Ameriprise Financial, | | | | | | | | | | |
| Jr. Sub. Notes | | 7.52 | | 6/1/66 | | 99,000 | | a | | 49,480 |
| Boeing Capital, | | | | | | | | | | |
| Sr. Unscd. Notes | | 7.38 | | 9/27/10 | | 175,000 | | | | 180,620 |
| Capmark Financial Group, | | | | | | | | | | |
| Gtd. Notes | | 5.88 | | 5/10/12 | | 85,000 | | | | 21,258 |
| Citigroup, | | | | | | | | | | |
| Sr. Unscd. Notes | | 6.00 | | 8/15/17 | | 140,000 | | | | 120,538 |
| Citigroup, | | | | | | | | | | |
| Sr. Sub. Bonds | | 6.00 | | 10/31/33 | | 20,000 | | | | 13,586 |
| Citigroup, | | | | | | | | | | |
| Sr. Unscd. Notes | | 6.13 | | 5/15/18 | | 340,000 | | | | 291,773 |
| Credit Suisse Guernsey, | | | | | | | | | | |
| Jr. Sub. Notes | | 5.86 | | 5/29/49 | | 145,000 | | a | | 82,937 |
| General Electric Capital, | | | | | | | | | | |
| Sr. Unscd. Notes | | 5.63 | | 5/1/18 | | 250,000 | | | | 206,168 |
| GenWorth Global Funding, | | | | | | | | | | |
| Scd. Notes | | 5.20 | | 10/8/10 | | 65,000 | | | | 45,939 |
| Goldman Sachs Capital II, | | | | | | | | | | |
| Gtd. Bonds | | 5.79 | | 12/29/49 | | 95,000 | | a | | 43,656 |
| Goldman Sachs Group, | | | | | | | | | | |
| Sr. Unscd. Notes | | 6.15 | | 4/1/18 | | 90,000 | | | | 74,681 |
| Goldman Sachs Group, | | | | | | | | | | |
| Sub. Notes | | 6.75 | | 10/1/37 | | 60,000 | | | | 39,170 |
12
| | | Coupon | | Maturity | | Principal | | | | |
| Bonds and Notes (continued) | | Rate (%) | | Date | | Amount ($) | | | | Value ($) |
| |
| |
| |
| |
| |
|
| Diversified Financial | | | | | | | | | | |
| Services (continued) | | | | | | | | | | |
| International Lease Finance, | | | | | | | | | | |
| Sr. Unscd. Notes | | 6.38 | | 3/25/13 | | 60,000 | | | | 39,271 |
| Janus Capital Group, | | | | | | | | | | |
| Sr. Unscd. Notes | | 6.70 | | 6/15/17 | | 310,000 | | | | 196,843 |
| Jefferies Group, | | | | | | | | | | |
| Notes | | 5.88 | | 6/8/14 | | 100,000 | | | | 83,900 |
| John Deere Capital, | | | | | | | | | | |
| Sr. Unscd. Notes | | 2.85 | | 9/1/09 | | 77,000 | | a | | 73,691 |
| JPMorgan Chase & Co., | | | | | | | | | | |
| Sr. Unscd. Notes | | 6.00 | | 1/15/18 | | 90,000 | | | | 80,875 |
| JPMorgan Chase & Co., | | | | | | | | | | |
| Sr. Unscd. Notes | | 6.40 | | 5/15/38 | | 85,000 | | | | 73,192 |
| Merrill Lynch & Co., | | | | | | | | | | |
| Sr. Unscd. Notes | | 6.40 | | 8/28/17 | | 50,000 | | | | 42,315 |
| Morgan Stanley, | | | | | | | | | | |
| Notes | | 5.55 | | 4/27/17 | | 115,000 | | | | 91,732 |
| NYSE Euronext, | | | | | | | | | | |
| Sr. Unscd. Notes | | 4.80 | | 6/28/13 | | 55,000 | | | | 51,626 |
| WEA Finance, | | | | | | | | | | |
| Sr. Notes | | 7.13 | | 4/15/18 | | 85,000 | | b | | 66,830 |
| | | | | | | | | | | 1,970,081 |
| Electric Utilities—3.1% | | | | | | | | | | |
| Cleveland Electric Illumination, | | | | | | | | | | |
| Sr. Unscd. Notes | | 5.70 | | 4/1/17 | | 85,000 | | | | 67,803 |
| Columbus Southern Power, | | | | | | | | | | |
| Sr. Unscd. Notes | | 6.05 | | 5/1/18 | | 10,000 | | | | 8,335 |
| Commonwealth Edison, | | | | | | | | | | |
| First Mortgage Bonds | | 6.15 | | 9/15/17 | | 60,000 | | | | 51,144 |
| Consolidated Edison of NY, | | | | | | | | | | |
| Sr. Unscd. Debs., Ser. 08-A | | 5.85 | | 4/1/18 | | 90,000 | | | | 76,796 |
| Dominion Resources, | | | | | | | | | | |
| Sr. Unscd. Notes | | 6.40 | | 6/15/18 | | 115,000 | | | | 97,609 |
| Duke Energy Carolinas, | | | | | | | | | | |
| Sr. Unscd. Notes | | 5.63 | | 11/30/12 | | 50,000 | | | | 48,553 |
| Enel Finance International, | | | | | | | | | | |
| Gtd. Bonds | | 6.25 | | 9/15/17 | | 155,000 | | b | | 128,432 |
| National Grid, | | | | | | | | | | |
| Unsub. Notes | | 6.30 | | 8/1/16 | | 72,000 | | | | 60,578 |
| | STATEMENT OF INVESTMENTS (continued) |
| | | | | Coupon | | Maturity | | Principal | | | | |
| Bonds and Notes (continued) | | Rate (%) | | Date | | Amount ($) | | | | Value ($) |
| |
| |
| |
| |
| |
|
| Electric Utilities (continued) | | | | | | | | | | | | |
| Nevada Power, | | | | | | | | | | | | |
| Mortgage Notes | | | | 6.50 | | 8/1/18 | | 55,000 | | | | 46,523 |
| NiSource Finance, | | | | | | | | | | | | |
| Gtd. Notes | | | | 3.38 | | 11/23/09 | | 45,000 | | a | | 40,964 |
| NiSource Finance, | | | | | | | | | | | | |
| Gtd. Notes | | | | 7.88 | | 11/15/10 | | 110,000 | | | | 99,365 |
| Ohio Power, | | | | | | | | | | | | |
| Sr. Unscd. Notes | | | | 4.39 | | 4/5/10 | | 45,000 | | a | | 44,290 |
| Ohio Power, | | | | | | | | | | | | |
| Sr. Unscd. Notes, Ser. G | | | | 6.60 | | 2/15/33 | | 20,000 | | | | 15,321 |
| | | | | | | | | | | | | 785,713 |
| Environmental Control—.9% | | | | | | | | | | | | |
| Oakmont Asset Trust, | | | | | | | | | | | | |
| Notes | | | | 4.51 | | 12/22/08 | | 155,000 | | b | | 155,174 |
| Veolia Environnement, | | | | | | | | | | | | |
| Sr. Unscd. Notes | | | | 5.25 | | 6/3/13 | | 75,000 | | | | 67,896 |
| | | | | | | | | | | | | 223,070 |
| Food & Beverages—1.7% | | | | | | | | | | | | |
| H.J. Heinz, | | | | | | | | | | | | |
| Sr. Unscd. Secs. | | | | 6.43 | | 12/1/20 | | 150,000 | | b | | 150,475 |
| Kraft Foods, | | | | | | | | | | | | |
| Sr. Unscd. Notes | | | | 6.00 | | 2/11/13 | | 15,000 | | | | 14,031 |
| Kroger, | | | | | | | | | | | | |
| Gtd. Notes | | | | 5.00 | | 4/15/13 | | 105,000 | | | | 94,768 |
| Kroger, | | | | | | | | | | | | |
| Gtd. Notes | | | | 6.40 | | 8/15/17 | | 55,000 | | | | 47,931 |
| Safeway, | | | | | | | | | | | | |
| Sr. Unscd. Notes | | | | 4.95 | | 8/16/10 | | 135,000 | | | | 133,254 |
| | | | | | | | | | | | | 440,459 |
| Foreign/Governmental—.4% | | | | | | | | | | | | |
| Federal Republic of Brazil, | | | | | | | | | | | | |
| Unsub. Bonds | | BRL | | 12.50 | | 1/5/16 | | 250,000 | | c | | 102,700 |
| Health Care—1.7% | | | | | | | | | | | | |
| Jackson National Life Global, | | | | | | | | | | | | |
| Sr. Scd. Notes | | | | 5.38 | | 5/8/13 | | 50,000 | | b | | 44,520 |
| Schering-Plough, | | | | | | | | | | | | |
| Sr. Unscd. Notes | | | | 5.55 | | 12/1/13 | | 125,000 | | a | | 118,676 |
| Teva Pharmaceutical Finance, | | | | | | | | | | | | |
| Gtd. Notes | | | | 6.15 | | 2/1/36 | | 115,000 | | | | 83,376 |
14
| | | Coupon | | Maturity | | Principal | | | | |
| Bonds and Notes (continued) | | Rate (%) | | Date | | Amount ($) | | | | Value ($) |
| |
| |
| |
| |
| |
|
| Health Care (continued) | | | | | | | | | | |
| UnitedHealth Group, | | | | | | | | | | |
| Sr. Unscd. Notes | | 5.25 | | 3/15/11 | | 150,000 | | | | 144,919 |
| Wellpoint, | | | | | | | | | | |
| Sr. Unscd. Notes | | 5.88 | | 6/15/17 | | 50,000 | | | | 40,938 |
| | | | | | | | | | | 432,429 |
| Manufacturing-Diversified—.4% | | | | | | | | | | |
| Siemens Financieringsmat, | | | | | | | | | | |
| Gtd. Notes | | 5.75 | | 10/17/16 | | 100,000 | | b | | 89,889 |
| Media—2.7% | | | | | | | | | | |
| British Sky Broadcasting, | | | | | | | | | | |
| Gtd. Notes | | 6.88 | | 2/23/09 | | 95,000 | | | | 93,655 |
| BSKYB Finance UK, | | | | | | | | | | |
| Gtd. Notes | | 6.50 | | 10/15/35 | | 85,000 | | b | | 64,048 |
| Comcast, | | | | | | | | | | |
| Gtd. Notes | | 5.12 | | 7/14/09 | | 160,000 | | a | | 153,316 |
| Cox Communications, | | | | | | | | | | |
| Notes | | 6.25 | | 6/1/18 | | 75,000 | | b | | 61,298 |
| News America, | | | | | | | | | | |
| Gtd. Notes | | 6.65 | | 11/15/37 | | 115,000 | | | | 91,339 |
| News America, | | | | | | | | | | |
| Gtd. Debs. | | 7.63 | | 11/30/28 | | 90,000 | | | | 76,208 |
| Time Warner, | | | | | | | | | | |
| Gtd. Debs. | | 6.50 | | 11/15/36 | | 70,000 | | | | 49,881 |
| Time Warner, | | | | | | | | | | |
| Gtd. Notes | | 6.75 | | 7/1/18 | | 110,000 | | | | 94,503 |
| | | | | | | | | | | 684,248 |
| Metals—.1% | | | | | | | | | | |
| Alcoa, | | | | | | | | | | |
| Sr. Unscd. Notes | | 6.00 | | 7/15/13 | | 40,000 | | | | 34,455 |
| Municipal Obligations—.2% | | | | | | | | | | |
| Clark County School District, | | | | | | | | | | |
| GO, Ser. F (Insured; FSA) | | 5.50 | | 6/15/17 | | 5,000 | | d | | 5,399 |
| Clark County School District, | | | | | | | | | | |
| GO, Ser. F (Insured; FSA) | | 5.50 | | 6/15/18 | | 5,000 | | d | | 5,399 |
| Clark County, | | | | | | | | | | |
| GO (Bond Bank) (Insured; MBIA) | | 5.25 | | 6/1/20 | | 10,000 | | d | | 10,789 |
| Cypress-Fairbanks Independent | | | | | | | | | | |
| School District, GO, Ser. A | | | | | | | | | | |
| (Schoolhouse) (Insured; PSF-GTD) | | 5.25 | | 2/15/22 | | 10,000 | | d | | 10,391 |
| STATEMENT OF INVESTMENTS (continued) |
| | | Coupon | | Maturity | | Principal | | | | |
| Bonds and Notes (continued) | | Rate (%) | | Date | | Amount ($) | | | | Value ($) |
| |
| |
| |
| |
| |
|
| Municipal Obligations (continued) | | | | | | | | | | |
| Williamson County, | | | | | | | | | | |
| GO, Ser. A (Insured; FSA) | | 6.00 | | 8/15/14 | | 10,000 | | d | | 10,617 |
| Wisconsin, | | | | | | | | | | |
| GO, Ser. G (Insured; MBIA) | | 5.00 | | 5/1/15 | | 5,000 | | d | | 5,354 |
| | | | | | | | | | | 47,949 |
| Office And Business Equipment—.1% | | | | | | | | | | |
| Xerox, | | | | | | | | | | |
| Sr. Unscd. Notes | | 5.50 | | 5/15/12 | | 15,000 | | | | 11,667 |
| Xerox, | | | | | | | | | | |
| Sr. Unscd. Notes | | 5.65 | | 5/15/13 | | 25,000 | | | | 19,750 |
| | | | | | | | | | | 31,417 |
| Oil & Gas—.9% | | | | | | | | | | |
| El Paso Natural Gas, | | | | | | | | | | |
| Sr. Unscd. Notes | | 5.95 | | 4/15/17 | | 20,000 | | | | 15,568 |
| Hess, | | | | | | | | | | |
| Sr. Unscd. Notes | | 6.65 | | 8/15/11 | | 115,000 | | | | 107,977 |
| Praxair, | | | | | | | | | | |
| Sr. Unscd. Notes | | 5.25 | | 11/15/14 | | 110,000 | | | | 102,785 |
| | | | | | | | | | | 226,330 |
| Property & Casualty Insurance—1.2% | | | | | | | | | | |
| Ace INA Holdings, | | | | | | | | | | |
| Gtd. Notes | | 5.70 | | 2/15/17 | | 85,000 | | | | 69,020 |
| Lincoln National, | | | | | | | | | | |
| Sr. Unscd. Notes | | 2.90 | | 3/12/10 | | 75,000 | | a | | 73,125 |
| Pacific Life Global Funding, | | | | | | | | | | |
| Notes | | 5.15 | | 4/15/13 | | 70,000 | | b | | 58,721 |
| Principal Financial Group, | | | | | | | | | | |
| Gtd. Notes | | 6.05 | | 10/15/36 | | 60,000 | | | | 35,902 |
| Willis North America, | | | | | | | | | | |
| Gtd. Notes | | 6.20 | | 3/28/17 | | 85,000 | | | | 62,034 |
| | | | | | | | | | | 298,802 |
| Real Estate Investment Trusts—5.1% | | | | | | | | | | |
| Arden Realty, | | | | | | | | | | |
| Sr. Unscd. Notes | | 5.20 | | 9/1/11 | | 140,000 | | | | 132,759 |
| Arden Realty, | | | | | | | | | | |
| Sr. Unscd. Notes | | 5.25 | | 3/1/15 | | 25,000 | | | | 20,828 |
| Boston Properties, | | | | | | | | | | |
| Sr. Unscd. Notes | | 6.25 | | 1/15/13 | | 140,000 | | | | 123,010 |
16
| | | Coupon | | Maturity | | Principal | | | | |
| Bonds and Notes (continued) | | Rate (%) | | Date | | Amount ($) | | | | Value ($) |
| |
| |
| |
| |
| |
|
| Real Estate Investment | | | | | | | | | | |
| Trusts (continued) | | | | | | | | | | |
| Duke Realty, | | | | | | | | | | |
| Sr. Unscd. Notes | | 5.25 | | 1/15/10 | | 80,000 | | | | 75,012 |
| Federal Realty Investment Trust, | | | | | | | | | | |
| Sr. Unscd. Notes | | 6.00 | | 7/15/12 | | 65,000 | | | | 59,877 |
| Federal Realty Investment Trust, | | | | | | | | | | |
| Sr. Unscd. Notes | | 6.20 | | 1/15/17 | | 90,000 | | | | 74,847 |
| First Industrial, | | | | | | | | | | |
| Sr. Notes | | 5.95 | | 5/15/17 | | 35,000 | | | | 26,066 |
| Healthcare Realty Trust, | | | | | | | | | | |
| Sr. Unscd. Notes | | 5.13 | | 4/1/14 | | 200,000 | | | | 170,004 |
| HRPT Properties Trust, | | | | | | | | | | |
| Sr. Unscd. Notes | | 3.42 | | 3/16/11 | | 50,000 | | a | | 45,632 |
| Liberty Property, | | | | | | | | | | |
| Sr. Unscd. Notes | | 5.50 | | 12/15/16 | | 35,000 | | | | 24,192 |
| Mack-Cali Realty, | | | | | | | | | | |
| Sr. Unscd. Notes | | 5.05 | | 4/15/10 | | 100,000 | | | | 100,247 |
| Mack-Cali Realty, | | | | | | | | | | |
| Sr. Unscd. Notes | | 5.13 | | 1/15/15 | | 70,000 | | | | 66,254 |
| Mack-Cali Realty, | | | | | | | | | | |
| Notes | | 5.25 | | 1/15/12 | | 35,000 | | | | 35,067 |
| National Retail Properties, | | | | | | | | | | |
| Sr. Unscd. Notes | | 6.15 | | 12/15/15 | | 100,000 | | | | 84,216 |
| Prologis, | | | | | | | | | | |
| Sr. Unscd. Notes | | 6.63 | | 5/15/18 | | 70,000 | | | | 40,351 |
| Regency Centers, | | | | | | | | | | |
| Gtd. Notes | | 5.25 | | 8/1/15 | | 105,000 | | | | 83,673 |
| Regency Centers, | | | | | | | | | | |
| Gtd. Notes | | 5.88 | | 6/15/17 | | 25,000 | | | | 19,075 |
| Simon Property Group, | | | | | | | | | | |
| Sr. Unscd. Notes | | 5.25 | | 12/1/16 | | 65,000 | | | | 44,244 |
| Simon Property Group, | | | | | | | | | | |
| Sr. Unscd. Notes | | 5.75 | | 5/1/12 | | 60,000 | | | | 51,795 |
| | | | | | | | | | | 1,277,149 |
| Residential Mortgage | | | | | | | | | | |
| Pass-Through Ctfs.—1.8% | | | | | | | | | | |
| American General Mortgage Loan | | | | | | | | | | |
| Trust, Ser. 2006-1, Cl. A1 | | 5.75 | | 12/25/35 | | 6,088 | | a,b | | 6,055 |
| STATEMENT OF INVESTMENTS (continued) |
| | | Coupon | | Maturity | | Principal | | | | |
| Bonds and Notes (continued) | | Rate (%) | | Date | | Amount ($) | | | | Value ($) |
| |
| |
| |
| |
| |
|
| Residential Mortgage | | | | | | | | | | |
| Pass-Through Ctfs. (continued) | | | | | | | | | | |
| Impac Secured Assets CMN Owner | | | | | | | | | | |
| Trust, Ser. 2006-1, Cl. 2A1 | | 3.61 | | 5/25/36 | | 59,817 | | a | | 51,173 |
| Nomura Asset Acceptance, | | | | | | | | | | |
| Ser. 2005-WF1, Cl. 2A5 | | 5.16 | | 3/25/35 | | 102,528 | | a | | 71,400 |
| WaMu Mortgage Pass Through | | | | | | | | | | |
| Certificates, Ser. 2004-AR7, Cl. A6 | | 3.94 | | 7/25/34 | | 150,000 | | a | | 147,696 |
| WaMu Mortgage Pass Through | | | | | | | | | | |
| Certificates, Ser. 2004-AR9, | | | | | | | | | | |
| Cl. A7 | | 4.14 | | 8/25/34 | | 195,000 | | a | | 189,285 |
| | | | | | | | | | | 465,609 |
| Retail—1.5% | | | | | | | | | | |
| CVS Caremark, | | | | | | | | | | |
| Sr. Unscd. Notes | | 3.11 | | 6/1/10 | | 60,000 | | a | | 54,234 |
| CVS Caremark, | | | | | | | | | | |
| Sr. Unscd. Notes | | 5.75 | | 6/1/17 | | 60,000 | | | | 48,500 |
| Delhaize Group, | | | | | | | | | | |
| Sr. Unscd. Notes | | 6.50 | | 6/15/17 | | 75,000 | | | | 60,985 |
| Lowe’s Companies, | | | | | | | | | | |
| Sr. Unscd. Notes | | 5.60 | | 9/15/12 | | 20,000 | | | | 19,813 |
| Lowe’s Companies, | | | | | | | | | | |
| Sr. Unscd. Notes | | 6.10 | | 9/15/17 | | 60,000 | | | | 52,008 |
| Macys Retail Holdings, | | | | | | | | | | |
| Gtd. Notes | | 5.90 | | 12/1/16 | | 25,000 | | | | 15,123 |
| Walgreen, | | | | | | | | | | |
| Sr. Unscd. Notes | | 4.88 | | 8/1/13 | | 60,000 | | | | 58,680 |
| Wal-Mart Stores, | | | | | | | | | | |
| Sr. Unscd. Notes | | 6.50 | | 8/15/37 | | 75,000 | | | | 67,525 |
| | | | | | | | | | | 376,868 |
| State/Territory Gen Oblg—2.2% | | | | | | | | | | |
| Erie Tobacco Asset | | | | | | | | | | |
| Securitization/NY, Tobacco | | | | | | | | | | |
| Settlement Asset-Backed Bonds | | 6.00 | | 6/1/28 | | 60,000 | | | | 50,879 |
| Michigan Tobacco Settlement | | | | | | | | | | |
| Finance Authority, Tobacco | | | | | | | | | | |
| Settlement Asset-Backed Bonds | | 7.31 | | 6/1/34 | | 270,000 | | | | 215,644 |
| Tobacco Settlement Authority of | | | | | | | | | | |
| Iowa, Tobacco Settlement | | | | | | | | | | |
| Asset-Backed Bonds | | 6.50 | | 6/1/23 | | 245,000 | | | | 204,847 |
18
| | | Coupon | | Maturity | | Principal | | |
| Bonds and Notes (continued) | | Rate (%) | | Date | | Amount ($) | | Value ($) |
| |
| |
| |
| |
|
| State/Territory Gen Oblg (continued) | | | | | | | | |
| Tobacco Settlement Finance Authority | | | | | | | | |
| of West Virginia, Tobacco | | | | | | | | |
| Settlement Asset-Backed Bonds | | 7.47 | | 6/1/47 | | 140,000 | | 91,141 |
| | | | | | | | | 562,511 |
| Telecommunications—4.1% | | | | | | | | |
| AT&T, | | | | | | | | |
| Sr. Unscd. Bonds | | 5.50 | | 2/1/18 | | 140,000 | | 119,157 |
| Deutsche Telekom International | | | | | | | | |
| Finance, Gtd. Bonds | | 3.39 | | 3/23/09 | | 235,000 a | | 232,309 |
| KONINKLIJKE KPN, | | | | | | | | |
| Sr. Unscd. Notes | | 8.00 | | 10/1/10 | | 20,000 | | 19,160 |
| KONINKLIJKE KPN, | | | | | | | | |
| Sr. Unscd. Bonds | | 8.38 | | 10/1/30 | | 10,000 | | 8,131 |
| New Cingular Wireless, | | | | | | | | |
| Sr. Unscd. Notes | | 7.88 | | 3/1/11 | | 170,000 | | 169,729 |
| Sprint Capital, | | | | | | | | |
| Gtd. Notes | | 6.88 | | 11/15/28 | | 35,000 | | 20,516 |
| Sprint Capital, | | | | | | | | |
| Gtd. Notes | | 8.38 | | 3/15/12 | | 135,000 | | 108,749 |
| Telecom Italia Capital, | | | | | | | | |
| Gtd. Notes | | 5.25 | | 11/15/13 | | 80,000 | | 60,786 |
| Telefonica Emisiones, | | | | | | | | |
| Gtd. Notes | | 5.98 | | 6/20/11 | | 185,000 | | 176,753 |
| Verizon Communications, | | | | | | | | |
| Sr. Unscd. Notes | | 6.10 | | 4/15/18 | | 45,000 | | 39,383 |
| Verizon Communications, | | | | | | | | |
| Bonds | | 6.90 | | 4/15/38 | | 60,000 | | 50,333 |
| Verizon Communications, | | | | | | | | |
| Sr. Unscd. Notes | | 8.95 | | 3/1/39 | | 40,000 | | 40,700 |
| | | | | | | | | 1,045,706 |
| Transportation—.8% | | | | | | | | |
| Canadian National Railway, | | | | | | | | |
| Sr. Unscd. Notes | | 5.55 | | 5/15/18 | | 85,000 | | 74,076 |
| Norfolk Southern, | | | | | | | | |
| Sr. Unscd. Notes | | 5.75 | | 4/1/18 | | 70,000 | | 60,358 |
| Union Pacific, | | | | | | | | |
| Sr. Unscd. Notes | | 6.65 | | 1/15/11 | | 60,000 | | 58,394 |
| | | | | | | | | 192,828 |
| STATEMENT OF INVESTMENTS (continued) |
| | | Principal | | |
| Bonds and Notes (continued) | | Amount ($) | | Value ($) |
| |
| |
|
| U.S. Government Agencies/ | | | | |
| Mortgage-Backed—59.6% | | | | |
| Federal Home Loan Mortgage Corp.: | | | | |
| 5.50% | | 1,715,000 e,f | | 1,688,929 |
| 4.00%, 10/1/09 | | 47,911 f | | 47,816 |
| 4.50%, 10/1/09 | | 68,835 f | | 69,359 |
| 5.50%, 9/1/37—1/1/38 | | 720,883 f | | 703,620 |
| 6.50%, 3/1/11—9/1/29 | | 27,416 f | | 28,073 |
| 7.00%, 3/1/12 | | 8,135 f | | 8,524 |
| 7.50%, 12/1/25—1/1/31 | | 34,468 f | | 36,358 |
| 8.00%, 10/1/19—10/1/30 | | 17,027 f | | 18,025 |
| 8.50%, 7/1/30 | | 1,233 f | | 1,324 |
| 9.00%, 8/1/30 | | 2,942 f | | 3,230 |
| Federal National Mortgage Association: | | | | |
| 5.00% | | 1,690,000 e,f | | 1,601,011 |
| 5.50% | | 1,275,000 e,f | | 1,245,715 |
| 6.00% | | 1,380,000 e,f | | 1,379,353 |
| 4.00%, 5/1/10 | | 122,993 f | | 122,590 |
| 4.50%, 6/1/10 | | 58,362 f | | 58,716 |
| 5.00%, 7/1/11—4/1/23 | | 873,968 f | | 857,842 |
| 5.50%, 1/1/34—4/1/38 | | 2,104,497 f | | 2,058,478 |
| 6.00%, 12/1/22—4/1/38 | | 1,698,770 f | | 1,705,124 |
| 7.00%, 7/1/15—6/1/29 | | 24,977 f | | 25,970 |
| 7.50%, 3/1/12—3/1/31 | | 29,015 f | | 30,468 |
| 8.00%, 5/1/13—3/1/31 | | 15,978 f | | 16,930 |
| Government National Mortgage Association I: | | | | |
| 6.00%, 1/15/29 | | 39,397 | | 39,571 |
| 6.50%, 4/15/28—6/15/29 | | 48,794 | | 49,614 |
| 7.00%, 8/15/25—9/15/31 | | 38,915 | | 39,997 |
| 7.50%, 12/15/26—11/15/30 | | 6,795 | | 7,177 |
| 8.00%, 1/15/30—10/15/30 | | 17,914 | | 19,156 |
| 8.50%, 4/15/25 | | 5,732 | | 6,175 |
| 9.00%, 10/15/27 | | 10,825 | | 11,795 |
| 9.50%, 2/15/25 | | 4,981 | | 5,537 |
| Ser. 2004-43, Cl. A, 2.82%, 12/16/19 | | 204,223 | | 201,095 |
| Ser. 2004-23, Cl. B, 2.95%, 3/16/19 | | 178,959 | | 176,650 |
| Ser. 2004-57, Cl. A, 3.02%, 1/16/19 | | 125,410 | | 123,902 |
| Ser. 2004-97, Cl. AB, 3.08%, 4/16/22 | | 200,178 | | 197,318 |
| Ser. 2004-9, Cl. A, 3.36%, 8/16/22 | | 221,799 | | 220,171 |
| Ser. 2004-25, Cl. AC, 3.38%, 1/16/23 | | 184,023 | | 182,565 |
| Ser. 2004-77, Cl. A, 3.40%, 3/16/20 | | 87,417 | | 86,887 |
| Ser. 2004-67, Cl. A, 3.65%, 9/16/17 | | 64,579 | | 64,315 |
| Ser. 2006-67, Cl. A, 3.95%, 10/6/11 | | 327,289 | | 324,092 |
| Ser. 2005-50, Cl. A, 4.02%, 10/16/26 | | 91,046 | | 90,473 |
20
| | | Principal | | |
| Bonds and Notes (continued) | | Amount ($) | | Value ($) |
| |
| |
|
| U.S. Government Agencies/ | | | | |
| Mortgage-Backed (continued) | | | | |
| Government National Mortgage Association I (continued): | | | | |
| Ser. 2005-9, Cl. A, 4.03%, 5/16/22 | | 81,839 | | 81,538 |
| Ser. 2005-12, Cl. A, 4.04%, 5/16/21 | | 72,811 | | 72,498 |
| Ser. 2005-42, Cl. A, 4.05%, 7/16/20 | | 107,229 | | 106,855 |
| Ser. 2007-52, Cl. A, 4.05%, 10/16/25 | | 96,203 | | 95,701 |
| Ser. 2006-66, Cl. A, 4.09%, 1/16/30 | | 189,585 | | 188,209 |
| Ser. 2004-51, Cl. A, 4.15%, 2/16/18 | | 189,578 | | 189,070 |
| Ser. 2006-9, Cl. A, 4.20%, 8/16/26 | | 251,536 | | 250,428 |
| Ser. 2006-3, Cl. A, 4.21%, 1/16/28 | | 82,987 | | 82,574 |
| Ser. 2005-67, Cl. A, 4.22%, 6/16/21 | | 15,895 | | 15,863 |
| Ser. 2006-51, Cl. A, 4.25%, 10/16/30 | | 134,117 | | 133,384 |
| Ser. 2005-59, Cl. A, 4.39%, 5/16/23 | | 53,656 | | 53,597 |
| Federal National Mortgage Association, | | | | |
| Grantor Trust, Ser. 2001-T11, Cl. B, | | | | |
| 5.50%, 9/25/11 | | 210,000 f | | 217,335 |
| | | | | 15,040,997 |
| U.S. Government Securities—2.0% | | | | |
| U.S. Treasury Bonds | | | | |
| 5.00%, 5/15/37 | | 153,000 | | 168,563 |
| U.S. Treasury Notes: | | | | |
| 3.50%, 5/31/13 | | 30,000 g | | 31,141 |
| 4.75%, 8/15/17 | | 160,000 g | | 169,400 |
| 4.88%, 4/30/11 | | 132,000 g | | 142,745 |
| | | | | 511,849 |
| Total Bonds and Notes | | | | |
| (cost $34,675,011) | | | | 31,466,849 |
| |
| |
|
| |
| | | Face Amount | | |
| | | Covered by | | |
| Options—.0% | | Contracts ($) | | Value ($) |
| |
| |
|
| Call Options | | | | |
| 3-Month Floor USD Libor-BBA | | | | |
| Interest Rate, January 2009 @ 2.50 | | | | |
| (cost $5,440) | | 1,900,000 a | | 0 |
| |
| |
|
| |
| | | Principal | | |
| Short-Term Investments—.3% | | Amount ($) | | Value ($) |
| |
| |
|
| U.S. Treasury Bills; | | | | |
| 0.38%, 1/2/09 | | | | |
| (cost $84,944) | | 85,000 h | | 84,941 |
| | STATEMENT OF INVESTMENTS (continued) |
| Investment of Cash Collateral | | | | |
| for Securities Loaned—1.3% | | Shares | | Value ($) |
| |
| |
|
| Registered Investment Company; | | | | |
| Dreyfus Institutional Cash Advantage Plus Fund | | | | |
| (cost $323,119) | | 323,119 i | | 323,119 |
| |
| |
|
| Total Investments (cost $35,088,514) | | 126.2% | | 31,874,909 |
| Liabilities, Less Cash and Receivables | | (26.2%) | | (6,609,766) |
| Net Assets | | 100.0% | | 25,265,143 |
| FSA—Financial Security Assurance |
| GO—General Obligation |
| LIBOR-BBA—London Interbank Offered Rate British Bankers’ Association |
| MBIA—Municipal Bond Investors Assurance Insurance Corporation |
| PSF-GTD—Permanent School Fund Guaranteed |
| a Variable rate security—interest rate subject to periodic change. |
| b Securities exempt from registration under Rule 144A of the Securities Act of 1933.These securities may be resold in |
| transactions exempt from registration, normally to qualified institutional buyers. At October 31, 2008, these securities |
| amounted to $2,480,348 or 9.8% of net assets. |
| c Principal amount stated in U.S. Dollars unless otherwise noted. |
| BRL—Brazilian Real |
| d These securities are prerefunded; the date shown represents the prerefunded date. Bonds which are prerefunded are |
| collateralized by U.S. Government securities which are held in escrow and are used to pay principal and interest on |
| the municipal issue and to retire the bonds in full at the earliest refunding date. |
| e Purchased on a forward commitment basis. |
| f On September 7, 2008, the Federal Housing Finance Agency (FHFA) placed Federal National Mortgage Association |
| and Federal Home Loan Mortgage Corporation into conservatorship with FHFA as the conservator. As such, the |
| FHFA will oversee the continuing affairs of these companies. |
| g All or a portion of these securities are on loan. At October 31, 2008, the total market value of the fund’s securities |
| on loan is $311,525 and the total market value of the collateral held by the fund is $323,119. |
| h All or partially held by a broker as collateral for open financial futures positions. |
| i Investment in affiliated money market mutual fund. |
| Portfolio Summary (Unaudited)† | | | | |
| |
| | | Value (%) | | | | Value (%) |
| |
| |
| |
|
| U.S. Government & Agencies | | 61.6 | | Money Market Investments | | 1.6 |
| Corporate Bonds | | 40.8 | | Foreign/Governmental | | .4 |
| Asset/Mortgage-Backed | | 19.6 | | Options | | .0 |
| State/Government | | | | | | |
| General Obligations | | 2.2 | | | | 126.2 |
| |
| † Based on net assets. | | | | | | |
| See notes to financial statements. | | | | | | |
22
STATEMENT OF FINANCIAL FUTURES
October 31, 2008
| | | | | | | | | Unrealized |
| | | | | Market Value | | | | Appreciation |
| | | | | Covered by | | | | (Depreciation) |
| | | Contracts | | Contracts ($) | | Expiration | | at 10/31/2008 ($) |
| |
| |
| |
| |
|
| Financial Futures Long | | | | | | | | |
| Long Gilt | | 10 | | 1,791,042 | | December 2008 | | (20,965) |
| U.S. Long Bond | | 15 | | 1,696,875 | | December 2008 | | (57,515) |
| Financial Futures Short | | | | | | | | |
| U.S. Treasury 2 year Notes | | 14 | | (3,007,594) | | December 2008 | | (36,110) |
| U.S. Treasury 5 year Notes | | 10 | | (1,132,578) | | December 2008 | | (9,991) |
| U.S. Treasury 10 year Notes | | 4 | | (452,313) | | December 2008 | | 8,502 |
| | | | | | | | | (116,079) |
| |
| See notes to financial statements. | | | | | | | | |
| STATEMENT OF OPTIONS WRITTEN | | | | |
| October 31, 2008 | | | | |
| |
| |
|
| |
| |
| |
| | | Face Amount | | |
| | | Covered by | | |
| | | Contracts ($) | | Value ($) |
| |
| |
|
| Call Options: | | | | |
| 5-Year USD Libor-BBA, | | | | |
| Swaption | | 1,092,000 a | | (11,148) |
| 10-Year USD Libor-BBA, | | | | |
| Swaption | | 267,000 a | | (3,113) |
| 5-Year USD Libor-BBA, | | | | |
| Swaption | | 526,000 a | | (3,902) |
| 10-Year USD Libor-BBA, | | | | |
| Swaption | | 285,000 a | | (174) |
| Put Options: | | | | |
| 5-Year USD Libor-BBA, | | | | |
| Swaption | | 1,092,000 a | | (5,224) |
| 10-Year USD Libor-BBA, | | | | |
| Swaption | | 267,000 a | | (4,464) |
| 5-Year USD Libor-BBA, | | | | |
| Swaption | | 526,000 a | | (6,937) |
| 10-Year USD Libor-BBA, | | | | |
| Swaption | | 285,000 a | | (7,964) |
| (Premiums received $58,126) | | | | (42,926) |
| |
| LIBOR-BBA—London Interbank Offered Rate British Bankers’ Association | | | | |
| a Non-income producing security. | | | | |
| See notes to financial statements. | | | | |
24
STATEMENT OF ASSETS AND LIABILITIES
October 31, 2008
| | | | | | | Cost | | Value |
| |
| |
| |
| |
|
| Assets ($): | | | | | | | | |
| Investments in securities—See Statement of Investments (including | | | | |
| securities on loan, valued at $311,525)—Note 1(c): | | | | | | |
| Unaffiliated issuers | | | | | | 34,765,395 | | 31,551,790 |
| Affiliated issuers | | | | | | 323,119 | | 323,119 |
| Cash on Initial Margin—Note 4 | | | | | | | | 15,000 |
| Cash denominated in foreign currencies | | | | 860 | | 860 |
| Receivable for investment securities sold | | | | | | 3,715,464 |
| Dividends and interest receivable | | | | | | | | 291,939 |
| Receivable for shares of Capital Stock subscribed | | | | | | 6,364 |
| Unrealized appreciation on forward currency exchange contracts—Note 4 | | 1,348 |
| | | | | | | | | 35,905,884 |
| |
| |
| |
| |
|
| Liabilities ($): | | | | | | | | |
| Due to The Dreyfus Corporation and affiliates—Note 3(b) | | | | 21,499 |
| Cash overdraft due to Custodian | | | | | | | | 249,131 |
| Payable for open mortgage-backed dollar rolls—Note 4 | | | | 9,680,377 |
| Liability for securities on loan—Note 1(c) | | | | | | 323,119 |
| Payable for shares of Capital Stock redeemed | | | | | | 185,694 |
| Payable for investment securities purchased | | | | | | 65,019 |
| Outstanding options written, at value (premiums received | | | | |
| $58,126)—See Statement of Options Written—Note 4 | | | | 42,926 |
| Payable for futures variation margin—Note 4 | | | | | | 24,630 |
| Unrealized depreciation on forward currency exchange contracts—Note 4 | | 15,283 |
| Unrealized depreciation on swap contracts—Note 4 | | | | | | 4,312 |
| Accrued expenses | | | | | | | | 28,751 |
| | | | | | | | | 10,640,741 |
| |
| |
| |
| |
|
| Net Assets ($) | | | | | | | | 25,265,143 |
| |
| |
| |
| |
|
| Composition of Net Assets ($): | | | | | | | | |
| Paid-in capital | | | | | | | | 30,491,365 |
| Accumulated undistributed investment income—net | | | | | | 67,410 |
| Accumulated net realized gain (loss) on investments | | | | | | (1,964,815) |
| Accumulated net unrealized appreciation (depreciation) on investments, | | |
| options transactions and foreign currency transactions [including | | | | |
| ($116,079) net unrealized (depreciation) on financial futures] | | | | (3,328,817) |
| |
| |
|
| Net Assets ($) | | | | | | | | 25,265,143 |
| |
| |
| |
| |
|
| |
| |
| |
| Net Asset Value Per Share | | | | | | | | |
| | | Class A | | Class B | | Class C | | Class I |
| |
| |
| |
| |
|
| Net Assets ($) | | 11,898,170 | | 1,570,995 | | 5,811,118 | | 5,984,860 |
| Shares Outstanding | | 1,240,897 | | 163,400 | | 612,819 | | 624,227 |
| |
| |
| |
| |
|
| Net Asset Value Per Share ($) | | 9.59 | | 9.61 | | 9.48 | | 9.59 |
| |
| See notes to financial statements. | | | | | | | | |
| | | | | | | The Fund | | 25 |
STATEMENT OF OPERATIONS
Year Ended October 31, 2008 |
| Investment Income ($): | | |
| Income: | | |
| Interest | | 1,626,765 |
| Income from securities lending | | 20,090 |
| Cash dividends; | | |
| Affiliated issuers | | 15,359 |
| Total Income | | 1,662,214 |
| Expenses: | | |
| Management fee—Note 3(a) | | 194,976 |
| Distribution and service fees—Note 3(b) | | 107,730 |
| Directors’ fees—Note 3(a) | | 2,178 |
| Loan commitment fees—Note 2 | | 147 |
| Total Expenses | | 305,031 |
| Less—Directors’ fees reimbursed by | | |
| the Manager—Note 3(a) | | (2,178) |
| Net Expenses | | 302,853 |
| Investment Income—Net | | 1,359,361 |
| |
|
| Realized and Unrealized Gain (Loss) on Investments—Note 4 ($): | | |
| Net realized gain (loss) on investments and foreign currency transactions | | (716,321) |
| Net realized gain (loss) on options transactions | | 48,972 |
| Net realized gain (loss) on financial futures | | (180,826) |
| Net realized gain (loss) on swap transactions | | 30,004 |
| Net realized gain (loss) on forward currency exchange contracts | | 8,786 |
| Net Realized Gain (Loss) | | (809,385) |
| Net unrealized appreciation (depreciation) on investments, foreign | | |
| currency transactions, swap transactions and options transactions | | |
| [including ($101,554) net unrealized (depreciation) on financial futures] | | (2,904,020) |
| Net Realized and Unrealized Gain (Loss) on Investments | | (3,713,405) |
| Net (Decrease) in Net Assets Resulting from Operations | | (2,354,044) |
| |
| See notes to financial statements. | | |
26
STATEMENT OF CHANGES IN NET ASSETS
| | | Year Ended October 31, |
| | |
|
| | | 2008 | | 2007a |
| |
| |
|
| Operations ($): | | | | |
| Investment income—net | | 1,359,361 | | 1,479,387 |
| Net realized gain (loss) on investments | | (809,385) | | (100,112) |
| Net unrealized appreciation | | | | |
| (depreciation) on investments | | (2,904,020) | | (302,177) |
| Net Increase (Decrease) in Net Assets | | | | |
| Resulting from Operations | | (2,354,044) | | 1,077,098 |
| |
| |
|
| Dividends to Shareholders from ($): | | | | |
| Investment income—net: | | | | |
| Class A Shares | | (637,000) | | (589,743) |
| Class B Shares | | (103,738) | | (205,174) |
| Class C Shares | | (261,862) | | (241,513) |
| Class I Shares | | (385,043) | | (476,557) |
| Total Dividends | | (1,387,643) | | (1,512,987) |
| |
| |
|
| Capital Stock Transactions ($): | | | | |
| Net proceeds from shares sold: | | | | |
| Class A Shares | | 4,274,576 | | 9,047,667 |
| Class B Shares | | 752,929 | | 318,567 |
| Class C Shares | | 2,365,282 | | 2,846,047 |
| Class I Shares | | 231,012 | | 1,707,229 |
| Dividends reinvested: | | | | |
| Class A Shares | | 474,592 | | 416,784 |
| Class B Shares | | 70,394 | | 145,674 |
| Class C Shares | | 196,892 | | 175,122 |
| Class I Shares | | 263,639 | | 345,486 |
| Cost of shares redeemed: | | | | |
| Class A Shares | | (5,948,703) | | (9,786,537) |
| Class B Shares | | (2,796,205) | | (3,594,594) |
| Class C Shares | | (2,003,913) | | (2,790,271) |
| Class I Shares | | (3,574,570) | | (1,731,258) |
| Increase (Decrease) in Net Assets | | | | |
| from Capital Stock Transactions | | (5,694,075) | | (2,900,084) |
| Total Increase (Decrease) in Net Assets | | (9,435,762) | | (3,335,973) |
| |
| |
|
| Net Assets ($): | | | | |
| Beginning of Period | | 34,700,905 | | 38,036,878 |
| End of Period | | 25,265,143 | | 34,700,905 |
| Undistributed investment income—net | | 67,410 | | 74,115 |
STATEMENT OF CHANGES IN NET ASSETS (continued)
| | | Year Ended October 31, |
| | |
|
| | | 2008 | | 2007a |
| |
| |
|
| Capital Share Transactions: | | | | |
| Class Ab | | | | |
| Shares sold | | 397,313 | | 824,235 |
| Shares issued for dividends reinvested | | 44,806 | | 38,100 |
| Shares redeemed | | (565,792) | | (888,657) |
| Net Increase (Decrease) in Shares Outstanding | | (123,673) | | (26,322) |
| |
| |
|
| Class Bb | | | | |
| Shares sold | | 70,652 | | 28,989 |
| Shares issued for dividends reinvested | | 6,556 | | 13,260 |
| Shares redeemed | | (260,626) | | (326,610) |
| Net Increase (Decrease) in Shares Outstanding | | (183,418) | | (284,361) |
| |
| |
|
| Class C | | | | |
| Shares sold | | 219,223 | | 262,513 |
| Shares issued for dividends reinvested | | 18,816 | | 16,197 |
| Shares redeemed | | (193,917) | | (258,444) |
| Net Increase (Decrease) in Shares Outstanding | | 44,122 | | 20,266 |
| |
| |
|
| Class I | | | | |
| Shares sold | | 21,785 | | 155,433 |
| Shares issued for dividends reinvested | | 24,731 | | 31,597 |
| Shares redeemed | | (337,413) | | (157,404) |
| Net Increase (Decrease) in Shares Outstanding | | (290,897) | | 29,626 |
| a | | Effective June 1, 2007, Class R shares were redesignated as Class I shares. |
| b | | During the period ended October 31, 2008, 143,720 Class B shares representing $1,539,554, were automatically |
| | | converted to 144,167 Class A shares and during the period ended October 31, 2007, 155,114 Class B shares |
| | | representing $1,707,921 were automatically converted to 155,620 Class A shares. |
| See notes to financial statements. |
28
FINANCIAL HIGHLIGHTS
The following tables describe the performance for each share class for the fiscal periods indicated.All information (except portfolio turnover rate) reflects financial results for a single fund share.Total return shows how much your investment in the fund would have increased (or decreased) during each period, assuming you had reinvested all dividends and distributions.These figures have been derived from the fund’s financial statements.
| | | | | Year Ended October 31, | | |
| | |
| |
| |
|
| Class A Shares | | 2008 | | 2007 | | 2006 | | 2005 | | 2004 |
| |
| |
| |
| |
| |
|
| Per Share Data ($): | | | | | | | | | | |
| Net asset value, beginning of period | | 10.88 | | 11.02 | | 11.14 | | 11.57 | | 11.44 |
| Investment Operations: | | | | | | | | | | |
| Investment income—neta | | .46 | | .49 | | .45 | | .38 | | .38 |
| Net realized and unrealized | | | | | | | | | | |
| gain (loss) on investments | | (1.29) | | (.13) | | .03 | | (.28) | | .16 |
| Total from Investment Operations | | (.83) | | .36 | | .48 | | .10 | | .54 |
| Distributions: | | | | | | | | | | |
| Dividends from investment income—net | | (.46) | | (.50) | | (.46) | | (.40) | | (.40) |
| Dividends from net realized | | | | | | | | | | |
| gain on investments | | — | | — | | (.14) | | (.13) | | (.01) |
| Total Distributions | | (.46) | | (.50) | | (.60) | | (.53) | | (.41) |
| Net asset value, end of period | | 9.59 | | 10.88 | | 11.02 | | 11.14 | | 11.57 |
| |
| |
| |
| |
| |
|
| Total Return (%)b | | (7.91) | | 3.31 | | 4.52 | | .88 | | 4.76 |
| |
| |
| |
| |
| |
|
| Ratios/Supplemental Data (%): | | | | | | | | | | |
| Ratio of total expenses | | | | | | | | | | |
| to average net assets | | .86 | | .86 | | .85 | | .85 | | .85 |
| Ratio of net expenses | | | | | | | | | | |
| to average net assets | | .85 | | .85 | | .85 | | .85 | | .85 |
| Ratio of net investment income | | | | | | | | | | |
| to average net assets | | 4.27 | | 4.44 | | 4.13 | | 3.34 | | 3.33 |
| Portfolio Turnover Ratec | | 343.74 | | 436.92 | | 458.50 | | 388.58 | | 202.27 |
| |
| |
| |
| |
| |
|
| Net Assets, end of period ($ x 1,000) | | 11,898 | | 14,843 | | 15,327 | | 17,278 | | 19,293 |
| a | | Based on average shares outstanding at each month end. |
| b | | Exclusive of sales charge. |
| c | | The portfolio turnover rates excluding mortgage dollar roll transactions for the periods ended October 31, 2008, |
| | | October 31, 2007, October 31, 2006, October 31, 2005 and October 31, 2004 were 121.35%, 344.58%, |
| | | 239.66%, 188.33% and 144.28%, respectively. |
| See notes to financial statements. |
| | FINANCIAL HIGHLIGHTS (continued) |
| | | | | Year Ended October 31, | | |
| | |
| |
| |
|
| Class B Shares | | 2008 | | 2007 | | 2006 | | 2005 | | 2004 |
| |
| |
| |
| |
| |
|
| Per Share Data ($): | | | | | | | | | | |
| Net asset value, beginning of period | | 10.91 | | 11.05 | | 11.17 | | 11.61 | | 11.47 |
| Investment Operations: | | | | | | | | | | |
| Investment income—neta | | .39 | | .42 | | .39 | | .32 | | .32 |
| Net realized and unrealized | | | | | | | | | | |
| gain (loss) on investments | | (1.28) | | (.12) | | .04 | | (.29) | | .17 |
| Total from Investment Operations | | (.89) | | .30 | | .43 | | .03 | | .49 |
| Distributions: | | | | | | | | | | |
| Dividends from investment income—net | | (.41) | | (.44) | | (.41) | | (.34) | | (.34) |
| Dividends from net realized | | | | | | | | | | |
| gain on investments | | — | | — | | (.14) | | (.13) | | (.01) |
| Total Distributions | | (.41) | | (.44) | | (.55) | | (.47) | | (.35) |
| Net asset value, end of period | | 9.61 | | 10.91 | | 11.05 | | 11.17 | | 11.61 |
| |
| |
| |
| |
| |
|
| Total Return (%)b | | (8.34) | | 2.80 | | 4.00 | | .29 | | 4.32 |
| |
| |
| |
| |
| |
|
| Ratios/Supplemental Data (%): | | | | | | | | | | |
| Ratio of total expenses | | | | | | | | | | |
| to average net assets | | 1.36 | | 1.36 | | 1.35 | | 1.35 | | 1.35 |
| Ratio of net expenses | | | | | | | | | | |
| to average net assets | | 1.35 | | 1.35 | | 1.35 | | 1.35 | | 1.35 |
| Ratio of net investment income | | | | | | | | | | |
| to average net assets | | 3.76 | | 3.91 | | 3.62 | | 2.84 | | 2.83 |
| Portfolio Turnover Ratec | | 343.74 | | 436.92 | | 458.50 | | 388.58 | | 202.27 |
| |
| |
| |
| |
| |
|
| Net Assets, end of period ($ x 1,000) | | 1,571 | | 3,785 | | 6,977 | | 11,855 | | 17,225 |
| a | | Based on average shares outstanding at each month end. |
| b | | Exclusive of sales charge. |
| c | | The portfolio turnover rates excluding mortgage dollar roll transactions for the periods ended October 31, 2008, |
| | | October 31, 2007, October 31, 2006, October 31, 2005 and October 31, 2004 were 121.35%, 344.58%, |
| | | 239.66%, 188.33% and 144.28%, respectively. |
| See notes to financial statements. |
30
| | | | | Year Ended October 31, | | |
| | |
| |
| |
|
| Class C Shares | | 2008 | | 2007 | | 2006 | | 2005 | | 2004 |
| |
| |
| |
| |
| |
|
| Per Share Data ($): | | | | | | | | | | |
| Net asset value, beginning of period | | 10.76 | | 10.90 | | 11.01 | | 11.44 | | 11.31 |
| Investment Operations: | | | | | | | | | | |
| Investment income—neta | | .40 | | .43 | | .39 | | .32 | | .32 |
| Net realized and unrealized | | | | | | | | | | |
| gain (loss) on investments | | (1.27) | | (.13) | | .05 | | (.28) | | .15 |
| Total from Investment Operations | | (.87) | | .30 | | .44 | | .04 | | .47 |
| Distributions: | | | | | | | | | | |
| Dividends from investment income—net | | (.41) | | (.44) | | (.41) | | (.34) | | (.33) |
| Dividends from net realized | | | | | | | | | | |
| gain on investments | | — | | — | | (.14) | | (.13) | | (.01) |
| Total Distributions | | (.41) | | (.44) | | (.55) | | (.47) | | (.34) |
| Net asset value, end of period | | 9.48 | | 10.76 | | 10.90 | | 11.01 | | 11.44 |
| |
| |
| |
| |
| |
|
| Total Return (%)b | | (8.32) | | 2.78 | | 4.10 | | .34 | | 4.25 |
| |
| |
| |
| |
| |
|
| Ratios/Supplemental Data (%): | | | | | | | | | | |
| Ratio of total expenses | | | | | | | | | | |
| to average net assets | | 1.36 | | 1.36 | | 1.35 | | 1.35 | | 1.35 |
| Ratio of net expenses | | | | | | | | | | |
| to average net assets | | 1.35 | | 1.35 | | 1.35 | | 1.35 | | 1.35 |
| Ratio of net investment income | | | | | | | | | | |
| to average net assets | | 3.76 | | 3.96 | | 3.63 | | 2.83 | | 2.83 |
| Portfolio Turnover Ratec | | 343.74 | | 436.92 | | 458.50 | | 388.58 | | 202.27 |
| |
| |
| |
| |
| |
|
| Net Assets, end of period ($ x 1,000) | | 5,811 | | 6,119 | | 5,977 | | 7,994 | | 9,838 |
| a | | Based on average shares outstanding at each month end. |
| b | | Exclusive of sales charge. |
| c | | The portfolio turnover rates excluding mortgage dollar roll transactions for the periods ended October 31, 2008, |
| | | October 31, 2007, October 31, 2006, October 31, 2005 and October 31, 2004 were 121.35%, 344.58%, |
| | | 239.66%, 188.33% and 144.28%, respectively. |
| See notes to financial statements. |
| | FINANCIAL HIGHLIGHTS (continued) |
| | | | | Year Ended October 31, | | |
| | |
| |
| |
|
| Class I Shares | | 2008 | | 2007a | | 2006 | | 2005 | | 2004 |
| |
| |
| |
| |
| |
|
| Per Share Data ($): | | | | | | | | | | |
| Net asset value, beginning of period | | 10.88 | | 11.02 | | 11.13 | | 11.57 | | 11.44 |
| Investment Operations: | | | | | | | | | | |
| Investment income—netb | | .49 | | .52 | | .48 | | .41 | | .41 |
| Net realized and unrealized | | | | | | | | | | |
| gain (loss) on investments | | (1.29) | | (.14) | | .04 | | (.29) | | .15 |
| Total from Investment Operations | | (.80) | | .38 | | .52 | | .12 | | .56 |
| Distributions: | | | | | | | | | | |
| Dividends from investment income—net | | (.49) | | (.52) | | (.49) | | (.43) | | (.42) |
| Dividends from net realized | | | | | | | | | | |
| gain on investments | | — | | — | | (.14) | | (.13) | | (.01) |
| Total Distributions | | (.49) | | (.52) | | (.63) | | (.56) | | (.43) |
| Net asset value, end of period | | 9.59 | | 10.88 | | 11.02 | | 11.13 | | 11.57 |
| |
| |
| |
| |
| |
|
| Total Return (%) | | (7.68) | | 3.56 | | 4.87 | | 1.03 | | 5.02 |
| |
| |
| |
| |
| |
|
| Ratios/Supplemental Data (%): | | | | | | | | | | |
| Ratio of total expenses | | | | | | | | | | |
| to average net assets | | .61 | | .61 | | .60 | | .60 | | .60 |
| Ratio of net expenses | | | | | | | | | | |
| to average net assets | | .60 | | .60 | | .60 | | .60 | | .60 |
| Ratio of net investment income | | | | | | | | | | |
| to average net assets | | 4.51 | | 4.69 | | 4.37 | | 3.57 | | 3.57 |
| Portfolio Turnover Ratec | | 343.74 | | 436.92 | | 458.50 | | 388.58 | | 202.27 |
| |
| |
| |
| |
| |
|
| Net Assets, end of period ($ x 1,000) | | 5,985 | | 9,954 | | 9,756 | | 11,794 | | 13,203 |
| a | | Effective June 1, 2007, Class R were redesignated as Class I shares. |
| b | | Based on average shares outstanding at each month end. |
| c | | The portfolio turnover rates excluding mortgage dollar roll transactions for the periods ended October 31, 2008, |
| | | October 31, 2007, October 31, 2006, October 31, 2005 and October 31, 2004 were 121.35%, 344.58%, |
| | | 239.66%, 188.33% and 144.28%, respectively. |
| See notes to financial statements. |
32
NOTES TO FINANCIAL STATEMENTS
NOTE 1—Significant Accounting Policies:
Dreyfus Limited Term Income Fund (the “fund”) is a separate diversified series of The Dreyfus/Laurel Funds, Inc. (the “Company”) which is registered under the Investment Company Act of 1940, as amended (the “Act”), as an open-end management investment company and operates as a series company currently offering fourteen series,including the fund. The fund’s investment objective is to obtain as high a level of current income as is consistent with safety of principal and maintenance of liq-uidity.Although the fund may invest in obligations with different remaining maturities, the fund’s average maturity normally will not exceed ten years.The Dreyfus Corporation (the“Manager”or“Dreyfus”),a wholly-owned subsidiary of The Bank of New York Mellon Corporation (“BNY Mellon”), serves as the fund’s investment adviser.
At a meeting of the fund’s Board of Directors held on July 24, 2008, the Board approved, effective December 1, 2008, a proposal to change the name of the fund from “Dreyfus Premier Limited Term Income Fund” to “Dreyfus Limited Term Income Fund”.
Effective July 1, 2008, BNY Mellon has reorganized and consolidated a number of its banking and trust company subsidiaries. As a result of the reorganization, any services previously provided to the fund by Mellon Bank, N.A. or Mellon Trust of New England, N.A. are now provided by The Bank of New York, which has changed its name to The Bank of New York Mellon.
MBSC Securities Corporation (the “Distributor”), a wholly-owned subsidiary of the Manager, is the distributor of the fund’s shares. The fund is authorized to issue 250 million shares of $.001 par value Capital Stock.The fund currently offers four classes of shares: Class A (50 million shares authorized), Class B (50 million shares authorized), Class C (50 million shares authorized) and Class I (100 million shares authorized). Class A, Class B and Class C shares are sold primarily to retail investors through financial intermediaries and bear a distribution fee and/or service fee. Class A shares are sold with a front-end sales charge, while Class B and Class C shares are subject to a contingent
| NOTES TO FINANCIAL STATEMENTS (continued) |
deferred sales charge (“CDSC”). Class B shares automatically convert to Class A shares after six years.The fund does not offer Class B shares, except in connection with dividend reinvestment and permitted exchanges of Class B shares. Class I shares are sold primarily to bank trust departments and other financial service providers (including The Bank of NewYork Mellon, a subsidiary of BNY Mellon and an affiliate of Dreyfus), acting on behalf of customers having a qualified trust or investment account or relationship at such institution, and bear no distribution or service fees. Class I shares are offered without a front-end sales charge or CDSC. Each class of shares has identical rights and privileges, except with respect to distribution and service fees and voting rights on matters affecting a single class. Income, expenses (other than expenses attributable to a specific class), and realized and unrealized gains or losses on investments are allocated to each class of shares based on its relative net assets.
The fund’s financial statements are prepared in accordance with U.S. generally accepted accounting principles, which may require the use of management estimates and assumptions. Actual results could differ from those estimates.
(a) Portfolio valuation: Investments in securities excluding short-term investments (other than U.S. Treasury Bills), financial futures, options, swaps and forward currency exchange contracts, are valued each business day by an independent pricing service (the “Service”) approved by the Board of Directors. Investments for which quoted bid prices are readily available and are representative of the bid side of the market in the judgment of the Service are valued at the mean between the quoted bid prices (as obtained by the Service from dealers in such securities) and asked prices (as calculated by the Service based upon its evaluation of the market for such securities). Other investments (which constitute a majority of the portfolio securities) are valued as determined by the Service, based on methods which include consideration of: yields or prices of securities of comparable quality, coupon, maturity and type; indications as to values from dealers; and general market conditions. Restricted securities, as well as securities or other
34
assets for which recent market quotations are not readily available, that are not valued by a pricing service approved by the Board of Directors, or are determined by the fund not to reflect accurately fair value, are valued at fair value as determined in good faith under the direction of the Board of Directors.The factors that may be considered when fair valuing a security include fundamental analytical data, the nature and duration of restrictions on disposition, an evaluation of the forces that influence the market in which the securities are purchased and sold and public trading in similar securities of the issuer or comparable issuers. Short-term investments, excluding U.S.Treasury Bills, are carried at amortized cost, which approximates value. Registered investment companies that are not traded on an exchange are valued at their net asset value. Financial futures and options, which are traded on an exchange, are valued at the last sales price on the securities exchange on which such securities are primarily traded or at the last sales price on the national securities market on each business day. Options traded over-the-counter are priced at the mean between the bid and asked price. Investments in swap transactions are valued each business day by an independent pricing service approved by the Board of Directors. Swaps are valued by the service by using a swap pricing model which incorporates among other factors, default probabilities, recovery rates, credit curves of the underlying issuer and swap spreads on interest rates. Investments denominated in foreign currencies are translated to U.S. dollars at the prevailing rates of exchange. Forward currency exchange contracts are valued at the forward rate.
The Financial Accounting Standards Board (“FASB”) released Statement of Financial Accounting Standards No. 157 “Fair Value Measurements” (“FAS 157”). FAS 157 establishes an authoritative definition of fair value, sets out a framework for measuring fair value, and requires additional disclosures about fair-value measurements. The application of FAS 157 is required for fiscal years beginning after November 15, 2007 and interim periods within those fiscal years. Management does not believe that the application of this standard will have a material impact on the financial statements of the fund.
| NOTES TO FINANCIAL STATEMENTS (continued) |
(b) Foreign currency transactions: The fund does not isolate that portion of the results of operations resulting from changes in foreign exchange rates on investments from the fluctuations arising from changes in the market prices of securities held. Such fluctuations are included with the net realized and unrealized gain or loss on investments.
Net realized foreign exchange gains or losses arise from sales and maturities of short-term securities, sales of foreign currencies, currency gains or losses realized on securities transactions and the difference between the amounts of dividends, interest and foreign withholding taxes recorded on the fund’s books and the U.S. dollar equivalent of the amounts actually received or paid. Net unrealized foreign exchange gains and losses arise from changes in the value of assets and liabilities other than investments in securities, resulting from changes in exchange rates. Such gains and losses are included with net realized and unrealized gain or loss on investments.
(c) Securities transactions and investment income: Securities transactions are recorded on a trade date basis. Realized gains and losses from securities transactions are recorded on the identified cost basis. Interest income, including, where applicable, accretion of discount and amortization of premium on investments, is recognized on the accrual basis.
Pursuant to a securities lending agreement with The Bank of New York Mellon, the fund may lend securities to qualified institutions. It is the fund’s policy that, at origination, all loans are secured by collateral of at least 102% of the value of U.S. securities loaned and 105% of the value of foreign securities loaned. Collateral equivalent to at least 100% of the market value of securities on loan is maintained at all times. Collateral is either in the form of cash, which can be invested in certain money market mutual funds managed by the Manager, U.S. Government and Agency securities or letters of credit. The fund is entitled to receive all income on securities loaned, in addition to income earned as a result of the lending transaction. Although each security loaned is fully collateralized, the fund bears the risk of delay in recovery of, or loss of rights in, the securities loaned should a borrower fail to return the securities in a timely manner. During the
36
period ended October 31, 2008, The Bank of New York Mellon earned $10,818 from lending fund portfolio securities, pursuant to the securities lending agreement.
(d) Affiliated issuers: Investments in other investment companies advised by the Manager are defined as “affiliated” in the Act.
(e) Concentration of Risk: The fund invests primarily in debt securities. Failure of an issuer of the debt securities to make timely interest or principal payments, or a decline or the perception of a decline in the credit quality of a debt security, can cause the debt security’s price to fall, potentially lowering the fund’s share price. In addition, the value of debt securities may decline due to general market conditions that are not specifically related to a particular company, such as real or perceived adverse economic conditions, changes in outlook for corporate earnings, changes in interest or currency rates or adverse investor sentiment. They may also decline because of factors that affect a particular industry.
(f) Dividends to shareholders: It is the policy of the fund to declare dividends daily from investment income-net; such dividends are paid monthly. Dividends from net realized capital gains, if any, are normally declared and paid annually, but the fund may make distributions on a more frequent basis to comply with the distribution requirements of the Internal Revenue Code of 1986, as amended (the “Code”).To the extent that net realized capital gains can be offset by capital loss carryovers, it is the policy of the fund not to distribute such gains. Income and capital gain distributions are determined in accordance with income tax regulations, which may differ from U.S. generally accepted accounting principles.
(g) Federal income taxes: It is the policy of the fund to continue to qualify as a regulated investment company, if such qualification is in the best interests of its shareholders, by complying with the applicable provisions of the Code, and to make distributions of taxable income sufficient to relieve it from substantially all federal income and excise taxes.
| NOTES TO FINANCIAL STATEMENTS (continued) |
The fund adopted FASB Interpretation No. 48 “Accounting for Uncertainty in Income Taxes” (“FIN 48”). FIN 48 provides guidance for how uncertain tax positions should be recognized, measured, presented and disclosed in the financial statements. FIN 48 requires the evaluation of tax positions taken or expected to be taken in the course of preparing the fund’s tax returns to determine whether the tax positions are “more-likely-than-not” of being sustained by the applicable tax authority. Liability for tax positions not deemed to meet the more-likely-than-not threshold would be recorded as a tax expense in the current year.The adoption of FIN 48 had no impact on the operations of the fund for the period ended October 31, 2008.
As of and during the period ended October 31, 2008, the fund did not have any liabilities for any unrecognized tax positions. The fund recognizes interest and penalties, if any, related to unrecognized tax positions as income tax expense in the Statement of Operations. During the period, the fund did not incur any interest or penalties.
Each of the tax years in the four-year period ended October 31, 2008 remains subject to examination by the Internal Revenue Service and state taxing authorities.
At October 31, 2008, the components of accumulated earnings on a tax basis were as follows: undistributed ordinary income $52,127, accumulated capital losses $2,026,108 and unrealized depreciation $3,252,241.
The accumulated capital loss carryover is available for federal income tax purposes to be applied against future net securities profits, if any, realized subsequent to October 31, 2008. If not applied, the $980,113 of the carryover expires in fiscal 2014, $155,048 expires in fiscal 2015 and $890,947 expires in fiscal 2016.
The tax character of distributions paid to shareholders during the fiscal periods ended October 31, 2008 and October 31, 2007 was as follows: ordinary income $1,387,643 and $1,512,987, respectively.
During the period ended October 31, 2008, as a result of permanent book to tax differences, primarily due to the tax treatment for pay-downs gains and losses on mortgage-backed securities, foreign currency
38
transactions, consent fees and treatment of swap periodic payments, the fund increased accumulated undistributed investment income-net by $21,577, decreased accumulated net realized gain (loss) on investments by $21,568 and decreased paid-in capital by $9. Net assets and net asset value per share were not affected by this reclassification.
NOTE 2—Bank Lines of Credit:
Prior to October 15, 2008, the fund participated with other Dreyfus-managed funds in a $350 million redemption credit facility. Effective October 15, 2008, the fund participates with other Dreyfus-managed funds in a $145 million redemption credit facility (the “Facility”) to be utilized for temporary or emergency purposes, including the financing of redemptions. In connection therewith, the fund has agreed to pay commitment fees on its pro rata portion of the Facility. Interest is charged to the fund based on prevailing market rates in effect at the time of borrowing. During the period ended October 31, 2008, the fund did not borrow under either Facility.
NOTE 3—Investment Management Fee and Other Transactions With Affiliates:
(a) Pursuant to an Investment Management Agreement with the Manager, the Manager provides or arranges for one or more third parties and/or affiliates to provide investment advisory, administrative, custody, fund accounting and transfer agency services to the fund.The Manager also directs the investments of the fund in accordance with its investment objective, policies and limitations. For these services, the fund is contractually obligated to pay the Manager a fee, calculated daily and paid monthly, at the annual rate of .60% of the value of the fund’s average daily net assets. Out of its fee, the Manager pays all of the expenses of the fund except brokerage fees, taxes, interest, commitment fees, Rule 12b-1 distribution fees, service fees and expenses, fees and expenses of non-interested Directors (including counsel fees) and extraordinary expenses. In addition, the Manager is required to reduce its fee in an amount equal to the fund’s allocable portion of fees and
| NOTES TO FINANCIAL STATEMENTS (continued) |
expenses of the non-interested Directors (including counsel fees). Each Director receives $45,000 per year, plus $6,000 for each joint Board meeting of the Company, The Dreyfus/Laurel Tax-Free Municipal Funds and The Dreyfus/Laurel Funds Trust (collectively, the “Dreyfus/Laurel Funds”) attended, $2,000 for separate in-person committee meetings attended which are not held in conjunction with a regularly scheduled Board meeting and $1,500 for Board meetings and separate committee meetings attended that are conducted by telephone and is reimbursed for travel and out-of-pocket expenses.With respect to Board meetings, the Chairman of the Board receives an additional 25% of such compensation (with the exception of reimbursable amounts). With respect to compensation committee meetings, the Chair of the compensation committee receives $900 per meeting and, prior to April 12, 2008, with respect to audit committee meetings, the Chair of the audit committee received $1,350 per meeting. In the event that there is an in-person joint committee meeting or a joint telephone meeting of the Dreyfus/Laurel Funds and Dreyfus HighYield Strategies Fund, the $2,000 or $1,500 fee, as applicable, will be allocated between the Dreyfus/Laurel Funds and Dreyfus High Yield Strategies Fund. These fees and expenses are charged and allocated to each series based on net assets.Amounts required to be paid by the Company directly to the non-interested Directors, that would be applied to offset a portion of the management fee payable to the Manager, are in fact paid directly by the Manager to the non-interested Directors.
During the period ended October 31, 2008, the Distributor retained $156 from commissions earned on sales of the fund’s Class A shares and $5,400 and $1,420 from CDSCs on redemptions of the fund’s Class B and Class C shares, respectively.
(b) Under separate Distribution Plans (the “Plans”) adopted pursuant to Rule 12b-1 under the Act, Class A shares may pay annually up to .25% of the value of its average daily net assets to compensate the Distributor for shareholder servicing activities and expenses primarily
40
intended to result in the sale of Class A shares. Class B and Class C shares pay the Distributor for distributing their shares at an aggregate annual rate of .50% of the value of the average daily net assets of Class B and Class C shares. Class B and Class C shares are also subject to a service plan adopted pursuant to Rule 12b-1 (the “Service Plan”), under which Class B and Class C shares pay the Distributor for providing certain services to the holders of their shares a fee at the annual rate of .25% of the value of the average daily net assets of Class B and Class C shares. During the period ended October 31, 2008, Class A, Class B and Class C shares were charged $36,555, $13,479 and $33,971, respectively, pursuant to their respective Plans. During the period ended October 31, 2008, Class B and Class C shares were charged $6,739 and $16,986, respectively, pursuant to the Service Plan.
Under its terms, the Plans and Service Plan shall remain in effect from year to year, provided such continuance is approved annually by a vote of a majority of those directors who are not “interested persons” of the Company and who have no direct or indirect financial interest in the operation of or in any agreement related to the Plans or Service Plan.
The components of “Due to The Dreyfus Corporation and affiliates” in the Statement of Assets and Liabilities consist of: management fees $13,728, Rule 12b-1 distribution plan fees $6,098 and service plan fees $1,673.
NOTE 4—Securities Transactions:
The aggregate amount of purchases and sales (including paydowns) of investment securities, excluding short-term securities, financial futures, options transactions, forward currency exchange contracts and swap transactions, during the period ended October 31, 2008, amounted to $139,590,315 and $151,253,168, respectively, of which $90,308,948 in purchases and $90,483,962 in sales were from mortgage dollar roll transactions.
| NOTES TO FINANCIAL STATEMENTS (continued) |
A mortgage dollar roll transaction involves a sale by the fund of mortgage related securities that it holds with an agreement by the fund to repurchase similar securities at an agreed upon price and date. The securities purchased will bear the same interest rate as those sold, but generally will be collateralized by pools of mortgages with different prepayment histories than those securities sold.
The fund may invest in financial futures contracts in order to gain exposure to or protect against changes in the market. The fund is exposed to market risk as a result of changes in the value of the underlying financial instruments. Investments in financial futures require the fund to “mark to market” on a daily basis, which reflects the change in the market value of the contract at the close of each day’s trading. Accordingly, variation margin payments are received or made to reflect daily unrealized gains or losses.When the contracts are closed, the fund recognizes a realized gain or loss.These investments require initial margin deposits with a broker, which consist of cash or cash equivalents. The amount of these deposits is determined by the exchange or Board of Trade on which the contract is traded and is subject to change. Contracts open at October 31, 2008, are set forth in the Statement of Financial Futures.
The fund may purchase and write (sell) put and call options in order to gain exposure to or to protect against changes in the market.
As a writer of call options, the fund receives a premium at the outset and then bears the market risk of unfavorable changes in the price of the financial instrument underlying the option. Generally, the fund would incur a gain, to the extent of the premium, if the price of the underlying financial instrument decreases between the date the option is written and the date on which the option is terminated. Generally, the fund would realize a loss, if the price of the financial instrument increases between those dates.
As a writer of put options, the fund receives a premium at the outset and then bears the market risk of unfavorable changes in the price of the financial instrument underlying the option. Generally, the fund
42
would incur a gain, to the extent of the premium, if the price of the underlying financial instrument increases between the date the option is written and the date on which the option is terminated. Generally, the fund would realize a loss, if the price of the financial instrument decreases between those dates.
The following summarizes the fund’s call/put options written for the period ended October 31, 2008:
| | | Face Amount | | | | Options Terminated |
| | | | | | |
|
| | | Covered by | | Premiums | | | | Net Realized |
| Options Written: | | Contracts ($) | | Received ($) | | Cost ($) | | Gain (Loss) ($) |
| |
| |
| |
| |
|
| Contracts outstanding | | | | | | | | |
| October 31, 2007 | | 1,500,000 | | 1,841 | | | | |
| Contracts written | | 29,202,000 | | 296,990 | | | | |
| Contracts terminated: | | | | | | | | |
| Closed | | 18,059,000 | | 172,338 | | 202,127 | | (29,789) |
| Expired | | 8,303,000 | | 68,367 | | — | | 68,367 |
| Total contracts | | | | | | | | |
| terminated | | 26,362,000 | | 240,705 | | 202,127 | | 38,578 |
| Contracts outstanding | | | | | | | | |
| October 31, 2008 | | 4,340,000 | | 58,126 | | | | |
The fund enters into forward currency exchange contracts in order to hedge its exposure to changes in foreign currency exchange rates on its foreign portfolio holdings and to settle foreign currency transactions. When executing forward currency exchange contracts, the fund is obligated to buy or sell a foreign currency at a specified rate on a certain date in the future.With respect to sales of forward currency exchange contracts, the fund would incur a loss if the value of the contract increases between the date the forward contract is opened and the date the forward contract is closed.The fund realizes a gain if the value of the contract decreases between those dates.With respect to purchases of forward currency exchange contracts, the fund would incur a loss if the value of the contract decreases between the date the forward contract is opened and the date the forward contract is closed.The fund realizes a gain if the value of the contract increases between those dates. The fund is also exposed to credit risk associated with counterparty nonperformance on these forward currency
| NOTES TO FINANCIAL STATEMENTS (continued) |
exchange contracts, which is typically limited to the unrealized gain on each open contract.The following summarizes open forward currency exchange contracts at October 31, 2008:
| | | Foreign | | | | | | Unrealized |
| Forward Currency | | Currency | | | | | | Appreciation |
| Exchange Contracts | | Amounts | | Cost ($) | | Value ($) (Depreciation) ($) |
| |
| |
| |
|
| Purchases: | | | | | | | | |
| Brazilian Real, | | | | | | | | |
| Expiring 12/17/2008 | | 60,000 | | 25,918 | | 27,266 | | 1,348 |
| Sales: | | | | Proceeds ($) | | | | |
| Brazilian Real, | | | | | | | | |
| Expiring 11/14/2008 | | 290,000 | | 117,767 | | 133,050 | | (15,283) |
| Total | | | | | | | | (13,935) |
The fund may enter into swap agreements to exchange the interest rate on, or return generated by, one nominal instrument for the return generated by another nominal instrument.
The fund accrues for the interim payments on swap contracts on a daily basis, with the net amount recorded within unrealized appreciation (depreciation) of swap contracts in the Statement of Assets and Liabilities. Once the interim payments are settled in cash, the net amount is recorded as realized gain (loss) on swaps, in addition to realized gain (loss) recorded upon the termination of swaps contracts in the Statement of Operations. Upfront payments made and/or received by the fund, are recorded as an asset and /or liability on the Statement of Assets and Liabilities and are recorded as a realized gain or loss ratably over the contract’s term/event with the exception of forward starting interest rate swaps which are recorded as realized gains or losses on termination date. Fluctuations in the value of swap contracts are recorded as a component of net change in unrealized appreciation (depreciation) on investments.
Credit default swaps involve commitments to pay a fixed interest rate in exchange for payment if a credit event affecting a third party (the referenced company) occurs. Credit events may include a failure to pay interest or principal, bankruptcy, or restructuring. For those credit default swaps in which the fund is receiving a fixed rate, the fund is
44
providing credit protection on the underlying instrument.The maximum payouts for these contracts are limited to the notional amount of each swap. The following summarizes open credit default swaps entered into by the fund at October 31, 2008:
| Notional | | Reference | | | | (Pay)/Receive | | Unrealized |
| Amount ($) | | Entity | | Counterparty | | Fixed Rate (%) Expiration (Depreciation) ($) |
| |
| |
| |
|
| |
| 215,000 | | General Electric | | | | | | |
| | | Capital, 6%, | | | | | | |
| | | 6/15/2012 | | CITICORP | | 4.80 12/20/2013 | | (4,312) |
The fund may enter into interest rate swaps, which involve the exchange of commitments to pay and receive interest based on a notional principal amount.At October 31, 2008, the fund had no open interest rate swaps.
Risks may arise upon entering into these agreements from the potential inability of the counterparties to meet the terms of the agreement and are generally limited to the amount of net payments to be received, if any, at the date of default.
At October 31, 2008, the cost of investments for federal income tax purposes was $35,120,298; accordingly, accumulated net unrealized depreciation on investments was $3,245,389, consisting of $47,810 gross unrealized appreciation and $3,293,199 gross unrealized depreciation.
In March 2008, the FASB released Statement of Financial Accounting Standards No. 161 “Disclosures about Derivative Instruments and Hedging Activities” (“FAS 161”). FAS 161 requires qualitative disclosures about objectives and strategies for using derivatives, quantitative disclosures about fair value amounts of gains and losses on derivative instruments and disclosures about credit-risk-related contingent features in derivative agreements.The application of FAS 161 is required for fiscal years and interim periods beginning after November 15, 2008. At this time, management is evaluating the implications of FAS 161 and its impact on the financial statements and the accompanying notes has not yet been determined.
| NOTES TO FINANCIAL STATEMENTS (continued) |
During September 2008, FASB Staff Position FAS 133-1 and FASB Interpretation 45-4,“Disclosures about Credit Derivatives and Certain Guarantees”: An Amendment of FASB Statement No. 133 and FASB Interpretation No. 45; and Clarification of the Effective Date of FASB Statement No. 161 (“Amendment”) was issued and is effective for annual and interim reporting periods ending after November 15, 2008. The Amendment requires enhanced disclosures regarding a fund’s credit derivatives holdings and hybrid financial instruments containing embedded credit derivatives. Management is currently evaluating the impact the adoption of the Amendment will have on the fund’s financial statement disclosures.
NOTE 5—Plan of Reorganization:
On July 24, 2008, the Board of Directors of the Company approved and on October 15, 2008, the shareholders of the fund approved an Agreement and Plan of Reorganization between the Company, on behalf of the fund, and Dreyfus Investment Funds, Inc. on behalf of Dreyfus Intermediate Term Income Fund (the “Acquiring Fund”).The merger provides for the transfer of the fund’s assets to the Acquiring Fund in a tax-free exchange for shares of the Acquiring Fund and the assumption by the Acquiring Fund to the fund’s shareholders and the subsequent termination of the fund (the “Reorganization”). In anticipation of the Reorganization, effective August 29, 2008, the fund was closed to any investments for new accounts.The Reorganization took place on December 17, 2008.
46
REPORT OF INDEPENDENT REGISTERED PUBLIC ACCOUNTING FIRM
The Board of Directors and Shareholders The Dreyfus/Laurel Funds, Inc.:
We have audited the accompanying statement of assets and liabilities, including the statements of investments,financial futures and options written of Dreyfus Limited Term Income Fund (formerly Dreyfus Premier Limited Term Income Fund) a series of The Dreyfus/Laurel Funds, Inc. (the “Fund”), as of October 31, 2008, and the related statement of operations for the year then ended, the statement of changes in net assets for each of the years in the two-year period then ended, and the financial highlights for each of the years in the five-year period then ended.These financial statements and financial highlights are the responsibility of the Fund’s management. Our responsibility is to express an opinion on these financial statements and financial highlights based on our audits.
We conducted our audits in accordance with the standards of the Public Company Accounting Oversight Board (United States).Those standards require that we plan and perform the audit to obtain reasonable assurance about whether the financial statements and financial highlights are free of material misstatement. An audit includes examining, on a test basis, evidence supporting the amounts and disclosures in the financial statements. Our procedures included confirmation of securities owned as of October 31, 2008, by correspondence with the custodian and brokers or by other appropriate auditing procedures where replies from brokers were not received. An audit also includes assessing the accounting principles used and significant estimates made by management, as well as evaluating the overall financial statement presentation.We believe that our audits provide a reasonable basis for our opinion.
In our opinion, the financial statements and financial highlights referred to above present fairly, in all material respects, the financial position of Dreyfus Limited Term Income Fund as of October 31, 2008, and the results of its operations for the year then ended, the changes in its net assets for each of the years in the two-year period then ended, and the financial highlights for each of the years in the five-year period then ended,in conformity with U.S.generally accepted accounting principles.

| | New York, New York
December 23, 2008 |
IMPORTANT TAX INFORMATION (Unaudited)
For federal tax purposes the fund hereby designates 98.01% of ordinary income dividends paid during the fiscal year ended October 31, 2008 as qualifying “interest related dividends”.
| PROXY RESULTS (Unaudited) |
The Dreyful/Laurel Funds,Inc.,held a special meeting of shareholders on October 15, 2008.The proposal considered at the meeting, and the results, are as follows:
| | | | | Shares | | |
| | |
| |
| |
|
| | | Votes for | | Authority Withheld | | Abstain |
| | |
| |
| |
|
| To approve an Agreement and Plan of | | | | | | |
| Reorganization providing for the | | | | | | |
| transfer of all of the assets of the | | | | | | |
| fund to Dreyfus Intermediate Term | | | | | | |
| Income Fund (the “Acquiring Fund”) | | 1,798,672 | | 22,531 | | 77,489 |
48
BOARD MEMBERS INFORMATION (Unaudited)
Joseph S. DiMartino (65)
Chairman of the Board (1999)
Principal Occupation During Past 5Years:
Corporate Director and Trustee
Other Board Memberships and Affiliations: |
- The Muscular Dystrophy Association, Director
- Century Business Services, Inc., a provider of outsourcing functions for small and medium size companies, Director
- The Newark Group, a provider of a national market of paper recovery facilities, paperboard mills and paperboard converting plants, Director
- Sunair Services Corporation, a provider of certain outdoor-related services to homes and businesses, Director
No. of Portfolios for which Board Member Serves: 167
James M. Fitzgibbons (74)
Board Member (1994)
Principal Occupation During Past 5Years:
Corporate Director and Trustee |
Other Board Memberships and Affiliations:
Bill Barrett Company, an oil and gas exploration company, Director
No. of Portfolios for which Board Member Serves: 25
Kenneth A. Himmel (62)
Board Member (1994)
Principal Occupation During Past 5Years: |
- President and CEO,Related Urban Development,a real estate development company (1996-present)
- President and CEO, Himmel & Company, a real estate development company (1980-present)
- CEO, American Food Management, a restaurant company (1983-present)
| No. of Portfolios for which Board Member Serves: 25 |
Stephen J. Lockwood (61)
Board Member (1994)
Principal Occupation During Past 5Years: |
- Chairman of the Board, Stephen J. Lockwood and Company LLC, an investment company (2000-present)
| No. of Portfolios for which Board Member Serves: 25 |
BOARD MEMBERS INFORMATION (Unaudited) (continued)
Roslyn M. Watson (59)
Board Member (1994) |
Principal Occupation During Past 5Years:
Principal,Watson Ventures, Inc., a real estate investment company (1993-present)
Other Board Memberships and Affiliations:
- American Express Bank, Director
- The Hyams Foundation Inc., a Massachusetts Charitable Foundation,Trustee
- National Osteoporosis Foundation,Trustee
- SBLI-USA, Director
| No. of Portfolios for which Board Member Serves: 25 |
Benaree Pratt Wiley (62)
Board Member (1998)
Principal Occupation During Past 5Years: |
- Principal,The Wiley Group, a firm specializing in strategy and business development (2005-present)
- President and CEO,The Partnership, an organization dedicated to increasing the representation of African Americans in positions of leadership, influence and decision-making in Boston, MA (1991-2005)
| Other Board Memberships and Affiliations: |
- Boston College,Trustee Associate
- Blue Cross Blue Shield of Massachusetts, Director
- CBIZ, professional support consultants and service providers for small, midsized and corporate business, Director
- Commonwealth Institute, Director
- Efficacy Institute, Director
- PepsiCo African-American, Chair of Advisory Board
- The Boston Foundation, Director
- Century Business Services, Inc., a provider of outsourcing functions for small and medium size companies, Director
| No. of Portfolios for which Board Member Serves: 36 |
Once elected all Board Members serve for an indefinite term, but achieve Emeritus status upon reaching age 80.The address of the Board Members and Officers is in c/o The Dreyfus Corporation, 200 Park Avenue, NewYork, NewYork 10166. Additional information about the Board Members is available in the fund’s Statement of Additional Information which can be obtained from Dreyfus free of charge by calling this toll free number: 1-800-554-4611.
Francis P. Brennan, Emeritus Board Member
J.Tomlinson Fort, Emeritus Board Member |
50
OFFICERS OF THE FUND (Unaudited)
| J. DAVID OFFICER, President since | | JONI LACKS CHARATAN, Vice President |
| December 2006. | | and Assistant Secretary since |
| Chief Operating Officer,Vice Chairman and a | | August 2005. |
| Director of the Manager, and an officer of 77 | | Senior Counsel of BNY Mellon, and an officer |
| investment companies (comprised of 167 | | of 78 investment companies (comprised of 188 |
| portfolios) managed by the Manager. He is 60 | | portfolios) managed by the Manager. She is 53 |
| years old and has been an employee of the | | years old and has been an employee of the |
| Manager since April 1998. | | Manager since October 1988. |
| |
| PHILLIP N. MAISANO, Executive Vice | | JOSEPH M. CHIOFFI, Vice President and |
| President since July 2007. | | Assistant Secretary since August 2005. |
| Chief Investment Officer,Vice Chair and a | | Senior Counsel of BNY Mellon, and an officer |
| director of the Manager, and an officer of 77 | | of 78 investment companies (comprised of 188 |
| investment companies (comprised of 167 | | portfolios) managed by the Manager. He is 47 |
| portfolios) managed by the Manager. Mr. | | years old and has been an employee of the |
| Maisano also is an officer and/or Board | | Manager since June 2000. |
| member of certain other investment | | |
| | | JANETTE E. FARRAGHER, Vice President |
| management subsidiaries of The Bank of New | | |
| | | and Assistant Secretary since |
| York Mellon Corporation, each of which is an | | |
| | | August 2005. |
| affiliate of the Manager. He is 61 years old and | | |
| has been an employee of the Manager since | | Assistant General Counsel of BNY Mellon, |
| November 2006. Prior to joining the Manager, | | and an officer of 78 investment companies |
| Mr. Maisano served as Chairman and Chief | | (comprised of 188 portfolios) managed by the |
| Executive Officer of EACM Advisors, an | | Manager. She is 45 years old and has been an |
| affiliate of the Manager, since August 2004, and | | employee of the Manager since February 1984. |
| served as Chief Executive Officer of Evaluation | | JOHN B. HAMMALIAN, Vice President and |
| Associates, a leading institutional investment | | Assistant Secretary since August 2005. |
| consulting firm, from 1988 until 2004. | | |
| | | Managing Counsel of BNY Mellon, and an |
| MICHAEL A. ROSENBERG, Vice President | | officer of 78 investment companies (comprised |
| and Secretary since August 2005. | | of 188 portfolios) managed by the Manager. |
| Assistant General Counsel of BNY Mellon, | | He is 45 years old and has been an employee |
| and an officer of 78 investment companies | | of the Manager since February 1991. |
| (comprised of 188 portfolios) managed by the | | ROBERT R. MULLERY, Vice President and |
| Manager. He is 48 years old and has been an | | Assistant Secretary since August 2005. |
| employee of the Manager since October 1991. | | |
| | | Managing Counsel of BNY Mellon, and an |
| JAMES BITETTO, Vice President and | | officer of 78 investment companies (comprised |
| Assistant Secretary since August 2005. | | of 188 portfolios) managed by the Manager. |
| Senior Counsel of BNY Mellon and Secretary | | He is 56 years old and has been an employee |
| of the Manager, and an officer of 78 | | of the Manager since May 1986. |
| investment companies (comprised of 188 | | |
| portfolios) managed by the Manager. He is 42 | | |
| years old and has been an employee of the | | |
| Manager since December 1996. | | |
OFFICERS OF THE FUND (Unaudited) (continued)
| JEFF PRUSNOFSKY, Vice President and | | ROBERT SALVIOLO, Assistant Treasurer |
| Assistant Secretary since August 2005. | | since July 2007. |
| Managing Counsel of BNY Mellon, and an | | Senior Accounting Manager – Equity Funds of |
| officer of 78 investment companies (comprised | | the Manager, and an officer of 78 investment |
| of 188 portfolios) managed by the Manager. | | companies (comprised of 188 portfolios) |
| He is 43 years old and has been an employee | | managed by the Manager. He is 41 years old |
| of the Manager since October 1990. | | and has been an employee of the Manager |
| | | since June 1989. |
| JAMES WINDELS, Treasurer since | | |
| November 2001. | | ROBERT SVAGNA, Assistant Treasurer |
| Director – Mutual Fund Accounting of the | | since December 2002. |
| Manager, and an officer of 78 investment | | Senior Accounting Manager – Equity Funds of |
| companies (comprised of 188 portfolios) | | the Manager, and an officer of 78 investment |
| managed by the Manager. He is 49 years old | | companies (comprised of 188 portfolios) |
| and has been an employee of the Manager | | managed by the Manager. He is 41 years old |
| since April 1985. | | and has been an employee of the Manager |
| | | since November 1990. |
| RICHARD CASSARO, Assistant Treasurer | | |
| since January 2008. | | JOSEPH W. CONNOLLY, Chief Compliance |
| Senior Accounting Manager – Money Market | | Officer since October 2004. |
| and Municipal Bond Funds of the Manager, | | Chief Compliance Officer of the Manager and |
| and an officer of 78 investment companies | | The Dreyfus Family of Funds (78 investment |
| (comprised of 188 portfolios) managed by | | companies, comprised of 188 portfolios). From |
| the Manager. He is 49 years old and has | | November 2001 through March 2004, Mr. |
| been an employee of the Manager since | | Connolly was first Vice-President, Mutual |
| September 1982. | | Fund Servicing for Mellon Global Securities |
| | | Services. In that capacity, Mr. Connolly was |
| GAVIN C. REILLY, Assistant Treasurer | | |
| | | responsible for managing Mellon’s Custody, |
| since December 2005. | | |
| | | Fund Accounting and Fund Administration |
| Tax Manager of the Investment Accounting | | services to third-party mutual fund clients. He |
| and Support Department of the Manager, and | | is 51 years old and has served in various |
| an officer of 78 investment companies | | capacities with the Manager since 1980, |
| (comprised of 188 portfolios) managed by the | | including manager of the firm’s Fund |
| Manager. He is 40 years old and has been an | | Accounting Department from 1997 through |
| employee of the Manager since April 1991. | | October 2001. |
| |
| ROBERT ROBOL, Assistant Treasurer | | WILLIAM GERMENIS, Anti-Money |
| since December 2002. | | Laundering Compliance Officer since |
| Senior Accounting Manager – Fixed Income | | July 2002. |
| Funds of the Manager, and an officer of 78 | | Vice President and Anti-Money Laundering |
| investment companies (comprised of 188 | | Compliance Officer of the Distributor, and the |
| portfolios) managed by the Manager. He is 44 | | Anti-Money Laundering Compliance Officer |
| years old and has been an employee of the | | of 74 investment companies (comprised of 184 |
| Manager since October 1988. | | portfolios) managed by the Manager. He is 38 |
| | | years old and has been an employee of the |
| | | Distributor since October 1998. |
52

Save time. Save paper. View your next shareholder report online as soon as it’s available. Log into www.dreyfus.com and sign up for Dreyfus eCommunications. It’s simple and only takes a few minutes.
The views expressed in this report reflect those of the portfolio manager only through the end of the period covered and do not necessarily represent the views of Dreyfus or any other person in the Dreyfus organization. Any such views are subject to change at any time based upon market or other conditions and Dreyfus disclaims any responsibility to update such views.These views may not be relied on as investment advice and, because investment decisions for a Dreyfus fund are based on numerous factors, may not be relied on as an indication of trading intent on behalf of any Dreyfus fund.
Not FDIC-Insured Not Bank-Guaranteed May Lose Value
| | Contents |
| |
| | THE FUND |
| |
| 2 | A Letter from the CEO |
| |
| 3 | Discussion of Fund Performance |
| |
| 6 | Fund Performance |
| |
| 8 | Understanding Your Fund’s Expenses |
| |
| 8 | Comparing Your Fund’s Expenses With Those of Other Funds |
| |
| 9 | Statement of Investments |
| |
| 17 | Statement of Assets and Liabilities |
| |
| 18 | Statement of Operations |
| |
| 19 | Statement of Changes in Net Assets |
| |
| 22 | Financial Highlights |
| |
| 27 | Notes to Financial Statements |
| |
| 36 | Report of Independent Registered Public Accounting Firm |
| |
| 37 | Important Tax Information |
| |
| 38 | Board Members Information |
| |
| 40 | Officers of the Fund |
| |
| | FOR MORE INFORMATION |
| |
| | Back Cover |
| |
Dreyfus
Small Cap Value Fund

A LETTER FROM THE CEO
Dear Shareholder: |
We present to you this annual report for Dreyfus Small Cap Value Fund, covering the 12-month period from November 1, 2007, through October 31, 2008.
These are difficult times for equity investors. A credit crunch that began in early 2007 has developed into a full-blown global financial crisis, recently resulting in the failure of several major financial institutions and prompting a massive government rescue effort. Meanwhile, the U.S. economic slowdown has gathered momentum,depressing investor sentiment, consumer confidence and business investment.These factors undermined returns in most stock market sectors, particularly financial companies and businesses that tend to be more sensitive to economic trends.
The depth and duration of the economic downturn will depend on how quickly the financial system can be stabilized.We believe that the Temporary Guarantee Program for Money Market Funds and the $700 billion rescue package intended to promote greater liquidity in the financial markets meet several critical requirements for addressing today’s financial stresses, and we expect these measures to contribute to a more orderly deleveraging process. However, recuperation from the financial crisis is likely to take time. In the meantime, we encourage you to keep in touch with your financial advisor and maintain a long-term and disciplined perspective to investing. Indeed, we already are seeing some positive signs, including a likely peak in global inflationary pressures, a bottoming of the U.S. dollar, attractive valuations among fundamentally sound companies and a large pool of worldwide financial liquidity that could be deployed gradually as the economic cycle turns.
For information about how the fund performed during the reporting period, as well as market perspectives, we have provided a Discussion of Fund Performance given by the fund’s Portfolio Managers.
Thank you for your continued confidence and support.

| | Jonathan R. Baum
Chief Executive Officer
The Dreyfus Corporation |

DISCUSSION OF FUND PERFORMANCE
For the period of November 1, 2007, through October 31, 2008, as provided by Ronald P. Gala and Adam T. Logan, Portfolio Managers
Fund and Market Performance Overview
For the 12-month period ended October 31, 2008, Dreyfus Small Cap Value Fund’s Class A shares produced a total return of –35.70%, Class B shares produced a total return of –36.20%, Class C shares produced a total return of –36.19%, Class I shares produced a total return of –35.57% and Class T shares produced a total return of –35.91% .1 In comparison, the fund’s benchmark, the Russell 2000 Value Index (the “Index”), returned –30.54% for the same period.2
During a highly challenging reporting period, stock prices tumbled along with virtually all other asset classes as an intensifying financial crisis and fears of global recession depressed investor sentiment. The fund produced lower total returns than its benchmark due in large part to disappointments in the financials and industrials sectors.
The Fund’s Investment Approach
The fund, which seeks capital appreciation, normally invests at least 80% of its assets in stocks of small U.S. companies.We use a disciplined process that combines computer-modeling techniques, fundamental analysis and risk management techniques to select undervalued stocks, which are normally characterized by relatively low price-to-earnings and low price-to-book ratios. Using this systematic approach, we select what we believe to be the most attractive companies from this pool of undervalued stocks.The fund is constructed with an emphasis on diversification and risk management, so that its sector weightings and risk characteristics are generally in line with those of its benchmark.
Volatility Increases as Financial Crisis Intensifies
A credit crisis that dominated much of the reporting period later developed into a full-blown global financial crisis amid an onslaught of negative economic news, including falling home prices, rising
The Fund 3
| DISCUSSION OF FUND PERFORMANCE (continued) |
unemployment and sluggish consumer spending.As concerns over the economic slowdown in the final months of the reporting period spread, market became increasingly risk averse and investors began to discount the impact tighter credit would have on future earnings.
The Federal Reserve Board (the “Fed”) responded aggressively to these developments by reducing short-term interest rates early in the reporting period and, in March 2008, participating in the rescue of a major investment bank.Although stocks subsequently rallied, the rebound proved to be short-lived. Over the summer, additional government rescues were announced for some of America’s largest financial institutions, while others were acquired by former rivals at fire-sale prices. In September, the financial crisis threatened to spin out of control, and the global banking system came close to collapse.
The U.S. Congress responded to the crisis by making $700 billion available to banks through the Troubled Asset Relief Program. In addition, the Fed and several of the world’s major central banks announced unprecedented, coordinated reductions in short-term interest rates. Nonetheless, the reporting period ended with all major stock market indices reporting negative double-digit returns.
Commodities’ Weakness Weighed on Industrials
After climbing over much of the reporting period, commodity prices fell sharply as the economic slowdown gained momentum. Despite relatively robust earnings reports, industrial stocks fell along with commodity prices, led by industrial materials producers and metals-and-mining companies. For example, despite reporting strong results and raising guidance in August, Greif Inc., a manufacturer of industrial packaging, plunged more than 38% in October as investors fled more economically sensitive stocks toward traditional safe havens.
Not surprisingly, the financial crisis produced damaging results in the financials sector, particularly among holdings within the bank and real estate investment trust (REIT) industries. Commercial-property REIT Lexington Realty Trust lost more than half its value during the last month of the reporting period. Declining markets and fund outflows at the end of the reporting period weighed on mutual fund managerWadell
4
& Reed Financial. Due to disappointing results, we eliminated several financial stocks from the fund’s portfolio, including East West Bancorp, which reported lower earnings and withdrew full-year guidance.
Some Positives in a Distressing Downtrend
On the other hand, several bright spots contributed positively to the fund’s relative performance. Insurance carrier Philadelphia Consolidated Holding agreed to be acquired, sparking a sharp rise in its share price. In the health care sector,the fund benefited from several biotechnology and pharmaceutical holdings, including drug developer Sciele Pharma, whose shares surged on news of a cash buyout offer.We sold the fund’s position in both Philadelphia Consolidated and Sciele Pharma during the reporting period. Marvel Entertainment fared well due to licensing fees derived from the Iron Man and Spider-Man franchises.
Maintaining a Diversified Approach
As of the reporting period’s end, the fund has continued to look for attractively valued stocks using a fundamentals-based evaluation process that focuses on companies with sound balance sheets, solid cash flows and positive earnings momentum.At the same time, we have intensified our emphasis on diversification, which we regard as an important risk management tool in today’s highly volatile market environment. With stocks of more than 220 companies in the fund’s portfolio, we believe that diversification can effectively mute the effects of unexpected disappointments in individual holdings on the overall fund’s performance.
November 17, 2008
| 1 | | Total return includes reinvestment of dividends and any capital gains paid, and does not take into |
| | | consideration the maximum initial sales charges in the case of Class A and Class T shares, or the |
| | | applicable contingent deferred sales charges imposed on redemptions in the case of Class B and |
| | | Class C shares. Had these charges been reflected, returns would have been lower. Past performance |
| | | is no guarantee of future results. Share price and investment return fluctuate such that upon |
| | | redemption, fund shares may be worth more or less than their original cost. Return figures |
| | | provided reflect the absorption of certain fund expenses by The Dreyfus Corporation pursuant to |
| | | an agreement in effect until April 4, 2009. Had these expenses not been absorbed, the fund’s |
| | | returns would have been lower. |
| 2 | | SOURCE: LIPPER INC. — Reflects the reinvestment of dividends and, where applicable, |
| | | capital gain distributions.The Russell 2000 Value Index is an unmanaged index, which measures |
| | | the performance of those Russell 2000 companies with lower price-to-book ratios and lower |
| | | forecasted growth values. |
The Fund 5
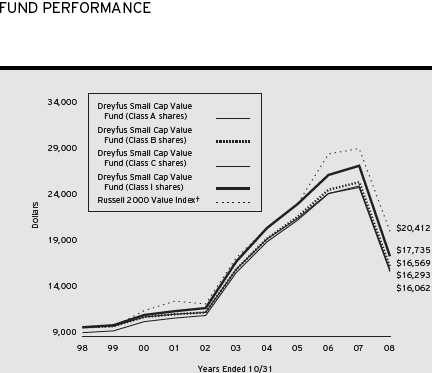
| Comparison of change in value of $10,000 investment in Dreyfus Small Cap Value Fund Class A |
| shares, Class B shares, Class C shares and Class I shares and the Russell 2000 Value Index |
| |
| † Source: Lipper Inc. |
| Past performance is not predictive of future performance. |
| The above graph compares a $10,000 investment made in each of the Class A, Class B, Class C and Class I shares of |
| Dreyfus Small Cap Value Fund on 10/31/98 to a $10,000 investment made in the Russell 2000 Value Index (the |
| “Index”) on that date. All dividends and capital gain distributions are reinvested. Performance for Class T shares will |
| vary from the performance of Class A, Class B, Class C and Class I shares shown above due to differences in charges |
| and expenses. |
| The fund’s performance shown in the line graph takes into account the maximum initial sales charge on Class A shares |
| and all other applicable fees and expenses on all classes.The Index is an unmanaged index which measures the |
| performance of those Russell 2000 companies with lower price-to-book ratios and lower forecasted growth values.The |
| Index is an unmanaged index of small-cap stock market performance and is composed of the 2,000 smallest companies |
| in the Russell 3000 Index.The Russell 3000 Index is composed of the 3,000 largest U.S. companies based on total |
| market capitalization. Unlike a mutual fund, the Index is not subject to charges, fees and other expenses. Investors cannot |
| invest directly in any index. Further information relating to fund performance, including expense reimbursements, if |
| applicable, is contained in the Financial Highlights section of the prospectus and elsewhere in this report. |
6
| Average Annual Total Returns as of 10/31/08 | | | | | | |
| |
| | | Inception | | | | | | | | From |
| | | Date | | 1 Year | | 5 Years | | 10 Years | | Inception |
| |
| |
| |
| |
| |
|
| Class A shares | | | | | | | | | | |
| with maximum sales charge (5.75%) | | | | (39.39)% | | (0.75)% | | 5.00% | | |
| without sales charge | | | | (35.70)% | | 0.43% | | 5.63% | | |
| Class B shares | | | | | | | | | | |
| with applicable redemption charge † | | | | (38.31)% | | (0.57)% | | 5.18% | | |
| without redemption | | | | (36.20)% | | (0.30)% | | 5.18% | | |
| Class C shares | | | | | | | | | | |
| with applicable redemption charge †† | | | | (36.72)% | | (0.31)% | | 4.85% | | |
| without redemption | | | | (36.19)% | | (0.31)% | | 4.85% | | |
| Class I shares | | | | (35.57)% | | 0.68% | | 5.90% | | |
| Class T shares | | | | | | | | | | |
| with applicable sales charge (4.5%) | | 3/1/00 | | (38.79)% | | (0.76)% | | — | | 5.78% |
| without sales charge | | 3/1/00 | | (35.91)% | | 0.17% | | — | | 6.35% |
| Past performance is not predictive of future performance.The fund’s performance shown in the graph and table does not |
| reflect the deduction of taxes that a shareholder would pay on fund distributions or the redemption of fund shares. |
| Performance for Class B shares assumes the conversion of Class B shares to Class A shares at the end of the sixth year |
| following the date of purchase. |
| † | | The maximum contingent deferred sales charge for Class B shares is 4%. After six years Class B shares convert to |
| | | Class A shares. |
| †† | | The maximum contingent deferred sales charge for Class C shares is 1% for shares redeemed within one year of the |
| | | date of purchase. |
The Fund 7
UNDERSTANDING YOUR FUND’S EXPENSES (Unaudited)
As a mutual fund investor, you pay ongoing expenses, such as management fees and other expenses. Using the information below, you can estimate how these expenses affect your investment and compare them with the expenses of other funds.You also may pay one-time transaction expenses, including sales charges (loads) and redemption fees, which are not shown in this section and would have resulted in higher total expenses. For more information, see your fund’s prospectus or talk to your financial adviser.
Review your fund’s expenses
The table below shows the expenses you would have paid on a $1,000 investment in Dreyfus Small CapValue Fund from May 1, 2008 to October 31, 2008. It also shows how much a $1,000 investment would be worth at the close of the period, assuming actual returns and expenses.
Expenses and Value of a $1,000 Investment assuming actual returns for the six months ended October 31, 2008
| | | Class A | | Class B | | Class C | | Class I | | Class T |
| |
| |
| |
| |
| |
|
| Expenses paid per $1,000† | | $ 5.90 | | $ 9.19 | | $ 9.19 | | $ 4.76 | | $ 7.00 |
| Ending value (after expenses) | | $751.90 | | $748.60 | | $749.00 | | $752.30 | | $750.30 |
COMPARING YOUR FUND’S EXPENSES WITH THOSE OF OTHER FUNDS (Unaudited)
Using the SEC’s method to compare expenses
The Securities and Exchange Commission (SEC) has established guidelines to help investors assess fund expenses. Per these guidelines, the table below shows your fund’s expenses based on a $1,000 investment, assuming a hypothetical 5% annualized return. You can use this information to compare the ongoing expenses (but not transaction expenses or total cost) of investing in the fund with those of other funds.All mutual fund shareholder reports will provide this information to help you make this comparison. Please note that you cannot use this information to estimate your actual ending account balance and expenses paid during the period.
Expenses and Value of a $1,000 Investment assuming a hypothetical 5% annualized return for the six months ended October 31, 2008
| | | Class A | | Class B | | Class C | | Class I | | Class T |
| |
| |
| |
| |
| |
|
| Expenses paid per $1,000† | | $ 6.80 | | $ 10.58 | | $ 10.58 | | $ 5.48 | | $ 8.06 |
| Ending value (after expenses) | | $1,018.40 | | $1,014.63 | | $1,014.63 | | $1,019.71 | | $1,017.14 |
| † Expenses are equal to the fund’s annualized expense ratio of 1.34% for Class A, 2.09% for Class B, 2.09% for |
| Class C, 1.08% for Class I and 1.59% for Class T, multiplied by the average account value over the period, |
| multiplied by 184/366 (to reflect the one-half year period). |
8
STATEMENT OF INVESTMENTS
October 31, 2008 |
| Common Stocks—100.8% | | Shares | | Value ($) |
| |
| |
|
| Banks—11.8% | | | | |
| Bank of the Ozarks | | 19,900 | | 604,960 |
| Community Bank System | | 49,400 a | | 1,232,530 |
| CVB Financial | | 153,830 a | | 1,947,488 |
| F.N.B | | 55,800 a | | 730,980 |
| First Commonwealth Financial | | 109,250 a | | 1,208,305 |
| Glacier Bancorp | | 79,000 a | | 1,593,430 |
| Hancock Holding | | 22,900 a | | 1,011,264 |
| National Penn Bancshares | | 80,000 a | | 1,355,200 |
| Old National Bancorp | | 86,300 a | | 1,634,522 |
| Oriental Financial Group | | 60,950 | | 989,828 |
| S&T Bancorp | | 46,850 | | 1,597,585 |
| Sterling Bancorp | | 41,850 | | 656,208 |
| Sterling Bancshares | | 148,900 | | 1,185,244 |
| SVB Financial Group | | 33,900 a,b | | 1,744,155 |
| UMB Financial | | 32,950 a | | 1,493,624 |
| Umpqua Holdings | | 23,950 a | | 407,629 |
| Westamerica Bancorporation | | 17,700 a | | 1,013,325 |
| | | | | 20,406,277 |
| Consumer Discretionary—13.1% | | | | |
| Aeropostale | | 26,900 a,b | | 651,249 |
| AnnTaylor Stores | | 36,800 b | | 462,576 |
| ATC Technology | | 36,700 b | | 804,831 |
| Barnes & Noble | | 21,500 a | | 405,920 |
| Blyth | | 68,600 | | 589,960 |
| Buckle | | 20,400 a | | 537,336 |
| Cato, Cl. A | | 52,800 | | 819,456 |
| CEC Entertainment | | 20,250 b | | 520,020 |
| Charlotte Russe Holding | | 24,500 a,b | | 207,025 |
| Choice Hotels International | | 31,650 a | | 865,311 |
| Collective Brands | | 88,400 b | | 1,130,636 |
| Corinthian Colleges | | 50,600 b | | 722,568 |
| Cox Radio, Cl. A | | 66,150 a,b | | 360,517 |
| Deckers Outdoor | | 9,850 a,b | | 835,871 |
| DSW, Cl. A | | 54,500 a,b | | 704,685 |
| Genesco | | 39,300 a,b | | 975,033 |
| Gymboree | | 20,250 b | | 523,665 |
The Fund 9
| STATEMENT OF INVESTMENTS (continued) |
| Common Stocks (continued) | | Shares | | Value ($) |
| |
| |
|
| Consumer Discretionary (continued) | | | | |
| Helen of Troy | | 36,800 b | | 662,032 |
| International Speedway, Cl. A | | 17,129 | | 537,679 |
| Jack in the Box | | 19,150 a,b | | 384,915 |
| JAKKS Pacific | | 36,800 a,b | | 823,216 |
| Live Nation | | 36,400 a,b | | 409,500 |
| Martha Stewart Living Omnimedia, Cl. A | | 160,450 a,b | | 839,154 |
| Marvel Entertainment | | 25,750 a,b | | 828,893 |
| Movado Group | | 61,750 | | 939,218 |
| Papa John’s International | | 24,100 b | | 543,696 |
| PetMed Express | | 24,400 b | | 430,904 |
| Polaris Industries | | 28,400 a | | 956,228 |
| RC2 | | 23,700 b | | 300,990 |
| RCN | | 55,850 a,b | | 360,233 |
| Rent-A-Center | | 95,950 a,b | | 1,400,870 |
| Steven Madden | | 21,750 b | | 473,715 |
| Timberland, Cl. A | | 74,400 b | | 900,240 |
| Wolverine World Wide | | 32,950 a | | 774,325 |
| | | | | 22,682,467 |
| Consumer Staples—3.2% | | | | |
| Andersons | | 40,200 a | | 1,070,526 |
| Bare Escentuals | | 117,800 a,b | | 492,404 |
| Chiquita Brands International | | 58,350 a,b | | 796,477 |
| Del Monte Foods | | 112,500 | | 709,875 |
| Elizabeth Arden | | 53,050 b | | 917,234 |
| Hansen Natural | | 22,050 a,b | | 558,306 |
| Nu Skin Enterprises, Cl. A | | 83,800 | | 1,080,182 |
| | | | | 5,625,004 |
| Energy—3.1% | | | | |
| Callon Petroleum | | 62,050 b | | 640,356 |
| Gulf Island Fabrication | | 15,250 | | 300,577 |
| Holly | | 34,450 | | 676,253 |
| Parker Drilling | | 88,900 a,b | | 455,168 |
| Stone Energy | | 32,350 b | | 981,499 |
| Swift Energy | | 57,600 a,b | | 1,847,808 |
| Unit | | 14,700 b | | 551,838 |
| | | | | 5,453,499 |
10
| Common Stocks (continued) | | Shares | | Value ($) |
| |
| |
|
| Exchange Traded Funds—.3% | | | | |
| iShares Russell 2000 Value Index Fund | | 8,350 a | | 443,719 |
| Financial—24.1% | | | | |
| American Equity Investment Life Holding | | 76,150 a | | 344,198 |
| American Physicians Capital | | 12,650 a | | 517,511 |
| Amerisafe | | 43,100 b | | 743,044 |
| AmTrust Financial Services | | 57,150 | | 561,213 |
| Aspen Insurance Holdings | | 58,350 | | 1,339,716 |
| BioMed Realty Trust | | 58,350 a | | 819,817 |
| Calamos Asset Management, Cl. A | | 36,350 | | 298,433 |
| Cash America International | | 30,400 | | 1,075,248 |
| Cedar Shopping Centers | | 93,900 a | | 897,684 |
| Cohen & Steers | | 42,650 a | | 774,950 |
| Corporate Office Properties Trust | | 21,950 a | | 682,425 |
| Dime Community Bancshares | | 66,100 | | 1,103,870 |
| Entertainment Properties Trust | | 20,800 | | 778,960 |
| Extra Space Storage | | 100,650 | | 1,158,481 |
| EZCORP, Cl. A | | 52,000 b | | 823,680 |
| FCStone Group | | 17,700 b | | 105,315 |
| First Industrial Realty Trust | | 32,750 a | | 338,635 |
| First Niagara Financial Group | | 106,100 a | | 1,673,197 |
| FirstMerit | | 83,800 | | 1,954,216 |
| FPIC Insurance Group | | 12,150 b | | 543,834 |
| Glimcher Realty Trust | | 149,800 a | | 784,952 |
| Greenhill & Co. | | 12,650 a | | 834,520 |
| Highwoods Properties | | 31,000 a | | 769,420 |
| Interactive Brokers Group, Cl. A | | 32,950 b | | 704,141 |
| Knight Capital Group, Cl. A | | 120,850 a,b | | 1,747,491 |
| Lexington Realty Trust | | 145,550 | | 1,168,767 |
| Medical Properties Trust | | 55,550 a | | 409,959 |
| National Retail Properties | | 65,750 a | | 1,172,323 |
| Omega Healthcare Investors | | 59,650 a | | 898,926 |
| optionsXpress Holdings | | 44,150 | | 784,104 |
| Pennsylvania Real Estate Investment Trust | | 48,200 a | | 609,730 |
| Penson Worldwide | | 86,600 b | | 618,324 |
| Phoenix Cos. | | 63,350 a | | 409,875 |
| Platinum Underwriters Holdings | | 29,200 | | 926,808 |
The Fund 11
| STATEMENT OF INVESTMENTS (continued) |
| Common Stocks (continued) | | Shares | | Value ($) |
| |
| |
|
| Financial (continued) | | | | |
| ProAssurance | | 31,150 a,b | | 1,711,693 |
| Provident Financial Services | | 74,900 | | 1,098,034 |
| Provident New York Bancorp | | 73,750 | | 887,950 |
| Realty Income | | 41,850 a | | 967,572 |
| Safety Insurance Group | | 31,650 | | 1,202,384 |
| Selective Insurance Group | | 52,250 | | 1,240,938 |
| Senior Housing Properties Trust | | 65,700 a | | 1,259,469 |
| Sunstone Hotel Investors | | 89,700 a | | 587,535 |
| Susquehanna Bancshares | | 73,650 a | | 1,140,839 |
| SWS Group | | 52,050 | | 966,048 |
| U-Store-It Trust | | 69,800 | | 478,828 |
| Waddell & Reed Financial, Cl. A | | 35,450 | | 514,734 |
| World Acceptance | | 20,300 a,b | | 375,144 |
| Zenith National Insurance | | 32,950 a | | 1,082,737 |
| | | | | 41,887,672 |
| Health Care—4.4% | | | | |
| AMERIGROUP | | 26,550 b | | 663,750 |
| Analogic | | 8,800 | | 388,608 |
| Centene | | 50,750 b | | 956,130 |
| CONMED | | 17,000 b | | 445,400 |
| CV Therapeutics | | 85,800 a,b | | 800,514 |
| HealthSpring | | 44,200 b | | 730,184 |
| ICU Medical | | 35,900 b | | 1,149,877 |
| Invacare | | 44,500 | | 809,455 |
| MedCath | | 41,850 b | | 645,327 |
| ViroPharma | | 85,000 a,b | | 1,065,900 |
| | | | | 7,655,145 |
| Industrial—14.5% | | | | |
| Acuity Brands | | 21,550 a | | 753,388 |
| American Reprographics | | 39,300 a,b | | 418,152 |
| Ameron International | | 12,300 | | 578,100 |
| Apogee Enterprises | | 41,850 | | 412,641 |
| Applied Industrial Technologies | | 45,950 a | | 927,730 |
| Arkansas Best | | 32,150 a | | 938,458 |
| AZZ | | 13,900 b | | 405,602 |
| Ceradyne | | 38,650 b | | 908,275 |
| Columbus McKinnon | | 53,350 b | | 749,034 |
12
| Common Stocks (continued) | | Shares | | Value ($) |
| |
| |
|
| Industrial (continued) | | | | |
| Comfort Systems USA | | 109,850 | | 1,024,900 |
| Deluxe | | 50,000 | | 608,000 |
| Ducommun | | 25,150 | | 507,778 |
| Dycom Industries | | 83,400 b | | 740,592 |
| EMCOR Group | | 88,750 a,b | | 1,577,087 |
| Encore Wire | | 71,000 a | | 1,361,070 |
| EnPro Industries | | 15,350 a,b | | 340,923 |
| Gibraltar Industries | | 34,300 a | | 454,475 |
| Granite Construction | | 19,000 | | 677,730 |
| HEICO | | 29,200 a | | 1,123,324 |
| Herman Miller | | 51,000 a | | 1,122,000 |
| Insteel Industries | | 36,850 | | 378,081 |
| Knoll | | 39,300 | | 568,278 |
| Korn/Ferry International | | 71,700 b | | 995,913 |
| Layne Christensen | | 19,550 a,b | | 513,774 |
| MPS Group | | 119,350 a,b | | 929,737 |
| Mueller Industries | | 33,350 a | | 762,715 |
| NCI Building Systems | | 37,300 b | | 694,153 |
| Pacer International | | 52,000 | | 587,080 |
| Perini | | 17,200 a,b | | 327,144 |
| Regal-Beloit | | 31,650 a | | 1,030,524 |
| Robbins & Myers | | 38,400 | | 783,360 |
| United Rentals | | 56,500 b | | 579,125 |
| United Stationers | | 13,700 b | | 512,243 |
| Universal Forest Products | | 17,100 | | 404,415 |
| Watson Wyatt Worldwide, Cl. A | | 9,550 | | 405,589 |
| | | | | 25,101,390 |
| Information Technology—14.0% | | | | |
| ADC Telecommunications | | 49,450 b | | 313,513 |
| Advanced Energy Industries | | 83,800 a,b | | 894,146 |
| Amkor Technology | | 189,700 b | | 770,182 |
| Arris Group | | 129,800 a,b | | 896,918 |
| Avocent | | 53,200 a,b | | 799,064 |
| Benchmark Electronics | | 82,300 b | | 986,777 |
| Brightpoint | | 109,500 b | | 630,720 |
| Brooks Automation | | 81,600 b | | 558,960 |
| Checkpoint Systems | | 36,600 b | | 461,526 |
The Fund 13
| STATEMENT OF INVESTMENTS (continued) |
| Common Stocks (continued) | | Shares | | Value ($) |
| |
| |
|
| Information Technology (continued) | | | | |
| CTS | | 50,750 | | 354,742 |
| Cymer | | 31,950 a,b | | 781,817 |
| EMS Technologies | | 33,150 b | | 692,835 |
| Emulex | | 60,950 a,b | | 579,025 |
| Entegris | | 137,100 b | | 368,799 |
| Harmonic | | 154,900 b | | 1,101,339 |
| Heartland Payment Systems | | 38,250 a | | 665,932 |
| Insight Enterprises | | 89,100 b | | 866,943 |
| Interwoven | | 40,250 a,b | | 507,552 |
| Ixia | | 93,900 a,b | | 625,374 |
| Methode Electronics | | 58,900 | | 447,051 |
| Micrel | | 68,600 a | | 504,210 |
| MicroStrategy, Cl. A | | 11,450 a,b | | 450,787 |
| MKS Instruments | | 43,100 b | | 799,505 |
| NETGEAR | | 48,150 b | | 532,058 |
| Oplink Communications | | 3,007 b | | 24,417 |
| OSI Systems | | 34,350 b | | 395,025 |
| Park Electrochemical | | 20,500 a | | 443,210 |
| Perficient | | 68,600 a,b | | 376,614 |
| Perot Systems, Cl. A | | 44,300 a,b | | 637,477 |
| Plantronics | | 58,350 | | 842,574 |
| QLogic | | 56,800 b | | 682,736 |
| Rackable Systems | | 90,100 b | | 642,413 |
| Rofin-Sinar Technologies | | 13,150 a,b | | 293,114 |
| Sigma Designs | | 45,700 a,b | | 506,813 |
| SonicWALL | | 107,050 a,b | | 479,584 |
| Technitrol | | 48,200 | | 278,114 |
| TIBCO Software | | 195,400 b | | 1,006,310 |
| United Online | | 165,498 | | 1,224,685 |
| Vignette | | 52,000 b | | 422,240 |
| Zoran | | 44,050 a,b | | 358,567 |
| | | | | 24,203,668 |
| Materials—4.6% | | | | |
| Ashland | | 45,700 | | 1,032,363 |
| Buckeye Technologies | | 48,200 b | | 283,898 |
14
| Common Stocks (continued) | | Shares | | Value ($) |
| |
| |
|
| Materials (continued) | | | | |
| Carpenter Technology | | 21,550 | | 390,055 |
| Ferro | | 37,000 | | 572,760 |
| Greif, Cl. A | | 29,350 | | 1,191,023 |
| Koppers Holdings | | 30,400 a | | 723,216 |
| NewMarket | | 7,150 a | | 269,484 |
| Olin | | 57,250 a | | 1,039,660 |
| Olympic Steel | | 20,500 a | | 468,630 |
| Pactiv | | 21,900 b | | 515,964 |
| Rock-Tenn, Cl. A | | 20,900 | | 635,569 |
| Schnitzer Steel Industries, Cl. A | | 11,950 a | | 321,814 |
| Schulman (A.) | | 34,250 a | | 613,418 |
| | | | | 8,057,854 |
| Telecommunication Services—.3% | | | | |
| Cincinnati Bell | | 201,150 a,b | | 480,748 |
| Utilities—7.4% | | | | |
| Atmos Energy | | 36,000 | | 873,720 |
| Avista | | 43,800 a | | 869,868 |
| Cleco | | 42,250 a | | 972,172 |
| El Paso Electric | | 31,850 a,b | | 589,862 |
| Laclede Group | | 24,100 | | 1,260,912 |
| New Jersey Resources | | 39,300 a | | 1,463,532 |
| Nicor | | 43,850 | | 2,026,309 |
| Northwest Natural Gas | | 21,050 | | 1,071,024 |
| Portland General Electric | | 26,000 | | 533,520 |
| Southwest Gas | | 46,150 | | 1,205,438 |
| WGL Holdings | | 59,850 a | | 1,926,572 |
| | | | | 12,792,929 |
| Total Common Stocks | | | | |
| (cost $231,456,996) | | | | 174,790,372 |
| |
| |
|
| |
| Other Investment—.3% | | | | |
| |
| |
|
| Registered Investment Company; | | | | |
| Dreyfus Institutional Preferred | | | | |
| Plus Money Market Fund | | | | |
| (cost $604,000) | | 604,000 c | | 604,000 |
The Fund 15
| STATEMENT OF INVESTMENTS (continued) |
| Investment of Cash Collateral | | | | |
| for Securities Loaned—25.9% | | Shares | | Value ($) |
| |
| |
|
| Registered Investment Company; | | | | |
| Dreyfus Institutional Cash | | | | |
| Advantage Plus Fund | | | | |
| (cost $44,843,698) | | 44,843,698 c | | 44,843,698 |
| |
| |
|
| |
| Total Investments (cost $276,904,694) | | 127.0% | | 220,238,070 |
| Liabilities, Less Cash and Receivables | | (27.0%) | | (46,810,989) |
| Net Assets | | 100.0% | | 173,427,081 |
| a All or a portion of these securities are on loan. At October 31, 2008, the total market value of the fund’s securities |
| on loan is $44,615,001 and the total market value of the collateral held by the fund is $45,294,597, consisting of |
| cash collateral of 44,843,698 and U.S. Government and agency securities valued at $450,899. |
| b Non-income producing security. |
| c Investment in affiliated money market mutual fund. |
| Portfolio Summary (Unaudited)† | | | | |
| |
| | | Value (%) | | | | Value (%) |
| |
| |
| |
|
| Money Market Investments | | 26.2 | | Materials | | 4.6 |
| Financial | | 24.1 | | Health Care | | 4.4 |
| Industrial | | 14.5 | | Consumer Staples | | 3.2 |
| Information Technology | | 14.0 | | Energy | | 3.1 |
| Consumer Discretionary | | 13.1 | | Exchange Traded Funds | | .3 |
| Banks | | 11.8 | | Telecommunication Services | | .3 |
| Utilities | | 7.4 | | | | 127.0 |
| |
| † Based on net assets. | | | | | | |
| See notes to financial statements. | | | | | | |
16
STATEMENT OF ASSETS AND LIABILITIES
October 31, 2008
| | | | | | | | | Cost | | Value |
| |
| |
| |
| |
| |
|
| Assets ($): | | | | | | | | | | |
| Investments in securities—See Statement of Investments (including | | | | |
| securities on loan, valued at $44,615,001)—Note 1(b): | | | | |
| Unaffiliated issuers | | | | | | 231,456,996 | | 174,790,372 |
| Affiliated issuers | | | | | | | | 45,447,698 | | 45,447,698 |
| Cash | | | | | | | | | | 185,588 |
| Receivable for investment securities sold | | | | | | 1,000,708 |
| Dividends and interest receivable | | | | | | | | 332,328 |
| Receivable for shares of Capital Stock subscribed | | | | | | 199,497 |
| | | | | | | | | | | 221,956,191 |
| |
| |
| |
| |
| |
|
| Liabilities ($): | | | | | | | | | | |
| Due to The Dreyfus Corporation and affiliates—Note 3(b) | | | | 211,399 |
| Liability for securities on loan—Note 1(b) | | | | | | | | 44,843,698 |
| Payable for shares of Capital Stock redeemed | | | | | | 2,729,601 |
| Payable for investment securities purchased | | | | | | 729,570 |
| Interest payable—Note 2 | | | | | | | | 14,842 |
| | | | | | | | | | | 48,529,110 |
| |
| |
| |
| |
| |
|
| Net Assets ($) | | | | | | | | | | 173,427,081 |
| |
| |
| |
| |
| |
|
| Composition of Net Assets ($): | | | | | | | | |
| Paid-in capital | | | | | | | | | | 311,984,911 |
| Accumulated undistributed investment income—net | | | | | | 1,352,492 |
| Accumulated net realized gain (loss) on investments | | | | | | (83,243,698) |
| Accumulated net unrealized appreciation | | | | | | |
| (depreciation) on investments | | | | | | | | (56,666,624) |
| |
| |
| |
| |
|
| Net Assets ($) | | | | | | | | | | 173,427,081 |
| |
| |
| |
| |
| |
|
| |
| |
| Net Asset Value Per Share | | | | | | | | |
| | | Class A | | Class B | | Class C | | Class I | | Class T |
| |
| |
| |
| |
| |
|
| Net Assets ($) | | 77,814,350 | | 6,588,858 | | 11,934,813 | | 68,233,246 | | 8,855,814 |
| Shares Outstanding | | 6,438,312 | | 596,396 | | 1,078,565 | | 5,534,123 | | 751,465 |
| |
| |
| |
| |
| |
|
| Net Asset Value | | | | | | | | | | |
| Per Share ($) | | 12.09 | | 11.05 | | 11.07 | | 12.33 | | 11.78 |
| |
| See notes to financial statements. | | | | | | | | |
The Fund 17
| STATEMENT OF OPERATIONS | | |
| Year Ended October 31, 2008 | �� | |
| |
|
| |
| |
| |
| |
| Investment Income ($): | | |
| Income: | | |
| Cash dividends (net of $3,491 foreign taxes withheld at source): | | |
| Unaffiliated issuers | | 5,623,815 |
| Affiliated issuers | | 65,573 |
| Income from securities lending | | 676,568 |
| Total Income | | 6,365,956 |
| Expenses: | | |
| Management fee—Note 3(a) | | 4,649,889 |
| Distribution and service plan fees—Note 3(b) | | 772,505 |
| Interest expense—Note 2 | | 20,812 |
| Directors’ fees—Note 3(a) | | 15,112 |
| Loan commitment fees—Note 2 | | 5,807 |
| Total Expenses | | 5,464,125 |
| Less—reduction in management fee | | |
| due to undertaking—Note 3(a) | | (556,243) |
| Less—Directors’ fees reimbursed | | |
| by the Manager—Note 3(a) | | (15,112) |
| Net Expenses | | 4,892,770 |
| Investment Income—Net | | 1,473,186 |
| |
|
| Realized and Unrealized Gain (Loss) on Investments—Note 4 ($): | | |
| Net realized gain (loss) on investments | | (83,265,215) |
| Net unrealized appreciation (depreciation) on investments | | (59,977,721) |
| Net Realized and Unrealized Gain (Loss) on Investments | | (143,242,936) |
| Net (Decrease) in Net Assets Resulting from Operations | | (141,769,750) |
| |
| See notes to financial statements. | | |
18
STATEMENT OF CHANGES IN NET ASSETS
| | | Year Ended October 31, |
| | |
|
| | | 2008 | | 2007a |
| |
| |
|
| Operations ($): | | | | |
| Investment income—net | | 1,473,186 | | 2,032,846 |
| Net realized gain (loss) on investments | | (83,265,215) | | 74,485,782 |
| Net unrealized appreciation | | | | |
| (depreciation) on investments | | (59,977,721) | | (49,375,286) |
| Net Increase (Decrease) in Net Assets | | | | |
| Resulting from Operations | | (141,769,750) | | 27,143,342 |
| |
| |
|
| Dividends to Shareholders from ($): | | | | |
| Investment income—net: | | | | |
| Class A Shares | | — | | (295,948) |
| Class I Shares | | (476,309) | | (905,635) |
| Net realized gain on investments: | | | | |
| Class A Shares | | (30,009,185) | | (26,507,825) |
| Class B Shares | | (2,747,963) | | (2,198,920) |
| Class C Shares | | (4,774,257) | | (4,570,698) |
| Class I Shares | | (35,458,048) | | (21,548,999) |
| Class T Shares | | (2,646,008) | | (1,882,790) |
| Total Dividends | | (76,111,770) | | (57,910,815) |
| |
| |
|
| Capital Stock Transactions ($): | | | | |
| Net proceeds from shares sold: | | | | |
| Class A Shares | | 46,871,194 | | 77,769,152 |
| Class B Shares | | 606,170 | | 508,829 |
| Class C Shares | | 2,475,509 | | 2,709,654 |
| Class I Shares | | 58,003,444 | | 90,000,701 |
| Class T Shares | | 4,577,191 | | 5,995,935 |
The Fund 19
STATEMENT OF CHANGES IN NET ASSETS (continued)
| | | Year Ended October 31, |
| | |
|
| | | 2008 | | 2007a |
| |
| |
|
| Capital Stock Transactions ($) (continued): | | | | |
| Dividends reinvested: | | | | |
| Class A Shares | | 22,960,613 | | 20,599,310 |
| Class B Shares | | 2,008,397 | | 1,648,557 |
| Class C Shares | | 2,484,535 | | 2,559,740 |
| Class I Shares | | 27,013,595 | | 16,645,108 |
| Class T Shares | | 2,050,095 | | 1,307,584 |
| Cost of shares redeemed: | | | | |
| Class A Shares | | (126,138,385) | | (260,618,892) |
| Class B Shares | | (7,061,179) | | (7,699,833) |
| Class C Shares | | (13,458,442) | | (21,929,692) |
| Class I Shares | | (181,661,730) | | (85,162,355) |
| Class T Shares | | (8,536,992) | | (9,234,874) |
| Increase (Decrease) in Net Assets | | | | |
| from Capital Stock Transactions | | (167,805,985) | | (164,901,076) |
| Total Increase (Decrease) in Net Assets | | (385,687,505) | | (195,668,549) |
| |
| |
|
| Net Assets ($): | | | | |
| Beginning of Period | | 559,114,586 | | 754,783,135 |
| End of Period | | 173,427,081 | | 559,114,586 |
| Undistributed investment income—net | | 1,352,492 | | 1,072,066 |
20
| | | Year Ended October 31, |
| | |
|
| | | 2008 | | 2007a |
| |
| |
|
| Capital Share Transactions: | | | | |
| Class Ab | | | | |
| Shares sold | | 2,855,944 | | 3,388,122 |
| Shares issued for dividends reinvested | | 1,347,903 | | 929,978 |
| Shares redeemed | | (7,775,272) | | (11,209,606) |
| Net Increase (Decrease) in Shares Outstanding | | (3,571,425) | | (6,891,506) |
| |
| |
|
| Class Bb | | | | |
| Shares sold | | 38,759 | | 24,312 |
| Shares issued for dividends reinvested | | 128,148 | | 79,192 |
| Shares redeemed | | (475,546) | | (356,610) |
| Net Increase (Decrease) in Shares Outstanding | | (308,639) | | (253,106) |
| |
| |
|
| Class C | | | | |
| Shares sold | | 159,781 | | 128,148 |
| Shares issued for dividends reinvested | | 158,322 | | 122,790 |
| Shares redeemed | | (875,138) | | (1,017,765) |
| Net Increase (Decrease) in Shares Outstanding | | (557,035) | | (766,827) |
| |
| |
|
| Class I | | | | |
| Shares sold | | 3,493,640 | | 3,846,991 |
| Shares issued for dividends reinvested | | 1,555,548 | | 740,397 |
| Shares redeemed | | (11,101,439) | | (3,665,627) |
| Net Increase (Decrease) in Shares Outstanding | | (6,052,251) | | 921,761 |
| |
| |
|
| Class T | | | | |
| Shares sold | | 289,744 | | 265,977 |
| Shares issued for dividends reinvested | | 123,188 | | 60,034 |
| Shares redeemed | | (538,715) | | (411,455) |
| Net Increase (Decrease) in Shares Outstanding | | (125,783) | | (85,444) |
| a | | Effective June 1, 2007, Class R shares were redesignated as Class I shares. |
| b | | During the period ended October 31, 2008, 160,701 Class B shares representing $2,408,699 were automatically |
| | | converted to 147,611 Class A shares and during the period ended October 31, 2007, 92,712 Class B shares |
| | | representing $2,020,908 were automatically converted to 86,984 Class A shares. |
| See notes to financial statements. |
The Fund 21
FINANCIAL HIGHLIGHTS
The following tables describe the performance for each share class for the fiscal periods indicated. All information (except portfolio turnover rate) reflects financial results for a single fund share.Total return shows how much your investment in the fund would have increased (or decreased) during each period, assuming you had reinvested all dividends and distributions.These figures have been derived from the fund’s financial statements.
| | | | | Year Ended October 31, | | |
| | |
| |
| |
|
| Class A Shares | | 2008 | | 2007 | | 2006 | | 2005 | | 2004 |
| |
| |
| |
| |
| |
|
| Per Share Data ($): | | | | | | | | | | |
| Net asset value, beginning of period | | 22.34 | | 23.55 | | 21.49 | | 20.19 | | 17.43 |
| Investment Operations: | | | | | | | | | | |
| Investment income (loss)—neta | | .06 | | .06 | | .06 | | (.02) | | .03 |
| Net realized and unrealized | | | | | | | | | | |
| gain (loss) on investments | | (7.11) | | .72 | | 2.70 | | 2.46 | | 3.50 |
| Total from Investment Operations | | (7.05) | | .78 | | 2.76 | | 2.44 | | 3.53 |
| Distributions: | | | | | | | | | | |
| Dividends from investment income—net | | — | | (.02) | | — | | — | | — |
| Dividends from net realized | | | | | | | | | | |
| gain on investments | | (3.20) | | (1.97) | | (.70) | | (1.14) | | (.77) |
| Total Distributions | | (3.20) | | (1.99) | | (.70) | | (1.14) | | (.77) |
| Net asset value, end of period | | 12.09 | | 22.34 | | 23.55 | | 21.49 | | 20.19 |
| |
| |
| |
| |
| |
|
| Total Return (%)b | | (35.70) | | 3.42 | | 13.18 | | 12.29 | | 20.86 |
| |
| |
| |
| |
| |
|
| Ratios/Supplemental Data (%): | | | | | | | | | | |
| Ratio of total expenses | | | | | | | | | | |
| to average net assets | | 1.51 | | 1.50 | | 1.50 | | 1.50 | | 1.50 |
| Ratio of net expenses | | | | | | | | | | |
| to average net assets | | 1.36 | | 1.42 | | 1.50 | | 1.50 | | 1.50 |
| Ratio of net investment income | | | | | | | | | | |
| (loss) to average net assets | | .34 | | .27 | | .27 | | (.08) | | .16 |
| Portfolio Turnover Rate | | 78.10 | | 66.35 | | 89.62 | | 100.57 | | 136.35 |
| |
| |
| |
| |
| |
|
| Net Assets, end of period ($ x 1,000) | | 77,814 | | 223,590 | | 398,035 | | 387,991 | | 116,828 |
| a | | Based on average shares outstanding at each month end |
| b | | Exclusive of sales charge. |
| See notes to financial statements. |
22
| | | | | Year Ended October 31, | | |
| | |
| |
| |
|
| Class B Shares | | 2008 | | 2007 | | 2006 | | 2005 | | 2004 |
| |
| |
| |
| |
| |
|
| Per Share Data ($): | | | | | | | | | | |
| Net asset value, beginning of period | | 20.86 | | 22.25 | | 20.50 | | 19.44 | | 16.91 |
| Investment Operations: | | | | | | | | | | |
| Investment (loss)—neta | | (.06) | | (.10) | | (.10) | | (.18) | | (.13) |
| Net realized and unrealized | | | | | | | | | | |
| gain (loss) on investments | | (6.55) | | .68 | | 2.55 | | 2.38 | | 3.43 |
| Total from Investment Operations | | (6.61) | | .58 | | 2.45 | | 2.20 | | 3.30 |
| Distributions: | | | | | | | | | | |
| Dividends from net realized | | | | | | | | | | |
| gain on investments | | (3.20) | | (1.97) | | (.70) | | (1.14) | | (.77) |
| Net asset value, end of period | | 11.05 | | 20.86 | | 22.25 | | 20.50 | | 19.44 |
| |
| |
| |
| |
| |
|
| Total Return (%)b | | (36.20) | | 2.65 | | 12.28 | | 11.44 | | 20.18 |
| |
| |
| |
| |
| |
|
| Ratios/Supplemental Data (%): | | | | | | | | | | |
| Ratio of total expenses | | | | | | | | | | |
| to average net assets | | 2.26 | | 2.25 | | 2.25 | | 2.25 | | 2.25 |
| Ratio of net expenses | | | | | | | | | | |
| to average net assets | | 2.11 | | 2.17 | | 2.25 | | 2.25 | | 2.25 |
| Ratio of net investment (loss) | | | | | | | | | | |
| to average net assets | | (.42) | | (.46) | | (.48) | | (.86) | | (.73) |
| Portfolio Turnover Rate | | 78.10 | | 66.35 | | 89.62 | | 100.57 | | 136.35 |
| |
| |
| |
| |
| |
|
| Net Assets, end of period ($ x 1,000) | | 6,589 | | 18,876 | | 25,767 | | 31,755 | | 23,897 |
| a | | Based on average shares outstanding at each month end. |
| b | | Exclusive of sales charge. |
| See notes to financial statements. |
The Fund 23
| FINANCIAL HIGHLIGHTS (continued) |
| | | | | Year Ended October 31, | | |
| | |
| |
| |
|
| Class C Shares | | 2008 | | 2007 | | 2006 | | 2005 | | 2004 |
| |
| |
| |
| |
| |
|
| Per Share Data ($): | | | | | | | | | | |
| Net asset value, beginning of period | | 20.89 | | 22.28 | | 20.52 | | 19.46 | | 16.94 |
| Investment Operations: | | | | | | | | | | |
| Investment (loss)—neta | | (.06) | | (.10) | | (.10) | | (.17) | | (.12) |
| Net realized and unrealized | | | | | | | | | | |
| gain (loss) on investments | | (6.56) | | .68 | | 2.56 | | 2.37 | | 3.41 |
| Total from Investment Operations | | (6.62) | | .58 | | 2.46 | | 2.20 | | 3.29 |
| Distributions: | | | | | | | | | | |
| Dividends from net realized | | | | | | | | | | |
| gain on investments | | (3.20) | | (1.97) | | (.70) | | (1.14) | | (.77) |
| Net asset value, end of period | | 11.07 | | 20.89 | | 22.28 | | 20.52 | | 19.46 |
| |
| |
| |
| |
| |
|
| Total Return (%)b | | (36.19) | | 2.65 | | 12.32 | | 11.49 | | 20.02 |
| |
| |
| |
| |
| |
|
| Ratios/Supplemental Data (%): | | | | | | | | | | |
| Ratio of total expenses | | | | | | | | | | |
| to average net assets | | 2.26 | | 2.25 | | 2.25 | | 2.25 | | 2.25 |
| Ratio of net expenses | | | | | | | | | | |
| to average net assets | | 2.11 | | 2.17 | | 2.25 | | 2.25 | | 2.25 |
| Ratio of net investment (loss) | | | | | | | | | | |
| to average net assets | | (.43) | | (.48) | | (.48) | | (.84) | | (.63) |
| Portfolio Turnover Rate | | 78.10 | | 66.35 | | 89.62 | | 100.57 | | 136.35 |
| |
| |
| |
| |
| |
|
| Net Assets, end of period ($ x 1,000) | | 11,935 | | 34,161 | | 53,520 | | 65,973 | | 26,828 |
| a | | Based on average shares outstanding at each month |
| b | | Exclusive of sales charge. |
| See notes to financial statements. |
24
| | | | | Year Ended October 31, | | |
| | |
| |
| |
|
| Class I Shares | | 2008 | | 2007a | | 2006 | | 2005 | | 2004 |
| |
| |
| |
| |
| |
|
| Per Share Data ($): | | | | | | | | | | |
| Net asset value, beginning of period | | 22.72 | | 23.92 | | 21.77 | | 20.39 | | 17.54 |
| Investment Operations: | | | | | | | | | | |
| Investment income—netb | | .11 | | .13 | | .12 | | .04 | | .10 |
| Net realized and unrealized | | | | | | | | | | |
| gain (loss) on investments | | (7.26) | | .72 | | 2.73 | | 2.48 | | 3.52 |
| Total from Investment Operations | | (7.15) | | .85 | | 2.85 | | 2.52 | | 3.62 |
| Distributions: | | | | | | | | | | |
| Dividends from investment income—net | | (.04) | | (.08) | | — | | — | | — |
| Dividends from net realized | | | | | | | | | | |
| gain on investments | | (3.20) | | (1.97) | | (.70) | | (1.14) | | (.77) |
| Total Distributions | | (3.24) | | (2.05) | | (.70) | | (1.14) | | (.77) |
| Net asset value, end of period | | 12.33 | | 22.72 | | 23.92 | | 21.77 | | 20.39 |
| |
| |
| |
| |
| |
|
| Total Return (%) | | (35.57) | | 3.68 | | 13.43 | | 12.58 | | 21.26 |
| |
| |
| |
| |
| |
|
| Ratios/Supplemental Data (%): | | | | | | | | | | |
| Ratio of total expenses | | | | | | | | | | |
| to average net assets | | 1.26 | | 1.25 | | 1.25 | | 1.25 | | 1.25 |
| Ratio of net expenses | | | | | | | | | | |
| to average net assets | | 1.11 | | 1.16 | | 1.25 | | 1.25 | | 1.25 |
| Ratio of net investment income | | | | | | | | | | |
| to average net assets | | .62 | | .57 | | .53 | | .20 | | .58 |
| Portfolio Turnover Rate | | 78.10 | | 66.35 | | 89.62 | | 100.57 | | 136.35 |
| |
| |
| |
| |
| |
|
| Net Assets, end of period ($ x 1,000) | | 68,233 | | 263,262 | | 255,151 | | 187,464 | | 15,740 |
| a | | Effective June1, 2007, Class R shares were redesignated as Class I shares. |
| b | | Based on average shares outstanding at each month end. |
| See notes to financial statements. |
The Fund 25
| FINANCIAL HIGHLIGHTS (continued) |
| | | | | Year Ended October 31, | | |
| | |
| |
| |
|
| Class T Shares | | 2008 | | 2007 | | 2006 | | 2005 | | 2004 |
| |
| |
| |
| |
| |
|
| Per Share Data ($): | | | | | | | | | | |
| Net asset value, beginning of period | | 21.92 | | 23.17 | | 21.21 | | 19.99 | | 17.30 |
| Investment Operations: | | | | | | | | | | |
| Investment income (loss)—neta | | .01 | | .01 | | .01 | | (.07) | | (.02) |
| Net realized and unrealized | | | | | | | | | | |
| gain (loss) on investments | | (6.95) | | .71 | | 2.65 | | 2.43 | | 3.48 |
| Total from Investment Operations | | (6.94) | | .72 | | 2.66 | | 2.36 | | 3.46 |
| Distributions: | | | | | | | | | | |
| Dividends from net realized | | | | | | | | | | |
| gain on investments | | (3.20) | | (1.97) | | (.70) | | (1.14) | | (.77) |
| Net asset value, end of period | | 11.78 | | 21.92 | | 23.17 | | 21.21 | | 19.99 |
| |
| |
| |
| |
| |
|
| Total Return (%)b | | (35.91) | | 3.18 | | 12.88 | | 12.00 | | 20.61 |
| |
| |
| |
| |
| |
|
| Ratios/Supplemental Data (%): | | | | | | | | | | |
| Ratio of total expenses | | | | | | | | | | |
| to average net assets | | 1.76 | | 1.75 | | 1.75 | | 1.75 | | 1.75 |
| Ratio of net expenses | | | | | | | | | | |
| to average net assets | | 1.61 | | 1.66 | | 1.75 | | 1.75 | | 1.75 |
| Ratio of net investment income | | | | | | | | | | |
| (loss) to average net assets | | .06 | | .05 | | .03 | | (.32) | | (.12) |
| Portfolio Turnover Rate | | 78.10 | | 66.35 | | 89.62 | | 100.57 | | 136.35 |
| |
| |
| |
| |
| |
|
| Net Assets, end of period ($ x 1,000) | | 8,856 | | 19,227 | | 22,310 | | 15,353 | | 3,282 |
| a | | Based on average shares outstanding at each month end. |
| b | | Exclusive of sales charge. |
| See notes to financial statements. |
26
NOTES TO FINANCIAL STATEMENTS
NOTE 1—Significant Accounting Policies:
Dreyfus Small Cap Value Fund (the “fund”) is a separate diversified series of The Dreyfus/Laurel Funds, Inc. (the “Company”) which is registered under the Investment Company Act of 1940, as amended (the “Act”), as an open-end management investment company and operates as a series company currently offering fourteen series, including the fund.The fund’s investment objective is to seek capital appreciation. The Dreyfus Corporation (the “Manager” or “Dreyfus”), a wholly-owned subsidiary of The Bank of New York Mellon Corporation (“BNY Mellon”), serves as the fund’s investment adviser. The fund was closed to new investors. Effective June 16, 2008, the fund reopened to new investors.
At a meeting of the fund’s Board of Directors held on July 24, 2008, the Board approved, effective December 1, 2008, a proposal to change the name of the fund from “Dreyfus Premier Small Cap Value Fund” to “Dreyfus Small Cap Value Fund”.
Effective July 1, 2008, BNY Mellon has reorganized and consolidated a number of its banking and trust company subsidiaries. As a result of the reorganization, any services previously provided to the fund by Mellon Bank, N.A. or Mellon Trust of New England, N.A. are now provided by The Bank of New York, which has changed its name to The Bank of New York Mellon.
MBSC Securities Corporation (the “Distributor”), a wholly-owned subsidiary of the Manager, is the distributor of the fund’s shares. The fund is authorized to issue an 100 million shares of $.001 par value shares of capital stock in the following classes of shares: Class A, Class B, Class C and Class I and 200 million shares of $.001 par value Capital Stock of Class T shares. Class A, Class B, Class C and Class T shares are sold primarily to retail investors through financial intermediaries and bear a distribution fee and/or service fee. Class A and Class T shares are sold with a front end sales charge, while Class B and Class C are subject to a contingent deferred sales charge (“CDSC”). Class B shares automatically convert to Class A shares after six years.The fund does not
The Fund 27
| NOTES TO FINANCIAL STATEMENTS (continued) |
offer Class B shares, except in connection with dividend reinvestment and permitted exchanges of Class B shares. Class I shares are sold primarily to bank trust departments and other financial services providers (includingThe Bank of NewYork Mellon, a subsidiary of BNY Mellon and an affiliate of Dreyfus, and its affiliates) acting on behalf of customers having a qualified or investment account or relationship at such institution, and bear no distribution or service fee. Class I shares are offered without a front-end sales charge or CDSC. Each class of shares has identical rights and privileges, except with respect to distribution and service fees and voting rights on matters affecting a single class. Income, expenses (other than expenses attributable to a specific class), and realized and unrealized gains or losses on investments are allocated to each class of shares based on its relative net assets.
The fund’s financial statements are prepared in accordance with U.S. generally accepted accounting principles, which may require the use of management estimates and assumptions. Actual results could differ from those estimates.
(a) Portfolio valuation: Investments in securities are valued at the last sales price on the securities exchange or national securities market on which such securities are primarily traded. Securities listed on the National Market System for which market quotations are available, are valued at the official closing price or, if there is no official closing price that day, at the last sales price. Securities not listed on an exchange or the national securities market, or securities for which there were no transactions, are valued at the average of the most recent bid and asked prices, except for open short positions, where the asked price is used for valuation purposes. Bid price is used when no asked price is available. Registered investment companies that are not traded on an exchange are valued at their net asset value. When market quotations or official closing prices are not readily available, or are determined not to reflect accurately fair value, such as when the value of a security has been significantly affected by events after the close of the exchange or market on which the security is principally traded (for example, a foreign exchange or market),but before the fund calculates its net asset value,the fund may value these investments at fair value as determined in accordance with
28
the procedures approved by the Board of Directors. Fair valuing of securities may be determined with the assistance of a pricing service using calculations based on indices of domestic securities and other appropriate indicators, such as prices of relevant ADRs and futures contracts. For other securities that are fair valued by the Board of Directors, certain factors may be considered such as: fundamental analytical data, the nature and duration of restrictions on disposition, an evaluation of the forces that influence the market in which the securities are purchased and sold, and public trading in similar securities of the issuer or comparable issuers. Financial futures are valued at the last sales price.
The Financial Accounting Standards Board (“FASB”) released Statement of Financial Accounting Standards No. 157 “Fair Value Measurements” (“FAS 157”). FAS 157 establishes an authoritative definition of fair value, sets out a framework for measuring fair value, and requires additional disclosures about fair-value measurements. The application of FAS 157 is required for fiscal years beginning after November 15, 2007 and interim periods within those fiscal years. Management does not believe that the application of this standard will have a material impact on the financial statements of the fund.
(b) Securities transactions and investment income: Securities transactions are recorded on a trade date basis. Realized gains and losses from securities transactions are recorded on the identified cost basis. Dividend income is recognized on the ex-dividend date and interest income, including, where applicable, accretion of discount and amortization of premium on investments, is recognized on the accrual basis.
Pursuant to a securities lending agreement with The Bank of New York Mellon, the fund may lend securities to qualified institutions. It is the funds policy that, at origination, all loans are secured by collateral of at least 102% of the value of U.S. securities loaned and 105% of the value of foreign securities loaned. Collateral equivalent to at least 100% of the market value of securities on loan is maintained at all times. Collateral is either in the form of cash, which can be invested in certain money market mutual funds managed by the Manager, U.S. Government and Agency securities or letters of credit. The fund is
The Fund 29
| NOTES TO FINANCIAL STATEMENTS (continued) |
entitled to receive all income on securities loaned, in addition to income earned as a result of the lending transaction. Although each security loaned is fully collateralized, the fund bears the risk of delay in recovery of, or loss of rights in, the securities loaned should a borrower fail to return the securities in a timely manner. During the period ended October 31, 2008, The Bank of New York Mellon earned $289,958, pursuant to the securities lending agreement.
(c) Affiliated issuers: Investments in other investment companies advised by the Manager are defined as “affiliated” in the Act.
(d) Dividends to shareholders: Dividends are recorded on the ex-dividend date. Dividends from investment income-net and dividends from net realized capital gains, are normally declared and paid annually, but the fund may make distributions on a more frequent basis to comply with the distribution requirements of the Internal Revenue Code of 1986, as amended (the “Code”).To the extent that net realized capital gains can be offset by capital loss carryovers, it is the policy of the fund not to distribute such gains. Income and capital gain distributions are determined in accordance with income tax regulations, which may differ from U.S. generally accepted accounting principles.
(e) Federal income taxes: It is the policy of the fund to continue to qualify as a regulated investment company, if such qualification is in the best interests of its shareholders, by complying with the applicable provisions of the Code, and to make distributions of taxable income sufficient to relieve it from substantially all federal income and excise taxes.
The fund adopted FASB Interpretation No. 48 “Accounting for Uncertainty in Income Taxes” (“FIN 48”). FIN 48 provides guidance for how uncertain tax positions should be recognized, measured, presented and disclosed in the financial statements. FIN 48 requires the evaluation of tax positions taken or expected to be taken in the course of preparing the fund’s tax returns to determine whether the tax positions are “more-likely-than-not” of being sustained by the applicable tax authority. Liability for tax positions not deemed to meet the more-likely-than-not threshold would be recorded as a tax expense in the
30
current year.The adoption of FIN 48 had no impact on the operations of the fund for the period ended October 31, 2008.
As of and during the period ended October 31, 2008, the fund did not have any liabilities for any unrecognized tax positions. The fund recognizes interest and penalties, if any, related to unrecognized tax positions as income tax expense in the Statement of Operations. During the period, the fund did not incur any interest or penalties.
Each of the tax years in the four-year period ended October 31, 2008 remains subject to examination by the Internal Revenue Service and state taxing authorities.
At October 31, 2008, the components of accumulated earnings on a tax basis were as follows: undistributed ordinary income $1,086,800, accumulated capital losses $82,291,775 and unrealized depreciation $57,352,855.
The accumulated capital loss carryover is available for federal income tax purposes to be applied against future net securities profits, if any, realized subsequent to October 31, 2008. If not applied, the carryover expires in fiscal 2016.
The tax character of distributions paid to shareholders during the fiscal periods ended October 31, 2008 and October 31, 2007 were as follows: ordinary income $37,494,465 and $30,811,669 and long-term capital gains $38,617,305 and $27,099,146, respectively.
During the period ended October 31, 2008, as a result of permanent book to tax differences, primarily due to the tax treatment for real estate investment trusts, the fund decreased accumulated undistributed investment income-net by $716,451 and increased accumulated net realized gain (loss) on investments by the same amount. Net assets and net asset value per share were not affected by this reclassification.
NOTE 2—Bank Lines of Credit:
Prior to October 15, 2008, the fund participated with other Dreyfus-managed funds in a $350 million redemption credit facility. Effective
The Fund 31
| NOTES TO FINANCIAL STATEMENTS (continued) |
October 15, 2008, the fund participates with other Dreyfus-managed funds in a $145 million redemption credit facility (the “Facility”) to be utilized for temporary or emergency purposes, including the financing of redemptions. In connection therewith, the fund has agreed to pay commitment fees on its pro rata portion of the Facility. Interest is charged to the fund based on prevailing market rates in effect at the time of borrowing.
The average daily amount of borrowings outstanding under the Facilities during the period ended October 31, 2008, was $671,900 with a related weighted average annualized interest rate of 3.10% .
NOTE 3—Investment Management Fee and Other Transactions With Affiliates:
(a) Pursuant to an Investment Management Agreement with the Manager, the Manager provides or arranges for one or more third parties and/or affiliates to provide investment advisory, administrative, custody, fund accounting and transfer agency services to the fund.The Manager also directs the investments of the fund in accordance with its investment objective, policies and limitations. For these services, the fund is contractually obligated to pay the Manager a fee, calculated daily and paid monthly, at the annual rate of 1.25% of the value of the fund’s average daily net assets. Out of its fee, the Manager pays all of the expenses of the fund except brokerage fees, taxes, interest, commitment fees, Rule 12b-1 distribution fees and expenses, service fees, fees and expenses of non-interested Directors (including counsel fees) and extraordinary expenses. In addition, the Manager is required to reduce its fee in an amount equal to the fund’s allocable portion of fees and expenses of the non-interested Directors (including counsel fees). Each Director receives $45,000 per year, plus $6,000 for each joint Board meeting of the Company, The Dreyfus/Laurel Tax-Free Municipal Funds and The Dreyfus/Laurel Funds Trust (collectively, the “Dreyfus/Laurel Funds”) attended, $2,000 for separate in-person committee meetings attended which are not held in conjunction with a regularly scheduled Board meeting and $1,500 for Board meetings and separate committee meetings attended that are conducted by telephone
32
and is reimbursed for travel and out-of-pocket expenses.With respect to Board meetings, the Chairman of the Board receives an additional 25% of such compensation (with the exception of reimbursable amounts). With respect to compensation committee meetings, the Chair of the compensation committee receives $900 per meeting and, prior to April 12, 2008, with respect to audit committee meetings, the Chair of the audit committee received $1,350 per meeting. In the event that there is an in-person joint committee meeting or a joint telephone meeting of the Dreyfus/Laurel Funds and Dreyfus HighYield Strategies Fund, the $2,000 or $1,500 fee, as applicable, will be allocated between the Dreyfus/Laurel Funds and Dreyfus High Yield Strategies Fund. These fees and expenses are charged and allocated to each series based on net assets.Amounts required to be paid by the Company directly to the non-interested Directors, that would be applied to offset a portion of the management fee payable to the Manager, are in fact paid directly by the Manager to the non-interested Directors.
The Manager had agreed from November 1, 2007 through April 4, 2008 to waive receipt of a portion of the fund’s management fee, in the amount of .12% of the value of the fund’s average daily net assets and thereafter has agreed from April 5, 2008 through April 4, 2009 to waive receipt of a portion of the fund’s management fee, in the amount of .15% of the value of the fund’s average daily net assets.The reduction in management fee, pursuant to the undertaking, amounted to $556,243 during the period ended October 31, 2008.
During the period ended October 31, 2008, the Distributor retained $5,582 and $5 from commissions earned on sales of fund’s Class A and Class T shares, respectively, and $64,250 and $2,698 from CDSCs on redemptions of the fund’s Class B and Class C shares, respectively.
(b) Under separate Distribution Plans (the “Plans”) adopted pursuant to Rule 12b-1 under the Act, Class A shares may pay annually up to .25% of the value of their average daily net assets to compensate the Distributor for shareholder servicing activities and expenses primarily intended to result in the sale of Class A shares. Class B, Class C and Class T shares pay the Distributor for distributing their shares at an aggregate
The Fund 33
| NOTES TO FINANCIAL STATEMENTS (continued) |
annual rate of .75% of the value of the average daily net assets of Class B and Class C shares and .25% of the value of the average daily net assets of ClassT shares.The Distributor may pay one or more agents in respect of advertising, marketing and other distribution services for Class T shares and determines the amounts, if any, to be paid to agents and the basis on which such payments are made. Class B, Class C and Class T shares are also subject to a service plan adopted pursuant to Rule 12b-1 (the “Service Plan”), under which Class B, Class C and Class T shares pay the Distributor for providing certain services to the holders of their shares a fee at the annual rate of .25% of the value of the average daily net assets of Class B,Class C and ClassT shares.During the period ended October 31, 2008, Class A, Class B, Class C and Class T shares were charged $375,913,$90,690,$155,745 and $34,006,respectively,pursuant to their respective Plans.Class B,Class C and ClassT shares were charged $30,230,$51,915 and $34,006,respectively,pursuant to the Service Plan.
Under its terms, the Plans and Service Plan shall remain in effect from year to year, provided such continuance is approved annually by a vote of a majority of those directors who are not “interested persons” of the Company and who have no direct or indirect financial interest in the operation of or in any agreement related to the Plans or Service Plan.
The components of “Due to The Dreyfus Corporation and affiliates” in the Statement of Assets and Liabilities consist of: management fees $196,870, Rule 12b-1 distribution plan fees $31,447 and service plan fees $5,962, which are offset against an expense reimbursement currently in effect in the amount of $22,880.
NOTE 4—Securities Transactions:
The aggregate amount of purchases and sales of investment securities, excluding short-term securities, during the period ended October 31, 2008, amounted to $290,729,624 and $528,646,947, respectively.
At October 31, 2008, the cost of investments for federal income tax purposes was $277,590,925; accordingly, accumulated net unrealized depreciation on investments was $57,352,855, consisting of $5,168,094 gross unrealized appreciation and $62,520,949 gross unrealized depreciation.
34
In March 2008, the FASB released Statement of Financial Accounting Standards No. 161, Disclosures about Derivative Instruments and Hedging Activities (“FAS 161”). FAS 161 requires qualitative disclosures about objectives and strategies for using derivatives, quantitative disclosures about fair value amounts of gains and losses on derivative instruments, and disclosures about credit-risk-related contingent features in derivative agreements.The application of FAS 161 is required for fiscal years and interim periods beginning after November 15, 2008. At this time, management is evaluating the implications of FAS 161 and its impact on the financial statements and the accompanying notes has not yet been determined.
NOTE 5—Subsequent Event:
Effective on or about February 4, 2009 (the “Effective Date”), the fund will issue to each holder of its Class T shares, in exchange for said shares, Class A shares of the fund having an aggregate net asset value equal to the aggregate net asset value of the shareholder’s Class T shares.Thereafter, the fund will no longer offer Class T shares.
Effective on or about December 3, 2008, no investments for new accounts were permitted in Class T of the fund, except that participants in certain group retirement plans were able to open a new account in Class T of the fund, provided that the fund was established as an investment option under the plans before December 3, 2008. After the Effective Date, subsequent investments in the fund’s Class A shares made by holders of the fund’s Class T shares who received Class A shares of the fund in exchange for their Class T shares will be subject to the front-end sales load schedule currently in effect for Class T shares. Otherwise, all other Class A share attributes will be in effect.
The Fund 35
REPORT OF INDEPENDENT REGISTERED PUBLIC ACCOUNTING FIRM
The Board of Directors and Shareholders The Dreyfus/Laurel Funds, Inc.:
We have audited the accompanying statement of assets and liabilities of Dreyfus Small Cap Value Fund (formerly Dreyfus Premier Small Cap Value Fund), a series of The Dreyfus/Laurel Funds, Inc. (the “Fund”), including the statement of investments, as of October 31, 2008, and the related statement of operations for the year then ended, the statement of changes in net assets for each of the years in the two-year period then ended, and the financial highlights for each of the years in the five-year period then ended. These financial statements and financial highlights are the responsibility of the Fund’s management. Our responsibility is to express an opinion on these financial statements and financial highlights based on our audits.
We conducted our audits in accordance with the standards of the Public Company Accounting Oversight Board (United States).Those standards require that we plan and perform the audit to obtain reasonable assurance about whether the financial statements and financial highlights are free of material misstatement. An audit includes examining, on a test basis, evidence supporting the amounts and disclosures in the financial statements. Our procedures included confirmation of securities owned as of October 31, 2008, by correspondence with the custodian and brokers or by other appropriate audit procedures where replies from brokers were not received. An audit also includes assessing the accounting principles used and significant estimates made by management, as well as evaluating the overall financial statement presentation. We believe that our audits provide a reasonable basis for our opinion.
In our opinion, the financial statements and financial highlights referred to above present fairly, in all material respects, the financial position of Dreyfus Small Cap Value Fund as of October 31, 2008, and the results of its operations for the year then ended, the changes in its net assets for each of the years in the two-year period then ended, and the financial highlights for each of the years in the five-year period then ended, in conformity with U.S. generally accepted accounting principles.

| | New York, New York
December 19, 2008 |
36
IMPORTANT TAX INFORMATION (Unaudited)
For federal tax purposes, the fund also hereby designates 24.71% of the ordinary dividends paid during the fiscal year ended October 31, 2008 as qualifying for the corporate dividends received deduction. For the fiscal year ended October 31, 2008, certain dividends paid by the fund may be subject to a maximum tax rate of 15%, as provided for by the Jobs and Growth Tax Relief Reconciliation Act of 2003. Of the distributions paid during the fiscal year, $13,117 represents the maximum amount that may be considered qualified dividend income. Shareholders will receive notification in January 2009 of the percentage applicable to the preparation of their 2008 income tax returns. Also, the fund hereby designates $1.6178 per share as a long-term capital gain distribution and $1.5602 per share as a short-term capital gain distribution of the $3.1780 per share paid on December 18, 2007 and also designates $.0160 per share as a long-term capital gain distribution and $.0060 per share as a short-term capital gain distribution of the $.0220 per share paid on March 26, 2008.
The Fund 37
BOARD MEMBERS INFORMATION (Unaudited)
Joseph S. DiMartino (65)
Chairman of the Board (1999)
Principal Occupation During Past 5Years:
Corporate Director and Trustee
Other Board Memberships and Affiliations: |
- The Muscular Dystrophy Association, Director
- Century Business Services, Inc., a provider of outsourcing functions for small and medium size companies, Director
- The Newark Group, a provider of a national market of paper recovery facilities, paperboard mills and paperboard converting plants, Director
- Sunair Services Corporation, a provider of certain outdoor-related services to homes and businesses, Director
No. of Portfolios for which Board Member Serves: 167
James M. Fitzgibbons (74)
Board Member (1994)
Principal Occupation During Past 5Years:
Corporate Director and Trustee |
Other Board Memberships and Affiliations:
Bill Barrett Company, an oil and gas exploration company, Director
No. of Portfolios for which Board Member Serves: 25
Kenneth A. Himmel (62)
Board Member (1994)
Principal Occupation During Past 5Years: |
- President and CEO,Related Urban Development,a real estate development company (1996-present)
- President and CEO, Himmel & Company, a real estate development company (1980-present)
- CEO, American Food Management, a restaurant company (1983-present)
| No. of Portfolios for which Board Member Serves: 25 |
Stephen J. Lockwood (61)
Board Member (1994)
Principal Occupation During Past 5Years: |
- Chairman of the Board, Stephen J. Lockwood and Company LLC, an investment company (2000-present)
| No. of Portfolios for which Board Member Serves: 25 |
38
Roslyn M. Watson (59)
Board Member (1994) |
Principal Occupation During Past 5Years:
Principal,Watson Ventures, Inc., a real estate investment company (1993-present)
Other Board Memberships and Affiliations:
- American Express Bank, Director
- The Hyams Foundation Inc., a Massachusetts Charitable Foundation,Trustee
- National Osteoporosis Foundation,Trustee
- SBLI-USA, Director
| No. of Portfolios for which Board Member Serves: 25 |
Benaree Pratt Wiley (62)
Board Member (1998)
Principal Occupation During Past 5Years: |
- Principal,The Wiley Group, a firm specializing in strategy and business development (2005-present)
- President and CEO,The Partnership, an organization dedicated to increasing the representation of African Americans in positions of leadership, influence and decision-making in Boston, MA (1991-2005)
| Other Board Memberships and Affiliations: |
- Boston College,Trustee Associate
- Blue Cross Blue Shield of Massachusetts, Director
- CBIZ, professional support consultants and service providers for small, midsized and corporate business, Director
- Commonwealth Institute, Director
- Efficacy Institute, Director
- PepsiCo African-American, Chair of Advisory Board
- The Boston Foundation, Director
- Century Business Services, Inc., a provider of outsourcing functions for small and medium size companies, Director
| No. of Portfolios for which Board Member Serves: 36 |
Once elected all Board Members serve for an indefinite term, but achieve Emeritus status upon reaching age 80.The address of the Board Members and Officers is in c/o The Dreyfus Corporation, 200 Park Avenue, NewYork, NewYork 10166. Additional information about the Board Members is available in the fund’s Statement of Additional Information which can be obtained from Dreyfus free of charge by calling this toll free number: 1-800-554-4611.
Francis P. Brennan, Emeritus Board Member
J.Tomlinson Fort, Emeritus Board Member |
The Fund 39
OFFICERS OF THE FUND (Unaudited)
| J. DAVID OFFICER, President since | | JONI LACKS CHARATAN, Vice President |
| December 2006. | | and Assistant Secretary since |
| Chief Operating Officer,Vice Chairman and a | | August 2005. |
| Director of the Manager, and an officer of 77 | | Senior Counsel of BNY Mellon, and an officer |
| investment companies (comprised of 167 | | of 78 investment companies (comprised of 188 |
| portfolios) managed by the Manager. He is 60 | | portfolios) managed by the Manager. She is 53 |
| years old and has been an employee of the | | years old and has been an employee of the |
| Manager since April 1998. | | Manager since October 1988. |
| |
| PHILLIP N. MAISANO, Executive Vice | | JOSEPH M. CHIOFFI, Vice President and |
| President since July 2007. | | Assistant Secretary since August 2005. |
| Chief Investment Officer,Vice Chair and a | | Senior Counsel of BNY Mellon, and an officer |
| director of the Manager, and an officer of 77 | | of 78 investment companies (comprised of 188 |
| investment companies (comprised of 167 | | portfolios) managed by the Manager. He is 47 |
| portfolios) managed by the Manager. Mr. | | years old and has been an employee of the |
| Maisano also is an officer and/or Board | | Manager since June 2000. |
| member of certain other investment | | |
| | | JANETTE E. FARRAGHER, Vice President |
| management subsidiaries of The Bank of New | | |
| | | and Assistant Secretary since |
| York Mellon Corporation, each of which is an | | |
| | | August 2005. |
| affiliate of the Manager. He is 61 years old and | | |
| has been an employee of the Manager since | | Assistant General Counsel of BNY Mellon, |
| November 2006. Prior to joining the Manager, | | and an officer of 78 investment companies |
| Mr. Maisano served as Chairman and Chief | | (comprised of 188 portfolios) managed by the |
| Executive Officer of EACM Advisors, an | | Manager. She is 45 years old and has been an |
| affiliate of the Manager, since August 2004, and | | employee of the Manager since February 1984. |
| served as Chief Executive Officer of Evaluation | | JOHN B. HAMMALIAN, Vice President and |
| Associates, a leading institutional investment | | Assistant Secretary since August 2005. |
| consulting firm, from 1988 until 2004. | | |
| | | Managing Counsel of BNY Mellon, and an |
| MICHAEL A. ROSENBERG, Vice President | | officer of 78 investment companies (comprised |
| and Secretary since August 2005. | | of 188 portfolios) managed by the Manager. |
| Assistant General Counsel of BNY Mellon, | | He is 45 years old and has been an employee |
| and an officer of 78 investment companies | | of the Manager since February 1991. |
| (comprised of 188 portfolios) managed by the | | ROBERT R. MULLERY, Vice President and |
| Manager. He is 48 years old and has been an | | Assistant Secretary since August 2005. |
| employee of the Manager since October 1991. | | |
| | | Managing Counsel of BNY Mellon, and an |
| JAMES BITETTO, Vice President and | | officer of 78 investment companies (comprised |
| Assistant Secretary since August 2005. | | of 188 portfolios) managed by the Manager. |
| Senior Counsel of BNY Mellon and Secretary | | He is 56 years old and has been an employee |
| of the Manager, and an officer of 78 | | of the Manager since May 1986. |
| investment companies (comprised of 188 | | |
| portfolios) managed by the Manager. He is 42 | | |
| years old and has been an employee of the | | |
| Manager since December 1996. | | |
40
| JEFF PRUSNOFSKY, Vice President and | | ROBERT SALVIOLO, Assistant Treasurer |
| Assistant Secretary since August 2005. | | since July 2007. |
| Managing Counsel of BNY Mellon, and an | | Senior Accounting Manager – Equity Funds of |
| officer of 78 investment companies (comprised | | the Manager, and an officer of 78 investment |
| of 188 portfolios) managed by the Manager. | | companies (comprised of 188 portfolios) |
| He is 43 years old and has been an employee | | managed by the Manager. He is 41 years old |
| of the Manager since October 1990. | | and has been an employee of the Manager |
| | | since June 1989. |
| JAMES WINDELS, Treasurer since | | |
| November 2001. | | ROBERT SVAGNA, Assistant Treasurer |
| Director – Mutual Fund Accounting of the | | since December 2002. |
| Manager, and an officer of 78 investment | | Senior Accounting Manager – Equity Funds of |
| companies (comprised of 188 portfolios) | | the Manager, and an officer of 78 investment |
| managed by the Manager. He is 49 years old | | companies (comprised of 188 portfolios) |
| and has been an employee of the Manager | | managed by the Manager. He is 41 years old |
| since April 1985. | | and has been an employee of the Manager |
| | | since November 1990. |
| RICHARD CASSARO, Assistant Treasurer | | |
| since January 2008. | | JOSEPH W. CONNOLLY, Chief Compliance |
| Senior Accounting Manager – Money Market | | Officer since October 2004. |
| and Municipal Bond Funds of the Manager, | | Chief Compliance Officer of the Manager and |
| and an officer of 78 investment companies | | The Dreyfus Family of Funds (78 investment |
| (comprised of 188 portfolios) managed by | | companies, comprised of 188 portfolios). From |
| the Manager. He is 49 years old and has | | November 2001 through March 2004, Mr. |
| been an employee of the Manager since | | Connolly was first Vice-President, Mutual |
| September 1982. | | Fund Servicing for Mellon Global Securities |
| | | Services. In that capacity, Mr. Connolly was |
| GAVIN C. REILLY, Assistant Treasurer | | |
| | | responsible for managing Mellon’s Custody, |
| since December 2005. | | |
| | | Fund Accounting and Fund Administration |
| Tax Manager of the Investment Accounting | | services to third-party mutual fund clients. He |
| and Support Department of the Manager, and | | is 51 years old and has served in various |
| an officer of 78 investment companies | | capacities with the Manager since 1980, |
| (comprised of 188 portfolios) managed by the | | including manager of the firm’s Fund |
| Manager. He is 40 years old and has been an | | Accounting Department from 1997 through |
| employee of the Manager since April 1991. | | October 2001. |
| |
| ROBERT ROBOL, Assistant Treasurer | | WILLIAM GERMENIS, Anti-Money |
| since December 2002. | | Laundering Compliance Officer since |
| Senior Accounting Manager – Fixed Income | | July 2002. |
| Funds of the Manager, and an officer of 78 | | Vice President and Anti-Money Laundering |
| investment companies (comprised of 188 | | Compliance Officer of the Distributor, and the |
| portfolios) managed by the Manager. He is 44 | | Anti-Money Laundering Compliance Officer |
| years old and has been an employee of the | | of 74 investment companies (comprised of 184 |
| Manager since October 1988. | | portfolios) managed by the Manager. He is 38 |
| | | years old and has been an employee of the |
| | | Distributor since October 1998. |
The Fund 41

Save time. Save paper. View your next shareholder report online as soon as it’s available. Log into www.dreyfus.com and sign up for Dreyfus eCommunications. It’s simple and only takes a few minutes.
The views expressed in this report reflect those of the portfolio manager only through the end of the period covered and do not necessarily represent the views of Dreyfus or any other person in the Dreyfus organization. Any such views are subject to change at any time based upon market or other conditions and Dreyfus disclaims any responsibility to update such views.These views may not be relied on as investment advice and, because investment decisions for a Dreyfus fund are based on numerous factors, may not be relied on as an indication of trading intent on behalf of any Dreyfus fund.
Not FDIC-Insured Not Bank-Guaranteed May Lose Value
| Contents |
| |
| | | THE FUND |
| |
|
| 2 | | A Letter from the CEO |
| 3 | | Discussion of Fund Performance |
| 6 | | Fund Performance |
| 8 | | Understanding Your Fund’s Expenses |
| 8 | | Comparing Your Fund’s Expenses |
| With Those of Other Funds |
| 9 | | Statement of Investments |
| 21 | | Statement of Financial Futures |
| 21 | | Statement of Options Written |
| 22 | | Statement of Assets and Liabilities |
| 23 | | Statement of Operations |
| 24 | | Statement of Changes in Net Assets |
| 26 | | Financial Highlights |
| 29 | | Notes to Financial Statements |
| 44 | | Report of Independent Registered |
| | | Public Accounting Firm |
| 45 | | Important Tax Information |
| 46 | | Board Members Information |
| 48 | | Officers of the Fund |
| |
| FOR MORE INFORMATION |
|
| | | Back Cover |
| Dreyfus |
| Strategic Income Fund |

A LETTER FROM THE CEO
Dear Shareholder:
We present to you this annual report for Dreyfus Strategic Income Fund, covering the 12-month period from November 1, 2007, through October 31, 2008.
These are difficult times for fixed-income investors. A credit crunch that began in 2007 has developed into a full-blown global financial crisis,recently resulting in the failure of several major financial institutions and prompting a massive government rescue effort.The U.S. economic slowdown also has gathered momentum, depressing investor sentiment and consumer confidence. These factors undermined returns in the bond market’s higher-yielding sectors, including high yield corporate and municipal securities, and even the traditional safe haven of U.S. government securities has encountered heightened yield volatility. The depth and duration of the economic downturn will depend on how quickly the financial system can be stabilized.We believe that the Temporary Guarantee Program for Money Market Funds and the $700 billion rescue package intended to promote greater liquidity in the financial markets meet several critical requirements for addressing today’s financial stresses, and we expect these measures to contribute to a more orderly deleveraging process. However, recuperation from the financial crisis is likely to take time. In the meantime, we encourage you to keep in touch with your financial advisor and maintain a long-term and disciplined perspective to investing. Indeed, we already are seeing some positive signs, including a likely peak in global inflationary pressures, a bottoming of the U.S. dollar and a large pool of worldwide financial liquidity that could be deployed gradually to riskier assets as the economic cycle turns.
For information about how the fund performed during the reporting period, as well as market perspectives, we have provided a Discussion of Fund Performance given by the fund’s Portfolio Manager.
Thank you for your continued confidence and support.
2

DISCUSSION OF FUND PERFORMANCE
For the period of November 1, 2007, through October 31, 2008, as provided by Kent Wosepka, Portfolio Manager
Fund and Market Performance Overview
For the 12-month period ended October 31, 2008, Dreyfus Strategic Income Fund’s Class A, Class C and Class I shares produced total returns of –14.21%, –14.95% and –14.06%, respectively.1 In comparison, the fund’s benchmark, the Barclays Capital U.S. Aggregate Index (the “Index”), produced a total return of 0.30% for the same period.2 In addition, the fund is reported in the Lipper Multi-Sector Income Funds category, and the average total return for all funds reported in this Lipper category was –15.36 for the reporting period.3
With the notable exception of U.S.Treasury securities,most sectors of the U.S.bond market suffered as a global financial crisis intensified during the reporting period, culminating in the near collapse of the U.S. and global banking systems in September 2008.The fund’s significant underperfor-mance of the benchmark index was due to its underweighted position in U.S.Treasury securities relative to the benchmark and heavier exposure to higher-yielding market sectors that fared poorly in the downturn.
The Fund’s Investment Approach
The fund seeks high current income as its primary goal and capital appreciation as a secondary goal.To pursue these goals, we typically allocate the fund’s assets across four sectors of the fixed-income market:U.S.high yield bonds rated below investment grade; U.S. government, investment grade corporate and mortgage-backed securities; foreign debt securities of developed markets; and foreign debt securities of emerging markets.
Our analysis of top down quantitative and macroeconomic factors guides the allocation of assets among market sectors, industries and positioning along the yield curve. Using fundamental analysis, we seek to identify individual securities with high current income, as well as appreciation potential, based on relative value, credit upgrade probability and extensive research into the credit history and current financial strength of the securities’ issuers.
Global Financial Crisis Sparked Broad Declines
A credit crunch that began in the sub-prime mortgage market in 2007 developed into a full-blown global financial crisis later in the reporting
The Fund 3
| DISCUSSION OF FUND PERFORMANCE (continued) |
period, leading to the failures of several major financial institutions.As the crisis came close to spinning out of control in September 2008, very difficult liquidity conditions in various credit markets — including the overnight interbank lending market — nearly led to the collapse of the global banking system. Unprecedented intervention by government authorities, which pumped billions of dollars of liquidity into the system, helped thaw frozen credit markets by the reporting period’s end.These efforts included the passage of the controversial Trouble Asset Relief Program (“TARP”) by the U.S. Congress and coordinated reductions of short-term interest rates by central banks, including the Federal Reserve Board, which lowered the federal funds rate to just 1.00% .
Meanwhile, slumping housing markets, rising unemployment and sharply lower consumer confidence exacerbated a downturn in the U.S. economy, giving rise to fears regarding a potentially deep and prolonged recession. Many commodity prices that had soared over the reporting period’s first half plummeted over the second half when demand abated for energy and construction materials worldwide.
As credit-market conditions deteriorated, many highly leveraged institutional investors were forced to de-lever their portfolios, selling their more liquid investments to raise cash for margin calls and redemption requests.As a result, selling pressure intensified even among fundamentally sound fixed-income securities, leading to broadly lower prices for corporate bonds, asset-backed securities, mortgage-backed securities, municipal bonds and the sovereign debt of developing nations. Lower-rated bonds were particularly hard-hit, while U.S. Treasury securities fared better as newly risk-averse investors flocked to the relatively safe haven provided by U.S. government-backed investments.
Sector Allocation Strategies Weighed on Performance
The fund’s longstanding preference for higher-yielding bond market sectors detracted from its relative performance in this challenging environment. Relatively light exposure to U.S.Treasury securities, which we believe offered unappealing yields, also contributed to lagging relative results. Conversely, overweighted positions in investment-grade and high yield corporate bonds, commercial mortgage-backed securities and asset-backed securities significantly impacted on the fund’s total return despite competitive income streams and sound credit fundamentals underlying the vast majority of its holdings.Within the corporate bond market, an emphasis on banks and finance companies fared particularly poorly.
4
On the other hand, the fund’s interest-rate strategies contributed positively to relative performance, as a “bulleted” emphasis on securities with three- to five-year maturities helped the fund benefit from widening yield differences along the bond market’s maturity range. Similarly, a modestly long average duration helped the fund participate more fully in the benefits of falling U.S. interest rates. Finally, a position in non-dollar securities enabled the fund to capture the benefits of falling interest rates in Europe, and trading strategies employing derivatives helped the fund profit from heightened market volatility.
Anticipating a Return to Fundamentals
As of the reporting period’s end, we have maintained the fund’s overweighted exposure to market sectors that we believe have been punished too severely by the credit crisis.After conducting extensive credit analysis, we have found particularly compelling values among certain commercial mortgage-backed securities and corporate bonds.In our view,these strategies position the fund for better performance potential when the financial crisis recedes. Of course, there is no guarantee when this may occur.
November 17, 2008
| | | The fund may use derivative instruments, such as options, futures and options on futures, forward |
| | | contracts, swaps (including credit default swaps on corporate bonds and asset-backed securities), |
| | | options on swaps, and other credit derivatives.A small investment in derivatives could have a |
| | | potentially large impact on the fund’s performance.The use of derivatives involves risks different |
| | | from, or possibly greater than, the risks associated with investing directly in the underlying assets. |
| | | Credit default swaps and similar instruments involve greater risks than if the fund had invested in |
| | | the reference obligation directly, since, in addition to general market risks, they are subject to |
| | | illiquidity risk, counterparty risk and credit risks. |
| 1 | | Total return includes reinvestment of dividends and any capital gains paid, and does not take into |
| | | consideration the maximum initial sales charge in the case of Class A shares, or the applicable |
| | | contingent deferred sales charges imposed on redemptions in the case of Class C shares. Had these |
| | | charges been reflected, returns would have been lower. Effective June 1, 2007, Class R shares of |
| | | the fund were renamed Class I shares. Past performance is no guarantee of future results. Share |
| | | price, yield and investment return fluctuate such that upon redemption, fund shares may be worth |
| | | more or less than their original cost. Return figures provided reflect the absorption of certain fund |
| | | expenses by The Dreyfus Corporation pursuant to an agreement in effect through March 1, |
| | | 2010, at which time it may be extended, modified or terminated. Had these expenses not been |
| | | absorbed, the fund’s returns would have been lower. |
| 2 | | SOURCE: LIPPER INC. — Reflects reinvestment of dividends and, where applicable, capital |
| | | gain distributions.The Barclays Capital U.S.Aggregate Index is a widely accepted, unmanaged |
| | | total return index of corporate, U.S. government and U.S. government agency debt instruments, |
| | | mortgage-backed securities and asset-backed securities with an average maturity of 1-10 years. |
| 3 | | Source: Lipper Inc. |
The Fund 5
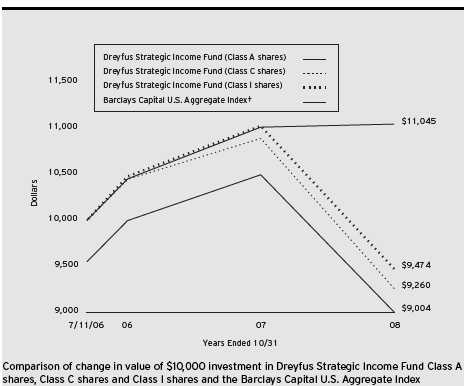
| † Source: Lipper Inc. |
| Past performance is not predictive of future performance. |
| The above graph compares a $10,000 investment made in Class A, Class C and Class I shares of Dreyfus Strategic |
| Income Fund on 7/11/06 (inception date) to a $10,000 investment made in the Barclays Capital U.S.Aggregate |
| Index (the “Index”) on that date. For comparative purposes, the value of the Index on 6/30/06 is used as the |
| beginning value on 7/11/06.All dividends and capital gain distributions are reinvested. |
| The fund invests primarily in fixed-income securities.The fund’s performance shown in the line graph takes into account |
| the maximum initial sales charge on Class A shares and all other applicable fees and expenses on all classes.The Index |
| is a widely accepted, unmanaged total return index of corporate, U.S. government and U.S. government agency debt |
| instruments, mortgage-backed securities and asset-backed securities with an average maturity of 1-10 years. Unlike a |
| mutual fund, the Index is not subject to charges, fees and other expenses. Investors cannot invest directly in any index. |
| Further information relating to fund performance, including expense reimbursements, if applicable, is contained in the |
| Financial Highlights section of the prospectus and elsewhere in this report. |
6
| Average Annual Total Returns as of 10/31/08 | | | | | | |
| |
| | | Inception | | | | From |
| | | Date | | 1 Year | | Inception |
| |
| |
| |
|
| Class A shares | | | | | | |
| with maximum sales charge (4.5%) | | 7/11/06 | | (18.04)% | | (4.44)% |
| without sales charge | | 7/11/06 | | (14.21)% | | (2.51)% |
| Class C shares | | | | | | |
| with applicable redemption charge † | | 7/11/06 | | (15.75)% | | (3.27)% |
| without redemption | | 7/11/06 | | (14.95)% | | (3.27)% |
| Class I shares | | 7/11/06 | | (14.06)% | | (2.31)% |
| Past performance is not predictive of future performance.The fund’s performance shown in the graph and table does not |
| reflect the deduction of taxes that a shareholder would pay on the fund distributions or the redemption of fund shares. |
| † The maximum contingent deferred sales charge for Class C shares is 1% for shares redeemed within one year of the |
| date of purchase. |
The Fund 7
UNDERSTANDING YOUR FUND’S EXPENSES (Unaudited)
As a mutual fund investor, you pay ongoing expenses, such as management fees and other expenses. Using the information below, you can estimate how these expenses affect your investment and compare them with the expenses of other funds.You also may pay one-time transaction expenses, including sales charges (loads) and redemption fees, which are not shown in this section and would have resulted in higher total expenses. For more information, see your fund’s prospectus or talk to your financial adviser.
Review your fund’s expenses
The table below shows the expenses you would have paid on a $1,000 investment in Dreyfus Strategic Income Fund from May 1, 2008 to October 31, 2008. It also shows how much a $1,000 investment would be worth at the close of the period, assuming actual returns and expenses.
| Expenses and Value of a $1,000 Investment | | | | |
| assuming actual returns for the six months ended October 31, 2008 | | |
| | | Class A | | Class C | | Class I |
| |
| |
| |
|
| Expenses paid per $1,000† | | $ 8.84 | | $ 12.70 | | $ 7.63 |
| Ending value (after expenses) | | $861.60 | | $858.00 | | $861.90 |
| COMPARING YOUR FUND’S EXPENSES |
| WITH THOSE OF OTHER FUNDS (Unaudited) |
Using the SEC’s method to compare expenses
The Securities and Exchange Commission (SEC) has established guidelines to help investors assess fund expenses. Per these guidelines, the table below shows your fund’s expenses based on a $1,000 investment, assuming a hypothetical 5% annualized return You can use this information to compare the ongoing expenses (but not transaction expenses or total cost) of investing in the fund with those of other funds.All mutual fund shareholder reports will provide this information to help you make this comparison Please note that you cannot use this information to estimate your actual ending account balance and expenses paid during the period.
| Expenses and Value of a $1,000 Investment | | | | |
| assuming a hypothetical 5% annualized return for the six months ended October 31, 2008 |
| | | Class A | | Class C | | Class I |
| |
| |
| |
|
| Expenses paid per $1,000† | | $ 9.58 | | $ 13.75 | | $ 8.26 |
| Ending value (after expenses) | | $1,015.63 | | $1,011.46 | | $1,016.94 |
† Expenses are equal to the fund’s annualized expense ratio of 1.89% for Class A, 2.72% for Class C and 1.63% Class I, multiplied by the average account value over the period, multiplied by 184/366 (to reflect the one-half year period).
8
STATEMENT OF INVESTMENTS
October 31, 2008
| | | Coupon | | Maturity | | Principal | | | |
| Bonds and Notes—87.4% | | Rate (%) | | Date | | Amount ($) | | | Value ($) |
| |
| |
| |
|
| |
|
| Advertising—.2% | | | | | | | | | |
| Lamar Media, | | | | | | | | | |
| Gtd. Notes, Ser. B | | 6.63 | | 8/15/15 | | 60,000 | | | 44,400 |
| Aerospace & Defense—.5% | | | | | | | | | |
| L-3 Communications, | | | | | | | | | |
| Gtd. Notes, Ser. B | | 6.38 | | 10/15/15 | | 115,000 | | | 96,025 |
| Agricultural—.5% | | | | | | | | | |
| Philip Morris International, | | | | | | | | | |
| Sr. Unscd. Notes | | 5.65 | | 5/16/18 | | 115,000 | | | 98,550 |
| Asset-Backed Ctfs./ | | | | | | | | | |
| Auto Receivables—5.4% | | | | | | | | | |
| AmeriCredit Automobile Receivables | | | | | | | | | |
| Trust, Ser. 2005-DA, Cl. A3 | | 4.87 | | 12/6/10 | | 9,852 | | | 9,702 |
| AmeriCredit Automobile Receivables | | | | | | | | | |
| Trust, Ser. 2006-BG, Cl. A3 | | 5.21 | | 10/6/11 | | 76,101 | | | 74,364 |
| Americredit Prime Automobile | | | | | | | | | |
| Receivables Trust, | | | | | | | | | |
| Ser. 2007-1, Cl. E | | 6.96 | | 3/8/16 | | 305,282 | a | | 180,116 |
| Capital One Auto Finance Trust, | | | | | | | | | |
| Ser. 2006-C, Cl. A3A | | 5.07 | | 7/15/11 | | 51,042 | | | 49,709 |
| Capital One Auto Finance Trust, | | | | | | | | | |
| Ser. 2007-C, Cl. A2A | | 5.29 | | 5/17/10 | | 7,326 | | | 7,300 |
| Capital One Auto Finance Trust, | | | | | | | | | |
| Ser. 2006-A, Cl. A3 | | 5.33 | | 11/15/10 | | 7,413 | | | 7,386 |
| Ford Credit Auto Owner Trust, | | | | | | | | | |
| Ser. 2006-C, Cl. D | | 6.89 | | 5/15/13 | | 625,000 | a | | 447,235 |
| Ford Credit Auto Owner Trust, | | | | | | | | | |
| Ser. 2007-A, Cl. D | | 7.05 | | 12/15/13 | | 250,000 | a | | 169,093 |
| Ford Credit Auto Owner Trust, | | | | | | | | | |
| Ser. 2006-B, Cl. D | | 7.12 | | 2/15/13 | | 250,000 | a | | 180,544 |
| | | | | | | | | | 1,125,449 |
| Asset-Backed Ctfs./Credit Cards—.3% | | | | | | | | | |
| American Express Credit Account | | | | | | | | | |
| Master Trust, Ser. 2007-1, Cl. C | | 4.83 | | 9/15/14 | | 100,000 | a,b | | 73,166 |
| Asset-Backed Ctfs./ | | | | | | | | | |
| Home Equity Loans—.9% | | | | | | | | | |
| Aames Mortgage Investment Trust, | | | | | | | | | |
| Ser. 2005-4, Cl. B1 | | 6.01 | | 10/25/35 | | 225,000 | b | | 5,372 |
| Accredited Mortgage Loan Trust, | | | | | | | | | |
| Ser. 2006-1, Cl. A3 | | 3.44 | | 4/25/36 | | 105,000 | b | | 89,185 |
The Fund 9
| STATEMENT OF INVESTMENTS (continued) |
| | | | | Coupon | | Maturity | | Principal | | | |
| Bonds and Notes (continued) | | Rate (%) | | Date | | Amount ($) | | | Value ($) |
| |
| |
| |
|
| |
|
| Asset-Backed Ctfs./ | | | | | | | | | | | |
| Home Equity Loans (continued) | | | | | | | | | |
| Countrywide Asset-Backed | | | | | | | | | | | |
| Certificates, Ser. 2006-13, | | | | | | | | | | | |
| Cl. MV5 | | | | 3.68 | | 1/25/37 | | 160,000 | b | | 15,814 |
| Countrywide Asset-Backed | | | | | | | | | | | |
| Certificates, Ser. 2004-3, Cl. M3 | | 4.13 | | 5/25/34 | | 18,394 | b | | 11,143 |
| Countrywide Asset-Backed | | | | | | | | | | | |
| Certificates, Ser. 2007-4, Cl. M8 | | 7.20 | | 9/25/37 | | 250,000 | | | 11,900 |
| Residential Asset Securities, | | | | | | | | | | | |
| Ser. 2005-EMX4, Cl. A2 | | | | 3.52 | | 11/25/35 | | 65,389 | b | | 61,786 |
| | | | | | | | | | | | 195,200 |
| Automotive, Trucks & Parts—.2% | | | | | | | | | |
| Goodyear Tire & Rubber, | | | | | | | | | | | |
| Gtd. Notes | | | | 6.68 | | 12/1/09 | | 35,000 | b | | 32,244 |
| Banks—10.6% | | | | | | | | | | | |
| BAC Capital Trust XIV, | | | | | | | | | | | |
| Bank Gtd. Notes | | | | 5.63 | | 12/31/49 | | 240,000 | b | | 112,913 |
| Bank of America, | | | | | | | | | | | |
| Jr. Sub. Bonds | | | | 8.00 | | 12/29/49 | | 105,000 | b | | 78,730 |
| Barclays Bank, | | | | | | | | | | | |
| Jr. Sub. Bonds | | | | 5.93 | | 9/29/49 | | 100,000 | a,b | | 53,756 |
| Capital One Financial, | | | | | | | | | | | |
| Sr. Unscd. Notes | | | | 3.10 | | 9/10/09 | | 225,000 | b | | 208,690 |
| Chevy Chase Bank, | | | | | | | | | | | |
| Sub. Notes | | | | 6.88 | | 12/1/13 | | 80,000 | | | 48,400 |
| European Investment Bank, | | | | | | | | | | | |
| Sr. Unscd. Notes | | NZD | | 7.00 | | 1/18/12 | | 830,000 | c | | 494,067 |
| J.P. Morgan & Co., | | | | | | | | | | | |
| Sub. Notes | | | | 6.25 | | 1/15/09 | | 90,000 | | | 89,899 |
| KFW, | | | | | | | | | | | |
| Gov’t Gtd. Notes | | TRY | | 17.75 | | 4/24/09 | | 725,000 | c | | 457,156 |
| Royal Bank of Scotland Group, | | | | | | | | | | | |
| Jr. Sub. Bonds | | | | 6.99 | | 10/29/49 | | 135,000 | a,b | | 72,455 |
| Sovereign Bancorp, | | | | | | | | | | | |
| Sr. Unscd. Notes | | | | 3.44 | | 3/23/10 | | 160,000 | b | | 145,097 |
| Sumitomo Mitsui Banking, | | | | | | | | | | | |
| Sub. Notes | | | | 5.63 | | 7/29/49 | | 135,000 | a,b | | 95,977 |
| SunTrust Preferred Capital I, | | | | | | | | | | | |
| Bank Gtd. Notes | | | | 5.85 | | 12/31/49 | | 230,000 | b | | 126,865 |
10
| | | Coupon | | Maturity | | Principal | | | |
| Bonds and Notes (continued) | | Rate (%) | | Date | | Amount ($) | | | Value ($) |
| |
| |
| |
|
| |
|
| Banks (continued) | | | | | | | | | |
| USB Capital IX, | | | | | | | | | |
| Gtd. Notes | | 6.19 | | 4/15/49 | | 450,000 | b | | 234,111 |
| | | | | | | | | | 2,218,116 |
| Building & Construction—.5% | | | | | | | | | |
| Home Depot, | | | | | | | | | |
| Sr. Unscd. Notes | | 5.25 | | 12/16/13 | | 30,000 | | | 25,297 |
| Home Depot, | | | | | | | | | |
| Sr. Unscd. Notes | | 5.88 | | 12/16/36 | | 65,000 | | | 38,976 |
| Masco, | | | | | | | | | |
| Sr. Unscd. Notes | | 3.12 | | 3/12/10 | | 45,000 | b | | 42,396 |
| | | | | | | | | | 106,669 |
| Commercial & Professional | | �� | | | | | | | |
| Services—1.5% | | | | | | | | | |
| Aramark, | | | | | | | | | |
| Gtd. Notes | | 8.50 | | 2/1/15 | | 55,000 | | | 47,300 |
| Ceridian, | | | | | | | | | |
| Sr. Unscd. Notes | | 11.25 | | 11/15/15 | | 20,000 | a | | 12,500 |
| Donnelley (R.R.) and Sons, | | | | | | | | | |
| Sr. Unscd. Notes | | 5.63 | | 1/15/12 | | 150,000 | | | 131,177 |
| Donnelley (R.R.) and Sons, | | | | | | | | | |
| Sr. Unscd. Notes | | 6.13 | | 1/15/17 | | 110,000 | | | 77,955 |
| ERAC USA Finance, | | | | | | | | | |
| Gtd. Notes | | 6.38 | | 10/15/17 | | 60,000 | a | | 36,854 |
| ERAC USA Finance, | | | | | | | | | |
| Gtd. Notes | | 7.00 | | 10/15/37 | | 30,000 | a | | 17,590 |
| | | | | | | | | | 323,376 |
| Commercial Mortgage | | | | | | | | | |
| Pass-Through Ctfs.—4.8% | | | | | | | | | |
| Bayview Commercial Asset Trust, | | | | | | | | | |
| Ser. 2004-1, Cl. A | | 3.62 | | 4/25/34 | | 36,504 | a,b | | 32,661 |
| Bayview Commercial Asset Trust, | | | | | | | | | |
| Ser. 2006-3A, Cl. B3 | | 5.86 | | 10/25/36 | | 380,551 | a,b | | 139,852 |
| Crown Castle Towers, | | | | | | | | | |
| Ser. 2006-1A, Cl. AFX | | 5.24 | | 11/15/36 | | 125,000 | a | | 120,029 |
| CS First Boston Mortgage | | | | | | | | | |
| Securities, Ser. 2005-C5, Cl. A4 | | 5.10 | | 8/15/38 | | 125,000 | b | | 100,709 |
| CS First Boston Mortgage | | | | | | | | | |
| Securities, Ser. 2001-CKN5, Cl. A4 | | 5.44 | | 9/15/34 | | 78,517 | | | 74,231 |
The Fund 11
| STATEMENT OF INVESTMENTS (continued) |
| | | | | Coupon | | Maturity | | Principal | | | |
| Bonds and Notes (continued) | | Rate (%) | | Date | | Amount ($) | | | Value ($) |
| |
| |
| |
|
| |
|
| Commercial Mortgage | | | | | | | | | | | |
| Pass-Through Ctfs. (continued) | | | | | | | | | |
| GMAC Commercial Mortgage | | | | | | | | | | | |
| Securities, Ser. 2003-C3, Cl. A3 | | 4.65 | | 4/10/40 | | 55,000 | | | 51,499 |
| Goldman Sachs Mortgage Securities | | | | | | | | | |
| Corporation II, Ser. 2007-EOP, | | | | | | | | | |
| Cl. K | | | | 5.09 | | 3/6/20 | | 100,000 | a,b | | 74,391 |
| Goldman Sachs Mortgage Securities | | | | | | | | | |
| Corporation II, Ser. 2007-EOP, | | | | | | | | | |
| Cl. L | | | | 5.34 | | 3/6/20 | | 335,000 | a,b | | 254,600 |
| SBA CMBS Trust, | | | | | | | | | | | |
| Ser. 2005-1A, Cl. C | | | | 5.73 | | 11/15/35 | | 25,000 | a | | 21,199 |
| SBA CMBS Trust, | | | | | | | | | | | |
| Ser. 2006-1A, Cl. D | | | | 5.85 | | 11/15/36 | | 65,000 | a | | 56,276 |
| Wachovia Bank Commercial Mortgage | | | | | | | | | |
| Trust, Ser. 2003-C5, Cl. A2 | | 3.99 | | 6/15/35 | | 90,000 | | | 75,700 |
| | | | | | | | | | | | 1,001,147 |
| Diversified Financial Services—13.7% | | | | | | | | | |
| Ace INA Holdings, | | | | | | | | | | | |
| Gtd. Notes | | | | 5.80 | | 3/15/18 | | 30,000 | | | 24,127 |
| Ameriprise Financial, | | | | | | | | | | | |
| Jr. Sub. Notes | | | | 7.52 | | 6/1/66 | | 150,000 | b | | 74,970 |
| Block Financial, | | | | | | | | | | | |
| Gtd. Notes | | | | 7.88 | | 1/15/13 | | 100,000 | | | 96,975 |
| Capmark Financial Group, | | | | | | | | | | | |
| Gtd. Notes | | | | 5.88 | | 5/10/12 | | 355,000 | | | 88,785 |
| Citigroup, | | | | | | | | | | | |
| Sr. Unscd. Notes | | | | 5.50 | | 4/11/13 | | 295,000 | | | 270,103 |
| Citigroup, | | | | | | | | | | | |
| Sr. Sub. Bonds | | | | 6.00 | | 10/31/33 | | 5,000 | | | 3,396 |
| Citigroup, | | | | | | | | | | | |
| Sr. Unscd. Notes | | | | 6.13 | | 5/15/18 | | 70,000 | | | 60,071 |
| Countrywide Home Loans, | | | | | | | | | | | |
| Gtd. Notes | | | | 4.13 | | 9/15/09 | | 30,000 | | | 28,776 |
| Credit Suisse Guernsey, | | | | | | | | | | | |
| Jr. Sub. Notes | | | | 5.86 | | 5/29/49 | | 30,000 | b | | 17,159 |
| FCE Bank, | | | | | | | | | | | |
| Sr. Unscd. Notes | | EUR | | 6.14 | | 9/30/09 | | 180,000 | b,c | | 181,241 |
12
| | | Coupon | | Maturity | | Principal | | | |
| Bonds and Notes (continued) | | Rate (%) | | Date | | Amount ($) | | | Value ($) |
| |
| |
| |
|
| |
|
| Diversified Financial | | | | | | | | | |
| Services (continued) | | | | | | | | | |
| Ford Motor Credit, | | | | | | | | | |
| Sr. Unscd. Notes | | 5.80 | | 1/12/09 | | 230,000 | | | 213,260 |
| Goldman Sachs Capital II, | | | | | | | | | |
| Gtd. Bonds | | 5.79 | | 12/29/49 | | 180,000 | b | | 82,716 |
| Goldman Sachs Group, | | | | | | | | | |
| Sub. Notes | | 6.75 | | 10/1/37 | | 50,000 | | | 32,642 |
| HUB International Holdings, | | | | | | | | | |
| Sr. Sub. Notes | | 10.25 | | 6/15/15 | | 170,000 | a | | 107,950 |
| International Lease Finance, | | | | | | | | | |
| Sr. Unscd. Notes | | 6.38 | | 3/25/13 | | 75,000 | | | 49,089 |
| Jackson National Life Global, | | | | | | | | | |
| Sr. Scd. Notes | | 5.38 | | 5/8/13 | | 55,000 | a | | 48,972 |
| Janus Capital Group, | | | | | | | | | |
| Sr. Unscd. Notes | | 6.25 | | 6/15/12 | | 220,000 | | | 173,537 |
| JPMorgan Chase & Co., | | | | | | | | | |
| Sr. Unscd. Notes | | 6.40 | | 5/15/38 | | 55,000 | | | 47,360 |
| Leucadia National, | | | | | | | | | |
| Sr. Unscd. Notes | | 7.00 | | 8/15/13 | | 115,000 | | | 101,775 |
| Leucadia National, | | | | | | | | | |
| Sr. Unscd. Notes | | 7.13 | | 3/15/17 | | 340,000 | | | 292,400 |
| Lincoln National, | | | | | | | | | |
| Jr. Sub. Bonds | | 6.05 | | 4/20/67 | | 130,000 | b | | 59,879 |
| Merrill Lynch & Co., | | | | | | | | | |
| Sr. Unscd. Notes, Ser. C | | 4.25 | | 2/8/10 | | 95,000 | | | 88,803 |
| Merrill Lynch & Co., | | | | | | | | | |
| Sr. Unscd. Notes | | 6.05 | | 8/15/12 | | 210,000 | | | 191,310 |
| Metropolitan Life Global Funding | | | | | | | | | |
| I, Sr. Scd. Notes | | 5.13 | | 4/10/13 | | 100,000 | a | | 89,477 |
| Morgan Stanley, | | | | | | | | | |
| Sr. Unscd. Notes | | 6.60 | | 4/1/12 | | 140,000 | | | 125,481 |
| Pacific Life Global Funding, | | | | | | | | | |
| Notes | | 5.15 | | 4/15/13 | | 55,000 | a | | 46,138 |
| SLM, | | | | | | | | | |
| Sr. Unscd. Notes, Ser. A | | 4.50 | | 7/26/10 | | 250,000 | | | 195,735 |
| UCI Holdco, | | | | | | | | | |
| Sr. Unscd. Notes | | 10.30 | | 12/15/13 | | 60,671 | b | | 23,358 |
The Fund 13
| STATEMENT OF INVESTMENTS (continued) |
| | | Coupon | | Maturity | | Principal | | | |
| Bonds and Notes (continued) | | Rate (%) | | Date | | Amount ($) | | | Value ($) |
| |
| |
| |
|
| |
|
| Diversified Financial | | | | | | | | | |
| Services (continued) | | | | | | | | | |
| WEA Finance, | | | | | | | | | |
| Sr. Notes | | 7.13 | | 4/15/18 | | 55,000 | a | | 43,243 |
| Willis North America, | | | | | | | | | |
| Gtd. Notes | | 6.20 | | 3/28/17 | | 20,000 | | | 14,596 |
| | | | | | | | | | 2,873,324 |
| Electric Utilities—6.0% | | | | | | | | | |
| Consolidated Edison of NY, | | | | | | | | | |
| Sr. Unscd. Debs., Ser. 08-A | | 5.85 | | 4/1/18 | | 60,000 | | | 51,198 |
| Dominion Resources, | | | | | | | | | |
| Sr. Unscd. Notes | | 6.40 | | 6/15/18 | | 80,000 | | | 67,902 |
| Edison Mission Energy, | | | | | | | | | |
| Sr. Unscd. Notes | | 7.50 | | 6/15/13 | | 200,000 | | | 169,500 |
| Enel Finance International, | | | | | | | | | |
| Gtd. Bonds | | 6.25 | | 9/15/17 | | 350,000 | a | | 290,007 |
| Energy Future Holdings, | | | | | | | | | |
| Gtd. Notes | | 10.88 | | 11/1/17 | | 320,000 | a | | 248,000 |
| FirstEnergy, | | | | | | | | | |
| Sr. Unscd. Notes, Ser. B | | 6.45 | | 11/15/11 | | 105,000 | | | 98,975 |
| General Electric Capital, | | | | | | | | | |
| Sr. Unscd. Notes | | 5.63 | | 5/1/18 | | 155,000 | | | 127,824 |
| National Grid, | | | | | | | | | |
| Sr. Unscd. Notes | | 6.30 | | 8/1/16 | | 35,000 | | | 29,448 |
| Nevada Power, | | | | | | | | | |
| Mortgage Notes | | 6.50 | | 8/1/18 | | 40,000 | | | 33,835 |
| Nisource Finance, | | | | | | | | | |
| Gtd. Notes | | 6.40 | | 3/15/18 | | 85,000 | | | 61,696 |
| Pacific Gas & Electric, | | | | | | | | | |
| Sr. Unscd. Notes | | 6.35 | | 2/15/38 | | 95,000 | | | 74,883 |
| | | | | | | | | | 1,253,268 |
| Environmental Control—.7% | | | | | | | | | |
| Oakmont Asset Trust, | | | | | | | | | |
| Notes | | 4.51 | | 12/22/08 | | 60,000 | a | | 60,067 |
| Veolia Environnement, | | | | | | | | | |
| Sr. Unscd. Notes | | 5.25 | | 6/3/13 | | 85,000 | | | 76,949 |
| | | | | | | | | | 137,016 |
14
| | | | | Coupon | | Maturity | | Principal | | |
| Bonds and Notes (continued) | | Rate (%) | | Date | | Amount ($) | | Value ($) |
| |
| |
| |
| |
|
| Food & Beverages—1.6% | | | | | | | | | | |
| Delhaize Group, | | | | | | | | | | |
| Sr. Unscd. Notes | | | | 6.50 | | 6/15/17 | | 85,000 | | 69,116 |
| Kraft Foods, | | | | | | | | | | |
| Sr. Unscd. Notes | | | | 6.13 | | 2/1/18 | | 45,000 | | 38,620 |
| Kraft Foods, | | | | | | | | | | |
| Sr. Unscd. Notes | | | | 6.88 | | 2/1/38 | | 60,000 | | 47,741 |
| Kroger, | | | | | | | | | | |
| Gtd. Notes | | | | 6.15 | | 1/15/20 | | 50,000 | | 41,126 |
| Safeway, | | | | | | | | | | |
| Sr. Unscd. Notes | | | | 6.35 | | 8/15/17 | | 50,000 | | 43,294 |
| Stater Brothers Holdings, | | | | | | | | | | |
| Gtd. Notes | | | | 8.13 | | 6/15/12 | | 115,000 | | 102,925 |
| | | | | | | | | | | 342,822 |
| Foreign/ | | | | | | | | | | |
| Governmental—3.0% | | | | | | | | | | |
| Province of Ontario Canada, | | | | | | | | | | |
| Unsub. Notes | | TRY | | 19.25 | | 12/12/08 | | 960,000 c | | 622,440 |
| Health Care—3.3% | | | | | | | | | | |
| Biomet, | | | | | | | | | | |
| Gtd. Notes | | | | 11.63 | | 10/15/17 | | 55,000 | | 48,125 |
| Davita, | | | | | | | | | | |
| Gtd. Notes | | | | 6.63 | | 3/15/13 | | 115,000 | | 101,487 |
| HCA, | | | | | | | | | | |
| Sr. Unscd. Notes | | | | 6.75 | | 7/15/13 | | 150,000 | | 96,750 |
| HCA, | | | | | | | | | | |
| Sr. Unscd. Notes | | | | 7.88 | | 2/1/11 | | 29,000 | | 24,360 |
| HCA, | | | | | | | | | | |
| Sr. Unscd. Notes | | | | 8.75 | | 9/1/10 | | 170,000 | | 150,450 |
| Medco Health Solutions, | | | | | | | | | | |
| Sr. Unscd. Notes | | | | 7.25 | | 8/15/13 | | 160,000 | | 153,182 |
| UnitedHealth Group, | | | | | | | | | | |
| Sr. Unscd. Notes | | | | 5.50 | | 11/15/12 | | 90,000 | | 79,562 |
| Wellpoint, | | | | | | | | | | |
| Sr. Unscd. Notes | | | | 5.88 | | 6/15/17 | | 55,000 | | 45,031 |
| | | | | | | | | | | 698,947 |
The Fund 15
| STATEMENT OF INVESTMENTS (continued) |
| | | Coupon | | Maturity | | Principal | | | |
| Bonds and Notes (continued) | | Rate (%) | | Date | | Amount ($) | | | Value ($) |
| |
| |
| |
|
| |
|
| Lodging & Entertainment—.3% | | | | | | | | | |
| Isle of Capri Casinos, | | | | | | | | | |
| Gtd. Notes | | 7.00 | | 3/1/14 | | 115,000 | | | 56,350 |
| Manufacturing—1.2% | | | | | | | | | |
| Bombardier, | | | | | | | | | |
| Sr. Unscd. Notes | | 6.30 | | 5/1/14 | | 200,000 | a | | 160,000 |
| Siemens Financieringsmat, | | | | | | | | | |
| Gtd. Notes | | 5.75 | | 10/17/16 | | 100,000 | a | | 89,889 |
| | | | | | | | | | 249,889 |
| Media—3.9% | | | | | | | | | |
| Comcast, | | | | | | | | | |
| Gtd. Notes | | 5.12 | | 7/14/09 | | 225,000 | b | | 215,601 |
| News America, | | | | | | | | | |
| Gtd. Notes | | 6.15 | | 3/1/37 | | 345,000 | | | 251,916 |
| Reed Elsevier Capital, | | | | | | | | | |
| Gtd. Notes | | 4.63 | | 6/15/12 | | 250,000 | | | 237,176 |
| Time Warner Cable, | | | | | | | | | |
| Gtd. Notes | | 6.75 | | 7/1/18 | | 40,000 | | | 34,365 |
| Time Warner, | | | | | | | | | |
| Gtd. Notes | | 3.03 | | 11/13/09 | | 85,000 | b | | 79,923 |
| | | | | | | | | | 818,981 |
| Mining—.6% | | | | | | | | | |
| Alcoa, | | | | | | | | | |
| Sr. Unscd. Notes | | 6.00 | | 7/15/13 | | 30,000 | | | 25,842 |
| Rio Tinto Finance USA, | | | | | | | | | |
| Gtd. Notes | | 5.88 | | 7/15/13 | | 110,000 | | | 93,956 |
| | | | | | | | | | 119,798 |
| Municipal Obligations—.4% | | | | | | | | | |
| Clark County School District, | | | | | | | | | |
| GO, Ser. F (Insured; FSA) | | 5.50 | | 6/15/17 | | 15,000 | d | | 16,198 |
| Clark County School District, | | | | | | | | | |
| GO, Ser. F (Insured; FSA) | | 5.50 | | 6/15/18 | | 10,000 | d | | 10,799 |
| Clark County, | | | | | | | | | |
| GO (Bond Bank) (Insured; MBIA) | | 5.25 | | 6/1/20 | | 15,000 | d | | 16,183 |
| Cypress-Fairbanks Independent | | | | | | | | | |
| School District, GO, Ser. A | | | | | | | | | |
| (Schoolhouse) (Insured; PSF-GTD) | | 5.25 | | 2/15/22 | | 10,000 | d | | 10,391 |
16
| | | Coupon | | Maturity | | Principal | | | |
| Bonds and Notes (continued) | | Rate (%) | | Date | | Amount ($) | | | Value ($) |
| |
| |
| |
|
| |
|
| Municipal Obligations (continued) | | | | | | | | | |
| Williamson County, | | | | | | | | | |
| GO, Ser. A (Insured; FSA) | | 6.00 | | 8/15/14 | | 5,000 | d | | 5,308 |
| Wisconsin, | | | | | | | | | |
| GO, Ser. G (Insured; MBIA) | | 5.00 | | 5/1/15 | | 15,000 | d | | 16,062 |
| | | | | | | | | | 74,941 |
| Office And Business Equipment—.7% | | | | | | | | | |
| International Business Machines, | | | | | | | | | |
| Sr. Unscd. Notes | | 5.70 | | 9/14/17 | | 110,000 | | | 100,091 |
| Xerox, | | | | | | | | | |
| Sr. Unscd. Notes | | 5.50 | | 5/15/12 | | 25,000 | | | 19,444 |
| Xerox, | | | | | | | | | |
| Sr. Unscd. Notes | | 5.65 | | 5/15/13 | | 30,000 | | | 23,700 |
| | | | | | | | | | 143,235 |
| Oil & Gas Exploration—.8% | | | | | | | | | |
| Anadarko Petroleum, | | | | | | | | | |
| Sr. Unscd. Notes | | 3.22 | | 9/15/09 | | 180,000 | b | | 170,069 |
| Packaging & Containers—1.8% | | | | | | | | | |
| Crown Americas, | | | | | | | | | |
| Gtd. Notes | | 7.63 | | 11/15/13 | | 115,000 | | | 101,775 |
| Crown Americas, | | | | | | | | | |
| Gtd. Notes | | 7.75 | | 11/15/15 | | 110,000 | | | 96,525 |
| Owens Brockway Glass Container, | | | | | | | | | |
| Gtd. Notes | | 6.75 | | 12/1/14 | | 200,000 | | | 174,000 |
| | | | | | | | | | 372,300 |
| Paper & Paper Related—.7% | | | | | | | | | |
| Georgia-Pacific, | | | | | | | | | |
| Sr. Unscd. Notes | | 8.13 | | 5/15/11 | | 135,000 | | | 114,750 |
| NewPage, | | | | | | | | | |
| Gtd. Notes | | 12.00 | | 5/1/13 | | 55,000 | | | 32,725 |
| | | | | | | | | | 147,475 |
| Real Estate Investment Trusts—1.4% | | | | | | | | | |
| Federal Realty Investment Trust, | | | | | | | | | |
| Sr. Unscd. Notes | | 5.40 | | 12/1/13 | | 50,000 | | | 43,022 |
| Host Hotels & Resorts, | | | | | | | | | |
| Sr. Scd. Notes | | 7.13 | | 11/1/13 | | 105,000 | | | 82,950 |
The Fund 17
| STATEMENT OF INVESTMENTS (continued) |
| | | Coupon | | Maturity | | Principal | | | |
| Bonds and Notes (continued) | | Rate (%) | | Date | | Amount ($) | | | Value ($) |
| |
| |
| |
|
| |
|
| Real Estate Investment | | | | | | | | | |
| Trusts (continued) | | | | | | | | | |
| Liberty Property, | | | | | | | | | |
| Sr. Unscd. Notes | | 6.63 | | 10/1/17 | | 190,000 | | | 139,519 |
| Prologis, | | | | | | | | | |
| Sr. Unscd. Notes | | 6.63 | | 5/15/18 | | 50,000 | | | 28,822 |
| | | | | | | | | | 294,313 |
| Retail—1.1% | | | | | | | | | |
| Bausch & Lomb, | | | | | | | | | |
| Sr. Unscd. Notes | | 9.88 | | 11/1/15 | | 165,000 | a | | 130,350 |
| Lowe’s Companies, | | | | | | | | | |
| Sr. Unscd. Notes | | 6.10 | | 9/15/17 | | 75,000 | | | 65,010 |
| Walgreen, | | | | | | | | | |
| Sr. Unscd. Notes | | 4.88 | | 8/1/13 | | 45,000 | | | 44,010 |
| | | | | | | | | | 239,370 |
| State/Territory Gen Oblg—.3% | | | | | | | | | |
| California | | | | | | | | | |
| GO (Insured; AMBAC) | | 3.50 | | 10/1/27 | | 65,000 | | | 44,884 |
| Tobacco Settlement Financing | | | | | | | | | |
| Corporation of New Jersey, | | | | | | | | | |
| Tobacco Settlement | | | | | | | | | |
| Asset-Backed Bonds | | 4.50 | | 6/1/23 | | 20,000 | | | 16,185 |
| | | | | | | | | | 61,069 |
| Telecommunications—3.6% | | | | | | | | | |
| Intelsat Jackson Holdings, | | | | | | | | | |
| Gtd. Notes | | 11.25 | | 6/15/16 | | 50,000 | | | 43,000 |
| Intelsat, | | | | | | | | | |
| Sr. Unscd. Notes | | 7.63 | | 4/15/12 | | 55,000 | | | 34,925 |
| Sprint Capital, | | | | | | | | | |
| Gtd. Notes | | 6.88 | | 11/15/28 | | 45,000 | | | 26,378 |
| Sprint Capital, | | | | | | | | | |
| Gtd. Notes | | 7.63 | | 1/30/11 | | 175,000 | | | 145,320 |
| Telecom Italia Capital, | | | | | | | | | |
| Gtd. Notes | | 5.25 | | 11/15/13 | | 25,000 | | | 18,996 |
| Telefonica Emisiones, | | | | | | | | | |
| Gtd. Notes | | 3.50 | | 6/19/09 | | 85,000 | b | | 81,867 |
| Time Warner Cable, | | | | | | | | | |
| Gtd. Notes | | 5.85 | | 5/1/17 | | 105,000 | | | 86,154 |
18
| | | Coupon | | Maturity | | Principal | | |
| Bonds and Notes (continued) | | Rate (%) | | Date | | Amount ($) | | Value ($) |
| |
| |
| |
| |
|
| Telecommunications (continued) | | | | | | | | |
| Time Warner, | | | | | | | | |
| Gtd. Notes | | 5.88 | | 11/15/16 | | 225,000 | | 180,347 |
| Verizon Communications, | | | | | | | | |
| Sr. Unscd. Notes | | 6.10 | | 4/15/18 | | 125,000 | | 109,398 |
| Verizon Communications, | | | | | | | | |
| Sr. Unscd. Notes | | 8.95 | | 3/1/39 | | 30,000 | | 30,525 |
| | | | | | | | | 756,910 |
| U.S. Government Agencies/ | | | | | | | | |
| Mortgage-Backed—10.0% | | | | | | | | |
| Federal National Mortgage Association: | | | | | | | | |
| 5.00% | | | | | | 555,000 e,f | | 525,776 |
| 5.50% | | | | | | 1,600,000 e,f | | 1,561,586 |
| | | | | | | | | 2,087,362 |
| U.S. Government Securities—6.9% | | | | | | | | |
| U.S. Treasury Bonds | | | | | | | | |
| 5.00%, 5/15/37 | | | | | | 85,000 | | 93,646 |
| U.S. Treasury Notes: | | | | | | | | |
| 3.50%, 5/31/13 | | | | | | 158,000 | | 164,011 |
| 4.75%, 8/15/17 | | | | | | 605,000 | | 640,544 |
| 4.88%, 4/30/11 | | | | | | 507,000 | | 548,273 |
| | | | | | | | | 1,446,474 |
| Total Bonds and Notes | | | | | | | | |
| (cost $23,084,006) | | | | | | | | 18,280,695 |
| |
| |
| |
| |
|
| |
| Short-Term Investments—18.0% | | | | | | | | |
| |
| |
| |
| |
|
| U.S. Government Agencies—16.1% | | | | | | | | |
| Federal National Mortgage | | | | | | | | |
| Association, Notes, 0.75%, 12/11/08 | | | | | | 1,700,000 e | | 1,698,583 |
| Federal National Mortgage | | | | | | | | |
| Association, Notes, 1.95%, 11/13/08 | | | | | | 1,670,000 e | | 1,668,916 |
| | | | | | | | | 3,367,499 |
| U.S. Treasury Bills—1.9% | | | | | | | | |
| 0.35%, 1/2/09 | | | | | | 390,000 g | | 389,728 |
| Total Short-Term Investments | | | | | | | | |
| (cost $3,757,262) | | | | | | | | 3,757,227 |
The Fund 19
| | STATEMENT OF INVESTMENTS (continued) |
| Other Investment—3.2% | | Shares | | Value ($) |
| |
| |
|
| Registered Investment Company; | | | | |
| Dreyfus Institutional Preferred | | | | |
| Plus Money Market Fund | | | | |
| (cost $684,000) | | 684,000 h | | 684,000 |
| |
| |
|
| |
| Total Investments (cost $27,525,268) | | 108.6% | | 22,721,922 |
| Liabilities, Less Cash and Receivables | | (8.6%) | | (1,823,844) |
| Net Assets | | 100.0% | | 20,898,078 |
| a Securities exempt from registration under Rule 144A of the Securities Act of 1933.These securities may be resold in |
| transactions exempt from registration, normally to qualified institutional buyers.At October 31, 2008, these securities |
| amounted to $3,352,387 or 16% of net assets. |
| b Variable rate security—interest rate subject to periodic change. |
| c Principal amount stated in U.S. Dollars unless otherwise noted. |
| EUR—Euro |
| NZD—New Zealand Dollar |
| TRY—Turkish Lira |
| d These securities are prerefunded; the date shown represents the prerefunded date. Bonds which are prerefunded are |
| collateralized by U.S. Government securities which are held in escrow and are used to pay principal and interest on |
| the municipal issue and to retire the bonds in full at the earliest refunding date. |
| e On September 7, 2008, the Federal Housing Finance Agency (FHFA) placed Federal National Mortgage |
| Association and Federal Home Loan Mortgage Corporation into conservatorship with FHFA as the conservator.As |
| such, the FHFA will oversee the continuing affairs of those companies. |
| f Purchased on a forward commitment basis. |
| g All or partially held by a broker as collateral for open financial futures positions. |
| h Investment in affiliated money market mutual fund. |
| Portfolio Summary (Unaudited)† | | | | |
| |
| | | Value (%) | | | | Value (%) |
| |
| |
| |
|
| Corporate Bonds | | 55.8 | | Foreign/Governmental | | 3.0 |
| Short-Term/ | | | | State/Government | | |
| Money Market Investments | | 21.2 | | General Obligations | | .3 |
| U.S. Government & Agencies | | 16.9 | | | | |
| Asset/Mortgage-Backed | | 11.4 | | | | 108.6 |
| † Based on net assets. |
| See notes to financial statements. |
20
| STATEMENT OF FINANCIAL FUTURES |
| October 31, 2008 |
| | | | | | | | | Unrealized |
| | | | | Market Value | | | | Appreciation |
| | | | | Covered by | | | | (Depreciation) |
| | | Contracts | | Contracts ($) | | Expiration | | at 10/31/2008 ($) |
| |
| |
| |
| |
|
| Financial Futures Long | | | | | | | | |
| British Long Gilt | | 8 | | 1,432,834 | | December 2008 | | (12,068) |
| U.S. Long Bond | | 12 | | 1,357,500 | | December 2008 | | (54,458) |
| US Treasury 2 Year Notes | | 11 | | 2,363,109 | | December 2008 | | 17,427 |
| U.S. Treasury 5 Year Notes | | 17 | | 1,925,383 | | December 2008 | | 13,463 |
| U.S. Treasury 10 Year Notes | | 1 | | 113,078 | | December 2008 | | 888 |
| | | | | | | | | (34,748) |
See notes to financial statements.
| STATEMENT OF OPTIONS WRITTEN |
| October 31, 2008 |
| | | Face Amount | | |
| | | Covered by | | |
| | | Contracts ($) | | Value ($) |
| |
| |
|
| Call Options: | | | | |
| 3-Month USD Libor-BBA, | | | | |
| Swaption | | 825,000 a | | (8,422) |
| 3-Month USD Libor-BBA, | | | | |
| Swaption | | 206,000 a | | (2,402) |
| 3-Month USD Libor-BBA, | | | | |
| Swaption | | 406,000 a | | (3,012) |
| 3-Month USD Libor-BBA, | | | | |
| Swaption | | 219,000 a | | (133) |
| Put Options: | | | | |
| 3-Month USD Libor-BBA, | | | | |
| Swaption | | 825,000 a | | (3,947) |
| 3-Month USD Libor-BBA, | | | | |
| Swaption | | 206,000 a | | (3,444) |
| 3-Month USD Libor-BBA, | | | | |
| Swaption | | 406,000 a | | (5,355) |
| 3-Month USD Libor-BBA, | | | | |
| Swaption | | 219,000 a | | (6,120) |
| (Premiums received $44,394) | | | | (32,835) |
| LIBOR-BBA—London Interbank Offered Rate British Bankers’Association |
| a Non-income producing security. |
| See notes to financial statements. |
The Fund 21
| STATEMENT OF ASSETS AND LIABILITIES |
| October 31, 2008 |
| | | | | Cost | | Value |
| |
| |
| |
|
| Assets ($): | | | | | | |
| Investments in securities—See Statement of Investments: | | | | |
| Unaffiliated issuers | | | | 26,841,268 | | 22,037,922 |
| Affiliated issuers | | | | 684,000 | | 684,000 |
| Cash | | | | | | 8,550 |
| Cash on Initial Margin—Note 4 | | | | | | 16,500 |
| Cash denominated in foreign currencies | | | | 5,235 | | 4,735 |
| Receivable for investment securities sold | | | | | | 1,505,880 |
| Dividends and interest receivable | | | | | | 448,693 |
| Unrealized appreciation on forward currency exchange contracts—Note 4 | | 310,716 |
| Unrealized appreciation on swap contracts—Note 4 | | | | | | 10,230 |
| Receivable from broker for swap transactions—Note 4 | | | | 3,265 |
| Prepaid expenses | | | | | | 17,747 |
| Due from The Dreyfus Corporation and affiliates—Note 3(d) | | | | 12,042 |
| | | | | | | 25,060,280 |
| |
| |
| |
|
| Liabilities ($): | | | | | | |
| Payable for open mortgage-backed dollar rolls—Note 4 | | | | 3,415,368 |
| Unrealized depreciation on swap contracts—Note 4 | | | | | | 311,202 |
| Payable to broker for swap transactions | | | | | | 138,447 |
| Payable for investment securities purchased | | | | | | 84,247 |
| Outstanding options written, at value (premiums received $44,394) | | | | |
| —See Statement of Options Written—Note 4 | | | | | | 32,835 |
| Payable for futures variation margin—Note 4 | | | | | | 30,184 |
| Payable for shares of Capital Stock redeemed | | | | | | 20,117 |
| Unrealized depreciation on forward currency exchange contracts—Note 4 | | 1,178 |
| Accrued expenses | | | | | | 56,490 |
| Other liabilities | | | | | | 72,134 |
| | | | | | | 4,162,202 |
| |
| |
| |
|
| Net Assets ($) | | | | | | 20,898,078 |
| |
| |
| |
|
| Composition of Net Assets ($): | | | | | | |
| Paid-in capital | | | | | | 25,920,517 |
| Accumulated undistributed investment income—net | | | | | | 211,867 |
| Accumulated net realized gain (loss) on investments | | | | | | (371,844) |
| Accumulated net unrealized appreciation (depreciation) on investments, | | |
| options transactions, swap transactions and foreign currency transactions | | |
| [including ($34,748) net unrealized (depreciation) on financial futures] | | (4,862,462) |
| |
|
| Net Assets ($) | | | | | | 20,898,078 |
| |
| |
| |
|
| |
| |
| |
| Net Asset Value Per Share | | | | | | |
| | | Class A | | Class C | | Class I |
| |
| |
| |
|
| Net Assets ($) | | 18,946,766 | | 1,429,861 | | 521,451 |
| Shares Outstanding | | 1,883,984 | | 142,634 | | 51,816 |
| |
| |
| |
|
| Net Asset Value Per Share ($) | | 10.06 | | 10.02 | | 10.06 |
| |
| See notes to financial statements. | | | | | | |
22
| STATEMENT OF OPERATIONS |
| Year Ended October 31, 2008 |
| Investment Income ($): | | |
| Income: | | |
| Interest | | 1,581,323 |
| Dividends: | | |
| Unaffiliated issuers | | 27,550 |
| Affiliated issuers | | 21,044 |
| Total Income | | 1,629,917 |
| Expenses: | | |
| Management fee—Note 3(a) | | 133,413 |
| Auditing fees | | 78,357 |
| Shareholder servicing costs—Note 3(d) | | 64,863 |
| Registration fees | | 34,836 |
| Custodian fees—Note 3(d) | | 32,278 |
| Prospectus and shareholders’ reports | | 11,610 |
| Distribution fees—Note 3(c) | | 9,383 |
| Legal fees | | 7,219 |
| Directors’ fees and expenses—Note 3(b) | | 1,493 |
| Miscellaneous | | 32,960 |
| Total Expenses | | 406,412 |
| Less—expense reimbursement from The Dreyfus | | |
| Corporation due to undertaking—Note 3(a) | | (153,417) |
| Less—reduction in fees due to earnings credits—Note 1(c) | | (1,973) |
| Net Expenses | | 251,022 |
| Investment Income—Net | | 1,378,895 |
| |
|
| Realized and Unrealized Gain (Loss) on Investments—Note 4 ($): | | |
| Net realized gain (loss) on investments and foreign currency transactions | | (964,068) |
| Net realized gain (loss) on options transactions | | 113,366 |
| Net realized gain (loss) on financial futures | | 733,198 |
| Net realized gain (loss) on swap transactions | | 281,234 |
| Net realized gain (loss) on forward currency exchange contracts | | (340,140) |
| Net Realized Gain (Loss) | | (176,410) |
| Net unrealized appreciation (depreciation) on investments, options | | |
| transactions, swap transactions and foreign currency transactions | | |
| [including ($167,544) net unrealized (depreciation) on financial futures] | | (4,674,541) |
| Net Realized and Unrealized Gain (Loss) on Investments | | (4,850,951) |
| Net (Decrease) in Net Assets Resulting from Operations | | (3,472,056) |
| |
| See notes to financial statements. | | |
The Fund 23
STATEMENT OF CHANGES IN NET ASSETS
| | | Year Ended October 31, |
| | |
|
| | | 2008 | | 2007a |
| |
| |
|
| Operations ($): | | | | |
| Investment income—net | | 1,378,895 | | 1,288,705 |
| Net realized gain (loss) on investments | | (176,410) | | 205,867 |
| Net unrealized appreciation | | | | |
| (depreciation) on investments | | (4,674,541) | | (538,366) |
| Net Increase (Decrease) in Net Assets | | | | |
| Resulting from Operations | | (3,472,056) | | 956,206 |
| |
| |
|
| Dividends to Shareholders from ($): | | | | |
| Investment income—net: | | | | |
| Class A Shares | | (1,230,034) | | (1,198,772) |
| Class C Shares | | (63,581) | | (54,276) |
| Class I Shares | | (38,386) | | (54,961) |
| Net realized gain on investments: | | | | |
| Class A Shares | | (243,474) | | (146,253) |
| Class C Shares | | (11,141) | | (8,014) |
| Class I Shares | | (7,770) | | (7,293) |
| Total Dividends | | (1,594,386) | | (1,469,569) |
| |
| |
|
| Capital Stock Transactions ($): | | | | |
| Net proceeds from shares sold: | | | | |
| Class A Shares | | 7,600,423 | | 7,684,736 |
| Class C Shares | | 1,070,703 | | 472,797 |
| Class I Shares | | — | | 30,000 |
| Dividends reinvested: | | | | |
| Class A Shares | | 1,393,256 | | 1,298,776 |
| Class C Shares | | 54,355 | | 57,453 |
| Class I Shares | | 46,156 | | 62,254 |
| Cost of shares redeemed: | | | | |
| Class A Shares | | (7,634,108) | | (1,769,377) |
| Class C Shares | | (355,271) | | (368,763) |
| Class I Shares | | (200,000) | | (50,000) |
| Increase (Decrease) in Net Assets | | | | |
| from Capital Stock Transactions | | 1,975,514 | | 7,417,876 |
| Total Increase (Decrease) in Net Assets | | (3,090,928) | | 6,904,513 |
| |
| |
|
| Net Assets ($): | | | | |
| Beginning of Period | | 23,989,006 | | 17,084,493 |
| End of Period | | 20,898,078 | | 23,989,006 |
| Undistributed investment income—net | | 211,867 | | 148,508 |
24
| | | Year Ended October 31, |
| | |
|
| | | 2008 | | 2007a |
| |
| |
|
| Capital Share Transactions: | | | | |
| Class A | | | | |
| Shares sold | | 641,711 | | 604,809 |
| Shares issued for dividends reinvested | | 115,768 | | 102,101 |
| Shares redeemed | | (632,491) | | (140,966) |
| Net Increase (Decrease) in Shares Outstanding | | 124,988 | | 565,944 |
| |
| |
|
| Class C | | | | |
| Shares sold | | 90,216 | | 37,979 |
| Shares issued for dividends reinvested | | 4,539 | | 4,518 |
| Shares redeemed | | (30,157) | | (29,829) |
| Net Increase (Decrease) in Shares Outstanding | | 64,598 | | 12,668 |
| |
| |
|
| Class I | | | | |
| Shares sold | | — | | 2,331 |
| Shares issued for dividends reinvested | | 3,829 | | 4,888 |
| Shares redeemed | | (15,911) | | (3,991) |
| Net Increase (Decrease) in Shares Outstanding | | (12,082) | | 3,228 |
| a Effective June 1, 2007, Class R shares were redesignated as Class I shares. |
| See notes to financial statements. |
The Fund 25
FINANCIAL HIGHLIGHTS
The following tables describe the performance for each share class for the fiscal periods indicated. All information (except portfolio turnover rate) reflects financial results for a single fund share.Total return shows how much your investment in the fund would have increased (or decreased) during each period, assuming you had reinvested all dividends and distributions.These figures have been derived from the fund’s financial statements.
| | | | | Year Ended October 31, |
| | |
| |
|
| Class A Shares | | 2008 | | 2007 | | 2006a |
| |
| |
| |
|
| Per Share Data ($): | | | | | | |
| Net asset value, beginning of period | | 12.62 | | 12.95 | | 12.50 |
| Investment Operations: | | | | | | |
| Investment income—netb | | .73 | | .81 | | .18 |
| Net realized and unrealized | | | | | | |
| gain (loss) on investments | | (2.40) | | (.19) | | .40 |
| Total from Investment Operations | | (1.67) | | .62 | | .58 |
| Distributions: | | | | | | |
| Dividends from investment income—net | | (.73) | | (.83) | | (.13) |
| Dividends from net realized gain on investments | | (.16) | | (.12) | | — |
| Total Distributions | | (.89) | | (.95) | | (.13) |
| Net asset value, end of period | | 10.06 | | 12.62 | | 12.95 |
| |
| |
| |
|
| Total Return (%)c | | (14.21) | | 4.98 | | 4.69d |
| |
| |
| |
|
| Ratios/Supplemental Data (%): | | | | | | |
| Ratio of total expenses to average net assets | | 1.78 | | 1.74 | | 2.75e,f |
| Ratio of net expenses to average net assets | | 1.09 | | 1.10 | | 1.05e |
| Ratio of net investment income | | | | | | |
| to average net assets | | 6.24 | | 6.37 | | 4.62e |
| Portfolio Turnover Rateg | | 265.85 | | 310.92 | | 279.33d |
| |
| |
| |
|
| Net Assets, end of period ($ x 1,000) | | 18,947 | | 22,200 | | 15,452 |
| a | | From July 11, 2006 (commencement of operations) to October 31, 2006. |
| b | | Based on average shares outstanding at each month end. |
| c | | Exclusive of sales charge. |
| d | | Not annualized. |
| e | | Annualized. |
| f | | The fund’s expense ratio net of earnings credits for Class A was 2.71%. |
| g | | The portfolio turnover rates excluding mortgage dollar roll transactions for the periods ended October 31, 2008, |
| | | October 31, 2007 and October 31, 2006, were 178.23%, 285.25% and 271.65%, respectively. |
| See notes to financial statements. |
26
| | | | | Year Ended October 31, |
| | |
| |
|
| Class C Shares | | 2008 | | 2007 | | 2006a |
| |
| |
| |
|
| Per Share Data ($): | | | | | | |
| Net asset value, beginning of period | | 12.59 | | 12.94 | | 12.50 |
| Investment Operations: | | | | | | |
| Investment income—netb | | .64 | | .71 | | .15 |
| Net realized and unrealized | | | | | | |
| gain (loss) on investments | | (2.41) | | (.18) | | .40 |
| Total from Investment Operations | | (1.77) | | .53 | | .55 |
| Distributions: | | | | | | |
| Dividends from investment income—net | | (.64) | | (.76) | | (.11) |
| Dividends from net realized gain on investments | | (.16) | | (.12) | | — |
| Total Distributions | | (.80) | | (.88) | | (.11) |
| Net asset value, end of period | | 10.02 | | 12.59 | | 12.94 |
| |
| |
| |
|
| Total Return (%)c | | (14.95) | | 4.26 | | 4.44d |
| |
| |
| |
|
| Ratios/Supplemental Data (%): | | | | | | |
| Ratio of total expenses to average net assets | | 2.62 | | 2.55 | | 3.52e,f |
| Ratio of net expenses to average net assets | | 1.84 | | 1.85 | | 1.80e |
| Ratio of net investment income | | | | | | |
| to average net assets | | 5.48 | | 5.55 | | 3.87e |
| Portfolio Turnover Rateg | | 265.85 | | 310.92 | | 279.33d |
| |
| |
| |
|
| Net Assets, end of period ($ x 1,000) | | 1,430 | | 982 | | 846 |
| a | | From July 11, 2006 (commencement of operations) to October 31, 2006. |
| b | | Based on average shares outstanding at each month end. |
| c | | Exclusive of sales charge. |
| d | | Not annualized. |
| e | | Annualized. |
| f | | The fund’s expense ratios net of earnings credits for Class C was 3.47%. |
| g | | The portfolio turnover rates excluding mortgage dollar roll transactions for the periods ended October 31, 2008, |
| | | October 31, 2007 and October 31, 2006, were 178.23%, 285.25% and 271.65%, respectively. |
| See notes to financial statements. |
The Fund 27
| FINANCIAL HIGHLIGHTS (continued) |
| | | | | Year Ended October 31, |
| | |
| |
|
| Class I Shares | | 2008 | | 2007a | | 2006b |
| |
| |
| |
|
| Per Share Data ($): | | | | | | |
| Net asset value, beginning of period | | 12.62 | | 12.95 | | 12.50 |
| Investment Operations: | | | | | | |
| Investment income—netc | | .76 | | .84 | | .19 |
| Net realized and unrealized | | | | | | |
| gain (loss) on investments | | (2.41) | | (.19) | | .40 |
| Total from Investment Operations | | (1.65) | | .65 | | .59 |
| Distributions: | | | | | | |
| Dividends from investment income—net | | (.75) | | (.86) | | (.14) |
| Dividends from net realized gain on investments | | (.16) | | (.12) | | — |
| Total Distributions | | (.91) | | (.98) | | (.14) |
| Net asset value, end of period | | 10.06 | | 12.62 | | 12.95 |
| |
| |
| |
|
| Total Return (%) | | (14.06) | | 5.22 | | 4.76d |
| |
| |
| |
|
| Ratios/Supplemental Data (%): | | | | | | |
| Ratio of total expenses to average net assets | | 1.54 | | 1.53 | | 2.51e,f |
| Ratio of net expenses to average net assets | | .84 | | .85 | | .81e |
| Ratio of net investment income | | | | | | |
| to average net assets | | 6.49 | | 6.54 | | 4.87e |
| Portfolio Turnover Rateg | | 265.85 | | 310.92 | | 279.33d |
| |
| |
| |
|
| Net Assets, end of period ($ x 1,000) | | 521 | | 807 | | 786 |
| a | | Effective June 1, 2007, Class R were redesignated as Class I shares. |
| b | | From July 11, 2006 (commencement of operations) to October 31, 2006. |
| c | | Based on average shares outstanding at each month end. |
| d | | Not annualized. |
| e | | Annualized. |
| f | | The fund’s expense ratio net of earnings credits for Class I was 2.47%. |
| g | | The portfolio turnover rates excluding mortgage dollar roll transactions for the periods ended October 31, 2008, |
| | | October 31, 2007 and October 31, 2006, were 178.23%, 285.25% and 271.65%, respectively. |
| See notes to financial statements. |
28
NOTES TO FINANCIAL STATEMENTS
NOTE 1—Significant Accounting Policies:
Dreyfus Strategic Income Fund (the “fund”) is a separate diversified series of The Dreyfus/Laurel Funds, Inc. (the “Company”) which is registered under the Investment Company Act of 1940, as amended (the “Act”), as an open-end management investment company and operates as a series company currently offering fourteen series, including the fund.The fund’s investment objective is to seek high current income as its primary goal and capital appreciation as its secondary goal. The Dreyfus Corporation (the “Manager” or “Dreyfus”), a wholly-owned subsidiary of The Bank of New York Mellon Corporation (“BNY Mellon”), serves as the fund’s investment manager.
At a meeting of the fund’s Board of Directors held on July 24, 2008, the Board approved, effective December 1, 2008, a proposal to change the name of the fund from “Dreyfus Premier Strategic Income Fund” to “Dreyfus Strategic Income Fund”.
Effective July 1, 2008, BNY Mellon has reorganized and consolidated a number of its banking and trust company subsidiaries. As a result of the reorganization, any services previously provided to the fund by Mellon Bank, N.A. or Mellon Trust of New England, N.A. are now provided by The Bank of New York, which has changed its name to The Bank of New York Mellon.
MBSC Securities Corporation (the “Distributor”), a wholly-owned subsidiary of the Manager, is the distributor of the fund’s shares. The fund is authorized to issue 300 million shares of $.001 par value Capital Stock.The fund currently offers three classes of shares: Class A (100 million shares authorized), Class C (100 million shares authorized) and Class I (100 million shares authorized). Class A and Class C shares are sold primarily to retail investors through financial intermediaries and bear a distribution fee and/or shareholder service fee. Class A shares are sold with a front-end sales charge, while Class C shares are subject to a contingent deferred sales charge (“CDSC”). Class I shares are sold primarily to bank trust departments and other financial service providers (including The Bank of New York Mellon, a subsidiary
The Fund 29
| NOTES TO FINANCIAL STATEMENTS (continued) |
of BNY Mellon and an affiliate of Dreyfus), acting on behalf of customers having a qualified trust or investment account or relationship at such institution, and bear no distribution or service fees. Class I shares are offered without a front-end sales charge or CDSC. Each class of shares has identical rights and privileges, except with respect to distribution and service fees, the allocation of certain transfer agency costs and voting rights on matters affecting a single class. Income, expenses (other than expenses attributable to a specific class), and realized and unrealized gains or loses on investments are allocated to each class of shares based on its relative net assets.
As of October 31, 2008, MBC Investments Corp., an indirect subsidiary of BNY Mellon, held 880,446 of Class A, 48,023 of Class C and 49,226 of Class I shares of the fund.
The Company accounts separately for the assets, liabilities and operations of each series. Expenses directly attributable to each series are charged to that series’ operations: expenses which are applicable to all series are allocated among them on a pro rata basis.
The fund’s financial statements are prepared in accordance with U.S. generally accepted accounting principles, which may require the use of management estimates and assumptions. Actual results could differ from those estimates.
(a) Portfolio valuation: Investments in securities excluding short-term investments (other than U.S. Treasury Bills), financial futures, options, swaps and forward currency exchange contracts are valued each business day by an independent pricing service (the “Service”) approved by the Board of Directors. Investments for which quoted bid prices are readily available and are representative of the bid side of the market in the judgment of the Service are valued at the mean between the quoted bid prices (as obtained by the Service from dealers in such securities) and asked prices (as calculated by the Service based upon its evaluation of the market for such securities). Other investments (which constitute a majority of the portfolio securities) are valued as determined by the Service, based on methods which include consid-
30
eration of: yields or prices of securities of comparable quality, coupon, maturity and type; indications as to values from dealers; and general market conditions. Restricted securities, as well as securities or other assets for which recent market quotations are not readily available and are not valued by a pricing service approved by the Board of Directors, or are determined by the fund not to reflect accurately fair value are valued at fair value as determined in good faith under the direction of the Board of Directors.The factors that may be considered when fair valuing a security include fundamental analytical data, the nature and duration of restrictions on disposition, an evaluation of the forces that influence the market in which the securities are purchased and sold and public trading in similar securities of the issuer or comparable issuers. Short-term investments, excluding U.S.Treasury Bills, are carried at amortized cost, which approximates value. Registered investment companies that are not traded on an exchange are valued at their net asset value. Financial futures and options, which are traded on an exchange, are valued at the last sales price on the securities exchange on which such securities are primarily traded or at the last sales price on the national securities market on each business day. Options traded over-the-counter are priced at the mean between the bid and asked price. Investments in swap transactions are valued each business day by an independent pricing service approved by the Board of Directors. Swaps are valued by the service by using a swap pricing model which incorporates among other factors, default probabilities, recovery rates, credit curves of the underlying issuer and swap spreads on interest rates. Investments denominated in foreign currencies are translated to U.S. dollars at the prevailing rates of exchange. Forward currency exchange contracts are valued at the forward rate.
The Financial Accounting Standards Board (“FASB”) released Statement of Financial Accounting Standards No. 157 “Fair Value Measurements” (“FAS 157”). FAS 157 establishes an authoritative definition of fair value, sets out a framework for measuring fair value, and requires additional disclosures about fair-value measurements.The application of FAS 157 is required for fiscal years beginning after November 15, 2007 and
The Fund 31
| NOTES TO FINANCIAL STATEMENTS (continued) |
interim periods within those fiscal years. Management does not believe that the application of this standard will have a material impact on the financial statements of the fund.
(b) Foreign currency transactions: The fund does not isolate that portion of the results of operations resulting from changes in foreign exchange rates on investments from the fluctuations arising from changes in the market prices of securities held. Such fluctuations are included with the net realized and unrealized gain or loss on investments.
Net realized foreign exchange gains or losses arise from sales and maturities of short-term securities, sales of foreign currencies, currency gains or losses realized on securities transactions and the difference between the amounts of dividends, interest and foreign withholding taxes recorded on the fund’s books and the U.S. dollar equivalent of the amounts actually received or paid. Net unrealized foreign exchange gains and losses arise from changes in the value of assets and liabilities other than investments in securities, resulting from changes in exchange rates. Such gains and losses are included with net realized and unrealized gains or losses on investments.
(c) Securities transactions and investment income: Securities transactions are recorded on a trade date basis. Realized gains and losses from securities transactions are recorded on the identified cost basis. Dividend income is recognized on the ex-dividend date and interest income, including, where applicable, accretion of discount and amortization of premium on investments, is recognized on the accrual basis.
The fund has arrangements with the custodian and cash management banks whereby the fund may receive earnings credits when positive cash balances are maintained, which are used to offset custody and cash management fees. For financial reporting purposes, the fund includes net earnings credits as an expense offset in the Statement of Operations.
(d) Affiliated issuers: Investments in other investment companies advised by the Manager are defined as “affiliated” in the Act.
32
(e) Concentration of Risk: The fund invests primarily in debt securities. Failure of an issuer of the debt securities to make timely interest or principal payments, or a decline or the perception of a decline in the credit quality of a debt security, can cause the debt security’s price to fall, potentially lowering the fund’s share price. High yield (“junk”) bonds involve greater credit risk, including the risk of default, than investment grade bonds, and are considered predominantly speculative with respect to the issuer’s continuing ability to make principal and interest payments. In addition, the value of debt securities may decline due to general market conditions that are not specifically related to a particular company, such as real or perceived adverse economic conditions, changes in outlook for corporate earnings, changes in interest or currency rates or adverse investor sentiment. They may also decline because of factors that affect a particular industry.
(f) Dividends to shareholders: Dividends are recorded on the ex-dividend date. Dividends from investment income-net are declared and paid monthly. Dividends from net realized capital gains, if any, are normally declared and paid annually, but the fund may make distributions on a more frequent basis to comply with the distribution requirements of the Internal Revenue Code of 1986, as amended (the “Code”).To the extent that net realized capital gains can be offset by capital loss carryovers, it is the policy of the fund not to distribute such gains. Income and capital gain distributions are determined in accordance with income tax regulations, which may differ from U.S. generally accepted accounting principles.
On October 31, 2008, the Board of Directors declared a cash dividend of $.055, $.048 and $.057 per share from undistributed investment income-net for Class A, Class C and Class I shares, respectively, payable on November 3, 2008 (ex-dividend date), to shareholders of record as of the close of business on October 31, 2008.
The Fund 33
| NOTES TO FINANCIAL STATEMENTS (continued) |
(g) Federal income taxes: It is the policy of the fund to continue to qualify as a regulated investment company, if such qualification is in the best interests of its shareholders, by complying with the applicable provisions of the Code, and to make distributions of taxable income sufficient to relieve it from substantially all federal income and excise taxes.
The fund adopted FASB Interpretation No. 48 “Accounting for Uncertainty in Income Taxes” (“FIN 48”). FIN 48 provides guidance for how uncertain tax positions should be recognized, measured, presented and disclosed in the financial statements. FIN 48 requires the evaluation of tax positions taken or expected to be taken in the course of preparing the fund’s tax returns to determine whether the tax positions are “more-likely-than-not” of being sustained by the applicable tax authority. Liability for tax positions not deemed to meet the more-likely-than-not threshold would be recorded as a tax expense in the current year.The adoption of FIN 48 had no impact on the operations of the fund for the period ended October 31, 2008.
As of and during the period ended October 31, 2008, the fund did not have any liabilities for any unrecognized tax positions. The fund recognizes interest and penalties, if any, related to unrecognized tax positions as income tax expense in the Statement of Operations. During the period, the fund did not incur any interest or penalties.
Each of the tax years in the three-year period ended October 31, 2008 remains subject to examination by the Internal Revenue Service and state taxing authorities.
The accumulated capital loss carryover is available to be applied against future net securities profits, if any, realized subsequent to October 31, 2008. If not applied the carryover expires in fiscal 2016.
At October 31, 2008, the components of accumulated earnings on a tax basis were as follows: undistributed ordinary income $283,649, accumulated capital losses $356,747 and unrealized depreciation $4,949,341.
The tax character of distributions paid to shareholders during the fiscal periods ended October 31, 2008 and October 31, 2007 was as follows:
34
ordinary income $1,431,173 and $1,452,520 and long-term capital gains $163,213 and $17,049, respectively.
During the period ended October 31, 2008, as a result of permanent book to tax differences, primarily due to the tax treatment for consent fees paydown gains and losses, amortization of premiums, foreign currency transactions and treatment of swap periodic payments, the fund increased accumulated undistributed investment income-net by $16,465, decreased accumulated net realized gain (loss) on investments by $16,463 and decreased paid-in capital by $2. Net assets and net asset value per share were not affected by this reclassification.
NOTE 2—Bank Lines of Credit:
Prior to May 1, 2008, the fund had the ability to borrow up to $1 million for leveraging purposes under a short-term unsecured line of credit and participated with other Dreyfus-managed funds in a $100 million unsecured line of credit. Effective May 1, 2008, the fund participates with other Dreyfus-managed funds in a $300 million unsecured line of credit primarily to be utilized for temporary or emergency purposes, including the financing of redemptions.The terms of the line of credit agreement limit the amount of individual fund borrowings. Interest is charged to the fund based on prevailing market rates in effect at the time of borrowing. Effective October 15, 2008, in connection therewith, the fund has agreed to pay commitment fees on its pro rata portion of the unsecured line of credit. During the period ended October 31, 2008, the fund did not borrow under any line of credit.
NOTE 3—Investment Management Fee and Other Transactions with Affiliates:
(a) Pursuant to an Investment Management Agreement with the Manager and the Company, the Company has agreed to pay the Manager a management fee computed at the annual rate of .60% of the value of the fund’s average daily net assets and is payable monthly.The Manager has contractually agreed to waive receipt of its fees and/or assume certain expenses of the fund, until March 11, 2010, so the
The Fund 35
| NOTES TO FINANCIAL STATEMENTS (continued) |
expenses, exclusive of taxes, brokerage fees, interest on borrowings, Rule 12b-1 distribution plan fees, shareholder services fees and extraordinary expenses, do not exceed an annual rate of .85% of the value of the fund’s average daily net assets.The expense reimbursement, pursuant to the undertaking, amounted to $153,417 during the period ended October 31, 2008.
(b) Each Director receives $45,000 per year, plus $6,000 for each joint Board meeting of the Company, The Dreyfus/Laurel Tax-Free Municipal Funds and The Dreyfus/Laurel Funds Trust (collectively, the “Dreyfus/Laurel Funds”) attended, $2,000 for separate in-person committee meetings attended which are not held in conjunction with a regularly scheduled Board meeting and $1,500 for Board meetings and separate committee meetings attended that are conducted by telephone and is reimbursed for travel and out-of-pocket expenses. With respect to Board meetings, the Chairman of the Board receives an additional 25% of such compensation (with the exception of reimbursable amounts). With respect to compensation committee meetings, the Chair of the compensation committee receives $900 per meeting and, prior to April 12, 2008, with respect to audit committee meetings, the Chair of the audit committee received $1,350 per meeting. In the event that there is an in-person joint committee meeting of the Dreyfus/Laurel Funds and Dreyfus High Yield Strategies Fund, the $2,000 or $1,500 fee, as applicable, will be allocated between the Dreyfus/Laurel Funds and Dreyfus High Yield Strategies Fund. These fees and expenses are charged and allocated to each series based on net assets. Amounts required to be paid by the Company directly to the non-interested Directors, that would be applied to offset a portion of the management fee payable by certain other series of the Company to the Manager, are in fact paid directly by the Manager to the non-interested Directors.
During the period ended October 31, 2008, the Distributor retained $593 from CDSCs on redemptions of the fund’s Class C shares.
(c) Under the Distribution Plan (the “Plan”) adopted pursuant to Rule 12b-1 under the Act, Class C shares pay the Distributor for distributing their shares at an annual rate of .75% of the value of the average
36
daily net assets of Class C shares. During the period ended October 31, 2008, Class C shares were charged $9,383, pursuant to the Plan.
(d) Under the Shareholder Services Plan, Class A and Class C shares pay the Distributor for the provision of certain services to the holders of their shares at an annual rate of .25% of the value of their average daily net assets. During the period ended October 31, 2008, Class A and Class C shares were charged $50,924 and $3,128, respectively, pursuant to the Shareholder Services Plan. Other amounts included in shareholder servicing costs relate to transfer agent charges.
Under its terms, the Plan and Shareholder Services Plan shall remain in effect from year to year, provided such continuance is approved annually by a vote of a majority of those directors who are not “ interested persons” of the Company and who have no direct or indirect financial interest in the operation of or in any agreement related to the Plan or Shareholder Services Plan.
The fund compensates DreyfusTransfer, Inc., a wholly-owned subsidiary of the Manager, under a transfer agency agreement for providing personnel and facilities to perform transfer agency services for the fund. During the period ended October 31, 2008, the fund was charged $2,958 pursuant to the transfer agency agreement.
The fund compensates The Bank of New York Mellon under a cash management agreement for performing cash management services related to fund subscriptions and redemptions. During the period ended October 31, 2008, the fund was charged $558 pursuant to the cash management agreement.
The fund compensates The Bank of New York Mellon under a custody agreement for providing custodial services for the fund. During the period ended October 31, 2008, the fund was charged $32,278 pursuant to the custody agreement.
During the period ended October 31, 2008, the fund was charged $6,203 for services performed by the Chief Compliance Officer.
The Fund 37
| NOTES TO FINANCIAL STATEMENTS (continued) |
The components of “Due from The Dreyfus Corporation and affiliates” in the Statement of Assets and Liabilities consist of: an expense reimbursement of $44,577, which is offset by management fees $10,927, Rule 12b-1 distribution plan fees $932, Shareholder services plan fees $4,429, custodian fees $13,669, chief compliance officer fees $1,973 and transfer agency per account fees $605.
NOTE 4—Securities Transactions:
The aggregate amount of purchases and sales (including paydowns) of investment securities, excluding short-term securities, forward currency exchange contracts, financial futures, options transactions and swap transactions during the period ended October 31, 2008, amounted to $60,607,522 and $61,165,002, of which $19,975,319 in purchases and $20,013,164 in sales were from mortgage dollar roll transactions.
A mortgage dollar roll transaction involves a sale by the fund of mortgage related securities that it holds with an agreement by the fund to repurchase similar securities at an agreed upon price and date. The securities purchased will bear the same interest rate as those sold, but generally will be collateralized by pools of mortgages with different prepayment histories than those securities sold.
The fund may invest in financial futures contracts in order to gain exposure to or protect against changes in the market.The fund is exposed to market risk as a result of changes in the value of the underlying financial instruments. Investments in financial futures require the fund to “mark to market” on a daily basis, which reflects the change in the market value of the contract at the close of each day’s trading. Accordingly, variation margin payments are received or made to reflect daily unrealized gains or losses.When the contracts are closed, the fund recognizes a realized gain or loss.These investments require initial margin deposits with a broker, which consist of cash or cash equivalents.The amount of these deposits is determined by the exchange or Board of Trade on which the contract is traded and is subject to change. Contracts open at October 31, 2008, are set forth in the Statement of Financial Futures.
38
The fund may purchase and write (sell) put and call options in order to gain exposure to or to protect against changes in the market.
As a writer of call options, the fund receives a premium at the outset and then bears the market risk of unfavorable changes in the price of the financial instrument underlying the option. Generally, the fund would incur a gain, to the extent of the premium, if the price of the underlying financial instrument decreases between the date the option is written and the date on which the option is terminated. Generally, the fund would realize a loss, if the price of the financial instrument increases between those dates.
As a writer of put options, the fund receives a premium at the outset and then bears the market risk of unfavorable changes in the price of the financial instrument underlying the option. Generally, the fund would incur a gain, to the extent of the premium, if the price of the underlying financial instrument increases between the date the option is written and the date on which the option is terminated. Generally, the fund would realize a loss, if the price of the financial instrument decreases between those dates.
The following summarizes the fund’s call/put options written for the period ended October 31, 2008:
| | | Face Amount | | | | Options Terminated |
| | | | | | |
|
| | | Covered by | | Premiums | | | | Net Realized |
| Options Written: | | Contracts ($) | | Received ($) | | Cost ($) | | Gain (Loss) ($) |
| |
| |
| |
| |
|
| Contracts outstanding | | | | | | | | |
| October 31, 2007 | | 3,900,000 | | 7,827 | | | | |
| Contracts written | | 156,324,000 | | 304,731 | | | | |
| Contracts terminated: | | | | | | | | |
| Closed | | 148,612,000 | | 210,996 | | 262,520 | | (51,524) |
| Expired | | 8,300,000 | | 57,168 | | — | | 57,168 |
| Total contracts | | | | | | | | |
| terminated | | 156,912,000 | | 268,164 | | 262,520 | | 5,644 |
| Contracts outstanding | | | | | | | | |
| October 31, 2008 | | 3,312,000 | | 44,394 | | | | |
The Fund 39
| NOTES TO FINANCIAL STATEMENTS (continued) |
The fund enters into forward currency exchange contracts in order to hedge its exposure to changes in foreign currency exchange rates on its foreign portfolio holdings and to settle foreign currency transac-tions.When executing forward currency exchange contracts, the fund is obligated to buy or sell a foreign currency at a specified rate on a certain date in the future. With respect to sales of forward currency exchange contracts, the fund would incur a loss if the value of the contract increases between the date the forward contract is opened and the date the forward contract is closed.The fund realizes a gain if the value of the contract decreases between those dates. With respect to purchases of forward currency exchange contracts, the fund would incur a loss if the value of the contract decreases between the date the forward contract is opened and the date the forward contract is closed. The fund realizes a gain if the value of the contract increases between those dates. The fund is also exposed to credit risk associated with counterparty nonperformance on these forward currency exchange contracts, which is typically limited to the unrealized gain on each open contract. The following summarizes open forward currency exchange contracts at October 31, 2008:
| | | Foreign | | | | | | Unrealized |
| Forward Currency | | Currency | | | | | | Appreciation |
| Exchange Contracts | | Amounts | | Cost ($) | | Value ($) (Depreciation) ($) |
| |
| |
| |
|
| Purchases: | | | | | | | | |
| Euro | | | | | | | | |
| Expiring 12/17/2008 | | 40,000 | | 52,090 | | 50,912 | | (1,178) |
| Sales: | | | | Proceeds ($) | | | | |
| Euro, | | | | | | | | |
| Expiring 11/3/2008 | | 45,282 | | 59,016 | | 57,714 | | 1,302 |
| New Zealand Dollar, | | | | | | | | |
| Expiring 12/17/2008 | | 840,000 | | 556,769 | | 486,289 | | 70,480 |
| Turkish Lira, | | | | | | | | |
| Expiring 12/12/2008 | | 1,015,000 | | 776,503 | | 646,848 | | 129,655 |
| Turkish Lira, | | | | | | | | |
| Expiring 4/24/2009 | | 845,000 | | 617,858 | | 508,579 | | 109,279 |
| Total | | | | | | | | 309,538 |
The fund may enter into swap agreements to exchange the interest rate on, or return generated by, one nominal instrument for the return generated by another nominal instrument.
40
The fund accrues for the interim payments on swap contracts on a daily basis, with the net amount recorded within unrealized appreciation (depreciation) of swap contracts in the Statement of Assets and Liabilities. Once the interim payments are settled in cash, the net amount is recorded as realized gain (loss) on swaps, in addition to realized gain (loss) recorded upon the termination of swaps contracts in the Statement of Operations. Upfront payments made and/or received by the fund, are recorded as an asset and /or liability on the Statement of Assets and Liabilities and are recorded as a realized gain or loss ratably over the contract’s term/event with the exception of forward starting interest rate swaps which are recorded as realized gains or losses on termination date. Fluctuations in the value of swap contracts are recorded as a component of net change in unrealized appreciation (depreciation) on investments.
Credit default swaps involve commitments to pay a fixed interest rate in exchange for payment if a credit event affecting a third party (the referenced company) occurs. Credit events may include a failure to pay interest or principal, bankruptcy, or restructuring. For those credit default swaps in which the fund is receiving a fixed rate, the fund is providing credit protection on the underlying instrument.The maximum payouts for these contracts are limited to the notional amount of each swap. The following summarizes open credit default swaps entered into by the fund at October 31, 2008:
| | | | | | | | | Unrealized |
| Notional | | Reference | | | | (Pay)/Receive | | Appreciation |
| Amount ($) | | Entity | | Counterparty | | Fixed Rate (%) Expiration (Depreciation) ($) |
| |
| |
| |
|
| |
| 50,000 | | Block Financial, | | | | | | |
| | | 5.125%, | | J.P. Morgan | | | | |
| | | 10/30/2014 | | Chase | | (2.25) 12/20/2012 | | (1,385) |
| 50,000 | | Block Financial, | | | | | | |
| | | 5.125%, | | J.P. Morgan | | | | |
| | | 10/30/2014 | | Chase | | (2.80) 12/20/2012 | | (2,437) |
| 50,000 | | Bristol-Myers | | | | | | |
| | | Squibb, 6.8%, | | Deutsche | | | | |
| | | 11/15/2026 | | Bank | | (0.45) 6/20/2018 | | 600 |
| 60,000 | | Bristol-Myers | | | | | | |
| | | Squibb,6.8%, | | Goldman, | | | | |
| | | 11/15/2026 | | Sachs & Co. | | (0.43) 6/20/2018 | | 815 |
The Fund 41
| NOTES TO FINANCIAL STATEMENTS (continued) |
| | | | | | | | | Unrealized |
| Notional | | Reference | | | | (Pay)/Receive | | Appreciation |
| Amount ($) | | Entity | | Counterparty | | Fixed Rate (%) Expiration (Depreciation) ($) |
| |
| |
| |
|
| |
| 250,000 | | Campbell Soup Co., | | | | | | |
| | | 4.875%, | | Deutsche | | | | |
| | | 10/1/2013 | | Bank | | (0.53) 3/20/2013 | | (1,938) |
| 65,000 | | Campbell Soup | | | | | | |
| | | Co., 4.875%, | | Deutsche | | | | |
| | | 10/1/2013 | | Bank | | (0.53) 3/20/2013 | | (504) |
| 195,000 | | General Electric | | | | | | |
| | | Capital, 6%, | | | | | | |
| | | 6/15/2012 | | Citibank | | 4.80 12/20/2013 | | (3,911) |
| 230,000 | | Kohls, 6.3%, | | J.P. Morgan | | | | |
| | | 3/1/2011 | | Chase | | (1.70) 6/20/2013 | | 738 |
| 70,000 | | Kohls, 6.3%, | | J.P. Morgan | | | | |
| | | 3/1/2011 | | Chase | | (1.70) 6/20/2013 | | 224 |
| 100,000 | | Pfizer Inc., | | Goldman, | | | | |
| | | 4.65%,3/1/2018 | | Sachs & Co. | | (0.41) 6/20/2018 | | 1,901 |
| 110,000 | | R.R. Donnelley & | | | | | | |
| | | Sons, 4.95%, | | Deutsche | | | | |
| | | 4/1/2014 | | Bank | | (1.60) 3/20/2012 | | 2,192 |
| 40,000 | | R.R. Donnelley & | | | | | | |
| | | Sons, 4.95%, | | J.P. Morgan | | | | |
| | | 4/1/2014 | | Chase | | (1.70) 12/20/2011 | | 603 |
| 250,000 | | Reed Elsevier | | | | | | |
| | | Capital, 4.625%, | | Deutsche | | | | |
| | | 6/15/2012 | | Bank | | (0.96) 6/20/2012 | | 3,157 |
| 100,000 | | Rite Aid, 7.7%, | | J.P. Morgan | | | | |
| | | 2/15/2027 | | Chase | | 3.55 9/20/2010 | | (45,656) |
| 261,553 | | Standish | | | | | | |
| | | Structured Tranched | | | | | | |
| | | Portfolio 0-3% | | Barclays | | 13.40 6/20/2012 | | (255,371) |
| Total | | | | | | | | (300,972) |
Risks may arise upon entering into these agreements from the potential inability of the counterparties to meet the terms of the agreement and are generally limited to the amount of net payments to be received, if any, at the date of default.
At October 31, 2008, the cost of investments for federal income tax purposes was $27,547,267; accordingly, accumulated net unrealized depreciation on investments was $4,825,345, consisting of $17,109 gross unrealized appreciation and $4,842,454 gross unrealized depreciation.
42
In March 2008, the FASB released Statement of Financial Accounting Standards No. 161 “Disclosures about Derivative Instruments and Hedging Activities” (“FAS 161”). FAS 161 requires qualitative disclosures about objectives and strategies for using derivatives, quantitative disclosures about fair value amounts of gains and losses on derivative instruments and disclosures about credit-risk-related contingent features in derivative agreements.The application of FAS 161 is required for fiscal years and interim periods beginning after November 15, 2008. At this time, management is evaluating the implications of FAS 161 and its impact on the financial statements and the accompanying notes has not yet been determined.
During September 2008, FASB Staff Position FAS 133-1 and FASB Interpretation 45-4,“Disclosures about Credit Derivatives and Certain Guarantees”: An Amendment of FASB Statement No. 133 and FASB Interpretation No. 45; and Clarification of the Effective Date of FASB Statement No. 161 (“Amendment”) was issued and is effective for annual and interim reporting periods ending after November 15, 2008. The Amendment requires enhanced disclosures regarding a fund’s credit derivatives holdings and hybrid financial instruments containing embedded credit derivatives. Management is currently evaluating the impact the adoption of the Amendment will have on the fund’s financial statement disclosures.
The Fund 43
| REPORT OF INDEPENDENT REGISTERED |
| PUBLIC ACCOUNTING FIRM |
| The Board of Directors and Shareholders |
| The Dreyfus/Laurel Fund, Inc.: |
We have audited the accompanying statement of assets and liabilities, of Dreyfus Strategic Income Fund (formerly Dreyfus Premier Strategic Income Fund), a series of The Dreyfus/Laurel Funds, Inc. (the “Fund”), including the statements of investments,financial futures and options written, as of October 31, 2008, and the related statement of operation for the year then ended,the statement of changes in net assets for each of the years in the two-year period then ended and the financial highlights for each of the years in the two-year period then ended and for the period from July 11, 2006 (commencement of operations) to October 31, 2006.These financial statements and financial highlights are the responsibility of the Fund’s management. Our responsibility is to express an opinion on these financial statements and financial highlights based on our audits.
We conducted our audits in accordance with the standards of the Public Company Accounting Oversight Board (United States).Those standards require that we plan and perform the audit to obtain reasonable assurance about whether the financial statements and financial highlights are free of material misstatement. An audit includes examining, on a test basis, evidence supporting the amounts and disclosures in the financial statements. Our procedures included confirmation of securities owned as of October 31, 2008, by correspondence with the custodian and brokers or by other appropriate auditing procedures where replies from broker were not received. An audit also includes assessing the accounting principles used and significant estimates made by management, as well as evaluating the overall financial statement presentation. We believe that our audits provide a reasonable basis for our opinion.
In our opinion, the financial statements and financial highlights referred to above present fairly, in all material respects, the financial position of Dreyfus Strategic Income Fund as of October 31, 2008, and the results of its operations for the year then ended, the changes in its net assets for each of the years in the two-year period then ended and the financial highlights for each of the years in the two-year period then ended and for the period from July 11, 2006 (commencement of operations) to October 31, 2006, in conformity with U.S. generally accepted accounting principles.

| | New York, New York
December 23, 2008 |
44
IMPORTANT TAX INFORMATION (Unaudited)
For federal tax purposes the fund hereby designates 1.73% of the ordinary dividends paid during the fiscal year ended October 31, 2008 as qualifying for the corporate dividends received deduction. Also certain dividends paid by the fund may be subject to a maximum tax rate of 15%, as provided for by the Jobs and GrowthTax Relief Reconciliation Act of 2003. Of the distributions paid during the fiscal year, $26,720 represents the maximum amount that may be considered qualified dividend income.Shareholders will receive notification in January 2009 of the percentage applicable to the preparation of their 2008 income tax returns. Also, the fund hereby designates 72.31% of ordinary income dividends paid during the fiscal year ended October 31, 2008 as qualifying “interest related dividends”.Also, the fund hereby designates $.0992 per share as a long-term capital gain distribution and $.0606 per share as a short-term capital gain distribution paid on December 28, 2007.
The Fund 45
BOARD MEMBERS INFORMATION (Unaudited)
| | Joseph S. DiMartino (65)
Chairman of the Board (1999) |
Principal Occupation During Past 5Years:
- Corporate Director and Trustee
Other Board Memberships and Affiliations:
- The Muscular Dystrophy Association, Director
- Century Business Services, Inc., a provider of outsourcing functions for small and medium size companies, Director
- The Newark Group, a provider of a national market of paper recovery facilities, paperboard mills and paperboard converting plants, Director
- Sunair Services Corporation, a provider of certain outdoor-related services to homes and businesses, Director
No. of Portfolios for which Board Member Serves: 167
| | James M. Fitzgibbons (74)
Board Member (1994)
Principal Occupation During Past 5Years: |
- Corporate Director and Trustee
Other Board Memberships and Affiliations:
- Bill Barrett Company, an oil and gas exploration company, Director
No. of Portfolios for which Board Member Serves: 25
| | Kenneth A. Himmel (62)
Board Member (1994)
Principal Occupation During Past 5Years: |
- President and CEO,Related Urban Development,a real estate development company (1996-present)
- President and CEO, Himmel & Company, a real estate development company (1980-present)
- CEO, American Food Management, a restaurant company (1983-present)
| | No. of Portfolios for which Board Member Serves: 25 |
| | Stephen J. Lockwood (61)
Board Member (1994)
Principal Occupation During Past 5Years: |
- Chairman of the Board, Stephen J. Lockwood and Company LLC, an investment company (2000-present)
| | No. of Portfolios for which Board Member Serves: 25 |
46
| | Roslyn M. Watson (59)
Board Member (1994) |
Principal Occupation During Past 5Years:
- Principal,Watson Ventures, Inc., a real estate investment company (1993-present)
Other Board Memberships and Affiliations:
- American Express Bank, Director
- The Hyams Foundation Inc., a Massachusetts Charitable Foundation,Trustee
- National Osteoporosis Foundation,Trustee
- SBLI-USA, Director
| | No. of Portfolios for which Board Member Serves: 25 |
| | Benaree Pratt Wiley (62)
Board Member (1998)
Principal Occupation During Past 5Years: |
- Principal,The Wiley Group, a firm specializing in strategy and business development (2005-present)
- President and CEO,The Partnership, an organization dedicated to increasing the representation of African Americans in positions of leadership, influence and decision-making in Boston, MA (1991-2005)
| | Other Board Memberships and Affiliations: |
- Boston College,Trustee Associate
- Blue Cross Blue Shield of Massachusetts, Director
- CBIZ, professional support consultants and service providers for small, midsized and corporate business, Director
- Commonwealth Institute, Director
- Efficacy Institute, Director
- PepsiCo African-American, Chair of Advisory Board
- The Boston Foundation, Director
- Century Business Services, Inc., a provider of outsourcing functions for small and medium size companies, Director
| | No. of Portfolios for which Board Member Serves: 36 |
Once elected all Board Members serve for an indefinite term, but achieve Emeritus status upon reaching age 80.The address of the Board Members and Officers is in c/o The Dreyfus Corporation, 200 Park Avenue, NewYork, NewYork 10166.Additional information about the Board Members is available in the fund’s Statement of Additional Information which can be obtained from Dreyfus free of charge by calling this toll free number: 1-800-554-4611.
| | Francis P. Brennan, Emeritus Board Member
J.Tomlinson Fort, Emeritus Board Member |
The Fund 47
OFFICERS OF THE FUND (Unaudited)
J. DAVID OFFICER, President since December 2006.
Chief Operating Officer,Vice Chairman and a Director of the Manager, and an officer of 77 investment companies (comprised of 167 portfolios) managed by the Manager. He is 60 years old and has been an employee of the Manager since April 1998.
PHILLIP N. MAISANO, Executive Vice President since July 2007.
Chief Investment Officer,Vice Chair and a director of the Manager, and an officer of 77 investment companies (comprised of 167 portfolios) managed by the Manager. Mr. Maisano also is an officer and/or Board member of certain other investment management subsidiaries of The Bank of New York Mellon Corporation, each of which is an affiliate of the Manager. He is 61 years old and has been an employee of the Manager since November 2006. Prior to joining the Manager, Mr. Maisano served as Chairman and Chief Executive Officer of EACM Advisors, an affiliate of the Manager, since August 2004, and served as Chief Executive Officer of Evaluation Associates, a leading institutional investment consulting firm, from 1988 until 2004.
MICHAEL A. ROSENBERG, Vice President and Secretary since August 2005.
Assistant General Counsel of BNY Mellon, and an officer of 78 investment companies (comprised of 188 portfolios) managed by the Manager. He is 48 years old and has been an employee of the Manager since October 1991.
JAMES BITETTO, Vice President and Assistant Secretary since August 2005.
Senior Counsel of BNY Mellon and Secretary of the Manager, and an officer of 78 investment companies (comprised of 188 portfolios) managed by the Manager. He is 42 years old and has been an employee of the Manager since December 1996.
JONI LACKS CHARATAN, Vice President and Assistant Secretary since August 2005.
Senior Counsel of BNY Mellon, and an officer of 78 investment companies (comprised of 188 portfolios) managed by the Manager. She is 53 years old and has been an employee of the Manager since October 1988.
JOSEPH M. CHIOFFI, Vice President and Assistant Secretary since August 2005.
Senior Counsel of BNY Mellon, and an officer of 78 investment companies (comprised of 188 portfolios) managed by the Manager. He is 47 years old and has been an employee of the Manager since June 2000.
JANETTE E. FARRAGHER, Vice President and Assistant Secretary since August 2005.
Assistant General Counsel of BNY Mellon, and an officer of 78 investment companies (comprised of 188 portfolios) managed by the Manager. She is 45 years old and has been an employee of the Manager since February 1984.
JOHN B. HAMMALIAN, Vice President and Assistant Secretary since August 2005.
Managing Counsel of BNY Mellon, and an officer of 78 investment companies (comprised of 188 portfolios) managed by the Manager. He is 45 years old and has been an employee of the Manager since February 1991.
ROBERT R. MULLERY, Vice President and Assistant Secretary since August 2005.
Managing Counsel of BNY Mellon, and an officer of 78 investment companies (comprised of 188 portfolios) managed by the Manager. He is 56 years old and has been an employee of the Manager since May 1986.
48
JEFF PRUSNOFSKY, Vice President and Assistant Secretary since August 2005.
Managing Counsel of BNY Mellon, and an officer of 78 investment companies (comprised of 188 portfolios) managed by the Manager. He is 43 years old and has been an employee of the Manager since October 1990.
JAMES WINDELS, Treasurer since November 2001.
Director – Mutual Fund Accounting of the Manager, and an officer of 78 investment companies (comprised of 188 portfolios) managed by the Manager. He is 49 years old and has been an employee of the Manager since April 1985.
RICHARD CASSARO, Assistant Treasurer since January 2008.
Senior Accounting Manager – Money Market and Municipal Bond Funds of the Manager, and an officer of 78 investment companies (comprised of 188 portfolios) managed by the Manager. He is 49 years old and has been an employee of the Manager since September 1982.
GAVIN C. REILLY, Assistant Treasurer since December 2005.
Tax Manager of the Investment Accounting and Support Department of the Manager, and an officer of 78 investment companies (comprised of 188 portfolios) managed by the Manager. He is 40 years old and has been an employee of the Manager since April 1991.
ROBERT ROBOL, Assistant Treasurer since December 2002.
Senior Accounting Manager – Fixed Income Funds of the Manager, and an officer of 78 investment companies (comprised of 188 portfolios) managed by the Manager. He is 44 years old and has been an employee of the Manager since October 1988.
ROBERT SALVIOLO, Assistant Treasurer since July 2007.
Senior Accounting Manager – Equity Funds of the Manager, and an officer of 78 investment companies (comprised of 188 portfolios) managed by the Manager. He is 41 years old and has been an employee of the Manager since June 1989.
ROBERT SVAGNA, Assistant Treasurer since December 2002.
Senior Accounting Manager – Equity Funds of the Manager, and an officer of 78 investment companies (comprised of 188 portfolios) managed by the Manager. He is 41 years old and has been an employee of the Manager since November 1990.
JOSEPH W. CONNOLLY, Chief Compliance Officer since October 2004.
Chief Compliance Officer of the Manager and The Dreyfus Family of Funds (78 investment companies, comprised of 188 portfolios). From November 2001 through March 2004, Mr. Connolly was first Vice-President, Mutual Fund Servicing for Mellon Global Securities Services. In that capacity, Mr. Connolly was responsible for managing Mellon’s Custody, Fund Accounting and Fund Administration services to third-party mutual fund clients. He is 51 years old and has served in various capacities with the Manager since 1980, including manager of the firm’s Fund Accounting Department from 1997 through October 2001.
WILLIAM GERMENIS, Anti-Money Laundering Compliance Officer since July 2002.
Vice President and Anti-Money Laundering Compliance Officer of the Distributor, and the Anti-Money Laundering Compliance Officer of 74 investment companies (comprised of 184 portfolios) managed by the Manager. He is 38 years old and has been an employee of the Distributor since October 1998.
The Fund 49

Item 2. Code of Ethics.
The Registrant has adopted a code of ethics that applies to the Registrant's principal executive officer, principal financial officer, principal accounting officer or controller, or persons performing similar functions. There have been no amendments to, or waivers in connection with, the Code of Ethics during the period covered by this Report.
Item 3. Audit Committee Financial Expert.
The Registrant's Board has determined that Joseph S. DiMartino, a member of the Audit Committee of the Board, is an audit committee financial expert as defined by the Securities and Exchange Commission (the "SEC"). Joseph S. DiMartino is "independent" as defined by the SEC for purposes of audit committee financial expert determinations.
Item 4. Principal Accountant Fees and Services.
(a) Audit Fees. The aggregate fees billed for each of the last two fiscal years (the "Reporting Periods") for professional services rendered by the Registrant's principal accountant (the "Auditor") for the audit of the Registrant's annual financial statements, or services that are normally provided by the Auditor in connection with the statutory and regulatory filings or engagements for the Reporting Periods, were $448,730 in 2007 and $384,105 in 2008.
(b) Audit-Related Fees. The aggregate fees billed in the Reporting Periods for assurance and related services by the Auditor that are reasonably related to the performance of the audit of the Registrant's financial statements and are not reported under paragraph (a) of this Item 4 were $53,640 in 2007 and $48,675 in 2008. These services consisted of security counts required by Rule 17f-2 under the Investment Company Act of 1940, as amended.
The aggregate fees billed in the Reporting Periods for non-audit assurance and related services by the Auditor to the Registrant's investment adviser (not including any sub-investment adviser whose role is primarily portfolio management and is subcontracted with or overseen by another investment adviser), and any entity controlling, controlled by or under common control with the investment adviser that provides ongoing services to the Registrant ("Service Affiliates"), that were reasonably related to the performance of the annual audit of the Service Affiliate, which required pre-approval by the Audit Committee were $0 in 2007 and $0 in 2008.
Note: For the second paragraph in each of (b) through (d) of this Item 4, certain of such services were not pre-approved prior to May 6, 2003, when such services were required to be pre-approve .On and after May 6, 2003, 100% of all services provided by the Auditor were pre-approved as required. For comparative purposes, the fees shown assume that all such services were pre-approved, including services that were not pre-approved prior to the compliance date of the pre-approval requirement.
(c) Tax Fees. The aggregate fees billed in the Reporting Periods for professional services rendered by the Auditor for tax compliance, tax advice and tax planning ("Tax Services") were $27,170 in 2007 and $27,950 in 2008. These services consisted of review or preparation of U.S. federal, state, local and excise tax returns.
The aggregate fees billed in the Reporting Periods for Tax Services by the Auditor to Service Affiliates which required pre-approval by the Audit Committee were $0 in 2007 and $0 in 2008.
(d) All Other Fees. The aggregate fees billed in the Reporting Periods for products and services provided by the Auditor, other than the services reported in paragraphs (a) through (c) of this Item, were $0 in 2007 and $0 in 2008.
The aggregate fees billed in the Reporting Periods for Non-Audit Services by the Auditor to Service Affiliates, other than the services reported in paragraphs (b) through (c) of this Item, which required pre-approval by the Audit Committee were $0 in 2007 and $0 in 2008.
Audit Committee Pre-Approval Policies and Procedures. The Registrant's Audit Committee has established policies and procedures (the "Policy") for pre-approval (within specified fee limits) of the Auditor's engagements for non-audit services to the Registrant and Service Affiliates without specific case-by-case consideration. Pre-approval considerations include whether the proposed services are compatible with maintaining the Auditor's independence. Pre-approvals pursuant to the Policy are considered annually.
Non-Audit Fees. The aggregate non-audit fees billed by the Auditor for services rendered to the Registrant, and rendered to Service Affiliates, for the Reporting Periods were $2,455,000 in 2007 and $2,532,612 in 2008.
Auditor Independence. The Registrant's Audit Committee has considered whether the provision of non-audit services that were rendered to Service Affiliates which were not pre-approved (not requiring pre-approval) is compatible with maintaining the Auditor's independence.
| Item 5. | | Audit Committee of Listed Registrants. |
| | | Not applicable. |
| Item 6. | | Schedule of Investments. |
| (a) | | Not applicable. |
| Item 7. | | Disclosure of Proxy Voting Policies and Procedures for Closed-End Management |
| | | Investment Companies. |
| | | Not applicable. |
| Item 8. | | Portfolio Managers of Closed-End Management Investment Companies. |
| | | Not applicable |
| Item 9. | | Purchases of Equity Securities by Closed-End Management Investment Companies and |
| | | Affiliated Purchasers. |
| | | Not applicable. |
| Item 10. | | Submission of Matters to a Vote of Security Holders. |
The Registrant has a Nominating Committee (the "Committee"), which is responsible for selecting and nominating persons for election or appointment by the Registrant's Board as Board members. The Committee has adopted a Nominating Committee Charter (the "Charter"). Pursuant to the Charter, the Committee will consider recommendations for nominees from shareholders submitted to the Secretary of the Registrant, c/o The Dreyfus Corporation Legal Department, 200 Park Avenue, 8th Floor East, New York, New York 10166. A nomination submission must include information regarding the recommended nominee as specified in the Charter. This information includes all information relating to a recommended nominee that is required to be disclosed in solicitations or proxy statements for the election of Board members, as well as information sufficient to evaluate the factors to be considered by the Committee, including character and integrity, business and professional experience, and whether the person has the ability to apply sound and independent business judgment and would act in the interests of the Registrant and its shareholders. Nomination
submissions are required to be accompanied by a written consent of the individual to stand for election if nominated by the Board and to serve if elected by the shareholders, and such additional information must be provided regarding the recommended nominee as reasonably requested by the Committee.
Item 11. Controls and Procedures.
(a) The Registrant's principal executive and principal financial officers have concluded, based on their evaluation of the Registrant's disclosure controls and procedures as of a date within 90 days of the filing date of this report, that the Registrant's disclosure controls and procedures are reasonably designed to ensure that information required to be disclosed by the Registrant on Form N-CSR is recorded, processed, summarized and reported within the required time periods and that information required to be disclosed by the Registrant in the reports that it files or submits on Form N-CSR is accumulated and communicated to the Registrant's management, including its principal executive and principal financial officers, as appropriate to allow timely decisions regarding required disclosure.
(b) There were no changes to the Registrant's internal control over financial reporting that occurred during the second fiscal quarter of the period covered by this report that have materially affected, or are reasonably likely to materially affect, the Registrant's internal control over financial reporting.
Item 12. Exhibits.
| (a)(1) | | Code of ethics referred to in Item 2. |
| (a)(2) | | Certifications of principal executive and principal financial officers as required by Rule 30a-2(a) |
| under the Investment Company Act of 1940. |
| (a)(3) | | Not applicable. |
| (b) | | Certification of principal executive and principal financial officers as required by Rule 30a-2(b) |
| under the Investment Company Act of 1940. |
Pursuant to the requirements of the Securities Exchange Act of 1934 and the Investment Company Act of 1940, the Registrant has duly caused this Report to be signed on its behalf by the undersigned, thereunto duly authorized.
| The Dreyfus/Laurel Funds, Inc. |
| |
| By: | | /s/ J. David Officer |
| | J. David Officer |
| | | President |
| |
| Date: | | December 18, 2008 |
Pursuant to the requirements of the Securities Exchange Act of 1934 and the Investment Company Act of 1940, this Report has been signed below by the following persons on behalf of the Registrant and in the capacities and on the dates indicated.
| | | /s/ J. David Officer |
| | | J. David Officer |
| | President |
| |
| Date: | | December 18, 2008 |
| |
| By: | | /s/ James Windels |
| | | James Windels |
| | Treasurer |
| |
| Date: | | December 18, 2008 |
| (a)(1) | | Code of ethics referred to in Item 2. |
| |
| (a)(2) | | Certifications of principal executive and principal financial officers as required by Rule 30a- |
| 2(a) under the Investment Company Act of 1940. (EX-99.CERT) |
| |
| (b) | | Certification of principal executive and principal financial officers as required by Rule 30a- |
| 2(b) under the Investment Company Act of 1940. (EX-99.906CERT) |