Washington, D.C. 20549
220 East 42nd Street, New York, N.Y. 10017
| ¢ | Value Line Strategic Asset Management Trust (Unaudited) | Semiannual Report |
| To Contractowners |
| Stephen E. Grant, |
| Portfolio Manager |
| (right) |
| Jeffrey D. Geffen, |
Director of Fixed Income(left) |
| |
| Objective: |
| High total investment return consistent with reasonable risk |
| |
| Inception Date: |
| October 1, 1987 |
| |
| Net Assets at June 30, 2010: |
| $330,829,290 |
| |
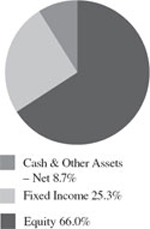
| Portfolio Composition at June 30, 2010: |
| (Percentage of Total Net Assets) |
Top Ten Holdings (As of 6/30/2010)
| Company | | | Percentage of Total Net Assets | |
| U.S. Treasury Notes, 1.00%, 9/30/11 | | 3.04 | % | |
| Government National Mortgage Association, 5.50%, 8/20/37 | | 2.28 | % | |
| U.S. Treasury Notes, 1.00%, 8/31/11 | | 1.83 | % | |
| Federal Home Loan Banks, 2.00%, 7/27/12 | | 1.82 | % | |
| U.S. Treasury Notes, 6.13%, 11/15/27 | | 1.59 | % | |
| SLM Corp., 3.86%, 4/1/14 | | 1.55 | % | |
| Express Scripts, Inc. | | 1.48 | % | |
| Federal Home Loan Banks, 1.38%, 5/16/11 | | 1.22 | % | |
| U.S. Treasury Notes, 1.13%, 6/30/11 | | 1.22 | % | |
| Federal National Mortgage Association, 2.05%, 7/30/12 | | 1.21 | % | |
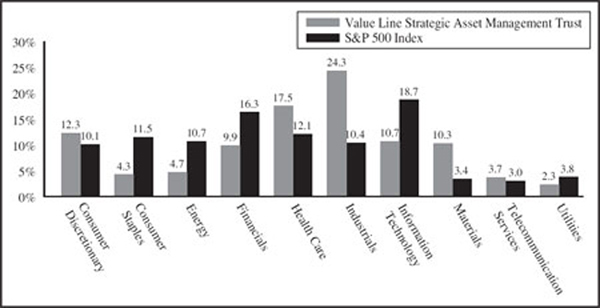
Equity Sector Weightings vs. Index (As of 6/30/2010)
| | |
| About information in this report: |
| | |
| • | It is important to consider the Trust’s investment objectives, risks, fees and expenses before investing. All funds involve some risk, including possible loss of the principal amount invested. |
| | |
| • | The S&P 500 Index is an unmanaged index of 500 primarily large cap U.S. stocks that is generally considered to be representative of U.S. stock market activity. The Barclays Government/Credit Index is an unmanaged index that is generally considered to be representative of U.S. government and corporate bond market activity. Index returns are provided for comparative purposes. Please note that the indices are not available for direct investment and their returns do not reflect the fees and expenses that have been deducted from the Trust. |
| VALUE LINE STRATEGIC ASSET MANAGEMENT TRUST | 1 |
| ¢ | Value Line Strategic Asset Management Trust (Unaudited) | Semiannual Report |
| To Contractowners |
Average Annual Total Returns (For periods ended 6/30/2010)
| | | | | | | | | | | | | | | | | | | | |
| | | Year to Date (not annualized) | | 1 Yr | | 3 Yrs | | 5 Yrs | | 10 Yrs | | Since Inception 10/01/1987 | |
| Value Line Strategic Asset Management Trust | | | (1.34 | )% | | | 12.19 | % | | (4.21 | )% | | 1.98 | % | | 0.91 | % | | 9.08 | % | |
| S&P 500 Index | | | (6.65 | )% | | | 14.43 | % | | (9.81 | )% | | (0.79 | )% | | (1.59 | )% | | 8.83 | % | |
| Barclays Government/Credit Bond Index | | | 5.49 | % | | | 9.65 | % | | 7.37 | % | | 5.26 | % | | 6.48 | % | | 7.44 | % | |
All performance data quoted is historical and the results represent past performance and neither guarantee nor predict future investment results. To obtain performance data current to the most recent month (available within 7 business days of the most recent month end), please call us at (800) 221-3253 or visit our website at www.guardianinvestor.com. Current performance may be higher or lower than the performance quoted here. Investment return and principal value will fluctuate so that an investor’s shares, when redeemed, may be worth more or less than the original cost.
Total return figures are historical and assume the reinvestment of dividends and distributions and the deduction of all Trust expenses. The actual total returns for owners of variable annuity contracts or variable life insurance policies that provide for investment in the Trust will be lower to reflect separate account and contract/policy charges. The return figures shown do not reflect the deduction of taxes that a contractowner may pay on distributions or redemption of units.
Trust Expenses
By investing in the Trust, you incur two types of costs: (1) transaction costs, including, as applicable, sales charges on purchase payments, reinvested dividends, or other distributions; redemption fees and exchange fees; and (2) ongoing costs, including, as applicable, management fees; distribution and/or service (12b-1) fees; and other Trust expenses. This example is intended to help you understand your ongoing costs (in dollars) of investing in the Trust and to compare these costs with the ongoing costs of investing in other mutual funds.
The example below is based on an investment of $1,000 invested on January 1, 2010 and held for six months ended June 30, 2010.
Actual Expenses
The first line in the table provides information about actual account values and actual expenses. You may use the information in this line, together with the amount you invested, to estimate the expenses that you paid over the period. Simply divide your account value by $1,000 (for example, an $8,600 account value divided by $1,000 = 8.6), then multiply the result by the number in the first line under the heading entitled “Expenses Paid During Period” to estimate the expenses you paid on your account during this period.
| | |
| 2 | VALUE LINE STRATEGIC ASSET MANAGEMENT TRUST |
| ¢ | Value Line Strategic Asset Management Trust (Unaudited) | Semiannual Report |
| To Contractowners |
Hypothetical Example for Comparison Purposes
The second line in the table provides information about hypothetical account values and hypothetical expenses based on the Trust’s actual expense ratio and an assumed rate of return of 5% per year before expenses, which is not the Trust’s actual return. The hypothetical account values and expenses may not be used to estimate the actual ending account balance or expenses you paid for the period. You may use this information to compare the ongoing costs of investing in the Trust and other funds. To do so, compare this 5% hypothetical example with the 5% hypothetical examples that appear in the shareholder reports of the other funds.
Please note that the expenses shown in the table are meant to highlight your ongoing costs only and do not reflect any transactional costs, such as sales charges (loads), redemption fees, or exchange fees. Therefore, the table is useful in comparing ongoing costs only, and will not help you determine the relative total costs of owning different funds. In addition, if transactional costs were included, your costs would have been higher.
| | | | | | | | | | | | | | |
| | | Beginning Account Value January 1, 2010 | | Ending Account Value June 30, 2010 | | Expenses Paid During Period* | | Annualized Expense Ratio | |
| Actual | | $ | 1,000 | | $ | 986.64 | | $ | 3.89 | | | 0.79 | % |
| Hypothetical (5% return before expenses) | | $ | 1,000 | | $ | 1,020.88 | | $ | 3.96 | | | 0.79 | % |
| * | Expenses are equal to the Trust’s annualized expense ratio multiplied by the average account value over the period, multiplied by 181/365 (to reflect the Trust’s most recent fiscal half-year). This expense ratio may differ from the expense ratio shown in the financial highlights. The annualized expense ratio would have been 0.87% gross of nonrecurring legal fee reimbursement. |
| VALUE LINE STRATEGIC ASSET MANAGEMENT TRUST | 3 |
| Value Line Strategic Asset Management Trust |
| | |
| Schedule of Investments |
| | |
| June 30, 2010 (Unaudited) |
| Common Stocks — 66.0% |
| Shares | | | | | Value | |
| Consumer Discretionary — 8.6% | | | | |
| | 37,500 | | Aeropostale, Inc. * | | $ | 1,074,000 | |
| | 10,000 | | AutoZone, Inc. * | | | 1,932,200 | |
| | 18,000 | | Bed Bath & Beyond, Inc. * | | | 667,440 | |
| | 24,000 | | BorgWarner, Inc. * | | | 896,160 | |
| | 39,000 | | Buckle, Inc. (The) | | | 1,264,380 | |
| | 25,000 | | Coinstar, Inc. * | | | 1,074,250 | |
| | 54,000 | | Guess?, Inc. | | | 1,686,960 | |
| | 6,000 | | hhgregg, Inc. * | | | 139,920 | |
| | 20,000 | | J. Crew Group, Inc. * | | | 736,200 | |
| | 19,000 | | Jo-Ann Stores, Inc. * | | | 712,690 | |
| | 87,000 | | Johnson Controls, Inc. | | | 2,337,690 | |
| | 83,000 | | LKQ Corp. * | | | 1,600,240 | |
| | 28,000 | | O’Reilly Automotive, Inc. * | | | 1,331,680 | |
| | 28,000 | | Phillips-Van Heusen Corp. | | | 1,295,560 | |
| | 2,000 | | Priceline.com, Inc. * | | | 353,080 | |
| | 6,700 | | Strayer Education, Inc. | | | 1,392,863 | |
| | 44,000 | | TJX Companies, Inc. (The) | | | 1,845,800 | |
| | 34,000 | | TRW Automotive Holdings Corp. * | | | 937,380 | |
| | 55,000 | | Tupperware Brands Corp. | | | 2,191,750 | |
| | 29,000 | | Warnaco Group, Inc. (The) * | | | 1,048,060 | |
| | 38,000 | | WMS Industries, Inc. * | | | 1,491,500 | |
| | 30,000 | | Wolverine World Wide, Inc. | | | 756,600 | |
| | 10,000 | | Wyndham Worldwide Corp. | | | 201,400 | |
| | 42,000 | | Yum! Brands, Inc. | | | 1,639,680 | |
| | | | | | | 28,607,483 | |
| Consumer Staples — 2.4% | | | | |
| | 16,900 | | British American Tobacco PLC ADR | | | 1,069,770 | |
| | 25,000 | | Church & Dwight Co., Inc. | | | 1,567,750 | |
| | 56,000 | | Flowers Foods, Inc. | | | 1,368,080 | |
| | 40,500 | | Green Mountain Coffee Roasters, Inc. * | | | 1,040,850 | |
| | 30,000 | | Hormel Foods Corp. | | | 1,214,400 | |
| | 16,000 | | TreeHouse Foods, Inc. * | | | 730,560 | |
| | 23,000 | | Whole Foods Market, Inc. * | | | 828,460 | |
| | | | | | | 7,819,870 | |
| Energy — 2.6% | | | | |
| | 11,000 | | Concho Resources, Inc. * | | | 608,630 | |
| | 50,000 | | FMC Technologies, Inc. * | | | 2,633,000 | |
| | 42,200 | | Range Resources Corp. | | | 1,694,330 | |
| | 22,000 | | SM Energy Co. | | | 883,520 | |
| | 40,950 | | Southern Union Co. | | | 895,167 | |
| | 15,000 | | Southwestern Energy Co. * | | | 579,600 | |
| | 15,000 | | Tenaris S.A. ADR | | | 519,150 | |
| | 32,000 | | World Fuel Services Corp. | | | 830,080 | |
| | | | | | | 8,643,477 | |
| Financials — 5.4% | | | | |
| | 6,000 | | Affiliated Managers Group, Inc. * | | | 364,620 | |
| | 37,000 | | AFLAC, Inc. | | | 1,578,790 | |
| | 4,000 | | Arch Capital Group Ltd. * | | | 298,000 | |
| | 69,000 | | Banco Bilbao Vizcaya Argentaria, S.A. ADR | | | 710,010 | |
| | 56,000 | | Bank of Hawaii Corp. | | | 2,707,600 | |
| | 12,500 | | BlackRock, Inc. | | | 1,792,500 | |
| | 35,000 | | DuPont Fabros Technology, Inc. | | | 859,600 | |
| | 36,000 | | Eaton Vance Corp. | | | 993,960 | |
| | 15,000 | | Franklin Resources, Inc. | | | 1,292,850 | |
| | 8,800 | | Goldman Sachs Group, Inc. (The) | | | 1,155,176 | |
| | 7,000 | | MSCI, Inc. Class A * | | | 191,800 | |
| | 36,800 | | Royal Bank of Canada | | | 1,758,672 | |
| | 26,000 | | T. Rowe Price Group, Inc. | | | 1,154,140 | |
| Shares | | | | | Value | |
| | 11,284 | | Toronto-Dominion Bank (The) | | $ | 732,444 | |
| | 46,000 | | U.S. Bancorp | | | 1,028,100 | |
| | 46,000 | | Wells Fargo & Co. | | | 1,177,600 | |
| | | | | | | 17,795,862 | |
| Health Care — 12.3% | | | | |
| | 22,000 | | Acorda Therapeutics, Inc. * | | | 684,420 | |
| | 9,600 | | Alcon, Inc. | | | 1,422,624 | |
| | 34,000 | | Alexion Pharmaceuticals, Inc. * | | | 1,740,460 | |
| | 17,400 | | Allergan, Inc. | | | 1,013,724 | |
| | 6,000 | | Amedisys, Inc. * | | | 263,820 | |
| | 12,000 | | Cerner Corp. * | | | 910,680 | |
| | 38,000 | | Covance, Inc. * | | | 1,950,160 | |
| | 16,000 | | Covidien PLC | | | 642,880 | |
| | 50,000 | | DENTSPLY International, Inc. | | | 1,495,500 | |
| | 12,000 | | Edwards Lifesciences Corp. * | | | 672,240 | |
| | 14,000 | | Emergency Medical Services Corp. Class A * | | | 686,420 | |
| | 104,000 | | Express Scripts, Inc. * | | | 4,890,080 | |
| | 1,400 | | Fresenius Medical Care AG & Co. KGaA ADR | | | 75,166 | |
| | 52,000 | | Henry Schein, Inc. * | | | 2,854,800 | |
| | 46,000 | | IDEXX Laboratories, Inc. * | | | 2,801,400 | |
| | 35,000 | | Illumina, Inc. * | | | 1,523,550 | |
| | 11,000 | | Intuitive Surgical, Inc. * | | | 3,471,820 | |
| | 13,000 | | Masimo Corp. | | | 309,530 | |
| | 13,000 | | Medco Health Solutions, Inc. * | | | 716,040 | |
| | 21,000 | | Mettler-Toledo International, Inc. * | | | 2,344,230 | |
| | 10,000 | | Novo Nordisk A/S ADR | | | 810,200 | |
| | 47,250 | | Owens & Minor, Inc. | | | 1,340,955 | |
| | 11,000 | | ResMed, Inc. * | | | 668,910 | |
| | 8,000 | | SXC Health Solutions Corp. * | | | 586,000 | |
| | 9,300 | | Techne Corp. | | | 534,285 | |
| | 28,000 | | Teva Pharmaceutical Industries Ltd. ADR | | | 1,455,720 | |
| | 54,000 | | Thermo Fisher Scientific, Inc. * | | | 2,648,700 | |
| | 24,200 | | United Therapeutics Corp. * | | | 1,181,202 | |
| | 10,000 | | Warner Chilcott PLC Class A * | | | 228,500 | |
| | 17,000 | | West Pharmaceutical Services, Inc. | | | 620,330 | |
| | | | | | | 40,544,346 | |
| Industrials — 16.8% | | | | |
| | 16,000 | | Acuity Brands, Inc. | | | 582,080 | |
| | 15,000 | | Alliant Techsystems, Inc. * | | | 930,900 | |
| | 73,500 | | AMETEK, Inc. | | | 2,951,025 | |
| | 6,300 | | Atlas Air Worldwide Holdings, Inc. * | | | 299,250 | |
| | 41,000 | | Barnes Group, Inc. | | | 671,990 | |
| | 25,000 | | BE Aerospace, Inc. * | | | 635,750 | |
| | 24,000 | | Brink’s Co. (The) | | | 456,720 | |
| | 35,000 | | C.H. Robinson Worldwide, Inc. | | | 1,948,100 | |
| | 32,000 | | Canadian National Railway Co. | | | 1,836,160 | |
| | 34,000 | | CLARCOR, Inc. | | | 1,207,680 | |
| | 24,400 | | Cooper Industries PLC Class A | | | 1,073,600 | |
| | 27,000 | | Copart, Inc. * | | | 966,870 | |
| | 52,000 | | Corrections Corp. of America * | | | 992,160 | |
| | 28,000 | | Curtiss-Wright Corp. | | | 813,120 | |
| | 39,200 | | Danaher Corp. | | | 1,455,104 | |
| | 23,000 | | Donaldson Co., Inc. | | | 980,950 | |
| | 54,800 | | EMCOR Group, Inc. * | | | 1,269,716 | |
| | 21,000 | | EnerSys * | | | 448,770 | |
| | 23,000 | | Esterline Technologies Corp. * | | | 1,091,350 | |
| | 16,000 | | Flowserve Corp. | | | 1,356,800 | |
| | 17,000 | | FTI Consulting, Inc. * | | | 741,030 | |
| 4 | See Notes to Financial Statements. |
| | |
| Value Line Strategic Asset Management Trust |
| | |
| Schedule of Investments (Continued) |
| June 30, 2010 (Unaudited) | | | | |
| Shares | | | | | Value | |
| | 22,000 | | General Dynamics Corp. | | $ | 1,288,320 | |
| | 63,000 | | Geo Group, Inc. (The) * | | | 1,307,250 | |
| | 42,000 | | IDEX Corp. | | | 1,199,940 | |
| | 19,000 | | IHS, Inc. Class A * | | | 1,109,980 | |
| | 57,000 | | ITT Corp. | | | 2,560,440 | |
| | 40,000 | | Kansas City Southern * | | | 1,454,000 | |
| | 11,000 | | Kirby Corp. * | | | 420,750 | |
| | 21,000 | | L-3 Communications Holdings, Inc. | | | 1,487,640 | |
| | 34,000 | | Lennox International, Inc. | | | 1,413,380 | |
| | 24,000 | | McDermott International, Inc. * | | | 519,840 | |
| | 20,000 | | Navistar International Corp. * | | | 984,000 | |
| | 20,000 | | Polypore International, Inc. * | | | 454,800 | |
| | 58,000 | | Quanta Services, Inc. * | | | 1,197,700 | |
| | 23,500 | | Raytheon Co. | | | 1,137,165 | |
| | 63,500 | | Republic Services, Inc. | | | 1,887,855 | |
| | 18,000 | | Rockwell Collins, Inc. | | | 956,340 | |
| | 29,000 | | Roper Industries, Inc. | | | 1,622,840 | |
| | 36,000 | | Stericycle, Inc. * | | | 2,360,880 | |
| | 17,000 | | Toro Co. (The) | | | 835,040 | |
| | 19,000 | | TransDigm Group, Inc. | | | 969,570 | |
| | 36,000 | | United Technologies Corp. | | | 2,336,760 | |
| | 14,000 | | URS Corp. * | | | 550,900 | |
| | 13,600 | | Valmont Industries, Inc. | | | 988,176 | |
| | 13,000 | | W.W. Grainger, Inc. | | | 1,292,850 | |
| | 51,000 | | Waste Connections, Inc. * | | | 1,779,390 | |
| | 24,000 | | Woodward Governor Co. | | | 612,720 | |
| | | | | | | 55,437,651 | |
| Information Technology — 7.5% | | | | |
| | 17,000 | | Accenture PLC Class A | | | 657,050 | |
| | 6,000 | | Acme Packet, Inc. * | | | 161,280 | |
| | 48,000 | | Amphenol Corp. Class A | | | 1,885,440 | |
| | 12,000 | | Anixter International, Inc. * | | | 511,200 | |
| | 19,000 | | ANSYS, Inc. * | | | 770,830 | |
| | 4,000 | | Apple, Inc. * | | | 1,006,120 | |
| | 64,000 | | Aruba Networks, Inc. * | | | 911,360 | |
| | 7,000 | | Blackboard, Inc. * | | | 261,310 | |
| | 18,000 | | Cavium Networks, Inc. * | | | 471,420 | |
| | 23,000 | | Check Point Software Technologies Ltd. * | | | 678,040 | |
| | 58,000 | | Cognizant Technology Solutions Corp. Class A * | | | 2,903,480 | |
| | 8,000 | | CommVault Systems, Inc * | | | 180,000 | |
| | 22,000 | | Concur Technologies, Inc. * | | | 938,960 | |
| | 6,000 | | DG Fastchannel, Inc. * | | | 195,480 | |
| | 31,400 | | Dolby Laboratories, Inc. Class A * | | | 1,968,466 | |
| | 18,800 | | Equinix, Inc. * | | | 1,526,936 | |
| | 21,000 | | FactSet Research Systems, Inc. | | | 1,406,790 | |
| | 32,000 | | Informatica Corp. * | | | 764,160 | |
| | 7,000 | | Itron, Inc. * | | | 432,740 | |
| | 23,000 | | Nuance Communications, Inc. * | | | 343,850 | |
| | 18,400 | | Salesforce.com, Inc. * | | | 1,579,088 | |
| | 20,000 | | Solera Holdings, Inc. | | | 724,000 | |
| | 36,000 | | Sybase, Inc. * | | | 2,327,760 | |
| | 22,000 | | Teradata Corp. * | | | 670,560 | |
| | 13,000 | | VistaPrint NV * | | | 617,370 | |
| | 15,000 | | VMware, Inc. Class A * | | | 938,850 | |
| | | | | | | 24,832,540 | |
| Materials — 6.9% | | | | |
| | 17,000 | | Air Products & Chemicals, Inc. | | | 1,101,770 | |
| | 19,000 | | Airgas, Inc. | | | 1,181,800 | |
| | 32,200 | | Albemarle Corp. | | | 1,278,662 | |
| Shares | | | | | Value | |
| | 30,000 | | AptarGroup, Inc. | | $ | 1,134,600 | |
| | 14,000 | | Ball Corp. | | | 739,620 | |
| | 27,500 | | Celanese Corp. Series A | | | 685,025 | |
| | 40,000 | | Cliffs Natural Resources, Inc. | | | 1,886,400 | |
| | 29,000 | | Crown Holdings, Inc. * | | | 726,160 | |
| | 65,000 | | Ecolab, Inc. | | | 2,919,150 | |
| | 22,000 | | FMC Corp. | | | 1,263,460 | |
| | 19,000 | | Greif, Inc. Class A | | | 1,055,260 | |
| | 23,500 | | Lubrizol Corp. (The) | | | 1,887,285 | |
| | 6,000 | | NewMarket Corp. | | | 523,920 | |
| | 32,000 | | Praxair, Inc. | | | 2,431,680 | |
| | 8,000 | | Rockwood Holdings, Inc. * | | | 181,520 | |
| | 16,000 | | Scotts Miracle-Gro Co. (The) Class A | | | 710,560 | |
| | 48,400 | | Sigma-Aldrich Corp. | | | 2,411,772 | |
| | 24,000 | | Valspar Corp. (The) | | | 722,880 | |
| | | | | | | 22,841,524 | |
| Telecommunication Services — 1.9% | | | | |
| | 46,000 | | American Tower Corp. Class A * | | | 2,047,000 | |
| | 42,000 | | Crown Castle International Corp. * | | | 1,564,920 | |
| | 44,000 | | SBA Communications Corp. Class A * | | | 1,496,440 | |
| | 12,300 | | Telefonica S.A. ADR | | | 683,019 | |
| | 38,000 | | TW Telecom, Inc. * | | | 633,840 | |
| | | | | | | 6,425,219 | |
| Utilities — 1.6% | | | | |
| | 62,000 | | EQT Corp. | | | 2,240,680 | |
| | 20,600 | | ITC Holdings Corp. | | | 1,089,946 | |
| | 7,000 | | Questar Corp. | | | 318,430 | |
| | 21,000 | | South Jersey Industries, Inc. | | | 902,160 | |
| | 17,000 | | Wisconsin Energy Corp. | | | 862,580 | |
| | | | | | | 5,413,796 | |
| | | | Total Common Stocks (1) | | | | |
| | | | (Cost $167,878,203) | | $ | 218,361,768 | |
| | | | | | | | |
| Principal | | | | | | |
| Amount | | | | | Value | |
| U.S. Government Agency Obligations — 12.3% |
| $ | 4,000,000 | | Federal Home Loan Banks, 1.38%, 5/16/11 | | $ | 4,032,792 | |
| | 6,000,000 | | Federal Home Loan Banks, 2.00%, 7/27/12 | | | 6,006,144 | |
| | 4,000,000 | | Federal Home Loan Mortgage Corp., 2.25%, 7/16/12 | | | 4,002,656 | |
| | 1,663,500 | | Federal Home Loan Mortgage Corp., 4.00%, 12/15/13 | | | 1,695,216 | |
| | 243,835 | | Federal Home Loan Mortgage Corp., 5.00%, 1/1/21 | | | 261,646 | |
| | 58,851 | | Federal Home Loan Mortgage Corp., 5.00%, 10/1/21 | | | 63,003 | |
| | 99,195 | | Federal Home Loan Mortgage Corp., 5.00%, 10/1/21 | | | 106,193 | |
| | 305,392 | | Federal Home Loan Mortgage Corp., 5.00%, 11/1/21 | | | 326,936 | |
| | 384,587 | | Federal Home Loan Mortgage Corp., 5.50%, 4/15/22 | | | 405,277 | |
| | 3,799,145 | | Federal Home Loan Mortgage Corp., 4.50%, 6/15/23 | | | 3,936,770 | |
| | 1,855,589 | | Federal Home Loan Mortgage Corp., 5.50%, 3/15/24 | | | 1,932,858 | |
| See Notes to Financial Statements. | 5 |
| Value Line Strategic Asset Management Trust |
| Schedule of Investments (Continued) | |
| | | | | | | | |
| June 30, 2010 (Unaudited) | | | | |
Principal Amount | | | | Value | |
| $ | 1,829,026 | | Federal Home Loan Mortgage Corp., 4.50%, 10/15/27 | | $ | 1,926,029 | |
| | 4,000,000 | | Federal National Mortgage Association, 2.05%, 7/30/12 | | | 4,004,076 | |
| | 1,750,793 | | Federal National Mortgage Association, 5.00%, 11/1/34 | | | 1,860,564 | |
| | 787,106 | | Government National Mortgage Association, 5.50%, 1/15/36 | | | 853,593 | |
| | 8,633,915 | | Government National Mortgage Association, 5.50%, 8/20/37 | | | 9,337,128 | |
| | | | Total U.S. Government Agency Obligations (2) | | | | |
| | | | (Cost $39,478,186) | | | 40,750,881 | |
| | | | | | | | |
| U.S. Treasury Obligations — 8.8% | | | |
| | | | | | | | |
| | 4,000,000 | | U.S. Treasury Notes, 1.13%, 6/30/11 | | | 4,028,908 | |
| | 6,000,000 | | U.S. Treasury Notes, 1.00%, 8/31/11 | | | 6,038,904 | |
| | 10,000,000 | | U.S. Treasury Notes, 1.00%, 9/30/11 | | | 10,068,750 | |
| | 3,560,790 | | U.S. Treasury Notes, 1.88%, 7/15/13 (4) | | | 3,766,369 | |
| | 4,000,000 | | U.S. Treasury Notes, 6.13%, 11/15/27 | | | 5,265,000 | |
| | | | Total U.S. Treasury Obligations (2) | | | | |
| | | | (Cost $27,531,287) | | | 29,167,931 | |
| | | | | | | | |
| Corporate Bonds & Notes — 4.2% | | | | |
| | | | | | | | |
| Basic Materials — 0.3% | | | | |
| | 1,000,000 | | EI du Pont de Nemours & Co., 3.25%, 1/15/15 | | | 1,043,225 | |
| | | | | | | 1,043,225 | |
| Communications — 0.7% | | | | |
| | 2,000,000 | | BellSouth Corp., 5.20%, 9/15/14 | | | 2,222,398 | |
| | | | | | | 2,222,398 | |
| Consumer, Non-cyclical — 0.7% | | | | |
| | 1,000,000 | | Pfizer, Inc., 5.35%, 3/15/15 | | | 1,132,972 | |
| | 1,000,000 | | Campbell Soup Co., 3.38%, 8/15/14 | | | 1,059,236 | |
| | | | | | | 2,192,208 | |
| Energy — 0.7% | | | | |
| | 1,000,000 | | ConocoPhillips, Fixed, 4.60%, 1/15/15 | | | 1,092,450 | |
| | 1,000,000 | | Halliburton Co., Fixed, 6.15%, 9/15/19 | | | 1,095,408 | |
| | | | | | | 2,187,858 | |
| Financial — 1.5% | | | | |
| | 6,000,000 | | SLM Corp., 3.86%, 4/1/14 (3) | | | 5,135,280 | |
| | | | | | | 5,135,280 | |
| Industrial — 0.3% | | | | |
| | 1,000,000 | | Boeing Co. (The), Fixed, 3.50%, 2/15/15 | | | 1,054,861 | |
| | | | | | | 1,054,861 | |
| | | | Total Corporate Bonds & Notes (2) | | | | |
| | | | (Cost $14,161,410) | | | 13,835,830 | |
| | | | | | | | |
| | | | Total Investments — 91.3% | | | | |
| | | | (Cost $249,049,086) | | $ | 302,116,410 | |
Principal Amount | | | | Value | |
| | | | | | | | |
| Short-Term Investments — 8.5% | |
| | | | | |
| Repurchase Agreements — 8.5% | | | | |
| $ | 28,000,000 | | With Morgan Stanley, 0.005%, dated 06/30/10, due 07/01/10, delivery value $28,000,004 (collateralized by $28,650,000 U.S. Treasury Notes 0.8750%, due 03/31/11, with a value of $28,837,673) | | $ | 28,000,000 | |
| | | | Total Short-Term Investments (2) | | | | |
| | | | (Cost $28,000,000) | | $ | 28,000,000 | |
| Cash And Other Assets In Excess Of Liabilities — 0.2% | | | 712,880 | |
| Net Assets — 100.0% | | $ | 330,829,290 | |
Net Asset Value Per Outstanding Share ($330,829,290 ÷ 21,324,268 shares outstanding ) | | $ | 15.51 | |
| * | Non-income producing. |
| (1) | Unless otherwise indicated, the values of the Portfolio are determined based on Level 1 inputs established by FASB ASC 820-10, Fair Value Measurements and Disclosures. |
| (2) | Values determined based on Level 2 inputs established by FASB ASC 820-10, Fair Value Measurements and Disclosures. |
| (3) | The rate shown on floating rate securities is the rate at the end of the reporting period. The rate changes monthly. |
| (4) | Treasury Inflation-Protection Security (TIPS) |
| ADR | American Depositary Receipt. |
| 6 | See Notes to Financial Statements. |
| Value Line Strategic Asset Management Trust |
| Statement of Assets and Liabilities | | | | |
| | | | | |
| June 30, 2010 (Unaudited) | | | | |
| | | | | |
| ASSETS: | | | | |
| Investment securities, at value (Cost - $249,049,086) | | $ | 302,116,410 | |
| Repurchase agreement (Cost - $28,000,000) | | | 28,000,000 | |
| Cash | | | 679,538 | |
| Interest and dividends receivable | | | 694,375 | |
| Other | | | 119,694 | |
| Prepaid expenses | | | 20,214 | |
| Receivable for trust shares sold | | | 551 | |
| Total Assets | | | 331,630,782 | |
| LIABILITIES: | | | | |
| Payable for trust shares redeemed | | | 318,981 | |
| Payable for securities purchased | | | 232,940 | |
| Accrued expenses: | | | | |
| Advisory fee | | | 141,196 | |
| Service and distribution plan fees | | | 70,615 | |
| Trustees’ fees and expenses | | | 5,226 | |
| Other | | | 32,534 | |
| Total Liabilities | | | 801,492 | |
| Net Assets | | $ | 330,829,290 | |
| NET ASSETS CONSIST OF: | | | | |
| Shares of beneficial interest, at $0.01 par value (authorized unlimited, outstanding 21,324,268 shares) | | $ | 213,243 | |
| Additional paid-in capital | | | 283,486,033 | |
| Undistributed net investment income | | | 3,831,626 | |
| Accumulated net realized loss on investments and foreign currency | | | (9,768,880 | ) |
| Net unrealized appreciation of investments and foreign currency translations | | | 53,067,268 | |
| Net Assets | | $ | 330,829,290 | |
| Net Asset Value Per Outstanding Share | | | | |
| ($330,829,290 ÷ 21,324,268 shares outstanding) | | $ | 15.51 | |
| | | | | |
| Statement of Operations | | | | |
| | | | | |
| For the Six Months Ended | | | | |
| June 30, 2010 (Unaudited) | | | | |
| | | | | |
| INVESTMENT INCOME: | | | | |
| Interest | | $ | 1,285,163 | |
| Dividends (net of foreign withholding tax of $24,401) | | | 1,147,971 | |
| Total Income | | | 2,433,134 | |
| Expenses: | | | | |
| Advisory fee | | | 887,436 | |
| Service and distribution plan fees | | | 709,949 | |
| Auditing and legal fees | | | 116,723 | |
| Trustees’ fees and expenses | | | 27,322 | |
| Custodian fees | | | 24,796 | |
| Insurance | | | 22,177 | |
| Printing and postage | | | 10,034 | |
| Other | | | 19,154 | |
| Total Expenses Before Custody Credits and Fees Waived | | | 1,817,591 | |
| Less: Legal Fee Reimbursement | | | (151,383 | ) |
| Less: Service and Distribution Plan Fees Waived | | | (266,231 | ) |
| Less: Custody Credits | | | (272 | ) |
| Net Expenses | | | 1,399,705 | |
| Net Investment Income | | | 1,033,429 | |
| NET REALIZED AND UNREALIZED GAIN/(LOSS) ON INVESTMENTS AND FOREIGN EXCHANGE TRANSACTIONS: | | | | |
| Net Realized Gain | | | 5,626,611 | |
| Change in Net Unrealized Appreciation/ (Depreciation) | | | (10,203,636 | ) |
| Net Realized Gain and Change in Net Unrealized Appreciation/(Depreciation) on Investments and Foreign Exchange Transactions | | | (4,577,025 | ) |
| NET DECREASE IN NET ASSETS FROM OPERATIONS | | $ | (3,543,596 | ) |
| See Notes to Financial Statements. | 7 |
| Value Line Strategic Asset Management Trust |
| | |
| Statement of Changes in Net Assets |
| | | Six Months Ended June 30, 2010 (unaudited) | | | Year Ended December 31, 2009 | |
| Operations: | | | | | | |
| Net investment income | | $ | 1,033,429 | | | $ | 2,806,233 | |
| Net realized gain/(loss) on investments and foreign currency | | | 5,626,611 | | | | (15,299,055 | ) |
| Change in net unrealized appreciation/(depreciation) | | | (10,203,636 | ) | | | 78,082,054 | |
| Net increase/(decrease) in net assets from operations | | | (3,543,596 | ) | | | 65,589,232 | |
| Distributions to Shareholders: | | | | | | | | |
| Net investment income | | | — | | | | (3,895,465 | ) |
| Net realized gain from investment transactions | | | — | | | | (28,591,766 | ) |
| Decrease in net assets from distributions to shareholders | | | — | | | | (32,487,231 | ) |
| Trust Share Transactions: | | | | | | | | |
| Proceeds from sale of shares | | | 2,694,243 | | | | 5,156,167 | |
| Proceeds from reinvestment of dividends and distributions to shareholders | | | — | | | | 32,487,231 | |
| Cost of shares redeemed | | | (31,276,377 | ) | | | (63,676,985 | ) |
| Net decrease in net assets from trust share transactions | | | (28,582,134 | ) | | | (26,033,587 | ) |
| Total Increase/(Decrease) in Net Assets | | | (32,125,730 | ) | | | 7,068,414 | |
| | | | | | | | | |
| NET ASSETS: | | | | | | | | |
| Beginning of period | | | 362,955,020 | | | | 355,886,606 | |
| End of period | | $ | 330,829,290 | | | $ | 362,955,020 | |
| Undistributed net investment income, at end of period | | $ | 3,831,626 | | | $ | 2,798,197 | |
| 8 | See Notes to Financial Statements. |
| Value Line Strategic Asset Management Trust |
| | |
| Financial Highlights |
Selected data for a share of beneficial interest outstanding throughout each period:
| | | | | | | | | | | | | | | | | | | | |
| | | Six Months Ended June 30, 2010 (Unaudited) | | | |
| | | | Years Ended December 31, | |
| | | | 2009 | | 2008 | | 2007 | | 2006 | | 2005 | |
| Net asset value, beginning of period | | | $ | 15.72 | | | $ | 14.36 | | $ | 23.67 | | $ | 23.16 | | $ | 22.22 | | $ | 20.46 | |
| Income from investment operations: | | | | | | | | | | | | | | | | | | | | | |
| Net investment income | | | | 0.06 | | | | 0.14 | | | 0.20 | | | 0.28 | | | 0.24 | | | 0.20 | |
| Net gains or (losses) on securities (both realized and unrealized) | | | | (0.27 | ) | | | 2.67 | | | (6.44 | ) | | 3.22 | | | 1.23 | | | 1.65 | |
| Total from investment operations | | | | (0.21 | ) | | | 2.81 | | | (6.24 | ) | | 3.50 | | | 1.47 | | | 1.85 | |
| Less distributions: | | | | | | | | | | | | | | | | | | | | | |
| Dividends from net investment income | | | | — | | | | (0.17 | ) | | (0.30 | ) | | (0.24 | ) | | (0.21 | ) | | (0.09 | ) |
| Distributions from net realized gains | | | | — | | | | (1.28 | ) | | (2.77 | ) | | (2.75 | ) | | (0.32 | ) | | — | |
| Total distributions | | | | — | | | | (1.45 | ) | | (3.07 | ) | | (2.99 | ) | | (0.53 | ) | | (0.09 | ) |
| Net asset value, end of period | | | $ | 15.51 | | | $ | 15.72 | | $ | 14.36 | | $ | 23.67 | | $ | 23.16 | | $ | 22.22 | |
Total return* | | | | (1.34 | )%(3) | | | 21.16 | % | | (29.39 | )% | | 15.28 | % | | 6.85 | % | | 9.08 | % |
| Ratios/Supplemental Data: | | | | | | | | | | | | | | | | | | | | | |
| Net assets, end of period (in thousands) | | | $ | 330,829 | | | $ | 362,955 | | $ | 355,887 | | $ | 605,133 | | $ | 628,674 | | $ | 711,012 | |
Ratio of expenses to average net assets(1) | | | | 1.02 | %(4) | | | 1.02 | % | | 1.00 | % | | 0.95 | % | | 0.97 | % | | 0.95 | % |
Ratio of expenses to average net assets(2) | | | | 0.79 | %(4) | | | 0.87 | % | | 0.84 | % | | 0.78 | % | | 0.88 | % | | 0.95 | % |
| Ratio of net investment income to average net assets | | | | 0.58 | %(4) | | | 0.81 | % | | 0.82 | % | | 1.06 | % | | 0.87 | % | | 0.84 | % |
| Portfolio turnover rate | | | | 8 | %(3) | | | 16 | % | | 24 | % | | 26 | % | | 26 | % | | 33 | % |
| * | Total returns do not reflect the effects of charges deducted under the terms of Guardian Insurance and Annuity Company, Inc.’s (GIAC) variable contracts. Including such charges would reduce the total returns for all periods shown. |
| (1) | Ratio reflects expenses grossed up for custody credit arrangement and grossed up for the waiver of a portion of the service and distribution plan fees by the Distributor and the reimbursement of a portion of the legal fees. The ratio of expenses to average net assets net of custody credits, but exclusive of the fee waivers would have been 0.99% for the year ended December 31, 2008 and would not have changed for the other periods shown. |
| (2) | Ratio reflects expenses net of the custody credit arrangement and net of the waiver of a portion of the service and distribution plan fees by the Distributor and the reimbursement of a portion of the legal fees. |
| (3) | Not annualized. |
| (4) | Annualized. |
| See Notes to Financial Statements. | 9 |
| Value Line Strategic Asset Management Trust |
| | |
| Notes to Financial Statements |
| |
| June 30, 2010 (Unaudited) |
| 1. | Significant Accounting Policies |
Value Line Strategic Asset Management Trust (the “Trust”) is an open-end diversified management investment company registered under the Investment Company Act of 1940, as amended, which seeks to achieve a high total investment return consistent with reasonable risk by investing primarily in a broad range of common stocks, bonds and money market instruments. The Trust will attempt to achieve its objective by following an asset allocation strategy based on data derived from computer models for the stock and bond markets that shifts the assets of the Trust among equity, debt and money market securities as the models indicate and its investment adviser, EULAV Asset Management, LLC (the “Adviser”), deems appropriate.
The following significant accounting policies are in conformity with generally accepted accounting principles for investment companies. Such policies are consistently followed by the Trust in the preparation of its financial statements. Generally accepted accounting principles require management to make estimates and assumptions that affect the reported amounts and disclosures in the financial statements. Actual results may differ from those estimates.
(A) Security Valuation
Securities listed on a securities exchange are valued at the closing sales prices on the date as of which the net asset value is being determined. Securities traded on the NASDAQ Stock Market are valued at the NASDAQ Official Closing Price. In the absence of closing sales prices for such securities traded in the over-the-counter market, the security is valued at the midpoint between the latest available and representative asked and bid prices.
The Board of Trustees has determined that the value of bonds and other fixed-income securities be calculated on the valuation date by reference to valuations obtained from an independent pricing service which determines valuations for normal institutional-size trading units of debt securities, without exclusive reliance upon quoted prices. This service takes into account appropriate factors such as institutional-size trading in similar groups of securities, yield, quality, coupon rate, maturity, type of issue, trading characteristics and other market data in determining valuations.
Short-term investments with maturities of 60 days or less at the date of purchase are valued at amortized cost which approximates market value. Short-term instruments with maturities greater than 60 days at the date of purchase are valued at the midpoint between the latest available and representative asked and bid prices, and commencing 60 days prior to maturity such securities are valued at amortized cost.
Securities for which market quotations are not readily available or which are not readily marketable are valued at fair value as the Board of Trustees may determine in good faith. In addition, the Trust may use the fair value of a security when the closing market price on the primary exchange where the security is traded no longer accurately reflects the value of a security due to factors affecting one or more relevant securities markets or the specific issuer.
(B) Fair Value Measurements
In accordance with Financial Accounting Standards Board Accounting Standards Codification (FASB ASC 820-10), Fair Value Measurements and Disclosures, (formerly Statement of Financial Accounting Standards (“SFAS”) No. 157), the Trust discloses the fair value of its investments in a hierarchy that prioritizes the inputs to valuation techniques used to measure the fair value. The hierarchy gives the highest priority to valuations based upon unadjusted quoted prices in active markets for identical assets or liabilities (level 1 measurement) and the lowest priority to valuations based upon unobservable inputs that are significant to the valuation (level 3 measurements). FASB ASC 820-10-35-39 to 55 provides three levels of the fair value hierarchy as follows:
| | |
| ● | Level 1 — Inputs that reflect unadjusted quoted prices in active markets for identical assets or liabilities that the Trust has the ability to access at the measurement date; |
| Level 2 — Inputs other than quoted prices that are observable for the asset or liability either directly or indirectly, including inputs in markets that are not considered to be active; |
| Level 3 — Inputs that are unobservable. |
During the six months ended June 30, 2010, the Trust adopted the authoritative guidance included in FASB ASC 820-10, Fair Value Measurements and Disclosures, on determining fair value when the volume and level of activity for the asset or liability have significantly decreased and identifying transactions that are not orderly (formerly FSP FAS 157-4). FASB ASC 820-10-35-51A to 51H indicates that if an entity determines that either the volume and/or level of activity for an asset or liability has significantly decreased (from normal conditions for that asset or liability) or price quotations or observable inputs are not associated with orderly transactions, increased analysis and management judgment will be required to estimate fair value.
| Value Line Strategic Asset Management Trust |
| | |
| Notes to Financial Statements (Continued) |
| | |
| June 30, 2010 (Unaudited) |
Valuation techniques such as an income approach might be appropriate to supplement or replace a market approach in those circumstances. It provides a list of factors to determine whether there has been a significant decrease in relation to normal market activity. Regardless, however, of the valuation technique and inputs used, the objective for the fair value measurement in those circumstances is unchanged from what it would be if markets were operating at normal activity levels and/or transactions were orderly; that is, to determine the current exit price as promulgated by FASB ASC 820-10.
The following is a summary of the inputs used as of June 30, 2010 in valuing the Trust’s investments carried at value:
| | | | | | | | | | | | | | |
| Investments in Securities: | | Level 1 | | Level 2 | | Level 3 | | Total | |
| Assets | | | | | | | | | | | | | |
| Common Stocks | | $ | 218,361,768 | | $ | 0 | | $ | 0 | | $ | 218,361,768 | |
| U.S. Government Agency Obligations | | | 0 | | | 40,750,881 | | | 0 | | | 40,750,881 | |
| U.S. Treasury Obligations | | | 0 | | | 29,167,931 | | | 0 | | | 29,167,931 | |
| Corporate Bonds & Notes | | | 0 | | | 13,835,830 | | | 0 | | | 13,835,830 | |
| Short-Term Investments | | | 0 | | | 28,000,000 | | | 0 | | | 28,000,000 | |
| Total Investments in Securities | | $ | 218,361,768 | | $ | 111,754,642 | | $ | 0 | | $ | 330,116,410 | |
As of June 30, 2010, there was no significant security transfer activity from Level 1 to Level 2 or from Level 2 to Level 1.
For the six months ended June 30, 2010, there were no Level 3 investments. The types of inputs used to value each security are identified in the Schedule of Investments, which also includes a breakdown of the Schedule’s investments by category.
(C) Repurchase Agreements
In connection with transactions in repurchase agreements, the Trust’s custodian takes possession of the underlying collateral securities, the value of which exceeds the principal amount of the repurchase transaction, including accrued interest. To the extent that any repurchase transaction exceeds one business day, it is the Trust’s policy to mark-to-market the collateral on a daily basis to ensure the adequacy of the collateral. In the event of default of the obligation to repurchase, the Trust has the right to liquidate the collateral and apply the proceeds in satisfaction of the obligation. Under certain circumstances, in the event of default or bankruptcy by the other party to the agreement, realization and/or retention of the collateral or proceeds may be subj ect to legal proceedings.
(D) Federal Income Taxes
It is the policy of the Trust to qualify as a regulated investment company by complying with the provisions available to regulated investment companies, as defined in applicable sections of the Internal Revenue Code, and to distribute all of its investment income and capital gains to its shareholders. Therefore, no provision for federal income tax is required.
(E) Dividends and Distributions
It is the Trust’s policy to distribute to its shareholders, as dividends and as capital gains distributions, all the net investment income for the year and all the net capital gains realized by the Trust, if any. Such distributions are determined in accordance with income tax regulations, which may differ from generally accepted accounting principles. All dividends or distributions will be payable in shares of the Trust at the net asset value on the ex-dividend date. This policy is, however, subject to change at any time by the Board of Trustees.
(F) Securities Transactions and Income
Securities transactions are recorded on a trade date basis. Realized gains and losses from securities transactions are recorded on the identified cost basis. Interest income on investments, adjusted for amortization of discount and premium, if applicable, is earned from settlement date and recognized on the accrual basis. Dividend income is recorded on the ex-dividend date.
The Trust may invest in Treasury Inflation-Protection Securities (TIPS). The principal value and interest payout of TIPS are periodically adjusted according to the rate of the inflation based on the Consumer Price Index. The adjustments for principal and income due to inflation are reflected in interest income in the Statement of Operations.
(G) Foreign Currency Translation
The books and records of the Trust are maintained in U.S. dollars. Assets and liabilities which are denominated in foreign currencies are translated to U.S. dollars at the prevailing rates of exchange on the valuation date. The Trust does not isolate changes in the value of investments caused by foreign exchange rate differences from the changes due to other circumstances.
Income and expenses are translated to U.S. dollars based upon the rates of exchange on the respective dates of such transactions.
Net realized foreign exchange gains or losses arise from currency fluctuations realized between the trade and settlement dates on securities transactions, the differences between the U.S. dollar amounts of dividends, interest, and foreign withholding taxes recorded by the Trust, and the U.S. dollar equivalent of the amounts actually received or paid. Net unrealized foreign exchange gains and losses arise from changes in the value of assets and liabilities, other than investments, at the end of the fiscal period, resulting from changes in the exchange rates. The effect of the change in foreign exchange rates on the value of investments is included in realized gain/(loss) on investments and change in net unrealized appreciation/ (depreciation) on investments.
| Value Line Strategic Asset Management Trust |
| | |
| Notes to Financial Statements (Continued) |
| | |
| June 30, 2010 (Unaudited) |
(H) Representations and Indemnifications
In the normal course of business, the Trust enters into contracts that contain a variety of representations and warranties which provide general indemnifications. The Trust’s maximum exposure under these arrangements is unknown, as this would involve future claims that may be made against the Trust that have not yet occurred. However, based on experience, the Trust expects the risk of loss to be remote.
(I) Accounting for Real Estate Investment Trusts
The Trust owns shares of Real Estate Investment Trusts (“REITs”) which report information on the source of their distributions annually. Distributions received from REITs during the year which represent a return of capital are recorded as a reduction of cost and distributions which represent a capital gain dividend are recorded as a realized long-term capital gain on investments.
(J) Foreign Taxes
The Trust may be subject to foreign taxes on income, gains on investments, or currency repatriation, a portion of which may be recoverable. The Trust will accrue such taxes and recoveries as applicable, based upon its current interpretation of tax rules and regulations that exist in the markets in which it invests.
(K) Other
On November 4, 2009, the Securities and Exchange Commission (“SEC”), Value Line, Inc. (“Value Line or VLI”), the Distributor and two former directors and officers of Value Line settled a matter related to brokerage commissions charged by the Distributor to certain Value Line mutual funds (“Funds”), from 1986 through November of 2004 involving alleged misleading disclosures provided by Value Line to the Boards of Directors/Trustees and shareholders of the Funds regarding such brokerage commissions. Value Line paid disgorgement, interest and penalty of $43.7 million in connection with the settlement, which amounts are expected to constitute a “Fair Fund” to be distributed to investors in the Funds who were disadvantaged by such bro kerage practices. Value Line will bear all costs associated with any Fair Fund distribution, including retaining a third-party consultant approved by the SEC staff to administer any Fair Fund distribution.
On March 11, 2010, VLI and the Boards of Trustees/Directors of the Value Line Funds entered into an agreement pursuant to which VLI will reimburse the Funds in the aggregate amount of $917,302 for various expenses incurred by the Funds in connection with the SEC matter dated November 4, 2009. The receivable for this expense reimbursement was accrued on March 11, 2010 by the applicable Funds that incurred the expenses and will be paid by VLI in twelve monthly installments commencing April 1, 2010. The Trust accrued $151,383 in expense reimbursements from VLI.
(L) Subsequent Events
On July 20, 2010, the Board of Directors of Value Line approved a transaction involving its wholly owned subsidiaries, EULAV Asset Management, LLC (“EULAV”) and EULAV Securities, Inc. (“ESI”). Completion of the transaction is subject to various conditions. If the transaction is completed, Value Line will contribute all of the outstanding stock of ESI to EULAV, EULAV will be converted to a Delaware statutory trust named EULAV Asset Management (“EAM”), Value Line will restructure its ownership of EAM so that it has no voting authority with respect to the election or removal of the trustees of EAM and retains only interests in the revenues and residual profits of EAM and EAM will grant residual profits interests to five individuals s elected by the independent directors of Value Line.
Value Line has informed the Boards of Directors/Trustees of the Value Line Funds (the “Fund Board”) that, after the closing of the proposed restructuring, Value Line will no longer control EAM, which will result in the automatic termination of the Fund’s investment advisory agreements in accordance with the requirements of the Investment Company Act of 1940. On July 20, 2010, the Fund Board considered matters relevant to the proposed restructuring and approved new investment advisory agreements between the Funds and EAM to take effect upon the closing of the restructuring. The effectiveness of each investment advisory agreement is also contingent upon approval by shareholders of the applicable Value Line mutual fund. Toward this end, a s pecial shareholder meeting for each Value Line mutual fund will be held at which shareholders as of the record date will vote on the proposed new investment advisory agreements with EAM and to elect three persons as members of the Fund Board. It is anticipated that in September 2010, a proxy statement describing the proposals will be sent to each shareholder of record as of the record date. Shareholders who did not own shares as of the record date will not be entitled to notice of, or to vote at, the special shareholder meetings.
| | |
| 2. | Trust Share Transactions, Dividends and Distributions |
Shares of the Trust are available to the public only through the purchase of certain contracts issued by The Guardian Insurance and Annuity Company, Inc. (GIAC). Transactions in shares of beneficial interest in the Trust were as follows:
| Value Line Strategic Asset Management Trust |
| | |
| Notes to Financial Statements (Continued) |
| | |
| June 30, 2010 (Unaudited) |
| | | Six Months Ended June 30, 2010 (unaudited) | | | Year Ended December 31, 2009 | |
| Shares sold | | | 166,216 | | | | 349,574 | |
| Shares issued in reinvestment of dividends and distributions | | | — | | | | 2,392,285 | |
| Shares redeemed | | | (1,934,488 | ) | | | (4,429,685 | ) |
| Net decrease | | | (1,768,272 | ) | | | (1,687,826 | ) |
| Dividends per share from net investment income | | $ | — | | | $ | 0.1738 | |
| Distribution per share from net realized gains | | $ | — | | | $ | 1.2759 | |
| | | | | | | | |
| 3. Purchases and Sales of Securities | | | | | | | |
| | |
| Purchases and sales of investment securities, excluding short-term securities, were as follows: | |
| | | | | |
| | | Six Months Ended June 30, 2010 (unaudited) | |
| PURCHASES: | | | | |
| U.S. Treasury & Government Agency Obligations | | $ | 16,102,935 | |
| Other Investment Securities | | | 31,411,142 | |
| Total Purchases | | $ | 47,514,077 | |
| SALES: | | | | |
| U.S. Treasury & Government Agency Obligations | | $ | 1,010,710 | |
| Other Investment Securities | | | 22,419,137 | |
| Total Sales | | $ | 23,429,847 | |
| | | | | | | | |
| 4. Income Taxes | | | | | | | |
| | | | | | | | |
| At June 30, 2010, information on the tax components of capital is as follows: | |
| | | | | | | | |
| Cost of investments for tax purposes | | $ | 277,049,086 | |
| Gross tax unrealized appreciation | | $ | 62,151,490 | |
| Gross tax unrealized depreciation | | ($ | 9,084,166 | ) |
| Net tax unrealized appreciation on investments | | $ | 53,067,324 | |
| 5. | Investment Advisory Fee, Service and Distribution Fees and Transactions With Affiliates |
An advisory fee of $887,436 was paid or payable to EULAV Asset Management, LLC (the “Adviser”) for the six months ended June 30, 2010. This was computed at the rate of 0.50% of the average daily net assets of the Trust during the period and paid monthly. The Adviser provides research, investment programs, supervision of the investment portfolio and pays costs of administrative services, office space, equipment and compensation of administrative, bookkeeping, and clerical personnel necessary for managing the affairs of the Trust. The Adviser also provides persons, satisfactory to the Trust’s Board of Trustees, to act as officers and employees of the Trust and pays their salaries.
The Trust has a Service and Distribution Plan (the “Plan”), adopted pursuant to Rule 12b-1 under the Investment Company Act of 1940, which compensates EULAV Securities, Inc. (the “Distributor”) in advertising, marketing and distributing the Trust’s shares and for servicing the Trust’s shareholders at an annual rate of 0.40% of the Trust’s average daily net assets. For the six months ended June 30, 2010, fees amounting to $709,949, before fee waivers, were accrued under the Plan. Effective May 23, 2006, the Distributor voluntarily waived 0.15% of the 12b-1 fee. Effective May 1, 2007, 2008 and 2009, the Distributor contractually agreed to reduce the fee under the Plan by 0.15% for one year periods. On March 11, 2010, with an effective da te of May 1, 2010, the Distributor contractually agreed to waive 0.15% of the Rule 12b-1 fee for a one year period. For the six months ended June 30, 2010, the fees waived amounted to $266,231. The Distributor has no right to recoup previously waived amounts.
For the six months ended June 30, 2010, the Trust’s expenses were reduced by $272 under a custody credit arrangement with the custodian.
Direct expenses of the Trust are charged to the Trust while common expenses of the Value Line Funds are allocated proportionately based upon the Funds’ respective net assets. The Trust bears all other costs and expenses.
Certain officers, employees and directors of Value Line and/or affiliated companies are also officers and a Trustee of the Trust.
| Value Line Strategic Asset Management Trust |
| | |
| June 30, 2010 Semi-Annual Report |
FACTORS CONSIDERED BY THE BOARD IN APPROVING
THE INVESTMENT ADVISORY AGREEMENT
FOR VALUE LINE STRATEGIC ASSET MANAGEMENT TRUST
The Investment Company Act of 1940 (the “1940 Act”) requires the Board of Trustees, including a majority of Trustees who are not “interested persons” of Value Line Strategic Asset Management Trust (the “Trust”), as that term is defined in the 1940 Act (the “Independent Trustees”), annually to consider the investment advisory agreement (the “Agreement”) between the Trust and its investment adviser, EULAV Asset Management, LLC (the “Adviser”). As required by the 1940 Act, the Board requested and the Adviser provided such information as the Board deemed to be reasonably necessary to evaluate the terms of the Agreement. At meetings held throughout the year, including the meeting specifically focused upon the r eview of the Agreement, the Independent Trustees met in executive sessions separately from the non-Independent Trustee of the Trust and any officers of the Adviser. In selecting the Adviser and approving the continuance of the Agreement, the Independent Trustees relied upon the assistance of counsel to the Independent Trustees.
Both in the meetings which specifically addressed the approval of the Agreement and at other meetings held during the course of the year, the Board, including the Independent Trustees, received materials relating to the Adviser’s investment and management services under the Agreement. These materials included information on: (i) the investment performance of the Trust, compared to a peer group of funds consisting of the Trust and all mixed-asset target allocation growth funds underlying variable insurance products regardless of asset size or primary channel of distribution (the “Performance Universe”), and its benchmark index, each as classified by Lipper Inc., an independent evaluation service (“Lipper”); (ii) the investment process, portfolio ho ldings, investment restrictions, valuation procedures, and financial statements for the Trust; (iii) sales and redemption data with respect to the Trust; (iv) the general investment outlook in the markets in which the Trust invests; (v) arrangements with respect to the distribution of the Trust’s shares; (vi) the allocation and cost of the Trust’s brokerage (none of which was effected through any affiliate of the Adviser); and (vii) the overall nature, quality and extent of services provided by the Adviser.
As part of the review of the continuance of the Agreement, the Board requested, and the Adviser provided, additional information in order to evaluate the quality of the Adviser’s services and the reasonableness of its fees under the Agreement. In a separate executive session, the Independent Trustees reviewed information, which included data comparing: (i) the Trust’s management fee rate, transfer agent and custodian fee rates, service fee (including 12b-1 fees) rates, and the rate of the Trust’s other non-management fees, to those incurred by a peer group of funds consisting of the Trust and 10 other mixed-asset target allocation growth funds underlying variable insurance products, as selected objectively by Lipper (“Expense Group”), and a peer g roup of funds consisting of the Trust, the Expense Group and all other mixed-asset target allocation growth funds underlying variable insurance products (excluding outliers), as selected objectively by Lipper (“Expense Universe”); (ii) the Trust’s expense ratio to those of its Expense Group and Expense Universe; and (iii) the Trust’s investment performance over various time periods to the average performance of the Performance Universe as well as the appropriate Lipper Index, as selected objectively by Lipper (the “Lipper Index”). In the separate executive session, the Independent Trustees also reviewed information regarding: (a) the financial results and condition of the Adviser’s parent company, the Adviser’s and certain of its affiliates’ profitability from the services that have been performed for the Trust as well as the Value Line family of funds; (b) the Trust’s current investment management staffing; and (c) the Trust’s potential for a chieving economies of scale. In support of its review of the statistical information, the Board was provided with a detailed description of the methodology used by Lipper to determine the Expense Group, the Expense Universe and the Performance Universe to prepare its information. The Independent Directors also requested and reviewed information provided by the Adviser relating to the settlement of a matter brought by the Securities and Exchange Commission regarding Value Line Securities, Inc.1, the Trust’s principal underwriter and affiliate of the Adviser (the “Distributor”), Value Line, Inc., and two former directors and officers of Value Line, Inc. Value Line, Inc. informed the Board that it and the Adviser continue to have adequate liquid assets, and that the resolution of this matter did not have a materially adverse effect on the ability of the Adviser or the Distributor to perform their respective contract s with the Trust.
| | |
1 | On May 6, 2009, Value Line Securities, Inc. changed its name to EULAV Securities, Inc. No other change was made to the Distributor’s organization, including its operations and personnel. |
| Value Line Strategic Asset Management Trust |
| | |
| June 30, 2010 Semi-Annual Report |
The following summarizes matters considered by the Board in connection with its renewal of the Agreement. However, the Board did not identify any single factor as all-important or controlling, and the summary does not detail all the matters that were considered.
Investment Performance. The Board reviewed the Trust’s overall investment performance and compared it to its Performance Universe and the Lipper Index. The Board noted that the Trust outperformed both the Performance Universe average and the Lipper Index for the three-year and five-year periods ended December 31, 2009. The Board also noted that the Trust’s performance for the one-year and ten-year periods ended December 31, 2009 was below the performance of the Performance Universe average and the Lipper Index.
The Adviser’s Personnel and Methods. The Board reviewed the background of the portfolio managers responsible for the daily management of the Trust’s portfolio, seeking to achieve the Trust’s investment objective and adhering to the Trust’s investment strategies. The Independent Trustees also engaged in discussions with the Adviser’s senior management responsible for the overall functioning of the Trust’s investment operations. The Board concluded that the Trust’s management team and the Adviser’s overall resources were adequate and that the Adviser had investment management capabilities and personnel essential to performing its duties under the Agreement.
Management Fee and Expenses. The Board considered the Adviser’s fee under the Agreement relative to the management fees charged by its Expense Group and Expense Universe averages. The Board noted that, for the most recent fiscal year, the Trust’s management fee rate was less than that of both the Expense Group average and the Expense Universe average.
The Board also considered the Trust’s total expense ratio relative to its Expense Group and Expense Universe averages. The Board noted that the Distributor and the Board previously agreed that the Distributor would contractually waive a portion of the Trust’s Rule 12b-1 fee, effectively reducing the Trust’s Rule 12b-1 fee rate from 0.40% to 0.25% of the Trust’s average daily net assets for the one-year period ending April 30, 2010. The Distributor and the Board have currently agreed to extend this contractual 12b-1 fee waiver through April 30, 2011. Such waiver can not be changed without the Board’s approval during the contractual waiver period. As a result of this Rule 12b-1 fee waiver, the Board noted that the Trust’s total expense ratio a fter giving effect to this waiver was less than that of the Expense Group average and the Expense Universe average. The Board concluded that the average expense ratio was satisfactory for the purpose of approving the continuance of the Agreement for the coming year.
Nature and Quality of Other Services. The Board considered the nature, quality, cost and extent of other services provided by the Adviser and the Distributor. At meetings held throughout the year, the Board reviewed the effectiveness of the Adviser’s overall compliance program, as well as the services provided by the Distributor. The Board viewed favorably the increased emphasis being placed by the Adviser on its overall compliance program as well as steps being undertaken to enhance the shareholders’ experience with the Trust, such as a more robust website. The Board also reviewed the services provided by the Adviser and its affiliates in supervising third party service providers. Based on this review, the Board concluded that the nature, quality, cost and extent of such other services provided by the Adviser and its affiliates were satisfactory, reliable and beneficial to the Trust’s shareholders.
Profitability. The Board considered the level of profitability of the Adviser and its affiliates with respect to the Trust individually and in the aggregate for all the funds within the Value Line group of funds, including the impact of certain actions taken during prior years. These actions included the reduction (voluntary in some instances and contractual in other instances) of management and/or Rule 12b-1 fees for certain funds, the Adviser’s termination of the use of soft dollar research, and the cessation of trading through the Distributor. The Board concluded that the pro fitability of the Adviser and its affiliates with respect to the Trust, including the financial results derived from the Trust’s Agreement, were within a range the Board considered reasonable.
| Value Line Strategic Asset Management Trust |
| | |
| June 30, 2010 Semi-Annual Report |
Other Benefits. The Board also considered the character and amount of other direct and incidental benefits received by the Adviser and its affiliates from their association with the Trust. The Board concluded that potential “fall-out” benefits that the Adviser and its affiliates may receive, such as greater name recognition, appear to be reasonable, and may in some cases benefit the Trust.
Economies of Scale. The Board noted that, given the current and anticipated size of the Trust, any perceived and potential economies of scale were not yet a significant consideration for the Trust and the addition of break points was determined not to be necessary at this time.
Fees and Services Provided for Other Comparable Funds/Accounts Managed by the Adviser and its Affiliates. In addition to comparing the Trust’s management fee rate to unaffiliated mutual funds included in the Trust’s Expense Group and Expense Universe, the Board was informed by the Adviser that the Adviser and its affiliates do not manage any investment companies or other institutional accounts comparable to the Trust.
Conclusion. The Board, in light of the Adviser’s overall performance, considered it appropriate to continue to retain the Adviser as the Trust’s investment adviser. Based on their evaluation of all material factors deemed relevant, and with the advice of independent counsel, the Board determined that the Trust’s management fee rate payable to the Adviser under the Agreement does not constitute fees that are so disproportionately large as to bear no reasonable relationship to the services rendered and that could not have been the product of arm’s-length bargaini ng, and concluded that the management fee rate under the Agreement is fair and reasonable. Further, the Board concluded that the Trust’s Agreement is fair and reasonable and approved the continuation of the Agreement for another year.
| Value Line Strategic Asset Management Trust |
The Trust files its complete schedule of portfolio holdings with the Securities and Exchange Commission (“SEC”) for the first and third quarters of each fiscal year on Form N-Q. The Trust’s Forms N-Q are available on the SEC’s website at http://www.sec.gov and may be reviewed and copied at the SEC’s Public Reference Room in Washington, D.C. Information on the operation of the Public Reference Room may be obtained by calling 1-800-SEC-0330.
A description of the policies and procedures that the Trust uses to determine how to vote proxies relating to portfolio securities, and information regarding how the Trust voted these proxies for the 12-month period ended June 30 is available through the Trust’s website at http://www.vlfunds.com and on the SEC’s website at http://www.sec.gov. The description of the policies and procedures is also available without charge, upon request, by calling 1-800-243-2729.