UNITED STATES
SECURITIES AND EXCHANGE COMMISSION
Washington, D.C. 20549
FORM N-CSR
CERTIFIED SHAREHOLDER REPORT OF REGISTERED
MANAGEMENT INVESTMENT COMPANIES
Investment Company Act file Number 811-5276
Value Line Strategic Asset Management Trust
(Exact name of registrant as specified in charter)
| | |
220 East 42nd Street, New York, N.Y. 10017
|
| (Address of principal executive offices) (Zip Code) |
Registrant’s telephone number, including area code: 212-907-1500
Date of fiscal year end: December 31, 2004
Date of reporting period: June 30, 2005
Item 1. Reports to Stockholders.
A copy of the Semi-Annual Report to Stockholders for the period ended 6/30/05 is included with this Form.
| | |
n Value Line Strategic Asset Management Trust (Unaudited) | | Semiannual Report
To Contractowners |

Stephen E. Grant, Portfolio Manager (right),
Jeffrey D. Geffen, Director of Bond Management (left)
Objective:
High total investment return consistent with reasonable risk
Inception Date:
October 1, 1987
Net Assets at June 30, 2005:
$733,341,094
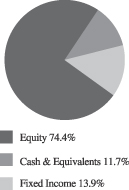
Portfolio composition at June 30, 2005:
(Percentage of Total Net Assets)
Top Ten Common Stock Holdings (As of 6/30/05)
| | | |
| Company | | Percentage of
Total Net Assets | |
CP Holders, Inc. (ADR) | | 1.33 | % |
Coach, Inc. | | 1.07 | % |
American Standard Companies, Inc. | | 0.95 | % |
ITT Industries, Inc. | | 0.93 | % |
Golden West Financial Corp. | | 0.79 | % |
Constellation Brands, Inc. Class “A” | | 0.72 | % |
St. Jude Medical, Inc. | | 0.71 | % |
WellPoint, Inc. | | 0.66 | % |
XTO Energy, Inc. | | 0.64 | % |
Everest Re Group, Ltd. | | 0.63 | % |
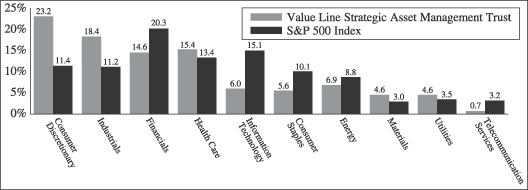
Sector Weightings vs. Index (As of 6/30/05)
Average Annual Total Returns (For periods ended 6/30/05)
| | | | | | | | | | | | |
| | | Year
to Date | | 1
Yr | | 3
Yrs | | 5
Yrs | | 10
Yrs | | Since
Inception
10/1/1987 |
Value Line Strategic Asset Management Trust | | 2.84% | | 10.14% | | 7.91% | | –0.15% | | 9.44% | | 11.17% |
60%/40% S&P 500 Index: Lehman Gov’t/Credit Bond Index | | 0.61% | | 6.70% | | 7.53% | | 1.66% | | 8.72% | | 10.25% |
About information in this report:
| • | | All performance data quoted is historical and the results represent past performance and neither guarantee nor predict future investment results. To obtain performance data current to the most recent month (availability within 7 business days of the most recent month end), please call us at (800) 221-3253 or visit our website at www.guardianinvestor.com. Current performance may be higher or lower than the performance quoted here. Investment return and principal value will fluctuate so that an investor’s shares, when redeemed, may be worth more or less than the original cost. |
| • | | It is important to consider the Fund’s investment objectives, risks, fees and expenses before investing. All funds involve some risk, including possible loss of the principal amount invested. |
| • | | The S&P 500 Index is an unmanaged index of 500 primarily large cap U.S. stocks that is generally considered to be representative of U.S. stock market activity. The Lehman Government/Credit Bond Index is an unmanaged index that is generally considered to be representative of U.S. government and corporate bond market activity. Index returns are provided for comparative purposes. Please note that the indices are not available for direct investment and their returns do not reflect the fees and expenses that have been deducted from the Fund. |
| • | | Total return figures are historical and assume the reinvestment of dividends and distributions and the deduction of all Fund expenses. The actual total returns for owners of variable annuity contracts or variable life insurance policies that provide for investment in the Fund will be lower to reflect separate account and contract/policy charges. The return figures shown do not reflect the deduction of taxes that a contractowner may pay on distributions or redemption of units. |
1 VALUE LINE STRATEGIC ASSET MANAGEMENT TRUST |
| | |
n Value Line Strategic Asset Management Trust (Unaudited) | | Semiannual Report
To Contractowners |
Fund Expenses
By investing in the Fund, you incur two types of costs: (1) transaction costs, including, as applicable, sales charges on purchase payments, reinvested dividends, or other distributions; redemption fees and exchange fees; and (2) ongoing costs, including, as applicable, management fees; distribution and/or service (12b-1) fees; and other Fund expenses. This example is intended to help you understand your ongoing costs (in dollars) of investing in the Fund and to compare these costs with the ongoing costs of investing in other underlying funds.
The example is based on an investment of $1,000 invested on January 1, 2005 and held for six months ended June 30, 2005.
Actual Expenses
The first line provides information about actual account values and actual expenses. You may use the information on this line, together with the amount you invested, to estimate the expenses that you paid over the period. Simply divide your account value by $1,000 (for example, an $8,600 account value divided by $1,000 = 8.6), then multiply the result by the number in the first line under the heading entitled “Expenses Paid During Period” to estimate the expenses you paid on your account during this period.
Hypothetical Example for Comparison Purposes
The second line provides information about hypothetical account values and hypothetical expenses based on the Fund's actual expense ratio and an assumed rate of return of 5% per year before expenses, which is not the Fund's actual return. The hypothetical account values and expenses may not be used to estimate the actual ending account balance or expenses you paid for the period. You may use this information to compare the ongoing costs of investing in the Fund and other funds. To do so, compare this 5% hypothetical example with the 5% hypothetical examples that appear in the shareholder reports of the other funds.
Please note that the expenses shown in the table are meant to highlight your ongoing costs only and do not reflect any transactional costs, such as sales charges (loads), redemption fees, or exchange fees. Therefore, the table is useful in comparing ongoing costs only, and will not help you determine the relative total costs of owning different funds. In addition, if these transactional costs were included, your costs would have been higher.
| | | | | | | | | | | |
| | | Beginning
Account Value
January 1, 2005 | | Ending
Account Value
June 30, 2005 | | Expenses Paid
During Period* | | Annualized
Expense Ratio |
Actual | | $ | 1,000 | | $ | 1,028.40 | | $ | 4.73 | | 0.94% |
Hypothetical (5% return before expenses) | | $ | 1,000 | | $ | 1,020.13 | | $ | 4.71 | | 0.94% |
| * | | Expenses are equal to the Fund's annualized expense ratio multiplied by the average account value over the period, multiplied by 181/365 (to reflect the Fund’s most recent fiscal half-year). |
2 | VALUE LINE STRATEGIC ASSET MANAGEMENT TRUST |
| n | | Value Line Strategic Asset Management Trust |
Schedule of Investments
June 30, 2005 (Unaudited)
| | | | | |
| Common Stocks — (74.4%) |
| Shares | | | | Value |
| | | | | | |
| Advertising — (0.3%) |
| 40,000 | | R.H. Donnelley Corp.* | | $ | 2,479,200 |
|
| Aerospace/Defense — (1.0%) | | | |
| 18,000 | | Engineered Support Systems, Inc. | | | 644,940 |
| 21,000 | | L-3 Communications Holdings, Inc. | | | 1,608,180 |
| 24,000 | | Precision Castparts Corp. | | | 1,869,600 |
| 66,000 | | Rockwell Collins, Inc. | | | 3,146,880 |
| | | | |
|
|
| | | | | | 7,269,600 |
|
| Air Transport — (0.3%) | | | |
| 27,000 | | FedEx Corp. | | | 2,187,270 |
|
| Apparel — (0.3%) | | | |
| 40,000 | | Polo Ralph Lauren Corp. | | | 1,724,400 |
| 12,000 | | VF Corp. | | | 686,640 |
| | | | |
|
|
| | | | | | 2,411,040 |
|
| Auto & Truck — (0.2%) | | | |
| 21,000 | | Oshkosh Truck Corp. | | | 1,643,880 |
|
| Auto Parts — (1.1%) | | | |
| 36,000 | | Autoliv, Inc. | | | 1,576,800 |
| 29,000 | | BorgWarner, Inc. | | | 1,556,430 |
| 18,000 | | Eaton Corp. | | | 1,078,200 |
| 73,000 | | Johnson Controls, Inc. | | | 4,112,090 |
| | | | |
|
|
| | | | | | 8,323,520 |
|
| Bank — (2.5%) | | | |
| 70,000 | | Bank of Hawaii Corp. | | | 3,552,500 |
| 23,000 | | City National Corp. | | | 1,649,330 |
| 43,000 | | Compass Bancshares, Inc. | | | 1,935,000 |
| 22,000 | | M&T Bank Corp. | | | 2,313,520 |
| 70,969 | | North Fork Bancorporation, Inc. | | | 1,993,519 |
| 23,520 | | TD Banknorth, Inc. | | | 700,896 |
| 32,000 | | Webster Financial Corp. | | | 1,494,080 |
| 72,000 | | Wells Fargo & Co. | | | 4,433,760 |
| | | | |
|
|
| | | | | | 18,072,605 |
|
| Bank–Canadian — (0.1%) | | | |
| 11,284 | | Toronto-Dominion Bank (The) | | | 503,379 |
|
| Bank–Midwest — (0.4%) | | | |
| 61,000 | | Huntington Bancshares, Inc. | | | 1,472,540 |
| 37,000 | | Marshall & Ilsley Corp. | | | 1,644,650 |
| | | | |
|
|
| | | | | | 3,117,190 |
|
| Beverage–Alcoholic — (0.9%) | | | |
| 24,000 | | Brown-Forman Corp. Class “B” | | | 1,451,040 |
| 178,000 | | Constellation Brands, Inc. Class “A”* | | | 5,251,000 |
| | | | |
|
|
| | | | | | 6,702,040 |
|
| Beverage–Soft Drink — (0.2%) | | | |
| 30,000 | | PepsiCo, Inc. | | | 1,617,900 |
|
| Biotechnology — (0.6%) | | | |
| 24,000 | | Gen-Probe, Inc.* | | | 869,520 |
| 27,000 | | Genentech, Inc.* | | | 2,167,560 |
| 34,000 | | United Therapeutics Corp.* | | | 1,638,800 |
| | | | |
|
|
| | | | | | 4,675,880 |
|
| Building Materials — (0.2%) | | | |
| 29,000 | | Jacobs Engineering Group, Inc.* | | | 1,631,540 |
|
| Canadian Energy — (0.3%) | | | |
| 63,000 | | Talisman Energy, Inc. | | | 2,366,910 |
|
| | | | | |
| Shares | | | | Value |
| | | | | | |
| Cement — (0.4%) | | | |
| 13,400 | | Ceradyne, Inc.* | | $ | 322,538 |
| 31,600 | | Florida Rock Industries, Inc. | | | 2,317,860 |
| | | | |
|
|
| | | | | | 2,640,398 |
|
| Chemical–Basic — (0.4%) | | | |
| 32,000 | | Potash Corp. of Saskatchewan, Inc. | | | 3,058,560 |
|
| Chemical–Diversified — (0.5%) | | | |
| 27,000 | | Air Products and Chemicals, Inc. | | | 1,628,100 |
| 28,000 | | Monsanto Co. | | | 1,760,360 |
| | | | |
|
|
| | | | | | 3,388,460 |
|
| Chemical–Speciality — (1.1%) | | | |
| 108,000 | | Ecolab, Inc. | | | 3,494,880 |
| 96,000 | | Praxair, Inc. | | | 4,473,600 |
| 4,000 | | Sherwin-Williams Co. (The) | | | 188,360 |
| | | | |
|
|
| | | | | | 8,156,840 |
|
| Coal — (0.6%) | | | |
| 32,000 | | CONSOL Energy, Inc. | | | 1,714,560 |
| 50,000 | | Peabody Energy Corp. | | | 2,602,000 |
| | | | |
|
|
| | | | | | 4,316,560 |
|
| Computer & Peripherals — (0.5%) | | | |
| 56,000 | | Dell, Inc.* | | | 2,212,560 |
| 46,000 | | NCR Corp.* | | | 1,615,520 |
| | | | |
|
|
| | | | | | 3,828,080 |
|
| Computer Software & Services — (1.6%) | | | |
| 78,000 | | Autodesk, Inc. | | | 2,680,860 |
| 34,000 | | CACI International, Inc. Class “A”* | | | 2,147,440 |
| 56,000 | | Cognizant Technology Solutions Corp. Class “A”* | | | 2,639,280 |
| 29,000 | | Cognos, Inc.* | | | 990,060 |
| 27,000 | | Infosys Technologies Ltd. | | | 2,091,690 |
| 24,000 | | SRA International, Inc. Class “A”* | | | 833,280 |
| | | | |
|
|
| | | | | | 11,382,610 |
|
| Diversified Companies — (3.9%) | | | |
| 167,000 | | American Standard Companies, Inc. | | | 7,000,640 |
| 49,000 | | AMETEK, Inc. | | | 2,050,650 |
| 6,000 | | Brink's Co. (The) | | | 216,000 |
| 66,600 | | Danaher Corp. | | | 3,485,844 |
| 26,000 | | Fortune Brands, Inc. | | | 2,308,800 |
| 70,000 | | ITT Industries, Inc. | | | 6,834,100 |
| 43,000 | | Pentair, Inc. | | | 1,840,830 |
| 21,000 | | Roper Industries, Inc. | | | 1,498,770 |
| 24,000 | | Textron, Inc. | | | 1,820,400 |
| 36,000 | | United Technologies Corp. | | | 1,848,600 |
| | | | |
|
|
| | | | | | 28,904,634 |
|
| Drug — (1.3%) | | | |
| 38,000 | | Celgene Corp.* | | | 1,549,260 |
| 38,000 | | Covance, Inc.* | | | 1,705,060 |
| 12,000 | | Genzyme Corp.* | | | 721,080 |
| 39,000 | | Gilead Sciences, Inc.* | | | 1,715,610 |
| 33,000 | | Immucor, Inc.* | | | 955,350 |
| 86,000 | | Teva Pharmaceutical Industries Ltd. (ADR) | | | 2,678,040 |
| | | | |
|
|
| | | | | | 9,324,400 |
|
| E-Commerce — (0.1%) | | | |
| 17,000 | | Websense, Inc.* | | | 816,850 |
|
See notes to financial statements.
| n | | Value Line Strategic Asset Management Trust |
Schedule of Investments (Continued)
June 30, 2005 (Unaudited)
| | | | | |
| Shares | | | | Value |
| | | | | | |
| Electrical Equipment — (1.0%) | | | |
| 120,000 | | FLIR Systems, Inc.* | | $ | 3,580,800 |
| 55,000 | | Trimble Navigation Ltd.* | | | 2,143,350 |
| 46,000 | | WESCO International, Inc.* | | | 1,443,480 |
| | | | |
|
|
| | | | | | 7,167,630 |
|
| Electrical Utility–Central — (1.0%) | | | |
| 38,000 | | Entergy Corp. | | | 2,870,900 |
| 51,000 | | TXU Corp. | | | 4,237,590 |
| | | | |
|
|
| | | | | | 7,108,490 |
|
| Electrical Utility–East — (0.7%) | | | |
| 28,000 | | Constellation Energy Group | | | 1,615,320 |
| 37,000 | | Exelon Corp. | | | 1,899,210 |
| 52,000 | | The Southern Company | | | 1,802,840 |
| | | | |
|
|
| | | | | | 5,317,370 |
|
| Electrical Utility–West — (0.2%) | | | |
| 41,000 | | Sempra Energy | | | 1,693,710 |
|
| Electronics — (0.6%) | | | |
| 53,000 | | Harman International Industries, Inc. | | | 4,312,080 |
|
| Entertainment Technology — (0.1%) | | | |
| 17,000 | | Avid Technology, Inc.* | | | 905,760 |
|
| Environmental Services — (0.5%) | | | |
| 53,000 | | Republic Services, Inc. | | | 1,908,530 |
| 38,000 | | Waste Connections, Inc.* | | | 1,417,020 |
| | | | |
|
|
| | | | | | 3,325,550 |
|
| Financial Services — (1.2%) | | | |
| 12,000 | | Affiliated Managers Group, Inc.* | | | 819,960 |
| 19,500 | | BlackRock, Inc. Class “A” | | | 1,568,775 |
| 26,000 | | Brown & Brown, Inc. | | | 1,168,440 |
| 35,000 | | CIT Group, Inc. | | | 1,503,950 |
| 26,300 | | Global Payments Inc. | | | 1,783,140 |
| 37,000 | | IndyMac Bancorp, Inc. | | | 1,507,010 |
| 10,000 | | Investors Financial Services Corp. | | | 378,200 |
| | | | |
|
|
| | | | | | 8,729,475 |
|
| Food Processing — (1.4%) | | | |
| 43,000 | | Bunge Ltd. | | | 2,726,200 |
| 57,000 | | Dean Foods Co.* | | | 2,008,680 |
| 28,000 | | Hershey Foods Corp. | | | 1,738,800 |
| 25,760 | | Smucker (J.M.) Co. | | | 1,209,174 |
| 11,400 | | TreeHouse Foods, Inc.* | | | 325,014 |
| 37,000 | | Wrigley (Wm.) Jr. Co. | | | 2,547,080 |
| | | | |
|
|
| | | | | | 10,554,948 |
|
| Food Wholesalers — (0.2%) | | | |
| 48,000 | | Sysco Corp. | | | 1,737,120 |
|
| Grocery — (0.6%) | | | |
| 39,000 | | Whole Foods Market, Inc. | | | 4,613,700 |
|
| Home Appliance — (0.8%) | | | |
| 23,000 | | Black & Decker Corp. (The) | | | 2,066,550 |
| 104,000 | | Toro Co. (The) | | | 4,015,440 |
| | | | |
|
|
| | | | | | 6,081,990 |
|
| Hotel/Gaming — (1.8%) | | | |
| 50,000 | | Boyd Gaming Corp. | | | 2,556,500 |
| 29,000 | | Choice Hotels International, Inc. | | | 1,905,300 |
| 27,000 | | Harrah's Entertainment, Inc. | | | 1,945,890 |
| 36,000 | | MGM MIRAGE* | | | 1,424,880 |
| 27,000 | | Starwood Hotels & Resorts
Worldwide, Inc. | | | 1,581,390 |
| | | | | |
| Shares | | | | Value |
| | | | | | |
| 30,000 | | Station Casinos, Inc. | | $ | 1,992,000 |
| 51,000 | | WMS Industries, Inc.* | | | 1,721,250 |
| | | | |
|
|
| | | | | | 13,127,210 |
|
| Household Products — (1.0%) | | | |
| 42,000 | | Energizer Holdings, Inc.* | | | 2,611,140 |
| 26,000 | | Scotts Miracle-Gro Co. (The) Class “A”* | | | 1,851,460 |
| 25,000 | | Spectrum Brands, Inc.* | | | 825,000 |
| 55,000 | | Yankee Candle Company, Inc. (The) | | | 1,765,500 |
| | | | |
|
|
| | | | | | 7,053,100 |
|
| Industrial Services — (0.7%) | | | |
| 41,000 | | C.H. Robinson Worldwide, Inc. | | | 2,386,200 |
| 7,000 | | Expeditors International of Washington, Inc. | | | 348,670 |
| 61,000 | | Iron Mountain Inc.* | | | 1,892,220 |
| 24,000 | | Navigant Consulting, Inc.* | | | 423,840 |
| | | | |
|
|
| | | | | | 5,050,930 |
|
| Information Services — (1.5%) | | | |
| 47,000 | | Alliance Data Systems Corp.* | | | 1,906,320 |
| 23,000 | | Corporate Executive Board Co. (The) | | | 1,801,590 |
| 36,000 | | Dun & Bradstreet Corp.(The)* | | | 2,219,400 |
| 40,000 | | Equifax, Inc. | | | 1,428,400 |
| 21,400 | | Getty Images, Inc.* | | | 1,589,164 |
| 44,000 | | Moody’s Corp. | | | 1,978,240 |
| | | | |
|
|
| | | | | | 10,923,114 |
|
| Insurance-Life — (1.4%) | | | |
| 37,000 | | AFLAC, Inc. | | | 1,601,360 |
| 15,000 | | CIGNA Corp. | | | 1,605,450 |
| 33,000 | | Manulife Financial Corp. | | | 1,577,730 |
| 35,000 | | MetLife, Inc. | | | 1,572,900 |
| 25,000 | | Prudential Financial, Inc. | | | 1,641,500 |
| 46,000 | | Torchmark Corp. | | | 2,401,200 |
| | | | |
|
|
| | | | | | 10,400,140 |
|
| Insurance Property & Casualty — (2.1%) | | | |
| 28,000 | | Allstate Corp. (The) | | | 1,673,000 |
| 94,500 | | Berkley (W.R.) Corp. | | | 3,371,760 |
| 50,000 | | Everest Re Group, Ltd. | | | 4,650,000 |
| 68,750 | | Fidelity National Financial, Inc. | | | 2,453,688 |
| 35,000 | | Progressive Corp. (The) | | | 3,458,350 |
| | | | |
|
|
| | | | | | 15,606,798 |
|
| Internet — (0.2%) | | | |
| 48,000 | | VeriSign, Inc.* | | | 1,380,480 |
|
| Machinery — (0.9%) | | | |
| 39,000 | | Actuant Corp. – Class “A”* | | | 1,869,660 |
| 20,000 | | Caterpillar, Inc. | | | 1,906,200 |
| 42,000 | | Donaldson Co., Inc. | | | 1,273,860 |
| 52,000 | | Graco Inc. | | | 1,771,640 |
| | | | |
|
|
| | | | | | 6,821,360 |
|
| Manufactured Housing/Recreation Vehicle — (0.3%) | | | |
| 20,000 | | Thor Industries, Inc. | | | 628,600 |
| 46,000 | | Winnebago Industries, Inc. | | | 1,506,500 |
| | | | |
|
|
| | | | | | 2,135,100 |
|
| Medical Services — (5.0%) | | | |
| 32,000 | | Aetna, Inc. | | | 2,650,240 |
| 42,000 | | American Healthways, Inc.* | | | 1,775,340 |
| 40,000 | | Community Health Systems, Inc.* | | | 1,511,600 |
| 27,500 | | Coventry Health Care, Inc.* | | | 1,945,625 |
| 54,256 | | DaVita, Inc.* | | | 2,467,563 |
See notes to financial statements.
| n | | Value Line Strategic Asset Management Trust |
Schedule of Investments (Continued)
June 30, 2005 (Unaudited)
| | | | | |
| Shares | | | | Value |
| | | | | | |
| 35,000 | | Haemonetics Corp.* | | $ | 1,422,400 |
| 40,000 | | Humana, Inc.* | | | 1,589,600 |
| 23,000 | | PacifiCare Health Systems, Inc.* | | | 1,643,350 |
| 30,000 | | Quest Diagnostics, Inc. | | | 1,598,100 |
| 57,000 | | Renal Care Group, Inc.* | | | 2,627,700 |
| 41,000 | | Sierra Health Services, Inc.* | | | 2,929,860 |
| 30,000 | | Triad Hospitals, Inc.* | | | 1,639,200 |
| 85,280 | | Unitedhealth Group, Inc. | | | 4,446,499 |
| 24,000 | | Universal Health Services, Inc. Class “B” | | | 1,492,320 |
| 30,000 | | WellChoice, Inc.* | | | 2,084,100 |
| 70,000 | | WellPoint, Inc.* | | | 4,874,800 |
| | | | |
|
|
| | | | | | 36,698,297 |
|
| Medical Supplies — (5.1%) | | | |
| 40,000 | | Advanced Medical Optics, Inc.* | | | 1,590,000 |
| 16,000 | | Alcon, Inc. | | | 1,749,600 |
| 34,000 | | Biomet, Inc. | | | 1,177,760 |
| 43,000 | | C.R. Bard, Inc. | | | 2,859,930 |
| 15,000 | | Charles River Laboratories International* | | | 723,750 |
| 30,000 | | Edwards Lifesciences Corp.* | | | 1,290,600 |
| 66,000 | | Fisher Scientific International, Inc.* | | | 4,283,400 |
| 70,000 | | Henry Schein, Inc.* | | | 2,906,400 |
| 31,000 | | IDEXX Laboratories, Inc.* | | | 1,932,230 |
| 35,000 | | Johnson & Johnson | | | 2,275,000 |
| 18,000 | | Mentor Corp. | | | 746,640 |
| 75,000 | | Patterson Companies, Inc.* | | | 3,381,000 |
| 120,000 | | St. Jude Medical, Inc.* | | | 5,233,200 |
| 33,000 | | The Cooper Companies, Inc. | | | 2,008,380 |
| 94,000 | | Varian Medical Systems, Inc.* | | | 3,509,020 |
| 20,000 | | Zimmer Holdings, Inc.* | | | 1,523,400 |
| | | | |
|
|
| | | | | | 37,190,310 |
|
| Metal Fabricating — (0.2%) | | | |
| 26,000 | | Harsco Corp. | | | 1,418,300 |
|
| Natural Gas–Distribution — (0.6%) | | | |
| 39,000 | | Southern Union Co.* | | | 957,450 |
| 132,000 | | UGI Corp. | | | 3,682,800 |
| | | | |
|
|
| | | | | | 4,640,250 |
|
| Natural Gas–Diversified — (2.0%) | | | |
| 84,000 | | Energen Corp. | | | 2,944,200 |
| 35,000 | | Equitable Resources, Inc. | | | 2,380,000 |
| 21,000 | | Kinder Morgan, Inc. | | | 1,747,200 |
| 34,000 | | Questar Corp. | | | 2,240,600 |
| 8,000 | | Southwestern Energy Co.* | | | 375,840 |
| 138,888 | | XTO Energy, Inc. | | | 4,720,803 |
| | | | |
|
|
| | | | | | 14,408,643 |
|
| Newspaper — (0.3%) | | | |
| 50,000 | | E.W. Scripps Co. (The) Class “A” | | | 2,440,000 |
|
| Office Equipment & Supplies — (0.5%) | | | |
| 165,000 | | Staples, Inc. | | | 3,517,800 |
|
| Oilfield Services/Equipment — (0.2%) | | | |
| 49,000 | | FMC Technologies, Inc.* | | | 1,566,530 |
|
| Packaging & Container — (0.7%) | | | |
| 54,000 | | Ball Corp. | | | 1,941,840 |
| 56,000 | | Jarden Corp.* | | | 3,019,520 |
| | | | |
|
|
| | | | | | 4,961,360 |
|
| Petroleum–Integrated — (1.5%) | | | |
| 38,000 | | ConocoPhillips | | | 2,184,620 |
| 28,000 | | Denbury Resources, Inc.* | | | 1,113,560 |
| 46,000 | | Murphy Oil Corp. | | | 2,402,580 |
| | | | | |
| Shares | | | | Value |
| | | | | | |
| 23,000 | | Premcor, Inc. | | $ | 1,706,140 |
| 14,500 | | Sunoco, Inc. | | | 1,648,360 |
| 20,000 | | Valero Energy Corp. | | | 1,582,200 |
| | | | |
|
|
| | | | | | 10,637,460 |
|
| Petroleum–Producing — (2.5%) | | | |
| 43,000 | | Apache Corp. | | | 2,777,800 |
| 40,000 | | Burlington Resources, Inc. | | | 2,209,600 |
| 100,000 | | Chesapeake Energy Corp. | | | 2,280,000 |
| 25,000 | | Pogo Producing Co. | | | 1,298,000 |
| 36,000 | | Precision Drilling Corp.* | | | 1,421,280 |
| 71,800 | | Range Resources Corp. | | | 1,931,420 |
| 37,000 | | Suncor Energy, Inc. | | | 1,750,840 |
| 14,000 | | Tenaris S.A. | | | 1,095,780 |
| 124,000 | | Ultra Petroleum Corp.* | | | 3,764,640 |
| | | | |
|
|
| | | | | | 18,529,360 |
|
| Pharmacy — (0.8%) | | | |
| 92,700 | | Caremark Rx, Inc.* | | | 4,127,004 |
| 38,000 | | Express Scripts, Inc.* | | | 1,899,240 |
| | | | |
|
|
| | | | | | 6,026,244 |
|
| Publishing — (0.6%) | | | |
| 44,000 | | Donnelley (R.R.) & Sons Co. | | | 1,518,440 |
| 24,000 | | McGraw-Hill Companies, Inc. (The) | | | 1,062,000 |
| 35,000 | | Meredith Corp. | | | 1,717,100 |
| | | | |
|
|
| | | | | | 4,297,540 |
|
| R.E.I.T. — (1.1%) | | | |
| 24,000 | | American Home Mortgage Investment Corp. | | | 839,040 |
| 30,000 | | CBL & Associates Properties, Inc. | | | 1,292,100 |
| 20,000 | | General Growth Properties, Inc. | | | 821,800 |
| 30,000 | | Macerich Co. (The) | | | 2,011,500 |
| 54,000 | | ProLogis | | | 2,172,960 |
| 18,000 | | Weingarten Realty Investors | | | 705,960 |
| | | | |
|
|
| | | | | | 7,843,360 |
|
| Railroad — (1.7%) | | | |
| 34,000 | | Burlington Northern Santa Fe Corp. | | | 1,600,720 |
| 14,000 | | Canadian National Railway Co. | | | 807,100 |
| 98,000 | | CP Holders, Inc. (ADR) | | | 9,724,540 |
| | | | |
|
|
| | | | | | 12,132,360 |
|
| Recreation — (0.5%) | | | |
| 38,000 | | Royal Caribbean Cruises Ltd. | | | 1,837,680 |
| 76,500 | | Shuffle Master, Inc.* | | | 2,144,295 |
| | | | |
|
|
| | | | | | 3,981,975 |
|
| Restaurant — (2.1%) | | | |
| 114,000 | | Applebee’s International, Inc. | | | 3,019,860 |
| 46,000 | | Cheesecake Factory, Inc. (The)* | | | 1,597,580 |
| 60,000 | | CKE Restaurants, Inc. | | | 835,200 |
| 50,000 | | Darden Restaurants, Inc. | | | 1,649,000 |
| 45,000 | | P.F. Changs China Bistro, Inc.* | | | 2,654,100 |
| 29,000 | | Panera Bread Co. Class “A”* | | | 1,800,465 |
| 56,500 | | Sonic Corp.* | | | 1,724,945 |
| 45,000 | | Yum! Brands, Inc. | | | 2,343,600 |
| | | | |
|
|
| | | | | | 15,624,750 |
|
| Retail Automotive — (0.6%) | | | |
| 30,600 | | Advance Auto Parts, Inc.* | | | 1,975,230 |
| 68,000 | | O’Reilly Automotive, Inc.* | | | 2,027,080 |
| | | | |
|
|
| | | | | | 4,002,310 |
|
See notes to financial statements.
| n | | Value Line Strategic Asset Management Trust |
Schedule of Investments (Continued)
June 30, 2005 (Unaudited)
| | | | | |
| Shares | | | | Value |
| | | | | | |
| Retail Building Supplies — (0.9%) | | | |
| 51,000 | | Fastenal Co. | | $ | 3,124,260 |
| 59,000 | | Hughes Supply, Inc. | | | 1,657,900 |
| 31,000 | | Lowe’s Companies, Inc. | | | 1,804,820 |
| | | | |
|
|
| | | | | | 6,586,980 |
|
| Retail–Special Lines — (5.5%) | | | |
| 22,000 | | Abercrombie & Fitch Co. — Class “A” | | | 1,511,400 |
| 45,000 | | Aeropostale, Inc.* | | | 1,512,000 |
| 54,000 | | American Eagle Outfitters, Inc. | | | 1,655,100 |
| 12,000 | | Barnes & Noble, Inc.* | | | 465,600 |
| 69,000 | | bebe Stores, Inc. | | | 1,826,430 |
| 110,000 | | Bed Bath & Beyond, Inc.* | | | 4,595,800 |
| 70,000 | | Chico’s FAS, Inc.* | | | 2,399,600 |
| 59,000 | | Claire’s Stores, Inc. | | | 1,418,950 |
| 234,000 | | Coach, Inc.* | | | 7,855,380 |
| 50,000 | | CVS Corp. | | | 1,453,500 |
| 16,000 | | Dick’s Sporting Goods, Inc.* | | | 617,440 |
| 33,000 | | Guitar Center, Inc.* | | | 1,926,210 |
| 54,000 | | Men’s Wearhouse, Inc. (The)* | | | 1,859,220 |
| 44,000 | | Michaels Stores, Inc. | | | 1,820,280 |
| 40,000 | | PETsMART, Inc. | | | 1,214,000 |
| 116,000 | | Quiksilver, Inc.* | | | 1,853,680 |
| 68,000 | | TJX Companies, Inc. (The) | | | 1,655,800 |
| 33,000 | | Tractor Supply Co.* | | | 1,620,300 |
| 53,000 | | Urban Outfitters, Inc.* | | | 3,004,570 |
| 12,000 | | Zale Corp.* | | | 380,280 |
| | | | |
|
|
| | | | | | 40,645,540 |
|
| Retail Store — (1.1%) | | | |
| 21,000 | | Neiman Marcus Group, Inc. (The) Class “A” | | | 2,035,320 |
| 30,000 | | Nordstrom, Inc. | | | 2,039,100 |
| 46,500 | | Penney (J.C.) Company, Inc. | | | 2,444,970 |
| 12,400 | | Sears Holdings Corp.* | | | 1,858,388 |
| | | | |
|
|
| | | | | | 8,377,778 |
|
| Securities Brokerage — (0.6%) | | | |
| 20,000 | | Bear Stearns Companies, Inc. (The) | | | 2,078,800 |
| 22,000 | | Legg Mason, Inc. | | | 2,290,420 |
| | | | |
|
|
| | | | | | 4,369,220 |
|
| Shoe — (0.6%) | | | |
| 21,000 | | NIKE, Inc. Class “B” | | | 1,818,600 |
| 44,000 | | Timberland Co. (The) Class “A”* | | | 1,703,680 |
| 20,000 | | Wolverine World Wide, Inc. | | | 480,200 |
| | | | |
|
|
| | | | | | 4,002,480 |
|
| Steel–General — (0.1%) | | | |
| 9,000 | | IPSCO, Inc. | | | 393,300 |
|
| Telecommunication Equipment — (0.5%) | | | |
| 105,000 | | Corning, Inc.* | | | 1,745,100 |
| 51,000 | | Marvell Technology Group Ltd.* | | | 1,940,040 |
| | | | |
|
|
| | | | | | 3,685,140 |
|
| Telecommunication Services — (0.5%) | | | |
| 62,000 | | Crown Castle International Corp.* | | | 1,259,840 |
| 36,000 | | NII Holdings, Inc.* | | | 2,301,840 |
| | | | |
|
|
| | | | | | 3,561,680 |
|
| Thrift — (0.8%) | | | |
| 90,200 | | Golden West Financial Corp. | | | 5,807,076 |
|
| Tire & Rubber — (0.2%) | | | |
| 24,000 | | Carlisle Companies, Inc. | | | 1,647,120 |
|
| | | | | | | |
| Shares | | | | Value | |
| | | | | | | | |
| | Trucking/Transportation Leasing — (0.6%) | | | | |
| | 28,000 | | CNF, Inc. | | $ | 1,257,200 | |
| | 86,000 | | Hunt (J.B.) Transport Services, Inc. | | | 1,659,800 | |
| | 33,000 | | Yellow Roadway Corp.* | | | 1,676,401 | |
| | | | | |
|
|
|
| | | | | | | 4,593,401 | |
|
|
|
| | | | Total Common Stocks
(Cost $373,954,830) | | $ | 546,451,965 | |
|
|
|
| | | | | | | | |
| | U.S. Treasury Obligations — (2.1%) | | | | |
Principal
Amount | | | | Value | |
| $ | 2,000,000 | | United States Treasury Notes
3.5%, due 11/15/06 | | | 1,997,734 | |
| | 3,000,000 | | United States Treasury Notes
4.00%, due 11/15/12 | | | 3,033,633 | |
| | 8,000,000 | | United States Treasury Bonds
6.125%, 11/15/27 | | | 10,103,128 | |
|
|
|
| | | | Total U.S. Treasury Obligations
(Cost $13,405,073) | | $ | 15,134,495 | |
|
|
|
| | | | | | | | |
| | U.S. Government Agency Obligations — (11.0%) | |
| $ | 7,000,000 | | Private Export Funding Corp. Series “J”
7.650%, due 5/15/06 | | | 7,231,364 | |
| | 6,000,000 | | Federal Home Loan Banks
3.50%, due 8/15/06 | | | 5,980,872 | |
| | 4,000,000 | | Federal National Mortgage Association
3.310%, due 1/26/07 | | | 3,965,440 | |
| | 7,000,000 | | Federal Home Loan Banks
3.375%, due 2/23/07 | | | 6,949,908 | |
| | 6,000,000 | | Federal Home Loan Mortgage Corp.
4.875%, due 3/15/07 | | | 6,109,194 | |
| | 8,000,000 | | Federal National Mortgage Association
5.250%, due 4/15/07 | | | 8,196,112 | |
| | 4,000,000 | | Federal Home Loan Mortgage Corp.
3.25%, due 11/2/07 | | | 3,941,612 | |
| | 6,000,000 | | Federal Home Loan Banks
3.05%, (until 11/9/05 4% thereafter) due 11/9/07 | | | 5,964,558 | |
| | 4,000,000 | | Federal Home Loan Banks
3.30%, due 12/28/07 | | | 3,905,020 | |
| | 5,000,000 | | Federal National Mortgage Association
3.250%, due 1/15/08 | | | 4,931,190 | |
| | 10,000,000 | | Federal National Mortgage Assocation Pool #380188,
6.450%, 4/1/08 | | | 10,337,500 | |
| | 2,000,000 | | Federal Home Loan Banks
4.10%, due 6/13/08 | | | 1,996,734 | |
| | 2,000,000 | | Federal Home Loan Mortgage Corp.
5.875%, due 3/21/11 | | | 2,156,444 | |
| | 4,000,000 | | Federal Home Loan Mortgage Corp.
5.250%, due 11/5/12 | | | 4,039,148 | |
| | 2,000,000 | | Federal Home Loan Mortgage Corp.
4.500%, due 1/15/13 | | | 2,047,014 | |
| | 2,962,723 | | Federal National Mortgage Assocation Pool #802813,
5.00%, 11/1/34 | | | 2,965,919 | |
|
|
|
| | | | Total U.S. Government Agency Obligations
(Cost $79,956,344) | | $ | 80,718,029 | |
|
|
|
| | | | | | | | |
See notes to financial statements.
| n | | Value Line Strategic Asset Management Trust |
Schedule of Investments (Continued)
June 30, 2005 (Unaudited)
| | | | | | | |
| | Corporate Notes — (0.8%) | | | | |
Principal
Amount | | | | Value | |
| | | | | | | | |
| $ | 6,000,000 | | SLM Corp. Floating Rate Notes,
4.77%,** due 4/1/14 | | $ | 5,806,800 | |
|
|
|
| | | | Total Corporate Notes
(Cost $5,959,832) | | | 5,806,800 | |
|
|
|
| | | | Total Investment Securities — 88.3%
(Cost $473,276,079) | | | 648,111,289 | |
|
|
|
| | | | | | | | |
| | Short-Term Investments — (10.8%) | | | | |
| | U.S. Government Agency Obligations — (2.5%) | | | | |
| $ | 10,000,000 | | Federal Home Loan Bank
2.96%, discount note due 7/13/05 | | | 9,990,133 | |
| | 8,000,000 | | Federal Home Loan Banks
3.60%, due 7/13/06 | | | 8,000,000 | |
| | | | | |
|
|
|
| | | | Total U.S. Government Agency Obligations
(Cost $17,990,133) | | | 17,990,133 | |
|
|
|
| | Corporate Bonds — (0.7%) | | | | |
| | 5,000,000 | | Nebhelp, Inc., Series A-2
3.34%, 7/7/05*** | | | 5,000,000 | |
| | | | | |
|
|
|
| | | | Total Corporate Bonds
(Cost $5,000,000) | | | 5,000,000 | |
|
|
|
| Repurchase Agreements — (7.6%)
(including accrued interest) | | | | |
| $ | 28,800,000 | | Collateralized by $23,223,000 U.S. Treasury Bonds 6.125%, due 11/15/27, with a value of $29,671,011 (with UBS Warburg LLC, 2.75%, dated 6/30/05, due 7/1/05 delivery value $28,802,200) | | $ | 28,802,200 | |
| | 27,000,000 | | Collateralized by $26,210,000 U.S. Treasury Bonds 12.75%, due 11/15/10, with a value of $27,905,459 (with Morgan Stanley, 2.80%, dated 6/30/05, due 7/1/05 delivery value $27,002,100) | | | 27,002,100 | |
|
|
|
| | | | Total Repurchase Agreements
(Cost $55,804,300) | | | 55,804,300 | |
|
|
|
| Total Short-Term Investments
(Cost $78,794,433) | | $ | 78,794,433 | |
| Cash and Other Assets In Excess of
Liabilities — (0.9%) | | | 6,435,372 | |
|
|
|
| | Net Assets (100.0%) | | $ | 733,341,094 | |
|
|
|
| ** | | Rate at 6/30/05, Floating Rate changes monthly. |
| *** | | Rate at 6/30/05, Floating Rate changes weekly. |
(ADR) — American Depositary Receipts
See notes to financial statements.
| n | | Value Line Strategic Asset Management Trust |
Statement of Assets and Liabilities
at June 30, 2005 (Unaudited)
| | | | |
ASSETS: | | | | |
Investment securities, at value
(Cost — $473,276,079) | | $ | 648,111,289 | |
Short-term Investments (Cost — $78,794,433) | | | 78,794,433 | |
Cash | | | 69,059 | |
Receivable for securities sold | | | 13,999,295 | |
Interest and dividends receivable | | | 1,360,789 | |
Receivable for trust shares sold | | | 69,708 | |
Prepaid insurance expense | | | 7,453 | |
Other assets | | | 1,019 | |
| | |
|
|
|
Total Assets | | | 742,413,045 | |
| | |
|
|
|
LIABILITIES: | | | | |
Payable for securities purchased | | | 8,000,000 | |
Payable for trust shares repurchased | | | 511,822 | |
Accrued expenses: | | | | |
Advisory fee | | | 302,816 | |
Service and distribution plan fees payable | | | 242,253 | |
Other | | | 15,060 | |
| | |
|
|
|
Total Liabilities | | | 9,071,951 | |
| | |
|
|
|
Net Assets | | $ | 733,341,094 | |
| | |
|
|
|
NET ASSETS CONSIST OF: | | | | |
Shares of beneficial interest, at $0.01 par value (authorized unlimited, outstanding 34,851,101 shares) | | $ | 348,511 | |
Additional paid-in capital | | | 564,814,233 | |
Undistributed net investment income | | | 6,418,938 | |
Accumulated net realized loss on investments | | | (13,075,739 | ) |
Net unrealized appreciation of investments | | | 174,835,151 | |
| | |
|
|
|
Net Assets | | $ | 733,341,094 | |
| | |
|
|
|
| |
Net Asset Value Per Outstanding Share ($733,341,094 ÷ 34,851,101 shares of beneficial interest outstanding) | | | $21.04 | |
| | |
|
|
|
Statement of Operations
for the Six Months Ended
June 30, 2005 (Unaudited)
| | | | |
INVESTMENT INCOME: | | | | |
Interest | | $ | 3,459,105 | |
Dividends (Net of foreign withholding tax of $26,335) | | | 3,136,821 | |
| | |
|
|
|
Total Income | | | 6,595,926 | |
| | |
|
|
|
Expenses: | | | | |
Advisory fee | | | 1,838,585 | |
Service and distribution plan fee | | | 1,470,868 | |
Custodian fees | | | 54,425 | |
Insurance | | | 44,164 | |
Auditing and legal fees | | | 32,580 | |
Trustees’ fees and expenses | | | 11,765 | |
Other | | | 5,973 | |
| | |
|
|
|
Total Expenses Before Custody Credits | | | 3,458,360 | |
Less: Custody Credits | | | (1,935 | ) |
| | |
|
|
|
Net Expenses | | | 3,456,425 | |
| | |
|
|
|
Net Investment Income | | | 3,139,501 | |
| | |
|
|
|
NET REALIZED AND UNREALIZED GAIN
ON INVESTMENTS: | | | | |
Net Realized Gain | | | 26,825,061 | |
Change in Net Unrealized Appreciation | | | (9,995,602 | ) |
| | |
|
|
|
Net Realized Gain and Change in Net Unrealized Appreciation on Investments | | | 16,829,459 | |
| | |
|
|
|
NET INCREASE IN NET ASSETS
FROM OPERATIONS | | $ | 19,968,960 | |
| | |
|
|
|
See notes to financial statements.
| n | | Value Line Strategic Asset Management Trust |
Statement of Changes in Net Assets
| | | | | | | | |
| | | Six Months Ended
June 30, 2005
(unaudited)
| | | Year Ended
December 31,
2004
| |
Operations: | | | | | | | | |
Net investment income | | $ | 3,139,501 | | | $ | 3,265,020 | |
Net realized gain on investments | | | 26,825,061 | | | | 57,399,799 | |
Change in net unrealized appreciation | | | (9,995,602 | ) | | | 27,233,318 | |
| | |
|
|
| |
|
|
|
Net increase in net assets from operations | | | 19,968,960 | | | | 87,898,137 | |
| | |
|
|
| |
|
|
|
| | |
Distributions to Shareholders: | | | | | | | | |
Net investment income | | | — | | | | (2,609,963 | ) |
| | |
|
|
| |
|
|
|
| | |
Trust Share Transactions: | | | | | | | | |
Proceeds from sale of shares | | | 8,738,257 | | | | 19,935,376 | |
Proceeds from reinvestment of dividends and distributions to shareholder | | | — | | | | 2,609,963 | |
Cost of shares repurchased | | | (68,906,810 | ) | | | (123,066,307 | ) |
| | |
|
|
| |
|
|
|
Net decrease from trust share transactions | | | (60,168,553 | ) | | | (100,520,968 | ) |
| | |
|
|
| |
|
|
|
Total Decrease in Net Assets | | | (40,199,593 | ) | | | (15,232,794 | ) |
| | |
NET ASSETS: | | | | | | | | |
| | |
Beginning of period | | | 773,540,687 | | | | 788,773,481 | |
| | |
|
|
| |
|
|
|
End of period | | $ | 733,341,094 | | | $ | 773,540,687 | |
| | |
|
|
| |
|
|
|
| | |
Undistributed Net Investment Income, at End of Period | | $ | 6,418,938 | | | $ | 3,279,437 | |
| | |
|
|
| |
|
|
|
See notes to financial statements.
| n | | Value Line Strategic Asset Management Trust |
Notes to Financial Statements
June 30, 2005 (Unaudited)
1. Significant Accounting Policies
Value Line Strategic Asset Management Trust (the “Trust”) is an open-end diversified management investment company registered under the Investment Company Act of 1940, as amended, which seeks to achieve a high total investment return consistent with reasonable risk by investing primarily in a broad range of common stocks, bonds and money market instruments. The Trust will attempt to achieve its objective by following an asset allocation strategy based on data derived from computer models for the stock and bond markets that shifts the assets of the Trust among equity, debt and money market securities as the models indicate and its investment adviser, Value Line, Inc. (the “Adviser”), deems appropriate.
The preparation of financial statements in conformity with generally accepted accounting principles requires management to make estimates and assumptions that affect the reported amounts of assets and liabilities and disclosure of contingent assets and liabilities at the date of the financial statements and the reported amounts of revenues and expenses during the reporting period. Actual results could differ from those estimates. The following is a summary of significant accounting policies consistently followed by the Trust in the preparation of its financial statements.
(A) Security Valuation
Securities listed on a securities exchange are valued at the closing sales price on the date as of which the net asset value is being determined. Securities traded on the NASDAQ Stock market are valued at the NASDAQ Official Closing Price. In the absence of closing sales prices for such securities and for securities traded in the over-the-counter market, the security is valued at the midpoint between the latest available and representative asked and bid prices.
The Board of Trustees has determined that the value of bonds and other fixed-income securities be calculated on the valuation date by reference to valuations obtained from an independent pricing service which determines valuations for normal institutional-size trading units of debt securities, without exclusive reliance upon quoted prices. This service takes into account appropriate factors such as institutional-size trading in similar groups of securities, yield, quality, coupon rate, maturity, type of issue, trading characteristics and other market data in determining valuations.
Short-term instruments with maturities of 60 days or less are valued at amortized cost which approximates market value. Short-term instruments with maturities greater than 60 days, at the date of purchase, are valued at the midpoint between the latest available and representative asked and bid prices, and commencing 60 days prior to maturity such securities are valued at amortized cost.
Other assets and securities for which market valuations are not readily available are valued at fair value as the Board of Trustees may determine in good faith. In addition, the Trust may use the fair value of a security when the closing market price on the primary exchange where the security is traded no longer accurately reflects the value of a security due to factors affecting one or more relevant securities markets or the specific issuer.
(B) Repurchase Agreements
In connection with transactions in repurchase agreements, the Trust’s custodian takes possession of the underlying collateral securities, the value of which exceeds the principal amount of the repurchase transaction, including accrued interest. To the extent that any repurchase transaction exceeds one business day, the value of the collateral is marked-to-market on a daily basis to ensure the adequacy of the collateral. In the event of default of the obligation to repurchase, the Trust has the right to liquidate the collateral and apply the proceeds in satisfaction of the obligation. Under certain circumstances, in the event of default or bankruptcy by the other party to the agreement, realization and/or retention of the collateral or proceeds may be subject to legal proceedings.
(C) Federal Income Taxes
It is the Trust’s policy to comply with the requirements of the Internal Revenue Code applicable to regulated investment companies and to distribute all of its taxable income to its shareholders. Therefore, no federal income tax provision is required.
(D) Dividends and Distributions
It is the Trust’s policy to distribute to its shareholders, as dividends and as capital gains distributions, all the net investment income for the year and all the net capital gains realized by the Trust, if any. Such distributions are determined in accordance with income tax regulations, which may differ from generally accepted accounting principles. All dividends or distributions will be payable in shares of the Trust at the net asset value on the ex-dividend date. This policy is, however, subject to change at any time by the Board of Trustees.
| n | | Value Line Strategic Asset Management Trust |
Notes to Financial Statements (Continued)
June 30, 2005 (Unaudited)
(E) Investments
Securities transactions are recorded on a trade date basis. Realized gains and losses from securities transactions are recorded on the identified cost basis. Interest income on investments, adjusted for amortization of discount and premium, is earned from settlement date and recognized on the accrual basis. Dividend income is recorded on the ex-dividend date. Dividends received in excess of income are recorded as a reduction of cost of investments and/or realized gain on Real Estate Investment Trusts (REITs).
(F) Representations and Indemnifications
In the normal course of business the Trust enters into contracts that contain a variety of representations and warranties which provide general indemnifications. The Trust’s maximum exposure under these arrangements is unknown, as this would involve future claims that may be made against the Trust that have not yet occurred. However, based on experience, the Trust expects the risk of loss to be remote.
2. Trust Share Transactions, Dividends and Distributions
Shares of the Trust are available to the public only through the purchase of certain contracts issued by The Guardian Insurance and Annuity Company, Inc. (GIAC). Transactions in shares of beneficial interest in the Trust were as follows:
| | | | | | | | |
| | | Six Months Ended
June 30, 2005
(Unaudited)
| | | Year Ended
December 31,
2004
| |
Shares sold | | | 429,617 | | | | 1,047,012 | |
Shares issued in reinvestment of dividends and distributions | | | — | | | | 139,347 | |
| | |
|
|
| |
|
|
|
| | | | 429,617 | | | | 1,186,359 | |
Shares repurchased | | | (3,378,927 | ) | | | (6,481,724 | ) |
| | |
|
|
| |
|
|
|
Net decrease | | | (2,949,310 | ) | | | (5,295,365 | ) |
| | |
|
|
| |
|
|
|
Dividends per share from net investment income | | $ | .000 | | | $ | .065 | |
| | |
|
|
| |
|
|
|
3. Purchases and Sales of Securities
Purchases and sales of investment securities, excluding short-term investments, were as follows:
| | | |
| | | Six Months Ended
June 30, 2005
(Unaudited)
|
PURCHASES: | | | |
U.S. Treasury and U.S. Government Agency Obligations | | $ | 14,909,310 |
Other Investment Securities | | | 134,206,934 |
| | |
|
|
| | | $ | 149,116,244 |
| | |
|
|
SALES: | | | |
U.S. Treasury and U.S. Government Agency Obligations | | $ | — |
Other Investment Securities | | | 131,866,709 |
| | |
|
|
| | | $ | 131,866,709 |
| | |
|
|
4. Income Taxes
At June 30, 2005, information on the tax components of capital is as follows: (Unaudited)
| | | | |
Cost of investments for tax purposes | | $ | 552,070,512 | |
| | |
|
|
|
Gross tax unrealized appreciation | | $ | 177,746,966 | |
Gross tax unrealized depreciation | | | (2,911,756 | ) |
| | |
|
|
|
Net tax unrealized appreciation on Investments | | $ | 174,835,210 | |
| | |
|
|
|
Undistributed ordinary income | | $ | 6,418,938 | |
| | |
|
|
|
Capital loss carryforward expiring December 31, 2008 | | $ | 39,805,119 | |
| | |
|
|
|
To the extent future capital gains are offset by capital losses, the Trust does not anticipate distributing any such gains to shareholders.
Net investment income and net realized gain (loss) differ for financial statement and tax purposes primarily due to differing treatment of bond discounts and premiums.
| n | | Value Line Strategic Asset Management Trust |
Notes to Financial Statements (Continued)
June 30, 2005 (Unaudited)
5. Investment Advisory Contract, Management Fees and Transactions with Affiliates
An advisory fee of $1,838,585 was paid or payable to Value Line, Inc. (the “Adviser”), the Trust’s investment adviser, for the six months ended June 30, 2005. This was computed at the rate of 1/2 of 1% of the average daily net assets of the Trust during the period and paid monthly. The Adviser provides research, investment programs, supervision of the investment portfolio and pays costs of administrative services, office space, equipment and compensation of administrative, bookkeeping, and clerical personnel necessary for managing the affairs of the Trust. The Adviser also provides persons, satisfactory to the Trust’s Board of Trustees, to act as officers and employees of the Trust and pays their salaries and wages. The Trust bears all other costs and expenses.
The Trust has a Service and Distribution Plan (the “Plan”) adopted pursuant to Rule 12b-1 under the Investment Company Act of 1940, for the payment of certain expenses incurred by Value Line Securities, Inc. (the “Distributor”), a wholly-owned subsidiary of the Adviser, in advertising marketing and distributing the Trust’s shares and for servicing the Trust’s shareholders at an annual rate of 0.40% of the Trust’s average daily net assets. For the six months ended June 30, 2005, fees amounting to $1,470,868 were paid or payable to the Distributor under this plan.
For the six months ended June 30, 2005, the Trust’s expenses were reduced by $1,935 under a custody credit arrangement with the Custodian.
| n | | Value Line Strategic Asset Management Trust |
Financial Highlights
Selected data for a share of capital stock outstanding throughout each period:
| | | | | | | | | | | | | | | | | | |
| | | Six Months Ended
June 30, 2005 (Unaudited)
| | | Years Ended December 31,
| |
| | | | 2004 | | | 2003 | | | 2002 | | | 2001 | | | 2000 | |
Net asset value, beginning of period | | $20.46 | | | $18.30 | | | $15.82 | | | $18.36 | | | $23.62 | | | $29.39 | |
|
|
Income from investment operations: | | | | | | | | | | | | | | | | | | |
Net investment income | | .10 | | | .09 | | | .07 | | | .13 | | | .24 | | | .68 | |
Net gains (losses) on securities (both realized and unrealized) | | .48 | | | 2.13 | | | 2.53 | | | (2.45 | ) | | (3.25 | ) | | .17 | |
|
|
Total from investment operations | | .58 | | | 2.22 | | | 2.60 | | | (2.32 | ) | | (3.01 | ) | | .85 | |
|
|
Less distributions: | | | | | | | | | | | | | | | | | | |
Dividends from net investment income | | — | | | (.06 | ) | | (.12 | ) | | (.22 | ) | | (.69 | ) | | (.62 | ) |
Distributions from net realized gains | | — | | | — | | | — | | | — | | | (1.56 | ) | | (6.00 | ) |
|
|
Total Distributions | | — | | | (.06 | ) | | (.12 | ) | | (.22 | ) | | (2.25 | ) | | (6.62 | ) |
|
|
Net asset value, end of period | | $21.04 | | | $20.46 | | | $18.30 | | | $15.82 | | | $18.36 | | | $23.62 | |
|
|
Total return** | | $2.84 | %+ | | 12.19 | % | | 16.53 | % | | (12.53 | )% | | (12.92 | )% | | 1.95 | % |
|
|
Ratios/supplemental data: | | | | | | | | | | | | | | | | | | |
Net assets, end of period (in thousands) | | $733,341 | | | $773,541 | | | $788,773 | | | $788,102 | | | $1,113,568 | | | $1,489,962 | |
Ratio of expenses to average net assets(1) | | .94 | %* | | .94 | % | | .96 | % | | .73 | % | | .56 | % | | .57 | % |
Ratio of net investment income
to average net assets | | .85 | %* | | .42 | % | | .35 | % | | .59 | % | | .96 | % | | 2.54 | % |
Portfolio turnover rate | | 21 | %+ | | 41 | % | | 30 | % | | 35 | % | | 69 | % | | 88 | % |
|
|
| (1) | | Ratio reflects expenses grossed up for custody credit arrangement. The ratio of expenses to average net assets net of custody credits would not have changed. |
| ** | | Total returns do not reflect the effects of charges deducted under the terms of GIAC’s variable contracts. Including such charges would reduce the total returns for all periods shown. |
See notes to financial statements.
| n | | Value Line Strategic Asset Management Trust |
Form N-Q
The Fund files its complete schedule of portfolio holdings with the Securities and Exchange Commission (“SEC”) for the first and third quarters of each fiscal year on Form N-Q. The Fund’s Forms N-Q are available on the SEC’s website at http://www.sec.gov and may be reviewed and copied at the SEC’s Public Reference Room in Washington, D.C. Information on the operation of the Public Reference Room may be obtained by calling 1-800-SEC-0330.
Proxy Voting
A description of the policies and procedures that the Fund uses to determine how to vote proxies relating to portfolio securities, and information regarding how the Fund voted these proxies during the most recent 12-month period ended June 30 is available through the Fund’s website at http://www.vlfunds.com and on the SEC’s website at http://www.sec.gov. The description of the policies and procedures is also available without charge, upon request, by calling 1-800-243-2729.
Value Line Strategic Asset Management Trust
Factors Considered by the Independent Directors in Approving the Agreement (Unaudited)
The Investment Company Act of 1940 requires that the Fund’s Agreement be approved annually by both the Board of Directors (collectively “the Directors”) and a majority of the Directors who are not affiliated with Value Line, Inc. the Fund’s investment adviser (“Value Line”) (the “Independent Directors”) voting separately. The Directors have determined that the terms of the Fund’s investment advisory agreement (the “Agreement”) are fair and reasonable and that renewal of the contract is in the best interests of the Fund and its shareholders. In making such determinations, the Independent Directors relied upon the assistance of counsel to the Independent Directors. Throughout the year, including the meeting specifically focused upon the review of the Agreement, the Independent Directors met in executive sessions separately from the Interested Directors of the Fund and any officers of Value Line.
Both in meetings specifically addressed to renewal of the Agreement and at other meetings during the course of the year, the Directors, including the Independent Directors, received materials relating to Value Line’s investment and management services under the Agreement. These materials included (i) information on the investment performance of the Fund, a peer group of funds and an index, (ii) sales and redemption data in respect of the Fund, (iii) the general investment outlook in the markets in which the Fund invests, (iv) arrangements in respect of the distribution of the Fund’s shares, (v) the allocation of the Fund’s brokerage, and (vi) the record of compliance with the Fund’s investment policies and restrictions and with the Fund’s Code of Ethics, and the structure and responsibilities of Value Line’s compliance department.
As part of the review of the Agreement, the Independent Directors requested and Value Line provided additional information in order to evaluate the quality of Value Line’s services and the reasonableness of the fee under the Agreement. Among other items, this information included data or analyses of (1) management and other fees incurred by a peer group of funds selected by an independent evaluation service (the “Peer Group”), (2) expense ratios for the Fund and the Peer Group, (3) the investment performance for the Fund and its Peer Group, (4) Value Line’s financial results and condition, including its and certain of its affiliates’ profitability from services performed for the Fund, and (5) investment management staffing, (6) the potential for achieving further economies of scale.
The following summarizes matters considered by the Directors in connection with their renewal of the Agreement. However, the Directors did not identify any single factor as all-important or controlling, and the summary does not detail all the matters that were considered.
Compliance and Investment Performance. The Directors determined that Value Line had policies and systems reasonably designed to achieve compliance with the Fund’s investment objective and regulatory requirements. The Directors also reviewed the Fund’s investment performance, as well as the Fund’s performance compared to both the performance of a peer group and the results of an index. The Fund outperformed its Peer Group for the one-year and 10-year periods ended December 31, 2004. Although the Fund underperformed its Peer Group for the three-year and five-year periods ended December 31, 2004, the Directors concluded that the Fund’s overall performance supported the continuation of the Agreement.
Value Line’s Personnel and Methods. The Directors reviewed the background of members of the team responsible for the daily management of the Fund and the Fund’s investment objective and discipline. The Independent Directors also engaged in discussions with senior management of Value Line responsible for investment operations. The Directors concluded that Value Line has the quality and depth of personnel and the well-developed methods essential to performing its duties under the Agreement.
Nature and Quality of Other Services. The Directors considered the nature, quality, cost and extent of other services provided to shareholders of the Fund. The Directors also considered the nature and extent of the other services provided by Value Line’s affiliates under other contracts and its supervision of third party service providers. Based on these considerations, the Directors concluded that the nature, quality, cost and extent of such services are satisfactory and reliable and serve the shareholders of the Fund well.
Management Fee and Expenses. The Directors considered Value Line’s fee under the Agreement relative to the management fees charged by the Peer Group. The Fund’s management fee was lower than the average management fee of the Peer Group, and the Directors concluded that the Adviser’s fee was reasonable in light of the services and expertise provided to the Fund by the Adviser’s management team and the Adviser’s proprietary ranking system. While the total expenses of the Fund exceeded the average expenses of the Peer Group, the Board concluded that the Fund’s expenses were reasonable.
Profitability. The Directors considered the level of Value Line’s profits with respect to the management of the Fund. This consideration included a review of Value Line’s methodology in allocating certain of its costs to the management of each Fund. The
Value Line Strategic Asset Management Trust
Factors Considered by the Independent Directors in Approving the Agreement (Unaudited)
Directors concluded that Value Line’s profits from management of the Funds, including the financial results derived from the Fund, bear a reasonable relationship to the services rendered and are fair for the management of the Fund in light of the business risks involved.
Economies of Scale. The Directors noted that, given the current and anticipated size of the Fund, any perceived and potential economies of scale were not yet a relevant consideration for the Fund.
Other Benefits to Value Line. The Directors also considered the character and amount of fees paid by the Fund, other than under the Agreement, and by the Fund’s shareholders for services provided by Value Line and affiliates.
Conclusion. The Directors, in light of Value Line’s overall performance, considered it appropriate to continue to retain the management services of Value Line. Based on their evaluation of all material factors deemed relevant and the advice of independent counsel, the Directors concluded that the Agreement with the Fund is fair and reasonable and voted to approve the continuation of the Agreement for another year.
Item 2. Code of Ethics
N/A
Item 3. Audit Committee Financial Expert.
N/A
Item 4. Principal Accountant Fees and Services
N/A
Item 11. Controls and Procedures.
| | (a) | The registrant’s principal executive officer and principal financial officer have concluded that the registrant’s disclosure controls and procedures (as defined in rule 30a-2(c) under the Act (17 CFR 270.30a-2(c) ) based on their evaluation of these controls and procedures as of a date within 90 days of the |
| | filing date of this report, are appropriately designed to ensure that material information relating to the registrant is made known to such officers and are operating effectively. |
| | (b) | The registrant’s principal executive officer and principal financial officer have determined that there have been no significant changes in the registrant’s internal controls or in other factors that could significantly affect these controls subsequent to the date of their evaluation, including corrective actions with regard to significant deficiencies and material weaknesses. |
Item 12. Exhibits.
| | (a) | (1) Certification pursuant to Rule 30a-2(a) under the Investment Company Act of 1940 (17 CFR 270.30a-2) attached hereto as Exhibit 99.CERT. |
(2) Certification pursuant to Section 906 of the Sarbanes-Oxley Act of 2002 attached hereto as Exhibit 99.906.CERT.
SIGNATURES
Pursuant to the requirements of the Securities Exchange Act of 1934 and the Investment Company Act of 1940, the registrant has duly caused this report to be signed on its behalf by the undersigned, thereunto duly authorized.
| | |
| By: | | /s/ JEAN B. BUTTNER
|
| | | Jean B. Buttner, President |
| |
| Date: | | September 6, 2005
|
Pursuant to the requirements of the Securities Exchange Act of 1934 and the Investment Company Act of 1940, this report has been signed below by the following persons on behalf of the registrant and in the capacities and on the dates indicated.
| | |
| By: | | /s/ JEAN B. BUTTNER
|
| | | Jean B. Buttner, President, Principal Executive Officer |
| |
| By: | | /s/ DAVID T. HENIGSON
|
| | | David T. Henigson, Vice President, Treasurer, Principal Financial Officer |
| |
| Date: | | September 6, 2005
|