Exhibit 96.4
Technical Report Summary on
U.S. Lime Company – St. Clair – Marble Mountain Limestone Operation
Sequoyah County, Oklahoma, USA
Prepared for:
United States Lime and Minerals, Inc.
SK-1300 Report
Effective Date December 31, 2021
Report Date: March 2, 2022
Page 1 of 56
DISCLAIMERS AND QUALIFICATIONS
SYB Group, LLC (“SYB”) was retained by United States Lime & Minerals, Inc. (“USLM”) to prepare this Technical Report Summary (“TRS”) related to U.S. Lime Company – St. Clair (“St. Clair”) limestone reserves and resources. This TRS provides a statement of St. Clair’s limestone reserves and resources at its mine located in Sequoyah County, Oklahoma and has been prepared in accordance with the U.S. Securities and Exchange Commission (“SEC”), Regulation S-K 1300 for Mining Property Disclosure (S-K 1300) and 17 Code of Federal Regulations (“CFR”) § 229.601(b)(96)(iii)(B) reporting requirements. This report was prepared for the sole use by USLM and its affiliates and is effective December 31, 2021.
This TRS was prepared by SYB Group’s President who meets the SEC’s definition of a Qualified Person and has sufficient experience in the relevant type of mineralization and deposit under consideration in this TRS.
In preparing this TRS, SYB relied upon data, written reports and statements provided by St. Clair and USLM. SYB has taken all appropriate steps, in its professional opinion, to ensure information provided by St. Clair and USLM is reasonable and reliable for use in this report.
The Economic Analysis and resulting net present value estimate in this TRS were made for the purposes of confirming the economic viability of the reported limestone reserves and not for the purposes of valuing St. Clair or its assets. Internal Rate of Return and project payback were not calculated, as there was no initial investment considered in the financial model. Certain information set forth in this report contains “forward-looking information,” including production, productivity, operating costs, capital costs, sales prices, and other assumptions. These statements are not guarantees of future performance and undue reliance should not be placed on them. The ability to recover the reported reserves depends on numerous factors beyond the control of SYB Group that cannot be anticipated. Some of these factors include, but are not limited to, future limestone prices, mining and geologic conditions, obtaining permits and regulatory approvals in a timely manner, the decisions and abilities of management and employees, and unanticipated changes in environmental or other regulations that could impact performance. The opinions and estimates included in this report apply exclusively to the St. Clair mine as of the effective date of this report.
All data used as source material plus the text, tables, figures, and attachments of this document have been reviewed and prepared in accordance with generally accepted professional geologic practices.
SYB hereby consents to the use of St. Clair’s limestone reserve and resource estimates as of December 31, 2021 in USLM’s SEC filings and to the filing of this TRS as an exhibit to USLM’s SEC filings.
Qualified Person: /s/ Keith V. Vickers
Keith V. Vickers, TXPG #3938
President, SYB Group, LLC
1216 W. Cleburne Rd
Crowley, TX 76036
Page 2 of 56
Table of Contents
| | |
| | |
List of Figures | 4 | |
List of Tables | 5 | |
1 | Executive Summary | 6 |
2 | Introduction | 7 |
3 | Property Description | 10 |
4 | Accessibility, Climate, Local Resources, Infrastructure, and Physiography | 11 |
5 | History | 12 |
6 | Geological Setting, Mineralization, and Deposit | 13 |
7 | Exploration | 18 |
8 | Sample Preparation, Analyses, and Security | 26 |
9 | Data Verification | 27 |
10 | Mineral Processing and Metallurgical Testing | 28 |
11 | Mineral Resource Estimates | 28 |
12 | Mineral Reserve Estimates | 32 |
13 | Mining Methods | 33 |
14 | Processing and Recovery Methods | 35 |
15 | Infrastructure | 35 |
16 | Market Studies | 36 |
17 | Environmental Studies, Permitting and Plans, Negotiations or Agreements with Local Individuals or Groups | 36 |
18 | Capital and Operating Costs | 37 |
19 | Economic Analysis | 37 |
20 | Adjacent Properties | 39 |
21 | Other Relevant Data and Information | 39 |
22 | Interpretation and Conclusions | 40 |
23 | Recommendations | 40 |
24 | References | 40 |
25 | Reliance on Information Provided by the Registrant | 41 |
Appendix A: List of Data Included in the Geologic Model | 42 | |
Appendix B: Annual Cash Flow Analysis | 43 | |
Page 3 of 56
List of Figures
1. | Fig. 3.1 | Location Map for St Clair Lime Company |
2. | Fig. 6.1 | Geologic Map of Oklahoma |
3. | Fig. 6.4-1 | Stratigraphic Columns for the St Clair Area |
4. | Fig. 6.4-2 | Marble City Member Cross Section South to North |
5. | Fig. 7.1-1 | All St. Clair Drill Locations |
6. | Fig. 7.1-2 | St Clair Core Hole Log |
7. | Fig. 11.3 | St. Clair, Top of Marble City Member Map |
8. | Fig. 13.2 | Current Estimate of Final Mine Limits |
9. | Fig. 15.1 | Infrastructure For St Clair Operations |
Page 4 of 56
List of Tables
1. | Table 1.1 | U.S. Lime Company – St. Clair – Summary of Limestone Mineral Resources as of December 31, 2021, Based On $11.05 Crushed Limestone |
2. | Table 1.2 | U.S. Lime Company – St. Clair – Summary of Limestone Mineral Reserves as of December 31, 2021, Based On $11.05 Crushed Limestone |
3. | Table 1.3 | Capital Costs |
4. | Table 1.4 | Operating Costs |
5. | Table 2.3 | Glossary of Terms and Abbreviations |
6. | Table 2.4 | Visits Made by QP to St. Clair Mine |
7. | Table 5.1 | Company Ownership History |
8. | Table 5.2 | St. Clair Historical Drilling Projects |
9. | Table 6.4 | St. Clair Property Stratigraphy |
10. | Table 7.1-1 | All St. Clair Drilling Projects |
11. | Table 7.1-2 | Drilling Summary of OGS 1965 Study |
12. | Table 7.1-3 | Summary of 2000 Exploration Drilling |
13. | Table 7.1-4 | Summary of 2005 Exploration Drilling |
14. | Table 7.1-5 | Summary of 2017 Exploration Drilling |
15. | Table 7.2 | Surface Location Summary of OGS 1965 Study |
16. | Table 11.2.4 | Resource Parameter Assumptions |
17. | Table 11.3 | Summary of Drill Hole Database for the Model |
18. | Table 11.4.1 | U.S. Lime Company – St. Clair – Summary of Limestone Mineral Resources as of December 31, 2021, Based On $11.05 Crushed Limestone |
19. | Table 12.4 | U.S. Lime Company – St. Clair – Summary of Limestone Mineral Reserves as of December 31, 2021, Based On $11.05 Crushed Limestone |
20. | Table 17.1 | Mining and Environmental Permits |
21. | Table 18.1 | Capital Costs |
22. | Table 18.2 | Operating Costs |
23. | Table 19.3-1 | Sensitivity Analysis: Varying Discount Rate |
24. | Table 19.3-2 | Sensitivity Analysis: Varying Limestone Mining Costs |
25. | Table 19.3-3 | Sensitivity Analysis: Selling Price Change |
Page 5 of 56
1 | Executive Summary |
The U.S. Lime Company-St. Clair (“St. Clair”) mine is a production stage, underground mine that produces high-grade limestone with above 96.0% calcium carbonate (“CaCO3”) from the upper Marble City member formation that is delivered to St. Clair’s primary crusher. The St. Clair plant processes the limestone into various products that are sold to a variety of customers. The St. Clair mine is located in Sequoyah County, Oklahoma on approximately 1,400 acres owned by St. Clair and an additional 1,340 acres covered by long-term mineral leases. Underground operations began at the St. Clair mine in the 1950’s.
Geologic and analytical data from regional and local drilling, subsurface, and surface sampling/mapping have proven that the Marble City member has a consistently high CaCO3 content above 96.0% and a consistent mining thickness of 30 plus ft. across the entire St. Clair property. These analytical results cover from 1962 to 2021 and are sufficient to establish reasonable certainty of geological presence and grade or quality continuity on the operation’s property.
Mining at the St. Clair mine is performed using a room and pillar method. The pillars are 30 ft. by 30 ft. and the room is 50 ft. wide. Conventional limestone mining equipment is used to transport the limestone from the mine to the primary crusher. Any non-ore material encountered is moved a short distance to an area that is not in use.
The St. Clair mine has procured, and is operating in compliance with, the required air and storm water permits that were last issued by the Oklahoma Department of Mines and the Oklahoma Department of Environmental Quality. St. Clair will be required to renew the permits when they expire in 2045 and 2025, respectively.
The St. Clair mine currently averages an annual production rate of approximately 425,000 tons of limestone per year. The expected mine life at that rate of production is approximately 55 years.
As noted in section 2.1, Keith Vickers of SYB Group (“SYB”), a consultant for United States Lime & Minerals, Inc. (“USLM”) for over 20 years served as the Qualified Person (“QP”) and prepared the estimates of limestone mineral resources and reserves for the St. Clair mine. Summaries of the St. Clair mine’s limestone mineral resources and reserves are shown below in Tables 1.1 and 1.2, respectively. Sections 11 and 12 set forth the definitions of mineral resources and reserves as well as the methods and assumptions used by the QP in determining the estimates and classifications of the St. Clair mine’s limestone mineral resources and reserves.
Table 1.1. U.S. Lime Company – St. Clair – Summary of Limestone Mineral Resources as of December 31, 2021,
Based On $11.05 Crushed Limestone 1, 2
Resource Category |
| In Place |
| Cutoff Grade |
| Processing Recovery |
Measured Mineral Resources | | 36,648,000 | | Above 96.0 (CaCO3) | | N/A |
Indicated Mineral Resources | | 129,747,000 | | Above 96.0 (CaCO3) | | N/A |
Total Measured and Indicated | | 166,395,000 | | Above 96.0 (CaCO3) | | N/A |
Notes: 1 Price Source from USGS Mineral Commodity Summaries 2021.
2 Shot limestone delivered to the primary crusher.
3 N/A: Not Applicable because estimated resources are in place.
Table 1.2. U.S. Lime Company – St. Clair – Summary of Limestone Mineral Reserves as of December 31, 2021,
Based On $11.05 Crushed Limestone 1, 2
| ||||||
Reserve Category |
| Extractable |
| Cutoff Grade (% X) |
| Mining Recovery |
Probable Reserves | | 0 | | Above 96.0 (CaCO3) | | 81.0 |
Proven Reserves | | 23,387,000 | | Above 96.0 (CaCO3) | | 81.0 |
Total Probable and Proven | | 23,387,000 | | Above 96.0 (CaCO3) | | 81.0 |
Notes: 1 Price Source from USGS Mineral Commodity Summaries 2021.
2 Shot limestone delivered to the primary crusher.
The modeling and analysis of the St. Clair mine’s resources and reserves has been developed by St. Clair and USLM personnel and reviewed by management of the companies, as well as the QP. The development of such resources and reserves estimates, including related assumptions, was a collaborative effort between the QP and personnel of the companies.
Annual sustaining capital costs were estimated using prior-year capital expenditures and St. Clair’s 2022 capital budget. Capital expenditures for major mobile equipment replacements were estimated using information from vendors. Limestone mining costs for St. Clair were estimated using historical data and its 2022 budget.
Page 6 of 56
Table 1.3 Capital Costs
| | |
Capital Cost Estimate |
| Cost |
Annual Maintenance of Operations | | $500,000 |
Table 1.4 Operating Costs
| | | |
Operating Cost Estimate |
| Cost |
|
Limestone Mining Cost Per Ton | | $4.79 | |
It is the QP’s overall conclusions that:
1. | Geologically, the St. Clair mine limestone deposit has been proven by abundant widespread local sampling production and drilling results to have quality and thickness that are very consistent. Because of this consistency, the mining method for the mine is straightforward and consists of standard room and pillar underground mining. |
2. | The data detailed in this report that was used to estimate the resources was adequate for the resource interpretation and estimation. |
3. | St. Clair has successfully mined this resource for many years using the same methods that are projected into the future. Significant increases in the cost of mining coupled with large decreases in the selling price of limestone would be required to make mining uneconomic. Historically, St. Clair has been able to increase sales prices in line with cost increases. |
4. | There are no significant factors onsite that will impact the extraction of this ore body. St. Clair has been in operation for many decades during varying economic and market conditions. |
5. | Absent unforeseen changes in economic or other factors, including additional federal or state environmental regulations, the economic analysis and the amount of Proven Reserves indicate the operation reasonably has approximately 55 years of estimated mine life at current production levels. |
The QP recommends that ground water could be better controlled at the mine face with an improved configuration of the floor.
2Introduction
2.1Issuer of the Report
Mr. Keith Vickers of SYB Group, LLC (“SYB”), a consultant for USLM for over 20 years, prepared this Technical Report Summary (“TRS”) on ALC’s mining operations located in Independence County, Arkansas. Mr. Vickers is a Qualified Person (“QP”). USLM is a publicly-traded company on the NASDAQ Stock Exchange under the ticker symbol USLM and ALC is a wholly-owned subsidiary of USLM.
2.2Terms of Reference and Purpose
The purpose of this TRS is to support the disclosure of mineral resource and mineral reserve estimates for St. Clair’s existing mining operations located in Sequoyah County, Oklahoma, as of December 31, 2021. This report is to fulfill 17 Code of Federal Regulations (“CFR”) § 229, “Standard Instructions for Filing Forms Under Securities Act of 1933, Securities Exchange Act of 1934 and Energy Policy and Conservation Act of 1975 – Regulation S-K,” subsection 1300, “Disclosure by Registrants Engaged in Mining Operations.” The mineral resource and reserve estimates presented herein are classified according to 17 CFR § 229.1300 Definitions.
The QP prepared this TRS with information from various sources with detailed data about the historical and current mining operations, including individuals who are experts in an appropriate technical field. St. Clair has not previously filed a TRS.
The quality of information, conclusions, and estimates contained herein are based on: 1) information available at the time of preparation; and 2) the assumptions, conditions, and qualifications outlined in this TRS.
Unless stated otherwise, all volumes and grades are in U.S. customary units and currencies are expressed in 2021 U.S. dollars. Distances are described in U.S. standard units.
Page 7 of 56
2.3Sources of Information
This TRS is based upon engineering data, financial and technical information developed and maintained by St. Clair or USLM personnel, work undertaken by third-party contractors and consultants on behalf of the mine, public data sourced from the United States Geological Survey, the Oklahoma Geological Survey, internal St. Clair technical reports, previous technical studies, maps, St. Clair letters and memoranda, and public information as cited throughout this TRS and listed in Section 24. Table 2.3 is a list of the terms used in this TRS.
This TRS was prepared by Keith V. Vickers, BSGeol, MSGeol, TXPG #3938, CPetG #6152. Detailed discussions with the following were held during the preparation of the TRS:
Mr. Timothy W. Byrne, President, CEO USLM, Dallas, Texas
Mr. Michael L. Wiedemer, Vice President, CFO USLM, Dallas, Texas
Mr. Russell R. Riggs, Vice President, Production, USLM, Dallas, Texas
Mr. M. Michael Owens, Corporate Treasurer, USLM, Dallas, Texas
Mr. Jason Nutzman, Director of Legal and Compliance, USLM, Dallas, Texas
Mr. Wendell Smith, Director Environmental, USLM, Dallas, Texas
Mr. Ron Terrell, Mine Manager, St. Clair, Marble City, Oklahoma
Mr. Branden Crowder, Production Manager, St. Clair, Marble City, Oklahoma
Mr. Zach Carter, Accounting Manager, St. Clair, Marble City, Oklahoma
Mr. Keith Vickers, SYB Group, USLM Consulting Geologist, Crowley, Texas
Page 8 of 56
Table 2.3 Glossary of Terms and Abbreviations
Term |
| Definition |
AAPG | | American Association of Professional Geologists |
AASHTO | | American Association of State Highway and Transportation Officials |
ALC | | Arkansas Lime Company |
AMR | | Advanced Minimum Royalty |
ASTM | | American Society for Testing and Materials |
AWWA | | American Water Works Association |
BLM | | Bureau of Land Management |
CaCO3 | | Calcium Carbonate |
CEO | | Chief Executive Officer |
CFO | | Chief Financial Officer |
CFR | | Code of Federal Regulations |
DXF | | Drawing Exchange File |
E | | East |
F. | | Fahrenheit |
Fig. | | Figure |
ft. | | Feet |
GLONASS | | Global Navigation Satellite System |
GPS | | Global Positioning System |
LIBOR | | London Inter-Bank Offered Rate |
LST | | Limestone |
N | | North |
NAD | | North American Datum |
NPV | | Net Present Value |
ODEQ | | Oklahoma Department of Environmental Quality |
ODOM | | Oklahoma Department of Mines |
OGS | | Oklahoma Geological Survey |
PG | | Professional Geologist |
PLSS | | Public Land Survey System |
QP | | Qualified Person |
QC/QA | | Quality Control/Quality Assurance |
S | | South |
TRS | | Technical Report Summary |
UG | | Underground |
U.S. | | United States |
USGS | | United States Geological Survey |
USLM | | United States Lime and Minerals, Inc. |
WAAS | | Wide Area Augmentation System |
W | | West |
XRF | | X-Ray Fluorescence |
| | |
2.4Personal Inspection
The QP, who has been a consulting geologist for USLM for over 20 years is familiar with St. Clair’s mine geology and operation. Over the years, the QP has visited the operation to supervise drilling, log cores and investigate geologic issues associated with specific areas in the mine. Table 2.4 is a partial list of dates the QP has visited the mine. Data, protocols, and specific information required for the TRS were gathered during onsite visits. The St. Clair plant manager and the mine manager provided any detailed information the QP required for the reserve operation and mine plan sections of this report.
Page 9 of 56
Table 2.4 Visits Made by QP to St. Clair Mine
| | |
Date |
| Reason |
2005 | | Due Diligence for Acquisition & Core Drilling |
2006 | | Supervise Core Drilling Project |
2018 | | Supervise Core Drilling Project |
2018 | | Inspection Sampling Locations for Physical Testing |
2021 | | Meeting to Review and Obtain detailed Information for TRS |
On January 27, 2022, the QP met in the St. Clair mine office to review the drill hole and surface sample database and discuss the data needed for the TRS. The QP inspected the mine, visited faces to examine the consistency and thickness, and discussed core storage in the mine. The equipment suite, blasting and mining methods, and costs were reviewed and verified. QP discussed quality control and quality assurance at the mine office with the plant QC/QA lab personnel. The QC/QA lab personnel provided lab XRF standard certifications and instrument service/care contracts. A review of the core and sample preparation for analytical tests occurred and their documentation was provided.
The QP reviewed a report checklist with St. Clair management and the mine manager to ensure all materials needed for the TRS were available. The resource areas, fixed grade control, and production hole sampling procedures were reviewed and clarified. The mining faces were compared to the existing geologic model, and a comparison of the core to production sample chemistry was discussed. The QP had a meeting with the Accounting Manager to obtain the financials for the mine economic analysis.
3Property Description
3.1Property Description and Location
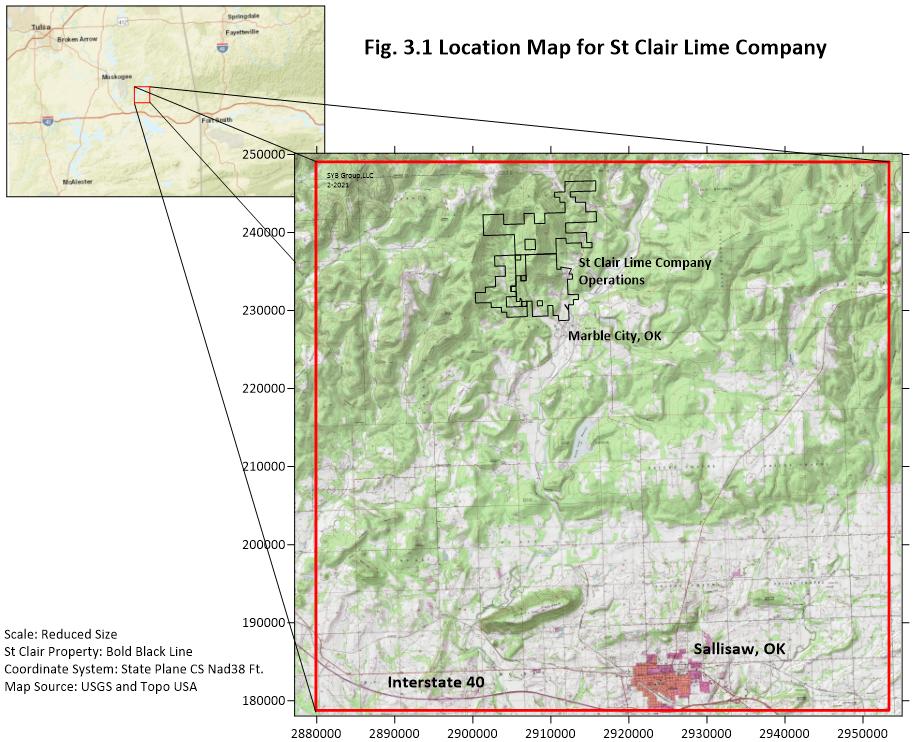
St. Clair operations (35°35’52.80”N, -94°49’57.35”W, Fig. 3.1 GoogleEarth 2021) are located in Sequoyah County, north of Sallisaw, Oklahoma, 9.5 miles by county road to Marble City and then another 1.5 miles north.
Page 10 of 56
3.2Mineral Rights
St. Clair owns approximately 1,400 acres in fee and has mineral leases covering approximately 1,340 acres (AcreValue website, 2021) (USLM internal report). St. Clair holds all surface and mineral rights on the fee property. The mineral leases convey the right to explore, build infrastructure, extract, and process limestone. A detailed mineral lease discussion follows in Section 3.4.
3.3 | Significant Encumbrances or Risks to Perform work on Property |
There are no significant issues or risks to work on the properties outside of those generally related to mining operations.
3.4Lease Agreements or Income from Royalties
Currently, St. Clair is not mining on any leased property and anticipates continuing to mine on the company’s fee land until resources there are depleted.
There are eleven leases that were signed between 1985 and 1986. They were assigned to St. Clair by O-N Minerals in 2005 with the property owners (referred to herein, collectively, as the “Lessors”), providing the authority for St. Clair to explore, build infrastructure, extract, and process limestone and dolomite. The following summarizes the leases in which St. Clair is the Lessee, as stated in the 2005 Executive Property Summary prepared for due diligence (USLM Internal Report by staff, 2005). Lease ownership history is listed:
· | Pluess-Staufer Industries – Originator |
· | Global Stone Assignment from Pluess-Staufer |
· | O-N Minerals Assignment from Global Stone |
· | St. Clair (USLM) Assignment from O-N Minerals |
The state of Oklahoma’s property system is organized under the PLSS of the United States government. The mineral leases are with private owners. Material terms are predominately standard with AMR being the same except for one lease and production royalty rates being the same for each lease. There is generally a stated initial term of each lease, with automatic extensions for so long as the lease terms are met, or mining operations are conducted in a described area. The leases’ current term ranges from 25 to 75 years. The description of the leased area has remained the same over the years and is described in terms as defined by the BLM Manual of Surveying Instructions (Abbey, 2009). Examples are 1/4NE 1/4NE 1/4SW, N2 NW1/4, NE1/4 of T5N R13E S 11 or Township 5 North, Range 13 East, Section11.
Initially, the Lessee paid an AMR per lease, either $50 or $300 per month, and payments are recoupable against earned royalties due under the leases. The production royalty is $0.25 per ton when production is established. Both AMR and Production Royalty are indexed to the Producer Price Index for Non-metallic Mineral Products (Code 13) every five years. Under the existing mineral leases, the Lessor is responsible for ad valorem taxes. The Lessee is responsible for any taxes on infrastructure and equipment they own. Any taxes directly related to production from an operating mine are the responsibility of the Lessee.
St. Clair currently has no royalty interest in any fee or leased lands in the operational area.
4 | Accessibility, Climate, Local Resources, Infrastructure, and Physiography |
4.1Topography, Vegetation, and Physiography
The area’s topography is characterized by narrow valleys with steep-sided ridges connecting to several main river drainages. St. Clair’s operations are located at the base of Quarry Mountain ridge. The elevation ranges from 1,450 ft. to 550 ft. The valleys are covered with thick alluvial sediments and the ridges have moderate soil cover on top but little to no soil on the sides.
The tree types are dominated by oak, hickory, pine, and cedar glades (Rafferty, 1988). The flat valley floors are primarily agricultural land cover in typical grasses common to the area.
The operation is in the physiographic region known as the Ozark Plateau (Digitalprairie website, 2021). Three distinct plateau regions characterize the province connected one time in the past, but erosion has separated them. The areas have been eroded into high ridges approximately the same height separated by steep-walled valleys that merge into larger open flat areas occupied by the main river drainages.
Page 11 of 56
4.2Accessibility and Local Resources
Primary access to the operation is by county highway N4610 from Marble City and S4620 from the city of Sallisaw, located on Interstate 40. Marble City is a small community that does not have an airport. A municipal airport serves Sallisaw and commercial airline travel is through Ft. Smith, Arkansas (25 miles) or Tulsa, Oklahoma (95 miles). Roads are paved and are traveled daily by multi-axial vehicles. The Kansas City Southern Railway runs near the plant and there is a spur into the operation. Most of the operation’s workers live in the rural area near the mine or Sallisaw (GoogleMaps website, 2021).
4.3Climate and Operating Season
The average rainfall for Sequoyah County, Oklahoma, is 38 inches of rain per year. The County averages four inches of snow per year. On average, there are 218 sunny days per year. The County averages 87 precipitation days per year. Precipitation is rain, snow, sleet, or hail that falls to the ground. Temperature ranges from a high in July of 92 degrees F. to a low of 27 degrees F. in January. The underground mine is not affected by the weather conditions and the operating season can be year-round. (www.bestplaces.net/climate, 2021)
4.4Infrastructure
4.4.1Water
There are no issues with the water supply. The operation water requirements are served by spring and surface water from the mine.
4.4.2Energy Supply
The mine fuel supply is from distributors in Ft. Smith, Arkansas. A state power grid supply supplies electrical power to the operation.
4.4.3Personnel
Ft. Smith has a population of over 87,000, and the nearby town of Sallisaw has 8,500 people that the mine can draw from for new or replacement employees (www.population.com, 2021).
4.4.4Supplies
The supply chain is a low priority issue for the mine as its proximity to Sallisaw and Ft. Smith provide the most common needs. Tulsa and Oklahoma City are alternate sources if needed. Tulsa and Oklahoma City are large suppliers to the state’s oilfield and other mining operations. Several trucking companies provide service to the operation from the above supply centers.
5History
5.1Prior Company Ownership
In 1937, the OGS convinced the owners of a lime company at Oklahoma City to move to the current location of the St. Clair mine (Ham et al., 1943). The OGS made the recommendation because of the detailed field and analytical work that OGS had done on the Quarry Mountain formation.
Page 12 of 56
Table 5.1 Company Ownership History
Year |
| Company |
| Operations/Activity |
1938 | | Homer & Hilmer Dunlap, dba St. Clair Lime Company | | Company Startup, Surface Mine |
1938 | | St. Clair Lime Company | | Built 2 Shaft kilns in Sallisaw, OK (plant) |
1953 | | St. Clair Lime Company | | First Portal to Underground Mine, East Side |
1955 | | St. Clair Lime Company | | Second Portal, Underground, South Side |
1964 | | St. Clair Lime Company | | Built 1st Rotary Kiln (KVS) |
1971 | | St. Clair Lime Company | | Built 2nd Rotary Kiln (Fuller) |
1995 | | Global Stone Corporation | | Purchased St. Clair Lime Company |
1998 | | Oglebay Norton Company | | Purchased Global Stone Corporation and later renamed it O-N Minerals – St. Clair |
2005 | | United States Lime & Minerals, Inc. | | Purchased O-N Minerals – St. Clair and renamed it U.S. Lime Company – St. Clair |
Source: St. Clair and USLM personnel.
5.2Exploration and Development History
Table 5.2 St. Clair Historical Drilling Projects
| ||||||||
Year |
| Company |
| Purpose |
| Summary of Work |
| Comment |
1962 | | St. Clair Lime | | Development | | Limited Surface & Production Drilling | | 4 cores utilized by OGS in the 1965 regional study |
1965 | | OGS | | Research, Geologic Study | | 3 holes drilled regionally, measured sections | | OGS Bulletin 105 was published |
2000 | | Wallace Mitchell PG | | Resource Extent | | Examined ore coverage on entire Property | | Drilled 2 holes north end of the leased area and utilized UG face, outcrops, and offset property holes |
2004 to Present | | O-N Minerals – St. Clair | | Development | | Mining face QC/QA production drilling sampling | | Daily sampling of mine faces to confirm the quality |
2005-06 | | USLM | | Acquisition Exploration | | Established ore present on the total property (fee and leased) | | Drilled 8 holes on north leases and 1 hole on fee to complement the previous data points. |
2017 | | St. Clair | | Development and explore full potential of ore thickness | | Proved economic ore thickness in the south in front of mine | | Drilled 16 holes on fee land southwest of UG mine. |
Note: A detailed discussion of all drilling and results is in Section 7.1.
6Geologic Setting, Mineralization, and Deposit
The first mining operations in the area were for dimension stone, commonly called “Marble” because of the limestone’s hardness and suitability for construction. This “Marble” would later be identified as the Quarry Mountain Limestone (Silurian Age). Marble City, the upper member of the Marble Mountain formation, had the appearance of marble and was one of the few outcrops in the state that met that demand. In 1938 the St. Clair Lime Company was formed, producing lime from two shaft kilns. The mining operation started as an open pit mine and transitioned to an underground mine in 1958. The mine has supplied limestone to the plant continuously since 1938 (more than 80 years).
6.1Regional Geology
The following is an excerpted summary of the sedimentary history of the Ozark region from Huffman, 1958 (OGS Bulletin 77, 1958):
The advance of the Upper Cambrian age seas deposited thick sequences of dolomite. The sea advance was followed by a period of erosion and then advancing seas in the Upper Ordovician started a long period of limestone development. During this time, limestone was deposited in thick beds with periodic shale deposition because of deeper seas. A period of receding seas resulted in extreme erosion removing strata to the bottom of the Late Ordovician age Sylvain shale.
Page 13 of 56
The Quarry Mountain limestone (Hi-calcium) was deposited when the seas advanced in the Silurian age. Next, from the Silurian until the middle of the Devonian, a series of fluctuating sea levels deposited limestones and sandstones. Then significant erosion would occur when the sea receded. This erosion would partially or entirely erode the pervious strata in areas leaving scattered remnants of formations. Then a period of tilting produced more erosion in front of the advancing Late Devonian sea that covered the Ozark Uplift with deep water and deposited the thick Chattanooga shale.
Alternating cherty limestones and shales characterize the period from the Mississippian to the Pennsylvanian age as the sea level, tilting, and uplift events continued to repeat, with erosion occurring when the seas had a significant retreat.
In Early Pennsylvanian time, emergence and uplift to the north of the region provided land-derived clay and sand input, so limestone deposition contained significant amounts of the material.
These lithologies continued until the Middle Pennsylvanian time when alternating shales and sandstone dominated the area and limestone deposition was subordinate.
Next, the Ozark Uplift was significantly elevated, which is believed to be caused by the tensional stresses resulting from the Arkoma Basin development and filling. The uplifting resulted in large-scale regional Northeast trending normal faults.
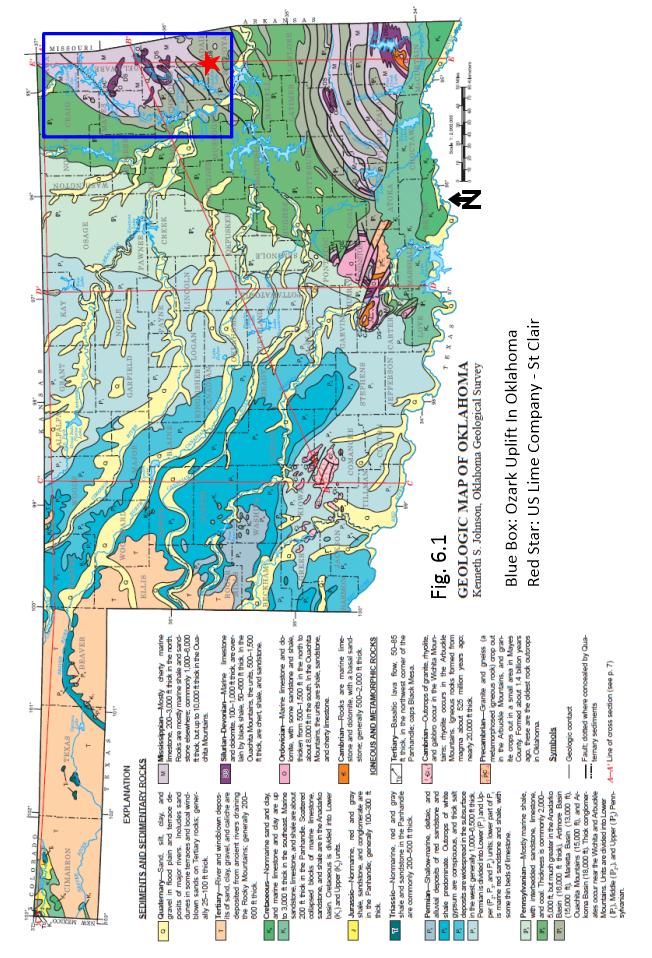
Since the end of the Pennsylvanian, recent geologic history has been marked by erosion of the Uplift producing extensive valleys and the deposition of sand and gravels. Fig. 6.1 shows the regional geology of northeastern Oklahoma with a stratigraphic column.
Page 14 of 56
Page 15 of 56
6.2Local and St. Clair Property Geology
Locally, Sequoyah County surface geology consists of parallel gentle anticlines and synclines with numerous parallel faults between them. Oil well data has shown that the Marble City formation is 3,000 ft. below the mine elevation across the entire southeastern part of Sequoyah County, including the Sallisaw area. The St. Clair area is located at the far south end of the Ozark Uplift, approximately 24 miles north of the subsurface edge of the Arkoma Basin.
The rocks in the St. Clair area range in geologic age from the Quaternary to the Ordovician. The strata from above the lower Pennsylvanian (Atoka Formation) to the Quaternary has been eroded or missing because of non-deposition.
The Ordovician lithologies represent high sea levels and clear water. The lower part was dominantly marine rocks with the deposition of limestone and dolomite. The inter-layered clean sandstones in the upper part were deposited offshore and reworked by the advancing sea (Snider, 1915). The age ended with a complete withdrawal of the sea and a period of substantial erosion occurred. The Silurian age lithologies represent another high sea-level stand reversing the conditions at the end of the Ordovician. These conditions were perfect for reef growth which produced sediments high in CaCO3 material. The Marble Mountain limestone is the only Silurian age formation present locally. The outcrop near the mine is one of the few in the state. The end of the Silurian and the beginning of the Devonian was a period of falling sea level. This period of exposure and erosion was long-term and removed several formations by producing erosional valleys and plains. At the same time, there was a structural down warping to the south, which tilted the existing lower rocks to the south. The Frisco limestone and Sallisaw sandstone are transitional lithologies from low to high sea levels. The Chattanooga shale (Devonian and Mississippian ages) exemplifies fine-grain deep water sediments. This shale deposition is widespread across Eastern Oklahoma, Arkansas, Missouri, Tennessee, and Ohio.
The remainder of the Mississippian age was dominated by recurring deep water sediments followed by shallow water carbonates with the occasional period of exposure and erosion. There are six sea level cycles in the geologic record. In the middle of the Pennsylvanian, the depositional environment changed to sediments from a land origin. This change is evidenced by the rocks of the Atoka formation consisting of river and deltaic sediments, producing rocks dominated by high clay and silica content.
The St. Clair area structure presents nothing different from the regional structural fabric. The units dip east-southwest gently (4 to 5 degrees) toward the Arkoma Basin unless they are very near a structural feature where the dip can reach a magnitude of 40 degrees. In the immediate area south of the operation, the Marble City and the Lyon faults form a southeast truncation for any exposures of the Marble Mountain formation. Both faults trend northeast to southwest. The displacement across the faults is estimated greater than 500 ft. since the Atoka formation is at the surface in the valley on the southeast side of the fault and top of Quarry Mountain (1,300 ft.) on the northwest side of the fault.
No faults have been encountered in the history of mining at St. Clair. The Quarry Mountain ridge is characterized as a low-angle anticline. This anticline trends the same as the regional structures. The mine area is located on the eastern limb. (Ham and Teal, 1943)
6.3Mineralization
High calcium limestones are the product of unique depositional environments only, not by subsurface alteration or enhancement. No subsurface mineralization has occurred to create or enhance the CaCO3 content in this deposit. The CaCO3 content is the product of reef organisms that build their exoskeletons out of CaCO3 derived from the marine environment. The reef area has very limited or no exposure to sources of noncarbonate materials such as clay, silica, iron that would reduce the CaCO3 content.
6.4Stratigraphy and Mineralogy
The Quarry Mountain formation is subdivided into two members. The Upper Marble City member is a clean high purity calcium limestone with a CaCO3 composite consistently above 96.0%. This limestone has been extracted throughout the mine’s history at St. Clair. The Lower Barber member ranges from a dolomitic limestone to dolomite. The OGS marks the division between the two members where the MgCO3 content exceeds ten percent. This use of MgCO3 content is a somewhat arbitrary division. The dolomite content was used for dividing the members because no clear division was defined by lithology and fossil content.
Infrequently in the Marble City member, there are dolomitic lenses and there are lenses of non-magnesium limestone in the Barber. The lenses have a limited lateral extent and St. Clair utilizes appropriate mining practices when these are encountered.
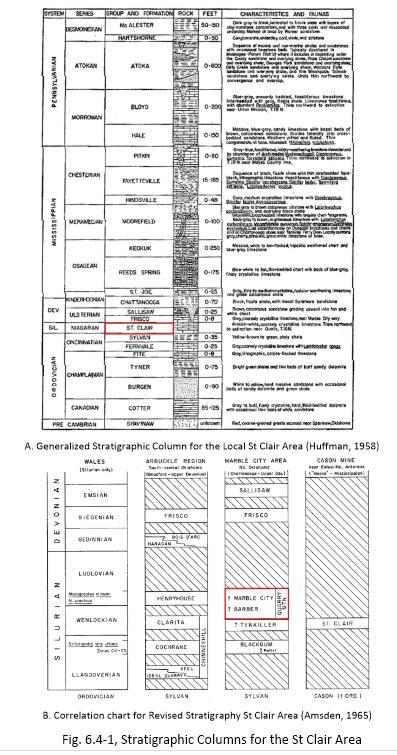
Fig. 6.4-1 are stratigraphic columns for the local area and the St. Clair mine. Fig. 6.4-2 shows a cross-section and index map south of the mine. The section is oriented north and south to the south edge of the mined area. The cross-section only highlights the topography and top and bottom structures of the ore interval.
Page 16 of 56
Page 17 of 56
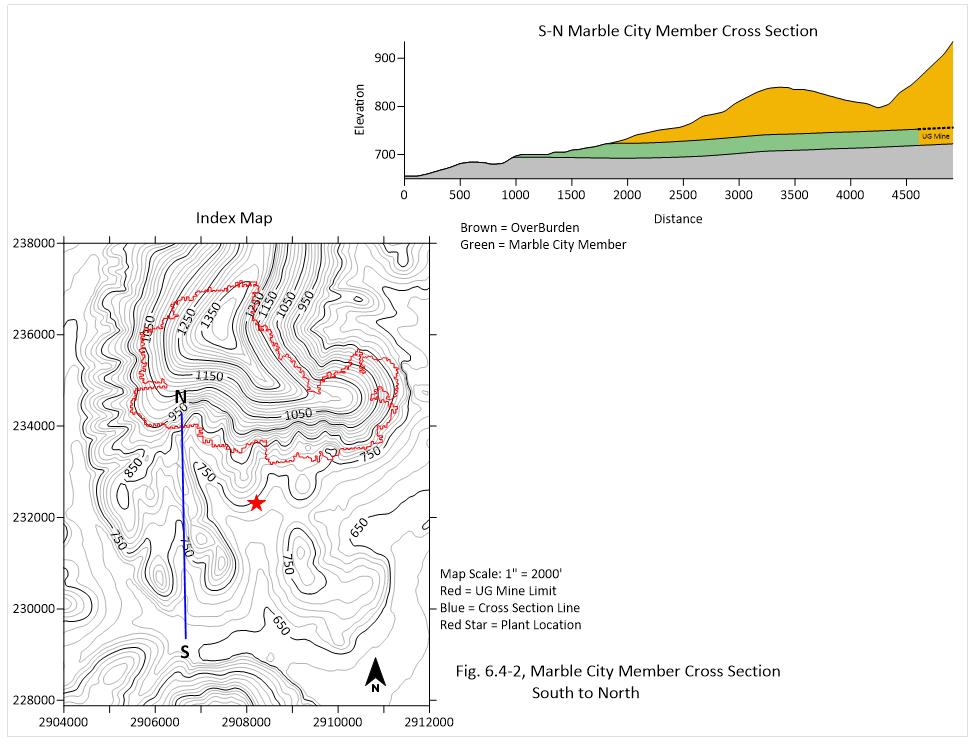
Table 6.4 St. Clair Property Stratigraphy
Stratigraphic Unit | Thickness Approximate Range | Primary Lithology |
Frisco LST | 0 ft. to 8 ft. | Coarse Crystalline Limestone Devonian Age |
Marble City Member LST | 0 ft. to 160 ft. | Upper Part of Quarry Mountain, pure Bioclastic LST, Silurian Age |
Barber Member LST/Dolomite | 0 ft. to 80 ft. | Lower Part of Quarry Mountain, Dolomite/LST to Dolomite, Little Insolubles. |
Tenkiller LST | 0 ft. to 27 ft. | Limestone, Bioclastic, Moderate Insolubles |
7Exploration
The database used for the St. Clair geologic model is composed of multiple sources of data types. These sources include core and drill cuttings, measured sections (from OGS), and underground mine production sampling. Minor exploration drilling has been necessary for the past 30 years because of St. Clair’s significant land position. A considerable amount of recent drilling has been near the mine and on St. Clair property.
Page 18 of 56
7.1Drilling Programs
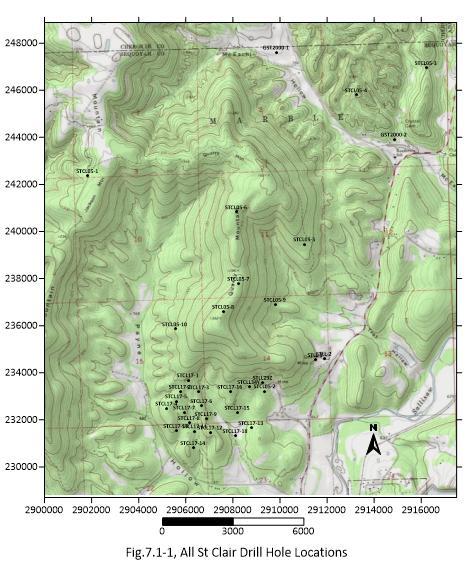
A summary of drilling projects to date in the local vicinity and on St. Clair property is in Table 7.1-1. These projects include research, exploration, development, and production drilling by diamond and percussion bit methods. Fig. 7.1-1 shows all the St. Clair Drill Holes.
Table 7.1-1 All St. Clair Drilling Projects
| | | | |
Year | Company | Purpose | Summary of Work | Comment |
1962 | St. Clair Lime | Development | Limited Surface & Production Drilling | 4 cores utilized by OGS in the 1965 regional study |
1965 | OGS | Research, Geologic Study | 3 holes drilled regionally, measured sections | OGS Bulletin 105 was published |
2000 | Wallace Mitchell PG | Resource Extent | Examined ore coverage on entire Property | Drilled 2 holes north end of the leased area and utilized UG face, outcrops, and offset property holes |
2004 to Present | O-N Minerals – St. Clair | Development | Mining face QC/QA production drilling sampling | Daily sampling of mine faces to confirm the quality |
2005-06 | USLM | Acquisition Exploration | Established ore present on the total property (fee and leased) | Drilled 8 holes on north leases and 1 hole on fee to complement the previous data points. |
2017 | St. Clair | Development and explore full potential of ore thickness | Proved economic ore thickness in the south in front of mine | Drilled 16 holes on fee land southwest of UG mine. |
Page 19 of 56
In 1965, the OGS conducted a detailed study on the limestone stratigraphy and lithology at St. Clair which at the time was designated as the St. Clair formation (Amsden TW and Rowland TL, 1965). The study utilized four cores donated from St. Clair Lime Company, three cores from a previous OGS drilling program, cuttings from 17 rotary/cable tool rigs (oilfield), measured sections of surface exposures, and mining faces in the St. Clair mine. The lab work consisted of chemical analysis, insoluble residue, and thin sections of the surface samples and the available cores. Because the limestone at St. Clair had very few outcrops, existing oilfield down-hole logs and drill cuttings were examined in areas where the formation was below the subsurface to confirm regional continuity (not chemical content). The results provided evidence the limestone at the mine was mistakenly identified as the St. Clair formation. It was renamed as the Quarry Mountain formation and divided into two members: the Upper Marble City member and the Lower Barber member. The division was based on the chemical content of the members. The average CaCO3 percent from the Marble City member chemical analysis was 97.6% Two of these cores are beyond the St. Clair area. The oil well cuttings examination revealed the Marble City member is present 40 miles to the west and 30 miles to the south at depths between 1,000 ft. and 2000 ft. This project proved the Marble City member existed over the St. Clair property with reasonable thickness and chemical qualities.
Procedures for the study were as follows:
· | Measured sections followed standard field practices for determining lithology and thickness. Individual samples from beds and channel sampling for chemical analysis were taken from the sections. |
· | Cores were sawed lengthwise and a large section was saved and stored. The smaller section was used for examination and analysis. Core recovery was 100%, with a few exceptions. |
· | Oil well cuttings were collected and logged at the rig and any well with mislabeled, missing samples, or caving in the crucial interval was omitted. Marble City presence was determined from cuttings and thin sections by comparison to |
Page 20 of 56
cores and surface exposures. Down-hole logs supplemented these determinations. Dolomite content by visual assessment of formic acid reaction. Insoluble residue by visual determination after digestion with HCl acid. The OGS author cautions that the results from the cutting analysis represent a lower order of precision than other sample methods.
· | The OGS lab conducted chemical analyses under their standardized procedures. The smaller section of the sawed core was visually examined for lithology and carbonate content (Lemburg staining) determination. Then lithostratigraphic units were subdivided into smaller intervals for chemical analysis. These smaller lots were crushed with a jaw-crusher (1/4 in. size) and split, employing a riffle splitter to a split size of approximately 2 pounds. The split was then ground to -60 mesh. This procedure was utilized so the chemical analysis would represent a continuous channel sample of rocks cored. |
· | Two analyses were performed on the prepared core samples: 1) Acid digestion of a sample, then analyzed the soluble part by titration to determine the total calcium and magnesium carbonate content, and the insolubles were reported as a percentage. OGS lab reports the precision of this technique is on the order of 0.1% or better; and 2) complete analysis on composites of smaller lots, weighted samples composed of one gram from each ft., analyzed for LOI, CaCO3, and MgCO3 as above, SiO2, R2O3, Fe2O3, Al2O3, P2O5, K2O, S, trace element analysis by emission spectrochemical analysis using artificial external standards. Analytic reproducibility is accurate (at the time of the study) to be within +/- 10%. |
Note: This TRS is focused on the Marble City member of the formation and those results will be presented herein.
The measured sections and surface sampling results from this project are presented in Section 7.3 below.
Page 21 of 56
Table 7.1-2 Drilling Summary of OGS 1965 Study from the Amsden TW and Rowland TL, 1965
Core/Cuttings |
| LST Thickness (ft.) |
| Top Depth (ft.) |
| Average CaCO3 Percentage (%) |
OGS 1 Core | | 34 | | 0 | | 98.0 |
OGS-2 Core (Barber) | | 37* | | 0 | | 22.9* |
OGS-3 Core | | 70 | | 0 | | 97.2 |
STCL-1 Core | | 63 | | 22 | | 97.4 |
STCL-2 Core (Barber) | | 59* | | Above collar | | 19.3* |
STCL-29Z Core | | 61 | | 26 | | 98.6 |
STCL-34Y Core | | 32 | | 42 | | 97.1 |
Well A-Mabee Cuttings | | 160 | | 910 | | No Chemistry |
Well B-Burke Cuttings | | 110 | | 580 | | No Chemistry |
Well C-Ready Cuttings | | 61 | | 20 | | No Chemistry |
Well D-Cook Cuttings | | 160 (upper mixed)^ | | 755 | | No Chemistry |
Well E-Cheek Cuttings | | 135 | | 3,020 | | No Chemistry |
Well F-Snow Cuttings | | 155 | | 1,030 | | No Chemistry |
Well G-Blake Cuttings | | 171 (mixed)^ | | 2,209 | | No Chemistry |
Well H-Padgett Cuttings | | 55# (log top) | | 905# | | No Chemistry |
Well I-Dunagan Cuttings | | 133 | | 2,327 | | No Chemistry |
Well Williamson. Cuttings | | 50 | | 2,210 | | No Chemistry |
Well K-Walker Cuttings | | 0 | | None | | No Chemistry |
Well L-Bennett. Cuttings | | 0 | | None | | No Chemistry |
Well M-Graham Cuttings | | 100 | | 4,655 | | No Chemistry |
Well N-Grant Cuttings | | 0 | | None | | No Chemistry |
Well O-Brandon Cuttings | | 0 | | None | | No Chemistry |
Well P-Lackey Cuttings | | 0 | | None | | No Chemistry |
Well Q-Haggard Cuttings | | 0 | | None | | No Chemistry |
Note: * No Marble City present, Barber Analyzed
^ Mixed Samples from 2 units, unclear
# Log top used
In 2000, the mine owner drilled two exploration core holes at the far north end of the St. Clair property (Fig. 7.1). The purpose was to confirm the continuity, thickness, and chemical quality of the Marble City member at the northern end property. The project’s procedure was:
· | A GPS unit surveyed hole locations. Both locations were chosen where the Marble City was close to the surface to limit drilling time. |
· | The geologist supervising the project visited nearby hollows and valleys) and confirmed the presence of Marble city outcrops that the 1965 study had examined. Some data were available from holes drilled by a previous owner to the geologist (data not available or lost now). |
· | Core size was drilled using a rig with a wireline retrievable core barrel setup. A Cone rock bit was used to drill through overburden until bedrock was encountered. |
· | The core was logged at the hole site using routine logging methods; MgCO3 and SiO2 were listed on the log after analysis was completed. |
· | The cores were split and then analyzed for CaO, MgO, Al2O3, SiO2. The lab performing the work was not listed. Analysis samples were composited based on lithology. |
The results of the hole analysis are presented in Table 7.1-3 below.
Table 7.1-3 Summary of 2000 Exploration Drilling
Property |
| Number of |
| Average LST Thickness (Ft.) |
| Average CaCO3 Percentage (%) |
St. Clair N. Property | | 2 | | 60 | | 98.1 |
Note: W. Mitchell Report, 2000 drilling.
Page 22 of 56
W. Mitchell reported the data from 5 holes about three miles north of the St. Clair mine. The data was incomplete, some holes had logs, and others did not. They all had analysis and four out of the five confirmed continuity and chemical quality of the limestone ore zone. These holes were not part of the drillhole database. This project provided data confirming the lateral continuity and chemical quality of the Marble City member at the far northern extent of the St. Clair property.
In 2005, USLM purchased all the outstanding stock of O-N Minerals (St. Clair) Company from O-N Minerals (Lime) Company, a subsidiary of Oglebay Norton Company. Part of the due diligence was to drill the property to confirm the existence of the ore between the active mine and the northern two 2000 project holes. Because the terrain is very rugged with steep-sided ridges, it was decided to drill a widespread pattern of locations with existing reasonable access. Historical quality and thickness from the mine were used in designing the drilling criteria and pattern. In 2005, the mine had an 8,500 ft. long face forming a 180-degree continuous ore zone exposure. The mine face was used as a continuous drill hole for correlation purposes. The mining had operated continuously for approximately 60 years providing the plant with shot limestone for processing into products with consistent quality. The drilling program consisted of nine core holes; five were drilled on St. Clair property north of the mine and four were drilled nearby the mine. USLM approved the methods and procedures. These protocols for drilling, logging, and sampling cores had been developed over several years as equipment and analyses had changed. The project procedures were:
· | Contract geologists selected core drilling locations with the approval of sites and drilling budget by USLM management. |
· | Core drilling was conducted directly under the supervision of contract geologists. All core was logged by SYB Group or an approved USLM contract geologist using a protocol modified from the Shell Sample Examination Manual (Swanson, 1981) that was modified by SYB and approved by USLM. |
· | After final selection, hole locations were surveyed by hand GPS (WAAS and GLONASS capable). |
· | Immediately upon retrieval, the core was placed on a V-shaped trough. All core pieces were fitted together and labeled with a permanent marker in one-foot intervals. |
· | Characteristics related to the suitability of the limestone for the St. Clair plant processing and geology were recorded. These items are stratigraphy, key marker lenses/layers, lithology characteristics, visual identification of ore top and bottom, and structural disturbance. |
· | The core from each drill hole was placed into cardboard boxes in two-foot intervals totaling 10 ft. at the drill site. The boxes were labeled with a box number, company information, hole number, core runs, and depths marked on each box. The boxes were then delivered to the St. Clair core processing area. Then they were prepped for transport to the ALC core storage center. |
· | The contract geologists were responsible for examining the core and compiling a detailed interval list for XRF analysis. This list was later entered into Excel to build an analysis database. The analysis intervals were chosen on two ft. lengths and intervals of six to ten ft. above and below the lithologically identified ore zone were chosen. This excess was so the top and bottom of the ore could be chemically defined. |
· | Once the cores were at the ALC core storage area, the core intervals were diamond sawed into two-thirds to one-third splits. The interval’s one-third split was then bagged in a plastic bag and labeled with the depth interval to be analyzed. The two-thirds split was carefully placed back in the box for reference. |
· | The bagged intervals are kept in plastic labeled buckets or boxes in separate groups by the hole and then submitted to the ALC QC/QA lab for XRF analysis. Any portions of samples not destroyed during the testing process are still stored at the ALC core storage facility. |
The ALC QC/QA lab performed the XRF analysis on these cores using the USLM lab protocols (discussed in Section 8).
This drilling further substantiated the lateral continuity, consistent vertical thickness, and average CaCO3 quality above 96.0% for the Marble City member ore interval. Holes drilled on the northern properties confirmed the results from the Marble City member’s 2000 hole chemistry and thickness. The four holes drilled nearby the mine agreed with the production chemistry and mining thickness observed in the mine. The chemistry and thickness from drilling and historical data from the mining operation would be used in future mine planning. The results from this project are listed in Table 7.1-4 below:
Page 23 of 56
Table 7.1-4 Summary of 2005 Exploration Drilling
| | | | | | | |
Property |
| Number of Holes |
| Average LST |
| Average CaCO3 |
|
St. Clair N Leased Prop. | | 5 | | 51 | | 97.7 | |
St. Clair Fee Prop | | 4 | | 45 | | 98.01 | |
Total | | 9 | | 48 | | 97.8 | |
Note: From 2006 SYB Group Drilling Report.
Recent acquisitions (2017) by St. Clair southwest of the mine required drilling for resource assessment. Mining face chemistry and thickness again was considered as drill hole data. The project's design and criteria considered the results from two existing holes nearby. The area consisted of a set of elongate north-south trending ridges. The ridges had outcrops on three sides. The hole pattern consisted of 16 holes in a grid pattern of variable spacing to accommodate the topography. Primary objectives for the drilling were: 1) to confirm the ore body presence, extent, consistency; and 2) drill to the bottom of the Quarry Mountain formation since little deep drilling had been done in the past. This project’s protocols and procedures are the same as the 2005 drilling project listed above.
The bottom of the Quarry Mountain formation was drilled in each hole and the vertical extent of the existing ore zone was defined. The Marble City member was present in every hole, but one, and the thickness was consistent with the mining height. The ore thickness was thicker than the mining face height in three holes. The occurrence of small dolomitic limestone pods or lenses in two holes will require production monitoring methods currently being utilized in the mine.
The results of this drilling project are presented in Table 7.1-5.
Table 7.1-5 Summary of 2017 Exploration Drilling
| | | | | | | |
Project |
| Number of Holes |
| Average LST |
| Average CaCO3 |
|
St. Clair 2017 Drilling | | 17 | | 34 | | 97.6 | |
Note: From 2017 SYB Group Drilling Report.
The mine had a production QC/QA program before USLM purchased the operation and was continued with modification to the present day. Complete records for the analytical program have existed since 2004. Records from prior years are incomplete or unlocatable.
This database provides a comprehensive insight into the ore zone’s composition, thickness, and variability over a considerable time span. The program consists of compositing cuttings for one row from the top, middle, and bottom of the face blast hole pattern. Every mining face to be blasted is sampled using this method. This sampling amounts to 40% of the hole pattern. It is estimated that the average number of samples analyzed for production QC per year over the past five years is 490.
St. Clair Procedure for Collecting Drill Cuttings:
· | Drill operator identifies face location. Row (Numerical), Column (Alphabetical), Cardinal Direction (N, E, S, W) (Example 1 A North). |
· | Labels collection bags with location and hole location (Top, Middle, Bottom). |
· | Driller starts drilling the face. |
· | Driller collects floor cuttings across the face from left to right and puts them into a bag labeled bottom (Example 1 A North Bottom). |
· | Driller collects middle cuttings across the face from left to right and puts them into a bag labeled middle (Example 1 A North Middle). |
· | Driller collects roof cuttings across the face from left to right and puts them into a bag labeled top (Example 1 A North Top). |
· | Driller drops off drill cuttings at the lab at the end of shift. |
· | The cuttings are then logged in and processed by the lab personnel using USLM protocols (discussed below in section 8.0). |
This production data has been used to map chemical trends in the ore deposit to estimate quality ahead of the mining faces and floor. This QC data’s average mine production quality has been above 96.0% CaCO3.
A list of the holes used in the model with the hole name and XY coordinates can be found in Appendix A.
Page 24 of 56
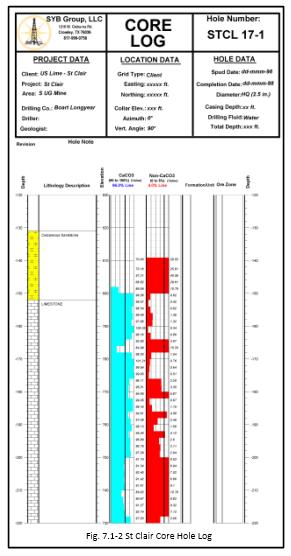
All holes’ lithology, chemical analysis, and ore interval were plotted as logs. These logs were used to correlate stratigraphy, lithology, and ore zone intercepts. Also, they form a visual catalog of all the hole data. A recent core log is shown below in Fig. 7.1-2.
7.2Surface Mapping and Sampling
In 1943, OGS (Ham et al., 1943) performed a study to define the extent and chemical content of the Marble City member (named St. Clair then) in more detail than previous work. The OGS sampled outcrops and mine faces in and around the St. Clair Lime Company mine. The work identified three chemical zones that matched the three differing lithologies of the member. The results for zone two represent the ore zone in the St. Clair mine. The zone two thickness ranged from 55 to 70 ft. and chemistry was consistently above 96.0 % CaCO3. Some small random lenses of dolomitic stone were sampled, which slightly lowered the CaCO3 content. In all areas sampled, CaCO3 and MgCO3 content were 99 % of zone two limestone. St. Clair zone two CaCO3 content averaged above 96.0%, and Independent Gravel Company quarry (an adjacent operation) CaCO3 averaged above 96.0%. The results of this study documented in detail the high purity of the Marble City member 70 years ago.
The procedures for the study are as follows:
· | Surface samples were taken every inch along a perpendicular line to the dip of the beds. Samples were composited every five ft. or when there was a change in lithology. |
· | The OGS lab analyzed samples under the direction of the Survey Chemist. |
The 1965 OGS comprehensive study (Amsden and Rowland, 1965) utilized surface examination, fossil collection, and measured sections as part of the project. There is not an entire section exposed at any one of the sites. The authors relied on quarries and mines to supplement the outcrops. The correlation of these partial sections also benefited from the subsurface cores and wells nearby used in the study.
Page 25 of 56
The surface sampling was limited to fossil collection. This part of the study was directed toward obtaining lithological and stratigraphic information. It is essential because the sampling locations provided evidence on the lateral extent of the Marble City member ore interval. Table 7.2 lists the surface locations where the Marble City member was present and the measured thickness. The distribution of these locations supports the recent drilling proving the Marble City member is consistently present across the entire St. Clair property. The QP has visited some of the nearby locations mentioned in this report to confirm the report findings and observe the ore zone in the outcrop.
Table 7.2 Surface Location Summary of OGS 1965 Study
| | | |
Location |
| LST Thickness (Ft.) |
|
Ch1, SE Cherokee Co. | | Top Marble City exposed only | |
Ch2 SE Shore Tenkiller Lake | | Upper Barber exposed | |
Ch3 SE Town of Barber | | No exposure | |
Ch4 W Town of Qualls | | No exposure | |
Ch5 W town of Qualls | | No exposure | |
Ch6 W Town of Qualls | | No exposure | |
Ch7 NW Town of Qualls | | No exposure | |
S15 Walkingstick Hollow | | Top 25 ft. Marble City | |
S16 Walkingstick Hollow | | Top 25 ft. Marble City | |
S17 N St. Clair Quarry | | Top 20 ft. Marble City | |
S18 St. Clair Quarry Floor | | Upper Barber Member | |
S19 W Payne Hollow | | Top 30 ft. Marble City | |
S20 Indpen. Gravel Quarry | | Top 55 ft. Marble City | |
S21 W Lake Tenkiller Dam | | Top 8 ft. Marble City | |
Ad1 Malloy Hollow | | Top 22 ft. Marble City | |
7.3Hydrogeology Information
The State of Oklahoma does not require hydrogeological studies.
7.4Geotechnical Information
The State of Oklahoma does not require geotechnical studies to be performed. As part of due diligence prior to acquisition, USLM performed a pillar analysis to ensure the pillar dimensions were safe and adequate for the existing mine design.
8Sample Preparation, Analyses, and Security
8.1Sample Preparation and XRF Analysis
The St. Clair plant produces many products which are under strict parameters for chemical and physical quality. The St. Clair lab was established many years ago and was upgraded several times to meet the increasing demands of the customer base. The most significant upgrade was in 2017 when the original O-N Minerals XRF was replaced with a higher quality instrument. In addition, customer quality control labs test St. Clair product shipments frequently.
XRF is one of the primary methods for determining the chemical content of limestone. The St. Clair QC/QA labo has been responsible for conducting XRF analysis on plant products and all limestone samples from stockpiles, belt feed samples, drilling, to hand samples collected for outcrop identification. The five significant oxides are analyzed. CaO is most important because of the plant’s raw limestone requirement above 96.0% CaCO3.
XRF sample preparation, whether hand sample, core, or cuttings, is crushed the entire sample to -10 mesh. The sample is then separated and reduced by a ruffle to 250 grams, drying and pulverizing a representative split to -150 mesh. The samples are analyzed for these oxides CaO, MgO, Fe2O3, Al2O3, and SiO2, following USLM’s XRF analytical method for limestone analysis. The technique involves pressing the powder into a pellet using a wax binder to hold the shape. The analytical procedure and protocol information was provided by St. Clair QC/QA personnel and other information for this section was provided by St. Clair personnel.
8.2 Quality Control/Quality Assurance
The limestone samples are analyzed twice in a run to confirm repeatability. All sample preparation equipment is cleaned after preparing each sample and before the subsequent preparation. The instrument is cleaned and calibrated each year by the manufacturer and is under a service contract. Whenever the device becomes dirty and registers out of calibration or out of specification for the
Page 26 of 56
standards, a manufacturer service call is made to clean, recalibrate, and repair if necessary. The oxide results of each sample are totaled to determine if the data is within an acceptable error range around 100%. The sample analysis is rerun if the total oxide percentage exceeds acceptable error limits. The rerun is to correct or help define the error issue. Sample preparation and a newly prepped sample usually correct the problem in many cases. The lab has a set of certified limestone standards to cover the content range of the major oxides that can occur in limestones. The appropriate standard is run concurrently with the unknown samples. The standard results are compared run to run to ensure the instrument operates correctly.
USLM has four QC/QA labs among its wholly-owned subsidiaries. These labs can perform many of the same analyses, specifically XRF. At any time one lab goes down or needs verification of analytical (XRF) results, samples can be sent to another lab for continuing analysis of the samples or cross verification.
The St. Clair QC/QA lab is certified by:
· | Highway Departments in Oklahoma, Arkansas, Kansas; |
· | The Food and Drug Administration; |
· | Underwriters Laboratory; and |
· | FAA. |
The lab follows procedures and protocols set forth by:
· | ASTM Methods: C-25, 50. 51, 110, 602, 706, 977, 1271; |
· | AASHTO Methods: M216-05; |
· | AWWA B-202-02; |
· | pH 4500 Standard; and |
· | USLM Company protocols for testing limestone samples. |
The lab utilizes certified limestone samples to verify the accuracy and calibration of its instrumentation. These are:
· | JLS-1; |
· | NIST 1D; and |
· | China National Analysis Center: |
· | NCS DC 70301; |
· | NCS DC 70302; |
· | NCS DC 70307; |
· | NCS DC 70308; and |
· | NCS DC 73375. |
The security for geological samples is not required compared to the procedures needed for precious metals (gold, silver, etc.). Core or other samples are immediately after drilling or at the end of the current shift taken to the core storage area by the contract geologist, member of the drill crew, or limestone sample collector. They are logged in and processed by St. Clair QC/QA lab personnel. The change of possession is limited to two or three people that can be identified and held accountable for the location of the samples before delivery to the lab. This information was provided by St. Clair QC/QA lab personnel.
8.3Opinion of the Qualified Person on Adequacy of Sample Preparation
The analysis of geologic samples is conducted with the same care as the St. Clair QC/QA testing for the plant’s products. The QP reviewed the preparation and analytical procedure protocols by QC/QA lab personnel and shift workers for proper adherence. The QP’s opinion is that the analytical program and lab provide reasonably accurate data for determining resource estimates.
9Data Verification
9.1Source Material
The QP worked with onsite St. Clair personnel to obtain databases and raw data. There was an ongoing interface with St. Clair personnel while reviewing and verifying the data needed for input into the geologic resource model. For this TRS, the hard copy data was compared with the digital database for correctness and thoroughness. The geologic data from the old drilling programs were validated as reasonably as possible by comparing lithology and depths from nearby recent holes and production data. Chemical results from the older work were compared to recent chemical results from the nearest production data or hole. This comparison was
Page 27 of 56
necessary to verify using the older data in the model. Recent hole ore intercepts were cross-checked with the appropriate mine data to verify and confirm surveyed collar data and check the ore zone.
The 1965 OGS hole maps with the plotted surveyed locations were georeferenced using Global MapperTM and then digitally overlaid on age-appropriate USGS Quad Geotiff raster maps to verify location, convert to State Plane System, and verify collar elevation.
The core logs from the various drilling projects were reviewed to confirm logging was suitable for the intercept data determination. The original 1965 hole analyses were composited above 96.0% CaCO3 cutoff when possible. If recompositing was not possible, the analytical results had to average above 96.0% cutoff. A local surveyor performed surface surveying of tracts, and each year an underground survey is performed.
The QP met with QC/QA lab personnel to validate that the QC/QA protocol was followed for the geologic samples and reviewed the instrument’s status records. The sources for this data are the St. Clair QC/QA lab, Satterfield Surveyors (surface) and Osburn Surveyors (underground), and contract geologists.
9.2 Opinion of the Qualified Person on Data Adequacy
After contacting St. Clair personnel and subcontractors, reviewing the material, and performing verification processes, the QP is satisfied the drill hole database and chemical analysis data are reasonably valid. The QP’s opinion is that the data utilized has been analyzed and collected appropriately and reasonably and that the data was adequate for the resource interpretation and estimation.
10Mineral Processing and Metallurgical Testing
The Marble City member mined at the St. Clair property is sedimentary without alteration due to metamorphic or igneous geologic processes. The uniqueness and suitability of the raw limestone for making the plant’s products are based on the percent of CaCO3 content in the limestone. There is no metal content in the ore and no need to perform metallurgical testing. Shot limestone from the mine has been supplied to the plant’s primary crusher for decades. The mine does not operate crushing and screening processes, so testing is unnecessary. St. Clair personnel furnished the preceding information.
11Mineral Resource Estimates
11.1Definitions
A mineral resource is an estimate of mineralization by considering relevant factors such as cutoff grade, likely mining dimensions, location, or continuity that, with the assumed and justifiable technical and economic conditions, is likely to, in whole or in part become economically extractable. Mineral resources are categorized based on the level of confidence in the geologic evidence. According to 17 CFR § 229.1301 (2021), the following definitions of mineral resource categories are included for reference:
An inferred mineral resource is that part of a mineral resource for which quantity and grade or quality are estimated on the basis of limited geological evidence and sampling. An inferred mineral resource has the lowest level of geological confidence of all mineral resources, which prevents the application of the modifying factors in a manner useful for the evaluation of economic viability. An inferred mineral resource, therefore, may not be converted to a mineral reserve.
An indicated mineral resource is that part of a mineral resource for which quantity and grade or quality are estimated on the basis of adequate geological evidence and sampling. An indicated mineral resource has a lower level of confidence than the level of confidence of a measured mineral resource and may only be converted to a probable mineral reserve. As used in this subpart, the term adequate geological evidence means evidence that is sufficient to establish geological and grade or quality continuity with reasonable certainty.
A measured mineral resource is that part of a mineral resource for which quantity and grade or quality are estimated on the basis of conclusive geological evidence and sampling. As used in this subpart, the term conclusive geological evidence means evidence that is sufficient to test and confirm geological and grade or quality continuity.
Page 28 of 56
11.2Key Assumptions, Parameters, and Methods
11.2.1Resource Classification Criteria
Geologic and analytical data from regional and local drilling, subsurface, and surface sampling have proven that the Marble City member has a consistently high CaCO3 content (above 96.0%) and a consistent mining thickness of 30 plus ft. across the entire St. Clair property. These analytical results cover from 1962 to 2021 and are sufficient to establish reasonable certainty of geological presence and grade or quality continuity on the operation’s property. 300 acres (per 2021 UG survey) have been mined since the operation went underground in 1953.
The many years the St. Clair mine has operated in a wide range of economic conditions historically proves the extraction of the deposit to be economical. Geologic confidence is high based on the verified consistent analysis from sampling. Classifying these resources in the indicated and measured categories is appropriate. The indicated category for the northern tracts is appropriate because the chemical data is consistent, the total acreage is large, and drill spacing is widespread. The measured category for the tracts adjacent to the mine is appropriate because the mine’s operations for 65 plus years extracting limestone from hundreds of acres coupled with the existing core hole results provide high confidence in the resource model for this acreage.
11.2.2Market Price
A reasonable market survey for industrial mineral prices is conducted by the USGS each year. The publication is titled “USGS Mineral Commodity Summaries 2021.” Their database is comprised of sources from the entire United States. The study considers such material issues as regional price differences, weather effects, production issues, and decreased demand from downstream users. For 2020, USGS reported an average value price per metric ton of $12.19, which converts to $11.05 per short ton for crushed limestone. St. Clair mine’s only product is crushed limestone and is the sole supplier to the St. Clair plant.
11.2.3Fixed Cutoff Grade
The St. Clair mine supplies shot limestone to the plant’s primary crusher that is further processed by the St. Clair plant for products to sell to end-user markets. The plant must be provided with a limestone source above an average CaCO3 threshold for customer needs. No matter the product, the raw limestone must exceed a minimum average content above 96.0% CaCO3. This percentage is considered a fixed cutoff grade because the percentage does not vary for the current plant products. The average percent of CaCO3 can be higher but not lower to meet the quality requirement of the plant. Mining limestone with a significantly higher average CaCO3 percentage results in the deposit being high-graded which shortens the mine’s life. Lowering the grade is unacceptable for the plant.
A primary XRF analysis quality control check is to total all the oxide percentages to determine how close the analysis total is to 100%. CaO is the primary oxide of the sample analyzed and the remainder is comprised of MgO, Fe2O3, Al2O3, and SiO2 (refer to Section 8).
Since the mine operates on a fixed cutoff grade, there are no specific economic criteria for changing the cutoff grade. The fixed cutoff grade determines the mining thickness. In underground mines, this can be an issue for various reasons. Any cost factors that increase the mining cost of limestone at this fixed grade would be offset by appropriate downstream price increases in the St. Clair plant’s products.
11.2.4Summary of Parameters
Primary modifying factors are fixed cutoff grade, the final underground mine layout, and property line offset. Key assumptions and parameters applied to estimate mineral resources are in Table 11.2.4.
Table 11.2.4 Resource Parameter Assumptions
Modifying Factor |
| Parameter |
|
Fixed Grade Cutoff | | Above 96.0% CaCO3 | |
Estimated Final UG Mine Layout | | Final Underground Mine Outline | |
Mining Thickness | | Height Suitable for Mining and Use of Equipment | |
Property Offset | | 800 ft. contour with 20 ft. property offset | |
Mineability | | Reasonably Expected to be Feasible to Mine | |
Page 29 of 56
11.3Resource Model
Once the database had been updated, a final data entry check was performed. Table 11.3 lists the drill holes and the samples used in the model data base.
The mine is surveyed every year to document the mining face advance during the year. Surveyed elevation points are advanced in the mine as needed. The existing mine map is updated with the newly surveyed mining face and oriented to the mapping grid. The current underground survey dated January 7, 2022, was used for the underground mine limits for the TRS resource estimate. The new underground survey and most recent USGS Light Detection and Ranging topography were edited using Global MapperTM software to reduce file size and crop to the resource area. The existing coordinate system was State Plane NAD 83 ft. and was not changed.
The ore body consists of a horizontal single limestone bed defined by top and bottom surfaces. The top and the bottom ore intercepts were from total ore interval composites. The average CaCO3 content above the 96.0% cutoff or higher was used to determine the ore interval in each hole. If any hole’s composite were below 96.0% CaCO3, that area would be excluded from the resource estimate. This situation did not occur. In many holes, the thickness of ore grade limestone was thicker than the current mining interval. The larger thickness was noted but the current mining thickness was used to pick ore intercepts in the hole regardless of the total ore grade thickness. Next, the hole intercepts were utilized to produce top and bottom three-dimensional structural surfaces.
The method chosen to model the ore structures was gridding using SURFERTM software and gridded by Kriging was selected from eleven other algorithms. The selection process involved four steps:
· | Rough hand contour data for trend and structure preview for comparison; |
· | Run gridding script with basic inputs to compare 12 gridding methods rough maps with hand contoured map; |
· | Select appropriate grid methods after comparison, then refine with specific inputs to further the selection process; and |
· | Run a residual test to select which grid method specifically honors the ore intercepts and approximates the hand contouring. |
Contour structure maps of the ore top and bottom were created and utilized in Geovia SurpacTM as vertical boundary surfaces to develop an ore block model. These structural surfaces were then truncated against the current topography to account for erosional effects. This truncation was necessary because the ore bed position was not located in the valley subsurface. The outline of the St. Clair property was then used to define the gross boundary of the resource areas. The 800 ft. elevation as the mining limit for the resource was chosen.
Next, ore isochore (thickness) and overburden isochore maps were constructed. These maps were compared to the Surpac block model to determine conformity and validate the block model limits. Fig 11.3 is a map of the resource area ore thickness.
The block model was then utilized to update the mine design and aid mine planning. The revised mine design determined the limits for defining the outer boundary for resource estimation.
The resource volume and tonnage were estimated using Surpac software. After surfaces of the ore top and bottom were imported into Surpac (DXF files), Digital Terrain Model surfaces were created using the imported surface files. The same topography and underground survey were imported into Surpac. Blocks were coded above the ore bottom surface and below the top ore surface. The blocks were 20 ft. northing by 20 ft. easting and 2 ft. thick. The blocks were coded within the resource boundaries for each area. Future mine areas were designed using a pillar design of 30 ft. by 30 ft. with 50 ft. rooms. The boundary limits of mining were developed with a combination of property lines inside the 800 ft. contour and the 800 ft. contour when the boundary was inside the property line. A property offset of 20 ft. was applied when the property lines were used.
Page 30 of 56
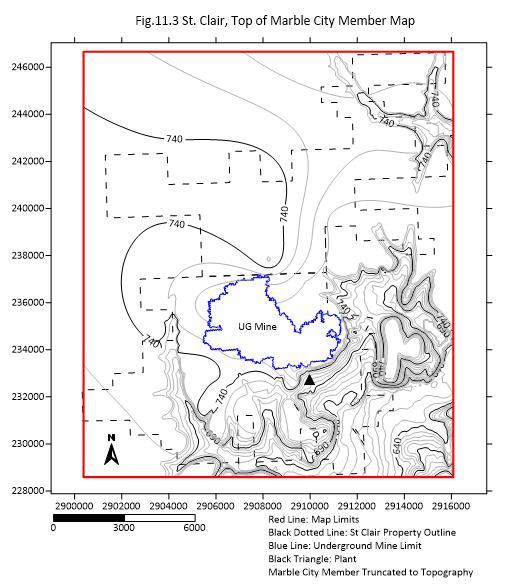
Table 11.3 Summary of Drill Hole Database for the Model
Data Type |
| Number of Records |
|
Total Holes | | 35 | |
Lithology | | 35 | |
Chemical Analyses(Includes Mine Faces) | | 48 | |
Hole Composites | | 35 | |
Holes Not on St. Clair Property | | 4 | |
11.4Mineral Resources
11.4.1Estimate of Mineral Resources
Resources for this deposit were estimated as in-place volumes and tonnages. The estimate of measured, indicated, and inferred mineral in-place limestone resources for the St. Clair operation effective December 31, 2021, as estimated from applying the resource parameters to the geologic model, are in Table 11.4-1.
Page 31 of 56
Table 11.4.1. U.S. Lime Company – St. Clair – Summary of Limestone Mineral Resources as of December 31, 2021,
Based On $11.05 Crushed Limestone 1, 2
| | | | | | | |
Resource Category |
| In Place |
| Cutoff Grade |
| Processing Recovery |
|
Measured Mineral Resources | | 36,648,000 | | Above 96.0 (CaCO3) | | N/A | |
Indicated Mineral Resources | | 129,747,000 | | Above 96.0 (CaCO3) | | N/A | |
Total Measured and Indicated | | 166,395,000 | | Above 96.0 (CaCO3) | | N/A | |
Notes: 1 Price Source from USGS Mineral Commodity Summaries 2021.
2 Shot limestone delivered to the primary crusher.
3 N/A: Not Applicable because estimated resources are in place.
11.4.2Geologic Confidence and Uncertainty
The samples in the database have been verified and there is a high degree of geologic confidence in the database. Theore composite analysis results were constantly above the 96.0% CaCO3 cutoff. The Marble City member is a tabular, medium bedded limestone. For many decades, the St. Clair mining operation has produced crushed limestone meeting or surpassing the quality limits required by the plant during its entire operational history.
The continuity and quality consistency has been documented by widespread local production and drilling results on the property. Because of those results and the fact that the production quality is constantly above the CaCO3 cutoff for the deposit, there is high confidence in the definition of the ore zone limits.
11.5Opinion of the Qualified Person
There are no significant factors onsite that will impact the extraction of this ore body. Most directly involve the St. Clair plant and not the mine. After reviewing the resource model, the QP is confident that drilling the property above the Marble City outcrop would yield ore quality limestone. The QP is also confident that St. Clair will continue to economically extract limestone above the quality cutoff for the foreseeable future.
The QP’s opinion is that the following technical and economic factors could influence the economic extraction of the resource, but the St. Clair plant insulates most of them from the mine. Although, if lime production becomes unfeasible, the St. Clair plant would no longer require limestone from the St. Clair mine to produce lime.
· | Regional supply and demand – Due to the shipping cost of lime, sales are limited to a regional footprint at the plant. The plant is insulated from global import and export market changes, as sales are domestic and regional. |
· | Fuel cost – mining equipment are major diesel consumers at the St. Clair mine. As diesel prices rise, the price per ton of production also rises and will need to be offset by increases in the plant’s product prices. |
· | Skilled labor – This site is located near three metropolitan areas (Sallisaw, Oklahoma, Ft. Smith, Arkansas, Tulsa, Oklahoma). |
· | Environmental Matters: |
· | Federal or State regulations/legislation regarding greenhouse gas emission |
· | Air and water quality standards |
12Mineral Reserve Estimates
Mineral resources were converted to reserves using a 81% recovery factor. The limits of underground mining were assumed to be the 800 ft. elevation contour around the mine. The limestone is mined using the room and pillar method. An average of 14% of the limestone is left in the mine as pillars. An estimated 5% of the remaining ore after the pillars is lost to the roof, floor, and to dust and spillage. The limestone below the targeted mine floor in places is slightly lower quality. It is blended with higher-grade ore to meet the fixed cutoff when encountered. Dilution volume is minimal and not estimated.
12.1Definitions
Mineral reserve is an estimate of tonnage and grade or quality of indicated and measured mineral resources that, in the opinion of the qualified person, can be the basis of an economically viable project. More specifically, it is the economically mineable part of a measured or indicated mineral resource, which includes diluting materials and allowances for losses that may occur when the material is mined or extracted (Dorsey, 2019).
Page 32 of 56
Probable mineral reserve is the economically mineable part of an indicated and, in some cases, a measured mineral resource. For a probable mineral reserve, the qualified person’s confidence in the results obtained from the application of the modifying factors and in the estimates of tonnage and grade or quality is lower than what is sufficient for a classification as a proven mineral reserve, but is still sufficient to demonstrate that, at the time of reporting, extraction of the mineral reserve is economically viable under reasonable investment and market assumptions (Dorsey, 2019).
Proven mineral reserve is the economically mineable part of a measured mineral resource. For a proven mineral reserve, the qualified person has a high degree of confidence in the results obtained from the application of the modifying factors and in the estimates of tonnage and grade or quality. Proven mineral reserve is the economically mineable part of a measured mineral resource and can only result from conversion of a measured mineral resource (Dorsey, 2019).
12.2Price
The St. Clair mine is the sole supplier of crushed limestone to the St. Clair plant. A reasonable market survey for industrial mineral prices is conducted by the USGS each year. The publication is titled “USGS Mineral Commodity Summaries 2021.” Their database comprises sources from the entire United States and considers such material issues as regional price difference, weather effects, production issues, and decreased demand from downstream users. As stated in Section 11.2.2, USGS reports average crushed limestone value price of $12.19 per metric ton, which converts to $11.05 per short ton.
12.3Costs
Annual sustaining capital costs were estimated using prior-year capital expenditures and St. Clair’s 2022 capital budget. Capital expenditures for major mobile equipment replacements were estimated using information from vendors. Limestone mining costs for St. Clair were estimated using historical data and its 2022 budget.
12.4 Reserve Estimates
Table 12.4 U.S. Lime Company –St. Clair – Summary of Limestone Mineral Reserves as of December 31, 2021,
Based On $11.05 Crushed Limestone 1, 2
| | | | | | | |
Reserve Category |
| Extractable |
| Cutoff Grade |
| Mining Recovery |
|
Probable Reserves | | 0 | | Above 96.0 (CaCO3) | | 81.0 | |
Proven Reserves | | 23,387,000 | | Above 96.0 (CaCO3) | | 81.0 | |
Total Probable and Proven | | 23,387,000 | | Above 96.0 (CaCO3) | | 81.0 | |
Notes: 1 Price Source from USGS Mineral Commodity Summaries 2021.
2 Shot limestone delivered to the primary crusher.
12.5 Opinion of the Qualified Person
St. Clair has successfully mined this resource for many years using the same methods that are projected into the future. Significant increases in the cost of mining coupled with large decreases in the selling price of limestone would make mining uneconomic. Historically, St. Clair has increased sales prices in line with cost increases. The limestone is consistent across the reserve area and allows for stable operating requirements from year to year.
13Mining Methods
13.1Geotechnical and Hydrologic Considerations
Currently, the State of Oklahoma does not require geotechnical or hydrology modeling in mining operations. The only geotechnical aspect considered was determining if the room and pillar design was appropriate for the mining height (St. Clair Internal Report, 2006).
The only investigation into hydrologic conditions was to determine the water table height so that a suitable plan was put into action to pump water from the mine.
13.2Mine Operating Parameters
The mine currently averages an annual production rate of approximately 425,000 tons per year. The current expected mine life at the average rate stated is approximately 55 years.
Page 33 of 56
The St. Clair mine has a natural draft throughout. The natural draft is adequate for the equipment fleet. Air quality testing is performed using a multi-gas detector and a sampling pump used for diesel particulate content analyzed by an outside lab. Typical air quality readings in the mine meet regulatory standards. Testing is done daily by St. Clair mine personnel and a minimum of twice a year by external entities during their regular yearly inspections.
Figure 13.2 reflects a current estimate of the final mine limits.
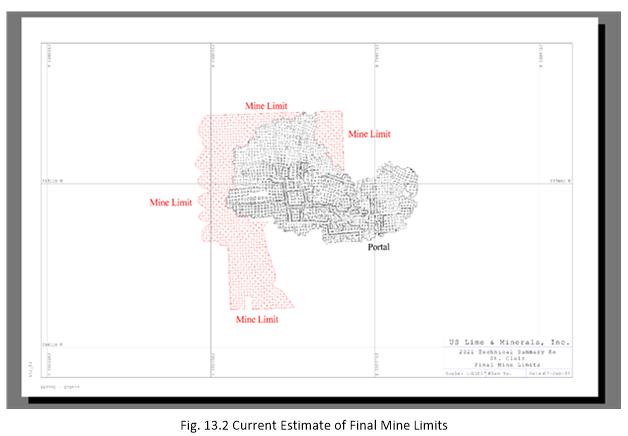
13.3Mining Plan
The mining method used at the St. Clair mine is room and pillar. The pillars are 30 ft. by 30 ft. The room is 50 ft. wide. A horizontal drill performs drilling with typical holes that are 18 ft. long and 2.5 inches in diameter. The typical blast pattern is 60 holes in a V-cut. A front-end loader and three haul trucks transport the limestone out of the mine. Any unusable limestone encountered is moved a short distance to an area outside the mine.
Mining operations at the St. Clair Property are straightforward and relatively simple. Limestone is mined with pillars left in place to stabilize the mine workings. Limestone is hauled to the primary crusher near the mine portal. Mining operations are a repeated cycle of drilling, blasting, scaling, followed by loading and haulage of the limestone. St. Clair performs the drilling and blasting. The mine completes the load and haul operations using front-end loaders and haul trucks with a small ancillary equipment fleet, including a scaler and a grader.
13.4Mine Plant, Equipment, and Personnel
The mining equipment fleet consists of three haul trucks and a loader. A horizontal drill does the drilling with 18 ft. holes. Ancillary mobile equipment includes an Anfo truck, a grader, a scaler, a maintenance truck, and light vehicles. Equipment necessary for mining operations includes water pumps. The mine operates 3 to 6 days per week depending on demand from the plant and maintenance requirements. Operating personnel consist of skilled operators and a mine manager supervising the operations. The St. Clair plant personnel and equipment are not discussed because the mining operations end at the plant’s primary crusher for this TRS.
Page 34 of 56
14Processing and Recovery Methods
14.1Process Plant and Description
This section does not apply to the report because the mine delivers shot limestone to the St. Clair primary crusher, where the plant processes the limestone into various products. Crusher Flow Sheet was not included in the report because we only consider mined limestone delivered to the plant’s primary crusher.
14.2Plant Throughput and Design
This section does not apply to the report because the mine is the sole limestone supplier to the plant’s primary crusher.
14.3 Plant Operational Requirements
This section does not apply to the report because the mine is the sole limestone supplier to the plant’s primary crusher.
14.4Application of Novel or Unproven Technology
Mining operations at the site follow standard underground methods. There has not been any application of novel or unproven technologies or techniques.
15Infrastructure
The St. Clair property is accessible by a paved state highway and rail. The mine operation is accessed by a gravel haul road maintained by the mine personnel. The mine site is a land-locked location with no port facilities access. A rail spur is located on plant property connected to the Kansas City Southern Railway. The mine shares an office and maintenance shop with the plant. The mine has its mobile equipment maintenance shop located in the underground mine. Three-phase electric power is provided to the site via above-ground utility lines. A water source is available but not utilized by the mine. A water supply is from the county system but bottled water is supplied for drinking. The plant pumps water from the mine for water needs. Load-out to the primary crusher is on the plant property. The shot limestone stockpiles are on the plant property. Fig. 15.1 shows an aerial photo of the mine area and significant infrastructure features.
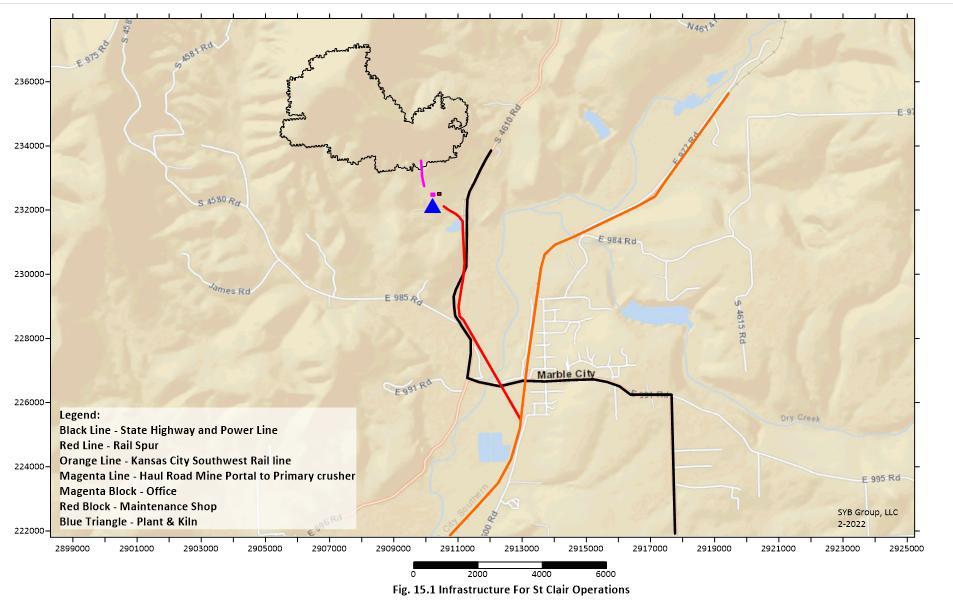
Page 35 of 56
16Market Studies
16.1 Market Outlook and Forecast
Demand for limestone produced at the St. Clair mine is solely for St. Clair’s lime and limestone production facilities next to the mine which has been in existence for over 80 years. Lime kilns have been in existence at the current St. Clair lime and limestone production facilities since 1964. Its lime and limestone products are delivered to its geographic market areas by either truck or rail.
Demand for limestone for the St. Clair lime and limestone production facilities has averaged approximately 425,000 tons per year over the previous five years. Primary demand for lime and limestone products from St. Clair’s operations is from stable markets including the construction industry, steel manufacturers, paper and glass manufacturers, municipal sanitation and water treatment facilities, roof shingle manufacturers, and poultry and cattle feed. Current market conditions for these customers should result in continued steady demand for lime and limestone products in St. Clair’s market areas for the foreseeable future.
16.2 Material Contracts
The St. Clair mine is the sole provider of limestone to St. Clair’s lime and limestone production facilities. There are no material contracts with outside purchasers.
17Environmental Studies, Permitting, and Plans, Negotiations, or Agreements with Local Individuals or Groups
17.1 Environmental Studies and Permitting Requirements
The State of Oklahoma Department of Environmental Quality (“ODEQ”) has environmental laws that regulate air and water resources. The ODEQ regulates the surface and mine water in the mine and around the proposed reclamation area. The Oklahoma Department of Mines (“ODOM”) regulates the mining and reclamation of mines. The environmental and mining permit information is provided in Table 17.1.
Table 17.1 Mining and Environmental Permits
Permit Number |
| Issuer |
| Purpose |
| Expiration Date |
| Status |
|
L.E. – 1451-B | | ODOM | | Permit to Mine and Reclamation | | 11-30-2045 | | Active | |
OK0034401 | | ODEQ | | Permit ponds and stormwater runoff | | 7-21-2025 | | Active | |
The permit for ponds and stormwater runoff covers weather-related discharge throughout St. Clair’s operations, including the mine areas.
17.2 Overburden, Site Monitoring, and Water Management
At St. Clair, the mine is underground and no overburden is disturbed in the mining process. As a result, there are no overburden piles or need to manage stripped materials.
Stormwater and springwater percolates into the mine and management is predominantly without discharging. However, during years of excessive precipitation, the increase in mine water is allowed to be discharged via the ODEQ permit listed above.
There are no automated onsite monitors in or around the mine property. The only air quality monitoring is in accordance with regulatory agencies to determine the quality of air in the mine. All mine water discharge is sampled by the mine personnel and tested in the plant lab. The monitoring and reporting are conducted under regulations promulgated by the agencies.
17.3 Post-Mining Land Use and Reclamation
The State of Oklahoma has laws and regulations pertaining to reclamation for mineral resources, including limestone. The State requires a mining permit which includes a reclamation plan to operate limestone mines. The ODOM has regular oversight of the mine and reclamation and requires bonding for future reclamation. The ODOM permit information associated with the mine is listed in Table 17.1.
Page 36 of 56
The current reclamation plan for the underground mine, required by the state, covers the entire operation with sections specific to each area. The following is a summary of the state requirements pertaining to the mine property only.
· | Land over the mine is utilized for forest and agriculture and this usage is expected to be retained after mine closure. Therefore, openings and entrances will be permanently sealed. |
· | Haul roads to the primary crusher will be graded, disked, and prepared for seeding. |
· | Topsoil initially removed will be distributed over the mined area. The highwall slopes will be addressed and berms put in place to prevent accidental entry if any open pit mining occurs. Any areas where benching remains will have appropriate access restrictions. |
· | Final soil distribution and revegetation are to be conducted according to the procedure outlined in the permit plan. |
The projected estimated life of the mine is 55 years. The operation is considered a tangible, long-lived asset. St. Clair has reasonably projected reclamation and remediation costs as asset retirement obligations reported annually in the USLM’s annual report on Form 10K (USLM’s 2021 Form 10K to which this TRS is attached as an exhibit).
17.4 Local or Community Engagement and Agreements
The operation has developed relationships over the years with various neighboring communities, including the small community of Marble City.
17.5 Opinion of the Qualified Person
Oklahoma is a heavily regulated State of environmental laws and regulations and has numerous permits that require ongoing compliance and oversight from the State agencies. All permits require constant reporting and oversight from the State mining and environmental agencies. St. Clair and USLM personnel are well trained and stay up-to-date on all mining and environmental regulations. In the QP’s opinion, there are no current or outstanding issues in environmental governance.
18Capital and Operating Costs
St. Clair mine has been a stable producer of limestone using the current equipment fleet and operating parameters for many years. This operating history and its 2022 budget were used to estimate the unit costs for limestone mining and annual sustaining capital expenditures.
18.1Capital Costs
Table 18.1 Capital Costs
| | |
Capital Cost Estimate |
| Cost |
Annual Maintenance of Operations | | $500,000 |
18.2Operating Costs
Table 18.2 Operating Costs
| | | |
Operating Cost Estimate |
| Cost |
|
Limestone Mining Cost Per Ton | | $4.79 | |
19Economic Analysis
The block model estimated limestone ore volumes for each reserve area. Limestone volumes are converted to tons for cost and revenue estimation using a density factor of 168 pounds per cubic foot.
The ore thickness is generally uniform in each area. The current mining method and equipment are suitable for all reserve areas.
19.1Key Parameters and Assumptions
The discount rate used in the economic analysis is 1.09%. This rate is St. Clair’s incremental borrowing cost. Per the current debt agreement and St. Clair’s current leverage ratio, our borrowing rate is 1.09% (calculated from the November 2021 LIBOR of 0.09%).
Page 37 of 56
The tax was estimated using St. Clair’s current effective income tax rate calculated on September 30, 2021. In reviewing the September 30, 2021 tax provision, the effective tax contained no material non-recurring permanent items that would influence the rate, so it is considered not applicable to future periods. Demand for limestone is projected to be approximately 425,000 tons per year for the life of the mine. The sales price per ton is estimated using the USGS Mineral Commodity Summaries 2021. Depreciation was estimated using existing assets and the approved items in the 2022 budget. The later years’ depreciations are calculated using the capital budget forecast and the asset life with a mid-year convention.
19.2Economic Viability
St. Clair has positive cash flow, and the current mine plan does not require a significant capital expenditure; therefore, payback and return on investment calculations are irrelevant. NPV of the life of mine plan is $68.1 million. The annual cash flows are in Appendix B.
19.3Sensitivity Analysis
Sensitivity analysis was performed on the discount rate, mining costs, St. Clair mining costs, and limestone price.
Table 19.3-1 Sensitivity Analysis: Varying Discount Rate
| | | |
Discount Rate |
| NPV |
|
0.0% | | $94,588 | |
1% | | $72,544 | |
2% | | $57,137 | |
5% | | $32,124 | |
10% | | $17,149 | |
15% | | $11,482 | |
20% | | $8,611 | |
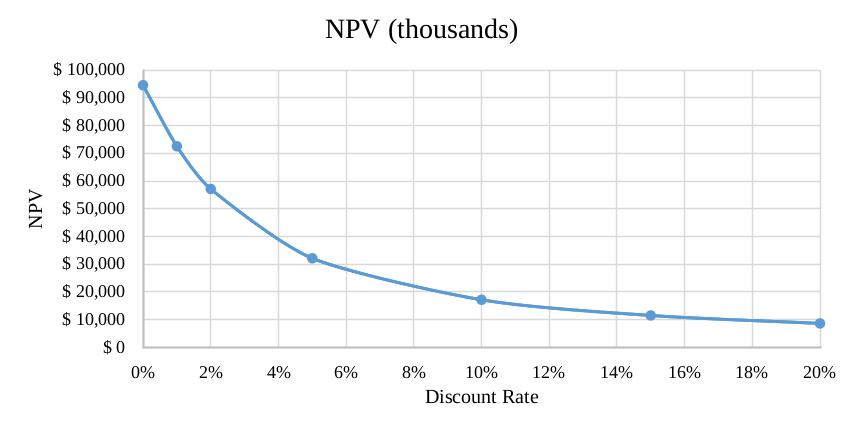
Table 19.3-2 Sensitivity Analysis: Varying Limestone Mining Costs
| | | |
Limestone Mining Costs Per Ton |
| NPV |
|
$4.79 | | $71,111 | |
$5.79 | | $57,455 | |
$6.79 | | $43,799 | |
$7.79 | | $30,142 | |
$8.79 | | $16,486 | |
Page 38 of 56
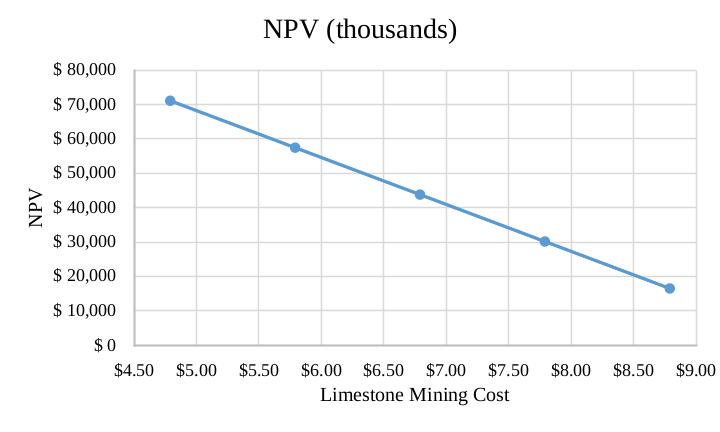
Table 19.3-3 Sensitivity Analysis: Selling Price Change
| | | | |
Selling Price Change (%) |
| NPV |
| |
-20% | | | $40,188 | |
-10% | | | $55,650 | |
0% | | | $71,111 | |
10% | | | $86,572 | |
20% | | | $102,033 | |
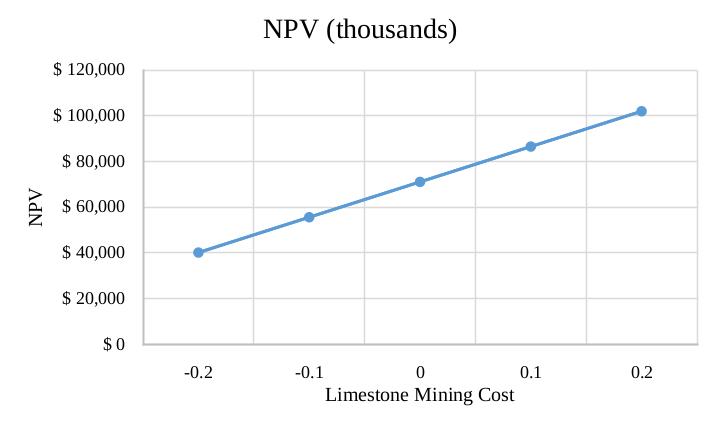
20Adjacent Properties
Geologic information from adjacent properties was limited to that performed by the OGS. This material consisted of core holes, sampled surface locations, and oil wells drilled nearby. The information is public domain. It was utilized primarily as evidence of lateral continuity and extent and quality if the chemical analysis was available. The core holes in the OGS study were used in the geologic model.
21Other Relevant Data and Information
All data relevant to the supporting studies and estimates of mineral resources and reserves have been included in the sections of this TRS. No additional information or explanation is necessary to make this TRS understandable and not misleading.
Page 39 of 56
22Interpretation and Conclusions
22.1 Interpretations and Conclusions
Geologically, the deposit is a simple tabular, single bed limestone deposit with minor structure in the proven reserve areas and a shallow dip angle. The formation has been proven by local, detailed sampling, and drilling in and around the mine that the quality and thickness are very consistent. Because of this simple geology, the mining method is straightforward and consists of uncomplicated underground mining.
The mine operation has been modernized since USLM acquired St. Clair in 2005, which has allowed it to optimize mining. St. Clair has been in operation for many decades during varying economic and market conditions, and the St. Clair plant has maintained a steady market share. The economic analysis and amount of Mineral Resources and Proven Reserves indicate the operation reasonably has approximately 55 years of estimated mine life at current production levels.
22.2 Risks and Uncertainties
Internal to the mining operation, risks and uncertainties are minimal because of the uncomplicated geology and the employment of a standard mining method. Governmental, legal, and regulatory risks, such as greenhouse gases, could adversely affect the markets the St. Clair operation supplies.
23Recommendations
The mine has operated for many years under the current mining practices. The quality control practices have helped to optimize the thickness and quality of the ore zone over the period of operation. The QP recommends that ground water could be better controlled at the mine face with an improved configuration of the floor.
24References
AcreValue.com. 2021. {Accessed 2021}.https://www.acrevalue.com/map/?lat=40.628229&lng=-90.5&zoom=4 Abbey R. 2009. Manual of Surveying Instructions for the Survey of the Public Lands of the United States. BLM. 515 pgs.
Amsden TW and Rowland TL. 1965. Silurian Stratigraphy of Northeastern Oklahoma, OGS Bull. 105. Pgs. 195 Bestplaces.com. 2021. Marble City, Oklahoma Weather. [Accessed 2021]. www.bestplaces.net/climate
Digitalprairie.com. 2021. Oklahoma Geography: Physiographic Regions. QKA. Pg. 996.[accessed 2021] https://digitalprairie.ok.gov/digital/api/collection/almanacs/id/47773/download
Dorsey. 2019. How will the new rules affect the definitions of mineral reserves, probable mineral reserves, and proven mineral reserves? [Accessed 2020]
GoogleMaps.com. 2021. Sequoyah Oklahoma Road Map. [Accessed 2021] https://www.google.com/maps/place/Sequoyah+County,+OK/@35.464973,-94.9216917,11z/data=!3m1!4b1!4m5!3m4!1s0x87ca14b25955be37:0xbf93173495ff0ef0!8m2!3d35.5155322!4d-94.7691586
Ham et al. 1943. Geology and Mineral Composition of St. Clair Limestone near Marble City, Oklahoma. OGS MR #16. Pgs. 17
Huffman GG, 1958. Geology of the Flanks of the Ozark Uplift, Northeastern Oklahoma. OGS Bull. 77. Pgs. 292
Population.com. 2021. Sequoyah County, Oklahoma, City Populations. [Accessed 2021]. www.population.com
Rafferty M. 1988. Ozarks as a Region: A geographer’s description. OW. V1. #4.
Snider LC. 1915. Geology of a Portion of Northeastern Oklahoma. OGS Bull. 24. Pgs.71.
St. Clair Staff. 2006 Pillar Study Internal Report. St. Clair. Pgs. 10
Swanson RG. 1981. Shell Sample Examination Manual. MIES1. AAPG. 102 pgs.
USLM. 2005 Property Records, Executive Summary. Company Internal Report. Pgs. 23
US Geological Survey. 2021. MapView Website. [Accessed 2021]. https://ngmdb.usgs.gov/mapview/?center=-97,39.6&zoom=4.
Page 40 of 56
US Geological Survey. 2021. Mineral Commodity Summaries 2021. Stone (Crushed). pg. 154. USGS. 200 pgs.
US Geological Survey. 2021. MapView Website. [Accessed 2021]. https://ngmdb.usgs.gov/mapview/?center=-97,39.6&zoom=4.
25Reliance on Information Provided by the Registrant
The QP has relied upon information and data from St. Clair and USLM personnel and historical records in completing this TRS. This material included written reports and statements of other individuals and companies with whom it does business. The material also includes permits, licenses, historical exploration data, production records, equipment lists, geologic and ore body resource and reserve information, mine modeling data, financial data and summaries, mine equipment specifications and summaries, records, and equipment lists. This material has been relied upon in the mine planning, capital and cost planning, and audited. The St. Clair mine engineer assisted the QP in reviewing these materials and performed the final reserve modeling and economic analysis under the direction of the QP. The QP believes that the assumptions were factual and accurate and that the interpretations were reasonable. There is no reason to believe that any material facts have been withheld or misstated. In his professional judgment, the QP has taken all appropriate steps to ensure that the information or advice from St. Clair and USLM personnel and records and outside entities are accurate. The QP does not disclaim any responsibility for this Technical Report Summary.
Page 41 of 56
Appendix A: List of Data included in the Geologic Model
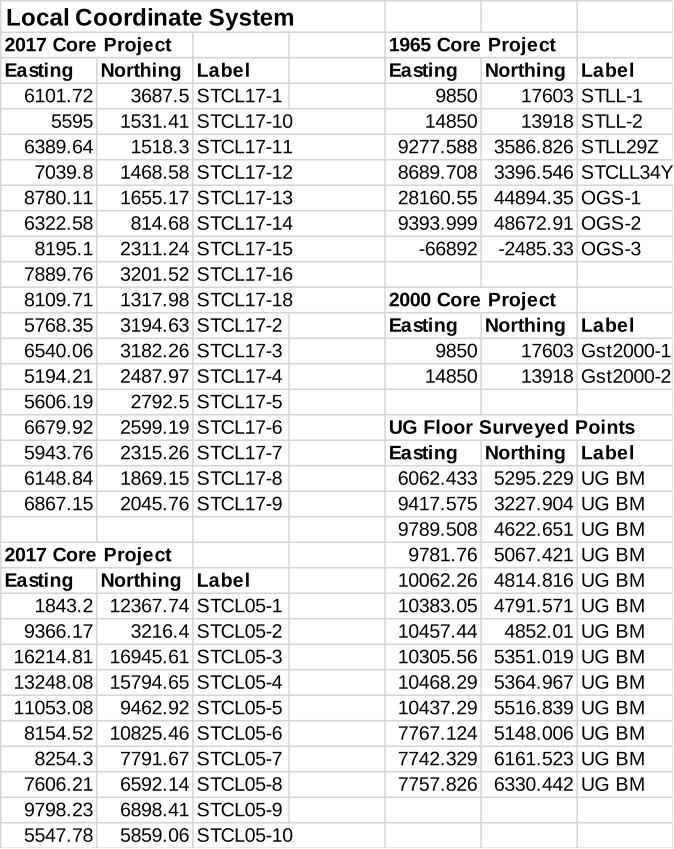
Page 42 of 56
Appendix B: Annual Cash Flow Analysis
| | | | | | ||||||||||||||
St. Clair – Discounted Cash Flow |
| |
|
| |
|
| |
|
| |
|
| |
|
| |
|
|
In Thousands | | | | | | | | | | | | | | | | | | | |
Discount Factor 1.09% | | | | | | | | | | | | | | | | | | | |
NPV $71,111 |
| | | | | | | | | | | | | | | | | | |
| | | 2022 | | | 2023 | | | 2024 | | | 2025 | | | 2026 | | | 2027 | |
Tons Limestone Sold | | | 425 | | | 425 | | | 425 | | | 425 | | | 425 | | | 425 | |
Sales Price/Ton | | $ | 11.05 | | $ | 11.05 | | $ | 11.05 | | $ | 11.05 | | $ | 11.05 | | $ | 11.05 | |
Revenue | | $ | 4,696 | | $ | 4,696 | | $ | 4,696 | | $ | 4,696 | | $ | 4,696 | | $ | 4,696 | |
-Operating Costs | | $ | (2,036) | | $ | (2,036) | | $ | (2,036) | | $ | (2,036) | | $ | (2,036) | | $ | (2,036) | |
-Depreciation | | $ | (443) | | $ | (461) | | $ | (459) | | $ | (492) | | $ | (456) | | $ | (472) | |
Taxable Income | | $ | 2,217 | | $ | 2,200 | | $ | 2,201 | | $ | 2,169 | | $ | 2,204 | | $ | 2,188 | |
-Tax | | $ | (446) | | $ | (442) | | $ | (442) | | $ | (436) | | $ | (443) | | $ | (440) | |
+Depreciation | | $ | 443 | | $ | 461 | | $ | 459 | | $ | 492 | | $ | 456 | | $ | 472 | |
-Capital Expenses | | $ | (500) | | $ | (500) | | $ | (500) | | $ | (500) | | $ | (500) | | $ | (500) | |
Free Cash Flow | | $ | 1,715 | | $ | 1,718 | | $ | 1,718 | | $ | 1,725 | | $ | 1,717 | | $ | 1,721 | |
| | | | | | | | | | | | | | | | | | | |
St. Clair – Discounted Cash Flow |
| |
|
| |
|
| |
|
| |
|
| |
|
| |
|
|
In Thousands | | | | | | | | | | | | | | | | | | | |
| | | 2028 | | | 2029 | | | 2030 | | | 2031 | | | 2032 | | | 2033 | |
Tons Limestone Sold | | | 425 | | | 425 | | | 425 | | | 425 | | | 425 | | | 425 | |
Sales Price/Ton | | $ | 11.05 | | $ | 11.05 | | $ | 11.05 | | $ | 11.05 | | $ | 11.05 | | $ | 11.05 | |
Revenue | | $ | 4,696 | | $ | 4,696 | | $ | 4,696 | | $ | 4,696 | | $ | 4,696 | | $ | 4,696 | |
-Operating Costs | | $ | (2,036) | | $ | (2,036) | | $ | (2,036) | | $ | (2,036) | | $ | (2,036) | | $ | (2,036) | |
-Depreciation | | $ | (544) | | $ | (544) | | $ | (544) | | $ | (500) | | $ | (500) | | $ | (500) | |
Taxable Income | | $ | 2,117 | | $ | 2,117 | | $ | 2,117 | | $ | 2,160 | | $ | 2,160 | | $ | 2,160 | |
-Tax | | $ | (425) | | $ | (425) | | $ | (425) | | $ | (434) | | $ | (434) | | $ | (434) | |
+Depreciation | | $ | 544 | | $ | 544 | | $ | 544 | | $ | 500 | | $ | 500 | | $ | 500 | |
-Capital Expenses | | $ | (500) | | $ | (500) | | $ | (500) | | $ | (500) | | $ | (500) | | $ | (500) | |
Free Cash Flow | | $ | 1,735 | | $ | 1,735 | | $ | 1,735 | | $ | 1,726 | | $ | 1,726 | | $ | 1,726 | |
| | | | | | | | | | | | | | | | | | | |
St. Clair – Discounted Cash Flow |
|
|
|
|
|
|
|
|
|
|
|
|
| ||||||
In Thousands | | | | | | | | | | | | | | ||||||
| | | 2034 | | | 2035 | | | 2036 | | | 2037 | | | 2038 | | | 2039 | |
Tons Limestone Sold | | | 425 | | | 425 | | | 425 | | | 425 | | | 425 | | | 425 | |
Sales Price/Ton | | $ | 11.05 | | $ | 11.05 | | $ | 11.05 | | $ | 11.05 | | $ | 11.05 | | $ | 11.05 | |
Revenue | | $ | 4,696 | | $ | 4,696 | | $ | 4,696 | | $ | 4,696 | | $ | 4,696 | | $ | 4,696 | |
-Operating Costs | | $ | (2,036) | | $ | (2,036) | | $ | (2,036) | | $ | (2,036) | | $ | (2,036) | | $ | (2,036) | |
-Depreciation | | $ | (500) | | $ | (500) | | $ | (500) | | $ | (500) | | $ | (500) | | $ | (500) | |
Taxable Income | | $ | 2,160 | | $ | 2,160 | | $ | 2,160 | | $ | 2,160 | | $ | 2,160 | | $ | 2,160 | |
-Tax | | $ | (434) | | $ | (434) | | $ | (434) | | $ | (434) | | $ | (434) | | $ | (434) | |
+Depreciation | | $ | 500 | | $ | 500 | | $ | 500 | | $ | 500 | | $ | 500 | | $ | 500 | |
-Capital Expenses | | $ | (500) | | $ | (500) | | $ | (500) | | $ | (500) | | $ | (500) | | $ | (500) | |
Free Cash Flow | | $ | 1,726 | | $ | 1,726 | | $ | 1,726 | | $ | 1,726 | | $ | 1,726 | | $ | 1,726 | |
| | | | | | | | | | | | | | | | | | | |
Page 43 of 56
| | | | | | | | | | | | |||||||||||||||||||||||||
St. Clair – Discounted Cash Flow |
|
|
|
|
|
|
|
|
|
|
|
| ||||||||||||||||||||||||
In Thousands | | | | | | | | | | | | | ||||||||||||||||||||||||
| | 2040 | | 2041 | | 2042 | | 2043 | | 2044 | | 2045 | ||||||||||||||||||||||||
Tons Limestone Sold | | | 425 | | | 425 | | | 425 | | | 425 | | | 425 | | | 425 | ||||||||||||||||||
Sales Price/Ton | | $ | 11.05 | | $ | 11.05 | | $ | 11.05 | | $ | 11.05 | | $ | 11.05 | | $ | 11.05 | ||||||||||||||||||
Revenue | | $ | 4,696 | | $ | 4,696 | | $ | 4,696 | | $ | 4,696 | | $ | 4,696 | | $ | 4,696 | ||||||||||||||||||
-Operating Costs | | $ | (2,036) | | $ | (2,036) | | $ | (2,036) | | $ | (2,036) | | $ | (2,036) | | $ | (2,036) | ||||||||||||||||||
-Depreciation | | $ | (500) | | $ | (500) | | $ | (500) | | $ | (500) | | $ | (500) | | $ | (500) | ||||||||||||||||||
Taxable Income | | $ | 2,160 | | $ | 2,160 | | $ | 2,160 | | $ | 2,160 | | $ | 2,160 | | $ | 2,160 | ||||||||||||||||||
-Tax | | $ | (434) | | $ | (434) | | $ | (434) | | $ | (434) | | $ | (434) | | $ | (434) | ||||||||||||||||||
+Depreciation | | $ | 500 | | $ | 500 | | $ | 500 | | $ | 500 | | $ | 500 | | $ | 500 | ||||||||||||||||||
-Capital Expenses | | $ | (500) | | $ | (500) | | $ | (500) | | $ | (500) | | $ | (500) | | $ | (500) | ||||||||||||||||||
Free Cash Flow | | $ | 1,726 | | $ | 1,726 | | $ | 1,726 | | $ | 1,726 | | $ | 1,726 | | $ | 1,726 | ||||||||||||||||||
| | | | | | | | | | | | | | | | | | | ||||||||||||||||||
| | | | | | | | | | | | | | | | | | | ||||||||||||||||||
St. Clair – Discounted Cash Flow |
|
|
|
|
|
|
|
|
|
|
|
| ||||||||||||||||||||||||
In Thousands | | | | | | | | | | | | | ||||||||||||||||||||||||
| | 2046 | | 2047 | | 2048 | | 2049 | | 2050 | | 2051 | ||||||||||||||||||||||||
Tons Limestone Sold | | | 425 | | | 425 | | | 425 | | | 425 | | | 425 | | | 425 | ||||||||||||||||||
Sales Price/Ton | | $ | 11.05 | | $ | 11.05 | | $ | 11.05 | | $ | 11.05 | | $ | 11.05 | | $ | 11.05 | ||||||||||||||||||
Revenue | | $ | 4,696 | | $ | 4,696 | | $ | 4,696 | | $ | 4,696 | | $ | 4,696 | | $ | 4,696 | ||||||||||||||||||
-Operating Costs | | $ | (2,036) | | $ | (2,036) | | $ | (2,036) | | $ | (2,036) | | $ | (2,036) | | $ | (2,036) | ||||||||||||||||||
-Depreciation | | $ | (500) | | $ | (500) | | $ | (500) | | $ | (500) | | $ | (500) | | $ | (500) | ||||||||||||||||||
Taxable Income | | $ | 2,160 | | $ | 2,160 | | $ | 2,160 | | $ | 2,160 | | $ | 2,160 | | $ | 2,160 | ||||||||||||||||||
-Tax | | $ | (434) | | $ | (434) | | $ | (434) | | $ | (434) | | $ | (434) | | $ | (434) | ||||||||||||||||||
+Depreciation | | $ | 500 | | $ | 500 | | $ | 500 | | $ | 500 | | $ | 500 | | $ | 500 | ||||||||||||||||||
-Capital Expenses | | $ | (500) | | $ | (500) | | $ | (500) | | $ | (500) | | $ | (500) | | $ | (500) | ||||||||||||||||||
Free Cash Flow | | $ | 1,726 | | $ | 1,726 | | $ | 1,726 | | $ | 1,726 | | $ | 1,726 | | $ | 1,726 | ||||||||||||||||||
| | | | | | | | | | | | | | | | | | | ||||||||||||||||||
St. Clair – Discounted Cash Flow |
|
|
|
|
|
|
|
|
|
|
|
| ||||||||||||||||||||||||
In Thousands | | | | | | | | | | | | | ||||||||||||||||||||||||
| | 2052 | | 2053 | | 2054 | | 2055 | | 2056 | | 2057 | ||||||||||||||||||||||||
Tons Limestone Sold | | | 425 | | | 425 | | | 425 | | | 425 | | | 425 | | | 425 | ||||||||||||||||||
Sales Price/Ton | | $ | 11.05 | | $ | 11.05 | | $ | 11.05 | | $ | 11.05 | | $ | 11.05 | | $ | 11.05 | ||||||||||||||||||
Revenue | | $ | 4,696 | | $ | 4,696 | | $ | 4,696 | | $ | 4,696 | | $ | 4,696 | | $ | 4,696 | ||||||||||||||||||
-Operating Costs | | $ | (2,036) | | $ | (2,036) | | $ | (2,036) | | $ | (2,036) | | $ | (2,036) | | $ | (2,036) | ||||||||||||||||||
-Depreciation | | $ | (500) | | $ | (500) | | $ | (500) | | $ | (500) | | $ | (500) | | $ | (500) | ||||||||||||||||||
Taxable Income | | $ | 2,160 | | $ | 2,160 | | $ | 2,160 | | $ | 2,160 | | $ | 2,160 | | $ | 2,160 | ||||||||||||||||||
-Tax | | $ | (434) | | $ | (434) | | $ | (434) | | $ | (434) | | $ | (434) | | $ | (434) | ||||||||||||||||||
+Depreciation | | $ | 500 | | $ | 500 | | $ | 500 | | $ | 500 | | $ | 500 | | $ | 500 | ||||||||||||||||||
-Capital Expenses | | $ | (500) | | $ | (500) | | $ | (500) | | $ | (500) | | $ | (500) | | $ | (500) | ||||||||||||||||||
Free Cash Flow | | $ | 1,726 | | $ | 1,726 | | $ | 1,726 | | $ | 1,726 | | $ | 1,726 | | $ | 1,726 | ||||||||||||||||||
| | | | | | | | | | | | | | | | | | | ||||||||||||||||||
| | | | | | | | | | | | | | | | | | | ||||||||||||||||||
| | | | | | | | | | | | | | | | | | | ||||||||||||||||||
St. Clair – Discounted Cash Flow |
|
|
|
|
|
|
|
|
|
|
|
| ||||||||||||||||||||||||
In Thousands | | | | | | | | | | | | | ||||||||||||||||||||||||
| | 2058 | | 2059 | | 2060 | | 2061 | | 2062 | | 2063 | ||||||||||||||||||||||||
Tons Limestone Sold | | | 425 | | | 425 | | | 425 | | | 425 | | | 425 | | | 425 | ||||||||||||||||||
Sales Price/Ton | | $ | 11.05 | | $ | 11.05 | | $ | 11.05 | | $ | 11.05 | | $ | 11.05 | | $ | 11.05 | ||||||||||||||||||
Revenue | | $ | 4,696 | | $ | 4,696 | | $ | 4,696 | | $ | 4,696 | | $ | 4,696 | | $ | 4,696 | ||||||||||||||||||
-Operating Costs | | $ | (2,036) | | $ | (2,036) | | $ | (2,036) | | $ | (2,036) | | $ | (2,036) | | $ | (2,036) | ||||||||||||||||||
-Depreciation | | $ | (500) | | $ | (500) | | $ | (500) | | $ | (500) | | $ | (500) | | $ | (500) | ||||||||||||||||||
Taxable Income | | $ | 2,160 | | $ | 2,160 | | $ | 2,160 | | $ | 2,160 | | $ | 2,160 | | $ | 2,160 | ||||||||||||||||||
-Tax | | $ | (434) | | $ | (434) | | $ | (434) | | $ | (434) | | $ | (434) | | $ | (434) | ||||||||||||||||||
+Depreciation | | $ | 500 | | $ | 500 | | $ | 500 | | $ | 500 | | $ | 500 | | $ | 500 | ||||||||||||||||||
-Capital Expenses | | $ | (500) | | $ | (500) | | $ | (500) | | $ | (500) | | $ | (500) | | $ | (500) | ||||||||||||||||||
Free Cash Flow | | $ | 1,726 | | $ | 1,726 | | $ | 1,726 | | $ | 1,726 | | $ | 1,726 | | $ | 1,726 | ||||||||||||||||||
| | | | | | | | | | | | | | | | | | | ||||||||||||||||||
Page 44 of 56
| | | | | | | | | | | | | | ||||||
St. Clair – Discounted Cash Flow |
|
|
|
|
|
|
|
|
|
|
|
|
| ||||||
In Thousands | | | | | | | | | | | | | | ||||||
| | | 2064 | | | 2065 | | | 2066 | | | 2067 | | | 2068 | | | 2069 | |
Tons Limestone Sold | | | 425 | | | 425 | | | 425 | | | 425 | | | 425 | | | 425 | |
Sales Price/Ton | | $ | 11.05 | | $ | 11.05 | | $ | 11.05 | | $ | 11.05 | | $ | 11.05 | | $ | 11.05 | |
Revenue | | $ | 4,696 | | $ | 4,696 | | $ | 4,696 | | $ | 4,696 | | $ | 4,696 | | $ | 4,696 | |
-Operating Costs | | $ | (2,036) | | $ | (2,036) | | $ | (2,036) | | $ | (2,036) | | $ | (2,036) | | $ | (2,036) | |
-Depreciation | | $ | (500) | | $ | (500) | | $ | (500) | | $ | (500) | | $ | (500) | | $ | (500) | |
Taxable Income | | $ | 2,160 | | $ | 2,160 | | $ | 2,160 | | $ | 2,160 | | $ | 2,160 | | $ | 2,160 | |
-Tax | | $ | (434) | | $ | (434) | | $ | (434) | | $ | (434) | | $ | (434) | | $ | (434) | |
+Depreciation | | $ | 500 | | $ | 500 | | $ | 500 | | $ | 500 | | $ | 500 | | $ | 500 | |
-Capital Expenses | | $ | (500) | | $ | (500) | | $ | (500) | | $ | (500) | | $ | (500) | | $ | (500) | |
Free Cash Flow | | $ | 1,726 | | $ | 1,726 | | $ | 1,726 | | $ | 1,726 | | $ | 1,726 | | $ | 1,726 | |
| | | | | | | | | | | | | | | | | | | |
| | | | | | | | | | | | | | | | | | | |
St. Clair – Discounted Cash Flow |
|
|
|
|
|
|
|
|
|
|
|
|
| ||||||
In Thousands | | | | | | | | | | | | | | ||||||
| | | 2070 | | | 2071 | | | 2072 | | | 2073 | | | 2074 | | | 2075 | |
Tons Limestone Sold | | | 425 | | | 425 | | | 425 | | | 425 | | | 425 | | | 425 | |
Sales Price/Ton | | $ | 11.05 | | $ | 11.05 | | $ | 11.05 | | $ | 11.05 | | $ | 11.05 | | $ | 11.05 | |
Revenue | | $ | 4,696 | | $ | 4,696 | | $ | 4,696 | | $ | 4,696 | | $ | 4,696 | | $ | 4,696 | |
-Operating Costs | | $ | (2,036) | | $ | (2,036) | | $ | (2,036) | | $ | (2,036) | | $ | (2,036) | | $ | (2,036) | |
-Depreciation | | $ | (500) | | $ | (500) | | $ | (500) | | $ | (500) | | $ | (500) | | $ | (500) | |
Taxable Income | | $ | 2,160 | | $ | 2,160 | | $ | 2,160 | | $ | 2,160 | | $ | 2,160 | | $ | 2,160 | |
-Tax | | $ | (434) | | $ | (434) | | $ | (434) | | $ | (434) | | $ | (434) | | $ | (434) | |
+Depreciation | | $ | 500 | | $ | 500 | | $ | 500 | | $ | 500 | | $ | 500 | | $ | 500 | |
-Capital Expenses | | $ | (500) | | $ | (500) | | $ | (500) | | $ | (500) | | $ | (500) | | $ | (500) | |
Free Cash Flow | | $ | 1,726 | | $ | 1,726 | | $ | 1,726 | | $ | 1,726 | | $ | 1,726 | | $ | 1,726 | |
| | | | | | | | | | | | | | | | | | | |
St. Clair – Discounted Cash Flow |
|
|
|
|
|
|
|
|
|
|
|
|
| ||||||
In Thousands | | | | | | | | | | | | | | ||||||
| | | 2076 | | | | | | | | | | | | | | | | |
Tons Limestone Sold | | | 425 | | | | | | | | | | | | | | | | |
Sales Price/Ton | | $ | 11.05 | | | | | | | | | | | | | | | | |
Revenue | | $ | 4,696 | | | | | | | | | | | | | | | | |
-Operating Costs | | $ | (2,036) | | | | | | | | | | | | | | | | |
-Depreciation | | $ | (500) | | | | | | | | | | | | | | | | |
Taxable Income | | $ | 2,160 | | | | | | | | | | | | | | | | |
-Tax | | $ | (434) | | | | | | | | | | | | | | | | |
+Depreciation | | $ | 500 | | | | | | | | | | | | | | | | |
-Capital Expenses | | $ | (500) | | | | | | | | | | | | | | | | |
Free Cash Flow | | $ | 1,726 | | | | | | | | | | | | | | | | |
| | | | | | | | | | | | | | | | | | | |
Page 45 of 56