UNITED STATES
SECURITIES AND EXCHANGE COMMISSION
Washington, D.C. 20549
_________________________
FORM 10-K
(Mark One)
| þ | ANNUAL REPORT PURSUANT TO SECTION 13 OR 15(d) OF THE SECURITIES EXCHANGE ACT OF 1934 |
| | For the fiscal year ended December 31, 2011 |
| o | TRANSITION REPORT PURSUANT TO SECTION 13 OR 15(d) OF THE SECURITIES EXCHANGE ACT OF 1934 |
| | For the transition period from ______ to ______ |
Commission file number 1-14279
_______________________
ORBITAL SCIENCES CORPORATION
(Exact name of registrant as specified in its charter)
| Delaware | 06-1209561 |
| (State or other jurisdiction of incorporation or organization) | (I.R.S. Employer Identification No.) |
| | |
45101 Warp Drive Dulles, Virginia 20166 (Address of principal executive offices) (703) 406-5000 (Registrant’s telephone number, including area code) |
| | |
| Securities registered pursuant to Section 12(b) of the Act: |
| | |
Title of each class Common Stock, par value $.01 per share | Name of each exchange on which registered The New York Stock Exchange |
| | |
Securities registered pursuant to Section 12(g) of the Act: None |
_______________________
Indicate by check mark if the registrant is a well-known seasoned issuer, as defined in Rule 405 of the Securities Act. Yes þ No o
Indicate by check mark if the registrant is not required to file reports pursuant to Section 13 or Section 15(d) of the Act. Yes o No þ
Indicate by check mark whether the registrant (1) has filed all reports required to be filed by Section 13 or 15(d) of the Securities Exchange Act of 1934 during the preceding 12 months (or for such shorter period that the registrant was required to file such reports), and (2) has been subject to such filing requirements for the past 90 days. Yes þ No o
Indicate by check mark whether the registrant has submitted electronically and posted on its corporate website, if any, every Interactive Data File required to be submitted and posted pursuant to Rule 405 of Regulation S-T (§232.405 of this chapter) during the preceding 12 months (or for such shorter period that the registrant was required to submit and post such files). Yes þ No o
Indicate by check mark if disclosure of delinquent filers pursuant to Item 405 of Regulation S-K (§229.405 of this chapter) is not contained herein, and will not be contained, to the best of registrant’s knowledge, in definitive proxy or information statements incorporated by reference in Part III of this Form 10-K or any amendment to this Form 10-K. o
Indicate by check mark whether the registrant is a large accelerated filer, an accelerated filer, a non-accelerated filer or a smaller reporting company. See the definitions of “large accelerated filer,” “accelerated filer” and “smaller reporting company” in Rule 12b-2 of the Exchange Act. (Check one):
Large accelerated filer þ | Accelerated filer o | Non-accelerated filer o | Smaller reporting company o |
| | (Do not check if a smaller reporting company) |
Indicate by check mark whether the registrant is a shell company (as defined in Rule 12b-2 of the Exchange Act). Yes o No þ
The aggregate market value of the registrant’s Common Stock held by non-affiliates of the registrant based on the closing sales price of the registrant’s Common Stock as reported on The New York Stock Exchange on June 30, 2011 was approximately $971,000,000.
As of February 28, 2012, 58,944,976 shares of the registrant’s Common Stock were outstanding.
Portions of the registrant’s definitive proxy statement to be filed on or about March 7, 2012 are incorporated by reference in Part III of this report.
|
| Item | | Page |
| | | |
| | |
| | |
| | |
| | |
| | |
| | |
| | | |
| | | |
| | |
| | |
| | |
| | |
| | |
| | |
| | |
| | |
| | | |
| | | |
| | |
| | |
| | |
| | |
| | |
| | | |
| | | |
| | |
| | | |
| | | |
Pegasus is a registered trademark and service mark of Orbital Sciences Corporation; Taurus is a registered trademark of Orbital Sciences Corporation; Orbital, Minotaur, Antares and Cygnus are trademarks of Orbital Sciences Corporation. |
General
We develop and manufacture small- and medium-class rockets and space systems for commercial, military and civil government customers, including the U.S. Department of Defense (“DoD”), the National Aeronautics and Space Administration (“NASA”) and other U.S. Government agencies. Our products and services are grouped into three reportable business segments: launch vehicles, satellites and space systems and advanced space programs, which are described below.
| | · | Launch Vehicles - Rockets that are used as small- and medium-class space launch vehicles that place satellites into Earth orbit and escape trajectories, interceptor and target vehicles for missile defense systems, and suborbital launch vehicles that place payloads into a variety of high-altitude trajectories. |
| | · | Satellites and Space Systems - Small- and medium-class satellites that are used to enable global and regional communications and broadcasting, conduct space-related scientific research, collect imagery and other remotely-sensed data about the Earth, carry out interplanetary and other deep-space exploration missions and demonstrate new space technologies. |
| | · | Advanced Space Programs - Human-rated space systems for Earth-orbit and deep-space exploration, and small- and medium-class satellites primarily used for national security space programs and to demonstrate new space technologies. |
Our general strategy is to develop and expand a core integrated business of space and launch systems technologies and products, focusing on the design and manufacture of affordable rockets, satellites and other space systems in order to establish and expand positions in niche markets that have not typically been emphasized by our larger competitors. Another part of our strategy is to seek customer contracts that will fund new product development and enhancements to our existing launch vehicle and space systems product lines. As a result of our capabilities and experience in designing, developing, manufacturing and operating a broad range of small- and medium-class rockets and space systems, we believe we are well positioned to capitalize on the demand for more affordable space-technology systems in commercial satellite communications, space-based military and intelligence operations, and missile defense programs, and to take advantage of government-sponsored initiatives for human space exploration, space-based scientific research and interplanetary exploration.
Orbital was incorporated in Delaware in 1987 to consolidate the assets, liabilities and operations of two predecessor entities established in 1982 and 1983. Our corporate headquarters are located at 45101 Warp Drive, Dulles, Virginia 20166 and our telephone number is (703) 406-5000.
Description of Orbital’s Products and Services
Launch Vehicles
Our launch vehicles segment develops and produces space launch vehicles, interceptor launch vehicles and target launch vehicles.
Space Launch Vehicles - We develop and produce small-class launch vehicles that place satellites weighing up to 4,000 lbs. into low-Earth orbit, including the Pegasus, Taurus and Minotaur space launch vehicles that are used by commercial, civil government and military customers. Our Pegasus launch vehicle is launched from our L-1011 carrier aircraft to deploy relatively lightweight satellites into low-Earth orbit. The Taurus launch vehicle is a ground-launched derivative of the Pegasus vehicle that can carry heavier payloads into orbit. The ground-launched Minotaur launch vehicle family combines Minuteman II and Peacekeeper ballistic missile rocket motors with our Pegasus and Taurus technology. In 2011, we conducted four successful Minotaur launches. In March 2011, a Taurus XL rocket launch failed when its payload fairing did not separate.
We also are engaged in a major product development effort to create a medium-capacity rocket, Antares, formerly referred to as “Taurus II,” that we expect will increase the payload capacity of our space launch vehicles to approximately 12,000 lbs. for launches to low-Earth orbit. Antares will be used initially on our Commercial Orbital Transportation Services (“COTS”) demonstration mission for NASA and under our Commercial Resupply Services (“CRS”) contract with NASA to deliver cargo to the International Space Station (“ISS”). We also are marketing the vehicle to other U.S. Government and commercial customers. We believe the Antares launch vehicle will be ready for an initial test flight in mid-2012.
Interceptor Launch Vehicles - We develop and produce rockets that are used as interceptor launch vehicles for missile defense systems, including interceptor boosters that carry “kill vehicles” designed to defend against ballistic missile attacks. Pursuant to a contract with The Boeing Company (“Boeing”), we have been the sole supplier of operational and test interceptor boosters for the U.S. Missile Defense Agency’s (“MDA”) Ground-based Midcourse Defense (“GMD”) program, for which our interceptor boost vehicle, a modified version of our Pegasus rocket, is being used as a major operational element in the U.S. national missile defense system. There was one delivery and no test launches of this launch vehicle during 2011. With the award of the follow-on GMD development and sustainment contract in 2011, Orbital will continue to provide booster vehicles in support of the GMD program for an additional seven years.
Target Launch Vehicles - We design and produce target launch vehicles used in the development and testing of missile defense systems. Our target launch vehicles include suborbital rockets and their principal subsystems, as well as payloads carried by such vehicles. Various branches and agencies of the U.S. military, including MDA, use our target launch vehicles as targets for defense-related applications such as ballistic missile interceptor testing and related experiments. These rockets are programmed to simulate incoming enemy missiles, offering an affordable and reliable means to test advanced missile defense systems. Our family of target vehicles extends from long-range ballistic target launch vehicles, which include targets
for testing MDA’s GMD system, to medium- and short-range target vehicles designed to simulate threats to U.S. and allied military forces deployed in overseas theaters. We have also developed a short-range supersonic sea-skimming target that flies just above the ocean’s surface and is currently being used by the U.S. Navy. In 2011, we performed a total of 13 successful target missions.
Satellites and Space Systems
Our satellites and space systems segment is involved in developing and producing communications satellites, science and remote sensing satellites, and related subsystems, and we also provide space technical services primarily related to scientific satellite missions.
Communications Satellites - We design and manufacture small geosynchronous-Earth orbit (“GEO”) satellites that provide cable and direct-to-home television distribution, business data network connectivity, regional mobile telephony and other space-based communications services. During 2011, our satellite deliveries included four GEO communications satellites for commercial customers, all of which entered operation during the year.
Science and Remote Sensing Satellites - Our small- and medium-class low-Earth orbit satellites and other spacecraft are used to conduct space-related scientific research, collect imagery and other remotely-sensed data about the Earth, carry out interplanetary and other deep-space exploration missions, and to demonstrate new space technologies. During 2011, Orbital’s first interplanetary spacecraft, Dawn, arrived at the asteroid Vesta in July after a nearly four-year 1.7 billion mile journey to the asteroid belt between Mars and Jupiter. Dawn will continue its journey to rendezvous with Ceres, the Solar System’s largest asteroid, in 2015.
Space Technical Services - We provide advanced space systems and subsystems, including satellite command and data handling, attitude control and structural subsystems and a broad range of space-related technical services, including analytical, engineering and manufacturing services for space-related science and defense programs.
Advanced Space Programs
Our advanced space programs segment is involved in developing and producing human-rated space systems and satellites and related systems primarily used for national security space programs.
Human-Rated Space Systems - We design and manufacture advanced human-rated spacecraft to be used in Earth orbit, planetary exploration and other space missions. In 2008, under the COTS research and development program, we entered into an agreement with NASA to design, build and demonstrate a new space transportation system that has the capability to deliver cargo and other supplies to the ISS. This system will include a new advanced maneuvering spacecraft called Cygnus that will be launched on our Antares launch vehicle and will autonomously rendezvous with the ISS to deliver cargo to the astronauts on board. We expect the COTS demonstration mission will occur in the second half of 2012. Also in 2008, under the CRS program, NASA entered into a contract with us to perform eight cargo transportation missions to
the ISS using the Antares/Cygnus space transportation system we are developing under our COTS program. We expect these missions to be carried out over four years, beginning in late 2012.
National Security Space Systems - We develop and produce small- and medium-class satellites and related systems used primarily for national security space missions and related technology demonstration programs. In 2011, the Commercially Hosted Infrared Payload sensor we developed for the U.S. Air Force was launched as a secondary payload on the Orbital-built SES-2 communications satellite and was successfully placed into operation.
Customers
Customers that accounted for 10% or more of our consolidated revenues in 2011 were DoD, NASA and Boeing. Customers that accounted for 10% or more of our consolidated revenues in 2010 were DoD and NASA. Customers that accounted for 10% or more of our consolidated revenues in 2009 were DoD, Intelsat, Ltd., Lockheed Martin Corporation, NASA and Boeing.
Competition
We believe that competition for sales of our products and services is based primarily on performance and technical features, reliability, price, delivery schedule and our ability to customize our products to meet particular customer needs, and we believe that we compete favorably on the basis of these factors. The table below identifies the entities we believe to be our primary competitors for each major product line.
| Product Line | Competitors |
| Space launch vehicles | Space Exploration Technologies Corp. United Launch Alliance (a joint venture between Lockheed Martin Corporation and The Boeing Company) Alliant Techsystems Inc. Lockheed Martin Corporation Russian, Indian and Chinese launch vehicles could represent competition for commercial, as opposed to U.S. Government, launches |
| Interceptor launch vehicles | Lockheed Martin Corporation Raytheon Company |
| Target launch vehicles | Alliant Techsystems Inc. L-3 Communications, Inc. Lockheed Martin Corporation Composite Engineering Inc. |
| Communications satellites | EADS Astrium Lockheed Martin Corporation Loral Space & Communications Inc. |
| | Reshetnev Company - Information Satellite Systems Thales Alenia Space The Boeing Company Mitsubishi Electric Corp. |
| Science and remote sensing satellites and national security space systems | Alliant Techsystems Inc. Ball Aerospace and Technologies Corp. Lockheed Martin Corporation Northrop Grumman Corporation The Boeing Company Sierra Nevada Corporation Surrey Satellite Technology Limited, a subsidiary of EADS Astrium |
| Space technical services | Our space technical services compete with many companies, from large defense companies to small niche competitors |
| Human-rated space systems | Space Exploration Technologies Corp. European Space Agency Japan Aerospace Exploration Agency Russian Federal Space Agency |
Many of our competitors are larger and have substantially greater resources than we do. Further, it is possible that other domestic or foreign companies or governments, some with greater experience in the space and defense industry and many with greater financial resources than we possess, will seek to provide products or services that compete with ours in the future. Any such foreign competitor could benefit from subsidies from, or other protective measures by, its home country.
Research and Development
We invest in product-related research and development to conceive and develop new products and to enhance existing products. Our research and development expenses totaled approximately $102.8 million, $122.3 million and $109.8 million for the years ended December 31, 2011, 2010 and 2009, respectively. We believe our research and development expenses will be significant in 2012 but will continue to decline from their 2010 peak. Our investment in research and development in the last three years primarily has related to our Antares launch vehicle development program and the COTS program. Under certain arrangements, such as the Antares and COTS programs, our customers share in product development costs. For a further discussion of the research and development expenses being funded by our government customer with respect to our COTS program, please see “Consolidated Results of Operations for the Years Ended December 31, 2011, 2010 and 2009 – Research and Development Expenses” in “Item 7 – Management’s Discussion and Analysis of Financial Condition and Results of Operations.”
Patents and Proprietary Rights
We rely in part on patents, trade secrets and know-how to develop and maintain our competitive position and technological advantage, particularly with respect to our launch vehicle and satellite products. While our intellectual property rights in the aggregate are important to the operation of our business, we do not believe that any single existing patent or other intellectual property right is of such importance that its loss or termination would have a material adverse effect on our business, taken as a whole.
Components and Raw Materials; Seasonality
We purchase a significant percentage of our subassemblies and instruments from domestic and foreign suppliers. We also obtain from the U.S. Government parts and equipment that are used in the production of our products or in the provision of our services. Generally, we have not experienced material difficulty in obtaining product components or necessary parts and equipment and we believe that alternatives to our existing sources of supply are available, although we could incur increased costs and possible delays in securing alternative sources of supply. We rely upon sole-source suppliers for most solid-propellant rocket motors and liquid-propellant rocket engines used on our launch vehicles. While we believe that alternative sources for rocket motors and engines would be available, the inability of our current suppliers to provide us with rocket motors and engines could result in significant program delays, expenses and loss of revenues.
Our business is not seasonal.
U.S. Government Contracts
During 2011, 2010 and 2009, approximately 71%, 74% and 78%, respectively, of our total annual revenues were derived from contracts with the U.S. Government and its agencies or from subcontracts with other U.S. Government contractors. Most of our U.S. Government contracts are funded incrementally on a year-to-year basis.
Our major contracts with the U.S. Government primarily fall into two categories: cost-reimbursable contracts and fixed-price contracts. Approximately 63% and 37% of our revenues from U.S. Government contracts in 2011 were derived from cost-reimbursable contracts and fixed-price contracts, respectively. Under cost-reimbursable contracts, we recover our actual allowable costs incurred, allocable indirect costs and a fee consisting of (i) a base amount that is fixed at the inception of the contract and/or (ii) an award amount that is based on the customer’s evaluation of our performance in terms of the criteria stated in the contract. Our fixed-price contracts include firm fixed-price and fixed-price incentive fee contracts. Under firm fixed-price contracts, work performed and products shipped are paid for at a fixed price without adjustment for actual costs incurred in connection with the contract. Therefore, we bear the risk of loss if costs increase, although some of this risk may be passed on to subcontractors. Fixed-price incentive fee contracts provide for sharing by us and the customer of unexpected costs incurred or savings realized within specified limits, and may provide for adjustments in price depending on actual contract performance other than costs. Costs in excess of the negotiated maximum
(ceiling) price and the risk of loss by reason of such excess costs are borne by us, although some of this risk may be passed on to subcontractors.
As noted above, we derive a significant portion of our revenues from U.S. Government contracts, which are dependent on continued political support and funding. All our U.S. Government contracts and, in general, our subcontracts with other U.S. Government prime contractors provide that such contracts may be terminated for convenience at any time by the U.S. Government or the prime contractor, respectively. Furthermore, any of these contracts may become subject to a government-issued stop work order under which we would be required to suspend production. In the event of a termination for convenience, contractors generally are entitled to receive the purchase price for delivered items, reimbursement for allowable costs for work in process and an allowance for reasonable profit thereon or adjustment for loss if completion of performance would have resulted in a loss. For a more detailed description of risks relating to the U.S. Government contract industry, see “Item 1A – Risk Factors.”
A portion of our business is classified for national security purposes by the U.S. Government and cannot be specifically described. The operating results of these classified programs are included in our consolidated financial statements. The business risks associated with classified programs, as a general matter, do not differ materially from those of our other U.S. Government contracts.
Regulation
Our ability to pursue our business activities is regulated by various agencies and departments of the U.S. Government and, in certain circumstances, the governments of other countries. Commercial space launches require licenses from the U.S. Department of Transportation (“DoT”) and the reentry of our Cygnus maneuvering spacecraft during the COTS demonstration mission and the operation of our L-1011 aircraft require licenses from certain agencies of the DoT, including the Federal Aviation Administration. Launches of our Antares rocket, which will use modified Russian rocket engines, require a Russian government license, which we have obtained. The Federal Communications Commission (“FCC”) also requires licenses for radio communications during our rocket launches. Our classified programs require that we and certain of our employees maintain appropriate security clearances. We also require export licenses from the U.S. Department of State (“DoS”), the U.S. Department of Commerce (“DoC”) and, occasionally, the governments of other countries with respect to transactions we have with foreign customers or foreign subcontractors.
Contract Backlog
Our firm backlog was approximately $2.39 billion at December 31, 2011 and approximately $2.03 billion at December 31, 2010. While there can be no assurance, we expect to convert approximately $1.12 billion of the 2011 year-end firm backlog into revenues during 2012. Our firm backlog as of December 31, 2011 included approximately $1.99 billion of contracts with the U.S. Government and its agencies or from subcontracts with prime contractors of the U.S. Government. Most of our U.S. Government contracts are funded incrementally on a year-to-year basis. Firm backlog from U.S. Government contracts at December 31, 2011 included total
funded orders of about $750 million and orders not yet funded of about $1.24 billion. Changes in government policies, priorities or funding levels through agency or program budget reductions by the U.S. Congress or executive agencies could materially adversely affect our financial condition and results of operations. Furthermore, contracts with the U.S. Government may be terminated or suspended by the U.S. Government at any time, with or without cause, which could result in a reduction in backlog.
Total backlog was approximately $5.29 billion at December 31, 2011. Total backlog includes firm backlog in addition to unexercised options, indefinite-quantity contracts and undefinitized orders and contract award selections.
Employees
As of February 23, 2012, Orbital had approximately 3,500 employees. None of our employees is subject to collective bargaining agreements. We believe our employee relations are good.
Executive Officers of the Registrant
The following table sets forth the name, age and position of each of the executive officers of Orbital as of February 23, 2012. All executive officers are appointed annually and serve at the discretion of the Board of Directors.
Name | | Age | | Position |
David W. Thompson | | 57 | | Chairman of the Board, President and Chief Executive Officer |
| | | | | |
Garrett E. Pierce | | 67 | | Vice Chairman and Chief Financial Officer, Director |
| | | | | |
Ronald J. Grabe | | 66 | | Executive Vice President and General Manager, Launch Systems Group |
| | | | | |
Michael E. Larkin | | 56 | | Executive Vice President and General Manager, Space Systems Group |
| | | | | |
| Antonio L. Elias | | 62 | | Executive Vice President and General Manager, Advanced Programs Group |
| | | | | |
| Susan Herlick | | 47 | | Senior Vice President, General Counsel and Corporate Secretary |
David W. Thompson is a co-founder of Orbital and has been Chairman of the Board and Chief Executive Officer of Orbital since 1982. From 1982 until October 1999, he also served as our President, a role he resumed in 2011 following the retirement of James R. Thompson from this position. Prior to founding Orbital, Mr. Thompson was employed by Hughes Electronics Corporation as special assistant to the President of its Missile Systems Group and by NASA at the Marshall Space Flight Center as a project manager and engineer, and also worked on the Space Shuttle’s autopilot design at the Charles Stark Draper Laboratory. Mr. Thompson is a Fellow of the American Institute of Aeronautics and Astronautics, the American Astronautical Society and the Royal Aeronautical Society, and is a member of the U.S. National Academy of Engineering.
Garrett E. Pierce has been Vice Chairman and Chief Financial Officer since April 2002, and was Executive Vice President and Chief Financial Officer since August 2000. He has been a director of the Company since August 2000. From 1996 until August 2000, he was Executive Vice President and Chief Financial Officer of Sensormatic Electronics Corp., a supplier of electronic security systems, where he was also named Chief Administrative Officer in July 1998. Prior to joining Sensormatic, Mr. Pierce was the Executive Vice President and Chief Financial Officer of California Microwave, Inc., a supplier of microwave, radio frequency and satellite systems and products for communications and wireless networks. From 1980 to 1993, Mr. Pierce was with Materials Research Corporation, a provider of thin film equipment and high purity materials to the semiconductor, telecommunications and media storage industries, where he progressed from Chief Financial Officer to President and Chief Executive Officer. Materials Research Corporation was acquired by Sony Corporation as a wholly owned subsidiary in 1989. From 1972 to 1980, Mr. Pierce held various management positions with The Signal Companies. Mr. Pierce is a director of Kulicke and Soffa Industries, Inc.
Ronald J. Grabe has been Executive Vice President and General Manager, Launch Systems Group since 1999. From 1996 to 1999, he was Senior Vice President and Assistant General Manager of the Launch Systems Group and Senior Vice President of the Launch Systems Group since 1995. From 1994 to 1995, Mr. Grabe served as Vice President for Business Development in the Launch Systems Group. From 1980 to 1993, Mr. Grabe was a NASA astronaut during which time he flew four Space Shuttle missions and was lead astronaut for development of the International Space Station.
Michael E. Larkin has been Executive Vice President and General Manager, Space Systems Group since February 2008 and was Senior Vice President and Deputy General Manager of the Space Systems Group since 2006. From 2004 to 2006, he served as Senior Vice President of Finance of the Space Systems Group. From 1996 to 2004, he was Vice President of the Space Systems Group, and was Director of Finance of the Space Systems Group from 1994 to 1996. Prior to that, he held a variety of program and financial management positions at Fairchild Space and Defense Corporation, a space and military electronics company, until its acquisition by Orbital in 1994.
Antonio L. Elias has been Executive Vice President and General Manager, Advanced Programs Group since October 2001, and was Senior Vice President and General Manager, Advanced Programs Group since August 1997. From January 1996 until August 1997, Dr. Elias
served as Senior Vice President and Chief Technical Officer of Orbital. From May 1993 through December 1995, he was Senior Vice President for Advanced Projects, and was Senior Vice President, Space Systems Division from 1990 to April 1993. He was Vice President, Engineering of Orbital from 1989 to 1990 and was Chief Engineer from 1986 to 1989. From 1980 to 1986, Dr. Elias was an Assistant Professor of Aeronautics and Astronautics at Massachusetts Institute of Technology. He was elected to the National Academy of Engineering in 2001.
Susan Herlick has been Senior Vice President, General Counsel and Corporate Secretary since January 2006 and served as Vice President and Deputy General Counsel from 2003 to 2005. From 1997 to 2002, she was Vice President and Assistant General Counsel. She joined Orbital as Assistant General Counsel in 1995. Prior to that, she was an attorney at the law firm of Hogan & Hartson LLP, now Hogan Lovells US LLP.
Available Information
We maintain an Internet website at www.orbital.com. In addition to news and other information about our company, we make available on or through the Investor Relations section of our website our Annual Report on Form 10-K, our Quarterly Reports on Form 10-Q, our current reports on Form 8-K and all amendments to these reports as soon as reasonably practicable after we electronically file this material with, or furnish it to, the U.S. Securities and Exchange Commission (“SEC”).
At the Investor Relations section of our website, we have a Corporate Governance page that includes, among other things, copies of our Code of Business Conduct and Ethics, our Corporate Governance Guidelines and the charters for each standing committee of our Board of Directors, including the Audit and Finance Committee, the Corporate Governance and Nominating Committee and the Human Resources and Compensation Committee.
Printed copies of all of the above-referenced reports and documents may be requested by contacting our Investor Relations Department either by mail at our corporate headquarters, by telephone at (703) 406-5543 or by e-mail at investor.relations@orbital.com. All of the above-referenced reports and documents are available from us free of charge.
* * *
Financial information about our products and services, business segments, domestic and foreign operations and export sales is included in “Management’s Discussion and Analysis of Financial Condition and Results of Operations” and the notes to our consolidated financial statements, and is incorporated herein by reference.
Special Note Regarding Forward-Looking Statements
Certain statements contained in this Annual Report on Form 10-K are forward-looking statements within the meaning of the Private Securities Litigation Reform Act of 1995 and Section 21E of the Securities Exchange Act of 1934. These forward-looking statements include, but are not limited to, those related to our financial outlook, liquidity, goals, business strategy, projected plans and objectives of management for future operating results, and forecasts of future events. These statements can be identified by the fact that they do not relate strictly to historical or current facts. Forward-looking statements often include the words “anticipate,” “forecast,” “expect,” “believe,” “should,” “will,” “intend,” “plan” and words of similar substance. Such forward-looking statements are subject to risks, trends and uncertainties that could cause the actual results or performance of the company to be materially different from the forward-looking statement. Uncertainty surrounding factors such as continued government support and funding for key space and defense programs, new product development programs, product performance and market acceptance of products and technologies, achievement of contractual milestones, government contract procurement and termination risks, income tax rates and the outcome of our current discussions with the SEC regarding our financial reporting may materially impact Orbital’s actual financial and operational results. We are under no obligation to, and expressly disclaim any obligation or undertaking to update or alter any forward-looking statement, whether as a result of new information, subsequent events or otherwise, except as required by law.
Investors should carefully consider, among other factors, the risks listed below.
We derive a significant portion of our revenues from U.S. Government contracts, which are dependent on continued political support and funding and are subject to termination by the U.S. Government at any time.
The majority of our total annual revenues and our firm backlog at December 31, 2011 was derived from U.S. Government contracts. Most of our U.S. Government contracts are funded incrementally on a year-to-year basis and are subject to uncertain future funding levels. Our direct and indirect contracts with the U.S. Government may be terminated or suspended by the U.S. Government or its prime contractors at any time, with or without cause. Termination or suspension of any of our significant U.S. Government contracts could result in the loss of future revenues and unreimbursable expenses or charges that could have a materially adverse effect on our financial condition and results of operations. Furthermore, key human space initiatives, missile defense programs, and other space programs must compete with other programs for consideration during the federal budgeting and appropriation process, and support and funding for any U.S. Government program may be influenced by general economic conditions, political considerations and other factors. A decline in U.S. Government support and funding for programs in which we participate could result in contract terminations, delays in contract awards, the failure to exercise contract options, the cancellation of planned procurements and fewer new business opportunities, any of which could have a material adverse effect on our financial condition and results of operations.
We are subject to a number of domestic and international laws, regulations and restrictions, the non-compliance with which may expose us to adverse consequences.
As a government contractor, we are subject to extensive and complex U.S. Government procurement laws and regulations, including the Procurement Integrity Act and the False Claims Act. Failure to comply with these laws and regulations could result in contract termination, price or fee reductions, civil or criminal penalties, injunctions and/or administrative sanctions such as suspension or debarment from contracting with the U.S. Government.
In addition, our international business subjects us to numerous U.S. and foreign laws and regulations, including the Foreign Corrupt Practices Act and regulations relating to import-export control. Our failure to comply with these laws and regulations could result in administrative, civil or criminal penalties and administrative sanctions such as suspension or debarment from contracting with the U.S. Government or suspension of our export privileges.
Our business could be adversely affected by adverse audit findings by the U.S. Government.
U.S. Government agencies, including the Defense Contract Audit Agency and various agency Inspectors General, routinely audit and investigate government contractors. These agencies review a contractor’s performance under its contracts, cost structure and compliance with applicable laws, regulations and standards. Charging practices relating to labor, research and development, and other costs that may be charged directly or indirectly to U.S. Government contracts are often scrutinized to determine that such costs are allowable under U.S. Government contracts and furthermore that such costs are reasonable. Any costs determined to be unallowable or unreasonable may not be reimbursed, and such costs already reimbursed may be subject to repayment. If the amount of such costs were significant, our results of operations and financial condition could be materially adversely affected. For example, we expect to recover a significant portion of our research and development expenses, including those related to the Antares development program, through billings under certain of our government contracts in accordance with applicable regulations, but we cannot assure you that this will occur. Our inability to recover a significant portion of such expenses could materially adversely affect our financial condition and results of operations.
The above-mentioned agencies also review the adequacy of, and a contractor’s compliance with, its internal control systems and policies, including the contractor’s purchasing, property, estimating, compensation, accounting and information systems. Adverse findings relating to our systems could result in the U.S. Government customer withholding a percentage of payments and also could impact our ability to win new U.S. Government contract awards or option exercises.
Responding to government audits, inquiries or investigations may involve significant expense and divert management attention. Also, if an audit or investigation uncovers improper or illegal activities, we may be subject to civil and criminal penalties and administrative sanctions, including termination of contracts, forfeiture of profits, suspension of payments, fines and suspension or prohibition from doing business with the U.S. Government. In addition, we could suffer serious reputational harm if allegations of impropriety were to be made against us.
Termination of our contracts could materially adversely affect our backlog and our future financial results.
Approximately 71% of our 2011 revenues were derived from direct or indirect contracts with the U.S. Government. All of our direct and indirect contracts with the U.S. Government or its prime contractors may be terminated or suspended at any time, with or without cause, for the convenience of the government. U.S. Government contract awards also may be subject to bid protests, which may result in a contract award being rescinded or subject to reprocurement. In addition, our commercial satellite contracts also give the customer the right to unilaterally terminate the contract. For these reasons, we cannot assure you that all of our backlog will ultimately be recognized in revenues. The loss of future revenue, incurrence of unreimbursed costs, or liability to the U.S. Government or our commercial customers in connection with other cancelled or rescinded contracts could have a material adverse effect on our financial condition and results of operations. Furthermore, the termination of any contracts for default also could have a material adverse effect on our ability to obtain new business in the future.
We are dependent on a single U.S. Government contract for a large percentage of our revenues and backlog.
Our CRS contract to deliver cargo to the International Space Station (“ISS”) accounted for approximately 18% of our revenues in 2011, and we expect it to continue to account for a material percentage of our revenues in 2012. Given the uncertainty surrounding future government spending and the right of U.S. Government customers to terminate our contracts for convenience, there can be no assurance that the current backlog for this contract ultimately will be recognized in revenues. The cancellation of our CRS contract for any reason, including as a result of reductions in appropriations or the failure to achieve milestones due to technical issues or delays, would have a material adverse effect on our financial condition and results of operations. In addition, the failure to achieve certain milestones related to the successful launch of our Antares rocket and the successful delivery of cargo to the ISS could result in a material reduction of future revenues and profit.
We use estimates in accounting for our contracts. Changes in our estimates could materially adversely affect our financial results.
Contract accounting requires judgments in assessing risks, estimating contract revenues and costs and making assumptions related to schedule and technical issues. Due to the nature of many of our contracts, the estimation of total revenues and costs at completion may be complex and is subject to many variables. For example, we make assumptions regarding our performance under contracts, the labor hours, labor rates and costs of materials and subcontracts. Our assumptions regarding the timing and amounts of incentives, penalties, award fees and milestones related to performance on contracts involve a high degree of judgment and estimates by our management. These assumptions are important factors that impact the revenues and profits that we recognize. In the event of a change in total estimated contract revenue, cost or profit, the cumulative effect of such change is recorded in the period the change in estimate occurs.
Because of the significance of the judgments and estimates inherent in our accounting processes described above, it is possible that material adjustments to our financial results could be required if we determine, based on current facts and circumstances known to us, that our prior assumptions are no longer reasonable and need to be revised.
If the SEC disagrees with our assumptions underlying our CRS contract revenues recognized in 2011, 2010 and 2009, we may be required to reverse a portion of such revenues and we could be required to restate our financial statements for prior periods.
In December 2011, we received a comment letter from the staff of the SEC in connection with a routine review of our Annual Report on Form 10-K for the year ended December 31, 2010 and Quarterly Report on Form 10-Q for the quarter ended September 30, 2011. The SEC comment letter included, among other things, a request for supplemental information on certain of our accounting policies and disclosures related to the timing of revenue recognition, including for our CRS contract with NASA to resupply the International Space Station. We are currently engaged in discussions with the SEC staff regarding our assumptions relating to the recognition of launch and delivery milestones under the CRS contract. Our consolidated results contained in this Annual Report on Form 10-K were prepared in accordance with our existing accounting policies, using assumptions which we believe are appropriate based on current facts and circumstances, all of which are consistent with those applied in prior audited periods. See “Critical Accounting Policies and Significant Estimates” in “Item 7 - Management’s Discussion and Analysis of Financial Condition and Results of Operations” for a discussion of our accounting policies and assumptions related to revenue recognition.
If the SEC disagrees with our assumptions underlying our CRS contract revenue recognized in 2011, 2010 and 2009, we may be required to reverse a portion of such revenues and we could be required to restate our financial statements for prior periods. We also could be required to defer recognizing a portion of future CRS contract revenues until and unless certain contract milestones are achieved. The CRS contract accounted for approximately 18%, 21% and 9% of our revenues in 2011, 2010 and 2009, respectively; consequently, there is a risk that a restatement could materially reduce the amount of revenues and profit reported in those periods.
We may not receive full payment for our satellites or launch services and we could incur penalties in the event of a failure or malfunction or if our satellites are not delivered or our rockets are not launched on schedule.
Some of our satellite contracts provide for performance-based payments to be made to us after the satellite is in orbit over periods that may be as long as 15 years. Additionally, some satellite contracts require us to refund cash to the customer if performance criteria, which cover periods of up to 15 years, are not satisfied. Certain contracts include payment milestones that are
contingent upon a successful launch. While our practice is generally to procure insurance policies that we believe would indemnify us for satellite and launch success incentive fees or contract milestones that are not earned and for performance refund obligations, insurance may not continue to be available on economical terms, if at all. Further, we may elect not to procure insurance. In addition, some of our satellite and launch contracts require us to pay penalties in the event that satellites are not delivered or a launch does not occur, on a timely basis, or to refund cash receipts to the customer if a contract is terminated for default. Our failure to earn performance-based contract milestones, or a requirement that we refund cash to the customer or pay delay penalties, could materially adversely affect our financial condition and results of operations.
Contract cost overruns could materially adversely impact our financial results.
We provide our products and services primarily through cost-reimbursable and fixed-price contracts. Cost overruns, if significant, could materially adversely impact our financial results:
| | · | Under cost-reimbursable contracts, we are reimbursed for allowable incurred costs plus a fee, which may be fixed or variable (based, entirely or in part, on the customer’s evaluation of our performance under the contract). There is no guarantee as to the amount of fee, if any, that we will be awarded under a cost-reimbursable contract with a variable fee. In addition, the price on a cost-reimbursable contract is based on allowable costs incurred, but generally is subject to customer funding limitations. If we incur costs in excess of the amount funded, we may not be able to recover such costs. |
| | · | Under fixed-price contracts, our customers pay us for work performed and products shipped based on an agreed-upon price, without adjustment for any cost overruns. Therefore, we generally bear all of the financial risk as a result of increased costs on these contracts, although some of this risk may be passed on to subcontractors. Some of our fixed-price contracts provide for sharing of unexpected cost increases or savings realized within specified limits and may provide for adjustments in price depending on actual contract performance. We bear the entire risk of cost overruns in excess of the negotiated maximum amount of unexpected costs to be shared. Our commercial contracts are generally fixed price agreements. In addition, a significant percentage of our revenues from U.S. Government contracts over the last three years were derived from fixed-price agreements, and we believe this trend will continue in future years. |
Our growth strategy depends on major new product development initiatives involving significant technical challenges.
We are incurring substantial expenses relating to the design and development of the Antares launch vehicle. We also are developing the Cygnus advanced maneuvering spacecraft, and considering other product enhancements. The development of new or enhanced products is a complex and uncertain process that requires the accurate anticipation of technological and market trends and can require a significant amount of time and expense to complete. New product development programs often experience schedule delays and cost overruns. Our inability to successfully complete our new product development initiatives on schedule and
within budget, or to obtain market acceptance, could have a material adverse effect on our financial condition and results of operations.
The Mid-Atlantic Regional Spaceport (“MARS”) is designing and constructing a new launch site for the Antares launch vehicle at NASA’s Wallops Flight Facility. The inability of MARS to complete the launch site on schedule has resulted in rescheduling of our initial Antares test launch. Further delays in launch site completion could have a material adverse effect on our financial condition and results of operations.
Our success depends on our ability to penetrate and retain markets for our existing products and to continue to conceive, design, manufacture and market new products on a cost-effective and timely basis.
We may experience design, manufacturing, marketing and other difficulties that could delay or prevent the development, introduction or acceptance of new products and enhancements. There can be no assurance that we will be able to achieve the technological advances necessary to remain competitive and profitable, that new products will be developed and manufactured on schedule or on a cost-effective basis or that our existing products will not become technologically obsolete. Our failure to predict accurately the needs of our customers and prospective customers, and to develop products or product enhancements that address those needs, may result in the loss of current customers or the inability to secure new customers.
There can be no assurance that our products will be successfully developed or manufactured or that they will perform as intended.
Most of the products we develop and manufacture are technologically advanced and sometimes include novel systems that must function under highly demanding operating conditions. From time to time, we experience product failures, cost overruns in developing and manufacturing our products, delays in delivery and other operational problems. We have experienced product and service failures, schedule delays and other problems in connection with certain of our launch vehicles, satellites, advanced space systems and other products, and may have similar occurrences in the future. Some of our satellite and launch services contracts impose monetary penalties on us for delays and for performance failures, which penalties could be significant. In addition to any costs resulting from product warranties or required remedial action, product failures or significant delays may result in increased costs or loss of revenues due to the postponement or cancellation of subsequently scheduled operations or product deliveries and may have a material adverse effect on our financial condition and results of operations. Negative publicity from product failures could damage our reputation and impair our ability to win new contracts.
If our key suppliers fail to perform as expected, we may experience delays and cost increases, and our financial results may be materially adversely impacted.
We purchase a significant percentage of our subassemblies and instruments from domestic and foreign suppliers. We also obtain from the U.S. Government parts and equipment used in the production of our products or the provision of our services. In addition, we rely on sole
source suppliers for most rocket motors and engines we use on our launch vehicles, including Antares. As a result, if our suppliers fail to perform as expected or encounter financial difficulties, we may have difficulty replacing them in a timely or cost effective manner. A supply disruption could cause significant delays that could result in substantial additional costs, a customer terminating our contract for default, or damage to our customer relationships, causing our financial results to be materially adversely impacted. In addition, negative publicity from any failure of one of our products as a result of a failure by a key supplier could damage our reputation and limit our ability to win new contracts.
Our international business is subject to risks that may have a material adverse effect on our financial results.
We sell certain of our communications satellites and other products to non-U.S. customers. We also procure certain key product components from non-U.S. vendors. International contracts are subject to numerous risks, including:
| | · | political and economic instability in foreign markets; |
| | · | restrictive trade policies of the U.S. Government and foreign governments; |
| | · | inconsistent product regulation by foreign agencies or governments; |
| | · | the imposition of product tariffs and burdens; |
| | · | the cost of complying with a variety of U.S. and international laws and regulations, including regulations relating to import-export control, and the risk of non-compliance; |
| | · | the complexity and necessity of using non-U.S. representatives and consultants; |
| | · | the inability to obtain required U.S. or foreign country export licenses; and |
| | · | foreign currency exposure. |
Such risks could have a material adverse effect on our financial results by increasing our costs, causing material delays or subjecting us to penalties.
We operate in a regulated industry, and our inability to secure or maintain the licenses, clearances or approvals necessary to operate our business could have a material adverse effect on our financial results.
Our ability to pursue our business activities is regulated by various agencies and departments of the U.S. Government and, in certain circumstances, the governments of other countries. Commercial space launches, the reentry of our Cygnus maneuvering spacecraft during the COTS demonstration and CRS operational missions, and operation of our L-1011 aircraft require licenses from certain agencies of the DoT, including the Federal Aviation Administration. Launches of our Antares rocket, which will use modified Russian rocket engines, require a Russian government license. The FCC also requires licenses for radio communications during our rocket launches. Our classified programs require that certain of our facilities and certain of our employees maintain appropriate security clearances.
Exports of our products, services and technical information generally require licenses from the DoS or the DoC. In addition, exports of products from our international suppliers may require export licenses from the governments of other countries. We have a number of
international customers and suppliers. Our inability to secure or maintain any necessary licenses or approvals or significant delays in obtaining such licenses or approvals could negatively impact our ability to compete successfully in international markets, and could result in an event of default under certain of our international contracts.
There can be no assurance that we will be successful in our future efforts to secure and maintain necessary licenses, clearances or other U.S. or foreign government regulatory approvals. Our failure to do so could prevent or delay the launch of our rockets or delivery of our other products, which could have a material adverse effect on our financial condition and results of operations.
We face significant competition in each of our lines of business and many of our competitors possess substantially more resources than we do.
Many of our competitors are larger and have substantially greater resources than we do. Furthermore, it is possible that other domestic or foreign companies or governments, some with greater experience in the space and defense industry and many with greater financial resources than we possess, could seek to produce products or services that compete with our products or services, including new launch vehicles using new technology which could render our launch vehicles less competitively viable. Some of our domestic and foreign competitors currently benefit from, and others may benefit in the future from, subsidies from or other protective measures by their home countries.
Our financial covenants may restrict our operating activities.
Our credit facility contains certain financial and operating covenants, including, among other things, certain coverage ratios, as well as limitations on our ability to incur debt, make dividend payments, make investments, sell all or substantially all of our assets and engage in mergers and consolidations and certain acquisitions. These covenants may restrict our ability to pursue certain business initiatives or certain acquisition transactions. In addition, failure to meet any of the financial covenants in our credit facility could cause an event of default under and/or accelerate some or all of our indebtedness, which would have a material adverse effect on our financial condition and results of operations.
The loss of our executive officers or a failure to retain other key personnel could materially adversely affect our operations.
The departure of any of our executive officers or a failure to retain other key employees could have a material adverse effect on our operations. We require experienced and highly skilled engineers and scientists, and personnel with security clearances to perform our contracts and further our business objectives. The competition and demand for such skilled and experienced employees is great, and there can be no assurance that we will continue to attract and retain key personnel. Our failure to do so could have a material adverse effect on our operations by hindering our ability to execute our contracts in a timely and satisfactory manner and to obtain new business.
The anticipated benefits of future acquisitions may not be realized.
From time to time we may evaluate potential acquisitions that we believe would enhance our business. The anticipated benefits of completed business acquisitions may not be fully realized if we are unable to successfully integrate the acquired operations, technologies and personnel into our organization.
We are subject to environmental regulation.
We are subject to various federal, state and local environmental laws and regulations relating to the operation of our business, including those governing pollution, the handling, storage and disposal of hazardous substances and the ownership and operation of real property. Such laws and regulations may result in significant liabilities and costs. There can be no assurance that our failure to comply with such laws and regulations will not have a material adverse effect on our business in the future.
Our restated certificate of incorporation, our amended and restated bylaws, and Delaware law contain anti-takeover provisions that may adversely affect the rights of our stockholders.
Our charter documents contain provisions which could have an anti-takeover effect, including:
| | · | our charter provides for a staggered Board of Directors as a result of which only one of the three classes of directors is elected each year; |
| | · | any merger, acquisition or other business combination that is not approved by our Board of Directors must be approved by 66 2/3% of voting stockholders; |
| | · | stockholders holding less than 10% of our outstanding voting stock cannot call a special meeting of stockholders; and |
| | · | stockholders must give advance notice to nominate directors or submit proposals for consideration at stockholder meetings. |
In addition, we are subject to the anti-takeover provisions of Section 203 of the Delaware General Corporation Law, which restrict the ability of current stockholders holding more than 15% of our voting shares to acquire us without the approval of 66 2/3% of the other stockholders. These provisions could discourage potential acquisition proposals and could delay or prevent a change in control transaction. They could also have the effect of discouraging others from making tender offers for our common stock. As a result, these provisions may prevent our stock price from increasing substantially in response to actual or rumored takeover attempts. These provisions may also prevent changes in our management.
Certain repurchase rights in our 2.4375% convertible senior subordinated notes could discourage a potential acquirer.
We would be required to make an offer to repurchase our 2.4375% convertible senior subordinated notes upon the occurrence of a “fundamental change” of our company, which
includes a change of control in connection with a sale of the company. This repurchase right on the part of the holders of our notes could discourage a potential acquirer.
Conversion of our 2.4375% convertible senior subordinated notes may dilute the ownership interests of existing stockholders.
Upon conversion of our 2.4375% convertible senior subordinated notes, we will deliver in respect of each $1,000 principal amount of notes tendered for conversion (1) an amount in cash (“principal return”) equal to the lesser of (a) the principal amount of the converted notes and (b) the conversion value (such value equal to the conversion rate multiplied by the average price of our common shares over a 10 consecutive-day trading period) and (2) if the conversion value is greater than the principal return, an amount in cash or common stock, or a combination thereof (at our option) with a value equal to the difference between the conversion value and the principal return. Any common stock issued upon conversion of the notes will dilute the ownership interests of existing stockholders. Any sales in the public market of the common stock issuable upon such conversion could adversely affect prevailing market prices of our common stock. In addition, the existence of the notes may encourage short selling by market participants because the conversion of the notes could depress the price of our common stock.
Not applicable.
Our business operations use approximately 1.6 million square feet of office, engineering and manufacturing space in various locations in the United States, as summarized in the table below.
| | Business Unit | Principal Location(s) |
| | Corporate Headquarters | Dulles, Virginia |
| | Launch Vehicles | Chandler, Arizona; Dulles, Virginia; Vandenberg Air Force Base, California |
| | Satellites and Space Systems | Dulles, Virginia; Gilbert, Arizona; Greenbelt, Maryland; Wallops Island, Virginia |
| | Advanced Space Programs | Dulles, Virginia; Gilbert, Arizona |
Approximately 1.3 million square feet of our property, consisting primarily of office space, is leased and 270,000 square feet is owned. Our owned property consists of our two 135,000 square foot state-of-the-art space systems manufacturing facilities that primarily house our satellite manufacturing, assembly and testing activities in Dulles, Virginia and Gilbert, Arizona. Our manufacturing facility for our launch vehicles in Chandler, Arizona, consisting of approximately 370,000 square feet, is leased.
We believe our existing facilities are adequate for our immediate requirements.
From time to time we are party to certain litigation or other legal proceedings arising in the ordinary course of business. Because of the uncertainties inherent in litigation, we cannot predict whether the outcome of such litigation or other legal proceedings will have a material adverse effect on our results of operations or financial condition; however, we believe that none of these matters will have a material adverse effect on our results of operations or financial condition.
Not applicable.
Item 5. Market for Registrant’s Common Equity, Related Stockholder Matters and Issuer Purchases of Equity Securities
On February 23, 2012, there were 2,327 Orbital common stockholders of record.
Our common stock trades on The New York Stock Exchange (“NYSE”) under the symbol ORB. The range of high and low sales prices of Orbital common stock, as reported on the NYSE, was as follows:
| 2011 | | High | | | Low | |
4th Quarter | | $ | 15.96 | | | $ | 11.80 | |
3rd Quarter | | | 18.48 | | | | 12.19 | |
2nd Quarter | | | 19.33 | | | | 16.33 | |
1st Quarter | | | 19.38 | | | | 16.62 | |
| | | | | | | | | |
| | | | | | | | | |
| 2010 | | High | | | Low | |
4th Quarter | | $ | 17.84 | | | $ | 14.50 | |
3rd Quarter | | | 16.52 | | | | 12.66 | |
2nd Quarter | | | 19.52 | | | | 14.41 | |
1st Quarter | | | 19.63 | | | | 15.44 | |
We have never paid any cash dividends on our common stock, nor do we anticipate paying cash dividends on our common stock at any time in the foreseeable future. Moreover, our credit facility contains covenants limiting our ability to pay cash dividends. For a discussion of these limitations, see “Item 7 – Management’s Discussion and Analysis of Financial Condition and Results of Operations - Liquidity and Capital Resources.”
We did not repurchase any of our equity securities during the fourth quarter of 2011. We did not issue any equity securities on an unregistered basis during 2011.
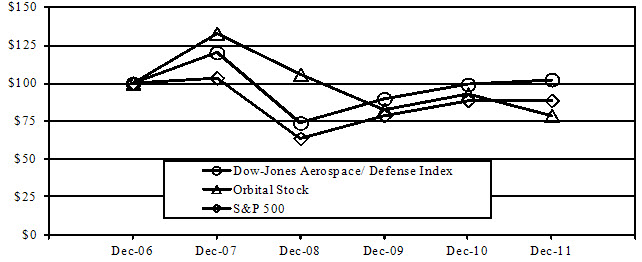
The following graph compares the yearly cumulative total return on the company’s common stock against the cumulative total return on the S&P 500 Index and the Dow-Jones Aerospace/Defense Index for the five-year period commencing on December 31, 2006 and ending on December 31, 2011.
| | Date | Dec-06 | Dec-07 | Dec-08 | Dec-09 | Dec-10 | Dec-11 |
| | S&P 500 Index | 100.000 | 103.530 | 63.685 | 78.622 | 88.672 | 88.670 |
| | Dow-Jones Aerospace/Defense Index | 100.000 | 120.306 | 73.796 | 89.760 | 99.247 | 102.442 |
| | Orbital Stock $100 Value | 100.000 | 132.972 | 105.911 | 82.755 | 92.896 | 78.796 |
Selected Consolidated Financial Data
The selected consolidated financial data presented below for the years ended December 31, 2011, 2010, 2009, 2008 and 2007 are derived from our audited consolidated financial statements. The selected consolidated financial data should be read in conjunction with Management’s Discussion and Analysis of Financial Condition and Results of Operations and our consolidated financial statements and the related notes included elsewhere in this Form 10-K.
| | | Years Ended December 31, | |
| | | 2011 | | | 2010 | | | 2009 | | | 2008 | | | 2007 | |
| | | (In thousands, except per share data) | |
| Operating Data: | | | | | | | | | | | | | | | |
| Revenues | | $ | 1,345,923 | | | $ | 1,294,577 | | | $ | 1,125,295 | | | $ | 1,168,635 | | | $ | 1,033,940 | |
| Cost of revenues | | | 1,074,389 | | | | 1,007,668 | | | | 890,313 | | | | 955,754 | | | | 859,294 | |
| Operating expenses | | | 191,740 | | | | 213,895 | | | | 182,689 | | | | 128,599 | | | | 93,422 | |
| Income from operations | | | 79,794 | | | | 73,014 | | | | 52,293 | | | | 84,282 | | | | 81,224 | |
| Investment gains and losses, net | | | — | | | | — | | | | (2,162 | ) | | | (17,800 | ) | | | — | |
| Interest income and other | | | 19,335 | | | | 1,848 | | | | 7,130 | | | | 6,982 | | | | 12,976 | |
| Interest expense | | | (11,096 | ) | | | (9,778 | ) | | | (9,039 | ) | | | (8,770 | ) | | | (8,810 | ) |
| Income from continuing operations before taxes | | | 88,033 | | | | 65,084 | | | | 48,222 | | | | 64,694 | | | | 85,390 | |
| Income tax provision | | | (20,639 | ) | | | (17,615 | ) | | | (11,615 | ) | | | (22,078 | ) | | | (34,262 | ) |
| Income from continuing operations | | | 67,394 | | | | 47,469 | | | | 36,607 | | | | 42,616 | | | | 51,128 | |
| Income from discontinued operations, net of taxes | | | — | | | | — | | | | — | | | | 15,918 | | | | 3,075 | |
| Net income | | $ | 67,394 | | | $ | 47,469 | | | $ | 36,607 | | | $ | 58,534 | | | $ | 54,203 | |
| Basic income per share: | | | | | | | | | | | | | | | | | | | | |
| Income from continuing operations | | $ | 1.14 | | | $ | 0.81 | | | $ | 0.64 | | | $ | 0.71 | | | $ | 0.85 | |
| Income from discontinued operations | | | — | | | | — | | | | — | | | | 0.27 | | | | 0.05 | |
| Net income | | | 1.14 | | | | 0.81 | | | | 0.64 | | | | 0.98 | | | | 0.90 | |
| Diluted income per share: | | | | | | | | | | | | | | | | | | | | |
| Income from continuing operations | | $ | 1.13 | | | $ | 0.81 | | | $ | 0.63 | | | $ | 0.70 | | | $ | 0.83 | |
| Income from discontinued operations | | | — | | | | — | | | | — | | | | 0.26 | | | | 0.05 | |
| Net income | | | 1.13 | | | | 0.81 | | | | 0.63 | | | | 0.96 | | | | 0.88 | |
| Basic weighted-average shares outstanding | | | 58,531 | | | | 57,683 | | | | 56,787 | | | | 58,569 | | | | 59,164 | |
| Diluted weighted-average shares outstanding | | | 59,127 | | | | 58,335 | | | | 57,496 | | | | 59,725 | | | | 60,526 | |
| Cash Flow Data: | | | | | | | | | | | | | | | | | | | | |
| Cash flow from operating activities | | $ | 65,136 | | | $ | (479 | ) | | $ | 102,783 | | | $ | 108,823 | | | $ | 100,406 | |
| Cash flow from investing activities | | | (59,815 | ) | | | (134,452 | ) | | | (44,105 | ) | | | 17,253 | | | | (46,995 | ) |
| Cash flow from financing activities | | | 1,483 | | | | 14,360 | | | | (13,999 | ) | | | (33,591 | ) | | | (17,340 | ) |
| Balance Sheet Data: | | | | | | | | | | | | | | | | | | | | |
| Cash, cash equivalents and restricted cash | | $ | 259,219 | | | $ | 252,415 | | | $ | 372,986 | | | $ | 328,307 | | | $ | 235,822 | |
| Net working capital | | | 416,050 | | | | 316,617 | | | | 364,429 | | | | 349,454 | | | | 281,043 | |
| Total assets | | | 1,130,800 | | | | 1,062,536 | | | | 929,481 | | | | 853,895 | | | | 762,352 | |
| Long-term obligations, net | | | 131,182 | | | | 125,535 | | | | 120,274 | | | | 115,372 | | | | 110,806 | |
| Stockholders’ equity | | | 643,279 | | | | 568,617 | | | | 502,460 | | | | 473,106 | | | | 440,070 | |
Item 7. Management’s Discussion and Analysis of Financial Condition and Results of Operations
With the exception of historical information, the matters discussed within this Item 7 and elsewhere in this Form 10-K include forward-looking statements within the meaning of the Private Securities Litigation Reform Act of 1995 and Section 21E of the Securities Exchange Act of 1934, as amended, that involve risks and uncertainties, many of which are beyond our control. Readers should be cautioned that a number of important factors, including those identified above in “Item 1 – Special Note Regarding Forward-Looking Statements” and “Item 1A – Risk Factors,” may affect actual results and may cause our actual results to differ materially from those anticipated or expected in any forward-looking statement. Our historical results of operations may not be indicative of our future operating results.
Overview
Introduction
Orbital Sciences Corporation develops and manufactures small- and medium-class rockets and space systems for commercial, military and civil government customers. Our primary products and services include the following:
| · | Launch Vehicles - Rockets that are used as small- and medium-class space launch vehicles that place satellites into Earth orbit and escape trajectories, interceptor and target vehicles for missile defense systems and suborbital launch vehicles that place payloads into a variety of high-altitude trajectories. |
| · | Satellites and Space Systems - Small- and medium-class satellites that are used to enable global and regional communications and broadcasting, conduct space-related scientific research, collect imagery and other remotely-sensed data about the Earth, carry out interplanetary and other deep-space exploration missions and demonstrate new space technologies. |
| · | Advanced Space Programs - Human-rated space systems for Earth-orbit and deep-space exploration, and small- and medium-class satellites primarily used for national security space programs and to demonstrate new space technologies. |
Our general strategy is to develop and expand a core integrated business of space and launch system technologies and products, focusing on the design and manufacture of affordable rockets, satellites and other space systems in order to establish and expand positions in niche markets that have not typically been emphasized by our larger competitors. Another part of our strategy is to seek customer contracts that will fund new product development and enhancements to our existing launch vehicle and space systems product lines. As a result of our capabilities and experience in designing, developing, manufacturing and operating a broad range of small- and medium-class rockets and space systems, we believe we are well positioned to capitalize on the demand for more affordable space-technology systems in commercial satellite communications, space-based military and intelligence operations and military defense programs, and to take
advantage of government-sponsored initiatives for human space exploration, space-based scientific research and interplanetary exploration.
In April 2010, we acquired the spacecraft development and manufacturing business of General Dynamics Advanced Information Systems, a subsidiary of General Dynamics Corporation, for $55 million, as further discussed in Note 2 to our consolidated financial statements in this Form 10-K. This acquisition further strengthened our competitive position in defense and intelligence, civil government and commercial satellite markets.
Business and Industry Considerations
U.S. Government Business - During 2011, 2010 and 2009, approximately 71%, 74% and 78%, respectively, of our consolidated revenues were derived from contracts with the U.S. Government and its agencies or from subcontracts with other U.S. Government contractors. Most of our U.S. Government contracts are funded incrementally on a year-to-year basis. As a result, our operations and our financial results in any period could be impacted substantially by trends in U.S. Government spending, shifting priorities in DoD (including MDA), NASA and other agency budgets, the types of contracts and payment terms mandated by the U.S. Government and changes in the Executive Branch and Congress. These factors, which are largely beyond our control, could have a significant impact on our business.
We expect federal spending on space and missile defense programs to be flat or slightly lower compared to historical levels over the next couple of years. Given the political gridlock we have witnessed over the past several years regarding the federal budget, it is uncertain whether appropriations legislation for the agencies with whom we do business will be enacted and, if so, in what form. Automatic across-the-board cuts could be triggered under The Budget Control Act of 2011 unless a law is enacted that provides funding direction through individual appropriation bills or an omnibus appropriation bill. The exact manner in which this impact would be felt currently is uncertain, and as 2012 is a presidential election year, it is difficult to anticipate the direction federal budgetary policy will take in future years.
NASA continues to prioritize funding for development of U.S. commercial cargo and crew services for the International Space Station. Accordingly, funding for our COTS demonstration mission, including an Antares test launch, and the CRS contract remains on track and unaffected by budget cuts. Priorities with respect to Earth and space science investigations are less clear, however. While NASA has a number of anticipated procurements for science and exploration missions, it is difficult to predict the timing of future awards.
The majority of Orbital’s interceptor and target launch vehicle revenues comes from programs sponsored by MDA. Due to uncertainties regarding funding and the expectation that budgets will continue to be reduced, however, several target programs have been delayed or reduced in scope and it is possible that trend will continue for the foreseeable future. Funding for MDA’s GMD program, on which Orbital has performed as a major subcontractor, has declined over the last several years, and while MDA recently awarded a follow-on contract that extends through 2018, it is funded substantially lower than historic levels. Defense priorities appear to be shifting away from long-range threats toward missile systems with short- and
medium-range capability. However, we believe the capabilities of our target launch vehicle product lines could meet the requirements of a variety of national missile defense systems. For example, in 2011, Orbital was awarded a contract by MDA to supply Intermediate-Range Ballistic Missile target vehicles for use in testing missile defense systems against medium-range threats.
Finally, budget constraints have and, we believe, will continue to impact national security space programs, resulting in program delays, cancellations or scope reductions. DoD and the intelligence community have for some missions historically relied on large multi-mission space systems that are very expensive and take a long time to be deployed. It is anticipated that they will explore ways to address their operational requirements on more limited budgets by considering smaller and more affordable space systems that can perform the missions these customers need on more economical and timely terms. Over time, we believe this may create a competitive advantage for our national security space systems product line that we believe will result in more contract awards in the future.
Commercial Satellites Business - Our largest commercial business is the design and manufacture of small-class GEO communications satellites. Commercial communications satellites accounted for 29%, 26% and 22% of our consolidated revenues in 2011, 2010 and 2009, respectively.
The commercial communications satellite market is driven by economic conditions that may affect satellite operators directly as well as their satellite replacement requirements. The majority of GEO communications satellites are medium-class and large-class satellites. In 2011, the total number of commercial GEO satellite orders decreased for the second straight year. The record high number of orders in 2009 reflected a surge in capital expenditures by the major commercial satellite operators that was anticipated to decline steadily. We believe the number of satellite orders will be relatively flat for the near future as activity from regional operators and start-up companies focusing on under-served geographic markets offset the slowdown in expenditures by large, established operators to some extent. We believe these smaller operators are well-matched to Orbital’s product focus on small- and medium-class satellites.
Critical Accounting Policies and Significant Estimates
The preparation of consolidated financial statements requires management to make judgments based upon estimates and assumptions that are inherently uncertain. Such judgments affect the reported amounts of assets, liabilities, revenues and expenses, and related disclosure of contingent assets and liabilities. Management continuously evaluates its estimates and assumptions, including those related to long-term contracts and incentives, inventories, long-lived assets, income taxes, contingencies and litigation, and the carrying values of assets and liabilities. Management bases its estimates on historical experience and on various other assumptions that it believes to be reasonable under the circumstances. Actual results may differ from these estimates under different assumptions or conditions, and such differences may be material.
The following is a summary of the most critical accounting policies used in the preparation of our consolidated financial statements.
Revenue Recognition - Our revenues are derived primarily from long-term contracts. Revenues on long-term contracts are recognized using the percentage-of-completion method of accounting. Such revenues are recorded based on the percentage that costs incurred to date bear to the most recent estimates of total costs to complete each contract. Estimating future revenues, costs and profit, is a process requiring a high degree of management judgment, including management’s assumptions regarding our future operational performance as well as general economic conditions. In the event of a change in total estimated contract revenue, cost or profit, the cumulative effect of such change is recorded in the period the change in estimate occurs. Frequently, the period of performance of a contract extends over a long period of time and, as such, revenue recognition and our profitability from a particular contract may be adversely affected to the extent that estimated costs to complete or incentive or award fee estimates are revised, delivery schedules are delayed, performance-based milestones are not achieved or progress under a contract is otherwise impeded. Accordingly, our recorded revenues and operating profit from period to period can fluctuate significantly. In the event cost estimates indicate a loss on a contract, the total amount of such loss, excluding general and administrative expense, is recorded in the period in which the loss is first estimated.
Many of our contracts include provisions that increase or decrease contract value based on performance in relation to established targets or customer evaluations. Mission success milestones and incentive and award fees are included in estimated contract revenue when we are able to make reasonable predictions about whether the performance targets will be achieved and make dependable estimates of such amounts based upon our historical experience with similar types of activities and other objective criteria. We include the estimated amount of mission success milestones and incentive and award fees in estimated contract revenue at the inception of each contract, with reassessments made each quarter throughout the period of contract performance. If performance under such contracts were to differ from previous assumptions, or if we were to revise our estimates or assumptions, current period revenues and profit would be adjusted and could fluctuate significantly. Our assessments are guided by the historical performance of our products and product families, the reliability record of the technology employed and assessments of technological considerations for each contract.
As part of our risk management strategy, we generally insure significant mission success milestone receipts. Insurance recoveries are recorded as other income in the consolidated financial statements.
As of December 31, 2011 and 2010, unbilled receivables included approximately $10 million and $15 million, respectively, of incentive fees on certain completed satellite contracts that become due incrementally over periods of up to 15 years, subject to the achievement of performance criteria.
Certain satellite contracts require the company to refund cash to the customer if performance criteria, which cover periods of up to 15 years, are not satisfied. As of December 31, 2011, we
could be required to refund up to approximately $14 million to customers if certain completed satellites were to fail to satisfy performance criteria. We generally procure insurance policies under which we believe we would recover satellite incentive fees that are not earned and potential performance refund obligations.
Mission success milestones relating to the launch of our Antares rocket with its Cygnus payload and the successful delivery of cargo to the ISS comprise approximately 25% of total CRS contract value. If we do not achieve these mission success milestones, we may be required to record revenue and profit reductions. As of December 31, 2011, we have recognized $628 million of revenues for this contract.
Research and Development - Expenditures for company-sponsored research and development projects are expensed as incurred. Research and development projects performed under contracts for customers are recorded as contract costs. In 2008, we entered into the COTS agreement with NASA to design, build and demonstrate a new space transportation system for delivering cargo and supplies to the ISS. The COTS agreement is being accounted for as a best-efforts research and development cost-sharing arrangement. As such, the amounts funded by NASA are recognized proportionally as an offset to our COTS program research and development expenses, including associated general and administrative expenses.
Income Taxes - We account for income taxes using the asset and liability method. Under this method, deferred tax assets and liabilities are recorded for the future tax consequences attributable to differences between the financial statement carrying amounts of assets and liabilities and their respective tax bases. Deferred tax assets and liabilities are measured using enacted tax rates expected to apply to taxable income in the years in which those temporary differences are expected to be recovered or settled. The effect of a tax rate change on deferred tax assets and liabilities is recognized in income in the period that includes the enactment date. We record valuation allowances to reduce net deferred tax assets to the amount considered more likely than not to be realized. Changes in estimates of future taxable income can materially change the amount of such valuation allowances.
Consolidated Results of Operations for the Years Ended December 31, 2011, 2010 and 2009
Revenues - Our consolidated revenues were $1,345.9 million in 2011, an increase of $51.3 million, or 4%, compared to 2010 due to higher revenues in all business segments. Satellites and space systems segment revenues increased $56.8 million, or 11%, in 2011 due to increased activity on communications satellite contracts and space technical services contracts, partly offset by lower activity on science and remote sensing satellite contracts. Launch vehicles segment revenues increased $48.7 million, or 11%, in 2011 primarily due to increased activity on target launch vehicle and space launch vehicle contracts, partly offset by decreased activity on missile defense interceptor contracts. Advanced space programs segment revenues increased $10.4 million, or 2%, in 2011 primarily due to increased activity on national security satellite contracts, partially offset by a decrease in activity on the Orion contract, which was terminated for convenience in the second quarter of 2010, and decreased activity on the CRS contract.
Eliminations of intersegment revenues increased to $125.1 million in 2011 as compared to $60.6 million in 2010. Intersegment revenues included $114.4 million and $51.8 million in 2011 and 2010, respectively, pertaining to Antares launch vehicle production work in our launch vehicles segment for the COTS program that is being conducted in our advanced space programs segment.
The CRS contract was our largest contract in 2011. The launch vehicle portion of the CRS contract is reported in our launch vehicles segment and the remainder of the CRS contract is reported in our advanced space programs segment. CRS contract revenues totaled $247.4 million in 2011, a decrease of $30.3 million, or 11%, compared to 2010, attributable to decreased activity in 2011.
Our consolidated revenues were $1,294.6 million in 2010, an increase of $169.3 million, or 15%, compared to 2009 due to higher revenues in our satellites and space systems and advanced space programs segments, offset by slightly lower revenues in our launch vehicles segment. Satellites and space systems segment revenues increased $144.8 million, or 41%, in 2010 due to increased activity on communications satellite contracts, science and remote sensing satellite contracts, including contracts acquired in our April 2010 spacecraft business acquisition (“2010 acquisition”), and technical services contracts. Advanced space programs segment revenues increased $78.8 million, or 23%, in 2010 primarily due to increased activity on the CRS contract and national security satellite contracts, including contracts acquired in our 2010 acquisition, partially offset by a decrease in activity on the Orion contract due to the termination of that contract for convenience by the customer in the second quarter of 2010. Launch vehicles segment revenues decreased $5.7 million, or 1%, in 2010 primarily due to decreased activity on missile defense interceptor and target launch vehicle contracts, partially offset by an increase in space launch vehicle revenues primarily attributable to a substantial increase in Antares launch vehicle revenues.
Cost of Revenues - Our cost of revenues was $1,074.4 million in 2011, an increase of $66.7 million, or 7%, compared to 2010. Cost of revenues includes the cost of personnel, materials, subcontractors and overhead. The increase in cost of revenues was principally due to an increased level of subcontract activity and materials purchases that were generally consistent with the consolidated revenue increase discussed above. Cost of revenues in the launch vehicles segment increased $73.4 million, or 22%, in 2011 compared to 2010, which exceeded the revenue increase in this segment largely due to the impact on revenue of a Taurus XL launch failure in March 2011. Cost of revenues in the satellites and space systems segment increased $48.5 million, or 11%, in 2011. Cost of revenues in the advanced space programs segment increased $9.3 million, or 3%, in 2011. Eliminations of intersegment cost of revenues increased $64.5 million in 2011 attributable to the increase in intersegment revenues discussed above.
Our cost of revenues was $1,007.7 million in 2010, an increase of $117.3 million, or 13%, compared to 2009. The increase in cost of revenues was principally due to the increased level of contract activity that was generally consistent with the 15% consolidated revenue increase discussed above. Cost of revenues in the satellites and space systems segment increased $134.5 million, or 47%, in 2010 compared to 2009. Cost of revenues in the advanced space programs segment increased $39.3 million, or 14%, in 2010. Cost of revenues in the launch vehicles
segment decreased $7.8 million, or 2%, in 2010. Eliminations of intersegment cost of revenues increased $48.7 million in 2010 attributable to the increase in intersegment revenues discussed above.
Research and Development Expenses - Our research and development expenses totaled $102.8 million, or 8% of revenues, in 2011, a $19.5 million decrease compared to $122.3 million, or 9% of revenues, in 2010. Our research and development expenses in 2009 were $109.8 million, or 10% of revenues. The majority of our research and development expenses in 2009 through 2011 were attributable to the COTS program and our Antares launch vehicle development program.
The COTS program is being accounted for as a best-efforts research and development cost-sharing arrangement. As such, the amounts funded by NASA are recognized proportionally as an offset to the company’s COTS program research and development expenses, including associated general and administrative expenses. Under the COTS agreement, as amended, as of December 31, 2011, NASA has agreed to pay us $288 million in cash milestone payments, partially funding our program costs which are currently estimated to be approximately $465 million. We expect to complete this program in 2012. As of December 31, 2011, deferred revenue and customer advances on our balance sheet included $6.2 million of cash received from NASA that had not yet been recorded as an offset to research and development expenses. The following table summarizes the COTS program costs incurred and amounts funded by NASA recorded in research and development expenses (in millions):
| | | 2011 | | | 2010 | | | 2009 | | | Inception To Date | |
Research and development costs incurred (1) | | $ | 158.8 | | | $ | 136.5 | | | $ | 96.6 | | | $ | 417.9 | |
| Less amounts funded by NASA | | | (108.0 | ) | | | (69.1 | ) | | | (60.6 | ) | | | (260.3 | ) |
| Net research and development expenses | | $ | 50.8 | | | $ | 67.4 | | | $ | 36.0 | | | $ | 157.6 | |
(1) Includes associated general and administrative expenses.
Research and development expenses attributable to our Antares launch vehicle development program were $34.3 million, $48.3 million and $66.5 million in 2011, 2010 and 2009, respectively.
We believe that the majority of our research and development expenses are recoverable and billable under our contracts with the U.S. Government. Charging practices relating to research and development and other costs that may be charged directly or indirectly to government contracts are subject to audit by U.S. Government agencies to determine if such costs are reasonable and allowable under government contracting regulations and accounting practices. We believe that the research and development costs incurred in connection with our Antares development program are allowable, although the U.S. Government has not yet made a final determination. During 2011, 2010 and 2009, we incurred $34.3 million, $43.2 million and $41.3 million, respectively, of such expenses that have been recorded as allowable costs. Since the inception of the Antares program through December 31, 2011, we have incurred $153.5 million of such costs. If such costs were determined to be unallowable, we could be required to record revenue and profit reductions in future periods.
In 2010 and 2009, we established self-imposed ceilings on the amount of research and development expenses that we would recover under our U.S. Government contracts. Although we believe that such expenses would otherwise have been allowable and recoverable under government contracting regulations and accounting practices, in 2010 and 2009, we incurred $5.1 million and $25.1 million, respectively, of research and development costs in excess of our self-imposed ceiling for which we did not seek recovery under our U.S. Government contracts.
Selling, General and Administrative Expenses - Selling, general and administrative expenses were $89.0 million, $91.6 million and $72.9 million in 2011, 2010 and 2009, respectively, or 7% of revenues in each year. Selling, general and administrative expenses include the cost of our finance, legal, administrative and general management functions, as well as bid, proposal and marketing costs.
Selling, general and administrative expenses decreased $2.6 million, or 3%, in 2011 compared to 2010 primarily due to a decrease in bid, proposal and marketing costs in all of our business segments and the absence of $1.6 million of transaction expenses incurred in 2010 in connection with the business acquisition noted above.
Selling, general and administrative expenses increased $18.7 million, or 26%, in 2010 compared to 2009 primarily due to increased bid and proposal costs in connection with the pursuit of certain contracts in our advanced space programs and launch vehicles segments. In addition, 2010 selling, general and administrative expenses included $1.6 million of acquisition costs incurred in connection with our 2010 business acquisition.
Operating Income - Our consolidated operating income was $79.8 million in 2011, an increase of $6.8 million, or 9%, compared to 2010 due to higher operating income in the advanced space programs segment and the satellites and space systems segment partially offset by lower operating income in the launch vehicles segment. Advanced space programs segment operating income increased $7.0 million, or 33%, primarily due to increased activity on national security satellite contracts. Satellites and space systems segment operating income increased $3.8 million, or 11%, primarily due to increased activity on communications satellite contracts partially offset by decreased activity on science and remote sensing satellite contracts. Launch vehicles segment operating income decreased $7.0 million, or 33%, primarily due to the effect of the Taurus XL launch failure in March 2011, partially offset by the absence of unrecovered research and development expenses that were recognized in 2010.
Total operating income from the CRS contract was $12.5 million in 2011, a decrease of $1.2 million, or 9%, attributable to decreased activity.
Our consolidated operating income was $73.0 million in 2010, an increase of $20.7 million, or 40%, compared to 2009 due to higher operating income in all three of our segments. Advanced space programs segment operating income increased $10.2 million, or 95%, primarily due to increased activity on national security satellite contracts, including contracts acquired in our 2010 acquisition, and increased activity on the CRS contract, partially offset by a decrease in activity on the Orion contract due to the termination of that contract. In addition, the increase in
advanced space programs segment operating income was due in part to cost increases in 2009 on certain national security satellite contracts that did not recur in 2010. Launch vehicles segment operating income increased $7.0 million, or 50%, primarily due to a decrease in unrecovered Antares research and development expenses and an increase in Antares launch vehicle operating income attributable to activity on the CRS contract, partially offset by decreased activity on missile defense interceptor launch vehicle contracts and certain space launch vehicle contracts. Satellites and space systems segment operating income increased $6.4 million, or 24%, primarily due to increased activity on science and remote sensing satellite contracts, including contracts acquired in our 2010 acquisition, partially offset by a decrease in communications satellite operating income related to the Galaxy 15 satellite anomaly in April 2010. Corporate and other operating loss of $2.9 million in 2010 included unallocated corporate-level costs and $1.6 million of business acquisition costs.
Total operating income from the CRS contract was $13.7 million in 2010, an increase of $8.5 million, or 163%, attributable to increased activity. The 2010 acquisition contributed $7.3 million of operating income in 2010.
Interest Income and Other - Interest income and other was $19.3 million, $1.8 million and $5.0 million in 2011, 2010 and 2009, respectively. In 2011, 2010 and 2009, we earned interest income of $1.0 million, $1.2 million and $1.7 million, respectively, on short-term invested cash balances. The decreases in interest income were attributable to lower interest rates on our short-term cash investments. We recorded a $0.9 million gain on the sale of an auction-rate debt security in 2010 and a $1.1 million gain on the sale of an investment in 2009, and recorded other-than-temporary impairment charges of $0, $0.9 million and $3.3 million in 2011, 2010 and 2009, respectively, to record the reduction in value of our investments in certain securities.
Interest income and other in 2011 included the recognition of $17.8 million of insurance recoveries, comprised of an $11.3 million insurance recovery pertaining to a mission success milestone that was not earned due to the March 2011 Taurus XL launch failure, and a $6.5 million insurance recovery pertaining to a customer contract settlement in the fourth quarter of 2011. Interest income and other in 2009 included the recognition of a $5.3 million insurance recovery in connection with a Taurus launch failure that occurred in February 2009.
Interest Expense - Interest expense was $11.1 million, $9.8 million and $9.0 million in 2011, 2010 and 2009, respectively. These amounts are primarily attributable to our long-term convertible debt. The 2011 amount also includes the write off of unamortized financing fees associated with our prior credit facility, which was replaced in 2011 as discussed below.
Income Tax Provision - Our income tax provision was $20.6 million, $17.6 million and $11.6 million in 2011, 2010 and 2009, respectively. The effective tax rate for 2011, 2010 and 2009 was 23%, 27% and 24%, respectively. Our income tax provision includes the effect of federal research and development tax credits of $5.1 million, $7.4 million and $8.3 million in 2011, 2010 and 2009, respectively. In addition, we recorded a favorable income tax adjustment of $7.7 million in 2011 pertaining to our election to claim extraterritorial income exclusions related to export activities.
We used net operating loss carryforwards that substantially offset taxable income in 2009 through 2011. As a result, our cash payments for income taxes, which primarily relate to alternative minimum taxes, were approximately equal to 3%, 4% and 3% of pretax income in 2011, 2010 and 2009, respectively.
Net Income - Net income was $67.4 million, $47.5 million and $36.6 million, or $1.13, $0.81 and $0.63 diluted earnings per share, in 2011, 2010 and 2009, respectively.
Segment Results
Our products and services are grouped into three reportable segments: launch vehicles, satellites and space systems and advanced space programs. Corporate office transactions that have not been attributed to a particular segment, as well as consolidating eliminations and adjustments, are reported in corporate and other.
The following tables of financial information and related discussion of the results of operations of our business segments are consistent with the presentation of segment information in Note 3 to the consolidated financial statements in this Form 10-K.
Launch Vehicles
Launch vehicles segment operating results were as follows (in thousands, except percentages):
| | | 2011 | | | 2010 | | | % Change | | | 2010 | | | 2009 | | | % Change | |
| Revenues | | $ | 483,177 | | | $ | 434,511 | | | | 11% | | | $ | 434,511 | | | $ | 440,172 | | | | (1% | ) |
| Operating income | | | 14,147 | | | | 21,188 | | | | (33% | ) | | | 21,188 | | | | 14,166 | | | | 50% | |
| Operating margin | | | 2.9% | | | | 4.9% | | | | | | | | 4.9% | | | | 3.2% | | | | | |
Segment Revenues - Launch vehicles segment revenues increased $48.7 million, or 11%, in 2011 compared to 2010 primarily due to increased activity on target launch vehicle and space launch vehicle contracts, partially offset by decreased activity on missile defense interceptor contracts. Target launch vehicle revenues increased $53.4 million, or 63%, primarily due to activity on new contracts awarded in 2011. Space launch vehicle revenues increased $19.3 million, or 8%, due to increased production work on Antares launch vehicles, partially offset by decreased activity on Taurus and Minotaur space launch vehicles and an $11.3 million revenue reduction related to our failure to earn a launch success milestone when our Taurus XL rocket experienced a launch failure in March 2011. Antares launch vehicle revenues were $199.7 million and $148.8 million in 2011 and 2010, respectively, which included $85.3 million and
$97.0 million, respectively, related to the CRS contract and $114.4 million and $51.8 million, respectively, related to the COTS program. Antares launch vehicle revenues accounted for 41% and 35% of total launch vehicles segment revenues in 2011 and 2010, respectively. Missile defense interceptor revenues decreased $25.8 million, or 23%, due primarily to decreased activity on our GMD contract in 2011. Missile defense interceptor revenues accounted for 18% and 26% of total launch vehicles segment revenues in 2011 and 2010, respectively.
Launch vehicles segment revenues decreased $5.7 million, or 1%, in 2010 compared to 2009 primarily due to decreased activity on missile defense interceptor and target launch vehicle contracts, partially offset by an increase in activity on space launch vehicle contracts. Interceptor launch vehicle revenues decreased $101.0 million, or 47%, due primarily to decreased activity on our GMD contract in 2010 and lower revenues as a result of the termination of the Kinetic Energy Interceptor (“KEI”) contract in the second quarter of 2009. Interceptor launch vehicle contracts accounted for 26% and 49% of total launch vehicles segment revenues in 2010 and 2009, respectively. Space launch vehicle revenues increased $122.0 million, or 116%, primarily due to a $132.6 million increase in activity on Antares launch vehicle contracts, partially offset by a $10.6 million net reduction in revenues on certain other space launch vehicle contracts. Antares launch vehicle revenues were $148.8 million and $16.2 million in 2010 and 2009, respectively, which included $97.0 million and $8.2 million, respectively, related to the CRS contract and $51.8 million and $8.0 million, respectively, related to the COTS program. Antares launch vehicle revenues accounted for 35% and 4% of total launch vehicles segment revenues in 2010 and 2009, respectively. Target launch vehicle revenues decreased $31.0 million, or 27%, primarily due to a decline in activity on certain contracts.
Segment Operating Income - Operating income in the launch vehicles segment decreased $7.0 million, or 33%, in 2011 compared to 2010 primarily due to lower space launch vehicle contract operating income partially offset by increased operating income from target launch vehicle contracts and the absence of $5.1 million of unrecovered research and development expenses that were recognized in 2010. Operating income from space launch vehicle contracts decreased $12.8 million primarily due to an $11.3 million reduction in operating income resulting from the effect of the March 2011 Taurus XL launch failure. Operating income from Antares launch vehicle production work for the CRS contract was $4.4 million and $4.7 million in 2011 and 2010, respectively. This segment does not recognize any profit pertaining to the Antares rockets that are being built for the COTS program that is being conducted in our advanced space programs segment. Operating income from interceptor launch vehicle contracts was $11.7 million and $12.1 million in 2011 and 2010, respectively. Operating income from target vehicle contracts increased $4.2 million primarily due to activity from recently awarded contracts. In addition, there was a decrease in operating income in this segment of $2.7 million largely attributable to the absence of a favorable cost adjustment which was recorded in 2010.
Operating income in the launch vehicles segment increased $7.0 million, or 50%, in 2010 compared to 2009 primarily due to a $20.0 million decrease in unrecovered Antares research and development expenses and a $4.3 million increase in Antares launch vehicle operating income attributable to activity on the CRS contract, partially offset by a decrease in operating income of $15.9 million, or 57%, attributable to decreased activity on missile defense interceptor contracts and a $4.1 million net reduction in operating income on certain other space launch vehicle
contracts attributable to lower revenues and certain contract cost increases in 2010. Segment operating income was reduced by $5.1 million and $25.1 million in 2010 and 2009, respectively, due to unrecovered research and development expenses that exceeded our self-imposed ceiling on such costs. Operating income from interceptor launch vehicle contracts was $12.1 million and $27.9 million in 2010 and 2009, respectively. Operating income from Antares launch vehicle production work for the CRS contract was $4.7 million and $0.4 million in 2010 and 2009, respectively. This segment does not recognize any profit pertaining to its Antares production work for the COTS program that is being conducted in our advanced space programs segment. Despite the $31.0 million revenue decrease in target launch vehicle contracts in 2010, operating income from such contracts increased $0.8 million largely due to favorable profit adjustments on certain target launch vehicle contracts. In addition, there was a net improvement of $1.9 million in 2010 operating income in this segment largely attributable to certain other favorable cost adjustments.
Launch vehicles segment operating margins (as a percentage of revenues) were 2.9%, 4.9% and 3.2% in 2011, 2010 and 2009, respectively. The decrease in operating margin in 2011 as compared to 2010 was primarily due to the effect of the Taurus XL launch failure in March 2011 and higher Antares intersegment revenues (which do not generate profit) partially offset by the absence of unrecovered research and development expenses recorded in 2010 discussed above. The increase in 2010 segment operating margin as compared to 2009 was primarily due to the reduction in unrecovered research and development expenses.
Satellites and Space Systems
Satellites and space systems segment operating results were as follows (in thousands, except percentages):
| | | 2011 | | | 2010 | | | % Change | | | 2010 | | | 2009 | | | % Change | |
| Revenues | | $ | 553,797 | | | $ | 497,015 | | | | 11% | | | $ | 497,015 | | | $ | 352,252 | | | | 41% | |
| Operating income | | | 37,623 | | | | 33,775 | | | | 11% | | | | 33,775 | | | | 27,329 | | | | 24% | |
| Operating margin | | | 6.8% | | | | 6.8% | | | | | | | | 6.8% | | | | 7.8% | | | | | |
Segment Revenues - Satellites and space systems segment revenues increased $56.8 million, or 11%, in 2011 compared to 2010 primarily due to increased revenues on communications satellite contracts and space technical services contracts partially offset by decreased revenues on science and remote sensing satellite contracts. Communications satellite revenues increased $40.7 million, or 12%, principally attributable to activity on contracts that were awarded in late 2010 and early 2011. Communications satellite contract revenues accounted for 67% of total segment revenues in both 2011 and 2010. Space technical services revenues increased $25.6 million, or 39%, primarily due to production work on a contract that was awarded in the third quarter of 2010. Revenues from science and remote sensing satellite contracts decreased $9.0 million, or 10%, primarily due to decreased activity on certain contracts.
Satellites and space systems segment revenues increased $144.8 million, or 41%, in 2010 compared to 2009 primarily due to an increase in communications satellite revenues of $81.6 million, or 33%, principally attributable to activity on new communications satellite contracts awarded in the fourth quarter of 2009. Communications satellite contract revenues accounted for 67% and 71% of total segment revenues in 2010 and 2009, respectively. The 2010 acquisition also contributed $48.6 million of science and remote sensing satellite contract revenues to this segment in 2010. Revenues from other science and remote sensing satellite contracts, technical services contracts and intersegment revenues increased $14.6 million, primarily due to production work on recently awarded contracts.
Segment Operating Income - Operating income in the satellites and space systems segment increased $3.8 million, or 11%, in 2011 compared to 2010 primarily due to increased activity and improved performance on communications satellite contracts and increased activity on space technical services contracts partially offset by decreased activity on science and remote sensing satellite contracts. Communications satellite operating income increased $5.1 million primarily due to new activity on contracts that were awarded in late 2010 and early 2011. In addition, communications satellite operating income in 2011 was reduced by a $6.5 million customer contract settlement. In 2010, communications satellite operating income was reduced by $5.0 million as the result of efforts associated with the resolution of a satellite anomaly. Communications satellite operating income accounted for 64% and 56% of total segment operating income in 2011 and 2010, respectively. Space technical services operating income increased $1.4 million primarily due to production work on a contract awarded in the third quarter of 2010. Science and remote sensing satellite operating income decreased $1.3 million primarily due to decreased activity.
Operating income in the satellites and space systems segment increased $6.4 million, or 24%, in 2010 compared to 2009 primarily due to a $7.5 million increase in science and remote sensing satellite operating income, including $5.7 million of operating income generated by contracts acquired in our 2010 acquisition. Communications satellite operating income decreased $1.2 million, or 6%, in 2010 compared to 2009 primarily due to an approximately $5.0 million reduction in operating income related to the Galaxy 15 satellite anomaly and net favorable adjustments in 2009 pertaining to certain communications satellite contracts, partially offset by operating income attributable to activity on new communications satellite contracts awarded in the fourth quarter of 2009. Communications satellite operating income accounted for 73% of total segment operating income in 2009.
Satellites and space systems segment operating margins (as a percentage of revenues) were 6.8%, 6.8% and 7.8% in 2011, 2010 and 2009, respectively. Operating margins in 2011 and 2010 remained constant, reflecting slight profit margin improvements on communications satellite contracts offset by slightly lower profit margins on all other contracts. The decrease in operating margin in 2010 as compared to 2009 was primarily due to the effect of the Galaxy 15 anomaly resolution costs discussed above and net favorable adjustments in 2009 pertaining to certain satellite contracts.
Advanced Space Programs
Advanced space programs segment operating results were as follows (in thousands, except percentages):
| | | 2011 | | | 2010 | | | % Change | | | 2010 | | | 2009 | | | % Change | |
| Revenues | | $ | 434,036 | | | $ | 423,614 | | | | 2% | | | $ | 423,614 | | | $ | 344,787 | | | | 23% | |
| Operating income | | | 28,024 | | | | 20,999 | | | | 33% | | | | 20,999 | | | | 10,798 | | | | 94% | |
| Operating margin | | | 6.5% | | | | 5.0% | | | | | | | | 5.0% | | | | 3.1% | | | | | |
Segment Revenues - Advanced space programs segment revenues increased $10.4 million, or 2%, in 2011 compared to 2010 primarily due to increased revenues on national security satellite contracts offset by a reduction in activity on the Orion contract and the CRS contract. National security satellite revenues increased $70.0 million, or 36%, attributable to increased activity. This increase in revenues was partially offset by a reduction in Orion contract revenues of $40.9 million, or 87%, due to the termination of the contract for convenience by the customer in the second quarter of 2010 and a reduction in revenue on the CRS contract of $18.6 million, or 10%, attributable to decreased activity. In 2011, national security satellite contracts, the CRS contract and the Orion contract accounted for 61%, 37% and 1%, respectively, of total segment revenues, compared to 46%, 43% and 11%, respectively, of total segment revenues in 2010.
Advanced space programs segment revenues increased $78.8 million, or 23%, in 2010 compared to 2009 primarily due to an increase in revenues on the CRS contract of $85.6 million, or 90%, attributable to increased activity. National security satellite contract revenues increased $55.5 million, or 40%, driven primarily by activity on recently awarded contracts, in addition to $21.2 million of revenues attributable to contracts acquired in our 2010 acquisition. Revenues from the Orion contract decreased $62.6 million, or 57%, due to the termination of the contract for convenience by the customer in the second quarter of 2010. In 2009, national security satellite contracts, the CRS contract and the Orion contract accounted for 40%, 28% and 32%, respectively, of total segment revenues.
Segment Operating Income - Operating income in the advanced space programs segment increased $7.0 million, or 33%, in 2011 compared to 2010 primarily due to an increase in national security satellite operating income partially offset by a decrease in operating income on the CRS contract. National security satellite operating income increased $7.3 million attributable to increased activity. This increase in operating income was partially offset by a $0.9 million decrease in operating income on the CRS contract attributable to decreased activity.
Operating income in the advanced space programs segment increased $10.2 million, or 94%, in 2010 compared to 2009 primarily due to increased activity on the CRS contract and national security satellite contracts, and due to cost increases in 2009 on certain national security satellite contracts that did not recur in 2010. CRS contract operating income increased $4.2 million and operating income from national security satellite contracts increased $12.9 million, which included $1.6 million of operating income attributable to those contracts acquired in our 2010 acquisition. Operating income from the Orion contract decreased $9.4 million due to the termination of the contract. In addition, 2009 operating income included legal fees of
approximately $1.0 million incurred in connection with the protest of a contract award to the company.
Advanced space programs segment operating margins (as a percentage of revenues) were 6.5%, 5.0% and 3.1% in 2011, 2010 and 2009, respectively. The increase in operating margin in 2011 as compared to 2010 was primarily due to operational improvements and growth in national security satellite contracts. The increase in operating margin in 2010 as compared to 2009 was primarily due to margin improvement on national security satellite contracts largely due to the absence in 2010 of cost increases on certain contracts that occurred in 2009.
Corporate and Other
Corporate and other revenues were comprised solely of the elimination of intersegment revenues of $125.1 million, $60.6 million and $11.9 million in 2011, 2010 and 2009, respectively. The increase in intersegment revenue eliminations is due to Antares production work performed in the launch vehicles segment for the COTS research and development program that is being conducted in the advanced space programs segment. Antares revenues for the COTS program which were reported as intersegment revenues in our launch vehicles segment totaled $114.4 million, $51.8 million and $8.0 million in 2011, 2010 and 2009, respectively.
Corporate and other operating loss was $0, $2.9 million and $0 in 2011, 2010 and 2009, respectively. Corporate and other operating loss in 2010 is comprised of unallocated corporate-level costs and includes $1.6 million of transaction expenses incurred in connection with our 2010 acquisition.
Liquidity and Capital Resources
Cash Flow from Operating Activities
Cash provided by operating activities in 2011 was $65.1 million, as compared to cash used in operating activities of $0.5 million in 2010. The increase in operating cash flows resulted primarily from a $35.9 million increase in cash provided by favorable changes in working capital and certain other assets and liabilities, in addition to a $19.9 million increase in net income. During 2011, net changes in working capital and certain other assets and liabilities used $64.9 million of cash, compared to a net use of $100.8 million of cash in 2010. In 2011, other assets increased $37.3 million primarily due to prepayments to vendors related to certain contracts made at the end of 2011. In addition, accounts payable and accrued expenses decreased $14.9 million attributable to reductions in contract-related liabilities, and receivables increased $7.0 million primarily related to the CRS contract. Under the terms of the CRS contract, a substantial percentage of the customer cash receipts are billable and collectible only upon the achievement of certain mission success milestones associated with launch and post-launch activities. The first CRS mission is scheduled to occur in 2012.
Cash used in operating activities in 2010 was $0.5 million, as compared to cash provided by operating activities of $102.8 million in 2009. The decrease in operating cash flows resulted
from a decrease in the net effect of changes in working capital and certain other assets and liabilities, partially offset by the effect of increased net income in 2010. During 2010, changes in working capital and certain other assets and liabilities used $100.8 million of cash, compared to providing $23.4 million of cash in 2009. In 2010, receivables increased by $117.1 million, after giving effect to the 2010 acquisition, primarily due to an increase in unbilled receivables pertaining to the CRS contract. Inventories increased by $17.6 million in 2010 primarily due to expenditures for materials for the CRS contract. Deferred revenues and customer advances decreased $14.9 million primarily due to recognition of contract performance on the COTS program and CRS contract offsetting cash proceeds previously received. These cash uses in 2010 were offset by a $53.8 million source of cash from the increase in accounts payable and accrued expenses, after giving effect to the 2010 acquisition.
Cash Flow from Investing Activities
Cash used in investing activities in 2011 was $59.8 million, as compared to $134.5 million in 2010. We spent $59.8 million for capital expenditures in 2011, as compared to $83.7 million in 2010. The decrease in capital expenditures was primarily due to decreased spending for equipment to support our Antares and COTS programs and our CRS contract. In 2010, we paid $55 million to acquire a spacecraft business further discussed above. Also in 2010, we sold an auction-rate debt security for $4.3 million.
Cash used in investing activities in 2010 was $134.5 million, as compared to $44.1 million in 2009. We spent $83.7 million for capital expenditures in 2010, as compared to $45.3 million in 2009. The increase in capital expenditures was primarily due to the acquisition of equipment to support our Antares and COTS programs and our CRS contract. Also in 2009, we sold an investment for $1.1 million.
Cash Flow from Financing Activities
Cash provided by financing activities was $1.5 million and $14.4 million in 2011 and 2010, respectively, and cash used in financing activities was $14.0 million in 2009. During 2011, 2010 and 2009, we issued 0.7 million, 1.4 million and 0.6 million shares of common stock and received $2.9 million, $12.1 million and $2.5 million, respectively, in connection with stock option exercises and employee stock plan purchases. In 2011, we paid $3.1 million of financing fees associated with establishing a new credit facility. During 2009, we repurchased and retired 1.2 million shares of our common stock at a cost of $16.7 million. We did not repurchase any of our common stock in 2011 and 2010.
Convertible Notes - In December 2006, we issued $143.8 million of 2.4375% convertible senior subordinated notes due 2027 with interest payable semi-annually each January 15 and July 15. The convertible notes are convertible into cash, or a combination of cash and common stock at our election, based on an initial conversion rate of 40.8513 shares of our common stock per $1,000 in principal amount of the convertible notes (equivalent to an initial conversion price of approximately $24.48 per share) under certain circumstances.
At any time on or after January 21, 2014, the convertible notes are subject to redemption at our option, in whole or in part, for cash equal to 100% of the principal amount of the convertible notes, plus unpaid interest, if any, accrued to the redemption date.
Holders of the convertible notes may require us to repurchase the convertible notes, in whole or in part, on January 15, 2014, January 15, 2017 or January 15, 2022, or, if a “fundamental change” (as such term is defined in the indenture governing the convertible notes) occurs, for cash equal to 100% of the principal amount of the convertible notes, plus unpaid interest, if any, accrued to the redemption date.
Credit Facility - In June 2011, we entered into a five-year $300 million revolving secured credit facility (the “Credit Facility”), which replaced the $100 million revolving secured credit facility that was established in 2007. The Credit Facility includes the option to increase the amount of the Credit Facility up to $150 million to the extent that any one or more lenders, whether or not currently party to the Credit Facility commits to be a lender for such additional amount. Loans under the Credit Facility bear interest at LIBOR plus an applicable margin ranging from 1.75% to 2.50%, with the applicable margin varying according to the company’s total leverage ratio, or, at the election of the company, at a prime base rate plus 0.75% to 1.50%. The Credit Facility expires in 2016 and is secured by substantially all of the company’ assets except for real property. Up to $125 million of the Credit Facility may be reserved for letters of credit. As of December 31, 2011, there were no borrowings under the Credit Facility, although $17.9 million of letters of credit were issued under the Credit Facility. Accordingly, as of December 31, 2011, $282.1 million of the Credit Facility was available for borrowings.
Debt Covenants - Our Credit Facility contains covenants limiting our ability to, among other things, pay cash dividends, incur debt or liens, redeem or repurchase company stock, enter into transactions with affiliates, make investments, merge or consolidate with others or dispose of assets. In addition, the Credit Facility contains financial covenants with respect to leverage and interest coverage. As of December 31, 2011, we were in compliance with all of these covenants.
Available Cash and Future Funding
At December 31, 2011, we had $259.2 million of unrestricted cash and cash equivalents. Management currently believes that available cash, cash expected to be generated from operations and the borrowing capacity under our Credit Facility will be sufficient to fund our operating and capital expenditure requirements, including research and development expenditures, over the next 12 months and for the foreseeable future. However, there can be no assurance that this will be the case. We believe that we will continue to incur significant costs in 2012 related to the Antares and COTS research and development programs. Additionally, significant unforeseen events such as termination of major orders or late delivery or failure of launch vehicle or satellite products could adversely affect our liquidity and results of operations. If market opportunities exist, we may choose to undertake additional financing actions to further enhance our liquidity, which could include obtaining new bank debt or raising funds through capital market transactions; however, our ability to borrow additional funds is limited by the terms of our Credit Facility.
As discussed in Note 7 to the consolidated financial statements in this Form 10-K, we currently hold investments in auction-rate securities and preferred stock that have experienced a decline in fair value. Given the sufficiency of our available cash and other funding sources as discussed above, we believe that we will not need, nor do we intend, to liquidate these investments in the foreseeable future. Accordingly, we do not believe that any fluctuations in the fair values of these securities will have a significant impact on our liquidity.
Aggregate Contractual Obligations
The following summarizes our contractual obligations at December 31, 2011, and the effect such obligations are expected to have on our liquidity and cash flow in future periods (in millions):
| | | Payments Due by Period | |
| | | | | | Less than | | | 1 to 3 | | | 3 to 5 | | | More than | |
| | | Total | | | 1 Year | | | Years | | | Years | | | 5 Years | |
Long-term debt (1) | | $ | 143.8 | | | $ | — | | | $ | — | | | $ | — | | | $ | 143.8 | |
Interest on long-term debt (1) | | | 52.7 | | | | 3.5 | | | | 7.0 | | | | 7.0 | | | | 35.2 | |
Operating leases (2) | | | 152.7 | | | | 18.6 | | | | 32.1 | | | | 30.3 | | | | 71.7 | |
Purchase obligations (3) | | | 593.4 | | | | 425.6 | | | | 163.7 | | | | 4.1 | | | | — | |
| Total | | $ | 942.6 | | | $ | 447.7 | | | $ | 202.8 | | | $ | 41.4 | | | $ | 250.7 | |
____________
| | (1) | Holders of our convertible notes may require us to repurchase the convertible notes, in whole or in part, on January 15, 2014, January 15, 2017 or January 15, 2022, or if a “fundamental change” (as defined in the indenture governing the notes) occurs. |
| | (2) | Our obligations under operating leases consist of minimum rental commitments under non-cancelable operating leases primarily for office space and equipment. |
| | (3) | Purchase obligations consist of open purchase orders that we issued to acquire materials, parts or services in future periods. |
Occasionally, certain contracts require us to post letters of credit supporting our performance obligations under the contracts. We had $17.9 million of letters of credit outstanding at December 31, 2011, all of which were issued under the Credit Facility.
As of December 31, 2011 and 2010, our total amount of unrecognized tax benefits was $16.7 million and $12.4 million, respectively. We are unable to make a reasonably reliable estimate of when a cash settlement, if any, will occur with the taxing authorities.
Off-Balance Sheet Arrangements
We do not have any material off-balance sheet arrangements that have or are reasonably likely to have a current or future effect on our financial condition, changes in financial condition, revenues or expenses, results of operations, liquidity, capital expenditures or capital resources
Recent Accounting Pronouncements
In September 2011, the Financial Accounting Standards Board (“FASB”) issued Accounting Standards Update (“ASU”) No. 2011-08, “Testing Goodwill for Impairment.” This ASU provides an option for companies to use a qualitative approach to test goodwill for impairment if certain conditions are met. After assessment of certain qualitative factors, if it is determined to be more likely than not that the fair value of a reporting unit is less than its carrying amount, entities must perform the quantitative analysis of the goodwill impairment test. Otherwise, the quantitative test becomes optional. The provisions of this ASU are effective for interim and annual periods beginning after December 15, 2011; however, early adoption is permitted. We did not elect to adopt this ASU in 2011. The adoption of the ASU is not expected to have a material impact on our financial statements.
In June 2011, the FASB issued ASU No. 2011-05, “Presentation of Comprehensive Income.” This ASU intends to enhance comparability and transparency of other comprehensive income components. The guidance provides an option to present total comprehensive income, the components of net income and the components of other comprehensive income either in a single continuous statement of comprehensive income or in two separate but consecutive statements. This ASU eliminates the option to present the components of other comprehensive income as part of the statement of stockholders’ equity. The provisions of this ASU will be applied retrospectively for interim and annual periods beginning after December 15, 2011. There will be no impact on the consolidated financial results as this ASU relates only to financial statement presentation.
In May 2011, the FASB issued ASU No. 2011-04, “Amendments to Achieve Common Fair Value Measurement and Disclosure Requirements in U.S. GAAP and International Financial Reporting Standards (Topic 820)—Fair Value Measurement.” This ASU clarifies certain concepts related to the fair value measurement of financial instruments and related disclosures. The provisions of this ASU are effective prospectively for interim and annual periods beginning on or after December 15, 2011. We are currently evaluating the impact of the pending adoption of this ASU on our financial statements.
Discussions with U.S. Securities and Exchange Commission
In December 2011, we received a comment letter from the staff of the U.S. Securities and Exchange Commission (“SEC”) in connection with a routine review of our Annual Report on Form 10-K for the year ended December 31, 2010 and Quarterly Report on Form 10-Q for the quarter ended September 30, 2011. The SEC comment letter included, among other things, a request for supplemental information on certain of our accounting policies and disclosures related to the timing of revenue recognition, including for our CRS contract with NASA to resupply cargo to the International Space Station. We responded to the SEC comment letter in January 2012. We are currently engaged in discussions with the SEC staff regarding our assumptions relating primarily to the timing of the recognition of launch and delivery milestones under the CRS contract. The launch and delivery milestones comprise approximately 25% of total CRS contract value. Total CRS contract revenue recognized through December 31, 2011 is approximately $628 million. Our consolidated results contained in this Annual Report on Form
10-K were prepared in accordance with our existing accounting policies and using assumptions which we believe are appropriate based on current facts and circumstances, all of which are consistent with those applied in prior audited periods. Until these discussions are resolved, we cannot determine if we will be required to supplement our disclosures or restate or make other changes to our historical consolidated financial statements, including the financial information contained in this Annual Report on Form 10-K.
Item 7A. Quantitative and Qualitative Disclosures About Market Risk
We believe that our market risk exposure is primarily related to the market value of certain investments that we hold as of December 31, 2011, changes in foreign currency exchange rates and interest rate risk. We manage these market risks through our normal financing and operating activities and, when appropriate, through the use of derivative financial instruments. We do not enter into derivatives for trading or other speculative purposes, nor do we use leveraged financial instruments.
Investments
As discussed in Note 7 to the consolidated financial statements in this Form 10-K, we currently hold investments in certain auction-rate and preferred stock securities that have experienced a decline in fair value resulting in our recording certain other-than-temporary impairment charges. We may be required to record additional impairment charges if there are further reductions in the fair value of these investments in future periods.
Foreign Currency Exchange Rate Risk
We believe that the potential change in foreign currency exchange rates is not a substantial risk to us because the large majority of our business transactions are denominated in U.S. dollars. At December 31, 2011, we had $1.0 million of receivables denominated in Japanese yen.
From time to time, we enter into forward exchange contracts to hedge against foreign currency fluctuations on receivables or expected payments denominated in foreign currency. At December 31, 2011, we had no foreign currency forward exchange contracts.
Interest Rate Risk
We are exposed to changes in interest rates in the normal course of our business operations as a result of our ongoing investing and financing activities, which include debt as well as cash and cash equivalents. As of December 31, 2011, we had $143.8 million of convertible senior subordinated notes with a fixed interest rate of 2.4375%. Generally, the fair market value of our fixed interest rate debt will increase as interest rates fall and decrease as interest rates rise. In addition, the fair value of our convertible notes is affected by our stock price. The total estimated fair value of our convertible debt at December 31, 2011 was $145.2 million. The fair value was determined based upon market prices quoted by a broker-dealer.
We believe that our exposure to market risk related to interest rate fluctuations for cash and cash equivalents is not significant. As of December 31, 2011, a hypothetical 100 basis point change in interest rates would result in an annual change of approximately $2.9 million in interest income earned.
We assess our interest rate risks on a regular basis and do not currently use financial instruments to mitigate these risks.
Deferred Compensation Plan
We have an unfunded deferred compensation plan for senior managers and executive officers with a total liability balance of $10.3 million at December 31, 2011. This liability is subject to fluctuation based upon the market value of the investment options selected by participants.
Item 8. Financial Statements and Supplementary Data
INDEX TO FINANCIAL STATEMENTS AND SCHEDULE
| | Page |
| Report of Independent Registered Public Accounting Firm | 47 |
| Consolidated Income Statements | 49 |
| Consolidated Balance Sheets | 50 |
| Consolidated Statements of Stockholders’ Equity | 51 |
| Consolidated Statements of Cash Flows | 52 |
| Notes to Consolidated Financial Statements | 53 |
| Schedule II – Valuation and Qualifying Accounts | 76 |
Report of Independent Registered Public Accounting Firm
To the Board of Directors and Stockholders of
Orbital Sciences Corporation:
In our opinion, the consolidated financial statements listed in the accompanying index present fairly, in all material respects, the financial position of Orbital Sciences Corporation and its subsidiaries at December 31, 2011 and 2010, and the results of their operations and their cash flows for each of the three years in the period ended December 31, 2011 in conformity with accounting principles generally accepted in the United States of America. In addition, in our opinion, the financial statement schedule listed in the accompanying index presents fairly, in all material respects, the information set forth therein when read in conjunction with the related consolidated financial statements. Also in our opinion, the Company and its subsidiaries maintained, in all material respects, effective internal control over financial reporting as of December 31, 2011, based on criteria established in Internal Control - Integrated Framework issued by the Committee of Sponsoring Organizations of the Treadway Commission (COSO). The Company’s management is responsible for these financial statements and financial statement schedule, for maintaining effective internal control over financial reporting and for its assessment of the effectiveness of internal control over financial reporting, included in Management’s Report on Internal Control over Financial Reporting appearing under Item 9A. Our responsibility is to express opinions on these financial statements, on the financial statement schedule, and on the Company’s internal control over financial reporting based on our integrated audits. We conducted our audits in accordance with the standards of the Public Company Accounting Oversight Board (United States). Those standards require that we plan and perform the audits to obtain reasonable assurance about whether the financial statements are free of material misstatement and whether effective internal control over financial reporting was maintained in all material respects. Our audits of the financial statements included examining, on a test basis, evidence supporting the amounts and disclosures in the financial statements, assessing the accounting principles used and significant estimates made by management, and evaluating the overall financial statement presentation. Our audit of internal control over financial reporting included obtaining an understanding of internal control over financial reporting, assessing the risk that a material weakness exists, and testing and evaluating the design and operating effectiveness of internal control based on the assessed risk. Our audits also included performing such other procedures as we considered necessary in the circumstances. We believe that our audits provide a reasonable basis for our opinions.
A company’s internal control over financial reporting is a process designed to provide reasonable assurance regarding the reliability of financial reporting and the preparation of financial statements for external purposes in accordance with generally accepted accounting principles. A company’s internal control over financial reporting includes those policies and procedures that (i) pertain to the maintenance of records that, in reasonable detail, accurately and fairly reflect the transactions and dispositions of the assets of the company; (ii) provide reasonable assurance that transactions are recorded as necessary to permit preparation of financial statements in accordance with generally accepted accounting principles, and that receipts and expenditures of the company are being made only in accordance with authorizations of management and directors of the company; and (iii) provide reasonable assurance regarding prevention or timely
detection of unauthorized acquisition, use, or disposition of the company’s assets that could have a material effect on the financial statements.
Because of its inherent limitations, internal control over financial reporting may not prevent or detect misstatements. Also, projections of any evaluation of effectiveness to future periods are subject to the risk that controls may become inadequate because of changes in conditions, or that the degree of compliance with the policies or procedures may deteriorate.
/s/ PricewaterhouseCoopers LLP
McLean, Virginia
February 29, 2012
ORBITAL SCIENCES CORPORATION
CONSOLIDATED INCOME STATEMENTS
(In thousands, except per share data)
| | | Years Ended December 31, | |
| | | 2011 | | | 2010 | | | 2009 | |
| | | | | | | | | | |
| Revenues | | $ | 1,345,923 | | | $ | 1,294,577 | | | $ | 1,125,295 | |
| Cost of revenues | | | 1,074,389 | | | | 1,007,668 | | | | 890,313 | |
| Research and development expenses | | | 102,751 | | | | 122,270 | | | | 109,754 | |
| Selling, general and administrative expenses | | | 88,989 | | | | 91,625 | | | | 72,935 | |
| Income from operations | | | 79,794 | | | | 73,014 | | | | 52,293 | |
| Interest income and other | | | 19,335 | | | | 1,848 | | | | 4,968 | |
| Interest expense | | | (11,096 | ) | | | (9,778 | ) | | | (9,039 | ) |
| Income before income taxes | | | 88,033 | | | | 65,084 | | | | 48,222 | |
| Income tax provision | | | (20,639 | ) | | | (17,615 | ) | | | (11,615 | ) |
| Net income | | $ | 67,394 | | | $ | 47,469 | | | $ | 36,607 | |
| | | | | | | | | | | | | |
| | | | | | | | | | | | | |
| Basic income per share: | | $ | 1.14 | | | $ | 0.81 | | | $ | 0.64 | |
| | | | | | | | | | | | | |
| Diluted income per share: | | $ | 1.13 | | | $ | 0.81 | | | $ | 0.63 | |
See accompanying notes to consolidated financial statements.
ORBITAL SCIENCES CORPORATION
CONSOLIDATED BALANCE SHEETS
(In thousands, except share data)
| | | December 31, | |
| | | 2011 | | | 2010 | |
| ASSETS | | | | | | |
| Current assets: | | | | | | |
| Cash and cash equivalents | | $ | 259,219 | | | $ | 252,415 | |
| Receivables | | | 333,467 | | | | 326,543 | |
| Inventories | | | 64,335 | | | | 56,217 | |
| Deferred income taxes, net | | | 51,413 | | | | 24,348 | |
| Other current assets | | | 46,965 | | | | 18,111 | |
| Total current assets | | | 755,399 | | | | 677,634 | |
| Investments | | | 8,500 | | | | 8,600 | |
| Property, plant and equipment, net | | | 259,972 | | | | 232,706 | |
| Goodwill | | | 75,261 | | | | 74,747 | |
| Deferred income taxes, net | | | 2,731 | | | | 47,806 | |
| Other non-current assets | | | 28,937 | | | | 21,043 | |
| Total assets | | $ | 1,130,800 | | | $ | 1,062,536 | |
| | | | | | | | | |
| LIABILITIES AND STOCKHOLDERS’ EQUITY | | | | | | | | |
| Current liabilities: | | | | | | | | |
| Accounts payable | | $ | 13,444 | | | $ | 19,928 | |
| Accrued expenses | | | 220,935 | | | | 228,907 | |
| Deferred revenues and customer advances | | | 104,970 | | | | 112,182 | |
| Total current liabilities | | | 339,349 | | | | 361,017 | |
| Long-term obligations | | | 131,182 | | | | 125,535 | |
| Other non-current liabilities | | | 16,990 | | | | 7,367 | |
| Total liabilities | | | 487,521 | | | | 493,919 | |
| Commitments and contingencies | | | | | | | | |
| Stockholders’ equity: | | | | | | | | |
| Preferred Stock, par value $.01; 10,000,000 shares authorized, none outstanding | | | — | | | | — | |
| Common Stock, par value $.01; 200,000,000 shares authorized, 58,914,802 and | | | | | | | | |
| 58,239,875 shares outstanding, respectively | | | 589 | | | | 582 | |
| Additional paid-in capital | | | 566,624 | | | | 558,015 | |
| Accumulated other comprehensive loss | | | (3,359 | ) | | | (2,011 | ) |
| Retained earnings | | | 79,425 | | | | 12,031 | |
| Total stockholders’ equity | | | 643,279 | | | | 568,617 | |
| Total liabilities and stockholders’ equity | | $ | 1,130,800 | | | $ | 1,062,536 | |
See accompanying notes to consolidated financial statements.
ORBITAL SCIENCES CORPORATION
CONSOLIDATED STATEMENTS OF STOCKHOLDERS’ EQUITY
(In thousands)
| | | | | | | | | | | | Accumulated | | | Retained | | | | |
| | | | | | | | | Additional | | | Other | | | Earnings | | | | |
| | | Common Stock | | | Paid-In | | | Comprehensive | | | (Accumulated | | | | |
| | | Shares | | | Amount | | | Capital | | | Income (Loss) | | | Deficit) | | | Total | |
| Balance, December 31, 2008 | | | 57,499 | | | $ | 575 | | | $ | 547,389 | | | $ | (2,813 | ) | | $ | (72,045 | ) | | $ | 473,106 | |
| Shares issued to employees, | | | | | | | | | | | | | | | | | | | | | | | | |
| officers and directors | | | 550 | | | | 6 | | | | 2,474 | | | | | | | | | | | | 2,480 | |
| Repurchases of common stock | | | (1,169 | ) | | | (12 | ) | | | (16,669 | ) | | | | | | | | | | | (16,681 | ) |
| Stock-based compensation, net | | | | | | | | | | | 7,048 | | | | | | | | | | | | 7,048 | |
| Tax effect of stock-based | | | | | | | | | | | | | | | | | | | | | | | | |
| compensation, net | | | | | | | | | | | (1,007 | ) | | | | | | | | | | | (1,007 | ) |
| Comprehensive income (loss): | | | | | | | | | | | | | | | | | | | | | | | | |
| Net income | | | | | | | | | | | | | | | | | | | 36,607 | | | | 36,607 | |
| Unrealized loss on investments | | | | | | | | | | | | | | | (300 | ) | | | | | | | (300 | ) |
| Defined benefit plans, net of tax | | | | | | | | | | | | | | | | | | | | | | | | |
| of $752 | | | | | | | | | | | | | | | 1,207 | | | | | | | | 1,207 | |
| Comprehensive income | | | | | | | | | | | | | | | | | | | | | | | 37,514 | |
| Balance, December 31, 2009 | | | 56,880 | | | | 569 | | | | 539,235 | | | | (1,906 | ) | | | (35,438 | ) | | | 502,460 | |
| Shares issued to employees, | | | | | | | | | | | | | | | | | | | | | | | | |
| officers and directors | | | 1,360 | | | | 13 | | | | 12,113 | | | | | | | | | | | | 12,126 | |
| Stock-based compensation, net | | | | | | | | | | | 5,589 | | | | | | | | | | | | 5,589 | |
| Tax effect of stock-based | | | | | | | | | | | | | | | | | | | | | | | | |
| compensation, net | | | | | | | | | | | 1,078 | | | | | | | | | | | | 1,078 | |
| Comprehensive income (loss): | | | | | | | | | | | | | | | | | | | | | | | | |
| Net income | | | | | | | | | | | | | | | | | | | 47,469 | | | | 47,469 | |
| Unrealized loss on investments | | | | | | | | | | | | | | | (250 | ) | | | | | | | (250 | ) |
| Defined benefit plans, net of tax | | | | | | | | | | | | | | | | | | | | | | | | |
| of $90 | | | | | | | | | | | | | | | 145 | | | | | | | | 145 | |
| Comprehensive income | | | | | | | | | | | | | | | | | | | | | | | 47,364 | |
| Balance, December 31, 2010 | | | 58,240 | | | | 582 | | | | 558,015 | | | | (2,011 | ) | | | 12,031 | | | | 568,617 | |
| Shares issued to employees, | | | | | | | | | | | | | | | | | | | | | | | | |
| officers and directors | | | 675 | | | | 7 | | | | 2,884 | | | | | | | | | | | | 2,891 | |
| Stock-based compensation, net | | | | | | | | | | | 4,490 | | | | | | | | | | | | 4,490 | |
| Tax effect of stock-based | | | | | | | | | | | | | | | | | | | | | | | | |
| compensation, net | | | | | | | | | | | 1,235 | | | | | | | | | | | | 1,235 | |
| Comprehensive income (loss): | | | | | | | | | | | | | | | | | | | | | | | | |
| Net income | | | | | | | | | | | | | | | | | | | 67,394 | | | | 67,394 | |
| Unrealized loss on investments | | | | | | | | | | | | | | | (100 | ) | | | | | | | (100 | ) |
| Defined benefit plans, net of tax | | | | | | | | | | | | | | | | | | | | | | | | |
| of ($773) | | | | | | | | | | | | | | | (1,248 | ) | | | | | | | (1,248 | ) |
| Comprehensive income | | | | | | | | | | | | | | | | | | | | | | | 66,046 | |
| Balance, December 31, 2011 | | | 58,915 | | | $ | 589 | | | $ | 566,624 | | | $ | (3,359 | ) | | $ | 79,425 | | | $ | 643,279 | |
See accompanying notes to consolidated financial statements.
ORBITAL SCIENCES CORPORATION
CONSOLIDATED STATEMENTS OF CASH FLOWS
(In thousands)
| | | Years Ended December 31, | |
| | | 2011 | | | 2010 | | | 2009 | |
| | | | | | | | | | |
| Operating Activities: | | | | | | | | | |
| Net income | | $ | 67,394 | | | $ | 47,469 | | | $ | 36,607 | |
| Adjustments to reconcile net income to net cash provided by (used in) | | | | | | | | | | | | |
| operating activities: | | | | | | | | | | | | |
| Depreciation and amortization expense | | | 32,739 | | | | 26,186 | | | | 19,208 | |
| Deferred income taxes | | | 18,788 | | | | 15,985 | | | | 9,530 | |
| Stock-based compensation | | | 6,222 | | | | 7,022 | | | | 9,236 | |
| Amortization of debt costs | | | 6,590 | | | | 5,768 | | | | 5,399 | |
| Investment gains and losses, net | | | — | | | | — | | | | 3,300 | |
| Other | | | (1,703 | ) | | | (2,113 | ) | | | (3,933 | ) |
| Changes in assets and liabilities, net of business acquisition: | | | | | | | | | | | | |
| Receivables | | | (6,969 | ) | | | (117,083 | ) | | | 3,629 | |
| Inventories | | | (8,118 | ) | | | (17,555 | ) | | | (5,228 | ) |
| Other assets | | | (37,346 | ) | | | (4,585 | ) | | | (13,203 | ) |
| Accounts payable and accrued expenses | | | (14,915 | ) | | | 53,830 | | | | (10,959 | ) |
| Deferred revenue and customer advances | | | (7,212 | ) | | | (14,874 | ) | | | 46,997 | |
| Other liabilities | | | 9,666 | | | | (529 | ) | | | 2,200 | |
| Net cash provided by (used in) operating activities | | | 65,136 | | | | (479 | ) | | | 102,783 | |
| Investing Activities: | | | | | | | | | | | | |
| Capital expenditures | | | (59,815 | ) | | | (83,702 | ) | | | (45,343 | ) |
| Acquisition of business | | | — | | | | (55,000 | ) | | | — | |
| Net proceeds from sales of investments | | | — | | | | 4,250 | | | | 1,138 | |
| Net proceeds from sales of property | | | — | | | | — | | | | 100 | |
| Net cash used in investing activities | | | (59,815 | ) | | | (134,452 | ) | | | (44,105 | ) |
| Financing Activities: | | | | | | | | | | | | |
| Net proceeds from issuance of common stock | | | 2,890 | | | | 12,126 | | | | 2,480 | |
| Repurchase and retirement of common stock | | | — | | | | — | | | | (16,681 | ) |
| Tax benefit of stock-based compensation | | | 1,677 | | | | 2,234 | | | | 202 | |
| Debt issuance costs | | | (3,084 | ) | | | — | | | | — | |
| Net cash provided by (used in) financing activities | | | 1,483 | | | | 14,360 | | | | (13,999 | ) |
| Net increase (decrease) in cash and cash equivalents | | | 6,804 | | | | (120,571 | ) | | | 44,679 | |
| Cash and cash equivalents, beginning of year | | | 252,415 | | | | 372,986 | | | | 328,307 | |
| Cash and cash equivalents, end of year | | $ | 259,219 | | | $ | 252,415 | | | $ | 372,986 | |
See accompanying notes to consolidated financial statements.
ORBITAL SCIENCES CORPORATION
NOTES TO CONSOLIDATED FINANCIAL STATEMENTS
1. Business and Summary of Significant Accounting Policies
Business Operations
Orbital Sciences Corporation (together with its subsidiaries, “Orbital” or the “company”), a Delaware corporation, develops and manufactures small- and medium-class rockets and space systems for commercial, military and civil government customers.
Principles of Consolidation
The consolidated financial statements include the accounts of Orbital and its wholly owned subsidiaries. All significant intersegment balances and transactions have been eliminated.
Preparation of Consolidated Financial Statements
The preparation of consolidated financial statements in conformity with generally accepted accounting principles in the United States requires management to make estimates and assumptions, including estimates of future contract costs and earnings. Such estimates and assumptions affect the reported amounts of assets and liabilities at the date of the consolidated financial statements and the reported amounts of revenues and earnings during the current reporting period. Management periodically assesses and evaluates the adequacy and/or deficiency of estimated liabilities recorded for various reserves, liabilities, contract risks and uncertainties. Actual results could differ from these estimates.
All financial amounts are stated in U.S. dollars unless otherwise indicated.
Revenue Recognition
Orbital’s revenues are derived primarily from long-term contracts. Revenues on long-term contracts are recognized using the percentage-of-completion method of accounting. Such revenues are recorded based on the percentage that costs incurred to date bear to the most recent estimates of total costs to complete each contract. Estimating future revenues, costs and profit, is a process requiring a high degree of management judgment, including management’s assumptions regarding the company’s operational performance as well as general economic conditions. In the event of a change in total estimated contract revenue, cost or profit, the cumulative effect of such change is recorded in the period the change in estimate occurs. Frequently, the period of performance of a contract extends over a long period of time and, as such, revenue recognition and the company’s profitability from a particular contract may be adversely affected to the extent that estimated costs to complete or incentive or award fee estimates are revised, delivery schedules are delayed, performance-based milestones are not achieved or progress under a contract is otherwise impeded. Accordingly, the company’s recorded revenues and operating profit from period to period can fluctuate significantly. In the
event cost estimates indicate a loss on a contract, the total amount of such loss, excluding general and administrative expenses, is recorded in the period in which the loss is first estimated.
Many of the company’s contracts include provisions that increase or decrease contract value based on performance in relation to established targets or customer evaluations. Mission success milestones and incentive and award fees are included in estimated contract revenue when the company is able to make reasonable predictions about whether the performance targets will be achieved and make dependable estimates of such amounts based upon the company’s historical experience with similar types of activities and other objective criteria. The company includes the estimated amount of mission success milestones and incentive and award fees in estimated contract revenue at the inception of each contract, with reassessments made each quarter throughout the period of contract performance. If performance under such contracts were to differ from previous assumptions, or if the company were to revise its estimates or assumptions, current period revenues and profit would be adjusted and could fluctuate significantly. The company’s assessments are guided by the historical performance of the company’s products and product families, the reliability record of the technology employed and assessments of technological considerations for each contract.
As part of the company’s risk management strategy, the company generally insures significant mission success milestones. Insurance recoveries are recorded as other income in the consolidated financial statements. The company recognized insurance recoveries of $17.8 million, $0 and $5.3 million for the years ended December 31, 2011, 2010 and 2009, respectively.
Property, Plant and Equipment
Property, plant and equipment are stated at cost. Major improvements are capitalized while expenditures for maintenance, repairs and minor improvements are charged to expense. When assets are retired or otherwise disposed of, the assets and related accumulated depreciation and amortization are eliminated from the accounts and any resulting gain or loss is reflected in operations. Depreciation expense is determined using the straight-line method based on the following useful lives:
| Buildings | 20 years |
| Machinery, equipment and software | 3 to 12 years |
| Leasehold improvements | Shorter of estimated useful life or lease term |
Recoverability of Long-Lived Assets
Orbital’s policy is to evaluate its long-lived assets for impairment whenever events or changes in circumstances indicate that the carrying amount of an asset may not be recoverable. When an evaluation indicates that an impairment has occurred, a loss is recognized and the asset is adjusted to its estimated fair value. Given the inherent technical and commercial risks within the aerospace industry and the special purpose use of certain of the company’s assets, future impairment charges could be required if the company were to change its current expectation that it will recover the carrying amount of its long-lived assets from future operations.
Income Taxes
Orbital accounts for income taxes using the asset and liability method. Under this method, deferred tax assets and liabilities are recorded for the estimated future tax consequences attributable to differences between the financial statement carrying amounts of assets and liabilities and their respective tax bases. Deferred tax assets and liabilities are measured using enacted tax rates expected to apply to taxable income in the years in which those temporary differences are expected to be recovered or settled. The effect of a tax rate change on deferred tax assets and liabilities is recognized in income in the period that includes the enactment date. The company records valuation allowances to reduce net deferred tax assets to the amount considered more likely than not to be realized. Changes in estimates of future taxable income can materially change the amount of such valuation allowances.
Earnings per Share
Basic earnings per share is calculated using the weighted-average number of common shares outstanding during the periods. Diluted earnings per share includes the weighted-average effect of all dilutive securities outstanding during the periods.
The computation of basic and diluted earnings per share is as follows (dollars in thousands, except per share amounts):
| | | | | Years Ended December 31, | |
| Numerator | | 2011 | | | 2010 | | | 2009 | |
| | | Net Income | | $ | 67,394 | | | $ | 47,469 | | | $ | 36,607 | |
| | | Percentage allocated to shareholders (1) | | | 99.1% | | | | 99.0% | | | | 98.8% | |
| | | Numerator for basic and diluted earnings per share | | $ | 66,787 | | | $ | 46,994 | | | $ | 36,168 | |
| | | | | | | | | | | | | | | |
| Denominator | | | | | | | | | | | | |
| | | Denominator for basic earnings per share - | | | | | | | | | | | | |
| | | weighted-average shares outstanding | | | 58,531 | | | | 57,683 | | | | 56,787 | |
| | | Dilutive effect of stock options and restricted stock units | | | 596 | | | | 652 | | | | 709 | |
| | | Denominator for diluted earnings per share | | | 59,127 | | | | 58,335 | | | | 57,496 | |
| | | | | | | | | | | | | | | |
| Per share income | | | | | | | | | | | | |
| | | Basic | | $ | 1.14 | | | $ | 0.81 | | | $ | 0.64 | |
| | | Diluted | | | 1.13 | | | | 0.81 | | | | 0.63 | |
| _________________________ | | | | | | | | | | | | |
| | | (1) | Basic weighted-average shares outstanding | | | 58,531 | | | | 57,683 | | | | 56,787 | |
| | | | Basic weighted-average shares outstanding and | | | | | | | | | | | | |
| | | | unvested restricted stock units expected to vest | | | 59,078 | | | | 58,254 | | | | 57,494 | |
| | | | Percentage allocated to shareholders | | | 99.1% | | | | 99.0% | | | | 98.8% | |
In the first quarter of 2009, the company adopted a new accounting standard that requires unvested share-based payment awards that have non-forfeitable rights to dividends or dividend equivalents to be treated as a separate class of securities in calculating earnings per share. Certain of the company’s unvested restricted stock units (“RSUs”) contain rights to receive non-forfeitable dividends, and thus are participating securities requiring the two-class method to be used for computing earnings per share. The calculation of earnings per share shown above excludes the income attributable to the unvested RSUs that include rights to receive non-forfeitable dividends from the numerator and excludes the impact of those units from the denominator.
In 2011, 2010 and 2009, diluted weighted-average shares outstanding excluded the effect of the company’s convertible notes that were anti-dilutive.
Cash and Cash Equivalents
Cash and cash equivalents consist of cash and short-term, highly liquid investments with maturities of 90 days or less.
Inventories
Inventory is stated at the lower of cost or estimated market value. Cost is determined on an average cost or specific identification basis. Estimated market value is determined based on assumptions about future demand and market conditions. If actual market conditions were less favorable than those previously projected by management, inventory write-downs could be required.
Investments
The company’s investments in securities are reported at fair value. These investments are classified as available-for-sale securities at the time of purchase and the company re-evaluates such designation as of each balance sheet date. The company evaluates its investments periodically for possible other-than-temporary impairment by reviewing factors such as the length of time and extent to which fair value has been below cost basis, the financial condition of the issuer, the company’s ability and intent to hold the investment for a period of time which may be sufficient for anticipated recovery of market value, and the credit values of debt securities. The company records an impairment expense to the extent that the amortized cost exceeds the estimated fair market value of the securities held and the decline in value is determined to be other-than-temporary. Temporary changes in fair value are included in accumulated other comprehensive income (loss), a component of stockholders’ equity.
Self-Constructed Assets
The company self-constructs some of its ground and airborne support and special test equipment utilized in the manufacture, production and delivery of some of its products. Orbital capitalizes direct costs incurred in constructing such equipment and certain allocated indirect costs. The company also capitalizes certain costs incurred in connection with internally
developed software. These capitalized costs generally include direct software coding costs and certain allocated indirect costs.
Goodwill
Goodwill is comprised of costs in excess of fair values assigned to the underlying net assets of acquired businesses. Goodwill is evaluated for potential impairment at least annually or whenever events or circumstances indicate that the carrying value of goodwill may not be recoverable. The evaluation includes comparing the fair value of a reporting unit to its carrying value. If the carrying value exceeds the fair value, impairment is measured by comparing the derived value of goodwill to its carrying value and recorded in the current period. Goodwill balances are included in the identifiable assets of the business segment to which they have been assigned. There was no impairment of goodwill recorded during the three years ending December 31, 2011.
In September 2011, the Financial Accounting Standards Board (“FASB”) issued Accounting Standards Update (“ASU”) No. 2011-08, “Testing Goodwill for Impairment.” This ASU provides an option for companies to use a qualitative approach to test goodwill for impairment if certain conditions are met. After assessment of certain qualitative factors, if it is determined to be more likely than not that the fair value of a reporting unit is less than its carrying amount, entities must perform the quantitative analysis of the goodwill impairment test. Otherwise, the quantitative test becomes optional. The provisions of this ASU are effective for interim and annual periods beginning after December 15, 2011; however, early adoption is permitted. The company did not elect to adopt this ASU in 2011. The adoption of the ASU is not expected to have a material impact on the company’s financial statements.
Deferred Revenue and Customer Advances
The company accounts for cash receipts from customers in excess of amounts recognized on certain contracts as “deferred revenues and customer advances.” These amounts are recorded as current liabilities since the associated services are performed within one year.
Financial Instruments
Orbital occasionally uses forward contracts and interest rate swaps to manage certain foreign currency and interest rate exposures, respectively. Derivative instruments, such as forward contracts and interest rate swaps, are viewed as risk management tools by Orbital and are not used for trading or speculative purposes. Derivatives used for hedging purposes are generally designated as effective hedges. Accordingly, changes in the fair value of a derivative contract are highly correlated with changes in the fair value of the underlying hedged item at inception of the hedge and over the life of the hedge contract. Derivative instruments are recorded on the balance sheet at fair value. The ineffective portion of all hedges, if any, is recognized currently in earnings. The company did not have any derivative instruments as of December 31, 2011 and 2010.
Research and Development Expenses
Expenditures for company-sponsored research and development projects are expensed as incurred. Research and development projects performed under contracts for customers are recorded as contract costs.
In 2008, the company entered into an agreement with the National Aeronautics and Space Administration (“NASA”) to design, build and demonstrate a new space transportation system under a program called Commercial Orbital Transportation Services (“COTS”), for delivering cargo and supplies to the International Space Station. Under the agreement, as amended, as of December 31, 2011, NASA has agreed to pay the company $288 million in cash milestone payments, partially funding Orbital’s project costs which are currently estimated to be approximately $465 million. The company expects to complete this project in the second quarter of 2012.
The COTS agreement is being accounted for as a best-efforts research and development cost-sharing arrangement. As such, the amounts funded by NASA are recognized proportionally as an offset to the company’s COTS program research and development expenses, including associated general and administrative expenses. As of December 31, 2011 and 2010, deferred revenue and customer advances on the accompanying balance sheet included $6.2 million and $25.2 million, respectively, of cash received from NASA that had not yet been recorded as an offset to research and development expenses. The following table summarizes the COTS program research and development expenses incurred and amounts funded by NASA (in millions):
| | | 2011 | | | 2010 | | | 2009 | | | Inception To Date | |
Research and development costs incurred (1) | | $ | 158.8 | | | $ | 136.5 | | | $ | 96.6 | | | $ | 417.9 | |
| Less amounts funded by NASA | | | (108.0 | ) | | | (69.1 | ) | | | (60.6 | ) | | | (260.3 | ) |
| Net research and development expenses | | $ | 50.8 | | | $ | 67.4 | | | $ | 36.0 | | | $ | 157.6 | |
(1) Includes associated general and administrative expenses.
The company is engaged in a major product development program of a medium capacity rocket named Antares. Approximately $34.3 million, $48.3 million and $66.5 million of the company’s research and development expenses in 2011, 2010 and 2009, respectively, were attributable to the Antares program. Since the inception of the Antares program through December 31, 2011, the company has incurred $192.2 million of such costs.
Stock-Based Compensation
The company determines the fair value of its restricted stock unit grants based on the closing price of Orbital’s common stock on the date of grant. The fair value of stock options granted is determined using the Black-Scholes valuation model, although the company has not granted stock options since 2006. Compensation expense pertaining to stock-based awards is recognized as expense over the service period, net of estimated forfeitures. The company uses the tax law ordering method to determine intra-period tax allocation related to the tax attributes of stock-based compensation.
Subsequent Events
The company has evaluated subsequent events in accordance with U.S. GAAP. Management has evaluated the events and transactions that have occurred through the date the financial statements were issued and noted no items requiring adjustment or disclosure in the financial statements.
Recent Accounting Pronouncements
In June 2011, the FASB issued ASU No. 2011-05, “Presentation of Comprehensive Income.” This ASU intends to enhance comparability and transparency of other comprehensive income components. The guidance provides an option to present total comprehensive income, the components of net income and the components of other comprehensive income either in a single continuous statement of comprehensive income or in two separate but consecutive statements. This ASU eliminates the option to present the components of other comprehensive income as part of the statement of stockholders’ equity. The provisions of this ASU will be applied retrospectively for interim and annual periods beginning after December 15, 2011. There will be no impact on the consolidated financial results as this ASU relates only to financial statement presentation.
In May 2011, the FASB issued ASU No. 2011-04, “Amendments to Achieve Common Fair Value Measurement and Disclosure Requirements in U.S. GAAP and International Financial Reporting Standards (Topic 820)—Fair Value Measurement.” This ASU clarifies certain concepts related to the fair value measurement of financial instruments and related disclosures. The provisions of this ASU are effective prospectively for interim and annual periods beginning on or after December 15, 2011. The company is currently evaluating the impact of the pending adoption of this ASU on its financial statements.
2. Business Acquisitions
On April 2, 2010, the company acquired certain assets and liabilities of the spacecraft development and manufacturing business of General Dynamics Advanced Information Systems, a subsidiary of General Dynamics Corporation (the “Seller”), for $55 million in cash, subject to a potential working capital adjustment. The company’s consolidated financial statements reflect the operations of the acquired business since the date of acquisition. Revenues and operating income of the acquired business were $69.8 million and $7.3 million, respectively, for the period from April 2, 2010 to December 31, 2010.
The acquisition was accounted for under the acquisition method in accordance with Accounting Standards Codification (“ASC”) Topic 805, “Business Combinations.” The allocation of the purchase price for the tangible and identifiable intangible assets acquired and liabilities assumed was based on their estimated fair values at the date of acquisition using established valuation techniques. The company may recognize changes to the acquired assets or liabilities as a result of a working capital adjustment. In 2011, the company recorded an additional $0.5 million of goodwill related to the update of purchase accounting associated with
the acquisition. The company and the Seller are each disputing the other party’s claim for a purchase price adjustment based on the calculation of working capital as of the closing date.
The table below reflects the purchase price allocation (in thousands):
| Property, plant and equipment | | $ | 42,268 | |
| Intangible assets | | | 7,100 | |
| Goodwill | | | 19,710 | |
| Net working capital | | | (14,078 | ) |
| Total purchase price | | $ | 55,000 | |
The purchased intangible assets consist of acquired technology and are being amortized over a 10-year period. The company recorded $19.7 million of goodwill, all of which is deductible for tax purposes. The primary items that generated the goodwill include the value of the synergies between the company and the acquired business and the acquired assembled workforce, neither of which qualifies as an amortizable intangible asset.
3. Segment Information
Orbital’s products and services are grouped into three reportable business segments: launch vehicles, satellites and space systems and advanced space programs. Reportable segments are generally organized based upon product lines. Corporate office transactions that have not been attributed to a particular segment, as well as consolidating eliminations and adjustments, are reported in corporate and other. The primary products and services from which the company’s reportable segments derive revenues are:
| | · | Launch Vehicles - Rockets that are used as small- and medium-class space launch vehicles that place satellites into Earth orbit and escape trajectories, interceptor and target vehicles for missile defense systems and suborbital launch vehicles that place payloads into a variety of high-altitude trajectories. |
| | · | Satellites and Space Systems - Small- and medium-class satellites that are used to enable global and regional communications and broadcasting, conduct space-related scientific research, collect imagery and other remotely-sensed data about the Earth, carry out interplanetary and other deep-space exploration missions and demonstrate new space technologies. |
| | · | Advanced Space Programs - Human-rated space systems for Earth-orbit and deep-space exploration, and small- and medium-class satellites primarily used for national security space programs and to demonstrate new space technologies. |
Intersegment sales are generally negotiated and accounted for under terms and conditions that are similar to other commercial and government contracts. Substantially all of the company’s assets and operations are located within the United States.
The following table presents operating information and identifiable assets by reportable segment (in thousands):
| | | Years Ended December 31, | |
| | | 2011 | | | 2010 | | | 2009 | |
| Launch Vehicles: | | | | | | | | | |
| Revenues | | $ | 483,177 | | | $ | 434,511 | | | $ | 440,172 | |
| Operating income | | | 14,147 | | | | 21,188 | | | | 14,166 | |
| Identifiable assets | | | 210,642 | | | | 212,360 | | | | 151,249 | |
| Capital expenditures | | | 27,999 | | | | 50,001 | | | | 10,115 | |
| Depreciation and amortization | | | 14,293 | | | | 9,412 | | | | 5,954 | |
| Satellites and Space Systems: | | | | | | | | | | | | |
| Revenues | | $ | 553,797 | | | $ | 497,015 | | | $ | 352,252 | |
| Operating income | | | 37,623 | | | | 33,775 | | | | 27,329 | |
| Identifiable assets | | | 282,344 | | | | 268,804 | | | | 178,233 | |
| Capital expenditures | | | 12,433 | | | | 10,675 | | | | 9,931 | |
Depreciation and amortization (2) | | | 6,841 | | | | 5,917 | | | | 4,780 | |
| Advanced Space Programs: | | | | | | | | | | | | |
| Revenues | | $ | 434,036 | | | $ | 423,614 | | | $ | 344,787 | |
| Operating income | | | 28,024 | | | | 20,999 | | | | 10,798 | |
| Identifiable assets | | | 254,769 | | | | 188,184 | | | | 91,981 | |
| Capital expenditures | | | 13,515 | | | | 19,586 | | | | 21,739 | |
Depreciation and amortization (2) | | | 5,033 | | | | 4,522 | | | | 3,983 | |
| Corporate and Other: | | | | | | | | | | | | |
Revenues (1) | | $ | (125,087 | ) | | $ | (60,563 | ) | | $ | (11,916 | ) |
Operating loss (3) | | | — | | | | (2,948 | ) | | | — | |
| Identifiable assets | | | 383,045 | | | | 393,188 | | | | 508,018 | |
| Capital expenditures | | | 5,868 | | | | 3,440 | | | | 3,558 | |
| Depreciation and amortization | | | 6,572 | | | | 6,335 | | | | 4,491 | |
| Consolidated: | | | | | | | | | | | | |
| Revenues | | $ | 1,345,923 | | | $ | 1,294,577 | | | $ | 1,125,295 | |
| Operating income | | | 79,794 | | | | 73,014 | | | | 52,293 | |
| Identifiable assets | | | 1,130,800 | | | | 1,062,536 | | | | 929,481 | |
| Capital expenditures | | | 59,815 | | | | 83,702 | | | | 45,343 | |
| Depreciation and amortization | | | 32,739 | | | | 26,186 | | | | 19,208 | |
___________________
| | (1) | Corporate and other revenues are comprised solely of the elimination of intersegment revenues. Intersegment revenues are summarized as follows (in millions): |
| | | | Years Ended December 31, | |
| | | | 2011 | | | 2010 | | | 2009 | |
| | Launch Vehicles | | $ | 118.3 | | | $ | 53.4 | | | $ | 8.0 | |
| | Satellites and Space Systems | | | 5.6 | | | | 5.9 | | | | 3.7 | |
| | Advanced Space Programs | | | 1.2 | | | | 1.3 | | | | 0.2 | |
| | Total intersegment revenues | | $ | 125.1 | | | $ | 60.6 | | | $ | 11.9 | |
| | (2) | Prior period amounts have been reclassified to conform to the current period presentation. |
| | (3) | The corporate and other operating loss in 2010 is comprised of unallocated corporate-level costs and includes $1.6 million of transaction expenses incurred in connection with a business acquisition (see Note 2). |
4. Export Sales and Major Customers
Orbital’s revenues by geographic area, as determined by customer location, were as follows (in thousands):
| | | Years Ended December 31, | |
| | | 2011 | | | 2010 | | | 2009 | |
| United States | | $ | 1,035,090 | | | $ | 1,084,131 | | | $ | 1,020,722 | |
| Europe | | | 146,623 | | | | 102,106 | | | | 72,955 | |
| Mexico and South America | | | 131,240 | | | | 93,855 | | | | — | |
| East Asia and Australia | | | 32,970 | | | | 14,485 | | | | 31,618 | |
| Total | | $ | 1,345,923 | | | $ | 1,294,577 | | | $ | 1,125,295 | |
Approximately 71%, 74% and 78% of the company’s revenues in 2011, 2010 and 2009, respectively, were generated under contracts with the U.S. Government and its agencies or under subcontracts with the U.S. Government’s prime contractors. All such revenues were recorded in the launch vehicles, satellites and space systems or advanced space programs segments.
5. Balance Sheet Accounts and Supplemental Disclosures
Receivables
The components of receivables were as follows (in thousands):
| | | December 31, | |
| | | 2011 | | | 2010 | |
| Billed | | $ | 77,505 | | | $ | 56,035 | |
| Unbilled | | | 255,209 | | | | 268,836 | |
| Retainages due upon contract completion | | | 753 | | | | 1,672 | |
| Total | | $ | 333,467 | | | $ | 326,543 | |
Approximately 95% of unbilled receivables and retainages at December 31, 2011 are due within one year and will be billed on the basis of contract terms and delivery schedules. Approximately 90% and 87% of the company’s receivables at December 31, 2011 and 2010, respectively, were related to contracts with the U.S. Government and its agencies or under subcontracts with the U.S. Government’s prime contractors. Receivables from non-U.S. customers totaled $29.7 million and $30.8 million at December 31, 2011 and 2010, respectively.
As of December 31, 2011 and 2010, unbilled receivables included $10.2 million and $14.9 million, respectively, of incentive fees on certain completed satellite contracts that become due incrementally over periods of up to 15 years, subject to the achievement of performance criteria.
Certain satellite contracts require the company to refund cash to the customer if performance criteria, which cover periods of up to 15 years, are not satisfied. As of December 31, 2011, the company could be required to refund up to approximately $14.1 million to customers if certain completed satellites were to fail to satisfy performance criteria. Orbital generally procures insurance policies under which the company believes it would recover satellite incentive fees that are not earned and performance refund obligations.
Inventory
As of December 31, 2011 and 2010, inventories were $64.3 million and $56.2 million, respectively. Substantially all of the company’s inventory consisted of component parts, raw materials and milestone payments for future delivery of component parts. The company had no significant allowances for obsolete inventory as of December 31, 2011 and 2010.
Property, Plant and Equipment
Property, plant and equipment consisted of the following (in thousands):
| | | December 31, | |
| | | 2011 | | | 2010 | |
| Land | | $ | 10,656 | | | $ | 9,113 | |
| Buildings and leasehold improvements | | | 80,885 | | | | 78,534 | |
| Furniture, fixtures and equipment | | | 262,906 | | | | 215,623 | |
| Assets under construction | | | 65,645 | | | | 65,087 | |
| Software and other | | | 27,063 | | | | 23,791 | |
| | | | 447,155 | | | | 392,148 | |
| Accumulated depreciation and amortization | | | (187,183 | ) | | | (159,442 | ) |
| Total | | $ | 259,972 | | | $ | 232,706 | |
Depreciation expense for the years ended December 31, 2011, 2010 and 2009 was $32.0 million, $25.7 million and $19.2 million, respectively.
Goodwill and Intangible Assets
Changes in the carrying amount of the company’s goodwill balances by reportable business segment are as follows (in thousands):
| | | Launch Vehicles | | | Satellites and Space Systems | | | Advanced Space Programs | | | Total | |
| Balance at December 31, 2010 | | $ | 10,310 | | | $ | 53,301 | | | $ | 11,136 | | | $ | 74,747 | |
| Goodwill resulting from business combination | | | - | | | | 216 | | | | 298 | | | | 514 | |
| Balance at December 31, 2011 | | $ | 10,310 | | | $ | 53,517 | | | $ | 11,434 | | | $ | 75,261 | |
Intangible assets consist of technology assets that were acquired in the 2010 spacecraft business acquisition. As of December 31, 2011 and 2010, the balance of intangible assets was $5.9 million and $6.6 million, respectively, reported in “other non-current assets.” Amortization expense for the years ended December 31, 2011 and 2010 was $0.7 million and $0.5 million, respectively.
Accrued expenses consisted of the following (in thousands):
| | | December 31, | |
| | | 2011 | | | 2010 | |
| Contract related accruals | | $ | 142,735 | | | $ | 150,831 | |
| Payroll related accruals | | | 64,321 | | | | 60,997 | |
| Interest | | | 1,946 | | | | 1,627 | |
| Other | | | 11,933 | | | | 15,452 | |
| Total | | $ | 220,935 | | | $ | 228,907 | |
Cash Flow
Cash payments for interest and income taxes were as follows (in thousands):
| | | Years Ended December 31, | |
| | | 2011 | | | 2010 | | | 2009 | |
| Interest paid | | $ | 4,158 | | | $ | 3,735 | | | $ | 3,741 | |
| Income taxes paid | | | 2,242 | | | | 2,531 | | | | 1,309 | |
6. Debt Obligations
Convertible Notes
On December 13, 2006, the company issued $143.8 million of 2.4375% convertible senior subordinated notes due 2027 with interest payable semi-annually each January 15 and July 15. Debt issuance costs incurred in connection with the convertible notes amounted to $3.4 million and are being amortized to interest expense over a seven-year term.
The convertible notes are convertible into cash, or a combination of cash and common stock at the company’s election, based on an initial conversion rate of 40.8513 shares of the company’s common stock per $1,000 in principal amount of the convertible notes (equivalent to an initial conversion price of approximately $24.48 per share) only under any of the following circumstances: (1) if, prior to January 13, 2027, the closing sale price of the common stock of Orbital for at least 20 trading days (whether or not consecutive) in the period of 30 consecutive trading days ending on the last trading day of the preceding calendar quarter is greater than 130% of the conversion price per common share in effect on the applicable trading day; (2) if, prior to January 13, 2027, during the 5 consecutive trading-day period following any 5 consecutive trading-day period in which the trading price of the convertible notes was less than 98% of the product of the closing sale price of the company’s common stock multiplied by the applicable conversion rate; (3) if the convertible notes have been called for redemption, at any time prior to the close of business on the third business day prior to the redemption date; (4) if the company elects to distribute to all holders of Orbital common stock certain rights entitling them to purchase, for a period expiring within 60 days, the company’s common stock at less than the average of the closing sale prices of Orbital common stock for the 10 consecutive trading days immediately preceding the declaration date of such distribution; (5) if the company elects to
distribute to all holders of Orbital common stock, assets, debt securities or certain rights topurchase securities of the company, which distribution has a per share value exceeding 10% of the closing sale price of Orbital common stock on the trading day immediately preceding the declaration date of such distribution; or (6) during a specified period, if a ‘‘fundamental change’’ (as such term is defined in the indenture governing the convertible notes) occurs. The conversion rate is subject to adjustments in certain circumstances set forth in the indenture governing the convertible notes.
Upon conversion of the convertible notes, the company will deliver in respect of each $1,000 principal amount of notes tendered for conversion (1) an amount in cash (“principal return”) equal to the lesser of (a) the principal amount of the converted notes and (b) the conversion value (such value equal to the conversion rate multiplied by the average price of the company’s common shares over a 10 consecutive-day trading period) and (2) if the conversion value is greater than the principal return, an amount in cash or common stock, or a combination thereof (at the company’s option) with a value equal to the difference between the conversion value and the principal return.
At any time on or after January 21, 2014, the convertible notes are subject to redemption at the option of Orbital, in whole or in part, for cash equal to 100% of the principal amount of the convertible notes, plus unpaid interest, if any, accrued to the redemption date.
Holders of the convertible notes may require the company to repurchase the convertible notes, in whole or in part, on January 15, 2014, January 15, 2017 or January 15, 2022, for cash equal to 100% of the principal amount of the convertible notes plus unpaid interest, if any, accrued to the redemption date. In addition, holders of the convertible notes may require the company to repurchase the convertible notes, in whole or in part, for cash equal to 100% of the principal amount of the convertible notes, plus unpaid interest, if any, accrued to the redemption date, if a ‘‘fundamental change’’ occurs prior to maturity of the convertible notes.
Credit Facility
In June 2011, the company entered into a five-year $300 million revolving secured credit facility (the “Credit Facility”), which replaced the company’s $100 million revolving credit facility that was established in 2007. All letters of credit outstanding under the terminated credit facility were transferred to the Credit Facility. The Credit Facility has a scheduled maturity date of June 7, 2016. The company’s obligations under the Credit Facility are secured by substantially all of the company’s assets except for real property.
The Credit Facility provides capacity for up to $300 million of revolving loans and permits the company to utilize up to $125 million of such capacity for the issuance of standby letters of credit. The company has the option to increase the amount of the Credit Facility by up to $150 million to the extent that any one or more lenders, whether or not currently party to the Credit Facility, commits to be a lender for such amount. Loans under the Credit Facility bear interest at LIBOR plus an applicable margin ranging from 1.75% to 2.50%, with the applicable margin varying according to the company’s total leverage ratio, or, at the election of the company, at a prime base rate plus 0.75% to 1.50%. Letters of credit issued under the Credit Facility accrue
fees at a rate equal to the applicable margin for LIBOR loans. In addition, the company isrequired to pay a quarterly commitment fee for the unused portion of the Credit Facility, if any, at a rate ranging from 0.30% to 0.50%.
As of December 31, 2011, there were no borrowings under the Credit Facility, although $17.9 million of letters of credit were issued under the Credit Facility. Accordingly, as of December 31, 2011, $282.1 million of the Credit Facility was available for borrowings.
Debt Covenants
Orbital’s Credit Facility contains covenants limiting the company’s ability to, among other things, pay cash dividends, incur debt or liens, redeem or repurchase company stock, enter into transactions with affiliates, make investments, merge or consolidate with others or dispose of assets. In addition, the Credit Facility contains financial covenants with respect to leverage and interest coverage. As of December 31, 2011, the company was in compliance with all of these covenants.
7. Fair Value of Financial Instruments
As of December 31, 2011, the company held investments consisting of three auction-rate debt securities (life insurance company capital reserve funds), an auction-rate equity security (financial guarantee company capital reserve fund) and two preferred stock investments. These investments are classified as available for sale securities and as non-current assets on the company’s balance sheet. Contractual maturities for the debt securities are 13 years or greater and the remaining securities have no fixed maturity. The amortized cost and fair value of these investments were as follows (in thousands):
| | | December 31, 2011 | | | December 31, 2010 | |
| | | Cost or Amortized Cost | | | Net Unrealized Gain (Loss) | | | Fair Value | | | Cost or Amortized Cost | | | Net Unrealized Gain (Loss) | | | Fair Value | |
| Debt | | $ | 7,150 | | | $ | (1,050 | ) | | $ | 6,100 | | | $ | 7,150 | | | $ | (450 | ) | | $ | 6,700 | |
Equity(1) | | | 2,000 | | | | 400 | | | | 2,400 | | | | 2,000 | | | | (100 | ) | | | 1,900 | |
| Total | | $ | 9,150 | | | $ | (650 | ) | | $ | 8,500 | | | $ | 9,150 | | | $ | (550 | ) | | $ | 8,600 | |
| | | | | | | | | | | | | | | | | | | | | | | | | |
_______________________
| | (1) As of December 31, 2011 and 2010, the amortized cost and fair values of the two preferred stock investments were $0. |
The changes in fair value of the investments were as follows (in thousands):
| | | | Years Ended December 31, |
| | | | 2011 | | | 2010 |
| Debt Securities | | | | | |
| Fair value at beginning of period | $ | 6,700 | | $ | 10,900 |
| Temporary impairment (charges) credits, net | | (600) | | | 50 |
| Other-than-temporary impairment charges | | — | | | (850) |
| Sale of security | | — | | | (3,400) |
| | Net change in fair value | | (600) | | | (4,200) |
| Fair value at end of period | $ | 6,100 | | $ | 6,700 |
| | | | | | | |
| Equity Securities | | | | | |
| Fair value at beginning of period | $ | 1,900 | | $ | 2,200 |
| Temporary impairment credits (charges), net | | 500 | | | (300) |
| | Net change in fair value | | 500 | | | (300) |
| Fair value at end of period | $ | 2,400 | | $ | 1,900 |
| | | | | | | |
| Total | | | | | |
| Fair value at beginning of period | $ | 8,600 | | $ | 13,100 |
| Temporary impairment charges, net | | (100) | | | (250) |
| Other-than-temporary impairment charges | | — | | | (850) |
| Sale of security | | — | | | (3,400) |
| | Net change in fair value | | (100) | | | (4,500) |
| Fair value at end of period | $ | 8,500 | | $ | 8,600 |
Auction-rate securities are intended to be structured to provide liquidity through an auction process that resets the applicable interest rate at predetermined calendar intervals. This mechanism allows existing investors either to roll over or liquidate their holdings by selling such securities at par. Since the third quarter of 2007 and through December 31, 2011, the auctions, which occur approximately every 28 days for the auction-rate securities held by the company, have not had sufficient buyers to cover investors’ sell orders, resulting in unsuccessful auctions. These unsuccessful auctions result in a resetting of the interest rate paid on the securities until the next auction date, at which time the process is repeated.
The company has estimated the fair value of these securities based on an income approach using a discounted cash flow analysis which considered the following key inputs: (i) the underlying structure of each security; (ii) the present value of future principal and interest payments discounted at rates considered to reflect current market conditions and the relevant risk associated with each security; and (iii) the time horizon until each security will be sold. The discount rates used in the present value calculations are based on yields on U.S. Treasury securities with similar time horizons plus interest rate risk premiums that are intended to compensate for general market risk and the risk specific to each security. The risk premiums are based upon current credit default swap pricing market data for similar or related securities or credit spreads for corporate bonds with similar credit ratings and similar maturities. The discounted cash flow analysis is a Level 3 valuation.
In 2010, the company sold an auction-rate debt security for $4.3 million resulting in a $0.9 million gain. There was no other sale, purchase, issuance, settlement or transfer activity related to these investments during the periods presented.
For the year ended December 31, 2011, the company did not record any other-than-temporary impairment charges. For the years ended December 31, 2010 and 2009, the company recorded other-than-temporary impairment charges of $0.9 million and $3.3 million, respectively. The company records other-than-temporary impairment charges with respect to equity securities based on the company’s assessment that it is likely that the fair value of the investment will not fully recover in the foreseeable future given the duration, severity and continuing declining trend of the fair value of the security, as well as the uncertain financial condition and near-term prospects of the issuer. The company determines other-than-temporary impairment charges for its debt securities based on credit losses.
At this time it is uncertain if or when the liquidity issues relating to these investments will improve, and there can be no assurance that the market for auction-rate securities will stabilize. The fair value of the auction-rate securities could change significantly in the future and the company may be required to record additional temporary or other-than-temporary impairment charges if there are further reductions in fair value in future periods.
Convertible Notes
The fair value of the 2.4375% convertible notes at December 31, 2011 and 2010 was estimated at approximately $145.2 million and $150.2 million, respectively. The fair value was determined based on market prices quoted by a broker-dealer.
8. Income Taxes
The significant components of the company’s deferred tax assets and liabilities as of December 31, 2011 and 2010 were (in thousands):
| | | December 31, | |
| | | 2011 | | | 2010 | |
| Current Deferred Tax Assets: | | | | | | |
| U.S. federal and state net operating loss carryforwards | | $ | 36,028 | | | $ | 6,020 | |
| Accruals, reserves and other | | | 20,322 | | | | 21,950 | |
| Valuation allowance | | | (4,937 | ) | | | (3,622 | ) |
| Current deferred tax assets, net | | | 51,413 | | | | 24,348 | |
| | | | | | | | | |
| Noncurrent Deferred Tax Assets (Liabilities): | | | | | | | | |
| U.S. federal and state net operating loss carryforwards | | | 8,448 | | | | 28,394 | |
| Capitalized research and development costs | | | 25,374 | | | | 23,214 | |
| Tax credit and capital loss carryforwards | | | 14,885 | | | | 18,695 | |
| Intangible assets and other | | | 2,159 | | | | 517 | |
| Debt costs | | | (4,710 | ) | | | (6,835 | ) |
| Excess tax depreciation and other | | | (38,969 | ) | | | (7,008 | ) |
| | | | 7,187 | | | | 56,977 | |
| Valuation allowance | | | (4,456 | ) | | | (9,171 | ) |
| Noncurrent deferred tax assets, net | | | 2,731 | | | | 47,806 | |
| Total deferred tax assets, net | | $ | 54,144 | | | $ | 72,154 | |
The company’s income tax provisions from continuing operations for the years ended December 31, 2011, 2010 and 2009 were comprised of the following (in thousands):
| | | Years Ended December 31, | |
| | | 2011 | | | 2010 | | | 2009 | |
| Current: | | | | | | | | | |
| Federal | | $ | 384 | | | $ | 960 | | | $ | 1,127 | |
| State | | | 841 | | | | 816 | | | | 1,901 | |
| Foreign | | | 115 | | | | — | | | | — | |
| Total current | | | 1,340 | | | | 1,776 | | | | 3,028 | |
| | | | | | | | | | | | | |
| Deferred: | | | | | | | | | | | | |
| Federal | | | 29,558 | | | | 21,247 | | | | 16,407 | |
| State | | | (10,259 | ) | | | (5,408 | ) | | | (7,820 | ) |
| Total deferred | | | 19,299 | | | | 15,839 | | | | 8,587 | |
| Total income tax provision | | $ | 20,639 | | | $ | 17,615 | | | $ | 11,615 | |
The company’s income before income taxes included $0.4 million of foreign income.
A reconciliation of the statutory federal income tax rate to the company’s effective tax rate for the years ended December 31, 2011, 2010 and 2009 is as follows:
| | | 2011 | | | 2010 | | | 2009 | |
| | | | | | | | | | |
| U.S. federal statutory rate | | | 35.0% | | | | 35.0% | | | | 35.0% | |
| State taxes | | | 3.3 | | | | 3.4 | | | | 3.4 | |
| Extraterritorial income exclusion | | | (8.7 | ) | | | — | | | | — | |
| Research and development credits | | | (4.5 | ) | | | (11.4 | ) | | | (17.1 | ) |
| Other, net | | | (1.7 | ) | | | 0.1 | | | | 2.2 | |
| Changes in valuation allowance, net | | | — | | | | — | | | | 0.6 | |
| Effective rate | | | 23.4% | | | | 27.1% | | | | 24.1% | |
The company recognized research and development tax credits in all periods presented that were primarily attributable to the company’s Antares and COTS research and development programs that are further discussed in Note 1. In addition, the company recorded a favorable income tax adjustment of $7.7 million in 2011 pertaining to the company’s election to claim extraterritorial income exclusions related to prior year export activity.
At December 31, 2011, the company had U.S. federal net operating loss carryforwards of $128.9 million, portions of which expire beginning in 2022 through 2030, and U.S. capital loss carryforwards of $0.8 million, which expire in 2015. The deferred tax assets related to capital losses have been fully offset with a valuation allowance due to the uncertainty of realization. These net operating loss and capital loss carryforwards are subject to certain limitations and other restrictions.
Changes in the company’s unrecognized tax benefits were as follows (in thousands):
| | | 2011 | | | 2010 | | | 2009 | |
| Unrecognized tax benefits at beginning of year | | $ | 12,386 | | | $ | 7,508 | | | $ | 2,891 | |
| Additions based on tax positions related to the current year | | | 2,325 | | | | 4,372 | | | | 3,430 | |
| Additions for tax positions of prior years | | | 2,351 | | | | 562 | | | | 1,187 | |
| Settlements with taxing authorities and other | | | — | | | | (56 | ) | | | — | |
| Reduction resulting from lapse of statute of limitation | | | (330 | ) | | | — | | | | — | |
| Unrecognized tax benefits at end of year | | $ | 16,732 | | | $ | 12,386 | | | $ | 7,508 | |
All unrecognized tax benefits, if recognized, would lower the effective tax rate.
The company is subject to U.S. federal income tax and income tax in multiple state jurisdictions. The company has substantially concluded all income tax matters for years through 1989. In addition, the IRS completed an audit of the company’s 2005 federal income tax return in 2008.
The company’s practice is to recognize interest and/or penalties related to income tax matters in income tax expense. No interest or penalties are recorded in the accompanying consolidated financial statements.
9. Commitments and Contingencies
Leases
Aggregate minimum commitments under non-cancelable operating leases, primarily for office space and equipment rentals, at December 31, 2011 were as follows (in thousands):
| | 2012 | | $ | 18,589 | |
| | 2013 | | | 16,908 | |
| | 2014 | | | 15,165 | |
| | 2015 | | | 15,059 | |
| | 2016 | | | 15,285 | |
| | Thereafter | | | 71,717 | |
| | | | $ | 152,723 | |
Rent expense for 2011, 2010 and 2009 was $19.3 million, $21.4 million and $17.4 million, respectively.
U.S. Government Contracts
The accuracy and appropriateness of costs charged to U.S. Government contracts are subject to regulation, audit and possible disallowance by the Defense Contract Audit Agency or other government agencies. Accordingly, costs billed or billable to U.S. Government customers are subject to potential adjustment upon audit by such agencies.
Most of the company’s U.S. Government contracts are funded incrementally on a year-to-year basis. Changes in government policies, priorities or funding levels through agency or program budget reductions by the U.S. Congress or executive agencies could materially adversely affect the company’s financial condition or results of operations. Furthermore, contracts with the U.S. Government may be terminated or suspended by the U.S. Government at any time, with or without cause. Such contract suspensions or terminations could result in unreimbursable expenses or charges or otherwise adversely affect the company’s financial condition and/or results of operations.
Research and Development Expenses
The company believes that a majority of the company’s research and development expenses are recoverable and billable under contracts with the U.S. Government, from which the majority of the company’s revenues are derived. Charging practices relating to research and development and other costs that may be charged directly or indirectly to government contracts are subject to audit by U.S. Government agencies to determine if such costs are reasonable and allowable under government contracting regulations and accounting practices. The company believes that research and development costs incurred in connection with the company’s Antares development program (see Note 1) are allowable, although the U.S. Government has not yet made a final determination. During 2011, 2010 and 2009, the company incurred $34.3 million, $43.2 million and $41.3 million, respectively, of such expenses that have been recorded as allowable costs. Since the inception of the Antares program through December 31, 2011, the company has incurred $153.5 million of such costs. If such costs were determined to be unallowable, the company could be required to record revenue and profit reductions in future periods.
Terminated Contracts
The Orion Launch Abort System contract and a Taurus XL rocket contract were terminated for convenience by the customer in 2010 and in early 2012, respectively. The company has recognized its best estimates of the revenues and profit that will ultimately be realized in the final termination settlements.
In April 2011, the company negotiated a settlement with its customer with respect to fees earned on the Kinetic Energy Interceptor contract that had been terminated in 2009. The resolution of this matter did not have a material impact on the company’s financial statements.
Litigation
From time to time the company is party to certain litigation or other legal proceedings arising in the ordinary course of business. Because of the uncertainties inherent in litigation, the company cannot predict the outcome of such litigation or other legal proceedings; however, the company believes that none of these matters will have a material adverse effect on the company’s results of operations or financial condition.
Discussions with U.S. Securities and Exchange Commission
In December 2011, the company received a comment letter from the staff of the U.S. Securities and Exchange Commission (“SEC”) in connection with a routine review of the company’s Annual Report on Form 10-K for the year ended December 31, 2010 and Quarterly Report on Form 10-Q for the quarter ended September 30, 2011. The SEC comment letter included, among other things, a request for supplemental information on certain of the company’s accounting policies and disclosures related to the timing of revenue recognition, including for the company’s Commercial Resupply Services ("CRS") contract with NASA to resupply cargo to the International Space Station. The company responded to the SEC comment letter in January 2012. The company is currently engaged in discussions with the SEC staff regarding the company’s assumptions relating primarily to the timing of the recognition of launch and delivery milestones under the CRS contract. The launch and delivery milestones comprise approximately 25% of total CRS contract value. Total CRS contract revenue recognized through December 31, 2011 is approximately $628 million. The company’s consolidated results contained in this Annual Report on Form 10-K were prepared in accordance with our existing accounting policies and using assumptions which the company believes are appropriate based on current facts and circumstances, all of which are consistent with those applied in prior audited periods. Until these discussions are resolved, the company cannot determine if it will be required to supplement its disclosures or restate or make other changes to its historical consolidated financial statements, including the financial information contained in this Annual Report on Form 10-K.
10. Stock Plans and Equity Transactions
Stock Plans
The company’s share-based incentive plans permit the company to grant restricted stock units, restricted stock, incentive or non-qualified stock options, and certain other instruments to employees, directors, consultants and advisers of the company. Restricted stock units and stock options generally vest over three years and are not subject to any performance criteria. Options expire no more than 10 years following the grant date. Shares issued under the plans upon option exercise or stock unit conversion are generally issued from authorized but previously unissued shares.
The company also has an Employee Stock Purchase Plan (“ESPP”) whereby employees may purchase shares of stock at the lesser of 85% of the fair market value of shares at the beginning or the end of quarterly offering periods. As of December 31, 2011, approximately 540,000 shares of common stock were available for purchase under the ESPP. Compensation expense associated with the ESPP was $0.4 million for each of the years ended December 31, 2011, 2010 and 2009, respectively.
Equity Transactions
The following tables summarize information related to stock-based compensation transactions and plans:
| | Restricted Stock Units | | Stock Options |
| | | | | Weighted Average | | | | Weighted Average |
| | Number of | | | Measurement | | Number of | | Exercise |
| | Units | | | Date Fair Value | | Options | | Price |
| Outstanding at December 31, 2008 | 877,794 | | $ | 23.01 | | 2,500,233 | | $ | 9.01 | |
Granted (1) | 86,760 | | | 15.14 | | — | | | — | |
| Exercised | — | | | — | | (107,728) | | | 9.82 | |
| Vested | (466,155) | | | 21.69 | | — | | | — | |
| Forfeited | (24,784) | | | 23.18 | | (7,500) | | | 12.15 | |
| Expired | — | | | — | | (83,700) | | | 27.52 | |
| Outstanding at December 31, 2009 | 473,615 | | | 22.88 | | 2,301,305 | | | 8.29 | |
Granted (1) | 520,470 | | | 14.47 | | — | | | — | |
| Exercised | — | | | — | | (1,038,624) | | | 10.21 | |
| Vested | (300,969) | | | 23.17 | | — | | | — | |
| Forfeited | (8,442) | | | 19.98 | | (2,599) | | | 6.29 | |
| Expired | — | | | — | | (33,500) | | | 16.24 | |
| Outstanding at December 31, 2010 | 684,674 | | | 16.38 | | 1,226,582 | | | 6.46 | |
Granted (1) | 442,110 | | | 17.39 | | — | | | — | |
| Exercised | — | | | — | | (317,647) | | | 4.26 | |
| Vested | (330,356) | | | 18.47 | | — | | | — | |
| Forfeited | (14,316) | | | 16.57 | | (448) | | | 5.79 | |
| Expired | — | | | — | | (6,200) | | | 3.91 | |
| Outstanding at December 31, 2011 | 782,112 | | $ | 16.07 | | 902,287 | (2) | $ | 7.25 | |
____________
| | (1) | The fair value of restricted stock unit grants is determined based on the closing market price of Orbital’s common stock on the date of grant. Such value is recognized as expense over the service period, net of estimated forfeitures. |
| | (2) | The weighted average remaining contractual term is 1.60 years. |
| | | | Options Outstanding (1) |
| | | | | | | Weighted Average | | Weighted |
| Range of | | | Number | | | Remaining Contractual | | Average |
| Exercise Prices | | | Outstanding | | | Term (Years) | | Exercise Price |
| | $4.33 - $7.08 | | | | 545,711 | | | | 1.29 | | | $ | 5.89 | |
| | 7.09 - 12.18 | | | | 306,576 | | | | 1.77 | | | | 8.73 | |
| | 12.19 - 12.98 | | | | 50,000 | | | | 4.01 | | | | 12.98 | |
| | $4.33 - $12.98 | | | | 902,287 | | | | 1.60 | | | $ | 7.25 | |
_____________
| | (1) | All outstanding options were exercisable as of December 31, 2011. |
(in millions) | | Years Ended December 31, | |
| | | 2011 | | | 2010 | | | 2009 | |
| Stock-based compensation expense recognized | | $ | 6.2 | | | $ | 7.0 | | | $ | 9.2 | |
| Income tax benefit related to stock-based compensation expense | | | 2.0 | | | | 2.3 | | | | 3.1 | |
| Intrinsic value of options exercised, computed as the market price | | | | | | | | | | | | |
| on the exercise date less the price paid to exercise the options | | | 3.8 | | | | 8.1 | | | | 0.6 | |
| Cash received from exercise of options | | | 1.4 | | | | 10.6 | | | | 1.1 | |
| Grant date fair value of vested restricted stock units | | | 6.1 | | | | 7.0 | | | | 10.1 | |
| Tax benefit (expense) recorded as an increase (decrease) to additional | | | | | | | | | | | | |
| paid-in capital related to stock-based compensation transactions | | | 1.2 | | | | 1.1 | | | | (1.1 | ) |
| | | As of | |
| (in millions) | | December 31, 2011 | |
| Shares of common stock available for grant under the company’s stock-based incentive plans | | | 0.9 | |
| Aggregate intrinsic value of restricted stock units that are expected to vest | | $ | 11.4 | |
| Unrecognized compensation expense related to non-vested restricted stock units, expected to | | | | |
| be recognized over a weighted-average period of 2.17 years | | | 10.1 | |
| Aggregate intrinsic value of stock options outstanding, all fully vested | | | 6.6 | |
Securities Repurchase Transactions
The company repurchased and retired 1.2 million shares of its common stock at a cost of $16.7 million during 2009. There have been no other repurchases of the company’s common stock since 2009.
11. Employee Benefit Plans
The company has a defined contribution plan (the “Plan”) generally covering all full-time employees. Company contributions to the Plan are made based on plan provisions and at the discretion of the Board of Directors. The company made contributions of $18.6 million, $17.5 million and $16.3 million during 2011, 2010 and 2009, respectively.
The company also has two overfunded defined benefit plans that were frozen upon acquisition in a 1994 business combination. As of December 31, 2011 and 2010, the company had recorded a $2.1 million and $3.9 million asset, respectively, in other non-current assets related to the pension plans. The plans are not significant to the accompanying consolidated financial statements taken as a whole; accordingly, additional related disclosures are omitted from these notes to the consolidated financial statements.
The company has a deferred compensation plan for senior managers and executive officers. At December 31, 2011 and 2010, liabilities related to this plan totaling $10.3 million and $9.5 million, respectively, were included in accrued expenses.
12. Summary of Selected Quarterly Financial Data (Unaudited)
The following is a summary of selected quarterly financial data for the previous two years (in thousands, except per share data):
| | | Quarters Ended | |
| | | March 31 | | | June 30 | | | Sept. 30 | | | Dec. 31 | |
| 2011 | | | | | | | | | | | | |
| Revenues | | $ | 317,703 | | | $ | 350,599 | | | $ | 342,170 | | | $ | 335,451 | |
| Income from operations | | | 10,116 | | | | 22,807 | | | | 24,668 | | | | 22,203 | |
| Net income | | | 12,335 | | | | 21,217 | | | | 16,473 | | | | 17,369 | |
| Basic income per share | | | 0.21 | | | | 0.36 | | | | 0.28 | | | | 0.29 | |
| Diluted income per share | | | 0.21 | | | | 0.36 | | | | 0.28 | | | | 0.29 | |
| | | | | | | | | | | | | | | | | |
| 2010 | | | | | | | | | | | | | | | | |
| Revenues | | $ | 296,190 | | | $ | 337,726 | | | $ | 314,519 | | | $ | 346,142 | |
| Income from operations | | | 17,365 | | | | 12,228 | | | | 19,356 | | | | 24,065 | |
| Net income | | | 9,268 | | | | 6,345 | | | | 10,629 | | | | 21,227 | (1) |
| Basic income per share | | | 0.16 | | | | 0.11 | | | | 0.18 | | | | 0.36 | |
| Diluted income per share | | | 0.16 | | | | 0.11 | | | | 0.18 | | | | 0.36 | |
_____________
| (1) | Includes a reduction in income tax expense resulting from the reinstatement of the federal research and development tax credit that increased net income by $7.4 million. |
| ORBITAL SCIENCES CORPORATION |
SCHEDULE II — VALUATION AND QUALIFYING ACCOUNTS
FORM 10-K FOR THE YEARS ENDED DECEMBER 31, 2011, 2010 AND 2009
(In thousands)
| | | | | | Additions | | | | |
| | | | | | | | | Charged/ | | | | | | | |
| | | Balance at | | | Charged to | | | Credited to | | | | | | Balance | |
| | | Start of | | | Costs and | | | Other | | | | | | at End of | |
| Description | | Period | | | Expenses | | | Accounts | | | Deductions | | | Period | |
| YEAR ENDED DECEMBER 31, 2009 | | | | | | | | | | | | | | | |
| Allowance for doubtful accounts | | $ | 50 | | | $ | — | | | $ | — | | | $ | (50 | ) | | $ | — | |
| Deferred income tax valuation allowance | | | 12,925 | | | | 846 | | | | 115 | | | | (1,232 | ) | | | 12,654 | |
| YEAR ENDED DECEMBER 31, 2010 | | | | | | | | | | | | | | | | | | | | |
| Deferred income tax valuation allowance | | | 12,654 | | | | 350 | | | | 96 | | | | (307 | ) | | | 12,793 | |
| YEAR ENDED DECEMBER 31, 2011 | | | | | | | | | | | | | | | | | | | | |
| Deferred income tax valuation allowance | | | 12,793 | | | | 75 | | | | 38 | | | | (3,513 | ) | | | 9,393 | |
Item 9. Changes in and Disagreements with Accountants on Accounting and Financial Disclosure
None.
Conclusion Regarding the Effectiveness of Disclosure Controls and Procedures and Changes in Internal Control Over Financial Reporting
An evaluation was performed under the supervision and with the participation of our management, including our Chief Executive Officer and Chief Financial Officer, of the effectiveness of our disclosure controls and procedures (as defined in Rules 13a-15(e) and 15d-15(e) under the Securities Exchange Act of 1934, as amended) as of the end of the period covered by this report. Based on that evaluation, the Chief Executive Officer and Chief Financial Officer concluded that these disclosure controls and procedures were effective. There has been no change in our internal control over financial reporting during our most recent fiscal quarter that has materially affected, or is reasonably likely to materially affect, our internal control over financial reporting.
Management’s Report on Internal Control Over Financial Reporting
Management is responsible for establishing and maintaining adequate internal control over financial reporting, as such term is defined in Rule 13a-15(f) under the Securities Exchange Act of 1934, as amended. Under the supervision and with the participation of our management, including the Chief Executive Officer and Chief Financial Officer, we conducted an evaluation of the effectiveness of our internal control over financial reporting based on the framework in Internal Control - Integrated Framework issued by the Committee of Sponsoring Organizations of the Treadway Commission. Our internal control over financial reporting is a process designed to provide reasonable assurance regarding the reliability of financial reporting and the preparation of financial statements for external purposes in accordance with accounting principles generally accepted in the United States of America. Because of its inherent limitations, internal control over financial reporting may not prevent or detect misstatements. Also, projections of any evaluation of effectiveness to future periods are subject to the risk that controls may become inadequate because of changes in conditions or that the degree of compliance with the policies or procedures may deteriorate.
Based on our evaluation under the framework in Internal Control - Integrated Framework, management concluded that our internal control over financial reporting was effective as of December 31, 2011. The effectiveness of the company’s internal control over financial reporting as of December 31, 2011 has been audited by PricewaterhouseCoopers LLP, an independent registered public accounting firm, as stated in their report which is included herein.
None.
The information required by this Item is included under the captions “Executive Officers of the Registrant” in Part I above and under the captions “Proposal 1 - Election of Directors - Directors to be Elected at the 2012 Annual Meeting, - Directors Whose Terms Expire in 2013, - Directors Whose Terms Expire in 2014,” “Corporate Governance - Code of Business Conduct and Ethics,” “Information Concerning the Board of Directors and Its Committees - Board Committees” and “Other Matters - Section 16(a) Beneficial Ownership Reporting Compliance” in our definitive proxy statement to be filed pursuant to Regulation 14A on or about March 7, 2012 and is incorporated herein by reference.
The information required by this Item is included under the captions “Executive Compensation - Compensation Discussion and Analysis, - Human Resources and Compensation Committee Report, - Summary Compensation Table, - Grants of Plan-Based Awards, - Outstanding Equity Awards at Fiscal Year-End, - Option Exercises and Stock Vested, - Pension Benefits, - Nonqualified Deferred Compensation, - Potential Payments Upon Termination or Change in Control,” “Compensation Committee Interlocks and Insider Participation” and “Information Concerning the Board of Directors and Its Committees - Director Compensation” in our definitive proxy statement to be filed pursuant to Regulation 14A on or about March 7, 2012 and is incorporated herein by reference.
Item 12. Security Ownership of Certain Beneficial Owners and Management and Related Stockholder Matters
The information required by this Item is included under the captions “Ownership of Common Stock” and “Proposal 4 — Approval of the Orbital Sciences Corporation Amended and Restated 2005 Stock Incentive Plan — Equity Compensation Plan Information” in our definitive proxy statement to be filed pursuant to Regulation 14A on or about March 7, 2012 and is incorporated herein by reference.
Item 13. Certain Relationships and Related Transactions, and Director Independence
The information required by this Item is included under the caption “Information Concerning the Board of Directors and Its Committees - Related Person Transactions Policy, - Director Independence” in our definitive proxy statement to be filed pursuant to Regulation 14A on or about March 7, 2012 and is incorporated herein by reference.
Item 14. Principal Accounting Fees and Services
The information required by this Item is included under the caption “Other Matters - Fees of Independent Registered Public Accounting Firm, - Pre-Approval of Audit and Non-Audit Services” in our definitive proxy statement to be filed pursuant to Regulation 14A on or about March 7, 2012 and is incorporated herein by reference.
Item 15. Exhibits and Financial Statement Schedule
| (a) | | Documents filed as part of this Report: |
| | | | | | | |
| | | 1. | | Financial Statements. |
| | | | | The following financial statements, together with the report of independent registered public accounting firm, are filed as a part of this report: |
| | | | | | | |
| | | | | | A. | Report of Independent Registered Public Accounting Firm |
| | | | | | B. | Consolidated Income Statements |
| | | | | | C. | Consolidated Balance Sheets |
| | | | | | D. | Consolidated Statements of Stockholders’ Equity |
| | | | | | | |
| | | | | | E. | Consolidated Statements of Cash Flows |
| | | | | | F. | Notes to Consolidated Financial Statements |
| | | | | | | |
| | | 2. | | Financial Statement Schedule. |
| | | | | The following additional financial data are transmitted with this report and should be read in conjunction with the consolidated financial statements contained herein. Schedules other than those listed below have been omitted because they are inapplicable or are not required. |
| | | | | | Schedule II — Valuation and Qualifying Accounts |
| | | | | | | |
| | | 3. | | Exhibits. |
| | | | | A complete listing of exhibits required is given in the Exhibit Index that precedes the exhibits filed with this report. |
| | | | | | | |
| (b) | | See Item 15(a)(3) of this report. |
| (c) | | See Item 15(a)(2) of this report. |
Pursuant to the requirements of Section 13 or 15(d) of the Securities Exchange Act of 1934, the registrant has duly caused this report to be signed on its behalf by the undersigned, thereunto duly authorized.
| Dated: February 29, 2012 | ORBITAL SCIENCES CORPORATION |
| | By: | /s/ David W. Thompson |
| | | David W. Thompson Chairman of the Board, President and Chief Executive Officer |
Pursuant to the requirements of the Securities Exchange Act of 1934, this report has been signed below by the following persons on behalf of the registrant and in the capacities and on the date indicated.
Dated: February 29, 2012
Signature: | | Title: |
/s/ David W. Thompson David W. Thompson | | Chairman of the Board, President and Chief Executive Officer, Director (Principal Executive Officer) |
/s/ Garrett E. Pierce Garrett E. Pierce | | Vice Chairman and Chief Financial Officer, Director (Principal Financial Officer) |
/s/ Hollis M. Thompson Hollis M. Thompson | | Senior Vice President and Controller (Principal Accounting Officer) |
/s/ Kevin P. Chilton Kevin P. Chilton | | Director | |
/s/ Lennard A. Fisk Lennard A. Fisk | | Director | |
/s/ Robert M. Hanisee Robert M. Hanisee | | Director | |
/s/ Robert J. Hermann Robert J. Hermann | | Director | |
/s/ Ronald T. Kadish Ronald T. Kadish | | Director | |
/s/ Janice I. Obuchowski Janice I. Obuchowski | | Director | |
/s/ James G. Roche James G. Roche | | Director | |
/s/ Frank L. Salizzoni Frank L. Salizzoni | | Director | |
/s/ Harrison H. Schmitt Harrison H. Schmitt | | Director | |
/s/ James R. Thompson James R. Thompson | | Director | |
/s/ Scott L. Webster Scott L. Webster | | Director | |
EXHIBIT INDEX
The following exhibits are filed as part of this report. Where such filing is made by incorporation by reference to a previously filed statement or report, such statement or report is identified in parentheses.
Exhibit Number | Description of Exhibit |
| 3.1 | Restated Certificate of Incorporation (incorporated by reference to Exhibit 4.1 to the company’s Registration Statement on Form S-3 (File Number 333-08769) filed and effective on July 25, 1996). |
| 3.2 | Amended and Restated Bylaws (incorporated by reference to Exhibit 3.1 to the company’s Current Report on Form 8-K filed on October 31, 2011). |
| 3.3 | Certificate of Amendment to Restated Certificate of Incorporation, dated April 29, 1997 (incorporated by reference to Exhibit 3.3 to the company’s Annual Report on Form 10-K for the fiscal year ended December 31, 1998). |
| 3.4 | Certificate of Amendment to Restated Certificate of Incorporation, dated April 30, 2003 (incorporated by reference to Exhibit 3.4 to the company’s Quarterly Report on Form 10-Q for the quarter ended June 30, 2003). |
| 4.1 | Form of Certificate of Common Stock (incorporated by reference to Exhibit 4.1 to the company’s Registration Statement on Form S-1 (File Number 33-33453) filed on February 9, 1990 and effective on April 24, 1990). |
| 4.2 | Indenture dated as of December 13, 2006, by and between Orbital Sciences Corporation and The Bank of New York, as Trustee (incorporated by reference to Exhibit 4.1 to the company’s Current Report on Form 8-K filed on December 13, 2006). |
| 4.3 | Form of 2.4375% Convertible Senior Subordinated Note due 2027 (incorporated by reference to Exhibit 4.2 to the company’s Current Report on Form 8-K filed on December 13, 2006). |
| 10.6 | Orbital Sciences Corporation 1997 Stock Option and Incentive Plan, amended as of November 1, 2007 (incorporated by reference to Exhibit 10.8 to the company’s Annual Report on Form 10-K for the year ended December 31, 2007).* |
| 10.7 | Orbital Sciences Corporation 2005 Stock Incentive Plan (incorporated by reference to Exhibit 10.1 to the company’s Current Report on Form 8-K filed on May 2, 2005).* |
10.8 | Orbital Sciences Corporation Nonqualified Management Deferred Compensation Plan, amended and restated as of January 1, 2005 (incorporated by reference to Exhibit 10.13 to the company’s Annual Report on Form10-K for the year ended December 31, 2006).* |
| 10.9 | Executive Relocation Agreement dated as of August 7, 2003, by and between Orbital Sciences Corporation and Ronald J. Grabe, Executive Vice President and General Manager, Launch Systems Group (incorporated by reference to Exhibit 10.1 to the company’s Quarterly Report on Form 10-Q for the quarter ended September 30, 2003).* |
| 10.10 | First Amendment to Executive Relocation Agreement dated as of April 28, 2005, by and between Orbital Sciences Corporation and Ronald J. Grabe, Executive Vice President and General Manager, Launch Systems Group (incorporated by reference to Exhibit 10.4 to the company’s Current Report on Form 8-K filed on May 2, 2005).* |
| 10.11 | Amended and Restated Executive Severance Agreement dated as of November 30, 2007, by and between Orbital Sciences Corporation and Garrett E. Pierce (incorporated by reference to Exhibit 10.2 to the company’s Current Report on Form 8-K filed on December 4, 2007).* |
| 10.12 | Form of Director and Executive Officer Indemnification Agreement (incorporated by reference to Exhibit 10.23 to the company’s Annual Report on Form 10-K for the fiscal year ended December 31, 1998).* |
10.13 | Form of Amended and Restated Executive Change in Control Severance Agreement (incorporated by reference to Exhibit 10.1 to the company’s Current Report on Form 8-K filed on December 4, 2007).* |
| 10.14 | Contract No. NNJ09GA02B for ISS Commercial Resupply Services dated December 23, 2008, by and between Orbital Sciences Corporation and the National Aeronautics and Space Administration (incorporated by reference to Exhibit 10.24 to the company’s Annual Report on Form 10-K for the year ended December 31, 2008).** |
| 10.15 | Task Order No.1 for Contract NNJ09GA02B for ISS Commercial Resupply Services dated December 23, 2008, by and between Orbital Sciences Corporation and the National Aeronautics and Space Administration (incorporated by reference to Exhibit 10.25 to the company’s Annual Report on Form 10-K for the year ended December 31, 2008).** |
| 10.16 | Form of Executive Nonstatutory Stock Option Agreement under the 1997 Stock Option and Incentive Plan (incorporated by reference to Exhibit 10.23 to the company’s Annual Report on Form 10-K for the fiscal year ended December 31, 2004).* |
| 10.17 | Form of Non-Employee Director Nonstatutory Stock Option Agreement under the 1997 Stock Option and Incentive Plan (incorporated by reference to Exhibit 10.24 to the company’s Annual Report on Form 10-K for the fiscal year ended December 31, 2004).* |
| 10.18 | Form of Non-Employee Director Stock Unit Agreement under the 1997 Stock Option and Incentive Plan (filed herewith).* |
| 10.19 | Form of Stock Unit Agreement under the 2005 Stock Incentive Plan (incorporated by reference to Exhibit 10.2 to the company’s Current Report on Form 8-K filed on May 2, 2005).* |
| 10.20 | Form of Stock Unit Agreement under the 2005 Stock Incentive Plan (version 2) (filed herewith).* |
| 12 | Statement re Computation of Ratio of Earnings to Fixed Charges (filed herewith). |
| 23 | Consent of PricewaterhouseCoopers LLP (filed herewith). |
| 31.1 | Certification of Chairman and Chief Executive Officer Pursuant to Section 302 of the Sarbanes-Oxley Act of 2002 (18 U.S.C. Section 1350) (filed herewith). |
| 31.2 | Certification of Vice Chairman and Chief Financial Officer Pursuant to Section 302 of the Sarbanes-Oxley Act of 2002 (18 U.S.C. Section 1350) (filed herewith). |
| 32.1 | Written Statement of Chairman and Chief Executive Officer Pursuant to Section 906 of the Sarbanes-Oxley Act of 2002 (18 U.S.C. Section 1350) (filed herewith). |
| 32.2 | Written Statement of Vice Chairman and Chief Financial Officer Pursuant to Section 906 of the Sarbanes-Oxley Act of 2002 (18 U.S.C. Section 1350) (filed herewith). |
| | |
101.INS† | XBRL Instance Document |
| | |
101.SCH† | XBRL Taxonomy Extension Schema |
| | |
101.CAL† | XBRL Taxonomy Extension Calculation Linkbase |
| | |
101.LAB† | XBRL Taxonomy Extension Labels Linkbase |
101.PRE† | XBRL Taxonomy Extension Presentation Linkbase |
101.DEF† | XBRL Taxonomy Extension Definition Linkbase |
__________
* Management Contract or Compensatory Plan or Arrangement.
| | ** | Certain portions of this Exhibit were omitted by means of redacting a portion of the text in accordance with Rule 0-6 or Rule 24b-2 of the Securities Exchange Act of 1934, as amended. |
| | † | Pursuant to Rule 406T of Regulation S-T, the Interactive Data Files in Exhibit 101 hereto are deemed not filed or part of a registration statement or prospectus for purposes of Sections 11 or 12 of the Securities Act of 1933, as amended, are deemed not filed for purposes of Section 18 of the Securities Exchange Act of 1934, as amended, and otherwise are not subject to liability under those sections. |