UNITED STATES
SECURITIES AND EXCHANGE COMMISSION
Washington, D.C. 20549
FORM N-CSR
CERTIFIED SHAREHOLDER REPORT OF REGISTERED
MANAGEMENT INVESTMENT COMPANIES
Investment Company Act file number 811-05309
First American Investment Funds, Inc.
(Exact name of registrant as specified in charter)
| | | |
800 Nicollet Mall, Minneapolis, MN | |
55402 |
| (Address of principal executive offices) | | (Zip code) |
Charles D. Gariboldi, Jr., 800 Nicollet Mall, Minneapolis, MN 55402
(Name and address of agent for service)
Registrant’s telephone number, including area code: 800-677-3863
Date of fiscal period end: October 31, 2009
Date of reporting period: October 31, 2009
Form N-CSR is to be used by management investment companies to file reports with the Commission not later than 10 days after the transmission to stockholders of any report that is required to be transmitted to stockholders under Rule 30e-1 under the Investment Company Act of 1940 (17 CFR 270.30e-1). The Commission may use the information provided on Form N-CSR in its regulatory, disclosure review, inspection, and policymaking roles.
A registrant is required to disclose the information specified by Form N-CSR, and the Commission will make this information public. A registrant is not required to respond to the collection of information contained in Form N-CSR unless the Form displays a currently valid Office of Management and Budget (“OMB”) control number. Please direct comments concerning the accuracy of the information collection burden estimate and any suggestions for reducing the burden to Secretary, Securities and Exchange Commission, 450 Fifth Street, NW, Washington, DC 20549-0609. The OMB has reviewed this collection of information under the clearance requirements of 44 U.S.C. Section 3507.
Table of Contents
Mutual fund investing involves risk; principal loss is possible.
NOT FDIC INSURED NO BANK GUARANTEE MAY LOSE VALUE
Dear Shareholders:
We invite you to take a few minutes to review the results of the fiscal year ended October 31, 2009.
This report includes portfolio commentaries, comparative performance graphs and tables, complete listings of portfolio holdings, and additional fund information. We hope you will find this helpful in monitoring your investment portfolio.
Also, through our website, firstamericanfunds.com, we provide quarterly performance fact sheets on all First American Funds, the economic outlook as viewed by our senior investment officers, and other information about fund investments and portfolio strategies.
Please contact your financial professional if you have questions about First American Funds or contact First American Investor Services at 800.677.FUND.
We appreciate your investment with First American Funds and look forward to serving your financial needs in the future.
Sincerely,
| | | |
 | |  |
| | | |
Virginia L. Stringer
Chairperson of the Board
First American Investment Funds, Inc. | | Thomas S. Schreier, Jr.
President
First American Investment Funds, Inc. |
First American Funds 2009 Annual Report 1
As a shareholder in First American Funds, you receive shareholder reports semiannually. We strive to present this financial information in an easy-to-understand format; however, for many investors, the information contained in this shareholder report may seem very technical. So, we would like to take this opportunity to explain several sections of the shareholder report.
The Schedule of Investments details all of the securities held in the fund and their related dollar values on the last day of the reporting period. Securities are usually presented by type (common stock, bonds, etc.) and by industry classification (banking, communications, etc.). This information is useful for analyzing how your fund’s assets are invested and seeing where your portfolio manager believes the best opportunities exist to meet your objectives. Holdings are subject to change without notice and do not constitute a recommendation of any individual security. The Notes to the Financial Statements provide additional details on how the securities are valued.
The Statement of Assets and Liabilities lists the assets and liabilities of the fund and presents the fund’s net asset value (“NAV”) per share on the last day of the reporting period. The NAV is calculated by dividing the fund’s net assets (assets minus liabilities) by the number of shares outstanding. The investments, as presented in the Schedule of Investments, comprise substantially all of the fund’s assets. Other assets include cash and receivables for items such as income earned by the fund but not yet received. Liabilities include payables for items such as fund expenses incurred but not yet paid.
The Statement of Operations details the dividends and interest income earned from securities as well as the expenses incurred by the fund during the reporting period. Fund expenses may be reduced through fee waivers or reimbursements. This statement reflects total expenses before any waivers or reimbursements, the amount of waivers and reimbursements (if any), and the net expenses. This statement also shows the net realized and unrealized gains and losses from investments owned during the period. The Notes to Financial Statements provide additional details on investment income and expenses of the fund.
The Statement of Changes in Net Assets describes how the fund’s net assets were affected by its operating results, distributions to shareholders, and shareholder transactions during the reporting period. This statement is important to investors because it shows exactly what caused the fund’s net asset size to change during the period.
The Financial Highlights provide a per-share breakdown of the components that affected the fund’s NAV for the current and past reporting periods. It also shows total return, expense ratios, net investment income ratios, and portfolio turnover rates. The net investment income ratios summarize the income earned less expenses, divided by the average net assets. The expense ratios represent the percentage of average net assets that were used to cover operating expenses during the period. Expense ratios can vary across funds for a number of reasons, including differences in advisory fees and the average shareholder account size. The portfolio turnover rate represents the percentage of the fund’s holdings that have changed over the course of the period, and gives an idea of how long the fund holds onto a particular security. A 100% turnover rate implies that an amount equal to the value of the entire portfolio is turned over in a year through the purchase and sale of securities.
The Notes to Financial Statements disclose the organizational background of the fund, its significant accounting policies, federal tax information, fees and compensation paid to affiliates, and significant risks and contingencies.
We hope this guide to your shareholder report will help you get the most out of this important resource. You can visit First American Funds’ website for other useful information on each of our funds, including fund prices, performance, fund manager bios, dividends, and downloadable fact sheets. For more information, call First American Investor Services at 800.677.FUND or visit firstamericanfunds.com.
2 First American Funds 2009 Annual Report
Equity Income Fund
Investment Objective: long-term growth of capital and income
How did the fund perform for the fiscal year ended October 31, 2009?
The First American Equity Income Fund (the “fund”), Class Y shares, returned 10.51% for the fiscal year ended October 31, 2009 (Class A shares returned 10.32% without taking the sales charge into account). By comparison, the fund’s broad-based benchmark, the Standard & Poor’s 500 Index*, returned 9.80% for the same period and the fund’s custom benchmark, the Standard and Poor’s 500 Dividend Only Stocks Index*, returned 6.30% for the same period.
How did market conditions affect stock market performance during the fiscal year?
The U.S. economy appears to have emerged from the most severe recession of the postwar era during the third quarter of 2009. Gross Domestic Product expanded at a 2.8% annual rate during the quarter, and leading indicators currently suggest that positive growth will be maintained during the final quarter of the year and into 2010. Despite the return to positive growth since midyear, the unemployment rate has continued to rise and reached a new cyclical high of 10.2% in October. The continued increase in the unemployment rate reflects both a historical pattern, where it is common for the unemployment rate to reach its peak after economic activity has reached its trough during the cycle, as well as the subdued pace of the growth recovery to date. In order for the unemployment rate to decline in a sustained manner, economic growth needs to exceed the economy’s potential growth and this set of circumstances has yet to occur. The severity of the recession has left high levels of unutilized resources in the industrial sector and property markets, and the labor market as well. The combined effect of this broad-based resource underutilization has resulted in downward pressure on inflation trends throughout 2009. This trend is expected to remain in place in 2010. The exceptionally high level of unemployment and muted inflation trends have led the Federal Reserve to cut its target overnight lending rate to a range of 0% to 0.25% and engage in a host of nontraditional easing activities, including large-scale purchases of mortgage securities. These activities have resulted in a significant increase in the monetary base, which along with other policy initiatives has worked to restore normal functioning in intrabank funding markets and has supported a broad-based improvement in financial conditions. This policy stance is expected to persist well into 2010 in an effort to support financial conditions and an ongoing recovery in economic activity.
As a result of the broad-based easing of monetary policy and mortgage-related asset purchases by the Federal Reserve, equity markets began moving higher after reaching their low in March, anticipating that these actions would ease financial strains and contribute to a stabilization and improvement in economic and corporate earnings performance. Subsequent economic data and earnings reports validated the initial expectations and have contributed to further gains in the equity markets as the fiscal year progressed.
| |
| * | Unlike mutual funds, index returns do not reflect any expenses, transaction costs, or cash flow effects. |
Top 10 Holdings as of October 31, 20091 (% of net assets)
| | | | | |
| Chevron | | | 3.8 | % |
| Exxon Mobil | | | 3.5 | |
| ConocoPhillips | | | 2.9 | |
| Microsoft | | | 2.5 | |
| McDonald’s | | | 2.5 | |
| Emerson Electric | | | 2.5 | |
| JPMorgan Chase | | | 2.3 | |
| Westar Energy | | | 2.3 | |
| Bank of America | | | 2.2 | |
| E.I. Du Pont de Nemours | | | 2.1
| |
Sector Allocation as of October 31, 20091 (% of net assets)
| | | | | |
| Financials | | | 15.5 | % |
| Energy | | | 15.3 | |
| Industrials | | | 14.4 | |
| Information Technology | | | 13.5 | |
| Healthcare | | | 10.5 | |
| Consumer Discretionary | | | 8.8 | |
| Consumer Staples | | | 8.0 | |
| Telecommunication Services | | | 5.0 | |
| Utilities | | | 4.4 | |
| Materials | | | 4.0 | |
| Short-Term Investment | | | 0.5 | |
Other Assets and Liabilities, Net2 | | | 0.1 | |
| | | | | |
| | | | 100.0 | %
|
| |
| 1 | Fund holdings and sector allocations are subject to change at any time and are not recommendations to buy or sell any security. |
| |
| 2 | Investments typically comprise substantially all of the fund’s net assets. Other assets and liabilities include receivables for items such as income earned but not yet received and payables for items such as fund expenses incurred but not yet paid. |
First American Funds 2009 Annual Report 3
Equity Income Fund
What worked for the fund and why?
The fund’s sector allocation during the fiscal year significantly enhanced fund performance. Relative to the fund’s custom benchmark, the fund was underweight in financials for the early part of the period, when the sector was the weakest performer in the market. Being overweight in information technology, a strong performing sector, also enhanced fund performance. Additionally, the fund made a timely allocation to increase the weights in industrials, consumer discretionary and financial sectors during the period and benefited when these sectors subsequently rebounded. These sector moves reflected the fund managers’ growing conviction during the period that the U.S. financial crisis was ending, as evidenced by the U.S. economy stabilizing, corporate earnings returning to profitability, and the global economy rebounding more quickly and strongly than that of the U.S.
Stock selection contributed positively to fund results in several sectors. In financials, ICICI Bank was a standout performer, reflecting the strong rebound in the Indian stock market and its strong market position in the banking industry of that country. The fund initiated timely positions in several REIT holdings, including Ventas, Mack Cali Realty and Annaly Capital Management, which rebounded sharply as the corporate finance markets recovered. Other strong performers included JP Morgan Chase, BlackRock, and Goldman Sachs Group, leading financial institutions which maintained their strong capital and competitive positions relative to their competition throughout the global financial crisis.
In the consumer discretionary sector, Harley Davidson and J.C. Penney were significant positive contributors, as the fund initiated positions at very compelling valuations and benefited when these stocks rebounded. Industrial sector stock selection was another positive for the period, where a timely purchase of Deere paid off as the stock’s valuation recovered. Emerson Electric, one of the fund’s largest industrial holdings, also outperformed in this sector, reflecting its increasing global opportunities and continued strong financial position. In the materials sector, Praxair, which operates in the industrial gas business, performed strongly, reflecting its leading global market position and continued relatively strong business trends in its overseas markets throughout the period. In the information technology sector, the fund’s emphasis on out-of-favor semi-conductor stocks was rewarded as the fund holdings rebounded, including strong performance from Maxim Integrated Products, Texas Instruments, Intel and QUALCOMM.
What did not work for the fund and why?
The fund’s worst performing sectors relative to the custom benchmark were consumer staples and energy. In the former, the fund was under-represented in the stronger performing food and beverage stocks. In the latter, the fund’s holdings did not include the higher volatility and lower dividend paying oil service and E&P (exploration and production) companies, which were the strongest performers for the period.
The fund’s holding of Fairpoint Communications was a very poor performer due to market concerns over subscriber losses in the wireline business, delays in merging the operations of businesses acquired from Verizon, and a highly leveraged balance sheet.
What strategic moves were made by the fund and why?
As of the close of the fiscal year, the fund has repositioned for the anticipated end of the U.S. recession and continued rebound in the broad global economy, led by Asian countries, albeit at a moderating pace. Sector overweights include industrials, information technology, and energy. In the consumer staples and utilities sectors, the fund is underweight relative to the custom benchmark. The fund continues to emphasize primarily large U.S.-based companies with growing global franchises and with dividend policies that support above average current yields and dividend growth.
4 First American Funds 2009 Annual Report
Annual Performance1,2
| | | | | | | | | | | | | | | | | | | | | | | | | | | | | | | | | |
| | | October 31, 2009 | | September 30, 2009* |
| | | | | | | | | Since Inception | | | | | | | | Since Inception |
| | | 1 year | | 5 years | | 10 years | | 9/24/2001 | | 1 year | | 5 years | | 10 years | | 9/24/2001 |
Average annual return with sales charge (POP) | | | | | | | | | | | | | | | | | | | | | | | | | | | | | | | | |
| Class A | | | 4.23 | % | | | 0.78 | % | | | 1.56 | % | | | — | | | | (8.54 | )% | | | 1.36 | % | | | 2.41 | % | | | — | |
| |
| |
| Class B | | | 4.41 | % | | | 0.84 | % | | | 1.37 | % | | | — | | | | (8.62 | )% | | | 1.43 | % | | | 2.22 | % | | | — | |
| |
| |
| Class C | | | 8.41 | % | | | 1.15 | % | | | 1.36 | % | | | — | | | | (4.85 | )% | | | 1.77 | % | | | 2.23 | % | | | — | |
| | | | | | | | | | | | | | | | | | | | | | | | | | | | | | | | | |
Average annual return without sales charge (NAV) | | | | | | | | | | | | | | | | | | | | | | | | | | | | | | | | |
| Class A | | | 10.32 | % | | | 1.93 | % | | | 2.13 | % | | | — | | | | (3.24 | )% | | | 2.51 | % | | | 2.99 | % | | | — | |
| |
| |
| Class B | | | 9.41 | % | | | 1.16 | % | | | 1.37 | % | | | — | | | | (3.95 | )% | | | 1.75 | % | | | 2.22 | % | | | — | |
| |
| |
| Class C | | | 9.41 | % | | | 1.15 | % | | | 1.36 | % | | | — | | | | (3.91 | )% | | | 1.77 | % | | | 2.23 | % | | | — | |
| |
| |
| Class R | | | 9.92 | % | | | 1.65 | % | | | — | | | | 3.02 | % | | | (3.44 | )% | | | 2.25 | % | | | — | | | | 3.33 | % |
| |
| |
| Class Y | | | 10.51 | % | | | 2.17 | % | | | 2.38 | % | | | — | | | | (2.89 | )% | | | 2.78 | % | | | 3.25 | % | | | — | |
| |
| |
S&P 500 Index3 | | | 9.80 | % | | | 0.33 | % | | | (0.95 | )% | | | 1.88 | %5 | | | (6.91 | )% | | | 1.02 | % | | | (0.15 | ) | | | 2.14 | %5 |
| |
| |
S&P 500 Dividend Only Stocks Index4 | | | 6.30 | % | | | 0.07 | % | | | 0.14 | % | | | 1.69 | %5 | | | (9.93 | )% | | | 0.59 | % | | | 0.91 | % | | | 1.89 | %5 |
| | | | | | | | | | | | | | | | | | | | | | | | | | | | | | | | | |
| | | | | | | | | | | | | | | | | | | | | | | | | | | | | | | | | |
The performance data quoted on this page represents past performance and does not guarantee future results. The investment return and principal value of an investment will fluctuate so that an investor’s shares, when redeemed, may be worth more or less than their original cost. Current performance of the fund may be lower or higher than the performance data quoted. Performance data current to the most recent month-end may be obtained by calling 800.677.FUND.
| |
| 1 | Total returns at net asset value (“NAV”) reflect performance over the time period indicated without including the fund’s maximum sales charge and assume reinvestment of all distributions at NAV. |
Total returns at public offering price (“POP”) reflect performance over the time period indicated including the maximum sales charge of 5.50% for Class A shares and the maximum contingent deferred sales charge (“CDSC”) for Class B and Class C shares for the relevant period. Maximum CDSC is 5.00% for Class B shares in the first year, decreasing annually to 0% in the seventh year following purchase, and 1.00% for Class C shares. Total returns assume reinvestment of all distributions at NAV.
| |
| | As reflected in the prospectus for the fiscal year ended October 31, 2008, the fund’s total annual operating expense ratio including the expenses of other investment companies in which the fund invests, if any (“acquired fund fees and expenses”), for Class A, Class B, Class C, Class R, and Class Y shares was 1.17%, 1.92%, 1.92%, 1.42%, and 0.92%, respectively. |
| | |
| | * | This table represents average annual total returns through the latest calendar quarter – rather than through the end of the fiscal period. |
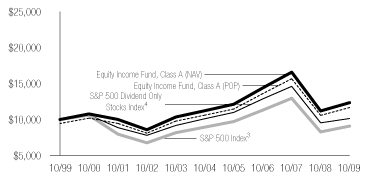
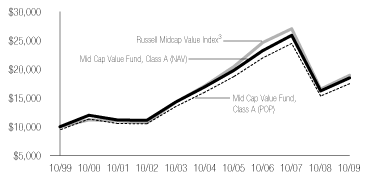
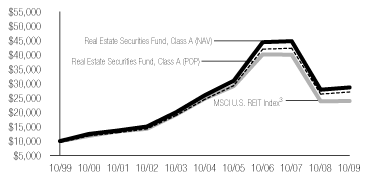
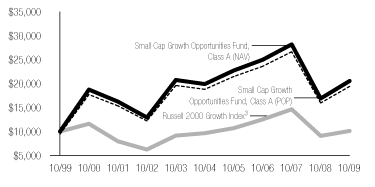
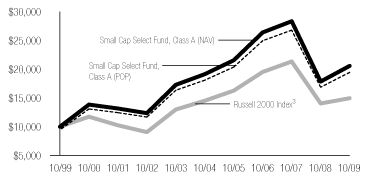
Value of $10,000 Investment1,2,6 as of October 31, 2009
This chart illustrates the total value of an assumed $10,000 investment in the fund’s Class A shares (from 10/31/1999 to 10/31/2009) as compared to the S&P 500 Index3 and the S&P 500 Dividend Only Stocks Index4.
| |
| 2 | Performance does not reflect the deduction of taxes that a shareholder would pay on fund distributions or redemption of fund shares. Performance reflects fee waivers that were in effect during the periods indicated. In the absence of such fee waivers, total returns would be reduced. Index performance is for illustrative purposes only and does not reflect any expenses, transaction costs, or cash flow effects. Direct investment in the index is not available. |
| |
| 3 | An unmanaged market capitalization-weighted index based on the average weighted performance of 500 widely held common stocks. |
| |
| 4 | The S&P 500 Dividend Only Stocks Index custom benchmark is composed of companies in the S&P 500 Index that have an indicated annual dividend. |
| |
| 5 | The performance since inception of this index is calculated from the month end following the inception of the class. |
| |
| 6 | Performance for Class B, Class C, Class R, and Class Y shares is not presented. Performance for these classes will vary due to their different expense structures. |
First American Funds 2009 Annual Report 5
Global Infrastructure Fund
Investment Objective: to provide long-term growth of capital and income
How did the fund perform for the fiscal year ended October 31, 2009?
The First American Global Infrastructure Fund (the “fund”), Class Y shares, returned 23.14% for the fiscal year ended October 31, 2009 (Class A shares returned 22.76% without taking the sales charge into account). By comparison, the fund’s benchmark, the Standard & Poor’s Global Infrastructure Index*, returned 16.88% for the same period.
How did market conditions affect stock market performance during the fiscal year?
The U.S. economy appears to have emerged from the most severe recession of the postwar era during the third quarter of 2009. Gross Domestic Product (“GDP”) expanded at a 2.8% annual rate during the quarter, and leading indicators currently suggest that positive growth will be maintained during the final quarter of the year and into 2010. Despite the return to positive growth since midyear, the unemployment rate has continued to rise and reached a new cyclical high of 10.2% in October. The continued increase in the unemployment rate reflects both a historical pattern, where it is common for the unemployment rate to reach its peak after economic activity has reached its trough during the cycle, as well as the subdued pace of the growth recovery to date. In order for the unemployment rate to decline in a sustained manner, economic growth needs to exceed the economy’s potential growth and this set of circumstances has yet to occur. The severity of the recession has left high levels of unutilized resources in the industrial sector and property markets, and the labor market as well. The combined effect of this broad-based resource underutilization has resulted in downward pressure on inflation trends throughout 2009. This trend is expected to remain in place in 2010. The exceptionally high level of unemployment and muted inflation trends have led the Federal Reserve to cut its target overnight lending rate to a range of 0% to 0.25% and engage in a host of nontraditional easing activities, including large-scale purchases of mortgage securities. These activities have resulted in a significant increase in the monetary base, which along with other policy initiatives have worked to restore normal functioning in intrabank funding markets and have supported a broad-based improvement in financial conditions. This policy stance is expected to persist well into 2010 in an effort to support financial conditions and an ongoing recovery in economic activity.
As a result of the broad-based easing of monetary policy and mortgage-related asset purchases by the Federal Reserve, equity markets began moving higher after reaching the low in March, anticipating that these actions would ease financial strains and contribute to a stabilization and improvement in economic and corporate earnings performance. Subsequent economic data and earnings reports validated the initial expectations and have contributed to further gains in the equity markets as the fiscal year progressed.
What worked for the fund and why?
The fund’s performance outpaced the benchmark for the fiscal year. The portfolio benefited from broad asset price appreciation during the year, as the infrastructure segment as a whole did well, with liquidity returning to the market. The fund’s high quality bias and defensive positioning served it well during the difficult fourth quarter of 2008 and first quarter of 2009.
| |
| * | Unlike mutual funds, index returns do not reflect any expenses, transaction costs, or cash flow effects. |
Top 10 Holdings as of October 31, 20091 (% of net assets)
| | | | | |
| Abertis Infraestructuras | | | 3.6 | % |
| Transurban Group | | | 3.4 | |
| Spectra Energy | | | 3.1 | |
| Enbridge | | | 3.1 | |
| Kinder Morgan Management | | | 3.0 | |
| Cheung Kong Infrastructure Holdings | | | 2.4 | |
| TransCanada | | | 2.2 | |
| Companhia de Transmissao de Energia Electrica Paulista | | | 2.1 | |
| Fraport | | | 2.1 | |
| Vinci | | | 1.9 | |
| | | | | |
| | | | | |
Country Allocation as of October 31, 20091 (% of net assets)
| | | | | |
| United States | | | 18 | .0% |
| Hong Kong | | | 10 | .1 |
| United Kingdom | | | 8 | .5 |
| Spain | | | 8 | .0 |
| Canada | | | 6 | .9 |
| France | | | 6 | .1 |
| China | | | 4 | .8 |
| Singapore | | | 4 | .8 |
| Brazil | | | 4 | .5 |
| Australia | | | 4 | .4 |
| Other | | | 20 | .6 |
| Short-Term Investment | | | 0 | .1 |
Other Assets & Liabilities, Net2 | | | 3 | .2 |
| | | | | |
| | | | 100 | .0% |
| | | | | |
| | | | | |
| |
| 1 | Fund holdings and country allocations are subject to change at any time and are not recommendations to buy or sell any security. |
| |
| 2 | Investments typically comprise substantially all of the fund’s net assets. Other assets and liabilities include receivables for items such as income earned but not yet received and payables for items such as fund expenses incurred but not yet paid. |
6 First American Funds 2009 Annual Report
On a sector basis, the portfolio outperformed within electric utilities due to its underweight stance compared to the benchmark. As the economy moved into a recovery period, electric utilities fell short of the market as many investors sold their electric utility holdings as a source of cash to fund more risky equity investments. Our portfolio is often underweight in electric utilities because most of the companies in the benchmark don’t qualify under our definition of infrastructure. When we own electric utilities, we look for companies that have a significant amount of exposure to regulated, hard assets such as electric transmission and distribution because of their consistent cash flows. During the fiscal year, the performance of such stocks greatly benefited the fund.
The portfolio’s performance was also rewarded for its overweight position relative to the benchmark in gas utilities, and our focus on companies that develop and own gas pipeline and distribution systems in China. As China’s urbanization trend continues, the demand for piped gas will continue to increase. Because the Chinese government controls gas distribution, we invest in the gas utilities and distribution companies whose long-standing relationships allow them to benefit from the continued build-out.
Clean water is also a key component of developing nations’ ability to climb the economic ladder. Specifically, the fund benefited from exposure to Asian waste water treatment plants. We also benefited from favorable stock selection in toll roads, as well-timed increases in our weightings to Transurban Group, an Australian toll road company, and APRR, a French toll road company, helped drive positive results for the fiscal year. In addition, our focus on high-cash-flow companies in energy infrastructure and logistics boosted fund performance.
What did not work for the fund and why?
Our approach to investing in infrastructure generally results in the portfolio’s beta, a measure of volatility, being lower than that of the fund’s benchmark. The fund’s relatively lower risk positioning was a drag on performance during a period in which higher-beta companies outperformed. Sectors whose performance is closely linked with business cycles, such as ports and airports, also had a negative impact on fund performance; the fund’s exposure to these sectors was relatively limited at a time when they enjoyed a cyclical rebound.
What strategic moves were made by the fund and why?
We continued to slightly increase the portfolio’s beta compared to its benchmark as the recessionary environment gradually gave way to recovery. Still, staying true to our investment strategy, we remained at a lower risk level than our benchmark and other more diversified global indices. As prices fell for many of the overvalued higher-volatility stocks, we began looking for opportunities to add to positions in sectors poised to gain in the recovering economic environment. Some of the opportunistic buys we made were in the airport, pipeline, toll road, and seaport sectors. These sectors are more correlated to GDP and, while a little less cyclical than the broader market, they are more cyclical than other infrastructure segments.
First American Funds 2009 Annual Report 7
Global Infrastructure Fund
Annual Performance1,2
| | | | | | | | | | | | | | | | | | | | | | | | | |
| | | October 31, 2009 | | September 30, 2009* |
| | | | | Since Inception | | | | Since Inception |
| | | 1 year | | 12/17/2007 | | 11/3/2008† | | 1 year | | 12/17/2007 | | 11/3/2008† |
Average annual return with sales charge (POP) | | | | | | | | | | | | | | | | | | | | | | | | |
| Class A | | | 16.08 | % | | | (14.47 | )% | | | — | | | | (2.87 | )% | | | (14.68 | )% | | | — | |
| |
| |
| Class C | | | — | | | | — | | | | 20.00 | % | | | — | | | | — | | | | 21.25 | % |
| | | | | | | | | | | | | | | | | | | | | | | | | |
Average annual return without sales charge (NAV) | | | | | | | | | | | | | | | | | | | | | | | | |
| Class A | | | 22.76 | % | | | (11.86 | )% | | | — | | | | 2.77 | % | | | (11.95 | )% | | | — | |
| |
| |
| Class C | | | — | | | | — | | | | 21.00 | % | | | — | | | | — | | | | 22.25 | % |
| |
| |
| Class R | | | — | | | | — | | | | 21.48 | % | | | — | | | | — | | | | 22.57 | % |
| |
| |
| Class Y | | | 23.14 | % | | | (11.71 | )% | | | — | | | | 2.95 | % | | | (11.80 | )% | | | — | |
| |
| |
S&P Global Infrastructure Index3 | | | 16.88 | % | | | (15.94 | )% | | | 14.55 | % | | | (2.78 | )% | | | (15.62 | )% | | | 18.82 | % |
| | | | | | | | | | | | | | | | | | | | | | | | | |
| | | | | | | | | | | | | | | | | | | | | | | | | |
The performance data quoted on this page represents past performance and does not guarantee future results. The investment return and principal value of an investment will fluctuate so that an investor’s shares, when redeemed, may be worth more or less than their original cost. Current performance of the fund may be lower or higher than the performance data quoted. Performance data current to the most recent month-end may be obtained by calling 800.677.FUND.
| |
| 1 | Total returns at net asset value (“NAV”) reflect performance over the time period indicated without including the fund’s maximum sales charge and assume reinvestment of all distributions at NAV. |
Total returns at public offering price (“POP”) reflect performance over the time period indicated including the maximum sales charge of 5.50% for Class A shares and the maximum contingent deferred sales charge of 1.00% for Class C shares for the relevant period. Total returns assume reinvestment of all distributions at NAV.
International investing involves risks not typically associated with domestic investing, including risks of adverse currency fluctuations, potential political and economic instability, different accounting standards, foreign government regulations, currency exchange rates, limited liquidity, and volatile prices.
As reflected in the prospectus for the fiscal year ended October 31, 2008, the fund’s total annual operating expense ratio, before waivers and including the expenses of other investment companies in which the fund invests, if any (“acquired fund fees and expenses”), for Class A, Class C, Class R, and Class Y shares was 4.17%, 4.92%, 4.42%, and 3.91%, respectively. The advisor has contractually agreed to waive fees through February 28, 2010 so that total annual fund operating expenses, not including any acquired fund fees and expenses, for Class A, Class C, Class R, and Class Y shares do not exceed 1.25%, 2.00%, 1.50%, and 1.00%, respectively. These fee waivers may be terminated at any time after February 28, 2010, at the discretion of the advisor. Prior to that time, such waivers may not be terminated without the approval of the fund’s board of directors.
| | |
| | * | This table represents average annual total returns through the latest calendar quarter – rather than through the end of the fiscal period. |
| |
| | † | Returns not annualized. |
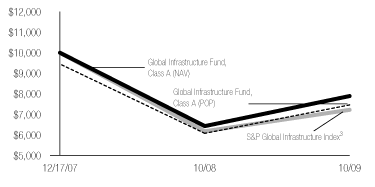
Value of $10,000 Investment1,2,4 as of October 31, 2009
This chart illustrates the total value of an assumed $10,000 investment in the fund’s Class A shares (from 12/17/2007 to 10/31/2009) as compared to the S&P Global Infrastructure Index3.
| |
| 2 | Performance does not reflect the deduction of taxes that a shareholder would pay on fund distributions or redemption of fund shares. Performance reflects fee waivers that were in effect during the periods indicated. In the absence of such fee waivers, total returns would be reduced. Index performance is for illustrative purposes only and does not reflect any expenses, transaction costs, or cash flow effects. Direct investment in the index is not available. |
| |
| 3 | The unmanaged S&P Global Infrastructure Index in comprised of 75 of the largest publicly listed infrastructure companies from around the world that meet specific investability requirements. |
| |
| 4 | Performance for Class C, Class R and Class Y shares is not presented. Performance for these classes will vary due to their different expense structures. |
8 First American Funds 2009 Annual Report
International Fund
Investment Objective: long-term growth of capital
How did the fund perform for the fiscal year ended October 31, 2009?
The First American International Fund (the “fund”), Class Y shares, returned 25.68% for the fiscal year ended October 31, 2009 (Class A shares returned 25.29% without taking the sales charge into account). By comparison, the fund’s benchmark, the MSCI EAFE Index*, returned 28.41% for the same period.
How did market conditions affect stock performance during the fiscal year?
For the 12 months ended October 31, 2009, the international equity markets produced a total return of 34.79%, the developed markets produced a total return of 28.41%, and emerging markets produced a total return of 64.63% for the period, as represented by the MSCI All Country World Index ex USA, the MSCI EAFE Index, and the MSCI Emerging Market Index, respectively. The only major market to produce a negative total return during the period was Ireland, where the market was down 19% during the fiscal year. The primary drivers of global equity returns were policy actions to inject liquidity into the marketplace and the resumption of economic growth around much of the world.
What worked for the fund and why?
The fund currently uses two subadvisors who select stocks according to either a growth or value style, while the fund’s advisor allocates between the subadvisors, adjusts the overall portfolio balance and country emphasis using index-related investments, and selects stocks in the infrastructure sector. Each of these were positive contributors to performance during the past year – the subadvisors primarily by smartly selecting individual stock and sector emphases, and our overall portfolio management by successfully redirecting to the strongest performing markets. Relative to the fund’s benchmark, the fund was overweight to the consumer services sector and an underweight to financials, which benefited performance. Country positions that yielded positive results included overweights to Brazil, Indonesia, and Russia, and underweights to Japan and the United Kingdom.
What did not work for the fund and why?
The fund emphasized emerging markets over European stocks during the summer months when European stocks rebounded more sharply. This phase of underperformance partially offset our overall success in country choices.
What strategic moves were made by the fund and why?
The primary move made by the fund was from a conservative allocation in October 2008, to a fully invested posture starting in March 2009, as markets began to rebound. Similarly, we shifted from a developed-nation emphasis to a significant tilt toward emerging economies, starting with an emphasis on China and Hong Kong earlier in the year.
| |
| * | Unlike mutual funds, index returns do not reflect any expenses, transaction costs, or cash flow effects. |
Top 10 Holdings as of October 31, 20091 (% of net assets)
| | | | | |
| State Street Institutional Liquid Reserves Fund | | | 5.9 | % |
| U.S. Treasury Bill, 0.227%, 11/19/2009 | | | 3.3 | |
| Nestle | | | 2.1 | |
| GlaxoSmithKline | | | 1.3 | |
| Adidas | | | 1.3 | |
| Covidien | | | 1.2 | |
| BNP Paribas | | | 1.2 | |
| FANUC | | | 1.2 | |
| BP – ADR | | | 1.1 | |
| Novartis | | | 1.1 | |
| | | | | |
Country Allocation as of October 31, 20091 (% of net assets)
| | | | | |
| United Kingdom | | | 18 | .3% |
| Japan | | | 18 | .1 |
| France | | | 9 | .2 |
| Germany | | | 7 | .6 |
| Switzerland | | | 6 | .0 |
| Canada | | | 4 | .2 |
| Hong Kong | | | 3 | .1 |
| Spain | | | 2 | .4 |
| China | | | 1 | .8 |
| Australia | | | 1 | .7 |
| Other | | | 18 | .1 |
| Short-Term Investments | | | 9 | .2 |
Other Assets & Liabilities, Net2 | | | 0 | .3 |
| | | | | |
| | | | 100 | .0% |
| | | | | |
| |
| 1 | Fund holdings and country allocations are subject to change at any time and are not recommendations to buy or sell any security. Allocations reflect the fund’s exposure to each country through direct investments and do not reflect the impact on country allocation of holding derivative instruments, such as futures contracts. See note 2 in Notes to Financial Statements and the fund’s Schedule of Investments for derivatives held at October 31, 2009. |
| |
| 2 | Investments typically comprise substantially all of the fund’s net assets. Other assets and liabilities include receivables on derivative instruments based on mark-to-market adjustments as well as receivables for items such as income earned but not yet received and payables for items such as fund expenses incurred but not yet paid. |
First American Funds 2009 Annual Report 9
International Fund
Our overall management of the portfolio continues to emphasize sectors and countries believed to offer stronger potential for growth. At year end, the overall themes for the portfolio include a modest overweight versus the benchmark to resource nations, an underweight to high-debt financial services economies, and an overweight to domestic growth economies such as China and India. As of fiscal year end, the portfolio consists of an overweight to emerging markets and an underweight to developed markets. Regionally, the portfolio is overweight the Americas, Asia Pacific excluding Japan, and Africa, and selectively underweight Europe (overweight in Germany and France, underweight in Spain and the United Kingdom). We continue to maintain overweight positions in Brazil, Russia, India, and China (Hong Kong), also known as the BRIC countries. We are overweight developed resource nations such as Canada and Australia and underweight Japan relative to the benchmark.
10 First American Funds 2009 Annual Report
Annual Performance1,2
| | | | | | | | | | | | | | | | | | | | | | | | | | | | | | | | | |
| | | October 31, 2009 | | September 30, 2009* |
| | | | | | | | | Since Inception | | | | | | | | Since Inception |
| | | 1 year | | 5 years | | 10 years | | 9/24/2001 | | 1 year | | 5 years | | 10 years | | 9/24/2001 |
| |
Average annual return with sales charge (POP) | | | | | | | | | | | | | | | | | | | | | | | | | | | | | | | | |
| Class A | | | 18 | .34% | | | 2.55 | % | | | 0.00 | % | | | — | | | | (2 | .86)% | | | 3.76 | % | | | 0.61 | % | | | — | |
| |
| |
| Class B | | | 19 | .24% | | | 2.56 | % | | | (0.19 | )% | | | — | | | | (3 | .09)% | | | 3.78 | % | | | 0.41 | % | | | — | |
| |
| |
| Class C | | | 23 | .36% | | | 2.93 | % | | | — | | | | 4.22 | % | | | 1 | .03% | | | 4.15 | % | | | — | | | | 4.65 | % |
| | | | | | | | | | | | | | | | | | | | | | | | | | | | | | | | | |
Average annual return without sales charge (NAV) | | | | | | | | | | | | | | | | | | | | | | | | | | | | | | | | |
| Class A | | | 25 | .29% | | | 3.72 | % | | | 0.57 | % | | | — | | | | 2 | .76% | | | 4.93 | % | | | 1.18 | % | | | — | |
| |
| |
| Class B | | | 24 | .24% | | | 2.92 | % | | | (0.19 | )% | | | — | | | | 1 | .91% | | | 4.12 | % | | | 0.41 | % | | | — | |
| |
| |
| Class C | | | 24 | .36% | | | 2.93 | % | | | — | | | | 4.22 | % | | | 2 | .03% | | | 4.15 | % | | | — | | | | 4.65 | % |
| |
| |
| Class R | | | 25 | .39% | | | 3.44 | % | | | 0.36 | % | | | — | | | | 2 | .88% | | | 4.70 | % | | | 0.99 | % | | | — | |
| |
| |
| Class Y | | | 25 | .68% | | | 3.96 | % | | | 0.82 | % | | | — | | | | 2 | .96% | | | 5.19 | % | | | 1.43 | % | | | — | |
| |
| |
MSCI EAFE Index3 | | | 28 | .41% | | | 5.59 | % | | | 2.46 | % | | | 8.06 | % | | | 3 | .80% | | | 6.57 | % | | | 2.97 | % | | | 8.32 | % |
| | | | | | | | | | | | | | | | | | | | | | | | | | | | | | | | | |
| | | | | | | | | | | | | | | | | | | | | | | | | | | | | | | | | |
The performance data quoted on this page represents past performance and does not guarantee future results. The investment return and principal value of an investment will fluctuate so that an investor’s shares, when redeemed, may be worth more or less than their original cost. Current performance of the fund may be lower or higher than the performance data quoted. Performance data current to the most recent month-end may be obtained by calling 800.677.FUND.
| |
| 1 | Total returns at net asset value (“NAV”) reflect performance over the time period indicated without including the fund’s maximum sales charge and assume reinvestment of all distributions at NAV. |
Total returns at public offering price (“POP”) reflect performance over the time period indicated including the maximum sales charge of 5.50% for Class A shares and the maximum contingent deferred sales charge (“CDSC”) for Class B and Class C shares for the relevant period. Maximum CDSC is 5.00% for Class B shares in the first year, decreasing annually to 0% in the seventh year following purchase, and 1.00% for Class C shares. Total returns assume reinvestment of all distributions at NAV.
International investing involves risks not typically associated with domestic investing, including risks of adverse currency fluctuations, potential political and economic instability, different accounting standards, foreign government regulations, currency exchange rates, limited liquidity, and volatile prices.
As reflected in the prospectus for the fiscal year ended October 31, 2008, the fund’s total annual operating expense ratio, before waivers and including the expenses of other investment companies in which the fund invests, if any (“acquired fund fees and expenses”), for Class A, Class B, Class C, Class R, and Class Y shares was 1.54%, 2.29%, 2.29%, 1.79%, and 1.29%, respectively. The advisor has contractually agreed to waive fees through February 28, 2010 so that total annual fund operating expenses, not including any acquired fund fees and expenses, for Class A, Class B, Class C, Class R, and Class Y shares do not exceed 1.49%, 2.24%, 2.24%, 1.74%, and 1.24%, respectively. These fee waivers may be terminated at any time after February 28, 2010, at the discretion of the advisor. Prior to that time, such waivers may not be terminated without the approval of the fund’s board of directors.
| |
| * | This table represents average annual total returns through the latest calendar quarter – rather than through the end of the fiscal period. |
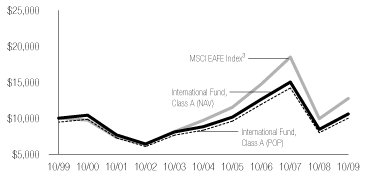
Value of $10,000 Investment1,2,4 as of October 31, 2009
This chart illustrates the total value of an assumed $10,000 investment in the fund’s Class A shares (from 10/31/1999 to 10/31/2009) as compared to the MSCI EAFE Index.3
| |
| 2 | Performance does not reflect the deduction of taxes that a shareholder would pay on fund distributions or redemption of fund shares. Performance reflects fee waivers that were in effect during the periods indicated. In the absence of such fee waivers, total returns would be reduced. Index performance is for illustrative purposes only and does not reflect any expenses, transaction costs, or cash flow effects. Direct investment in the index is not available. |
| |
| | Effective November 3, 2008, Altrinsic Global Advisors, LLC and Hansberger Global Investors, Inc. were named subadvisors of the fund and began managing the fund’s assets. On September 24, 2001, the First American International Fund merged with Firstar International Growth Fund and Firstar International Value Fund. Performance history prior to September 24, 2001 represents that of the Firstar International Growth Fund. |
| |
| 3 | An unmanaged index of common stocks in Europe, Australasia, and the Far East. |
| |
| 4 | Performance for Class B, Class C, Class R, and Class Y shares is not presented. Performance for these classes will vary due to their different expense structures. |
First American Funds 2009 Annual Report 11
International Select Fund
Investment Objective: long-term growth of capital
How did the fund perform for the fiscal year ended October 31, 2009?
The First American International Select Fund (the “fund”), Class Y shares, returned 32.68% for the fiscal year ended October 31, 2009 (Class A shares returned 32.32% without taking the sales charge into account). By comparison, the fund’s benchmark, the MSCI All Country World Investable Market Index ex USA*, returned 37.33% for the same period.
How did market conditions affect stock performance during the fiscal year?
For the 12 months ended October 31, 2009, the international equity markets produced a total return of 34.79%, the developed markets produced a total return of 28.41%, and emerging markets produced a total return of 64.63% for the period, as represented by the MSCI All Country World Index ex USA, the MSCI EAFE Index, and the MSCI Emerging Market Index, respectively. The only major market to produce a negative total return during the period was Ireland, where the market was down 19% during the fiscal year. The primary drivers of global equity returns were policy actions to inject liquidity into the marketplace and the resumption of economic growth around much of the world.
What worked for the fund and why?
The fund currently uses three subadvisors who select stocks according to growth, value, or emerging market styles, while the fund’s advisor allocates between the subadvisors, adjusts the overall portfolio balance and country emphasis using index-related investments, and selects stocks in the infrastructure sector. Each of these were positive contributors to performance during the past year – the subadvisors primarily by smartly selecting individual stock and sector emphases, and our overall portfolio management by successfully redirecting to the strongest performing markets. Relative to the fund’s benchmark, the fund was overweight to the consumer services sector and an underweight to financials, which benefited performance. Country positions that yielded positive results included overweights to Brazil, Indonesia, and Russia, and underweights to Japan and the United Kingdom.
What did not work for the fund and why?
The fund emphasized emerging markets over European stocks during the summer months when European stocks rebounded more sharply. This phase of underperformance partially offset our overall success in country choices.
What strategic moves were made by the fund and why?
The primary move made by the fund was from a conservative allocation in October 2008, to a fully invested posture starting in March 2009, as markets began to rebound. Similarly, we shifted from a developed-nation emphasis to a significant tilt toward emerging economies, starting with an emphasis on China and Hong Kong earlier in the year.
| |
| * | Unlike mutual funds, index returns do not reflect any expenses, transaction costs, or cash flow effects. |
Top 10 Holdings as of October 31, 20091 (% of net assets)
| | | | | |
| State Street Institutional Liquid Reserves Fund | | | 10 | .6% |
| U.S. Treasury Bill, 0.131%, 11/19/2009 | | | 4 | .1 |
| Nestle | | | 1 | .4 |
| GlaxoSmithKline | | | 1 | .0 |
| Adidas | | | 0 | .9 |
| Covidien | | | 0 | .9 |
| BNP Paribas | | | 0 | .9 |
| BP – ADR | | | 0 | .8 |
| Vendanta Resources | | | 0 | .8 |
| Mitsubishi | | | 0 | .8 |
| | | | | |
| | | | | |
Country Allocation as of October 31, 20091 (% of net assets)
| | | | | |
| Japan | | | 12 | .2% |
| United Kingdom | | | 12 | .0 |
| France | | | 6 | .5 |
| Germany | | | 5 | .5 |
| Brazil | | | 5 | .1 |
| Switzerland | | | 4 | .1 |
| Canada | | | 3 | .7 |
| South Africa | | | 3 | .2 |
| China | | | 3 | .0 |
| Hong Kong | | | 2 | .8 |
| Other | | | 27 | .0 |
| Short-Term Investments | | | 14 | .7 |
Other Assets & Liabilities, Net2 | | | 0 | .2 |
| | | | | |
| | | | 100 | .0% |
| | | | | |
| | | | | |
| |
| 1 | Fund holdings and country allocations are subject to change at any time and are not recommendations to buy or sell any security. Allocations reflect the fund’s exposure to each country through direct investments and do not reflect the impact on country allocation of holding derivative instruments, such as futures contracts. See note 2 in Notes to Financial Statements and the fund’s Schedule of Investments for derivatives held at October 31, 2009. |
| |
| 2 | Investments typically comprise substantially all of the fund’s net assets. Other assets and liabilities include receivables on derivative instruments based on mark-to-market adjustments as well as receivables for items such as income earned but not yet received and payables for items such as fund expenses incurred but not yet paid. |
12 First American Funds 2009 Annual Report
Our overall management of the portfolio continues to emphasize sectors and countries believed to offer stronger potential for growth. At year end, the overall themes for the portfolio include a modest overweight versus the benchmark to resource nations, an underweight to high-debt financial services economies, and an overweight to domestic growth economies such as China and India. As of fiscal year end, the portfolio consists of an overweight to emerging markets and an underweight to developed markets. Regionally, the portfolio is overweight the Americas, Asia Pacific excluding Japan, and Africa, and selectively underweight Europe (overweight in Germany and France, underweight in Spain and the United Kingdom). We continue to maintain overweight positions in Brazil, Russia, India, and China (Hong Kong), also known as the BRIC countries. We are overweight developed resource nations such as Canada and Australia and underweight Japan relative to the benchmark.
First American Funds 2009 Annual Report 13
International Select Fund
Annual Performance1,2
| | | | | | | | | | | | | | | | | |
| | | October 31, 2009 | | September 30, 2009* |
| | | | | Since Inception | | | | Since Inception |
| | | 1 year | | 12/21/2006 | | 1 year | | 12/21/2006 |
| |
Average annual return with sales charge (POP) | | | | | | | | | | | | | | | | |
| Class A | | | 25 | .04% | | | (6.06 | )% | | | (0.29 | )% | | | (5.45 | )% |
| |
| |
| Class C | | | 30 | .43% | | | (4.93 | )% | | | 3.81 | % | | | (4.23 | )% |
| | | | | | | | | | | | | | | | | |
Average annual return without sales charge (NAV) | | | | | | | | | | | | | | | | |
| Class A | | | 32 | .32% | | | (4.19 | )% | | | 5.54 | % | | | (3.51 | )% |
| |
| |
| Class C | | | 31 | .43% | | | (4.93 | )% | | | 4.81 | % | | | (4.23 | )% |
| |
| |
| Class R | | | 31 | .99% | | | (4.47 | )% | | | 5.23 | % | | | (3.79 | )% |
| |
| |
| Class Y | | | 32 | .68% | | | (3.96 | )% | | | 5.89 | % | | | (3.27 | )% |
| |
| |
MSCI AC World Index ex USA3 | | | 34 | .79% | | | (4.57 | )% | | | 6.43 | % | | | (4.28 | )% |
| |
| |
MSCI AC World Investable Market Index ex USA4 | | | 37 | .33% | | | (4.48 | )% | | | 7.89 | % | | | (4.19 | )% |
| | | | | | | | | | | | | | | | | |
| | | | | | | | | | | | | | | | | |
The performance data quoted on this page represents past performance and does not guarantee future results. The investment return and principal value of an investment will fluctuate so that an investor’s shares, when redeemed, may be worth more or less than their original cost. Current performance of the fund may be lower or higher than the performance data quoted. Performance data current to the most recent month-end may be obtained by calling 800.677.FUND.
| |
| 1 | Total returns at net asset value (“NAV”) reflect performance over the time period indicated without including the fund’s maximum sales charge and assume reinvestment of all distributions at NAV. |
Total returns at public offering price (“POP”) reflect performance over the time period indicated including the maximum sales charge of 5.50% for Class A shares and the maximum contingent deferred sales charge of 1.00% for Class B and Class C shares for the relevant period. Total returns assume reinvestment of all distributions at NAV.
International investing involves risks not typically associated with domestic investing, including risks of adverse currency fluctuations, potential political and economic instability, different accounting standards, foreign government regulations, currency exchange rates, limited liquidity, and volatile prices.
As reflected in the prospectus for the fiscal year ended October 31, 2008, the fund’s total annual operating expense ratio, before waivers and including the expenses of other investment companies in which the fund invests, if any (“acquired fund fees and expenses”), for Class A, Class C, Class R, and Class Y shares was 1.73%, 2.48%, 2.48%, 1.98%, and 1.48%, respectively. The advisor has contractually agreed to waive fees through February 28, 2010 so that total annual fund operating expenses, not including any acquired fund fees and expenses, for Class A, Class C, Class R, and Class Y shares do not exceed 1.49%, 2.24%, 2.24%, 1.74% and 1.24%, respectively. These fee waivers may be terminated at any time after February 28, 2010, at the discretion of the advisor. Prior to that time, such waivers may not be terminated without the approval of the fund’s board of directors.
| | |
| | * | This table represents average annual total returns through the latest calendar quarter – rather than through the end of the fiscal period. |
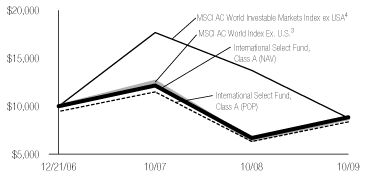
Value of $10,000 Investment1,2,5 as of October 31, 2009
This chart illustrates the total value of an assumed $10,000 investment in the fund’s Class A shares (from 12/21/2006 to 10/31/2009) as compared to the MSCI AC World Index ex USA3 and the MSCI AC World Investable Market Index ex USA4.
| |
| 2 | Performance does not reflect the deduction of taxes that a shareholder would pay on fund distributions or redemption of fund shares. Performance reflects fee waivers that were in effect during the periods indicated. In the absence of such fee waivers, total returns would be reduced. Index performance is for illustrative purposes only and does not reflect any expenses, transaction costs, or cash flow effects. Direct investment in the index is not available. |
| |
| 3 | An unmanaged index of stocks representing developed and emerging markets around the world that collectively comprise most foreign stock markets. |
| |
| 4 | Previously, the fund used the MSCI AC World Index ex USA as a benchmark. Going forward, the fund’s performance will be compared to the MSCI AC World Investable Market Index ex USA because it more closely reflects the fund’s investment universe. The MSCI AC World Investable Market Index ex USA is an unmanaged index that tracks the performance of small-, mid-, and large-capitalization stocks of non-U.S. companies representing developed and emerging markets around the world that collectively comprise most foreign stock markets. |
| |
| 5 | Performance for Class C, Class R, and Class Y shares is not presented. Performance for these classes will vary due to their different expense structures. |
14 First American Funds 2009 Annual Report
Large Cap Growth Opportunities Fund
Investment Objective: long-term growth of capital
How did the fund perform for the fiscal year ended October 31, 2009?
The First American Large Cap Growth Opportunities Fund (the “fund”), Class Y shares, returned 13.02% for the fiscal year ended October 31, 2009 (Class A shares returned 12.73% without taking the sales charge into account). By comparison, the fund’s benchmark, the Russell 1000 Growth Index*, returned 17.51% for the same period.
How did market conditions affect stock market performance during the fiscal year?
The U.S. economy appears to have emerged from the most severe recession of the postwar era during the third quarter of 2009. Gross Domestic Product expanded at a 2.8% annual rate during the quarter, and leading indicators currently suggest that positive growth will be maintained during the final quarter of the year and into 2010. Despite the return to positive growth since midyear, the unemployment rate has continued to rise and reached a new cyclical high of 10.2% in October. The continued increase in the unemployment rate reflects both a historical pattern, where it is common for the unemployment rate to reach its peak after economic activity has reached its trough during the cycle, as well as the subdued pace of the growth recovery to date. In order for the unemployment rate to decline in a sustained manner, economic growth needs to exceed the economy’s potential growth and this set of circumstances has yet to occur. The severity of the recession has left high levels of unutilized resources in the industrial sector and property markets, and the labor market as well. The combined effect of this broad-based resource underutilization has resulted in downward pressure on inflation trends throughout 2009. This trend is expected to remain in place in 2010. The exceptionally high level of unemployment and muted inflation trends have led the Federal Reserve to cut its target overnight lending rate to a range of 0% to 0.25% and engage in a host of nontraditional easing activities, including large-scale purchases of mortgage securities. These activities have resulted in a significant increase in the monetary base, which along with other policy initiatives have worked to restore normal functioning in intrabank funding markets and have supported a broad-based improvement in financial conditions. This policy stance is expected to persist well into 2010 in an effort to support financial conditions and an ongoing recovery in economic activity.
As a result of the broad-based easing of monetary policy and mortgage-related asset purchases by the Federal Reserve, equity markets began moving higher after reaching the low in March, anticipating that these actions would ease financial strains and contribute to a stabilization and improvement in economic and corporate earnings performance. Subsequent economic data and earnings reports validated the initial expectations and have contributed to further gains in the equity markets as the fiscal year progressed.
| |
| * | Unlike mutual funds, index returns do not reflect any expenses, transaction costs, or cash flow effects. |
Top 10 Holdings as of October 31, 20091 (% of net assets)
| | | | | |
| Apple | | | 5.7 | % |
| Cisco Systems | | | 3.3 | |
| Philip Morris International | | | 3.0 | |
| Hewlett-Packard | | | 2.9 | |
| Amazon.com | | | 2.2 | |
| Goldman Sachs Group | | | 2.2 | |
| Visa, Class A | | | 2.1 | |
| Priceline.com | | | 2.0 | |
| Medco Health Solutions | | | 2.0 | |
| Google, Class A | | | 2.0 | |
| | | | | |
| | | | | |
Sector Allocation as of October 31, 20091 (% of net assets)
| | | | | |
| Information Technology | | | 39.3 | % |
| Consumer Discretionary | | | 15.2 | |
| Healthcare | | | 10.5 | |
| Industrials | | | 10.4 | |
| Consumer Staples | | | 7.4 | |
| Financials | | | 6.1 | |
| Energy | | | 5.7 | |
| Materials | | | 3.1 | |
| Telecommunication Services | | | 1.8 | |
| Short-Term Investment | | | 0.7 | |
Other Assets and Liabilities, Net2 | | | (0.2 | ) |
| | | | | |
| | | | 100.0 | % |
| | | | | |
| | | | | |
| |
| 1 | Fund holdings and sector allocations are subject to change at any time and are not recommendations to buy or sell any security. |
| |
| 2 | Investments typically comprise substantially all of the fund’s net assets. Other assets and liabilities include receivables for items such as income earned but not yet received and payables for items such as fund expenses incurred but not yet paid. |
First American Funds 2009 Annual Report 15
Large Cap Growth Opportunities Fund
What worked for the fund and why?
As is typical for the fund, individual stock selection (as opposed to broad themes or sector weights) had the greatest impact on performance during the past fiscal year. As the financial markets shifted from fear of economic calamity to recognition of stability, and then to hope for recovery, beneficiaries of cyclical improvement outperformed. Accordingly, portfolio holdings such as Goldman Sachs Group, Priceline.com and Apple rebounded sharply. Goldman Sachs, the premier global investment banking/capital markets franchise, gained market share from more challenged competitors due to its strong capital position and its stable and talented senior management team. Worldwide, travelers increasingly are turning to the internet to arrange their travel plans. Priceline.com, which has positioned itself to capitalize on this trend with a strong value proposition and an unrivaled breadth of hotel property relationships, also gained meaningful share during the past twelve months. Apple was also a strong market share gainer. Buoyed by extraordinary innovation, Apple continued to enhance its position in the personal computer and the personal media device markets while its iPhone drove its emergence as the fastest growing high-end mobile phone manufacturer. These winners, along with others such as BlackRock, F5 Networks and Polo Ralph Lauren, shared several characteristics: each had a strong secular earnings growth outlook, each had catalysts that would drive growth in the shorter-term and each began the period with a stock price that had fallen meaningfully due to the broad economic concerns. All of these remain important fund holdings.
What did not work for the fund and why?
As described above, individual stock selection has the largest impact on the fund’s performance. When analyzing what underperformed the most during the year, this was especially true in the healthcare and information technology sectors. In healthcare, three separate issues were challenges. First, two large Russell 1000 Growth benchmark positions (Schering-Plough and Genentech) that were not owned in the fund were acquired at substantial premiums. Second, as the market rebounded and was led by recovery beneficiaries, defensive fund holdings with strong but stable (rather than improving) earnings, such as Abbott Laboratories and Baxter International, experienced significant valuation compression. Third, some of our judgements proved to be incorrect. In the case of St. Jude Medical, for example, we were too optimistic about the market growth rate for certain medical devices and St. Jude’s market share potential. In the information technology sector, choices that had proven beneficial in the past worked against the fund’s performance this past year. For example, historically we have favored Hewlett-Packard over IBM (although we own both) but over the past year IBM outperformed Hewlett. Similarly, for years we have favored Oracle over Microsoft (and have been rewarded for that choice) but during the past twelve months Microsoft performed better than Oracle. Although we believe that these choices will be correct over the longer term, we recognize that IBM and Microsoft, too, have investment merit.
What strategic moves were made by the fund and why?
Our basic philosophy remains the same. We identify companies with attractive long-term earnings growth prospects, solid management teams and durable competitive advantages. From that group, we invest in those with fair valuations and approaching catalysts. During any year, although there are individual position changes, the basic framework holds. This past year was no different. Two subtle shifts, however, were made. First, we modestly increased our exposure to companies that are beneficiaries of an improving economy. In that context, we initiated positions in leadership companies such as American Express, Walt Disney, Amazon.com and 3M while eliminating some solid but more defensive companies like Wal-Mart Stores and Procter & Gamble. All of these are franchise growth companies but we believe the former group should experience faster earnings growth over the next 12 to 18 months. Second, in an effort to highlight those companies in which we have the highest conviction, the concentration in our favorite holdings has increased. This list would include Apple, Goldman Sachs Group, Priceline.com, Visa, Medco Health Solutions, Amazon.com, BlackRock, Polo Ralph Lauren, Kellogg and Precision Castparts. Again, these shifts are subtle. We will continue to identify franchise growth companies, buy them at what we believe to be opportune moments, and hold them for the long term, with a goal of outperforming our benchmark over time.
16 First American Funds 2009 Annual Report
Annual Performance1,2
| | | | | | | | | | | | | | | | | | | | | | | | | | | | | | | | | | | | | | | | | |
| | | October 31, 2009 | | September 30, 2009* |
| | | | | | | | | Since Inception | | | | | | | | Since Inception |
| | | 1 year | | 5 years | | 10 years | | 11/27/2000 | | 9/24/2001 | | 1 year | | 5 years | | 10 years | | 11/27/2000 | | 9/24/2001 |
Average annual return with sales charge (POP) | | | | | | | | | | | | | | | | | | | | | | | | | | | | | | | | | | | | | | | | |
| |
| |
| Class A | | | 6.55 | % | | | 0.04 | % | | | (2.12 | )% | | | — | | | | — | | | | (8.08 | )% | | | 0.75 | % | | | (1.42 | )% | | | — | | | | — | |
| |
| |
| Class B | | | 6.94 | % | | | 0.06 | % | | | (2.29 | )% | | | — | | | | — | | | | (8.27 | )% | | | 0.77 | % | | | (1.60 | )% | | | — | | | | — | |
| |
| |
| Class C | | | 10.92 | % | | | 0.42 | % | | | — | | | | — | | | | 0.91 | % | | | (4.46 | )% | | | 1.13 | % | | | — | | | | — | | | | 1.13 | % |
Average annual return without sales charge (NAV) | | | | | | | | | | | | | | | | | | | | | | | | | | | | | | | | | | | | | | | | |
| Class A | | | 12.73 | % | | | 1.17 | % | | | (1.56 | )% | | | — | | | | — | | | | (2.72 | )% | | | 1.90 | % | | | (0.86 | )% | | | — | | | | — | |
| |
| |
| Class B | | | 11.94 | % | | | 0.42 | % | | | (2.29 | )% | | | — | | | | — | | | | (3.45 | )% | | | 1.14 | % | | | (1.60 | )% | | | — | | | | — | |
| |
| |
| Class C | | | 11.92 | % | | | 0.42 | % | | | — | | | | — | | | | 0.91 | % | | | (3.49 | )% | | | 1.13 | % | | | — | | | | — | | | | 1.13 | % |
| |
| |
| Class R | | | 12.51 | % | | | 0.92 | % | | | — | | | | (3.13 | )% | | | — | | | | (2.95 | )% | | | 1.65 | % | | | — | | | | (2.98 | )% | | | — | |
| |
| |
| Class Y | | | 13.02 | % | | | 1.42 | % | | | (1.31 | )% | | | — | | | | — | | | | (2.49 | )% | | | 2.16 | % | | | (0.61 | )% | | | — | | | | — | |
| |
| |
Russell 1000 Growth Index3 | | | 17.51 | % | | | 1.27 | % | | | (3.39 | )% | | | (3.74 | )% | | | 1.94 | % | | | (1.85 | )% | | | 1.86 | % | | | (2.56 | )% | | | (3.63 | )% | | | 2.14 | % |
| | | | | | | | | | | | | | | | | | | | | | | | | | | | | | | | | | | | | | | | | |
| | | | | | | | | | | | | | | | | | | | | | | | | | | | | | | | | | | | | | | | | |
The performance data quoted on this page represents past performance and does not guarantee future results. The investment return and principal value of an investment will fluctuate so that an investor’s shares, when redeemed, may be worth more or less than their original cost. Current performance of the fund may be lower or higher than the performance data quoted. Performance data current to the most recent month-end may be obtained by calling 800.677.FUND.
| |
| 1 | Total returns at net asset value (“NAV”) reflect performance over the time period indicated without including the fund’s maximum sales charge and assume reinvestment of all distributions at NAV. |
Total returns at public offering price (“POP”) reflect performance over the time period indicated including the maximum sales charge of 5.50% for Class A shares and the maximum contingent deferred sales charge (“CDSC”) for Class B and Class C shares for the relevant period. Maximum CDSC is 5.00% for Class B shares in the first year, decreasing annually to 0% in the seventh year following purchase, and 1.00% for Class C shares. Total returns assume reinvestment of all distributions at NAV.
| |
| | Growth stocks typically have more volatility than value stocks; whereas value stocks tend to have slower earnings growth rates. |
| |
| | As reflected in the prospectus for the fiscal year ended October 31, 2008, the fund’s total annual operating expense ratio, including the expenses of other investment companies in which the fund invests, if any (“acquired fund fees and expenses”), for Class A, Class B, Class C, Class R, and Class Y shares was 1.20%, 1.95%, 1.95%, 1.45%, and 0.95%, respectively. |
| | |
| | * | This table represents average annual total returns through the latest calendar quarter – rather than through the end of the fiscal period. |
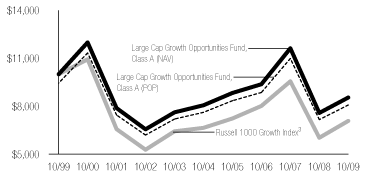
Value of $10,000 Investment1,2,4 as of October 31, 2009
This chart illustrates the total value of an assumed $10,000 investment in the fund’s Class A shares (from 10/31/1999 to 10/31/2009) as compared to the Russell 1000 Growth Index3.
| |
| 2 | Performance does not reflect the deduction of taxes that a shareholder would pay on fund distributions or redemption of fund shares. Performance reflects fee waivers that were in effect during the periods indicated. In the absence of such fee waivers, total returns would be reduced. Index performance is for illustrative purposes only and does not reflect any expenses, transaction costs, or cash flow effects. Direct investment in the index is not available. |
| |
| | On September 24, 2001, the First American Large Cap Growth Opportunities Fund became the successor by merger to the Firstar Large Cap Core Equity Fund, a series of Firstar Funds, Inc. Prior to the merger, the First American fund had no assets or liabilities. Performance presented prior to September 24, 2001 represents that of the Firstar Large Cap Core Equity Fund. |
| |
| 3 | An unmanaged index that measures the performance of those companies within the Russell 1000 Index (large-cap index) with higher price-to-book ratios and higher forecasted growth values. |
| |
| 4 | Performance for Class B, Class C, Class R, and Class Y shares is not presented. Performance for these classes will vary due to their different expense structures. |
First American Funds 2009 Annual Report 17
Large Cap Select Fund
Investment Objective: capital appreciation
How did the fund perform for the fiscal year ended October 31, 2009?
The First American Large Cap Select Fund (the “fund”), Class Y shares, returned 11.81% for the fiscal year ended October 31, 2009 (Class A shares returned 11.54% without taking the sales charge into account). By comparison, the fund’s benchmark, the Standard & Poor’s 500 Index* (“S&P 500 Index”), returned 9.80% for the same period.
How did market conditions affect stock performance during the fiscal year?
The U.S. economy appears to have emerged from the most severe recession of the postwar era during the third quarter of 2009. Gross Domestic Product expanded at a 2.8% annual rate during the quarter, and leading indicators currently suggest that positive growth will be maintained during the final quarter of the year and into 2010. Despite the return to positive growth since midyear, the unemployment rate has continued to rise and reached a new cyclical high of 10.2% in October. The continued increase in the unemployment rate reflects both a historical pattern, where it is common for the unemployment rate to reach its peak after economic activity has reached its trough during the cycle, as well as the subdued pace of the growth recovery to date. In order for the unemployment rate to decline in a sustained manner, economic growth needs to exceed the economy’s potential growth and this set of circumstances has yet to occur. The severity of the recession has left high levels of unutilized resources in the industrial sector and property markets, and the labor market as well. The combined effect of this broad-based resource underutilization has resulted in downward pressure on inflation trends throughout 2009. This trend is expected to remain in place in 2010. The exceptionally high level of unemployment and muted inflation trends have led the Federal Reserve to cut its target overnight lending rate to a range of 0% to 0.25% and engage in a host of nontraditional easing activities, including large-scale purchases of mortgage securities. These activities have resulted in a significant increase in the monetary base, which along with other policy initiatives have worked to restore normal functioning in intrabank funding markets and have supported a broad-based improvement in financial conditions. This policy stance is expected to persist well into 2010 in an effort to support financial conditions and an ongoing recovery in economic activity.
As a result of the broad-based easing of monetary policy and mortgage-related asset purchases by the Federal Reserve, equity markets began moving higher after reaching the low in March, anticipating that these actions would ease financial strains and contribute to a stabilization and improvement in economic and corporate earnings performance. Subsequent economic data and earnings reports validated the initial expectations and have contributed to further gains in the equity markets as the fiscal year progressed.
| |
| * | Unlike mutual funds, index returns do not reflect any expenses, transaction costs, or cash flow effects. |
Top 10 Holdings as of October 31, 20091 (% of net assets)
| | | | | |
| JPMorgan Chase | | | 3.7 | % |
| Bank of America | | | 3.4 | |
| Apple | | | 3.1 | |
| Cisco Systems | | | 3.0 | |
| Teradata | | | 2.7 | |
| Goldman Sachs Group | | | 2.6 | |
| Pfizer | | | 2.5 | |
| Hewlett-Packard | | | 2.4 | |
| Coach | | | 2.2 | |
| Wells Fargo | | | 1.9 | |
| | | | | |
| | | | | |
Sector Allocation as of October 31, 20091 (% of net assets)
| | | | | |
| Information Technology | | | 24.7 | % |
| Financials | | | 18.7 | |
| Consumer Discretionary | | | 15.4 | |
| Energy | | | 12.8 | |
| Industrials | | | 10.1 | |
| Healthcare | | | 9.5 | |
| Materials | | | 3.6 | |
| Consumer Staples | | | 3.2 | |
| Telecommunication Services | | | 1.2 | |
| Utilities | | | 0.7 | |
Other Assets and Liabilities, Net2 | | | 0.1 | |
| | | | | |
| | | | 100.0 | % |
| | | | | |
| | | | | |
| |
| 1 | Fund holdings and sector allocations are subject to change at any time and are not recommendations to buy or sell any security. |
| |
| 2 | Investments typically comprise substantially all of the fund’s net assets. Other assets and liabilities include receivables for items such as income earned but not yet received and payables for items such as fund expenses incurred but not yet paid. |
18 First American Funds 2009 Annual Report
What worked for the fund and why?
Being nimble, and focusing on the major risks and opportunities in the marketplace, helped the Large Cap Select Fund perform in an extremely volatile time. We started the fiscal year defensively positioned given the severity of the financial and economic crisis. When the economy and markets appeared to be bottoming, we added risk in a thoughtful manner. Specifically, we took an overweight position relative to the fund’s benchmark in high-quality financials. The financial sector was down almost 7% for the fiscal year, but since March 1, 2009, this sector returned 88% through fiscal year-end. Our returns in the financial sector trailed the benchmark, given the higher quality nature of our holdings. However, the portfolio in total benefited from the overweight position in financials.
On a stock level, several selections in the consumer services and energy sectors outperformed. Online travel company Priceline.com was punished during the economic crisis, even though the company continued to generate free cash flow and had a pristine balance sheet. As economic conditions improved, the stock went up twofold for the portfolio. In the energy sector, we focused on companies that had growing production. Whiting Petroleum and Pioneer Natural Resources are two examples that added meaningfully to performance during the period.
What did not work for the fund and why?
We had poor performance in the healthcare product sector. Our holdings were down 7.4% for the fiscal year compared to a 4% gain for the healthcare sector. This sector proved to be more economically sensitive than we thought it would be, and the uncertainty surrounding healthcare reform weighed on the group. This sector saw some meaningful merger and acquisition activity, with both Schering-Plough and Wyeth being acquired at premium prices during the period. Unfortunately, we did not hold either of these companies.
What strategic moves were made by the fund and why?
Early in this past fiscal year, the fund had a more defensive posture as the severity of the financial and economic crisis was accelerating and deepening. In March 2009, some signs began to emerge that the economy and markets were finding a bottom. At that time we became more aggressive and added to our cyclical and financial holdings. We continue to hold overweight positions in financials and cyclicals relative to the benchmark. We believe that the fundamentals for these stocks will continue to improve, and that their prices do not fully reflect this anticipated improvement.
First American Funds 2009 Annual Report 19
Large Cap Select Fund
Annual Performance1,2
| | | | | | | | | | | | | | | | | | | | | | | | | |
| | | October 31, 2009 | | September 30, 2009* |
| | | | | | | Since Inception | | | | | | Since Inception |
| | | 1 year | | 5 years | | 1/31/2003 | | 1 year | | 5 years | | 1/31/2003 |
Average annual return with sales charge (POP) | | | | | | | | | | | | | | | | | | | | | | | | |
| Class A | | | 5.45 | % | | | (1.65 | )% | | | 2.68 | % | | | (9.92 | )% | | | (0.65 | )% | | | 3.19 | % |
| |
| |
| Class C | | | 9.64 | % | | | (1.33 | )% | | | 2.72 | % | | | (6.35 | )% | | | (0.31 | )% | | | 3.25 | % |
| | | | | | | | | | | | | | | | | | | | | | | | | |
Average annual return without sales charge (NAV) | | | | | | | | | | | | | | | | | | | | | | | | |
| Class A | | | 11.54 | % | | | (0.53 | )% | | | 3.54 | % | | | (4.68 | )% | | | 0.48 | % | | | 4.07 | % |
| |
| |
| Class C | | | 10.64 | % | | | (1.33 | )% | | | 2.72 | % | | | (5.40 | )% | | | (0.31 | )% | | | 3.25 | % |
| |
| |
| Class R | | | 11.31 | % | | | (0.77 | )% | | | 3.31 | % | | | (4.96 | )% | | | 0.23 | % | | | 3.82 | % |
| |
| |
| Class Y | | | 11.81 | % | | | (0.27 | )% | | | 3.81 | % | | | (4.39 | )% | | | 0.76 | % | | | 4.34 | % |
| |
| |
S&P 500 Index3 | | | 9.80 | % | | | 0.33 | % | | | 4.94 | % | | | (6.91 | )% | | | 1.02 | % | | | 5.30 | % |
| | | | | | | | | | | | | | | | | | | | | | | | | |
| | | | | | | | | | | | | | | | | | | | | | | | | |
The performance data quoted on this page represents past performance and does not guarantee future results. The investment return and principal value of an investment will fluctuate so that an investor’s shares, when redeemed, may be worth more or less than their original cost. Current performance of the fund may be lower or higher than the performance data quoted. Performance data current to the most recent month-end may be obtained by calling 800.677.FUND.
| |
| 1 | Total returns at net asset value (“NAV”) reflect performance over the time period indicated without including the fund’s maximum sales charge and assume reinvestment of all distributions at NAV. |
Total returns at public offering price (“POP”) reflect performance over the time period indicated including the maximum sales charge of 5.50% for Class A shares and the maximum contingent deferred sales charge of 1.00% for Class C shares for the relevant period. Total returns assume reinvestment of all distributions at NAV.
As reflected in the prospectus for the fiscal year ended October 31, 2008, the fund’s total annual operating expense ratio, including the expenses of other investment companies in which the fund invests, if any (“acquired fund fees and expenses”), for Class A, Class C, Class R, and Class Y shares was 1.21%, 1.96%, 1.46%, and 0.96%, respectively.
| | |
| | * | This table represents average annual total returns through the latest calendar quarter – rather than through the end of the fiscal period. |
Value of $10,000 Investment 1,2,4 as of October 31, 2009
This chart illustrates the total value of an assumed $10,000 investment in the fund’s Class A shares (from 1/31/2003 to 10/31/2009) as compared to the S&P 500 Index3.
| |
| 2 | Performance does not reflect the deduction of taxes that a shareholder would pay on fund distributions or redemption of fund shares. Performance reflects fee waivers that were in effect during the periods indicated. In the absence of such fee waivers, total returns would be reduced. Index performance is for illustrative purposes only and does not reflect any expenses, transaction costs, or cash flow effects. Direct investment in the index is not available. |
| |
| 3 | An unmanaged market capitalization-weighted index based on the average weighted performance of 500 widely held common stocks. |
| |
| 4 | Performance for Class C, Class R, and Class Y shares is not presented. Performance for these classes will vary due to their different expense structures. |
20 First American Funds 2009 Annual Report
Large Cap Value Fund
Investment Objective: primary – capital appreciation; secondary – current income
How did the fund perform for the fiscal year ended October 31, 2009?
The First American Large Cap Value Fund (the “fund”), Class Y shares, returned 3.54% for the fiscal year ended October 31, 2009 (Class A shares returned 3.24% without taking the sales charge into account). By comparison, the fund’s benchmark, the Russell 1000 Value Index*, returned 4.78% for the same period.
How did market conditions affect stock market performance during the fiscal year?
The U.S. economy appears to have emerged from the most severe recession of the postwar era during the third quarter of 2009. Gross Domestic Product expanded at a 2.8% annual rate during the quarter, and leading indicators currently suggest that positive growth will be maintained during the final quarter of the year and into 2010. Despite the return to positive growth since midyear, the unemployment rate has continued to rise and reached a new cyclical high of 10.2% in October. The continued increase in the unemployment rate reflects both a historical pattern, where it is common for the unemployment rate to reach its peak after economic activity has reached its trough during the cycle, as well as the subdued pace of the growth recovery to date. In order for the unemployment rate to decline in a sustained manner, economic growth needs to exceed the economy’s potential growth and this set of circumstances has yet to occur. The severity of the recession has left high levels of unutilized resources in the industrial sector and property markets, and the labor market as well. The combined effect of this broad-based resource underutilization has resulted in downward pressure on inflation trends throughout 2009. This trend is expected to remain in place in 2010. The exceptionally high level of unemployment and muted inflation trends have led the Federal Reserve to cut its target overnight lending rate to a range of 0% to 0.25% and engage in a host of nontraditional easing activities, including large-scale purchases of mortgage securities. These activities have resulted in a significant increase in the monetary base, which along with other policy initiatives have worked to restore normal functioning in intrabank funding markets and have supported a broad-based improvement in financial conditions. This policy stance is expected to persist well into 2010 in an effort to support financial conditions and an ongoing recovery in economic activity.
As a result of the broad-based easing of monetary policy and mortgage-related asset purchases by the Federal Reserve, equity markets began moving higher after reaching the low in March, anticipating that these actions would ease financial strains and contribute to a stabilization and improvement in economic and corporate earnings performance. Subsequent economic data and earnings reports validated the initial expectations and have contributed to further gains in the equity markets as the fiscal year progressed.
| |
| * | Unlike mutual funds, index returns do not reflect any expenses, transaction costs, or cash flow effects. |
Top 10 Holdings as of October 31, 20091 (% of net assets)
| | | | | |
| JPMorgan Chase | | | 4.4 | % |
| Exxon Mobil | | | 4.3 | |
| Chevron | | | 4.2 | |
| Wells Fargo | | | 3.5 | |
| AT&T | | | 3.0 | |
| General Electric | | | 3.0 | |
| Bank of America | | | 2.9 | |
| Walt Disney | | | 2.7 | |
| Occidental Petroleum | | | 2.6 | |
| Pfizer | | | 2.3 | |
| | | | | |
| | | | | |
Sector Allocation as of October 31, 20091 (% of net assets)
| | | | | |
| Financials | | | 21.9 | % |
| Energy | | | 21.6 | |
| Industrials | | | 11.0 | |
| Consumer Discretionary | | | 10.1 | |
| Healthcare | | | 9.4 | |
| Information Technology | | | 8.2 | |
| Consumer Staples | | | 6.0 | |
| Utilities | | | 5.1 | |
| Materials | | | 3.1 | |
| Telecommunication Services | | | 3.0 | |
| Short-Term Investment | | | 0.3 | |
Other Assets and Liabilities, Net2 | | | 0.3 | |
| | | | | |
| | | | 100.0 | % |
| | | | | |
| | | | | |
| |
| 1 | Fund holdings and sector allocations are subject to change at any time and are not recommendations to buy or sell any security. |
| |
| 2 | Investments typically comprise substantially all of the fund’s net assets. Other assets and liabilities include receivables for items such as income earned but not yet received and payables for items such as fund expenses incurred but not yet paid. |
First American Funds 2009 Annual Report 21
Large Cap Value Fund
What worked for the fund and why?
For the most part, individual stock selection drove the positive performances within the fund during the fiscal year. Specifically, the fund benefited from retailers Gap and Kohl’s, both of which had resilient profit margins due to strong inventory control despite lower sales during the period. In information technology, BMC Software outperformed with strong earnings due to an upgrade cycle in its core mainframe business and a new software solution for data centers. In addition, network equipment provider Cisco Systems experienced an improvement in its core operations due to growth in internet-related business. In metals, copper miner Freeport-McMoRan Copper & Gold rebounded strongly as copper prices rose due to emerging market demand. California utility stock PG&E rose due to a more favorable regulatory environment and Michigan’s CMS Energy benefited from higher electricity rates. General Mills, a branded food manufacturer, outperformed our earnings expectations with a strong product portfolio that drove higher sales, as well as a cost focus that improved profit margins. The fund was overweight relative to the benchmark in the consumer discretionary and information technology sectors, which outperformed during the period. The fund was also overweight relative to the benchmark in the healthcare sector, which posted strong relative performance in the beginning of the period.
What did not work for the fund and why?
Food retailer Kroger saw limited sales gains and depressed profit margins as food inflation declined during the period. Household products company Procter & Gamble also performed poorly due to sales declines caused by a premium product portfolio that lost share to lower priced competitors. Financial company State Street underperformed due to capital adequacy concerns caused by off-balance-sheet liabilities, and lower earnings expectations due to low interest rates and declines in capital markets business. Property casualty insurance provider ACE and insurance broker AON declined due to concerns over lower future insurance pricing that may limit earnings growth and returns. The fund was overweight relative to the benchmark in the energy sector, which also underperformed during the fiscal year.
Bank of New York Mellon, following the 2007 purchase of Mellon, has not met expectations as earnings declined due to historically low interest rates and pressure on fee income caused by lower asset values tied to underperforming capital markets. We expect these negative impacts to reverse as interest rates move higher and capital markets stabilize.
What strategic moves were made by the fund and why?
We continued to focus on companies that we believed would benefit from improving fundamentals not fully recognized by the market. The fund established a number of new positions across a variety of industries, including diversified industrial company Ingersoll-Rand, specialty gas manufacturer Air Products and Chemicals, media and entertainment conglomerate Walt Disney, food manufacturer General Mills, shipping company FedEx, technology firms Teradata and Applied Materials, hotel operator Starwood Hotels & Resorts Worldwide, online travel agent Expedia, oil and gas exploration companies Apache and Newfield Exploration, and oil field service company Schlumberger.
The portfolio eliminated several positions including household product manufacturer Procter & Gamble, medical device manufacturer Medtronic, telecom services provider Verizon Communications, biotech drug maker Amgen, food and staples retailer Wal-Mart Stores, waste disposal companies Waste Management and Republic Services, diversified financial firm Citigroup, asset manager Invesco, quick service restaurant operator Burger King, packaging companies Pactiv and Sonoco Products, and food manufacturer H.J. Heinz.
Our basic view of the investment environment is balanced with a focus on stabilizing economic activity that may reduce the downward pressure on near- to intermediate-term company fundamentals. Additionally, significant fiscal and monetary stimulus may support near-term valuation levels. The portfolio is overweight relative to the benchmark in the information technology, energy and consumer discretionary sectors while maintaining an underweight allocation toward the financial, utility, and telecommunication services sectors. We continue to implement the portfolio’s investment process of selecting companies that exhibit improving fundamentals, sell at attractive valuations, and exhibit a near-term catalyst that could improve investor perception.
22 First American Funds 2009 Annual Report
Annual Performance1,2
| | | | | | | | | | | | | | | | | | | | | | | | | | | | | | | | | |
| | | October 31, 2009 | | September 30, 2009* |
| | | | | | | | | Since Inception | | | | | | | | Since Inception |
| | | 1 year | | 5 years | | 10 years | | 9/24/2001 | | 1 year | | 5 years | | 10 years | | 9/24/2001 |
Average annual return with sales charge (POP) | | | | | | | | | | | | | | | | | | | | | | | | | | | | | | | | |
| Class A | | | (2.44 | )% | | | (0.96 | )% | | | (1.12 | )% | | | — | | | | (14.59 | )% | | | (0.07 | )% | | | (0.38 | )% | | | — | |
| |
| |
| Class B | | | (2.52 | )% | | | (0.89 | )% | | | (1.30 | )% | | | — | | | | (14.78 | )% | | | — | | | | (0.56 | )% | | | — | |
| |
| |
| Class C | | | 1.47 | % | | | (0.58 | )% | | | (1.30 | )% | | | — | | | | (11.25 | )% | | | 0.30 | % | | | (0.57 | )% | | | — | |
| | | | | | | | | | | | | | | | | | | | | | | | | | | | | | | | | |
Average annual return without sales charge (NAV) | | | | | | | | | | | | | | | | | | | | | | | | | | | | | | | | |
| Class A | | | 3.24 | % | | | 0.17 | % | | | (0.56 | )% | | | — | | | | (9.61 | )% | | | 1.06 | % | | | 0.19 | % | | | — | |
| |
| |
| Class B | | | 2.48 | % | | | (0.58 | )% | | | (1.30 | )% | | | — | | | | (10.33 | )% | | | 0.30 | % | | | (0.56 | )% | | | — | |
| |
| |
| Class C | | | 2.47 | % | | | (0.58 | )% | | | (1.30 | )% | | | — | | | | (10.36 | )% | | | 0.30 | % | | | (0.57 | )% | | | — | |
| |
| |
| Class R | | | 2.96 | % | | | (0.10 | )% | | | — | | | | 2.01 | % | | | (9.88 | )% | | | 0.80 | % | | | — | | | | 2.35 | % |
| |
| |
| Class Y | | | 3.54 | % | | | 0.43 | % | | | (0.30 | )% | | | — | | | | (9.41 | )% | | | 1.32 | % | | | 0.44 | % | | | — | |
| |
| |
Russell 1000 Value Index3 | | | 4.78 | % | | | (0.05 | )% | | | 1.70 | % | | | 3.45 | % | | | (10.62 | )% | | | 0.90 | % | | | 2.59 | % | | | 3.89 | % |
| | | | | | | | | | | | | | | | | | | | | | | | | | | | | | | | | |
| | | | | | | | | | | | | | | | | | | | | | | | | | | | | | | | | |
The performance data quoted on this page represents past performance and does not guarantee future results. The investment return and principal value of an investment will fluctuate so that an investor’s shares, when redeemed, may be worth more or less than their original cost. Current performance of the fund may be lower or higher than the performance data quoted. Performance data current to the most recent month-end may be obtained by calling 800.677.FUND.
| |
| 1 | Total returns at net asset value (“NAV”) reflect performance over the time period indicated without including the fund’s maximum sales charge and assume reinvestment of all distributions at NAV. |
Total returns at public offering price (“POP”) reflect performance over the time period indicated including the maximum sales charge of 5.50% for Class A shares and the maximum contingent deferred sales charge (“CDSC”) for Class B and Class C shares for the relevant period. Maximum CDSC is 5.00% for Class B shares in the first year, decreasing annually to 0% in the seventh year following purchase, and 1.00% for Class C shares. Total returns assume reinvestment of all distributions at NAV.
As reflected in the prospectus for the fiscal year ended October 31, 2008, the fund’s total annual operating expense ratio, including the expenses of other investment companies in which the fund invests, if any (“acquired fund fees and expenses”), for Class A, Class B, Class C, Class R, and Class Y shares was 1.19%, 1.94%, 1.94%, 1.44%, and 0.94%, respectively.
| | |
| | * | This table represents average annual total returns through the latest calendar quarter – rather than through the end of the fiscal period. |
Value of $10,000 Investment1,2,4 as of October 31, 2009
This chart illustrates the total value of an assumed $10,000 investment in the fund’s Class A shares (from 10/31/1999 to 10/31/2009) as compared to the Russell 1000 Value Index3.
| |
| 2 | Performance does not reflect the deduction of taxes that a shareholder would pay on fund distributions or redemption of fund shares. Performance reflects fee waivers that were in effect during the periods indicated. In the absence of such fee waivers, total returns would be reduced. Index performance is for illustrative purposes only and does not reflect any expenses, transaction costs, or cash flow effects. Direct investment in the index is not available. |
| |
| 3 | An unmanaged index that measures the performance of those companies within the Russell 1000 Index (a large-cap index) with lower price-to-book ratios and lower forecasted growth values. |
| |
| 4 | Performance for Class B, Class C, Class R and Class Y shares is not presented. Performance for these classes will vary due to their different expense structures. |
First American Funds 2009 Annual Report 23
Mid Cap Growth Opportunities Fund
Investment Objective: capital appreciation
How did the fund perform for the fiscal year ended October 31, 2009?
The First American Mid Cap Growth Opportunities Fund (the “fund”), Class Y shares, returned 21.00% for the fiscal year ended October 31, 2009 (Class A shares returned 20.73% without taking the sales charge into account). By comparison, the fund’s benchmark, the Russell Midcap Growth Index*, returned 22.48% for the same period.
How did market conditions affect stock performance during the fiscal year?
The U.S. economy appears to have emerged from the most severe recession of the postwar era during the third quarter of 2009. Gross Domestic Product expanded at a 2.8% annual rate during the quarter, and leading indicators currently suggest that positive growth will be maintained during the final quarter of the year and into 2010. Despite the return to positive growth since midyear, the unemployment rate has continued to rise and reached a new cyclical high of 10.2% in October. The continued increase in the unemployment rate reflects both a historical pattern, where it is common for the unemployment rate to reach its peak after economic activity has reached its trough during the cycle, as well as the subdued pace of the growth recovery to date. In order for the unemployment rate to decline in a sustained manner, economic growth needs to exceed the economy’s potential growth and this set of circumstances has yet to occur. The severity of the recession has left high levels of unutilized resources in the industrial sector and property markets, and the labor market as well. The combined effect of this broad-based resource underutilization has resulted in downward pressure on inflation trends throughout 2009. This trend is expected to remain in place in 2010. The exceptionally high level of unemployment and muted inflation trends have led the Federal Reserve to cut its target overnight lending rate to a range of 0% to 0.25% and engage in a host of nontraditional easing activities, including large-scale purchases of mortgage securities. These activities have resulted in a significant increase in the monetary base, which along with other policy initiatives have worked to restore normal functioning in intrabank funding markets and have supported a broad-based improvement in financial conditions. This policy stance is expected to persist well into 2010 in an effort to support financial conditions and an ongoing recovery in economic activity.
As a result of the broad-based easing of monetary policy and mortgage-related asset purchases by the Federal Reserve, equity markets began moving higher after reaching the low in March, anticipating that these actions would ease financial strains and contribute to a stabilization and improvement in economic and corporate earnings performance. Subsequent economic data and earnings reports validated the initial expectations and have contributed to further gains in the equity markets as the fiscal year progressed.
| |
| * | Unlike mutual funds, index returns do not reflect any expenses, transaction costs, or cash flow effects. |
Top 10 Holdings as of October 31, 20091 (% of net assets)
| | | | | |
| Precision Castparts | | | 2.4 | % |
| Coach | | | 2.0 | |
| Flowserve | | | 2.0 | |
| TD Ameritrade | | | 2.0 | |
| Priceline.com | | | 1.9 | |
| Cameron International | | | 1.9 | |
| Teradata | | | 1.8 | |
| MasterCard, Class A | | | 1.8 | |
| Polo Ralph Lauren | | | 1.7 | |
| American Tower, Class A | | | 1.7 | |
| | | | | |
| | | | | |
Sector Allocation as of October 31, 20091 (% of net assets)
| | | | | |
| Information Technology | | | 26.1 | % |
| Consumer Discretionary | | | 22.0 | |
| Industrials | | | 15.4 | |
| Healthcare | | | 10.3 | |
| Energy | | | 8.0 | |
| Financials | | | 7.6 | |
| Telecommunication Services | | | 3.9 | |
| Consumer Staples | | | 3.2 | |
| Materials | | | 3.2 | |
| Short-Term Investment | | | 0.5 | |
Other Assets and Liabilities, Net2 | | | (0.2 | ) |
| | | | | |
| | | | 100.0 | % |
| | | | | |
| | | | | |
| |
| 1 | Fund holdings and sector allocations are subject to change at any time and are not recommendations to buy or sell any security. |
| |
| 2 | Investments typically comprise substantially all of the fund’s net assets. Other assets and liabilities include receivables for items such as income earned but not yet received and payables for items such as fund expenses incurred but not yet paid. |
24 First American Funds 2009 Annual Report
What worked for the fund and why?
As is typical for the fund, individual stock selection (as opposed to broad themes or sector weights) had the greatest impact on performance during the past fiscal year. As the financial markets shifted from fear of economic calamity to recognition of stability, and then to hope for recovery, beneficiaries of cyclical improvement outperformed. Accordingly, portfolio holdings such as Priceline.com, F5 Networks and WMS Industries rebounded sharply. Worldwide, travelers increasingly are turning to the internet to arrange their travel plans. Priceline.com, which has positioned itself to capitalize on this trend with a strong value proposition and an unrivaled breadth of hotel property relationships, gained meaningful share during the past twelve months. WMS Industries was also a strong market share gainer. Buoyed by new product innovation, WMS Industries continued to enhance its position in gaming machines and video lottery terminals for customers worldwide. F5 Networks, a leading supplier of application networking solutions to help companies manage application traffic on their networks, saw consistent improvement in demand for their flagship BIG-IP products and is poised to capture meaningful share gains as enterprise spending rebounds. These winners, along with others such as Polo Ralph Lauren, Flowserve and Teradata, shared several characteristics: Each had a strong secular earnings growth outlook, each had catalysts that would drive growth in the shorter term and each began the period with a stock price that had fallen meaningfully due to the broad economic concerns. All of these remain important fund holdings.
What did not work for the fund and why?
As described above, individual stock selection has the largest impact on the fund’s performance. When analyzing what underperformed the most during the year, this was especially true in the healthcare and materials sectors. In healthcare, two separate issues were challenges. First, as the market rebounded and was led by recovery beneficiaries, defensive fund holdings with strong but stable (rather than improving) earnings, such as C.R. Bard, Thermo Fisher Scientific, and Omnicare, experienced significant valuation compression. Second, some of our judgements proved to be incorrect. In the case of St. Jude Medical, for example, we were too optimistic about the market growth rate for certain medical devices and St. Jude’s market share potential. In the materials sector, a large Russell Mid Cap Growth benchmark position (Rohm & Haas) was acquired at a large premium and not owned in the fund. In addition, the fund did not own many of the commodity-based companies in the index that experienced large upward price moves during the year, especially since March 2009.
What strategic moves were made by the fund and why?
Our basic philosophy remains the same. We identify companies with attractive long-term earnings growth prospects, solid management teams and durable competitive advantages. From that group, we invest in those with fair valuations and approaching catalysts. During any year, although there are individual position changes, the basic framework holds. This past year was no different, however, two subtle shifts were made. First, we modestly increased our exposure to companies that are beneficiaries of an improving economy. In that context, we initiated positions in leadership companies such as Wynn Resorts, Nordstrom, J.Crew Group, and Precision Castparts while eliminating some solid but more defensive companies like H.J. Heinz, Family Dollar Stores, Yum! Brands, and Dun & Bradstreet. All of these are franchise growth companies but we believe the former group should experience faster earnings growth over the next 12 to 18 months. Second, in an effort to highlight those companies in which we have the highest conviction, the concentration in our favorite holdings has increased. This list includes Priceline.com, Cameron International, Precision Castparts, and Flowserve. Again, these shifts are subtle. We will continue to identify franchise growth companies, buy them at what we believe to be opportune moments, and hold them for the long term, with a goal of outperforming our benchmark over time.
First American Funds 2009 Annual Report 25
Mid Cap Growth Opportunities Fund
Annual Performance1,2,3
| | | | | | | | | | | | | | | | | | | | | | | | | | | | | | | | | | | | | | | | | |
| | | October 31, 2009 | | September 30, 2009* |
| | | | | | | | | Since Inception | | | | | | | | Since Inception |
| | | 1 year | | 5 years | | 10 years | | 12/11/2000 | | 9/24/2001 | | 1 year | | 5 years | | 10 years | | 12/11/2000 | | 9/24/2001 |
Average annual return with sales charge (POP) | | | | | | | | | | | | | | | | | | | | | | | | | | | | | | | | | | | | | | | | |
| Class A | | | 14.09 | % | | | 1.43 | % | | | 6.29 | % | | | — | | | | — | | | | (3.44 | )% | | | 3.22 | % | | | 7.50 | % | | | — | | | | — | |
| |
| |
| Class B | | | 14.84 | % | | | 1.58 | % | | | 6.09 | % | | | — | | | | — | | | | (3.58 | )% | | | 3.36 | % | | | 7.29 | % | | | — | | | | — | |
| |
| |
| Class C | | | 18.81 | % | | | 1.82 | % | | | — | | | | — | | | | 6.08 | % | | | 0.42 | % | | | 3.61 | % | | | — | | | | — | | | | 6.69 | % |
| | | | | | | | | | | | | | | | | | | | | | | | | | | | | | | | | | | | | | | | | |
Average annual return without sales charge (NAV) | | | | | | | | | | | | | | | | | | | | | | | | | | | | | | | | | | | | | | | | |
| Class A | | | 20.73 | % | | | 2.59 | % | | | 6.90 | % | | | — | | | | — | | | | 2.18 | % | | | 4.39 | % | | | 8.11 | % | | | — | | | | — | |
| |
| |
| Class B | | | 19.84 | % | | | 1.83 | % | | | 6.09 | % | | | — | | | | — | | | | 1.42 | % | | | 3.61 | % | | | 7.29 | % | | | — | | | | — | |
| |
| |
| Class C | | | 19.81 | % | | | 1.82 | % | | | — | | | | — | | | | 6.08 | % | | | 1.42 | % | | | 3.61 | % | | | — | | | | — | | | | 6.69 | % |
| |
| |
| Class R | | | 20.42 | % | | | 2.33 | % | | | — | | | | 2.93 | % | | | — | | | | 1.93 | % | | | 4.14 | % | | | — | | | | 3.44 | % | | | — | |
| |
| |
| Class Y | | | 21.00 | % | | | 2.85 | % | | | 7.16 | % | | | — | | | | — | | | | 2.45 | % | | | 4.66 | % | | | 8.38 | % | | | — | | | | — | |
| |
| |
Russell Midcap Growth Index4 | | | 22.48 | % | | | 2.22 | % | | | 1.01 | % | | | (1.88 | )% | | | 5.64 | % | | | (0.40 | )% | | | 3.75 | % | | | 2.18 | % | | | (1.44 | )% | | | 6.24 | % |
| | | | | | | | | | | | | | | | | | | | | | | | | | | | | | | | | | | | | | | | | |
| | | | | | | | | | | | | | | | | | | | | | | | | | | | | | | | | | | | | | | | | |
The performance data quoted on this page represents past performance and does not guarantee future results. The investment return and principal value of an investment will fluctuate so that an investor’s shares, when redeemed, may be worth more or less than their original cost. Current performance of the fund may be lower or higher than the performance data quoted. Performance data current to the most recent month-end may be obtained by calling 800.677.FUND.
| |
| 1 | Total returns at net asset value (“NAV”) reflect performance over the time period indicated without including the fund’s maximum sales charge and assume reinvestment of all distributions at NAV. |
Total returns at public offering price (“POP”) reflect performance over the time period indicated including the maximum sales charge of 5.50% for Class A shares and the maximum contingent deferred sales charge (“CDSC”) for Class B and Class C shares for the relevant period. Maximum CDSC is 5.00% for Class B shares in the first year, decreasing annually to 0% in the seventh year following purchase, and 1.00% for Class C shares. Total returns assume reinvestment of all distributions at NAV.
Stocks of mid-capitalization companies may be slightly less volatile than those of small-capitalization companies, but they still involve substantial risk and may be subject to increased volatility and more price fluctuation than large-capitalization companies.
| |
| | As reflected in the prospectus for the fiscal year ended October 31, 2008, the fund’s total annual operating expense ratio, including the expenses of other investment companies in which the fund invests, if any (“acquired fund fees and expenses”), for Class A, Class B, Class C, Class R, and Class Y shares was 1.22%, 1.97%, 1.97%, 1.47%, and 0.97%, respectively. |
| | |
| | * | This table represents average annual total returns through the latest calendar quarter – rather than through the end of the fiscal period. |
Value of $10,000 Investment1,2,3,5 as of October 31, 2009
This chart illustrates the total value of an assumed $10,000 investment in the fund’s Class A shares (from 10/31/1999 to 10/31/2009) as compared to the Russell Midcap Growth Index4.
| |
| 2 | Performance does not reflect the deduction of taxes that a shareholder would pay on fund distributions or redemption of fund shares. Performance reflects fee waivers that were in effect during the periods indicated. In the absence of such fee waivers, total returns would be reduced. Index performance is for illustrative purposes only and does not reflect any expenses, transaction costs, or cash flow effects. Direct investment in the index is not available. |
| |
| 3 | On September 24, 2001, the First American Mid Cap Growth Opportunities Fund became the successor by merger to the Firstar MidCap Core Equity Fund, a series of Firstar Funds, Inc. Prior to the merger, the First American fund had no assets or liabilities. Performance presented prior to September 24, 2001 represents that of the Firstar MidCap Core Equity Fund. |
| |
| 4 | An unmanaged index that measures the performance of those Russell midcap companies with higher price-to-book ratios and higher forecasted growth values. |
| |
| 5 | Performance for Class B, Class C, Class R, and Class Y shares is not presented. Performance for these classes will vary due to their different expense structures. |
26 First American Funds 2009 Annual Report
Mid Cap Select Fund
Investment Objective: long-term growth of capital
How did the fund perform for the fiscal year ended October 31, 2009?
The First American Mid Cap Select Fund (the “fund”), Class Y shares, returned 9.62% for the fiscal year ended October 31, 2009 (Class A shares returned 9.32% without taking the sales charge into account). By comparison, the fund’s benchmark, the Russell Midcap Index*, returned 18.75% for the same period.
How did market conditions affect stock performance during the fiscal year?
The U.S. economy appears to have emerged from the most severe recession of the postwar era during the third quarter of 2009. Gross Domestic Product expanded at a 2.8% annual rate during the quarter, and leading indicators currently suggest that positive growth will be maintained during the final quarter of the year and into 2010. Despite the return to positive growth since midyear, the unemployment rate has continued to rise and reached a new cyclical high of 10.2% in October. The continued increase in the unemployment rate reflects both a historical pattern, where it is common for the unemployment rate to reach its peak after economic activity has reached its trough during the cycle, as well as the subdued pace of the growth recovery to date. In order for the unemployment rate to decline in a sustained manner, economic growth needs to exceed the economy’s potential growth and this set of circumstances has yet to occur. The severity of the recession has left high levels of unutilized resources in the industrial sector and property markets, and the labor market as well. The combined effect of this broad-based resource underutilization has resulted in downward pressure on inflation trends throughout 2009. This trend is expected to remain in place in 2010. The exceptionally high level of unemployment and muted inflation trends have led the Federal Reserve to cut its target overnight lending rate to a range of 0% to 0.25% and engage in a host of nontraditional easing activities, including large-scale purchases of mortgage securities. These activities have resulted in a significant increase in the monetary base, which along with other policy initiatives have worked to restore normal functioning in intrabank funding markets and have supported a broad-based improvement in financial conditions. This policy stance is expected to persist well into 2010 in an effort to support financial conditions and an ongoing recovery in economic activity.
As a result of the broad-based easing of monetary policy and mortgage-related asset purchases by the Federal Reserve, equity markets began moving higher after reaching the low in March, anticipating that these actions would ease financial strains and contribute to a stabilization and improvement in economic and corporate earnings performance. Subsequent economic data and earnings reports validated the initial expectations and have contributed to further gains in the equity markets as the fiscal year progressed.
| |
| * | Unlike mutual funds, index returns do not reflect any expenses, transaction costs, or cash flow effects. |
Top 10 Holdings as of October 31, 20091 (% of net assets)
| | | | | |
| Teradata | | | 3 | .5% |
| WMS Industries | | | 2 | .6 |
| Pioneer Natural Resources | | | 2 | .5 |
| Whiting Petroleum | | | 2 | .2 |
| Jarden | | | 2 | .1 |
| Unum Group | | | 2 | .0 |
| BlackRock | | | 1 | .9 |
| Freeport-McMoRan Copper & Gold | | | 1 | .9 |
| F5 Networks | | | 1 | .8 |
| Evercore Partners, Class A | | | 1 | .7 |
| | | | | |
| | | | | |
Sector Allocation as of October 31, 20091 (% of net assets)
| | | | | |
| Information Technology | | | 21 | .7% |
| Consumer Discretionary | | | 21 | .6 |
| Financials | | | 18 | .3 |
| Industrials | | | 12 | .3 |
| Energy | | | 9 | .9 |
| Materials | | | 4 | .7 |
| Healthcare | | | 4 | .4 |
| Telecommunication Services | | | 2 | .3 |
| Utilities | | | 2 | .2 |
| Consumer Staples | | | 1 | .3 |
| Short-Term Investment | | | 1 | .4 |
Other Assets & Liabilities, Net2 | | | (0 | .1) |
| | | | | |
| | | | 100 | .0% |
| | | | | |
| | | | | |
| |
| 1 | Fund holdings and sector allocations are subject to change at any time and are not recommendations to buy or sell any security. |
| |
| 2 | Investments typically comprise substantially all of the fund’s net assets. Other assets and liabilities include receivables for items such as income earned but not yet received and payables for items such as fund expenses incurred but not yet paid. |
First American Funds 2009 Annual Report 27
Mid Cap Select Fund
What worked for the fund and why?
Effective size, sector and market positioning, as well as individual stock selection, added to fund performance during the fiscal year. As the economy recovered, our overweight in small cap names relative to the benchmark, along with a subsequent underweight in larger cap names, added significantly to performance. Our tilt toward more cyclical sectors such as information technology and industrials and away from defensive sectors like utilities and healthcare also added to performance. Based on our view of an economic recovery, we took overweight positions relative to the benchmark in fundamentally strong, economically sensitive names such as mining firm Freeport-McMoRan Copper & Gold, semiconductor manufacturer Amkor Technology, industrial machinery company Chart Industries and financial firm Fifth Third Bancorp. All of these names added significantly to performance, as did opportunistic beta (higher volatility) and market-exposure investments.
What did not work for the fund and why?
From a stock selection point of view, the largest detractors from performance were medical specialties company Immucor, steel company Cliffs Natural Resources and regional banks Astoria Financial and Bank of the Ozarks. Fund performance was also hindered when we did not react quickly enough to the turn in the economy. We were in position to outperform by adding beta in early March, but we simply did not appreciate the rebound that was about to occur for the economically sensitive names. This was illustrated clearly when the fund’s underweight position in consumer discretionary and telecom services held back its performance.
What strategic moves were made by the fund and why?
We continue to emphasize the cyclical areas of the market as data continues to indicate the worst is behind us. We expect returns to be driven primarily by stock selection, and we remain focused on strong or improving business fundamentals, attractive valuations and positive catalysts for improved market recognition. We are overweight cyclical stocks relative to the benchmark, with attractive risk/reward characteristics that we believe investors will value based upon eventual earnings recovery. These stocks include Teradata, WMS Industries, Pioneer Natural Resources, Jarden, and Freeport-McMoRan Copper & Gold. At the sector level, we continue be overweight relative to the benchmark in the cyclical sectors such as financial, information technology and consumer discretionary. We fund the overweights with negative bets in utilities, healthcare and consumer staples. As we move into the anticipated economic recovery of 2010, we believe that the valuation gap between cyclical and non-cyclical stocks will close and we will reduce our cyclical tilt in the portfolio.
28 First American Funds 2009 Annual Report
Annual Performance1,2
| | | | | | | | | | | | | | | | | | | | | | | | | | | | | | | | | |
| | | October 31, 2009 | | September 30, 2009* |
| | | | | | | | | Since Inception | | | | | | | | Since Inception |
| | | 1 year | | 5 years | | 10 years | | 2/1/2000 | | 1 year | | 5 years | | 10 years | | 2/1/2000 |
Average annual return with sales charge (POP) | | | | | | | | | | | | | | | | | | | | | | | | | | | | | | | | |
| Class A | | | 3.27 | % | | | (1.44 | )% | | | (11.65 | )% | | | — | | | | (11.02 | )% | | | 0.56 | % | | | (9.72 | )% | | | — | |
| |
| |
| Class B | | | 3.49 | % | | | (1.50 | )% | | | (11.82 | )% | | | — | | | | (11.20 | )% | | | 0.57 | % | | | (9.89 | )% | | | — | |
| |
| |
| Class C | | | 7.54 | % | | | (1.06 | )% | | | — | | | | (16.26 | )% | | | (7.43 | )% | | | 0.96 | % | | | — | | | | (15.95 | )% |
| | | | | | | | | | | | | | | | | | | | | | | | | | | | | | | | | |
Average annual return without sales charge (NAV) | | | | | | | | | | | | | | | | | | | | | | | | | | | | | | | | |
| Class A | | | 9.32 | % | | | (0.33 | )% | | | (11.15 | )% | | | — | | | | (5.82 | )% | | | 1.70 | % | | | (9.20 | )% | | | — | |
| |
| |
| Class B | | | 8.49 | % | | | (1.10 | )% | | | (11.82 | )% | | | — | | | | (6.53 | )% | | | 0.96 | % | | | (9.89 | )% | | | — | |
| |
| |
| Class C | | | 8.54 | % | | | (1.06 | )% | | | — | | | | (16.26 | )% | | | (6.49 | )% | | | 0.96 | % | | | — | | | | (15.95 | )% |
| |
| |
| Class Y | | | 9.62 | % | | | (0.09 | )% | | | (10.91 | )% | | | — | | | | (5.65 | )% | | | 1.95 | % | | | (8.97 | )% | | | — | |
| |
| |
Russell 2500 Index3 | | | 13.26 | % | | | 1.61 | % | | | 5.42 | % | | | 3.93 | % | | | (5.68 | )% | | | 3.29 | % | | | 6.28 | % | | | 4.61 | % |
| |
| |
Russell Midcap Index4 | | | 18.75 | % | | | 2.40 | % | | | 5.09 | % | | | 4.22 | % | | | (3.55 | )% | | | 3.89 | % | | | 6.05 | % | | | 4.74 | % |
| | | | | | | | | | | | | | | | | | | | | | | | | | | | | | | | | |
| | | | | | | | | | | | | | | | | | | | | | | | | | | | | | | | | |
The performance data quoted on this page represents past performance and does not guarantee future results. The investment return and principal value of an investment will fluctuate so that an investor’s shares, when redeemed, may be worth more or less than their original cost. Current performance of the fund may be lower or higher than the performance data quoted. Performance data current to the most recent month-end may be obtained by calling 800.677.FUND.
| |
| 1 | Total returns at net asset value (“NAV”) reflect performance over the time period indicated without including the fund’s maximum sales charge and assume reinvestment of all distributions at NAV. |
Total returns at public offering price (“POP”) reflect performance over the time period indicated including the maximum sales charge of 5.50% for Class A shares and the maximum contingent deferred sales charge (“CDSC”) for Class B and Class C shares for the relevant period. Maximum CDSC is 5.00% for Class B shares in the first year, decreasing annually to 0% in the seventh year following purchase, and 1.00% for Class C shares. Total returns assume reinvestment of all distributions at NAV.
Stocks of mid-capitalization companies may be slightly less volatile than those of small-capitalization companies, but they still involve substantial risk and may be subject to increased volatility and more price fluctuation than large-capitalization companies.
| |
| | As reflected in the prospectus for the fiscal year ended October 31, 2008, the fund’s total annual operating expense ratio, before waivers and including the expenses of other investment companies in which the fund invests, if any (“acquired fund fees and expenses”), for Class A, Class B, Class C, and Class Y shares was 1.60%, 2.35%, 2.35%, and 1.35%, respectively. The advisor has contractually agreed to waiver fees through February 28, 2010 so that total annual fund operating expenses, not including any acquired fund fees and expenses, for Class A, Class B, Class C, and Class Y shares do not exceed 1.41%, 2.16%, 2.16% and 1.16%, respectively. These fee waivers may be terminated at any time after February 28, 2010, at the discretion of the advisor. Prior to that time, such waivers may not be terminated without the approval of the fund’s board of directors. |
| | |
| | * | This table represents average annual total returns through the latest calendar quarter – rather than through the end of the fiscal period. |
Value of $10,000 Investment1,2,5 as of October 31, 2009
This chart illustrates the total value of an assumed $10,000 investment in the fund’s Class A shares (from 10/31/1999 to 10/31/2009) as compared to the Russell 2500 Index3 and the Russell Midcap Index4.
| |
| 2 | Performance does not reflect the deduction of taxes that a shareholder would pay on fund distributions or redemption of fund shares. Performance reflects fee waivers that were in effect during the periods indicated. In the absence of such fee waivers, total returns would be reduced. Index performance is for illustrative purposes only and does not reflect any expenses, transaction costs, or cash flow effects. Direct investment in the index is not available. |
| |
| | Performance for periods prior to May 4, 2009 reflects the fund’s operation using different investment strategies than are currently in place. Effective October 3, 2005, the fund’s principal investment strategy changed from investing primarily in technology stocks to investing primarily in common stocks of small- and mid- capitalization companies, and the fund’s name changed from Technology Fund to Small-Mid Cap Core Fund. Thereafter, effective May 4, 2009, the fund’s principal investment strategy was changed from investing primarily in common stocks of small- and mid-capitalization companies to investing primarily in common stocks of mid-capitalization companies, and the fund’s name changed from Small-Mid Cap Core Fund to Mid Cap Select Fund. |
| |
| 3 | An unmanaged small- and mid-cap index that measures the performance of the 2,500 smallest companies in the Russell 3000 Index. |
| |
| 4 | Previously, the fund used the Russell 2500 Index as a benchmark. Going forward, the fund’s performance will be compared to the Russell Midcap Index because it more closely reflects the fund’s investment universe. The Russell Midcap Index is an unmanaged index that measures the performance of the 800 smallest companies in the Russell 1000 Index. |
| |
| 5 | Performance for Class B, Class C, and Class Y shares is not presented. Performance for these classes will vary due to their different expense structures. |
First American Funds 2009 Annual Report 29
Mid Cap Value Fund
Investment Objective: capital appreciation
How did the fund perform for the fiscal year ended October 31, 2009?
The First American Mid Cap Value Fund (the “fund”), Class Y shares, returned 14.24% for the fiscal year ended October 31, 2009 (Class A shares returned 13.95% without taking the sales charge into account). By comparison, the fund’s benchmark, the Russell Midcap Value Index*, returned 14.52% for the same period.
How did market conditions affect stock market performance during the fiscal year?
The U.S. economy appears to have emerged from the most severe recession of the postwar era during the third quarter of 2009. Gross Domestic Product expanded at a 2.8% annual rate during the quarter, and leading indicators currently suggest that positive growth will be maintained during the final quarter of the year and into 2010. Despite the return to positive growth since midyear, the unemployment rate has continued to rise and reached a new cyclical high of 10.2% in October. The continued increase in the unemployment rate reflects both a historical pattern, where it is common for the unemployment rate to reach its peak after economic activity has reached its trough during the cycle, as well as the subdued pace of the growth recovery to date. In order for the unemployment rate to decline in a sustained manner, economic growth needs to exceed the economy’s potential growth and this set of circumstances has yet to occur. The severity of the recession has left high levels of unutilized resources in the industrial sector and property markets, and the labor market as well. The combined effect of this broad-based resource underutilization has resulted in downward pressure on inflation trends throughout 2009. This trend is expected to remain in place in 2010. The exceptionally high level of unemployment and muted inflation trends have led the Federal Reserve to cut its target overnight lending rate to a range of 0% to 0.25% and engage in a host of nontraditional easing activities, including large-scale purchases of mortgage securities. These activities have resulted in a significant increase in the monetary base, which along with other policy initiatives have worked to restore normal functioning in intrabank funding markets and have supported a broad-based improvement in financial conditions. This policy stance is expected to persist well into 2010 in an effort to support financial conditions and an ongoing recovery in economic activity.
As a result of the broad-based easing of monetary policy and mortgage-related asset purchases by the Federal Reserve, equity markets began moving higher after reaching the low in March, anticipating that these actions would ease financial strains and contribute to a stabilization and improvement in economic and corporate earnings performance. Subsequent economic data and earnings reports validated the initial expectations and have contributed to further gains in the equity markets as the fiscal year progressed.
| |
| * | Unlike mutual funds, index returns do not reflect any expenses, transaction costs, or cash flow effects. |
Top 10 Holdings as of October 31, 20091 (% of net assets)
| | | | | |
| Newfield Exploration | | | 2.5 | % |
| Sempra Energy | | | 2.2 | |
| Unum Group | | | 2.1 | |
| ConAgra Foods | | | 1.9 | |
| Noble Energy | | | 1.9 | |
| Air Products and Chemicals | | | 1.8 | |
| CMS Energy | | | 1.8 | |
| Edison International | | | 1.7 | |
| AON | | | 1.7 | |
| Comerica | | | 1.6 | |
| | | | | |
| | | | | |
Sector Allocation as of October 31, 20091 (% of net assets)
| | | | | |
| Financials | | | 24.6 | % |
| Consumer Discretionary | | | 13.9 | |
| Energy | | | 11.2 | |
| Industrials | | | 10.3 | |
| Information Technology | | | 9.8 | |
| Utilities | | | 9.6 | |
| Consumer Staples | | | 7.7 | |
| Materials | | | 6.5 | |
| Healthcare | | | 4.4 | |
| Telecommunication Services | | | 1.1 | |
| Short-Term Investment | | | 0.9 | |
| | | | | |
| | | | 100.0 | % |
| | | | | |
| | | | | |
| |
| 1 | Fund holdings and sector allocations are subject to change at any time and are not recommendations to buy or sell any security. |
30 First American Funds 2009 Annual Report
What worked for the fund and why?
Fund performance benefited from favorable security selection in the utilities and materials sectors. In addition, sector allocation was favorable stemming from an overweight stance relative to the fund’s benchmark in the consumer cyclical and information technology sectors, as well as an underweight allocation to utilities and financials. Chemical manufacturer Celanese and copper miner Freeport McMoRan Copper & Gold were significant contributors to performance as commodity prices moved higher, driven by an increase in developing market demand, particularly from China. Enterprise software provider BMC Software posted a strong performance because of an upgrade cycle in its core mainframe business as well as increased demand for their new data center software solution. Despite a sluggish sales environment, retailers Gap and Kohl’s were standouts due to strong cost controls and aggressive inventory management. Other holdings that helped fund performance included electronic component manufacturer Amphenol, rural telecom service carrier Windstream, regional bank Comerica, pharmaceutical distributor AmerisourceBergen, and soft drink bottler Pepsi Bottling Group.
What did not work for the fund and why?
Fund performance was negatively impacted by unfavorable stock selection in the healthcare, technology, consumer cyclical, and financial sectors. An overweight allocation toward industrials also negatively impacted performance. Regional banks TCF Bank, M&T Bank, and Regions Financial, as well as thrift Astoria Financial, all underperformed the benchmark due to rising credit costs and sluggish loan demand. Metals recycler Schnitzer Steel underperformed due to sluggish volumes and adverse margin trends in its core recycling business. Homebuilder Toll Brothers underperformed because of a slower-than-expected recovery in new orders. Other holdings which underperformed during the period included real estate investor Essex Property Trust, food retailer Kroger, business process outsourcing provider Affiliated Computer Services, and healthcare benefits provider Cigna.
What strategic moves were made by the fund and why?
The fund established a number of new positions during the year, including energy exploration company Newfield Exploration, diversified insurance carrier Unum Group, industrial gas producer Air Products and Chemicals, utilities CMS Energy and Edison International, regional bank Comerica, and diversified industrial manufacturer Ingersoll-Rand. The fund eliminated a number of positions including packaging manufacturer Pactiv, diversified insurance carrier Arch Capital Group, thrift Astoria Financial, utility PG&E, soft drink bottler Pepsi Bottling Group, packaged food producer HJ Heinz, and quick service restaurant operator Burger King Holdings. We continue to implement the fund’s investment process of selecting companies that exhibit improving fundamentals, sell at attractive valuations, and exhibit a near-term catalyst that could improve investor perception.
First American Funds 2009 Annual Report 31
Mid Cap Value Fund
Annual Performance1,2
| | | | | | | | | | | | | | | | | | | | | | | | | | | | | | | | | |
| | | October 31, 2009 | | September 30, 2009* |
| | | | | | | | | Since Inception | | | | | | | | Since Inception |
| | | 1 year | | 5 years | | 10 years | | 9/24/2001 | | 1 year | | 5 years | | 10 years | | 9/24/2001 |
Average annual return with sales charge (POP) | | | | | | | | | | | | | | | | | | | | | | | | | | | | | | | | |
| Class A | | | 7.67 | % | | | 0.64 | % | | | 5.74 | % | | | — | | | | (9.48 | )% | | | 1.94 | % | | | 5.85 | % | | | — | |
| |
| |
| Class B | | | 8.13 | % | | | 0.69 | % | | | 5.56 | % | | | — | | | | (9.60 | )% | | | 1.99 | % | | | 5.67 | % | | | — | |
| |
| |
| Class C | | | 12.10 | % | | | 1.02 | % | | | 5.56 | | | | — | | | | (5.83 | )% | | | 2.32 | % | | | 5.66 | % | | | — | |
| | | | | | | | | | | | | | | | | | | | | | | | | | | | | | | | | |
Average annual return without sales charge (NAV) | | | | | | | | | | | | | | | | | | | | | | | | | | | | | | | | |
| Class A | | | 13.95 | % | | | 1.78 | % | | | 6.34 | % | | | — | | | | (4.20 | )% | | | 3.10 | % | | | 6.45 | % | | | — | |
| |
| |
| Class B | | | 13.13 | % | | | 1.03 | % | | | 5.56 | % | | | — | | | | (4.85 | )% | | | 2.33 | % | | | 5.67 | % | | | — | |
| |
| |
| Class C | | | 13.10 | % | | | 1.02 | % | | | 5.56 | | | | — | | | | (4.88 | )% | | | 2.32 | % | | | 5.66 | % | | | — | |
| |
| |
| Class R | | | 13.63 | % | | | 1.52 | % | | | — | | | | 6.83 | % | | | (4.40 | )% | | | 2.85 | % | | | — | | | | 7.41 | % |
| |
| |
| Class Y | | | 14.24 | % | | | 2.03 | % | | | 6.60 | % | | | — | | | | (3.96 | )% | | | 3.35 | % | | | 6.71 | % | | | — | |
| |
| |
Russell Midcap Value Index3 | | | 14.52 | % | | | 2.05 | % | | | 6.59 | % | | | 7.43 | % | | | (7.12 | )% | | | 3.53 | % | | | 7.43 | % | | | 8.16 | % |
| | | | | | | | | | | | | | | | | | | | | | | | | | | | | | | | | |
| | | | | | | | | | | | | | | | | | | | | | | | | | | | | | | | | |
The performance data quoted on this page represents past performance and does not guarantee future results. The investment return and principal value of an investment will fluctuate so that an investor’s shares, when redeemed, may be worth more or less than their original cost. Current performance of the fund may be lower or higher than the performance data quoted. Performance data current to the most recent month-end may be obtained by calling 800.677.FUND.
| |
| 1 | Total returns at net asset value (“NAV”) reflect performance over the time period indicated without including the fund’s maximum sales charge and assume reinvestment of all distributions at NAV. |
Total returns at public offering price (“POP”) reflect performance over the time period indicated including the maximum sales charge of 5.50% for Class A shares and the maximum contingent deferred sales charge (“CDSC”) for Class B and Class C shares for the relevant period. Maximum CDSC is 5.00% for Class B shares in the first year, decreasing annually to 0% in the seventh year following purchase, and 1.00% for Class C shares. Total returns assume reinvestment of all distributions at NAV.
Stocks of mid-capitalization companies may be slightly less volatile than those of small-capitalization companies, but they still involve substantial risk and may be subject to increased volatility and more price fluctuation than large-capitalization companies.
As reflected in the prospectus for the fiscal year ended October 31, 2008, the fund’s total annual operating expense ratio, including the expenses of other investment companies in which the fund invests, if any (“acquired fund fees and expenses”), for Class A, Class B, Class C, Class R, and Class Y shares was 1.23%, 1.98%, 1.98%, 1.49%, and 0.99%, respectively.
| | |
| | * | This table represents average annual total returns through the latest calendar quarter – rather than through the end of the fiscal period. |
Value of $10,000 Investment1,2,4 as of October 31, 2009
This chart illustrates the total value of an assumed $10,000 investment in the fund’s Class A shares (from 10/31/1999 to 10/31/2009) as compared to the Russell Midcap Value Index3.
| |
| 2 | Performance does not reflect the deduction of taxes that a shareholder would pay on fund distributions or redemption of fund shares. Performance reflects fee waivers that were in effect during the periods indicated. In the absence of such fee waivers, total returns would be reduced. Index performance is for illustrative purposes only and does not reflect any expenses, transaction costs, or cash flow effects. Direct investment in the index is not available. |
| |
| 3 | An unmanaged index that measures the performance of those Russell mid-cap companies with lower price-to-book ratios and lower forecasted growth values. |
| |
| 4 | Performance for Class B, Class C, Class R, and Class Y shares is not presented. Performance for these classes will vary due to their different expense structures. |
32 First American Funds 2009 Annual Report
Real Estate Securities Fund
Investment Objective: above-average current income and long-term capital appreciation
How did the fund perform for the fiscal year ended October 31, 2009?
The First American Real Estate Securities Fund (the “fund”), Class Y shares, returned 3.11% for the fiscal year ended October 31, 2009 (Class A shares returned 2.82% without taking the sales charge into account). By comparison, the fund’s benchmark, the MSCI U.S. REIT Index*, returned 0.47% for the same period.
How did market conditions affect stock market performance during the fiscal year?
The U.S. economy appears to have emerged from the most severe recession of the post-war era during the third quarter of 2009. Gross Domestic Product expanded at a 2.8% annual rate during the quarter, and leading indicators currently suggest that positive growth will be maintained during the final quarter of the year and into 2010. Despite the return to positive growth since mid-year, the unemployment rate has continued to rise and reached a new cyclical high of 10.2% in October. The continued increase in the unemployment rate reflects both a historical pattern, where it is common for the unemployment rate to reach its peak after economic activity has reached its trough during the cycle, as well as the subdued pace of the growth recovery to date. In order for the unemployment rate to decline in a sustained manner, economic growth needs to exceed the economy’s potential growth and this set of circumstances has yet to occur. The severity of the recession has left high levels of unutilized resources in the industrial sector and property markets, and the labor market as well. The combined effect of this broad-based resource underutilization has resulted in downward pressure on inflation trends throughout 2009. This trend is expected to remain in place in 2010. The exceptionally high level of unemployment and muted inflation trends have led the Federal Reserve to cut its target overnight lending rate to a range of 0% to 0.25% and engage in a host of non-traditional easing activities, including large-scale purchases of mortgage securities. These activities have resulted in a significant increase in the monetary base, which along with other policy initiatives have worked to restore normal functioning in intra-bank funding markets and have supported a broad-based improvement in financial conditions. This policy stance is expected to persist well into 2010 in an effort to support financial conditions and an ongoing recovery in economic activity.
During the fiscal year, weak economic conditions, rising unemployment rates, and a capital-constrained environment contributed to a weak fundamental environment for commercial real estate. The sector experienced higher vacancy levels and falling rental rates. In particular, commercial real estate suffered from a severely constrained debt financing climate, leading to a dramatic reduction in the number of private transactions. In concert with these underlying challenges, publicly traded real estate stocks sold off dramatically during most of the first half of the fiscal year. However, public real estate companies rallied sharply since March lows, with improved access to capital giving them a significant advantage over private competitors.
| |
| * | Unlike mutual funds, index returns do not reflect any expenses, transaction costs, or cash flow effects. |
Top 10 Holdings as of October 31, 20091 (% of net assets)
| | | | | |
| Simon Property Group | | | 9.6 | % |
| Public Storage | | | 5.4 | |
| Boston Properties | | | 4.7 | |
| Vornado Realty Trust | | | 4.4 | |
| Host Hotels & Resorts | | | 3.9 | |
| Ventas | | | 3.3 | |
| Equity Residential Properties Trust | | | 3.3 | |
| HCP | | | 3.0 | |
| Liberty Property Trust | | | 2.5 | |
| Federal Realty Investment Trust | | | 2.4 | |
Sector Allocation as of October 31, 20091 (% of net assets)
| | | | | | |
| Office | | | 20 | .9 | % |
| Malls | | | 12 | .5 | |
| Healthcare | | | 12 | .4 | |
| Apartments | | | 11 | .9 | |
| Community Centers | | | 8 | .3 | |
| Industrials | | | 6 | .9 | |
| Diversified | | | 6 | .4 | |
| Self Storage | | | 5 | .9 | |
| Hotels | | | 5 | .7 | |
| Net Lease | | | 3 | .4 | |
| Student Housing | | | 2 | .3 | |
| Infrastructure | | | 1 | .5 | |
| Manufactured Homes | | | 0 | .9 | |
| Real Estate Service Provider | | | 0 | .0 | |
| Private Real Estate Companies | | | 0 | .0 | |
| Short-Term Investment | | | 0 | .5 | |
Other Assets and Liabilities, Net2 | | | 0 | .5 | |
| | | | | | |
| | | | 100 | .0 | %
|
| |
| 1 | Fund holdings and sector allocations are subject to change at any time and are not recommendations to buy or sell any security. |
| |
| 2 | Investments typically comprise substantially all of the fund’s net assets. Other assets and liabilities include receivables for items such as income earned but not yet received and payables for items such as fund expenses incurred but not yet paid. |
First American Funds 2009 Annual Report 33
Real Estate Securities Fund
What worked for the fund and why?
The fund benefited from individual stock selection. The portfolio had a bias toward higher-quality companies (those with consistent, visible cash flows), and continues to invest on a relative-value basis (with a focus on individual stocks rather than economic or market cycles). This strategy helped the fund avoid several underperforming stocks. Reduced holdings in job markets with financial services industry exposure also proved beneficial. The fund invests in a fairly sector-neutral manner, which we believe provides shareholders with a well-diversified portfolio of public real estate stocks. The fund’s best-performing sectors on a relative basis were malls, apartments and industrials.
What did not work for the fund and why?
The broad REIT rally that occurred during the fiscal year saw lower quality stocks generally outperform higher quality stocks. Thus, the fund’s emphasis on higher quality stocks actually hurt the fund’s performance. We have resisted the temptation to change our long-term investment process as a reaction to this low quality stock performance period. Early in the fiscal year, many of the low-quality stocks had severe balance sheet issues and were dramatically overleveraged. Beginning in March 2009, several companies managed to dispel the perception that they would fail, and the stocks rallied correspondingly.
What strategic moves were made by the fund and why?
Reducing exposure to the financial services industry proved to be a successful strategy through much of the year. In addition, because the fund continued to invest on a relative-value basis, it garnered a fairly balanced position across the various property types, which benefited the fund by reducing the impact of any one negatively performing sector. The fund continued to use international stocks to supplement domestic holdings in an attempt to access more dynamic parts of the global real estate cycle. At the end of the fiscal year, the fund had less than 2% of assets in non-dollar denominated stocks.
34 First American Funds 2009 Annual Report
Annual Performance1,2
| | | | | | | | | | | | | | | | | | | | | | | | | | | | | | | | | | | | | | | | | |
| | | October 31, 2009 | | September 30, 2009* |
| | | | | | | | | Since Inception | | | | | | | | Since Inception |
| | | 1 year | | 5 years | | 10 years | | 2/1/2000 | | 9/24/2001 | | 1 year | | 5 years | | 10 years | | 2/1/2000 | | 9/24/2001 |
Average annual return with sales charge (POP) | | | | | | | | | | | | | | | | | | | | | | | | | | | | | | | | | | | | | | | | |
| Class A | | | (2.86 | )% | | | 0.86 | % | | | 10.48 | % | | | — | | | | — | | | | (28.47 | )% | | | 3.02 | % | | | 10.71 | % | | | — | | | | — | |
| |
| |
| Class B | | | (2.78 | )% | | | 1.02 | % | | | 10.28 | % | | | — | | | | — | | | | (28.45 | )% | | | 3.17 | % | | | 10.52 | % | | | — | | | | — | |
| |
| |
| | | | | | | | | | | | | | | | | | | | | | | | | | | | | | | | | | | | | | | | | |
| Class C | | | 1.11 | % | | | 1.25 | % | | | — | | | | 10.25 | % | | | — | | | | (25.57 | )% | | | 3.42 | % | | | — | | | | 10.89 | % | | | — | |
| | | | | | | | | | | | | | | | | | | | | | | | | | | | | | | | | | | | | | | | | |
Average annual return without sales charge (NAV) | | | | | | | | | | | | | | | | | | | | | | | | | | | | | | | | | | | | | | | | |
| Class A | | | 2.82 | % | | | 2.01 | % | | | 11.10 | % | | | — | | | | — | | | | (24.31 | )% | | | 4.19 | % | | | 11.34 | % | | | — | | | | — | |
| |
| |
| Class B | | | 2.13 | % | | | 1.25 | % | | | 10.28 | % | | | — | | | | — | | | | (24.83 | )% | | | 3.41 | % | | | 10.52 | % | | | — | | | | — | |
| |
| |
| Class C | | | 2.09 | % | | | 1.25 | % | | | — | | | | 10.25 | % | | | — | | | | (24.85 | )% | | | 3.42 | % | | | — | | | | 10.89 | % | | | — | |
| |
| |
| Class R | | | 2.62 | % | | | 1.75 | % | | | — | | | | — | | | | 9.57 | % | | | (24.46 | )% | | | 3.92 | % | | | — | | | | — | | | | 10.33 | % |
| |
| |
| Class Y | | | 3.11 | % | | | 2.26 | % | | | 11.38 | % | | | — | | | | — | | | | (24.12 | )% | | | 4.44 | % | | | 11.62 | % | | | — | | | | — | |
| |
| |
MSCI U.S. REIT Index3 | | | 0.47 | % | | | (0.68 | )% | | | 9.12 | % | | | 9.06 | % | | | 7.71 | % | | | (28.16 | )% | | | 1.34 | % | | | 9.39 | % | | | 9.68 | % | | | 8.44 | % |
| | | | | | | | | | | | | | | | | | | | | | | | | | | | | | | | | | | | | | | | | |
| | | | | | | | | | | | | | | | | | | | | | | | | | | | | | | | | | | | | | | | | |
The performance data quoted on this page represents past performance and does not guarantee future results. The investment return and principal value of an investment will fluctuate so that an investor’s shares, when redeemed, may be worth more or less than their original cost. Current performance of the fund may be lower or higher than the performance data quoted. Performance data current to the most recent month-end may be obtained by calling 800.677.FUND.
| |
| 1 | Total returns at net asset value (“NAV”) reflect performance over the time period indicated without including the fund’s maximum sales charge and assume reinvestment of all distributions at NAV. |
Total returns at public offering price (“POP”) reflect performance over the time period indicated including the maximum sales charge of 5.50% for Class A shares and the maximum contingent deferred sales charge (“CDSC”) for Class B and Class C shares for the relevant period. Maximum CDSC is 5.00% for Class B shares in the first year, decreasing annually to 0% in the seventh year following purchase, and 1.00% for Class C shares. Total returns assume reinvestment of all distributions at NAV.
| |
| | Sector funds such as the Real Estate Securities Fund are more vulnerable to price fluctuation as a result of events that may affect the industry in which they focus than are funds that invest in multiple industries. Share prices of sector funds also will fluctuate with changing market conditions, as will share prices of other stock funds. Sector funds should not be treated as a core investment; rather, their role is to round out the growth portion of a well-diversified investment portfolio. |
| |
| | As reflected in the prospectus for the fiscal year ended October 31, 2008, the fund’s total annual operating expense ratio, including the expenses of other investment companies in which the fund invests, if any (“acquired fund fees and expenses”), for Class A, Class B, Class C, Class R, and Class Y shares was 1.25%, 2.00%, 2.00%, 1.50%, and 1.00%, respectively. |
| | |
| | * | This table represents average annual total returns through the latest calendar quarter – rather than through the end of the fiscal period. |
Value of $10,000 Investment1,2,4 as of October 31, 2009
This chart illustrates the total value of an assumed $10,000 investment in the fund’s Class A shares (from 10/31/1999 to 10/31/2009) as compared to the MSCI U.S. REIT Index3.
| |
| 2 | Performance does not reflect the deduction of taxes that a shareholder would pay on fund distributions or redemption of fund shares. Performance reflects fee waivers that were in effect during the periods indicated. In the absence of such fee waivers, total returns would be reduced. Index performance is for illustrative purposes only and does not reflect any expenses, transaction costs, or cash flow effects. Direct investment in the index is not available. |
| |
| 3 | An unmanaged index of the most actively traded real estate investment trusts. |
| |
| 4 | Performance for Class B, Class C, Class R, and Class Y shares is not presented. Performance for these classes will vary due to their different expense structures. |
First American Funds 2009 Annual Report 35
Small Cap Growth Opportunities Fund
Investment Objective: growth of capital
How did the fund perform for the fiscal year ended October 31, 2009?
The First American Small Cap Growth Opportunities Fund (the “fund”), Class Y shares, returned 22.01% for the fiscal year ended October 31, 2009 (Class A shares returned 21.66% without taking the sales charge into account). By comparison, the fund’s benchmark, the Russell 2000 Growth Index*, returned 11.34% for the same period.
How did market conditions affect stock market performance during the fiscal year?
The U.S. economy appears to have emerged from the most severe recession of the postwar era during the third quarter of 2009. Gross Domestic Product expanded at a 2.8% annual rate during the quarter, and leading indicators currently suggest that positive growth will be maintained during the final quarter of the year and into 2010. Despite the return to positive growth since midyear, the unemployment rate has continued to rise and reached a new cyclical high of 10.2% in October. The continued increase in the unemployment rate reflects both a historical pattern, where it is common for the unemployment rate to reach its peak after economic activity has reached its trough during the cycle, as well as the subdued pace of the growth recovery to date. In order for the unemployment rate to decline in a sustained manner, economic growth needs to exceed the economy’s potential growth and this set of circumstances has yet to occur. The severity of the recession has left high levels of unutilized resources in the industrial sector and property markets, and the labor market as well. The combined effect of this broad-based resource underutilization has resulted in downward pressure on inflation trends throughout 2009. This trend is expected to remain in place in 2010. The exceptionally high level of unemployment and muted inflation trends have led the Federal Reserve to cut its target overnight lending rate to a range of 0% to 0.25% and engage in a host of nontraditional easing activities, including large-scale purchases of mortgage securities. These activities have resulted in a significant increase in the monetary base, which along with other policy initiatives have worked to restore normal functioning in intrabank funding markets and have supported a broad-based improvement in financial conditions. This policy stance is expected to persist well into 2010 in an effort to support financial conditions and an ongoing recovery in economic activity.
As a result of the broad-based easing of monetary policy and mortgage-related asset purchases by the Federal Reserve, equity markets began moving higher after reaching the low in March, anticipating that these actions would ease financial strains and contribute to a stabilization and improvement in economic and corporate earnings performance. Subsequent economic data and earnings reports validated the initial expectations and have contributed to further gains in the equity markets as the fiscal year progressed.
| |
| * | Unlike mutual funds, index returns do not reflect any expenses, transaction costs, or cash flow effects. |
Top 10 Holdings as of October 31, 20091 (% of net assets)
| | | | | |
| Synaptics | | | 2.3 | % |
| First American Prime Obligations Fund, Class Z | | | 2.0 | |
| Wolverine World Wide | | | 1.9 | |
| PMC-Sierra | | | 1.7 | |
| Warnaco Group | | | 1.7 | |
| Neutral Tandem | | | 1.6 | |
| Bally Technologies | | | 1.6 | |
| Polycom | | | 1.6 | |
| Kenexa | | | 1.6 | |
| Monolithic Power Systems | | | 1.5
| |
Sector Allocation as of October 31, 20091 (% of net assets)
| | | | | | |
| Information Technology | | | 28 | .6 | % |
| Healthcare | | | 20 | .5 | |
| Industrials | | | 15 | .5 | |
| Consumer Discretionary | | | 14 | .9 | |
| Financials | | | 6 | .7 | |
| Energy | | | 4 | .2 | |
| Consumer Staples | | | 3 | .8 | |
| Telecommunication Services | | | 2 | .8 | |
| Materials | | | 1 | .0 | |
| Short-Term Investment | | | 2 | .0 | |
| | | | | | |
| | | | 100 | .0 | %
|
| |
| 1 | Fund holdings and sector allocations are subject to change at any time and are not recommendations to buy or sell any security. |
36 First American Funds 2009 Annual Report
What worked for the fund and why?
The most significant positive contributor to 2009 performance was stock selection in the information technology sector, primarily among networking and semiconductor-related issues as balance sheet concerns abated on improved credit market access, and as investors reacted to strong earnings reports. CommScope, a manufacturer of coaxial cable and infrastructure equipment for communications end markets, rose sharply in the second quarter on the back of a positive earnings call, and when management stated that debt covenants would not be violated later in the year. Plantronics, a manufacturer of lightweight telecommunications headsets, reported strong quarterly results that topped expectations throughout the fiscal year, which sent shares higher. PMC-Sierra, a manufacturer of specialty semiconductors for communications and storage equipment, also performed strongly as investors anticipated new storage product ramps, a resumption of fiber-to-the-home spending in Asia, and 3G wireless deployments in China.
The fund’s industrial holdings also performed well on a relative basis. Among them, Chart Industries, a leading provider of infrastructure equipment for the liquefied natural gas industry, performed well, especially in the first quarter. BE Aerospace, the largest manufacturer of cabin interior products for commercial airlines and a leading aftermarket distributor of airline fasteners, also demonstrated the resilience of its aftermarket business despite a challenging operating environment.
Stock selection in the financial sector also contributed positively to the fund’s relative return. The most significant positive contributor to performance was SVB Financial Group, a Silicon Valley-based commercial bank that specializes in lending to technology companies. Following a poor first-quarter performance, this sector improved its credit metrics in the second quarter, which helped drive strong stock price appreciation. Similarly, Investment Technology Group, an agency brokerage and technology company catering to the mutual fund industry, posted solid results, and the stock reacted favorably.
The energy sector also contributed to performance. Strong stock selection among the exploration and production names combined with higher commodity prices to outweigh the fund’s overall lack of exposure to energy service stocks. The primary driver of performance was a pair of oil-focused production companies, Arena Resources in the Permian Basin in Texas and Concho Resources in New Mexico, both of which grew production strongly during the second half of the year on generally higher oil prices.
What did not work for the fund and why?
The most notable detractor from relative performance over the past fiscal year was stock selection in the healthcare sector, particularly in the medical equipment group where execution issues, combined with concerns over potential procedure deferrals, weighed on results. Companies such as the orthopedic implant manufacturer, Wright Medical, and the surgical equipment provider, Integra LifeSciences Holdings, were considerably weak during the first half of the year as multiples contracted on fears of patients deferring elective procedures. Additionally, shares of Alliance Healthcare Services, the nation’s leading provider of diagnostic imaging and radiation therapy services, contracted sharply as the company lowered guidance to account for unexpected weakness in its interim MRI business that investors feared would spill over to its core value-added fixed-site imaging business.
What strategic moves were made by the fund and why?
In contrast to early 2009, there are now growing signals to suggest the U.S. economy may have reached an inflection point with decelerating labor market losses, increasing industrial production, and early signs of a stabilizing housing market. Accordingly, the primary sector changes that we made during the fiscal year were an attempt to capitalize on economic sensitivity and constrained access to capital. Given the healthy backdrop in ordering patterns and our view that data center spending would be at hand, we increased the fund’s information technology overweight relative to the benchmark, primarily in communications equipment and computers/peripherals. Similarly, we increased portfolio exposure to industrial stocks, particularly those in the trucking group, given its early-cycle characteristics coupled with our near-term expectation that capacity will be exiting the system and result in improved pricing power. To provide for these increases, the fund’s weight was reduced in the financial, healthcare, and consumer discretionary groups. As of the fiscal year ended October 31, 2009, the fund was overweight relative to the benchmark in information technology, industrials, financials, and energy; equal weight in consumer staples; and underweight in healthcare, consumer discretionary and materials. We continue to focus on secular trends that will provide investment opportunities in higher-quality companies that have the potential to generate above-average growth for investors.
First American Funds 2009 Annual Report 37
Small Cap Growth Opportunities Fund
Annual Performance1,2
| | | | | | | | | | | | | | | | | | | | | | | | | | | | | | | | | | | | | | | | | |
| | | October 31, 2009 | | September 30, 2009* |
| | | | | | | | | Since Inception | | | | | | | | Since Inception |
| | | 1 year | | 5 years | | 10 years | | 12/11/2000 | | 9/24/2001 | | 1 year | | 5 years | | 10 years | | 12/11/2000 | | 9/24/2001 |
Average annual return with sales charge (POP) |
| Class A | | | 14.93 | % | | | (0.49 | )% | | | 6.86 | % | | | — | | | | — | | | | (5.40 | )% | | | 1.54 | % | | | 8.24 | % | | | — | | | | — | |
| |
| |
| Class B | | | 15.72 | % | | | (0.36 | )% | | | 6.66 | % | | | — | | | | — | | | | (5.56 | )% | | | 1.68 | % | | | 8.03 | % | | | — | | | | — | |
| |
| |
| Class C | | | 19.75 | % | | | (0.11 | )% | | | — | | | | — | | | | 3.87 | % | | | (1.62 | )% | | | 1.94 | % | | | — | | | | — | | | | 4.69 | % |
| |
Average annual return without sales charge (NAV) |
| Class A | | | 21.66 | % | | | 0.64 | % | | | 7.46 | % | | | — | | | | — | | | | 0.13 | % | | | 2.70 | % | | | 8.85 | % | | | — | | | | — | |
| |
| |
| Class B | | | 20.72 | % | | | (0.12 | )% | | | 6.66 | % | | | — | | | | — | | | | (0.58 | )% | | | 1.93 | % | | | 8.03 | % | | | — | | | | — | |
| |
| |
| Class C | | | 20.75 | % | | | (0.11 | )% | | | — | | | | — | | | | 3.87 | % | | | (0.63 | )% | | | 1.94 | % | | | — | | | | — | | | | 4.69 | % |
| |
| |
| Class R | | | 21.39 | % | | | 0.41 | % | | | — | | | | 1.73 | % | | | — | | | | (0.13 | )% | | | 2.47 | % | | | — | | | | 2.43 | % | | | — | |
| |
| |
| Class Y | | | 22.01 | % | | | 0.87 | % | | | 7.73 | % | | | — | | | | — | | | | 0.42 | % | | | 2.95 | % | | | 9.12 | % | | | — | | | | — | |
| |
| |
Russell 2000 Growth Index3 | | | 11.34 | % | | | 0.95 | % | | | 0.12 | % | | | (0.67 | )% | | | 4.44 | % | | | (6.32 | )% | | | 2.91 | % | | | 1.10 | % | | | 0.14 | % | | | 5.43 | % |
| | | | | | | | | | | | | | | | | | | | | | | | | | | | | | | | | | | | | | | | | |
| | | | | | | | | | | | | | | | | | | | | | | | | | | | | | | | | | | | | | | | | |
The performance data quoted on this page represents past performance and does not guarantee future results. The investment return and principal value of an investment will fluctuate so that an investor’s shares, when redeemed, may be worth more or less than their original cost. Current performance of the fund may be lower or higher than the performance data quoted. Performance data current to the most recent month-end may be obtained by calling 800.677.FUND.
| |
| 1 | Total returns at net asset value (“NAV”) reflect performance over the time period indicated without including the fund’s maximum sales charge and assume reinvestment of all distributions at NAV. |
Total returns at public offering price (“POP”) reflect performance over the time period indicated including the maximum sales charge of 5.50% for Class A shares and the maximum contingent deferred sales charge (“CDSC”) for Class B and Class C shares for the relevant period. Maximum CDSC is 5.00% for Class B shares in the first year, decreasing annually to 0% in the seventh year following purchase, and 1.00% for Class C shares. Total returns assume reinvestment of all distributions at NAV.
Stocks of small-capitalization companies involve substantial risk. These stocks historically have experienced greater price volatility than stocks of larger companies, and they may be expected to do so in the future.
As reflected in the prospectus for the fiscal year ended October 31, 2008, the fund’s total annual operating expense ratio, before waivers and including the expenses of other investment companies in which the fund invests, if any (“acquired fund fees and expenses”), for Class A, Class B, Class C, Class R, and Class Y shares was 1.63%, 2.38%, 2.38%, 1.89%, and 1.39%, respectively. The advisor has contractually agreed to waive fees through February 28, 2010 so that total annual fund operating expenses, not including any acquired fund fees and expenses, for Class A, Class B, Class C, Class R, and Class Y shares do not exceed 1.47%, 2.22%, 2.22%, 1.72%, and 1.22%, respectively. These fee waivers may be terminated at any time after February 28, 2010, at the discretion of the advisor. Prior to that time, such waivers may not be terminated without the approval of the fund’s board of directors.
| | |
| | * | This table represents average annual total returns through the latest calendar quarter – rather than through the end of the fiscal period. |
Value of $10,000 Investment1,2,4 as of October 31, 2009
This chart illustrates the total value of an assumed $10,000 investment in the fund’s Class A shares (from 10/31/1999 to 10/31/2009) as compared to the Russell 2000 Growth Index3.
| |
| 2 | Performance does not reflect the deduction of taxes that a shareholder would pay on fund distributions or redemption of fund shares. Performance reflects fee waivers that were in effect during the periods indicated. In the absence of such fee waivers, total returns would be reduced. Index performance is for illustrative purposes only and does not reflect any expenses, transaction costs, or cash flow effects. Direct investment in the index is not available. |
On December 12, 2002, the fund changed its main investment strategy such that it was permitted to invest in securities of companies with market capitalizations within the range of companies in the Russell 2000 index. Previously, the fund invested primarily in companies with market capitalizations of below $500 million at the time of purchase.
On September 24, 2001, the First American Small Cap Growth Opportunities Fund became the successor by merger to the Firstar MicroCap Fund, a series of Firstar Funds, Inc. Prior to the merger, the First American Fund had no assets or liabilities. Performance presented prior to September 24, 2001, represents that of the Firstar MicroCap Fund.
| |
| 3 | An unmanaged index that measures the performance of those Russell 2000 Index (a small-cap index) with higher price-to-book ratios and higher forecasted growth values. |
| |
| 4 | Performance for Class B, Class C, Class R, and Class Y shares is not presented. Performance for these classes will vary due to their different expense structures. |
38 First American Funds 2009 Annual Report
Small Cap Select Fund
Investment Objective: capital appreciation
How did the fund perform for the fiscal year ended October 31, 2009?
The First American Small Cap Select Fund (the “fund”), Class Y shares, returned 15.55% for the fiscal year ended October 31, 2009 (Class A shares returned 15.24% without taking the sales charge into account). By comparison, the fund’s benchmark, the Russell 2000 Index*, returned 6.46% for the same period.
How did market conditions affect stock performance during the fiscal year?
The U.S. economy appears to have emerged from the most severe recession of the postwar era during the third quarter of 2009. Gross Domestic Product expanded at a 2.8% annual rate during the quarter, and leading indicators currently suggest that positive growth will be maintained during the final quarter of the year and into 2010. Despite the return to positive growth since midyear, the unemployment rate has continued to rise and reached a new cyclical high of 10.2% in October. The continued increase in the unemployment rate reflects both a historical pattern, where it is common for the unemployment rate to reach its peak after economic activity has reached its trough during the cycle, as well as the subdued pace of the growth recovery to date. In order for the unemployment rate to decline in a sustained manner, economic growth needs to exceed the economy’s potential growth and this set of circumstances has yet to occur. The severity of the recession has left high levels of unutilized resources in the industrial sector and property markets, and the labor market as well. The combined effect of this broad-based resource underutilization has resulted in downward pressure on inflation trends throughout 2009. This trend is expected to remain in place in 2010. The exceptionally high level of unemployment and muted inflation trends have led the Federal Reserve to cut its target overnight lending rate to a range of 0% to 0.25% and engage in a host of nontraditional easing activities, including large-scale purchases of mortgage securities. These activities have resulted in a significant increase in the monetary base, which along with other policy initiatives have worked to restore normal functioning in intrabank funding markets and have supported a broad-based improvement in financial conditions. This policy stance is expected to persist well into 2010 in an effort to support financial conditions and an ongoing recovery in economic activity.
As a result of the broad-based easing of monetary policy and mortgage-related asset purchases by the Federal Reserve, equity markets began moving higher after reaching the low in March, anticipating that these actions would ease financial strains and contribute to a stabilization and improvement in economic and corporate earnings performance. Subsequent economic data and earnings reports validated the initial expectations and have contributed to further gains in the equity markets as the fiscal year progressed.
| |
| * | Unlike mutual funds, index returns do not reflect any expenses, transaction costs, or cash flow effects. |
Top 10 Holdings as of October 31, 20091 (% of net assets)
| | | | | |
| First American Prime Obligations Fund, Class Z | | | 3.2 | % |
| Coinstar | | | 1.9 | |
| Delphi Financial Group, Class A | | | 1.8 | |
| Panera Bread, Class A | | | 1.7 | |
| Progress Software | | | 1.7 | |
| Platinum Underwriters Holdings | | | 1.5 | |
| MFA Mortgage Investments | | | 1.4 | |
| Silgan Holdings | | | 1.4 | |
| Umpqua Holdings | | | 1.4 | |
| Comstock Resources | | | 1.3 | |
| | | | | |
| | | | | |
Sector Allocation as of October 31, 20091 (% of net assets)
| | | | | | |
| Information Technology | | | 18 | .2 | % |
| Consumer Discretionary | | | 17 | .3 | |
| Financials | | | 16 | .8 | |
| Industrials | | | 15 | .9 | |
| Healthcare | | | 11 | .9 | |
| Energy | | | 6 | .9 | |
| Materials | | | 3 | .8 | |
| Consumer Staples | | | 2 | .9 | |
| Telecommunication Services | | | 1 | .9 | |
| Utilities | | | 0 | .8 | |
| Exchange-Traded Fund | | | 0 | .6 | |
| Short-Term Investment | | | 3 | .2 | |
Other Assets & Liabilities, Net2 | | | (0 | .2 | ) |
| | | | | | |
| | | | 100 | .0 | %
|
| |
| 1 | Fund holdings and sector allocations are subject to change at any time and are not recommendations to buy or sell any security. |
| |
| 2 | Investments typically comprise substantially all of the fund’s net assets. Other assets and liabilities include receivables for items such as income earned but not yet received and payables for items such as fund expenses incurred but not yet paid. |
First American Funds 2009 Annual Report 39
Small Cap Select Fund
What worked for the fund and why?
Stock selection within most of the sectors of the fund led to a substantial increase in value for the fund relative to the fund’s benchmark. The primary contributors to the fund’s relative return were from the financial, industrial, information technology, and energy sectors. Consumer discretionary, telecommunication services, and utilities were also positive contributors to overall performance during the fiscal year. These positive relative returns were reduced somewhat by negative relative performance in our consumer staples sector and our healthcare sector.
The fund earned some very good returns by investing in banks at the low end of the market. East West Bancorp and Wintrust Financial both were large contributors to relative performance, both gaining more than 100%. Insurance company Delphi Financial Group was also a very good performer with a total return of 46%. These positive returns stood in contrast to the market’s overall segment return of -13% for the period. We also gained from strong stock selection in industrials, including BE Aerospace, Interline Brands, MasTec, and IDEX, which were all up more than 20% during the fiscal year. For the period, industrials as a sector within the fund rose 17% versus the industrials sector of the benchmark, which had returns of -1.6%. In the information technology sector, good stock selection, especially in the semiconductor area, helped the sector return 38% versus the technology sector of the benchmark which was up 29%. Silicon Laboratories, Veeco Instruments, and F5 Networks were up in excess of 60% for the fiscal year, making meaningful contributions to the sector’s returns. The consumer discretionary sector was a positive contributor to performance during the fiscal year, led by strong relative performance from gaming companies WMS Industries and Bally Technologies, which were up 60% and 140%, respectively.
What did not work for the fund and why?
Healthcare and consumer staples were two underperforming sectors for the fund. In healthcare, KV Pharmaceutical had an FDA-mandated recall of one of its most profitable products, causing an earnings and stock price decline. In consumer staples, Hain Celestial Group was down for the year, as the recession took a toll on its higher-cost natural food products sales and was the main reason for the sector’s poor performance.
What strategic moves were made by the fund and why?
The fund continues to be well-diversified, staying within its discipline of buying good companies with good valuations. We have taken a more constructive view on the financial sector, especially the banking area, as the stocks have come down in price and their problem loans are working themselves through the system. Relative to the benchmark, the fund is currently overweight in banks and in the consumer space, where we are finding good valuations with improving operating performance. The other sectors in the fund are very close to the benchmark weight. We have been adding to cyclical ideas in the industrial space, and we continue to underweight the healthcare sector in part to buffer the fund from any adverse changes due to increased government involvement. The fund continues to have a large position in exploration and production companies as the sector is undergoing a significant decline in drilling activity, which we feel will lead to much improved commodity prices in 2010.
40 First American Funds 2009 Annual Report
Annual Performance1,2
| | | | | | | | | | | | | | | | | | | | | | | | | | | | | | | | | |
| | | October 31, 2009 | | | September 30, 2009* | |
| | | | | | | | | | | | Since Inception | | | | | | | | | | | | Since Inception | |
| | | 1 year | | | 5 years | | | 10 years | | | 9/24/2001 | | | 1 year | | | 5 years | | | 10 years | | | 9/24/2001 | |
Average annual return with sales charge (POP) | | | | | | | | | | | | | | | | | | | | | | | | | | | | | | | | |
| Class A | | | 8.91 | % | | | 0.32 | % | | | 6.88 | % | | | — | | | | (5.67 | )% | | | 2.31 | % | | | 7.57 | % | | | — | |
| |
| |
| Class B | | | 9.46 | % | | | 0.50 | % | | | 6.69 | % | | | — | | | | (5.93 | )% | | | 2.49 | % | | | 7.38 | % | | | — | |
| |
| |
| Class C | | | 13.42 | % | | | 0.72 | % | | | — | | | | 6.28 | % | | | (1.95 | )% | | | 2.71 | % | | | — | | | | 7.19 | % |
| | | | | | | | | | | | | | | | | | | | | | | | | | | | | | | | | |
Average annual return without sales charge (NAV) | | | | | | | | | | | | | | | | | | | | | | | | | | | | | | | | |
| Class A | | | 15.24 | % | | | 1.46 | % | | | 7.48 | % | | | — | | | | (0.20 | )% | | | 3.48 | % | | | 8.18 | % | | | — | |
| |
| |
| Class B | | | 14.46 | % | | | 0.70 | % | | | 6.69 | % | | | — | | | | (0.98 | )% | | | 2.69 | % | | | 7.38 | % | | | — | |
| |
| |
| Class C | | | 14.42 | % | | | 0.72 | % | | | — | | | | 6.28 | % | | | (0.96 | )% | | | 2.71 | % | | | — | | | | 7.19 | % |
| |
| |
| Class R | | | 15.02 | % | | | 1.21 | % | | | 7.36 | % | | | — | | | | (0.50 | )% | | | 3.22 | % | | | 8.06 | % | | | — | |
| |
| |
| Class Y | | | 15.55 | % | | | 1.71 | % | | | 7.75 | % | | | — | | | | 0.00 | % | | | 3.73 | % | | | 8.45 | % | | | — | |
| |
| |
Russell 2000 Index3 | | | 6.46 | % | | | 0.59 | % | | | 4.11 | % | | | 5.88 | % | | | (9.55 | )% | | | 2.41 | % | | | 4.88 | % | | | 6.88 | % |
| | | | | | | | | | | | | | | | | | | | | | | | | | | | | | | | | |
| | | | | | | | | | | | | | | | | | | | | | | | | | | | | | | | | |
The performance data quoted on this page represents past performance and does not guarantee future results. The investment return and principal value of an investment will fluctuate so that an investor’s shares, when redeemed, may be worth more or less than their original cost. Current performance of the fund may be lower or higher than the performance data quoted. Performance data current to the most recent month-end may be obtained by calling 800.677.FUND.
| |
| 1 | Total returns at net asset value (“NAV”) reflect performance over the time period indicated without including the fund’s maximum sales charge and assume reinvestment of all distributions at NAV. |
Total returns at public offering price (“POP”) reflect performance over the time period indicated including the maximum sales charge of 5.50% for Class A shares and the maximum contingent deferred sales charge (“CDSC”) for Class B and Class C shares for the relevant period. Maximum CDSC is 5.00% for Class B shares in the first year, decreasing annually to 0% in the seventh year following purchase, and 1.00% for Class C shares. Total returns assume reinvestment of all distributions at NAV.
Stocks of small-capitalization companies involve substantial risk. These stocks historically have experienced greater price volatility than stocks of larger companies, and they may be expected to do so in the future.
As reflected in the prospectus for the fiscal year ended October 31, 2008, the fund’s total annual operating expense ratio, including the expenses of other investment companies in which the fund invests, if any (“acquired fund fees and expenses”), for Class A, Class B, Class C, Class R, and Class Y shares was 1.27%, 2.02%, 2.02%, 1.52%, and 1.02%, respectively.
| | |
| | * | This table represents average annual total returns through the latest calendar quarter – rather than through the end of the fiscal period. |
Value of $10,000 Investment1,2,4 as of October 31, 2009
This chart illustrates the total value of an assumed $10,000 investment in the fund’s Class A shares (from 10/31/1999 to 10/31/2009) as compared to the Russell 2000 Index3.
| |
| 2 | Performance does not reflect the deduction of taxes that a shareholder would pay on fund distributions or redemption of fund shares. Performance reflects fee waivers that were in effect during the periods indicated. In the absence of such fee waivers, total returns would be reduced. Index performance is for illustrative purposes only and does not reflect any expenses, transaction costs, or cash flow effects. Direct investment in the index is not available. |
On September 24, 2001, the First American Small Cap Select Fund became the successor by merger to the Firstar SmallCap Core Equity Fund, a series of Firstar Funds, Inc. Prior to the merger, the First American Fund had no assets or liabilities. Performance presented prior to September 24, 2001, represents that of the Firstar SmallCap Core Equity Fund. The Firstar SmallCap Core Equity Fund was organized on November 27, 2000, and prior to that, was a separate series of Mercantile Funds, Inc.
| |
| 3 | An unmanaged small-cap index that measures the performance of the 2,000 smallest companies within the Russell 3000 Index. |
| |
| 4 | Performance for Class B, Class C, Class R, and Class Y shares is not presented. Performance for these classes will vary due to their different expense structures. |
First American Funds 2009 Annual Report 41
Small Cap Value Fund
Investment Objective: capital appreciation
How did the fund perform for the fiscal year ended October 31, 2009?
The First American Small Cap Value Fund (the “fund”), Class Y shares, returned 2.59% for the fiscal year ended October 31, 2009 (Class A shares returned 2.40% without taking the sales charge into account). By comparison, the fund’s benchmark, the Russell 2000 Value Index*, returned 1.96% for the same period.
How did market conditions affect stock market performance during the fiscal year?
The U.S. economy appears to have emerged from the most severe recession of the postwar era during the third quarter of 2009. Gross Domestic Product expanded at a 2.8% annual rate during the quarter, and leading indicators currently suggest that positive growth will be maintained during the final quarter of the year and into 2010. Despite the return to positive growth since midyear, the unemployment rate has continued to rise and reached a new cyclical high of 10.2% in October. The continued increase in the unemployment rate reflects both a historical pattern, where it is common for the unemployment rate to reach its peak after economic activity has reached its trough during the cycle, as well as the subdued pace of the growth recovery to date. In order for the unemployment rate to decline in a sustained manner, economic growth needs to exceed the economy’s potential growth and this set of circumstances has yet to occur. The severity of the recession has left high levels of unutilized resources in the industrial sector and property markets, and the labor market as well. The combined effect of this broad-based resource underutilization has resulted in downward pressure on inflation trends throughout 2009. This trend is expected to remain in place in 2010. The exceptionally high level of unemployment and muted inflation trends have led the Federal Reserve to cut its target overnight lending rate to a range of 0% to 0.25% and engage in a host of nontraditional easing activities, including large-scale purchases of mortgage securities. These activities have resulted in a significant increase in the monetary base, which along with other policy initiatives have worked to restore normal functioning in intrabank funding markets and have supported a broad-based improvement in financial conditions. This policy stance is expected to persist well into 2010 in an effort to support financial conditions and an ongoing recovery in economic activity.
As a result of the broad-based easing of monetary policy and mortgage-related asset purchases by the Federal Reserve, equity markets began moving higher after reaching the low in March, anticipating that these actions would ease financial strains and contribute to a stabilization and improvement in economic and corporate earnings performance. Subsequent economic data and earnings reports validated the initial expectations and have contributed to further gains in the equity markets as the fiscal year progressed.
| |
| * | Unlike mutual funds, index returns do not reflect any expenses, transaction costs, or cash flow effects. |
Top 10 Holdings as of October 31, 20091 (% of net assets)
| | | | | |
| Delphi Financial Group, Class A | | | 1.8 | % |
| United Online | | | 1.7 | |
| Arch Chemicals | | | 1.6 | |
| Plantronics | | | 1.5 | |
| Affiliated Managers Group | | | 1.5 | |
| Highwoods Properties | | | 1.5 | |
| Regal Beloit | | | 1.5 | |
| Silgan Holdings | | | 1.4 | |
| Progress Software | | | 1.4 | |
| Brady, Class A | | | 1.4 | |
| | | | | |
| | | | | |
Sector Allocation as of October 31, 20091 (% of net assets)
| | | | | |
| Financials | | | 29 | .5% |
| Industrials | | | 15 | .8 |
| Information Technology | | | 14 | .5 |
| Consumer Discretionary | | | 13 | .9 |
| Materials | | | 7 | .1 |
| Energy | | | 6 | .3 |
| Healthcare | | | 4 | .3 |
| Utilities | | | 4 | .2 |
| Exchange-Traded Funds | | | 1 | .7 |
| Consumer Staples | | | 1 | .6 |
| Telecommunications Service | | | 0 | .5 |
| Short-Term Investment | | | 0 | .4 |
Other Assets & Liabilities, Net2 | | | 0 | .2 |
| | | | | |
| | | | 100 | .0% |
| | | | | |
| | | | | |
| |
| 1 | Fund holdings and sector allocations are subject to change at any time and are not recommendations to buy or sell any security. |
| |
| 2 | Investments typically comprise substantially all of the fund’s net assets. Other assets and liabilities include receivables for items such as income earned but not yet received and payables for items such as fund expenses incurred but not yet paid. |
42 First American Funds 2009 Annual Report
What worked for the fund and why?
Strong stock selection within the industrial, information technology, and consumer discretionary sectors was the main positive contributor during the fiscal year. Being overweight relative to the fund’s benchmark in the consumer discretionary and information technology was also beneficial, as these sectors gained momentum as the fiscal year progressed. The fund also benefitted from being underweight financials and utilities as those sectors underperformed during the period. The top five positive contributors to the portfolio during the fiscal year included Plantronics (information technology), MFA Financial (financial: mortgage real estate investment trusts), URS Corporation (industrial: engineering and construction), Monro Muffler & Brake (consumer discretionary), and Perot Systems (information technology: consultant). Plantronics, a manufacturer of lightweight telecommunications headsets, benefitted from a restructuring and gained market share after starting the period with very low expectations. URS Corporation was well-positioned to take advantage of the global infrastructure spending that occurred during the fiscal year. Monro Muffler & Brake continued to benefit from margin expansion as the service side of the auto industry performed better than new auto sales. Perot Systems was acquired by Dell at a premium price due to its strong healthcare delivery model.
What did not work for the fund and why?
Stock selection within the consumer staples, energy, healthcare, and materials sectors was the primary detractor from fund performance during the fiscal year. Spartan Stores (consumer staples), PetroQuest (energy), CONMED (healthcare), and Zions Bancorporation (financials) in particular underachieved during the period. Spartan Stores, a Michigan-based grocer, struggled within the difficult economic environment in that state during the fiscal year. PetroQuest suffered during the period as natural gas and other commodity pricing fell, which forced it to pull back on growth opportunities. Zions Bancorporation, a financial company operating banks in western and southwestern states, fell back due to poor credit conditions. Additionally, our relative performance within the materials sector was negatively impacted by not holding any paper or specialty paper companies, which had positive results for the index.
What strategic moves were made by the fund and why?
Our bottom-up portfolio construction process, in conjunction with careful consideration as to where we think we are in the business cycle recovery phase, has resulted in a more pro-cyclical tilt. We are, therefore, overweight relative to the benchmark in sectors whose performance is closely linked to the business cycle, such as information technology and consumer discretionary, and we also have a modest overweight in the commodity-oriented materials and energy segments. We feel these sectors are positioned well now that the economic environment has shifted from one of recession to stabilization and recovery. We continue to underweight financials, consumer staples, and utilities relative to the benchmark.
Building a well-diversified portfolio of small-cap stocks with strengthening balance sheets and free cash flow characteristics remains our focus. We continue to target companies that can gain market share opportunistically in the current environment with sound business models and a strong competitive advantage. We remain committed to our approach of investing in quality companies that are trading at a discount to both intrinsic and relative value metrics.
First American Funds 2009 Annual Report 43
Small Cap Value Fund
Annual Performance1,2
| | | | | | | | | | | | | | | | | | | | | | | | | | | | | | | | | |
| | | October 31, 2009 | | | September 30, 2009* | |
| | | | | | | | | | | | Since Inception | | | | | | | | | | | | Since Inception | |
| | | 1 year | | | 5 years | | | 10 years | | | 9/24/2001 | | | 1 year | | | 5 years | | | 10 years | | | 9/24/2001 | |
Average annual return with sales charge (POP) | | | | | | | | | | | | | | | | | | | | | | | | | | | | | | | | |
| Class A | | | (3.20 | )% | | | (1.48 | )% | | | 5.70 | % | | | — | | | | (15.24 | )% | | | 0.21 | % | | | 5.91 | % | | | — | |
| |
| |
| Class C | | | 0.56 | % | | | (1.10 | )% | | | 5.49 | % | | | — | | | | (11.74 | )% | | | 0.61 | % | | | 5.72 | % | | | — | |
| | | | | | | | | | | | | | | | | | | | | | | | | | | | | | | | | |
Average annual return without sales charge (NAV) | | | | | | | | | | | | | | | | | | | | | | | | | | | | | | | | |
| Class A | | | 2.40 | % | | | (0.35 | )% | | | 6.29 | % | | | — | | | | (10.28 | )% | | | 1.35 | % | | | 6.51 | % | | | — | |
| |
| |
| Class C | | | 1.56 | % | | | (1.10 | )% | | | 5.49 | % | | | — | | | | (10.85 | )% | | | 0.61 | % | | | 5.72 | % | | | — | |
| |
| |
| Class R | | | 2.14 | % | | | (0.59 | )% | | | — | | | | 5.72 | % | | | (10.38 | )% | | | 1.13 | % | | | — | | | | 6.68 | % |
| |
| |
| Class Y | | | 2.59 | % | | | (0.12 | )% | | | 6.54 | % | | | — | | | | (9.96 | )% | | | 1.61 | % | | | 6.77 | % | | | — | |
| |
| |
Russell 2000 Value Index3 | | | 1.96 | % | | | 0.08 | % | | | 7.53 | % | | | 6.95 | % | | | (12.61 | )% | | | 1.78 | % | | | 8.05 | % | | | 7.95 | % |
| | | | | | | | | | | | | | | | | | | | | | | | | | | | | | | | | |
| | | | | | | | | | | | | | | | | | | | | | | | | | | | | | | | | |
The performance data quoted on this page represents past performance and does not guarantee future results. The investment return and principal value of an investment will fluctuate so that an investor’s shares, when redeemed, may be worth more or less than their original cost. Current performance of the fund may be lower or higher than the performance data quoted. Performance data current to the most recent month-end may be obtained by calling 800.677.FUND.
| |
| 1 | Total returns at net asset value (“NAV”) reflect performance over the time period indicated without including the fund’s maximum sales charge and assume reinvestment of all distributions at NAV. |
Total returns at public offering price (“POP”) reflect performance over the time period indicated including the maximum sales charge of 5.50% for Class A shares and the maximum contingent deferred sales charge of 1.00% for Class C shares for the relevant period. Total returns assume reinvestment of all distributions at NAV.
Stocks of small-capitalization companies involve substantial risk. These stocks historically have experienced greater price volatility than stocks of larger companies, and they may be expected to do so in the future.
As reflected in the prospectus for the fiscal year ended October 31, 2008, the fund’s total annual operating expense ratio, including the expenses of other investment companies in which the fund invests, if any (“acquired fund fees and expenses”), for Class A, Class C, Class R, and Class Y shares was 1.34%, 2.09%, 1.59%, and 1.09%, respectively.
| | |
| | * | This table represents average annual total returns through the latest calendar quarter – rather than through the end of the fiscal period. |
Value of $10,000 Investment1,2,4 as of October 31, 2009
This chart illustrates the total value of an assumed $10,000 investment in the fund’s Class A shares (from 10/31/1999 to 10/31/2009) as compared to the Russell 2000 Value Index.
| |
| 2 | Performance does not reflect the deduction of taxes that a shareholder would pay on fund distributions or redemption of fund shares. Performance reflects fee waivers that were in effect during the periods indicated. In the absence of such fee waivers, total returns would be reduced. Index performance is for illustrative purposes only and does not reflect any expenses, transaction costs, or cash flow effects. Direct investment in the index is not available. |
| |
| 3 | An unmanaged index that measures the performance of those companies within the Russell 2000 Index (small-cap index) with lower price-to-book ratios and lower forecasted growth values. |
| |
| 4 | Performance for Class C, Class R, and Class Y shares is not presented. Performance for these classes will vary due to their different expense structures. |
44 First American Funds 2009 Annual Report
Expense Examples
As a shareholder of one or more of the funds, you incur two types of costs: (1) transaction costs, including sales charges (loads) on purchase payments; and (2) ongoing costs, including investment advisory fees, distribution and/or service (12b-1) fees, and other fund expenses. The examples below are intended to help you understand your ongoing costs (in dollars) of investing in the funds and to compare these costs with the ongoing costs of investing in other mutual funds. The examples are based on an investment of $1,000 invested in a fund at the beginning of the period and held for the entire period from May 1, 2009 to October 31, 2009.
Actual Expenses
For each class of each fund, two lines are presented in the table below — the first line for each class provides information about actual account values and actual expenses. You may use the information in this line, together with the amount you invested in the particular fund and class, to estimate the expenses that you paid over the period. Simply divide your account value in the fund and class by $1,000 (for example, an $8,600 account value divided by $1,000 = 8.6), then multiply the result by the number in the first line under the heading entitled “Expenses Paid During Period” for your fund and class to estimate the expenses you paid on your account during this period.
Hypothetical Example for Comparison Purposes
For each class of each fund, the second line for each class provides information about hypothetical account values and hypothetical expenses based on the respective fund’s actual expense ratio and an assumed rate of return of 5% per year before expenses, which is not the fund’s actual return. The hypothetical account values and expenses may not be used to estimate the actual ending account balance or expenses you paid for the period. You may use this information to compare the ongoing costs of investing in the fund and other funds. To do so, compare this 5% hypothetical examples with the 5% hypothetical examples that appear in the shareholder reports of the other funds.
Please note that the expenses shown in the tables are meant to highlight your ongoing costs only and do not reflect any transactional costs, such as sales charges (loads). Therefore, the second line of the tables for each class of each fund is useful in comparing ongoing costs only, and will not help you determine the relative total costs of owning different funds. In addition, if these transactional costs were included, your costs would have been higher.
Equity Income Fund
| | | | | | | | | | | | | |
| | | | | | | Expenses Paid During
|
| | | Beginning Account
| | Ending Account
| | Period1 (5/01/09 to
|
| | | Value (5/01/09)
| | Value (10/31/09)
| | 10/31/09) |
| |
Class A Actual2 | | $ | 1,000.00 | | | $ | 1,174.20 | | | $ | 6.47 | |
| |
| |
| Class A Hypothetical (5% return before expenses) | | $ | 1,000.00 | | | $ | 1,019.26 | | | $ | 6.01 | |
| |
| |
| | | | | | | | | | | | | |
Class B Actual2 | | $ | 1,000.00 | | | $ | 1,168.90 | | | $ | 10.55 | |
| |
| |
| Class B Hypothetical (5% return before expenses) | | $ | 1,000.00 | | | $ | 1,015.48 | | | $ | 9.80 | |
| |
| |
| | | | | | | | | | | | | |
Class C Actual2 | | $ | 1,000.00 | | | $ | 1,168.70 | | | $ | 10.55 | |
| |
| |
| Class C Hypothetical (5% return before expenses) | | $ | 1,000.00 | | | $ | 1,015.48 | | | $ | 9.80 | |
| |
| |
| | | | | | | | | | | | | |
Class R Actual2 | | $ | 1,000.00 | | | $ | 1,171.80 | | | $ | 7.88 | |
| |
| |
| Class R Hypothetical (5% return before expenses) | | $ | 1,000.00 | | | $ | 1,017.95 | | | $ | 7.32 | |
| |
| |
| | | | | | | | | | | | | |
Class Y Actual2 | | $ | 1,000.00 | | | $ | 1,175.20 | | | $ | 5.10 | |
| |
| |
| Class Y Hypothetical (5% return before expenses) | | $ | 1,000.00 | | | $ | 1,020.52 | | | $ | 4.74 | |
| | | | | | | | | | | | | |
| | | | | | | | | | | | | |
| |
| 1 | Expenses are equal to the fund’s annualized expense ratio for the most recent six-month period of 1.18%, 1.93%, 1.93%, 1.44%, and 0.93% for Class A, Class B, Class C, Class R, and Class Y, respectively, multiplied by the average account value over the period, multiplied by the number of days in the most recent fiscal half-year/365 (to reflect the one-half year period). |
| |
| 2 | Based on the actual returns for the six-month period ended October 31, 2009 of 17.42%, 16.89%, 16.87%, 17.18%, and 17.52% for Class A, Class B, Class C, Class R, and Class Y, respectively. |
First American Funds 2009 Annual Report 45
Expense Examples
Global Infrastructure Fund
| | | | | | | | | | | | | |
| | | | | | | Expenses Paid During
|
| | | Beginning Account
| | Ending Account
| | Period1 (5/01/09 to
|
| | | Value (5/01/09)
| | Value (10/31/09)
| | 10/31/09) |
| |
Class A Actual2 | | $ | 1,000.00 | | | $ | 1,266.20 | | | $ | 7.14 | |
| |
| |
| Class A Hypothetical (5% return before expenses) | | $ | 1,000.00 | | | $ | 1,018.90 | | | $ | 6.36 | |
| |
| |
| | | | | | | | | | | | | |
Class C Actual2 | | $ | 1,000.00 | | | $ | 1,262.20 | | | $ | 11.40 | |
| |
| |
| Class C Hypothetical (5% return before expenses) | | $ | 1,000.00 | | | $ | 1,015.12 | | | $ | 10.16 | |
| |
| |
| | | | | | | | | | | | | |
Class R Actual2 | | $ | 1,000.00 | | | $ | 1,265.00 | | | $ | 8.56 | |
| |
| |
| Class R Hypothetical (5% return before expenses) | | $ | 1,000.00 | | | $ | 1,017.64 | | | $ | 7.63 | |
| |
| |
| | | | | | | | | | | | | |
Class Y Actual2 | | $ | 1,000.00 | | | $ | 1,267.40 | | | $ | 5.72 | |
| |
| |
| Class Y Hypothetical (5% return before expenses) | | $ | 1,000.00 | | | $ | 1,020.16 | | | $ | 5.09 | |
| | | | | | | | | | | | | |
| | | | | | | | | | | | | |
| |
| 1 | Expenses are equal to the fund’s annualized expense ratio for the most recent six-month period of 1.25%, 2.00%, 1.50%, and 1.00% for Class A, Class C, Class R, and Class Y, respectively, multiplied by the average account value over the period, multiplied by the number of days in the most recent fiscal half-year/365 (to reflect the one-half year period). |
| |
| 2 | Based on the actual returns for the six-month period ended October 31, 2009 of 26.62%, 26.22%, 26.50%, and 26.74% for Class A, Class C, Class R, and Class Y, respectively. |
International Fund
| | | | | | | | | | | | | |
| | | | | | | Expenses Paid During
|
| | | Beginning Account
| | Ending Account
| | Period3 (5/01/09 to
|
| | | Value (5/01/09)
| | Value (10/31/09)
| | 10/31/09) |
| |
Class A Actual4 | | $ | 1,000.00 | | | $ | 1,262.30 | | | $ | 6.90 | |
| |
| |
| Class A Hypothetical (5% return before expenses) | | $ | 1,000.00 | | | $ | 1,019.11 | | | $ | 6.16 | |
| |
| |
| | | | | | | | | | | | | |
Class B Actual4 | | $ | 1,000.00 | | | $ | 1,256.70 | | | $ | 12.57 | |
| |
| |
| Class B Hypothetical (5% return before expenses) | | $ | 1,000.00 | | | $ | 1,014.06 | | | $ | 11.22 | |
| |
| |
| | | | | | | | | | | | | |
Class C Actual4 | | $ | 1,000.00 | | | $ | 1,255.80 | | | $ | 10.63 | |
| |
| |
| Class C Hypothetical (5% return before expenses) | | $ | 1,000.00 | | | $ | 1,015.78 | | | $ | 9.50 | |
| |
| |
| | | | | | | | | | | | | |
Class R Actual4 | | $ | 1,000.00 | | | $ | 1,259.30 | | | $ | 6.15 | |
| |
| |
| Class R Hypothetical (5% return before expenses) | | $ | 1,000.00 | | | $ | 1,019.76 | | | $ | 5.50 | |
| |
| |
| | | | | | | | | | | | | |
Class Y Actual4 | | $ | 1,000.00 | | | $ | 1,263.90 | | | $ | 5.99 | |
| |
| |
| Class Y Hypothetical (5% return before expenses) | | $ | 1,000.00 | | | $ | 1,019.91 | | | $ | 5.35 | |
| | | | | | | | | | | | | |
| | | | | | | | | | | | | |
| |
| 3 | Expenses are equal to the fund’s annualized expense ratio for the most recent six-month period of 1.49%, 2.23%, 2.24%, 1.74%, and 1.24% for Class A, Class B, Class C, Class R, and Class Y, respectively, multiplied by the average account value over the period, multiplied by the number of days in the most recent fiscal half-year/365 (to reflect the one-half year period). |
| |
| 4 | Based on the actual returns for the six-month period ended October 31, 2009 of 26.23%, 25.67%, 25.58%, 25.93%, and 26.39% for Class A, Class B, Class C, Class R, and Class Y, respectively. |
46 First American Funds 2009 Annual Report
International Select Fund
| | | | | | | | | | | | | |
| | | | | | | Expenses Paid During
|
| | | Beginning Account
| | Ending Account
| | Period1 (5/01/09 to
|
| | | Value (5/01/09)
| | Value (10/31/09)
| | 10/31/09) |
| |
Class A Actual2 | | $ | 1,000.00 | | | $ | 1,284.80 | | | $ | 8.58 | |
| |
| |
| Class A Hypothetical (5% return before expenses) | | $ | 1,000.00 | | | $ | 1,017.69 | | | $ | 7.58 | |
| |
| |
| | | | | | | | | | | | | |
Class C Actual2 | | $ | 1,000.00 | | | $ | 1,279.60 | | | $ | 12.87 | |
| |
| |
| Class C Hypothetical (5% return before expenses) | | $ | 1,000.00 | | | $ | 1,013.91 | | | $ | 11.37 | |
| |
| |
| | | | | | | | | | | | | |
Class R Actual2 | | $ | 1,000.00 | | | $ | 1,281.60 | | | $ | 10.01 | |
| |
| |
| Class R Hypothetical (5% return before expenses) | | $ | 1,000.00 | | | $ | 1,016.43 | | | $ | 8.84 | |
| |
| |
| | | | | | | | | | | | | |
Class Y Actual2 | | $ | 1,000.00 | | | $ | 1,286.40 | | | $ | 7.15 | |
| |
| |
| Class Y Hypothetical (5% return before expenses) | | $ | 1,000.00 | | | $ | 1,018.95 | | | $ | 6.31 | |
| | | | | | | | | | | | | |
| | | | | | | | | | | | | |
| |
| 1 | Expenses are equal to the fund’s annualized expense ratio for the most recent six-month period of 1.49%, 2.24%, 1.74%, and 1.24% for Class A, Class C, Class R, and Class Y, respectively, multiplied by the average account value over the period, multiplied by the number of days in the most recent fiscal half-year/365 (to reflect the one-half year period). |
| |
| 2 | Based on the actual returns for the six-month period ended October 31, 2009 of 28.48%, 27.96%, 28.16%, and 28.64% for Class A, Class C, Class R and Class Y, respectively. |
Large Cap Growth Opportunities Fund
| | | | | | | | | | | | | |
| | | | | | | Expenses Paid During
|
| | | Beginning Account
| | Ending Account
| | Period3 (5/01/09 to
|
| | | Value (5/01/09)
| | Value (10/31/09)
| | 10/31/09) |
| |
Class A Actual4 | | $ | 1,000.00 | | | $ | 1,153.30 | | | $ | 6.51 | |
| |
| |
| Class A Hypothetical (5% return before expenses) | | $ | 1,000.00 | | | $ | 1,019.16 | | | $ | 6.11 | |
| |
| |
| | | | | | | | | | | | | |
Class B Actual4 | | $ | 1,000.00 | | | $ | 1,148.80 | | | $ | 10.56 | |
| |
| |
| Class B Hypothetical (5% return before expenses) | | $ | 1,000.00 | | | $ | 1,015.38 | | | $ | 9.91 | |
| |
| |
| | | | | | | | | | | | | |
Class C Actual4 | | $ | 1,000.00 | | | $ | 1,149.10 | | | $ | 10.56 | |
| |
| |
| Class C Hypothetical (5% return before expenses) | | $ | 1,000.00 | | | $ | 1,015.38 | | | $ | 9.91 | |
| |
| |
| | | | | | | | | | | | | |
Class R Actual4 | | $ | 1,000.00 | | | $ | 1,151.70 | | | $ | 7.86 | |
| |
| |
| Class R Hypothetical (5% return before expenses) | | $ | 1,000.00 | | | $ | 1,017.90 | | | $ | 7.37 | |
| |
| |
| | | | | | | | | | | | | |
Class Y Actual4 | | $ | 1,000.00 | | | $ | 1,154.60 | | | $ | 5.16 | |
| |
| |
| Class Y Hypothetical (5% return before expenses) | | $ | 1,000.00 | | | $ | 1,020.42 | | | $ | 4.84 | |
| | | | | | | | | | | | | |
| | | | | | | | | | | | | |
| |
| 3 | Expenses are equal to the fund’s annualized expense ratio for the most recent six-month period of 1.20%, 1.95%, 1.95%, 1.45%, and 0.95% for Class A, Class B, Class C, Class R, and Class Y, respectively, multiplied by the average account value over the period, multiplied by the number of days in the most recent fiscal half-year/365 (to reflect the one-half year period). |
| |
| 4 | Based on the actual returns for the six-month period ended October 31, 2009 of 15.33%, 14.88%, 14.91%, 15.17%, and 15.46% for Class A, Class B, Class C, Class R, and Class Y, respectively. |
First American Funds 2009 Annual Report 47
Expense Examples
Large Cap Select Fund
| | | | | | | | | | | | | |
| | | | | | | Expenses Paid During
|
| | | Beginning Account
| | Ending Account
| | Period1 (5/01/09 to
|
| | | Value (5/01/09)
| | Value (10/31/09)
| | 10/31/09) |
| |
Class A Actual2 | | $ | 1,000.00 | | | $ | 1,193.70 | | | $ | 7.08 | |
| |
| |
| Class A Hypothetical (5% return before expenses) | | $ | 1,000.00 | | | $ | 1,018.75 | | | $ | 6.51 | |
| |
| |
| | | | | | | | | | | | | |
Class C Actual2 | | $ | 1,000.00 | | | $ | 1,188.40 | | | $ | 11.20 | |
| |
| |
| Class C Hypothetical (5% return before expenses) | | $ | 1,000.00 | | | $ | 1,014.97 | | | $ | 10.31 | |
| |
| |
| | | | | | | | | | | | | |
Class R Actual2 | | $ | 1,000.00 | | | $ | 1,193.60 | | | $ | 8.74 | |
| |
| |
| Class R Hypothetical (5% return before expenses) | | $ | 1,000.00 | | | $ | 1,017.24 | | | $ | 8.03 | |
| |
| |
| | | | | | | | | | | | | |
Class Y Actual2 | | $ | 1,000.00 | | | $ | 1,195.40 | | | $ | 5.70 | |
| |
| |
| Class Y Hypothetical (5% return before expenses) | | $ | 1,000.00 | | | $ | 1,020.01 | | | $ | 5.24 | |
| | | | | | | | | | | | | |
| | | | | | | | | | | | | |
| |
| 1 | Expenses are equal to the fund’s annualized expense ratio for the most recent six-month period of 1.28%, 2.03%, 1.58%, and 1.03% for Class A, Class C, Class R, and Class Y, respectively, multiplied by the average account value over the period, multiplied by the number of days in the most recent fiscal half-year/365 (to reflect the one-half year period). |
| |
| 2 | Based on the actual returns for the six-month period ended October 31, 2009 of 19.37%, 18.84%, 19.36%, and 19.54% for Class A, Class C, Class R, and Class Y, respectively. |
Large Cap Value Fund
| | | | | | | | | | | | | |
| | | | | | | Expenses Paid During
|
| | | Beginning Account
| | Ending Account
| | Period3 (5/01/09 to
|
| | | Value (5/01/09)
| | Value (10/31/09)
| | 10/31/09) |
| |
Class A Actual4 | | $ | 1,000.00 | | | $ | 1,170.10 | | | $ | 6.62 | |
| |
| |
| Class A Hypothetical (5% return before expenses) | | $ | 1,000.00 | | | $ | 1,019.11 | | | $ | 6.16 | |
| |
| |
| | | | | | | | | | | | | |
Class B Actual4 | | $ | 1,000.00 | | | $ | 1,166.50 | | | $ | 10.70 | |
| |
| |
| Class B Hypothetical (5% return before expenses) | | $ | 1,000.00 | | | $ | 1,015.32 | | | $ | 9.96 | |
| |
| |
| | | | | | | | | | | | | |
Class C Actual4 | | $ | 1,000.00 | | | $ | 1,166.70 | | | $ | 10.70 | |
| |
| |
| Class C Hypothetical (5% return before expenses) | | $ | 1,000.00 | | | $ | 1,015.32 | | | $ | 9.96 | |
| |
| |
| | | | | | | | | | | | | |
Class R Actual4 | | $ | 1,000.00 | | | $ | 1,168.70 | | | $ | 7.98 | |
| |
| |
| Class R Hypothetical (5% return before expenses) | | $ | 1,000.00 | | | $ | 1,017.85 | | | $ | 7.43 | |
| |
| |
| | | | | | | | | | | | | |
Class Y Actual4 | | $ | 1,000.00 | | | $ | 1,172.90 | | | $ | 5.26 | |
| |
| |
| Class Y Hypothetical (5% return before expenses) | | $ | 1,000.00 | | | $ | 1,020.37 | | | $ | 4.89 | |
| | | | | | | | | | | | | |
| | | | | | | | | | | | | |
| |
| 3 | Expenses are equal to the fund’s annualized expense ratio for the most recent six-month period of 1.21%, 1.96%, 1.96%, 1.46%, and 0.96% for Class A, Class B, Class C, Class R, and Class Y, respectively, multiplied by the average account value over the period, multiplied by the number of days in the most recent fiscal half-year/365 (to reflect the one-half year period). |
| |
| 4 | Based on the actual returns for the six-month period ended October 31, 2009 of 17.01%, 16.65%, 16.67%, 16.87%, and 17.29% for Class A, Class B, Class C, Class R, and Class Y, respectively. |
48 First American Funds 2009 Annual Report
Mid Cap Growth Opportunities Fund
| | | | | | | | | | | | | |
| | | | | | | Expenses Paid During
|
| | | Beginning Account
| | Ending Account
| | Period1 (5/01/09 to
|
| | | Value (5/01/09)
| | Value (10/31/09)
| | 10/31/09) |
| |
Class A Actual2 | | $ | 1,000.00 | | | $ | 1,168.60 | | | $ | 6.67 | |
| |
| |
| Class A Hypothetical (5% return before expenses) | | $ | 1,000.00 | | | $ | 1,019.06 | | | $ | 6.21 | |
| |
| |
| | | | | | | | | | | | | |
Class B Actual2 | | $ | 1,000.00 | | | $ | 1,164.40 | | | $ | 10.75 | |
| |
| |
| Class B Hypothetical (5% return before expenses) | | $ | 1,000.00 | | | $ | 1,015.27 | | | $ | 10.01 | |
| |
| |
| | | | | | | | | | | | | |
Class C Actual2 | | $ | 1,000.00 | | | $ | 1,164.10 | | | $ | 10.75 | |
| |
| |
| Class C Hypothetical (5% return before expenses) | | $ | 1,000.00 | | | $ | 1,015.27 | | | $ | 10.01 | |
| |
| |
| | | | | | | | | | | | | |
Class R Actual2 | | $ | 1,000.00 | | | $ | 1,167.50 | | | $ | 8.03 | |
| |
| |
| Class R Hypothetical (5% return before expenses) | | $ | 1,000.00 | | | $ | 1,017.80 | | | $ | 7.48 | |
| |
| |
| | | | | | | | | | | | | |
Class Y Actual2 | | $ | 1,000.00 | | | $ | 1,170.20 | | | $ | 5.31 | |
| |
| |
| Class Y Hypothetical (5% return before expenses) | | $ | 1,000.00 | | | $ | 1,020.32 | | | $ | 4.94 | |
| | | | | | | | | | | | | |
| | | | | | | | | | | | | |
| |
| 1 | Expenses are equal to the fund’s annualized expense ratio for the most recent six-month period of 1.22%, 1.97%, 1.97%, 1.47%, and 0.97% for Class A, Class B, Class C, Class R, and Class Y, respectively, multiplied by the average account value over the period, multiplied by the number of days in the most recent fiscal half-year/365 (to reflect the one-half year period). |
| |
| 2 | Based on the actual returns for the six-month period ended October 31, 2009 of 16.86%, 16.44%, 16.41%, 16.75%, and 17.02% for Class A, Class B, Class C, Class R, and Class Y, respectively. |
Mid Cap Select Fund
| | | | | | | | | | | | | |
| | | | | | | Expenses Paid During
|
| | | Beginning Account
| | Ending Account
| | Period3 (5/01/09 to
|
| | | Value (5/01/09)
| | Value (10/31/09)
| | 10/31/09) |
| |
Class A Actual4 | | $ | 1,000.00 | | | $ | 1,135.00 | | | $ | 7.59 | |
| |
| |
| Class A Hypothetical (5% return before expenses) | | $ | 1,000.00 | | | $ | 1,018.10 | | | $ | 7.17 | |
| |
| |
| | | | | | | | | | | | | |
Class B Actual4 | | $ | 1,000.00 | | | $ | 1,130.00 | | | $ | 11.60 | |
| |
| |
| Class B Hypothetical (5% return before expenses) | | $ | 1,000.00 | | | $ | 1,014.32 | | | $ | 10.97 | |
| |
| |
| | | | | | | | | | | | | |
Class C Actual4 | | $ | 1,000.00 | | | $ | 1,132.00 | | | $ | 11.61 | |
| |
| |
| Class C Hypothetical (5% return before expenses) | | $ | 1,000.00 | | | $ | 1,014.32 | | | $ | 10.97 | |
| |
| |
| | | | | | | | | | | | | |
Class Y Actual4 | | $ | 1,000.00 | | | $ | 1,136.80 | | | $ | 6.25 | |
| |
| |
| Class Y Hypothetical (5% return before expenses) | | $ | 1,000.00 | | | $ | 1,019.36 | | | $ | 5.90 | |
| | | | | | | | | | | | | |
| | | | | | | | | | | | | |
| |
| 3 | Expenses are equal to the fund’s annualized expense ratio for the most recent six-month period of 1.41%, 2.16%, 2.16%, and 1.16% for Class A, Class B, Class C, and Class Y, respectively, multiplied by the average account value over the period, multiplied by the number of days in the most recent fiscal half-year/365 (to reflect the one-half year period). |
| |
| 4 | Based on the actual returns for the six-month period ended October 31, 2009 of 13.50%, 13.00%, 13.20%, and 13.68% for Class A, Class B, Class C, and Class Y, respectively. |
First American Funds 2009 Annual Report 49
Expense Examples
Mid Cap Value Fund
| | | | | | | | | | | | | |
| | | | | | | Expenses Paid During
|
| | | Beginning Account
| | Ending Account
| | Period1 (5/01/09 to
|
| | | Value (5/01/09)
| | Value (10/31/09)
| | 10/31/09) |
| |
Class A Actual2 | | $ | 1,000.00 | | | $ | 1,159.20 | | | $ | 6.75 | |
| |
| |
| Class A Hypothetical (5% return before expenses) | | $ | 1,000.00 | | | $ | 1,018.95 | | | $ | 6.31 | |
| |
| |
| | | | | | | | | | | | | |
Class B Actual2 | | $ | 1,000.00 | | | $ | 1,155.00 | | | $ | 10.59 | |
| |
| |
| Class B Hypothetical (5% return before expenses) | | $ | 1,000.00 | | | $ | 1,015.38 | | | $ | 9.91 | |
| |
| |
| | | | | | | | | | | | | |
Class C Actual2 | | $ | 1,000.00 | | | $ | 1,154.80 | | | $ | 10.81 | |
| |
| |
| Class C Hypothetical (5% return before expenses) | | $ | 1,000.00 | | | $ | 1,015.17 | | | $ | 10.11 | |
| |
| |
| | | | | | | | | | | | | |
Class R Actual2 | | $ | 1,000.00 | | | $ | 1,157.50 | | | $ | 8.10 | |
| |
| |
| Class R Hypothetical (5% return before expenses) | | $ | 1,000.00 | | | $ | 1,017.69 | | | $ | 7.58 | |
| |
| |
| | | | | | | | | | | | | |
Class Y Actual2 | | $ | 1,000.00 | | | $ | 1,160.70 | | | $ | 5.39 | �� |
| |
| |
| Class Y Hypothetical (5% return before expenses) | | $ | 1,000.00 | | | $ | 1,020.21 | | | $ | 5.04 | |
| | | | | | | | | | | | | |
| | | | | | | | | | | | | |
| |
| 1 | Expenses are equal to the fund’s annualized expense ratio for the most recent six-month period of 1.24%, 1.95%, 1.99%, 1.49%, and 0.99% for Class A, Class B, Class C, Class R, and Class Y, respectively, multiplied by the average account value over the period, multiplied by the number of days in the most recent fiscal half-year/365 (to reflect the one-half year period). |
| |
| 2 | Based on the actual returns for the six-month period ended October 31, 2009 of 15.92%, 15.50%, 15.48%, 15.75%, and 16.07% for Class A, Class B, Class C, Class R, and Class Y, respectively. |
Real Estate Securities Fund
| | | | | | | | | | | | | |
| | | | | | | Expenses Paid During
|
| | | Beginning Account
| | Ending Account
| | Period3 (5/01/2009 to
|
| | | Value (5/01/2009)
| | Value (10/31/09)
| | 10/31/09) |
| |
Class A Actual4 | | $ | 1,000.00 | | | $ | 1,253.10 | | | $ | 7.21 | |
| |
| |
| Class A Hypothetical (5% return before expenses) | | $ | 1,000.00 | | | $ | 1,018.80 | | | $ | 6.46 | |
| |
| |
| | | | | | | | | | | | | |
Class B Actual4 | | $ | 1,000.00 | | | $ | 1,249.20 | | | $ | 11.45 | |
| |
| |
| Class B Hypothetical (5% return before expenses) | | $ | 1,000.00 | | | $ | 1,015.02 | | | $ | 10.26 | |
| |
| |
| | | | | | | | | | | | | |
Class C Actual4 | | $ | 1,000.00 | | | $ | 1,248.70 | | | $ | 11.45 | |
| |
| |
| Class C Hypothetical (5% return before expenses) | | $ | 1,000.00 | | | $ | 1,015.02 | | | $ | 10.26 | |
| |
| |
| | | | | | | | | | | | | |
Class R Actual4 | | $ | 1,000.00 | | | $ | 1,251.00 | | | $ | 8.62 | |
| |
| |
| Class R Hypothetical (5% return before expenses) | | $ | 1,000.00 | | | $ | 1,017.54 | | | $ | 7.73 | |
| |
| |
| | | | | | | | | | | | | |
Class Y Actual4 | | $ | 1,000.00 | | | $ | 1,254.80 | | | $ | 5.80 | |
| |
| |
| Class Y Hypothetical (5% return before expenses) | | $ | 1,000.00 | | | $ | 1,020.06 | | | $ | 5.19 | |
| | | | | | | | | | | | | |
| | | | | | | | | | | | | |
| |
| 3 | Expenses are equal to the fund’s annualized expense ratio for the most recent six-month period of 1.27%, 2.02%, 2.02%, 1.52%, and 1.02% for Class A, Class B, Class C, Class R, and Class Y, respectively, multiplied by the average account value over the period, multiplied by the number of days in the most recent fiscal half-year/365 (to reflect the one-half year period). |
| |
| 4 | Based on the actual returns for the six-month period ended October 31, 2009 of 25.31%, 24.92%, 24.87%, 25.10%, and 25.48% for Class A, Class B, Class C, Class R and Class Y, respectively. |
50 First American Funds 2009 Annual Report
Small Cap Growth Opportunities Fund
| | | | | | | | | | | | | |
| | | | | | | Expenses Paid During
|
| | | Beginning Account
| | Ending Account
| | Period1 (5/01/09 to
|
| | | Value (5/01/09)
| | Value (10/31/09)
| | 10/31/09) |
| |
Class A Actual2 | | $ | 1,000.00 | | | $ | 1,215.50 | | | $ | 8.21 | |
| |
| |
| Class A Hypothetical (5% return before expenses) | | $ | 1,000.00 | | | $ | 1,017.80 | | | $ | 7.48 | |
| |
| |
| | | | | | | | | | | | | |
Class B Actual2 | | $ | 1,000.00 | | | $ | 1,210.60 | | | $ | 12.37 | |
| |
| |
| Class B Hypothetical (5% return before expenses) | | $ | 1,000.00 | | | $ | 1,014.01 | | | $ | 11.27 | |
| |
| |
| | | | | | | | | | | | | |
Class C Actual2 | | $ | 1,000.00 | | | $ | 1,210.80 | | | $ | 12.37 | |
| |
| |
| Class C Hypothetical (5% return before expenses) | | $ | 1,000.00 | | | $ | 1,014.01 | | | $ | 11.27 | |
| |
| |
| | | | | | | | | | | | | |
Class R Actual2 | | $ | 1,000.00 | | | $ | 1,213.90 | | | $ | 9.60 | |
| |
| |
| Class R Hypothetical (5% return before expenses) | | $ | 1,000.00 | | | $ | 1,016.53 | | | $ | 8.74 | |
| |
| |
| | | | | | | | | | | | | |
Class Y Actual2 | | $ | 1,000.00 | | | $ | 1,217.30 | | | $ | 6.82 | |
| |
| |
| Class Y Hypothetical (5% return before expenses) | | $ | 1,000.00 | | | $ | 1,019.06 | | | $ | 6.21 | |
| | | | | | | | | | | | | |
| | | | | | | | | | | | | |
| |
| 1 | Expenses are equal to the fund’s annualized expense ratio for the most recent six-month period of 1.47%, 2.22%, 2.22%, 1.72%, and 1.22% for Class A, Class B, Class C, Class R, and Class Y, respectively, multiplied by the average account value over the period, multiplied by the number of days in the most recent fiscal half-year/365 (to reflect the one-half year period). |
| |
| 2 | Based on the actual returns for the six-month period ended October 31, 2009 of 21.55%, 21.06%, 21.08%, 21.39%, and 21.73% for Class A, Class B, Class C, Class R, and Class Y, respectively. |
Small Cap Select Fund
| | | | | | | | | | | | | |
| | | | | | | Expenses Paid During
|
| | | Beginning Account
| | Ending Account
| | Period3 (5/01/09 to
|
| | | Value (5/01/09)
| | Value (10/31/09)
| | 10/31/09) |
| |
Class A Actual4 | | $ | 1,000.00 | | | $ | 1,152.40 | | | $ | 6.78 | |
| |
| |
| Class A Hypothetical (5% return before expenses) | | $ | 1,000.00 | | | $ | 1,018.90 | | | $ | 6.36 | |
| |
| |
| | | | | | | | | | | | | |
Class B Actual4 | | $ | 1,000.00 | | | $ | 1,148.00 | | | $ | 10.77 | |
| |
| |
| Class B Hypothetical (5% return before expenses) | | $ | 1,000.00 | | | $ | 1,015.17 | | | $ | 10.11 | |
| |
| |
| | | | | | | | | | | | | |
Class C Actual4 | | $ | 1,000.00 | | | $ | 1,148.70 | | | $ | 10.78 | |
| |
| |
| Class C Hypothetical (5% return before expenses) | | $ | 1,000.00 | | | $ | 1,015.17 | | | $ | 10.11 | |
| |
| |
| | | | | | | | | | | | | |
Class R Actual4 | | $ | 1,000.00 | | | $ | 1,151.70 | | | $ | 8.08 | |
| |
| |
| Class R Hypothetical (5% return before expenses) | | $ | 1,000.00 | | | $ | 1,017.69 | | | $ | 7.58 | |
| |
| |
| | | | | | | | | | | | | |
Class Y Actual4 | | $ | 1,000.00 | | | $ | 1,154.20 | | | $ | 5.38 | |
| |
| |
| Class Y Hypothetical (5% return before expenses) | | $ | 1,000.00 | | | $ | 1,020.21 | | | $ | 5.04 | |
| | | | | | | | | | | | | |
| | | | | | | | | | | | | |
| |
| 3 | Expenses are equal to the fund’s annualized expense ratio for the most recent six-month period of 1.25%, 1.99%, 1.99%, 1.49%, and 0.99% for Class A, Class B, Class C, Class R, and Class Y, respectively, multiplied by the average account value over the period, multiplied by the number of days in the most recent fiscal half-year/365 (to reflect the one-half year period). |
| |
| 4 | Based on the actual returns for the six-month period ended October 31, 2009 of 15.24%, 14.80%, 14.87%, 15.17%, and 15.42% for Class A, Class B, Class C, Class R, and Class Y, respectively. |
First American Funds 2009 Annual Report 51
Expense Examples
Small Cap Value Fund
| | | | | | | | | | | | | |
| | | | | | | Expenses Paid During
|
| | | Beginning Account
| | Ending Account
| | Period1 (5/01/09 to
|
| | | Value (5/01/09)
| | Value (10/31/09)
| | 10/31/09) |
| |
Class A Actual2 | | $ | 1,000.00 | | | $ | 1,148.00 | | | $ | 7.31 | |
| |
| |
| Class A Hypothetical (5% return before expenses) | | $ | 1,000.00 | | | $ | 1,018.40 | | | $ | 6.87 | |
| |
| |
| | | | | | | | | | | | | |
Class C Actual2 | | $ | 1,000.00 | | | $ | 1,144.00 | | | $ | 11.35 | |
| |
| |
| Class C Hypothetical (5% return before expenses) | | $ | 1,000.00 | | | $ | 1,014.62 | | | $ | 10.66 | |
| |
| |
| | | | | | | | | | | | | |
Class R Actual2 | | $ | 1,000.00 | | | $ | 1,145.70 | | | $ | 8.65 | |
| |
| |
| Class R Hypothetical (5% return before expenses) | | $ | 1,000.00 | | | $ | 1,017.14 | | | $ | 8.13 | |
| |
| |
| | | | | | | | | | | | | |
Class Y Actual2 | | $ | 1,000.00 | | | $ | 1,148.10 | | | $ | 5.96 | |
| |
| |
| Class Y Hypothetical (5% return before expenses) | | $ | 1,000.00 | | | $ | 1,019.66 | | | $ | 5.60 | |
| | | | | | | | | | | | | |
| | | | | | | | | | | | | |
| |
| 1 | Expenses are equal to the fund’s annualized expense ratio for the most recent six-month period of 1.35%, 2.10%, 1.60%, and 1.10% for Class A, Class C, Class R, and Class Y, respectively, multiplied by the average account value over the period, multiplied by the number of days in the most recent fiscal half-year/365 (to reflect the one-half year period). |
| |
| 2 | Based on the actual returns for the six-month period ended October 31, 2009 of 14.80%, 14.40%, 14.57%, and 14.81% for Class A, Class C, Class R, and Class Y, respectively. |
52 First American Funds 2009 Annual Report
To the Shareholders and Board of Directors
First American Investment Funds, Inc.
We have audited the accompanying statements of assets and liabilities, including the schedules of investments, of the Equity Income, Global Infrastructure, International, International Select, Large Cap Growth Opportunities, Large Cap Select, Large Cap Value, Mid Cap Growth Opportunities, Mid Cap Select (formerly Small-Mid Cap Core), Mid Cap Value, Real Estate Securities, Small Cap Growth Opportunities, Small Cap Select, and Small Cap Value Funds (series of First American Investment Funds, Inc.) (collectively, the “funds”) as of October 31, 2009, and the related statements of operations, the statements of changes in net assets and the financial highlights for each of the periods indicated therein. These financial statements and financial highlights are the responsibility of the funds’ management. Our responsibility is to express an opinion on these financial statements and financial highlights based on our audits.
We conducted our audits in accordance with the standards of the Public Company Accounting Oversight Board (United States). Those standards require that we plan and perform the audit to obtain reasonable assurance about whether the financial statements and financial highlights are free of material misstatement. We were not engaged to perform an audit of the funds’ internal control over financial reporting. Our audits included consideration of internal control over financial reporting as a basis for designing audit procedures that are appropriate in the circumstances, but not for the purpose of expressing an opinion on the effectiveness of the funds’ internal control over financial reporting. Accordingly, we express no such opinion. An audit also includes examining, on a test basis, evidence supporting the amounts and disclosures in the financial statements and financial highlights, assessing the accounting principles used and significant estimates made by management, and evaluating the overall financial statement presentation. Our procedures included confirmation of securities owned as of October 31, 2009, by correspondence with the custodians and brokers, or by other appropriate auditing procedures where replies from brokers were not received. We believe that our audits provide a reasonable basis for our opinion.
In our opinion, the financial statements and financial highlights referred to above present fairly, in all material respects, the financial position of the funds listed above of the First American Investment Funds, Inc. at October 31, 2009, the results of their operations, the changes in their net assets and the financial highlights for each of the periods indicated therein, in conformity with U.S. generally accepted accounting principles.
Minneapolis, Minnesota
December 22, 2009
First American Funds 2009 Annual Report 53
| | | | | | | | | |
| Equity Income Fund |
| DESCRIPTION | | SHARES | | FAIR VALUE |
| |
| |
Common Stocks – 99.4% |
| Consumer Discretionary – 8.8% |
| Hasbro | | | 284,998 | | | $ | 7,772 | |
Home Depot 6 | | | 468,022 | | | | 11,743 | |
| J.C. Penney | | | 193,083 | | | | 6,397 | |
| McDonald’s | | | 290,485 | | | | 17,025 | |
| Time Warner | | | 121,185 | | | | 3,650 | |
Yum! Brands 6 | | | 406,314 | | | | 13,388 | |
| | | | | | | | | |
| | | | | | | | 59,975 | |
| | | | | | | | | |
| Consumer Staples – 8.0% |
| Altria Group | | | 332,471 | | | | 6,021 | |
| ConAgra Foods | | | 242,133 | | | | 5,085 | |
| Hormel Foods | | | 184,363 | | | | 6,722 | |
| Philip Morris International | | | 197,096 | | | | 9,334 | |
SUPERVALU 6 | | | 613,772 | | | | 9,741 | |
Sysco 6 | | | 338,558 | | | | 8,955 | |
| Unilever NV | | | 275,917 | | | | 8,523 | |
| | | | | | | | | |
| | | | | | | | 54,381 | |
| | | | | | | | | |
| Energy – 15.3% |
| BP – ADR | | | 126,105 | | | | 7,140 | |
| Chevron | | | 337,744 | | | | 25,851 | |
| ConocoPhillips | | | 397,988 | | | | 19,971 | |
Enbridge Energy Partners 6 | | | 29,868 | | | | 1,388 | |
Enerplus Resources Fund 6 | | | 170,729 | | | | 3,708 | |
Exterran Partners 6 | | | 300,168 | | | | 5,742 | |
| Exxon Mobil | | | 329,788 | | | | 23,636 | |
| Total – ADR | | | 233,286 | | | | 14,014 | |
Williams 6 | | | 159,259 | | | | 3,002 | |
| | | | | | | | | |
| | | | | | | | 104,452 | |
| | | | | | | | | |
| Financials – 15.5% |
Aflac 6 | | | 183,910 | | | | 7,630 | |
Annaly Capital Management – REIT 6 | | | 473,883 | | | | 8,013 | |
| Astoria Financial | | | 547,891 | | | | 5,468 | |
| Bank of America | | | 1,048,995 | | | | 15,294 | |
Charles Schwab 6 | | | 240,434 | | | | 4,169 | |
| DCT Industrial Trust – REIT | | | 339,380 | | | | 1,537 | |
Goldman Sachs Group 6 | | | 69,236 | | | | 11,782 | |
JPMorgan Chase 6 | | | 378,529 | | | | 15,811 | |
KeyCorp 6 | | | 270,919 | | | | 1,460 | |
| Liberty Property Trust – REIT | | | 118,303 | | | | 3,475 | |
Mid-America Apartment Communities – REIT | | | 92,461 | | | | 4,052 | |
| Morgan Stanley | | | 105,022 | | | | 3,373 | |
| Old Republic International | | | 147,612 | | | | 1,577 | |
Prudential Financial 6 | | | 102,007 | | | | 4,614 | |
Regions Financial 6 | | | 297,426 | | | | 1,440 | |
Ventas – REIT 6 | | | 220,847 | | | | 8,863 | |
| Wells Fargo | | | 262,172 | | | | 7,215 | |
| | | | | | | | | |
| | | | | | | | 105,773 | |
| | | | | | | | | |
| Healthcare – 10.5% |
| Abbott Laboratories | | | 282,450 | | | | 14,283 | |
| Baxter International | | | 138,176 | | | | 7,470 | |
| Bristol-Myers Squibb | | | 668,755 | | | | 14,579 | |
| Covidien | | | 241,690 | | | | 10,180 | |
| Johnson & Johnson | | | 235,083 | | | | 13,881 | |
| McKesson | | | 118,489 | | | | 6,959 | |
| Pfizer | | | 277,791 | | | | 4,731 | |
| | | | | | | | | |
| | | | | | | | 72,083 | |
| | | | | | | | | |
| Industrials – 14.4% |
| 3M | | | 163,737 | | | | 12,046 | |
| Boeing | | | 107,497 | | | | 5,138 | |
Emerson Electric 6 | | | 450,766 | | | | 17,016 | |
| General Dynamics | | | 179,817 | | | | 11,274 | |
| General Electric | | | 897,963 | | | | 12,805 | |
| Hubbell, Class B | | | 99,002 | | | | 4,211 | |
| IESI-BFC | | | 313,787 | | | | 4,032 | |
| Lockheed Martin | | | 98,729 | | | | 6,792 | |
Manpower 6 | | | 58,101 | | | | 2,755 | |
| United Parcel Service, Class B | | | 219,672 | | | | 11,792 | |
United Technologies 6 | | | 176,498 | | | | 10,846 | |
| | | | | | | | | |
| | | | | | | | 98,707 | |
| | | | | | | | | |
| Information Technology – 13.5% |
| Analog Devices | | | 315,643 | | | | 8,090 | |
| Applied Materials | | | 663,270 | | | | 8,092 | |
Automatic Data Processing 6 | | | 62,812 | | | | 2,500 | |
| Intel | | | 710,642 | | | | 13,580 | |
MasterCard, Class A 6 | | | 16,847 | | | | 3,690 | |
Maxim Integrated Products 6 | | | 523,245 | | | | 8,722 | |
| Microsoft | | | 628,049 | | | | 17,416 | |
| Molex, Class A | | | 338,677 | | | | 5,605 | |
Oracle 6 | | | 322,932 | | | | 6,814 | |
| QUALCOMM | | | 239,893 | | | | 9,934 | |
| Texas Instruments | | | 325,248 | | | | 7,627 | |
| | | | | | | | | |
| | | | | | | | 92,070 | |
| | | | | | | | | |
| Materials – 4.0% |
| E.I. Du Pont de Nemours | | | 460,487 | | | | 14,653 | |
| Praxair | | | 89,716 | | | | 7,127 | |
| Rio Tinto – ADR | | | 30,725 | | | | 5,470 | |
| | | | | | | | | |
| | | | | | | | 27,250 | |
| | | | | | | | | |
| Telecommunication Services – 5.0% |
| AT&T | | | 448,140 | | | | 11,504 | |
CenturyTel 6 | | | 275,894 | | | | 8,956 | |
| Verizon Communications | | | 189,599 | | | | 5,610 | |
Windstream 6 | | | 871,379 | | | | 8,400 | |
| | | | | | | | | |
| | | | | | | | 34,470 | |
| | | | | | | | | |
| Utilities – 4.4% |
| American Electric Power | | | 95,948 | | | | 2,899 | |
| Duke Energy | | | 273,976 | | | | 4,334 | |
| PNM Resources | | | 672,213 | | | | 7,206 | |
| Westar Energy | | | 807,475 | | | | 15,463 | |
| | | | | | | | | |
| | | | | | | | 29,902 | |
| | | | | | | | | |
Total Common Stocks | | | | | | | | |
(Cost $575,322) | | | | | | | 679,063 | |
| | | | | | | | | |
Short-Term Investment – 0.5% |
First American Prime Obligations Fund, Class Z 0.148% Å Ω | | | | | | | | |
(Cost $3,195) | | | 3,194,515 | | | | 3,195 | |
| | | | | | | | | |
Investment Purchased with Proceeds
from Securities Lending – 14.8% |
| Mount Vernon Securities Lending Prime Portfolio 0.209% Ω † | | | | | | | | |
(Cost $101,004) | | | 101,003,734 | | | | 101,004 | |
| | | | | | | | | |
Total Investments 5 – 114.7% | | | | | | | | |
(Cost $679,521) | | | | | | | 783,262 | |
| | | | | | | | | |
Other Assets and Liabilities, Net – (14.7)% | | | | | | | (100,233 | ) |
| | | | | | | | | |
Total Net Assets – 100.0% | | | | | | $ | 683,029 | |
| | | | | | | | | |
The accompanying notes are an integral part of the financial statements.
54 First American Funds 2009 Annual Report
Equity Income Fund (concluded)
| | |
| 6 | | This security or a portion of this security is out on loan at October 31, 2009. Total loaned securities had a fair value of $93,490 at October 31, 2009. See note 2 in Notes to Financial Statements. |
| |
| Å | | Investment in affiliated security. This money market fund is advised by FAF Advisors, Inc., which also serves as advisor for this fund. See note 3 in Notes to Financial Statements. |
| |
| Ω | | The rate quoted is the annualized seven-day effective yield as of October 31, 2009. |
| |
| † | | The fund may loan securities representing up to one third of the fair value of its total assets (which includes collateral for securities on loan) to broker dealers, banks, or other institutional borrowers of securities. The fund maintains collateral equal to at least 100% of the fair value of the securities loaned. The adequacy of the collateral is monitored on a daily basis. The cash collateral received by the fund is invested in this affiliated money market fund. See note 2 in Notes to Financial Statements. |
| |
| 5 | | On October 31, 2009, the cost of investments for federal income tax purposes was $679,462. The aggregate gross unrealized appreciation and depreciation of investments, based on this cost, were as follows: |
| | | | | |
| Gross unrealized appreciation | | $ | 140,661 | |
| Gross unrealized depreciation | | | (36,861 | ) |
| | | | | |
| Net unrealized appreciation | | $ | 103,800 | |
| | | | | |
| |
| ADR – | American Depositary Receipt |
| |
| REIT – | Real Estate Investment Trust |
| | | | | | | | | |
| Global Infrastructure Fund |
| DESCRIPTION | | SHARES | | FAIR VALUE |
| |
| |
Common Stocks – 95.9% |
| Australia – 4.4% |
| APA Group | | | 45,931 | | | $ | 130 | |
| Asciano Group | | | 131,594 | | | | 176 | |
| Macquarie Infrastructure Group | | | 214,735 | | | | 275 | |
| Transurban Group | | | 503,069 | | | | 2,041 | |
| | | | | | | | | |
| | | | | | | | 2,622 | |
| | | | | | | | | |
| Austria – 1.0% |
| Oesterreichische Elektrizitaetswirtschafts, Class A | | | 13,918 | | | | 625 | |
| | | | | | | | | |
| Belgium – 0.2% |
| Elia System Operator | | | 3,144 | | | | 127 | |
| | | | | | | | | |
| Brazil – 3.7% |
| Companhia de Concessoes Rodoviarias | | | 47,039 | | | | 930 | |
| Companhia de Transmissao de Energia Electrica Paulista | | | 45,614 | | | | 1,258 | |
| CPFL Energia – ADR | | | 442 | | | | 23 | |
| | | | | | | | | |
| | | | | | | | 2,211 | |
| | | | | | | | | |
| Canada – 6.9% |
Boralex, Class A = | | | 1,081 | | | | 9 | |
| Brookfield Asset Management, Class A | | | 14,482 | | | | 303 | |
| Enbridge | | | 46,682 | | | | 1,813 | |
| Great Lakes Hydro Income Fund | | | 11,423 | | | | 193 | |
| TransCanada | | | 42,547 | | | | 1,299 | |
| TransCanada | | | 16,833 | | | | 516 | |
| | | | | | | | | |
| | | | | | | | 4,133 | |
| | | | | | | | | |
| Chile – 0.5% |
| Empresa Nacional De Electricidad – ADR | | | 2,626 | | | | 120 | |
| Enersis – ADR | | | 8,516 | | | | 151 | |
| | | | | | | | | |
| | | | | | | | 271 | |
| | | | | | | | | |
| China – 4.8% |
Beijing Capital International Airport, Class H = | | | 145,490 | | | | 98 | |
| China Communication Services, Class H | | | 1,828,002 | | | | 946 | |
| Dalian Port, Class H | | | 1,319,383 | | | | 479 | |
| Guangshen Railway – ADR | | | 11,461 | | | | 230 | |
| Hainan Meilan International Airport, Class H | | | 142,509 | | | | 114 | |
| Jiangsu Expressway, Class H | | | 597,100 | | | | 531 | |
| Xinao Gas Holdings | | | 53,271 | | | | 114 | |
| Zhejiang Expressway, Class H | | | 438,866 | | | | 373 | |
| | | | | | | | | |
| | | | | | | | 2,885 | |
| | | | | | | | | |
| Denmark – 0.3% |
| AP Moller – Maersk, Class B | | | 25 | | | | 171 | |
| | | | | | | | | |
| Finland – 0.5% |
| Fortum Oyj | | | 11,792 | | | | 279 | |
| | | | | | | | | |
| France – 6.1% |
| Aeroports de Paris | | | 11,039 | | | | 838 | |
| GDF Suez | | | 7,839 | | | | 328 | |
| Societe des Autoroutes Paris-Rhin-Rhone | | | 13,123 | | | | 986 | |
| Suez Environment | | | 5,100 | | | | 113 | |
| Veolia Environnement – ADR | | | 7,855 | | | | 256 | |
| Vinci | | | 21,677 | | | | 1,131 | |
| | | | | | | | | |
| | | | | | | | 3,652 | |
| | | | | | | | | |
| Germany – 4.3% |
| E.ON | | | 27,187 | | | | 1,042 | |
| Fraport | | | 25,919 | | | | 1,220 | |
| Hamburger Hafen und Logistik | | | 8,234 | | | | 321 | |
| | | | | | | | | |
| | | | | | | | 2,583 | |
| | | | | | | | | |
First American Funds 2009 Annual Report 55
Schedule of Investments October 31, 2009, all dollars are rounded to thousands (000)
| | | | | | | | | |
| Global Infrastructure Fund (continued) |
| DESCRIPTION | | SHARES | | FAIR VALUE |
| |
| |
| Hong Kong – 10.1% |
| Beijing Enterprise | | | 79,271 | | | $ | 475 | |
| Cheung Kong Infrastructure Holdings | | | 393,776 | | | | 1,400 | |
| China Everbright International | | | 1,594,036 | | | | 722 | |
| China Merchants Holdings International | | | 97,436 | | | | 311 | |
China Resources Gas Group ⊡ | | | 342,864 | | | | 332 | |
| China Water Affairs Group | | | 210,551 | | | | 61 | |
| Cosco Pacific | | | 179,400 | | | | 248 | |
| Guangdong Investment | | | 812,236 | | | | 424 | |
| Hopewell Highway Infrastructure | | | 1,080,995 | | | | 652 | |
| Hutchison Whampoa | | | 110,401 | | | | 775 | |
| MTR | | | 107,632 | | | | 381 | |
| NWS Holdings | | | 88,403 | | | | 168 | |
| Towngas China Company | | | 114,326 | | | | 46 | |
| | | | | | | | | |
| | | | | | | | 5,995 | |
| | | | | | | | | |
| Italy – 2.7% |
| Aeroporto Venezia | | | 281 | | | | 2 | |
| Ansaldo STS | | | 34,008 | | | | 651 | |
| Atlantia | | | 27,640 | | | | 654 | |
| Snam Rete Gas | | | 56,993 | | | | 276 | |
| | | | | | | | | |
| | | | | | | | 1,583 | |
| | | | | | | | | |
| Japan – 3.6% |
| Airport Facilities | | | 34,302 | | | | 203 | |
| East Japan Railway | | | 5,044 | | | | 323 | |
| Japan Airport Terminal | | | 14,076 | | | | 197 | |
| Kamigumi | | | 99,763 | | | | 749 | |
| Mitsubishi Logistics | | | 13,808 | | | | 150 | |
| Tokyo Electric Power Company | | | 4,209 | | | | 103 | |
| Tokyo Gas Company | | | 101,503 | | | | 402 | |
| | | | | | | | | |
| | | | | | | | 2,127 | |
| | | | | | | | | |
| Luxembourg – 1.0% |
| SES | | | 26,984 | | | | 585 | |
| | | | | | | | | |
| Mexico – 0.1% |
| Grupo Aeroportuario del Sureste – ADR | | | 2,169 | | | | 88 | |
| | | | | | | | | |
| Netherlands – 0.9% |
| Koninklijke Vopak | | | 7,935 | | | | 535 | |
| | | | | | | | | |
| New Zealand – 2.6% |
| Infratil | | | 338,868 | | | | 394 | |
| Port of Tauranga | | | 131,986 | | | | 664 | |
| Vector | | | 342,863 | | | | 475 | |
| | | | | | | | | |
| | | | | | | | 1,533 | |
| | | | | | | | | |
| Norway – 0.3% |
| Hafslund, Class B | | | 16,968 | | | | 192 | |
| | | | | | | | | |
| Portugal – 0.9% |
| Redes Energeticas Nacionais | | | 122,351 | | | | 536 | |
| | | | | | | | | |
| Singapore – 4.8% |
| CitySpring Infrastructure Trust | | | 5,154 | | | | 2 | |
| ComfortDelGro Corporation | | | 184,692 | | | | 201 | |
| Hyflux | | | 201,644 | | | | 438 | |
| Hyflux Water Trust | | | 49,986 | | | | 24 | |
| SembCorp Industries | | | 44,331 | | | | 104 | |
| Singapore Airport Terminal Services | | | 46,148 | | | | 81 | |
| Singapore Post | | | 564,530 | | | | 379 | |
| Singapore Telecomm | | | 390,247 | | | | 809 | |
| SMRT | | | 664,604 | | | | 793 | |
| | | | | | | | | |
| | | | | | | | 2,831 | |
| | | | | | | | | |
| Spain – 8.0% |
| Abertis Infraestructuras | | | 100,587 | | | | 2,139 | |
| Acciona | | | 2,681 | | | | 327 | |
| Cintra Concesiones de Infraestructuras de Transporte | | | 32,478 | | | | 334 | |
| Enagas | | | 33,040 | | | | 680 | |
| Iberdrola | | | 54,415 | | | | 493 | |
| Iberdrola Renovables | | | 90,751 | | | | 403 | |
| Red Electrica | | | 7,813 | | | | 403 | |
| | | | | | | | | |
| | | | | | | | 4,779 | |
| | | | | | | | | |
| Switzerland – 1.7% |
| BKW FMB Energie | | | 2,815 | | | | 232 | |
| Flughafen Zuerich | | | 2,677 | | | | 779 | |
| | | | | | | | | |
| | | | | | | | 1,011 | |
| | | | | | | | | |
| United Kingdom – 8.5% |
| Arriva | | | 75,315 | | | | 543 | |
| Balfour Beatty | | | 225,521 | | | | 980 | |
| Centrica | | | 66,459 | | | | 270 | |
| Forth Ports | | | 22,316 | | | | 404 | |
| International Power | | | 174,645 | | | | 725 | |
| National Grid – ADR | | | 8,886 | | | | 441 | |
| Pennon Group | | | 6,668 | | | | 50 | |
| Scottish & Southern Energy | | | 41,238 | | | | 728 | |
| Serco Group | | | 18,649 | | | | 154 | |
| United Utilities Group | | | 105,580 | | | | 761 | |
| | | | | | | | | |
| | | | | | | | 5,056 | |
| | | | | | | | | |
| United States – 18.0% |
American Tower, Class A = | | | 17,555 | | | | 646 | |
| American Water Works | | | 5,564 | | | | 106 | |
| Aqua America | | | 20,008 | | | | 309 | |
| Brookfield Infrastructure Partners | | | 72,394 | | | | 1,050 | |
| California Water Service Group | | | 8,780 | | | | 321 | |
| Connecticut Water Service | | | 3,524 | | | | 79 | |
| El Paso | | | 72,488 | | | | 711 | |
| Exelon | | | 7,224 | | | | 339 | |
| FPL Group | | | 15,915 | | | | 781 | |
| ITC Holdings | | | 13,544 | | | | 602 | |
| Kinder Morgan Management | | | 38,440 | | | | 1,799 | |
| Northeast Utilities | | | 17,936 | | | | 413 | |
| Northwest Natural Gas | | | 3,365 | | | | 141 | |
| Piedmont Natural Gas | | | 9,955 | | | | 232 | |
| South Jersey Industries | | | 13,346 | | | | 471 | |
| Southern Union | | | 42,899 | | | | 839 | |
| Spectra Energy | | | 97,378 | | | | 1,862 | |
| | | | | | | | | |
| | | | | | | | 10,701 | |
| | | | | | | | | |
Total Common Stocks
(Cost $54,653) | | | | | | | 57,111 | |
| | | | | | | | | |
Preferred Stock – 0.8% |
| Brazil – 0.8% |
| Companhia de Gas de Sao Paulo, Class A | | | | | | | | |
(Cost $425) | | | 23,891 | | | | 454 | |
| | | | | | | | | |
Short-Term Investment – 0.1% |
| State Street Institutional Liquid Reserves Fund, 0.250% Ω | | | | | | | | |
(Cost $67) | | | 67,144 | | | | 67 | |
| | | | | | | | | |
Total Investments 5 – 96.8% | | | | | | | | |
(Cost $55,145) | | | | | | | 57,632 | |
| | | | | | | | | |
Other Assets and Liabilities, Net – 3.2% | | | | | | | 1,904 | |
| | | | | | | | | |
Total Net Assets – 100.0% | | | | | | $ | 59,536 | |
| | | | | | | | | |
The accompanying notes are an integral part of the financial statements.
56 First American Funds 2009 Annual Report
Global Infrastructure Fund (concluded)
| | |
| = | | Non-income producing security. |
| |
| ⊡ | | Security is internally fair valued. As of October 31, 2009, the fair value of this investment was $332 or 0.6% of total net assets. See note 2 in Notes to Financial Statements. |
| |
| Ω | | The rate quoted is the annualized seven-day effective yield as of October 31, 2009. |
| |
| 5 | | On October 31, 2009, the cost of investments for federal income tax purposes was $55,676. The aggregate gross unrealized appreciation and depreciation of investments, based on this cost, were as follows: |
| | | | | |
| Gross unrealized appreciation | | $ | 4,316 | |
| Gross unrealized depreciation | | | (2,360 | ) |
| | | | | |
| Net unrealized appreciation | | $ | 1,956 | |
| | | | | |
| |
| ADR – | American Depositary Receipt |
At October 31, 2009, sector diversification of the fund was as follows:
| | | | | | | | | |
| | | % of
| | | | |
| Common and Preferred Stock | | Net Assets | | | Fair Value | |
| | |
| Industrials* | | | 41.3 | % | | $ | 24,574 | |
| Utilities* | | | 34.7 | | | | 20,658 | |
| Energy | | | 14.8 | | | | 8,839 | |
| Telecommunication Services | | | 4.0 | | | | 2,401 | |
| Consumer Discretionary | | | 1.0 | | | | 585 | |
| Financials | | | 0.9 | | | | 508 | |
| | | | | | | | | |
Total Common and Preferred Stock | | | 96.7 | | | | 57,565 | |
| | | | | | | | | |
Total Short-Term Investment | | | 0.1 | | | | 67 | |
| | | | | | | | | |
Total Investments | | | 96.8 | | | | 57,632 | |
| | | | | | | | | |
Other Assets and Liabilities, Net | | | 3.2 | | | | 1,904 | |
| | | | | | | | | |
Net Assets | | | 100.0 | % | | $ | 59,536 | |
| | | | | | | | | |
| | |
| * | | The fund is significantly invested in these sectors and therefore subject to additional risks. See note 7 in Notes to Financial Statements. |
| | | | | | | | | |
| International Fund |
| DESCRIPTION | | SHARES | | FAIR VALUE |
| |
| |
Common Stocks – 89.3% |
| Australia – 1.7% |
| APA Group | | | 28,994 | | | $ | 82 | |
Asciano Group = | | | 77,903 | | | | 104 | |
| CSL | | | 140,403 | | | | 3,942 | |
| Macquarie Infrastructure Group | | | 136,388 | | | | 175 | |
| National Australia Bank | | | 105,013 | | | | 2,775 | |
| Newcrest Mining | | | 135,260 | | | | 3,888 | |
| Transurban Group | | | 334,974 | | | | 1,359 | |
| | | | | | | | | |
| | | | | | | | 12,325 | |
| | | | | | | | | |
| Austria – 0.1% |
| Oesterreichische Elektrizitaetswirtschafts, Class A | | | 8,721 | | | | 391 | |
| | | | | | | | | |
| Belgium – 0.6% |
| Anheuser-Busch InBev | | | 84,968 | | | | 3,989 | |
| Elia System Operator | | | 2,255 | | | | 91 | |
| | | | | | | | | |
| | | | | | | | 4,080 | |
| | | | | | | | | |
| Brazil – 1.0% |
| Companhia de Concessoes Rodoviarias | | | 29,414 | | | | 581 | |
| Companhia de Transmissao de Energia Electrica Paulista | | | 29,088 | | | | 802 | |
| CPFL Energia – ADR | | | 323 | | | | 17 | |
| Petroleo Brasileiro – ADR | | | 54,067 | | | | 2,499 | |
| Vale – ADR | | | 122,304 | | | | 3,118 | |
| | | | | | | | | |
| | | | | | | | 7,017 | |
| | | | | | | | | |
| Canada – 4.2% |
| Agrium | | | 63,700 | | | | 2,991 | |
Boralex, Class A = | | | 674 | | | | 6 | |
| Brookfield Asset Management, Class A | | | 9,121 | | | | 191 | |
| Cameco | | | 178,850 | | | | 4,866 | |
| Enbridge | | | 29,587 | | | | 1,149 | |
| EnCana | | | 63,729 | | | | 3,534 | |
| Great Lakes Hydro Income Fund | | | 7,718 | | | | 131 | |
| Inmet Mining | | | 32,690 | | | | 1,732 | |
| Manulife Financial | | | 182,381 | | | | 3,390 | |
| Shoppers Drug Mart | | | 70,306 | | | | 2,793 | |
| Suncor Energy | | | 126,245 | | | | 4,169 | |
| TransCanada | | | 27,377 | | | | 836 | |
| TransCanada | | | 11,261 | | | | 345 | |
| Yamana Gold | | | 339,534 | | | | 3,616 | |
| | | | | | | | | |
| | | | | | | | 29,749 | |
| | | | | | | | | |
| Cayman Islands – 0.7% |
New Oriental Education & Technology Group – ADR = | | | 31,349 | | | | 2,190 | |
| Tencent Holdings | | | 169,900 | | | | 2,958 | |
| | | | | | | | | |
| | | | | | | | 5,148 | |
| | | | | | | | | |
| Chile – 0.0% |
| Empresa Nacional de Electricidad – ADR | | | 1,876 | | | | 86 | |
| Enersis – ADR | | | 5,984 | | | | 106 | |
| | | | | | | | | |
| | | | | | | | 192 | |
| | | | | | | | | |
| China – 1.8% |
| Agile Property Holdings | | | 1,632,000 | | | | 2,089 | |
Beijing Capital International Airport, Class H = | | | 87,272 | | | | 59 | |
| China Communication Services, Class H | | | 1,184,917 | | | | 613 | |
| China Communications Construction | | | 1,848,000 | | | | 1,987 | |
| China Merchants Bank | | | 1,003,850 | | | | 2,568 | |
| Dalian Port, Class H | | | 843,651 | | | | 306 | |
| Guangshen Railway – ADR | | | 7,500 | | | | 150 | |
| Hainan Meilan International Airport, Class H | | | 100,621 | | | | 81 | |
| Industrial & Commercial Bank of China, Class H | | | 3,030,000 | | | | 2,411 | |
| Jiangsu Expressway, Class H | | | 388,186 | | | | 345 | |
First American Funds 2009 Annual Report 57
Schedule of Investments October 31, 2009, all dollars are rounded to thousands (000)
| | | | | | | | | |
| International Fund (continued) |
| DESCRIPTION | | SHARES | | FAIR VALUE |
| |
| |
| PetroChina, Class H | | | 1,798,000 | | | $ | 2,163 | |
| Xinao Gas Holdings | | | 32,239 | | | | 69 | |
| Zhejiang Expressway, Class H | | | 284,313 | | | | 242 | |
| | | | | | | | | |
| | | | | | | | 13,083 | |
| | | | | | | | | |
| Denmark – 1.3% |
| AP Moller – Maersk, Class B | | | 16 | | | | 109 | |
| Novo Nordisk, Class B | | | 64,893 | | | | 4,032 | |
Vestas Wind Systems = | | | 75,099 | | | | 5,267 | |
| | | | | | | | | |
| | | | | | | | 9,408 | |
| | | | | | | | | |
| Finland – 0.8% |
| Fortum Oyj | | | 7,374 | | | | 175 | |
| Nokia Oyj | | | 436,227 | | | | 5,510 | |
| | | | | | | | | |
| | | | | | | | 5,685 | |
| | | | | | | | | |
| France – 9.2% |
| Aeroports de Paris | | | 6,774 | | | | 514 | |
| AXA | | | 202,180 | | | | 5,028 | |
| BNP Paribas | | | 114,014 | | | | 8,589 | |
| Carrefour | | | 150,292 | | | | 6,451 | |
| Electricite de France | | | 111,688 | | | | 6,225 | |
| GDF Suez | | | 4,712 | | | | 197 | |
| Iliad | | | 59,308 | | | | 6,422 | |
| L’oreal | | | 49,213 | | | | 5,032 | |
| Sanofi-Aventis | | | 104,864 | | | | 7,687 | |
| Societe des Autoroutes Paris-Rhin-Rhone | | | 8,178 | | | | 614 | |
| Suez Environment | | | 3,543 | | | | 79 | |
| Total | | | 106,664 | | | | 6,383 | |
| Total – ADR | | | 62,358 | | | | 3,746 | |
UbiSoft Entertainment = | | | 178,716 | | | | 2,817 | |
| Veolia Environnement – ADR | | | 5,006 | | | | 163 | |
| Vinci | | | 13,436 | | | | 701 | |
| Vivendi Universal | | | 182,682 | | | | 5,068 | |
| | | | | | | | | |
| | | | | | | | 65,716 | |
| | | | | | | | | |
| Germany – 6.8% |
| Adidas | | | 202,725 | | | | 9,386 | |
| Allianz | | | 35,543 | | | | 4,074 | |
| BASF | | | 36,620 | | | | 1,960 | |
| Deutsche Boerse | | | 50,245 | | | | 4,070 | |
| E.ON | | | 17,098 | | | | 655 | |
| Fraport | | | 16,044 | | | | 755 | |
| Hamburger Hafen und Logistik | | | 5,109 | | | | 199 | |
| Metro | | | 36,090 | | | | 2,003 | |
| SAP | | | 125,288 | | | | 5,675 | |
| SAP – ADR | | | 68,012 | | | | 3,079 | |
| Siemens | | | 61,280 | | | | 5,538 | |
| Symrise | | | 351,530 | | | | 6,374 | |
| Wacker Chemie | | | 33,506 | | | | 4,814 | |
| | | | | | | | | |
| | | | | | | | 48,582 | |
| | | | | | | | | |
| Hong Kong – 3.1% |
| Beijing Enterprise Holdings | | | 48,511 | | | | 290 | |
| Cheung Kong Holdings | | | 430,653 | | | | 5,466 | |
| Cheung Kong Infrastructure Holdings | | | 275,126 | | | | 978 | |
| China Everbright International | | | 1,033,625 | | | | 468 | |
| China Merchants Holdings International | | | 60,360 | | | | 193 | |
China Resources Gas Group ⊡ | | | 217,873 | | | | 211 | |
| China Water Affairs Group | | | 124,645 | | | | 36 | |
| COSCO Pacific | | | 112,467 | | | | 155 | |
| Esprit Holdings | | | 692,900 | | | | 4,613 | |
| Guangdong Investment | | | 506,015 | | | | 264 | |
| Hang Lung Properties | | | 875,000 | | | | 3,307 | |
| Hopewell Highway Infrastructure | | | 789,158 | | | | 476 | |
| Hutchison Whampoa | | | 67,828 | | | | 476 | |
| Li & Fung | | | 1,114,000 | | | | 4,633 | |
| MTR | | | 65,741 | | | | 233 | |
| NWS Holdings | | | 56,976 | | | | 108 | |
| Towngas China Company | | | 55,920 | | | | 22 | |
| | | | | | | | | |
| | | | | | | | 21,929 | |
| | | | | | | | | |
| India – 0.6% |
| HDFC Bank – ADR | | | 20,793 | | | | 2,300 | |
| Infosys Technologies – ADR | | | 42,879 | | | | 1,972 | |
| | | | | | | | | |
| | | | | | | | 4,272 | |
| | | | | | | | | |
| Ireland – 1.2% |
| Covidien | | | 204,490 | | | | 8,613 | |
| | | | | | | | | |
| Israel – 0.4% |
| Teva Pharmaceutical Industries – ADR | | | 52,983 | | | | 2,675 | |
| | | | | | | | | |
| Italy – 1.4% |
| Aeroporto Venezia | | | 203 | | | | 2 | |
| Ansaldo STS | | | 110,856 | | | | 2,122 | |
| Atlantia | | | 18,658 | | | | 441 | |
| Eni | | | 181,091 | | | | 4,485 | |
| Saipem | | | 104,862 | | | | 3,094 | |
| Snam Rete Gas | | | 40,915 | | | | 198 | |
| | | | | | | | | |
| | | | | | | | 10,342 | |
| | | | | | | | | |
| Japan – 18.1% |
| Airport Facilities | | | 20,197 | | | | 119 | |
| Canon | | | 97,747 | | | | 3,685 | |
| East Japan Railway | | | 3,233 | | | | 207 | |
| FANUC | | | 101,534 | | | | 8,434 | |
| Fast Retailing | | | 24,200 | | | | 3,983 | |
| Japan Airport Terminal | | | 8,360 | | | | 117 | |
| Jupiter Telecommunications | | | 5,644 | | | | 5,159 | |
| Kamigumi | | | 62,563 | | | | 470 | |
| Keyence | | | 17,613 | | | | 3,497 | |
| Kose | | | 215,585 | | | | 4,716 | |
| Mitsubishi | | | 363,507 | | | | 7,707 | |
| Mitsubishi Logistics | | | 8,680 | | | | 94 | |
| Mitsui | | | 313,412 | | | | 4,116 | |
| Mitsui Sumitomo Insurance Group | | | 135,953 | | | | 3,165 | |
| NGK Insulators | | | 253,000 | | | | 5,675 | |
| Nintendo | | | 23,367 | | | | 5,861 | |
| Nipponkoa Insurance | | | 991,520 | | | | 5,398 | |
| Nomura Holdings | | | 727,050 | | | | 5,124 | |
| Nomura Research Institute | | | 250,341 | | | | 5,413 | |
| SECOM | | | 70,887 | | | | 3,307 | |
| Seven & I Holdings | | | 309,048 | | | | 6,766 | |
| Shin-Etsu Chemical | | | 65,800 | | | | 3,489 | |
| SMC | | | 33,309 | | | | 3,804 | |
| Sony Financial Holdings | | | 1,708 | | | | 4,901 | |
| Sugi Holdings | | | 198,146 | | | | 4,304 | |
| Sumitomo Metal Mining | | | 367,137 | | | | 5,806 | |
| Sumitomo Trust & Banking | | | 513,392 | | | | 2,675 | |
| Suzuki Motor | | | 173,527 | | | | 4,199 | |
| The Bank of Yokohama | | | 757,497 | | | | 3,720 | |
| The Joyo Bank | | | 590,696 | | | | 2,599 | |
| Tokyo Electric Power | | | 3,021 | | | | 74 | |
| Tokyo Gas | | | 73,415 | | | | 291 | |
| Toyota Motor | | | 109,100 | | | | 4,307 | |
| Yamada Denki | | | 93,800 | | | | 5,716 | |
| | | | | | | | | |
| | | | | | | | 128,898 | |
| | | | | | | | | |
| Luxembourg – 0.6% |
Millicom International Cellular – ADR = | | | 61,520 | | | | 3,855 | |
| SES | | | 16,859 | | | | 365 | |
| | | | | | | | | |
| | | | | | | | 4,220 | |
| | | | | | | | | |
The accompanying notes are an integral part of the financial statements.
58 First American Funds 2009 Annual Report
| | | | | | | | | |
| International Fund (continued) |
| DESCRIPTION | | SHARES | | FAIR VALUE |
| |
| |
| Malaysia – 0.3% |
| Sime Darby Berhad | | | 696,492 | | | $ | 1,801 | |
| | | | | | | | | |
| Mexico – 0.4% |
| Grupo Aeroportuario del Sureste – ADR | | | 1,612 | | | | 65 | |
| Wal-Mart de Mexico – ADR | | | 69,373 | | | | 2,415 | |
| | | | | | | | | |
| | | | | | | | 2,480 | |
| | | | | | | | | |
| Netherlands – 0.9% |
| Heineken | | | 143,229 | | | | 6,331 | |
| Koninklijke Vopak | | | 5,090 | | | | 344 | |
| | | | | | | | | |
| | | | | | | | 6,675 | |
| | | | | | | | | |
| New Zealand – 0.1% |
| Infratil | | | 207,994 | | | | 242 | |
| Port of Tauranga | | | 83,035 | | | | 418 | |
| Vector | | | 214,635 | | | | 297 | |
| | | | | | | | | |
| | | | | | | | 957 | |
| | | | | | | | | |
| Norway – 0.7% |
| Hafslund, Class B | | | 9,842 | | | | 111 | |
| Statoil | | | 198,837 | | | | 4,686 | |
| | | | | | | | | |
| | | | | | | | 4,797 | |
| | | | | | | | | |
| Portugal – 0.5% |
| Energias de Portugal | | | 799,074 | | | | 3,534 | |
| Redes Energeticas Nacionais | | | 78,563 | | | | 344 | |
| | | | | | | | | |
| | | | | | | | 3,878 | |
| | | | | | | | | |
| Russia – 0.3% |
| Gazprom – ADR | | | 95,769 | | | | 2,318 | |
| | | | | | | | | |
| Singapore – 0.8% |
| CitySpring Infrastructure Trust | | | 3,189 | | | | 1 | |
| ComfortDelGro | | | 108,762 | | | | 118 | |
| DBS Group Holdings | | | 454,386 | | | | 4,161 | |
| Hyflux | | | 136,469 | | | | 296 | |
| Hyflux Water Trust | | | 36,780 | | | | 18 | |
| SembCorp Industries | | | 26,269 | | | | 62 | |
| Singapore Airport Terminal Services | | | 25,562 | | | | 45 | |
| Singapore Post | | | 366,498 | | | | 246 | |
| Singapore Telecommunications | | | 258,358 | | | | 536 | |
| SMRT | | | 439,682 | | | | 524 | |
| | | | | | | | | |
| | | | | | | | 6,007 | |
| | | | | | | | | |
| South Africa – 0.5% |
| Gold Fields – ADR | | | 96,082 | | | | 1,225 | |
| MTN Group | | | 137,949 | | | | 2,054 | |
| | | | | | | | | |
| | | | | | | | 3,279 | |
| | | | | | | | | |
| South Korea – 0.9% |
KB Financial Group – ADR = | | | 36,608 | | | | 1,737 | |
| Samsung Electronics | | | 2,592 | | | | 1,560 | |
| Samsung Electronics – GDR | | | 9,299 | | | | 2,843 | |
| | | | | | | | | |
| | | | | | | | 6,140 | |
| | | | | | | | | |
| Spain – 2.4% |
| Abertis Infraestructuras | | | 66,765 | | | | 1,420 | |
| Acciona | | | 1,662 | | | | 202 | |
| Banco Santander | | | 363,248 | | | | 5,846 | |
Banco Santander Euro = | | | 3,992 | | | | 65 | |
| Cintra Concesiones de Infraestructuras de Transporte | | | 23,839 | | | | 245 | |
| Enagas | | | 21,960 | | | | 452 | |
| Gamesa Corporacion Tecnologica | | | 153,246 | | | | 2,800 | |
| Iberdrola | | | 33,281 | | | | 301 | |
| Iberdrola Renovables | | | 55,430 | | | | 246 | |
| Red Electrica | | | 4,856 | | | | 251 | |
| Telefonica | | | 187,661 | | | | 5,241 | |
| | | | | | | | | |
| | | | | | | | 17,069 | |
| | | | | | | | | |
| Sweden – 1.4% |
| Atlas Copco, Class A | | | 276,452 | | | | 3,707 | |
| Ericsson | | | 626,209 | | | | 6,542 | |
| | | | | | | | | |
| | | | | | | | 10,249 | |
| | | | | | | | | |
| Switzerland – 6.0% |
ABB = | | | 183,792 | | | | 3,419 | |
| BKW FMB Energie | | | 1,766 | | | | 145 | |
| Credit Suisse Group | | | 83,586 | | | | 4,468 | |
| Flughafen Zuerich | | | 1,660 | | | | 483 | |
Foster Wheeler = | | | 93,933 | | | | 2,629 | |
Logitech International = | | | 184,337 | | | | 3,134 | |
| Nestle | | | 316,111 | | | | 14,700 | |
| Novartis | | | 150,272 | | | | 7,825 | |
| Roche Holding | | | 37,248 | | | | 5,966 | |
| | | | | | | | | |
| | | | | | | | 42,769 | |
| | | | | | | | | |
| Taiwan – 0.2% |
| Taiwan Semiconductor Manufacturing | | | 932,887 | | | | 1,692 | |
| | | | | | | | | |
| Thailand – 0.4% |
| Bangkok Bank | | | 758,381 | | | | 2,544 | |
| | | | | | | | | |
| United Kingdom – 18.3% |
Anglo American = | | | 123,971 | | | | 4,486 | |
| Antofagasta | | | 130,464 | | | | 1,644 | |
| ARM Holdings | | | 2,117,101 | | | | 5,143 | |
| Arriva | | | 45,848 | | | | 330 | |
Autonomy = | | | 293,728 | | | | 6,458 | |
| BAE Systems | | | 362,247 | | | | 1,863 | |
| Balfour Beatty | | | 141,013 | | | | 613 | |
| BG Group | | | 204,696 | | | | 3,524 | |
| BHP Billiton | | | 194,558 | | | | 5,242 | |
| BP – ADR | | | 143,786 | | | | 8,141 | |
| British Sky Broadcasting Group | | | 498,724 | | | | 4,348 | |
| Cadbury | | | 432,185 | | | | 5,464 | |
| Centrica | | | 47,158 | | | | 192 | |
| Diageo | | | 459,706 | | | | 7,488 | |
| Experian Group | | | 759,153 | | | | 6,937 | |
| Forth Ports | | | 13,603 | | | | 246 | |
| GlaxoSmithKline | | | 467,320 | | | | 9,586 | |
| ICAP | | | 452,980 | | | | 3,011 | |
| International Power | | | 107,560 | | | | 447 | |
| National Grid – ADR | | | 6,592 | | | | 327 | |
| Pennon Group | | | 4,667 | | | | 35 | |
| Prudential | | | 579,006 | | | | 5,259 | |
| Reed Elsevier | | | 666,065 | | | | 5,043 | |
| Rio Tinto | | | 88,135 | | | | 3,896 | |
| Scottish & Southern Energy | | | 237,291 | | | | 4,188 | |
| Serco Group | | | 11,479 | | | | 95 | |
| Smith & Nephew | | | 477,763 | | | | 4,223 | |
| Standard Chartered | | | 286,212 | | | | 7,021 | |
| Tesco | | | 839,398 | | | | 5,597 | |
| United Utilities Group | | | 68,472 | | | | 494 | |
| Vedanta Resources | | | 221,499 | | | | 7,579 | |
| Vodafone Group – ADR | | | 282,726 | | | | 6,274 | |
| WPP | | | 562,851 | | | | 5,044 | |
| | | | | | | | | |
| | | | | | | | 130,238 | |
| | | | | | | | | |
| United States – 1.6% |
American Tower, Class A = | | | 11,029 | | | | 406 | |
| American Water Works | | | 3,839 | | | | 73 | |
| Aqua America | | | 12,926 | | | | 200 | |
| Brookfield Infrastructure Partners | | | 53,542 | | | | 776 | |
| California Water Service Group | | | 5,660 | | | | 207 | |
First American Funds 2009 Annual Report 59
Schedule of Investments October 31, 2009, all dollars are rounded to thousands (000)
| | | | | | | | | |
| International Fund (continued) |
| DESCRIPTION | | SHARES/PAR | | FAIR VALUE |
| |
| |
| Connecticut Water Service | | | 2,287 | | | $ | 51 | |
| El Paso | | | 45,425 | | | | 446 | |
| Exelon | | | 4,480 | | | | 210 | |
| FPL Group | | | 10,207 | | | | 501 | |
| ITC Holdings | | | 10,047 | | | | 446 | |
| Kinder Morgan Management | | | 24,688 | | | | 1,156 | |
| Northeast Utilities | | | 11,562 | | | | 267 | |
| Northwest Natural Gas | | | 2,082 | | | | 87 | |
| Philip Morris International | | | 96,691 | | | | 4,579 | |
| Piedmont Natural Gas | | | 6,206 | | | | 144 | |
| South Jersey Industries | | | 8,348 | | | | 295 | |
| Southern Union | | | 27,437 | | | | 537 | |
| Spectra Energy | | | 64,547 | | | | 1,234 | |
| | | | | | | | | |
| | | | | | | | 11,615 | |
| | | | | | | | | |
Total Common Stocks | | | | | | | | |
(Cost $530,600) | | | | | | | 636,833 | |
| | | | | | | | | |
Preferred Stocks – 1.2% |
| Brazil – 0.4% |
| Companhia de Gas de Sao Paulo, Class A | | | 15,000 | | | | 285 | |
| Itau Unibanco Holding – ADR | | | 139,996 | | | | 2,679 | |
| | | | | | | | | |
| | | | | | | | 2,964 | |
| | | | | | | | | |
| Germany – 0.8% |
| Henkel KGAA | | | 123,790 | | | | 5,638 | |
| | | | | | | | | |
Total Preferred Stocks | | | | | | | | |
(Cost $5,530) | | | | | | | 8,602 | |
| | | | | | | | | |
Right – 0.0% |
| Belgium – 0.0% |
Fortis = ¥ ⊡ | | | | | | | | |
(Cost $0) | | | 303,628 | | | | — | |
| | | | | | | | | |
Short-Term Investments – 9.2% |
| Money Market Fund – 5.9% |
| State Street Institutional Liquid Reserves Fund, 0.250% Ω | | | 42,343,753 | | | | 42,344 | |
| | | | | | | | | |
| U.S. Treasury Obligation – 3.3% |
| U.S. Treasury Bill | | | | | | | | |
0.227%, 11/19/2009 o | | $ | 23,600 | | | | 23,597 | |
| | | | | | | | | |
Total Short-Term Investments | | | | | | | | |
(Cost $65,941) | | | | | | | 65,941 | |
| | | | | | | | | |
Total Investments 5 – 99.7% | | | | | | | | |
(Cost $602,071) | | | | | | | 711,376 | |
| | | | | | | | | |
Other Assets and Liabilities, Net – 0.3% | | | | | | | 2,178 | |
| | | | | | | | | |
Total Net Assets – 100.0% | | | | | | $ | 713,554 | |
| | | | | | | | | |
| | |
| = | | Non-income producing security. |
| |
| ¥ | | Security considered illiquid. As of October 31, 2009, the fair value of this investment was $0 or 0.0% of total net assets. See note 2 in Notes to Financial Statements. |
| |
| ⊡ | | Security is internally fair valued. As of October 31, 2009, the fair value of these investments was $211 or 0.0% of total net assets. See note 2 in Notes to Financial Statements. |
| |
| Ω | | The rate quoted is the annualized seven-day effective yield as of October 31, 2009. |
| |
| o | | Security has been deposited as initial margin on open futures contracts. Yield shown is the annualized effective yield as of October 31, 2009. See note 2 in Notes to Financial Statements. |
International Fund (continued)
| | |
| 5 | | On October 31, 2009, the cost of investments for federal income tax purposes was $602,612. The aggregate gross unrealized appreciation and depreciation of investments, based on this cost, were as follows: |
| | | | | |
| Gross unrealized appreciation | | $ | 130,560 | |
| Gross unrealized depreciation | | | (21,796 | ) |
| | | | | |
| Net unrealized appreciation | | $ | 108,764 | |
| | | | | |
| |
| ADR – | American Depositary Receipt |
| |
| GDR – | Global Depositary Receipt |
Schedule of Open Futures Contracts
| | | | | | | | | | | | | | | |
| | | | | | Number of
| | | | | | |
| | | | | | Contracts
| | | Notional
| | Unrealized
| |
| | | Settlement
| | | Purchased
| | | Contract
| | Appreciation
| |
| Description | | Month | | | (Sold) | | | Value | | (Depreciation) | |
| | |
| British Pound Currency Futures | | | December 2009 | | | | (70 | ) | | $ (7,193) | | $ | 37 | |
| CAC 40 10 Euro Index Futures | | | December 2009 | | | | 439 | | | 23,142 | | | (868 | ) |
| DAX Index Futures | | | December 2009 | | | | 115 | | | 22,862 | | | (959 | ) |
| Dow Jones Euro STOXX 50 Futures | | | December 2009 | | | | 878 | | | 35,223 | | | (1,369 | ) |
E-Mini MSCI EAFE Index Futures | | | December 2009 | | | | 77 | | | 5,790 | | | (151 | ) |
E-Mini MSCI Emerging Markets Index Futures | | | December 2009 | | | | (283 | ) | | (12,678) | | | 485 | |
| FTSE/JSE Top 40 Index Futures | | | December 2009 | | | | (208 | ) | | (6,346) | | | (231 | ) |
| Hang Seng China Enterprises Index Futures | | | November 2009 | | | | 76 | | | 6,238 | | | (129 | ) |
| IBEX 35 Index Futures | | | November 2009 | | | | (63 | ) | | (10,516) | | | 295 | |
| Mexican Bolsa Index Futures | | | December 2009 | | | | (320 | ) | | (6,986) | | | 219 | |
Nasdaq 100 E-Mini Futures | | | December 2009 | | | | (29 | ) | | (966) | | | 33 | |
| Nikkei 225 Index Futures | | | December 2009 | | | | (28 | ) | | (3,114) | | | (44 | ) |
| OMXS30 Index Futures | | | November 2009 | | | | (298 | ) | | (3,964) | | | (127 | ) |
| Russell 2000 Mini Index Futures | | | December 2009 | | | | (288 | ) | | (16,180) | | | 905 | |
| S&P 500 Futures | | | December 2009 | | | | (57 | ) | | (14,720) | | | 186 | |
| S&P MIB Index Futures | | | December 2009 | | | | 40 | | | 6,477 | | | (484 | ) |
| S&P TSE 60 Futures | | | December 2009 | | | | (135 | ) | | (16,112) | | | 551 | |
| SGX CNX Nifty Index Futures | | | November 2009 | | | | 922 | | | 8,659 | | | (469 | ) |
| SGX MSCI Singapore Index Futures | | | November 2009 | | | | 49 | | | 2,207 | | | (40 | ) |
| SPI 200 Futures | | | December 2009 | | | | 363 | | | 37,773 | | | 268 | |
| Swiss Market Index Futures | | | December 2009 | | | | 143 | | | 8,754 | | | (185 | ) |
| | | | | | | | | | | | | | | |
| | | | | | | | | | | | | $ | (2,077 | ) |
| | | | | | | | | | | | | | | |
The accompanying notes are an integral part of the financial statements.
60 First American Funds 2009 Annual Report
International Fund (concluded)
At October 31, 2009, sector diversification of the fund was as follows:
| | | | | | | | | |
| | | % of
| | |
| Common and Preferred Stock | | Net Assets | | Fair Value |
| |
| Financials | | | 15.5 | % | | $ | 110,751 | |
| Consumer Staples | | | 12.4 | | | | 88,266 | |
| Industrials | | | 12.1 | | | | 86,409 | |
| Information Technology | | | 9.5 | | | | 67,839 | |
| Consumer Discretionary | | | 9.0 | | | | 64,054 | |
| Materials | | | 8.7 | | | | 61,860 | |
| Energy | | | 8.3 | | | | 59,309 | |
| Healthcare | | | 7.6 | | | | 54,549 | |
| Utilities | | | 3.8 | | | | 26,998 | |
| Telecommunication Services | | | 3.6 | | | | 25,400 | |
| | | | | | | | | |
Total Common and Preferred Stock | | | 90.5 | | | | 645,435 | |
| | | | | | | | | |
Total Rights | | | — | | | | — | |
| | | | | | | | | |
Total Short-Term Investments | | | 9.2 | | | | 65,941 | |
| | | | | | | | | |
Total Investments | | | 99.7 | | | | 711,376 | |
| | | | | | | | | |
Other Assets and Liabilities, Net | | | 0.3 | | | | 2,178 | |
| | | | | | | | | |
Net Assets | | | 100.0 | % | | $ | 713,554 | |
| | | | | | | | | |
| | | | | | | | | |
| International Select Fund |
| DESCRIPTION | | SHARES | | FAIR VALUE |
| |
| |
Common Stocks – 83.4% |
| Australia – 2.4% |
| APA Group | | | 15,075 | | | $ | 43 | |
| Asciano Group | | | 40,502 | | | | 54 | |
| BHP Billiton | | | 98,698 | | | | 3,237 | |
| CSL | | | 101,404 | | | | 2,847 | |
| Macquarie Infrastructure Group | | | 70,906 | | | | 91 | |
| National Australia Bank | | | 62,197 | | | | 1,643 | |
| Newcrest Mining | | | 80,109 | | | | 2,303 | |
| Rio Tinto | | | 63,008 | | | | 3,493 | |
| Transurban Group | | | 174,139 | | | | 706 | |
| | | | | | | | | |
| | | | | | | | 14,417 | |
| | | | | | | | | |
| Austria – 0.0% |
| Oesterreichische Elektrizitaetswirtschafts, Class A | | | 4,535 | | | | 204 | |
| | | | | | | | | |
| Belgium – 0.4% |
| Anheuser-Busch InBev | | | 44,344 | | | | 2,082 | |
| Elia System Operator | | | 1,172 | | | | 47 | |
| | | | | | | | | |
| | | | | | | | 2,129 | |
| | | | | | | | | |
| Brazil – 3.9% |
| Banco do Brasil | | | 263,600 | | | | 4,221 | |
| Cia Brasileira de Meios de Pagamento | | | 351,000 | | | | 3,218 | |
| Companhia de Concessoes Rodoviarias | | | 113,193 | | | | 2,236 | |
| Companhia de Transmissao de Energia Electrica Paulista | | | 15,118 | | | | 417 | |
| CPFL Energia – ADR | | | 168 | | | | 9 | |
Fertilizantes Fosfatados = | | | 41,600 | | | | 395 | |
| Natura Cosmeticos | | | 55,200 | | | | 989 | |
| Petroleo Brasileiro – ADR | | | 61,893 | | | | 2,861 | |
| Redecard | | | 194,230 | | | | 2,883 | |
| Souza Cruz | | | 58,599 | | | | 2,069 | |
| Vale – ADR | | | 150,025 | | | | 3,824 | |
| | | | | | | | | |
| | | | | | | | 23,122 | |
| | | | | | | | | |
| Canada – 3.7% |
| Agrium | | | 37,730 | | | | 1,771 | |
Boralex, Class A = | | | 350 | | | | 3 | |
| Brookfield Asset Management, Class A | | | 4,741 | | | | 99 | |
| Cameco | | | 143,113 | | | | 3,894 | |
| Enbridge | | | 15,383 | | | | 598 | |
| EnCana | | | 37,747 | | | | 2,093 | |
| First Quantum Minerals | | | 15,000 | | | | 1,026 | |
| Great Lakes Hydro Income Fund | | | 4,015 | | | | 68 | |
| Inmet Mining | | | 17,734 | | | | 940 | |
| Inmet Mining | | | 1,630 | | | | 86 | |
| Manulife Financial | | | 172,955 | | | | 3,215 | |
| Shoppers Drug Mart | | | 53,244 | | | | 2,115 | |
| Suncor Energy | | | 92,905 | | | | 3,068 | |
| TransCanada | | | 14,234 | | | | 435 | |
| TransCanada | | | 5,854 | | | | 179 | |
| Yamana Gold | | | 201,099 | | | | 2,142 | |
| | | | | | | | | |
| | | | | | | | 21,732 | |
| | | | | | | | | |
| Chile – 0.0% |
| Empresa Nacional de Electricidad – ADR | | | 975 | | | | 45 | |
| Enersis – ADR | | | 3,112 | | | | 55 | |
| | | | | | | | | |
| | | | | | | | 100 | |
| | | | | | | | | |
| China – 3.0% |
| Agile Property Holdings | | | 2,062,000 | | | | 2,639 | |
Beijing Capital International Airport, Class H = | | | 45,373 | | | | 31 | |
| China Communication Services, Class H | | | 616,127 | | | | 319 | |
| China Communications Construction | | | 1,902,000 | | | | 2,045 | |
| China Merchants Bank | | | 933,900 | | | | 2,389 | |
| Dalian Port, Class H | | | 438,461 | | | | 159 | |
First American Funds 2009 Annual Report 61
Schedule of Investments October 31, 2009, all dollars are rounded to thousands (000)
| | | | | | | | | |
| International Select Fund (continued) |
| DESCRIPTION | | SHARES | | FAIR VALUE |
| |
| |
| Guangshen Railway – ADR | | | 3,899 | | | $ | 78 | |
| Hainan Meilan International Airport, Class H | | | 52,332 | | | | 42 | |
| Industrial & Commercial Bank of China, Class H | | | 2,883,000 | | | | 2,294 | |
| Jiangsu Expressway, Class H | | | 201,818 | | | | 179 | |
NetEase.com – ADR = | | | 26,000 | | | | 1,004 | |
New Oriental Education & Technology Group – ADR = | | | 28,553 | | | | 1,994 | |
| PetroChina, Class H | | | 1,712,000 | | | | 2,060 | |
| Shougang Concord International Enterprises | | | 3,634,000 | | | | 626 | |
| Xinao Gas Holdings | | | 16,755 | | | | 36 | |
| Zhejiang Expressway, Class H | | | 147,821 | | | | 126 | |
| | | | | | | | | |
| | | | | | | | 17,788 | |
| | | | | | | | | |
| Denmark – 0.9% |
| AP Moller – Maersk, Class B | | | 8 | | | | 55 | |
| Novo Nordisk, Class B | | | 34,035 | | | | 2,114 | |
Vestas Wind Systems = | | | 47,748 | | | | 3,349 | |
| | | | | | | | | |
| | | | | | | | 5,518 | |
| | | | | | | | | |
| Egypt – 0.7% |
| Commercial International Bank | | | 105,346 | | | | 1,085 | |
| Eastern Tobacco | | | 23,806 | | | | 559 | |
| Mobinil | | | 18,297 | | | | 700 | |
| Orascom Construction Industries | | | 43,803 | | | | 2,070 | |
| | | | | | | | | |
| | | | | | | | 4,414 | |
| | | | | | | | | |
| Finland – 0.6% |
| Fortum Oyj | | | 3,834 | | | | 91 | |
| Nokia Oyj | | | 258,369 | | | | 3,263 | |
| | | | | | | | | |
| | | | | | | | 3,354 | |
| | | | | | | | | |
| France – 6.5% |
| Aeroports de Paris | | | 3,522 | | | | 267 | |
| AXA | | | 129,131 | | | | 3,212 | |
| BNP Paribas | | | 66,905 | | | | 5,040 | |
| Carrefour | | | 89,014 | | | | 3,821 | |
| Electricite de France | | | 68,970 | | | | 3,844 | |
| GDF Suez | | | 2,449 | | | | 102 | |
| Iliad | | | 32,081 | | | | 3,474 | |
| L’oreal | | | 29,149 | | | | 2,980 | |
| Sanofi-Aventis | | | 62,109 | | | | 4,553 | |
| Societe des Autoroutes Paris-Rhin-Rhone | | | 4,253 | | | | 319 | |
| Suez Environment | | | 1,842 | | | | 41 | |
| Total | | | 63,173 | | | | 3,780 | |
| Total – ADR | | | 32,199 | | | | 1,934 | |
UbiSoft Entertainment = | | | 105,848 | | | | 1,668 | |
| Veolia Environnement – ADR | | | 2,603 | | | | 85 | |
| Vinci | | | 6,985 | | | | 365 | |
| Vivendi Universal | | | 108,199 | | | | 3,002 | |
| | | | | | | | | |
| | | | | | | | 38,487 | |
| | | | | | | | | |
| Germany – 5.0% |
| Adidas | | | 120,383 | | | | 5,574 | |
| Allianz | | | 21,054 | | | | 2,413 | |
| BASF | | | 21,691 | | | | 1,161 | |
| Deutsche Boerse | | | 34,021 | | | | 2,755 | |
| E.ON | | | 8,890 | | | | 341 | |
| Fraport | | | 8,341 | | | | 393 | |
| Hamburger Hafen und Logistik | | | 2,657 | | | | 104 | |
| Metro | | | 21,375 | | | | 1,186 | |
| SAP | | | 74,203 | | | | 3,361 | |
| SAP – ADR | | | 45,824 | | | | 2,074 | |
| Siemens | | | 36,295 | | | | 3,280 | |
| Symrise | | | 208,206 | | | | 3,775 | |
| Wacker Chemie | | | 20,269 | | | | 2,912 | |
| | | | | | | | | |
| | | | | | | | 29,329 | |
| | | | | | | | | |
| Hong Kong – 2.8% |
| Beijing Enterprises Holdings | | | 25,223 | | | | 151 | |
| Cheung Kong Holdings | | | 254,965 | | | | 3,236 | |
| Cheung Kong Infrastructure Holdings | | | 143,059 | | | | 509 | |
| China Everbright International | | | 537,339 | | | | 243 | |
| China Merchants Holdings International | | | 31,382 | | | | 100 | |
China Resources Gas Group ⊡ | | | 113,263 | | | | 110 | |
| China Water Affairs Group | | | 64,804 | | | | 19 | |
| COSCO Pacific | | | 58,451 | | | | 81 | |
| Esprit Holdings | | | 445,900 | | | | 2,968 | |
| Guangdong Investment | | | 263,082 | | | | 137 | |
| Hang Lung Properties | | | 566,000 | | | | 2,139 | |
| Hopewell Highway Infrastructure | | | 410,396 | | | | 248 | |
| Hutchison Whampoa | | | 35,264 | | | | 247 | |
| Li & Fung | | | 790,000 | | | | 3,285 | |
| MTR | | | 34,179 | | | | 121 | |
| NWS Holdings | | | 29,621 | | | | 56 | |
| Tencent Holdings | | | 233,200 | | | | 4,061 | |
| Towngas China Company | | | 29,073 | | | | 12 | |
| | | | | | | | | |
| | | | | | | | 15,956 | |
| | | | | | | | | |
| India – 1.6% |
| HDFC Bank – ADR | | | 27,158 | | | | 3,004 | |
| Infosys Technologies – ADR | | | 69,909 | | | | 3,216 | |
| Jindal Steel & Power | | | 80,235 | | | | 1,081 | |
| Punjab National Bank | | | 102,134 | | | | 1,834 | |
| | | | | | | | | |
| | | | | | | | 9,135 | |
| | | | | | | | | |
| Indonesia – 0.8% |
| Bank Mandiri | | | 3,075,700 | | | | 1,476 | |
| Tambang Batubara Bukit Asam | | | 364,500 | | | | 568 | |
| Telekomunikasi Indonesia – ADR | | | 55,500 | | | | 1,882 | |
| United Tractors | | | 609,166 | | | | 934 | |
| | | | | | | | | |
| | | | | | | | 4,860 | |
| | | | | | | | | |
| Ireland – 0.9% |
| Covidien | | | 121,080 | | | | 5,100 | |
| | | | | | | | | |
| Israel – 0.9% |
| Cellcom Israel | | | 15,700 | | | | 472 | |
| Delek Automotive Systems | | | 62,612 | | | | 711 | |
| Israel Chemicals | | | 165,493 | | | | 1,933 | |
| Teva Pharmaceutical Industries – ADR | | | 41,751 | | | | 2,108 | |
| | | | | | | | | |
| | | | | | | | 5,224 | |
| | | | | | | | | |
| Italy – 1.1% |
| Aeroporto Venezia | | | 105 | | | | 1 | |
| Ansaldo STS | | | 64,148 | | | | 1,228 | |
| Atlantia | | | 9,700 | | | | 229 | |
| Eni | | | 107,255 | | | | 2,656 | |
| Saipem | | | 66,734 | | | | 1,969 | |
| Snam Rete Gas | | | 22,997 | | | | 112 | |
| | | | | | | | | |
| | | | | | | | 6,195 | |
| | | | | | | | | |
| Japan – 12.2% |
| Airport Facilities | | | 10,501 | | | | 62 | |
| Canon | | | 57,888 | | | | 2,183 | |
| East Japan Railway | | | 1,681 | | | | 108 | |
| FANUC | | | 53,295 | | | | 4,427 | |
| Fast Retailing | | | 16,000 | | | | 2,633 | |
| Japan Airport Terminal | | | 4,347 | | | | 61 | |
| Jupiter Telecommunications | | | 2,769 | | | | 2,531 | |
| Kamigumi | | | 32,527 | | | | 244 | |
| Keyence | | | 10,429 | | | | 2,070 | |
| Kose | | | 109,813 | | | | 2,402 | |
| Mitsubishi | | | 215,274 | | | | 4,564 | |
| Mitsubishi Logistics | | | 4,512 | | | | 49 | |
| Mitsui | | | 185,618 | | | | 2,438 | |
The accompanying notes are an integral part of the financial statements.
62 First American Funds 2009 Annual Report
| | | | | | | | | |
| International Select Fund (continued) |
| DESCRIPTION | | SHARES | | FAIR VALUE |
| |
| |
| Mitsui Sumitomo Insurance Group | | | 80,514 | | | $ | 1,874 | |
| NGK Insulators | | | 128,000 | | | | 2,871 | |
| Nintendo | | | 13,838 | | | | 3,471 | |
| Nipponkoa Insurance | | | 587,047 | | | | 3,196 | |
| Nomura Holdings | | | 430,601 | | | | 3,035 | |
| Nomura Research Institute | | | 145,500 | | | | 3,146 | |
| SECOM | | | 41,977 | | | | 1,959 | |
| Seven & I Holdings | | | 183,033 | | | | 4,007 | |
| Shin-Etsu Chemical | | | 33,300 | | | | 1,766 | |
| SMC | | | 19,700 | | | | 2,250 | |
| Sony Financial Holdings | | | 693 | | | | 1,989 | |
| Sugi Holdings | | | 117,353 | | | | 2,549 | |
| Sumitomo Metal Mining | | | 217,289 | | | | 3,436 | |
| Sumitomo Trust & Banking | | | 303,686 | | | | 1,582 | |
| Suzuki Motor | | | 102,759 | | | | 2,486 | |
| The Bank of Yokohama | | | 448,537 | | | | 2,203 | |
| The Joyo Bank | | | 349,425 | | | | 1,537 | |
| Tokyo Electric Power | | | 1,571 | | | | 39 | |
| Tokyo Gas | | | 38,176 | | | | 151 | |
| Toyota Motor | | | 57,000 | | | | 2,250 | |
| Yamada Denki | | | 37,260 | | | | 2,271 | |
| | | | | | | | | |
| | | | | | | | 71,840 | |
| | | | | | | | | |
| Luxembourg – 0.5% |
Millicom International Cellular – ADR = | | | 42,783 | | | | 2,681 | |
| SES | | | 8,765 | | | | 190 | |
| | | | | | | | | |
| | | | | | | | 2,871 | |
| | | | | | | | | |
| Malaysia – 0.3% |
| British American Tobacco | | | 50,400 | | | | 662 | |
| PLUS Expressways | | | 114,000 | | | | 110 | |
| Sime Darby Berhad | | | 412,466 | | | | 1,066 | |
| | | | | | | | | |
| | | | | | | | 1,838 | |
| | | | | | | | | |
| Mexico – 1.8% |
| America Movil, Series L – ADR | | | 48,900 | | | | 2,158 | |
Desarrolladora Homex – ADR = | | | 28,500 | | | | 1,013 | |
| Fomento Economico Mexicano – ADR | | | 36,340 | | | | 1,574 | |
| Grupo Aeroportuario del Sureste – ADR | | | 907 | | | | 37 | |
| Grupo Mexico, Series B | | | 340,250 | | | | 676 | |
| Grupo Televisa – ADR | | | 117,400 | | | | 2,273 | |
| Kimberly-Clark de Mexico, Series A | | | 133,500 | | | | 527 | |
| Wal-Mart de Mexico – ADR | | | 60,265 | | | | 2,098 | |
| | | | | | | | | |
| | | | | | | | 10,356 | |
| | | | | | | | | |
| Netherlands – 0.7% |
| Heineken | | | 84,833 | | | | 3,750 | |
| Koninklijke Vopak | | | 2,645 | | | | 178 | |
| | | | | | | | | |
| | | | | | | | 3,928 | |
| | | | | | | | | |
| New Zealand – 0.1% |
| Infratil | | | 108,138 | | | | 126 | |
| Port of Tauranga | | | 43,172 | | | | 217 | |
| Vector | | | 111,592 | | | | 155 | |
| | | | | | | | | |
| | | | | | | | 498 | |
| | | | | | | | | |
| Norway – 0.5% |
| Hafslund, Class B | | | 5,118 | | | | 58 | |
| Statoil | | | 117,768 | | | | 2,775 | |
| | | | | | | | | |
| | | | | | | | 2,833 | |
| | | | | | | | | |
| Pakistan – 0.1% |
| Pakistan Petroleum | | | 340,632 | | | | 717 | |
| | | | | | | | | |
| Philippines – 0.5% |
| Philippine Long Distance Telephone – ADR | | | 51,300 | | | | 2,734 | |
| | | | | | | | | |
| Portugal – 0.4% |
| Energias de Portugal | | | 473,131 | | | | 2,092 | |
| Redes Energeticas Nacionais | | | 40,842 | | | | 179 | |
| | | | | | | | | |
| | | | | | | | 2,271 | |
| | | | | | | | | |
| Russia – 2.3% |
| Gazprom – ADR | | | 97,132 | | | | 2,350 | |
| LUKOIL – ADR | | | 57,400 | | | | 3,330 | |
Magnit – GDR = | | | 61,600 | | | | 801 | |
| Mobile TeleSystems – ADR | | | 68,900 | | | | 3,121 | |
| Oriflame Cosmetics – SDR | | | 19,205 | | | | 1,064 | |
TNK-BP Holding | | | 741,589 | | | | 1,358 | |
Uralkali – GDR, Class S = | | | 54,304 | | | | 1,222 | |
| | | | | | | | | |
| | | | | | | | 13,246 | |
| | | | | | | | | |
| Singapore – 0.6% |
| CitySpring Infrastructure Trust | | | 1,657 | | | | 1 | |
| ComfortDelGro | | | 56,546 | | | | 61 | |
| DBS Group Holdings | | | 269,336 | | | | 2,466 | |
| Hyflux | | | 70,946 | | | | 154 | |
| Hyflux Water Trust | | | 18,000 | | | | 9 | |
| SembCorp Industries | | | 13,658 | | | | 32 | |
| Singapore Airport Terminal Services | | | 13,290 | | | | 23 | |
| Singapore Post | | | 190,551 | | | | 128 | |
| Singapore Telecommunications | | | 134,328 | | | | 279 | |
| SMRT | | | 228,610 | | | | 273 | |
| | | | | | | | | |
| | | | | | | | 3,426 | |
| | | | | | | | | |
| South Africa – 3.2% |
| Gold Fields – ADR | | | 56,910 | | | | 725 | |
| Kumba Iron Ore | | | 43,608 | | | | 1,302 | |
| Massmart Holdings | | | 99,357 | | | | 1,148 | |
| MTN Group | | | 126,274 | | | | 1,880 | |
| Murray & Roberts Holdings | | | 250,495 | | | | 1,788 | |
| Nedbank Group | | | 156,022 | | | | 2,345 | |
| Pretoria Portland Cement | | | 283,592 | | | | 1,187 | |
| Sanlam | | | 973,555 | | | | 2,673 | |
| Shoprite Holdings | | | 69,411 | | | | 566 | |
| Standard Bank Group | | | 150,569 | | | | 1,879 | |
| Tiger Brands | | | 74,710 | | | | 1,496 | |
| Truworths International | | | 273,203 | | | | 1,564 | |
| | | | | | | | | |
| | | | | | | | 18,553 | |
| | | | | | | | | |
| South Korea – 2.5% |
| Amore Pacific | | | 600 | | | | 415 | |
| Hite Brewery | | | 6,418 | | | | 873 | |
KB Financial Group – ADR = | | | 21,680 | | | | 1,029 | |
| KT&G | | | 28,320 | | | | 1,649 | |
NHN = | | | 15,304 | | | | 2,257 | |
| S1 | | | 1,446 | | | | 58 | |
| Samsung Electronics | | | 1,533 | | | | 923 | |
| Samsung Electronics – GDR | | | 11,946 | | | | 3,653 | |
| Shinhan Financial Group – ADR | | | 27,448 | | | | 2,076 | |
| Woongjin Coway | | | 55,769 | | | | 1,864 | |
| | | | | | | | | |
| | | | | | | | 14,797 | |
| | | | | | | | | |
| Spain – 1.6% |
| Abertis Infraestructuras | | | 34,708 | | | | 738 | |
| Acciona | | | 865 | | | | 105 | |
| Banco Santander | | | 164,104 | | | | 2,641 | |
Banco Santander Euro = | | | 1,803 | | | | 29 | |
| Cintra Concesiones de Infraestructuras de Transporte | | | 12,398 | | | | 128 | |
| Enagas | | | 11,868 | | | | 244 | |
| Gamesa Corporacion Tecnologica | | | 89,888 | | | | 1,643 | |
| Iberdrola | | | 17,304 | | | | 157 | |
| Iberdrola Renovables | | | 28,819 | | | | 128 | |
First American Funds 2009 Annual Report 63
Schedule of Investments October 31, 2009, all dollars are rounded to thousands (000)
| | | | | | | | | |
| International Select Fund (continued) |
| DESCRIPTION | | SHARES | | FAIR VALUE |
| |
| |
| Red Electrica | | | 2,524 | | | $ | 130 | |
| Telefonica | | | 125,323 | | | | 3,500 | |
| | | | | | | | | |
| | | | | | | | 9,443 | |
| | | | | | | | | |
| Sweden – 1.0% |
| Atlas Copco, Class A | | | 154,138 | | | | 2,067 | |
| Ericsson | | | 370,893 | | | | 3,875 | |
| | | | | | | | | |
| | | | | | | | 5,942 | |
| | | | | | | | | |
| Switzerland – 4.1% |
ABB = | | | 109,266 | | | | 2,033 | |
| BKW FMB Energie | | | 919 | | | | 76 | |
| Credit Suisse Group | | | 48,865 | | | | 2,612 | |
| Flughafen Zuerich | | | 863 | | | | 251 | |
Foster Wheeler = | | | 55,632 | | | | 1,557 | |
Logitech International = | | | 126,756 | | | | 2,155 | |
| Nestle | | | 172,193 | | | | 8,007 | |
| Novartis | | | 80,392 | | | | 4,186 | |
| Roche Holding | | | 20,583 | | | | 3,297 | |
| | | | | | | | | |
| | | | | | | | 24,174 | |
| | | | | | | | | |
| Taiwan – 1.0% |
| Advanced Semiconductor Engineering | | | 924,233 | | | | 728 | |
| Hon Hai Precision Industry | | | 405,105 | | | | 1,587 | |
| HTC | | | 113,250 | | | | 1,125 | |
| Taiwan Semiconductor Manufacturing | | | 1,387,514 | | | | 2,517 | |
| | | | | | | | | |
| | | | | | | | 5,957 | |
| | | | | | | | | |
| Thailand – 0.5% |
| Bangkok Bank | | | 449,113 | | | | 1,506 | |
| Banpu Public | | | 64,500 | | | | 829 | |
| Kasikornbank Public | | | 321,600 | | | | 780 | |
| | | | | | | | | |
| | | | | | | | 3,115 | |
| | | | | | | | | |
| Turkey – 1.2% |
| Akbank T.A.S. | | | 337,907 | | | | 1,825 | |
| Koc Holding | | | 274,682 | | | | 700 | |
| Turkcell Iletisim Hizmetleri – ADR | | | 103,200 | | | | 1,696 | |
| Turkiye Is Bankasi, Class C | | | 804,908 | | | | 3,048 | |
| | | | | | | | | |
| | | | | | | | 7,269 | |
| | | | | | | | | |
| United Kingdom – 12.0% |
Anglo American = | | | 73,424 | | | | 2,657 | |
| Antofagasta | | | 77,270 | | | | 973 | |
| ARM Holdings | | | 1,184,112 | | | | 2,876 | |
| Arriva | | | 23,837 | | | | 172 | |
Autonomy = | | | 189,719 | | | | 4,171 | |
| BAE Systems | | | 214,549 | | | | 1,103 | |
| Balfour Beatty | | | 73,312 | | | | 319 | |
| BG Group | | | 130,769 | | | | 2,251 | |
| BP – ADR | | | 85,161 | | | | 4,822 | |
| British Sky Broadcasting Group | | | 254,076 | | | | 2,215 | |
| Cadbury | | | 225,809 | | | | 2,855 | |
| Centrica | | | 26,506 | | | | 108 | |
| Diageo | | | 272,273 | | | | 4,435 | |
| Experian Group | | | 449,633 | | | | 4,109 | |
| Forth Ports | | | 7,072 | | | | 128 | |
| GlaxoSmithKline | | | 276,695 | | | | 5,676 | |
| ICAP | | | 296,302 | | | | 1,969 | |
| International Power | | | 55,921 | | | | 232 | |
| National Grid – ADR | | | 3,705 | | | | 184 | |
| Pennon Group | | | 2,428 | | | | 18 | |
| Prudential | | | 385,406 | | | | 3,501 | |
| Reed Elsevier | | | 394,497 | | | | 2,987 | |
| Scottish & Southern Energy | | | 138,703 | | | | 2,448 | |
| Serco Group | | | 5,968 | | | | 49 | |
| Smith & Nephew | | | 231,355 | | | | 2,045 | |
| Standard Chartered | | | 158,506 | | | | 3,888 | |
| Tesco | | | 435,957 | | | | 2,907 | |
| United Utilities Group | | | 35,603 | | | | 257 | |
| Vedanta Resources | | | 139,022 | | | | 4,757 | |
| Vodafone Group – ADR | | | 167,453 | | | | 3,716 | |
| WPP | | | 307,277 | | | | 2,754 | |
WPP Group = | | | 26,090 | | | | 234 | |
| | | | | | | | | |
| | | | | | | | 70,816 | |
| | | | | | | | | |
| United States – 1.1% |
American Tower, Class A = | | | 5,734 | | | | 211 | |
| American Water Works | | | 1,997 | | | | 38 | |
| Aqua America | | | 6,718 | | | | 104 | |
| Brookfield Infrastructure Partners | | | 30,095 | | | | 436 | |
| California Water Service Group | | | 2,942 | | | | 108 | |
| Connecticut Water Service | | | 1,189 | | | | 27 | |
| El Paso | | | 23,617 | | | | 232 | |
| Exelon | | | 2,329 | | | | 109 | |
| FPL Group | | | 5,306 | | | | 261 | |
| ITC Holdings | | | 5,335 | | | | 237 | |
| Kinder Morgan Management | | | 12,836 | | | | 601 | |
| Northeast Utilities | | | 6,009 | | | | 139 | |
| Northwest Natural Gas | | | 1,082 | | | | 45 | |
| Philip Morris International | | | 57,269 | | | | 2,712 | |
| Piedmont Natural Gas | | | 3,227 | | | | 75 | |
| South Jersey Industries | | | 4,340 | | | | 153 | |
| Southern Union | | | 14,265 | | | | 279 | |
| Spectra Energy | | | 33,550 | | | | 641 | |
| | | | | | | | | |
| | | | | | | | 6,408 | |
| | | | | | | | | |
Total Common Stocks | | | | | | | | |
(Cost $463,635) | | | | | | | 490,096 | |
| | | | | | | | | |
Preferred Stocks – 1.7% |
Brazil – 1.2% |
| AES Tiete | | | 32,214 | | | | 363 | |
| Companhia de Gas de Sao Paulo, Class A | | | 7,800 | | | | 148 | |
| Companhia Energetica de Minas Gerais – ADR | | | 49,800 | | | | 786 | |
| Eletropaulo Metropolitana, Class B | | | 32,200 | | | | 602 | |
| Itau Unibanco Holding – ADR | | | 161,705 | | | | 3,095 | |
| Suzano Papel e Celulose | | | 24,910 | | | | 217 | |
| Usinas Siderurgicas de Minas Gerais, Class A | | | 66,900 | | | | 1,747 | |
| | | | | | | | | |
| | | | | | | | 6,958 | |
| | | | | | | | | |
| Germany – 0.5% |
| Henkel KGAA | | | 73,316 | | | | 3,339 | |
| | | | | | | | | |
Total Preferred Stocks | | | | | | | | |
(Cost $9,223) | | | | | | | 10,297 | |
| | | | | | | | | |
Short-Term Investments – 14.7% |
| Money Market Fund – 10.6% |
| State Street Institutional Liquid Reserves Fund | | | | | | | | |
| 0.250% Ω | | | 62,129,377 | | | | 62,129 | |
| | | | | | | | | |
| U.S. Treasury Obligation – 4.1% |
| U.S. Treasury Bill | | | | | | | | |
0.131%, 11/19/2009 o | | $ | 24,150 | | | | 24,149 | |
| | | | | | | | | |
Total Short-Term Investments | | | | | | | | |
(Cost $86,278) | | | | | | | 86,278 | |
| | | | | | | | | |
Total Investments 5 – 99.8% | | | | | | | | |
(Cost $559,136) | | | | | | | 586,671 | |
| | | | | | | | | |
Other Assets and Liabilities, Net – 0.2% | | | | | | | 1,288 | |
| | | | | | | | | |
Total Net Assets – 100.0% | | | | | | $ | 587,959 | |
| | | | | | | | | |
The accompanying notes are an integral part of the financial statements.
64 First American Funds 2009 Annual Report
International Select Fund (continued)
| | |
| = | | Non-income producing security. |
| |
| ⊡ | | Security is internally fair valued. As of October 31, 2009, the fair value of this investment was $110 or 0.0% of total net assets. See note 2 in Notes to Financial Statements. |
| |
| Ω | | The rate quoted is the annualized seven-day effective yield as of October 31, 2009. |
| |
| o | | Security has been deposited as initial margin on open futures contracts. Yield shown is the annualized effective yield as of October 31, 2009. See note 2 in Notes to Financial Statements. |
| |
| 5 | | On October 31, 2009, the cost of investments for federal income tax purposes was $565,861. The aggregate gross unrealized appreciation and depreciation of investments, based on this cost, were as follows: |
| | | | | |
| Gross unrealized appreciation | | $ | 57,059 | |
| Gross unrealized depreciation | | | (36,249 | ) |
| | | | | |
| Net unrealized appreciation | | $ | 20,810 | |
| | | | | |
| |
| ADR – | American Depositary Receipt |
| |
| GDR – | Global Depositary Receipt |
| |
| SDR – | Swedish Depositary Receipt |
Schedule of Open Futures Contracts
| | | | | | | | | | | | | | | | | |
| | | | | | Number of
| | | | | | | |
| | | | | | Contracts
| | | Notional
| | | Unrealized
| |
| | | Settlement
| | | Purchased
| | | Contract
| | | Appreciation
| |
| Description | | Month | | | (Sold) | | | Value | | | (Depreciation) | |
| | |
| British Pound Currency Futures | | | December 2009 | | | | (57 | ) | | $ | (5,857 | ) | | $ | 22 | |
| CAC 40 10 Euro Index Futures | | | December 2009 | | | | 280 | | | | 14,760 | | | | (562 | ) |
| DAX Index Futures | | | December 2009 | | | | 62 | | | | 12,326 | | | | (526 | ) |
| FTSE/JSE Top 40 Index Futures | | | December 2009 | | | | (130 | ) | | | (3,966 | ) | | | (92 | ) |
| Hang Seng China Enterprises Index Futures | | | November 2009 | | | | 257 | | | | 21,093 | | | | (438 | ) |
| IBEX 35 Index Futures | | | November 2009 | | | | (55 | ) | | | (9,181 | ) | | | 258 | |
| Mexican Bolsa Index Futures | | | December 2009 | | | | (130 | ) | | | (2,838 | ) | | | 89 | |
| MSCI Taiwan Index Futures | | | November 2009 | | | | 215 | | | | 5,708 | | | | (216 | ) |
Nasdaq 100 E-Mini Futures | | | December 2009 | | | | (29 | ) | | | (966 | ) | | | 33 | |
| Nikkei 225 Index Futures | | | December 2009 | | | | (60 | ) | | | (6,672 | ) | | | (94 | ) |
| OMXS30 Index Futures | | | November 2009 | | | | (298 | ) | | | (3,964 | ) | | | (128 | ) |
| Russell 2000 Mini Index Futures | | | December 2009 | | | | (319 | ) | | | (17,921 | ) | | | 1,205 | |
| S&P 500 Futures | | | December 2009 | | | | (58 | ) | | | (14,979 | ) | | | 262 | |
| S&P MIB Index Futures | | | December 2009 | | | | 34 | | | | 5,505 | | | | (411 | ) |
| S&P TSE 60 Futures | | | December 2009 | | | | 276 | | | | 32,940 | | | | (1,109 | ) |
| SGX CNX Nifty Index Futures | | | November 2009 | | | | 1,197 | | | | 11,242 | | | | (609 | ) |
| SGX MSCI Singapore Index Futures | | | November 2009 | | | | 98 | | | | 4,414 | | | | (80 | ) |
| SPI 200 Futures | | | December 2009 | | | | 269 | | | | 27,991 | | | | 186 | |
| Swiss Market Index Futures | | | December 2009 | | | | 121 | | | | 7,407 | | | | (154 | ) |
| | | | | | | | | | | | | | | | | |
| | | | | | | | | | | | | | | $ | (2,364 | ) |
| | | | | | | | | | | | | | | | | |
International Select Fund (concluded)
At October 31, 2009, sector diversification of the fund was as follows:
| | | | | | | | | |
| | | % of
| | | | |
| | | Net Assets | | | Fair Value | |
| | |
Common and Preferred Stocks | | | | | | | | |
| Financials | | | 16.2 | % | | $ | 95,535 | |
| Consumer Staples | | | 11.2 | | | | 65,637 | |
| Information Technology | | | 10.5 | | | | 61,485 | |
| Industrials | | | 9.8 | | | | 57,931 | |
| Materials | | | 8.7 | | | | 50,975 | |
| Energy | | | 7.9 | | | | 46,280 | |
| Consumer Discretionary | | | 7.6 | | | | 44,799 | |
| Healthcare | | | 5.4 | | | | 31,926 | |
| Telecommunication Services | | | 4.9 | | | | 28,823 | |
| Utilities | | | 2.9 | | | | 17,002 | |
| | | | | | | | | |
Total Common and Preferred Stocks | | | 85.1 | | | | 500,393 | |
| | | | | | | | | |
Total Short-Term Investments | | | 14.7 | | | | 86,278 | |
| | | | | | | | | |
Total Investments | | | 99.8 | | | | 586,671 | |
| | | | | | | | | |
Other Assets and Liabilities, Net | | | 0.2 | | | | 1,288 | |
| | | | | | | | | |
Net Assets | | | 100.0 | % | | $ | 587,959 | |
| | | | | | | | | |
First American Funds 2009 Annual Report 65
Schedule of Investments October 31, 2009, all dollars are rounded to thousands (000)
| | | | | | | | | |
| Large Cap Growth Opportunities Fund |
| DESCRIPTION | | SHARES | | FAIR VALUE |
| |
| |
Common Stocks – 99.5% |
| Consumer Discretionary – 15.2% |
Amazon.com 6 = | | | 102,594 | | | $ | 12,189 | |
| Carnival | | | 132,189 | | | | 3,849 | |
Chipotle Mexican Grill, Class A 6 = | | | 47,254 | | | | 3,851 | |
| Coach | | | 78,562 | | | | 2,590 | |
Dick’s Sporting Goods 6 = | | | 219,853 | | | | 4,988 | |
| Harman International Industries | | | 87,942 | | | | 3,308 | |
J. Crew Group 6 = | | | 159,197 | | | | 6,492 | |
| Nordstrom | | | 164,633 | | | | 5,232 | |
Polo Ralph Lauren 6 | | | 116,272 | | | | 8,653 | |
Priceline.com 6 = | | | 71,061 | | | | 11,213 | |
| Target | | | 174,505 | | | | 8,451 | |
| Walt Disney | | | 196,458 | | | | 5,377 | |
WMS Industries = | | | 59,670 | | | | 2,386 | |
Wynn Resorts 6 = | | | 90,975 | | | | 4,933 | |
| | | | | | | | | |
| | | | | | | | 83,512 | |
| | | | | | | | | |
| Consumer Staples – 7.4% |
Colgate-Palmolive 6 | | | 89,964 | | | | 7,074 | |
| CVS Caremark | | | 185,416 | | | | 6,545 | |
Kellogg 6 | | | 210,383 | | | | 10,843 | |
| Philip Morris International | | | 345,740 | | | | 16,374 | |
| | | | | | | | | |
| | | | | | | | 40,836 | |
| | | | | | | | | |
| Energy – 5.7% |
Dril-Quip = | | | 80,237 | | | | 3,899 | |
| Occidental Petroleum | | | 64,994 | | | | 4,932 | |
| Petroleo Brasileiro – ADR | | | 104,832 | | | | 4,845 | |
| Pioneer Natural Resources | | | 104,646 | | | | 4,302 | |
| Schlumberger | | | 130,043 | | | | 8,088 | |
Southwestern Energy = | | | 120,466 | | | | 5,250 | |
| | | | | | | | | |
| | | | | | | | 31,316 | |
| | | | | | | | | |
| Financials – 6.1% |
| American Express | | | 213,595 | | | | 7,442 | |
BlackRock 6 | | | 41,085 | | | | 8,894 | |
Goldman Sachs Group 6 | | | 70,123 | | | | 11,933 | |
| JPMorgan Chase | | | 125,653 | | | | 5,249 | |
| | | | | | | | | |
| | | | | | | | 33,518 | |
| | | | | | | | | |
| Healthcare – 10.5% |
Amgen = | | | 73,519 | | | | 3,950 | |
| Baxter International | | | 114,115 | | | | 6,169 | |
| DENTSPLY International | | | 184,842 | | | | 6,092 | |
Edwards Lifesciences = | | | 56,492 | | | | 4,346 | |
Express Scripts = | | | 112,572 | | | | 8,997 | |
Gilead Sciences = | | | 96,435 | | | | 4,103 | |
Illumina 6 = | | | 119,518 | | | | 3,837 | |
Medco Health Solutions = | | | 199,661 | | | | 11,205 | |
Teva Pharmaceutical – ADR 6 | | | 85,312 | | | | 4,307 | |
Thermo Fisher Scientific 6 = | | | 101,361 | | | | 4,561 | |
| | | | | | | | | |
| | | | | | | | 57,567 | |
| | | | | | | | | |
| Industrials – 10.4% |
| 3M | | | 130,921 | | | | 9,632 | |
| Boeing | | | 58,255 | | | | 2,785 | |
| C.H. Robinson Worldwide | | | 113,016 | | | | 6,228 | |
| Cummins | | | 115,730 | | | | 4,983 | |
Joy Global 6 | | | 113,540 | | | | 5,724 | |
| Manpower | | | 74,331 | | | | 3,524 | |
| Precision Castparts | | | 80,731 | | | | 7,712 | |
Robert Half International 6 | | | 219,722 | | | | 5,097 | |
| United Technologies | | | 134,138 | | | | 8,243 | |
Verisk Analytics, Class A = | | | 112,823 | | | | 3,095 | |
| | | | | | | | | |
| | | | | | | | 57,023 | |
| | | | | | | | | |
| Information Technology ⊳ – 39.3% |
| Accenture, Class A | | | 75,099 | | | | 2,785 | |
Adobe Systems = | | | 135,273 | | | | 4,456 | |
| Altera | | | 169,137 | | | | 3,347 | |
| Amphenol, Class A | | | 97,599 | | | | 3,916 | |
| Analog Devices | | | 104,033 | | | | 2,666 | |
Apple = | | | 166,983 | | | | 31,476 | |
Applied Materials 6 | | | 317,872 | | | | 3,878 | |
BMC Software 6 = | | | 123,094 | | | | 4,574 | |
Broadcom, Class A 6 = | | | 203,334 | | | | 5,411 | |
Cisco Systems = | | | 803,338 | | | | 18,356 | |
Dolby Laboratories, Class A = | | | 140,611 | | | | 5,897 | |
eBay = | | | 173,758 | | | | 3,870 | |
Equinix 6 = | | | 44,282 | | | | 3,778 | |
F5 Networks = | | | 157,875 | | | | 7,087 | |
Google, Class A 6 = | | | 20,480 | | | | 10,980 | |
| Hewlett-Packard | | | 332,192 | | | | 15,766 | |
| IBM | | | 67,781 | | | | 8,175 | |
Lam Research 6 = | | | 145,459 | | | | 4,905 | |
| MasterCard, Class A | | | 30,614 | | | | 6,705 | |
| Microsoft | | | 336,251 | | | | 9,324 | |
| Oracle | | | 420,073 | | | | 8,864 | |
| QUALCOMM | | | 225,559 | | | | 9,340 | |
Red Hat = | | | 151,458 | | | | 3,909 | |
Salesforce.com = | | | 133,362 | | | | 7,568 | |
Sybase 6 = | | | 111,064 | | | | 4,394 | |
Teradata = | | | 218,755 | | | | 6,099 | |
Visa, Class A 6 | | | 155,700 | | | | 11,796 | |
Yahoo! = | | | 416,223 | | | | 6,618 | |
| | | | | | | | | |
| | | | | | | | 215,940 | |
| | | | | | | | | |
| Materials – 3.1% |
Ecolab 6 | | | 114,349 | | | | 5,027 | |
| Freeport-McMoRan Copper & Gold | | | 73,729 | | | | 5,409 | |
| Praxair | | | 81,815 | | | | 6,499 | |
| | | | | | | | | |
| | | | | | | | 16,935 | |
| | | | | | | | | |
| Telecommunication Services – 1.8% |
American Tower, Class A = | | | 270,033 | | | | 9,943 | |
| | | | | | | | | |
Total Common Stocks | | | | | | | | |
(Cost $461,567) | | | | | | | 546,590 | |
| | | | | | | | | |
| Short-Term Investment – 0.7% |
| First American Prime Obligations Fund, Class Z | | | | | | | | |
0.148% Å Ω | | | | | | | | |
(Cost $3,966) | | | 3,966,189 | | | | 3,966 | |
| | | | | | | | | |
| Investment Purchased with Proceeds from Securities Lending – 19.1% |
| Mount Vernon Securities Lending Prime Portfolio | | | | | | | | |
| 0.209% Ω † | | | | | | | | |
(Cost $104,521) | | | 104,521,135 | | | | 104,521 | |
| | | | | | | | | |
Total Investments 5 – 119.3% | | | | | | | | |
(Cost $570,054) | | | | | | | 655,077 | |
| | | | | | | | | |
Other Assets and Liabilities, Net – (19.3)% | | | | | | | (105,967 | ) |
| | | | | | | | | |
Total Net Assets – 100.0% | | | | | | $ | 549,110 | |
| | | | | | | | | |
| | |
| 6 | | This security or a portion of this security is out on loan at October 31, 2009. Total loaned securities had a fair value of $99,135 at October 31, 2009. See note 2 in Notes to Financial Statements. |
| |
| = | | Non-income producing security. |
| |
| ⊳ | | The fund is significantly invested in this sector and therefore is subject to additional risks. See note 7 in Notes to Financial Statements. |
The accompanying notes are an integral part of the financial statements.
66 First American Funds 2009 Annual Report
Large Cap Growth Opportunities Fund (concluded)
| | |
| Å | | Investment in affiliated security. This money market fund is advised by FAF Advisors, Inc., which also serves as advisor for this fund. See note 3 in Notes to Financial Statements. |
| |
| Ω | | The rate quoted is the annualized seven-day effective yield as of October 31, 2009. |
| |
| † | | The fund may loan securities representing up to one third of the fair value of its total assets (which includes collateral for securities on loan) to broker-dealers, banks, or other institutional borrowers of securities. The fund maintains collateral equal to at least 100% of the fair value of the securities loaned. The adequacy of the collateral is monitored on a daily basis. The cash collateral received by the fund is invested in this affiliated money market fund. See note 2 in Notes to Financial Statements. |
| |
| 5 | | On October 31, 2009, the cost of investments for federal income tax purposes was $574,781. The aggregate gross unrealized appreciation and depreciation of investments, based on this cost, were as follows: |
| | | | | |
| Gross unrealized appreciation | | $ | 101,130 | |
| Gross unrealized depreciation | | | (20,834 | ) |
| | | | | |
| Net unrealized appreciation | | $ | 80,296 | |
| | | | | |
| |
| ADR – | American Depositary Receipt |
| | | | | | | | | |
| Large Cap Select Fund |
| DESCRIPTION | | SHARES | | FAIR VALUE |
| |
| |
Common Stocks – 99.9% |
| Consumer Discretionary – 15.4% |
| Coach | | | 100,979 | | | $ | 3,329 | |
Discovery Communications, Class A 6 = | | | 52,411 | | | | 1,441 | |
Expedia = | | | 70,448 | | | | 1,597 | |
| Guess? | | | 40,216 | | | | 1,470 | |
| Hasbro | | | 44,405 | | | | 1,211 | |
| Jarden | | | 82,283 | | | | 2,254 | |
Panera Bread, Class A 6 = | | | 28,359 | | | | 1,701 | |
Priceline.com 6 = | | | 10,255 | | | | 1,618 | |
| Target | | | 37,920 | | | | 1,837 | |
| WABCO Holdings | | | 96,028 | | | | 2,278 | |
| Walt Disney | | | 76,374 | | | | 2,090 | |
WMS Industries = | | | 59,274 | | | | 2,370 | |
| | | | | | | | | |
| | | | | | | | 23,196 | |
| | | | | | | | | |
| Consumer Staples – 3.2% |
| Coca-Cola | | | 18,970 | | | | 1,011 | |
| CVS Caremark | | | 57,448 | | | | 2,028 | |
| General Mills | | | 26,864 | | | | 1,771 | |
| | | | | | | | | |
| | | | | | | | 4,810 | |
| | | | | | | | | |
| Energy – 12.8% |
Alpha Natural Resources 6 = | | | 18,019 | | | | 612 | |
| Apache | | | 27,430 | | | | 2,582 | |
| Chevron | | | 37,835 | | | | 2,896 | |
| Exxon Mobil | | | 35,237 | | | | 2,525 | |
Occidental Petroleum 6 | | | 36,470 | | | | 2,767 | |
Oceaneering International = | | | 14,918 | | | | 762 | |
Pioneer Natural Resources 6 | | | 56,212 | | | | 2,311 | |
Whiting Petroleum 6 = | | | 28,706 | | | | 1,619 | |
| Williams | | | 95,636 | | | | 1,803 | |
| XTO Energy | | | 32,764 | | | | 1,362 | |
| | | | | | | | | |
| | | | | | | | 19,239 | |
| | | | | | | | | |
| Financials – 18.7% |
| ACE | | | 31,977 | | | | 1,642 | |
| Bank of America | | | 353,017 | | | | 5,147 | |
BlackRock 6 | | | 7,499 | | | | 1,624 | |
Comerica 6 | | | 67,999 | | | | 1,887 | |
Discover Financial Services 6 | | | 123,373 | | | | 1,745 | |
Goldman Sachs Group 6 | | | 23,153 | | | | 3,940 | |
| JPMorgan Chase | | | 132,971 | | | | 5,554 | |
KeyCorp 6 | | | 247,640 | | | | 1,335 | |
| Lincoln National | | | 43,300 | | | | 1,032 | |
Regions Financial 6 | | | 283,932 | | | | 1,374 | |
| Wells Fargo | | | 106,515 | | | | 2,931 | |
| | | | | | | | | |
| | | | | | | | 28,211 | |
| | | | | | | | | |
| Healthcare – 9.5% |
| Allergan | | | 31,972 | | | | 1,798 | |
Amgen = | | | 43,473 | | | | 2,336 | |
| Bristol-Myers Squibb | | | 105,164 | | | | 2,293 | |
Forest Laboratories = | | | 50,600 | | | | 1,400 | |
Medco Health Solutions = | | | 28,830 | | | | 1,618 | |
| Pfizer | | | 218,702 | | | | 3,724 | |
Thermo Fisher Scientific 6 = | | | 24,970 | | | | 1,124 | |
| | | | | | | | | |
| | | | | | | | 14,293 | |
| | | | | | | | | |
First American Funds 2009 Annual Report 67
Schedule of Investments October 31, 2009, all dollars are rounded to thousands (000)
| | | | | | | | | |
| Large Cap Select Fund (continued) |
| DESCRIPTION | | SHARES | | FAIR VALUE |
| |
| |
| Industrials – 10.1% |
Boeing 6 | | | 31,737 | | | $ | 1,517 | |
| Illinois Tool Works | | | 28,614 | | | | 1,314 | |
| Ingersoll-Rand | | | 48,054 | | | | 1,518 | |
Manitowoc 6 | | | 165,426 | | | | 1,512 | |
Manpower 6 | | | 29,596 | | | | 1,403 | |
| Oshkosh | | | 48,794 | | | | 1,525 | |
| Rockwell Collins | | | 38,401 | | | | 1,935 | |
| Tyco International | | | 46,348 | | | | 1,555 | |
| United Technologies | | | 32,017 | | | | 1,967 | |
Werner Enterprises 6 | | | 54,934 | | | | 1,030 | |
| | | | | | | | | |
| | | | | | | | 15,276 | |
| | | | | | | | | |
| Information Technology – 24.7% |
Accenture, Class A 6 | | | 45,203 | | | | 1,676 | |
Altera 6 | | | 116,693 | | | | 2,309 | |
| Analog Devices | | | 95,401 | | | | 2,445 | |
Apple 6 = | | | 24,796 | | | | 4,674 | |
Automatic Data Processing 6 | | | 49,263 | | | | 1,961 | |
BMC Software 6 = | | | 47,291 | | | | 1,757 | |
Cisco Systems = | | | 195,796 | | | | 4,474 | |
eBay = | | | 86,424 | | | | 1,925 | |
Hewlett-Packard 6 | | | 76,048 | | | | 3,609 | |
Lam Research 6 = | | | 35,341 | | | | 1,192 | |
Maxim Integrated Products 6 | | | 120,664 | | | | 2,011 | |
| Microsoft | | | 78,766 | | | | 2,184 | |
Sybase 6 = | | | 46,307 | | | | 1,832 | |
Teradata = | | | 148,272 | | | | 4,134 | |
Yahoo! = | | | 67,346 | | | | 1,071 | |
| | | | | | | | | |
| | | | | | | | 37,254 | |
| | | | | | | | | |
| Materials – 3.6% |
| AK Steel | | | 41,746 | | | | 663 | |
| Cliffs Natural Resources | | | 28,590 | | | | 1,017 | |
| Freeport-McMoRan Copper & Gold | | | 18,600 | | | | 1,364 | |
| Packaging Corporation of America | | | 87,234 | | | | 1,595 | |
| Sonoco Products | | | 29,281 | | | | 783 | |
| | | | | | | | | |
| | | | | | | | 5,422 | |
| | | | | | | | | |
| Telecommunication Services – 1.2% |
American Tower, Class A = | | | 50,422 | | | | 1,856 | |
| | | | | | | | | |
| Utilities – 0.7% |
CMS Energy 6 | | | 83,743 | | | | 1,114 | |
| | | | | | | | | |
Total Common Stocks
(Cost $132,187) | | | | | | | 150,671 | |
| | | | | | | | | |
Investment Purchased with Proceeds
from Securities Lending – 29.2% |
| Mount Vernon Securities Lending Prime Portfolio | | | | | | | | |
| 0.209% † Ω | | | | | | | | |
(Cost $43,990) | | | 43,989,836 | | | | 43,990 | |
| | | | | | | | | |
Total Investments 5 – 129.1%
(Cost $176,177) | | | | | | | 194,661 | |
| | | | | | | | | |
Other Assets and Liabilities, Net – (29.1)% | | | | | | | (43,886 | ) |
| | | | | | | | | |
Total Net Assets – 100.0% | | | | | | $ | 150,775 | |
| | | | | | | | | |
| | |
| 6 | | This security or a portion of this security is out on loan at October 31, 2009. Total loaned securities had a fair value of $40,664 at October 31, 2009. See note 2 in Notes to Financial Statements. |
| |
| = | | Non-income producing security. |
Large Cap Select Fund (concluded)
| | |
| † | | The fund may loan securities representing up to one third of the fair value of its total assets (which includes collateral for securities on loan) to broker dealers, banks, or other institutional borrowers of securities. The fund maintains collateral equal to at least 100% of the fair value of the securities loaned. The adequacy of the collateral is monitored on a daily basis. The cash collateral received by the fund is invested in this affiliated money market fund. See note 2 in Notes to Financial Statements. |
| |
| Ω | | The rate quoted is the annualized seven-day effective yield as of October 31, 2009. |
| |
| 5 | | On October 31, 2009, the cost of investments for federal income tax purposes was $178,127. The aggregate gross unrealized appreciation and depreciation of investments, based on this cost, were as follows: |
| | | | | |
| Gross unrealized appreciation | | $ | 22,165 | |
| Gross unrealized depreciation | | | (5,631 | ) |
| | | | | |
| Net unrealized appreciation | | $ | 16,534 | |
| | | | | |
The accompanying notes are an integral part of the financial statements.
68 First American Funds 2009 Annual Report
| | | | | | | | | |
| Large Cap Value Fund |
| DESCRIPTION | | SHARES | | FAIR VALUE |
| |
| |
Common Stocks – 99.4% |
| Consumer Discretionary – 10.1% |
Comcast, Class A 6 | | | 519,056 | | | $ | 7,526 | |
Expedia = | | | 166,735 | | | | 3,780 | |
Ford Motor 6 = | | | 553,049 | | | | 3,871 | |
| Gap | | | 219,445 | | | | 4,683 | |
| Home Depot | | | 258,760 | | | | 6,492 | |
| Starwood Hotels & Resorts Worldwide | | | 94,001 | | | | 2,732 | |
| Walt Disney | | | 396,895 | | | | 10,863 | |
| | | | | | | | | |
| | | | | | | | 39,947 | |
| | | | | | | | | |
| Consumer Staples – 6.0% |
| ConAgra Foods | | | 312,476 | | | | 6,562 | |
| CVS Caremark | | | 171,700 | | | | 6,061 | |
| General Mills | | | 88,529 | | | | 5,836 | |
| Kroger | | | 227,283 | | | | 5,257 | |
| | | | | | | | | |
| | | | | | | | 23,716 | |
| | | | | | | | | |
| Energy – 21.6% |
| Apache | | | 74,036 | | | | 6,968 | |
| Chevron | | | 217,076 | | | | 16,615 | |
| EOG Resources | | | 54,701 | | | | 4,467 | |
| Exxon Mobil | | | 237,647 | | | | 17,032 | |
Newfield Exploration = | | | 185,023 | | | | 7,590 | |
| Noble | | | 116,298 | | | | 4,738 | |
Occidental Petroleum 6 | | | 136,124 | | | | 10,329 | |
Peabody Energy 6 | | | 118,038 | | | | 4,673 | |
| Schlumberger | | | 83,940 | | | | 5,221 | |
Transocean = | | | 55,394 | | | | 4,648 | |
| XTO Energy | | | 80,894 | | | | 3,362 | |
| | | | | | | | | |
| | | | | | | | 85,643 | |
| | | | | | | | | |
| Financials – 21.9% |
| ACE | | | 124,748 | | | | 6,407 | |
| American Express | | | 96,180 | | | | 3,351 | |
AON 6 | | | 98,974 | | | | 3,812 | |
| Bank of America | | | 781,899 | | | | 11,400 | |
| Bank of New York Mellon | | | 181,208 | | | | 4,831 | |
BB&T 6 | | | 166,603 | | | | 3,984 | |
Goldman Sachs Group 6 | | | 39,413 | | | | 6,707 | |
| JPMorgan Chase | | | 414,698 | | | | 17,322 | |
| Morgan Stanley | | | 133,033 | | | | 4,273 | |
| Prudential Financial | | | 100,401 | | | | 4,541 | |
Unum Group 6 | | | 297,359 | | | | 5,932 | |
| Wells Fargo | | | 507,564 | | | | 13,968 | |
| | | | | | | | | |
| | | | | | | | 86,528 | |
| | | | | | | | | |
| Healthcare – 9.4% |
| AmerisourceBergen | | | 191,834 | | | | 4,249 | |
| Bristol-Myers Squibb | | | 416,307 | | | | 9,076 | |
| Johnson & Johnson | | | 128,576 | | | | 7,592 | |
| Pfizer | | | 543,754 | | | | 9,260 | |
| Quest Diagnostics, Inc. | | | 66,559 | | | | 3,723 | |
| UnitedHealth Group | | | 127,006 | | | | 3,296 | |
| | | | | | | | | |
| | | | | | | | 37,196 | |
| | | | | | | | | |
| Industrials – 11.0% |
| Boeing | | | 58,120 | | | | 2,778 | |
FedEx 6 | | | 109,805 | | | | 7,982 | |
| General Electric | | | 838,802 | | | | 11,961 | |
| Ingersoll-Rand | | | 197,811 | | | | 6,249 | |
ITT 6 | | | 118,143 | | | | 5,990 | |
| Norfolk Southern | | | 67,774 | | | | 3,159 | |
| United Technologies | | | 88,018 | | | | 5,409 | |
| | | | | | | | | |
| | | | | | | | 43,528 | |
| | | | | | | | | |
| Information Technology – 8.2% |
| Analog Devices | | | 150,337 | | | | 3,853 | |
Applied Materials 6 | | | 330,080 | | | | 4,027 | |
BMC Software 6 = | | | 142,128 | | | | 5,281 | |
Cisco Systems = | | | 330,010 | | | | 7,541 | |
| Hewlett-Packard | | | 157,494 | | | | 7,475 | |
Teradata = | | | 151,163 | | | | 4,214 | |
| | | | | | | | | |
| | | | | | | | 32,391 | |
| | | | | | | | | |
| Materials – 3.1% |
| Air Products and Chemicals | | | 77,936 | | | | 6,011 | |
Dow Chemical 6 | | | 129,522 | | | | 3,041 | |
| Freeport-McMoRan Copper & Gold | | | 43,625 | | | | 3,201 | |
| | | | | | | | | |
| | | | | | | | 12,253 | |
| | | | | | | | | |
| Telecommunication Services – 3.0% |
| AT&T | | | 469,658 | | | | 12,056 | |
| | | | | | | | | |
| Utilities – 5.1% |
CMS Energy 6 | | | 323,924 | | | | 4,308 | |
| Edison International | | | 157,471 | | | | 5,011 | |
| Entergy | | | 40,243 | | | | 3,088 | |
| Sempra Energy | | | 74,523 | | | | 3,834 | |
Xcel Energy 6 | | | 205,141 | | | | 3,869 | |
| | | | | | | | | |
| | | | | | | | 20,110 | |
| | | | | | | | | |
Total Common Stocks | | | | | | | | |
(Cost $378,815) | | | | | | | 393,368 | |
| | | | | | | | | |
Short-Term Investment – 0.3% |
| First American Prime Obligations Fund, Class Z | | | | | | | | |
0.148% Å Ω | | | | | | | | |
(Cost $1,117) | | | 1,117,420 | | | | 1,117 | |
| | | | | | | | | |
Investment Purchased with Proceeds from Securities Lending – 17.7% |
| Mount Vernon Securities Lending Prime Portfolio | | | | | | | | |
| 0.209% Ω † | | | | | | | | |
(Cost $70,130) | | | 70,130,428 | | | | 70,130 | |
| | | | | | | | | |
Total Investments 5 –��117.4% | | | | | | | | |
(Cost $450,062) | | | | | | | 464,615 | |
| | | | | | | | | |
Other Assets and Liabilities, Net – (17.4)% | | | | | | | (69,003 | ) |
| | | | | | | | | |
Total Net Assets – 100.0% | | | | | | $ | 395,612 | |
| | | | | | | | | |
| | |
| 6 | | This security or a portion of this security is out on loan at October 31, 2009. Total loaned securities had a fair value of $64,588 at October 31, 2009. See note 2 in Notes to Financial Statements. |
| |
| = | | Non-income producing security. |
| |
| Å | | Investment in affiliated security. This money market fund is advised by FAF Advisors, Inc., which also serves as advisor for this fund. See note 3 in Notes to Financial Statements. |
| |
| Ω | | The rate quoted is the annualized seven-day effective yield as of October 31, 2009. |
| |
| † | | The fund may loan securities representing up to one third of the fair value of its total assets (which includes collateral for securities on loan) to broker dealers, banks, or other institutional borrowers of securities. The fund maintains collateral equal to at least 100% of the fair value of the securities loaned. The adequacy of the collateral is monitored on a daily basis. The cash collateral received by the fund is invested in this affiliated money market fund. See note 2 in Notes to Financial Statements. |
| |
| 5 | | On October 31, 2009, the cost of investments for federal income tax purposes was $459,575. The aggregate gross unrealized appreciation and depreciation of investments, based on this cost, were as follows: |
| | | | | |
| Gross unrealized appreciation | | $ | 46,260 | |
| Gross unrealized depreciation | | | (41,220 | ) |
| | | | | |
| Net unrealized appreciation | | $ | 5,040 | |
| | | | | |
First American Funds 2009 Annual Report 69
Schedule of Investments October 31, 2009, all dollars are rounded to thousands (000)
| | | | | | | | | |
| Mid Cap Growth Opportunities Fund |
| DESCRIPTION | | SHARES | | FAIR VALUE |
| |
| |
Common Stocks – 99.7% |
| Consumer Discretionary – 22.0% |
Advance Auto Parts 6 | | | 384,730 | | | $ | 14,335 | |
Aeropostale 6 = | | | 298,493 | | | | 11,202 | |
Apollo Group, Class A 6 = | | | 220,858 | | | | 12,611 | |
Bed Bath & Beyond = | | | 524,178 | | | | 18,456 | |
Chipotle Mexican Grill, Class A 6 = | | | 157,865 | | | | 12,864 | |
| Coach | | | 735,229 | | | | 24,241 | |
Coinstar 6 = | | | 409,092 | | | | 12,985 | |
DeVry 6 | | | 262,796 | | | | 14,530 | |
Dick’s Sporting Goods 6 = | | | 642,114 | | | | 14,570 | |
Expedia = | | | 342,379 | | | | 7,762 | |
| Harman International Industries | | | 527,151 | | | | 19,826 | |
J.Crew Group 6 = | | | 298,559 | | | | 12,175 | |
| Nordstrom | | | 372,235 | | | | 11,830 | |
| Polo Ralph Lauren | | | 275,923 | | | | 20,534 | |
Priceline.com 6 = | | | 143,331 | | | | 22,616 | |
TJX 6 | | | 245,062 | | | | 9,153 | |
WMS Industries = | | | 389,281 | | | | 15,564 | |
Wynn Resorts 6 = | | | 103,414 | | | | 5,607 | |
| | | | | | | | | |
| | | | | | | | 260,861 | |
| | | | | | | | | |
| Consumer Staples – 3.2% |
Alberto-Culver 6 | | | 422,761 | | | | 11,338 | |
Central European Distribution = | | | 219,442 | | | | 6,827 | |
| Lorillard | | | 260,717 | | | | 20,263 | |
| | | | | | | | | |
| | | | | | | | 38,428 | |
| | | | | | | | | |
| Energy – 8.0% |
Alpha Natural Resources = | | | 360,278 | | | | 12,239 | |
Cameron International 6 = | | | 603,827 | | | | 22,323 | |
| Noble Energy | | | 165,217 | | | | 10,843 | |
Oceaneering International = | | | 207,182 | | | | 10,587 | |
Petrohawk Energy = | | | 733,871 | | | | 17,261 | |
Quicksilver Resources 6 = | | | 910,376 | | | | 11,107 | |
Southwestern Energy = | | | 250,950 | | | | 10,936 | |
| | | | | | | | | |
| | | | | | | | 95,296 | |
| | | | | | | | | |
| Financials – 7.6% |
Affiliated Managers Group 6 = | | | 188,155 | | | | 11,946 | |
Alexandria Real Estate Equities – REIT 6 | | | 265,814 | | | | 14,399 | |
IntercontinentalExchange = | | | 193,879 | | | | 19,425 | |
| Lincoln National | | | 349,880 | | | | 8,338 | |
PartnerRe 6 | | | 158,184 | | | | 12,098 | |
TD Ameritrade = | | | 1,212,356 | | | | 23,398 | |
| | | | | | | | | |
| | | | | | | | 89,604 | |
| | | | | | | | | |
| Healthcare – 10.3% |
| Allergan | | | 309,035 | | | | 17,383 | |
| C.R. Bard | | | 204,625 | | | | 15,361 | |
DENTSPLY International 6 | | | 495,289 | | | | 16,325 | |
Edwards Lifesciences = | | | 98,712 | | | | 7,595 | |
Express Scripts 6 = | | | 179,472 | | | | 14,343 | |
Henry Schein 6 = | | | 287,013 | | | | 15,163 | |
Illumina 6 = | | | 394,491 | | | | 12,663 | |
NuVasive 6 = | | | 319,174 | | | | 11,583 | |
Thermo Fisher Scientific 6 = | | | 273,238 | | | | 12,296 | |
| | | | | | | | | |
| | | | | | | | 122,712 | |
| | | | | | | | | |
| Industrials – 15.4% |
C.H. Robinson Worldwide 6 | | | 227,736 | | | | 12,551 | |
| Copa Holdings, Class A | | | 241,723 | | | | 10,208 | |
| Cummins | | | 189,262 | | | | 8,150 | |
| Expeditors International of Washington | | | 240,016 | | | | 7,733 | |
| Flowserve | | | 239,652 | | | | 23,536 | |
| Fluor | | | 372,554 | | | | 16,549 | |
ITT 6 | | | 150,946 | | | | 7,653 | |
Joy Global 6 | | | 189,554 | | | | 9,556 | |
| Manpower | | | 285,958 | | | | 13,557 | |
| Oshkosh | | | 282,699 | | | | 8,837 | |
| Precision Castparts | | | 295,832 | | | | 28,261 | |
| Robert Half International | | | 45,447 | | | | 1,054 | |
| Roper Industries | | | 277,526 | | | | 14,029 | |
Spirit AeroSystems Holdings, Class A 6 = | | | 525,521 | | | | 8,366 | |
URS = | | | 271,928 | | | | 10,567 | |
Verisk Analytics, Class A = | | | 63,987 | | | | 1,755 | |
| | | | | | | | | |
| | | | | | | | 182,362 | |
| | | | | | | | | |
| Information Technology ⊳ – 26.1% |
| Altera | | | 792,243 | | | | 15,678 | |
Amphenol, Class A 6 | | | 471,438 | | | | 18,914 | |
| Analog Devices | | | 511,846 | | | | 13,119 | |
ANSYS 6 = | | | 298,849 | | | | 12,127 | |
Blackboard = | | | 236,978 | | | | 8,406 | |
BMC Software = | | | 499,380 | | | | 18,557 | |
Broadcom, Class A 6 = | | | 369,686 | | | | 9,837 | |
Dolby Laboratories, Class A 6 = | | | 328,020 | | | | 13,757 | |
Equinix 6 = | | | 65,061 | | | | 5,551 | |
F5 Networks = | | | 407,944 | | | | 18,313 | |
| Global Payments | | | 300,885 | | | | 14,813 | |
Juniper Networks 6 = | | | 448,357 | | | | 11,438 | |
Lam Research 6 = | | | 446,429 | | | | 15,054 | |
Marvell Technology Group = | | | 741,709 | | | | 10,176 | |
| MasterCard, Class A | | | 94,852 | | | | 20,774 | |
Maxim Integrated Products 6 | | | 341,844 | | | | 5,698 | |
MicroStrategy, Class A = | | | 142,410 | | | | 12,428 | |
NetApp 6 = | | | 744,215 | | | | 20,131 | |
Red Hat = | | | 334,983 | | | | 8,646 | |
Salesforce.com = | | | 269,183 | | | | 15,276 | |
Sybase 6 = | | | 478,838 | | | | 18,943 | |
Teradata = | | | 779,361 | | | | 21,729 | |
| | | | | | | | | |
| | | | | | | | 309,365 | |
| | | | | | | | | |
| Materials – 3.2% |
Air Products and Chemicals 6 | | | 164,196 | | | | 12,664 | |
| Cliffs Natural Resources | | | 279,808 | | | | 9,953 | |
| Ecolab | | | 349,251 | | | | 15,353 | |
| | | | | | | | | |
| | | | | | | | 37,970 | |
| | | | | | | | | |
| Telecommunication Services – 3.9% |
American Tower, Class A = | | | 552,512 | | | | 20,343 | |
NII Holdings 6 = | | | 467,703 | | | | 12,595 | |
SBA Communications, Class A 6 = | | | 452,665 | | | | 12,770 | |
| | | | | | | | | |
| | | | | | | | 45,708 | |
| | | | | | | | | |
Total Common Stocks
(Cost $1,025,728) | | | | | | | 1,182,306 | |
| | | | | | | | | |
Short-Term Investment – 0.5% |
| First American Prime Obligations Fund, Class Z | | | | | | | | |
0.148% Å Ω
(Cost $5,757) | | | 5,756,634 | | | | 5,757 | |
| | | | | | | | | |
Investments Purchased with Proceeds
from Securities Lending – 24.6% |
| Mount Vernon Securities Lending Prime Portfolio | | | | | | | | |
| 0.209% Ω † | | | | | | | | |
(Cost $291,904) | | | 291,904,131 | | | | 291,904 | |
| | | | | | | | | |
The accompanying notes are an integral part of the financial statements.
70 First American Funds 2009 Annual Report
| | | | | | | | | |
| Mid Cap Growth Opportunities Fund (concluded) |
| DESCRIPTION | | SHARES | | FAIR VALUE |
| |
| |
Total Investments 5 – 124.8%
(Cost $1,323,389) | | | | | | $ | 1,479,967 | |
| | | | | | | | | |
Other Assets and Liabilities, Net – (24.8)% | | | | | | | (293,921 | ) |
| | | | | | | | | |
Total Net Assets – 100.0% | | | | | | $ | 1,186,046 | |
| | | | | | | | | |
| | |
| 6 | | This security or a portion of this security is out on loan at October 31, 2009. Total loaned securities had a fair value of $ 275,411 at October 31, 2009. See note 2 in Notes to Financial Statements. |
| |
| = | | Non-income producing security. |
| |
| ⊳ | | The fund is significantly invested in this sector and therefore is subject to additional risks. See note 7 in Notes to Financial Statements. |
| |
| Å | | Investment in affiliated security. This money market fund is advised by FAF Advisors, Inc., which also serves as advisor for this fund. See note 3 in Notes to Financial Statements. |
| |
| Ω | | The rate quoted is the annualized seven-day effective yield as of October 31, 2009. |
| |
| † | | The fund may loan securities representing up to one third of the fair value of its total assets (which includes collateral for securities on loan) to broker- dealers, banks, or other institutional borrowers of securities. The fund maintains collateral equal to at least 100% of the fair value of the securities loaned. The adequacy of the collateral is monitored on a daily basis. The cash collateral received by the fund is invested in this affiliated money market fund. See note 2 in Notes to Financial Statements. |
| |
| 5 | | On October 31, 2009, the cost of investments for federal income tax purposes was $1,328,654. The aggregate gross unrealized appreciation and depreciation of investments, based on this cost, were as follows: |
| | | | | |
| Gross unrealized appreciation | | $ | 191,356 | |
| Gross unrealized depreciation | | | (40,043 | ) |
| | | | | |
| Net unrealized appreciation | | $ | 151,313 | |
| | | | | |
| |
| REIT – | Real Estate Investment Trust |
| | | | | | | | | |
| Mid Cap Select Fund |
| DESCRIPTION | | SHARES | | FAIR VALUE |
| |
| |
Common Stocks – 98.7% |
| Consumer Discretionary – 21.6% |
1-800-FLOWERS.com, Class A = | | | 134,190 | | | $ | 515 | |
Bally Technologies = | | | 12,813 | | | | 505 | |
Bed Bath & Beyond = 6 | | | 13,141 | | | | 463 | |
| Coach | | | 23,055 | | | | 760 | |
Coinstar = 6 | | | 23,007 | | | | 730 | |
Discovery Communications, Class A = | | | 16,217 | | | | 446 | |
Expedia = | | | 22,710 | | | | 515 | |
Gannett 6 | | | 44,036 | | | | 432 | |
| Guess? | | | 9,186 | | | | 336 | |
J.C. Penney 6 | | | 20,439 | | | | 677 | |
| Jarden | | | 33,715 | | | | 924 | |
Macy’s 6 | | | 38,435 | | | | 675 | |
Office Depot = | | | 78,439 | | | | 475 | |
| WABCO Holdings | | | 16,951 | | | | 402 | |
Warnaco Group = | | | 11,716 | | | | 475 | |
WMS Industries = | | | 28,020 | | | | 1,120 | |
| | | | | | | | | |
| | | | | | | | 9,450 | |
| | | | | | | | | |
| Consumer Staples – 1.3% |
Bare Escentuals = | | | 43,280 | | | | 547 | |
| | | | | | | | | |
| Energy – 9.9% |
Alpha Natural Resources = | | | 18,207 | | | | 618 | |
Cameron International = 6 | | | 10,141 | | | | 375 | |
Complete Production Services = | | | 48,862 | | | | 466 | |
Noble Energy 6 | | | 6,966 | | | | 457 | |
| Pioneer Natural Resources | | | 26,789 | | | | 1,101 | |
Whiting Petroleum = | | | 16,829 | | | | 949 | |
| Williams | | | 19,247 | | | | 363 | |
| | | | | | | | | |
| | | | | | | | 4,329 | |
| | | | | | | | | |
| Financials – 18.3% |
American International Group = 6 | | | 9,678 | | | | 325 | |
BlackRock 6 | | | 3,923 | | | | 849 | |
Comerica 6 | | | 22,240 | | | | 617 | |
| Delphi Financial Group, Class A | | | 15,056 | | | | 327 | |
Digital Realty Trust – REIT 6 | | | 9,615 | | | | 434 | |
| Discover Financial Services | | | 34,405 | | | | 487 | |
| East West Bancorp | | | 24,606 | | | | 222 | |
| Evercore Partners, Class A | | | 23,348 | | | | 762 | |
| Fifth Third Bancorp | | | 47,824 | | | | 428 | |
First Midwest Bancorp 6 | | | 22,530 | | | | 234 | |
| Liberty Property Trust – REIT | | | 24,527 | | | | 720 | |
| MFA Mortgage Investments – REIT | | | 63,999 | | | | 475 | |
PartnerRe 6 | | | 9,542 | | | | 730 | |
Regions Financial 6 | | | 42,238 | | | | 204 | |
| Unum Group | | | 44,092 | | | | 880 | |
Zions Bancorporation 6 | | | 21,933 | | | | 311 | |
| | | | | | | | | |
| | | | | | | | 8,005 | |
| | | | | | | | | |
| Healthcare – 4.4% |
Express Scripts = 6 | | | 8,986 | | | | 718 | |
Isis Pharmaceuticals = 6 | | | 7,195 | | | | 91 | |
MEDNAX = | | | 9,242 | | | | 480 | |
Onyx Pharmaceuticals = | | | 3,767 | | | | 100 | |
Regeneron Pharmaceuticals = | | | 5,136 | | | | 81 | |
Thermo Fisher Scientific = | | | 10,039 | | | | 452 | |
| | | | | | | | | |
| | | | | | | | 1,922 | |
| | | | | | | | | |
First American Funds 2009 Annual Report 71
Schedule of Investments October 31, 2009, all dollars are rounded to thousands (000)
| | | | | | | | | |
| Mid Cap Select Fund (continued) |
| DESCRIPTION | | SHARES | | FAIR VALUE |
| |
| |
| Industrials – 12.3% |
Altra Holdings = | | | 51,701 | | | $ | 453 | |
| Belden | | | 20,712 | | | | 475 | |
Chart Industries = | | | 18,345 | | | | 363 | |
EMCOR Group = | | | 31,570 | | | | 746 | |
Joy Global 6 | | | 10,958 | | | | 552 | |
Manitowoc 6 | | | 66,228 | | | | 605 | |
Manpower 6 | | | 8,215 | | | | 390 | |
| Oshkosh | | | 21,529 | | | | 673 | |
Verisk Analytics, Class A = | | | 23,777 | | | | 652 | |
W.W. Grainger 6 | | | 4,992 | | | | 468 | |
| | | | | | | | | |
| | | | | | | | 5,377 | |
| | | | | | | | | |
| Information Technology – 21.7% |
| Altera | | | 36,287 | | | | 718 | |
Amkor Technology = 6 | | | 78,689 | | | | 434 | |
| Amphenol, Class A | | | 13,474 | | | | 541 | |
Avnet = | | | 18,178 | | | | 451 | |
BMC Software = | | | 19,438 | | | | 722 | |
CommScope = | | | 20,981 | | | | 567 | |
Computer Sciences = | | | 9,034 | | | | 458 | |
F5 Networks = | | | 17,739 | | | | 796 | |
LoopNet = | | | 48,364 | | | | 422 | |
| Maxim Integrated Products | | | 25,428 | | | | 424 | |
MICROS Systems = | | | 11,879 | | | | 320 | |
Perficient = | | | 44,697 | | | | 364 | |
| Plantronics | | | 13,794 | | | | 333 | |
Polycom = | | | 21,534 | | | | 462 | |
Sybase = 6 | | | 13,104 | | | | 518 | |
Teradata = | | | 54,869 | | | | 1,530 | |
Virtusa = | | | 46,469 | | | | 417 | |
| | | | | | | | | |
| | | | | | | | 9,477 | |
| | | | | | | | | |
| Materials – 4.7% |
| AK Steel | | | 23,531 | | | | 373 | |
| Celanese, Class A | | | 16,966 | | | | 466 | |
| Freeport-McMoRan Copper & Gold | | | 11,367 | | | | 834 | |
| Packaging Corporation of America | | | 21,223 | | | | 388 | |
| | | | | | | | | |
| | | | | | | | 2,061 | |
| | | | | | | | | |
| Telecommunication Services – 2.3% |
Cogent Communications Group = 6 | | | 48,491 | | | | 491 | |
| Windstream | | | 54,766 | | | | 528 | |
| | | | | | | | | |
| | | | | | | | 1,019 | |
| | | | | | | | | |
| Utilities – 2.2% |
CMS Energy 6 | | | 35,086 | | | | 467 | |
Xcel Energy 6 | | | 25,693 | | | | 484 | |
| | | | | | | | | |
| | | | | | | | 951 | |
| | | | | | | | | |
Total Common Stocks | | | | | | | | |
(Cost $39,988) | | | | | | | 43,138 | |
| | | | | | | | | |
Warrants – 0.0% |
Lantronix = ¥ ⊡ | | | | | | | | |
(Cost $0) | | | 746 | | | | — | |
| | | | | | | | | |
Short-Term Investment – 1.4% |
| First American Prime Obligations Fund, Class Z | | | | | | | | |
0.148% Å Ω | | | | | | | | |
(Cost $623) | | | 623,285 | | | | 623 | |
| | | | | | | | | |
Investment Purchased with Proceeds
from Securities Lending – 23.5% |
| Mount Vernon Securities Lending Prime Portfolio | | | | | | | | |
| 0.209% Ω † | | | | | | | | |
(Cost $10,291) | | | 10,290,988 | | | | 10,291 | |
| | | | | | | | | |
Total Investments 5 – 123.6% | | | | | | | | |
(Cost $50,902) | | | | | | | 54,052 | |
| | | | | | | | | |
Other Assets and Liabilities, Net – (23.6)% | | | | | | | (10,318 | ) |
| | | | | | | | | |
Total Net Assets – 100.0% | | | | | | $ | 43,734 | |
| | | | | | | | | |
| | |
| = | | Non-income producing security. |
| |
| 6 | | This security or a portion of this security is out on loan at October 31, 2009. Total loaned securities had a fair value of $9,477 at October 31, 2009. See note 2 in Notes to Financial Statements. |
| |
| ¥ | | Security considered illiquid. As of October 31,2009, the fair value of the fund’s investments considered to be illiquid was $0 or 0.0% of total net assets. See note 2 in Notes to Financial Statements. |
| |
| ⊡ | | Security is internally fair valued. As of October 31, 2009, the fair value of this investment was $0 or 0.0% of total net assets. See note 2 in Notes to Financial Statements. |
| |
| Å | | Investment in affiliated security. This money market fund is advised by FAF Advisors, Inc., which also serves as advisor for this fund. See note 3 in Notes to Financial Statements. |
| |
| Ω | | The rate quoted is the annualized seven-day effective yield as of October 31, 2009. |
| |
| † | | The fund may loan securities representing up to one third of the fair value of its total assets (which includes collateral for securities on loan) to broker dealers, banks, or other institutional borrowers of securities. The fund maintains collateral equal to at least 100% of the fair value of the securities loaned. The adequacy of the collateral is monitored on a daily basis. The cash collateral received by the fund is invested in this affiliated money market fund. See note 2 in Notes to Financial Statements. |
| |
| 5 | | On October 31, 2009, the cost of investments for federal income tax purposes was $51,112. The aggregate gross unrealized appreciation and depreciation of investments, based on this cost, were as follows: |
| | | | | |
| Gross unrealized appreciation | | $ | 5,250 | |
| Gross unrealized depreciation | | | (2,310 | ) |
| | | | | |
| Net unrealized appreciation | | $ | 2,940 | |
| | | | | |
| |
| REIT – | Real Estate Investment Trust |
The accompanying notes are an integral part of the financial statements.
72 First American Funds 2009 Annual Report
| | | | | | | | | |
| Mid Cap Value Fund |
| DESCRIPTION | | SHARES | | FAIR VALUE |
| |
| |
Common Stocks – 99.1% |
| Consumer Discretionary – 13.9% |
| Cablevision Systems | | | 337,575 | | | $ | 7,751 | |
| CBS, Class B | | | 517,670 | | | | 6,093 | |
Expedia = | | | 257,686 | | | | 5,842 | |
Gannett 6 | | | 506,316 | | | | 4,972 | |
| Gap | | | 344,084 | | | | 7,343 | |
J.C. Penney 6 | | | 209,750 | | | | 6,949 | |
| Jarden | | | 337,132 | | | | 9,234 | |
Macy’s 6 | | | 430,543 | | | | 7,564 | |
Magna International, Class A 6 | | | 105,909 | | | | 4,197 | |
Newell Rubbermaid 6 | | | 436,184 | | | | 6,329 | |
Starwood Hotels & Resorts Worldwide 6 | | | 256,573 | | | | 7,456 | |
Toll Brothers = 6 | | | 335,436 | | | | 5,810 | |
WMS Industries = | | | 147,483 | | | | 5,896 | |
| | | | | | | | | |
| | | | | | | | 85,436 | |
| | | | | | | | | |
| Consumer Staples – 7.7% |
| Alberto-Culver | | | 245,154 | | | | 6,575 | |
| ConAgra Foods | | | 557,610 | | | | 11,710 | |
Dr. Pepper Snapple Group = | | | 237,712 | | | | 6,480 | |
| JM Smucker | | | 127,942 | | | | 6,746 | |
| Kroger | | | 298,980 | | | | 6,916 | |
| Lorillard | | | 109,095 | | | | 8,479 | |
| | | | | | | | | |
| | | | | | | | 46,906 | |
| | | | | | | | | |
| Energy – 11.2% |
Alpha Natural Resources = 6 | | | 226,219 | | | | 7,685 | |
| El Paso | | | 404,660 | | | | 3,970 | |
| EOG Resources | | | 88,426 | | | | 7,221 | |
Murphy Oil 6 | | | 124,639 | | | | 7,620 | |
Nabors Industries = | | | 144,365 | | | | 3,007 | |
Newfield Exploration = | | | 368,409 | | | | 15,112 | |
| Noble | | | 127,220 | | | | 5,183 | |
| Noble Energy | | | 177,197 | | | | 11,630 | |
| Pioneer Natural Resources | | | 178,044 | | | | 7,319 | |
| | | | | | | | | |
| | | | | | | | 68,747 | |
| | | | | | | | | |
| Financials – 24.6% |
Ameriprise Financial 6 | | | 269,508 | | | | 9,344 | |
AON 6 | | | 261,995 | | | | 10,090 | |
BOK Financial 6 | | | 105,687 | | | | 4,541 | |
| Boston Properties – REIT | | | 87,091 | | | | 5,293 | |
Comerica 6 | | | 358,823 | | | | 9,957 | |
| Discover Financial Services | | | 697,801 | | | | 9,867 | |
Essex Property Trust – REIT 6 | | | 86,491 | | | | 6,502 | |
| Everest Re Group | | | 77,427 | | | | 6,774 | |
| Federal Realty Investment Trust – REIT | | | 133,228 | | | | 7,865 | |
| Fifth Third Bancorp | | | 888,266 | | | | 7,941 | |
| Invesco | | | 348,527 | | | | 7,371 | |
| KeyCorp | | | 730,670 | | | | 3,938 | |
| Liberty Property Trust – REIT | | | 214,186 | | | | 6,291 | |
Lincoln National 6 | | | 352,951 | | | | 8,411 | |
PartnerRe 6 | | | 107,048 | | | | 8,187 | |
Regions Financial 6 | | | 1,279,348 | | | | 6,192 | |
TD Ameritrade = | | | 332,975 | | | | 6,426 | |
| Unum Group | | | 632,402 | | | | 12,616 | |
Ventas – REIT 6 | | | 222,717 | | | | 8,938 | |
Vornado Realty Trust – REIT 6 | | | 66,304 | | | | 3,949 | |
| | | | | | | | | |
| | | | | | | | 150,493 | |
| | | | | | | | | |
| Healthcare – 4.4% |
| AmerisourceBergen | | | 381,179 | | | | 8,443 | |
| CIGNA | | | 172,443 | | | | 4,801 | |
| Quest Diagnostics | | | 122,630 | | | | 6,858 | |
| Universal Health Services | | | 119,333 | | | | 6,641 | |
| | | | | | | | | |
| | | | | | | | 26,743 | |
| | | | | | | | | |
| Industrials – 10.3% |
| Goodrich | | | 124,493 | | | | 6,766 | |
| Ingersoll-Rand PLC | | | 312,395 | | | | 9,869 | |
ITT 6 | | | 189,984 | | | | 9,632 | |
| Manpower | | | 81,373 | | | | 3,858 | |
Republic Services 6 | | | 187,529 | | | | 4,859 | |
Ryder System 6 | | | 182,219 | | | | 7,389 | |
Stanley Works 6 | | | 176,966 | | | | 8,004 | |
W.W. Grainger 6 | | | 72,492 | | | | 6,795 | |
Werner Enterprises 6 | | | 329,659 | | | | 6,181 | |
| | | | | | | | | |
| | | | | | | | 63,353 | |
| | | | | | | | | |
| Information Technology – 9.8% |
Altera 6 | | | 336,280 | | | | 6,655 | |
Amphenol, Class A 6 | | | 166,072 | | | | 6,663 | |
| Analog Devices | | | 352,253 | | | | 9,028 | |
Avnet = | | | 304,460 | | | | 7,544 | |
BMC Software = 6 | | | 231,178 | | | | 8,591 | |
Computer Sciences = | | | 180,575 | | | | 9,157 | |
KLA-Tencor 6 | | | 182,766 | | | | 5,942 | |
Teradata = | | | 232,502 | | | | 6,482 | |
| | | | | | | | | |
| | | | | | | | 60,062 | |
| | | | | | | | | |
| Materials – 6.5% |
| Air Products and Chemicals | | | 144,341 | | | | 11,133 | |
| Celanese, Class A | | | 254,090 | | | | 6,975 | |
| Cliffs Natural Resources | | | 111,413 | | | | 3,963 | |
| International Paper | | | 204,905 | | | | 4,571 | |
| Packaging Corporation of America | | | 242,160 | | | | 4,427 | |
| Sonoco Products | | | 316,436 | | | | 8,465 | |
| | | | | | | | | |
| | | | | | | | 39,534 | |
| | | | | | | | | |
| Telecommunication Services – 1.1% |
| Windstream | | | 680,960 | | | | 6,564 | |
| | | | | | | | | |
| Utilities – 9.6% |
CMS Energy 6 | | | 814,773 | | | | 10,837 | |
| Edison International | | | 332,099 | | | | 10,567 | |
| Entergy | | | 105,527 | | | | 8,096 | |
| Sempra Energy | | | 267,006 | | | | 13,737 | |
| Wisconsin Energy | | | 186,380 | | | | 8,139 | |
Xcel Energy 6 | | | 393,360 | | | | 7,419 | |
| | | | | | | | | |
| | | | | | | | 58,795 | |
| | | | | | | | | |
Total Common Stocks
(Cost $562,848) | | | | | | | 606,633 | |
| | | | | | | | | |
Short-Term Investment – 0.9% |
| First American Prime Obligations Fund, Class Z | | | | | | | | |
0.148% Å Ω | | | | | | | | |
(Cost $5,759) | | | 5,759,236 | | | | 5,759 | |
| | | | | | | | | |
First American Funds 2009 Annual Report 73
Schedule of Investments October 31, 2009, all dollars are rounded to thousands (000)
| | | | | | | | | |
| Mid Cap Value Fund (concluded) |
| DESCRIPTION | | SHARES | | FAIR VALUE |
| |
| |
Investment Purchased with Proceeds
from Securities Lending – 19.4% |
| | | | | | | | |
| Mount Vernon Securities Lending Prime Portfolio 0.209% Ω † | | | | | | | | |
(Cost $118,965) | | | 118,965,403 | | | $ | 118,965 | |
| | | | | | | | | |
Total Investments 5 – 119.4% | | | | | | | | |
(Cost $687,572) | | | | | | | 731,357 | |
| | | | | | | | | |
Other Assets and Liabilities, Net – (19.4)% | | | | | | | (118,982 | ) |
| | | | | | | | | |
Total Net Assets – 100.0% | | | | | | $ | 612,375 | |
| | | | | | | | | |
| | |
| = | | Non-income producing security. |
| |
| 6 | | This security or a portion of this security is out on loan at October 31, 2009. Total loaned securities had a fair value of $109,399 at October 31, 2009. See note 2 in Notes to Financial Statements. |
| |
| Å | | Investment in affiliated security. This money market fund is advised by FAF Advisors, Inc., which also serves as advisor for this fund. See note 3 in Notes to Financial Statements. |
| |
| Ω | | The rate quoted is the annualized seven-day effective yield as of October 31, 2009. |
| |
| † | | The fund may loan securities representing up to one third of the fair value of its total assets (which includes collateral for securities on loan) to broker- dealers, banks, or other institutional borrowers of securities. The fund maintains collateral equal to at least 100% of the fair value of the securities loaned. The adequacy of the collateral is monitored on a daily basis. The cash collateral received by the fund is invested in this affiliated money market fund. See note 2 in Notes to Financial Statements. |
| |
| 5 | | On October 31, 2009, the cost of investments for federal income tax purposes was $691,708. The aggregate gross unrealized appreciation and depreciation of investments, based on this cost, were as follows: |
| | | | | |
| Gross unrealized appreciation | | $ | 75,695 | |
| Gross unrealized depreciation | | | (36,046 | ) |
| | | | | |
| Net unrealized appreciation | | $ | 39,649 | |
| | | | | |
| |
| REIT – | Real Estate Investment Trust |
| | | | | | | | | |
| Real Estate Securities Fund |
| DESCRIPTION | | SHARES | | FAIR VALUE |
| |
| |
Common Stocks ⊳ – 99.0% |
| Apartments – 11.9% |
Apartment Investment & Management, Class A 6 ⊲ | | | 38,524 | | | $ | 476 | |
Avalonbay Communities 6 ⊲ | | | 321,945 | | | | 22,143 | |
BRE Properties 6 ⊲ | | | 20,254 | | | | 552 | |
Camden Property Trust ⊲ | | | 381,539 | | | | 13,831 | |
Equity Residential Properties Trust 6 ⊲ | | | 1,163,669 | | | | 33,607 | |
Essex Property Trust 6 ⊲ | | | 255,539 | | | | 19,211 | |
Home Properties 6 ⊲ | | | 12,235 | | | | 479 | |
Mid-America Apartment Communities 6 ⊲ | | | 393,736 | | | | 17,253 | |
Post Properties ⊲ | | | 292,530 | | | | 4,824 | |
UDR 6 ⊲ | | | 545,797 | | | | 7,849 | |
| | | | | | | | | |
| | | | | | | | 120,225 | |
| | | | | | | | | |
| Community Centers – 8.3% |
Acadia Realty Trust ⊲ | | | 198,675 | | | | 3,159 | |
Equity One 6 ⊲ | | | 219,210 | | | | 3,271 | |
Federal Realty Investment Trust 6 ⊲ | | | 406,756 | | | | 24,011 | |
Kimco Realty 6 ⊲ | | | 1,642,566 | | | | 20,762 | |
Kite Realty Group Trust 6 ⊲ | | | 190,139 | | | | 705 | |
Ramco-Gershenson Properties Trust 6 ⊲ | | | 418,591 | | | | 3,700 | |
Regency Centers 6 ⊲ | | | 457,954 | | | | 15,364 | |
Saul Centers ⊲ | | | 146,716 | | | | 4,513 | |
Urstadt Biddle Properties, Class A ⊲ | | | 186,066 | | | | 2,748 | |
Weingarten Realty Investors 6 ⊲ | | | 329,219 | | | | 6,091 | |
| | | | | | | | | |
| | | | | | | | 84,324 | |
| | | | | | | | | |
| Diversified – 6.4% |
Colonial Properties Trust ⊲ | | | 25,924 | | | | 273 | |
Cousins Properties 6 ⊲ | | | 1,165,084 | | | | 8,528 | |
Forest City Enterprises, Class A 6 | | | 406,189 | | | | 3,542 | |
Vornado Realty Trust 6 ⊲ | | | 755,199 | | | | 44,980 | |
Washington Real Estate Investment Trust 6 ⊲ | | | 283,848 | | | | 7,579 | |
| | | | | | | | | |
| | | | | | | | 64,902 | |
| | | | | | | | | |
| Healthcare – 12.4% |
Assisted Living Concepts, Class A = | | | 51,198 | | | | 1,061 | |
Capital Senior Living = | | | 419,435 | | | | 2,219 | |
Cogdell Spencer 6 ⊲ ◖ | | | 1,298,838 | | | | 6,027 | |
HCP 6 ⊲ | | | 1,037,017 | | | | 30,685 | |
Health Care 6 ⊲ | | | 270,750 | | | | 12,013 | |
Healthcare Realty Trust 6 ⊲ | | | 191,909 | | | | 3,997 | |
LTC Properties ⊲ | | | 155,182 | | | | 3,686 | |
Nationwide Health Properties ⊲ | | | 394,893 | | | | 12,735 | |
OMEGA Healthcare Investors ⊲ | | | 1,013,686 | | | | 15,367 | |
Parkway Life ⊲ * | | | 1,275,740 | | | | 1,112 | |
Universal Health Realty Income Trust ⊲ | | | 91,958 | | | | 2,920 | |
Ventas 6 ⊲ | | | 840,077 | | | | 33,712 | |
| | | | | | | | | |
| | | | | | | | 125,534 | |
| | | | | | | | | |
| Hotels – 5.7% |
DiamondRock Hospitality 6 = ⊲ | | | 293,628 | | | | 2,234 | |
Gaylord Entertainment 6 = | | | 351,513 | | | | 5,283 | |
Hersha Hospitality Trust ⊲ | | | 250,314 | | | | 641 | |
Host Hotels & Resorts 6 ⊲ | | | 3,953,734 | | | | 39,972 | |
LaSalle Hotel Properties 6 ⊲ | | | 128,440 | | | | 2,204 | |
| Marcus | | | 181,395 | | | | 2,122 | |
Marriott International, Class A 6 | | | 56,213 | | | | 1,409 | |
Sunstone Hotel Investors 6 ⊲ | | | 505,900 | | | | 3,820 | |
| | | | | | | | | |
| | | | | | | | 57,685 | |
| | | | | | | | | |
The accompanying notes are an integral part of the financial statements.
74 First American Funds 2009 Annual Report
| | | | | | | | | |
| Real Estate Securities Fund (continued) |
| DESCRIPTION | | SHARES | | FAIR VALUE |
| |
| |
| Industrials – 6.9% |
AMB Property ⊲ | | | 771,262 | | | $ | 16,952 | |
DCT Industrial Trust 6 ⊲ | | | 2,190,817 | | | | 9,924 | |
EastGroup Properties 6 ⊲ | | | 335,498 | | | | 12,350 | |
First Industrial Realty Trust ⊲ | | | 11,426 | | | | 50 | |
Mapletree Logistics Trust ⊲ * | | | 281,083 | | | | 150 | |
Prologis 6 ⊲ | | | 1,573,147 | | | | 17,824 | |
PS Business Parks ⊲ | | | 262,023 | | | | 12,831 | |
| | | | | | | | | |
| | | | | | | | 70,081 | |
| | | | | | | | | |
| Infrastructure – 1.5% |
American Tower, Class A = | | | 198,603 | | | | 7,313 | |
Brookfield Asset Management, Class A 6 | | | 387,044 | | | | 8,089 | |
| | | | | | | | | |
| | | | | | | | 15,402 | |
| | | | | | | | | |
| Malls – 12.5% |
CBL & Associates Properties 6 ⊲ | | | 353,679 | | | | 2,886 | |
Cedar Shopping Centers ⊲ | | | 76,290 | | | | 463 | |
Glimcher Realty Trust ⊲ | | | 257,269 | | | | 695 | |
Macerich 6 ⊲ | | | 311,472 | | | | 9,282 | |
Simon Property Group 6 ⊲ | | | 1,436,474 | | | | 97,522 | |
Tanger Factory Outlet Centers 6 ⊲ | | | 160,689 | | | | 6,117 | |
Taubman Centers 6 ⊲ | | | 324,441 | | | | 9,899 | |
| | | | | | | | | |
| | | | | | | | 126,864 | |
| | | | | | | | | |
| Manufactured Homes – 0.9% |
Equity Lifestyle Properties 6 ⊲ | | | 204,312 | | | | 9,490 | |
| | | | | | | | | |
| Net Lease – 3.4% |
National Retail Properties 6 ⊲ | | | 886,011 | | | | 17,171 | |
Realty Income 6 ⊲ | | | 748,153 | | | | 17,342 | |
| | | | | | | | | |
| | | | | | | | 34,513 | |
| | | | | | | | | |
| Office – 20.9% |
Alexandria Real Estate Equities 6 ⊲ | | | 186,692 | | | | 10,113 | |
BioMed Realty Trust 6 ⊲ | | | 550,517 | | | | 7,471 | |
Boston Properties 6 ⊲ | | | 782,477 | | | | 47,551 | |
Brandywine Realty Trust ⊲ | | | 1,522,117 | | | | 14,552 | |
Brookfield Properties 6 | | | 1,214,299 | | | | 12,337 | |
Corporate Office Properties Trust 6 ⊲ | | | 563,503 | | | | 18,703 | |
Digital Realty Trust 6 ⊲ | | | 391,408 | | | | 17,664 | |
Douglas Emmett 6 ⊲ | | | 888,249 | | | | 10,481 | |
Duke Realty 6 ⊲ | | | 884,070 | | | | 9,937 | |
Franklin Street Properties 6 ⊲ | | | 240,813 | | | | 2,596 | |
Highwoods Properties 6 ⊲ | | | 569,766 | | | | 15,680 | |
Kilroy Realty 6 ⊲ | | | 37,167 | | | | 1,027 | |
Liberty Property Trust 6 ⊲ | | | 856,937 | | | | 25,168 | |
Mack-Cali Realty ⊲ | | | 257,856 | | | | 7,981 | |
SL Green Realty 6 ⊲ | | | 271,418 | | | | 10,520 | |
| | | | | | | | | |
| | | | | | | | 211,781 | |
| | | | | | | | | |
| Real Estate Service Provider – 0.0% |
HFF = | | | 33,588 | | | | 193 | |
| | | | | | | | | |
| Self Storage – 5.9% |
Public Storage 6 ⊲ | | | 743,820 | | | | 54,745 | |
Sovran Self Storage 6 ⊲ | | | 89,037 | | | | 2,680 | |
U-Store-It Trust ⊲ | | | 342,384 | | | | 1,952 | |
| | | | | | | | | |
| | | | | | | | 59,377 | |
| | | | | | | | | |
| Student Housing – 2.3% |
American Campus Communities 6 ⊲ | | | 836,844 | | | | 22,611 | |
Education Realty Trust ⊲ | | | 191,566 | | | | 960 | |
| | | | | | | | | |
| | | | | | | | 23,571 | |
| | | | | | | | | |
Total Common Stocks
(Cost $916,130) | | | | | | | 1,003,942 | |
| | | | | | | | | |
Private Real Estate Company – 0.0% |
Newcastle Investment Holdings = ¥ ⊡ | | | | | | | | |
(Cost $153) | | | 35,000 | | | | 111 | |
| | | | | | | | | |
Short-Term Investment – 0.5% |
| First American Prime Obligations Fund, Class Z | | | | | | | | |
0.148% Å Ω | | | | | | | | |
(Cost $5,733) | | | 5,733,085 | | | | 5,733 | |
| | | | | | | | | |
Investment Purchased with Proceeds
from Securities Lending – 46.7% |
| Mount Vernon Securities Lending Prime Portfolio 0.209% Ω † | | | | | | | | |
(Cost $473,358) | | | 473,358,188 | | | | 473,358 | |
| | | | | | | | | |
Total Investments 5 – 146.2% | | | | | | | | |
(Cost $1,395,374) | | | | | | | 1,483,144 | |
| | | | | | | | | |
Other Assets and Liabilities, Net – (46.2)% | | | | | | | (468,602 | ) |
| | | | | | | | | |
Total Net Assets – 100.0% | | | | | | $ | 1,014,542 | |
| | | | | | | | | |
| | |
| ⊳ | | The fund is primarily invested in the Real Estate sector and therefore is subject to additional risks. See notes 1 and 7 in Notes to Financial Statements. |
| |
| 6 | | This security or a portion of this security is out on loan at October 31, 2009. Total loaned securities had a fair value of $449,686 at October 31, 2009. See note 2 in Notes to Financial Statements. |
| |
| ⊲ | | Real Estate Investment Trust. As of October 31, 2009, the fair value of these investments was $960,374 or 94.7% of total net assets. |
| |
| = | | Non-income producing security. |
| |
| ◖ | | A company is considered to be an affiliate of the fund under the Investment Company Act of 1940 if the fund’s holdings of that company represent 5% or more of the outstanding voting securities of the company. Transactions with companies that are or were affiliates during the fiscal year ended October 31, 2009 are as follows: |
| | | | | | | | | | | | | | | | | | | | | | | | | | | | | |
| | | Beginning
| | | Purchase
| | | Sales
| | | Ending
| | | Dividend
| | | | | | | |
| Issuer | | Cost | | | Cost | | | Cost | | | Cost | | | Income | | | Shares | | | Fair Value | |
| | |
| Cogdell Spencer | | $ | 13,367 | | | $ | 4,769 | | | $ | 3,790 | | | $ | 14,346 | | | $ | 646 | | | | 1,298,838 | | | $ | 6,027 | |
| | |
| * | | Foreign Denominated security fair values stated in U.S. dollars. Principal amounts are U.S. dollars unless otherwise noted. |
| |
| ¥ | | Security considered illiquid. As of October 31, 2009, the fair value of the fund’s investment considered to be illiquid was $111 or 0.0% of total net assets. See note 2 in Notes to Financial Statements. |
| |
| ⊡ | | Security is internally fair valued. As of October 31, 2009, the fair value of this investment was $111 or 0.0% of total net assets. See note 2 in Notes to Financial Statements. |
| |
| Å | | Investment in affiliated security. This money market fund is advised by FAF Advisors, Inc., which also serves as advisor for this fund. See note 3 in Notes to Financial Statements. |
| |
| Ω | | The rate quoted is the annualized seven-day effective yield as of October 31, 2009. |
| |
| † | | The fund may loan securities representing up to one third of the fair value of its total assets (which includes collateral for securities on loan) to broker-dealers, banks, or other institutional borrowers of securities. The fund maintains collateral equal to at least 100% of the fair value of the securities loaned. The adequacy of the collateral is monitored on a daily basis. The cash collateral received by the fund is invested in this affiliated money market fund. See note 2 in Notes to Financial Statements. |
| |
| 5 | | On October 31, 2009, the cost of investments for federal income tax purposes was $1,476,955. The aggregate gross unrealized appreciation and depreciation of investments, based on this cost, were as follows: |
| | | | | |
| Gross unrealized appreciation | | $ | 135,300 | |
| Gross unrealized depreciation | | | (129,111 | ) |
| | | | | |
| Net unrealized appreciation | | $ | 6,189 | |
| | | | | |
First American Funds 2009 Annual Report 75
Schedule of Investments October 31, 2009, all dollars are rounded to thousands (000)
| | | | | | | | | |
| Small Cap Growth Opportunities Fund |
| DESCRIPTION | | SHARES | | FAIR VALUE |
| |
| |
Common Stocks – 98.0% |
| Consumer Discretionary – 14.9% |
Bally Technologies = | | | 56,271 | | | $ | 2,216 | |
Gymboree = 6 | | | 48,803 | | | | 2,077 | |
hhgregg = 6 | | | 125,457 | | | | 2,069 | |
P.F. Chang’s China Bistro = 6 | | | 60,704 | | | | 1,772 | |
Panera Bread, Class A = 6 | | | 32,374 | | | | 1,942 | |
Texas Roadhouse = | | | 170,789 | | | | 1,617 | |
Tractor Supply = | | | 43,796 | | | | 1,958 | |
Warnaco Group = | | | 56,577 | | | | 2,293 | |
WMS Industries = | | | 48,822 | | | | 1,952 | |
| Wolverine World Wide | | | 104,725 | | | | 2,679 | |
| | | | | | | | | |
| | | | | | | | 20,575 | |
| | | | | | | | | |
| Consumer Staples – 3.8% |
Bare Escentuals = | | | 131,963 | | | | 1,667 | |
Chattem = 6 | | | 29,074 | | | | 1,842 | |
| Diamond Foods | | | 59,349 | | | | 1,789 | |
| | | | | | | | | |
| | | | | | | | 5,298 | |
| | | | | | | | | |
| Energy – 4.2% |
Comstock Resources = | | | 50,861 | | | | 2,090 | |
GMX Resources = 6 | | | 89,894 | | | | 1,144 | |
Penn Virginia 6 | | | 62,629 | | | | 1,268 | |
Whiting Petroleum = 6 | | | 24,688 | | | | 1,393 | |
| | | | | | | | | |
| | | | | | | | 5,895 | |
| | | | | | | | | |
| Financials – 6.7% |
CoBiz Financial 6 | | | 321,461 | | | | 1,533 | |
| East West Bancorp | | | 207,889 | | | | 1,877 | |
| First Midwest Bancorp | | | 149,265 | | | | 1,552 | |
Investment Technology Group = | | | 74,373 | | | | 1,604 | |
Penson Worldwide = 6 | | | 140,656 | | | | 1,372 | |
Stifel Financial = 6 | | | 27,035 | | | | 1,405 | |
| | | | | | | | | |
| | | | | | | | 9,343 | |
| | | | | | | | | |
| Healthcare – 20.5% |
Alliance Imaging = | | | 297,409 | | | | 1,618 | |
Amedisys = 6 | | | 44,461 | | | | 1,769 | |
Auxilium Pharmaceuticals = 6 | | | 21,124 | | | | 665 | |
BioMarin Pharmaceutical = | | | 103,283 | | | | 1,607 | |
Haemonetics = | | | 38,725 | | | | 1,994 | |
Halozyme Therapeutics = 6 | | | 170,591 | | | | 1,034 | |
Human Genome Sciences = 6 | | | 54,669 | | | | 1,022 | |
Isis Pharmaceuticals = 6 | | | 96,512 | | | | 1,223 | |
Masimo = | | | 66,949 | | | | 1,779 | |
MedAssets = | | | 72,916 | | | | 1,600 | |
Nektar Therapeutics = | | | 155,514 | | | | 1,263 | |
NuVasive = 6 | | | 45,673 | | | | 1,657 | |
Onyx Pharmaceuticals = | | | 53,307 | | | | 1,418 | |
OSI Pharmaceuticals = 6 | | | 49,482 | | | | 1,594 | |
| Owens & Minor | | | 39,086 | | | | 1,598 | |
Regeneron Pharmaceuticals = | | | 64,821 | | | | 1,018 | |
RTI Biologics = | | | 288,344 | | | | 1,130 | |
Seattle Genetics = | | | 124,147 | | | | 1,127 | |
Thoratec = | | | 52,902 | | | | 1,389 | |
Zoll Medical = | | | 94,361 | | | | 1,833 | |
| | | | | | | | | |
| | | | | | | | 28,338 | |
| | | | | | | | | |
| Industrials – 15.5% |
| Actuant, Class A | | | 112,154 | | | | 1,751 | |
Advisory Board = | | | 62,818 | | | | 1,548 | |
Altra Holdings = | | | 135,693 | | | | 1,190 | |
BE Aerospace = | | | 98,079 | | | | 1,739 | |
ESCO Technologies = | | | 38,583 | | | | 1,515 | |
GrafTech International = | | | 114,956 | | | | 1,552 | |
| HNI | | | 51,240 | | | | 1,349 | |
| Interface, Class A | | | 212,474 | | | | 1,649 | |
Navigant Consulting = | | | 129,510 | | | | 1,844 | |
Old Dominion Freight Line = | | | 52,304 | | | | 1,359 | |
Orbital Sciences = | | | 136,310 | | | | 1,756 | |
Trina Solar Limited = 6 | | | 23,196 | | | | 753 | |
TrueBlue = | | | 116,508 | | | | 1,410 | |
Waste Connections = | | | 63,857 | | | | 2,007 | |
| | | | | | | | | |
| | | | | | | | 21,422 | |
| | | | | | | | | |
| Information Technology ⊳ – 28.6% |
3Com = | | | 312,971 | | | | 1,609 | |
CommScope = | | | 66,720 | | | | 1,803 | |
Double-Take Software = | | | 160,541 | | | | 1,488 | |
Forrester Research = | | | 63,101 | | | | 1,598 | |
Kenexa = | | | 170,318 | | | | 2,146 | |
LoopNet = 6 | | | 154,530 | | | | 1,349 | |
MICROS Systems = 6 | | | 66,267 | | | | 1,784 | |
Monolithic Power Systems = | | | 106,599 | | | | 2,131 | |
| National Instruments | | | 74,621 | | | | 1,992 | |
NetScout Systems = | | | 145,266 | | | | 1,785 | |
Perficient = | | | 199,816 | | | | 1,626 | |
| Plantronics | | | 66,965 | | | | 1,615 | |
PMC-Sierra = | | | 272,616 | | | | 2,323 | |
Polycom = | | | 100,669 | | | | 2,161 | |
QLogic = | | | 77,635 | | | | 1,362 | |
Quest Software = 6 | | | 107,985 | | | | 1,811 | |
Semtech = | | | 116,528 | | | | 1,803 | |
Silicon Laboratories = | | | 37,137 | | | | 1,556 | |
Silicon Motion Technology – ADR = 6 | | | 308,991 | | | | 1,075 | |
Synaptics = 6 | | | 140,369 | | | | 3,158 | |
Verigy = 6 | | | 178,643 | | | | 1,758 | |
VideoPropulsion = ¥ ⊡ | | | 780,460 | | | | — | |
Virtusa = | | | 180,024 | | | | 1,617 | |
| | | | | | | | | |
| | | | | | | | 39,550 | |
| | | | | | | | | |
| Materials – 1.0% |
| Arch Chemicals | | | 50,778 | | | | 1,406 | |
| | | | | | | | | |
| Telecommunication Services – 2.8% |
NeuStar, Class A = | | | 67,710 | | | | 1,564 | |
Neutral Tandem = 6 | | | 107,610 | | | | 2,270 | |
| | | | | | | | | |
| | | | | | | | 3,834 | |
| | | | | | | | | |
Total Common Stocks | | | | | | | | |
(Cost $130,344) | | | | | | | 135,661 | |
| | | | | | | | | |
Warrants – 0.0% |
Hollis-Eden Pharmaceuticals, Warrants = ¥ ⊡ | | | 70,545 | | | | — | |
Lantronix, Warrants = ¥ ⊡ | | | 11,236 | | | | — | |
| | | | | | | | | |
Total Warrants | | | | | | | | |
(Cost $161) | | | | | | | — | |
| | | | | | | | | |
Short-Term Investment – 2.0% |
| First American Prime Obligations Fund, Class Z | | | | | | | | |
0.148% Å Ω | | | | | | | | |
(Cost $2,799) | | | 2,798,543 | | | | 2,799 | |
| | | | | | | | | |
The accompanying notes are an integral part of the financial statements.
76 First American Funds 2009 Annual Report
| | | | | | | | | |
| Small Cap Growth Opportunities Fund (concluded) |
| DESCRIPTION | | SHARES | | FAIR VALUE |
| |
| |
Investment Purchased with Proceeds
from Securities Lending - 22.2% |
| Mount Vernon Securities Lending Prime Portfolio | | | | | | | | |
| 0.209% Ω † | | | | | | | | |
(Cost $30,805) | | | 30,805,069 | | | $ | 30,805 | |
| | | | | | | | | |
Total Investments 5 – 122.2% | | | | | | | | |
(Cost $164,109) | | | | | | | 169,265 | |
| | | | | | | | | |
Other Assets and Liabilities, Net – (22.2)% | | | | | | | (30,805 | ) |
| | | | | | | | | |
Total Net Assets – 100.0% | | | | | | $ | 138,460 | |
| | | | | | | | | |
| | |
| = | | Non-income producing security. |
| |
| 6 | | This security or a portion of this security is out on loan at October 31, 2009. Total loaned securities had a fair value of $28,556 at October 31, 2009. See note 2 in Notes to Financial Statements. |
| |
| ⊳ | | The fund is significantly invested in this sector and therefore is subject to additional risks. See note 7 in Notes to Financial Statements. |
| |
| ¥ | | Security considered illiquid. As of October 31,2009, the fair value of the fund’s investments considered to be illiquid was $0 or 0.0% of total net assets. See note 2 in Notes to Financial Statements. |
| |
| ⊡ | | Security is internally fair valued. As of October 31, 2009, the fair value of these investments was $0 or 0.0% of total net assets. |
| |
| Å | | Investment in affiliated security. This money market fund is advised by FAF Advisors, Inc., which also serves as advisor for this fund. See note 3 in Notes to Financial Statements. |
| |
| Ω | | The rate quoted is the annualized seven-day effective yield as of October 31, 2009. |
| |
| † | | The fund may loan securities representing up to one third of the fair value of its total assets (which includes collateral for securities on loan) to broker dealers, banks, or other institutional borrowers of securities. The fund maintains collateral equal to at least 100% of the fair value of the securities loaned. The adequacy of the collateral is monitored on a daily basis. The cash collateral received by the fund is invested in this affiliated money market fund. See note 2 in Notes to Financial Statements. |
| |
| 5 | | On October 31, 2009, the cost of investments for federal income tax purposes was $168,436. The aggregate gross unrealized appreciation and depreciation of investments, based on this cost, were as follows: |
| | | | | |
| Gross unrealized appreciation | | $ | 14,612 | |
| Gross unrealized depreciation | | | 13,783 | |
| | | | | |
| Net unrealized appreciation | | $ | 829 | |
| | | | | |
| |
| ADR – | American Depositary Receipt |
| | | | | | | | | |
| Small Cap Select Fund |
| DESCRIPTION | | SHARES | | FAIR VALUE |
| |
| |
Common Stocks – 96.4% |
| Consumer Discretionary – 17.3% |
1-800-Flowers.com, Class A = | | | 1,648,312 | | | $ | 6,329 | |
Amerigon = 6 | | | 639,241 | | | | 4,110 | |
Bally Technologies = | | | 196,733 | | | | 7,749 | |
Children’s Place Retail Stores = 6 | | | 239,903 | | | | 7,545 | |
Coinstar = 6 | | | 407,688 | | | | 12,940 | |
Collective Brands = | | | 422,074 | | | | 7,830 | |
DG Fastchannel = | | | 186,747 | | | | 3,916 | |
Dress Barn = 6 | | | 365,582 | | | | 6,599 | |
FGX International Holdings Limited = | | | 338,672 | | | | 4,467 | |
Fossil = | | | 249,299 | | | | 6,664 | |
| Harman International Industries | | | 176,132 | | | | 6,624 | |
Hibbett Sports = 6 | | | 179,445 | | | | 3,363 | |
P.F. Chang’s China Bistro = 6 | | | 129,180 | | | | 3,771 | |
Panera Bread, Class A = 6 | | | 189,936 | | | | 11,392 | |
Ryland Group 6 | | | 101,498 | | | | 1,883 | |
Tractor Supply = 6 | | | 144,183 | | | | 6,445 | |
Vitacost.com = 6 | | | 120,232 | | | | 1,193 | |
Warnaco Group = | | | 159,773 | | | | 6,476 | |
WMS Industries = | | | 143,935 | | | | 5,755 | |
| | | | | | | | | |
| | | | | | | | 115,051 | |
| | | | | | | | | |
| Consumer Staples – 2.9% |
Chattem = 6 | | | 133,475 | | | | 8,458 | |
Hain Celestial Group = 6 | | | 273,400 | | | | 4,795 | |
NBTY = | | | 174,003 | | | | 6,336 | |
| | | | | | | | | |
| | | | | | | | 19,589 | |
| | | | | | | | | |
| Energy – 6.9% |
Advantage Oil & Gas 6 | | | 457,915 | | | | 2,821 | |
Arena Resources = | | | 165,019 | | | | 6,148 | |
Comstock Resources = 6 | | | 215,435 | | | | 8,852 | |
Concho Resources = | | | 174,705 | | | | 6,658 | |
GMX Resources = 6 | | | 369,523 | | | | 4,704 | |
Newpark Resources = | | | 785,634 | | | | 2,365 | |
Penn Virginia 6 | | | 259,996 | | | | 5,265 | |
Petroleum Development = 6 | | | 171,609 | | | | 2,866 | |
Whiting Petroleum = 6 | | | 113,328 | | | | 6,392 | |
| | | | | | | | | |
| | | | | | | | 46,071 | |
| | | | | | | | | |
| Financials – 16.8% |
Astoria Financial 6 | | | 197,808 | | | | 1,974 | |
Bank of the Ozarks 6 | | | 384,625 | | | | 8,750 | |
| Calamos Asset Management, Class A | | | 159,056 | | | | 1,686 | |
Cullen/Frost Bankers 6 | | | 54,448 | | | | 2,548 | |
CVB Financial 6 | | | 210,006 | | | | 1,682 | |
| Delphi Financial Group, Class A | | | 556,166 | | | | 12,069 | |
| Dime Community Bancshares | | | 386,618 | | | | 4,249 | |
| Evercore Partners, Class A | | | 92,482 | | | | 3,019 | |
Glacier Bancorp 6 | | | 619,763 | | | | 8,113 | |
HCC Insurance Holdings 6 | | | 202,916 | | | | 5,355 | |
Independent Bank 6 | | | 343,813 | | | | 7,313 | |
KBW = 6 | | | 110,370 | | | | 3,090 | |
Knight Capital Group, Class A = | | | 237,261 | | | | 3,998 | |
| MFA Mortgage Investments – REIT | | | 1,271,241 | | | | 9,432 | |
National Retail Properties – REIT 6 | | | 245,550 | | | | 4,759 | |
| Platinum Underwriters Holdings | | | 273,625 | | | | 9,787 | |
| Senior Housing Properties Trust – REIT | | | 280,590 | | | | 5,410 | |
TCF Financial 6 | | | 604,121 | | | | 7,147 | |
| Tower Group | | | 90,962 | | | | 2,236 | |
Umpqua Holdings 6 | | | 925,487 | | | | 9,171 | |
| | | | | | | | | |
| | | | | | | | 111,788 | |
| | | | | | | | | |
| Healthcare – 11.9% |
Alexion Pharmaceuticals = 6 | | | 68,833 | | | | 3,057 | |
Allscripts-Misys Healthcare Solutions = 6 | | | 184,761 | | | | 3,603 | |
First American Funds 2009 Annual Report 77
Schedule of Investments October 31, 2009, all dollars are rounded to thousands (000)
| | | | | | | | | |
| Small Cap Select Fund (continued) |
| DESCRIPTION | | SHARES | | FAIR VALUE |
| |
| |
Amedisys = 6 | | | 201,619 | | | $ | 8,022 | |
Auxilium Pharmaceuticals = 6 | | | 32,465 | | | | 1,021 | |
Bio-Reference Laboratories = | | | 102,319 | | | | 3,308 | |
Cubist Pharmaceuticals = 6 | | | 64,087 | | | | 1,086 | |
DexCom = 6 | | | 331,395 | | | | 2,273 | |
Endologix = | | | 744,723 | | | | 3,545 | |
Genoptix = 6 | | | 97,661 | | | | 3,398 | |
Haemonetics = | | | 155,860 | | | | 8,027 | |
Human Genome Sciences = 6 | | | 125,483 | | | | 2,345 | |
ICU Medical = | | | 76,803 | | | | 2,688 | |
IPC The Hospitalist = | | | 95,039 | | | | 2,880 | |
Isis Pharmaceuticals = 6 | | | 195,751 | | | | 2,480 | |
LHC Group = | | | 118,489 | | | | 3,307 | |
Masimo = | | | 99,375 | | | | 2,640 | |
MEDNAX = | | | 154,306 | | | | 8,012 | |
Onyx Pharmaceuticals = | | | 94,367 | | | | 2,510 | |
PDL BioPharma 6 | | | 144,016 | | | | 1,211 | |
Regeneron Pharmaceuticals = | | | 153,936 | | | | 2,417 | |
RTI Biologics = | | | 987,307 | | | | 3,870 | |
Seattle Genetics = | | | 91,485 | | | | 831 | |
Zoll Medical = | | | 325,053 | | | | 6,312 | |
| | | | | | | | | |
| | | | | | | | 78,843 | |
| | | | | | | | | |
| Industrials – 15.9% |
Actuant, Class A 6 | | | 531,236 | | | | 8,292 | |
Advisory Board = | | | 192,739 | | | | 4,749 | |
Allegiant Travel = 6 | | | 166,794 | | | | 6,290 | |
Altra Holdings = | | | 399,787 | | | | 3,506 | |
BE Aerospace = | | | 438,883 | | | | 7,781 | |
CBIZ = | | | 393,183 | | | | 2,768 | |
ESCO Technologies = 6 | | | 86,039 | | | | 3,380 | |
GrafTech International = | | | 533,783 | | | | 7,206 | |
| IDEX | | | 174,731 | | | | 4,968 | |
| Interface, Class A | | | 879,055 | | | | 6,821 | |
JA Solar Holdings = 6 | | | 324,989 | | | | 1,245 | |
MasTec = 6 | | | 570,006 | | | | 6,726 | |
MYR Group = | | | 322,580 | | | | 5,542 | |
Navigant Consulting = | | | 519,172 | | | | 7,393 | |
Old Dominion Freight Line = | | | 318,854 | | | | 8,287 | |
Orbital Sciences = | | | 481,739 | | | | 6,205 | |
Simpson Manufacturing 6 | | | 95,284 | | | | 2,229 | |
Trina Solar Limited – ADR = 6 | | | 128,875 | | | | 4,186 | |
Waste Connections = | | | 266,621 | | | | 8,380 | |
| | | | | | | | | |
| | | | | | | | 105,954 | |
| | | | | | | | | |
| Information Technology – 18.2% |
ADC Telecommunications = 6 | | | 853,027 | | | | 5,536 | |
Advanced Analogic Technologies = ◖ | | | 2,174,212 | | | | 6,849 | |
Amkor Technology = 6 | | | 1,114,512 | | | | 6,141 | |
| Cognex | | | 186,471 | | | | 3,000 | |
CommVault Systems = | | | 201,063 | | | | 3,961 | |
DealerTrack Holdings = 6 | | | 461,886 | | | | 7,612 | |
F5 Networks = | | | 152,206 | | | | 6,832 | |
| Fair Isaac | | | 169,978 | | | | 3,456 | |
Global Payments 6 | | | 142,878 | | | | 7,034 | |
Harris Stratex Networks, Class A = | | | 749,344 | | | | 4,721 | |
International Rectifier = | | | 384,605 | | | | 7,030 | |
Mellanox Technologies = | | | 228,206 | | | | 3,982 | |
Netlogic Microsystems = 6 | | | 129,466 | | | | 4,921 | |
Polycom = 6 | | | 324,973 | | | | 6,977 | |
Progress Software = | | | 490,072 | | | | 11,321 | |
Rofin-Sinar Technologies = | | | 137,236 | | | | 2,944 | |
Sapient = | | | 651,632 | | | | 5,304 | |
Silicon Laboratories = 6 | | | 149,777 | | | | 6,276 | |
Stratasys = 6 | | | 209,887 | | | | 3,312 | |
Tessera Technologies = | | | 237,658 | | | | 5,255 | |
TTM Technologies = 6 | | | 506,966 | | | | 5,156 | |
ValueClick = | | | 335,866 | | | | 3,305 | |
| | | | | | | | | |
| | | | | | | | 120,925 | |
| | | | | | | | | |
| Materials – 3.8% |
| Albemarle | | | 100,091 | | | | 3,161 | |
| Arch Chemicals | | | 230,645 | | | | 6,387 | |
Buckeye Technologies = | | | 381,614 | | | | 3,419 | |
| Silgan Holdings | | | 175,368 | | | | 9,426 | |
Thompson Creek Metals = 6 | | | 270,931 | | | | 2,758 | |
| | | | | | | | | |
| | | | | | | | 25,151 | |
| | | | | | | | | |
| Telecommunication Services – 1.9% |
Cogent Communications Group = 6 | | | 451,556 | | | | 4,574 | |
NeuStar, Class A = | | | 214,980 | | | | 4,966 | |
| NTELOS Holdings | | | 204,546 | | | | 3,089 | |
| | | | | | | | | |
| | | | | | | | 12,629 | |
| | | | | | | | | |
| Utilities – 0.8% |
| NSTAR | | | 166,343 | | | | 5,148 | |
| | | | | | | | | |
Total Common Stocks | | | | | | | | |
(Cost $608,709) | | | | | | | 641,149 | |
| | | | | | | | | |
Exchange-Traded Fund – 0.6% |
SPDR KBW Regional Banking ETF 6 | | | | | | | | |
(Cost $3,376) | | | 181,184 | | | | 3,683 | |
| | | | | | | | | |
Warrants – 0.0% |
Lantronix, Warrants = ⊡ ¥ | | | | | | | | |
(Cost $0) | | | 5,143 | | | | — | |
| | | | | | | | | |
Short-Term Investment – 3.2% |
| First American Prime Obligations Fund, Class Z | | | | | | | | |
0.148% Å Ω | | | | | | | | |
(Cost $21,593) | | | 21,593,081 | | | | 21,593 | |
| | | | | | | | | |
Investment Purchased with Proceeds from Securities Lending – 30.1% |
| Mount Vernon Securities Lending Prime Portfolio | | | | | | | | |
| 0.209% Ω † | | | | | | | | |
(Cost $200,149) | | | 200,149,178 | | | | 200,149 | |
| | | | | | | | | |
Total Investments 5 – 130.3% | | | | | | | | |
(Cost $833,827) | | | | | | | 866,574 | |
| | | | | | | | | |
Other Assets and Liabilities, Net – (30.3)% | | | | | | | (201,418 | ) |
| | | | | | | | | |
Total Net Assets – 100.0% | | | | | | $ | 665,156 | |
| | | | | | | | | |
| | |
| = | | Non-income producing security. |
| |
| 6 | | This security or a portion of this security is out on loan at October 31, 2009. Total loaned securities had a fair value of $185,533 at October 31, 2009. See note 2 in Notes to Financial Statements. |
| |
| ◖ | | A company is considered to be an affiliate of the fund under the Investment Company Act of 1940 if the fund’s holdings of that company represent 5% or more of the outstanding voting securities of the company. Transactions with companies that are or were affiliates during the fiscal year ended October 31, 2009 are as follows: |
| | | | | | | | | | | | | | | | | | | | | | | | | | | | | |
| | | Beginning
| | | Purchase
| | | Sales
| | | Ending
| | | Dividend
| | | | | | | |
| Issuer | | Cost | | | Cost | | | Cost | | | Cost | | | Income | | | Shares | | | Fair Value | |
| | |
| Advanced Analogic Technologies | | $ | 13,680 | | | $ | 799 | | | $ | 2,180 | | | $ | 12,299 | | | $ | — | | | | 2,174,212 | | | $ | 6,849 | |
| | |
| ¥ | | Security considered illiquid. As of October 31,2009, the fair value of this investment was $0 or 0.0% of total net assets. See note 2 in Notes to Financial Statements. |
| |
| ⊡ | | Security is internally fair valued. As of October 31, 2009, the fair value of this investment was $0 or 0.0% of total net assets. |
The accompanying notes are an integral part of the financial statements.
78 First American Funds 2009 Annual Report
Small Cap Select Fund (concluded)
| | |
| Å | | Investment in affiliated security. This money market fund is advised by FAF Advisors, Inc., which also serves as advisor for this fund. See note 3 in Notes to Financial Statements. |
| |
| Ω | | The rate quoted is the annualized seven-day effective yield as of October 31, 2009. |
| |
| † | | The fund may loan securities representing up to one third of the fair value of its total assets (which includes collateral for securities on loan) to broker-dealers, banks, or other institutional borrowers of securities. The fund maintains collateral equal to at least 100% of the fair value of the securities loaned. The adequacy of the collateral is monitored on a daily basis. The cash collateral received by the fund is invested in this affiliated money market fund. See note 2 in Notes to Financial Statements. |
| |
| 5 | | On October 31, 2009, the cost of investments for federal income tax purposes was $846,895. The aggregate gross unrealized appreciation and depreciation of investments, based on this cost, were as follows: |
| | | | | |
| Gross unrealized appreciation | | $ | 85,583 | |
| Gross unrealized depreciation | | | (65,904 | ) |
| | | | | |
| Net unrealized appreciation | | $ | 19,679 | |
| | | | | |
| |
| ADR – | American Depositary Receipt |
| |
| REIT – | Real Estate Investment Trust |
| | | | | | | | | |
| Small Cap Value Fund |
| DESCRIPTION | | SHARES | | FAIR VALUE |
| |
| |
Common Stocks – 97.7% |
| Consumer Discretionary – 13.9% |
America’s Car-Mart = | | | 62,346 | | | $ | 1,292 | |
Ameristar Casinos 6 | | | 119,682 | | | | 1,762 | |
Bally Technologies = | | | 62,090 | | | | 2,446 | |
Callaway Golf 6 | | | 136,567 | | | | 934 | |
Children’s Place Retail Stores = 6 | | | 71,694 | | | | 2,255 | |
Core-Mark Holding = | | | 78,027 | | | | 2,135 | |
Domino’s Pizza = | | | 243,999 | | | | 1,791 | |
Ethan Allen Interiors 6 | | | 88,995 | | | | 1,109 | |
Genesco = | | | 72,602 | | | | 1,893 | |
Group 1 Automotive 6 | | | 78,773 | | | | 2,002 | |
| Jarden | | | 66,227 | | | | 1,814 | |
Jos. A. Bank Clothiers = 6 | | | 27,249 | | | | 1,117 | |
Rent-A-Center = | | | 101,449 | | | | 1,863 | |
Ryland Group 6 | | | 62,752 | | | | 1,164 | |
Sally Beauty Holdings = | | | 281,343 | | | | 1,899 | |
| | | | | | | | | |
| | | | | | | | 25,476 | |
| | | | | | | | | |
| Consumer Staples – 1.6% |
Chattem = 6 | | | 13,037 | | | | 826 | |
Spartan Stores 6 | | | 147,125 | | | | 2,083 | |
| | | | | | | | | |
| | | | | | | | 2,909 | |
| | | | | | | | | |
| Energy – 6.3% |
Complete Production Services = | | | 115,788 | | | | 1,104 | |
Hornbeck Offshore Services = | | | 47,775 | | | | 1,161 | |
Matrix Service = | | | 78,396 | | | | 695 | |
Natural Gas Services Group = | | | 89,072 | | | | 1,503 | |
Penn Virginia 6 | | | 115,465 | | | | 2,338 | |
| St. Mary Land & Exploration | | | 64,089 | | | | 2,185 | |
Swift Energy = | | | 88,078 | | | | 1,866 | |
Western Refining = 6 | | | 119,059 | | | | 668 | |
| | | | | | | | | |
| | | | | | | | 11,520 | |
| | | | | | | | | |
| Financials ⊳ – 29.5% |
Affiliated Managers Group = 6 | | | 42,690 | | | | 2,710 | |
Alexandria Real Estate Equities – REIT 6 | | | 34,876 | | | | 1,889 | |
American Campus Communities – REIT 6 | | | 82,143 | | | | 2,219 | |
Argo Group International Holdings = | | | 53,903 | | | | 1,831 | |
Bank of the Ozarks 6 | | | 88,014 | | | | 2,002 | |
| Cedar Shopping Centers – REIT | | | 275,352 | | | | 1,671 | |
| Community Bank System | | | 117,029 | | | | 2,178 | |
| Delphi Financial Group, Class A | | | 149,196 | | | | 3,238 | |
DiamondRock Hospitality – REIT = | | | 187,687 | | | | 1,428 | |
| Financial Federal | | | 77,219 | | | | 1,577 | |
First Midwest Bancorp 6 | | | 171,211 | | | | 1,781 | |
FirstMerit 6 | | | 99,425 | | | | 1,884 | |
FPIC Insurance Group = | | | 70,965 | | | | 2,401 | |
| Highwoods Properties – REIT | | | 97,560 | | | | 2,685 | |
Home Properties – REIT 6 | | | 48,426 | | | | 1,897 | |
| IBERIABANK | | �� | 28,513 | | | | 1,235 | |
| Independent Bank | | | 84,329 | | | | 1,794 | |
Knight Capital Group, Class A = | | | 111,153 | | | | 1,873 | |
| MFA Mortgage Investments – REIT | | | 194,686 | | | | 1,445 | |
| Mission West Properties – REIT | | | 172,769 | | | | 1,149 | |
National Retail Properties – REIT 6 | | | 101,929 | | | | 1,975 | |
Pinnacle Financial Partners = 6 | | | 104,877 | | | | 1,332 | |
| Presidential Life | | | 101,095 | | | | 943 | |
Raymond James Financial 6 | | | 97,110 | | | | 2,293 | |
SeaBright Insurance Holdings = | | | 173,518 | | | | 1,940 | |
| SWS Group | | | 158,010 | | | | 2,114 | |
Texas Capital Bancshares = | | | 130,217 | | | | 1,897 | |
| WSFS Financial | | | 70,759 | | | | 1,953 | |
Zions Bancorporation 6 | | | 51,642 | | | | 731 | |
| | | | | | | | | |
| | | | | | | | 54,065 | |
| | | | | | | | | |
First American Funds 2009 Annual Report 79
Schedule of Investments October 31, 2009, all dollars are rounded to thousands (000)
| | | | | | | | | |
| Small Cap Value Fund (continued) |
| DESCRIPTION | | SHARES | | FAIR VALUE |
| |
| |
| Healthcare – 4.3% |
Greatbatch = 6 | | | 72,274 | | | $ | 1,422 | |
Hanger Orthopedic Group = | | | 116,772 | | | | 1,616 | |
LHC Group = | | | 45,214 | | | | 1,262 | |
MEDNAX = | | | 30,923 | | | | 1,605 | |
Res-Care = | | | 162,866 | | | | 1,959 | |
| | | | | | | | | |
| | | | | | | | 7,864 | |
| | | | | | | | | |
| Industrials – 15.8% |
Altra Holdings = | | | 102,356 | | | | 898 | |
Apogee Enterprises 6 | | | 68,987 | | | | 913 | |
ATC Technology = | | | 54,918 | | | | 1,148 | |
Atlas Air Worldwide Holdings = | | | 71,248 | | | | 1,873 | |
| Brady, Class A | | | 92,149 | | | | 2,495 | |
EMCOR Group = | | | 94,513 | | | | 2,233 | |
| Ennis | | | 100,739 | | | | 1,526 | |
EnPro Industries = | | | 55,753 | | | | 1,259 | |
GrafTech International = | | | 174,880 | | | | 2,361 | |
Heartland Express 6 | | | 122,710 | | | | 1,669 | |
| Interface, Class A | | | 265,736 | | | | 2,062 | |
Interline Brands = | | | 82,664 | | | | 1,207 | |
MPS Group = | | | 69,629 | | | | 941 | |
| Nordson | | | 38,004 | | | | 2,006 | |
Regal-Beloit 6 | | | 57,214 | | | | 2,682 | |
Sterling Construction = | | | 107,690 | | | | 1,737 | |
| Triumph Group | | | 42,667 | | | | 1,997 | |
| | | | | | | | | |
| | | | | | | | 29,007 | |
| | | | | | | | | |
| Information Technology – 14.5% |
3Com = | | | 220,034 | | | | 1,131 | |
Amkor Technology = 6 | | | 302,531 | | | | 1,667 | |
CACI International, Class A = | | | 20,367 | | | | 970 | |
Ixia = | | | 223,229 | | | | 1,484 | |
MKS Instruments = | | | 109,302 | | | | 1,710 | |
Pericom Semiconductor = | | | 17,792 | | | | 167 | |
Perot Systems, Class A = | | | 63,232 | | | | 1,893 | |
| Plantronics | | | 114,221 | | | | 2,754 | |
PMC-Sierra = | | | 216,516 | | | | 1,845 | |
Polycom = 6 | | | 90,670 | | | | 1,947 | |
Progress Software = | | | 108,614 | | | | 2,509 | |
Rogers = | | | 85,514 | | | | 2,219 | |
TriQuint Semiconductor = | | | 201,596 | | | | 1,087 | |
TTM Technologies = | | | 188,034 | | | | 1,912 | |
United Online 6 | | | 394,403 | | | | 3,155 | |
| | | | | | | | | |
| | | | | | | | 26,450 | |
| | | | | | | | | |
| Materials – 7.1% |
| Albemarle | | | 43,435 | | | | 1,372 | |
| Arch Chemicals | | | 107,723 | | | | 2,983 | |
Buckeye Technologies = | | | 160,374 | | | | 1,437 | |
| Commercial Metals | | | 91,120 | | | | 1,352 | |
| Minerals Technologies | | | 20,038 | | | | 987 | |
Rockwood Holdings = | | | 112,267 | | | | 2,232 | |
| Silgan Holdings | | | 48,185 | | | | 2,590 | |
| | | | | | | | | |
| | | | | | | | 12,953 | |
| | | | | | | | | |
| Telecommunication Services – 0.5% |
| NTELOS Holdings | | | 58,329 | | | | 881 | |
| | | | | | | | | |
| Utilities – 4.2% |
El Paso Electric = | | | 130,785 | | | | 2,452 | |
| Northwest Natural Gas | | | 35,620 | | | | 1,490 | |
Portland General Electric 6 | | | 97,050 | | | | 1,804 | |
| Unitil | | | 93,777 | | | | 1,940 | |
| | | | | | | | | |
| | | | | | | | 7,686 | |
| | | | | | | | | |
Total Common Stocks | | | | | | | | |
(Cost $185,944) | | | | | | | 178,811 | |
| | | | | | | | | |
Exchange-Traded Funds – 1.7% |
iShares Russell Microcap Index Fund 6 | | | 63,199 | | | | 2,266 | |
SPDR S&P Biotech 6 | | | 15,946 | | | | 745 | |
| | | | | | | | | |
Total Exchange-Traded Funds | | | | | | | | |
(Cost $3,133) | | | | | | | 3,011 | |
| | | | | | | | | |
Short-Term Investment – 0.4% |
| First American Prime Obligations Fund, Class Z | | | | | | | | |
0.148% Å Ω | | | | | | | | |
(Cost $799) | | | 799,135 | | | | 799 | |
| | | | | | | | | |
Investment Purchased with Proceeds
from Securities Lending – 20.3% |
| Mount Vernon Securities Lending Prime Portfolio 0.209% Ω † | | | | | | | | |
(Cost $37,160) | | | 37,160,178 | | | | 37,160 | |
| | | | | | | | | |
Total Investments 5 – 120.1% | | | | | | | | |
(Cost $227,036) | | | | | | | 219,781 | |
| | | | | | | | | |
Other Assets and Liabilities, Net – (20.1)% | | | | | | | (36,833 | ) |
| | | | | | | | | |
Total Net Assets – 100.0% | | | | | | $ | 182,948 | |
| | | | | | | | | |
| | |
| = | | Non-income producing security. |
| |
| 6 | | This security or a portion of this security is out on loan at October 31, 2009. Total loaned securities had a fair value of $34,194 at October 31, 2009. See note 2 in Notes to Financial Statements. |
| |
| ⊳ | | The fund is significantly invested in this sector and therefore is subject to additional risks. See note 7 in Notes to Financial Statements. |
| |
| Å | | Investment in affiliated security. This money market fund is advised by FAF Advisors, Inc., which also serves as advisor for this fund. See note 3 in Notes to Financial Statements. |
| |
| Ω | | The rate quoted is the annualized seven-day effective yield as of October 31, 2009. |
| |
| † | | The fund may loan securities representing up to one third of the fair value of its total assets (which includes collateral for securities on loan) to broker- dealers, banks, or other institutional borrowers of securities. The fund maintains collateral equal to at least 100% of the fair value of the securities loaned. The adequacy of the collateral is monitored on a daily basis. The cash collateral received by the fund is invested in this affiliated money market fund. See note 2 in Notes to Financial Statements. |
| |
| 5 | | On October 31, 2009, the cost of investments for federal income tax purposes was $227,798. The aggregate gross unrealized appreciation and depreciation of investments, based on this cost, were as follows: |
| | | | | |
| Gross unrealized appreciation | | $ | 19,606 | |
| Gross unrealized depreciation | | | (27,623 | ) |
| | | | | |
| Net unrealized depreciation | | $ | (8,017 | ) |
| | | | | |
| |
| REIT – | Real Estate Investment Trust |
The accompanying notes are an integral part of the financial statements.
80 First American Funds 2009 Annual Report
(This page intentionally left blank.)
Statements ofAssets and Liabilities October 31, 2009, all dollars are rounded to thousands (000)
| | | | | | | | | | | | | | | | | | | | | | | | | | | |
| | | | | | | | | | | | | | | | | | | | | | |
| | | Equity
| | | | Global
| | | | | | | | International
| | | | Large Cap Growth
| | | |
| | | Income Fund | | | | Infrastructure Fund | | | | International Fund | | | | Select Fund | | | | Opportunities Fund | | | |
| |
Unaffiliated investments,
at cost | | $ | 575,322 | | | | $ | 55,145 | | | | $ | 602,071 | | | | $ | 559,136 | | | | $ | 461,567 | | | |
| Affiliated investments, at cost | | | 3,195 | | | | | — | | | | | — | | | | | — | | | | | 3,966 | | | |
| Affiliated investments purchased with proceeds from securities lending, at cost (note 2) | | | 101,004 | | | | | — | | | | | — | | | | | — | | | | | 104,521 | | | |
| Cash denominated in foreign currencies, at cost | | | — | | | | | 43 | | | | | 12,034 | | | | | 625 | | | | | — | | | |
| |
| |
ASSETS: | | | | | | | | | | | | | | | | | | | | | | | | | | |
| Unaffiliated investments, at fair value* (note 2) | | $ | 679,063 | | | | $ | 57,632 | | | | $ | 711,376 | | | | $ | 586,671 | | | | $ | 546,590 | | | |
| Affiliated investments, at fair value (note 2) | | | 3,195 | | | | | — | | | | | — | | | | | — | | | | | 3,966 | | | |
| Affiliated investments purchased with proceeds from securities lending, at fair value (note 2) | | | 101,004 | | | | | — | | | | | — | | | | | — | | | | | 104,521 | | | |
| Cash denominated in foreign currencies, at fair value (note 2) | | | — | | | | | 43 | | | | | — | | | | | — | | | | | — | | | |
| Cash | | | — | | | | | 212 | | | | | 11,562 | | | | | 1,522 | | | | | 56 | | | |
| Receivable for dividends and interest | | | 1,292 | | | | | 72 | | | | | 1,155 | | | | | 857 | | | | | 251 | | | |
| Receivable for investments sold | | | — | | | | | 2,653 | | | | | 3,843 | | | | | 2,884 | | | | | — | | | |
| Receivable for capital shares sold | | | 686 | | | | | 777 | | | | | 513 | | | | | 1,150 | | | | | 211 | | | |
| Receivable for foreign withholding tax reclaim | | | — | | | | | 8 | | | | | 647 | | | | | 200 | | | | | — | | | |
| Receivable for variation margin (note 2) | | | — | | | | | — | | | | | — | | | | | 120 | | | | | — | | | |
| Prepaid expenses and other assets | | | 35 | | | | | 23 | | | | | 35 | | | | | 11 | | | | | 29 | | | |
| |
| |
Total assets | | | 785,275 | | | | | 61,420 | | | | | 729,131 | | | | | 593,415 | | | | | 655,624 | | | |
| |
| |
LIABILITIES: | | | | | | | | | | | | | | | | | | | | | | | | | | |
| Bank overdraft | | | — | | | | | 148 | | | | | — | | | | | — | | | | | — | | | |
| Cash denominated in foreign currencies, at fair value (note 2) | | | — | | | | | — | | | | | 12,174 | | | | | 563 | | | | | — | | | |
| Payable for investments purchased | | | — | | | | | 1,396 | | | | | 1,870 | | | | | 4,274 | | | | | 795 | | | |
| Payable upon return of securities loaned (note 2) | | | 101,004 | | | | | — | | | | | — | | | | | — | | | | | 104,521 | | | |
| Payable for capital shares redeemed | | | 647 | | | | | 214 | | | | | 100 | | | | | 85 | | | | | 712 | | | |
| Payable for foreign withholding tax | | | — | | | | | — | | | | | — | | | | | — | | | | | — | | | |
| Payable for variation margin (note 2) | | | — | | | | | — | | | | | 534 | | | | | — | | | | | — | | | |
| Payable to affiliates (note 3) | | | 554 | | | | | 72 | | | | | 811 | | | | | 384 | | | | | 457 | | | |
| Payable to custodian (note 3) | | | — | | | | | 39 | | | | | 70 | | | | | 146 | | | | | — | | | |
| Payable for distribution and shareholder servicing fees | | | 32 | | | | | 7 | | | | | 10 | | | | | 1 | | | | | 21 | | | |
| Accrued expenses and other liabilities | | | 9 | | | | | 8 | | | | | 8 | | | | | 3 | | | | | 8 | | | |
| |
| |
Total liabilities | | | 102,246 | | | | | 1,884 | | | | | 15,577 | | | | | 5,456 | | | | | 106,514 | | | |
| |
| |
Net assets | | $ | 683,029 | | | | $ | 59,536 | | | | $ | 713,554 | | | | $ | 587,959 | | | | $ | 549,110 | | | |
| |
| |
COMPOSITION OF NET ASSETS: | | | | | | | | | | | | | | | | | | | | | | | | | | |
| Portfolio capital | | $ | 605,717 | | | | $ | 58,206 | | | | $ | 661,227 | | | | $ | 630,912 | | | | $ | 575,665 | | | |
| Undistributed (distributions in excess of) net investment income | | | 2,092 | | | | | 941 | | | | | 4,397 | | | | | 2,268 | | | | | 2,094 | | | |
| Accumulated net realized loss on investments, futures contracts and foreign currency transactions | | | (28,521 | ) | | | | (2,099 | ) | | | | (59,214 | ) | | | | (70,537 | ) | | | | (113,672 | ) | | |
| Net unrealized appreciation or depreciation of: | | | | | | | | | | | | | | | | | | | | | | | | | | |
| Investments | | | 103,741 | | | | | 2,487 | | | | | 109,305 | | | | | 27,535 | | | | | 85,023 | | | |
| Futures contracts | | | — | | | | | — | | | | | (2,077 | ) | | | | (2,364 | ) | | | | — | | | |
| Foreign currency, and translation of other assets and liabilities denominated in foreign currency (note 2) | | | — | | | | | 1 | | | | | (84 | ) | | | | 145 | | | | | — | | | |
| |
| |
Net assets | | $ | 683,029 | | | | $ | 59,536 | | | | $ | 713,554 | | | | $ | 587,959 | | | | $ | 549,110 | | | |
| |
| |
| * Including securities loaned, at value | | $ | 93,490 | | | | $ | — | | | | $ | — | | | | $ | — | | | | $ | 99,135 | | | |
| |
| |
The accompanying notes are an integral part of the financial statements.
82 First American Funds 2009 Annual Report
| | | | | | | | | | | | | | | | | | | | | | | | | | | | | | | | | | | | | | | | | | | | | | | |
| | | | | | | | | | | | | | | | | | | | | | | | | | | | | | | | | | | | | | |
| | | Large Cap
| | | | Large Cap
| | | | Mid Cap Growth
| | | | Mid Cap
| | | | Mid Cap
| | | | Real Estate
| | | | Small Cap Growth
| | | | Small Cap
| | | | Small Cap
| | | |
| | | Select Fund | | | | Value Fund | | | | Opportunities Fund | | | | Select Fund | | | | Value Fund | | | | Securities Fund | | | | Opportunities Fund | | | | Select Fund | | | | Value Fund | | | |
| |
| | | $ | 132,187 | | | | $ | 378,815 | | | | $ | 1,025,728 | | | | $ | 39,988 | | | | $ | 562,848 | | | | $ | 901,937 | | | | $ | 130,505 | | | | $ | 599,786 | | | | $ | 189,077 | | | |
| | | | — | | | | | 1,117 | | | | | 5,757 | | | | | 623 | | | | | 5,759 | | | | | 20,079 | | | | | 2,799 | | | | | 33,892 | | | | | 799 | | | |
| | | | | | | | | | | | | | | | | | | | | | | | | | | | | | | | | | | | | | | | | | | | | | | |
| | | | 43,990 | | | | | 70,130 | | | | | 291,904 | | | | | 10,291 | | | | | 118,965 | | | | | 473,358 | | | | | 30,805 | | | | | 200,149 | | | | | 37,160 | | | |
| | | | — | | | | | — | | | | | — | | | | | — | | | | | — | | | | | — | | | | | — | | | | | — | | | | | — | | | |
| |
| |
| | | | | | | | | | | | | | | | | | | | | | | | | | | | | | | | | | | | | | | | | | | | | | | |
| | | $ | 150,671 | | | | $ | 393,368 | | | | $ | 1,182,306 | | | | $ | 43,138 | | | | $ | 606,633 | | | | $ | 998,026 | | | | $ | 135,661 | | | | $ | 637,983 | | | | $ | 181,822 | | | |
| | | | — | | | | | 1,117 | | | | | 5,757 | | | | | 623 | | | | | 5,759 | | | | | 11,760 | | | | | 2,799 | | | | | 28,442 | | | | | 799 | | | |
| | | | | | | | | | | | | | | | | | | | | | | | | | | | | | | | | | | | | | | | | | | | | | | |
| | | | 43,990 | | | | | 70,130 | | | | | 291,904 | | | | | 10,291 | | | | | 118,965 | | | | | 473,358 | | | | | 30,805 | | | | | 200,149 | | | | | 37,160 | | | |
| | | | — | | | | | — | | | | | — | | | | | — | | | | | — | | | | | — | | | | | — | | | | | — | | | | | — | | | |
| | | | — | | | | | 8 | | | | | — | | | | | — | | | | | 13 | | | | | — | | | | | — | | | | | — | | | | | — | | | |
| | | | 115 | | | | | 643 | | | | | 175 | | | | | 10 | | | | | 492 | | | | | 1,204 | | | | | 42 | | | | | 416 | | | | | 124 | | | |
| | | | 2,435 | | | | | 996 | | | | | 12,799 | | | | | 182 | | | | | 11,149 | | | | | 11,109 | | | | | 1,273 | | | | | 6,006 | | | | | 4,733 | | | |
| | | | 69 | | | | | 134 | | | | | 1,097 | | | | | 5 | | | | | 280 | | | | | 8,838 | | | | | 151 | | | | | 1,833 | | | | | 53 | | | |
| | | | — | | | | | — | | | | | — | | | | | — | | | | | — | | | | | — | | | | | — | | | | | — | | | | | — | | | |
| | | | — | | | | | — | | | | | — | | | | | — | | | | | — | | | | | — | | | | | — | | | | | — | | | | | — | | | |
| | | | 26 | | | | | 77 | | | | | 37 | | | | | 28 | | | | | 48 | | | | | 57 | | | | | 51 | | | | | 39 | | | | | 32 | | | |
| |
| |
| | | | 197,306 | | | | | 466,473 | | | | | 1,494,075 | | | | | 54,277 | | | | | 743,339 | | | | | 1,504,352 | | | | | 170,782 | | | | | 874,868 | | | | | 224,723 | | | |
| |
| |
| | | | | | | | | | | | | | | | | | | | | | | | | | | | | | | | | | | | | | | | | | | | | | | |
| | | | 402 | | | | | — | | | | | — | | | | | — | | | | | — | | | | | — | | | | | — | | | | | — | | | | | — | | | |
| | | | — | | | | | — | | | | | — | | | | | — | | | | | — | | | | | — | | | | | — | | | | | — | | | | | — | | | |
| | | | 1,876 | | | | | — | | | | | 14,211 | | | | | 170 | | | | | 10,844 | | | | | 14,310 | | | | | 1,276 | | | | | 8,188 | | | | | 4,353 | | | |
| | | | 43,990 | | | | | 70,130 | | | | | 291,904 | | | | | 10,291 | | | | | 118,965 | | | | | 473,358 | | | | | 30,805 | | | | | 200,149 | | | | | 37,160 | | | |
| | | | 121 | | | | | 371 | | | | | 807 | | | | | 30 | | | | | 555 | | | | | 1,178 | | | | | 68 | | | | | 686 | | | | | 67 | | | |
| | | | — | | | | | — | | | | | — | | | | | — | | | | | — | | | | | 6 | | | | | — | | | | | — | | | | | — | | | |
| | | | — | | | | | — | | | | | — | | | | | — | | | | | — | | | | | — | | | | | — | | | | | — | | | | | — | | | |
| | | | 133 | | | | | 336 | | | | | 1,017 | | | | | 37 | | | | | 537 | | | | | 852 | | | | | 154 | | | | | 584 | | | | | 177 | | | |
| | | | — | | | | | — | | | | | — | | | | | — | | | | | — | | | | | — | | | | | — | | | | | — | | | | | — | | | |
| | | | 1 | | | | | 16 | | | | | 81 | | | | | 7 | | | | | 55 | | | | | 98 | | | | | 10 | | | | | 97 | | | | | 10 | | | |
| | | | 8 | | | | | 8 | | | | | 9 | | | | | 8 | | | | | 8 | | | | | 8 | | | | | 9 | | | | | 8 | | | | | 8 | | | |
| |
| |
| | | | 46,531 | | | | | 70,861 | | | | | 308,029 | | | | | 10,543 | | | | | 130,964 | | | | | 489,810 | | | | | 32,322 | | | | | 209,712 | | | | | 41,775 | | | |
| |
| |
| | | $ | 150,775 | | | | $ | 395,612 | | | | $ | 1,186,046 | | | | $ | 43,734 | | | | $ | 612,375 | | | | $ | 1,014,542 | | | | $ | 138,460 | | | | $ | 665,156 | | | | $ | 182,948 | | | |
| |
| |
| | | | | | | | | | | | | | | | | | | | | | | | | | | | | | | | | | | | | | | | | | | | | | | |
| | | $ | 251,568 | | | | $ | 512,460 | | | | $ | 1,317,839 | | | | $ | 170,593 | | | | $ | 753,158 | | | | $ | 1,218,570 | | | | $ | 183,394 | | | | $ | 823,525 | | | | $ | 254,395 | | | |
| | | | 921 | | | | | 4,984 | | | | | (13 | ) | | | | 155 | | | | | 7,349 | | | | | (10 | ) | | | | (8 | ) | | | | 170 | | | | | (7 | ) | | |
| | | | | | | | | | | | | | | | | | | | | | | | | | | | | | | | | | | | | | | | | | | | | | | |
| | | | (120,198 | ) | | | | (136,385 | ) | | | | (288,358 | ) | | | | (130,164 | ) | | | | (191,917 | ) | | | | (291,788 | ) | | | | (50,082 | ) | | | | (191,286 | ) | | | | (64,185 | ) | | |
| | | | | | | | | | | | | | | | | | | | | | | | | | | | | | | | | | | | | | | | | | | | | | | |
| | | | 18,484 | | | | | 14,553 | | | | | 156,578 | | | | | 3,150 | | | | | 43,785 | | | | | 87,770 | | | | | 5,156 | | | | | 32,747 | | | | | (7,255 | ) | | |
| | | | — | | | | | — | | | | | — | | | | | — | | | | | — | | | | | — | | | | | — | | | | | — | | | | | — | | | |
| | | | | | | | | | | | | | | | | | | | | | | | | | | | | | | | | | | | | | | | | | | | | | | |
| | | | — | | | | | — | | | | | — | | | | | — | | | | | — | | | | | — | | | | | — | | | | | — | | | | | — | | | |
| |
| |
| | | $ | 150,775 | | | | $ | 395,612 | | | | $ | 1,186,046 | | | | $ | 43,734 | | | | $ | 612,375 | | | | $ | 1,014,542 | | | | $ | 138,460 | | | | $ | 665,156 | | | | $ | 182,948 | | | |
| |
| |
| | | $ | 40,664 | | | | $ | 64,588 | | | | $ | 275,411 | | | | $ | 9,477 | | | | $ | 109,399 | | | | $ | 449,686 | | | | $ | 28,556 | | | | $ | 185,533 | | | | $ | 34,194 | | | |
| |
| |
First American Funds 2009 Annual Report 83
| |
| Statements ofAssets and Liabilities | continued, all dollars are rounded to thousands (000), except per share data |
| | | | | | | | | | | | | | | | | | | | | | | | | | | |
| | | | | | | | | | | | | | | | | | | | | | |
| | | Equity
| | | | Global
| | | | | | | | International
| | | | Large Cap Growth
| | | |
| | | Income Fund | | | | Infrastructure Fund | | | | International Fund | | | | Select Fund | | | | Opportunities Fund | | | |
| |
Class A: | | | | | | | | | | | | | | | | | | | | | | | | | | |
| Net assets | | $ | 100,059 | | | | $ | 19,901 | | | | $ | 27,995 | | | | $ | 3,029 | | | | $ | 56,963 | | | |
Shares issued and outstanding
($0.0001 par value – 2 billion authorized) | | | 9,299 | | | | | 2,553 | | | | | 2,597 | | | | | 357 | | | | | 2,351 | | | |
| Net asset value and redemption price per share | | $ | 10.76 | | | | $ | 7.80 | | | | $ | 10.78 | | | | $ | 8.48 | | | | $ | 24.23 | | | |
Maximum offering price per share1 | | $ | 11.39 | | | | $ | 8.25 | | | | $ | 11.41 | | | | $ | 8.97 | | | | $ | 25.64 | | | |
Class B2: | | | | | | | | | | | | | | | | | | | | | | | | | | |
| Net assets | | $ | 7,237 | | | | | — | | | | $ | 1,976 | | | | | — | | | | $ | 4,749 | | | |
Shares issued and outstanding
($0.0001 par value – 2 billion authorized) | | | 682 | | | | | — | | | | | 201 | | | | | — | | | | | 213 | | | |
Net asset value, offering price, and redemption price per share3 | | $ | 10.61 | | | | | — | | | | $ | 9.84 | | | | | — | | | | $ | 22.31 | | | |
Class C: | | | | | | | | | | | | | | | | | | | | | | | | | | |
| Net assets | | $ | 4,921 | | | | $ | 3,034 | | | | $ | 3,269 | | | | $ | 244 | | | | $ | 4,509 | | | |
Shares issued and outstanding
($0.0001 par value – 2 billion authorized) | | | 463 | | | | | 392 | | | | | 319 | | | | | 29 | | | | | 198 | | | |
Net asset value, offering price and redemption price per share3 | | $ | 10.63 | | | | $ | 7.75 | | | | $ | 10.26 | | | | $ | 8.42 | | | | $ | 22.81 | | | |
Class R4: | | | | | | | | | | | | | | | | | | | | | | | | | | |
| Net assets | | $ | 122 | | | | $ | 6 | | | | $ | 5 | | | | $ | 19 | | | | $ | 667 | | | |
Shares issued and outstanding
($0.0001 par value – 2 billion authorized) | | | 11 | | | | | 1 | | | | | — | ** | | | | 2 | | | | | 28 | | | |
| Net asset value, offering price, and redemption price per share | | $ | 10.76 | | | | $ | 7.78 | | | | $ | 10.78 | | | | $ | 8.42 | | | | $ | 23.92 | | | |
Class Y: | | | | | | | | | | | | | | | | | | | | | | | | | | |
| Net assets | | $ | 570,690 | | | | $ | 36,595 | | | | $ | 680,309 | | | | $ | 584,667 | | | | $ | 482,222 | | | |
Shares issued and outstanding
($0.0001 par value – 2 billion authorized) | | | 52,578 | | | | | 4,678 | | | | | 62,301 | | | | | 68,880 | | | | | 19,219 | | | |
| Net asset value, offering price, and redemption price per share | | $ | 10.85 | | | | $ | 7.82 | | | | $ | 10.92 | | | | $ | 8.49 | | | | $ | 25.09 | | | |
| |
| |
| | |
| | 1 | The offering price is calculated by dividing the net asset value by 1 minus the maximum sales charge of 5.50% |
| |
| | 2 | No new or additional investments are allowed in Class B shares. See note 1 in Notes to Financial Statements. |
| |
| | 3 | Class B and Class C have a contingent deferred sales charge. For a description of this sales charge, see notes 1 and 3 in Notes to Financial Statements. |
| |
| | 4 | Class R is not offered by Mid Cap Select Fund. |
| |
| ** | Due to the presentation of the Financial Statements in thousands, the number rounds to zero. |
The accompanying notes are an integral part of the financial statements.
84 First American Funds 2009 Annual Report
| | | | | | | | | | | | | | | | | | | | | | | | | | | | | | | | | | | | | | | | | | | | | | | |
| | | | | | | | | | | | | | | | | | | | | | | | | | | | | | | | | | | | | | |
| | | | | | | | | | | Mid Cap
| | | | | | | | | | | | | | | | Small Cap
| | | | | | | | | | | |
| | | | | | | | | | | Growth
| | | | | | | | | | | | Real Estate
| | | | Growth
| | | | | | | | | | | |
| | | Large Cap
| | | | Large Cap
| | | | Opportunities
| | | | Mid Cap
| | | | Mid Cap
| | | | Securities
| | | | Opportunities
| | | | Small Cap
| | | | Small Cap
| | | |
| | | Select Fund | | | | Value Fund | | | | Fund | | | | Select Fund | | | | Value Fund | | | | Fund | | | | Fund | | | | Select Fund | | | | Value Fund | | | |
| |
| | | | | | | | | | | | | | | | | | | | | | | | | | | | | | | | | | | | | | | | | | | |
| | | $ | 3,292 | | | | $ | 55,401 | | | | $ | 231,743 | | | | $ | 12,487 | | | | $ | 130,222 | | | | $ | 287,493 | | | | $ | 30,202 | | | | $ | 295,348 | | | | $ | 29,026 | | | |
| | | | | | | | | | | | | | | | | | | | | | | | | | | | | | | | | | | | | | | | | | | |
| | | | 336 | | | | | 4,215 | | | | | 8,038 | | | | | 1,632 | | | | | 7,124 | | | | | 23,108 | | | | | 2,076 | | | | | 30,989 | | | | | 3,532 | | | |
| | | $ | 9.80 | | | | $ | 13.14 | | | | $ | 28.83 | | | | $ | 7.65 | | | | $ | 18.28 | | | | $ | 12.44 | | | | $ | 14.55 | | | | $ | 9.53 | | | | $ | 8.22 | | | |
| | | $ | 10.37 | | | | $ | 13.90 | | | | $ | 30.51 | | | | $ | 8.10 | | | | $ | 19.34 | | | | $ | 13.16 | | | | $ | 15.40 | | | | $ | 10.08 | | | | $ | 8.70 | | | |
| | | | | | | | | | | | | | | | | | | | | | | | | | | | | | | | | | | | | | | | | | | |
| | | | — | | | | $ | 2,266 | | | | $ | 6,762 | | | | $ | 1,691 | | | | $ | 3,481 | | | | $ | 2,693 | | | | $ | 2,025 | | | | $ | 5,511 | | | | | — | | | |
| | | | | | | | | | | | | | | | | | | | | | | | | | | | | | | | | | | | | | | | | | | |
| | | | — | | | | | 180 | | | | | 266 | | | | | 259 | | | | | 202 | | | | | 221 | | | | | 158 | | | | | 725 | | | | | — | | | |
| | | | — | | | | $ | 12.61 | | | | $ | 25.43 | | | | $ | 6.52 | | | | $ | 17.21 | | | | $ | 12.17 | | | | $ | 12.82 | | | | $ | 7.60 | | | | | — | | | |
| | | | | | | | | | | | | | | | | | | | | | | | | | | | | | | | | | | | | | | | | | | |
| | | $ | 186 | | | | $ | 2,016 | | | | $ | 12,894 | | | | $ | 2,526 | | | | $ | 12,040 | | | | $ | 17,632 | | | | $ | 1,341 | | | | $ | 16,938 | | | | $ | 2,080 | | | |
| | | | | | | | | | | | | | | | | | | | | | | | | | | | | | | | | | | | | | | | | | | |
| | | | 20 | | | | | 157 | | | | | 484 | | | | | 355 | | | | | 684 | | | | | 1,444 | | | | | 100 | | | | | 1,941 | | | | | 285 | | | |
| | | $ | 9.46 | | | | $ | 12.81 | | | | $ | 26.67 | | | | $ | 7.12 | | | | $ | 17.61 | | | | $ | 12.21 | | | | $ | 13.44 | | | | $ | 8.73 | | | | $ | 7.31 | | | |
| | | | | | | | | | | | | | | | | | | | | | | | | | | | | | | | | | | | | | | | | | | |
| | | $ | 66 | | | | $ | 340 | | | | $ | 26,822 | | | | | — | | | | $ | 25,664 | | | | $ | 46,382 | | | | $ | 1,469 | | | | $ | 24,701 | | | | $ | 2,327 | | | |
| | | | | | | | | | | | | | | | | | | | | | | | | | | | | | | | | | | | | | | | | | | |
| | | | 7 | | | | | 26 | | | | | 945 | | | | | — | | | | | 1,414 | | | | | 3,689 | | | | | 102 | | | | | 2,644 | | | | | 287 | | | |
| | | $ | 9.74 | | | | $ | 13.09 | | | | $ | 28.37 | | | | | — | | | | $ | 18.15 | | | | $ | 12.57 | | | | $ | 14.36 | | | | $ | 9.34 | | | | $ | 8.10 | | | |
| | | | | | | | | | | | | | | | | | | | | | | | | | | | | | | | | | | | | | | | | | | |
| | | $ | 147,231 | | | | $ | 335,589 | | | | $ | 907,825 | | | | $ | 27,030 | | | | $ | 440,968 | | | | $ | 660,342 | | | | $ | 103,423 | | | | $ | 322,658 | | | | $ | 149,515 | | | |
| | | | | | | | | | | | | | | | | | | | | | | | | | | | | | | | | | | | | | | | | | | |
| | | | 14,953 | | | | | 25,375 | | | | | 29,338 | | | | | 3,387 | | | | | 23,943 | | | | | 52,524 | | | | | 6,617 | | | | | 31,230 | | | | | 17,690 | | | |
| | | $ | 9.85 | | | | $ | 13.23 | | | | $ | 30.94 | | | | $ | 7.98 | | | | $ | 18.42 | | | | $ | 12.57 | | | | $ | 15.63 | | | | $ | 10.33 | | | | $ | 8.45 | | | |
| |
| |
First American Funds 2009 Annual Report 85
| |
| Statements ofOperations | For the year ended October 31, 2009, all dollars are rounded to thousands (000) |
| | | | | | | | | | | | | | | | | | | | | | | | | | | |
| | | | | | | | | | | | | | | | | | | | | | |
| | | Equity
| | | | Global
| | | | | | | | International
| | | | Large Cap Growth
| | | |
| | | Income Fund | | | | Infrastructure Fund | | | | International Fund | | | | Select Fund | | | | Opportunities Fund | | | |
| |
INVESTMENT INCOME: | | | | | | | | | | | | | | | | | | | | | | | | | | |
| Interest from unaffiliated investments | | $ | — | | | | $ | 5 | | | | $ | 311 | | | | $ | 79 | | | | $ | 1 | | | |
| Dividends from unaffiliated investments | | | 26,167 | | | | | 1,599 | | | | | 17,033 | | | | | 8,960 | | | | | 6,471 | | | |
| Dividends from affiliated investments | | | 74 | | | | | — | | | | | — | | | | | — | | | | | 21 | | | |
| Less: Foreign taxes withheld | | | (170 | ) | | | | (119 | ) | | | | (1,533 | ) | | | | (839 | ) | | | | — | | | |
| Securities lending income | | | 511 | | | | | — | | | | | 37 | | | | | 250 | | | | | 479 | | | |
| |
| |
Total investment income | | | 26,582 | | | | | 1,485 | | | | | 15,848 | | | | | 8,450 | | | | | 6,972 | | | |
| |
| |
EXPENSES (note 3): | | | | | | | | | | | | | | | | | | | | | | | | | | |
| Investment advisory fees | | | 4,121 | | | | | 371 | | | | | 6,365 | | | | | 3,489 | | | | | 3,121 | | | |
| Administration fees | | | 1,388 | | | | | 107 | | | | | 1,441 | | | | | 809 | | | | | 1,054 | | | |
| Transfer agent fees | | | 277 | | | | | 89 | | | | | 208 | | | | | 115 | | | | | 269 | | | |
| Custodian fees | | | 32 | | | | | 183 | | | | | 320 | | | | | 666 | | | | | 25 | | | |
| Legal fees | | | 15 | | | | | 17 | | | | | 16 | | | | | 15 | | | | | 15 | | | |
| Audit fees | | | 29 | | | | | 30 | | | | | 31 | | | | | 57 | | | | | 29 | | | |
| Registration fees | | | 49 | | | | | 62 | | | | | 47 | | | | | 48 | | | | | 50 | | | |
| Postage & printing fees | | | 34 | | | | | 6 | | | | | 59 | | | | | 18 | | | | | 35 | | | |
| Directors’ fees | | | 30 | | | | | 30 | | | | | 30 | | | | | 35 | | | | | 30 | | | |
| Other expenses | | | 22 | | | | | 21 | | | | | 24 | | | | | 27 | | | | | 22 | | | |
| Distribution and shareholder servicing fees: | | | | | | | | | | | | | | | | | | | | | | | | | | |
| Class A | | | 227 | | | | | 30 | | | | | 62 | | | | | 5 | | | | | 127 | | | |
Class B1 | | | 75 | | | | | — | | | | | 19 | | | | | 2 | | | | | 48 | | | |
| Class C | | | 43 | | | | | 14 | | | | | 31 | | | | | 2 | | | | | 42 | | | |
Class R2 | | | 2 | | | | | — | | | | | — | | | | | — | | | | | 3 | | | |
| |
| |
Total expenses | | | 6,344 | | | | | 960 | | | | | 8,653 | | | | | 5,288 | | | | | 4,870 | | | |
| |
| |
| Less: Fee waivers (note 3) | | | (8 | ) | | | | (503 | ) | | | | (642 | ) | | | | (936 | ) | | | | (2 | ) | | |
| |
| |
Total net expenses | | | 6,336 | | | | | 457 | | | | | 8,011 | | | | | 4,352 | | | | | 4,868 | | | |
| |
| |
Investment income (loss) – net | | | 20,246 | | | | | 1,028 | | | | | 7,837 | | | | | 4,098 | | | | | 2,104 | | | |
| |
| |
REALIZED AND UNREALIZED GAINS (LOSSES) – NET (note 5): | | | | | | | | | | | | | | | | | | | | | | | | | | |
| Net realized gain (loss) on: | | | | | | | | | | | | | | | | | | | | | | | | | | |
| Unaffiliated investments | | | (14,066 | ) | | | | 2,258 | | | | | (59,460 | ) | | | | (45,089 | ) | | | | (66,901 | ) | | |
| Affiliated investments | | | — | | | | | — | | | | | — | | | | | — | | | | | — | | | |
| Futures contracts | | | — | | | | | — | | | | | (15,635 | ) | | | | 4,615 | | | | | 6,794 | | | |
| Options written | | | — | | | | | — | | | | | — | | | | | — | | | | | — | | | |
| Forward foreign currency contracts, foreign currency, and translation of other assets and liabilities denominated in foreign currency (note 2) | | | (1 | ) | | | | 3 | | | | | (2,356 | ) | | | | (1,097 | ) | | | | — | | | |
| Net change in unrealized appreciation or depreciation of: | | | | | | | | | | | | | | | | | | | | | | | | | | |
| Unaffiliated investments | | | 56,206 | | | | | 7,143 | | | | | 197,864 | | | | | 138,434 | | | | | 121,303 | | | |
| Affiliated investments | | | — | | | | | — | | | | | — | | | | | — | | | | | — | | | |
| Futures contracts | | | — | | | | | — | | | | | 14,698 | | | | | 2,599 | | | | | — | | | |
| Foreign currency, and translation of other assets and liabilities denominated in foreign currency (note 2) | | | — | | | | | 2 | | | | | (314 | ) | | | | (53 | ) | | | | — | | | |
| |
| |
Net income (loss) on investments, futures contracts, options written, foreign currency transactions, and swap agreements | | | 42,139 | | | | | 9,406 | | | | | 134,797 | | | | | 99,409 | | | | | 61,196 | | | |
| |
| |
| Net increase in net assets resulting from operations | | $ | 62,385 | | | | $ | 10,434 | | | | $ | 142,634 | | | | $ | 103,507 | | | | $ | 63,300 | | | |
| |
| |
| | |
| | 1 | Class B is not offered by Global Infrastructure Fund. |
| |
| | 2 | Class R is not offered by Mid Cap Select Fund. |
The accompanying notes are an integral part of the financial statements.
86 First American Funds 2009 Annual Report
| | | | | | | | | | | | | | | | | | | | | | | | | | | | | | | | | | | | | | | | | | | | | | | |
| | | | | | | | | | | | | | | | | | | | | | | | | | | | | | | | | | | | | | |
| | | | | | | | | | | Mid Cap
| | | | | | | | | | | | | | | | Small Cap
| | | | | | | | | | | |
| | | | | | | | | | | Growth
| | | | | | | | | | | | Real Estate
| | | | Growth
| | | | | | | | | | | |
| | | Large Cap
| | | | Large Cap
| | | | Opportunities
| | | | Mid Cap
| | | | Mid Cap
| | | | Securities
| | | | Opportunities
| | | | Small Cap
| | | | Small Cap
| | | |
| | | Select Fund | | | | Value Fund | | | | Fund | | | | Select Fund | | | | Value Fund | | | | Fund | | | | Fund | | | | Select Fund | | | | Value Fund | | | |
| |
| | | | | | | | | | | | | | | | | | | | | | | | | | | | | | | | | | | | | | | | | | | | | | | |
| | | $ | — | | | | $ | — | | | | $ | 2 | | | | $ | 1 | | | | $ | — | | | | $ | — | | | | $ | — | | | | $ | — | | | | $ | — | | | |
| | | | 2,828 | | | | | 10,373 | | | | | 7,386 | | | | | 866 | | | | | 14,374 | | | | | 35,504 | | | | | 386 | | | | | 5,354 | | | | | 2,837 | | | |
| | | | 7 | | | | | 27 | | | | | 80 | | | | | 3 | | | | | 88 | | | | | 91 | | | | | 22 | | | | | 142 | | | | | 17 | | | |
| | | | (2 | ) | | | | — | | | | | — | | | | | — | | | | | (3 | ) | | | | (79 | ) | | | | — | | | | | — | | | | | — | | | |
| | | | 167 | | | | | 351 | | | | | 1,398 | | | | | 47 | | | | | 660 | | | | | 1,047 | | | | | 191 | | | | | 833 | | | | | 256 | | | |
| |
| |
| | | | 3,000 | | | | | 10,751 | | | | | 8,866 | | | | | 917 | | | | | 15,119 | | | | | 36,563 | | | | | 599 | | | | | 6,329 | | | | | 3,110 | | | |
| |
| |
| | | | | | | | | | | | | | | | | | | | | | | | | | | | | | | | | | | | | | | | | | | | | | | |
| | | | 1,049 | | | | | 2,559 | | | | | 6,911 | | | | | 329 | | | | | 3,828 | | | | | 4,813 | | | | | 1,076 | | | | | 3,717 | | | | | 1,179 | | | |
| | | | 361 | | | | | 866 | | | | | 2,157 | | | | | 112 | | | | | 1,200 | | | | | 1,508 | | | | | 245 | | | | | 1,166 | | | | | 377 | | | |
| | | | 115 | | | | | 218 | | | | | 383 | | | | | 180 | | | | | 241 | | | | | 440 | | | | | 178 | | | | | 267 | | | | | 177 | | | |
| | | | 14 | | | | | 21 | | | | | 49 | | | | | 4 | | | | | 27 | | | | | 36 | | | | | 5 | | | | | 31 | | | | | 9 | | | |
| | | | 15 | | | | | 15 | | | | | 15 | | | | | 15 | | | | | 15 | | | | | 15 | | | | | 15 | | | | | 15 | | | | | 15 | | | |
| | | | 29 | | | | | 29 | | | | | 29 | | | | | 29 | | | | | 29 | | | | | 29 | | | | | 29 | | | | | 29 | | | | | 29 | | | |
| | | | 46 | | | | | 49 | | | | | 57 | | | | | 39 | | | | | 59 | | | | | 79 | | | | | 46 | | | | | 71 | | | | | 46 | | | |
| | | | 5 | | | | | 24 | | | | | 73 | | | | | 27 | | | | | 41 | | | | | 52 | | | | | 11 | | | | | 54 | | | | | 11 | | | |
| | | | 30 | | | | | 30 | | | | | 30 | | | | | 30 | | | | | 30 | | | | | 30 | | | | | 30 | | | | | 30 | | | | | 30 | | | |
| | | | 21 | | | | | 21 | | | | | 24 | | | | | 20 | | | | | 22 | | | | | 22 | | | | | 20 | | | | | 22 | | | | | 20 | | | |
| | | | | | | | | | | | | | | | | | | | | | | | | | | | | | | | | | | | | | | | | | | | | | | |
| | | | 8 | | | | | 131 | | | | | 505 | | | | | 29 | | | | | 289 | | | | | 409 | | | | | 67 | | | | | 521 | | | | | 64 | | | |
| | | | 2 | | | | | 26 | | | | | 65 | | | | | 19 | | | | | 34 | | | | | 25 | | | | | 18 | | | | | 54 | | | | | 14 | | | |
| | | | 2 | | | | | 22 | | | | | 114 | | | | | 26 | | | | | 116 | | | | | 108 | | | | | 11 | | | | | 156 | | | | | 21 | | | |
| | | | — | | | | | 1 | | | | | 115 | | | | | — | | | | | 123 | | | | | 141 | | | | | 4 | | | | | 112 | | | | | 11 | | | |
| |
| |
| | | | 1,697 | | | | | 4,012 | | | | | 10,527 | | | | | 859 | | | | | 6,054 | | | | | 7,707 | | | | | 1,755 | | | | | 6,245 | | | | | 2,003 | | | |
| |
| |
| | | | (1 | ) | | | | (2 | ) | | | | (13 | ) | | | | (239 | ) | | | | (10 | ) | | | | (10 | ) | | | | (346 | ) | | | | (21 | ) | | | | (2 | ) | | |
| |
| |
| | | | 1,696 | | | | | 4,010 | | | | | 10,514 | | | | | 620 | | | | | 6,044 | | | | | 7,697 | | | | | 1,409 | | | | | 6,224 | | | | | 2,001 | | | |
| |
| |
| | | | 1,304 | | | | | 6,741 | | | | | (1,648 | ) | | | | 297 | | | | | 9,075 | | | | | 28,866 | | | | | (810 | ) | | | | 105 | | | | | 1,109 | | | |
| |
| |
| | | | | | | | | | | | | | | | | | | | | | | | | | | | | | | | | | | | | | | | | | | | | | | |
| | | | | | | | | | | | | | | | | | | | | | | | | | | | | | | | | | | | | | | | | | | | | | | |
| | | | (49,896 | ) | | | | (81,898 | ) | | | | (161,489 | ) | | | | (16,427 | ) | | | | (84,621 | ) | | | | (162,772 | ) | | | | (5,607 | ) | | | | (93,728 | ) | | | | (37,715 | ) | | |
| | | | — | | | | | — | | | | | — | | | | | — | | | | | — | | | | | (1,573 | ) | | | | — | | | | | (1,433 | ) | | | | — | | | |
| | | | — | | | | | — | | | | | 15,590 | | | | | 994 | | | | | — | | | | | — | | | | | — | | | | | — | | | | | — | | | |
| | | | — | | | | | — | | | | | — | | | | | (321 | ) | | | | — | | | | | — | | | | | — | | | | | — | | | | | — | | | |
| | | | — | | | | | — | | | | | — | | | | | — | | | | | — | | | | | (8 | ) | | | | — | | | | | — | | | | | — | | | |
| | | | | | | | | | | | | | | | | | | | | | | | | | | | | | | | | | | | | | | | | | | | | | | |
| | | | 61,203 | | | | | 81,677 | | | | | 340,238 | | | | | 18,365 | | | | | 147,981 | | | | | 203,043 | | | | | 27,775 | | | | | 176,157 | | | | | 39,307 | | | |
| | | | — | | | | | — | | | | | — | | | | | — | | | | | — | | | | | (4,227 | ) | | | | — | | | | | 1,710 | | | | | — | | | |
| | | | — | | | | | — | | | | | — | | | | | — | | | | | — | | | | | — | | | | | — | | | | | — | | | | | — | | | |
| | | | — | | | | | — | | | | | — | | | | | — | | | | | — | | | | | — | | | | | — | | | | | — | | | | | — | | | |
| |
| |
| | | | 11,307 | | | | | (221 | ) | | | | 194,339 | | | | | 2,611 | | | | | 63,360 | | | | | 34,463 | | | | | 22,168 | | | | | 82,706 | | | | | 1,592 | | | |
| |
| |
| | | $ | 12,611 | | | | $ | 6,520 | | | | $ | 192,691 | | | | $ | 2,908 | | | | $ | 72,435 | | | | $ | 63,329 | | | | $ | 21,358 | | | | $ | 82,811 | | | | $ | 2,701 | | | |
| |
| |
First American Funds 2009 Annual Report 87
| |
| Statements ofChanges in Net Assets | all dollars are rounded to thousands (000) |
| | | | | | | | | | | | | | | | | | | | |
| | | | | | | | | | | | | | | | |
| | | | | | | Global
| | | |
| | | Equity
| | | | Infrastructure
| | | |
| | | Income Fund | | | | Fund1 | | | |
| |
| | | | | | | | | | | | | 12/17/072
| | | |
| | | Year Ended
| | | Year Ended
| | | | Year Ended
| | | to
| | | |
| | | 10/31/09 | | | 10/31/08 | | | | 10/31/09 | | | 10/31/08 | | | |
| |
OPERATIONS: | | | | | | | | | | | | | | | | | | | |
| Investment income (loss) – net | | $ | 20,246 | | | $ | 26,124 | | | | $ | 1,028 | | | $ | 208 | | | |
| Net realized gain (loss) on: | | | | | | | | | | | | | | | | | | | |
| Unaffiliated investments | | | (14,066 | ) | | | (12,130 | ) | | | | 2,258 | | | | (4,310 | ) | | |
| Redemptions in-kind (note 9) | | | — | | | | 4,349 | | | | | — | | | | — | | | |
| Futures contracts | | | — | | | | — | | | | | — | | | | — | | | |
| Forward foreign currency contracts, foreign currency, and translation of other assets and liabilities denominated in foreign currency (note 2) | | | (1 | ) | | | — | | | | | 3 | | | | 2 | | | |
| Net change in unrealized appreciation or depreciation of: | | | | | | | | | | | | | | | | | | | |
| Unaffiliated investments | | | 56,206 | | | | (379,560 | ) | | | | 7,143 | | | | (4,656 | ) | | |
| Futures contracts | | | — | | | | — | | | | | — | | | | — | | | |
| Foreign currency, and translation of other assets and liabilities denominated in foreign currency (note 2) | | | — | | | | — | | | | | 2 | | | | (1 | ) | | |
| |
| |
| Net increase (decrease) in net assets resulting from operations | | | 62,385 | | | | (361,217 | ) | | | | 10,434 | | | | (8,757 | ) | | |
| |
| |
DISTRIBUTIONS TO SHAREHOLDERS FROM: | | | | | | | | | | | | | | | | | | | |
| Investment income – net: | | | | | | | | | | | | | | | | | | | |
| Class A | | | (3,050 | ) | | | (3,201 | ) | | | | (86 | ) | | | — | | | |
| Class B | | | (200 | ) | | | (204 | ) | | | | — | | | | — | | | |
| Class C | | | (114 | ) | | | (110 | ) | | | | — | | | | — | | | |
| Class R | | | (9 | ) | | | (16 | ) | | | | — | | | | — | | | |
| Class Y | | | (19,001 | ) | | | (19,995 | ) | | | | (262 | ) | | | — | | | |
| Net realized gain on investments: | | | | | | | | | | | | | | | | | | | |
| Class A | | | — | | | | (11,805 | ) | | | | — | | | | — | | | |
| Class B | | | — | | | | (1,124 | ) | | | | — | | | | — | | | |
| Class C | | | — | | | | (605 | ) | | | | — | | | | — | | | |
| Class R | | | — | | | | (63 | ) | | | | — | | | | — | | | |
| Class Y | | | — | | | | (67,897 | ) | | | | — | | | | — | | | |
| |
| |
| Total distributions | | | (22,374 | ) | | | (105,020 | ) | | | | (348 | ) | | | — | | | |
| |
| |
CAPITAL SHARE TRANSACTIONS (note 4): | | | | | | | | | | | | | | | | | | | |
| Class A: | | | | | | | | | | | | | | | | | | | |
| Proceeds from sales | | | 9,072 | | | | 7,241 | | | | | 16,619 | | | | 5,363 | | | |
| Reinvestment of distributions | | | 2,785 | | | | 13,962 | | | | | 67 | | | | — | | | |
| Payments for redemptions | | | (17,930 | ) | | | (31,641 | ) | | | | (4,091 | ) | | | (272 | ) | | |
| |
| |
| Increase (decrease) in net assets from Class A transactions | | | (6,073 | ) | | | (10,438 | ) | | | | 12,595 | | | | 5,091 | | | |
| |
| |
Class B3: | | | | | | | | | | | | | | | | | | | |
| Proceeds from sales | | | 113 | | | | 411 | | | | | — | | | | — | | | |
| Reinvestment of distributions | | | 187 | | | | 1,248 | | | | | — | | | | — | | | |
| Payments for redemptions (note 3) | | | (2,480 | ) | | | (3,181 | ) | | | | — | | | | — | | | |
| |
| |
| Increase (decrease) in net assets from Class B transactions | | | (2,180 | ) | | | (1,522 | ) | | | | — | | | | — | | | |
| |
| |
| Class C: | | | | | | | | | | | | | | | | | | | |
| Proceeds from sales | | | 1,181 | | | | 595 | | | | | 2,639 | | | | — | | | |
| Reinvestment of distributions | | | 107 | | | | 666 | | | | | — | | | | — | | | |
| Payments for redemptions (note 3) | | | (1,258 | ) | | | (2,522 | ) | | | | (32 | ) | | | — | | | |
| |
| |
| Increase (decrease) in net assets from Class C transactions | | | 30 | | | | (1,261 | ) | | | | 2,607 | | | | — | | | |
| |
| |
| Class R: | | | | | | | | | | | | | | | | | | | |
| Proceeds from sales | | | 52 | | | | 78 | | | | | 5 | | | | — | | | |
| Reinvestment of distributions | | | 9 | | | | 79 | | | | | — | | | | — | | | |
| Payments for redemptions | | | (452 | ) | | | (193 | ) | | | | — | | | | — | | | |
| |
| |
| Increase (decrease) in net assets from Class R transactions | | | (391 | ) | | | (36 | ) | | | | 5 | | | | — | | | |
| |
| |
| Class Y: | | | | | | | | | | | | | | | | | | | |
| Proceeds from sales | | | 127,721 | | | | 77,778 | | | | | 41,075 | | | | 32,934 | | | |
| Reinvestment of distributions | | | 4,494 | | | | 39,603 | | | | | 141 | | | | — | | | |
| Payments for redemptions | | | (169,842 | ) | | | (216,514 | ) | | | | (28,216 | ) | | | (8,025 | ) | | |
| |
| |
| Increase (decrease) in net assets from Class Y transactions | | | (37,627 | ) | | | (99,133 | ) | | | | 13,000 | | | | 24,909 | | | |
| |
| |
| Increase (decrease) in net assets from capital share transactions | | | (46,241 | ) | | | (112,390 | ) | | | | 28,207 | | | | 30,000 | | | |
| Increase in net assets from regulatory settlement proceeds (note 10) | | | — | | | | — | | | | | — | | | | — | | | |
| |
| |
| Total increase (decrease) in net assets | | | (6,230 | ) | | | (578,627 | ) | | | | 38,293 | | | | 21,243 | | | |
Net assets at beginning of year | | | 689,259 | | | | 1,267,886 | | | | | 21,243 | | | | — | | | |
| |
| |
Net assets at end of year | | $ | 683,029 | | | $ | 689,259 | | | | $ | 59,536 | | | $ | 21,243 | | | |
| |
| |
Undistributed (distributions in excess of) net investment income at end of year | | $ | 2,092 | | | $ | 2,097 | | | | $ | 941 | | | $ | 210 | | | |
| |
| |
| | |
| | 1 | The fund began offering Class C and Class R on November 3, 2008. |
| |
| | 2 | Commencement of operations. |
| |
| | 3 | No new additional investments are allowed in Class B shares. See Note 1 in Notes to Financial Statements. |
The accompanying notes are an integral part of the financial statements.
88 First American Funds 2009 Annual Report
| | | | | | | | | | | | | | | | | | | | | | | | | | | | | | | | | | | | | | | | | | | | | | | |
| | | | | | | | | | | | | | | | | | | | | | | | | | | | | | | | | | | | | |
| | | International
| | | | International
| | | | Large Cap Growth
| | | | Large Cap
| | | | Large Cap
| | | |
| | | Fund | | | | Select Fund | | | | Opportunities Fund | | | | Select Fund | | | | Value Fund | | | |
| |
| | | Year Ended
| | | Year Ended
| | | | Year Ended
| | | Year Ended
| | | | Year Ended
| | | Year Ended
| | | | Year Ended
| | | Year Ended
| | | | Year Ended
| | | Year Ended
| | | |
| | | 10/31/09 | | | 10/31/08 | | | | 10/31/09 | | | 10/31/08 | | | | 10/31/09 | | | 10/31/08 | | | | 10/31/09 | | | 10/31/08 | | | | 10/31/09 | | | 10/31/08 | | | |
| |
| | | | | | | | | | | | | | | | | | | | | | | | | | | | | | | | | | | | | | | | | | | | | | | |
| | | $ | 7,837 | | | $ | 27,555 | | | | $ | 4,098 | | | $ | 5,378 | | | | $ | 2,104 | | | $ | 1,891 | | | | $ | 1,304 | | | $ | 2,530 | | | | $ | 6,741 | | | $ | 10,809 | | | |
| | | | | | | | | | | | | | | | | | | | | | | | | | | | | | | | | | | | | | | | | | | | | | | |
| | | | (59,460 | ) | | | 43,357 | | | | | (45,089 | ) | | | (24,099 | ) | | | | (66,901 | ) | | | (52,117 | ) | | | | (49,896 | ) | | | (68,940 | ) | | | | (81,898 | ) | | | (53,971 | ) | | |
| | | | — | | | | 23,282 | | | | | — | | | | — | | | | | — | | | | — | | | | | — | | | | — | | | | | — | | | | — | | | |
| | | | (15,635 | ) | | | (12,795 | ) | | | | 4,615 | | | | (2,901 | ) | | | | 6,794 | | | | — | | | | | — | | | | — | | | | | — | | | | — | | | |
| | | | (2,356 | ) | | | (796 | ) | | | | (1,097 | ) | | | 181 | | | | | — | | | | — | | | | | — | | | | — | | | | | — | | | | — | | | |
| | | | | | | | | | | | | | | | | | | | | | | | | | | | | | | | | | | | | | | | | | | | | | | |
| | | | 197,864 | | | | (666,682 | ) | | | | 138,434 | | | | (148,884 | ) | | | | 121,303 | | | | (229,507 | ) | | | | 61,203 | | | | (93,774 | ) | | | | 81,677 | | | | (214,939 | ) | | |
| | | | 14,698 | | | | (16,775 | ) | | | | 2,599 | | | | (6,171 | ) | | | | — | | | | — | | | | | — | | | | — | | | | | — | | | | — | | | |
| | | | (314 | ) | | | 138 | | | | | (53 | ) | | | 186 | | | | | — | | | | — | | | | | — | | | | — | | | | | — | | | | — | | | |
| |
| |
| | | | 142,634 | | | | (602,716 | ) | | | | 103,507 | | | | (176,310 | ) | | | | 63,300 | | | | (279,733 | ) | | | | 12,611 | | | | (160,184 | ) | | | | 6,520 | | | | (258,101 | ) | | |
| |
| |
| | | | | | | | | | | | | | | | | | | | | | | | | | | | | | | | | | | | | | | | | | | | | | | |
| | | | | | | | | | | | | | | | | | | | | | | | | | | | | | | | | | | | | | | | | | | | | | | |
| | | | (236 | ) | | | (504 | ) | | | | (30 | ) | | | (19 | ) | | | | (59 | ) | | | — | | | | | (15 | ) | | | (21 | ) | | | | (635 | ) | | | (844 | ) | | |
| | | | — | | | | (16 | ) | | | | (2 | ) | | | (1 | ) | | | | — | | | | — | | | | | — | | | | — | | | | | (21 | ) | | | (26 | ) | | |
| | | | — | | | | (9 | ) | | | | (1 | ) | | | (1 | ) | | | | — | | | | — | | | | | — | | | | (1 | ) | | | | (15 | ) | | | (15 | ) | | |
| | | | — | | | | — | | | | | (1 | ) | | | — | | | | | — | | | | — | | | | | — | | | | — | | | | | (2 | ) | | | (1 | ) | | |
| | | | (8,282 | ) | | | (17,791 | ) | | | | (6,078 | ) | | | (2,254 | ) | | | | (1,833 | ) | | | (464 | ) | | | | (1,109 | ) | | | (1,853 | ) | | | | (4,702 | ) | | | (6,296 | ) | | |
| | | | | | | | | | | | | | | | | | | | | | | | | | | | | | | | | | | | | | | | | | | | | | | |
| | | | — | | | | (4,764 | ) | | | | — | | | | (58 | ) | | | | — | | | | (8,176 | ) | | | | — | | | | (1,002 | ) | | | | — | | | | (13,581 | ) | | |
| | | | — | | | | (604 | ) | | | | — | | | | (7 | ) | | | | — | | | | (1,066 | ) | | | | — | | | | (87 | ) | | | | — | | | | (962 | ) | | |
| | | | — | | | | (611 | ) | | | | — | | | | (6 | ) | | | | — | | | | (757 | ) | | | | — | | | | (42 | ) | | | | — | | | | (561 | ) | | |
| | | | — | | | | (1 | ) | | | | — | | | | — | | | | | — | | | | (50 | ) | | | | — | | | | (5 | ) | | | | — | | | | (23 | ) | | |
| | | | — | | | | (133,882 | ) | | | | — | | | | (5,572 | ) | | | | — | | | | (61,331 | ) | | | | — | | | | (55,522 | ) | | | | — | | | | (86,486 | ) | | |
| |
| |
| | | | (8,518 | ) | | | (158,182 | ) | | | | (6,112 | ) | | | (7,918 | ) | | | | (1,892 | ) | | | (71,844 | ) | | | | (1,124 | ) | | | (58,533 | ) | | | | (5,375 | ) | | | (108,795 | ) | | |
| |
| |
| | | | | | | | | | | | | | | | | | | | | | | | | | | | | | | | | | | | | | | | | | | | | | | |
| | | | | | | | | | | | | | | | | | | | | | | | | | | | | | | | | | | | | | | | | | | | | | | |
| | | | 3,228 | | | | 6,019 | | | | | 1,588 | | | | 1,504 | | | | | 7,172 | | | | 7,836 | | | | | 856 | | | | 888 | | | | | 2,954 | | | | 3,879 | | | |
| | | | 219 | | | | 4,612 | | | | | 25 | | | | 67 | | | | | 56 | | | | 7,846 | | | | | 12 | | | | 817 | | | | | 579 | | | | 13,370 | | | |
| | | | (6,232 | ) | | | (14,884 | ) | | | | (1,027 | ) | | | (1,162 | ) | | | | (9,957 | ) | | | (19,590 | ) | | | | (1,480 | ) | | | (2,403 | ) | | | | (9,418 | ) | | | (20,859 | ) | | |
| |
| |
| | | | (2,785 | ) | | | (4,253 | ) | | | | 586 | | | | 409 | | | | | (2,729 | ) | | | (3,908 | ) | | | | (612 | ) | | | (698 | ) | | | | (5,885 | ) | | | (3,610 | ) | | |
| |
| |
| | | | | | | | | | | | | | | | | | | | | | | | | | | | | | | | | | | | | | | | | | | | | | | |
| | | | 77 | | | | 341 | | | | | 2 | | | | 202 | | | | | 42 | | | | 407 | | | | | 3 | | | | 18 | | | | | 15 | | | | 161 | | | |
| | | | — | | | | 597 | | | | | 2 | | | | 7 | | | | | — | | | | 1,032 | | | | | — | | | | 88 | | | | | 20 | | | | 964 | | | |
| | | | (975 | ) | | | (2,149 | ) | | | | (298 | ) | | | (61 | ) | | | | (1,629 | ) | | | (2,852 | ) | | | | (324 | ) | | | (117 | ) | | | | (1,394 | ) | | | (2,115 | ) | | |
| |
| |
| | | | (898 | ) | | | (1,211 | ) | | | | (294 | ) | | | 148 | | | | | (1,587 | ) | | | (1,413 | ) | | | | (321 | ) | | | (11 | ) | | | | (1,359 | ) | | | (990 | ) | | |
| |
| |
| | | | | | | | | | | | | | | | | | | | | | | | | | | | | | | | | | | | | | | | | | | | | | | |
| | | | 331 | | | | 462 | | | | | 21 | | | | 244 | | | | | 481 | | | | 706 | | | | | 22 | | | | 54 | | | | | 217 | | | | 319 | | | |
| | | | — | | | | 556 | | | | | 1 | | | | 5 | | | | | — | | | | 707 | | | | | — | | | | 38 | | | | | 15 | | | | 510 | | | |
| | | | (985 | ) | | | (1,585 | ) | | | | (61 | ) | | | (105 | ) | | | | (845 | ) | | | (2,155 | ) | | | | (36 | ) | | | (70 | ) | | | | (869 | ) | | | (741 | ) | | |
| |
| |
| | | | (654 | ) | | | (567 | ) | | | | (39 | ) | | | 144 | | | | | (364 | ) | | | (742 | ) | | | | (14 | ) | | | 22 | | | | | (637 | ) | | | 88 | | | |
| |
| |
| | | | | | | | | | | | | | | | | | | | | | | | | | | | | | | | | | | | | | | | | | | | | | | |
| | | | 1 | | | | 3 | | | | | 4 | | | | 62 | | | | | 225 | | | | 231 | | | | | 102 | | | | 13 | | | | | 176 | | | | 105 | | | |
| | | | — | | | | 1 | | | | | 1 | | | | — | | | | | — | | | | 50 | | | | | — | | | | 5 | | | | | 2 | | | | 24 | | | |
| | | | — | | | | (3 | ) | | | | (42 | ) | | | (8 | ) | | | | (114 | ) | | | (89 | ) | | | | (55 | ) | | | (15 | ) | | | | (35 | ) | | | (36 | ) | | |
| |
| |
| | | | 1 | | | | 1 | | | | | (37 | ) | | | 54 | | | | | 111 | | | | 192 | | | | | 47 | | | | 3 | | | | | 143 | | | | 93 | | | |
| |
| |
| | | | | | | | | | | | | | | | | | | | | | | | | | | | | | | | | | | | | | | | | | | | | | | |
| | | | 54,320 | | | | 210,818 | | | | | 363,659 | | | | 201,444 | | | | | 116,710 | | | | 111,241 | | | | | 39,404 | | | | 108,988 | | | | | 38,047 | | | | 74,224 | | | |
| | | | 5,049 | | | | 101,831 | | | | | 1,729 | | | | 4,127 | | | | | 724 | | | | 32,809 | | | | | 441 | | | | 23,632 | | | | | 2,849 | | | | 59,454 | | | |
| | | | (165,305 | ) | | | (597,730 | ) | | | | (127,280 | ) | | | (116,875 | ) | | | | (106,659 | ) | | | (172,512 | ) | | | | (111,700 | ) | | | (159,401 | ) | | | | (107,134 | ) | | | (146,403 | ) | | |
| |
| |
| | | | (105,936 | ) | | | (285,081 | ) | | | | 238,108 | | | | 88,696 | | | | | 10,775 | | | | (28,462 | ) | | | | (71,855 | ) | | | (26,781 | ) | | | | (66,238 | ) | | | (12,725 | ) | | |
| |
| |
| | | | (110,272 | ) | | | (291,111 | ) | | | | 238,324 | | | | 89,451 | | | | | 6,206 | | | | (34,333 | ) | | | | (72,755 | ) | | | (27,465 | ) | | | | (73,976 | ) | | | (17,144 | ) | | |
| | | | 359 | | | | — | | | | | — | | | | — | | | | | — | | | | — | | | | | — | | | | — | | | | | — | | | | — | | | |
| |
| |
| | | | 24,203 | | | | (1,052,009 | ) | | | | 335,719 | | | | (94,777 | ) | | | | 67,614 | | | | (385,910 | ) | | | | (61,268 | ) | | | (246,182 | ) | | | | (72,831 | ) | | | (384,040 | ) | | |
| | | | 689,351 | | | | 1,741,360 | | | | | 252,240 | | | | 347,017 | | | | | 481,496 | | | | 867,406 | | | | | 212,043 | | | | 458,225 | | | | | 468,443 | | | | 852,483 | | | |
| |
| |
| | | $ | 713,554 | | | $ | 689,351 | | | | $ | 587,959 | | | $ | 252,240 | | | | $ | 549,110 | | | $ | 481,496 | | | | $ | 150,775 | | | $ | 212,043 | | | | $ | 395,612 | | | $ | 468,443 | | | |
| |
| |
| | | $ | 4,397 | | | $ | 7,434 | | | | $ | 2,268 | | | $ | 5,358 | | | | $ | 2,094 | | | $ | 1,882 | | | | $ | 921 | | | $ | 727 | | | | $ | 4,984 | | | $ | 3,618 | | | |
| |
| |
First American Funds 2009 Annual Report 89
| |
| Statements ofChanges in Net Assets | continued |
| | | | | | | | | | | | | | | | | | | | |
| | | | | | | | | | | | | | | | |
| | | Mid Cap Growth
| | | | Mid Cap
| | | |
| | | Opportunities Fund | | | | Select Fund | | | |
| |
| | | Year Ended
| | | Year Ended
| | | | Year Ended
| | | Year Ended
| | | |
| | | 10/31/09 | | | 10/31/08 | | | | 10/31/09 | | | 10/31/08 | | | |
| |
OPERATIONS: | | | | | | | | | | | | | | | | | | | |
| Investment income (loss) – net | | $ | (1,648 | ) | | $ | (4,280 | ) | | | $ | 297 | | | $ | (26 | ) | | |
| Net realized gain (loss) on: | | | | | | | | | | | | | | | | | | | |
| Unaffiliated investments | | | (161,489 | ) | | | (139,560 | ) | | | | (16,427 | ) | | | (7,982 | ) | | |
| Affiliated investments | | | — | | | | — | | | | | — | | | | — | | | |
| Redemptions in-kind (note 9) | | | — | | | | — | | | | | — | | | | — | | | |
| Futures contracts | | | 15,590 | | | | — | | | | | 994 | | | | — | | | |
| Options written | | | — | | | | — | | | | | (321 | ) | | | — | | | |
| Forward foreign currency contracts, foreign currency, and translation of other assets and liabilities denominated in foreign currency (note 2) | | | — | | | | — | | | | | — | | | | — | | | |
| Net change in unrealized appreciation or depreciation of: | | | | | | | | | | | | | | | | | | | |
| Unaffiliated investments | | | 340,238 | | | | (635,741 | ) | | | | 18,365 | | | | (26,410 | ) | | |
| Affiliated investments | | | — | | | | — | | | | | — | | | | — | | | |
| Futures contracts | | | — | | | | — | | | | | — | | | | — | | | |
| Options written | | | — | | | | — | | | | | — | | | | — | | | |
| Foreign currency, and translation of other assets and liabilities denominated in foreign currency (note 2) | | | — | | | | — | | | | | — | | | | — | | | |
| |
| |
| Net increase (decrease) in net assets resulting from operations | | | 192,691 | | | | (779,581 | ) | | | | 2,908 | | | | (34,418 | ) | | |
| |
| |
DISTRIBUTIONS TO SHAREHOLDERS FROM: | | | | | | | | | | | | | | | | | | | |
| Investment income – net: | | | | | | | | | | | | | | | | | | | |
| Class A | | | — | | | | — | | | | | (4 | ) | | | — | | | |
| Class B | | | — | | | | — | | | | | — | | | | — | | | |
| Class C | | | — | | | | — | | | | | — | | | | — | | | |
| Class R | | | — | | | | — | | | | | — | | | | — | | | |
| Class Y | | | — | | | | — | | | | | (143 | ) | | | — | | | |
| Net realized gain on investments: | | | | | | | | | | | | | | | | | | | |
| Class A | | | — | | | | (42,869 | ) | | | | — | | | | — | | | |
| Class B | | | — | | | | (1,753 | ) | | | | — | | | | — | | | |
| Class C | | | — | | | | (3,115 | ) | | | | — | | | | — | | | |
| Class R | | | — | | | | (3,185 | ) | | | | — | | | | — | | | |
| Class Y | | | — | | | | (137,824 | ) | | | | — | | | | — | | | |
| Return of Capital: | | | | | | | | | | | | | | | | | | | |
| Class A | | | — | | | | — | | | | | — | | | | — | | | |
| Class B | | | — | | | | — | | | | | — | | | | — | | | |
| Class C | | | — | | | | — | | | | | — | | | | — | | | |
| Class R | | | — | | | | — | | | | | — | | | | — | | | |
| Class Y | | | — | | | | — | | | | | — | | | | — | | | |
| |
| |
| Total distributions | | | — | | | | (188,746 | ) | | | | (147 | ) | | | — | | | |
| |
| |
CAPITAL SHARE TRANSACTIONS (note 4): | | | | | | | | | | | | | | | | | | | |
| Class A: | | | | | | | | | | | | | | | | | | | |
| Proceeds from sales | | | 36,041 | | | | 59,598 | | | | | 1,858 | | | | 3,246 | | | |
| Reinvestment of distributions | | | — | | | | 41,285 | | | | | 3 | | | | — | | | |
| Payments for redemptions | | | (51,431 | ) | | | (104,324 | ) | | | | (3,132 | ) | | | (5,139 | ) | | |
| |
| |
| Increase (decrease) in net assets from Class A transactions | | | (15,390 | ) | | | (3,441 | ) | | | | (1,271 | ) | | | (1,893 | ) | | |
| |
| |
Class B1: | | | | | | | | | | | | | | | | | | | |
| Proceeds from sales | | | 54 | | | | 738 | | | | | 8 | | | | 118 | | | |
| Reinvestment of distributions | | | — | | | | 1,643 | | | | | — | | | | — | | | |
| Payments for redemptions (note 3) | | | (1,623 | ) | | | (3,120 | ) | | | | (917 | ) | | | (2,833 | ) | | |
| |
| |
| Increase (decrease) in net assets from Class B transactions | | | (1,569 | ) | | | (739 | ) | | | | (909 | ) | | | (2,715 | ) | | |
| |
| |
| Class C: | | | | | | | | | | | | | | | | | | | |
| Proceeds from sales | | | 2,061 | | | | 4,282 | | | | | 190 | | | | 696 | | | |
| Reinvestment of distributions | | | — | | | | 2,677 | | | | | — | | | | — | | | |
| Payments for redemptions (note 3) | | | (3,972 | ) | | | (8,531 | ) | | | | (894 | ) | | | (1,120 | ) | | |
| |
| |
| Increase (decrease) in net assets from Class C transactions | | | (1,911 | ) | | | (1,572 | ) | | | | (704 | ) | | | (424 | ) | | |
| |
| |
Class R2: | | | | | | | | | | | | | | | | | | | |
| Proceeds from sales | | | 11,251 | | | | 16,036 | | | | | — | | | | — | | | |
| Reinvestment of distributions | | | — | | | | 3,185 | | | | | — | | | | — | | | |
| Payments for redemptions | | | (10,412 | ) | | | (9,288 | ) | | | | — | | | | — | | | |
| |
| |
| Increase (decrease) in net assets from Class R transactions | | | 839 | | | | 9,933 | | | | | — | | | | — | | | |
| |
| |
| Class Y: | | | | | | | | | | | | | | | | | | | |
| Proceeds from sales | | | 171,004 | | | | 150,690 | | | | | 10,760 | | | | 17,744 | | | |
| Reinvestment of distributions | | | — | | | | 104,398 | | | | | 33 | | | | — | | | |
| Payments for redemptions | | | (142,727 | ) | | | (286,403 | ) | | | | (25,773 | ) | | | (32,921 | ) | | |
| |
| |
| Increase (decrease) in net assets from Class Y transactions | | | 28,277 | | | | (31,315 | ) | | | | (14,980 | ) | | | (15,177 | ) | | |
| |
| |
| Increase (decrease) in net assets from capital share transactions | | | 10,246 | | | | (27,134 | ) | | | | (17,864 | ) | | | (20,209 | ) | | |
| Increase in net assets from regulatory settlement proceeds (note 10) | | | — | | | | — | | | | | — | | | | — | | | |
| |
| |
| Total increase (decrease) in net assets | | | 202,937 | | | | (995,461 | ) | | | | (15,103 | ) | | | (54,627 | ) | | |
Net assets at beginning of year | | | 983,109 | | | | 1,978,570 | | | | | 58,837 | | | | 113,464 | | | |
| |
| |
Net assets at end of year | | $ | 1,186,046 | | | $ | 983,109 | | | | $ | 43,734 | | | $ | 58,837 | | | |
| |
| |
Undistributed (distributions in excess of) net investment income at end of year | | $ | (13 | ) | | $ | (11 | ) | | | $ | 155 | | | $ | (6 | ) | | |
| |
| |
| | |
| | 1 | No new or additional investments are allowed in Class B shares. See Note 1 in Notes to Financial Statements. |
| |
| | 2 | Class R is not offered by Mid Cap Select Fund. |
The accompanying notes are an integral part of the financial statements.
90 First American Funds 2009 Annual Report
| | | | | | | | | | | | | | | | | | | | | | | | | | | | | | | | | | | | | | | | | | | | | | | |
| | | | | | | | | | | | | | | | | | | | | | | | | | | | | | | | | | | | | |
| | | Mid Cap
| | | | Real Estate
| | | | Small Cap Growth
| | | | Small Cap
| | | | Small Cap
| | | |
| | | Value Fund | | | | Securities Fund | | | | Opportunities Fund | | | | Select Fund | | | | Value Fund | | | |
| |
| | | Year Ended
| | | Year Ended
| | | | Year Ended
| | | Year Ended
| | | | Year ended
| | | Year Ended
| | | | Year Ended
| | | Year Ended
| | | | Year Ended
| | | Year Ended
| | | |
| | | 10/31/09 | | | 10/31/08 | | | | 10/31/09 | | | 10/31/08 | | | | 10/31/09 | | | 10/31/08 | | | | 10/31/09 | | | 10/31/08 | | | | 10/31/09 | | | 10/31/08 | | | |
| |
| | | | | | | | | | | | | | | | | | | | | | | | | | | | | | | | | | | | | | | | | | | | | | | |
| | | $ | 9,075 | | | $ | 9,178 | | | | $ | 28,866 | | | $ | 27,147 | | | | $ | (810 | ) | | $ | (1,646 | ) | | | $ | 105 | | | $ | (311 | ) | | | $ | 1,109 | | | $ | 2,560 | | | |
| | | | | | | | | | | | | | | | | | | | | | | | | | | | | | | | | | | | | | | | | | | | | | | |
| | | | (84,621 | ) | | | (107,430 | ) | | | | (162,772 | ) | | | (128,631 | ) | | | | (5,607 | ) | | | (40,776 | ) | | | | (93,728 | ) | | | (93,456 | ) | | | | (37,715 | ) | | | (26,457 | ) | | |
| | | | — | | | | — | | | | | (1,573 | ) | | | — | | | | | — | | | | — | | | | | (1,433 | ) | | | — | | | | | — | | | | — | | | |
| | | | — | | | | — | | | | | — | | | | — | | | | | — | | | | 247 | | | | | — | | | | — | | | | | — | | | | — | | | |
| | | | — | | | | — | | | | | — | | | | — | | | | | — | | | | 305 | | | | | — | | | | — | | | | | — | | | | — | | | |
| | | | — | | | | — | | | | | — | | | | — | | | | | — | | | | — | | | | | — | | | | — | | | | | — | | | | — | | | |
| | | | | | | | | | | | | | | | | | | | | | | | | | | | | | | | | | | | | | | | | | | | | | | |
| | | | — | | | | — | | | | | (8 | ) | | | (31 | ) | | | | — | | | | — | | | | | — | | | | — | | | | | — | | | | — | | | |
| | | | 147,981 | | | | (268,835 | ) | | | | 203,043 | | | | (281,542 | ) | | | | 27,775 | | | | (52,783 | ) | | | | 176,157 | | | | (234,746 | ) | | | | 39,307 | | | | (77,076 | ) | | |
| | | | — | | | | — | | | | | (4,227 | ) | | | — | | | | | — | | | | — | | | | | 1,710 | | | | — | | | | | — | | | | — | | | |
| | | | — | | | | — | | | | | — | | | | — | | | | | — | | | | — | | | | | — | | | | — | | | | | — | | | | — | | | |
| | | | — | | | | — | | | | | — | | | | — | | | | | — | | | | — | | | | | — | | | | — | | | | | — | | | | — | | | |
| | | | | | | | | | | | | | | | | | | | | | | | | | | | | | | | | | | | | | | | | | | | | | | |
| | | | — | | | | — | | | | | — | | | | — | | | | | — | | | | — | | | | | — | | | �� | — | | | | | — | | | | — | | | |
| |
| |
| | | | 72,435 | | | | (367,087 | ) | | | | 63,329 | | | | (383,057 | ) | | | | 21,358 | | | | (94,653 | ) | | | | 82,811 | | | | (328,513 | ) | | | | 2,701 | | | | (100,973 | ) | | |
| |
| |
| | | | | | | | | | | | | | | | | | | | | | | | | | | | | | | | | | | | | | | | | | | | | | | |
| | | | | | | | | | | | | | | | | | | | | | | | | | | | | | | | | | | | | | | | | | | | | | | |
| | | | (600 | ) | | | (1,408 | ) | | | | (5,684 | ) | | | (3,653 | ) | | | | — | | | | — | | | | | — | | | | — | | | | | (281 | ) | | | (573 | ) | | |
| | | | (2 | ) | | | (22 | ) | | | | (61 | ) | | | (78 | ) | | | | — | | | | — | | | | | — | | | | — | | | | | (3 | ) | | | (24 | ) | | |
| | | | (7 | ) | | | (63 | ) | | | | (291 | ) | | | (217 | ) | | | | — | | | | — | | | | | — | | | | — | | | | | (7 | ) | | | (20 | ) | | |
| | | | (90 | ) | | | (175 | ) | | | | (899 | ) | | | (409 | ) | | | | — | | | | — | | | | | — | | | | — | | | | | (18 | ) | | | (33 | ) | | |
| | | | (2,658 | ) | | | (5,086 | ) | | | | (16,569 | ) | | | (14,270 | ) | | | | — | | | | — | | | | | — | | | | (290 | ) | | | | (1,989 | ) | | | (3,749 | ) | | |
| | | | | | | | | | | | | | | | | | | | | | | | | | | | | | | | | | | | | | | | | | | | | | | |
| | | | — | | | | (16,522 | ) | | | | — | | | | (22,068 | ) | | | | — | | | | (10,823 | ) | | | | — | | | | (14,448 | ) | | | | — | | | | (5,182 | ) | | |
| | | | — | | | | (565 | ) | | | | — | | | | (816 | ) | | | | — | | | | (340 | ) | | | | — | | | | (980 | ) | | | | — | | | | (645 | ) | | |
| | | | — | | | | (1,759 | ) | | | | — | | | | (2,036 | ) | | | | — | | | | (169 | ) | | | | — | | | | (2,230 | ) | | | | — | | | | (434 | ) | | |
| | | | — | | | | (1,982 | ) | | | | — | | | | (2,193 | ) | | | | — | | | | (39 | ) | | | | — | | | | (2,457 | ) | | | | — | | | | (336 | ) | | |
| | | | — | | | | (48,932 | ) | | | | — | | | | (68,467 | ) | | | | — | | | | (9,817 | ) | | | | — | | | | (34,350 | ) | | | | — | | | | (27,249 | ) | | |
| | | | | | | | | | | | | | | | | | | | | | | | | | | | | | | | | | | | | | | | | | | | | | | |
| | | | — | | | | — | | | | | (2,077 | ) | | | — | | | | | — | | | | — | | | | | — | | | | — | | | | | — | | | | — | | | |
| | | | — | | | | — | | | | | (33 | ) | | | — | | | | | — | | | | — | | | | | — | | | | — | | | | | — | | | | — | | | |
| | | | — | | | | — | | | | | (141 | ) | | | — | | | | | — | | | | — | | | | | — | | | | — | | | | | — | | | | — | | | |
| | | | — | | | | — | | | | | (356 | ) | | | — | | | | | — | | | | — | | | | | — | | | | — | | | | | — | | | | — | | | |
| | | | — | | | | — | | | | | (6,186 | ) | | | — | | | | | — | | | | — | | | | | — | | | | — | | | | | — | | | | — | | | |
| |
| |
| | | | (3,357 | ) | | | (76,514 | ) | | | | (32,297 | ) | | | (114,207 | ) | | | | — | | | | (21,188 | ) | | | | — | | | | (54,755 | ) | | | | (2,298 | ) | | | (38,245 | ) | | |
| |
| |
| | | | | | | | | | | | | | | | | | | | | | | | | | | | | | | | | | | | | | | | | | | | | | | |
| | | | | | | | | | | | | | | | | | | | | | | | | | | | | | | | | | | | | | | | | | | | | | | |
| | | | 29,555 | | | | 48,087 | | | | | 197,810 | | | | 96,399 | | | | | 3,534 | | | | 17,198 | | | | | 148,270 | | | | 111,735 | | | | | 5,254 | | | | 2,653 | | | |
| | | | 583 | | | | 17,368 | | | | | 7,096 | | | | 24,612 | | | | | — | | | | 10,653 | | | | | — | | | | 13,800 | | | | | 270 | | | | 5,531 | | | |
| | | | (38,523 | ) | | | (94,410 | ) | | | | (71,600 | ) | | | (85,724 | ) | | | | (7,288 | ) | | | (101,235 | ) | | | | (55,873 | ) | | | (89,826 | ) | | | | (5,111 | ) | | | (12,847 | ) | | |
| |
| |
| | | | (8,385 | ) | | | (28,955 | ) | | | | 133,306 | | | | 35,287 | | | | | (3,754 | ) | | | (73,384 | ) | | | | 92,397 | | | | 35,709 | | | | | 413 | | | | (4,663 | ) | | |
| |
| |
| | | | | | | | | | | | | | | | | | | | | | | | | | | | | | | | | | | | | | | | | | | | | | | |
| | | | 47 | | | | 357 | | | | | 51 | | | | 517 | | | | | 47 | | | | 103 | | | | | 46 | | | | 324 | | | | | 16 | | | | 44 | | | |
| | | | 2 | | | | 554 | | | | | 81 | | | | 773 | | | | | — | | | | 325 | | | | | — | | | | 937 | | | | | 3 | | | | 642 | | | |
| | | | (1,032 | ) | | | (1,801 | ) | | | | (558 | ) | | | (2,144 | ) | | | | (320 | ) | | | (1,039 | ) | | | | (1,443 | ) | | | (3,322 | ) | | | | (2,690 | ) | | | (1,622 | ) | | |
| |
| |
| | | | (983 | ) | | | (890 | ) | | | | (426 | ) | | | (854 | ) | | | | (273 | ) | | | (611 | ) | | | | (1,397 | ) | | | (2,061 | ) | | | | (2,671 | ) | | | (936 | ) | | |
| |
| |
| | | | | | | | | | | | | | | | | | | | | | | | | | | | | | | | | | | | | | | | | | | | | | | |
| | | | 676 | | | | 2,358 | | | | | 8,357 | | | | 6,738 | | | | | 271 | | | | 214 | | | | | 1,427 | | | | 4,504 | | | | | 201 | | | | 477 | | | |
| | | | 7 | | | | 1,585 | | | | | 338 | | | | 1,755 | | | | | — | | | | 154 | | | | | — | | | | 2,068 | | | | | 6 | | | | 411 | | | |
| | | | (3,112 | ) | | | (6,416 | ) | | | | (2,664 | ) | | | (6,111 | ) | | | | (239 | ) | | | (583 | ) | | | | (3,469 | ) | | | (10,197 | ) | | | | (499 | ) | | | (869 | ) | | |
| |
| |
| | | | (2,429 | ) | | | (2,473 | ) | | | | 6,031 | | | | 2,382 | | | | | 32 | | | | (215 | ) | | | | (2,042 | ) | | | (3,625 | ) | | | | (292 | ) | | | 19 | | | |
| |
| |
| | | | | | | | | | | | | | | | | | | | | | | | | | | | | | | | | | | | | | | | | | | | | | | |
| | | | 14,902 | | | | 16,462 | | | | | 25,869 | | | | 24,530 | | | | | 1,204 | | | | 299 | | | | | 7,603 | | | | 13,319 | | | | | 1,693 | | | | 1,187 | | | |
| | | | 90 | | | | 2,152 | | | | | 1,255 | | | | 2,601 | | | | | — | | | | 39 | | | | | — | | | | 2,457 | | | | | 18 | | | | 369 | | | |
| | | | (16,399 | ) | | | (9,556 | ) | | | | (6,732 | ) | | | (8,819 | ) | | | | (314 | ) | | | (127 | ) | | | | (9,240 | ) | | | (14,269 | ) | | | | (1,683 | ) | | | (1,207 | ) | | |
| |
| |
| | | | (1,407 | ) | | | 9,058 | | | | | 20,392 | | | | 18,312 | | | | | 890 | | | | 211 | | | | | (1,637 | ) | | | 1,507 | | | | | 28 | | | | 349 | | | |
| |
| |
| | | | | | | | | | | | | | | | | | | | | | | | | | | | | | | | | | | | | | | | | | | | | | | |
| | | | 66,387 | | | | 57,392 | | | | | 382,082 | | | | 388,360 | | | | | 26,506 | | | | 12,641 | | | | | 68,946 | | | | 70,683 | | | | | 17,091 | | | | 19,705 | | | |
| | | | 1,760 | | | | 39,960 | | | | | 14,186 | | | | 49,830 | | | | | — | | | | 7,546 | | | | | — | | | | 26,896 | | | | | 1,747 | | | | 27,122 | | | |
| | | | (92,117 | ) | | | (140,793 | ) | | | | (269,156 | ) | | | (198,925 | ) | | | | (14,191 | ) | | | (35,529 | ) | | | | (76,685 | ) | | | (259,101 | ) | | | | (27,723 | ) | | | (78,089 | ) | | |
| |
| |
| | | | (23,970 | ) | | | (43,441 | ) | | | | 127,112 | | | | 239,265 | | | | | 12,315 | | | | (15,342 | ) | | | | (7,739 | ) | | | (161,522 | ) | | | | (8,885 | ) | | | (31,262 | ) | | |
| |
| |
| | | | (37,174 | ) | | | (66,701 | ) | | | | 286,415 | | | | 294,392 | | | | | 9,210 | | | | (89,341 | ) | | | | 79,582 | | | | (129,992 | ) | | | | (11,407 | ) | | | (36,493 | ) | | |
| | | | — | | | | — | | | | | — | | | | — | | | | | — | | | | 2,103 | | | | | — | | | | — | | | | | — | | | | — | | | |
| |
| |
| | | | 31,904 | | | | (510,302 | ) | | | | 317,447 | | | | (202,872 | ) | | | | 30,568 | | | | (203,079 | ) | | | | 162,393 | | | | (513,260 | ) | | | | (11,004 | ) | | | (175,711 | ) | | |
| | | | 580,471 | | | | 1,090,773 | | | | | 697,095 | | | | 899,967 | | | | | 107,892 | | | | 310,971 | | | | | 502,763 | | | | 1,016,023 | | | | | 193,952 | | | | 369,663 | | | |
| |
| |
| | | $ | 612,375 | | | | 580,471 | | | | $ | 1,014,542 | | | $ | 697,095 | | | | $ | 138,460 | | | $ | 107,892 | | | | $ | 665,156 | | | $ | 502,763 | | | | $ | 182,948 | | | $ | 193,952 | | | |
| |
| |
| | | $ | 7,349 | | | $ | 1,332 | | | | $ | (10 | ) | | $ | (8 | ) | | | $ | (8 | ) | | $ | (7 | ) | | | $ | 170 | | | $ | (9 | ) | | | $ | (7 | ) | | $ | 1,164 | | | |
| |
| |
First American Funds 2009 Annual Report 91
| | | | | | | | | | | | | | | | | | | | | | | | | | | | | | | | | | | | | | | | | | |
| | | | | | | | | | | | | | | | | | | | | | | | | | |
| | | | | | | | | Realized and
| | | | | | | | | | | | | | | | | |
| | | Net Asset
| | | | | | Unrealized
| | | | | | Distributions
| | | | | | | | | Net Asset
| | |
| | | Value
| | | Net
| | | Gains
| | | Total from
| | | from Net
| | | Distributions
| | | | | | Value
| | |
| | | Beginning
| | | Investment
| | | (Losses) on
| | | Investment
| | | Investment
| | | from Net
| | | Total
| | | End of
| | |
| | | of Period | | | Income | | | Investments | | | Operations | | | Income | | | Realized Gains | | | Distributions | | | Period | | |
| |
Equity Income Fund1 | | | | | | | | | | | | | | | | | | | | | | | | | | | | | | | | | | | | | | | | | |
| Class A | | | | | | | | | | | | | | | | | | | | | | | | | | | | | | | | | | | | | | | | | |
20092 | | $ | 10.09 | | | | $ | 0.29 | | | | $ | 0.71 | | | | $ | 1.00 | | | | $ | (0.33 | ) | | | $ | — | | | | $ | (0.33 | ) | | | $ | 10.76 | | | |
20082 | | | 16.43 | | | | | 0.33 | | | | | (5.28 | ) | | | | (4.95 | ) | | | | (0.29 | ) | | | | (1.10 | ) | | | | (1.39 | ) | | | | 10.09 | | | |
20072 | | | 15.90 | | | | | 0.29 | | | | | 1.96 | | | | | 2.25 | | | | | (0.29 | ) | | | | (1.43 | ) | | | | (1.72 | ) | | | | 16.43 | | | |
20062 | | | 13.67 | | | | | 0.20 | | | | | 2.32 | | | | | 2.52 | | | | | (0.21 | ) | | | | (0.08 | ) | | | | (0.29 | ) | | | | 15.90 | | | |
20053 | | | 13.89 | | | | | 0.01 | | | | | (0.22 | ) | | | | (0.21 | ) | | | | (0.01 | ) | | | | — | | | | | (0.01 | ) | | | | 13.67 | | | |
20054 | | | 12.77 | | | | | 0.20 | | | | | 1.15 | | | | | 1.35 | | | | | (0.22 | ) | | | | (0.01 | ) | | | | (0.23 | ) | | | | 13.89 | | | |
| Class B | | | | | | | | | | | | | | | | | | | | | | | | | | | | | | | | | | | | | | | | | |
20092 | | $ | 9.96 | | | | $ | 0.22 | | | | $ | 0.68 | | | | $ | 0.90 | | | | $ | (0.25 | ) | | | $ | — | | | | $ | (0.25 | ) | | | $ | 10.61 | | | |
20082 | | | 16.23 | | | | | 0.22 | | | | | (5.19 | ) | | | | (4.97 | ) | | | | (0.20 | ) | | | | (1.10 | ) | | | | (1.30 | ) | | | | 9.96 | | | |
20072 | | | 15.75 | | | | | 0.17 | | | | | 1.94 | | | | | 2.11 | | | | | (0.20 | ) | | | | (1.43 | ) | | | | (1.63 | ) | | | | 16.23 | | | |
20062 | | | 13.57 | | | | | 0.09 | | | | | 2.30 | | | | | 2.39 | | | | | (0.13 | ) | | | | (0.08 | ) | | | | (0.21 | ) | | | | 15.75 | | | |
20053 | | | 13.79 | | | | | — | | | | | (0.22 | ) | | | | (0.22 | ) | | | | — | | | | | — | | | | | — | | | | | 13.57 | | | |
20054 | | | 12.68 | | | | | 0.10 | | | | | 1.14 | | | | | 1.24 | | | | | (0.12 | ) | | | | (0.01 | ) | | | | (0.13 | ) | | | | 13.79 | | | |
| Class C | | | | | | | | | | | | | | | | | | | | | | | | | | | | | | | | | | | | | | | | | |
20092 | | $ | 9.98 | | | | $ | 0.21 | | | | $ | 0.69 | | | | $ | 0.90 | | | | $ | (0.25 | ) | | | $ | — | | | | $ | (0.25 | ) | | | $ | 10.63 | | | |
20082 | | | 16.26 | | | | | 0.22 | | | | | (5.20 | ) | | | | (4.98 | ) | | | | (0.20 | ) | | | | (1.10 | ) | | | | (1.30 | ) | | | | 9.98 | | | |
20072 | | | 15.78 | | | | | 0.17 | | | | | 1.94 | | | | | 2.11 | | | | | (0.20 | ) | | | | (1.43 | ) | | | | (1.63 | ) | | | | 16.26 | | | |
20062 | | | 13.59 | | | | | 0.10 | | | | | 2.30 | | | | | 2.40 | | | | | (0.13 | ) | | | | (0.08 | ) | | | | (0.21 | ) | | | | 15.78 | | | |
20053 | | | 13.81 | | | | | — | | | | | (0.22 | ) | | | | (0.22 | ) | | | | — | | | | | — | | | | | — | | | | | 13.59 | | | |
20054 | | | 12.70 | | | | | 0.11 | | | | | 1.13 | | | | | 1.24 | | | | | (0.12 | ) | | | | (0.01 | ) | | | | (0.13 | ) | | | | 13.81 | | | |
| Class R | | | | | | | | | | | | | | | | | | | | | | | | | | | | | | | | | | | | | | | | | |
20092 | | $ | 10.08 | | | | $ | 0.28 | | | | $ | 0.68 | | | | $ | 0.96 | | | | $ | (0.28 | ) | | | $ | — | | | | $ | (0.28 | ) | | | $ | 10.76 | | | |
20082 | | | 16.41 | | | | | 0.29 | | | | | (5.26 | ) | | | | (4.97 | ) | | | | (0.26 | ) | | | | (1.10 | ) | | | | (1.36 | ) | | | | 10.08 | | | |
20072 | | | 15.88 | | | | | 0.23 | | | | | 1.98 | | | | | 2.21 | | | | | (0.25 | ) | | | | (1.43 | ) | | | | (1.68 | ) | | | | 16.41 | | | |
20062 | | | 13.66 | | | | | 0.17 | | | | | 2.31 | | | | | 2.48 | | | | | (0.18 | ) | | | | (0.08 | ) | | | | (0.26 | ) | | | | 15.88 | | | |
20053 | | | 13.88 | | | | | 0.01 | | | | | (0.23 | ) | | | | (0.22 | ) | | | | — | | | | | — | | | | | — | | | | | 13.66 | | | |
20054 | | | 12.78 | | | | | 0.11 | | | | | 1.20 | | | | | 1.31 | | | | | (0.20 | ) | | | | (0.01 | ) | | | | (0.21 | ) | | | | 13.88 | | | |
| Class Y | | | | | | | | | | | | | | | | | | | | | | | | | | | | | | | | | | | | | | | | | |
20092 | | $ | 10.18 | | | | $ | 0.32 | | | | $ | 0.70 | | | | $ | 1.02 | | | | $ | (0.35 | ) | | | $ | — | | | | $ | (0.35 | ) | | | $ | 10.85 | | | |
20082 | | | 16.55 | | | | | 0.36 | | | | | (5.30 | ) | | | | (4.94 | ) | | | | (0.33 | ) | | | | (1.10 | ) | | | | (1.43 | ) | | | | 10.18 | | | |
20072 | | | 16.00 | | | | | 0.33 | | | | | 1.98 | | | | | 2.31 | | | | | (0.33 | ) | | | | (1.43 | ) | | | | (1.76 | ) | | | | 16.55 | | | |
20062 | | | 13.76 | | | | | 0.24 | | | | | 2.33 | | | | | 2.57 | | | | | (0.25 | ) | | | | (0.08 | ) | | | | (0.33 | ) | | | | 16.00 | | | |
20053 | | | 13.98 | | | | | 0.01 | | | | | (0.21 | ) | | | | (0.20 | ) | | | | (0.01 | ) | | | | (0.01 | ) | | | | (0.02 | ) | | | | 13.76 | | | |
20054 | | | 12.85 | | | | | 0.24 | | | | | 1.15 | | | | | 1.39 | | | | | (0.25 | ) | | | | (0.01 | ) | | | | (0.26 | ) | | | | 13.98 | | | |
| |
| |
| | |
| | 1 | Per share data calculated using average shares outstanding method. |
| |
| | 2 | For the period November 1 to October 31 in the fiscal year indicated. |
| |
| | 3 | For the period October 1, 2005 to October 31, 2005. Effective October 1, 2005, the fund’s fiscal year end was changed from September 30 to October 31. All ratios for the period have been annualized, except total return and portfolio turnover. |
| |
| | 4 | For the period October 1 to September 30 in the year indicated. |
| |
| | 5 | Total return does not include sales charges. Total return would have been lower had certain expenses not been waived. |
The accompanying notes are an integral part of the financial statements.
92 First American Funds 2009 Annual Report
| | | | | | | | | | | | | | | | | | | | | | | | | | | | | | | | | | | | | |
| | | | | | | | | | | | | | | | | | | | | | | |
| | | | | | | | | | | | | | | | | | Ratio of Net
| | | | | |
| | | | | | | | | | | | | | | Ratio of
| | | Investment
| | | | | |
| | | | | | | | | | | | Ratio of Net
| | | Expenses
| | | Income (Loss)
| | | | | |
| | | | | | | | | Ratio of
| | | Investment
| | | to Average
| | | to Average
| | | | | |
| | | | | | Net Assets
| | | Expenses
| | | Income (Loss)
| | | Net Assets
| | | Net Assets
| | | Portfolio
| | |
| | | Total
| | | End of
| | | to Average
| | | to Average
| | | (Excluding
| | | (Excluding
| | | Turnover
| | |
| | | Return5 | | | Period (000) | | | Net Assets | | | Net Assets | | | Waivers) | | | Waivers) | | | Rate | | |
| |
| | | | | | | | | | | | | | | | | | | | | | | | | | | | | | | | | | | | | |
| | | | | | | | | | | | | | | | | | | | | | | | | | | | | | | | | | | | | |
| | | | 10.32 | % | | | $ | 100,059 | | | | | 1.19 | % | | | | 3.00 | % | | | | 1.19 | % | | | | 3.00 | % | | | | 48 | % | | |
| | | | (32.51 | ) | | | | 100,824 | | | | | 1.17 | | | | | 2.45 | | | | | 1.17 | | | | | 2.45 | | | | | 32 | | | |
| | | | 15.24 | | | | | 179,379 | | | | | 1.16 | | | | | 1.83 | | | | | 1.16 | | | | | 1.83 | | | | | 20 | | | |
| | | | 18.66 | | | | | 171,814 | | | | | 1.18 | | | | | 1.40 | | | | | 1.18 | | | | | 1.40 | | | | | 23 | | | |
| | | | (1.53 | ) | | | | 171,998 | | | | | 1.20 | | | | | 0.70 | | | | | 1.20 | | | | | 0.70 | | | | | — | | | |
| | | | 10.65 | | | | | 176,878 | | | | | 1.16 | | | | | 1.51 | | | | | 1.19 | | | | | 1.48 | | | | | 27 | | | |
| | | | | | | | | | | | | | | | | | | | | | | | | | | | | | | | | | | | | |
| | | | 9.41 | % | | | $ | 7,237 | | | | | 1.94 | % | | | | 2.28 | % | | | | 1.94 | % | | | | 2.28 | % | | | | 48 | % | | |
| | | | (32.95 | ) | | | | 9,113 | | | | | 1.92 | | | | | 1.69 | | | | | 1.92 | | | | | 1.69 | | | | | 32 | | | |
| | | | 14.40 | | | | | 16,893 | | | | | 1.91 | | | | | 1.09 | | | | | 1.91 | | | | | 1.09 | | | | | 20 | | | |
| | | | 17.76 | | | | | 19,845 | | | | | 1.93 | | | | | 0.65 | | | | | 1.93 | | | | | 0.65 | | | | | 23 | | | |
| | | | (1.60 | ) | | | | 21,003 | | | | | 1.95 | | | | | (0.05 | ) | | | | 1.95 | | | | | (0.05 | ) | | | | — | | | |
| | | | 9.86 | | | | | 21,639 | | | | | 1.91 | | | | | 0.78 | | | | | 1.94 | | | | | 0.75 | | | | | 27 | | | |
| | | | | | | | | | | | | | | | | | | | | | | | | | | | | | | | | | | | | |
| | | | 9.41 | % | | | $ | 4,921 | | | | | 1.94 | % | | | | 2.23 | % | | | | 1.94 | % | | | | 2.23 | % | | | | 48 | % | | |
| | | | (32.95 | ) | | | | 4,625 | | | | | 1.92 | | | | | 1.69 | | | | | 1.92 | | | | | 1.69 | | | | | 32 | | | |
| | | | 14.37 | | | | | 9,241 | | | | | 1.91 | | | | | 1.09 | | | | | 1.91 | | | | | 1.09 | | | | | 20 | | | |
| | | | 17.80 | | | | | 11,225 | | | | | 1.93 | | | | | 0.68 | | | | | 1.93 | | | | | 0.68 | | | | | 23 | | | |
| | | | (1.59 | ) | | | | 15,313 | | | | | 1.95 | | | | | (0.05 | ) | | | | 1.95 | | | | | (0.05 | ) | | | | — | | | |
| | | | 9.84 | | | | | 16,128 | | | | | 1.91 | | | | | 0.79 | | | | | 1.94 | | | | | 0.76 | | | | | 27 | | | |
| | | | | | | | | | | | | | | | | | | | | | | | | | | | | | | | | | | | | |
| | | | 9.92 | % | | | $ | 122 | | | | | 1.45 | % | | | | 2.94 | % | | | | 1.45 | % | | | | 2.94 | % | | | | 48 | % | | |
| | | | (32.64 | ) | | | | 535 | | | | | 1.42 | | | | | 2.20 | | | | | 1.42 | | | | | 2.20 | | | | | 32 | | | |
| | | | 14.98 | | | | | 940 | | | | | 1.41 | | | | | 1.48 | | | | | 1.41 | | | | | 1.48 | | | | | 20 | | | |
| | | | 18.33 | | | | | 511 | | | | | 1.43 | | | | | 1.14 | | | | | 1.57 | | | | | 1.00 | | | | | 23 | | | |
| | | | (1.55 | ) | | | | 418 | | | | | 1.45 | | | | | 0.45 | | | | | 1.60 | | | | | 0.30 | | | | | — | | | |
| | | | 10.33 | | | | | 415 | | | | | 1.41 | | | | | 0.83 | | | | | 1.59 | | | | | 0.65 | | | | | 27 | | | |
| | | | | | | | | | | | | | | | | | | | | | | | | | | | | | | | | | | | | |
| | | | 10.51 | % | | | $ | 570,690 | | | | | 0.94 | % | | | | 3.25 | % | | | | 0.94 | % | | | | 3.25 | % | | | | 48 | % | | |
| | | | (32.29 | ) | | | | 574,162 | | | | | 0.92 | | | | | 2.70 | | | | | 0.92 | | | | | 2.70 | | | | | 32 | | | |
| | | | 15.54 | | | | | 1,061,433 | | | | | 0.91 | | | | | 2.09 | | | | | 0.91 | | | | | 2.09 | | | | | 20 | | | |
| | | | 18.89 | | | | | 1,129,971 | | | | | 0.93 | | | | | 1.65 | | | | | 0.93 | | | | | 1.65 | | | | | 23 | | | |
| | | | (1.50 | ) | | | | 1,169,267 | | | | | 0.95 | | | | | 0.95 | | | | | 0.95 | | | | | 0.95 | | | | | — | | | |
| | | | 10.94 | | | | | 1,206,483 | | | | | 0.91 | | | | | 1.80 | | | | | 0.94 | | | | | 1.77 | | | | | 27 | | | |
| |
| |
First American Funds 2009 Annual Report 93
Financial Highlights For a share outstanding throughout the indicated periods.
| | | | | | | | | | | | | | | | | | | | | | | | | | | | | | | | |
| | | | | | | | | | | | | | | | | | | | |
| | | | | | | | | Realized and
| | | | | | | | | | | |
| | | Net Asset
| | | | | | Unrealized
| | | | | | Distributions
| | | Net Asset
| | |
| | | Value
| | | Net
| | | Gains
| | | Total from
| | | from Net
| | | Value
| | |
| | | Beginning
| | | Investment
| | | (Losses) on
| | | Investment
| | | Investment
| | | End of
| | |
| | | of Period | | | Income | | | Investments | | | Operations | | | Income | | | Period | | |
| |
Global Infrastructure Fund1 | | | | | | | | | | | | | | | | | | | | | | | | | | | | | | | |
| Class A | | | | | | | | | | | | | | | | | | | | | | | | | | | | | | | |
20092 | | $ | 6.43 | | | | $ | 0.16 | | | | $ | 1.29 | | | | $ | 1.45 | | | | $ | (0.08 | ) | | | $ | 7.80 | | | |
20083 | | | 10.00 | | | | | 0.05 | | | | | (3.62 | ) | | | | (3.57 | ) | | | | — | | | | | 6.43 | | | |
| Class C | | | | | | | | | | | | | | | | | | | | | | | | | | | | | | | |
20094 | | $ | 6.48 | | | | $ | 0.11 | | | | $ | 1.24 | | | | $ | 1.35 | | | | $ | (0.08 | ) | | | $ | 7.75 | | | |
| Class R | | | | | | | | | | | | | | | | | | | | | | | | | | | | | | | |
20094 | | $ | 6.48 | | | | $ | 0.14 | | | | $ | 1.24 | | | | $ | 1.38 | | | | $ | (0.08 | ) | | | $ | 7.78 | | | |
| Class Y | | | | | | | | | | | | | | | | | | | | | | | | | | | | | | | |
20092 | | $ | 6.43 | | | | $ | 0.17 | | | | $ | 1.30 | | | | $ | 1.47 | | | | $ | (0.08 | ) | | | $ | 7.82 | | | |
20083 | | | 10.00 | | | | | 0.16 | | | | | (3.73 | ) | | | | (3.57 | ) | | | | — | | | | | 6.43 | | | |
| |
| |
| | |
| | 1 | Per share data calculated using average shares outstanding method. |
| |
| | 2 | For the period November 1 to October 31 in the fiscal year indicated. |
| |
| | 3 | Commenced operations on December 17, 2007. All ratios for the period ended October 31, 2008 have been annualized, except total return and portfolio turnover. |
| |
| | 4 | For the period November 3, 2008, when the class of shares was offered, to October 31, 2009. All ratios for the period have been annualized, except total return and portfolio turnover. |
| |
| | 5 | Total return does not reflect sales charges. Total return would have been lower had certain expenses not been waived. |
The accompanying notes are an integral part of the financial statements.
94 First American Funds 2009 Annual Report
| | | | | | | | | | | | | | | | | | | | | | | | | | | | | | | | | | | | | |
| | | | | | | | | | | | | | | | | | | | | | | |
| | | | | | | | | | | | | | | | | | Ratio of Net
| | | | | |
| | | | | | | | | | | | | | | Ratio of
| | | Investment
| | | | | |
| | | | | | | | | | | | Ratio of Net
| | | Expenses
| | | Income (Loss)
| | | | | |
| | | | | | | | | Ratio of
| | | Investment
| | | to Average
| | | to Average
| | | | | |
| | | | | | Net Assets
| | | Expenses
| | | Income
| | | Net Assets
| | | Net Assets
| | | Portfolio
| | |
| | | Total
| | | End of
| | | to Average
| | | to Average
| | | (Excluding
| | | (Excluding
| | | Turnover
| | |
| | | Return5 | | | Period (000) | | | Net Assets | | | Net Assets | | | Waivers) | | | Waivers) | | | Rate | | |
| |
| | | | | | | | | | | | | | | | | | | | | | | | | | | | | | | | | | | | | |
| | | | | | | | | | | | | | | | | | | | | | | | | | | | | | | | | | | | | |
| | | | 22.76 | % | | | $ | 19,901 | | | | | 1.25 | % | | | | 2.34 | % | | | | 2.47 | % | | | | 1.12 | % | | | | 299 | % | | |
| | | | (35.70 | ) | | | | 4,022 | | | | | 1.25 | | | | | 0.80 | | | | | 4.16 | | | | | (2.11 | ) | | | | 304 | | | |
| | | | | | | | | | | | | | | | | | | | | | | | | | | | | | | | | | | | | |
| | | | 21.00 | % | | | $ | 3,034 | | | | | 2.00 | % | | | | 1.59 | % | | | | 3.22 | % | | | | 0.37 | % | | | | 299 | % | | |
| | | | | | | | | | | | | | | | | | | | | | | | | | | | | | | | | | | | | |
| | | | 21.48 | % | | | $ | 6 | | | | | 1.50 | % | | | | 2.15 | % | | | | 2.72 | % | | | | 0.93 | % | | | | 299 | % | | |
| | | | | | | | | | | | | | | | | | | | | | | | | | | | | | | | | | | | | |
| | | | 23.14 | % | | | $ | 36,595 | | | | | 1.00 | % | | | | 2.57 | % | | | | 2.22 | % | | | | 1.35 | % | | | | 299 | % | | |
| | | | (35.70 | ) | | | | 17,221 | | | | | 0.99 | | | | | 2.18 | | | | | 3.90 | | | | | (0.73 | ) | | | | 304 | | | |
| |
| |
First American Funds 2009 Annual Report 95
Financial Highlights For a share outstanding throughout the indicated periods.
| | | | | | | | | | | | | | | | | | | | | | | | | | | | | | | | | | | | | | | | | | |
| | | | | | | | | | | | | | | | | | | | | | | | | | |
| | | | | | | | | Realized and
| | | | | | | | | | | | | | | | | |
| | | Net Asset
| | | | | | Unrealized
| | | | | | Distributions
| | | | | | | | | Net Asset
| | |
| | | Value
| | | Net
| | | Gains
| | | Total from
| | | from Net
| | | Distributions
| | | | | | Value
| | |
| | | Beginning
| | | Investment
| | | (Losses) on
| | | Investment
| | | Investment
| | | from Net
| | | Total
| | | End of
| | |
| | | of Period | | | Income (Loss) | | | Investments | | | Operations | | | Income | | | Realized Gains | | | Distributions | | | Period | | |
| |
International Fund1 | | | | | | | | | | | | | | | | | | | | | | | | | | | | | | | | | | | | | | | | | |
| Class A | | | | | | | | | | | | | | | | | | | | | | | | | | | | | | | | | | | | | | | | | |
20092 | | $ | 8.68 | | | | $ | 0.09 | | | | $ | 2.09 | | | | $ | 2.18 | | | | $ | (0.08 | ) | | | $ | — | | | | $ | (0.08 | ) | | | $ | 10.78 | | | |
20082 | | | 17.15 | | | | | 0.26 | | | | | (7.14 | ) | | | | (6.88 | ) | | | | (0.14 | ) | | | | (1.45 | ) | | | | (1.59 | ) | | | | 8.68 | | | |
20072 | | | 14.80 | | | | | 0.15 | | | | | 2.59 | | | | | 2.74 | | | | | (0.13 | ) | | | | (0.26 | ) | | | | (0.39 | ) | | | | 17.15 | | | |
20062 | | | 12.01 | | | | | 0.12 | | | | | 2.80 | | | | | 2.92 | | | | | (0.13 | ) | | | | — | | | | | (0.13 | ) | | | | 14.80 | | | |
20053 | | | 12.24 | | | | | 0.01 | | | | | (0.24 | ) | | | | (0.23 | ) | | | | — | | | | | — | | | | | — | | | | | 12.01 | | | |
20054 | | | 10.19 | | | | | 0.09 | | | | | 2.02 | | | | | 2.11 | | | | | (0.06 | ) | | | | — | | | | | (0.06 | ) | | | | 12.24 | | | |
| Class B | | | | | | | | | | | | | | | | | | | | | | | | | | | | | | | | | | | | | | | | | |
20092 | | $ | 7.92 | | | | $ | 0.02 | | | | $ | 1.90 | | | | $ | 1.92 | | | | $ | — | | | | $ | — | | | | $ | — | | | | $ | 9.84 | | | |
20082 | | | 15.78 | | | | | 0.14 | | | | | (6.52 | ) | | | | (6.38 | ) | | | | (0.03 | ) | | | | (1.45 | ) | | | | (1.48 | ) | | | | 7.92 | | | |
20072 | | | 13.65 | | | | | 0.03 | | | | | 2.39 | | | | | 2.42 | | | | | (0.03 | ) | | | | (0.26 | ) | | | | (0.29 | ) | | | | 15.78 | | | |
20062 | | | 11.09 | | | | | 0.02 | | | | | 2.58 | | | | | 2.60 | | | | | (0.04 | ) | | | | — | | | | | (0.04 | ) | | | | 13.65 | | | |
20053 | | | 11.31 | | | | | — | | | | | (0.22 | ) | | | | (0.22 | ) | | | | — | | | | | — | | | | | — | | | | | 11.09 | | | |
20054 | | | 9.43 | | | | | — | | | | | 1.88 | | | | | 1.88 | | | | | — | | | | | — | | | | | — | | | | | 11.31 | | | |
| Class C | | | | | | | | | | | | | | | | | | | | | | | | | | | | | | | | | | | | | | | | | |
20092 | | $ | 8.25 | | | | $ | 0.02 | | | | $ | 1.99 | | | | $ | 2.01 | | | | $ | — | | | | $ | — | | | | $ | — | | | | $ | 10.26 | | | |
20082 | | | 16.36 | | | | | 0.15 | | | | | (6.79 | ) | | | | (6.64 | ) | | | | (0.02 | ) | | | | (1.45 | ) | | | | (1.47 | ) | | | | 8.25 | | | |
20072 | | | 14.13 | | | | | 0.03 | | | | | 2.48 | | | | | 2.51 | | | | | (0.02 | ) | | | | (0.26 | ) | | | | (0.28 | ) | | | | 16.36 | | | |
20062 | | | 11.47 | | | | | 0.02 | | | | | 2.67 | | | | | 2.69 | | | | | (0.03 | ) | | | | — | | | | | (0.03 | ) | | | | 14.13 | | | |
20053 | | | 11.70 | | | | | — | | | | | (0.23 | ) | | | | (0.23 | ) | | | | — | | | | | — | | | | | — | | | | | 11.47 | | | |
20054 | | | 9.76 | | | | | — | | | | | 1.94 | | | | | 1.94 | | | | | — | | | | | — | | | | | — | | | | | 11.70 | | | |
Class R5 | | | | | | | | | | | | | | | | | | | | | | | | | | | | | | | | | | | | | | | | | |
20092 | | $ | 8.67 | | | | $ | 0.07 | | | | $ | 2.11 | | | | $ | 2.18 | | | | $ | (0.07 | ) | | | $ | — | | | | $ | (0.07 | ) | | | $ | 10.78 | | | |
20082 | | | 17.17 | | | | | 0.19 | | | | | (7.10 | ) | | | | (6.91 | ) | | | | (0.14 | ) | | | | (1.45 | ) | | | | (1.59 | ) | | | | 8.67 | | | |
20072 | | | 14.81 | | | | | 0.10 | | | | | 2.61 | | | | | 2.71 | | | | | (0.09 | ) | | | | (0.26 | ) | | | | (0.35 | ) | | | | 17.17 | | | |
20062 | | | 11.94 | | | | | 0.05 | | | | | 2.82 | | | | | 2.87 | | | | | — | | | | | — | | | | | — | | | | | 14.81 | | | |
20053 | | | 12.17 | | | | | (0.02 | ) | | | | (0.21 | ) | | | | (0.23 | ) | | | | — | | | | | — | | | | | — | | | | | 11.94 | | | |
20054 | | | 10.11 | | | | | 0.09 | | | | | 1.97 | | | | | 2.06 | | | | | — | | | | | — | | | | | — | | | | | 12.17 | | | |
| Class Y | | | | | | | | | | | | | | | | | | | | | | | | | | | | | | | | | | | | | | | | | |
20092 | | $ | 8.81 | | | | $ | 0.11 | | | | $ | 2.12 | | | | $ | 2.23 | | | | $ | (0.12 | ) | | | $ | — | | | | $ | (0.12 | ) | | | $ | 10.92 | | | |
20082 | | | 17.38 | | | | | 0.30 | | | | | (7.24 | ) | | | | (6.94 | ) | | | | (0.18 | ) | | | | (1.45 | ) | | | | (1.63 | ) | | | | 8.81 | | | |
20072 | | | 14.99 | | | | | 0.19 | | | | | 2.62 | | | | | 2.81 | | | | | (0.16 | ) | | | | (0.26 | ) | | | | (0.42 | ) | | | | 17.38 | | | |
20062 | | | 12.16 | | | | | 0.16 | | | | | 2.83 | | | | | 2.99 | | | | | (0.16 | ) | | | | — | | | | | (0.16 | ) | | | | 14.99 | | | |
20053 | | | 12.39 | | | | | 0.01 | | | | | (0.24 | ) | | | | (0.23 | ) | | | | — | | | | | — | | | | | — | | | | | 12.16 | | | |
20054 | | | 10.31 | | | | | 0.12 | | | | | 2.05 | | | | | 2.17 | | | | | (0.09 | ) | | | | — | | | | | (0.09 | ) | | | | 12.39 | | | |
| |
| |
| | |
| | 1 | Per share data calculated using average shares outstanding method. |
| |
| | 2 | For the period November 1 to October 31 in the fiscal year indicated. |
| |
| | 3 | For the period October 1, 2005 to October 31, 2005. Effective October 1, 2005, the fund’s fiscal year end was changed from September 30 to October 31. All ratios for the period have been annualized, except total return and portfolio turnover. |
| |
| | 4 | For the period October 1 to September 30 in the year indicated. |
| |
| | 5 | Total return does not reflect sales charges. Total return would have been lower had certain expenses not been waived. |
| |
| | 6 | During the period indicated, the fund received a regulatory settlement, which had no impact on total return. |
The accompanying notes are an integral part of the financial statements.
96 First American Funds 2009 Annual Report
| | | | | | | | | | | | | | | | | | | | | | | | | | | | | | | | | | | | | |
| | | | | | | | | | | | | | | | | | | | | | | |
| | | | | | | | | | | | | | | Ratio of
| | | Ratio of Net
| | | | | |
| | | | | | | | | | | | Ratio of Net
| | | Expenses
| | | Investment
| | | | | |
| | | | | | | | | Ratio of
| | | Investment
| | | to Average
| | | Income (Loss)
| | | | | |
| | | | | | Net Assets
| | | Expenses to
| | | Income (Loss)
| | | Net Assets
| | | to Average
| | | Portfolio
| | |
| | | Total
| | | End of
| | | Average
| | | to Average
| | | (Excluding
| | | Net Assets (Excluding
| | | Turnover
| | |
| | | Return5 | | | Period (000) | | | Net Assets | | | Net Assets | | | Waivers) | | | Waivers) | | | Rate | | |
| |
| | | | | | | | | | | | | | | | | | | | | | | | | | | | | | | | | | | | | |
| | | | | | | | | | | | | | | | | | | | | | | | | | | | | | | | | | | | | |
| | | | 25.29 | %6 | | | $ | 27,995 | | | | | 1.49 | % | | | | 1.00 | % | | | | 1.59 | % | | | | 0.90 | % | | | | 231 | % | | |
| | | | (43.82 | ) | | | | 25,342 | | | | | 1.49 | | | | | 1.92 | | | | | 1.54 | | | | | 1.87 | | | | | 18 | | | |
| | | | 18.92 | | | | | 56,705 | | | | | 1.49 | | | | | 0.97 | | | | | 1.53 | | | | | 0.93 | | | | | 14 | | | |
| | | | 24.50 | | | | | 52,489 | | | | | 1.51 | | | | | 0.89 | | | | | 1.54 | | | | | 0.86 | | | | | 17 | | | |
| | | | (1.88 | ) | | | | 48,439 | | | | | 1.51 | | | | | 0.58 | | | | | 1.55 | | | | | 0.54 | | | | | — | | | |
| | | | 20.80 | | | | | 48,851 | | | | | 1.56 | | | | | 0.77 | | | | | 1.61 | | | | | 0.72 | | | | | 74 | | | |
| | | | | | | | | | | | | | | | | | | | | | | | | | | | | | | | | | | | | |
| | | | 24.24 | %6 | | | $ | 1,976 | | | | | 2.24 | % | | | | 0.23 | % | | | | 2.34 | % | | | | 0.13 | % | | | | 231 | % | | |
| | | | (44.19 | ) | | | | 2,499 | | | | | 2.24 | | | | | 1.16 | | | | | 2.29 | | | | | 1.11 | | | | | 18 | | | |
| | | | 18.05 | | | | | 6,668 | | | | | 2.24 | | | | | 0.22 | | | | | 2.28 | | | | | 0.18 | | | | | 14 | | | |
| | | | 23.50 | | | | | 7,172 | | | | | 2.26 | | | | | 0.15 | | | | | 2.29 | | | | | 0.12 | | | | | 17 | | | |
| | | | (1.95 | ) | | | | 6,632 | | | | | 2.26 | | | | | (0.17 | ) | | | | 2.30 | | | | | (0.21 | ) | | | | — | | | |
| | | | 19.94 | | | | | 6,819 | | | | | 2.31 | | | | | — | | | | | 2.36 | | | | | (0.05 | ) | | | | 74 | | | |
| | | | | | | | | | | | | | | | | | | | | | | | | | | | | | | | | | | | | |
| | | | 24.36 | %6 | | | $ | 3,269 | | | | | 2.24 | % | | | | 0.24 | % | | | | 2.34 | % | | | | 0.14 | % | | | | 231 | % | | |
| | | | (44.21 | ) | | | | 3,232 | | | | | 2.24 | | | | | 1.20 | | | | | 2.29 | | | | | 1.15 | | | | | 18 | | | |
| | | | 18.09 | | | | | 7,173 | | | | | 2.24 | | | | | 0.20 | | | | | 2.28 | | | | | 0.16 | | | | | 14 | | | |
| | | | 23.53 | | | | | 8,049 | | | | | 2.26 | | | | �� | 0.16 | | | | | 2.29 | | | | | 0.13 | | | | | 17 | | | |
| | | | (1.97 | ) | | | | 7,520 | | | | | 2.26 | | | | | (0.17 | ) | | | | 2.30 | | | | | (0.21 | ) | | | | — | | | |
| | | | 19.88 | | | | | 7,915 | | | | | 2.31 | | | | | (0.01 | ) | | | | 2.36 | | | | | (0.06 | ) | | | | 74 | | | |
| | | | | | | | | | | | | | | | | | | | | | | | | | | | | | | | | | | | | |
| | | | 25.39 | %6 | | | $ | 5 | | | | | 1.74 | % | | | | 0.73 | % | | | | 1.84 | % | | | | 0.63 | % | | | | 231 | % | | |
| | | | (43.94 | ) | | | | 2 | | | | | 1.74 | | | | | 1.40 | | | | | 1.79 | | | | | 1.35 | | | | | 18 | | | |
| | | | 18.66 | | | | | 4 | | | | | 1.74 | | | | | 0.60 | | | | | 1.78 | | | | | 0.56 | | | | | 14 | | | |
| | | | 24.04 | | | | | 1 | | | | | 1.76 | | | | | 0.39 | | | | | 1.91 | | | | | 0.24 | | | | | 17 | | | |
| | | | (1.89 | ) | | | | 1 | | | | | 1.76 | | | | | 0.33 | | | | | 1.95 | | | | | 0.14 | | | | | — | | | |
| | | | 20.38 | | | | | 163 | | | | | 1.81 | | | | | 0.77 | | | | | 2.01 | | | | | 0.57 | | | | | 74 | | | |
| | | | | | | | | | | | | | | | | | | | | | | | | | | | | | | | | | | | | |
| | | | 25.68 | %6 | | | $ | 680,309 | | | | | 1.24 | % | | | | 1.25 | % | | | | 1.34 | % | | | | 1.15 | % | | | | 231 | % | | |
| | | | (43.68 | ) | | | | 658,276 | | | | | 1.24 | | | | | 2.19 | | | | | 1.29 | | | | | 2.14 | | | | | 18 | | | |
| | | | 19.23 | | | | | 1,670,810 | | | | | 1.24 | | | | | 1.21 | | | | | 1.28 | | | | | 1.17 | | | | | 14 | | | |
| | | | 24.81 | | | | | 1,738,254 | | | | | 1.26 | | | | | 1.16 | | | | | 1.29 | | | | | 1.13 | | | | | 17 | | | |
| | | | (1.86 | ) | | | | 1,516,510 | | | | | 1.26 | | | | | 0.83 | | | | | 1.30 | | | | | 0.79 | | | | | — | | | |
| | | | 21.12 | | | | | 1,523,057 | | | | | 1.31 | | | | | 1.07 | | | | | 1.36 | | | | | 1.02 | | | | | 74 | | | |
| |
| |
First American Funds 2009 Annual Report 97
Financial Highlights For a share outstanding throughout the indicated periods.
| | | | | | | | | | | | | | | | | | | | | | | | | | | | | | | | | | | | | | | | | | |
| | | | | | | | | | | | | | | | | | | | | | | | | | |
| | | | | | | | | Realized and
| | | | | | | | | | | | | | | | | |
| | | Net Asset
| | | | | | Unrealized
| | | | | | Distributions
| | | | | | | | | Net Asset
| | |
| | | Value
| | | Net
| | | Gains
| | | Total from
| | | from Net
| | | Distributions
| | | | | | Value
| | |
| | | Beginning
| | | Investment
| | | (Losses) on
| | | Investment
| | | Investment
| | | from Net
| | | Total
| | | End of
| | |
| | | of Period | | | Income | | | Investments | | | Operations | | | Income | | | Realized Gains | | | Distributions | | | Period | | |
| |
International Select Fund1 | | | | | | | | | | | | | | | | | | | | | | | | | | | | | | | | | | | | | | | | | |
| Class A | | | | | | | | | | | | | | | | | | | | | | | | | | | | | | | | | | | | | | | | | |
20092 | | $ | 6.53 | | | | $ | 0.07 | | | | $ | 2.00 | | | | $ | 2.07 | | | | $ | (0.12 | ) | | | $ | — | | | | $ | (0.12 | ) | | | $ | 8.48 | | | |
20082 | | | 12.15 | | | | | 0.15 | | | | | (5.52 | ) | | | | (5.37 | ) | | | | (0.06 | ) | | | | (0.19 | ) | | | | (0.25 | ) | | | | 6.53 | | | |
20073 | | | 10.00 | | | | | 0.09 | | | | | 2.07 | | | | | 2.16 | | | | | (0.01 | ) | | | | — | | | | | (0.01 | ) | | | | 12.15 | | | |
| Class C | | | | | | | | | | | | | | | | | | | | | | | | | | | | | | | | | | | | | | | | | |
20092 | | $ | 6.46 | | | | $ | 0.03 | | | | $ | 1.97 | | | | $ | 2.00 | | | | $ | (0.04 | ) | | | $ | — | | | | $ | (0.04 | ) | | | $ | 8.42 | | | |
20082 | | | 12.07 | | | | | 0.09 | | | | | (5.48 | ) | | | | (5.39 | ) | | | | (0.03 | ) | | | | (0.19 | ) | | | | (0.22 | ) | | | | 6.46 | | | |
20073 | | | 10.00 | | | | | 0.03 | | | | | 2.04 | | | | | 2.07 | | | | | — | | | | | — | | | | | — | | | | | 12.07 | | | |
| Class R | | | | | | | | | | | | | | | | | | | | | | | | | | | | | | | | | | | | | | | | | |
20092 | | $ | 6.52 | | | | $ | 0.09 | | | | $ | 1.94 | | | | $ | 2.03 | | | | $ | (0.13 | ) | | | $ | — | | | | $ | (0.13 | ) | | | $ | 8.42 | | | |
20082 | | | 12.12 | | | | | 0.08 | | | | | (5.46 | ) | | | | (5.38 | ) | | | | (0.03 | ) | | | | (0.19 | ) | | | | (0.22 | ) | | | | 6.52 | | | |
20073 | | | 10.00 | | | | | 0.07 | | | | | 2.06 | | | | | 2.13 | | | | | (0.01 | ) | | | | — | | | | | (0.01 | ) | | | | 12.12 | | | |
| Class Y | | | | | | | | | | | | | | | | | | | | | | | | | | | | | | | | | | | | | | | | | |
20092 | | $ | 6.55 | | | | $ | 0.08 | | | | $ | 2.01 | | | | $ | 2.09 | | | | $ | (0.15 | ) | | | $ | — | | | | $ | (0.15 | ) | | | $ | 8.49 | | | |
20082 | | | 12.17 | | | | | 0.17 | | | | | (5.52 | ) | | | | (5.35 | ) | | | | (0.08 | ) | | | | (0.19 | ) | | | | (0.27 | ) | | | | 6.55 | | | |
20073 | | | 10.00 | | | | | 0.13 | | | | | 2.05 | | | | | 2.18 | | | | | (0.01 | ) | | | | — | | | | | (0.01 | ) | | | | 12.17 | | | |
| |
| |
| | |
| | 1 | Per share data calculated using average shares outstanding method. |
| |
| | 2 | For the period November 1 to October 31 in the fiscal year indicated. |
| |
| | 3 | Commenced operations on December 21, 2006. All ratios for the period ended October 31, 2007 have been annualized, except total return and portfolio turnover. |
| |
| | 4 | Total return does not reflect sales charges. Total return would have been lower had certain expenses not been waived. |
The accompanying notes are an integral part of the financial statements.
98 First American Funds 2009 Annual Report
| | | | | | | | | | | | | | | | | | | | | | | | | | | | | | | | | | | | | |
| | | | | | | | | | | | | | | | | | | | | | | |
| | | | | | | | | | | | | | | | | | Ratio of Net
| | | | | |
| | | | | | | | | | | | | | | Ratio of
| | | Investment
| | | | | |
| | | | | | | | | | | | Ratio of Net
| | | Expenses
| | | Income (Loss)
| | | | | |
| | | | | | | | | Ratio of
| | | Investment
| | | to Average
| | | to Average
| | | | | |
| | | | | | Net Assets
| | | Expenses to
| | | Income
| | | Net Assets
| | | Net Assets
| | | Portfolio
| | |
| | | Total
| | | End of
| | | Average
| | | to Average
| | | (Excluding
| | | (Excluding
| | | Turnover
| | |
| | | Return4 | | | Period (000) | | | Net Assets | | | Net Assets | | | Waivers) | | | Waivers) | | | Rate | | |
| |
| | | | | | | | | | | | | | | | | | | | | | | | | | | | | | | | | | | | | |
| | | | | | | | | | | | | | | | | | | | | | | | | | | | | | | | | | | | | |
| | | | 32.32 | % | | | $ | 3,029 | | | | | 1.49 | % | | | | 1.04 | % | | | | 1.76 | % | | | | 0.77 | % | | | | 64 | % | | |
| | | | (45.00 | ) | | | | 1,904 | | | | | 1.49 | | | | | 1.52 | | | | | 1.70 | | | | | 1.31 | | | | | 63 | | | |
| | | | 21.58 | | | | | 3,228 | | | | | 1.49 | | | | | 0.95 | | | | | 1.89 | | | | | 0.55 | | | | | 45 | | | |
| | | | | | | | | | | | | | | | | | | | | | | | | | | | | | | | | | | | | |
| | | | 31.43 | % | | | $ | 244 | | | | | 2.24 | % | | | | 0.40 | % | | | | 2.51 | % | | | | 0.13 | % | | | | 64 | % | | |
| | | | (45.39 | ) | | | | 226 | | | | | 2.24 | | | | | 0.92 | | | | | 2.45 | | | | | 0.71 | | | | | 63 | | | |
| | | | 20.75 | | | | | 287 | | | | | 2.24 | | | | | 0.30 | | | | | 2.64 | | | | | (0.10 | ) | | | | 45 | | | |
| | | | | | | | | | | | | | | | | | | | | | | | | | | | | | | | | | | | | |
| | | | 31.99 | % | | | $ | 19 | | | | | 1.74 | % | | | | 1.30 | % | | | | 2.01 | % | | | | 1.03 | % | | | | 64 | % | | |
| | | | (45.10 | ) | | | | 48 | | | | | 1.74 | | | | | 0.90 | | | | | 1.95 | | | | | 0.69 | | | | | 63 | | | |
| | | | 21.27 | | | | | 17 | | | | | 1.74 | | | | | 0.77 | | | | | 2.14 | | | | | 0.37 | | | | | 45 | | | |
| | | | | | | | | | | | | | | | | | | | | | | | | | | | | | | | | | | | | |
| | | | 32.68 | % | | | $ | 584,667 | | | | | 1.24 | % | | | | 1.17 | % | | | | 1.51 | % | | | | 0.90 | % | | | | 64 | % | | |
| | | | (44.86 | ) | | | | 249,805 | | | | | 1.24 | | | | | 1.72 | | | | | 1.45 | | | | | 1.51 | | | | | 63 | | | |
| | | | 21.78 | | | | | 343,161 | | | | | 1.24 | | | | | 1.36 | | | | | 1.64 | | | | | 0.96 | | | | | 45 | | | |
| |
| |
First American Funds 2009 Annual Report 99
Financial Highlights For a share outstanding throughout the indicated periods.
| | | | | | | | | | | | | | | | | | | | | | | | | | | | | | | | | | | | | | | | | | | | | | | |
| | | | | | | | | | | | | | | | | | | | | | | | | | | | | |
| | | | | | | | | Realized and
| | | | | | | | | | | | | | | | | | | | |
| | | Net Asset
| | | | | | Unrealized
| | | | | | Distributions
| | | | | | | | | | | | Net Asset
| | |
| | | Value
| | | Net
| | | Gains
| | | Total From
| | | from Net
| | | Distributions
| | | Distributions
| | | | | | Value
| | |
| | | Beginning
| | | Investment
| | | (Losses) on
| | | Investment
| | | Investment
| | | from Net
| | | from Return
| | | Total
| | | End of
| | |
| | | of Period | | | Income (Loss) | | | Investments | | | Operations | | | Income | | | Realized Gains | | | of Capital | | | Distributions | | | Period | | |
| |
Large Cap Growth Opportunities Fund1 | | | | | | | | | | | | | | | | | | | | | | | | | | | | | | | | | | | | | | | | | | |
| Class A | | | | | | | | | | | | | | | | | | | | | | | | | | | | | | | | | | | | | | | | | | | | | | |
20092 | | $ | 21.52 | | | | $ | 0.05 | | | | $ | 2.68 | | | | $ | 2.73 | | | | $ | (0.02 | ) | | | $ | — | | | | $ | — | | | | $ | (0.02 | ) | | | $ | 24.23 | | | |
20082 | | | 36.27 | | | | | 0.02 | | | | | (11.65 | ) | | | | (11.63 | ) | | | | — | | | | | (3.12 | ) | | | | — | | | | | (3.12 | ) | | | | 21.52 | | | |
20072 | | | 29.58 | | | | | (0.05 | ) | | | | 7.08 | | | | | 7.03 | | | | | — | | | | | (0.34 | ) | | | | — | | | | | (0.34 | ) | | | | 36.27 | | | |
20062 | | | 27.86 | | | | | (0.02 | ) | | | | 1.74 | | | | | 1.72 | | | | | — | | | | | — | | | | | — | | | | | — | | | | | 29.58 | | | |
20053 | | | 28.02 | | | | | (0.01 | ) | | | | (0.15 | ) | | | | (0.16 | ) | | | | — | | | | | — | | | | | — | | | | | — | | | | | 27.86 | | | |
20054 | | | 25.00 | | | | | (0.01 | ) | | | | 3.08 | | | | | 3.07 | | | | | (0.04 | ) | | | | — | | | | | (0.01 | ) | | | | (0.05 | ) | | | | 28.02 | | | |
| Class B | | | | | | | | | | | | | | | | | | | | | | | | | | | | | | | | | | | | | | | | | | | | | | |
20092 | | $ | 19.93 | | | | $ | (0.09 | ) | | | $ | 2.47 | | | | $ | 2.38 | | | | $ | — | | | | $ | — | | | | $ | — | | | | $ | — | | | | $ | 22.31 | | | |
20082 | | | 34.08 | | | | | (0.19 | ) | | | | (10.84 | ) | | | | (11.03 | ) | | | | — | | | | | (3.12 | ) | | | | — | | | | | (3.12 | ) | | | | 19.93 | | | |
20072 | | | 28.01 | | | | | (0.27 | ) | | | | 6.68 | | | | | 6.41 | | | | | — | | | | | (0.34 | ) | | | | — | | | | | (0.34 | ) | | | | 34.08 | | | |
20062 | | | 26.58 | | | | | (0.22 | ) | | | | 1.65 | | | | | 1.43 | | | | | — | | | | | — | | | | | — | | | | | — | | | | | 28.01 | | | |
20053 | | | 26.75 | | | | | (0.03 | ) | | | | (0.14 | ) | | | | (0.17 | ) | | | | — | | | | | — | | | | | — | | | | | — | | | | | 26.58 | | | |
20054 | | | 24.02 | | | | | (0.20 | ) | | | | 2.96 | | | | | 2.76 | | | | | (0.02 | ) | | | | — | | | | | (0.01 | ) | | | | (0.03 | ) | | | | 26.75 | | | |
| Class C | | | | | | | | | | | | | | | | | | | | | | | | | | | | | | | | | | | | | | | | | | | | | | |
20092 | | $ | 20.38 | | | | $ | (0.10 | ) | | | $ | 2.53 | | | | $ | 2.43 | | | | $ | — | | | | $ | — | | | | $ | — | | | | $ | — | | | | $ | 22.81 | | | |
20082 | | | 34.77 | | | | | (0.19 | ) | | | | (11.08 | ) | | | | (11.27 | ) | | | | — | | | | | (3.12 | ) | | | | — | | | | | (3.12 | ) | | | | 20.38 | | | |
20072 | | | 28.58 | | | | | (0.28 | ) | | | | 6.81 | | | | | 6.53 | | | | | — | | | | | (0.34 | ) | | | | — | | | | | (0.34 | ) | | | | 34.77 | | | |
20062 | | | 27.12 | | | | | (0.23 | ) | | | | 1.69 | | | | | 1.46 | | | | | — | | | | | — | | | | | — | | | | | — | | | | | 28.58 | | | |
20053 | | | 27.29 | | | | | (0.03 | ) | | | | (0.14 | ) | | | | (0.17 | ) | | | | — | | | | | — | | | | | — | | | | | — | | | | | 27.12 | | | |
20054 | | | 24.51 | | | | | (0.20 | ) | | | | 3.00 | | | | | 2.80 | | | | | (0.01 | ) | | | | — | | | | | (0.01 | ) | | | | (0.02 | ) | | | | 27.29 | | | |
| Class R | | | | | | | | | | | | | | | | | | | | | | | | | | | | | | | | | | | | | | | | | | | | | | |
20092 | | $ | 21.26 | | | | $ | (0.01 | ) | | | $ | 2.67 | | | | $ | 2.66 | | | | $ | — | | | | $ | — | | | | $ | — | | | | $ | — | | | | $ | 23.92 | | | |
20082 | | | 35.97 | | | | | (0.05 | ) | | | | (11.54 | ) | | | | (11.59 | ) | | | | — | | | | | (3.12 | ) | | | | — | | | | | (3.12 | ) | | | | 21.26 | | | |
20072 | | | 29.41 | | | | | (0.12 | ) | | | | 7.02 | | | | | 6.90 | | | | | — | | | | | (0.34 | ) | | | | — | | | | | (0.34 | ) | | | | 35.97 | | | |
20062 | | | 27.78 | | | | | (0.09 | ) | | | | 1.72 | | | | | 1.63 | | | | | — | | | | | — | | | | | — | | | | | — | | | | | 29.41 | | | |
20053 | | | 27.94 | | | | | (0.02 | ) | | | | (0.14 | ) | | | | (0.16 | ) | | | | — | | | | | — | | | | | — | | | | | — | | | | | 27.78 | | | |
20054 | | | 24.98 | | | | | (0.16 | ) | | | | 3.17 | | | | | 3.01 | | | | | (0.05 | ) | | | | — | | | | | — | 5 | | | | (0.05 | ) | | | | 27.94 | | | |
| Class Y | | | | | | | | | | | | | | | | | | | | | | | | | | | | | | | | | | | | | | | | | | | | | | |
20092 | | $ | 22.31 | | | | $ | 0.11 | | | | $ | 2.77 | | | | $ | 2.88 | | | | $ | (0.10 | ) | | | $ | — | | | | $ | — | | | | $ | (0.10 | ) | | | $ | 25.09 | | | |
20082 | | | 37.42 | | | | | 0.10 | | | | | (12.07 | ) | | | | (11.97 | ) | | | | (0.02 | ) | | | | (3.12 | ) | | | | — | | | | | (3.14 | ) | | | | 22.31 | | | |
20072 | | | 30.48 | | | | | 0.03 | | | | | 7.30 | | | | | 7.33 | | | | | (0.05 | ) | | | | (0.34 | ) | | | | — | | | | | (0.39 | ) | | | | 37.42 | | | |
20062 | | | 28.64 | | | | | 0.05 | | | | | 1.79 | | | | | 1.84 | | | | | — | | | | | — | | | | | — | | | | | — | | | | | 30.48 | | | |
20053 | | | 28.79 | | | | | (0.01 | ) | | | | (0.14 | ) | | | | (0.15 | ) | | | | — | | | | | — | | | | | — | | | | | — | | | | | 28.64 | | | |
20054 | | | 25.63 | | | | | 0.07 | | | | | 3.15 | | | | | 3.22 | | | | | (0.04 | ) | | | | — | | | | | (0.02 | ) | | | | (0.06 | ) | | | | 28.79 | | | |
| |
| |
| | |
| | 1 | Per share data calculated using average shares outstanding method. |
| |
| | 2 | For the period November 1 to October 31 in the fiscal year indicated. |
| |
| | 3 | For the period October 1, 2005 to October 31, 2005. Effective in 2005, the fund’s fiscal year-end was changed from September 30 to October 31. All ratios for the period have been annualized, except total return and portfolio turnover. |
| |
| | 4 | For the period October 1 to September 30 in the year indicated. |
| |
| | 5 | Includes a tax return of capital of less than $0.01. |
| |
| | 6 | Total return does not reflect sales charges. Total return would have been lower had certain expenses not been waived. |
The accompanying notes are an integral part of the financial statements.
100 First American Funds 2009 Annual Report
| | | | | | | | | | | | | | | | | | | | | | | | | | | | | | | | | | | | | |
| | | | | | | | | | | | | | | | | | | | | | | | | | | | | |
| | | | | | | | | | | | | | | | | | | | | | Ratio of Net
| | | | | | | |
| | | | | | | | | | | | | | | | | | Ratio of
| | | | Investment
| | | | | | | |
| | | | | | | | | | | | | | Ratio of Net
| | | | Expenses
| | | | Income (Loss)
| | | | | | | |
| | | | | | | | | | Ratio of
| | | | Investment
| | | | to Average
| | | | to Average
| | | | | | | |
| | | | | | | Net Assets
| | | Expenses to
| | | | Income (Loss)
| | | | Net Assets
| | | | Net Assets
| | | | Portfolio
| | | |
| | | Total
| | | | End of
| | | Average
| | | | to Average
| | | | (Excluding
| | | | (Excluding
| | | | Turnover
| | | |
| | | Return6 | | | | Period (000) | | | Net Assets | | | | Net Assets | | | | Waivers) | | | | Waivers) | | | | Rate | | | |
| |
| | | | | | | | | | | | | | | | | | | | | | | | | | | | | | | | | | | | | |
| | | | | | | | | | | | | | | | | | | | | | | | | | | | | | | | | | | | | |
| | | | 12.73 | % | | | $ | 56,963 | | | | | 1.22 | % | | | | 0.24 | % | | | | 1.22 | % | | | | 0.24 | % | | | | 112 | % | | |
| | | | (34.81 | ) | | | | 53,430 | | | | | 1.20 | | | | | 0.07 | | | | | 1.20 | | | | | 0.07 | | | | | 92 | | | |
| | | | 24.01 | | | | | 96,514 | | | | | 1.19 | | | | | (0.15 | ) | | | | 1.19 | | | | | (0.15 | ) | | | | 102 | | | |
| | | | 6.17 | | | | | 90,285 | | | | | 1.19 | | | | | (0.07 | ) | | | | 1.19 | | | | | (0.07 | ) | | | | 94 | | | |
| | | | (0.57 | ) | | | | 104,960 | | | | | 1.21 | | | | | (0.47 | ) | | | | 1.21 | | | | | (0.47 | ) | | | | 6 | | | |
| | | | 12.30 | | | | | 107,079 | | | | | 1.17 | | | | | (0.03 | ) | | | | 1.20 | | | | | (0.06 | ) | | | | 103 | | | |
| | | | | | | | | | | | | | | | | | | | | | | | | | | | | | | | | | | | | |
| | | | 11.94 | % | | | $ | 4,749 | | | | | 1.97 | % | | | | (0.48 | )% | | | | 1.97 | % | | | | (0.48 | )% | | | | 112 | % | | |
| | | | (35.33 | ) | | | | 5,907 | | | | | 1.95 | | | | | (0.68 | ) | | | | 1.95 | | | | | (0.68 | ) | | | | 92 | | | |
| | | | 23.13 | | | | | 11,955 | | | | | 1.94 | | | | | (0.90 | ) | | | | 1.94 | | | | | (0.90 | ) | | | | 102 | | | |
| | | | 5.38 | | | | | 13,990 | | | | | 1.94 | | | | | (0.82 | ) | | | | 1.94 | | | | | (0.82 | ) | | | | 94 | | | |
| | | | (0.64 | ) | | | | 19,601 | | | | | 1.96 | | | | | (1.22 | ) | | | | 1.96 | | | | | (1.22 | ) | | | | 6 | | | |
| | | | 11.47 | | | | | 20,239 | | | | | 1.92 | | | | | (0.77 | ) | | | | 1.95 | | | | | (0.80 | ) | | | | 103 | | | |
| | | | | | | | | | | | | | | | | | | | | | | | | | | | | | | | | | | | | |
| | | | 11.92 | % | | | $ | 4,509 | | | | | 1.97 | % | | | | (0.51 | )% | | | | 1.97 | % | | | | (0.51 | )% | | | | 112 | % | | |
| | | | (35.31 | ) | | | | 4,368 | | | | | 1.95 | | | | | (0.68 | ) | | | | 1.95 | | | | | (0.68 | ) | | | | 92 | | | |
| | | | 23.09 | | | | | 8,506 | | | | | 1.94 | | | | | (0.90 | ) | | | | 1.94 | | | | | (0.90 | ) | | | | 102 | | | |
| | | | 5.38 | | | | | 8,424 | | | | | 1.94 | | | | | (0.82 | ) | | | | 1.94 | | | | | (0.82 | ) | | | | 94 | | | |
| | | | (0.62 | ) | | | | 10,739 | | | | | 1.96 | | | | | (1.22 | ) | | | | 1.96 | | | | | (1.22 | ) | | | | 6 | | | |
| | | | 11.44 | | | | | 11,147 | | | | | 1.92 | | | | | (0.78 | ) | | | | 1.95 | | | | | (0.81 | ) | | | | 103 | | | |
| | | | | | | | | | | | | | | | | | | | | | | | | | | | | | | | | | | | | |
| | | | 12.51 | % | | | $ | 667 | | | | | 1.47 | % | | | | (0.05 | )% | | | | 1.47 | % | | | | (0.05 | )% | | | | 112 | % | | |
| | | | (35.00 | ) | | | | 454 | | | | | 1.45 | | | | | (0.18 | ) | | | | 1.45 | | | | | (0.18 | ) | | | | 92 | | | |
| | | | 23.70 | | | | | 566 | | | | | 1.44 | | | | | (0.39 | ) | | | | 1.44 | | | | | (0.39 | ) | | | | 102 | | | |
| | | | 5.87 | | | | | 558 | | | | | 1.44 | | | | | (0.32 | ) | | | | 1.57 | | | | | (0.45 | ) | | | | 94 | | | |
| | | | (0.57 | ) | | | | 290 | | | | | 1.46 | | | | | (0.72 | ) | | | | 1.61 | | | | | (0.87 | ) | | | | 6 | | | |
| | | | 12.04 | | | | | 290 | | | | | 1.42 | | | | | (0.57 | ) | | | | 1.60 | | | | | (0.75 | ) | | | | 103 | | | |
| | | | | | | | | | | | | | | | | | | | | | | | | | | | | | | | | | | | | |
| | | | 13.02 | % | | | $ | 482,222 | | | | | 0.97 | % | | | | 0.48 | % | | | | 0.97 | % | | | | 0.48 | % | | | | 112 | % | | |
| | | | (34.65 | ) | | | | 417,337 | | | | | 0.95 | | | | | 0.32 | | | | | 0.95 | | | | | 0.32 | | | | | 92 | | | |
| | | | 24.32 | | | | | 749,865 | | | | | 0.94 | | | | | 0.11 | | | | | 0.94 | | | | | 0.11 | | | | | 102 | | | |
| | | | 6.42 | | | | | 793,853 | | | | | 0.94 | | | | | 0.18 | | | | | 0.94 | | | | | 0.18 | | | | | 94 | | | |
| | | | (0.52 | ) | | | | 849,194 | | | | | 0.96 | | | | | (0.22 | ) | | | | 0.96 | | | | | (0.22 | ) | | | | 6 | | | |
| | | | 12.58 | | | | | 849,382 | | | | | 0.92 | | | | | 0.26 | | | | | 0.95 | | | | | 0.23 | | | | | 103 | | | |
| |
| |
First American Funds 2009 Annual Report 101
Financial Highlights For a share outstanding throughout the indicated periods.
| | | | | | | | | | | | | | | | | | | | | | | | | | | | | | | | | | | | | | | | | | |
| | | | | | | | | | | | | | | | | | | | | | | | | | |
| | | | | | | | | Realized and
| | | | | | | | | | | | | | | | | |
| | | Net Asset
| | | | | | Unrealized
| | | | | | Distributions
| | | | | | | | | Net Asset
| | |
| | | Value
| | | Net
| | | Gains
| | | Total from
| | | from Net
| | | Distributions
| | | | | | Value
| | |
| | | Beginning
| | | Investment
| | | (Losses) on
| | | Investment
| | | Investment
| | | from Net
| | | Total
| | | End of
| | |
| | | of Period | | | Income (Loss) | | | Investments | | | Operations | | | Income | | | Realized Gains | | | Distributions | | | Period | | |
| |
Large Cap Select Fund1 | | | | | | | | | | | | | | | | | | | | | | | | | | | | | | | | |
| Class A | | | | | | | | | | | | | | | | | | | | | | | | | | | | | | | | | | | | | | | | | |
20092 | | $ | 8.83 | | | | $ | 0.04 | | | | $ | 0.97 | | | | $ | 1.01 | | | | $ | (0.04 | ) | | | $ | — | | | | $ | (0.04 | ) | | | $ | 9.80 | | | |
20082 | | | 17.05 | | | | | 0.06 | | | | | (6.04 | ) | | | | (5.98 | ) | | | | (0.04 | ) | | | | (2.20 | ) | | | | (2.24 | ) | | | | 8.83 | | | |
20072 | | | 15.18 | | | | | 0.03 | | | | | 2.12 | | | | | 2.15 | | | | | (0.03 | ) | | | | (0.25 | ) | | | | (0.28 | ) | | | | 17.05 | | | |
20062 | | | 14.30 | | | | | 0.06 | | | | | 1.48 | | | | | 1.54 | | | | | (0.06 | ) | | | | (0.60 | ) | | | | (0.66 | ) | | | | 15.18 | | | |
20053 | | | 14.47 | | | | | — | | | | | (0.17 | ) | | | | (0.17 | ) | | | | — | | | | | — | | | | | — | | | | | 14.30 | | | |
20054 | | | 12.52 | | | | | 0.06 | | | | | 2.15 | | | | | 2.21 | | | | | (0.06 | ) | | | | (0.20 | ) | | | | (0.26 | ) | | | | 14.47 | | | |
| Class C | | | | | | | | | | | | | | | | | | | | | | | | | | | | | | | | | | | | | | | | | |
20092 | | $ | 8.56 | | | | $ | (0.02 | ) | | | $ | 0.93 | | | | $ | 0.91 | | | | $ | (0.01 | ) | | | $ | — | | | | $ | (0.01 | ) | | | $ | 9.46 | | | |
20082 | | | 16.69 | | | | | (0.03 | ) | | | | (5.90 | ) | | | | (5.93 | ) | | | | — | | | | | (2.20 | ) | | | | (2.20 | ) | | | | 8.56 | | | |
20072 | | | 14.95 | | | | | (0.09 | ) | | | | 2.08 | | | | | 1.99 | | | | | — | | | | | (0.25 | ) | | | | (0.25 | ) | | | | 16.69 | | | |
20062 | | | 14.13 | | | | | (0.05 | ) | | | | 1.48 | | | | | 1.43 | | | | | (0.01 | ) | | | | (0.60 | ) | | | | (0.61 | ) | | | | 14.95 | | | |
20053 | | | 14.31 | | | | | (0.01 | ) | | | | (0.17 | ) | | | | (0.18 | ) | | | | — | | | | | — | | | | | — | | | | | 14.13 | | | |
20054 | | | 12.43 | | | | | (0.05 | ) | | | | 2.14 | | | | | 2.09 | | | | | (0.01 | ) | | | | (0.20 | ) | | | | (0.21 | ) | | | | 14.31 | | | |
| Class R | | | | | | | | | | | | | | | | | | | | | | | | | | | | | | | | | | | | | | | | | |
20092 | | $ | 8.78 | | | | $ | 0.01 | | | | $ | 0.98 | | | | $ | 0.99 | | | | $ | (0.03 | ) | | | $ | — | | | | $ | (0.03 | ) | | | $ | 9.74 | | | |
20082 | | | 16.97 | | | | | 0.03 | | | | | (6.00 | ) | | | | (5.97 | ) | | | | (0.02 | ) | | | | (2.20 | ) | | | | (2.22 | ) | | | | 8.78 | | | |
20072 | | | 15.12 | | | | | — | | | | | 2.11 | | | | | 2.11 | | | | | (0.01 | ) | | | | (0.25 | ) | | | | (0.26 | ) | | | | 16.97 | | | |
20062 | | | 14.26 | | | | | 0.01 | | | | | 1.49 | | | | | 1.50 | | | | | (0.04 | ) | | | | (0.60 | ) | | | | (0.64 | ) | | | | 15.12 | | | |
20053 | | | 14.43 | | | | | (0.01 | ) | | | | (0.16 | ) | | | | (0.17 | ) | | | | — | | | | | — | | | | | — | | | | | 14.26 | | | |
20054 | | | 12.49 | | | | | 0.02 | | | | | 2.15 | | | | | 2.17 | | | | | (0.03 | ) | | | | (0.20 | ) | | | | (0.23 | ) | | | | 14.43 | | | |
| Class Y | | | | | | | | | | | | | | | | | | | | | | | | | | | | | | | | | | | | | | | | | |
20092 | | $ | 8.87 | | | | $ | 0.07 | | | | $ | 0.96 | | | | $ | 1.03 | | | | $ | (0.05 | ) | | | $ | — | | | | $ | (0.05 | ) | | | $ | 9.85 | | | |
20082 | | | 17.10 | | | | | 0.09 | | | | | (6.05 | ) | | | | (5.96 | ) | | | | (0.07 | ) | | | | (2.20 | ) | | | | (2.27 | ) | | | | 8.87 | | | |
20072 | | | 15.22 | | | | | 0.07 | | | | | 2.13 | | | | | 2.20 | | | | | (0.07 | ) | | | | (0.25 | ) | | | | (0.32 | ) | | | | 17.10 | | | |
20062 | | | 14.33 | | | | | 0.10 | | | | | 1.49 | | | | | 1.59 | | | | | (0.10 | ) | | | | (0.60 | ) | | | | (0.70 | ) | | | | 15.22 | | | |
20053 | | | 14.49 | | | | | — | | | | | (0.16 | ) | | | | (0.16 | ) | | | | — | | | | | — | | | | | — | | | | | 14.33 | | | |
20054 | | | 12.53 | | | | | 0.09 | | | | | 2.16 | | | | | 2.25 | | | | | (0.09 | ) | | | | (0.20 | ) | | | | (0.29 | ) | | | | 14.49 | | | |
| |
| |
| | |
| | 1 | Per share data calculated using average shares outstanding method. |
| |
| | 2 | For the period November 1 to October 31 in the fiscal year indicated |
| |
| | 3 | For the period October 1, 2005 to October 31, 2005. Effective in 2005, the fund’s fiscal year-end was changed from September 30 to October 31. All ratios for the period have been annualized, except total return and portfolio turnover. |
| |
| | 4 | For the period October 1 to September 30 in the year indicated. |
| |
| | 5 | Total return does not reflect sales charges. Total return would have been lower had certain expenses not been waived. |
The accompanying notes are an integral part of the financial statements.
102 First American Funds 2009 Annual Report
| | | | | | | | | | | | | | | | | | | | | | | | | | | | | | | | | | | | | |
| | | | | | | | | | | | | | | | | | | | | | | |
| | | | | | | | | | | | | | | | | | Ratio of Net
| | | | | |
| | | | | | | | | | | | | | | Ratio of
| | | Investment
| | | | | |
| | | | | | | | | | | | Ratio of Net
| | | Expenses
| | | Income (Loss)
| | | | | |
| | | | | | | | | Ratio of
| | | Investment
| | | to Average
| | | to Average
| | | | | |
| | | | | | Net Assets
| | | Expenses to
| | | Income (Loss)
| | | Net Assets
| | | Net Assets
| | | Portfolio
| | |
| | | Total
| | | End of
| | | Average
| | | to Average
| | | (Excluding
| | | (Excluding
| | | Turnover
| | |
| | | Return5 | | | Period (000) | | | Net Assets | | | Net Assets | | | Waivers) | | | Waivers) | | | Rate | | |
| |
| | | | | | | | | | | | | | | | | | | | | | | | | | | | | | | | | | | | | |
| | | | | | | | | | | | | | | | | | | | | | | | | | | | | | | | | | | | | |
| | | | 11.54 | % | | | $ | 3,292 | | | | | 1.29 | % | | | | 0.52 | % | | | | 1.29 | % | | | | 0.52 | % | | | | 185 | % | | |
| | | | (39.81 | ) | | | | 3,608 | | | | | 1.21 | | | | | 0.49 | | | | | 1.21 | | | | | 0.49 | | | | | 210 | | | |
| | | | 14.36 | | | | | 7,998 | | | | | 1.19 | | | | | 0.20 | | | | | 1.19 | | | | | 0.20 | | | | | 138 | | | |
| | | | 11.07 | | | | | 7,152 | | | | | 1.20 | | | | | 0.41 | | | | | 1.20 | | | | | 0.41 | | | | | 112 | | | |
| | | | (1.17 | ) | | | | 5,682 | | | | | 1.19 | | | | | (0.20 | ) | | | | 1.19 | | | | | (0.20 | ) | | | | 8 | | | |
| | | | 17.83 | | | | | 5,299 | | | | | 1.17 | | | | | 0.41 | | | | | 1.22 | | | | | 0.36 | | | | | 176 | | | |
| | | | | | | | | | | | | | | | | | | | | | | | | | | | | | | | | | | | | |
| | | | 10.64 | % | | | $ | 186 | | | | | 2.05 | % | | | | (0.23 | )% | | | | 2.05 | % | | | | (0.23 | )% | | | | 185 | % | | |
| | | | (40.38 | ) | | | | 180 | | | | | 1.96 | | | | | (0.26 | ) | | | | 1.96 | | | | | (0.26 | ) | | | | 210 | | | |
| | | | 13.45 | | | | | 325 | | | | | 1.94 | | | | | (0.57 | ) | | | | 1.94 | | | | | (0.57 | ) | | | | 138 | | | |
| | | | 10.36 | | | | | 248 | | | | | 1.95 | | | | | (0.35 | ) | | | | 1.95 | | | | | (0.35 | ) | | | | 112 | | | |
| | | | (1.26 | ) | | | | 180 | | | | | 1.94 | | | | | (0.95 | ) | | | | 1.94 | | | | | (0.95 | ) | | | | 8 | | | |
| | | | 16.91 | | | | | 182 | | | | | 1.92 | | | | | (0.35 | ) | | | | 1.97 | | | | | (0.40 | ) | | | | 176 | | | |
| | | | | | | | | | | | | | | | | | | | | | | | | | | | | | | | | | | | | |
| | | | 11.31 | % | | | $ | 66 | | | | | 1.56 | % | | | | 0.12 | % | | | | 1.56 | % | | | | 0.12 | % | | | | 185 | % | | |
| | | | (39.94 | ) | | | | 20 | | | | | 1.46 | | | | | 0.24 | | | | | 1.46 | | | | | 0.24 | | | | | 210 | | | |
| | | | 14.09 | | | | | 37 | | | | | 1.44 | | | | | 0.02 | | | | | 1.44 | | | | | 0.02 | | | | | 138 | | | |
| | | | 10.79 | | | | | 118 | | | | | 1.45 | | | | | 0.08 | | | | | 1.57 | | | | | (0.04 | ) | | | | 112 | | | |
| | | | (1.18 | ) | | | | 2 | | | | | 1.44 | | | | | (0.45 | ) | | | | 1.59 | | | | | (0.60 | ) | | | | 8 | | | |
| | | | 17.54 | | | | | 2 | | | | | 1.42 | | | | | 0.14 | | | | | 1.62 | | | | | (0.06 | ) | | | | 176 | | | |
| | | | | | | | | | | | | | | | | | | | | | | | | | | | | | | | | | | | | |
| | | | 11.81 | % | | | $ | 147,231 | | | | | 1.04 | % | | | | 0.82 | % | | | | 1.04 | % | | | | 0.82 | % | | | | 185 | % | | |
| | | | (39.63 | ) | | | | 207,904 | | | | | 0.96 | | | | | 0.74 | | | | | 0.96 | | | | | 0.74 | | | | | 210 | | | |
| | | | 14.65 | | | | | 449,201 | | | | | 0.94 | | | | | 0.45 | | | | | 0.94 | | | | | 0.45 | | | | | 138 | | | |
| | | | 11.37 | | | | | 476,154 | | | | | 0.95 | | | | | 0.66 | | | | | 0.95 | | | | | 0.66 | | | | | 112 | | | |
| | | | (1.10 | ) | | | | 341,061 | | | | | 0.94 | | | | | 0.05 | | | | | 0.94 | | | | | 0.05 | | | | | 8 | | | |
| | | | 18.14 | | | | | 329,656 | | | | | 0.92 | | | | | 0.67 | | | | | 0.97 | | | | | 0.62 | | | | | 176 | | | |
| |
| |
First American Funds 2009 Annual Report 103
Financial Highlights For a share outstanding throughout the indicated periods.
| | | | | | | | | | | | | | | | | | | | | | | | | | | | | | | | | | | | | | | | | | |
| | | | | | | | | | | | | | | | | | | | | | | | | | |
| | | | | | | | | Realized and
| | | | | | | | | | | | | | | | | |
| | | Net Asset
| | | | | | Unrealized
| | | | | | Distributions
| | | | | | | | | Net Asset
| | |
| | | Value
| | | Net
| | | Gains
| | | Total from
| | | from Net
| | | Distributions
| | | | | | Value
| | |
| | | Beginning
| | | Investment
| | | (Losses) on
| | | Investment
| | | Investment
| | | from Net
| | | Total
| | | End of
| | |
| | | of Period | | | Income (Loss) | | | Investments | | | Operations | | | Income | | | Realized Gains | | | Distributions | | | Period | | |
| |
Large Cap Value Fund1 | | | | | | | | | | | | | | | | | | | | | | | | | | | | | | | | |
| Class A | | | | | | | | | | | | | | | | | | | | | | | | | | | | | | | | | | | | | | | | | |
20092 | | $ | 12.88 | | | | $ | 0.18 | | | | $ | 0.22 | | | | $ | 0.40 | | | | $ | (0.14 | ) | | | $ | — | | | | $ | (0.14 | ) | | | $ | 13.14 | | | |
20082 | | | 22.61 | | | | | 0.25 | | | | | (7.02 | ) | | | | (6.77 | ) | | | | (0.16 | ) | | | | (2.80 | ) | | | | (2.96 | ) | | | | 12.88 | | | |
20072 | | | 22.12 | | | | | 0.23 | | | | | 2.19 | | | | | 2.42 | | | | | (0.24 | ) | | | | (1.69 | ) | | | | (1.93 | ) | | | | 22.61 | | | |
20062 | | | 19.56 | | | | | 0.21 | | | | | 3.19 | | | | | 3.40 | | | | | (0.21 | ) | | | | (0.63 | ) | | | | (0.84 | ) | | | | 22.12 | | | |
20053 | | | 20.06 | | | | | — | | | | | (0.50 | ) | | | | (0.50 | ) | | | | — | | | | | — | | | | | — | | | | | 19.56 | | | |
20054 | | | 17.21 | | | | | 0.17 | | | | | 2.85 | | | | | 3.02 | | | | | (0.17 | ) | | | | — | | | | | (0.17 | ) | | | | 20.06 | | | |
| Class B | | | | | | | | | | | | | | | | | | | | | | | | | | | | | | | | | | | | | | | | | |
20092 | | $ | 12.39 | | | | $ | 0.09 | | | | $ | 0.21 | | | | $ | 0.30 | | | | $ | (0.08 | ) | | | $ | — | | | | $ | (0.08 | ) | | | $ | 12.61 | | | |
20082 | | | 21.92 | | | | | 0.11 | | | | | (6.77 | ) | | | | (6.66 | ) | | | | (0.07 | ) | | | | (2.80 | ) | | | | (2.87 | ) | | | | 12.39 | | | |
20072 | | | 21.54 | | | | | 0.07 | | | | | 2.12 | | | | | 2.19 | | | | | (0.12 | ) | | | | (1.69 | ) | | | | (1.81 | ) | | | | 21.92 | | | |
20062 | | | 19.12 | | | | | 0.06 | | | | | 3.11 | | | | | 3.17 | | | | | (0.12 | ) | | | | (0.63 | ) | | | | (0.75 | ) | | | | 21.54 | | | |
20053 | | | 19.62 | | | | | (0.01 | ) | | | | (0.49 | ) | | | | (0.50 | ) | | | | — | | | | | — | | | | | — | | | | | 19.12 | | | |
20054 | | | 16.87 | | | | | 0.03 | | | | | 2.78 | | | | | 2.81 | | | | | (0.06 | ) | | | | — | | | | | (0.06 | ) | | | | 19.62 | | | |
| Class C | | | | | | | | | | | | | | | | | | | | | | | | | | | | | | | | | | | | | | | | | |
20092 | | $ | 12.59 | | | | $ | 0.09 | | | | $ | 0.21 | | | | $ | 0.30 | | | | $ | (0.08 | ) | | | $ | — | | | | $ | (0.08 | ) | | | $ | 12.81 | | | |
20082 | | | 22.21 | | | | | 0.11 | | | | | (6.86 | ) | | | | (6.75 | ) | | | | (0.07 | ) | | | | (2.80 | ) | | | | (2.87 | ) | | | | 12.59 | | | |
20072 | | | 21.81 | | | | | 0.07 | | | | | 2.14 | | | | | 2.21 | | | | | (0.12 | ) | | | | (1.69 | ) | | | | (1.81 | ) | | | | 22.21 | | | |
20062 | | | 19.35 | | | | | 0.06 | | | | | 3.15 | | | | | 3.21 | | | | | (0.12 | ) | | | | (0.63 | ) | | | | (0.75 | ) | | | | 21.81 | | | |
20053 | | | 19.85 | | | | | (0.01 | ) | | | | (0.49 | ) | | | | (0.50 | ) | | | | — | | | | | — | | | | | — | | | | | 19.35 | | | |
20054 | | | 17.07 | | | | | 0.03 | | | | | 2.81 | | | | | 2.84 | | | | | (0.06 | ) | | | | — | | | | | (0.06 | ) | | | | 19.85 | | | |
| Class R | | | | | | | | | | | | | | | | | | | | | | | | | | | | | | | | | | | | | | | | | |
20092 | | $ | 12.85 | | | | $ | 0.13 | | | | $ | 0.23 | | | | $ | 0.36 | | | | $ | (0.12 | ) | | | $ | — | | | | $ | (0.12 | ) | | | $ | 13.09 | | | |
20082 | | | 22.57 | | | | | 0.20 | | | | | (6.99 | ) | | | | (6.79 | ) | | | | (0.13 | ) | | | | (2.80 | ) | | | | (2.93 | ) | | | | 12.85 | | | |
20072 | | | 22.10 | | | | | 0.17 | | | | | 2.17 | | | | | 2.34 | | | | | (0.18 | ) | | | | (1.69 | ) | | | | (1.87 | ) | | | | 22.57 | | | |
20062 | | | 19.55 | | | | | 0.12 | | | | | 3.23 | | | | | 3.35 | | | | | (0.17 | ) | | | | (0.63 | ) | | | | (0.80 | ) | | | | 22.10 | | | |
20053 | | | 20.06 | | | | | (0.01 | ) | | | | (0.50 | ) | | | | (0.51 | ) | | | | — | | | | | — | | | | | — | | | | | 19.55 | | | |
20054 | | | 17.22 | | | | | 0.12 | | | | | 2.85 | | | | | 2.97 | | | | | (0.13 | ) | | | | — | | | | | (0.13 | ) | | | | 20.06 | | | |
| Class Y | | | | | | | | | | | | | | | | | | | | | | | | | | | | | | | | | | | | | | | | | |
20092 | | $ | 12.95 | | | | $ | 0.21 | | | | $ | 0.23 | | | | $ | 0.44 | | | | $ | (0.16 | ) | | | $ | — | | | | $ | (0.16 | ) | | | $ | 13.23 | | | |
20082 | | | 22.69 | | | | | 0.29 | | | | | (7.04 | ) | | | | (6.75 | ) | | | | (0.19 | ) | | | | (2.80 | ) | | | | (2.99 | ) | | | | 12.95 | | | |
20072 | | | 22.19 | | | | | 0.29 | | | | | 2.18 | | | | | 2.47 | | | | | (0.28 | ) | | | | (1.69 | ) | | | | (1.97 | ) | | | | 22.69 | | | |
20062 | | | 19.62 | | | | | 0.26 | | | | | 3.21 | | | | | 3.47 | | | | | (0.27 | ) | | | | (0.63 | ) | | | | (0.90 | ) | | | | 22.19 | | | |
20053 | | | 20.12 | | | | | — | | | | | (0.50 | ) | | | | (0.50 | ) | | | | — | | | | | — | | | | | — | | | | | 19.62 | | | |
20054 | | | 17.26 | | | | | 0.22 | | | | | 2.86 | | | | | 3.08 | | | | | (0.22 | ) | | | | — | | | | | (0.22 | ) | | | | 20.12 | | | |
| |
| |
| | |
| | 1 | Per share data calculated using average shares outstanding method. |
| |
| | 2 | For the period November 1 to October 31 in the fiscal year indicated. |
| |
| | 3 | For the period October 1, 2005 to October 31, 2005. Effective in 2005, the fund’s fiscal year-end was changed from September 30 to October 31. All ratios for the period have been annualized, except total return and portfolio turnover. |
| |
| | 4 | For the period October 1 to September 30 in the year indicated. |
| |
| | 5 | Total return does not reflect sales charges. Total return would have been lower had certain expenses not been waived. |
The accompanying notes are an integral part of the financial statements.
104 First American Funds 2009 Annual Report
| | | | | | | | | | | | | | | | | | | | | | | | | | | | | | | | | | | | | |
| | | | | | | | | | | | | | | | | | | | | | | |
| | | | | | | | | | | | | | | | | | Ratio of Net
| | | | | |
| | | | | | | | | | | | | | | Ratio of
| | | Investment
| | | | | |
| | | | | | | | | | | | Ratio of Net
| | | Expenses
| | | Income (Loss)
| | | | | |
| | | | | | | | | Ratio of
| | | Investment
| | | to Average
| | | to Average
| | | | | |
| | | | | | Net Assets
| | | Expenses
| | | Income (Loss)
| | | Net Assets
| | | Net Assets
| | | Portfolio
| | |
| | | Total
| | | End of
| | | to Average
| | | to Average
| | | (Excluding
| | | (Excluding
| | | Turnover
| | |
| | | Return5 | | | Period (000) | | | Net Assets | | | Net Assets | | | Waivers) | | | Waivers) | | | Rate | | |
| |
| | | | | | | | | | | | | | | | | | | | | | | | | | | | | | | | | | | | | |
| | | | | | | | | | | | | | | | | | | | | | | | | | | | | | | | | | | | | |
| | | | 3.24 | % | | | $ | 55,401 | | | | | 1.22 | % | | | | 1.49 | % | | | | 1.22 | % | | | | 1.49 | % | | | | 68 | % | | |
| | | | (34.00 | ) | | | | 60,870 | | | | | 1.19 | | | | | 1.41 | | | | | 1.19 | | | | | 1.41 | | | | | 90 | | | |
| | | | 11.60 | | | | | 113,223 | | | | | 1.17 | | | | | 1.05 | | | | | 1.17 | | | | | 1.05 | | | | | 81 | | | |
| | | | 17.93 | | | | | 115,438 | | | | | 1.19 | | | | | 1.05 | | | | | 1.19 | | | | | 1.05 | | | | | 55 | | | |
| | | | (2.48 | ) | | | | 118,443 | | | | | 1.21 | | | | | (0.17 | ) | | | | 1.21 | | | | | (0.17 | ) | | | | 2 | | | |
| | | | 17.62 | | | | | 121,809 | | | | | 1.17 | | | | | 0.90 | | | | | 1.20 | | | | | 0.87 | | | | | 61 | | | |
| | | | | | | | | | | | | | | | | | | | | | | | | | | | | | | | | | | | | |
| | | | 2.48 | % | | | $ | 2,266 | | | | | 1.97 | % | | | | 0.83 | % | | | | 1.97 | % | | | | 0.83 | % | | | | 68 | % | | |
| | | | (34.51 | ) | | | | 3,750 | | | | | 1.94 | | | | | 0.65 | | | | | 1.94 | | | | | 0.65 | | | | | 90 | | | |
| | | | 10.76 | | | | | 7,973 | | | | | 1.92 | | | | | 0.31 | | | | | 1.92 | | | | | 0.31 | | | | | 81 | | | |
| | | | 17.04 | | | | | 9,815 | | | | | 1.94 | | | | | 0.32 | | | | | 1.94 | | | | | 0.32 | | | | | 55 | | | |
| | | | (2.55 | ) | | | | 13,826 | | | | | 1.96 | | | | | (0.92 | ) | | | | 1.96 | | | | | (0.92 | ) | | | | 2 | | | |
| | | | 16.70 | | | | | 14,876 | | | | | 1.92 | | | | | 0.15 | | | | | 1.95 | | | | | 0.12 | | | | | 61 | | | |
| | | | | | | | | | | | | | | | | | | | | | | | | | | | | | | | | | | | | |
| | | | 2.47 | % | | | $ | 2,016 | | | | | 1.97 | % | | | | 0.76 | % | | | | 1.97 | % | | | | 0.76 | % | | | | 68 | % | | |
| | | | (34.46 | ) | | | | 2,643 | | | | | 1.94 | | | | | 0.66 | | | | | 1.94 | | | | | 0.66 | | | | | 90 | | | |
| | | | 10.71 | | | | | 4,587 | | | | | 1.92 | | | | | 0.31 | | | | | 1.92 | | | | | 0.31 | | | | | 81 | | | |
| | | | 17.05 | | | | | 5,174 | | | | | 1.94 | | | | | 0.30 | | | | | 1.94 | | | | | 0.30 | | | | | 55 | | | |
| | | | (2.52 | ) | | | | 5,399 | | | | | 1.96 | | | | | (0.92 | ) | | | | 1.96 | | | | | (0.92 | ) | | | | 2 | | | |
| | | | 16.75 | | | | | 5,710 | | | | | 1.92 | | | | | 0.15 | | | | | 1.95 | | | | | 0.12 | | | | | 61 | | | |
| | | | | | | | | | | | | | | | | | | | | | | | | | | | | | | | | | | | | |
| | | | 2.96 | % | | | $ | 340 | | | | | 1.47 | % | | | | 1.06 | % | | | | 1.47 | % | | | | 1.06 | % | | | | 68 | % | | |
| | | | (34.13 | ) | | | | 174 | | | | | 1.44 | | | | | 1.18 | | | | | 1.44 | | | | | 1.18 | | | | | 90 | | | |
| | | | 11.25 | | | | | 188 | | | | | 1.42 | | | | | 0.78 | | | | | 1.42 | | | | | 0.78 | | | | | 81 | | | |
| | | | 17.63 | | | | | 164 | | | | | 1.44 | | | | | 0.58 | | | | | 1.55 | | | | | 0.47 | | | | | 55 | | | |
| | | | (2.54 | ) | | | | 7 | | | | | 1.46 | | | | | (0.42 | ) | | | | 1.61 | | | | | (0.57 | ) | | | | 2 | | | |
| | | | 17.34 | | | | | 7 | | | | | 1.42 | | | | | 0.61 | | | | | 1.60 | | | | | 0.43 | | | | | 61 | | | |
| | | | | | | | | | | | | | | | | | | | | | | | | | | | | | | | | | | | | |
| | | | 3.54 | % | | | $ | 335,589 | | | | | 0.97 | % | | | | 1.76 | % | | | | 0.97 | % | | | | 1.76 | % | | | | 68 | % | | |
| | | | (33.80 | ) | | | | 401,006 | | | | | 0.94 | | | | | 1.66 | | | | | 0.94 | | | | | 1.66 | | | | | 90 | | | |
| | | | 11.83 | | | | | 726,512 | | | | | 0.92 | | | | | 1.30 | | | | | 0.92 | | | | | 1.30 | | | | | 81 | | | |
| | | | 18.23 | | | | | 825,633 | | | | | 0.94 | | | | | 1.29 | | | | | 0.94 | | | | | 1.29 | | | | | 55 | | | |
| | | | (2.47 | ) | | | | 740,511 | | | | | 0.96 | | | | | 0.08 | | | | | 0.96 | | | | | 0.08 | | | | | 2 | | | |
| | | | 17.92 | | | | | 764,679 | | | | | 0.92 | | | | | 1.17 | | | | | 0.95 | | | | | 1.14 | | | | | 61 | | | |
| |
| |
First American Funds 2009 Annual Report 105
Financial Highlights For a share outstanding throughout the indicated periods.
| | | | | | | | | | | | | | | | | | | | | | | | | | | | | | | | |
| | | | | | | | | | | | | | | | | | | | |
| | | | | | | | | Realized and
| | | | | | | | | | | |
| | | Net Asset
| | | | | | Unrealized
| | | | | | | | | Net Asset
| | |
| | | Value
| | | Net
| | | Gains
| | | Total from
| | | Distributions
| | | Value
| | |
| | | Beginning
| | | Investment
| | | (Losses) on
| | | Investment
| | | from Net
| | | End of
| | |
| | | of Period | | | Loss | | | Investments | | | Operations | | | Realized Gains | | | Period | | |
| |
Mid Cap Growth Opportunities Fund1 | | | | | | | | | | | | | | | | | | | | | | | | | | | | | | | |
| Class A | | | | | | | | | | | | | | | | | | | | | | | | | | | | | | | |
20092 | | $ | 23.88 | | | | $ | (0.08 | ) | | | $ | 5.03 | | | | $ | 4.95 | | | | $ | — | | | | $ | 28.83 | | | |
20082 | | | 46.57 | | | | | (0.16 | ) | | | | (17.86 | ) | | | | (18.02 | ) | | | | (4.67 | ) | | | | 23.88 | | | |
20072 | | | 41.43 | | | | | (0.24 | ) | | | | 9.19 | | | | | 8.95 | | | | | (3.81 | ) | | | | 46.57 | | | |
20062 | | | 40.77 | | | | | (0.11 | ) | | | | 5.04 | | | | | 4.93 | | | | | (4.27 | ) | | | | 41.43 | | | |
20053 | | | 41.55 | | | | | (0.02 | ) | | | | (0.76 | ) | | | | (0.78 | ) | | | | — | | | | | 40.77 | | | |
20054 | | | 38.19 | | | | | (0.24 | ) | | | | 9.65 | | | | | 9.41 | | | | | (6.05 | ) | | | | 41.55 | | | |
| Class B | | | | | | | | | | | | | | | | | | | | | | | | | | | | | | | |
20092 | | $ | 21.22 | | | | $ | (0.23 | ) | | | $ | 4.44 | | | | $ | 4.21 | | | | $ | — | | | | $ | 25.43 | | | |
20082 | | | 42.21 | | | | | (0.38 | ) | | | | (15.94 | ) | | | | (16.32 | ) | | | | (4.67 | ) | | | | 21.22 | | | |
20072 | | | 38.15 | | | | | (0.51 | ) | | | | 8.38 | | | | | 7.87 | | | | | (3.81 | ) | | | | 42.21 | | | |
20062 | | | 38.12 | | | | | (0.38 | ) | | | | 4.68 | | | | | 4.30 | | | | | (4.27 | ) | | | | 38.15 | | | |
20053 | | | 38.87 | | | | | (0.05 | ) | | | | (0.70 | ) | | | | (0.75 | ) | | | | — | | | | | 38.12 | | | |
20054 | | | 36.31 | | | | | (0.51 | ) | | | | 9.12 | | | | | 8.61 | | | | | (6.05 | ) | | | | 38.87 | | | |
| Class C | | | | | | | | | | | | | | | | | | | | | | | | | | | | | | | |
20092 | | $ | 22.26 | | | | $ | (0.24 | ) | | | $ | 4.65 | | | | $ | 4.41 | | | | $ | — | | | | $ | 26.67 | | | |
20082 | | | 44.03 | | | | | (0.40 | ) | | | | (16.70 | ) | | | | (17.10 | ) | | | | (4.67 | ) | | | | 22.26 | | | |
20072 | | | 39.65 | | | | | (0.53 | ) | | | | 8.72 | | | | | 8.19 | | | | | (3.81 | ) | | | | 44.03 | | | |
20062 | | | 39.46 | | | | | (0.40 | ) | | | | 4.86 | | | | | 4.46 | | | | | (4.27 | ) | | | | 39.65 | | | |
20053 | | | 40.23 | | | | | (0.05 | ) | | | | (0.72 | ) | | | | (0.77 | ) | | | | — | | | | | 39.46 | | | |
20054 | | | 37.40 | | | | | (0.53 | ) | | | | 9.41 | | | | | 8.88 | | | | | (6.05 | ) | | | | 40.23 | | | |
| Class R | | | | | | | | | | | | | | | | | | | | | | | | | | | | | | | |
20092 | | $ | 23.56 | | | | $ | (0.14 | ) | | | $ | 4.95 | | | | $ | 4.81 | | | | $ | — | | | | $ | 28.37 | | | |
20082 | | | 46.11 | | | | | (0.24 | ) | | | | (17.64 | ) | | | | (17.88 | ) | | | | (4.67 | ) | | | | 23.56 | | | |
20072 | | | 41.15 | | | | | (0.34 | ) | | | | 9.11 | | | | | 8.77 | | | | | (3.81 | ) | | | | 46.11 | | | |
20062 | | | 40.61 | | | | | (0.23 | ) | | | | 5.04 | | | | | 4.81 | | | | | (4.27 | ) | | | | 41.15 | | | |
20053 | | | 41.40 | | | | | (0.03 | ) | | | | (0.76 | ) | | | | (0.79 | ) | | | | — | | | | | 40.61 | | | |
20054 | | | 38.15 | | | | | (0.31 | ) | | | | 9.61 | | | | | 9.30 | | | | | (6.05 | ) | | | | 41.40 | | | |
| Class Y | | | | | | | | | | | | | | | | | | | | | | | | | | | | | | | |
20092 | | $ | 25.57 | | | | $ | (0.02 | ) | | | $ | 5.39 | | | | $ | 5.37 | | | | $ | — | | | | $ | 30.94 | | | |
20082 | | | 49.40 | | | | | (0.07 | ) | | | | (19.09 | ) | | | | (19.16 | ) | | | | (4.67 | ) | | | | 25.57 | | | |
20072 | | | 43.62 | | | | | (0.14 | ) | | | | 9.73 | | | | | 9.59 | | | | | (3.81 | ) | | | | 49.40 | | | |
20062 | | | 42.61 | | | | | (0.01 | ) | | | | 5.29 | | | | | 5.28 | | | | | (4.27 | ) | | | | 43.62 | | | |
20053 | | | 43.42 | | | | | (0.02 | ) | | | | (0.79 | ) | | | | (0.81 | ) | | | | — | | | | | 42.61 | | | |
20054 | | | 39.58 | | | | | (0.16 | ) | | | | 10.05 | | | | | 9.89 | | | | | (6.05 | ) | | | | 43.42 | | | |
| |
| |
| | |
| | 1 | Per share data calculated using average shares outstanding method. |
| |
| | 2 | For the period November 1 to October 31 in the fiscal year indicated. |
| |
| | 3 | For the period October 1, 2005 to October 31, 2005. Effective October 1, 2005, the fund’s fiscal year end was changed from September 30 to October 31. All ratios for the period have been annualized, except total return and portfolio turnover. |
| |
| | 4 | For the period October 1 to September 30 in the year indicated. |
| |
| | 5 | Total return does not reflect sales charges. Total return would have been lower had certain expenses not been waived. |
The accompanying notes are an integral part of the financial statements.
106 First American Funds 2009 Annual Report
| | | | | | | | | | | | | | | | | | | | | | | | | | | | | | | | | | | | | |
| | | | | | | | | | | | | | | | | | | | | | | |
| | | | | | | | | | | | | | | Ratio of
| | | Ratio of Net
| | | | | |
| | | | | | | | | | | | Ratio of Net
| | | Expenses
| | | Investment
| | | | | |
| | | | | | | | | Ratio of
| | | Investment
| | | to Average
| | | Loss
| | | | | |
| | | | | | Net Assets
| | | Expenses
| | | Loss
| | | Net Assets
| | | to Average Net
| | | Portfolio
| | |
| | | Total
| | | End of
| | | to Average
| | | to Average
| | | (Excluding
| | | Assets (Excluding
| | | Turnover
| | |
| | | Return5 | | | Period (000) | | | Net Assets | | | Net Assets | | | Waivers) | | | Waivers) | | | Rate | | |
| |
| | | | | | | | | | | | | | | | | | | | | | | | | | | | | | | | | | | | | |
| | | | | | | | | | | | | | | | | | | | | | | | | | | | | | | | | | | | | |
| | | | 20.73 | % | | | $ | 231,743 | | | | | 1.23 | % | | | | (0.33 | )% | | | | 1.23 | % | | | | (0.33 | )% | | | | 123 | % | | |
| | | | (42.75 | ) | | | | 209,052 | | | | | 1.22 | | | | | (0.43 | ) | | | | 1.22 | | | | | (0.43 | ) | | | | 113 | | | |
| | | | 23.36 | | | | | 425,995 | | | | | 1.21 | | | | | (0.56 | ) | | | | 1.21 | | | | | (0.56 | ) | | | | 96 | | | |
| | | | 12.69 | | | | | 322,385 | | | | | 1.23 | | | | | (0.26 | ) | | | | 1.23 | | | | | (0.26 | ) | | | | 75 | | | |
| | | | (1.88 | ) | | | | 314,830 | | | | | 1.23 | | | | | (0.72 | ) | | | | 1.23 | | | | | (0.72 | ) | | | | 9 | | | |
| | | | 26.25 | | | | | 317,906 | | | | | 1.21 | | | | | (0.62 | ) | | | | 1.24 | | | | | (0.65 | ) | | | | 107 | | | |
| | | | | | | | | | | | | | | | | | | | | | | | | | | | | | | | | | | | | |
| | | | 19.84 | % | | | $ | 6,762 | | | | | 1.98 | % | | | | (1.06 | )% | | | | 1.98 | % | | | | (1.06 | )% | | | | 123 | % | | |
| | | | (43.18 | ) | | | | 7,241 | | | | | 1.97 | | | | | (1.18 | ) | | | | 1.97 | | | | | (1.18 | ) | | | | 113 | | | |
| | | | 22.47 | | | | | 15,820 | | | | | 1.96 | | | | | (1.31 | ) | | | | 1.96 | | | | | (1.31 | ) | | | | 96 | | | |
| | | | 11.83 | | | | | 15,605 | | | | | 1.98 | | | | | (1.02 | ) | | | | 1.98 | | | | | (1.02 | ) | | | | 75 | | | |
| | | | (1.93 | ) | | | | 14,586 | | | | | 1.98 | | | | | (1.47 | ) | | | | 1.98 | | | | | (1.47 | ) | | | | 9 | | | |
| | | | 25.29 | | | | | 14,922 | | | | | 1.96 | | | | | (1.40 | ) | | | | 1.99 | | | | | (1.43 | ) | | | | 107 | | | |
| | | | | | | | | | | | | | | | | | | | | | | | | | | | | | | | | | | | | |
| | | | 19.81 | % | | | $ | 12,894 | | | | | 1.98 | % | | | | (1.07 | )% | | | | 1.98 | % | | | | (1.07 | )% | | | | 123 | % | | |
| | | | (43.16 | ) | | | | 13,011 | | | | | 1.97 | | | | | (1.18 | ) | | | | 1.97 | | | | | (1.18 | ) | | | | 113 | | | |
| | | | 22.42 | | | | | 28,891 | | | | | 1.96 | | | | | (1.31 | ) | | | | 1.96 | | | | | (1.31 | ) | | | | 96 | | | |
| | | | 11.84 | | | | | 19,540 | | | | | 1.98 | | | | | (1.02 | ) | | | | 1.98 | | | | | (1.02 | ) | | | | 75 | | | |
| | | | (1.91 | ) | | | | 15,435 | | | | | 1.98 | | | | | (1.47 | ) | | | | 1.98 | | | | | (1.47 | ) | | | | 9 | | | |
| | | | 25.27 | | | | | 17,079 | | | | | 1.96 | | | | | (1.40 | ) | | | | 1.99 | | | | | (1.43 | ) | | | | 107 | | | |
| | | | | | | | | | | | | | | | | | | | | | | | | | | | | | | | | | | | | |
| | | | 20.42 | % | | | $ | 26,822 | | | | | 1.48 | % | | | | (0.59 | )% | | | | 1.48 | % | | | | (0.59 | )% | | | | 123 | % | | |
| | | | (42.88 | ) | | | | 21,246 | | | | | 1.47 | | | | | (0.69 | ) | | | | 1.47 | | | | | (0.69 | ) | | | | 113 | | | |
| | | | 23.06 | | | | | 29,490 | | | | | 1.46 | | | | | (0.81 | ) | | | | 1.46 | | | | | (0.81 | ) | | | | 96 | | | |
| | | | 12.41 | | | | | 17,853 | | | | | 1.48 | | | | | (0.57 | ) | | | | 1.61 | | | | | (0.70 | ) | | | | 75 | | | |
| | | | (1.91 | ) | | | | 5,502 | | | | | 1.48 | | | | | (0.97 | ) | | | | 1.63 | | | | | (1.12 | ) | | | | 9 | | | |
| | | | 25.95 | | | | | 5,501 | | | | | 1.46 | | | | | (0.77 | ) | | | | 1.64 | | | | | (0.95 | ) | | | | 107 | | | |
| | | | | | | | | | | | | | | | | | | | | | | | | | | | | | | | | | | | | |
| | | | 21.00 | % | | | $ | 907,825 | | | | | 0.98 | % | | | | (0.09 | )% | | | | 0.98 | % | | | | (0.09 | )% | | | | 123 | % | | |
| | | | (42.59 | ) | | | | 732,559 | | | | | 0.97 | | | | | (0.18 | ) | | | | 0.97 | | | | | (0.18 | ) | | | | 113 | | | |
| | | | 23.68 | | | | | 1,478,374 | | | | | 0.96 | | | | | (0.31 | ) | | | | 0.96 | | | | | (0.31 | ) | | | | 96 | | | |
| | | | 12.98 | | | | | 1,243,776 | | | | | 0.98 | | | | | (0.02 | ) | | | | 0.98 | | | | | (0.02 | ) | | | | 75 | | | |
| | | | (1.86 | ) | | | | 1,238,595 | | | | | 0.98 | | | | | (0.47 | ) | | | | 0.98 | | | | | (0.47 | ) | | | | 9 | | | |
| | | | 26.57 | | | | | 1,273,320 | | | | | 0.96 | | | | | (0.40 | ) | | | | 0.99 | | | | | (0.43 | ) | | | | 107 | | | |
| |
| |
First American Funds 2009 Annual Report 107
Financial Highlights For a share outstanding throughout the indicated periods.
| | | | | | | | | | | | | | | | | | | | | | | | | | | | | | | | |
| | | | | | | | | | | | | | | | | | | | |
| | | | | | | | | Realized and
| | | | | | | | | | | |
| | | Net Asset
| | | | | | Unrealized
| | | | | | Distributions
| | | Net Asset
| | |
| | | Value
| | | Net
| | | Gains
| | | Total from
| | | from Net
| | | Value
| | |
| | | Beginning
| | | Investment
| | | (Losses) on
| | | Investment
| | | Investment
| | | End of
| | |
| | | of Period | | | Income (Loss) | | | Investments | | | Operations | | | Income | | | Period | | |
| |
Mid Cap Select Fund1,2 | | | | | | | | | | | | | | | | | | | | | | | | | | | | | | | |
| Class A | | | | | | | | | | | | | | | | | | | | | | | | | | | | | | | |
20093 | | $ | 7.00 | | | | $ | 0.03 | | | | $ | 0.62 | | | | $ | 0.65 | | | | $ | — | | | | $ | 7.65 | | | |
20083 | | | 10.64 | | | | | (0.01 | ) | | | | (3.63 | ) | | | | (3.64 | ) | | | | — | | | | | 7.00 | | | |
20073 | | | 9.57 | | | | | (0.02 | ) | | | | 1.09 | | | | | 1.07 | | | | | — | | | | | 10.64 | | | |
20063 | | | 8.03 | | | | | 0.01 | | | | | 1.53 | | | | | 1.54 | | | | | — | | | | | 9.57 | | | |
20054 | | | 8.31 | | | | | (0.01 | ) | | | | (0.27 | ) | | | | (0.28 | ) | | | | — | | | | | 8.03 | | | |
20055 | | | 7.40 | | | | | (0.07 | ) | | | | 0.98 | | | | | 0.91 | | | | | — | | | | | 8.31 | | | |
| Class B | | | | | | | | | | | | | | | | | | | | | | | | | | | | | | | |
20093 | | $ | 6.01 | | | | $ | (0.01 | ) | | | $ | 0.52 | | | | $ | 0.51 | | | | $ | — | | | | $ | 6.52 | | | |
20083 | | | 9.21 | | | | | (0.07 | ) | | | | (3.13 | ) | | | | (3.20 | ) | | | | — | | | | | 6.01 | | | |
20073 | | | 8.34 | | | | | (0.08 | ) | | | | 0.95 | | | | | 0.87 | | | | | — | | | | | 9.21 | | | |
20063 | | | 7.06 | | | | | (0.04 | ) | | | | 1.32 | | | | | 1.28 | | | | | — | | | | | 8.34 | | | |
20054 | | | 7.31 | | | | | (0.01 | ) | | | | (0.24 | ) | | | | (0.25 | ) | | | | — | | | | | 7.06 | | | |
20055 | | | 6.55 | | | | | (0.11 | ) | | | | 0.87 | | | | | 0.76 | | | | | — | | | | | 7.31 | | | |
| Class C | | | | | | | | | | | | | | | | | | | | | | | | | | | | | | | |
20093 | | $ | 6.56 | | | | $ | (0.01 | ) | | | $ | 0.57 | | | | $ | 0.56 | | | | $ | — | | | | $ | 7.12 | | | |
20083 | | | 10.04 | | | | | (0.08 | ) | | | | (3.40 | ) | | | | (3.48 | ) | | | | — | | | | | 6.56 | | | |
20073 | | | 9.09 | | | | | (0.09 | ) | | | | 1.04 | | | | | 0.95 | | | | | — | | | | | 10.04 | | | |
20063 | | | 7.69 | | | | | (0.05 | ) | | | | 1.45 | | | | | 1.40 | | | | | — | | | | | 9.09 | | | |
20054 | | | 7.97 | | | | | (0.01 | ) | | | | (0.27 | ) | | | | (0.28 | ) | | | | — | | | | | 7.69 | | | |
20055 | | | 7.14 | | | | | (0.12 | ) | | | | 0.95 | | | | | 0.83 | | | | | — | | | | | 7.97 | | | |
| Class Y | | | | | | | | | | | | | | | | | | | | | | | | | | | | | | | |
20093 | | $ | 7.31 | | | | $ | 0.06 | | | | $ | 0.64 | | | | $ | 0.70 | | | | $ | (0.03 | ) | | | $ | 7.98 | | | |
20083 | | | 11.09 | | | | | 0.01 | | | | | (3.79 | ) | | | | (3.78 | ) | | | | — | | | | | 7.31 | | | |
20073 | | | 9.95 | | | | | — | | | | | 1.15 | | | | | 1.15 | | | | | (0.01 | ) | | | | 11.09 | | | |
20063 | | | 8.34 | | | | | 0.04 | | | | | 1.57 | | | | | 1.61 | | | | | — | | | | | 9.95 | | | |
20054 | | | 8.63 | | | | | — | | | | | (0.29 | ) | | | | (0.29 | ) | | | | — | | | | | 8.34 | | | |
20055 | | | 7.66 | | | | | (0.05 | ) | | | | 1.02 | | | | | 0.97 | | | | | — | | | | | 8.63 | | | |
| |
| |
| | |
| | 1 | Per share data calculated using average shares outstanding method. |
| |
| | 2 | The financial highlights for Mid Cap Select Fund as set forth herein include the historical financial highlights of the First American Technology Fund and Small-Mid Cap Core Fund. Effective October 3, 2005, the fund’s principal investment strategy changed from investing primarily in technology stocks to investing primarily in common stocks of small- and mid- capitalization companies, and the fund’s name changed from Technology Fund to Small-Mid Cap Core Fund. Thereafter, effective May 4, 2009, the fund’s principal investment strategy was changed from investing primarily in common stocks of small- and mid-capitalization companies to investing primarily in common stocks of mid-capitalization companies, and the fund’s name changed from Small-Mid Cap Core Fund to Mid Cap Select Fund. |
| |
| | 3 | For the period November 1 to October 31 in the fiscal year indicated. |
| |
| | 4 | For the period October 1, 2005 to October 31, 2005. Effective October 1, 2005, the fund’s fiscal year end was changed from September 30 to October 31. All ratios for the period have been annualized, except total return and portfolio turnover. |
| |
| | 5 | For the period October 1 to September 30 in the year indicated. |
| |
| | 6 | Total return does not reflect sales charges. Total return would have been lower had certain expenses not been waived. |
The accompanying notes are an integral part of the financial statements.
108 First American Funds 2009 Annual Report
| | | | | | | | | | | | | | | | | | | | | | | | | | | | | | | | | | | | | |
| | | | | | | | | | | | | | | | | | | | | | | |
| | | | | | | | | | | | | | | Ratio of
| | | Ratio of Net
| | | | | |
| | | | | | | | | | | | Ratio of Net
| | | Expenses
| | | Investment
| | | | | |
| | | | | | | | | Ratio of
| | | Investment
| | | to Average
| | | Income (Loss)
| | | | | |
| | | | | | Net Assets
| | | Expenses to
| | | Income (Loss)
| | | Net Assets
| | | to Average Net
| | | Portfolio
| | |
| | | Total
| | | End of
| | | Average
| | | to Average
| | | (Excluding
| | | Assets (Excluding
| | | Turnover
| | |
| | | Return6 | | | Period (000) | | | Net Assets | | | Net Assets | | | Waivers) | | | Waivers) | | | Rate | | |
| |
| | | | | | | | | | | | | | | | | | | | | | | | | | | | | | | | | | | | | |
| | | | | | | | | | | | | | | | | | | | | | | | | | | | | | | | | | | | | |
| | | | 9.32 | % | | | $ | 12,487 | | | | | 1.41 | % | | | | 0.49 | % | | | | 1.92 | % | | | | (0.02 | )% | | | | 186 | % | | |
| | | | (34.21 | ) | | | | 12,848 | | | | | 1.41 | | | | | (0.13 | ) | | | | 1.60 | | | | | (0.32 | ) | | | | 170 | | | |
| | | | 11.18 | | | | | 21,817 | | | | | 1.41 | | | | | (0.20 | ) | | | | 1.49 | | | | | (0.28 | ) | | | | 151 | | | |
| | | | 19.18 | | | | | 26,190 | | | | | 1.39 | | | | | 0.12 | | | | | 1.46 | | | | | 0.05 | | | | | 110 | | | |
| | | | (3.37 | ) | | | | 22,339 | | | | | 1.34 | | | | | (0.86 | ) | | | | 1.34 | | | | | (0.86 | ) | | | | 80 | | | |
| | | | 12.30 | | | | | 23,016 | | | | | 1.42 | | | | | (0.83 | ) | | | | 1.50 | | | | | (0.91 | ) | | | | 197 | | | |
| | | | | | | | | | | | | | | | | | | | | | | | | | | | | | | | | | | | | |
| | | | 8.49 | % | | | $ | 1,691 | | | | | 2.16 | % | | | | (0.20 | )% | | | | 2.67 | % | | | | (0.71 | )% | | | | 186 | % | | |
| | | | (34.74 | ) | | | | 2,512 | | | | | 2.16 | | | | | (0.88 | ) | | | | 2.35 | | | | | (1.07 | ) | | | | 170 | | | |
| | | | 10.43 | | | | | 6,883 | | | | | 2.16 | | | | | (0.94 | ) | | | | 2.24 | | | | | (1.02 | ) | | | | 151 | | | |
| | | | 18.13 | | | | | 8,689 | | | | | 2.14 | | | | | (0.58 | ) | | | | 2.21 | | | | | (0.65 | ) | | | | 110 | | | |
| | | | (3.42 | ) | | | | 10,054 | | | | | 2.09 | | | | | (1.61 | ) | | | | 2.09 | | | | | (1.61 | ) | | | | 80 | | | |
| | | | 11.60 | | | | | 10,685 | | | | | 2.17 | | | | | (1.59 | ) | | | | 2.25 | | | | | (1.67 | ) | | | | 197 | | | |
| | | | | | | | | | | | | | | | | | | | | | | | | | | | | | | | | | | | | |
| | | | 8.54 | % | | | $ | 2,526 | | | | | 2.16 | % | | | | (0.24 | )% | | | | 2.67 | % | | | | (0.75 | )% | | | | 186 | % | | |
| | | | (34.66 | ) | | | | 3,068 | | | | | 2.16 | | | | | (0.88 | ) | | | | 2.35 | | | | | (1.07 | ) | | | | 170 | | | |
| | | | 10.45 | | | | | 5,190 | | | | | 2.16 | | | | | (0.96 | ) | | | | 2.24 | | | | | (1.04 | ) | | | | 151 | | | |
| | | | 18.21 | | | | | 4,986 | | | | | 2.14 | | | | | (0.64 | ) | | | | 2.21 | | | | | (0.71 | ) | | | | 110 | | | |
| | | | (3.51 | ) | | | | 4,253 | | | | | 2.09 | | | | | (1.61 | ) | | | | 2.09 | | | | | (1.61 | ) | | | | 80 | | | |
| | | | 11.62 | | | | | 4,485 | | | | | 2.17 | | | | | (1.59 | ) | | | | 2.25 | | | | | (1.67 | ) | | | | 197 | | | |
| | | | | | | | | | | | | | | | | | | | | | | | | | | | | | | | | | | | | |
| | | | 9.62 | % | | | $ | 27,030 | | | | | 1.16 | % | | | | 0.81 | % | | | | 1.67 | % | | | | 0.30 | % | | | | 186 | % | | |
| | | | (34.08 | ) | | | | 40,409 | | | | | 1.16 | | | | | 0.12 | | | | | 1.35 | | | | | (0.07 | ) | | | | 170 | | | |
| | | | 11.62 | | | | | 79,574 | | | | | 1.16 | | | | | 0.02 | | | | | 1.24 | | | | | (0.06 | ) | | | | 151 | | | |
| | | | 19.30 | | | | | 67,437 | | | | | 1.14 | | | | | 0.35 | | | | | 1.21 | | | | | 0.28 | | | | | 110 | | | |
| | | | (3.36 | ) | | | | 31,381 | | | | | 1.09 | | | | | (0.61 | ) | | | | 1.09 | | | | | (0.61 | ) | | | | 80 | | | |
| | | | 12.66 | | | | | 33,537 | | | | | 1.17 | | | | | (0.58 | ) | | | | 1.25 | | | | | (0.66 | ) | | | | 197 | | | |
| |
| |
First American Funds 2009 Annual Report 109
Financial Highlights For a share outstanding throughout the indicated periods.
| | | | | | | | | | | | | | | | | | | | | | | | | | | | | | | | | | | | | | | | | | |
| | | | | | | | | | | | | | | | | | | | | | | | | | |
| | | | | | | | | Realized and
| | | | | | | | | | | | | | | | | |
| | | Net Asset
| | | | | | Unrealized
| | | | | | Distributions
| | | Distributions
| | | | | | Net Asset
| | |
| | | Value
| | | Net
| | | Gains
| | | Total from
| | | from Net
| | | from Net
| | | | | | Value
| | |
| | | Beginning
| | | Investment
| | | (Losses) on
| | | Investment
| | | Investment
| | | Realized
| | | Total
| | | End of
| | |
| | | of Period | | | Income (Loss) | | | Investments | | | Operations | | | Income | | | Gains | | | Distributions | | | Period | | |
| |
Mid Cap Value Fund1 | | | | | | | | | | | | | | | | | | | | | | | | | | | | | | | | | | | | | | | | | |
| Class A | | | | | | | | | | | | | | | | | | | | | | | | | | | | | | | | | | | | | | | | | |
20092 | | $ | 16.13 | | | | $ | 0.24 | | | | $ | 1.99 | | | | $ | 2.23 | | | | $ | (0.08 | ) | | | $ | — | | | | $ | (0.08 | ) | | | $ | 18.28 | | | |
20082 | | | 27.83 | | | | | 0.21 | | | | | (9.92 | ) | | | | (9.71 | ) | | | | (0.16 | ) | | | | (1.83 | ) | | | | (1.99 | ) | | | | 16.13 | | | |
20072 | | | 26.65 | | | | | 0.14 | | | | | 2.78 | | | | | 2.92 | | | | | (0.16 | ) | | | | (1.58 | ) | | | | (1.74 | ) | | | | 27.83 | | | |
20062 | | | 24.04 | | | | | 0.14 | | | | | 3.89 | | | | | 4.03 | | | | | (0.16 | ) | | | | (1.26 | ) | | | | (1.42 | ) | | | | 26.65 | | | |
20053 | | | 24.88 | | | | | (0.01 | ) | | | | (0.83 | ) | | | | (0.84 | ) | | | | — | | | | | — | | | | | — | | | | | 24.04 | | | |
20054 | | | 20.09 | | | | | 0.13 | | | | | 4.76 | | | | | 4.89 | | | | | (0.10 | ) | | | | — | | | | | (0.10 | ) | | | | 24.88 | | | |
| Class B | | | | | | | | | | | | | | | | | | | | | | | | | | | | | | | | | | | | | | | | | |
20092 | | $ | 15.22 | | | | $ | 0.13 | | | | $ | 1.87 | | | | $ | 2.00 | | | | $ | (0.01 | ) | | | $ | — | | | | $ | (0.01 | ) | | | $ | 17.21 | | | |
20082 | | | 26.48 | | | | | 0.03 | | | | | (9.39 | ) | | | | (9.36 | ) | | | | (0.07 | ) | | | | (1.83 | ) | | | | (1.90 | ) | | | | 15.22 | | | |
20072 | | | 25.50 | | | | | (0.05 | ) | | | | 2.65 | | | | | 2.60 | | | | | (0.04 | ) | | | | (1.58 | ) | | | | (1.62 | ) | | | | 26.48 | | | |
20062 | | | 23.12 | | | | | (0.03 | ) | | | | 3.71 | | | | | 3.68 | | | | | (0.04 | ) | | | | (1.26 | ) | | | | (1.30 | ) | | | | 25.50 | | | |
20053 | | | 23.94 | | | | | (0.02 | ) | | | | (0.80 | ) | | | | (0.82 | ) | | | | — | | | | | — | | | | | — | | | | | 23.12 | | | |
20054 | | | 19.39 | | | | | (0.05 | ) | | | | 4.60 | | | | | 4.55 | | | | | — | | | | | — | | | | | — | | | | | 23.94 | | | |
| Class C | | | | | | | | | | | | | | | | | | | | | | | | | | | | | | | | | | | | | | | | | |
20092 | | $ | 15.58 | | | | $ | 0.12 | | | | $ | 1.92 | | | | $ | 2.04 | | | | $ | (0.01 | ) | | | $ | — | | | | $ | (0.01 | ) | | | $ | 17.61 | | | |
20082 | | | 27.05 | | | | | 0.03 | | | | | (9.60 | ) | | | | (9.57 | ) | | | | (0.07 | ) | | | | (1.83 | ) | | | | (1.90 | ) | | | | 15.58 | | | |
20072 | | | 26.02 | | | | | (0.06 | ) | | | | 2.72 | | | | | 2.66 | | | | | (0.05 | ) | | | | (1.58 | ) | | | | (1.63 | ) | | | | 27.05 | | | |
20062 | | | 23.57 | | | | | (0.04 | ) | | | | 3.80 | | | | | 3.76 | | | | | (0.05 | ) | | | | (1.26 | ) | | | | (1.31 | ) | | | | 26.02 | | | |
20053 | | | 24.40 | | | | | (0.02 | ) | | | | (0.81 | ) | | | | (0.83 | ) | | | | — | | | | | — | | | | | — | | | | | 23.57 | | | |
20054 | | | 19.77 | | | | | (0.03 | ) | | | | 4.66 | | | | | 4.63 | | | | | — | | | | | — | | | | | — | | | | | 24.40 | | | |
| Class R | | | | | | | | | | | | | | | | | | | | | | | | | | | | | | | | | | | | | | | | | |
20092 | | $ | 16.04 | | | | $ | 0.19 | | | | $ | 1.98 | | | | $ | 2.17 | | | | $ | (0.06 | ) | | | $ | — | | | | $ | (0.06 | ) | | | $ | 18.15 | | | |
20082 | | | 27.72 | | | | | 0.15 | | | | | (9.87 | ) | | | | (9.72 | ) | | | | (0.13 | ) | | | | (1.83 | ) | | | | (1.96 | ) | | | | 16.04 | | | |
20072 | | | 26.56 | | | | | 0.06 | | | | | 2.78 | | | | | 2.84 | | | | | (0.10 | ) | | | | (1.58 | ) | | | | (1.68 | ) | | | | 27.72 | | | |
20062 | | | 24.00 | | | | | 0.05 | | | | | 3.91 | | | | | 3.96 | | | | | (0.14 | ) | | | | (1.26 | ) | | | | (1.40 | ) | | | | 26.56 | | | |
20053 | | | 24.83 | | | | | (0.01 | ) | | | | (0.82 | ) | | | | (0.83 | ) | | | | — | | | | | — | | | | | — | | | | | 24.00 | | | |
20054 | | | 20.09 | | | | | 0.12 | | | | | 4.70 | | | | | 4.82 | | | | | (0.08 | ) | | | | — | | | | | (0.08 | ) | | | | 24.83 | | | |
| Class Y | | | | | | | | | | | | | | | | | | | | | | | | | | | | | | | | | | | | | | | | | |
20092 | | $ | 16.24 | | | | $ | 0.28 | | | | $ | 2.01 | | | | $ | 2.29 | | | | $ | (0.11 | ) | | | $ | — | | | | $ | (0.11 | ) | | | $ | 18.42 | | | |
20082 | | | 27.98 | | | | | 0.27 | | | | | (9.99 | ) | | | | (9.72 | ) | | | | (0.19 | ) | | | | (1.83 | ) | | | | (2.02 | ) | | | | 16.24 | | | |
20072 | | | 26.77 | | | | | 0.22 | | | | | 2.80 | | | | | 3.02 | | | | | (0.23 | ) | | | | (1.58 | ) | | | | (1.81 | ) | | | | 27.98 | | | |
20062 | | | 24.14 | | | | | 0.22 | | | | | 3.89 | | | | | 4.11 | | | | | (0.22 | ) | | | | (1.26 | ) | | | | (1.48 | ) | | | | 26.77 | | | |
20053 | | | 24.98 | | | | | — | | | | | (0.84 | ) | | | | (0.84 | ) | | | | — | | | | | — | | | | | — | | | | | 24.14 | | | |
20054 | | | 20.17 | | | | | 0.18 | | | | | 4.78 | | | | | 4.96 | | | | | (0.15 | ) | | | | — | | | | | (0.15 | ) | | | | 24.98 | | | |
| |
| |
| | |
| | 1 | Per share data calculated using average shares outstanding method. |
| |
| | 2 | For the period November 1 to October 31 in the fiscal year indicated. |
| |
| | 3 | For the period October 1, 2005 to October 31, 2005. Effective October 1, 2005, the fund’s fiscal year end was changed from September 30 to October 31. All ratios for the period have been annualized, except total return and portfolio turnover. |
| |
| | 4 | For the period October 1 to September 30 in the year indicated. |
| |
| | 5 | Total return does not include sales charges. Total return would have been lower had certain expenses not been waived. |
The accompanying notes are an integral part of the financial statements.
110 First American Funds 2009 Annual Report
| | | | | | | | | | | | | | | | | | | | | | | | | | | | | | | | | | | | | |
| | | | | | | | | | | | | | | | | | | | | | | |
| | | | | | | | | | | | | | | Ratio of
| | | Ratio of Net
| | | | | |
| | | | | | | | | | | | Ratio of Net
| | | Expenses
| | | Investment
| | | | | |
| | | | | | | | | Ratio of
| | | Investment
| | | to Average
| | | Income (Loss)
| | | | | |
| | | | | | Net Assets
| | | Expenses
| | | Income (Loss)
| | | Net Assets
| | | to Average Net
| | | Portfolio
| | |
| | | Total
| | | End of
| | | to Average
| | | to Average
| | | (Excluding
| | | Assets (Excluding
| | | Turnover
| | |
| | | Return5 | | | Period (000) | | | Net Assets | | | Net Assets | | | Waivers) | | | Waivers) | | | Rate | | |
| |
| | | | | | | | | | | | | | | | | | | | | | | | | | | | | | | | | | | | | |
| | | | | | | | | | | | | | | | | | | | | | | | | | | | | | | | | | | | | |
| | | | 13.95 | % | | | $ | 130,222 | | | | | 1.25 | % | | | | 1.52 | % | | | | 1.25 | % | | | | 1.52 | % | | | | 106 | % | | |
| | | | (37.32 | ) | | | | 124,275 | | | | | 1.23 | | | | | 0.90 | | | | | 1.23 | | | | | 0.90 | | | | | 93 | | | |
| | | | 11.47 | | | | | 254,342 | | | | | 1.22 | | | | | 0.58 | | | | | 1.22 | | | | | 0.58 | | | | | 95 | | | |
| | | | 17.36 | | | | | 156,576 | | | | | 1.24 | | | | | 0.50 | | | | | 1.24 | | | | | 0.50 | | | | | 70 | | | |
| | | | (3.38 | ) | | | | 56,125 | | | | | 1.23 | | | | | (0.48 | ) | | | | 1.23 | | | | | (0.48 | ) | | | | 10 | | | |
| | | | 24.38 | | | | | 54,360 | | | | | 1.21 | | | | | 0.59 | | | | | 1.25 | | | | | 0.55 | | | | | 101 | | | |
| | | | | | | | | | | | | | | | | | | | | | | | | | | | | | | | | | | | | |
| | | | 13.13 | % | | | $ | 3,481 | | | | | 1.98 | % | | | | 0.85 | % | | | | 1.98 | % | | | | 0.85 | % | | | | 106 | % | | |
| | | | (37.82 | ) | | | | 4,133 | | | | | 1.98 | | | | | 0.14 | | | | | 1.98 | | | | | 0.14 | | | | | 93 | | | |
| | | | 10.67 | | | | | 8,360 | | | | | 1.97 | | | | | (0.13 | ) | | | | 1.97 | | | | | (0.13 | ) | | | | 95 | | | |
| | | | 16.45 | | | | | 8,590 | | | | | 1.99 | | | | | (0.17 | ) | | | | 1.99 | | | | | (0.17 | ) | | | | 70 | | | |
| | | | (3.43 | ) | | | | 9,252 | | | | | 1.98 | | | | | (1.25 | ) | | | | 1.98 | | | | | (1.25 | ) | | | | 10 | | | |
| | | | 23.47 | | | | | 10,157 | | | | | 1.96 | | | | | (0.21 | ) | | | | 2.00 | | | | | (0.25 | ) | | | | 101 | | | |
| | | | | | | | | | | | | | | | | | | | | | | | | | | | | | | | | | | | | |
| | | | 13.10 | % | | | $ | 12,040 | | | | | 2.00 | % | | | | 0.80 | % | | | | 2.00 | % | | | | 0.80 | % | | | | 106 | % | | |
| | | | (37.80 | ) | | | | 13,154 | | | | | 1.98 | | | | | 0.14 | | | | | 1.98 | | | | | 0.14 | | | | | 93 | | | |
| | | | 10.66 | | | | | 26,141 | | | | | 1.97 | | | | | (0.18 | ) | | | | 1.97 | | | | | (0.18 | ) | | | | 95 | | | |
| | | | 16.47 | | | | | 18,162 | | | | | 1.99 | | | | | (0.24 | ) | | | | 1.99 | | | | | (0.24 | ) | | | | 70 | | | |
| | | | (3.40 | ) | | | | 7,439 | | | | | 1.98 | | | | | (1.24 | ) | | | | 1.98 | | | | | (1.24 | ) | | | | 10 | | | |
| | | | 23.43 | | | | | 7,426 | | | | | 1.96 | | | | | (0.15 | ) | | | | 2.00 | | | | | (0.19 | ) | | | | 101 | | | |
| | | | | | | | | | | | | | | | | | | | | | | | | | | | | | | | | | | | | |
| | | | 13.63 | % | | | $ | 25,664 | | | | | 1.50 | % | | | | 1.21 | % | | | | 1.50 | % | | | | 1.21 | % | | | | 106 | % | | |
| | | | (37.47 | ) | | | | 23,423 | | | | | 1.49 | | | | | 0.64 | | | | | 1.49 | | | | | 0.64 | | | | | 93 | | | |
| | | | 11.18 | | | | | 29,752 | | | | | 1.47 | | | | | 0.29 | | | | | 1.47 | | | | | 0.29 | | | | | 95 | | | |
| | | | 17.06 | | | | | 17,724 | | | | | 1.49 | | | | | 0.15 | | | | | 1.61 | | | | | 0.03 | | | | | 70 | | | |
| | | | (3.34 | ) | | | | 785 | | | | | 1.47 | | | | | (0.69 | ) | | | | 1.62 | | | | | (0.84 | ) | | | | 10 | | | |
| | | | 24.04 | | | | | 380 | | | | | 1.46 | | | | | 0.52 | | | | | 1.65 | | | | | 0.33 | | | | | 101 | | | |
| | | | | | | | | | | | | | | | | | | | | | | | | | | | | | | | | | | | | |
| | | | 14.24 | % | | | $ | 440,968 | | | | | 1.00 | % | | | | 1.76 | % | | | | 1.00 | % | | | | 1.76 | % | | | | 106 | % | | |
| | | | (37.17 | ) | | | | 415,486 | | | | | 0.99 | | | | | 1.14 | | | | | 0.99 | | | | | 1.14 | | | | | 93 | | | |
| | | | 11.79 | | | | | 772,178 | | | | | 0.97 | | | | | 0.86 | | | | | 0.97 | | | | | 0.86 | | | | | 95 | | | |
| | | | 17.63 | | | | | 728,014 | | | | | 0.99 | | | | | 0.81 | | | | | 0.99 | | | | | 0.81 | | | | | 70 | | | |
| | | | (3.36 | ) | | | | 598,428 | | | | | 0.98 | | | | | (0.24 | ) | | | | 0.98 | | | | | (0.24 | ) | | | | 10 | | | |
| | | | 24.68 | | | | | 621,172 | | | | | 0.96 | | | | | 0.80 | | | | | 1.00 | | | | | 0.76 | | | | | 101 | | | |
| |
| |
First American Funds 2009 Annual Report 111
Financial Highlights For a share outstanding throughout the indicated periods.
| | | | | | | | | | | | | | | | | | | | | | | | | | | | | | | | | | | | | | | | | | | | | | | |
| | | | | | | | | | | | | | | | | | | | | | | | | | | | | |
| | | | | | | | | Realized and
| | | | | | | | | | | | | | | | | | | | |
| | | Net Asset
| | | | | | Unrealized
| | | | | | Distributions
| | | | | | | | | | | | Net Asset
| | |
| | | Value
| | | Net
| | | Gains
| | | Total from
| | | from Net
| | | Distributions
| | | Distributions
| | | | | | Value
| | |
| | | Beginning
| | | Investment
| | | (Losses) on
| | | Investment
| | | Investment
| | | from Net
| | | from Return
| | | Total
| | | End of
| | |
| | | of Period | | | Income | | | Investments | | | Operations | | | Income | | | Realized Gains | | | of Capital | | | Distributions | | | Period | | |
| |
Real Estate Securities Fund1 | | | | | | | | | | | | | | | | | | | | | | | | | | | | | | | | | | | | | | | | | | | | | | |
| Class A | | | | | | | | | | | | | | | | | | | | | | | | | | | | | | | | | | | | | | | | | | | | | | |
20092 | | $ | 12.67 | | | | $ | 0.41 | | | | $ | (0.16 | ) | | | $ | 0.25 | | | | $ | (0.34 | ) | | | $ | — | | | | $ | (0.14 | ) | | | $ | (0.48 | ) | | | $ | 12.44 | | | |
20082 | | | 23.99 | | | | | 0.60 | | | | | (8.78 | ) | | | | (8.18 | ) | | | | (0.40 | ) | | | | (2.74 | ) | | | | — | | | | | (3.14 | ) | | | | 12.67 | | | |
20072 | | | 26.49 | | | | | 0.47 | | | | | (0.24 | ) | | | | 0.23 | | | | | (0.36 | ) | | | | (2.37 | ) | | | | — | | | | | (2.73 | ) | | | | 23.99 | | | |
20062 | | | 21.42 | | | | | 0.47 | | | | | 7.77 | | | | | 8.24 | | | | | (0.58 | ) | | | | (2.59 | ) | | | | — | | | | | (3.17 | ) | | | | 26.49 | | | |
20053 | | | 21.81 | | | | | 0.03 | | | | | (0.42 | ) | | | | (0.39 | ) | | | | — | | | | | — | | | | | — | | | | | — | | | | | 21.42 | | | |
20054 | | | 18.62 | | | | | 0.69 | | | | | 4.47 | | | | | 5.16 | | | | | (0.55 | ) | | | | (1.42 | ) | | | | — | | | | | (1.97 | ) | | | | 21.81 | | | |
| Class B | | | | | | | | | | | | | | | | | | | | | | | | | | | | | | | | | | | | | | | | | | | | | | |
20092 | | $ | 12.39 | | | | $ | 0.36 | | | | $ | (0.19 | ) | | | $ | 0.17 | | | | $ | (0.25 | ) | | | $ | — | | | | $ | (0.14 | ) | | | $ | (0.39 | ) | | | $ | 12.17 | | | |
20082 | | | 23.53 | | | | | 0.46 | | | | | (8.60 | ) | | | | (8.14 | ) | | | | (0.26 | ) | | | | (2.74 | ) | | | | — | | | | | (3.00 | ) | | | | 12.39 | | | |
20072 | | | 26.08 | | | | | 0.27 | | | | | (0.22 | ) | | | | 0.05 | | | | | (0.23 | ) | | | | (2.37 | ) | | | | — | | | | | (2.60 | ) | | | | 23.53 | | | |
20062 | | | 21.14 | | | | | 0.29 | | | | | 7.66 | | | | | 7.95 | | | | | (0.42 | ) | | | | (2.59 | ) | | | | — | | | | | (3.01 | ) | | | | 26.08 | | | |
20053 | | | 21.53 | | | | | 0.01 | | | | | (0.40 | ) | | | | (0.39 | ) | | | | — | | | | | — | | | | | — | | | | | — | | | | | 21.14 | | | |
20054 | | | 18.41 | | | | | 0.54 | | | | | 4.40 | | | | | 4.94 | | | | | (0.40 | ) | | | | (1.42 | ) | | | | — | | | | | (1.82 | ) | | | | 21.53 | | | |
| Class C | | | | | | | | | | | | | | | | | | | | | | | | | | | | | | | | | | | | | | | | | | | | | | |
20092 | | $ | 12.44 | | | | $ | 0.34 | | | | $ | (0.17 | ) | | | $ | 0.17 | | | | $ | (0.26 | ) | | | $ | — | | | | $ | (0.14 | ) | | | $ | (0.40 | ) | | | $ | 12.21 | | | |
20083 | | | 23.62 | | | | | 0.45 | | | | | (8.63 | ) | | | | (8.18 | ) | | | | (0.26 | ) | | | | (2.74 | ) | | | | — | | | | | (3.00 | ) | | | | 12.44 | | | |
20072 | | | 26.17 | | | | | 0.26 | | | | | (0.21 | ) | | | | 0.05 | | | | | (0.23 | ) | | | | (2.37 | ) | | | | — | | | | | (2.60 | ) | | | | 23.62 | | | |
20062 | | | 21.21 | | | | | 0.28 | | | | | 7.70 | | | | | 7.98 | | | | | (0.43 | ) | | | | (2.59 | ) | | | | — | | | | | (3.02 | ) | | | | 26.17 | | | |
20053 | | | 21.61 | | | | | 0.01 | | | | | (0.41 | ) | | | | (0.40 | ) | | | | — | | | | | — | | | | | — | | | | | — | | | | | 21.21 | | | |
20054 | | | 18.47 | | | | | 0.54 | | | | | 4.42 | | | | | 4.96 | | | | | (0.40 | ) | | | | (1.42 | ) | | | | — | | | | | (1.82 | ) | | | | 21.61 | | | |
| Class R | | | | | | | | | | | | | | | | | | | | | | | | | | | | | | | | | | | | | | | | | | | | | | |
20092 | | $ | 12.79 | | | | $ | 0.39 | | | | $ | (0.16 | ) | | | $ | 0.23 | | | | $ | (0.31 | ) | | | $ | — | | | | $ | (0.14 | ) | | | $ | (0.45 | ) | | | $ | 12.57 | | | |
20082 | | | 24.20 | | | | | 0.54 | | | | | (8.85 | ) | | | | (8.31 | ) | | | | (0.36 | ) | | | | (2.74 | ) | | | | — | | | | | (3.10 | ) | | | | 12.79 | | | |
20072 | | | 26.72 | | | | | 0.38 | | | | | (0.21 | ) | | | | 0.17 | | | | | (0.32 | ) | | | | (2.37 | ) | | | | — | | | | | (2.69 | ) | | | | 24.20 | | | |
20062 | | | 21.61 | | | | | 0.35 | | | | | 7.90 | | | | | 8.25 | | | | | (0.55 | ) | | | | (2.59 | ) | | | | — | | | | | (3.14 | ) | | | | 26.72 | | | |
20053 | | | 22.00 | | | | | 0.02 | | | | | (0.41 | ) | | | | (0.39 | ) | | | | — | | | | | — | | | | | — | | | | | — | | | | | 21.61 | | | |
20054 | | | 18.80 | | | | | 0.72 | | | | | 4.43 | | | | | 5.15 | | | | | (0.53 | ) | | | | (1.42 | ) | | | | — | | | | | (1.95 | ) | | | | 22.00 | | | |
| Class Y | | | | | | | | | | | | | | | | | | | | | | | | | | | | | | | | | | | | | | | | | | | | | | |
20092 | | $ | 12.79 | | | | $ | 0.47 | | | | $ | (0.19 | ) | | | $ | 0.28 | | | | $ | (0.36 | ) | | | $ | — | | | | $ | (0.14 | ) | | | $ | (0.50 | ) | | | $ | 12.57 | | | |
20082 | | | 24.18 | | | | | 0.64 | | | | | (8.84 | ) | | | | (8.20 | ) | | | | (0.45 | ) | | | | (2.74 | ) | | | | — | | | | | (3.19 | ) | | | | 12.79 | | | |
20072 | | | 26.67 | | | | | 0.53 | | | | | (0.24 | ) | | | | 0.29 | | | | | (0.41 | ) | | | | (2.37 | ) | | | | — | | | | | (2.78 | ) | | | | 24.18 | | | |
20062 | | | 21.54 | | | | | 0.53 | | | | | 7.82 | | | | | 8.35 | | | | | (0.63 | ) | | | | (2.59 | ) | | | | — | | | | | (3.22 | ) | | | | 26.67 | | | |
20053 | | | 21.92 | | | | | 0.03 | | | | | (0.41 | ) | | | | (0.38 | ) | | | | — | | | | | — | | | | | — | | | | | — | | | | | 21.54 | | | |
20054 | | | 18.71 | | | | | 0.74 | | | | | 4.49 | | | | | 5.23 | | | | | (0.60 | ) | | | | (1.42 | ) | | | | — | | | | | (2.02 | ) | | | | 21.92 | | | |
| |
| |
| | |
| | 1 | Per share data calculated using average shares outstanding method. |
| |
| | 2 | For the period November 1 to October 31 in the fiscal year indicated. |
| |
| | 3 | For the period October 1, 2005 to October 31, 2005. Effective October 1, 2005, the fund’s fiscal year end was changed from September 30 to October 31. All ratios for the period have been annualized, except total return and portfolio turnover. |
| |
| | 4 | For the period October 1 to September 30 in the year indicated. |
| |
| | 5 | Total return does not reflect sales charges. Total return would have been lower had certain expenses not been waived. |
The accompanying notes are an integral part of the financial statements.
112 First American Funds 2009 Annual Report
| | | | | | | | | | | | | | | | | | | | | | | | | | | | | | | | | | | | | |
| | | | | | | | | | | | | | | | | | | | | | | |
| | | | | | | | | | | | | | | | | | Ratio of Net
| | | | | |
| | | | | | | | | | | | | | | Ratio of
| | | Investment
| | | | | |
| | | | | | | | | | | | Ratio of Net
| | | Expenses
| | | Income
| | | | | |
| | | | | | | | | Ratio of
| | | Investment
| | | to Average
| | | to Average
| | | | | |
| | | | | | Net Assets
| | | Expenses
| | | Income
| | | Net Assets
| | | Net Assets
| | | Portfolio
| | |
| | | Total
| | | End of
| | | to Average
| | | to Average
| | | (Excluding
| | | (Excluding
| | | Turnover
| | |
| | | Return5 | | | Period (000) | | | Net Assets | | | Net Assets | | | Waivers) | | | Waivers) | | | Rate | | |
| |
| | | | | | | | | | | | | | | | | | | | | | | | | | | | | | | | | | | | | |
| | | | | | | | | | | | | | | | | | | | | | | | | | | | | | | | | | | | | |
| | | | 2.82 | % | | | $ | 287,493 | | | | | 1.27 | % | | | | 3.81 | % | | | | 1.27 | % | | | | 3.81 | % | | | | 117 | % | | |
| | | | (37.71 | ) | | | | 133,162 | | | | | 1.23 | | | | | 3.31 | | | | | 1.23 | | | | | 3.31 | | | | | 150 | | | |
| | | | 0.78 | | | | | 203,101 | | | | | 1.22 | | | | | 1.87 | | | | | 1.22 | | | | | 1.87 | | | | | 210 | | | |
| | | | 43.25 | | | | | 228,186 | | | | | 1.23 | | | | | 2.06 | | | | | 1.23 | | | | | 2.06 | | | | | 161 | | | |
| | | | (1.79 | ) | | | | 133,339 | | | | | 1.23 | | | | | 1.48 | | | | | 1.23 | | | | | 1.48 | | | | | 11 | | | |
| | | | 28.99 | | | | | 135,745 | | | | | 1.23 | | | | | 3.43 | | | | | 1.25 | | | | | 3.41 | | | | | 118 | | | |
| | | | | | | | | | | | | | | | | | | | | | | | | | | | | | | | | | | | | |
| | | | 2.13 | % | | | $ | 2,693 | | | | | 2.02 | % | | | | 3.57 | % | | | | 2.02 | % | | | | 3.57 | % | | | | 117 | % | | |
| | | | (38.18 | ) | | | | 3,276 | | | | | 1.98 | | | | | 2.57 | | | | | 1.98 | | | | | 2.57 | | | | | 150 | | | |
| | | | — | | | | | 7,391 | | | | | 1.97 | | | | | 1.12 | | | | | 1.97 | | | | | 1.12 | | | | | 210 | | | |
| | | | 42.17 | | | | | 7,288 | | | | | 1.98 | | | | | 1.30 | | | | | 1.98 | | | | | 1.30 | | | | | 161 | | | |
| | | | (1.81 | ) | | | | 4,419 | | | | | 1.98 | | | | | 0.74 | | | | | 1.98 | | | | | 0.74 | | | | | 11 | | | |
| | | | 27.98 | | | | | 4,700 | | | | | 1.98 | | | | | 2.69 | | | | | 2.00 | | | | | 2.67 | | | | | 118 | | | |
| | | | | | | | | | | | | | | | | | | | | | | | | | | | | | | | | | | | | |
| | | | 2.09 | % | | | $ | 17,632 | | | | | 2.02 | % | | | | 3.26 | % | | | | 2.02 | % | | | | 3.26 | % | | | | 117 | % | | |
| | | | (38.19 | ) | | | | 11,458 | | | | | 1.98 | | | | | 2.56 | | | | | 1.98 | | | | | 2.56 | | | | | 150 | | | |
| | | | 0.03 | | | | | 18,403 | | | | | 1.97 | | | | | 1.06 | | | | | 1.97 | | | | | 1.06 | | | | | 210 | | | |
| | | | 42.16 | | | | | 12,281 | | | | | 1.98 | | | | | 1.25 | | | | | 1.98 | | | | | 1.25 | | | | | 161 | | | |
| | | | (1.85 | ) | | | | 4,669 | | | | | 1.98 | | | | | 0.75 | | | | | 1.98 | | | | | 0.75 | | | | | 11 | | | |
| | | | 28.00 | | | | | 4,954 | | | | | 1.98 | | | | | 2.68 | | | | | 2.00 | | | | | 2.66 | | | | | 118 | | | |
| | | | | | | | | | | | | | | | | | | | | | | | | | | | | | | | | | | | | |
| | | | 2.62 | % | | | $ | 46,382 | | | | | 1.52 | % | | | | 3.61 | % | | | | 1.52 | % | | | | 3.61 | % | | | | 117 | % | | |
| | | | (37.90 | ) | | | | 22,813 | | | | | 1.48 | | | | | 3.01 | | | | | 1.48 | | | | | 3.01 | | | | | 150 | | | |
| | | | 0.52 | | | | | 18,493 | | | | | 1.47 | | | | | 1.52 | | | | | 1.47 | | | | | 1.52 | | | | | 210 | | | |
| | | | 42.87 | | | | | 9,423 | | | | | 1.48 | | | | | 1.50 | | | | | 1.60 | | | | | 1.38 | | | | | 161 | | | |
| | | | (1.77 | ) | | | | 57 | | | | | 1.48 | | | | | 1.23 | | | | | 1.63 | | | | | 1.08 | | | | | 11 | | | |
| | | | 28.60 | | | | | 36 | | | | | 1.48 | | | | | 3.37 | | | | | 1.65 | | | | | 3.20 | | | | | 118 | | | |
| | | | | | | | | | | | | | | | | | | | | | | | | | | | | | | | | | | | | |
| | | | 3.11 | % | | | $ | 660,342 | | | | | 1.02 | % | | | | 4.39 | % | | | | 1.02 | % | | | | 4.39 | % | | | | 117 | % | | |
| | | | (37.56 | ) | | | | 526,386 | | | | | 0.98 | | | | | 3.51 | | | | | 0.98 | | | | | 3.51 | | | | | 150 | | | |
| | | | 1.01 | | | | | 652,579 | | | | | 0.97 | | | | | 2.12 | | | | | 0.97 | | | | | 2.12 | | | | | 210 | | | |
| | | | 43.58 | | | | | 756,868 | | | | | 0.98 | | | | | 2.31 | | | | | 0.98 | | | | | 2.31 | | | | | 161 | | | |
| | | | (1.73 | ) | | | | 504,655 | | | | | 0.98 | | | | | 1.74 | | | | | 0.98 | | | | | 1.74 | | | | | 11 | | | |
| | | | 29.25 | | | | | 525,196 | | | | | 0.98 | | | | | 3.66 | | | | | 1.00 | | | | | 3.64 | | | | | 118 | | | |
| |
| |
First American Funds 2009 Annual Report 113
Financial Highlights For a share outstanding throughout the indicated periods.
| | | | | | | | | | | | | | | | | | | | | | | | | | | | | | | | |
| | | | | | | | | | | | | | | | | | | | |
| | | | | | | | | Realized and
| | | | | | | | | | | |
| | | Net Asset
| | | | | | Unrealized
| | | | | | | | | Net Asset
| | |
| | | Value
| | | Net
| | | Gains
| | | Total from
| | | Distributions
| | | Value
| | |
| | | Beginning
| | | Investment
| | | (Losses) on
| | | Investment
| | | from Net
| | | End of
| | |
| | | of Period | | | Loss | | | Investments | | | Operations | | | Realized Gains | | | Period | | |
| |
Small Cap Growth Opportunities Fund1 | | | | | | | | | | | | | | | | | | | | | | | | | | | | | | | |
| Class A | | | | | | | | | | | | | | | | | | | | | | | | | | | | | | | |
20092 | | $ | 11.96 | | | | $ | (0.11 | ) | | | $ | 2.70 | | | | $ | 2.59 | | | | $ | — | | | | $ | 14.55 | | | |
20082 | | | 21.65 | | | | | (0.14 | ) | | | | (7.97 | ) | | | | (8.11 | ) | | | | (1.58 | ) | | | | 11.96 | | | |
20072 | | | 20.49 | | | | | (0.19 | ) | | | | 2.67 | | | | | 2.48 | | | | | (1.32 | ) | | | | 21.65 | | | |
20062 | | | 22.79 | | | | | (0.18 | ) | | | | 2.37 | | | | | 2.19 | | | | | (4.49 | ) | | | | 20.49 | | | |
20053 | | | 23.75 | | | | | (0.02 | ) | | | | (0.94 | ) | | | | (0.96 | ) | | | | — | | | | | 22.79 | | | |
20054 | | | 21.74 | | | | | (0.32 | ) | | | | 5.28 | | | | | 4.96 | | | | | (2.95 | ) | | | | 23.75 | | | |
| Class B | | | | | | | | | | | | | | | | | | | | | | | | | | | | | | | |
20092 | | $ | 10.62 | | | | $ | (0.18 | ) | | | $ | 2.38 | | | | $ | 2.20 | | | | $ | — | | | | $ | 12.82 | | | |
20082 | | | 19.56 | | | | | (0.23 | ) | | | | (7.13 | ) | | | | (7.36 | ) | | | | (1.58 | ) | | | | 10.62 | | | |
20072 | | | 18.76 | | | | | (0.31 | ) | | | | 2.43 | | | | | 2.12 | | | | | (1.32 | ) | | | | 19.56 | | | |
20062 | | | 21.36 | | | | | (0.31 | ) | | | | 2.20 | | | | | 1.89 | | | | | (4.49 | ) | | | | 18.76 | | | |
20053 | | | 22.27 | | | | | (0.03 | ) | | | | (0.88 | ) | | | | (0.91 | ) | | | | — | | | | | 21.36 | | | |
20054 | | | 20.69 | | | | | (0.45 | ) | | | | 4.98 | | | | | 4.53 | | | | | (2.95 | ) | | | | 22.27 | | | |
| Class C | | | | | | | | | | | | | | | | | | | | | | | | | | | | | | | |
20092 | | $ | 11.13 | | | | $ | (0.19 | ) | | | $ | 2.50 | | | | $ | 2.31 | | | | $ | — | | | | $ | 13.44 | | | |
20082 | | | 20.41 | | | | | (0.24 | ) | | | | (7.46 | ) | | | | (7.70 | ) | | | | (1.58 | ) | | | | 11.13 | | | |
20072 | | | 19.53 | | | | | (0.33 | ) | | | | 2.53 | | | | | 2.20 | | | | | (1.32 | ) | | | | 20.41 | | | |
20062 | | | 22.05 | | | | | (0.32 | ) | | | | 2.29 | | | | | 1.97 | | | | | (4.49 | ) | | | | 19.53 | | | |
20053 | | | 23.00 | | | | | (0.04 | ) | | | | (0.91 | ) | | | | (0.95 | ) | | | | — | | | | | 22.05 | | | |
20054 | | | 21.28 | | | | | (0.48 | ) | | | | 5.15 | | | | | 4.67 | | | | | (2.95 | ) | | | | 23.00 | | | |
| Class R | | | | | | | | | | | | | | | | | | | | | | | | | | | | | | | |
20092 | | $ | 11.83 | | | | $ | (0.16 | ) | | | $ | 2.69 | | | | $ | 2.53 | | | | $ | — | | | | $ | 14.36 | | | |
20082 | | | 21.49 | | | | | (0.17 | ) | | | | (7.91 | ) | | | | (8.08 | ) | | | | (1.58 | ) | | | | 11.83 | | | |
20072 | | | 20.39 | | | | | (0.24 | ) | | | | 2.66 | | | | | 2.42 | | | | | (1.32 | ) | | | | 21.49 | | | |
20062 | | | 22.75 | | | | | (0.23 | ) | | | | 2.36 | | | | | 2.13 | | | | | (4.49 | ) | | | | 20.39 | | | |
20053 | | | 23.72 | | | | | (0.03 | ) | | | | (0.94 | ) | | | | (0.97 | ) | | | | — | | | | | 22.75 | | | |
20054 | | | 21.74 | | | | | (0.48 | ) | | | | 5.41 | | | | | 4.93 | | | | | (2.95 | ) | | | | 23.72 | | | |
| Class Y | | | | | | | | | | | | | | | | | | | | | | | | | | | | | | | |
20092 | | $ | 12.81 | | | | $ | (0.09 | ) | | | $ | 2.91 | | | | $ | 2.82 | | | | $ | — | | | | $ | 15.63 | | | |
20082 | | | 23.03 | | | | | (0.10 | ) | | | | (8.54 | ) | | | | (8.64 | ) | | | | (1.58 | ) | | | | 12.81 | | | |
20072 | | | 21.66 | | | | | (0.15 | ) | | | | 2.84 | | | | | 2.69 | | | | | (1.32 | ) | | | | 23.03 | | | |
20062 | | | 23.81 | | | | | (0.13 | ) | | | | 2.47 | | | | | 2.34 | | | | | (4.49 | ) | | | | 21.66 | | | |
20053 | | | 24.81 | | | | | (0.02 | ) | | | | (0.98 | ) | | | | (1.00 | ) | | | | — | | | | | 23.81 | | | |
20054 | | | 22.55 | | | | | (0.27 | ) | | | | 5.48 | | | | | 5.21 | | | | | (2.95 | ) | | | | 24.81 | | | |
| |
| |
| | |
| | 1 | Per share data calculated using average shares outstanding method. |
| |
| | 2 | For the period November 1 to October 31 in the fiscal year indicated. |
| |
| | 3 | For the period October 1, 2005 to October 31, 2005. Effective October 1, 2005, the fund’s fiscal year end was changed from September 30 to October 31. All ratios for the period have been annualized, except total return and portfolio turnover. |
| |
| | 4 | For the period October 1 to September 30 in the year indicated. |
| |
| | 5 | Total return does not reflect sales charges. Total return would have been lower had certain expenses not been waived. |
| |
| | 6 | During the period indicated, the fund received a regulatory settlement, which had a positive impact on total return of 0.75% for Class A, Class C, and Class Y, 0.79% for Class B, and 0.76% for Class R. |
| |
| | 7 | During the period indicated, the fund received a regulatory settlement, which had a positive impact on total return of 0.05% for Class A, Class R, and Class Y and 0.06% for Class B and Class C. |
The accompanying notes are an integral part of the financial statements.
114 First American Funds 2009 Annual Report
| | | | | | | | | | | | | | | | | | | | | | | | | | | | | | | | | | | | | |
| | | | | | | | | | | | | | | | | | | | | | | |
| | | | | | | | | | | | | | | | | | Ratio of Net
| | | | | |
| | | | | | | | | | | | | | | Ratio of
| | | Investment
| | | | | |
| | | | | | | | | | | | Ratio of Net
| | | Expenses
| | | Loss
| | | | | |
| | | | | | | | | Ratio of
| | | Investment
| | | to Average
| | | to Average
| | | | | |
| | | | | | Net Assets
| | | Expenses
| | | Loss
| | | Net Assets
| | | Net Assets
| | | Portfolio
| | |
| | | Total
| | | End of
| | | to Average
| | | to Average
| | | (Excluding
| | | (Excluding
| | | Turnover
| | |
| | | Return5 | | | Period (000) | | | Net Assets | | | Net Assets | | | Waivers) | | | Waivers) | | | Rate | | |
| |
| | | | | | | | | | | | | | | | | | | | | | | | | | | | | | | | | | | | | |
| | | | | | | | | | | | | | | | | | | | | | | | | | | | | | | | | | | | | |
| | | | 21 | .66% | | | $ | 30,202 | | | | | 1.47 | % | | | | (0.89 | )% | | | | 1.79 | % | | | | (1.21 | )% | | | | 169 | % | | |
| | | | (40 | .07)6 | | | | 29,022 | | | | | 1.46 | | | | | (0.82 | ) | | | | 1.63 | | | | | (0.99 | ) | | | | 138 | | | |
| | | | 12 | .817 | | | | 149,231 | | | | | 1.47 | | | | | (0.89 | ) | | | | 1.59 | | | | | (1.01 | ) | | | | 118 | | | |
| | | | 9 | .91 | | | | 138,786 | | | | | 1.47 | | | | | (0.88 | ) | | | | 1.58 | | | | | (0.99 | ) | | | | 209 | | | |
| | | | (4 | .04) | | | | 78,357 | | | | | 1.47 | | | | | (1.17 | ) | | | | 1.56 | | | | | (1.26 | ) | | | | 14 | | | |
| | | | 24 | .21 | | | | 84,567 | | | | | 1.82 | | | | | (1.42 | ) | | | | 1.87 | | | | | (1.47 | ) | | | | 190 | | | |
| | | | | | | | | | | | | | | | | | | | | | | | | | | | | | | | | | | | | |
| | | | 20 | .72% | | | $ | 2,025 | | | | | 2.22 | % | | | | (1.64 | )% | | | | 2.54 | % | | | | (1.96 | )% | | | | 169 | % | | |
| | | | (40 | .55)6 | | | | 1,978 | | | | | 2.21 | | | | | (1.57 | ) | | | | 2.38 | | | | | (1.74 | ) | | | | 138 | | | |
| | | | 12 | .037 | | | | 4,467 | | | | | 2.22 | | | | | (1.65 | ) | | | | 2.34 | | | | | (1.77 | ) | | | | 118 | | | |
| | | | 9 | .03 | | | | 6,540 | | | | | 2.22 | | | | | (1.62 | ) | | | | 2.33 | | | | | (1.73 | ) | | | | 209 | | | |
| | | | (4 | .09) | | | | 8,271 | | | | | 2.22 | | | | | (1.93 | ) | | | | 2.31 | | | | | (2.02 | ) | | | | 14 | | | |
| | | | 23 | .27 | | | | 8,760 | | | | | 2.57 | | | | | (2.16 | ) | | | | 2.62 | | | | | (2.21 | ) | | | | 190 | | | |
| | | | | | | | | | | | | | | | | | | | | | | | | | | | | | | | | | | | | |
| | | | 20 | .75% | | | $ | 1,341 | | | | | 2.22 | % | | | | (1.66 | )% | | | | 2.54 | % | | | | (1.98 | )% | | | | 169 | % | | |
| | | | (40 | .53)6 | | | | 1,104 | | | | | 2.21 | | | | | (1.56 | ) | | | | 2.38 | | | | | (1.73 | ) | | | | 138 | | | |
| | | | 11 | .967 | | | | 2,295 | | | | | 2.22 | | | | | (1.64 | ) | | | | 2.34 | | | | | (1.76 | ) | | | | 118 | | | |
| | | | 9 | .11 | | | | 2,664 | | | | | 2.22 | | | | | (1.63 | ) | | | | 2.33 | | | | | (1.74 | ) | | | | 209 | | | |
| | | | (4 | .13) | | | | 2,962 | | | | | 2.22 | | | | | (1.93 | ) | | | | 2.31 | | | | | (2.02 | ) | | | | 14 | | | |
| | | | 23 | .28 | | | | 3,152 | | | | | 2.57 | | | | | (2.20 | ) | | | | 2.62 | | | | | (2.25 | ) | | | | 190 | | | |
| | | | | | | | | | | | | | | | | | | | | | | | | | | | | | | | | | | | | |
| | | | 21 | .39% | | | $ | 1,469 | | | | | 1.72 | % | | | | (1.24 | )% | | | | 2.04 | % | | | | (1.56 | )% | | | | 169 | % | | |
| | | | (40 | .24)6 | | | | 433 | | | | | 1.72 | | | | | (1.04 | ) | | | | 1.89 | | | | | (1.21 | ) | | | | 138 | | | |
| | | | 12 | .567 | | | | 522 | | | | | 1.72 | | | | | (1.17 | ) | | | | 1.84 | | | | | (1.29 | ) | | | | 118 | | | |
| | | | 9 | .62 | | | | 1,323 | | | | | 1.72 | | | | | (1.16 | ) | | | | 1.95 | | | | | (1.39 | ) | | | | 209 | | | |
| | | | (4 | .09) | | | | 5 | | | | | 1.72 | | | | | (1.43 | ) | | | | 1.96 | | | | | (1.67 | ) | | | | 14 | | | |
| | | | 24 | .06 | | | | 5 | | | | | 2.07 | | | | | (2.14 | ) | | | | 2.27 | | | | | (2.34 | ) | | | | 190 | | | |
| | | | | | | | | | | | | | | | | | | | | | | | | | | | | | | | | | | | | |
| | | | 22 | .01% | | | $ | 103,423 | | | | | 1.22 | % | | | | (0.67 | )% | | | | 1.54 | % | | | | (0.99 | )% | | | | 169 | % | | |
| | | | (39 | .97)6 | | | | 75,355 | | | | | 1.22 | | | | | (0.56 | ) | | | | 1.39 | | | | | (0.73 | ) | | | | 138 | | | |
| | | | 13 | .107 | | | | 154,456 | | | | | 1.22 | | | | | (0.64 | ) | | | | 1.34 | | | | | (0.76 | ) | | | | 118 | | | |
| | | | 10 | .16 | | | | 182,429 | | | | | 1.22 | | | | | (0.63 | ) | | | | 1.33 | | | | | (0.74 | ) | | | | 209 | | | |
| | | | (4 | .03) | | | | 210,769 | | | | | 1.22 | | | | | (0.92 | ) | | | | 1.31 | | | | | (1.01 | ) | | | | 14 | | | |
| | | | 24 | .47 | | | | 220,772 | | | | | 1.57 | | | | | (1.15 | ) | | | | 1.62 | | | | | (1.20 | ) | | | | 190 | | | |
| |
| |
First American Funds 2009 Annual Report 115
Financial Highlights For a share outstanding throughout the indicated periods.
| | | | | | | | | | | | | | | | | | | | | | | | | | | | | | | | | | | | | | | | | | |
| | | | | | | | | | | | | | | | | | | | | | | | | | |
| | | | | | | | | Realized and
| | | | | | | | | | | | | | | | | |
| | | Net Asset
| | | | | | Unrealized
| | | | | | Distributions
| | | | | | | | | Net Asset
| | |
| | | Value
| | | Net
| | | Gains
| | | Total from
| | | from Net
| | | Distributions
| | | | | | Value
| | |
| | | Beginning
| | | Investment
| | | (Losses) on
| | | Investment
| | | Investment
| | | from Net
| | | Total
| | | End of
| | |
| | | of Period | | | Income (Loss) | | | Investments | | | Operations | | | Income | | | Realized Gains | | | Distributions | | | Period | | |
| |
Small Cap Select Fund1 | | | | | | | | | | | | | | | | | | | | | | | | | | | | | | | | |
| Class A | | | | | | | | | | | | | | | | | | | | | | | | | | | | | | | | | | | | | | | | | |
20092 | | $ | 8.27 | | | | $ | (0.01 | ) | | | $ | 1.27 | | | | $ | 1.26 | | | | $ | — | | | | $ | — | | | | $ | — | | | | $ | 9.53 | | | |
20082 | | | 14.06 | | | | | (0.02 | ) | | | | (4.92 | ) | | | | (4.94 | ) | | | | — | | | | | (0.85 | ) | | | | (0.85 | ) | | | | 8.27 | | | |
20072 | | | 15.12 | | | | | (0.02 | ) | | | | 1.04 | | | | | 1.02 | | | | | — | | | | | (2.08 | ) | | | | (2.08 | ) | | | | 14.06 | | | |
20062 | | | 15.33 | | | | | (0.05 | ) | | | | 3.05 | | | | | 3.00 | | | | | — | | | | | (3.21 | ) | | | | (3.21 | ) | | | | 15.12 | | | |
20053 | | | 15.82 | | | | | (0.01 | ) | | | | (0.48 | ) | | | | (0.49 | ) | | | | — | | | | | — | | | | | — | | | | | 15.33 | | | |
20054 | | | 15.95 | | | | | (0.08 | ) | | | | 3.10 | | | | | 3.02 | | | | | — | | | | | (3.15 | ) | | | | (3.15 | ) | | | | 15.82 | | | |
| Class B | | | | | | | | | | | | | | | | | | | | | | | | | | | | | | | | | | | | | | | | | |
20092 | | $ | 6.64 | | | | $ | (0.05 | ) | | | $ | 1.01 | | | | $ | 0.96 | | | | $ | — | | | | $ | — | | | | $ | — | | | | $ | 7.60 | | | |
20082 | | | 11.56 | | | | | (0.08 | ) | | | | (3.99 | ) | | | | (4.07 | ) | | | | — | | | | | (0.85 | ) | | | | (0.85 | ) | | | | 6.64 | | | |
20072 | | | 12.88 | | | | | (0.11 | ) | | | | 0.87 | | | | | 0.76 | | | | | — | | | | | (2.08 | ) | | | | (2.08 | ) | | | | 11.56 | | | |
20062 | | | 13.58 | | | | | (0.13 | ) | | | | 2.64 | | | | | 2.51 | | | | | — | | | | | (3.21 | ) | | | | (3.21 | ) | | | | 12.88 | | | |
20053 | | | 14.02 | | | | | (0.02 | ) | | | | (0.42 | ) | | | | (0.44 | ) | | | | — | | | | | — | | | | | — | | | | | 13.58 | | | |
20054 | | | 14.56 | | | | | (0.17 | ) | | | | 2.78 | | | | | 2.61 | | | | | — | | | | | (3.15 | ) | | | | (3.15 | ) | | | | 14.02 | | | |
| Class C | | | | | | | | | | | | | | | | | | | | | | | | | | | | | | | | | | | | | | | | | |
20092 | | $ | 7.63 | | | | $ | (0.06 | ) | | | $ | 1.16 | | | | $ | 1.10 | | | | $ | — | | | | $ | — | | | | $ | — | | | | $ | 8.73 | | | |
20082 | | | 13.13 | | | | | (0.09 | ) | | | | (4.56 | ) | | | | (4.65 | ) | | | | — | | | | | (0.85 | ) | | | | (0.85 | ) | | | | 7.63 | | | |
20072 | | | 14.36 | | | | | (0.12 | ) | | | | 0.97 | | | | | 0.85 | | | | | — | | | | | (2.08 | ) | | | | (2.08 | ) | | | | 13.13 | | | |
20062 | | | 14.79 | | | | | (0.16 | ) | | | | 2.94 | | | | | 2.78 | | | | | — | | | | | (3.21 | ) | | | | (3.21 | ) | | | | 14.36 | | | |
20053 | | | 15.28 | | | | | (0.02 | ) | | | | (0.47 | ) | | | | (0.49 | ) | | | | — | | | | | — | | | | | — | | | | | 14.79 | | | |
20054 | | | 15.60 | | | | | (0.19 | ) | | | | 3.02 | | | | | 2.83 | | | | | — | | | | | (3.15 | ) | | | | (3.15 | ) | | | | 15.28 | | | |
| Class R | | | | | | | | | | | | | | | | | | | | | | | | | | | | | | | | | | | | | | | | | |
20092 | | $ | 8.12 | | | | $ | (0.03 | ) | | | $ | 1.25 | | | | $ | 1.22 | | | | $ | — | | | | $ | — | | | | $ | — | | | | $ | 9.34 | | | |
20082 | | | 13.86 | | | | | (0.04 | ) | | | | (4.85 | ) | | | | (4.89 | ) | | | | — | | | | | (0.85 | ) | | | | (0.85 | ) | | | | 8.12 | | | |
20072 | | | 14.98 | | | | | (0.05 | ) | | | | 1.01 | | | | | 0.96 | | | | | — | | | | | (2.08 | ) | | | | (2.08 | ) | | | | 13.86 | | | |
20062 | | | 15.24 | | | | | (0.09 | ) | | | | 3.04 | | | | | 2.95 | | | | | — | | | | | (3.21 | ) | | | | (3.21 | ) | | | | 14.98 | | | |
20053 | | | 15.73 | | | | | (0.01 | ) | | | | (0.48 | ) | | | | (0.49 | ) | | | | — | | | | | — | | | | | — | | | | | 15.24 | | | |
20054 | | | 15.91 | | | | | (0.08 | ) | | | | 3.05 | | | | | 2.97 | | | | | — | | | | | (3.15 | ) | | | | (3.15 | ) | | | | 15.73 | | | |
| Class Y | | | | | | | | | | | | | | | | | | | | | | | | | | | | | | | | | | | | | | | | | |
20092 | | $ | 8.94 | | | | $ | 0.02 | | | | $ | 1.37 | | | | $ | 1.39 | | | | $ | — | | | | $ | — | | | | $ | — | | | | $ | 10.33 | | | |
20082 | | | 15.10 | | | | | 0.01 | | | | | (5.31 | ) | | | | (5.30 | ) | | | | (0.01 | ) | | | | (0.85 | ) | | | | (0.86 | ) | | | | 8.94 | | | |
20072 | | | 16.06 | | | | | 0.01 | | | | | 1.11 | | | | | 1.12 | | | | | — | | | | | (2.08 | ) | | | | (2.08 | ) | | | | 15.10 | | | |
20062 | | | 16.06 | | | | | (0.01 | ) | | | | 3.22 | | | | | 3.21 | | | | | — | | | | | (3.21 | ) | | | | (3.21 | ) | | | | 16.06 | | | |
20053 | | | 16.57 | | | | | (0.01 | ) | | | | (0.50 | ) | | | | (0.51 | ) | | | | — | | | | | — | | | | | — | | | | | 16.06 | | | |
20054 | | | 16.54 | | | | | (0.04 | ) | | | | 3.22 | | | | | 3.18 | | | | | — | | | | | (3.15 | ) | | | | (3.15 | ) | | | | 16.57 | | | |
| |
| |
| | |
| | 1 | Per share data calculated using average shares outstanding method. |
| |
| | 2 | For the period November 1 to October 31 in the fiscal year indicated. |
| |
| | 3 | For the period October 1, 2005 to October 31, 2005. Effective October 1, 2005, the fund’s fiscal year end was changed from September 30 to October 31. All ratios for the period have been annualized, except total return and portfolio turnover. |
| |
| | 4 | For the period October 1 to September 30 in the year indicated. |
| |
| | 5 | Total return does not reflect sales charges. Total return would have been lower had certain expenses not been waived. |
The accompanying notes are an integral part of the financial statements.
116 First American Funds 2009 Annual Report
| | | | | | | | | | | | | | | | | | | | | | | | | | | | | | | | | | | | | |
| | | | | | | | | | | | | | | | | | | | | | | |
| | | | | | | | | | | | | | | Ratio of
| | | Ratio of Net
| | | | | |
| | | | | | | | | | | | Ratio of Net
| | | Expenses
| | | Investment
| | | | | |
| | | | | | | | | Ratio of
| | | Investment
| | | to Average
| | | Income (Loss)
| | | | | |
| | | | | | Net Assets
| | | Expenses to
| | | Income (Loss)
| | | Net Assets
| | | to Average Net
| | | Portfolio
| | |
| | | Total
| | | End of
| | | Average
| | | to Average
| | | (Excluding
| | | Assets (Excluding
| | | Turnover
| | |
| | | Return5 | | | Period (000) | | | Net Assets | | | Net Assets | | | Waivers) | | | Waivers) | | | Rate | | |
| |
| | | | | | | | | | | | | | | | | | | | | | | | | | | | | | | | | | | | | |
| | | | | | | | | | | | | | | | | | | | | | | | | | | | | | | | | | | | | |
| | | | 15.24 | % | | | $ | 295,348 | | | | | 1.26 | % | | | | (0.09 | )% | | | | 1.26 | % | | | | (0.09 | )% | | | | 99 | % | | |
| | | | (37.00 | ) | | | | 166,698 | | | | | 1.26 | | | | | (0.15 | ) | | | | 1.26 | | | | | (0.15 | ) | | | | 92 | | | |
| | | | 7.35 | | | | | 238,129 | | | | | 1.23 | | | | | (0.22 | ) | | | | 1.23 | | | | | (0.22 | ) | | | | 97 | | | |
| | | | 22.46 | | | | | 222,293 | | | | | 1.24 | | | | | (0.38 | ) | | | | 1.24 | | | | | (0.38 | ) | | | | 111 | | | |
| | | | (3.10 | ) | | | | 104,568 | | | | | 1.25 | | | | | (0.92 | ) | | | | 1.25 | | | | | (0.92 | ) | | | | 14 | | | |
| | | | 20.46 | | | | | 107,270 | | | | | 1.22 | | | | | (0.53 | ) | | | | 1.25 | | | | | (0.56 | ) | | | | 122 | | | |
| | | | | | | | | | | | | | | | | | | | | | | | | | | | | | | | | | | | | |
| | | | 14.46 | % | | | $ | 5,511 | | | | | 2.01 | % | | | | (0.80 | )% | | | | 2.01 | % | | | | (0.80 | )% | | | | 99 | % | | |
| | | | (37.52 | ) | | | | 6,249 | | | | | 2.01 | | | | | (0.90 | ) | | | | 2.01 | | | | | (0.90 | ) | | | | 92 | | | |
| | | | 6.51 | | | | | 13,720 | | | | | 1.98 | | | | | (0.97 | ) | | | | 1.98 | | | | | (0.97 | ) | | | | 97 | | | |
| | | | 21.59 | | | | | 15,077 | | | | | 1.99 | | | | | (1.14 | ) | | | | 1.99 | | | | | (1.14 | ) | | | | 111 | | | |
| | | | (3.14 | ) | | | | 13,406 | | | | | 2.00 | | | | | (1.67 | ) | | | | 2.00 | | | | | (1.67 | ) | | | | 14 | | | |
| | | | 19.45 | | | | | 14,023 | | | | | 1.97 | | | | | (1.28 | ) | | | | 2.00 | | | | | (1.31 | ) | | | | 122 | | | |
| | | | | | | | | | | | | | | | | | | | | | | | | | | | | | | | | | | | | |
| | | | 14.42 | % | | | $ | 16,938 | | | | | 2.01 | % | | | | (0.80 | )% | | | | 2.01 | % | | | | (0.80 | )% | | | | 99 | % | | |
| | | | (37.44 | ) | | | | 17,062 | | | | | 2.01 | | | | | (0.90 | ) | | | | 2.01 | | | | | (0.90 | ) | | | | 92 | | | |
| | | | 6.46 | | | | | 34,505 | | | | | 1.98 | | | | | (0.95 | ) | | | | 1.98 | | | | | (0.95 | ) | | | | 97 | | | |
| | | | 21.64 | | | | | 18,794 | | | | | 1.99 | | | | | (1.14 | ) | | | | 1.99 | | | | | (1.14 | ) | | | | 111 | | | |
| | | | (3.21 | ) | | | | 13,453 | | | | | 2.00 | | | | | (1.67 | ) | | | | 2.00 | | | | | (1.67 | ) | | | | 14 | | | |
| | | | 19.58 | | | | | 14,418 | | | | | 1.97 | | | | | (1.28 | ) | | | | 2.00 | | | | | (1.31 | ) | | | | 122 | | | |
| | | | | | | | | | | | | | | | | | | | | | | | | | | | | | | | | | | | | |
| | | | 15.02 | % | | | $ | 24,701 | | | | | 1.51 | % | | | | (0.31 | )% | | | | 1.51 | % | | | | (0.31 | )% | | | | 99 | % | | |
| | | | (37.19 | ) | | | | 23,069 | | | | | 1.51 | | | | | (0.40 | ) | | | | 1.51 | | | | | (0.40 | ) | | | | 92 | | | |
| | | | 6.99 | | | | | 38,181 | | | | | 1.48 | | | | | (0.43 | ) | | | | 1.48 | | | | | (0.43 | ) | | | | 97 | | | |
| | | | 22.23 | | | | | 2,697 | | | | | 1.49 | | | | | (0.59 | ) | | | | 1.62 | | | | | (0.72 | ) | | | | 111 | | | |
| | | | (3.11 | ) | | | | 333 | | | | | 1.50 | | | | | (1.14 | ) | | | | 1.65 | | | | | (1.29 | ) | | | | 14 | | | |
| | | | 20.16 | | | | | 312 | | | | | 1.47 | | | | | (0.53 | ) | | | | 1.65 | | | | | (0.71 | ) | | | | 122 | | | |
| | | | | | | | | | | | | | | | | | | | | | | | | | | | | | | | | | | | | |
| | | | 15.55 | % | | | $ | 322,658 | | | | | 1.01 | % | | | | 0.19 | % | | | | 1.01 | % | | | | 0.19 | % | | | | 99 | % | | |
| | | | (36.86 | ) | | | | 289,685 | | | | | 1.01 | | | | | 0.10 | | | | | 1.01 | | | | | 0.10 | | | | | 92 | | | |
| | | | 7.58 | | | | | 691,488 | | | | | 0.98 | | | | | 0.03 | | | | | 0.98 | | | | | 0.03 | | | | | 97 | | | |
| | | | 22.81 | | | | | 732,252 | | | | | 0.99 | | | | | (0.15 | ) | | | | 0.99 | | | | | (0.15 | ) | | | | 111 | | | |
| | | | (3.08 | ) | | | | 682,088 | | | | | 1.00 | | | | | (0.67 | ) | | | | 1.00 | | | | | (0.67 | ) | | | | 14 | | | |
| | | | 20.73 | | | | | 715,496 | | | | | 0.97 | | | | | (0.28 | ) | | | | 1.00 | | | | | (0.31 | ) | | | | 122 | | | |
| |
| |
First American Funds 2009 Annual Report 117
Financial Highlights For a share outstanding throughout the indicated periods.
| | | | | | | | | | | | | | | | | | | | | | | | | | | | | | | | | | | | | | | | | | |
| | | | | | | | | | | | | | | | | | | | | | | | | | |
| | | | | | | | | Realized and
| | | | | | | | | | | | | | | | | |
| | | Net Asset
| | | | | | Unrealized
| | | | | | Distributions
| | | | | | | | | Net Asset
| | |
| | | Value
| | | Net
| | | Gains
| | | Total from
| | | from Net
| | | Distributions
| | | | | | Value
| | |
| | | Beginning
| | | Investment
| | | (Losses) on
| | | Investment
| | | Investment
| | | from Net
| | | Total
| | | End of
| | |
| | | of Period | | | Income (Loss) | | | Investments | | | Operations | | | Income | | | Realized Gains | | | Distributions | | | Period | | |
| |
Small Cap Value Fund1 | | | | | | | | | | | | | | | | | | | | | | | | | | | | | | | | | | | | | | | | | |
| Class A | | | | | | | | | | | | | | | | | | | | | | | | | | | | | | | | | | | | | | | | | |
20092 | | $ | 8.12 | | | | $ | 0.03 | | | | $ | 0.15 | | | | $ | 0.18 | | | | $ | (0.08 | ) | | | $ | — | | | | $ | (0.08 | ) | | | $ | 8.22 | | | |
20082 | | | 13.52 | | | | | 0.08 | | | | | (3.97 | ) | | | | (3.89 | ) | | | | (0.14 | ) | | | | (1.37 | ) | | | | (1.51 | ) | | | | 8.12 | | | |
20072 | | | 15.38 | | | | | 0.12 | | | | | 0.48 | | | | | 0.60 | | | | | (0.02 | ) | | | | (2.44 | ) | | | | (2.46 | ) | | | | 13.52 | | | |
20062 | | | 16.34 | | | | | 0.03 | | | | | 2.86 | | | | | 2.89 | | | | | (0.04 | ) | | | | (3.81 | ) | | | | (3.85 | ) | | | | 15.38 | | | |
20053 | | | 16.78 | | | | | 0.01 | | | | | (0.45 | ) | | | | (0.44 | ) | | | | — | | | | | — | | | | | — | | | | | 16.34 | | | |
20054 | | | 16.84 | | | | | 0.03 | | | | | 2.63 | | | | | 2.66 | | | | | (0.06 | ) | | | | (2.66 | ) | | | | (2.72 | ) | | | | 16.78 | | | |
| Class C | | | | | | | | | | | | | | | | | | | | | | | | | | | | | | | | | | | | | | | | | |
20092 | | $ | 7.22 | | | | $ | (0.02 | ) | | | $ | 0.13 | | | | $ | 0.11 | | | | $ | (0.02 | ) | | | $ | — | | | | $ | (0.02 | ) | | | $ | 7.31 | | | |
20082 | | | 12.19 | | | | | — | | | | | (3.54 | ) | | | | (3.54 | ) | | | | (0.06 | ) | | | | (1.37 | ) | | | | (1.43 | ) | | | | 7.22 | | | |
20072 | | | 14.17 | | | | | 0.02 | | | | | 0.44 | | | | | 0.46 | | | | | — | | | | | (2.44 | ) | | | | (2.44 | ) | | | | 12.19 | | | |
20062 | | | 15.39 | | | | | (0.07 | ) | | | | 2.66 | | | | | 2.59 | | | | | — | | | | | (3.81 | ) | | | | (3.81 | ) | | | | 14.17 | | | |
20053 | | | 15.82 | | | | | — | | | | | (0.43 | ) | | | | (0.43 | ) | | | | — | | | | | — | | | | | — | | | | | 15.39 | | | |
20054 | | | 16.10 | | | | | (0.09 | ) | | | | 2.50 | | | | | 2.41 | | | | | (0.03 | ) | | | | (2.66 | ) | | | | (2.69 | ) | | | | 15.82 | | | |
| Class R | | | | | | | | | | | | | | | | | | | | | | | | | | | | | | | | | | | | | | | | | |
20092 | | $ | 8.00 | | | | $ | 0.01 | | | | $ | 0.15 | | | | $ | 0.16 | | | | $ | (0.06 | ) | | | $ | — | | | | $ | (0.06 | ) | | | $ | 8.10 | | | |
20082 | | | 13.35 | | | | | 0.05 | | | | | (3.91 | ) | | | | (3.86 | ) | | | | (0.12 | ) | | | | (1.37 | ) | | | | (1.49 | ) | | | | 8.00 | | | |
20072 | | | 15.24 | | | | | 0.10 | | | | | 0.47 | | | | | 0.57 | | | | | (0.02 | ) | | | | (2.44 | ) | | | | (2.46 | ) | | | | 13.35 | | | |
20062 | | | 16.29 | | | | | (0.01 | ) | | | | 2.84 | | | | | 2.83 | | | | | (0.07 | ) | | | | (3.81 | ) | | | | (3.88 | ) | | | | 15.24 | | | |
20053 | | | 16.74 | | | | | 0.01 | | | | | (0.46 | ) | | | | (0.45 | ) | | | | — | | | | | — | | | | | — | | | | | 16.29 | | | |
20054 | | | 16.83 | | | | | (0.01 | ) | | | | 2.64 | | | | | 2.63 | | | | | (0.06 | ) | | | | (2.66 | ) | | | | (2.72 | ) | | | | 16.74 | | | |
| Class Y | | | | | | | | | | | | | | | | | | | | | | | | | | | | | | | | | | | | | | | | | |
20092 | | $ | 8.36 | | | | $ | 0.05 | | | | $ | 0.15 | | | | $ | 0.20 | | | | $ | (0.11 | ) | | | $ | — | | | | $ | (0.11 | ) | | | $ | 8.45 | | | |
20082 | | | 13.87 | | | | | 0.11 | | | | | (4.08 | ) | | | | (3.97 | ) | | | | (0.17 | ) | | | | (1.37 | ) | | | | (1.54 | ) | | | | 8.36 | | | |
20072 | | | 15.71 | | | | | 0.16 | | | | | 0.49 | | | | | 0.65 | | | | | (0.05 | ) | | | | (2.44 | ) | | | | (2.49 | ) | | | | 13.87 | | | |
20062 | | | 16.62 | | | | | 0.07 | | | | | 2.90 | | | | | 2.97 | | | | | (0.07 | ) | | | | (3.81 | ) | | | | (3.88 | ) | | | | 15.71 | | | |
20053 | | | 17.06 | | | | | 0.01 | | | | | (0.45 | ) | | | | (0.44 | ) | | | | — | | | | | — | | | | | — | | | | | 16.62 | | | |
20054 | | | 17.05 | | | | | 0.07 | | | | | 2.67 | | | | | 2.74 | | | | | (0.07 | ) | | | | (2.66 | ) | | | | (2.73 | ) | | | | 17.06 | | | |
| |
| |
| | |
| | 1 | Per share data calculated using average shares outstanding method. |
| |
| | 2 | For the period November 1 to October 31 in the fiscal year indicated. |
| |
| | 3 | For the period October 1, 2005 to October 31, 2005. Effective October 1, 2005, the fund’s fiscal year end was changed from September 30 to October 31. All ratios for the period have been annualized, except total return and portfolio turnover. |
| |
| | 4 | For the period October 1 to September 30 in the year indicated. |
| |
| | 5 | Total return does not reflect sales charges. Total return would have been lower had certain expenses not been waived. |
The accompanying notes are an integral part of the financial statements.
118 First American Funds 2009 Annual Report
| | | | | | | | | | | | | | | | | | | | | | | | | | | | | | | | | | | | | |
| | | | | | | | | | | | | | | | | | | | | | | |
| | | | | | | | | | | | | | | | | | Ratio of Net
| | | | | |
| | | | | | | | | | | | | | | Ratio of
| | | Investment
| | | | | |
| | | | | | | | | | | | Ratio of Net
| | | Expenses
| | | Income (Loss)
| | | | | |
| | | | | | | | | Ratio of
| | | Investment
| | | to Average
| | | to Average
| | | | | |
| | | | | | Net Assets
| | | Expenses
| | | Income (Loss)
| | | Net Assets
| | | Net Assets
| | | Portfolio
| | |
| | | Total
| | | End of
| | | to Average
| | | to Average
| | | (Excluding
| | | (Excluding
| | | Turnover
| | |
| | | Return5 | | | Period (000) | | | Net Assets | | | Net Assets | | | Waivers) | | | Waivers) | | | Rate | | |
| |
| | | | | | | | | | | | | | | | | | | | | | | | | | | | | | | | | | | | | |
| | | | | | | | | | | | | | | | | | | | | | | | | | | | | | | | | | | | | |
| | | | 2.40 | % | | | $ | 29,026 | | | | | 1.37 | % | | | | 0.46 | % | | | | 1.37 | % | | | | 0.46 | % | | | | 73 | % | | |
| | | | (31.75 | ) | | | | 28,344 | | | | | 1.31 | | | | | 0.75 | | | | | 1.31 | | | | | 0.75 | | | | | 49 | | | |
| | | | 4.18 | | | | | 53,498 | | | | | 1.26 | | | | | 0.90 | | | | | 1.26 | | | | | 0.90 | | | | | 63 | | | |
| | | | 20.78 | | | | | 57,922 | | | | | 1.26 | | | | | 0.21 | | | | | 1.26 | | | | | 0.21 | | | | | 96 | | | |
| | | | (2.62 | ) | | | | 46,467 | | | | | 1.25 | | | | | 0.78 | | | | | 1.25 | | | | | 0.78 | | | | | 15 | | | |
| | | | 16.78 | | | | | 48,128 | | | | | 1.24 | | | | | 0.19 | | | | | 1.26 | | | | | 0.17 | | | | | 72 | | | |
| | | | | | | | | | | | | | | | | | | | | | | | | | | | | | | | | | | | | |
| | | | 1.56 | % | | | $ | 2,080 | | | | | 2.12 | % | | | | (0.27 | )% | | | | 2.12 | % | | | | (0.27 | )% | | | | 73 | % | | |
| | | | (32.23 | ) | | | | 2,373 | | | | | 2.06 | | | | | — | | | | | 2.06 | | | | | — | | | | | 49 | | | |
| | | | 3.42 | | | | | 4,006 | | | | | 2.01 | | | | | 0.14 | | | | | 2.01 | | | | | 0.14 | | | | | 63 | | | |
| | | | 19.89 | | | | | 4,405 | | | | | 2.01 | | | | | (0.53 | ) | | | | 2.01 | | | | | (0.53 | ) | | | | 96 | | | |
| | | | (2.72 | ) | | | | 4,590 | | | | | 2.00 | | | | | 0.03 | | | | | 2.00 | | | | | 0.03 | | | | | 15 | | | |
| | | | 15.92 | | | | | 4,808 | | | | | 1.99 | | | | | (0.56 | ) | | | | 2.01 | | | | | (0.58 | ) | | | | 72 | | | |
| | | | | | | | | | | | | | | | | | | | | | | | | | | | | | | | | | | | | |
| | | | 2.14 | % | | | $ | 2,327 | | | | | 1.62 | % | | | | 0.19 | % | | | | 1.62 | % | | | | 0.19 | % | | | | 73 | % | | |
| | | | (31.90 | ) | | | | 2,159 | | | | | 1.56 | | | | | 0.50 | | | | | 1.56 | | | | | 0.50 | | | | | 49 | | | |
| | | | 3.96 | | | | | 3,263 | | | | | 1.51 | | | | | 0.72 | | | | | 1.51 | | | | | 0.72 | | | | | 63 | | | |
| | | | 20.44 | | | | | 1,849 | | | | | 1.51 | | | | | (0.09 | ) | | | | 1.63 | | | | | (0.21 | ) | | | | 96 | | | |
| | | | (2.69 | ) | | | | 4 | | | | | 1.50 | | | | | 0.59 | | | | | 1.65 | | | | | 0.44 | | | | | 15 | | | |
| | | | 16.60 | | | | | 4 | | | | | 1.49 | | | | | (0.04 | ) | | | | 1.66 | | | | | (0.21 | ) | | | | 72 | | | |
| | | | | | | | | | | | | | | | | | | | | | | | | | | | | | | | | | | | | |
| | | | 2.59 | % | | | $ | 149,515 | | | | | 1.12 | % | | | | 0.72 | % | | | | 1.12 | % | | | | 0.72 | % | | | | 73 | % | | |
| | | | (31.56 | ) | | | | 158,112 | | | | | 1.06 | | | | | 1.00 | | | | | 1.06 | | | | | 1.00 | | | | | 49 | | | |
| | | | 4.45 | | | | | 302,683 | | | | | 1.01 | | | | | 1.15 | | | | | 1.01 | | | | | 1.15 | | | | | 63 | | | |
| | | | 21.01 | | | | | 355,148 | | | | | 1.01 | | | | | 0.47 | | | | | 1.01 | | | | | 0.47 | | | | | 96 | | | |
| | | | (2.58 | ) | | | | 348,166 | | | | | 1.00 | | | | | 1.03 | | | | | 1.00 | | | | | 1.03 | | | | | 15 | | | |
| | | | 17.08 | | | | | 363,261 | | | | | 0.99 | | | | | 0.44 | | | | | 1.01 | | | | | 0.42 | | | | | 72 | | | |
| |
| |
| |
| Notes to Financial Statements | October 31, 2009, all dollars and shares are rounded to thousands
(000) |
Equity Income Fund, Global Infrastructure Fund, International Fund, International Select Fund, Large Cap Growth Opportunities Fund, Large Cap Select Fund, Large Cap Value Fund, Mid Cap Growth Opportunities Fund, Mid Cap Select Fund (formerly Small-Mid Cap Core Fund), Mid Cap Value Fund, Real Estate Securities Fund, Small Cap Growth Opportunities Fund, Small Cap Select Fund, and Small Cap Value Fund (each a “fund” and collectively, the “funds”) are mutual funds offered by First American Investment Funds, Inc. (“FAIF”), which is a member of the First American Family of Funds. As of October 31, 2009, FAIF offered 40 funds, including the funds listed above. FAIF is registered under the Investment Company Act of 1940, as amended, as an open-end management investment company. FAIF’s articles of incorporation permit the funds’ board of directors to create additional funds in the future. Each fund other than Real Estate Securities Fund is a diversified open-end management investment company. Real Estate Securities Fund is a non-diversified, open-end management investment company. From October 3, 2005 to May 4, 2009, Mid Cap Select Fund had different investment strategies and was named Small-Mid Cap Core Fund. Prior thereto, the fund, was named Technology Fund, had different investment strategies and also was non-diversified. Non-diversified funds may invest a large component of their net assets in securities of relatively few issuers.
FAIF offers Class A, Class C, Class R, and Class Y shares. Class A shares are sold with a front-end sales charge. Class C shares may be subject to a contingent deferred sales charge for 12 months. Class R shares have no sales charge and are offered only through certain tax-deferred retirement plans. Class Y shares have no sales charge and are offered only to qualifying institutional investors and certain other qualifying accounts. Class R shares are not offered by the Mid Cap Select Fund. Prior to November 3, 2008, Class C and Class R were not offered by Global Infrastructure Fund. Prior to the close of business on June 30, 2008, each fund except Global Infrastructure Fund offered Class B shares. Subsequent to that date, no new or additional investments are allowed in Class B shares, except through permitted exchanges and any reinvested dividends. Class B shares are subject to a contingent deferred sales charge for six years and automatically convert to Class A shares after eight years.
The funds’ prospectuses provide descriptions of each fund’s investment objective, principal investment strategies, and principal risks. All classes of shares in a fund have identical voting, dividend, liquidation, and other rights, and the same terms and conditions, except that certain fees and expenses, including distribution and shareholder servicing fees, may differ among classes. Each class has exclusive voting rights on any matters relating to that class’s servicing or distribution arrangements.
| |
| 2 > | Summary of Significant Accounting Policies |
The significant accounting policies followed by the funds are as follows:
SECURITY VALUATIONS – Security valuations for the funds’ investments are furnished by an independent pricing service that has been approved by the funds’ board of directors. Investments in equity securities that are traded on a national securities exchange (or reported on the Nasdaq national market system) are stated at the last quoted sales price if readily available for such securities on each business day. For securities traded on the Nasdaq national market system, the funds utilize the Nasdaq Official Closing Price which compares the last trade to the bid/ask range of a security. If the last trade falls within the bid/ask range, then that price will be the closing price. If the last trade is outside the bid/ask range, and falls above the ask, then the ask will be the closing price. If the last trade is below the bid, then the bid will be the closing price. Other equity securities traded in the over-the-counter market and listed equity securities for which no sale was reported on that date are stated at the last quoted bid price. Investments in open-end funds are valued at their respective net asset values on the valuation date.
Debt obligations exceeding 60 days to maturity are valued by an independent pricing service. The pricing service may employ methodologies that utilize actual market transactions, broker-dealer supplied valuations, or other formula-driven valuation techniques. These techniques generally consider such factors as yields or prices of bonds of comparable quality, type of issue, coupon, maturity, ratings, and general market conditions. Securities for which prices are not available from an independent pricing service, but where an active market exists, are valued using market quotations obtained from one or more dealers that make markets in the securities or from a widely used quotation system. Debt obligations with 60 days or less remaining until maturity may be valued at their amortized cost, which approximates fair value.
The following investment vehicles, when held by a fund, are priced as follows: Exchange listed futures and options on futures are priced at their last sale price on the exchange on which they are principally traded, as determined by FAF Advisors, Inc. (“FAF Advisors”), on the day the valuation is made. If there were no sales on that day, futures and options on futures will be valued at the last reported bid price. Options on securities, indices, and currencies traded on Nasdaq or listed on a stock exchange, whether domestic or foreign, are valued at the last sale price on Nasdaq or on any exchange on the day the valuation is made. If there were no sales on that day, the options will be valued at the last sale price on the previous valuation date. Last sale prices are obtained from an independent pricing service. Forward contracts (other than foreign currency forward contracts), and over-the-counter options on securities, indices, and currencies are valued at
120 First American Funds 2009 Annual Report
the quotations received from an independent pricing service, if available. Foreign currency forward contracts are valued at the current day’s interpolated foreign exchange rate, as calculated using the current day’s exchange rate, and the 30-, 60-, 90-, 180-, and 360-day forward rates provided by an independent pricing service.
When market quotations are not readily available, securities are internally valued at fair value as determined in good faith by procedures established and approved by the funds’ board of directors. Some of the factors which may be considered in determining fair value are fundamental analytical data relating to the investment; the nature and duration of any restrictions on disposition; trading in similar securities of the same issuer or comparable companies; information from broker-dealers; and an evaluation of the forces that influence the market in which the securities are purchased and sold. If events occur that materially affect the value of securities (including non-U.S. securities) between the close of trading in those securities and the close of regular trading on the New York Stock Exchange, the securities will be valued at fair value. As of October 31, 2009, Global Infrastructure Fund, International Fund, International Select Fund, Mid Cap Select Fund, Real Estate Securities Fund, Small Cap Growth Opportunities Fund, and Small Cap Select Fund held internally fair valued securities with a total fair value of $332, $211, $110, $0, $111, $0, and $0, respectively, or 0.6%, 0.0%, 0.0%, 0.0%, 0.0%, 0.0%, and 0.0% of total net assets, respectively. The fair values of foreign securities held by Global Infrastructure Fund, International Fund, and International Select Fund are determined on each business day by an independent third party based on factors such as price changes for futures contracts, sector indices, American Depositary Receipts, and currency exchange rates that occur between the close of the local market and the close of the New York Stock Exchange. The use of daily fair value pricing by the Global Infrastructure Fund, International Fund, and International Select Fund may cause the net asset value of their shares to differ significantly from the net asset value that would be determined without fair value pricing. Foreign securities are valued at the closing prices on the principal exchange on which they trade unless they are fair valued as described above. The prices for foreign securities are reported in local currency and converted to U.S. dollars using currency exchange rates. Exchange rates are provided daily by recognized independent pricing agents.
Generally accepted accounting principles (“GAAP”) require disclosures regarding the inputs and valuation techniques used to measure fair value and any changes in valuation inputs or technique. These principles establish a three-tier fair value hierarchy for inputs used in measuring fair value. Fair value inputs are summarized in the three broad levels listed below:
Level 1 – Quoted prices in active markets for identical securities.
Level 2 – Other significant observable inputs (including quoted prices for similar securities, with similar interest rates, prepayment speeds, credit risk, etc. and foreign securities for which an independent pricing service may be employed for purposes of fair market valuation).
Level 3 – Significant unobservable inputs (including a fund’s own assumptions in determining the fair value of investments). Generally, the types of securities included in Level 3 of a fund are securities for which there is limited or no observable fair value inputs available, and as such the fair value is determined through independent broker quotations or management’s fair value procedures established by the funds’ board of directors.
The valuation levels are not necessarily an indication of the risk associated with investing in these investments.
First American Funds 2009 Annual Report 121
| |
| Notes to Financial Statements | October 31, 2009, all dollars and shares are rounded to thousands
(000) |
As of October 31, 2009, each fund’s investments were classified as follows:
| | | | | | | | | | | | | | | | | |
| | | | | | | | | | | | Total
| |
| Fund | | Level 1 | | | Level 2 | | | Level 3 | | | Fair Value | |
| | |
Equity Income Fund | | | | | | | | | | | | | | | | |
| Common Stocks | | $ | 679,063 | | | $ | — | | | $ | — | | | $ | 679,063 | |
| Short-Term Investments | | | 104,199 | | | | — | | | | — | | | | 104,199 | |
| |
| |
| Total Investments | | $ | 783,262 | | | $ | — | | | $ | — | | | $ | 783,262 | |
| |
| |
Global Infrastructure Fund | | | | | | | | | | | | | | | | |
| Common and Preferred Stocks | | $ | 15,426 | | | $ | 41,807 | 1 | | $ | 332 | 1 | | $ | 57,565 | |
| Short-Term Investment | | | 67 | | | | — | | | | — | | | | 67 | |
| |
| |
| Total Investments | | $ | 15,493 | | | $ | 41,807 | | | $ | 332 | | | $ | 57,632 | |
| |
| |
| | |
| | 1 | The Common and Preferred Stocks Level 2 and Level 3 balance consists of the fair value of the associated Level 2 and Level 3 investments in the following industries: |
| | | | | | | | | | | | | | | | | |
| Consumer Discretionary | | $ | 585 | | | | | | | | | | | | | |
| Energy | | | 516 | | | | | | | | | | | | | |
| Financials | | | 204 | | | | | | | | | | | | | |
| Industrials | | | 24,255 | | | | | | | | | | | | | |
| Telecommunication Services | | | 1,755 | | | | | | | | | | | | | |
| Utilities | | | 14,824 | | | | | | | | | | | | | |
| |
| |
| | | $ | 42,139 | | | | | | | | | | | | | |
| |
| |
| | | | | | | | | | | | | | | | | |
| | | | | | | | | | | | Total
| |
| Fund | | Level 1 | | | Level 2 | | | Level 3 | | | Fair Value | |
| | |
International Fund | | | | | | | | | | | | | | | | |
| Common and Preferred Stocks | | $ | 101,179 | | | $ | 544,045 | 2 | | $ | 211 | 2 | | $ | 645,435 | |
| Short-Term Investments | | | 42,344 | | | | 23,597 | | | | — | | | | 65,941 | |
| |
| |
| Total Investments | | $ | 143,523 | | | $ | 567,642 | | | $ | 211 | | | $ | 711,376 | |
| |
| |
| | |
| | 2 | The Common and Preferred Stocks Level 2 and Level 3 balances consist of the fair value of the associated Level 2 and Level 3 investments in the following industries: |
| | | | | | | | | | | | | | | | | |
| Consumer Discretionary | | $ | 61,864 | | | | | | | | | | | | | |
| Consumer Staples | | | 81,272 | | | | | | | | | | | | | |
| Energy | | | 28,214 | | | | | | | | | | | | | |
| Financials | | | 100,454 | | | | | | | | | | | | | |
| Healthcare | | | 43,261 | | | | | | | | | | | | | |
| Industrials | | | 83,565 | | | | | | | | | | | | | |
| Information Technology | | | 56,811 | | | | | | | | | | | | | |
| Materials | | | 50,910 | | | | | | | | | | | | | |
| Telecommunication Services | | | 14,866 | | | | | | | | | | | | | |
| Utilities | | | 23,039 | | | | | | | | | | | | | |
| |
| |
| | | $ | 544,256 | | | | | | | | | | | | | |
| |
| |
| | | | | | | | | | | | | | | | | |
International Select Fund | | | | | | | | | | | | | | | | |
| Common and Preferred Stocks | | $ | 96,908 | | | $ | 403,375 | 3 | | $ | 110 | 3 | | $ | 500,393 | |
| Short-Term Investments | | | 62,129 | | | | 24,149 | | | | — | | | | 86,278 | |
| |
| |
| Total Investments | | $ | 159,037 | | | $ | 427,524 | | | $ | 110 | | | $ | 586,671 | |
| |
| |
| | |
| | 3 | The Common and Preferred Stocks Level 2 and Level 3 balances consist of the fair value of the associated Level 2 and Level 3 investments in the following industries: |
| | | | | | | | | | | | | | | | | |
| Consumer Discretionary | | $ | 39,519 | | | | | | | | | | | | | |
| Consumer Staples | | | 59,253 | | | | | | | | | | | | | |
| Financials | | | 83,017 | | | | | | | | | | | | | |
| Industrials | | | 56,259 | | | | | | | | | | | | | |
| Information Technology | | | 49,383 | | | | | | | | | | | | | |
| Materials | | | 42,513 | | | | | | | | | | | | | |
| Telecommunication Services | | | 10,152 | | | | | | | | | | | | | |
| Healthcare | | | 24,718 | | | | | | | | | | | | | |
| Energy | | | 24,565 | | | | | | | | | | | | | |
| Utilities | | | 14,106 | | | | | | | | | | | | | |
| |
| |
| | | $ | 403,485 | | | | | | | | | | | | | |
| |
| |
122 First American Funds 2009 Annual Report
| | | | | | | | | | | | | | | | | |
Large Cap Growth Opportunities Fund | | | | | | | | | | | | | | | | |
| Common Stocks | | $ | 546,590 | | | $ | — | | | $ | — | | | $ | 546,590 | |
| Short-Term Investments | | | 108,487 | | | | — | | | | — | | | | 108,487 | |
| |
| |
| Total Investments | | $ | 655,077 | | | $ | — | | | $ | — | | | $ | 655,077 | |
| |
| |
| | | | | | | | | | | | | | | | | |
Large Cap Select Fund | | | | | | | | | | | | | | | | |
| Common Stocks | | $ | 150,671 | | | $ | — | | | $ | — | | | $ | 150,671 | |
| Short-Term Investments | | | 43,990 | | | | — | | | | — | | | | 43,990 | |
| |
| |
| Total Investments | | $ | 194,661 | | | $ | — | | | $ | — | | | $ | 194,661 | |
| |
| |
| | | | | | | | | | | | | | | | | |
Large Cap Value Fund | | | | | | | | | | | | | | | | |
| Common Stocks | | $ | 393,368 | | | $ | — | | | $ | — | | | $ | 393,368 | |
| Short-Term Investments | | | 71,247 | | | | — | | | | — | | | | 71,247 | |
| |
| |
| Total Investments | | $ | 464,615 | | | $ | — | | | $ | — | | | $ | 464,615 | |
| |
| |
| | | | | | | | | | | | | | | | | |
Mid Cap Growth Opportunities Fund | | | | | | | | | | | | | | | | |
| Common Stocks | | $ | 1,182,306 | | | $ | — | | | $ | — | | | $ | 1,182,306 | |
| Short-Term Investments | | | 297,661 | | | | — | | | | — | | | | 297,661 | |
| |
| |
| Total Investments | | $ | 1,479,967 | | | $ | — | | | $ | — | | | $ | 1,479,967 | |
| |
| |
| | | | | | | | | | | | | | | | | |
Mid Cap Select Fund | | | | | | | | | | | | | | | | |
| Common Stocks | | $ | 43,138 | | | $ | — | | | $ | — | | | $ | 43,138 | |
| Warrants | | | — | | | | — | | | | — | | | | — | |
| Short-Term Investments | | | 10,914 | | | | — | | | | — | | | | 10,914 | |
| |
| |
| Total Investments | | $ | 54,052 | | | $ | — | | | $ | — | | | $ | 54,052 | |
| |
| |
| | | | | | | | | | | | | | | | | |
Mid Cap Value Fund | | | | | | | | | | | | | | | | |
| Common Stocks | | $ | 606,633 | | | $ | — | | | $ | — | | | $ | 606,633 | |
| Short-Term Investments | | | 124,724 | | | | — | | | | — | | | | 124,724 | |
| |
| |
| Total Investments | | $ | 731,357 | | | $ | — | | | $ | — | | | $ | 731,357 | |
| |
| |
| | | | | | | | | | | | | | | | | |
Real Estate Securities Fund | | | | | | | | | | | | | | | | |
| Common Stocks | | $ | 1,003,942 | | | $ | — | | | $ | — | | | $ | 1,003,942 | |
| Private Real Estate Company | | | — | | | | — | | | | 111 | | | | 111 | |
| Short-Term Investments | | | 479,091 | | | | — | | | | — | | | | 479,091 | |
| |
| |
| Total Investments | | $ | 1,483,033 | | | $ | — | | | $ | 111 | | | $ | 1,483,144 | |
| |
| |
| | | | | | | | | | | | | | | | | |
Small Cap Growth Opportunities Fund | | | | | | | | | | | | | | | | |
| Common Stocks | | $ | 135,661 | | | $ | — | | | $ | — | | | $ | 135,661 | |
| Warrants | | | — | | | | — | | | | — | | | | — | |
| Short-Term Investments | | | 33,604 | | | | — | | | | — | | | | 33,604 | |
| |
| |
| Total Investments | | $ | 169,265 | | | $ | — | | | $ | — | | | $ | 169,265 | |
| |
| |
| | | | | | | | | | | | | | | | | |
Small Cap Select Fund | | | | | | | | | | | | | | | | |
| Common Stocks | | $ | 641,149 | | | $ | — | | | $ | — | | | $ | 641,149 | |
| Exchange-Traded Funds | | | 3,683 | | | | — | | | | — | | | | 3,683 | |
| Warrants | | | — | | | | — | | | | — | | | | — | |
| Short-Term Investments | | | 221,742 | | | | — | | | | — | | | | 221,742 | |
| |
| |
| Total Investments | | $ | 866,574 | | | $ | — | | | $ | — | | | $ | 866,574 | |
| |
| |
| | | | | | | | | | | | | | | | | |
Small Cap Value Fund | | | | | | | | | | | | | | | | |
| Common Stocks | | $ | 178,811 | | | $ | — | | | $ | — | | | $ | 178,811 | |
| Exchange-Traded Funds | | | 3,011 | | | | — | | | | — | | | | 3,011 | |
| Short-Term Investments | | | 37,959 | | | | — | | | | — | | | | 37,959 | |
| |
| |
| Total Investments | | $ | 219,781 | | | $ | — | | | $ | — | | | $ | 219,781 | |
| |
| |
Refer to the Schedule of Investments for further industry breakout.
First American Funds 2009 Annual Report 123
| |
| Notes to Financial Statements | October 31, 2009, all dollars and shares are rounded to thousands
(000) |
As of October 31, 2009, each fund’s investments in other financial instruments* were classified as follows:
| | | | | | | | | | | | | | | | | |
| | | | | | | | | | | | Total Unrealized
| |
| | | | | | | | | | | | Appreciation
| |
| Fund | | Level 1 | | | Level 2 | | | Level 3 | | | (Depreciation) | |
| | |
| International Fund | | $ | (2,077 | ) | | $ | — | | | $ | — | | | $ | (2,077 | ) |
| International Select Fund | | | (2,364 | ) | | | — | | | | — | | | | (2,364 | ) |
| |
| |
| | |
| | * | Other financial instruments are derivative instruments such as futures, which are valued at the unrealized appreciation (depreciation) on the instrument. |
The following is a reconciliation of Level 3 assets for which significant unobservable inputs were used to determine fair value for funds which held Level 3 asset as of October 31, 2009:
| | | | | | | | | | | | | | | | | |
| | | Global
| | | | | | | | | Real Estate
| |
| | | Infrastructure
| | | International
| | | International
| | | Securities
| |
| | | Fund | | | Fund | | | Select Fund | | | Fund | |
| | |
| Balance as of October 31, 2008 | | $ | — | | | $ | — | | | $ | — | | | $ | 159 | |
| Accrued discounts/premiums | | | — | | | | — | | | | — | | | | — | |
| Realized gain (loss) | | | — | | | | — | | | | — | | | | — | |
| Net change in unrealized appreciation or depreciation | | | 29 | | | | 18 | | | | 10 | | | | (48 | ) |
| Net purchases (sales) | | | 303 | | | | 193 | | | | 100 | | | | — | |
Transfers in and/or (out) of Level 3 | | | — | | | | — | | | | — | | | | — | |
Balance as of October 31, 2009 | | $ | 332 | | | $ | 211 | | | $ | 110 | | | $ | 111 | |
| |
| |
| Net change in unrealized appreciation or depreciation of Level 3 investments held as of October 31, 2009 | | $ | 29 | | | $ | 18 | | | $ | 10 | | | $ | (48 | ) |
| |
| |
SECURITY TRANSACTIONS AND INVESTMENT INCOME – For financial statement purposes, the funds record security transactions on the trade date of the security purchase or sale. Dividend income is recorded on the ex-dividend date. Interest income, including accretion of bond discounts and amortization of bond premiums, is recorded on an accrual basis. Security gains and losses are determined on the basis of identified cost, which is the same basis used for federal income tax purposes. The resulting gain/loss is calculated as the difference between the sales price and the underlying cost of the security on the transaction date.
DISTRIBUTIONS TO SHAREHOLDERS – Equity Income Fund and Real Estate Securities Fund declare and pay income dividends quarterly. Global Infrastructure Fund, International Fund, International Select Fund, Large Cap Growth Opportunities Fund, Large Cap Select Fund, Large Cap Value Fund, Mid Cap Growth Opportunities Fund, Mid Cap Select Fund, Mid Cap Value Fund, Small Cap Growth Opportunities Fund, Small Cap Select Fund, and Small Cap Value Fund declare and pay income dividends annually. Distributions are payable in cash or reinvested in additional shares of the funds. Any net realized capital gains on sales of a fund’s securities are distributed to shareholders at least annually.
Real Estate Securities Fund receives substantial distributions from holdings in real estate investment trusts (“REITs”). Additionally, other funds also invest in REITs. Distributions from REITs may be characterized as ordinary income, net capital gain, or a return of capital to the REIT shareholder. The proper characterization of REIT distributions is generally not known until after the end of each calendar year. As such, Real Estate Securities Fund, and other funds that invest in REITs, must use estimates in reporting the character of their income and distributions for financial statement purposes. The actual character of distributions to fund shareholders will be reflected on the Form 1099 received by shareholders after the end of the calendar year. Due to the nature of REIT investments, a portion of the distributions received by a fund shareholder may represent a return of capital.
FEDERAL TAXES – Each fund is treated as a separate taxable entity. Each fund intends to continue to qualify as a regulated investment company as provided in Subchapter M of the Internal Revenue Code, as amended, and to distribute all taxable income, if any, to its shareholders. Accordingly, no provision for federal income taxes is required.
As of October 31, 2009, the funds did not have any tax positions that did not meet the “more-likely-than-not” threshold of being sustained by the applicable tax authority. Generally, tax authorities can examine all the tax returns filed for the last three years.
Net investment income and net realized gains (losses) may differ for financial statement and tax purposes because of temporary or permanent book-to-tax differences. These differences are primarily due to deferred wash sale and straddle losses, foreign currency gains and losses, investments in limited partnerships and REITs, and the “mark-to-market” of certain passive foreign investment companies (“PFICs”) for tax purposes. To the extent these differences are permanent, reclassifications are made to the appropriate capital accounts in the fiscal period that the differences arise.
124 First American Funds 2009 Annual Report
On the Statements of Assets and Liabilities the following reclassifications were made:
| | | | | | | | | | | | | |
| | | Accumulated
| | | Undistributed
| | | | |
| | | Net Realized
| | | Net Investment
| | | Portfolio
| |
| Fund | | Gain (Loss) | | | Income | | | Capital | |
| | |
| Equity Income Fund | | $ | (1,505 | ) | | $ | 2,123 | | | $ | (618 | ) |
| Global Infrastructure Fund | | | (51 | ) | | | 51 | | | | — | |
| International Fund | | | 2,356 | | | | (2,356 | ) | | | — | |
| International Select Fund | | | 1,076 | | | | (1,076 | ) | | | — | |
| Large Cap Growth Opportunities Fund | | | 47,305 | | | | — | | | | (47,305 | ) |
| Large Cap Select Fund | | | 43 | | | | 14 | | | | (57 | ) |
| Mid Cap Growth Opportunities Fund | | | 20,174 | | | | 1,646 | | | | (21,820 | ) |
| Mid Cap Select Fund | | | 334,032 | | | | 11 | | | | (334,043 | ) |
| Mid Cap Value Fund | | | (285 | ) | | | 299 | | | | (14 | ) |
| Real Estate Securities Fund | | | 5,771 | | | | 3,429 | | | | (9,200 | ) |
| Small Cap Growth Opportunities Fund | | | (9 | ) | | | 809 | | | | (800 | ) |
| Small Cap Select Fund | | | 19,462 | | | | 74 | | | | (19,536 | ) |
| Small Cap Value Fund | | | (18 | ) | | | 18 | | | | — | |
| |
| |
The character of distributions made during the tax year from net investment income or net realized gains may differ from their ultimate characterization for federal income tax purposes. In addition, due to the timing of dividend distributions, the fiscal year in which the amounts are distributed may differ from the year that the income or realized gains (losses) were recorded by the funds. The distributions paid during the fiscal years ended October 31, 2009, and October 31, 2008 were as follows:
| | | | | | | | | | | | | |
| | | October 31, 2009 | |
| | |
| | | Ordinary
| | | Return of
| | | | |
| Fund | | Income | | | Capital | | | Total | |
| | |
| Equity Income Fund | | $ | 22,374 | | | $ | — | | | $ | 22,374 | |
| Global Infrastructure Fund | | | 348 | | | | — | | | | 348 | |
| International Fund | | | 8,518 | | | | — | | | | 8,518 | |
| International Select Fund | | | 6,112 | | | | — | | | | 6,112 | |
| Large Cap Growth Opportunities Fund | | | 1,892 | | | | — | | | | 1,892 | |
| Large Cap Select Fund | | | 1,124 | | | | — | | | | 1,124 | |
| Large Cap Value Fund | | | 5,375 | | | | — | | | | 5,375 | |
| Mid Cap Select Fund | | | 147 | | | | — | | | | 147 | |
| Mid Cap Value Fund | | | 3,357 | | | | — | | | | 3,357 | |
| Real Estate Securities Fund | | | 23,504 | | | | 8,793 | | | | 32,297 | |
| Small Cap Value Fund | | | 2,298 | | | | — | | | | 2,298 | |
| |
| |
| | | | | | | | | | | | | |
| | | | | | | | | | | | | |
| | | October 31, 2008 | |
| | |
| | | Ordinary
| | | Long Term
| | | | |
| Fund | | Income | | | Gain | | | Total | |
| | |
| Equity Income Fund | | $ | 30,036 | | | $ | 74,984 | | | $ | 105,020 | |
| International Fund | | | 21,018 | | | | 137,164 | | | | 158,182 | |
| International Select Fund | | | 6,421 | | | | 1,497 | | | | 7,918 | |
| Large Cap Growth Opportunities Fund | | | 13,656 | | | | 58,188 | | | | 71,844 | |
| Large Cap Select Fund | | | 35,710 | | | | 22,823 | | | | 58,533 | |
| Large Cap Value Fund | | | 34,901 | | | | 73,894 | | | | 108,795 | |
| Mid Cap Growth Opportunities Fund | | | 27,657 | | | | 161,089 | | | | 188,746 | |
| Mid Cap Value Fund | | | 30,903 | | | | 45,611 | | | | 76,514 | |
| Real Estate Securities Fund | | | 45,177 | | | | 69,030 | | | | 114,207 | |
| Small Cap Growth Opportunities Fund | | | 17,232 | | | | 3,956 | | | | 21,188 | |
| Small Cap Select Fund | | | 9,296 | | | | 45,459 | | | | 54,755 | |
| Small Cap Value Fund | | | 18,134 | | | | 20,111 | | | | 38,245 | |
| |
| |
First American Funds 2009 Annual Report 125
| |
| Notes to Financial Statements | October 31, 2009, all dollars and shares are rounded to thousands
(000) |
As of October 31, 2009, components of accumulated earnings (deficit) on a tax-basis were as follows:
| | | | | | | | | | | | | | | | | | | | | |
| | | | | | Accumulated
| | | | | | | | | | |
| | | Undistributed
| | | Capital and
| | | Unrealized
| | | Other
| | | Total
| |
| | | Ordinary
| | | Post-October
| | | Appreciation
| | | Accumulated
| | | Accumulated
| |
| Fund | | Income | | | Losses | | | (Depreciation) | | | Gains (Losses) | | | Earnings (Deficit) | |
| | |
| Equity Income Fund | | $ | 2,044 | | | $ | (28,521 | ) | | $ | 103,800 | | | $ | — | | | $ | 77,323 | |
| Global Infrastructure Fund | | | 959 | | | | (1,583 | ) | | | 1,956 | | | | 1 | | | | 1,333 | |
| International Fund | | | 4,420 | | | | (60,760 | ) | | | 108,764 | | | | (82 | ) | | | 52,342 | |
| International Select Fund | | | 2,280 | | | | (66,180 | ) | | | 20,810 | | | | 145 | | | | (42,945 | ) |
| Large Cap Growth Opportunities Fund | | | 2,107 | | | | (108,946 | ) | | | 80,296 | | | | — | | | | (26,543 | ) |
| Large Cap Select Fund | | | 930 | | | | (118,248 | ) | | | 16,534 | | | | — | | | | (100,784 | ) |
| Large Cap Value Fund | | | 4,996 | | | | (126,873 | ) | | | 5,040 | | | | — | | | | (116,837 | ) |
| Mid Cap Growth Opportunities Fund | | | — | | | | (283,092 | ) | | | 151,313 | | | | — | | | | 131,779 | |
| Mid Cap Select Fund | | | 161 | | | | (129,952 | ) | | | 2,940 | | | | — | | | | (126,851 | ) |
| Mid Cap Value Fund | | | 7,361 | | | | (187,782 | ) | | | 39,649 | | | | — | | | | (140,772 | ) |
| Real Estate Securities Fund | | | — | | | | (210,207 | ) | | | 6,189 | | | | — | | | | (204,018 | ) |
| Small Cap Growth Opportunities Fund | | | 1 | | | | (45,755 | ) | | | 829 | | | | — | | | | (44,925 | ) |
| Small Cap Select Fund | | | 182 | | | | (178,220 | ) | | | 19,679 | | | | — | | | | (158,359 | ) |
| Small Cap Value Fund | | | 3 | | | | (63,423 | ) | | | (8,017 | ) | | | — | | | | (71,437 | ) |
| |
| |
The differences between book and tax basis unrealized appreciation (depreciation) are primarily due to the tax deferral of losses on wash sales and investments in limited partnerships, the amount of gain (loss) recognized for tax purposes due to mark-to-market adjustments on open futures contracts, and the mark-to-market for certain PFICs for tax purposes.
As of October 31, 2009, the following funds had capital loss carryforwards, which, if not offset by subsequent capital gains, will expire on the funds’ fiscal year-ends as follows:
| | | | | | | | | | | | | | | | | | | | | | | | | | | | | | | | | | | | | |
| | | Expiration Year | |
| | |
| Fund | | 2010 | | | 2011 | | | 2012 | | | 2013 | | | 2014 | | | 2015 | | | 2016 | | | 2017 | | | Total | |
| | |
| | | | | | | | | | | | | | | | | | | | | | | | | | | | | | | | | | | | | |
| Equity Income Fund | | $ | — | | | $ | — | | | $ | — | | | $ | — | | | $ | — | | | $ | — | | | $ | 11,961 | | | $ | 16,560 | | | $ | 28,521 | |
| Global Infrastructure Fund | | | — | | | | — | | | | — | | | | — | | | | — | | | | — | | | | 1,583 | | | | — | | | | 1,583 | |
| International Fund | | | — | | | | — | | | | — | | | | — | | | | — | | | | — | | | | — | | | | 60,760 | | | | 60,760 | |
| International Select Fund | | | — | | | | — | | | | — | | | | — | | | | — | | | | — | | | | 30,787 | | | | 35,393 | | | | 66,180 | |
| Large Cap Growth Opportunities Fund | | | — | | | | — | | | | — | | | | — | | | | — | | | | — | | | | 49,626 | | | | 59,320 | | | | 108,946 | |
| Large Cap Select Fund | | | — | | | | — | | | | — | | | | — | | | | — | | | | — | | | | 63,932 | | | | 54,316 | | | | 118,248 | |
| Large Cap Value Fund | | | — | | | | — | | | | — | | | | — | | | | — | | | | — | | | | 45,994 | | | | 80,879 | | | | 126,873 | |
| Mid Cap Growth Opportunities Fund | | | | | | | — | | | | — | | | | — | | | | — | | | | — | | | | 131,264 | | | | 151,828 | | | | 283,092 | |
| Mid Cap Select Fund | | | 102,106 | | | | 4,320 | | | | — | | | | — | | | | — | | | | — | | | | 7,819 | | | | 15,707 | | | | 129,952 | |
| Mid Cap Value Fund | | | — | | | | — | | | | — | | | | — | | | | — | | | | — | | | | 101,981 | | | | 85,801 | | | | 187,782 | |
| Real Estate Securities Fund | | | — | | | | — | | | | — | | | | — | | | | — | | | | — | | | | 77,591 | | | | 132,616 | | | | 210,207 | |
| Small Cap Growth Opportunities Fund | | | — | | | | — | | | | — | | | | — | | | | — | | | | — | | | | 34,593 | | | | 11,162 | | | | 45,755 | |
| Small Cap Select Fund | | | — | | | | — | | | | — | | | | — | | | | — | | | | — | | | | 80,713 | | | | 97,507 | | | | 178,220 | |
| Small Cap Value Fund | | | — | | | | — | | | | — | | | | — | | | | — | | | | — | | | | 26,329 | | | | 37,094 | | | | 63,423 | |
| |
| |
DERIVATIVES – The funds may invest in derivative financial instruments in order to manage risk or gain exposure to various other investments or markets. The funds’ investment objectives allow the funds to enter into various types of derivative contracts, including, but not limited to, futures contracts, forward foreign exchange contracts, and purchased and written options. Derivatives may contain various risks including the potential inability of the counterparty to fulfill their obligations under the terms of the contract, the potential for an illiquid secondary market, and the potential for market movements which may expose the funds to gains or losses in excess of the amounts shown on the Statements of Assets and Liabilities.
FUTURES TRANSACTIONS – The funds are subject to equity price risk, interest rate risk, and foreign currency exchange rate risk in the normal course of pursuing their investment objectives. In order to gain exposure to or protect against changes in the market and to maintain sufficient liquidity to meet redemption requests, certain funds may enter into futures contracts. Upon entering into a futures contract, a fund is required to deposit cash or pledge U.S. Government securities. The margin required for a futures contract is set by the exchange on which the contract is traded. Subsequent payments, which are dependent on the daily fluctuations in the value of the underlying security or securities, are made or received by the fund each day (daily variation margin) and are recorded as unrealized gains (losses) until the contract is closed. When the contract is closed, the fund records a realized gain (loss) equal to the difference between the proceeds from (or cost of) the closing transaction and the fund’s basis in the contract.
Risks of entering into futures contracts, in general, include the possibility that there will not be a perfect price correlation between the futures contracts and the
126 First American Funds 2009 Annual Report
underlying securities. Second, it is possible that a lack of liquidity for futures contracts could exist in the secondary market, resulting in an inability to close a futures position prior to its maturity date. Third, the purchase of a futures contract involves the risk that a fund could lose more than the original margin deposit required to initiate a futures transaction. These contracts involve market risk in excess of the amount reflected in the funds’ Statements of Assets and Liabilities. Unrealized gains (losses) on outstanding positions in futures contracts held at the close of the year will be recognized as capital gains (losses) for federal income tax purposes.
As of October 31, 2009, International Fund and International Select Fund held outstanding futures contracts as disclosed in their Schedules of Investments.
OPTIONS TRANSACTIONS – The funds may utilize options in an attempt to manage market or business risk or enhance returns. When a call or put option is written, an amount equal to the premium received is recorded as a liability. The liability is marked-to-market daily to reflect the current market value of the option written. When a written option expires, a gain is realized in the amount of the premium originally received. If a closing purchase contract is entered into, a gain or loss is realized in the amount of the original premium less the cost of the closing transaction. If a written call option is exercised, a gain or loss is realized from the sale of the underlying security, and the proceeds from such sale are increased by the premium originally received. If a written put option is exercised, the amount of the premium originally received reduces the cost of the security which is purchased upon exercise of the option. As of October 31, 2009, the funds held no investments in outstanding written options.
Options purchased are recorded as investments and marked-to-market daily to reflect the current market value of the option contract. If an option purchased expires, a loss is realized in the amount of the cost of the option. If a closing transaction is entered into, a gain or loss is realized to the extent that the proceeds from the sale are greater or less than the cost of the option. If a purchased put option is exercised, a gain or loss is realized from the sale of the underlying security by adjusting the proceeds from such sale by the amount of the premium originally paid. If a purchased call option is exercised, the cost of the security purchased upon exercise is increased by the premium originally paid. As of October 31, 2009, the funds held no investments in options purchased.
For the fiscal year ended October 31, 2009, the quarterly average gross notional amounts of the derivatives held by the funds were:
| | | | | | | | | | | | | |
| | | Futures/
| | | Futures/
| | | Options
| |
| Fund | | Long | | | Short | | | Written-Call | |
| | |
| International Fund | | $ | 113,429 | | | $ | 79,795 | | | $ | — | |
| International Select Fund | | | 70,673 | | | | 31,453 | | | | — | |
| Large Cap Growth Opportunities Fund | | | — | | | | — | | | | — | |
| Mid Cap Growth Opportunities Fund | | | — | | | | — | | | | — | |
| Mid Cap Select Fund | | | 1,002 | | | | — | | | | 78 | |
| |
| |
As of October 31, 2009, the funds’ fair values of derivative instruments (i.e. futures contracts) categorized by risk exposure were classified as follows:
| | | | | | | | | | | |
| | | Statement of
| | | | | International
| |
| | | Assets and Liabilities
| | International
| | | Select
| |
| | | Location | | Fund | | | Fund | |
| | |
Asset Derivatives | | | | | | | | |
| Equity Contracts | | Receivables, Net Assets–Unrealized Appreciation* | | $ | 2,942 | | | $ | 2,033 | |
| Foreign Exchange Contracts | | Receivables | | | 37 | | | | 22 | |
| |
| |
| Balance as of October 31, 2009 | | | | $ | 2,979 | | | $ | 2,055 | |
| |
| |
Liability Derivatives | | | | | | | | | | |
| Equity Contracts | | Payables, Net Assets–Unrealized Depreciation* | | $ | 5,056 | | | $ | 4,419 | |
| |
| |
| Balance as of October 31, 2009 | | | | $ | 5,056 | | | $ | 4,419 | |
| |
| |
| | |
| | * | Includes cumulative appreciation/depreciation of futures contracts as reported in the footnotes to the funds’ Schedule of Investments. Only the current day’s variation margin is reported within the Statements of Assets and Liabilities. |
The effect of derivative instruments on the Statements of Operations for the fiscal year ended October 31, 2009:
Amount of realized gain (loss) on derivatives recognized in income:
| | | | | | | | | |
| International Fund | | Futures | | | Total | |
| | |
| Equity Contracts | | $ | (14,890 | ) | | $ | (14,890 | ) |
| Foreign Exchange Contracts | | | (745 | ) | | | (745 | ) |
| |
| |
First American Funds 2009 Annual Report 127
| |
| Notes to Financial Statements | October 31, 2009, all dollars and shares are rounded to thousands
(000) |
| | | | | | | | | |
| International Select Fund | | Futures | | | Total | |
| | |
| Equity Contracts | | $ | 5,095 | | | $ | 5,095 | |
| Foreign Exchange Contracts | | | (480 | ) | | | (480 | ) |
| |
| |
| | | | | | | | | |
| Large Cap Growth Opportunities Fund | | Futures | | | Total | |
| | |
| Equity Contracts | | $ | 6,794 | | | $ | 6,794 | |
| |
| |
| | | | | | | | | |
| Mid Cap Growth Opportunities Fund | | Futures | | | Total | |
| | |
| Equity Contracts | | $ | 15,590 | | | $ | 15,590 | |
| |
| |
| | | | | | | | | | | | | |
| Mid Cap Select Fund | | Options | | | Futures | | | Total | |
| | |
| Equity Contracts | | $ | (321 | ) | | $ | 994 | | | $ | 673 | |
| |
| |
Net change in unrealized appreciation or depreciation on derivatives recognized in income:
| | | | | | | | | |
| International Fund | | Futures | | | Total | |
| | |
| Equity Contracts | | $ | 14,661 | | | $ | 14,661 | |
| Foreign Exchange Contracts | | | 37 | | | | 37 | |
| |
| |
| | | | | | | | | |
| International Select Fund | | Futures | | | Total | |
| | |
| Equity Contracts | | $ | 2,577 | | | $ | 2,577 | |
| Foreign Exchange Contracts | | | 22 | | | | 22 | |
| |
| |
FOREIGN CURRENCY TRANSLATION – The books and records of Global Infrastructure Fund, International Fund, International Select Fund, and Real Estate Securities Fund, relating to the funds’ non-U.S. dollar denominated investments, are maintained in U.S. dollars on the following basis:
| | |
| | • | market value of investment securities, assets, and liabilities are translated at the current rate of exchange; and |
| |
| | • | purchases and sales of investment securities, income, and expenses are translated at the relevant rates of exchange prevailing on the respective dates of such transactions. |
The funds do not isolate the portion of gains and losses on investments in equity securities that is due to changes in the foreign exchange rates from that which is due to changes in market prices of equity securities.
The funds report certain foreign currency-related transactions as components of realized gains for financial reporting purposes, whereas such components are treated as ordinary income for federal income tax purposes. As of October 31, 2009, Global Infrastructure Fund, International Fund, and International Select Fund held foreign currency holdings consisting of multiple denominations.
FORWARD FOREIGN CURRENCY CONTRACTS – The funds may enter into forward foreign currency contracts as hedges against either specific transactions or fund positions. The aggregate principal amount of the contracts are not recorded because the funds intend to settle the contracts prior to delivery. All commitments are marked-to-market daily at the applicable foreign exchange rate, and any resulting unrealized gains or losses are recorded currently. The funds realize gains or losses at the time the forward contracts are extinguished. Unrealized gains or losses on outstanding positions in forward foreign currency contracts held at the close of the period are recognized as ordinary income or loss for federal income tax purposes.
The use of forward foreign currency contracts does not eliminate fluctuations in the underlying prices of the securities, but it does establish a rate of exchange that can be achieved in the future. Although forward foreign currency contracts limit the risk of loss due to a decline in the value of the hedged currency, they also limit a potential gain that might result should the value of the currency increase. These contracts involve market risk in excess of the amount reflected in the fund’s Statement of Assets and Liabilities. The face or contract amount in U.S. dollars reflects the total exposure the fund has in that particular currency contract. In addition, there could be exposure to risks (limited to the amount of unrealized gains) if the counterparties to the contracts are unable to meet the terms of their contracts. As of October 31, 2009, the funds held no investments in outstanding forward currency contracts.
SECURITIES PURCHASED ON A WHEN-ISSUED BASIS – Delivery and payment for securities that have been purchased by a fund on a when-issued or forward-commitment basis can take place up to a month or more after the transaction. Such securities do not earn interest, are subject to market fluctuations, and may increase or decrease in value prior to their delivery. Each fund segregates assets with a market value equal to or greater than the amount of its purchase commitments. The purchase of securities on a when-issued or forward-commitment basis may increase the volatility of the fund’s net asset value if the fund makes such purchases while remaining substantially fully invested. As
128 First American Funds 2009 Annual Report
of October 31, 2009, the funds held no investments in when-issued or forward-commitment securities.
In connection with the ability to purchase securities on a when-issued basis, each fund may also enter into dollar rolls in which the fund sells securities purchased on a forward-commitment basis and simultaneously contracts with a counterparty to repurchase similar (same type, coupon, and maturity), but not identical, securities on a specified future date. As an inducement for the fund to “roll over” its purchase commitments, the fund receives negotiated amounts in the form of reductions of the purchase price of the commitment. Dollar rolls are considered a form of leverage. As of and for the fiscal year ended October 31, 2009, the funds held no investments in dollar roll transactions.
ILLIQUID OR RESTRICTED SECURITIES – A security may be considered illiquid if it lacks a readily available market. Securities are generally considered liquid if they can be sold or disposed of in the ordinary course of business within seven days at approximately the price at which the security is valued by the fund. Illiquid securities may be valued under methods approved by the funds’ board of directors as reflecting fair value. Each fund intends to invest no more than 15% of its total net assets (determined at the time of purchase and reviewed periodically) in illiquid securities. Certain restricted securities may be considered illiquid. Restricted securities are often purchased in private placement transactions, are not registered under the Securities Act of 1933, may have contractual restrictions on resale, and may be valued under methods approved by the funds’ board of directors as reflecting fair value. Certain restricted securities eligible for resale to qualified institutional investors, including Rule 144A securities, are not subject to the limitation on a fund’s investment in illiquid securities if they are determined to be liquid in accordance with procedures adopted by the funds’ board of directors. As of October 31, 2009, International Fund, Mid Cap Select Fund, Real Estate Securities Fund, Small Cap Growth Opportunities Fund, and Small Cap Select Fund held investments in illiquid securities with a total value of $0, $0, $111, $0, and $0, respectively, or 0.0%, 0.0%, 0.0%, 0.0%, and 0.0%, respectively, of total net assets.
Information concerning illiquid securities, including restricted securities considered to be illiquid, is as follows:
| | | | | | | | | | | | | |
| | | | | | Dates
| | | Cost
| |
| International Fund | | Shares | | | Acquired | | | Basis | |
| | |
| Fortis Rights | | | 304 | | | | 11/08 | | | $ | — | |
| |
| |
| | | | | | | | | | | | | |
| | | | | | Dates
| | | Cost
| |
| Mid Cap Select Fund | | Shares | | | Acquired | | | Basis | |
| | |
| Lantronix Warrants | | | 1 | | | | 5/08 | | | $ | — | |
| |
| |
| | | | | | | | | | | | | |
| | | | | | Dates
| | | Cost
| |
| Real Estate Securities Fund | | Shares | | | Acquired | | | Basis | |
| | |
| Newcastle Investment Holdings | | | 35 | | | | 6/98 | | | $ | 153 | |
| |
| |
| | | | | | | | | | | | | |
| | | | | | Dates
| | | Cost
| |
| Small Cap Growth Opportunities Fund | | Shares | | | Acquired | | | Basis | |
| | |
| Hollis-Eden Pharmaceuticals Warrants | | | 71 | | | | 2/06 | | | $ | 161 | |
| Lantronix Warrants | | | 11 | | | | 5/08 | | | | — | |
| VideoPropulsion | | | 780 | | | | 12/99 | | | | — | |
| |
| |
| | | | | | | | | | | | | |
| | | | | | Dates
| | | Cost
| |
| Small Cap Select Fund | | Shares | | | Acquired | | | Basis | |
| | |
| Lantronix Warrants | | | 5 | | | | 6/08 | | | $ | — | |
| |
| |
SECURITIES LENDING – In order to generate additional income, a fund may lend securities representing up to one-third of the value of its total assets (which includes collateral for securities on loan) to broker-dealers, banks, or other institutional borrowers of securities. Each fund’s policy is to receive collateral from the borrower in the form of cash, U.S. Government securities, or other high-grade debt obligations equal to at least 100% of the value of securities loaned. If the value of the securities on loan increases, additional collateral is received from the borrower. As with other extensions of credit, there may be risks of delay in recovery of the securities or even loss of rights in the collateral should the borrower of the security fail financially.
U.S. Bank National Association (“U.S. Bank”), the parent company of the funds’ advisor, serves as the securities lending agent for the funds in transactions involving the lending of portfolio securities on behalf of the funds. U.S. Bank acts as the securities lending agent pursuant to, and subject to compliance with conditions contained in, an exemptive order issued by the Securities and Exchange Commission (“SEC”). U.S. Bank receives fees as a percentage of each fund’s net income from securities lending transactions. With respect to Global Infrastructure Fund, International Fund, and International Select Fund, a portion of this amount is paid to State Street Bank and Trust (“State Street”) for acting as sub-lending agent. For each fund other than Global Infrastructure Fund, International Fund, and International Select Fund, collateral for securities on loan is invested in a money market fund administered by FAF Advisors and FAF Advisors receives an administration fee equal to 0.02% of such fund’s average daily net assets. For Global Infrastructure Fund, International Fund, and International Select Fund, collateral for securities on loan is invested in a money market fund administered by State Street.
First American Funds 2009 Annual Report 129
| |
| Notes to Financial Statements | October 31, 2009, all dollars and shares are rounded to thousands
(000) |
Securities lending fees paid to U.S. Bank by the funds during the fiscal year ended October 31, 2009, were as follows:
| | | | | |
| Fund | | Amount | |
| | |
| Equity Income Fund | | $ | 187 | |
| International Select Fund | | | 59 | |
| Large Cap Growth Opportunities Fund | | | 186 | |
| Large Cap Select Fund | | | 63 | |
| Large Cap Value Fund | | | 131 | |
| Mid Cap Growth Opportunities Fund | | | 532 | |
| Mid Cap Select Fund | | | 18 | |
| Mid Cap Value Fund | | | 244 | |
| Real Estate Securities Fund | | | 396 | |
| Small Cap Growth Opportunities Fund | | | 68 | |
| Small Cap Select Fund | | | 286 | |
| Small Cap Value Fund | | | 84 | |
| |
| |
Income from securities lending is recorded on the Statements of Operations as securities lending income net of fees paid to U.S. Bank.
SECURITY LITIGATION SETTLEMENTS – Income from settlement proceeds related to portfolio securities no longer included in the portfolio is recorded as an adjustment to realized gains or losses. Adjustments made during the fiscal year ended October 31, 2009, were as follows:
| | | | | |
| Fund | | Amount | |
| | |
| Equity Income Fund | | $ | 604 | |
| Large Cap Growth Opportunities Fund | | | 1,317 | |
| Large Cap Select Fund | | | 55 | |
| Large Cap Value Fund | | | 353 | |
| Mid Cap Growth Opportunities Fund | | | 355 | |
| Mid Cap Select Fund | | | 125 | |
| Mid Cap Value Fund | | | 153 | |
| Real Estate Securities Fund | | | 1 | |
| Small Cap Growth Opportunities Fund | | | 603 | |
| Small Cap Select Fund | | | 466 | |
| Small Cap Value | | | 72 | |
| |
| |
EXPENSES – Expenses that are directly related to one of the funds are charged directly to that fund. Other operating expenses are allocated to the funds on several bases, including evenly across all funds, allocated based on relative net assets of all funds within the First American Family of Funds, or a combination of both methods. Class specific expenses, such as distribution fees and shareholder servicing fees, are borne by that class. Income, other expenses, and realized and unrealized gains and losses of a fund are allocated to each respective class in proportion to the relative net assets of each class.
INTERFUND LENDING PROGRAM – Pursuant to an exemptive order issued by the SEC, the funds, along with other registered investment companies in the First American Family of Funds, may participate in an interfund lending program. This program provides an alternative credit facility allowing the funds to borrow from, or lend money to, other participating funds. The funds did not have any interfund lending transactions during the fiscal year ended October 31, 2009.
DEFERRED COMPENSATION PLAN – Under a Deferred Compensation Plan (the “Plan”), non-interested directors of the First American Family of Funds may participate and elect to defer receipt of part or all of their annual compensation. Deferred amounts are treated as though equivalent dollar amounts had been invested in shares of selected open-end First American Funds, as designated by each director. All amounts in the Plan are 100% vested, and accounts under the Plan are obligations of the funds. Deferred amounts remain in the funds until distributed in accordance with the Plan.
USE OF ESTIMATES IN PREPARATION OF FINANCIAL STATEMENTS – The preparation of financial statements, in conformity with U.S. generally accepted accounting principles, requires management to make estimates and assumptions that affect the reported amount of assets and liabilities and disclosure of contingent assets and liabilities at the date of the financial statements and the reported results of operations during the reporting period. Actual results could differ from those estimates.
EVENTS SUBSEQUENT TO FISCAL YEAR END – Management has evaluated fund related events and transactions that occurred subsequent to October 31, 2009, through December 22, 2009, the date of issuance of the funds’ financial statements. There were no events or transactions that occurred during this period that materially impacted the amounts or disclosures in the funds’ financial statements.
INVESTMENT ADVISORY FEES – Pursuant to an investment advisory agreement (the “Agreement”), FAF Advisors manages each fund’s assets and furnishes related office facilities, equipment, research, and personnel. The Agreement requires each fund to pay FAF Advisors a
130 First American Funds 2009 Annual Report
monthly fee based upon average daily net assets. The annual fee for each fund is as follows:
| | | | | | | |
| | | Advisory Fee
| | | |
| | | as a % of Average
| | | |
| Fund | | Daily Net Assets | | | |
| |
| Equity Income Fund* | | | 0.65 | % | | |
| Global Infrastructure Fund | | | 0.90 | | | |
| International Fund | | | 1.00 | | | |
| International Select Fund | | | 1.00 | | | |
| Large Cap Growth Opportunities Fund* | | | 0.65 | | | |
| Large Cap Select Fund* | | | 0.65 | | | |
| Large Cap Value Fund* | | | 0.65 | | | |
| Mid Cap Growth Opportunities Fund | | | 0.70 | | | |
| Mid Cap Select Fund | | | 0.70 | | | |
| Mid Cap Value Fund | | | 0.70 | | | |
| Real Estate Securities Fund | | | 0.70 | | | |
| Small Cap Growth Opportunities Fund | | | 1.00 | | | |
| Small Cap Select Fund | | | 0.70 | | | |
| Small Cap Value Fund | | | 0.70 | | | |
| |
| |
| | |
| | * | The advisory fees for Equity Income Fund, Large Cap Growth Opportunities Fund, Large Cap Select Fund, and Large Cap Value Fund are equal to an annual rate of 0.65% of the average daily net assets up to $3 billion, 0.625% of the average daily net assets on the next $2 billion, and 0.60% of the average daily net assets in excess of $5 billion. |
FAF Advisors has agreed to contractually waive fees and reimburse other fund expenses for the following funds through February 28, 2010, so that total annual fund operating expenses, excluding indirect fees and expenses incurred through investment in exchange-traded funds and other investment companies, as a percentage of average daily net assets, do not exceed the following amounts:
| | | | | | | | | | | | | | | | | | | | | | | |
| | | | | | Share Class |
| |
| Fund | | A | | | B | | | C | | | R | | | Y | | | |
| |
Global Infrastructure Fund1 | | | 1.25 | % | | | N/A | | | | 2.00 | % | | | 1.50 | % | | | 1.00 | % | | |
| International Fund | | | 1.49 | | | | 2.24 | % | | | 2.24 | | | | 1.74 | | | | 1.24 | | | |
| International Select Fund | | | 1.49 | | | | 2.24 | | | | 2.24 | | | | 1.74 | | | | 1.24 | | | |
| Mid Cap Select Fund | | | 1.41 | | | | 2.16 | | | | 2.16 | | | | N/A | | | | 1.16 | | | |
| Small Cap Growth Opportunities Fund | | | 1.47 | | | | 2.22 | | | | 2.22 | | | | 1.72 | | | | 1.22 | | | |
| |
| |
N/A = Not Applicable
| | |
| | 1 | The fund began offering Class C and Class R on November 3, 2008. |
The funds may invest in related money market funds that are series of First American Funds, Inc., subject to certain limitations. In order to avoid the payment of duplicative investment advisory fees to FAF Advisors, which acts as the investment advisor to both the investing funds and the related money market funds, FAF Advisors will reimburse each investing fund an amount equal to that portion of FAF Advisor’s investment advisory fee received from the related money market funds that is attributable to the assets of the investing fund. This reimbursement, if any, is included in “Fee waivers” in the Statements of Operations.
ADMINISTRATION FEES – FAF Advisors serves as the funds’ administrator pursuant to an administration agreement between FAF Advisors and the funds. U.S. Bancorp Fund Services, LLC (“USBFS”) serves as sub-administrator pursuant to a sub-administration agreement between USBFS and FAF Advisors. FAF Advisors is a subsidiary of U.S. Bank. Both U.S. Bank and USBFS are direct subsidiaries of U.S. Bancorp. Under the administration agreement, FAF Advisors is compensated to provide, or compensates other entities to provide, services to the funds. These services include various legal, oversight, administrative, and accounting services. The funds pay FAF Advisors administration fees, which are calculated daily and paid monthly, equal to each fund’s pro rata share of an amount equal, on an annual basis, to 0.25% of the aggregate average daily net assets of all open-end funds in the First American Family of Funds up to $8 billion, 0.235% on the next $17 billion of the aggregate average daily net assets, 0.22% on the next $25 billion of the aggregate average daily net assets, and 0.20% of the aggregate average daily net assets in excess of $50 billion. All fees paid to the sub-administrator are paid from the administration fee. In addition to these fees, the funds may reimburse FAF Advisors and the sub-administrator for any out-of-pocket expenses incurred in providing administration services.
SUB-ADVISORY FEES – Altrinsic Global Advisors, LLC (“Altrinsic”) and Hansberger Global Investors, Inc. (“HGI”) each serve as investment sub-advisor to International Fund pursuant to separate sub-advisory agreements with FAF Advisors. Altrinsic, HGI, and Lazard Asset Management, LLC (“Lazard”) each serve as investment sub-advisor to the International Select Fund pursuant to separate sub-advisory agreements with FAF Advisors. Each sub-advisor has discretion to select portfolio securities for its portion of the respective fund. FAF Advisors pays monthly fees to Altrinsic, HGI, and Lazard for the services provided under their respective sub-advisory agreements with FAF Advisors.
TRANSFER AGENT FEES – USBFS serves as the funds’ transfer agent pursuant to a transfer agent agreement with FAIF. The funds are charged transfer agent fees based on a per shareholder account basis, subject to a minimum fee per share class. These fees are charged to each fund based on the number of accounts within that fund. In addition to these fees, the funds may reimburse USBFS for out-of-pocket expenses incurred in providing transfer agent services.
CUSTODIAN FEES – U.S. Bank serves as the custodian for each fund other than Global Infrastructure Fund, International Fund, and International Select Fund pursuant to a custodian agreement with FAIF. The fee for each fund (except Global Infrastructure Fund, International Fund, and International Select Fund) is equal to an annual rate of 0.005% of average daily net assets. State Street Bank (“SSB”) serves as the custodian for Global Infrastructure Fund, International Fund, and International Select Fund pursuant to a custodian agreement with FAIF. Global Infrastructure Fund, International Fund, and International Select Fund pay SSB various asset-based fees and
First American Funds 2009 Annual Report 131
| |
| Notes to Financial Statements | October 31, 2009, all dollars and shares are rounded to thousands
(000) |
transaction charges based on the issuer’s country. All fees are computed daily and paid monthly.
Under the custodian agreements, interest earned on uninvested cash balances is used to reduce a portion of each fund’s custodian expenses. Conversely, the custodian charges a fee for any cash overdrafts incurred, which increases the fund’s custodian expenses. Prior to January 2, 2008, Global Infrastructure Fund, International Fund, and International Select Fund have also received certain credits from SSB to reduce the amount of custody fees incurred. These credits, if any, are disclosed as “Indirect payments from custodian” in the Statements of Operations.
For the fiscal year ended October 31, 2009, custodian fees were increased as a result of overdrafts and decreased as a result of interest earned as follows:
| | | | | | | | | |
| Fund | | Increased | | | Decreased | |
| | |
| Large Cap Growth Opportunities Fund | | $ | 1 | | | $ | — | |
| Large Cap Select Fund | | | 6 | | | | — | |
| Large Cap Value Fund | | | 1 | | | | — | |
| Mid Cap Select | | | 2 | | | | — | |
| Real Estate Securities Fund | | | 2 | | | | — | |
| |
| |
DISTRIBUTION AND SHAREHOLDER SERVICING (12B-1) FEES – Quasar Distributors, LLC (“Quasar”), a subsidiary of U.S. Bancorp, serves as the distributor of the funds pursuant to a distribution agreement with FAIF. Under the distribution agreement, and pursuant to a plan adopted by each fund under rule 12b-1 of the Investment Company Act, each fund pays Quasar a monthly distribution and/or shareholder servicing fee equal to an annual rate of 0.25%, 1.00%, 1.00%, and 0.50% of each fund’s average daily net assets attributable to Class A, Class B, Class C, and Class R shares, respectively. No distribution or shareholder servicing fees are paid by Class Y shares. These fees may be used by Quasar to provide compensation for sales support, distribution activities, and/or shareholder servicing activities.
Under the distribution and shareholder servicing agreement, the following amounts were retained by affiliates of FAF Advisors for the fiscal year ended October 31, 2009:
| | | | | |
| Fund | | Amount | |
| | |
| Equity Income Fund | | $ | 196 | |
| Global Infrastructure Fund | | | 13 | |
| International Fund | | | 31 | |
| International Select Fund | | | 4 | |
| Large Cap Growth Opportunities Fund | | | 90 | |
| Large Cap Select Fund | | | 6 | |
| Large Cap Value Fund | | | 79 | |
| Mid Cap Growth Opportunities Fund | | | 184 | |
| Mid Cap Select Fund | | | 16 | |
| Mid Cap Value Fund | | | 51 | |
| Real Estate Securities Fund | | | 75 | |
| Small Cap Growth Opportunities Fund | | | 36 | |
| Small Cap Select Fund | | | 95 | |
| Small Cap Value Fund | | | 39 | |
| |
| |
OTHER FEES AND EXPENSES – In addition to investment advisory fees, administration fees, transfer agent fees, custodian fees, and distribution and shareholder servicing fees, each fund is responsible for paying other operating expenses, including: legal, auditing, registration fees, postage and printing of shareholder reports, fees and expenses of independent directors, insurance, and other miscellaneous expenses. For the fiscal year ended October 31, 2009, legal fees and expenses of $69 were paid to a law firm of which an Assistant Secretary of the funds is a partner.
CONTINGENT DEFERRED SALES CHARGES – A contingent deferred sales charge (“CDSC”) is imposed on redemptions made in the Class B shares. The CDSC varies depending on the number of years from time of payment for the purchase of Class B shares until the redemption of such shares. Class B shares automatically convert to Class A shares after eight years.
| | | | | | | |
| | | CDSC as a Percentage
| | | |
| | | of Dollar Amount
| | | |
| Year Since Purchase | | Subject to Charge | | | |
| |
| First | | | 5.00 | % | | |
| Second | | | 5.00 | | | |
| Third | | | 4.00 | | | |
| Fourth | | | 3.00 | | | |
| Fifth | | | 2.00 | | | |
| Sixth | | | 1.00 | | | |
| Seventh | | | — | | | |
| Eighth | | | — | | | |
| |
| |
A CDSC of 1.00% is imposed on redemptions made in Class C shares for the first 12 months.
The CDSC for Class B and Class C shares is imposed on the value of the purchased shares or the value at the time of redemption, whichever is less.
For the fiscal year ended October 31, 2009, total front-end sales charges and CDSCs retained by affiliates of FAF Advisors for distributing the funds’ shares were as follows:
| | | | | |
| Fund | | | |
| | |
| Equity Income Fund | | $ | 54 | |
| Global Infrastructure Fund | | | 14 | |
| International Fund | | | 9 | |
| International Select Fund | | | 3 | |
| Large Cap Growth Opportunities Fund | | | 27 | |
| Large Cap Select Fund | | | 5 | |
| Large Cap Value Fund | | | 13 | |
| Mid Cap Growth Opportunities Fund | | | 44 | |
| Mid Cap Select Fund | | | 5 | |
| Mid Cap Value Fund | | | 10 | |
| Real Estate Securities Fund | | | 9 | |
| Small Cap Growth Opportunities Fund | | | 9 | |
| Small Cap Select Fund | | | 21 | |
| Small Cap Value Fund | | | 6 | |
| |
| |
132 First American Funds 2009 Annual Report
| |
| 4 > | Capital Share Transactions |
FAIF has 370 billion shares of $0.0001 par value capital stock authorized. Capital share transactions for the funds were as follows:
| | | | | | | | | | | | | | | | | | | | | | | | | | | | | |
| | | | | | | | | | | | | | | | | | | | | | | |
| | | Equity
| | | | Global
| | | | | | | |
| | | Income Fund | | | | Infrastructure Fund | | | | International Fund | | | |
| |
| | | Year
| | | Year
| | | | Year
| | | 12/17/07*
| | | | Year
| | | Year
| | | |
| | | Ended
| | | Ended
| | | | Ended
| | | to
| | | | Ended
| | | Ended
| | | |
| | | 10/31/09 | | | 10/31/08 | | | | 10/31/09 | | | 10/31/08 | | | | 10/31/09 | | | 10/31/08 | | | |
| |
| Class A: | | | | | | | | | | | | | | | | | | | | | | | | | | | | |
| Shares issued | | | 922 | | | | 526 | | | | | 2,504 | | | | 664 | | | | | 357 | | | | 436 | | | |
| Shares issued in lieu of cash distributions | | | 291 | | | | 973 | | | | | 10 | | | | — | | | | | 26 | | | | 317 | | | |
| Shares redeemed | | | (1,903 | ) | | | (2,431 | ) | | | | (587 | ) | | | (38 | ) | | | | (704 | ) | | | (1,141 | ) | | |
| |
| |
Total Class A transactions | | | (690 | ) | | | (932 | ) | | | | 1,927 | | | | 626 | | | | | (321 | ) | | | (388 | ) | | |
| |
| |
Class B:1 | | | | | | | | | | | | | | | | | | | | | | | | | | | | |
| Shares issued | | | 11 | | | | 30 | | | | | — | | | | — | | | | | 9 | | | | 25 | | | |
| Shares issued in lieu of cash distributions | | | 20 | | | | 87 | | | | | — | | | | — | | | | | — | | | | 45 | | | |
| Shares redeemed | | | (264 | ) | | | (243 | ) | | | | — | | | | — | | | | | (124 | ) | | | (177 | ) | | |
| |
| |
Total Class B transactions | | | (233 | ) | | | (126 | ) | | | | — | | | | — | | | | | (115 | ) | | | (107 | ) | | |
| |
| |
Class C:1 | | | | | | | | | | | | | | | | | | | | | | | | | | | | |
| Shares issued | | | 124 | | | | 49 | | | | | 396 | | | | — | | | | | 39 | | | | 36 | | | |
| Shares issued in lieu of cash distributions | | | 11 | | | | 47 | | | | | — | | | | — | | | | | — | | | | 40 | | | |
| Shares redeemed | | | (136 | ) | | | (200 | ) | | | | (4 | ) | | | — | | | | | (112 | ) | | | (122 | ) | | |
| |
| |
Total Class C transactions | | | (1 | ) | | | (104 | ) | | | | 392 | | | | — | | | | | (73 | ) | | | (46 | ) | | |
| |
| |
Class R:1 | | | | | | | | | | | | | | | | | | | | | | | | | | | | |
| Shares issued | | | 5 | | | | 6 | | | | | 1 | | | | — | | | | | — | | | | — | | | |
| Shares issued in lieu of cash distributions | | | 1 | | | | 5 | | | | | — | | | | — | | | | | — | | | | — | | | |
| Shares redeemed | | | (48 | ) | | | (15 | ) | | | | — | | | | — | | | | | — | | | | — | | | |
| |
| |
Total Class R transactions | | | (42 | ) | | | (4 | ) | | | | 1 | | | | — | | | | | — | | | | — | | | |
| |
| |
| Class Y: | | | | | | | | | | | | | | | | | | | | | | | | | | | | |
| Shares issued | | | 13,237 | | | | 5,895 | | | | | 6,078 | | | | 3,662 | | | | | 6,013 | | | | 16,723 | | | |
| Shares issued in lieu of cash distributions | | | 467 | | | | 2,716 | | | | | 22 | | | | — | | | | | 593 | | | | 6,896 | | | |
| Shares redeemed | | | (17,527 | ) | | | (16,341 | ) | | | | (4,098 | ) | | | (986 | ) | | | | (18,994 | ) | | | (45,063 | ) | | |
| |
| |
Total Class Y transactions | | | (3,823 | ) | | | (7,730 | ) | | | | 2,002 | | | | 2,676 | | | | | (12,388 | ) | | | (21,444 | ) | | |
| |
| |
Net increase (decrease) in capital shares | | | (4,789 | ) | | | (8,896 | ) | | | | 4,322 | | | | 3,302 | | | | | (12,897 | ) | | | (21,985 | ) | | |
| |
| |
| | |
| | * | Commencement of operations. |
| | |
| | 1 | Class B, Class C, and Class R shares were not offered by Global Infrastructure Fund during the fiscal year ended October 31, 2008. The fund began offering Class C and Class R shares on November 3, 2008. |
| | | | | | | | | | | | | | | | | | | | | | | | | | | | | |
| | | | | | | | | | | | | | | | | | | | | | | |
| | | International
| | | | Large Cap Growth
| | | | Large Cap
| | | |
| | | Select Fund | | | | Opportunities Fund | | | | Select Fund | | | |
| |
| | | Year
| | | Year
| | | | Year
| | | Year
| | | | Year
| | | Year
| | | |
| | | Ended
| | | Ended
| | | | Ended
| | | Ended
| | | �� | Ended
| | | Ended
| | | |
| | | 10/31/09 | | | 10/31/08 | | | | 10/31/09 | | | 10/31/08 | | | | 10/31/09 | | | 10/31/08 | | | |
| |
| Class A: | | | | | | | | | | | | | | | | | | | | | | | | | | | | |
| Shares issued | | | 210 | | | | 143 | | | | | 342 | | | | 271 | | | | | 99 | | | | 71 | | | |
| Shares issued in lieu of cash distributions | | | 4 | | | | 6 | | | | | 3 | | | | 248 | | | | | 1 | | | | 59 | | | |
| Shares redeemed | | | (148 | ) | | | (124 | ) | | | | (478 | ) | | | (696 | ) | | | | (173 | ) | | | (190 | ) | | |
| |
| |
Total Class A transactions | | | 66 | | | | 25 | | | | | (133 | ) | | | (177 | ) | | | | (73 | ) | | | (60 | ) | | |
| |
| |
| Class B: | | | | | | | | | | | | | | | | | | | | | | | | | | | | |
| Shares issued | | | — | | | | 19 | | | | | 2 | | | | 14 | | | | | — | | | | 1 | | | |
| Shares issued in lieu of cash distributions | | | — | | | | 1 | | | | | — | | | | 35 | | | | | — | | | | 7 | | | |
| Shares redeemed | | | (40 | ) | | | (7 | ) | | | | (85 | ) | | | (104 | ) | | | | (39 | ) | | | (9 | ) | | |
| |
| |
Total Class B transactions | | | (40 | ) | | | 13 | | | | | (83 | ) | | | (55 | ) | | | | (39 | ) | | | (1 | ) | | |
| |
| |
| Class C: | | | | | | | | | | | | | | | | | | | | | | | | | | | | |
| Shares issued | | | 3 | | | | 23 | | | | | 25 | | | | 25 | | | | | 3 | | | | 4 | | | |
| Shares issued in lieu of cash distributions | | | — | | | | — | | | | | — | | | | 23 | | | | | — | | | | 3 | | | |
| Shares redeemed | | | (9 | ) | | | (12 | ) | | | | (41 | ) | | | (79 | ) | | | | (4 | ) | | | (5 | ) | | |
| |
| |
Total Class C transactions | | | (6 | ) | | | 11 | | | | | (16 | ) | | | (31 | ) | | | | (1 | ) | | | 2 | | | |
| |
| |
| Class R: | | | | | | | | | | | | | | | | | | | | | | | | | | | | |
| Shares issued | | | 1 | | | | 7 | | | | | 12 | | | | 8 | | | | | 10 | | | | 1 | | | |
| Shares issued in lieu of cash distributions | | | — | | | | — | | | | | — | | | | 1 | | | | | — | | | | — | | | |
| Shares redeemed | | | (6 | ) | | | (1 | ) | | | | (5 | ) | | | (4 | ) | | | | (5 | ) | | | (1 | ) | | |
| |
| |
Total Class R transactions | | | (5 | ) | | | 6 | | | | | 7 | | | | 5 | | | | | 5 | | | | — | | | |
| |
| |
| Class Y: | | | | | | | | | | | | | | | | | | | | | | | | | | | | |
| Shares issued | | | 50,353 | | | | 21,338 | | | | | 5,401 | | | | 3,761 | | | | | 4,793 | | | | 8,815 | | | |
| Shares issued in lieu of cash distributions | | | 276 | | | | 374 | | | | | 36 | | | | 1,002 | | | | | 56 | | | | 1,699 | | | |
| Shares redeemed | | | (19,878 | ) | | | (11,780 | ) | | | | (4,929 | ) | | | (6,090 | ) | | | | (13,346 | ) | | | (13,334 | ) | | |
| |
| |
Total Class Y transactions | | | 30,751 | | | | 9,932 | | | | | 508 | | | | (1,327 | ) | | | | (8,497 | ) | | | (2,820 | ) | | |
| |
| |
Net increase (decrease) in capital shares | | | 30,766 | | | | 9,987 | | | | | 283 | | | | (1,585 | ) | | | | (8,605 | ) | | | (2,879 | ) | | |
| |
| |
First American Funds 2009 Annual Report 133
| |
| Notes to Financial Statements | October 31, 2009, all dollars and shares are rounded to thousands
(000) |
| | | | | | | | | | | | | | | | | | | | | | | | | | | | | |
| | | | | | | | | | | | | | | | | | | | | | | |
| | | Large Cap
| | | | Mid Cap Growth
| | | | Mid Cap
| | | |
| | | Value Fund | | | | Opportunities Fund | | | | Select Fund | | | |
| |
| | | Year
| | | Year
| | | | Year
| | | Year
| | | | Year
| | | Year
| | | |
| | | Ended
| | | Ended
| | | | Ended
| | | Ended
| | | | Ended
| | | Ended
| | | |
| | | 10/31/09 | | | 10/31/08 | | | | 10/31/09 | | | 10/31/08 | | | | 10/31/09 | | | 10/31/08 | | | |
| |
| Class A: | | | | | | | | | | | | | | | | | | | | | | | | | | | | |
| Shares issued | | | 254 | | | | 226 | | | | | 1,472 | | | | 1,612 | | | | | 270 | | | | 341 | | | |
| Shares issued in lieu of cash distributions | | | 50 | | | | 711 | | | | | — | | | | 1,029 | | | | | 1 | | | | — | | | |
| Shares redeemed | | | (814 | ) | | | (1,221 | ) | | | | (2,187 | ) | | | (3,036 | ) | | | | (474 | ) | | | (556 | ) | | |
| |
| |
Total Class A transactions | | | (510 | ) | | | (284 | ) | | | | (715 | ) | | | (395 | ) | | | | (203 | ) | | | (215 | ) | | |
| |
| |
| Class B: | | | | | | | | | | | | | | | | | | | | | | | | | | | | |
| Shares issued | | | 1 | | | | 10 | | | | | 3 | | | | 21 | | | | | 1 | | | | 14 | | | |
| Shares issued in lieu of cash distributions | | | 2 | | | | 53 | | | | | — | | | | 46 | | | | | — | | | | — | | | |
| Shares redeemed | | | (126 | ) | | | (124 | ) | | | | (78 | ) | | | (101 | ) | | | | (160 | ) | | | (344 | ) | | |
| |
| |
Total Class B transactions | | | (123 | ) | | | (61 | ) | | | | (75 | ) | | | (34 | ) | | | | (159 | ) | | | (330 | ) | | |
| |
| |
| Class C: | | | | | | | | | | | | | | | | | | | | | | | | | | | | |
| Shares issued | | | 20 | | | | 19 | | | | | 88 | | | | 120 | | | | | 31 | | | | 77 | | | |
| Shares issued in lieu of cash distributions | | | 1 | | | | 28 | | | | | — | | | | 71 | | | | | — | | | | — | | | |
| Shares redeemed | | | (74 | ) | | | (43 | ) | | | | (188 | ) | | | (263 | ) | | | | (144 | ) | | | (126 | ) | | |
| |
| |
Total Class C transactions | | | (53 | ) | | | 4 | | | | | (100 | ) | | | (72 | ) | | | | (113 | ) | | | (49 | ) | | |
| |
| |
Class R:2 | | | | | | | | | | | | | | | | | | | | | | | | | | | | |
| Shares issued | | | 15 | | | | 6 | | | | | 464 | | | | 449 | | | | | — | | | | — | | | |
| Shares issued in lieu of cash distributions | | | — | | | | 1 | | | | | — | | | | 80 | | | | | — | | | | — | | | |
| Shares redeemed | | | (2 | ) | | | (2 | ) | | | | (421 | ) | | | (267 | ) | | | | — | | | | — | | | |
| |
| |
Total Class R transactions | | | 13 | | | | 5 | | | | | 43 | | | | 262 | | | | | — | | | | — | | | |
| |
| |
| Class Y: | | | | | | | | | | | | | | | | | | | | | | | | | | | | |
| Shares issued | | | 3,340 | | | | 4,518 | | | | | 6,379 | | | | 4,000 | | | | | 1,621 | | | | 1,776 | | | |
| Shares issued in lieu of cash distributions | | | 246 | | | | 3,150 | | | | | — | | | | 2,437 | | | | | 5 | | | | — | | | |
| Shares redeemed | | | (9,176 | ) | | | (8,720 | ) | | | | (5,692 | ) | | | (7,712 | ) | | | | (3,765 | ) | | | (3,428 | ) | | |
| |
| |
Total Class Y transactions | | | (5,590 | ) | | | (1,052 | ) | | | | 687 | | | | (1,275 | ) | | | | (2,139 | ) | | | (1,652 | ) | | |
| |
| |
Net increase (decrease) in capital shares | | | (6,263 | ) | | | (1,388 | ) | | | | (160 | ) | | | (1,514 | ) | | | | (2,614 | ) | | | (2,246 | ) | | |
| |
| |
2 Class R is not offered by the Mid Cap Select Fund.
| | | | | | | | | | | | | | | | | | | | | | | | | | | | | |
| | | | | | | | | | | | | | | | | | | | | | | |
| | | | | | | Real Estate
| | | | | | | |
| | | Mid Cap
| | | | Securities
| | | | Small Cap Growth
| | | |
| | | Value Fund | | | | Fund | | | | Opportunities Fund | | | |
| |
| | | Year
| | | Year
| | | | Year
| | | Year
| | | | Year
| | | Year
| | | |
| | | Ended
| | | Ended
| | | | Ended
| | | Ended
| | | | Ended
| | | Ended
| | | |
| | | 10/31/09 | | | 10/31/08 | | | | 10/31/09 | | | 10/31/08 | | | | 10/31/09 | | | 10/31/08 | | | |
| |
| Class A: | | | | | | | | | | | | | | | | | | | | | | | | | | | | |
| Shares issued | | | 1,853 | | | | 2,107 | | | | | 18,629 | | | | 5,449 | | | | | 286 | | | | 991 | | | |
| Shares issued in lieu of cash distributions | | | 39 | | | | 708 | | | | | 666 | | | | 1,377 | | | | | — | | | | 572 | | | |
| Shares redeemed | | | (2,473 | ) | | | (4,248 | ) | | | | (6,699 | ) | | | (4,781 | ) | | | | (637 | ) | | | (6,028 | ) | | |
| |
| |
Total Class A transactions | | | (581 | ) | | | (1,433 | ) | | | | 12,596 | | | | 2,045 | | | | | (351 | ) | | | (4,465 | ) | | |
| |
| |
| Class B: | | | | | | | | | | | | | | | | | | | | | | | | | | | | |
| Shares issued | | | 3 | | | | 16 | | | | | 5 | | | | 29 | | | | | 4 | | | | 7 | | | |
| Shares issued in lieu of cash distributions | | | — | | | | 23 | | | | | 8 | | | | 44 | | | | | — | | | | 20 | | | |
| Shares redeemed | | | (72 | ) | | | (84 | ) | | | | (56 | ) | | | (123 | ) | | | | (32 | ) | | | (69 | ) | | |
| |
| |
Total Class B transactions | | | (69 | ) | | | (45 | ) | | | | (43 | ) | | | (50 | ) | | | | (28 | ) | | | (42 | ) | | |
| |
| |
| Class C: | | | | | | | | | | | | | | | | | | | | | | | | | | | | |
| Shares issued | | | 44 | | | | 105 | | | | | 758 | | | | 398 | | | | | 22 | | | | 13 | | | |
| Shares issued in lieu of cash distributions | | | 1 | | | | 66 | | | | | 33 | | | | 100 | | | | | — | | | | 9 | | | |
| Shares redeemed | | | (205 | ) | | | (293 | ) | | | | (268 | ) | | | (356 | ) | | | | (21 | ) | | | (36 | ) | | |
| |
| |
Total Class C transactions | | | (160 | ) | | | (122 | ) | | | | 523 | | | | 142 | | | | | 1 | | | | (14 | ) | | |
| |
| |
| Class R: | | | | | | | | | | | | | | | | | | | | | | | | | | | | |
| Shares issued | | | 972 | | | | 731 | | | | | 2,407 | | | | 1,378 | | | | | 90 | | | | 18 | | | |
| Shares issued in lieu of cash distributions | | | 6 | | | | 88 | | | | | 118 | | | | 144 | | | | | — | | | | 2 | | | |
| Shares redeemed | | | (1,025 | ) | | | (431 | ) | | | | (619 | ) | | | (503 | ) | | | | (25 | ) | | | (7 | ) | | |
| |
| |
Total Class R transactions | | | (47 | ) | | | 388 | | | | | 1,906 | | | | 1,019 | | | | | 65 | | | | 13 | | | |
| |
| |
| Class Y: | | | | | | | | | | | | | | | | | | | | | | | | | | | | |
| Shares issued | | | 4,102 | | | | 2,573 | | | | | 36,806 | | | | 22,570 | | | | | 1,885 | | | | 701 | | | |
| Shares issued in lieu of cash distributions | | | 118 | | | | 1,620 | | | | | 1,335 | | | | 2,761 | | | | | — | | | | 380 | | | |
| Shares redeemed | | | (5,865 | ) | | | (6,204 | ) | | | | (26,769 | ) | | | (11,162 | ) | | | | (1,149 | ) | | | (1,906 | ) | | |
| |
| |
Total Class Y transactions | | | (1,645 | ) | | | (2,011 | ) | | | | 11,372 | | | | 14,169 | | | | | 736 | | | | (825 | ) | | |
| |
| |
Net increase (decrease) in capital shares | | | (2,502 | ) | | | (3,223 | ) | | | | 26,354 | | | | 17,325 | | | | | 423 | | | | (5,333 | ) | | |
| |
| |
134 First American Funds 2009 Annual Report
| | | | | | | | | | | | | | | | | | | | |
| | | | | | | | | | | | | | | | |
| | | Small Cap
| | | | Small Cap
| | | |
| | | Select Fund | | | | Value Fund | | | |
| |
| | | Year
| | | Year
| | | | Year
| | | Year
| | | |
| | | Ended
| | | Ended
| | | | Ended
| | | Ended
| | | |
| | | 10/31/09 | | | 10/31/08 | | | | 10/31/09 | | | 10/31/08 | | | |
| |
| Class A: | | | | | | | | | | | | | | | | | | | |
| Shares issued | | | 17,577 | | | | 10,356 | | | | | 700 | | | | 255 | | | |
| Shares issued in lieu of cash distributions | | | — | | | | 1,153 | | | | | 37 | | | | 496 | | | |
| Shares redeemed | | | (6,751 | ) | | | (8,283 | ) | | | | (696 | ) | | | (1,217 | ) | | |
| |
| |
Total Class A transactions | | | 10,826 | | | | 3,226 | | | | | 41 | | | | (466 | ) | | |
| |
| |
| Class B: | | | | | | | | | | | | | | | | | | | |
| Shares issued | | | 7 | | | | 34 | | | | | 2 | | | | 4 | | | |
| Shares issued in lieu of cash distributions | | | — | | | | 97 | | | | | 1 | | | | 66 | | | |
| Shares redeemed | | | (223 | ) | | | (377 | ) | | | | (423 | ) | | | (171 | ) | | |
| |
| |
Total Class B transactions | | | (216 | ) | | | (246 | ) | | | | (420 | ) | | | (101 | ) | | |
| |
| |
| Class C: | | | | | | | | | | | | | | | | | | | |
| Shares issued | | | 187 | | | | 420 | | | | | 31 | | | | 52 | | | |
| Shares issued in lieu of cash distributions | | | — | | | | 186 | | | | | 1 | | | | 41 | | | |
| Shares redeemed | | | (483 | ) | | | (996 | ) | | | | (76 | ) | | | (93 | ) | | |
| |
| |
Total Class C transactions | | | (296 | ) | | | (390 | ) | | | | (44 | ) | | | — | | | |
| |
| |
| Class R: | | | | | | | | | | | | | | | | | | | |
| Shares issued | | | 941 | | | | 1,227 | | | | | 230 | | | | 116 | | | |
| Shares issued in lieu of cash distributions | | | — | | | | 209 | | | | | 2 | | | | 34 | | | |
| Shares redeemed | | | (1,137 | ) | | | (1,350 | ) | | | | (215 | ) | | | (124 | ) | | |
| |
| |
Total Class R transactions | | | (196 | ) | | | 86 | | | | | 17 | | | | 26 | | | |
| |
| |
| Class Y: | | | | | | | | | | | | | | | | | | | |
| Shares issued | | | 7,705 | | | | 5,975 | | | | | 2,259 | | | | 1,837 | | | |
| Shares issued in lieu of cash distributions | | | — | | | | 2,082 | | | | | 239 | | | | 2,360 | | | |
| Shares redeemed | | | (8,879 | ) | | | (21,448 | ) | | | | (3,723 | ) | | | (7,102 | ) | | |
| |
| |
Total Class Y transactions | | | (1,174 | ) | | | (13,391 | ) | | | | (1,225 | ) | | | (2,905 | ) | | |
| |
| |
Net increase (decrease) in capital shares | | | 8,944 | | | | (10,715 | ) | | | | (1,631 | ) | | | (3,446 | ) | | |
| |
| |
Class B shares converted to Class A shares (reflected above as Class A shares issued and Class B shares redeemed) during the fiscal years ended October 31, 2009 and October 31, 2008, were as follows:
| | | | | | | | | |
| | | Fiscal
| | | Fiscal
| |
| | | Year
| | | Year
| |
| | | Ended
| | | Ended
| |
| Fund | | 10/31/09 | | | 10/31/08 | |
| | |
| Equity Income Fund | | | 83 | | | | 55 | |
| International Fund | | | 60 | | | | 99 | |
| International Select Fund | | | 38 | | | | 1 | |
| Large Cap Growth Opportunities Fund | | | 47 | | | | 52 | |
| Large Cap Select Fund | | | 29 | | | | — | |
| Large Cap Value Fund | | | 75 | | | | 68 | |
| Mid Cap Growth Opportunities Fund | | | 22 | | | | 17 | |
| Mid Cap Select Fund | | | 107 | | | | 219 | |
| Mid Cap Value Fund | | | 28 | | | | 23 | |
| Real Estate Securities Fund | | | 10 | | | | 14 | |
| Small Cap Growth Opportunities Fund | | | 3 | | | | 1 | |
| Small Cap Select Fund | | | 61 | | | | 67 | |
| Small Cap Value Fund | | | 359 | | | | 41 | |
| |
| |
| |
| 5 > | Investment Security Transactions |
During the fiscal year ended October 31, 2009, purchases of securities and proceeds from sales of securities, other than temporary investments in short-term securities, were as follows:
| | | | | | | | | |
| Fund | | Purchases | | | Sales | |
| | |
| Equity Income Fund | | $ | 301,875 | | | $ | 336,422 | |
| Global Infrastructure Fund | | | 146,471 | | | | 118,529 | |
| International Fund | | | 1,335,800 | | | | 1,408,621 | |
| International Select Fund | | | 417,053 | | | | 194,342 | |
| Large Cap Growth Opportunities Fund | | | 564,457 | | | | 538,294 | |
| Large Cap Select Fund | | | 299,835 | | | | 371,116 | |
| Large Cap Value Fund | | | 266,589 | | | | 333,470 | |
| Mid Cap Growth Opportunities Fund | | | 1,251,169 | | | | 1,212,818 | |
| Mid Cap Select Fund | | | 88,038 | | | | 104,130 | |
| Mid Cap Value Fund | | | 574,885 | | | | 589,018 | |
| Real Estate Securities Fund | | | 1,114,537 | | | | 810,538 | |
| Small Cap Growth Opportunities Fund | | | 187,061 | | | | 178,750 | |
| Small Cap Select Fund | | | 581,929 | | | | 510,994 | |
| Small Cap Value Fund | | | 123,601 | | | | 133,353 | |
| | | | | | | | | |
First American Funds 2009 Annual Report 135
| |
| Notes to Financial Statements | October 31, 2009, all dollars and shares are rounded to thousands
(000) |
Transactions in options written for the fiscal year ended October 31, 2009, were as follows:
| | | | | | | | | | | | | | | | | |
| | | Put Options Written | | | Call Options Written | |
| | | Number of
| | | Premium
| | | Number of
| | | Premium
| |
| Mid Cap Select Fund | | Contracts | | | Amount | | | Contracts | | | Amount | |
| | |
| Balance at October 31, 2008 | | | — | | | $ | — | | | | — | | | $ | — | |
| Opened | | | — | | | | — | | | | 3,126 | | | | 297 | |
| Expired | | | — | | | | — | | | | (1,621 | ) | | | (48 | ) |
| Closed | | | — | | | | — | | | | (1,505 | ) | | | (249 | ) |
| | | | | | | | | | | | | | | | | |
| Balance at October 31, 2009 | | | — | | | $ | — | | | | — | | | $ | — | |
| |
| |
Portfolios that primarily invest in a particular sector may experience greater volatility than portfolios investing in a broad range of industry sectors. Real Estate Securities Fund primarily invests in income-producing common stocks of publicly traded companies engaged in the real estate industry. The real estate industry has been subject to substantial fluctuations and declines on a local, regional, and national basis in the past and that may continue in the future. Global Infrastructure Fund concentrates its investments in infrastructure-related securities of companies in the industrial and utility sectors. The securities of these companies in the industrial and utility sectors have greater exposure to adverse economic, regulatory, political, legal, and other changes affecting the issuers of such securities. As of October 31, 2009, Large Cap Growth Opportunities Fund, Mid Cap Growth Opportunities Fund, and Small Cap Growth Opportunities Fund each had a significant portion of their assets invested in the information technology sector, which could be more sensitive to short product cycles and aggressive pricing than the technology industry as a whole. As of the same date, Small Cap Value Fund had significant portions of its assets invested in the financials sector. The financials sector may be more greatly impacted by the performance of the overall economy, interest rates, competition, and consumer confidence and spending.
The funds enter into contracts that contain a variety of indemnifications. The funds’ maximum exposure under these arrangements is unknown. However, the funds have not had prior claims or losses pursuant to these contracts and expect the risk of loss to be remote.
| |
| 9 > | Redemption-in-Kind Transactions |
On March 14, 2008, $13,066 was redeemed from Equity Income Fund as a redemption-in-kind transaction, and on June 11, 2008, $84,930 was redeemed from International Fund as a redemption-in-kind transaction. In each transaction, the fund paid redemption proceeds by distributing a proportionate amount of securities in the funds portfolio. Remaining shareholders in the fund did not recognize any additional capital gains from the transaction.
| |
| 10 > | Regulatory Settlement Proceeds |
International Fund expects to receive a total of $359 during the fiscal year ended October 31, 2009 from Millennium Partners and Small Cap Growth Opportunities Fund received a total of $2,103 during the fiscal year ended October 31, 2008 from Bank of America, in each case as part of a settlement of an administrative proceeding with the Securities and Exchange Commission involving market timing and late trading of mutual funds. The settlement proceeds are presented in the funds’ Statements of Changes in Net Assets for the years ended October 31, 2009 and October 31, 2008. Neither of the funds nor their affiliates were involved in the proceedings.
136 First American Funds 2009 Annual Report
| |
| Notice toShareholders | October 31, 2009 (unaudited) |
TAX INFORMATION
The information set forth below is for each fund’s fiscal period as required by federal laws. Most shareholders, however, must report distributions on a calendar year basis for income tax purposes, which may include distributions for portions of two fiscal periods of a fund. Accordingly, the information needed for income tax purposes will be sent in early 2010 on Form 1099-DIV. Please consult your tax advisor for proper treatment of this information.
For the fiscal year ended October 31, 2009, each fund has designated long term capital gains, ordinary income, dividends qualifying for the corporate received deduction, and qualified dividend income with regard to distributions paid during the period as follows:
| | | | | | | | | | | | | | | | | | | |
| | | Long Term
| | | Ordinary
| | | | | | | | | |
| | | Capital Gains
| | | Income
| | | Return of
| | | Total
| | | |
| | | Distribution
| | | Distributions (Tax
| | | Capital
| | | Distributions
| | | |
| Fund | | (Tax Basis)1 | | | Basis)1 | | | (Tax Basis)1 | | | (Tax Basis) | | | |
| |
| Equity Income Fund | | | 0.00 | % | | | 100.00 | % | | | 0.00 | % | | | 100.00 | % | | |
| Global Infrastructure Fund | | | 0.00 | | | | 100.00 | | | | 0.00 | | | | 100.00 | | | |
International Fund2 | | | 0.00 | | | | 100.00 | | | | 0.00 | | | | 100.00 | | | |
International Select Fund2 | | | 0.00 | | | | 100.00 | | | | 0.00 | | | | 100.00 | | | |
| Large Cap Growth Opportunities Fund | | | 0.00 | | | | 100.00 | | | | 0.00 | | | | 100.00 | | | |
| Large Cap Select Fund | | | 0.00 | | | | 100.00 | | | | 0.00 | | | | 100.00 | | | |
| Large Cap Value Fund | | | 0.00 | | | | 100.00 | | | | 0.00 | | | | 100.00 | | | |
| Mid Cap Growth Opportunities Fund | | | 0.00 | | | | 0.00 | | | | 0.00 | | | | 0.00 | | | |
| Mid Cap Select Fund | | | 0.00 | | | | 100.00 | | | | 0.00 | | | | 100.00 | | | |
| Mid Cap Value Fund | | | 0.00 | | | | 100.00 | | | | 0.00 | | | | 100.00 | | | |
| Real Estate Securities Fund | | | 0.00 | | | | 73.00 | | | | 27.00 | | | | 100.00 | | | |
| Small Cap Growth Opportunities Fund | | | 0.00 | | | | 0.00 | | | | 0.00 | | | | 0.00 | | | |
| Small Cap Select Fund | | | 0.00 | | | | 0.00 | | | | 0.00 | | | | 0.00 | | | |
| Small Cap Value Fund | | | 0.00 | | | | 100.00 | | | | 0.00 | | | | 100.00 | | | |
| |
| |
| | |
| | 1 | Based on a percentage of the fund’s total distributions. |
| |
| | 2 | The Global Infrastructure Fund, International Fund, and International Select Fund have elected to pass through to shareholders foreign taxes under Section 853 of the Internal Revenue Code. Foreign taxes paid for the funds were $97, $1,492 and $713, respectively, and foreign source income for the funds was $1,191, $12,195 and $6,777, respectively. |
Shareholder Notification of Federal Tax Status:
Each fund has designated the following percentages of the ordinary income distributions during the fiscal year ended October 31, 2009 as dividends qualifying for the dividends received deduction available to corporate shareholders:
| | | | | | | |
| Fund | | | | | |
| |
| Equity Income Fund | | | 100.00 | % | | |
| Global Infrastructure Fund | | | 13.60 | | | |
| International Fund | | | 0.13 | | | |
| International Select Fund | | | 0.98 | | | |
| Large Cap Growth Opportunities Fund | | | 100.00 | | | |
| Large Cap Select Fund | | | 100.00 | | | |
| Large Cap Value Fund | | | 100.00 | | | |
| Mid Cap Growth Opportunities Fund | | | 0.00 | | | |
| Mid Cap Select Fund | | | 100.00 | | | |
| Mid Cap Value Fund | | | 100.00 | | | |
| Real Estate Securities Fund | | | 5.54 | | | |
| Small Cap Growth Opportunities Fund | | | 0.00 | | | |
| Small Cap Select Fund | | | 100.00 | | | |
| Small Cap Value Fund | | | 100.00 | | | |
| |
| |
First American Funds 2009 Annual Report 137
| |
| Notice toShareholders | October 31, 2009 (unaudited) |
In addition, each fund has designated the following percentages of the ordinary income distributions from net investment income during the fiscal year ended October 31, 2009 as qualified dividend income available to individual shareholders under the Jobs and Growth Tax Relief Reconciliation Act of 2003:
| | | | | | | |
| Fund | | | | | |
| |
| Equity Income Fund | | | 100.00 | % | | |
| Global Infrastructure Fund | | | 94.12 | | | |
| International Fund | | | 100.00 | | | |
| International Select Fund | | | 100.00 | | | |
| Large Cap Growth Opportunities Fund | | | 100.00 | | | |
| Large Cap Select Fund | | | 100.00 | | | |
| Large Cap Value Fund | | | 100.00 | | | |
| Mid Cap Growth Opportunities Fund | | | 0.00 | | | |
| Mid Cap Select Fund | | | 100.00 | | | |
| Mid Cap Value Fund | | | 100.00 | | | |
| Real Estate Securities Fund | | | 5.50 | | | |
| Small Cap Growth Opportunities Fund | | | 0.00 | | | |
| Small Cap Select Fund | | | 100.00 | | | |
| Small Cap Value Fund | | | 100.00 | | | |
| |
| |
Additional Information Applicable to Foreign Shareholders Only:
The percentage of ordinary income distributions that are designated as interest-related dividends under Internal Revenue Code Section 871(k)(1)(c) for each fund was as follows:
| | | | | | | |
| Fund | | | | | |
| |
| Equity Income Fund | | | 0.67 | % | | |
| Global Infrastructure Fund | | | 0.13 | | | |
| International Fund (b) | | | 1.31 | | | |
| International Select Fund (b) | | | 0.37 | | | |
| Large Cap Growth Opportunities Fund | | | 2.27 | | | |
| Large Cap Select Fund | | | 2.48 | | | |
| Large Cap Value Fund | | | 0.34 | | | |
| Mid Cap Growth Opportunities Fund | | | 0.00 | | | |
| Mid Cap Select Fund | | | 0.36 | | | |
| Mid Cap Value Fund | | | 1.85 | | | |
| Real Estate Securities Fund | | | 0.39 | | | |
| Small Cap Growth Opportunities Fund | | | 0.00 | | | |
| Small Cap Select Fund | | | 2.23 | | | |
| Small Cap Value Fund | | | 5.54 | | | |
| |
| |
The percentage of ordinary income distributions that are designated as short-term capital gain distributions under Internal Revenue Code Section 871(k)(2)(c) for each fund was as follows:
| | | | | | | |
| Fund | | | | | |
| |
| Equity Income Fund | | | 0.00 | % | | |
| Global Infrastructure Fund | | | 0.00 | | | |
| International Fund (b) | | | 0.00 | | | |
| International Select Fund (b) | | | 0.00 | | | |
| Large Cap Growth Opportunities Fund | | | 0.00 | | | |
| Large Cap Select Fund | | | 0.00 | | | |
| Large Cap Value Fund | | | 0.00 | | | |
| Mid Cap Growth Opportunities Fund | | | 0.00 | | | |
| Mid Cap Select Fund | | | 0.00 | | | |
| Mid Cap Value Fund | | | 0.00 | | | |
| Real Estate Securities Fund | | | 0.00 | | | |
| Small Cap Growth Opportunities Fund | | | 0.00 | | | |
| Small Cap Select Fund | | | 0.00 | | | |
| Small Cap Value Fund | | | 0.00 | | | |
| |
| |
138 First American Funds 2009 Annual Report
HOW TO OBTAIN A COPY OF THE FUNDS’ PROXY VOTING POLICIES AND PROXY VOTING RECORD
A description of the policies and procedures that the funds use to determine how to vote proxies relating to portfolio securities, as well as information regarding how the funds voted proxies relating to portfolio securities is available at firstamericanfunds.com and on the U.S. Securities and Exchange Commission’s website at www.sec.gov. A description of the funds’ policies and procedures is also available without charge, upon request, by calling 800.677.FUND.
FORM N-Q HOLDINGS INFORMATION
Each fund is required to file its complete schedule of portfolio holdings for the first and third quarters of each fiscal period with the Securities and Exchange Commission on Form N-Q. The funds’ Forms N-Q are available without charge (1) upon request by calling 800.677.FUND and (2) on the Securities and Exchange Commission’s website at www.sec.gov. In addition, you may review and copy the funds’ Forms N-Q at the Commission’s Public Reference Room in Washington, D.C. You may obtain information on the operation of the Public Reference Room by calling 800.SEC.0330.
QUARTERLY PORTFOLIO HOLDINGS
Each fund will make portfolio holdings information publicly available by posting the information at firstamericanfunds.com on a quarterly basis. The funds will attempt to post such information within 10 business days of the calendar quarter end.
APPROVAL OF THE FUNDS’ INVESTMENT ADVISORY AND SUB-ADVISORY AGREEMENTS
The Board of Directors of the Funds (the “Board”), which is comprised entirely of independent directors, oversees the management of each Fund and, as required by law, determines annually whether to renew the Funds’ advisory agreement with FAF Advisors, Inc. (“FAF Advisors”). In addition to determining whether to renew the Agreement with FAF Advisors, the Board also is responsible for determining whether to approve sub-advisory agreements for the Funds.
At a meeting on May 5-7, 2009, the Board considered information relating to the Funds’ investment advisory agreement with FAF Advisors (the “Agreement”) and: (i) with respect to the International Select Fund, information relating to each sub-advisory agreement between FAF Advisors and Altrinsic Global Advisors, LLC (“Altrinsic”), Hansberger Global Investors, Inc. (“HGI”), and Lazard Asset Management LLC (“Lazard”), and (ii) with respect to the International Fund, information relating to the sub-advisory agreements between FAF Advisors and HGI and Altrinsic (collectively the “Sub-Advisory Agreements” and the “Sub-Advisors”). In advance of the meeting, the Board received materials relating to the Agreement and the Sub-Advisory Agreements, and had the opportunity to ask questions and request further information in connection with their consideration. At a subsequent meeting on June 16-18, 2009, the Board concluded its consideration of and approved the Agreement and the Sub-Advisory Agreements through June 30, 2010.
Although the Agreement, which is with First American Investment Funds, Inc., relates to all of the Funds, the Board separately considered and approved the Agreement with respect to each Fund. In considering the Agreement, the Board, advised by independent legal counsel, reviewed and considered the factors it deemed relevant, including: (1) the nature, quality and extent of FAF Advisors’ services to each Fund, (2) the investment performance of each Fund, (3) the profitability of FAF Advisors related to the Funds, including an analysis of FAF Advisors’ cost of providing services and comparative expense information, (4) whether economies of scale may be realized as the Funds grow and whether fee levels are adjusted to enable Fund investors to share in these potential economies of scale, and (5) other benefits that accrue to FAF Advisors through its relationship with the Funds. In its deliberations, the Board did not identify any single factor which alone was responsible for the Board’s decision to approve the Agreement and the Sub-Advisory Agreements.
Before approving the Agreement and the Sub-Advisory Agreements, the Board met in executive session with its independent counsel on numerous occasions to consider the materials provided by FAF Advisors and the terms of the Agreement and the Sub-Advisory Agreements. Based on its evaluation of those materials, the Board concluded that the Agreement is fair and in the best interests of the shareholders of each Fund and that the Sub-Advisory Agreements are fair and in the interests of the shareholders of the International Fund and of the International Select Fund. In reaching its conclusions, the Board considered the following:
Nature, Quality and Extent of Investment Advisory Services
The Board examined the nature, quality and extent of the services provided by FAF Advisors to each Fund, and the nature, quality and extent of the services provided by the Sub-Advisors to the International Fund and to the International Select Fund.
First American Funds 2009 Annual Report 139
| |
| Notice toShareholders | October 31, 2009 (unaudited) |
For each Fund, the Board reviewed FAF Advisors’ key personnel who provide investment management services to the Fund as well as the fact that, under the Agreement, FAF Advisors has the authority and responsibility to make and execute investment decisions for each Fund within the framework of the Fund’s investment policies and restrictions, subject to review by the Board. The Board further considered that FAF Advisors’ duties with respect to each Fund include: (i) investment research and security selection, (ii) adherence to (and monitoring compliance with) the Fund’s investment policies and restrictions and the Investment Company Act of 1940, (iii) monitoring the performance of the various organizations providing services to each Fund, including the Fund’s distributor, sub-administrator, transfer agent and custodian. The Board also considered that, with respect to International Fund and International Select Fund, FAF Advisors is responsible for allocating assets among the Sub-Advisors, monitoring the performance of the Sub-Advisors and managing assets that have not been allocated to a Sub-Advisor. Finally, the Board considered FAF Advisors’ representation that the services provided by FAF Advisors under the Agreement are the type of services customarily provided by investment advisors in the fund industry.
With respect to the International Fund and the International Select Fund, the Board examined the nature, quality and extent of the services provided by each Sub-Advisor and reviewed each Sub-Advisor’s key personnel who provide investment management services to the Funds. The Board noted that, under the Sub-Advisory Agreements, the Sub-Advisors have the authority and responsibility to make and execute investment decisions for the Funds with respect to assets that have been allocated to them and within the framework of the Funds’ investment policies and restrictions, subject to the supervision of FAF Advisors and review by the Board. The Board further considered that the Sub-Advisors’ duties with respect to the International Fund and the International Select Fund include investment research and stock selection and adherence to the Funds’ investment policies and restrictions. The Board noted that, under the Agreement, FAF Advisors is responsible for monitoring the performance of the Sub-Advisors.
The Board considered compliance reports about FAF Advisors, Altrinsic, HGI and Lazard from the Fund’s Chief Compliance Officer (“CCO”).
Based on the foregoing, the Board concluded that: (i) each Fund is likely to benefit from the nature, extent and quality of the services provided by FAF Advisors under the Agreement, and (ii) the International Fund and the International Select Fund are likely to benefit from the nature, extent and quality of the services provided by their respective Sub-Advisors under the Sub-Advisory Agreements into which each of them has entered.
Investment Performance of the Funds
The Board considered the performance of each Fund on a gross-of-expenses basis, including comparative information provided by an independent data service, regarding the median performance of a group of comparable funds selected by that data service (the “performance universe”) and how each Fund performed versus its benchmark index. The performance periods considered by the Board all ended on February 28, 2009, unless noted otherwise.
Equity Income Fund. The Board considered that the Fund outperformed its performance universe median for the one-, three- and five-year periods, though it underperformed its performance universe median for the ten-year period. The Board also considered that the Fund outperformed its benchmark index for all periods. The Board concluded that, in light of the Fund’s competitive performance, it would be in the interest of the Fund and its shareholders to renew the Agreement.
International Fund. The Board noted that the Fund outperformed its performance universe median for the one- and three-year periods, though it underperformed its performance universe median for the five- and ten-year periods. The Board also noted that the Fund outperformed its benchmark index for the one-, three- and ten-year periods, though it underperformed its benchmark index for the five-year period. The Board considered that the Fund’s sub-advisors, Altrinsic and HGI, did not begin to manage the Fund until November 2008, and that for the four-month period ended February 28, 2009, the Fund outperformed both its performance universe and its benchmark index. The Board concluded that, in light of the foregoing, it would be in the interest of the Fund and its shareholders to renew the Agreement and the Sub-Advisory Agreements.
International Select Fund. The Board considered that the Fund outperformed both its performance universe median and its benchmark index for the one-year period and since the Fund’s inception on December 21, 2006. The Board concluded that, in light of the Fund’s competitive performance, it would be in the interest of the Fund and its shareholders to renew the Agreement and the Sub-Advisory Agreements.
Large Cap Growth Opportunities Fund. The Board considered that the Fund outperformed its performance universe median for the one-, three- and five-year periods, though it underperformed its performance universe median for the ten-year period. The Board also noted that the Fund outperformed its benchmark index for all periods. The Board concluded that, in light of the Fund’s competitive performance, it would be in the interest of the Fund and its shareholders to renew the Agreement.
Large Cap Select Fund. The Board considered that the Fund underperformed its performance universe median for the one-, three- and five-year periods. The Board also considered that the Fund outperformed its benchmark index for the five-year
140 First American Funds 2009 Annual Report
period, though it underperformed its benchmark index for the one- and three-year periods. The Board considered that three new analysts, who will support the portfolio management process, were added in May 2008 and that a new director of research, who also supports portfolio management, was added in August 2008. The Board also noted that the Fund outperformed both its performance universe and its benchmark index for the quarter ended March 31, 2009. The Board concluded that, in light of the changes in the research organization that supports portfolio management and the Fund’s improved performance, it would be in the interest of the Fund and its shareholders to renew the Agreement. The Board also concluded to closely monitor the performance of this Fund.
Large Cap Value Fund. The Board considered that the Fund outperformed both its performance universe median and its benchmark index for the one-, three- and five-year periods, though it underperformed both its performance universe median and its benchmark index for the ten-year period. The Board noted FAF Advisors’ assertion that the Fund’s underperformance over the ten-year period could be attributed primarily to a former management team. The Board concluded that, in light of the Fund’s competitive performance for the one-, three- and five-year periods, it would be in the interest of the Fund and its shareholders to renew the Agreement.
Mid Cap Growth Opportunities Fund. The Board considered that the Fund outperformed both its performance universe median and its benchmark index for the one-, three-, five- and ten-year periods. The Board concluded that, in light of the Fund’s competitive performance, it would be in the interest of the Fund and its shareholders to renew the Agreement.
Mid Cap Value Fund. The Board considered that the Fund outperformed its performance universe median for the one-, three- and five-year periods, though it underperformed its performance universe median for the ten-year period. The Board also considered that the Fund outperformed its benchmark index for all periods. The Board noted FAF Advisors’ assertion that the Fund’s underperformance vis-à-vis its performance universe median for the ten-year period could be attributed primarily to a former management team. The Board concluded that, in light of the Fund’s competitive performance, it would be in the interest of the Fund and its shareholders to renew the Agreement.
Global Infrastructure Fund. The Board considered that the Fund outperformed its benchmark index for the one-year period and since its inception on July 31, 2007. The Board also considered that the Fund performed competitively against its performance universe median for the period since its inception on July 31, 2007, though it underperformed its performance universe median for the one-year period. The Board concluded that, in light of the Fund’s competitive performance, it would be in the interest of the Fund and its shareholders to renew the Agreement.
Real Estate Securities Fund. The Board considered that the Fund outperformed both its benchmark index and its performance universe median for the one-, three-, five-, and ten-year periods. The Board concluded that, in light of the Fund’s competitive performance, it would be in the interest of the Fund and its shareholders to renew the Agreement.
Small Cap Growth Opportunities Fund. The Board considered that the Fund outperformed its performance universe median and its benchmark index for the one- and ten-year periods, though it underperformed both its performance universe median and its benchmark index for the three-and five-year periods. The Board considered FAF Advisors’ assertion that the underperformance for the three- and five-year periods could be attributed in part to performance prior to the management team restructuring that occurred in 2007. The Board concluded that, in light of the Fund’s improved performance for the one-year period and the newer management team, it would be in the interest of the Fund and its shareholders to renew the Agreement.
Small Cap Select Fund. The Board considered that the Fund outperformed both its performance universe and its benchmark index for the one-, three-, five- and ten-year periods. The Board concluded that, in light of the Fund’s competitive performance, it would be in the interest of the Fund and its shareholders to renew the Agreement.
Small Cap Value Fund. The Board considered that the Fund outperformed its performance universe median for the one- and three-year periods, though it underperformed its performance universe median for the five- and ten-year periods. The Board also considered that the Fund outperformed its benchmark index for all periods. The Board concluded that, in light of the Fund’s competitive performance, especially in more recent periods, it would be in the interest of the Fund and its shareholders to renew the Agreement.
Mid Cap Select Fund (formerly Small-Mid Cap Core Fund). Effective May 4, 2009, the Fund’s principal investment strategy was changed from investing primarily in common stocks of small- and mid-capitalization companies to investing primarily in common stocks of mid-capitalization companies. At the same time, the Fund’s name changed from Small-Mid Cap Core Fund to Mid Cap Select Fund. In connection with its annual consideration of the Agreement with respect to the Fund, the Board considered the Fund’s performance through February 28, 2009, when the Fund was operating as Small-Mid Cap Core Fund. The Board considered that the Fund outperformed its performance universe median and its benchmark index for the one- and three-year periods, though it underperformed both its performance universe median and its benchmark index for the five- and ten-year periods. The Board considered FAF Advisors’ assertion that the Fund began operating as a small-mid
First American Funds 2009 Annual Report 141
| |
| Notice toShareholders | October 31, 2009 (unaudited) |
cap core fund on October 3, 2005; therefore, comparisons of the Fund’s performance against a mid-cap core performance universe and the Russell 2500 benchmark index for the five- and ten-year periods are not meaningful. In light of this and of the Fund’s competitive performance for the one- and three-year periods, the Board concluded it would be in the interest of the Fund and its shareholders to renew the Agreement.
Costs of Services and Profits Realized by FAF Advisors
The Board reviewed FAF Advisors’ costs in serving as the Funds’ investment manager, including the costs associated with the personnel and systems necessary to manage the Funds. The Board also considered the profitability of FAF Advisors and its affiliates resulting from their relationship with each Fund. The Board compared fee and expense information for each Fund to fee and expense information for comparable funds managed by other advisors. The Board also reviewed advisory fees for other funds advised or sub-advised by FAF Advisors and for private accounts managed by FAF Advisors. The Board found that while the management fees for FAF Advisors’ institutional separate accounts are generally lower than the management fees charged by FAF Advisors to mutual funds, mutual funds receive additional services from FAF Advisors that separate accounts do not receive.
Using information provided by an independent data service, the Board also evaluated each Fund’s advisory fee compared to the median advisory fee for other mutual funds similar in size, character and investment strategy, and each Fund’s expense ratio after waivers compared to the median expense ratio, after waivers, of comparable funds. In connection with its review of Fund fees and expenses, the Board considered FAF Advisors’ pricing philosophy. FAF Advisors attempts generally to maintain each Fund’s total operating expenses at a level that approximates the median of a peer group of funds selected by an independent data service. In addition, FAF Advisors has committed to waive its investment advisory fees to the extent necessary to maintain the Funds’ total expense ratios at levels generally in line with their respective peer groups.
Further detail considered by the Board regarding the advisory fees and expense ratios of each Fund is set forth below:
Large Cap Growth Opportunities Fund, Small Cap Growth Opportunities Fund, Small Cap Select Fund, Small Cap Value Fund, Mid Cap Select Fund (formerly Small-Mid Cap Core Fund). The Board considered that, after waivers, each Fund’s advisory fee and total expense ratio are lower than the peer group median. The Board concluded that the Funds’ advisory fee and total expense ratio are reasonable in light of the services provided.
Equity Income Fund, International Fund, Large Cap Select Fund, Large Cap Value Fund. The Board considered that, after waivers, each Fund’s advisory fee and total expense ratio are higher than the peer group median, though consistent with FAF Advisors’ pricing philosophy. The Board concluded that the advisory fee and total expense ratio are reasonable in light of the services provided.
International Select Fund. The Board considered that, after waivers, the Fund’s advisory fee is lower that the peer group median and that the Fund’s total expense ratio is equal to that of the peer group median. The Board concluded that the Fund’s advisory fee and total expense ratio are reasonable in light of the services provided.
Mid Cap Growth Opportunities Fund, Real Estate Securities Fund. The Board considered that, after waivers, each Fund’s advisory fee is equal to that of the peer group median, and that each Fund’s total expense ratio is lower than the peer group median. The Board concluded that the Funds’ advisory fee and total expense ratio are reasonable in light of the services provided.
Mid Cap Value Fund. The Board considered that, after waivers, the Fund’s advisory fee is higher than the peer group median and that the Fund’s total expense ratio is lower than the peer group median. The Board concluded that the Fund’s advisory fee and total expense ratio are reasonable in light of the services provided.
Global Infrastructure Fund. The Board considered that the Fund’s advisory fees was waived during the Fund’s last fiscal year. The Board also noted that the Fund’s total expense ratio is lower than the peer group median. The Board concluded that the Fund’s advisory fee and total expense ratio are reasonable in light of the services provided.
Economies of Scale in Providing Investment Advisory Services
The Board considered the extent to which each Fund’s investment advisory fee reflects economies of scale for the benefit of Fund shareholders. Based on information provided by FAF Advisors, the Board noted that profitability will likely increase somewhat as assets grow over time. The Board considered that, although most Funds do not have advisory fee breakpoints in place, FAF Advisors has committed to waive advisory fees to the extent necessary to keep each Fund’s total expenses generally in line with the median total expenses of a peer group of funds as selected by an independent data service. The Board considered information presented by FAF Advisors to support its assertion that the median total expense ratio of a Fund’s peer group should reflect the effect of any breakpoints in the advisory fee schedules of the funds in that group and
142 First American Funds 2009 Annual Report
any economies of scale which those funds realize. Therefore, by capping a Fund’s total expense ratio at a level close to the median, Fund shareholders will effectively receive the benefit of any breakpoints in the comparable funds’ advisory fee schedules and any such economies of scale. In light of FAF Advisors’ commitment to keep total Fund expenses competitive, the Board concluded that it would be reasonable and in the best interest of each Fund and its shareholders to renew the Agreement.
Other Benefits to FAF Advisors
In evaluating the benefits that accrue to FAF Advisors through its relationship with the Funds, the Board noted that FAF Advisors and certain of its affiliates serve the Funds in various capacities, including as investment advisor, administrator, transfer agent, distributor, custodian and securities lending agent, and receive compensation from the Funds in connection with providing services to the Funds. The Board considered that each service provided to the Funds by FAF Advisors or one of its affiliates is pursuant to a written agreement, which the Board evaluates periodically as required by law.
The Board also considered FAF Advisors’ use of the Funds’ portfolio brokerage transactions to obtain research. The Board concluded, based on its own review and on representations of FAF Advisors and the CCO, that FAF Advisors’ use of “soft” commission dollars was consistent with regulatory requirements.
After full consideration of these and other factors, the Board concluded that approval of the Agreement and the Sub-Advisory Agreements was in the interest of each Fund and its shareholders.
First American Funds 2009 Annual Report 143
| |
| Notice toShareholders | October 31, 2009 (unaudited) |
Directors and Officers of the Funds
| | | | | | | | | | | |
| Independent Directors |
| | | | | | | | | | | Other
|
| | | Position(s)
| | Term of Office
| | | | Number of Portfolios
| | Directorships
|
Name, Address, and
| | Held
| | and Length of
| | Principal Occupation(s)
| | in Fund Complex
| | Held by
|
| Year of Birth | | with Funds | | Time Served | | During Past 5 Years | | Overseen by Director | | Director † |
| |
Benjamin R. Field III
P.O. Box 1329
Minneapolis, MN
55440-1329
(1938) | | Director | | Term expiring earlier of death, resignation, removal, disqualification, or successor duly elected and qualified. Director of FAIF since September 2003 | | Retired | | First American Funds Complex: twelve registered investment companies, including fifty-eight portfolios | | None |
| |
| |
Roger A. Gibson
P.O. Box 1329
Minneapolis, MN
55440-1329
(1946) | | Director | | Term expiring earlier of death, resignation, removal, disqualification, or successor duly elected and qualified. Director of FAIF since
October 1997 | | Director, Charterhouse Group, Inc., a private equity firm, since October 2005; Advisor/Consultant, Future Freighttm, a logistics/supply chain company; Trustee, National Jewish Health; Board Member/Co-founder, Shades of Blue, an aviation-related youth development organization; Vice President and Chief Operating Officer, Cargo-United Airlines, from July 2001 until retirement in November 2005 | | First American Funds Complex: twelve registered investment companies, including fifty-eight portfolios | | None |
| |
| |
Victoria J. Herget
P.O. Box 1329
Minneapolis, MN
55440-1329
(1951) | | Director | | Term expiring earlier of death, resignation, removal, disqualification, or successor duly elected and qualified. Director of FAIF since September 2003 | | Investment consultant and non-profit board member; Board Chair, United Educators Insurance Company | | First American Funds Complex: twelve registered investment companies, including fifty-eight portfolios | | None |
| |
| |
John P. Kayser
P.O. Box 1329
Minneapolis, MN
55440-1329
(1949) | | Director | | Term expiring earlier of death, resignation, removal, disqualification, or successor duly elected and qualified. Director of FAIF since
October 2006 | | Retired; Principal from 1983 to 2004, William Blair & Company, LLC, a Chicago-based investment firm | | First American Funds Complex: twelve registered investment companies, including fifty-eight portfolios | | None |
| |
| |
Leonard W. Kedrowski
P.O. Box 1329
Minneapolis, MN
55440-1329
(1941) | | Director | | Term expiring earlier of death, resignation, removal, disqualification, or successor duly elected and qualified. Director of FAIF since November 1993 | | Owner and President, Executive and Management Consulting, Inc., a management consulting firm; Board member, GC McGuiggan Corporation (dba Smyth Companies), a label printer; member, investment advisory committee, Sisters of the Good Shepherd | | First American Funds Complex: twelve registered investment companies, including fifty-eight portfolios | | None |
| |
| |
Richard K. Riederer
P.O. Box 1329
Minneapolis, MN
55440-1329
(1944) | | Director | | Term expiring earlier of death, resignation, removal, disqualification, or successor duly elected and qualified. Director of FAIF since
August 2001 | | Owner and Chief Executive Officer, RKR Consultants, Inc., a consulting company providing advice on business strategy, mergers and acquisitions; non-profit board member since 2005 | | First American Funds Complex: twelve registered investment companies, including fifty-eight portfolios | | Cliffs Natural Resources, Inc. (a producer of iron ore pellets and coal) |
| |
| |
Joseph D. Strauss
P.O. Box 1329
Minneapolis, MN
55440-1329
(1940) | | Director | | Term expiring earlier of death, resignation, removal, disqualification, or successor duly elected and qualified. Director of FAIF since
April 1991 | | Attorney At Law; Owner and President, Strauss Management Company, a Minnesota holding company for various organizational management business ventures; Owner, Chairman, and Chief Executive Officer, Community Resource Partnerships, Inc., a corporation engaged in strategic planning, operations management, government relations, transportation planning, and public relations; Owner, Chairman, and Chief Executive Officer, Excensustm, LLC, a demographic planning and application development firm | | First American Funds Complex: twelve registered investment companies, including fifty-eight portfolios | | None |
| |
| |
144 First American Funds 2009 Annual Report
| | | | | | | | | | | |
Independent Directors – concluded |
| | | | | | | | | | | Other
|
| | | Position(s)
| | Term of Office
| | | | Number of Portfolios
| | Directorships
|
Name, Address, and
| | Held
| | and Length of
| | Principal Occupation(s)
| | in Fund Complex
| | Held by
|
| Year of Birth | | with Funds | | Time Served | | During Past 5 Years | | Overseen by Director | | Director † |
| |
Virginia L. Stringer
P.O. Box 1329
Minneapolis, MN
55440-1329
(1944) | | Chair; Director | | Chair Term three years. Directors Term expiring earlier of death, resignation, removal, disqualification, or successor duly elected and qualified. Chair of FAIF’s Board since September 1997; Director of FAIF since September 1987 | | Governance consultant and non-profit board member; former Owner and President, Strategic Management Resources, Inc., a management consulting firm; Chair, St. Paul Riverfront Corporation, since 2005 | | First American Funds Complex: twelve registered investment companies, including fifty-eight portfolios | | None |
| |
| |
James M. Wade
P.O. Box 1329
Minneapolis, MN
55440-1329
(1943) | | Director | | Term expiring earlier of death, resignation, removal, disqualification, or successor duly elected and qualified. Director of FAIF since
August 2001 | | Owner and President, Jim Wade Homes, a homebuilding company | | First American Funds Complex: twelve registered investment companies, including fifty-eight portfolios | | None |
| |
| |
| |
| † | Includes only directorships in a company with a class of securities registered pursuant to Section 12 of the Securities Exchange Act or subject to the requirements of Section 15(d) of the Securities Exchange Act, or any company registered as an investment company under the Investment Company Act. |
The Statement of Additional Information (SAI) includes additional information about fund directors and is available upon request without charge by calling 800.677.FUND or writing to First American Funds, P.O. Box 1330, Minneapolis, Minnesota, 55440-1330.
First American Funds 2009 Annual Report 145
| |
| Notice toShareholders | October 31, 2009 (unaudited) |
| | | | | | | |
| Officers |
| | | Position(s)
| | Term of Office
| | |
Name, Address, and
| | Held
| | and Length of
| | |
| Year of Birth | | with Funds | | Time Served | | Principal Occupation(s) During Past 5 Years |
| |
Thomas S. Schreier, Jr.
FAF Advisors, Inc.
800 Nicollet Mall
Minneapolis, MN 55402
(1962)* | | President | | Re-elected by the Board annually; President of FAIF since February 2001 | | Chief Executive Officer, FAF Advisors, Inc.; Chief Investment Officer, FAF Advisors, Inc., since September 2007 |
| |
| |
Jeffery M. Wilson
FAF Advisors, Inc.
800 Nicollet Mall
Minneapolis, MN 55402
(1956)* | | Vice President – Administration | | Re-elected by the Board annually; Vice President – Administration of FAIF since March 2000 | | Senior Vice President, FAF Advisors, Inc. |
| |
| |
Charles D. Gariboldi, Jr.
FAF Advisors, Inc.
800 Nicollet Mall
Minneapolis, MN 55402
(1959)* | | Treasurer | | Re-elected by the Board annually; Treasurer of FAIF since December 2004 | | Mutual Funds Treasurer, FAF Advisors, Inc., since October 2004; prior thereto, Vice President – Investment Accounting and Fund Treasurer, Thrivent Financial for Lutherans |
| |
| |
Jill M. Stevenson
FAF Advisors, Inc.
800 Nicollet Mall
Minneapolis, MN 55402
(1965)* | | Assistant Treasurer | | Re-elected by the Board annually; Assistant Treasurer of FAIF since September 2005 | | Mutual Funds Assistant Treasurer, FAF Advisors, Inc., since September 2005; prior thereto, Director and Senior Project Manager, FAF Advisors, Inc. |
| |
| |
David H. Lui
FAF Advisors, Inc.
800 Nicollet Mall
Minneapolis, MN 55402
(1960)* | | Chief Compliance Officer | | Re-elected by the Board annually; Chief Compliance Officer of FAIF since
March 2005 | | Chief Compliance Officer, FAF Advisors, Inc., since March 2005; prior thereto, Chief Compliance Officer, Franklin Advisors, Inc., and Chief Compliance Counsel, Franklin Templeton Investments |
| |
| |
Jason K. Mitchell
FAF Advisors, Inc.
800 Nicollet Mall
Minneapolis, MN 55402
(1976)* | | Anti-Money Laundering Officer | | Re-elected by the Board annually; Anti-Money Laundering Officer of FAIF since December 2008 and from September 2006 through August 2008 | | Compliance Manager, FAF Advisors, Inc., since June 2006; prior thereto, Compliance Analyst, FAF Advisors, Inc., from October 2004 to June 2006 |
| |
| |
Kathleen L. Prudhomme
FAF Advisors, Inc.
800 Nicollet Mall
Minneapolis, MN 55402
(1953)* | | Secretary | | Re-elected by the Board annually; Secretary of FAIF since December 2004; prior thereto, Assistant Secretary of FAIF since September 1998 | | Deputy General Counsel, FAF Advisors, Inc., since November 2004; prior thereto, Partner, Dorsey & Whitney LLP, a Minneapolis-based law firm |
| |
| |
James D. Alt
Dorsey & Whitney LLP
50 South Sixth Street
Suite 1500,
Minneapolis, MN 55402
(1951) | | Assistant Secretary | | Re-elected by the Board annually; Assistant Secretary of FAIF since December 2004; prior thereto, Secretary of FAIF since June 2002; Assistant Secretary of FAIF from September 1998 through June 2002 | | Partner, Dorsey & Whitney LLP, a Minneapolis-based law firm |
| |
| |
James R. Arnold
U.S. Bancorp Fund Services, LLC
615 E. Michigan Street
Milwaukee, WI 53202
(1957)* | | Assistant Secretary | | Re-elected by the Board annually; Assistant Secretary of FAIF since
June 2003 | | Senior Vice President, U.S. Bancorp Fund Services, LLC |
| |
| |
Richard J. Ertel
FAF Advisors, Inc.
800 Nicollet Mall
Minneapolis, MN 55402
(1967)* | | Assistant Secretary | | Re-elected by the Board annually; Assistant Secretary of FAIF since June 2006 and from June 2003 through August 2004 | | Counsel, FAF Advisors, Inc., since May 2006; prior thereto, Counsel, Ameriprise Financial Services, Inc., September 2004 to May 2006 |
| |
| |
Michael W. Kremenak
FAF Advisors, Inc.
800 Nicollet Mall
Minneapolis, MN 55402
(1978)* | | Assistant Secretary | | Re-elected by the Board annually; Assistant Secretary of FAIF since February 2009 | | Counsel, FAF Advisors Inc., since January 2009; prior thereto, Associate, Skadden, Arps, Slate, Meagher & Flom LLP, a New York City-based law firm, from September 2005 to January 2009 |
| |
| |
| |
| * | Messrs. Schreier, Wilson, Gariboldi, Lui, Mitchell, Ertel, and Kremenak, Ms. Stevenson and Ms. Prudhomme are each officers and/or employees of FAF Advisors, Inc., which serves as investment adviser and administrator for FAIF. Mr. Arnold is an officer of U.S. Bancorp Fund Services, LLC, which is a subsidiary of U.S. Bancorp and which serves as transfer agent for FAIF. |
146 First American Funds 2009 Annual Report
First American Funds’ Privacy Policy
We want you to understand what information we collect and how it’s used.
“Nonpublic personal information” is nonpublic information that we obtain while providing financial products or services to you.
Why we collect your information
We gather nonpublic personal information about you and your accounts so that we can:
| |
| • | Know who you are and prevent unauthorized access to your information. |
| • | Design and improve the products we offer. |
| • | Comply with the laws and regulations that govern us. |
The types of information we collect
We may collect the following nonpublic personal information about you:
| |
| • | Information about your identity, such as your name, address, and social security number |
| • | Information about your transactions with us |
| • | Information you provide on applications, such as your beneficiaries |
Confidentiality and security
We operate through service providers. We require our service providers to restrict access to nonpublic personal information about you to those employees who need that information in order to provide products or services to you. We also require them to maintain physical, electronic, and procedural safeguards that comply with applicable federal standards and regulations to guard your information.
What information we disclose
We may share all of the nonpublic personal information that we collect about you with our affiliated providers of financial services, including our family of funds and their advisor, and with companies that perform marketing services on our behalf.
We’re permitted by law to disclose nonpublic personal information about you to other third parties in certain circumstances. For example, we may disclose nonpublic personal information about you to affiliated and nonaffiliated third parties to assist us in servicing your account (e.g., mailing of fund-related materials) and to government entities (e.g., IRS for tax purposes).
We’ll continue to adhere to the privacy policies and practices described here even after your account is closed or becomes inactive.
Additional rights and protections
You may have other privacy protections under applicable state laws, such as California and Vermont. To the extent that these state laws apply, we will comply with them when we share information about you. This privacy policy does not apply to your relationship with other financial service providers, such as broker-dealers. We may amend this privacy notice at any time, and we will inform you of changes as required by law.
Our pledge applies to products and services offered by:
| |
| • | First American Funds, Inc. |
| • | First American Investment Funds, Inc. |
| • | First American Strategy Funds, Inc. |
| • | American Strategic Income Portfolio Inc. |
| • | American Strategic Income Portfolio Inc. II |
| • | American Strategic Income Portfolio Inc. III |
| • | American Select Portfolio Inc. |
| • | American Municipal Income Portfolio Inc. |
| • | Minnesota Municipal Income Portfolio Inc. |
| • | First American Minnesota Municipal Income Fund II, Inc. |
| • | American Income Fund, Inc. |
NOT FDIC INSURED NO BANK GUARANTEE MAY LOSE VALUE
(This page intentionally left blank.)
Board of Directors First American Investment Funds, Inc.
Virginia Stringer
Chairperson of First American Investment Funds, Inc.
Governance Consultant; Chair of Saint Paul Riverfront Corporation; former Owner
and President of Strategic Management Resources, Inc.
Benjamin Field III
Director of First American Investment Funds, Inc.
Retired; former Senior Financial Advisor, Senior Vice President,
Chief Financial Officer, and Treasurer of Bemis Company, Inc.
Roger Gibson
Director of First American Investment Funds, Inc.
Director of Charterhouse Group, Inc.
Victoria Herget
Director of First American Investment Funds, Inc.
Investment Consultant; Chair of United Educators Insurance Company; former
Managing Director of Zurich Scudder Investments
John Kayser
Director of First American Investment Funds, Inc.
Retired; former Principal, Chief Financial Officer, and Chief Administrative Officer of William Blair & Company, LLC
Leonard Kedrowski
Director of First American Investment Funds, Inc.
Owner and President of Executive and Management Consulting, Inc.
Richard Riederer
Director of First American Investment Funds, Inc.
Owner and Chief Executive Officer of RKR Consultants, Inc.
Joseph Strauss
Director of First American Investment Funds, Inc.
Owner and President of Strauss Management Company
James Wade
Director of First American Investment Funds, Inc.
Owner and President of Jim Wade Homes
First American Investment Funds’ Board of Directors is comprised entirely of
independent directors.
P.O. Box 1330
Minneapolis, MN 55440-1330
This report and the financial statements contained herein are not intended to be a forecast of future events, a guarantee of future results, or investment advice. Further, there is no assurance that certain securities will remain in or out of each fund’s portfolio. The views expressed in this report reflect those of the portfolio managers only through the period ended October 31, 2009. The portfolio managers views are subject to change at any time based upon market or other conditions. This report is for the information of shareholders of the First American Investment Funds, Inc. It may also be used as sales literature when preceded or accompanied by a current prospectus, which contains information concerning investment objectives, risks, and charges and expenses of the funds. Read the prospectus carefully before investing.
The figures in this report represent past performance and do not guarantee future results. The principal value of an investment and investment return will fluctuate so that an investor’s shares, when redeemed, may be worth more or less than their original cost.
| | | | | |
INVESTMENT ADVISOR
FAF Advisors, Inc.
800 Nicollet Mall
Minneapolis, Minnesota 55402
ADMINISTRATOR
FAF Advisors, Inc.
800 Nicollet Mall
Minneapolis, Minnesota 55402
TRANSFER AGENT
U.S. Bancorp Fund Services, LLC
615 East Michigan Street
Milwaukee, Wisconsin 53202 | | CUSTODIANS
U.S. Bank National Association
60 Livingston Avenue
St. Paul, Minnesota 55101
State Street Bank and Trust Company
2 Avenue de Lafayette
Boston, Massachusetts 02111
DISTRIBUTOR
Quasar Distributors, LLC
615 East Michigan Street
Milwaukee, Wisconsin 53202 | | INDEPENDENT REGISTERED
PUBLIC ACCOUNTING FIRM
Ernst & Young LLP
220 South Sixth Street
Suite 1400
Minneapolis, Minnesota 55402
COUNSEL
Dorsey & Whitney LLP
50 South Sixth Street
Suite 1500
Minneapolis, Minnesota 55402 |

In an attempt to reduce shareholder costs and help eliminate duplication, First American Funds will try to limit their mailing to one report for each address that lists one or more shareholders with the same last name. If you would like additional copies, please call First American Investor Services at 800.677.FUND or visit firstamericanfunds.com.
0202-09 12/2009 AR-STOCK
Table of Contents
| | | | | |
| | | 1 | |
| | | 2 | |
| | | 3 | |
| | | 12 | |
| | | 15 | |
| | | 16 | |
| | | 42 | |
| | | 44 | |
| | | 45 | |
| | | 46 | |
| | | 52 | |
| | | 60 | |
Mutual fund investing involves risk; principal loss is possible.
NOT FDIC INSURED NO BANK GUARANTEE MAY LOSE VALUE
Message to Shareholders December 7, 2009
Dear Shareholders:
We invite you to take a few minutes to review the results of the fiscal year ended October 31, 2009.
This report includes portfolio commentaries, comparative performance graphs and tables, complete listings of portfolio holdings, and additional fund information. We hope you will find this helpful in monitoring your investment portfolio.
Also, through our website, firstamericanfunds.com, we provide quarterly performance fact sheets on all First American Funds, the economic outlook as viewed by our senior investment officers, and other information about fund investments and portfolio strategies.
Please contact your financial professional if you have questions about First American Funds or contact First American Investor Services at 800.677.FUND.
We appreciate your investment with First American Funds and look forward to serving your financial needs in the future.
Sincerely,
| | | |
| | |
| | | |
Virginia L. Stringer
Chairperson of the Board
First American Investment Funds, Inc. | | Thomas S. Schreier, Jr.
President
First American Investment Funds, Inc. |
First American Funds 2009 Annual Report 1
Explanation of Financial Statements
As a shareholder in First American Funds, you receive shareholder reports semiannually. We strive to present this financial information in an easy-to-understand format; however, for many investors, the information contained in this shareholder report may seem very technical. So, we would like to take this opportunity to explain several sections of the shareholder report.
The Schedule of Investments details all of the securities held in the fund and their related dollar values on the last day of the reporting period. Securities are usually presented by type (common stock, bonds, etc.) and by industry classification (banking, communications, etc.). This information is useful for analyzing how your fund’s assets are invested and seeing where your portfolio manager believes the best opportunities exist to meet your objectives. Holdings are subject to change without notice and do not constitute a recommendation of any individual security. The Notes to the Financial Statements provide additional details on how the securities are valued.
The Statement of Assets and Liabilities lists the assets and liabilities of the fund and presents the fund’s net asset value (“NAV”) per share on the last day of the reporting period. The NAV is calculated by dividing the fund’s net assets (assets minus liabilities) by the number of shares outstanding. The investments, as presented in the Schedule of Investments, comprise substantially all of the fund’s assets. Other assets include cash and receivables for items such as income earned by the fund but not yet received. Liabilities include payables for items such as fund expenses incurred but not yet paid.
The Statement of Operations details the dividends and interest income earned from securities as well as the expenses incurred by the fund during the reporting period. Fund expenses may be reduced through fee waivers or reimbursements. This statement reflects total expenses before any waivers or reimbursements, the amount of waivers and reimbursements (if any), and the net expenses. This statement also shows the net realized and unrealized gains and losses from investments owned during the period. The Notes to Financial Statements provide additional details on investment income and expenses of the fund.
The Statement of Changes in Net Assets describes how the fund’s net assets were affected by its operating results, distributions to shareholders, and shareholder transactions during the reporting period. This statement is important to investors because it shows exactly what caused the fund’s net asset size to change during the period.
The Financial Highlights provide a per-share breakdown of the components that affected the fund’s NAV for the current and past reporting periods. It also shows total return, expense ratios, net investment income ratios, and portfolio turnover rates. The net investment income ratios summarize the income earned less expenses, divided by the average net assets. The expense ratios represent the percentage of average net assets that were used to cover operating expenses during the period. Expense ratios can vary across funds for a number of reasons, including differences in advisory fees and the average shareholder account size. The portfolio turnover rate represents the percentage of the fund’s holdings that have changed over the course of the period, and gives an idea of how long the fund holds onto a particular security. A 100% turnover rate implies that an amount equal to the value of the entire portfolio is turned over in a year through the purchase and sale of securities.
The Notes to Financial Statements disclose the organizational background of the fund, its significant accounting policies, federal tax information, fees and compensation paid to affiliates, and significant risks and contingencies.
We hope this guide to your shareholder report will help you get the most out of this important resource. You can visit First American Funds’ website for other useful information on each of our funds, including fund prices, performance, fund manager bios, dividends, and downloadable fact sheets. For more information, call First American Investor Services at 800.677.FUND or visit firstamericanfunds.com.
2 First American Funds 2009 Annual Report
Equity Index Fund
Investment Objective: to provide investment results that correspond to the performance of the Standard & Poor’s
500 Index* (“S&P 500 Index”).
How did the fund perform for the fiscal year ended October 31, 2009?
The First American Equity Index Fund (the “fund”), Class Y shares, returned 9.78% for the fiscal year ended October 31, 2009 (Class A shares returned 9.51% without taking the sales charge into account). By comparison, the fund’s benchmark, the S&P 500 Index*, returned 9.80% for the same period.
How did market conditions affect stock market performance during the fiscal year?
The U.S. economy appears to have emerged from the most severe recession of the postwar era during the third quarter of 2009. Gross Domestic Product expanded at a 2.8% annual rate during the quarter, and leading indicators currently suggest that positive growth will be maintained during the final quarter of the year and into 2010. Despite the return to positive growth since midyear, the unemployment rate has continued to rise and reached a new cyclical high of 10.2% in October. The continued increase in the unemployment rate reflects both a historical pattern, where it is common for the unemployment rate to reach its peak after economic activity has reached its trough during the cycle, as well as the subdued pace of the growth recovery to date. In order for the unemployment rate to decline in a sustained manner, economic growth needs to exceed the economy’s potential growth and this set of circumstances has yet to occur. The severity of the recession has left high levels of unutilized resources in the industrial sector and property markets, and the labor market as well. The combined effect of this broad-based resource underutilization has resulted in downward pressure on inflation trends throughout 2009. This trend is expected to remain in place in 2010. The exceptionally high level of unemployment and muted inflation trends have led the Federal Reserve (“the Fed”) to cut its target overnight lending rate to a range of 0% to 0.25% and engage in a host of nontraditional easing activities, including large-scale purchases of mortgage securities. These activities have resulted in a significant increase in the monetary base, which along with other policy initiatives have worked to restore normal functioning in intrabank funding markets and have supported a broad-based improvement in financial conditions. This policy stance is expected to persist well into 2010 in an effort to support financial conditions and an ongoing recovery in economic activity.
As a result of the broad-based easing of monetary policy and mortgage-related asset purchases by the Fed, equity markets began moving higher after reaching the low in March, anticipating that these actions would ease financial strains and contribute to a stabilization and improvement in economic and corporate earnings performance. Subsequent economic data and earnings reports validated the initial expectations and have contributed to further gains in the equity markets as the fiscal year progressed.
| |
| * | Unlike mutual funds, index returns do not reflect any expenses, transaction costs, or cash flow effects. |
Top 10 Holdings as of October 31, 20091 (% of net assets)
| | | | | |
| Exxon Mobil | | | 3 | .7% |
| Microsoft | | | 2 | .3 |
| Proctor & Gamble | | | 1 | .9 |
| Apple | | | 1 | .8 |
| JPMorgan Chase | | | 1 | .8 |
| Johnson & Johnson | | | 1 | .8 |
| IBM | | | 1 | .7 |
| Chevron | | | 1 | .7 |
| AT&T | | | 1 | .6 |
| General Electric | | | 1 | .6 |
| | | | | |
| | | | | |
Sector Allocation as of October 31, 20091 (% of net assets)
| | | | | |
| Information Technology | | | 18 | .9% |
| Financials | | | 14 | .5 |
| Healthcare | | | 12 | .5 |
| Energy | | | 12 | .2 |
| Consumer Staples | | | 11 | .7 |
| Industrials | | | 10 | .0 |
| Consumer Discretionary | | | 9 | .0 |
| Utilities | | | 3 | .6 |
| Materials | | | 3 | .3 |
| Telecommunication Services | | | 3 | .1 |
| Short-Term Investments | | | 1 | .2 |
Other Assets and Liabilities, Net2 | | | 0 | .0 |
| | | | | |
| | | | 100 | .0% |
| | | | | |
| | | | | |
| |
| 1 | Fund holdings and sector allocations are subject to change and are not recommendations to buy or sell any security. Allocations reflect the fund’s exposure to each sector through direct investments and do not reflect the impact on sector allocation of holding derivative instruments, such as futures contracts. See note 2 in Notes to Financial Statements and the fund’s Schedule of Investments for derivatives held at October 31, 2009. |
| |
| 2 | Investments typically comprise substantially all of the fund’s net assets. Other assets and liabilities include receivables and payables on derivative instruments based on mark-to-market adjustments as well as receivables for items such as income earned but not yet received and payables for items such as fund expenses incurred but not yet paid. |
First American Funds 2009 Annual Report 3
Equity Index Fund
What will be the likely developments in the equity markets in the coming fiscal year?
With equity markets having rebounded decisively from their March lows, most equity investments appear to have the economic rebound fully incorporated into their prices. As measured by the VIX Index of volatility in the S&P options marketplace, perceived risk levels have dropped sharply to levels consistent with long-term averages. Further reassuring markets, the Obama Administration and the Fed are both committed to very accommodative policies that should soften the concerns of ongoing unemployment and its effects on the economic health of the U.S.
As noted above, policy makers have stabilized losses, but conditions still remain guarded. An advantage of index investments is that their broad and effective diversification can help to avoid excess risks, minimizing surprises that can impact individual sectors or groups of stocks with similar “style” characteristics*. For example, if the Fed starts to pull back on its “quantitative easing,” through its purchase of long-term agency and mortgage-backed securities, firms with higher debt/equity ratios could again be disadvantaged if corporate bond yields rise in response. Another concern is that, with unemployment stubbornly high, firms that depend on strong consumer confidence may need to further trim operations.
Fund Overview
The fund is invested to replicate the S&P 500 Index as closely as possible with consideration given to turnover costs and fees. As a result, the fund performed very similarly to the index. The index includes 500 leading companies in the major industries of the U.S. economy and covers about 75% of the dollar value of all traded stocks in the U.S. market.
The best-performing sectors during the fiscal year were information technology, consumer discretionary, and materials, having gained 31%, 21%, and 16% respectively. The sector that declined the most over the same period was financials, which fell 7%.
| |
| * | Diversification does not assure a profit or protect against a loss in a declining market. |
4 First American Funds 2009 Annual Report
Equity Index Fund
Annual Performance1,2
| | | | | | | | | | | | | | | | | | | | | | | | | | | | | | | | | |
| | | October 31, 2009 | | September 30, 2009* |
| | | | | | | | | Since Inception | | | | | | | | Since Inception |
| | | 1 year | | 5 years | | 10 years | | 9/24/2001 | | 1 year | | 5 years | | 10 years | | 9/24/2001 |
| |
Average annual return with sales charge (POP) | | | | | | | | | | | | | | | | | | | | | | | | | | | | | | | | |
| Class A | | | 3 | .51% | | | (1.23 | )% | | | (2.03 | )% | | | — | | | | (12.30 | )% | | | (0.56 | )% | | | (1.25 | )% | | | — | |
| |
| |
| Class B | | | 3 | .69% | | | (1.23 | )% | | | (2.21 | )% | | | — | | | | (12.47 | )% | | | (0.56 | )% | | | (1.43 | )% | | | — | |
| |
| |
| Class C | | | 7 | .69% | | | (0.86 | )% | | | (2.21 | )% | | | — | | | | (8.84 | )% | | | (0.19 | )% | | | (1.43 | )% | | | — | |
| | | | | | | | | | | | | | | | | | | | | | | | | | | | | | | | | |
Average annual return without sales charge (NAV) | | | | | | | | | | | | | | | | | | | | | | | | | | | | | | | | |
| Class A | | | 9 | .51% | | | (0.11 | )% | | | (1.48 | )% | | | — | | | | (7.21 | )% | | | 0.57 | % | | | (0.68 | )% | | | — | |
| |
| |
| Class B | | | 8 | .69% | | | (0.86 | )% | | | (2.21 | )% | | | — | | | | (7.93 | )% | | | (0.18 | )% | | | (1.43 | )% | | | — | |
| |
| |
| Class C | | | 8 | .69% | | | (0.86 | )% | | | (2.21 | )% | | | — | | | | (7.93 | )% | | | (0.19 | )% | | | (1.43 | )% | | | — | |
| |
| |
| Class R | | | 9 | .27% | | | (0.35 | )% | | | — | | | | 1.68 | % | | | (7.48 | )% | | | 0.31 | % | | | — | | | | 1.93 | % |
| |
| |
| Class Y | | | 9 | .78% | | | 0.14 | % | | | (1.23 | )% | | | — | | | | (7.03 | )% | | | 0.81 | % | | | (0.44 | )% | | | — | |
| |
| |
S&P 500 Index3 | | | 9 | .80% | | | 0.33 | % | | | (0.95 | )% | | | 2.35 | % | | | (6.91 | )% | | | 1.02 | % | | | (0.15 | )% | | | 2.61 | % |
| | | | | | | | | | | | | | | | | | | | | | | | | | | | | | | | | |
| | | | | | | | | | | | | | | | | | | | | | | | | | | | | | | | | |
The performance data quoted on this page represents past performance and does not guarantee future results. The investment return and principal value of an investment will fluctuate so that an investor’s shares, when redeemed, may be worth more or less than their original cost. Current performance of the fund may be lower or higher than the performance data quoted. Performance data current to the most recent month-end may be obtained by calling 800.677.FUND.
| |
| 1 | Total returns at net asset value (“NAV”) reflect performance over the time period indicated without including the fund’s maximum sales charge and assume reinvestment of all distributions at NAV. |
Total returns at public offering price (“POP”) reflect performance over the time period indicated including the maximum sales charge of 5.50% for Class A shares and the maximum contingent deferred sales charge (“CDSC”) for Class B and Class C shares for the relevant period. Maximum CDSC is 5.00% for Class B shares in the first year, decreasing annually to 0% in the seventh year following purchase, and 1.00% for Class C shares. Total returns assume reinvestment of all distributions at NAV.
As reflected in the prospectus for the fiscal year ended October 31, 2008, the fund’s total annual operating expense ratio, before waivers and including the expenses of other investment companies in which the fund invests, if any (“acquired fund fees and expenses”), for Class A, Class B, Class C, Class R, and Class Y shares was 0.78%, 1.53%, 1.53%, 1.03%, and 0.53%, respectively. The advisor has contractually agreed to waive fees through February 28, 2010 so that total annual fund operating expenses, not including any acquired fund fees and expenses, for Class A, Class B, Class C, Class R, and Class Y shares do not exceed 0.62%, 1.37%, 1.37%, 0.87%, and 0.37%, respectively. These fee waivers may be terminated at any time after February 28, 2010, at the discretion of the advisor. Prior to that time, such waivers may not be terminated without the approval of the fund’s board of directors.
| | |
| | * | This table represents average annual total returns through the latest calendar quarter – rather than through the end of the fiscal period. |
Value of $10,000 Investment 1,2,4 as of October 31, 2009
This chart illustrates the total value of an assumed $10,000 investment in the fund’s Class A shares (from 10/31/1999 to 10/31/2009) as compared to the S&P 500 Index3.
| |
| 2 | Performance does not reflect the deduction of taxes that a shareholder would pay on fund distributions or redemption of fund shares. Performance reflects fee waivers that were in effect during the periods indicated. In the absence of such fee waivers, total returns would be reduced. Index performance is for illustrative purposes only and does not reflect any expenses, transaction costs, or cash flow effects. Direct investment in the index is not available. |
| |
| 3 | An unmanaged, market capitalization-weighted index based on the average weighted performance of 500 widely held large-cap common stocks. |
| |
| 4 | Performance for Class B, Class C, Class R, and Class Y shares is not presented. Performance for these classes will vary due to their different expense structures. |
First American Funds 2009 Annual Report 5
Mid Cap Index Fund
Investment Objective: to provide investment results that correspond to the performance of the Standard & Poor’s MidCap 400 Index* (“S&P MidCap 400 Index”).
How did the fund perform for the fiscal year ended October 31, 2009?
The First American Mid Cap Index Fund (the “fund”), Class Y shares, returned 17.92% for the fiscal year ended October 31, 2009 (Class A shares returned 17.53% without taking the sales charge into account). By comparison, the fund’s benchmark, the S&P MidCap 400 Index*, returned 18.18% for the same period.
How did market conditions affect stock market performance during the fiscal year?
The U.S. economy appears to have emerged from the most severe recession of the postwar era during the third quarter of 2009. Gross Domestic Product expanded at a 2.8% annual rate during the quarter, and leading indicators currently suggest that positive growth will be maintained during the final quarter of the year and into 2010. Despite the return to positive growth since midyear, the unemployment rate has continued to rise and reached a new cyclical high of 10.2% in October. The continued increase in the unemployment rate reflects both a historical pattern, where it is common for the unemployment rate to reach its peak after economic activity has reached its trough during the cycle, as well as the subdued pace of the growth recovery to date. In order for the unemployment rate to decline in a sustained manner, economic growth needs to exceed the economy’s potential growth and this set of circumstances has yet to occur. The severity of the recession has left high levels of unutilized resources in the industrial sector and property markets, and the labor market as well. The combined effect of this broad-based resource underutilization has resulted in downward pressure on inflation trends throughout 2009. This trend is expected to remain in place in 2010. The exceptionally high level of unemployment and muted inflation trends have led the Federal Reserve (“the Fed”) to cut its target overnight lending rate to a range of 0% to 0.25% and engage in a host of nontraditional easing activities, including large-scale purchases of mortgage securities. These activities have resulted in a significant increase in the monetary base, which along with other policy initiatives have worked to restore normal functioning in intrabank funding markets and have supported a broad-based improvement in financial conditions. This policy stance is expected to persist well into 2010 in an effort to support financial conditions and an ongoing recovery in economic activity.
As a result of the broad-based easing of monetary policy and mortgage-related asset purchases by the Fed, equity markets began moving higher after reaching the low in March, anticipating that these actions would ease financial strains and contribute to a stabilization and improvement in economic and corporate earnings performance. Subsequent economic data and earnings reports validated the initial expectations and have contributed to further gains in the equity markets as the fiscal year progressed.
| |
| * | Unlike mutual funds, index returns do not reflect any expenses, transaction costs, or cash flow effects. |
Top 10 Holdings as of October 31, 20091 (% of net assets)
| | | | | |
| First American Prime Obligations Fund, Class Z | | | 8 | .1% |
| U.S. Treasury Bill, 0.230%, 11/19/2009 | | | 1 | .2 |
| Priceline.com | | | 0 | .7 |
| Vertex Pharmaceuticals | | | 0 | .7 |
| Newfield Exploration | | | 0 | .6 |
| Everest Re Group | | | 0 | .6 |
| Ross Stores | | | 0 | .6 |
| Joy Global | | | 0 | .6 |
| Pride International | | | 0 | .6 |
| Cerner | | | 0 | .6 |
| | | | | |
| | | | | |
Sector Allocation as of October 31, 20091 (% of net assets)
| | | | | |
| Financials | | | 16 | .8% |
| Consumer Discretionary | | | 14 | .4 |
| Industrials | | | 13 | .6 |
| Information Technology | | | 13 | .6 |
| Healthcare | | | 11 | .1 |
| Energy | | | 6 | .0 |
| Materials | | | 6 | .0 |
| Utilities | | | 5 | .9 |
| Consumer Staples | | | 3 | .5 |
| Telecommunication Services | | | 0 | .5 |
| Short-Term Investments | | | 9 | .3 |
Other Assets and Liabilities, Net2 | | | (0 | .7) |
| | | | | |
| | | | 100 | .0% |
| | | | | |
| | | | | |
| |
| 1 | Fund holdings and sector allocations are subject to change and are not recommendations to buy or sell any security. Allocations reflect the fund’s exposure to each sector through direct investments and do not reflect the impact on sector allocation of holding derivative instruments, such as futures contracts. See note 2 in Notes to Financial Statements and the fund’s Schedule of Investments for derivatives held at October 31, 2009. |
| |
| 2 | Investments typically comprise substantially all of the fund’s net assets. Other assets and liabilities include receivables and payables on derivative instruments based on mark-to-market adjustments as well as receivables for items such as income earned but not yet received and payables for items such as fund expenses incurred but not yet paid. |
6 First American Funds 2009 Annual Report
What will be the likely developments in the equity markets in the coming fiscal year?
With equity markets having rebounded decisively from their March lows, most equity investments appear to have the economic rebound fully incorporated into their prices. As measured by the VIX Index of volatility in the S&P options marketplace, perceived risk levels have dropped sharply to levels consistent with long-term averages. Further reassuring markets, the Obama Administration and the Fed are both committed to very accommodative policies that should soften the concerns of ongoing unemployment and its effects on the economic health of the U.S.
As noted above, policy makers have stabilized losses, but conditions still remain guarded. An advantage of index investments is that their broad and effective diversification can help to avoid excess risks, minimizing surprises that can impact individual sectors or groups of stocks with similar “style” characteristics*. For example, if the Fed starts to pull back on its “quantitative easing,” through its purchase of long-term agency and mortgage-backed securities, firms with higher debt/equity ratios could again be disadvantaged if corporate bond yields rise in response. Another concern is that, with unemployment stubbornly high, firms that depend on strong consumer confidence may need to further trim operations.
Fund Overview
The fund is invested to replicate the S&P MidCap 400 Index as closely as possible with consideration given to turnover costs and fees. As a result, the fund performed very similarly to the index. The index includes stocks that reflect the risk and return characteristics of the broader mid-cap universe. Mid-cap stocks are now being recognized as an independent asset class and the capitalization range of this index covers about 10% of U.S. equities market.
The best-performing sectors during the fiscal year were information technology, consumer discretionary, and materials, having gained 35%, 31%, and 25% respectively. The worst-performing sector over the same period was financials, which fell 1%.
| |
| * | Diversification does not assure a profit or protect against a loss in a declining market. |
First American Funds 2009 Annual Report 7
Mid Cap Index Fund
Annual Performance1,2
| | | | | | | | | | | | | | | | | | | | | | | | | | | | | | | | | | | | | | | | | |
| | | October 31, 2009 | | September 30, 2009* |
| | | | | | | Since Inception | | | | | | Since Inception |
| | | 1 year | | 5 years | | 11/04/1999 | | 11/27/2000 | | 9/24/2001 | | 1 year | | 5 years | | 11/04/1999 | | 11/27/2000 | | 9/24/2001 |
| |
Average annual return with sales charge (POP) | | | | | | | | | | | | | | | | | | | | | | | | | | | | | | | | | | | | | | | | |
| Class A | | | 11 | .11% | | | 1.61 | % | | | 4.73 | % | | | — | | | | — | | | | (8.81 | )% | | | 2.87 | % | | | 5.27 | % | | | — | | | | — | |
| |
| |
| Class C | | | 15 | .68% | | | 2.01 | % | | | — | | | | — | | | | 5.71 | % | | | (5.05 | )% | | | 3.28 | % | | | — | | | | — | | | | 6.40 | % |
| | | | | | | | | | | | | | | | | | | | | | | | | | | | | | | | | | | | | | | | | |
Average annual return without sales charge (NAV) | | | | | | | | | | | | | | | | | | | | | | | | | | | | | | | | | | | | | | | | |
| Class A | | | 17 | .53% | | | 2.77 | % | | | 5.32 | % | | | — | | | | — | | | | (3.47 | )% | | | 4.04 | % | | | 5.87 | % | | | — | | | | — | |
| |
| |
| Class C | | | 16 | .68% | | | 2.01 | % | | | — | | | | — | | | | 5.71 | % | | | (4.17 | )% | | | 3.28 | % | | | — | | | | — | | | | 6.40 | % |
| |
| |
| Class R | | | 17 | .29% | | | 2.48 | % | | | — | | | | 3.44 | % | | | — | | | | (3.70 | )% | | | 3.78 | % | | | — | | | | 4.04 | % | | | — | |
| |
| |
| Class Y | | | 17 | .92% | | | 3.02 | % | | | 5.59 | % | | | — | | | | — | | | | (3.22 | )% | | | 4.32 | % | | | 6.14 | % | | | — | | | | — | |
| |
| |
S&P MidCap 400 Index3 | | | 18 | .18% | | | 3.24 | % | | | 6.20 | % | | | 4.35 | % | | | 7.16 | % | | | (3.11 | )% | | | 4.53 | % | | | 6.75 | % | | | 4.94 | % | | | 7.86 | % |
| | | | | | | | | | | | | | | | | | | | | | | | | | | | | | | | | | | | | | | | | |
| | | | | | | | | | | | | | | | | | | | | | | | | | | | | | | | | | | | | | | | | |
The performance data quoted on this page represents past performance and does not guarantee future results. The investment return and principal value of an investment will fluctuate so that an investor’s shares, when redeemed, may be worth more or less than their original cost. Current performance of the fund may be lower or higher than the performance data quoted. Performance data current to the most recent month-end may be obtained by calling 800.677.FUND.
| |
| 1 | Stocks of mid-capitalization companies may be slightly less volatile than those of small-capitalization companies, but they still involve substantial risk and may be subject to increased volatility and more price fluctuation than large-capitalization companies. |
Total returns at net asset value (“NAV”) reflect performance over the time period indicated without including the fund’s maximum sales charge and assume reinvestment of all distributions at NAV.
Total returns at public offering price (“POP”) reflect performance over the time period indicated including the maximum sales charge of 5.50% for Class A shares and the maximum contingent deferred sales charge of 1.00% for Class C shares for the relevant period. Total returns assume reinvestment of all distributions at NAV.
| |
| | As reflected in the prospectus for the fiscal year ended October 31, 2008, the fund’s total annual operating expense ratio, before waivers and including the expenses of other investment companies in which the fund invests, if any (“acquired fund fees and expenses”), for Class A, Class C, Class R, and Class Y shares was 0.85%, 1.59%, 1.11%, and 0.60%, respectively. The advisor has contractually agreed to waive fees through February 28, 2010 so that total annual fund operating expenses, not including any acquired fund fees and expenses, for Class A, Class C, Class R, and Class Y shares do not exceed 0.75%, 1.50%, 1.00%, and 0.50%, respectively. These fee waivers may be terminated at any time after February 28, 2010, at the discretion of the advisor. Prior to that time, such waivers may not be terminated without the approval of the fund’s board of directors. |
| | |
| | * | This table represents average annual total returns through the latest calendar quarter – rather than through the end of the fiscal period. |
Value of $10,000 Investment1,2,4 as of October 31, 2009
This chart illustrates the total value of an assumed $10,000 investment in the fund’s Class A shares (from 11/04/1999 to 10/31/2009) as compared to the S&P MidCap 400 Index3.
| |
| 2 | Performance does not reflect the deduction of taxes that a shareholder would pay on fund distributions or redemption of fund shares. Performance reflects fee waivers that were in effect during the periods indicated. In the absence of such fee waivers, total returns would be reduced. Index performance is for illustrative purposes only and does not reflect any expenses, transaction costs, or cash flow effects. Direct investment in the index is not available. |
| |
| 3 | An unmanaged, market value-weighted index of 400 mid-cap companies. |
| |
| 4 | Performance for Class C, Class R, and Class Y shares is not presented. Performance for these classes will vary due to their different expense structures. |
8 First American Funds 2009 Annual Report
Small Cap Index Fund
Investment Objective: to provide investment results that correspond to the performance of the Russell 2000 Index*.
How did the fund perform for the fiscal year ended October 31, 2009?
The First American Small Cap Index Fund (the “fund”), Class Y shares, returned 6.50% for the fiscal year ended October 31, 2009 (Class A shares returned 6.34% without taking the sales charge into account). By comparison, the fund’s benchmark, the Russell 2000 Index*, returned 6.46% for the same period.
How did market conditions affect stock market performance during the fiscal year?
The U.S. economy appears to have emerged from the most severe recession of the postwar era during the third quarter of 2009. Gross Domestic Product expanded at a 2.8% annual rate during the quarter, and leading indicators currently suggest that positive growth will be maintained during the final quarter of the year and into 2010. Despite the return to positive growth since midyear, the unemployment rate has continued to rise and reached a new cyclical high of 10.2% in October. The continued increase in the unemployment rate reflects both a historical pattern, where it is common for the unemployment rate to reach its peak after economic activity has reached its trough during the cycle, as well as the subdued pace of the growth recovery to date. In order for the unemployment rate to decline in a sustained manner, economic growth needs to exceed the economy’s potential growth and this set of circumstances has yet to occur. The severity of the recession has left high levels of unutilized resources in the industrial sector and property markets, and the labor market as well. The combined effect of this broad-based resource underutilization has resulted in downward pressure on inflation trends throughout 2009. This trend is expected to remain in place in 2010. The exceptionally high level of unemployment and muted inflation trends have led the Federal Reserve (“the Fed”) to cut its target overnight lending rate to a range of 0% to 0.25% and engage in a host of nontraditional easing activities, including large-scale purchases of mortgage securities. These activities have resulted in a significant increase in the monetary base, which along with other policy initiatives have worked to restore normal functioning in intrabank funding markets and have supported a broad-based improvement in financial conditions. This policy stance is expected to persist well into 2010 in an effort to support financial conditions and an ongoing recovery in economic activity.
As a result of the broad-based easing of monetary policy and mortgage-related asset purchases by the Fed, equity markets began moving higher after reaching the low in March, anticipating that these actions would ease financial strains and contribute to a stabilization and improvement in economic and corporate earnings performance. Subsequent economic data and earnings reports validated the initial expectations and have contributed to further gains in the equity markets as the fiscal year progressed.
| |
| * | Unlike mutual funds, index returns do not reflect any expenses, transaction costs, or cash flow effects. |
Top 10 Holdings as of October 31, 20091 (% of net assets)
| | | | | |
| First American Prime Obligations Fund, Class Z | | | 8 | .4% |
| U.S. Treasury Bill, 0.230%, 11/19/2009 | | | 1 | .6 |
| Human Genome Sciences | | | 0 | .3 |
| Tupperware | | | 0 | .3 |
| Perot Systems, Class A | | | 0 | .3 |
| Solera Holdings | | | 0 | .2 |
| Bally Technologies | | | 0 | .2 |
| E*TRADE Financial | | | 0 | .2 |
| J. Crew Group | | | 0 | .2 |
| 3Com | | | 0 | .2 |
| | | | | |
| | | | | |
Sector Allocation as of October 31, 20091 (% of net assets)
| | | | | |
| Financials | | | 18 | .5% |
| Information Technology | | | 17 | .0 |
| Industrials | | | 14 | .3 |
| Consumer Discretionary | | | 12 | .7 |
| Healthcare | | | 12 | .7 |
| Energy | | | 4 | .5 |
| Materials | | | 4 | .0 |
| Utilities | | | 3 | .0 |
| Consumer Staples | | | 3 | .0 |
| Telecommunication Services | | | 1 | .0 |
| Short-Term Investments | | | 10 | .0 |
Other Assets and Liabilities, Net2 | | | (0 | .7) |
| | | | | |
| | | | 100 | .0% |
| | | | | |
| | | | | |
| |
| 1 | Fund holdings and sector allocations are subject to change and are not recommendations to buy or sell any security. Allocations reflect the fund’s exposure to each sector through direct investments and do not reflect the impact on sector allocation of holding derivative instruments, such as futures contracts. See note 2 in Notes to Financial Statements and the fund’s Schedule of Investments for derivatives held at October 31, 2009. |
| |
| 2 | Investments typically comprise substantially all of the fund’s net assets. Other assets and liabilities include receivables and payables on derivative instruments based on mark-to-market adjustments as well as receivables for items such as income earned but not yet received and payables for items such as fund expenses incurred but not yet paid. |
First American Funds 2009 Annual Report 9
Small Cap Index Fund
What will be the likely developments in the equity markets in the coming fiscal year?
With equity markets having rebounded decisively from their March lows, most equity investments appear to have the economic rebound fully incorporated into their prices. As measured by the VIX index of volatility in the S&P options marketplace, perceived risk levels have dropped sharply to levels consistent with long-term averages, if not as low as were assessed prior to the bear markets. Further reassuring markets, the Obama Administration and the Fed are both committed to very accommodative policies that should soften the concerns of ongoing unemployment and its effects on the economic health of the U.S.
As noted above, policy makers have stabilized losses, but conditions still remain guarded. An advantage of index investments is that their broad and effective diversification can help to avoid excess risks, minimizing surprises that can impact individual sectors or groups of stocks with similar “style” characteristics*. For example, if the Fed starts to pull back on its “quantitative easing,” through its purchase of long-term agency and mortgage-backed securities, firms with higher debt/equity ratios could again be disadvantaged if corporate bond yields rise in response. Another concern is that, with unemployment stubbornly high, firms that depend on strong consumer confidence may need to further trim operations.
Fund Overview
The fund is invested to replicate the Russell 2000 Index as closely as possible with consideration given to turnover costs and fees. As a result, the fund performed very similarly to the index. The index includes the traded shares of U.S. companies ranked 1,001 through 3,000 in size, thereby skipping large-and mid-capitalization names in the list of investable companies.
The best-performing sectors during the fiscal year were information technology, consumer discretionary, and materials, having gained 29%, 28%, and 28% respectively. The sector that declined the most over the same period was financials, which fell 13%.
| |
| * | Diversification does not assure a profit or protect against a loss in a declining market. |
10 First American Funds 2009 Annual Report
Small Cap Index Fund
Annual Performance1,2
| | | | | | | | | | | | | | | | | | | | | | | | | | | | | | | | | |
| | | October 31, 2009 | | September 30, 2009* |
| | | | | | | | | Since Inception
| | | | | | | | Since Inception
|
| | | 1 year | | 5 years | | 10 years | | 9/24/2001 | | 1 year | | 5 years | | 10 years | | 9/24/2001 |
| |
Average annual return with sales charge (POP) | | | | | | | | | | | | | | | | | | | | | | | | | | | | | | | | |
| Class A | | | 0 | .48% | | | (0.97 | )% | | | 4.21 | % | | | — | | | | (14.17 | )% | | | 0.81 | % | | | 4.92 | % | | | — | |
| |
| |
| Class C | | | 4 | .72% | | | (0.66 | )% | | | — | | | | 4.12 | % | | | (10.61 | )% | | | 1.12 | % | | | — | | | | 5.09 | % |
| | | | | | | | | | | | | | | | | | | | | | | | | | | | | | | | | |
Average annual return without sales charge (NAV) | | | | | | | | | | | | | | | | | | | | | | | | | | | | | | | | |
| Class A | | | 6 | .34% | | | 0.16 | % | | | 4.80 | % | | | — | | | | (9.19 | )% | | | 1.96 | % | | | 5.51 | % | | | — | |
| |
| |
| Class C | | | 5 | .60% | | | (0.66 | )% | | | — | | | | 4.12 | % | | | (9.86 | )% | | | 1.12 | % | | | — | | | | 5.09 | % |
| |
| |
| Class R | | | 6 | .08% | | | (0.17 | )% | | | 4.57 | % | | | — | | | | (9.37 | )% | | | 1.64 | % | | | 5.30 | % | | | — | |
| |
| |
| Class Y | | | 6 | .50% | | | 0.32 | % | | | 5.00 | % | | | — | | | | (9.04 | )% | | | 2.13 | % | | | 5.72 | % | | | — | |
| |
| |
Russell 2000 Index3 | | | 6 | .46% | | | 0.59 | % | | | 4.11 | % | | | 5.88 | % | | | (9.55 | )% | | | 2.41 | % | | | 4.88 | % | | | 6.88 | % |
| | | | | | | | | | | | | | | | | | | | | | | | | | | | | | | | | |
| | | | | | | | | | | | | | | | | | | | | | | | | | | | | | | | | |
The performance data quoted on this page represents past performance and does not guarantee future results. The investment return and principal value of an investment will fluctuate so that an investor’s shares, when redeemed, may be worth more or less than their original cost. Current performance of the fund may be lower or higher than the performance data quoted. Performance data current to the most recent month-end may be obtained by calling 800.677.FUND.
| |
| 1 | Stocks of small-capitalization companies involve substantial risk. These stocks historically have experienced greater price volatility than stocks of larger companies, and they may be expected to do so in the future. |
Total returns at net asset value (“NAV”) reflect performance over the time period indicated without including the fund’s maximum sales charge and assume reinvestment of all distributions at NAV.
Total returns at public offering price (“POP”) reflect performance over the time period indicated including the maximum sales charge of 5.50% for Class A shares and the maximum contingent deferred sales charge of 1.00% for Class C shares for the relevant period. Total returns assume reinvestment of all distributions at NAV.
As reflected in the prospectus for the fiscal year ended October 31, 2008, the fund’s total annual operating expense ratio, before waivers and including the expenses of other investment companies in which the fund invests, if any (“acquired fund fees and expenses”), for Class A, Class C, Class R, and Class Y shares was 1.35%, 2.10%, 1.61%, and 1.10%, respectively. The advisor has contractually agreed to waive fees through February 28, 2010 so that total annual fund operating expenses, not including any acquired fund fees and expenses, for Class A, Class C, Class R, and Class Y shares do not exceed 0.83%, 1.58%, 1.08%, and 0.58%, respectively. These fee waivers may be terminated at any time after February 28, 2010, at the discretion of the advisor. Prior to that time, such waivers may not be terminated without the approval of the fund’s board of directors.
| |
| * | This table represents average annual total returns through the latest calendar quarter – rather than through the end of the fiscal period. |
Value of $10,000 Investment1,2,4 as of October 31, 2009
This chart illustrates the total value of an assumed $10,000 investment in the fund’s Class A and Class Y shares (from 10/31/1999 to 10/31/2009) as compared to the Russell 2000 Index.3
| |
| 2 | Performance does not reflect the deduction of taxes that a shareholder would pay on fund distributions or redemption of fund shares. Performance reflects fee waivers that were in effect during the periods indicated. In the absence of such fee waivers, total returns would be reduced. Index performance is for illustrative purposes only and does not reflect any expenses, transaction costs, or cash flow effects. Direct investment in the index is not available. |
On September 24, 2001, the Small Cap Index Fund became the successor by merger to the Firstar Small Cap Index Fund, a series of Firstar Funds, Inc. Prior to the merger, the First American Fund had no assets or liabilities. Performance presented prior to September 24, 2001, represents that of the Firstar Small Cap Index Fund. The Firstar Small Cap Index Fund was organized on December 11, 2000, and, prior to that, was a separate series of Mercantile Mutual Funds, Inc.
| |
| 3 | An unmanaged index that measures the performance of the 2,000 smallest companies in the Russell 2000 Index. |
| |
| 4 | Performance for Class C, Class R, and Class Y shares is not presented. Performance for these classes will vary due to their different expense structures. |
First American Funds 2009 Annual Report 11
Expense Examples
As a shareholder of one or more of the funds, you incur two types of costs: (1) transaction costs, including sales charges (loads) on purchase payments; and (2) ongoing costs, including investment advisory fees, distribution and/or service (12b-1) fees, and other fund expenses. The examples below are intended to help you understand your ongoing costs (in dollars) of investing in the funds and to compare these costs with the ongoing costs of investing in other mutual funds. The examples are based on an investment of $1,000 invested in a fund at the beginning of the period and held for the entire period from May 1, 2009 to October 31, 2009.
Actual Expenses
For each class of each fund, two lines are presented in the table below — the first line for each class provides information about actual account values and actual expenses. You may use the information in this line, together with the amount you invested in the particular fund and class, to estimate the expenses that you paid over the period. Simply divide your account value in the fund and class by $1,000 (for example, an $8,600 account value divided by $1,000 = 8.6), then multiply the result by the number in the first line under the heading entitled “Expenses Paid During Period” for your fund and class to estimate the expenses you paid on your account during this period.
Hypothetical Example for Comparison Purposes
For each class of each fund, the second line for each class provides information about hypothetical account values and hypothetical expenses based on the respective fund’s actual expense ratio and an assumed rate of return of 5% per year before expenses, which is not the fund’s actual return. The hypothetical account values and expenses may not be used to estimate the actual ending account balance or expenses you paid for the period. You may use this information to compare the ongoing costs of investing in the fund and other funds. To do so, compare this 5% hypothetical examples with the 5% hypothetical examples that appear in the shareholder reports of the other funds.
Please note that the expenses shown in the tables are meant to highlight your ongoing costs only and do not reflect any transactional costs, such as sales charges (loads). Therefore, the second line of the tables for each class of each fund is useful in comparing ongoing costs only, and will not help you determine the relative total costs of owning different funds. In addition, if these transactional costs were included, your costs would have been higher.
Equity Index Fund
| | | | | | | | | | | | | |
| | | | | | | Expenses Paid During
|
| | | Beginning Account
| | Ending Account
| | Period1 (5/01/09 to
|
| | | Value (5/01/09)
| | Value (10/31/09)
| | 10/31/09) |
| |
Class A Actual2 | | $ | 1,000.00 | | | $ | 1,197.60 | | | $ | 3.43 | |
| |
| |
| Class A Hypothetical (5% return before expenses) | | $ | 1,000.00 | | | $ | 1,022.08 | | | $ | 3.16 | |
| |
| |
| | | | | | | | | | | | | |
Class B Actual2 | | $ | 1,000.00 | | | $ | 1,192.90 | | | $ | 7.57 | |
| |
| |
| Class B Hypothetical (5% return before expenses) | | $ | 1,000.00 | | | $ | 1,018.30 | | | $ | 6.97 | |
| |
| |
| | | | | | | | | | | | | |
Class C Actual2 | | $ | 1,000.00 | | | $ | 1,192.90 | | | $ | 7.57 | |
| |
| |
| Class C Hypothetical (5% return before expenses) | | $ | 1,000.00 | | | $ | 1,018.30 | | | $ | 6.97 | |
| |
| |
| | | | | | | | | | | | | |
Class R Actual2 | | $ | 1,000.00 | | | $ | 1,196.50 | | | $ | 4.82 | |
| |
| |
| Class R Hypothetical (5% return before expenses) | | $ | 1,000.00 | | | $ | 1,020.82 | | | $ | 4.43 | |
| |
| |
| | | | | | | | | | | | | |
Class Y Actual2 | | $ | 1,000.00 | | | $ | 1,199.00 | | | $ | 2.05 | |
| |
| |
| Class Y Hypothetical (5% return before expenses) | | $ | 1,000.00 | | | $ | 1,023.34 | | | $ | 1.89 | |
| | | | | | | | | | | | | |
| | | | | | | | | | | | | |
| |
| 1 | Expenses are equal to the fund’s annualized expense ratio for the most recent six-month period of 0.62%, 1.37%, 1.37%, 0.87%, and 0.37% for Class A, Class B, Class C, Class R, and Class Y, respectively, multiplied by the average account value over the period, multiplied by the number of days in the most recent fiscal half-year/365 (to reflect the one-half year period). |
| |
| 2 | Based on the actual returns for the six-month period ended October 31, 2009 of 19.76%, 19.29%, 19.29%, 19.65%, and 19.90% for Class A, Class B, Class C, Class R, and Class Y, respectively. |
12 First American Funds 2009 Annual Report
Mid Cap Index Fund
| | | | | | | | | | | | | |
| | | | | | | Expenses Paid During
|
| | | Beginning Account
| | Ending Account
| | Period1 (5/01/09 to
|
| | | Value (5/01/09)
| | Value (10/31/09)
| | 10/31/09) |
| |
Class A Actual2 | | $ | 1,000.00 | | | $ | 1,179.70 | | | $ | 4.07 | |
| |
| |
| Class A Hypothetical (5% return before expenses) | | $ | 1,000.00 | | | $ | 1,021.48 | | | $ | 3.77 | |
| |
| |
| | | | | | | | | | | | | |
Class C Actual2 | | $ | 1,000.00 | | | $ | 1,176.20 | | | $ | 8.17 | |
| |
| |
| Class C Hypothetical (5% return before expenses) | | $ | 1,000.00 | | | $ | 1,017.69 | | | $ | 7.58 | |
| |
| |
| | | | | | | | | | | | | |
Class R Actual2 | | $ | 1,000.00 | | | $ | 1,178.80 | | | $ | 5.44 | |
| |
| |
| Class R Hypothetical (5% return before expenses) | | $ | 1,000.00 | | | $ | 1,020.21 | | | $ | 5.04 | |
| |
| |
| | | | | | | | | | | | | |
Class Y Actual2 | | $ | 1,000.00 | | | $ | 1,181.90 | | | $ | 2.69 | |
| |
| |
| Class Y Hypothetical (5% return before expenses) | | $ | 1,000.00 | | | $ | 1,022.74 | | | $ | 2.50 | |
| | | | | | | | | | | | | |
| | | | | | | | | | | | | |
| |
| 1 | Expenses are equal to the fund’s annualized expense ratio for the most recent six-month period of 0.74%, 1.49%, 0.99%, and 0.49% for Class A, Class C, Class R, and Class Y, respectively, multiplied by the average account value over the period, multiplied by the number of days in the most recent fiscal half-year/365 (to reflect the one-half year period). |
| |
| 2 | Based on the actual returns for the six month period ended October 31, 2009 of 17.97%, 17.62%, 17.88%, and 18.19% for Class A, Class C, Class R, and Class Y, respectively. |
Small Cap Index Fund
| | | | | | | | | | | | | |
| | | | | | | Expenses Paid During
|
| | | Beginning Account
| | Ending Account
| | Period3 (5/01/09 to
|
| | | Value (5/01/09)
| | Value (10/31/09)
| | 10/31/09) |
| |
Class A Actual4 | | $ | 1,000.00 | | | $ | 1,158.40 | | | $ | 4.46 | |
| |
| |
| Class A Hypothetical (5% return before expenses) | | $ | 1,000.00 | | | $ | 1,021.07 | | | $ | 4.18 | |
| |
| |
| | | | | | | | | | | | | |
Class C Actual4 | | $ | 1,000.00 | | | $ | 1,154.50 | | | $ | 8.53 | |
| |
| |
| Class C Hypothetical (5% return before expenses) | | $ | 1,000.00 | | | $ | 1,017.29 | | | $ | 7.98 | |
| |
| |
| | | | | | | | | | | | | |
Class R Actual4 | | $ | 1,000.00 | | | $ | 1,157.20 | | | $ | 5.82 | |
| |
| |
| Class R Hypothetical (5% return before expenses) | | $ | 1,000.00 | | | $ | 1,019.81 | | | $ | 5.45 | |
| |
| |
| | | | | | | | | | | | | |
Class Y Actual4 | | $ | 1,000.00 | | | $ | 1,159.80 | | | $ | 3.10 | |
| |
| |
| Class Y Hypothetical (5% return before expenses) | | $ | 1,000.00 | | | $ | 1,022.33 | | | $ | 2.91 | |
| | | | | | | | | | | | | |
| | | | | | | | | | | | | |
| |
| 3 | Expenses are equal to the fund’s annualized expense ratio for the most recent six-month period of 0.82%, 1.57%, 1.07%, and 0.57% for Class A, Class C, Class R, and Class Y, respectively, multiplied by the average account value over the period, multiplied by the number of days in the most recent fiscal half-year/365 (to reflect the one-half year period). |
| |
| 4 | Based on the actual returns for the six month period ended October 31, 2009 of 15.84%, 15.45%, 15.72%, and 15.98% for Class A, Class C, Class R, and Class Y, respectively. |
First American Funds 2009 Annual Report 13
(This page intentionally left blank.)
Report of Independent Registered Public Accounting Firm
To the Shareholders and Board of Directors
First American Investment Funds, Inc.
We have audited the accompanying statements of assets and liabilities, including the schedules of investments, of the Equity Index, Mid Cap Index, and Small Cap Index Funds (series of First American Investment Funds, Inc.) (collectively, the “funds”) as of October 31, 2009, and the related statements of operations, the statements of changes in net assets and the financial highlights for each of the periods indicated therein. These financial statements and financial highlights are the responsibility of the funds’ management. Our responsibility is to express an opinion on these financial statements and financial highlights based on our audits.
We conducted our audits in accordance with the standards of the Public Company Accounting Oversight Board (United States). Those standards require that we plan and perform the audit to obtain reasonable assurance about whether the financial statements and financial highlights are free of material misstatement. We were not engaged to perform an audit of the funds’ internal control over financial reporting. Our audits included consideration of internal control over financial reporting as a basis for designing audit procedures that are appropriate in the circumstances, but not for the purpose of expressing an opinion on the effectiveness of the funds’ internal control over financial reporting. Accordingly, we express no such opinion. An audit also includes examining, on a test basis, evidence supporting the amounts and disclosures in the financial statements and financial highlights, assessing the accounting principles used and significant estimates made by management, and evaluating the overall financial statement presentation. Our procedures included confirmation of securities owned as of October 31, 2009, by correspondence with the custodian and brokers, or by other appropriate auditing procedures where replies from brokers were not received. We believe that our audits provide a reasonable basis for our opinion.
In our opinion, the financial statements and financial highlights referred to above present fairly, in all material respects, the financial position of the funds listed above of the First American Investment Funds, Inc. at October 31, 2009, the results of their operations, the changes in their net assets, and the financial highlights for the periods indicated therein, in conformity with U.S. generally accepted accounting principles.
Minneapolis, Minnesota
December 22, 2009
First American Funds 2009 Annual Report 15
Schedule of Investments October 31, 2009, all dollars are rounded to thousands (000)
| | | | | | | | | |
| Equity Index Fund |
| DESCRIPTION | | SHARES | | FAIR VALUE |
| |
| |
Common Stocks – 98.8% |
| Consumer Discretionary – 9.0% |
Abercrombie & Fitch, Class A 6 | | | 8,944 | | | $ | 294 | |
Amazon.com = 6 | | | 33,700 | | | | 4,004 | |
Apollo Group, Class A = 6 | | | 11,200 | | | | 639 | |
AutoNation = 6 | | | 11,440 | | | | 197 | |
Autozone = | | | 3,657 | | | | 495 | |
Bed Bath & Beyond = 6 | | | 27,538 | | | | 970 | |
Best Buy 6 | | | 36,516 | | | | 1,394 | |
Big Lots = | | | 10,678 | | | | 267 | |
| Black & Decker | | | 6,852 | | | | 324 | |
Carnival 6 | | | 43,015 | | | | 1,253 | |
| CBS, Class B | | | 81,493 | | | | 959 | |
| Coach | | | 35,278 | | | | 1,163 | |
Comcast, Class A 6 | | | 310,950 | | | | 4,509 | |
D.R. Horton 6 | | | 29,192 | | | | 320 | |
Darden Restaurants 6 | | | 13,369 | | | | 405 | |
DeVry 6 | | | 6,240 | | | | 345 | |
DIRECTV Group = 6 | | | 47,362 | | | | 1,246 | |
Eastman Kodak 6 | | | 28,855 | | | | 108 | |
Expedia = 6 | | | 20,927 | | | | 474 | |
Family Dollar Stores 6 | | | 16,112 | | | | 456 | |
Ford Motor = 6 | | | 340,731 | | | | 2,385 | |
| Fortune Brands | | | 14,093 | | | | 549 | |
GameStop, Class A = | | | 16,874 | | | | 410 | |
Gannett 6 | | | 24,446 | | | | 240 | |
| Gap | | | 46,873 | | | | 1,000 | |
| Genuine Parts | | | 17,806 | | | | 623 | |
Goodyear Tire & Rubber = | | | 25,533 | | | | 329 | |
| H&R Block | | | 33,712 | | | | 618 | |
Harley-Davidson 6 | | | 25,115 | | | | 626 | |
| Harman International Industries | | | 6,278 | | | | 236 | |
| Hasbro | | | 13,177 | | | | 359 | |
| Home Depot | | | 179,763 | | | | 4,510 | |
| International Game Technology | | | 34,698 | | | | 619 | |
Interpublic Group of Companies = | | | 46,584 | | | | 280 | |
| J.C. Penney | | | 22,913 | | | | 759 | |
| Johnson Controls | | | 66,176 | | | | 1,583 | |
| KB HOME | | | 8,125 | | | | 115 | |
Kohl’s = 6 | | | 31,000 | | | | 1,774 | |
| Leggett & Platt | | | 19,284 | | | | 373 | |
| Lennar | | | 15,690 | | | | 198 | |
Limited Brands 6 | | | 32,174 | | | | 566 | |
| Lowe’s | | | 158,305 | | | | 3,098 | |
Macy’s 6 | | | 47,282 | | | | 831 | |
Marriott International, Class A 6 | | | 26,482 | | | | 664 | |
| Mattel | | | 39,671 | | | | 751 | |
| McDonald’s | | | 116,807 | | | | 6,846 | |
| McGraw-Hill | | | 37,083 | | | | 1,067 | |
| Meredith | | | 46 | | | | 1 | |
New York Times, Class A 6 | | | 15,185 | | | | 121 | |
Newell Rubbermaid 6 | | | 27,101 | | | | 393 | |
News, Class A 6 | | | 240,337 | | | | 2,769 | |
Nike, Class B 6 | | | 41,024 | | | | 2,551 | |
Nordstrom 6 | | | 16,829 | | | | 535 | |
Office Depot = | | | 28,498 | | | | 172 | |
Omnicom Group 6 | | | 33,856 | | | | 1,161 | |
O’Reilly Automotive = | | | 11,263 | | | | 420 | |
Polo Ralph Lauren 6 | | | 6,435 | | | | 479 | |
| Pulte Homes | | | 35,527 | | | | 320 | |
RadioShack 6 | | | 14,537 | | | | 245 | |
| Scripps Networks Interactive, Class A | | | 7,226 | | | | 273 | |
Sears Holdings = 6 | | | 6,045 | | | | 410 | |
| Sherwin-Williams | | | 11,114 | | | | 634 | |
Staples 6 | | | 74,182 | | | | 1,610 | |
Starbucks = | | | 76,690 | | | | 1,456 | |
Starwood Hotels & Resorts Worldwide 6 | | | 19,648 | | | | 571 | |
Target 6 | | | 81,280 | | | | 3,936 | |
Tiffany & Company 6 | | | 13,046 | | | | 513 | |
| Time Warner | | | 126,074 | | | | 3,797 | |
Time Warner Cable 6 | | | 33,020 | | | | 1,302 | |
| TJX | | | 43,805 | | | | 1,636 | |
| VF | | | 8,792 | | | | 625 | |
Viacom, Class B = | | | 67,039 | | | | 1,850 | |
| Walt Disney | | | 198,989 | | | | 5,446 | |
| Washington Post, Class B | | | 161 | | | | 70 | |
Whirlpool 6 | | | 7,999 | | | | 573 | |
| Wyndham Worldwide | | | 18,834 | | | | 321 | |
Wynn Resorts = 6 | | | 7,092 | | | | 384 | |
| Yum! Brands | | | 49,063 | | | | 1,617 | |
| | | | | | | | | |
| | | | | | | | 87,422 | |
| | | | | | | | | |
| Consumer Staples – 11.7% |
| Altria Group | | | 217,025 | | | | 3,930 | |
| Archer-Daniels-Midland | | | 66,575 | | | | 2,005 | |
| Avon Products | | | 46,964 | | | | 1,505 | |
| Brown-Forman, Class B | | | 9,551 | | | | 466 | |
| Campbell Soup | | | 17,138 | | | | 544 | |
| Clorox | | | 15,494 | | | | 918 | |
| Coca-Cola | | | 234,050 | | | | 12,477 | |
Coca-Cola Enterprises 6 | | | 33,432 | | | | 638 | |
Colgate-Palmolive 6 | | | 52,399 | | | | 4,120 | |
| ConAgra Foods | | | 47,405 | | | | 996 | |
Constellation Brands, Class A = | | | 19,292 | | | | 305 | |
| Costco Wholesale | | | 45,176 | | | | 2,568 | |
| CVS Caremark | | | 150,017 | | | | 5,296 | |
Dean Foods = | | | 13,810 | | | | 252 | |
Dr. Pepper Snapple Group = | | | 26,896 | | | | 733 | |
| Estee Lauder, Class A | | | 10,638 | | | | 452 | |
| General Mills | | | 32,552 | | | | 2,146 | |
| H.J. Heinz | | | 34,342 | | | | 1,382 | |
| Hershey | | | 18,795 | | | | 710 | |
| Hormel Foods | | | 5,058 | | | | 184 | |
| JM Smucker | | | 12,422 | | | | 655 | |
| Kellogg | | | 25,951 | | | | 1,338 | |
| Kimberly-Clark | | | 44,171 | | | | 2,702 | |
Kraft Foods, Class A 6 | | | 159,882 | | | | 4,400 | |
Kroger 6 | | | 68,632 | | | | 1,587 | |
| Lorillard | | | 16,812 | | | | 1,307 | |
McCormick 6 | | | 13,641 | | | | 478 | |
Molson Coors Brewing, Class B 6 | | | 15,906 | | | | 779 | |
| Pepsi Bottling Group | | | 13,947 | | | | 522 | |
| PepsiCo | | | 166,307 | | | | 10,070 | |
| Philip Morris International | | | 206,462 | | | | 9,778 | |
| Procter & Gamble | | | 311,036 | | | | 18,040 | |
| Reynolds American | | | 17,634 | | | | 855 | |
Safeway 6 | | | 43,879 | | | | 980 | |
| Sara Lee | | | 78,238 | | | | 883 | |
| SUPERVALU | | | 21,222 | | | | 337 | |
| Sysco | | | 69,005 | | | | 1,825 | |
| Tyson Foods, Class A | | | 32,032 | | | | 401 | |
Walgreen 6 | | | 102,177 | | | | 3,865 | |
| Wal-Mart Stores | | | 227,541 | | | | 11,304 | |
Whole Foods Market = 6 | | | 14,575 | | | | 467 | |
| | | | | | | | | |
| | | | | | | | 114,200 | |
| | | | | | | | | |
| Energy – 12.2% |
Anadarko Petroleum 6 | | | 52,851 | | | | 3,220 | |
| Apache | | | 35,393 | | | | 3,331 | |
| Baker Hughes | | | 34,588 | | | | 1,455 | |
| BJ Services | | | 30,518 | | | | 586 | |
| Cabot Oil & Gas | | | 10,916 | | | | 420 | |
The accompanying notes are an integral part of the financial statements.
16 First American Funds 2009 Annual Report
| | | | | | | | | |
| Equity Index Fund (continued) |
| DESCRIPTION | | SHARES | | FAIR VALUE |
| |
| |
Cameron International = 6 | | | 22,748 | | | $ | 841 | |
Chesapeake Energy 6 | | | 59,693 | | | | 1,462 | |
| Chevron | | | 214,361 | | | | 16,407 | |
| ConocoPhillips | | | 158,190 | | | | 7,938 | |
| CONSOL Energy | | | 18,845 | | | | 807 | |
Denbury Resources = 6 | | | 26,350 | | | | 385 | |
| Devon Energy | | | 47,117 | | | | 3,049 | |
| Diamond Offshore Drilling | | | 7,612 | | | | 725 | |
| El Paso | | | 74,218 | | | | 728 | |
ENSCO International 6 | | | 15,064 | | | | 690 | |
| EOG Resources | | | 26,522 | | | | 2,166 | |
| Exxon Mobil | | | 507,642 | | | | 36,383 | |
FMC Technologies = 6 | | | 13,377 | | | | 704 | |
| Halliburton | | | 97,963 | | | | 2,861 | |
| Hess | | | 29,828 | | | | 1,633 | |
Marathon Oil 6 | | | 72,084 | | | | 2,305 | |
| Massey Energy | | | 8,318 | | | | 242 | |
| Murphy Oil | | | 17,863 | | | | 1,092 | |
Nabors Industries = | | | 30,259 | | | | 630 | |
National-Oilwell Varco = | | | 44,076 | | | | 1,807 | |
| Noble Energy | | | 18,353 | | | | 1,204 | |
Occidental Petroleum 6 | | | 85,135 | | | | 6,460 | |
| Peabody Energy | | | 28,404 | | | | 1,124 | |
| Pioneer Natural Resources | | | 12,684 | | | | 521 | |
Range Resources 6 | | | 16,353 | | | | 818 | |
| Rowan | | | 11,070 | | | | 257 | |
| Schlumberger | | | 124,719 | | | | 7,758 | |
Smith International 6 | | | 22,324 | | | | 619 | |
Southwestern Energy = | | | 37,056 | | | | 1,615 | |
Spectra Energy 6 | | | 59,508 | | | | 1,138 | |
| Sunoco | | | 12,628 | | | | 389 | |
Tesoro 6 | | | 14,116 | | | | 200 | |
| Valero Energy | | | 58,985 | | | | 1,068 | |
| Williams | | | 62,111 | | | | 1,171 | |
| XTO Energy | | | 61,129 | | | | 2,541 | |
| | | | | | | | | |
| | | | | | | | 118,750 | |
| | | | | | | | | |
| Financials – 14.5% |
| Aflac | | | 50,183 | | | | 2,082 | |
| Allstate | | | 59,319 | | | | 1,754 | |
| American Express | | | 124,623 | | | | 4,342 | |
American International Group 6 | | | 14,144 | | | | 476 | |
| Ameriprise Financial | | | 23,619 | | | | 819 | |
| AON | | | 30,627 | | | | 1,179 | |
Apartment Investment & Management – REIT 6 | | | 15,211 | | | | 188 | |
Assurant 6 | | | 9,825 | | | | 294 | |
AvalonBay Communities – REIT 6 | | | 8,531 | | | | 587 | |
| Bank of America | | | 915,374 | | | | 13,346 | |
| Bank of New York Mellon | | | 126,568 | | | | 3,374 | |
BB&T 6 | | | 68,489 | | | | 1,638 | |
Boston Properties – REIT 6 | | | 14,665 | | | | 891 | |
Capital One Financial 6 | | | 47,470 | | | | 1,737 | |
CB Richard Ellis Group = 6 | | | 25,051 | | | | 259 | |
Charles Schwab 6 | | | 98,575 | | | | 1,709 | |
Chubb 6 | | | 36,588 | | | | 1,775 | |
Cincinnati Financial 6 | | | 15,590 | | | | 395 | |
| Citigroup | | | 1,373,976 | | | | 5,620 | |
| CME Group | | | 7,096 | | | | 2,147 | |
Comerica 6 | | | 17,200 | | | | 477 | |
| Discover Financial Services | | | 50,671 | | | | 716 | |
E *TRADE Financial = 6 | | | 151,597 | | | | 221 | |
| Equity Residential Properties Trust – REIT | | | 30,555 | | | | 882 | |
| Federated Investors, Class B | | | 8,275 | | | | 217 | |
| Fifth Third Bancorp | | | 84,255 | | | | 753 | |
First Horizon National = 6 | | | 23,502 | | | | 278 | |
Franklin Resources 6 | | | 17,304 | | | | 1,811 | |
Genworth Financial, Class A = 6 | | | 50,697 | | | | 538 | |
Goldman Sachs Group 6 | | | 53,162 | | | | 9,047 | |
Hartford Financial Services Group 6 | | | 40,644 | | | | 997 | |
HCP – REIT 6 | | | 29,500 | | | | 873 | |
| Health Care – REIT | | | 9,728 | | | | 432 | |
| Host Hotels & Resorts – REIT | | | 63,653 | | | | 644 | |
| Hudson City Bancorp | | | 54,311 | | | | 714 | |
Huntington Bancshares 6 | | | 63,202 | | | | 241 | |
IntercontinentalExchange = | | | 8,001 | | | | 802 | |
| Invesco | | | 41,994 | | | | 888 | |
Janus Capital Group 6 | | | 18,597 | | | | 244 | |
| JPMorgan Chase | | | 413,034 | | | | 17,252 | |
KeyCorp 6 | | | 89,913 | | | | 485 | |
| Kimco Realty – REIT | | | 39,651 | | | | 501 | |
| Legg Mason | | | 17,108 | | | | 498 | |
Leucadia National = | | | 17,450 | | | | 392 | |
| Lincoln National | | | 31,348 | | | | 747 | |
| Loew’s | | | 38,387 | | | | 1,271 | |
M&T Bank 6 | | | 8,662 | | | | 544 | |
| Marsh & McLennan | | | 52,809 | | | | 1,239 | |
| Marshall & Ilsley | | | 45,997 | | | | 245 | |
MBIA = 6 | | | 21,267 | | | | 86 | |
| MetLife | | | 86,904 | | | | 2,957 | |
Moody’s 6 | | | 22,417 | | | | 531 | |
| Morgan Stanley | | | 143,108 | | | | 4,597 | |
NASDAQ OMX Group = | | | 14,316 | | | | 259 | |
| Northern Trust | | | 23,147 | | | | 1,163 | |
| NYSE Euronext | | | 27,528 | | | | 712 | |
| Peoples United Financial | | | 36,870 | | | | 591 | |
Plum Creek Timber – REIT 6 | | | 19,296 | | | | 604 | |
PNC Financial Services Group 6 | | | 48,732 | | | | 2,385 | |
Principal Financial Group 6 | | | 32,888 | | | | 823 | |
Progressive = | | | 72,101 | | | | 1,154 | |
ProLogis – REIT 6 | | | 46,958 | | | | 532 | |
| Prudential Financial | | | 48,293 | | | | 2,184 | |
| Public Storage – REIT | | | 14,259 | | | | 1,049 | |
Regions Financial 6 | | | 125,179 | | | | 606 | |
Simon Property Group – REIT 6 | | | 29,205 | | | | 1,983 | |
SLM = 6 | | | 48,261 | | | | 468 | |
| State Street | | | 52,275 | | | | 2,194 | |
SunTrust Banks 6 | | | 51,583 | | | | 986 | |
T. Rowe Price Group 6 | | | 27,829 | | | | 1,356 | |
| Torchmark | | | 8,886 | | | | 361 | |
| Travelers | | | 63,933 | | | | 3,183 | |
U.S. Bancorp 6◖ | | | 200,802 | | | | 4,663 | |
| Unum Group | | | 34,572 | | | | 690 | |
| Ventas – REIT | | | 15,579 | | | | 625 | |
Vornado Realty Trust – REIT 6 | | | 16,238 | | | | 967 | |
| Wells Fargo | | | 492,952 | | | | 13,566 | |
XL Capital, Class A 6 | | | 36,355 | | | | 597 | |
Zions Bancorporation 6 | | | 13,320 | | | | 189 | |
| | | | | | | | | |
| | | | | | | | 140,622 | |
| | | | | | | | | |
| Healthcare – 12.5% |
| Abbott Laboratories | | | 164,592 | | | | 8,323 | |
| Aetna | | | 49,036 | | | | 1,276 | |
| Allergan | | | 31,609 | | | | 1,778 | |
| AmerisourceBergen | | | 35,267 | | | | 781 | |
Amgen = | | | 109,754 | | | | 5,897 | |
| Baxter International | | | 64,086 | | | | 3,464 | |
| Becton, Dickinson & Company | | | 25,832 | | | | 1,766 | |
Biogen Idec = | | | 30,523 | | | | 1,286 | |
Boston Scientific = | | | 158,442 | | | | 1,287 | |
| Bristol-Myers Squibb | | | 203,400 | | | | 4,434 | |
| C.R. Bard | | | 10,617 | | | | 797 | |
| Cardinal Health | | | 39,244 | | | | 1,112 | |
First American Funds 2009 Annual Report 17
Schedule of Investments October 31, 2009, all dollars are rounded to thousands (000)
| | | | | | | | | |
| Equity Index Fund (continued) |
| DESCRIPTION | | SHARES | | FAIR VALUE |
| |
| |
CareFusion = | | | 19,622 | | | $ | 439 | |
Celgene = | | | 48,560 | | | | 2,479 | |
Cephalon = 6 | | | 6,887 | | | | 376 | |
| CIGNA | | | 29,989 | | | | 835 | |
Coventry Health Care = 6 | | | 16,340 | | | | 324 | |
DaVita = | | | 10,494 | | | | 556 | |
DENTSPLY International 6 | | | 11,312 | | | | 373 | |
| Eli Lilly | | | 105,962 | | | | 3,604 | |
Express Scripts = 6 | | | 26,593 | | | | 2,125 | |
Forest Laboratories = | | | 33,099 | | | | 916 | |
Genzyme = 6 | | | 28,687 | | | | 1,452 | |
Gilead Sciences = | | | 97,023 | | | | 4,128 | |
Hospira = | | | 16,843 | | | | 752 | |
Humana = | | | 16,438 | | | | 618 | |
| IMS Health | | | 19,214 | | | | 315 | |
Intuitive Surgical = 6 | | | 4,193 | | | | 1,033 | |
| Johnson & Johnson | | | 291,745 | | | | 17,228 | |
King Pharmaceuticals = | | | 24,897 | | | | 252 | |
Laboratory Corporation of America = 6 | | | 11,759 | | | | 810 | |
Life Technologies = 6 | | | 18,274 | | | | 862 | |
| McKesson | | | 28,038 | | | | 1,647 | |
Medco Health Solutions = 6 | | | 53,058 | | | | 2,978 | |
| Medtronic | | | 122,090 | | | | 4,359 | |
Merck 6 | | | 222,173 | | | | 6,872 | |
Millipore = | | | 4,739 | | | | 318 | |
Mylan, Inc. = 6 | | | 32,099 | | | | 521 | |
Patterson Companies = 6 | | | 12,581 | | | | 321 | |
| PerkinElmer | | | 14,199 | | | | 264 | |
| Pfizer | | | 846,624 | | | | 14,418 | |
| Quest Diagnostics, Inc. | | | 16,172 | | | | 904 | |
| Schering-Plough | | | 171,559 | | | | 4,838 | |
St. Jude Medical = 6 | | | 34,588 | | | | 1,179 | |
Stryker 6 | | | 25,036 | | | | 1,152 | |
Tenet Healthcare = | | | 50,207 | | | | 257 | |
Thermo Fisher Scientific = 6 | | | 41,722 | | | | 1,877 | |
UnitedHealth Group 6 | | | 122,463 | | | | 3,178 | |
Varian Medical Systems = | | | 13,183 | | | | 540 | |
Watson Pharmaceuticals = | | | 11,312 | | | | 389 | |
WellPoint = | | | 51,001 | | | | 2,385 | |
Zimmer Holdings = | | | 22,774 | | | | 1,197 | |
| | | | | | | | | |
| | | | | | | | 121,272 | |
| | | | | | | | | |
| Industrials – 10.0% |
| 3M | | | 74,704 | | | | 5,496 | |
| Avery Dennison | | | 10,934 | | | | 390 | |
| Boeing | | | 77,783 | | | | 3,718 | |
| Burlington Northern Santa Fe | | | 27,584 | | | | 2,078 | |
C.H. Robinson Worldwide 6 | | | 17,623 | | | | 971 | |
Caterpillar 6 | | | 64,478 | | | | 3,550 | |
Cintas 6 | | | 13,678 | | | | 379 | |
| CSX | | | 42,173 | | | | 1,779 | |
| Cummins | | | 21,635 | | | | 932 | |
Danaher 6 | | | 25,190 | | | | 1,719 | |
| Deere & Company | | | 45,620 | | | | 2,078 | |
| Dover | | | 15,716 | | | | 592 | |
| Dun & Bradstreet | | | 4,990 | | | | 382 | |
| Eaton | | | 14,316 | | | | 865 | |
Emerson Electric 6 | | | 79,559 | | | | 3,003 | |
| Equifax | | | 13,027 | | | | 357 | |
Expeditors International of Washington 6 | | | 19,438 | | | | 626 | |
Fastenal 6 | | | 13,701 | | | | 473 | |
| FedEx | | | 32,248 | | | | 2,344 | |
First Solar = 6 | | | 5,078 | | | | 619 | |
| Flowserve | | | 6,076 | | | | 597 | |
| Fluor | | | 18,607 | | | | 826 | |
| General Dynamics | | | 38,888 | | | | 2,438 | |
| General Electric | | | 1,121,634 | | | | 15,994 | |
| Goodrich | | | 12,006 | | | | 653 | |
Honeywell International 6 | | | 76,832 | | | | 2,757 | |
| Illinois Tool Works | | | 41,333 | | | | 1,898 | |
Iron Mountain = 6 | | | 18,967 | | | | 463 | |
| ITT | | | 18,528 | | | | 939 | |
Jacobs Engineering Group = | | | 12,691 | | | | 537 | |
L-3 Communications Holdings 6 | | | 12,881 | | | | 931 | |
| Lockheed Martin | | | 34,013 | | | | 2,340 | |
| Masco | | | 39,380 | | | | 463 | |
Monster Worldwide = 6 | | | 13,044 | | | | 189 | |
| Norfolk Southern | | | 39,613 | | | | 1,847 | |
Northrop Grumman 6 | | | 36,538 | | | | 1,832 | |
Paccar 6 | | | 38,855 | | | | 1,454 | |
| Pall | | | 12,883 | | | | 409 | |
| Parker Hannifin | | | 18,018 | | | | 954 | |
Pitney Bowes 6 | | | 16,420 | | | | 402 | |
Precision Castparts 6 | | | 13,969 | | | | 1,334 | |
Quanta Services = | | | 20,642 | | | | 438 | |
| R.R. Donnelley & Sons | | | 22,729 | | | | 456 | |
| Raytheon | | | 43,482 | | | | 1,969 | |
| Republic Services | | | 31,292 | | | | 811 | |
| Robert Half International | | | 16,769 | | | | 389 | |
Rockwell Automation 6 | | | 16,485 | | | | 675 | |
Rockwell Collins 6 | | | 16,786 | | | | 846 | |
Ryder System 6 | | | 6,266 | | | | 254 | |
| Snap-On | | | 5,916 | | | | 216 | |
Southwest Airlines 6 | | | 77,939 | | | | 655 | |
Stanley Works 6 | | | 8,201 | | | | 371 | |
Stericycle = | | | 8,049 | | | | 422 | |
Textron 6 | | | 25,326 | | | | 450 | |
| Union Pacific | | | 53,950 | | | | 2,975 | |
| United Parcel Service, Class B | | | 107,216 | | | | 5,755 | |
| United Technologies | | | 102,343 | | | | 6,289 | |
| W.W. Grainger | | | 6,772 | | | | 635 | |
Waste Management 6 | | | 53,917 | | | | 1,611 | |
| | | | | | | | | |
| | | | | | | | 96,825 | |
| | | | | | | | | |
| Information Technology – 18.9% |
Adobe Systems = 6 | | | 56,924 | | | | 1,875 | |
Advanced Micro Devices = 6 | | | 63,263 | | | | 291 | |
Affiliated Computer Services, Class A = | | | 10,246 | | | | 534 | |
Agilent Technologies = 6 | | | 41,731 | | | | 1,032 | |
Akamai Technologies = 6 | | | 17,646 | | | | 388 | |
| Altera | | | 32,451 | | | | 642 | |
Amphenol, Class A 6 | | | 18,732 | | | | 752 | |
| Analog Devices | | | 30,665 | | | | 786 | |
Apple = 6 | | | 94,039 | | | | 17,726 | |
| Applied Materials | | | 141,577 | | | | 1,727 | |
Autodesk = 6 | | | 23,192 | | | | 578 | |
| Automatic Data Processing | | | 54,837 | | | | 2,183 | |
BMC Software = | | | 19,579 | | | | 728 | |
Broadcom, Class A = 6 | | | 45,178 | | | | 1,202 | |
| CA | | | 42,961 | | | | 899 | |
Ciena = 6 | | | 9,649 | | | | 113 | |
Cisco Systems = | | | 610,671 | | | | 13,954 | |
Citrix Systems = 6 | | | 19,820 | | | | 729 | |
Cognizant Technology Solutions, Class A = 6 | | | 29,432 | | | | 1,138 | |
Computer Sciences = | | | 17,677 | | | | 896 | |
Compuware = | | | 26,196 | | | | 185 | |
Convergys = | | | 14,743 | | | | 160 | |
| Corning | | | 161,869 | | | | 2,365 | |
Dell = | | | 184,211 | | | | 2,669 | |
eBay = | | | 115,412 | | | | 2,570 | |
Electronic Arts = | | | 30,796 | | | | 562 | |
EMC = | | | 217,179 | | | | 3,577 | |
The accompanying notes are an integral part of the financial statements.
18 First American Funds 2009 Annual Report
| | | | | | | | | |
| Equity Index Fund (continued) |
| DESCRIPTION | | SHARES | | FAIR VALUE |
| |
| |
| Fidelity National Information Services | | | 20,036 | | | $ | 436 | |
Fiserv = 6 | | | 16,474 | | | | 756 | |
FLIR Systems = 6 | | | 14,552 | | | | 405 | |
Google, Class A = 6 | | | 25,451 | | | | 13,645 | |
| Harris | | | 14,149 | | | | 590 | |
| Hewlett-Packard | | | 254,689 | | | | 12,088 | |
| IBM | | | 139,903 | | | | 16,874 | |
| Intel | | | 593,518 | | | | 11,342 | |
Intuit = 6 | | | 34,204 | | | | 994 | |
| Jabil Circuit | | | 22,632 | | | | 303 | |
JDS Uniphase = | | | 23,341 | | | | 130 | |
Juniper Networks = 6 | | | 54,774 | | | | 1,397 | |
KLA-Tencor 6 | | | 17,877 | | | | 581 | |
Lexmark International, Class A = | | | 10,079 | | | | 257 | |
| Linear Technology | | | 22,819 | | | | 591 | |
LSI Logic = | | | 67,797 | | | | 347 | |
| MasterCard, Class A | | | 10,073 | | | | 2,206 | |
McAfee = | | | 16,166 | | | | 677 | |
MEMC Electronic Materials = | | | 23,721 | | | | 295 | |
Microchip Technology 6 | | | 19,460 | | | | 466 | |
Micron Technology = 6 | | | 85,867 | | | | 583 | |
| Microsoft | | | 810,339 | | | | 22,471 | |
| Molex | | | 14,621 | | | | 273 | |
| Motorola | | | 239,227 | | | | 2,050 | |
| National Semiconductor | | | 20,577 | | | | 266 | |
NetApp = 6 | | | 37,872 | | | | 1,024 | |
Novell = | | | 40,209 | | | | 164 | |
Novellus Systems = 6 | | | 10,490 | | | | 216 | |
NVIDIA = 6 | | | 56,663 | | | | 678 | |
| Oracle | | | 400,988 | | | | 8,461 | |
| Paychex | | | 33,879 | | | | 963 | |
QLogic = | | | 12,900 | | | | 226 | |
| QUALCOMM | | | 171,914 | | | | 7,119 | |
Red Hat = | | | 15,903 | | | | 410 | |
Salesforce.com = | | | 10,888 | | | | 618 | |
SanDisk = | | | 23,496 | | | | 481 | |
Sun Microsystems = | | | 79,530 | | | | 651 | |
Symantec = 6 | | | 91,984 | | | | 1,617 | |
Tellabs = | | | 48,132 | | | | 290 | |
Teradata = | | | 18,686 | | | | 521 | |
Teradyne = 6 | | | 20,257 | | | | 170 | |
| Texas Instruments | | | 136,733 | | | | 3,206 | |
| Total System Services | | | 12,554 | | | | 201 | |
VeriSign = 6 | | | 20,392 | | | | 465 | |
Waters = | | | 11,727 | | | | 673 | |
Western Digital = 6 | | | 23,602 | | | | 795 | |
| Western Union | | | 76,849 | | | | 1,396 | |
Xerox 6 | | | 98,833 | | | | 743 | |
| Xilinx | | | 29,471 | | | | 641 | |
Yahoo! = | | | 125,672 | | | | 1,998 | |
| | | | | | | | | |
| | | | | | | | 184,011 | |
| | | | | | | | | |
| Materials – 3.3% |
| Air Products and Chemicals | | | 23,415 | | | | 1,806 | |
| Airgas | | | 8,204 | | | | 364 | |
| AK Steel | | | 11,800 | | | | 187 | |
| Alcoa | | | 103,151 | | | | 1,281 | |
| Allegheny Technologies | | | 10,652 | | | | 329 | |
| Ball | | | 10,689 | | | | 527 | |
| Bemis | | | 10,776 | | | | 278 | |
| CF Industries Holdings | | | 5,902 | | | | 491 | |
Dow Chemical 6 | | | 120,907 | | | | 2,839 | |
| E.I. Du Pont de Nemours | | | 93,217 | | | | 2,966 | |
| Eastman Chemical | | | 7,369 | | | | 387 | |
Ecolab 6 | | | 19,033 | | | | 837 | |
| FMC | | | 6,189 | | | | 316 | |
Freeport-McMoRan Copper & Gold = | | | 43,733 | | | | 3,208 | |
| International Flavors & Fragrances | | | 6,699 | | | | 255 | |
| International Paper | | | 44,998 | | | | 1,004 | |
| MeadWestvaco | | | 18,555 | | | | 424 | |
| Monsanto | | | 57,483 | | | | 3,862 | |
| Newmont Mining | | | 51,690 | | | | 2,246 | |
| Nucor | | | 32,660 | | | | 1,302 | |
Owens-Illinois = | | | 17,674 | | | | 563 | |
Pactiv = | | | 15,308 | | | | 354 | |
| PPG Industries | | | 17,185 | | | | 970 | |
| Praxair | | | 32,552 | | | | 2,586 | |
| Sealed Air | | | 16,651 | | | | 320 | |
| Sigma-Aldrich | | | 13,803 | | | | 717 | |
Titanium Metals 6 | | | 8,890 | | | | 76 | |
| United States Steel | | | 14,463 | | | | 499 | |
Vulcan Materials 6 | | | 12,902 | | | | 594 | |
| Weyerhaeuser | | | 23,036 | | | | 837 | |
| | | | | | | | | |
| | | | | | | | 32,425 | |
| | | | | | | | | |
| Telecommunication Services – 3.1% |
American Tower, Class A = | | | 42,746 | | | | 1,574 | |
| AT&T | | | 623,551 | | | | 16,007 | |
CenturyTel 6 | | | 32,400 | | | | 1,052 | |
Frontier Communications 6 | | | 36,035 | | | | 258 | |
MetroPCS Communications = | | | 26,832 | | | | 167 | |
Qwest Communications International 6 | | | 160,601 | | | | 577 | |
Sprint Nextel = 6 | | | 304,305 | | | | 901 | |
| Verizon Communications | | | 297,275 | | | | 8,796 | |
| Windstream | | | 49,737 | | | | 479 | |
| | | | | | | | | |
| | | | | | | | 29,811 | |
| | | | | | | | | |
| Utilities – 3.6% |
AES = 6 | | | 71,084 | | | | 929 | |
| Allegheny Energy | | | 17,921 | | | | 409 | |
| Ameren | | | 21,675 | | | | 528 | |
| American Electric Power | | | 49,460 | | | | 1,495 | |
| CenterPoint Energy | | | 36,600 | | | | 461 | |
| CMS Energy | | | 23,595 | | | | 314 | |
Consolidated Edison 6 | | | 27,212 | | | | 1,107 | |
| Constellation Energy Group | | | 21,154 | | | | 654 | |
| Dominion Resources | | | 61,930 | | | | 2,111 | |
| DTE Energy | | | 16,538 | | | | 612 | |
| Duke Energy | | | 136,052 | | | | 2,152 | |
Dynegy, Class A = | | | 53,385 | | | | 107 | |
| Edison International | | | 34,613 | | | | 1,101 | |
| Entergy | | | 23,939 | | | | 1,837 | |
| EQT | | | 13,878 | | | | 581 | |
| Exelon | | | 69,378 | | | | 3,258 | |
| FirstEnergy | | | 33,962 | | | | 1,470 | |
| FPL Group | | | 43,076 | | | | 2,115 | |
| Integrys Energy Group | | | 8,016 | | | | 277 | |
| Nicor | | | 4,691 | | | | 174 | |
| NiSource | | | 28,180 | | | | 364 | |
| Northeast Utilities | | | 16,288 | | | | 375 | |
Pepco Holdings 6 | | | 21,275 | | | | 318 | |
| PG&E | | | 40,083 | | | | 1,639 | |
| Pinnacle West Capital | | | 10,290 | | | | 322 | |
| PPL | | | 39,924 | | | | 1,175 | |
| Progress Energy | | | 27,665 | | | | 1,038 | |
| Public Service Enterprise Group | | | 52,117 | | | | 1,553 | |
| Questar | | | 18,102 | | | | 721 | |
| SCANA | | | 9,239 | | | | 313 | |
| Sempra Energy | | | 27,599 | | | | 1,420 | |
| Southern | | | 81,149 | | | | 2,531 | |
| TECO Energy | | | 21,468 | | | | 308 | |
| Wisconsin Energy | | | 12,398 | | | | 541 | |
First American Funds 2009 Annual Report 19
Schedule of Investments October 31, 2009, all dollars are rounded to thousands (000)
| | | | | | | | | |
| Equity Index Fund (continued) |
| DESCRIPTION | | SHARES/PAR | | FAIR VALUE |
| |
| |
Xcel Energy 6 | | | 47,541 | | | $ | 897 | |
| | | | | | | | | |
| | | | | | | | 35,207 | |
| | | | | | | | | |
Total Common Stocks | | | | | | | | |
(Cost $737,070) | | | | | | | 960,545 | |
| | | | | | | | | |
Short-Term Investments – 1.2% |
Money Market Fund – 0.5% |
| First American Prime Obligations Fund, Class Z | | | | | | | | |
0.148% Å Ω | | | 5,033,310 | | | | 5,033 | |
| | | | | | | | | |
| U.S. Treasury Obligation – 0.7% |
| U.S. Treasury Bill | | | | | | | | |
0.207%, 11/19/2009 o | | $ | 6,400 | | | | 6,400 | |
| | | | | | | | | |
Total Short-Term Investments | | | | | | | | |
(Cost $11,433) | | | | | | | 11,433 | |
| | | | | | | | | |
Investment Purchased with Proceeds
from Securities Lending – 17.5% |
| Mount Vernon Securities Lending Prime Portfolio | | | | | | | | |
| 0.209% Ω † | | | | | | | | |
(Cost $169,796) | | | 169,795,665 | | | | 169,796 | |
| | | | | | | | | |
Total Investments 5 – 117.5% | | | | | | | | |
(Cost $918,299) | | | | | | | 1,141,774 | |
| | | | | | | | | |
Other Assets and Liabilities, Net – (17.5)% | | | | | | | (170,018 | ) |
| | | | | | | | | |
Total Net Assets – 100.0% | | | | | | $ | 971,756 | |
| | | | | | | | | |
| | |
| 6 | | This security or a portion of this security is out on loan at October 31, 2009. Total loaned securities had a fair value of $158,534 at October 31, 2009. See note 2 in Notes to Financial Statements. |
| |
| = | | Non-income producing security. |
| |
| ◖ | | Investment in affiliated security. FAF Advisors, Inc., which serves as the fund’s advisor, is a subsidiary of U.S. Bank, National Association, which is a subsidiary of U.S. Bancorp. Details of transactions with this affiliated company for the fiscal year ended October 31, 2009 were as follows: |
| | | | | | | | | | | | | | | | | | | | | | | | | | | | | |
| | | Beginning
| | | Purchase
| | | Sales
| | | Ending
| | | Dividend
| | | | | | Fair
| |
| Issuer | | Cost | | | Cost | | | Cost | | | Cost | | | Income | | | Shares | | | Value | |
| | |
| U.S. Bancorp | | $ | 5,053 | | | $ | 295 | | | $ | 936 | | | $ | 4,412 | | | $ | 122 | | | | 200,802 | | | $ | 4,663 | |
Equity Index Fund (concluded)
| | |
| Å | | Investment in affiliated security. This money market fund is advised by FAF Advisors, Inc., which also serves as advisor for this fund. See note 3 in Notes to Financial Statements. |
| |
| Ω | | The rate quoted is the annualized seven-day effective yield as of October 31, 2009. |
| |
| o | | Security has been deposited as initial margin on open futures contracts. Yield shown is the annualized effective yield as of October 31, 2009. See note 2 in Notes to Financial Statements. |
| |
| † | | The fund may loan securities representing up to one third of the fair value of its total assets (which includes collateral for securities on loan) to broker-dealers, banks, or other institutional borrowers of securities. The fund maintains collateral equal to at least 100% of the fair value of the securities loaned. The adequacy of the collateral is monitored on a daily basis. The cash collateral received by the fund is invested in this affiliated money market fund. See note 2 in Notes to Financial Statements. |
| |
| 5 | | On October 31, 2009, the cost of investments for federal income tax purposes was $935,101. The aggregate gross unrealized appreciation and depreciation of investments, based on this cost, were as follows: |
| | | | | |
| Gross unrealized appreciation | | $ | 374,739 | |
| Gross unrealized depreciation | | | (168,066 | ) |
| | | | | |
| Net unrealized appreciation | | $ | 206,673 | |
| | | | | |
| |
| REIT – | Real Estate Investment Trust |
Schedule of Open Futures Contracts
| | | | | | | | | | | | | | | |
| | | | | | Number of
| | | Notional
| | | |
| | | Settlement
| | | Contracts
| | | Contract
| | Unrealized
| |
| Description | | Month | | | Purchased | | | Value | | Depreciation | |
| | |
| S&P 500 Futures | | | December 2009 | | | | 39 | | | $10,072 | | $ | (366 | ) |
| | | | | | | | | | | | | | | |
The accompanying notes are an integral part of the financial statements.
20 First American Funds 2009 Annual Report
Equity Index Fund (concluded)
Equity Index Fund (concluded)
| | | | | | | | | |
| Mid Cap Index Fund |
| DESCRIPTION | | SHARES | | FAIR VALUE |
| |
| |
Common Stocks – 91.4% |
| Consumer Discretionary – 14.4% |
99 Cents Only Stores = | | | 10,188 | | | $ | 116 | |
Aaron’s 6 | | | 11,785 | | | | 295 | |
| Advance Auto Parts | | | 20,531 | | | | 765 | |
Aeropostale = | | | 14,531 | | | | 545 | |
| American Eagle Outfitters | | | 46,876 | | | | 820 | |
| American Greetings, Class A | | | 9,876 | | | | 201 | |
AnnTaylor Stores = 6 | | | 13,488 | | | | 175 | |
Barnes & Noble 6 | | | 8,002 | | | | 133 | |
| Blyth | | | 1,553 | | | | 55 | |
| Bob Evans Farms | | | 7,832 | | | | 206 | |
BorgWarner 6 | | | 26,916 | | | | 816 | |
Boyd Gaming = | | | 12,109 | | | | 89 | |
| Brinker International | | | 23,030 | | | | 291 | |
Brinks Home Security Holdings = | | | 9,794 | | | | 303 | |
| Callaway Golf | | | 14,577 | | | | 100 | |
Career Education = | | | 16,364 | | | | 341 | |
CarMax = 6 | | | 49,222 | | | | 968 | |
Cheesecake Factory = | | | 13,057 | | | | 237 | |
Chico’s FAS = | | | 40,139 | | | | 480 | |
Chipotle Mexican Grill, Class A = 6 | | | 7,138 | | | | 582 | |
Coldwater Creek = 6 | | | 10,347 | | | | 59 | |
Collective Brands = | | | 14,304 | | | | 265 | |
Corinthian Colleges = 6 | | | 18,271 | | | | 290 | |
Dick’s Sporting Goods = 6 | | | 21,763 | | | | 494 | |
Dollar Tree = | | | 19,582 | | | | 884 | |
DreamWorks Animation, Class A = | | | 16,860 | | | | 539 | |
| Foot Locker | | | 33,746 | | | | 354 | |
Fossil = | | | 10,500 | | | | 281 | |
| Gentex | | | 32,139 | | | | 514 | |
| Guess? | | | 13,177 | | | | 482 | |
Hanesbrands = | | | 20,844 | | | | 451 | |
| Harte-Hanks | | | 11,303 | | | | 133 | |
| International Speedway, Class A | | | 6,819 | | | | 174 | |
ITT Educational Services = | | | 7,395 | | | | 668 | |
J. Crew Group = 6 | | | 12,435 | | | | 507 | |
| John Wiley & Sons, Class A | | | 9,191 | | | | 324 | |
Lamar Advertising, Class A = 6 | | | 11,484 | | | | 279 | |
Life Time Fitness = 6 | | | 9,286 | | | | 200 | |
LKQ = | | | 30,704 | | | | 530 | |
| M.D.C. Holdings | | | 8,395 | | | | 274 | |
Marvel Entertainment = | | | 10,637 | | | | 531 | |
| Matthews International, Class A | | | 6,794 | | | | 249 | |
Mohawk Industries = | | | 12,541 | | | | 537 | |
Netflix = 6 | | | 10,135 | | | | 542 | |
NVR = 6 | | | 1,299 | | | | 860 | |
Panera Bread, Class A = 6 | | | 6,971 | | | | 418 | |
| PetSmart | | | 28,002 | | | | 659 | |
| Phillips-Van Heusen | | | 11,142 | | | | 447 | |
Priceline.com = | | | 9,444 | | | | 1,490 | |
| Regis | | | 12,758 | | | | 207 | |
Rent-A-Center = | | | 15,553 | | | | 286 | |
| Ross Stores | | | 27,612 | | | | 1,215 | |
| Ryland Group | | | 9,582 | | | | 178 | |
Saks = 6 | | | 35,624 | | | | 200 | |
| Scholastic | | | 5,478 | | | | 136 | |
Scientific Games, Class A = | | | 14,098 | | | | 198 | |
Service International 6 | | | 58,926 | | | | 405 | |
Sotheby’s Holdings, Class A 6 | | | 14,414 | | | | 229 | |
Strayer Education 6 | | | 3,129 | | | | 635 | |
| Thor Industries | | | 7,712 | | | | 202 | |
Timberland, Class A = | | | 11,008 | | | | 178 | |
Toll Brothers = | | | 30,636 | | | | 531 | |
| Tupperware | | | 14,070 | | | | 633 | |
Under Armour, Class A = 6 | | | 8,561 | | | | 230 | |
Urban Outfitters = | | | 28,956 | | | | 909 | |
Warnaco Group = | | | 10,039 | | | | 407 | |
| Wendy’s/Arby’s Group, Class A | | | 89,309 | | | | 353 | |
Williams-Sonoma 6 | | | 23,624 | | | | 444 | |
WMS Industries = | | | 11,803 | | | | 472 | |
| | | | | | | | | |
| | | | | | | | 29,001 | |
| | | | | | | | | |
| Consumer Staples – 3.5% |
| Alberto-Culver | | | 18,209 | | | | 488 | |
BJ’s Wholesale Club = | | | 12,266 | | | | 430 | |
| Church & Dwight | | | 15,709 | | | | 894 | |
| Corn Products International | | | 16,232 | | | | 457 | |
Energizer Holdings = | | | 15,507 | | | | 944 | |
Flowers Foods 6 | | | 17,550 | | | | 410 | |
Hansen Natural = | | | 16,088 | | | | 582 | |
| Lancaster Colony | | | 4,767 | | | | 232 | |
NBTY = | | | 13,824 | | | | 503 | |
| PepsiAmericas | | | 13,279 | | | | 388 | |
Ralcorp Holdings = | | | 12,328 | | | | 662 | |
| Ruddick | | | 9,107 | | | | 243 | |
Smithfield Foods = 6 | | | 31,466 | | | | 420 | |
| Tootsie Roll Industries | | | 6,343 | | | | 157 | |
Universal 6 | | | 5,936 | | | | 247 | |
| | | | | | | | | |
| | | | | | | | 7,057 | |
| | | | | | | | | |
| Energy – 6.0% |
Arch Coal 6 | | | 35,301 | | | | 765 | |
Bill Barrett = | | | 8,118 | | | | 251 | |
| Cimarex Energy | | | 18,220 | | | | 713 | |
Comstock Resources = | | | 9,983 | | | | 410 | |
Encore Acquisition = | | | 14,093 | | | | 522 | |
Exterran Holdings = 6 | | | 13,723 | | | | 280 | |
Forest Oil = | | | 23,888 | | | | 468 | |
| Frontier Oil | | | 23,026 | | | | 319 | |
Helix Energy Solutions Group = | | | 19,641 | | | | 270 | |
Helmerich & Payne 6 | | | 24,186 | | | | 920 | |
Mariner Energy = | | | 21,507 | | | | 274 | |
Newfield Exploration = | | | 31,058 | | | | 1,274 | |
Oceaneering International = | | | 12,176 | | | | 622 | |
Overseas Shipholding Group 6 | | | 5,982 | | | | 235 | |
Patriot Coal = 6 | | | 16,095 | | | | 182 | |
Patterson-UTI Energy 6 | | | 33,457 | | | | 521 | |
Plains Exploration & Production = | | | 31,115 | | | | 825 | |
Pride International = 6 | | | 38,788 | | | | 1,147 | |
Quicksilver Resources = | | | 28,528 | | | | 348 | |
| Southern Union | | | 32,221 | | | | 631 | |
Superior Energy Services = 6 | | | 17,586 | | | | 380 | |
Tidewater 6 | | | 11,157 | | | | 465 | |
Unit = | | | 9,228 | | | | 361 | |
| | | | | | | | | |
| | | | | | | | 12,183 | |
| | | | | | | | | |
| Financials – 16.8% |
Affiliated Managers Group = 6 | | | 9,691 | | | | 615 | |
Alexandria Real Estate Equities – REIT 6 | | | 9,362 | | | | 507 | |
| AMB Property – REIT | | | 31,851 | | | | 700 | |
| American Financial Group | | | 17,633 | | | | 434 | |
AmeriCredit = 6 | | | 23,299 | | | | 411 | |
Apollo Investment 6 | | | 34,955 | | | | 315 | |
| Arthur J. Gallagher | | | 22,611 | | | | 504 | |
Associated Banc 6 | | | 29,046 | | | | 372 | |
| Astoria Financial | | | 17,873 | | | | 178 | |
BancorpSouth 6 | | | 15,777 | | | | 356 | |
Bank of Hawaii 6 | | | 11,662 | | | | 518 | |
BRE Properties – REIT 6 | | | 14,438 | | | | 393 | |
| Brown & Brown | | | 24,402 | | | | 448 | |
| Camden Property Trust – REIT | | | 13,600 | | | | 493 | |
Cathay General Bancorp 6 | | | 10,832 | | | | 96 | |
First American Funds 2009 Annual Report 21
Schedule of Investments October 31, 2009, all dollars are rounded to thousands (000)
Equity Index Fund (concluded)
Equity Index Fund (concluded)
| | | | | | | | | |
| Mid Cap Index Fund (continued) |
| DESCRIPTION | | SHARES | | FAIR VALUE |
| |
| |
City National 6 | | | 10,219 | | | $ | 385 | |
| Commerce Bancshares | | | 14,598 | | | | 560 | |
| Corporate Office Properties Trust – REIT | | | 12,720 | | | | 422 | |
| Cousins Properties – REIT | | | 20,041 | | | | 147 | |
| Cullen/Frost Bankers | | | 12,973 | | | | 607 | |
| Duke Realty – REIT | | | 48,758 | | | | 548 | |
Eaton Vance 6 | | | 26,782 | | | | 760 | |
| Equity One – REIT | | | 8,280 | | | | 124 | |
| Essex Property Trust – REIT | | | 6,013 | | | | 452 | |
| Everest Re Group | | | 13,929 | | | | 1,219 | |
Federal Realty Investment Trust – REIT 6 | | | 15,291 | | | | 903 | |
| Fidelity National Financial, Class A | | | 50,393 | | | | 684 | |
| First American | | | 20,422 | | | | 621 | |
| First Niagara Financial Group | | | 40,919 | | | | 525 | |
FirstMerit 6 | | | 18,998 | | | | 360 | |
Fulton Financial 6 | | | 39,333 | | | | 325 | |
| Hanover Insurance Group | | | 11,250 | | | | 473 | |
| HCC Insurance Holdings | | | 24,699 | | | | 652 | |
| Highwoods Properties – REIT | | | 15,546 | | | | 428 | |
| Horace Mann Educators | | | 9,496 | | | | 118 | |
| Hospitality Properties Trust – REIT | | | 26,062 | | | | 503 | |
International Bancshares 6 | | | 11,145 | | | | 166 | |
Jefferies Group = 6 | | | 27,579 | | | | 720 | |
| Jones Lang LaSalle | | | 9,075 | | | | 425 | |
| Liberty Property Trust – REIT | | | 24,154 | | | | 709 | |
Macerich – REIT 6 | | | 20,735 | | | | 618 | |
| Mack-Cali Realty – REIT | | | 16,680 | | | | 516 | |
| Mercury General | | | 7,750 | | | | 283 | |
| Nationwide Health Properties – REIT | | | 25,943 | | | | 837 | |
New York Community Bancorp 6 | | | 78,194 | | | | 844 | |
| NewAlliance Bancshares | | | 20,470 | | | | 227 | |
| Old Republic International | | | 49,688 | | | | 531 | |
| OMEGA Healthcare Investors – REIT | | | 17,994 | | | | 273 | |
| PacWest Bancorp | | | 6,649 | | | | 113 | |
| Potlatch – REIT | | | 8,327 | | | | 232 | |
| Protective Life | | | 18,202 | | | | 350 | |
Raymond James Financial 6 | | | 22,071 | | | | 521 | |
| Rayonier – REIT | | | 17,075 | | | | 659 | |
Realty Income – REIT 6 | | | 22,815 | | | | 529 | |
Regency Centers – REIT 6 | | | 17,184 | | | | 577 | |
| Reinsurance Group America | | | 17,025 | | | | 785 | |
| SEI Investments | | | 29,191 | | | | 510 | |
SL Green Realty – REIT 6 | | | 18,579 | | | | 720 | |
| StanCorp Financial Group | | | 11,303 | | | | 415 | |
SVB Financial Group = 6 | | | 7,748 | | | | 320 | |
| Synovus Financial | | | 109,450 | | | | 243 | |
TCF Financial 6 | | | 23,959 | | | | 283 | |
| Trustmark | | | 9,670 | | | | 183 | |
| UDR – REIT | | | 31,860 | | | | 458 | |
| Unitrin | | | 11,349 | | | | 222 | |
Valley National Bancorp 6 | | | 34,667 | | | | 460 | |
| W.R. Berkley | | | 32,660 | | | | 807 | |
| Waddell & Reed Financial, Class A | | | 18,358 | | | | 515 | |
| Washington Federal | | | 25,823 | | | | 443 | |
| Webster Financial | | | 14,326 | | | | 162 | |
Weingarten Realty Investors – REIT 6 | | | 22,339 | | | | 413 | |
Westamerica Bancorporation 6 | | | 6,472 | | | | 309 | |
Wilmington Trust 6 | | | 14,847 | | | | 179 | |
| | | | | | | | | |
| | | | | | | | 33,713 | |
| | | | | | | | | |
| Healthcare – 11.1% |
Affymetrix = | | | 14,934 | | | | 78 | |
| Beckman Coulter | | | 15,317 | | | | 985 | |
Bio-Rad Laboratories, Class A = | | | 4,191 | | | | 375 | |
Cerner = 6 | | | 15,029 | | | | 1,143 | |
Charles River Laboratories International = | | | 14,834 | | | | 542 | |
Community Health Systems = | | | 20,703 | | | | 647 | |
Covance = | | | 14,293 | | | | 739 | |
Edwards Lifesciences = | | | 12,790 | | | | 984 | |
Endo Pharmaceuticals Holdings = | | | 26,744 | | | | 599 | |
Gen-Probe = | | | 11,367 | | | | 474 | |
Health Management Associates, Class A = | | | 52,387 | | | | 319 | |
Health Net = | | | 23,923 | | | | 357 | |
Henry Schein = | | | 20,151 | | | | 1,064 | |
| Hill-Rom Holdings | | | 13,206 | | | | 259 | |
Hologic = | | | 57,341 | | | | 847 | |
IDEXX Laboratories = 6 | | | 13,031 | | | | 666 | |
Immucor = 6 | | | 15,364 | | | | 275 | |
Kindred Healthcare = | | | 8,721 | | | | 128 | |
Kinetic Concepts = 6 | | | 13,961 | | | | 463 | |
Lifepoint Hospitals = | | | 12,804 | | | | 363 | |
Lincare Holdings = 6 | | | 15,925 | | | | 500 | |
Masimo = | | | 11,585 | | | | 308 | |
| Medicis Pharmaceutical, Class A | | | 12,839 | | | | 272 | |
Mettler-Toledo International = | | | 7,531 | | | | 734 | |
| Omnicare | | | 26,668 | | | | 578 | |
OSI Pharmaceuticals = 6 | | | 12,620 | | | | 407 | |
| Owens & Minor | | | 9,335 | | | | 382 | |
| Perrigo | | | 17,723 | | | | 659 | |
Pharmaceutical Product Development 6 | | | 26,399 | | | | 569 | |
Psychiatric Solutions = | | | 11,899 | | | | 246 | |
ResMed = | | | 16,459 | | | | 810 | |
STERIS 6 | | | 14,277 | | | | 418 | |
| Techne | | | 8,149 | | | | 509 | |
| Teleflex | | | 8,565 | | | | 426 | |
Thoratec = 6 | | | 12,218 | | | | 321 | |
United Therapeutics = | | | 9,934 | | | | 423 | |
| Universal Health Services | | | 10,696 | | | | 595 | |
Valeant Pharmaceuticals International = 6 | | | 14,549 | | | | 428 | |
Varian = | | | 7,032 | | | | 360 | |
VCA Antech = | | | 17,679 | | | | 421 | |
Vertex Pharmaceuticals = 6 | | | 41,742 | | | | 1,401 | |
WellCare Health Plans = | | | 8,997 | | | | 235 | |
| | | | | | | | | |
| | | | | | | | 22,309 | |
| | | | | | | | | |
| Industrials – 13.6% |
AECOM Technology = | | | 24,650 | | | | 622 | |
AGCO = 6 | | | 20,023 | | | | 563 | |
AirTran Holdings = 6 | | | 25,650 | | | | 108 | |
Alaska Air Group = | | | 8,365 | | | | 215 | |
| Alexander & Baldwin | | | 8,991 | | | | 259 | |
Alliant Techsystems = | | | 7,309 | | | | 568 | |
| AMETEK | | | 23,276 | | | | 812 | |
BE Aerospace = | | | 21,302 | | | | 378 | |
| Brinks | | | 9,794 | | | | 232 | |
Bucyrus International 6 | | | 16,787 | | | | 746 | |
| Carlisle Companies | | | 12,897 | | | | 400 | |
Clean Harbors = | | | 5,094 | | | | 288 | |
| Con-way | | | 10,954 | | | | 361 | |
Copart = 6 | | | 15,036 | | | | 484 | |
| Corporate Executive Board | | | 7,753 | | | | 186 | |
Corrections Corporation of America = 6 | | | 24,832 | | | | 594 | |
| Crane | | | 11,097 | | | | 309 | |
| Deluxe | | | 11,339 | | | | 161 | |
| Donaldson | | | 17,120 | | | | 611 | |
Dycom Industries = | | | 9,269 | | | | 92 | |
| Federal Signal | | | 10,396 | | | | 64 | |
FTI Consulting = | | | 11,076 | | | | 452 | |
GATX 6 | | | 10,601 | | | | 288 | |
| Graco | | | 13,765 | | | | 379 | |
Granite Construction 6 | | | 7,467 | | | | 213 | |
| Harsco | | | 17,992 | | | | 567 | |
The accompanying notes are an integral part of the financial statements.
22 First American Funds 2009 Annual Report
Equity Index Fund (concluded)
Equity Index Fund (concluded)
| | | | | | | | | |
| Mid Cap Index Fund (continued) |
| DESCRIPTION | | SHARES | | FAIR VALUE |
| |
| |
Herman Miller 6 | | | 13,506 | | | $ | 209 | |
HNI 6 | | | 10,057 | | | | 265 | |
| Hubbell, Class B | | | 12,651 | | | | 538 | |
| IDEX | | | 17,092 | | | | 486 | |
| J.B. Hunt Transport Services | | | 19,907 | | | | 598 | |
JetBlue Airways = 6 | | | 50,630 | | | | 251 | |
Joy Global 6 | | | 22,869 | | | | 1,153 | |
Kansas City Southern = | | | 21,209 | | | | 514 | |
| KBR | | | 36,733 | | | | 752 | |
| Kelly Services, Class A | | | 4,022 | | | | 45 | |
| Kennametal | | | 17,128 | | | | 404 | |
Kirby = | | | 11,727 | | | | 396 | |
Korn/Ferry International = | | | 9,576 | | | | 153 | |
| Landstar System | | | 10,363 | | | | 365 | |
| Lennox International | | | 11,738 | | | | 395 | |
| Lincoln Electric Holdings | | | 9,365 | | | | 444 | |
Manpower 6 | | | 17,648 | | | | 837 | |
| Mine Safety Appliances | | | 6,750 | | | | 172 | |
MPS Group = | | | 23,314 | | | | 315 | |
| MSC Industrial Direct, Class A | | | 10,232 | | | | 440 | |
Navigant Consulting = | | | 9,921 | | | | 141 | |
| Nordson | | | 7,347 | | | | 388 | |
| Oshkosh | | | 19,973 | | | | 624 | |
| Pentair | | | 21,699 | | | | 631 | |
| Rollins | | | 9,325 | | | | 169 | |
| Roper Industries | | | 22,043 | | | | 1,114 | |
Shaw Group = | | | 17,803 | | | | 457 | |
| SPX | | | 10,833 | | | | 572 | |
Terex = | | | 25,150 | | | | 509 | |
Thomas & Betts = | | | 12,909 | | | | 442 | |
| Timken | | | 18,579 | | | | 409 | |
Trinity Industries 6 | | | 17,520 | | | | 296 | |
United Rentals = | | | 13,104 | | | | 124 | |
URS = | | | 18,133 | | | | 705 | |
| Valmont Industries | | | 4,460 | | | | 322 | |
Waste Connections = | | | 17,442 | | | | 548 | |
| Watson Wyatt Worldwide, Class A | | | 8,970 | | | | 391 | |
Werner Enterprises 6 | | | 9,891 | | | | 185 | |
| Westinghouse Air Brake Technologies | | | 10,478 | | | | 385 | |
| Woodward Governor | | | 11,935 | | | | 281 | |
| | | | | | | | | |
| | | | | | | | 27,377 | |
| | | | | | | | | |
| Information Technology – 13.6% |
3Com = | | | 86,262 | | | | 443 | |
ACI Worldwide = | | | 8,147 | | | | 131 | |
Acxiom = | | | 17,629 | | | | 202 | |
ADC Telecommunications = 6 | | | 21,089 | | | | 137 | |
ADTRAN 6 | | | 13,433 | | | | 310 | |
Advent Software = 6 | | | 3,647 | | | | 139 | |
Alliance Data Systems = 6 | | | 12,413 | | | | 682 | |
ANSYS = | | | 19,237 | | | | 781 | |
Arrow Electronics = | | | 26,376 | | | | 668 | |
Atmel = | | | 104,851 | | | | 390 | |
Avnet = | | | 33,757 | | | | 837 | |
Avocent = | | | 9,795 | | | | 244 | |
| Broadridge Financial Solutions | | | 31,123 | | | | 648 | |
Cadence Design Systems = | | | 59,189 | | | | 362 | |
CommScope = | | | 20,253 | | | | 547 | |
Cree = 6 | | | 22,515 | | | | 948 | |
| Diebold | | | 14,395 | | | | 435 | |
Digital River = | | | 8,087 | | | | 185 | |
DST Systems = | | | 9,633 | | | | 402 | |
Equinix = 6 | | | 8,626 | | | | 736 | |
F5 Networks = | | | 17,112 | | | | 768 | |
| FactSet Research Systems | | | 8,973 | | | | 575 | |
| Fair Isaac | | | 10,991 | | | | 223 | |
Fairchild Semiconductor International = 6 | | | 26,293 | | | | 197 | |
Gartner, Class A = 6 | | | 12,870 | | | | 240 | |
| Global Payments | | | 17,357 | | | | 854 | |
Hewitt Associates, Class A = | | | 18,278 | | | | 649 | |
| Imation | | | 7,182 | | | | 63 | |
Informatica = | | | 18,525 | | | | 393 | |
Ingram Micro, Class A = | | | 39,234 | | | | 692 | |
Integrated Device Technology = | | | 37,410 | | | | 220 | |
International Rectifier = | | | 15,566 | | | | 285 | |
| Intersil, Class A | | | 26,568 | | | | 333 | |
Itron = | | | 8,615 | | | | 517 | |
| Jack Henry & Associates | | | 19,470 | | | | 449 | |
Lam Research = 6 | | | 28,295 | | | | 954 | |
| Lender Processing Services | | | 21,481 | | | | 855 | |
ManTech International = | | | 4,294 | | | | 188 | |
Mentor Graphics = | | | 19,269 | | | | 141 | |
MICROS Systems = | | | 17,616 | | | | 474 | |
| National Instruments | | | 12,167 | | | | 325 | |
NCR = | | | 36,608 | | | | 372 | |
NeuStar, Class A = | | | 16,212 | | | | 375 | |
Palm = 6 | | | 35,792 | | | | 416 | |
Parametric Technology = | | | 24,816 | | | | 370 | |
| Plantronics | | | 10,435 | | | | 252 | |
Polycom = | | | 19,512 | | | | 419 | |
Quest Software = | | | 13,471 | | | | 226 | |
RF Micro Devices = | | | 62,933 | | | | 250 | |
Rovi = | | | 22,720 | | | | 626 | |
SAIC = | | | 46,873 | | | | 830 | |
Semtech = | | | 14,412 | | | | 223 | |
Silicon Laboratories = | | | 9,734 | | | | 408 | |
| Solera Holdings | | | 16,183 | | | | 521 | |
SRA International, Class A = | | | 11,133 | | | | 209 | |
Sybase = 6 | | | 19,054 | | | | 754 | |
Synopsys = | | | 32,563 | | | | 716 | |
Tech Data = | | | 10,850 | | | | 417 | |
Trimble Navigation = | | | 26,157 | | | | 549 | |
ValueClick = | | | 18,981 | | | | 187 | |
Vishay Intertechnology = | | | 40,777 | | | | 254 | |
Zebra Technologies, Class A = | | | 13,225 | | | | 331 | |
| | | | | | | | | |
| | | | | | | | 27,327 | |
| | | | | | | | | |
| Materials – 6.0% |
| Albemarle | | | 19,910 | | | | 629 | |
AptarGroup 6 | | | 14,809 | | | | 523 | |
| Ashland | | | 16,631 | | | | 574 | |
| Cabot Microelectronics | | | 14,823 | | | | 325 | |
| Carpenter Technology | | | 9,645 | | | | 203 | |
| Cliffs Natural Resources | | | 29,269 | | | | 1,041 | |
| Commercial Metals | | | 25,465 | | | | 378 | |
| Cytec Industries | | | 12,030 | | | | 399 | |
| Greif, Class A | | | 7,438 | | | | 398 | |
Louisiana Pacific = 6 | | | 27,211 | | | | 143 | |
| Lubrizol | | | 15,080 | | | | 1,004 | |
| Martin Marietta Materials | | | 10,306 | | | | 859 | |
| Minerals Technologies | | | 4,402 | | | | 217 | |
| Olin | | | 17,480 | | | | 267 | |
| Packaging Corporation of America | | | 24,030 | | | | 439 | |
Reliance Steel & Aluminum 6 | | | 14,021 | | | | 511 | |
| RPM International | | | 32,033 | | | | 564 | |
| Scotts Miracle-Gro, Class A | | | 9,383 | | | | 381 | |
| Sensient Technologies | | | 9,922 | | | | 251 | |
| Sonoco Products | | | 22,049 | | | | 590 | |
| Steel Dynamics | | | 48,074 | | | | 644 | |
| Temple-Inland | | | 23,269 | | | | 360 | |
| Terra Industries | | | 22,227 | | | | 706 | |
First American Funds 2009 Annual Report 23
Schedule of Investments October 31, 2009, all dollars are rounded to thousands (000)
Equity Index Fund (concluded)
Equity Index Fund (concluded)
| | | | | | | | | |
| Mid Cap Index Fund (continued) |
| DESCRIPTION | | SHARES/PAR | | FAIR VALUE |
| |
| |
| Valspar | | | 21,494 | | | $ | 545 | |
Worthington Industries 6 | | | 14,509 | | | | 160 | |
| | | | | | | | | |
| | | | | | | | 12,111 | |
| | | | | | | | | |
| Telecommunication Services – 0.5% |
Cincinnati Bell = | | | 53,463 | | | | 165 | |
Syniverse Holdings = | | | 15,362 | | | | 263 | |
| Telephone & Data Systems | | | 20,482 | | | | 607 | |
| | | | | | | | | |
| | | | | | | | 1,035 | |
| | | | | | | | | |
| Utilities – 5.9% |
AGL Resources 6 | | | 16,870 | | | | 590 | |
| Alliant Energy | | | 27,855 | | | | 740 | |
Aqua America 6 | | | 28,586 | | | | 442 | |
| Atmos Energy | | | 21,494 | | | | 599 | |
| Black Hills | | | 7,697 | | | | 188 | |
| Cleco | | | 13,170 | | | | 326 | |
| DPL | | | 25,810 | | | | 654 | |
| Energen | | | 15,644 | | | | 686 | |
| Great Plains Energy | | | 37,141 | | | | 642 | |
Hawaiian Electric Industries 6 | | | 19,549 | | | | 349 | |
| IDACORP | | | 9,178 | | | | 258 | |
| MDU Resources Group | | | 39,552 | | | | 821 | |
| National Fuel Gas | | | 17,167 | | | | 778 | |
| NSTAR | | | 23,750 | | | | 735 | |
| NV Energy | | | 49,665 | | | | 569 | |
| OGE Energy | | | 20,301 | | | | 674 | |
ONEOK 6 | | | 23,459 | | | | 849 | |
| PNM Resources | | | 18,920 | | | | 203 | |
| UGI | | | 23,714 | | | | 566 | |
| Vectren | | | 16,707 | | | | 377 | |
| Westar Energy | | | 22,331 | | | | 428 | |
| WGL Holdings | | | 10,644 | | | | 352 | |
| | | | | | | | | |
| | | | | | | | 11,826 | |
| | | | | | | | | |
Total Common Stocks
(Cost $185,866) | | | | | | | 183,939 | |
| | | | | | | | | |
Warrants – 0.0% |
Krispy Kreme Doughnuts, Warrants = | | | | | | | | |
(Cost $0) | | | 1,473 | | | | — | |
| | | | | | | | | |
Short-Term Investments – 9.3% |
| Money Market Fund – 8.1% |
| First American Prime Obligations Fund, Class Z | | | | | | | | |
0.148% Å Ω | | | 16,288,643 | | | | 16,289 | |
| | | | | | | | | |
| U.S. Treasury Obligation – 1.2% |
| U.S. Treasury Bill | | | | | | | | |
0.230%, 11/19/2009 o | | $ | 2,320 | | | | 2,320 | |
| | | | | | | | | |
Total Short-Term Investments | | | | | | | | |
(Cost $18,609) | | | | | | | 18,609 | |
| | | | | | | | | |
Investment Purchased with Proceeds from Securities Lending – 19.1% |
| Mount Vernon Securities Lending Prime Portfolio | | | | | | | | |
| 0.209% Ω † | | | | | | | | |
(Cost $38,456) | | | 38,455,578 | | | | 38,456 | |
| | | | | | | | | |
Total Investments 5 – 119.8% | | | | | | | | |
(Cost $242,931) | | | | | | | 241,004 | |
| | | | | | | | | |
Other Assets and Liabilities, Net – (19.8)% | | | | | | | (39,828 | ) |
| | | | | | | | | |
Total Net Assets – 100.0% | | | | | | $ | 201,176 | |
| | | | | | | | | |
| | |
| = | | Non-income producing security. |
| |
| 6 | | This security or a portion of this security is out on loan at October 31, 2009. Total loaned securities had a fair value of $35,784 at October 31, 2009. See note 2 in Notes to Financial Statements. |
| |
| Å | | Investment in affiliated security. This money market fund is advised by FAF Advisors, Inc., which also serves as advisor for this fund. See note 3 in Notes to Financial Statements. |
| |
| Ω | | The rate quoted is the annualized seven-day effective yield as of October 31, 2009. |
| |
| o | | Security has been deposited as initial margin on open futures contracts. Yield shown is the annualized effective yield as of October 31, 2009. See note 2 in Notes to Financial Statements. |
| |
| † | | The fund may loan securities representing up to one third of the fair value of its total assets (which includes collateral for securities on loan) to broker dealers, banks, or other institutional borrowers of securities. The fund maintains collateral equal to at least 100% of the fair value of the securities loaned. The adequacy of the collateral is monitored on a daily basis. The cash collateral received by the fund is invested in this affiliated money market fund. See note 2 in Notes to Financial Statements. |
| |
| 5 | | On October 31, 2009, the cost of investments for federal income tax purposes was $244,633. The aggregate gross unrealized appreciation and depreciation of investments, based on this cost, were as follows: |
| | | | | |
| Gross unrealized appreciation | | $ | 36,442 | |
| Gross unrealized depreciation | | | (40,071 | ) |
| | | | | |
| Net unrealized depreciation | | $ | (3,629 | ) |
| | | | | |
| |
| REIT – | Real Estate Investment Trust |
Schedule of Open Futures Contracts
| | | | | | | | | | | | | | | |
| | | | | | Number of
| | | Notional
| | | |
| | | Settlement
| | | Contracts
| | | Contract
| | Unrealized
| |
| Description | | Month | | | Purchased | | | Value | | Depreciation | |
| | |
S&P Mid Cap 400 E-Mini Futures | | | December 2009 | | | | 246 | | | $16,172 | | $ | (497 | ) |
| | | | | | | | | | | | | | | |
The accompanying notes are an integral part of the financial statements.
24 First American Funds 2009 Annual Report
| | | | | | | | | |
| Small Cap Index Fund |
| DESCRIPTION | | SHARES | | FAIR VALUE |
| |
| |
Common Stocks – 90.7% |
| Consumer Discretionary – 12.7% |
1-800-Flowers.com, Class A = | | | 1,466 | | | $ | 6 | |
99 Cents Only Stores = | | | 2,750 | | | | 31 | |
AFC Enterprises = | | | 1,504 | | | | 12 | |
| Ambassadors Group | | | 1,074 | | | | 14 | |
American Apparel = | | | 1,970 | | | | 6 | |
American Axle & Manufacturing Holdings 6 | | | 2,699 | | | | 16 | |
American Greetings, Class A 6 | | | 2,600 | | | | 53 | |
American Public Education = | | | 1,107 | | | | 35 | |
America’s Car-Mart = 6 | | | 583 | | | | 12 | |
Amerigon = | | | 1,317 | | | | 8 | |
Ameristar Casinos 6 | | | 1,561 | | | | 23 | |
AnnTaylor Stores = 6 | | | 3,572 | | | | 46 | |
| Arbitron | | | 1,587 | | | | 34 | |
| ArvinMeritor | | | 4,512 | | | | 35 | |
Asbury Automotive Group = | | | 1,962 | | | | 19 | |
Ascent Media = | | | 859 | | | | 20 | |
Audiovox = | | | 1,015 | | | | 7 | |
Bally Technologies = | | | 3,321 | | | | 131 | |
Beazer Homes USA = 6 | | | 2,369 | | | | 10 | |
| Bebe Stores | | | 1,444 | | | | 9 | |
| Belo, Class A | | | 5,184 | | | | 24 | |
Benihana = | | | 803 | | | | 4 | |
Big 5 Sporting Goods 6 | | | 1,341 | | | | 20 | |
BJ’s Restaurants = 6 | | | 1,195 | | | | 19 | |
Blue Nile = 6 | | | 776 | | | | 47 | |
Bluegreen = | | | 713 | | | | 2 | |
| Blyth | | | 340 | | | | 12 | |
| Bob Evans Farms | | | 1,803 | | | | 47 | |
| Books-A-Million | | | 429 | | | | 4 | |
Borders Group = | | | 3,519 | | | | 7 | |
Bridgepoint Education = | | | 846 | | | | 12 | |
Brookfield Homes = 6 | | | 523 | | | | 3 | |
| Brown Shoe | | | 2,480 | | | | 26 | |
| Brunswick | | | 5,379 | | | | 51 | |
| Buckle | | | 1,554 | | | | 47 | |
Buffalo Wild Wings = 6 | | | 1,097 | | | | 45 | |
Build-A-Bear Workshop = | | | 1,026 | | | | 5 | |
Cabela’s = 6 | | | 2,434 | | | | 31 | |
California Pizza Kitchen = 6 | | | 1,176 | | | | 15 | |
Callaway Golf 6 | | | 3,854 | | | | 26 | |
Capella Education = 6 | | | 888 | | | | 61 | |
Caribou Coffee = 6 | | | 417 | | | | 3 | |
| Carmike Cinemas | | | 670 | | | | 7 | |
Carrols Restaurant Group = | | | 688 | | | | 4 | |
Carters = | | | 3,458 | | | | 82 | |
| Cato, Class A | | | 1,621 | | | | 32 | |
Cavco Industries = | | | 350 | | | | 11 | |
CEC Entertainment = | | | 1,404 | | | | 41 | |
Charming Shoppes = 6 | | | 7,038 | | | | 32 | |
Cheesecake Factory = | | | 3,664 | | | | 67 | |
| Cherokee | | | 464 | | | | 9 | |
Children’s Place Retail Stores = 6 | | | 1,454 | | | | 46 | |
China Automotive Systems = | | | 264 | | | | 3 | |
ChinaCast Education = | | | 1,792 | | | | 11 | |
| Christopher & Banks | | | 2,187 | | | | 13 | |
| Churchill Downs | | | 557 | | | | 17 | |
| Cinemark Holdings | | | 1,684 | | | | 19 | |
Citi Trends = | | | 896 | | | | 24 | |
| CKE Restaurants | | | 2,989 | | | | 26 | |
CKX = | | | 3,542 | | | | 23 | |
Coinstar = 6 | | | 1,840 | | | | 58 | |
Coldwater Creek = 6 | | | 3,334 | | | | 19 | |
Collective Brands = | | | 3,906 | | | | 72 | |
| Columbia Sportswear | | | 725 | | | | 28 | |
Conn’s = 6 | | | 574 | | | | 4 | |
| Cooper Tire & Rubber | | | 3,596 | | | | 55 | |
Core-Mark Holding = | | | 548 | | | | 15 | |
Corinthian Colleges = 6 | | | 4,953 | | | | 79 | |
CPI 6 | | | 306 | | | | 3 | |
| Cracker Barrel Old Country Store | | | 1,379 | | | | 46 | |
Crocs = | | | 5,110 | | | | 31 | |
Crown Media Holdings, Class A = 6 | | | 1,579 | | | | 2 | |
| CSS Industries | | | 430 | | | | 9 | |
Dana Holding = | | | 8,398 | | | | 48 | |
Deckers Outdoor = | | | 799 | | | | 72 | |
Denny’s = | | | 5,565 | | | | 12 | |
Destination Maternity = | | | 287 | | | | 6 | |
| Dillard’s, Class A | | | 3,318 | | | | 45 | |
DineEquity = 6 | | | 1,073 | | | | 23 | |
Dolan Media = | | | 1,827 | | | | 22 | |
Domino’s Pizza = | | | 2,213 | | | | 16 | |
Dorman Products = | | | 692 | | | | 10 | |
| Dover Downs Gaming & Entertainment | | | 785 | | | | 4 | |
Dress Barn = 6 | | | 2,738 | | | | 49 | |
Drew Industries = | | | 1,146 | | | | 22 | |
Drugstore.com = | | | 4,897 | | | | 14 | |
DSW = 6 | | | 749 | | | | 14 | |
E.W. Scripps, Class A = | | | 1,746 | | | | 11 | |
Eastman Kodak 6 | | | 16,355 | | | | 61 | |
Einstein Noah Restaurant Group = | | | 238 | | | | 3 | |
Ethan Allen Interiors 6 | | | 1,442 | | | | 18 | |
Exide Technologies = | | | 3,694 | | | | 23 | |
FGX International Holdings Limited = | | | 890 | | | | 12 | |
| Finish Line, Class A | | | 2,479 | | | | 25 | |
Fisher Communications = | | | 377 | | | | 7 | |
Fossil = | | | 2,860 | | | | 76 | |
| Fred’s | | | 2,322 | | | | 27 | |
| Frisch’s Restaurants | | | 135 | | | | 3 | |
Fuel Systems Solutions = 6 | | | 764 | | | | 25 | |
Fuqi International = 6 | | | 679 | | | | 14 | |
| Furniture Brands International | | | 2,621 | | | | 11 | |
Gaiam, Class A = | | | 1,045 | | | | 7 | |
Gander Mountain = | | | 315 | | | | 2 | |
Gaylord Entertainment = | | | 2,311 | | | | 35 | |
Genesco = | | | 1,171 | | | | 31 | |
G-iii Apparel Group = | | | 795 | | | | 13 | |
Global Sources = | | | 961 | | | | 6 | |
Grand Canyon Education = | | | 963 | | | | 16 | |
Great Wolf Resorts = | | | 1,695 | | | | 6 | |
Group 1 Automotive 6 | | | 1,467 | | | | 37 | |
Gymboree = | | | 1,779 | | | | 76 | |
| Harte-Hanks | | | 2,134 | | | | 25 | |
Haverty Furniture = | | | 1,044 | | | | 13 | |
Hawk = | | | 334 | | | | 5 | |
Helen of Troy = | | | 1,769 | | | | 40 | |
hhgregg��= 6 | | | 726 | | | | 12 | |
Hibbett Sports = 6 | | | 1,696 | | | | 32 | |
| Hooker Furniture | | | 657 | | | | 8 | |
Hot Topic = 6 | | | 2,684 | | | | 21 | |
Hovnanian Enterprises, Class A = 6 | | | 3,162 | | | | 12 | |
HSN = | | | 2,423 | | | | 36 | |
Iconix Brand Group = | | | 4,080 | | | | 48 | |
Interval Leisure Group = | | | 2,413 | | | | 27 | |
iRobot = 6 | | | 1,185 | | | | 16 | |
Isle of Capri Casinos = 6 | | | 918 | | | | 7 | |
J. Crew Group = 6 | | | 3,067 | | | | 125 | |
Jack in the Box = | | | 3,444 | | | | 65 | |
| Jackson Hewitt Tax Service | | | 1,666 | | | | 8 | |
JAKKS Pacific = | | | 1,703 | | | | 24 | |
Jo-Ann Stores = | | | 1,612 | | | | 43 | |
First American Funds 2009 Annual Report 25
Schedule of Investments October 31, 2009, all dollars are rounded to thousands (000)
| | | | | | | | | |
| Small Cap Index Fund (continued) |
| DESCRIPTION | | SHARES | | FAIR VALUE |
| |
| |
| Jones Apparel Group | | | 5,207 | | | $ | 93 | |
Jos. A. Bank Clothiers = 6 | | | 1,116 | | | | 46 | |
| Journal Communications, Class A | | | 2,456 | | | | 9 | |
K12 = | | | 1,440 | | | | 23 | |
| Kenneth Cole Productions | | | 537 | | | | 5 | |
Kirkland’s = | | | 757 | | | | 9 | |
Knology = | | | 1,812 | | | | 18 | |
Krispy Kreme Doughnuts = | | | 3,554 | | | | 12 | |
| K-Swiss, Class A | | | 1,479 | | | | 12 | |
Lakes Entertainment = | | | 1,142 | | | | 3 | |
Landry’s Restaurants = | | | 648 | | | | 7 | |
| La-Z-Boy | | | 3,139 | | | | 22 | |
LeapFrog Enterprises = | | | 2,041 | | | | 7 | |
Learning Tree International = | | | 485 | | | | 5 | |
Life Time Fitness = 6 | | | 2,456 | | | | 53 | |
Lin TV, Class A = | | | 1,556 | | | | 6 | |
Lincoln Educational Services = | | | 591 | | | | 12 | |
Lithia Motors = 6 | | | 1,023 | | | | 9 | |
Live Nation = | | | 5,100 | | | | 34 | |
| Liz Claiborne | | | 5,798 | | | | 33 | |
LodgeNet Entertainment = | | | 1,233 | | | | 6 | |
Luby’s = | | | 1,169 | | | | 4 | |
Lululemon Athletica = | | | 2,479 | | | | 62 | |
Lumber Liquidators = 6 | | | 881 | | | | 19 | |
M/I Homes = 6 | | | 1,067 | | | | 12 | |
Mac-Gray = | | | 698 | | | | 6 | |
Maidenform Brands = | | | 1,306 | | | | 18 | |
| Marcus | | | 1,177 | | | | 14 | |
| Marine Products | | | 968 | | | | 5 | |
Martha Stewart Living = | | | 1,388 | | | | 7 | |
| Matthews International, Class A | | | 1,846 | | | | 68 | |
McCormick & Schmick’s Seafood Restaurants = | | | 905 | | | | 5 | |
Mediacom Communications = | | | 2,582 | | | | 12 | |
| Men’s Wearhouse | | | 3,176 | | | | 74 | |
Meritage Homes = | | | 1,910 | | | | 35 | |
Midas = | | | 855 | | | | 7 | |
| Modine Manufacturing | | | 2,623 | | | | 27 | |
Monarch Casino & Resort = 6 | | | 703 | | | | 5 | |
| Monro Muffler Brake | | | 967 | | | | 30 | |
Morgans Hotel Group = | | | 1,523 | | | | 5 | |
| Movado Group | | | 987 | | | | 10 | |
Multimedia Games = | | | 1,625 | | | | 8 | |
| National Cinemedia | | | 2,569 | | | | 41 | |
| National Presto Industries | | | 292 | | | | 25 | |
New York & Company = | | | 1,324 | | | | 6 | |
NIVS IntelliMedia Technology Group = | | | 499 | | | | 1 | |
Nobel Learning Communities = | | | 248 | | | | 2 | |
NutriSystem 6 | | | 1,872 | | | | 40 | |
O’Charleys = | | | 1,013 | | | | 7 | |
OfficeMax = | | | 4,653 | | | | 53 | |
Orbitz Worldwide = | | | 2,199 | | | | 11 | |
Orient-Express Hotels, Class A 6 | | | 4,685 | | | | 40 | |
Outdoor Channel Holdings = | | | 886 | | | | 6 | |
Overstock.com = 6 | | | 897 | | | | 13 | |
| Oxford Industries | | | 833 | | | | 16 | |
P.F. Chang’s China Bistro = 6 | | | 1,406 | | | | 41 | |
Pacific Sunwear of California = | | | 3,821 | | | | 23 | |
Pantry = | | | 1,371 | | | | 19 | |
Papa John’s International = | | | 1,271 | | | | 29 | |
Peet’s Coffee & Tea = 6 | | | 793 | | | | 27 | |
| Pep Boys – Manny, Moe & Jack | | | 2,969 | | | | 26 | |
Perry Ellis International = | | | 687 | | | | 9 | |
| PetMed Express | | | 1,380 | | | | 22 | |
Pier 1 Imports = 6 | | | 5,217 | | | | 18 | |
Pinnacle Entertainment = | | | 3,662 | | | | 31 | |
Playboy Enterprises, Class B = 6 | | | 1,374 | | | | 4 | |
Polaris Industries 6 | | | 1,916 | | | | 81 | |
| Pool | | | 2,949 | | | | 58 | |
Pre-Paid Legal Services = 6 | | | 482 | | | | 19 | |
| Primedia | | | 1,761 | | | | 4 | |
Princeton Review = | | | 725 | | | | 3 | |
Quiksilver = | | | 7,811 | | | | 16 | |
Raser Technologies = 6 | | | 3,719 | | | | 4 | |
RC2 = | | | 1,020 | | | | 13 | |
RCN = | | | 2,205 | | | | 18 | |
Reading International = | | | 1,057 | | | | 4 | |
Red Lion Hotels = | | | 811 | | | | 4 | |
Red Robin Gourmet Burgers = | | | 947 | | | | 16 | |
Regis 6 | | | 3,082 | | | | 50 | |
Rent-A-Center = | | | 4,027 | | | | 74 | |
Rentrak = | | | 575 | | | | 9 | |
Retail Ventures = | | | 1,693 | | | | 11 | |
Rex Stores = | | | 493 | | | | 6 | |
Ruby Tuesday = | | | 3,953 | | | | 26 | |
Ruth’s Hospitality Group = | | | 1,134 | | | | 4 | |
Ryland Group 6 | | | 2,624 | | | | 49 | |
Saks = 6 | | | 7,246 | | | | 41 | |
Sally Beauty Holdings = | | | 5,729 | | | | 39 | |
| Scholastic | | | 1,399 | | | | 35 | |
Sealy = 6 | | | 2,753 | | | | 8 | |
Shoe Carnival = | | | 516 | | | | 8 | |
Shuffle Master = | | | 3,271 | | | | 26 | |
Shutterfly = | | | 1,145 | | | | 16 | |
| Sinclair Broadcast Group, Class A | | | 2,843 | | | | 11 | |
Skechers U.S.A., Class A = | | | 2,021 | | | | 44 | |
| Skyline | | | 389 | | | | 7 | |
Smith & Wesson = | | | 3,245 | | | | 14 | |
Sonic = | | | 3,703 | | | | 35 | |
Sonic Automotive, Class A 6 | | | 1,858 | | | | 17 | |
Sotheby’s Holdings, Class A 6 | | | 4,084 | | | | 65 | |
| Spartan Motors | | | 1,978 | | | | 10 | |
| Speedway Motorsports | | | 791 | | | | 11 | |
| Sport Supply Group | | | 562 | | | | 6 | |
| Stage Stores | | | 2,314 | | | | 27 | |
Stamps.com = | | | 768 | | | | 8 | |
| Standard Motor Products | | | 954 | | | | 8 | |
Standard-Pacific = | | | 5,846 | | | | 18 | |
| Stanley Furniture | | | 630 | | | | 5 | |
Steak ’N Shake = | | | 1,670 | | | | 19 | |
Stein Mart = | | | 1,558 | | | | 15 | |
Steiner Leisure = | | | 920 | | | | 34 | |
Steinway Musical Instruments = | | | 540 | | | | 6 | |
Steven Madden = | | | 1,026 | | | | 42 | |
| Stewart Enterprises, Class A | | | 5,516 | | | | 25 | |
Stoneridge = | | | 918 | | | | 7 | |
Sturm, Ruger & Company 6 | | | 1,161 | | | | 12 | |
| Superior Industries International | | | 1,409 | | | | 19 | |
SYMS = | | | 360 | | | | 3 | |
Systemax = | | | 607 | | | | 8 | |
| Talbots | | | 1,431 | | | | 13 | |
Tempur-Pedic International = | | | 4,568 | | | | 88 | |
Tenneco Automotive = | | | 3,042 | | | | 41 | |
Texas Roadhouse = | | | 3,050 | | | | 29 | |
Ticketmaster Entertainment = | | | 2,298 | | | | 22 | |
Timberland, Class A = | | | 2,779 | | | | 45 | |
Town Sports International Holdings = | | | 1,183 | | | | 3 | |
Tractor Supply = | | | 2,168 | | | | 97 | |
True Religion Apparel = 6 | | | 1,552 | | | | 40 | |
Tuesday Morning = | | | 1,760 | | | | 6 | |
| Tupperware | | | 3,818 | | | | 172 | |
Tween Brands = | | | 1,454 | | | | 12 | |
U.S. Auto Parts Network = | | | 601 | | | | 3 | |
The accompanying notes are an integral part of the financial statements.
26 First American Funds 2009 Annual Report
| | | | | | | | | |
| Small Cap Index Fund (continued) |
| DESCRIPTION | | SHARES | | FAIR VALUE |
| |
| |
ULTA = | | | 1,687 | | | $ | 26 | |
Under Armour, Class A = 6 | | | 2,020 | | | | 54 | |
Unifi = | | | 2,449 | | | | 7 | |
| UniFirst | | | 835 | | | | 35 | |
Universal Electronics = | | | 822 | | | | 17 | |
Universal Technical Institute = | | | 1,313 | | | | 24 | |
Universal Travel Group = 6 | | | 612 | | | | 7 | |
Vail Resorts = 6 | | | 1,793 | | | | 62 | |
Valassis Communications = | | | 2,932 | | | | 53 | |
| Value Line | | | 78 | | | | 2 | |
Volcom = 6 | | | 1,151 | | | | 19 | |
Warnaco Group = | | | 2,792 | | | | 113 | |
West Marine = 6 | | | 871 | | | | 7 | |
Wet Seal, Class A = | | | 5,912 | | | | 19 | |
| Weyco Group | | | 424 | | | | 9 | |
Winnebago Industries = 6 | | | 1,697 | | | | 19 | |
| Wolverine World Wide | | | 2,894 | | | | 74 | |
Wonder Auto Technology = | | | 897 | | | | 12 | |
| World Wrestling Entertainment | | | 1,243 | | | | 16 | |
Youbet.com = | | | 1,829 | | | | 4 | |
Zale = | | | 1,875 | | | | 9 | |
Zumiez = 6 | | | 1,151 | | | | 15 | |
| | | | | | | | | |
| | | | | | | | 7,054 | |
| | | | | | | | | |
| Consumer Staples – 3.0% |
Agfeed Industries = 6 | | | 1,683 | | | | 7 | |
| Alico | | | 268 | | | | 8 | |
Alliance One International = 6 | | | 5,484 | | | | 24 | |
American Dairy = 6 | | | 591 | | | | 17 | |
American Italian Pasta = | | | 1,277 | | | | 35 | |
American Oriental Bioengineering = 6 | | | 3,762 | | | | 15 | |
| Andersons | | | 1,110 | | | | 34 | |
| B & G Foods | | | 1,090 | | | | 9 | |
Bare Escentuals = | | | 4,038 | | | | 51 | |
Boston Beer, Class A = | | | 457 | | | | 17 | |
| Calavo Growers | | | 562 | | | | 10 | |
Cal-Maine Foods 6 | | | 761 | | | | 21 | |
| Casey’s General Stores | | | 3,100 | | | | 98 | |
Central Garden & Pet, Class A = | | | 3,743 | | | | 35 | |
Chattem = 6 | | | 1,186 | | | | 75 | |
China Sky One Medical = 6 | | | 636 | | | | 8 | |
China-biotics = | | | 445 | | | | 5 | |
Chiquita Brands International = 6 | | | 2,716 | | | | 44 | |
Coca-Cola Bottling | | | 276 | | | | 12 | |
Darling International = | | | 5,014 | | | | 35 | |
| Diamond Foods | | | 941 | | | | 28 | |
Diedrich Coffee = | | | 183 | | | | 4 | |
Elizabeth Arden = | | | 1,378 | | | | 15 | |
| Farmer Brothers | | | 339 | | | | 6 | |
Fresh Del Monte Produce = | | | 2,439 | | | | 53 | |
Great Atlantic & Pacific Tea = 6 | | | 1,990 | | | | 20 | |
| Griffin Land & Nurseries | | | 186 | | | | 6 | |
Hain Celestial Group = | | | 2,356 | | | | 41 | |
Heckmann = 6 | | | 4,879 | | | | 21 | |
HQ Sustainable Maritime Industries = | | | 538 | | | | 4 | |
| Imperial Sugar | | | 698 | | | | 9 | |
| Ingles Markets, Class A | | | 775 | | | | 12 | |
| Inter Parfums | | | 761 | | | | 9 | |
| J&J Snack Foods | | | 802 | | | | 31 | |
| Lancaster Colony | | | 1,181 | | | | 57 | |
| Lance | | | 1,652 | | | | 40 | |
Lifeway Foods = | | | 263 | | | | 3 | |
Mannatech 6 | | | 1,108 | | | | 4 | |
Medifast = | | | 791 | | | | 17 | |
| Nash-Finch | | | 746 | | | | 22 | |
National Beverage = | | | 528 | | | | 6 | |
| Nu Skin Enterprises, Class A | | | 2,901 | | | | 66 | |
Nutraceutical International = | | | 664 | | | | 7 | |
| Oil-Dri Corporation of America | | | 313 | | | | 5 | |
Omega Protein = | | | 996 | | | | 4 | |
Orchids Paper Products = | | | 491 | | | | 9 | |
Overhill Farms = | | | 965 | | | | 5 | |
Prestige Brand Holdings = | | | 1,897 | | | | 13 | |
| PriceSmart | | | 974 | | | | 19 | |
Revlon = | | | 1,187 | | | | 10 | |
| Ruddick | | | 2,447 | | | | 65 | |
| Sanderson Farms | | | 1,239 | | | | 45 | |
| Schiff Nutrition International | | | 523 | | | | 3 | |
Seneca Foods = | | | 393 | | | | 11 | |
Smart Balance = | | | 3,643 | | | | 19 | |
Spartan Stores 6 | | | 1,354 | | | | 19 | |
Star Scientific = 6 | | | 4,301 | | | | 4 | |
Susser Holdings = | | | 421 | | | | 5 | |
Synutra International = 6 | | | 1,097 | | | | 13 | |
The Female Health = | | | 968 | | | | 5 | |
| Tootsie Roll Industries | | | 1,459 | | | | 36 | |
Treehouse Foods = | | | 1,923 | | | | 72 | |
United Natural Foods = | | | 2,618 | | | | 63 | |
Universal 6 | | | 1,425 | | | | 59 | |
USANA Health Sciences = | | | 472 | | | | 14 | |
| Vector Group | | | 2,113 | | | | 31 | |
| Village Super Market | | | 371 | | | | 11 | |
| WD-40 Company | | | 962 | | | | 30 | |
| Weis Markets | | | 618 | | | | 22 | |
Winn Dixie Stores = | | | 3,322 | | | | 37 | |
Zapata = | | | 551 | | | | 4 | |
Zhongpin = 6 | | | 1,136 | | | | 15 | |
| | | | | | | | | |
| | | | | | | | 1,666 | |
| | | | | | | | | |
| Energy – 4.5% |
Allis Chalmers Energy = | | | 3,600 | | | | 13 | |
| Alon USA Energy | | | 605 | | | | 5 | |
| Apco Oil & Gas International | | | 557 | | | | 12 | |
Approach Resources = | | | 732 | | | | 6 | |
Arena Resources = | | | 2,331 | | | | 87 | |
| Atlas Energy | | | 2,074 | | | | 54 | |
ATP Oil & Gas = 6 | | | 2,395 | | | | 41 | |
Basic Energy Services = | | | 1,867 | | | | 13 | |
| Berry Petroleum, Class A | | | 2,611 | | | | 66 | |
Bill Barrett = | | | 2,341 | | | | 73 | |
Bolt Technology = | | | 468 | | | | 5 | |
Boots & Coots = | | | 4,768 | | | | 7 | |
BPZ Energy = | | | 5,142 | | | | 32 | |
Brigham Exploration = | | | 5,059 | | | | 48 | |
Bristow Group = | | | 1,778 | | | | 52 | |
Bronco Drilling = | | | 1,528 | | | | 10 | |
Cal Dive International = | | | 2,571 | | | | 20 | |
Carbo Ceramics 6 | | | 1,158 | | | | 68 | |
Carrizo Oil & Gas = | | | 1,701 | | | | 39 | |
Cheniere Energy = | | | 3,296 | | | | 8 | |
Clayton Williams Energy = | | | 358 | | | | 9 | |
Clean Energy Fuels = 6 | | | 1,830 | | | | 21 | |
Complete Production Services = | | | 3,557 | | | | 34 | |
Contango Oil & Gas Company = | | | 764 | | | | 36 | |
Credo Pete = | | | 429 | | | | 4 | |
Crosstex Energy 6 | | | 2,215 | | | | 12 | |
Cubic Energy = | | | 1,649 | | | | 2 | |
CVR Energy = | | | 1,348 | | | | 14 | |
Dawson Geophysical = | | | 474 | | | | 11 | |
| Delek US Holdings | | | 731 | | | | 5 | |
Delta Petroleum = 6 | | | 10,847 | | | | 14 | |
| DHT Maritime | | | 3,026 | | | | 10 | |
First American Funds 2009 Annual Report 27
Schedule of Investments October 31, 2009, all dollars are rounded to thousands (000)
| | | | | | | | | |
| Small Cap Index Fund (continued) |
| DESCRIPTION | | SHARES | | FAIR VALUE |
| |
| |
Dril-Quip = | | | 1,798 | | | $ | 87 | |
Endeavour International = | | | 6,612 | | | | 7 | |
ENGlobal = | | | 1,526 | | | | 5 | |
Evergreen Energy = 6 | | | 7,569 | | | | 3 | |
FX Energy = | | | 2,469 | | | | 7 | |
| General Maritime | | | 2,975 | | | | 21 | |
Geokinetics = | | | 387 | | | | 6 | |
Georesources = | | | 441 | | | | 5 | |
Global Industries = | | | 6,083 | | | | 44 | |
GMX Resources = 6 | | | 1,880 | | | | 24 | |
Golar LNG 6 | | | 2,055 | | | | 25 | |
Goodrich Petroleum = | | | 1,493 | | | | 38 | |
Gran Tierra Energy = | | | 13,695 | | | | 65 | |
Green Plains Renewable Energy = | | | 568 | | | | 4 | |
| Gulf Island Fabrication | | | 713 | | | | 14 | |
GulfMark Offshore = | | | 1,311 | | | | 36 | |
Gulfport Energy = | | | 1,536 | | | | 12 | |
Harvest Natural Resources = | | | 1,993 | | | | 11 | |
Hercules Offshore = | | | 6,126 | | | | 31 | |
Hornbeck Offshore Services = | | | 1,348 | | | | 33 | |
International Coal Group = 6 | | | 6,618 | | | | 27 | |
Ion Geophysical = 6 | | | 6,412 | | | | 25 | |
Isramco = | | | 65 | | | | 5 | |
James River Coal = | | | 1,684 | | | | 32 | |
Key Energy Services = | | | 7,536 | | | | 55 | |
| Knightsbridge Tankers | | | 994 | | | | 13 | |
| Lufkin Industries | | | 862 | | | | 49 | |
Matrix Service = | | | 1,512 | | | | 13 | |
McMoRan Exploration = 6 | | | 4,616 | | | | 36 | |
Natco Group = | | | 1,215 | | | | 53 | |
Natural Gas Services Group = | | | 709 | | | | 12 | |
Newpark Resources = | | | 5,031 | | | | 15 | |
Nordic American Tanker Shipping 6 | | | 2,573 | | | | 73 | |
Northern Oil & Gas = | | | 1,719 | | | | 16 | |
Oilsands Quest = 6 | | | 13,408 | | | | 16 | |
OYO Geospace = | | | 247 | | | | 6 | |
| Panhandle Oil And Gas | | | 398 | | | | 8 | |
Parker Drilling = | | | 7,077 | | | | 37 | |
Patriot Coal = 6 | | | 4,464 | | | | 50 | |
Penn Virginia 6 | | | 2,767 | | | | 56 | |
Petroleum Development = | | | 863 | | | | 14 | |
PetroQuest Energy = | | | 3,091 | | | | 19 | |
PHI = | | | 793 | | | | 14 | |
Pioneer Drilling = | | | 2,895 | | | | 19 | |
PrimeEnergy = | | | 51 | | | | 2 | |
Rex Energy = | | | 1,547 | | | | 13 | |
Rosetta Resources = | | | 3,188 | | | | 43 | |
| RPC | | | 1,869 | | | | 17 | |
Ship Finance International 6 | | | 2,653 | | | | 30 | |
Stone Energy = | | | 2,516 | | | | 39 | |
SulphCo = 6 | | | 4,141 | | | | 4 | |
Superior Well Services = 6 | | | 961 | | | | 10 | |
Swift Energy = | | | 1,998 | | | | 42 | |
Syntroleum = 6 | | | 3,848 | | | | 9 | |
T-3 Energy Services = | | | 767 | | | | 15 | |
Teekay Tankers, Class A 6 | | | 732 | | | | 6 | |
TETRA Technologies = | | | 4,589 | | | | 43 | |
TGC Industries = | | | 805 | | | | 4 | |
| Toreador Resources | | | 1,239 | | | | 11 | |
Union Drilling = | | | 761 | | | | 6 | |
Uranerz Energy Corporation = | | | 2,746 | | | | 4 | |
Uranium Energy = 6 | | | 3,395 | | | | 9 | |
USEC = 6 | | | 6,851 | | | | 26 | |
| Vaalco Energy | | | 3,605 | | | | 15 | |
Vantage Drilling Company = | | | 1,822 | | | | 3 | |
Venoco = | | | 1,187 | | | | 15 | |
| W&T Offshore | | | 2,071 | | | | 24 | |
Warren Resources = | | | 3,591 | | | | 8 | |
Western Refining = 6 | | | 1,737 | | | | 10 | |
Westmoreland Coal = | | | 516 | | | | 3 | |
Willbros Group = | | | 2,407 | | | | 32 | |
World Fuel Services 6 | | | 1,683 | | | | 86 | |
Zion Oil & Gas = 6 | | | 725 | | | | 5 | |
| | | | | | | | | |
| | | | | | | | 2,506 | |
| | | | | | | | | |
| Financials – 18.5% |
| 1st Source | | | 834 | | | | 12 | |
| Abington Bancorp | | | 1,325 | | | | 9 | |
| Acadia Realty Trust – REIT | | | 2,418 | | | | 38 | |
| Advance America Cash Advance Centers | | | 2,798 | | | | 14 | |
| Agree Realty – REIT | | | 436 | | | | 10 | |
Alexander’s = | | | 132 | | | | 35 | |
| Alliance Financial | | | 251 | | | | 7 | |
| Allied Capital | | | 10,897 | | | | 34 | |
Ambac Financial Group 6 | | | 17,524 | | | | 20 | |
American Campus Communities – REIT 6 | | | 3,183 | | | | 86 | |
American Capital 6 | | | 16,913 | | | | 45 | |
| American Capital Agency – REIT | | | 541 | | | | 14 | |
| American Equity Investment Life Holding | | | 3,463 | | | | 23 | |
| American National Bankshares | | | 372 | | | | 8 | |
| American Physicians Capital | | | 669 | | | | 19 | |
| American Physicians Service Group | | | 388 | | | | 9 | |
American Safety Insurance Holdings = | | | 576 | | | | 9 | |
| Ameris Bancorp | | | 794 | | | | 5 | |
Amerisafe = | | | 1,150 | | | | 21 | |
Ames National 6 | | | 349 | | | | 7 | |
| Amtrust Financial Services | | | 1,386 | | | | 16 | |
Anthracite Capital – REIT 6 | | | 4,799 | | | | 3 | |
| Anworth Mortgage Asset – REIT | | | 6,198 | | | | 44 | |
Apollo Investment 6 | | | 9,833 | | | | 89 | |
Ares Capital 6 | | | 5,925 | | | | 62 | |
Argo Group International Holdings = | | | 1,720 | | | | 58 | |
| Arrow Financial | | | 517 | | | | 13 | |
Ashford Hospitality Trust – REIT = 6 | | | 3,771 | | | | 15 | |
Asset Acceptance Capital = | | | 966 | | | | 7 | |
| Associated Estates Realty – REIT | | | 901 | | | | 8 | |
Assured Guaranty 6 | | | 6,067 | | | | 101 | |
| Astoria Financial | | | 5,214 | | | | 52 | |
| Auburn National Bancorp | | | 144 | | | | 3 | |
Avatar Holdings = | | | 332 | | | | 5 | |
| Baldwin & Lyons, Class B | | | 402 | | | | 9 | |
| BancFirst | | | 411 | | | | 15 | |
| Banco Latinoamericano de Exportaciones | | | 1,670 | | | | 24 | |
Bancorp Bank = | | | 1,208 | | | | 6 | |
| Bancorp Rhode Island | | | 222 | | | | 6 | |
| Bank Mutual | | | 3,041 | | | | 21 | |
| Bank of Kentucky Financial | | | 187 | | | | 4 | |
| Bank Of Marin Bancorp | | | 316 | | | | 10 | |
Bank of the Ozarks 6 | | | 794 | | | | 18 | |
| BankFinancial | | | 1,099 | | | | 10 | |
Banner 6 | | | 949 | | | | 3 | |
| Bar Harbor Bankshares | | | 176 | | | | 5 | |
Beneficial Mutual Bancorp = | | | 1,775 | | | | 16 | |
| Berkshire Hills Bancorp | | | 836 | | | | 17 | |
| BGC Partners, Class A | | | 2,823 | | | | 14 | |
| BioMed Realty Trust – REIT | | | 5,979 | | | | 81 | |
| Blackrock Kelso Capital | | | 704 | | | | 5 | |
| Boston Private Financial Holdings | | | 4,134 | | | | 25 | |
| Bridge Bancorp | | | 379 | | | | 8 | |
Broadpoint Gleacher Securities = 6 | | | 2,888 | | | | 18 | |
| Brookline Bancorp | | | 3,346 | | | | 33 | |
| Brooklyn Federal Bancorp | | | 188 | | | | 2 | |
The accompanying notes are an integral part of the financial statements.
28 First American Funds 2009 Annual Report
| | | | | | | | | |
| Small Cap Index Fund (continued) |
| DESCRIPTION | | SHARES | | FAIR VALUE |
| |
| |
| Bryn Mawr Bank | | | 373 | | | $ | 6 | |
| Calamos Asset Management | | | 1,416 | | | | 15 | |
| California First National Bancorp | | | 112 | | | | 1 | |
| Camden National | | | 465 | | | | 14 | |
Cape Bancorp = | | | 718 | | | | 5 | |
Capital City Bank Group 6 | | | 662 | | | | 8 | |
| Capital Southwest | | | 178 | | | | 13 | |
| CapLease – REIT | | | 2,923 | | | | 10 | |
| Capstead Mortgage – REIT | | | 3,873 | | | | 51 | |
| Cardinal Financial | | | 1,642 | | | | 13 | |
Cardtronics = | | | 816 | | | | 8 | |
| Care Investment Trust – REIT | | | 719 | | | | 6 | |
Cash America International 6 | | | 1,802 | | | | 55 | |
Cathay General Bancorp 6 | | | 3,021 | | | | 27 | |
CBL & Associates Properties – REIT 6 | | | 8,330 | | | | 68 | |
| Cedar Shopping Centers – REIT | | | 2,510 | | | | 15 | |
| Center Bancorp | | | 753 | | | | 6 | |
| Centerstate Banks of Florida | | | 1,121 | | | | 8 | |
Central Pacific Financial 6 | | | 1,626 | | | | 2 | |
| Century Bancorp | | | 215 | | | | 5 | |
| Chemical Financial | | | 1,312 | | | | 29 | |
| Cheviot Financial | | | 171 | | | | 1 | |
Chicopee Bancorp = | | | 393 | | | | 5 | |
China Housing & Land Development = 6 | | | 1,566 | | | | 5 | |
Citizens = 6 | | | 2,297 | | | | 14 | |
| Citizens & Northern | | | 486 | | | | 6 | |
Citizens Banking = 6 | | | 23,787 | | | | 14 | |
| Citizens Holding | | | 243 | | | | 5 | |
| City Holdings | | | 1,106 | | | | 34 | |
| Clifton Savings Bancorp | | | 589 | | | | 5 | |
CNA Surety = | | | 1,001 | | | | 15 | |
CNB Financial 6 | | | 527 | | | | 8 | |
| CoBiz Financial | | | 1,784 | | | | 9 | |
| Cogdell Spencer – REIT | | | 1,698 | | | | 8 | |
Cohen & Steers 6 | | | 1,049 | | | | 20 | |
| Colonial Properties Trust – REIT | | | 3,997 | | | | 42 | |
| Columbia Banking System | | | 1,697 | | | | 25 | |
| Community Bank System | | | 1,991 | | | | 37 | |
| Community Trust Bancorp | | | 871 | | | | 21 | |
| Compass Diversified Trust | | | 1,454 | | | | 15 | |
Compucredit Holdings = | | | 900 | | | | 3 | |
Conseco = | | | 11,268 | | | | 59 | |
| Consolidated-Tomoka Land | | | 330 | | | | 11 | |
| Cousins Properties – REIT | | | 4,408 | | | | 32 | |
Crawford & Company = | | | 1,307 | | | | 7 | |
Credit Acceptance = | | | 335 | | | | 12 | |
CVB Financial 6 | | | 4,962 | | | | 40 | |
| Cypress Sharpridge Investments | | | 997 | | | | 13 | |
Danvers Bancorp 6 | | | 967 | | | | 13 | |
DCT Industrial Trust – REIT 6 | | | 12,347 | | | | 56 | |
| Delphi Financial Group, Class A | | | 2,642 | | | | 57 | |
Developers Diversified Realty – REIT 6 | | | 8,643 | | | | 74 | |
Diamond Hill Investment Group = | | | 130 | | | | 7 | |
DiamondRock Hospitality – REIT = | | | 7,014 | | | | 53 | |
| Dime Community Bancshares | | | 1,574 | | | | 17 | |
Dollar Financial = | | | 1,410 | | | | 26 | |
| Donegal Group, Class A | | | 937 | | | | 14 | |
Doral Financial = 6 | | | 296 | | | | 1 | |
| Duff & Phelps, Class A | | | 989 | | | | 17 | |
| DuPont Fabros Technology – REIT | | | 1,614 | | | | 24 | |
| Dynex Capital – REIT | | | 685 | | | | 6 | |
E *TRADE Financial = 6 | | | 88,366 | | | | 129 | |
Eagle Bancorp = | | | 913 | | | | 9 | |
| East West Bancorp | | | 5,571 | | | | 50 | |
| Eastern Insurance Holdings | | | 478 | | | | 3 | |
| EastGroup Properties – REIT | | | 1,448 | | | | 53 | |
| Education Realty Trust – REIT | | | 3,421 | | | | 17 | |
eHealth = | | | 1,461 | | | | 21 | |
| EMC Insurance Group | | | 349 | | | | 7 | |
| Employers Holdings | | | 2,788 | | | | 41 | |
Encore Capital Group = | | | 896 | | | | 13 | |
Enstar Group = | | | 407 | | | | 25 | |
| Enterprise Bancorp | | | 308 | | | | 3 | |
| Enterprise Financial Services | | | 644 | | | | 6 | |
| Entertainment Properties Trust – REIT | | | 2,131 | | | | 73 | |
| Epoch Holdings | | | 774 | | | | 7 | |
| Equity Lifestyle Properties – REIT | | | 1,362 | | | | 63 | |
Equity One – REIT 6 | | | 2,278 | | | | 34 | |
| ESB Financial | | | 560 | | | | 7 | |
| Essa Bancorp | | | 921 | | | | 11 | |
| Evercore Partners, Class A | | | 671 | | | | 22 | |
| Extra Space Storage – REIT | | | 5,268 | | | | 50 | |
Ezcorp = | | | 2,633 | | | | 34 | |
| F.N.B | | | 6,873 | | | | 49 | |
| Farmers Capital Bank | | | 391 | | | | 4 | |
| FBL Financial Group, Class A | | | 927 | | | | 19 | |
FBR Capital Markets = | | | 1,631 | | | | 10 | |
| FelCor Lodging Trust – REIT | | | 3,945 | | | | 12 | |
| Fifth Street Finance | | | 1,973 | | | | 19 | |
| Financial Federal | | | 1,451 | | | | 30 | |
| Financial Institutions | | | 638 | | | | 7 | |
First Acceptance = | | | 1,142 | | | | 3 | |
| First Bancorp | | | 532 | | | | 8 | |
| First Bancorp – North Carolina | | | 836 | | | | 11 | |
First Bancorp of Puerto Rico 6 | | | 4,898 | | | | 9 | |
First Busey 6 | | | 2,470 | | | | 10 | |
First California Financial Group = | | | 344 | | | | 1 | |
First Cash Financial Services = | | | 1,400 | | | | 24 | |
| First Commonwealth Financial | | | 4,982 | | | | 26 | |
| First Community Bancshares – Nevada | | | 849 | | | | 10 | |
| First Defiance Financial | | | 496 | | | | 7 | |
| First Financial – Indiana | | | 709 | | | | 20 | |
| First Financial Bancorp – Ohio | | | 3,104 | | | | 39 | |
First Financial Bankshares 6 | | | 1,269 | | | | 62 | |
| First Financial Holdings | | | 853 | | | | 12 | |
| First Financial Northwest | | | 1,239 | | | | 7 | |
| First Financial Services | | | 246 | | | | 2 | |
| First Industrial Realty Trust – REIT | | | 3,188 | | | | 14 | |
First Marblehead = 6 | | | 3,748 | | | | 7 | |
| First Merchants | | | 1,226 | | | | 8 | |
| First Mercury Financial | | | 819 | | | | 10 | |
First Midwest Bancorp 6 | | | 3,304 | | | | 34 | |
| First of Long Island | | | 329 | | | | 8 | |
| First Potomac Realty Trust – REIT | | | 1,528 | | | | 17 | |
First South Bancorp 6 | | | 443 | | | | 5 | |
| FirstMerit | | | 5,033 | | | | 95 | |
Flagstar Bancorp = | | | 4,698 | | | | 4 | |
| Flagstone Reinsurance Holdings | | | 2,386 | | | | 26 | |
| Flushing Financial | | | 1,560 | | | | 18 | |
Forestar Real Estate Group = | | | 2,186 | | | | 32 | |
Fox Chase Bancorp = | | | 345 | | | | 3 | |
FPIC Insurance Group = | | | 524 | | | | 18 | |
| Franklin Street Properties – REIT | | | 3,332 | | | | 36 | |
| GAMCO Investors | | | 441 | | | | 19 | |
German Amern Bancorp 6 | | | 675 | | | | 10 | |
| Getty Realty – REIT | | | 1,252 | | | | 31 | |
| GFI Group | | | 4,116 | | | | 21 | |
Glacier Bancorp 6 | | | 3,751 | | | | 49 | |
| Gladstone Capital | | | 1,286 | | | | 11 | |
| Gladstone Commercial – REIT | | | 523 | | | | 7 | |
| Gladstone Investment | | | 1,347 | | | | 7 | |
| Glimcher Realty Trust – REIT | | | 3,723 | | | | 10 | |
First American Funds 2009 Annual Report 29
Schedule of Investments October 31, 2009, all dollars are rounded to thousands (000)
| | | | | | | | | |
| Small Cap Index Fund (continued) |
| DESCRIPTION | | SHARES | | FAIR VALUE |
| |
| |
Government Properties Income Trust – REIT = | | | 606 | | | $ | 14 | |
Gramercy Capital – REIT = | | | 3,791 | | | | 12 | |
Great Southern Bancorp 6 | | | 612 | | | | 14 | |
Greenlight Capital = | | | 1,625 | | | | 30 | |
Guaranty Bancorp = | | | 2,881 | | | | 4 | |
Hallmark Financial Services = | | | 577 | | | | 4 | |
Hampton Roads Bankshares 6 | | | 1,125 | | | | 2 | |
| Hancock Holding | | | 1,496 | | | | 54 | |
| Harleysville Group | | | 815 | | | | 26 | |
Harleysville National 6 | | | 2,488 | | | | 14 | |
Harris & Harris Group = | | | 1,505 | | | | 6 | |
Hatteras Financial – REIT 6 | | | 2,208 | | | | 62 | |
Healthcare Realty Trust – REIT 6 | | | 3,420 | | | | 71 | |
Heartland Financial USA 6 | | | 895 | | | | 12 | |
| Hercules Technology Growth Capital | | | 2,155 | | | | 20 | |
| Heritage Financial | | | 339 | | | | 4 | |
| Hersha Hospitality Trust – REIT | | | 2,702 | | | | 7 | |
| Highwoods Properties – REIT | | | 4,319 | | | | 119 | |
Hilltop Holdings = | | | 2,517 | | | | 30 | |
Home Bancorp = | | | 545 | | | | 7 | |
| Home Bancshares | | | 853 | | | | 18 | |
| Home Federal Bancorp | | | 1,019 | | | | 12 | |
| Home Properties – REIT | | | 1,935 | | | | 76 | |
| Horace Mann Educators | | | 2,655 | | | | 33 | |
| IBERIABANK | | | 1,244 | | | | 54 | |
| Independence Holdings | | | 395 | | | | 2 | |
| Independent Bank | | | 1,275 | | | | 27 | |
| Infinity Property & Casualty | | | 921 | | | | 36 | |
| Inland Real Estate – REIT | | | 4,287 | | | | 37 | |
International Assets Holding = | | | 765 | | | | 14 | |
| International Bancshares | | | 3,179 | | | | 47 | |
Invesco Mortgage Capital = | | | 519 | | | | 10 | |
Investors Bancorp = | | | 2,905 | | | | 32 | |
| Investors Real Estate Trust – REIT | | | 3,339 | | | | 28 | |
iStar Financial – REIT = 6 | | | 7,609 | | | | 16 | |
| JMP Group | | | 893 | | | | 8 | |
| K Fed Bancorp | | | 245 | | | | 2 | |
| Kansas City Life Insurance | | | 248 | | | | 7 | |
KBW = | | | 2,125 | | | | 60 | |
| Kearny Financial | | | 1,168 | | | | 12 | |
| Kentucky First Fed Bancorp | | | 186 | | | | 2 | |
Kilroy Realty – REIT 6 | | | 2,606 | | | | 72 | |
| Kite Realty Group Trust – REIT | | | 2,822 | | | | 10 | |
Knight Capital Group, Class A = | | | 5,669 | | | | 96 | |
| Kohlberg Capital | | | 1,116 | | | | 6 | |
LaBranche = | | | 3,377 | | | | 9 | |
Lakeland Bancorp 6 | | | 1,430 | | | | 9 | |
| Lakeland Financial | | | 686 | | | | 14 | |
LaSalle Hotel Properties – REIT 6 | | | 3,835 | | | | 66 | |
| Legacy Bancorp | | | 450 | | | | 4 | |
| Lexington Corporate Properties Trust – REIT | | | 5,468 | | | | 23 | |
Life Partners Holdings 6 | | | 403 | | | | 7 | |
| LTC Properties – REIT | | | 1,413 | | | | 34 | |
| Maiden Holdings | | | 2,858 | | | | 20 | |
Main Street Capital 6 | | | 431 | | | | 6 | |
| MainSource Financial Group | | | 1,125 | | | | 7 | |
MarketAxess Holdings = | | | 1,935 | | | | 23 | |
| Max Capital Hamilton | | | 3,242 | | | | 67 | |
| MB Financial | | | 3,029 | | | | 54 | |
| MCG Capital | | | 4,432 | | | | 18 | |
| Meadowbrook Insurance Group | | | 3,503 | | | | 24 | |
| Medallion Financial | | | 806 | | | | 6 | |
Medical Properties Trust – REIT 6 | | | 4,670 | | | | 37 | |
| Mercer Insurance Group | | | 341 | | | | 6 | |
| Merchants Bancshares | | | 291 | | | | 7 | |
Meridian Interstate Bancorp = | | | 580 | | | | 5 | |
Metro Bancorp = | | | 579 | | | | 7 | |
MF Global = 6 | | | 5,902 | | | | 42 | |
| MFA Mortgage Investments – REIT | | | 15,665 | | | | 116 | |
MGIC Investment = | | | 7,628 | | | | 33 | |
Mid-America Apartment Communities – REIT 6 | | | 1,721 | | | | 75 | |
| Midsouth Bancorp | | | 279 | | | | 4 | |
| Mission West Properties – REIT | | | 891 | | | | 6 | |
| Monmouth Real Estate Investment, Class A – REIT | | | 1,106 | | | | 8 | |
| Montpelier Holdings | | | 5,407 | | | | 87 | |
| MVC Capital | | | 1,371 | | | | 13 | |
| Nara Bancorp | | | 1,991 | | | | 15 | |
| NASB Financial | | | 288 | | | | 7 | |
| National Bankshares | | | 422 | | | | 11 | |
National Financial Partners = | | | 2,676 | | | | 22 | |
| National Health Investors – REIT | | | 1,569 | | | | 47 | |
| National Interstate | | | 266 | | | | 5 | |
National Penn Bancshares 6 | | | 7,628 | | | | 43 | |
National Retail Properties – REIT 6 | | | 4,874 | | | | 94 | |
National Western Life Insurance, Class A 6 | | | 151 | | | | 27 | |
Navigators Group = | | | 650 | | | | 35 | |
| NBT Bancorp | | | 1,990 | | | | 43 | |
Nelnet, Class A = | | | 1,175 | | | | 17 | |
| NewAlliance Bancshares | | | 6,347 | | | | 70 | |
Newstar Financial = | | | 1,688 | | | | 4 | |
| NGP Capital Resources | | | 1,221 | | | | 9 | |
| Northeast Community Bancorp | | | 359 | | | | 2 | |
| Northfield Bancorp | | | 1,067 | | | | 13 | |
| Northrim Bancorp | | | 387 | | | | 6 | |
NorthStar Realty Finance – REIT 6 | | | 3,541 | | | | 13 | |
| Northwest Bancorp | | | 957 | | | | 21 | |
| Norwood Financial | | | 115 | | | | 3 | |
| NYMAGIC | | | 228 | | | | 3 | |
| OceanFirst Financial | | | 479 | | | | 5 | |
Ocwen Financial = | | | 2,826 | | | | 31 | |
Ohio Valley Banc 6 | | | 242 | | | | 5 | |
| Old National Bancorp | | | 5,256 | | | | 55 | |
| Old Point Financial | | | 122 | | | | 2 | |
Old Second Bancorp 6 | | | 757 | | | | 4 | |
| OMEGA Healthcare Investors – REIT | | | 4,763 | | | | 72 | |
| Oppenheimer Holdings | | | 576 | | | | 15 | |
| optionsXpress Holdings | | | 2,576 | | | | 40 | |
| Oriental Financial Group | | | 1,477 | | | | 16 | |
| Oritani Financial | | | 704 | | | | 9 | |
Orrstown Financial Services 6 | | | 312 | | | | 10 | |
Pacific Cap Bancorp New 6 | | | 2,602 | | | | 3 | |
| Pacific Continental | | | 784 | | | | 9 | |
PacWest Bancorp 6 | | | 1,625 | | | | 28 | |
| Park National | | | 641 | | | | 37 | |
| Parkway Properties – REIT | | | 1,221 | | | | 22 | |
| Peapack-Gladstone Financial | | | 473 | | | | 6 | |
| PennantPark Investment | | | 1,530 | | | | 12 | |
| Penns Woods Bancorp | | | 233 | | | | 7 | |
| Pennsylvania Real Estate Investment Trust – REIT | | | 2,331 | | | | 17 | |
Pennymac Mortgage Investment Trust = | | | 1,013 | | | | 19 | |
Penson Worldwide = 6 | | | 1,190 | | | | 12 | |
| Peoples Bancorp – Ohio | | | 629 | | | | 7 | |
| Peoples Financial | | | 231 | | | | 4 | |
PHH = 6 | | | 3,316 | | | | 54 | |
Phoenix Companies = | | | 7,050 | | | | 22 | |
PICO Holdings = | | | 1,149 | | | | 39 | |
Pinnacle Financial Partners = 6 | | | 2,002 | | | | 25 | |
Piper Jaffray Companies = | | | 1,201 | | | | 56 | |
| Platinum Underwriters Holdings | | | 3,092 | | | | 111 | |
PMA Capital = | | | 1,906 | | | | 9 | |
The accompanying notes are an integral part of the financial statements.
30 First American Funds 2009 Annual Report
| | | | | | | | | |
| Small Cap Index Fund (continued) |
| DESCRIPTION | | SHARES | | FAIR VALUE |
| |
| |
PMI Group 6 | | | 4,759 | | | $ | 12 | |
| Porter Bancorp | | | 164 | | | | 3 | |
Portfolio Recovery Associates = 6 | | | 884 | | | | 41 | |
| Post Properties – REIT | | | 2,920 | | | | 48 | |
| Potlatch – REIT | | | 2,423 | | | | 68 | |
| PremierWest Bancorp | | | 1,321 | | | | 3 | |
| Presidential Life | | | 1,519 | | | | 14 | |
Primus Guaranty = | | | 1,293 | | | | 4 | |
| PrivateBancorp | | | 2,129 | | | | 19 | |
ProAssurance = | | | 1,994 | | | | 100 | |
Prospect Capital 6 | | | 2,517 | | | | 25 | |
| Prosperity Bancshares | | | 2,812 | | | | 101 | |
| Provident Financial Services | | | 3,471 | | | | 37 | |
| Provident New York Bancorp | | | 2,388 | | | | 20 | |
| Prudential Bancorp | | | 245 | | | | 2 | |
| PS Business Parks – REIT | | | 939 | | | | 46 | |
Pzena Investment Management = | | | 470 | | | | 3 | |
| QC Holdings | | | 209 | | | | 1 | |
| Radian Group | | | 4,994 | | | | 29 | |
RAIT Financial Trust – REIT 6 | | | 5,114 | | | | 9 | |
Ramco-Gershenson Properties Trust – REIT 6 | | | 1,374 | | | | 12 | |
| Redwood Trust – REIT | | | 4,726 | | | | 66 | |
| Renasant | | | 1,227 | | | | 18 | |
Republic Bancorp – Kentucky, Class A 6 | | | 604 | | | | 11 | |
Republic First Bancorp = | | | 437 | | | | 2 | |
| Resource America, Class A | | | 768 | | | | 3 | |
| Resource Capital – REIT | | | 1,253 | | | | 6 | |
| Rewards Network | | | 389 | | | | 4 | |
Riskmetrics Group = | | | 1,342 | | | | 20 | |
| RLI | | | 1,119 | | | | 56 | |
| Rockville Financial | | | 499 | | | | 5 | |
| Roma Financial | | | 476 | | | | 6 | |
S&T Bancorp 6 | | | 1,436 | | | | 23 | |
Safeguard Scientifics = | | | 1,259 | | | | 12 | |
| Safety Insurance Group | | | 946 | | | | 32 | |
| Sanders Morris Harris Group | | | 1,098 | | | | 6 | |
Sandy Spring Bancorp 6 | | | 1,003 | | | | 12 | |
Santander Bancorp = | | | 259 | | | | 3 | |
| Saul Centers – REIT | | | 672 | | | | 21 | |
| SCBT Financial | | | 741 | | | | 19 | |
SeaBright Insurance Holdings = | | | 1,197 | | | | 13 | |
| Selective Insurance Group | | | 3,182 | | | | 49 | |
| Shore Bancshares | | | 512 | | | | 8 | |
| Sierra Bancorp | | | 410 | | | | 4 | |
Signature Bank = | | | 2,158 | | | | 68 | |
| Simmons First National, Class A | | | 854 | | | | 25 | |
| Smithtown Bancorp | | | 893 | | | | 9 | |
| South Financial Group | | | 12,988 | | | | 10 | |
| Southside Bancshares | | | 783 | | | | 16 | |
| Southwest Bancorp – Oklahoma | | | 917 | | | | 9 | |
| Sovran Self Storage – REIT | | | 1,271 | | | | 38 | |
Starwood Property Trust = | | | 2,446 | | | | 49 | |
| State Auto Financial | | | 956 | | | | 16 | |
| State Bancorp | | | 777 | | | | 6 | |
| StellarOne | | | 1,384 | | | | 15 | |
| Sterling Bancorp | | | 1,304 | | | | 9 | |
Sterling Bancshares 6 | | | 5,023 | | | | 28 | |
Sterling Financial – Washington = 6 | | | 3,195 | | | | 3 | |
| Stewart Information Services | | | 987 | | | | 9 | |
Stifel Financial = 6 | | | 1,669 | | | | 87 | |
Strategic Hotels & Resorts – REIT = 6 | | | 5,791 | | | | 10 | |
Suffolk Bancorp 6 | | | 629 | | | | 18 | |
Sun Bancorp – New Jersey = | | | 1,087 | | | | 4 | |
| Sun Communities – REIT | | | 1,465 | | | | 26 | |
| Sunstone Hotel Investors – REIT | | | 5,920 | | | | 45 | |
Susquehanna Bancshares 6 | | | 5,259 | | | | 29 | |
SVB Financial Group = 6 | | | 2,011 | | | | 83 | |
| SWS Group | | | 1,467 | | | | 20 | |
| SY Bancorp | | | 841 | | | | 19 | |
| Tanger Factory Outlet Centers – REIT | | | 2,244 | | | | 85 | |
Tejon Ranch = | | | 635 | | | | 17 | |
Territorial Bancorp = | | | 512 | | | | 8 | |
Teton Advisors = | | | 6 | | | | — | |
Texas Capital Bancshares = | | | 2,172 | | | | 32 | |
Thomas Weisel Partners Group = | | | 1,177 | | | | 5 | |
| TICC Capital | | | 2,121 | | | | 10 | |
| Tompkins Trustco | | | 503 | | | | 22 | |
| Tower Bancorp | | | 212 | | | | 5 | |
| Tower Group | | | 2,467 | | | | 61 | |
Townebank Portsmouth 6 | | | 1,208 | | | | 14 | |
TradeStation Group = | | | 2,031 | | | | 16 | |
Tree.com = | | | 391 | | | | 3 | |
Triangle Capital 6 | | | 679 | | | | 8 | |
| TriCo Bancshares | | | 872 | | | | 13 | |
TrustCo Bank Corporation of New York 6 | | | 4,401 | | | | 26 | |
Trustmark 6 | | | 3,499 | | | | 66 | |
UCBH Holdings 6 | | | 7,345 | | | | 7 | |
| UMB Financial | | | 1,963 | | | | 78 | |
| UMH Properties – REIT | | | 534 | | | | 4 | |
| Umpqua Holdings | | | 5,179 | | | | 51 | |
| Union Bankshares | | | 934 | | | | 12 | |
United American Indemnity = | | | 2,038 | | | | 14 | |
United Bankshares 6 | | | 2,328 | | | | 42 | |
United Community Banks = | | | 4,949 | | | | 20 | |
| United Financial Bancorp | | | 965 | | | | 12 | |
| United Fire & Casualty | | | 1,323 | | | | 23 | |
United Security Bancshares 6 | | | 366 | | | | 8 | |
| Universal Health Realty Income Trust – REIT | | | 866 | | | | 28 | |
| Universal Insurance Holdings | | | 805 | | | | 4 | |
| Univest Corporation of Pennsylvania | | | 849 | | | | 16 | |
| Urstadt Biddle Properties, Class A | | | 1,658 | | | | 25 | |
US Global Investors 6 | | | 800 | | | | 8 | |
| U-Store-It Trust – REIT | | | 4,809 | | | | 27 | |
| Viewpoint Financial | | | 609 | | | | 8 | |
Virtus Investment Partners = | | | 353 | | | | 5 | |
| Walter Investment Management – REIT | | | 1,389 | | | | 18 | |
| Washington Banking | | | 581 | | | | 5 | |
| Washington Real Estate Investment Trust – REIT | | | 3,413 | | | | 91 | |
| Washington Trust Bancorp | | | 789 | | | | 12 | |
Waterstone Financial = | | | 389 | | | | 1 | |
Webster Financial 6 | | | 4,116 | | | | 47 | |
| WesBanco | | | 1,463 | | | | 21 | |
| West Bancorp | | | 945 | | | | 4 | |
Westamerica Bancorporation 6 | | | 1,687 | | | | 81 | |
Western Alliance Bancorp = | | | 2,796 | | | | 12 | |
| Westfield Financial | | | 1,724 | | | | 14 | |
| Westwood Holdings | | | 342 | | | | 12 | |
| Wilber | | | 354 | | | | 2 | |
Wilshire Bancorp 6 | | | 1,310 | | | | 9 | |
| Winthrop Realty Trust – REIT | | | 624 | | | | 6 | |
Wintrust Financial 6 | | | 1,461 | | | | 41 | |
World Acceptance = | | | 950 | | | | 24 | |
| WSFS Financial | | | 373 | | | | 10 | |
| Yadkin Valley Financial | | | 891 | | | | 3 | |
| Zenith National Insurance | | | 2,178 | | | | 62 | |
| | | | | | | | | |
| | | | | | | | 10,270 | |
| | | | | | | | | |
| Healthcare – 12.7% |
Abaxis = | | | 1,335 | | | | 30 | |
ABIOMED = | | | 1,993 | | | | 18 | |
Accelrys = | | | 1,452 | | | | 8 | |
Accuray = | | | 2,418 | | | | 14 | |
First American Funds 2009 Annual Report 31
Schedule of Investments October 31, 2009, all dollars are rounded to thousands (000)
| | | | | | | | | |
| Small Cap Index Fund (continued) |
| DESCRIPTION | | SHARES | | FAIR VALUE |
| |
| |
Acorda Therapeutics = | | | 2,319 | | | $ | 50 | |
Acura Pharmaceuticals = 6 | | | 442 | | | | 2 | |
Adolor = | | | 2,497 | | | | 4 | |
Affymax = | | | 841 | | | | 17 | |
Affymetrix = | | | 4,311 | | | | 23 | |
Air Methods = | | | 647 | | | | 20 | |
Akorn = 6 | | | 3,092 | | | | 4 | |
Albany Molecular Research = | | | 1,421 | | | | 12 | |
Align Technology = | | | 3,470 | | | | 55 | |
Alkermes = | | | 5,764 | | | | 46 | |
Alliance Imaging = | | | 1,601 | | | | 9 | |
Allied Healthcare International = | | | 2,743 | | | | 7 | |
Allion Healthcare = | | | 1,212 | | | | 8 | |
Allos Therapeutics = | | | 3,803 | | | | 21 | |
Almost Family = | | | 437 | | | | 13 | |
Alnylam Pharmaceuticals = | | | 2,197 | | | | 37 | |
Alphatec Holdings = | | | 1,827 | | | | 9 | |
AMAG Pharmaceuticals = 6 | | | 1,039 | | | | 39 | |
Amedisys = 6 | | | 1,667 | | | | 66 | |
| America Service Group | | | 504 | | | | 7 | |
American Caresource Holding = | | | 646 | | | | 2 | |
American Dental Partners = | | | 789 | | | | 9 | |
American Medical Systems = 6 | | | 4,502 | | | | 69 | |
AMERIGROUP = | | | 3,138 | | | | 69 | |
AMICAS = | | | 2,147 | | | | 7 | |
Amicus Therapeutics = | | | 924 | | | | 4 | |
AMN Healthcare Services = | | | 1,944 | | | | 16 | |
Amsurg, Class A = | | | 1,869 | | | | 39 | |
| Analogic | | | 780 | | | | 29 | |
AngioDynamics = | | | 1,490 | | | | 23 | |
Ardea Biosciences = | | | 813 | | | | 11 | |
Arena Pharmaceuticals = 6 | | | 5,630 | | | | 20 | |
Ariad Pharmaceuticals = 6 | | | 6,575 | | | | 12 | |
ArQule = | | | 2,524 | | | | 8 | |
Array BioPharma = | | | 2,934 | | | | 5 | |
Aryx Therapeutics = | | | 1,269 | | | | 3 | |
Aspect Medical Systems = | | | 1,062 | | | | 13 | |
Assisted Living Concepts, Class A = | | | 638 | | | | 13 | |
Athenahealth = 6 | | | 2,043 | | | | 77 | |
| Atrion | | | 81 | | | | 10 | |
ATS Medical = 6 | | | 2,890 | | | | 8 | |
Auxilium Pharmaceuticals = 6 | | | 2,604 | | | | 82 | |
AVANIR Pharmaceuticals = 6 | | | 3,702 | | | | 7 | |
AVI BioPharma = 6 | | | 5,798 | | | | 9 | |
BioCryst Pharmaceuticals = 6 | | | 1,307 | | | | 12 | |
Biodel = | | | 928 | | | | 4 | |
BioDelivery Sciences International = | | | 575 | | | | 2 | |
Biomimetic Therapeutics = | | | 777 | | | | 9 | |
Bio-Reference Laboratories = | | | 723 | | | | 23 | |
BioScrip = | | | 2,551 | | | | 19 | |
Biospecifics Technologies = | | | 236 | | | | 7 | |
BMP Sunstone = | | | 1,974 | | | | 7 | |
Bovie Medical = 6 | | | 1,039 | | | | 8 | |
Bruker BioSciences = | | | 3,341 | | | | 36 | |
Cadence Pharmaceuticals = 6 | | | 1,557 | | | | 14 | |
Cambrex = | | | 1,692 | | | | 10 | |
Cantel Medical = | | | 726 | | | | 12 | |
Capital Senior Living = | | | 1,382 | | | | 7 | |
Caraco Pharmaceutical Laboratories = | | | 907 | | | | 3 | |
Cardiac Science = | | | 1,054 | | | | 4 | |
Cardionet = | | | 1,449 | | | | 9 | |
Cardiovascular Systems = | | | 548 | | | | 3 | |
Cardium Therapeutics = 6 | | | 2,373 | | | | 2 | |
Catalyst Health Solutions = | | | 2,237 | | | | 70 | |
Celera = | | | 4,990 | | | | 31 | |
Cell Therapeutics = 6 | | | 32,581 | | | | 31 | |
Celldex Therapeutics = | | | 1,509 | | | | 7 | |
Centene = | | | 2,544 | | | | 45 | |
Cepheid = 6 | | | 3,533 | | | | 47 | |
Chelsea Therapeutics International = | | | 1,969 | | | | 5 | |
| Chemed | | | 1,345 | | | | 61 | |
Chindex International = | | | 812 | | | | 11 | |
Clarient = | | | 1,823 | | | | 6 | |
Clinical Data = 6 | | | 657 | | | | 10 | |
| Computer Programs & Systems | | | 538 | | | | 23 | |
Conceptus = 6 | | | 1,861 | | | | 33 | |
CONMED = | | | 1,679 | | | | 36 | |
Continucare = | | | 1,786 | | | | 5 | |
Cornerstone Therapeutics = | | | 398 | | | | 2 | |
Corvel = | | | 482 | | | | 14 | |
Cross Country Healthcare = | | | 1,784 | | | | 15 | |
CryoLife = | | | 1,618 | | | | 10 | |
Cubist Pharmaceuticals = 6 | | | 3,514 | | | | 60 | |
Curis = 6 | | | 3,882 | | | | 8 | |
Cutera = | | | 811 | | | | 7 | |
Cyberonics = 6 | | | 1,667 | | | | 24 | |
Cynosure = | | | 518 | | | | 5 | |
Cypress Bioscience = | | | 2,320 | | | | 14 | |
Cytokinetics = | | | 2,526 | | | | 8 | |
Cytori Therapeutics = | | | 1,651 | | | | 5 | |
Delcath Systems = 6 | | | 1,383 | | | | 6 | |
DepoMed = | | | 2,969 | | | | 9 | |
DexCom = | | | 2,800 | | | | 19 | |
Dionex = | | | 1,066 | | | | 72 | |
Discovery Laboratories = 6 | | | 7,301 | | | | 7 | |
Durect = | | | 5,012 | | | | 11 | |
Dyax = | | | 4,028 | | | | 13 | |
Eclipsys = | | | 3,425 | | | | 64 | |
Electro Optical Sciences = 6 | | | 1,076 | | | | 11 | |
Emergency Medical Services = | | | 576 | | | | 28 | |
Emergent Biosolutions = | | | 995 | | | | 14 | |
Emeritus = 6 | | | 1,144 | | | | 21 | |
Endologix = | | | 2,676 | | | | 13 | |
| Ensign Group | | | 671 | | | | 10 | |
Enteromedics = 6 | | | 929 | | | | 1 | |
Enzo Biochem = | | | 1,884 | | | | 10 | |
Enzon = 6 | | | 2,762 | | | | 23 | |
eResearchTechnology = | | | 2,513 | | | | 19 | |
ev3 = | | | 4,322 | | | | 51 | |
Exactech = | | | 442 | | | | 7 | |
Exelixis = | | | 6,492 | | | | 39 | |
Facet Biotech = | | | 1,498 | | | | 26 | |
Genomic Health = | | | 816 | | | | 15 | |
Genoptix = 6 | | | 1,028 | | | | 36 | |
Gentiva Health Services = | | | 1,765 | | | | 42 | |
Geron = 6 | | | 5,430 | | | | 33 | |
Greatbatch = 6 | | | 1,414 | | | | 28 | |
GTx = 6 | | | 1,164 | | | | 10 | |
Haemonetics = | | | 1,495 | | | | 77 | |
Halozyme Therapeutics = | | | 3,830 | | | | 23 | |
Hanger Orthopedic Group = | | | 1,791 | | | | 25 | |
Hansen Medical = | | | 1,415 | | | | 4 | |
Harvard Bioscience = | | | 1,497 | | | | 5 | |
Health Grades = | | | 1,449 | | | | 6 | |
Healthsouth = | | | 5,384 | | | | 79 | |
Healthspring = | | | 2,986 | | | | 43 | |
Healthways = | | | 2,044 | | | | 33 | |
Heartware International = | | | 284 | | | | 9 | |
Hemispherx Biopharma = 6 | | | 7,099 | | | | 10 | |
Hi-Tech Pharmaceutical = | | | 494 | | | | 9 | |
HMS Holdings = | | | 1,577 | | | | 68 | |
Home Diagnostics = | | | 705 | | | | 4 | |
The accompanying notes are an integral part of the financial statements.
32 First American Funds 2009 Annual Report
| | | | | | | | | |
| Small Cap Index Fund (continued) |
| DESCRIPTION | | SHARES | | FAIR VALUE |
| |
| |
Human Genome Sciences = 6 | | | 9,835 | | | $ | 184 | |
ICU Medical = | | | 775 | | | | 27 | |
Idenix Pharmaceuticals = | | | 1,726 | | | | 4 | |
Idera Pharmaceuticals = | | | 1,318 | | | | 7 | |
I-Flow = | | | 1,328 | | | | 17 | |
Immucor = 6 | | | 4,295 | | | | 77 | |
ImmunoGen = | | | 3,116 | | | | 21 | |
Immunomedics = | | | 3,946 | | | | 14 | |
Impax Laboratories = | | | 3,700 | | | | 33 | |
Incyte = 6 | | | 5,247 | | | | 31 | |
Indevus Pharmaceuticals, escrow shares = ¥ ⊡ | | | 4,270 | | | | — | |
Infinity Pharmaceuticals = | | | 1,093 | | | | 6 | |
Insmed = | | | 7,622 | | | | 5 | |
Inspire Pharmaceuticals = | | | 3,705 | | | | 17 | |
Insulet = 6 | | | 1,587 | | | | 18 | |
Integra LifeSciences = | | | 1,149 | | | | 35 | |
InterMune = | | | 2,330 | | | | 28 | |
| Invacare | | | 1,865 | | | | 42 | |
inVentiv Health = | | | 2,040 | | | | 35 | |
IPC The Hospitalist = | | | 982 | | | | 30 | |
IRIS International = | | | 1,070 | | | | 11 | |
Isis Pharmaceuticals = 6 | | | 5,679 | | | | 72 | |
ISTA Pharmaceuticals = | | | 2,026 | | | | 7 | |
Javelin Pharmaceuticals = 6 | | | 2,712 | | | | 4 | |
Kendle International = | | | 905 | | | | 15 | |
Kensey Nash = | | | 597 | | | | 14 | |
Kindred Healthcare = | | | 2,379 | | | | 35 | |
K-V Pharmaceutical, Class A = | | | 2,272 | | | | 9 | |
| Landauer | | | 548 | | | | 28 | |
Lannett = | | | 616 | | | | 4 | |
LCA-Vision = | | | 1,003 | | | | 5 | |
Lexicon Pharmaceuticals = | | | 6,272 | | | | 8 | |
LHC Group = | | | 925 | | | | 26 | |
Life Sciences Research = | | | 474 | | | | 4 | |
Ligand Pharmaceuticals = | | | 6,909 | | | | 12 | |
Luminex = 6 | | | 2,526 | | | | 37 | |
Magellan Health Services = | | | 2,130 | | | | 68 | |
Mako Surgical = 6 | | | 797 | | | | 7 | |
MannKind = 6 | | | 3,489 | | | | 18 | |
Map Pharmaceuticals = | | | 424 | | | | 3 | |
Martek Biosciences = | | | 2,021 | | | | 36 | |
Masimo = | | | 3,094 | | | | 82 | |
Matrixx Initiatives = | | | 576 | | | | 3 | |
Maxygen = | | | 1,542 | | | | 9 | |
MedAssets = | | | 2,405 | | | | 53 | |
MedCath = | | | 863 | | | | 7 | |
Medical Action Industries = | | | 864 | | | | 9 | |
Medicines = 6 | | | 3,217 | | | | 23 | |
| Medicis Pharmaceutical, Class A | | | 3,588 | | | | 76 | |
Medidata Solutions = | | | 381 | | | | 6 | |
Medivation = | | | 1,750 | | | | 45 | |
MedQuist = | | | 558 | | | | 3 | |
Merge Healthcare = | | | 1,582 | | | | 6 | |
| Meridian Bioscience | | | 2,470 | | | | 55 | |
Merit Medical Systems = | | | 1,703 | | | | 29 | |
Metabolix = 6 | | | 1,183 | | | | 12 | |
Metropolitan Health Networks = | | | 2,463 | | | | 5 | |
Micromet = 6 | | | 3,462 | | | | 18 | |
Micrus Endovascular = | | | 905 | | | | 11 | |
Middlebrook Pharmaceutical = | | | 1,944 | | | | 2 | |
Molecular Insight Pharmaceuticals = 6 | | | 1,029 | | | | 5 | |
Molina Healthcare = | | | 813 | | | | 15 | |
Momenta Pharmaceuticals = | | | 2,146 | | | | 20 | |
MWI Veterinary Supply = | | | 657 | | | | 23 | |
Myriad Pharmaceuticals = | | | 1,399 | | | | 8 | |
NABI Biopharmaceuticals = | | | 3,583 | | | | 12 | |
Nanosphere = | | | 699 | | | | 5 | |
| National Healthcare | | | 471 | | | | 17 | |
| National Research | | | 97 | | | | 2 | |
Natus Medical = | | | 1,707 | | | | 24 | |
Nektar Therapeutics = | | | 5,645 | | | | 46 | |
Neogen = | | | 783 | | | | 25 | |
Neurocrine Biosciences = | | | 2,234 | | | | 5 | |
NeurogesX = | | | 630 | | | | 5 | |
Nighthawk Radiology Holdings = | | | 1,393 | | | | 8 | |
Novamed = 6 | | | 1,218 | | | | 5 | |
Novavax = 6 | | | 4,028 | | | | 15 | |
NPS Pharmaceuticals = | | | 2,745 | | | | 9 | |
NuVasive = 6 | | | 2,223 | | | | 81 | |
NxStage Medical = 6 | | | 1,462 | | | | 8 | |
Obagi Medical Products = | | | 963 | | | | 10 | |
Odyssey Healthcare = | | | 2,106 | | | | 29 | |
Omnicell = | | | 1,846 | | | | 18 | |
Oncogenex Pharmaceuticals = | | | 244 | | | | 7 | |
Onyx Pharmaceuticals = | | | 3,524 | | | | 94 | |
Opko Health = | | | 2,603 | | | | 6 | |
Optimer Pharmaceuticals = 6 | | | 1,747 | | | | 20 | |
OraSure Technologies = | | | 2,623 | | | | 9 | |
Orexigen Therapeutics = | | | 1,605 | | | | 10 | |
Orthofix International = | | | 1,043 | | | | 33 | |
Orthovita = 6 | | | 3,880 | | | | 14 | |
Osiris Therapeutics = 6 | | | 1,022 | | | | 6 | |
| Owens & Minor | | | 2,539 | | | | 104 | |
Oxigene = | | | 1,660 | | | | 2 | |
Pain Therapeutics = | | | 2,014 | | | | 10 | |
Palomar Medical Technologies = | | | 1,061 | | | | 11 | |
Par Pharmaceutical Companies = | | | 2,026 | | | | 42 | |
PAREXEL = | | | 3,508 | | | | 44 | |
PDL BioPharma 6 | | | 7,285 | | | | 61 | |
Pharmasset = | | | 1,276 | | | | 24 | |
Pharmerica = | | | 1,860 | | | | 29 | |
Phase Forward = | | | 2,631 | | | | 34 | |
Poniard Pharmaceuticals = | | | 1,405 | | | | 9 | |
POZEN = | | | 1,514 | | | | 9 | |
Progenics Pharmaceutical = | | | 1,548 | | | | 6 | |
Protalix Biotherapeutics = | | | 2,109 | | | | 20 | |
PSS World Medical = 6 | | | 3,629 | | | | 73 | |
Psychiatric Solutions = | | | 3,430 | | | | 71 | |
Quality Systems 6 | | | 1,437 | | | | 88 | |
Questcor Pharmaceuticals = | | | 3,500 | | | | 16 | |
Quidel = | | | 1,638 | | | | 23 | |
Radnet = | | | 1,779 | | | | 4 | |
Regeneron Pharmaceuticals = | | | 3,843 | | | | 60 | |
RehabCare Group = | | | 1,122 | | | | 21 | |
Repligen = | | | 1,819 | | | | 9 | |
Repros Therapeutics = 6 | | | 576 | | | | 1 | |
Res-Care = | | | 1,442 | | | | 17 | |
Rigel Pharmaceuticals = | | | 3,004 | | | | 19 | |
Rochester Medical = | | | 610 | | | | 6 | |
Rockwell Medical Technologies = 6 | | | 861 | | | | 6 | |
RTI Biologics = | | | 3,126 | | | | 12 | |
Salix Pharmaceuticals = 6 | | | 2,798 | | | | 51 | |
Sangamo BioSciences = | | | 2,507 | | | | 13 | |
Santarus = 6 | | | 3,161 | | | | 10 | |
Savient Pharmaceuticals = 6 | | | 4,017 | | | | 51 | |
Sciclone Pharmaceuticals = | | | 2,178 | | | | 5 | |
Seattle Genetics = | | | 4,367 | | | | 40 | |
Sequenom = 6 | | | 3,729 | | | | 10 | |
SIGA Technologies = 6 | | | 1,580 | | | | 10 | |
Sirona Dental Systems = | | | 1,046 | | | | 28 | |
Skilled Healthcare Group, Class A = | | | 1,215 | | | | 10 | |
Somanetics = | | | 711 | | | | 11 | |
First American Funds 2009 Annual Report 33
Schedule of Investments October 31, 2009, all dollars are rounded to thousands (000)
| | | | | | | | | |
| Small Cap Index Fund (continued) |
| DESCRIPTION | | SHARES | | FAIR VALUE |
| |
| |
SonoSite = | | | 1,016 | | | $ | 25 | |
Spectranetics = | | | 1,872 | | | | 11 | |
Spectrum Pharmaceuticals = 6 | | | 2,607 | | | | 11 | |
StemCells = 6 | | | 6,293 | | | | 7 | |
Stereotaxis = 6 | | | 1,731 | | | | 6 | |
| STERIS | | | 3,565 | | | | 104 | |
Sucampo Pharmaceuticals = | | | 656 | | | | 3 | |
Sun Healthcare Group = | | | 2,658 | | | | 24 | |
Sunrise Senior Living = | | | 2,630 | | | | 11 | |
SuperGen = | | | 3,603 | | | | 8 | |
SurModics = 6 | | | 939 | | | | 24 | |
Symmetry Medical = | | | 2,063 | | | | 16 | |
Synovis Life Technologies = | | | 676 | | | | 8 | |
Synta Pharmaceuticals = | | | 908 | | | | 3 | |
The Provident Service = | | | 748 | | | | 9 | |
Theravance = 6 | | | 3,250 | | | | 45 | |
Thoratec = | | | 3,443 | | | | 90 | |
TomoTherapy = | | | 2,812 | | | | 9 | |
TranS1 = | | | 662 | | | | 3 | |
Transcend Services = | | | 382 | | | | 7 | |
Triple-S Management = | | | 1,253 | | | | 21 | |
U.S. Physical Therapy = | | | 644 | | | | 9 | |
Universal American Financial = | | | 2,383 | | | | 24 | |
| Utah Medical Products | | | 195 | | | | 6 | |
Vanda Pharmaceuticals = 6 | | | 1,626 | | | | 17 | |
Varian = | | | 1,718 | | | | 88 | |
Vascular Solutions = | | | 987 | | | | 8 | |
Vical = 6 | | | 2,573 | | | | 8 | |
ViroPharma = | | | 4,720 | | | | 36 | |
Virtual Radiologic = | | | 380 | | | | 5 | |
Vital Images = | | | 972 | | | | 11 | |
Vivus = 6 | | | 4,850 | | | | 38 | |
Volcano = | | | 2,946 | | | | 42 | |
WellCare Health Plans = | | | 2,575 | | | | 67 | |
West Pharmaceutical Services 6 | | | 1,997 | | | | 79 | |
Wright Medical Group = | | | 2,320 | | | | 38 | |
XenoPort = | | | 1,666 | | | | 28 | |
| Young Innovations | | | 332 | | | | 8 | |
Zoll Medical = | | | 1,285 | | | | 25 | |
ZymoGenetics = | | | 2,321 | | | | 11 | |
| | | | | | | | | |
| | | | | | | | 7,046 | |
| | | | | | | | | |
| Industrials – 14.3% |
3D Systems = | | | 1,044 | | | | 9 | |
| A.O. Smith | | | 1,338 | | | | 53 | |
| AAON | | | 780 | | | | 14 | |
AAR = | | | 2,360 | | | | 46 | |
| ABM Industries | | | 2,803 | | | | 53 | |
Acacia Research = | | | 1,949 | | | | 15 | |
ACCO Brands = | | | 3,327 | | | | 20 | |
| Aceto | | | 1,511 | | | | 8 | |
| Actuant, Class A | | | 3,709 | | | | 58 | |
Acuity Brands 6 | | | 2,496 | | | | 79 | |
| Administaff | | | 1,305 | | | | 32 | |
Advanced Battery Technologies = 6 | | | 2,974 | | | | 10 | |
Advisory Board = | | | 929 | | | | 23 | |
AeroVironment = | | | 810 | | | | 22 | |
Air Transport Services Group = | | | 3,389 | | | | 9 | |
| Aircastle | | | 2,861 | | | | 23 | |
AirTran Holdings = 6 | | | 7,314 | | | | 31 | |
| Alamo Group | | | 388 | | | | 5 | |
Alaska Air Group = | | | 2,220 | | | | 57 | |
| Albany International, Class A | | | 1,727 | | | | 29 | |
Allegiant Travel = 6 | | | 936 | | | | 35 | |
Altra Holdings = | | | 1,627 | | | | 14 | |
Amerco = | | | 524 | | | | 22 | |
American Commercial Lines = | | | 509 | | | | 11 | |
| American Ecology | | | 1,107 | | | | 18 | |
| American Railcar Industries | | | 529 | | | | 5 | |
American Reprographics = | | | 2,118 | | | | 13 | |
| American Science & Engineering | | | 560 | | | | 37 | |
American Superconductor = | | | 2,647 | | | | 89 | |
| American Woodmark | | | 760 | | | | 15 | |
| Ameron International | | | 538 | | | | 32 | |
| Ampco-Pittsburgh | | | 485 | | | | 13 | |
Amrep = | | | 117 | | | | 1 | |
APAC Customer Services = | | | 1,550 | | | | 10 | |
Apogee Enterprises 6 | | | 1,682 | | | | 22 | |
| Applied Industrial Technology | | | 2,577 | | | | 52 | |
| Applied Signal Technology | | | 793 | | | | 16 | |
Argan = | | | 451 | | | | 6 | |
Argon ST = | | | 789 | | | | 15 | |
| Arkansas Best | | | 1,543 | | | | 40 | |
Ascent Solar Technologies = | | | 1,140 | | | | 6 | |
Astec Industries = | | | 1,104 | | | | 25 | |
Astronics = | | | 564 | | | | 5 | |
ATC Technology = | | | 1,189 | | | | 25 | |
Atlas Air Worldwide Holdings = | | | 1,043 | | | | 27 | |
Avis Budget Group = | | | 6,207 | | | | 52 | |
AZZ = | | | 741 | | | | 25 | |
Badger Meter 6 | | | 904 | | | | 34 | |
Baldor Electric 6 | | | 2,840 | | | | 73 | |
| Barnes Group | | | 2,782 | | | | 44 | |
| Barrett Business Services | | | 467 | | | | 5 | |
Beacon Roofing Supply = | | | 2,749 | | | | 39 | |
| Belden | | | 2,840 | | | | 65 | |
Blount International = | | | 2,338 | | | | 21 | |
BlueLinx Holdings = | | | 708 | | | | 2 | |
| Bowne & Company | | | 1,599 | | | | 10 | |
| Brady, Class A | | | 2,921 | | | | 79 | |
Briggs & Stratton 6 | | | 3,038 | | | | 57 | |
Broadwind Energy = 6 | | | 1,914 | | | | 11 | |
Builders FirstSource = 6 | | | 897 | | | | 3 | |
CAI International = | | | 593 | | | | 4 | |
| Cascade | | | 547 | | | | 14 | |
CBIZ = | | | 2,501 | | | | 18 | |
| CDI | | | 722 | | | | 9 | |
Celadon Group = | | | 1,347 | | | | 13 | |
Cenveo = | | | 2,847 | | | | 20 | |
Ceradyne = | | | 1,532 | | | | 25 | |
Chart Industries = | | | 1,732 | | | | 34 | |
| Chase | | | 371 | | | | 4 | |
China BAK Battery = | | | 3,097 | | | | 10 | |
China Fire & Security Group = 6 | | | 855 | | | | 12 | |
| CIRCOR International | | | 1,035 | | | | 28 | |
| CLARCOR | | | 3,105 | | | | 91 | |
Clean Harbors = | | | 1,158 | | | | 65 | |
Colfax = | | | 1,440 | | | | 16 | |
Columbus McKinnon = | | | 1,161 | | | | 19 | |
| Comfort Systems USA | | | 2,319 | | | | 25 | |
COMSYS IT Partners = | | | 932 | | | | 6 | |
Consolidated Graphics = | | | 580 | | | | 12 | |
Cornell = | | | 673 | | | | 15 | |
| Corporate Executive Board | | | 2,079 | | | | 50 | |
CoStar Group = 6 | | | 1,135 | | | | 44 | |
| Courier | | | 621 | | | | 9 | |
CRA International = | | | 658 | | | | 16 | |
| Cubic | | | 953 | | | | 33 | |
| Curtiss-Wright | | | 2,758 | | | | 82 | |
| Deluxe | | | 2,996 | | | | 43 | |
| Diamond Management & Technology Consultation | | | 1,454 | | | | 9 | |
The accompanying notes are an integral part of the financial statements.
34 First American Funds 2009 Annual Report
| | | | | | | | | |
| Small Cap Index Fund (continued) |
| DESCRIPTION | | SHARES | | FAIR VALUE |
| |
| |
DigitalGlobe = | | | 898 | | | $ | 20 | |
Dollar Thrifty Automotive = 6 | | | 1,322 | | | | 24 | |
| Ducommun | | | 619 | | | | 11 | |
DXP Enterprises = | | | 650 | | | | 7 | |
Dycom Industries = | | | 2,347 | | | | 23 | |
Dynamex = | | | 632 | | | | 12 | |
| Dynamic Materials | | | 783 | | | | 15 | |
DynCorp International = | | | 1,586 | | | | 27 | |
Eagle Bulk Shipping 6 | | | 2,869 | | | | 14 | |
| Eastern | | | 363 | | | | 6 | |
EMCOR Group = | | | 3,947 | | | | 93 | |
Encore Wire 6 | | | 1,198 | | | | 25 | |
Ener1 = | | | 2,914 | | | | 15 | |
Energy Conversion Devices = 6 | | | 2,789 | | | | 30 | |
Energy Recovery = 6 | | | 2,046 | | | | 11 | |
| EnergySolutions | | | 4,605 | | | | 38 | |
EnerNOC = | | | 724 | | | | 21 | |
EnerSys = | | | 2,461 | | | | 54 | |
| Ennis | | | 1,649 | | | | 25 | |
EnPro Industries = | | | 1,240 | | | | 28 | |
ESCO Technologies = | | | 1,598 | | | | 63 | |
Esterline Technologies = | | | 1,810 | | | | 76 | |
Evergreen Solar = 6 | | | 11,453 | | | | 17 | |
Exponent = | | | 760 | | | | 20 | |
| Federal Signal | | | 2,969 | | | | 18 | |
First Advantage = | | | 656 | | | | 12 | |
Flanders = | | | 871 | | | | 4 | |
Flow International = | | | 2,104 | | | | 5 | |
Force Protection = | | | 4,329 | | | | 19 | |
Forward Air 6 | | | 1,752 | | | | 37 | |
Franklin Covey = | | | 777 | | | | 4 | |
| Franklin Electric | | | 1,406 | | | | 38 | |
| FreightCar America | | | 728 | | | | 17 | |
FuelCell Energy = 6 | | | 3,988 | | | | 13 | |
Fuel-Tech = | | | 1,106 | | | | 13 | |
Furmanite = | | | 2,118 | | | | 8 | |
Fushi Copperweld = | | | 964 | | | | 7 | |
| G&K Services, Class A | | | 1,085 | | | | 24 | |
Genco Shipping & Trading 6 | | | 1,571 | | | | 31 | |
GenCorp = | | | 3,216 | | | | 24 | |
Genesee & Wyoming, Class A = | | | 1,998 | | | | 58 | |
Geo Group = | | | 3,117 | | | | 66 | |
GeoEye = | | | 1,132 | | | | 29 | |
| Gibraltar Industries | | | 1,517 | | | | 16 | |
| Gorman-Rupp | | | 841 | | | | 21 | |
GP Strategies = | | | 962 | | | | 7 | |
GrafTech International = | | | 7,333 | | | | 99 | |
| Graham | | | 871 | | | | 12 | |
Granite Construction 6 | | | 2,089 | | | | 60 | |
| Great Lakes Dredge & Dock | | | 2,316 | | | | 14 | |
| Greenbrier Companies | | | 1,363 | | | | 12 | |
Griffon = | | | 3,137 | | | | 28 | |
GT Solar International = 6 | | | 1,920 | | | | 10 | |
H & E Equipment Services = | | | 1,665 | | | | 18 | |
Harbin Electric = | | | 691 | | | | 11 | |
Hawaiian Holdings = | | | 3,147 | | | | 22 | |
| Healthcare Services Group | | | 2,517 | | | | 50 | |
Heartland Express 6 | | | 3,006 | | | | 41 | |
HEICO 6 | | | 1,408 | | | | 54 | |
| Heidrick & Struggles International | | | 1,035 | | | | 28 | |
Heritage Crystal Clean = | | | 156 | | | | 2 | |
Herley Industries = | | | 826 | | | | 9 | |
Herman Miller 6 | | | 3,263 | | | | 50 | |
Hexcel = | | | 5,887 | | | | 65 | |
Hill International = | | | 1,516 | | | | 10 | |
HNI 6 | | | 2,737 | | | | 72 | |
| Horizon Lines, Class A | | | 1,806 | | | | 9 | |
Houston Wire & Cable 6 | | | 1,077 | | | | 13 | |
Hub Group = | | | 2,265 | | | | 56 | |
Hurco = | | | 361 | | | | 6 | |
Huron Consulting Group = | | | 1,313 | | | | 30 | |
ICF International = | | | 538 | | | | 15 | |
ICT Group = | | | 489 | | | | 8 | |
II-VI = | | | 1,517 | | | | 40 | |
InnerWorkings = | | | 1,714 | | | | 9 | |
Insituform Technologies, Class A = | | | 2,275 | | | | 48 | |
| Insteel Industries | | | 1,068 | | | | 12 | |
Integrated Electrical Services = | | | 430 | | | | 3 | |
| Interface, Class A | | | 3,099 | | | | 24 | |
Interline Brands = | | | 1,979 | | | | 29 | |
| International Shipholding | | | 327 | | | | 11 | |
JetBlue Airways = 6 | | | 14,043 | | | | 70 | |
| John Bean Technologies | | | 1,680 | | | | 28 | |
Kadant = | | | 780 | | | | 10 | |
| Kaman | | | 1,563 | | | | 32 | |
| Kaydon | | | 1,992 | | | | 70 | |
| Kelly Services, Class A | | | 1,526 | | | | 17 | |
Kforce = | | | 1,730 | | | | 20 | |
| Kimball International | | | 1,856 | | | | 14 | |
| Knight Transportation | | | 3,302 | | | | 53 | |
| Knoll | | | 2,837 | | | | 28 | |
Korn Ferry International = | | | 2,699 | | | | 43 | |
K-Tron International = | | | 151 | | | | 14 | |
LaBarge = | | | 769 | | | | 9 | |
Ladish = | | | 924 | | | | 12 | |
| Lawson Prods | | | 212 | | | | 3 | |
Layne Christensen = | | | 1,186 | | | | 31 | |
LB Foster = | | | 628 | | | | 18 | |
Lindsay Manufacturing 6 | | | 751 | | | | 25 | |
LMI Aerospace = | | | 508 | | | | 5 | |
| LSI Industries | | | 1,050 | | | | 7 | |
M & F Worldwide = | | | 711 | | | | 15 | |
Marten Transport = | | | 1,002 | | | | 18 | |
MasTec = 6 | | | 3,177 | | | | 37 | |
| McGrath Rentcorp | | | 1,446 | | | | 29 | |
| Met Pro | | | 816 | | | | 8 | |
Metalico = | | | 1,999 | | | | 8 | |
Michael Baker = | | | 479 | | | | 17 | |
Microvision = 6 | | | 4,491 | | | | 17 | |
Middleby = 6 | | | 1,053 | | | | 48 | |
Miller Industries = | | | 984 | | | | 10 | |
| Mine Safety Appliances | | | 1,803 | | | | 46 | |
Mobile Mini = | | | 2,162 | | | | 31 | |
Moog, Class A = | | | 2,596 | | | | 65 | |
MPS Group = | | | 5,465 | | | | 74 | |
| Mueller Industries | | | 2,157 | | | | 51 | |
| Mueller Water Products, Class A | | | 8,696 | | | | 39 | |
| Multi Color | | | 606 | | | | 8 | |
Myr Group = | | | 1,051 | | | | 18 | |
| NACCO Industries, Class A | | | 345 | | | | 21 | |
Navigant Consulting = | | | 3,043 | | | | 43 | |
NCI Building Systems = | | | 5,436 | | | | 11 | |
| Nordson | | | 2,048 | | | | 108 | |
North American Galvanizing & Coating = | | | 774 | | | | 4 | |
Northwest Pipe = | | | 563 | | | | 17 | |
Odyssey Marine Exploration = | | | 3,044 | | | | 5 | |
Old Dominion Freight Line = | | | 1,696 | | | | 44 | |
| Omega Flex | | | 170 | | | | 3 | |
On Assignment = | | | 2,076 | | | | 13 | |
Orbital Sciences = | | | 3,403 | | | | 44 | |
Orion Energy Systems = | | | 1,064 | | | | 4 | |
Orion Marine Group = | | | 1,618 | | | | 31 | |
First American Funds 2009 Annual Report 35
Schedule of Investments October 31, 2009, all dollars are rounded to thousands (000)
| | | | | | | | | |
| Small Cap Index Fund (continued) |
| DESCRIPTION | | SHARES | | FAIR VALUE |
| |
| |
Otter Tail 6 | | | 2,162 | | | $ | 50 | |
| Pacer International | | | 1,963 | | | | 6 | |
Patriot Transportation Holdings = | | | 88 | | | | 8 | |
Perma-Fix Environmental Services = | | | 3,294 | | | | 8 | |
Pike Electric = | | | 918 | | | | 12 | |
PMFG = 6 | | | 797 | | | | 12 | |
Polypore International = | | | 1,381 | | | | 15 | |
| Portec Rail Products | | | 406 | | | | 4 | |
Powell Industries = | | | 474 | | | | 17 | |
Power-One = 6 | | | 4,339 | | | | 12 | |
Powersecure International = | | | 1,047 | | | | 9 | |
| Preformed Line Products | | | 147 | | | | 6 | |
Primoris Services 6 | | | 498 | | | | 4 | |
| Quanex Building Products | | | 2,174 | | | | 32 | |
| Raven Industries | | | 937 | | | | 23 | |
RBC Bearings = | | | 1,324 | | | | 28 | |
| Regal-Beloit | | | 2,184 | | | | 102 | |
Republic Airways Holdings = | | | 1,973 | | | | 16 | |
Resources Connection = 6 | | | 2,737 | | | | 47 | |
| Robbins & Myers | | | 1,643 | | | | 38 | |
| Rollins | | | 2,674 | | | | 48 | |
RSC Holdings = | | | 2,990 | | | | 20 | |
Rush Enterprises = | | | 1,953 | | | | 21 | |
Saia = | | | 824 | | | | 12 | |
Satcon Technology = | | | 3,145 | | | | 6 | |
| Sauer-Danfoss | | | 658 | | | | 5 | |
| Schawk | | | 1,017 | | | | 10 | |
School Specialty = | | | 1,092 | | | | 24 | |
| Seaboard | | | 18 | | | | 24 | |
Simpson Manufacturing 6 | | | 2,324 | | | | 54 | |
| SkyWest | | | 3,393 | | | | 47 | |
Smartheat = | | | 406 | | | | 4 | |
Spherion = | | | 3,096 | | | | 15 | |
Standard Parking = | | | 454 | | | | 8 | |
| Standard Register | | | 918 | | | | 4 | |
| Standex International | | | 726 | | | | 13 | |
Stanley = | | | 700 | | | | 20 | |
| Steelcase, Class A | | | 4,354 | | | | 25 | |
Sterling Construction = | | | 805 | | | | 13 | |
Sun Hydraulics 6 | | | 756 | | | | 14 | |
Sykes Enterprises = | | | 2,112 | | | | 50 | |
| TAL International Group | | | 819 | | | | 10 | |
TASER International = | | | 3,668 | | | | 15 | |
TBS International = 6 | | | 817 | | | | 7 | |
Team = | | | 1,148 | | | | 19 | |
Tecumseh Products, Class A = | | | 1,126 | | | | 12 | |
Teledyne Technologies = | | | 2,198 | | | | 75 | |
| Tennant | | | 1,136 | | | | 30 | |
Tetra Tech = | | | 3,673 | | | | 95 | |
| Textainer Group Holdings | | | 520 | | | | 8 | |
| Titan International | | | 2,146 | | | | 18 | |
Titan Machinery = | | | 1,057 | | | | 11 | |
| Todd Shipyards | | | 351 | | | | 6 | |
| Tredegar | | | 1,802 | | | | 25 | |
Trex = | | | 940 | | | | 15 | |
Trimas = | | | 819 | | | | 4 | |
| Triumph Group | | | 1,016 | | | | 48 | |
TrueBlue = | | | 2,577 | | | | 31 | |
Tutor Perini = | | | 1,779 | | | | 31 | |
| Twin Disc | | | 485 | | | | 5 | |
UAL = | | | 10,072 | | | | 66 | |
Ultralife Batteries = | | | 681 | | | | 3 | |
Ultrapetrol Bahamas = | | | 1,411 | | | | 7 | |
United Capital = | | | 101 | | | | 2 | |
United Rentals = | | | 3,666 | | | | 35 | |
United Stationers = | | | 1,445 | | | | 68 | |
| Universal Forest Products | | | 1,169 | | | | 42 | |
| Universal Truckload Services | | | 334 | | | | 5 | |
US Airways Group = 6 | | | 9,719 | | | | 30 | |
USA Truck = | | | 474 | | | | 5 | |
Valence Technology = 6 | | | 3,116 | | | | 4 | |
| Viad | | | 1,214 | | | | 21 | |
Vicor = | | | 1,136 | | | | 8 | |
Volt Information Sciences = | | | 843 | | | | 7 | |
| VSE | | | 217 | | | | 10 | |
Waste Services = | | | 1,453 | | | | 10 | |
| Watsco | | | 1,455 | | | | 75 | |
| Watson Wyatt Worldwide, Class A | | | 2,600 | | | | 113 | |
| Watts Water Technologies, Class A | | | 1,784 | | | | 50 | |
| Werner Enterprises | | | 2,483 | | | | 47 | |
Willis Lease Finance = | | | 288 | | | | 4 | |
| Woodward Governor | | | 3,677 | | | | 86 | |
YRC Worldwide = 6 | | | 3,625 | | | | 13 | |
| | | | | | | | | |
| | | | | | | | 7,980 | |
| | | | | | | | | |
| Information Technology – 17.0% |
3Com = | | | 23,626 | | | | 121 | |
3PAR = 6 | | | 1,675 | | | | 16 | |
ACI Worldwide = 6 | | | 2,137 | | | | 34 | |
Acme Packet = | | | 2,370 | | | | 23 | |
Actel = | | | 1,481 | | | | 18 | |
ActivIdentity = | | | 2,794 | | | | 6 | |
Actuate = | | | 2,949 | | | | 15 | |
Acxiom = | | | 4,140 | | | | 48 | |
Adaptec = | | | 7,428 | | | | 24 | |
ADC Telecommunications = | | | 5,892 | | | | 38 | |
| ADTRAN | | | 3,268 | | | | 75 | |
Advanced Analogic Technologies = | | | 2,475 | | | | 8 | |
Advanced Energy Industries = 6 | | | 1,848 | | | | 23 | |
Advent Software = 6 | | | 963 | | | | 37 | |
| Agilysys | | | 1,320 | | | | 6 | |
Airvana = | | | 1,529 | | | | 9 | |
| American Software, Class A | | | 1,221 | | | | 8 | |
Amkor Technology = 6 | | | 6,663 | | | | 37 | |
ANADIGICS = | | | 3,667 | | | | 12 | |
Anaren = | | | 948 | | | | 14 | |
Anixter International = | | | 1,815 | | | | 76 | |
Applied Micro Circuits = | | | 3,749 | | | | 29 | |
Arcsight = 6 | | | 1,123 | | | | 28 | |
Ariba = | | | 5,329 | | | | 63 | |
Arris Group = | | | 7,555 | | | | 78 | |
Art Technology Group = | | | 7,491 | | | | 31 | |
Aruba Networks = | | | 3,591 | | | | 28 | |
AsiaInfo Holdings = | | | 1,763 | | | | 39 | |
Atheros Communications = 6 | | | 3,724 | | | | 92 | |
ATMI = | | | 1,880 | | | | 28 | |
Avid Technology = | | | 1,754 | | | | 22 | |
Avocent = | | | 2,602 | | | | 65 | |
| Bel Fuse | | | 690 | | | | 12 | |
Benchmark Electronics = | | | 3,924 | | | | 66 | |
Bigband Networks = | | | 2,165 | | | | 8 | |
| Black Box | | | 1,069 | | | | 28 | |
| Blackbaud | | | 2,601 | | | | 58 | |
Blackboard = | | | 1,931 | | | | 68 | |
Blue Coat Systems = | | | 2,409 | | | | 54 | |
Bottomline Technologies = | | | 1,529 | | | | 22 | |
Brightpoint = | | | 2,900 | | | | 21 | |
Brooks Automation = | | | 3,922 | | | | 27 | |
Cabot Microelectronics = | | | 1,365 | | | | 44 | |
CACI International, Class A = | | | 1,765 | | | | 84 | |
Callidus Software = | | | 1,633 | | | | 5 | |
| Cass Information Systems | | | 502 | | | | 15 | |
The accompanying notes are an integral part of the financial statements.
36 First American Funds 2009 Annual Report
| | | | | | | | | |
| Small Cap Index Fund (continued) |
| DESCRIPTION | | SHARES | | FAIR VALUE |
| |
| |
Cavium Networks = | | | 2,211 | | | $ | 42 | |
Ceva = | | | 1,180 | | | | 12 | |
Checkpoint Systems = | | | 2,307 | | | | 31 | |
China Information Security Technology = | | | 1,646 | | | | 11 | |
China Security & Surveillance Technology = | | | 1,993 | | | | 10 | |
China TransInfo Technology = | | | 528 | | | | 4 | |
Chordiant Software = | | | 1,758 | | | | 6 | |
CIBER = | | | 4,191 | | | | 13 | |
Cirrus Logic = | | | 3,979 | | | | 19 | |
Cogent = | | | 2,602 | | | | 25 | |
| Cognex | | | 2,364 | | | | 38 | |
Cogo Group = | | | 1,539 | | | | 9 | |
Coherent = | | | 1,374 | | | | 35 | |
| Cohu | | | 1,342 | | | | 15 | |
| Communications Systems | | | 382 | | | | 4 | |
CommVault Systems = | | | 2,487 | | | | 49 | |
Compellent Technologies = | | | 1,026 | | | | 19 | |
Computer Task Group = | | | 912 | | | | 6 | |
comScore = | | | 1,315 | | | | 20 | |
Comtech Telecommunications = | | | 1,716 | | | | 55 | |
Comverge = 6 | | | 1,270 | | | | 14 | |
Concur Technologies = 6 | | | 2,526 | | | | 90 | |
Constant Contact = | | | 1,462 | | | | 24 | |
CPI International = | | | 532 | | | | 5 | |
Cray = | | | 2,085 | | | | 16 | |
CSG Systems International = | | | 1,970 | | | | 32 | |
| CTS | | | 2,059 | | | | 18 | |
CyberSource = | | | 4,214 | | | | 69 | |
Cymer = | | | 1,765 | | | | 60 | |
| Daktronics | | | 1,908 | | | | 14 | |
DDi = | | | 874 | | | | 4 | |
DealerTrack Holdings = 6 | | | 2,386 | | | | 39 | |
Deltek = | | | 988 | | | | 7 | |
DemandTec = | | | 1,200 | | | | 11 | |
DG Fastchannel = | | | 1,110 | | | | 23 | |
Dice Holdings = | | | 873 | | | | 5 | |
Digi International = | | | 1,500 | | | | 12 | |
Digital River = | | | 2,328 | | | | 53 | |
Diodes = 6 | | | 1,945 | | | | 32 | |
Divx = | | | 1,978 | | | | 10 | |
Double-Take Software = | | | 1,005 | | | | 9 | |
DSP Group = | | | 1,288 | | | | 7 | |
DTS = | | | 1,036 | | | | 29 | |
Dynamics Research = | | | 526 | | | | 7 | |
EarthLink 6 | | | 6,430 | | | | 52 | |
Ebix = 6 | | | 375 | | | | 23 | |
Echelon = 6 | | | 1,979 | | | | 27 | |
| Electro Rent | | | 1,187 | | | | 13 | |
Electro Scientific Industries = | | | 1,628 | | | | 18 | |
Electronics For Imaging = | | | 3,022 | | | | 35 | |
eLoyalty = | | | 399 | | | | 3 | |
Emcore = | | | 4,591 | | | | 5 | |
EMS Technologies = | | | 948 | | | | 17 | |
Emulex = | | | 5,058 | | | | 51 | |
Entegris = | | | 6,791 | | | | 26 | |
Entropic Communications = | | | 3,219 | | | | 8 | |
Epicor Software = | | | 3,686 | | | | 28 | |
EPIQ Systems = | | | 1,956 | | | | 25 | |
ePlus = | | | 224 | | | | 3 | |
Euronet Worldwide = 6 | | | 2,966 | | | | 70 | |
Exar = | | | 2,107 | | | | 15 | |
Exlservice Holdings = | | | 911 | | | | 12 | |
Extreme Networks = | | | 5,416 | | | | 11 | |
| Fair Isaac | | | 2,979 | | | | 61 | |
FalconStor Software = | | | 2,102 | | | | 7 | |
FARO Technologies = | | | 970 | | | | 15 | |
FEI = | | | 2,280 | | | | 54 | |
FormFactor = | | | 3,005 | | | | 51 | |
Forrester Research = | | | 959 | | | | 24 | |
Gartner, Class A = 6 | | | 3,612 | | | | 67 | |
Global Cash Access Holdings = | | | 2,463 | | | | 16 | |
Globecomm Systems = | | | 1,181 | | | | 8 | |
GSE Systems = | | | 974 | | | | 6 | |
GSI Commerce = | | | 1,514 | | | | 29 | |
GSI Technology = | | | 1,124 | | | | 4 | |
Hackett Group = | | | 2,232 | | | | 7 | |
Harmonic = | | | 5,834 | | | | 31 | |
Harris Stratex Networks, Class A = | | | 3,598 | | | | 23 | |
| Heartland Payment Systems | | | 2,285 | | | | 28 | |
Hittite Microwave = | | | 1,306 | | | | 48 | |
Hughes Communications = | | | 543 | | | | 13 | |
i2 Technologies = | | | 910 | | | | 14 | |
ICx Technologies = | | | 743 | | | | 4 | |
| iGATE | | | 1,395 | | | | 12 | |
| Imation | | | 1,669 | | | | 15 | |
| Imergent | | | 477 | | | | 3 | |
Immersion = | | | 1,723 | | | | 6 | |
Infinera = | | | 5,397 | | | | 40 | |
Infogroup = | | | 1,938 | | | | 13 | |
Informatica = | | | 5,148 | | | | 109 | |
Information Services Group = | | | 1,448 | | | | 5 | |
Infospace = | | | 1,925 | | | | 17 | |
Innodata Isogen = | | | 1,307 | | | | 8 | |
Insight Enterprises = | | | 2,795 | | | | 29 | |
Integral Systems = | | | 987 | | | | 8 | |
Intellon = | | | 1,298 | | | | 9 | |
Interactive Intelligence = | | | 784 | | | | 13 | |
Interdigital = | | | 2,637 | | | | 54 | |
Intermec = | | | 3,782 | | | | 47 | |
Internap Network Services = | | | 3,097 | | | | 10 | |
Internet Brands = | | | 1,672 | | | | 12 | |
Internet Capital Group = | | | 2,167 | | | | 16 | |
Intevac = | | | 1,269 | | | | 13 | |
| iPass | | | 3,071 | | | | 4 | |
IPG Photonics = 6 | | | 1,409 | | | | 19 | |
Isilon Systems = | | | 1,390 | | | | 7 | |
Ixia = | | | 2,304 | | | | 15 | |
IXYS = | | | 1,367 | | | | 9 | |
J2 Global Communications = | | | 2,583 | | | | 53 | |
| Jack Henry & Associates | | | 4,718 | | | | 109 | |
JDA Software = | | | 1,496 | | | | 30 | |
Kenexa = | | | 1,369 | | | | 17 | |
Keynote Systems = | | | 750 | | | | 8 | |
Kopin = | | | 4,011 | | | | 18 | |
Kulicke & Soffa = | | | 3,540 | | | | 16 | |
KVH Industries = | | | 852 | | | | 9 | |
L-1 Identity Solutions = | | | 4,562 | | | | 27 | |
Lattice Semiconductor = | | | 6,542 | | | | 12 | |
Lawson Software = | | | 8,385 | | | | 53 | |
Limelight Networks = | | | 2,004 | | | | 7 | |
Lionbridge Technologies = | | | 3,500 | | | | 7 | |
Liquidity Services = | | | 916 | | | | 9 | |
Littelfuse = | | | 1,324 | | | | 36 | |
Liveperson = | | | 2,517 | | | | 13 | |
Logmein = | | | 294 | | | | 6 | |
LoopNet = | | | 1,216 | | | | 11 | |
Loral Space & Communications = | | | 678 | | | | 18 | |
Manhattan Associates = | | | 1,444 | | | | 33 | |
ManTech International = | | | 1,335 | | | | 59 | |
| Marchex | | | 1,536 | | | | 7 | |
| MAXIMUS | | | 1,026 | | | | 47 | |
Maxwell Technologies = 6 | | | 1,368 | | | | 25 | |
First American Funds 2009 Annual Report 37
Schedule of Investments October 31, 2009, all dollars are rounded to thousands (000)
| | | | | | | | | |
| Small Cap Index Fund (continued) |
| DESCRIPTION | | SHARES | | FAIR VALUE |
| |
| |
Measurement Specialties = | | | 859 | | | $ | 7 | |
Memsic = | | | 946 | | | | 3 | |
Mentor Graphics = | | | 5,740 | | | | 42 | |
MercadoLibre = | | | 1,576 | | | | 56 | |
Mercury Computer Systems = | | | 1,332 | | | | 14 | |
| Methode Electronics, Class A | | | 2,226 | | | | 16 | |
| Micrel | | | 2,775 | | | | 21 | |
Microsemi = | | | 4,806 | | | | 64 | |
MicroStrategy = | | | 525 | | | | 46 | |
Microtune = | | | 3,089 | | | | 5 | |
MIPS Technologies, Class A = | | | 2,744 | | | | 11 | |
MKS Instruments = | | | 3,006 | | | | 47 | |
ModusLink Global Solutions = | | | 2,814 | | | | 23 | |
MoneyGram International = | | | 5,033 | | | | 15 | |
Monolithic Power Systems = | | | 2,066 | | | | 41 | |
Monotype Imaging Holdings = | | | 1,322 | | | | 10 | |
Move = | | | 9,405 | | | | 19 | |
| MTS Systems | | | 1,020 | | | | 27 | |
Multi-Fineline Electronix = | | | 600 | | | | 16 | |
NCI = | | | 397 | | | | 11 | |
Ness Technologies = | | | 2,361 | | | | 16 | |
Net 1 UEPS Technologies = | | | 2,233 | | | | 39 | |
Netezza = | | | 2,876 | | | | 27 | |
NETGEAR = | | | 2,056 | | | | 37 | |
Netlogic Microsystems = 6 | | | 1,102 | | | | 42 | |
NetScout Systems = | | | 1,714 | | | | 21 | |
NetSuite = 6 | | | 1,018 | | | | 14 | |
Network Equipment Technologies = | | | 1,779 | | | | 6 | |
Newport = | | | 2,109 | | | | 16 | |
| NIC | | | 3,074 | | | | 27 | |
Novatel Wireless = 6 | | | 1,844 | | | | 16 | |
NVE = | | | 272 | | | | 10 | |
OmniVision Technologies = 6 | | | 3,081 | | | | 38 | |
Online Resources = | | | 1,689 | | | | 9 | |
Opentable = 6 | | | 184 | | | | 5 | |
OpenTV = | | | 4,877 | | | | 8 | |
Openwave Systems = | | | 5,081 | | | | 12 | |
Oplink Communications = | | | 1,249 | | | | 19 | |
| OPNET Technologies | | | 715 | | | | 8 | |
Opnext = | | | 1,511 | | | | 4 | |
OSI Systems = | | | 966 | | | | 19 | |
Palm = 6 | | | 9,720 | | | | 113 | |
PAR Technology = | | | 495 | | | | 3 | |
Parametric Technology = | | | 7,066 | | | | 105 | |
| Park Electrochemical | | | 1,183 | | | | 27 | |
ParkerVision = | | | 1,791 | | | | 5 | |
PC Connection = | | | 476 | | | | 3 | |
PC Mall = | | | 600 | | | | 4 | |
PC-Tel = | | | 1,161 | | | | 7 | |
| Pegasystems | | | 915 | | | | 26 | |
Perficient = | | | 1,791 | | | | 15 | |
Pericom Semiconductor = | | | 1,543 | | | | 15 | |
Perot Systems, Class A = | | | 5,068 | | | | 152 | |
Pervasive Software = | | | 936 | | | | 5 | |
Phoenix Technologies = | | | 1,690 | | | | 4 | |
Photronics = 6 | | | 3,196 | | | | 13 | |
| Plantronics | | | 2,981 | | | | 72 | |
Plexus = | | | 2,406 | | | | 61 | |
PLX Technology = | | | 1,896 | | | | 6 | |
Polycom = | | | 5,092 | | | | 109 | |
| Power Integrations | | | 1,439 | | | | 45 | |
Powerwave Technologies = | | | 8,048 | | | | 10 | |
Progress Software = | | | 2,415 | | | | 56 | |
PROS Holdings = | | | 1,163 | | | | 10 | |
| QAD | | | 871 | | | | 4 | |
Quantum = | | | 12,818 | | | | 24 | |
Quest Software = | | | 2,863 | | | | 48 | |
Rackspace Hosting = | | | 4,050 | | | | 68 | |
Radiant Systems = | | | 1,673 | | | | 16 | |
RadiSys = | | | 1,423 | | | | 12 | |
RAE Systems = | | | 2,475 | | | | 2 | |
RealNetworks = | | | 4,948 | | | | 18 | |
| Renaissance Learning | | | 562 | | | | 5 | |
RF Micro Devices = | | | 16,210 | | | | 65 | |
RightNow Technologies = | | | 1,569 | | | | 24 | |
Rimage = | | | 525 | | | | 10 | |
Riverbed Technology = | | | 3,338 | | | | 68 | |
Rofin-Sinar Technologies = | | | 1,726 | | | | 37 | |
Rogers = | | | 988 | | | | 26 | |
Rosetta Stone = 6 | | | 381 | | | | 8 | |
Rubicon Technology = 6 | | | 771 | | | | 12 | |
Rudolph Technologies = | | | 1,792 | | | | 11 | |
S1 = | | | 3,222 | | | | 19 | |
Saba Software = | | | 1,500 | | | | 6 | |
Sapient = | | | 5,144 | | | | 42 | |
SAVVIS = | | | 2,186 | | | | 32 | |
ScanSource = | | | 1,617 | | | | 41 | |
SeaChange International = | | | 1,795 | | | | 12 | |
Semitool = | | | 1,383 | | | | 10 | |
Semtech = | | | 3,617 | | | | 56 | |
Shoretel = | | | 2,696 | | | | 18 | |
Sigma Designs = 6 | | | 1,622 | | | | 19 | |
Silicon Graphics International = | | | 1,822 | | | | 11 | |
Silicon Image = | | | 4,560 | | | | 10 | |
Silicon Storage Technology = | | | 4,693 | | | | 10 | |
Skyworks Solutions = 6 | | | 10,211 | | | | 107 | |
Smart Modular Technologies = | | | 2,704 | | | | 11 | |
Smith Micro Software = | | | 1,890 | | | | 17 | |
Solarwinds = 6 | | | 739 | | | | 13 | |
Solera Holdings 6 | | | 4,240 | | | | 137 | |
SonicWALL = | | | 2,981 | | | | 24 | |
Sonus Networks = | | | 12,577 | | | | 24 | |
Sourcefire = | | | 1,350 | | | | 27 | |
Spectrum Control = | | | 766 | | | | 6 | |
SRA International, Class A = | | | 2,492 | | | | 47 | |
SRS Labs = | | | 707 | | | | 5 | |
Standard Microsystems = | | | 1,286 | | | | 25 | |
Starent Networks = | | | 2,389 | | | | 81 | |
StarTek = | | | 726 | | | | 4 | |
STEC = 6 | | | 1,585 | | | | 34 | |
Stratasys = | | | 1,156 | | | | 18 | |
SuccessFactors = 6 | | | 2,384 | | | | 36 | |
Super Micro Computer = | | | 1,329 | | | | 11 | |
Supertex = | | | 626 | | | | 15 | |
Support.com = | | | 5,337 | | | | 13 | |
Switch & Data Facilities = | | | 1,194 | | | | 20 | |
Sycamore Networks = | | | 11,738 | | | | 33 | |
Symmetricom = | | | 2,939 | | | | 14 | |
Symyx Technologies = | | | 2,079 | | | | 12 | |
Synaptics = 6 | | | 2,092 | | | | 47 | |
Synchronoss Technologies = | | | 1,239 | | | | 14 | |
SYNNEX = | | | 1,174 | | | | 30 | |
Syntel 6 | | | 700 | | | | 25 | |
Take-Two Interactive Software = | | | 4,898 | | | | 54 | |
Taleo, Class A = | | | 1,905 | | | | 41 | |
| Technitrol | | | 2,499 | | | | 19 | |
Techtarget = | | | 755 | | | | 5 | |
Techwell = | | | 900 | | | | 9 | |
Tekelec = | | | 4,059 | | | | 61 | |
Telecommunication Systems = | | | 2,332 | | | | 21 | |
Teletech Holdings = | | | 1,961 | | | | 35 | |
Terremark Worldwide = 6 | | | 3,073 | | | | 20 | |
The accompanying notes are an integral part of the financial statements.
38 First American Funds 2009 Annual Report
| | | | | | | | | |
| Small Cap Index Fund (continued) |
| DESCRIPTION | | SHARES | | FAIR VALUE |
| |
| |
Tessera Technologies = | | | 2,966 | | | $ | 66 | |
The Knot = | | | 1,730 | | | | 18 | |
THQ = | | | 4,119 | | | | 22 | |
TIBCO Software = | | | 10,522 | | | | 92 | |
Tier Technologies = | | | 1,069 | | | | 9 | |
TiVo = | | | 6,372 | | | | 69 | |
TNS = | | | 1,498 | | | | 42 | |
Travelzoo = | | | 338 | | | | 5 | |
Trident Microsystems = | | | 3,838 | | | | 7 | |
TriQuint Semiconductor = | | | 8,986 | | | | 48 | |
TTM Technologies = | | | 2,630 | | | | 27 | |
Tyler Technologies = | | | 1,887 | | | | 36 | |
Ultimate Software Group = | | | 1,430 | | | | 36 | |
Ultratech = | | | 1,439 | | | | 19 | |
Unica = | | | 770 | | | | 5 | |
Unisys = | | | 2,533 | | | | 74 | |
United Online 6 | | | 5,098 | | | | 41 | |
Universal Display = 6 | | | 1,781 | | | | 20 | |
UTStarcom = | | | 6,904 | | | | 12 | |
ValueClick = | | | 5,304 | | | | 52 | |
VASCO Data Security International = | | | 1,600 | | | | 10 | |
Veeco Instruments = 6 | | | 1,959 | | | | 48 | |
VeriFone Holdings = | | | 4,400 | | | | 59 | |
ViaSat = | | | 1,583 | | | | 46 | |
Virage Logic = | | | 987 | | | | 6 | |
Virtusa = | | | 805 | | | | 7 | |
Vocus = | | | 1,011 | | | | 18 | |
Volterra Semiconductor = | | | 1,375 | | | | 19 | |
Web.com Group = | | | 1,499 | | | | 11 | |
Websense = | | | 2,626 | | | | 42 | |
White Electric Designs = | | | 699 | | | | 3 | |
Wright Express = | | | 2,340 | | | | 65 | |
X-Rite = | | | 1,581 | | | | 3 | |
Zix = | | | 3,862 | | | | 7 | |
Zoran = | | | 3,012 | | | | 27 | |
Zygo = | | | 901 | | | | 6 | |
| | | | | | | | | |
| | | | | | | | 9,463 | |
| | | | | | | | | |
| Materials – 4.0% |
| A. Schulman | | | 1,529 | | | | 27 | |
| A.M. Castle & Company | | | 924 | | | | 10 | |
AEP Industries = | | | 318 | | | | 11 | |
Allied Nevada Gold = | | | 3,328 | | | | 32 | |
| AMCOL International | | | 1,593 | | | | 41 | |
| American Vanguard | | | 1,189 | | | | 10 | |
Ampal-American Israel, Class A = | | | 1,101 | | | | 3 | |
| Arch Chemicals | | | 1,528 | | | | 42 | |
| Balchem | | | 1,054 | | | | 29 | |
Boise = | | | 2,288 | | | | 11 | |
Brush Engineered Metals = | | | 1,186 | | | | 22 | |
Buckeye Technologies = | | | 2,744 | | | | 25 | |
BWAY Holding Company = | | | 439 | | | | 8 | |
Calgon Carbon = 6 | | | 3,337 | | | | 53 | |
Century Aluminum = | | | 2,771 | | | | 24 | |
China Green Agriculture = | | | 499 | | | | 6 | |
China Precision Steel = 6 | | | 1,888 | | | | 4 | |
Clearwater Paper = | | | 715 | | | | 32 | |
Coeur d’Alene Mines = | | | 4,371 | | | | 88 | |
| Deltic Timber | | | 647 | | | | 27 | |
Domtar = | | | 2,533 | | | | 106 | |
| Ferro | | | 2,543 | | | | 16 | |
General Moly = | | | 3,885 | | | | 9 | |
General Steel Holdings = | | | 940 | | | | 3 | |
| Glatfelter | | | 3,003 | | | | 32 | |
Graphic Packaging Holding = | | | 8,706 | | | | 20 | |
| H.B. Fuller | | | 2,988 | | | | 57 | |
Hawkins 6 | | | 531 | | | | 11 | |
Haynes International = | | | 697 | | | | 20 | |
Headwaters = | | | 2,460 | | | | 10 | |
Hecla Mining = 6 | | | 14,266 | | | | 59 | |
Horsehead Holding = | | | 2,614 | | | | 25 | |
ICO = | | | 1,502 | | | | 6 | |
| Innophos Holdings | | | 1,051 | | | | 20 | |
| Innospec | | | 1,370 | | | | 16 | |
| Kaiser Aluminum | | | 923 | | | | 37 | |
Kapstone Paper & Packaging = | | | 1,242 | | | | 9 | |
| Koppers Holdings | | | 1,212 | | | | 32 | |
Landec = | | | 1,601 | | | | 10 | |
Louisiana Pacific = 6 | | | 6,744 | | | | 35 | |
LSB Industries = | | | 1,018 | | | | 13 | |
| Minerals Technologies | | | 1,098 | | | | 54 | |
| Myers Industries | | | 1,920 | | | | 17 | |
| Neenah Paper | | | 859 | | | | 9 | |
| NewMarket Group | | | 688 | | | | 64 | |
| NL Industries | | | 381 | | | | 2 | |
| Olin | | | 4,751 | | | | 73 | |
| Olympic Steel | | | 552 | | | | 14 | |
OM Group = 6 | | | 1,863 | | | | 50 | |
Omnova Solutions = | | | 2,674 | | | | 17 | |
Paramount Gold & Silver = 6 | | | 3,872 | | | | 4 | |
PolyOne = | | | 5,424 | | | | 30 | |
| Quaker Chemical | | | 630 | | | | 13 | |
| Rock-Tenn, Class A | | | 2,338 | | | | 102 | |
Rockwood Holdings = | | | 3,005 | | | | 60 | |
RTI International Metals = | | | 1,570 | | | | 33 | |
| Schweitzer-Mauduit International | | | 918 | | | | 47 | |
| Sensient Technologies | | | 2,795 | | | | 71 | |
ShengdaTech = | | | 1,660 | | | | 10 | |
| Silgan Holdings | | | 1,477 | | | | 79 | |
Solutia = | | | 6,872 | | | | 76 | |
| Spartech | | | 1,777 | | | | 17 | |
| Stepan | | | 447 | | | | 26 | |
Stillwater Mining = | | | 2,316 | | | | 14 | |
Sutor Technology Group = | | | 413 | | | | 1 | |
| Texas Industries | | | 1,358 | | | | 45 | |
United States Lime & Minerals = | | | 98 | | | | 3 | |
Universal Stainless & Alloy = | | | 370 | | | | 6 | |
US Concrete = | | | 2,226 | | | | 4 | |
US Gold = | | | 4,864 | | | | 13 | |
W.R. Grace & Company = | | | 4,400 | | | | 96 | |
| Wausau-Mosinee Paper | | | 2,580 | | | | 23 | |
Westlake Chemical 6 | | | 1,082 | | | | 26 | |
Worthington Industries 6 | | | 3,740 | | | | 41 | |
| Zep | | | 1,288 | | | | 22 | |
Zoltek Companies = | | | 1,693 | | | | 15 | |
| | | | | | | | | |
| | | | | | | | 2,228 | |
| | | | | | | | | |
| Telecommunication Services – 1.0% |
Abovenet = | | | 754 | | | | 36 | |
Alaska Communications Systems Group 6 | | | 2,444 | | | | 19 | |
Atlantic Tele-Network | | | 513 | | | | 23 | |
Cbeyond = 6 | | | 1,404 | | | | 19 | |
Centennial Communications, Class A = | | | 5,183 | | | | 44 | |
Cincinnati Bell = | | | 13,276 | | | | 41 | |
Cogent Communications Group = | | | 2,684 | | | | 27 | |
| Consolidated Communications Holdings | | | 1,348 | | | | 19 | |
| D&E Communications | | | 880 | | | | 10 | |
General Communication, Class A = | | | 2,979 | | | | 18 | |
Global Crossing = | | | 1,658 | | | | 19 | |
| HickoryTech | | | 796 | | | | 7 | |
iBasis = | | | 1,722 | | | | 4 | |
Incontact = | | | 1,650 | | | | 4 | |
First American Funds 2009 Annual Report 39
Schedule of Investments October 31, 2009, all dollars are rounded to thousands (000)
| | | | | | | | | |
| Small Cap Index Fund (continued) |
| DESCRIPTION | | SHARES | | FAIR VALUE |
| |
| |
| Iowa Telecommunication Services | | | 1,861 | | | $ | 22 | |
iPCS = | | | 998 | | | | 24 | |
Neutral Tandem = 6 | | | 2,002 | | | | 42 | |
| NTELOS Holdings | | | 1,751 | | | | 26 | |
Paetec Holding = | | | 7,186 | | | | 23 | |
Premiere Global Services = | | | 3,701 | | | | 28 | |
| Shenandoah Telecommunications | | | 1,318 | | | | 22 | |
Surewest Communications = | | | 870 | | | | 8 | |
Syniverse Holdings = | | | 4,175 | | | | 72 | |
| USA Mobility | | | 1,378 | | | | 15 | |
Virgin Mobile USA, Class A = | | | 2,320 | | | | 9 | |
| | | | | | | | | |
| | | | | | | | 581 | |
| | | | | | | | | |
| Utilities – 3.0% |
| Allete | | | 1,562 | | | | 53 | |
| American States Water | | | 1,169 | | | | 39 | |
Artesian Resources 6 | | | 379 | | | | 6 | |
| Avista | | | 3,332 | | | | 63 | |
| Black Hills | | | 2,234 | | | | 54 | |
Cadiz = | | | 700 | | | | 8 | |
| California Water Service Group | | | 1,199 | | | | 44 | |
| Central Vermont Public Service | | | 674 | | | | 13 | |
| CH Energy Group | | | 963 | | | | 40 | |
| Chesapeake Utilities | | | 568 | | | | 18 | |
Cleco 6 | | | 3,684 | | | | 91 | |
| Connecticut Water Service | | | 490 | | | | 11 | |
| Consolidated Water | | | 845 | | | | 12 | |
El Paso Electric = | | | 2,739 | | | | 51 | |
| Empire District Electric | | | 2,083 | | | | 38 | |
| IDACORP | | | 2,875 | | | | 81 | |
| Laclede Group | | | 1,384 | | | | 43 | |
| MGE Energy | | | 1,408 | | | | 49 | |
| Middlesex Water Company | | | 720 | | | | 11 | |
| New Jersey Resources | | | 2,569 | | | | 90 | |
| Nicor | | | 2,548 | | | | 95 | |
| Northwest Natural Gas | | | 1,615 | | | | 68 | |
| NorthWestern | | | 2,088 | | | | 50 | |
| Pennichuck | | | 259 | | | | 6 | |
Piedmont Natural Gas 6 | | | 4,265 | | | | 99 | |
| PNM Resources | | | 5,282 | | | | 57 | |
Portland General Electric 6 | | | 4,402 | | | | 82 | |
| SJW | | | 937 | | | | 20 | |
| South Jersey Industries | | | 1,904 | | | | 67 | |
| Southwest Gas | | | 2,726 | | | | 68 | |
Southwest Water 6 | | | 1,499 | | | | 8 | |
| UIL Holdings | | | 1,718 | | | | 44 | |
| UniSource Energy Holding | | | 2,171 | | | | 63 | |
| Unitil | | | 641 | | | | 13 | |
US Geothermal = | | | 3,634 | | | | 6 | |
| WGL Holdings | | | 3,057 | | | | 101 | |
York Water 6 | | | 695 | | | | 11 | |
| | | | | | | | | |
| | | | | | | | 1,673 | |
| | | | | | | | | |
Total Common Stocks | | | | | | | | |
(Cost $50,778) | | | | | | | 50,467 | |
| | | | | | | | | |
| Warrants = – 0.0% |
Greenhunter Energy 6 ¥ ⊡ | | | 30 | | | | — | |
| Krispy Kreme Doughnuts | | | 210 | | | | — | |
Lantronix ¥ ⊡ | | | 39 | | | | — | |
| | | | | | | | | |
Total Warrants | | | | | | | | |
(Cost $0) | | | | | | | — | |
| | | | | | | | | |
| Rights – 0.0% |
Winthrop Realty Trust ¥ | | | 178 | | | | — | |
Zion Oil & Gas 6 | | | 167 | | | | — | |
| | | | | | | | | |
Total Rights | | | | | | | | |
(Cost $0) | | | | | | | — | |
| | | | | | | | | |
| Closed-End Fund – 0.0% |
| Kayne Anderson Energy | | | | | | | | |
(Cost $14) | | | 585 | | | | 7 | |
| | | | | | | | | |
Short-Term Investments – 10.0% |
| Money Market Fund – 8.4% |
| First American Prime Obligations Fund | | | | | | | | |
0.148% Å Ω | | | 4,665,284 | | | | 4,665 | |
| | | | | | | | | |
| U.S. Treasury Obligation – 1.6% |
| U.S. Treasury Bill | | | | | | | | |
0.230%, 11/19/2009 o | | $ | 920 | | | | 920 | |
| | | | | | | | | |
Total Short-Term Investments | | | | | | | | |
(Cost $5,585) | | | | | | | 5,585 | |
| | | | | | | | | |
Investment Purchased with Proceeds
from Securities Lending – 20.2% |
| Mount Vernon Securities Lending Prime Portfolio | | | | | | | | |
| 0.209% Ω † | | | | | | | | |
(Cost $11,229) | | | 11,228,898 | | | | 11,229 | |
| | | | | | | | | |
Total Investments 5 – 120.9% | | | | | | | | |
(Cost $67,606) | | | | | | | 67,288 | |
| | | | | | | | | |
Other Assets and Liabilities, Net – (20.9)% | | | | | | | (11,626 | ) |
| | | | | | | | | |
Total Net Assets – 100.0% | | | | | | $ | 55,662 | |
| | | | | | | | | |
| | |
| = | | Non-income producing security. |
| |
| 6 | | This security or a portion of this security is out on loan at October 31, 2009. Total loaned securities had a fair value of $10,125 at October 31, 2009. See note 2 in Notes to Financial Statements. |
| |
| ¥ | | Security considered illiquid. As of October 31, 2009, the fair value of the fund’s investments considered to be illiquid was $0 or 0.0% of total net assets. See note 2 in Notes to Financial Statements. |
| |
| ⊡ | | Security is internally fair valued. As of October 31, 2009, the fair value of these investments was $0 or 0.0% of total net assets. See note 2 in Notes to Financial Statements. |
| |
| Å | | Investment in affiliated security. This money market fund is advised by FAF Advisors, Inc., which also serves as advisor for this fund. See note 3 in Notes to Financial Statements. |
| |
| Ω | | The rate quoted is the annualized seven-day effective yield as of October 31, 2009. |
| |
| o | | Security has been deposited as initial margin on open futures contracts. Yield shown is the annualized effective yield as of October 31, 2009. See note 2 in Notes to Financial Statements. |
| |
| † | | The fund may loan securities representing up to one third of the fair value of its total assets (which includes collateral for securities on loan) to broker- dealers, banks, or other institutional borrowers of securities. The fund maintains collateral equal to at least 100% of the fair value of the securities loaned. The adequacy of the collateral is monitored on a daily basis. The cash collateral received by the fund is invested in this affiliated money market fund. See note 2 in Notes to Financial Statements. |
| |
| 5 | | On October 31, 2009, the cost of investments for federal income tax purposes was $68,138. The aggregate gross unrealized appreciation and depreciation of investments, based on this cost, were as follows: |
| | | | | |
| Gross unrealized appreciation | | $ | 11,976 | |
| Gross unrealized depreciation | | | (12,826 | ) |
| | | | | |
| Net unrealized depreciation | | $ | (850 | ) |
| | | | | |
| |
| REIT – | Real Estate Investment Trust |
The accompanying notes are an integral part of the financial statements.
40 First American Funds 2009 Annual Report
Small Cap Index Fund (concluded)
Schedule of Open Futures Contracts
| | | | | | | | | | | | | | | |
| | | | | | Number of
| | | Notional
| | | |
| | | Settlement
| | | Contracts
| | | Contract
| | Unrealized
| |
| Description | | Month | | | Purchased | | | Value | | Depreciation | |
| | |
| Russell 2000 Mini Index Futures | | | December 2009 | | | | 93 | | | $5,225 | | $ | (322 | ) |
| | | | | | | | | | | | | | | |
First American Funds 2009 Annual Report 41
| |
| Statements of Assets and Liabilities | October 31, 2009, all dollars and shares are rounded to thousands (000), except per share data |
| | | | | | | | | | | | | | | | | |
| | | | | | | | | | | | | | |
| | | Equity
| | | | Mid Cap
| | | | Small Cap
| | | |
| | | Index Fund | | | | Index Fund | | | | Index Fund | | | |
| |
| Unaffiliated investments, at cost | | $ | 739,058 | | | | $ | 188,186 | | | | $ | 51,712 | | | |
| Affiliated investments, at cost | | | 9,445 | | | | | 16,289 | | | | | 4,665 | | | |
| Affiliated investment purchased with proceeds from securities lending, at cost (note 2) | | | 169,796 | | | | | 38,456 | | | | | 11,229 | | | |
| |
| |
ASSETS: | | | | | | | | | | | | | | | | |
| Unaffiliated investments, at fair value* (note 2) | | $ | 962,282 | | | | $ | 186,259 | | | | $ | 51,394 | | | |
| Affiliated investments, at fair value* (note 2) | | | 9,696 | | | | | 16,289 | | | | | 4,665 | | | |
| Affiliated investment purchased with proceeds from securities lending, at fair value (note 2) | | | 169,796 | | | | | 38,456 | | | | | 11,229 | | | |
| Cash | | | 4 | | | | | — | | | | | 20 | | | |
| Receivable for dividends and interest | | | 1,225 | | | | | 98 | | | | | 34 | | | |
| Receivable for investments sold | | | — | | | | | — | | | | | 1 | | | |
| Receivable for capital shares sold | | | 826 | | | | | 6,083 | | | | | 47 | | | |
| Receivable from advisor (note 3) | | | — | | | | | — | | | | | 11 | | | |
| Prepaid expenses and other assets | | | 31 | | | | | 53 | | | | | 33 | | | |
| |
| |
Total assets | | | 1,143,860 | | | | | 247,238 | | | | | 67,434 | | | |
| |
| |
LIABILITIES: | | | | | | | | | | | | | | | | |
| Payable upon return of securities loaned (note 2) | | | 169,796 | | | | | 38,456 | | | | | 11,229 | | | |
| Payable for investments purchased | | | — | | | | | 6,767 | | | | | 190 | | | |
| Payable for capital shares redeemed | | | 1,546 | | | | | 261 | | | | | 140 | | | |
| Payable for variation margin | | | 309 | | | | | 470 | | | | | 153 | | | |
| Payable to affiliates (note 3) | | | 394 | | | | | 84 | | | | | 38 | | | |
| Payable for distribution and shareholder servicing fees | | | 46 | | | | | 12 | | | | | 5 | | | |
| Accrued expenses and other liabilities | | | 13 | | | | | 12 | | | | | 17 | | | |
| |
| |
Total liabilities | | | 172,104 | | | | | 46,062 | | | | | 11,772 | | | |
| |
| |
Net assets | | $ | 971,756 | | | | $ | 201,176 | | | | $ | 55,662 | | | |
| |
| |
COMPOSITION OF NET ASSETS: | | | | | | | | | | | | | | | | |
| Portfolio capital | | $ | 762,083 | | | | $ | 215,469 | | | | $ | 64,606 | | | |
| Undistributed net investment income | | | 953 | | | | | 1,313 | | | | | 285 | | | |
| Accumulated net realized loss on investments and futures contracts (note 2) | | | (14,389 | ) | | | | (13,182 | ) | | | | (8,589 | ) | | |
| Net unrealized appreciation (depreciation) of: | | | | | | | | | | | | | | | | |
| Investments | | | 223,475 | | | | | (1,927 | ) | | | | (318 | ) | | |
| Futures contracts | | | (366 | ) | | | | (497 | ) | | | | (322 | ) | | |
| |
| |
Net assets | | $ | 971,756 | | | | $ | 201,176 | | | | $ | 55,662 | | | |
| |
| |
| * Including securities loaned, at fair value | | $ | 158,534 | | | | $ | 35,784 | | | | $ | 10,125 | | | |
| |
| |
The accompanying notes are an integral part of the financial statements.
42 First American Funds 2009 Annual Report
| | | | | | | | | | | | | | | | | |
| | | | | | | | | | | | | | |
| | | Equity
| | | | Mid Cap
| | | | Small Cap
| | | |
| | | Index Fund | | | | Index Fund | | | | Index Fund | | | |
| |
Class A: | | | | | | | | | | | | | | | | |
| Net assets | | $ | 115,213 | | | | $ | 22,766 | | | | $ | 8,591 | | | |
| Shares issued and outstanding ($0.0001 par value – 2 billion authorized) | | | 6,108 | | | | | 2,391 | | | | | 1,088 | | | |
| Net asset value, and redemption price per share | | $ | 18.86 | | | | $ | 9.52 | | | | $ | 7.90 | | | |
Maximum offering price per share1 | | $ | 19.96 | | | | $ | 10.07 | | | | $ | 8.36 | | | |
Class B2: | | | | | | | | | | | | | | | | |
| Net assets | | $ | 9,822 | | | | | — | | | | | — | | | |
| Shares issued and outstanding ($0.0001 par value – 2 billion authorized) | | | 529 | | | | | — | | | | | — | | | |
Net asset value, offering price, and redemption price per share3 | | $ | 18.58 | | | | | — | | | | | — | | | |
Class C: | | | | | | | | | | | | | | | | |
| Net assets | | $ | 8,661 | | | | $ | 2,766 | | | | $ | 1,380 | | | |
| Shares issued and outstanding ($0.0001 par value – 2 billion authorized) | | | 463 | | | | | 298 | | | | | 181 | | | |
Net asset value, offering price, and redemption price per share3 | | $ | 18.70 | | | | $ | 9.28 | | | | $ | 7.62 | | | |
Class R: | | | | | | | | | | | | | | | | |
| Net assets | | $ | 10,915 | | | | $ | 12,212 | | | | $ | 2,512 | | | |
| Shares issued and outstanding ($0.0001 par value – 2 billion authorized) | | | 580 | | | | | 1,295 | | | | | 325 | | | |
| Net asset value, offering price, and redemption price per share | | $ | 18.83 | | | | $ | 9.43 | | | | $ | 7.73 | | | |
Class Y: | | | | | | | | | | | | | | | | |
| Net assets | | $ | 827,145 | | | | $ | 163,432 | | | | $ | 43,179 | | | |
| Shares issued and outstanding ($0.0001 par value – 2 billion authorized) | | | 43,863 | | | | | 17,115 | | | | | 5,456 | | | |
| Net asset value, offering price, and redemption price per share | | $ | 18.86 | | | | $ | 9.55 | | | | $ | 7.91 | | | |
| |
| |
| | |
| | 1 | The offering price is calculated by dividing the net asset value by 1 minus the maximum sales charge of 5.50%. |
| |
| | 2 | No new or additional investments are allowed in Class B shares. See note 1 in Notes to Financial Statements. |
| |
| | 3 | Class B and Class C have a contingent deferred sales charge. For a description of this sales charge, see notes 1 and 3 in Notes to Financial Statements. |
The accompanying notes are an integral part of the financial statements.
First American Funds 2009 Annual Report 43
| |
| Statements of Operations | For the year ended October 31, 2009, all dollars are rounded to thousands (000) |
| | | | | | | | | | | | | | | | | |
| | | | | | | | | | | | | | |
| | | Equity
| | | | Mid Cap
| | | | Small Cap
| | | |
| | | Index Fund | | | | Index Fund | | | | Index Fund | | | |
| |
INVESTMENT INCOME: | | | | | | | | | | | | | | | | |
| Dividends from unaffiliated investments | | $ | 23,711 | | | | $ | 2,940 | | | | $ | 687 | | | |
| Dividends from affiliated investments | | | 210 | | | | | 52 | | | | | 21 | | | |
| Interest from unaffiliated investments | | | 14 | | | | | 6 | | | | | 3 | | | |
| Securities lending income | | | 1,085 | | | | | 256 | | | | | 139 | | | |
| |
| |
Total investment income | | | 25,020 | | | | | 3,254 | | | | | 850 | | | |
| |
| |
EXPENSES (note 3): | | | | | | | | | | | | | | | | |
| Investment advisory fees | | | 2,338 | | | | | 416 | | | | | 194 | | | |
| Administration fees | | | 2,053 | | | | | 380 | | | | | 184 | | | |
| Transfer agent fees | | | 316 | | | | | 131 | | | | | 119 | | | |
| Custodian fees | | | 48 | | | | | 9 | | | | | 2 | | | |
| Legal fees | | | 15 | | | | | 15 | | | | | 15 | | | |
| Audit fees | | | 29 | | | | | 29 | | | | | 29 | | | |
| Registration fees | | | 57 | | | | | 48 | | | | | 48 | | | |
| Postage and printing fees | | | 73 | | | | | 13 | | | | | 7 | | | |
| Directors’ fees | | | 30 | | | | | 30 | | | | | 30 | | | |
| Other expenses | | | 54 | | | | | 33 | | | | | 61 | | | |
| Distribution and shareholder servicing fees: | | | | | | | | | | | | | | | | |
| Class A | | | 259 | | | | | 35 | | | | | 15 | | | |
| Class B | | | 101 | | | | | 6 | | | | | 4 | | | |
| Class C | | | 82 | | | | | 27 | | | | | 13 | | | |
| Class R | | | 51 | | | | | 45 | | | | | 8 | | | |
| |
| |
Total expenses | | | 5,506 | | | | | 1,217 | | | | | 729 | | | |
| |
| |
| Less: Fee waivers (note 3) | | | (1,565 | ) | | | | (280 | ) | | | | (410 | ) | | |
| |
| |
Total net expenses | | | 3,941 | | | | | 937 | | | | | 319 | | | |
| |
| |
Investment income – net | | | 21,079 | | | | | 2,317 | | | | | 531 | | | |
| |
| |
REALIZED AND UNREALIZED GAINS (LOSSES) – NET (note 5): | | | | | | | | | | | | | | | | |
| Net realized gain (loss) on: | | | | | | | | | | | | | | | | |
| Unaffiliated investments | | | (381 | ) | | | | (12,559 | ) | | | | (8,262 | ) | | |
| Affiliated investments | | | (117 | ) | | | | — | | | | | — | | | |
| Futures contracts | | | 2,686 | | | | | (2,979 | ) | | | | (288 | ) | | |
| Net change in unrealized appreciation or depreciation of: | | | | | | | | | | | | | | | | |
| Unaffiliated investments | | | 51,528 | | | | | 34,624 | | | | | 9,224 | | | |
| Affiliated investments | | | (1,386 | ) | | | | — | | | | | — | | | |
| Future contracts | | | 2,540 | | | | | 2,869 | | | | | 246 | | | |
| |
| |
Net gain on investments and futures contracts | | | 54,870 | | | | | 21,955 | | | | | 920 | | | |
| |
| |
Net increase in net assets resulting from operations | | $ | 75,949 | | | | $ | 24,272 | | | | $ | 1,451 | | | |
| |
| |
The accompanying notes are an integral part of the financial statements.
44 First American Funds 2009 Annual Report
| |
| Statements of Changes in Net Assets | all dollars are rounded to thousands (000) |
| | | | | | | | | | | | | | | | | | | | | | | | | | | | | |
| | | | | | | | | | | | | | | | | | | | | | | |
| | | Equity
| | | | Mid Cap
| | | | Small Cap
| | | |
| | | Index Fund | | | | Index Fund | | | | Index Fund | | | |
| |
| | | Year Ended
| | | Year Ended
| | | | Year Ended
| | | Year Ended
| | | | Year Ended
| | | Year Ended
| | | |
| | | 10/31/09 | | | 10/31/08 | | | | 10/31/09 | | | 10/31/08 | | | | 10/31/09 | | | 10/31/08 | | | |
| |
OPERATIONS: | | | | | | | | | | | | | | | | | | | | | | | | | | | | |
| Investment income – net | | $ | 21,079 | | | $ | 31,393 | | | | $ | 2,317 | | | $ | 3,577 | | | | $ | 531 | | | $ | 1,145 | | | |
| Net realized gain (loss) on: | | | | | | | | | | | | | | | | | | | | | | | | | | | | |
| Unaffiliated investments | | | (381 | ) | | | 11,988 | | | | | (12,559 | ) | | | 19,413 | | | | | (8,262 | ) | | | 11,307 | | | |
| Affiliated investments | | | (117 | ) | | | 254 | | | | | — | | | | — | | | | | — | | | | — | | | |
Redemption-in-kind (note 7) | | | — | | | | 33,430 | | | | | — | | | | — | | | | | — | | | | — | | | |
| Futures contracts | | | 2,686 | | | | (14,113 | ) | | | | (2,979 | ) | | | (3,523 | ) | | | | (288 | ) | | | (1,568 | ) | | |
| Net change in unrealized appreciation or depreciation of: | | | | | | | | | | | | | | | | | | | | | | | | | | | | |
| Unaffiliated investments | | | 51,528 | | | | (721,395 | ) | | | | 34,624 | | | | (134,758 | ) | | | | 9,224 | | | | (46,893 | ) | | |
| Affiliated investments | | | (1,386 | ) | | | (1,060 | ) | | | | — | | | | — | | | | | — | | | | — | | | |
| Futures contracts | | | 2,540 | | | | (3,051 | ) | | | | 2,869 | | | | (3,623 | ) | | | | 246 | | | | (577 | ) | | |
| |
| |
| Net increase (decrease) in net assets resulting from operations | | | 75,949 | | | | (662,554 | ) | | | | 24,272 | | | | (118,914 | ) | | | | 1,451 | | | | (36,586 | ) | | |
| |
| |
DISTRIBUTIONS TO SHAREHOLDERS FROM: | | | | | | | | | | | | | | | | | | | | | | | | | | | | |
| Investment income – net: | | | | | | | | | | | | | | | | | | | | | | | | | | | | |
| Class A | | | (2,257 | ) | | | (2,631 | ) | | | | (115 | ) | | | (126 | ) | | | | (58 | ) | | | (63 | ) | | |
| Class B | | | (149 | ) | | | (193 | ) | | | | (5 | ) | | | (5 | ) | | | | (3 | ) | | | (3 | ) | | |
| Class C | | | (116 | ) | | | (132 | ) | | | | (12 | ) | | | (11 | ) | | | | (7 | ) | | | (6 | ) | | |
| Class R | | | (198 | ) | | | (101 | ) | | | | (63 | ) | | | (42 | ) | | | | (11 | ) | | | (6 | ) | | |
| Class Y | | | (19,546 | ) | | | (25,572 | ) | | | | (1,368 | ) | | | (2,674 | ) | | | | (427 | ) | | | (785 | ) | | |
| Net realized gain on investments: | | | | | | | | | | | | | | | | | | | | | | | | | | | | |
| Class A | | | — | | | | (3,893 | ) | | | | (883 | ) | | | (1,774 | ) | | | | (868 | ) | | | (947 | ) | | |
| Class B | | | — | | | | (552 | ) | | | | (80 | ) | | | (232 | ) | | | | (97 | ) | | | (132 | ) | | |
| Class C | | | — | | | | (351 | ) | | | | (204 | ) | | | (548 | ) | | | | (207 | ) | | | (311 | ) | | |
| Class R | | | — | | | | (144 | ) | | | | (581 | ) | | | (602 | ) | | | | (185 | ) | | | (86 | ) | | |
| Class Y | | | — | | | | (31,878 | ) | | | | (9,460 | ) | | | (32,293 | ) | | | | (6,118 | ) | | | (10,301 | ) | | |
| |
| |
| Total distributions | | | (22,266 | ) | | | (65,447 | ) | | | | (12,771 | ) | | | (38,307 | ) | | | | (7,981 | ) | | | (12,640 | ) | | |
| |
| |
CAPITAL SHARE TRANSACTIONS (note 4): | | | | | | | | | | | | | | | | | | | | | | | | | | | | |
| Class A: | | | | | | | | | | | | | | | | | | | | | | | | | | | | |
| Proceeds from sales | | | 15,557 | | | | 20,758 | | | | | 13,274 | | | | 4,704 | | | | | 5,583 | | | | 1,928 | | | |
| Reinvestment of distributions | | | 2,158 | | | | 6,237 | | | | | 920 | | | | 1,717 | | | | | 882 | | | | 975 | | | |
| Payments for redemptions | | | (24,174 | ) | | | (49,679 | ) | | | | (4,446 | ) | | | (4,543 | ) | | | | (3,361 | ) | | | (1,862 | ) | | |
| |
| |
| Increase (decrease) in net assets from Class A transactions | | | (6,459 | ) | | | (22,684 | ) | | | | 9,748 | | | | 1,878 | | | | | 3,104 | | | | 1,041 | | | |
| |
| |
Class B1: | | | | | | | | | | | | | | | | | | | | | | | | | | | | |
| Proceeds from sales | | | 33 | | | | 770 | | | | | 34 | | | | 122 | | | | | 3 | | | | 156 | | | |
| Reinvestment of distributions | | | 146 | | | | 720 | | | | | 78 | | | | 225 | | | | | 98 | | | | 131 | | | |
| Payments for redemptions (note 3) | | | (3,587 | ) | | | (10,397 | ) | | | | (1,187 | ) | | | (499 | ) | | | | (644 | ) | | | (320 | ) | | |
| |
| |
| Decrease in net assets from Class B transactions | | | (3,408 | ) | | | (8,907 | ) | | | | (1,075 | ) | | | (152 | ) | | | | (543 | ) | | | (33 | ) | | |
| |
| |
| Class C: | | | | | | | | | | | | | | | | | | | | | | | | | | | | |
| Proceeds from sales | | | 792 | | | | 1,128 | | | | | 252 | | | | 797 | | | | | 141 | | | | 127 | | | |
| Reinvestment of distributions | | | 106 | | | | 449 | | | | | 180 | | | | 502 | | | | | 198 | | | | 285 | | | |
| Payments for redemptions (note 3) | | | (2,424 | ) | | | (4,643 | ) | | | | (929 | ) | | | (1,051 | ) | | | | (324 | ) | | | (585 | ) | | |
| |
| |
| Increase (decrease) in net assets from Class C transactions | | | (1,526 | ) | | | (3,066 | ) | | | | (497 | ) | | | 248 | | | | | 15 | | | | (173 | ) | | |
| |
| |
| Class R: | | | | | | | | | | | | | | | | | | | | | | | | | | | | |
| Proceeds from sales | | | 5,367 | | | | 9,125 | | | | | 6,776 | | | | 8,117 | | | | | 1,902 | | | | 1,239 | | | |
| Reinvestment of distributions | | | 198 | | | | 244 | | | | | 644 | | | | 644 | | | | | 196 | | | | 92 | | | |
| Payments for redemptions | | | (5,283 | ) | | | (2,841 | ) | | | | (4,346 | ) | | | (2,163 | ) | | | | (738 | ) | | | (379 | ) | | |
| |
| |
| Increase in net assets from Class R transactions | | | 282 | | | | 6,528 | | | | | 3,074 | | | | 6,598 | | | | | 1,360 | | | | 952 | | | |
| |
| |
| Class Y: | | | | | | | | | | | | | | | | | | | | | | | | | | | | |
| Proceeds from sales | | | 170,677 | | | | 303,124 | | | | | 41,509 | | | | 34,746 | | | | | 13,371 | | | | 22,782 | | | |
| Reinvestment of distributions | | | 9,611 | | | | 32,635 | | | | | 6,315 | | | | 17,958 | | | | | 3,291 | | | | 5,060 | | | |
| Payments for redemptions | | | (352,443 | ) | | | (464,413 | ) | | | | (70,209 | ) | | | (68,345 | ) | | | | (22,718 | ) | | | (44,407 | ) | | |
| |
| |
| Decrease in net assets from Class Y transactions | | | (172,155 | ) | | | (128,654 | ) | | | | (22,385 | ) | | | (15,641 | ) | | | | (6,056 | ) | | | (16,565 | ) | | |
| |
| |
| Decrease in net assets from capital share transactions | | | (183,266 | ) | | | (156,783 | ) | | | | (11,135 | ) | | | (7,069 | ) | | | | (2,120 | ) | | | (14,778 | ) | | |
| |
| |
| Total increase (decrease) in net assets | | | (129,583 | ) | | | (884,784 | ) | | | | 366 | | | | (164,290 | ) | | | | (8,650 | ) | | | (64,004 | ) | | |
Net assets at beginning of year | | | 1,101,339 | | | | 1,986,123 | | | | | 200,810 | | | | 365,100 | | | | | 64,312 | | | | 128,316 | | | |
| |
| |
Net assets at end of year | | $ | 971,756 | | | $ | 1,101,339 | | | | $ | 201,176 | | | $ | 200,810 | | | | $ | 55,662 | | | $ | 64,312 | | | |
| |
| |
Undistributed net investment income at end of year | | $ | 953 | | | $ | 2,285 | | | | $ | 1,313 | | | $ | 806 | | | | $ | 285 | | | $ | 281 | | | |
| |
| |
| | |
| | 1 | No new or additional investments are allowed in Class B shares. See note 1 in Notes to Financial Statements. |
The accompanying notes are an integral part of the financial statements.
First American Funds 2009 Annual Report 45
Financial Highlights For a share outstanding throughout the indicated periods.
| | | | | | | | | | | | | | | | | | | | | | | | | | | | | | | | | | | | | | | | | | |
| | | | | | | | | | | | | | | | | | | | | | | | | | |
| | | | | | | | | Realized and
| | | | | | | | | | | | | | | | | |
| | | Net Asset
| | | | | | Unrealized
| | | | | | Distributions
| | | | | | | | | Net Asset
| | |
| | | Value
| | | Net
| | | Gains
| | | Total from
| | | from Net
| | | Distributions
| | | | | | Value
| | |
| | | Beginning
| | | Investment
| | | (Losses) on
| | | Investment
| | | Investment
| | | from Net
| | | Total
| | | End of
| | |
| | | of Period | | | Income | | | Investments | | | Operations | | | Income | | | Realized Gains | | | Distributions | | | Period | | |
| |
Equity Index Fund1 | | | | | | | | | | | | | | | | | | | | | | | | | | | | | | | | | | | | | | | | | |
| Class A | | | | | | | | | | | | | | | | | | | | | | | | | | | | | | | | | | | | | | | | | |
20092 | | $ | 17.61 | | | | $ | 0.34 | | | | $ | 1.27 | | | | $ | 1.61 | | | | $ | (0.36 | ) | | | $ | — | | | | $ | (0.36 | ) | | | $ | 18.86 | | | |
20082 | | | 28.67 | | | | | 0.42 | | | | | (10.57 | ) | | | | (10.15 | ) | | | | (0.38 | ) | | | | (0.53 | ) | | | | (0.91 | ) | | | | 17.61 | | | |
20072 | | | 25.80 | | | | | 0.37 | | | | | 3.16 | | | | | 3.53 | | | | | (0.36 | ) | | | | (0.30 | ) | | | | (0.66 | ) | | | | 28.67 | | | |
20062 | | | 22.59 | | | | | 0.33 | | | | | 3.21 | | | | | 3.54 | | | | | (0.33 | ) | | | | — | | | | | (0.33 | ) | | | | 25.80 | | | |
20053 | | | 23.00 | | | | | 0.01 | | | | | (0.40 | ) | | | | (0.39 | ) | | | | (0.02 | ) | | | | — | | | | | (0.02 | ) | | | | 22.59 | | | |
20054 | | | 20.91 | | | | | 0.34 | | | | | 2.09 | | | | | 2.43 | | | | | (0.34 | ) | | | | — | | | | | (0.34 | ) | | | | 23.00 | | | |
| Class B | | | | | | | | | | | | | | | | | | | | | | | | | | | | | | | | | | | | | | | | | |
20092 | | $ | 17.35 | | | | $ | 0.22 | | | | $ | 1.25 | | | | $ | 1.47 | | | | $ | (0.24 | ) | | | $ | — | | | | $ | (0.24 | ) | | | $ | 18.58 | | | |
20082 | | | 28.27 | | | | | 0.24 | | | | | (10.42 | ) | | | | (10.18 | ) | | | | (0.21 | ) | | | | (0.53 | ) | | | | (0.74 | ) | | | | 17.35 | | | |
20072 | | | 25.47 | | | | | 0.17 | | | | | 3.11 | | | | | 3.28 | | | | | (0.18 | ) | | | | (0.30 | ) | | | | (0.48 | ) | | | | 28.27 | | | |
20062 | | | 22.31 | | | | | 0.15 | | | | | 3.17 | | | | | 3.32 | | | | | (0.16 | ) | | | | — | | | | | (0.16 | ) | | | | 25.47 | | | |
20053 | | | 22.72 | | | | | — | | | | | (0.40 | ) | | | | (0.40 | ) | | | | (0.01 | ) | | | | — | | | | | (0.01 | ) | | | | 22.31 | | | |
20054 | | | 20.66 | | | | | 0.18 | | | | | 2.06 | | | | | 2.24 | | | | | (0.18 | ) | | | | — | | | | | (0.18 | ) | | | | 22.72 | | | |
| Class C | | | | | | | | | | | | | | | | | | | | | | | | | | | | | | | | | | | | | | | | | |
20092 | | $ | 17.46 | | | | $ | 0.21 | | | | $ | 1.26 | | | | $ | 1.47 | | | | $ | (0.23 | ) | | | $ | — | | | | $ | (0.23 | ) | | | $ | 18.70 | | | |
20082 | | | 28.45 | | | | | 0.24 | | | | | (10.48 | ) | | | | (10.24 | ) | | | | (0.22 | ) | | | | (0.53 | ) | | | | (0.75 | ) | | | | 17.46 | | | |
20072 | | | 25.62 | | | | | 0.17 | | | | | 3.14 | | | | | 3.31 | | | | | (0.18 | ) | | | | (0.30 | ) | | | | (0.48 | ) | | | | 28.45 | | | |
20062 | | | 22.44 | | | | | 0.15 | | | | | 3.19 | | | | | 3.34 | | | | | (0.16 | ) | | | | — | | | | | (0.16 | ) | | | | 25.62 | | | |
20053 | | | 22.85 | | | | | — | | | | | (0.40 | ) | | | | (0.40 | ) | | | | (0.01 | ) | | | | — | | | | | (0.01 | ) | | | | 22.44 | | | |
20054 | | | 20.78 | | | | | 0.18 | | | | | 2.07 | | | | | 2.25 | | | | | (0.18 | ) | | | | — | | | | | (0.18 | ) | | | | 22.85 | | | |
| Class R | | | | | | | | | | | | | | | | | | | | | | | | | | | | | | | | | | | | | | | | | |
20092 | | $ | 17.58 | | | | $ | 0.29 | | | | $ | 1.28 | | | | $ | 1.57 | | | | $ | (0.32 | ) | | | $ | — | | | | $ | (0.32 | ) | | | $ | 18.83 | | | |
20082 | | | 28.63 | | | | | 0.35 | | | | | (10.54 | ) | | | | (10.19 | ) | | | | (0.33 | ) | | | | (0.53 | ) | | | | (0.86 | ) | | | | 17.58 | | | |
20072 | | | 25.77 | | | | | 0.29 | | | | | 3.17 | | | | | 3.46 | | | | | (0.30 | ) | | | | (0.30 | ) | | | | (0.60 | ) | | | | 28.63 | | | |
20062 | | | 22.57 | | | | | 0.26 | | | | | 3.21 | | | | | 3.47 | | | | | (0.27 | ) | | | | — | | | | | (0.27 | ) | | | | 25.77 | | | |
20053 | | | 22.98 | | | | | 0.01 | | | | | (0.40 | ) | | | | (0.39 | ) | | | | (0.02 | ) | | | | — | | | | | (0.02 | ) | | | | 22.57 | | | |
20054 | | | 20.91 | | | | | 0.26 | | | | | 2.11 | | | | | 2.37 | | | | | (0.30 | ) | | | | — | | | | | (0.30 | ) | | | | 22.98 | | | |
| Class Y | | | | | | | | | | | | | | | | | | | | | | | | | | | | | | | | | | | | | | | | | |
20092 | | $ | 17.61 | | | | $ | 0.38 | | | | $ | 1.27 | | | | $ | 1.65 | | | | $ | (0.40 | ) | | | $ | — | | | | $ | (0.40 | ) | | | $ | 18.86 | | | |
20082 | | | 28.66 | | | | | 0.48 | | | | | (10.56 | ) | | | | (10.08 | ) | | | | (0.44 | ) | | | | (0.53 | ) | | | | (0.97 | ) | | | | 17.61 | | | |
20072 | | | 25.79 | | | | | 0.44 | | | | | 3.16 | | | | | 3.60 | | | | | (0.43 | ) | | | | (0.30 | ) | | | | (0.73 | ) | | | | 28.66 | | | |
20062 | | | 22.58 | | | | | 0.39 | | | | | 3.21 | | | | | 3.60 | | | | | (0.39 | ) | | | | — | | | | | (0.39 | ) | | | | 25.79 | | | |
20053 | | | 22.99 | | | | | 0.02 | | | | | (0.41 | ) | | | | (0.39 | ) | | | | (0.02 | ) | | | | — | | | | | (0.02 | ) | | | | 22.58 | | | |
20054 | | | 20.91 | | | | | 0.40 | | | | | 2.08 | | | | | 2.48 | | | | | (0.40 | ) | | | | — | | | | | (0.40 | ) | | | | 22.99 | | | |
| |
| |
| | |
| | 1 | Per share data calculated using average shares outstanding method. |
| |
| | 2 | For the period November 1 to October 31 in the fiscal year indicated. |
| |
| | 3 | For the period October 1, 2005 to October 31, 2005. Effective in 2005, the fund’s fiscal year-end was changed from September 30 to October 31. All ratios for the period have been annualized, except total return and portfolio turnover. |
| |
| | 4 | For the period October 1 to September 30 in the year indicated. |
| |
| | 5 | Total return does not reflect sales charges. Total return would have been lower had certain expenses not been waived. |
The accompanying notes are an integral part of the financial statements.
46 First American Funds 2009 Annual Report
| | | | | | | | | | | | | | | | | | | | | | | | | | | | | | | | | | | | | |
| | | | | | | | | | | | | | | | | | | | | | | |
| | | | | | | | | | | | | | | Ratio of
| | | Ratio of Net
| | | | | |
| | | | | | | | | | | | Ratio of Net
| | | Expenses
| | | Investment
| | | | | |
| | | | | | | | | Ratio of
| | | Investment
| | | to Average
| | | Income (Loss)
| | | | | |
| | | | | | Net Assets
| | | Expenses
| | | Income (Loss)
| | | Net Assets
| | | to Average
| | | Portfolio
| | |
| | | Total
| | | End of
| | | to Average
| | | to Average
| | | (Excluding
| | | Net Assets
| | | Turnover
| | |
| | | Return5 | | | Period (000) | | | Net Assets | | | Net Assets | | | Waivers) | | | (Excluding Waivers) | | | Rate | | |
| |
| | | | | | | | | | | | | | | | | | | | | | | | | | | | | | | | | | | | | |
| | | | | | | | | | | | | | | | | | | | | | | | | | | | | | | | | | | | | |
| | | | 9.51 | % | | | $ | 115,213 | | | | | 0.62 | % | | | | 2.03 | % | | | | 0.79 | % | | | | 1.86 | % | | | | 10 | % | | |
| | | | (36.35 | ) | | | | 114,654 | | | | | 0.62 | | | | | 1.74 | | | | | 0.78 | | | | | 1.58 | | | | | 4 | | | |
| | | | 13.93 | | | | | 213,957 | | | | | 0.62 | | | | | 1.37 | | | | | 0.76 | | | | | 1.23 | | | | | 4 | | | |
| | | | 15.76 | | | | | 229,185 | | | | | 0.62 | | | | | 1.36 | | | | | 0.77 | | | | | 1.21 | | | | | 3 | | | |
| | | | (1.70 | ) | | | | 234,629 | | | | | 0.62 | | | | | 0.69 | | | | | 0.79 | | | | | 0.52 | | | | | — | | | |
| | | | 11.69 | | | | | 238,379 | | | | | 0.62 | | | | | 1.53 | | | | | 0.79 | | | | | 1.36 | | | | | 4 | | | |
| | | | | | | | | | | | | | | | | | | | | | | | | | | | | | | | | | | | | |
| | | | 8.69 | % | | | $ | 9,822 | | | | | 1.37 | % | | | | 1.33 | % | | | | 1.54 | % | | | | 1.16 | % | | | | 10 | % | | |
| | | | (36.82 | ) | | | | 12,856 | | | | | 1.37 | | | | | 0.99 | | | | | 1.53 | | | | | 0.83 | | | | | 4 | | | |
| | | | 13.05 | | | | | 31,343 | | | | | 1.37 | | | | | 0.63 | | | | | 1.51 | | | | | 0.49 | | | | | 4 | | | |
| | | | 14.94 | | | | | 43,369 | | | | | 1.37 | | | | | 0.63 | | | | | 1.52 | | | | | 0.48 | | | | | 3 | | | |
| | | | (1.78 | ) | | | | 56,097 | | | | | 1.37 | | | | | (0.06 | ) | | | | 1.54 | | | | | (0.23 | ) | | | | — | | | |
| | | | 10.86 | | | | | 58,857 | | | | | 1.37 | | | | | 0.79 | | | | | 1.54 | | | | | 0.62 | | | | | 4 | | | |
| | | | | | | | | | | | | | | | | | | | | | | | | | | | | | | | | | | | | |
| | | | 8.69 | % | | | $ | 8,661 | | | | | 1.37 | % | | | | 1.31 | % | | | | 1.54 | % | | | | 1.14 | % | | | | 10 | % | | |
| | | | (36.83 | ) | | | | 9,784 | | | | | 1.37 | | | | | 0.99 | | | | | 1.53 | | | | | 0.83 | | | | | 4 | | | |
| | | | 13.09 | | | | | 19,585 | | | | | 1.37 | | | | | 0.62 | | | | | 1.51 | | | | | 0.48 | | | | | 4 | | | |
| | | | 14.93 | | | | | 20,714 | | | | | 1.37 | | | | | 0.62 | | | | | 1.52 | | | | | 0.47 | | | | | 3 | | | |
| | | | (1.78 | ) | | | | 24,195 | | | | | 1.37 | | | | | (0.05 | ) | | | | 1.54 | | | | | (0.22 | ) | | | | — | | | |
| | | | 10.84 | | | | | 26,258 | | | | | 1.37 | | | | | 0.79 | | | | | 1.54 | | | | | 0.62 | | | | | 4 | | | |
| | | | | | | | | | | | | | | | | | | | | | | | | | | | | | | | | | | | | |
| | | | 9.27 | % | | | $ | 10,915 | | | | | 0.87 | % | | | | 1.73 | % | | | | 1.04 | % | | | | 1.56 | % | | | | 10 | % | | |
| | | | (36.51 | ) | | | | 9,463 | | | | | 0.87 | | | | | 1.49 | | | | | 1.03 | | | | | 1.33 | | | | | 4 | | | |
| | | | 13.65 | | | | | 7,230 | | | | | 0.87 | | | | | 1.07 | | | | | 1.01 | | | | | 0.93 | | | | | 4 | | | |
| | | | 15.47 | | | | | 3,419 | | | | | 0.87 | | | | | 1.08 | | | | | 1.15 | | | | | 0.80 | | | | | 3 | | | |
| | | | (1.72 | ) | | | | 1,715 | | | | | 0.87 | | | | | 0.44 | | | | | 1.19 | | | | | 0.12 | | | | | — | | | |
| | | | 11.38 | | | | | 1,663 | | | | | 0.87 | | | | | 1.14 | | | | | 1.19 | | | | | 0.82 | | | | | 4 | | | |
| | | | | | | | | | | | | | | | | | | | | | | | | | | | | | | | | | | | | |
| | | | 9.78 | % | | | $ | 827,145 | | | | | 0.37 | % | | | | 2.31 | % | | | | 0.54 | % | | | | 2.14 | % | | | | 10 | % | | |
| | | | (36.18 | ) | | | | 954,582 | | | | | 0.37 | | | | | 1.99 | | | | | 0.53 | | | | | 1.83 | | | | | 4 | | | |
| | | | 14.22 | | | | | 1,714,008 | | | | | 0.37 | | | | | 1.62 | | | | | 0.51 | | | | | 1.48 | | | | | 4 | | | |
| | | | 16.07 | | | | | 1,935,614 | | | | | 0.37 | | | | | 1.61 | | | | | 0.52 | | | | | 1.46 | | | | | 3 | | | |
| | | | (1.69 | ) | | | | 1,882,517 | | | | | 0.37 | | | | | 0.94 | | | | | 0.54 | | | | | 0.77 | | | | | — | | | |
| | | | 11.92 | | | | | 1,940,567 | | | | | 0.37 | | | | | 1.78 | | | | | 0.54 | | | | | 1.61 | | | | | 4 | | | |
| |
| |
First American Funds 2009 Annual Report 47
Financial Highlights For a share outstanding throughout the indicated periods.
| | | | | | | | | | | | | | | | | | | | | | | | | | | | | | | | | | | | | | | | | | |
| | | | | | | | | | | | | | | | | | | | | | | | | | |
| | | | | | | | | Realized and
| | | | | | | | | | | | | | | | | |
| | | Net Asset
| | | | | | Unrealized
| | | | | | Distributions
| | | | | | | | | Net Asset
| | |
| | | Value
| | | Net
| | | Gains
| | | Total from
| | | from Net
| | | Distributions
| | | | | | Value
| | |
| | | Beginning
| | | Investment
| | | (Losses) on
| | | Investment
| | | Investment
| | | from Net
| | | Total
| | | End of
| | |
| | | of Period | | | Income (Loss) | | | Investments | | | Operations | | | Income | | | Realized Gains | | | Distributions | | | Period | | |
| |
Mid Cap Index Fund1 | | | | | | | | | | | | | | | | | | | | | | | | | | | | | | | | | | | | | | | | | |
| Class A | | | | | | | | | | | | | | | | | | | | | | | | | | | | | | | | | | | | | | | | | |
20092 | | $ | 8.83 | | | | $ | 0.09 | | | | $ | 1.27 | | | | $ | 1.36 | | | | $ | (0.07 | ) | | | $ | (0.60 | ) | | | $ | (0.67 | ) | | | $ | 9.52 | | | |
20082 | | | 15.69 | | | | | 0.13 | | | | | (5.30 | ) | | | | (5.17 | ) | | | | (0.10 | ) | | | | (1.59 | ) | | | | (1.69 | ) | | | | 8.83 | | | |
20072 | | | 14.25 | | | | | 0.15 | | | | | 2.08 | | | | | 2.23 | | | | | (0.13 | ) | | | | (0.66 | ) | | | | (0.79 | ) | | | | 15.69 | | | |
20062 | | | 13.52 | | | | | 0.11 | | | | | 1.55 | | | | | 1.66 | | | | | (0.11 | ) | | | | (0.82 | ) | | | | (0.93 | ) | | | | 14.25 | | | |
20053 | | | 13.82 | | | | | — | | | | | (0.30 | ) | | | | (0.30 | ) | | | | — | | | | | — | | | | | — | | | | | 13.52 | | | |
20054 | | | 11.84 | | | | | 0.09 | | | | | 2.40 | | | | | 2.49 | | | | | (0.09 | ) | | | | (0.42 | ) | | | | (0.51 | ) | | | | 13.82 | | | |
| Class C | | | | | | | | | | | | | | | | | | | | | | | | | | | | | | | | | | | | | | | | | |
20092 | | $ | 8.64 | | | | $ | 0.04 | | | | $ | 1.23 | | | | $ | 1.27 | | | | $ | (0.03 | ) | | | $ | (0.60 | ) | | | $ | (0.63 | ) | | | $ | 9.28 | | | |
20082 | | | 15.41 | | | | | 0.04 | | | | | (5.19 | ) | | | | (5.15 | ) | | | | (0.03 | ) | | | | (1.59 | ) | | | | (1.62 | ) | | | | 8.64 | | | |
20072 | | | 14.03 | | | | | 0.04 | | | | | 2.03 | | | | | 2.07 | | | | | (0.03 | ) | | | | (0.66 | ) | | | | (0.69 | ) | | | | 15.41 | | | |
20062 | | | 13.32 | | | | | — | | | | | 1.55 | | | | | 1.55 | | | | | (0.02 | ) | | | | (0.82 | ) | | | | (0.84 | ) | | | | 14.03 | | | |
20053 | | | 13.63 | | | | | (0.01 | ) | | | | (0.30 | ) | | | | (0.31 | ) | | | | — | | | | | — | | | | | — | | | | | 13.32 | | | |
20054 | | | 11.70 | | | | | (0.01 | ) | | | | 2.38 | | | | | 2.37 | | | | | (0.02 | ) | | | | (0.42 | ) | | | | (0.44 | ) | | | | 13.63 | | | |
| Class R | | | | | | | | | | | | | | | | | | | | | | | | | | | | | | | | | | | | | | | | | |
20092 | | $ | 8.76 | | | | $ | 0.07 | | | | $ | 1.26 | | | | $ | 1.33 | | | | $ | (0.06 | ) | | | $ | (0.60 | ) | | | $ | (0.66 | ) | | | $ | 9.43 | | | |
20082 | | | 15.60 | | | | | 0.10 | | | | | (5.27 | ) | | | | (5.17 | ) | | | | (0.08 | ) | | | | (1.59 | ) | | | | (1.67 | ) | | | | 8.76 | | | |
20072 | | | 14.19 | | | | | 0.11 | | | | | 2.07 | | | | | 2.18 | | | | | (0.11 | ) | | | | (0.66 | ) | | | | (0.77 | ) | | | | 15.60 | | | |
20062 | | | 13.48 | | | | | 0.07 | | | | | 1.55 | | | | | 1.62 | | | | | (0.09 | ) | | | | (0.82 | ) | | | | (0.91 | ) | | | | 14.19 | | | |
20053 | | | 13.78 | | | | | — | | | | | (0.30 | ) | | | | (0.30 | ) | | | | — | | | | | — | | | | | — | | | | | 13.48 | | | |
20054 | | | 11.83 | | | | | 0.04 | | | | | 2.41 | | | | | 2.45 | | | | | (0.08 | ) | | | | (0.42 | ) | | | | (0.50 | ) | | | | 13.78 | | | |
| Class Y | | | | | | | | | | | | | | | | | | | | | | | | | | | | | | | | | | | | | | | | | |
20092 | | $ | 8.84 | | | | $ | 0.12 | | | | $ | 1.27 | | | | $ | 1.39 | | | | $ | (0.08 | ) | | | $ | (0.60 | ) | | | $ | (0.68 | ) | | | $ | 9.55 | | | |
20082 | | | 15.70 | | | | | 0.17 | | | | | (5.31 | ) | | | | (5.14 | ) | | | | (0.13 | ) | | | | (1.59 | ) | | | | (1.72 | ) | | | | 8.84 | | | |
20072 | | | 14.27 | | | | | 0.19 | | | | | 2.07 | | | | | 2.26 | | | | | (0.17 | ) | | | | (0.66 | ) | | | | (0.83 | ) | | | | 15.70 | | | |
20062 | | | 13.53 | | | | | 0.15 | | | | | 1.56 | | | | | 1.71 | | | | | (0.15 | ) | | | | (0.82 | ) | | | | (0.97 | ) | | | | 14.27 | | | |
20053 | | | 13.83 | | | | | 0.01 | | | | | (0.31 | ) | | | | (0.30 | ) | | | | — | | | | | — | | | | | — | | | | | 13.53 | | | |
20054 | | | 11.84 | | | | | 0.12 | | | | | 2.41 | | | | | 2.53 | | | | | (0.12 | ) | | | | (0.42 | ) | | | | (0.54 | ) | | | | 13.83 | | | |
| |
| |
| | |
| | 1 | Per share data calculated using average shares outstanding method. |
| |
| | 2 | For the period November 1 to October 31 in the fiscal year indicated. |
| |
| | 3 | For the period October 1, 2005 to October 31, 2005. Effective in 2005, the fund’s fiscal year end was changed from September 30 to October 31. All ratios for the period have been annualized, except total return and portfolio turnover. |
| |
| | 4 | For the period October 1 to September 30 in the year indicated. |
| |
| | 5 | Total return does not reflect sales charges. Total return would have been lower had certain expenses not been waived. |
The accompanying notes are an integral part of the financial statements.
48 First American Funds 2009 Annual Report
| | | | | | | | | | | | | | | | | | | | | | | | | | | | | | | | | | | | | |
| | | | | | | | | | | | | | | | | | | | | | | |
| | | | | | | | | | | | | | | Ratio of
| | | Ratio of Net
| | | | | |
| | | | | | | | | | | | Ratio of Net
| | | Expenses
| | | Investment
| | | | | |
| | | | | | | | | Ratio of
| | | Investment
| | | to Average
| | | Income (Loss)
| | | | | |
| | | | | | Net Assets
| | | Expenses
| | | Income (Loss)
| | | Net Assets
| | | to Average
| | | Portfolio
| | |
| | | Total
| | | End of
| | | to Average
| | | to Average
| | | (Excluding
| | | Net Assets
| | | Turnover
| | |
| | | Return5 | | | Period (000) | | | Net Assets | | | Net Assets | | | Waivers) | | | (Excluding Waivers) | | | Rate | | |
| |
| | | | | | | | | | | | | | | | | | | | | | | | | | | | | | | | | | | | | |
| | | | | | | | | | | | | | | | | | | | | | | | | | | | | | | | | | | | | |
| | | | 17.53 | % | | | $ | 22,766 | | | | | 0.75 | % | | | | 1.15 | % | | | | 0.92 | % | | | | 0.98 | % | | | | 18 | % | | |
| | | | (36.46 | ) | | | | 11,374 | | | | | 0.74 | | | | | 1.04 | | | | | 0.84 | | | | | 0.94 | | | | | 15 | | | |
| | | | 16.32 | | | | | 17,868 | | | | | 0.75 | | | | | 1.02 | | | | | 0.81 | | | | | 0.96 | | | | | 15 | | | |
| | | | 12.70 | | | | | 14,722 | | | | | 0.75 | | | | | 0.77 | | | | | 0.81 | | | | | 0.71 | | | | | 7 | | | |
| | | | (2.17 | ) | | | | 14,318 | | | | | 0.75 | | | | | 0.26 | | | | | 0.80 | | | | | 0.21 | | | | | 1 | | | |
| | | | 21.43 | | | | | 14,827 | | | | | 0.75 | | | | | 0.68 | | | | | 0.82 | | | | | 0.61 | | | | | 15 | | | |
| | | | | | | | | | | | | | | | | | | | | | | | | | | | | | | | | | | | | |
| | | | 16.68 | % | | | $ | 2,766 | | | | | 1.50 | % | | | | 0.48 | % | | | | 1.67 | % | | | | 0.31 | % | | | | 18 | % | | |
| | | | (36.91 | ) | | | | 3,101 | | | | | 1.48 | | | | | 0.30 | | | | | 1.58 | | | | | 0.20 | | | | | 15 | | | |
| | | | 15.39 | | | | | 5,287 | | | | | 1.50 | | | | | 0.28 | | | | | 1.56 | | | | | 0.22 | | | | | 15 | | | |
| | | | 11.96 | | | | | 4,320 | | | | | 1.50 | | | | | 0.02 | | | | | 1.56 | | | | | (0.04 | ) | | | | 7 | | | |
| | | | (2.27 | ) | | | | 3,388 | | | | | 1.50 | | | | | (0.49 | ) | | | | 1.55 | | | | | (0.54 | ) | | | | 1 | | | |
| | | | 20.60 | | | | | 3,533 | | | | | 1.50 | | | | | (0.08 | ) | | | | 1.57 | | | | | (0.15 | ) | | | | 15 | | | |
| | | | | | | | | | | | | | | | | | | | | | | | | | | | | | | | | | | | | |
| | | | 17.29 | % | | | $ | 12,212 | | | | | 1.00 | % | | | | 0.89 | % | | | | 1.17 | % | | | | 0.72 | % | | | | 18 | % | | |
| | | | (36.66 | ) | | | | 8,157 | | | | | 1.00 | | | | | 0.80 | | | | | 1.10 | | | | | 0.70 | | | | | 15 | | | |
| | | | 16.01 | | | | | 5,913 | | | | | 1.00 | | | | | 0.78 | | | | | 1.06 | | | | | 0.72 | | | | | 15 | | | |
| | | | 12.40 | | | | | 4,032 | | | | | 1.00 | | | | | 0.47 | | | | | 1.17 | | | | | 0.30 | | | | | 7 | | | |
| | | | (2.18 | ) | | | | 131 | | | | | 1.00 | | | | | 0.01 | | | | | 1.20 | | | | | (0.19 | ) | | | | 1 | | | |
| | | | 21.09 | | | | | 122 | | | | | 1.00 | | | | | 0.28 | | | | | 1.22 | | | | | 0.06 | | | | | 15 | | | |
| | | | | | | | | | | | | | | | | | | | | | | | | | | | | | | | | | | | | |
| | | | 17.92 | % | | | $ | 163,432 | | | | | 0.50 | % | | | | 1.47 | % | | | | 0.67 | % | | | | 1.30 | % | | | | 18 | % | | |
| | | | (36.31 | ) | | | | 177,038 | | | | | 0.49 | | | | | 1.29 | | | | | 0.59 | | | | | 1.19 | | | | | 15 | | | |
| | | | 16.52 | | | | | 333,784 | | | | | 0.50 | | | | | 1.29 | | | | | 0.56 | | | | | 1.23 | | | | | 15 | | | |
| | | | 13.05 | | | | | 333,636 | | | | | 0.50 | | | | | 1.03 | | | | | 0.56 | | | | | 0.97 | | | | | 7 | | | |
| | | | (2.17 | ) | | | | 342,072 | | | | | 0.50 | | | | | 0.51 | | | | | 0.55 | | | | | 0.46 | | | | | 1 | | | |
| | | | 21.82 | | | | | 353,354 | | | | | 0.50 | | | | | 0.92 | | | | | 0.57 | | | | | 0.85 | | | | | 15 | | | |
| |
| |
First American Funds 2009 Annual Report 49
Financial Highlights For a share outstanding throughout the indicated periods.
| | | | | | | | | | | | | | | | | | | | | | | | | | | | | | | | | | | | | | | | | | |
| | | | | | | | | | | | | | | | | | | | | | | | | | |
| | | | | | | | | Realized and
| | | | | | | | | | | | | | | | | |
| | | Net Asset
| | | | | | Unrealized
| | | | | | Distributions
| | | | | | | | | Net Asset
| | |
| | | Value
| | | Net
| | | Gains
| | | Total from
| | | from Net
| | | Distributions
| | | | | | Value
| | |
| | | Beginning
| | | Investment
| | | (Losses) on
| | | Investment
| | | Investment
| | | from Net
| | | Total
| | | End of
| | |
| | | of Period | | | Income (Loss) | | | Investments | | | Operations | | | Income | | | Realized Gains | | | Distributions | | | Period | | |
| |
Small Cap Index Fund1 | | | | | | | | | | | | | | | | | | | | | | | | | | | | | | | | | | | | | | | | | |
| Class A | | | | | | | | | | | | | | | | | | | | | | | | | | | | | | | | | | | | | | | | | |
20092 | | $ | 8.91 | | | | $ | 0.06 | | | | $ | 0.27 | | | | $ | 0.33 | | | | $ | (0.07 | ) | | | $ | (1.27 | ) | | | $ | (1.34 | ) | | | $ | 7.90 | | | |
20082 | | | 15.37 | | | | | 0.13 | | | | | (4.88 | ) | | | | (4.75 | ) | | | | (0.10 | ) | | | | (1.61 | ) | | | | (1.71 | ) | | | | 8.91 | | | |
20072 | | | 16.23 | | | | | 0.14 | | | | | 1.13 | | | | | 1.27 | | | | | (0.12 | ) | | | | (2.01 | ) | | | | (2.13 | ) | | | | 15.37 | | | |
20062 | | | 14.12 | | | | | 0.07 | | | | | 2.56 | | | | | 2.63 | | | | | (0.10 | ) | | | | (0.42 | ) | | | | (0.52 | ) | | | | 16.23 | | | |
20053 | | | 14.57 | | | | | — | | | | | (0.45 | ) | | | | (0.45 | ) | | | | — | | | | | — | | | | | — | | | | | 14.12 | | | |
20054 | | | 13.38 | | | | | 0.07 | | | | | 2.17 | | | | | 2.24 | | | | | (0.06 | ) | | | | (0.99 | ) | | | | (1.05 | ) | | | | 14.57 | | | |
| Class C | | | | | | | | | | | | | | | | | | | | | | | | | | | | | | | | | | | | | | | | | |
20092 | | $ | 8.66 | | | | $ | 0.01 | | | | $ | 0.26 | | | | $ | 0.27 | | | | $ | (0.04 | ) | | | $ | (1.27 | ) | | | $ | (1.31 | ) | | | $ | 7.62 | | | |
20082 | | | 15.02 | | | | | 0.04 | | | | | (4.76 | ) | | | | (4.72 | ) | | | | (0.03 | ) | | | | (1.61 | ) | | | | (1.64 | ) | | | | 8.66 | | | |
20072 | | | 15.92 | | | | | 0.03 | | | | | 1.10 | | | | | 1.13 | | | | | (0.02 | ) | | | | (2.01 | ) | | | | (2.03 | ) | | | | 15.02 | | | |
20062 | | | 13.88 | | | | | (0.04 | ) | | | | 2.51 | | | | | 2.47 | | | | | (0.01 | ) | | | | (0.42 | ) | | | | (0.43 | ) | | | | 15.92 | | | |
20053 | | | 14.34 | | | | | (0.01 | ) | | | | (0.45 | ) | | | | (0.46 | ) | | | | — | | | | | — | | | | | — | | | | | 13.88 | | | |
20054 | | | 13.26 | | | | | (0.03 | ) | | | | 2.10 | | | | | 2.07 | | | | | — | | | | | (0.99 | ) | | | | (0.99 | ) | | | | 14.34 | | | |
| Class R | | | | | | | | | | | | | | | | | | | | | | | | | | | | | | | | | | | | | | | | | |
20092 | | $ | 8.76 | | | | $ | 0.04 | | | | $ | 0.26 | | | | $ | 0.30 | | | | $ | (0.06 | ) | | | $ | (1.27 | ) | | | $ | (1.33 | ) | | | $ | 7.73 | | | |
20082 | | | 15.16 | | | | | 0.10 | | | | | (4.81 | ) | | | | (4.71 | ) | | | | (0.08 | ) | | | | (1.61 | ) | | | | (1.69 | ) | | | | 8.76 | | | |
20072 | | | 16.04 | | | | | 0.11 | | | | | 1.11 | | | | | 1.22 | | | | | (0.09 | ) | | | | (2.01 | ) | | | | (2.10 | ) | | | | 15.16 | | | |
20062 | | | 13.97 | | | | | 0.03 | | | | | 2.53 | | | | | 2.56 | | | | | (0.07 | ) | | | | (0.42 | ) | | | | (0.49 | ) | | | | 16.04 | | | |
20053 | | | 14.43 | | | | | — | | | | | (0.46 | ) | | | | (0.46 | ) | | | | — | | | | | — | | | | | — | | | | | 13.97 | | | |
20054 | | | 13.31 | | | | | 0.04 | | | | | 2.11 | | | | | 2.15 | | | | | (0.04 | ) | | | | (0.99 | ) | | | | (1.03 | ) | | | | 14.43 | | | |
| Class Y | | | | | | | | | | | | | | | | | | | | | | | | | | | | | | | | | | | | | | | | | |
20092 | | $ | 8.92 | | | | $ | 0.09 | | | | $ | 0.25 | | | | $ | 0.34 | | | | $ | (0.08 | ) | | | $ | (1.27 | ) | | | $ | (1.35 | ) | | | $ | 7.91 | | | |
20082 | | | 15.37 | | | | | 0.16 | | | | | (4.88 | ) | | | | (4.72 | ) | | | | (0.12 | ) | | | | (1.61 | ) | | | | (1.73 | ) | | | | 8.92 | | | |
20072 | | | 16.23 | | | | | 0.18 | | | | | 1.13 | | | | | 1.31 | | | | | (0.16 | ) | | | | (2.01 | ) | | | | (2.17 | ) | | | | 15.37 | | | |
20062 | | | 14.12 | | | | | 0.11 | | | | | 2.55 | | | | | 2.66 | | | | | (0.13 | ) | | | | (0.42 | ) | | | | (0.55 | ) | | | | 16.23 | | | |
20053 | | | 14.57 | | | | | 0.01 | | | | | (0.46 | ) | | | | (0.45 | ) | | | | — | | | | | — | | | | | — | | | | | 14.12 | | | |
20054 | | | 13.43 | | | | | 0.11 | | | | | 2.12 | | | | | 2.23 | | | | | (0.10 | ) | | | | (0.99 | ) | | | | (1.09 | ) | | | | 14.57 | | | |
| |
| |
| | |
| | 1 | Per share data calculated using average shares outstanding method. |
| |
| | 2 | For the period November 1 to October 31 in the fiscal year indicated. |
| |
| | 3 | For the period October 1, 2005 to October 31, 2005. Effective in 2005, the fund’s fiscal year-end was changed from September 30 to October 31. All ratios for the period have been annualized, except total return and portfolio turnover. |
| |
| | 4 | For the period October 1 to September 30 in the year indicated. |
| |
| | 5 | Total return does not reflect sales charges. Total return would have been lower had certain expenses not been waived. |
The accompanying notes are an integral part of the financial statements.
50 First American Funds 2009 Annual Report
| | | | | | | | | | | | | | | | | | | | | | | | | | | | | | | | | | | | | |
| | | | | | | | | | | | | | | | | | | | | | | |
| | | | | | | | | | | | | | | Ratio of
| | | Ratio of Net
| | | | | |
| | | | | | | | | | | | Ratio of Net
| | | Expenses
| | | Investment
| | | | | |
| | | | | | | | | Ratio of
| | | Investment
| | | to Average
| | | Income (Loss)
| | | | | |
| | | | | | Net Assets
| | | Expenses
| | | Income (Loss)
| | | Net Assets
| | | to Average
| | | Portfolio
| | |
| | | Total
| | | End of
| | | to Average
| | | to Average
| | | (Excluding
| | | Net Assets
| | | Turnover
| | |
| | | Return5 | | | Period (000) | | | Net Assets | | | Net Assets | | | Waivers) | | | (Excluding Waivers) | | | Rate | | |
| |
| | | | | | | | | | | | | | | | | | | | | | | | | | | | | | | | | | | | | |
| | | | | | | | | | | | | | | | | | | | | | | | | | | | | | | | | | | | | |
| | | | 6.34 | % | | | $ | 8,591 | | | | | 0.82 | % | | | | 0.87 | % | | | | 1.66 | % | | | | 0.03 | % | | | | 22 | % | | |
| | | | (34.15 | ) | | | | 6,043 | | | | | 0.82 | | | | | 1.09 | | | | | 1.31 | | | | | 0.60 | | | | | 19 | | | |
| | | | 8.56 | | | | | 9,109 | | | | | 0.83 | | | | | 0.92 | | | | | 1.12 | | | | | 0.63 | | | | | 12 | | | |
| | | | 19.02 | | | | | 10,639 | | | | | 0.83 | | | | | 0.47 | | | | | 1.08 | | | | | 0.22 | | | | | 17 | | | |
| | | | (3.09 | ) | | | | 10,067 | | | | | 0.83 | | | | | 0.27 | | | | | 1.01 | | | | | 0.09 | | | | | — | | | |
| | | | 17.08 | | | | | 10,323 | | | | | 0.90 | | | | | 0.53 | | | | | 1.03 | | | | | 0.40 | | | | | 23 | | | |
| | | | | | | | | | | | | | | | | | | | | | | | | | | | | | | | | | | | | |
| | | | 5.60 | % | | | $ | 1,380 | | | | | 1.57 | % | | | | 0.17 | % | | | | 2.41 | % | | | | (0.67 | )% | | | | 22 | % | | |
| | | | (34.67 | ) | | | | 1,531 | | | | | 1.57 | | | | | 0.34 | | | | | 2.06 | | | | | (0.15 | ) | | | | 19 | | | |
| | | | 7.78 | | | | | 2,916 | | | | | 1.58 | | | | | 0.17 | | | | | 1.87 | | | | | (0.12 | ) | | | | 12 | | | |
| | | | 18.15 | | | | | 2,662 | | | | | 1.58 | | | | | (0.28 | ) | | | | 1.83 | | | | | (0.53 | ) | | | | 17 | | | |
| | | | (3.21 | ) | | | | 2,068 | | | | | 1.58 | | | | | (0.48 | ) | | | | 1.76 | | | | | (0.66 | ) | | | | — | | | |
| | | | 15.84 | | | | | 2,256 | | | | | 1.65 | | | | | (0.23 | ) | | | | 1.78 | | | | | (0.36 | ) | | | | 23 | | | |
| | | | | | | | | | | | | | | | | | | | | | | | | | | | | | | | | | | | | |
| | | | 6.08 | % | | | $ | 2,512 | | | | | 1.07 | % | | | | 0.55 | % | | | | 1.91 | % | | | | (0.29 | )% | | | | 22 | % | | |
| | | | (34.33 | ) | | | | 1,121 | | | | | 1.08 | | | | | 0.87 | | | | | 1.57 | | | | | 0.38 | | | | | 19 | | | |
| | | | 8.34 | | | | | 703 | | | | | 1.08 | | | | | 0.71 | | | | | 1.37 | | | | | 0.43 | | | | | 12 | | | |
| | | | 18.75 | | | | | 280 | | | | | 1.08 | | | | | 0.23 | | | | | 1.47 | | | | | (0.16 | ) | | | | 17 | | | |
| | | | (3.19 | ) | | | | 23 | | | | | 1.08 | | | | | 0.02 | | | | | 1.41 | | | | | (0.31 | ) | | | | — | | | |
| | | | 16.45 | | | | | 11 | | | | | 1.15 | | | | | 0.30 | | | | | 1.43 | | | | | 0.02 | | | | | 23 | | | |
| | | | | | | | | | | | | | | | | | | | | | | | | | | | | | | | | | | | | |
| | | | 6.50 | % | | | $ | 43,179 | | | | | 0.57 | % | | | | 1.19 | % | | | | 1.41 | % | | | | 0.35 | % | | | | 22 | % | | |
| | | | (33.95 | ) | | | | 54,932 | | | | | 0.57 | | | | | 1.33 | | | | | 1.06 | | | | | 0.84 | | | | | 19 | | | |
| | | | 8.84 | | | | | 114,343 | | | | | 0.58 | | | | | 1.16 | | | | | 0.87 | | | | | 0.87 | | | | | 12 | | | |
| | | | 19.32 | | | | | 135,802 | | | | | 0.58 | | | | | 0.72 | | | | | 0.83 | | | | | 0.47 | | | | | 17 | | | |
| | | | (3.09 | ) | | | | 153,572 | | | | | 0.58 | | | | | 0.52 | | | | | 0.76 | | | | | 0.34 | | | | | — | | | |
| | | | 16.93 | | | | | 164,156 | | | | | 0.65 | | | | | 0.78 | | | | | 0.78 | | | | | 0.65 | | | | | 23 | | | |
| |
| |
First American Funds 2009 Annual Report 51
| |
| Notes to Financial Statements | October 31, 2009, all dollars and shares are rounded to thousands (000) |
Equity Index Fund, Mid Cap Index Fund, and Small Cap Index Fund (each a “fund” and collectively, the “funds”) are mutual funds offered by First American Investment Funds, Inc. (“FAIF”), which is a member of the First American Family of Funds. As of October 31, 2009, FAIF offered 40 funds, including the funds listed above. FAIF is registered under the Investment Company Act of 1940, as amended, as an open-end management investment company. FAIF’s articles of incorporation permit the funds’ board of directors to create additional funds in the future. Equity Index Fund, Mid Cap Index Fund, and Small Cap Index Fund are each diversified open-end management investment companies.
FAIF offers Class A, Class C, Class R, and Class Y shares. Class A shares are sold with a front-end sales charge. Class C shares may be subject to a contingent deferred sales charge for 12 months. Class R shares have no sales charge and are offered only through certain tax-deferred retirement plans. Class Y shares have no sales charge and are offered only to qualifying institutional investors and certain other qualifying accounts. Prior to the close of business on June 30, 2008, each fund offered Class B shares. Subsequent to that date, no new or additional investments are allowed in Class B shares, except for permitted exchanges and any reinvested dividends. Class B shares are subject to a contingent deferred sales charge for six years and automatically convert to Class A shares after eight years.
The funds’ prospectus provides descriptions of each fund’s investment objective, principal investment strategies, and principal risks. All classes of shares in a fund have identical voting, dividend, liquidation, and other rights, and the same terms and conditions, except that certain fees and expenses, including distribution and shareholder servicing fees, may differ among classes. Each class has exclusive voting rights on any matters relating to that class’s servicing or distribution arrangements.
| |
| 2 > | Summary of Significant Accounting Policies |
The significant accounting policies followed by the funds are as follows:
SECURITY VALUATIONS – Security valuations for the funds’ investments are furnished by an independent pricing service that has been approved by the funds’ board of directors. Investments in equity securities that are traded on a national securities exchange (or reported on the Nasdaq national market system) are stated at the last quoted sales price if readily available for such securities on each business day. For securities traded on the Nasdaq national market system, the funds utilize the Nasdaq Official Closing Price which compares the last trade to the bid/ask range of a security. If the last trade falls within the bid/ask range, then that price will be the closing price. If the last trade is outside the bid/ask range, and falls above the ask, then the ask will be the closing price. If the last trade is below the bid, then the bid will be the closing price. Other equity securities traded in the over-the-counter market and listed equity securities for which no sale was reported on that date are stated at the last quoted bid price. Investments in open-end funds are valued at their respective net asset values on the valuation date.
Debt obligations exceeding 60 days to maturity are valued by an independent pricing service. The pricing service may employ methodologies that utilize actual market transactions, broker-dealer supplied valuations, or other formula-driven valuation techniques. These techniques generally consider such factors as yields or prices of bonds of comparable quality, type of issue, coupon, maturity, ratings, and general market conditions. Securities for which prices are not available from an independent pricing service, but where an active market exists, are valued using market quotations obtained from one or more dealers that make markets in the securities or from a widely used quotation system. Debt obligations with 60 days or less remaining until maturity may be valued at their amortized cost, which approximates fair value.
The following investment vehicles, when held by a fund, are priced as follows: Exchange listed futures and options on futures are priced at their last sale price on the exchange on which they are principally traded, as determined by FAF Advisors, Inc. (“FAF Advisors”), on the day the valuation is made. If there were no sales on that day, futures and options on futures will be valued at the last reported bid price. Options on securities, indices, and currencies traded on Nasdaq or listed on a stock exchange, whether domestic or foreign, are valued at the last sale price on Nasdaq or on any exchange on the day the valuation is made. If there were no sales on that day, the options will be valued at the last sale price on the previous valuation date. Last sale prices are obtained from an independent pricing service. Forward contracts and over-the-counter options on securities, indices, and currencies are valued at the quotations received from an independent pricing service, if available.
When market quotations are not readily available, securities are internally valued at fair value as determined in good faith by procedures established and approved by the funds’ board of directors. Some of the factors which may be considered in determining fair value are fundamental analytical data relating to the investment; the nature and duration of any restrictions on disposition; trading in similar securities of the same issuer or comparable companies; information from broker-dealers; and an evaluation of the forces that influence the market in which the securities are purchased and sold. If events occur that materially affect the value of securities (including non-U.S. securities) between the close of trading in those securities and the close of regular trading on the New York Stock Exchange, the securities will be valued at fair value. As of October 31, 2009, Small Cap Index Fund held internally fair valued securities with a total fair value of $0 or 0.0% of the fund’s total net assets.
52 First American Funds 2009 Annual Report
Generally accepted accounting principles (GAAP) require disclosures regarding the inputs and valuation techniques used to measure fair value and any changes in valuation inputs or technique. These principles establish a three-tier fair value hierarchy for inputs used in measuring fair value. Fair value inputs are summarized in the 3 broad levels listed below:
Level 1 – Quoted prices in active markets for identical securities.
Level 2 – Other significant observable inputs (including quoted prices for similar securities, with similar interest rates, prepayment speeds, credit risk, etc.).
Level 3 – Significant unobservable inputs (including a fund’s own assumptions in determining the fair value of investments). Generally, the types of securities included in Level 3 of a fund are securities for which there is limited or no observable fair value inputs available, and as such the fair value is determined through independent broker quotations or management’s fair value procedures established by the funds’ board of directors.
The valuation levels are not necessarily an indication of the risk associated with investing in these investments.
As of October 31, 2009, each fund’s investments were classified as follows:
| | | | | | | | | | | | | | | | | |
| | | | | | | | | | | | Total
| |
| Equity Index Fund | | Level 1 | | | Level 2 | | | Level 3 | | | Fair Value | |
| | |
| Common Stocks | | $ | 960,545 | | | $ | — | | | $ | — | | | $ | 960,545 | |
| Short-Term Investments | | | 174,829 | | | | 6,400 | | | | — | | | | 181,229 | |
| |
| |
| Total Investments in Securities | | $ | 1,135,374 | | | $ | 6,400 | | | $ | — | | | $ | 1,141,774 | |
| |
| |
| | | | | | | | | | | | | | | | | |
| | | | | | | | | | | | Total
| |
| Mid Cap Index Fund | | Level 1 | | | Level 2 | | | Level 3 | | | Fair Value | |
| | |
| Common Stocks | | $ | 183,939 | | | $ | — | | | $ | — | | | $ | 183,939 | |
| Warrants | | | — | | | | — | | | | — | | | | — | |
| Short-Term Investments | | | 54,745 | | | | 2,320 | | | | — | | | | 57,065 | |
| |
| |
| Total Investments in Securities | | $ | 238,684 | | | $ | 2,320 | | | $ | — | | | $ | 241,004 | |
| |
| |
| | | | | | | | | | | | | | | | | |
| | | | | | | | | | | | Total
| |
| Small Cap Index Fund | | Level 1 | | | Level 2 | | | Level 3 | | | Fair Value | |
| | |
| Common Stocks | | $ | 50,467 | | | $ | — | | | $ | — | | | $ | 50,467 | |
| Warrants | | | — | | | | — | | | | — | | | | — | |
| Rights | | | — | | | | — | | | | — | | | | — | |
| Closed-End Fund | | | 7 | | | | — | | | | — | | | | 7 | |
| Short-Term Investments | | | 15,894 | | | | 920 | | | | — | | | | 16,814 | |
| |
| |
| Total Investments in Securities | | $ | 66,368 | | | $ | 920 | | | $ | — | | | $ | 67,288 | |
| |
| |
See each fund’s Schedule of Investments for further industry breakout.
As of October 31, 2009, each fund’s investments in other financial instruments* were classified as follows:
| | | | | | | | | | | | | | | | | |
| | | | | | | | | | | | Total
| |
| Fund | | Level 1 | | | Level 2 | | | Level 3 | | | Fair Value | |
| | |
| Equity Index Fund | | $ | (366 | ) | | $ | — | | | $ | — | | | $ | (366 | ) |
| Mid Cap Index Fund | | | (497 | ) | | | — | | | | — | | | | (497 | ) |
| Small Cap Index Fund | | | (322 | ) | | | — | | | | — | | | | (322 | ) |
| |
| |
| | |
| | * | Other financial instruments include futures, which are valued at the unrealized appreciation (depreciation) on the instrument. |
The following is a reconciliation of Level 3 investments for which significant unobservable inputs were used to determine fair value:
| | | | | | | | | | | | | |
| | | Equity
| | | Mid Cap
| | | Small Cap
| |
| | | Index
| | | Index
| | | Index
| |
| | | Fund | | | Fund | | | Fund | |
| | |
| Balance as of October 31, 2008 | | $ | — | | | $ | — | | | $ | 0 | |
| Realized gain (loss) | | | — | | | | — | | | | 0 | |
| Net change in unrealized appreciation or depreciation | | | — | | | | — | | | | 0 | |
| Net purchases (sales) | | | — | | | | — | | | | 0 | |
Transfers in and/or out of Level 3 | | | — | | | | — | | | | 0 | |
Balance as of October 31, 2009 | | $ | — | | | $ | — | | | $ | 0 | |
| |
| |
| Net change in unrealized appreciation or depreciation of Level 3 securities as of October 31, 2009 | | | — | | | | — | | | | 0 | |
| |
| |
First American Funds 2009 Annual Report 53
| |
| Notes to Financial Statements | October 31, 2009, all dollars and shares are rounded to thousands (000) |
SECURITY TRANSACTIONS AND INVESTMENT INCOME – For financial statement purposes, the funds record security transactions on the trade date of the security purchase or sale. Dividend income is recorded on the ex-dividend date. Interest income, including amortization of bond premium and discount, is recorded on an accrual basis. Security gains and losses are determined on the basis of identified cost, which is the same basis used for federal income tax purposes. The resulting gain/loss is calculated as the difference between the sales price and the underlying cost of the security on the transaction date.
DISTRIBUTIONS TO SHAREHOLDERS – Distributions from net investment income are declared and paid annually for Mid Cap Index Fund and Small Cap Index Fund and quarterly for Equity Index Fund. Distributions are payable in cash or reinvested in additional shares of the fund. Any net realized capital gains on sales of a fund’s securities are distributed to shareholders at least annually.
FEDERAL TAXES – Each fund is treated as a separate taxable entity. Each fund intends to continue to qualify as a regulated investment company as provided in Subchapter M of the Internal Revenue Code, as amended, and to distribute all taxable income, if any, to its shareholders. Accordingly, no provision for federal income taxes is required.
As of October 31, 2009, the funds did not have any tax positions that did not meet the “more-likely-than-not” threshold of being sustained by the applicable tax authority. Generally, tax authorities can examine all tax returns filed for the last three years.
Net investment income and net realized gains (losses) may differ for financial statement and tax purposes because of temporary or permanent book-to-tax differences. These differences are primarily due to losses deferred from wash sales, the tax recognition of mark to market gains (losses) on open futures contracts, proceeds from securities litigation, and the sale of real estate investment trust securities (“REITs”). To the extent these differences are permanent, reclassifications are made to the appropriate equity accounts in the period in which the differences arise.
On the Statements of Assets and Liabilities the following reclassifications were made:
| | | | | | | | | | | | | |
| | | Accumulated
| | | Undistributed
| | | | |
| | | Net Realized
| | | Net Investment
| | | Portfolio
| |
| Fund | | Gain (Loss) | | | Income | | | Capital | |
| | |
| Equity Index Fund | | $ | 18 | | | $ | (145 | ) | | $ | 127 | |
| Mid Cap Index Fund | | | 247 | | | | (247 | ) | | | — | |
| Small Cap Index Fund | | | 21 | | | | (21 | ) | | | — | |
| |
| |
The character of distributions paid during the year from net investment income or net realized gains may differ from their ultimate characterization for federal income tax purposes. In addition, due to the timing of dividend distributions, the fiscal period or year in which the amounts are distributed may differ from the period or year that the income or realized gains (losses) are recorded by the funds. The tax character of distributions paid during the fiscal years ended October 31, 2009 and October 31, 2008, were as follows:
| | | | | | | | | | | | | |
| | | October 31, 2009 | |
| | |
| | | Ordinary
| | | Long Term
| | | | |
| Fund | | Income | | | Gain | | | Total | |
| | |
| Equity Index Fund | | $ | 22,266 | | | $ | — | | | $ | 22,266 | |
| Mid Cap Index Fund | | | 1,563 | | | | 11,208 | | | | 12,771 | |
| Small Cap Index Fund | | | 506 | | | | 7,475 | | | | 7,981 | |
| |
| |
| | | | | | | | | | | | | |
| | | October 31, 2008 | |
| | |
| | | Ordinary
| | | Long Term
| | | | |
| Fund | | Income | | | Gain | | | Total | |
| | |
| Equity Index Fund | | $ | 29,606 | | | $ | 35,841 | | | $ | 65,447 | |
| Mid Cap Index Fund | | | 3,585 | | | | 34,722 | | | | 38,307 | |
| Small Cap Index Fund | | | 1,739 | | | | 10,901 | | | | 12,640 | |
| |
| |
As of October 31, 2009, the components of accumulated earnings (deficit) on a tax basis were as follows:
| | | | | | | | | | | | | | | | | | | | | |
| | | | | | | | | Accumulated
| | | | | | | |
| | | Undistributed
| | | Undistributed
| | | Capital and
| | | Unrealized
| | | Total
| |
| | | Ordinary
| | | Long Term
| | | Post October
| | | Appreciation
| | | Accumulated
| |
| Fund | | Income | | | Capital Gains | | | Losses | | | (Depreciation) | | | Earnings (Deficit) | |
| | |
| Equity Index Fund | | $ | 966 | | | $ | 2,047 | | | $ | — | | | $ | 206,673 | | | $ | 209,686 | |
| Mid Cap Index Fund | | | 1,323 | | | | — | | | | (11,978 | ) | | | (3,629 | ) | | | (14,284 | ) |
| Small Cap Index Fund | | | 291 | | | | — | | | | (8,379 | ) | | | (850 | ) | | | (8,938 | ) |
| |
| |
54 First American Funds 2009 Annual Report
The differences between book and tax basis unrealized appreciation (depreciation) are primarily due to the tax deferral of losses on wash sales and the amount of gain (loss) recognized for tax purposes due to mark-to-market adjustments on open futures contracts.
As of October 31, 2009, Mid Cap Index Fund and Small Cap Index Fund had capital loss carryforwards of $11,978 and $8,379 respectively, which if not offset by subsequent capital gains, will expire in 2017.
DERIVATIVES – The funds may invest in derivative financial instruments in order to manage risk or gain exposure to various other investments or markets. The funds’ investment objectives allow the funds to enter into various types of derivatives contracts. Derivatives may contain various risks including the potential inability of the counterparty to fulfill their obligations under the terms of the contract, the potential for an illiquid secondary market, and the potential for market movements which may expose the funds to gains or losses in excess of the amounts shown on the Statement of Assets and Liabilities.
FUTURES TRANSACTIONS – The funds are subject to equity price risk, interest rate risk, and foreign currency exchange rate risk in the normal course of pursuing its investment objectives. In order to gain exposure or protect against changes in the market and to maintain sufficient liquidity to meet redemption requests, each fund may enter into futures contracts. Upon entering into a futures contract, the fund is required to deposit cash or pledge U.S. Government securities. The margin required for a futures contract is set by the exchange on which the contract is traded. Subsequent payments, which are dependent on the daily fluctuations in the value of the underlying security or securities, are made or received by the fund each day (daily variation margin) and are recorded as unrealized gains (losses) until the contract is closed. When the contract is closed, the fund records a realized gain (loss) equal to the difference between the proceeds from (or cost of) the closing transaction and the fund’s basis in the contract.
Risks of entering into futures contracts, in general, include the possibility that there will not be a perfect price correlation between the futures contracts and the underlying securities. Second, it is possible that a lack of liquidity for futures contracts could exist in the secondary market, resulting in an inability to close a futures position prior to its maturity date. Third, the purchase of a futures contract involves the risk that a fund could lose more than the original margin deposit required to initiate a futures transaction. These contracts involve market risk in excess of the amount reflected in the fund’s Statement of Assets and Liabilities. Unrealized gains (losses) on outstanding positions in futures contracts held at the close of the year will be recognized as capital gains (losses) for federal income tax purposes.
The funds’ outstanding futures contracts as of October 31, 2009, are disclosed in the Schedule of Investments.
For the fiscal year ended October 31, 2009, the quarterly average gross notional amounts of the derivatives held by the funds were:
| | | | | |
| | | Futures/
| |
| Fund | | Long | |
| | |
| Equity Index Fund | | $ | 24,983 | |
| Mid Cap Index Fund | | | 11,473 | |
| Small Cap Index Fund | | | 4,298 | |
| |
| |
As of October 31, 2009, the funds’ fair values of derivative instruments categorized by risk exposure were classified as follows:
| | | | | | | | | | | | | | | |
| | | Statement of
| | | | | | | | | |
| | | Assets and Liabilities
| | Equity
| | | Mid Cap
| | | Small Cap
| |
| | | Location | | Index Fund | | | Index Fund | | | Index Fund | |
| | |
Liability Derivatives | | | | | | | | | | | | | | |
| Equity Contracts | | Payables, Net Assets--Unrealized Depreciation* | | $ | 366 | | | $ | 497 | | | $ | 322 | |
| |
| |
| Balance as of October 31, 2009 | | | | $ | 366 | | | $ | 497 | | | $ | 322 | |
| |
| |
| | |
| | * | Includes cumulative appreciation/depreciation of futures contracts as reported in the footnotes to the funds’ Schedule of Investments. Only the current day’s variation margin is reported within the Statements of Assets and Liabilities. |
The effect of derivative instruments on the Statements of Operations for the fiscal year ended October 31, 2009:
Amount of realized gain (loss) on derivatives recognized in income:
| | | | | |
| Equity Index Fund | | Futures | |
| | |
| Equity Contracts | | $ | 2,686 | |
| |
| |
| | | | | |
| Mid Cap Index Fund | | Futures | |
| | |
| Equity Contracts | | $ | (2,979 | ) |
| |
| |
| | | | | |
| Small Cap Index Fund | | Futures | |
| | |
| Equity Contracts | | $ | (288 | ) |
| |
| |
Change in unrealized appreciation on derivatives recognized in income:
| | | | | |
| Equity Index Fund | | Futures | |
| | |
| Equity Contracts | | $ | 2,540 | |
| |
| |
| | | | | |
| Mid Cap Index Fund | | Futures | |
| | |
| Equity Contracts | | $ | 2,869 | |
| |
| |
First American Funds 2009 Annual Report 55
| |
| Notes to Financial Statements | October 31, 2009, all dollars and shares are rounded to thousands (000) |
| | | | | |
| Small Cap Index Fund | | Futures | |
| | |
| Equity Contracts | | $ | 246 | |
| |
| |
ILLIQUID OR RESTRICTED SECURITIES – A security may be considered illiquid if it lacks a readily available market. Securities are generally considered liquid if they can be sold or disposed of in the ordinary course of business within seven days at approximately the price at which the security is valued by the fund. Illiquid securities may be valued under methods approved by the funds’ board of directors as reflecting fair value. Each fund intends to invest no more than 15% of its total net assets (determined at the time of purchase and reviewed periodically) in illiquid securities. Certain restricted securities may be considered illiquid. Restricted securities are often purchased in private placement transactions, are not registered under the Securities Act of 1933, may have contractual restrictions on resale, and may be valued under methods approved by the funds’ board of directors as reflecting fair value. Certain restricted securities eligible for resale to qualified institutional investors, including Rule 144A securities, are not subject to the limitation on a fund’s investment in illiquid securities if they are determined to be liquid in accordance with procedures adopted by the funds’ board of directors. At October 31, 2009, Small Cap Index Fund had investments in illiquid securities with a total value of $0 or 0.0% of total net assets.
Information concerning illiquid securities, including restricted securities considered to be illiquid, is as follows:
| | | | | | | | | | | | | |
| | | | | | Dates
| | | Cost
| |
| Small Cap Index Fund | | Shares | | | Acquired | | | Basis | |
| | |
| Greenhunter Energy, Warrants | | | —* | | | | 6/08 | | | | — | |
| Indevus Pharmaceuticals, Escrow Shares | | | 4 | | | | 3/09 | | | | — | |
| Lantronix, Warrants | | | —* | | | | 5/08 | | | | — | |
| Winthrop Realty Trust, Rights | | | —* | | | | 6/06-12/08 | | | | — | |
| |
| |
| | |
| | * | Due to the presentation of the financial statements in thousands, this number rounds to zero. |
SECURITIES LENDING – In order to generate additional income, each fund may lend securities representing up to one-third of the value of its total assets (which includes collateral for securities on loan) to broker-dealers, banks, or other institutional borrowers of securities. Each fund’s policy is to receive collateral from the borrower in the form of cash, U.S. Government securities, or other high-grade debt obligations equal to at least 100% of the value of securities loaned. If the value of the securities on loan increases, additional collateral is received from the borrower. As with other extensions of credit, there may be risks of delay in recovery of the securities or even loss of rights in the collateral should the borrower of the security fail financially.
U.S. Bank National Association (“U.S. Bank”), the parent company of the funds’ advisor, serves as the securities lending agent for the funds in transactions involving the lending of portfolio securities on behalf of the funds. U.S. Bank acts as the securities lending agent pursuant to, and subject to compliance with conditions contained in, an exemptive order issued by the Securities and Exchange Commission (“SEC”). U.S. Bank receives fees as a percentage of each fund’s net income from securities lending transactions. Collateral for securities on loan is invested in a money market fund administered by FAF Advisors and FAF Advisors receives an administration fee equal to 0.02% of such money market fund’s average daily net assets. Securities lending fees paid to U.S. Bank by the funds during the fiscal year ended October 31, 2009, were as follows:
| | | | | |
| Fund | | Amount | |
| | |
| Equity Index Fund | | $ | 400 | |
| Mid Cap Index Fund | | | 89 | |
| Small Cap Index Fund | | | 46 | |
| |
| |
Income from securities lending is recorded on the Statements of Operations as securities lending income net of fees paid to U.S. Bank.
SECURITY LITIGATION SETTLEMENTS – Income from settlement proceeds related to portfolio securities no longer included in the portfolio is recorded as an adjustment to realized gains or losses when cash is received. Adjustments made during the fiscal year ended October 31, 2009, were as follows:
| | | | | |
| Fund | | Amount | |
| | |
| Equity Index Fund | | $ | 583 | |
| Mid Cap Index Fund | | | 34 | |
| Small Cap Index Fund | | | 108 | |
| |
| |
EXPENSES – Expenses that are directly related to one of the funds are charged directly to that fund. Other operating expenses are allocated to the funds on several bases, including evenly across all funds, allocated based on relative net assets of all funds within the First American Family of Funds, or a combination of both methods. Class specific expenses, such as distribution fees and shareholder servicing fees, are borne by that class. Income, other expenses, and realized and unrealized gains and losses of a fund are allocated to each respective class in proportion to the relative net assets of each class.
INTERFUND LENDING PROGRAM – Pursuant to an exemptive order issued by the SEC, the funds, along with other registered investment companies in the First American Family of Funds, may participate in an interfund lending program. This program provides an alternative credit facility allowing the funds to borrow from, or lend money to, other participating funds. The funds did not have any interfund lending transactions during the fiscal year ended October 31, 2009.
DEFERRED COMPENSATION PLAN – Under a Deferred Compensation Plan (the “Plan”), non-interested directors of the First American Family of Funds may participate and elect to defer receipt of part or all of their annual compensation. Deferred amounts are treated as though equivalent dollar amounts had been invested in shares of
56 First American Funds 2009 Annual Report
open-end First American Funds, as designated by each director. All amounts in the Plan are 100% vested and accounts under the Plan are obligations of the funds. Deferred amounts remain in the funds until distributed in accordance with the Plan.
USE OF ESTIMATES IN PREPARATION OF FINANCIAL STATEMENTS – The preparation of financial statements, in conformity with U.S. generally accepted accounting principles, requires management to make estimates and assumptions that affect the reported amounts of assets and liabilities and disclosure of contingent assets and liabilities at the date of the financial statements and the reported results of operations during the reporting period. Actual results could differ from those estimates.
EVENTS SUBSEQUENT TO FISCAL YEAR END – Management has evaluated fund related events and transactions that occurred subsequent to October 31, 2009, through December 22, 2009, the date of issuance of the funds’ financial statements. There were no events or transactions that occurred during this period that materially impacted the amounts or disclosures in the funds’ financial statements.
INVESTMENT ADVISORY FEES – Pursuant to an investment advisory agreement (the “Agreement”), FAF Advisors manages each fund’s assets and furnishes related office facilities, equipment, research, and personnel. The Agreement requires each fund to pay FAF Advisors a monthly fee based upon average daily net assets. The annual fee for Equity Index Fund, Mid Cap Index Fund, and Small Cap Index Fund is 0.25%, 0.25%, and 0.40%, respectively. FAF Advisors has agreed to contractually waive fees and reimburse other fund expenses through February 28, 2010, so that total annual fund operating expenses, excluding indirect fees and expenses incurred through investment in exchange traded funds and other investment companies, as a percentage of average daily net assets, do not exceed the following amounts:
| | | | | | | | | | | | | | | | | | | | | | | |
| | | Share Class | | | |
| |
| Fund | | A | | | B | | | C | | | R | | | Y | | | |
| |
| Equity Index Fund | | | 0.62 | % | | | 1.37 | % | | | 1.37 | % | | | 0.87 | % | | | 0.37 | % | | |
| Mid Cap Index Fund | | | 0.75 | | | | N/A | | | | 1.50 | | | | 1.00 | | | | 0.50 | | | |
| Small Cap Index Fund | | | 0.83 | | | | N/A | | | | 1.58 | | | | 1.08 | | | | 0.58 | | | |
| |
| |
N/A = Not Applicable
The funds may invest in related money market funds that are series of First American Funds, Inc., subject to certain limitations. In order to avoid the payment of duplicative investment advisory fees to FAF Advisors, which acts as the investment advisor to both the investing funds and the related money market funds, FAF Advisors will reimburse each investing fund an amount equal to that portion of FAF Advisors’ investment advisory fee received from the related money market funds that is attributable to the assets of the investing fund. This reimbursement, if any, is included in “Fee waivers” in the Statement of Operations.
ADMINISTRATION FEES – FAF Advisors serves as the funds’ administrator pursuant to an administration agreement between FAF Advisors and the funds. U.S. Bancorp Fund Services, LLC (“USBFS”) serves as sub-administrator pursuant to a sub-administration agreement between USBFS and FAF Advisors. FAF Advisors is a subsidiary of U.S. Bank. Both U.S. Bank and USBFS are direct subsidiaries of U.S. Bancorp. Under the administration agreement, FAF Advisors is compensated to provide, or compensates other entities to provide, services to the funds. These services include various legal, oversight, administrative, and accounting services. The funds pay FAF Advisors administration fees, which are calculated daily and paid monthly, equal to each fund’s pro rata share of an amount equal, on an annual basis, to 0.25% of the aggregate average daily net assets of all open-end funds in the First American Family of Funds up to $8 billion, 0.235% on the next $17 billion of the aggregate average daily net assets, 0.22% on the next $25 billion of the aggregate average daily net assets, and 0.20% of the aggregate average daily net assets in excess of $50 billion. All fees paid to the sub-administrator are paid from the administration fee. In addition to these fees, the funds may reimburse FAF Advisors and the sub-administrator for any out-of-pocket expenses incurred in providing administration services.
TRANSFER AGENT FEES – USBFS serves as the funds’ transfer agent pursuant to a transfer agent agreement with FAIF. The funds are charged transfer agent fees on a per shareholder account basis, subject to a minimum fee per share class. These fees are charged to each fund based upon the number of accounts within that fund. In addition to these fees, the funds may reimburse USBFS for out-of-pocket expenses incurred in providing transfer agent services.
CUSTODIAN FEES – U.S. Bank serves as the funds’ custodian pursuant to a custodian agreement with FAIF. The custodian fee charged for each fund is equal to an annual rate of 0.005% of average daily net assets. All fees are computed daily and paid monthly.
Under the custodian agreement, interest earned on uninvested cash balances is used to reduce a portion of each fund’s custodian expenses. These credits, if any, are disclosed as “Indirect payments from the custodian” in the Statement of Operations. Conversely, the custodian charges a fee for any cash overdrafts incurred, which will increase the fund’s custodian expenses. For the fiscal year ended October 31, 2009, custodian fees for Equity Index Fund, Mid Cap Index Fund, and Small Cap Index Fund were not increased as a result of overdrafts and were not decreased as a result of interest earned.
DISTRIBUTION AND SHAREHOLDER SERVICING (12B-1) FEES – Quasar Distributors, LLC (“Quasar”), a subsidiary of U.S. Bancorp, serves as distributor of the funds pursuant to a distribution agreement with FAIF. Under the distribution agreement, and pursuant to a plan adopted by each fund under rule 12b-1 of the Investment Company Act, each fund
First American Funds 2009 Annual Report 57
| |
| Notes to Financial Statements | October 31, 2009, all dollars and shares are rounded to thousands (000) |
pays Quasar a monthly distribution and/or shareholder servicing fee equal to an annual rate of 0.25%, 1.00%, 1.00% and 0.50% of each fund’s average daily net assets attributable to Class A, Class B, Class C, and Class R shares, respectively. Class Y shares pay no distribution or shareholder servicing fees. These fees may be used by Quasar to provide compensation for sales support, distribution activities, and/or shareholder servicing activities.
Under the distribution agreement, the following amounts were retained by affiliates of FAF Advisors for the fiscal year ended October 31, 2009:
| | | | | |
| Fund | | Amount | |
| | |
| Equity Index Fund | | $ | 167 | |
| Mid Cap Index Fund | | | 20 | |
| Small Cap Index Fund | | | 8 | |
| |
| |
OTHER FEES AND EXPENSES – In addition to investment advisory fees, administration fees, transfer agent fees, custodian fees, and distribution and shareholder servicing fees, each fund is responsible for paying other operating expenses including: legal, auditing, registration fees, postage and printing of shareholder reports, fees and expenses of independent directors, insurance, and other miscellaneous expenses. For the fiscal year ended October 31, 2009, legal fees and expenses of $15 were paid to a law firm of which an Assistant Secretary of the funds is a partner.
CONTINGENT DEFERRED SALES CHARGES – A contingent deferred sales charge (“CDSC”) is imposed on redemptions made in Class B shares. The CDSC varies depending on the number of years from time of payment for the purchase of Class B shares until the redemption of such shares. Class B shares automatically convert to Class A shares after eight years.
| | | | | | | |
| | | CDSC as a Percentage
| | | |
| | | of Dollar Amount
| | | |
| Year Since Purchase | | Subject to Charge | | | |
| |
| First | | | 5.00 | % | | |
| Second | | | 5.00 | | | |
| Third | | | 4.00 | | | |
| Fourth | | | 3.00 | | | |
| Fifth | | | 2.00 | | | |
| Sixth | | | 1.00 | | | |
| Seventh | | | — | | | |
| Eighth | | | — | | | |
| |
| |
A CDSC of 1.00% is imposed on redemptions made in Class C shares for the first twelve months.
The CDSC for Class B shares and Class C shares is imposed on the value of the purchased shares or the value at the time of redemption, whichever is less.
For the fiscal year ended October 31, 2009, total front-end sales charges and CDSCs retained by affiliates of FAF Advisors for distributing the funds’ shares were as follows:
| | | | | |
| Fund | | Amount | |
| | |
| Equity Index Fund | | $ | 54 | |
| Mid Cap Index Fund | | | 4 | |
| Small Cap Index Fund | | | 1 | |
| |
| |
58 First American Funds 2009 Annual Report
| |
| 4 > | Capital Share Transactions |
FAIF has 370 billion shares of $0.0001 par value capital stock authorized. Capital share transactions for the funds were as follows:
| | | | | | | | | | | | | | | | | | | | | | | | | | | | | |
| | | | | | | | | | | | | | | | | | | | | | | |
| | | Equity
| | | | Mid Cap
| | | | Small Cap
| | | |
| | | Index Fund | | | | Index Fund | | | | Index Fund | | | |
| |
| | | Year
| | | Year
| | | | Year
| | | Year
| | | | Year
| | | Year
| | | |
| | | Ended
| | | Ended
| | | | Ended
| | | Ended
| | | | Ended
| | | Ended
| | | |
| | | 10/31/09 | | | 10/31/08 | | | | 10/31/09 | | | 10/31/08 | | | | 10/31/09 | | | 10/31/08 | | | |
| |
| Class A: | | | | | | | | | | | | | | | | | | | | | | | | | | | | |
| Shares issued | | | 950 | | | | 868 | | | | | 1,515 | | | | 387 | | | | | 765 | | | | 168 | | | |
| Shares issued in lieu of cash distributions | | | 133 | | | | 244 | | | | | 123 | | | | 130 | | | | | 130 | | | | 77 | | | |
| Shares redeemed | | | (1,484 | ) | | | (2,065 | ) | | | | (535 | ) | | | (368 | ) | | | | (485 | ) | | | (160 | ) | | |
| |
| |
Total Class A transactions | | | (401 | ) | | | (953 | ) | | | | 1,103 | | | | 149 | | | | | 410 | | | | 85 | | | |
| |
| |
| Class B: | | | | | | | | | | | | | | | | | | | | | | | | | | | | |
| Shares issued | | | 2 | | | | 31 | | | | | 5 | | | | 9 | | | | | 1 | | | | 12 | | | |
| Shares issued in lieu of cash distributions | | | 9 | | | | 28 | | | | | 11 | | | | 17 | | | | | 15 | | | | 11 | | | |
| Shares redeemed | | | (223 | ) | | | (427 | ) | | | | (148 | ) | | | (40 | ) | | | | (96 | ) | | | (27 | ) | | |
| |
| |
Total Class B transactions | | | (212 | ) | | | (368 | ) | | | | (132 | ) | | | (14 | ) | | | | (80 | ) | | | (4 | ) | | |
| |
| |
| Class C: | | | | | | | | | | | | | | | | | | | | | | | | | | | | |
| Shares issued | | | 48 | | | | 47 | | | | | 32 | | | | 67 | | | | | 20 | | | | 11 | | | |
| Shares issued in lieu of cash distributions | | | 7 | | | | 18 | | | | | 24 | | | | 39 | | | | | 30 | | | | 23 | | | |
| Shares redeemed | | | (152 | ) | | | (193 | ) | | | | (117 | ) | | | (90 | ) | | | | (46 | ) | | | (51 | ) | | |
| |
| |
Total Class C transactions | | | (97 | ) | | | (128 | ) | | | | (61 | ) | | | 16 | | | | | 4 | | | | (17 | ) | | |
| |
| |
| Class R: | | | | | | | | | | | | | | | | | | | | | | | | | | | | |
| Shares issued | | | 338 | | | | 398 | | | | | 802 | | | | 685 | | | | | 274 | | | | 107 | | | |
| Shares issued in lieu of cash distributions | | | 12 | | | | 10 | | | | | 86 | | | | 49 | | | | | 30 | | | | 7 | | | |
| Shares redeemed | | | (308 | ) | | | (123 | ) | | | | (524 | ) | | | (182 | ) | | | | (107 | ) | | | (32 | ) | | |
| |
| |
Total Class R transactions | | | 42 | | | | 285 | | | | | 364 | | | | 552 | | | | | 197 | | | | 82 | | | |
| |
| |
| Class Y: | | | | | | | | | | | | | | | | | | | | | | | | | | | | |
| Shares issued | | | 10,499 | | | | 12,669 | | | | | 5,103 | | | | 2,915 | | | | | 1,908 | | | | 1,954 | | | |
| Shares issued in lieu of cash distributions | | | 593 | | | | 1,273 | | | | | 838 | | | | 1,357 | | | | | 483 | | | | 400 | | | |
| Shares redeemed | | | (21,437 | ) | | | (19,533 | ) | | | | (8,845 | ) | | | (5,510 | ) | | | | (3,096 | ) | | | (3,632 | ) | | |
| |
| |
Total Class Y transactions | | | (10,345 | ) | | | (5,591 | ) | | | | (2,904 | ) | | | (1,238 | ) | | | | (705 | ) | | | (1,278 | ) | | |
| |
| |
Net decrease in capital shares | | | (11,013 | ) | | | (6,755 | ) | | | | (1,630 | ) | | | (535 | ) | | | | (174 | ) | | | (1,132 | ) | | |
| |
| |
Class B shares converted to Class A shares (reflected as Class A shares issued and Class B shares redeemed) during the fiscal year ended October 31, 2009 and the fiscal year ended October 31, 2008, as follows:
| | | | | | | | | |
| | | Fiscal
| | | Fiscal
| |
| | | Year Ended
| | | Year Ended
| |
| Fund | | 10/31/09 | | | 10/31/08 | |
| | |
| Equity Index Fund | | | 131 | | | | 188 | |
| Mid Cap Index Fund | | | 129 | | | | 4 | |
| Small Cap Index Fund | | | 84 | | | | 4 | |
| |
| |
| |
| 5 > | Investment Security Transactions |
During the fiscal year ended October 31, 2009, purchases of securities and proceeds from sales of securities other than temporary investments in short-term securities, were as follows:
| | | | | | | | | |
| Fund | | Purchases | | | Sales | |
| | |
| Equity Index Fund | | $ | 90,186 | | | $ | 257,661 | |
| Mid Cap Index Fund | | | 29,357 | | | | 50,505 | |
| Small Cap Index Fund | | | 9,815 | | | | 18,519 | |
| |
| |
The funds enter into contracts that contain a variety of indemnifications. The funds’ maximum exposure under these arrangements is unknown. However, the funds have not had prior claims or losses pursuant to these contracts and expect the risk of loss to be remote.
| |
| 7 > | Redemption-in-Kind Transaction |
On August 1, 2008, $65,171 was redeemed from Equity Index Fund as a redemption-in-kind transaction. In this transaction, the fund distributed a proportionate amount of securities in the fund’s portfolio to the U.S. Bancorp Pension Plan. Remaining shareholders in the fund did not recognize any additional capital gains from the transactions.
First American Funds 2009 Annual Report 59
| |
| Notice to Shareholders | October 31, 2009 (unaudited) |
TAX INFORMATION
The information set forth below is for each fund’s fiscal year as required by federal laws. Most shareholders, however, must report distributions on a calendar year basis for income tax purposes, which may include distributions for portions of two fiscal years of a fund. Accordingly, the information needed for income tax purposes will be sent in early 2010 on Form 1099-DIV. Please consult your tax advisor for proper treatment of this information.
For the fiscal year ended October 31, 2009, each fund has designated long term capital gains and ordinary income with regard to distributions paid during the period as follows:
| | | | | | | | | | | | | | | | | |
| | | Long Term
| | | Ordinary
| | | | | | | | |
| | | Capital Gains
| | | Income
| | | Total
| | | | | |
| | | Distributions
| | | Distributions
| | | Distributions
| | | | | |
| Fund | | (Tax Basis)1 | | | (Tax Basis)1 | | | (Tax Basis)2 | | | | | |
| |
| Equity Index Fund | | | 0.00 | % | | | 100.00 | % | | | 100.00 | % | | | | |
| Mid Cap Index Fund | | | 87.76 | | | | 12.24 | | | | 100.00 | | | | | |
| Small Cap Index Fund | | | 93.66 | | | | 6.34 | | | | 100.00 | | | | | |
| |
| |
| | |
| | 1 | Based on a percentage of the fund’s total distributions. The funds may also designate as distributions from long-term capital gains, to the extent necessary to fully distribute those gains, earnings and profits distributed to shareholders on their redemption of shares. |
| |
| | 2 | None of the distributions made by these funds are eligible for the dividends received deduction or are characterized as qualified dividend income. |
Shareholder Notification of Federal Tax Status:
Each fund has designated the following percentages of the ordinary income distributions during the fiscal year ended October 31, 2009 as dividends qualifying for the dividends received deduction available to corporate shareholders:
| | | | | | | | | |
| Fund | | | | | | | |
| |
| Equity Index Fund | | | 100.00 | % | | | | |
| Mid Cap Index Fund | | | 98.59 | | | | | |
| Small Cap Index Fund | | | 86.60 | | | | | |
| |
| |
In addition, each fund has designated the following percentages of the ordinary income distributions from net investment income during the fiscal year ended October 31, 2009 as qualified dividend income available to individual shareholders under the Jobs and Growth Tax Relief Reconciliation Act of 2003:
| | | | | | | | | |
| Fund | | | | | | | |
| |
| Equity Index Fund | | | 100.00 | % | | | | |
| Mid Cap Index Fund | | | 99.21 | | | | | |
| Small Cap Index Fund | | | 90.86 | | | | | |
| |
| |
Additional Information Applicable to Foreign Shareholders Only:
The percentage of ordinary income distributions that are designated as interest-related dividends under Internal Revenue Code Section 871(k)(1)(c) for each fund were as follows:
| | | | | | | |
| Fund | | | | | |
| |
| Equity Index Fund | | | 0.66 | % | | |
| Mid Cap Index Fund | | | 4.89 | | | |
| Small Cap Index Fund | | | 7.15 | | | |
| |
| |
The percentage of ordinary income distributions that are designated as short-term capital gain distributions under Internal Revenue Code Section 871(k)(2)(c) for each fund were as follows:
| | | | | | | | | |
| Fund | | | | | | | |
| |
| Equity Index Fund | | | 0.00 | % | | | | |
| Mid Cap Index Fund | | | 0.00 | | | | | |
| Small Cap Index Fund | | | 0.00 | | | | | |
| |
| |
60 First American Funds 2009 Annual Report
HOW TO OBTAIN A COPY OF THE FUNDS’ PROXY VOTING POLICIES AND PROXY VOTING RECORD
A description of the policies and procedures that the funds use to determine how to vote proxies relating to portfolio securities, as well as information regarding how the funds voted proxies relating to portfolio securities during the most recent 12-month period ended June 30, is available at firstamericanfunds.com and on the Securities and Exchange Commission’s website at www.sec.gov. A description of the funds’ policies and procedures is also available without charge, upon request, by calling 800.677.FUND.
FORM N-Q HOLDINGS INFORMATION
Each fund is required to file its complete schedule of portfolio holdings for the first and third quarters of each fiscal year with the Securities and Exchange Commission on Form N-Q. The funds’ Forms N-Q are available without charge (1) upon request by calling 800.677.FUND and (2) on the Securities and Exchange Commission’s website at www.sec.gov. In addition, you may review and copy the funds’ Forms N-Q at the Commission’s Public Reference Room in Washington, D.C. You may obtain information on the operation of the Public Reference Room by calling 1.800.SEC.0330.
APPROVAL OF THE FUNDS’ INVESTMENT ADVISORY AGREEMENT
The Board of Directors of the Funds (the “Board”), which is comprised entirely of independent directors, oversees the management of each Fund and, as required by law, determines annually whether to renew the Funds’ advisory agreement with FAF Advisors, Inc. (“FAF Advisors”).
At a meeting on May 5-7, 2009, the Board considered information relating to the Funds’ investment advisory agreement with FAF Advisors (the “Agreement”). In advance of the meeting, the Board received materials relating to the Agreement, and had the opportunity to ask questions and request further information in connection with its consideration. At a subsequent meeting on June 16-18, 2009, the Board concluded its consideration of and approved the Agreement through June 30, 2010.
Although the Agreement, which is with First American Investment Funds, Inc., relates to all of the Funds, the Board separately considered and approved the Agreement with respect to each Fund. In considering the Agreement, the Board, advised by independent legal counsel, reviewed and considered the factors it deemed relevant, including: (1) the nature, quality and extent of FAF Advisors’ services to each Fund, (2) the investment performance of the Funds, (3) the profitability of FAF Advisors related to the Funds, including an analysis of FAF Advisors’ cost of providing services and comparative expense information, (4) whether economies of scale may be realized as the Funds grow and whether fee levels are adjusted to enable Fund investors to share in these potential economies of scale, and (5) other benefits that accrue to FAF Advisors through its relationship with the Funds. In its deliberations, the Board did not identify any single factor which alone was responsible for the Board’s decision to approve the Agreement with respect to any Fund.
Before approving the Agreement, the Board met in executive session with its independent counsel on numerous occasions to consider the materials provided by FAF Advisors and the terms of the Agreement. Based on its evaluation of those materials, the Board concluded that the Agreement is fair and in the best interests of the shareholders of each Fund. In reaching its conclusions, the Board considered the following:
Nature, Quality and Extent of Investment Advisory Services
The Board examined the nature, quality and extent of the services provided by FAF Advisors to each Fund. The Board reviewed FAF Advisors’ key personnel who provide investment management services to each Fund as well as the fact that, under the Agreement, FAF Advisors has the authority and responsibility to make and execute investment decisions for each Fund within the framework of that Fund’s investment policies and restrictions, subject to review by the Board. The Board further considered that FAF Advisors’ duties with respect to each Fund include: (i) investment research and security selection, (ii) adherence to (and monitoring compliance with) the Fund’s investment policies and restrictions and the Investment Company Act of 1940, and (iii) monitoring the performance of the various organizations providing services to the Funds, including the Funds’ distributor, sub-administrator, transfer agent and custodian. Finally, the Board considered FAF Advisors’ representation that the services provided by FAF Advisors under the Agreement are the types of services customarily provided by investment advisors in the fund industry. The Board also considered compliance reports about FAF Advisors from the Funds’ Chief Compliance Officer.
Based on the foregoing, the Board concluded that each Fund is likely to benefit from the nature, quality and extent of the services provided by FAF Advisors under the Agreement.
First American Funds 2009 Annual Report 61
| |
| Notice to Shareholders | October 31, 2009 (unaudited) |
Investment Performance of the Funds
The Board considered the performance of each Fund on a gross-of-expenses basis, including comparative information provided by an independent data service, regarding the median performance of a group of comparable funds selected by that data service (the “performance universe”) and how each Fund performed versus its benchmark index. The performance periods reviewed by the Board all ended on February 28, 2009.
Equity Index Fund. The Board considered that the Fund outperformed its performance universe median and its benchmark index for the one-, three-, five- and ten-year periods. The Board concluded that, in light of the Fund’s competitive performance, it would be in the interest of the Fund and its shareholders to renew the Agreement.
Mid Cap Index Fund. The Board considered that the Fund outperformed its performance universe median and its benchmark index for the one-, three- and five-year periods. The Board concluded that, in light of the Fund’s competitive performance, it would be in the interest of the Fund and its shareholders to renew the Agreement.
Small Cap Index Fund. The Board considered that the Fund outperformed its benchmark index for the one-, three- and five-year periods. The Board also considered that the Fund outperformed its performance universe median for the one-year period, though it underperformed its performance universe median for the three- and five-year periods. The Board considered that, in light of the Fund’s competitive performance, it would be in the interest of the Fund and its shareholders to renew the Agreement.
Costs of Services and Profits Realized by FAF Advisors
The Board reviewed FAF Advisors’ costs in serving as the Funds’ investment manager, including the costs associated with the personnel and systems necessary to manage the Funds. The Board also considered the profitability of FAF Advisors and its affiliates resulting from their relationship with each Fund. The Board compared fee and expense information for each Fund to fee and expense information for comparable funds managed by other advisors. The Board also reviewed advisory fees for other funds advised or sub-advised by FAF Advisors and for private accounts managed by FAF Advisors. The Board found that while the management fees for FAF Advisors’ institutional separate accounts are generally lower than the management fees charged by FAF Advisors to mutual funds, mutual funds receive additional services from FAF Advisors that separate accounts do not receive.
Using information provided by an independent data service, the Board also evaluated each Fund’s advisory fee compared to the median advisory fee for other mutual funds similar in size, character and investment strategy, and each Fund’s total expense ratio after waivers compared to the median total expense ratio of comparable funds. In connection with its review of Fund fees and expenses, the Board considered FAF Advisors’ pricing philosophy. FAF Advisors attempts generally to maintain each Fund’s total operating expenses at a level that approximates the median of a peer group of funds selected by an independent data service. In addition, FAF Advisors has committed to waive its investment advisory fees to the extent necessary to maintain the Funds’ total expense ratios at levels generally in line with their respective peer groups.
Further detail considered by the Board regarding the advisory fees and total expense ratios of each Fund is set forth below:
Equity Index Fund. The Board considered that the Fund’s advisory fee, after waivers, is only one basis point higher than the peer group median. The Board also considered that the Fund’s total expense ratio, after waivers, was higher than the peer group median, though consistent with FAF Advisors’ pricing philosophy. The Board took note of FAF Advisors’ commitment to continue to monitor the total expenses of the Fund with the objective of reducing such expenses and aligning the Fund’s total expenses to its peer group median. Given the Fund’s strong investment performance and the competitive advisory fee, the Board concluded that the Fund’s advisory fee and total expense ratio are reasonable in light of the services provided.
Mid Cap Index Fund. The Board considered that the Fund’s advisory fee, after waivers, is lower than the peer group median and that the Fund’s total expense ratio, after waivers, is slightly higher than the peer group median, though consistent with FAF Advisors’ pricing philosophy. Given the Fund’s strong investment performance, the Board concluded that the Fund’s advisory fee and total expense ratio are reasonable in light of the services provided.
Small Cap Index Fund. The Board considered that the Fund’s advisory fee, after waivers, and the Fund’s total expense ratio, after waivers, are lower than the peer group median. The Board concluded that the Fund’s advisory fee and total expense ratio are reasonable in light of the services provided.
Economies of Scale in Providing Investment Advisory Services
The Board considered the extent to which each Fund’s investment advisory fee reflects economies of scale for the benefit of Fund shareholders. Based on information provided by FAF Advisors, the Board noted that profitability likely will increase as assets grow over time. The Board considered that, although the Funds do not have advisory fee breakpoints in place, FAF
62 First American Funds 2009 Annual Report
Advisors has committed to waive advisory fees to the extent necessary to keep each Fund’s total expenses generally in line with the median total expenses of a peer group of funds as selected by an independent data service. The Board considered information presented by FAF Advisors to support its assertion that the median total expense ratio of a Fund’s peer group should reflect the effect of any breakpoints in the advisory fee schedules of the funds in that group and any economies of scale which those funds realize. Therefore, by capping a Fund’s total expense ratio at a level close to the median, Fund shareholders will effectively receive the benefit of any breakpoints in the comparable funds’ advisory fee schedules and any such economies of scale. In light of FAF Advisors’ commitment to keep total Fund expenses competitive, the Board concluded that it would be reasonable and in the best interest of each Fund and its shareholders to renew the Agreement.
Other Benefits to FAF Advisors
In evaluating the benefits that accrue to FAF Advisors through its relationship with the Funds, the Board noted that FAF Advisors and certain of its affiliates serve the Funds in various capacities, including as investment advisor, administrator, transfer agent, distributor, custodian and securities lending agent, and receive compensation from the Funds in connection with providing services to the Funds. The Board considered that each service provided to the Funds by FAF Advisors or one of its affiliates is pursuant to a written agreement, which the Board evaluates periodically as required by law.
The Board also considered FAF Advisors’ use of the Funds’ portfolio brokerage transactions to obtain research. The Board concluded, based on its own review and on representations of FAF Advisors and the Chief Compliance Officer, that FAF Advisors’ use of “soft” commission dollars was consistent with regulatory requirements.
After full consideration of these factors, the Board concluded that approval of the Agreement was in the best interest of each Fund and its shareholders.
First American Funds 2009 Annual Report 63
| |
| Notice to Shareholders | October 31, 2009 (unaudited) |
Directors and Officers of the Funds
| | | | | | | | | | | |
| Independent Directors |
| | | | | | | | | | | Other
|
| | | Position(s)
| | Term of Office
| | | | Number of Portfolios
| | Directorships
|
Name, Address, and
| | Held
| | and Length of
| | Principal Occupation(s)
| | in Fund Complex
| | Held by
|
| Year of Birth | | with Funds | | Time Served | | During Past 5 Years | | Overseen by Director | | Director † |
| |
Benjamin R. Field III
P.O. Box 1329
Minneapolis, MN
55440-1329
(1938) | | Director | | Term expiring earlier of death, resignation, removal, disqualification, or successor duly elected and qualified. Director of FAIF since September 2003 | | Retired | | First American Funds Complex: twelve registered investment companies, including fifty-eight portfolios | | None |
| |
| |
Roger A. Gibson
P.O. Box 1329
Minneapolis, MN
55440-1329
(1946) | | Director | | Term expiring earlier of death, resignation, removal, disqualification, or successor duly elected and qualified. Director of FAIF since
October 1997 | | Director, Charterhouse Group, Inc., a private equity firm, since October 2005; Advisors/Consultant, Future Freighttm, a logistic/supply chain company; Trustee, National Jewish Health; Board Member/Co-founder, Shades of Blue, an aviation-related youth development organization; Vice President and Chief Operating Officer, Cargo-United Airlines, from July 2001 until retirement in November 2005 | | First American Funds Complex: twelve registered investment companies, including fifty-eight portfolios | | None |
| |
| |
Victoria J. Herget
P.O. Box 1329
Minneapolis, MN
55440-1329
(1951) | | Director | | Term expiring earlier of death, resignation, removal, disqualification, or successor duly elected and qualified. Director of FAIF since September 2003 | | Investment consultant and non-profit board member; Board Chair, United Educators Insurance Company | | First American Funds Complex: twelve registered investment companies, including fifty-eight portfolios | | None |
| |
| |
John P. Kayser
P.O. Box 1329
Minneapolis, MN
55440-1329
(1949) | | Director | | Term expiring earlier of death, resignation, removal, disqualification, or successor duly elected and qualified. Director of FAIF since
October 2006 | | Retired; Principal from 1983 to 2004, William Blair & Company, LLC, a Chicago-based investment firm | | First American Funds Complex: twelve registered investment companies, including fifty-eight portfolios | | None |
| |
| |
Leonard W. Kedrowski
P.O. Box 1329
Minneapolis, MN
55440-1329
(1941) | | Director | | Term expiring earlier of death, resignation, removal, disqualification, or successor duly elected and qualified. Director of FAIF since November 1993 | | Owner and President, Executive and Management Consulting, Inc., a management consulting firm; Board member, GC McGuiggan Corporation (dba Smyth Companies), a label printer; member, investment advisory committee, sisters of the Good Shepherd | | First American Funds Complex: twelve registered investment companies, including fifty-eight portfolios | | None |
| |
| |
Richard K. Riederer
P.O. Box 1329
Minneapolis, MN
55440-1329
(1944) | | Director | | Term expiring earlier of death, resignation, removal, disqualification, or successor duly elected and qualified. Director of FAIF since
August 2001 | | Owner and Chief Executive Officer, RKR Consultants, Inc., a consulting company providing advice on business strategy, mergers and acquisitions; non-profit board member since 2005 | | First American Funds Complex: twelve registered investment companies, including fifty-eight portfolios | | Cliffs Natural Resources, Inc. (a producer of iron ore pellets and coal) |
| |
| |
Joseph D. Strauss
P.O. Box 1329
Minneapolis, MN
55440-1329
(1940) | | Director | | Term expiring earlier of death, resignation, removal, disqualification, or successor duly elected and qualified. Director of FAIF since
April 1991 | | Attorney At Law; Owner and President, Strauss Management Company, a Minnesota holding company for various organizational management business ventures; Owner, Chairman, and Chief Executive Officer, Community Resource Partnerships, Inc., a corporation engaged in strategic planning, operations management, government relations, transportation planning, and public relations; Owner, Chairman, and Chief Executive Officer, Excensus,tm LLC, a demographic planning and application development firm | | First American Funds Complex: twelve registered investment companies, including fifty-eight portfolios | | None |
| |
| |
64 First American Funds 2009 Annual Report
| | | | | | | | | | | |
Independent Directors – concluded |
| | | | | | | | | | | Other
|
| | | Position(s)
| | Term of Office
| | | | Number of Portfolios
| | Directorships
|
Name, Address, and
| | Held
| | and Length of
| | Principal Occupation(s)
| | in Fund Complex
| | Held by
|
| Year of Birth | | with Funds | | Time Served | | During Past 5 Years | | Overseen by Director | | Director † |
| |
Virginia L. Stringer
P.O. Box 1329
Minneapolis, MN
55440-1329
(1944) | | Chair; Director | | Chair Term three years. Directors Term expiring earlier of death, resignation, removal, disqualification, or successor duly elected and qualified. Chair of FAIF’s Board since September 1997; Director of FAIF since September 1987 | | Governance consultant and non-profit board member; former Owner and President, Strategic Management Resources, Inc., a management consulting firm; Chair, St. Paul Riverfront Corporation, since 2005 | | First American Funds Complex: twelve registered investment companies, including fifty-eight portfolios | | None |
| |
| |
James M. Wade
P.O. Box 1329
Minneapolis, MN
55440-1329
(1943) | | Director | | Term expiring earlier of death, resignation, removal, disqualification, or successor duly elected and qualified. Director of FAIF since
August 2001 | | Owner and President, Jim Wade Homes, a homebuilding company | | First American Funds Complex: twelve registered investment companies, including fifty-eight portfolios | | None |
| |
| |
| |
| † | Includes only directorships in a company with a class of securities registered pursuant to Section 12 of the Securities Exchange Act or subject to the requirements of Section 15(d) of the Securities Exchange Act, or any company registered as an investment company under the Investment Company Act. |
The Statement of Additional Information (SAI) includes additional information about fund directors and is available upon request without charge by calling 800.677.FUND or writing to First American Funds, P.O. Box 1330, Minneapolis, Minnesota, 55440-1330.
First American Funds 2009 Annual Report 65
| |
| Notice to Shareholders | October 31, 2009 (unaudited) |
| | | | | | | |
| Officers |
| | | Position(s)
| | Term of Office
| | |
Name, Address, and
| | Held
| | and Length of
| | |
| Year of Birth | | with Funds | | Time Served | | Principal Occupation(s) During Past 5 Years |
| |
Thomas S. Schreier, Jr.
FAF Advisors, Inc.
800 Nicollet Mall
Minneapolis, MN 55402
(1962)* | | President | | Re-elected by the Board annually; President of FAIF since February 2001 | | Chief Executive Officer, FAF Advisors, Inc.; Chief Investment Officer, FAF Advisors, Inc., since September 2007 |
| |
| |
Jeffery M. Wilson
FAF Advisors, Inc.
800 Nicollet Mall
Minneapolis, MN 55402
(1956)* | | Vice President – Administration | | Re-elected by the Board annually; Vice President – Administration of FAIF since March 2000 | | Senior Vice President, FAF Advisors, Inc. |
| |
| |
Charles D. Gariboldi, Jr.
FAF Advisors, Inc.
800 Nicollet Mall
Minneapolis, MN 55402
(1959)* | | Treasurer | | Re-elected by the Board annually; Treasurer of FAIF since December 2004 | | Mutual Funds Treasurer, FAF Advisors, Inc., since October 2004; prior thereto, Vice President – Investment Accounting and Fund Treasurer, Thrivent Financial for Lutherans |
| |
| |
Jill M. Stevenson
FAF Advisors, Inc.
800 Nicollet Mall
Minneapolis, MN 55402
(1965)* | | Assistant Treasurer | | Re-elected by the Board annually; Assistant Treasurer of FAIF since September 2005 | | Mutual Funds Assistant Treasurer, FAF Advisors, Inc., since September 2005; prior thereto, Director and Senior Project Manager, FAF Advisors, Inc. |
| |
| |
David H. Lui
FAF Advisors, Inc.
800 Nicollet Mall
Minneapolis, MN 55402
(1960)* | | Chief Compliance Officer | | Re-elected by the Board annually; Chief Compliance Officer of FAIF since
March 2005 | | Chief Compliance Officer, FAF Advisors, Inc., since March 2005; prior thereto, Chief Compliance Officer, Franklin Advisors, Inc., and Chief Compliance Counsel, Franklin Templeton Investments |
| |
| |
Jason K. Mitchell
FAF Advisors, Inc.
800 Nicollet Mall
Minneapolis, MN 55402
(1976)* | | Anti-Money Laundering Officer | | Re-elected by the Board annually; Anti-Money Laundering Officer of FAIF since December 2008 and from September 2006 through August 2008 | | Compliance Manager, FAF Advisors, Inc., since June 2006; prior thereto, Compliance Analyst, FAF Advisors, Inc., from October 2004 to June 2006 |
| |
| |
Kathleen L. Prudhomme
FAF Advisors, Inc.
800 Nicollet Mall
Minneapolis, MN 55402
(1953)* | | Secretary | | Re-elected by the Board annually; Secretary of FAIF since December 2004; prior thereto, Assistant Secretary of FAIF since September 1998 | | Deputy General Counsel, FAF Advisors, Inc., since November 2004; prior thereto, Partner, Dorsey & Whitney LLP, a Minneapolis-based law firm |
| |
| |
James D. Alt
Dorsey & Whitney LLP
50 South Sixth Street
Suite 1500,
Minneapolis, MN 55402
(1951) | | Assistant Secretary | | Re-elected by the Board annually; Assistant Secretary of FAIF since December 2004; prior thereto, Secretary of FAIF since June 2002; Assistant Secretary of FAIF from September 1998 through June 2002 | | Partner, Dorsey & Whitney LLP, a Minneapolis-based law firm |
| |
| |
James R. Arnold
U.S. Bancorp Fund Services, LLC
615 E. Michigan Street
Milwaukee, WI 53202
(1957)* | | Assistant Secretary | | Re-elected by the Board annually; Assistant Secretary of FAIF since
June 2003 | | Senior Vice President, U.S. Bancorp Fund Services, LLC |
| |
| |
Richard J. Ertel
FAF Advisors, Inc.
800 Nicollet Mall
Minneapolis, MN 55402
(1967)* | | Assistant Secretary | | Re-elected by the Board annually; Assistant Secretary of FAIF since June 2006 and from June 2003 through August 2004 | | Counsel, FAF Advisors, Inc., since May 2006; prior thereto, Counsel, Ameriprise Financial Services, Inc., September 2004 to May 2006 |
| |
| |
Michael W. Kremenak
FAF Advisors, Inc.
800 Nicollet Mall
Minneapolis, MN 55402
(1978)* | | Assistant Secretary | | Re-elected by the Board annually; Assistant Secretary of FAIF since February 2009 | | Counsel, FAF Advisors Inc., since January 2009; prior thereto, Associate, Skadden, Arps, Slate, Meagher & Flom LLP, a New York city-based law firm, from September 2005 to
January 2009 |
| |
| |
| |
| * | Messrs. Schreier, Wilson, Gariboldi, Lui, Mitchell, Ertel, and Kremenak, Ms. Stevenson and Ms. Prudhomme are each officers and/or employees of FAF Advisors, Inc., which serves as investment adviser and administrator for FAIF. Mr. Arnold is an officer of U.S. Bancorp Fund Services, LLC, which is a subsidiary of U.S. Bancorp and which serves as transfer agent for FAIF. |
66 First American Funds 2009 Annual Report
(This page intentionally left blank.)
First American Funds’ Privacy Policy
We want you to understand what information we collect and how it’s used.
“Nonpublic personal information” is nonpublic information that we obtain while providing financial products or services to you.
Why we collect your information
We gather nonpublic personal information about you and your accounts so that we can:
| |
| • | Know who you are and prevent unauthorized access to your information. |
| • | Design and improve the products we offer. |
| • | Comply with the laws and regulations that govern us. |
The types of information we collect
We may collect the following nonpublic personal information about you:
| |
| • | Information about your identity, such as your name, address, and social security number |
| • | Information about your transactions with us |
| • | Information you provide on applications, such as your beneficiaries |
Confidentiality and security
We operate through service providers. We require our service providers to restrict access to nonpublic personal information about you to those employees who need that information in order to provide products or services to you. We also require them to maintain physical, electronic, and procedural safeguards that comply with applicable federal standards and regulations to guard your information.
What information we disclose
We may share all of the nonpublic personal information that we collect about you with our affiliated providers of financial services, including our family of funds and their advisor, and with companies that perform marketing services on our behalf.
We’re permitted by law to disclose nonpublic personal information about you to other third parties in certain circumstances. For example, we may disclose nonpublic personal information about you to affiliated and nonaffiliated third parties to assist us in servicing your account (e.g., mailing of fund-related materials) and to government entities (e.g., IRS for tax purposes).
We’ll continue to adhere to the privacy policies and practices described here even after your account is closed or becomes inactive.
Additional rights and protections
You may have other privacy protections under applicable state laws, such as California and Vermont. To the extent that these state laws apply, we will comply with them when we share information about you. This privacy policy does not apply to your relationship with other financial service providers, such as broker-dealers. We may amend this privacy notice at any time, and we will inform you of changes as required by law.
Our pledge applies to products and services offered by:
| | | |
| • First American Funds, Inc. | | • American Select Portfolio Inc. |
| • First American Investment Funds, Inc. | | • American Municipal Income Portfolio Inc. |
| • First American Strategy Funds, Inc. | | • Minnesota Municipal Income Portfolio Inc. |
| • American Strategic Income Portfolio Inc. | | • First American Minnesota Municipal Income Fund II, Inc. |
| • American Strategic Income Portfolio Inc. II | | • American Income Fund, Inc. |
| • American Strategic Income Portfolio Inc. III | | |
NOT FDIC INSURED NO BANK GUARANTEE MAY LOSE VALUE
Board of Directors First American Investment Funds, Inc.
Virginia Stringer
Chairperson of First American Investment Funds, Inc.
Governance Consultant; Chair of Saint Paul Riverfront Corporation; former Owner
and President of Strategic Management Resources, Inc.
Benjamin Field III
Director of First American Investment Funds, Inc.
Retired; former Senior Financial Advisor, Senior Vice President,
Chief Financial Officer, and Treasurer of Bemis Company, Inc.
Roger Gibson
Director of First American Investment Funds, Inc.
Director of Charterhouse Group, Inc.
Victoria Herget
Director of First American Investment Funds, Inc.
Investment Consultant; Chair of United Educators Insurance Company; former
Managing Director of Zurich Scudder Investments
John Kayser
Director of First American Investment Funds, Inc.
Retired; former Principal, Chief Financial Officer, and Chief Administrative Officer of William Blair & Company, LLC
Leonard Kedrowski
Director of First American Investment Funds, Inc.
Owner and President of Executive and Management Consulting, Inc.
Richard Riederer
Director of First American Investment Funds, Inc.
Owner and Chief Executive Officer of RKR Consultants, Inc.
Joseph Strauss
Director of First American Investment Funds, Inc.
Owner and President of Strauss Management Company
James Wade
Director of First American Investment Funds, Inc.
Owner and President of Jim Wade Homes
First American Investment Funds’ Board of Directors is comprised entirely of
independent directors.
P.O. Box 1330
Minneapolis, MN 55440-1330
This report and the financial statements contained herein are not intended to be a forecast of future events, a guarantee of future results, or investment advice. Further, there is no assurance that certain securities will remain in or out of each fund’s portfolio. The views expressed in this report reflect those of the portfolio managers only through the period ended October 31, 2009. The portfolio managers views are subject to change at any time based upon market or other conditions. This report is for the information of shareholders of the First American Investment Funds, Inc. It may also be used as sales literature when preceded or accompanied by a current prospectus, which contains information concerning investment objectives, risks, and charges and expenses of the funds. Read the prospectus carefully before investing.
The figures in this report represent past performance and do not guarantee future results. The principal value of an investment and investment return will fluctuate so that an investor’s shares, when redeemed, may be worth more or less than their original cost.
| | | | | |
INVESTMENT ADVISOR
FAF Advisors, Inc.
800 Nicollet Mall
Minneapolis, Minnesota 55402
ADMINISTRATOR
FAF Advisors, Inc.
800 Nicollet Mall
Minneapolis, Minnesota 55402
TRANSFER AGENT
U.S. Bancorp Fund Services, LLC
615 East Michigan Street
Milwaukee, Wisconsin 53202 | | CUSTODIAN
U.S. Bank National Association
60 Livingston Avenue
St. Paul, Minnesota 55101
DISTRIBUTOR
Quasar Distributors, LLC
615 East Michigan Street
Milwaukee, Wisconsin 53202 | | INDEPENDENT REGISTERED
PUBLIC ACCOUNTING FIRM
Ernst & Young LLP
220 South Sixth Street
Suite 1400
Minneapolis, Minnesota 55402
COUNSEL
Dorsey & Whitney LLP
50 South Sixth Street
Suite 1500
Minneapolis, Minnesota 55402 |
In an attempt to reduce shareholder costs and help eliminate duplication, First American Funds will try to limit their mailing to one report for each address that lists one or more shareholders with the same last name. If you would like additional copies, please call First American Investor Services at 800.677.FUND or visit firstamericanfunds.com.
0202-09 12/2009 AR-INDEX
Table of Contents
| | | | | |
| | | 1 | |
| | | 2 | |
| | | 3 | |
| | | 12 | |
| | | 14 | |
| | | 15 | |
| | | 26 | |
| | | 27 | |
| | | 28 | |
| | | 30 | |
| | | 32 | |
| | | 39 | |
Mutual fund investing involves risk; principal loss is possible.
First American Funds’ quantitative funds are actively managed using our proprietary macro quant process, which projects individual stock performance based on multiple factors and current economic conditions. Stocks selected using this process could underperform if the current performance of the factors differs from their historic performance. Turnover, expenses, and taxes will be similar to other actively managed funds.
NOT FDIC INSURED NO BANK GUARANTEE MAY LOSE VALUE
Message to Shareholders December 7, 2009
Dear Shareholders:
We invite you to take a few minutes to review the results of the fiscal year ended October 31, 2009.
This report includes portfolio commentaries, comparative performance graphs and tables, complete listings of portfolio holdings, and additional fund information. We hope you will find this helpful in monitoring your investment portfolio.
Also, through our website, firstamericanfunds.com, we provide quarterly performance fact sheets on all First American Funds, the economic outlook as viewed by our senior investment officers, and other information about fund investments and portfolio strategies.
Please contact your financial professional if you have questions about First American Funds or contact First American Investor Services at 800.677.FUND.
We appreciate your investment with First American Funds and look forward to serving your financial needs in the future.
Sincerely,
| | | |
| | |
| | | |
Virginia L. Stringer
Chairperson of the Board
First American Investment Funds, Inc. | | Thomas S. Schreier, Jr.
President
First American Investment Funds, Inc. |
First American Funds 2009 Annual Report 1
Explanation of Financial Statements
As a shareholder in First American Funds, you receive shareholder reports semiannually. We strive to present this financial information in an easy-to-understand format; however, for many investors, the information contained in this shareholder report may seem very technical. So, we would like to take this opportunity to explain several sections of the shareholder report.
The Schedule of Investments details all of the securities held in the fund and their related dollar values on the last day of the reporting period. Securities are usually presented by type (common stock, bonds, etc.) and by industry classification (banking, communications, etc.). This information is useful for analyzing how your fund’s assets are invested and seeing where your portfolio manager believes the best opportunities exist to meet your objectives. Holdings are subject to change without notice and do not constitute a recommendation of any individual security. The Notes to the Financial Statements provide additional details on how the securities are valued.
The Statement of Assets and Liabilities lists the assets and liabilities of the fund and presents the fund’s net asset value (“NAV”) per share on the last day of the reporting period. The NAV is calculated by dividing the fund’s net assets (assets minus liabilities) by the number of shares outstanding. The investments, as presented in the Schedule of Investments, comprise substantially all of the fund’s assets. Other assets include cash and receivables for items such as income earned by the fund but not yet received. Liabilities include payables for items such as fund expenses incurred but not yet paid.
The Statement of Operations details the dividends and interest income earned from securities as well as the expenses incurred by the fund during the reporting period. Fund expenses may be reduced through fee waivers or reimbursements. This statement reflects total expenses before any waivers or reimbursements, the amount of waivers and reimbursements (if any), and the net expenses. This statement also shows the net realized and unrealized gains and losses from investments owned during the period. The Notes to Financial Statements provide additional details on investment income and expenses of the fund.
The Statement of Changes in Net Assets describes how the fund’s net assets were affected by its operating results, distributions to shareholders, and shareholder transactions during the reporting period. This statement is important to investors because it shows exactly what caused the fund’s net asset size to change during the period.
The Financial Highlights provide a per-share breakdown of the components that affected the fund’s NAV for the current and past reporting periods. It also shows total return, expense ratios, net investment income ratios, and portfolio turnover rates. The net investment income ratios summarize the income earned less expenses, divided by the average net assets. The expense ratios represent the percentage of average net assets that were used to cover operating expenses during the period. Expense ratios can vary across funds for a number of reasons, including differences in advisory fees and the average shareholder account size. The portfolio turnover rate represents the percentage of the fund’s holdings that have changed over the course of the period, and gives an idea of how long the fund holds onto a particular security. A 100% turnover rate implies that an amount equal to the value of the entire portfolio is turned over in a year through the purchase and sale of securities.
The Notes to Financial Statements disclose the organizational background of the fund, its significant accounting policies, federal tax information, fees and compensation paid to affiliates, and significant risks and contingencies.
We hope this guide to your shareholder report will help you get the most out of this important resource. You can visit First American Funds’ website for other useful information on each of our funds, including fund prices, performance, fund manager bios, dividends, and downloadable fact sheets. For more information, call First American Investor Services at 800.677.FUND or visit firstamericanfunds.com.
2 First American Funds 2009 Annual Report
Quantitative Large Cap Core Fund
Investment Objective: to provide, over the long term, a total return that exceeds that of the S&P 500 Index*
How did the fund perform for the fiscal year ended October 31, 2009?
The First American Quantitative Large Cap Core Fund (the “fund”), Class Y shares, returned 10.13% for the fiscal year ended October 31, 2009 (Class A shares returned 9.87% without taking the sales charge into account). By comparison, the fund’s benchmark, the S&P 500 Index*, returned 9.80% for the same period.
How did market conditions affect stock market performance during the fiscal year?
The U.S. economy appears to have emerged from the most severe recession of the postwar era during the third quarter of 2009. Gross Domestic Product expanded at a 2.8% annual rate during the quarter, and leading indicators currently suggest that positive growth will be maintained during the final quarter of the year and into 2010. Despite the return to positive growth since midyear, the unemployment rate has continued to rise and reached a new cyclical high of 10.2% in October. The continued increase in the unemployment rate reflects both a historical pattern, where it is common for the unemployment rate to reach its peak after economic activity has reached its trough during the cycle, as well as the subdued pace of the growth recovery to date. In order for the unemployment rate to decline in a sustained manner, economic growth needs to exceed the economy’s potential growth and this set of circumstances has yet to occur. The severity of the recession has left high levels of unutilized resources in the industrial sector and property markets, and the labor market as well. The combined effect of this broad-based resource underutilization has resulted in downward pressure on inflation trends throughout 2009. This trend is expected to remain in place in 2010. The exceptionally high level of unemployment and muted inflation trends have led the Federal Reserve (“the Fed”) to cut its target overnight lending rate to a range of 0% to 0.25% and engage in a host of nontraditional easing activities, including large-scale purchases of mortgage securities. These activities have resulted in a significant increase in the monetary base, which along with other policy initiatives have worked to restore normal functioning in intrabank funding markets and have supported a broad-based improvement in financial conditions. This policy stance is expected to persist well into 2010 in an effort to support financial conditions and an ongoing recovery in economic activity.
As a result of the broad-based easing of monetary policy and mortgage-related asset purchases by the Fed, equity markets began moving higher after reaching the low in March, anticipating that these actions would ease financial strains and contribute to a stabilization and improvement in economic and corporate earnings performance. Subsequent economic data and earnings reports validated the initial expectations and have contributed to further gains in the equity markets as the fiscal year progressed.
What worked for the fund and why?
During the early part of the fiscal year, as U.S. equity markets were in a state of advanced turmoil, concerns spread that distress in the banking system might cause a general breakdown in American business. Our measures of the financial system’s negative outlook caused us to successfully underweight the financials sector late in 2008 relative to the benchmark. An underweight in energy, as well as a defensive overweight in healthcare stocks, were also very helpful. These sector calls were the most significant drivers of performance during the fiscal year.
| |
| * | Unlike mutual funds, index returns do not reflect any expenses, transaction costs, or cash flow effects. |
Top 10 Holdings as of October 31, 20091 (% of net assets)
| | | | | |
| First American Prime Obligations Fund, Class Z | | | 4 | .6% |
| Exxon Mobil | | | 3 | .3 |
| Microsoft | | | 2 | .9 |
| Pfizer | | | 2 | .0 |
| Chevron | | | 1 | .8 |
| IBM | | | 1 | .7 |
| Johnson & Johnson | | | 1 | .7 |
| Proctor & Gamble | | | 1 | .6 |
| JPMorgan Chase | | | 1 | .6 |
| General Electric | | | 1 | .5 |
Sector Allocation as of October 31, 20091 (% of net assets)
| | | | | |
| Information Technology | | | 25 | .8% |
| Financials | | | 16 | .2 |
| Healthcare | | | 13 | .3 |
| Energy | | | 10 | .0 |
| Industrials | | | 7 | .6 |
| Consumer Staples | | | 6 | .8 |
| Consumer Discretionary | | | 5 | .1 |
| Utilities | | | 4 | .4 |
| Materials | | | 2 | .7 |
| Telecommunication Services | | | 2 | .1 |
| Short-Term Investments | | | 6 | .0 |
Other Assets and Liabilities, Net2 | | | 0 | .0 |
| | | | | |
| | | | 100 | .0% |
| | | | | |
| | | | | |
| |
| 1 | Fund Holdings and sector allocations are subject to change and are not recommendations to buy or sell any security. Allocations reflect the fund’s exposure to each sector through direct investments and do not reflect the impact on sector allocation of holding derivative instruments, such as futures. See note 2 in Notes to Financial Statements and the fund’s Schedule of Investments for derivatives held at October 31, 2009. |
| |
| 2 | Investments typically comprise substantially all of the fund’s net assets. Other assets and liabilities include receivables and payables on derivative instruments based on mark-to-market adjustments as well as receivables for items such as income earned but not yet received and payables for items such as fund expenses incurred but not yet paid. |
First American Funds 2009 Annual Report 3
Quantitative Large Cap Core Fund
Less dramatic were our views of how the negative overall conditions would spread to non-financial sectors, which led us to seek lower-risk stocks during this period. The portfolio beta, or measure of volatility, dipped briefly below 0.9, which, all else being equal, would cause the portfolio to decline only 0.9% for every 1.0% decline in the market. This proved to be a successful approach.
In early March, as investors showed renewed confidence in equity opportunities, stocks experienced a sharp rally. By early April, we had revised our earlier, more defensive position in equities to experience full sensitivity to market changes, allowing the fund to capture the majority of the rebound.
Aspects of our investment style, chiefly our emphasis on stocks with lower price/earnings ratios (i.e., the current price of the stock divided by the company’s trailing 12 months’ earnings per share) also helped boost performance.
What did not work for the fund and why?
We attempt to minimize individual stock risk by diversifying*. During this fiscal year, however, stock selection was a detractor. The underweight in financials was very helpful in leading us to avoid underperformers Citicorp and Bank of America but harmful for strong performers JPMorgan Chase and Goldman Sachs. The largest single detracting name, however, was Apple. Although our risk-control discipline kept us from avoiding the stock entirely, our measures did not anticipate its meteoric success in the year.
What strategic moves were made by the fund and why?
We believe the models proved their mettle through this most difficult of markets by pulling into a conservative stance, then returning the portfolio to a slightly cautious stance. Although conventional wisdom holds that technology companies have volatile earnings and high price/earnings ratios, we have nonetheless moved to a significant overweight in technology stocks. While the fund has benefited from an underweight to financials in the past, the opportunities in the sector are now more favorable; the fund, therefore, held more financials than its benchmark at the end of the fiscal year.
| |
| * | Diversification does not assure a profit or protect against a loss in a declining market. |
4 First American Funds 2009 Annual Report
Quantitative Large Cap Core Fund
Annual Performance1,2
| | | | | | | | | | | | | | | | | |
| | | October 31, 2009 | | September 30, 2009* |
| | | 1 year | | Since Inception | | 1 year | | Since Inception |
| | | | | 7/31/2007 | | | | 7/31/2007 |
Average annual return with sales charge (POP) | | | | | | | | | | | | | | | | |
| Class A | | | 3 | .85% | | | (14.39 | )% | | | (12.03 | )% | | | (14.07 | )% |
| |
| |
| Class C | | | 8 | .05% | | | (12.88 | )% | | | (8.56 | )% | | | (12.46 | )% |
Average annual return without sales charge (NAV) | | | | | | | | | | | | | | | | |
| Class A | | | 9 | .87% | | | (12.21 | )% | | | (6.92 | )% | | | (11.79 | )% |
| |
| |
| Class C | | | 9 | .05% | | | (12.88 | )% | | | (7.64 | )% | | | (12.46 | )% |
| |
| |
| Class Y | | | 10 | .13% | | | (12.01 | )% | | | (6.69 | )% | | | (11.58 | )% |
| |
| |
S&P 500 Index3 | | | 9 | .80% | | | (11.96 | )% | | | (6.91 | )% | | | (11.64 | )% |
| | | | | | | | | | | | | | | | | |
| | | | | | | | | | | | | | | | | |
The performance data quoted on this page represents past performance and does not guarantee future results. The investment return and principal value of an investment will fluctuate so that an investor’s shares, when redeemed, may be worth more or less than their original cost. Current performance of the fund may be lower or higher than the performance data quoted. Performance data current to the most recent month-end may be obtained by calling 800.677.FUND.
| |
| 1 | Total returns at net asset value (“NAV”) reflect performance over the time period indicated without including the fund’s maximum sales charge and assume reinvestment of all distributions at NAV. |
Total returns at public offering price (“POP”) reflect performance over the time period indicated including the maximum sales charge of 5.50% for Class A shares and the maximum contingent deferred sales charge of 1.00% for Class C shares for the relevant period. Total returns assume reinvestment of all distributions at NAV.
| |
| | As reflected in the prospectus for the fiscal year ended October 31, 2008, the fund’s total annual operating expense ratio, before waivers and including the expenses of other investment companies in which the fund invests, if any (“acquired fund fees and expenses”), for Class A, Class C, and Class Y shares was 1.19%, 1.94%, and 0.94%, respectively. The advisor has contractually agreed to waive fees through February 28, 2010 so that total annual fund operating expenses, not including any acquired fund fees and expenses, for Class A, Class C, and Class Y shares do not exceed 0.70%, 1.45%, and 0.45%, respectively. These fee waivers may be terminated at any time after February 28, 2010, at the discretion of the advisor. Prior to that time, such waivers may not be terminated without the approval of the fund’s board of directors. |
| | |
| | * | This table represents average annual total returns through the latest calendar quarter – rather than through the end of the fiscal period. |
Value of $10,000 Investment1,2,4 as of October 31, 2009
This chart illustrates the total value of an assumed $10,000 investment in the fund’s Class A shares (from 7/31/2007 to 10/31/2009) as compared to the S&P 500 Index3.
| |
| 2 | Performance does not reflect the deduction of taxes that a shareholder would pay on fund distributions or redemption of fund shares. Performance reflects fee waivers that were in effect during the periods indicated. In the absence of such fee waivers, total returns would be reduced. Index performance is for illustrative purposes only and does not reflect any expenses, transaction costs, or cash flow effects. Direct investment in the index is not available. |
| |
| 3 | An unmanaged, market capitalization-weighted index based on the average weighted performance of 500 widely held large-cap common stocks. |
| |
| 4 | Performance for Class C and Class Y shares is not presented. Performance for these classes will vary due to their different expense structures. |
First American Funds 2009 Annual Report 5
Quantitative Large Cap Growth Fund
Investment Objective: to provide, over the long term, a total return that exceeds that of the Russell 1000 Growth Index*
How did the fund perform for the fiscal year ended October 31, 2009?
The First American Quantitative Large Cap Growth Fund (the “fund”), Class Y shares, returned 15.42% for the fiscal year ended October 31, 2009 (Class A shares returned 15.09% without taking the sales charge into account). By comparison, the fund’s benchmark, the Russell 1000 Growth Index*, returned 17.51% for the same period.
How did market conditions affect stock market performance during the fiscal year?
The U.S. economy appears to have emerged from the most severe recession of the postwar era during the third quarter of 2009. Gross Domestic Product expanded at a 2.8% annual rate during the quarter, and leading indicators currently suggest that positive growth will be maintained during the final quarter of the year and into 2010. Despite the return to positive growth since midyear, the unemployment rate has continued to rise and reached a new cyclical high of 10.2% in October. The continued increase in the unemployment rate reflects both a historical pattern, where it is common for the unemployment rate to reach its peak after economic activity has reached its trough during the cycle, as well as the subdued pace of the growth recovery to date. In order for the unemployment rate to decline in a sustained manner, economic growth needs to exceed the economy’s potential growth and this set of circumstances has yet to occur. The severity of the recession has left high levels of unutilized resources in the industrial sector and property markets, and the labor market as well. The combined effect of this broad-based resource underutilization has resulted in downward pressure on inflation trends throughout 2009. This trend is expected to remain in place in 2010. The exceptionally high level of unemployment and muted inflation trends have led the Federal Reserve (“the Fed”) to cut its target overnight lending rate to a range of 0% to 0.25% and engage in a host of nontraditional easing activities, including large-scale purchases of mortgage securities. These activities have resulted in a significant increase in the monetary base, which along with other policy initiatives have worked to restore normal functioning in intrabank funding markets and have supported a broad-based improvement in financial conditions. This policy stance is expected to persist well into 2010 in an effort to support financial conditions and an ongoing recovery in economic activity.
As a result of the broad-based easing of monetary policy and mortgage-related asset purchases by the Fed, equity markets began moving higher after reaching the low in March, anticipating that these actions would ease financial strains and contribute to a stabilization and improvement in economic and corporate earnings performance. Subsequent economic data and earnings reports validated the initial expectations and have contributed to further gains in the equity markets as the fiscal year progressed.
What worked for the fund and why?
The fund employs three main strategies: portfolio beta (sensitivity to market moves), sectors, and styles. All three strategies were helpful for the fund, especially our choices to reduce beta (i.e., lower the volatility of the holdings) during the early part of the period. By mid-January, we had reduced the beta to 0.93 and continued to lower it as markets sank lower, yet restored it to near-market levels by mid-April. For such a tumultuous time, this proved to be successful management of beta.
| |
| * | Unlike mutual funds, index returns do not reflect any expenses, transaction costs, or cash flow effects. |
Top 10 Holdings as of October 31, 20091 (% of net assets)
| | | | | |
| Microsoft | | | 4 | .4% |
| IBM | | | 3 | .1 |
| Apple | | | 2 | .6 |
| Google, Class A | | | 2 | .4 |
| First American Prime Obligations Fund, Class Z | | | 2 | .3 |
| Cisco Systems | | | 2 | .3 |
| Johnson & Johnson | | | 2 | .2 |
| Hewlett-Packard | | | 2 | .0 |
| Procter & Gamble | | | 1 | .8 |
| Oracle | | | 1 | .8 |
| | | | | |
| | | | | |
Sector Allocation as of October 31, 20091 (% of net assets)
| | | | | |
| Information Technology | | | 39 | .2% |
| Healthcare | | | 17 | .0 |
| Consumer Staples | | | 11 | .5 |
| Industrials | | | 7 | .5 |
| Consumer Discretionary | | | 7 | .2 |
| Financials | | | 7 | .0 |
| Materials | | | 2 | .7 |
| Energy | | | 2 | .2 |
| Utilities | | | 1 | .9 |
| Telecommunication Services | | | 0 | .7 |
| Short-Term Investments | | | 2 | .9 |
Other Assets and Liabilities, Net2 | | | 0 | .2 |
| | | | | |
| | | | 100 | .0% |
| | | | | |
| | | | | |
| |
| 1 | Sector allocations are subject to change and are not recommendations to buy or sell any security. Allocations reflect the fund’s exposure to each sector through direct investments and do not reflect the impact on sector allocation of holding derivative instruments, such as futures. See note 2 in Notes to Financial Statements and the fund’s Schedule of Investments for derivatives held at October 31, 2009. |
| |
| 2 | Investments typically comprise substantially all of the fund’s net assets. Other assets and liabilities include receivables and payables on derivative instruments based on mark-to-market adjustments as well as receivables for items such as income earned but not yet received and payables for items such as fund expenses incurred but not yet paid. |
6 First American Funds 2009 Annual Report
Quantitative Large Cap Growth Fund
Our sector choices were also helpful. In the early part of the fiscal year, we successfully steered the fund to be significantly overweight in healthcare and underweight in transportation names (which were then dominated by the rapidly shrinking U.S. auto producers) relative to the benchmark.
Finally, we gained modestly from our choices of investment style. Our most successful call was in avoiding stocks whose value was boosted by market momentum. Our models have found that in recessions and other challenging environments, companies frequently change leadership. Such changes can serve as catalysts that galvanize underperforming stocks, making a “contrarian” approach – one that seeks out promising underperformers – more likely to succeed. Our next most successful style was to emphasize stocks with a lower price-earnings ratio (i.e., the current price of the stock divided by the company’s trailing 12 months’ earnings per share) than that of the fund’s benchmark.
What did not work for the fund and why?
The fund relies on a strategy of diversification to avoid adverse stock selection, but on balance some of the picks were unhelpful*. We had a significant overweight in information technology stocks, and only a modest underweight in Apple as part of our risk control. However, Apple was extremely successful during the period, which hurt fund performance relative to the benchmark. Within the healthcare sector, we chose to overweight Pfizer and underweight Schering-Plough, whereas the converse would have been much more favorable. Less significantly, our relatively low volatility held the portfolio back during the sharp rally that began in March 2009.
What strategic moves were made by the fund and why?
We believe the models proved their mettle through this most difficult of markets by pulling into a conservative stance, then returning the portfolio to a slightly cautious stance. Although conventional wisdom holds that technology companies have volatile earnings and high price/earnings ratios, we have nonetheless moved to a significant overweight in technology stocks.
| |
| * | Diversification does not assure a profit or protect against a loss in a declining market. |
First American Funds 2009 Annual Report 7
Quantitative Large Cap Growth Fund
Annual Performance1,2
| | | | | | | | | | | | | | | | | |
| | | October 31, 2009 | | September 30, 2009* |
| | | | | Since Inception | | | | Since Inception |
| | | 1 year | | 7/31/2007 | | 1 year | | 7/31/2007 |
| |
Average annual return with sales charge (POP) | | | | | | | | | | | | | | | | |
| Class A | | | 8 | .78% | | | (10.13 | )% | | | (7.37 | )% | | | (9.88 | )% |
| |
| |
| Class C | | | 13 | .27% | | | (8.52 | )% | | | (3.65 | )% | | | (8.16 | )% |
| | | | | | | | | | | | | | | | | |
Average annual return without sales charge (NAV) | | | | | | | | | | | | | | | | |
| Class A | | | 15 | .09% | | | (7.84 | )% | | | (1.98 | )% | | | (7.49 | )% |
| |
| |
| Class C | | | 14 | .27% | | | (8.52 | )% | | | (2.68 | )% | | | (8.16 | )% |
| |
| |
| Class Y | | | 15 | .42% | | | (7.61 | ))% | | | (1.74 | )% | | | (7.25 | )% |
| |
| |
Russell 1000 Growth Index3 | | | 17 | .51% | | | (8.89 | )% | | | (1.85 | )% | | | (8.65 | )% |
| |
| |
The performance data quoted on this page represents past performance and does not guarantee future results. The investment return and principal value of an investment will fluctuate so that an investor’s shares, when redeemed, may be worth more or less than their original cost. Current performance of the fund may be lower or higher than the performance data quoted. Performance data current to the most recent month-end may be obtained by calling 800.677.FUND.
| |
| 1 | Total returns at net asset value (“NAV”) reflect performance over the time period indicated without including the fund’s maximum sales charge and assume reinvestment of all distributions at NAV. |
| |
| | Total returns at public offering price (“POP”) reflect performance over the time period indicated including the maximum sales charge of 5.50% for Class A shares and the maximum contingent deferred sales charge of 1.00% for Class C shares for the relevant period. Total returns assume reinvestment of all distributions at NAV. |
As reflected in the prospectus for the fiscal year ended October 31, 2008, the fund’s total annual operating expense ratio, before waivers and including the expenses of other investment companies in which the fund invests, if any (“acquired fund fees and expenses”), for Class A, Class C, and Class Y shares was 2.90%, 3.65%, and 2.65%, respectively. The advisor has contractually agreed to waive fees through February 28, 2010 so that total annual fund operating expenses, not including any acquired fund fees and expenses, for Class A, Class C, and Class Y shares do not exceed 0.70%, 1.45%, and 0.45%, respectively. These fee waivers may be terminated at any time after February 28, 2010, at the discretion of the advisor. Prior to that time, such waivers may not be terminated without the approval of the fund’s board of directors.
| |
| * | This table represents average annual total returns through the latest calendar quarter – rather than through the end of the fiscal period. |
Value of $10,000 Investment1,2,4 as of October 31, 2009
This chart illustrates the total value of an assumed $10,000 investment in the fund’s Class A shares (from 7/31/2007 to 10/31/2009) as compared to the Russell 1000 Growth Index3.
| |
| 2 | Performance does not reflect the deduction of taxes that a shareholder would pay on fund distributions or redemption of fund shares. Performance reflects fee waivers that were in effect during the periods indicated. In the absence of such fee waivers, total returns would be reduced. Index performance is for illustrative purposes only and does not reflect any expenses, transaction costs, or cash flow effects. Direct investment in the index is not available. |
| |
| 3 | An unmanaged growth index that measures the performance of those companies within the Russell 1000 Index (large-cap index) with higher book-to-price ratios and lower forecasted growth rates. |
| |
| 4 | Performance for Class C and Class Y shares is not presented. Performance for these classes will vary due to their different expense structures. |
8 First American Funds 2009 Annual Report
Quantitative Large Cap Value Fund
Investment Objective: to provide, over the long term, a total return that exceeds that of the Russell 1000 Value Index*
How did the fund perform for the fiscal year ended October 31, 2009?
The First American Quantitative Large Cap Value Fund (the “fund”), Class Y shares, returned 9.00% for the fiscal year ended October 31, 2009 (Class A shares returned 8.73% without taking the sales charge into account). By comparison, the fund’s benchmark, the Russell 1000 Value Index*, returned 4.78% for the same period.
How did market conditions affect stock market performance during the fiscal year?
The U.S. economy appears to have emerged from the most severe recession of the postwar era during the third quarter of 2009. Gross Domestic Product expanded at a 2.8% annual rate during the quarter, and leading indicators currently suggest that positive growth will be maintained during the final quarter of the year and into 2010. Despite the return to positive growth since midyear, the unemployment rate has continued to rise and reached a new cyclical high of 10.2% in October. The continued increase in the unemployment rate reflects both a historical pattern, where it is common for the unemployment rate to reach its peak after economic activity has reached its trough during the cycle, as well as the subdued pace of the growth recovery to date. In order for the unemployment rate to decline in a sustained manner, economic growth needs to exceed the economy’s potential growth and this set of circumstances has yet to occur. The severity of the recession has left high levels of unutilized resources in the industrial sector and property markets, and the labor market as well. The combined effect of this broad-based resource underutilization has resulted in downward pressure on inflation trends throughout 2009. This trend is expected to remain in place in 2010. The exceptionally high level of unemployment and muted inflation trends have led the Federal Reserve (“the Fed”) to cut its target overnight lending rate to a range of 0% to 0.25% and engage in a host of nontraditional easing activities, including large-scale purchases of mortgage securities. These activities have resulted in a significant increase in the monetary base, which along with other policy initiatives have worked to restore normal functioning in intrabank funding markets and have supported a broad-based improvement in financial conditions. This policy stance is expected to persist well into 2010 in an effort to support financial conditions and an ongoing recovery in economic activity.
As a result of the broad-based easing of monetary policy and mortgage-related asset purchases by the Fed, equity markets began moving higher after reaching the low in March, anticipating that these actions would ease financial strains and contribute to a stabilization and improvement in economic and corporate earnings performance. Subsequent economic data and earnings reports validated the initial expectations and have contributed to further gains in the equity markets as the fiscal year progressed.
What worked for the fund and why?
At the beginning of the fiscal year, the models we use to guide strategy in the fund were indicating a sharply negative outlook for three key sectors in the value space: financials, energy, and durable goods. In underweighting all three, we dramatically reduced the portfolio beta, or sensitivity to market moves. Our statistical tracking shows the beta as responsible for over half of the outperformance versus the fund’s benchmark.
| |
| * | Unlike mutual funds, index returns do not reflect any expenses, transaction costs, or cash flow effects. |
Top 10 Holdings as of October 31, 20091 (% of net assets)
| | | | | |
| Exxon Mobil | | | 5 | .1% |
| Chevron | | | 3 | .4 |
| Pfizer | | | 3 | .2 |
| General Electric | | | 2 | .9 |
| JPMorgan Chase | | | 2 | .8 |
| AT&T | | | 2 | .6 |
| Bank of America | | | 2 | .5 |
| Wells Fargo | | | 2 | .0 |
| ConocoPhillips | | | 1 | .7 |
| Goldman Sachs Group | | | 1 | .6 |
| | | | | |
| | | | | |
Sector Allocation as of October 31, 20091 (% of net assets)
| | | | | |
| Financials | | | 26 | .0% |
| Energy | | | 16 | .9 |
| Information Technology | | | 11 | .6 |
| Healthcare | | | 10 | .5 |
| Utilities | | | 8 | .6 |
| Industrials | | | 8 | .0 |
| Consumer Discretionary | | | 6 | .5 |
| Telecommunication Services | | | 4 | .7 |
| Materials | | | 3 | .1 |
| Consumer Staples | | | 2 | .2 |
| Short-Term Investments | | | 1 | .7 |
Other Assets and Liabilities, Net2 | | | 0 | .2 |
| | | | | |
| | | | 100 | .0% |
| | | | | |
| | | | | |
| |
| 1 | Sector allocations are subject to change and are not recommendations to buy or sell any security. Allocations reflect the fund’s exposure to each sector through direct investments and do not reflect the impact on sector allocation of holding derivative instruments, such as futures. See note 2 in Notes to Financial Statements and the fund’s Schedule of Investments for derivatives held at October 31, 2009. |
| |
| 2 | Investments typically comprise substantially all of the fund’s net assets. Other assets and liabilities include receivables and payables on derivative instruments based on mark-to-market adjustments as well as receivables for items such as income earned but not yet received and payables for items such as fund expenses incurred but not yet paid. |
First American Funds 2009 Annual Report 9
Quantitative Large Cap Value Fund
Despite the spreading concern at the beginning of the fiscal year that the banking system troubles would take down the broader economy, we targeted those sectors that seemed the least at risk from the then-current difficulties. Healthcare and technology scored the best on our models and were successfully overweighted relative to the benchmark. Still, the underweight on financials accounted for more than half of our successful sector positioning.
The third leg of our strategy, portfolio styles, also weighed in positively. In the shrinking economy, our emphasis on stocks with low price/earnings ratios (i.e., the current price of the stock divided by the company’s trailing 12 months’ earnings per share) was very favorable. Based largely on interest rate and business activity indicators, we avoided firms with higher debt/equity ratios (financial leverage) and steered clear of stocks that owed their appreciation solely to market momentum.
Finally, our outperformance also relates to our models’ success in re-orienting our strategy to the more favorable investing climate. By March 12 – just three days after the bottom of most U.S. indices – we moved the portfolio beta back above 1.0 briefly and kept it at near-market levels for the balance of the fiscal year. Our macro-sensitive models allowed the portfolio to continue to add value during the second half of the fiscal year.
What did not work for the fund and why?
In the approximately two dozen style and sector positions that we track, only the “volatility” characteristic, inherent in stocks that tend to fluctuate more, was a notable detractor. For most of the fiscal year, the fund underweighted volatility stocks, and they outperformed.
We normally depend on diversification to address unanticipated ups and downs of individual stocks that are not associated with movements in styles and sectors*. For this fiscal year, stock selection was, on balance, a negative, though only a modest one thanks to good diversification. The timing of our underweight positions in Goldman Sachs, Ford, and Anadarko Petroleum worked to our detriment due to their relatively stronger performance, as did overweight positions in the underperforming financial firm NYSE Euronext and energy company Mirant.
What strategic moves were made by the fund and why?
We believe the models proved their mettle through this most difficult of markets by pulling into a conservative stance, then returning the portfolio to a slightly cautious stance. Although conventional wisdom holds that technology companies have volatile earnings and high price/earnings ratios, we have nonetheless moved to a significant overweight in technology stocks. Even more striking, the portfolio, at the end of the fiscal year, held more financials than its benchmark.
| |
| * | Diversification does not assure a profit or protect against a loss in a declining market. |
10 First American Funds 2009 Annual Report
Quantitative Large Cap Value Fund
Annual Performance1,2
| | | | | | | | | | | | | | | | | |
| | | October 31, 2009 | | September 30, 2009* |
| | | | | Since Inception | | | | Since Inception |
| | | 1 year | | 7/31/2007 | | 1 year | | 7/31/2007 |
| |
Average annual return with sales charge (POP) | | | | | | | | | | | | | | | | |
| Class A | | | 2 | .75% | | | (13.94 | )% | | | (11.00 | )% | | | (13.19 | )% |
| |
| |
| Class C | | | 7 | .21% | | | (12.28 | )% | | | (7.18 | )% | | | (11.44 | )% |
| | | | | | | | | | | | | | | | | |
Average annual return without sales charge (NAV) | | | | | | | | | | | | | | | | |
| Class A | | | 8 | .73% | | | (11.74 | )% | | | (5.80 | )% | | | (10.89 | )% |
| |
| |
| Class C | | | 8 | .21% | | | (12.28 | )% | | | (6.24 | )% | | | (11.44 | )% |
| |
| |
| Class Y | | | 9 | .00% | | | (11.52 | )% | | | (5.56 | )% | | | (10.66 | )% |
| |
| |
Russell 1000 Value Index3 | | | 4 | .78% | | | (15.04 | )% | | | (10.62 | )% | | | (14.36 | )% |
| | | | | | | | | | | | | | | | | |
| | | | | | | | | | | | | | | | | |
The performance data quoted on this page represents past performance and does not guarantee future results. The investment return and principal value of an investment will fluctuate so that an investor’s shares, when redeemed, may be worth more or less than their original cost. Current performance of the fund may be lower or higher than the performance data quoted. Performance data current to the most recent month-end may be obtained by calling 800.677.FUND.
| |
| 1 | Total returns at net asset value (“NAV”) reflect performance over the time period indicated without including the fund’s maximum sales charge and assume reinvestment of all distributions at NAV. |
Total returns at public offering price (“POP”) reflect performance over the time period indicated including the maximum sales charge of 5.50% for Class A shares and the maximum contingent deferred sales charge of 1.00% for Class C shares for the relevant period. Total returns assume reinvestment of all distributions at NAV.
| |
| | As reflected in the prospectus for the fiscal year ended October 31, 2008, the fund’s total annual operating expense ratio, before waivers and including the expenses of other investment companies in which the fund invests, if any (“acquired fund fees and expenses”), for Class A, Class C, and Class Y shares was 3.79%, 4.54%, and 3.54%, respectively. The advisor has contractually agreed to waive fees through February 28, 2010 so that total annual fund operating expenses, not including any acquired fund fees and expenses, for Class A, Class C, and Class Y shares do not exceed 0.70%, 1.45%, and 0.45%, respectively. These fee waivers may be terminated at any time after February 28, 2010, at the discretion of the advisor. Prior to that time, such waivers may not be terminated without the approval of the fund’s board of directors. |
| | |
| | * | This table represents average annual total returns through the latest calendar quarter – rather than through the end of the fiscal period. |
Value of $10,000 Investment1,2,4 as of October 31, 2009
This chart illustrates the total value of an assumed $10,000 investment in the fund’s Class A shares (from 7/31/2007 to 10/31/2009) as compared to the Russell 1000 Value Index3.
| |
| 2 | Performance does not reflect the deduction of taxes that a shareholder would pay on fund distributions or redemption of fund shares. Performance reflects fee waivers that were in effect during the periods indicated. In the absence of such fee waivers, total returns would be reduced. Index performance is for illustrative purposes only and does not reflect any expenses, transaction costs, or cash flow effects. Direct investment in the index is not available. |
| |
| 3 | An unmanaged value index that measures the performance of those companies within the Russell 1000 Index (large-cap index) with higher book-to-price ratios and lower forecasted growth rates. |
| |
| 4 | Performance for Class C and Class Y shares is not presented. Performance for these classes will vary due to their different expense structures. |
First American Funds 2009 Annual Report 11
Expense Examples
As a shareholder of one or more of the funds, you incur two types of costs: (1) transaction costs, including sales charges (loads) on purchase payments; and (2) ongoing costs, including investment advisory fees, distribution and/or service (12b-1) fees, and other fund expenses. The examples below are intended to help you understand your ongoing costs (in dollars) of investing in the funds and to compare these costs with the ongoing costs of investing in other mutual funds. The examples are based on an investment of $1,000 invested in a fund at the beginning of the period and held for the entire period from May 1, 2009 to October 31, 2009.
Actual Expenses
For each class of each fund, two lines are presented in the table below — the first line for each class provides information about actual account values and actual expenses. You may use the information in this line, together with the amount you invested in the particular fund and class, to estimate the expenses that you paid over the period. Simply divide your account value in the fund and class by $1,000 (for example, an $8,600 account value divided by $1,000 = 8.6), then multiply the result by the number in the first line under the heading entitled “Expenses Paid During Period” for your fund and class to estimate the expenses you paid on your account during this period.
Hypothetical Example for Comparison Purposes
For each class of each fund, the second line for each class provides information about hypothetical account values and hypothetical expenses based on the respective fund’s actual expense ratio and an assumed rate of return of 5% per year before expenses, which is not the fund’s actual return. The hypothetical account values and expenses may not be used to estimate the actual ending account balance or expenses you paid for the period. You may use this information to compare the ongoing costs of investing in the fund and other funds. To do so, compare this 5% hypothetical examples with the 5% hypothetical examples that appear in the shareholder reports of the other funds.
Please note that the expenses shown in the tables are meant to highlight your ongoing costs only and do not reflect any transactional costs, such as sales charges (loads). Therefore, the second line of the tables for each class of each fund is useful in comparing ongoing costs only, and will not help you determine the relative total costs of owning different funds. In addition, if these transactional costs were included, your costs would have been higher.
Quantitative Large Cap Core Fund
| | | | | | | | | | | | | |
| | | | | | | Expenses Paid During
|
| | | Beginning Account
| | Ending Account
| | Period1 (5/01/09 to
|
| | | Value (5/01/09)
| | Value (10/31/09)
| | 10/31/09) |
| |
Class A Actual2 | | $ | 1,000.00 | | | $ | 1,192.70 | | | $ | 3.81 | |
| |
| |
| Class A Hypothetical (5% return before expenses) | | $ | 1,000.00 | | | $ | 1,021.73 | | | $ | 3.52 | |
| |
| |
| | | | | | | | | | | | | |
Class C Actual2 | | $ | 1,000.00 | | | $ | 1,188.50 | | | $ | 7.94 | |
| |
| |
| Class C Hypothetical (5% return before expenses) | | $ | 1,000.00 | | | $ | 1,017.95 | | | $ | 7.32 | |
| |
| |
| | | | | | | | | | | | | |
Class Y Actual2 | | $ | 1,000.00 | | | $ | 1,193.90 | | | $ | 2.43 | |
| |
| |
| Class Y Hypothetical (5% return before expenses) | | $ | 1,000.00 | | | $ | 1,022.99 | | | $ | 2.24 | |
| | | | | | | | | | | | | |
| | | | | | | | | | | | | |
| |
| 1 | Expenses are equal to the fund’s annualized expense ratio for the most recent six-month period of 0.69%, 1.44%, and 0.44% for Class A, Class C, and Class Y, respectively, multiplied by the average account value over the period, multiplied by the number of days in the most recent fiscal half-year/365 (to reflect the one-half year period). |
| |
| 2 | Based on the actual returns for the six-month period ended October 31, 2009 of 19.27%, 18.85%, and 19.39% for Class A, Class C, and Class Y, respectively. |
12 First American Funds 2009 Annual Report
Quantitative Large Cap Growth Fund
| | | | | | | | | | | | | |
| | | | | | | Expenses Paid During
|
| | | Beginning Account
| | Ending Account
| | Period1 (5/01/09 to
|
| | | Value (5/01/09)
| | Value (10/31/09)
| | 10/31/09) |
| |
Class A Actual2 | | $ | 1,000.00 | | | $ | 1,185.20 | | | $ | 3.86 | |
| |
| |
| Class A Hypothetical (5% return before expenses) | | $ | 1,000.00 | | | $ | 1,021.68 | | | $ | 3.57 | |
| |
| |
| | | | | | | | | | | | | |
Class C Actual2 | | $ | 1,000.00 | | | $ | 1,180.60 | | | $ | 7.97 | |
| |
| |
| Class C Hypothetical (5% return before expenses) | | $ | 1,000.00 | | | $ | 1,017.90 | | | $ | 7.37 | |
| |
| |
| | | | | | | | | | | | | |
Class Y Actual2 | | $ | 1,000.00 | | | $ | 1,186.80 | | | $ | 2.48 | |
| |
| |
| Class Y Hypothetical (5% return before expenses) | | $ | 1,000.00 | | | $ | 1,022.94 | | | $ | 2.29 | |
| | | | | | | | | | | | | |
| | | | | | | | | | | | | |
| |
| 1 | Expenses are equal to the fund’s annualized expense ratio for the most recent six-month period of 0.70%, 1.45%, and 0.45% for Class A, Class C, and Class Y, respectively, multiplied by the average account value over the period, multiplied by the number of days in the most recent fiscal half-year/365 (to reflect the one-half year period). |
| |
| 2 | Based on the actual returns for the six-month period ended October 31, 2009 of 18.52%, 18.06%, and 18.68% for Class A, Class C, and Class Y, respectively. |
Quantitative Large Cap Value Fund
| | | | | | | | | | | | | |
| | | | | | | Expenses Paid During
|
| | | Beginning Account
| | Ending Account
| | Period3 (5/01/09 to
|
| | | Value (5/01/09)
| | Value (10/31/09)
| | 10/31/09) |
| |
Class A Actual4 | | $ | 1,000.00 | | | $ | 1,204.00 | | | $ | 3.89 | |
| |
| |
| Class A Hypothetical (5% return before expenses) | | $ | 1,000.00 | | | $ | 1,021.68 | | | $ | 3.57 | |
| |
| |
| | | | | | | | | | | | | |
Class C Actual4 | | $ | 1,000.00 | | | $ | 1,201.60 | | | $ | 7.99 | |
| |
| |
| Class C Hypothetical (5% return before expenses) | | $ | 1,000.00 | | | $ | 1,017.95 | | | $ | 7.32 | |
| |
| |
| | | | | | | | | | | | | |
Class Y Actual4 | | $ | 1,000.00 | | | $ | 1,205.20 | | | $ | 2.50 | |
| |
| |
| Class Y Hypothetical (5% return before expenses) | | $ | 1,000.00 | | | $ | 1,022.94 | | | $ | 2.29 | |
| | | | | | | | | | | | | |
| | | | | | | | | | | | | |
| |
| 3 | Expenses are equal to the fund’s annualized expense ratio for the most recent six-month period of 0.70%, 1.44%, and 0.45% for Class A, Class C, and Class Y, respectively, multiplied by the average account value over the period, multiplied by the number of days in the most recent fiscal half-year/365 (to reflect the one-half year period). |
| |
| 4 | Based on the actual returns for the six-month period ended October 31, 2009 of 20.40%, 20.16%, and 20.52% for Class A, Class C, and Class Y, respectively. |
First American Funds 2009 Annual Report 13
To the Shareholders and Board of Directors
First American Investment Funds, Inc.
We have audited the accompanying statements of assets and liabilities, including the schedules of investments, of the Quantitative Large Cap Core, Quantitative Large Cap Growth, and Quantitative Large Cap Value Funds (series of First American Investment Funds, Inc.) (collectively, the “funds”) as of October 31, 2009, and the related statements of operations, the statements of changes in net assets and the financial highlights for each of the periods indicated therein. These financial statements and financial highlights are the responsibility of the funds’ management. Our responsibility is to express an opinion on these financial statements and financial highlights based on our audits.
We conducted our audits in accordance with the standards of the Public Company Accounting Oversight Board (United States). Those standards require that we plan and perform the audit to obtain reasonable assurance about whether the financial statements and financial highlights are free of material misstatement. We were not engaged to perform an audit of the funds’ internal control over financial reporting. Our audits included consideration of internal control over financial reporting as a basis for designing audit procedures that are appropriate in the circumstances, but not for the purpose of expressing an opinion on the effectiveness of the funds’ internal control over financial reporting. Accordingly, we express no such opinion. An audit also includes examining, on a test basis, evidence supporting the amounts and disclosures in the financial statements and financial highlights, assessing the accounting principles used and significant estimates made by management, and evaluating the overall financial statement presentation. Our procedures included confirmation of securities owned as of October 31, 2009, by correspondence with the custodian and brokers, or by other appropriate auditing procedures where replies from brokers were not received. We believe that our audits provide a reasonable basis for our opinion.
In our opinion, the financial statements and financial highlights referred to above present fairly, in all material respects, the financial position of the funds listed above of First American Investment Funds, Inc. at October 31, 2009, the results of their operations, the changes in their net assets and the financial highlights for each of the periods indicated therein, in conformity with U.S. generally accepted accounting principles.
Minneapolis, Minnesota
December 22, 2009
14 First American Funds 2009 Annual Report
Schedule of Investments October 31, 2009, all dollars are rounded to thousands (000)
| | | | | | | | | |
| Quantitative Large Cap Core Fund |
| DESCRIPTION | | SHARES | | FAIR VALUE |
| |
| |
Common Stocks – 94.0% |
| Consumer Discretionary – 5.1% |
Amazon.com = 6 | | | 3,083 | | | $ | 366 | |
Bed Bath & Beyond = | | | 1,138 | | | | 40 | |
| Best Buy | | | 4,558 | | | | 174 | |
| Carnival | | | 7,690 | | | | 224 | |
Comcast, Class A 6 | | | 13,924 | | | | 202 | |
DISH Network, Class A = 6 | | | 2,949 | | | | 51 | |
Ford Motor = | | | 26,905 | | | | 188 | |
| Fortune Brands | | | 5,321 | | | | 207 | |
Garmin 6 | | | 2,882 | | | | 87 | |
| H&R Block | | | 33,463 | | | | 614 | |
Harley-Davidson 6 | | | 7,766 | | | | 194 | |
| Harman International Industries | | | 247 | | | | 9 | |
| Hasbro | | | 7,283 | | | | 199 | |
| Home Depot | | | 20,250 | | | | 508 | |
| International Game Technology | | | 2,215 | | | | 40 | |
| International Speedway, Class A | | | 8,384 | | | | 214 | |
| Lowe’s | | | 30,582 | | | | 598 | |
Marriott International, Class A 6 | | | 7,990 | | | | 200 | |
| Mattel | | | 7,755 | | | | 147 | |
| McDonald’s | | | 2,657 | | | | 156 | |
| McGraw-Hill | | | 12,333 | | | | 355 | |
Meredith 6 | | | 1,777 | | | | 48 | |
Newell Rubbermaid 6 | | | 13,624 | | | | 198 | |
| News, Class A | | | 24,409 | | | | 281 | |
| Omnicom Group | | | 5,910 | | | | 203 | |
| Sherwin-Williams | | | 7,817 | | | | 446 | |
| Staples | | | 5,086 | | | | 110 | |
| Starwood Hotels & Resorts Worldwide | | | 2,955 | | | | 86 | |
| VF | | | 343 | | | | 24 | |
Viacom, Class B = | | | 10,483 | | | | 289 | |
| Walt Disney | | | 19,950 | | | | 546 | |
| Washington Post, Class B | | | 1,121 | | | | 484 | |
Williams-Sonoma 6 | | | 2,701 | | | | 51 | |
| | | | | | | | | |
| | | | | | | | 7,539 | |
| | | | | | | | | |
| Consumer Staples – 6.8% |
| Altria Group | | | 42,040 | | | | 761 | |
| Archer-Daniels-Midland | | | 1,681 | | | | 51 | |
| Avon Products | | | 2,055 | | | | 66 | |
| Brown-Forman, Class B | | | 1,703 | | | | 83 | |
| Coca-Cola | | | 15,918 | | | | 849 | |
Colgate-Palmolive 6 | | | 3,727 | | | | 293 | |
| CVS Caremark | | | 16,108 | | | | 569 | |
| Kimberly-Clark | | | 8,069 | | | | 493 | |
| Kraft Foods, Class A | | | 10,495 | | | | 289 | |
| Lorillard | | | 1,885 | | | | 147 | |
| Molson Coors Brewing, Class B | | | 8,035 | | | | 393 | |
| PepsiCo | | | 13,687 | | | | 829 | |
| Philip Morris International | | | 35,447 | | | | 1,679 | |
| Procter & Gamble | | | 40,181 | | | | 2,330 | |
| Safeway | | | 5,416 | | | | 121 | |
| Sara Lee | | | 8,350 | | | | 94 | |
Sysco 6 | | | 7,623 | | | | 202 | |
| Walgreen | | | 12,959 | | | | 490 | |
| Wal-Mart Stores | | | 4,192 | | | | 208 | |
| | | | | | | | | |
| | | | | | | | 9,947 | |
| | | | | | | | | |
| Energy – 10.0% |
| Anadarko Petroleum | | | 1,787 | | | | 109 | |
| Apache | | | 8,587 | | | | 808 | |
Arch Coal 6 | | | 2,887 | | | | 63 | |
Baker Hughes 6 | | | 3,121 | | | | 131 | |
| BJ Services | | | 2,266 | | | | 44 | |
| Chevron | | | 34,312 | | | | 2,626 | |
| ConocoPhillips | | | 19,852 | | | | 996 | |
CONSOL Energy 6 | | | 3,948 | | | | 169 | |
| Devon Energy | | | 8,212 | | | | 531 | |
ENSCO International 6 | | | 6,314 | | | | 289 | |
| EOG Resources | | | 1,268 | | | | 104 | |
| Exxon Mobil | | | 67,864 | | | | 4,864 | |
Frontline 6 | | | 14,240 | | | | 332 | |
| Halliburton | | | 23,821 | | | | 696 | |
| Hess | | | 54 | | | | 3 | |
Marathon Oil 6 | | | 11,577 | | | | 370 | |
| Murphy Oil | | | 1,460 | | | | 89 | |
National-Oilwell Varco = | | | 6,807 | | | | 279 | |
| Occidental Petroleum | | | 3,371 | | | | 256 | |
Peabody Energy 6 | | | 1,066 | | | | 42 | |
| Rowan | | | 8,862 | | | | 206 | |
| Schlumberger | | | 10,417 | | | | 648 | |
| Smith International | | | 5,403 | | | | 150 | |
| Sunoco | | | 9,836 | | | | 303 | |
| Tidewater | | | 6,711 | | | | 280 | |
Valero Energy 6 | | | 9,102 | | | | 165 | |
| XTO Energy | | | 2,947 | | | | 122 | |
| | | | | | | | | |
| | | | | | | | 14,675 | |
| | | | | | | | | |
| Financials – 16.2% |
Affiliated Managers Group = 6 | | | 2,477 | | | | 157 | |
| Aflac | | | 9,014 | | | | 374 | |
| Allied World Assurance Company Holdings | | | 3,099 | | | | 139 | |
| Allstate | | | 9,836 | | | | 291 | |
| American Express | | | 25,082 | | | | 874 | |
| American Financial Group | | | 8,631 | | | | 212 | |
| Ameriprise Financial | | | 7,949 | | | | 276 | |
| AON | | | 11,445 | | | | 441 | |
Arch Capital Group = | | | 1,715 | | | | 115 | |
| Assurant | | | 14,910 | | | | 446 | |
| Axis Capital Holdings | | | 4,213 | | | | 122 | |
| Bank of America | | | 125,907 | | | | 1,836 | |
Bank of Hawaii 6 | | | 11,004 | | | | 489 | |
| Bank of New York Mellon | | | 20,117 | | | | 536 | |
BB&T 6 | | | 15,942 | | | | 381 | |
| Camden Property Trust – REIT | | | 5,188 | | | | 188 | |
| Charles Schwab | | | 24,103 | | | | 418 | |
| Chimera Investment – REIT | | | 31,214 | | | | 109 | |
| Chubb | | | 8,577 | | | | 416 | |
Cincinnati Financial 6 | | | 15,963 | | | | 405 | |
| Citigroup | | | 58,088 | | | | 238 | |
CME Group 6 | | | 660 | | | | 200 | |
| Cullen/Frost Bankers | | | 2,676 | | | | 125 | |
| Discover Financial Services | | | 6,180 | | | | 87 | |
| Everest Re Group | | | 3,143 | | | | 275 | |
Federated Investors, Class B 6 | | | 18,758 | | | | 492 | |
Franklin Resources 6 | | | 4,779 | | | | 500 | |
Goldman Sachs Group 6 | | | 8,771 | | | | 1,492 | |
Hartford Financial Services Group 6 | | | 2,516 | | | | 62 | |
Interactive Brokers Group, Class A = | | | 24,765 | | | | 396 | |
IntercontinentalExchange = 6 | | | 2,296 | | | | 230 | |
| Invesco | | | 8,994 | | | | 190 | |
Investment Technology Group = | | | 8,142 | | | | 176 | |
| Janus Capital Group | | | 7,761 | | | | 102 | |
| JPMorgan Chase | | | 54,749 | | | | 2,287 | |
| Lazard, Class A | | | 7,196 | | | | 272 | |
| Legg Mason | | | 15,058 | | | | 438 | |
| Lincoln National | | | 6,920 | | | | 165 | |
First American Funds 2009 Annual Report 15
Schedule of Investments October 31, 2009, all dollars are rounded to thousands (000)
| | | | | | | | | |
| Quantitative Large Cap Core Fund (continued) |
| DESCRIPTION | | SHARES | | FAIR VALUE |
| |
| |
| Marsh & McLennan | | | 3,248 | | | $ | 76 | |
| MetLife | | | 10,398 | | | | 354 | |
| Morgan Stanley | | | 31,754 | | | | 1,020 | |
NASDAQ OMX Group = | | | 8,619 | | | | 156 | |
New York Community Bancorp 6 | | | 12,863 | | | | 139 | |
| PartnerRe | | | 3,169 | | | | 242 | |
| PNC Financial Services Group | | | 5,491 | | | | 269 | |
Principal Financial Group 6 | | | 9,176 | | | | 230 | |
Progressive = | | | 1,637 | | | | 26 | |
| Protective Life | | | 13,679 | | | | 263 | |
| Prudential Financial | | | 9,056 | | | | 410 | |
Public Storage – REIT 6 | | | 798 | | | | 59 | |
| Rayonier – REIT | | | 9,676 | | | | 373 | |
| SEI Investments | | | 1,763 | | | | 31 | |
| StanCorp Financial Group | | | 3,475 | | | | 128 | |
| State Street | | | 8,938 | | | | 375 | |
T. Rowe Price Group 6 | | | 1,166 | | | | 57 | |
TD Ameritrade = | | | 23,634 | | | | 456 | |
| Torchmark | | | 3,953 | | | | 160 | |
| Travelers | | | 9,931 | | | | 494 | |
| Unitrin | | | 3,138 | | | | 61 | |
| Unum Group | | | 3,414 | | | | 68 | |
| W.R. Berkley | | | 5,404 | | | | 134 | |
| Wells Fargo | | | 70,730 | | | | 1,946 | |
Wilmington Trust 6 | | | 7,360 | | | | 89 | |
| XL Capital, Class A | | | 7,716 | | | | 127 | |
| | | | | | | | | |
| | | | | | | | 23,695 | |
| | | | | | | | | |
| Healthcare – 13.3% |
| Abbott Laboratories | | | 23,052 | | | | 1,166 | |
| Aetna | | | 4,594 | | | | 120 | |
| Allergan | | | 4,195 | | | | 236 | |
| AmerisourceBergen | | | 13,869 | | | | 307 | |
Amgen = | | | 14,608 | | | | 785 | |
| Baxter International | | | 11,557 | | | | 625 | |
| Becton, Dickinson & Company | | | 7,033 | | | | 481 | |
Boston Scientific = | | | 18,335 | | | | 149 | |
| Bristol-Myers Squibb | | | 66,498 | | | | 1,450 | |
| C.R. Bard | | | 3,443 | | | | 258 | |
| Cardinal Health | | | 9,944 | | | | 282 | |
CareFusion = | | | 4,972 | | | | 111 | |
| CIGNA | | | 21,152 | | | | 589 | |
| Cooper | | | 1,382 | | | | 39 | |
Eli Lilly 6 | | | 31,218 | | | | 1,062 | |
Endo Pharmaceuticals Holdings = | | | 15,135 | | | | 339 | |
Forest Laboratories = | | | 20,767 | | | | 575 | |
Genzyme = 6 | | | 4,897 | | | | 248 | |
Gilead Sciences = | | | 8,083 | | | | 344 | |
Hospira = | | | 48 | | | | 2 | |
| IMS Health | | | 5,202 | | | | 85 | |
| Johnson & Johnson | | | 40,970 | | | | 2,419 | |
King Pharmaceuticals = | | | 6,444 | | | | 65 | |
| McKesson | | | 3,240 | | | | 190 | |
| Medtronic | | | 17,467 | | | | 624 | |
| Merck | | | 42,931 | | | | 1,328 | |
Mettler-Toledo International = | | | 2,357 | | | | 230 | |
| Pfizer | | | 174,120 | | | | 2,965 | |
| Schering-Plough | | | 10,822 | | | | 305 | |
St. Jude Medical = | | | 4,355 | | | | 148 | |
Stryker 6 | | | 11,747 | | | | 540 | |
| Techne | | | 547 | | | | 34 | |
| Teleflex | | | 2,364 | | | | 118 | |
Thermo Fisher Scientific = | | | 7,323 | | | | 329 | |
| UnitedHealth Group | | | 15,012 | | | | 389 | |
Varian Medical Systems = | | | 2,946 | | | | 121 | |
Zimmer Holdings = | | | 8,098 | | | | 426 | |
| | | | | | | | | |
| | | | | | | | 19,484 | |
| | | | | | | | | |
| Industrials – 7.6% |
| 3M | | | 13,421 | | | | 987 | |
| Avery Dennison | | | 6,048 | | | | 216 | |
| Burlington Northern Santa Fe | | | 3,288 | | | | 248 | |
Caterpillar 6 | | | 6,713 | | | | 370 | |
Cintas 6 | | | 1,382 | | | | 38 | |
| CSX | | | 1,966 | | | | 83 | |
| Danaher | | | 10,682 | | | | 729 | |
| Deere & Company | | | 4,708 | | | | 214 | |
| Dover | | | 7,012 | | | | 264 | |
| Eaton | | | 5,875 | | | | 355 | |
| Emerson Electric | | | 11,871 | | | | 448 | |
| Equifax | | | 4,026 | | | | 110 | |
| FedEx | | | 5,508 | | | | 400 | |
| Fluor | | | 1,654 | | | | 73 | |
| General Dynamics | | | 1,544 | | | | 97 | |
| General Electric | | | 158,277 | | | | 2,257 | |
| Harsco | | | 2,126 | | | | 67 | |
| Honeywell International | | | 11,062 | | | | 397 | |
| Illinois Tool Works | | | 9,622 | | | | 442 | |
| ITT | | | 169 | | | | 9 | |
| Masco | | | 12,335 | | | | 145 | |
| Norfolk Southern | | | 8,358 | | | | 390 | |
| Northrop Grumman | | | 6,982 | | | | 350 | |
| Parker Hannifin | | | 803 | | | | 42 | |
Pitney Bowes 6 | | | 31,006 | | | | 760 | |
| R.R. Donnelley & Sons | | | 11,249 | | | | 226 | |
| Roper Industries | | | 1,059 | | | | 54 | |
| Snap-On | | | 503 | | | | 18 | |
Trinity Industries 6 | | | 3,064 | | | | 52 | |
| Union Pacific | | | 5,313 | | | | 293 | |
| United Parcel Service, Class B | | | 10,951 | | | | 588 | |
| United Technologies | | | 7,165 | | | | 440 | |
| | | | | | | | | |
| | | | | | | | 11,162 | |
| | | | | | | | | |
| Information Technology ⊳ – 25.8% |
Adobe Systems = | | | 12,488 | | | | 411 | |
Agilent Technologies = 6 | | | 12,123 | | | | 300 | |
Akamai Technologies = 6 | | | 52 | | | | 1 | |
| Altera | | | 12,263 | | | | 243 | |
Amdocs = | | | 25,347 | | | | 639 | |
| Amphenol, Class A | | | 3,806 | | | | 153 | |
| Analog Devices | | | 24,151 | | | | 619 | |
Apple = | | | 11,329 | | | | 2,136 | |
Applied Materials 6 | | | 24,784 | | | | 302 | |
Atmel = | | | 78,055 | | | | 290 | |
Autodesk = | | | 5,438 | | | | 136 | |
| Automatic Data Processing | | | 20,364 | | | | 810 | |
| AVX | | | 25,908 | | | | 293 | |
BMC Software = | | | 18,718 | | | | 696 | |
| CA | | | 46,057 | | | | 964 | |
Cisco Systems = | | | 98,621 | | | | 2,253 | |
Citrix Systems = | | | 5,378 | | | | 198 | |
Cognizant Technology Solutions, Class A = | | | 2,001 | | | | 77 | |
CommScope = | | | 375 | | | | 10 | |
Computer Sciences = | | | 6,640 | | | | 337 | |
Compuware = | | | 44,115 | | | | 311 | |
| Corning | | | 29,308 | | | | 428 | |
The accompanying notes are an integral part of the financial statements.
16 First American Funds 2009 Annual Report
| | | | | | | | | |
| Quantitative Large Cap Core Fund (continued) |
| DESCRIPTION | | SHARES | | FAIR VALUE |
| |
| |
Dell = | | | 29,151 | | | $ | 422 | |
| Diebold | | | 5,826 | | | | 176 | |
eBay = | | | 19,662 | | | | 438 | |
Electronic Arts = | | | 6,177 | | | | 113 | |
EMC = | | | 44,086 | | | | 726 | |
FLIR Systems = | | | 6,136 | | | | 171 | |
Google, Class A = 6 | | | 2,791 | | | | 1,496 | |
| Harris | | | 10,459 | | | | 436 | |
| Hewlett-Packard | | | 44,646 | | | | 2,119 | |
IAC/InterActive = 6 | | | 3,275 | | | | 62 | |
| IBM | | | 21,006 | | | | 2,534 | |
| Intel | | | 102,177 | | | | 1,953 | |
Intuit = | | | 14,256 | | | | 414 | |
| KLA-Tencor | | | 4,714 | | | | 153 | |
| Lender Processing Services | | | 4,921 | | | | 196 | |
Lexmark International, Class A = | | | 9,527 | | | | 243 | |
Linear Technology 6 | | | 18,802 | | | | 487 | |
Marvell Technology Group = | | | 11,520 | | | | 158 | |
| Maxim Integrated Products | | | 5,978 | | | | 100 | |
McAfee = | | | 9,686 | | | | 406 | |
MEMC Electronic Materials = | | | 7,478 | | | | 93 | |
Microchip Technology 6 | | | 5,063 | | | | 121 | |
| Microsoft | | | 150,761 | | | | 4,181 | |
| Motorola | | | 16,137 | | | | 138 | |
| National Instruments | | | 15,163 | | | | 405 | |
| National Semiconductor | | | 13,561 | | | | 175 | |
Novell = | | | 47,282 | | | | 193 | |
Novellus Systems = | | | 10,584 | | | | 218 | |
NVIDIA = 6 | | | 22,172 | | | | 265 | |
| Oracle | | | 59,290 | | | | 1,251 | |
Paychex 6 | | | 14,245 | | | | 405 | |
QLogic = | | | 15,504 | | | | 272 | |
| QUALCOMM | | | 25,896 | | | | 1,072 | |
Red Hat = | | | 7,061 | | | | 182 | |
Salesforce.com = | | | 2,303 | | | | 131 | |
Sybase = 6 | | | 5,718 | | | | 226 | |
Symantec = | | | 13,504 | | | | 237 | |
Synopsys = | | | 35,742 | | | | 786 | |
| Texas Instruments | | | 45,148 | | | | 1,059 | |
| Total System Services | | | 18,607 | | | | 297 | |
Trimble Navigation = | | | 3,090 | | | | 65 | |
VMware, Class A = | | | 410 | | | | 16 | |
Western Digital = | | | 6,135 | | | | 207 | |
| Western Union | | | 13,851 | | | | 252 | |
Xerox 6 | | | 23,732 | | | | 178 | |
Xilinx 6 | | | 23,140 | | | | 503 | |
Yahoo! = | | | 7,709 | | | | 123 | |
Zebra Technologies, Class A = | | | 9,977 | | | | 249 | |
| | | | | | | | | |
| | | | | | | | 37,710 | |
| | | | | | | | | |
| Materials – 2.7% |
Alcoa 6 | | | 26,247 | | | | 326 | |
| Allegheny Technologies | | | 641 | | | | 20 | |
| Ashland | | | 4,650 | | | | 161 | |
| Bemis | | | 2,591 | | | | 67 | |
| Cabot Microelectronics | | | 1,143 | | | | 25 | |
Carpenter Technology Corp. 6 | | | 3,706 | | | | 78 | |
| Celanese, Class A | | | 6,108 | | | | 168 | |
| Cliffs Natural Resources | | | 1,439 | | | | 51 | |
Compass Minerals International 6 | | | 1,674 | | | | 104 | |
Crown Holdings = | | | 8,501 | | | | 227 | |
| Cytec Industries | | | 1,443 | | | | 48 | |
Dow Chemical 6 | | | 29,495 | | | | 693 | |
| E.I. Du Pont de Nemours | | | 9,679 | | | | 308 | |
| FMC | | | 3,254 | | | | 166 | |
Freeport-McMoRan Copper & Gold = | | | 1,074 | | | | 79 | |
| Monsanto | | | 1,149 | | | | 77 | |
| Nucor | | | 7,222 | | | | 288 | |
Pactiv = | | | 6,689 | | | | 154 | |
| PPG Industries | | | 5,191 | | | | 293 | |
| Praxair | | | 495 | | | | 39 | |
| Scotts Miracle-Gro, Class A | | | 5,421 | | | | 220 | |
| Sealed Air | | | 2,736 | | | | 53 | |
| Sonoco Products | | | 2,588 | | | | 69 | |
| Temple-Inland | | | 14,789 | | | | 228 | |
| | | | | | | | | |
| | | | | | | | 3,942 | |
| | | | | | | | | |
| Telecommunication Services – 2.1% |
American Tower, Class A = | | | 6,773 | | | | 249 | |
| AT&T | | | 63,568 | | | | 1,632 | |
MetroPCS Communications = | | | 20,885 | | | | 130 | |
NII Holdings = 6 | | | 8,991 | | | | 242 | |
U.S. Cellular = | | | 2,717 | | | | 99 | |
| Verizon Communications | | | 25,701 | | | | 761 | |
| | | | | | | | | |
| | | | | | | | 3,113 | |
| | | | | | | | | |
| Utilities – 4.4% |
AGL Resources 6 | | | 4,738 | | | | 166 | |
| Allegheny Energy | | | 4,831 | | | | 110 | |
| Alliant Energy | | | 8,006 | | | | 213 | |
| Ameren | | | 17,536 | | | | 427 | |
| American Electric Power | | | 13,528 | | | | 409 | |
Consolidated Edison 6 | | | 5,084 | | | | 207 | |
| Constellation Energy Group | | | 11,532 | | | | 356 | |
| DTE Energy | | | 3,161 | | | | 117 | |
Duke Energy 6 | | | 15,660 | | | | 248 | |
| Edison International | | | 7,963 | | | | 253 | |
| Entergy | | | 2,114 | | | | 162 | |
| EQT | | | 4,322 | | | | 181 | |
| Exelon | | | 4,711 | | | | 221 | |
| FirstEnergy | | | 13,735 | | | | 594 | |
| FPL Group | | | 2,563 | | | | 126 | |
| Great Plains Energy | | | 14,832 | | | | 257 | |
| Integrys Energy Group | | | 19,717 | | | | 682 | |
Mirant = | | | 20,221 | | | | 283 | |
| Pepco Holdings | | | 22,671 | | | | 338 | |
| PG&E | | | 2,425 | | | | 99 | |
| Pinnacle West Capital | | | 7,330 | | | | 230 | |
| Questar | | | 3,696 | | | | 147 | |
| Sempra Energy | | | 2,786 | | | | 143 | |
| Southern | | | 10,451 | | | | 326 | |
| Wisconsin Energy | | | 2,861 | | | | 125 | |
| Xcel Energy | | | 1,148 | | | | 22 | |
| | | | | | | | | |
| | | | | | | | 6,442 | |
| | | | | | | | | |
Total Common Stocks | | | | | | | | |
(Cost $131,372) | | | | | | | 137,709 | |
| | | | | | | | | |
Short-Term Investments – 6.0% |
| Money Market Fund – 4.6% |
| First American Prime Obligations Fund, Class Z | | | | | | | | |
0.148% Å Ω | | | 6,713,522 | | | | 6,714 | |
| | | | | | | | | |
| U.S. Treasury Obligation – 1.4% |
| U.S. Treasury Bill | | | | | | | | |
0.145%, 11/19/2009 o | | $ | 2,000 | | | | 2,000 | |
| | | | | | | | | |
Total Short-Term Investments | | | | | | | | |
(Cost $8,714) | | | | | | | 8,714 | |
| | | | | | | | | |
First American Funds 2009 Annual Report 17
Schedule of Investments October 31, 2009, all dollars are rounded to thousands (000)
| | | | | | | | | |
| Quantitative Large Cap Core Fund (concluded) |
| DESCRIPTION | | SHARES | | FAIR VALUE |
| |
| |
Investment Purchased with Proceeds
from Securities Lending – 10.9% |
| Mount Vernon Securities Lending Prime Portfolio, 0.209% † Ω | | | | | | | | |
(Cost $15,942) | | | 15,942,203 | | | $ | 15,942 | |
| | | | | | | | | |
Total Investments 5 – 110.9% | | | | | | | | |
(Cost $156,028) | | | | | | | 162,365 | |
| | | | | | | | | |
Other Assets and Liabilities, Net – (10.9)% | | | | | | | (15,938 | ) |
| | | | | | | | | |
Total Net Assets – 100.0% | | | | | | $ | 146,427 | |
| | | | | | | | | |
| | |
| = | | Non-income producing security. |
| |
| 6 | | This security or a portion of this security is out on loan at October 31, 2009. Total loaned securities had a fair value of $14,928 at October 31, 2009. See note 2 in Notes to Financial Statements. |
| |
| ⊳ | | The fund is significantly invested in this sector and therefore is subject to additional risks. See note 6 in Notes to Financial Statements. |
| |
| Å | | Investment in affiliated security. This money market fund is advised by FAF Advisors, Inc., which also serves as advisor for this fund. See note 3 in Notes to Financial Statements. |
| |
| Ω | | The rate quoted is the annualized seven-day effective yield as of October 31, 2009. |
| |
| o | | Security has been deposited as initial margin on open futures contracts. Yield shown is the annualized effective yield as of October 31, 2009. See note 2 in Notes to Financial Statements. |
| |
| † | | The fund may loan securities representing up to one third of the value of its total assets (which includes collateral for securities on loan) to broker dealers, banks, or other institutional borrowers of securities. The fund maintains collateral equal to at least 100% of the value of the securities loaned. The adequacy of the collateral is monitored on a daily basis. The cash collateral received by the fund is invested in this affiliated money market fund. See note 2 in Notes to Financial Statements. |
| |
| 5 | | On October 31, 2009, the cost of investments for federal income tax purposes was $156,775. The aggregate gross unrealized appreciation and depreciation of investments, based on this cost, were as follows: |
| | | | | |
| Gross unrealized appreciation | | $ | 13,648 | |
| Gross unrealized depreciation | | | (8,058 | ) |
| | | | | |
| Net unrealized appreciation | | $ | 5,590 | |
| | | | | |
| |
| REIT – | Real Estate Investment Trust |
Schedule of Open Futures Contracts
| | | | | | | | | | | | | | | |
| | | | | | Number of
| | | Notional
| | | |
| | | Settlement
| | | Contracts
| | | Contract
| | Unrealized
| |
| Description | | Month | | | Purchased | | | Value | | Depreciation | |
| | |
| S&P 500 Futures | | | December 2009 | | | | 33 | | | $8,522 | | $ | (234 | ) |
| | | | | | | | | | | | | | | |
| | | | | | | | | |
| Quantitative Large Cap Growth Fund |
| DESCRIPTION | | SHARES | | FAIR VALUE |
| |
| |
Common Stocks – 96.9% |
| Consumer Discretionary – 7.2% |
| Advance Auto Parts | | | 368 | | | $ | 14 | |
Amazon.com = 6 | | | 1,533 | | | | 182 | |
Apollo Group, Class A = | | | 187 | | | | 11 | |
Bed Bath & Beyond = | | | 1,181 | | | | 42 | |
| Best Buy | | | 1,305 | | | | 50 | |
| Carnival | | | 403 | | | | 12 | |
| Choice Hotels International | | | 641 | | | | 19 | |
| Coach | | | 773 | | | | 26 | |
DIRECTV Group = 6 | | | 814 | | | | 21 | |
Dollar Tree = | | | 894 | | | | 40 | |
DreamWorks Animation, Class A = | | | 777 | | | | 25 | |
Garmin 6 | | | 1,666 | | | | 50 | |
| Guess? | | | 202 | | | | 7 | |
| H&R Block | | | 4,982 | | | | 91 | |
Harley-Davidson 6 | | | 614 | | | | 15 | |
| Hasbro | | | 792 | | | | 22 | |
| Hillenbrand | | | 735 | | | | 15 | |
| International Game Technology | | | 1,198 | | | | 21 | |
| International Speedway, Class A | | | 1,915 | | | | 49 | |
| John Wiley & Sons, Class A | | | 1,269 | | | | 45 | |
| Johnson Controls | | | 224 | | | | 5 | |
| Lowe’s | | | 3,404 | | | | 67 | |
| Mattel | | | 1,537 | | | | 29 | |
| McDonald’s | | | 3,608 | | | | 211 | |
| McGraw-Hill | | | 1,826 | | | | 53 | |
Meredith 6 | | | 825 | | | | 22 | |
Newell Rubbermaid 6 | | | 300 | | | | 4 | |
| Nike, Class B | | | 1,267 | | | | 79 | |
| Omnicom Group | | | 2,405 | | | | 82 | |
O’Reilly Automotive = | | | 741 | | | | 28 | |
| Phillips-Van Heusen | | | 298 | | | | 12 | |
RadioShack 6 | | | 35 | | | | 1 | |
| Sherwin-Williams | | | 2,276 | | | | 130 | |
Signet Jewelers Limited = | | | 33 | | | | 1 | |
| Staples | | | 2,602 | | | | 56 | |
Starbucks = | | | 2,740 | | | | 52 | |
| Target | | | 1,974 | | | | 96 | |
Tiffany & Company 6 | | | 260 | | | | 10 | |
| Tim Hortons | | | 1,962 | | | | 56 | |
| VF | | | 387 | | | | 28 | |
Viacom, Class B = | | | 1,427 | | | | 39 | |
| Washington Post, Class B | | | 177 | | | | 76 | |
| | | | | | | | | |
| | | | | | | | 1,894 | |
| | | | | | | | | |
| Consumer Staples – 11.5% |
| Altria Group | | | 5,560 | | | | 101 | |
| Archer-Daniels-Midland | | | 911 | | | | 27 | |
| Avon Products | | | 2,313 | | | | 74 | |
| Brown-Forman, Class B | | | 494 | | | | 24 | |
| Campbell Soup | | | 31 | | | | 1 | |
| Coca-Cola | | | 6,938 | | | | 370 | |
Colgate-Palmolive 6 | | | 2,180 | | | | 171 | |
| CVS Caremark | | | 2,965 | | | | 105 | |
| Estee Lauder, Class A | | | 630 | | | | 27 | |
| Kimberly-Clark | | | 1,083 | | | | 66 | |
| Lorillard | | | 1,183 | | | | 92 | |
Mead Johnson Nutrition, Class A 6 | | | 232 | | | | 10 | |
| Molson Coors Brewing, Class B | | | 766 | | | | 37 | |
| PepsiCo | | | 6,373 | | | | 386 | |
| Philip Morris International | | | 9,710 | | | | 460 | |
| Procter & Gamble | | | 8,136 | | | | 472 | |
| Safeway | | | 103 | | | | 2 | |
Sysco 6 | | | 2,964 | | | | 78 | |
The accompanying notes are an integral part of the financial statements.
18 First American Funds 2009 Annual Report
| | | | | | | | | |
| Quantitative Large Cap Growth Fund (continued) |
| DESCRIPTION | | SHARES | | FAIR VALUE |
| |
| |
Walgreen 6 | | | 4,800 | | | $ | 182 | |
| Wal-Mart Stores | | | 6,960 | | | | 346 | |
| | | | | | | | | |
| | | | | | | | 3,031 | |
| | | | | | | | | |
| Energy – 2.2% |
Alpha Natural Resources = | | | 32 | | | | 1 | |
| Arch Coal | | | 179 | | | | 4 | |
CONSOL Energy 6 | | | 775 | | | | 33 | |
Denbury Resources = | | | 26 | | | | — | |
ENSCO International 6 | | | 572 | | | | 26 | |
| Exxon Mobil | | | 4,291 | | | | 307 | |
| Frontier Oil | | | 1,079 | | | | 15 | |
Frontline 6 | | | 1,824 | | | | 43 | |
Holly 6 | | | 285 | | | | 8 | |
Peabody Energy 6 | | | 1,056 | | | | 42 | |
| Rowan | | | 981 | | | | 23 | |
| Sunoco | | | 1,814 | | | | 56 | |
Tidewater 6 | | | 973 | | | | 41 | |
| | | | | | | | | |
| | | | | | | | 599 | |
| | | | | | | | | |
| Financials – 7.0% |
Affiliated Managers Group = 6 | | | 753 | | | | 48 | |
| Aflac | | | 2,009 | | | | 83 | |
| Allied World Assurance Company Holdings | | | 1,254 | | | | 56 | |
| Ameriprise Financial | | | 447 | | | | 15 | |
Arch Capital Group = | | | 848 | | | | 57 | |
| Assurant | | | 1,606 | | | | 48 | |
| Axis Capital Holdings | | | 1,130 | | | | 33 | |
| BlackRock | | | 151 | | | | 33 | |
| Charles Schwab | | | 5,347 | | | | 93 | |
Cincinnati Financial 6 | | | 1,659 | | | | 42 | |
CME Group 6 | | | 167 | | | | 51 | |
Eaton Vance 6 | | | 1,145 | | | | 33 | |
| Everest Re Group | | | 376 | | | | 33 | |
Federated Investors, Class B 6 | | | 3,021 | | | | 79 | |
Franklin Resources 6 | | | 1,006 | | | | 105 | |
Goldman Sachs Group 6 | | | 171 | | | | 29 | |
| Greenhill & Company | | | 215 | | | | 19 | |
Interactive Brokers Group, Class A = | | | 5,448 | | | | 87 | |
IntercontinentalExchange = 6 | | | 1,197 | | | | 120 | |
Investment Technology Group = | | | 2,009 | | | | 43 | |
| Janus Capital Group | | | 1,176 | | | | 15 | |
| Lazard, Class A | | | 1,969 | | | | 74 | |
| Lincoln National | | | 251 | | | | 6 | |
| Morgan Stanley | | | 921 | | | | 30 | |
NASDAQ OMX Group = | | | 1,584 | | | | 29 | |
| NYSE Euronext | | | 3,050 | | | | 79 | |
| PartnerRe | | | 519 | | | | 40 | |
| Principal Financial Group | | | 1,982 | | | | 50 | |
| Protective Life | | | 1,258 | | | | 24 | |
| Prudential Financial | | | 1,178 | | | | 53 | |
| RenaissanceRe Holdings | | | 406 | | | | 21 | |
| SEI Investments | | | 2,767 | | | | 48 | |
| StanCorp Financial Group | | | 891 | | | | 33 | |
| State Street | | | 1,580 | | | | 66 | |
T. Rowe Price Group 6 | | | 935 | | | | 46 | |
TD Ameritrade = | | | 1,999 | | | | 39 | |
| Torchmark | | | 749 | | | | 30 | |
| W.R. Berkley | | | 1,836 | | | | 45 | |
| Waddell & Reed Financial, Class A | | | 842 | | | | 24 | |
| | | | | | | | | |
| | | | | | | | 1,859 | |
| | | | | | | | | |
| Healthcare – 17.0% |
| Abbott Laboratories | | | 7,901 | | | | 400 | |
| Aetna | | | 686 | | | | 18 | |
| Allergan | | | 1,991 | | | | 112 | |
| AmerisourceBergen | | | 4,286 | | | | 95 | |
Amgen = | | | 3,185 | | | | 171 | |
| Baxter International | | | 3,275 | | | | 177 | |
| Beckman Coulter | | | 552 | | | | 36 | |
| Becton, Dickinson & Company | | | 2,390 | | | | 163 | |
Biogen Idec = | | | 995 | | | | 42 | |
Bio-Rad Laboratories, Class A = | | | 217 | | | | 19 | |
| Bristol-Myers Squibb | | | 10,613 | | | | 231 | |
| C.R. Bard | | | 1,600 | | | | 120 | |
| Cardinal Health | | | 1,577 | | | | 45 | |
CareFusion = | | | 788 | | | | 18 | |
Celgene = | | | 1,730 | | | | 88 | |
| CIGNA | | | 1,493 | | | | 42 | |
Coventry Health Care = | | | 133 | | | | 3 | |
Eli Lilly 6 | | | 4,777 | | | | 162 | |
Endo Pharmaceuticals Holdings = | | | 3,264 | | | | 73 | |
Forest Laboratories = | | | 3,999 | | | | 111 | |
Gen-Probe = | | | 483 | | | | 20 | |
Genzyme = | | | 1,775 | | | | 90 | |
Gilead Sciences = | | | 3,785 | | | | 161 | |
Henry Schein = | | | 180 | | | | 10 | |
Hospira = | | | 930 | | | | 42 | |
Humana = | | | 139 | | | | 5 | |
| IMS Health | | | 1,366 | | | | 22 | |
| Johnson & Johnson | | | 9,719 | | | | 574 | |
Kinetic Concepts = 6 | | | 764 | | | | 25 | |
| McKesson | | | 752 | | | | 44 | |
Medco Health Solutions = | | | 919 | | | | 52 | |
| Medtronic | | | 5,964 | | | | 213 | |
| Merck | | | 5,246 | | | | 162 | |
Mettler-Toledo International = | | | 1,153 | | | | 112 | |
| Pfizer | | | 11,303 | | | | 193 | |
| Pharmaceutical Product Development | | | 132 | | | | 3 | |
ResMed = | | | 353 | | | | 17 | |
| Schering-Plough | | | 5,690 | | | | 160 | |
St. Jude Medical = | | | 1,812 | | | | 62 | |
Stryker 6 | | | 3,088 | | | | 142 | |
| Techne | | | 912 | | | | 57 | |
| Teleflex | | | 791 | | | | 39 | |
Thermo Fisher Scientific = | | | 967 | | | | 44 | |
Varian Medical Systems = | | | 1,169 | | | | 48 | |
Zimmer Holdings = | | | 1,548 | | | | 81 | |
| | | | | | | | | |
| | | | | | | | 4,504 | |
| | | | | | | | | |
| Industrials – 7.5% |
| 3M | | | 4,363 | | | | 321 | |
| AMETEK | | | 134 | | | | 5 | |
| Burlington Northern Santa Fe | | | 497 | | | | 37 | |
| C.H. Robinson Worldwide | | | 820 | | | | 45 | |
| Carlisle Companies | | | 426 | | | | 13 | |
Caterpillar 6 | | | 1,539 | | | | 85 | |
| Cintas | | | 1,519 | | | | 42 | |
| Danaher | | | 3,186 | | | | 217 | |
| Deere & Company | | | 828 | | | | 38 | |
| Dover | | | 1,450 | | | | 55 | |
| Eaton | | | 1,044 | | | | 63 | |
| Emerson Electric | | | 2,186 | | | | 83 | |
| Equifax | | | 767 | | | | 21 | |
Expeditors International of Washington 6 | | | 959 | | | | 31 | |
| Fluor | | | 862 | | | | 38 | |
| Harsco | | | 1,159 | | | | 36 | |
| Honeywell International | | | 3,884 | | | | 139 | |
| IDEX | | | 205 | | | | 6 | |
| Illinois Tool Works | | | 1,009 | | | | 46 | |
| ITT | | | 249 | | | | 13 | |
First American Funds 2009 Annual Report 19
Schedule of Investments October 31, 2009, all dollars are rounded to thousands (000)
| | | | | | | | | |
| Quantitative Large Cap Growth Fund (continued) |
| DESCRIPTION | | SHARES | | FAIR VALUE |
| |
| |
Jacobs Engineering Group = | | | 256 | | | $ | 11 | |
Joy Global 6 | | | 340 | | | | 17 | |
| MSC Industrial Direct, Class A | | | 85 | | | | 4 | |
| Parker Hannifin | | | 109 | | | | 6 | |
Pitney Bowes 6 | | | 4,341 | | | | 106 | |
| R.R. Donnelley & Sons | | | 881 | | | | 18 | |
Rockwell Automation 6 | | | 445 | | | | 18 | |
| Roper Industries | | | 826 | | | | 42 | |
| Snap-On | | | 299 | | | | 11 | |
| Union Pacific | | | 1,557 | | | | 86 | |
| United Parcel Service, Class B | | | 3,067 | | | | 165 | |
| United Technologies | | | 2,587 | | | | 159 | |
WESCO International = 6 | | | 10 | | | | — | |
| | | | | | | | | |
| | | | | | | | 1,977 | |
| | | | | | | | | |
| Information Technology ⊳ – 39.2% |
| Accenture, Class A | | | 5,867 | | | | 217 | |
Adobe Systems = | | | 3,878 | | | | 128 | |
Agilent Technologies = 6 | | | 1,539 | | | | 38 | |
Akamai Technologies = 6 | | | 2,123 | | | | 47 | |
| Altera | | | 2,739 | | | | 54 | |
Amdocs = | | | 5,081 | �� | | | 128 | |
| Amphenol, Class A | | | 1,332 | | | | 53 | |
| Analog Devices | | | 3,546 | | | | 91 | |
ANSYS = 6 | | | 1,324 | | | | 54 | |
Apple = | | | 3,636 | | | | 685 | |
Applied Materials 6 | | | 7,845 | | | | 96 | |
Autodesk = | | | 1,066 | | | | 27 | |
| Automatic Data Processing | | | 5,564 | | | | 221 | |
Avnet = | | | 892 | | | | 22 | |
| AVX | | | 2,784 | | | | 31 | |
BMC Software = | | | 4,517 | | | | 168 | |
Broadcom, Class A = 6 | | | 2,652 | | | | 71 | |
| CA | | | 8,185 | | | | 171 | |
Cisco Systems = | | | 26,127 | | | | 597 | |
Citrix Systems = | | | 2,129 | | | | 78 | |
Cognizant Technology Solutions, Class A = | | | 913 | | | | 35 | |
Computer Sciences = | | | 1,445 | | | | 73 | |
Compuware = | | | 9,008 | | | | 64 | |
| Corning | | | 8,517 | | | | 124 | |
Dell = | | | 9,536 | | | | 138 | |
| Diebold | | | 1,179 | | | | 36 | |
Dolby Laboratories, Class A = | | | 525 | | | | 22 | |
DST Systems = 6 | | | 349 | | | | 15 | |
eBay = | | | 2,206 | | | | 49 | |
Electronic Arts = | | | 2,823 | | | | 51 | |
EMC = | | | 7,105 | | | | 117 | |
FLIR Systems = | | | 1,885 | | | | 52 | |
Genpact Limited = | | | 743 | | | | 9 | |
Google, Class A = 6 | | | 1,164 | | | | 624 | |
| Harris | | | 3,373 | | | | 141 | |
| Hewlett-Packard | | | 10,946 | | | | 519 | |
| IBM | | | 6,815 | | | | 822 | |
Integrated Device Technology = | | | 177 | | | | 1 | |
| Intel | | | 22,699 | | | | 434 | |
Intuit = | | | 4,612 | | | | 134 | |
Itron = | | | 429 | | | | 26 | |
| KLA-Tencor | | | 857 | | | | 28 | |
| Lender Processing Services | | | 936 | | | | 37 | |
Lexmark International, Class A = | | | 1,380 | | | | 35 | |
Linear Technology 6 | | | 4,359 | | | | 113 | |
Marvell Technology Group = | | | 870 | | | | 12 | |
McAfee = | | | 2,681 | | | | 112 | |
MEMC Electronic Materials = | | | 2,564 | | | | 32 | |
| Microsoft | | | 41,723 | | | | 1,157 | |
| National Instruments | | | 3,622 | | | | 97 | |
| National Semiconductor | | | 3,383 | | | | 44 | |
NCR = | | | 859 | | | | 9 | |
NetApp = 6 | | | 379 | | | | 10 | |
NeuStar, Class A = | | | 2,255 | | | | 52 | |
Novell = | | | 10,197 | | | | 42 | |
Nuance Communications = | | | 1,942 | | | | 25 | |
| Oracle | | | 21,969 | | | | 463 | |
Paychex 6 | | | 2,808 | | | | 80 | |
| QUALCOMM | | | 8,539 | | | | 354 | |
Red Hat = | | | 2,353 | | | | 61 | |
Rovi = | | | 768 | | | | 21 | |
Salesforce.com = | | | 574 | | | | 33 | |
Silicon Laboratories = | | | 710 | | | | 30 | |
Sybase = 6 | | | 2,724 | | | | 108 | |
Symantec = | | | 4,093 | | | | 72 | |
Synopsys = | | | 6,273 | | | | 138 | |
Teradata = | | | 13 | | | | — | |
| Texas Instruments | | | 10,425 | | | | 244 | |
| Total System Services | | | 4,487 | | | | 72 | |
Trimble Navigation = | | | 1,232 | | | | 26 | |
Visa, Class A 6 | | | 786 | | | | 59 | |
VMware, Class A = | | | 207 | | | | 8 | |
Waters = | | | 571 | | | | 33 | |
Western Digital = 6 | | | 1,132 | | | | 38 | |
| Western Union | | | 3,168 | | | | 58 | |
| Xilinx | | | 4,318 | | | | 94 | |
Yahoo! = | | | 5,702 | | | | 91 | |
| | | | | | | | | |
| | | | | | | | 10,351 | |
| | | | | | | | | |
| Materials – 2.7% |
| Air Products and Chemicals | | | 150 | | | | 12 | |
Alcoa 6 | | | 2,106 | | | | 26 | |
| Allegheny Technologies | | | 194 | | | | 6 | |
| Ashland | | | 758 | | | | 26 | |
| Ball | | | 825 | | | | 41 | |
| Bemis | | | 575 | | | | 15 | |
| Cabot Microelectronics | | | 304 | | | | 7 | |
| Carpenter Technology | | | 815 | | | | 17 | |
| Cliffs Natural Resources | | | 612 | | | | 22 | |
Crown Holdings = | | | 1,104 | | | | 29 | |
| Cytec Industries | | | 550 | | | | 18 | |
Ecolab 6 | | | 388 | | | | 17 | |
| Monsanto | | | 1,775 | | | | 119 | |
| Mosaic | | | 512 | | | | 24 | |
| Nucor | | | 926 | | | | 37 | |
Pactiv = | | | 3,344 | | | | 77 | |
| PPG Industries | | | 836 | | | | 47 | |
| Praxair | | | 1,092 | | | | 87 | |
| Reliance Steel & Aluminum | | | 283 | | | | 10 | |
| Scotts Miracle-Gro, Class A | | | 62 | | | | 3 | |
| Sigma-Aldrich | | | 58 | | | | 3 | |
| Sonoco Products | | | 392 | | | | 11 | |
Titanium Metals 6 | | | 162 | | | | 1 | |
Valspar 6 | | | 2,107 | | | | 53 | |
| | | | | | | | | |
| | | | | | | | 708 | |
| | | | | | | | | |
| Telecommunication Services – 0.7% |
American Tower, Class A = | | | 2,349 | | | | 87 | |
MetroPCS Communications = | | | 4,231 | | | | 26 | |
NII Holdings = | | | 2,022 | | | | 54 | |
U.S. Cellular = | | | 290 | | | | 11 | |
| | | | | | | | | |
| | | | | | | | 178 | |
| | | | | | | | | |
The accompanying notes are an integral part of the financial statements.
20 First American Funds 2009 Annual Report
| | | | | | | | | |
| Quantitative Large Cap Growth Fund (concluded) |
| DESCRIPTION | | SHARES/PAR | | VALUE |
| |
| |
| Utilities – 1.9% |
| Allegheny Energy | | | 1,305 | | | $ | 30 | |
| Alliant Energy | | | 2,240 | | | | 59 | |
| Ameren | | | 65 | | | | 2 | |
| Constellation Energy Group | | | 1,885 | | | | 58 | |
| FirstEnergy | | | 1,168 | | | | 51 | |
| Great Plains Energy | | | 4,017 | | | | 69 | |
| Integrys Energy Group | | | 134 | | | | 5 | |
Mirant = | | | 3,830 | | | | 54 | |
| NSTAR | | | 514 | | | | 16 | |
| PPL | | | 1,105 | | | | 32 | |
| SCANA | | | 662 | | | | 22 | |
| Sempra Energy | | | 593 | | | | 30 | |
| Vectren | | | 236 | | | | 5 | |
| Westar Energy | | | 1,386 | | | | 27 | |
| Wisconsin Energy | | | 1,025 | | | | 45 | |
| | | | | | | | | |
| | | | | | | | 505 | |
| | | | | | | | | |
Total Common Stocks | | | | | | | | |
(Cost $24,007) | | | | | | | 25,606 | |
| | | | | | | | | |
Short-Term Investments – 2.9% |
| Money Market Fund – 2.3% |
| First American Prime Obligations Fund, Class Z | | | | | | | | |
0.148% Å Ω | | | 622,420 | | | | 622 | |
| | | | | | | | | |
| U.S. Treasury Obligation – 0.6% |
| U.S. Treasury Bill | | | | | | | | |
0.107%, 11/19/2009 o | | $ | 150 | | | | 150 | |
| | | | | | | | | |
Total Short-Term Investments | | | | | | | | |
(Cost $772) | | | | | | | 772 | |
| | | | | | | | | |
Investment Purchased with Proceeds
from Securities Lending – 13.0% |
| Mount Vernon Securities Lending Prime Portfolio, 0.209% Ω † | | | | | | | | |
(Cost $3,423) | | | 3,422,865 | | | | 3,423 | |
| | | | | | | | | |
Total Investments 5 – 112.8% | | | | | | | | |
(Cost $28,202) | | | | | | | 29,801 | |
| | | | | | | | | |
Other Assets and Liabilities, Net – (12.8)% | | | | | | | (3,379 | ) |
| | | | | | | | | |
Total Net Assets – 100.0% | | | | | | $ | 26,422 | |
| | | | | | | | | |
| | |
| = | | Non-income producing security. |
| |
| 6 | | This security or a portion of this security is out on loan at October 31, 2009. Total loaned securities had a fair value of $3,235 at October 31, 2009. See note 2 in Notes to Financial Statements. |
| |
| ⊳ | | The fund is significantly invested in this sector and therefore is subject to additional risks. See note 6 in Notes to Financial Statements. |
| |
| Å | | Investment in affiliated security. This money market fund is advised by FAF Advisors, Inc., which also serves as advisor for this fund. See note 3 in Notes to Financial Statements. |
| |
| Ω | | The rate quoted is the annualized seven-day effective yield as of October 31, 2009. |
| |
| o | | Security has been deposited as initial margin on open futures contracts. Yield shown is the annualized effective yield as of October 31, 2009. See note 2 in Notes to Financial Statements. |
| |
| † | | The fund may loan securities representing up to one third of the value of its total assets (which includes collateral for securities on loan) to broker dealers, banks, or other institutional borrowers of securities. The fund maintains collateral equal to at least 100% of the value of the securities loaned. The adequacy of the collateral is monitored on a daily basis. The cash collateral received by the fund is invested in this affiliated money market fund. See note 2 in Notes to Financial Statements. |
Quantitative Large Cap Growth Fund (concluded)
| | |
| 5 | | On October 31, 2009, the cost of investments for federal income tax purposes was $28,318. The aggregate gross unrealized appreciation and depreciation of investments, based on this cost, were as follows: |
| | | | | |
| Gross unrealized appreciation | | $ | 2,772 | |
| Gross unrealized depreciation | | | (1,289 | ) |
| | | | | |
| Net unrealized appreciation | | $ | 1,483 | |
| | | | | |
| |
| REIT – | Real Estate Investment Trust |
Schedule of Open Futures Contracts
| | | | | | | | | | | | | | | |
| | | | | | Number of
| | | Notional
| | | |
| | | Settlement
| | | Contracts
| | | Contract
| | Unrealized
| |
| Description | | Month | | | Purchased | | | Value | | Depreciation | |
| | |
S&P 500 E-Mini Futures | | | December 2009 | | | | 14 | | | $723 | | $ | (22 | ) |
| | | | | | | | | | | | | | | |
First American Funds 2009 Annual Report 21
Schedule of Investments October 31, 2009, all dollars are rounded to thousands (000)
| | | | | | | | | |
| Quantitative Large Cap Value Fund |
| DESCRIPTION | | SHARES | | FAIR VALUE |
| |
| |
Common Stocks – 98.1% |
| Consumer Discretionary – 6.5% |
| Black & Decker | | | 429 | | | $ | 20 | |
| Carnival | | | 2,014 | | | | 59 | |
Comcast, Class A 6 | | | 5,905 | | | | 86 | |
DISH Network, Class A = | | | 2,911 | | | | 51 | |
Ford Motor 6 = | | | 1,652 | | | | 12 | |
| Fortune Brands | | | 1,493 | | | | 58 | |
Gannett 6 | | | 4,815 | | | | 47 | |
Garmin 6 | | | 1,386 | | | | 42 | |
| H&R Block | | | 3,057 | | | | 56 | |
Harley-Davidson 6 | | | 177 | | | | 4 | |
| Harman International Industries | | | 695 | | | | 26 | |
| Hasbro | | | 969 | | | | 26 | |
| Home Depot | | | 4,801 | | | | 120 | |
| International Game Technology | | | 363 | | | | 6 | |
| International Speedway, Class A | | | 1,920 | | | | 49 | |
| John Wiley & Sons, Class A | | | 376 | | | | 13 | |
| Johnson Controls | | | 754 | | | | 18 | |
| Lowe’s | | | 3,735 | | | | 73 | |
| Mattel | | | 829 | | | | 16 | |
| McGraw-Hill | | | 1,552 | | | | 45 | |
Meredith 6 | | | 1,463 | | | | 40 | |
Newell Rubbermaid 6 | | | 4,441 | | | | 64 | |
| News, Class A | | | 7,886 | | | | 91 | |
| Omnicom Group | | | 954 | | | | 33 | |
RadioShack 6 | | | 169 | | | | 3 | |
Royal Caribbean Cruises 6 = | | | 658 | | | | 13 | |
| Sherwin-Williams | | | 785 | | | | 45 | |
| Time Warner | | | 4,093 | | | | 123 | |
Viacom, Class B = | | | 734 | | | | 20 | |
| Walt Disney | | | 7,046 | | | | 193 | |
| Washington Post, Class B | | | 208 | | | | 90 | |
| Whirlpool | | | 499 | | | | 36 | |
| | | | | | | | | |
| | | | | | | | 1,578 | |
| | | | | | | | | |
| Consumer Staples – 2.2% |
| Altria Group | | | 1,425 | | | | 26 | |
Bunge Limited 6 | | | 466 | | | | 27 | |
| CVS Caremark | | | 605 | | | | 21 | |
| Kimberly-Clark | | | 482 | | | | 29 | |
Kraft Foods, Class A 6 | | | 3,877 | | | | 107 | |
| Molson Coors Brewing, Class B | | | 2,182 | | | | 107 | |
| Philip Morris International | | | 71 | | | | 3 | |
| Procter & Gamble | | | 3,476 | | | | 202 | |
| Sara Lee | | | 1,224 | | | | 14 | |
| | | | | | | | | |
| | | | | | | | 536 | |
| | | | | | | | | |
| Energy – 16.9% |
| Anadarko Petroleum | | | 1,646 | | | | 100 | |
| Apache | | | 1,219 | | | | 115 | |
| Arch Coal | | | 2,425 | | | | 53 | |
Atwood Oceanics = | | | 54 | | | | 2 | |
Baker Hughes 6 | | | 1,460 | | | | 61 | |
| BJ Services | | | 1,489 | | | | 29 | |
Chesapeake Energy 6 | | | 2,674 | | | | 66 | |
| Chevron | | | 10,892 | | | | 834 | |
| ConocoPhillips | | | 8,110 | | | | 407 | |
| Devon Energy | | | 1,838 | | | | 119 | |
ENSCO International 6 | | | 1,103 | | | | 50 | |
| EOG Resources | | | 749 | | | | 61 | |
| Exxon Mobil | | | 17,237 | | | | 1,235 | |
| Frontier Oil | | | 545 | | | | 8 | |
Frontline 6 | | | 3,004 | | | | 70 | |
| Halliburton | | | 4,081 | | | | 119 | |
Helix Energy Solutions Group = | | | 20 | | | | — | |
| Hess | | | 514 | | | | 28 | |
Holly 6 | | | 87 | | | | 3 | |
Marathon Oil 6 | | | 3,232 | | | | 103 | |
Nabors Industries = | | | 3,137 | | | | 65 | |
National-Oilwell Varco = | | | 1,909 | | | | 78 | |
| Noble Energy | | | 551 | | | | 36 | |
| Occidental Petroleum | | | 1,267 | | | | 96 | |
Oceaneering International = | | | 16 | | | | 1 | |
Oil States International = | | | 663 | | | | 23 | |
| Rowan | | | 974 | | | | 23 | |
| Schlumberger | | | 998 | | | | 62 | |
| Smith International | | | 962 | | | | 27 | |
| Sunoco | | | 1,955 | | | | 60 | |
Tesoro 6 | | | 848 | | | | 12 | |
Tidewater 6 | | | 1,162 | | | | 48 | |
Unit = | | | 408 | | | | 16 | |
| Valero Energy | | | 2,901 | | | | 52 | |
| XTO Energy | | | 1,438 | | | | 60 | |
| | | | | | | | | |
| | | | | | | | 4,122 | |
| | | | | | | | | |
Financials ⊳ – 26.0% |
Affiliated Managers Group 6 = | | | 491 | | | | 31 | |
| Aflac | | | 584 | | | | 24 | |
| Allied World Assurance Company Holdings | | | 557 | | | | 25 | |
| Allstate | | | 3,187 | | | | 94 | |
| American Express | | | 3,986 | | | | 139 | |
| American Financial Group | | | 859 | | | | 21 | |
| American National Insurance | | | 310 | | | | 26 | |
| Ameriprise Financial | | | 2,212 | | | | 77 | |
| Annaly Capital Management – REIT | | | 3,087 | | | | 52 | |
Associated Banc 6 | | | 2,419 | | | | 31 | |
| Assurant | | | 3,214 | | | | 96 | |
| Axis Capital Holdings | | | 666 | | | | 19 | |
| Bank of America | | | 41,586 | | | | 606 | |
Bank of Hawaii 6 | | | 1,403 | | | | 62 | |
| Bank of New York Mellon | | | 6,644 | | | | 177 | |
BB&T 6 | | | 2,575 | | | | 62 | |
| BlackRock | | | 268 | | | | 58 | |
Capital One Financial 6 | | | 1,033 | | | | 38 | |
| Chimera Investment – REIT | | | 11,599 | | | | 41 | |
| Chubb | | | 1,593 | | | | 77 | |
Cincinnati Financial 6 | | | 2,062 | | | | 52 | |
| Citigroup | | | 33,674 | | | | 138 | |
City National 6 | | | 1,647 | | | | 62 | |
CME Group 6 | | | 397 | | | | 120 | |
| Commerce Bancshares | | | 58 | | | | 2 | |
| Discover Financial Services | | | 3,130 | | | | 44 | |
| Erie Indemnity, Class A | | | 925 | | | | 33 | |
| Everest Re Group | | | 578 | | | | 51 | |
Federated Investors, Class B 6 | | | 1,063 | | | | 28 | |
| Fidelity National Financial, Class A | | | 777 | | | | 11 | |
| First American | | | 248 | | | | 8 | |
Franklin Resources 6 | | | 568 | | | | 59 | |
Genworth Financial, Class A = | | | 3,004 | | | | 32 | |
Goldman Sachs Group 6 | | | 2,317 | | | | 394 | |
Hartford Financial Services Group 6 | | | 3,457 | | | | 85 | |
| HCC Insurance Holdings | | | 1,863 | | | | 49 | |
| Hospitality Properties Trust – REIT | | | 1,016 | | | | 20 | |
Huntington Bancshares 6 | | | 1,245 | | | | 5 | |
Interactive Brokers Group, Class A = | | | 5,102 | | | | 82 | |
IntercontinentalExchange 6 = | | | 409 | | | | 41 | |
| Invesco | | | 2,359 | | | | 50 | |
Investment Technology Group = | | | 1,515 | | | | 33 | |
| Janus Capital Group | | | 2,074 | | | | 27 | |
| JPMorgan Chase | | | 16,535 | | | | 691 | |
The accompanying notes are an integral part of the financial statements.
22 First American Funds 2009 Annual Report
| | | | | | | | | |
| Quantitative Large Cap Value Fund (continued) |
| DESCRIPTION | | SHARES | | FAIR VALUE |
| |
| |
| KeyCorp | | | 181 | | | $ | 1 | |
| Kimco Realty – REIT | | | 2,397 | | | | 30 | |
| Lazard, Class A | | | 1,426 | | | | 54 | |
| Legg Mason | | | 4,063 | | | | 118 | |
| Lincoln National | | | 2,029 | | | | 48 | |
| Loew’s | | | 1,569 | | | | 52 | |
| Marsh & McLennan | | | 1,553 | | | | 36 | |
| Marshall & Ilsley | | | 124 | | | | 1 | |
MBIA 6 = | | | 60 | | | | — | |
| Mercury General | | | 941 | | | | 34 | |
| MetLife | | | 2,501 | | | | 85 | |
| Morgan Stanley | | | 4,583 | | | | 147 | |
NASDAQ OMX Group = | | | 1,344 | | | | 24 | |
New York Community Bancorp 6 | | | 11,122 | | | | 120 | |
| NYSE Euronext | | | 4,149 | | | | 107 | |
| Old Republic International | | | 787 | | | | 8 | |
| PNC Financial Services Group | | | 2,870 | | | | 140 | |
| Principal Financial Group | | | 2,321 | | | | 58 | |
Progressive = | | | 1,539 | | | | 25 | |
ProLogis – REIT 6 | | | 2,558 | | | | 29 | |
| Protective Life | | | 3,824 | | | | 74 | |
| Prudential Financial | | | 2,757 | | | | 125 | |
Public Storage – REIT 6 | | | 1,257 | | | | 93 | |
Raymond James Financial 6 | | | 395 | | | | 9 | |
SLM = | | | 2,657 | | | | 26 | |
| StanCorp Financial Group | | | 1,238 | | | | 45 | |
| State Street | | | 1,881 | | | | 79 | |
SunTrust Banks 6 | | | 261 | | | | 5 | |
| T. Rowe Price Group | | | 187 | | | | 9 | |
TD Ameritrade Holding = | | | 1,345 | | | | 26 | |
| Torchmark | | | 1,535 | | | | 62 | |
| Transatlantic Holdings | | | 31 | | | | 2 | |
| Travelers | | | 2,283 | | | | 114 | |
| Unitrin | | | 1,490 | | | | 29 | |
| W.R. Berkley | | | 2,817 | | | | 70 | |
| Wells Fargo | | | 17,671 | | | | 486 | |
Wilmington Trust 6 | | | 4,619 | | | | 56 | |
| XL Capital, Class A | | | 2,978 | | | | 49 | |
| | | | | | | | | |
| | | | | | | | 6,349 | |
| | | | | | | | | |
| Healthcare – 10.5% |
| Aetna | | | 1,269 | | | | 33 | |
| AmerisourceBergen | | | 2,138 | | | | 47 | |
| Becton, Dickinson & Company | | | 655 | | | | 45 | |
Boston Scientific = | | | 1,906 | | | | 16 | |
| Bristol-Myers Squibb | | | 2,463 | | | | 54 | |
| Cardinal Health | | | 2,492 | | | | 71 | |
CareFusion = | | | 1,246 | | | | 28 | |
| CIGNA | | | 2,625 | | | | 73 | |
| Cooper | | | 590 | | | | 17 | |
Coventry Health Care = | | | 911 | | | | 18 | |
Eli Lilly 6 | | | 4,714 | | | | 160 | |
Endo Pharmaceuticals Holdings = | | | 3,561 | | | | 80 | |
Forest Laboratories = | | | 4,032 | | | | 112 | |
Health Net = | | | 682 | | | | 10 | |
| IMS Health | | | 1,900 | | | | 31 | |
| Johnson & Johnson | | | 3,564 | | | | 210 | |
King Pharmaceuticals = | | | 3,371 | | | | 34 | |
| McKesson | | | 355 | | | | 21 | |
| Medtronic | | | 428 | | | | 15 | |
| Merck | | | 9,560 | | | | 296 | |
Mettler-Toledo International = | | | 345 | | | | 34 | |
| Pfizer | | | 45,887 | | | | 781 | |
Stryker 6 | | | 1,334 | | | | 61 | |
| Teleflex | | | 369 | | | | 18 | |
Thermo Fisher Scientific = | | | 1,769 | | | | 80 | |
| UnitedHealth Group | | | 3,328 | | | | 86 | |
WellPoint = | | | 715 | | | | 33 | |
Zimmer Holdings = | | | 1,664 | | | | 88 | |
| | | | | | | | | |
| | | | | | | | 2,552 | |
| | | | | | | | | |
| Industrials – 8.0% |
| 3M | | | 1,019 | | | | 75 | |
| Avery Dennison | | | 820 | | | | 29 | |
| Brinks | | | 21 | | | | 1 | |
| Carlisle Companies | | | 39 | | | | 1 | |
Caterpillar 6 | | | 1,633 | | | | 90 | |
| Cintas | | | 13 | | | | — | |
| CSX | | | 1,138 | | | | 48 | |
| Danaher | | | 826 | | | | 56 | |
| Deere & Company | | | 1,101 | | | | 50 | |
| Dover | | | 380 | | | | 14 | |
| Eaton | | | 1,005 | | | | 61 | |
| FedEx | | | 1,656 | | | | 120 | |
| General Dynamics | | | 979 | | | | 61 | |
| General Electric | | | 49,550 | | | | 707 | |
| Harsco | | | 1,577 | | | | 50 | |
| Honeywell International | | | 538 | | | | 19 | |
| Illinois Tool Works | | | 3,329 | | | | 153 | |
| ITT | | | 35 | | | | 2 | |
Manitowoc 6 | | | 1,315 | | | | 12 | |
| Norfolk Southern | | | 1,953 | | | | 91 | |
| Northrop Grumman | | | 93 | | | | 5 | |
Pitney Bowes 6 | | | 6,255 | | | | 153 | |
| R.R. Donnelley & Sons | | | 3,812 | | | | 77 | |
| Snap-On | | | 78 | | | | 3 | |
Terex = | | | 1,402 | | | | 28 | |
| Timken | | | 977 | | | | 22 | |
Trinity Industries 6 | | | 2,024 | | | | 34 | |
| | | | | | | | | |
| | | | | | | | 1,962 | |
| | | | | | | | | |
| Information Technology – 11.6% |
| Accenture, Class A | | | 845 | | | | 31 | |
Adobe Systems = | | | 1,115 | | | | 37 | |
Agilent Technologies 6 = | | | 1,938 | | | | 48 | |
Akamai Technologies 6 = | | | 794 | | | | 17 | |
Amdocs = | | | 6,814 | | | | 172 | |
| Amphenol, Class A | | | 574 | | | | 23 | |
| Analog Devices | | | 2,894 | | | | 74 | |
ANSYS 6 = | | | 576 | | | | 23 | |
Applied Materials 6 | | | 7,157 | | | | 87 | |
Autodesk = | | | 1,566 | | | | 39 | |
| Automatic Data Processing | | | 662 | | | | 26 | |
Avnet = | | | 457 | | | | 11 | |
| AVX | | | 7,027 | | | | 80 | |
BMC Software = | | | 2,388 | | | | 89 | |
| CA | | | 6,425 | | | | 134 | |
Citrix Systems = | | | 596 | | | | 22 | |
CommScope = | | | 884 | | | | 24 | |
Computer Sciences = | | | 1,887 | | | | 96 | |
Compuware = | | | 9,275 | | | | 65 | |
Convergys = | | | 749 | | | | 8 | |
| Corning | | | 1,785 | | | | 26 | |
DST Systems 6 = | | | 104 | | | | 4 | |
eBay = | | | 4,707 | | | | 105 | |
Electronic Arts = | | | 1,975 | | | | 36 | |
EMC = | | | 8,958 | | | | 147 | |
FLIR Systems = | | | 1,519 | | | | 42 | |
| Harris | | | 2,032 | | | | 85 | |
Integrated Device Technology = | | | 3,184 | | | | 19 | |
| Intel | | | 7,470 | | | | 143 | |
| Intersil, Class A | | | 306 | | | | 4 | |
First American Funds 2009 Annual Report 23
Schedule of Investments October 31, 2009, all dollars are rounded to thousands (000)
| | | | | | | | | |
| Quantitative Large Cap Value Fund (continued) |
| DESCRIPTION | | SHARES | | FAIR VALUE |
| |
| |
Intuit = | | | 1,467 | | | $ | 43 | |
| Jabil Circuit | | | 2,359 | | | | 32 | |
| KLA-Tencor | | | 1,725 | | | | 56 | |
Lexmark International, Class A = | | | 2,245 | | | | 57 | |
Linear Technology 6 | | | 4,139 | | | | 107 | |
Marvell Technology Group = | | | 1,670 | | | | 23 | |
| Maxim Integrated Products | | | 1,082 | | | | 18 | |
McAfee = | | | 933 | | | | 39 | |
MEMC Electronic Materials = | | | 1,923 | | | | 24 | |
| Microsoft | | | 1,643 | | | | 46 | |
| Motorola | | | 8,013 | | | | 69 | |
| National Instruments | | | 2,221 | | | | 59 | |
| National Semiconductor | | | 3,881 | | | | 50 | |
Novell = | | | 12,364 | | | | 51 | |
Nuance Communications = | | | 1,254 | | | | 16 | |
Red Hat = | | | 1,262 | | | | 33 | |
Sybase 6 = | | | 836 | | | | 33 | |
Synopsys = | | | 5,498 | | | | 121 | |
| Texas Instruments | | | 980 | | | | 23 | |
| Total System Services | | | 3,372 | | | | 54 | |
Trimble Navigation = | | | 990 | | | | 21 | |
VMware, Class A = | | | 564 | | | | 22 | |
Xerox 6 | | | 7,527 | | | | 57 | |
| Xilinx | | | 2,688 | | | | 58 | |
| | | | | | | | | |
| | | | | | | | 2,829 | |
| | | | | | | | | |
| Materials – 3.1% |
Alcoa 6 | | | 7,406 | | | | 92 | |
| Allegheny Technologies | | | 315 | | | | 10 | |
| Ashland | | | 1,261 | | | | 44 | |
| Bemis | | | 281 | | | | 7 | |
| Cabot Microelectronics | | | 1,217 | | | | 27 | |
| Carpenter Technology Corp. | | | 1,763 | | | | 37 | |
| Celanese, Class A | | | 5 | | | | — | |
| Cytec Industries | | | 844 | | | | 28 | |
Dow Chemical 6 | | | 4,558 | | | | 107 | |
| E.I. Du Pont de Nemours | | | 2,930 | | | | 93 | |
| International Paper | | | 2,643 | | | | 59 | |
| Nucor | | | 1,979 | | | | 79 | |
| Packaging Corporation of America | | | 1,251 | | | | 23 | |
Pactiv = | | | 1,098 | | | | 25 | |
| PPG Industries | | | 800 | | | | 45 | |
| RPM International | | | 140 | | | | 2 | |
| Sonoco Products | | | 180 | | | | 5 | |
Titanium Metals 6 | | | 1,164 | | | | 10 | |
Valspar 6 | | | 1,406 | | | | 36 | |
Vulcan Materials 6 | | | 391 | | | | 18 | |
| | | | | | | | | |
| | | | | | | | 747 | |
| | | | | | | | | |
| Telecommunication Services – 4.7% |
| AT&T | | | 25,078 | | | | 644 | |
Leap Wireless International = | | | 453 | | | | 6 | |
MetroPCS Communications = | | | 4,011 | | | | 25 | |
NII Holdings = | | | 3,164 | | | | 85 | |
Sprint Nextel 6 = | | | 6,366 | | | | 19 | |
U.S. Cellular = | | | 651 | | | | 24 | |
| Verizon Communications | | | 12,068 | | | | 357 | |
| | | | | | | | | |
| | | | | | | | 1,160 | |
| | | | | | | | | |
| Utilities – 8.6% |
AGL Resources 6 | | | 1,543 | | | | 54 | |
| Allegheny Energy | | | 1,327 | | | | 30 | |
| Alliant Energy | | | 2,596 | | | | 69 | |
| Ameren | | | 4,197 | | | | 102 | |
| American Electric Power | | | 3,070 | | | | 93 | |
| Atmos Energy | | | 945 | | | | 26 | |
Consolidated Edison 6 | | | 1,194 | | | | 49 | |
| Constellation Energy Group | | | 3,122 | | | | 97 | |
| Dominion Resources | | | 2,054 | | | | 70 | |
| DTE Energy | | | 634 | | | | 23 | |
Duke Energy 6 | | | 7,551 | | | | 119 | |
Dynegy, Class A = | | | 6,100 | | | | 12 | |
| Edison International | | | 2,560 | | | | 81 | |
| Energen | | | 253 | | | | 11 | |
| Entergy | | | 379 | | | | 29 | |
| EQT | | | 850 | | | | 36 | |
| Exelon | | | 1,463 | | | | 69 | |
| FirstEnergy | | | 2,889 | | | | 125 | |
| FPL Group | | | 1,298 | | | | 64 | |
| Great Plains Energy | | | 5,160 | | | | 89 | |
| Integrys Energy Group | | | 2,735 | | | | 95 | |
Mirant = | | | 7,911 | | | | 111 | |
NRG Energy 6 = | | | 856 | | | | 20 | |
| Nstar | | | 524 | | | | 16 | |
| OGE Energy | | | 1,269 | | | | 42 | |
| Pepco Holdings | | | 7,003 | | | | 105 | |
| PG&E | | | 709 | | | | 29 | |
| Pinnacle West Capital | | | 979 | | | | 31 | |
| Questar | | | 1,590 | | | | 63 | |
| SCANA | | | 1,400 | | | | 47 | |
| Sempra Energy | | | 1,978 | | | | 102 | |
| Southern | | | 3,272 | | | | 102 | |
| Vectren | | | 944 | | | | 21 | |
| Wisconsin Energy | | | 741 | | | | 32 | |
| Xcel Energy | | | 1,210 | | | | 23 | |
| | | | | | | | | |
| | | | | | | | 2,087 | |
| | | | | | | | | |
Total Common Stocks | | | | | | | | |
(Cost $23,081) | | | | | | | 23,922 | |
| | | | | | | | | |
Short-Term Investments – 1.7% |
Money Market Fund – 1.4% |
| First American Prime Obligations Fund, Class Z | | | | | | | | |
0.148% Å Ω | | | 337,454 | | | | 337 | |
| | | | | | | | | |
| U.S. Treasury Obligation – 0.3% |
| U.S. Treasury Bill | | | | | | | | |
0.260%, 11/19/2009 o | | $ | 75 | | | | 75 | |
| | | | | | | | | |
Total Short-Term Investments | | | | | | | | |
(Cost $412) | | | | | | | 412 | |
| | | | | | | | | |
Investment Purchased with Proceeds
from Securities Lending – 15.0% |
| Mount Vernon Securities Lending Prime Portfolio | | | | | | | | |
| 0.209% Ω † | | | | | | | | |
(Cost $3,664) | | | 3,663,644 | | | | 3,664 | |
| | | | | | | | | |
Total Investments 5 – 114.8% | | | | | | | | |
(Cost $27,157) | | | | | | | 27,998 | |
| | | | | | | | | |
Other Assets and Liabilities, Net – (14.8)% | | | | | | | (3,606 | ) |
| | | | | | | | | |
Total Net Assets – 100.0% | | | | | | $ | 24,392 | |
| | | | | | | | | |
| | |
| 6 | | This security or a portion of this security is out on loan at October 31, 2009. Total loaned securities had a fair value of $3,391 at October 31, 2009. See note 2 in Notes to Financial Statements. |
| |
| = | | Non-income producing security. |
| |
| ⊳ | | The fund is significantly invested in this sector and therefore is subject to additional risks. See note 6 in Notes to Financial Statements. |
| |
| Å | | Investment in affiliated security. This money market fund is advised by FAF Advisors, Inc., which also serves as advisor for this fund. See note 3 in Notes to Financial Statements. |
The accompanying notes are an integral part of the financial statements.
24 First American Funds 2009 Annual Report
Quantitative Large Cap Value Fund (concluded)
| | |
| Ω | | The rate quoted is the annualized seven-day effective yield as of October 31, 2009. |
| |
| o | | Security has been deposited as initial margin on open futures contracts. Yield shown is the annualized effective yield as of October 31, 2009. See note 2 in Notes to Financial Statements. |
| | |
| † | | The fund may loan securities representing up to one third of the fair value of its total assets (which includes collateral for securities on loan) to broker-dealers, banks, or other institutional borrowers of securities. The fund maintains collateral equal to at least 100% of the fair value of the securities loaned. The adequacy of the collateral is monitored on a daily basis. The cash collateral received by the fund is invested in this affiliated money market fund. See note 2 in Notes to Financial Statements. |
| |
| 5 | | On October 31, 2009, the cost of investments for federal income tax purposes was $27,281. The aggregate gross unrealized appreciation and depreciation of investments, based on this cost, were as follows: |
| | | | | |
| Gross unrealized appreciation | | $ | 2,762 | |
| Gross unrealized depreciation | | | (2,045 | ) |
| | | | | |
| Net unrealized appreciation | | $ | 717 | |
| | | | | |
| |
| REIT – | Real Estate Investment Trust |
Schedule of Open Futures Contracts
| | | | | | | | | | | | | | | |
| | | | | | Number of
| | | Notional
| | | |
| | | Settlement
| | | Contracts
| | | Contract
| | Unrealized
| |
| Description | | Month | | | Purchased | | | Value | | Depreciation | |
| | |
S&P 500 E-Mini Futures | | | December 2009 | | | | 7 | | | $362 | | $ | (13 | ) |
| | | | | | | | | | | | | | | |
First American Funds 2009 Annual Report 25
| |
| Statements ofAssets and Liabilities | October 31, 2009, all dollars and shares are rounded to thousands (000), except per share data |
| | | | | | | | | | | | | | | | | | |
| | | | | | | | | | | | | | | |
| | | Quantitative
| | | | Quantitative
| | | | Quantitative
| | | | |
| | | Large Cap
| | | | Large Cap
| | | | Large Cap
| | | | |
| | | Core Fund | | | | Growth Fund | | | | Value Fund | | | | |
| |
| Unaffiliated investments, at cost | | $ | 133,372 | | | | $ | 24,157 | | | | $ | 23,156 | | | | |
| Affiliated money market fund, at cost | | | 6,714 | | | | | 622 | | | | | 337 | | | | |
| Affiliated investment purchased with proceeds from securities lending, at cost (note 2) | | | 15,942 | | | | | 3,423 | | | | | 3,664 | | | | |
| |
| |
ASSETS: | | | | | | | | | | | | | | | | | |
| Unaffiliated investments, at fair value* (note 2) | | $ | 139,709 | | | | $ | 25,756 | | | | $ | 23,997 | | | | |
| Affiliated money market fund, at fair value (note 2) | | | 6,714 | | | | | 622 | | | | | 337 | | | | |
| Affiliated investment purchased with proceeds from securities lending, at fair value (note 2) | | | 15,942 | | | | | 3,423 | | | | | 3,664 | | | | |
| Receivable for dividends and interest | | | 149 | | | | | 24 | | | | | 35 | | | | |
| Receivable for capital shares sold | | | 100 | | | | | — | | | | | — | | | | |
| Receivable from advisor | | | — | | | | | 22 | | | | | 14 | | | | |
| Prepaid expenses and other assets | | | 44 | | | | | 43 | | | | | 44 | | | | |
| |
| |
Total assets | | | 162,658 | | | | | 29,890 | | | | | 28,091 | | | | |
| |
| |
LIABILITIES: | | | | | | | | | | | | | | | | | |
| Payable upon return of securities loaned (note 2) | | | 15,942 | | | | | 3,423 | | | | | 3,664 | | | | |
| Payable for capital shares redeemed | | | 3 | | | | | — | | | | | — | | | | |
| Payable to affiliates (note 3) | | | 48 | | | | | 17 | | | | | 17 | | | | |
| Payable for variation margin | | | 229 | | | | | 20 | | | | | 10 | | | | |
| Payable for distribution and shareholder servicing fees | | | — | | | | | — | | | | | — | | | | |
| Accrued expenses and other liabilities | | | 9 | | | | | 8 | | | | | 8 | | | | |
| |
| |
Total liabilities | | | 16,231 | | | | | 3,468 | | | | | 3,699 | | | | |
| |
| |
Net assets | | $ | 146,427 | | | | $ | 26,422 | | | | $ | 24,392 | | | | |
| |
| |
COMPOSITION OF NET ASSETS: | | | | | | | | | | | | | | | | | |
| Portfolio capital | | $ | 165,456 | | | | $ | 28,127 | | | | $ | 25,164 | | | | |
| Undistributed net investment income | | | 1,659 | | | | | 269 | | | | | 415 | | | | |
| Accumulated net realized loss on investments and futures contracts (note 2) | | | (26,791 | ) | | | | (3,551 | ) | | | | (2,015 | ) | | | |
| Net unrealized appreciation or depreciation of: | | | | | | | | | | | | | | | | | |
| Investments | | | 6,337 | | | | | 1,599 | | | | | 841 | | | | |
| Futures contracts | | | (234 | ) | | | | (22 | ) | | | | (13 | ) | | | |
| |
| |
Net assets | | $ | 146,427 | | | | $ | 26,422 | | | | $ | 24,392 | | | | |
| |
| |
| * Including securities loaned, at fair value | | $ | 14,928 | | | | $ | 3,235 | | | | $ | 3,391 | | | | |
| |
| |
Class A: | | | | | | | | | | | | | | | | | |
| Net assets | | $ | 243 | | | | $ | 66 | | | | $ | 24 | | | | |
| Shares issued and outstanding ($0.0001 par value – 2 billion authorized) | | | 14 | | | | | 3 | | | | | 1 | | | | |
| Net asset value, and redemption price per share | | $ | 18.01 | | | | $ | 20.29 | | | | $ | 18.12 | | | | |
Maximum offering price per share1 | | $ | 19.06 | | | | $ | 21.47 | | | | $ | 19.17 | | | | |
Class C: | | | | | | | | | | | | | | | | | |
| Net assets | | $ | 4 | | | | $ | 26 | | | | $ | 6 | | | | |
| Shares issued and outstanding ($0.0001 par value – 2 billion authorized) | | | —** | | | | | 1 | | | | | —** | | | | |
Net asset value, offering price, and redemption price per share2 | | $ | 17.91 | | | | $ | 20.20 | | | | $ | 18.18 | | | | |
Class Y: | | | | | | | | | | | | | | | | | |
| Net assets | | $ | 146,180 | | | | $ | 26,330 | | | | $ | 24,362 | | | | |
| Shares issued and outstanding ($0.0001 par value – 2 billion authorized) | | | 8,101 | | | | | 1,295 | | | | | 1,343 | | | | |
| Net asset value, offering price, and redemption price per share | | $ | 18.04 | | | | $ | 20.33 | | | | $ | 18.15 | | | | |
| |
| |
| | |
| | 1 | The offering price is calculated by dividing the net asset value by 1 minus the maximum sales charge of 5.50%. |
| |
| | 2 | Class C has a contingent deferred sales charge. For a description of this sales charge, see notes 1 and 3 in Notes to Financial Statements. |
| | |
| | ** | Due to the presentation of the Financial Statements in thousands, the number rounds to zero. |
The accompanying notes are an integral part of the financial statements.
26 First American Funds 2009 Annual Report
| |
| Statements ofOperations | For the year ended October 31, 2009, all dollars are rounded to thousands (000) |
| | | | | | | | | | | | | | | | | | |
| | | | | | | | | | | | | | | |
| | | Quantitative
| | | | Quantitative
| | | | Quantitative
| | | | |
| | | Large Cap
| | | | Large Cap
| | | | Large Cap
| | | | |
| | | Core Fund | | | | Growth Fund | | | | Value Fund | | | | |
| |
INVESTMENT INCOME: | | | | | | | | | | | | | | | | | |
| Dividends from unaffiliated investments | | $ | 2,516 | | | | $ | 439 | | | | $ | 592 | | | | |
| Dividends from affiliated money market fund | | | 52 | | | | | 3 | | | | | 8 | | | | |
| Interest from unaffiliated investments | | | 4 | | | | | 1 | | | | | 1 | | | | |
| Securities lending income | | | 65 | | | | | 14 | | | | | 21 | | | | |
| |
| |
Total investment income | | | 2,637 | | | | | 457 | | | | | 622 | | | | |
| |
| |
EXPENSES (note 3): | | | | | | | | | | | | | | | | | |
| Investment advisory fees | | | 300 | | | | | 65 | | | | | 59 | | | | |
| Administration fees | | | 232 | | | | | 64 | | | | | 58 | | | | |
| Transfer agent fees | | | 90 | | | | | 90 | | | | | 90 | | | | |
| Custodian fees | | | 6 | | | | | 1 | | | | | 1 | | | | |
| Legal fees | | | 15 | | | | | 15 | | | | | 15 | | | | |
| Audit fees | | | 29 | | | | | 29 | | | | | 29 | | | | |
| Registration fees | | | 44 | | | | | 43 | | | | | 43 | | | | |
| Postage and printing fees | | | 3 | | | | | 2 | | | | | — | | | | |
| Directors’ fees | | | 30 | | | | | 30 | | | | | 30 | | | | |
| Other expenses | | | 20 | | | | | 19 | | | | | 20 | | | | |
| Distribution and shareholder servicing fees: | | | | | | | | | | | | | | | | | |
| Class A | | | — | | | | | — | | | | | — | | | | |
| Class C | | | — | | | | | — | | | | | — | | | | |
| |
| |
Total expenses | | | 769 | | | | | 358 | | | | | 345 | | | | |
| |
| |
| Less: Fee waivers (note 3) | | | (325 | ) | | | | (261 | ) | | | | (257 | ) | | | |
| |
| |
Total net expenses | | | 444 | | | | | 97 | | | | | 88 | | | | |
| |
| |
Investment income – net | | | 2,193 | | | | | 360 | | | | | 534 | | | | |
| |
| |
REALIZED AND UNREALIZED GAINS (LOSSES) ON INVESTMENTS AND FUTURES CONTRACTS – NET (note 5): | | | | | | | | | | | | | | | | | |
| Net realized gain (loss) on: | | | | | | | | | | | | | | | | | |
| Investments | | | (18,929 | ) | | | | (3,088 | ) | | | | (1,066 | ) | | | |
| Futures contracts | | | 1,549 | | | | | 120 | | | | | (31 | ) | | | |
| Net change in unrealized appreciation or depreciation of: | | | | | | | | | | | | | | | | | |
| Investments | | | 27,924 | | | | | 6,093 | | | | | 3,364 | | | | |
| Futures contracts | | | (358 | ) | | | | (22 | ) | | | | (41 | ) | | | |
| |
| |
Net gain on investments and futures contracts | | | 10,186 | | | | | 3,103 | | | | | 2,226 | | | | |
| |
| |
Net increase in net assets resulting from operations | | $ | 12,379 | | | | $ | 3,463 | | | | $ | 2,760 | | | | |
| |
| |
First American Funds 2009 Annual Report 27
| |
| Statements ofChanges in Net Assets | all dollars are rounded to thousands (000) |
| | | | | | | | | | | | | | | | | | | | | | | | | | | | | | |
| | | | | | | | | | | | | | | | | | | | | | | | |
| | | Quantitative
| | | | Quantitative
| | | | Quantitative
| | | | |
| | | Large Cap
| | | | Large Cap
| | | | Large Cap
| | | | |
| | | Core Fund | | | | Growth Fund | | | | Value Fund | | | | |
| |
| | | Year
| | | Year
| | | | Year
| | | Year
| | | | Year
| | | Year
| | | | |
| | | Ended
| | | Ended
| | | | Ended
| | | Ended
| | | | Ended
| | | Ended
| | | | |
| | | 10/31/09 | | | 10/31/08 | | | | 10/31/09 | | | 10/31/08 | | | | 10/31/09 | | | 10/31/08 | | | | |
| |
OPERATIONS: | | | | | | | | | | | | | | | | | | | | | | | | | | | | | |
| Investment income – net | | $ | 2,193 | | | $ | 1,422 | | | | $ | 360 | | | $ | 148 | | | | $ | 534 | | | $ | 214 | | | | |
| Net realized gain (loss) on: | | | | | | | | | | | | | | | | | | | | | | | | | | | | | |
| Investments | | | (18,929 | ) | | | (7,587 | ) | | | | (3,088 | ) | | | (746 | ) | | | | (1,066 | ) | | | (1,073 | ) | | | |
| Futures contracts | | | 1,549 | | | | (1,790 | ) | | | | 120 | | | | 167 | | | | | (31 | ) | | | 184 | | | | |
| Net change in unrealized appreciation or depreciation of: | | | | | | | | | | | | | | | | | | | | | | | | | | | | | |
| Investments | | | 27,924 | | | | (24,537 | ) | | | | 6,093 | | | | (5,124 | ) | | | | 3,364 | | | | (2,879 | ) | | | |
| Futures contracts | | | (358 | ) | | | 116 | | | | | (22 | ) | | | (1 | ) | | | | (41 | ) | | | 15 | | | | |
| |
| |
| Net increase (decrease) in net assets resulting from operations | | | 12,379 | | | | (32,376 | ) | | | | 3,463 | | | | (5,556 | ) | | | | 2,760 | | | | (3,539 | ) | | | |
| |
| |
DISTRIBUTIONS TO SHAREHOLDERS FROM: | | | | | | | | | | | | | | | | | | | | | | | | | | | | | |
| Investment income – net: | | | | | | | | | | | | | | | | | | | | | | | | | | | | | |
| Class A | | | (1 | ) | | | (2 | ) | | | | — | | | | — | | | | | — | | | | — | | | | |
| Class C | | | — | | | | — | | | | | — | | | | — | | | | | — | | | | — | | | | |
| Class R | | | — | | | | — | | | | | — | | | | — | | | | | — | | | | — | | | | |
| Class Y | | | (1,072 | ) | | | (941 | ) | | | | (151 | ) | | | (94 | ) | | | | (200 | ) | | | (149 | ) | | | |
| Net realized gain on investments: | | | | | | | | | | | | | | | | | | | | | | | | | | | | | |
| Class A | | | — | | | | (1 | ) | | | | — | | | | (1 | ) | | | | — | | | | — | | | | |
| Class C | | | — | | | | — | | | | | — | | | | — | | | | | — | | | | — | | | | |
| Class R | | | — | | | | — | | | | | — | | | | — | | | | | — | | | | — | | | | |
| Class Y | | | — | | | | (451 | ) | | | | — | | | | (77 | ) | | | | — | | | | (77 | ) | | | |
| |
| |
| Total distributions | | | (1,073 | ) | | | (1,395 | ) | | | | (151 | ) | | | (172 | ) | | | | (200 | ) | | | (226 | ) | | | |
| |
| |
CAPITAL SHARE TRANSACTIONS (note 4): | | | | | | | | | | | | | | | | | | | | | | | | | | | | | |
| Class A: | | | | | | | | | | | | | | | | | | | | | | | | | | | | | |
| Proceeds from sales | | | 130 | | | | 109 | | | | | 19 | | | | 51 | | | | | 11 | | | | 7 | | | | |
| Reinvestment of distributions | | | 1 | | | | 3 | | | | | — | | | | 1 | | | | | — | | | | 1 | | | | |
| Payments for redemptions | | | (20 | ) | | | (72 | ) | | | | (18 | ) | | | (39 | ) | | | | (2 | ) | | | (16 | ) | | | |
| |
| |
| Increase (decrease) in net assets from Class A transactions | | | 111 | | | | 40 | | | | | 1 | | | | 13 | | | | | 9 | | | | (8 | ) | | | |
| |
| |
| Class C: | | | | | | | | | | | | | | | | | | | | | | | | | | | | | |
| Proceeds from sales | | | — | | | | — | | | | | 13 | | | | — | | | | | 11 | | | | — | | | | |
| Reinvestment of distributions | | | — | | | | — | | | | | — | | | | — | | | | | — | | | | — | | | | |
| Payments for redemptions (note 3) | | | (6 | ) | | | — | | | | | (2 | ) | | | — | | | | | (11 | ) | | | — | | | | |
| |
| |
| Increase (decrease) in net assets from Class C transactions | | | (6 | ) | | | — | | | | | 11 | | | | — | | | | | — | | | | — | | | | |
| |
| |
| Class R: | | | | | | | | | | | | | | | | | | | | | | | | | | | | | |
| Proceeds from sales | | | — | | | | — | | | | | — | | | | — | | | | | — | | | | — | | | | |
| Reinvestment of distributions | | | — | | | | — | | | | | — | | | | — | | | | | — | | | | — | | | | |
| Payments for redemptions | | | (3 | ) | | | — | | | | | (4 | ) | | | — | | | | | (3 | ) | | | — | | | | |
| |
| |
| Decrease in net assets from Class R transactions | | | (3 | ) | | | — | | | | | (4 | ) | | | — | | | | | (3 | ) | | | — | | | | |
| |
| |
| Class Y: | | | | | | | | | | | | | | | | | | | | | | | | | | | | | |
| Proceeds from sales | | | 94,121 | | | | 84,298 | | | | | 5,095 | | | | 18,446 | | | | | 6,486 | | | | 12,884 | | | | |
| Reinvestment of distributions | | | 546 | | | | 1,108 | | | | | 119 | | | | 147 | | | | | 169 | | | | 206 | | | | |
| Payments for redemptions | | | (49,049 | ) | | | (11,171 | ) | | | | (2,158 | ) | | | (652 | ) | | | | (1,628 | ) | | | (16 | ) | | | |
| |
| |
| Increase in net assets from Class Y transactions | | | 45,618 | | | | 74,235 | | | | | 3,056 | | | | 17,941 | | | | | 5,027 | | | | 13,074 | | | | |
| |
| |
| Increase in net assets from capital share transactions | | | 45,720 | | | | 74,275 | | | | | 3,064 | | | | 17,954 | | | | | 5,033 | | | | 13,066 | | | | |
| |
| |
| Total increase in net assets | | | 57,026 | | | | 40,504 | | | | | 6,376 | | | | 12,226 | | | | | 7,593 | | | | 9,301 | | | | |
Net assets at beginning of period | | | 89,401 | | | | 48,897 | | | | | 20,046 | | | | 7,820 | | | | | 16,799 | | | | 7,498 | | | | |
| |
| |
Net assets at end of period | | $ | 146,427 | | | $ | 89,401 | | | | $ | 26,422 | | | $ | 20,046 | | | | $ | 24,392 | | | $ | 16,799 | | | | |
| |
| |
Undistributed net investment income at end of period | | $ | 1,659 | | | $ | 539 | | | | $ | 269 | | | $ | 60 | | | | $ | 415 | | | $ | 82 | | | | |
| |
| |
The accompanying notes are an integral part of the financial statements.
28 First American Funds 2009 Annual Report
(This page intentionally left blank.)
Financial Highlights For a share outstanding throughout the indicated period.
| | | | | | | | | | | | | | | | | | | | | | | | | | | | | | | | | | | | | | | | | | |
| | | | | | | | | | | | | | | | | | | | | | | | | | |
| | | Net Asset
| | | | | | Realized and
| | | | | | Distributions
| | | | | | | | | Net Asset
| | |
| | | Value
| | | Net
| | | Unrealized
| | | Total from
| | | from Net
| | | Distributions
| | | | | | Value
| | |
| | | Beginning
| | | Investment
| | | Gains (Losses) on
| | | Investment
| | | Investment
| | | from Net Realized
| | | Total
| | | End of
| | |
| | | of Period | | | Income (Loss) | | | Investments | | | Operations | | | Income | | | Gains | | | Distributions | | | Period | | |
| |
Quantitative Large Cap Core Fund1 | | | | | | | | | | | | | | | | | | | | | | | | | | | | | | | | | | | | | | | | | |
| Class A | | | | | | | | | | | | | | | | | | | | | | | | | | | | | | | | | | | | | | | | | |
20092 | | $ | 16.56 | | | | $ | 0.31 | | | | $ | 1.29 | | | | $ | 1.60 | | | | $ | (0.15 | ) | | | $ | — | | | | $ | (0.15 | ) | | | $ | 18.01 | | | |
20082 | | | 26.90 | | | | | 0.40 | | | | | (10.21 | ) | | | $ | (9.81 | ) | | | | (0.29 | ) | | | | (0.24 | ) | | | | (0.53 | ) | | | | 16.56 | | | |
20073 | | | 25.00 | | | | | 0.06 | | | | | 1.91 | | | | | 1.97 | | | | | (0.07 | ) | | | | — | | | | | (0.07 | ) | | | | 26.90 | | | |
| Class C | | | | | | | | | | | | | | | | | | | | | | | | | | | | | | | | | | | | | | | | | |
20092 | | $ | 16.51 | | | | $ | 0.24 | | | | $ | 1.24 | | | | $ | 1.48 | | | | $ | (0.08 | ) | | | $ | — | | | | $ | (0.08 | ) | | | $ | 17.91 | | | |
20082 | | | 26.88 | | | | | 0.23 | | | | | (10.20 | ) | | | $ | (9.97 | ) | | | | (0.16 | ) | | | | (0.24 | ) | | | | (0.40 | ) | | | | 16.51 | | | |
20073 | | | 25.00 | | | | | 0.02 | | | | | 1.90 | | | | | 1.92 | | | | | (0.04 | ) | | | | — | | | | | (0.04 | ) | | | | 26.88 | | | |
| Class Y | | | | | | | | | | | | | | | | | | | | | | | | | | | | | | | | | | | | | | | | | |
20092 | | $ | 16.57 | | | | $ | 0.35 | | | | $ | 1.29 | | | | $ | 1.64 | | | | $ | (0.17 | ) | | | $ | — | | | | $ | (0.17 | ) | | | $ | 18.04 | | | |
20082 | | | 26.90 | | | | | 0.44 | | | | | (10.20 | ) | | | $ | (9.76 | ) | | | | (0.33 | ) | | | | (0.24 | ) | | | | (0.57 | ) | | | | 16.57 | | | |
20073 | | | 25.00 | | | | | 0.11 | | | | | 1.87 | | | | | 1.98 | | | | | (0.08 | ) | | | | — | | | | | (0.08 | ) | | | | 26.90 | | | |
| |
| |
Quantitative Large Cap Growth Fund1 | | | | | | | | | | | | | | | | | | | | | | | | | | | | | | | | | | | | | | | | | |
| Class A | | | | | | | | | | | | | | | | | | | | | | | | | | | | | | | | | | | | | | | | | |
20092 | | $ | 17.75 | | | | $ | 0.26 | | | | $ | 2.39 | | | | $ | 2.65 | | | | $ | (0.11 | ) | | | $ | — | | | | $ | (0.11 | ) | | | $ | 20.29 | | | |
20082 | | | 27.51 | | | | | 0.24 | | | | | (9.58 | ) | | | | (9.34 | ) | | | | (0.16 | ) | | | | (0.26 | ) | | | | (0.42 | ) | | | | 17.75 | | | |
20073 | | | 25.00 | | | | | 0.02 | | | | | 2.53 | | | | | 2.55 | | | | | (0.04 | ) | | | | — | | | | | (0.04 | ) | | | | 27.51 | | | |
| Class C | | | | | | | | | | | | | | | | | | | | | | | | | | | | | | | | | | | | | | | | | |
20092 | | $ | 17.69 | | | | $ | 0.11 | | | | $ | 2.41 | | | | $ | 2.52 | | | | $ | (0.01 | ) | | | $ | — | | | | $ | (0.01 | ) | | | $ | 20.20 | | | |
20082 | | | 27.47 | | | | | 0.05 | | | | | (9.55 | ) | | | | (9.50 | ) | | | | (0.02 | ) | | | | (0.26 | ) | | | | (0.28 | ) | | | | 17.69 | | | |
20073 | | | 25.00 | | | | | (0.03 | ) | | | | 2.53 | | | | | 2.50 | | | | | (0.03 | ) | | | | — | | | | | (0.03 | ) | | | | 27.47 | | | |
| Class Y | | | | | | | | | | | | | | | | | | | | | | | | | | | | | | | | | | | | | | | | | |
20092 | | $ | 17.76 | | | | $ | 0.30 | | | | $ | 2.40 | | | | $ | 2.70 | | | | $ | (0.13 | ) | | | $ | — | | | | $ | (0.13 | ) | | | $ | 20.33 | | | |
20082 | | | 27.52 | | | | | 0.28 | | | | | (9.57 | ) | | | | (9.29 | ) | | | | (0.21 | ) | | | | (0.26 | ) | | | | (0.47 | ) | | | | 17.76 | | | |
20073 | | | 25.00 | | | | | 0.07 | | | | | 2.50 | | | | | 2.57 | | | | | (0.05 | ) | | | | — | | | | | (0.05 | ) | | | | 27.52 | | | |
| |
| |
Quantitative Large Cap Value Fund1 | | | | | | | | | | | | | | | | | | | | | | | | | | | | | | | | | | | | | | | | | |
| Class A | | | | | | | | | | | | | | | | | | | | | | | | | | | | | | | | | | | | | | | | | |
20092 | | $ | 16.84 | | | | $ | 0.39 | | | | $ | 1.05 | | | | $ | 1.44 | | | | $ | (0.16 | ) | | | $ | — | | | | $ | (0.16 | ) | | | $ | 18.12 | | | |
20082 | | | 26.53 | | | | | 0.52 | | | | | (9.56 | ) | | | | (9.04 | ) | | | | (0.40 | ) | | | | (0.25 | ) | | | | (0.65 | ) | | | | 16.84 | | | |
20073 | | | 25.00 | | | | | 0.10 | | | | | 1.51 | | | | | 1.61 | | | | | (0.08 | ) | | | | — | | | | | (0.08 | ) | | | | 26.53 | | | |
| Class C | | | | | | | | | | | | | | | | | | | | | | | | | | | | | | | | | | | | | | | | | |
20092 | | $ | 16.80 | | | | $ | 0.16 | | | | $ | 1.22 | | | | $ | 1.38 | | | | $ | — | | | | $ | — | | | | $ | — | | | | $ | 18.18 | | | |
20082 | | | 26.51 | | | | | 0.35 | | | | | (9.55 | ) | | | | (9.20 | ) | | | | (0.26 | ) | | | | (0.25 | ) | | | | (0.51 | ) | | | | 16.80 | | | |
20073 | | | 25.00 | | | | | 0.08 | | | | | 1.48 | | | | | 1.56 | | | | | (0.05 | ) | | | | — | | | | | (0.05 | ) | | | | 26.51 | | | |
| Class Y | | | | | | | | | | | | | | | | | | | | | | | | | | | | | | | | | | | | | | | | | |
20092 | | $ | 16.85 | | | | $ | 0.44 | | | | $ | 1.04 | | | | $ | 1.48 | | | | $ | (0.18 | ) | | | $ | — | | | | $ | (0.18 | ) | | | $ | 18.15 | | | |
20082 | | | 26.54 | | | | | 0.55 | | | | | (9.54 | ) | | | | (8.99 | ) | | | | (0.45 | ) | | | | (0.25 | ) | | | | (0.70 | ) | | | | 16.85 | | | |
20073 | | | 25.00 | | | | | 0.15 | | | | | 1.48 | | | | | 1.63 | | | | | (0.09 | ) | | | | — | | | | | (0.09 | ) | | | | 26.54 | | | |
| |
| |
| | |
| | 1 | Per share data calculated using average share method. |
| |
| | 2 | For the period November 1 to October 31 in the fiscal year indicated. |
| |
| | 3 | Commenced operations on July 31, 2007. All ratios for the period July 31, 2007 to October 31, 2007 have been annualized, except total return and portfolio turnover. |
| |
| | 4 | Total return does not reflect sales charges. Total return would have been lower had certain expenses not been waived. |
The accompanying notes are an integral part of the financial statements.
30 First American Funds 2009 Annual Report
| | | | | | | | | | | | | | | | | | | | | | | | | | | | | | | | | | | | | |
| | | | | | | | | | | | | | | | | | | | | | | |
| | | | | | | | | | | | | | | | | | Ratio of Net
| | | | | |
| | | | | | | | | | | | | | | Ratio of
| | | Investment
| | | | | |
| | | | | | | | | | | | Ratio of Net
| | | Expenses
| | | Income
| | | | | |
| | | | | | | | | Ratio of
| | | Investment
| | | to Average
| | | (Loss)
| | | | | |
| | | | | | Net Assets
| | | Expenses to
| | | Income (Loss)
| | | Net Assets
| | | to Average
| | | Portfolio
| | |
| | | Total
| | | End of
| | | Average
| | | to Average
| | | (Excluding
| | | Net Assets
| | | Turnover
| | |
| | | Return4 | | | Period (000) | | | Net Assets | | | Net Assets | | | Waivers) | | | (Excluding Waivers) | | | Rate | | |
| |
| | | | | | | | | | | | | | | | | | | | | | | | | | | | | | | | | | | | | |
| | | | | | | | | | | | | | | | | | | | | | | | | | | | | | | | | | | | | |
| | | | 9.87 | % | | | $ | 243 | | | | | 0.69 | % | | | | 1.94 | % | | | | 1.01 | % | | | | 1.62 | % | | | | 75 | % | | |
| | | | (37.08 | ) | | | | 118 | | | | | 0.70 | | | | | 1.77 | | | | | 1.18 | | | | | 1.29 | | | | | 153 | | | |
| | | | 7.89 | | | | | 131 | | | | | 0.70 | | | | | 0.91 | | | | | 1.40 | | | | | 0.21 | | | | | 55 | | | |
| | | | | | | | | | | | | | | | | | | | | | | | | | | | | | | | | | | | | |
| | | | 9.05 | % | | | $ | 4 | | | | | 1.44 | % | | | | 1.57 | % | | | | 1.76 | % | | | | 1.25 | % | | | | 75 | % | | |
| | | | (37.58 | ) | | | | 10 | | | | | 1.45 | | | | | 0.99 | | | | | 1.93 | | | | | 0.51 | | | | | 153 | | | |
| | | | 7.69 | | | | | 15 | | | | | 1.45 | | | | | 0.23 | | | | | 2.15 | | | | | (0.47 | ) | | | | 55 | | | |
| | | | | | | | | | | | | | | | | | | | | | | | | | | | | | | | | | | | | |
| | | | 10.13 | % | | | $ | 146,180 | | | | | 0.44 | % | | | | 2.19 | % | | | | 0.76 | % | | | | 1.87 | % | | | | 75 | % | | |
| | | | (36.93 | ) | | | | 89,270 | | | | | 0.45 | | | | | 1.99 | | | | | 0.93 | | | | | 1.51 | | | | | 153 | | | |
| | | | 7.93 | | | | | 48,745 | | | | | 0.45 | | | | | 1.73 | | | | | 1.15 | | | | | 1.03 | | | | | 55 | | | |
| |
| |
| | | | | | | | | | | | | | | | | | | | | | | | | | | | | | | | | | | | | |
| | | | 15.09 | % | | | $ | 66 | | | | | 0.70 | % | | | | 1.46 | % | | | | 1.91 | % | | | | 0.25 | % | | | | 66 | % | | |
| | | | (34.41 | ) | | | | 56 | | | | | 0.69 | | | | | 0.99 | | | | | 2.89 | | | | | (1.21 | ) | | | | 161 | | | |
| | | | 10.22 | | | | | 71 | | | | | 0.70 | | | | | 0.23 | | | | | 4.70 | | | | | (3.77 | ) | | | | 58 | | | |
| | | | | | | | | | | | | | | | | | | | | | | | | | | | | | | | | | | | | |
| | | | 14.27 | % | | | $ | 26 | | | | | 1.45 | % | | | | 0.62 | % | | | | 2.66 | % | | | | (0.59 | )% | | | | 66 | % | | |
| | | | (34.91 | ) | | | | 12 | | | | | 1.44 | | | | | 0.23 | | | | | 3.64 | | | | | (1.97 | ) | | | | 161 | | | |
| | | | 10.01 | | | | | 18 | | | | | 1.45 | | | | | (0.36 | ) | | | | 5.45 | | | | | (4.36 | ) | | | | 58 | | | |
| | | | | | | | | | | | | | | | | | | | | | | | | | | | | | | | | | | | | |
| | | | 15.42 | % | | | $ | 26,330 | | | | | 0.45 | % | | | | 1.67 | % | | | | 1.66 | % | | | | 0.46 | % | | | | 66 | % | | |
| | | | (34.27 | ) | | | | 19,974 | | | | | 0.44 | | | | | 1.23 | | | | | 2.64 | | | | | (0.97 | ) | | | | 161 | | | |
| | | | 10.29 | | | | | 7,725 | | | | | 0.45 | | | | | 1.07 | | | | | 4.45 | | | | | (2.93 | ) | | | | 58 | | | |
| |
| |
| | | | | | | | | | | | | | | | | | | | | | | | | | | | | | | | | | | | | |
| | | | | | | | | | | | | | | | | | | | | | | | | | | | | | | | | | | | | |
| | | | 8.73 | % | | | $ | 24 | | | | | 0.70 | % | | | | 2.44 | % | | | | 2.01 | % | | | | 1.13 | % | | | | 59 | % | | |
| | | | (34.79 | ) | | | | 14 | | | | | 0.69 | | | | | 2.26 | | | | | 3.78 | | | | | (0.83 | ) | | | | 178 | | | |
| | | | 6.46 | | | | | 31 | | | | | 0.70 | | | | | 1.57 | | | | | 4.73 | | | | | (2.46 | ) | | | | 65 | | | |
| | | | | | | | | | | | | | | | | | | | | | | | | | | | | | | | | | | | | |
| | | | 8.21 | % | | | $ | 6 | | | | | 1.45 | % | | | | 1.01 | % | | | | 2.76 | % | | | | (0.30 | )% | | | | 59 | % | | |
| | | | (35.25 | ) | | | | 3 | | | | | 1.44 | | | | | 1.52 | | | | | 4.53 | | | | | (1.57 | ) | | | | 178 | | | |
| | | | 6.25 | | | | | 5 | | | | | 1.45 | | | | | 1.18 | | | | | 5.48 | | | | | (2.85 | ) | | | | 65 | | | |
| | | | | | | | | | | | | | | | | | | | | | | | | | | | | | | | | | | | | |
| | | | 9.00 | % | | | $ | 24,362 | | | | | 0.45 | % | | | | 2.72 | % | | | | 1.76 | % | | | | 1.41 | % | | | | 59 | % | | |
| | | | (34.63 | ) | | | | 16,779 | | | | | 0.44 | | | | | 2.51 | | | | | 3.53 | | | | | (0.58 | ) | | | | 178 | | | |
| | | | 6.52 | | | | | 7,457 | | | | | 0.45 | | | | | 2.28 | | | | | 4.48 | | | | | (1.75 | ) | | | | 65 | | | |
| |
| |
First American Funds 2009 Annual Report 31
| |
| Notes toFinancial Statements | October 31, 2009, all dollars and shares are rounded to thousands (000) |
Quantitative Large Cap Core Fund, Quantitative Large Cap Growth Fund, and Quantitative Large Cap Value Fund (each a “fund” and collectively, the “funds”) are mutual funds offered by First American Investment Funds, Inc. (“FAIF”), which is a member of the First American Family of Funds. As of October 31, 2009, FAIF offered 40 funds, including the funds listed above. FAIF is registered under the Investment Company Act of 1940, as amended, as an open-end management investment company. FAIF’s articles of incorporation permit the funds’ board of directors to create additional funds in the future. Quantitative Large Cap Core Fund, Quantitative Large Cap Growth Fund, and Quantitative Large Cap Value Fund are each diversified open-end management investment companies.
The funds offer Class A, Class C, and Class Y shares. Class A shares are sold with a front-end sales charge. Class C shares may be subject to a contingent deferred sales charge for 12 months. Class Y shares have no sales charge and are offered only to qualifying institutional investors and certain other qualifying accounts. Prior to the close of business on April 28, 2009, each fund offered Class R Shares. Subsequent to this date, no new or additional investments are allowed in Class R Shares.
The funds’ prospectus provides descriptions of each fund’s investment objective, principal investment strategies, and principal risks. All classes of shares in a fund have identical voting, dividend, liquidation, and other rights, and the same terms and conditions, except that certain fees and expenses, including distribution and shareholder servicing fees, may differ among classes. Each class has exclusive voting rights on any matters relating to that class’s servicing or distribution arrangements.
| |
| 2 > | Summary of Significant Accounting Policies |
The significant accounting policies followed by the funds are as follows:
SECURITY VALUATIONS – Security valuations for the funds’ investments are furnished by an independent pricing service that has been approved by the funds’ board of directors. Investments in equity securities that are traded on a national securities exchange (or reported on the Nasdaq national market system) are stated at the last quoted sales price if readily available for such securities on each business day. For securities traded on the Nasdaq national market system, the funds utilize the Nasdaq Official Closing Price which compares the last trade to the bid/ask range of a security. If the last trade falls within the bid/ask range, then that price will be the closing price. If the last trade is outside the bid/ask range, and falls above the ask, then the ask will be the closing price. If the last trade is below the bid, then the bid will be the closing price. Other equity securities traded in the over-the-counter market and listed equity securities for which no sale was reported on that date are stated at the last quoted bid price. Investments in open-end funds are valued at their respective net asset values on the valuation date.
Debt obligations exceeding 60 days to maturity are valued by an independent pricing service. The pricing service may employ methodologies that utilize actual market transactions, broker-dealer supplied valuations, or other formula-driven valuation techniques. These techniques generally consider such factors as yields or prices of bonds of comparable quality, type of issue, coupon, maturity, ratings, and general market conditions. Securities for which prices are not available from an independent pricing service, but where an active market exists, are valued using market quotations obtained from one or more dealers that make markets in the securities or from a widely used quotation system. Debt obligations with 60 days or less remaining until maturity may be valued at their amortized cost, which approximates fair value.
The following investment vehicles, when held by a fund, are priced as follows: Exchange listed futures and options on futures are priced at their last sale price on the exchange on which they are principally traded, as determined by FAF Advisors, Inc (“FAF Advisors”), on the day the valuation is made. If there were no sales on that day, futures and options on futures will be valued at the last reported bid price. Options on securities, indices, and currencies traded on Nasdaq or listed on a stock exchange, whether domestic or foreign, are valued at the last sale price on Nasdaq or on any exchange on the day the valuation is made. If there were no sales on that day, the options will be valued at the last sale price on the previous valuation date. Last sale prices are obtained from an independent pricing service. Forward contracts and over-the-counter options on securities, indices, and currencies are valued at the quotations received from an independent pricing service, if available.
When market quotations are not readily available, securities are internally valued at fair value as determined in good faith by procedures established and approved by the funds’ board of directors. Some of the factors which may be considered in determining fair value are fundamental analytical data relating to the investment; the nature and duration of any restrictions on disposition; trading in similar securities of the same issuer or comparable companies; information from broker-dealers; and an evaluation of the forces that influence the market in which the securities are purchased and sold. If events occur that materially affect the value of securities (including non-U.S. securities) between the close of trading in those securities and the close of regular trading on the New York Stock Exchange, the securities will be valued at fair value. Price movements in futures contracts and ADRs (American Depositary Receipts), and various other indices, may be reviewed in the course of making a good faith determination of a security’s fair value. The use of fair value pricing by a fund may cause the net asset value of its
32 First American Funds 2009 Annual Report
shares to differ significantly from net asset value that would be calculated without regard to such considerations. As of October 31, 2009, Quantitative Large Cap Core Fund, Quantitative Large Cap Growth Fund, and Quantitative Large Cap Value Fund held no internally fair valued securities.
Generally accepted accounting principles (GAAP) require disclosures regarding the inputs and valuation techniques used to measure fair value and any changes in valuation inputs or technique. These principles establish a three-tier fair value hierarchy for inputs used in measuring fair value. Fair value inputs are summarized in the 3 broad levels listed below:
Level 1 – Quoted prices in active markets for identical securities.
Level 2 – Other significant observable inputs (including quoted prices for similar securities, with similar interest rates, prepayment speeds, credit risk, etc.).
Level 3 – Significant unobservable inputs (including a fund’s own assumptions in determining the fair value of investments). Generally, the types of securities included in Level 3 of a fund are securities for which there is limited or no observable fair value inputs available, and as such the fair value is determined through independent broker quotations or management’s fair value procedures established by the funds’ board of directors.
The valuation levels are not necessarily an indication of the risk associated with investing in these investments.
As of October 31, 2009, the fund’s investments were classified as follows:
| | | | | | | | | | | | | | | | | |
| | | | | | | | | | | | Total
| |
| Fund | | Level 1 | | | Level 2 | | | Level 3 | | | Fair Value | |
| | |
Quantitative Large Cap Core Fund | | | | | | | | | | | | | | | | |
| Common Stocks | | $ | 137,709 | | | $ | — | | | $ | — | | | $ | 137,709 | |
| Short-Term Investments | | | 22,656 | | | | 2,000 | | | | — | | | | 24,656 | |
| |
| |
| Total Investments | | $ | 160,365 | | | $ | 2,000 | | | $ | — | | | $ | 162,365 | |
| |
| |
Quantitative Large Cap Growth Fund | | | | | | | | | | | | | | | | |
| Common Stocks | | $ | 25,606 | | | $ | — | | | $ | — | | | $ | 25,606 | |
| Short-Term Investments | | | 4,045 | | | | 150 | | | | — | | | | 4,195 | |
| |
| |
| Total Investments | | $ | 29,651 | | | $ | 150 | | | $ | — | | | $ | 29,801 | |
| |
| |
Quantitative Large Cap Value Fund | | | | | | | | | | | | | | | | |
| Common Stocks | | $ | 23,922 | | | $ | — | | | $ | — | | | $ | 23,922 | |
| Short-Term Investments | | | 4,001 | | | | 75 | | | | — | | | | 4,076 | |
| |
| |
| Total Investments | | $ | 27,923 | | | $ | 75 | | | $ | — | | | $ | 27,998 | |
| |
| |
See each fund’s Schedule of Investments for further industry breakout.
As of October 31, 2009, each fund’s investments in other financial instruments* were classified as follows:
| | | | | | | | | | | | | | | | | |
| | | | | | | | | | | | Total
| |
| Fund | | Level 1 | | | Level 2 | | | Level 3 | | | Fair Value | |
| | |
| Quantitative Large Cap Core Fund | | $ | (234 | ) | | $ | — | | | $ | — | | | $ | (234 | ) |
| Quantitative Large Cap Growth Fund | | | (22 | ) | | | — | | | | — | | | | (22 | ) |
| Quantitative Large Cap Value Fund | | | (13 | ) | | | — | | | | — | | | | (13 | ) |
| |
| |
| | |
| | * | Other financial instruments include futures, which are valued at the unrealized appreciation (depreciation) on the instrument. |
During the fiscal year ended October 31, 2009, the funds held no Level 3 securities, therefore no reconciliation of Level 3 securities is presented.
SECURITY TRANSACTIONS AND INVESTMENT INCOME – For financial statement purposes, the funds record security transactions on the trade date of the security purchase or sale. Dividend income is recorded on the ex-dividend date. Interest income, including amortization of bond premium and discount, is recorded on an accrual basis. Security gains and losses are determined on the basis of identified cost, which is the same basis used for federal income tax purposes. The resulting gain/loss is calculated as the difference between the sales price and the underlying cost of the security on the transaction date.
DISTRIBUTIONS TO SHAREHOLDERS – Distributions from net investment income are declared and paid annually by each of the funds. Distributions are payable in cash or reinvested in additional shares of the fund. Any net realized capital gains on sales of a fund’s securities are distributed to shareholders at least annually.
FEDERAL TAXES – Each fund is treated as a separate taxable entity. Each fund intends to continue to qualify as a regulated investment company as provided in Subchapter M of the Internal Revenue Code, as amended, and to distribute all taxable income, if any, to its shareholders. Accordingly, no provision for federal income taxes is required.
As of October 31, 2009, the funds did not have any tax positions that did not meet the “more-likely-than-not”
First American Funds 2009 Annual Report 33
| |
| Notes toFinancial Statements | October 31, 2009, all dollars and shares are rounded to thousands (000) |
threshold of being sustained by the applicable tax authority. Generally, tax authorities can examine all the tax returns filed for the last three years.
Net investment income and net realized gains (losses) may differ for financial statement and tax purposes because of temporary or permanent book-to-tax differences. These differences are primarily due to losses deferred from wash sales, the tax recognition of mark to market gains (losses) on open future contracts, proceeds from securities litigation, and the sale of real estate investment trust securities (“REITs”). To the extent these differences are permanent, reclassifications are made to the appropriate equity accounts in the period in which the differences arise.
On the Statements of Assets and Liabilities the following reclassifications were made:
| | | | | | | | | | | | | |
| | | Accumulated
| | | Undistributed
| | | | |
| | | Net Realized
| | | Net Investment
| | | Portfolio
| |
| Fund | | Gain (Loss) | | | Income | | | Capital | |
| | |
| Quantitative Large Cap Value Fund | | $ | 1 | | | $ | (1 | ) | | $ | — | |
| |
| |
The character of distributions made during the fiscal year from net investment income or net realized gains may differ from their ultimate characterization for federal income tax purposes. In addition, due to the timing of dividend distributions, the fiscal year in which the amounts are distributed may differ from the year that the income or realized gains (losses) were recorded by the funds. The distributions paid during the fiscal years ended October 31, 2009 and October 31, 2008, were as follows:
| | | | | | | | | | | | | |
| | | October 31, 2009 | |
| | |
| | | | | | | | | Ordinary
| |
| Fund | | | | | | | | Income | |
| | |
| Quantitative Large Cap Core Fund | | | | | | | | | | $ | 1,073 | |
| Quantitative Large Cap Growth Fund | | | | | | | | | | | 151 | |
| Quantitative Large Cap Value Fund | | | | | | | | | | | 200 | |
| |
| |
| | | | | | | | | | | | | |
| | | October 31, 2008 | |
| | |
| | | Ordinary
| | | Long Term
| | | | |
| Fund | | Income | | | Gain | | | Total | |
| | |
| Quantitative Large Cap Core Fund | | $ | 1,341 | | | $ | 54 | | | $ | 1,395 | |
| Quantitative Large Cap Growth Fund | | | 171 | | | | 1 | | | | 172 | |
| Quantitative Large Cap Value Fund | | | 219 | | | | 7 | | | | 226 | |
| |
| |
As of October 31, 2009, the funds’ most recently completed fiscal year-end, the components of accumulated earnings (deficit) on a tax basis were as follows:
| | | | | | | | | | | | | | | | | |
| | | | | | Accumulated
| | | | | | | |
| | | Undistributed
| | | Capital and
| | | | | | Total
| |
| | | Ordinary
| | | Post-October
| | | Unrealized
| | | Accumulated
| |
| Fund | | Income | | | Losses | | | Appreciation | | | Deficit | |
| | |
| Quantitative Large Cap Core Fund | | $ | 1,660 | | | $ | (26,276 | ) | | $ | 5,590 | | | $ | (19,026 | ) |
| Quantitative Large Cap Growth Fund | | | 272 | | | | (3,456 | ) | | | 1,483 | | | | (1,701 | ) |
| Quantitative Large Cap Value Fund | | | 418 | | | | (1,903 | ) | | | 717 | | | | (768 | ) |
| |
| |
The difference between book and tax basis unrealized appreciation (depreciation) is primarily due to the tax deferral of losses on wash sales and the amount of gain (loss) recognized for tax purposes due to mark-to-market adjustments on open futures contracts.
As of October 31, 2009, the funds had capital loss carryforwards, which, if not offset by subsequent capital gains, will expire on the funds’ fiscal year-ends as follows:
| | | | | | | | | | | | | |
| Fund | | 2016 | | | 2017 | | | Total | |
| | |
| Quantitative Large Cap Core Fund | | $ | 7,444 | | | $ | 18,832 | | | $ | 26,276 | |
| Quantitative Large Cap Growth Fund | | | 313 | | | | 3,143 | | | | 3,456 | |
| Quantitative Large Cap Value Fund | | | 378 | | | | 1,525 | | | | 1,903 | |
| |
| |
DERIVATIVES – The funds may invest in derivative financial instruments in order to manage risk or gain exposure to various other investments or markets. The funds’ investment objectives allow the funds to enter into stock index futures. Derivatives may contain various risk including the potential inability of the counterparty to fulfill their obligations under the terms of the contract, the potential for an illiquid secondary market, and the potential for market movements which may expose the funds to gains or losses in excess of the amounts shown on the Statement of Assets and Liabilities.
FUTURES TRANSACTIONS – The funds are subject to equity price risk and interest rate risk in the normal course of pursuing their investment objectives. In order to gain exposure to or protect against changes in the market and to maintain sufficient liquidity to meet redemption requests, each fund may enter into futures contracts. Upon entering into a futures contract, the fund is required to deposit cash or pledge U.S. Government securities. The margin required for a futures contract is set by the exchange on which the contract is traded. Subsequent payments, which are dependent on the daily fluctuations in the value of the underlying security or securities, are made or received by the fund each day (daily variation margin) and are recorded as unrealized gains (losses) until the contract is closed. When the contract is closed, the fund records a realized gain (loss) equal to the difference between the proceeds from (or cost of) the closing transaction and the fund’s basis in the contract.
Risks of entering into futures contracts, in general, include the possibility that there will not be a perfect price correlation between the futures contracts and the underlying securities. Second, it is possible that a lack of liquidity for futures contracts could exist in the secondary market, resulting in an inability to close a futures position prior to its maturity date. Third, the purchase of a futures
34 First American Funds 2009 Annual Report
contract involves the risk that a fund could lose more than the original margin deposit required to initiate a futures transaction. These contracts involve market risk in excess of the amount reflected in the fund’s Statement of Assets and Liabilities. Unrealized gains (losses) on outstanding positions in futures contracts held at the close of the year will be recognized as capital gains (losses) for federal income tax purposes.
As of October 31, 2009, Quantitative Large Cap Core Fund, Quantitative Large Cap Growth Fund, and Quantitative Large Cap Value Fund had outstanding futures contracts as disclosed in their Schedule of Investments.
For the fiscal year ended October 31, 2009, the quarterly average gross notional amounts of the derivatives held by the funds were:
| | | | | | | | | |
| | | Futures/
| | | Futures/
| |
| Fund | | Long | | | Short | |
| | |
| Quantitative Large Cap Core Fund | | $ | 5,265 | | | $ | 370 | |
| Quantitative Large Cap Growth Fund | | | 364 | | | | — | |
| Quantitative Large Cap Value Fund | | | 640 | | | | — | |
| |
| |
As of October 31, 2009, the funds’ fair values of derivative instruments categorized by risk exposure were classified as follows:
| | | | | | | | | | | | | | | |
| | | Statement of
| | Quantitative
| | | Quantitative
| | | Quantitative
| |
| | | Assets and Liabilities
| | Large Cap
| | | Large Cap
| | | Large Cap
| |
| | | Location | | Core Fund | | | Growth Fund | | | Value Fund | |
| | |
Liability Derivatives | | | | | | | | | | | | | | |
| Equity Contracts | | Payables, Net Assets – Unrealized Depreciation* | | $ | 234 | | | $ | 22 | | | $ | 13 | |
| |
| |
| Balance as of October 31, 2009 | | | | $ | 234 | | | $ | 22 | | | $ | 13 | |
| |
| |
| | |
| | * | Includes cumulative appreciation/depreciation of futures contracts as reported in the footnotes to the funds’ Schedules of Investments. Only the current day’s variation margin is reported within the Statements of Assets and Liabilities. |
The effect of derivative instruments on the Statements of Operations for the fiscal year ended October 31, 2009:
Amount of realized gain (loss) on derivatives recognized in income:
| | | | | |
| Quantitative Large Cap Core Fund | | Futures | |
| | |
| Equity Contracts | | $ | 1,549 | |
| | | | | |
| Quantitative Large Cap Growth Fund | | Futures | |
| | |
| Equity Contracts | | $ | 120 | |
| | | | | |
| Quantitative Large Cap Value Fund | | Futures | |
| | |
| Equity Contracts | | $ | (31 | ) |
Change in unrealized appreciation (depreciation) on derivatives recognized in income:
| | | | | |
| Quantitative Large Cap Core Fund | | Futures | |
| | |
| Equity Contracts | | $ | (358 | ) |
| | | | | |
| Quantitative Large Cap Growth Fund | | Futures | |
| | |
| Equity Contracts | | $ | (22 | ) |
| | | | | |
| Quantitative Large Cap Value Fund | | Futures | |
| | |
| Equity Contracts | | $ | (41 | ) |
ILLIQUID OR RESTRICTED SECURITIES – A security may be considered illiquid if it lacks a readily available market. Securities are generally considered liquid if they can be sold or disposed of in the ordinary course of business within seven days at approximately the price at which the security is valued by the fund. Illiquid securities may be valued under methods approved by the funds’ board of directors as reflecting fair value. Each fund intends to invest no more than 15% of its total net assets (determined at the time of purchase and reviewed periodically) in illiquid securities. Certain restricted securities may be considered illiquid. Restricted securities are often purchased in private placement transactions, are not registered under the Securities Act of 1933, may have contractual restrictions on resale, and may be valued under methods approved by the funds’ board of directors as reflecting fair value. Certain restricted securities eligible for resale to qualified institutional investors, including Rule 144A securities, are not subject to the limitation on a fund’s investment in illiquid securities if they are determined to be liquid in accordance with procedures adopted by the funds’ board of directors. At October 31,
First American Funds 2009 Annual Report 35
| |
| Notes toFinancial Statements | October 31, 2009, all dollars and shares are rounded to thousands (000) |
2009, Quantitative Large Cap Core Fund, Quantitative Large Cap Growth Fund, and Quantitative Large Cap Value Fund held no investments in illiquid securities.
SECURITIES LENDING – In order to generate additional income, each fund may lend securities representing up to one-third of the value of its total assets (which includes collateral for securities on loan) to broker-dealers, banks, or other institutional borrowers of securities. Each fund’s policy is to receive collateral from the borrower in the form of cash, U.S. government securities, or other high-grade debt obligations equal to at least 100% of the value of securities loaned. If the value of the securities on loan increases, additional collateral is received from the borrower. As with other extensions of credit, there may be risks of delay in recovery of the securities or even loss of rights in the collateral should the borrower of the security fail financially.
U.S. Bank National Association (“U.S. Bank”), the parent company of the funds’ advisor, serves as the securities lending agent for the funds in transactions involving the lending of portfolio securities on behalf of the funds. U.S. Bank acts as the securities lending agent pursuant to, and subject to compliance with conditions contained in, an exemptive order issued by the Securities and Exchange Commission (“SEC”). U.S. Bank receives fees as a percentage of each fund’s net income from securities lending transactions. Collateral for securities on loan is invested in a money market fund administered by FAF Advisors and FAF Advisors receives an administration fee equal to 0.02% of such fund’s average daily net assets. Securities lending fees paid to U.S. Bank by the funds for the fiscal year ended October 31, 2009, were as follows:
| | | | | |
| Fund | | Amount | |
| | |
| Quantitative Large Cap Core Fund | | $ | 25 | |
| Quantitative Large Cap Growth Fund | | | 5 | |
| Quantitative Large Cap Value Fund | | | 8 | |
| |
| |
Income from securities lending is recorded on the Statements of Operations as securities lending income net of fees paid to U.S. Bank.
SECURITY LITIGATION SETTLEMENTS – Income from settlement proceeds related to portfolio securities no longer included in the portfolio is recorded as an adjustment to realized gains or losses. The funds did not have any adjustments made for the fiscal year ended October 31, 2009.
EXPENSES – Expenses that are directly related to one of the funds are charged directly to that fund. Other operating expenses are allocated to the funds on several bases, including evenly across all funds, allocated based on relative net assets of all funds within the First American Family of Funds, or a combination of both methods. Class specific expenses, such as distribution fees and shareholder servicing fees, are borne by that class. Income, other expenses, and realized and unrealized gains and losses of a fund are allocated to each respective class in proportion to the relative net assets of each class.
INTERFUND LENDING PROGRAM – Pursuant to an exemptive order issued by the SEC, the funds, along with other registered investment companies in the First American Family of Funds, may participate in an interfund lending program. This program provides an alternative credit facility allowing the funds to borrow from, or lend money to, other participating funds. The funds did not have any interfund lending transactions during the fiscal year ended October 31, 2009.
DEFERRED COMPENSATION PLAN – Under a Deferred Compensation Plan (the “Plan”), non-interested directors of the First American Family of Funds may participate and elect to defer receipt of part or all of their annual compensation. Deferred amounts are treated as though equivalent dollar amounts had been invested in shares of open-end First American Funds, as designated by each director. All amounts in the Plan are 100% vested and accounts under the Plan are obligations of the funds. Deferred amounts remain in the funds until distributed in accordance with the Plan.
USE OF ESTIMATES IN PREPARATION OF FINANCIAL STATEMENTS – The preparation of financial statements, in conformity with U.S. generally accepted accounting principles, requires management to make estimates and assumptions that affect the reported amounts of assets and liabilities and disclosure of contingent assets and liabilities at the date of the financial statements and the reported results of operations during the reporting period. Actual results could differ from those estimates.
EVENTS SUBSEQUENT TO FISCAL YEAR END – Management has evaluated fund related events and transactions that occurred subsequent to October 31, 2009, through December 22, 2009, the date of issuance of the funds’ financial statements. There were no events or transactions that occurred during this period that materially impacted the amounts or disclosures in the funds’ financial statements.
INVESTMENT ADVISORY FEES – Pursuant to an investment advisory agreement (the “Agreement”), FAF Advisors manages each fund’s assets and furnishes related office facilities, equipment, research, and personnel. The Agreement requires each fund to pay FAF Advisors a monthly fee based upon average daily net assets. The annual fee is 0.30% for each of Quantitative Large Cap Core Fund, Quantitative Large Cap Growth Fund, and Quantitative Large Cap Value Fund. FAF Advisors has agreed to contractually waive fees and reimburse other fund expenses through February 28, 2010, so that total annual fund operating expenses, excluding indirect fees and expenses incurred through investment in exchange traded funds and other investment companies, as a
36 First American Funds 2009 Annual Report
percentage of average daily net assets, do not exceed the following amounts:
| | | | | | | | | | | | | | | |
| Fund | | A | | | C | | | Y | | | |
| |
| Quantitative Large Cap Core Fund | | | 0.70 | % | | | 1.45 | % | | | 0.45 | % | | |
| Quantitative Large Cap Growth Fund | | | 0.70 | | | | 1.45 | | | | 0.45 | | | |
| Quantitative Large Cap Value Fund | | | 0.70 | | | | 1.45 | | | | 0.45 | | | |
| |
| |
The funds may invest in related money market funds that are series of First American Funds, Inc., subject to certain limitations. In order to avoid the payment of duplicative investment advisory fees to FAF Advisors, which acts as the investment advisor to both the investing funds and the related money market funds, FAF Advisors will reimburse each investing fund an amount equal to that portion of FAF Advisors’ investment advisory fee received from the related money market funds that is attributable to the assets of the investing fund. This reimbursement, if any, is included in “Fee waivers” in the Statement of Operations.
ADMINISTRATION FEES – FAF Advisors serves as the funds’ administrator pursuant to an administration agreement between FAF Advisors and the funds. U.S. Bancorp Fund Services, LLC (“USBFS”) serves as sub-administrator pursuant to a sub-administration agreement between USBFS and FAF Advisors. FAF Advisors is a subsidiary of U.S. Bank National Association (“U.S. Bank”). Both U.S. Bank and USBFS are direct subsidiaries of U.S. Bancorp. Under the administration agreement, FAF Advisors is compensated to provide, or compensates other entities to provide, services to the funds. These services include various legal, oversight, administrative, and accounting services. The funds pay FAF Advisors administration fees, which are calculated daily and paid monthly, equal to each fund’s pro rata share of an amount equal, on a annual basis, to 0.25% of the aggregate average daily net assets of all open-end funds in the First American Family of Funds up to $8 billion, 0.235% on the next $17 billion of the aggregate average daily net assets, 0.22% on the next $25 billion of the aggregate average daily net assets, and 0.20% of the aggregate average daily net assets in excess of $50 billion. All fees paid to the sub-administrator are paid from the administration fee. In addition to these fees, the funds may reimburse FAF Advisors and the sub-administrator for any out-of-pocket expenses incurred in providing administration services.
TRANSFER AGENT FEES – USBFS serves as the funds’ transfer agent pursuant to a transfer agent agreement with FAIF. The funds are charged transfer agent fees on a per shareholder account basis, subject to a minimum fee per share class. These fees are charged to each fund based upon the number of accounts within that fund. In addition to these fees, the funds may reimburse USBFS for out-of-pocket expenses incurred in providing transfer agent services.
CUSTODIAN FEES – U.S. Bank serves as the funds’ custodian pursuant to a custodian agreement with FAIF. The custodian fee charged for each fund is equal to an annual rate of 0.005% of average daily net assets. All fees are computed daily and paid monthly.
Under the custodian agreement, interest earned on uninvested cash balances is used to reduce a portion of each fund’s custodian expenses. These credits, if any, are disclosed as “Indirect payments from custodian” in the Statement of Operations. Conversely, the custodian charges a fee for any cash overdrafts incurred, which will increase the fund’s custodian expenses. For the fiscal year ended October 31, 2009, custodian fees for Quantitative Large Cap Core Fund, Quantitative Large Cap Growth Fund, and Quantitative Large Cap Value Fund were increased by $1, $0, and $0, respectively, as a result of overdrafts and were not decreased as a result of interest earned.
DISTRIBUTION AND SHAREHOLDER SERVICING (12b-1) FEES – Quasar Distributors, LLC (“Quasar”), a subsidiary of U.S. Bancorp, serves as distributor of the funds pursuant to a distribution agreement with FAIF. Under the distribution agreement, and pursuant to a plan adopted by each fund under rule 12b-1 of the Investment Company Act, each fund pays Quasar a monthly distribution and/or shareholder servicing fee equal to an annual rate of 0.25% and 1.00% of each fund’s average daily net assets attributable to Class A shares and Class C shares, respectively. Class Y shares pay no distribution or shareholder servicing fees. These fees may be used by Quasar to provide compensation for sales support, distribution activities, and/or shareholder servicing activities.
Under the distribution and shareholder servicing agreement, the following amounts were retained by affiliates of FAF Advisors for the fiscal year ended October 31, 2009:
| | | | | |
| Fund | | Amount | |
| | |
| Quantitative Large Cap Core Fund | | $ | — | |
| Quantitative Large Cap Growth Fund | | | — | |
| Quantitative Large Cap Value Fund | | | — | |
| |
| |
OTHER FEES AND EXPENSES – In addition to the investment advisory fees, administration fees, transfer agent fees, custodian fees, and distribution and shareholder servicing fees, each fund is responsible for paying other operating expenses, including: legal, auditing, registration fees, postage and printing of shareholder reports, fees and expenses of independent directors, insurance, and other miscellaneous expenses. For the fiscal year ended October 31, 2009, legal fees and expenses of $15 were paid to a law firm of which an Assistant Secretary of the funds is a partner.
First American Funds 2009 Annual Report 37
| |
| Notes toFinancial Statements | October 31, 2009, all dollars and shares are rounded to thousands (000) |
CONTINGENT DEFERRED SALES CHARGES – A contingent deferred sales charge (“CDSC”) of 1.00% is imposed on redemptions made in the Class C shares for the first 12 months. The CDSC is imposed on the value of the purchased shares, or the value at the time of redemption, whichever is less.
For the fiscal year ended October 31, 2009, total front-end sales charges and CDSCs retained by affiliates of FAF Advisors for distributing the funds’ shares were as follows:
| | | | | |
| Fund | | Amount | |
| | |
| Quantitative Large Cap Core Fund | | $ | — | |
| Quantitative Large Cap Growth Fund | | | — | |
| Quantitative Large Cap Value Fund | | | — | |
| |
| |
| |
| 4 > | Capital Share Transactions |
FAIF has 370 billion shares of $0.0001 par value capital stock authorized. Capital share transactions for the funds were as follows:
| | | | | | | | | | | | | | | | | | | | | | | | | | | | | |
| | | | | | | | | | | | | | | | | | | | | | | |
| | | Quantitative
| | | | Quantitative
| | | | Quantitative
| | | |
| | | Large Cap
| | | | Large Cap
| | | | Large Cap
| | | |
| | | Core Fund | | | | Growth Fund | | | | Value Fund | | | |
| |
| | | Year
| | | Year
| | | | Year
| | | Year
| | | | Year
| | | Year
| | | |
| | | Ended
| | | Ended
| | | | Ended
| | | Ended
| | | | Ended
| | | Ended
| | | |
| | | 10/31/09 | | | 10/31/08 | | | | 10/31/09 | | | 10/31/08 | | | | 10/31/09 | | | 10/31/08 | | | |
| |
| Class A: | | | | | | | | | | | | | | | | | | | | | | | | | | | | |
| Shares issued | | | 8 | | | | 5 | | | | | 1 | | | | 2 | | | | | — | | | | — | | | |
| Shares issued in lieu of cash distributions | | | — | | | | — | | | | | — | | | | — | | | | | — | | | | — | | | |
| Shares redeemed | | | (1 | ) | | | (3 | ) | | | | (1 | ) | | | (1 | ) | | | | — | | | | — | | | |
| |
| |
Total Class A transactions | | | 7 | | | | 2 | | | | | — | | | | 1 | | | | | — | | | | — | | | |
| |
| |
| Class C: | | | | | | | | | | | | | | | | | | | | | | | | | | | | |
| Shares issued | | | — | | | | — | | | | | — | | | | — | | | | | 1 | | | | — | | | |
| Shares issued in lieu of cash distributions | | | — | | | | — | | | | | — | | | | — | | | | | — | | | | — | | | |
| Shares redeemed | | | (1 | ) | | | — | | | | | — | | | | — | | | | | (1 | ) | | | — | | | |
| |
| |
Total Class C transactions | | | (1 | ) | | | — | | | | | — | | | | — | | | | | — | | | | — | | | |
| |
| |
| Class Y: | | | | | | | | | | | | | | | | | | | | | | | | | | | | |
| Shares issued | | | 5,877 | | | | 4,109 | | | | | 283 | | | | 870 | | | | | 436 | | | | 707 | | | |
| Shares issued in lieu of cash distributions | | | 36 | | | | 46 | | | | | 7 | | | | 6 | | | | | 11 | | | | 9 | | | |
| Shares redeemed | | | (3,199 | ) | | | (580 | ) | | | | (119 | ) | | | (33 | ) | | | | (100 | ) | | | (1 | ) | | |
| |
| |
Total Class Y transactions | | | 2,714 | | | | 3,575 | | | | | 171 | | | | 843 | | | | | 347 | | | | 715 | | | |
| |
| |
Net increase in capital shares | | | 2,720 | | | | 3,577 | | | | | 171 | | | | 844 | | | | | 347 | | | | 715 | | | |
| |
| |
| |
| 5 > | Investment Security Transactions |
During the fiscal year ended October 31, 2009, purchases of securities and proceeds from sales of securities, other than temporary investments in short-term securities, were as follows:
| | | | | | | | | |
| Fund | | Purchases | | | Sales | |
| | |
| Quantitative Large Cap Core Fund | | $ | 119,196 | | | $ | 70,274 | |
| Quantitative Large Cap Growth Fund | | | 16,888 | | | | 13,781 | |
| Quantitative Large Cap Value Fund | | | 18,043 | | | | 11,000 | |
| |
| |
Portfolios that primarily invest in a particular sector may experience greater volatility than portfolios investing in a broad range of industry sectors. As of October 31, 2009, Quantitative Large Cap Core Fund and Quantitative Large Cap Growth Fund had a significant portion of their assets invested in the information technology sector, which could be more sensitive to short product cycles and aggressive pricing than the technology industry as a whole. As of the same date, Quantitative Large Cap Value Fund had a significant portion of its assets invested in the financials sector. The financials sector may be more greatly impacted by the performance of the overall economy, interest rates, competition, and consumer confidence and spending.
The funds enter into contracts that contain a variety of indemnifications. The funds’ maximum exposure under these arrangements is unknown. However, the funds have not had prior claims or losses pursuant to these contracts and expect the risk of loss to be remote.
38 First American Funds 2009 Annual Report
| |
| Notice toShareholders | October 31, 2009 (unaudited) |
TAX INFORMATION
The information set forth below is for each fund’s fiscal year as required by federal laws. Most shareholders, however, must report distributions on a calendar year basis for income tax purposes, which may include distributions for portions of two fiscal years of a fund. Accordingly, the information needed for income tax purposes will be sent in early 2010 on Form 1099-DIV. Please consult your tax advisor for proper treatment of this information.
For the fiscal year ended October 31, 2009, each fund has designated long term capital gains and ordinary income with regard to distributions paid during the period as follows:
| | | | | | | | | | | | | |
| | | Ordinary
| | | | | | | | |
| | | Income
| | | Total
| | | | | |
| | | Distributions
| | | Distributions
| | | | | |
| Fund | | (Tax Basis)1 | | | (Tax Basis)2 | | | | | |
| |
| Quantitative Large Cap Core Fund | | | 100.00 | % | | | 100.00 | % | | | | |
| Quantitative Large Cap Growth Fund | | | 100.00 | | | | 100.00 | | | | | |
| Quantitative Large Cap Value Fund | | | 100.00 | | | | 100.00 | | | | | |
| |
| |
| | |
| | 1 | Based on a percentage of the fund’s total distributions. |
| | 2 | None of the distributions made by these funds are eligible for the dividends received deduction or are characterized as qualified dividend income. |
Shareholder Notification of Federal Tax Status:
Each fund has designated the following percentages of the ordinary income distributions during the fiscal year ended October 31, 2009 as dividends qualifying for the dividends received deduction available to corporate shareholders:
| | | | | | | |
| Fund | | | | | |
| |
| Quantitative Large Cap Core Fund | | | 100.00 | % | | |
| Quantitative Large Cap Growth Fund | | | 100.00 | | | |
| Quantitative Large Cap Value Fund | | | 100.00 | | | |
| |
| |
In addition, each fund has designated the following percentages of the ordinary income distributions from net investment income during the fiscal year ended October 31, 2009 as qualified dividend income available to individual shareholders under the Jobs and Growth Tax Relief Reconciliation Act of 2003:
| | | | | | | |
| Fund | | | | | |
| |
| Quantitative Large Cap Core Fund | | | 100.00 | % | | |
| Quantitative Large Cap Growth Fund | | | 100.00 | | | |
| Quantitative Large Cap Value Fund | | | 99.63 | | | |
| |
| |
Additional Information Applicable to Foreign Shareholders Only:
The percentage of ordinary income distributions that are designated as interest-related dividends under Internal Revenue Code Section 871(k)(1)(c) for each fund was as follows:
| | | | | | | |
| Fund | | | | | |
| |
| Quantitative Large Cap Core Fund | | | 3.71 | % | | |
| Quantitative Large Cap Growth Fund | | | 9.31 | | | |
| Quantitative Large Cap Value Fund | | | 1.47 | | | |
| |
| |
The percentage of ordinary income distributions that are designated as short-term capital gain distributions under Internal Revenue Code Section 871(k)(2)(c) for each fund was as follows:
| | | | | | | |
| Fund | | | | | |
| |
| Quantitative Large Cap Core Fund | | | 0.00 | % | | |
| Quantitative Large Cap Growth Fund | | | 0.00 | | | |
| Quantitative Large Cap Value Fund | | | 0.00 | | | |
| |
| |
First American Funds 2009 Annual Report 39
| |
| Notice toShareholders | October 31, 2009 (unaudited) |
HOW TO OBTAIN A COPY OF THE FUNDS’ PROXY VOTING POLICIES AND PROXY VOTING RECORD
A description of the policies and procedures that the funds use to determine how to vote proxies relating to portfolio securities, as well as information regarding how the funds voted proxies relating to portfolio securities is available at firstamericanfunds.com and on the U.S. Securities and Exchange Commission’s website at www.sec.gov. A description of the funds’ policies and procedures is also available without charge, upon request, by calling 800.677.FUND.
FORM N-Q HOLDINGS INFORMATION
Each fund is required to file its complete schedule of portfolio holdings for the first and third quarters of each fiscal period with the Securities and Exchange Commission on Form N-Q. The funds’ Forms N-Q are available without charge (1) upon request by calling 800.677.FUND and (2) on the Securities and Exchange Commission’s website at www.sec.gov. In addition, you may review and copy the funds’ Forms N-Q at the Commission’s Public Reference Room in Washington, D.C. You may obtain information on the operation of the Public Reference Room by calling 1.800.SEC.0330.
QUARTERLY PORTFOLIO HOLDINGS
Each fund will make portfolio holdings information publicly available by posting the information at firstamericanfunds.com on a quarterly basis. The funds will attempt to post such information within 10 business days of the calendar quarter end.
APPROVAL OF THE FUNDS’ INVESTMENT ADVISORY AGREEMENT
The Board of Directors of the Funds (the “Board”), which is comprised entirely of independent directors, oversees the management of each Fund and, as required by law, determines annually whether to renew the Funds’ advisory agreement with FAF Advisors, Inc. (“FAF Advisors”).
At a meeting on May 5-7, 2009, the Board considered information relating to the Funds’ investment advisory agreement with FAF Advisors (the “Agreement”). In advance of the meeting, the Board received materials relating to the Agreement, and had the opportunity to ask questions and request further information in connection with their consideration. At a subsequent meeting on June 16-18, 2009, the Board concluded its consideration of and approved the Agreement through June 30, 2010.
Although the Agreement, which is with First American Investment Funds, Inc., relates to all of the Funds, the Board separately considered and approved the Agreement with respect to each Fund. In considering the Agreement, the Board, advised by independent legal counsel, reviewed and considered the factors it deemed relevant, including: (1) the nature, quality and extent of FAF Advisors’ services to each Fund, (2) the investment performance of each Fund, (3) the profitability of FAF Advisors related to the Funds, including an analysis of FAF Advisors’ cost of providing services and comparative expense information, (4) whether economies of scale may be realized as the Funds grow and whether fee levels are adjusted to enable Fund investors to share in these potential economies of scale, and (5) other benefits that accrue to FAF Advisors through its relationship with the Funds. In its deliberations, the Board did not identify any single factor which alone was responsible for the Board’s decision to approve the Agreement with respect to any Fund.
Before approving the Agreement, the Board met in executive session with its independent counsel on numerous occasions to consider the materials provided by FAF Advisors and the terms of the Agreement. Based on its evaluation of those materials, the Board concluded that the Agreement is fair and in the best interests of the shareholders of each Fund. In reaching its conclusions, the Board considered the following:
Nature, Quality and Extent of Investment Advisory Services
The Board examined the nature, quality and extent of the services provided by FAF Advisors to each Fund. For each Fund, the Board reviewed FAF Advisors’ key personnel who provide investment management services to the Fund as well as the fact that, under the Agreement, FAF Advisors has the authority and responsibility to make and execute investment decisions for each Fund within the framework of that Fund’s investment policies and restrictions, subject to review by the Board. The Board further considered that FAF Advisors’ duties with respect to each Fund include: (i) investment research and security selection, (ii) adherence to (and monitoring compliance with) the Fund’s investment policies and restrictions and the Investment Company Act of 1940, (iii) monitoring the performance of the various organizations providing services to each Fund, including the Fund’s distributor, sub-administrator, transfer agent and custodian. Finally, the Board considered FAF Advisors’ representation that the services provided by FAF Advisors under the Agreement are the type of services customarily provided by investment advisors in the fund industry. The Board considered compliance reports about FAF Advisors from the Funds’ Chief Compliance Officer (“CCO”).
40 First American Funds 2009 Annual Report
Based on the foregoing, the Board concluded that each Fund is likely to benefit from the nature, extent and quality of the services provided by FAF Advisors under the Agreement.
Investment Performance of the Funds
The Board considered the performance of each Fund on a gross-of-expenses basis, including comparative information provided by an independent data service, regarding the median performance of a group of comparable funds selected by that data service (the “performance universe”) and how each Fund performed versus its benchmark index. The performance periods considered by the Board all ended on February 28, 2009.
Quantitative Large Cap Core Fund. The Board considered that the Fund outperformed its benchmark index for the one-year period and since its inception on July 31, 2007, though it underperformed its performance universe median for both periods. The Board also considered, however, the Fund’s short operating history and concluded that it would be in the interest of the Fund and its shareholders to renew the Agreement and permit the Fund to develop a longer performance record.
Quantitative Large Cap Growth Fund. The Board considered that the Fund outperformed both its benchmark index and its performance universe median for the one-year period and since its inception on July 31, 2007. The Board concluded that, in light of the Fund’s competitive performance, it would be in the interest of the Fund and its shareholders to renew the Agreement.
Quantitative Large Cap Value Fund. The Board considered that the Fund outperformed both its benchmark index and its performance universe median for the one-year period and since its inception on July 31, 2007. The Board concluded that, in light of the Fund’s competitive performance, it would be in the interest of the Fund and its shareholders to renew the Agreement.
Costs of Services and Profits Realized by FAF Advisors
The Board reviewed FAF Advisors’ costs in serving as the Funds’ investment manager, including the costs associated with the personnel and systems necessary to manage the Funds. The Board also considered the profitability of FAF Advisors and its affiliates resulting from their relationship with each Fund. The Board compared fee and expense information for each Fund to fee and expense information for comparable funds managed by other advisors. The Board also reviewed advisory fees for other funds advised or sub-advised by FAF Advisors and for private accounts managed by FAF Advisors. The Board found that while the management fees for FAF Advisors’ institutional separate accounts are generally lower than the management fees charged by FAF Advisors to mutual funds, mutual funds receive additional services from FAF Advisors that separate accounts do not receive.
Using information provided by an independent data service, the Board also evaluated each Fund’s advisory fee compared to the median advisory fee for other mutual funds similar in size, character and investment strategy, and each Fund’s expense ratio after waivers compared to the median expense ratio, after waivers, of comparable funds. In connection with its review of Fund fees and expenses, the Board considered FAF Advisors’ pricing philosophy. FAF Advisors attempts generally to maintain each Fund’s total operating expenses at a level that approximates the median of a peer group of funds selected by an independent data service. In addition, FAF Advisors has committed to waive its investment advisory fees to the extent necessary to maintain the Funds’ total expense ratios at levels generally in line with their respective peer groups.
The Board considered that each Fund’s advisory fees were waived during the Funds’ last fiscal year. The Board also noted that each Fund’s total expense ratio is lower than the peer group median. The Board concluded that each Fund’s advisory fee and total expense ratio are reasonable in light of the services provided.
Economies of Scale in Providing Investment Advisory Services
The Board considered the extent to which each Fund’s investment advisory fee reflects economies of scale for the benefit of Fund shareholders. Based on information provided by FAF Advisors, the Board noted that profitability likely will increase as assets grow over time. The Board considered that each Fund has advisory fee breakpoints in place, and that FAF Advisors has committed to waive advisory fees to the extent necessary to keep each Fund’s total expenses generally in line with the median total expenses of a peer group of funds as selected by an independent data service. In light of the fee breakpoints currently in place for each Fund and FAF Advisors’ commitment to keep total Fund expenses competitive, the Board concluded that it would be reasonable and in the best interest of each Fund and its shareholders to renew the Agreement.
First American Funds 2009 Annual Report 41
| |
| Notice toShareholders | October 31, 2009 (unaudited) |
Other Benefits to FAF Advisors
In evaluating the benefits that accrue to FAF Advisors through its relationship with the Funds, the Board noted that FAF Advisors and certain of its affiliates serve the Funds in various capacities, including as investment advisor, administrator, transfer agent, distributor, custodian and securities lending agent, and receive compensation from the Funds in connection with providing services to the Funds. The Board considered that each service provided to the Funds by FAF Advisors or one of its affiliates is pursuant to a written agreement, which the Board evaluates periodically as required by law.
The Board also considered FAF Advisors’ use of the Funds’ portfolio brokerage transactions to obtain research. The Board concluded, based on its own review and on representations of FAF Advisors and the CCO, that FAF Advisors’ use of “soft” commission dollars was consistent with regulatory requirements.
After full consideration of these and other factors, the Board concluded that approval of the Agreement was in the best interest of each Fund and its shareholders.
42 First American Funds 2009 Annual Report
Directors and Officers of the Funds
| | | | | | | | | | | |
| Independent Directors |
| | | | | | | | | | | Other
|
| | | Position(s)
| | Term of Office
| | | | Number of Portfolios
| | Directorships
|
Name, Address, and
| | Held
| | and Length of
| | Principal Occupation(s)
| | in Fund Complex
| | Held by
|
| Year of Birth | | with Funds | | Time Served | | During Past 5 Years | | Overseen by Director | | Director † |
| |
Benjamin R. Field III
P.O. Box 1329
Minneapolis, MN
55440-1329
(1938) | | Director | | Term expiring earlier of death, resignation, removal, disqualification, or successor duly elected and qualified. Director of FAIF since September 2003 | | Retired | | First American Funds Complex: twelve registered investment companies, including fifty-eight portfolios | | None |
| |
| |
Roger A. Gibson
P.O. Box 1329
Minneapolis, MN
55440-1329
(1946) | | Director | | Term expiring earlier of death, resignation, removal, disqualification, or successor duly elected and qualified. Director of FAIF since
October 1997 | | Director, Charterhouse Group, Inc., a private equity firm, since October 2005; Advisor/Consultant, Future Freighttm, a logistics/supply chain company; Trustee, National Jewish Health; Board Member/Co-founder, Shades of Blue, an aviation-related youth development organization; Vice President and Chief Operating Officer, Cargo-United Airlines, from July 2001 until retirement in November 2005 | | First American Funds Complex: twelve registered investment companies, including fifty-eight portfolios | | None |
| |
| |
Victoria J. Herget
P.O. Box 1329
Minneapolis, MN
55440-1329
(1951) | | Director | | Term expiring earlier of death, resignation, removal, disqualification, or successor duly elected and qualified. Director of FAIF since September 2003 | | Investment consultant and non-profit board member; Board Chair, United Educators Insurance Company | | First American Funds Complex: twelve registered investment companies, including fifty-eight portfolios | | None |
| |
| |
John P. Kayser
P.O. Box 1329
Minneapolis, MN
55440-1329
(1949) | | Director | | Term expiring earlier of death, resignation, removal, disqualification, or successor duly elected and qualified. Director of FAIF since
October 2006 | | Retired; Principal from 1983 to 2004, William Blair & Company, LLC, a Chicago-based investment firm | | First American Funds Complex: twelve registered investment companies, including fifty-eight portfolios | | None |
| |
| |
Leonard W. Kedrowski
P.O. Box 1329
Minneapolis, MN
55440-1329
(1941) | | Director | | Term expiring earlier of death, resignation, removal, disqualification, or successor duly elected and qualified. Director of FAIF since November 1993 | | Owner and President, Executive and Management Consulting, Inc., a management consulting firm; Board member, GC McGuiggan Corporation (dba Smyth Companies), a label printer; member, investment advisory committee, Sisters of the Good Shepherd | | First American Funds Complex: twelve registered investment companies, including fifty-eight portfolios | | None |
| |
| |
Richard K. Riederer
P.O. Box 1329
Minneapolis, MN
55440-1329
(1944) | | Director | | Term expiring earlier of death, resignation, removal, disqualification, or successor duly elected and qualified. Director of FAIF since
August 2001 | | Owner and Chief Executive Officer, RKR Consultants, Inc., a consulting company providing advice on business strategy, mergers and acquisitions; non-profit board member since 2005 | | First American Funds Complex: twelve registered investment companies, including fifty-eight portfolios | | Cliffs Natural Resources, Inc. (a producer of iron ore pellets and coal) |
| |
| |
Joseph D. Strauss
P.O. Box 1329
Minneapolis, MN
55440-1329
(1940) | | Director | | Term expiring earlier of death, resignation, removal, disqualification, or successor duly elected and qualified. Director of FAIF since
April 1991 | | Attorney At Law; Owner and President, Strauss Management Company, a Minnesota holding company for various organizational management business ventures; Owner, Chairman, and Chief Executive Officer, Community Resource Partnerships, Inc., a corporation engaged in strategic planning, operations management, government relations, transportation planning, and public relations; Owner, Chairman, and Chief Executive Officer, Excensustm, LLC, a demographic planning and application development firm | | First American Funds Complex: twelve registered investment companies, including fifty-eight portfolios | | None |
| |
| |
First American Funds 2009 Annual Report 43
| |
| Notice toShareholders | October 31, 2009 (unaudited) |
| | | | | | | | | | | |
Independent Directors – concluded |
| | | | | | | | | | | Other
|
| | | Position(s)
| | Term of Office
| | | | Number of Portfolios
| | Directorships
|
Name, Address, and
| | Held
| | and Length of
| | Principal Occupation(s)
| | in Fund Complex
| | Held by
|
| Year of Birth | | with Funds | | Time Served | | During Past 5 Years | | Overseen by Director | | Director † |
| |
Virginia L. Stringer
P.O. Box 1329
Minneapolis, MN
55440-1329
(1944) | | Chair; Director | | Chair Term three years. Directors Term expiring earlier of death, resignation, removal, disqualification, or successor duly elected and qualified. Chair of FAIF’s Board since September 1997; Director of FAIF since September 1987 | | Governance consultant and non-profit board member; former Owner and President, Strategic Management Resources, Inc., a management consulting firm; Chair, St. Paul Riverfront Corporation, since 2005 | | First American Funds Complex: twelve registered investment companies, including fifty-eight portfolios | | None |
| |
| |
James M. Wade
P.O. Box 1329
Minneapolis, MN
55440-1329
(1943) | | Director | | Term expiring earlier of death, resignation, removal, disqualification, or successor duly elected and qualified. Director of FAIF since
August 2001 | | Owner and President, Jim Wade Homes, a homebuilding company | | First American Funds Complex: twelve registered investment companies, including fifty-eight portfolios | | None |
| |
| |
| |
| † | Includes only directorships in a company with a class of securities registered pursuant to Section 12 of the Securities Exchange Act or subject to the requirements of Section 15(d) of the Securities Exchange Act, or any company registered as an investment company under the Investment Company Act. |
The Statement of Additional Information (SAI) includes additional information about fund directors and is available upon request without charge by calling 800.677.FUND or writing to First American Funds, P.O. Box 1330, Minneapolis, Minnesota, 55440-1330.
44 First American Funds 2009 Annual Report
| | | | | | | |
| Officers |
| | | Position(s)
| | Term of Office
| | |
Name, Address, and
| | Held
| | and Length of
| | |
| Year of Birth | | with Funds | | Time Served | | Principal Occupation(s) During Past 5 Years |
| |
Thomas S. Schreier, Jr.
FAF Advisors, Inc.
800 Nicollet Mall
Minneapolis, MN 55402
(1962)* | | President | | Re-elected by the Board annually; President of FAIF since February 2001 | | Chief Executive Officer, FAF Advisors, Inc.; Chief Investment Officer, FAF Advisors, Inc., since September 2007 |
| |
| |
Jeffery M. Wilson
FAF Advisors, Inc.
800 Nicollet Mall
Minneapolis, MN 55402
(1956)* | | Vice President – Administration | | Re-elected by the Board annually; Vice President – Administration of FAIF since March 2000 | | Senior Vice President, FAF Advisors, Inc. |
| |
| |
Charles D. Gariboldi, Jr.
FAF Advisors, Inc.
800 Nicollet Mall
Minneapolis, MN 55402
(1959)* | | Treasurer | | Re-elected by the Board annually; Treasurer of FAIF since December 2004 | | Mutual Funds Treasurer, FAF Advisors, Inc., since October 2004; prior thereto, Vice President — Investment Accounting and Fund Treasurer, Thrivent Financial for Lutherans |
| |
| |
Jill M. Stevenson
FAF Advisors, Inc.
800 Nicollet Mall
Minneapolis, MN 55402
(1965)* | | Assistant Treasurer | | Re-elected by the Board annually; Assistant Treasurer of FAIF since September 2005 | | Mutual Funds Assistant Treasurer, FAF Advisors, Inc., since September 2005; prior thereto, Director and Senior Project Manager, FAF Advisors, Inc. |
| |
| |
David H. Lui
FAF Advisors, Inc.
800 Nicollet Mall
Minneapolis, MN 55402
(1960)* | | Chief Compliance Officer | | Re-elected by the Board annually; Chief Compliance Officer of FAIF since
March 2005 | | Chief Compliance Officer, FAF Advisors, Inc., since March 2005; prior thereto, Chief Compliance Officer, Franklin Advisors, Inc., and Chief Compliance Counsel, Franklin Templeton Investments |
| |
| |
Jason K. Mitchell
FAF Advisors, Inc.
800 Nicollet Mall
Minneapolis, MN 55402
(1976)* | | Anti-Money Laundering Officer | | Re-elected by the Board annually; Anti-Money Laundering Officer of FAIF since December 2008 and from September 2006 through August 2008 | | Compliance Manager, FAF Advisors, Inc., since June 2006; prior thereto, Compliance Analyst, FAF Advisors, Inc., from October 2004 to June 2006 |
| |
| |
Kathleen L. Prudhomme
FAF Advisors, Inc.
800 Nicollet Mall
Minneapolis, MN 55402
(1953)* | | Secretary | | Re-elected by the Board annually; Secretary of FAIF since December 2004; prior thereto, Assistant Secretary of FAIF since September 1998 | | Deputy General Counsel, FAF Advisors, Inc., since November 2004; prior thereto, Partner, Dorsey & Whitney LLP, a Minneapolis-based law firm |
| |
| |
James D. Alt
Dorsey & Whitney LLP
50 South Sixth Street
Suite 1500,
Minneapolis, MN 55402
(1951) | | Assistant Secretary | | Re-elected by the Board annually; Assistant Secretary of FAIF since December 2004; prior thereto, Secretary of FAIF since June 2002; Assistant Secretary of FAIF from September 1998 through June 2002 | | Partner, Dorsey & Whitney LLP, a Minneapolis-based law firm |
| |
| |
James R. Arnold
U.S. Bancorp Fund Services, LLC
615 E. Michigan Street
Milwaukee, WI 53202
(1957)* | | Assistant Secretary | | Re-elected by the Board annually; Assistant Secretary of FAIF since
June 2003 | | Senior Vice President, U.S. Bancorp Fund Services, LLC |
| |
| |
Richard J. Ertel
FAF Advisors, Inc.
800 Nicollet Mall
Minneapolis, MN 55402
(1967)* | | Assistant Secretary | | Re-elected by the Board annually; Assistant Secretary of FAIF since June 2006 and from June 2003 through August 2004 | | Counsel, FAF Advisors, Inc., since May 2006; prior thereto, Counsel, Ameriprise Financial Services, Inc., September 2004 to May 2006 |
| |
| |
Michael W. Kremenak
FAF Advisors, Inc.
800 Nicollet Mall
Minneapolis, MN 55402
(1978)* | | Assistant Secretary | | Re-elected by the Board annually; Assistant Secretary of FAIF since February 2009 | | Counsel, FAF Advisors Inc., since January 2009; prior thereto, Associate, Skadden, Arps, Slate, Meagher & Flom LLP, a New York City-based law firm, from September 2005 to January 2009 |
| |
| |
| |
| * | Messrs. Schreier, Wilson, Gariboldi, Lui, Mitchell, Ertel, and Kremenak, Ms. Stevenson and Ms. Prudhomme are each officers and/or employees of FAF Advisors, Inc., which serves as investment adviser and administrator for FAIF. Mr. Arnold is an officer of U.S. Bancorp Fund Services, LLC, which is a subsidiary of U.S. Bancorp and which serves as transfer agent for FAIF. |
First American Funds 2009 Annual Report 45
First American Funds’ Privacy Policy
We want you to understand what information we collect and how it’s used.
“Nonpublic personal information” is nonpublic information that we obtain while providing financial products or services to you.
Why we collect your information
We gather nonpublic personal information about you and your accounts so that we can:
| |
| • | Know who you are and prevent unauthorized access to your information. |
| • | Design and improve the products we offer. |
| • | Comply with the laws and regulations that govern us. |
The types of information we collect
We may collect the following nonpublic personal information about you:
| |
| • | Information about your identity, such as your name, address, and social security number |
| • | Information about your transactions with us |
| • | Information you provide on applications, such as your beneficiaries |
Confidentiality and security
We operate through service providers. We require our service providers to restrict access to nonpublic personal information about you to those employees who need that information in order to provide products or services to you. We also require them to maintain physical, electronic, and procedural safeguards that comply with applicable federal standards and regulations to guard your information.
What information we disclose
We may share all of the nonpublic personal information that we collect about you with our affiliated providers of financial services, including our family of funds and their advisor, and with companies that perform marketing services on our behalf.
We’re permitted by law to disclose nonpublic personal information about you to other third parties in certain circumstances. For example, we may disclose nonpublic personal information about you to affiliated and nonaffiliated third parties to assist us in servicing your account (e.g., mailing of fund-related materials) and to government entities (e.g., IRS for tax purposes).
We’ll continue to adhere to the privacy policies and practices described here even after your account is closed or becomes inactive.
Additional rights and protections
You may have other privacy protections under applicable state laws, such as California and Vermont. To the extent that these state laws apply, we will comply with them when we share information about you. This privacy policy does not apply to your relationship with other financial service providers, such as broker-dealers. We may amend this privacy notice at any time, and we will inform you of changes as required by law.
Our pledge applies to products and services offered by:
| | | |
| • First American Funds, Inc. | | • American Select Portfolio Inc. |
| • First American Investment Funds, Inc. | | • American Municipal Income Portfolio Inc. |
| • First American Strategy Funds, Inc. | | • Minnesota Municipal Income Portfolio Inc. |
| • American Strategic Income Portfolio Inc. | | • First American Minnesota Municipal Income Fund II, Inc. |
| • American Strategic Income Portfolio Inc. II | | • American Income Fund, Inc. |
| • American Strategic Income Portfolio Inc. III | | |
NOT FDIC INSURED NO BANK GUARANTEE MAY LOSE VALUE
Board of Directors First American Investment Funds, Inc.
Virginia Stringer
Chairperson of First American Investment Funds, Inc.
Governance Consultant; Chair of Saint Paul Riverfront Corporation; former Owner
and President of Strategic Management Resources, Inc.
Benjamin Field III
Director of First American Investment Funds, Inc.
Retired; former Senior Financial Advisor, Senior Vice President,
Chief Financial Officer, and Treasurer of Bemis Company, Inc.
Roger Gibson
Director of First American Investment Funds, Inc.
Director of Charterhouse Group, Inc.
Victoria Herget
Director of First American Investment Funds, Inc.
Investment Consultant; Chair of United Educators Insurance Company; former
Managing Director of Zurich Scudder Investments
John Kayser
Director of First American Investment Funds, Inc.
Retired; former Principal, Chief Financial Officer, and Chief Administrative Officer of William Blair & Company, LLC
Leonard Kedrowski
Director of First American Investment Funds, Inc.
Owner and President of Executive and Management Consulting, Inc.
Richard Riederer
Director of First American Investment Funds, Inc.
Owner and Chief Executive Officer of RKR Consultants, Inc.
Joseph Strauss
Director of First American Investment Funds, Inc.
Owner and President of Strauss Management Company
James Wade
Director of First American Investment Funds, Inc.
Owner and President of Jim Wade Homes
First American Investment Funds’ Board of Directors is comprised entirely of
independent directors.
P.O. Box 1330
Minneapolis, MN 55440-1330
This report and the financial statements contained herein are not intended to be a forecast of future events, a guarantee of future results, or investment advice. Further, there is no assurance that certain securities will remain in or out of each fund’s portfolio. The views expressed in this report reflect those of the portfolio managers only through the period ended October 31, 2009. The portfolio managers views are subject to change at any time based upon market or other conditions. This report is for the information of shareholders of the First American Investment Funds, Inc. It may also be used as sales literature when preceded or accompanied by a current prospectus, which contains information concerning investment objectives, risks, and charges and expenses of the funds. Read the prospectus carefully before investing.
The figures in this report represent past performance and do not guarantee future results. The principal value of an investment and investment return will fluctuate so that an investor’s shares, when redeemed, may be worth more or less than their original cost.
| | | | | |
INVESTMENT ADVISOR
FAF Advisors, Inc.
800 Nicollet Mall
Minneapolis, Minnesota 55402
ADMINISTRATOR
FAF Advisors, Inc.
800 Nicollet Mall
Minneapolis, Minnesota 55402
TRANSFER AGENT
U.S. Bancorp Fund Services, LLC
615 East Michigan Street
Milwaukee, Wisconsin 53202 | | CUSTODIAN
U.S. Bank National Association
60 Livingston Avenue
St. Paul, Minnesota 55101
DISTRIBUTOR
Quasar Distributors, LLC
615 East Michigan Street
Milwaukee, Wisconsin 53202 | | INDEPENDENT REGISTERED
PUBLIC ACCOUNTING FIRM
Ernst & Young LLP
220 South Sixth Street
Suite 1400
Minneapolis, Minnesota 55402
COUNSEL
Dorsey & Whitney LLP
50 South Sixth Street
Suite 1500
Minneapolis, Minnesota 55402 |
In an attempt to reduce shareholder costs and help eliminate duplication, First American Funds will try to limit their mailing to one report for each address that lists one or more shareholders with the same last name. If you would like additional copies, please call First American Investor Services at 800.677.FUND or visit firstamericanfunds.com.
0202-09 12/2009 AR-QUANT
Item 2—Code of Ethics
The registrant has adopted a code of ethics that applies to its principal executive officer and principal financial officer. During the period covered by this report, there were no amendments to the provisions of the registrant’s code of ethics that apply to the registrant’s principal executive officer and principal financial officer and that relate to any element of the code of ethics definition enumerated in this Item. During the period covered by this report, the registrant did not grant any waivers, including implicit waivers, from any provision of its code of ethics that apply to the registrant’s principal executive officer or principal financial officer. The registrant undertakes to furnish a copy of its code of ethics to any person upon request, without charge, by calling 1-800-677-3863.
Item 3—Audit Committee Financial Expert
The registrant’s Board of Directors has determined that Leonard W. Kedrowski, Benjamin R. Field III, John P. Kayser, and Richard K. Riederer, members of the registrant’s Audit Committee, are each an “audit committee financial expert” and are “independent,” as these terms are defined in this Item.
Item 4—Principal Accountant Fees and Services
| (a) | | Audit Fees — Ernst & Young LLP (“E&Y”) billed the registrant audit fees totaling $1,139,190 in the fiscal period ended October 31, 2009 and $1,080,747 in the fiscal year ended October 31, 2008, including fees associated with the annual audit, SEC Rule 17f-2 security count filings and filings of the registrant’s Form N-CSR. |
| |
| (b) | | Audit-Related Fees — E&Y billed the registrant audit-related fees totaling $108,154 in the fiscal period ended October 31, 2009 and $3,647 in the fiscal year ended October 31, 2008, including fees associated with the semi-annual review of fund disclosures. |
| |
| (c) | | Tax Fees — E&Y billed the registrant fees of $170,849 in the fiscal period ended October 31, 2009 and $209,423 in the fiscal year ended October 31, 2008, for tax services, including tax compliance, tax advice, and tax planning. Tax compliance, tax advice, and tax planning services primarily related to preparation of original and amended tax returns, timely RIC qualification reviews, and tax distribution analysis and planning. |
| |
| (d) | | All Other Fees — There were no fees billed by E&Y for other services to the registrant during the fiscal years ended October 31, 2009 and October 31, 2008. |
| |
| (e)(1) | | The audit committee’s pre-approval policies and procedures pursuant to paragraph (c)(7) of Rule 2-01 of Regulation S-X are set forth below: |
| |
| | | Audit Committee policy regarding pre-approval of services provided by the Independent Auditor |
| |
| | | The Audit Committee of the First American Funds (“Committee”) has responsibility for ensuring that all services performed by the independent audit firm for the funds do not impair the firm’s independence. This review is intended to provide reasonable oversight without removing management from its responsibility for day-to-day operations. In this regard, the Committee should: |
| | • | | Understand the nature of the professional services expected to be provided and their impact on auditor independence and audit quality |
| |
| | • | | Examine and evaluate the safeguards put into place by the Company and the auditor to safeguard independence |
| |
| | • | | Meet quarterly with the partner of the independent audit firm |
| |
| | • | | Consider approving categories of service that are not deemed to impair independence for a one-year period |
| | | | It is important that a qualitative rather than a mere quantitative evaluation be performed by the Committee in discharging its responsibilities. |
| |
| | | | Policy for Audit and Non-Audit Services Provided to the Funds |
| | | | On an annual basis, the Committee will review and consider whether to pre-approve the financial plan for audit fees as well as categories of audit-related and non-audit services that may be performed by the funds’ independent audit firm directly for the funds. At least annually the Committee will receive a report from the independent audit firm of all audit and non-audit services, which were approved during the year. |
| |
| | | | The engagement of the independent audit firm for any non-audit service requires the written pre-approval of the Treasurer of the funds and all non-audit services performed by the independent audit firm will be disclosed in the required SEC periodic filings. |
| |
| | | | In connection with the Committee review and pre-approval responsibilities, the review by the Committee will consist of the following: |
| |
| | | | Audit Services |
| |
| | | | The categories of audit services and related fees to be reviewed and considered for pre-approval annually by the Committee or its delegate include the following: |
| | • | | Annual Fund financial statement audits |
| |
| | • | | Seed audits (related to new product filings, as required) |
| |
| | • | | SEC and regulatory filings and consents |
| | | | Audit-related Services |
| |
| | | | In addition, the following categories of audit-related services are deemed to be consistent with the role of the independent audit firm and, as such, will be considered for pre-approval by the Committee or its delegate, on an annual basis. |
| | • | | Accounting consultations |
| |
| | • | | Fund merger support services |
| |
| | • | | Other accounting related matters |
| |
| | • | | Agreed Upon Procedure Reports |
| |
| | • | | Attestation Reports |
| |
| | • | | Other Internal Control Reports |
| | | | Notwithstanding any annual pre-approval of these categories of services, individual projects with an estimated fee in excess of $25,000 are subject to pre-approval by the Committee Chair or its delegate on a case-by-case basis. Individual projects with an estimated fee in excess of $50,000 are subject to pre-approval by the Committee or its delegate on a case-by-case basis. |
| |
| | | | Tax Services |
| |
| | | | The following categories of tax services are deemed to be consistent with the role of the independent audit firm and, as such, will be considered for pre-approval by the Committee or its delegate, on an annual basis. |
| | • | | Tax compliance services related to the filing or amendment of the following: |
| | • | | Federal, state and local income tax compliance, and |
| |
| | • | | Sales and use tax compliance |
| | • | | Timely RIC qualification reviews |
| |
| | • | | Tax distribution analysis and planning |
| |
| | • | | Tax authority examination services |
| | • | | Tax appeals support services |
| |
| | • | | Accounting methods studies |
| |
| | • | | Fund merger support services |
| |
| | • | | Tax consulting services and related projects |
| | | | Notwithstanding any annual pre-approval of these categories of services, individual projects with an estimated fee in excess of $25,000 are subject to pre-approval by the Committee Chair or its delegate on a case-by-case basis. Individual projects with an estimated fee in excess of $50,000 are subject to pre-approval by the Committee or its delegate on a case-by-case basis. |
| |
| | | | Other Non-audit Services |
| |
| | | | The SEC auditor independence rules adopted in response to the Sarbanes-Oxley Act specifically allow certain non-audit services. Because of the nature of these services, none of these services may be commenced by the independent audit firm without the prior approval of the Committee. The Committee may delegate this responsibility to one or more of the Committee members, with the decisions presented to the full Committee at the next scheduled meeting. |
| |
| | | | Proscribed Services |
| |
| | | | In accordance with SEC rules on independence, the independent audit firm is prohibited from performing services in the following categories of non-audit services: |
| | • | | Management functions |
| |
| | • | | Accounting and bookkeeping services |
| |
| | • | | Internal audit services |
| |
| | • | | Financial information systems design and implementation |
| |
| | • | | Valuation services supporting the financial statements |
| |
| | • | | Actuarial services supporting the financial statements |
| |
| | • | | Executive recruitment |
| |
| | • | | Expert services (e.g., litigation support) |
| |
| | • | | Investment banking |
| | | | Policy for Pre-approval of Non-Audit Services Provided to Other Entities within the Investment Company Complex |
| |
| | | | The Committee is also responsible for pre-approving certain non-audit services provided to FAF Advisors, Inc., U.S. Bank N.A., Quasar Distributors, LLC, U.S. Bancorp Fund Services, LLC and any other entity under common control with FAF Advisors, Inc., that provides ongoing services to the funds. The only non-audit services provided to these entities which require pre-approval are those services that relate directly to the operations and financial reporting of the funds. |
| |
| | | | Although the Committee is not required to pre-approve all services provided to FAF Advisors, Inc. and other affiliated service providers, the Committee will annually receive a report from the independent audit firm on the aggregate fees for all services provided to U.S. Bancorp and affiliates. |
| (e)(2) | | All of the services described in paragraphs (b) through (d) of this Item 4 were pre-approved by the audit committee. |
| |
| (f) | | All services performed on the engagement to audit the registrant’s financial statements for the most recent fiscal period end were performed by the principal accountant’s full-time, permanent employees. |
| (g) | | The aggregate non-audit fees billed by E&Y to the registrant, the registrant’s investment adviser, and any entity controlling, controlled by, or under common control with the adviser that provides ongoing services to the registrant, totaled $1,071,003 in the fiscal period October 31, 2009 and $321,233 in the fiscal year ended October 31, 2008. |
| |
| (h) | | The registrant’s audit committee has determined that the provision of non-audit services to the registrant’s investment adviser, and any entity controlling, controlled by, or under common control with the investment adviser that provides ongoing services to the registrant, that were not pre-approved is compatible with maintaining E&Y’s independence. |
Item 5—Audit Committee of Listed Registrants
Not applicable.
Item 6—Schedule of Investments
The schedule is included as part of the report to shareholders filed under Item 1 of this Form.
Item 7—Disclosure of Proxy Voting Policies and Procedures for Closed-End Management Investment Companies
Not applicable.
Item 8—Portfolio Managers of Closed-End Management Investment Companies
Not applicable.
Item 9—Purchases of Equity Securities by Closed-End Management Investment Company and Affiliated Purchasers
Not applicable.
Item 10—Submission of Matters to a Vote of Security Holders
There have been no material changes to the procedures by which shareholders may recommend nominees to the registrant’s board of directors, where those changes were implemented after the registrant last provided disclosure in response to the requirements of Item 7(d)(2)(ii)(G) of Schedule 14A, or this Item.
Item 11—Controls and Procedures
| (a) | | The registrant’s principal executive officer and principal financial officer have evaluated the effectiveness of the registrant’s disclosure controls and procedures within 90 days of the date of this filing and have concluded that the registrant’s disclosure controls and procedures were effective, as of that date, in ensuring that information required to be disclosed by the registrant in this Form N-CSR was recorded, processed, summarized and reported timely. |
| |
| (b) | | There were no changes in the registrant’s internal control over financial reporting that occurred during the second fiscal quarter of the period covered by this report that have materially affected, or are reasonably likely to materially affect, the registrant’s internal control over financial reporting. |
Item 12—Exhibits
| (a)(1) | | Not applicable. Registrant’s code of ethics is provided to any person upon request without charge. |
| |
| (a)(2) | | Certifications of the principal executive officer and principal financial officer of the registrant as required by Rule 30a-2(a) under the Investment Company Act of 1940 are filed as exhibits hereto. |
| (a)(3) | | Not applicable. |
| |
| (b) | | Certifications of the principal executive officer and principal financial officer of the registrant as required by Rule 30a-2(b) under the Investment Company Act of 1940 are filed as exhibits hereto. |
Signatures
Pursuant to the requirements of the Securities Exchange Act of 1934 and the Investment Company Act of 1940, the registrant has duly caused this report to be signed on its behalf by the undersigned, thereunto duly authorized.
First American Investment Funds, Inc.
| | | |
| By: | | /s/ Thomas S. Schreier, Jr. |
| |
| | | |
| | | Thomas S. Schreier, Jr. |
| | | President |
Date: December 24, 2009
Pursuant to the requirements of the Securities Exchange Act of 1934 and the Investment Company Act of 1940, this report has been signed below by the following persons on behalf of the registrant and in the capacities and on the dates indicated.
| | | |
| By: | | /s/ Thomas S. Schreier, Jr. |
| |
| | | |
| | | Thomas S. Schreier, Jr. |
| | | President |
Date: December 24, 2009
| | | |
| By: | | /s/Charles D. Gariboldi, Jr. |
| |
| | | |
| | | Charles D. Gariboldi, Jr. |
| | | Treasurer |
Date: December 24, 2009