UNITED STATES
SECURITIES AND EXCHANGE COMMISSION
Washington, D.C. 20549
FORM N-CSR
CERTIFIED SHAREHOLDER REPORT OF REGISTERED MANAGEMENT
INVESTMENT COMPANIES
Investment Company Act file number 811-05309
Nuveen Investment Funds, Inc.
(Exact name of registrant as specified in charter)
Nuveen Investments
333 West Wacker Drive, Chicago, IL 60606
(Address of principal executive offices) (Zip code)
Kevin J. McCarthy
Nuveen Investments
333 West Wacker Drive
Chicago, IL 60606
(Name and address of agent for service)
Registrant’s telephone number, including area code: (312) 917-7700
Date of fiscal year end: February 28
Date of reporting period: February 28, 2011
Form N-CSR is to be used by management investment companies to file reports with the Commission not later than 10 days after the transmission to stockholders of any report that is required to be transmitted to stockholders under Rule 30e-1 under the Investment Company Act of 1940 (17 CFR 270.30e-1). The Commission may use the information provided on Form N-CSR in its regulatory, disclosure review, inspection, and policy making roles.
A registrant is required to disclose the information specified by Form N-CSR, and the Commission will make this information public. A registrant is not required to respond to the collection of information contained in Form N-CSR unless the Form displays a currently valid Office of Management and Budget (“OMB”) control number. Please direct comments concerning the accuracy of the information collection burden estimate and any suggestions for reducing the burden to Secretary, Securities and Exchange Commission, 450 Fifth Street, NW, Washington, DC 20549-0609. The OMB has reviewed this collection of information under the clearance requirements of 44 U.S.C. ss.3507.
ITEM 1. REPORTS TO STOCKHOLDERS.

Mutual Funds
Nuveen Municipal Bond Funds
(formerly First American California Tax Free Fund)
Dependable, tax-free income because it’s not what you earn, it’s what you keep.®
Annual Report
February 28, 2011
| | | | | | |
| | | Share Class / Ticker Symbol |
| | | Class A | | Class C1 | | Class I |
Nuveen California Tax Free Fund | | FCAAX | | FCCAX | | FCAYX |
INVESTMENT ADVISER NAME CHANGE
Effective January 1, 2011, Nuveen Asset Management, the Fund’s investment adviser, changed its name to Nuveen Fund Advisors, Inc. (“Nuveen Fund Advisors”). Concurrently, Nuveen Fund Advisors formed a wholly-owned subsidiary, Nuveen Asset Management, LLC, to house its portfolio management capabilities.
NUVEEN INVESTMENTS COMPLETES STRATEGIC COMBINATION WITH FAF ADVISORS
On December 31, 2010, Nuveen Investments completed the strategic combination between Nuveen Asset Management, LLC, the largest investment affiliate of Nuveen Investments, and FAF Advisors. As part of this transaction, U.S. Bancorp – the parent of FAF Advisors – received cash consideration and a 9.5% stake in Nuveen Investments in exchange for the long term investment business of FAF Advisors, including investment-management responsibilities for the non-money market mutual funds of the First American Funds family.
The approximately $27 billion of mutual fund and institutional assets managed by FAF Advisors, along with the investment professionals managing these assets and other key personnel, have become part of Nuveen Asset Management, LLC. With these additions to Nuveen Asset Management, LLC, this affiliate now manages more than $100 billion of assets across a broad range of strategies from municipal and taxable fixed income to traditional and specialized equity investments.
This combination does not affect the investment objectives or strategies of this Fund. Over time, Nuveen Investments expects that the combination will provide even more ways to meet the needs of investors who work with financial advisors and consultants by enhancing the multi-boutique model of Nuveen Investments, which also includes highly respected investment teams at HydePark, NWQ Investment Management, Santa Barbara Asset Management, Symphony Asset Management, Tradewinds Global Investors and Winslow Capital. Nuveen Investments managed approximately $197 billion of assets as of December 31, 2010.
| | | | | | |
| Must be preceded by or accompanied by a prospectus. | | NOT FDIC INSURED | | MAY LOSE VALUE | | NO BANK GUARANTEE |
Table of Contents
Chairman’s
Letter to Shareholders

Dear Shareholders,
In 2010, the global economy recorded another year of recovery from the financial and economic crises of 2008, but many of the factors that caused the downturn still weigh on the prospects for continued improvement. In the U.S., ongoing weakness in housing values has put pressure on homeowners and mortgage lenders. Similarly, the strong earnings recovery for corporations and banks is only slowly being translated into increased hiring or more active lending. Globally, deleveraging by private and public borrowers has inhibited economic growth and that process is far from complete.
Encouragingly, constructive actions are being taken by governments around the world to deal with economic issues. In the U.S., the recent passage of a stimulatory tax bill relieved some of the pressure on the Federal Reserve to promote economic expansion through quantitative easing and offers the promise of sustained economic growth. A number of European governments are undertaking programs that could significantly reduce their budget deficits. Governments across the emerging markets are implementing various steps to deal with global capital flows without undermining international trade and investment.
The success of these government actions could determine whether 2011 brings further economic recovery and financial market progress. One risk associated with the extraordinary efforts to strengthen U.S. economic growth is that the debt of the U.S. government will continue to grow to unprecedented levels. Another risk is that over time there could be inflationary pressures on asset values in the U.S. and abroad, because what happens in the U.S. impacts the rest of the world economy. Also, these various actions are being taken in a setting of heightened global economic uncertainty, primarily about the supplies of energy and other critical commodities. In this challenging environment, your Nuveen investment team continues to seek sustainable investment opportunities and to remain alert to potential risks in a recovery still facing many headwinds. On your behalf, we monitor their activities to assure they maintain their investment disciplines.
As you will note elsewhere in this report, on December 31, 2010, Nuveen Investments completed a strategic combination with FAF Advisors, Inc., the manager of the First American Funds. The combination adds highly respected and distinct investment teams to meet the needs of investors and their advisors and is designed to benefit all fund shareholders by creating a fund organization with the potential for further economies of scale and the ability to draw from even greater talent and expertise to meet those investor needs.
As always, I encourage you to contact your financial consultant if you have any questions about your investment in a Nuveen Fund. On behalf of the other members of your Fund Board, we look forward to continuing to earn your trust in the months and years ahead.
Sincerely,

Robert P. Bremner
Chairman of the Board
April 26, 2011
Portfolio Manager’s Comments
Certain statements in this report are forward-looking statements. Discussions of specific investments are for illustration only and are not intended as recommendations of individual investments. The forward-looking statements and other views expressed herein are those of the portfolio manager as of the date of this report. Actual future results or occurrences may differ significantly from those anticipated in any forward-looking statements and the views expressed herein are subject to change at any time, due to numerous market and other factors. The Fund disclaims any obligation to update publicly or revise any forward-looking statements or views expressed herein.
Any reference to credit ratings for portfolio holdings denotes the highest rating assigned by a Nationally Recognized Statistical Rating Organization (NRSRO) such as Standard & Poor’s (S&P), Moody’s, or Fitch. AAA, AA, A and BBB ratings are investment grade; BB, B, CCC, CC, C and D ratings are below investment grade. Holdings and ratings may change over time.
Nuveen California Tax Free Fund
(formerly known as First American California Tax Free Fund)
Recently, the Nuveen California Tax Free Fund changed its fiscal year end to February 28/29 from June 30. As a result, this annual report covers an eight-month period. Portfolio manager Scott Romans, PhD, reviews market conditions at the national and state levels, key investment strategies and the Fund’s performance during this period. Scott, who has twelve years of investment experience, assumed portfolio management responsibilities for the Fund in January 2011. The previous portfolio managers for the Fund, Christopher Drahn and Michael Hamilton, managed it from 2005 and 2002, respectively, until December 2010.
What factors affected the U.S. economy and the national and state municipal bond markets during the eight-month reporting period ended February 28, 2011?
The main drivers of municipal bond performance during the period were significant supply and demand issues in the marketplace. During the first half of this reporting period, fixed-income assets across the board continued to rally as investors migrated out of money market funds and into mutual funds. The market’s bullish nature was driven by the perception that short rates would stay low for an extended period as well as the possibility that quantitative easing would drive down long rates. The municipal market also participated in the rally with prices moving higher and yields continuing to grind lower until they reached historically low levels in August 2010. Throughout this period, municipal bond funds experienced strong inflows as investors felt more confident moving out on the yield curve and taking on additional credit and interest rate risk. At the same time, the supply of municipal bonds was scarce as a great deal of issuance continued to be taken out of the tax-exempt arena and offered through the Build America Bond (BAB) program. While tax-exempt fund managers had difficulty finding longer maturity bonds for their portfolios, the steepness of the yield curve caused detrimental income consequences if they purchased shorter maturity bonds.
The environment reversed very quickly in the final half of the period as valuations suffered due to several factors. First, rates began to climb across fixed-income markets as concerns about Federal stimulus programs and potential inflation drove Treasury rates higher. Valuations in the municipal market declined along with the Treasury market. Second, municipal bond funds, particularly high yield funds, began to experience a large volume of outflows starting in mid-November 2010 and the market became relatively illiquid. As high yield bond funds offered to sell bonds to meet redemptions, buyers were very cautious about what they would bid for these bonds. Consequently, trades that took
place at lower levels impacted valuations across the market. Investors watched their fund values decrease, which in turn caused more outflows. The final element that played into the market downturn were the negative stories in the media about the fiscal struggles of states and municipalities. The fear of potential defaults caused more investors to exit the municipal marketplace. These events in the final months of the period disrupted the earlier positive performance of municipal bonds. Over the eight months ended February 2011, municipal bond issuance nationwide totaled $260.5 billion.
Supply and demand issues instead of credit factors drove performance at the state level as well. While California finally established a budget in October 2010 after an extended stalemate, the state remained in a fiscal predicament. Unemployment within the state lingered at 12.4% as of February 2011, which was the second highest rate in the country. Also, the state’s general obligation (GO) debt carried an A1 rating by Moody’s, the only state besides Illinois to have that rating. Despite ongoing fiscal concerns, state GO bonds rallied strongly during the period, outperforming the California market in general. The outperformance was not a result of improved credit quality for the state, but rather from a significant drop in the amount of municipal bonds California brought to market, especially compared to the record issuance in the fourth quarter of 2009. At the same time, investors became more comfortable owning California GOs, particularly with the attractive structures of the bonds issued in late 2009. This caused credit spreads – meaning the extra income investors demanded for investing in lower-rated securities – to narrow during the period and stay that way. Even when the overall market traded off and funds started to see redemptions, California GO bonds held up well.
Despite the fact that the BAB program was discontinued at the end of 2010, municipal bond issuance was extremely low early in 2011. Many issuers raced to get their 2011 deals done as BAB bonds in the fourth quarter of 2010 when it became clear that the program would not be re-established. Projections for issuance across the nation and in California for the remainder of 2011 are also very low as it does not appear that the expiration of the program will bring significant tax-exempt issuance back in the near term.
How did the Fund perform during the eight-month reporting period ended February 28, 2011?
The table within the Fund Performance section of this report provides total returns for the eight-month, one-year, five-year and ten-year reporting periods ending February 28, 2011. The Fund’s Class A Share total returns are compared with the performance of a corresponding index and an appropriate Lipper peer fund average. During the eight-month period, the Fund’s Class A Shares at net asset value (NAV) outpaced its peer group, the Lipper California Municipal Debt Funds Average, but lagged the Barclays Capital Municipal Bond Index.
Sector selection was the primary driver of the Fund’s underperformance relative to the index during the reporting period. First, the Fund’s results were hindered by its underweight position in California GO bonds. While the Fund had approximately a 4% weighting in these bonds, they constituted more than 25% of the index and dramatically outperformed the market in general as discussed earlier. We are not able to match a market-level position in California GOs due to the Fund’s diversification requirements as
well as the ability to gain access to the bonds. To a lesser extent, the Fund’s performance was hurt by an overweight position in local GO bonds (unified school districts and community colleges) as concerns about state and local municipalities caused that sector to underperform. The Fund had approximately 29% in local GOs versus 11% for the index at period end. However, our strong security selection within the local GO sector partially offset the negative effects of the weighting. The same scenario took place in health care, where spreads remained wide because that sector was not eligible to participate in the BAB program. While the Fund’s overweight to health care proved detrimental as the sector underperformed the market, our positive security selection partially cancelled out the impact. Additionally, the Fund benefited from a lack of exposure to tobacco bonds, which performed extremely poorly near the end of the period as high yield funds unloaded them to meet redemptions.
Credit quality was a secondary, but much smaller, factor in the Fund’s performance. As has historically been the case, the Fund was positioned with an overweight to mid-grade and non-rated bonds. The BBB-rated sector in California performed poorly compared to the overall market during the period. As the high yield market traded off, spreads on lower rated bonds widened. However, we again benefited from security selection as the BBB-rated bonds we held tended to outperform the sector, helping to offset most of the negative effects of the overweight. At period end, BBB-rated bonds made up around 17% of the portfolio versus approximately 6% of the index.
What strategies did you use to manage the Fund?
The Fund continued to employ the same fundamental investment strategies and tactics used in previous years. Our focus remains on bottom-up security selection, evaluating potential opportunities one at a time based on thorough credit research. Now more than ever, the in-depth credit research performed by our team is important. In part, this is because relatively few new issues carrying municipal bond insurance. This is a change from several years ago when as much as 50% of new issuance was insured. In addition to bottom-up security selection, our long-term strategy in the Fund has been to emphasize mid grade and non-rated bonds due to the favorable returns these credits have historically generated. We have also tended to overweight select sectors – such as health care – where our research team has in-depth expertise. We continued to favor these areas in the Fund during the period. In addition, we made slight adjustments to the Fund’s yield curve positioning; however, we don’t believe these moves add as much value as security selection.
Going into the reporting period, we were comfortable with the Fund’s positioning and were only able to make modest adjustments to its weightings due to the scarcity of bonds. We did actively search for opportunities in health care because of the wider spreads and stronger structures (higher coupons with longer call protections) available in that sector. We added one holding to the portfolio, Sutter Health, which is an AA–rated hospital system bond. For the purchase, we used cash on the Fund’s balance sheet and did not need to sell any positions. The Fund also owned several bonds that were called during the period.
Risk Considerations
Mutual fund investing involves risk; principal loss is possible. Debt or fixed income securities are subject to credit risk and interest rate risk. Market interest rate changes will cause the value of debt securities (and the value of shares of funds that invest in them) to fluctuate, and may also impact income over time. Credit risk refers to an issuer’s ability to make interest and principal payments when due.
Dividend Information
During the reporting period, all share classes of the Nuveen California Tax Free Fund remained stable.
Each Fund seeks to pay dividends at a rate that reflects the past and projected performance of the Fund. To permit a Fund to maintain a more stable monthly dividend, the Fund may pay dividends at a rate that may be more or less than the amount of net investment income actually earned by the Fund during the period. If the Fund has cumulatively earned more than it has paid in dividends, it will hold the excess in reserve as undistributed net investment income (UNII) as part of the Fund’s net asset value. Conversely, if the Fund has cumulatively paid in dividends more than it has earned, the excess will constitute a negative UNII that will likewise be reflected in the Fund’s net asset value. Each Fund will, over time, pay all its net investment income as dividends to shareholders. As of February 28, 2011, the Fund had a positive UNII balance for tax purposes and positive UNII balances for financial reporting purposes.
Fund Performance (Unaudited)
Returns quoted represent past performance, which is no guarantee of future results. Current performance may be higher or lower than the performance shown. Investment returns and principal value will fluctuate so that when shares are redeemed, they may be worth more or less than their original cost. Returns without sales charges would be lower if the sales charge were included. Returns do not reflect the deduction of taxes that a shareholder would pay on Fund distributions or the redemption of Fund shares.
Returns may reflect a contractual agreement between the Fund and the investment adviser to waive certain fees and expenses; see Notes to Financial Statements, Footnote 7 — Management Fees and Other Transactions with Affiliates for more information. In addition, returns may reflect a voluntary expense limitation by the Fund’s investment adviser that may be modified or discontinued at any time without notice. For the most recent month-end performance visit www.nuveen.com or call (800) 257-8787.
Returns reflect differences in sales charges and expenses, which are primarily differences in distribution and service fees. Fund returns assume reinvestment of dividends and capital gains.
Comparative index and benchmark return information is provided for the Fund’s Class A Shares at net asset value (NAV) only.
Class A Shares – Average Annual Total Returns as of February 28, 2011*
| | | | | | | | | | | | | | | | |
| | | Cumulative | | | Average Annual | |
| | | 8-Month | | | 1-Year | | | 5-Year | | | 10-Year | |
Nuveen California Tax Free Fund | | | | | | | | | | | | | | | | |
A Shares at NAV | | | -0.68% | | | | 1.44% | | | | 3.13% | | | | 4.21% | |
A Shares at Offer | | | -4.87% | | | | -2.79% | | | | 2.25% | | | | 3.77% | |
Barclays Capital Municipal Bond Index** | | | 0.07% | | | | 1.72% | | | | 4.06% | | | | 4.79% | |
Lipper California Municipal Debt Funds Average** | | | -1.86% | | | | 0.17% | | | | 2.12% | | | | 3.49% | |
| | | | | | | | | | | | | | | | |
Class C1 Shares | | | -0.91% | | | | 0.94% | | | | 2.66% | | | | 3.77% | |
Class I Shares | | | -0.57% | | | | 1.60% | | | | 3.30% | | | | 4.43% | |
| | | | | | | | | | | | |
| Latest Calendar Quarter – Average Annual Total Returns as of March 31, 2011 | |
| | | Average Annual | |
| | | 1-Year | | | 5-Year | | | 10-Year | |
Class A Shares at NAV | | | 1.41% | | | | 3.22% | | | | 4.08% | |
Class A Shares at Offer | | | -2.85% | | | | 2.33% | | | | 3.64% | |
Class C1 Shares | | | 0.91% | | | | 2.75% | | | | 3.65% | |
Class I Shares | | | 1.57% | | | | 3.39% | | | | 4.31% | |
Class A Shares have a maximum 4.20% sales charge. Class A Share purchases of $1 million or more are sold at net asset value without an up-front sales charge but may be subject to a contingent deferred sales charge (CDSC), also known as a back-end sales charge, if redeemed within twelve months of purchase. Class C1 Shares have a 1% CDSC for redemptions within less than one year, which is not reflected in the one-year total return. Class I Shares have no sales charge and may be purchased under limited circumstances or by specified classes of investors.
|
| Growth of an Assumed $10,000 Investment as of February 28, 2011 – Class A Shares |
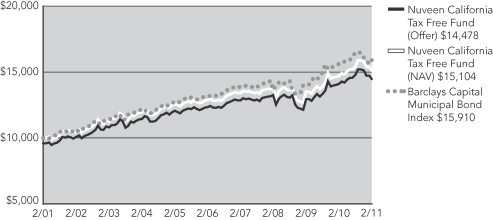
The graphs do not reflect the deduction of taxes, such as state and local income taxes or capital gains taxes that a shareholder may pay on Fund distributions or the redemption of Fund shares.
| * | Eight-month returns are cumulative; all other returns are annualized. |
| ** | Refer to the Glossary of Terms Used in this Report for definitions. |
Yields as of February 28, 2011 (Unaudited)
Dividend Yield is the most recent dividend per share (annualized) divided by the offering price per share.
The SEC 30-Day Yield is a standardized measure of a Fund’s yield that accounts for the future amortization of premiums or discounts of bonds held in the Fund’s portfolio. The SEC 30-Day Yield is computed under an SEC standardized formula and is based on the maximum offer price per share. The 30-Day Yield is computed under the same formula but is based on the net asset value (NAV) per share. Dividend Yield may differ from the SEC 30-Day Yield because the Fund may be paying out more or less than it is earning and it may not include the effect of amortization of bond premium.
The Taxable-Equivalent Yield represents the yield that must be earned on a fully taxable investment in order to equal the yield of the Fund on an after-tax basis at a specified tax rate. With respect to investments that generate qualified dividend income that is taxable at a maximum rate of 15%, the Taxable-Equivalent Yield is lower.
The SEC 30-Day Yield and Taxable-Equivalent Yield on A Shares at NAV applies only to A Shares purchased at no-load pursuant to the Fund’s policy permitting waiver of the A Share load in certain specified circumstances.
| | | | | | | | | | | | | | | | |
| | | | |
| | | Dividend
Yield | | | 30-Day
Yield | | | SEC 30-Day
Yield | | | Taxable-
Equivalent
Yield1 | |
Class A Shares at NAV | | | 4.35% | | | | 4.48% | | | | — | | | | 6.86% | |
Class A Shares at Offer | | | 4.17% | | | | — | | | | 4.29% | | | | 6.57% | |
Class C1 Shares | | | 3.94% | | | | 3.98% | | | | — | | | | 6.09% | |
Class I Shares | | | 4.58% | | | | 4.62% | | | | — | | | | 7.08% | |
| 1 | The Taxable-Equivalent Yield is based on the Fund’s 30-Day Yield on the indicated date and a combined federal and state income tax rate of 34.7%. |
Holding Summaries as of February 28, 2011 (Unaudited)
This data relates to the securities held in the Fund’s portfolio of investments. It should not be construed as a measure of performance for the Fund itself.
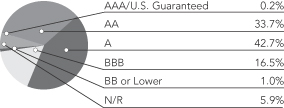
Ratings shown are the highest of Standard & Poor’s Group, Moody’s Investor Service, Inc. or Fitch, Inc. AAA includes bonds with an implied AAA rating since they are backed by U.S. Government or agency securities. AAA, AA, A and BBB ratings are investment grade; BB, B, CCC, CC, C and D ratings are below-investment grade. Holdings designated N/R are not rated by any of these national rating agencies.
Bond Credit Quality1
| | | | |
| Portfolio Composition1 | | | |
General Obligation | | | 29.5% | |
Health Care | | | 19.8% | |
Lease Revenue | | | 12.4% | |
Education | | | 11.8% | |
Tax Revenue | | | 8.5% | |
Utilities | | | 6.5% | |
Certificates of Participation | | | 5.5% | |
Other | | | 6.0% | |
| 1 | As a percentage of total municipal bonds as of February 28, 2011. Holdings are subject to change. |
Expense Ratios (Unaudited)
The expense ratios below reflect the Fund’s total operating expenses as shown in the Fund’s most recent prospectus. The expense ratios include management fees and other fees and expenses but exclude interest expense on self-deposited inverse floaters held by the Fund, if any.
| | | | | | | | |
| Share Class | | Gross
Expense
Ratios | | | Net
Expense
Ratios | |
| Class A | | | 1.01% | | | | 0.85% | |
| Class C1 | | | 1.46% | | | | 1.35% | |
| Class I | | | 0.81% | | | | 0.70% | |
The Fund’s investment adviser has contractually agreed to waive fees and reimburse other Fund expenses through June 30, 2011 so that total annual fund operating expenses, after fee waivers and/or expense reimbursements and excluding Acquired Fund Fees and Expenses, do not exceed 0.65%, 1.15%, and 0.50% for Class A, Class C1, and Class I Shares, respectively, and waive fees and reimburse other Fund expenses through March 31, 2012 so that annual fund operating expenses, after fee waivers and/or expense reimbursements and excluding Acquired Fund Fees and Expenses, do not exceed 0.85%, 1.35%, and 0.70% for Class A, Class C1, and Class I Shares, respectively. Fee waivers and expense reimbursements will not be terminated prior to that time without the approval of the Fund’s board of directors.
Expense Examples (Unaudited)
As a shareholder of the Fund, you incur two types of costs: (1) transaction costs, including up-front and back-end sales charges (loads) or redemption fees, where applicable; and (2) ongoing costs, including management fees; distribution and service (12b-1) fees, where applicable; and other Fund expenses. This Example is intended to help you understand your ongoing costs (in dollars) of investing in the Fund and to compare these costs with the ongoing costs of investing in other mutual funds.
The Example below is based on an investment of $1,000 invested at the beginning of the period and held for the period.
The information under “Actual Performance,” together with the amount you invested, allows you to estimate actual expenses incurred over the reporting period. Simply divide your account value by $1,000 (for example, an $8,600 account value divided by $1,000 = 8.60) and multiply the result by the cost shown for your share class, in the row entitled “Expenses Incurred During Period” to estimate the expenses incurred on your account during this period.
The information under “Hypothetical Performance,” provides information about hypothetical account values and hypothetical expenses based on the Fund’s actual expense ratio and an assumed rate of return of 5% per year before expenses, which is not the Fund’s actual return. The hypothetical account values and expenses may not be used to estimate the actual ending account balance or expense you incurred for the period. You may use this information to compare the ongoing costs of investing in the Fund and other Funds. To do so, compare this 5% hypothetical example with the 5% hypothetical examples that appear in the shareholder reports of the other funds.
Please note that the expenses shown in the table are meant to highlight your ongoing costs only and do not reflect any transaction costs, such as up-front and back-end sales charges (loads) or redemption fees, where applicable. Therefore, the hypothetical information is useful in comparing ongoing costs only, and will not help you determine the relative total costs of owning different funds or share classes. In addition, if these transaction costs were included, your costs would have been higher.
| | | | | | | | | | | | | | | | | | | | | | | | |
| | | | | | | | | | | | Hypothetical Performance | |
| | | Actual Performance | | | (5% annualized return before expenses) | |
| | | A Shares | | | C1 Shares | | | I Shares | | | A Shares | | | C1 Shares | | | I Shares | |
| Beginning Account Value (9/01/10) | | $ | 1,000.00 | | | $ | 1,000.00 | | | $ | 1,000.00 | | | $ | 1,000.00 | | | $ | 1,000.00 | | | $ | 1,000.00 | |
| Ending Account Value (2/28/11) | | $ | 952.20 | | | $ | 949.90 | | | $ | 952.90 | | | $ | 1,021.57 | | | $ | 1,019.09 | | | $ | 1,022.32 | |
| Expenses Incurred During Period | | $ | 3.15 | | | $ | 5.56 | | | $ | 2.42 | | | $ | 3.26 | | | $ | 5.76 | | | $ | 2.51 | |
For each class of the Fund, expenses are equal to the Fund’s annualized net expense ratio of .65%, 1.15% and .50% for Classes A, C1 and I, respectively, multiplied by the average account value over the period, multiplied by 181/365 (to reflect the six month period).
Shareholder Meeting Report (Unaudited)
A special meeting of shareholders was held in the offices of FAF Advisors, Inc. on December 17, 2010; at this meeting the shareholders were asked to vote on the election of Board Members, the approval of an Investment Advisory Agreement and the approval of an Investment Sub-Advisory Agreement.
| | | | |
| | | Nuveen California Tax Free Fund | |
To approve an investment advisory agreement with Nuveen Fund Advisors (formerly Nuveen Asset Management) and an investment sub-advisory agreement between Nuveen Fund Advisors and Nuveen Asset Management, LLC. | | | | |
For | | | 7,628,557 | |
Against | | | 21,138 | |
Abstain | | | 2,990 | |
Broker Non-Votes | | | 1,953,316 | |
Total | | | 9,606,001 | |
Approval of the Board Members was reached as follows: | | | | |
| |
John P. Amboian | | | | |
For | | | 9,584,863 | |
Withhold | | | 21,138 | |
Total | | | 9,606,001 | |
Robert P. Bremner | | | | |
For | | | 9,584,863 | |
Withhold | | | 21,138 | |
Total | | | 9,606,001 | |
Jack B. Evans | | | | |
For | | | 9,584,863 | |
Withhold | | | 21,138 | |
Total | | | 9,606,001 | |
William C. Hunter | | | | |
For | | | 9,584,863 | |
Withhold | | | 21,138 | |
Total | | | 9,606,001 | |
David J. Kundert | | | | |
For | | | 9,584,863 | |
Withhold | | | 21,138 | |
Total | | | 9,606,001 | |
William J. Schneider | | | | |
For | | | 9,584,863 | |
Withhold | | | 21,138 | |
Total | | | 9,606,001 | |
Judith M. Stockdale | | | | |
For | | | 9,584,863 | |
Withhold | | | 21,138 | |
Total | | | 9,606,001 | |
Carole E. Stone | | | | |
For | | | 9,584,863 | |
Withhold | | | 21,138 | |
Total | | | 9,606,001 | |
Virginia L. Stringer | | | | |
For | | | 9,584,863 | |
Withhold | | | 21,138 | |
Total | | | 9,606,001 | |
Terence J. Toth | | | | |
For | | | 9,584,863 | |
Withhold | | | 21,138 | |
Total | | | 9,606,001 | |
Report of
Independent Registered Public Accounting Firm
The Board of Directors and Shareholders
Nuveen California Tax Free Fund (formerly First American California Tax Free Fund)
We have audited the accompanying statement of assets and liabilities, including the portfolio of investments, of Nuveen California Tax Free Fund (formerly First American California Tax Free Fund) (the “Fund”) as of February 28, 2011, and the related statements of operations, changes in net assets, and the financial highlights for each of the periods indicated therein. These financial statements and financial highlights are the responsibility of the Fund’s management. Our responsibility is to express an opinion on these financial statements and financial highlights based on our audits.
We conducted our audits in accordance with the standards of the Public Company Accounting Oversight Board (United States). Those standards require that we plan and perform the audits to obtain reasonable assurance about whether the financial statements and financial highlights are free of material misstatement. We were not engaged to perform an audit of the Fund’s internal control over financial reporting. Our audits included consideration of internal control over financial reporting as a basis for designing audit procedures that are appropriate in the circumstances, but not for the purpose of expressing an opinion on the effectiveness of the Fund’s internal control over financial reporting. Accordingly, we express no such opinion. An audit also includes examining, on a test basis, evidence supporting the amounts and disclosures in the financial statements and financial highlights, assessing the accounting principles used and significant estimates made by management, and evaluating the overall financial statement presentation. Our procedures included confirmation of securities owned as of February 28, 2011, by correspondence with the custodian. We believe that our audits provide a reasonable basis for our opinion.
In our opinion, the financial statements and financial highlights referred to above present fairly, in all material respects, the financial position of Nuveen California Tax Free Fund (formerly First American California Tax Free Fund) at February 28, 2011, and the results of its operations, the changes in its net assets, and the financial highlights for each of the periods indicated therein in conformity with U.S. generally accepted accounting principles.

Chicago, Illinois
April 27, 2011
Portfolio of Investments
Nuveen California Tax Free Fund
(formerly known as First American California Tax Free Fund)
February 28, 2011
| | | | | | | | |
Principal
Amount (000) | | | Description p | | Value | |
| | | | | | | | |
| | | | Municipal Bonds – 98.5% | | | | |
| | |
| | | | Certificates of Participation – 5.4% | | | | |
| | |
| | | | Eden Township Healthcare District | | | | |
| $ | 1,000 | | | 6.000%, 06/01/2030 | | $ | 943,310 | |
| | |
| | | | Escondido, Series A (FGIC) (NATL) | | | | |
| | 140 | | | 5.625%, 09/01/2020 | | | 141,919 | |
| | |
| | | | Los Angeles, Sonnenblick del Rio, West Los Angeles (AMBAC) | | | | |
| | 330 | | | 6.000%, 11/01/2019 | | | 333,844 | |
| | |
| | | | Oakdale Irrigation District, Water Facilities Project | | | | |
| | 805 | | | 5.500%, 08/01/2034 | | | 808,196 | |
| | |
| | | | Pasadena, Series C | | | | |
| | 50 | | | 4.500%, 02/01/2026 | | | 47,899 | |
| | |
| | | | Poway (AMBAC) | | | | |
| | 585 | | | 4.500%, 08/01/2016 | | | 619,380 | |
| | |
| | | | Ramona Unified School District (FGIC) (NATL) (Convertible CAB) | | | | |
| | 500 | | | 0.000% through 05/01/2012, thereafter 5.000%, 05/01/2032 g | | | 407,695 | |
| | |
| | | | Rowland Water District, Recycled Water Project | | | | |
| | 565 | | | 5.750%, 12/01/2024 | | | 607,064 | |
| | 480 | | | 5.750%, 12/01/2025 | | | 512,410 | |
| | 500 | | | 6.250%, 12/01/2039 | | | 520,810 | |
| | |
| | | | Travis Unified School District, (FGIC) (NATL) | | | | |
| | 300 | | | 4.500%, 09/01/2016 | | | 294,693 | |
| | 5,255 | | | Total Certificates of Participation | | | 5,237,220 | |
| | | | Continuing Care Retirement Communities – 0.9% | | | | |
| | |
| | | | Association of Bay Area Governments Financial Authority, Lincoln Glen Manor Senior Citizens (CMI) | | | | |
| | 240 | | | 6.100%, 02/15/2025 | | | 240,086 | |
| | |
| | | | Illinois Finance Authority, Franciscan Communities, Series A | | | | |
| | 300 | | | 5.500%, 05/15/2027 | | | 241,800 | |
| | |
| | | | La Verne, Brethren Hillcrest Homes, Series B (ACA) | | | | |
| | 500 | | | 5.600%, 02/15/2033 | | | 395,935 | |
| | 1,040 | | | Total Continuing Care Retirement Communities | | | 877,821 | |
| | | | Education – 11.6% | | | | |
| | |
| | | | California Educational Facilities Authority, Claremont Graduate University, Series A | | | | |
| | 655 | | | 4.750%, 03/01/2020 | | | 665,336 | |
| | 240 | | | 5.000%, 03/01/2020 | | | 246,446 | |
| | 865 | | | 5.000%, 03/01/2023 | | | 864,222 | |
| | 500 | | | 5.125%, 03/01/2028 | | | 468,950 | |
| | |
| | | | California Educational Facilities Authority, Fresno Pacific University, Series A | | | | |
| | 380 | | | 6.750%, 03/01/2019 | | | 380,798 | |
| | |
| | | | California Educational Facilities Authority, Golden Gate University | | | | |
| | 430 | | | 5.000%, 10/01/2020 | | | 403,435 | |
| | |
| | | | California Educational Facilities Authority, Lutheran University, Series C | | | | |
| | 675 | | | 4.750%, 10/01/2015 | | | 703,917 | |
| | |
| | | | California Educational Facilities Authority, Pitzer College | | | | |
| | 1,000 | | | 5.375%, 04/01/2034 | | | 916,540 | |
| | |
| | | | California Educational Facilities Authority, University of Redlands, Series A | | | | |
| | 1,000 | | | 5.000%, 08/01/2028 | | | 923,270 | |
| | |
| | | | California Educational Facilities Authority, University of the Pacific | | | | |
| | 1,000 | | | 5.000%, 11/01/2030 | | | 961,180 | |
| | |
| | | | California Educational Facilities Authority, Woodbury University | | | | |
| | 450 | | | 4.400%, 01/01/2015 | | | 444,969 | |
| | 470 | | | 4.500%, 01/01/2016 | | | 460,769 | |
Portfolio of Investments
Nuveen California Tax Free Fund (continued)
February 28, 2011
| | | | | | | | |
Principal
Amount (000) | | | Description p | | Value | |
| | | | | | | | |
| | | | Education (continued) | | | | |
| | |
| | | | California Municipal Finance Authority, American Heritage Education Foundation Project, Series A | | | | |
| $ | 400 | | | 5.250%, 06/01/2026 | | $ | 329,080 | |
| | |
| | | | California Municipal Finance Authority, Biola University | | | | |
| | 1,000 | | | 5.000%, 10/01/2018 | | | 1,032,460 | |
| | 500 | | | 5.625%, 10/01/2023 | | | 500,115 | |
| | |
| | | | California Municipal Finance Authority, Loma Linda University | | | | |
| | 300 | | | 4.250%, 04/01/2018 | | | 304,902 | |
| | 300 | | | 4.375%, 04/01/2019 | | | 303,267 | |
| | |
| | | | California State University, Series C (NATL) | | | | |
| | 1,000 | | | 5.000%, 11/01/2025 | | | 1,000,760 | |
| | |
| | | | California Statewide Communities Development Authority, Viewpoint School (ACA) | | | | |
| | 405 | | | 4.125%, 10/01/2014 | | | 414,011 | |
| | 11,570 | | | Total Education | | | 11,324,427 | |
| | | | General Obligations – 29.0% | | | | |
| | |
| | | | Acalanes Unified High School District, Election 2008, Series A | | | | |
| | 1,000 | | | 0.000%, 08/01/2026 | | | 394,020 | |
| | |
| | | | Baldwin Park Unified School District, Election of 2002 (AMBAC) | | | | |
| | 1,000 | | | 0.000%, 08/01/2020 | | | 582,440 | |
| | |
| | | | California | | | | |
| | 600 | | | 5.625%, 04/01/2026 | | | 631,608 | |
| | 1,000 | | | 5.500%, 11/01/2039 | | | 989,950 | |
| | |
| | | | Central Unified School District, Election of 2008, Series A (AGC) | | | | |
| | 500 | | | 5.625%, 08/01/2033 | | | 504,815 | |
| | |
| | | | College of the Sequoias, Visalia Area Improvement District #2, Election of 2008, Series A (AGC) | | | | |
| | 1,000 | | | 5.250%, 08/01/2029 | | | 994,120 | |
| | |
| | | | Corona-Norco Unified School District, Election of 2006 (Convertible CAB) | | | | |
| | 500 | | | 0.000% through 08/01/2017, thereafter 6.800%, 08/01/2039 g | | | 332,310 | |
| | |
| | | | Corona-Norco Unified School District, Election of 2006, Series B (AGC) | | | | |
| | 500 | | | 5.375%, 02/01/2034 | | | 494,455 | |
| | |
| | | | Cupertino Unified School District, Election of 2001, Series D | | | | |
| | 1,705 | | | 0.000%, 08/01/2030 | | | 479,361 | |
| | |
| | | | Desert Sands Unified School District, Election of 2001 | | | | |
| | 350 | | | 5.250%, 08/01/2023 | | | 365,613 | |
| | |
| | | | Grossmont Union High School District, Election of 2008, Series A | | | | |
| | 950 | | | 5.500%, 08/01/2031 | | | 973,104 | |
| | |
| | | | Hemet Unified School District, Election of 2006, Series B (AGC) | | | | |
| | 600 | | | 5.000%, 08/01/2030 | | | 599,238 | |
| | |
| | | | Jefferson Union High School District, San Mateo County, Series A (NATL) | | | | |
| | 300 | | | 6.250%, 02/01/2014 | | | 328,821 | |
| | 460 | | | 6.250%, 08/01/2020 | | | 519,078 | |
| | |
| | | | Long Beach Unified School District, Election of 2008, Series A | | | | |
| | 500 | | | 5.500%, 08/01/2029 | | | 515,610 | |
| | |
| | | | Los Angeles Community College District, Election of 2008, Series C | | | | |
| | 3,000 | | | 5.250%, 08/01/2039 | | | 2,956,290 | |
| | |
| | | | Los Angeles Unified School District, Series D | | | | |
| | 100 | | | 5.000%, 01/01/2034 | | | 95,410 | |
| | |
| | | | Los Angeles Unified School District, Election of 2002 Series B (AMBAC) | | | | |
| | 240 | | | 4.500%, 07/01/2025 | | | 227,453 | |
| | |
| | | | Lucia Mar Unified School District (FGIC) (NATL) | | | | |
| | 100 | | | 5.250%, 08/01/2022 | | | 107,612 | |
| | |
| | | | Oakland, Series A (NATL) | | | | |
| | 435 | | | 5.000%, 01/15/2026 | | | 435,361 | |
| | | | | | | | |
Principal
Amount (000) | | | Description p | | Value | |
| | | | | | | | |
| | | | General Obligations (continued) | | | | |
| | |
| | | | Pittsburg Unified School District, Election of 2006, Series B (AGM) | | | | |
| $ | 1,155 | | | 5.500%, 08/01/2034 | | $ | 1,181,057 | |
| | |
| | | | Pomona Unified School District, Series A (NATL) | | | | |
| | 855 | | | 5.950%, 02/01/2017 | | | 952,162 | |
| | |
| | | | Poway Unified School District, Election of 2008, District 2007-1-A | | | | |
| | 5,000 | | | 0.000%, 08/01/2029 | | | 1,458,450 | |
| | |
| | | | Puerto Rico Commonwealth, Series B (AGM) | | | | |
| | 1,000 | | | 6.500%, 07/01/2015 | | | 1,120,710 | |
| | |
| | | | Puerto Rico Commonwealth, Government Development, Series B | | | | |
| | 50 | | | 5.000%, 12/01/2014 | | | 52,946 | |
| | |
| | | | San Bernardino Community College District, Election of 2002, Series A | | | | |
| | 1,265 | | | 6.500%, 08/01/2027 | | | 1,416,370 | |
| | |
| | | | San Diego Unified School District, Election of 2008, Series A (Convertible CAB) | | | | |
| | 2,000 | | | 0.000% through 07/01/2019, thereafter 6.000%, 07/01/2033 g | | | 1,143,160 | |
| | |
| | | | Santa Ana Union School District, Election of 2008, Series A | | | | |
| | 1,000 | | | 5.250%, 08/01/2028 | | | 1,000,570 | |
| | |
| | | | Santa Barbara Community College District, Election of 2008, Series A | | | | |
| | 1,000 | | | 5.250%, 08/01/2027 | | | 1,037,270 | |
| | |
| | | | Tulare Local Health Care District, Election 2005, Series B | | | | |
| | 500 | | | 6.375%, 08/01/2025 | | | 540,280 | |
| | 1,005 | | | 6.500%, 08/01/2026 | | | 1,083,500 | |
| | |
| | | | Victor Valley Community College District, Election of 2008, Series A (AGC) | | | | |
| | 1,530 | | | 5.000%, 08/01/2031 | | | 1,476,787 | |
| | |
| | | | Victor Valley Joint Union High School District, Election of 2008, Series A (AGC) (Convertible CAB) | | | | |
| | 2,000 | | | 0.000% through 08/01/2019, thereafter 5.750%, 08/01/2031 g | | | 1,116,660 | |
| | |
| | | | West Contra Costa Unified School District, Election of 2005, Series B | | | | |
| | 1,100 | | | 6.000%, 08/01/2024 | | | 1,178,386 | |
| | |
| | | | West Covina Unified School District, Series A (NATL) | | | | |
| | 770 | | | 5.350%, 02/01/2020 | | | 818,633 | |
| | |
| | | | Whittier Unified High School District | | | | |
| | 1,000 | | | 0.000%, 08/01/2034 | | | 197,750 | |
| | 36,070 | | | Total General Obligations | | | 28,301,360 | |
| | | | Health Care – 19.5% | | | | |
| | |
| | | | Association of Bay Area Governments Financial Authority, Children’s Hospital & Research, Series A | | | | |
| | 425 | | | 4.500%, 12/01/2019 | | | 426,696 | |
| | 350 | | | 4.750%, 12/01/2022 | | | 345,695 | |
| | |
| | | | California Health Facilities Financing Authority, Adventist Health System West, Series C | | | | |
| | 500 | | | 5.250%, 03/01/2021 | | | 512,140 | |
| | |
| | | | California Health Facilities Financing Authority, Casa Colina | | | | |
| | 350 | | | 5.500%, 04/01/2013 | | | 358,085 | |
| | |
| | | | California Health Facilities Financing Authority, Catholic Healthcare West, Series G | | | | |
| | 1,000 | | | 5.500%, 07/01/2025 | | | 1,004,710 | |
| | |
| | | | California Health Facilities Financing Authority, Marshall Medical Center, Series A (CMI) | | | | |
| | 1,760 | | | 4.750%, 11/01/2019 | | | 1,763,467 | |
| | |
| | | | California Health Facilities Financing Authority, Scripps Health, Series A | | | | |
| | 200 | | | 5.000%, 10/01/2022 | | | 203,722 | |
| | |
| | | | California Health Facilities Financing Authority, Stanford Hospital, Series A | | | | |
| | 1,000 | | | 5.000%, 11/15/2025 | | | 1,001,680 | |
| | |
| | | | California Health Facilities Financing Authority, Sutter Health, Series A | | | | |
| | 250 | | | 5.000%, 08/15/2038 | | | 212,102 | |
| | |
| | | | California Health Facilities Financing Authority, Sutter Health, Series B | | | | |
| | 1,000 | | | 6.000%, 08/15/2042 | | | 990,200 | |
Portfolio of Investments
Nuveen California Tax Free Fund (continued)
February 28, 2011
| | | | | | | | |
Principal
Amount (000) | | | Description p | | Value | |
| | | | | | | | |
| | | | Health Care (continued) | | | | |
| | |
| | | | California Statewide Communities Development Authority, Adventist Health, Series A | | | | |
| $ | 300 | | | 5.000%, 03/01/2030 | | $ | 272,577 | |
| | |
| | | | California Statewide Communities Development Authority, Catholic Healthcare West, Series C | | | | |
| | 1,000 | | | 5.625%, 07/01/2035 | | | 958,400 | |
| | |
| | | | California Statewide Communities Development Authority, Daughters of Charity Health, Series A | | | | |
| | 100 | | | 5.250%, 07/01/2030 | | | 86,144 | |
| | |
| | | | California Statewide Communities Development Authority, Daughters of Charity Health, Series G | | | | |
| | 400 | | | 5.250%, 07/01/2013 | | | 414,312 | |
| | |
| | | | California Statewide Communities Development Authority, Elder Care Alliance, Series A (ETM) | | | | |
| | 140 | | | 7.250%, 11/15/2011 | | | 146,755 | |
| | |
| | | | California Statewide Communities Development Authority, Enloe Medical Center, Series A (CMI) | | | | |
| | 125 | | | 5.250%, 08/15/2019 | | | 129,858 | |
| | 500 | | | 5.500%, 08/15/2023 | | | 503,910 | |
| | |
| | | | California Statewide Communities Development Authority, Henry Mayo Newhall Memorial Hospital Series A (CMI) | | | | |
| | 500 | | | 5.000%, 10/01/2020 | | | 499,975 | |
| | 400 | | | 5.000%, 10/01/2027 | | | 359,476 | |
| | |
| | | | California Statewide Communities Development Authority, Henry Mayo Newhall Memorial Hospital Series B (AMBAC) (CMI) | | | | |
| | 500 | | | 5.200%, 10/01/2037 | | | 431,165 | |
| | |
| | | | California Statewide Communities Development Authority, Jewish Home (CMI) | | | | |
| | 560 | | | 4.500%, 11/15/2019 | | | 549,679 | |
| | 500 | | | 5.000%, 11/15/2037 | | | 418,140 | |
| | |
| | | | California Statewide Communities Development Authority, Redlands Community Hospital, Series A (RAAI) | | | | |
| | 500 | | | 5.000%, 04/01/2015 | | | 518,395 | |
| | |
| | | | California Statewide Communities Development Authority, St. Joseph, Series B (FGIC) | | | | |
| | 1,100 | | | 5.500%, 07/01/2027 | | | 1,071,015 | |
| | |
| | | | California Statewide Communities Development Authority, St. Joseph, Series C (FGIC) | | | | |
| | 500 | | | 5.500%, 07/01/2027 | | | 486,825 | |
| | |
| | | | Loma Linda University Medical Center, Series A | | | | |
| | 1,000 | | | 5.000%, 12/01/2015 | | | 974,750 | |
| | 1,000 | | | 8.250%, 12/01/2038 | | | 1,075,120 | |
| | |
| | | | Northern Inyo County Hospital District | | | | |
| | 500 | | | 6.375%, 12/01/2025 | | | 487,590 | |
| | |
| | | | Sierra View Health Care District | | | | |
| | 1,000 | | | 5.250%, 07/01/2024 | | | 959,170 | |
| | 1,000 | | | 5.300%, 07/01/2026 | | | 933,680 | |
| | |
| | | | Turlock Health Facilities Revenue, Emanuel Medical Center | | | | |
| | 1,000 | | | 5.000%, 10/15/2024 | | | 869,910 | |
| | 19,460 | | | Total Health Care | | | 18,965,343 | |
| | | | Housing – 1.2% | | | | |
| | |
| | | | California Statewide Communities Development Authority, UCI East Campus | | | | |
| | 410 | | | 5.500%, 05/15/2026 | | | 392,448 | |
| | |
| | | | Ventura County Area Housing Authority, Mira Vista Senior Apartments Series A (AMBAC) (AMT) | | | | |
| | 1,000 | | | 5.150%, 12/01/2031 | | | 756,210 | |
| | 1,410 | | | Total Housing | | | 1,148,658 | |
| | | | Lease Revenue – 12.2% | | | | |
| | |
| | | | Apple Valley Public Financing Authority, Town Hall Annex Project Series A (AMBAC) | | | | |
| | 485 | | | 4.500%, 09/01/2017 | | | 519,716 | |
| | 500 | | | 5.000%, 09/01/2027 | | | 500,270 | |
| | |
| | | | California Public Works Board, California Community Colleges, Series A | | | | |
| | 200 | | | 4.875%, 12/01/2018 | | | 200,938 | |
| | |
| | | | California Public Works Board, California Community Colleges, Series B | | | | |
| | 1,035 | | | 5.500%, 06/01/2019 | | | 1,081,627 | |
| | | | | | | | |
Principal
Amount (000) | | | Description p | | Value | |
| | | | | | | | |
| | | | Lease Revenue (continued) | | | | |
| | |
| | | | California Public Works Board, California State University, Series B-1 | | | | |
| $ | 500 | | | 5.400%, 03/01/2026 | | $ | 493,425 | |
| | |
| | | | California Public Works Board, California State University, Series J | | | | |
| | 695 | | | 5.500%, 11/01/2026 | | | 692,776 | |
| | |
| | | | California Public Works Board, Department of Corrections & Rehabilitation, Series F (FGIC) (NATL) | | | | |
| | 1,500 | | | 5.000%, 11/01/2016 | | | 1,605,495 | |
| | |
| | | | California Public Works Board, Department of Mental Health Coalinga, Series A | | | | |
| | 540 | | | 5.500%, 06/01/2016 | | | 566,752 | |
| | |
| | | | California Public Works Board, Regents University of California, Series E | | | | |
| | 1,250 | | | 5.000%, 04/01/2034 | | | 1,157,988 | |
| | |
| | | | California Public Works Board, Various Capital Projects, Series G-1 | | | | |
| | 1,500 | | | 5.750%, 10/01/2030 | | | 1,477,395 | |
| | |
| | | | Golden State Tobacco Securitization Corporation, California Tobacco Settlement, Series A (AGM) | | | | |
| | 1,650 | | | 4.550%, 06/01/2022 | | | 1,520,904 | |
| | |
| | | | Los Angeles Community Redevelopment Agency, Manchester Social Services Project (AMBAC) | | | | |
| | 1,200 | | | 5.000%, 09/01/2016 | | | 1,260,156 | |
| | |
| | | | Lynwood Public Financing Authority, Lease Revenue, Civic Center Improvement Project, Series A | | | | |
| | 500 | | | 5.375%, 09/01/2030 | | | 441,320 | |
| | 150 | | | 5.500%, 09/01/2040 | | | 123,676 | |
| | |
| | | | Yuba Levee Financing Authority Project, Series A (AGC) | | | | |
| | 250 | | | 5.000%, 09/01/2038 | | | 229,730 | |
| | 11,955 | | | Total Lease Revenue | | | 11,872,168 | |
| | | | Miscellaneous – 2.8% | | | | |
| | |
| | | | Golden West Schools Financing Authority, Series A (NATL) | | | | |
| | 440 | | | 0.000%, 02/01/2012 | | | 430,553 | |
| | 670 | | | 5.700%, 02/01/2013 | | | 720,612 | |
| | 770 | | | 5.750%, 02/01/2014 | | | 847,886 | |
| | 320 | | | 5.800%, 08/01/2022 | | | 364,234 | |
| | 345 | | | 5.800%, 08/01/2023 | | | 390,236 | |
| | 2,545 | | | Total Miscellaneous | | | 2,753,521 | |
| | | | Recreational Facility Authority – 0.1% | | | | |
| | |
| | | | California Infrastructure & Economic Development, Performing Arts Center | | | | |
| | 100 | | | 4.000%, 12/01/2015 | | | 103,600 | |
| | | | Tax Revenue – 8.4% | | | | |
| | |
| | | | Antioch Area Public Facilities Financing Agency, Special Tax, Community Facilities District #1989-1 (AMBAC) | | | | |
| | 1,000 | | | 4.000%, 08/01/2018 | | | 949,410 | |
| | |
| | | | Los Angeles County Community Facilities District #3, Special Tax, Improvement Area B, Series A (AMBAC) | | | | |
| | 715 | | | 5.250%, 09/01/2018 | | | 708,880 | |
| | |
| | | | Murrieta Community Facilities, Special Tax, District #2, The Oaks Improvement Area, Series A | | | | |
| | 350 | | | 5.750%, 09/01/2020 | | | 345,968 | |
| | |
| | | | Norco, Special Tax, Community Facilities District #97-1 (AGC) | | | | |
| | 300 | | | 4.875%, 10/01/2030 | | | 267,426 | |
| | |
| | | | Palm Desert Financing Authority, Tax Allocation, Project Area #4, Series A (NATL) | | | | |
| | 1,000 | | | 5.000%, 10/01/2029 | | | 863,640 | |
| | |
| | | | Poway Unified School District, Special Tax, Community Facilities District #6 4S Ranch | | | | |
| | 650 | | | 5.000%, 09/01/2023 | | | 607,100 | |
| | |
| | | | Puerto Rico Sales Tax Financing Corporation, Series C | | | | |
| | 1,000 | | | 5.250%, 08/01/2041 | | | 900,780 | |
| | |
| | | | Rancho Cucamonga Redevelopment Agency, Tax Allocation, Series A (NATL) | | | | |
| | 310 | | | 4.125%, 09/01/2018 | | | 299,649 | |
| | 500 | | | 5.000%, 09/01/2034 | | | 399,080 | |
| | |
| | | | San Bernardino Redevelopment Agency, Tax Allocation, San Sevaine Redevelopment Project, Series A (RAAI) | | | | |
| | 850 | | | 5.000%, 09/01/2016 | | | 845,554 | |
Portfolio of Investments
Nuveen California Tax Free Fund (continued)
February 28, 2011
| | | | | | | | |
Principal
Amount (000) | | | Description p | | Value | |
| | | | | | | | |
| | | | Tax Revenue (continued) | | | | |
| | |
| | | | San Francisco City & County Redevelopment Financing Authority, Tax Allocation, Mission Bay North Redevelopment Project, Series B (RAAI) | | | | |
| $ | 325 | | | 4.100%, 08/01/2014 | | $ | 327,889 | |
| | 250 | | | 4.250%, 08/01/2016 | | | 249,285 | |
| | 380 | | | 4.375%, 08/01/2018 | | | 369,584 | |
| | |
| | | | Sand City Redevelopment Agency, Tax Allocation, Series A (AGC) | | | | |
| | 315 | | | 4.000%, 11/01/2019 | | | 292,421 | |
| | |
| | | | Soledad Redevelopment Agency, Tax Allocation, Series A (SGI) | | | | |
| | 205 | | | 4.500%, 12/01/2016 | | | 211,236 | |
| | |
| | | | South Tahoe Redevelopment Agency, Special Tax, Community Facilities District #2001-1 | | | | |
| | 120 | | | 4.400%, 10/01/2015 | | | 121,019 | |
| | 125 | | | 4.500%, 10/01/2016 | | | 124,873 | |
| | 280 | | | 4.600%, 10/01/2018 | | | 269,287 | |
| | 8,675 | | | Total Tax Revenue | | | 8,153,081 | |
| | | | Transportation – 1.0% | | | | |
| | |
| | | | Alameda Corridor Transportation Authority (AMBC) | | | | |
| | 1,000 | | | 0.000%, 10/01/2014 | | | 841,590 | |
| | |
| | | | Puerto Rico Commonwealth, Highway & Transportation Authority, Series X (IBC) (NATL) | | | | |
| | 100 | | | 5.500%, 07/01/2015 | | | 106,168 | |
| | 1,100 | | | Total Transportation | | | 947,758 | |
| | | | Utilities – 6.4% | | | | |
| | |
| | | | Banning Utility Authority, Water Enterprise, Refunding and Improvement Projects, (FGIC) (NATL) | | | | |
| | 1,025 | | | 5.000%, 11/01/2020 | | | 1,069,905 | |
| | 1,040 | | | 5.000%, 11/01/2023 | | | 1,058,949 | |
| | |
| | | | California Pollution Control Financing Authority, Solid Waste Disposal, Waste Management Incorporated Project, Series A-2 (AMT) (GTY) | | | | |
| | 500 | | | 5.400%, 04/01/2025 | | | 500,195 | |
| | |
| | | | California Pollution Control Financing Authority, Solid Waste Disposal, Waste Management Incorporated Project, Series B (AMT) (GTY) | | | | |
| | 500 | | | 5.000%, 07/01/2027 | | | 473,030 | |
| | |
| | | | Compton Sewer (IBC) (NATL) | | | | |
| | 1,150 | | | 5.375%, 09/01/2023 | | | 1,150,138 | |
| | |
| | | | Imperial, Wastewater Treatment Facility (FGIC) (NATL) | | | | |
| | 1,000 | | | 5.000%, 10/15/2020 | | | 1,007,700 | |
| | |
| | | | Norco, Financing Authority, Enterprise Revenue (AGM) | | | | |
| | 1,000 | | | 5.625%, 10/01/2034 | | | 1,004,330 | |
| | 6,215 | | | Total Utilities | | | 6,264,247 | |
| $ | 105,395 | | | Total Municipal Bonds (cost $97,692,948) | | | 95,949,204 | |
| | |
| Shares | | | Description p | | Value | |
| | | | | | | | |
| | | | Short-Term Investments – 1.2% | | | | |
| | |
| | | | Money Market Fund – 1.2% | | | | |
| | |
| | 1,128,903 | | | First American Tax Free Obligations Fund, 0.000% W | | $ | 1,128,903 | |
| | | | Total Short-Term Investment (cost $1,128,903) | | | 1,128,903 | |
| | | | Total Investments (cost $98,821,851) – 99.7% | | | 97,078,107 | |
| | | | Other Assets Less Liabilities – 0.3% | | | 315,404 | |
| | | | Net Assets – 100.0% | | $ | 97,393,511 | |
| | p | | All percentages shown in the Portfolio of Investments are based on net assets. |
| | g | | Convertible Capital Appreciation Bonds (Convertible CABs) – These bonds initially pay no interest but accrete in value from the date of issuance through the conversion date, at which time the bonds start to accrue and pay interest on a semiannual basis until final maturity. |
| | W | | The rate shown is the annualized seven-day effective yield as of February 28, 2011. |
| | (ETM) | | Escrowed to maturity. |
Statement of Assets and Liabilities
February 28, 2011 (all dollars and shares are rounded to thousands (000), except for per share data)
| | | | |
Assets | | | | |
Investments, at value (cost $98,822) | | $ | 97,078 | |
Receivables: | | | | |
Interest | | | 1,193 | |
From Adviser | | | 2 | |
Shares sold | | | 32 | |
Other assets | | | 7 | |
Total assets | | | 98,312 | |
Liabilities | | | | |
Payables: | | | | |
Dividends | | | 307 | |
Shares redeemed | | | 514 | |
Accrued expenses: | | | | |
12b-1 distribution and service fees | | | 5 | |
Other | | | 91 | |
Total liabilities | | | 918 | |
Net assets | | $ | 97,394 | |
Class A Shares | | | | |
Net assets | | $ | 16,453 | |
Shares outstanding | | | 1,570 | |
Net asset value per share | | $ | 10.48 | |
Offering price per share (net asset value per share plus
maximum sales charge of 4.20% of offering price) | | $ | 10.95 | |
Class C1 Shares | | | | |
Net assets | | $ | 5,762 | |
Shares outstanding | | | 549 | |
Net asset value and offering price per share | | $ | 10.50 | |
Class I Shares | | | | |
Net assets | | $ | 75,179 | |
Shares outstanding | | | 7,175 | |
Net asset value and offering price per share | | $ | 10.48 | |
Net Assets Consist of: | | | | |
Capital paid-in | | $ | 98,995 | |
Undistributed (Over-distribution of) net investment income | | | 44 | |
Accumulated net realized gain (loss) | | | 99 | |
Net unrealized appreciation (depreciation) | | | (1,744 | ) |
Net assets | | $ | 97,394 | |
Authorized shares | | $ | 2 billion | |
Par value per share | | $ | 0.0001 | |
See accompanying notes to financial statements.
Statement of Operations (all dollars are rounded to thousands (000))
| | | | | | | | |
| | | Eight Months Ended
2/28/11 | | | Year Ended 6/30/10 | |
Dividend and Interest Income | | $ | 3,449 | | | $ | 5,002 | |
Expenses | | | | | | | | |
Management fees | | | 371 | | | | 499 | |
12b-1 service fees – Class A | | | 28 | | | | 42 | |
12b-1 distribution and service fees – Class C1 | | | 25 | | | | 26 | |
Administration fees | | | 129 | | | | 231 | |
Shareholders’ servicing agent fees and expenses | | | 44 | | | | 80 | |
Custodian’s fees and expenses | | | 4 | | | | 5 | |
Directors’ fees and expenses | | | 17 | | | | 31 | |
Professional fees | | | 26 | | | | 51 | |
Shareholders’ reports – printing and mailing expenses | | | 63 | | | | 7 | |
Federal and state registration fees | | | 5 | | | | 7 | |
Other expenses | | | 10 | | | | 20 | |
Total expenses before expense reimbursement | | | 722 | | | | 999 | |
Expense reimbursement | | | (334) | | | | (449) | |
Net expenses | | | 388 | | | | 550 | |
Net investment income | | $ | 3,061 | | | $ | 4,452 | |
Realized and Unrealized Gain (Loss) | | | | | | | | |
Net realized gain (loss) from investments | | | 130 | | | | 499 | |
Change in net unrealized appreciation (depreciation) of investments | | | (3,828) | | | | 5,413 | |
Net realized and unrealized gain (loss) | | | (3,698) | | | | 5,912 | |
Net increase (decrease) in net assets from operations | | $ | (637) | | | $ | 10,364 | |
See accompanying notes to financial statements.
Statement of Changes in Net Assets (all dollars are rounded to thousands (000))
| | | | | | | | | | | | |
| | | Eight Months Ended
2/28/11 | | | Year Ended
6/30/10 | | | Year Ended
6/30/09 | |
Operations | | | | | | | | | | | | |
Net investment income | | $ | 3,061 | | | $ | 4,452 | | | $ | 3,079 | |
Net realized gain (loss) from investments | | | 130 | | | | 499 | | | | 82 | |
Change in net unrealized appreciation (depreciation) of investments | | | (3,828 | ) | | | 5,413 | | | | (3,078 | ) |
Net increase (decrease) in net assets from operations | | | (637 | ) | | | 10,364 | | | | 83 | |
Distributions to Shareholders | | | | | | | | | | | | |
From net investment income: | | | | | | | | | | | | |
Class A | | | (505 | ) | | | (722 | ) | | | (622 | ) |
Class C1 | | | (143 | ) | | | (153 | ) | | | (115 | ) |
Class I | | | (2,396 | ) | | | (3,542 | ) | | | (2,343 | ) |
From accumulated net realized gains: | | | | | | | | | | | | |
Class A | | | (38 | ) | | | (44 | ) | | | — | |
Class C1 | | | (12 | ) | | | (11 | ) | | | — | |
Class I | | | (166 | ) | | | (211 | ) | | | — | |
Decrease in net assets from distributions to shareholders | | | (3,260 | ) | | | (4,683 | ) | | | (3,080 | ) |
Fund Share Transactions | | | | | | | | | | | | |
Proceeds from Fund merger | | | — | | | | — | | | | 59,132 | |
Proceeds from sale of shares | | | 17,541 | | | | 20,363 | | | | 18,191 | |
Proceeds from shares issued to shareholders due to reinvestment of distributions | | | 532 | | | | 674 | | | | 544 | |
| | | 18,073 | | | | 21,037 | | | | 77,867 | |
Cost of shares redeemed | | | (20,380 | ) | | | (21,217 | ) | | | (21,814 | ) |
Net increase (decrease) in net assets from Fund share transactions | | | (2,307 | ) | | | (180 | ) | | | 56,053 | |
Net increase (decrease) in net assets | | | (6,204 | ) | | | 5,501 | | | | 53,056 | |
Net assets at the beginning of period | | | 103,598 | | | | 98,097 | | | | 45,041 | |
Net assets at the end of period | | $ | 97,394 | | | $ | 103,598 | | | $ | 98,097 | |
Undistributed (Over-distribution of) net investment income at the end of period | | $ | 44 | | | $ | 28 | | | $ | (7 | ) |
See accompanying notes to financial statements.
Financial Highlights
Financial Highlights
| | | | | | | | | | | | | | | | | | | | | | | | | | | | | | | | |
| Selected data for a share outstanding throughout each period: | |
| | | | | | |
| Class (Commencement Date) | | | | | | | | | | | | | | | | | | | |
| | | | | | Investment Operations | | | Less Distributions | |
| | |
| | | | | | | | |
| | | Beginning
Net
Asset
Value | | | Net
Invest-
ment
Income(a) | | | Net
Realized/
Unrealized
Gain (Loss) | | | Total | | | Net
Invest-
ment
Income | | | Capital
Gains(b) | | | Total | | | Ending
Net
Asset
Value | |
Class A (2/00) | | | | | | | | | | | | | | | | | | | | | | | | | | | | | |
Year Ended 2/28: | | | | | | | | | | | | | | | | | | | | | | | | | | | | | |
2011(e) | | $ | 10.88 | | | $ | .31 | | | $ | (.38 | ) | | $ | (.07 | ) | | $ | (.31 | ) | | $ | (.02 | ) | | $ | (.33 | ) | | $ | 10.48 | |
Year Ended 6/30: | | | | | | | | | | | | | | | | | | | | | | | | | | | | | |
2010 | | | 10.27 | | | | .47 | | | | .63 | | | | 1.10 | | | | (.46 | ) | | | (.03 | ) | | | (.49 | ) | | | 10.88 | |
2009 | | | 10.71 | | | | .46 | | | | (.44 | ) | | | .02 | | | | (.46 | ) | | | — | | | | (.46 | ) | | | 10.27 | |
2008 | | | 10.98 | | | | .46 | | | | (.23 | ) | | | .23 | | | | (.46 | ) | | | (.04 | ) | | | (.50 | ) | | | 10.71 | |
2007 | | | 10.96 | | | | .45 | | | | .06 | | | | .51 | | | | (.45 | ) | | | (.04 | ) | | | (.49 | ) | | | 10.98 | |
2006(f) | | | 11.24 | | | | .33 | | | | (.26 | ) | | | .07 | | | | (.33 | ) | | | (.02 | ) | | | (.35 | ) | | | 10.96 | |
Class C1 (2/00)(g) | | | | | | | | | | | | | | | | | | | | | | | | | | | | | |
Year Ended 2/28: | | | | | | | | | | | | | | | | | | | | | | | | | | | | | |
2011(e) | | | 10.89 | | | | .28 | | | | (.38 | ) | | | (.10 | ) | | | (.27 | ) | | | (.02 | ) | | | (.29 | ) | | | 10.50 | |
Year Ended 6/30: | | | | | | | | | | | | | | | | | | | | | | | | | | | | | |
2010 | | | 10.28 | | | | .41 | | | | .64 | | | | 1.05 | | | | (.41 | ) | | | (.03 | ) | | | (.44 | ) | | | 10.89 | |
2009 | | | 10.72 | | | | .41 | | | | (.44 | ) | | | (.03 | ) | | | (.41 | ) | | | — | | | | (.41 | ) | | | 10.28 | |
2008 | | | 10.99 | | | | .40 | | | | (.22 | ) | | | .18 | | | | (.41 | ) | | | (.04 | ) | | | (.45 | ) | | | 10.72 | |
2007 | | | 10.97 | | | | .41 | | | | .05 | | | | .46 | | | | (.40 | ) | | | (.04 | ) | | | (.44 | ) | | | 10.99 | |
2006(f) | | | 11.25 | | | | .30 | | | | (.26 | ) | | | .04 | | | | (.30 | ) | | | (.02 | ) | | | (.32 | ) | | | 10.97 | |
Class I (2/00)(g) | | | | | | | | | | | | | | | | | | | | | | | | | | | | | |
Year Ended 2/28: | | | | | | | | | | | | | | | | | | | | | | | | | | | | | |
2011(e) | | | 10.88 | | | | .32 | | | | (.38 | ) | | | (.06 | ) | | | (.32 | ) | | | (.02 | ) | | | (.34 | ) | | | 10.48 | |
Year Ended 6/30: | | | | | | | | | | | | | | | | | | | | | | | | | | | | | |
2010 | | | 10.27 | | | | .48 | | | | .64 | | | | 1.12 | | | | (.48 | ) | | | (.03 | ) | | | (.51 | ) | | | 10.88 | |
2009 | | | 10.71 | | | | .48 | | | | (.45 | ) | | | .03 | | | | (.47 | ) | | | — | | | | (.47 | ) | | | 10.27 | |
2008 | | | 10.98 | | | | .48 | | | | (.23 | ) | | | .25 | | | | (.48 | ) | | | (.04 | ) | | | (.52 | ) | | | 10.71 | |
2007 | | | 10.97 | | | | .47 | | | | .05 | | | | .52 | | | | (.47 | ) | | | (.04 | ) | | | (.51 | ) | | | 10.98 | |
2006(f) | | | 11.25 | | | | .35 | | | | (.26 | ) | | | .09 | | | | (.35 | ) | | | (.02 | ) | | | (.37 | ) | | | 10.97 | |
| | | | | | | | | | | | | | | | | | | | | | | | | | |
| | | | | |
| | | | |
| | | | | | | | | | | | | | |
| | | | Ratios/Supplemental Data | |
| | | | |
| | | | | | | Ratios to Average
Net Assets Before
Reimbursement | | | Ratios to Average
Net Assets After
Reimbursement(d) | | | | |
Total
Return(c) | | |
Ending
Net
Assets
(000) | | | Expenses | | | Net
Invest-
ment
Income | | | Expenses | | | Net
Invest-
ment
Income | | | Portfolio
Turnover
Rate | |
| | | | | | | | | | | | | | | | | | | | | | | | | | |
| | | | | | | | | | | | | | | | | | | | | | | | | | |
| | (.68 | )% | | $ | 16,453 | | | | 1.20 | %* | | | 3.76 | %* | | | .65 | %* | | | 4.31 | %* | | | 8 | % |
| | | | | | | | | | | | | | | | | | | | | | | | | | |
| | 10.89 | | | | 17,315 | | | | 1.18 | | | | 3.83 | | | | .65 | | | | 4.36 | | | | 16 | |
| | .29 | | | | 16,417 | | | | 1.28 | | | | 3.88 | | | | .65 | | | | 4.51 | | | | 27 | |
| | 2.11 | | | | 12,076 | | | | 1.46 | | | | 3.40 | | | | .67 | | | | 4.19 | | | | 45 | |
| | 4.62 | | | | 11,375 | | | | 1.46 | | | | 3.29 | | | | .75 | | | | 4.00 | | | | 36 | |
| | .63 | | | | 10,783 | | | | 1.34 | * | | | 3.40 | * | | | .75 | * | | | 3.99 | * | | | 24 | |
| | | | | | | | | | | | | | | | | | | | | | | | | | |
| | | | | | | | | | | | | | | | | | | | | | | | | | |
| | (.91 | ) | | | 5,762 | | | | 1.62 | * | | | 3.36 | * | | | 1.15 | * | | | 3.83 | * | | | 8 | |
| | | | | | | | | | | | | | | | | | | | | | | | | | |
| | 10.33 | | | | 4,674 | | | | 1.58 | | | | 3.43 | | | | 1.15 | | | | 3.86 | | | | 16 | |
| | (.21 | ) | | | 4,064 | | | | 1.68 | | | | 3.48 | | | | 1.15 | | | | 4.01 | | | | 27 | |
| | 1.61 | | | | 2,480 | | | | 1.85 | | | | 2.98 | | | | 1.15 | | | | 3.68 | | | | 45 | |
| | 4.17 | | | | 1,507 | | | | 1.98 | | | | 2.77 | | | | 1.15 | | | | 3.60 | | | | 36 | |
| | .33 | | | | 3,592 | | | | 2.09 | * | | | 2.66 | * | | | 1.15 | * | | | 3.60 | * | | | 24 | |
| | | | | | | | | | | | | | | | | | | | | | | | | | |
| | | | | | | | | | | | | | | | | | | | | | | | | | |
| | (.57 | ) | | | 75,179 | | | | .96 | * | | | 4.00 | * | | | .50 | * | | | 4.46 | * | | | 8 | |
| | | | | | | | | | | | | | | | | | | | | | | | | | |
| | 11.06 | | | | 81,609 | | | | .93 | | | | 4.08 | | | | .50 | | | | 4.51 | | | | 16 | |
| | .44 | | | | 77,616 | | | | 1.03 | | | | 4.09 | | | | .50 | | | | 4.62 | | | | 27 | |
| | 2.28 | | | | 30,485 | | | | 1.20 | | | | 3.66 | | | | .50 | | | | 4.36 | | | | 45 | |
| | 4.78 | | | | 24,835 | | | | 1.21 | | | | 3.54 | | | | .50 | | | | 4.25 | | | | 36 | |
| | .82 | | | | 21,767 | | | | 1.09 | * | | | 3.65 | * | | | .50 | * | | | 4.24 | * | | | 24 | |
| (a) | Per share Net Investment Income is calculated using the average daily shares method. |
| (b) | Distributions from Capital Gains include short-term capital gains, if any. |
| (c) | Total return is the combination of changes in net asset value without any sales charge, reinvested dividend income at net asset value and reinvested capital gains distributions at net asset value, if any. Total returns are not annualized. |
| (d) | After expense reimbursement from the Adviser, where applicable. Ratios do not reflect the effect of custodian fee credits earned on the Fund’s net cash on deposit with the custodian bank, where applicable. |
| (e) | For the period July 1, 2010 to February 28, 2011. |
| (f) | For the period October 1, 2005 to June 30, 2006. |
| (g) | Effective January 18, 2011, Class C Shares were renamed Class C1 Shares and Class Y Shares were renamed Class I Shares. |
See accompanying notes to financial statements.
Notes to Financial Statements (all dollars and shares are rounded to thousands (000))
1. General Information and Significant Accounting Policies
General Information
On July 28, 2010, U.S. Bancorp, the indirect parent company of FAF Advisors, Inc. (“FAF Advisors”), entered into an agreement to sell a portion of FAF Advisors’ asset management business to Nuveen Investments, Inc. (“Nuveen”). Included in the sale was the part of FAF Advisors’ asset management business that advises the fund included in this report. The sale closed on December 31, 2010.
In connection with the transaction, the fund’s Board of Directors was asked to consider and approve new investment advisory agreements for the fund with Nuveen Asset Management, a wholly-owned subsidiary of Nuveen. The new investment advisory agreements for the fund was submitted to the fund’s shareholders for approval and took effect on January 1, 2011. The fund’s Board of Directors also approved new distribution agreements with Nuveen Investments, LLC. There was no change in the fund’s investment objectives or policies as a result of the transaction. The transition did result in a change to the fund’s name effective January 1, 2011.
Effective January 1, 2011, the fund’s adviser, Nuveen Asset Management, changed its name to Nuveen Fund Advisors, Inc. (“Nuveen Fund Advisors” or the “Adviser”). Concurrently, the Adviser formed a wholly-owned subsidiary, Nuveen Asset Management, LLC (the “Sub-Adviser”), to house its portfolio management capabilities and to serve as the fund’s sub-adviser pursuant to a sub-advisory agreement that had been approved by shareholders. The fund’s portfolio manager has become an employee of the Sub-Adviser. The Adviser will compensate the Sub-Adviser for the portfolio management services it provides to the fund from the fund’s management fee.
First American Investment Funds, Inc., known as Nuveen Investment Funds, Inc. effective April 4, 2011 (the “Trust” or “FAIF”), is an open-end investment company registered under the Investment Company Act of 1940, as amended. The Trust is comprised the Nuveen California Tax Free Fund (the “Fund”), formerly known as First American California Tax Free Fund, among others. After the close of business on January 16, 2009, the Fund acquired all the net assets of the First American California Intermediate Tax Free Fund (“California Intermediate Tax Free”). California Intermediate Tax Free’s net assets of $59,132 at that date included $86 of net unrealized appreciation which was combined with that of the Fund. The combined net assets of the Fund after the merger were $97,848. For accounting and performance reporting purposes, the Fund is the survivor.
The investment objective of the Fund is to provide maximum current income that is exempt from both federal income tax and California state income tax to the extent consistent with prudent investment risk.
Under normal market conditions, as a fundamental policy, the Fund invests at least 80% of its net assets (plus the amount of any borrowings for investment purposes) in municipal securities that pay interest that is exempt from federal and California income tax, including the federal and state alternative minimum tax. The Fund normally may invest up to 20% of its net assets in taxable obligations, including obligations the interest on which is subject to the federal and state alternative minimum tax. The Fund may invest up to 20% of its total assets in securities that, at the time of purchase, are rated lower than investment grade or are unrated and of comparable quality (securities commonly referred to as “high-yield” securities or “junk bonds”). The Fund’s most recent prospectus provides further descriptions of the Fund’s investment objective, principal investment strategies, and principal risks.
During the current fiscal period, the Fund’s Board of Directors approved a change in the Fund’s fiscal and tax year end from June 30 to February 28/29.
Effective January 18, 2011, Class C Shares were renamed Class C1 Shares and Class Y Shares were renamed Class I Shares.
Significant Accounting Policies
The following is a summary of significant accounting policies followed by the Fund in the preparation of its financial statements in accordance with U.S. generally accepted accounting principles (“U.S. GAAP”).
Investment Valuation
Security valuations for the Fund’s investments are furnished by an independent pricing service that has been approved by the Fund’s Board of Directors. These securities are generally classified as Level 2. Debt obligations exceeding 60 days to maturity are valued by an independent pricing service. The pricing service may employ methodologies that utilize actual market transactions, broker-dealer supplied valuations, or other formula-driven valuation techniques. These techniques generally consider such factors as yields or prices of bonds of comparable quality, type of issue, coupon, maturity, ratings, and general market conditions. Securities for which prices are not available from an independent pricing service, but where an active market exists, are valued using market quotations obtained from one or more dealers that make markets in the securities or from a widely-used quotation system. These securities are generally classified as Level 2 or Level 3 depending on the priority of significant inputs. Investment grade debt obligations with 60 days or less remaining until maturity will be valued at their amortized cost, which approximates fair value. These securities are generally classified as Level 2. Investments in open-end funds are valued at their respective net asset values on the valuation date. These investment vehicles are generally classified as Level 1. The following investment vehicles, when held by a Fund, are priced as follows: Exchange listed futures and options on futures are priced at their last sale price on the exchange on which they are principally traded, as determined by the Adviser, on the day the valuation is made. These investment vehicles are generally classified as Level 1. If there were no sales on that day, futures and options on futures will be valued at the last reported bid price. Options on securities, indices, and currencies traded on NASDAQ National Market (“NASDAQ”) or listed on a domestic stock exchange are valued at the last sale
price on NASDAQ or on any exchange on the day the valuation is made. If there were no sales on that day, the options will be valued at the last sale price on the previous valuation date. Last sale prices are obtained from an independent pricing service. Forward contracts, swaps, and over-the-counter options on securities and indices are valued at the quotations received from an independent pricing service, if available. These investment vehicles are generally classified as Level 2.
When market quotations are not readily available, securities are internally valued at fair value as determined in good faith by procedures established and approved by the Fund’s Board of Directors. Some of the factors which may be considered in determining fair value are fundamental analytical data relating to the investment; the nature and duration of any restrictions on disposition; trading in similar securities of the same issuer or comparable companies; information from broker-dealers; and an evaluation of the forces that influence the market in which the securities are purchased and sold. If events occur that materially affect the value of securities between the close of trading in those securities and the close of regular trading on the New York Stock Exchange, the securities will be valued at fair value. The use of fair value pricing by a Fund may cause the net asset value of its shares to differ significantly from the net asset value that would be calculated without fair value pricing. These securities are generally classified as Level 2 or Level 3 depending on the priority of significant inputs.
Refer to Footnote 2 – Fair Value Measurements for further details on the leveling of securities held by the Fund as of the end of the reporting period.
Investment Transactions
Investment transactions are recorded on a trade date basis. Realized gains and losses from transactions are determined on the specific identification method, which is the same basis used for federal income tax purposes. Investments purchased on a when-issued/delayed delivery basis may have extended settlement periods. Any investments so purchased are subject to market fluctuation during this period. The Fund has instructed the custodian to segregate assets with a current value at least equal to the amount of the when-issued/delayed delivery purchase commitments. At February 28, 2011, the Fund had no such outstanding purchase commitments.
Investment Income
Interest income, which reflects the amortization of premiums and includes accretion of discounts for financial reporting purposes, is recorded on an accrual basis. Dividend income is recorded on the ex-dividend date. Investment income also reflects paydown gains and losses, if any.
Income Taxes
The Fund is a separate taxpayer for federal income tax purposes. The Fund intends to distribute substantially all of its net investment income and net capital gains to shareholders and to otherwise comply with the requirements of Subchapter M of the Internal Revenue Code applicable to regulated investment companies. Therefore, no federal income tax provision is required. Furthermore, the Fund intends to satisfy conditions that will enable interest from municipal securities, which is exempt from regular federal and designated state income taxes, to retain such tax-exempt status when distributed to shareholders of the Fund. Net realized capital gains and ordinary income distributions paid by the Fund are subject to federal taxation.
For all open tax years and all major taxing jurisdictions, management of the Fund has concluded that there are no significant uncertain tax positions that would require recognition in the financial statements. Open tax years are those that are open for examination by taxing authorities (i.e., generally the last four tax year ends and the interim tax period since then). Furthermore, management of the Fund is also not aware of any tax positions for which it is reasonably possible that the total amounts of unrecognized tax benefits will significantly change in the next twelve months.
Dividends and Distributions to Shareholders
The Fund declares dividends from its net investment income daily and pays shareholders monthly. Fund shares begin to accrue dividends on the business day after the day when the monies used to purchase Fund shares are collected by the Fund’s transfer agent.
Net realized capital gains and/or market discount from investment transactions, if any, are declared and distributed to shareholders at least annually. Furthermore, capital gains are distributed only to the extent they exceed available capital loss carryforwards.
Distributions to shareholders of net investment income, net realized capital gains and/or market discount, if any, are recorded on the ex-dividend date. The amount and timing of distributions are determined in accordance with federal income tax regulations, which may differ from U.S. GAAP.
Inverse Floating Rate Securities
The Fund is authorized to invest in inverse floating rate securities. An inverse floating rate security is created by depositing a municipal bond, typically with a fixed interest rate, into a special purpose trust created by a broker-dealer. In turn, this trust (a) issues floating rate certificates, in face amounts equal to some fraction of the deposited bond’s par amount or market value, that typically pay short-term tax-exempt interest rates to third parties, and (b) issues to a long-term investor (such as the Fund) an inverse floating rate certificate (sometimes referred to as an “inverse floater”) that represents all remaining or residual interest in the trust. The income received by the inverse floater holder varies inversely with the short-term rate paid to the floating rate certificates’ holders, and in most circumstances the inverse floater holder bears substantially all of the underlying bond’s downside investment risk and also benefits disproportionately from any potential appreciation of the underlying bond’s value. The price of an inverse floating rate
Notes to Financial Statements (continued) (all dollars and shares are rounded to thousands (000))
security will be more volatile than that of the underlying bond because the interest rate is dependent on not only the fixed coupon rate of the underlying bond but also on the short-term interest paid on the floating rate certificates, and because the inverse floating rate security essentially bears the risk of loss of the greater face value of the underlying bond.
The Fund may purchase an inverse floating rate security in a secondary market transaction without first owning the underlying bond (referred to as an “externally-deposited inverse floater”), or instead by first selling a fixed-rate bond to a broker-dealer for deposit into the special purpose trust and receiving in turn the residual interest in the trust (referred to as a “self-deposited inverse floater”). The inverse floater held by the Fund gives the Fund the right (a) to cause the holders of the floating rate certificates to tender their notes at par, and (b) to have the broker transfer the fixed-rate bond held by the trust to the Fund, thereby collapsing the trust. An investment in an externally-deposited inverse floater is identified in the Portfolio of Investments as “(IF) – Inverse floating rate investment.” An investment in a self-deposited inverse floater is accounted for as a financing transaction. In such instances, a fixed-rate bond deposited into a special purpose trust is identified in the Portfolio of Investments as “(UB) – Underlying bond of an inverse floating rate trust reflected as a financing transaction,” with the Fund accounting for the short-term floating rate certificates issued by the trust as “Floating rate obligations” on the Statement of Assets and Liabilities. In addition, the Fund reflects in “Interest from unaffiliated investments” the entire earnings of the underlying bond and recognizes the related interest paid to the holders of the short-term floating rate certificates as “Interest expense on floating rate obligations” on the Statement of Operations.
During the eight months ended February 28, 2011, the Fund did not invest in externally-deposited inverse floaters and/or self-deposited inverse floaters.
Derivative Financial Instruments
The Fund is authorized to invest in certain derivative instruments, including futures, options, and swap contracts. Although the Fund is authorized to invest in such derivative instruments, and may do so in the future, it did not make any such investments during the eight months ended February 28, 2011.
Market and Counterparty Credit Risk
In the normal course of business the Fund may invest in financial instruments and enter into financial transactions where risk of potential loss exists due to changes in the market (market risk) or failure of the other party to the transaction to perform (counterparty credit risk). The potential loss could exceed the value of the financial assets recorded on the financial statements. Financial assets, which potentially expose the Fund to counterparty credit risk, consist principally of cash due from counterparties on forward, option and swap transactions, when applicable. The extent of the Fund’s exposure to counterparty credit risk in respect to these financial assets approximates their carrying value as recorded on the Statement of Assets and Liabilities. Futures contracts, when applicable, expose a Fund to minimal counterparty credit risk as they are exchange traded and the exchange’s clearinghouse, which is counterparty to all exchange traded futures, guarantees the futures contracts against default.
The Fund helps manage counterparty credit risk by entering into agreements only with counterparties the Adviser believes have the financial resources to honor their obligations and by having the Adviser monitor the financial stability of the counterparties. Additionally, counterparties may be required to pledge collateral daily (based on the daily valuation of the financial asset) on behalf of the Fund with a value approximately equal to the amount of any unrealized gain above a predetermined threshold. Reciprocally, when the Fund has an unrealized loss, the Fund has instructed the custodian to pledge assets of the Fund as collateral with a value approximately equal to the amount of the unrealized loss above a predetermined threshold. Collateral pledges are monitored and subsequently adjusted if and when the valuations fluctuate, either up or down, by at least the pre-determined threshold amount.
Zero Coupon Securities
The Fund is authorized to invest in zero coupon securities. A zero coupon security does not pay a regular interest coupon to its holders during the life of the security. Tax-exempt income to the holder of the security comes from accretion of the difference between the original purchase price of the security at issuance and the par value of the security at maturity and is effectively paid at maturity. The market prices of zero coupon securities generally are more volatile than the market prices of securities that pay interest periodically.
Multiclass Operations and Allocations
Income and expenses of the Fund that are not directly attributable to a specific class of shares are prorated among the classes based on the relative net assets of each class. Expenses directly attributable to a class of shares, which presently only include 12b-1 distribution and shareholder service fees, are recorded to the specific class.
Income, realized and unrealized capital gains and losses of the Fund are prorated among the classes based on the relative net assets of each class.
Interfund Lending Program
During the period July 1, 2010 through December 31, 2010, pursuant to an exemptive order issued by the Securities and Exchange Commission, the Fund, along with other registered investment companies in the First American Funds family, were allowed to participate in an interfund lending program. This program provided an alternative credit facility allowing the Fund to borrow from, or lend money to, other participating funds. The Fund did not have any interfund lending transactions during the period July 1, 2010 through December 31, 2010. The exemptive order terminated with respect to the Fund on December 31, 2010, in connection with the closing of the sale.
Indemnifications
Under the Trust’s organizational documents, its officers and directors are indemnified against certain liabilities arising out of the performance of their duties to the Trust. In addition, in the normal course of business, the Trust enters into contracts that provide general indemnifications to other parties. The Trust’s maximum exposure under these arrangements is unknown as this would involve future claims that may be made against the Trust that have not yet occurred. However, the Trust has not had prior claims or losses pursuant to these contracts and expects the risk of loss to be remote.
Use of Estimates
The preparation of financial statements in conformity with U.S. GAAP requires management to make estimates and assumptions that affect the reported amounts of assets and liabilities at the date of the financial statements and the reported amounts of increases and decreases in net assets from operations during the reporting period. Actual results may differ from those estimates.
2. Fair Value Measurements
Fair value is defined as the price that the Fund would receive upon selling an investment or transferring a liability in an orderly transaction to an independent buyer in the principal or most advantageous market of the investment. A three-tier hierarchy is used to maximize the use of observable market data and minimize the use of unobservable inputs and to establish classification of fair value measurements for disclosure purposes. Observable inputs reflect the assumptions market participants would use in pricing the asset or liability. Observable inputs are based on market data obtained from sources independent of the reporting entity. Unobservable inputs reflect the reporting entity’s own assumptions about the assumptions market participants would use in pricing the asset or liability. Unobservable inputs are based on the best information available in the circumstances. The three-tier hierarchy of inputs is summarized in the three broad levels listed below:
| | |
| Level 1 – | | Quoted prices in active markets for identical securities. |
| Level 2 – | | Other significant observable inputs (including quoted prices for similar securities, interest rates, prepayment speeds, credit risk, etc.). |
| Level 3 – | | Significant unobservable inputs (including management’s assumptions in determining the fair value of investments). |
The inputs or methodologies used for valuing securities are not an indication of the risk associated with investing in those securities. The following is a summary of the Fund’s fair value measurements as of February 28, 2011:
| | | | | | | | | | | | | | | | |
| | | Level 1 | | | Level 2 | | | Level 3 | | | Total | |
Investments: | | | | | | | | | | | | | | | | |
Municipal Bonds | | $ | — | | | $ | 95,949 | | | $ | — | | | $ | 95,949 | |
Short-Term Investments | | | 1,129 | | | | — | | | | — | | | | 1,129 | |
Total | | $ | 1,129 | | | $ | 95,949 | | | $ | — | | | $ | 97,078 | |
During the eight months ended February 28, 2011, the Fund recognized no significant transfers to/from Level 1, Level 2, or Level 3.
3. Derivative Instruments and Hedging Activities
The Fund records derivative instruments at fair value, with changes in fair value recognized on the Statement of Operations, when applicable. Even though the Fund’s investments in derivatives may represent economic hedges, they are not considered to be hedge transactions for financial reporting purposes. The Fund did not invest in derivative instruments during the eight months ended February 28, 2011.
Notes to Financial Statements (continued) (all dollars and shares are rounded to thousands (000))
4. Fund Shares
Transactions in Fund shares were as follows:
| | | | | | | | | | | | | | | | | | | | | | | | |
| | | Eight Months Ended
2/28/11 | | | Year Ended
6/30/10 | | | Year Ended
6/30/09 | |
| | | Shares | | | Amount | | | Shares | | | Amount | | | Shares | | | Amount | |
Shares issued in the Merger: | | | | | | | | | | | | | | | | | | | | | | | | |
Class A | | | — | | | $ | — | | | | — | | | $ | — | | | | 459 | | | $ | 4,782 | |
Class C1(1) | | | — | | | | — | | | | — | | | | — | | | | — | | | | — | |
Class I(1) | | | — | | | | — | | | | — | | | | — | | | | 5,217 | | | | 54,350 | |
Shares sold: | | | | | | | | | | | | | | | | | | | | | | | | |
Class A | | | 282 | | | | 3,121 | | | | 269 | | | | 2,905 | | | | 417 | | | | 4,306 | |
Class C1(1) | | | 764 | | | | 2,201 | | | | 148 | | | | 1,599 | | | | 189 | | | | 1,946 | |
Class I(1) | | | 1,133 | | | | 12,220 | | | | 1,473 | | | | 15,859 | | | | 1,184 | | | | 11,939 | |
Shares issued to shareholders due to reinvestment of distributions: | | | | | | | | | | | | | | | | | | | | | | | | |
Class A | | | 34 | | | | 373 | | | | 44 | | | | 466 | | | | 39 | | | | 398 | |
Class C1(1) | | | 7 | | | | 76 | | | | 11 | | | | 112 | | | | 8 | | | | 81 | |
Class I(1) | | | 8 | | | | 83 | | | | 9 | | | | 96 | | | | 6 | | | | 65 | |
| | | | 2,228 | | | | 18,074 | | | | 1,954 | | | | 21,037 | | | | 7,519 | | | | 77,867 | |
Shares redeemed: | | | | | | | | | | | | | | | | | | | | | | | | |
Class A | | | (338 | ) | | | (3,662 | ) | | | (320 | ) | | | (3,438 | ) | | | (444 | ) | | | (4,585 | ) |
Class C1(1) | | | (651 | ) | | | (947 | ) | | | (125 | ) | | | (1,329 | ) | | | (33 | ) | | | (327 | ) |
Class I(1) | | | (1,468 | ) | | | (15,772 | ) | | | (1,541 | ) | | | (16,450 | ) | | | (1,693 | ) | | | (16,902 | ) |
| | | | (2,457 | ) | | | (20,381 | ) | | | (1,986 | ) | | | (21,217 | ) | | | (2,170 | ) | | | (21,814 | ) |
Net increase (decrease) | | | (229 | ) | | $ | (2,307 | ) | | | (32 | ) | | $ | (180 | ) | | | 5,349 | | | $ | 56,053 | |
| (1) | Effective January 18, 2011, Class C Shares are renamed Class C1 Shares and Class Y Shares are renamed Class I Shares. |
5. Investment Transactions
Purchases and sales (including maturities but excluding short-term investments) during the eight months ended February 28, 2011, aggregated $8,191 and $8,444, respectively.
6. Income Tax Information
The following information is presented on an income tax basis. Differences between amounts for financial statement and federal income tax purposes are primarily due to timing differences in recognizing certain gains and losses on investment transactions and the treatment of investments in inverse floating rate securities reflected as financing transactions, if any. To the extent that differences arise that are permanent in nature, such amounts are reclassified within the capital accounts as detailed below. Temporary differences do not require reclassification. Temporary and permanent differences do not impact the net asset value of the Fund.
At February 28, 2011, the cost and unrealized appreciation (depreciation) of investments, as determined on a federal income tax basis, were as follows:
| | | | |
Cost of investments | | $ | 98,822 | |
Gross unrealized: | | | | |
Appreciation | | $ | 1,438 | |
Depreciation | | | (3,182 | ) |
Net unrealized appreciation (depreciation) of investments | | $ | (1,744 | ) |
Permanent differences, primarily due to equalization, resulted in reclassifications among the Fund’s components of net assets at February 28, 2011, the Fund’s tax year-end, as follows:
| | | | |
Capital paid-in | | $ | 31 | |
Undistributed (Over-distribution of) net investment income | | | — | |
Accumulated net realized gain (loss) | | | (31 | ) |
The tax components of undistributed net tax-exempt income, net ordinary income and net long-term capital gains at February 28, 2011, the Fund’s tax year end, were as follows:
| | | | |
Undistributed net tax-exempt income* | | $ | 428 | |
Undistributed net ordinary income** | | | — | |
Undistributed net long-term capital gains | | | 99 | |
| * | Undistributed net tax exempt income (on a tax basis) has not been reduced for the dividend declared during the period February 1, 2011 through February 28, 2011 and paid on March 1, 2011. |
| ** | Net ordinary income consists of taxable market discount income and net short-term capital gains, if any. |
The tax character of distributions paid during the eight months ended February 28, 2011, and during the tax years ended June 30, 2010 and June 30, 2009, was designated for purposes of the dividends paid deduction as follows:
| | | | |
| Eight months ended February 28, 2011 | | | |
Distributions from net tax-exempt income*** | | $ | 3,004 | |
Distributions from net ordinary income** | | | 23 | |
Distributions from net long-term capital gains**** | | | 224 | |
| | | | |
| 2010 | | | |
Distributions from net tax-exempt income | | $ | 4,311 | |
Distributions from net ordinary income ** | | | 88 | |
Distributions from net long-term gains | | | 266 | |
| | | | |
| 2009 | | | |
Distributions from net tax-exempt income | | $ | 2,894 | |
Distributions from net ordinary income ** | | | — | |
Distributions from net long-term gains | | | — | |
| ** | Net ordinary income consists of taxable market discount income and net short-term capital gains, if any. |
| *** | The Fund hereby designates this amount paid during the eight months ended February 28, 2011, as Exempt Interest Dividends. |
| **** | The Fund designated as long-term capital gain dividend, pursuant to the Internal Revenue Code Section 852 (b)(3), the amount necessary to reduce earnings and profits of the Fund related to net capital gain to zero for the eight months ended February 28, 2011. |
7. Management Fees and Other Transactions with Affiliates
Investment Advisory Fees
During the period July 1, 2010 through December 31, 2010, pursuant to an investment advisory agreement (the “Agreement”), FAF Advisors managed the Fund’s assets and furnished related office facilities, equipment, research, and personnel. The Agreement required the Fund to pay FAF Advisors a monthly fee equal, on an annual basis, to 0.50% of the Fund’s average daily net assets. FAF Advisors also agreed to waive fees and reimburse other Fund expenses at least through October 31, 2010, so that total fund operating expenses, as a percentage of average daily net assets, did not exceed 0.65% for Class A Shares, 1.15% for Class C Shares (renamed Class C1 Shares) and 0.50% for Class Y Shares (renamed Class I Shares).
During the period July 1, 2010 through December 31, 2010, the Fund may have invested in related money market funds that are series of First American Funds, Inc., subject to certain limitations. In order to avoid the payment of duplicative investment advisory fees to FAF Advisors, which acted as the investment advisor to both the investing Fund and the related money market funds, FAF Advisors reimbursed the investing Fund an amount equal to that portion of FAF Advisors’ investment advisory fee received from the related money market funds that was attributable to the assets of the investing Fund. This reimbursement, if any, is recognized as a component of “Expense Reimbursement” on the Statement of Operations, and terminated with respect to the Fund on December 31, 2010, in connection with the closing of the sale.
Effective January 1, 2011, pursuant to a new investment advisory agreement (the “New Agreement”), the Fund’s new investment adviser is Nuveen Fund Advisors. Under the New Agreement, the Fund’s management fee consists of two components – a fund-level fee, based only on the amount of assets within the Fund, and a complex-level fee, based on the aggregate amount of all eligible fund assets managed by the Nuveen Fund Advisors. This pricing structure enables the Fund’s shareholders to benefit from growth in the assets within its Fund as well as from growth in the amount of complex-wide assets managed by the Nuveen Fund Advisors.
The annual fund-level fee, payable monthly, is calculated according to the following schedule:
| | | | |
| Average Daily Net Assets | | Fund-Level Fee Rate | |
For the first $125 million | | | 0.4500 | % |
For the next $125 million | | | 0.4375 | |
For the next $250 million | | | 0.4250 | |
For the next $500 million | | | 0.4125 | |
For the next $1 billion | | | 0.4000 | |
For net assets over $2 billion | | | 0.3750 | |
Notes to Financial Statements (continued) (all dollars and shares are rounded to thousands (000))
The annual complex-level fee for the Fund, payable monthly, is determined by taking the complex-level fee rate, which is based on the aggregate amount of “eligible assets” of all Nuveen funds as set forth in the schedule below, and making, as appropriate, an upward adjustment to that rate based upon the percentage of the particular fund’s assets that are not “eligible assets.” The complex-level fee schedule is as follows:
| | | | |
| Complex-Level Asset Breakpoint Level* | | Effective Rate at Breakpoint Level | |
$55 billion | | | 0.2000 | % |
$56 billion | | | 0.1996 | |
$57 billion | | | 0.1989 | |
$60 billion | | | 0.1961 | |
$63 billion | | | 0.1931 | |
$66 billion | | | 0.1900 | |
$71 billion | | | 0.1851 | |
$76 billion | | | 0.1806 | |
$80 billion | | | 0.1773 | |
$91 billion | | | 0.1691 | |
$125 billion | | | 0.1599 | |
$200 billion | | | 0.1505 | |
$250 billion | | | 0.1469 | |
$300 billion | | | 0.1445 | |
| * | The complex-level fee is calculated based upon the aggregate daily “eligible assets” of all Nuveen funds. Eligible assets do not include assets attributable to investments in other Nuveen funds or assets in excess of $2 billion added to the Nuveen fund complex in connection with Nuveen Fund Advisors’ assumption of the management of the former First American Funds effective January 1, 2011. Eligible assets include closed-end fund assets managed by Nuveen Fund Advisors that are attributable to financial leverage. For these purposes, financial leverage includes the closed-end funds’ use of preferred stock and borrowings and investments in the residual interest certificates (also called inverse floating rate securities) in tender option bond (TOB) trusts, including the portion of assets held by the TOB trust that has been effectively financed by the trust’s issuance of floating rate securities, subject to an agreement by Nuveen Fund Advisors as to certain funds to limit the amount of such assets for determining eligible assets in certain circumstances. As of February 28, 2011, the Fund’s complex-level fee rate was .1975%. |
The management fee will compensate Nuveen Fund Advisors for the overall investment advisory and administrative services and general office facilities it provides for the Fund. Effective January 1, 2011, Nuveen Fund Advisors has entered into a sub-advisory agreement with the Sub-Adviser. The Sub-Adviser will be compensated for its services to the Fund from the management fee paid to Nuveen Fund Advisors.
Effective January 1, 2011, Nuveen Fund Advisors has contractually agreed to waive fees and reimburse expenses of the Fund so that total annual fund operating expenses, after waivers and excluding Acquired Fund Fees and Expenses, do not exceed the percent of the Fund’s average daily net assets, for each share class and for the time periods stated, as set forth in the following table:
| | | | |
Class A | | | 0.6500 | % |
Class C1(1) | | | 1.1500 | |
Class I(1) | | | 0.5000 | |
Through first expiration date | | | June 30, 2011 | |
After first expiration date: | | | | |
Class A | | | 0.8500 | |
Class C1(1) | | | 1.3500 | |
Class I(1) | | | 0.7000 | |
Expiration date | | | March 31, 2012 | |
| (1) | Effective January 18, 2011, Class C Shares are renamed Class C1 Shares and Class Y Shares are renamed Class I Shares. |
During the period July 1, 2010 through December 31, 2010, independent directors of the Fund may have participated and elected to defer receipt of part or all of their annual compensation under a deferred compensation plan (the “Plan”). Deferred amounts were treated as though equivalent dollar amounts had been invested in shares of selected open-end funds as designated by each director. All amounts in the Plan were 100% vested and accounts under the Plan were obligations of the Fund. Deferred amounts remain in the Fund until distributed in accordance with the Plan.
Effective January 1, 2011, independent directors may elect to defer receipt of all or a portion of the annual compensation they are entitled to receive from certain funds advised by Nuveen Fund Advisors. Under the plan, deferred amounts are treated as though equal dollar amounts had been invested in shares of select funds advised by Nuveen Fund Advisors.
Administration Fees
During the period July 1, 2010 through December 31, 2010, FAF Advisors served as the Fund’s administrator pursuant to an administration agreement between FAF Advisors and the Fund. U.S. Bancorp Fund Services, LLC (“USBFS”) served as sub-administrator pursuant to a sub-administration agreement between USBFS and FAF Advisors. FAF Advisors is a subsidiary of U.S. Bank National Association (“U.S. Bank”). Both U.S. Bank and USBFS are direct subsidiaries of U.S. Bancorp. Under the administration agreement, FAF Advisors was compensated to provide, or compensated other entities to provide, services to the Fund. These services included various legal, oversight, and administrative and accounting services. The Fund paid FAF Advisors administration fees, which were calculated daily and paid monthly, equal to the Fund’s pro rata share of an amount equal, on an annual basis, to 0.25% of the aggregate average daily net assets of all open-end funds in the First American Funds family up to $8 billion, 0.235% on the next $17 billion of the aggregate average daily net assets, 0.22% on the next $25 billion of the aggregate average daily net assets, and 0.20% of the aggregate average daily net assets in excess of $50 billion. All fees paid to the sub-administrator were paid from the administration fee. In addition to these fees, the Fund may have reimbursed FAF Advisors and the sub-administrator for any out-of-pocket expenses incurred in providing administration services. Effective January 1, 2011, FAF Advisors and USBFS no longer serve as the Fund’s administrator and sub-administrator, respectively, and the Fund has not entered into any new administration or sub-administration agreements.
Transfer Agent Fees
USBFS serves as the Fund’s transfer agent pursuant to a transfer agent agreement with FAIF. The Fund was charged transfer agent fees on a per shareholder account basis, subject to a minimum fee per share class. These fees are charged to the Fund based upon the number of accounts within the Fund. In addition to these fees, the Fund may reimburse USBFS for out-of-pocket expenses incurred in providing transfer agent services.
Custodian Fees
U.S. Bank serves as the custodian for the Fund pursuant to a custodian agreement with FAIF. The custodian fee charged for the Fund is equal to an annual rate of 0.005% of average daily net assets. All fees are computed daily and paid monthly. Interest earned on uninvested cash balances was used to reduce a portion of the Fund’s custodian expenses. These credits, if any, are recognized as “Custodian Fee Credit” on the Statements of Operations. Conversely, the custodian charged a fee for any cash overdrafts incurred, which increased the Fund’s custodian expenses.
Distribution and Shareholder Servicing (12b-1) Fees
During the period July 1, 2010 through December 31, 2010, Quasar Distributors, LLC (“Quasar”), a subsidiary of U.S. Bancorp, served as the distributor of the Fund pursuant to a distribution agreement with FAIF. Under the distribution agreement, and pursuant to a plan adopted by the Fund under Rule 12b-1 of the Investment Company Act, the Fund paid Quasar a monthly distribution and/or shareholder servicing fee equal to an annual rate of 0.25% and 0.65% of the Fund’s average daily net assets of Class A and Class C Shares (renamed Class C1 Shares), respectively. No distribution or shareholder servicing fees were paid by Class Y Shares (renamed Class I Shares). These fees may have been used by Quasar to provide compensation for sales support, distribution activities, and/or shareholder servicing activities. During the period July 1, 2010 through December 31, 2010, there were no distribution and shareholder servicing fees waived by Quasar.
Effective January 1, 2011, the Fund has entered into a distribution agreement with Nuveen Investments LLC (the “Distributor”), who now serves as the Fund’s distributor. Under the new agreement, Class A Shares incur a .20% annual 12b-1 service fee. Class C1 Shares continue to incur a .40% annual 12b-1 distribution fee and a .25% annual 12b-1 service fee. Class I Shares will continue to not be subject to any sales charge or 12b-1 distribution or service fees. Annual distribution and service fees are based on average daily net assets.
All 12b-1 service and distribution fees collected on Class C Shares during the first year following a purchase are retained by Quasar and the Distributor to compensate for commissions advanced to financial intermediaries. During the eight months ended February 28, 2011, Quasar and the Distributor retained such 12b-1 fees as follows:
| | | | |
| | | Amount | |
12b-1 fees retained (Unaudited) | | $ | 35 | |
Beginning January 18, 2011, Quasar and the Distributor compensated financial intermediaries directly with commission advances at the time of purchase as follows:
Notes to Financial Statements (continued) (all dollars and shares are rounded to thousands (000))
Other Fees and Expenses
In addition to the investment advisory fees, administration fees, transfer agent fees, custodian fees, and distribution and shareholder servicing fees, the Fund is responsible for paying other operating expenses, including: legal, auditing, registration fees, postage and printing of shareholder reports, fees and expenses of independent directors, insurance, and other miscellaneous expenses. During the period July 1, 2010 through December 31, 2010, legal fees and expenses of $2 were paid to a law firm of which an Assistant Secretary of the Fund was a partner.
Contingent Deferred Sales Charges
During the period July 1, 2010 through January 17, 2011, Class A Shares of the Fund were sold with an up-front sales charge of 4.25%. Class C Shares (renamed Class C1 Shares) were subject to a contingent deferred sales charge (“CDSC”) of 1% for twelve months. Class Y Shares (renamed Class I Shares) had no sales charge and were offered only to qualifying institutional investors and certain other qualifying accounts.
Effective January 18, 2011, Class A Shares of the Fund are sold with an up-front sales charge of 4.20%. Class A Share purchases of the Fund of $1 million or more are sold at net asset value without an sales charge. Class A Share purchases of the Fund may be subject to a CDSC if redeemed within eighteen months of purchase. Class C1 Shares are subject to a CDSC of 1% if redeemed within one year of purchase.
Quasar and the Distributor collected and retained CDSC on share redemptions during the eight months ended February 28, 2011, as follows:
| | | | |
| | | Amount | |
CDSC retained (Unaudited) | | $ | 77 | |
8. Subsequent Events
Name Changes
On April 30, 2011, the Distributor will change its name from Nuveen Investments, LLC to Nuveen Securities, LLC.
Trustees and Officers (Unaudited)
The management of the Funds, including general supervision of the duties performed for the Funds by the Adviser, is the responsibility of the Board of Trustees of the Funds. The number of trustees of the Funds is currently set at ten. None of the trustees who are not “interested” persons of the Funds (referred to herein as “independent trustees”) has ever been a director or employee of, or consultant to, Nuveen or its affiliates. The names and business addresses of the trustees and officers of the Funds, their principal occupations and other affiliations during the past five years, the number of portfolios each oversees and other directorships they hold are set forth below.
The Funds’ Statement of Additional Information (“SAI”) includes more information about the trustees. To request a free copy, call Nuveen Investments at (800) 257-8787 or visit the Funds’ website at www.nuveen.com.
| | | | | | | | |
Name, Birthdate and Address | | Position(s) Held with the Funds | | Year First Elected or Appointed (1) | | Principal Occupation(s) Including other Directorships During Past 5 Years | | Number of Portfolios in Fund Complex Overseen by Trustee |
| | |
| Independent Trustees: | | | | |
Robert P. Bremner (2) 8/22/40 333 W. Wacker Drive Chicago, IL 60606 | | Chairman of the Board and Trustee | | 1996 | | Private Investor and Management Consultant; Treasurer and Director, Humanities Council of Washington, D.C.; Board Member, Independent Directors Council affiliated with the Investment Company Institute. | | 246 |
Jack B. Evans 10/22/48 333 W. Wacker Drive Chicago, IL 60606 | | Trustee | | 1999 | | President, The Hall-Perrine Foundation, a private philanthropic corporation (since 1996); Director and Chairman, United Fire Group, a publicly held company; President Pro Tem of the Board of Regents for the State of Iowa University System; Director, Source Media Group; Life Trustee of Coe College and the Iowa College Foundation; formerly, Director, Alliant Energy; formerly, Director, Federal Reserve Bank of Chicago; formerly, President and Chief Operating Officer, SCI Financial Group, Inc., a regional financial services firm. | | 246 |
William C. Hunter 3/6/48 333 W. Wacker Drive Chicago, IL 60606 | | Trustee | | 2004 | | Dean, Tippie College of Business, University of Iowa (since 2006); Director (since 2004) of Xerox Corporation; Director (since 2005), Beta Gamma Sigma International Honor Society; Director of Wellmark, Inc. (since 2009); formerly, Dean and Distinguished Professor of Finance, School of Business at the University of Connecticut (2003-2006); previously, Senior Vice President and Director of Research at the Federal Reserve Bank of Chicago (1995-2003); formerly, Director (1997-2007), Credit Research Center at George Washington University. | | 246 |
David J. Kundert (2) 10/28/42 333 W. Wacker Drive Chicago, IL 60606 | | Trustee | | 2005 | | Director, Northwestern Mutual Wealth Management Company; retired (since 2004) as Chairman, JPMorgan Fleming Asset Management, President and CEO, Banc One Investment Advisors Corporation, and President, One Group Mutual Funds; prior thereto, Executive Vice President, Banc One Corporation and Chairman and CEO, Banc One Investment Management Group; Member, Board of Regents, Luther College; member of the Wisconsin Bar Association; member of Board of Directors, Friends of Boerner Botanical Gardens; member of Board of Directors and Chair of Investment Committee, Greater Milwaukee Foundation. | | 246 |
William J. Schneider (2) 9/24/44 333 W. Wacker Drive Chicago, IL 60606 | | Trustee | | 1997 | | Chairman of Miller-Valentine Partners Ltd., a real estate investment company; formerly, Senior Partner and Chief Operating Officer (retired 2004) of Miller-Valentine Group; member, University of Dayton Business School Advisory Council; member, Mid-America Health System Board; formerly, member and chair, Dayton Philharmonic Orchestra Association; formerly, member, Business Advisory Council, Cleveland Federal Reserve Bank. | | 246 |
Judith M. Stockdale 12/29/47 333 W. Wacker Drive Chicago, IL 60606 | | Trustee | | 1997 | | Executive Director, Gaylord and Dorothy Donnelley Foundation (since 1994); prior thereto, Executive Director, Great Lakes Protection Fund (1990-1994). | | 246 |
Carole E. Stone (2) 6/28/47 333 W. Wacker Drive Chicago, IL 60606 | | Trustee | | 2007 | | Director, Chicago Board Options Exchange (since 2006); Director, C2 Options Exchange, Incorporated (since 2009); formerly, Commissioner, New York State Commission on Public Authority Reform (2005-2010); formerly, Chair, New York Racing Association Oversight Board (2005-2007). | | 246 |
Trustees and Officers (Unaudited) (continued)
| | | | | | | | |
Name, Birthdate and Address | | Position(s) Held with the Funds | | Year First Elected or Appointed | | Principal Occupation(s) During Past Five Years | | Number of Portfolios in Fund Complex Overseen by Officer |
Virginia L. Stringer 8/16/44 333 West Wacker Drive Chicago, IL 60606 | | Trustee | | 2011 | | Board Member, Mutual Fund Directors Forum; Member, Governing Board, Investment Company Institute’s Independent Directors Council; governance consultant and non-profit board member; former Owner and President, Strategic Management Resources, Inc. a management consulting firm; previously, held several executive positions in general management, marketing and human resources at IBM and The Pillsbury Company; Independent Director, First American Fund Complex (1987-2010) and Chair (1997-2010). | | 246 |
Name, Birthdate and Address | | Position(s) Held with the Funds | | Year First Elected or Appointed (1) | | Principal Occupation(s) Including other Directorships During Past 5 Years | | Number of Portfolios in Fund Complex Overseen by Trustee |
Terence J. Toth (2) 9/29/59 333 W. Wacker Drive Chicago, IL 60606 | | Trustee | | 2008 | | Director, Legal & General Investment Management America, Inc. (since 2008); Managing Partner, Promus Capital (since 2008); formerly, CEO and President, Northern Trust Global Investments (2004-2007); Executive Vice President, Quantitative Management & Securities Lending (2000-2004); prior thereto, various positions with Northern Trust Company (since 1994); member: Goodman Theatre Board (since 2004); Chicago Fellowship Board (since 2005), and Catalyst Schools of Chicago Board (since 2008); formerly, member: Northern Trust Mutual Funds Board (2005-2007), Northern Trust Global Investments Board (2004-2007), Northern Trust Japan Board (2004-2007), Northern Trust Securities Inc. Board (2003-2007) and Northern Trust Hong Kong Board (1997-2004). | | 246 |
| | |
| Interested Trustee: | | | | |
John P. Amboian (3) 6/14/61 333 W. Wacker Drive Chicago, IL 60606 | | Trustee | | 2008 | | Chief Executive Officer and Chairman (since 2007), and Director (since 1999) of Nuveen Investments, Inc., formerly, President (1999-2007); Chief Executive Officer (since 2007) of Nuveen Investments Advisors, Inc.; Director (since 1998) formerly, Chief Executive Officer (2007-2010) of Nuveen Fund Advisors, Inc. | | 246 |
Name, Birthdate and Address | | Position(s) Held with the Funds | | Year First Elected or Appointed (4) | | Principal Occupation(s) During Past 5 Years | | Number of Portfolios in Fund Complex Overseen by Officer |
| | |
| Officers of the Funds: | | | | |
Gifford R. Zimmerman 9/9/56 333 W. Wacker Drive Chicago, IL 60606 | | Chief Administrative Officer | | 1988 | | Managing Director (since 2002), Assistant Secretary and Associate General Counsel of Nuveen Investments LLC; Managing Director (since 2004) and Assistant Secretary (since 1994) of Nuveen Investments, Inc.; Managing Director (since 2002), Assistant Secretary (since 1997) and Co-General Counsel (since 2011) of Nuveen Fund Advisors, Inc.; Managing Director, Assistant Secretary and Associate General Counsel of Nuveen Asset Management, LLC (since 2011); Managing Director, Associate General Counsel and Assistant Secretary of Symphony Asset Management LLC (since 2003); Vice President and Assistant Secretary of NWQ Investment Management Company, LLC (since 2002), Nuveen Investments Advisers Inc. (since 2002), Tradewinds Global Investors LLC, and Santa Barbara Asset Management, LLC (since 2006), Nuveen HydePark Group LLC and Nuveen Investment Solutions, Inc. (since 2007) and of Winslow Capital Management Inc. (since 2010); Chief Administrative Officer and Chief Compliance Officer (since 2010) of Nuveen Commodities Asset Management, LLC; Chartered Financial Analyst. | | 246 |
| | | | | | | | |
Name, Birthdate and Address | | Position(s) Held with the Funds | | Year First Elected or Appointed (4) | | Principal Occupation(s) During Past 5 Years | | Number of Portfolios in Fund Complex Overseen by Officer |
Margo L. Cook 4/11/64 333 W. Wacker Drive Chicago, IL 60606 | | Vice President | | 2009 | | Executive Vice President (since 2008) of Nuveen Investments, Inc. and of Nuveen Fund Advisors, Inc. (since 2011); previously, Head of Institutional Asset Management (2007-2008) of Bear Stearns Asset Management; Head of Institutional Asset Management (1986-2007) of Bank of NY Mellon; Chartered Financial Analyst. | | 246 |
Lorna C. Ferguson 10/24/45 333 W. Wacker Drive Chicago, IL 60606 | | Vice President | | 1998 | | Managing Director (since 2004) of Nuveen Investments, LLC and Managing Director (since 2005) of Nuveen Fund Advisors, Inc. | | 246 |
Name, Birthdate and Address | | Position(s) Held with the Funds | | Year First Elected or Appointed (1) | | Principal Occupation(s) Including other Directorships During Past 5 Years | | Number of Portfolios in Fund Complex Overseen by Trustee |
Stephen D. Foy 5/31/54 333 W. Wacker Drive Chicago, IL 60606 | | Vice President and Controller | | 1998 | | Senior Vice President (since 2010), formerly, Vice President (1993-2010) and Funds Controller (since 1998) of Nuveen Investments, LLC; Senior Vice President (since 2010), formerly, Vice President (2005-2010) of Nuveen Fund Advisors, Inc.; Certified Public Accountant. | | 246 |
Scott S. Grace 8/20/70 333 W. Wacker Drive Chicago, IL 60606 | | Vice President and Treasurer | | 2009 | | Managing Director, Corporate Finance & Development, Treasurer (since 2009) of Nuveen Investments, LLC; Managing Director and Treasurer (since 2009) of Nuveen Fund Advisors, Inc., Nuveen Investment Solutions, Inc., Nuveen Investments Advisers, Inc., Nuveen Investments Holdings Inc. and (since (2011) Nuveen Asset Management, LLC; Vice President and Treasurer of NWQ Investment Management Company, LLC, Tradewinds Global Investors, LLC, Symphony Asset Management LLC and Winslow Capital Management, Inc.; Vice President of Santa Barbara Asset Management, LLC; formerly, Treasurer (2006-2009), Senior Vice President (2008-2009), previously, Vice President (2006-2008) of Janus Capital Group, Inc.; formerly, Senior Associate in Morgan Stanley’s Global Financial Services Group (2000-2003); Chartered Accountant Designation. | | 246 |
Walter M. Kelly 2/24/70 333 W. Wacker Drive Chicago, IL 60606 | | Chief Compliance Officer and Vice President | | 2003 | | Senior Vice President (since 2008), Vice President (2006-2008) of Nuveen Investments, LLC; Senior Vice President (since 2008) and Assistant Secretary (since 2008) of Nuveen Fund Advisors, Inc. | | 246 |
Tina M. Lazar 8/27/61 333 W. Wacker Drive Chicago, IL 60606 | | Vice President | | 2002 | | Senior Vice President (since 2009), formerly, Vice President of Nuveen Investments, LLC (1999-2009); Senior Vice President (since 2010), formerly, Vice President (2005-2010) of Nuveen Fund Advisors, Inc. | | 246 |
Larry W. Martin 7/27/51 333 West Wacker Drive Chicago, IL 60606 | | Vice President and Assistant Secretary | | 1997 | | Senior Vice President (since 2010), formerly, Vice President (1993-2010), Assistant Secretary and Assistant General Counsel of Nuveen Investments, LLC; Senior Vice President (since 2011) of Nuveen Asset Management, LLC: Senior Vice President (since 2010), formerly, Vice President (2005-2010), and Assistant Secretary of Nuveen Investments, Inc.; Senior Vice President (since 2010), formerly Vice President (2005-2010), and Assistant Secretary (since 1997) of Nuveen Fund Advisors, Vice President and Assistant Secretary of Nuveen Investments Advisers Inc. (since 2002), NWQ Investment Management Company, LLC, Symphony Asset Management, LLC (since 2003), Tradewinds Global Investors, LLC, Santa Barbara Asset Management, LLC (since 2006), Nuveen HydePark Group, LLC and Nuveen Investment Solutions, Inc. (since 2007); Vice President and Assistant Secretary of Nuveen Commodities Asset Management LLC (since 2010). | | 246 |
Trustees and Officers (Unaudited) (continued)
| | | | | | | | |
Name, Birthdate and Address | | Position(s) Held with the Funds | | Year First Elected or Appointed (1) | | Principal Occupation(s) Including other Directorships During Past 5 Years | | Number of Portfolios in Fund Complex Overseen by Trustee |
Kevin J. McCarthy 3/26/66 333 W. Wacker Drive Chicago, IL 60606 | | Vice President and Secretary | | 2007 | | Managing Director (since 2008), formerly, Vice President (2007-2008), Nuveen Investments, LLC; Managing Director (since 2008), Assistant Secretary (since 2007) and Co-General Counsel (since 2011) of Nuveen Fund Advisors, Inc.; Managing Director, Assistant Secretary and Associate General Counsel (since 2011) of Nuveen Asset Management, LLC; Managing Director (since 2008), and Assistant Secretary, Nuveen Investment Holdings, Inc.; Vice President (since 2007) and Assistant Secretary, Nuveen Investment Advisers Inc., NWQ Investment Management Company, LLC, Tradewinds Global Investors LLC, NWQ Holdings, LLC, Symphony Asset Management LLC, Santa Barbara Asset Management, LLC, Nuveen HydePark Group, LLC and Nuveen Investment Solutions, Inc. (since 2007) and of Winslow Capital Management, Inc. (since 2010); Vice President and Secretary (since 2010) of Nuveen Commodities Asset Management, LLC; prior thereto, Partner, Bell, Boyd & Lloyd LLP (1997-2007). | | 246 |
Kathleen L. Prudhomme 3/30/53 800 Nicollet Mall Minneapolis, MN 55402 | | Vice President and Assistant Secretary | | 2011 | | Managing Director, Assistant Secretary and Co-General Counsel (since 2011) of Nuveen Fund Advisors; Managing Director, Assistant Secretary and Associate General Counsel (since 2011) of Nuveen Asset Management, LLC; Managing Director and Assistant Secretary (since 2011) of Nuveen Investments, LLC; formerly, Secretary of FASF (2004-2010); Deputy General Counsel, FAF Advisors, Inc. (2004-2010). | | 246 |
Jeffrey M. Wilson 3/13/56 333 West Wacker Drive Chicago, IL 60606 | | Vice President | | 2011 | | Senior Vice President of Nuveen Investments, LLC (since 2011), formerly, Senior Vice President of FAF Advisors, Inc. (2000-2010). | | 114 |
| (1) | Trustees serve an indefinite term until his/her successor is elected or appointed. The year first elected or appointed represents the year in which the trustee was first elected or appointed to any fund in the Nuveen Fund Complex. |
| (2) | Also serves as a trustee of the Nuveen Diversified Commodity Fund, an exchange-traded commodity pool managed by Nuveen Commodities Asset Management, LLC, an affiliate of the Adviser. |
| (3) | Mr. Amboian is an interested trustee because of his position with Nuveen Investments, Inc. and certain of its subsidiaries, which are affiliates of the Nuveen Funds. |
| (4) | Officers serve one year terms through August of each year. The year first elected or appointed represents the year in which the officer was first elected or appointed to any fund in the Nuveen Fund Complex. |
Annual Investment Management Agreement Approval Process
(Unaudited)
A. Background
Prior to January 1, 2011, FAF Advisors, Inc. (“FAF”), a wholly-owned subsidiary of U.S. Bank National Association (“U.S. Bank”), served as investment adviser to the Fund pursuant to an investment advisory agreement between First American Investment Funds, Inc. (the “Company”) and FAF (the “Prior Advisory Agreement”), and as administrator to the Fund pursuant to an administrative agreement between the Company and FAF (the “Prior Administrative Agreement”). On July 29, 2010, U.S. Bank and FAF entered into a definitive agreement with Nuveen Investments, Inc. (“Nuveen”), Nuveen Asset Management (“NAM”) and certain Nuveen affiliates, whereby NAM would acquire a portion of the asset management business of FAF (the “Transaction”). The acquired business included the assets of FAF used in providing investment advisory services, research, sales and distribution in connection with equity, fixed income, real estate, global infrastructure and asset allocation investment products (other than the money market business and closed-end funds advised by FAF), including the Fund. In connection with the Transaction, the Board of Directors (the “Prior Board”) serving the Fund as directors at that time (each a “Prior Director” and, collectively, the “Prior Directors”) considered a number of proposals designed to integrate the Company’s funds (including the Fund) into the Nuveen family of funds, including the appointment of NAM as investment adviser and Nuveen Investments, LLC as distributor to the Fund. The Prior Board also considered a proposal in connection with an internal restructuring of NAM (the “Restructuring”), for Nuveen Asset Management, LLC (“NAM LLC”), a wholly-owned subsidiary of NAM formed in anticipation of the Restructuring, to serve as sub-advisor for the Fund.
The Prior Board approved a new investment advisory agreement (the “New Advisory Agreement”) for the Fund with NAM and an investment sub-advisory agreement between NAM and NAM LLC (the “NAM Sub-Advisory Agreement”). At a meeting of the Fund’s stockholders held on December 17, 2010, stockholders of the Fund approved the New Advisory Agreement and the NAM Sub-Advisory Agreement. In addition, stockholders of the Company’s funds (including the Fund) elected ten directors, including one Prior Director, to the board of directors of the Company (the “New Board”).
On December 31, 2010, the Transaction closed and the New Board (which replaced the Prior Board) took effect. On January 1, 2011, the New Advisory Agreement and the NAM Sub-Advisory Agreement became effective. In addition, in connection with the Restructuring, NAM has changed its name to Nuveen Fund Advisors, Inc. (“NFA”). The following is a summary of the considerations of the Prior Board, which were set forth in a proxy statement dated November 10, 2010 (the “Proxy Statement”), in approving the New Advisory Agreement and the NAM Sub-Advisory Agreement for the Fund.
B. Prior Board Considerations
The New Advisory Agreement for the Fund was approved by the Prior Board after consideration of all factors determined to be relevant to its deliberations, including those discussed below. The Prior Board authorized the submission of the New Advisory Agreement for consideration by the Fund’s stockholders.
At meetings held in May and June of 2010, the Prior Board was apprised of the general terms of the Transaction and, as a result, began the process of considering the transition of services from FAF to NFA. In preparation for its September 21-23, 2010 meeting, the Prior Board received, in response to a written due diligence request prepared by the Prior Board and its independent legal counsel and provided to NFA and FAF, a significant amount of information covering a range of issues in advance of the meeting. To assist the Prior Board in its consideration of the New Advisory Agreement for the Fund, NFA provided materials and information about, among other things: (1) NFA and its affiliates, including their history and organizational structure, product lines, experience in providing investment advisory, administrative and other services, and financial condition, (2) the nature, extent and quality of services to be provided under the New Advisory Agreement, (3) proposed Fund fees and expenses and comparative information relating thereto, and (4) NFA’s compliance and risk management capabilities and processes. In addition, the Prior Board was provided with a memorandum from independent legal counsel outlining the legal duties of the Prior Board under the Investment Company Act of 1940, as amended (the “1940 Act”). In response to further requests from the Prior Board and its independent legal counsel, NFA and FAF provided additional information to the Prior Board following its September 21-23 meeting.
An additional in-person meeting of the Prior Board to consider the New Advisory Agreement was held on October 7, 2010, at which the members of the Prior Board in attendance, all of whom were not considered to be “interested persons” of the Company as defined in the 1940 Act (the “Independent Prior Directors”), approved the New Advisory Agreement with NFA for the Fund.
In considering the New Advisory Agreement for the Fund, the Prior Board, advised by independent legal counsel, reviewed and analyzed the factors it deemed relevant, including: (1) the nature, quality, and extent of services to be rendered to the Fund by NFA, (2) the cost of services to be provided, including Fund expense information, and (3) whether economies of scale may be realized as the Fund grows and whether fee levels are adjusted to enable Fund investors to share in these potential economies of scale.
In considering the New Advisory Agreement, the Prior Board did not identify any particular information that was all-important or controlling, and each Prior Director may have attributed different weights to the various factors discussed below. Where appropriate, the Prior Directors evaluated all information available to them regarding the Company’s funds on a fund-by-fund basis, and their determinations were made separately with respect to each such fund (including the Fund). The Prior Directors, all of whom were Independent Prior Directors, concluded that the terms of the New Advisory Agreement and the fee rates to be paid in light of the services to be provided to the Fund are in the best interests of the Fund, and that the New Advisory Agreement should be approved
Annual Investment Management Agreement Approval Process
(Unaudited) (continued)
and recommended to stockholders for approval. In voting to approve the New Advisory Agreement with respect to the Fund, the Prior Board considered in particular the following factors:
Nature, Extent and Quality of Services. In considering approval of the New Advisory Agreement, the Prior Board considered the nature, extent and quality of services to be provided by NFA, including advisory services and administrative services. The Prior Board reviewed materials outlining, among other things, NFA’s organizational structure and business; the types of services that NFA or its affiliates are expected to provide to the Fund; the performance record of the Fund (as described in further detail below); and fund product lines offered by NFA. The Prior Board considered that affiliation with a larger fund complex and well-recognized sponsor may result in a broader distribution network, potential economies of scale with respect to other services or fees and broader shareholder services including exchange options.
With respect to personnel, the Prior Board considered information regarding retention plans for current FAF employees who would be offered employment by NFA, and the background and experience of NFA employees who would become portfolio managers as of the closing of the Transaction. The Prior Board also reviewed information regarding portfolio manager compensation arrangements to evaluate NFA’s ability to attract and retain high quality investment personnel.
In evaluating the services of NFA, the Prior Board also considered NFA’s ability to supervise the Fund’s other service providers and, given the importance of compliance, NFA’s compliance program. Among other things, the Prior Board considered the report of NFA’s chief compliance officer regarding NFA’s compliance policies and procedures.
In addition to advisory services, the Prior Board considered the quality of administrative services expected to be provided by NFA and its affiliates including product management, fund administration, oversight of service providers, shareholder services, administration of Board relations, regulatory and portfolio compliance and legal support.
The Prior Board considered that, based on representations from FAF and NFA, the Transaction would allow stockholders to continue their investment in each of the Company’s funds with the same investment objective and principal strategies. The Prior Board considered the historical investment performance of each of the Company’s funds (including the Fund) previously provided during the annual contract renewal process.
Cost of Services Provided by NFA. In evaluating the costs of the services to be provided by NFA under the New Advisory Agreement, the Prior Board received a comparison of the Fund’s annual operating expenses as of June 30, 2010 under the Prior Advisory Agreement and under the New Advisory Agreement, in each case adjusted to reflect a decrease in net assets for certain of the Company’s funds from redemptions by the U.S. Bank 401(k) Plan expected to occur prior to the closing of the Transaction. The Prior Board considered, among other things, that the advisory fee rates and other expenses would change as a result of NFA serving as investment adviser to the Fund. The Prior Board noted that the services provided by NFA under the New Advisory Agreement would include certain administrative services, which services (along with other services) were provided pursuant to the Prior Administrative Agreement and were charged separately from the advisory fee. Accordingly, the Prior Board considered that the fee rates paid under the New Advisory Agreement include bundled investment advisory and administrative fees and thus are higher than the fee rates paid under the Prior Advisory Agreement for most of the Company’s funds, but lower than the combined fee rates paid under the Prior Advisory Agreement and the Prior Administrative Agreement. The Prior Board also noted that certain administrative services provided under the Prior Administrative Agreement will not be provided under the New Advisory Agreement and will be delegated to other service providers. Similarly, certain fees paid by FAF under the Prior Administrative Agreement will not be paid by NFA under the New Advisory Agreement and will be paid directly by the Fund. However, immediately following the closing of the Transaction, the net expense ratio of each of the Company’s funds was expected to be the same or lower than the fund’s net expense ratio as of June 30, 2010, adjusted (where applicable) to reflect a decrease in net assets resulting from redemptions by the U.S. Bank 401(k) Plan expected to occur prior to the closing of the Transaction, assuming the fund’s net assets at the time of the closing of the Transaction were no lower than their adjusted June 30 level. In addition, the Prior Board noted that NFA has committed to certain undertakings to maintain current fee caps and/or to waive fees or reimburse expenses to maintain net management fees at certain levels and Nuveen has represented to the Prior Board that Nuveen and its affiliates will not take any action that imposes an “unfair burden” on the Fund as a result of the Transaction. The Board also considered that fees payable under the New Advisory Agreement include both a fund-level fee and a complex-level fee, and that schedules for the fund-level and complex-level fees contain breakpoints that are based, respectively, on fund assets and Nuveen complex-wide assets. The Board considered that breakpoints in the fund-level fee allow for the possibility that this portion of the advisory fee could decline in the future if Fund assets were to increase or increase in the future if Fund assets were to decline. The Prior Board also considered that breakpoints in the complex-level fee allow for the possibility that this portion of the advisory fee could decline in the future if complex-wide assets were to increase or increase in the future if complex-wide assets were to decline, regardless, in each case, of whether assets of a particular fund of the Company had increased or decreased.
In considering the compensation to be paid to NFA, the Prior Board also reviewed fee information regarding NFA-sponsored funds, to the extent such funds had similar investment objectives and strategies to the Company’s funds. The Prior Board reviewed information provided by NFA regarding similar funds managed by NFA and noted that the fee rates payable by these funds were generally comparable to the fee rates proposed for the Company’s funds. The Prior Board also compared proposed fee and expense information to the median fees and expenses of comparable funds, using information provided by an independent data service.
In evaluating the compensation, the Prior Board also considered other amounts expected to be paid to NFA by the Fund as well as any indirect benefits (such as soft dollar arrangements, if any) NFA and its affiliates are expected to receive, that are directly attributable to the management of the Fund.
The Prior Board also considered that the Fund would not bear any of the costs relating to the Transaction, including the costs of preparing, printing and mailing the Proxy Statement.
Economies of Scale. The Prior Board reviewed information regarding potential economies of scale or other efficiencies that might result from the Fund’s potential association with Nuveen. The Prior Board noted that the New Advisory Agreement provides for breakpoints in the Fund’s fund-level and complex-level management fee rates as the assets of the Fund and the assets held by the various registered investment companies sponsored by Nuveen increase, respectively. The Prior Board concluded that the structure of the investment management fee rates, with the breakpoints for the Fund under the New Advisory Agreement, reflected sharing of potential economies of scale with the Fund’s stockholders.
Conclusion. After deliberating in executive session, the members of the Prior Board in attendance, all of whom were Independent Prior Directors, approved the New Advisory Agreement with respect to the Fund, concluding that the New Advisory Agreement was in the best interests of the Fund.
NAM Sub-Advisory Agreement. The Prior Board also approved the NAM Sub-Advisory Agreement between NFA and NAM LLC as a result of the Restructuring expected to occur with NFA. The Prior Board considered that the services to be provided by NAM LLC under the NAM Sub-Advisory Agreement would not result in any material change in the nature or level of investment advisory services or administrative services provided to the Fund. In addition, the portfolio managers will continue to manage the Fund in their capacity as employees of NAM LLC. The Prior Board considered that NFA will pay a portion of the advisory fee it receives from the Fund to NAM LLC for its services as sub-advisor. The Prior Board concluded, based upon the conclusions that the Prior Board reached in connection with the approval of the New Advisory Agreement and after determining that it need not reconsider all of the factors that it had considered in connection with the approval of the New Advisory Agreement, to approve the NAM Sub-Advisory Agreement.
Notes
Notes
Glossary of Terms Used in this Report
Average Annual Total Return: This is a commonly used method to express an investment’s performance over a particular, usually multi-year time period. It expresses the return that would have been necessary each year to equal the investment’s actual cumulative performance (including change in NAV or offer price and reinvested dividends and capital gains distributions, if any) over the time period being considered.
The Barclays Capital Municipal Bond Index: An unmanaged index composed of a broad range of investment grade municipal bonds.
The Lipper California Municipal Debt Funds Average: Represents the average annualized total return for all reporting funds in the Lipper California Municipal Debt Fund Category. The Lipper California Municipal Debt Funds Average contained 122, 99 and 83 funds for the 1-year, 5-year and 10-years period, respectively, ended February 28, 2011.
Net Asset Value (NAV): A Fund’s NAV is the dollar value of one share in the Fund. It is calculated by subtracting the liabilities of the Fund from its total assets and then dividing the remainder by the number of shares outstanding. Fund NAVs are calculated at the end of each business day.
Pre-refundings: Pre-refundings, also known as advance refundings or refinancings, occur when an issuer sells new bonds and uses the proceeds to fund principal and interest payments of older existing bonds. This process often results in lower borrowing costs for bond issuers.
Fund Information
Fund Manager
Nuveen Fund Advisors, Inc.
333 West Wacker Drive
Chicago, IL 60606
Sub-Adviser
Nuveen Asset Management, LLC
333 West Wacker Drive
Chicago, IL 60606
Legal Counsel
Chapman and Cutler LLP
Chicago, IL
Independent Registered
Public Accounting Firm
Ernst & Young LLP
Chicago, IL
Custodian
U.S. Bank National Association
St. Paul, MN
Transfer Agent and
Shareholder Services
U.S. Bancorp Fund Services, LLC
615 East Michigan Street
Milwaukee, WI 53202
Quarterly Portfolio of Investments and Proxy Voting Information: You may obtain (i) the Fund’s quarterly portfolio of investments, (ii) information regarding how the Fund voted proxies relating to portfolio securities held during the most recent twelve-month period ended June 30, and (iii) a description of the policies and procedures that the Fund used to determine how to vote proxies relating to portfolio securities without charge, upon request, by calling Nuveen Investments at (800) 257-8787 or on Nuveen’s website at www.nuveen.com.
You may also obtain this and other Fund information directly from the Securities and Exchange Commission (SEC). The SEC may charge a copying fee for this information. Visit the SEC on-line at http://www.sec.gov or in person at the SEC’s Public Reference Room in Washington, D.C. Call the SEC at (202) 942-8090 for room hours and operation. You may also request Fund information by sending an e-mail request to publicinfo@sec.gov or by writing to the SEC’s Public Reference Section at 100 F Street NE, Washington, D.C. 20549.
The Financial Industry Regulatory Authority (FINRA) provides a Public Disclosure Program which supplies certain information regarding the disciplinary history of FINRA members and their associated persons in response to either telephone inquiries at (800) 289-9999 or written inquiries at www.finra.org. FINRA also provides an investor brochure that includes information describing the Public Disclosure Program.
Nuveen Investments:
Serving Investors For Generations
Since 1898, financial advisors and their clients have relied on Nuveen Investments to provide dependable investment solutions through continued adherence to proven, longterm investing principles. Today, we offer a range of high quality equity and fixed-income solutions designed to be integral components of a well-diversified core portfolio.
Focused on meeting investor needs.
Nuveen Investments is a global investment management firm that seeks to help secure the long-term goals of institutions and high net worth investors as well as the consultants and financial advisors who serve them. We market our growing range of specialized investment solutions under the high-quality brands of HydePark, NWQ, Nuveen Asset Management, Santa Barbara, Symphony, Tradewinds and Winslow Capital. In total, Nuveen Investments managed approximately $197 billion of assets as of December 31, 2010.
Find out how we can help you.
To learn more about how the products and services of Nuveen Investments may be able to help you meet your financial goals, talk to your financial advisor, or call us at (800) 257-8787. Please read the information provided carefully before you invest. Investors should consider the investment objective and policies, risk considerations, charges and expenses of any investment carefully. Where applicable, be sure to obtain a prospectus, which contains this and other relevant information. To obtain a prospectus, please contact your securities representative or Nuveen Investments, 333 W. Wacker Dr., Chicago, IL 60606. Please read the prospectus carefully before you invest or send money.
Learn more about Nuveen Funds at: www.nuveen.com/mf
Nuveen makes things e-simple.
It only takes a minute to sign up for e-Reports. Once enrolled, you’ll receive an e-mail as soon as your Nuveen Fund information is ready–no more waiting for delivery by regular mail. Just click on the link within the e-mail to see the report and save it on your computer if you wish.
Free e-Reports right to your e-mail!
www.investordelivery.com
If you receive your Nuveen Fund distributions and statements from your financial advisor or brokerage account.
OR
www.nuveen.com/accountaccess
If you receive your Nuveen Fund distributions and statements directly from Nuveen.
| | |
Distributed by Nuveen Investments, LLC 333 West Wacker Drive Chicago, IL 60606 www.nuveen.com | | |
MAN-FCA-0211P
ITEM 2. CODE OF ETHICS.
As of the end of the period covered by this report, the registrant has adopted a code of ethics that applies to the registrant’s principal executive officer, principal financial officer, principal accounting officer or controller, or persons performing similar functions. There were no amendments to or waivers from the code during the period covered by this report. The registrant has posted the code of ethics on its website at www.nuveen.com/mf. (To view the code, click on the Shareholder Resources drop down menu box, click on Fund Governance and then click on Code of Conduct.)
ITEM 3. AUDIT COMMITTEE FINANCIAL EXPERT.
The registrant’s Board of Directors determined that the registrant has at least one “audit committee financial expert” (as defined in Item 3 of Form N-CSR) serving on its Audit Committee. The registrant’s audit committee financial expert is Carole E. Stone, who is “independent” for purposes of Item 3 of Form N-CSR.
Ms. Stone served for five years as Director of the New York State Division of the Budget. As part of her role as Director, Ms. Stone was actively involved in overseeing the development of the State’s operating, local assistance and capital budgets, its financial plan and related documents; overseeing the development of the State’s bond-related disclosure documents and certifying that they fairly presented the State’s financial position; reviewing audits of various State and local agencies and programs; and coordinating the State’s system of internal audit and control. Prior to serving as Director, Ms Stone worked as a budget analyst/examiner with increasing levels of responsibility over a 30 year period, including approximately five years as Deputy Budget Director. Ms. Stone has also served as Chair of the New York State Racing Association Oversight Board, as Chair of the Public Authorities Control Board, as a Commissioner on the New York State Commission on Public Authority Reform and as a member of the Boards of Directors of several New York State public authorities. These positions have involved overseeing operations and finances of certain entities and assessing the adequacy of project/entity financing and financial reporting. Currently, Ms. Stone is on the Board of Directors of CBOE Holdings, Inc., of the Chicago Board Options Exchange, and of C2 Options Exchange. Ms. Stone’s position on the boards of these entities and as a member of both CBOE Holdings’ Audit Committee and its Finance Committee has involved, among other things, the oversight of audits, audit plans and preparation of financial statements.
ITEM 4. PRINCIPAL ACCOUNTANT FEES AND SERVICES.
The following tables show the amount of fees that Ernst & Young LLP, the registrant’s auditor, billed to the registrant during the registrant’s last two full fiscal years. The Audit Committee approved in advance all audit services and non-audit services that Ernst & Young LLP provided to the registrant, except for those non-audit services that were subject to the pre-approval exception under Rule 2-01 of Regulation S-X (the “pre-approval exception”). The pre-approval exception for services provided directly to the registrant waives the pre-approval requirement for services other than audit, review or attest services if: (A) the aggregate amount of all such services provided constitutes no more than 5% of the total amount of revenues paid by the registrant during the fiscal year in which the services are provided; (B) the registrant did not recognize the services as non-audit services at the time of the engagement; and (C) the services are promptly brought to the Audit Committee’s attention, and the Committee (or its delegate) approves the services before the audit is completed.
The Audit Committee has delegated certain pre-approval responsibilities to its Chairman (or, in his absence, any other member of the Audit Committee).
SERVICES THAT THE REGISTRANT’S AUDITOR BILLED TO THE REGISTRANT
| | | | | | | | | | | | | | | | |
Fiscal Year Ended February 28, 2011 | | Audit Fees Billed
to Funds 1 | | | Audit-Related Fees
Billed to Funds 2 | | | Tax Fees
Billed to Funds 3 | | | All Other Fees
Billed to Funds 4 | |
Name of Series | | | | | | | | | | | | | | | | |
California Tax Free Fund5 | | | 19,091 | | | | 0 | | | | 1,348 | | | | 0 | |
| | | | | | | | | | | | | | | | |
Total | | $ | 19,091 | | | $ | 0 | | | $ | 1,348 | | | $ | 0 | |
| 1 | | “Audit Fees” are the aggregate fees billed for professional services for the audit of the Fund’s annual financial statements and services provided in connection with statutory and regulatory filings or engagements. |
| 2 | | “Audit Related Fees” are the aggregate fees billed for assurance and related services reasonably related to the performance of the audit or review of financial statements and are not reported under “Audit Fees”. |
| 3 | | “Tax Fees” are the aggregate fees billed for professional services for tax advice, tax compliance, and tax planning. |
| 4 | | “All Other Fees” are the aggregate fees billed for products and services other than “Audit Fees”, “Audit Related Fees”, and “Tax Fees”. |
| 5 | | The fund was acquired on December 31, 2010 and changed fiscal year from June to February beginning in 2011. |
| | | | | | | | | | | | | | | | |
| | | Percentage Approved Pursuant to Pre-approval Exception | |
| | | Audit Fees Billed
to Funds | | | Audit-Related Fees
Billed to Funds | | | Tax Fees
Billed to Funds | | | All Other Fees
Billed to Funds | |
Name of Series | | | | | | | | | | | | | | | | |
California Tax Free Fund1 | | | 0 | % | | | 0 | % | | | 0 | % | | | 0 | % |
| 1 | | The fund was acquired on December 31, 2010 and changed fiscal year from June to February beginning in 2011. |
| | | | | | | | | | | | | | | | |
Fiscal Year Ended June 30, 2010 | | Audit Fees Billed
to Funds 1 | | | Audit-Related Fees
Billed to Funds 2 | | | Tax Fees
Billed to Funds 3 | | | All Other Fees
Billed to Funds 4 | |
Name of Series | | | | | | | | | | | | | | | | |
California Tax Free Fund | | | 111,074 | | | | 352 | | | | 21,941 | | | | 0 | |
| | | | | | | | | | | | | | | | |
Total | | $ | 111,074 | | | $ | 352 | | | $ | 21,941 | | | $ | 0 | |
| 1 | | “Audit Fees” are the aggregate fees billed for professional services for the audit of the Fund’s annual financial statements and services provided in connection with statutory and regulatory filings or engagements. |
| 2 | | “Audit Related Fees” are the aggregate fees billed for assurance and related services reasonably related to the performance of the audit or review of financial statements and are not reported under “Audit Fees”. |
| 3 | | “Tax Fees” are the aggregate fees billed for professional services for tax advice, tax compliance, and tax planning. |
| 4 | | “All Other Fees” are the aggregate fees billed for products and services other than “Audit Fees”, “Audit Related Fees”, and “Tax Fees”. |
| | | | | | | | | | | | | | | | |
| | | Percentage Approved Pursuant to Pre-approval Exception | |
| | | Audit Fees Billed
to Funds | | | Audit-Related Fees
Billed to Funds | | | Tax Fees
Billed to Funds | | | All Other Fees
Billed to Funds | |
Name of Series | | | | | | | | | | | | | | | | |
California Tax Free Fund | | | 0 | % | | | 0 | % | | | 0 | % | | | 0 | % |
SERVICES THAT THE REGISTRANT’S AUDITOR BILLED TO THE
ADVISER AND AFFILIATED FUND SERVICE PROVIDERS
The following tables show the amount of fees billed by Ernst & Young LLP to Nuveen Fund Advisors, Inc. (formerly Nuveen Asset Management) (the “Adviser”), and any entity controlling, controlled by or under common control with the Adviser that provides ongoing services to the registrant (“Affiliated Fund Service Provider”), for engagements directly related to the registrant’s operations and financial reporting, during the registrant’s last two full fiscal years.
| | | | | | | | | | | | |
Fiscal Year Ended February 28, 2011 | | Audit-Related Fees
Billed to Adviser and
Affiliated Fund
Service Providers | | | Tax Fees Billed to
Adviser and
Affiliated Fund
Service Providers | | | All Other Fees
Billed to Adviser
and Affiliated Fund
Service Providers | |
First American Investment Funds Inc.1 | | $ | 0 | | | $ | 0 | | | $ | 0 | |
| |
| | | Percentage Approved Pursuant to Pre-approval Exception | |
| | | Audit-Related Fees
Billed to Adviser and
Affiliated Fund
Service Providers | | | Tax Fees Billed to
Adviser and
Affiliated Fund
Service Providers | | | All Other Fees
Billed to Adviser
and Affiliated Fund
Service Providers | |
| | | 0 | % | | | 0 | % | | | 0 | % |
| | | |
Fiscal Year Ended June 30, 2010 | | Audit-Related Fees
Billed to Adviser and
Affiliated Fund
Service Providers | | | Tax Fees Billed to
Adviser and
Affiliated Fund
Service Providers | | | All Other Fees
Billed to Adviser
and Affiliated Fund
Service Providers | |
First American Investment Funds Inc. | | $ | 0 | | | $ | 0 | | | $ | 0 | |
| |
| | | Percentage Approved Pursuant to Pre-approval Exception | |
| | | Audit-Related Fees
Billed to Adviser and
Affiliated Fund
Service Providers | | | Tax Fees Billed to
Adviser and
Affiliated Fund
Service Providers | | | All Other Fees
Billed to Adviser
and Affiliated Fund
Service Providers | |
| | | 0 | % | | | 0 | % | | | 0 | % |
| 1 | | The Trust was renamed Nuveen Investment Funds, Inc. on April 4, 2011. |
The tables also show the percentage of fees subject to the pre-approval exception. The pre-approval exception for services provided to the Adviser and any Affiliated Fund Service Provider (other than audit, review or attest services) waives the pre-approval requirement if: (A) the aggregate amount of all such services provided constitutes no more than 5% of the total amount of revenues paid to Ernst & Young LLP by the registrant, the Adviser and Affiliated Fund Service Providers during the fiscal year in which the services are provided that would have to be pre-approved by the Audit Committee; (B) the registrant did not recognize the services as non-audit services at the time of the engagement; and (C) the services are promptly brought to the Audit Committee’s attention, and the Committee (or its delegate) approves the services before the registrant’s audit is completed.
NON-AUDIT SERVICES
| | | | | | | | | | | | | | | | |
Fiscal Year Ended February 28, 2011 | | Total Non-Audit Fees
Billed to Registrant | | | Total Non-Audit Fees
billed to Adviser and
Affiliated Fund Service
Providers (engagements
related directly to the
operations and financial
reporting of the Registrant) | | | Total Non-Audit Fees
billed to Adviser and
Affiliated Fund Service
Providers (all other
engagements) | | | Total | |
Name of Series | | | | | | | | | | | | | | | | |
California Tax Free Fund1 | | | 1,348 | | | | 0 | | | | 0 | | | | 1,348 | |
| | | | | | | | | | | | | | | | |
Total | | $ | 1,348 | | | $ | 0 | | | $ | 0 | | | $ | 1,348 | |
“Non-Audit Fees Billed to Registrant” represent “Tax Fees” and “All Other Fees” billed to each Fund in their respective amounts from the previous table.
| 1 | | The fund was acquired on December 31, 2010 and changed fiscal year from June to February beginning in 2011. |
| | | | | | | | | | | | | | | | |
Fiscal Year Ended June 30, 2010 | | Total Non-Audit Fees
Billed to Registrant | | | Total Non-Audit Fees
billed to Adviser and
Affiliated Fund Service
Providers (engagements
related directly to the
operations and financial
reporting of the Registrant) | | | Total Non-Audit Fees
billed to Adviser and
Affiliated Fund Service
Providers (all other
engagements) | | | Total | |
Name of Series | | | | | | | | | | | | | | | | |
California Tax Free Fund | | | 21,941 | | | | 0 | | | | 0 | | | | 21,941 | |
| | | | | | | | | | | | | | | | |
Total | | $ | 21,941 | | | $ | 0 | | | $ | 0 | | | $ | 21,941 | |
“Non-Audit Fees Billed to Registrant” represent “Tax Fees” and “All Other Fees” billed to each Fund in their respective amounts from the previous table.
Audit Committee Pre-Approval Policies and Procedures. Generally, the Audit Committee must approve (i) all non-audit services to be performed for the registrant by the registrant’s independent accountants and (ii) all audit and non-audit services to be performed by the registrant’s independent accountants for the Affiliated Fund Service Providers with respect to the operations and financial reporting of the registrant. Regarding tax and research projects conducted by the independent accountants for the registrant and Affiliated Fund Service Providers (with respect to operations and financial reports of the registrant), such engagements will be (i) pre-approved by the Audit Committee if they are expected to be for amounts greater than $10,000; (ii) reported to the Audit Committee Chairman for his verbal approval prior to engagement if they are expected to be for amounts under $10,000 but greater than $5,000; and (iii) reported to the Audit Committee at the next Audit Committee meeting if they are expected to be for an amount under $5,000.
ITEM 5. AUDIT COMMITTEE OF LISTED REGISTRANTS
Not applicable to this registrant.
ITEM 6. SCHEDULE OF INVESTMENTS
| a) | | See Portfolio of Investments in Item 1 |
ITEM 7. DISCLOSURE OF PROXY VOTING POLICIES AND PROCEDURES FOR CLOSED-END
MANAGEMENT INVESTMENT COMPANIES
Not applicable to this registrant.
ITEM 8. PORTFOLIO MANAGERS OF CLOSED-END MANAGEMENT INVESTMENT COMPANIES
Not applicable to this registrant.
ITEM 9. PURCHASES OF EQUITY SECURITIES BY CLOSED-END MANAGEMENT INVESTMENT COMPANY AND AFFILIATED PURCHASERS
Not applicable to this registrant.
ITEM 10. SUBMISSION OF MATTERS TO A VOTE OF SECURITY HOLDERS
Shareholders who wish to recommend nominees for election to the registrant’s Board of Directors should send suggestions in writing to Lorna Ferguson, Manager of Fund Board Relations, Nuveen Investments, 333 West Wacker Drive, Chicago, IL 60606. This information must include evidence of Fund ownership of the person or entity recommending the candidate, a full listing of the proposed candidate’s education, experience, current employment, date of birth, names and addresses of at least three professional references, information as to whether the candidate is an “interested person” (as such term is defined in the Investment Company Act of 1940, as amended) in relation to the Fund and such other information that would be helpful to the nominating and governance committee in evaluating the candidate. All satisfactorily completed information regarding candidates will be forwarded to the chairman of the nominating and governance committee and the outside counsel to the Independent Board Members. Recommendations for candidates to the Board will be evaluated in light of whether the number of Board members is expected to change and whether the Board expects any vacancies. All nominations from Fund shareholders will be acknowledged, although there may be times when the committee is not actively recruiting new Board members. In those circumstances nominations will be kept on file until active recruitment is under way.
ITEM 11. CONTROLS AND PROCEDURES.
| | (a) | | The registrant’s principal executive and principal financial officers, or persons performing similar functions, have concluded that the registrant’s disclosure controls and procedures (as defined in Rule 30a-3(c) under the Investment Company Act of 1940, as amended (the “1940 Act”) (17 CFR 270.30a-3(c))) are effective, as of a date within 90 days of the filing date of this report that includes the disclosure required by this paragraph, based on their evaluation of the controls and procedures required by Rule 30a-3(b) under the 1940 Act (17 CFR 270.30a-3(b)) and Rules 13a-15(b) or 15d-15(b) under the Securities Exchange Act of 1934, as amended (the “Exchange Act”) (17 CFR 240.13a-15(b) or 240.15d-15(b)). |
| | (b) | | There were no changes in the registrant’s internal control over financial reporting (as defined in Rule 30a-3(d) under the 1940 Act (17 CFR 270.30a-3(d)) that occurred during the second fiscal quarter of the period covered by this report that has materially affected, or is reasonably likely to materially affect, the registrant’s internal control over financial reporting. |
ITEM 12. EXHIBITS
File the exhibits listed below as part of this Form.
| | |
| (a)(1) | | Any code of ethics, or amendment thereto, that is the subject of the disclosure required by Item 2, to the extent that the registrant intends to satisfy the Item 2 requirements through filing of an exhibit: Not applicable because the code is posted on registrant’s website at www.nuveen.com/mf and there were no amendments during the period covered by this report. (To view the code, click on the Shareholder Resources drop down menu box, click on Fund Governance and then Code of Conduct.) |
| |
| (a)(2) | | A separate certification for each principal executive officer and principal financial officer of the registrant as required by
Rule 30a-2(a) under the 1940 Act (17 CFR 270.30a-2(a)) in the exact form set forth below: See EX-99.CERT attached hereto. |
| |
| (a)(3) | | Any written solicitation to purchase securities under Rule 23c-1 under the 1940 Act (17 CFR 270.23c-1) sent or given during the period covered by the report by or on behalf of the registrant to 10 or more persons: Not applicable to this registrant. |
| |
| (b) | | If the report is filed under Section 13(a) or 15(d) of the Exchange Act, provide the certifications required by Rule 30a-2(b) under the 1940 Act (17 CFR 270.30a-2(b)), Rule 13a-14(b) or Rule 15d-14(b) under the Exchange Act (17 CFR 240.13a-14(b) or 240.15d-14(b)), and Section 1350 of Chapter 63 of Title 18 of the United States Code (18 U.S.C. 1350) as an Exhibit. A certification furnished pursuant to this paragraph will not be deemed “filed” for purposes of Section 18 of the Exchange Act (15 U.S.C. 78r), or otherwise subject to the liability of that section. Such certification will not be deemed to be incorporated by reference into any filing under the Securities Act of 1933 or the Exchange Act, except to the extent that the registration specifically incorporates it by reference: See EX-99.906 CERT attached hereto. |
SIGNATURES
Pursuant to the requirements of the Securities Exchange Act of 1934 and the Investment Company Act of 1940, the registrant has duly caused this report to be signed on its behalf by the undersigned, thereunto duly authorized.
(Registrant) Nuveen Investment Funds, Inc.
| | |
| |
By (Signature and Title) | | /s/ Kevin J. McCarthy |
| | Kevin J. McCarthy |
| | Vice President and Secretary |
Date May 6, 2011
Pursuant to the requirements of the Securities Exchange Act of 1934 and the Investment Company Act of 1940, this report has been signed below by the following persons on behalf of the registrant and in the capacities and on the dates indicated.
| | |
| |
By (Signature and Title) | | /s/ Gifford R. Zimmerman |
| | Gifford R. Zimmerman |
| | Chief Administrative Officer |
| | (principal executive officer) |
Date May 6, 2011
| | |
| |
| By (Signature and Title) | | /s/ Stephen D. Foy |
| | Stephen D. Foy |
| | Vice President and Controller |
| | (principal financial officer) |
Date May 6, 2011