UNITED STATES
SECURITIES AND EXCHANGE COMMISSION
Washington, D.C. 20549
FORM N-CSR/A
CERTIFIED SHAREHOLDER REPORT OF REGISTERED MANAGEMENT
INVESTMENT COMPANIES
Investment Company Act file number 811-05309
Nuveen Investment Funds, Inc.
(Exact name of registrant as specified in charter)
Nuveen Investments
333 West Wacker Drive, Chicago, IL 60606
(Address of principal executive offices) (Zip code)
Kevin J. McCarthy
Nuveen Investments
333 West Wacker Drive
Chicago, IL 60606
(Name and address of agent for service)
Registrant’s telephone number, including area code: (312) 917-7700
Date of fiscal year end: May 31
Date of reporting period: May 31, 2011
Form N-CSR is to be used by management investment companies to file reports with the Commission not later than 10 days after the transmission to stockholders of any report that is required to be transmitted to stockholders under Rule 30e-1 under the Investment Company Act of 1940 (17 CFR 270.30e-1). The Commission may use the information provided on Form N-CSR in its regulatory, disclosure review, inspection, and policy making roles.
A registrant is required to disclose the information specified by Form N-CSR, and the Commission will make this information public. A registrant is not required to respond to the collection of information contained in Form N-CSR unless the Form displays a currently valid Office of Management and Budget (“OMB”) control number. Please direct comments concerning the accuracy of the information collection burden estimate and any suggestions for reducing the burden to Secretary, Securities and Exchange Commission, 450 Fifth Street, NW, Washington, DC 20549-0609. The OMB has reviewed this collection of information under the clearance requirements of 44 U.S.C. ss.3507.
ITEM 1. REPORTS TO STOCKHOLDERS.

Mutual Funds
Nuveen Municipal Bond Funds
(formerly First American Tax Free Income Funds)
Dependable, tax-free income because it’s not what you earn, it’s what you keep.®
Annual Report
May 31, 2011
| | | | | | | | |
| | | Share Class / Ticker Symbol |
| Fund Name | | Class A | | Class C | | Class C1 | | Class I |
Nuveen Colorado Tax Free Fund | | FCOAX | | — | | FCCOX | | FCOYX |
Nuveen Minnesota Intermediate Municipal Bond Fund | | FAMAX | | NIBMX | | FACMX | | FAMTX |
Nuveen Minnesota Municipal Bond Fund | | FJMNX | | NMBCX | | FCMNX | | FYMNX |
Nuveen Missouri Tax Free Fund | | ARMOX | | — | | FFMCX | | ARMIX |
Nuveen Nebraska Municipal Bond Fund | | FNTAX | | NCNBX | | FNTCX | | FNTYX |
Nuveen Ohio Tax Free Fund | | FOFAX | | — | | FOTCX | | FOTYX |
Nuveen Oregon Intermediate Municipal Bond Fund | | FOTAX | | NIMOX | | — | | FORCX |
INVESTMENT ADVISER NAME CHANGE
Effective January 1, 2011, Nuveen Asset Management, the Funds’ investment adviser, changed its name to Nuveen Fund Advisors, Inc. (“Nuveen Fund Advisors”). Concurrently, Nuveen Fund Advisors formed a wholly-owned subsidiary, Nuveen Asset Management, LLC, to house its portfolio management capabilities.
NUVEEN INVESTMENTS COMPLETES STRATEGIC COMBINATION WITH FAF ADVISORS
On December 31, 2010, Nuveen Investments completed the strategic combination between Nuveen Asset Management, the largest investment affiliate of Nuveen Investments, and FAF Advisors. As part of this transaction, U.S. Bancorp — the parent of FAF Advisors — received cash consideration and a 9.5% stake in Nuveen Investments in exchange for the long-term investment business of FAF Advisors, including investment-management responsibilities for the non-money market mutual funds of the First American Funds family.
The approximately $27 billion of mutual fund and institutional assets managed by FAF Advisors, along with the investment professionals managing these assets and other key personnel, have become part of Nuveen Asset Management, LLC. With these additions to Nuveen Asset Management, LLC, this affiliate now manages more than $100 billion of assets across a broad range of strategies from municipal and taxable fixed income to traditional and specialized equity investments.
This combination does not affect the investment objectives or strategies of the Funds in this report. Over time, Nuveen Investments expects that the combination will provide even more ways to meet the needs of investors who work with financial advisors and consultants by enhancing the multi-boutique model of Nuveen Investments, which also includes highly respected investment teams at HydePark, NWQ Investment Management, Santa Barbara Asset Management, Symphony Asset Management, Tradewinds Global Investors and Winslow Capital. Nuveen Investments managed approximately $206 billion of assets as of March 31, 2011.
| | | | | | |
| Must be preceded by or accompanied by a prospectus. | | NOT FDIC INSURED | | MAY LOSE VALUE | | NO BANK GUARANTEE |
Table of Contents
Chairman’s
Letter to Shareholders

Dear Shareholders,
In 2010, the global economy recorded another year of recovery from the financial and economic crises of 2008, but many of the factors that caused the downturn still weigh on the prospects for continued improvement. In the U.S., ongoing weakness in housing values has put pressure on homeowners and mortgage lenders. Similarly, the strong earnings recovery for corporations and banks is only slowly being translated into increased hiring or more active lending. Globally, deleveraging by private and public borrowers has inhibited economic growth and that process is far from complete.
Encouragingly, constructive actions are being taken by governments around the world to deal with economic issues. In the U.S., the recent passage of a stimulatory tax bill relieved some of the pressure on the Federal Reserve to promote economic expansion through quantitative easing and offers the promise of sustained economic growth. A number of European governments are undertaking programs that could significantly reduce their budget deficits. Governments across the emerging markets are implementing various steps to deal with global capital flows without undermining international trade and investment.
The success of these government actions could determine whether 2011 brings further economic recovery and financial market progress. One risk associated with the extraordinary efforts to strengthen U.S. economic growth is that the debt of the U.S. government will continue to grow to unprecedented levels. Another risk is that over time there could be inflationary pressures on asset values in the U.S. and abroad, because what happens in the U.S. impacts the rest of the world economy. Also, these various actions are being taken in a setting of heightened global economic uncertainty, primarily about the supplies of energy and other critical commodities. In this challenging environment, your Nuveen investment team continues to seek sustainable investment opportunities and to remain alert to potential risks in a recovery still facing many headwinds. On your behalf, we monitor their activities to assure they maintain their investment disciplines.
As you will note elsewhere in this report, on December 31, 2010, Nuveen Investments completed a strategic combination with FAF Advisors, Inc., the manager of the First American Funds. The combination adds highly respected and distinct investment teams to meet the needs of investors and their advisors and is designed to benefit all fund shareholders by creating a fund organization with the potential for further economies of scale and the ability to draw from even greater talent and expertise to meet those investor needs.
As always, I encourage you to contact your financial consultant if you have any questions about your investment in a Nuveen Fund. On behalf of the other members of your Fund Board, we look forward to continuing to earn your trust in the months and years ahead.
Sincerely,

Robert P. Bremner
Chairman of the Board
July 21, 2011
Portfolio Managers’ Comments
Certain statements in this report are forward-looking statements. Discussions of specific investments are for illustration only and are not intended as recommendations of individual investments. The forward-looking statements and other views expressed herein are those of the portfolio managers as of the date of this report. Actual future results or occurrences may differ significantly from those anticipated in any forward-looking statements and the views expressed herein are subject to change at any time, due to numerous market and other factors. The Funds disclaim any obligation to update publicly or revise any forward-looking statements or views expressed herein.
Any reference to credit ratings for portfolio holdings denotes the highest rating assigned by a Nationally Recognized Statistical Rating Organization (NRSRO) such as Standard & Poor’s (S&P), Moody’s or Fitch. AAA, AA, A and BBB ratings are investment grade; BB, B, CCC, CC, C and D ratings are below investment grade. Holdings and ratings may change over time.
Nuveen Colorado Tax Free Fund
(formerly known as First American Colorado Tax Free Fund)
Nuveen Minnesota Intermediate Municipal Bond Fund
(formerly known as First American Minnesota Intermediate Tax Free Fund)
Nuveen Minnesota Municipal Bond Fund
(formerly known as First American Minnesota Tax Free Fund)
Nuveen Missouri Tax Free Fund
(formerly known as First American Missouri Tax Free Fund)
Nuveen Nebraska Municipal Bond Fund
(formerly known as First American Nebraska Tax Free Fund)
Nuveen Ohio Tax Free Fund
(formerly known as First American Ohio Tax Free Fund)
Nuveen Oregon Intermediate Municipal Bond Fund
(formerly known as First American Oregon Intermediate Tax Free Fund)
These Funds feature portfolio management by Nuveen Asset Management, LLC, an affiliate of Nuveen Investments. Recently, the Nuveen Colorado Tax Free Fund, the Nuveen Minnesota Intermediate Municipal Bond Fund, the Nuveen Minnesota Municipal Bond Fund, the Nuveen Missouri Tax Free Fund, the Nuveen Nebraska Municipal Bond Fund, the Nuveen Ohio Tax Free Fund and the Nuveen Oregon Intermediate Municipal Bond Fund changed their fiscal year ends to May 31 from June 30. As a result, this annual report covers an eleven-month period.
Here portfolio managers Daniel Close, Christopher Drahn, Michael Hamilton and Douglas White examine economic and municipal market conditions, key investment strategies and the Funds’ performance during the eleven months ending May 31, 2011.
Daniel Close, CFA, who has 13 years of investment experience, assumed portfolio management responsibility for the Nuveen Ohio Tax Free Fund in January 2011. Michael Hamilton and Christopher Drahn are no longer co-managers of the Fund.
Christopher Drahn, CFA, with 31 years of investment experience, assumed sole portfolio management responsibility for the Nuveen Colorado Tax Free Fund, the Nuveen Minnesota Intermediate Municipal Bond Fund and the Nuveen Missouri Tax Free Fund in January 2011. Michael Welle is no longer a co-manager of the Nuveen Colorado Tax Free Fund, while Douglas White is no longer a co-manager for the Nuveen Minnesota Intermediate Municipal Bond Fund and the Nuveen Missouri Tax Free Fund.
Michael Hamilton, who has 22 years of investment experience, assumed sole portfolio management responsibility for the Nuveen Oregon Intermediate Municipal Bond Fund in January 2011. Christopher Drahn is no longer a co-manager of the Fund.
Douglas White, CFA, with 28 years of investment experience, assumed sole portfolio management responsibility for the Nuveen Minnesota Municipal Bond Fund and the Nuveen Nebraska Municipal Bond Fund in January 2011. Michael Welle and Christopher Drahn are no longer co-managers of the Funds.
What factors affected the U.S. economic and municipal market environments during the eleven-month reporting period ended May 31, 2011?
During this period, the U.S. economy demonstrated some signs of modest improvement, supported by the efforts of both the Federal Reserve (Fed) and the federal government. For its part, the Fed continued to hold the benchmark fed funds rate in a target range of zero to 0.25% since cutting it to this record low level in December 2008. At its June 2011 meeting (following the end of this reporting period), the central bank stated that it anticipated keeping the fed funds rate at “exceptionally low levels” for an “extended period.” The Fed also completed its second round of quantitative easing with the purchase of $600 billion in longer-term U.S. Treasury bonds. The goal of this plan was to lower long-term interest rates and thereby stimulate economic activity and create jobs. The federal government continued to focus on implementing the economic stimulus package passed in early 2009 and aimed at providing job creation, tax relief, fiscal assistance to state and local governments, and expansion of unemployment benefits and other federal social welfare programs.
In the first quarter of 2011, the U.S. economy, as measured by the U.S. gross domestic product (GDP), grew at an annualized rate of 1.9%, marking the seventh consecutive quarter of positive growth. The employment situation slowly improved, with the national jobless rate registering 9.1% in May 2011, down from 9.6% a year earlier. While the Fed’s longer-term inflation expectations remained stable, inflation over this period posted its largest twelve-month gain since October 2008, as the Consumer Price Index (CPI) rose 3.6% year-over-year as of May 2011. The core CPI (which excludes food and energy) increased 1.5%, staying within the Fed’s unofficial objective of 2.0% or lower for this measure. The housing market remained a major weak spot in the economy. For the twelve months ended April 2011 (most recent data available at the time this report was prepared), the average home price in the Standard & Poor’s (S&P)/Case-Shiller Index of 20 major metropolitan areas lost 4.0%, with six of the 20 metropolitan areas hitting their lowest levels since housing prices peaked in 2006.
The municipal bond market was affected by a significant decline in new tax-exempt issuance during this period. One reason for the decrease in new tax-exempt supply was the heavy issuance of taxable municipal debt in 2010 under the Build America Bond (BAB) program, which was created as part of the American Recovery and Reinvestment Act of February 2009 and expired on December 31, 2010. Between the beginning of this reporting period on June 1, 2010, and the end of the BAB program, taxable Build America Bond issuance totaled $74.5 billion, accounting for 28% of new bonds issued in the municipal market.
After rallying strongly during the first part of the period, the municipal market suffered a reversal in mid-November 2010, due largely to investor concerns about inflation, the federal deficit, and the deficit’s impact on demand for U.S. Treasury securities. Adding to this market pressure was media coverage of the strained finances of some state and local governments. As a result, money began to flow out of municipal mutual funds as yields rose and valuations declined. As we moved into the second quarter of 2011, we saw the environment in the municipal market improve.
Over the eleven months ended May 31, 2011, municipal bond issuance nationwide — both tax-exempt and taxable — totaled $315.5 billion. For the first five months of 2011, municipal issuance nationwide was down 50% from the first five months of 2010. This decline reflects the heavy issuance of BABs at the end of 2010, as borrowers took advantage of the program’s favorable terms before its expiration at year end.
Yields generally rose across the curve in the last half of 2010, but then reversed course and declined in the first five months of 2011. The municipal yield curve steepened with yields on 15-year and longer maturity bonds showing a net rise for the overall period. Rates generally fell for short- and intermediate-term bonds that had maturities of ten years or less. For the period, total returns were generally positive for municipal bond maturities across the yield curve; however, intermediate bonds with maturities between five and ten years were the best-performing segment during the time frame.
Colorado
Colorado’s unemployment rate was 8.7% at the end of the reporting period, slightly better than the national average of 9.1%. Recently, job growth in Colorado has started to accelerate, ranking in the nation’s second quintile — this growth is driven by the professional services, health care and leisure/hospitality industries. In the Denver area, major projects such as the redevelopment of the former Fitzsimons Army Base and the construction of the FasTracks public transportation project are underway. Despite these positive growth characteristics, Colorado faces challenges resulting from the recession. However, Colorado’s near-term difficulties are moderate compared to those of other states, and it has demonstrated a proactive approach to addressing fiscal concerns, especially over the past few challenging years. At the end of the fiscal period, Colorado held credit ratings of Aa2 and AA- from Moody’s and S&P, respectively, on its long-term appropriation-backed obligations. The state’s constitution prohibits the state from issuing long-term general obligation (GO) debt. During the reporting period, Colorado issued $6.9 billion in municipal bonds, nearly matching the level seen in the prior twelve-month period, as compared to a 15.1% drop in national issuance.
Minnesota
Although the recovery in Minnesota’s economy stumbled somewhat at the end of 2010, it still continued to be stronger than the United States overall as unemployment figures have been lower than the national average and job growth has been above average. The state’s unemployment rate of approximately 6.4% is significantly below the national average of
9.1%. Minnesota’s current biennial budget for the 2010 and 2011 fiscal years ended on June 30, 2011 (after the close of this reporting period). State government was forced to partially shut down for nearly three weeks as newly elected Democratic governor Mark Dayton and the Republican-controlled legislature could not agree over how to close a $1.3 billion budget gap. On July 20 the governor and legislature finally agreed to a two-year $35.7 billion budget which defers $700 million in school spending into the next biennium and calls for issuing approximately $600 million in bonds secured by revenues from the 1998 tobacco companies lawsuit settlement. Although the shutdown was somewhat out of the ordinary, the magnitude of the gap was still modest compared to the deficits many other states had to close. In addition, Minnesota is still regarded as having a good fiscal track record, a diversified economy, and above-average wealth levels.
Much of the municipal bond issuance that took place in 2010 was in intermediate maturity securities as many Minnesota borrowers used the Build America Bond (BAB) program to issue longer maturities, directing supply into the taxable marketplace. This made the availability of longer maturity, tax-exempt bonds quite limited in the state. For the first five months of 2011, state issuance was down nearly 20% versus the same period last year compared to a 50% decline in issuance at the national level. At period end, Minnesota held credit ratings of Aa1 from Moody’s and AAA from Standard & Poor’s, respectively. The state’s credit position reflected its well-balanced and diverse economy, above-average wealth levels, moderate debt burden and strong debt management balanced by recent fiscal strains caused by below-budget income and sales tax revenues.
Missouri
For 2010, Missouri posted GDP growth of 1.4%, compared with the national measure of 2.6%, which ranked Missouri 39th in percentage GDP growth by state. Although this represented a significant turnaround from 2009, when Missouri’s economy contracted 3.8%, the state’s heavy reliance on the manufacturing sector has hampered its ability to more fully participate in recovery. In May 2011, the jobless rate in Missouri was 8.9%, its lowest level since March 2009, down from 9.5% in May 2010. In May 2011, the Missouri legislature approved a $23.2 billion state budget for fiscal 2012 that cut funding for colleges and universities by 5.5% and held basic aid for K-12 education flat. As of May 2011, Moody’s and S&P rated Missouri general obligation debt at Aaa and AAA, respectively, with stable outlooks. During the twelve months ended May 31, 2011, municipal issuance in Missouri was down 28% from the previous twelve-month period, to $4.6 billion.
Nebraska
Nebraska’s economic recovery remained ahead of much of the nation as the impact from the recent recession was less severe. Throughout the downturn, unemployment in the state has remained far below the national average, while job growth finally appears to be gaining some traction after giving back some gains in 2010. In fact, job additions within education, health care and professional services have outweighed some job losses for
goods producers. As of May 2011, Nebraska’s unemployment rate fell to 4.1%, which is well below the national average of 9.1%.
The state has a high dependence on the agriculture and food processing industries, which are benefiting from the recent trend toward higher food costs. Nebraska is one of the top five exporters of corn and soybeans in the United States and futures prices for both crops are up significantly from a year ago. In fact, prices are nearing or surpassing their 2008 highs. Not only will higher prices benefit farmers and food producers, but the effects should spill over to the manufacturing and retail sectors as well. Nebraska is also gaining ground as a transportation hub for the country, which is resulting in higher wages in rail and trucking transportation than the U.S. average.
During the first five months of 2011, Nebraska’s municipal bond issuance was down 31% from the same period last year, compared to a 50% decrease at the national level. The decline in issuance made the availability of longer maturity, tax-exempt bonds quite limited in the state. At period end, Nebraska held credit ratings of Aa2 from Moody’s and AAA from Standard & Poor’s.
Ohio
Ohio’s economy continued to slowly improve with its job market finally turning the corner in 2011 after giving up many of its gains in 2010. The state’s unemployment rate in May 2011 was 8.6%, which was slightly below the national average of 9.1%. This is down from its peak of 10.6% at the beginning of 2010. However, Ohio’s housing market continues to weigh on the state due to a high inventory of foreclosed properties on the market, particularly in the larger metropolitan areas of Cincinnati, Dayton and Toledo. While the housing price decline in Ohio has been less severe than the nation overall, prices are likely to fall further before bottoming out this year. Ohio’s economy is widely diversified, but the manufacturing sector still accounts for more than 12% of the jobs in the state versus the national average of approximately 9%. Although this sector benefited from inventory replenishing early in the recovery, that trend has since waned. Also, the higher commodity prices experienced recently have put pressure on the state’s manufacturers in terms of both raw material and production costs. As manufacturing jobs continue to decline, job growth in other areas such as education and health services have not been able to completely offset the trend.
Over the past few years, Ohio’s structurally unbalanced operations have completely exhausted its Budget Stabilization Fund and drawn down its General Fund reserves, reducing the state’s ability to address future budget shortfalls. The current budget contains considerable funding cuts for local governments, universities, schools and nursing homes in an effort to close an estimated $6 billion shortfall over the next two years.
The state issued approximately $12.8 billion in new municipal bonds during the year ending May 31, 2011, which is a 14% year-over-year increase, compared to a 15% decrease in issuance nationwide. However, Ohio’s year-to-date issuance through May 2011 is down dramatically, nearly 70% lower than the same five-month period a year ago. Toward the end of the fiscal period, Moody’s and Standard & Poor’s reaffirmed Ohio’s credit ratings of Aa1 and AA+, respectively.
Oregon
Oregon’s economic recovery finally appeared to be gaining some momentum as the state makes a transition away from its agricultural and natural resources focus and more toward technology. In October, Intel announced a $6 billion investment to build a new research and development plant in Portland, which should help bolster the state’s economy. The state’s unemployment rate has steadily improved since it peaked as the second highest level in the nation in June 2009. As of May 2011, Oregon’s unemployment rate stood at 9.3%, slightly above the national average.
Oregon has shown strong budgetary controls as the state was able to close an estimated $3.8 billion budget gap with its current $13 billion two-year budget that ends this year. In February, the Governor released his proposed 2011-2013 biennium budget of $14.55 billion that addresses another $3.5 billion gap due to the loss of federal stimulus money and increases to service expenses. The budget deals with the shortfall through cuts to K-12 funding, limits to state worker’s wages, and reductions in human services and juvenile corrections. In Oregon, personal income taxes make up a substantial percentage of the state’s revenues and the recent recession caused a dramatic 18.4% reduction in this income source from its high in fiscal year 2008. Also, with Oregon employing a higher percentage of government workers than the national average, any budget solutions that result in state and local government layoffs or furloughs will impact the economy to a greater degree than other states.
Approximately $3.8 billion in Oregon municipal bonds were issued during 2010, an 11.8% decline from the previous year, compared to a 5.8% increase in issuance nationwide. For the first five months of 2011, state issuance is down another 30.5% compared to a 50% decrease at the national level. In March 2011, Standard & Poor’s raised the state’s credit rating from AA to AA+, which also raised state agencies and related debt one notch. Oregon holds a credit rating of Aa1 from Moody’s.
How did the Funds perform during the eleven-month period ended May 31, 2011?
The tables in the Fund Performance and Expense Ratios section of this report provide total return performance information for the eleven-month, one-year, five-year, ten-year and since inception periods ending May 31, 2011. Each Fund’s Class A Share total returns are compared with the performance of the appropriate Barclays Capital municipal bond index and Lipper peer fund average.
What strategies were used to manage the Funds during the eleven-month reporting period? How did these strategies influence performance?
All of the Funds continued to employ the same fundamental investment strategies and tactics used in previous years, although our ability to implement those strategies depended on the individual characteristics of the portfolios, as well as market conditions within each state. Going into the reporting period, we were generally comfortable with the Funds’ positionings and saw little need to make large-scale shifts to the Funds’ weightings.
Nuveen Colorado Tax Free Fund
The Fund’s Class A Shares at net asset value (NAV) outpaced both the Lipper Colorado Municipal Debt Funds Average and the Barclays Capital Municipal Bond Index for the eleven-month period.
As in all types of market environments, our ongoing focus continued to be on using fundamental credit research to find attractively valued bonds backed by financially solid issuers. Fund results generally benefited from a slight emphasis on intermediate maturities in the mid to lower credit rating categories for much of the period. Although longer maturity, lower rated bonds were the worst performers overall for the period, they did rebound in 2011. Performance also benefited from several purchases made in the second half of the period. Given the rise in yields and the steepness of the yield curve, we decided to position the Fund more aggressively from a maturity standpoint by buying a number of longer bonds in 2011. This served to maintain the Fund’s duration, or sensitivity to interest-rate movements, modestly longer than its Barclays Capital index. To fund these purchases, we used the proceeds from the tactical sales of several bonds and a few called bonds.
Performance was also aided by a number of these tactical sales during the period, which we typically make in the Fund as opportunities arise. With these tactical trades, we sell holdings that are relatively fully priced and replace them with bonds that we believe have more attractive long-term value. These tactical sales usually take place when demand is high or particularly focused on specific structures or characteristics. Additionally, the Fund’s performance benefited from several special situations where bonds were pre-refunded or called during the period. As an example, a number of non-rated, Colorado private school bonds trading at a discount were called. The bonds were issued by the Colorado Educational and Cultural Facilities Authority for the Front Range Christian School.
The purchases we made for the Fund were fairly diversified across the investment-grade spectrum, except for AAA-rated bonds which are typically scarce in Colorado. Due to the limited supply in 2010, we bought a small number of out-of-state bonds. We sold those positions before the end of the fiscal year, ending with more than 99% of the Fund’s portfolio in Colorado-exempt bonds as we were able to add longer maturity bonds from a variety of Colorado issuers and sectors. For example, we added school district general obligation (GO) bonds rated Aa2/AA- from Mapleton School District in Adams County during the period. Additionally, we purchased Twin Peaks Charter Academy bonds rated BBB- from the Colorado Educational and Cultural Facilities Authority. We also found several attractive opportunities in investment-grade, tax-backed metropolitan district bonds, which are used to finance real-estate development projects. They typically have a lower credit quality rating than a bond issued by a more established city or county. An example here was the purchase of an insured GO bond from the Park Creek Metropolitan District. As a result of the purchases, the Fund ended the period positioned with an underweight in one- to five-year bonds, a fairly neutral position in five- to 20-year maturities and a slight overweight in bonds longer than 20 years. As has historically been the case, we continued to overweight the health care sector, particularly hospitals, and the education sector, including both charter schools and higher education bonds.
Nuveen Minnesota Intermediate Municipal Bond Fund
The Fund’s Class A Shares at net asset value (NAV) outpaced both the Lipper Intermediate Municipal Debt Funds Average and the Barclays Capital 1-15 Year Blend Municipal Bond Index for the eleven-month period.
The Fund’s performance benefited from its overweight position in bonds with intermediate maturities, as this was the best-performing segment of the yield curve during the period. We generally laddered the Fund’s holdings out to 15 years, with a modest overweight in the seven- to ten-year part of the yield curve and a slight underweight in two- to five- year bonds. In comparison, the Barclays Capital 1-15 Year Blend Municipal Bond Index is comprised of bonds with maturities spread out fairly evenly between one and seventeen years. We believe the Fund also benefited from both security selection and the general outperformance of Minnesota bonds versus the rest of the country. Minnesota is one of the higher rated states and has lately been one of the stronger performers as the market’s perception of its credit risk is low.
In terms of credit quality, the Fund’s performance in rating segments ranging from AA to BBB was positive overall during the period. However, the Fund’s overweighting in non-rated securities slightly hindered performance as this segment fell short of the broader Minnesota market.
Performance was also aided by a number of tactical sales during the period, which we typically make in the Fund as opportunities arise. With these tactical trades, we sell holdings that are relatively fully priced and replace them with bonds that we believe have more attractive long-term value. These tactical sales usually take place when demand is high or particularly focused on specific structures or characteristics.
The Fund also benefited from several purchases made in early 2011. Given the steepness of the yield curve and the rise in rates that had transpired, we decided to position the Fund more aggressively from a maturity standpoint by buying a number of longer bonds in January. This lengthened the Fund’s duration, or sensitivity to interest-rate movements, which had already been positioned modestly longer than the duration of the Barclays Capital index. To fund these purchases, we used the proceeds from a few called bonds as well as several bonds we were able to tactically sell at advantageous prices.
Our ongoing focus continued to be on using fundamental credit research to find attractively valued bonds backed by financially solid issuers. The purchases we made in the Fund were fairly diversified from a ratings and sector standpoint. As has historically been the case, we favored higher education bonds and health care bonds, particularly hospitals. For example, we bought Rochester Mayo Clinic bonds rated AA (S&P), Gillette Children’s Hospital bonds rated A- (S&P) and Minnesota Higher Education Hamline University bonds rated BBB. We also added to the Fund’s utilities exposure with electric revenue bonds rated A- (S&P) from the Northern Municipal Power Agency. Other notable purchases included a strip of maturities of general obligation (GO) bonds rated Aaa3 (Moody’s) from the City of Bemidji. Conversely, we sold a non-rated, continuing care facility bond as we were unsure about its long-term prospects.
We did not strategically change the Fund’s ratings profile during the period. We maintained our emphasis on mid-quality bonds, A- and BBB-rated, which we have done
historically due to the beneficial income attributes and manageable credit risk we believe these positions represent. We also continued to underweight AAA- and AA-rated bonds. The Fund’s exposure to AAA-rated bonds fell slightly during the period as one bond insurer experienced a downgrade, which brought several holdings down to an AA credit quality rating. These downgrades did not affect the Fund’s performance and only slightly impacted the overall credit quality of the portfolio.
Nuveen Minnesota Municipal Bond Fund
The Fund’s Class A Shares at net asset value (NAV) outpaced the Lipper Minnesota Municipal Debt Funds Average for the eleven-month period. However, the Fund trailed the Barclays Capital Municipal Bond Index over this time frame.
The biggest positive contributor to the Fund’s performance during the period was its longer duration, or sensitivity to interest-rate movements, versus the Barclays Capital index. Given the steepness of the yield curve, we maintained this longer duration stance throughout the period. The Fund also benefited from its holdings at the longer end of its maturity spectrum, specifically bonds with maturities of 17 years and beyond. For the most part, bonds with maturities under 17 years did not have a positive impact on performance.
Individual security selection and select sector positioning also contributed positively to results. For example, the Fund benefited from an overweight position in health care holdings as well as more favorable bond selection within the segment. Health care, which is an area the Fund has historically overweighted, was an outperforming sector during the period. In the local general obligation (GO) bond segment, the Fund was rewarded for an underweight position in this underperforming sector as well as stronger bond selection. The Fund also benefited from positive security selection in housing and transportation bonds. On the negative side, the Fund was hurt by an underweight stance and poor security selection in the state GO sector and an underweight position in water and sewer bonds.
In terms of credit quality, the Fund benefited from its overweight position in the lower categories, including A-rated, BBB-rated and non-rated bonds. Overall, these lower credit qualities were the better performers during the eleven-month period. The Fund’s results were negatively impacted by its selection of AAA-rated bonds, which underperformed for the most part during the period. However, the Fund’s was underweight in the AAA-rated segment of the market which helped comparative performance.
Because of the steep yield curve, we decided to position the Fund more aggressively from a maturity standpoint by purchasing a number of bonds in the 20- to 30-year range. While the Fund’s duration was only slightly lengthened, this did increase its average maturity by more than two years. As a result of the purchases, the Fund’s overweight in longer maturities of more than 20 years is now more pronounced than it was in the previous reporting period. In the remainder of the portfolio, we’ve maintained a generally laddered structure with relatively equal weights in maturities between eight and 20 years.
In order to make these purchases, we liquidated some positions in higher quality, intermediate maturity GO bonds and drew down the Fund’s cash level, which had been as high as 7% at the beginning of the reporting period. Cash had been elevated because the supply of longer maturity municipal bonds was more limited in Minnesota last year and we weren’t able to find attractive buying opportunities.
The purchases we made were primarily in mid-quality bonds in sectors such as higher education, hospitals, continuing care facilities and miscellaneous revenue, which offered more attractive spreads. Through these purchases, we meaningfully increased the Fund’s emphasis on mid-quality bonds rated A and BBB. For example, A-rated bonds increased from approximately 30% to 34% and BBB-rated bonds went from approximately 6% to 15% of the Fund’s net assets during the period, while AAA-rated holdings were reduced from approximately 18% to 11%. We have historically overweighted these mid-grade rating categories due to the beneficial income attributes and manageable credit risk we believe these positions represent. We also continued to underweight AAA- and AA-rated bonds in the Fund’s portfolio.
As is typically the case, we engaged in a number of tactical sales in the Fund as opportunities arose. With these tactical trades, we sell holdings that we can obtain full prices for and replace them with bonds that we believe have more attractive long-term values. These transactions typically take place with investors who are looking for bonds with certain types of structures or characteristics and are willing to pay us full prices for bonds that we own.
Nuveen Missouri Tax Free Fund
The Fund’s Class A Shares at net asset value (NAV) outpaced both the Lipper Other States Municipal Debt Funds Average and the Barclays Capital Municipal Bond Index for the eleven-month period.
The Fund experienced strong outperformance for the period due to several factors. Missouri in general was one of the stronger performing states over the past eleven months, benefiting from a big drop-off in new issue supply, strong demand for municipal bonds and the state’s solid fiscal position. Missouri is also one of only a handful of states that has a long-term AAA S&P rating/Aaa Moody’s rating for its state general obligation (GO) bonds. The Fund’s performance was also helped by a sizeable position in a 20-year, A1/AA- rated Kansas City Special Facilities revenue bond that was pre-refunded during the period. The bond’s price rose significantly due to the pre-refunding, which effectively converted the bond into a four-year maturity and also increased its credit quality (reflecting the government security collateralization now backing the bond). Additionally, the Fund benefited from its purchases of primarily intermediate maturity bonds in 2010. Although the BAB program had reduced long-term, tax-exempt issuance in 2010, the intermediate segment of the yield curve was still the best-performing area overall for the period. After yields backed up and the yield curve steepened, results were also aided by several purchases of longer maturity bonds in 2011.
Performance also benefited from a number of tactical sales during the period, which we typically make in the Fund as opportunities arise. With these tactical trades, we sell holdings that are relatively fully priced and replace them with bonds that we believe have more attractive long-term value. These tactical sales usually take place when demand is high or particularly focused on specific structures or characteristics.
We used the proceeds from the tactical sales and called bonds to fund new purchases in the portfolio. As mentioned in the state’s overview, the supply of bonds in Missouri was down nearly 28% over the past year. Additionally, the majority of tax-exempt bonds that
did come to market in 2010 were more weighted in the short and intermediate maturity range. Most of the purchases we made in the Fund in the second half of 2010 were in intermediate maturities. The Build America Bond program expired at the end of 2010, but supply did not pick up and has fallen even more in 2011. Municipalities are being conservative and hesitant to approve new projects that would require municipal bond issuance. As a result, opportunities in the longer maturity, new issue market continued to be somewhat constrained.
As mentioned earlier, we made a few longer maturity purchases. For example, we bought some A1 rated, Puerto Rico sales tax revenue bonds for the Fund. These bonds are double tax-exempt in all states and can be advantageous when state bond supply is low. We also invested in BBB rated, Rockhurst University revenue bonds issued by the Missouri Health & Educational Facilities Authority in January that we felt were attractively priced. In addition, we purchased A+ rated GO bonds from the city of Belton, Missouri. As has historically been the case, we continued to overweight health care bonds in the Fund’s portfolio, particularly hospitals.
The Fund’s duration, or sensitivity to interest-rate movements, was modestly longer than its benchmark. The Fund ended the period with an underweight to 1- to 10-year bonds, a slight overweight in 10- to 20-year maturities and a fairly neutral position in bonds longer than 20 years.
We did not strategically change the Fund’s ratings profile during the period. We maintained our overweight to mid-quality (A-rated and BBB-rated) and non-rated bonds, which we have done historically due to the beneficial income attributes and manageable credit risk we believe these positions represent. We also continued to be underweight AAA- and AA-rated bonds.
Nuveen Nebraska Municipal Bond Fund
The Fund’s Class A Shares at net asset value (NAV) outpaced both the Lipper Other States Municipal Debt Funds Average and the Barclays Capital Municipal Bond Index for the eleven-month period.
The biggest positive contributors to the Fund’s performance during the period were its security selections within certain sectors as well as select sector weightings. For example, the Fund benefited from both overweight stances as well as stronger bond selections within three outperforming sectors during the period: health care, education and local general obligation (GO) bonds. Health care and education are two areas that we have historically favored and overweighted in the Fund. Results were also enhanced by an overweight position in electric revenue bonds, another segment that surpassed the index during the time frame. On the negative side, the Fund was hurt by an underweight stance and poor security selection in the state GO sector, an area that also outperformed. Results were also impacted by weaker security selection in pre-refunded bonds, although the Fund’s underweight position in this underperforming segment of the market was helpful.
The Fund’s slightly shorter duration, or sensitivity to interest-rate movements, than the Barclays Capital index was a slight drag on performance during the period. Because of
the steepness of the yield curve, we would have liked to extend the Fund’s duration, but the extremely low supply of longer maturity bonds in Nebraska prevented us from doing so. However, the security selection and sector positioning mentioned earlier more than offset the negative impact of the Fund’s shorter duration. The holdings the Fund did have at the longer end of its maturity spectrum, specifically bonds with maturities of 15 years and beyond, helped performance. For the most part, bonds with maturities under 15 years did not have a positive impact on performance.
In terms of credit quality, the Fund was rewarded for its overweight position in the mid and lower categories, including A-rated and non-rated bonds. Overall, these lower credit qualities were the better performers during the eleven-month period. The Fund’s results were negatively impacted by its AAA-rated bonds, which underperformed for the most part during this time frame. However, the Fund was underweight in the AAA-rated segment of the market which helped comparative performance.
Despite the shortage of supply in the state, we were able to find a few opportunities to buy bonds in the 20- to 30-year range. While the Fund’s duration was little changed by these purchases, its average maturity lengthened by more than two years. To make these purchases, we deployed the cash we received from several called bonds as well as the proceeds from some high-quality bonds that we liquidated. Because of the purchases we made, the Fund’s overweight in longer maturities of more than 20 years is now more pronounced than it was in the previous reporting period. In the remainder of the portfolio, we’ve maintained a generally laddered structure with relatively equal weights in maturities between 8 and 20 years.
The bonds we selected were primarily mid and lower quality (BBB, A and non-rated) in sectors such as higher education and hospitals where some supply was available. For example, we added to the Fund’s existing position in non-rated Nebraska Educational Finance Authority bonds issued for Concordia University in Seward. We also purchased a new position in Immanuel Obligated Group bonds rated A- by Fitch issued by the Hospital Authority No. 1 in Lancaster County.
As a result of the recent purchases, we increased the Fund’s emphasis to mid-quality bonds. For example, its exposure to BBB-rated bonds, which typically aren’t issued very often in the state of Nebraska, increased from approximately 0% to 4% of the Fund’s net assets during the period. The Fund’s non-rated position went from approximately 9% to 18% during this time frame and its A-rated bonds increased slightly from approximately 32% to 26%. We have historically overweighted these mid-grade credit qualities due to the beneficial income attributes and manageable credit risk we believe these positions represent. We also continued to underweight AAA- and AA-rated bonds in the Fund, decreasing its AAA exposure to from approximately 16% to 12% of net assets. Additionally, we reduced the Fund’s exposure to the GO and miscellaneous revenue categories, while adding to the higher education sector.
Nuveen Ohio Tax Free Fund
The Fund’s Class A Shares at net asset value (NAV) outpaced the Lipper Ohio Municipal Debt Funds Average for the eleven-month period. However, the Fund trailed the Barclays Capital Municipal Bond Index over this time frame.
The Fund’s performance benefited from its longer duration, or sensitivity to interest-rate movements, versus the Barclays Capital index. Given the steepness of the yield curve, we maintained this longer duration stance throughout the period. Specifically, our portfolio’s position in shorter maturities was beneficial; however, an overweight to the longest maturities detracted from performance as this specific portion of the yield curve was the worst-performing area during the period.
In terms of sectors, performance was enhanced by strong security selection in health care, a sector we typically overweight. This favorable bond selection outweighed the negative effects of the overweight as this sector underperformed the index for this time frame. Conversely, the Fund’s underweight in state general obligation (GO) bonds hindered results as the sector was one of the better performers during the period. Also, the Fund’s overweight position in BBB-rated bonds hurt performance as this credit quality segment fell short of the index.
Purchasing activity was fairly muted in the Fund during the period because of the supply shortage of Ohio bonds discussed in the state’s overview. The purchases we made for the Fund were mainly confined to two sectors: health care, and water and sewer. We were able to find select opportunities in the health care sector as some new-issue deals came to market in Ohio during the period. For example, we bought AA-rated bonds from northeast Ohio’s Cleveland Clinic Health System, Toledo-based Promedica Health System, and Catholic Healthcare Partners, the largest health system in Ohio. In the secondary market, we found an opportunity to add a water and sewer position in the Fund: A-rated bonds from the City of Marysville Wastewater System. Other than these purchases, we did not meaningfully change the Fund’s ratings profile or sector weightings during the period.
The Fund also experienced net outflows over the period. In order to facilitate these outflows, we sold some pre-refunded bonds and used the proceeds from several called bonds and from the tactical selling of some lower coupon, intermediate maturity bonds. With the tactical moves, we sold various positions in the secondary market to retail investors who were looking for bonds with certain types of structures or characteristics and were willing to pay us attractive prices.
Nuveen Oregon Intermediate Municipal Bond Fund
The Fund’s Class A Shares at net asset value (NAV) performed basically in line with its two benchmarks during the eleven-month period, slightly outpacing the Lipper Intermediate Municipal Debt Funds Average and outperformed the Barclays Capital 1-15 Year Blend Municipal Bond Index.
The largest positive contributor to the Fund’s performance during the period was its maturity distribution. The Fund benefited from an overweight position in bonds with maturities in the eight- to twelve-year range as intermediate bonds outperformed during this time frame. Also, an underweight to bonds with maturities less than four years aided results. From a ratings standpoint, the Fund’s underweight to AAA-rated securities was detrimental as that segment outperformed; however, our strong security selection within the AAA segment cancelled out any negative impact. Also, the Fund’s overweight in lower rated bonds, including BBB and non-rated, hurt performance as these segments underperformed the index.
On a sector basis, performance benefited from favorable security selection in hospital bonds, which offset the negative effects of our overweight position in this underperforming sector. However, the biggest drag on performance was the Fund’s underweight to state general obligation (GO) bonds, one of the better performing sectors during the period. As investors’ concerns about the credit quality of municipal bond issuers increased, they turned to bonds that are backed by larger sources of revenues such as states. We tend to avoid investing in state GO bonds because they typically offer lower yields than other types of municipal bonds.
During the period, our overweight to the longer end of the intermediate maturity range and underweight in shorter term bonds helped keep the Fund’s duration, or sensitivity to interest rates changes, longer than the Barclays Capital index. The index is comprised of bonds with maturities spread out fairly evenly between 1 and 17 years. We sought to maintain this longer duration throughout the period and traded bonds accordingly to keep the Fund positioned that way.
In addition to the credit quality weightings mentioned above, the Fund remained very overweighted in AA-rated bonds and neutral in A-rated bonds. One of the reasons for the large AA overweight is that the state of Oregon is heavily populated by those credits. This is largely the result of its School Bond Guaranty Program, which allows lower rated school districts to go to the state and have their bonds wrapped by the program, thus receiving a credit rating of the state of AA+ and Aa1 from S&P and Moody’s, respectively.
In terms of other sector weights, the Fund had slightly higher-than-index positions in education, local GOs, and water and sewer bonds. As in all types of market environments, our ongoing focus continued to be on using fundamental credit research to find attractively valued bonds backed by financially solid issuers. We were able to add a few positions to the portfolio despite the infrequent number of issues that came to market in Oregon during the period. In particular, we found compelling opportunities in the higher education sector including: BBB-rated issues from Linfield College, AA-rated bonds from Reed College and A-rated issues from Lewis & Clark College.
Finally, the Fund did experience net outflows over the period. In order to facilitate these outflows, we sold some bonds due in less than two years and made a number of tactical sales of longer maturity positions. With these tactical moves, we sold various odd-lot positions in the secondary market to investors who were looking for bonds with certain types of structures or characteristics and were willing to pay us full prices. We were patient and received very favorable prices for a number of Oregon bonds that we tactically sold.
Risk Considerations
Mutual fund investing involves risk; principal loss is possible. Debt or fixed income securities are subject to credit risk and interest rate risk. The value of, and income generated by debt securities will decrease or increase based on changes in market interest rates. As interest rates rise, bond prices fall. Credit risk refers to an issuer’s ability to make interest and principal payments when due. Credit risk is heightened for below investment grade bonds. A concentration in specific states exposes the Funds to the additional risks facing issuers in those states.
Dividend Information
Nuveen Colorado Tax Free Fund
The Class A Shares of the Nuveen Colorado Tax Free Fund had dividend increases in November 2010 and February and May 2011 and a dividend reduction in August, September and October 2010. The Class C1 Shares had dividend increases in November 2010 and January and May 2011 and a dividend reduction in August, September and October 2010 while the Fund’s Class I Shares had a dividend increase in May 2011 and dividend reductions in August, September and October 2011..
Nuveen Minnesota Intermediate Municipal Bond Fund
The Class A Shares of the Nuveen Minnesota Intermediate Municipal Bond Fund had one dividend increase in January 2011 and dividend reductions in August 2010 and February 2011. The Fund’s Class C Shares had a dividend increase in February 2011. The Fund’s C1 Shares had dividend increases in September and November 2010 and January and February 2011 and dividend reductions in August, October and December 2010. The Fund’s Class I Shares had a dividend increase in January 2011 and a dividend reduction in August 2010.
Nuveen Minnesota Municipal Bond Fund
The Class A Shares of the Nuveen Minnesota Municipal Bond Fund had dividend increases in September 2010 and January and May 2011 and dividend reductions in August 2010 and February 2011. The Fund’s Class C Shares had dividend increases in February and May 2011. The Fund’s Class CI Shares had dividend increases in September and November 2010 and January 2011 and dividend reductions in August and October 2011 and February 2011. The Fund’s Class I Shares had a dividend increase in September 2010 and January and May 2011 and a dividend reduction in August 2010.
Nuveen Missouri Tax Free Fund
The Class A Shares of the Nuveen Missouri Tax Free Fund had dividend increases in September, October and November 2010 and January 2011 and dividend reductions in August 2010 and February 2011. The Fund’s Class C1 Shares had dividend increase in September, October and November 2010 and January 2011 and dividend reductions in August and September 2010 and February 2011. The Fund’s Class I Shares had dividend increases in September, October and November 2010 and January 2011 and a dividend reduction August 2010.
Nuveen Nebraska Municipal Bond Fund
The Class A Shares of the Nuveen Nebraska Municipal Bond Fund had dividend increases in November 2010 and January and February 2011 and dividend reductions in December 2010 and May 2011. The Fund’s Class C Shares had a dividend reduction in February and May 2011. The Fund’s Class C1 Shares had dividend increases in September and November 2010 and January 2011 and dividend reductions in October 2010 and May 2011. The Fund’s Class I Shares had a dividend increase in November 2010 and a dividend reduction in May 2011.
Nuveen Ohio Tax Free Fund
The Class A Shares of the Nuveen Ohio Tax Free Fund experienced dividend increases in December 2010 and January and February 2011 and a dividend reduction in October 2010. The Fund’s Class C1 Shares experienced dividend increases in September and November 2010 and January 2011 and a dividend reduction in October 2010 and February 2011. The Fund’s Class I Shares maintained the same dividend throughout the period.
Nuveen Oregon Intermediate Municipal Bond Fund
The Class A Shares of the Nuveen Oregon Intermediate Municipal Bond Fund experienced dividend increases in October and November 2010 and May 2011 and dividend reductions in August and December 2010 and February 2011. The Fund’s Class C Shares had dividend increases in February and May 2011. The Fund’s Class I Shares experienced dividend increases in October and November 2010 and May 2011 and a dividend reduction in August 2010 .
Each Fund seeks to pay dividends at a rate that reflects the past and projected performance of the Fund. To permit a Fund to maintain a more stable monthly dividend, the Fund may pay dividends at a rate that may be more or less than the amount of net investment income actually earned by the Fund during the period. If the Fund has cumulatively earned more than it has paid in dividends, it will hold the excess in reserve as undistributed net investment income (UNII) as part of the Fund’s net asset value. Conversely, if the Fund has cumulatively paid in dividends more than it has earned, the excess will constitute a negative UNII that will likewise be reflected in the Fund’s net asset value. Each Fund will, over time, pay all its net investment income as dividends to shareholders. As of May 31, 2011, each Fund except Nuveen Nebraska Municipal Bond Fund had positive UNII balances for both tax purposes and financial reporting purposes. As of May 31, 2011, the Nuveen Nebraska Municipal Bond Fund had a positive UNII balance for tax purposes and a negative UNII balance for financial reporting purposes.
Fund Performance and Expense Ratios (Unaudited)
The Fund Performance and Expense Ratios for each Fund are shown on the following 12 pages.
Returns quoted represent past performance, which is no guarantee of future results. Current performance may be higher or lower than the performance shown. Investment returns and principal value will fluctuate so that when shares are redeemed, they may be worth more or less than their original cost. Returns without sales charges would be lower if the sales charge were included. Returns do not reflect the deduction of taxes that a shareholder would pay on Fund distributions or the redemption of Fund shares. Income is generally exempt from regular federal income taxes. Some income may be subject to state and local income taxes and to the federal alternative minimum tax. Capital gains, if any, are subject to tax.
Returns may reflect a contractual agreement between certain Funds and the investment adviser to waive certain fees and expenses; see Notes to Financial Statements, Footnote 7 — Management Fees and Other Transactions with Affiliates for more information. In addition, returns may reflect a voluntary expense limitation by the Funds’ investment adviser that may be modified or discontinued at any time without notice. For the most recent month-end performance visit www.nuveen.com or call (800) 257-8787.
Returns reflect differences in sales charges and expenses, which are primarily differences in distribution and service fees. Fund returns assume reinvestment of dividends and capital gains.
Comparative index and benchmark return information is provided for the Funds’ Class A Shares at net asset value (NAV) only.
Effective January 18, 2011, Class C Shares and Class Y Shares previously offered by FAF Advisors, Inc. are renamed Class C1 Shares and Class I Shares, respectively, and the Nuveen Minnesota Intermediate Municipal Bond Fund, Nuveen Minnesota Municipal Bond Fund, Nuveen Nebraska Municipal Bond Fund and Nuveen Oregon Intermediate Municipal Bond Fund begin offering Class C Shares only to qualifying institutional investors and certain other qualifying accounts.
The expense ratios shown reflect the Funds’ total operating expenses (before fee waivers or expense reimbursements, if any) as shown in the Funds’ most recent prospectus. The expense ratios include management fees and other fees and expenses.
Fund Performance and Expense Ratios (Unaudited) (continued)
Nuveen Colorado Tax Free Fund
Refer to the first page of this Fund Performance and Expense Ratios section for further explanation of the information included within this page.
Fund Performance
Average Annual Total Returns as of May 31, 2011*
| | | | | | | | | | | | | | | | |
| | |
| | | Cumulative | | | Average Annual | |
| | | | |
| | | 11-Month | | | 1-Year | | | 5-Year | | | 10-Year | |
Class A Shares at NAV | | | 3.93% | | | | 3.91% | | | | 3.70% | | | | 4.52% | |
Class A Shares at maximum Offering Price | | | -0.40% | | | | -0.49% | | | | 2.82% | | | | 4.08% | |
Barclays Capital Municipal Bond Index** | | | 3.11% | | | | 3.17% | | | | 4.78% | | | | 5.02% | |
Lipper Colorado Municipal Debt Funds Average** | | | 1.66% | | | | 1.92% | | | | 3.41% | | | | 4.18% | |
| | | | |
Class C1 Shares*** | | | 3.53% | | | | 3.48% | | | | 3.27% | | | | 4.10% | |
Class I Shares | | | 4.24% | | | | 4.24% | | | | 3.97% | | | | 4.78% | |
Latest Calendar Quarter – Average Annual Total Returns as of June 30, 2011
| | | | | | | | | | | | |
| |
| | | Average Annual | |
| | | |
| | | 1-Year | | | 5-Year | | | 10-Year | |
Class A Shares at NAV | | | 4.40% | | | | 3.88% | | | | 4.47% | |
Class A Shares at maximum Offering Price | | | 0.05% | | | | 2.99% | | | | 4.02% | |
Class C1 Shares*** | | | 3.96% | | | | 3.45% | | | | 4.04% | |
Class I Shares | | | 4.73% | | | | 4.14% | | | | 4.73% | |
Class A Shares have a maximum 4.20% sales charge (Offering Price). Class A Share purchases of $1 million or more are sold at net asset value without an up-front sales charge but may be subject to a contingent deferred sales charge (CDSC), also known as a back-end sales charge, if redeemed within eighteen months of purchase. Class C1 Shares have a 1% CDSC for redemptions within less than twelve months, which is not reflected in the one-year total return. Class I Shares have no sales charge and may be purchased under limited circumstances or by specified classes of investors.
| | | | | | | | |
| Expense Ratios | |
| | |
| Share Class | | Gross
Expense
Ratios | | | Net
Expense
Ratios | |
Class A | | | 1.08% | | | | 0.90% | |
Class C1*** | | | 1.53% | | | | 1.35% | |
Class I | | | 0.88% | | | | 0.70% | |
The Fund’s adviser has contractually agreed to waive fees and reimburse other Fund expenses through June 30, 2011, so that total annual Fund operating expenses, after fee waivers and/or expense reimbursements and excluding acquired Fund fees and expenses, do not exceed 0.70%, 1.15%, and 0.50%, for Class A, Class C1, and Class I Shares, respectively, and waive fees and reimburse other Fund expenses through March 31, 2012 so that annual Fund operating expenses, after fee waivers and/or expense reimbursements and excluding acquired Fund fees and expenses, do not exceed 0.90%, 1.35% and 0.70% for Class A, Class C1 and Class I Shares, respectively. Fee waivers and expense reimbursements will not be terminated prior to that time without the approval of the Fund’s Board of Directors.
| * | Eleven-month returns are cumulative; all other returns are annualized. |
| ** | Refer to the Glossary of Terms Used in the Report for definitions. |
| *** | Class C1 Shares are not available for new accounts or for additional investment into existing accounts, but Class C1 Shares can be issued for purposes of dividend reinvestment. |
Growth of an Assumed $10,000 Investment as of May 31, 2011
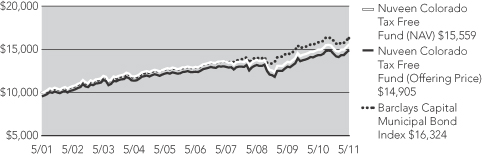
The graphs do not reflect the deduction of taxes, such as state and local income taxes or capital gains taxes, that a shareholder may pay on Fund distributions or the redemption of Fund shares.
Fund Performance and Expense Ratios (Unaudited) (continued)
Nuveen Minnesota Intermediate Municipal Bond Fund
Refer to the first page of this Fund Performance and Expense Ratios section for further explanation of the information included within this page.
Fund Performance
Average Annual Total Returns as of May 31, 2011*
| | | | | | | | | | | | | | | | |
| | | Cumulative | | | Average Annual | |
| | | | |
| | | 11-Month | | | 1-Year | | | 5-Year | | | 10-Year | |
Class A Shares at NAV | | | 4.00% | | | | 4.20% | | | | 4.61% | | | | 4.32% | |
Class A Shares at maximum Offering Price | | | 0.91% | | | | 1.11% | | | | 3.97% | | | | 4.00% | |
Barclays Capital 1-15 Year Blend Municipal Bond Index** | | | 3.59% | | | | 3.80% | | | | 5.16% | | | | 2.70% | |
Lipper Intermediate Municipal Debt Funds Average** | | | 3.35% | | | | 3.39% | | | | 4.13% | | | | 4.08% | |
| | | | |
Class I Shares | | | 4.00% | | | | 4.20% | | | | 4.68% | | | | 4.43% | |
| | | | | | | | | | | | |
| | | Cumulative | | | Average Annual | |
| | | |
| | | 11-Month | | | 1-Year | | | Since
Inception**** | |
Class C Shares | | | N/A | | | | N/A | | | | 4.88% | |
Class C1 Shares*** | | | 3.46% | | | | 3.71% | | | | 4.82% | |
Latest Calendar Quarter – Average Annual Total Returns as of June 30, 2011
| | | | | | | | | | | | |
| | | Average Annual | |
| | | |
| | | 1-Year | | | 5-Year | | | 10-Year | |
Class A Shares at NAV | | | 4.30% | | | | 4.73% | | | | 4.29% | |
Class A Shares at maximum Offering Price | | | 1.20% | | | | 4.09% | | | | 3.98% | |
Class I Shares | | | 4.41% | | | | 4.82% | | | | 4.41% | |
| | | | | | | | |
| | | Average Annual | |
| | |
| | | 1-Year | | | Since
Inception**** | |
Class C Shares | | | N/A | | | | 5.23% | |
Class C1 Shares*** | | | 3.72% | | | | 4.73% | |
Class A Shares have a maximum 3.00% sales charge (Offering Price). Class A Share purchases of $1 million or more are sold at net asset value without an up-front sales charge but may be subject to a contingent deferred sales charge (CDSC), also known as a back-end sales charge, if redeemed within eighteen months of purchase. Class C Shares and Class C1 Shares have a 1% CDSC for redemptions within less than twelve months, which is not reflected in the one-year total return. Class I Shares have no sales charge and may be purchased under limited circumstances or by specified classes of investors.
| | | | | | | | |
| Expense Ratios | |
| Share Class | | Gross
Expense
Ratios | | | Net
Expense
Ratios | |
Class A | | | 0.85% | | | | 0.76% | |
Class C | | | 1.40% | | | | 1.40% | |
Class C1*** | | | 1.30% | | | | 1.30% | |
Class I | | | 0.65% | | | | 0.65% | |
The Fund’s adviser has contractually agreed to reimburse Class A Share 12b-1 fees through March 31, 2012 to the extent necessary so that total annual Fund operating expenses, after fee waivers and/or expense reimbursement and excluding acquired Fund fees and expenses, do not exceed 0.75% for Class A Shares. Fee waivers and/or expense reimbursements will not be terminated prior to that time without with approval of the Fund’s Board of Directors. In addition, the Fund’s distributor has contractually agreed to limit its Class A Share 12b-1 fees to 0.15% of average daily net assets through March 31, 2012.
| * | Eleven-month returns are cumulative; all other returns are annualized. |
| ** | Refer to the Glossary of Terms Used in the Report for definitions. |
| *** | Class C1 Shares are not available for new accounts or for additional investment into existing accounts, but Class C1 Shares can be issued for purposes of dividend reinvestment. |
| **** | Since inception returns for Class C and Class C1 Shares are from 1/18/11 and 10/28/09, respectively. Since inception returns for Class C Shares are cumulative. |
Growth of an Assumed $10,000 Investment as of May 31, 2011
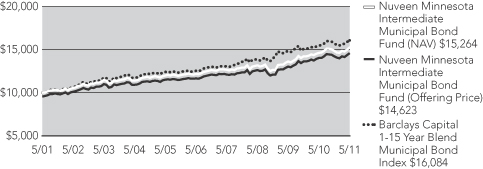
The graphs do not reflect the deduction of taxes, such as state and local income taxes or capital gains taxes, that a shareholder may pay on Fund distributions or the redemption of Fund shares.
Fund Performance and Expense Ratios (Unaudited) (continued)
Nuveen Minnesota Municipal Bond Fund
Refer to the first page of this Fund Performance and Expense Ratios section for further explanation of the information included within this page.
Fund Performance
Average Annual Total Returns as of May 31, 2011*
| | | | | | | | | | | | | | | | |
| | | Cumulative | | | Average Annual | |
| | | | |
| | | 11-Month | | | 1-Year | | | 5-Year | | | 10-Year | |
Class A Shares at NAV | | | 2.94% | | | | 2.96% | | | | 3.97% | | | | 4.47% | |
Class A Shares at maximum Offering Price | | | -1.41% | | | | -1.38% | | | | 3.09% | | | | 4.02% | |
Barclays Capital Municipal Bond Index** | | | 3.11% | | | | 3.17% | | | | 4.78% | | | | 5.02% | |
Lipper Minnesota Municipal Debt Funds Average** | | | 2.45% | | | | 2.52% | | | | 3.73% | | | | 4.26% | |
| | | | |
Class C1 Shares*** | | | 2.48% | | | | 2.46% | | | | 3.50% | | | | 4.02% | |
Class I Shares | | | 3.09% | | | | 3.23% | | | | 4.18% | | | | 4.71% | |
| | | | |
| | | Cumulative | |
| |
| | | Since
Inception**** | |
Class C Shares | | | 6.99% | |
Latest Calendar Quarter – Average Annual Total Returns as of June 30, 2011
| | | | | | | | | | | | |
| |
| | | Average Annual | |
| | | |
| | | 1-Year | | | 5-Year | | | 10-Year | |
Class A Shares at NAV | | | 3.74% | | | | 4.21% | | | | 4.48% | |
Class A Shares at maximum Offering Price | | | -0.64% | | | | 3.33% | | | | 4.03% | |
Class C1 Shares*** | | | 3.24% | | | | 3.72% | | | | 4.02% | |
Class I Shares | | | 3.91% | | | | 4.40% | | | | 4.71% | |
| | | | |
| | | Cumulative | |
| |
| | | Since
Inception**** | |
Class C Shares | | | 7.87% | |
Class A Shares have a maximum 4.20% sales charge (Offering Price). Class A Share purchases of $1 million or more are sold at net asset value without an up-front sales charge but may be subject to a contingent deferred sales charge (CDSC), also known as a back-end sales charge, if redeemed within eighteen months of purchase. Class C Shares and Class C1 Shares have a 1% CDSC for redemptions within less than twelve months, which is not reflected in the one-year total return. Class I Shares have no sales charge and may be purchased under limited circumstances or by specified classes of investors.
| | | | | | | | |
| Expense Ratios | |
| | |
| Share Class | | Gross
Expense
Ratios | | | Net
Expense
Ratios | |
Class A | | | 0.89% | | | | 0.86% | |
Class C | | | 1.44% | | | | 1.44% | |
Class C1*** | | | 1.34% | | | | 1.34% | |
Class I | | | 0.69% | | | | 0.69% | |
The Fund’s adviser has contractually agreed to reimburse Class A Share 12b-1 fees through March 31, 2012 to the extent necessary so that total annual Fund operating expenses, after fee waivers and/or expense reimbursement and excluding acquired Fund fees and expenses, do not exceed 0.85% for Class A Shares. Fee waivers and/or expense reimbursements will not be terminated prior to that time without the approval of the Fund’s Board of Directors.
| * | Eleven-month returns are cumulative; all other returns are annualized. |
| ** | Refer to the Glossary of Terms Used in the Report for definitions. |
| *** | Class C1 Shares are not available for new accounts or for additional investment into existing accounts, but Class C1 Shares can be issued for purposes of dividend reinvestment. |
| **** | Since inception returns for Class C Shares from 1/18/11. |
Growth of an Assumed $10,000 Investment as of May 31, 2011
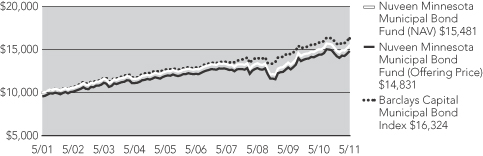
The graphs do not reflect the deduction of taxes, such as state and local income taxes or capital gains taxes, that a shareholder may pay on Fund distributions or the redemption of Fund shares.
Fund Performance and Expense Ratios (Unaudited) (continued)
Nuveen Missouri Tax Free Fund
Refer to the first page of this Fund Performance and Expense Ratios section for further explanation of the information included within this page.
Fund Performance
Average Annual Total Returns as of May 31, 2011*
| | | | | | | | | | | | | | | | |
| | | Cumulative | | | Average Annual | |
| | | | |
| | | 11-Month | | | 1-Year | | | 5-Year | | | 10-Year | |
Class A Shares at NAV | | | 4.18% | | | | 4.16% | | | | 4.31% | | | | 4.34% | |
Class A Shares at maximum Offering Price | | | -0.18% | | | | -0.18% | | | | 3.42% | | | | 3.89% | |
Barclays Capital Municipal Bond Index** | | | 3.11% | | | | 3.17% | | | | 4.78% | | | | 5.02% | |
Lipper Other States Municipal Debt Funds Average** | | | 2.13% | | | | 1.98% | | | | 3.41% | | | | 4.04% | |
| | | | |
Class I Shares | | | 4.25% | | | | 4.25% | | | | 4.52% | | | | 4.58% | |
| | | | | | | | | | | | | | | | |
| | | Cumulative | | | Average Annual | |
| | | | |
| | | 11-Month | | | 1-Year | | | 5-Year | | | Since
Inception**** | |
Class C1 Shares*** | | | 3.72% | | | | 3.66% | | | | 3.86% | | | | 3.73% | |
Latest Calendar Quarter – Average Annual Total Returns as of June 30, 2011
| | | | | | | | | | | | |
| | | Average Annual | |
| | | |
| | | 1-Year | | | 5-Year | | | 10-Year | |
Class A Shares at NAV | | | 4.79% | | | | 4.53% | | | | 4.34% | |
Class A Shares at Offering Price | | | 0.41% | | | | 3.63% | | | | 3.89% | |
Class I Shares | | | 4.88% | | | | 4.75% | | | | 4.58% | |
| | | | | | | | | | | | |
| | | Average Annual | |
| | | |
| | | 1-Year | | | 5-Year | | | Since
Inception**** | |
Class C1 Shares*** | | | 4.20% | | | | 4.07% | | | | 3.74% | |
Class A Shares have a maximum 4.20% sales charge (Offering Price). Class A Share purchases of $1 million or more are sold at net asset value without an up-front sales charge but may be subject to a contingent deferred sales charge (CDSC), also known as a back-end sales charge, if redeemed within eighteen months of purchase. Class C1 Shares have a 1% CDSC for redemptions within less than twelve months, which is not reflected in the one-year total return. Class I Shares have no sales charge and may be purchased under limited circumstances or by specified classes of investors.
| | | | | | | | |
| Expense Ratios | |
| | |
| Share Class | | Gross
Expense
Ratios | | | Net
Expense
Ratios | |
Class A | | | 0.99% | | | | 0.86% | |
Class C1*** | | | 1.44% | | | | 1.36% | |
Class I | | | 0.79% | | | | 0.71% | |
The Fund’s adviser has contractually agreed to waive fees and reimburse other Fund expenses through March 31, 2012 so that annual Fund operating expenses, after fee waivers and/or expense reimbursements and excluding acquired Fund fees and expenses, do not exceed 0.85%, 1.35% and 0.70% for Class A, Class C1 and Class I, respectively. Fee waivers and expense reimbursements will not be terminated prior to that time without the approval of the Fund’s Board of Directors.
| * | Eleven-month returns are cumulative; all other returns are annualized. |
| ** | Refer to the Glossary of Terms Used in the Report for definitions. |
| *** | Class C1 Shares are not available for new accounts or for additional investment into existing accounts, but Class C1 Shares can be issued for purposes of dividend reinvestment. |
| **** | Since inception returns for Class C1 Shares are from 9/24/11. |
Growth of an Assumed $10,000 Investment as of May 31, 2011
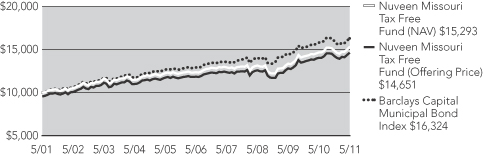
The graphs do not reflect the deduction of taxes, such as state and local income taxes or capital gains taxes, that a shareholder may pay on Fund distributions or the redemption of Fund shares.
Fund Performance and Expense Ratios (Unaudited) (continued)
Nuveen Nebraska Municipal Bond Fund
Refer to the first page of this Fund Performance and Expense Ratios section for further explanation of the information included within this page.
Fund Performance
Average Annual Total Returns as of May 31, 2011*
| | | | | | | | | | | | | | | | |
| | | Cumulative | | | Average Annual | |
| | | | |
| | | 11-Month | | | 1-Year | | | 5-Year | | | 10-Year | |
Class A Shares at NAV | | | 3.28% | | | | 3.23% | | | | 4.12% | | | | 4.54% | |
Class A Shares at maximum Offering Price | | | -1.03% | | | | -1.15% | | | | 3.22% | | | | 4.09% | |
Barclays Capital Municipal Bond Index** | | | 3.11% | | | | 3.17% | | | | 4.78% | | | | 5.02% | |
Lipper Other States Municipal Debt Funds Average** | | | 2.13% | | | | 1.98% | | | | 3.41% | | | | 4.04% | |
| | | | |
Class C1 Shares*** | | | 2.80% | | | | 2.81% | | | | 3.71% | | | | 4.13% | |
Class I Shares | | | 3.39% | | | | 3.46% | | | | 4.35% | | | | 4.79% | |
| | | | |
| | | Cumulative | |
| |
| | | Since
Inception**** | |
Class C Shares | | | 5.70% | |
Latest Calendar Quarter – Average Annual Total Returns as of June 30, 2011
| | | | | | | | | | | | |
| | | Average Annual | |
| | | |
| | | 1-Year | | | 5-Year | | | 10-Year | |
Class A Shares at NAV | | | 3.73% | | | | 4.32% | | | | 4.52% | |
Class A Shares at maximum Offering Price | | | -0.60% | | | | 3.44% | | | | 4.07% | |
Class C1 Shares*** | | | 3.31% | | | | 3.91% | | | | 4.11% | |
Class I Shares | | | 3.96% | | | | 4.58% | | | | 4.78% | |
| | | | |
| | | Cumulative | |
| |
| | | Since
Inception**** | |
Class C Shares | | | 6.21% | |
Class A Shares have a maximum 4.20% sales charge (Offering Price). Class A Share purchases of $1 million or more are sold at net asset value without an up-front sales charge but may be subject to a contingent deferred sales charge (CDSC), also known as a back-end sales charge, if redeemed within eighteen months of purchase. Class C Shares and Class C1 Shares have a 1% CDSC for redemptions within less than twelve months, which is not reflected in the one-year total return. Class I Shares have no sales charge and may be purchased under limited circumstances or by specified classes of investors.
| | | | | | | | |
| Expense Ratios | |
| | |
| Share Class | | Gross
Expense
Ratios | | | Net
Expense
Ratios | |
Class A | | | 1.11% | | | | 0.91% | |
Class C | | | 1.66% | | | | 1.46% | |
Class C1*** | | | 1.56% | | | | 1.36% | |
Class I | | | 0.91% | | | | 0.71% | |
The Fund’s adviser has contractually agreed to waive fees and reimburse other Fund expenses through June 30, 2011, so that total annual Fund operating expenses, after fee waivers and/or expense reimbursements and excluding acquired Fund fees and expenses, do not exceed 0.70%, 1.25%, 1.15% and 0.50%, for Class A, Class C, Class C1, and Class I Shares, respectively, and waive fees and reimburse other Fund expenses through March 31, 2012 so that annual Fund operating expenses, after fee waivers and/or expense reimbursements and excluding acquired Fund fees and expenses, do not exceed 0.90%, 1.45%, 1.35% and 0.70% for Class A, Class C, Class C1 and Class I Shares, respectively. Fee waivers and expense reimbursements will not be terminated prior to that time without the approval of the Fund’s Board of Directors.
| * | Eleven-month returns are cumulative; all other returns are annualized. |
| ** | Refer to the Glossary of Terms Used in the Report for definitions. |
| *** | Class C1 Shares are not available for new accounts or for additional investment into existing accounts, but Class C1 Shares can be issued for purposes of dividend reinvestment. |
| **** | Since inception returns for Class C Shares are from 1/18/11. |
Growth of an Assumed $10,000 Investment as of May 31, 2011
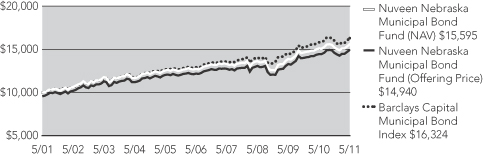
The graphs do not reflect the deduction of taxes, such as state and local income taxes or capital gains taxes, that a shareholder may pay on Fund distributions or the redemption of Fund shares.
Fund Performance and Expense Ratios (Unaudited) (continued)
Nuveen Ohio Tax Free Fund
Refer to the first page of this Fund Performance and Expense Ratios section for further explanation of the information included within this page.
Fund Performance
Average Annual Total Returns as of May 31, 2011*
| | | | | | | | | | | | | | | | |
| | | Cumulative | | | Average Annual | |
| | | | |
| | | 11-Month | | | 1-Year | | | 5-Year | | | Since
Inception**** | |
Class A Shares at NAV | | | 2.69% | | | | 2.72% | | | | 4.14% | | | | 4.33% | |
Class A Shares at maximum Offering Price | | | 1.65% | | | | -1.61% | | | | 3.25% | | | | 3.83% | |
Barclays Capital Municipal Bond Index** | | | 3.11% | | | | 3.17% | | | | 4.78% | | | | 5.02% | |
Lipper Ohio Municipal Debt Funds Average** | | | 1.54% | | | | 1.42% | | | | 3.43% | | | | 4.04% | |
| | | | |
Class C1 Shares*** | | | 2.31% | | | | 2.30% | | | | 3.71% | | | | 3.79% | |
Class I Shares | | | 2.81% | | | | 2.96% | | | | 4.38% | | | | 4.57% | |
Latest Calendar Quarter – Average Annual Total Returns as of June 30, 2011
| | | | | | | | | | | | |
| | | Average Annual | |
| | | |
| | | 1-Year | | | 5-Year | | | Since
Inception**** | |
Class A Shares at NAV | | | 3.22% | | | | 4.37% | | | | 4.35% | |
Class A Shares at maximum Offering Price | | | -1.14% | | | | 3.47% | | | | 3.86% | |
Class C1 Shares*** | | | 2.80% | | | | 3.94% | | | | 3.81% | |
Class I Shares | | | 3.36% | | | | 4.61% | | | | 4.59% | |
Class A Shares have a maximum 4.20% sales charge (Offering Price). Class A Share purchases of $1 million or more are sold at net asset value without an up-front sales charge but may be subject to a contingent deferred sales charge (CDSC), also known as a back-end sales charge, if redeemed within eighteen months of purchase. Class C1 Shares have a 1% CDSC for redemptions within less than twelve months, which is not reflected in the one-year total return. Class I Shares have no sales charge and may be purchased under limited circumstances or by specified classes of investors.
| | | | | | | | |
| Expense Ratios | |
| | |
| Share Class | | Gross
Expense
Ratios | | | Net
Expense
Ratios | |
Class A | | | 1.14% | | | | 0.92% | |
Class C1*** | | | 1.59% | | | | 1.37% | |
Class I | | | 0.94% | | | | 0.72% | |
The Fund’s adviser has contractually agreed to waive fees and reimburse other Fund expenses through June 30, 2011, so that total annual Fund operating expenses, after fee waivers and/or expense reimbursements and excluding acquired Fund fees and expenses, do not exceed 0.70%, 1.15%, and 0.50%, for Class A, Class C1, and Class I Shares, respectively, and waive fees and reimburse other Fund expenses through March 31, 2012 so that annual Fund operating expenses, after fee waivers and/or expense reimbursements and excluding acquired Fund fees and expenses, do not exceed 0.90%, 1.35% and 0.70% for Class A, Class C1 and Class I Shares, respectively. Fee waivers and expense reimbursements will not be terminated prior to that time without the approval of the Fund’s Board of Directors.
| * | Eleven-month returns are cumulative; all other returns are annualized. |
| ** | Refer to the Glossary of Terms Used in the Report for definitions. |
| *** | Class C1 Shares are not available for new accounts or for additional investment into existing accounts, but Class C1 Shares can be issued for purposes of dividend reinvestment. |
| **** | Since inception returns are from 4/30/02. |
Growth of an Assumed $10,000 Investment as of May 31, 2011
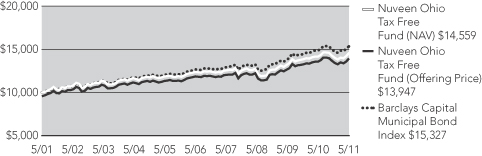
The graphs do not reflect the deduction of taxes, such as state and local income taxes or capital gains taxes, that a shareholder may pay on Fund distributions or the redemption of Fund shares.
Fund Performance and Expense Ratios (Unaudited) (continued)
Nuveen Oregon Intermediate Municipal Bond Fund
Refer to the first page of this Fund Performance and Expense Ratios section for further explanation of the information included within this page.
Fund Performance
Average Annual Total Returns as of May 31, 2011*
| | | | | | | | | | | | | | | | |
| | | Cumulative | | | Average Annual | |
| | | | |
| | | 11-Month | | | 1-Year | | | 5-Year | | | 10-Year | |
Class A Shares at NAV | | | 3.46% | | | | 3.64% | | | | 4.35% | | | | 4.08% | |
Class A Shares at maximum Offering Price | | | 0.39% | | | | 0.56% | | | | 3.72% | | | | 3.76% | |
Barclays Capital 1-15 Year Blend Municipal Bond Index** | | | 3.59% | | | | 3.80% | | | | 5.16% | | | | 2.70% | |
Lipper Intermediate Municipal Debt Funds Average** | | | 3.35% | | | | 3.39% | | | | 4.13% | | | | 4.08% | |
| | | | |
Class I Shares | | | 3.62% | | | | 3.80% | | | | 4.48% | | | | 4.23% | |
| | | | |
| | | Cumulative | |
| |
| | | Since
Inception*** | |
Class C Shares | | | 5.04% | |
Latest Calendar Quarter – Average Annual Total Returns as of June 30, 2011
| | | | | | | | | | | | |
| | | Average Annual | |
| | | |
| | | 1-Year | | | 5-Year | | | 10-Year | |
Class A Shares at NAV | | | 3.84% | | | | 4.51% | | | | 4.07% | |
Class A Shares at maximum Offering Price | | | 0.75% | | | | 3.88% | | | | 3.75% | |
Class I Shares | | | 3.91% | | | | 4.65% | | | | 4.20% | |
| | | | |
| | | Cumulative | |
| |
| | | Since
Inception*** | |
Class C Shares | | | 5.34% | |
Class A Shares have a maximum 3.00% sales charge (Offering Price). Class A Share purchases of $1 million or more are sold at net asset value without an up-front sales charge but may be subject to a contingent deferred sales charge (CDSC), also known as a back-end sales charge, if redeemed within eighteen months of purchase. Class C Shares have a 1% CDSC for redemptions within less than twelve months, which is not reflected in the one-year total return. Class I Shares have no sales charge and may be purchased under limited circumstances or by specified classes of investors.
| | | | | | | | |
| Expense Ratios | |
| | |
| Share Class | | Gross
Expense
Ratios | | | Net
Expense
Ratios | |
Class A | | | 0.87% | | | | 0.86% | |
Class C | | | 1.42% | | | | 1.42% | |
Class I | | | 0.67% | | | | 0.67% | |
The Fund’s adviser has contractually agreed to reimburse Class A Share 12b-1 fees through March 31, 2012 to the extent necessary so that total annual Fund operating expenses, after fee waivers and/or expense reimbursement and excluding acquired Fund fees and expenses, do not exceed 0.85% for Class A Shares. Fee waivers and/or expense reimbursements will not be terminated prior to that time without the approval of the Fund’s Board of Directors.
| * | Eleven-month returns are cumulative; all other returns are annualized. |
| ** | Refer to the Glossary of Terms Used in the Report for definitions. |
| *** | Since inception returns for Class C Shares are from 1/18/11. |
Growth of an Assumed $10,000 Investment as of May 31, 2011
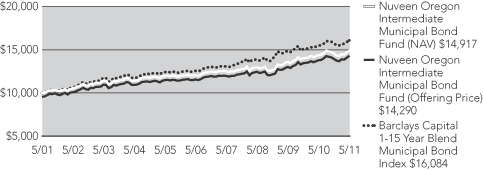
The graphs do not reflect the deduction of taxes, such as state and local income taxes or capital gains taxes, that a shareholder may pay on Fund distributions or the redemption of Fund shares.
Yields (Unaudited) as of May 31, 2011
Dividend Yield is the most recent dividend per share (annualized) divided by the offering price per share.
The SEC 30-Day Yield is a standardized measure of a Fund’s yield that accounts for the future amortization of premiums or discounts of bonds held in the Fund’s portfolio. The SEC 30-Day Yield is computed under an SEC standardized formula and is based on the maximum offer price per share. Dividend Yield may differ from the SEC 30-Day Yield because the Fund may be paying out more or less than it is earning and it may not include the effect of amortization of bond premium.
The Taxable-Equivalent Yield represents the yield that must be earned on a fully taxable investment in order to equal the yield of the Fund on an after-tax basis at a specified tax rate. With respect to investments that generate qualified dividend income that is taxable at a maximum rate of 15%, the Taxable-Equivalent Yield is lower.
Nuveen Colorado Tax Free Fund
| | | | | | | | | | | | |
| | | |
| | | Dividend
Yield | | | SEC 30-Day
Yield | | | Taxable-
Equivalent
Yield1 | |
Class A Shares at maximum Offering Price4 | | | 4.01% | | | | 3.79% | | | | 5.52% | |
Class C1 Shares | | | 3.72% | | | | 3.41% | | | | 4.96% | |
Class I Shares | | | 4.35% | | | | 4.11% | | | | 5.98% | |
Nuveen Minnesota Intermediate Municipal Bond Fund
| | | | | | | | | | | | |
| | | |
| | | Dividend
Yield | | | SEC 30-Day
Yield | | | Taxable-
Equivalent
Yield2 | |
Class A Shares at maximum Offering Price4 | | | 3.31% | | | | 2.62% | | | | 3.95% | |
Class C Shares | | | 2.78% | | | | 2.12% | | | | 3.20% | |
Class C1 Shares | | | 2.94% | | | | 2.03% | | | | 3.06% | |
Class I Shares | | | 3.55% | | | | 2.74% | | | | 4.13% | |
Nuveen Minnesota Municipal Bond Fund
| | | | | | | | | | | | |
| | | |
| | | Dividend
Yield | | | SEC 30-Day
Yield | | | Taxable-
Equivalent
Yield2 | |
Class A Shares at maximum Offering Price4 | | | 3.66% | | | | 4.22% | | | | 6.37% | |
Class C Shares | | | 3.22% | | | | 3.91% | | | | 5.90% | |
Class C1 Shares | | | 3.34% | | | | 3.62% | | | | 5.46% | |
Class I Shares | | | 3.99% | | | | 4.54% | | | | 6.85% | |
Nuveen Missouri Tax Free Fund
| | | | | | | | | | | | |
| | | |
| | | Dividend
Yield | | | SEC 30-Day
Yield | | | Taxable-
Equivalent
Yield3 | |
Class A Shares at maximum Offering Price4 | | | 3.83% | | | | 3.73% | | | | 5.51% | |
Class C1 Shares | | | 3.54% | | | | 3.37% | | | | 4.98% | |
Class I Shares | | | 4.20% | | | | 4.02% | | | | 5.94% | |
| 1 | The Taxable-Equivalent Yield is based on the Fund’s SEC 30-Day Yield on the indicated date and a combined federal and state income tax rate of 31.3%. |
| 2 | The Taxable-Equivalent Yield is based on the Fund’s SEC 30-Day Yield on the indicated date and a combined federal and state income tax rate of 33.7%. |
| 3 | The Taxable-Equivalent Yield is based on the Fund’s SEC 30-Day Yield on the indicated date and a combined federal and state income tax rate of 32.3%. |
| 4 | The SEC Yield for Class A shares quoted in the table reflects the maximum sales load. Investors paying a reduced load because of volume discounts, investors paying no load because they qualify for one of the several exclusions from the load, and existing shareholders who previously paid a load but would like to know the SEC Yield applicable to their shares on a going-forward basis, should understand that the SEC Yield effectively applicable to them would be higher than the figure quoted in the table. |
Nuveen Nebraska Municipal Bond Fund
| | | | | | | | | | | | |
| | | |
| | | Dividend
Yield | | | SEC 30-Day
Yield | | | Taxable-
Equivalent
Yield5 | |
Class A Shares at maximum Offering Price4 | | | 3.91% | | | | 3.54% | | | | 5.28% | |
Class C Shares | | | 3.50% | | | | 3.01% | | | | 4.49% | |
Class C1 Shares | | | 3.65% | | | | 2.99% | | | | 4.46% | |
Class I Shares | | | 4.26% | | | | 3.82% | | | | 5.69% | |
Nuveen Ohio Tax Free Fund
| | | | | | | | | | | | |
| | | |
| | | Dividend
Yield | | | SEC 30-Day
Yield | | | Taxable-
Equivalent
Yield6 | |
Class A Shares at maximum Offering Price4 | | | 3.73% | | | | 3.46% | | | | 5.08% | |
Class C1 Shares | | | 3.42% | | | | 3.11% | | | | 4.57% | |
Class I Shares | | | 4.07% | | | | 3.75% | | | | 5.51% | |
Nuveen Oregon Intermediate Municipal Bond Fund
| | | | | | | | | | | | |
| | | |
| | | Dividend
Yield | | | SEC 30-Day
Yield | | | Taxable-
Equivalent
Yield7 | |
Class A Shares at maximum Offering Price4 | | | 3.09% | | | | 1.98% | | | | 3.08% | |
Class C Shares | | | 3.37% | | | | 1.59% | | | | 2.48% | |
Class I Shares | | | 3.36% | | | | 2.24% | | | | 3.49% | |
| 5 | The Taxable-Equivalent Yield is based on the Fund’s SEC 30-Day Yield on the indicated date and a combined federal and state income tax rate of 32.9%. |
| 6 | The Taxable-Equivalent Yield is based on the Fund’s SEC 30-Day Yield on the indicated date and a combined federal and state income tax rate of 31.9%. |
| 7 | The Taxable-Equivalent Yield is based on the Fund’s SEC 30-Day Yield on the indicated date and a combined federal and state income tax rate of 35.8%. |
Holding Summaries as of May 31, 2011 (Unaudited)
This data relates to the securities held in the Fund’s portfolio of investments. It should not be construed as a measure of performance for the Fund itself.
Ratings shown are the highest of Standard & Poor’s Group, Moody’s Investor Service, Inc. or Fitch, Inc. AAA includes bonds with an implied AAA rating since they are backed by U.S. Government or agency securities. AAA, AA, A and BBB ratings are investment grade; BB, B, CCC, CC, C and D ratings are below-investment grade. Holdings designated N/R are not rated by any of these national rating agencies.
Nuveen Colorado Tax Free Fund
Bond Credit Quality1
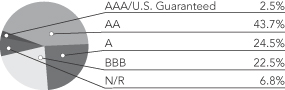
Nuveen Minnesota Intermediate Municipal Bond Fund
Bond Credit Quality1
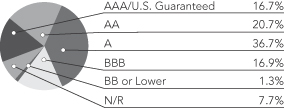
Nuveen Minnesota Municipal Bond Fund
Bond Credit Quality1
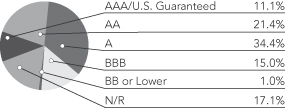
Nuveen Missouri Tax Free Fund
Bond Credit Quality1
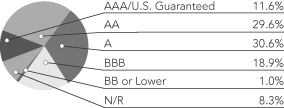
| | | | |
| Portfolio Composition1 | | | |
| Education | | | 21.5% | |
| General Obligations | | | 21.2% | |
| Health Care | | | 16.0% | |
| Utilities | | | 9.4% | |
| Certificates of Participation | | | 8.3% | |
| Transportation | | | 7.7% | |
| Housing | | | 5.7% | |
| Tax Revenue | | | 5.3% | |
| Other | | | 4.6% | |
| Short-Term Investments | | | 0.3% | |
| | | | |
| Portfolio Composition1 | | | |
| Health Care | | | 28.7% | |
| General Obligations | | | 23.8% | |
| Education | | | 18.3% | |
| Utilities | | | 9.7% | |
| Miscellaneous | | | 4.6% | |
| Other | | | 14.0% | |
| Short-Term Investments | | | 0.9% | |
| | | | |
| Portfolio Composition1 | | | |
| Health Care | | | 30.6% | |
| Utilities | | | 17.6% | |
| General Obligations | | | 11.9% | |
| Education | | | 10.5% | |
| Transportation | | | 9.0% | |
| Housing | | | 8.2% | |
| Other | | | 10.5% | |
| Short-Term Investments | | | 1.7% | |
| | | | |
| Portfolio Composition1 | | | |
| Health Care | | | 24.4% | |
| Lease Revenue | | | 16.0% | |
| Tax Revenue | | | 12.2% | |
| Utilities | | | 11.0% | |
| General Obligations | | | 8.3% | |
| Certificates of Participation | | | 7.9% | |
| Education | | | 5.6% | |
| Continuing Care Retirement Communities | | | 5.1% | |
| Other | | | 9.1% | |
| Short-Term Investments | | | 0.4% | |
| 1 | As a percentage of total municipal bonds as of May 31, 2011. Holdings are subject to change. |
Nuveen Nebraska Municipal Bond Fund
Bond Credit Quality1
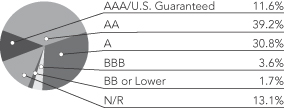
Nuveen Ohio Tax Free Fund
Bond Credit Quality1
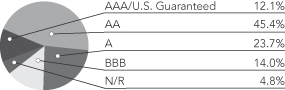
Nuveen Oregon Intermediate Municipal Bond Fund
Bond Credit Quality1
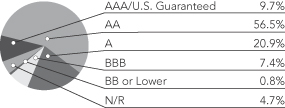
| | | | |
| Portfolio Composition1 | | | |
| Education | | | 24.6% | |
| Utilities | | | 22.3% | |
| Health Care | | | 15.6% | |
| General Obligations | | | 14.6% | |
| Continuing Care Retirement Communities | | | 7.1% | |
| Housing | | | 6.1% | |
| Other | | | 7.8% | |
| Short-Term Investments | | | 1.9% | |
| | | | |
| Portfolio Composition1 | | | |
| General Obligations | | | 27.3% | |
| Health Care | | | 24.4% | |
| Education | | | 16.4% | |
| Utilities | | | 13.4% | |
| Lease Revenue | | | 4.4% | |
| Other | | | 13.4% | |
| Short-Term Investments | | | 0.7% | |
| | | | |
| Portfolio Composition1 | | | |
| General Obligations | | | 47.3% | |
| Health Care | | | 13.4% | |
| Utilities | | | 10.1% | |
| Education | | | 9.4% | |
| Tax Revenue | | | 6.8% | |
| Other | | | 12.8% | |
| Short-Term Investments | | | 0.2% | |
| 1 | As a percentage of total municipal bonds as of May 31, 2011. Holdings are subject to change. |
Expense Examples (Unaudited)
As a shareholder of one or more of the Funds, you incur two types of costs: (1) transaction costs, including up-front and back-end sales charges (loads) or redemption fees, where applicable; and (2) ongoing costs, including management fees; distribution and service (12b-1) fees, where applicable; and other Fund expenses. The Examples below are intended to help you understand your ongoing costs (in dollars) of investing in the Funds and to compare these costs with the ongoing costs of investing in other mutual funds. Since the expense examples for Class C Shares of Minnesota Intermediate Municipal Bond Fund, Minnesota Municipal Bond Fund, Nebraska Municipal Bond Fund and Oregon Intermediate Municipal Bond Fund reflect only the first 134 days of the Funds’ operations they may not provide a meaningful understanding of the Funds’ ongoing expenses.
The Examples below are based on an investment of $1,000 invested at the beginning of the period and held for the period.
The information under “Actual Performance,” together with the amount you invested, allows you to estimate actual expenses incurred over the reporting period. Simply divide your account value by $1,000 (for example, an $8,600 account value divided by $1,000 = 8.60) and multiply the result by the cost shown for your share class, in the row entitled “Expenses Incurred During Period” to estimate the expenses incurred on your account during this period.
The information under “Hypothetical Performance,” provides information about hypothetical account values and hypothetical expenses based on the respective Fund’s actual expense ratio and an assumed rate of return of 5% per year before expenses, which is not the Fund’s actual return. The hypothetical account values and expenses may not be used to estimate the actual ending account balance or expense you incurred for the period. You may use this information to compare the ongoing costs of investing in the Fund and other Funds. To do so, compare this 5% hypothetical example with the 5% hypothetical examples that appear in the shareholder reports of the other funds.
Please note that the expenses shown in the table are meant to highlight your ongoing costs only and do not reflect any transaction costs. Therefore, the hypothetical information is useful in comparing ongoing costs only, and will not help you determine the relative total costs of owning different funds or share classes. In addition, if these transaction costs were included, your costs would have been higher.
Nuveen Colorado Tax Free Fund
| | | | | | | | | | | | | | | | | | | | | | | | | | |
| | | Actual Performance | | | | | Hypothetical Performance | |
| | | A Shares | | | C1 Shares | | | I Shares | | | | | A Shares | | | C1 Shares | | | I Shares | |
| Beginning Account Value (12/01/10) | | $ | 1,000.00 | | | $ | 1,000.00 | | | $ | 1,000.00 | | | | | $ | 1,000.00 | | | $ | 1,000.00 | | | $ | 1,000.00 | |
| Ending Account Value (5/31/11) | | $ | 1,029.00 | | | $ | 1,026.70 | | | $ | 1,030.00 | | | | | $ | 1,021.39 | | | $ | 1,019.20 | | | $ | 1,022.44 | |
| Expenses Incurred During Period | | $ | 3.59 | | | $ | 5.81 | | | $ | 2.53 | | | | | $ | 3.58 | | | $ | 5.79 | | | $ | 2.52 | |
For each class of the Fund, expenses are equal to the Fund’s annualized net expense ratio of .71%, 1.15% and .50% for Classes A, C1 and I, respectively, multiplied by the average account value over the period, multiplied by 182/365 (to reflect the one-half year period).
Nuveen Minnesota Intermediate Municipal Bond Fund
| | | | | | | | | | | | | | | | | | | | | | | | | | | | | | | | | | |
| | | Actual Performance | | | | | Hypothetical Performance | |
| | | A Shares | | | C Shares | | | C1 Shares | | | I Shares | | | | | A Shares | | | C Shares | | | C1 Shares | | | I Shares | |
| Beginning Account Value (12/01/10) | | $ | 1,000.00 | | | $ | 1,000.00 | | | $ | 1,000.00 | | | $ | 1,000.00 | | | | | $ | 1,000.00 | | | $ | 1,000.00 | | | $ | 1,000.00 | | | $ | 1,000.00 | |
| Ending Account Value (5/31/11) | | $ | 1,026.60 | | | $ | 1,048.80 | | | $ | 1,023.80 | | | $ | 1,026.20 | | | | | $ | 1,021.19 | | | $ | 1,018.15 | | | $ | 1,018.50 | | | $ | 1,021.74 | |
| Expenses Incurred During Period | | $ | 3.79 | | | $ | 6.95 | | | $ | 6.51 | | | $ | 3.23 | | | | | $ | 3.78 | | | $ | 6.84 | | | $ | 6.49 | | | $ | 3.23 | |
For each class of the Fund, expenses are equal to the Fund’s annualized net expense ratio of .75%, 1.29% and .64% for Classes A, C1 and I, respectively, multiplied by the average account value over the period, multiplied by 182/365 (to reflect the one-half year period). For Class C of the Fund, expenses are equal to the Fund’s annualized net expense ratio of 1.36% multiplied by the average account value over the period, multiplied by 134/365 (to reflect the 134 days in the period since class commencement of operations).
Nuveen Minnesota Municipal Bond Fund
| | | | | | | | | | | | | | | | | | | | | | | | | | | | | | | | | | |
| | | Actual Performance | | | | | Hypothetical Performance | |
| | | A Shares | | | C Shares | | | C1 Shares | | | I Shares | | | | | A Shares | | | C Shares | | | C1 Shares | | | I Shares | |
| Beginning Account Value (12/01/10) | | $ | 1,000.00 | | | $ | 1,000.00 | | | $ | 1,000.00 | | | $ | 1,000.00 | | | | | $ | 1,000.00 | | | $ | 1,000.00 | | | $ | 1,000.00 | | | $ | 1,000.00 | |
| Ending Account Value (5/31/11) | | $ | 1,016.80 | | | $ | 1,069.90 | | | $ | 1,014.30 | | | $ | 1,018.60 | | | | | $ | 1,020.69 | | | $ | 1,017.85 | | | $ | 1,018.30 | | | $ | 1,021.54 | |
| Expenses Incurred During Period | | $ | 4.29 | | | $ | 7.33 | | | $ | 6.68 | | | $ | 3.42 | | | | | $ | 4.28 | | | $ | 7.14 | | | $ | 6.69 | | | $ | 3.43 | |
For each class of the Fund, expenses are equal to the Fund’s annualized net expense ratio of .85%, 1.33% and .68% for Classes A, C1 and I, respectively, multiplied by the average account value over the period, multiplied by 182/365 (to reflect the one-half year period). For Class C of the Fund, expenses are equal to the Fund’s annualized net expense ratio of 1.42% multiplied by the average account value over the period, multiplied by 134/365 (to reflect the 134 days in the period since class commencement of operations).
Nuveen Missouri Tax Free Fund
| | | | | | | | | | | | | | | | | | | | | | | | | | |
| | | Actual Performance | | | | | Hypothetical Performance | |
| | | A Shares | | | C1 Shares | | | I Shares | | | | | A Shares | | | C1 Shares | | | I Shares | |
| Beginning Account Value (12/01/10) | | $ | 1,000.00 | | | $ | 1,000.00 | | | $ | 1,000.00 | | | | | $ | 1,000.00 | | | $ | 1,000.00 | | | $ | 1,000.00 | |
| Ending Account Value (5/31/11) | | $ | 1,025.80 | | | $ | 1,023.40 | | | $ | 1,026.80 | | | | | $ | 1,020.69 | | | $ | 1,018.20 | | | $ | 1,021.44 | |
| Expenses Incurred During Period | | $ | 4.29 | | | $ | 6.81 | | | $ | 3.54 | | | | | $ | 4.28 | | | $ | 6.79 | | | $ | 3.53 | |
For each class of the Fund, expenses are equal to the Fund’s annualized net expense ratio of .85%, 1.35% and .70% for Classes A, C1 and I, respectively, multiplied by the average account value over the period, mulitplied by 182/365 (to reflect the one-half year period).
Nuveen Nebraska Municipal Bond Fund
| | | | | | | | | | | | | | | | | | | | | | | | | | | | | | | | | | |
| | | Actual Performance | | | | | Hypothetical Performance | |
| | | A Shares | | | C Shares | | | C1 Shares | | | I Shares | | | | | A Shares | | | C Shares | | | C1 Shares | | | I Shares | |
| Beginning Account Value (12/01/10) | | $ | 1,000.00 | | | $ | 1,000.00 | | | $ | 1,000.00 | | | $ | 1,000.00 | | | | | $ | 1,000.00 | | | $ | 1,000.00 | | | $ | 1,000.00 | | | $ | 1,000.00 | |
| Ending Account Value (5/31/11) | | $ | 1,023.60 | | | $ | 1,057.00 | | | $ | 1,020.50 | | | $ | 1,023.70 | | | | | $ | 1,021.39 | | | $ | 1,018.75 | | | $ | 1,019.20 | | | $ | 1,022.44 | |
| Expenses Incurred During Period | | $ | 3.58 | | | $ | 6.36 | | | $ | 5.79 | | | $ | 2.52 | | | | | $ | 3.58 | | | $ | 6.24 | | | $ | 5.79 | | | $ | 2.52 | |
For each class of the Fund, expenses are equal to the Fund’s annualized net expense ratio of .71%, 1.15% and .50% for Classes A, C1 and I, respectively, multiplied by the average account value over the period, mulitplied by 182/365 (to reflect the one-half year period). For Class C of the Fund, expenses are equal to the Fund’s annualized net expense ratio of 1.24% multiplied by the average account value over the period, multiplied by 134/365 (to reflect the 134 days in the period since class commencement of operations).
Nuveen Ohio Tax Free Fund
| | | | | | | | | | | | | | | | | | | | | | | | | | |
| | | Actual Performance | | | | | Hypothetical Performance | |
| | | A Shares | | | C1 Shares | | | I Shares | | | | | A Shares | | | C1 Shares | | | I Shares | |
| Beginning Account Value (12/01/10) | | $ | 1,000.00 | | | $ | 1,000.00 | | | $ | 1,000.00 | | | | | $ | 1,000.00 | | | $ | 1,000.00 | | | $ | 1,000.00 | |
| Ending Account Value (5/31/11) | | $ | 1,019.00 | | | $ | 1,016.70 | | | $ | 1,020.00 | | | | | $ | 1,021.39 | | | $ | 1,019.20 | | | $ | 1,022.44 | |
| Expenses Incurred During Period | | $ | 3.57 | | | $ | 5.78 | | | $ | 2.52 | | | | | $ | 3.58 | | | $ | 5.79 | | | $ | 2.52 | |
For each class of the Fund, expenses are equal to the Fund’s annualized net expense ratio of .71%, 1.15% and .50% for Classes A, C1 and I, respectively, multiplied by the average account value over the period, mulitplied by 182/365 (to reflect the one-half year period).
Nuveen Oregon Intermediate Municipal Bond Fund
| | | | | | | | | | | | | | | | | | | | | | | | | | |
| | | Actual Performance | | | | | Hypothetical Performance | |
| | | A Shares | | | C Shares | | | I Shares | | | | | A Shares | | | C Shares | | | I Shares | |
| Beginning Account Value (12/01/10) | | $ | 1,000.00 | | | $ | 1,000.00 | | | $ | 1,000.00 | | | | | $ | 1,000.00 | | | $ | 1,000.00 | | | $ | 1,000.00 | |
| Ending Account Value (5/31/11) | | $ | 1,025.00 | | | $ | 1,050.40 | | | $ | 1,025.80 | | | | | $ | 1,020.84 | | | $ | 1,018.15 | | | $ | 1,021.79 | |
| Expenses Incurred During Period | | $ | 4.14 | | | $ | 6.95 | | | $ | 3.18 | | | | | $ | 4.13 | | | $ | 6.84 | | | $ | 3.18 | |
For each class of the Fund, expenses are equal to the Fund’s annualized net expense ratio of .82%, and .63% for Classes A, and I, respectively, multiplied by the average account value over the period, mulitplied by 182/365 (to reflect the one-half year period). For Class C of the Fund, expenses are equal to the Fund’s annualized net expense ratio of 1.36% multiplied by the average account value over the period, multiplied by 134/365 (to reflect the 134 days in the period since class commencement of operations).
Shareholder Meeting Report (Unaudited)
A special meeting of shareholders was held in the offices of FAF Advisors, Inc. on December 17, 2010; at this meeting the shareholders were asked to vote on the election of Board Members, the approval of an Investment Advisory Agreement and the approval of an Investment Sub-Advisory Agreement.
| | | | | | | | | | | | | | | | | | | | | | | | | | | | |
| | | Nuveen
Colorado
Tax-Free
Fund | | | Nuveen
Minnesota
Intermediate
Municipal Bond
Fund | | | Nuveen
Minnesota
Municipal Bond
Fund | | | Nuveen
Missouri
Tax-Free
Fund | | | Nuveen
Nebraska
Municipal Bond
Fund | | | Nuveen
Ohio
Tax-Free
Fund | | | Nuveen
Oregon
Intermediate
Municipal Bond
Fund | |
| To approve an investment advisory agreement with Nuveen Asset Management and an investment sub-advisory agreement between Nuveen Asset Management and Nuveen Asset Management, LLC.: | | | | | | | | | | | | | | | | | |
For | | | 4,924,164 | | | | 19,537,687 | | | | 8,409,806 | | | | 12,195,273 | | | | 3,241,179 | | | | 5,928,705 | | | | 13,552,722 | |
Against | | | 32,152 | | | | 41,211 | | | | 177,157 | | | | 142,212 | | | | 4,582 | | | | 1,971 | | | | 10,580 | |
Abstain | | | 25,835 | | | | 48,161 | | | | 350,276 | | | | 14,876 | | | | 20,216 | | | | 3,765 | | | | 129,457 | |
Broker Non-Votes | | | 1,040,586 | | | | 3,391,332 | | | | 6,268,998 | | | | 1,674,001 | | | | 793,738 | | | | 307,848 | | | | 2,281,069 | |
Total | | | 6,022,737 | | | | 23,018,391 | | | | 15,206,237 | | | | 14,026,362 | | | | 4,059,715 | | | | 6,242,289 | | | | 15,973,828 | |
Approval of the Board Members was reached as follows: | | | | | | | | | | | | | | | | | | | | | | | | | | | | |
| | | | | | | |
John P. Amboian | | | | | | | | | | | | | | | | | | | | | | | | | | | | |
For | | | 6,022,737 | | | | 22,954,140 | | | | 14,653,464 | | | | 13,985,592 | | | | 4,045,243 | | | | 6,231,991 | | | | 15,936,945 | |
Withhold | | | — | | | | 64,251 | | | | 552,773 | | | | 40,770 | | | | 14,472 | | | | 10,298 | | | | 36,883 | |
Total | | | 6,022,737 | | | | 23,018,391 | | | | 15,206,237 | | | | 14,026,362 | | | | 4,059,715 | | | | 6,242,289 | | | | 15,973,828 | |
Robert P. Bremner | | | | | | | | | | | | | | | | | | | | | | | | | | | | |
For | | | 6,022,737 | | | | 22,920,630 | | | | 14,653,464 | | | | 13,981,128 | | | | 4,045,243 | | | | 6,231,991 | | | | 15,936,945 | |
Withhold | | | — | | | | 97,761 | | | | 552,773 | | | | 45,234 | | | | 14,472 | | | | 10,298 | | | | 36,883 | |
Total | | | 6,022,737 | | | | 23,018,391 | | | | 15,206,237 | | | | 14,026,362 | | | | 4,059,715 | | | | 6,242,289 | | | | 15,973,828 | |
Jack B. Evans | | | | | | | | | | | | | | | | | | | | | | | | | | | | |
For | | | 6,022,737 | | | | 22,959,263 | | | | 14,653,464 | | | | 13,981,996 | | | | 4,045,243 | | | | 6,231,991 | | | | 15,936,945 | |
Withhold | | | — | | | | 59,128 | | | | 552,773 | | | | 44,366 | | | | 14,472 | | | | 10,298 | | | | 36,883 | |
Total | | | 6,022,737 | | | | 23,018,391 | | | | 15,206,237 | | | | 14,026,362 | | | | 4,059,715 | | | | 6,242,289 | | | | 15,973,828 | |
William C. Hunter | | | | | | | | | | | | | | | | | | | | | | | | | | | | |
For | | | 6,022,737 | | | | 22,959,263 | | | | 14,653,464 | | | | 13,981,996 | | | | 4,045,243 | | | | 6,231,991 | | | | 15,936,945 | |
Withhold | | | — | | | | 59,128 | | | | 552,773 | | | | 44,366 | | | | 14,472 | | | | 10,298 | | | | 36,883 | |
Total | | | 6,022,737 | | | | 23,018,391 | | | | 15,206,237 | | | | 14,026,362 | | | | 4,059,715 | | | | 6,242,289 | | | | 15,973,828 | |
David J. Kundert | | | | | | | | | | | | | | | | | | | | | | | | | | | | |
For | | | 6,022,737 | | | | 22,920,630 | | | | 14,653,464 | | | | 13,981,128 | | | | 4,045,243 | | | | 6,231,991 | | | | 15,936,945 | |
Withhold | | | — | | | | 97,761 | | | | 552,773 | | | | 45,234 | | | | 14,472 | | | | 10,298 | | | | 36,883 | |
Total | | | 6,022,737 | | | | 23,018,391 | | | | 15,206,237 | | | | 14,026,362 | | | | 4,059,715 | | | | 6,242,289 | | | | 15,973,828 | |
William J. Schneider | | | | | | | | | | | | | | | | | | | | | | | | | | | | |
For | | | 6,022,737 | | | | 22,920,630 | | | | 14,653,464 | | | | 13,981,996 | | | | 4,045,243 | | | | 6,231,991 | | | | 15,936,945 | |
Withhold | | | — | | | | 97,761 | | | | 552,773 | | | | 44,366 | | | | 14,472 | | | | 10,298 | | | | 36,883 | |
Total | | | 6,022,737 | | | | 23,018,391 | | | | 15,206,237 | | | | 14,026,362 | | | | 4,059,715 | | | | 6,242,289 | | | | 15,973,828 | |
Judith M. Stockdale | | | | | | | | | | | | | | | | | | | | | | | | | | | | |
For | | | 6,022,737 | | | | 22,954,140 | | | | 14,653,464 | | | | 13,981,996 | | | | 4,045,243 | | | | 6,231,991 | | | | 15,946,994 | |
Withhold | | | — | | | | 64,251 | | | | 552,773 | | | | 44,366 | | | | 14,472 | | | | 10,298 | | | | 26,834 | |
Total | | | 6,022,737 | | | | 23,018,391 | | | | 15,206,237 | | | | 14,026,362 | | | | 4,059,715 | | | | 6,242,289 | | | | 15,973,828 | |
Carole E. Stone | | | | | | | | | | | | | | | | | | | | | | | | | | | | |
For | | | 6,022,737 | | | | 22,959,263 | | | | 14,653,464 | | | | 13,981,996 | | | | 4,045,243 | | | | 6,231,991 | | | | 15,946,994 | |
Withhold | | | — | | | | 59,128 | | | | 552,773 | | | | 44,366 | | | | 14,472 | | | | 10,298 | | | | 26,834 | |
Total | | | 6,022,737 | | | | 23,018,391 | | | | 15,206,237 | | | | 14,026,362 | | | | 4,059,715 | | | | 6,242,289 | | | | 15,973,828 | |
Virginia L. Stringer | | | | | | | | | | | | | | | | | | | | | | | | | | | | |
For | | | 6,022,737 | | | | 22,915,507 | | | | 14,653,464 | | | | 13,981,128 | | | | 4,045,243 | | | | 6,231,991 | | | | 15,946,994 | |
Withhold | | | — | | | | 102,884 | | | | 552,773 | | | | 45,234 | | | | 14,472 | | | | 10,298 | | | | 26,834 | |
Total | | | 6,022,737 | | | | 23,018,391 | | | | 15,206,237 | | | | 14,026,362 | | | | 4,059,715 | | | | 6,242,289 | | | | 15,973,828 | |
Terence J. Toth | | | | | | | | | | | | | | | | | | | | | | | | | | | | |
For | | | 6,022,737 | | | | 22,959,263 | | | | 14,653,464 | | | | 13,985,592 | | | | 4,045,243 | | | | 6,231,991 | | | | 15,936,945 | |
Withhold | | | — | | | | 59,128 | | | | 552,773 | | | | 40,770 | | | | 14,472 | | | | 10,298 | | | | 36,883 | |
Total | | | 6,022,737 | | | | 23,018,391 | | | | 15,206,237 | | | | 14,026,362 | | | | 4,059,715 | | | | 6,242,289 | | | | 15,973,828 | |
Report of
Independent Registered
Public Accounting Firm
The Board of Directors and Shareholders
Nuveen Colorado Tax Free Fund (formerly known as First American Colorado Tax Free Fund)
Nuveen Minnesota Intermediate Municipal Bond Fund (formerly known as First American Minnesota Intermediate Tax Free Fund)
Nuveen Minnesota Municipal Bond Fund (formerly known as First American Minnesota Tax Free Fund)
Nuveen Missouri Tax Free Fund (formerly known as First American Missouri Tax Free Fund)
Nuveen Nebraska Municipal Bond Fund (formerly known as First American Nebraska Tax Free Fund)
Nuveen Ohio Tax Free Fund (formerly known as First American Ohio Tax Free Fund)
Nuveen Oregon Intermediate Municipal Bond Fund (formerly known as First American Oregon Intermediate Tax Free Fund)
We have audited the accompanying statements of assets and liabilities, including the portfolios of investments, of Nuveen Colorado Tax Free Fund (formerly known as First American Colorado Tax Free Fund), Nuveen Minnesota Intermediate Municipal Bond Fund (formerly known as First American Minnesota Intermediate Tax Free Fund), Nuveen Minnesota Municipal Bond Fund (formerly known as First American Minnesota Tax Free Fund), Nuveen Missouri Tax Free Fund (formerly known as First American Missouri Tax Free Fund), Nuveen Nebraska Municipal Bond Fund (formerly known as First American Nebraska Tax Free Fund), Nuveen Ohio Tax Free Fund (formerly known as First American Ohio Tax Free Fund), and Nuveen Oregon Intermediate Municipal Bond Fund (formerly known as First American Oregon Intermediate Tax Free Fund) (the “Funds”) as of May 31, 2011, and the related statements of operations, the statements of changes in net assets, and the financial highlights for each of the periods indicated therein. These financial statements and financial highlights are the responsibility of the Funds’ management. Our responsibility is to express an opinion on these financial statements and financial highlights based on our audits.
We conducted our audits in accordance with the standards of the Public Company Accounting Oversight Board (United States). Those standards require that we plan and perform the audits to obtain reasonable assurance about whether the financial statements and financial highlights are free of material misstatement. We were not engaged to perform an audit of the Funds’ internal control over financial reporting. Our audits included consideration of internal control over financial reporting as a basis for designing audit procedures that are appropriate in the circumstances, but not for the purpose of expressing an opinion on the effectiveness of the Funds’ internal control over financial reporting. Accordingly, we express no such opinion. An audit also includes examining, on a test basis, evidence supporting the amounts and disclosures in the financial statements and financial highlights, assessing the accounting principles used and significant estimates made by management, and evaluating the overall financial statement presentation. Our procedures included confirmation of securities owned as of May 31, 2011, by correspondence with the custodian and brokers or by other appropriate auditing procedures where replies from brokers were not received. We believe that our audits provide a reasonable basis for our opinion.
In our opinion, the financial statements and financial highlights referred to above present fairly, in all material respects, the financial positions of Nuveen Colorado Tax Free Fund (formerly known as First American Colorado Tax Free Fund), Nuveen Minnesota Intermediate Municipal Bond Fund (formerly known as First American Minnesota Intermediate Tax Free Fund), Nuveen Minnesota Municipal Bond Fund (formerly known as First American Minnesota Tax Free Fund), Nuveen Missouri Tax Free Fund (formerly known as First American Missouri Tax Free Fund), Nuveen Nebraska Municipal Bond Fund (formerly known as First American Nebraska Tax Free Fund), Nuveen Ohio Tax Free Fund (formerly known as First American Ohio Tax Free Fund), and Nuveen Oregon Intermediate Municipal Bond Fund (formerly known as First American Oregon Intermediate Tax Free Fund) at May 31, 2011, and the results of their operations, the changes in their net assets, and the financial highlights for each of the periods indicated therein in conformity with U.S. generally accepted accounting principles.

Chicago, Illinois
July 28, 2011
Portfolio of Investments
Nuveen Colorado Tax Free Fund
(formerly known as First American Colorado Tax Free Fund)
May 31, 2011
| | | | | | | | | | | | | | |
Principal
Amount (000) | | | Description p | | | | | | | | Value | |
| | | | | | | | | | | | | | |
| | | | MUNICIPAL BONDS – 98.6% | | | | | | | | | | |
| | | | | |
| | | | Certificates of Participation – 8.2% | | | | | | | | | | |
| | | | | |
| | | | Colorado Higher Education Capital Construction Lease | | | | | | | | | | |
| $ | 425 | | | 5.500%, 11/01/2019 | | | | | | | | $ | 481,661 | |
| | 1,255 | | | 5.500%, 11/01/2027 | | | | | | | | | 1,335,383 | |
| | | | | |
| | | | Colorado Higher Education Capital Construction Lease (Pre-refunded 11/01/2018 @ 100) | | | | | | | | | | |
| | 465 | | | 5.500%, 11/01/2027 | | | | | | | | | 569,936 | |
| | | | | |
| | | | Eagle River Fire District | | | | | | | | | | |
| | 225 | | | 6.125%, 12/01/2019 | | | | | | | | | 235,253 | |
| | 220 | | | 6.625%, 12/01/2024 | | | | | | | | | 228,002 | |
| | 400 | | | 6.785%, 12/01/2030 | | | | | | | | | 404,224 | |
| | | | | |
| | | | Garfield County Public Library, Regional Lease Financing Program | | | | | | | | | | |
| | 835 | | | 5.375%, 12/01/2027 | | | | | | | | | 891,604 | |
| | | | | |
| | | | Pueblo County, Capital Construction | | | | | | | | | | |
| | 210 | | | 4.400%, 12/01/2016 | | | | | | | | | 225,494 | |
| | 200 | | | 5.000%, 12/01/2024 | | | | | | | | | 204,278 | |
| | 4,235 | | | Total Certificates of Participation | | | | | | | | | 4,575,835 | |
| | | | Continuing Care Retirement Communities – 3.0% | | | | | | | | | | |
| | | | | |
| | | | Colorado Health Facilities Authority, Christian Living Communities Project, Series A | | | | | | | | | | |
| | 250 | | | 5.250%, 01/01/2014 | | | | | | | | | 249,750 | |
| | 100 | | | 5.750%, 01/01/2026 | | | | | | | | | 92,507 | |
| | | | | |
| | | | Colorado Health Facilities Authority, Covenant Retirement Communities | | | | | | | | | | |
| | 500 | | | 5.000%, 12/01/2016 | | | | | | | | | 516,825 | |
| | 200 | | | 5.250%, 12/01/2025 | | | | | | | | | 184,370 | |
| | | | | |
| | | | Colorado Health Facilities Authority, Covenant Retirement Communities, Series B | | | | | | | | | | |
| | 350 | | | 6.125%, 12/01/2033 | | | | | | | | | 336,592 | |
| | | | | |
| | | | Illinois Finance Authority, Franciscan Communities, Series A | | | | | | | | | | |
| | 225 | | | 5.500%, 05/15/2037 | | | | | | | | | 165,010 | |
| | | | | |
| | | | Illinois Finance Authority, Three Crowns Park Plaza, Series A | | | | | | | | | | |
| | 100 | | | 5.875%, 02/15/2026 | | | | | | | | | 93,678 | |
| | 1,725 | | | Total Continuing Care Retirement Communities | | | | | | | | | 1,638,732 | |
| | | | Education – 21.2% | | | | | | | | | | |
| | | | | |
| | | | Adams State College Auxiliary Facilities Improvement Series A, (STAID) | | | | | | | | | | |
| | 1,340 | | | 5.500%, 05/15/2034 | | | | | | | | | 1,405,459 | |
| | 1,000 | | | 5.500%, 05/15/2039 | | | | | | | | | 1,038,780 | |
| | | | | |
| | | | Colorado Educational & Cultural Facilities Authority, Ave Maria School Project (RAAI) | | | | | | | | | | |
| | 220 | | | 4.750%, 12/01/2014 | | | | | | | | | 228,765 | |
| | 230 | | | 4.750%, 12/01/2015 | | | | | | | | | 238,478 | |
| | 250 | | | 4.850%, 12/01/2025 | | | | | | | | | 219,985 | |
| | | | | |
| | | | Colorado Educational & Cultural Facilities Authority, Bromley East Charter School Project
Series A | | | | | | | | | | |
| | 65 | | | 6.250%, 09/15/2011 (ETM) | | | | | | | | | 66,049 | |
| | | | | |
| | | | Colorado Educational & Cultural Facilities Authority, Charter School | | | | | | | | | | |
| | 1,000 | | | 5.625%, 05/01/2040 | | | | | | | | | 962,680 | |
| | | | | |
| | | | Colorado Educational & Cultural Facilities Authority, Charter School, James Irwin Foundation (CIFG) (STAID) | | | | | | | | | | |
| | 250 | | | 5.000%, 08/01/2027 | | | | | | | | | 251,365 | |
| | | | | |
| | | | Colorado Educational & Cultural Facilities Authority, Charter School, Parker Core (SMO) | | | | | | | | | | |
| | 500 | | | 5.000%, 11/01/2037 | | | | | | | | | 434,125 | |
| | | | | |
| | | | Colorado Educational & Cultural Facilities Authority, Charter School, Pinnacle High School | | | | | | | | | | |
| | 1,000 | | | 5.000%, 12/01/2029 | | | | | | | | | 978,740 | |
| | | | | |
| | | | Colorado Educational & Cultural Facilities Authority, Charter School, Twin Peaks, Series B | | | | | | | | | | |
| | 600 | | | 7.500%, 03/15/2035 | | | | | | | | | 613,044 | |
| | | | | | | | | | | | | | |
Principal
Amount (000) | | | Description p | | | | | | | | Value | |
| | | | | | | | | | | | | | |
| | | | Education (continued) | | | | | | | | | | |
| | | | | |
| | | | Colorado Educational & Cultural Facilities Authority, Cheyenne Mountain Charter School, Series A, (SMO) | | | | | | | | | | |
| $ | 240 | | | 5.000%, 06/15/2018 | | | | | | | | $ | 255,953 | |
| | 255 | | | 5.000%, 06/15/2019 | | | | | | | | | 268,416 | |
| | 265 | | | 5.000%, 06/15/2020 | | | | | | | | | 275,197 | |
| | 500 | | | 5.250%, 06/15/2029 | | | | | | | | | 483,030 | |
| | | | | |
| | | | Colorado Educational & Cultural Facilities Authority, Kent Denver School Project | | | | | | | | | | |
| | 500 | | | 5.125%, 10/01/2039 | | | | | | | | | 489,715 | |
| | | | | |
| | | | Colorado Educational & Cultural Facilities Authority, Northwest Nazarene | | | | | | | | | | |
| | 690 | | | 4.500%, 11/01/2015 | | | | | | | | | 696,389 | |
| | | | | |
| | | | Colorado Educational & Cultural Facilities Authority, Vail Mountain School Project | | | | | | | | | | |
| | 1,000 | | | 6.125%, 05/01/2040 | | | | | | | | | 941,420 | |
| | | | | |
| | | | University of Colorado Enterprise System, Series A | | | | | | | | | | |
| | 335 | | | 5.750%, 06/01/2028 | | | | | | | | | 373,950 | |
| | 500 | | | 5.375%, 06/01/2032 | | | | | | | | | 531,020 | |
| | | | | |
| | | | Western State College (STAID) | | | | | | | | | | |
| | 1,000 | | | 5.000%, 05/15/2034 | | | | | | | | | 1,015,390 | |
| | 11,740 | | | Total Education | | | | | | | | | 11,767,950 | |
| | | | General Obligations – 21.0% | | | | | | | | | | |
| | | | | |
| | | | Adams & Arapahoe Counties School District, #28J, Aurora (STAID) | | | | | | | | | | |
| | 300 | | | 5.500%, 12/01/2021 | | | | | | | | | 353,010 | |
| | 165 | | | 5.500%, 12/01/2025 | | | | | | | | | 186,336 | |
| | | | | |
| | | | Adams County School District #1, Mapleton Public Schools (STAID) | | | | | | | | | | |
| | 1,000 | | | 6.250%, 12/01/2035 | | | | | | | | | 1,128,710 | |
| | | | | |
| | | | Belle Creek Metropolitan School District #1 | | | | | | | | | | |
| | 670 | | | 6.000%, 12/01/2026 | | | | | | | | | 713,919 | |
| | | | | |
| | | | Boulder, Larimer & Weld Counties, St. Vrain Valley School District #RE1J (STAID) | | | | | | | | | | |
| | 2,000 | | | 5.000%, 12/15/2033 | | | | | | | | | 2,108,380 | |
| | | | | |
| | | | Denver City & County School District #1, Series A, (STAID) | | | | | | | | | | |
| | 1,000 | | | 5.000%, 12/01/2028 | | | | | | | | | 1,074,620 | |
| | | | | |
| | | | Gunnison Watershed School District, #RE1J, Series 2009, (STAID) | | | | | | | | | | |
| | 1,000 | | | 5.250%, 12/01/2026 | | | | | | | | | 1,108,650 | |
| | 1,800 | | | 5.250%, 12/01/2033 | | | | | | | | | 1,931,886 | |
| | | | | |
| | | | North Range Metropolitan District #1 (ACA) | | | | | | | | | | |
| | 295 | | | 4.250%, 12/15/2018 | | | | | | | | | 250,098 | |
| | | | | |
| | | | Puerto Rico Commonwealth, Series A | | | | | | | | | | |
| | 500 | | | 5.500%, 07/01/2018 | | | | | | | | | 537,580 | |
| | | | | |
| | | | Puerto Rico Commonwealth, Series C-7, (NATL) | | | | | | | | | | |
| | 250 | | | 6.000%, 07/01/2027 | | | | | | | | | 259,463 | |
| | | | | |
| | | | Puerto Rico Commonwealth, Public Improvement, Series A | | | | | | | | | | |
| | 375 | | | 5.250%, 07/01/2026 | | | | | | | | | 370,751 | |
| | | | | |
| | | | Rio Blanco County School District, #RE1, Meeker (STAID) | | | | | | | | | | |
| | 500 | | | 5.250%, 12/01/2022 | | | | | | | | | 560,150 | |
| | 150 | | | 5.250%, 12/01/2024 | | | | | | | | | 165,117 | |
| | | | | |
| | | | Sand Creek Metropolitan District, Limited Tax, Series B | | | | | | | | | | |
| | 1,000 | | | 5.000%, 12/01/2040 | | | | | | | | | 873,650 | |
| | 11,005 | | | Total General Obligations | | | | | | | | | 11,622,320 | |
| | | | Health Care – 15.8% | | | | | | | | | | |
| | | | | |
| | | | Colorado Health Facilities Authority, Catholic Health Initiatives, Series A | | | | | | | | | | |
| | 500 | | | 5.000%, 07/01/2039 | | | | | | | | | 483,860 | |
| | | | | |
| | | | Colorado Health Facilities Authority, Catholic Health Initiatives, Series D | | | | | | | | | | |
| | 500 | | | 5.125%, 10/01/2017 | | | | | | | | | 581,830 | |
| | 500 | | | 6.250%, 10/01/2033 | | | | | | | | | 541,125 | |
Portfolio of Investments
Nuveen Colorado Tax Free Fund (continued)
May 31, 2011
| | | | | | | | | | | | | | |
Principal
Amount (000) | | | Description p | | | | | | | | Value | |
| | | | | | | | | | | | | | |
| | | | Health Care (continued) | | | | | | | | | | |
| | | | | |
| | | | Colorado Health Facilities Authority, Evangelical Lutheran | | | | | | | | | | |
| $ | 250 | | | 5.000%, 06/01/2016 | | | | | | | | $ | 268,488 | |
| | 195 | | | 6.900%, 12/01/2025 | | | | | | | | | 199,136 | |
| | | | | |
| | | | Colorado Health Facilities Authority, Evangelical Lutheran, Series A | | | | | | | | | | |
| | 230 | | | 5.250%, 06/01/2034 | | | | | | | | | 206,259 | |
| | | | | |
| | | | Colorado Health Facilities Authority, Health & Residential Care Facilities, Volunteers of America | | | | | | | | | | |
| | | | Series A | | | | | | | | | | |
| | 500 | | | 5.000%, 07/01/2015 | | | | | | | | | 487,740 | |
| | | | | |
| | | | Colorado Health Facilities Authority, Longmont United Hospital, Series B, (RAAI) | | | | | | | | | | |
| | 325 | | | 4.625%, 12/01/2024 | | | | | | | | | 296,241 | |
| | | | | |
| | | | Colorado Health Facilities Authority, National Jewish Medical & Research Center | | | | | | | | | | |
| | 855 | | | 5.375%, 01/01/2016 | | | | | | | | | 855,880 | |
| | | | | |
| | | | Colorado Health Facilities Authority, Portercare Adventist Health | | | | | | | | | | |
| | | | (Pre-refunded 11/15/2011 @ 101) | | | | | | | | | | |
| | 600 | | | 6.500%, 11/15/2023 | | | | | | | | | 622,800 | |
| | | | | |
| | | | Colorado Health Facilities Authority, Valley View Hospital Association Project | | | | | | | | | | |
| | 400 | | | 5.500%, 05/15/2028 | | | | | | | | | 380,520 | |
| | | | | |
| | | | Colorado Health Facilities, NCMC Income Project, Series A, (AGM) | | | | | | | | | | |
| | 1,000 | | | 5.250%, 05/15/2026 | | | | | | | | | 1,033,120 | |
| | | | | |
| | | | Colorado Health Facilities, Total Longterm Care National, Series A | | | | | | | | | | |
| | 780 | | | 6.250%, 11/15/2040 | | | | | | | | | 762,528 | |
| | | | | |
| | | | Colorado Springs Hospital | | | | | | | | | | |
| | 750 | | | 6.250%, 12/15/2033 | | | | | | | | | 789,990 | |
| | | | | |
| | | | Delta County Memorial Hospital District Enterprise | | | | | | | | | | |
| | 500 | | | 5.350%, 09/01/2017 | | | | | | | | | 507,325 | |
| | 515 | | | 5.500%, 09/01/2025 | | | | | | | | | 511,436 | |
| | | | | |
| | | | Denver Health & Hospital Authority, Healthcare, Series A | | | | | | | | | | |
| | 250 | | | 4.750%, 12/01/2027 | | | | | | | | | 221,145 | |
| | 8,650 | | | Total Health Care | | | | | | | | | 8,749,423 | |
| | | | Housing – 5.6% | | | | | | | | | | |
| | | | | |
| | | | Colorado Educational & Cultural Facilities Authority, Student Housing, Campus Village Apartment | | | | | | | | | | |
| | 810 | | | 5.000%, 06/01/2022 | | | | | | | | | 854,210 | |
| | 50 | | | 5.500%, 06/01/2038 | | | | | | | | | 48,597 | |
| | | | | |
| | | | Colorado Housing & Finance Authority, Series E-2, (AMT) | | | | | | | | | | |
| | 25 | | | 7.000%, 02/01/2030 | | | | | | | | | 25,676 | |
| | | | | |
| | | | Colorado Housing & Finance Authority, Multifamily Project, Series B-4, Class I | | | | | | | | | | |
| | 95 | | | 5.900%, 04/01/2031 | | | | | | | | | 95,057 | |
| | | | | |
| | | | Colorado Housing & Finance Authority, Single Family Program, Series B-2, (AMT) | | | | | | | | | | |
| | 10 | | | 7.100%, 04/01/2017 | | | | | | | | | 10,370 | |
| | | | | |
| | | | Denver City & County Housing Authority, Capital Funding Program, Three Towers Rehabilitation Project (AGM) (AMT) | | | | | | | | | | |
| | 1,500 | | | 4.550%, 11/01/2017 | | | | | | | | | 1,575,075 | |
| | 500 | | | 5.200%, 11/01/2027 | | | | | | | | | 504,725 | |
| | 2,990 | | | Total Housing | | | | | | | | | 3,113,710 | |
| | | | Lease Revenue – 1.0% | | | | | | | | | | |
| | | | | |
| | | | Puerto Rico Public Buildings Authority, Government Facilities | | | | | | | | | | |
| | | | Series M-2, Mandatory Put 07/01/2017 @ 100 (AMBAC) (COMGTY) | | | | | | | | | | |
| | 500 | | | 5.500%, 07/01/2035 | | | | | | | | | 533,175 | |
| | | | Miscellaneous – 0.7% | | | | | | | | | | |
| | | | | |
| | | | High Plains Metropolitan District, Series B | | | | | | | | | | |
| | 400 | | | 4.375%, 12/01/2015 | | | | | | | | | 401,412 | |
| | | | | | | | | | | | | | |
Principal
Amount (000) | | | Description p | | | | | | | | Value | |
| | | | | | | | | | | | | | |
| | | | Tax Revenue – 5.3% | | | | | | | | | | |
| | | | | |
| | | | Lone Tree Sales & Use Tax, Recreational Projects, Series A | | | | | | | | | | |
| $ | 340 | | | 5.000%, 12/01/2020 | | | | | | | | $ | 385,050 | |
| | | | | |
| | | | Park Creek Metropolitan District, Limited Property Tax, Series A, (AGM) | | | | | | | | | | |
| | 1,000 | | | 6.125%, 12/01/2041 | | | | | | | | | 1,033,440 | |
| | | | | |
| | | | Park Meadows Business Improvement District, Shared Sales Tax | | | | | | | | | | |
| | 225 | | | 5.000%, 12/01/2017 | | | | | | | | | 224,876 | |
| | 475 | | | 5.300%, 12/01/2027 | | | | | | | | | 409,203 | |
| | | | | |
| | | | Puerto Rico, Sales Tax Financing, Series A | | | | | | | | | | |
| | 550 | | | 6.000%, 08/01/2042 | | | | | | | | | 564,938 | |
| | | | | |
| | | | Superior Open Space Sales & Use Tax | | | | | | | | | | |
| | 330 | | | 5.000%, 06/01/2026 | | | | | | | | | 315,243 | |
| | 2,920 | | | Total Tax Revenue | | | | | | | | | 2,932,750 | |
| | | | Transportation – 7.6% | | | | | | | | | | |
| | | | | |
| | | | Denver City & County Airport Revenue, Series A | | | | | | | | | | |
| | 1,000 | | | 5.000%, 11/15/2031 | | | | | | | | | 1,017,570 | |
| | | | | |
| | | | E-470 Public Highway Authority, Series B (NATL) | | | | | | | | | | |
| | 1,575 | | | 0.000%, 09/01/2017 | | | | | | | | | 1,131,842 | |
| | 960 | | | 0.000%, 09/01/2019 | | | | | | | | | 590,880 | |
| | 1,000 | | | 0.000%, 09/01/2022 | | | | | | | | | 486,570 | |
| | | | | |
| | | | E-470 Public Highway Authority, Series C, Convertible CABs (NATL) | | | | | | | | | | |
| | 500 | | | 0.000% through 09/01/2011, thereafter 5.000%, 09/01/2017 | | | | | | | | | 514,530 | |
| | | | | |
| | | | E-470 Public Highway Authority, Series D1, (NATL) | | | | | | | | | | |
| | 300 | | | 5.500%, 09/01/2024 | | | | | | | | | 293,352 | |
| | | | | |
| | | | Eagle County Air Terminal, Airport Terminal Improvement Project | | | | | | | | | | |
| | | | Series B, (AMT) | | | | | | | | | | |
| | 205 | | | 5.250%, 05/01/2020 | | | | | | | | | 194,463 | |
| | 5,540 | | | Total Transportation | | | | | | | | | 4,229,207 | |
| | | | Utilities – 9.2% | | | | | | | | | | |
| | | | | |
| | | | Arkansas River Power Authority | | | | | | | | | | |
| | 225 | | | 6.000%, 10/01/2040 | | | | | | | | | 219,672 | |
| | 1,255 | | | 6.125%, 10/01/2040 | | | | | | | | | 1,247,257 | |
| | | | | |
| | | | Broomfield Water Activity Enterprise (NATL) | | | | | | | | | | |
| | 500 | | | 5.500%, 12/01/2017 | | | | | | | | | 506,710 | |
| | | | | |
| | | | Colorado Housing & Finance Authority, Waste Disposal, Management Income Project (AMT) | | | | | | | | | | |
| | 250 | | | 5.700%, 07/01/2018 | | | | | | | | | 268,878 | |
| | | | | |
| | | | Colorado Springs Utilities, Series C | | | | | | | | | | |
| | 1,200 | | | 5.500%, 11/15/2048 | | | | | | | | | 1,261,992 | |
| | | | | |
| | | | Colorado Water Resources & Power Development Authority, Fountain Electric Water Utility | | | | | | | | | | |
| | | | Series A, (AGM) | | | | | | | | | | |
| | 350 | | | 5.000%, 09/01/2036 | | | | | | | | | 353,188 | |
| | | | | |
| | | | Eagle River Water & Sanitation Revenue (AGTY) | | | | | | | | | | |
| | 800 | | | 5.000%, 12/01/2034 | | | | | | | | | 823,440 | |
| | | | | |
| | | | Public Authority for Colorado Energy Natural Gas | | | | | | | | | | |
| | 425 | | | 6.250%, 11/15/2028 | | | | | | | | | 449,650 | |
| | 5,005 | | | Total Utilities | | | | | | | | | 5,130,787 | |
| | 54,710 | | | Total Municipal Bonds (cost $53,248,299) | | | | | | | | | 54,695,301 | |
Portfolio of Investments
Nuveen Colorado Tax Free Fund (continued)
May 31, 2011
| | | | | | | | | | | | | | |
| | | | | |
| Shares | | | Description p | | | | | | | | Value | |
| | | | | | | | | | | | | | |
| | | | SHORT-TERM INVESTMENTS – 0.3% | | | | | | | | | | |
| | | | | |
| | | | Money Market Funds – 0.3% | | | | | | | | | | |
| | | | | |
| | 146,724 | | | First American Tax Free Obligations Fund, Class Z, 0.000% | | | | | | | | $ | 146,724 | |
| | | | Total Short-Term Investments (cost $146,724) | | | | | | | | | 146,724 | |
| | | | Total Investments – 98.9% (cost $53,395,023) | | | | | | | | | 54,842,025 | |
| | | | Other Assets Less Liabilities – 1.1% | | | | | | | | | 611,573 | |
| | | | Net Assets – 100.0% | | | | | | | | $ | 55,453,598 | |
| | p | | All percentages shown in the Portfolio of Investments are based on net assets. |
| | | | Convertible Capital Appreciation Bonds (Convertible CABs) initially pay no interest but accrete in value from the date of issuance through the conversion date, at which time the bonds start to accrue and pay interest on a semiannual basis until final maturity. |
| | | | The rate shown is the annualized seven-day effective yield as of May 31, 2011. |
| | (ETM) | | Escrowed to maturity. |
See accompanying notes to financial statements.
Portfolio of Investments
Nuveen Minnesota Intermediate Municipal Bond Fund
(formerly known as First American Minnesota Intermediate Tax Free Fund)
May 31, 2011
| | | | | | | | | | | | | | |
Principal
Amount (000) | | | Description p | | | | | | | | Value | |
| | | | | | | | | | | | | | |
| | | | MUNICIPAL BONDS – 98.5% | | | | | | | | | | |
| | | | | |
| | | | Certificates of Participation – 1.3% | | | | | | | | | | |
| | | | | |
| | | | Duluth Independent School District #709, Series B (MSDCEP) | | | | | | | | | | |
| $ | 1,890 | | | 4.000%, 02/01/2019 | | | | | | | | $ | 2,103,230 | |
| | | | | |
| | | | Northeast Metropolitan Intermediate School District #916 | | | | | | | | | | |
| | 1,000 | | | 4.250%, 01/01/2015 | | | | | | | | | 1,052,090 | |
| | 2,890 | | | Total Certificates of Participation | | | | | | | | | 3,155,320 | |
| | | | Economic Development – 2.2% | | | | | | | | | | |
| | | | | |
| | | | Minneapolis Community Development Agency, Series G-3, (Pre-refunded 12/01/2011 @ 100) | | | | | | | | | | |
| | 975 | | | 5.350%, 12/01/2021 | | | | | | | | | 999,970 | |
| | | | | |
| | | | Minneapolis Development, Common Bond, Series 1A, (AMT) | | | | | | | | | | |
| | 480 | | | 4.550%, 12/01/2013 | | | | | | | | | 508,617 | |
| | 505 | | | 4.625%, 12/01/2014 | | | | | | | | | 539,820 | |
| | | | | |
| | | | Minneapolis Development, Common Bond, Series 2A | | | | | | | | | | |
| | 2,000 | | | 4.625%, 12/01/2020 | | | | | | | | | 2,076,500 | |
| | | | | |
| | | | Minneapolis Supported Development, Common Bond, Series 2A, (AMT) | | | | | | | | | | |
| | 1,000 | | | 5.125%, 06/01/2022 | | | | | | | | | 1,006,410 | |
| | 4,960 | | | Total Economic Development | | | | | | | | | 5,131,317 | |
| | | | Education – 18.2% | | | | | | | | | | |
| | | | | |
| | | | Minneapolis, The Blake School Project | | | | | | | | | | |
| | 550 | | | 4.000%, 09/01/2019 | | | | | | | | | 594,930 | |
| | 315 | | | 4.000%, 09/01/2021 | | | | | | | | | 335,103 | |
| | | | Minneapolis, The Blake School Project, (Pre-refunded 09/01/2011 @ 100) | | | | | | | | | | |
| | 445 | | | 5.000%, 09/01/2012 | | | | | | | | | 450,375 | |
| | | | | |
| | | | Minnesota Colleges & Universities, Series A | | | | | | | | | | |
| | 985 | | | 4.000%, 10/01/2022 | | | | | | | | | 1,035,728 | |
| | 1,755 | | | 4.000%, 10/01/2023 | | | | | | | | | 1,820,725 | |
| | 1,415 | | | 4.250%, 10/01/2024 | | | | | | | | | 1,483,132 | |
| | 750 | | | 4.375%, 10/01/2025 | | | | | | | | | 781,777 | |
| | 870 | | | 4.500%, 10/01/2026 | | | | | | | | | 907,601 | |
| | | | | |
| | | | Minnesota Higher Education Facilities Authority, Augsburg College, Series 6-C | | | | | | | | | | |
| | 1,075 | | | 4.750%, 05/01/2018 | | | | | | | | | 1,106,293 | |
| | | | | |
| | | | Minnesota Higher Education Facilities Authority, Augsburg College, Series 6-J1 | | | | | | | | | | |
| | 320 | | | 5.000%, 05/01/2013 | | | | | | | | | 338,518 | |
| | 375 | | | 5.000%, 05/01/2016 | | | | | | | | | 404,527 | |
| | 1,295 | | | 5.000%, 05/01/2020 | | | | | | | | | 1,338,629 | |
| | | | | |
| | | | Minnesota Higher Education Facilities Authority, Augsburg College, Series 7-G | | | | | | | | | | |
| | 815 | | | 4.000%, 10/01/2021 | | | | | | | | | 797,600 | |
| | | | | |
| | | | Minnesota Higher Education Facilities Authority, Bethel University, Series 6-R | | | | | | | | | | |
| | 1,125 | | | 5.500%, 05/01/2018 | | | | | | | | | 1,169,201 | |
| | 1,185 | | | 5.500%, 05/01/2019 | | | | | | | | | 1,224,153 | |
| | 1,050 | | | 5.500%, 05/01/2024 | | | | | | | | | 1,024,380 | |
| | | | | |
| | | | Minnesota Higher Education Facilities Authority, College of Art & Design, Series 6-K | | | | | | | | | | |
| | 310 | | | 5.000%, 05/01/2013 | | | | | | | | | 327,940 | |
| | 320 | | | 5.000%, 05/01/2014 | | | | | | | | | 345,520 | |
| | 340 | | | 5.000%, 05/01/2015 | | | | | | | | | 372,144 | |
| | 355 | | | 5.000%, 05/01/2016 | | | | | | | | | 385,835 | |
| | 370 | | | 5.000%, 05/01/2017 | | | | | | | | | 396,577 | |
| | | | | |
| | | | Minnesota Higher Education Facilities Authority, Gustavus Adolfus College, Series 7-B | | | | | | | | | | |
| | 1,500 | | | 5.000%, 10/01/2018 | | | | | | | | | 1,697,370 | |
| | 1,040 | | | 5.000%, 10/01/2023 | | | | | | | | | 1,111,354 | |
| | 150 | | | 4.250%, 10/01/2024 | | | | | | | | | 150,569 | |
Portfolio of Investments
Nuveen Minnesota Intermediate Municipal Bond Fund (continued)
May 31, 2011
| | | | | | | | | | | | | | |
Principal
Amount (000) | | | Description p | | | | | | | | Value | |
| | | | | | | | | | | | | | |
| | | | Education (continued) | | | | | | | | | | |
| | | | | |
| | | | Minnesota Higher Education Facilities Authority, Hamline University, Series 7-E | | | | | | | | | | |
| $ | 1,000 | | | 4.125%, 10/01/2018 | | | | | | | | $ | 1,031,450 | |
| | 1,370 | | | 4.375%, 10/01/2020 | | | | | | | | | 1,396,989 | |
| | 500 | | | 4.500%, 10/01/2021 | | | | | | | | | 509,250 | |
| | 250 | | | 5.000%, 10/01/2029 | | | | | | | | | 244,698 | |
| | | | | |
| | | | Minnesota Higher Education Facilities Authority, Hamline University, Series K-1 | | | | | | | | | | |
| | 1,000 | | | 4.250%, 10/01/2018 | | | | | | | | | 1,032,080 | |
| | | | | |
| | | | Minnesota Higher Education Facilities Authority, Hamline University, Series K-2 | | | | | | | | | | |
| | 625 | | | 6.000%, 10/01/2032 | | | | | | | | | 655,356 | |
| | | | | |
| | | | Minnesota Higher Education Facilities Authority, St. Benedict College, Series V | | | | | | | | | | |
| | 1,585 | | | 4.500%, 03/01/2017 | | | | | | | | | 1,710,516 | |
| | | | | |
| | | | Minnesota Higher Education Facilities Authority, St. Catherine College, Series 5-N1 | | | | | | | | | | |
| | 500 | | | 5.250%, 10/01/2022 | | | | | | | | | 505,445 | |
| | | | | |
| | | | Minnesota Higher Education Facilities Authority, St. John’s University, Series 6-U | | | | | | | | | | |
| | 290 | | | 4.200%, 10/01/2019 | | | | | | | | | 310,338 | |
| | 385 | | | 4.300%, 10/01/2020 | | | | | | | | | 409,752 | |
| | 145 | | | 4.500%, 10/01/2022 | | | | | | | | | 152,831 | |
| | | | | |
| | | | Minnesota Higher Education Facilities Authority, St. Olaf College, Series 6-O | | | | | | | | | | |
| | 500 | | | 5.000%, 10/01/2016 | | | | | | | | | 571,290 | |
| | | | | |
| | | | Minnesota Higher Education Facilities Authority, St. Scholastica College, Series 6-S | | | | | | | | | | |
| | 360 | | | 4.375%, 12/01/2016 | | | | | | | | | 382,860 | |
| | 380 | | | 4.500%, 12/01/2017 | | | | | | | | | 402,602 | |
| | | | | |
| | | | Minnesota Higher Education Facilities Authority, St. Scholastica College, Series 7-J | | | | | | | | | | |
| | 150 | | | 6.000%, 12/01/2028 | | | | | | | | | 158,900 | |
| | | | | |
| | | | Minnesota Higher Education Facilities Authority, St. Scholastica College, Series H | | | | | | | | | | |
| | 750 | | | 5.125%, 12/01/2030 | | | | | | | | | 738,645 | |
| | | | | |
| | | | Minnesota Higher Education Facilities Authority, University of St. Thomas | | | | | | | | | | |
| | | | Series 6-I | | | | | | | | | | |
| | 1,045 | | | 4.000%, 04/01/2014 | | | | | | | | | 1,116,583 | |
| | | | | |
| | | | Minnesota Higher Education Facilities Authority, University of St. Thomas, Series 6-X | | | | | | | | | | |
| | 500 | | | 4.500%, 04/01/2021 | | | | | | | | | 528,130 | |
| | 1,250 | | | 5.000%, 04/01/2024 | | | | | | | | | 1,317,387 | |
| | | | | |
| | | | Minnesota Higher Education Facilities Authority, University of St. Thomas, Series 7-A | | | | | | | | | | |
| | 1,000 | | | 4.000%, 10/01/2017 | | | | | | | | | 1,087,020 | |
| | 1,000 | | | 4.500%, 10/01/2018 | | | | | | | | | 1,111,470 | |
| | 1,845 | | | 4.500%, 10/01/2019 | | | | | | | | | 2,034,481 | |
| | | | | |
| | | | Moorhead Educational Facilities, Concordia College, Series A | | | | | | | | | | |
| | 500 | | | 4.100%, 12/15/2014 | | | | | | | | | 533,630 | |
| | 880 | | | 4.200%, 12/15/2015 | | | | | | | | | 948,904 | |
| | 925 | | | 4.300%, 12/15/2016 | | | | | | | | | 993,959 | |
| | 1,005 | | | 5.000%, 12/15/2018 | | | | | | | | | 1,079,571 | |
| | 1,060 | | | 5.000%, 12/15/2019 | | | | | | | | | 1,127,554 | |
| | | | | |
| | | | University of Minnesota, Series C | | | | | | | | | | |
| | 1,000 | | | 5.000%, 12/01/2019 | | | | | | | | | 1,185,110 | |
| | 40,510 | | | Total Education | | | | | | | | | 42,876,782 | |
| | | | General Obligations – 23.7% | | | | | | | | | | |
| | | | | |
| | | | Anoka County Capital Improvement, Series A | | | | | | | | | | |
| | 610 | | | 4.100%, 02/01/2018 | | | | | | | | | 654,365 | |
| | 1,000 | | | 5.000%, 02/01/2020 | | | | | | | | | 1,148,170 | |
| | | | | |
| | | | Anoka County Capital Improvement, Series C | | | | | | | | | | |
| | 285 | | | 4.100%, 02/01/2018 | | | | | | | | | 321,586 | |
| | 595 | | | 4.200%, 02/01/2019 | | | | | | | | | 663,514 | |
| | | | | |
| | | | Anoka County Capital Improvement, Series D | | | | | | | | | | |
| | 500 | | | 5.000%, 02/01/2024 | | | | | | | | | 542,290 | |
| | | | | | | | | | | | | | |
Principal
Amount (000) | | | Description p | | | | | | | | Value | |
| | | | | | | | | | | | | | |
| | | | General Obligations (continued) | | | | | | | | | | |
| | | | | |
| | | | Bemidji | | | | | | | | | | |
| $ | 635 | | | 5.500%, 02/01/2023 | | | | | | | | $ | 751,002 | |
| | 750 | | | 5.500%, 02/01/2024 | | | | | | | | | 874,897 | |
| | 875 | | | 5.500%, 02/01/2025 | | | | | | | | | 1,007,580 | |
| | 1,010 | | | 5.500%, 02/01/2026 | | | | | | | | | 1,152,592 | |
| | 1,150 | | | 5.500%, 02/01/2027 | | | | | | | | | 1,303,376 | |
| | | | | |
| | | | Burnsville Independent School District #191, Alternative Facilities, Series A (AGM) (MSDCEP) | | | | | | | | | | |
| | 350 | | | 4.200%, 02/01/2025 | | | | | | | | | 358,589 | |
| | | | | |
| | | | Burnsville Independent School District #191, Alternative Facilities, Series A (MSDCEP) | | | | | | | | | | |
| | 1,200 | | | 4.250%, 02/01/2020 | | | | | | | | | 1,321,440 | |
| | | | | |
| | | | Chaska Independent School District #112, School Building, Series A (MSDCEP) (NATL) | | | | | | | | | | |
| | 1,000 | | | 4.250%, 02/01/2019 | | | | | | | | | 1,101,850 | |
| | | | | |
| | | | Chatfield Independent School District #227, School Building, Series A (AGM) (MSDCEP) | | | | | | | | | | |
| | 450 | | | 4.000%, 02/01/2018 | | | | | | | | | 504,976 | |
| | | | | |
| | | | Dakota County Community Development Agency, Senior Housing Facilities, Series A | | | | | | | | | | |
| | 510 | | | 4.375%, 01/01/2019 | | | | | | | | | 561,377 | |
| | 215 | | | 4.500%, 01/01/2020 | | | | | | | | | 234,619 | |
| | | | | |
| | | | Duluth DECC Improvement, Series A | | | | | | | | | | |
| | 1,160 | | | 4.500%, 02/01/2021 | | | | | | | | | 1,265,630 | |
| | 465 | | | 4.500%, 02/01/2022 | | | | | | | | | 500,405 | |
| | 1,100 | | | 4.625%, 02/01/2024 | | | | | | | | | 1,162,370 | |
| | | | | |
| | | | Duluth Independent School District #709, Series A (AGM) (MSDCEP) | | | | | | | | | | |
| | 1,150 | | | 4.250%, 02/01/2022 | | | | | | | | | 1,229,706 | |
| | | | | |
| | | | Lakeville Independent School District #194 Series A, Crossover refunded 02/01/2013 @ 100 | | | | | | | | | | |
| | | | (FGIC) (MSDCEP) | | | | | | | | | | |
| | 1,260 | | | 5.000%, 02/01/2022 | | | | | | | | | 1,335,814 | |
| | | | | |
| | | | Mankato, Series A | | | | | | | | | | |
| | 765 | | | 3.500%, 02/01/2018 | | | | | | | | | 832,435 | |
| | 775 | | | 3.500%, 02/01/2019 | | | | | | | | | 827,413 | |
| | | | | |
| | | | Minneapolis Special School District #1 (MSDCEP) | | | | | | | | | | |
| | 1,135 | | | 4.000%, 02/01/2018 | | | | | | | | | 1,216,890 | |
| | | | | |
| | | | Minnesota, Series C | | | | | | | | | | |
| | 500 | | | 5.000%, 08/01/2019 | | | | | | | | | 603,035 | |
| | | | | |
| | | | Moorhead Independent School District #152, Crossover refunded 04/01/2012 @ 100 | | | | | | | | | | |
| | | | (FGIC) (MSDCEP) | | | | | | | | | | |
| | 3,450 | | | 5.000%, 04/01/2015 | | | | | | | | | 3,564,333 | |
| | 2,510 | | | 5.000%, 04/01/2016 | | | | | | | | | 2,593,181 | |
| | | | | |
| | | | Mounds View Independent School District #621, School Building, Series A (MSDCEP) | | | | | | | | | | |
| | 625 | | | 3.250%, 02/01/2017 | | | | | | | | | 682,062 | |
| | 1,000 | | | 4.000%, 02/01/2021 | | | | | | | | | 1,098,180 | |
| | 750 | | | 4.000%, 02/01/2022 | | | | | | | | | 817,095 | |
| | | | Mounds View Independent School District #621, School Building, Series A, Crossover refunded 02/01/2012 @ 100 (MSDCEP) | | | | | | | | | | |
| | 2,565 | | | 5.000%, 02/01/2019 | | | | | | | | | 2,646,593 | |
| | | | Mounds View Independent School District #621, School Building, Series A, Crossover refunded 02/01/2012 @ 100 (MSDCEP) (NATL) | | | | | | | | | | |
| | 2,340 | | | 5.000%, 02/01/2018 | | | | | | | | | 2,414,435 | |
| | | | | |
| | | | Osseo Independent School District #279 | | | | | | | | | | |
| | | | Series A (MSDCEP) | | | | | | | | | | |
| | 1,180 | | | 4.000%, 02/01/2021 | | | | | | | | | 1,271,096 | |
| | | | | |
| | | | Otter Tail County, Disposal System, Prairie Lakes Municipal Solid Waste Authority (AMT) (MCCEP) | | | | | | | | | | |
| | 620 | | | 4.750%, 05/01/2027 (WI/DD, Settling 6/01/11) | | | | | | | | | 628,054 | |
| | | | | |
| | | | Pequot Lakes Independent School District #186, Crossover refunded 02/01/2012 @ 100
(FGIC) (MSDCEP) | | | | | | | | | | |
| | 500 | | | 5.125%, 02/01/2018 | | | | | | | | | 514,005 | |
Portfolio of Investments
Nuveen Minnesota Intermediate Municipal Bond Fund (continued)
May 31, 2011
| | | | | | | | | | | | | | |
Principal
Amount (000) | | | Description p | | | | | | | | Value | |
| | | | | | | | | | | | | | |
| | | | General Obligations (continued) | | | | | | | | | | |
| | | | | |
| | | | Perham, Disposal System (AMT) | | | | | | | | | | |
| $ | 1,205 | | | 5.850%, 05/01/2015 | | | | | | | | $ | 1,207,603 | |
| | | | | |
| | | | Puerto Rico Commonwealth, (NATL) | | | | | | | | | | |
| | 1,605 | | | 6.000%, 07/01/2014 | | | | | | | | | 1,747,524 | |
| | | | | |
| | | | Puerto Rico Commonwealth, Series A | | | | | | | | | | |
| | 575 | | | 5.500%, 07/01/2018 | | | | | | | | | 618,217 | |
| | 1,000 | | | 5.500%, 07/01/2018 | | | | | | | | | 1,075,160 | |
| | | | | |
| | | | Puerto Rico Commonwealth, Series A (SGI) | | | | | | | | | | |
| | 1,000 | | | 5.500%, 07/01/2017 | | | | | | | | | 1,082,210 | |
| | | | | |
| | | | Puerto Rico Commonwealth, Government Development, Series B | | | | | | | | | | |
| | 1,000 | | | 5.000%, 12/01/2014 | | | | | | | | | 1,062,900 | |
| | | | | |
| | | | Ramsey County Capital Improvement, Series A | | | | | | | | | | |
| | 520 | | | 4.000%, 02/01/2018 | | | | | | | | | 588,864 | |
| | | | | |
| | | | Robbinsdale Independent School District #281, Alternative Facility, Series B (MSDCEP) | | | | | | | | | | |
| | 500 | | | 4.500%, 02/01/2021 | | | | | | | | | 551,570 | |
| | | | | |
| | | | Rochester Wastewater, Series A | | | | | | | | | | |
| | 1,140 | | | 4.000%, 12/01/2018 | | | | | | | | | 1,267,007 | |
| | | | | |
| | | | South Washington County, Independent School District #833, Series A (MSDCEP) | | | | | | | | | | |
| | 2,000 | | | 4.000%, 02/01/2022 | | | | | | | | | 2,142,940 | |
| | | | | |
| | | | South Washington County, Independent School District #833, Series B, Crossover refunded 02/01/2012 @ 100 (AGM) (MSDCEP) | | | | | | | | | | |
| | 1,030 | | | 5.000%, 02/01/2015 | | | | | | | | | 1,055,977 | |
| | | | | |
| | | | St. Cloud Library Sales Tax, Series B (AGM) | | | | | | | | | | |
| | 1,000 | | | 4.000%, 02/01/2018 | | | | | | | | | 1,089,550 | |
| | | | | |
| | | | St. Michael Independent School District #885, Crossover refunded 02/01/2012 @ 100
(AGM) (MSDCEP) | | | | | | | | | | |
| | 1,000 | | | 5.000%, 02/01/2017 | | | | | | | | | 1,026,840 | |
| | | | | |
| | | | St. Peter, Series A (AGM) | | | | | | | | | | |
| | 550 | | | 3.000%, 09/01/2018 | | | | | | | | | 578,232 | |
| | 515 | | | 3.150%, 09/01/2019 | | | | | | | | | 540,904 | |
| | 585 | | | 3.300%, 09/01/2020 | | | | | | | | | 614,104 | |
| | | | | |
| | | | Wadena Deer Creek Independent School District #2155 (MSDCEP) | | | | | | | | | | |
| | 430 | | | 4.000%, 02/01/2018 | | | | | | | | | 475,193 | |
| | 410 | | | 4.000%, 02/01/2019 | | | | | | | | | 445,777 | |
| | | | | |
| | | | Wright County Jail, Series A (MCCEP) | | | | | | | | | | |
| | 640 | | | 4.500%, 12/01/2020 | | | | | | | | | 711,763 | |
| | | | | |
| | | | Zumbrota-Mazeppa Independent School District #2805, Alternative Facilities, Series A | | | | | | | | | | |
| | | | (MSDCEP) | | | | | | | | | | |
| | 200 | | | 4.000%, 02/01/2019 | | | | | | | | | 220,496 | |
| | 51,890 | | | Total General Obligations | | | | | | | | | 55,807,786 | |
| | | | Health Care – 28.5% | | | | | | | | | | |
| | | | | |
| | | | Aitkin Health Care Facilities, Riverwood Healthcare Center | | | | | | | | | | |
| | 735 | | | 5.250%, 02/01/2015 | | | | | | | | | 715,390 | |
| | | | | |
| | | | Bemidji Health Care Facilities, North County Health Services | | | | | | | | | | |
| | 500 | | | 5.000%, 09/01/2017 | | | | | | | | | 532,450 | |
| | 1,050 | | | 5.000%, 09/01/2018 | | | | | | | | | 1,109,399 | |
| | 1,110 | | | 5.000%, 09/01/2019 | | | | | | | | | 1,158,984 | |
| | | | | |
| | | | Cuyuna Range Hospital District | | | | | | | | | | |
| | 425 | | | 5.000%, 06/01/2016 | | | | | | | | | 421,851 | |
| | 1,340 | | | 5.000%, 06/01/2017 | | | | | | | | | 1,320,918 | |
| | 1,320 | | | 5.000%, 06/01/2019 | | | | | | | | | 1,267,847 | |
| | | | | |
| | | | Duluth Economic Development Authority, Benedictine Health System-St. Mary’s, | | | | | | | | | | |
| | | | (Pre-refunded 02/15/2014 @ 100) | | | | | | | | | | |
| | 2,045 | | | 5.375%, 02/15/2022 | | | | | | | | | 2,298,580 | |
| | | | | | | | | | | | | | |
Principal
Amount (000) | | | Description p | | | | | | | | Value | |
| | | | | | | | | | | | | | |
| | | | Health Care (continued) | | | | | | | | | | |
| | | | | |
| | | | Fergus Falls Health Care Facilities, Lake Region Health Care | | | | | | | | | | |
| $ | 400 | | | 4.750%, 08/01/2025 | | | | | | | | $ | 397,528 | |
| | | | | |
| | | | Glencoe Health Care Facilities, Regional Health Services Project | | | | | | | | | | |
| | 760 | | | 5.000%, 04/01/2013 | | | | | | | | | 792,072 | |
| | 800 | | | 5.000%, 04/01/2014 | | | | | | | | | 837,856 | |
| | 845 | | | 5.000%, 04/01/2015 | | | | | | | | | 881,969 | |
| | 1,815 | | | 5.000%, 04/01/2017 | | | | | | | | | 1,869,740 | |
| | | | | |
| | | | Maple Grove Health Care Facilities, North Memorial Health Care | | | | | | | | | | |
| | 1,730 | | | 4.500%, 09/01/2017 | | | | | | | | | 1,812,313 | |
| | | | | |
| | | | Maple Grove Health Care System, Maple Grove Hospital | | | | | | | | | | |
| | 1,000 | | | 5.000%, 05/01/2017 | | | | | | | | | 1,091,230 | |
| | | | | |
| | | | Marshall Medical Center, Avera Marshall Regional Medical Center Project, | | | | | | | | | | |
| | 345 | | | 4.500%, 11/01/2013 (ETM) | | | | | | | | | 372,966 | |
| | | | | |
| | | | Marshall Medical Center, Avera Marshall Regional Medical Center Project,
(Pre-refunded 11/01/2015 @ 100) | | | | | | | | | | |
| | 1,155 | | | 4.750%, 11/01/2020 | | | | | | | | | 1,308,372 | |
| | | | | |
| | | | Meeker County Hospital Facilities, Memorial Hospital Project | | | | | | | | | | |
| | 1,000 | | | 5.625%, 11/01/2022 | | | | | | | | | 1,001,810 | |
| | | | | |
| | | | Minneapolis & St. Paul Housing & Redevelopment Authority, Minnesota Children’s Hospitals & Clinics | | | | | | | | | | |
| | | | Series A | | | | | | | | | | |
| | 1,000 | | | 5.250%, 08/15/2025 | | | | | | | | | 1,070,580 | |
| | | | | |
| | | | Minneapolis Health Care System, Allina Health System, Series A, (Pre-refunded 11/15/2012 @ 100) | | | | | | | | | | |
| | 2,500 | | | 6.000%, 11/15/2023 | | | | | | | | | 2,707,575 | |
| | 1,300 | | | 5.750%, 11/15/2032 | | | | | | | | | 1,403,220 | |
| | | | | |
| | | | Minneapolis Health Care System, Fairview Health Services, | | | | | | | | | | |
| | | | Series A | | | | | | | | | | |
| | 4,000 | | | 6.375%, 11/15/2023 | | | | | | | | | 4,474,760 | |
| | | | | |
| | | | Minneapolis Health Care System, Fairview Health Services, Series A | | | | | | | | | | |
| | 605 | | | 5.000%, 05/15/2012 (ETM) | | | | | | | | | 632,830 | |
| | | | | |
| | | | Minneapolis National Marrow Donor Program | | | | | | | | | | |
| | 3,000 | | | 4.250%, 08/01/2020 | | | | | | | | | 2,977,380 | |
| | | | | |
| | | | Minnesota Agricultural & Economic Development Board, Essentia Health Obligated Group | | | | | | | | | | |
| | | | Series C-1 (AGC) | | | | | | | | | | |
| | 1,000 | | | 5.500%, 02/15/2025 | | | | | | | | | 1,079,070 | |
| | | | | |
| | | | Minnesota Agricultural & Economic Development Board, Evangelical Lutheran Project | | | | | | | | | | |
| | 200 | | | 5.500%, 02/01/2012 | | | | | | | | | 205,204 | |
| | 730 | | | 5.500%, 02/01/2015 | | | | | | | | | 750,141 | |
| | | | | |
| | | | Minnesota Agricultural & Economic Development Board, Health Care System | | | | | | | | | | |
| | | | Series A (NATL) | | | | | | | | | | |
| | 305 | | | 5.500%, 11/15/2017 | | | | | | | | | 305,985 | |
| | 10 | | | 5.750%, 11/15/2026 | | | | | | | | | 10,004 | |
| | | | | |
| | | | Monticello-Big Lake Community Hospital District, Health Care Facilities, Series C | | | | | | | | | | |
| | 2,320 | | | 5.750%, 12/01/2015 | | | | | | | | | 2,297,867 | |
| | | | | |
| | | | Northfield Hospital | | | | | | | | | | |
| | 515 | | | 5.000%, 11/01/2013 | | | | | | | | | 540,214 | |
| | 920 | | | 5.000%, 11/01/2014 | | | | | | | | | 973,875 | |
| | 1,080 | | | 5.500%, 11/01/2017 | | | | | | | | | 1,164,694 | |
| | | | | |
| | | | Redwood Falls Hospital Facilities, Redwood Area Hospital Project | | | | | | | | | | |
| | 1,015 | | | 5.000%, 12/01/2021 | | | | | | | | | 998,730 | |
| | | | | |
| | | | Rochester Health Care Facilities, Mayo Clinic, Series C | | | | | | | | | | |
| | 1,140 | | | 4.500%, 11/15/2038 | | | | | | | | | 1,222,867 | |
| | | | | |
| | | | Rochester Health Care Facilities, Olmsted Medical Center Project | | | | | | | | | | |
| | 1,000 | | | 5.125%, 07/01/2020 | | | | | | | | | 1,035,950 | |
| | | | | |
| | | | Shakopee Health Care Facilities, St. Francis Regional Medical Center | | | | | | | | | | |
| | 1,785 | | | 5.000%, 09/01/2017 | | | | | | | | | 1,881,640 | |
Portfolio of Investments
Nuveen Minnesota Intermediate Municipal Bond Fund (continued)
May 31, 2011
| | | | | | | | | | | | | | |
Principal
Amount (000) | | | Description p | | | | | | | | Value | |
| | | | | | | | | | | | | | |
| | | | Health Care (continued) | | | | | | | | | | |
| | | | | |
| | | | St. Cloud Health Care, CentraCare Health System Project (AGC) | | | | | | | | | | |
| $ | 1,000 | | | 5.375%, 05/01/2031 | | | | | | | | $ | 1,034,460 | |
| | | | St. Cloud Health Care, CentraCare Health System Project, Series A | | | | | | | | | | |
| | 1,000 | | | 4.250%, 05/01/2021 | | | | | | | | | 1,025,130 | |
| | | | | |
| | | | St. Louis Park Health Care Facilities, Park Nicollet Health Services | | | | | | | | | | |
| | 1,300 | | | 5.500%, 07/01/2029 | | | | | | | | | 1,283,815 | |
| | | | St. Louis Park Health Care Facilities, Park Nicollet Health Services, Series C | | | | | | | | | | |
| | 2,500 | | | 5.625%, 07/01/2026 | | | | | | | | | 2,520,925 | |
| | | | | |
| | | | St. Paul Housing & Redevelopment Authority, Allina Health System, Series A, (NATL) | | | | | | | | | | |
| | 500 | | | 5.000%, 11/15/2015 | | | | | | | | | 560,980 | |
| | 1,200 | | | 5.000%, 11/15/2019 | | | | | | | | | 1,316,628 | |
| | | | St. Paul Housing & Redevelopment Authority, Allina Health System, Series A-1 | | | | | | | | | | |
| | 3,000 | | | 5.000%, 11/15/2024 | | | | | | | | | 3,110,010 | |
| | | | | |
| | | | St. Paul Housing & Redevelopment Authority, Gillette Children’s Specialty Healthcare | | | | | | | | | | |
| | 1,560 | | | 5.000%, 02/01/2019 | | | | | | | | | 1,610,123 | |
| | 1,000 | | | 5.000%, 02/01/2019 | | | | | | | | | 1,073,400 | |
| | 500 | | | 5.000%, 02/01/2020 | | | | | | | | | 513,545 | |
| | | | | |
| | | | St. Paul Housing & Redevelopment Authority, HealthEast Project | | | | | | | | | | |
| | 1,840 | | | 5.150%, 11/15/2020 | | | | | | | | | 1,700,786 | |
| | | | | |
| | | | St. Paul Housing & Redevelopment Authority, HealthPartners Obligated Group Project | | | | | | | | | | |
| | 1,350 | | | 5.250%, 05/15/2019 | | | | | | | | | 1,416,771 | |
| | | | | |
| | | | St. Paul Port Authority, HealthEast Midway Campus, Series A | | | | | | | | | | |
| | 1,230 | | | 5.250%, 05/01/2015 | | | | | | | | | 1,210,750 | |
| | 2,000 | | | 5.750%, 05/01/2025 | | | | | | | | | 1,846,640 | |
| | | | | |
| | | | Todd, Morrison, Cass & Wadena Counties, United Hospital District, Lakewood Health System | | | | | | | | | | |
| | 400 | | | 4.000%, 12/01/2013 | | | | | | | | | 428,968 | |
| | | | | |
| | | | Winona Health Care Facilities, Winona Health Obligated Group | | | | | | | | | | |
| | 1,000 | | | 5.000%, 07/01/2020 | | | | | | | | | 1,015,940 | |
| | | | Winona Health Care Facilities, Winona Health Obligated Group, Series A | | | | | | | | | | |
| | 525 | | | 5.300%, 07/01/2017 | | | | | | | | | 543,286 | |
| | 64,705 | | | Total Health Care | | | | | | | | | 67,136,018 | |
| | | | Housing – 1.9% | | | | | | | | | | |
| | | | | |
| | | | Anoka Housing & Redevelopment Authority, Woodland Park Project, Series A (FHLMC) | | | | | | | | | | |
| | 500 | | | 5.000%, 04/01/2027 | | | | | | | | | 506,760 | |
| | | | | |
| | | | Minnesota State Housing Finance Agency, Nonprofit Housing | �� | | | | | | | | | |
| | 1,185 | | | 5.250%, 08/01/2027 | | | | | | | | | 1,250,850 | |
| | | | | |
| | | | Moorhead Senior Housing, Sheyenne Crossing Project | | | | | | | | | | |
| | 2,000 | | | 5.600%, 04/01/2025 | | | | | | | | | 1,865,520 | |
| | | | | |
| | | | Worthington Housing Authority, Meadows Worthington Project, Series A | | | | | | | | | | |
| | 885 | | | 5.000%, 11/01/2017 | | | | | | | | | 840,653 | |
| | 4,570 | | | Total Housing | | | | | | | | | 4,463,783 | |
| | | | Lease Revenue – 2.7% | | | | | | | | | | |
| | | | | |
| | | | Andover Economic Development Authority Public Facilities, Community Center | | | | | | | | | | |
| | | | Crossover refunded 02/01/2014 @ 100 | | | | | | | | | | |
| | 495 | | | 5.000%, 02/01/2019 | | | | | | | | | 535,793 | |
| | 730 | | | 5.000%, 02/01/2019 | | | | | | | | | 790,160 | |
| | | | | |
| | | | Pine County Housing & Redevelopment Authority, Public Project, Series A | | | | | | | | | | |
| | 465 | | | 4.500%, 02/01/2016 | | | | | | | | | 503,362 | |
| | 385 | | | 4.500%, 02/01/2017 | | | | | | | | | 411,346 | |
| | | | | |
| | | | St. Paul Housing & Redevelopment Authority, Jimmy Lee Recreation Center | | | | | | | | | | |
| | 180 | | | 4.500%, 12/01/2019 | | | | | | | | | 194,722 | |
| | 290 | | | 4.500%, 12/01/2020 | | | | | | | | | 310,648 | |
| | | | | |
| | | | St. Paul Port Authority, Office Building | | | | | | | | | | |
| | 2,415 | | | 5.000%, 12/01/2019 | | | | | | | | | 2,527,225 | |
| | | | | | | | | | | | | | |
Principal
Amount (000) | | | Description p | | | | | | | | Value | |
| | | | | | | | | | | | | | |
| | | | Lease Revenue (continued) | | | | | | | | | | |
| | | | | |
| | | | Stevens County Housing & Redevelopment Authority, Public Project, Series A | | | | | | | | | | |
| $ | 315 | | | 4.000%, 02/01/2018 | | | | | | | | $ | 336,883 | |
| | 325 | | | 4.000%, 02/01/2019 | | | | | | | | | 343,652 | |
| | 340 | | | 4.100%, 02/01/2020 | | | | | | | | | 358,506 | |
| | 5,940 | | | Total Lease Revenue | | | | | | | | | 6,312,297 | |
| | | | Miscellaneous – 4.6% | | | | | | | | | | |
| | | | | |
| | | | Itasca County, Charles K. Blandin Foundation | | | | | | | | | | |
| | 635 | | | 4.000%, 05/01/2018 | | | | | | | | | 652,253 | |
| | 255 | | | 4.000%, 05/01/2019 | | | | | | | | | 259,623 | |
| | | | | |
| | | | Seaway Port Authority of Duluth, Cargill Incorporated Project | | | | | | | | | | |
| | 2,000 | | | 4.200%, 05/01/2013 | | | | | | | | | 2,065,100 | |
| | | | | |
| | | | St. Paul Housing & Redevelopment Authority, Minnesota Public Radio Project (APM) | | | | | | | | | | |
| | 2,395 | | | 5.000%, 12/01/2025 | | | | | | | | | 2,520,809 | |
| | | | | |
| | | | St. Paul Housing & Redevelopment Authority, Parking Facilities Project, Series A | | | | | | | | | | |
| | 805 | | | 4.000%, 08/01/2021 | | | | | | | | | 824,666 | |
| | 895 | | | 4.125%, 08/01/2023 | | | | | | | | | 900,603 | |
| | 935 | | | 4.250%, 08/01/2024 | | | | | | | | | 940,891 | |
| | 575 | | | 4.250%, 08/01/2025 | | | | | | | | | 571,038 | |
| | | | | |
| | | | St. Paul Port Authority, Amherst H. Wilder Foundation, Series 3 | | | | | | | | | | |
| | 2,000 | | | 5.000%, 12/01/2024 | | | | | | | | | 2,116,400 | |
| | 10,495 | | | Total Miscellaneous | | | | | | | | | 10,851,383 | |
| | | | Tax Revenue – 1.7% | | | | | | | | | | |
| | | | | |
| | | | Hennepin County Sales Tax, Ballpark Project, Series B | | | | | | | | | | |
| | 555 | | | 4.375%, 12/15/2022 | | | | | | | | | 594,821 | |
| | 1,000 | | | 5.000%, 12/15/2029 | | | | | | | | | 1,059,680 | |
| | | | | |
| | | | Minneapolis St. Anthony Falls Project | | | | | | | | | | |
| | 1,040 | | | 5.000%, 02/01/2017 | | | | | | | | | 1,016,870 | |
| | 570 | | | 5.300%, 02/01/2021 | | | | | | | | | 525,267 | |
| | | | | |
| | | | Minneapolis Tax Increment, Grant Park Project | | | | | | | | | | |
| | 1,000 | | | 5.200%, 02/01/2022 | | | | | | | | | 907,300 | |
| | 4,165 | | | Total Tax Revenue | | | | | | | | | 4,103,938 | |
| | | | Transportation – 4.0% | | | | | | | | | | |
| | | | | |
| | | | Minneapolis & St. Paul Metropolitan Airports Commission, Series A | | | | | | | | | | |
| | 1,000 | | | 4.000%, 01/01/2019 | | | | | | | | | 1,061,430 | |
| | 1,000 | | | 5.000%, 01/01/2020 | | | | | | | | | 1,122,830 | |
| | 500 | | | 5.000%, 01/01/2021 | | | | | | | | | 554,300 | |
| | | | | |
| | | | Minneapolis & St. Paul Metropolitan Airports Commission, Series A (NATL) | | | | | | | | | | |
| | 1,000 | | | 5.000%, 01/01/2019 | | | | | | | | | 1,037,920 | |
| | 2,200 | | | 5.000%, 01/01/2020 | | | | | | | | | 2,243,692 | |
| | | | | |
| | | | Minneapolis & St. Paul Metropolitan Airports Commission, Series B (AMBAC) (AMT) | | | | | | | | | | |
| | 2,125 | | | 5.000%, 01/01/2020 | | | | | | | | | 2,186,986 | |
| | | | | |
| | | | Puerto Rico Commonwealth, Highway & Transportation Authority, Series X (IBC) (NATL) | | | | | | | | | | |
| | 1,250 | | | 5.500%, 07/01/2013 | | | | | | | | | 1,289,125 | |
| | 9,075 | | | Total Transportation | | | | | | | | | 9,496,283 | |
| | | | Utilities – 9.7% | | | | | | | | | | |
| | | | | |
| | | | Chaska Electric, Series A | | | | | | | | | | |
| | 1,000 | | | 4.200%, 10/01/2015 | | | | | | | | | 1,088,130 | |
| | | | | |
| | | | Cohasset Pollution Control, Allete Project (IBCC) (RAAI) | | | | | | | | | | |
| | 2,230 | | | 4.950%, 07/01/2022 | | | | | | | | | 2,261,332 | |
| | | | | |
| | | | Litchfield Electric Utilities, Series C (AGC) | | | | | | | | | | |
| | 500 | | | 5.000%, 02/01/2029 | | | | | | | | | 521,250 | |
Portfolio of Investments
Nuveen Minnesota Intermediate Municipal Bond Fund (continued)
May 31, 2011
| | | | | | | | | | | | | | |
Principal
Amount (000) | | | Description p | | | | | | | | Value | |
| | | | | | | | | | | | | | |
| | | | Utilities (continued) | | | | | | | | | | |
| | | | | |
| | | | Marshall Public Utilities, Series A (AGC) | | | | | | | | | | |
| $ | 315 | | | 3.500%, 07/01/2016 | | | | | | | | $ | 338,278 | |
| | 275 | | | 3.500%, 07/01/2017 | | | | | | | | | 293,953 | |
| | 340 | | | 3.750%, 07/01/2018 | | | | | | | | | 364,368 | |
| | | | | |
| | | | Minnesota State Municipal Power Agency | | | | | | | | | | |
| | 420 | | | 4.125%, 10/01/2017 | | | | | | | | | 454,360 | |
| | 1,000 | | | 5.250%, 10/01/2022 | | | | | | | | | 1,088,930 | |
| | | | | |
| | | | Northern Municipal Power Agency, Series A1 | | | | | | | | | | |
| | 2,830 | | | 5.000%, 01/01/2020 | | | | | | | | | 3,167,902 | |
| | | | | |
| | | | Northern Municipal Power Agency, Minnesota Electric Systems, Series A (AGC) | | | | | | | | | | |
| | 1,000 | | | 5.000%, 01/01/2019 | | | | | | | | | 1,124,690 | |
| | 2,000 | | | 5.000%, 01/01/2021 | | | | | | | | | 2,196,560 | |
| | | | | |
| | | | Northern Municipal Power Agency, Minnesota Electric Systems, Series A (AMBAC) | | | | | | | | | | |
| | 380 | | | 5.000%, 01/01/2013 | | | | | | | | | 403,724 | |
| | 460 | | | 5.000%, 01/01/2017 | | | | | | | | | 524,331 | |
| | | | | |
| | | | Puerto Rico Commonwealth, Aqueduct & Sewer Authority, Series A (AGC) | | | | | | | | | | |
| | 500 | | | 5.000%, 07/01/2016 | | | | | | | | | 561,600 | |
| | | | | |
| | | | Shakopee Public Utilities, Series A (AGM) | | | | | | | | | | |
| | 295 | | | 4.250%, 02/01/2018 | | | | | | | | | 314,337 | |
| | | | | |
| | | | Southern Minnesota Municipal Power Agency, Series A (AMBAC) | | | | | | | | | | |
| | 2,000 | | | 5.250%, 01/01/2014 | | | | | | | | | 2,207,840 | |
| | | | | |
| | | | Southern Minnesota Municipal Power Agency, Series A (NATL) | | | | | | | | | | |
| | 3,500 | | | 0.000%, 01/01/2020 | | | | | | | | | 2,495,535 | |
| | 5,000 | | | 0.000%, 01/01/2021 | | | | | | | | | 3,366,650 | |
| | 24,045 | | | Total Utilities | | | | | | | | | 22,773,770 | |
| | 223,245 | | | Total Municipal Bonds (cost $221,747,817) | | | | | | | | | 232,108,677 | |
| | | | | |
| Shares | | | Description p | | | | | | | | Value | |
| | | | SHORT-TERM INVESTMENTS – 1.0% | | | | | | | | | | |
| | | | | |
| | | | Money Market Funds – 1.0% | | | | | | | | | | |
| | | | | |
| | 2,203,121 | | | Federated Minnesota Municipal Cash Trust, 0.010% | | | | | | | | $ | 2,203,121 | |
| | | | Total Short-Term Investments (cost $2,203,121) | | | | | | | | | 2,203,121 | |
| | | | Total Investments – 99.5% (cost $223,950,938) | | | | | | | | | 234,311,798 | |
| | | | Other Assets Less Liabilities – 0.5% | | | | | | | | | 1,243,836 | |
| | | | Net Assets – 100.0% | | | | | | | | $ | 235,555,634 | |
| | p | | All percentages shown in the Portfolio of Investments are based on net assets. |
| | | | The rate shown is the annualized seven-day effective yield as of May 31, 2011. |
| | (ETM) | | Escrowed to maturity. |
| | (WI/DD) | | Investment, or portion of investment, Purchased on a when-issued or delayed delivery basis. |
See accompanying notes to financial statements.
Portfolio of Investments
Nuveen Minnesota Municipal Bond Fund
(formerly known as First American Minnesota Tax Free Fund)
May 31, 2011
| | | | | | | | | | | | | | |
Principal
Amount (000) | | | Description p | | | | | | | | Value | |
| | | | | | | | | | | | | | |
| | | | MUNICIPAL BONDS – 99.7% | | | | | | | | | | |
| | | | | |
| | | | Certificate of Participation – 1.4% | | | | | | | | | | |
| | | | | |
| | | | Duluth Independent School District #709, Series B (MSDCEP) | | | | | | | | | | |
| $ | 2,000 | | | 4.000%, 02/01/2019 | | | | | | | | $ | 2,225,641 | |
| | | | Continuing Care Retirement Communities – 0.8% | | | | | | | | | | |
| | | | | |
| | | | Golden Valley Covenant Retirement Communities, Series A | | | | | | | | | | |
| | 1,450 | | | 5.500%, 12/01/2029 | | | | | | | | | 1,330,245 | |
| | | | Economic Development – 1.5% | | | | | | | | | | |
| | | | | |
| | | | Minnesota Agricultural & Economic Development Board, Minnesota Small Business Program,
Series A (AMT) | | | | | | | | | | |
| | 500 | | | 5.550%, 08/01/2016 | | | | | | | | | 494,095 | |
| | | | | |
| | | | Moorhead, American Crystal Sugar Recovery Zone Facility | | | | | | | | | | |
| | 1,800 | | | 5.650%, 06/01/2027 | | | | | | | | | 1,808,820 | |
| | 2,300 | | | Total Economic Development | | | | | | | | | 2,302,915 | |
| | | | Education – 10.6% | | | | | | | | | | |
| | | | | |
| | | | Baytown Lease, St. Croix Preparatory Academy, Series A | | | | | | | | | | |
| | 1,500 | | | 7.000%, 08/01/2038 | | | | | | | | | 1,400,220 | |
| | | | | |
| | | | Duluth Housing & Redevelopment Authority, Public Schools Academy, Series A | | | | | | | | | | |
| | 1,750 | | | 5.600%, 11/01/2030 | | | | | | | | | 1,527,068 | |
| | | | | |
| | | | Minnesota Higher Education Facilities Authority, Bethel University, Series 6-R | | | | | | | | | | |
| | 1,725 | | | 5.500%, 05/01/2026 | | | | | | | | | 1,647,202 | |
| | 820 | | | 5.500%, 05/01/2027 | | | | | | | | | 777,483 | |
| | | | | |
| | | | Minnesota Higher Education Facilities Authority, College of Art & Design, Series 6-K | | | | | | | | | | |
| | 30 | | | 5.000%, 05/01/2026 | | | | | | | | | 30,158 | |
| | | | | |
| | | | Minnesota Higher Education Facilities Authority, Gustavus Adolfus College, Series 7-B | | | | | | | | | | |
| | 1,000 | | | 5.000%, 10/01/2031 | | | | | | | | | 1,015,940 | |
| | | | | |
| | | | Minnesota Higher Education Facilities Authority, Hamline University, Series K-2 | | | | | | | | | | |
| | 625 | | | 6.000%, 10/01/2032 | | | | | | | | | 655,356 | |
| | 2,000 | | | 6.000%, 10/01/2040 | | | | | | | | | 2,046,180 | |
| | | | | |
| | | | Minnesota Higher Education Facilities Authority, St. Scholastica College, Series 7-J | | | | | | | | | | |
| | 1,835 | | | 6.300%, 12/01/2040 | | | | | | | | | 1,908,859 | |
| | | | | |
| | | | Minnesota Higher Education Facilities Authority, Vermilion Community College Project, Series 3-T | | | | | | | | | | |
| | 155 | | | 6.000%, 01/01/2013 | | | | | | | | | 155,313 | |
| | | | | |
| | | | St. Paul Housing & Redevelopment Authority, Community Peace Academy Project, Series A | | | | | | | | | | |
| | 2,550 | | | 5.000%, 12/01/2036 | | | | | | | | | 1,903,906 | |
| | | | | |
| | | | St. Paul Housing & Redevelopment Authority, St. Paul Academy & Summit School Project | | | | | | | | | | |
| | 2,000 | | | 5.000%, 10/01/2024 | | | | | | | | | 2,106,240 | |
| | | | | |
| | | | University of Minnesota, Series A | | | | | | | | | | |
| | 1,540 | | | 5.250%, 12/01/2029 | | | | | | | | | 1,718,625 | |
| | 17,530 | | | Total Education | | | | | | | | | 16,892,550 | |
| | | | General Obligations – 12.0% | | | | | | | | | | |
| | | | | |
| | | | Bemidji | | | | | | | | | | |
| | 10,000 | | | 6.000%, 02/01/2041 | | | | | | | | | 11,447,300 | |
| | | | | |
| | | | Burnsville Independent School District #191, Alternative Facilities, Series A (MSDCEP) | | | | | | | | | | |
| | 1,430 | | | 4.500%, 02/01/2022 | | | | | | | | | 1,554,982 | |
| | | | | |
| | | | Hopkins Independent School District #270, Series A (MSDCEP) | | | | | | | | | | |
| | 1,000 | | | 5.000%, 02/01/2028 | | | | | | | | | 1,097,550 | |
| | | | | |
| | | | Perham, Disposal System (AMT) | | | | | | | | | | |
| | 1,500 | | | 6.000%, 05/01/2022 | | | | | | | | | 1,503,330 | |
| | | | | |
| | | | St. Paul Independent School District #625, Series A (MSDCEP) | | | | | | | | | | |
| | 1,795 | | | 4.000%, 02/01/2031 (WI/DD, Settling 6/15/11) | | | | | | | | | 1,757,790 | |
| | 1,880 | | | 4.000%, 02/01/2032 (WI/DD, Settling 6/15/11) | | | | | | | | | 1,806,923 | |
| | 17,605 | | | Total General Obligations | | | | | | | | | 19,167,875 | |
Portfolio of Investments
Nuveen Minnesota Municipal Bond Fund (continued)
May 31, 2011
| | | | | | | | | | | | | | |
Principal
Amount (000) | | | Description p | | | | | | | | Value | |
| | | | | | | | | | | | | | |
| | | | Health Care – 31.0% | | | | | | | | | | |
| | | | | |
| | | | Anoka County Housing & Redevelopment Authority, Park River Estates Care Center, Series D | | | | | | | | | | |
| $ | 1,500 | | | 6.750%, 11/01/2036 | | | | | | | | $ | 1,439,340 | |
| | | | | |
| | | | Chippewa County, Montevideo Hospital Project | | | | | | | | | | |
| | 2,370 | | | 5.500%, 03/01/2037 | | | | | | | | | 2,203,650 | |
| | | | | |
| | | | Duluth Economic Development Authority, Benedictine Health System-St.Mary’s, (Pre-refunded 02/15/2014) | | | | | | | | | | |
| | 1,065 | | | 5.250%, 02/15/2028 | | | | | | | | | 1,193,503 | |
| | | | | |
| | | | Glencoe Health Care Facilities, Regional Health Services Project | | | | | | | | | | |
| | 2,000 | | | 5.000%, 04/01/2031 | | | | | | | | | 1,828,140 | |
| | | | | |
| | | | Hawaii Pacific Health, Series B | | | | | | | | | | |
| | 2,500 | | | 5.750%, 07/01/2040 | | | | | | | | | 2,323,800 | |
| | | | | |
| | | | Maple Grove Health Care System, Maple Grove Hospital | | | | | | | | | | |
| | 1,500 | | | 4.500%, 05/01/2023 | | | | | | | | | 1,463,985 | |
| | 1,000 | | | 5.250%, 05/01/2025 | | | | | | | | | 1,004,140 | |
| | | | | |
| | | | Marshall Medical Center, Weiner Memorial Medical Center Project, Series A, (Pre-refunded 11/01/2013 @ 100) | | | | | | | | | | |
| | 305 | | | 5.250%, 11/01/2016 | | | | | | | | | 335,161 | |
| | 875 | | | 5.850%, 11/01/2023 | | | | | | | | | 974,024 | |
| | | | | |
| | | | Minneapolis & St. Paul Housing & Redevelopment Authority, Minnesota Children’s Hospitals & Clinics, Series A | | | | | | | | | | |
| | 2,275 | | | 5.250%, 08/15/2035 | | | | | | | | | 2,307,988 | |
| | | | | |
| | | | Minneapolis Health Care System, Fairview Health Services, Series A | | | | | | | | | | |
| | 3,000 | | | 6.625%, 11/15/2028 | | | | | | | | | 3,272,940 | |
| | | | | |
| | | | Minneapolis National Marrow Donor Program | | | | | | | | | | |
| | 2,000 | | | 4.875%, 08/01/2025 | | | | | | | | | 1,936,240 | |
| | | | | |
| | | | Minnesota Agricultural & Economic Development Board, Essentia Health Obligated Group, Series C-1 (AGC) | | | | | | | | | | |
| | 1,000 | | | 5.000%, 02/15/2030 | | | | | | | | | 1,003,780 | |
| | | | | |
| | | | Minnesota Agricultural & Economic Development Board, Health Care System, Fairview Health Services, Series A | | | | | | | | | | |
| | 125 | | | 6.375%, 11/15/2029 | | | | | | | | | 125,471 | |
| | | | | |
| | | | Monticello-Big Lake Community Hospital District, Health Care Facilities, Series C | | | | | | | | | | |
| | 1,000 | | | 6.200%, 12/01/2022 | | | | | | | | | 965,780 | |
| | | | | |
| | | | New Hope Housing & Health Care Facilities, Masonic Home North Ridge | | | | | | | | | | |
| | 1,600 | | | 5.750%, 03/01/2015 | | | | | | | | | 1,552,960 | |
| | | | | |
| | | | Rochester Health Care & Housing, Samaritan Bethany, Series A | | | | | | | | | | |
| | 1,100 | | | 7.375%, 12/01/2041 | | | | | | | | | 1,112,782 | |
| | | | | |
| | | | Rochester Health Care Facilities, Olmsted Medical Center Project | | | | | | | | | | |
| | 1,700 | | | 5.875%, 07/01/2030 | | | | | | | | | 1,672,154 | |
| | | | | |
| | | | Shakopee Health Care Facilities, St. Francis Regional Medical Center | | | | | | | | | | |
| | 2,000 | | | 5.250%, 09/01/2034 | | | | | | | | | 1,904,440 | |
| | | | | |
| | | | St. Cloud Health Care, CentraCare Health System Project, Series A | | | | | | | | | | |
| | 1,000 | | | 5.125%, 05/01/2030 | | | | | | | | | 1,007,430 | |
| | | | | |
| | | | St. Louis Park Health Care Facilities, Park Nicollet Health Services | | | | | | | | | | |
| | 2,000 | | | 5.750%, 07/01/2039 | | | | | | | | | 1,950,940 | |
| | | | | |
| | | | St. Louis Park Health Care Facilities, Park Nicollet Health Services, Series B, (Pre-refunded 07/01/2014) | | | | | | | | | | |
| | 2,000 | | | 5.500%, 07/01/2025 | | | | | | | | | 2,276,180 | |
| | | | | |
| | | | St. Louis Park Health Care Facilities, Park Nicollet Health Services, Series C | | | | | | | | | | |
| | 1,000 | | | 5.750%, 07/01/2030 | | | | | | | | | 1,005,720 | |
| | | | | |
| | | | St. Paul Housing & Redevelopment Authority, Allina Health System, Series A-1 | | | | | | | | | | |
| | 3,050 | | | 5.250%, 11/15/2029 | | | | | | | | | 3,125,213 | |
| | | | | |
| | | | St. Paul Housing & Redevelopment Authority, Episcopal Nursing Home | | | | | | | | | | |
| | 2,190 | | | 5.630%, 10/01/2033 | | | | | | | | | 1,894,026 | |
| | | | | |
| | | | St. Paul Housing & Redevelopment Authority, Gillette Children’s Specialty Healthcare | | | | | | | | | | |
| | 2,060 | | | 5.000%, 02/01/2029 | | | | | | | | | 2,010,292 | |
| | | | | | | | | | | | | | |
Principal
Amount (000) | | | Description p | | | | | | | | Value | |
| | | | | | | | | | | | | | |
| | | | Health Care (continued) | | | | | | | | | | |
| | | | | |
| | | | St. Paul Housing & Redevelopment Authority, Health Partners Obligated Group Project | | | | | | | | | | |
| $ | 2,000 | | | 5.250%, 05/15/2026 | | | | | | | | $ | 1,947,420 | |
| | 2,000 | | | 5.250%, 05/15/2036 | | | | | | | | | 1,826,360 | |
| | | | | |
| | | | St. Paul Housing & Redevelopment Authority, HealthEast Project | | | | | | | | | | |
| | 800 | | | 6.000%, 11/15/2030 | | | | | | | | | 719,560 | |
| | | | | |
| | | | St. Paul Housing & Redevelopment Authority, Regions Hospital Project | | | | | | | | | | |
| | 500 | | | 5.250%, 05/15/2018 | | | | | | | | | 500,520 | |
| | | | | |
| | | | St. Paul Port Authority, HealthEast Midway Campus, Series A | | | | | | | | | | |
| | 900 | | | 5.875%, 05/01/2030 | | | | | | | | | 804,168 | |
| | | | | |
| | | | St. Paul Port Authority, HealthEast Midway Campus, Series B | | | | | | | | | | |
| | 1,800 | | | 6.000%, 05/01/2030 | | | | | | | | | 1,631,916 | |
| | 50,215 | | | Total Health Care | | | | | | | | | 49,320,023 | |
| | | | Housing – 8.3% | | | | | | | | | | |
| | | | | |
| | | | Cottage Grove Senior Housing, PHS/Cottage Grove Inc. Project, Series A | | | | | | | | | | |
| | 850 | | | 5.000%, 12/01/2031 | | | | | | | | | 711,764 | |
| | | | | |
| | | | Dakota County Community Development Agency, Multifamily Housing, Ebenezer Ridges Project (GNMA) | | | | | | | | | | |
| | 1,980 | | | 5.900%, 04/20/2042 | | | | | | | | | 2,007,740 | |
| | | | | |
| | | | Maplewood Multifamily Housing, Carefree Cottages ll, Mandatory Put 04/15/2019 @ 100 (AMT) (FNMA) | | | | | | | | | | |
| | 2,000 | | | 4.800%, 04/15/2034 | | | | | | | | | 2,026,660 | |
| | | | | |
| | | | Minneapolis & St. Paul Housing Financing Board, Single Family Mortgage, Series A4 (AMT) (FHLMC) (FNMA) (GNMA) | | | | | | | | | | |
| | 596 | | | 5.000%, 11/01/2038 | | | | | | | | | 592,548 | |
| | | | | |
| | | | Minneapolis Housing, Keeler Apartments Project, Series A | | | | | | | | | | |
| | 1,350 | | | 5.000%, 10/01/2037 | | | | | | | | | 1,093,257 | |
| | | | | |
| | | | Minneapolis Multifamily Housing, Vantage Flats Project (AMT) (GNMA) | | | | | | | | | | |
| | 865 | | | 5.200%, 10/20/2048 | | | | | | | | | 824,103 | |
| | | | | |
| | | | Minnesota Housing Finance Agency, Residential Housing | | | | | | | | | | |
| | | | Series B (AMT) | | | | | | | | | | |
| | 395 | | | 5.650%, 07/01/2033 | | | | | | | | | 395,079 | |
| | | | Minnesota Housing Finance Agency, Residential Housing, Series D (AMT) | | | | | | | | | | |
| | 3,465 | | | 4.700%, 07/01/2027 | | | | | | | | | 3,306,684 | |
| | | | | |
| | | | Moorhead Senior Housing, Sheyenne Crossing Project | | | | | | | | | | |
| | 1,620 | | | 5.650%, 04/01/2041 | | | | | | | | | 1,327,865 | |
| | | | | |
| | | | St. Paul Housing & Redevelopment Authority, Rossy & Richard Shaller, Series A | | | | | | | | | | |
| | 1,100 | | | 5.250%, 10/01/2042 | | | | | | | | | 854,469 | |
| | 14,221 | | | Total Housing | | | | | | | | | 13,140,169 | |
| | | | Lease Revenue – 3.2% | | | | | | | | | | |
| | | | | |
| | | | Lakeville Housing & Redevelopment Authority, Ice Arena Project | | | | | | | | | | |
| | 585 | | | 4.625%, 02/01/2032 | | | | | | | | | 585,140 | |
| | | | | |
| | | | Pine County Housing & Redevelopment Authority, Public Project, Series A | | | | | | | | | | |
| | 1,000 | | | 5.000%, 02/01/2028 | | | | | | | | | 1,001,990 | |
| | 1,890 | | | 5.000%, 02/01/2031 | | | | | | | | | 1,850,499 | |
| | | | | |
| | | | St. Paul Housing & Redevelopment Authority, Jimmy Lee Recreation Center | | | | | | | | | | |
| | 500 | | | 4.750%, 12/01/2026 | | | | | | | | | 514,500 | |
| | | | | |
| | | | St. Paul Port Authority, Regions Hospital Parking Ramp Project, Series 1 | | | | | | | | | | |
| | 1,375 | | | 5.000%, 08/01/2036 | | | | | | | | | 1,186,323 | |
| | 5,350 | | | Total Lease Revenue | | | | | | | | | 5,138,452 | |
| | | | Miscellaneous – 2.6% | | | | | | | | | | |
| | | | | |
| | | | Little Canada Commercial Development, RLF Minnesota Project | | | | | | | | | | |
| | 340 | | | 5.000%, 04/01/2013 | | | | | | | | | 341,765 | |
| | | | | |
| | | | Seaway Port Authority of Duluth, Cargill Incorporated Project | | | | | | | | | | |
| | 1,130 | | | 4.200%, 05/01/2013 | | | | | | | | | 1,166,781 | |
Portfolio of Investments
Nuveen Minnesota Municipal Bond Fund (continued)
May 31, 2011
| | | | | | | | | | | | | | |
Principal
Amount (000) | | | Description p | | | | | | | | Value | |
| | | | | | | | | | | | | | |
| | | | Miscellaneous (continued) | | | | | | | | | | |
| | | | | |
| | | | St. Paul Housing & Redevelopment Authority, Parking Facilities Project, Series A | | | | | | | | | | |
| $ | 1,070 | | | 5.000%, 08/01/2030 | | | | | | | | $ | 1,088,425 | |
| | 1,500 | | | 5.000%, 08/01/2035 | | | | | | | | | 1,463,925 | |
| | 4,040 | | | Total Miscellaneous | | | | | | | | | 4,060,896 | |
| | | | Recreational Facility Authority – 1.2% | | | | | | | | | | |
| | | | | |
| | | | Moorhead Golf Course, Series B | | | | | | | | | | |
| | 1,885 | | | 5.875%, 12/01/2021 | | | | | | | | | 1,828,356 | |
| | | | Tax Revenue – 0.2% | | | | | | | | | | |
| | | | | |
| | | | Minneapolis St. Anthony Falls Project | | | | | | | | | | |
| | 400 | | | 5.650%, 02/01/2027 | | | | | | | | | 352,528 | |
| | | | Transportation – 9.1% | | | | | | | | | | |
| | | | | |
| | | | Minneapolis & St. Paul Metropolitan Airports Commission Series A (AMBAC) | | | | | | | | | | |
| | 3,250 | | | 5.000%, 01/01/2019 | | | | | | | | | 3,580,915 | |
| | 5,000 | | | 5.000%, 01/01/2020 | | | | | | | | | 5,482,150 | |
| | | | | |
| | | | Minneapolis & St. Paul Metropolitan Airports Commission, Series B (AMT) | | | | | | | | | | |
| | 4,000 | | | 5.000%, 01/01/2020 | | | | | | | | | 4,356,160 | |
| | | | | |
| | | | Mozaic Parking Project, Series A | | | | | | | | | | |
| | 1,000 | | | 8.500%, 01/01/2041 | | | | | | | | | 1,018,200 | |
| | 13,250 | | | Total Transportation | | | | | | | | | 14,437,425 | |
| | | | Utilities – 17.8% | | | | | | | | | | |
| | | | | |
| | | | Chaska Electric, Series A | | | | | | | | | | |
| | 45 | | | 6.100%, 10/01/2030 | | | | | | | | | 45,048 | |
| | | | | |
| | | | Minnesota Municipal Power Agency, Series A | | | | | | | | | | |
| | 5,000 | | | 5.000%, 10/01/2030 | | | | | | | | | 5,087,350 | |
| | | | | |
| | | | Northern Municipal Power Agency, Minnesota Electric Systems, Series A (AMBAC) | | | | | | | | | | |
| | 2,000 | | | 5.000%, 01/01/2026 | | | | | | | | | 2,070,760 | |
| | | | | |
| | | | Puerto Rico Commonwealth, Aqueduct & Sewer Authority, Series A | | | | | | | | | | |
| | 1,500 | | | 6.000%, 07/01/2038 | | | | | | | | | 1,504,620 | |
| | | | | |
| | | | Puerto Rico Electric Power Authority, Series SS (NATL) | | | | | | | | | | |
| | 2,000 | | | 5.000%, 07/01/2024 | | | | | | | | | 2,002,100 | |
| | | | | |
| | | | Southern Minnesota Municipal Power Agency, Series A (NATL) | | | | | | | | | | |
| | 2,000 | | | 0.000%, 01/01/2019 | | | | | | | | | 1,506,700 | |
| | 1,765 | | | 0.000%, 01/01/2021 | | | | | | | | | 1,188,428 | |
| | 3,000 | | | 0.000%, 01/01/2023 | | | | | | | | | 1,781,550 | |
| | 11,000 | | | 0.000%, 01/01/2024 | | | | | | | | | 6,123,260 | |
| | 4,770 | | | 0.000%, 01/01/2025 | | | | | | | | | 2,487,840 | |
| | 6,100 | | | 0.000%, 01/01/2026 | | | | | | | | | 2,972,835 | |
| | 2,300 | | | 0.000%, 01/01/2027 | | | | | | | | | 1,052,503 | |
| | | | | |
| | | | Western Minnesota Municipal Power Agency (NATL) | | | | | | | | | | |
| | 410 | | | 9.750%, 01/01/2016 (ETM) | | | | | | | | | 539,080 | |
| | 41,890 | | | Total Utilities | | | | | | | | | 28,362,074 | |
| | 172,136 | | | Total Municipal Bonds (cost $155,926,740) | | | | | | | | | 158,559,149 | |
| | | | | |
| Shares | | | Description p | | | | | | | | Value | |
| | | | SHORT-TERM INVESTMENTS – 1.6% | | | | | | | | | | |
| | | | | |
| | | | Money Market Funds – 1.6% | | | | | | | | | | |
| | | | | |
| | 2,660,415 | | | Federated Minnesota Municipal Cash Trust, 0.010% | | | | | | | | $ | 2,660,415 | |
| | | | Total Short-Term Investments (cost $2,660,415) | | | | | | | | | 2,660,415 | |
| | | | Total Investments – 101.3% (cost $158,587,155) | | | | | | | | | 161,219,564 | |
| | | | Other Assets Less Liabilities – (1.3)% | | | | | | | | | (2,113,031) | |
| | | | Net Assets – 100.0% | | | | | | | | $ | 159,106,533 | |
| | p | | All percentages shown in the Portfolio of Investments are based on net assets. |
| | | | The rate shown is the annualized seven-day effective yield as of May 31, 2011. |
| | (ETM) | | Escrowed to maturity. |
| | (WI/DD) | | Investment, or portion of investment, purchased on a when-issued or delayed delivery basis. |
See accompanying notes to financial statements.
Portfolio of Investments
Nuveen Missouri Tax Free Fund
(formerly known as First American Missouri Tax Free Fund)
May 31, 2011
| | | | | | | | | | | | | | |
Principal
Amount (000) | | | Description p | | | | | | | | Value | |
| | | | MUNICIPAL BONDS – 98.8% | | | | | | | | | | |
| | | | | |
| | | | Certificates of Participation – 7.8% | | | | | | | | | | |
| | | | | |
| | | | Belton Refunding & Improvement | | | | | | | | | | |
| $ | 355 | | | 5.250%, 03/01/2029 | | | | | | | | $ | 360,613 | |
| | | | | |
| | | | Belton Refunding & Improvement (NATL) | | | | | | | | | | |
| | 600 | | | 4.375%, 03/01/2019 | | | | | | | | | 616,920 | |
| | 250 | | | 4.500%, 03/01/2022 | | | | | | | | | 250,612 | |
| | | | | |
| | | | Cass County | | | | | | | | | | |
| | 1,975 | | | 4.000%, 05/01/2022 | | | | | | | | | 1,955,132 | |
| | | | | |
| | | | Cottleville | | | | | | | | | | |
| | 200 | | | 5.125%, 08/01/2026 | | | | | | | | | 187,446 | |
| | 1,700 | | | 5.250%, 08/01/2031 | | | | | | | | | 1,526,209 | |
| | | | | |
| | | | Hazelwood School District, Energy Improvements Project | | | | | | | | | | |
| | 515 | | | 4.500%, 03/01/2017 | | | | | | | | | 559,450 | |
| | 445 | | | 4.500%, 03/01/2018 | | | | | | | | | 477,302 | |
| | | | | |
| | | | Kansas City Metropolitan Junior College District | | | | | | | | | | |
| | 1,025 | | | 4.500%, 07/01/2021 | | | | | | | | | 1,103,976 | |
| | | | | |
| | | | Lincoln County Public Water Supply, District #1 | | | | | | | | | | |
| | 1,500 | | | 6.750%, 06/15/2035 | | | | | | | | | 1,548,900 | |
| | | | | |
| | | | Missouri School Boards Association, Liberty Public School District #53 (AGM) | | | | | | | | | | |
| | 1,015 | | | 5.250%, 03/01/2025 | | | | | | | | | 1,086,689 | |
| | | | | |
| | | | Taney County Public Water Supply, District #3 | | | | | | | | | | |
| | 590 | | | 4.500%, 07/01/2025 | | | | | | | | | 592,472 | |
| | | | | |
| | | | Texas County Justice Center Project (AGC) | | | | | | | | | | |
| | 1,595 | | | 4.500%, 12/01/2025 | | | | | | | | | 1,618,670 | |
| | | | | |
| | | | Union, Series A | | | | | | | | | | |
| | 520 | | | 5.200%, 07/01/2023 | | | | | | | | | 525,060 | |
| | 12,285 | | | Total Certificates of Participation | | | | | | | | | 12,409,451 | |
| | | | Continuing Care Retirement Communities – 5.1% | | | | | | | | | | |
| | | | | |
| | | | Cole County Industrial Development Authority, Lutheran Services Heisinger Project | | | | | | | | | | |
| | 2,000 | | | 5.250%, 02/01/2024 | | | | | | | | | 1,948,600 | |
| | | | | |
| | | | Illinois Finance Authority, Franciscan Communities, Series A | | | | | | | | | | |
| | 500 | | | 5.500%, 05/15/2027 | | | | | | | | | 403,055 | |
| | | | | |
| | | | Kirkwood Industrial Development Authority, Aberdeen, Series C-2 | | | | | | | | | | |
| | 1,500 | | | 7.000%, 11/15/2015 | | | | | | | | | 1,501,845 | |
| | | | | |
| | | | Lee’s Summit Industrial Development Authority, Senior Living Facilities, John Knox Village Group, Series A | | | | | | | | | | |
| | 1,035 | | | 5.000%, 08/15/2014 | | | | | | | | | 1,082,538 | |
| | | | | |
| | | | Missouri Health & Educational Facilities Authority, Senior Living Facilities, Lutheran Senior, Series A | | | | | | | | | | |
| | 1,500 | | | 5.375%, 02/01/2035 | | | | | | | | | 1,337,100 | |
| | | | | |
| | | | St. Louis County Industrial Development Authority, Friendship Village West, Series A | | | | | | | | | | |
| | 2,000 | | | 5.500%, 09/01/2028, DD | | | | | | | | | 1,827,040 | |
| | 8,535 | | | Total Continuing Care Retirement Communities | | | | | | | | | 8,100,178 | |
| | | | Education – 5.6% | | | | | | | | | | |
| | | | | |
| | | | Curators University System Facilities, Series A | | | | | | | | | | |
| | 1,000 | | | 5.000%, 11/01/2033 | | | | | | | | | 1,038,570 | |
| | | | | |
| | | | Lincoln University Auxiliary System (AGC) | | | | | | | | | | |
| | 1,000 | | | 5.125%, 06/01/2037 | | | | | | | | | 1,002,050 | |
| | | | | |
| | | | Missouri Development Finance Board, Midwest Research Institute Project | | | | | | | | | | |
| | 1,185 | | | 5.000%, 11/01/2017 | | | | | | | | | 1,269,443 | |
| | | | | |
| | | | Missouri Health & Educational Facilities Authority, Rockhurst University, Series A | | | | | | | | | | |
| | 1,000 | | | 6.500%, 10/01/2030 | | | | | | | | | 1,034,870 | |
| | 1,300 | | | 6.500%, 10/01/2035 | | | | | | | | | 1,320,371 | |
Portfolio of Investments
Nuveen Missouri Tax Free Fund (continued)
May 31, 2011
| | | | | | | | | | | | | | |
Principal
Amount (000) | | | Description p | | | | | | | | Value | |
| | | | Education (continued) | | | | | | | | | | |
| | | | | |
| | | | Missouri Health & Educational Facilities Authority, Washington University, Series A | | | | | | | | | | |
| $ | 3,000 | | | 5.375%, 03/15/2039 | | | | | | | | $ | 3,199,770 | |
| | 8,485 | | | Total Education | | | | | | | | | 8,865,074 | |
| | | | General Obligations – 8.2% | | | | | | | | | | |
| | | | | |
| | | | Belton | | | | | | | | | | |
| | 1,520 | | | 5.000%, 03/01/2027 | | | | | | | | | 1,650,492 | |
| | 680 | | | 5.000%, 03/01/2030 | | | | | | | | | 710,648 | |
| | 1,000 | | | 4.750%, 03/01/2031 | | | | | | | | | 1,022,270 | |
| | | | | |
| | | | Blue Springs Neighborhood Improvement, South Area Improvement Project | | | | | | | | | | |
| | 850 | | | 5.000%, 02/15/2029 | | | | | | | | | 888,335 | |
| | | | | |
| | | | Jackson County School District #4, Blue Springs, Series A | | | | | | | | | | |
| | 2,000 | | | 4.750%, 03/01/2026 | | | | | | | | | 2,098,320 | |
| | | | | |
| | | | Jackson County School District #7, Lee’s Summit | | | | | | | | | | |
| | 1,000 | | | 4.750%, 03/01/2027 | | | | | | | | | 1,050,870 | |
| | | | | |
| | | | Platte County School District #R-3 (NATL) | | | | | | | | | | |
| | 685 | | | 5.000%, 03/01/2024 | | | | | | | | | 714,386 | |
| | | | | |
| | | | Puerto Rico Commonwealth, Public Improvement, Series A | | | | | | | | | | |
| | 1,000 | | | 5.250%, 07/01/2026 | | | | | | | | | 988,670 | |
| | | | | |
| | | | Richmond Heights, Manhasset Village Neighborhood | | | | | | | | | | |
| | 690 | | | 4.500%, 04/01/2026 | | | | | | | | | 691,780 | |
| | | | | |
| | | | St. Charles County, Francis Howell School District (MDDP) | | | | | | | | | | |
| | 1,000 | | | 5.000%, 03/01/2027 | | | | | | | | | 1,078,800 | |
| | | | | |
| | | | Wentzville School District #R-04, Refunding & Improvement, Series A, (MDDP) | | | | | | | | | | |
| | 5,000 | | | 0.000%, 03/01/2026 | | | | | | | | | 2,244,150 | |
| | 15,425 | | | Total General Obligations | | | | | | | | | 13,138,721 | |
| | | | Health Care – 24.2% | | | | | | | | | | |
| | | | | |
| | | | Boone County Hospital | | | | | | | | | | |
| | 1,115 | | | 5.050%, 08/01/2020 | | | | | | | | | 1,126,005 | |
| | 2,000 | | | 5.625%, 08/01/2038 | | | | | | | | | 2,005,080 | |
| | | | | |
| | | | Cape Girardeau County Industrial Development Authority, Health Care Facilities, Saint Francis Medical Center, Series A | | | | | | | | | | |
| | 250 | | | 5.125%, 06/01/2023 | | | | | | | | | 261,237 | |
| | 200 | | | 5.125%, 06/01/2024 | | | | | | | | | 205,870 | |
| | 500 | | | 5.500%, 06/01/2029 | | | | | | | | | 505,800 | |
| | 2,000 | | | 5.750%, 06/01/2039 | | | | | | | | | 2,034,600 | |
| | | | | |
| | | | Cape Girardeau County Industrial Development Authority, Health Care Facilities, Southeast Missouri Hospital | | | | | | | | | | |
| | 245 | | | 5.625%, 06/01/2022 | | | | | | | | | 246,156 | |
| | | | | |
| | | | Cape Girardeau County Industrial Development Authority, Health Care Facilities, Southeast Missouri Hospital (Pre-refunded 06/01/2012 @ 100) | | | | | | | | | | |
| | 1,255 | | | 5.625%, 06/01/2022 | | | | | | | | | 1,319,997 | |
| | | | | |
| | | | Cass County Hospital | | | | | | | | | | |
| | 2,000 | | | 5.500%, 05/01/2027 | | | | | | | | | 1,833,020 | |
| | | | | |
| | | | Clinton County Industrial Development Authority, Health Facilities, Cameron Regional Medical Center | | | | | | | | | | |
| | 1,000 | | | 5.000%, 12/01/2037 | | | | | | | | | 670,310 | |
| | | | | |
| | | | Colorado Health Facilities Authority, Sisters of Charity of Leavenworth, Series B | | | | | | | | | | |
| | 495 | | | 5.250%, 01/01/2025 | | | | | | | | | 522,977 | |
| | | | | |
| | | | Grundy County Industrial Development Authority Health Facilities, Wright Memorial Hospital | | | | | | | | | | |
| | 1,120 | | | 5.650%, 09/01/2022 | | | | | | | | | 1,122,822 | |
| | 1,000 | | | 5.750%, 09/01/2023 | | | | | | | | | 1,000,550 | |
| | | | | |
| | | | Hannibal Industrial Development Authority Health Facilities | | | | | | | | | | |
| | 1,345 | | | 4.300%, 03/01/2013 | | | | | | | | | 1,378,800 | |
| | 850 | | | 5.375%, 09/01/2019 | | | | | | | | | 882,750 | |
| | 1,835 | | | 5.000%, 03/01/2022 | | | | | | | | | 1,836,395 | |
| | | | | | | | | | | | | | |
Principal
Amount (000) | | | Description p | | | | | | | | Value | |
| | | | Health Care (continued) | | | | | | | | | | |
| | | | | |
| | | | Joplin Industrial Development Authority Health Facilities, Freeman Health System Project | | | | | | | | | | |
| $ | 2,000 | | | 5.500%, 02/15/2024 | | | | | | | | $ | 2,007,000 | |
| | | | | |
| | | | Missouri Health & Educational Facilities Authority, BJC Health System, Series A, | | | | | | | | | | |
| | 2,310 | | | 6.750%, 05/15/2012 (ETM) | | | | | | | | | 2,436,011 | |
| | | | | |
| | | | Missouri Health & Educational Facilities Authority, Children’s Mercy Hospital | | | | | | | | | | |
| | 2,500 | | | 5.625%, 05/15/2039 | | | | | | | | | 2,537,525 | |
| | | | | |
| | | | Missouri Health & Educational Facilities Authority, Jefferson Memorial Hospital (RAAI) | | | | | | | | | | |
| | 2,300 | | | 5.000%, 08/15/2019 | | | | | | | | | 2,328,681 | |
| | | | | |
| | | | Missouri Health & Educational Facilities Authority, Lake Regional Health System Project | | | | | | | | | | |
| | 515 | | | 5.000%, 02/15/2012 | | | | | | | | | 528,102 | |
| | | | | |
| | | | Missouri Health & Educational Facilities Authority, Saint Luke’s Health System | | | | | | | | | | |
| | | | Series 2003-B (AGM) | | | | | | | | | | |
| | 2,000 | | | 5.500%, 11/15/2032 | | | | | | | | | 2,095,120 | |
| | | | | |
| | | | Missouri Health & Educational Facilities, Series A | | | | | | | | | | |
| | 485 | | | 5.250%, 11/15/2025 | | | | | | | | | 510,196 | |
| | 500 | | | 5.000%, 11/15/2030 | | | | | | | | | 503,360 | |
| | | | | |
| | | | Missouri Health & Educational Facilities Authority, Senior Living Facilities, Lutheran Senior | | | | | | | | | | |
| | 1,250 | | | 5.500%, 02/01/2042 | | | | | | | | | 1,110,225 | |
| | | | | |
| | | | Missouri Health & Educational Facilities Authority, SSM Health Care | | | | | | | | | | |
| | | | Series A | | | | | | | | | | |
| | 2,000 | | | 5.000%, 06/01/2036 | | | | | | | | | 2,001,160 | |
| | | | | |
| | | | Missouri Health & Educational Facilities Authority, SSM Health Care, Series B | | | | | | | | | | |
| | 1,500 | | | 5.000%, 06/01/2030 | | | | | | | | | 1,533,825 | |
| | | | | |
| | | | Saline County Industrial Development Authority, Health Facilities, John Fitzgibbon Memorial Hospital | | | | | | | | | | |
| | 1,000 | | | 5.600%, 12/01/2028 | | | | | | | | | 949,760 | |
| | 1,000 | | | 5.625%, 12/01/2035 | | | | | | | | | 794,910 | |
| | | | | |
| | | | St. Louis County Industrial Development Authority, Health Facilities, Ranken-Jordan Project | | | | | | | | | | |
| | 125 | | | 4.250%, 11/15/2014 | | | | | | | | | 117,833 | |
| | 670 | | | 5.000%, 11/15/2027 | | | | | | | | | 551,872 | |
| | 1,300 | | | 5.000%, 11/15/2035 | | | | | | | | | 990,158 | |
| | | | | |
| | | | St. Louis County Industrial Development Authority, Health Facilities, Ranken-Jordan Project, Series A, (Pre-refunded 11/15/2013) | | | | | | | | | | |
| | 500 | | | 6.625%, 11/15/2035 | | | | | | | | | 571,405 | |
| | 39,165 | | | Total Health Care | | | | | | | | | 38,519,512 | |
| | | | Housing – 2.6% | | | | | | | | | | |
| | | | | |
| | | | Joplin Industrial Development Authority, Christian Homes, Series F | | | | | | | | | | |
| | 500 | | | 5.750%, 05/15/2031 | | | | | | | | | 448,625 | |
| | | | | |
| | | | Kansas City Industrial Development Authority, Multifamily Housing, Grand Boulevard, Series A (GNMA) | | | | | | | | | | |
| | 1,290 | | | 5.300%, 11/20/2049 | | | | | | | | | 1,301,184 | |
| | | | | |
| | | | Missouri Housing Development Commission, Homeownership Loan Program, Series A1 | | | | | | | | | | |
| | | | (AMT) (FHLMC) (FNMA) (GNMA) | | | | | | | | | | |
| | 370 | | | 5.300%, 03/01/2039 | | | | | | | | | 364,676 | |
| | | | | |
| | | | Missouri Housing Development Commission, Homeownership Loan Program, Series B (AMT) (FNMA) (GNMA) | | | | | | | | | | |
| | 485 | | | 4.800%, 09/01/2031 | | | | | | | | | 463,772 | |
| | | | | |
| | | | Missouri Housing Development Commission, Homeownership Loan Program, Series C1 (AMT) (FNMA) (GNMA) | | | | | | | | | | |
| | 245 | | | 5.000%, 09/01/2037 | | | | | | | | | 236,645 | |
| | | | | |
| | | | Riverside Industrial Development Authority, Riverside Horizons Project, Series A (ACA) | | | | | | | | | | |
| | 1,400 | | | 5.000%, 05/01/2027 | | | | | | | | �� | 1,383,298 | |
| | 4,290 | | | Total Housing | | | | | | | | | 4,198,200 | |
| | | | Lease Revenue – 15.9% | | | | | | | | | | |
| | | | | |
| | | | Cape Girardeau County, Jackson School District #R-2 (NATL) | | | | | | | | | | |
| | 1,000 | | | 5.250%, 03/01/2026 | | | | | | | | | 1,037,960 | |
Portfolio of Investments
Nuveen Missouri Tax Free Fund (continued)
May 31, 2011
| | | | | | | | | | | | | | |
Principal
Amount (000) | | | Description p | | | | | | | | Value | |
| | | | Lease Revenue (continued) | | | | | | | | | | |
| | | | | |
| | | | Clay County Public Building Authority, Series A (AGM) | | | | | | | | | | |
| $ | 1,425 | | | 5.125%, 05/15/2014 | | | | | | | | $ | 1,430,002 | |
| | | | | |
| | | | Kansas City Industrial Development Authority, National Security Campus | | | | | | | | | | |
| | 1,250 | | | 4.000%, 09/01/2013 | | | | | | | | | 1,270,625 | |
| | 1,115 | | | 4.000%, 09/01/2014 | | | | | | | | | 1,124,355 | |
| | | | | |
| | | | Kansas City Municipal Assistance, Capital Appreciation Leasehold, Series B-1 (AMBAC) | | | | | | | | | | |
| | 2,000 | | | 0.000%, 04/15/2027 | | | | | | | | | 814,580 | |
| | | | | |
| | | | Kansas City Special Facilities, MCI Overhaul Base Project, Series G, (Pre-refunded 09/01/2015) (AMT) | | | | | | | | | | |
| | 4,000 | | | 4.750%, 09/01/2028 | | | | | | | | | 4,473,840 | |
| | | | | |
| | | | Missouri Board of Public Buildings, Special Obligation, Series A | | | | | | | | | | |
| | 1,000 | | | 5.000%, 10/15/2027 | | | | | | | | | 1,031,630 | |
| | | | | |
| | | | Missouri Board of Public Buildings, State Office Building Special Obligation | | | | | | | | | | |
| | | | Series A | | | | | | | | | | |
| | 5,000 | | | 5.125%, 05/01/2026 | | | | | | | | | 5,013,100 | |
| | | | Missouri Board of Public Buildings, State Office Building Special Obligation, Series A (NATL) | | | | | | | | | | |
| | 3,000 | | | 5.000%, 05/01/2024 | | | | | | | | | 3,009,300 | |
| | | | | |
| | | | Missouri Development Finance Board, Infrastructure Facilities, Branson, Series A | | | | | | | | | | |
| | 1,000 | | | 5.000%, 12/01/2017 | | | | | | | | | 1,029,270 | |
| | 750 | | | 5.375%, 12/01/2022 | | | | | | | | | 763,095 | |
| | | | | |
| | | | Missouri Development Finance Board, Infrastructure Facilities, Independence Water System Improvement, Series C | | | | | | | | | | |
| | 500 | | | 5.750%, 11/01/2029 | | | | | | | | | 513,515 | |
| | | | | |
| | | | Platte County School District #R-3 (MDDP) | | | | | | | | | | |
| | 200 | | | 5.000%, 03/01/2028 | | | | | | | | | 207,698 | |
| | | | | |
| | | | Springfield Public Building, Capital Improvement Program (AMBAC) | | | | | | | | | | |
| | 2,000 | | | 5.000%, 03/01/2024 | | | | | | | | | 2,133,760 | |
| | | | | |
| | | | St. Louis Municipal Finance Leasehold, Convention Center Capital Improvement, Series A (AGC) | | | | | | | | | | |
| | 1,000 | | | 0.000%, 07/15/2026 | | | | | | | | | 413,250 | |
| | 1,000 | | | 0.000%, 07/15/2027 | | | | | | | | | 382,540 | |
| | 1,000 | | | 0.000%, 07/15/2028 | | | | | | | | | 354,460 | |
| | 1,000 | | | 0.000%, 07/15/2029 | | | | | | | | | 323,240 | |
| | 28,240 | | | Total Lease Revenue | | | | | | | | | 25,326,220 | |
| | | | Miscellaneous – 2.4% | | | | | | | | | | |
| | | | | |
| | | | Kansas City Industrial Development Authority, Downtown Redevelopment District, Series A | | | | | | | | | | |
| | 200 | | | 5.000%, 09/01/2032 (WI/DD) | | | | | | | | | 194,750 | |
| | | | | |
| | | | Kennett Industrial Development Authority, Manac Trailers USA Inc Project (AMT) | | | | | | | | | | |
| | 1,500 | | | 4.250%, 03/01/2022 | | | | | | | | | 1,241,685 | |
| | 500 | | | 4.250%, 03/01/2024 | | | | | | | | | 393,480 | |
| | | | | |
| | | | Missouri Development Finance Board, Infrastructure Facilities, Eastland Center Project, Series A | | | | | | | | | | |
| | 1,010 | | | 4.250%, 04/01/2015 | | | | | | | | | 1,079,347 | |
| | | | | |
| | | | Sugar Creek Industrial Development, Lafarge North America, Series A (AMT) | | | | | | | | | | |
| | 1,000 | | | 5.650%, 06/01/2037 | | | | | | | | | 872,080 | |
| | 4,210 | | | Total Miscellaneous | | | | | | | | | 3,781,342 | |
| | | | Revolving Funds – 1.3% | | | | | | | | | | |
| | | | | |
| | | | Missouri Environmental Improvement & Energy Resources Authority, Water Pollution Control | | | | | | | | | | |
| | | | Series A | | | | | | | | | | |
| | 1,000 | | | 5.750%, 01/01/2029 | | | | | | | | | 1,138,340 | |
| | | | | |
| | | | Missouri Environmental Improvement & Energy Resources Authority, Water Pollution Control, Series B | | | | | | | | | | |
| | 110 | | | 5.250%, 01/01/2015 | | | | | | | | | 110,427 | |
| | | | | |
| | | | Missouri Environmental Improvement & Energy Resources Authority, Water Pollution Control, Series C | | | | | | | | | | |
| | 410 | | | 4.750%, 07/01/2023 | | | | | | | | | 439,954 | |
| | 470 | | | 5.000%, 07/01/2023 | | | | | | | | | 471,490 | |
| | 1,990 | | | Total Revolving Funds | | | | | | | | | 2,160,211 | |
| | | | | | | | | | | | | | |
Principal
Amount (000) | | | Description p | | | | | | | | Value | |
| | | | Tax Revenue – 12.1% | | | | | | | | | | |
| | | | | |
| | | | Columbia Special Obligation, Electric Utility Improvement, Series A | | | | | | | | | | |
| $ | 400 | | | 5.000%, 10/01/2021 | | | | | | | | $ | 445,816 | |
| | 445 | | | 5.000%, 10/01/2023 | | | | | | | | | 487,021 | |
| | 500 | | | 5.125%, 10/01/2030 | | | | | | | | | 526,165 | |
| | | | | |
| | | | Fenton Tax Increment, Gravois Bluffs Redevelopment Project | | | | | | | | | | |
| | 1,000 | | | 5.000%, 04/01/2014 | | | | | | | | | 1,069,870 | |
| | | | | |
| | | | Harrisonville Towne Center Project | | | | | | | | | | |
| | 340 | | | 4.375%, 11/01/2017 | | | | | | | | | 351,778 | |
| | 715 | | | 4.500%, 11/01/2022 | | | | | | | | | 720,777 | |
| | | | | |
| | | | Howard Bend Levee District (SGI) | | | | | | | | | | |
| | 1,745 | | | 5.500%, 03/01/2026 | | | | | | | | | 1,813,840 | |
| | | | | |
| | | | Jackson County Special Obligation, Harry S. Truman Sports Complex (AMBAC) | | | | | | | | | | |
| | 3,000 | | | 5.000%, 12/01/2028 | | | | | | | | | 3,062,850 | |
| | | | | |
| | | | Kansas City Tax Increment Financing Commission, Maincor Project, Series A | | | | | | | | | | |
| | 500 | | | 5.250%, 03/01/2018 | | | | | | | | | 482,340 | |
| | | | | |
| | | | Missouri Development Finance Board, Independence Centerpoint Project, Series E | | | | | | | | | | |
| | 1,000 | | | 5.125%, 04/01/2025 | | | | | | | | | 1,023,450 | |
| | | | | |
| | | | Missouri Development Finance Board, Independence Crackerneck Creek Project, Series B | | | | | | | | | | |
| | 1,000 | | | 5.000%, 03/01/2025 | | | | | | | | | 1,005,610 | |
| | | | | |
| | | | Monarch-Chesterfield Levee District | | | | | | | | | | |
| | 1,000 | | | 3.000%, 03/01/2018 | | | | | | | | | 1,022,230 | |
| | | | | |
| | | | Osage Beach Tax Increment, Prewitt’s Point Project | | | | | | | | | | |
| | 1,455 | | | 5.000%, 05/01/2023 | | | | | | | | | 1,196,621 | |
| | | | | |
| | | | Puerto Rico Sales Tax Financing Corporation, Series A | | | | | | | | | | |
| | 1,500 | | | 6.000%, 08/01/2042 | | | | | | | | | 1,540,740 | |
| | | | | |
| | | | Puerto Rico Sales Tax Financing Corporation, Series C | | | | | | | | | | |
| | 1,530 | | | 6.000%, 08/01/2039 | | | | | | | | | 1,575,487 | |
| | 1,000 | | | 5.250%, 08/01/2041 | | | | | | | | | 956,230 | |
| | | | | |
| | | | Raytown Live Redevelopment Plan, Project #1 | | | | | | | | | | |
| | 1,000 | | | 5.125%, 12/01/2031 | | | | | | | | | 979,500 | |
| | | | | |
| | | | Riverside Tax Increment, L-385 Levee Project | | | | | | | | | | |
| | 1,000 | | | 5.250%, 05/01/2020 | | | | | | | | | 1,027,340 | |
| | 19,130 | | | Total Tax Revenue | | | | | | | | | 19,287,665 | |
| | | | Transportation – 2.7% | | | | | | | | | | |
| | | | | |
| | | | Puerto Rico Commonwealth Highway & Transportation Authority, Series K | | | | | | | | | | |
| | 1,000 | | | 5.000%, 07/01/2017 | | | | | | | | | 1,038,630 | |
| | | | | |
| | | | St. Louis, Lambert-St. Louis International Airport, Series A (AGM) | | | | | | | | | | |
| | 1,000 | | | 5.000%, 07/01/2020 | | | | | | | | | 1,049,090 | |
| | | | | |
| | | | St. Louis, Lambert-St. Louis International Airport, Series A-1 | | | | | | | | | | |
| | 2,000 | | | 6.125%, 07/01/2024 | | | | | | | | | 2,153,380 | |
| | 4,000 | | | Total Transportation | | | | | | | | | 4,241,100 | |
| | | | Utilities – 10.9% | | | | | | | | | | |
| | | | | |
| | | | Carroll County Public Water Supply, District #I | | | | | | | | | | |
| | 500 | | | 6.000%, 03/01/2039 | | | | | | | | | 523,145 | |
| | | | | |
| | | | Jefferson County Public Water Supply, District #C-1 | | | | | | | | | | |
| | 745 | | | 4.125%, 12/01/2024 | | | | | | | | | 761,502 | |
| | 500 | | | 4.250%, 12/01/2025 | | | | | | | | | 509,675 | |
| | | | | |
| | | | Kansas City Sanitary Sewer System, Series A | | | | | | | | | | |
| | 2,000 | | | 5.250%, 01/01/2034 | | | | | | | | | 2,089,520 | |
| | | | | |
| | | | Kansas City Water, Series A | | | | | | | | | | |
| | 500 | | | 5.250%, 12/01/2032 | | | | | | | | | 537,305 | |
Portfolio of Investments
Nuveen Missouri Tax Free Fund (continued)
May 31, 2011
| | | | | | | | | | | | | | |
Principal
Amount (000) | | | Description p | | | | | | | | Value | |
| | | | Utilities (continued) | | | | | | | | | | |
| | | | | |
| | | | Metropolitan St. Louis Sewer District, Wastewater System, Series A | | | | | | | | | | |
| $ | 500 | | | 5.750%, 05/01/2038 | | | | | | | | $ | 538,990 | |
| | | | | |
| | | | Missouri Development Finance Board, Independence Water System Improvements (AMBAC) | | | | | | | | | | |
| | 1,000 | | | 5.000%, 11/01/2024 | | | | | | | | | 1,015,950 | |
| | | | | |
| | | | Missouri Environmental Improvement & Energy Resources Authority, Tri-County Water Authority Project | | | | | | | | | | |
| | 140 | | | 4.000%, 04/01/2018 | | | | | | | | | 154,976 | |
| | 1,000 | | | 4.000%, 04/01/2022 | | | | | | | | | 1,073,850 | |
| | | | | |
| | | | Missouri Environmental Improvement & Energy Resources Authority, Water Pollution Control, Series C, (Pre-refunded 07/01/2011) | | | | | | | | | | |
| | 1,685 | | | 5.000%, 07/01/2023 | | | | | | | | | 1,691,200 | |
| | | | | |
| | | | Missouri Joint Municipal Electric Utility Commission, Power Project, Iatan 2 Project, Series A | | | | | | | | | | |
| | 2,000 | | | 6.000%, 01/01/2039 | | | | | | | | | 2,074,380 | |
| | | | | |
| | | | Missouri Joint Municipal Electric Utility Commission, Power Project, Iatan 2 Project, Series A (AMBAC) | | | | | | | | | | |
| | 1,000 | | | 5.000%, 01/01/2028 | | | | | | | | | 1,010,350 | |
| | | | | |
| | | | Missouri Joint Municipal Electric Utility Commission, Power Project, Plum Point Project (NATL) | | | | | | | | | | |
| | 1,500 | | | 5.000%, 01/01/2016 | | | | | | | | | 1,633,230 | |
| | | | | |
| | | | North Central Regional Water Commission, Waterworks Systems | | | | | | | | | | |
| | 2,070 | | | 5.000%, 01/01/2037 | | | | | | | | | 1,800,920 | |
| | | | | |
| | | | Puerto Rico Electric Power Authority, Series WW | | | | | | | | | | |
| | 1,000 | | | 5.250%, 07/01/2025 | | | | | | | | | 1,001,710 | |
| | | | | |
| | | | St. Joseph Industrial Development Authority, Sewer System Improvements Project | | | | | | | | | | |
| | 500 | | | 4.750%, 04/01/2020 | | | | | | | | | 528,640 | |
| | 390 | | | 4.750%, 04/01/2021 | | | | | | | | | 408,993 | |
| | 17,030 | | | Total Utilities | | | | | | | | | 17,354,336 | |
| | 162,785 | | | Total Municipal Bonds (cost $155,976,264) | | | | | | | | | 157,382,010 | |
| | | | | |
| Shares | | | Description p | | | | | | | | Value | |
| | | | SHORT-TERM INVESTMENT – 0.4% | | | | | | | | | | |
| | | | | |
| | | | Money Market Funds – 0.4% | | | | | | | | | | |
| | | | | |
| | 565,168 | | | First American Tax Free Obligations Fund, Class Z, 0.000% | | | | | | | | $ | 565,168 | |
| | | | Total Short-Term Investments (cost $565,168) | | | | | | | | | 565,168 | |
| | | | Total Investments – 99.2% (cost $156,541,432) | | | | | | | | | 157,947,178 | |
| | | | Other Assets Less Liabilities – 0.8% | | | | | | | | | 1,275,011 | |
| | | | Net Assets – 100.0% | | | | | | | | $ | 159,222,189 | |
| | p | | All percentages shown in the Portfolio of Investments are based on net assets. |
| | | | The rate shown is the annualized seven-day effective yield as of May 31, 2011. |
| | DD | | Investment, or portion of investment, purchased on a delayed delivery basis. |
| | (ETM) | | Escrowed to maturity. |
See accompanying notes to financial statements.
Portfolio of Investments
Nuveen Nebraska Municipal Bond Fund
(formerly known as First American Nebraska Tax Free Fund)
May 31, 2011
| | | | | | | | | | | | | | |
Principal
Amount (000) | | | Description p | | | | | | | | Value | |
| | | | | | | | | | | | | | |
| | | | MUNICIPAL BONDS – 98.9% | | | | | | | | | | |
| | | | | |
| | | | Continuing Care Retirement Communities – 7.2% | | | | | | | | | | |
| | | | | |
| | | | Colorado Health Facilities Authority, Christian Living Communities Project, Series A | | | | | | | | | | |
| $ | 100 | | | 5.750%, 01/01/2026 | | | | | | | | $ | 92,507 | |
| | | | | |
| | | | Illinois Finance Authority, Franciscan Communities, Series A | | | | | | | | | | |
| | 275 | | | 5.500%, 05/15/2037 | | | | | | | | | 201,680 | |
| | | | | |
| | | | Illinois Finance Authority, Three Crowns Park Plaza, Series A | | | | | | | | | | |
| | 200 | | | 5.875%, 02/15/2026 | | | | | | | | | 187,356 | |
| | | | | |
| | | | Lancaster County Hospital Authority #1, Immanuel Obligation Group | | | | | | | | | | |
| | 2,090 | | | 5.625%, 01/01/2040 | | | | | | | | | 2,030,602 | |
| | | | | |
| | | | South Dakota Health & Educational Facilities Authority, Westhills Village Retirement Community | | | | | | | | | | |
| | 600 | | | 5.000%, 09/01/2025 | | | | | | | | | 591,954 | |
| | 3,265 | | | Total Continuing Care Retirement Communities | | | | | | | | | 3,104,099 | |
| | | | Education – 24.8% | | | | | | | | | | |
| | | | | |
| | | | Colorado Educational & Cultural Facilities Authority, Charter School | | | | | | | | | | |
| | 990 | | | 5.625%, 05/01/2040 | | | | | | | | | 953,053 | |
| | | | | |
| | | | Douglas County Educational Facilities, Creighton University, Series A | | | | | | | | | | |
| | 1,000 | | | 5.500%, 07/01/2030 | | | | | | | | | 1,031,680 | |
| | | | | |
| | | | Missouri Health & Educational Facilities Authority, Washington University, Series A | | | | | | | | | | |
| | 500 | | | 5.375%, 03/15/2039 | | | | | | | | | 533,295 | |
| | | | | |
| | | | Nebraska Educational Finance Authority (RAAI) | | | | | | | | | | |
| | 605 | | | 5.000%, 04/01/2017 | | | | | | | | | 610,820 | |
| | | | | |
| | | | Nebraska Educational Finance Authority, Clarkson College Project | | | | | | | | | | |
| | 500 | | | 5.450%, 09/01/2035 | | | | | | | | | 507,090 | |
| | | | | |
| | | | Nebraska Educational Finance Authority, Concordia University Project | | | | | | | | | | |
| | 2,690 | | | 5.000%, 10/01/2037, DD | | | | | | | | | 2,213,332 | |
| | | | | |
| | | | Nebraska Utility Corporation, University of Nebraska, Lincoln Project | | | | | | | | | | |
| | | | (Pre-refunded 01/01/2012) | | | | | | | | | | |
| | 1,045 | | | 5.250%, 01/01/2015 | | | | | | | | | 1,075,838 | |
| | | | | |
| | | | University of Nebraska Facilities Corporation, Medical Center Research Project | | | | | | | | | | |
| | 500 | | | 5.000%, 02/15/2015 | | | | | | | | | 514,615 | |
| | | | | |
| | | | University of Nebraska, Lincoln Memorial Stadium, Series A | | | | | | | | | | |
| | 500 | | | 5.000%, 11/01/2015 | | | | | | | | | 545,870 | |
| | | | | |
| | | | University of Nebraska, Lincoln Student Fees | | | | | | | | | | |
| | 750 | | | 5.000%, 07/01/2022 | | | | | | | | | 785,243 | |
| | | | | |
| | | | University of Nebraska, Omaha Health & Recreation Project | | | | | | | | | | |
| | 1,000 | | | 5.000%, 05/15/2033 | | | | | | | | | 1,034,690 | |
| | | | | |
| | | | University of Nebraska, Omaha Student Facilities Project | | | | | | | | | | |
| | 350 | | | 5.000%, 05/15/2032 | | | | | | | | | 361,539 | |
| | | | | |
| | | | University of Nebraska, Omaha Student Housing Project | | | | | | | | | | |
| | 500 | | | 5.000%, 05/15/2023 | | | | | | | | | 537,505 | |
| | 10,930 | | | Total Education | | | | | | | | | 10,704,570 | |
| | | | General Obligations – 14.8% | | | | | | | | | | |
| | | | | |
| | | | Brown County | | | | | | | | | | |
| | 200 | | | 4.350%, 06/15/2026 | | | | | | | | | 200,548 | |
| | 400 | | | 4.700%, 12/15/2026 | | | | | | | | | 400,508 | |
| | | | | |
| | | | Buffalo County (AGC) | | | | | | | | | | |
| | 195 | | | 6.000%, 12/15/2028 | | | | | | | | | 207,119 | |
| | | | | |
| | | | Douglas County School District #10, Elkhorn Public Schools | | | | | | | | | | |
| | 500 | | | 6.000%, 06/15/2028 | | | | | | | | | 523,230 | |
Portfolio of Investments
Nuveen Nebraska Municipal Bond Fund (continued)
May 31, 2011
| | | | | | | | | | | | | | |
Principal
Amount (000) | | | Description p | | | | | | | | Value | |
| | | | | | | | | | | | | | |
| | | | General Obligations (continued) | | | | | | | | | | |
| | | | | |
| | | | Douglas County School District #54, Ralston Public Schools (Pre-refunded 08/15/2011) (AGM) | | | | | | | | | | |
| $ | 845 | | | 5.000%, 12/15/2016 | | | | | | | | $ | 853,391 | |
| | | | | |
| | | | Douglas County School District #59 | | | | | | | | | | |
| | 350 | | | 4.700%, 12/15/2032 | | | | | | | | | 356,030 | |
| | | | | |
| | | | La Vista | | | | | | | | | | |
| | 345 | | | 4.800%, 12/15/2026 | | | | | | | | | 345,166 | |
| | | | | |
| | | | Lincoln Stormwater | | | | | | | | | | |
| | 400 | | | 4.500%, 06/01/2030 | | | | | | | | | 414,532 | |
| | | | | |
| | | | Lincoln-Lancaster County Public Building Commission, Tax Supported Lease Rental | | | | | | | | | | |
| | 750 | | | 4.500%, 10/15/2026 | | | | | | | | | 760,478 | |
| | | | | |
| | | | Omaha | | | | | | | | | | |
| | 450 | | | 5.750%, 10/15/2028 | | | | | | | | | 515,115 | |
| | | | | |
| | | | Puerto Rico Commonwealth, Series C-7, (NATL) | | | | | | | | | | |
| | 250 | | | 6.000%, 07/01/2027 | | | | | | | | | 259,463 | |
| | | | | |
| | | | Puerto Rico Commonwealth, Public Improvement, Series A | | | | | | | | | | |
| | 375 | | | 5.250%, 07/01/2026 | | | | | | | | | 370,751 | |
| | | | | |
| | | | Saunders County (AGM) | | | | | | | | | | |
| | 650 | | | 5.000%, 11/01/2030 | | | | | | | | | 650,598 | |
| | | | | |
| | | | Scotts Bluff County | | | | | | | | | | |
| | 500 | | | 4.550%, 01/15/2026 | | | | | | | | | 500,440 | |
| | 6,210 | | | Total General Obligations | | | | | | | | | 6,357,369 | |
| | | | Health Care – 15.7% | | | | | | | | | | |
| | | | | |
| | | | Colorado Health Facilities Authority, Evangelical Lutheran | | | | | | | | | | |
| | | | Series B, Mandatory Put 12/01/2014 @ 100 | | | | | | | | | | |
| | 250 | | | 5.000%, 06/01/2039 | | | | | | | | | 266,248 | |
| | | | | |
| | | | Douglas County Hospital Authority #2, Boy’s Town Project | | | | | | | | | | |
| | 1,000 | | | 4.750%, 09/01/2028 | | | | | | | | | 1,014,940 | |
| | | | | |
| | | | Douglas County Hospital Authority #2, Children’s Hospital | | | | | | | | | | |
| | 1,000 | | | 6.000%, 08/15/2028 | | | | | | | | | 1,048,900 | |
| | | | | |
| | | | Douglas County Hospital Authority #3, Methodist Health | | | | | | | | | | |
| | 275 | | | 5.750%, 11/01/2028 | | | | | | | | | 280,805 | |
| | 1,000 | | | 5.500%, 11/01/2038 | | | | | | | | | 965,660 | |
| | | | | |
| | | | Halifax, Florida Hospital Medical Center | | | | | | | | | | |
| | | | Series A | | | | | | | | | | |
| | 600 | | | 5.000%, 06/01/2038 | | | | | | | | | 534,168 | |
| | | | | |
| | | | Indiana Health & Educational Facility Financing Authority, Schneck Memorial Hospital Project, | | | | | | | | | | |
| | | | Series A | | | | | | | | | | |
| | 600 | | | 5.250%, 02/15/2030 | | | | | | | | | 561,276 | |
| | | | | |
| | | | Lancaster County Hospital Authority #1, BryanLGH Medical Center Project Series A,
(Pre-refunded 06/01/2011) (AMBAC) | | | | | | | | | | |
| | 500 | | | 5.000%, 06/01/2019 | | | | | | | | | 500,000 | |
| | | | | |
| | | | Madison County Hospital Authority #1, Faith Regional Health Services Project | | | | | | | | | | |
| | | | (Pre-refunded 01/01/2012) (RAAI) | | | | | | | | | | |
| | 500 | | | 5.500%, 07/01/2021 | | | | | | | | | 514,675 | |
| | | | | |
| | | | Nebraska Investment Finance Authority, Great Plains Regional Medical Center Project (RAAI) | | | | | | | | | | |
| | 250 | | | 5.200%, 11/15/2016 | | | | | | | | | 255,925 | |
| | 805 | | | 5.300%, 11/15/2017 | | | | | | | | | 822,380 | |
| | 6,780 | | | Total Health Care | | | | | | | | | 6,764,977 | |
| | | | Housing – 6.1% | | | | | | | | | | |
| | | | | |
| | | | Nebraska Investment Finance Authority, Single Family Housing, Series A | | | | | | | | | | |
| | | | (FHLMC) (FNMA) (GNMA) | | | | | | | | | | |
| | 2,000 | | | 5.700%, 09/01/2031 | | | | | | | | | 2,114,640 | |
| | | | | | | | | | | | | | |
Principal
Amount (000) | | | Description p | | | | | | | | Value | |
| | | | | | | | | | | | | | |
| | | | Housing (continued) | | | | | | | | | | |
| | | | | |
| | | | Omaha Housing Authority, Multifamily Housing, Timbercreek Apartments (GNMA) | | | | | | | | | | |
| $ | 520 | | | 5.150%, 11/20/2022 | | | | | | | | $ | 521,524 | |
| | 2,520 | | | Total Housing | | | | | | | | | 2,636,164 | |
| | | | Miscellaneous – 2.1% | | | | | | | | | | |
| | | | | |
| | | | Forsyth, Montana, Pollution Control, Northwestern Corporation (AMBAC) | | | | | | | | | | |
| | 585 | | | 4.650%, 08/01/2023 | | | | | | | | | 608,184 | |
| | | | | |
| | | | Washington County Wastewater Facilities, Cargill Incorporated Project (AMT) | | | | | | | | | | |
| | 300 | | | 5.900%, 11/01/2027 | | | | | | | | | 306,675 | |
| | 885 | | | Total Miscellaneous | | | | | | | | | 914,859 | |
| | | | Recreational Facility Authority – 1.6% | | | | | | | | | | |
| | | | | |
| | | | Douglas County Zoo Facility, Omaha’s Henry Doorly Zoo Project | | | | | | | | | | |
| | 665 | | | 4.750%, 09/01/2024 | | | | | | | | | 678,612 | |
| | | | Revolving Funds – 1.4% | | | | | | | | | | |
| | | | | |
| | | | Nebraska Investment Finance Authority, Drinking Water, Series A | | | | | | | | | | |
| | 580 | | | 5.150%, 01/01/2016 | | | | | | | | | 581,839 | |
| | | | Tax Revenue – 2.8% | | | | | | | | | | |
| | | | | |
| | | | Omaha Special Tax | | | | | | | | | | |
| | 650 | | | 5.250%, 10/15/2028 | | | | | | | | | 695,194 | |
| | | | | |
| | | | Omaha Special Tax, Series A | | | | | | | | | | |
| | 500 | | | 5.125%, 02/01/2032 | | | | | | | | | 506,705 | |
| | 1,150 | | | Total Tax Revenue | | | | | | | | | 1,201,899 | |
| | | | Utilities – 22.4% | | | | | | | | | | |
| | | | | |
| | | | Arkansas River Power Authority | | | | | | | | | | |
| | 1,000 | | | 6.125%, 10/01/2040 | | | | | | | | | 993,830 | |
| | | | | |
| | | | Central Plains Energy Project, Nebraska Gas Project #1, Series A | | | | | | | | | | |
| | 750 | | | 5.250%, 12/01/2021 | | | | | | | | | 734,085 | |
| | | | | |
| | | | Grand Island Electric System (NATL) | | | | | | | | | | |
| | 750 | | | 5.125%, 08/15/2016 | | | | | | | | | 752,737 | |
| | | | | |
| | | | Hastings Electric System (AGM) | | | | | | | | | | |
| | 250 | | | 5.000%, 01/01/2015 | | | | | | | | | 250,000 | |
| | | | | |
| | | | Lincoln Electric System | | | | | | | | | | |
| | 250 | | | 5.000%, 09/01/2026 | | | | | | | | | 261,622 | |
| | | | | |
| | | | Municipal Energy Agency of Nebraska, Power Supply System, Series A, (BHAC) | | | | | | | | | | |
| | 150 | | | 5.375%, 04/01/2039 | | | | | | | | | 156,911 | |
| | | | | |
| | | | Nebraska Public Power District, Series B | | | | | | | | | | |
| | 500 | | | 5.000%, 01/01/2033 | | | | | | | | | 513,945 | |
| | | | | |
| | | | Omaha Public Power District, Electric System, Series A | | | | | | | | | | |
| | 1,000 | | | 5.500%, 02/01/2033 | | | | | | | | | 1,076,960 | |
| | 1,200 | | | 5.500%, 02/01/2035 | | | | | | | | | 1,281,552 | |
| | | | | |
| | | | Puerto Rico Commonwealth, Aqueduct & Sewer Authority, Series A | | | | | | | | | | |
| | 500 | | | 6.000%, 07/01/2038 | | | | | | | | | 501,540 | |
| | | | | |
| | | | Puerto Rico Commonwealth, Aqueduct & Sewer Authority, Series A, (AGC) | | | | | | | | | | |
| | 500 | | | 5.000%, 07/01/2025 | | | | | | | | | 513,020 | |
| | | | | |
| | | | Puerto Rico Electric Power Authority, Series WW | | | | | | | | | | |
| | 1,000 | | | 5.250%, 07/01/2025 | | | | | | | | | 1,001,710 | |
| | | | | |
| | | | Southern Nebraska Public Power District, Electric System | | | | | | | | | | |
| | 1,500 | | | 5.250%, 12/15/2028 | | | | | | | | | 1,626,555 | |
| | 9,350 | | | Total Utilities | | | | | | | | | 9,664,467 | |
| | 42,335 | | | Total Municipal Bonds (cost $41,515,276) | | | | | | | | | 42,608,855 | |
Portfolio of Investments
Nuveen Nebraska Municipal Bond Fund (continued)
May 31, 2011
| | | | | | | | | | | | | | |
| | | | | |
| Shares | | | Description p | | | | | | | | Value | |
| | | | SHORT-TERM INVESTMENTS – 1.9% | | | | | | | | | | |
| | | | | |
| | | | Money Market Funds – 1.9% | | | | | | | | | | |
| | | | | |
| | 825,840 | | | First American Tax Free Obligations Fund, Class Z, 0.000% | | | | | | | | $ | 825,840 | |
| | | | Total Short-Term Investments (cost $825,840) | | | | | | | | | 825,840 | |
| | | | Total Investments – 100.8% (cost $42,341,116) | | | | | | | | | 43,434,695 | |
| | | | Other Assets Less Liabilities – (0.8)% | | | | | | | | | (344,190) | |
| | | | Net Assets – 100.0% | | | | | | | | $ | 43,090,505 | |
| | p | | All percentages shown in the Portfolio of Investments are based on net assets. |
| | | | The rate shown is the annualized seven-day effective yield as of May 31, 2011. |
| | DD | | Investment, or portion of investment, purchased on a delayed delivery basis. |
See accompanying notes to financial statements.
Portfolio of Investments
Nuveen Ohio Tax Free Fund
(formerly known as First American Ohio Tax Free Fund)
May 31, 2011
| | | | | | | | | | | | | | |
Principal
Amount (000) | | | Description p | | | | | | | | Value | |
| | | | | | | | | | | | | | |
| | | | MUNICIPAL BONDS – 98.6% | | | | | | | | | | |
| | | | | |
| | | | Certificates of Participation – 2.0% | | | | | | | | | | |
| | | | | |
| | | | Mahoning County Career & Technical Center, Series B | | | | | | | | | | |
| $ | 475 | | | 4.750%, 12/01/2036 | | | | | | | | $ | 476,055 | |
| | | | | |
| | | | Mayfield County School District, Middle School Project, Series B | | | | | | | | | | |
| | 435 | | | 0.000%, 09/01/2027 | | | | | | | | | 185,036 | |
| | 855 | | | 0.000%, 09/01/2028 | | | | | | | | | 337,947 | |
| | 1,765 | | | Total Certificates of Participation | | | | | | | | | 999,038 | |
| | | | Continuing Care Retirement Communities – 2.2% | | | | | | | | | | |
| | | | | |
| | | | Franklin County Health Care Facilities, Refunding & Improvement, Ohio Presbyterian, Series A | | | | | | | | | | |
| | 800 | | | 5.000%, 07/01/2026 | | | | | | | | | 735,440 | |
| | | | | |
| | | | Hamilton County Health Care, Life Enriching Communities Project, Series A | | | | | | | | | | |
| | 400 | | | 5.000%, 01/01/2027 | | | | | | | | | 360,224 | |
| | 1,200 | | | Total Continuing Care Retirement Communities | | | | | | | | | 1,095,664 | |
| | | | Education – 16.2% | | | | | | | | | | |
| | | | | |
| | | | Bowling Green Student Housing, State University Project | | | | | | | | | | |
| | 500 | | | 5.750%, 06/01/2031 | | | | | | | | | 483,860 | |
| | | | | |
| | | | Cincinnati Port Development Authority, Economic Development Authority, Sisters of Mercy | | | | | | | | | | |
| | 250 | | | 5.000%, 10/01/2025 | | | | | | | | | 246,090 | |
| | | | | |
| | | | Ohio Higher Educational Facilities, Baldwin-Wallace College Project | | | | | | | | | | |
| | 750 | | | 5.000%, 12/01/2013 | | | | | | | | | 810,863 | |
| | | | | |
| | | | Ohio Higher Educational Facilities, College of Wooster Project | | | | | | | | | | |
| | 400 | | | 5.000%, 09/01/2020 | | | | | | | | | 423,564 | |
| | | | | |
| | | | Ohio Higher Educational Facilities, John Carroll University Project | | | | | | | | | | |
| | 1,000 | | | 5.000%, 04/01/2019 | | | | | | | | | 1,074,870 | |
| | | | | |
| | | | Ohio Higher Educational Facilities, Mount Union College Project | | | | | | | | | | |
| | 1,000 | | | 5.000%, 10/01/2031 | | | | | | | | | 1,009,250 | |
| | | | | |
| | | | Ohio Higher Educational Facilities, Ohio Northern University Project | | | | | | | | | | |
| | 1,000 | | | 5.000%, 05/01/2026 | | | | | | | | | 979,380 | |
| | | | | |
| | | | Ohio Higher Educational Facilities, Otterbein College Project, Series A | | | | | | | | | | |
| | 500 | | | 5.500%, 12/01/2028 | | | | | | | | | 526,490 | |
| | | | | |
| | | | Ohio Higher Educational Facilities, University of Dayton Project | | | | | | | | | | |
| | 645 | | | 5.375%, 12/01/2029 | | | | | | | | | 672,870 | |
| | | | | |
| | | | Ohio Higher Educational Facilities, Wittenburg University 2005 Project | | | | | | | | | | |
| | 505 | | | 5.000%, 12/01/2024 | | | | | | | | | 475,195 | |
| | | | | |
| | | | Ohio Higher Educational Facilities, Xavier University Project | | | | | | | | | | |
| | 500 | | | 5.000%, 05/01/2040 | | | | | | | | | 489,865 | |
| | | | | |
| | | | University of Cincinnati, Series A, (Pre-refunded 06/01/2011) (FGIC) (NATL) | | | | | | | | | | |
| | 1,000 | | | 5.500%, 06/01/2014 | | | | | | | | | 1,010,000 | |
| | 8,050 | | | Total Education | | | | | | | | | 8,202,297 | |
| | | | General Obligations – 27.1% | | | | | | | | | | |
| | | | | |
| | | | Cincinnati, Series A | | | | | | | | | | |
| | 150 | | | 4.500%, 12/01/2029 | | | | | | | | | 154,521 | |
| | | | | |
| | | | Cincinnati City School District, Classroom Construction & Improvement | | | | | | | | | | |
| | | | (FGIC) (NATL) | | | | | | | | | | |
| | 535 | | | 5.250%, 12/01/2019 | | | | | | | | | 628,716 | |
| | 380 | | | 5.250%, 12/01/2027 | | | | | | | | | 428,363 | |
| | | | | |
| | | | Cincinnati City School District, School Improvement | | | | | | | | | | |
| | 300 | | | 5.250%, 06/01/2021 | | | | | | | | | 346,950 | |
| | | | | |
| | | | Columbus City School District, School Facilities Construction & Improvement, Series B | | | | | | | | | | |
| | 1,320 | | | 5.000%, 12/01/2027 | | | | | | | | | 1,418,761 | |
Portfolio of Investments
Nuveen Ohio Tax Free Fund (continued)
May 31, 2011
| | | | | | | | | | | | | | |
Principal
Amount (000) | | | Description p | | | | | | | | Value | |
| | | | | | | | | | | | | | |
| | | | General Obligations (continued) | | | | | | | | | | |
| | | | | |
| | | | Cuyahoga Falls, Various Purpose | | | | | | | | | | |
| $ | 750 | | | 4.250%, 12/01/2034 | | | | | | | | $ | 751,478 | |
| | | | | |
| | | | Dayton City School District, School Facilities Construction & Improvement, Series D, | | | | | | | | | | |
| | | | (FGIC) (NATL) | | | | | | | | | | |
| | 500 | | | 5.000%, 12/01/2011 | | | | | | | | | 511,490 | |
| | | | | |
| | | | Franklin County | | | | | | | | | | |
| | 690 | | | 4.500%, 12/01/2027 | | | | | | | | | 712,970 | |
| | | | | |
| | | | Gahanna (NATL) | | | | | | | | | | |
| | 400 | | | 5.000%, 12/01/2027 | | | | | | | | | 421,176 | |
| | | | | |
| | | | Greene County, General Infrastructure (AMBAC) | | | | | | | | | | |
| | 1,000 | | | 5.250%, 12/01/2026 | | | | | | | | | 1,070,630 | |
| | | | | |
| | | | Highland School District (OSDCEP) | | | | | | | | | | |
| | 100 | | | 0.000%, 12/01/2022 | | | | | | | | | 61,280 | |
| | | | | |
| | | | Highland School District, School Facilities Construction & Improvement (OSDCEP) | | | | | | | | | | |
| | 1,000 | | | 5.375%, 12/01/2033 | | | | | | | | | 1,072,600 | |
| | | | | |
| | | | Ohio Common Schools, Series A, (Pre-refunded 03/15/2012) | | | | | | | | | | |
| | 1,000 | | | 5.125%, 09/15/2022 | | | | | | | | | 1,038,860 | |
| | | | | |
| | | | Ohio State Infrastructure Improvement, Series A | | | | | | | | | | |
| | 1,000 | | | 5.500%, 02/01/2020 | | | | | | | | | 1,221,350 | |
| | | | | |
| | | | Ohio State Parks & Recreational Facilities, Series II-A, (AGM) | | | | | | | | | | |
| | 1,000 | | | 5.250%, 02/01/2020 | | | | | | | | | 1,111,360 | |
| | | | | |
| | | | Puerto Rico Commonwealth, Government Development, Series B | | | | | | | | | | |
| | 260 | | | 5.000%, 12/01/2014 | | | | | | | | | 276,354 | |
| | | | | |
| | | | Sidney City School District (FGIC) (NATL) | | | | | | | | | | |
| | 755 | | | 4.375%, 12/01/2027 | | | | | | | | | 759,243 | |
| | | | | |
| | | | Solon Rebuilding & Improvement | | | | | | | | | | |
| | 1,000 | | | 5.000%, 12/01/2021 | | | | | | | | | 1,055,460 | |
| | | | | |
| | | | St. Marys City School District, Construction & Improvement (AGM) (OSDCEP) | | | | | | | | | | |
| | 600 | | | 5.000%, 12/01/2028 | | | | | | | | | 623,136 | |
| | 12,740 | | | Total General Obligations | | | | | | | | | 13,664,698 | |
| | | | Health Care – 24.2% | | | | | | | | | | |
| | | | | |
| | | | Allen County Hospital Facilities, Catholic Healthcare, Series A | | | | | | | | | | |
| | 250 | | | 5.000%, 06/01/2038 | | | | | | | | | 236,893 | |
| | 100 | | | 5.250%, 06/01/2038 | | | | | | | | | 98,300 | |
| | | | | |
| | | | Allen County Hospital Facilities, Catholic Healthcare, Series B | | | | | | | | | | |
| | 500 | | | 4.125%, 09/01/2020 | | | | | | | | | 524,085 | |
| | | | | |
| | | | Butler County Hospital Facilities, UC Health | | | | | | | | | | |
| | 750 | | | 5.500%, 11/01/2022 | | | | | | | | | 753,795 | |
| | | | | |
| | | | Fairfield County Hospital Facilities, Fairfield Medical Center Project (RAAI) | | | | | | | | | | |
| | 345 | | | 5.000%, 06/15/2022 | | | | | | | | | 324,407 | |
| | | | | |
| | | | Franklin County Health Care Facilities, Ohio Presbyterian Services, Series A | | | | | | | | | | |
| | 500 | | | 5.625%, 07/01/2026 | | | | | | | | | 499,220 | |
| | | | | |
| | | | Franklin County Hospital Improvement, Nationwide Children’s Hospital Project | | | | | | | | | | |
| | 750 | | | 5.000%, 11/01/2034 | | | | | | | | | 736,763 | |
| | | | | |
| | | | Franklin County Hospital Improvement, Nationwide Children’s Hospital Project, Series A | | | | | | | | | | |
| | 365 | | | 4.750%, 11/01/2023 | | | | | | | | | 376,260 | |
| | | | | |
| | | | Franklin County, Trinity Health, Series C | | | | | | | | | | |
| | 500 | | | 4.500%, 12/01/2037 | | | | | | | | | 440,810 | |
| | | | | |
| | | | Lake County Hospital Facilities, Lake Hospital System, Series C | | | | | | | | | | |
| | 750 | | | 5.625%, 08/15/2029 | | | | | | | | | 714,248 | |
| | | | | |
| | | | Lorain County Hospital, Catholic Healthcare | | | | | | | | | | |
| | 350 | | | 5.500%, 10/01/2017 | | | | | | | | | 368,120 | |
| | | | | | | | | | | | | | |
Principal
Amount (000) | | | Description p | | | | | | | | Value | |
| | | | | | | | | | | | | | |
| | | | Health Care (continued) | | | | | | | | | | |
| | | | | |
| | | | Lucas County Hospital, Promedica Healthcare, Series A | | | | | | | | | | |
| $ | 575 | | | 6.000%, 11/15/2041 | | | | | | | | $ | 606,504 | |
| | | | | |
| | | | Lucas County Hospital, Promedica Healthcare, Series D | | | | | | | | | | |
| | 400 | | | 5.000%, 11/15/2038 | | | | | | | | | 378,860 | |
| | | | | |
| | | | Miami County Hospital Facilities, Refunding & Improvement, Upper Valley Medical Center | | | | | | | | | | |
| | 500 | | | 5.250%, 05/15/2026 | | | | | | | | | 500,635 | |
| | | | | |
| | | | Montgomery County, Catholic Health Initiatives, Series A | | | | | | | | | | |
| | 750 | | | 5.000%, 05/01/2039 | | | | | | | | | 730,155 | |
| | | | | |
| | | | Montgomery County, Catholic Health Series D | | | | | | | | | | |
| | 100 | | | 6.250%, 10/01/2033 | | | | | | | | | 107,587 | |
| | | | | |
| | | | Montgomery County, Healthcare & Multi-Family Housing Revenue, St. Leonard | | | | | | | | | | |
| | 500 | | | 6.625%, 04/01/2040 | | | | | | | | | 475,650 | |
| | | | | |
| | | | Ohio Higher Educational Facilities, University Hospitals Health System, Series 2009A | | | | | | | | | | |
| | 500 | | | 6.750%, 01/15/2039 | | | | | | | | | 515,770 | |
| | | | | |
| | | | Ohio Hospital Facilities, Cleveland Clinic, Series A | | | | | | | | | | |
| | 1,990 | | | 5.500%, 01/01/2039 | | | | | | | | | 2,029,421 | |
| | | | | |
| | | | Richland County Hospital Facilities, Medcentral Health System Obligated Group | | | | | | | | | | |
| | 535 | | | 5.250%, 11/15/2036 | | | | | | | | | 502,847 | |
| | | | | |
| | | | Ross County Hospital, Adena Health Systems | | | | | | | | | | |
| | 500 | | | 5.500%, 12/01/2028 | | | | | | | | | 503,050 | |
| | | | | |
| | | | Scioto County Hospital Revenue, Southern Ohio Medical Center | | | | | | | | | | |
| | 800 | | | 5.750%, 02/15/2038 | | | | | | | | | 793,447 | |
| | 12,310 | | | Total Health Care | | | | | | | | | 12,216,827 | |
| | | | Housing – 3.9% | | | | | | | | | | |
| | | | | |
| | | | Ohio Housing Finance Agency, Residential Mortgage Backed Securities, Series C,
(FHLMC) (FNMA) (GNMA) | | | | | | | | | | |
| | 905 | | | 5.200%, 09/01/2029 | | | | | | | | | 918,792 | |
| | | | | |
| | | | Ohio Housing Finance Agency, Residential Mortgage Backed Securities, Series E, (AMT) (FNMA) (GNMA) | | | | | | | | | | |
| | 440 | | | 4.850%, 09/01/2026 | | | | | | | | | 436,691 | |
| | | | | |
| | | | Ohio Housing Finance Agency, Residential Mortgage Backed Securities, Series F, (FHLMC) (FNMA) (GNMA) | | | | | | | | | | |
| | 600 | | | 5.450%, 09/01/2033 | | | | | | | | | 613,536 | |
| | 1,945 | | | Total Housing | | | | | | | | | 1,969,019 | |
| | | | Lease Revenue – 4.4% | | | | | | | | | | |
| | | | | |
| | | | Cleveland-Cuyahoga County Port Authority, Rita Project (RAAI) | | | | | | | | | | |
| | 750 | | | 5.000%, 11/15/2019 | | | | | | | | | 766,673 | |
| | | | | |
| | | | Riversouth Authority, Lazarus Building Redevelopment, Series A | | | | | | | | | | |
| | 400 | | | 5.750%, 12/01/2027 | | | | | | | | | 357,452 | |
| | | | | |
| | | | Riversouth Authority, Riverfront Area Redevelopment, Series A | | | | | | | | | | |
| | 1,000 | | | 5.250%, 12/01/2017 | | | | | | | | | 1,096,720 | |
| | 2,150 | | | Total Lease Revenue | | | | | | | | | 2,220,845 | |
| | | | Revolving Funds – 2.1% | | | | | | | | | | |
| | | | | |
| | | | Ohio Water Development Authority, Water Pollution Control (Pre-refunded 06/01/2012) | | | | | | | | | | |
| | 1,000 | | | 5.050%, 12/01/2021 | | | | | | | | | 1,048,130 | |
| | | | Tax Revenue – 1.2% | | | | | | | | | | |
| | | | | |
| | | | Buckeye Tobacco Settlement, Series A-2 | | | | | | | | | | |
| | 200 | | | 5.875%, 06/01/2030 | | | | | | | | | 146,466 | |
| | | | | |
| | | | Puerto Rico Sales Tax Financing, Series A | | | | | | | | | | |
| | 500 | | | 5.375%, 08/01/2039 | | | | | | | | | 488,260 | |
| | 700 | | | Total Tax Revenue | | | | | | | | | 634,726 | |
Portfolio of Investments
Nuveen Ohio Tax Free Fund (continued)
May 31, 2011
| | | | | | | | | | | | | | |
Principal
Amount (000) | | | Description p | | | | | | | | Value | |
| | | | | | | | | | | | | | |
| | | | Transportation – 2.0% | | | | | | | | | | |
| | | | | |
| | | | Columbus Regional Airport Authority (NATL) | | | | | | | | | | |
| $ | 1,000 | | | 5.000%, 01/01/2028 | | | | | | | | $ | 1,016,750 | |
| | | | Utilities – 13.3% | | | | | | | | | | |
| | | | | |
| | | | American Municipal Power, Prairie State Energy Campus Project, Series A | | | | | | | | | | |
| | 1,000 | | | 5.000%, 02/15/2031 | | | | | | | | | 1,014,430 | |
| | | | | |
| | | | Hamilton County Sewer System, Metropolitan Sewer District, Series A, (NATL) | | | | | | | | | | |
| | 930 | | | 5.000%, 12/01/2026 | | | | | | | | | 986,107 | |
| | | | | |
| | | | Hamilton Electric, Series A, (AGM) | | | | | | | | | | |
| | 1,000 | | | 4.300%, 10/15/2016 | | | | | | | | | 1,111,970 | |
| | | | | |
| | | | Marysville Ohio Wastewater Treatment Systems | | | | | | | | | | |
| | 250 | | | 5.250%, 12/01/2025 (WI/DD, Settling 6/01/11) | | | | | | | | | 259,160 | |
| | | | | |
| | | | Montgomery County Water, Greater Moraine Beaver (AMBAC) | | | | | | | | | | |
| | 1,000 | | | 5.375%, 11/15/2016 | | | | | | | | | 1,035,210 | |
| | | | | |
| | | | Northeast Ohio Regional Sewer District, Wastewater Revenue (NATL) | | | | | | | | | | |
| | 700 | | | 4.500%, 11/15/2037 | | | | | | | | | 658,224 | |
| | | | | |
| | | | Ohio Air Quality Development Authority, Firstenergy Generation, Series A | | | | | | | | | | |
| | 500 | | | 5.700%, 08/01/2020 | | | | | | | | | 528,840 | |
| | | | | |
| | | | Ohio Air Quality Development Authority, Pollution Control, Nuclear Generation | | | | | | | | | | |
| | | | Series A, Mandatory Put 07/01/2015 @ 100 (AGM) | | | | | | | | | | |
| | 500 | | | 3.375%, 07/01/2033 | | | | | | | | | 504,750 | |
| | | | | |
| | | | Ohio Water Development Authority, Water Quality, Series A | | | | | | | | | | |
| | 200 | | | 5.000%, 06/01/2030 | | | | | | | | | 213,920 | |
| | | | | |
| | | | Puerto Rico Electric Power Authority, Series WW | | | | | | | | | | |
| | 400 | | | 5.375%, 07/01/2023 | | | | | | | | | 413,900 | |
| | 6,480 | | | Total Utilities | | | | | | | | | 6,726,511 | |
| | 49,340 | | | Total Municipal Bonds (cost $48,764,258) | | | | | | | | | 49,794,505 | |
| | | | | |
| Shares | | | Description p | | | | | | | | Value | |
| | | | SHORT-TERM INVESTMENTS – 0.7% | | | | | | | | | | |
| | | | | |
| | | | Money Market Funds – 0.7% | | | | | | | | | | |
| | | | | |
| | 332,467 | | | First American Tax Free Obligations Fund, Class Z, 0.000% | | | | | | | | | 332,467 | |
| | | | Total Short-Term Investments (cost $332,467) | | | | | | | | | 332,467 | |
| | | | Total Investments – 99.3% (cost $49,096,725) | | | | | | | | | 50,126,972 | |
| | | | Other Assets Less Liabilities – 0.7% | | | | | | | | | 364,728 | |
| | | | Net Assets – 100.0% | | | | | | | | $ | 50,491,700 | |
| | p | | All percentages shown in the Portfolio of Investments are based on net assets. |
| | | | The rate shown is the annualized seven-day effective yield as of May 31, 2011. |
| | WI/DD | | Investment, or portion of investment, purchased on a when-issued or delayed delivery basis. |
See accompanying notes to financial statements.
Portfolio of Investments
Nuveen Oregon Intermediate Municipal Bond Fund
(formerly known as First American Oregon Intermediate Tax Free Fund)
May 31, 2011
| | | | | | | | | | | | | | |
Principal
Amount (000) | | | Description p | | | | | | | | Value | |
| | | | | | | | | | | | | | |
| | | | MUNICIPAL BONDS – 98.7% | | | | | | | | | | |
| | | | | |
| | | | Certificates of Participation – 2.7% | | | | | | | | | | |
| | | | | |
| | | | Oregon Department of Administrative Services, Series A | | | | | | | | | | |
| $ | 1,500 | | | 4.700%, 05/01/2025 | | | | | | | | $ | 1,567,905 | |
| | | | Oregon Department of Administrative Services, Series A (FGIC) (NATL) | | | | | | | | | | |
| | 1,060 | | | 5.000%, 11/01/2018 | | | | | | | | | 1,192,192 | |
| | | | Oregon Department of Administrative Services, Series C | | | | | | | | | | |
| | 1,055 | | | 5.000%, 11/01/2025 | | | | | | | | | 1,131,836 | |
| | 3,615 | | | Total Certificates of Participation | | | | | | | | | 3,891,933 | |
| | | | Continuing Care Retirement Communities – 3.1% | | | | | | | | | | |
| | | | | |
| | | | Clackamas County Hospital Facility Authority, Robison Jewish Home | | | | | | | | | | |
| | 1,000 | | | 5.125%, 10/01/2024 | | | | | | | | | 856,930 | |
| | | | | |
| | | | Illinois Finance Authority, Franciscan Communities, Series A | | | | | | | | | | |
| | 1,000 | | | 5.500%, 05/15/2027 | | | | | | | | | 806,110 | |
| | | | | |
| | | | Multnomah County Hospital Facilities Authority, Terwilliger Plaza Project | | | | | | | | | | |
| | 1,900 | | | 6.500%, 12/01/2029 | | | | | | | | | 1,906,460 | |
| | | | | |
| | | | Multnomah County Hospital Facilities Authority, Terwilliger Plaza Project Series A | | | | | | | | | | |
| | 1,000 | | | 5.250%, 12/01/2026 | | | | | | | | | 959,050 | |
| | 4,900 | | | Total Continuing Care Retirement Communities | | | | | | | | | 4,528,550 | |
| | | | Education – 9.3% | | | | | | | | | | |
| | | | | |
| | | | Forest Grove Campus Improvement, Pacific University Project | | | | | | | | | | |
| | 250 | | | 5.750%, 05/01/2024 | | | | | | | | | 256,792 | |
| | | | | |
| | | | Forest Grove Campus Improvement, Pacific University Project Series A (RAAI) | | | | | | | | | | |
| | 2,350 | | | 5.000%, 05/01/2022 | | | | | | | | | 2,374,017 | |
| | | | | |
| | | | Oregon Facilities Authority, Concordia University Projects, Series A | | | | | | | | | | |
| | 1,140 | | | 6.125%, 09/01/2030 | | | | | | | | | 1,144,264 | |
| | | | | |
| | | | Oregon Facilities Authority, Lewis & Clark College Project, Series A | | | | | | | | | | |
| | 625 | | | 4.000%, 10/01/2017 | | | | | | | | | 674,637 | |
| | 500 | | | 5.250%, 10/01/2024 | | | | | | | | | 537,965 | |
| | | | | |
| | | | Oregon Facilities Authority, Linfield College Project, Series A | | | | | | | | | | |
| | 1,000 | | | 5.000%, 10/01/2025 | | | | | | | | | 1,016,280 | |
| | | | | |
| | | | Oregon Facilities Authority, LTD College Project, Series A | | | | | | | | | | |
| | 500 | | | 4.750%, 10/01/2028 | | | | | | | | | 501,465 | |
| | | | | |
| | | | Oregon Facilities Authority, Reed College Project, Series A | | | | | | | | | | |
| | 1,000 | | | 5.000%, 07/01/2029 | | | | | | | | | 1,078,270 | |
| | | | | |
| | | | Oregon Facilities Authority, University of Portland Projects, Series A | | | | | | | | | | |
| | 1,000 | | | 4.250%, 04/01/2014 | | | | | | | | | 1,058,960 | |
| | 250 | | | 5.000%, 04/01/2017 | | | | | | | | | 277,413 | |
| | 2,000 | | | 4.500%, 04/01/2021 | | | | | | | | | 2,061,600 | |
| | | | | |
| | | | Oregon Facilities Authority, Willamette University Projects, Series A | | | | | | | | | | |
| | 1,085 | | | 4.300%, 10/01/2021 | | | | | | | | | 1,109,098 | |
| | 450 | | | 4.000%, 10/01/2024 | | | | | | | | | 445,482 | |
| | | | | |
| | | | Oregon Health & Science University, Series A (NATL) | | | | | | | | | | |
| | 1,000 | | | 5.250%, 07/01/2022 | | | | | | | | | 1,021,580 | |
| | 13,150 | | | Total Education | | | | | | | | | 13,557,823 | |
| | | | General Obligations – 46.7% | | | | | | | | | | |
| | | | | |
| | | | Blue Mountain Hospital District | | | | | | | | | | |
| | 605 | | | 4.250%, 02/01/2019 | | | | | | | | | 642,746 | |
| | 655 | | | 4.500%, 02/01/2020 | | | | | | | | | 700,542 | |
| | 255 | | | 5.000%, 02/01/2021 | | | | | | | | | 279,011 | |
| | | | | |
| | | | Central Oregon Community College District (SBG) | | | | | | | | | | |
| | 1,000 | | | 4.000%, 06/15/2019 | | | | | | | | | 1,118,580 | |
| | 800 | | | 4.500%, 06/15/2020 | | | | | | | | | 922,496 | |
Portfolio of Investments
Nuveen Oregon Intermediate Municipal Bond Fund (continued)
May 31, 2011
| | | | | | | | | | | | | | |
Principal
Amount (000) | | | Description p | | | | | | | | Value | |
| | | | | | | | | | | | | | |
| | | | General Obligations (continued) | | | | | | | | | | |
| | | | | |
| | | | Chemeketa, Oregon, Community College District (SBG) | | | | | | | | | | |
| $ | 1,000 | | | 5.500%, 06/15/2024 | | | | | | | | $ | 1,133,610 | |
| | | | | |
| | | | Chemeketa, Oregon, Community College District (FGIC) | | | | | | | | | | |
| | 2,170 | | | 5.500%, 06/01/2013 (ETM) | | | | | | | | | 2,388,042 | |
| | | | | |
| | | | Clackamas Community College District (NATL) | | | | | | | | | | |
| | 1,145 | | | 5.000%, 05/01/2019 | | | | | | | | | 1,272,828 | |
| | | | | |
| | | | Clackamas County School District #115, Series B (NATL) (SBG) | | | | | | | | | | |
| | 1,975 | | | 4.500%, 06/15/2021 | | | | | | | | | 2,117,338 | |
| | | | | |
| | | | Clackamas County School District #12, North Clackamas, Deferred Interest, Series B, Convertible CABs (AGM) (SBG) 0.000% through 06/15/2011, thereafter | | | | | | | | | | |
| | 685 | | | 5.000%, 06/15/2019 | | | | | | | | | 766,816 | |
| | | | | |
| | | | Clackamas County School District #12, North Clackamas, Deferred Interest, Series B, Convertible CABs (AGM) (SBG) 0.000% through 06/15/2011, thereafter | | | | | | | | | | |
| | 3,665 | | | 5.000%, 06/15/2021 | | | | | | | | | 4,034,505 | |
| | | | | |
| | | | Clackamas County School District #12, North Clackamas, Deferred Interest, Series B, Convertible CABs (AGM) (SBG) 0.000% through 06/15/2011, thereafter | | | | | | | | | | |
| | 3,135 | | | 5.000%, 06/15/2022 | | | | | | | | | 3,420,128 | |
| | | | | |
| | | | Clackamas County School District #46, Oregon Trail, Series A (SBG) | | | | | | | | | | |
| | 1,000 | | | 5.000%, 06/15/2024 | | | | | | | | | 1,120,360 | |
| | | | | |
| | | | Clackamas County School District #7J, Lake Oswego (AGM) | | | | | | | | | | |
| | 200 | | | 5.250%, 06/01/2025 | | | | | | | | | 236,550 | |
| | | | | |
| | | | Clackamas County School District #86, Canby (AGM) (SBG) | | | | | | | | | | |
| | 1,000 | | | 5.000%, 06/15/2018 | | | | | | | | | 1,115,840 | |
| | 1,305 | | | 5.000%, 06/15/2021 | | | | | | | | | 1,435,017 | |
| | | | | |
| | | | Deschutes & Jefferson Counties School District #2-J, Redmond | | | | | | | | | | |
| | | | Series A (FGIC) (NATL) (SBG) | | | | | | | | | | |
| | 1,250 | | | 5.000%, 06/15/2013 | | | | | | | | | 1,359,738 | |
| | | | | |
| | | | Deschutes & Jefferson Counties School District #2-J, Richmond, Series B, (SBG) | | | | | | | | | | |
| | 3,030 | | | 0.000%, 06/15/2022 | | | | | | | | | 1,927,080 | |
| | | | | |
| | | | Deschutes County (AGM) | | | | | | | | | | |
| | 1,755 | | | 5.000%, 12/01/2014 | | | | | | | | | 1,866,600 | |
| | | | | |
| | | | Josephine County Unit School District, Three Rivers (FGIC) (NATL) (SBG) | | | | | | | | | | |
| | 1,000 | | | 5.000%, 12/15/2019 | | | | | | | | | 1,178,680 | |
| | | | | |
| | | | Linn County Community School District #9, Lebanon, (Pre-refunded 06/15/2013) (FGIC) (SBG) | | | | | | | | | | |
| | 1,000 | | | 5.550%, 06/15/2021 | | | | | | | | | 1,103,580 | |
| | | | | |
| | | | Marion & Clackamas Counties School District #4J, Silver Falls (NATL) (SBG) | | | | | | | | | | |
| | 1,305 | | | 4.500%, 06/15/2022 | | | | | | | | | 1,385,479 | |
| | | | | |
| | | | McMinnville School District #40 (AGM) | | | | | | | | | | |
| | 1,000 | | | 5.500%, 06/15/2013 | | | | | | | | | 1,101,770 | |
| | | | | |
| | | | Metro National Areas | | | | | | | | | | |
| | 1,000 | | | 5.250%, 09/01/2014 | | | | | | | | | 1,024,010 | |
| | 1,635 | | | 5.000%, 06/01/2020 | | | | | | | | | 1,873,890 | |
| | | | | |
| | | | Multnomah-Clackamas Counties School District #10JT, Gresham-Barlow (AGM) (SBG) | | | | | | | | | | |
| | 1,000 | | | 5.250%, 06/15/2017 | | | | | | | | | 1,199,740 | |
| | | | | |
| | | | Multnomah-Clackamas Counties School District #28JT, Zero Coupon Bond (AMBAC) (SBG) | | | | | | | | | | |
| | 1,000 | | | 0.000%, 06/01/2016 | | | | | | | | | 820,160 | |
| | | | | |
| | | | North Lincoln Fire & Rescue District #1 (AGM) | | | | | | | | | | |
| | 125 | | | 4.250%, 02/01/2018 | | | | | | | | | 137,829 | |
| | | | | |
| | | | Oregon Department of Administrative Services, Oregon Opportunity | | | | | | | | | | |
| | 1,500 | | | 5.000%, 12/01/2020 | | | | | | | | | 1,782,855 | |
| | | | | |
| | | | Oregon, Alternate Energy, Series B (AMT) | | | | | | | | | | |
| | 540 | | | 5.000%, 01/01/2020 | | | | | | | | | 598,536 | |
| | 535 | | | 5.000%, 01/01/2021 | | | | | | | | | 589,538 | |
| | 100 | | | 5.000%, 01/01/2023 | | | | | | | | | 107,604 | |
| | | | | | | | | | | | | | |
Principal
Amount (000) | | | Description p | | | | | | | | Value | |
| | | | General Obligations (continued) | | | | | | | | | | |
| | | | | |
| | | | Pacific City Joint Water Sanitation Authority | | | | | | | | | | |
| $ | 455 | | | 4.650%, 07/01/2022 | | | | | | | | $ | 465,388 | |
| | | | | |
| | | | Puerto Rico Commonwealth, Government Development, Series B | | | | | | | | | | |
| | 1,000 | | | 5.000%, 12/01/2014 | | | | | | | | | 1,062,900 | |
| | | | | |
| | | | Puerto Rico Public Buildings Authority, Series J, Mandatory Put 07/01/2012 @ 100 (AMBAC) (COMGTY) | | | | | | | | | | |
| | 1,000 | | | 5.000%, 07/01/2036 | | | | | | | | | 1,022,270 | |
| | | | | |
| | | | Redmond, Terminal Expansion Project | | | | | | | | | | |
| | 240 | | | 4.000%, 06/01/2021 | | | | | | | | | 247,531 | |
| | 200 | | | 4.250%, 06/01/2023 | | | | | | | | | 203,368 | |
| | 500 | | | 4.625%, 06/01/2029 | | | | | | | | | 496,980 | |
| | | | | |
| | | | Salem-Keizer School District #24J (AGM) (SBG) | | | | | | | | | | |
| | 1,150 | | | 5.000%, 06/15/2014 | | | | | | | | | 1,291,876 | |
| | | | | |
| | | | Salem-Keizer School District #24J Series B, Deferred Interest (SBG) | | | | | | | | | | |
| | 635 | | | 0.000%, 06/15/2022 | | | | | | | | | 403,860 | |
| | | | | |
| | | | Sandy | | | | | | | | | | |
| | 190 | | | 4.000%, 06/01/2015 | | | | | | | | | 204,894 | |
| | 150 | | | 4.000%, 06/01/2016 | | | | | | | | | 160,522 | |
| | 210 | | | 4.000%, 06/01/2017 | | | | | | | | | 222,802 | |
| | 240 | | | 4.000%, 06/01/2018 | | | | | | | | | 252,168 | |
| | 100 | | | 4.000%, 06/01/2019 | | | | | | | | | 104,254 | |
| | | | | |
| | | | The Dalles | | | | | | | | | | |
| | 130 | | | 4.000%, 06/01/2017 | | | | | | | | | 143,239 | |
| | 140 | | | 4.000%, 06/01/2018 | | | | | | | | | 153,192 | |
| | 75 | | | 4.000%, 06/01/2019 | | | | | | | | | 80,690 | |
| | | | | |
| | | | Tualatin Hills Park & Recreation District (FGIC) (NATL) | | | | | | | | | | |
| | 870 | | | 5.750%, 03/01/2013 | | | | | | | | | 950,101 | |
| | | | | |
| | | | Umatilla County School District #16R, Pendleton (FGIC) (NATL) | | | | | | | | | | |
| | 1,540 | | | 5.250%, 07/01/2014 | | | | | | | | | 1,712,126 | |
| | | | | |
| | | | Wasco County School District #12 (AGM) (SBG) | | | | | | | | | | |
| | 1,080 | | | 5.500%, 06/15/2014 | | | | | | | | | 1,230,790 | |
| | | | | |
| | | | Washington & Clackamas Counties School District #23J, Tigard (FGIC) (NATL) | | | | | | | | | | |
| | 1,000 | | | 5.500%, 06/01/2013 | | | | | | | | | 1,097,420 | |
| | | | | |
| | | | Washington & Clackamas Counties School District #23J, Tigard | | | | | | | | | | |
| | 1,030 | | | 0.000%, 06/15/2014 | | | | | | | | | 970,404 | |
| | | | | |
| | | | Washington County | | | | | | | | | | |
| | 1,525 | | | 5.000%, 06/01/2022 | | | | | | | | | 1,689,365 | |
| | | | | |
| | | | Washington County School District #48J, Beaverton, Series A (AGM) | | | | | | | | | | |
| | 1,600 | | | 5.000%, 06/01/2014 | | | | | | | | | 1,797,280 | |
| | 1,500 | | | 5.000%, 06/01/2016 | | | | | | | | | 1,687,485 | |
| | | | | |
| | | | Washington, Multnomah & Yamhill Counties School District #1J | | | | | | | | | | |
| | 1,000 | | | 5.000%, 11/01/2014 | | | | | | | | | 1,136,730 | |
| | | | | |
| | | | Washington, Multnomah & Yamhill Counties School District #1J, Hillsboro (NATL) | | | | | | | | | | |
| | 2,490 | | | 5.000%, 06/15/2019 | | | | | | | | | 2,850,253 | |
| | | | | |
| | | | West Vy Fire District | | | | | | | | | | |
| | 120 | | | 2.000%, 02/01/2012 | | | | | | | | | 120,347 | |
| | 120 | | | 3.000%, 02/01/2013 | | | | | | | | | 122,400 | |
| | 125 | | | 3.000%, 02/01/2014 | | | | | | | | | 127,855 | |
| | 125 | | | 3.000%, 02/01/2015 | | | | | | | | | 127,770 | |
| | 130 | | | 3.500%, 02/01/2016 | | | | | | | | | 134,927 | |
| | 135 | | | 4.000%, 02/01/2017 | | | | | | | | | 142,610 | |
| | 140 | | | 4.000%, 02/01/2018 | | | | | | | | | 146,723 | |
| | 145 | | | 4.000%, 02/01/2019 | | | | | | | | | 149,625 | |
| | | | | |
| | | | Yamhill County School District #29J, Newberg (FGIC) (NATL) (SBG) | | | | | | | | | | |
| | 1,260 | | | 5.250%, 06/15/2015 | | | | | | | | | 1,449,403 | |
| | 1,835 | | | 5.250%, 06/15/2016 | | | | | | | | | 2,155,263 | |
Portfolio of Investments
Nuveen Oregon Intermediate Municipal Bond Fund (continued)
May 31, 2011
| | | | | | | | | | | | | | |
Principal
Amount (000) | | | Description p | | | | | | | | Value | |
| | | | General Obligations (continued) | | | | | | | | | | |
| | | | | |
| | | | Yamhill County School District #40, McMinnville (AGM) (SBG) | | | | | | | | | | |
| $ | 1,005 | | | 5.000%, 06/15/2023 | | | | | | | | $ | 1,103,148 | |
| | 63,560 | | | Total General Obligations | | | | | | | | | 68,179,457 | |
| | | | Health Care – 13.3% | | | | | | | | | | |
| | | | | |
| | | | Clackamas County Hospital Facility Authority, Legacy Health System, Series A | | | | | | | | | | |
| | 1,000 | | | 5.000%, 07/15/2021 | | | | | | | | | 1,050,940 | |
| | | | | |
| | | | Clackamas County Hospital Facility Authority, Willamette Falls Hospital Project (RAAI) | | | | | | | | | | |
| | 1,200 | | | 5.500%, 04/01/2022 | | | | | | | | | 1,203,636 | |
| | | | | |
| | | | Deschutes County Facilities Authority, Cascade Healthcare Community | | | | | | | | | | |
| | 1,500 | | | 7.375%, 01/01/2023 | | | | | | | | | 1,792,500 | |
| | | | Series B (AMBAC) | | | | | | | | | | |
| | 250 | | | 5.000%, 01/01/2016 | | | | | | | | | 268,485 | |
| | | | | |
| | | | Klamath Falls Community Hospital Authority, Merle West Medical Center Project (AGC) | | | | | | | | | | |
| | 960 | | | 4.750%, 09/01/2020 | | | | | | | | | 982,992 | |
| | | | | |
| | | | Medford Hospital Facilities Authority, Asante Health System (AGM) | | | | | | | | | | |
| | 1,900 | | | 5.500%, 08/15/2028 | | | | | | | | | 2,035,128 | |
| | | | | |
| | | | Multnomah County Hospital Facilities Authority, Adventist Health System/West, Series A | | | | | | | | | | |
| | 440 | | | 4.500%, 09/01/2021 | | | | | | | | | 460,121 | |
| | 1,875 | | | 5.000%, 09/01/2021 | | | | | | | | | 2,026,481 | |
| | | | | |
| | | | Multnomah County Hospital Facilities Authority, Providence Health System | | | | | | | | | | |
| | 1,000 | | | 5.250%, 10/01/2022 | | | | | | | | | 1,085,450 | |
| | | | | |
| | | | Oregon Facilities Authority, Legacy Health System, Series A | | | | | | | | | | |
| | 2,000 | | | 4.250%, 03/15/2017 | | | | | | | | | 2,128,580 | |
| | 1,000 | | | 4.750%, 03/15/2024 | | | | | | | | | 1,006,360 | |
| | | | | |
| | | | Oregon Facilities Authority, Peacehealth, Series A | | | | | | | | | | |
| | 1,000 | | | 5.000%, 11/01/2020 | | | | | | | | | 1,113,910 | |
| | | | | |
| | | | Oregon Facilities Authority, Samaritan Health Services, Series A | | | | | | | | | | |
| | 1,250 | | | 5.000%, 10/01/2019 | | | | | | | | | 1,360,875 | |
| | 500 | | | 5.000%, 10/01/2024 | | | | | | | | | 512,795 | |
| | | | | |
| | | | Salem Hospital Facility Authority, Series A | | | | | | | | | | |
| | 1,500 | | | 5.750%, 08/15/2023 | | | | | | | | | 1,631,400 | |
| | | | | |
| | | | Umatilla County Hospital Facilities Authority, Catholic Health Initiatives, Series A | | | | | | | | | | |
| | 690 | | | 5.000%, 03/01/2012 | | | | | | | | | 714,164 | |
| | 18,065 | | | Total Health Care | | | | | | | | | 19,373,817 | |
| | | | Housing – 2.4% | | | | | | | | | | |
| | | | | |
| | | | Oregon Housing & Community Services, Multifamily Housing, Series A (AMT) | | | | | | | | | | |
| | 750 | | | 4.000%, 07/01/2019 | | | | | | | | | 740,295 | |
| | 500 | | | 4.250%, 07/01/2021 | | | | | | | | | 491,530 | |
| | | | | |
| | | | Oregon Housing & Community Services, Single Family Mortgage Program | | | | | | | | | | |
| | | | Series A | | | | | | | | | | |
| | 235 | | | 4.050%, 01/01/2018 | | | | | | | | | 238,943 | |
| | | | Series D | | | | | | | | | | |
| | 1,230 | | | 4.750%, 07/01/2022 | | | | | | | | | 1,268,155 | |
| | | | | |
| | | | Portland Housing Authority, Yards Union Station Project (AMT) | | | | | | | | | | |
| | 705 | | | 4.750%, 05/01/2022 | | | | | | | | | 710,034 | |
| | 3,420 | | | Total Housing | | | | | | | | | 3,448,957 | |
| | | | Lease Revenue – 0.7% | | | | | | | | | | |
| | | | | |
| | | | Puerto Rico Public Buildings Authority, Government Facilities | | | | | | | | | | |
| | | | Series M-2, Mandatory Put 07/01/2017 @ 100 (AMBAC) (COMGTY) | | | | | | | | | | |
| | 1,000 | | | 5.500%, 07/01/2035 | | | | | | | | | 1,066,350 | |
| | | | Recreational Facility Authority – 0.7% | | | | | | | | | | |
| | | | | |
| | | | Portland Urban Renewal & Redevelopment, Convention Center, Series A (AMBAC) | | | | | | | | | | |
| | 1,000 | | | 5.750%, 06/15/2015 | | | | | | | | | 1,003,930 | |
| | | | | | | | | | | | | | |
Principal
Amount (000) | | | Description p | | | | | | | | Value | |
| | | | Tax Revenue – 6.7% | | | | | | | | | | |
| | | | | |
| | | | Keizer Assessment, Keizer Station Area A Local Improvement District | | | | | | | | | | |
| $ | 905 | | | 5.200%, 06/01/2031 | | | | | | | | $ | 922,539 | |
| | | | | |
| | | | Medford Urban Renewal Agency | | | | | | | | | | |
| | 1,010 | | | 4.500%, 06/01/2013 | | | | | | | | | 1,063,833 | |
| | | | | |
| | | | Portland Economic Development, Broadway Project, Series A | | | | | | | | | | |
| | 880 | | | 5.125%, 04/01/2016 | | | | | | | | | 1,002,065 | |
| | 1,355 | | | 6.250%, 04/01/2023 | | | | | | | | | 1,546,489 | |
| | | | | |
| | | | Portland Urban Renewal & Redevelopment, North MacAdam, Series B | | | | | | | | | | |
| | 2,655 | | | 5.000%, 06/15/2024 | | | | | | | | | 2,795,582 | |
| | | | | |
| | | | Portland Urban Renewal & Redevelopment, South Park Blocks, Series B | | | | | | | | | | |
| | 2,030 | | | 5.000%, 06/15/2021 | | | | | | | | | 2,186,939 | |
| | | | | |
| | | | Seaside Urban Renewal Agency, Greater Seaside Urban Renewal | | | | | | | | | | |
| | 280 | | | 4.750%, 06/01/2015 | | | | | | | | | 294,196 | |
| | 9,115 | | | Total Tax Revenue | | | | | | | | | 9,811,643 | |
| | | | Transportation – 3.1% | | | | | | | | | | |
| | | | | |
| | | | Oregon Department of Transportation, Highway User Tax | | | | | | | | | | |
| | | | Series A | | | | | | | | | | |
| | 1,000 | | | 5.000%, 11/15/2021 | | | | | | | | | 1,154,060 | |
| | 700 | | | 5.000%, 11/15/2024 | | | | | | | | | 738,787 | |
| | | | | |
| | | | Oregon Department of Transportation, Highway User Tax, Series A, (Pre-refunded 11/15/2012) | | | | | | | | | | |
| | 1,000 | | | 5.500%, 11/15/2016 | | | | | | | | | 1,074,860 | |
| | | | | |
| | | | Portland International Airport (AMT) | | | | | | | | | | |
| | 1,000 | | | 5.000%, 07/01/2017 | | | | | | | | | 1,113,080 | |
| | | | | |
| | | | Portland International Airport, Series B | | | | | | | | | | |
| | 250 | | | 5.000%, 07/01/2018 | | | | | | | | | 276,393 | |
| | | | | |
| | | | Redmond Airport | | | | | | | | | | |
| | 215 | | | 5.500%, 06/01/2024 | | | | | | | | | 217,356 | |
| | 4,165 | | | Total Transportation | | | | | | | | | 4,574,536 | |
| | | | Utilities – 10.0% | | | | | | | | | | |
| | | | | |
| | | | Lane County Metropolitan Wastewater Management | | | | | | | | | | |
| | 1,500 | | | 5.000%, 11/01/2022 | | | | | | | | | 1,655,805 | |
| | | | Lane County Metropolitan Wastewater Management (FGIC) (NATL) | | | | | | | | | | |
| | 820 | | | 5.000%, 11/01/2021 | | | | | | | | | 891,578 | |
| | | | | |
| | | | Lebanon Wastewater Revenue (AGM) | | | | | | | | | | |
| | 165 | | | 4.000%, 03/01/2017 | | | | | | | | | 182,327 | |
| | 435 | | | 4.000%, 03/01/2018 | | | | | | | | | 478,778 | |
| | | | | |
| | | | Portland Sewer System, First Lien, Series A | | | | | | | | | | |
| | 1,000 | | | 4.750%, 06/15/2024 | | | | | | | | | 1,079,770 | |
| | | | | |
| | | | Portland Sewer System, Second Lien, Series B (NATL) | | | | | | | | | | |
| | 1,175 | | | 5.000%, 06/15/2023 | | | | | | | | | 1,273,371 | |
| | | | | |
| | | | Portland Water System, Series A | | | | | | | | | | |
| | 2,000 | | | 5.000%, 05/01/2015 | | | | | | | | | 2,302,520 | |
| | | | | |
| | | | Portland Water System, Second Lien, Series A (NATL) | | | | | | | | | | |
| | 500 | | | 4.375%, 10/01/2024 | | | | | | | | | 519,490 | |
| | | | | |
| | | | Puerto Rico Commonwealth, Aqueduct & Sewer Authority, Series A (AGC) | | | | | | | | | | |
| | 1,500 | | | 5.000%, 07/01/2025 | | | | | | | | | 1,539,060 | |
| | | | | |
| | | | Puerto Rico Electric Power Authority, Series WW | | | | | | | | | | |
| | 800 | | | 5.375%, 07/01/2023 | | | | | | | | | 827,800 | |
| | | | | |
| | | | Redmond Water Revenue | | | | | | | | | | |
| | 450 | | | 4.500%, 06/01/2025 | | | | | | | | | 478,584 | |
| | | | | |
| | | | The Dalles Water Revenue (AMBAC) | | | | | | | | | | |
| | 325 | | | 4.250%, 06/01/2020 | | | | | | | | | 349,466 | |
Portfolio of Investments
Nuveen Oregon Intermediate Municipal Bond Fund (continued)
May 31, 2011
| | | | | | | | | | | | | | |
Principal
Amount (000) | | | Description p | | | | | | | | Value | |
| | | | Utilities (continued) | | | | | | | | | | |
| | | | | |
| | | | Washington County Clean Water Services (FGIC) (NATL) | | | | | | | | | | |
| $ | 1,790 | | | 5.125%, 10/01/2014 | | | | | | | | $ | 1,815,149 | |
| | | | | |
| | | | Washington County Clean Water Services (NATL) | | | | | | | | | | |
| | 1,000 | | | 5.000%, 10/01/2014 | | | | | | | | | 1,134,680 | |
| | 13,460 | | | Total Utilities | | | | | | | | | 14,528,378 | |
| | 135,450 | | | Total Municipal Bonds (cost $137,036,412) | | | | | | | | | 143,965,374 | |
| | | | | |
| Shares | | | Description p | | | | | | | | Value | |
| | | | Short-Term Investments – 0.2% | | | | | | | | | | |
| | | | | |
| | | | Money Market Funds – 0.2% | | | | | | | | | | |
| | | | | |
| | 274,764 | | | First American Tax Free Obligations Fund, Class Z, 0.000% | | | | | | | | $ | 274,764 | |
| | | | Total Short-Term Investments (cost $274,764) | | | | | | | | | 274,764 | |
| | | | Total Investments – 98.9% (cost $137,311,176) | | | | | | | | | 144,240,138 | |
| | | | Other Assets Less Liabilities – 1.1% | | | | | | | | | 1,617,703 | |
| | | | Net Assets – 100.0% | | | | | | | | $ | 145,857,841 | |
| | p | | All percentages shown in the Portfolio of Investments are based on net assets. |
| | | | Convertible Capital Appreciation Bonds (Convertible CABs) initially pay no interest but accrete in value from the date of issuance through the conversion date, at which time the bonds start to accrue and pay interest on a semi-annual basis until final maturity. |
| | | | The rate shown is the annualized seven-day effective yield as of May 31, 2011. |
| | (ETM) | | Escrowed to maturity. |
See accompanying notes to financial statements.
Statement of Assets & Liabilities
May 31, 2011 (all dollars and shares are rounded to thousands (000), except for per share data)
| | | | | | | | | | | | | | | | | | | | | | | | | | | | |
| | | Colorado
Tax Free | | | Minnesota
Intermediate | | | Minnesota | | | Missouri
Tax Free | | | Nebraska | | | Ohio
Tax Free | | | Oregon
Intermediate | |
Assets | | | | | | | | | | | | | | | | | | | | | | | | | | | | |
Investments, at value (cost $53,395, $223,951, $158,587, $156,541, $42,341, $49,097 and $137,311, respectively) | | $ | 54,842 | | | $ | 234,312 | | | $ | 161,220 | | | $ | 157,947 | | | $ | 43,435 | | | $ | 50,127 | | | $ | 144,240 | |
Receivables: | | | | | | | | | | | | | | | | | | | | | | | | | | | | |
From Adviser | | | — | | | | — | | | | — | | | | — | | | | 3 | | | | 1 | | | | — | |
Interest | | | 806 | | | | 2,921 | | | | 2,026 | | | | 2,108 | | | | 627 | | | | 830 | | | | 2,044 | |
Investments sold | | | — | | | | — | | | | — | | | | — | | | | 1,096 | | | | — | | | | — | |
Shares sold | | | 22 | | | | 137 | | | | 211 | | | | 216 | | | | 1 | | | | 2 | | | | 8 | |
Other assets | | | 8 | | | | 7 | | | | 9 | | | | 8 | | | | 9 | | | | 7 | | | | 7 | |
Total assets | | | 55,678 | | | | 237,377 | | | | 163,466 | | | | 160,279 | | | | 45,171 | | | | 50,967 | | | | 146,299 | |
Liabilities | | | | | | | | | | | | | | | | | | | | | | | | | | | | |
Payables: | | | | | | | | | | | | | | | | | | | | | | | | | | | | |
Dividends | | | 153 | | | | 572 | | | | 280 | | | | 494 | | | | 107 | | | | 158 | | | | 323 | |
Investments purchased | | | — | | | | 613 | | | | 3,627 | | | | 195 | | | | 1,815 | | | | 259 | | | | — | |
Shares redeemed | | | 20 | | | | 448 | | | | 286 | | | | 230 | | | | 111 | | | | 9 | | | | 2 | |
Accrued expenses: | | | | | | | | | | | | | | | | | | | | | | | | | | | | |
Management fees | | | 1 | | | | 92 | | | | 52 | | | | 65 | | | | — | | | | — | | | | 54 | |
12b-1 distribution and service fees | | | 3 | | | | 9 | | | | 27 | | | | 5 | | | | 4 | | | | 1 | | | | 6 | |
Other | | | 47 | | | | 87 | | | | 87 | | | | 68 | | | | 43 | | | | 48 | | | | 56 | |
Total liablities | | | 224 | | | | 1,821 | | | | 4,359 | | | | 1,057 | | | | 2,080 | | | | 475 | | | | 441 | |
Net assets | | $ | 55,454 | | | $ | 235,556 | | | $ | 159,107 | | | $ | 159,222 | | | $ | 43,091 | | | $ | 50,492 | | | $ | 145,858 | |
Class A Shares | | | | | | | | | | | | | | | | | | | | | | | | | | | | |
Net assets | | $ | 10,812 | | | $ | 37,175 | | | $ | 85,183 | | | $ | 22,951 | | | $ | 7,099 | | | $ | 1,642 | | | $ | 31,399 | |
Shares outstanding | | | 1,076 | | | | 3,646 | | | | 7,864 | | | | 1,958 | | | | 691 | | | | 159 | | | | 3,087 | |
Net asset value per share | | $ | 10.04 | | | $ | 10.20 | | | $ | 10.83 | | | $ | 11.72 | | | $ | 10.28 | | | $ | 10.33 | | | $ | 10.17 | |
Offering price per share (net asset value per share plus maximum sales charge of 4.20%, 3.00%, 4.20%, 4.20%, 4.20%, 4.20% and 3.00%, respectively, of offering price) | | $ | 10.48 | | | $ | 10.52 | | | $ | 11.30 | | | $ | 12.23 | | | $ | 10.73 | | | $ | 10.78 | | | $ | 10.48 | |
Class C Shares | | | | | | | | | | | | | | | | | | | | | | | | | | | | |
Net assets | | | N/A | | | $ | 623 | | | $ | 618 | | | | N/A | | | $ | 321 | | | | N/A | | | $ | 632 | |
Shares outstanding | | | N/A | | | | 61 | | | | 57 | | | | N/A | | | | 31 | | | | N/A | | | | 62 | |
Net asset value and offering price per share | | | N/A | | | $ | 10.14 | | | $ | 10.82 | | | | N/A | | | $ | 10.28 | | | | N/A | | | $ | 10.15 | |
Class C1 Shares(1) | | | | | | | | | | | | | | | | | | | | | | | | | | | | |
Net assets | | $ | 2,481 | | | $ | 6,242 | | | $ | 22,190 | | | $ | 1,661 | | | $ | 4,201 | | | $ | 1,681 | | | | N/A | |
Shares outstanding | | | 248 | | | | 611 | | | | 2,058 | | | | 142 | | | | 412 | | | | 165 | | | | N/A | |
Net asset value and offering price per share | | $ | 10.01 | | | $ | 10.22 | | | $ | 10.78 | | | $ | 11.69 | | | $ | 10.19 | | | $ | 10.18 | | | | N/A | |
Class I Shares(1) | | | | | | | | | | | | | | | | | | | | | | | | | | | | |
Net assets | | $ | 42,161 | | | $ | 191,516 | | | $ | 51,116 | | | $ | 134,610 | | | $ | 31,470 | | | $ | 47,169 | | | $ | 113,827 | |
Shares outstanding | | | 4,188 | | | | 18,903 | | | | 4,726 | | | | 11,484 | | | | 3,064 | | | | 4,570 | | | | 11,195 | |
Net asset value and offering price per share | | $ | 10.07 | | | $ | 10.13 | | | $ | 10.82 | | | $ | 11.72 | | | $ | 10.27 | | | $ | 10.32 | | | $ | 10.17 | |
Net assets consist of: | | | | | | | | | | | | | | | | | | | | | | | | | | | | |
Capital paid-in | | $ | 53,892 | | | $ | 224,853 | | | $ | 156,840 | | | $ | 157,425 | | | $ | 42,605 | | | $ | 50,413 | | | $ | 139,108 | |
Undistributed (Over-distribution of) net investment income | | | 66 | | | | 250 | | | | 585 | | | | 201 | | | | (1 | ) | | | 50 | | | | 131 | |
Accumulated net realized gain (loss) | | | 49 | | | | 92 | | | | (951 | ) | | | 190 | | | | (607 | ) | | | (1,001 | ) | | | (310 | ) |
Net unrealized appreciation (depreciation) | | | 1,447 | | | | 10,361 | | | | 2,633 | | | | 1,406 | | | | 1,094 | | | | 1,030 | | | | 6,929 | |
Net assets | | $ | 55,454 | | | $ | 235,556 | | | $ | 159,107 | | | $ | 159,222 | | | | 43,091 | | | $ | 50,492 | | | $ | 145,858 | |
Authorized shares | | | 2 billion | | | | 2 billion | | | | 2 billion | | | | 2 billion | | | | 2 billion | | | | 2 billion | | | | 2 billion | |
Par value per share | | $ | 0.0001 | | | $ | 0.0001 | | | $ | 0.0001 | | | $ | 0.0001 | | | $ | 0.0001 | | | $ | 0.0001 | | | $ | 0.0001 | |
| N/A | – Colorado Tax Free, Missouri Tax Free and Ohio Tax Free do not offer Class C Shares. Oregon Intermediate does not offer Class C1 Shares. |
| (1) | – Effective January 18, 2011, Class C Shares and Class Y Shares previously offered by FAF Advisors, Inc. were renamed Class C1 Shares and Class I Shares, respectively. |
See accompanying notes to financial statements.
Statement of Operations
(all dollars are rounded to thousands (000))
| | | | | | | | | | | | | | | | |
| | | Colorado Tax Free | | | Minnesota Intermediate | |
| | | Eleven Months Ended
5/31/11 | | | Year Ended
6/30/10 | | | Eleven Months Ended
5/31/11 | | | Year Ended
6/30/10 | |
Investment Income | | | | | | | | | | | | | | | | |
Interest and dividends from non-affiliated investments | | $ | 2,833 | | | $ | 3,218 | | | $ | 9,437 | | | $ | 9,413 | |
Interest and dividends from affiliated investments | | | — | | | | — | | | | — | | | | — | |
Total investment Income | | | 2,833 | | | | 3,218 | | | | 9,437 | | | | 9,413 | |
Expenses | | | | | | | | | | | | | | | | |
Management fees | | | 321 | | | | 323 | | | | 1,129 | | | | 1,079 | |
12b-1 service fees – Class A | | | 24 | | | | 28 | | | | 71 | | | | 71 | |
12b-1 distribution and service fees – Class C | | | N/A | | | | N/A | | | | 1 | | | | — | |
12b-1 distribution and service fees – Class C1(1) | | | 17 | | | | 20 | | | | 35 | | | | 8 | |
Adminstration fees | | | 81 | | | | 151 | | | | 293 | | | | 493 | |
Shareholders’ servicing agent fees and expenses | | | 48 | | | | 80 | | | | 62 | | | | 75 | |
Custodian’s fees and expenses | | | 5 | | | | 3 | | | | 15 | | | | 11 | |
Directors’ fees and expenses | | | 16 | | | | 31 | | | | 18 | | | | 31 | |
Professional fees | | | 33 | | | | 51 | | | | 33 | | | | 50 | |
Shareholders’ reports – printing and mailing expenses | | | 11 | | | | 5 | | | | 32 | | | | 9 | |
Federal and state registration fees | | | 4 | | | | 6 | | | | 8 | | | | 12 | |
Other expenses | | | 13 | | | | 20 | | | | 16 | | | | 22 | |
Total expenses before expense reimbursement | | | 573 | | | | 718 | | | | 1,713 | | | | 1,861 | |
Expense reimbursement | | | (249 | ) | | | (347 | ) | | | (192 | ) | | | (327 | ) |
Net expenses | | | 324 | | | | 371 | | | | 1,521 | | | | 1,534 | |
Net investment income (loss) | | | 2,509 | | | | 2,847 | | | | 7,916 | | | | 7,879 | |
Realized and Unrealized Gain (Loss) | | | | | | | | | | | | | | | | |
Net realized gain (loss) from: | | | | | | | | | | | | | | | | |
Investments | | | 214 | | | | 1,080 | | | | 91 | | | | 42 | |
Futures | | | — | | | | — | | | | — | | | | — | |
Change in net unrealized appreciation (depreciation) of investments | | | (442 | ) | | | 2,902 | | | | 888 | | | | 9,395 | |
Net realized and unrealized gain (loss) | | | (228 | ) | | | 3,982 | | | | 979 | | | | 9,437 | |
Net increase (decrease) in net assets from operations | | $ | 2,281 | | | $ | 6,829 | | | $ | 8,895 | | | $ | 17,316 | |
| N/A – | Colorado Tax Free, Missouri Tax Free and previously offered by FAF Advisors, Inc. Ohio Tax Free do not offer Class C Shares. Oregon Intermediate does not offer Class C1 Shares. |
| (1) | – Effective January 18, 2011, Class C Shares were renamed Class C1 Shares. |
See accompanying notes to financial statements.
| | | | | | | | | | | | | | | | |
| | | Minnesota | | | Missouri Tax Free | |
| | | Eleven Months Ended
5/31/11 | | | Year Ended
6/30/10 | | | Eleven Months Ended
5/31/11 | | | Year Ended
6/30/10 | |
Investment Income | | | | | | | | | | | | | | | | |
Interest and dividends from non-affiliated investments | | $ | 7,252 | | | $ | 7,729 | | | $ | 7,366 | | | $ | 7,512 | |
Interest and dividends from affiliated investments | | | — | | | | 1 | | | | 1 | | | | 1 | |
Total investment Income | | | 7,252 | | | | 7,730 | | | | 7,367 | | | | 7,513 | |
Expenses | | | | | | | | | | | | | | | | |
Management fees | | | 789 | | | | 822 | | | | 838 | | | | 753 | |
12b-1 service fees – Class A | | | 185 | | | | 228 | | | | 51 | | | | 57 | |
12b-1 distribution and service fees – Class C | | | 1 | | | | — | | | | N/A | | | | N/A | |
12b-1 distribution and service fees – Class C1(1) | | | 153 | | | | 158 | | | | 11 | | | | 7 | |
Administration fees | | | 211 | | | | 377 | | | | 203 | | | | 346 | |
Shareholders’ servicing agent fees and expenses | | | 66 | | | | 82 | | | | 56 | | | | 82 | |
Custodian’s fees and expenses | | | 10 | | | | 8 | | | | 10 | | | | 8 | |
Directors’ fees and expenses | | | 17 | | | | 31 | | | | 17 | | | | 31 | |
Professional fees | | | 33 | | | | 51 | | | | 33 | | | | 51 | |
Shareholders’ reports – printing and mailing expenses | | | 42 | | | | 8 | | | | 22 | | | | 7 | |
Federal and state registration fees | | | 10 | | | | 13 | | | | 7 | | | | 9 | |
Other expenses | | | 15 | | | | 21 | | | | 13 | | | | 21 | |
Total expenses before expense reimbursement | | | 1,532 | | | | 1,799 | | | | 1,261 | | | | 1,372 | |
Expense reimbursement | | | (204 | ) | | | (355 | ) | | | (179 | ) | | | (281 | ) |
Net expenses | | | 1,328 | | | | 1,444 | | | | 1,082 | | | | 1,091 | |
Net investment income (loss) | | | 5,924 | | | | 6,286 | | | | 6,285 | | | | 6,422 | |
Realized and Unrealized Gain (Loss) | | | | | | | | | | | | | | | | |
Net realized gain (loss) from: | | | | | | | | | | | | | | | | |
Investments | | | (721 | ) | | | 1,108 | | | | 317 | | | | 835 | |
Futures | | | — | | | | — | | | | — | | | | — | |
Change in net unrealized appreciation (depreciation) of investments | | | (727 | ) | | | 12,393 | | | | (46 | ) | | | 7,851 | |
Net realized and unrealized gain (loss) | | | (1,448 | ) | | | 13,501 | | | | 271 | | | | 8,686 | |
Net increase (decrease) in net assets from operations | | $ | 4,476 | | | $ | 19,787 | | | $ | 6,556 | | | $ | 15,108 | |
| N/A – | Colorado Tax Free, Missouri Tax Free and Ohio Tax Free do not offer Class C Shares. Oregon Intermediate does not offer Class C1 Shares. |
| (1) | – Effective January 18, 2011, Class C Shares previously offered by FAF Advisors, Inc. were renamed Class C1 Shares. |
See accompanying notes to financial statements.
Statement of Operations (continued)
(all dollars are rounded to thousands (000))
| | | | | | | | | | | | | | | | |
| | | Nebraska | | | Ohio Tax Free | |
| | | Eleven Months Ended
5/31/11 | | | Year Ended
6/30/10 | | | Eleven Months Ended
5/31/11 | | | Year Ended
6/30/10 | |
Investment Income | | | | | | | | | | | | | | | | |
Interest and dividends from non-affiliated investments | | $ | 1,883 | | | $ | 1,984 | | | $ | 2,502 | | | $ | 2,474 | |
Interest and dividends from affiliated investments | | | — | | | | — | | | | — | | | | — | |
Total investment Income | | | 1,883 | | | | 1,984 | | | | 2,502 | | | | 2,474 | |
Expenses | | | | | | | | | | | | | | | | |
Management fees | | | 203 | | | | 208 | | | | 304 | | | | 277 | |
12b-1 service fees – Class A | | | 14 | | | | 16 | | | | 4 | | | | 4 | |
12b-1 distribution and service fees – Class C | | | 1 | | | | — | | | | N/A | | | | N/A | |
12b-1 distribution and service fees – Class C1(1) | | | 26 | | | | 23 | | | | 9 | | | | 5 | |
Administration fees | | | 55 | | | | 100 | | | | 82 | | | | 131 | |
Shareholders’ servicing agent fees and expenses | | | 48 | | | | 80 | | | | 50 | | | | 80 | |
Custodian’s fees and expenses | | | 4 | | | | 2 | | | | 5 | | | | 3 | |
Directors’ fees and expenses | | | 16 | | | | 31 | | | | 16 | | | | 31 | |
Professional fees | | | 33 | | | | 50 | | | | 33 | | | | 51 | |
Shareholders’ reports – printing and mailing expenses | | | 10 | | | | 3 | | | | 11 | | | | 3 | |
Federal and state registration fees | | | 7 | | | | 9 | | | | 4 | | | | 6 | |
Other expenses | | | 14 | | | | 21 | | | | 14 | | | | 21 | |
Total expenses before expense reimbursement | | | 431 | | | | 543 | | | | 532 | | | | 612 | |
Expense reimbursement | | | (196 | ) | | | (298 | ) | | | (248 | ) | | | (328 | ) |
Net expenses | | | 235 | | | | 245 | | | | 284 | | | | 284 | |
Net investment income (loss) | | | 1,648 | | | | 1,739 | | | | 2,218 | | | | 2,190 | |
Realized and Unrealized Gain (Loss) | | | | | | | | | | | | | | | | |
Net realized gain (loss) from: | | | | | | | | | | | | | | | | |
Investments | | | 31 | | | | (19 | ) | | | (448 | ) | | | 19 | |
Futures | | | — | | | | — | | | | — | | | | — | |
Change in net unrealized appreciation (depreciation) of investments | | | (323 | ) | | | 2,000 | | | | (779 | ) | | | 2,508 | |
Net realized and unrealized gain (loss) | | | (292 | ) | | | 1,981 | | | | (1,227 | ) | | | 2,527 | |
Net increase (decrease) in net assets from operations | | $ | 1,356 | | | $ | 3,720 | | | $ | 991 | | | $ | 4,717 | |
| N/A – | Colorado Tax Free, Missouri Tax Free and Ohio Tax Free do not offer Class C Shares. Oregon Intermediate does not offer Class C1 Shares. |
| (1) | – Effective January 18, 2011, Class C Shares previously offered by FAF Advisors, Inc. were renamed Class C1 Shares. |
See accompanying notes to financial statements.
| | | | | | | | |
| | | Oregon Intermediate | |
| | | Eleven Months Ended
5/31/11 | | | Year Ended
6/30/10 | |
Investment Income | | | | | | | | |
Interest and dividends from non-affiliated investments | | $ | 5,824 | | | $ | 6,369 | |
Interest and dividends from affiliated investments | | | 1 | | | | 2 | |
Total investment Income | | | 5,825 | | | | 6,371 | |
Expenses | | | | | | | | |
Management fees | | | 756 | | | | 755 | |
12b-1 service fees – Class A | | | 70 | | | | 54 | |
12b-1 distribution and service fees – Class C | | | 1 | | | | — | |
12b-1 distribution and service fees – Class C1(1) | | | N/A | | | | N/A | |
Administration fees | | | 202 | | | | 346 | |
Shareholders’ servicing agent fees and expenses | | | 40 | | | | 60 | |
Custodian’s fees and expenses | | | 10 | | | | 8 | |
Directors’ fees and expenses | | | 17 | | | | 30 | |
Professional fees | | | 33 | | | | 50 | |
Shareholders’ reports – printing and mailing expenses | | | 16 | | | | 6 | |
Federal and state registration fees | | | 6 | | | | 6 | |
Other expenses | | | 14 | | | | 21 | |
Total expenses before expense reimbursement | | | 1,165 | | | | 1,336 | |
Expense reimbursement | | | (146 | ) | | | (252 | ) |
Net expenses | | | 1,019 | | | | 1,084 | |
Net investment income (loss) | | | 4,806 | | | | 5,287 | |
Realized and Unrealized Gain (Loss) | | | | | | | | |
Net realized gain (loss) from: | | | | | | | | |
Investments | | | 192 | | | | 528 | |
Futures | | | — | | | | (111 | ) |
Change in net unrealized appreciation (depreciation) of investments | | | 259 | | | | 4,379 | |
Net realized and unrealized gain (loss) | | | 451 | | | | 4,796 | |
Net increase (decrease) in net assets from operations | | $ | 5,257 | | | $ | 10,083 | |
| N/A – | Colorado Tax Free, Missouri Tax Free and Ohio Tax Free do not offer Class C Shares. Oregon Intermediate does not offer Class C1 Shares. |
| (1) | – Effective January 18, 2011, Class C Shares previously offered by FAF Advisors, Inc. were renamed Class C1 Shares. |
See accompanying notes to financial statements.
Statement of Changes in Net Assets (all dollars are rounded to thousands (000))
| | | | | | | | | | | | | | | | | | | | | | | | |
| | | Colorado Tax Free | | | Minnesota Intermediate | |
| | | Eleven Months Ended
5/31/11 | | | Year Ended
6/30/10 | | | Year Ended
6/30/09 | | | Eleven Months Ended
5/31/11 | | | Year Ended
6/30/10 | | | Year Ended
6/30/09 | |
Operations | | | | | | | | | | | | | | | | | | | | | | | | |
Net investment income (loss) | | $ | 2,509 | | | $ | 2,847 | | | $ | 2,049 | | | $ | 7,916 | | | $ | 7,879 | | | $ | 7,724 | |
Net realized gain (loss) from: | | | | | | | | | | | | | | | | | | | | | | | | |
Investments | | | 214 | | | | 1,080 | | | | 145 | | | | 91 | | | | 42 | | | | 277 | |
Futures | | | — | | | | — | | | | — | | | | — | | | | — | | | | — | |
Change in net unrealized appreciation (depreciation) of: | | | | | | | | | | | | | | | | | | | | | | | | |
Investments | | | (442 | ) | | | 2,902 | | | | (872 | ) | | | 888 | | | | 9,395 | | | | (1,942 | ) |
Futures | | | — | | | | — | | | | — | | | | — | | | | — | | | | — | |
Net increase (decrease) in net assets resulting from operations | | | 2,281 | | | | 6,829 | | | | 1,322 | | | | 8,895 | | | | 17,316 | | | | 6,059 | |
Distributions to Shareholders | | | | | | | | | | | | | | | | | | | | | | | | |
From net investment income: | | | | | | | | | | | | | | | | | | | | | | | | |
Class A | | | (425 | ) | | | (470 | ) | | | (367 | ) | | | (1,184 | ) | | | (1,021 | ) | | | (936 | ) |
Class C | | | N/A | | | | N/A | | | | N/A | | | | (3 | ) | | | — | | | | — | |
Class C1(1) | | | (95 | ) | | | (118 | ) | | | (123 | ) | | | (156 | ) | | | (38 | ) | | | — | |
Class I(1) | | | (1,897 | ) | | | (2,237 | ) | | | (1,611 | ) | | | (6,253 | ) | | | (6,807 | ) | | | (6,863 | ) |
From accumulated net realized gains: | | | | | | | | | | | | | | | | | | | | | | | | |
Class A | | | (99 | ) | | | (101 | ) | | | (46 | ) | | | — | | | | (14 | ) | | | (67 | ) |
Class C | | | N/A | | | | N/A | | | | N/A | | | | — | | | | — | | | | — | |
Class C1(1) | | | (24 | ) | | | (27 | ) | | | (24 | ) | | | — | | | | — | | | | — | |
Class I(1) | | | (432 | ) | | | (455 | ) | | | (132 | ) | | | — | | | | (90 | ) | | | (447 | ) |
Decrease in net assets from distributions to shareholders | | | (2,972 | ) | | | (3,408 | ) | | | (2,303 | ) | | | (7,596 | ) | | | (7,970 | ) | | | (8,313 | ) |
Fund Share Transactions | | | | | | | | | | | | | | | | | | | | | | | | |
Proceeds from sale of shares | | | 14,622 | | | | 11,522 | | | | 51,410 | | | | 52,793 | | | | 63,339 | | | | 49,457 | |
Proceeds from shares issued to shareholders due to reinvestment of distributions | | | 693 | | | | 742 | | | | 528 | | | | 1,207 | | | | 963 | | | | 966 | |
| | | 15,315 | | | | 12,264 | | | | 51,938 | | | | 54,000 | | | | 64,302 | | | | 50,423 | |
Cost of shares redeemed | | | (22,397 | ) | | | (17,958 | ) | | | (10,020 | ) | | | (52,108 | ) | | | (36,742 | ) | | | (50,450 | ) |
Net increase (decrease) in net assets from Fund share transactions | | | (7,082 | ) | | | (5,694 | ) | | | 41,918 | | | | 1,892 | | | | 27,560 | | | | (27 | ) |
Net increase (decrease) in net assets | | | (7,773 | ) | | | (2,273 | ) | | | 40,937 | | | | 3,191 | | | | 36,906 | | | | (2,281 | ) |
Net assets at the beginning of period | | | 63,227 | | | | 65,500 | | | | 24,563 | | | | 232,365 | | | | 195,459 | | | | 197,740 | |
Net assets at the end of period | | $ | 55,454 | | | $ | 63,227 | | | $ | 65,500 | | | $ | 235,556 | | | $ | 232,365 | | | $ | 195,459 | |
Undistributed (Over-distribution of) net investment income at end of period | | $ | 66 | | | $ | (26 | ) | | $ | (48 | ) | | $ | 250 | | | $ | (69 | ) | | $ | (82 | ) |
| N/A – | Colorado Tax Free, Missouri Tax Free and Ohio Tax Free do not offer Class C Shares. Oregon Intermediate does not offer Class C1 Shares. |
| (1) | – Effective January 18, 2011, Class C Shares and Class Y Shares previously offered by FAF Advisors, Inc. were renamed ClassC1 Shares and Class I Shares, respectively. |
See accompanying notes to financial statements.
| | | | | | | | | | | | | | | | | | | | | | | | |
| | | Minnesota | | | Missouri Tax Free | |
| | | Eleven Months Ended
5/31/11 | | | Year Ended
6/30/10 | | | Year Ended
6/30/09 | | | Eleven Months Ended
5/31/11 | | | Year Ended
6/30/10 | | | Year Ended
6/30/09 | |
Operations | | | | | | | | | | | | | | | | | | | | | | | | |
Net investment income (loss) | | $ | 5,924 | | | $ | 6,286 | | | $ | 6,466 | | | $ | 6,285 | | | $ | 6,422 | | | $ | 6,579 | |
Net realized gain (loss) from: | | | | | | | | | | | | | | | | | | | | | | | | |
Investments | | | (721 | ) | | | 1,108 | | | | (810 | ) | | | 317 | | | | 835 | | | | 685 | |
Futures | | | — | | | | — | | | | (154 | ) | | | — | | | | — | | | | — | |
Change in net unrealized appreciation (depreciation) of: | | | | | | | | | | | | | | | | | | | | | | | | |
Investments | | | (727 | ) | | | 12,393 | | | | (6,522 | ) | | | (46 | ) | | | 7,851 | | | | (4,614 | ) |
Futures | | | — | | | | — | | | | — | | | | — | | | | — | | | | — | |
Net increase (decrease) in net assets resulting from operations | | | 4,476 | | | | 19,787 | | | | (1,020 | ) | | | 6,556 | | | | 15,108 | | | | 2,650 | |
Distributions to Shareholders | | | | | | | | | | | | | | | | | | | | | | | | |
From net investment income: | | | | | | | | | | | | | | | | | | | | | | | | |
Class A | | | (2,870 | ) | | | (3,519 | ) | | | (3,870 | ) | | | (868 | ) | | | (951 | ) | | | (955 | ) |
Class C | | | (3 | ) | | | — | | | | — | | | | N/A | | | | N/A | | | | N/A | |
Class C1(1) | | | (719 | ) | | | (818 | ) | | | (735 | ) | | | (56 | ) | | | (42 | ) | | | (21 | ) |
Class I(1) | | | (1,771 | ) | | | (1,956 | ) | | | (1,856 | ) | | | (5,095 | ) | | | (5,466 | ) | | | (5,710 | ) |
From accumulated net realized gains: | | | | | | | | | | | | | | | | | | | | | | | | |
Class A | | | — | | | | (6 | ) | | | (519 | ) | | | (40 | ) | | | (168 | ) | | | (51 | ) |
Class C | | | — | | | | — | | | | — | | | | N/A | | | | N/A | | | | N/A | |
Class C1(1) | | | — | | | | (1 | ) | | | (109 | ) | | | (3 | ) | | | (8 | ) | | | (1 | ) |
Class I(1) | | | — | | | | (3 | ) | | | (234 | ) | | | (221 | ) | | | (918 | ) | | | (283 | ) |
Decrease in net assets from distributions to shareholders | | | (5,363 | ) | | | (6,303 | ) | | | (7,323 | ) | | | (6,283 | ) | | | (7,553 | ) | | | (7,021 | ) |
Fund Share Transactions | | | | | | | | | | | | | | | | | | | | | | | | |
Proceeds from sale of shares | | | 22,308 | | | | 35,124 | | | | 33,280 | | | | 28,087 | | | | 46,372 | | | | 32,119 | |
Proceeds from shares issued to shareholders due to reinvestment of distributions | | | 2,399 | | | | 2,893 | | | | 3,456 | | | | 705 | | | | 942 | | | | 724 | |
| | | 24,707 | | | | 38,017 | | | | 36,736 | | | | 28,792 | | | | 47,314 | | | | 32,843 | |
Cost of shares redeemed | | | (36,046 | ) | | | (29,968 | ) | | | (45,736 | ) | | | (32,375 | ) | | | (35,382 | ) | | | (46,714 | ) |
Net increase (decrease) in net assets from Fund share transactions | | | (11,339 | ) | | | 8,049 | | | | (9,000 | ) | | | (3,583 | ) | | | 11,932 | | | | (13,871 | ) |
Net increase (decrease) in net assets | | | (12,226 | ) | | | 21,533 | | | | (17,343 | ) | | | (3,310 | ) | | | 19,487 | | | | (18,242 | ) |
Net assets at the beginning of period | | | 171,333 | | | | 149,800 | | | | 167,143 | | | | 162,532 | | | | 143,045 | | | | 161,287 | |
Net assets at the end of period | | $ | 159,107 | | | $ | 171,333 | | | $ | 149,800 | | | $ | 159,222 | | | $ | 162,532 | | | $ | 143,045 | |
Undistributed (Over-distribution of) net investment income at end of period | | $ | 585 | | | $ | 24 | | | $ | 31 | | | $ | 201 | | | $ | (65 | ) | | $ | (28 | ) |
| N/A – | Colorado Tax Free, Missouri Tax Free and Ohio Tax Free do not offer Class C Shares. Oregon Intermediate does not offer Class C1 Shares. |
| (1) | – Effective January 18, 2011, Class C Shares and Class Y Shares previously offered by FAF Advisors, Inc. were renamed Class C1 Shares and Class I Shares, respectively. |
See accompanying notes to financial statements.
Statement of Changes in Net Assets (continued) (all dollars are rounded to thousands (000))
| | | | | | | | | | | | | | | | | | | | | | | | |
| | | Nebraska | | | Ohio Tax Free | |
| | | Eleven Months Ended
5/31/11 | | | Year Ended
6/30/10 | | | Year Ended
6/30/09 | | | Eleven Months Ended
5/31/11 | | | Year Ended
6/30/10 | | | Year Ended
6/30/09 | |
Operations | | | | | | | | | | | | | | | | | | | | | | | | |
Net investment income (loss) | | $ | 1,648 | | | $ | 1,739 | | | $ | 1,719 | | | $ | 2,218 | | | $ | 2,190 | | | $ | 2,020 | |
Net realized gain (loss) from: | | | | | | | | | | | | | | | | | | | | | | | | |
Investments | | | 31 | | | | (19 | ) | | | (202 | ) | | | (448 | ) | | | 19 | | | | (353 | ) |
Futures | | | — | | | | — | | | | (245 | ) | | | — | | | | — | | | | (195 | ) |
Change in net unrealized appreciation (depreciation) of: | | | | | | | | | | | | | | | | | | | | | | | | |
Investments | | | (323 | ) | | | 2,000 | | | | (344 | ) | | | (779 | ) | | | 2,508 | | | | (255 | ) |
Futures | | | — | | | | — | | | | — | | | | — | | | | — | | | | 2 | |
Net increase (decrease) in net assets resulting from operations | | | 1,356 | | | | 3,720 | | | | 928 | | | | 991 | | | | 4,717 | | | | 1,219 | |
Distributions to Shareholders | | | | | | | | | | | | | | | | | | | | | | | | |
From net investment income: | | | | | | | | | | | | | | | | | | | | | | | | |
Class A | | | (257 | ) | | | (244 | ) | | | (253 | ) | | | (66 | ) | | | (53 | ) | | | (31 | ) |
Class C | | | (2 | ) | | | — | | | | — | | | | N/A | | | | N/A | | | | N/A | |
Class C1(1) | | | (150 | ) | | | (123 | ) | | | (90 | ) | | | (50 | ) | | | (23 | ) | | | (10 | ) |
Class I(1) | | | (1,262 | ) | | | (1,333 | ) | | | (1,415 | ) | | | (2,086 | ) | | | (2,063 | ) | | | (2,005 | ) |
From accumulated net realized gains: | | | | | | | | | | | | | | | | | | | | | | | | |
Class A | | | — | | | | — | | | | — | | | | — | | | | — | | | | — | |
Class C | | | — | | | | — | | | | — | | | | N/A | | | | N/A | | | | N/A | |
Class C1(1) | | | — | | | | — | | | | — | | | | — | | | | — | | | | — | |
Class I(1) | | | — | | | | — | | | | — | | | | — | | | | — | | | | — | |
Decrease in net assets from distributions to shareholders | | | (1,671 | ) | | | (1,700 | ) | | | (1,758 | ) | | | (2,202 | ) | | | (2,139 | ) | | | (2,046 | ) |
Fund Share Transactions | | | | | | | | | | | | | | | | | | | | | | | | |
Proceeds from sale of shares | | | 6,584 | | | | 7,353 | | | | 9,170 | | | | 9,606 | | | | 20,563 | | | | 6,775 | |
Proceeds from shares issued to shareholders due to reinvestment of distributions | | | 435 | | | | 362 | | | | 304 | | | | 174 | | | | 247 | | | | 323 | |
| | | 7,019 | | | | 7,715 | | | | 9,474 | | | | 9,780 | | | | 20,810 | | | | 7,098 | |
Cost of shares redeemed | | | (5,884 | ) | | | (6,585 | ) | | | (6,543 | ) | | | (20,851 | ) | | | (6,844 | ) | | | (9,441 | ) |
Net increase (decrease) in net assets from Fund share transactions | | | 1,135 | | | | 1,130 | | | | 2,931 | | | | (11,071 | ) | | | 13,966 | | | | (2,343 | ) |
Net increase (decrease) in net assets | | | 820 | | | | 3,150 | | | | 2,101 | | | | (12,282 | ) | | | 16,544 | | | | (3,170 | ) |
Net assets at the beginning of period | | | 42,271 | | | | 39,121 | | | | 37,020 | | | | 62,774 | | | | 46,230 | | | | 49,400 | |
Net assets at the end of period | | $ | 43,091 | | | $ | 42,271 | | | $ | 39,121 | | | $ | 50,492 | | | $ | 62,774 | | | $ | 46,230 | |
Undistributed (Over-distribution of) net investment income at end of period | | $ | (1 | ) | | $ | 22 | | | $ | (17 | ) | | $ | 50 | | | $ | 34 | | | $ | (17 | ) |
| N/A – | Colorado Tax Free, Missouri Tax Free and Ohio Tax Free do not offer Class C Shares. Oregon Intermediate does not offer Class C1 Shares. |
| (1) | – Effective January 18, 2011, Class C Shares and Class Y Shares previously offered by FAF Advisors, Inc. were renamed Class C1 Shares and Class I Shares, respectively. |
See accompanying notes to financial statements.
| | | | | | | | | | | | |
| | | Oregon Intermediate | |
| | | Eleven Months Ended
5/31/11 | | | Year Ended
6/30/10 | | | Year Ended
6/30/09 | |
Operations | | | | | | | | | | | | |
Net investment income (loss) | | $ | 4,806 | | | $ | 5,287 | | | $ | 4,843 | |
Net realized gain (loss) from: | | | | | | | | | | | | |
Investments | | | 192 | | | | 528 | | | | (498 | ) |
Futures | | | — | | | | (111 | ) | | | (324 | ) |
Change in net unrealized appreciation (depreciation) of: | | | | | | | | | | | | |
Investments | | | 259 | | | | 4,379 | | | | 1,808 | |
Futures | | | — | | | | — | | | | 3 | |
Net increase (decrease) in net assets resulting from operations | | | 5,257 | | | | 10,083 | | | | 5,832 | |
Distributions to Shareholders | | | | | | | | | | | | |
From net investment income: | | | | | | | | | | | | |
Class A | | | (940 | ) | | | (719 | ) | | | (256 | ) |
Class C | | | (4 | ) | | | — | | | | — | |
Class C1(1) | | | N/A | | | | N/A | | | | N/A | |
Class I(1) | | | (3,702 | ) | | | (4,596 | ) | | | (4,645 | ) |
From accumulated net realized gains: | | | | | | | | | | | | |
Class A | | | — | | | | — | | | | — | |
Class C | | | — | | | | — | | | | — | |
Class C1(1) | | | N/A | | | | N/A | | | | N/A | |
Class I(1) | | | — | | | | — | | | | — | |
Decrease in net assets from distributions to shareholders | | | (4,646 | ) | | | (5,315 | ) | | | (4,901 | ) |
Fund Share Transactions | | | | | | | | | | | | |
Proceeds from sale of shares | | | 33,676 | | | | 66,046 | | | | 31,459 | |
Proceeds from shares issued to shareholders due to reinvestment of distributions | | | 871 | | | | 645 | | | | 228 | |
| | | 34,547 | | | | 66,691 | | | | 31,687 | |
Cost of shares redeemed | | | (54,159 | ) | | | (37,522 | ) | | | (28,463 | ) |
Net increase (decrease) in net assets from Fund share transactions | | | (19,612 | ) | | | 29,169 | | | | 3,224 | |
Net increase (decrease) in net assets | | | (19,001 | ) | | | 33,937 | | | | 4,155 | |
Net assets at the beginning of period | | | 164,859 | | | | 130,922 | | | | 126,767 | |
Net assets at the end of period | | $ | 145,858 | | | $ | 164,859 | | | $ | 130,922 | |
Undistributed (Over-distribution of) net investment income at end of period | | $ | 131 | | | $ | (29 | ) | | $ | (1 | ) |
| N/A – | Colorado Tax Free, Missouri Tax Free and Ohio Tax Free do not offer Class C Shares. Oregon Intermediate does not offer Class C1 Shares. |
| (1) | – Effective January 18, 2011, Class C Shares and Class Y Shares previously offered by FAF Advisors, Inc. were renamed Class C1 and Class I Shares, respectively. |
See accompanying notes to financial statements.
Financial Highlights
| | | | | | | | | | | | | | | | | | | | | | | | | | | | | | | | | | | | |
| Selected data for a share outstanding throughout each period: | | | | | | | | | | | | | | | | | | | |
| | | | | | | | |
| Class (Commencement Date) | | | | | | | | | | | | | | | | | | | | | | | | | |
| | | | | | Investment Operations | | | Less Distributions | | | | | | | |
| | | | | | | | |
| COLORADO TAX FREE | | | | | | | | | | | | | | | | | | | | | | | | | |
| | | Beginning
Net
Asset
Value | | | Net
Invest-
ment
Income
(Loss)(a) | | | Net
Realized/
Unrealized
Gain
(Loss) | | | Total | | | Net
Invest-
ment
Income | | | Capital
Gains(b) | | | Total | | | Ending
Net
Asset
Value | | | Total
Return(c) | |
Class A (2/00) | | | | | | | | | | | | | | | | | | | | | | | | | | | | | | | | | | | | |
Year Ended 5/31 | | | | | | | | | | | | | | | | | | | | | | | | | | | | | | | | | | | | |
2011(e) | | $ | 10.12 | | | $ | .39 | | | $ | — | | | $ | .39 | | | $ | (.38 | ) | | $ | (.09 | ) | | $ | (.47 | ) | | $ | 10.04 | | | | 3.93 | % |
Year Ended 6/30 | | | | | | | | | | | | | | | | | | | | | | | | | | | | | | | | | | | | |
2010 | | | 9.60 | | | | .43 | | | | .60 | | | | 1.03 | | | | (.42 | ) | | | (.09 | ) | | | (.51 | ) | | | 10.12 | | | | 10.91 | |
2009 | | | 10.28 | | | | .41 | | | | (.56 | ) | | | (.15 | ) | | | (.45 | ) | | | (.08 | ) | | | (.53 | ) | | | 9.60 | | | | (1.20 | ) |
2008 | | | 10.61 | | | | .48 | | | | (.33 | ) | | | .15 | | | | (.45 | ) | | | (.03 | ) | | | (.48 | ) | | | 10.28 | | | | 1.52 | |
2007 | | | 10.73 | | | | .46 | | | | (.02 | ) | | | .44 | | | | (.48 | ) | | | (.08 | ) | | | (.56 | ) | | | 10.61 | | | | 4.13 | |
2006(g) | | | 11.30 | | | | .35 | | | | (.26 | ) | | | .09 | | | | (.34 | ) | | | (.32 | ) | | | (.66 | ) | | | 10.73 | | | | .77 | |
Year Ended 9/30 | | | | | | | | | | | | | | | | | | | | | | | | | | | | | | | | | | | | |
2005 | | | 11.52 | | | | .49 | | | | (.11 | ) | | | .38 | | | | (.51 | ) | | | (.09 | ) | | | (.60 | ) | | | 11.30 | | | | 3.36 | |
Class C1 (2/00)(f) | | | | | | | | | | | | | | | | | | | | | | | | | | | | | | | | | | | | |
Year Ended 5/31 | | | | | | | | | | | | | | | | | | | | | | | | | | | | | | | | | | | | |
2011(e) | | | 10.09 | | | | .35 | | | | — | | | | .35 | | | | (.34 | ) | | | (.09 | ) | | | (.43 | ) | | | 10.01 | | | | 3.53 | |
Year Ended 6/30 | | | | | | | | | | | | | | | | | | | | | | | | | | | | | | | | | | | | |
2010 | | | 9.57 | | | | .38 | | | | .61 | | | | .99 | | | | (.38 | ) | | | (.09 | ) | | | (.47 | ) | | | 10.09 | | | | 10.51 | |
2009 | | | 10.26 | | | | .41 | | | | (.61 | ) | | | (.20 | ) | | | (.41 | ) | | | (.08 | ) | | | (.49 | ) | | | 9.57 | | | | (1.70 | ) |
2008 | | | 10.59 | | | | .42 | | | | (.31 | ) | | | .11 | | | | (.41 | ) | | | (.03 | ) | | | (.44 | ) | | | 10.26 | | | | 1.12 | |
2007 | | | 10.71 | | | | .42 | | | | (.02 | ) | | | .40 | | | | (.44 | ) | | | (.08 | ) | | | (.52 | ) | | | 10.59 | | | | 3.72 | |
2006(g) | | | 11.28 | | | | .32 | | | | (.27 | ) | | | .05 | | | | (.30 | ) | | | (.32 | ) | | | (.62 | ) | | | 10.71 | | | | .47 | |
Year Ended 9/30 | | | | | | | | | | | | | | | | | | | | | | | | | | | | | | | | | | | | |
2005 | | | 11.50 | | | | .43 | | | | (.10 | ) | | | .33 | | | | (.46 | ) | | | (.09 | ) | | | (.55 | ) | | | 11.28 | | | | 2.95 | |
Class I (2/00)(f) | | | | | | | | | | | | | | | | | | | | | | | | | | | | | | | | | | | | |
Year Ended 5/31 | | | | | | | | | | | | | | | | | | | | | | | | | | | | | | | | | | | | |
2011(e) | | | 10.14 | | | | .41 | | | | .01 | | | | .42 | | | | (.40 | ) | | | (.09 | ) | | | (.49 | ) | | | 10.07 | | | | 4.24 | |
Year Ended 6/30 | | | | | | | | | | | | | | | | | | | | | | | | | | | | | | | | | | | | |
2010 | | | 9.62 | | | | .45 | | | | .61 | | | | 1.06 | | | | (.45 | ) | | | (.09 | ) | | | (.54 | ) | | | 10.14 | | | | 11.16 | |
2009 | | | 10.29 | | | | .44 | | | | (.58 | ) | | | (.14 | ) | | | (.45 | ) | | | (.08 | ) | | | (.53 | ) | | | 9.62 | | | | (.85 | ) |
2008 | | | 10.63 | | | | .49 | | | | (.32 | ) | | | .17 | | | | (.48 | ) | | | (.03 | ) | | | (.51 | ) | | | 10.29 | | | | 1.67 | |
2007 | | | 10.75 | | | | .50 | | | | (.03 | ) | | | .47 | | | | (.51 | ) | | | (.08 | ) | | | (.59 | ) | | | 10.63 | | | | 4.39 | |
2006(g) | | | 11.32 | | | | .37 | | | | (.26 | ) | | | .11 | | | | (.36 | ) | | | (.32 | ) | | | (.68 | ) | | | 10.75 | | | | .96 | |
Year Ended 9/30 | | | | | | | | | | | | | | | | | | | | | | | | | | | | | | | | | | | | |
2005 | | | 11.53 | | | | .51 | | | | (.09 | ) | | | .42 | | | | (.54 | ) | | | (.09 | ) | | | (.63 | ) | | | 11.32 | | | | 3.70 | |
| | | | | | | | | | | | | | | | | | | | | | |
| | | | | |
| | | | | | | | | | | | | | | | | |
| Ratios/Supplemental Data | |
| | | |
Ratios to Average
Net Assets Before
Reimbursement | | | Ratios to Average
Net Assets After
Reimbursement(d) | | | | |
Ending
Net
Assets
(000) | | | Expenses | | | Net
Invest-
ment
Income
(Loss) | | | Expenses | | | Net
Invest-
ment
Income
(Loss) | | | Portfolio
Turnover
Rate | |
| | | | | | | | | | | | | | | | | | | | | | |
| | | | | | | | | | | | | | | | | | | | | | |
| $ | 10,812 | | | | 1.14 | %* | | | 3.84 | %* | | | .72 | %* | | | 4.27 | %* | | | 20 | % |
| | | | | | | | | | | | | | | | | | | | | | |
| | 10,811 | | | | 1.29 | | | | 3.69 | | | | .75 | | | | 4.23 | | | | 25 | |
| | 11,088 | | | | 1.45 | | | | 3.88 | | | | .75 | | | | 4.58 | | | | 41 | |
| | 5,815 | | | | 1.80 | | | | 3.35 | | | | .75 | | | | 4.40 | | | | 49 | |
| | 8,788 | | | | 1.75 | | | | 3.27 | | | | .75 | | | | 4.27 | | | | 47 | |
| | 8,507 | | | | 1.52 | * | | | 3.53 | * | | | .75 | * | | | 4.30 | * | | | 35 | |
| | | | | | | | | | | | | | | | | | | | | | |
| | 8,362 | | | | 1.18 | | | | 3.80 | | | | .75 | | | | 4.23 | | | | 30 | |
| | | | | | | | | | | | | | | | | | | | | | |
| | | | | | | | | | | | | | | | | | | | | | |
| | 2,481 | | | | 1.58 | * | | | 3.38 | * | | | 1.14 | * | | | 3.82 | * | | | 20 | |
| | | | | | | | | | | | | | | | | | | | | | |
| | 3,172 | | | | 1.69 | | | | 3.29 | | | | 1.15 | | | | 3.83 | | | | 25 | |
| | 2,891 | | | | 1.85 | | | | 3.49 | | | | 1.15 | | | | 4.19 | | | | 41 | |
| | 2,859 | | | | 2.20 | | | | 2.93 | | | | 1.15 | | | | 3.98 | | | | 49 | |
| | 2,888 | | | | 2.24 | | | | 2.78 | | | | 1.15 | | | | 3.87 | | | | 47 | |
| | 3,007 | | | | 2.27 | * | | | 2.78 | * | | | 1.15 | * | | | 3.90 | * | | | 35 | |
| | | | | | | | | | | | | | | | | | | | | | |
| | 3,423 | | | | 1.93 | | | | 3.05 | | | | 1.15 | | | | 3.83 | | | | 30 | |
| | | | | | | | | | | | | | | | | | | | | | |
| | | | | | | | | | | | | | | | | | | | | | |
| | 42,161 | | | | .92 | * | | | 4.04 | * | | | .49 | * | | | 4.47 | * | | | 20 | |
| | | | | | | | | | | | | | | | | | | | | | |
| | 49,244 | | | | 1.04 | | | | 3.94 | | | | .50 | | | | 4.48 | | | | 25 | |
| | 51,521 | | | | 1.20 | | | | 4.11 | | | | .50 | | | | 4.81 | | | | 41 | |
| | 15,889 | | | | 1.55 | | | | 3.58 | | | | .50 | | | | 4.63 | | | | 49 | |
| | 13,477 | | | | 1.50 | | | | 3.51 | | | | .50 | | | | 4.51 | | | | 47 | |
| | 10,181 | | | | 1.27 | * | | | 3.81 | * | | | .50 | * | | | 4.58 | * | | | 35 | |
| | | | | | | | | | | | | | | | | | | | | | |
| | 8,363 | | | | .93 | | | | 4.05 | | | | .50 | | | | 4.48 | | | | 30 | |
| (a) | Per share Net Investment Income (Loss) is calculated using the average daily shares method. |
| (b) | Distributions from Capital Gains include short-term capital gains, if any. |
| (c) | Total return is the combination of changes in net asset value without any sales charge, reinvested dividend income at net asset value and reinvested capital gains distributions at net asset value, if any. Total returns are not annualized. |
| (d) | After expense reimbursement from the Adviser, where applicable. Ratios do not reflect the effect of custodian fee credits earned on the Fund’s net cash on deposit with the custodian bank, where applicable. |
| (e) | For the eleven months ended May 31, 2011. |
| (f) | Effective January 18, 2011, Class C Shares and Class Y Shares previously offered by FAF Advisors were renamed Class C1 Shares and Class I Shares, respectively. |
| (g) | For the nine months ended June 30, 2006. |
See accompanying notes to financial statements.
Financial Highlights (continued)
| | | | | | | | | | | | | | | | | | | | | | | | | | | | | | | | | | | | |
| Selected data for a share outstanding throughout each period: | | | | | | | | | | | | | | | | | | | |
| | | | | | | | |
| Class (Commencement Date) | | | | | | | | | | | | | | | | | | | | | | | | | |
| | | | | | Investment Operations | | | Less Distributions | | | | | | | |
| | | | | | | | |
| MINNESOTA INTERMEDIATE | | | | | | | | | | | | | | | | | | | | | | | | | |
| | | Beginning
Net
Asset
Value | | | Net
Invest-
ment
Income
(Loss)(a) | | | Net
Realized/
Unrealized
Gain
(Loss) | | | Total | | | Net
Invest-
ment
Income | | | Capital
Gains(b) | | | Total | | | Ending
Net
Asset
Value | | | Total
Return(c) | |
Class A (2/94) | | | | | | | | | | | | | | | | | | | | | | | | | | | | | | | | | | | | |
Year Ended 5/31 | | | | | | | | | | | | | | | | | | | | | | | | | | | | | | | | | | | | |
2011(e) | | $ | 10.12 | | | $ | .33 | | | $ | .07 | | | $ | .40 | | | $ | (.32 | ) | | $ | — | | | $ | (.32 | ) | | $ | 10.20 | | | | 4.00 | % |
Year Ended 6/30 | | | | | | | | | | | | | | | | | | | | | | | | | | | | | | | | | | | | |
2010 | | | 9.67 | | | | .36 | | | | .46 | | | | .82 | | | | (.36 | ) | | | (.01 | ) | | | (.37 | ) | | | 10.12 | | | | 8.51 | |
2009 | | | 9.75 | | | | .38 | | | | (.05 | ) | | | .33 | | | | (.38 | ) | | | (.03 | ) | | | (.41 | ) | | | 9.67 | | | | 3.53 | |
2008 | | | 9.83 | | | | .39 | | | | (.05 | ) | | | .34 | | | | (.39 | ) | | | (.03 | ) | | | (.42 | ) | | | 9.75 | | | | 3.53 | |
2007 | | | 9.88 | | | | .39 | | | | (.01 | ) | | | .38 | | | | (.38 | ) | | | (.05 | ) | | | (.43 | ) | | | 9.83 | | | | 3.87 | |
2006(i) | | | 10.16 | | | | .29 | | | | (.22 | ) | | | .07 | | | | (.29 | ) | | | (.06 | ) | | | (.35 | ) | | | 9.88 | | | | .74 | |
Year Ended 9/30 | | | | | | | | | | | | | | | | | | | | | | | | | | | | | | | | | | | | |
2005 | | | 10.34 | | | | .39 | | | | (.15 | ) | | | .24 | | | | (.39 | ) | | | (.03 | ) | | | (.42 | ) | | | 10.16 | | | | 2.33 | |
Class C (1/11) | | | | | | | | | | | | | | | | | | | | | | | | | | | | | | | | | | | | |
Year Ended 5/31 | | | | | | | | | | | | | | | | | | | | | | | | | | | | | | | | | | | | |
2011(g) | | | 9.77 | | | | .11 | | | | .36 | | | | .47 | | | | (.10 | ) | | | — | | | | (.10 | ) | | | 10.14 | | | | 4.88 | |
Class C1 (10/09)(f) | | | | | | | | | | | | | | | | | | | | | | | | | | | | | | | | | | | | |
Year Ended 5/31 | | | | | | | | | | | | | | | | | | | | | | | | | | | | | | | | | | | | |
2011(e) | | | 10.14 | | | | .28 | | | | .07 | | | | .35 | | | | (.27 | ) | | | — | | | | (.27 | ) | | | 10.22 | | | | 3.46 | |
Year Ended 6/30 | | | | | | | | | | | | | | | | | | | | | | | | | | | | | | | | | | | | |
2010(h) | | | 9.94 | | | | .21 | | | | .20 | | | | .41 | | | | (.20 | ) | | | (.01 | ) | | | (.21 | ) | | | 10.14 | | | | 4.15 | |
Class I (2/94)(f) | | | | | | | | | | | | | | | | | | | | | | | | | | | | | | | | | | | | |
Year Ended 5/31 | | | | | | | | | | | | | | | | | | | | | | | | | | | | | | | | | | | | |
2011(e) | | | 10.06 | | | | .34 | | | | .06 | | | | .40 | | | | (.33 | ) | | | — | | | | (.33 | ) | | | 10.13 | | | | 4.00 | |
Year Ended 6/30 | | | | | | | | | | | | | | | | | | | | | | | | | | | | | | | | | | | | |
2010 | | | 9.62 | | | | .36 | | | | .45 | | | | .81 | | | | (.36 | ) | | | (.01 | ) | | | (.37 | ) | | | 10.06 | | | | 8.50 | |
2009 | | | 9.69 | | | | .39 | | | | (.04 | ) | | | .35 | | | | (.39 | ) | | | (.03 | ) | | | (.42 | ) | | | 9.62 | | | | 3.71 | |
2008 | | | 9.78 | | | | .39 | | | | (.05 | ) | | | .34 | | | | (.40 | ) | | | (.03 | ) | | | (.43 | ) | | | 9.69 | | | | 3.51 | |
2007 | | | 9.83 | | | | .40 | | | | — | | | | .40 | | | | (.40 | ) | | | (.05 | ) | | | (.45 | ) | | | 9.78 | | | | 4.05 | |
2006(i) | | | 10.11 | | | | .30 | | | | (.22 | ) | | | .08 | | | | (.30 | ) | | | (.06 | ) | | | (.36 | ) | | | 9.83 | | | | .85 | |
Year Ended 9/30 | | | | | | | | | | | | | | | | | | | | | | | | | | | | | | | | | | | | |
2005 | | | 10.29 | | | | .40 | | | | (.15 | ) | | | .25 | | | | (.40 | ) | | | (.03 | ) | | | (.43 | ) | | | 10.11 | | | | 2.50 | |
| | | | | | | | | | | | | | | | | | | | | | |
| | | | | |
| | | | | | | | | | | | | | | | | |
| Ratios/Supplemental Data | |
| | | |
| | | | Ratios to Average
Net Assets Before
Reimbursement | | | Ratios to Average
Net Assets After
Reimbursement(d) | | | | |
Ending
Net
Assets
(000) | | | Expenses | | | Net
Invest-
ment
Income
(Loss) | | | Expenses | | | Net
Invest-
ment
Income
(Loss) | | | Portfolio
Turnover
Rate | |
| | | | | | | | | | | | | | | | | | | | | | |
| | | | | | | | | | | | | | | | | | | | | | |
| $ | 37,175 | | | | .92 | %* | | | 3.40 | %* | | | .74 | %* | | | 3.60 | %* | | | 12 | % |
| | | | | | | | | | | | | | | | | | | | | | |
| | 34,957 | | | | 1.08 | | | | 3.28 | | | | .75 | | | | 3.61 | | | | 9 | |
| | 23,019 | | | | 1.07 | | | | 3.68 | | | | .75 | | | | 4.00 | | | | 18 | |
| | 22,059 | | | | 1.07 | | | | 3.65 | | | | .77 | | | | 3.95 | | | | 15 | |
| | 21,153 | | | | 1.07 | | | | 3.64 | | | | .85 | | | | 3.86 | | | | 18 | |
| | 26,526 | | | | 1.08 | * | | | 3.62 | * | | | .85 | * | | | 3.85 | * | | | 11 | |
| | | | | | | | | | | | | | | | | | | | | | |
| | 32,326 | | | | 1.06 | | | | 3.57 | | | | .85 | | | | 3.78 | | | | 15 | |
| | | | | | | | | | | | | | | | | | | | | | |
| | | | | | | | | | | | | | | | | | | | | | |
| | 623 | | | | 1.41 | * | | | 3.10 | * | | | 1.37 | * | | | 3.14 | * | | | 12 | |
| | | | | | | | | | | | | | | | | | | | | | |
| | | | | | | | | | | | | | | | | | | | | | |
| | 6,242 | | | | 1.37 | * | | | 2.99 | * | | | 1.31 | * | | | 3.05 | * | | | 12 | |
| | | | | | | | | | | | | | | | | | | | | | |
| | 3,965 | | | | 1.48 | * | | | 2.87 | * | | | 1.35 | * | | | 3.00 | * | | | 9 | |
| | | | | | | | | | | | | | | | | | | | | | |
| | | | | | | | | | | | | | | | | | | | | | |
| | 191,516 | | | | .72 | * | | | 3.60 | * | | | .66 | * | | | 3.67 | * | | | 12 | |
| | | | | | | | | | | | | | | | | | | | | | |
| | 193,443 | | | | .83 | | | | 3.53 | | | | .70 | | | | 3.66 | | | | 9 | |
| | 172,440 | | | | .82 | | | | 3.92 | | | | .70 | | | | 4.04 | | | | 18 | |
| | 175,681 | | | | .82 | | | | 3.90 | | | | .70 | | | | 4.02 | | | | 15 | |
| | 168,920 | | | | .82 | | | | 3.89 | | | | .70 | | | | 4.01 | | | | 18 | |
| | 175,485 | | | | .83 | * | | | 3.87 | * | | | .70 | * | | | 4.00 | * | | | 11 | |
| | | | | | | | | | | | | | | | | | | | | | |
| | 197,251 | | | | .81 | | | | 3.82 | | | | .70 | | | | 3.93 | | | | 15 | |
| (a) | Per share Net Investment Income (Loss) is calculated using the average daily shares method. |
| (b) | Distributions from Capital Gains include short-term capital gains, if any. |
| (c) | Total return is the combination of changes in net asset value without any sales charge, reinvested dividend income at net asset value and reinvested capital gains distributions at net asset value, if any. Total returns are not annualized. |
| (d) | After expense reimbursement from the Adviser, where applicable. Ratios do not reflect the effect of custodian fee credits earned on the Fund’s net cash on deposit with the custodian bank, where applicable. |
| (e) | For the eleven months ended May 31, 2011. |
| (f) | Effective January 18, 2011, Class C Shares and Class Y Shares previously offered by FAF Advisors were renamed Class C1 Shares and Class Y Shares and Class I Shares, respectively. |
| (g) | For the period January 18, 2011 (commencement of operations) through May 31, 2011. |
| (h) | For the period October 28, 2009 (commencement of operations) through June 30, 2010. |
| (i) | For the nine months ended June 30, 2006. |
See accompanying notes to financial statements.
Financial Highlights (continued)
| | | | | | | | | | | | | | | | | | | | | | | | | | | | | | | | | | | | |
| Selected data for a share outstanding throughout each period: | | | | | | | | | | | | | | | | | | | |
| | | | | | | | |
| Class (Commencement Date) | | | | | | | | | | | | | | | | | | | | | | | | | |
| | | | | | Investment Operations | | | Less Distributions | | | | | | | |
| | | | |
| MINNESOTA MUNICIPAL | | | | | | | | | | | | | |
| | | Beginning
Net
Asset
Value | | | Net
Invest-
ment
Income
(Loss)(a) | | | Net
Realized/
Unrealized
Gain
(Loss) | | | Total | | | Net
Invest-
ment
Income | | | Capital
Gains(b) | | | Total | | | Ending
Net
Asset
Value | | | Total
Return(c) | |
Class A (7/88) | | | | | | | | | | | | | | | | | | | | | | | | | | | | | | | | | |
Year Ended 5/31 | | | | | | | | | | | | | | | | | | | | | | | | | | | | | | | | | | | | |
2011(e) | | $ | 10.87 | | | $ | .39 | | | $ | (.08 | ) | | $ | .31 | | | $ | (.35 | ) | | $ | — | | | $ | (.35 | ) | | $ | 10.83 | | | | 2.94 | % |
Year Ended 6/30 | | | | | | | | | | | | | | | | | | | | | | | | | | | | | | | | | | | | |
2010 | | | 9.98 | | | | .41 | | | | .89 | | | | 1.30 | | | | (.41 | ) | | | — | | | | (.41 | ) | | | 10.87 | | | | 13.19 | |
2009 | | | 10.48 | | | | .43 | | | | (.44 | ) | | | (.01 | ) | | | (.43 | ) | | | (.06 | ) | | | (.49 | ) | | | 9.98 | | | | .07 | |
2008 | | | 10.93 | | | | .44 | | | | (.38 | ) | | | .06 | | | | (.45 | ) | | | (.06 | ) | | | (.51 | ) | | | 10.48 | | | | .54 | |
2007 | | | 10.97 | | | | .46 | | | | (.02 | ) | | | .44 | | | | (.45 | ) | | | (.03 | ) | | | (.48 | ) | | | 10.93 | | | | 4.05 | |
2006(h) | | | 11.21 | | | | .35 | | | | (.21 | ) | | | .14 | | | | (.35 | ) | | | (.03 | ) | | | (.38 | ) | | | 10.97 | | | | 1.28 | |
Year Ended 9/30 | | | | | | | | | | | | | | | | | | | | | | | | | | | | | | | | | | | | |
2005 | | | 11.23 | | | | .45 | | | | .03 | | | | .48 | | | | (.45 | ) | | | (.05 | ) | | | (.50 | ) | | | 11.21 | | | | 4.42 | |
Class C (1/11) | | | | | | | | | | | | | | | | | | | | | | | | | | | | | | | | | |
Year Ended 5/31 | | | | | | | | | | | | | | | | | | | | | | | | | | | | | | | | | | | | |
2011(g) | | | 10.23 | | | | .15 | | | | .56 | | | | .71 | | | | (.12 | ) | | | — | | | | (.12 | ) | | | 10.82 | | | | 6.99 | |
Class C1 (2/99)(f) | | | | | | | | | | | | | | | | | | | | | | | | | | | | | | | | | |
Year Ended 5/31 | | | | | | | | | | | | | | | | | | | | | | | | | | | | | | | | | | | | |
2011(e) | | | 10.82 | | | | .34 | | | | (.08 | ) | | | .26 | | | | (.30 | ) | | | — | | | | (.30 | ) | | | 10.78 | | | | 2.48 | |
Year Ended 6/30 | | | | | | | | | | | | | | | | | | | | | | | | | | | | | | | | | | | | |
2010 | | | 9.94 | | | | .36 | | | | .88 | | | | 1.24 | | | | (.36 | ) | | | — | | | | (.36 | ) | | | 10.82 | | | | 12.58 | |
2009 | | | 10.44 | | | | .38 | | | | (.44 | ) | | | (.06 | ) | | | (.38 | ) | | | (.06 | ) | | | (.44 | ) | | | 9.94 | | | | (.42 | ) |
2008 | | | 10.89 | | | | .40 | | | | (.39 | ) | | | .01 | | | | (.40 | ) | | | (.06 | ) | | | (.46 | ) | | | 10.44 | | | | .06 | |
2007 | | | 10.93 | | | | .42 | | | | (.02 | ) | | | .40 | | | | (.41 | ) | | | (.03 | ) | | | (.44 | ) | | | 10.89 | | | | 3.65 | |
2006(h) | | | 11.17 | | | | .31 | | | | (.20 | ) | | | .11 | | | | (.32 | ) | | | (.03 | ) | | | (.35 | ) | | | 10.93 | | | | .98 | |
Year Ended 9/30 | | | | | | | | | | | | | | | | | | | | | | | | | | | | | | | | | | | | |
2005 | | | 11.19 | | | | .41 | | | | .03 | | | | .44 | | | | (.41 | ) | | | (.05 | ) | | | (.46 | ) | | | 11.17 | | | | 4.02 | |
Class I (8/97)(f) | | | | | | | | | | | | | | | | | | | | | | | | | | | | | | | | | |
Year Ended 5/31 | | | | | | | | | | | | | | | | | | | | | | | | | | | | | | | | | | | | |
2011(e) | | | 10.86 | | | | .41 | | | | (.08 | ) | | | .33 | | | | (.37 | ) | | | — | | | | (.37 | ) | | | 10.82 | | | | 3.09 | |
Year Ended 6/30 | | | | | | | | | | | | | | | | | | | | | | | | | | | | | | | | | | | | |
2010 | | | 9.97 | | | | .42 | | | | .90 | | | | 1.32 | | | | (.43 | ) | | | — | | | | (.43 | ) | | | 10.86 | | | | 13.37 | |
2009 | | | 10.47 | | | | .44 | | | | (.44 | ) | | | — | | | | (.44 | ) | | | (.06 | ) | | | (.50 | ) | | | 9.97 | | | | .23 | |
2008 | | | 10.92 | | | | .46 | | | | (.38 | ) | | �� | .08 | | | | (.47 | ) | | | (.06 | ) | | | (.53 | ) | | | 10.47 | | | | .71 | |
2007 | | | 10.96 | | | | .48 | | | | (.01 | ) | | | .47 | | | | (.48 | ) | | | (.03 | ) | | | (.51 | ) | | | 10.92 | | | | 4.31 | |
2006(h) | | | 11.20 | | | | .36 | | | | (.20 | ) | | | .16 | | | | (.37 | ) | | | (.03 | ) | | | (.40 | ) | | | 10.96 | | | | 1.47 | |
Year Ended 9/30 | | | | | | | | | | | | | | | | | | | | | | | | | | | | | | | | | | | | |
2005 | | | 11.22 | | | | .48 | | | | .03 | | | | .51 | | | | (.48 | ) | | | (.05 | ) | | | (.53 | ) | | | 11.20 | | | | 4.69 | |
| | | | | | | | | | | | | | | | | | | | | | |
| | | | | |
| | | | | | | | | | | | | | | | | |
| Ratios/Supplemental Data | |
| | | |
| | | | Ratios to Average
Net Assets Before
Reimbursement | | | Ratios to Average
Net Assets After
Reimbursement(d) | | | | |
Ending
Net
Assets
(000) | | | Expenses | | | Net
Invest
ment
Income
(Loss) | | | Expenses | | | Net
Invest
ment
Income
(Loss) | | | Portfolio
Turnover
Rate | |
| | | | | | | | | | | | | | | | | | | | | | |
| | | | | | | | | | | | | | | | | | | | | | |
| $ | 85,183 | | | | 1.00 | %* | | | 3.77 | %* | | | .85 | %* | | | 3.94 | %* | | | 25 | % |
| | | | | | | | | | | | | | | | | | | | | | |
| | 91,922 | | | | 1.11 | | | | 3.60 | | | | .85 | | | | 3.86 | | | | 34 | |
| | 87,218 | | | | 1.11 | | | | 4.06 | | | | .85 | | | | 4.32 | | | | 28 | |
| | 102,089 | | | | 1.10 | | | | 3.91 | | | | .87 | | | | 4.14 | | | | 37 | |
| | 106,732 | | | | 1.10 | | | | 3.95 | | | | .95 | | | | 4.10 | | | | 20 | |
| | 101,142 | | | | 1.10 | * | | | 4.00 | * | | | .95 | * | | | 4.15 | * | | | 11 | |
| | | | | | | | | | | | | | | | | | | | | | |
| | 106,783 | | | | 1.06 | | | | 3.93 | | | | .95 | | | | 4.04 | | | | 16 | |
| | | | | | | | | | | | | | | | | | | | | | |
| | | | | | | | | | | | | | | | | | | | | | |
| | 618 | | | | 1.50 | * | | | 3.91 | * | | | 1.43 | * | | | 3.98 | * | | | 25 | |
| | | | | | | | | | | | | | | | | | | | | | |
| | | | | | | | | | | | | | | | | | | | | | |
| | 22,190 | | | | 1.43 | * | | | 3.33 | * | | | 1.33 | * | | | 3.43 | * | | | 25 | |
| | | | | | | | | | | | | | | | | | | | | | |
| | 26,772 | | | | 1.51 | | | | 3.19 | | | | 1.35 | | | | 3.35 | | | | 34 | |
| | 20,489 | | | | 1.51 | | | | 3.66 | | | | 1.35 | | | | 3.82 | | | | 28 | |
| | 20,061 | | | | 1.50 | | | | 3.48 | | | | 1.35 | | | | 3.63 | | | | 37 | |
| | 14,221 | | | | 1.58 | | | | 3.46 | | | | 1.35 | | | | 3.69 | | | | 20 | |
| | 10,359 | | | | 1.85 | * | | | 3.25 | * | | | 1.35 | * | | | 3.75 | * | | | 11 | |
| | | | | | | | | | | | | | | | | | | | | | |
| | 9,841 | | | | 1.81 | | | | 3.18 | | | | 1.35 | | | | 3.64 | | | | 16 | |
| | | | | | | | | | | | | | | | | | | | | | |
| | | | | | | | | | | | | | | | | | | | | | |
| | 51,116 | | | | .77 | * | | | 4.01 | * | | | .68 | * | | | 4.11 | * | | | 25 | |
| | | | | | | | | | | | | | | | | | | | | | |
| | 52,639 | | | | .86 | | | | 3.84 | | | | .70 | | | | 4.00 | | | | 34 | |
| | 42,093 | | | | .86 | | | | 4.31 | | | | .70 | | | | 4.47 | | | | 28 | |
| | 44,993 | | | | .85 | | | | 4.17 | | | | .70 | | | | 4.32 | | | | 37 | |
| | 56,181 | | | | .85 | | | | 4.20 | | | | .70 | | | | 4.35 | | | | 20 | |
| | 48,760 | | | | .85 | * | | | 4.25 | * | | | .70 | * | | | 4.40 | * | | | 11 | |
| | | | | | | | | | | | | | | | | | | | | | |
| | 46,471 | | | | .81 | | | | 4.18 | | | | .70 | | | | 4.29 | | | | 16 | |
| (a) | Per share Net Investment Income (Loss) is calculated using the average daily shares method. |
| (b) | Distributions from Capital Gains include short-term capital gains, if any. |
| (c) | Total return is the combination of changes in net asset value without any sales charge, reinvested dividend income at net asset value and reinvested capital gains distributions at net asset value, if any. Total returns are not annualized. |
| (d) | After expense reimbursement from the Adviser, where applicable. Ratios do not reflect the effect of custodian fee credits earned on the Fund’s net cash on deposit with the custodian bank, where applicable. |
| (e) | For the eleven months ended May 31, 2011. |
| (f) | Effective January 18, 2011, Class C Shares and Class Y Shares previously offered by FAF Advisors were renamed Class C1 Shares and Class I Shares, respectively. |
| (g) | For the period January 18, 2011 (commencement of operations) through May 31, 2011. |
| (h) | For the nine months ended June 30, 2006. |
See accompanying notes to financial statements.
Financial Highlights (continued)
| | | | | | | | | | | | | | | | | | | | | | | | | | | | | | | | | | | | |
| Selected data for a share outstanding throughout each period: | | | | | | | | | | | | | | | | | | | |
| | | | | | | | |
| Class (Commencement Date) | | | | | | | | | | | | | | | | | | | | | | | | | |
| | | | | | Investment Operations | | | Less Distributions | | | | | | | |
| | | | | | | | |
| MISSOURI TAX FREE | | | | | | | | | | | | | | | | | | | | | | | | | |
| | | Beginning
Net
Asset
Value | | | Net
Invest-
ment
Income
(Loss)(a) | | | Net
Realized/
Unrealized
Gain
(Loss) | | | Total | | | Net
Invest-
ment
Income | | | Capital
Gains(b) | | | Total | | | Ending
Net
Asset
Value | | | Total
Return(c) | |
Class A (9/90) | | | | | | | | | | | | | | | | | | | | | | | | | | | | | | | | | |
Year Ended 5/31 | | | | | | | | | | | | | | | | | | | | | | | | | | | | | | | | | | | | |
2011(e) | | $ | 11.68 | | | $ | .44 | | | $ | .04 | | | $ | .48 | | | $ | (.42 | ) | | $ | (.02 | ) | | $ | (.44 | ) | | $ | 11.72 | | | | 4.18 | % |
Year Ended 6/30 | | | | | | | | | | | | | | | | | | | | | | | | | | | | | | | | | | | | |
2010 | | | 11.11 | | | | .48 | | | | .66 | | | | 1.14 | | | | (.48 | ) | | | (.09 | ) | | | (.57 | ) | | | 11.68 | | | | 10.41 | |
2009 | | | 11.40 | | | | .47 | | | | (.26 | ) | | | .21 | | | | (.47 | ) | | | (.03 | ) | | | (.50 | ) | | | 11.11 | | | | 2.01 | |
2008 | | | 11.72 | | | | .46 | | | | (.29 | ) | | | .17 | | | | (.46 | ) | | | (.03 | ) | | | (.49 | ) | | | 11.40 | | | | 1.44 | |
2007 | | | 11.76 | | | | .45 | | | | .05 | | | | .50 | | | | (.45 | ) | | | (.09 | ) | | | (.54 | ) | | | 11.72 | | | | 4.23 | |
2006(g) | | | 12.14 | | | | .34 | | | | (.29 | ) | | | .05 | | | | (.34 | ) | | | (.09 | ) | | | (.43 | ) | | | 11.76 | | | | .38 | |
Year Ended 9/30 | | | | | | | | | | | | | | | | | | | | | | | | | | | | | | | | | | | | |
2005 | | | 12.32 | | | | .45 | | | | (.12 | ) | | | .33 | | | | (.45 | ) | | | (.06 | ) | | | (.51 | ) | | | 12.14 | | | | 2.74 | |
Class C1 (9/01)(f) | | | | | | | | | | | | | | | | | | | | | | | | | | | | | | | | | |
Year Ended 5/31 | | | | | | | | | | | | | | | | | | | | | | | | | | | | | | | | | | | | |
2011(e) | | | 11.65 | | | | .38 | | | | .05 | | | | .43 | | | | (.37 | ) | | | (.02 | ) | | | (.39 | ) | | | 11.69 | | | | 3.72 | |
Year Ended 6/30 | | | | | | | | | | | | | | | | | | | | | | | | | | | | | | | | | | | | |
2010 | | | 11.08 | | | | .43 | | | | .66 | | | | 1.09 | | | | (.43 | ) | | | (.09 | ) | | | (.52 | ) | | | 11.65 | | | | 9.90 | |
2009 | | | 11.36 | | | | .43 | | | | (.25 | ) | | | .18 | | | | (.43 | ) | | | (.03 | ) | | | (.46 | ) | | | 11.08 | | | | 1.70 | |
2008 | | | 11.69 | | | | .41 | | | | (.30 | ) | | | .11 | | | | (.41 | ) | | | (.03 | ) | | | (.44 | ) | | | 11.36 | | | | .95 | |
2007 | | | 11.73 | | | | .41 | | | | .04 | | | | .45 | | | | (.40 | ) | | | (.09 | ) | | | (.49 | ) | | | 11.69 | | | | 3.84 | |
2006(g) | | | 12.12 | | | | .30 | | | | (.30 | ) | | | — | | | | (.30 | ) | | | (.09 | ) | | | (.39 | ) | | | 11.73 | | | | — | |
Year Ended 9/30 | | | | | | | | | | | | | | | | | | | | | | | | | | | | | | | | | | | | |
2005 | | | 12.29 | | | | .40 | | | | (.11 | ) | | | .29 | | | | (.40 | ) | | | (.06 | ) | | | (.46 | ) | | | 12.12 | | | | 2.42 | |
Class I (7/88)(f) | | | | | | | | | | | | | | | | | | | | | | | | | | | | | | | | | |
Year Ended 5/31 | | | | | | | | | | | | | | | | | | | | | | | | | | | | | | | | | | | | |
2011(e) | | | 11.69 | | | | .45 | | | | .04 | | | | .49 | | | | (.44 | ) | | | (.02 | ) | | | (.46 | ) | | | 11.72 | | | | 4.25 | |
Year Ended 6/30 | | | | | | | | | | | | | | | | | | | | | | | | | | | | | | | | | | | | |
2010 | | | 11.12 | | | | .50 | | | | .66 | | | | 1.16 | | | | (.50 | ) | | | (.09 | ) | | | (.59 | ) | | | 11.69 | | | | 10.57 | |
2009 | | | 11.40 | | | | .49 | | | | (.24 | ) | | | .25 | | | | (.50 | ) | | | (.03 | ) | | | (.53 | ) | | | 11.12 | | | | 2.36 | |
2008 | | | 11.73 | | | | .48 | | | | (.30 | ) | | | .18 | | | | (.48 | ) | | | (.03 | ) | | | (.51 | ) | | | 11.40 | | | | 1.60 | |
2007 | | | 11.76 | | | | .48 | | | | .06 | | | | .54 | | | | (.48 | ) | | | (.09 | ) | | | (.57 | ) | | | 11.73 | | | | 4.58 | |
2006(g) | | | 12.15 | | | | .36 | | | | (.30 | ) | | | .06 | | | | (.36 | ) | | | (.09 | ) | | | (.45 | ) | | | 11.76 | | | | .49 | |
Year Ended 9/30 | | | | | | | | | | | | | | | | | | | | | | | | | | | | | | | | | | | | |
2005 | | | 12.32 | | | | .48 | | | | (.11 | ) | | | .37 | | | | (.48 | ) | | | (.06 | ) | | | (.54 | ) | | | 12.15 | | | | 3.08 | |
| | | | | | | | | | | | | | | | | | | | | | |
| | | | | |
| | | | | | | | | | | | | | | | | |
| Ratios/Supplemental Data | |
| | | |
| | | | Ratios to Average
Net Assets Before
Reimbursement | | | Ratios to Average
Net Assets After
Reimbursement(d) | | | | |
Ending
Net
Assets
(000) | | | Expenses | | | Net
Invest-
ment
Income
(Loss) | | | Expenses | | | Net
Invest-
ment
Income
(Loss) | | | Portfolio
Turnover
Rate | |
| | | | | | | | | | | | | | | | | | | | | | |
| | | | | | | | | | | | | | | | | | | | | | |
| $ | 22,951 | | | | 1.03 | %* | | | 3.92 | %* | | | .84 | %* | | | 4.11 | %* | | | 10 | % |
| | | | | | | | | | | | | | | | | | | | | | |
| | 23,830 | | | | 1.12 | | | | 3.87 | | | | .85 | | | | 4.14 | | | | 15 | |
| | 22,766 | | | | 1.12 | | | | 4.08 | | | | .95 | | | | 4.25 | | | | 17 | |
| | 23,135 | | | | 1.10 | | | | 3.77 | | | | .95 | | | | 3.92 | | | | 20 | |
| | 24,945 | | | | 1.10 | | | | 3.63 | | | | .95 | | | | 3.78 | | | | 33 | |
| | 26,972 | | | | 1.09 | * | | | 3.60 | * | | | .95 | * | | | 3.74 | * | | | 20 | |
| | | | | | | | | | | | | | | | | | | | | | |
| | 30,188 | | | | 1.06 | | | | 3.54 | | | | .95 | | | | 3.65 | | | | 19 | |
| | | | | | | | | | | | | | | | | | | | | | |
| | | | | | | | | | | | | | | | | | | | | | |
| | 1,661 | | | | 1.45 | * | | | 3.51 | * | | | 1.34 | * | | | 3.62 | * | | | 10 | |
| | | | | | | | | | | | | | | | | | | | | | |
| | 1,653 | | | | 1.52 | | | | 3.45 | | | | 1.35 | | | | 3.62 | | | | 15 | |
| | 757 | | | | 1.52 | | | | 3.68 | | | | 1.35 | | | | 3.85 | | | | 17 | |
| | 406 | | | | 1.50 | | | | 3.38 | | | | 1.35 | | | | 3.53 | | | | 20 | |
| | 518 | | | | 1.57 | | | | 3.13 | | | | 1.35 | | | | 3.35 | | | | 33 | |
| | 214 | | | | 1.84 | * | | | 2.85 | * | | | 1.35 | * | | | 3.34 | * | | | 20 | |
| | | | | | | | | | | | | | | | | | | | | | |
| | 190 | | | | 1.81 | | | | 2.79 | | | | 1.35 | | | | 3.25 | | | | 19 | |
| | | | | | | | | | | | | | | | | | | | | | |
| | | | | | | | | | | | | | | | | | | | | | |
| | 134,610 | | | | .80 | * | | | 4.16 | * | | | .69 | * | | | 4.27 | * | | | 10 | |
| | | | | | | | | | | | | | | | | | | | | | |
| | 137,049 | | | | .87 | | | | 4.12 | | | | .70 | | | | 4.29 | | | | 15 | |
| | 119,522 | | | | .87 | | | | 4.32 | | | | .70 | | | | 4.49 | | | | 17 | |
| | 137,746 | | | | .85 | | | | 4.02 | | | | .70 | | | | 4.17 | | | | 20 | |
| | 130,644 | | | | .85 | | | | 3.88 | | | | .70 | | | | 4.03 | | | | 33 | |
| | 138,394 | | | | .84 | * | | | 3.85 | * | | | .70 | * | | | 3.99 | * | | | 20 | |
| | | | | | | | | | | | | | | | | | | | | | |
| | 151,710 | | | | .81 | | | | 3.79 | | | | .70 | | | | 3.90 | | | | 19 | |
| (a) | Per share Net Investment Income (Loss) is calculated using the average daily shares method. |
| (b) | Distributions from Capital Gains include short-term capital gains, if any. |
| (c) | Total return is the combination of changes in net asset value without any sales charge, reinvested dividend income at net asset value and reinvested capital gains distributions at net asset value, if any. Total returns are not annualized. |
| (e) | For the eleven months ended May 31, 2011. |
| (d) | After expense reimbursement from the Adviser, where applicable. Ratios do not reflect the effect of custodian fee credits earned on the Fund’s net cash on deposit with the custodian bank, where applicable. |
| (f) | Effective January 18, 2011, Class C Shares and Class Y Shares previously offered by FAF Advisors were renamed Class C1 Shares and Class I Shares, respectively. |
| (g) | For the nine months ended June 30, 2006. |
See accompanying notes to financial statements.
Financial Highlights (continued)
| | | | | | | | | | | | | | | | | | | | | | | | | | | | | | | | | | | | |
| Selected data for a share outstanding throughout each period: | | | | | | | | | | | | | | | | | | | |
| | | | | | | | |
| Class (Commencement Date) | | | | | | | | | | | | | | | | | | | | | | | | | |
| | | | | | Investment Operations | | | Less Distributions | | | | | | | |
| | | | | | | | |
| NEBRASKA | | | | | | | | | | | | | | | | | | | | | | | | | |
| | | Beginning
Net
Asset
Value | | | Net
Invest-
ment
Income
(Loss)(a) | | | Net
Realized/
Unrealized
Gain
(Loss) | | | Total | | | Net
Invest-
ment
Income | | | Capital
Gains(b) | | | Total | | | Ending
Net
Asset
Value | | | Total
Return(c) | |
CLASS A (2/01) | | | | | | | | | | | | | | | | | | | | | | | | | | | | | | | | | | | | |
Year Ended 5/31 | | | | | | | | | | | | | | | | | | | | | | | | | | | | | | | | | | | | |
2011(e) | | $ | 10.34 | | | $ | .39 | | | $ | (.06 | ) | | $ | .33 | | | $ | (.39 | ) | | $ | — | | | $ | (.39 | ) | | $ | 10.28 | | | | 3.28 | % |
Year Ended 6/30 | | | | | | | | | | | | | | | | | | | | | | | | | | | | | | | | | | | | |
2010 | | | 9.84 | | | | .41 | | | | .49 | | | | .90 | | | | (.40 | ) | | | — | | | | (.40 | ) | | | 10.34 | | | | 9.26 | |
2009 | | | 10.06 | | | | .43 | | | | (.21 | ) | | | .22 | | | | (.44 | ) | | | — | | | | (.44 | ) | | | 9.84 | | | | 2.33 | |
2008 | | | 10.30 | | | | .42 | | | | (.20 | ) | | | .22 | | | | (.41 | ) | | | (.05 | ) | | | (.46 | ) | | | 10.06 | | | | 2.19 | |
2007 | | | 10.33 | | | | .42 | | | | .02 | | | | .44 | | | | (.42 | ) | | | (.05 | ) | | | (.47 | ) | | | 10.30 | | | | 4.24 | |
2006(h) | | | 10.58 | | | | .31 | | | | (.24 | ) | | | .07 | | | | (.30 | ) | | | (.02 | ) | | | (.32 | ) | | | 10.33 | | | | .65 | |
Year Ended 9/30 | | | | | | | | | | | | | | | | | | | | | | | | | | | | | | | | | | | | |
2005 | | | 10.66 | | | | .39 | | | | (.05 | ) | | | .34 | | | | (.42 | ) | | | — | | | | (.42 | ) | | | 10.58 | | | | 3.20 | |
CLASS C (1/11) | | | | | | | | | | | | | | | | | | | | | | | | | | | | | | | | | | | | |
Year Ended 5/31 | | | | | | | | | | | | | | | | | | | | | | | | | | | | | | | | | | | | |
2011(g) | | | 9.86 | | | | .14 | | | | .42 | | | | .56 | | | | (.14 | ) | | | — | | | | (.14 | ) | | | 10.28 | | | | 5.70 | |
CLASS C1 (2/01)(f) | | | | | | | | | | | | | | | | | | | | | | | | | | | | | | | | | | | | |
Year Ended 5/31 | | | | | | | | | | | | | | | | | | | | | | | | | | | | | | | | | | | | |
2011(e) | | | 10.26 | | | | .34 | | | | (.06 | ) | | | .28 | | | | (.35 | ) | | | — | | | | (.35 | ) | | | 10.19 | | | | 2.80 | |
Year Ended 6/30 | | | | | | | | | | | | | | | | | | | | | | | | | | | | | | | | | | | | |
2010 | | | 9.76 | | | | .38 | | | | .48 | | | | .86 | | | | (.36 | ) | | | — | | | | (.36 | ) | | | 10.26 | | | | 8.91 | |
2009 | | | 9.99 | | | | .39 | | | | (.22 | ) | | | .17 | | | | (.40 | ) | | | — | | | | (.40 | ) | | | 9.76 | | | | 1.84 | |
2008 | | | 10.23 | | | | .38 | | | | (.20 | ) | | | .18 | | | | (.37 | ) | | | (.05 | ) | | | (.42 | ) | | | 9.99 | | | | 1.81 | |
2007 | | | 10.26 | | | | .37 | | | | .02 | | | | .39 | | | | (.37 | ) | | | (.05 | ) | | | (.42 | ) | | | 10.23 | | | | 3.86 | |
2006(h) | | | 10.50 | | | | .27 | | | | (.22 | ) | | | .05 | | | | (.27 | ) | | | (.02 | ) | | | (.29 | ) | | | 10.26 | | | | .46 | |
Year Ended 9/30 | | | | | | | | | | | | | | | | | | | | | | | | | | | | | | | | | | | | |
2005 | | | 10.58 | | | | .35 | | | | (.06 | ) | | | .29 | | | | (.37 | ) | | | — | | | | (.37 | ) | | | 10.50 | | | | 2.81 | |
CLASS I (2/01)(f) | | | | | | | | | | | | | | | | | | | | | | | | | | | | | | | | | | | | |
Year Ended 5/31 | | | | | | | | | | | | | | | | | | | | | | | | | | | | | | | | | | | | |
2011(e) | | | 10.34 | | | | .41 | | | | (.07 | ) | | | .34 | | | | (.41 | ) | | | — | | | | (.41 | ) | | | 10.27 | | | | 3.39 | |
Year Ended 6/30 | | | | | | | | | | | | | | | | | | | | | | | | | | | | | | | | | | | | |
2010 | | | 9.83 | | | | .44 | | | | .50 | | | | .94 | | | | (.43 | ) | | | — | | | | (.43 | ) | | | 10.34 | | | | 9.65 | |
2009 | | | 10.06 | | | | .45 | | | | (.22 | ) | | | .23 | | | | (.46 | ) | | | — | | | | (.46 | ) | | | 9.83 | | | | 2.48 | |
2008 | | | 10.30 | | | | .44 | | | | (.19 | ) | | | .25 | | | | (.44 | ) | | | (.05 | ) | | | (.49 | ) | | | 10.06 | | | | 2.45 | |
2007 | | | 10.33 | | | | .44 | | | | .02 | | | | .46 | | | | (.44 | ) | | | (.05 | ) | | | (.49 | ) | | | 10.30 | | | | 4.51 | |
2006(h) | | | 10.58 | | | | .32 | | | | (.23 | ) | | | .09 | | | | (.32 | ) | | | (.02 | ) | | | (.34 | ) | | | 10.33 | | | | .85 | |
Year Ended 9/30 | | | | | | | | | | | | | | | | | | | | | | | | | | | | | | | | | | | | |
2005 | | | 10.66 | | | | .43 | | | | (.07 | ) | | | .36 | | | | (.44 | ) | | | — | | | | (.44 | ) | | | 10.58 | | | | 3.45 | |
| | | | | | | | | | | | | | | | | | | | | | |
| | | | | |
| | | | | | | | | | | | | | | | | |
| Ratios/Supplemental Data | |
| | | |
Ratios to Average
Net Assets Before
Reimbursement | | | Ratios to Average
Net Assets After
Reimbursement(d) | | | | |
Ending
Net
Assets
(000) | | | Expenses | | | Net
Invest-
ment
Income
(Loss) | | | Expenses | | | Net
Invest-
ment
Income
(Loss) | | | Portfolio
Turnover
Rate | |
| | | | | | | | | | | | | | | | | | | | | | |
| | | | | | | | | | | | | | | | | | | | | | |
| $ | 7,099 | | | | 1.21 | %* | | | 3.62 | %* | | | .72 | %* | | | 4.11 | %* | | | 21 | % |
| | | | | | | | | | | | | | | | | | | | | | |
| | 6,333 | | | | 1.46 | | | | 3.30 | | | | .75 | | | | 4.01 | | | | 18 | |
| | 5,847 | | | | 1.50 | | | | 3.66 | | | | .75 | | | | 4.41 | | | | 34 | |
| | 5,689 | | | | 1.47 | | | | 3.34 | | | | .75 | | | | 4.06 | | | | 22 | |
| | 7,091 | | | | 1.44 | | | | 3.28 | | | | .75 | | | | 3.97 | | | | 39 | |
| | 6,910 | | | | 1.30 | * | | | 3.34 | * | | | .75 | * | | | 3.89 | * | | | 35 | |
| | | | | | | | | | | | | | | | | | | | | | |
| | 7,136 | | | | 1.12 | | | | 3.41 | | | | .75 | | | | 3.78 | | | | 21 | |
| | | | | | | | | | | | | | | | | | | | | | |
| | | | | | | | | | | | | | | | | | | | | | |
| | 321 | | | | 1.60 | * | | | 3.37 | * | | | 1.24 | * | | | 3.73 | * | | | 21 | |
| | | | | | | | | | | | | | | | | | | | | | |
| | | | | | | | | | | | | | | | | | | | | | |
| | 4,201 | | | | 1.64 | * | | | 3.19 | * | | | 1.14 | * | | | 3.69 | * | | | 21 | |
| | | | | | | | | | | | | | | | | | | | | | |
| | 4,181 | | | | 1.86 | | | | 2.91 | | | | 1.15 | | | | 3.62 | | | | 18 | |
| | 2,585 | | | | 1.90 | | | | 3.27 | | | | 1.15 | | | | 4.02 | | | | 34 | |
| | 1,798 | | | | 1.87 | | | | 2.93 | | | | 1.15 | | | | 3.65 | | | | 22 | |
| | 1,559 | | | | 1.92 | | | | 2.79 | | | | 1.15 | | | | 3.56 | | | | 39 | |
| | 1,487 | | | | 2.05 | * | | | 2.59 | * | | | 1.15 | * | | | 3.49 | * | | | 35 | |
| | | | | | | | | | | | | | | | | | | | | | |
| | 1,565 | | | | 1.87 | | | | 2.66 | | | | 1.15 | | | | 3.38 | | | | 21 | |
| | | | | | | | | | | | | | | | | | | | | | |
| | | | | | | | | | | | | | | | | | | | | | |
| | 31,470 | | | | .99 | * | | | 3.83 | * | | | .49 | * | | | 4.34 | * | | | 21 | |
| | | | | | | | | | | | | | | | | | | | | | |
| | 31,757 | | | | 1.21 | | | | 3.55 | | | | .50 | | | | 4.26 | | | | 18 | |
| | 30,689 | | | | 1.25 | | | | 3.92 | | | | .50 | | | | 4.67 | | | | 34 | |
| | 29,533 | | | | 1.22 | | | | 3.59 | | | | .50 | | | | 4.31 | | | | 22 | |
| | 32,502 | | | | 1.19 | | | | 3.53 | | | | .50 | | | | 4.22 | | | | 39 | |
| | 31,347 | | | | 1.05 | * | | | 3.59 | * | | | .50 | * | | | 4.14 | * | | | 35 | |
| | | | | | | | | | | | | | | | | | | | | | |
| | 32,418 | | | | .87 | | | | 3.66 | | | | .50 | | | | 4.03 | | | | 21 | |
| (a) | Per share Net Investment Income (Loss) is calculated using the average daily shares method. |
| (b) | Distributions from Capital Gains include short-term capital gains, if any. |
| (c) | Total return is the combination of changes in net asset value without any sales charge, reinvested dividend income at net asset value and reinvested capital gains distributions at net asset value, if any. Total returns are not annualized. |
| (d) | After expense reimbursement from the Adviser, where applicable. Ratios do not reflect the effect of custodian fee credits earned on the Fund’s net cash on deposit with the custodian bank, where applicable. |
| (e) | For the eleven months ended May 31, 2011. |
| (f) | Effective January 18, 2011, Class C Shares and Class Y Shares previously offered by FAF Advisors were renamed Class C1 Shares and Class I Shares, respectively. |
| (g) | For the period January 18, 2011 (commencement of operations) through May 31, 2011. |
| (h) | For the nine months ended June 30, 2006. |
See accompanying notes to financial statements.
Financial Highlights (continued)
| | | | | | | | | | | | | | | | | | | | | | | | | | | | | | | | | | | | |
| Selected data for a share outstanding throughout each period: | | | | | | | | | | | | | | | | | | | |
| | | | | | | | |
| Class (Commencement Date) | | | | | | | | | | | | | | | | | | | | | | | | | |
| | | | | | Investment Operations | | | Less Distributions | | | | | | | |
| | | | | | | | |
| OHIO TAX FREE | | | | | | | | | | | | | | | | | | | | | | | | | |
| | | Beginning
Net
Asset
Value | | | Net
Invest-
ment
Income
(Loss)(a) | | | Net
Realized/
Unrealized
Gain
(Loss) | | | Total | | | Net
Invest-
ment
Income | | | Capital
Gains(b) | | | Total | | | Ending
Net
Asset
Value | | | Total
Return(c) | |
Class A (4/02) | | | | | | | | | | | | | | | | | | | | | | | | | | | | | | | | | | | | |
Year Ended 5/31 | | | | | | | | | | | | | | | | | | | | | | | | | | | | | | | | | | | | |
2011(e) | | $ | 10.42 | | | $ | .37 | | | $ | (.10 | ) | | $ | .27 | | | $ | (.36 | ) | | $ | — | | | $ | (.36 | ) | | $ | 10.33 | | | | 2.69 | % |
Year Ended 6/30 | | | | | | | | | | | | | | | | | | | | | | | | | | | | | | | | | | | | |
2010 | | | 9.90 | | | | .38 | | | | .51 | | | | .89 | | | | (.37 | ) | | | — | | | | (.37 | ) | | | 10.42 | | | | 9.12 | |
2009 | | | 10.02 | | | | .40 | | | | (.12 | ) | | | .28 | | | | (.40 | ) | | | — | | | | (.40 | ) | | | 9.90 | | | | 2.99 | |
2008 | | | 10.20 | | | | .39 | | | | (.15 | ) | | | .24 | | | | (.39 | ) | | | (.03 | ) | | | (.42 | ) | | | 10.02 | | | | 2.38 | |
2007 | | | 10.17 | | | | .38 | | | | .05 | | | | .43 | | | | (.38 | ) | | | (.02 | ) | | | (.40 | ) | | | 10.20 | | | | 4.28 | |
2006(g) | | | 10.42 | | | | .29 | | | | (.25 | ) | | | .04 | | | | (.28 | ) | | | (.01 | ) | | | (.29 | ) | | | 10.17 | | | | .40 | |
Year Ended 9/30 | | | | | | | | | | | | | | | | | | | | | | | | | | | | | | | | | | | | |
2005 | | | 10.52 | | | | .36 | | | | (.06 | ) | | | .30 | | | | (.36 | ) | | | (.04 | ) | | | (.40 | ) | | | 10.42 | | | | 2.86 | |
Class C1 (4/02)(f) | | | | | | | | | | | | | | | | | | | | | | | | | | | | | | | | | | | | |
Year Ended 5/31 | | | | | | | | | | | | | | | | | | | | | | | | | | | | | | | | | | | | |
2011(e) | | | 10.27 | | | | .33 | | | | (.10 | ) | | | .23 | | | | (.32 | ) | | | — | | | | (.32 | ) | | | 10.18 | | | | 2.31 | |
Year Ended 6/30 | | | | | | | | | | | | | | | | | | | | | | | | | | | | | | | | | | | | |
2010 | | | 9.76 | | | | .35 | | | | .49 | | | | .84 | | | | (.33 | ) | | | — | | | | (.33 | ) | | | 10.27 | | | | 8.72 | |
2009 | | | 9.89 | | | | .37 | | | | (.13 | ) | | | .24 | | | | (.37 | ) | | | — | | | | (.37 | ) | | | 9.76 | | | | 2.52 | |
2008 | | | 10.07 | | | | .35 | | | | (.15 | ) | | | .20 | | | | (.35 | ) | | | (.03 | ) | | | (.38 | ) | | | 9.89 | | | | 2.00 | |
2007 | | | 10.05 | | | | .33 | | | | .05 | | | | .38 | | | | (.34 | ) | | | (.02 | ) | | | (.36 | ) | | | 10.07 | | | | 3.81 | |
2006(g) | | | 10.32 | | | | .25 | | | | (.26 | ) | | | (.01 | ) | | | (.25 | ) | | | (.01 | ) | | | (.26 | ) | | | 10.05 | | | | (.08 | ) |
Year Ended 9/30 | | | | | | | | | | | | | | | | | | | | | | | | | | | | | | | | | | | | |
2005 | | | 10.41 | | | | .32 | | | | (.05 | ) | | | .27 | | | | (.32 | ) | | | (.04 | ) | | | (.36 | ) | | | 10.32 | | | | 2.58 | |
Class I (4/02)(f) | | | | | | | | | | | | | | | | | | | | | | | | | | | | | | | | | | | | |
Year Ended 5/31 | | | | | | | | | | | | | | | | | | | | | | | | | | | | | | | | | | | | |
2011(e) | | | 10.42 | | | | .39 | | | | (.10 | ) | | | .29 | | | | (.39 | ) | | | — | | | | (.39 | ) | | | 10.32 | | | | 2.81 | |
Year Ended 6/30 | | | | | | | | | | | | | | | | | | | | | | | | | | | | | | | | | | | | |
2010 | | | 9.90 | | | | .41 | | | | .51 | | | | .92 | | | | (.40 | ) | | | — | | | | (.40 | ) | | | 10.42 | | | | 9.39 | |
2009 | | | 10.01 | | | | .42 | | | | (.10 | ) | | | .32 | | | | (.43 | ) | | | — | | | | (.43 | ) | | | 9.90 | | | | 3.36 | |
2008 | | | 10.19 | | | | .41 | | | | (.15 | ) | | | .26 | | | | (.41 | ) | | | (.03 | ) | | | (.44 | ) | | | 10.01 | | | | 2.63 | |
2007 | | | 10.17 | | | | .41 | | | | .04 | | | | .45 | | | | (.41 | ) | | | (.02 | ) | | | (.43 | ) | | | 10.19 | | | | 4.44 | |
2006(g) | | | 10.43 | | | | .30 | | | | (.25 | ) | | | .05 | | | | (.30 | ) | | | (.01 | ) | | | (.31 | ) | | | 10.17 | | | | .49 | |
Year Ended 9/30 | | | | | | | | | | | | | | | | | | | | | | | | | | | | | | | | | | | | |
2005 | | | 10.53 | | | | .38 | | | | (.05 | ) | | | .33 | | | | (.39 | ) | | | (.04 | ) | | | (.43 | ) | | | 10.43 | | | | 3.12 | |
| | | | | | | | | | | | | | | | | | | | | | |
| | | | | |
| | | | | | | | | | | | | | | | | |
| Ratios/Supplemental Data | |
| | | |
| | | | Ratios to Average
Net Assets Before
Reimbursement | | | Ratios to Average
Net Assets After
Reimbursement(d) | | | | |
Ending
Net
Assets
(000) | | | Expenses | | | Net
Invest-
ment
Income
(Loss) | | | Expenses | | | Net
Invest-
ment
Income
(Loss) | | | Portfolio
Turnover
Rate | |
| | | | | | | | | | | | | | | | | | | | | | |
| | | | | | | | | | | | | | | | | | | | | | |
| $ | 1,642 | | | | 1.17 | %* | | | 3.44 | %* | | | .72 | %* | | | 3.89 | %* | | | 9 | % |
| | | | | | | | | | | | | | | | | | | | | | |
| | 1,899 | | | | 1.34 | | | | 3.13 | | | | .75 | | | | 3.72 | | | | 14 | |
| | 1,048 | | | | 1.39 | | | | 3.45 | | | | .75 | | | | 4.09 | | | | 12 | |
| | 635 | | | | 1.39 | | | | 3.17 | | | | .75 | | | | 3.81 | | | | 12 | |
| | 808 | | | | 1.41 | | | | 3.04 | | | | .75 | | | | 3.70 | | | | 33 | |
| | 841 | | | | 1.28 | * | | | 3.07 | * | | | .75 | * | | | 3.60 | * | | | 11 | |
| | | | | | | | | | | | | | | | | | | | | | |
| | 988 | | | | 1.11 | | | | 3.05 | | | | .75 | | | | 3.41 | | | | 13 | |
| | | | | | | | | | | | | | | | | | | | | | |
| | | | | | | | | | | | | | | | | | | | | | |
| | 1,681 | | | | 1.57 | * | | | 3.08 | * | | | 1.14 | * | | | 3.52 | * | | | 9 | |
| | | | | | | | | | | | | | | | | | | | | | |
| | 1,347 | | | | 1.74 | | | | 2.75 | | | | 1.15 | | | | 3.34 | | | | 14 | |
| | 399 | | | | 1.79 | | | | 3.04 | | | | 1.15 | | | | 3.68 | | | | 12 | |
| | 255 | | | | 1.78 | | | | 2.76 | | | | 1.15 | | | | 3.39 | | | | 12 | |
| | 187 | | | | 1.90 | | | | 2.54 | | | | 1.15 | | | | 3.29 | | | | 33 | |
| | 209 | | | | 2.03 | * | | | 2.34 | * | | | 1.15 | * | | | 3.22 | * | | | 11 | |
| | | | | | | | | | | | | | | | | | | | | | |
| | 174 | | | | 1.86 | | | | 2.30 | | | | 1.15 | | | | 3.01 | | | | 13 | |
| | | | | | | | | | | | | | | | | | | | | | |
| | | | | | | | | | | | | | | | | | | | | | |
| | 47,169 | | | | .94 | * | | | 3.65 | * | | | .49 | * | | | 4.11 | * | | | 9 | |
| | | | | | | | | | | | | | | | | | | | | | |
| | 59,528 | | | | 1.09 | | | | 3.38 | | | | .50 | | | | 3.97 | | | | 14 | |
| | 44,783 | | | | 1.14 | | | | 3.71 | | | | .50 | | | | 4.35 | | | | 12 | |
| | 48,510 | | | | 1.14 | | | | 3.42 | | | | .50 | | | | 4.06 | | | | 12 | |
| | 42,223 | | | | 1.16 | | | | 3.28 | | | | .50 | | | | 3.94 | | | | 33 | |
| | 40,606 | | | | 1.03 | * | | | 3.32 | * | | | .50 | * | | | 3.85 | * | | | 11 | |
| | | | | | | | | | | | | | | | | | | | | | |
| | 41,104 | | | | .86 | | | | 3.30 | | | | .50 | | | | 3.66 | | | | 13 | |
| (a) | Per share Net Investment Income (Loss) is calculated using the average daily shares method. |
| (b) | Distributions from Capital Gains include short-term capital gains, if any. |
| (c) | Total return is the combination of changes in net asset value without any sales charge, reinvested dividend income at net asset value and reinvested capital gains distributions at net asset value, if any. Total returns are not annualized. |
| (d) | After expense reimbursement from the Adviser, where applicable. Ratios do not reflect the effect of custodian fee credits earned on the Fund’s net cash on deposit with the custodian bank, where applicable. |
| (e) | For the eleven months ended May 31, 2011. |
| (f) | Effective January 18, 2011, Class C Shares and Class Y Shares previously offered by FAF Advisors were renamed Class C1 Shares and Class I Shares, respectively. |
| (g) | For the nine months ended June 30, 2006. |
See accompanying notes to financial statements.
Financial Highlights (continued)
| | | | | | | | | | | | | | | | | | | | | | | | | | | | | | | | | | | | |
| Selected data for a share outstanding throughout each period: | | | | | | | | | | | | | | | | | | | |
| | | | | | | | |
| Class (Commencement Date) | | | | | | | | | | | | | | | | | | | | | | | | | |
| | | | | | Investment Operations | | | Less Distributions | | | | | | | |
| | | | | | | | |
| OREGON INTERMEDIATE | | | | | | | | | | | | | | | | | | | | | | | | | |
| | | Beginning
Net
Asset
Value | | | Net
Invest-
ment
Income
(Loss)(a) | | | Net
Realized/
Unrealized
Gain
(Loss) | | | Total | | | Net
Invest-
ment
Income | | | Capital
Gains(b) | | | Total | | | Ending
Net
Asset
Value | | | Total
Return(c) | |
Class A (2/99) | | | | | | | | | | | | | | | | | | | | | | | | | | | | | | | | | | | | |
Year Ended 5/31 | | | | | | | | | | | | | | | | | | | | | | | | | | | | | | | | | | | | |
2011(e) | | $ | 10.11 | | | $ | .29 | | | $ | .05 | | | $ | .34 | | | $ | (.28 | ) | | $ | — | | | $ | (.28 | ) | | $ | 10.17 | | | | 3.46 | % |
Year Ended 6/30 | | | | | | | | | | | | | | | | | | | | | | | | | | | | | | | | | | | | |
2010 | | | 9.77 | | | | .35 | | | | .33 | | | | .68 | | | | (.34 | ) | | | — | | | | (.34 | ) | | | 10.11 | | | | 7.05 | |
2009 | | | 9.68 | | | | .36 | | | | .09 | | | | .45 | | | | (.36 | ) | | | — | | | | (.36 | ) | | | 9.77 | | | | 4.77 | |
2008 | | | 9.72 | | | | .35 | | | | (.02 | ) | | | .33 | | | | (.36 | ) | | | (.01 | ) | | | (.37 | ) | | | 9.68 | | | | 3.39 | |
2007 | | | 9.78 | | | | .37 | | | | (.02 | ) | | | .35 | | | | (.37 | ) | | | (.04 | ) | | | (.41 | ) | | | 9.72 | | | | 3.54 | |
2006(h) | | | 10.07 | | | | .27 | | | | (.25 | ) | | | .02 | | | | (.27 | ) | | | (.04 | ) | | | (.31 | ) | | | 9.78 | | | | .16 | |
Year Ended 9/30 | | | | | | | | | | | | | | | | | | | | | | | | | | | | | | | | | | | | |
2005 | | | 10.30 | | | | .36 | | | | (.19 | ) | | | .17 | | | | (.36 | ) | | | (.04 | ) | | | (.40 | ) | | | 10.07 | | | | 1.67 | |
Class C (1/11) | | | | | | | | | | | | | | | | | | | | | | | | | | | | | | | | | | | | |
Year Ended 5/31 | | | | | | | | | | | | | | | | | | | | | | | | | | | | | | | | | | | | |
2011(g) | | | 9.78 | | | | .09 | | | | .40 | | | | .49 | | | | (.12 | ) | | | — | | | | (.12 | ) | | | 10.15 | | | | 5.04 | |
Class I (8/97)(f) | | | | | | | | | | | | | | | | | | | | | | | | | | | | | | | | | | | | |
Year Ended 5/31 | | | | | | | | | | | | | | | | | | | | | | | | | | | | | | | | | | | | |
2011(e) | | | 10.11 | | | | .31 | | | | .05 | | | | .36 | | | | (.30 | ) | | | — | | | | (.30 | ) | | | 10.17 | | | | 3.62 | |
Year Ended 6/30 | | | | | | | | | | | | | | | | | | | | | | | | | | | | | | | | | | | | |
2010 | | | 9.77 | | | | .35 | | | | .35 | | | | .70 | | | | (.36 | ) | | | — | | | | (.36 | ) | | | 10.11 | | | | 7.21 | |
2009 | | | 9.68 | | | | .37 | | | | .10 | | | | .47 | | | | (.38 | ) | | | — | | | | (.38 | ) | | | 9.77 | | | | 4.92 | |
2008 | | | 9.72 | | | | .37 | | | | (.03 | ) | | | .34 | | | | (.37 | ) | | | (.01 | ) | | | (.38 | ) | | | 9.68 | | | | 3.54 | |
2007 | | | 9.78 | | | | .38 | | | | (.02 | ) | | | .36 | | | | (.38 | ) | | | (.04 | ) | | | (.42 | ) | | | 9.72 | | | | 3.70 | |
2006(h) | | | 10.07 | | | | .28 | | | | (.25 | ) | | | .03 | | | | (.28 | ) | | | (.04 | ) | | | (.32 | ) | | | 9.78 | | | | .28 | |
Year Ended 9/30 | | | | | | | | | | | | | | | | | | | | | | | | | | | | | | | | | | | | |
2005 | | | 10.30 | | | | .38 | | | | (.19 | ) | | | .19 | | | | (.38 | ) | | | (.04 | ) | | | (.42 | ) | | | 10.07 | | | | 1.82 | |
| | | | | | | | | | | | | | | | | | | | | | |
| | | | | |
| | | | | | | | | | | | | | | | | |
| Ratios/Supplemental Data | |
| | | |
| | | | Ratios to Average
Net Assets Before
Reimbursement | | | Ratios to Average
Net Assets After
Reimbursement(d) | | | | |
Ending
Net
Assets
(000) | | | Expenses | | | Net
Invest-
ment
Income
(Loss) | | | Expenses | | | Net
Invest-
ment
Income
(Loss) | | | Portfolio
Turnover
Rate | |
| | | | | | | | | | | | | | | | | | | | | | |
| | | | | | | | | | | | | | | | | | | | | | |
| $ | 31,399 | | | | .97 | %* | | | 3.04 | %* | | | .82 | %* | | | 3.18 | %* | | | 12 | % |
| | | | | | | | | | | | | | | | | | | | | | |
| | 31,043 | | | | 1.10 | | | | 3.12 | | | | .85 | | | | 3.37 | | | | 19 | |
| | 10,963 | | | | 1.12 | | | | 3.43 | | | | .85 | | | | 3.70 | | | | 19 | |
| | 5,967 | | | | 1.12 | | | | 3.37 | | | | .85 | | | | 3.64 | | | | 15 | |
| | 7,895 | | | | 1.12 | | | | 3.44 | | | | .85 | | | | 3.71 | | | | 43 | |
| | 9,456 | | | | 1.11 | * | | | 3.36 | * | | | .85 | * | | | 3.62 | * | | | 13 | |
| | | | | | | | | | | | | | | | | | | | | | |
| | 9,356 | | | | 1.06 | | | | 3.35 | | | | .85 | | | | 3.56 | | | | 20 | |
| | | | | | | | | | | | | | | | | | | | | | |
| | | | | | | | | | | | | | | | | | | | | | |
| | 632 | | | | 1.40 | * | | | 2.50 | * | | | 1.36 | * | | | 2.53 | * | | | 12 | |
| | | | | | | | | | | | | | | | | | | | | | |
| | | | | | | | | | | | | | | | | | | | | | |
| | 113,827 | | | | .74 | * | | | 3.26 | * | | | .65 | * | | | 3.35 | * | | | 12 | |
| | | | | | | | | | | | | | | | | | | | | | |
| | 133,816 | | | | .85 | | | | 3.37 | | | | .70 | | | | 3.52 | | | | 19 | |
| | 119,959 | | | | .87 | | | | 3.67 | | | | .70 | | | | 3.84 | | | | 19 | |
| | 120,800 | | | | .87 | | | | 3.61 | | | | .70 | | | | 3.78 | | | | 15 | |
| | 109,357 | | | | .87 | | | | 3.69 | | | | .70 | | | | 3.86 | | | | 43 | |
| | 111,344 | | | | .86 | * | | | 3.61 | * | | | .70 | * | | | 3.77 | * | | | 13 | |
| | | | | | | | | | | | | | | | | | | | | | |
| | 133,613 | | | | .81 | | | | 3.60 | | | | .70 | | | | 3.71 | | | | 20 | |
| (a) | Per share Net Investment Income (Loss) is calculated using the average daily shares method. |
| (b) | Distributions from Capital Gains include short-term capital gains, if any. |
| (c) | Total return is the combination of changes in net asset value without any sales charge, reinvested dividend income at net asset value and reinvested capital gains distributions at net asset value, if any. Total returns are not annualized. |
| (d) | After expense reimbursement from the Adviser, where applicable. Ratios do not reflect the effect of custodian fee credits earned on the Fund’s net cash on deposit with the custodian bank, where applicable. |
| (e) | For the eleven months ended May 31, 2011. |
| (f) | Effective January 18, 2011, Class Y Shares previously offered by FAF Advisors were renamed Class I Shares. |
| (g) | For the period January 18, 2011 (commencement of operations) through May 31, 2011. |
| (h) | For the nine months ended June 30, 2006. |
See accompanying notes to financial statements.
Notes to Financial Statements (all dollars and shares are rounded to thousands (000))
1. General Information and Significant Accounting Policies General Information
On July 28, 2010, U.S. Bancorp, the indirect parent company of FAF Advisors, Inc. (“FAF Advisors”), entered into an agreement to sell a portion of FAF Advisors’ asset management business to Nuveen Investments, Inc. (“Nuveen”). Included in the sale was the part of FAF Advisors’ asset management business that advises the funds included in this report. The sale closed on December 31, 2010 (the “Sale”).
In connection with the Sale, the funds’ Board of Directors was asked to consider and approve new investment advisory agreements for the funds with Nuveen Asset Management, a wholly-owned subsidiary of Nuveen. The new investment advisory agreements for each fund were submitted to the funds’ shareholders for approval and took effect on January 1, 2011. Effective January 1, 2011, the funds’ adviser, Nuveen Asset Management, changed its name to Nuveen Fund Advisors, Inc. (“Nuveen Fund Advisors” or the “Adviser”). Concurrently, the Adviser formed a wholly-owned subsidiary, Nuveen Asset Management, LLC (the “Sub-Adviser”), to house its portfolio management capabilities and to serve as the funds’ sub-adviser, and the funds’ portfolio managers became employees of the Sub-Adviser. This allocation of responsibilities between the Adviser and the Sub-Adviser affects each of the funds. The Adviser will compensate the Sub-Adviser for the portfolio management services it provides to the funds from each fund’s management fee.
There was no change in the funds’ investment objectives or policies as a result of the Sale. The Sale did result in a change to each fund’s name effective January 1, 2011.
The funds’ Board of Directors also approved new distribution agreements with Nuveen Investments, LLC, a wholly-owned subsidiary of Nuveen. Effective April 30, 2011, Nuveen Investments, LLC changed its name to Nuveen Securities, LLC.
First American Investment Funds, Inc., known as Nuveen Investment Funds, Inc. effective April 4, 2011, (the “Trust”), is an open-end investment company registered under the Investment Company Act of 1940, as amended. The Trust is comprised of the Nuveen Colorado Tax Free Fund (“Colorado Tax Free”), formerly known as First American Colorado Tax Free Fund, Nuveen Minnesota Intermediate Municipal Bond Fund (“Minnesota Intermediate”), formerly known as First American Minnesota Intermediate Tax Free Fund, Nuveen Minnesota Municipal Bond Fund (“Minnesota”), formerly known as First American Minnesota Tax Free Fund, Nuveen Missouri Tax Free Fund (“Missouri Tax Free”), formerly known as First American Missouri Tax Free Fund, Nuveen Nebraska Municipal Bond Fund (“Nebraska”), formerly known as First American Nebraska Tax Free Fund, Nuveen Ohio Tax Free Fund (“Ohio Tax Free”), formerly known as First American Ohio Tax Free Fund and Nuveen Oregon Intermediate Municipal Bond Fund (“Oregon Intermediate”), formerly known as First American Oregon Intermediate Tax Free Fund (each a “Fund” and collectively, the “Funds”), among others.
The investment objective of Colorado Tax Free, Minnesota Intermediate, Minnesota, Missouri Tax Free, Nebraska, Ohio Tax Free and Oregon Intermediate is to provide maximum current income that is exempt from both federal income tax and its respective state income tax to the extent consistent with prudent investment risk.
Under normal market conditions, as a fundamental policy, each Fund invests at least 80% of its net assets (plus the amount of any borrowings for investment purposes) in municipal securities that pay interest that is exempt from federal and its respective state income tax, including the federal and state alternative minimum tax. Each Fund normally may invest up to 20% of its net assets in taxable obligations, including obligations the interest on which is subject to the federal and state, where applicable, alternative minimum tax.
Each Fund’s most recent prospectus provides further descriptions of each Fund’s investment objective, principal investment strategies and principal risks.
During the current fiscal period, the Funds’ Board of Directors approved a change in the Funds’ fiscal and tax year ends from June 30 to May 31.
Effective January 18, 2011, Class C Shares and Class Y Shares previously offered by FAF Advisors were renamed Class C1 Shares and Class I Shares, respectively. Class C1 Shares are not available for new accounts or for additional investment into existing accounts, but Class C1 Shares can be issued for purposes of dividend reinvestment.
Effective January 18, 2011, Minnesota Intermediate, Minnesota, Nebraska and Oregon Intermediate began offering Class C Shares only to qualifying institutional investors and certain other qualifying accounts.
Significant Accounting Policies
The following is a summary of significant accounting policies followed by the Funds in the preparation of their financial statements in accordance with U.S. generally accepted accounting principles (“U.S. GAAP”).
Investment Valuation
Prices of municipal bonds are provided by a pricing service approved by the Funds’ Board of Directors. These securities are generally classified as Level 2 for fair value measurement purposes. When price quotes are not readily available (which is usually the case for municipal bonds) the pricing service establishes a security’s fair value using methods that may include consideration of the following: yields or prices of investments of comparable quality, type of issue, coupon, maturity and rating, market quotes or indications of value
from security dealers, evaluations of anticipated cash flows or collateral, general market conditions and other information and analysis, including the obligor’s credit characteristics considered relevant. In pricing certain securities, particularly less liquid and lower quality securities, the pricing service may consider information about a security, its issuer, or market activity provided by the Adviser. These securities are generally classified as Level 2 or Level 3 depending on the priority of the significant inputs. Investments in open-end funds are valued at their respective net asset values on the valuation date. These investment vehicles are generally classified as Level 1.
Futures contracts are valued using the closing settlement price or, in the absence of such a price, the last traded price. Futures contracts are generally classified as Level 1.
Certain securities may not be able to be priced by the pre-established pricing methods as described above. Such securities may be valued by the Funds’ Board of Directors or its designee at fair value. These securities generally include, but are not limited to, restricted securities (securities which may not be publicly sold without registration under the Securities Act of 1933, as amended) for which a pricing service is unable to provide a market price; securities whose trading has been formally suspended; debt securities that have gone into default and for which there is no current market quotation; a security whose market price is not available from a pre-established pricing source; a security with respect to which an event has occurred that is likely to materially affect the value of the security after the market has closed but before the calculation of a Fund’s net asset value (as may be the case in non-U.S. markets on which the security is primarily traded) or make it difficult or impossible to obtain a reliable market quotation; and a security whose price, as provided by the pricing service, is not deemed to reflect the security’s fair value. As a general principle, the fair value of a security would appear to be the amount that the owner might reasonably expect to receive for them in a current sale. A variety of factors may be considered in determining the fair value of these securities, which may include consideration of the following: yields or prices of investments of comparable quality, type of issue, coupon, maturity and rating, market quotes or indications of value from security dealers, evaluations of anticipated cash flows or collateral, general market conditions and other information and analysis, including the obligor’s credit characteristics considered relevant. These securities are generally classified as Level 2 or Level 3 depending on the priority of the significant inputs. Regardless of the method employed to value a particular security, all valuations are subject to review by the Funds’ Board of Directors or its designee.
Refer to Footnote 2 – Fair Value Measurements for further details on the leveling of securities held by the Funds as of the end of the reporting period.
Investment Transactions
Investment transactions are recorded on a trade date basis. Realized gains and losses from transactions are determined on the specific identification method, which is the same basis used for federal income tax purposes. Investments purchased on a when-issued/ delayed delivery basis may have extended settlement periods. Any investments so purchased are subject to market fluctuation during this period. The Funds have instructed the custodian to segregate assets with a current value at least equal to the amount of the when-issued/delayed delivery purchase commitments. At May 31, 2011, Minnesota Intermediate, Minnesota, Missouri, Nebraska and Ohio had outstanding when issued/delayed delivery purchase commitments of $613,149, $3,627,243, $194,624, $1,815,386 and $259,160, respectively. There were no such outstanding purchase commitments in any of the other Funds.
Investment Income
Interest income, which reflects the amortization of premiums and includes accretion of discounts for financial reporting purposes, is recorded on an accrual basis. Dividend income is recorded on the ex-dividend date. Interest income also reflects pay down gains and losses, if any.
Professional Fees
Professional fees presented on the Statement of Operations consist of legal fees incurred in the normal course of operations, audit fees, tax consulting fees and, in some cases, workout expenditures. Workout expenditures are incurred in an attempt to protect or enhance an investment, or to pursue other claims or legal actions on behalf of Fund shareholders.
Income Taxes
Each Fund is a separate taxpayer for federal income tax purposes. Each Fund intends to distribute substantially all of its net investment income and net capital gains to shareholders and to otherwise comply with the requirements of Subchapter M of the Internal Revenue Code applicable to regulated investment companies. Therefore, no federal income tax provision is required. Furthermore, each Fund intends to satisfy conditions that will enable interest from municipal securities, which is exempt from regular federal and designated state income taxes, to retain such tax-exempt status when distributed to shareholders of the Funds. Net realized capital gains and ordinary income distributions paid by the Funds are subject to federal taxation.
For all open tax years and all major taxing jurisdictions, management of the Funds has concluded that there are no significant uncertain tax positions that would require recognition in the financial statements. Open tax years are those that are open for examination by taxing authorities (i.e., generally the last four tax year ends and the interim tax period since then). Furthermore, management of the Funds is also not aware of any tax positions for which it is reasonably possible that the total amounts of unrecognized tax benefits will significantly change in the next twelve months.
Notes to Financial Statements (continued)
Dividends and Distributions to Shareholders
The Funds declare dividends from their net investment income daily and pay shareholders monthly. Fund shares begin to accrue dividends on the business day after the day when the monies used to purchase Fund shares are collected by the Funds’ transfer agent.
Net realized capital gains and/or market discount from investment transactions, if any, are declared and distributed to shareholders at least annually. Furthermore, capital gains are distributed only to the extent they exceed available capital loss carryforwards.
Distributions to shareholders of net investment income, net realized capital gains and/or market discount, if any, are recorded on the ex-dividend date. The amount and timing of distributions are determined in accordance with federal income tax regulations, which may differ from U.S. GAAP.
Inverse Floating Rate Securities
Each Fund is authorized to invest in inverse floating rate securities. An inverse floating rate security is created by depositing a municipal bond, typically with a fixed interest rate, into a special purpose trust created by a broker-dealer. In turn, this trust (a) issues floating rate certificates, in face amounts equal to some fraction of the deposited bond’s par amount or market value, that typically pay short-term tax-exempt interest rates to third parties, and (b) issues to a long-term investor (such as the Fund) an inverse floating rate certificate (sometimes referred to as an “inverse floater”) that represents all remaining or residual interest in the trust. The income received by the inverse floater holder varies inversely with the short-term rate paid to the floating rate certificates’ holders, and In most circumstances the inverse floater holder bears substantially all of the underlying bond’s downside investment risk and also benefits disproportionately from any potential appreciation of the underlying bond’s value. The price of an inverse floating rate security will be more volatile than that of the underlying bond because the interest rate is dependent on not only the fixed coupon rate of the underlying bond but also on the short-term interest paid on the floating rate certificates, and because the inverse floating rate security essentially bears the risk of loss of the greater face value of the underlying bond.
A Fund may purchase an inverse floating rate security in a secondary market transaction without first owning the underlying bond (referred to as an “externally-deposited inverse floater”), or instead by first selling a fixed-rate bond to a broker-dealer for deposit into the special purpose trust and receiving in turn the residual interest in the trust (referred to as a “self-deposited inverse floater”). The inverse floater held by a Fund gives the Fund the right (a) to cause the holders of the floating rate certificates to tender their notes at par, and (b) to have the broker transfer the fixed-rate bond held by the trust to the Fund, thereby collapsing the trust. An investment in an externally-deposited inverse floater is identified in the Portfolio of Investments as “(IF) – Inverse floating rate investment.” An investment in a self-deposited inverse floater is accounted for as a financing transaction. In such instances, a fixed-rate bond deposited into a special purpose trust is identified in the Portfolio of Investments as “(UB) – Underlying bond of an inverse floating rate trust reflected as a financing transaction,” with the Fund accounting for the short-term floating rate certificates issued by the trust as “Floating rate obligations” on the Statement of Assets and Liabilities. In addition, the Fund reflects in “Interest and dividends from unaffiliated investments” the entire earnings of the underlying bond and recognizes the related interest paid to the holders of the short-term floating rate certificates as “Interest expense on floating rate obligations” on the Statement of Operations.
During the eleven months ended May 31, 2011, the Funds did not invest in externally-deposited inverse floaters and/or self-deposited inverse floaters.
Futures Contracts
Each Fund is subject to interest rate risk in the normal course of pursuing its investment objectives and is authorized to invest in futures contracts in attempt to manage such risk. Upon entering into a futures contract, a Fund is required to deposit with the broker an amount of cash or liquid securities equal to a specified percentage of the contract amount. This is known as the “initial margin.” Cash held by the broker to cover initial margin requirements on open futures contracts, if any, is recognized as “Deposits with brokers for open futures contracts” on the Statement of Assets and Liabilities. Subsequent payments (“variation margin”) are made or received by a Fund each day, depending on the daily fluctuation of the value of the contract. Variation margin is recognized as a receivable or payable for “Variation margin on futures contracts” on the Statement of Assets and Liabilities, when applicable.
During the period the futures contract is open, changes in the value of the contract are recognized as an unrealized gain or loss by “marking-to-market” on a daily basis to reflect the changes in market value of the contract, which is recognized as “Change in net unrealized appreciation (depreciation) of futures contracts” on the Statement of Operations. When the contract is closed or expired, the Fund records a realized gain or loss equal to the difference between the value of the contract on the closing date and value of the contract when originally entered into, which is recognized as “Net realized gain (loss) from futures contracts” on the Statement of Operations.
Risks of investments in futures contracts include the possible adverse movement in the price of the securities or indices underlying the contracts, the possibility that there may not be a liquid secondary market for the contracts and/or that a change in the value of the contract may not correlate with a change in the value of the underlying securities or indices. The Funds did not enter into futures contracts during the eleven months ended May 31, 2011.
Market and Counterparty Credit Risk
In the normal course of business each Fund may invest in financial instruments and enter into financial transactions where risk of potential loss exists due to changes in the market (market risk) or failure of the other party to the transaction to perform (counterparty credit risk). The potential loss could exceed the value of the financial assets recorded on the financial statements. Financial assets, which potentially expose each Fund to counterparty credit risk, consist principally of cash due from counterparties on forward, option and swap transactions, when applicable. The extent of each Fund’s exposure to counterparty credit risk in respect to these financial assets approximates their carrying value as recorded on the Statement of Assets and Liabilities. Futures contracts, when applicable, expose a Fund to minimal counterparty credit risk as they are exchange traded and the exchange’s clearinghouse, which is counterparty to all exchange traded futures, guarantees the futures contracts against default.
Each Fund helps manage counterparty credit risk by entering into agreements only with counterparties the Adviser believes have the financial resources to honor their obligations and by having the Adviser monitor the financial stability of the counterparties. Additionally, counterparties may be required to pledge collateral daily (based on the daily valuation of the financial asset) on behalf of each Fund with a value approximately equal to the amount of any unrealized gain above a predetermined threshold. Reciprocally, when each Fund has an unrealized loss, the Funds have instructed the custodian to pledge assets of the Funds as collateral with a value approximately equal to the amount of the unrealized loss above a pre-determined threshold. Collateral pledges are monitored and subsequently adjusted if and when the valuations fluctuate, either up or down, by at least the pre-determined threshold amount.
Zero Coupon Securities
Each Fund is authorized to invest in zero coupon securities. A zero coupon security does not pay a regular interest coupon to its holders during the life of the security. Tax-exempt income to the holder of the security comes from accretion of the difference between the original purchase price of the security at issuance and the par value of the security at maturity and is effectively paid at maturity. The market prices of zero coupon securities generally are more volatile than the market prices of securities that pay interest periodically.
Multiclass Operations and Allocations
Income and expenses of the Funds that are not directly attributable to a specific class of shares are prorated among the classes based on the relative net assets of each class. Expenses directly attributable to a class of shares, which presently only include 12b-1 distribution and shareholder service fees, are recorded to the specific class.
Income, realized and unrealized capital gains and losses of the Funds are prorated among the classes based on the relative net assets of each class.
Interfund Lending Program
During the period July 1, 2010 through December 31, 2010, pursuant to an exemptive order issued by the Securities and Exchange Commission, the Funds, along with other registered investment companies in the First American Funds family, were allowed to participate in an interfund lending program. This program provided an alternative credit facility allowing the Funds to borrow from, or lend money to, other participating funds. The Funds did not have any interfund lending transactions during the period July 1, 2010 through December 31, 2010. The exemptive order terminated with respect to the Funds on December 31, 2010, in connection with the Sale.
Indemnifications
Under the Trust’s organizational documents, its officers and directors are indemnified against certain liabilities arising out of the performance of their duties to the Trust. In addition, in the normal course of business, the Trust enters into contracts that provide general indemnifications to other parties. The Trust’s maximum exposure under these arrangements is unknown as this would involve future claims that may be made against the Trust that have not yet occurred. However, the Trust has not had prior claims or losses pursuant to these contracts and expects the risk of loss to be remote.
Use of Estimates
The preparation of financial statements in conformity with U.S. GAAP requires management to make estimates and assumptions that affect the reported amounts of assets and liabilities at the date of the financial statements and the reported amounts of increases and decreases in net assets from operations during the reporting period. Actual results may differ from those estimates.
Notes to Financial Statements (continued)
2. Fair Value Measurements
Fair value is defined as the price that the Funds would receive upon selling an investment or transferring a liability in an orderly transaction to an independent buyer in the principal or most advantageous market of the investment. A three-tier hierarchy is used to maximize the use of observable market data and minimize the use of unobservable inputs and to establish classification of fair value measurements for disclosure purposes. Observable inputs reflect the assumptions market participants would use in pricing the asset or liability. Observable inputs are based on market data obtained from sources independent of the reporting entity. Unobservable inputs reflect the reporting entity’s own assumptions about the assumptions market participants would use in pricing the asset or liability. Unobservable inputs are based on the best information available in the circumstances. The three-tier hierarchy of inputs is summarized in the three broad levels listed below:
| | |
| Level 1 – | | Quoted prices in active markets for identical securities. |
| Level 2 – | | Other significant observable inputs (including quoted prices for similar securities, interest rates, prepayment speeds, credit risk, etc.). |
| Level 3 – | | Significant unobservable inputs (including management’s assumptions in determining the fair value of investments). |
The inputs or methodologies used for valuing securities are not an indication of the risk associated with investing in those securities. The following is a summary of each Fund’s fair value measurements as of May 31, 2011:
| | | | | | | | | | | | | | | | |
| Colorado Tax Free | | Level 1 | | | Level 2 | | | Level 3 | | | Total | |
Investments: | | | | | | | | | | | | | | | | |
Municipal Bonds | | $ | — | | | $ | 54,695 | | | $ | — | | | $ | 54,695 | |
Short-Term Investments | | | 147 | | | | — | | | | — | | | | 147 | |
Total | | $ | 147 | | | $ | 54,695 | | | $ | — | | | $ | 54,842 | |
| | | | |
| Minnesota Intermediate | | Level 1 | | | Level 2 | | | Level 3 | | | Total | |
Investments: | | | | | | | | | | | | | | | | |
Municipal Bonds | | $ | — | | | $ | 232,109 | | | $ | — | | | $ | 232,109 | |
Short-Term Investments | | | 2,203 | | | | — | | | | — | | | | 2,203 | |
Total | | $ | 2,203 | | | $ | 232,109 | | | $ | — | | | $ | 234,312 | |
| | | | |
| Minnesota | | Level 1 | | | Level 2 | | | Level 3 | | | Total | |
Investments: | | | | | | | | | | | | | | | | |
Municipal Bonds | | $ | — | | | $ | 158,559 | | | $ | — | | | $ | 158,559 | |
Short-Term Investments | | | 2,661 | | | | — | | | | — | | | | 2,661 | |
Total | | $ | 2,661 | | | $ | 158,559 | | | $ | — | | | $ | 161,220 | |
| | | | |
| Missouri Tax Free | | Level 1 | | | Level 2 | | | Level 3 | | | Total | |
Investments: | | | | | | | | | | | | | | | | |
Municipal Bonds | | $ | — | | | $ | 157,382 | | | $ | — | | | $ | 157,382 | |
Short-Term Investments | | | 565 | | | | — | | | | — | | | | 565 | |
Total | | $ | 565 | | | $ | 157,382 | | | $ | — | | | $ | 157,947 | |
| | | | |
| Nebraska | | Level 1 | | | Level 2 | | | Level 3 | | | Total | |
Investments: | | | | | | | | | | | | | | | | |
Municipal Bonds | | $ | — | | | $ | 42,609 | | | $ | — | | | $ | 42,609 | |
Short-Term Investments | | | 826 | | | | — | | | | — | | | | 826 | |
Total | | $ | 826 | | | $ | 42,609 | | | $ | — | | | $ | 43,435 | |
| | | | |
| Ohio Tax Free | | Level 1 | | | Level 2 | | | Level 3 | | | Total | |
Investments: | | | | | | | | | | | | | | | | |
Municipal Bonds | | $ | — | | | $ | 49,795 | | | $ | — | | | $ | 49,795 | |
Short-Term Investments | | | 332 | | | | — | | | | — | | | | 332 | |
Total | | $ | 332 | | | $ | 49,795 | | | $ | — | | | $ | 50,127 | |
| | | | |
| Oregon Intermediate | | Level 1 | | | Level 2 | | | Level 3 | | | Total | |
Investments: | | | | | | | | | | | | | | | | |
Municipal Bonds | | $ | — | | | $ | 143,965 | | | $ | — | | | $ | 143,965 | |
Short-Term Investments | | | 275 | | | | — | | | | — | | | | 275 | |
Total | | $ | 275 | | | $ | 143,965 | | | $ | — | | | $ | 144,240 | |
During the eleven months ended May 31, 2011, the Funds recognized no significant transfers to/from Level 1, Level 2 or Level 3.
3. Derivative Instruments and Hedging Activities
The Funds record derivative instruments at fair value, with changes in fair value recognized on the Statement of Operations, when applicable. Even though the Funds’ investments in derivatives may represent economic hedges, they are not considered to be hedge transactions for financial reporting purposes. The Funds did not invest in derivative instruments during the eleven months ended May 31, 2011.
4. Fund Shares
Transactions in Fund shares were as follows:
| | | | | | | | | | | | | | | | | | | | | | | | |
| | | Colorado Tax Free | |
| | | Eleven Months Ended
5/31/11 | | | Year Ended
6/30/10 | | | Year Ended
6/30/09 | |
| | | Shares | | | Amount | | | Shares | | | Amount | | | Shares | | | Amount | |
Shares issued from merger (1): | | | | | | | | | | | | | | | | | | | | | | | | |
Class A | | | — | | | $ | — | | | | — | | | $ | — | | | | 614 | | | $ | 5,874 | |
Class C1 (2) | | | — | | | | — | | | | — | | | | — | | | | — | | | | — | |
Class I (2) | | | — | | | | — | | | | — | | | | — | | | | 4,418 | | | | 42,389 | |
Shares sold: | | | | | | | | | | | | | | | | | | | | | | | | |
Class A | | | 304 | | | | 3,013 | | | | 102 | | | | 1,018 | | | | 59 | | | | 877 | |
Class C1 (2) | | | 11 | | | | 115 | | | | 55 | | | | 554 | | | | 63 | | | | 598 | |
Class I (2) | | | 1,125 | | | | 11,494 | | | | 988 | | | | 9,950 | | | | 264 | | | | 1,672 | |
Shares issued to shareholders due to reinvestment of distributions: | | | | | | | | | | | | | | | | | | | | | | | | |
Class A | | | 40 | | | | 396 | | | | 44 | | | | 442 | | | | 34 | | | | 323 | |
Class C1 (2) | | | 8 | | | | 78 | | | | 10 | | | | 104 | | | | 12 | | | | 118 | |
Class I (2) | | | 22 | | | | 219 | | | | 19 | | | | 196 | | | | 10 | | | | 87 | |
| | | | (1,510 | ) | | | 15,315 | | | | 1,218 | | | | 12,264 | | | | 5,474 | | | | 51,938 | |
Shares redeemed: | | | | | | | | | | | | | | | | | | | | | | | | |
Class A | | | (337 | ) | | | (3,347 | ) | | | (232 | ) | | | (2,325 | ) | | | (118 | ) | | | (1,135 | ) |
Class C1 (2) | | | (86 | ) | | | (857 | ) | | | (53 | ) | | | (537 | ) | | | (52 | ) | | | (494 | ) |
Class I (2) | | | (1,815 | ) | | | (18,193 | ) | | | (1,507 | ) | | | (15,096 | ) | | | (879 | ) | | | (8,391 | ) |
| | | | (2,238 | ) | | | (22,397 | ) | | | (1,792 | ) | | | (17,958 | ) | | | (1,049 | ) | | | (10,020 | ) |
Net increase (decrease) | | | (728 | ) | | $ | (7,082 | ) | | | (574 | ) | | $ | (5,694 | ) | | | 4,425 | | | $ | 41,918 | |
| |
| | | Minnesota Intermediate | |
| | | Eleven Months Ended
5/31/11 | | | Year Ended
6/30/10 | | | Year Ended
6/30/09 | |
| | | Shares | | | Amount | | | Shares | | | Amount | | | Shares | | | Amount | |
Shares sold: | | | | | | | | | | | | | | | | | | | | | | | | |
Class A | | | 1,134 | | | $ | 11,516 | | | | 1,407 | | | $ | 14,085 | | | | 1,026 | | | $ | 9,912 | |
Class C (3) | | | 61 | | | | 610 | | | | — | | | | — | | | | — | | | | — | |
Class C1 (2) | | | 412 | | | | 4,205 | | | | 424 | | | | 4,278 | | | | — | | | | — | |
Class I (2) | | | 3,617 | | | | 36,462 | | | | 4,529 | | | | 44,976 | | | | 4,173 | | | | 39,545 | |
Shares issued to shareholders due to reinvestment of distributions: | | | | | | | | | | | | | | | | | | | | | | | | |
Class A | | | 91 | | | | 914 | | | | 76 | | | | 761 | | | | 72 | | | | 687 | |
Class C (3) | | | — | | | | 2 | | | | — | | | | — | | | | — | | | | — | |
Class C1 (2) | | | 12 | | | | 123 | | | | 3 | | | | 34 | | | | — | | | | — | |
Class I (2) | | | 17 | | | | 168 | | | | 17 | | | | 168 | | | | 29 | | | | 279 | |
| | | | 5,344 | | | | 54,000 | | | | 6,456 | | | | 64,302 | | | | 5,300 | | | | 50,423 | |
Shares redeemed: | | | | | | | | | | | | | | | | | | | | | | | | |
Class A | | | (1,032 | ) | | | (10,363 | ) | | | (409 | ) | | | (4,091 | ) | | | (982 | ) | | | (9,326 | ) |
Class C (3) | | | — | | | | — | | | | — | | | | — | | | | — | | | | — | |
Class C1 (2) | | | (204 | ) | | | (2,040 | ) | | | (36 | ) | | | (370 | ) | | | — | | | | — | |
Class I (2) | | | (3,957 | ) | | | (39,705 | ) | | | (3,247 | ) | | | (32,281 | ) | | | (4,400 | ) | | | (41,124 | ) |
| | | | (5,193 | ) | | | (52,108 | ) | | | (3,692 | ) | | | (36,742 | ) | | | (5,382 | ) | | | (50,450 | ) |
Net increase (decrease) | | | 151 | | | $ | 1,892 | | | | 2,764 | | | $ | 27,560 | | | | (82 | ) | | $ | (27 | ) |
| (1) | Refer to Footnote 8 – Fund Mergers for further details. |
| (2) | Effective January 18, 2011, Class C Shares and Class Y Shares previously offered by FAF Advisors, were renamed Class C1 Shares Class I Shares, respectively. |
| (3) | Class C Shares commenced operations on January 18, 2011. |
Notes to Financial Statements (continued)
| | | | | | | | | | | | | | | | | | | | | | | | |
| | | Minnesota | |
| | | Eleven Months Ended
5/31/11 | | | Year Ended
6/30/10 | | | Year Ended
6/30/09 | |
| | | Shares | | | Amount | | | Shares | | | Amount | | | Shares | | | Amount | |
Shares sold: | | | | | | | | | | | | | | | | | | | | | | | | |
Class A | | | 776 | | | $ | 8,397 | | | | 1,218 | | | $ | 12,953 | | | | 1,152 | | | $ | 11,454 | |
Class C (2) | | | 57 | | | | 601 | | | | 638 | | | | 6,758 | | | | — | | | | — | |
Class C1 (1) | | | 335 | | | | 3,329 | | | | — | | | | — | | | | 448 | | | | 4,451 | |
Class I (1) | | | 922 | | | | 9,980 | | | | 1,443 | | | | 15,413 | | | | 1,806 | | | | 17,375 | |
Shares issued to shareholders due to reinvestment of distributions: | | | | | | | | | | | | | | | | | | | | | | | | |
Class A | | | 165 | | | | 1,787 | | | | 207 | | | | 2,206 | | | | 283 | | | | 2,771 | |
Class C (2) | | | — | | | | 3 | | | | 58 | | | | 611 | | | | — | | | | — | |
Class C1 (1) | | | 50 | | | | 539 | | | | — | | | | — | | | | 60 | | | | 585 | |
Class I (1) | | | 7 | | | | 71 | | | | 7 | | | | 76 | | | | 10 | | | | 100 | |
| | | | 2,312 | | | | 24,707 | | | | 3,571 | | | | 38,017 | | | | 3,759 | | | | 36,736 | |
Shares redeemed: | | | | | | | | | | | | | | | | | | | | | | | | |
Class A | | | (1,533 | ) | | | (16,489 | ) | | | (1,708 | ) | | | (18,154 | ) | | | (2,438 | ) | | | (23,953 | ) |
Class C (2) | | | — | | | | — | | | | (284 | ) | | | (3,009 | ) | | | — | | | | — | |
Class C1 (1) | | | (802 | ) | | | (8,182 | ) | | | — | | | | — | | | | (368 | ) | | | (3,560 | ) |
Class I (1) | | | (1,051 | ) | | | (11,375 | ) | | | (824 | ) | | | (8,805 | ) | | | (1,892 | ) | | | (18,223 | ) |
| | | | (3,386 | ) | | | (36,046 | ) | | | (2,816 | ) | | | (29,968 | ) | | | (4,698 | ) | | | (45,736 | ) |
Net increase (decrease) | | | (1,074 | ) | | $ | (11,339 | ) | | | 755 | | | $ | 8,049 | | | | (939 | ) | | $ | (9,000 | ) |
| | | | | | | | | | | | | | | | | | | | | | | | |
| | | Missouri Tax Free | |
| | | Eleven Months Ended
5/31/11 | | | Year Ended
6/30/10 | | | Year Ended
6/30/09 | |
| | | Shares | | | Amount | | | Shares | | | Amount | | | Shares | | | Amount | |
Shares sold: | | | | | | | | | | | | | | | | | | | | | | | | |
Class A | | | 197 | | | $ | 2,319 | | | | 335 | | | $ | 3,897 | | | | 242 | | | $ | 2,562 | |
Class C1 (1) | | | 28 | | | | 333 | | | | 90 | | | | 1,029 | | | | 31 | | | | 342 | |
Class I (1) | | | 2,193 | | | | 25,435 | | | | 3,576 | | | | 41,446 | | | | 2,680 | | | | 29,215 | |
Shares issued to shareholders due to reinvestment of distributions: | | | | | | | | | | | | | | | | | | | | | | | | |
Class A | | | 43 | | | | 501 | | | | 56 | | | | 653 | | | | 47 | | | | 517 | |
Class C1 (1) | | | 3 | | | | 34 | | | | 3 | | | | 33 | | | | 1 | | | | 17 | |
Class I (1) | | | 15 | | | | 170 | | | | 22 | | | | 256 | | | | 18 | | | | 190 | |
| | | | 2,479 | | | | 28,792 | | | | 4,082 | | | | 47,314 | | | | 3,019 | | | | 32,843 | |
Shares redeemed: | | | | | | | | | | | | | | | | | | | | | | | | |
Class A | | | (321 | ) | | | (3,703 | ) | | | (401 | ) | | | (4,633 | ) | | | (270 | ) | | | (2,921 | ) |
Class C1 (1) | | | (31 | ) | | | (349 | ) | | | (19 | ) | | | (212 | ) | | | — | | | | (2 | ) |
Class I (1) | | | (2,449 | ) | | | (28,323 | ) | | | (2,625 | ) | | | (30,537 | ) | | | (4,026 | ) | | | (43,791 | ) |
| | | | (2,801 | ) | | | (32,375 | ) | | | (3,045 | ) | | | (35,382 | ) | | | (4,296 | ) | | | (46,714 | ) |
Net increase (decrease) | | | (322 | ) | | $ | (3,583 | ) | | | 1,037 | | | $ | 11,932 | | | | (1,277 | ) | | $ | (13,871 | ) |
| (1) | Effective January 18, 2011, Class C Shares and Class Y Shares previously offered by FAF Advisors, were renamed Class C1 Shares and Class I Shares, respectively. |
| (2) | Class C Shares commenced operations on January 18, 2011. |
| | | | | | | | | | | | | | | | | | | | | | | | |
| | | Nebraska | |
| | | Eleven Months Ended
5/31/11 | | | Year Ended
6/30/10 | | | Year Ended
6/30/09 | |
| | | Shares | | | Amount | | | Shares | | | Amount | | | Shares | | | Amount | |
Shares sold: | | | | | | | | | | | | | | | | | | | | | | | | |
Class A | | | 186 | | | $ | 1,922 | | | | 156 | | | $ | 1,600 | | | | 129 | | | $ | 1,265 | |
Class C (2) | | | 31 | | | | 312 | | | | — | | | | — | | | | — | | | | — | |
Class C1 (1) | | | 72 | | | | 730 | | | | 155 | | | | 1,575 | | | | 87 | | | | 819 | |
Class I (1) | | | 355 | | | | 3,620 | | | | 406 | | | | 4,178 | | | | 732 | | | | 7,086 | |
Shares issued to shareholders due to reinvestment of distributions: | | | | | | | | | | | | | | | | | | | | | | | | |
Class A | | | 14 | | | | 146 | | | | 15 | | | | 153 | | | | 17 | | | | 166 | |
Class C (2) | | | — | | | | 2 | | | | — | | | | — | | | | — | | | | — | |
Class C1 (1) | | | 9 | | | | 95 | | | | 7 | | | | 75 | | | | 5 | | | | 47 | |
Class I (1) | | | 19 | | | | 192 | | | | 13 | | | | 134 | | | | 9 | | | | 91 | |
| | | | 686 | | | | 7,019 | | | | 752 | | | | 7,715 | | | | 979 | | | | 9,474 | |
Shares redeemed: | | | | | | | | | | | | | | | | | | | | | | | | |
Class A | | | (121 | ) | | | (1,231 | ) | | | (153 | ) | | | (1,577 | ) | | | (117 | ) | | | (1,154 | ) |
Class C (2) | | | — | | | | — | | | | — | | | | — | | | | — | | | | — | |
Class C1 (1) | | | (77 | ) | | | (768 | ) | | | (20 | ) | | | (204 | ) | | | (7 | ) | | | (66 | ) |
Class I (1) | | | (381 | ) | | | (3,885 | ) | | | (468 | ) | | | (4,804 | ) | | | (556 | ) | | | (5,323 | ) |
| | | | (579 | ) | | | (5,884 | ) | | | (641 | ) | | | (6,585 | ) | | | (680 | ) | | | (6,543 | ) |
Net increase (decrease) | | | 107 | | | $ | 1,135 | | | | 111 | | | $ | 1,130 | | | | 299 | | | $ | 2,931 | |
| | | | | | | | | | | | | | | | | | | | | | | | |
| | | Ohio Tax Free | |
| | | Eleven Months Ended
5/31/11 | | | Year Ended
6/30/10 | | | Year Ended
6/30/09 | |
| | | Shares | | | Amount | | | Shares | | | Amount | | | Shares | | | Amount | |
Shares sold: | | | | | | | | | | | | | | | | | | | | | | | | |
Class A | | | 18 | | | $ | 186 | | | | 107 | | | $ | 1,100 | | | | 44 | | | $ | 425 | |
Class C1 (1) | | | 47 | | | | 487 | | | | 91 | | | | 927 | | | | 27 | | | | 266 | |
Class I (1) | | | 862 | | | | 8,933 | | | | 1,797 | | | | 18,536 | | | | 624 | | | | 6,084 | |
Shares issued to shareholders due to reinvestment of distributions: | | | | | | | | | | | | | | | | | | | | | | | | |
Class A | | | 5 | | | | 58 | | | | 5 | | | | 48 | | | | 3 | | | | 24 | |
Class C1 (1) | | | 3 | | | | 28 | | | | 1 | | | | 9 | | | | 1 | | | | 5 | |
Class I (1) | | | 8 | | | | 88 | | | | 19 | | | | 190 | | | | 30 | | | | 294 | |
| | | | 943 | | | | 9,780 | | | | 2,020 | | | | 20,810 | | | | 729 | | | | 7,098 | |
Shares redeemed: | | | | | | | | | | | | | | | | | | | | | | | | |
Class A | | | (46 | ) | | | (469 | ) | | | (36 | ) | | | (368 | ) | | | (4 | ) | | | (36 | ) |
Class C1 (1) | | | (16 | ) | | | (162 | ) | | | (2 | ) | | | (15 | ) | | | (13 | ) | | | (117 | ) |
Class I (1) | | | (2,015 | ) | | | (20,220 | ) | | | (625 | ) | | | (6,461 | ) | | | (975 | ) | | | (9,288 | ) |
| | | | (2,077 | ) | | | (20,851 | ) | | | (663 | ) | | | (6,844 | ) | | | (992 | ) | | | (9,441 | ) |
Net increase (decrease) | | | (1,134 | ) | | $ | (11,071 | ) | | | 1,357 | | | $ | 13,966 | | | | (263 | ) | | $ | (2,343 | ) |
| (1) | Effective January 18, 2011, Class C Shares and Class Y Shares previously offered by FAF Advisors, were renamed Class C1 Shares and Class I Shares, respectively. |
| (2) | Class C Shares commenced operations on January 18, 2011. |
Notes to Financial Statements (continued)
| | | | | | | | | | | | | | | | | | | | | | | | |
| | | Oregon Intermediate | |
| | | Eleven Months Ended
5/31/11 | | | Year Ended
6/30/10 | | | Year Ended
6/30/09 | |
| | | Shares | | | Amount | | | Shares | | | Amount | | | Shares | | | Amount | |
Shares sold: | | | | | | | | | | | | | | | | | | | | | | | | |
Class A | | | 939 | | | $ | 9,517 | | | | 2,048 | | | $ | 20,541 | | | | 645 | | | $ | 6,281 | |
Class C (2) | | | 62 | | | | 615 | | | | — | | | | — | | | | — | | | | — | |
Class I (1) | | | 2,355 | | | | 23,543 | | | | 4,537 | | | | 45,505 | | | | 2,596 | | | | 25,178 | |
Shares issued to shareholders due to reinvestment of distributions: | | | | | | | | | | | | | | | | | | | | | | | | |
Class A | | | 72 | | | | 727 | | | | 54 | | | | 542 | | | | 14 | | | | 141 | |
Class C (2) | | | — | | | | 4 | | | | — | | | | — | | | | — | | | | — | |
Class I (1) | | | 14 | | | | 141 | | | | 10 | | | | 103 | | | | 9 | | | | 87 | |
| | | | 3,442 | | | | 34,547 | | | | 6,649 | | | | 66,691 | | | | 3,264 | | | | 31,687 | |
Shares redeemed: | | | | | | | | | | | | | | | | | | | | | | | | |
Class A | | | (993 | ) | | | (9,904 | ) | | | (154 | ) | | | (1,554 | ) | | | (154 | ) | | | (1,497 | ) |
Class C (2) | | | — | | | | — | | | | — | | | | — | | | | — | | | | — | |
Class I (1) | | | (4,411 | ) | | | (44,255 | ) | | | (3,588 | ) | | | (35,968 | ) | | | (2,804 | ) | | | (26,966 | ) |
| | | | (5,404 | ) | | | (54,159 | ) | | | (3,742 | ) | | | (37,522 | ) | | | (2,958 | ) | | | (28,463 | ) |
Net increase (decrease) | | | (1,962 | ) | | $ | (19,612 | ) | | | 2,907 | | | $ | 29,169 | | | | 306 | | | $ | 3,224 | |
| (1) | Effective January 18, 2011, Class Y Shares previously offered by FAF Advisors were renamed Class I Shares. |
| (2) | Class C Shares commenced operations on January 18, 2011. |
5. Investment Transactions
Purchases and sales (including maturities but excluding short-term investments, where applicable) during the eleven months ended May 31, 2011, were as follows:
| | | | | | | | | | | | | | | | |
| | | Colorado
Tax Free | | | Minnesota Intermediate | | | Minnesota | | | Missouri Tax
Free | |
Purchases | | $ | 12,351 | | | $ | 38,742 | | | $ | 45,490 | | | $ | 23,126 | |
Sales and maturities | | | 17,314 | | | | 28,953 | | | | 39,589 | | | | 15,972 | |
| | | | | | Nebraska | | | Ohio Tax
Free | | | Oregon
Intermediate | |
Purchases | | | | | | $ | 12,492 | | | $ | 5,349 | | | $ | 18,597 | |
Sales and maturities | | | | | | | 8,706 | | | | 14,164 | | | | 26,699 | |
6. Income Tax Information
The following information is presented on an income tax basis. Differences between amounts for financial statement and federal income tax purposes are primarily due to timing differences in recognizing certain gains and losses on investment transactions. To the extent that differences arise that are permanent in nature, such amounts are reclassified within the capital accounts as detailed below. Temporary differences do not require reclassification. Temporary and permanent differences do not impact the net asset values of the Funds.
At May 31, 2011, the cost and unrealized appreciation (depreciation) of investments, as determined on a federal income tax basis, were as follows:
| | | | | | | | | | | | | | | | |
| | | Colorado
Tax Free | | | Minnesota
Intermediate | | | Minnesota | | | Missouri Tax
Free | |
Cost of investments | | $ | 53,395 | | | $ | 223,951 | | | $ | 158,587 | | | $ | 156,541 | |
Gross unrealized: | | | | | | | | | | | | | | | | |
Appreciation | | | 2,145 | | | | 11,211 | | | | 6,338 | | | | 4,799 | |
Depreciation | | | (698 | ) | | | (850 | ) | | | (3,706 | ) | | | (3,393 | ) |
Net unrealized appreciation (depreciation) of investments | | $ | 1,447 | | | $ | 10,361 | | | $ | 2,632 | | | $ | 1,406 | |
| | | | | | Nebraska | | | Ohio Tax
Free | | | Oregon
Intermediate | |
Cost of investments | | | | | | $ | 42,341 | | | $ | 49,097 | | | $ | 137,311 | |
Gross unrealized: | | | | | | | | | | | | | | | | |
Appreciation | | | | | | | 1,431 | | | | 1,626 | | | | 7,471 | |
Depreciation | | | | | | | (337 | ) | | | (596 | ) | | | (542 | ) |
Net unrealized appreciation (depreciation) of investments | | | | | | $ | 1,094 | | | $ | 1,030 | | | $ | 6,929 | |
Permanent differences, primarily due to tax equalization, resulted in reclassifications among the Funds’ components of net assets at May 31, 2011, the Funds’ tax year-end, as follows:
| | | | | | | | | | | | | | | | |
| | | Colorado
Tax Free | | | Minnesota
Intermediate | | | Minnesota | | | Missouri
Tax Free | |
Capital paid-in | | $ | 63 | | | $ | — | | | $ | — | | | $ | 28 | |
Undistributed (Over-distribution of) net investment income | | | — | | | | — | | | | — | | | | — | |
Accumulated net realized gain (loss) | | | (63 | ) | | | — | | | | — | | | | (28 | ) |
| | | | | | Nebraska | | | Ohio Tax
Free | | | Oregon
Intermediate | |
Capital paid-in | | | | | | $ | — | | | $ | — | | | $ | — | |
Undistributed (Over-distribution of) net investment income | | | | | | | — | | | | — | | | | — | |
Accumulated net realized gain (loss) | | | | | | | — | | | | — | | | | — | |
The tax components of undistributed net tax-exempt income, net ordinary income and net long-term capital gains at May 31, 2011, the Funds’ tax year end, were as follows:
| | | | | | | | | | | | | | | | |
| | | Colorado
Tax Free | | | Minnesota
Intermediate | | | Minnesota | | | Missouri
Tax Free | |
Undistributed net tax-exempt income* | | $ | 281 | | | $ | 921 | | | $ | 1,024 | | | $ | 729 | |
Undistributed net ordinary income** | | | 1 | | | | 29 | | | | 71 | | | | 142 | |
Undistributed net long-term capital gains | | | 49 | | | | 91 | | | | — | | | | 83 | |
| | | | |
| | | | | | Nebraska | | | Ohio Tax
Free | | | Oregon
Intermediate | |
Undistributed net tax-exempt income* | | | | | | $ | 133 | | | $ | 230 | | | $ | 450 | |
Undistributed net ordinary income** | | | | | | | 24 | | | | — | | | | 97 | |
Undistributed net long-term capital gains | | | | | | | — | | | | — | | | | 18 | |
| * | Undistributed net tax exempt income (on a tax basis) has not been reduced for the dividends declared during the period May 1, 2011 through May 31, 2011 and paid on June 1, 2011. |
| ** | Net ordinary income consists of net taxable income derived from dividends, interest and net short-term capital gains, if any. |
The tax character of distributions paid during the eleven months ended May 31, 2011, and during the tax years ended June 30, 2010 and June 30, 2009, was designated for purposes of the dividends paid deduction as follows:
| | | | | | | | | | | | | | | | |
| Eleven months ended May 31, 2011 | | Colorado
Tax Free | | | Minnesota
Intermediate | | | Minnesota | | | Missouri
Tax Free | |
Distributions from net tax-exempt income*** | | $ | 2,406 | | | $ | 7,479 | | | $ | 5,053 | | | $ | 5,941 | |
Distributions from net ordinary income** | | | 103 | | | | 15 | | | | 88 | | | | 97 | |
Distributions from net long-term capital gains**** | | | 520 | | | | — | | | | — | | | | 199 | |
| | | | |
| Eleven months ended May 31, 2011 | | | | | Nebraska | | | Ohio Tax
Free | | | Oregon
Intermediate | |
Distributions from net tax-exempt income*** | | | | | | $ | 1,620 | | | $ | 2,215 | | | $ | 4,508 | |
Distributions from net ordinary income** | | | | | | | 13 | | | | — | | | | 108 | |
Distributions from net long-term capital gains**** | | | | | | | — | | | | — | | | | — | |
| | | | | | | | | | | | | | | | |
| | | | |
| 2010 | | Colorado
Tax Free | | | Minnesota
Intermediate | | | Minnesota | | | Missouri Tax Free | |
Distributions from net tax-exempt income | | $ | 2,802 | | | $ | 7,780 | | | $ | 6,226 | | | $ | 6,465 | |
Distributions from net ordinary income** | | | 29 | | | | 36 | | | | 73 | | | | 7 | |
Distributions from net long-term capital gains | | | 583 | | | | 104 | | | | 10 | | | | 1,094 | |
| | | | | | | | | | | | | | |
| | | | |
| 2010 | | | | Nebraska | | | Ohio Tax
Free | | | Oregon
Intermediate | |
Distributions from net tax-exempt income | | | | $ | 1,703 | | | $ | 2,104 | | | $ | 5,244 | |
Distributions from net ordinary income** | | | | | 7 | | | | — | | | | 95 | |
Distributions from net long-term capital gains | | | | | — | | | | — | | | | — | |
| ** | Net ordinary income consists of net taxable income derived from dividends, interest and net short-term capital gains, if any. |
| *** | The Funds hereby designate these amounts paid during the eleven months ended May 31, 2011, as Exempt Interest Dividends |
| **** | The Funds designated as long-term capital gain dividend, pursuant to the Internal Revenue Code Section 852 (b)(3), the amount necessary to reduce earnings and profits of the Funds related to net capital gain to zero for the eleven months ended May 31, 2011. |
Notes to Financial Statements (continued)
| | | | | | | | | | | | | | | | |
| | | | |
| 2009 | | Colorado
Tax Free | | | Minnesota
Intermediate | | | Minnesota | | | Missouri
Tax Free | |
Distributions from net tax-exempt income | | $ | 1,960 | | | $ | 7,840 | | | $ | 6,482 | | | $ | 6,705 | |
Distributions from net ordinary income** | | | 67 | | | | 13 | | | | 2 | | | | 62 | |
Distributions from net long-term capital gains | | | 139 | | | | 514 | | | | 862 | | | | 273 | |
| | | | | | | | | | | | | | |
| | | | |
| 2009 | | | | Nebraska | | | Ohio Tax
Free | | | Oregon
Intermediate | |
Distributions from net tax-exempt income | | | | $ | 1,745 | | | $ | 2,045 | | | $ | 4,872 | |
Distributions from net ordinary income** | | | | | — | | | | — | | | | 4 | |
Distributions from net long-term capital gains | | | | | — | | | | — | | | | — | |
| ** | Net ordinary income consists of net taxable income derived from dividends, interest and net short-term capital gains, if any. |
At May 31, 2011, the Funds’ tax year end, the following Funds had unused capital loss carryforwards available for federal income tax purposes to be applied against future capital gains, if any. If not applied, the carryforwards will expire as follows:
| | | | | | | | | | | | |
| | | Minnesota | | | Nebraska | | | Ohio
Tax Free | |
Expiration: | | | | | | | | | | | | |
May 31, 2017 | | $ | — | | | $ | 328 | | | $ | 224 | |
May 31, 2018 | | | 65 | | | | 36 | | | | 205 | |
May 31, 2019 | | | 58 | | | | — | | | | 30 | |
Total | | $ | 123 | | | $ | 364 | | | $ | 459 | |
During the eleven months ended May 31, 2011, the following Funds utilized their capital loss carryforwards as follows:
| | | | | | | | |
| | | Nebraska | | | Oregon
Intermediate | |
Utilized capital loss carryforwards | | $ | 31 | | | $ | 141 | |
The Funds have elected to defer net realized losses from investments incurred from November 1, 2010 through May 31, 2011, the Funds’ tax year end, (“post-October losses”) in accordance with federal income tax regulations. Post-October losses are treated as having arisen on the first day of the following fiscal year. The following Funds have elected to defer post-October losses as follows:
| | | | | | | | |
| | | Minnesota | | | Ohio
Tax Free | |
Post-October capital losses | | $ | 663 | | | $ | 450 | |
7. Management Fees and Other Transactions with Affiliates
Investment Advisory Fees
During the period July 1, 2010 through December 31, 2010, pursuant to an investment advisory agreement (the “Agreement”), FAF Advisors managed each Fund’s assets and furnished related office facilities, equipment, research, and personnel. The Agreement required each Fund to pay FAF Advisors a monthly advisory fee equal, on an annual basis, to .50% of each Fund’s average daily net assets.
Effective January 1, 2011, pursuant to a new investment advisory agreement (the “New Agreement”), the Funds’ new investment adviser is Nuveen Fund Advisors. Under the New Agreement, each Fund’s management fee consists of two components – a fund-level fee, based only on the amount of assets within each individual Fund, and a complex-level fee, based on the aggregate amount of all eligible fund assets managed by Nuveen Fund Advisors. This pricing structure enables Fund shareholders to benefit from growth in the assets within their Fund as well as from growth in the amount of complex-wide assets managed by Nuveen Fund Advisors.
The annual fund-level fee for each Fund, payable monthly, is calculated according to the following schedule:
| | | | | | | | | | | | | | | | |
| Average Daily Net Assets | | Colorado
Tax Free | | | Minnesota
Intermediate | | | Minnesota | | | Missouri
Tax Free | |
For the first $125 million | | | .4500 | % | | | .3500 | % | | | .3500 | % | | | .4500 | % |
For the next $125 million | | | .4375 | | | | .3375 | | | | .3375 | | | | .4375 | |
For the next $250 million | | | .4250 | | | | .3250 | | | | .3250 | | | | .4250 | |
For the next $500 million | | | .4125 | | | | .3125 | | | | .3125 | | | | .4125 | |
For the next $1 billion | | | .4000 | | | | .3000 | | | | .3000 | | | | .4000 | |
For net assets over $2 billion | | | .3750 | | | | .2750 | | | | .2750 | | | | .3750 | |
| | | | |
| Average Daily Net Assets | | | | | Nebraska | | | Ohio
Tax Free | | | Oregon
Intermediate | |
For the first $125 million | | | | | | | .3500 | % | | | .4500 | % | | | .3500 | % |
For the next $125 million | | | | | | | .3375 | | | | .4375 | | | | .3375 | |
For the next $250 million | | | | | | | .3250 | | | | .4250 | | | | .3250 | |
For the next $500 million | | | | | | | .3125 | | | | .4125 | | | | .3125 | |
For the next $1 billion | | | | | | | .3000 | | | | .4000 | | | | .3000 | |
For net assets over $2 billion | | | | | | | .2750 | | | | .3750 | | | | .2750 | |
The annual complex-level fee for each Fund, payable monthly, is determined by taking the complex-level fee rate, which is based on the aggregate amount of “eligible assets” of all Nuveen funds as set forth in the schedule below, and making, as appropriate, an upward adjustment to that rate based upon the percentage of the particular fund’s assets that are not “eligible assets.” The complex-level fee schedule is as follows:
| | | | |
| Complex-Level Asset Breakpoint Level* | | Effective Rate at Breakpoint Level | |
$55 billion | | | .2000 | % |
$56 billion | | | .1996 | |
$57 billion | | | .1989 | |
$60 billion | | | .1961 | |
$63 billion | | | .1931 | |
$66 billion | | | .1900 | |
$71 billion | | | .1851 | |
$76 billion | | | .1806 | |
$80 billion | | | .1773 | |
$91 billion | | | .1691 | |
$125 billion | | | .1599 | |
$200 billion | | | .1505 | |
$250 billion | | | .1469 | |
$300 billion | | | .1445 | |
| * | The complex-level fee is calculated based upon the aggregate daily “eligible assets” of all Nuveen Funds. Eligible assets do not include assets attributable to investments in other Nuveen Funds or assets in excess of $2 billion added to the Nuveen fund complex in connection with Nuveen Fund Advisors’ assumption of the management of the former First American Funds effective January 1, 2011. Eligible assets include closed-end fund assets managed by Nuveen Fund Advisors that are attributable to financial leverage. For these purposes, financial leverage includes the closed-end funds’ use of preferred stock and borrowings and investments in the residual interest certificates (also called inverse floating rate securities) in tender option bond (TOB) trusts, including the portion of assets held by the TOB trust that has been effectively financed by the trust’s issuance of floating rate securities, subject to an agreement by Nuveen Fund Advisors as to certain funds to limit the amount of such assets for determining eligible assets in certain circumstances. |
As of May 31, 2011, the complex-level fee rate for each Fund was as follows:
| | | | |
| Fund | | Rate | |
Colorado Tax Free | | | .1989 | % |
Minnesota Intermediate | | | .1971 | |
Minnesota | | | .1975 | |
Missouri Tax Free | | | .1971 | |
Nebraska | | | .1964 | |
Ohio Tax Free | | | .2000 | |
Oregon Intermediate | | | .1986 | |
The management fee compensates Nuveen Fund Advisors for the overall investment advisory and administrative services and general office facilities it provides for the Funds. Effective January 1, 2011, Nuveen Fund Advisors has entered into a sub-advisory agreement with the Sub-Adviser. The Sub-Adviser is compensated for its services to the Funds from the management fees paid to Nuveen Fund Advisors.
During the period July 1, 2010 through December 31, 2010, the Funds may have invested in related money market funds that were series of First American Funds, Inc., subject to certain limitations. In order to avoid the payment of duplicative investment advisory fees to FAF Advisors, which acted as the investment advisor to both the investing Funds and the related money market funds, FAF Advisors reimbursed each investing Fund an amount equal to that portion of FAF Advisors’ investment advisory fee received from the related money market funds that was attributable to the assets of the investing Fund. This reimbursement, if any, is recognized as a component of “Expense Reimbursement” on the Statement of Operations and terminated with respect to the Funds on December 31, 2010, in connection with the Sale.
During the period July 1, 2010 through December 31, 2010, FAF Advisors agreed to waive fees and reimburse other Fund expenses through June 30, 2011, so that total Fund operating expenses, as a percentage of each Fund’s average daily net assets, did not exceed the following amounts:
| | | | | | | | | | | | |
| | | Share Class | |
| Fund | | A | | | C (1) | | | Y (1) | |
Colorado Tax Free | | | .75 | % | | | 1.15 | % | | | .50 | % |
Minnesota Intermediate | | | .75 | | | | 1.35 | | | | .70 | |
Minnesota | | | .85 | | | | 1.35 | | | | .70 | |
Missouri Tax Free | | | .85 | | | | 1.35 | | | | .70 | |
Nebraska | | | .75 | | | | 1.15 | | | | .50 | |
Ohio Tax Free | | | .75 | | | | 1.15 | | | | .50 | |
Oregon Intermediate | | | .85 | | | | N/A | | | | .70 | |
| N/A | – Not applicable; Fund did not offer Class C Shares during the six months ended December 31, 2010. |
| (1) | – Effective January 18, 2011, Class C Shares and Class Y shares previously offered by FAF Advisors were renamed Class C1 Shares and Class I Shares, respectively. |
Notes to Financial Statements (continued)
Effective January 1, 2011, Nuveen Fund Advisors has contractually agreed to waive fees and reimburse other Fund expenses of each Fund so that total annual Fund operating expenses, after waivers and/or expense reimbursements and excluding acquired Fund fees and expenses, do not exceed the average daily net assets of any class of Fund shares in the amounts and for the time periods stated in the following table.
| | | | | | | | | | | | | | | | |
| | | Colorado Tax Free | | | Minnesota
Intermediate | | | Minnesota | | | Missouri | |
Class A (1) | | | .7000 | % | | | .7500 | % | | | .8500 | % | | | .8500 | % |
Class C (2) | | | N/A | | | | 1.4500 | | | | 1.4500 | | | | N/A | |
Class C1(3) | | | 1.1500 | | | | 1.3500 | | | | 1.3500 | | | | 1.3500 | |
Class I (3) | | | .5000 | | | | .7000 | | | | .7000 | | | | .7000 | |
First expiration date | | | June 30, 2011 | | | | March 31, 2012 | | | | March 31, 2012 | | | | March 31, 2012 | |
| | | | | | | | | | | | | | | | |
After first expiration date: | | | | | | | | | | | | | | | | |
Class A (1) | | | .9000 | % | | | N/A | | | | N/A | | | | N/A | |
Class C1(3) | | | 1.3500 | | | | N/A | | | | N/A | | | | N/A | |
Class I (3) | | | .7000 | | | | N/A | | | | N/A | | | | N/A | |
Expiration date | | | March 31, 2012 | | | | N/A | | | | N/A | | | | N/A | |
| | | | |
| | | | | | Nebraska | | | Ohio Tax Free | | | Oregon
Intermediate | |
Class A (1) | | | | | | | .7000 | % | | | .7000 | % | | | .8500 | % |
Class C (2) | | | | | | | 1.2500 | | | | N/A | | | | 1.4500 | |
Class C1(3) | | | | | | | 1.1500 | | | | 1.1500 | | | | N/A | |
Class I (3) | | | | | | | .5000 | | | | .5000 | | | | .7000 | |
First expiration date | | | | | | | June 30, 2011 | | | | June 30, 2011 | | | | March 31, 2012 | |
| | | | | | | | | | | | | | | | |
After first expiration date: | | | | | | | | | | | | | | | | |
Class A (1) | | | | | | | .9000 | % | | | .9000 | % | | | N/A | |
Class C (2) | | | | | | | 1.4500 | | | | N/A | | | | N/A | |
Class C1(3) | | | | | | | 1.3500 | | | | 1.3500 | | | | N/A | |
Class I (3) | | | | | | | .7000 | | | | .7000 | | | | N/A | |
Expiration date | | | | | | | March 31, 2012 | | | | March 31, 2012 | | | | N/A | |
| (1) | – Nuveen Fund Advisors has contractually agreed to reimburse Class A Share 12b-1 fees to the extent necessary so that total annual Fund operating expenses, after waivers and/or expense reimbursements and excluding acquired Fund fees and expenses do not exceed .7500%, .8500% and .8500% for Class A Shares of Minnesota Intermediate, Minnesota and Oregon Intermediate, respectively. |
| (2) | – Effective January 18, 2011, Minnesota Intermediate, Minnesota, Nebraska and Oregon Intermediate began offering Class C1 Shares only to qualifying institutional investors and certain other qualifying accounts. |
| (3) | – Effective January 18, 2011, Class C Shares and Class Y Shares previously offered by FAF Advisors were renamed Class C1 Shares and Class I Shares, respectively. |
During the period July 1, 2010 through December 31, 2010, independent directors of the Funds may have participated and elected to defer receipt of part or all of their annual compensation under a deferred compensation plan (the “Plan”). Deferred amounts were treated as though equivalent dollar amounts had been invested in shares of selected open-end funds as designated by each director. All amounts in the Plan were 100% vested and accounts under the Plan were obligations of the Funds. Deferred amounts remain in the Funds until distributed in accordance with the Plan.
Effective January 1, 2011, independent directors may elect to defer receipt of all or a portion of the annual compensation they are entitled to receive from certain funds advised by Nuveen Fund Advisors. Under the plan, deferred amounts are treated as though equal dollar amounts had been invested in shares of select funds advised by Nuveen Fund Advisors.
Administration Fees
During the period July 1, 2010 through December 31, 2010, FAF Advisors served as the Funds’ administrator pursuant to an administration agreement between FAF Advisors and the Funds. U.S. Bancorp Fund Services, LLC (“USBFS”) served as sub-administrator pursuant to a sub-administration agreement between USBFS and FAF Advisors. FAF Advisors is a subsidiary of U.S. Bank National Association (“U.S. Bank”). Both U.S. Bank and USBFS are direct subsidiaries of U.S. Bancorp. Under the administration agreement, FAF Advisors was compensated to provide, or compensated other entities to provide, services to the Funds. These services included various legal, oversight, and administrative and accounting services. The Funds paid FAF Advisors administration fees, which were calculated daily and paid monthly, equal to the Funds’ pro rata share of an amount equal, on an annual basis, to .25% of the aggregate average daily net assets of all open-end funds in the First American Funds family up to $8 billion, .235% on the next $17 billion of the aggregate average daily net assets, .22% on the next $25 billion of the aggregate average daily net assets and .20% of the aggregate average daily net assets in excess of $50 billion. All fees paid to the sub-administrator were paid from the administration fee. In addition to these fees, the Funds may have reimbursed FAF Advisors and the sub-administrator for any out-of-pocket expenses incurred in providing administration services. Effective January 1, 2011, FAF Advisors and USBFS no longer serve as the Funds’ administrator and sub-administrator, respectively, and the Funds have not entered into any new administration or sub-administration agreements.
Transfer Agent Fees
USBFS serves as the Funds’ transfer agent pursuant to a transfer agent agreement with the Trust. The Funds are charged transfer agent fees on a per shareholder account basis, subject to a minimum fee per share class. These fees are charged to each Fund based upon the number of accounts within each Fund. In addition to these fees, the Funds may reimburse USBFS for out-of-pocket expenses incurred in providing transfer agent services.
Custodian Fees
U.S. Bank serves as the custodian for the Fund pursuant to a custodian agreement with the Trust. The custodian fee charged for each Fund is equal to an annual rate of .005% of average daily net assets. All fees are computed daily and paid monthly. Interest earned on un-invested cash balances is used to reduce a portion of each Fund’s custodian expenses. These credits, if any, are recognized as “Custodian fee credit” on the Statement of Operations. Conversely, the custodian charges a fee for any cash overdrafts incurred, which increases the Funds’ custodian expenses.
Distribution and Shareholder Servicing (12b-1) Fees
During the period July 1, 2010 through December 31, 2010, Quasar Distributors, LLC (“Quasar”), a subsidiary of U.S. Bancorp, served as the distributor of the Funds pursuant to a distribution agreement with the Trust. Under the distribution agreement, and pursuant to a plan adopted by each Fund under Rule 12b-1 of the Investment Company Act, the Funds paid Quasar a monthly distribution and/or shareholder servicing fee equal to an annual rate of .25% and .65% of the Funds’ average daily net assets attributable to Class A Shares and Class C Shares (renamed Class C1 Shares), respectively. No distribution or shareholder servicing fees were paid by Class Y Shares (renamed Class I Shares). These fees may have been used by Quasar to provide compensation for sales support, distribution activities, and/or shareholder servicing activities. During the period July 1, 2010 through December 31, 2010, total distribution and shareholder servicing fees waived by Quasar for the following Funds were as follows:
| | | | |
| Fund | | Amount | |
Minnesota Intermediate | | $ | 19 | |
Oregon Intermediate | | | 17 | |
Effective January 1, 2011, the Funds entered into a distribution agreement with Nuveen Securities, LLC, who now serves as the Funds’ distributor. Under the new agreement, Class A Shares incur a .20% (.15% for Class A Shares of Minnesota Intermediate) annual 12b-1 service fee. Class C Shares incur a .55% annual 12b-1 distribution fee and a .20% annual 12b-1 service fee. Class C1 Shares continue to incur a .40% annual 12b-1 distribution fee and a .25% annual 12b-1 service fee. Class I Shares continue to not be subject to any 12b-1 distribution or service fees. Annual distribution and service fees are based on average daily net assets.
Nuveen Securities LLC has contractually agreed to limit its Class A Share 12b-1 fees to .15% of average daily net assets through March 31, 2012 for Minnesota Intermediate.
All 12b-1 service and distribution fees collected on Class C1 Shares during the first year following a purchase were retained by Quasar and/or Nuveen Securities, LLC to compensate for commissions advanced to financial intermediaries. During the eleven months ended May 31, 2011, Quasar and/or Nuveen Securities, LLC. retained such 12b-1 fees as follows:
| | | | | | | | | | | | | | | | | | |
| | | | | Colorado Tax Free | | | Minnesota Intermediate | | | Minnesota | | | Missouri Tax Free | |
12b-1 fees retained (Unaudited) | | | | $ | 9 | | | $ | 46 | | | $ | 86 | | | $ | 32 | |
| | | | | | | | | | | | | | | | |
| | | | | | | Nebraska | | | Ohio Tax Free | | | Oregon Intermediate | |
12b-1 fees retained (Unaudited) | | | | | | $ | 12 | | | $ | 8 | | | $ | 14 | |
The remaining 12b-1 fees charged to the Funds were paid to compensate financial intermediaries for providing services to shareholders relating to their investments.
During the eleven months ended May 31, 2011, Quasar and/or Nuveen Securities, LLC compensated financial intermediaries directly with commission advances at the time of purchase as follows:
| | | | | | | | | | | | | | | | | | |
| | | | | Colorado Tax Free | | | Minnesota Intermediate | | | Minnesota | | | Missouri Tax Free | |
Sales charges collected (Unaudited) | | | | $ | 7 | | | $ | 60 | | | $ | 96 | | | $ | 36 | |
Paid to financial intermediaries (Unaudited) | | | | $ | 6 | | | $ | 54 | | | $ | 87 | | | $ | 34 | |
| | | | | | | | | | | | | | | | |
| | | | | | | Nebraska | | | Ohio Tax Free | | | Oregon Intermediate | |
Sales charges collected (Unaudited) | | | | | | $ | 13 | | | $ | 4 | | | $ | 24 | |
Paid to financial intermediaries (Unaudited) | | | | | | $ | 12 | | | $ | 3 | | | $ | 22 | |
During the eleven months ended May 31, 2011, Quasar and/or Nuveen Securities, LLC collected sales charges on purchases of Class A Shares, the majority of which were paid out as concessions to financial intermediaries as follows:
| | | | | | | | | | | | | | | | | | |
| | | | | Colorado Tax Free | | | Minnesota Intermediate | | | Minnesota | | | Missouri Tax Free | |
Commission advances (Unaudited) | | | | $ | 1 | | | $ | 23 | | | $ | 36 | | | $ | 13 | |
Notes to Financial Statements (continued)
| | | | | | | | | | | | | | | | |
| | | | | | | Nebraska | | | Ohio Tax Free | | | Oregon Intermediate | |
Commission advances (Unaudited) | | | | | | $ | 8 | | | $ | 2 | | | $ | 19 | |
Quasar and/or Nuveen Securities, LLC also received 12b-1 service fees on Class A Shares, substantially all of which were paid to compensate financial intermediaries for providing services to shareholders relating to their investments.
Other Fees and Expenses
In addition to investment advisory fees, transfer agent fees, custodian fees, and distribution and shareholder servicing fees, each Fund is responsible for paying other operating expenses, including: legal, auditing, registration fees, postage and printing of shareholder reports, fees and expenses of independent directors, insurance, and other miscellaneous expenses. During the period July 1, 2010 through December 31, 2010, legal fees and expenses of $17 were paid to a law firm of which an Assistant Secretary of the Funds was a partner.
Contingent Deferred Sales Charges
During the period July 1, 2010 through January 17, 2011, Class A Shares of Colorado Tax Free, Minnesota, Missouri, Nebraska and Ohio Tax Free were sold with an up-front sales charge of 4.25%. Class A Shares of Minnesota Intermediate and Oregon Intermediate were sold with an up-front sales charge of 2.25%. Class C Shares (renamed Class C1 Shares) were subject to a contingent deferred sales charge (“CDSC”) of 1% for twelve months. Class Y Shares (renamed Class I Shares) had no sales charge and were offered only to qualifying institutional investors and certain other qualifying accounts.
Effective January 18, 2011, Class A Shares of Colorado Tax Free, Minnesota, Missouri, Nebraska and Ohio Tax Free are sold with an up-front sales charge of 4.20%. Class A Shares of Minnesota Intermediate and Oregon Intermediate are sold with an up-front sales charge of 3.00%. Class A Share purchases of $1 million or more for the Funds are sold at net asset value without any sales charge. Class A Share purchases of the Funds may be subject to a CDSC if redeemed within eighteen months of purchase. Class C Shares and Class C1 Shares are subject to a CDSC of 1% if redeemed within twelve months of purchase. Class I Shares continue to have no sales charge and may be purchased under limited circumstance or by specified classes of investors.
Quasar and Nuveen Securities, LLC collected and retained CDSC on share redemptions during the eleven months ended May 31, 2011, as follows:
| | | | | | | | | | | | | | | | | | |
| | | | | Colorado Tax Free | | | Minnesota Intermediate | | | Minnesota | | | Missouri Tax Free | |
CDSC retained (Unaudited) | | | | $ | 1 | | | $ | 9 | | | $ | 12 | | | $ | 1 | |
| | | | | | | | | | | | | | | | |
| | | | | | | Nebraska | | | Ohio Tax Free | | | Oregon Intermediate | |
CDSC retained (Unaudited) | | | | | | $ | — | | | $ | — | | | $ | 3 | |
8. Fund Mergers
Effective after the close of business on January 16, 2009, Colorado Tax Free acquired the assets and assumed the liabilities of First American Colorado Intermediate Tax Free Fund (“Colorado Intermediate Tax Free”). Colorado Tax Free was deemed to be the accounting survivor in the merger. Shareholders of Colorado Intermediate Tax Free approved the merger on December 30, 2008.
The merger was accomplished by tax free exchanges as detailed below:
| | | | | | | | | | | | | | | | |
| | | Share Class | | | | |
| Colorado Tax Free | | Class A | | | Class C | | | Class Y | | | Total | |
Net assets of Colorado Intermediate Tax Free | | $ | 5,874 | | | $ | — | | | $ | 42,389 | | | $ | 48,263 | |
Colorado Intermediate Tax Free shares exchanged | | | 577 | | | | — | | | | 4,170 | | | | 4,747 | |
Colorado Tax Free shares issued | | | 614 | | | | — | | | | 4,418 | | | | 5,032 | |
Net assets of Colorado Tax Free immediately before the merger | | $ | 4,995 | | | $ | 2,897 | | | $ | 15,034 | | | $ | 22,926 | |
Net assets of Colorado Tax Free immediately after the merger | | $ | 10,869 | | | $ | 2,897 | | | $ | 57,423 | | | $ | 71,189 | |
9. New Accounting Pronouncements
Fair Value Measurements and Disclosures
On May 12, 2011, the Financial Accounting Standards Board (“FASB”) issued an Accounting Standard Update (“ASU”) modifying Topic 820, Fair Value Measurements and Disclosures. At the same time, the International Accounting Standards Board (“IASB”) issued International Financial Reporting Standard (“IFRS”) 13, Fair Value Measurement. The objective by the FASB and IASB is convergence of their guidance on fair value measurements and disclosures. Specifically, the ASU requires reporting entities to disclose ii) the amounts of any transfers between Level 1 and Level 2, and the reasons for the transfers, ii) for Level 3 fair value measurements, a) quantitative information about significant unobservable inputs used, b) a description of the valuation processes used by the reporting entity and c) a narrative description of the sensitivity of the fair value measurement to changes in unobservable inputs if a change in those inputs might result in a significantly higher or lower fair value measurement. The effective date of the ASU is for interim and annual periods beginning after December 15, 2011. At this time, management is evaluating the implications of this guidance and the impact it will have on the financial statement amounts and footnote disclosures, if any.
Trustees and Officers (Unaudited)
The management of the Funds, including general supervision of the duties performed for the Funds by the Adviser, is the responsibility of the Board of Trustees of the Funds. The number of trustees of the Funds is currently set at ten. None of the trustees who are not “interested” persons of the Funds (referred to herein as “independent trustees”) has ever been a director or employee of, or consultant to, Nuveen or its affiliates. The names and business addresses of the trustees and officers of the Funds, their principal occupations and other affiliations during the past five years, the number of portfolios each oversees and other directorships they hold are set forth below.
The Funds’ Statement of Additional Information (“SAI”) includes more information about the trustees. To request a free copy, call Nuveen Investments at (800) 257-8787 or visit the Funds’ website at www.nuveen.com.
| | | | | | | | |
Name, Birthdate and Address | | Position(s) Held with the Funds | | Year First Elected or Appointed (1) | | Principal Occupation(s) Including other Directorships During Past 5 Years | | Number of Portfolios in Fund Complex Overseen by Trustee |
| | |
| Independent Trustees: | | | | |
Robert P. Bremner (2) 8/22/40 333 W. Wacker Drive Chicago, IL 60606 | | Chairman of the Board and Trustee | | 1996 | | Private Investor and Management Consultant; Treasurer and Director, Humanities Council of Washington, D.C.; Board Member, Independent Directors Council affiliated with the Investment Company Institute. | | 245 |
Jack B. Evans 10/22/48 333 W. Wacker Drive Chicago, IL 60606 | | Trustee | | 1999 | | President, The Hall-Perrine Foundation, a private philanthropic corporation (since 1996); Director and Chairman, United Fire Group, a publicly held company; member of the Board of Regents for the State of Iowa University System; Director, Source Media Group; Life Trustee of Coe College and the Iowa College Foundation; formerly, Director, Alliant Energy; formerly, Director, Federal Reserve Bank of Chicago; formerly, President and Chief Operating Officer, SCI Financial Group, Inc., a regional financial services firm. | | 245 |
William C. Hunter 3/6/48 333 W. Wacker Drive Chicago, IL 60606 | | Trustee | | 2004 | | Dean, Tippie College of Business, University of Iowa (since 2006); Director (since 2004) of Xerox Corporation; Director (since 2005), Beta Gamma Sigma International Honor Society; Director of Wellmark, Inc. (since 2009); formerly, Dean and Distinguished Professor of Finance, School of Business at the University of Connecticut (2003-2006); previously, Senior Vice President and Director of Research at the Federal Reserve Bank of Chicago (1995-2003); formerly, Director (1997-2007), Credit Research Center at George Washington University. | | 245 |
David J. Kundert (2) 10/28/42 333 W. Wacker Drive Chicago, IL 60606 | | Trustee | | 2005 | | Director, Northwestern Mutual Wealth Management Company; retired (since 2004) as Chairman, JPMorgan Fleming Asset Management, President and CEO, Banc One Investment Advisors Corporation, and President, One Group Mutual Funds; prior thereto, Executive Vice President, Banc One Corporation and Chairman and CEO, Banc One Investment Management Group; Member, Board of Regents, Luther College; member of the Wisconsin Bar Association; member of Board of Directors, Friends of Boerner Botanical Gardens; member of Board of Directors and Chair of Investment Committee, Greater Milwaukee Foundation. | | 245 |
William J. Schneider (2) 9/24/44 333 W. Wacker Drive Chicago, IL 60606 | | Trustee | | 1997 | | Chairman of Miller-Valentine Partners Ltd., a real estate investment company; formerly, Senior Partner and Chief Operating Officer (retired 2004) of Miller-Valentine Group; member, University of Dayton Business School Advisory Council; member, Mid-America Health System Board; formerly, member and chair, Dayton Philharmonic Orchestra Association; formerly, member, Business Advisory Council, Cleveland Federal Reserve Bank. | | 245 |
Judith M. Stockdale 12/29/47 333 W. Wacker Drive Chicago, IL 60606 | | Trustee | | 1997 | | Executive Director, Gaylord and Dorothy Donnelley Foundation (since 1994); prior thereto, Executive Director, Great Lakes Protection Fund (1990-1994). | | 245 |
Carole E. Stone (2) 6/28/47 333 W. Wacker Drive Chicago, IL 60606 | | Trustee | | 2007 | | Director, Chicago Board Options Exchange (since 2006); Director, C2 Options Exchange, Incorporated (since 2009); formerly, Commissioner, New York State Commission on Public Authority Reform (2005-2010); formerly, Chair, New York Racing Association Oversight Board (2005-2007). | | 245 |
Trustees and Officers (Unaudited) (continued)
| | | | | | | | |
Name, Birthdate and Address | | Position(s) Held with the Funds | | Year First Elected or Appointed (1) | | Principal Occupation(s) During Past Five Years | | Number of Portfolios in Fund Complex Overseen by Trustee |
Virginia L. Stringer 8/16/44 333 West Wacker Drive Chicago, IL 60606 | | Trustee | | 2011 | | Board Member, Mutual Fund Directors Forum; Member, Governing Board, Investment Company Institute’s Independent Directors Council; governance consultant and non-profit board member; former Owner and President, Strategic Management Resources, Inc. a management consulting firm; previously, held several executive positions in general management, marketing and human resources at IBM and The Pillsbury Company; Independent Director, First American Fund Complex (1987-2010) and Chair (1997-2010). | | 245 |
Terence J. Toth (2) 9/29/59 333 W. Wacker Drive Chicago, IL 60606 | | Trustee | | 2008 | | Director, Legal & General Investment Management America, Inc. (since 2008); Managing Partner, Promus Capital (since 2008); formerly, CEO and President, Northern Trust Global Investments (2004-2007); Executive Vice President, Quantitative Management & Securities Lending (2000-2004); prior thereto, various positions with Northern Trust Company (since 1994); member: Goodman Theatre Board (since 2004), Chicago Fellowship Board (since 2005) and Catalyst Schools of Chicago Board (since 2008); formerly, member: Northern Trust Mutual Funds Board (2005-2007), Northern Trust Global Investments Board (2004-2007), Northern Trust Japan Board (2004-2007), Northern Trust Securities Inc. Board (2003-2007) and Northern Trust Hong Kong Board (1997-2004). | | 245 |
| | |
| Interested Trustee: | | | | |
John P. Amboian (3) 6/14/61 333 W. Wacker Drive Chicago, IL 60606 | | Trustee | | 2008 | | Chief Executive Officer and Chairman (since 2007), and Director (since 1999) of Nuveen Investments, Inc., formerly, President (1999-2007); Chief Executive Officer (since 2007) of Nuveen Investments Advisers Inc.; Director (since 1998) formerly, Chief Executive Officer (2007-2010) of Nuveen Fund Advisors, Inc. | | 245 |
Name, Birthdate and Address | | Position(s) Held with the Funds | | Year First Elected or Appointed (4) | | Principal Occupation(s) During Past 5 Years | | Number of Portfolios in Fund Complex Overseen by Officer |
| | |
| Officers of the Funds: | | | | |
Gifford R. Zimmerman 9/9/56 333 W. Wacker Drive Chicago, IL 60606 | | Chief Administrative Officer | | 1988 | | Managing Director (since 2002), Assistant Secretary and Associate General Counsel of Nuveen Securities, LLC; Managing Director (since 2004) and Assistant Secretary (since 1994) of Nuveen Investments, Inc.; Managing Director (since 2002), Assistant Secretary (since 1997) and Co-General Counsel (since 2011) of Nuveen Fund Advisors, Inc.; Managing Director, Assistant Secretary and Associate General Counsel of Nuveen Asset Management, LLC (since 2011); Managing Director, Associate General Counsel and Assistant Secretary of Symphony Asset Management LLC (since 2003); Vice President and Assistant Secretary of NWQ Investment Management Company, LLC (since 2002), Nuveen Investments Advisers Inc. (since 2002), Tradewinds Global Investors LLC, and Santa Barbara Asset Management, LLC (since 2006), Nuveen HydePark Group LLC and Nuveen Investment Solutions, Inc. (since 2007) and of Winslow Capital Management Inc. (since 2010); Chief Administrative Officer and Chief Compliance Officer (since 2010) of Nuveen Commodities Asset Management, LLC; Chartered Financial Analyst. | | 245 |
Margo L. Cook 4/11/64 333 W. Wacker Drive Chicago, IL 60606 | | Vice President | | 2009 | | Executive Vice President (since 2008) of Nuveen Investments, Inc. and of Nuveen Fund Advisors, Inc. (since 2011); previously, Head of Institutional Asset Management (2007-2008) of Bear Stearns Asset Management; Head of Institutional Asset Management (1986-2007) of Bank of NY Mellon; Chartered Financial Analyst. | | 245 |
| | | | | | | | |
Name, Birthdate and Address | | Position(s) Held with the Funds | | Year First Elected or Appointed (4) | | Principal Occupation(s) During Past 5 Years | | Number of Portfolios in Fund Complex Overseen by Officer |
Lorna C. Ferguson 10/24/45 333 W. Wacker Drive Chicago, IL 60606 | | Vice President | | 1998 | | Managing Director (since 2004) of Nuveen Securities, LLC and Managing Director (since 2005) of Nuveen Fund Advisors, Inc. | | 245 |
Stephen D. Foy 5/31/54 333 W. Wacker Drive Chicago, IL 60606 | | Vice President and Controller | | 1998 | | Senior Vice President (since 2010), formerly, Vice President (1993-2010) and Funds Controller (since 1998) of Nuveen Securities, LLC; Senior Vice President (since 2010), formerly, Vice President (2005-2010) of Nuveen Fund Advisors, Inc.; Certified Public Accountant. | | 245 |
Scott S. Grace 8/20/70 333 W. Wacker Drive Chicago, IL 60606 | | Vice President and Treasurer | | 2009 | | Managing Director, Corporate Finance & Development, Treasurer (since 2009) of Nuveen Securities, LLC; Managing Director and Treasurer (since 2009) of Nuveen Fund Advisors, Inc., Nuveen Investment Solutions, Inc., Nuveen Investments Advisers, Inc., Nuveen Investments Holdings Inc. and (since (2011) Nuveen Asset Management, LLC; Vice President and Treasurer of NWQ Investment Management Company, LLC, Tradewinds Global Investors, LLC, Symphony Asset Management LLC and Winslow Capital Management, Inc.; Vice President of Santa Barbara Asset Management, LLC; formerly, Treasurer (2006-2009), Senior Vice President (2008-2009), previously, Vice President (2006-2008) of Janus Capital Group, Inc.; formerly, Senior Associate in Morgan Stanley’s Global Financial Services Group (2000-2003); Chartered Accountant Designation. | | 245 |
Walter M. Kelly 2/24/70 333 W. Wacker Drive Chicago, IL 60606 | | Chief Compliance Officer and Vice President | | 2003 | | Senior Vice President (since 2008), Vice President (2006-2008) of Nuveen Securities, LLC; Senior Vice President (since 2008) and Assistant Secretary (since 2008) of Nuveen Fund Advisors, Inc. | | 245 |
Tina M. Lazar 8/27/61 333 W. Wacker Drive Chicago, IL 60606 | | Vice President | | 2002 | | Senior Vice President (since 2009), formerly, Vice President of Nuveen Securities, LLC (1999-2009); Senior Vice President (since 2010), formerly, Vice President (2005-2010) of Nuveen Fund Advisors, Inc. | | 245 |
Larry W. Martin 7/27/51 333 West Wacker Drive Chicago, IL 60606 | | Vice President and Assistant Secretary | | 1997 | | Senior Vice President (since 2010), formerly, Vice President (1993-2010), Assistant Secretary and Assistant General Counsel of Nuveen Securities, LLC; Senior Vice President (since 2011) of Nuveen Asset Management, LLC: Senior Vice President (since 2010), formerly, Vice President (2005-2010), and Assistant Secretary of Nuveen Investments, Inc.; Senior Vice President (since 2010), formerly Vice President (2005-2010), and Assistant Secretary (since 1997) of Nuveen Fund Advisors, Inc.; Vice President and Assistant Secretary of Nuveen Investments Advisers, Inc. (since 2002), NWQ Investment Management Company, LLC, Symphony Asset Management LLC (since 2003), Tradewinds Global Investors, LLC, Santa Barbara Asset Management, LLC (since 2006), Nuveen HydePark Group, LLC and Nuveen Investment Solutions, Inc. (since 2007), and of Winslow Capital Management, Inc. (since 2010); Vice President and Assistant Secretary of Nuveen Commodities Asset Management, LLC (since 2010). | | 245 |
Trustees and Officers (Unaudited) (continued)
| | | | | | | | |
Name, Birthdate and Address | | Position(s) Held with the Funds | | Year First Elected or Appointed (4) | | Principal Occupation(s) Including other Directorships During Past 5 Years | | Number of Portfolios in Fund Complex Overseen by Officer |
Kevin J. McCarthy 3/26/66 333 W. Wacker Drive Chicago, IL 60606 | | Vice President and Secretary | | 2007 | | Managing Director (since 2008), formerly, Vice President (2007-2008), Nuveen Securities, LLC; Managing Director (since 2008), Assistant Secretary (since 2007) and Co-General Counsel (since 2011) of Nuveen Fund Advisors, Inc.; Managing Director, Assistant Secretary and Associate General Counsel (since 2011) of Nuveen Asset Management, LLC; Managing Director (since 2008), and Assistant Secretary, Nuveen Investment Holdings, Inc.; Vice President (since 2007) and Assistant Secretary of Nuveen Investments Advisers Inc., NWQ Investment Management Company, LLC, Tradewinds Global Investors LLC, NWQ Holdings, LLC, Symphony Asset Management LLC, Santa Barbara Asset Management, LLC, Nuveen HydePark Group, LLC, Nuveen Investment Solutions, Inc. (since 2007) and of Winslow Capital Management, Inc. (since 2010); Vice President and Secretary (since 2010) of Nuveen Commodities Asset Management, LLC; prior thereto, Partner, Bell, Boyd & Lloyd LLP (1997-2007). | | 245 |
Kathleen L. Prudhomme 3/30/53 800 Nicollet Mall Minneapolis, MN 55402 | | Vice President and Assistant Secretary | | 2011 | | Managing Director, Assistant Secretary and Co-General Counsel (since 2011) of Nuveen Fund Advisors, Inc.; Managing Director, Assistant Secretary and Associate General Counsel (since 2011) of Nuveen Asset Management, LLC; Managing Director and Assistant Secretary (since 2011) of Nuveen Securities, LLC; formerly, Deputy General Counsel, FAF Advisors, Inc. (2004-2010). | | 245 |
Jeffrey M. Wilson 3/13/56 333 West Wacker Drive Chicago, IL 60606 | | Vice President | | 2011 | | Senior Vice President of Nuveen Investments (since 2011), formerly, Senior Vice President of FAF Advisors, Inc. (2000-2010). | | 112 |
| (1) | Trustees serve an indefinite term until his/her successor is elected or appointed. The year first elected or appointed represents the year in which the trustee was first elected or appointed to any fund in the Nuveen Fund Complex. |
| (2) | Also serves as a trustee of the Nuveen Diversified Commodity Fund, an exchange-traded commodity pool managed by Nuveen Commodities Asset Management, LLC, an affiliate of the Adviser. |
| (3) | Mr. Amboian is an interested trustee because of his position with Nuveen Investments, Inc. and certain of its subsidiaries, which are affiliates of the Nuveen Funds. |
| (4) | Officers serve one year terms through August of each year. The year first elected or appointed represents the year in which the officer was first elected or appointed to any fund in the Nuveen Fund Complex. |
Annual Investment Management Agreement Approval Process
(Unaudited)
A. Background
Prior to January 1, 2011, FAF Advisors, Inc. (“FAF”), a wholly-owned subsidiary of U.S. Bank National Association (“U.S. Bank”), served as investment adviser to each Fund pursuant to an investment advisory agreement between First American Investment Funds, Inc. (the “Company”) and FAF (the “Prior Advisory Agreement”), and as administrator to each Fund pursuant to an administrative agreement between the Company and FAF (the “Prior Administrative Agreement”). On July 29, 2010, U.S. Bank and FAF entered into a definitive agreement with Nuveen Investments, Inc. (“Nuveen”), Nuveen Asset Management (“NAM”) and certain Nuveen affiliates, whereby NAM would acquire a portion of the asset management business of FAF (the “Transaction”). The acquired business included the assets of FAF used in providing investment advisory services, research, sales and distribution in connection with equity, fixed income, real estate, global infrastructure and asset allocation investment products (other than the money market business and closed-end funds advised by FAF), including the Funds. In connection with the Transaction, the Board of Directors (the “Prior Board”) serving the Funds as directors at that time (each a “Prior Director” and, collectively, the “Prior Directors”) considered a number of proposals designed to integrate the Funds into the Nuveen family of funds, including the appointment of NAM as investment adviser and Nuveen Investments, LLC as distributor to the Funds. The Prior Board also considered a proposal in connection with an internal restructuring of NAM (the “Restructuring”), for Nuveen Asset Management, LLC (“NAM LLC”), a wholly-owned subsidiary of NAM formed in anticipation of the Restructuring, to serve as sub-advisor for each Fund.
The Prior Board approved a new investment advisory agreement (the “New Advisory Agreement”) for each Fund with NAM and an investment sub-advisory agreement between NAM and NAM LLC (the “NAM Sub-Advisory Agreement”). At a meeting of the Funds’ stockholders held on December 17, 2010, stockholders of the Funds approved the New Advisory Agreement and the NAM Sub-Advisory Agreement. In addition, stockholders of the Company’s funds (including the Funds) elected ten directors, including one Prior Director, to the board of directors of the Company (the “New Board”).
On December 31, 2010, the Transaction closed and the New Board (which replaced the Prior Board) took effect. On January 1, 2011, the New Advisory Agreement and the NAM Sub-Advisory Agreement became effective. In addition, in connection with the Restructuring, NAM has changed its name to Nuveen Fund Advisors, Inc. (“NFA”). The following is a summary of the considerations of the Prior Board, which were set forth in a proxy statement dated November 10, 2010 (the “Proxy Statement”), in approving the New Advisory Agreement and the NAM Sub-Advisory Agreement for the Funds.
B. Prior Board Considerations
The New Advisory Agreement for each Fund was approved by the Prior Board after consideration of all factors determined to be relevant to its deliberations, including those discussed below. The Prior Board authorized the submission of the New Advisory Agreement for consideration by each Fund’s stockholders.
At meetings held in May and June of 2010, the Prior Board was apprised of the general terms of the Transaction and, as a result, began the process of considering the transition of services from FAF to NFA. In preparation for its September 21-23, 2010 meeting, the Prior Board received, in response to a written due diligence request prepared by the Prior Board and its independent legal counsel and provided to NFA and FAF, a significant amount of information covering a range of issues in advance of the meeting. To assist the Prior Board in its consideration of the New Advisory Agreement for each Fund, NFA provided materials and information about, among other things: (1) NFA and its affiliates, including their history and organizational structure, product lines, experience in providing investment advisory, administrative and other services, and financial condition, (2) the nature, extent and quality of services to be provided under the New Advisory Agreement, (3) proposed Fund fees and expenses and comparative information relating thereto, and (4) NFA’s compliance and risk management capabilities and processes. In addition, the Prior Board was provided with a memorandum from independent legal counsel outlining the legal duties of the Prior Board under the Investment Company Act of 1940, as amended (the “1940 Act”). In response to further requests from the Prior Board and its independent legal counsel, NFA and FAF provided additional information to the Prior Board following its September 21-23 meeting.
An additional in-person meeting of the Prior Board to consider the New Advisory Agreement was held on October 7, 2010, at which the members of the Prior Board in attendance, all of whom were not considered to be “interested persons” of the Company as defined in the 1940 Act (the “Independent Prior Directors”), approved the New Advisory Agreement with NFA for each Fund.
In considering the New Advisory Agreement for each Fund, the Prior Board, advised by independent legal counsel, reviewed and analyzed the factors it deemed relevant, including: (1) the nature, quality, and extent of services to be rendered to the Funds by NFA, (2) the cost of services to be provided, including Fund expense information, and (3) whether economies of scale may be realized as the Funds grow and whether fee levels are adjusted to enable Fund investors to share in these potential economies of scale.
In considering the New Advisory Agreement, the Prior Board did not identify any particular information that was all-important or controlling, and each Prior Director may have attributed different weights to the various factors discussed below. Where appropriate, the Prior Directors evaluated all information available to them regarding the Company’s funds on a fund-by-fund basis, and their determinations were made separately with respect to each such fund (including each of the Funds). The Prior Directors, all of whom were Independent Prior Directors, concluded that the terms of the New Advisory Agreement and the fee rates to be paid in light of the services to be provided to each Fund are in the best interests of each Fund, and that the New Advisory Agreement should be
Annual Investment Management Agreement Approval Process
(Unaudited) (continued)
approved and recommended to stockholders for approval. In voting to approve the New Advisory Agreement with respect to each Fund, the Prior Board considered in particular the following factors:
Nature, Extent and Quality of Services. In considering approval of the New Advisory Agreement, the Prior Board considered the nature, extent and quality of services to be provided by NFA, including advisory services and administrative services. The Prior Board reviewed materials outlining, among other things, NFA’s organizational structure and business; the types of services that NFA or its affiliates are expected to provide to the Funds; the performance record of the applicable Fund (as described in further detail below); and fund product lines offered by NFA. The Prior Board considered that affiliation with a larger fund complex and well-recognized sponsor may result in a broader distribution network, potential economies of scale with respect to other services or fees and broader shareholder services including exchange options.
With respect to personnel, the Prior Board considered information regarding retention plans for current FAF employees who would be offered employment by NFA, and the background and experience of NFA employees who would become portfolio managers as of the closing of the Transaction. The Prior Board also reviewed information regarding portfolio manager compensation arrangements to evaluate NFA’s ability to attract and retain high quality investment personnel.
In evaluating the services of NFA, the Prior Board also considered NFA’s ability to supervise the Funds’ other service providers and, given the importance of compliance, NFA’s compliance program. Among other things, the Prior Board considered the report of NFA’s chief compliance officer regarding NFA’s compliance policies and procedures.
In addition to advisory services, the Prior Board considered the quality of administrative services expected to be provided by NFA and its affiliates including product management, fund administration, oversight of service providers, shareholder services, administration of Board relations, regulatory and portfolio compliance and legal support.
The Prior Board considered that, based on representations from FAF and NFA, the Transaction would allow stockholders to continue their investment in each of the Company’s funds with the same investment objective and principal strategies. The Prior Board considered the historical investment performance of each of the Company’s funds (including each Fund) previously provided during the annual contract renewal process.
Cost of Services Provided by NFA. In evaluating the costs of the services to be provided by NFA under the New Advisory Agreement, the Prior Board received a comparison of each Fund’s annual operating expenses as of June 30, 2010 under the Prior Advisory Agreement and under the New Advisory Agreement, in each case adjusted to reflect a decrease in net assets for certain of the Company’s funds from redemptions by the U.S. Bank 401(k) Plan expected to occur prior to the closing of the Transaction. The Prior Board considered, among other things, that the advisory fee rates and other expenses would change as a result of NFA serving as investment adviser to each Fund. The Prior Board noted that the services provided by NFA under the New Advisory Agreement would include certain administrative services, which services (along with other services) were provided pursuant to the Prior Administrative Agreement and were charged separately from the advisory fee. Accordingly, the Prior Board considered that the fee rates paid under the New Advisory Agreement include bundled investment advisory and administrative fees and thus are higher than the fee rates paid under the Prior Advisory Agreement for most of the Company’s funds, but lower than the combined fee rates paid under the Prior Advisory Agreement and the Prior Administrative Agreement. The Prior Board also noted that certain administrative services provided under the Prior Administrative Agreement would not be provided under the New Advisory Agreement and will be delegated to other service providers. Similarly, certain fees paid by FAF under the Prior Administrative Agreement will not be paid by NFA under the New Advisory Agreement and will be paid directly by the Funds. However, immediately following the closing of the Transaction, the net expense ratio of each Fund was expected to be the same or lower than the Fund’s net expense ratio as of June 30, 2010, adjusted (where applicable) to reflect a decrease in net assets resulting from redemptions by the U.S. Bank 401(k) Plan expected to occur prior to the closing of the Transaction, assuming the Fund’s net assets at the time of the closing of the Transaction were no lower than their adjusted June 30 level. In addition, the Prior Board noted that NFA has committed to certain undertakings to maintain current fee caps and/or to waive fees or reimburse expenses to maintain net management fees at certain levels and Nuveen has represented to the Prior Board that Nuveen and its affiliates will not take any action that imposes an “unfair burden” on any Fund as a result of the Transaction. The Prior Board also considered that fees payable under the New Advisory Agreement include both a fund-level fee and a complex-level fee, and that schedules for the fund-level and complex-level fees contain breakpoints that are based, respectively, on Fund assets and Nuveen complex-wide assets. The Prior Board considered that breakpoints in the fund-level fee allow for the possibility that this portion of the advisory fee could decline in the future if Fund assets were to increase or increase in the future if Fund assets were to decline. The Prior Board also considered that breakpoints in the complex-level fee allow for the possibility that this portion of the advisory fee could decline in the future if complex-wide assets were to increase or increase in the future if complex-wide assets were to decline, regardless, in each case, of whether assets of the particular Fund had increased or decreased.
In considering the compensation to be paid to NFA, the Prior Board also reviewed fee information regarding NFA-sponsored funds, to the extent such funds had similar investment objectives and strategies to the Funds. The Prior Board reviewed information provided by NFA regarding similar funds managed by NFA and noted that the fee rates payable by these funds were generally comparable to the fee rates proposed for the Company’s funds. The Prior Board also compared proposed fee and expense information to the median fees and expenses of comparable funds, using information provided by an independent data service.
In evaluating the compensation, the Prior Board also considered other amounts expected to be paid to NFA by the Funds as well as any indirect benefits (such as soft dollar arrangements, if any) NFA and its affiliates are expected to receive, that are directly attributable to the management of the Funds.
The Prior Board also considered that the Funds would not bear any of the costs relating to the Transaction, including the costs of preparing, printing and mailing the Proxy Statement.
Economies of Scale. The Prior Board reviewed information regarding potential economies of scale or other efficiencies that might result from the Funds’ potential association with Nuveen. The Prior Board noted that the New Advisory Agreement provides for breakpoints in the Funds’ fund-level and complex-level management fee rates as the assets of the Funds and the assets held by the various registered investment companies sponsored by Nuveen increase, respectively. The Prior Board concluded that the structure of the investment management fee rates, with the breakpoints for the Funds under the New Advisory Agreement, reflected sharing of potential economies of scale with the Funds’ stockholders.
Conclusion. After deliberating in executive session, the members of the Prior Board in attendance, all of whom were Independent Prior Directors, approved the New Advisory Agreement with respect to each Fund, concluding that the New Advisory Agreement was in the best interests of each Fund.
NAM Sub-Advisory Agreement. The Prior Board also approved the NAM Sub-Advisory Agreement between NFA and NAM LLC as a result of the Restructuring expected to occur with NFA. The Prior Board considered that the services to be provided by NAM LLC under the NAM Sub-Advisory Agreement would not result in any material change in the nature or level of investment advisory services or administrative services provided to the Funds. In addition, the portfolio managers will continue to manage the Funds in their capacity as employees of NAM LLC. The Prior Board considered that NFA will pay a portion of the advisory fee it receives from each Fund to NAM LLC for its services as sub-advisor. The Prior Board concluded, based upon the conclusions that the Prior Board reached in connection with the approval of the New Advisory Agreement and after determining that it need not reconsider all of the factors that it had considered in connection with the approval of the New Advisory Agreement, to approve the NAM Sub-Advisory Agreement.
Glossary of Terms Used in this Report
Average Annual Total Return: This is a commonly used method to express an investment’s performance over a particular, usually multi-year time period. It expresses the return that would have been necessary each year to equal the investment’s actual cumulative performance (including change in NAV or offer price and reinvested dividends and capital gains distributions, if any) over the time period being considered.
Average Effective Maturity: The market-value-weighted average of the effective maturity dates of the individual securities including cash. In the case of a bond that has been advance-refunded to a call date, the effective maturity is the date on which the bond is scheduled to be redeemed using the proceeds of an escrow account. In most other cases the effective maturity is the stated maturity date of the security.
Average Duration: Duration is a measure of the expected period over which a bond’s principal and interest will be paid, and consequently is a measure of the sensitivity of a bond’s (or bond fund’s) value to changes when market interest rates change. Generally, the longer a bond or Fund’s duration, the more the price of the bond or Fund will change as interest rates change.
Barclays Capital Municipal Bond Index: An unmanaged index comprised of fixed-rate, investment-grade tax- exempt bonds with remaining maturities of one year or more.
Barclays Capital 1-15 Year Blend Municipal Bond Index: An unmanaged index comprised of fixed-rate, investment-grade tax-exempt bonds with remaining maturities between 1 and 17 years.
Inverse Floaters: Inverse floating rate securities are created by depositing a municipal bond, typically with a fixed interest rate, into a special purpose trust created by a broker-dealer. This trust, in turn, (a) issues floating rate certificates typically paying short-term tax-exempt interest rates to third parties in amounts equal to some fraction of the deposited bond’s par amount or market value, and (b) issues an inverse floating rate certificate (sometimes referred to as an “inverse floater”) to an investor (such as a Fund) interested in gaining investment exposure to a long-term municipal bond. The income received by the holder of the inverse floater varies inversely with the short-term rate paid to the floating rate certificates’ holders, and in most circumstances the holder of the inverse floater bears substantially all of the underlying bond’s downside investment risk. The holder of the inverse floater typically also benefits disproportionately from any potential appreciation of the underlying bond’s value. Hence, an inverse floater essentially represents an investment in the underlying bond on a leveraged basis.
Lipper Colorado Municipal Debt Funds Average: Represents the average annualized total return for all reporting funds in the Lipper Colorado Municipal Debt Fund category. The Lipper Colorado Municipal Debt Funds Average contained 18, 18, 16 and 16 funds for the 11-month, 1-year, 5-year and 10-year periods, respectively, ended May 31, 2011.
Lipper Intermediate Municipal Debt Funds Average: Represents the average annualized total return for all reporting funds in the Lipper Intermediate Municipal Debt Funds Average category. The Lipper Intermediate Municipal Debt Funds Average contained 163, 163, 139 and 80 funds for the 11-month, 1-year, 5-year and 10-year periods, respectively, ended May 31, 2011.
Lipper Minnesota Municipal Debt Funds Average: Represents the average annualized total return for all reporting funds in the Lipper Minnesota Municipal Debt Fund category. The Lipper Minnesota Municipal Debt Funds Average contained 39, 39, 33 and 31 funds for the 11-month, 1-year, 5-year and 10-year periods, respectively, ended May 31, 2011.
Lipper Ohio Municipal Debt Funds Average: Represents the average annualized total return for all reporting funds in the Lipper Ohio Municipal Debt Fund category. The Lipper Ohio Municipal Debt Funds Average contained 43, 43, 36 and 32 funds for the 11-month, 1-year, 5-year and 10-year periods, respectively, ended May 31, 2011.
Lipper Other States Municipal Debt Funds Average: Represents the average annualized total return for all reporting funds in the Lipper Other States Municipal Debt Fund category. The Lipper Other States Municipal Debt Funds Average contained 144, 144, 137 and 123 funds for the 11-month, 1-year, 5-year and 10-year periods, respectively, ended May 31, 2011. Shareholders should note that the performance of the Lipper Other States Average represents the overall average of returns for funds from ten different states with a wide variety of municipal market conditions, making direct comparisons less meaningful.
Net Asset Value (NAV): A Fund’s NAV is the dollar value of one share in the Fund. It is calculated by subtracting the liabilities of the Fund from its total assets and then dividing the remainder by the number of shares outstanding. Fund NAVs are calculated at the end of each business day.
Pre-Refundings: Pre-Refundings, also known as advance refundings or refinancings, occur when an issuer sells new bonds and uses the proceeds to fund principal and interest payments of older existing bonds. This process often results in lower borrowing costs for bond issuers.
Zero Coupon Bond: A zero coupon bond does not pay a regular interest coupon to its holders during the life of the bond. Tax-exempt income to the holder of the bond comes from accretion of the difference between the original purchase price of the bond at issuance and the par value of the bond at maturity and is effectively paid at maturity. The market prices of zero coupon bonds generally are more volatile than the market prices of bonds that pay interest periodically.
Fund Information
Fund Manager
Nuveen Fund Advisors, Inc.
333 West Wacker Drive
Chicago, IL 60606
Sub-Adviser
Nuveen Asset Management, LLC
333 West Wacker Drive
Chicago, IL 60606
Legal Counsel
Chapman and Cutler LLP
Chicago, IL
Independent Registered Public Accounting Firm
Ernst & Young LLP
Chicago, IL
Custodian
U.S. Bank National Association
St. Paul, MN
Transfer Agent and Shareholder Services
U.S. Bancorp
Fund Services, LLC
615 E. Michigan Street
Milwaukee, WI 53202
Quarterly Portfolio of Investments and Proxy Voting information: You may obtain (i) each Fund’s quarterly portfolio of investments, (ii) information regarding how the Funds voted proxies relating to portfolio securities held during the most recent twelve-month period ended June 30, and (iii) a description of the policies and procedures that the Funds used to determine how to vote proxies relating to portfolio securities without charge, upon request, by calling Nuveen Investments at (800) 257-8787 or on Nuveen’s website at www.nuveen.com.
You may also obtain this and other Fund information directly from the Securities and Exchange Commission (SEC). The SEC may charge a copying fee for this information. Visit the SEC on-line at http://www.sec.gov or in person at the SEC’s Public Reference Room in Washington, D.C. Call the SEC at (202) 942-8090 for room hours and operation. You may also request Fund information by sending an e-mail request to publicinfo@sec.gov or by writing to the SEC’s Public Reference Section at 100 F Street NE, Washington, D.C. 20549.
The Financial Industry Regulatory Authority (FINRA) provides a Public Disclosure Program which supplies certain information regarding the disciplinary history of FINRA members and their associated persons in response to either telephone inquiries at (800) 289-9999 or written inquiries at www.finra.org. FINRA also provides an investor brochure that includes information describing the Public Disclosure Program.
Nuveen Investments:
Serving Investors for Generations
Since 1898, financial advisors and their clients have relied on Nuveen Investments to provide dependable investment solutions through continued adherence to proven, long-term investing principles. Today, we offer a range of high quality equity and fixed-income solutions designed to be integral components of a well-diversified core portfolio.
Focused on meeting investor needs.
Nuveen Investments is a global investment management firm that seeks to help secure the long-term goals of institutions and high net worth investors as well as the consultants and financial advisors who serve them. We market our growing range of specialized investment solutions under the high-quality brands of HydePark, NWQ, Nuveen Asset Management, Santa Barbara, Symphony, Tradewinds and Winslow Capital. In total, Nuveen Investments managed approximately $206 billion of assets as of March 31, 2011.
Find out how we can help you.
To learn more about how the products and services of Nuveen Investments may be able to help you meet your financial goals, talk to your financial advisor, or call us at (800) 257-8787. Please read the information provided carefully before you invest. Investors should consider the investment objective and policies, risk considerations, charges and expenses of any investment carefully. Where applicable, be sure to obtain a prospectus, which contains this and other relevant information. To obtain a prospectus, please contact your securities representative or Nuveen Investments, 333 W. Wacker Dr., Chicago, IL 60606. Please read the prospectus carefully before you invest or send money.
Learn more about Nuveen Funds at: www.nuveen.com/mf
Nuveen makes things e-simple.
It only takes a minute to sign up for e-Reports. Once enrolled, you’ll receive an e-mail as soon as your Nuveen Fund information is ready — no more waiting for delivery by regular mail. Just click on the link within the e-mail to see the report and save it on your computer if you wish.
Free e-Reports right to your e-mail!
www.investordelivery.com
If you receive your Nuveen Fund distributions and statements from your financial advisor or brokerage account.
OR
www.nuveen.com/accountaccess
If you receive your Nuveen Fund distributions and statements directly from Nuveen.
| | |
Distributed by Nuveen Securities, LLC 333 West Wacker Drive Chicago, IL 60606 www.nuveen.com | | |
MAN-FTFI-0511D
ITEM 2. CODE OF ETHICS.
As of the end of the period covered by this report, the registrant has adopted a code of ethics that applies to the registrant’s principal executive officer, principal financial officer, principal accounting officer or controller, or persons performing similar functions. There were no amendments to or waivers from the code during the period covered by this report. The registrant has posted the code of ethics on its website at www.nuveen.com/mf. (To view the code, click on the Shareholder Resources drop down menu box, click on Fund Governance and then click on Code of Conduct.)
ITEM 3. AUDIT COMMITTEE FINANCIAL EXPERT.
The registrant’s Board of Trustees determined that the registrant has at least one “audit committee financial expert” (as defined in Item 3 of Form N-CSR) serving on its Audit Committee. The registrant’s audit committee financial expert is Carole E. Stone, who is “independent” for purposes of Item 3 of Form N-CSR.
Ms. Stone served for five years as Director of the New York State Division of the Budget. As part of her role as Director, Ms. Stone was actively involved in overseeing the development of the State’s operating, local assistance and capital budgets, its financial plan and related documents; overseeing the development of the State’s bond-related disclosure documents and certifying that they fairly presented the State’s financial position; reviewing audits of various State and local agencies and programs; and coordinating the State’s system of internal audit and control. Prior to serving as Director, Ms. Stone worked as a budget analyst/examiner with increasing levels of responsibility over a 30 year period, including approximately five years as Deputy Budget Director. Ms. Stone has also served as Chair of the New York State Racing Association Oversight Board, as Chair of the Public Authorities Control Board, as a Commissioner on the New York State Commission on Public Authority Reform and as a member of the Boards of Directors of several New York State public authorities. These positions have involved overseeing operations and finances of certain entities and assessing the adequacy of project/entity financing and financial reporting. Currently, Ms. Stone is on the Board of Directors of CBOE Holdings, Inc., of the Chicago Board Options Exchange, and of C2 Options Exchange. Ms. Stone’s position on the boards of these entities and as a member of both CBOE Holdings’ Audit Committee and its Finance Committee has involved, among other things, the oversight of audits, audit plans and preparation of financial statements.
ITEM 4. PRINCIPAL ACCOUNTANT FEES AND SERVICES.
The following tables show the amount of fees that Ernst & Young LLP, the Trust’s auditor, billed to the Trust during the Trust’s last two full fiscal years. The Audit Committee approved in advance all audit services and non-audit services that Ernst & Young LLP provided to the Trust, except for those non-audit services that were subject to the pre-approval exception under Rule 2-01 of Regulation S-X (the “pre-approval exception”). The pre-approval exception for services provided directly to the Trust waives the pre-approval requirement for services other than audit, review or attest services if: (A) the aggregate amount of all such services provided constitutes no more than 5% of the total amount of revenues paid by the Trust during the fiscal year in which the services are provided; (B) the Trust did not recognize the services as non-audit services at the time of the engagement; and (C) the services are promptly brought to the Audit Committee’s attention, and the Committee (or its delegate) approves the services before the audit is completed.
The Audit Committee has delegated certain pre-approval responsibilities to its Chairman (or, in his absence, any other member of the Audit Committee).
SERVICES THAT THE TRUST’S AUDITOR BILLED TO THE TRUST
| | | | | | | | | | | | | | | | |
Fiscal Year Ended May 31, 2011 5 | | Audit Fees Billed
to Funds 1 | | | Audit-Related Fees
Billed to Funds 2 | | | Tax Fees
Billed to Funds 3 | | | All Other Fees
Billed to Funds 4 | |
Name of Series | | | | | | | | | | | | | | | | |
Colorado Tax Free Fund | | | 19,091 | | | | 0 | | | | 1,348 | | | | 0 | |
Minnesota Municipal Bond Fund | | | 19,091 | | | | 0 | | | | 1,348 | | | | 0 | |
Minnesota Intermediate Municipal Bond Fund | | | 19,091 | | | | 0 | | | | 1,056 | | | | 0 | |
Missouri Tax Free Fund | | | 19,091 | | | | 0 | | | | 1,348 | | | | 0 | |
Nebraska Municipal Bond Fund | | | 19,090 | | | | 0 | | | | 1,348 | | | | 0 | |
Ohio Tax Free Fund | | | 19,091 | | | | 0 | | | | 1,348 | | | | 0 | |
Oregon Intermediate Municipal Bond Fund | | | 19,091 | | | | 0 | | | | 1,348 | | | | 0 | |
| | | | | | | | | | | | | | | | |
Total | | $ | 133,636 | | | $ | 0 | | | $ | 9,144 | | | $ | 0 | |
| 1 | | “Audit Fees” are the aggregate fees billed for professional services for the audit of the Fund’s annual financial statements and services provided in connection with statutory and regulatory filings or engagements. |
| 2 | | “Audit Related Fees” are the aggregate fees billed for assurance and related services reasonably related to the performance of the audit or review of financial statements and are not reported under “Audit Fees”. |
| 3 | | “Tax Fees” are the aggregate fees billed for professional services for tax advice, tax compliance, and tax planning. |
| 4 | | “All Other Fees” are the aggregate fees billed for products and services other than “Audit Fees”, “Audit Related Fees”, and “Tax Fees”. |
| 5 | | The funds were acquired on December 31, 2010 and changed fiscal year from June to May beginning in January, 2011. |
| | | | | | | | | | | | | | | | |
| | | Percentage Approved Pursuant to Pre-approval Exception | |
| | | Audit Fees Billed
to Funds | | | Audit-Related Fees
Billed to Funds | | | Tax Fees
Billed to Funds | | | All Other Fees
Billed to Funds | |
Name of Series | | | | | | | | | | | | | | | | |
Colorado Tax Free Fund | | | 0 | % | | | 0 | % | | | 0 | % | | | 0 | % |
Minnesota Municipal Bond Fund | | | 0 | % | | | 0 | % | | | 0 | % | | | 0 | % |
Minnesota Intermediate Municipal Bond Fund | | | 0 | % | | | 0 | % | | | 0 | % | | | 0 | % |
Missouri Tax Free Fund | | | 0 | % | | | 0 | % | | | 0 | % | | | 0 | % |
Nebraska Municipal Bond Fund | | | 0 | % | | | 0 | % | | | 0 | % | | | 0 | % |
Ohio Tax Free Fund | | | 0 | % | | | 0 | % | | | 0 | % | | | 0 | % |
Oregon Intermediate Municipal Bond Fund | | | 0 | % | | | 0 | % | | | 0 | % | | | 0 | % |
| | | | |
Fiscal Year Ended June 30, 2010 | | Audit Fees Billed
to Funds 1 | | | Audit-Related Fees
Billed to Funds 2 | | | Tax Fees
Billed to Funds 3 | | | All Other Fees
Billed to Funds 4 | |
Name of Series | | | | | | | | | | | | | | | | |
Colorado Tax Free Fund | | | 111,074 | | | | 352 | | | | 21,941 | | | | 0 | |
Minnesota Municipal Bond Fund | | | 111,074 | | | | 352 | | | | 21,941 | | | | 0 | |
Minnesota Intermediate Municipal Bond Fund | | | 111,074 | | | | 352 | | | | 21,941 | | | | 0 | |
Missouri Tax Free Fund | | | 111,074 | | | | 352 | | | | 21,941 | | | | 0 | |
Nebraska Municipal Bond Fund | | | 111,074 | | | | 352 | | | | 21,941 | | | | 0 | |
Ohio Tax Free Fund | | | 111,074 | | | | 352 | | | | 21,941 | | | | 0 | |
Oregon Intermediate Municipal Bond Fund | | | 111,074 | | | | 352 | | | | 21,941 | | | | 0 | |
| | | | | | | | | | | | | | | | |
Total | | $ | 777,518 | | | $ | 2,464 | | | $ | 153,587 | | | $ | 0 | |
|
1 “Audit Fees” are the aggregate fees billed for professional services for the audit of the Fund’s annual financial statements and services provided in connection with statutory and regulatory filings or engagements. | |
2 “Audit Related Fees” are the aggregate fees billed for assurance and related services reasonably related to the performance of the audit or review of financial statements and are not reported under “Audit Fees”. | |
3 “Tax Fees” are the aggregate fees billed for professional services for tax advice, tax compliance, and tax planning. | |
4 “All Other Fees” are the aggregate fees billed for products and services other than “Audit Fees”, “Audit Related Fees”, and “Tax Fees”. | |
| |
| | | Percentage Approved Pursuant to Pre-approval Exception | |
| | | Audit Fees Billed
to Funds | | | Audit-Related Fees
Billed to Funds | | | Tax Fees
Billed to Funds | | | All Other Fees
Billed to Funds | |
Name of Series | | | | | | | | | | | | | | | | |
Colorado Tax Free Fund | | | 0 | % | | | 0 | % | | | 0 | % | | | 0 | % |
Minnesota Municipal Bond Fund | | | 0 | % | | | 0 | % | | | 0 | % | | | 0 | % |
Minnesota Intermediate Municipal Bond Fund | | | 0 | % | | | 0 | % | | | 0 | % | | | 0 | % |
Missouri Tax Free Fund | | | 0 | % | | | 0 | % | | | 0 | % | | | 0 | % |
Nebraska Municipal Bond Fund | | | 0 | % | | | 0 | % | | | 0 | % | | | 0 | % |
Ohio Tax Free Fund | | | 0 | % | | | 0 | % | | | 0 | % | | | 0 | % |
Oregon Intermediate Municipal Bond Fund | | | 0 | % | | | 0 | % | | | 0 | % | | | 0 | % |
| | | | | | | | | | | | |
Fiscal Year Ended May 31, 2011 | | Audit-Related Fees
Billed to Adviser and
Affiliated Fund
Service Providers | | | Tax Fees Billed to
Adviser and
Affiliated Fund
Service Providers | | | All Other Fees
Billed to Adviser
and Affiliated Fund
Service Providers | |
Nuveen Investment Funds, Inc. | | $ | 0 | | | $ | 0 | | | $ | 0 | |
| |
| | | Percentage Approved Pursuant to Pre-approval Exception | |
| | | Audit-Related Fees
Billed to Adviser and
Affiliated Fund
Service Providers | | | Tax Fees Billed to
Adviser and
Affiliated Fund
Service Providers | | | All Other Fees
Billed to Adviser
and Affiliated Fund
Service Providers | |
| | | 0 | % | | | 0 | % | | | 0 | % |
| | | |
Fiscal Year Ended June 30, 2010 | | Audit-Related Fees
Billed to Adviser and
Affiliated Fund
Service Providers | | | Tax Fees Billed to
Adviser and
Affiliated Fund
Service Providers
| | | All Other Fees
Billed to Adviser
and Affiliated Fund
Service Providers | |
Nuveen Investment Funds, Inc. | | $ | 0 | | | $ | 0 | | | $ | 0 | |
| |
| | | Percentage Approved Pursuant to Pre-approval Exception | |
| | | Audit-Related Fees
Billed to Adviser and
Affiliated Fund
Service Providers | | | Tax Fees Billed to
Adviser and
Affiliated Fund
Service Providers | | | All Other Fees
Billed to Adviser
and Affiliated Fund
Service Providers | |
| | | 0 | % | | | 0 | % | | | 0 | % |
| | | | | | | | | | | | | | | | |
Fiscal Year Ended May 31, 2011 1 | | Total Non-Audit Fees
Billed to Trust | | | Total Non-Audit Fees
billed to Adviser and
Affiliated Fund Service
Providers (engagements
related directly to the
operations and financial
reporting of the Trust) | | | Total Non-Audit Fees
billed to Adviser and
Affiliated Fund Service
Providers (all other
engagements) | | | Total | |
Name of Series | | | | | | | | | | | | | | | | |
Colorado Tax Free Fund | | | 1,348 | | | | 0 | | | | 0 | | | | 1,348 | |
Minnesota Municipal Bond Fund | | | 1,348 | | | | 0 | | | | 0 | | | | 1,348 | |
Minnesota Intermediate Municipal Bond Fund | | | 1,056 | | | | 0 | | | | 0 | | | | 1,056 | |
Missouri Tax Free Fund | | | 1,348 | | | | 0 | | | | 0 | | | | 1,348 | |
Nebraska Municipal Bond Fund | | | 1,348 | | | | 0 | | | | 0 | | | | 1,348 | |
Ohio Tax Free Fund | | | 1,348 | | | | 0 | | | | 0 | | | | 1,348 | |
Oregon Intermediate Municipal Bond Fund | | | 1,348 | | | | 0 | | | | 0 | | | | 1,348 | |
| | | | | | | | | | | | | | | | |
Total | | $ | 9,144 | | | $ | 0 | | | $ | 0 | | | $ | 9,144 | |
“Non-Audit Fees Billed to Trust” represent “Tax Fees” and “All Other Fees” billed to each Fund in their respective amounts from the previous table.
| 1 | | The funds were acquired on December 31, 2010 and changed fiscal year from June to May beginning in January, 2011. |
| | | | | | | | | | | | | | | | |
Fiscal Year Ended June 30, 2010 | | Total Non-Audit Fees
Billed to Trust | | | Total Non-Audit Fees
billed to Adviser and
Affiliated Fund Service
Providers (engagements
related directly to the
operations and financial
reporting of the Trust) | | | Total Non-Audit Fees
billed to Adviser and
Affiliated Fund Service
Providers (all other
engagements) | | | Total | |
Name of Series | | | | | | | | | | | | | | | | |
Colorado Tax Free Fund | | | 21,941 | | | | 0 | | | | 0 | | | | 21,941 | |
Minnesota Municipal Bond Fund | | | 21,941 | | | | 0 | | | | 0 | | | | 21,941 | |
Minnesota Intermediate Municipal Bond Fund | | | 21,941 | | | | 0 | | | | 0 | | | | 21,941 | |
Missouri Tax Free Fund | | | 21,941 | | | | 0 | | | | 0 | | | | 21,941 | |
Nebraska Municipal Bond Fund | | | 21,941 | | | | 0 | | | | 0 | | | | 21,941 | |
Ohio Tax Free Fund | | | 21,941 | | | | 0 | | | | 0 | | | | 21,941 | |
Oregon Intermediate Municipal Bond Fund | | | 21,941 | | | | 0 | | | | 0 | | | | 21,941 | |
| | | | | | | | | | | | | | | | |
Total | | $ | 153,587 | | | $ | 0 | | | $ | 0 | | | $ | 153,587 | |
“Non-Audit Fees Billed to Trust” represent “Tax Fees” and “All Other Fees” billed to each Fund in their respective amounts from the previous table.
Audit Committee Pre-Approval Policies and Procedures. Generally, the Audit Committee must approve (i) all non-audit services to be performed for the Trust by the Trust’s independent accountants and (ii) all audit and non-audit services to be performed by the Trust’s independent accountants for the Affiliated Fund Service Providers with respect to the operations and financial reporting of the Trust. Regarding tax and research projects conducted by the independent accountants for the Trust and Affiliated Fund Service Providers (with respect to operations and financial reports of the Trust), such engagements will be (i) pre-approved by the Audit Committee if they are expected to be for amounts greater than $10,000; (ii) reported to the Audit Committee Chairman for his verbal approval prior to engagement if they are expected to be for amounts under $10,000 but greater than $5,000; and (iii) reported to the Audit Committee at the next Audit Committee meeting if they are expected to be for an amount under $5,000.
ITEM 5. AUDIT COMMITTEE OF LISTED REGISTRANTS
Not applicable to this registrant.
ITEM 6. SCHEDULE OF INVESTMENTS
| a) | | See Portfolio of Investments in Item 1. |
ITEM 7. DISCLOSURE OF PROXY VOTING POLICIES AND PROCEDURES FOR CLOSED-END
MANAGEMENT INVESTMENT COMPANIES
Not applicable to this registrant.
ITEM 8. PORTFOLIO MANAGERS OF CLOSED-END MANAGEMENT INVESTMENT COMPANIES
Not applicable to this registrant.
ITEM 9. PURCHASES OF EQUITY SECURITIES BY CLOSED-END MANAGEMENT INVESTMENT COMPANY AND AFFILIATED PURCHASERS
Not applicable to this registrant.
ITEM 10. SUBMISSION OF MATTERS TO A VOTE OF SECURITY HOLDERS
There have been no material changes to the procedures by which shareholders may recommend nominees to the registrant’s Board of Trustees implemented after the registrant last provided disclosure in response to this Item.
ITEM 11. CONTROLS AND PROCEDURES.
| | (a) | | The registrant’s principal executive and principal financial officers, or persons performing similar functions, have concluded that the registrant’s disclosure controls and procedures (as defined in Rule 30a-3(c) under the Investment Company Act of 1940, as amended (the “1940 Act”) (17 CFR 270.30a-3(c))) are effective, as of a date within 90 days of the filing date of this report that includes the disclosure required by this paragraph, based on their evaluation of the controls and procedures required by Rule 30a-3(b) under the 1940 Act (17 CFR 270.30a-3(b)) and Rules 13a-15(b) or 15d-15(b) under the Securities Exchange Act of 1934, as amended (the “Exchange Act”) (17 CFR 240.13a-15(b) or 240.15d-15(b)). |
| | (b) | | There were no changes in the registrant’s internal control over financial reporting (as defined in Rule 30a-3(d) under the 1940 Act (17 CFR 270.30a-3(d)) that occurred during the second fiscal quarter of the period covered by this report that has materially affected, or is reasonably likely to materially affect, the registrant’s internal control over financial reporting. |
ITEM 12. EXHIBITS
File the exhibits listed below as part of this Form.
| | |
| (a)(1) | | Any code of ethics, or amendment thereto, that is the subject of the disclosure required by Item 2, to the extent that the registrant intends to satisfy the Item 2 requirements through filing of an exhibit: Not applicable because the code is posted on registrant’s website at www.nuveen.com/mf and there were no amendments during the period covered by this report. (To view the code, click on the Shareholder Resources drop down menu box, click on Fund Governance and then Code of Conduct.) |
| |
| (a)(2) | | A separate certification for each principal executive officer and principal financial officer of the registrant as required by
Rule 30a-2(a) under the 1940 Act (17 CFR 270.30a-2(a)) in the exact form set forth below: See EX-99.CERT attached hereto. |
| |
| (a)(3) | | Any written solicitation to purchase securities under Rule 23c-1 under the 1940 Act (17 CFR 270.23c-1) sent or given during the period covered by the report by or on behalf of the registrant to 10 or more persons: Not applicable to this registrant. |
| |
| (b) | | If the report is filed under Section 13(a) or 15(d) of the Exchange Act, provide the certifications required by Rule 30a-2(b) under the 1940 Act (17 CFR 270.30a-2(b)), Rule 13a-14(b) or Rule 15d-14(b) under the Exchange Act (17 CFR 240.13a-14(b) or 240.15d-14(b)), and Section 1350 of Chapter 63 of Title 18 of the United States Code (18 U.S.C. 1350) as an Exhibit. A certification furnished pursuant to this paragraph will not be deemed “filed” for purposes of Section 18 of the Exchange Act (15 U.S.C. 78r), or otherwise subject to the liability of that section. Such certification will not be deemed to be incorporated by reference into any filing under the Securities Act of 1933 or the Exchange Act, except to the extent that the registration specifically incorporates it by reference: See EX-99.906 CERT attached hereto. |
SIGNATURES
Pursuant to the requirements of the Securities Exchange Act of 1934 and the Investment Company Act of 1940, the registrant has duly caused this report to be signed on its behalf by the undersigned, thereunto duly authorized.
(Registrant) Nuveen Investment Funds, Inc.
| | |
| |
By (Signature and Title) | | /s/ Kevin J. McCarthy |
| | Kevin J. McCarthy |
| | Vice President and Secretary |
Date August 17, 2011
Pursuant to the requirements of the Securities Exchange Act of 1934 and the Investment Company Act of 1940, this report has been signed below by the following persons on behalf of the registrant and in the capacities and on the dates indicated.
| | |
| |
By (Signature and Title) | | /s/ Gifford R. Zimmerman |
| | Gifford R. Zimmerman |
| | Chief Administrative Officer |
| | (principal executive officer) |
Date August 17, 2011
| | |
| |
| By (Signature and Title) | | /s/ Stephen D. Foy |
| | Stephen D. Foy |
| | Vice President and Controller |
| | (principal financial officer) |
Date August 17, 2011