UNITED STATES
SECURITIES AND EXCHANGE COMMISSION
Washington, D.C. 20549
FORM N-CSR
CERTIFIED SHAREHOLDER REPORT OF REGISTERED MANAGEMENT
INVESTMENT COMPANIES
Investment Company Act file number 811-05309
Nuveen Investment Funds, Inc.
(Exact name of registrant as specified in charter)
Nuveen Investments
333 West Wacker Drive, Chicago, IL 60606
(Address of principal executive offices) (Zip code)
Kevin J. McCarthy
Nuveen Investments
333 West Wacker Drive
Chicago, IL 60606
(Name and address of agent for service)
Registrant’s telephone number, including area code: (312) 917-7700
Date of fiscal year end: June 30
Date of reporting period: June 30, 2011
Form N-CSR is to be used by management investment companies to file reports with the Commission not later than 10 days after the transmission to stockholders of any report that is required to be transmitted to stockholders under Rule 30e-1 under the Investment Company Act of 1940 (17 CFR 270.30e-1). The Commission may use the information provided on Form N-CSR in its regulatory, disclosure review, inspection, and policy making roles.
A registrant is required to disclose the information specified by Form N-CSR, and the Commission will make this information public. A registrant is not required to respond to the collection of information contained in Form N-CSR unless the Form displays a currently valid Office of Management and Budget (“OMB”) control number. Please direct comments concerning the accuracy of the information collection burden estimate and any suggestions for reducing the burden to Secretary, Securities and Exchange Commission, 450 Fifth Street, NW, Washington, DC 20549-0609. The OMB has reviewed this collection of information under the clearance requirements of 44 U.S.C. ss.3507.
ITEM 1. REPORTS TO STOCKHOLDERS.

Mutual Funds
Nuveen Income Funds
(formerly First American Taxable Income Funds)
For investors seeking attractive income and portfolio diversification potential.
Annual Report
June 30, 2011
| | | | | | | | | | |
| | | Share Class / Ticker Symbol |
| | | | | |
| Fund Name | | Class A | | Class B | | Class C | | Class R3 | | Class I |
Nuveen Core Bond Fund | | FAFIX | | FFIBX | | FFAIX | | FFISX | | FFIIX |
Nuveen High Income Bond Fund | | FJSIX | | FJSBX | | FCSIX | | FANSX | | FJSYX |
Nuveen Inflation Protected Securities Fund | | FAIPX | | — | | FCIPX | | FRIPX | | FYIPX |
Nuveen Intermediate Government Bond Fund | | FIGAX | | — | | FYGCX | | FYGRX | | FYGYX |
Nuveen Intermediate Term Bond Fund | | FAIIX | | — | | NTIBX | | — | | FINIX |
Nuveen Short Term Bond Fund | | FALTX | | — | | FBSCX | | — | | FLTIX |
Nuveen Total Return Bond Fund | | FCDDX | | FCBBX | | FCBCX | | FABSX | | FCBYX |
INVESTMENT ADVISER NAME CHANGE
Effective January 1, 2011, Nuveen Asset Management, the Funds’ investment adviser, changed its name to Nuveen Fund Advisors, Inc. (“Nuveen Fund Advisors”). Concurrently, Nuveen Fund Advisors formed a wholly-owned subsidiary, Nuveen Asset Management, LLC, to house its portfolio management capabilities.
NUVEEN INVESTMENTS COMPLETES STRATEGIC COMBINATION WITH FAF ADVISORS
On December 31, 2010, Nuveen Investments completed the strategic combination between Nuveen Asset Management, the largest investment affiliate of Nuveen Investments, and FAF Advisors. As part of this transaction, U.S. Bancorp — the parent of FAF Advisors — received cash consideration and a 9.5% stake in Nuveen Investments in exchange for the long-term investment business of FAF Advisors, including investment-management responsibilities for the non-money market mutual funds of the First American Funds family.
The approximately $27 billion of mutual fund and institutional assets managed by FAF Advisors, along with the investment professionals managing these assets and other key personnel, have become part of Nuveen Asset Management, LLC. With these additions to Nuveen Asset Management, LLC, this affiliate now manages more than $100 billion of assets across a broad range of strategies from municipal and taxable fixed income to traditional and specialized equity investments.
This combination does not affect the investment objectives or strategies of the Funds in this report. Over time, Nuveen Investments expects that the combination will provide even more ways to meet the needs of investors who work with financial advisors and consultants by enhancing the multi-boutique model of Nuveen Investments, which also includes highly respected investment teams at HydePark, NWQ Investment Management, Santa Barbara Asset Management, Symphony Asset Management, Tradewinds Global Investors and Winslow Capital. Nuveen Investments managed approximately $210 billion of assets as of June 30, 2011.
| | | | | | |
| Must be preceded by or accompanied by a prospectus. | | NOT FDIC INSURED | | MAY LOSE VALUE | | NO BANK GUARANTEE |
Table of Contents
Chairman’s
Letter to Shareholders

Dear Shareholders,
The global economy continues to be weighed down by an unusual combination of pressures facing the larger developed economies. Japanese leaders continue to work through the economic aftereffects of the March 2011 earthquake and tsunami. Political leaders in Europe and the U.S. have resolved some of the near term fiscal problems, but the financial markets are not convinced that these leaders are able to address more complex longer term fiscal issues. Despite improved earnings and capital increases, the largest banks in these countries continue to be vulnerable to deteriorating mortgage portfolios and sovereign credit exposure, adding another source of uncertainty to the global financial system.
In the U.S., recent economic statistics indicate that the economic recovery may be losing momentum. Consumption, which represents about 70% of the gross domestic product, faces an array of challenges from seemingly intractable declines in housing values, increased energy costs and limited growth in the job market. The failure of Congress and the administration to agree on the debt ceiling increase on a timely basis and the deep divisions between the political parties over fashioning a balanced program to address growing fiscal imbalances that led to the recent Standard & Poor’s ratings downgrade add considerable uncertainty to the domestic economic picture.
On a more positive note, corporate earnings continue to hold up well and the municipal bond market is recovering from recent weakness as states and municipalities implement various programs to reduce their budgetary deficits. In addition, the Federal Reserve System has made it clear that it stands ready to take additional steps should the economic recovery falter. However, there are concerns that the Fed is approaching the limits of its resources to intervene in the economy.
These perplexing times highlight the importance of professional investment management. Your Nuveen investment team is working hard to develop an appropriate response to increased risk, and they continue to seek out opportunities created by stressful markets using proven investment disciplines designed to help your Fund achieve its investment objectives. On your behalf, we monitor their activities to assure that they maintain their investment disciplines.
As always, I encourage you to contact your financial consultant if you have any questions about your investment in a Nuveen Fund. On behalf of the other members of your Fund Board, we look forward to continuing to earn your trust in the months and years ahead.
Sincerely,

Robert P. Bremner
Chairman of the Board
August 23, 2011
Portfolio Managers’ Comments
Certain statements in this report are forward-looking statements. Discussions of specific investments are for illustration only and are not intended as recommendations of individual investments. The forward-looking statements and other views expressed herein are those of the portfolio managers as of the date of this report. Actual future results or occurrences may differ significantly from those anticipated in any forward-looking statements and the views expressed herein are subject to change at any time, due to numerous market and other factors. The Funds disclaim any obligation to update publicly or revise any forward-looking statements or views expressed herein.
Ratings shown are the highest rating given by one of the following national rating agencies: S&P, Moody’s or Fitch. Credit ratings are subject to change. AAA, AA, A, and BBB are investment grade ratings; BB, B, CCC/CC/C and D are below-investment grade ratings. Bonds backed by U.S. Government or agency securities are given an implied rating equal to the rating of such securities. Holdings designated NR are not rated by a national rating agency.
Nuveen Core Bond Fund
(formerly known as First American Core Bond Fund)
Nuveen High Income Bond Fund
(formerly known as First American High Income Bond Fund)
Nuveen Inflation Protected Securities Fund
(formerly known as First American Inflation Protected Securities Fund)
Nuveen Intermediate Government Bond Fund
(formerly known as First American Intermediate Government Bond Fund)
Nuveen Intermediate Term Bond Fund
(formerly known as First American Intermediate Term Bond Fund)
Nuveen Short Term Bond Fund
(formerly known as First American Short Term Bond Fund)
Nuveen Total Return Bond Fund
(formerly known as First American Total Return Bond Fund)
These Funds, all former First American taxable income funds, are now managed by Nuveen Asset Management, LLC, an affiliate of Nuveen Investments.
Chris Neuharth, CFA, who has 30 years of investment experience, has managed the Nuveen Core Bond Fund since 2006. Timothy Palmer, CFA, with 25 years of investment experience, Wan-Chong Kung, CFA, with 27 years of financial experience, and Jeffrey Ebert, with 20 years of financial experience, have been part of the management team for the Fund since 2003, 2001, and 2005, respectively.
John Fruit, CFA, who has 23 years of investment experience, has managed the Nuveen High Income Bond Fund since 2006. Jeffrey Schmitz, CFA, with 24 years of investment experience, has been part of the management team for the Fund since 2008.
Wan-Chong Kung, CFA, has managed the Nuveen Inflation Protected Securities Fund since its inception in 2004. Effective October 28, 2010, Chad Kemper, with 12 years of investment experience, joined the Fund as a co-portfolio manager.
Wan-Chong Kung, CFA, has managed the Nuveen Intermediate Government Bond Fund and the Nuveen Intermediate Term Bond Fund since 2002. Chris Neuharth, CFA, and Jason O’Brien, CFA, with 18 years of investment experience, have been on the Intermediate Government Bond Fund’s management team since 2009. Jeffrey Ebert has served on the Intermediate Term Bond Fund’s management team since 2000.
Chris Neuharth, CFA, has been a co-portfolio manager of the Nuveen Short Term Bond Fund since 2004. Peter Agrimson, CFA, with six years of investment experience, joined the Fund as a co-portfolio manager on January 1, 2011.
Timothy Palmer, CFA, has been the lead manager of the Nuveen Total Return Bond Fund since 2005. Jeffrey Ebert has been on the management team since 2000. Marie Newcome, CFA, with 19 years of investment experience, joined the Fund as a co-portfolio manager in January 2011.
Here the portfolio management teams for the Funds examine economic and bond market conditions, key investment strategies and the Funds’ performance for the twelve-month period ended June 30, 2011.
What factors affected the U.S. economic and fixed income market environments during the twelve-month reporting period ended June 30, 2011?
Global economic growth was quite uneven over the twelve-month reporting period. The second half of 2010 began with widespread concerns about financial contagion from several European countries and very slow growth, raising the probability of a double-dip recession in the United States. These fears seemed to be quelled in late 2010 and early 2011 as another round of quantitative easing was introduced by the Federal Reserve and consumer spending rebounded sharply. However, this relief was relatively short lived as renewed weakness in housing and higher food and energy prices put a damper on consumption at about the same time that supply chain disruptions from the Japanese tsunami and earthquake were distorting growth and suppressing job creation in the U.S. and many areas around the world.
Throughout the period, the Fed continued to hold the benchmark fed funds rate in a target range of zero to 0.25% since cutting it to this record low level in December 2008. At its June 2011 meeting, the central bank downgraded growth estimates for the year while reaffirming that it anticipated keeping the fed funds rate at “exceptionally low levels” for an “extended period.”
From a macro perspective, we ended the fiscal period facing many of the same uncertainties that we did one year earlier. The Greek bailout had yet to be finalized and fiscal concerns had spread to other European countries such as Ireland, Italy, Portugal and Spain. At the same time, fears about slowing U.S. economic growth bubbled to the surface again, causing consumer spending to pull back. The employment situation seemed to plateau, with the national jobless rate registering 9.2% in June 2011, the fourth monthly increase in a row and just slightly lower than one year earlier. Also, the overall housing market continued to flounder, weighed down by a backlog of distressed properties on the market and falling prices. For the twelve months ended May 2011 (the most recent data available at the time this report was prepared), property values in the Standard & Poor’s (S&P)/Case-Shiller index of 20 major metropolitan areas fell 4.5% from one year ago. U.S. gross domestic product (GDP), the broadest measure of the nation’s economic health, was revised downward to an anemic 0.4% annual growth rate for the first quarter of 2011 and estimated to be 1.3% for the second quarter, according to the Commerce Department.
The high level of uncertainty throughout the twelve-month period resulted in a schizophrenic investor appetite for risk. Volatility was high as the inability of Wall Street firms to buy assets for their own balance sheets contributed to swings in valuations. Virtually all non-government sectors of the market enjoyed strong performance from late
2010 through the first quarter of 2011, as the liquidity provided by the Fed’s balance sheet expansion emboldened investor risk tolerance, causing a strong run in both equities and riskier fixed-income securities. This powerful positive technical rally came to an abrupt halt midway through the second quarter of 2011 as investors increasingly worried about a tightening of monetary policy in emerging markets, a Greek default, U.S. budget woes and a downshift in global growth. Despite second quarter’s give-back in relative performance, non-government bonds outperformed significantly overall for the reporting period, with sectors such as investment-grade corporate debt, high-yield corporate debt and commercial mortgage-backed securities (CMBS) beating U.S. Treasuries by considerable amounts.
The high-yield market, in particular, benefited from its high coupon levels in a low-interest rate market, leading to strong investor demand and record fund inflows into the asset class. Also, default rates continued to decrease as measured by Moody’s speculative-grade default rate, which finished the fiscal year at 2.2%, down from 6.4% a year ago. Across the high-yield sector, CCC-rated bonds were the best performers among the various quality tiers, returning 18.5% over the twelve-month period.
In the U.S. Treasury market, short and intermediate rates remained at historically low levels, falling even further during the fiscal year. For example, yields on one-year Treasury bills began the period at 0.32% and ended at 0.19%, while five-year Treasury notes went from 1.80% to 1.76%. Rates on longer term Treasury securities rose slightly over the year. For the majority of the period, U.S. Treasury Inflation-Protected Securities (TIPS) outpaced nominal Treasuries, particularly in the shorter maturity ranges, as stronger growth prospects, the rapid rise in energy prices and the expected flow-through of these prices to the consumer price index (CPI) fueled investors’ appetite for inflation protection. However, the TIPS market experienced somewhat of a reversal in performance in the second quarter of 2011 as inflation expectations lowered due to weaker-than-expected economic data, falling energy prices and an anticipated downturn in seasonal CPI reports.
How did the Funds perform during the twelve-month period ended June 30, 2011?
The tables in the Fund Performance and Expense Ratios section of this report provide total return performance information for the one-year, five-year, ten-year and since inception periods ending June 30, 2011. Each Fund’s returns are compared with the performance of the appropriate Barclays Capital bond index and Lipper peer fund category average.
What strategies were used to manage the Funds during the twelve-month reporting period? How did these strategies influence performance?
All of the Funds continued to employ the same fundamental investment strategies and tactics used in previous years, although our ability to implement those strategies depended on the individual characteristics of the portfolios, as well as market conditions. We use a highly collaborative, research-driven approach that we believe offers the best opportunity to achieve consistent, superior long-term performance on a risk-adjusted basis across the full range of market environments. Going into the reporting period, we were generally comfortable with the Funds’ positioning and saw little need to make large-scale shifts to the Funds’ weightings.
The Funds also invested in various derivative instruments to manage foreign currency exposure, duration and yield curve, to manage views of volatility, to hedge against changes in rate spreads and to increase credit exposure. (Refer to the Notes to Financial Statements, Footnote 1 – General Information and Significant Accounting Policies for further details on the derivative instruments each Fund invested during this reporting period.)
Nuveen Core Bond Fund (formerly known as First American Core Bond Fund)
The Fund’s Class A Shares at net asset value (NAV) outperformed both the Barclays Capital Aggregate Bond Index and the Lipper Intermediate Investment-Grade Debt Funds Category Average for the twelve-month period ended June 30, 2011. The majority of the Fund’s outperformance was driven by our sector positioning, specifically our overweights to investment-grade corporate bonds, CMBS and high-yield corporate bonds. We overweighted these sectors because of our view that the economy would recover to expand at a modest pace and that corporate credit fundamentals would continue to be extremely supportive of valuations within the sector. Furthermore, we anticipated that the Fed’s balance sheet expansion would be successful in moving cash off the sidelines and into riskier asset classes. Therefore, we increased the Fund’s overall risk level by adding exposure to both new-issue CMBS and high-yield corporates. These sectors were the strongest U.S. fixed-income performers during the reporting period.
We believed that positive bottom-up fundamentals and strong sector-specific technical factors would remain largely intact over the long run; however, as the last six months of the reporting period progressed, the combination of less attractive valuations and higher levels of macro uncertainty prompted us to reduce aggregate risk levels in the Fund. Specifically, we lowered the Fund’s exposure to investment-grade corporate bonds by about 9%, mostly by trimming exposure to the financial sector, which had enjoyed strong performance. As of June 30, 2011, the Fund’s investment-grade corporate credit exposure of approximately 30% was at its lowest level in several years. The proceeds of these sales were redeployed into the agency mortgage-backed securities sector as we felt that relative valuations were finally attractive enough to warrant a modest overweight. We also decreased the Fund’s overall risk within the CMBS sector by swapping into new-issue deals with stronger loan characteristics that came to market as the reporting period closed. At period end, the Fund’s CMBS weighting was approximately 13% of net assets.
Our duration policy, which focuses on the Fund’s sensitivity to interest rate changes, was close to neutral compared to the benchmark throughout most of the period. Therefore, it was not a major factor in the Fund’s performance.
Nuveen High Income Bond Fund (formerly known as First American High Income Bond Fund)
The Fund’s Class A Shares at net asset value (NAV) outperformed both the Barclays Capital High Yield 2% Issuer Capped Index and the Lipper High Current Yield Funds Category Average for the twelve-month period ended June 30, 2011. The Fund’s relative performance was aided by our tactical overweights to higher-yielding securities, generally single B and CCC rated debt, and from overweighting cyclical industries. For example, we overweighted the oilfield services, paper and media sectors, benefiting from the higher yields and improving fundamentals in these areas. Overall, the high-yield market continued to benefit from the ability of high-yield issuers to successfully refinance debt
and extend maturities. Indeed, defaults dropped significantly during the fiscal year, and the Fund experienced no new bankruptcies among its holdings. At the margin, the improvement in corporate liquidity benefited low-rated companies disproportionately more, which was a compelling reason for us to continue to overweight the single B and CCC rated segments in the Fund.
The Fund continued to maintain a roughly 10% allocation to emerging market corporate and sovereign debt. This was a small detractor to the Fund’s overall performance, as emerging market-related debt underperformed its domestic counterparts in the last three months of the reporting period. The reasons for the sector shortfall were both credit-specific, as in the case of Sino-Forest in Asia, and also reflected the growth uncertainty in the United States and the negative headlines surrounding Greece’s debt woes. While the Fund was not exposed to Sino-Forest and the accusations of faulty accounting, it did have other holdings in China that lost value in the resulting sell off of many Chinese securities. However, from a fundamental standpoint, we continued to anticipate strong fundamentals for emerging market corporates and plan to maintain or add to the Fund’s positions.
Also, the Fund’s below-market exposure to the technology and financial sectors was a slight detractor to results versus the index. Within the financial sector, many of the issuers were new entrants into the high-yield universe coming out of the financial crisis and did well as balance sheets were repaired in the banking and insurance sectors. While we were active in adding securities within the sector to the Fund, the powerful rally still left us and the majority of high-yield investors behind as it was difficult to gain exposure in a timely manner. In all, financials were among the top performers during the fiscal year, registering a 20.7% gain versus the broad high-yield market return of 15.5%, as measured by the Barclays Capital High Yield 2% Issuer Capped Index.
We added to the Fund’s holdings in energy, refining and oilfield services, which were some of the better-performing industries throughout the period. Specifically, the oilfield services sector continued to benefit from increased spending on exploration and production in North America and other areas of the world. Oil and natural gas companies are expected to spend $122 billion in the United States alone this year on exploration and production, a 22% increase from 2010. We also continued to overweight such areas as media, basic materials and industrials, all expected to benefit from a gradual acceleration in economic activity.
We used the more favorable environment for financials to add to select closed-end funds and preferred stocks. The Fund carried a roughly 10% allocation to out-of-index securities, consisting predominately of preferred stocks, various closed-end funds and dividend-paying stocks. Our allocation to preferred securities and equities increased marginally during the period, which was mainly a function of relative value opportunities versus traditional high-yield securities.
Fund flows into the high-yield asset class continued to be brisk until a quick reversal occurred in May and June 2011 when the markets began the process of analyzing the second mid-cycle slowdown in this reporting period. Market technical factors, however, still appear rather balanced despite the record amount of issuance. The pricing of $262 billion in high-yield bonds in 2010 and roughly $180 billion through the second quarter of 2011 has been met with strong investor demand. Nonetheless, as the more volatile financial market conditions spilled into the high-yield market, it experienced a bout of
outflows and selling pressure. However, we believed that the still-steep yield curve and the high base of current income left the high-yield sector positioned relatively well among competing asset classes.
Nuveen Inflation Protected Securities Fund (formerly known as First American Inflation Protected Securities Fund)
The Fund’s Class A Shares at net asset value (NAV) outperformed the Lipper U.S. Treasury Inflation-Protected Securities Category Average, but fell short of the Barclays Capital U.S. TIPS Index for the twelve-month period ended June 30, 2011. We began the Fund’s fiscal year with a modest underweight position in all TIPS segments, particularly 5-year maturities, which proved beneficial as TIPS underperformed. During the middle portion of the reporting period, improvements in economic data supported a more optimistic outlook for growth, which in turn increased investors’ appetite for inflation protection. The Fund’s continued underweight position in TIPS hindered performance as they outperformed nominal U.S. Treasuries. However, within the Fund’s TIPS exposure, we made an advantageous reallocation out of 10-year and longer maturity TIPS and overweighted 5-year maturities in the fourth quarter of 2010 and first quarter of 2011, which helped the Fund capture the relative outperformance of the 5-year securities on the TIPS yield curve. As the outlook for economic growth and inflation lowered toward the end of the reporting period, the Fund also benefited from a rotation out of 5-year maturities. This underweight at the front end of the TIPS yield curve aided results as the shortest maturities underperformed the most in the final months of the fiscal year.
The Fund’s performance also benefited from our allocations to non-TIPS spread sectors, which produced solid excess returns in the strong-performing environment for risk assets. For example, the Fund’s positions in the high-yield and CMBS sectors, which were 1.4% and 7.2% of Fund assets as of period end, respectively, contributed positively to performance. Foreign exposure also added to results with positions in non-dollar bonds and currency exposures performing well. The Fund particularly benefited from positions in growth-sensitive currencies such as the Canadian and Australian dollar.
At the end of the reporting period, the Fund was positioned for TIPS yields to move higher and for the continued relative outperformance of longer maturity TIPS over shorter maturity TIPS out to five years. Because we remained fundamentally constructive on high-yield corporate bonds and CMBS, we maintained the Fund’s positions in both sectors. We are also maintaining the Fund’s foreign exposure.
Our duration policy, which focuses on the Fund’s sensitivity to interest rate changes, was close to neutral compared to the benchmark throughout most of the period. Therefore, it was not a major factor in the Fund’s performance.
Nuveen Intermediate Government Bond Fund (formerly known as First American Intermediate Government Bond Fund)
The Fund’s Class A Shares at net asset value (NAV) outperformed both the Barclays Capital Intermediate Government Bond Index and the Lipper Intermediate U.S. Government Funds Category Average for the twelve-month period ended June 30, 2011. The majority of the Fund’s outperformance was driven by our sector positioning, specifically our overweights to CMBS, mortgage-backed securities (MBS) and agency debt. We emphasized these sectors because of our view that the economy would recover
to expand at a modest pace and that non-U.S. Treasury fundamental and technical factors would continue to be extremely supportive of valuations. The Fund’s corresponding underweight to nominal U.S. Treasuries also was beneficial as the Treasury market underperformed other fixed-income asset classes over the year.
During the twelve-month period, we reduced the Fund’s U.S. Treasury exposure by about 17% because we believed we could find more compelling opportunities in other sectors. MBS, in particular, enjoyed continued strong underpinnings, given investors’ appetite for high-quality assets that offer incremental yield to Treasuries and low prepayment risk due to the constrained refinancing housing environment. At period end, the Fund’s MBS weighting had increased to approximately 39% of net assets. We also modestly increased our overall exposure to agency debt and asset-backed securities, ending the period with approximately 41% and 6% in these two sectors, respectively. Agency bonds offer incremental yield over U.S. Treasuries while asset-backed securities are high-quality securities that provide additional yield in the shorter maturity section of the yield curve.
Throughout the period, we made a number of tactical changes to the Fund’s duration (its price sensitivity to interest-rate movements), but overall did not stray far from a neutral position relative to the benchmark.
Nuveen Intermediate Term Bond Fund (formerly known as First American Intermediate Term Bond Fund)
The Fund’s Class A Shares at net asset value (NAV) outperformed both the Barclays Capital Intermediate Government/Credit Index and the Lipper Short-Intermediate Investment-Grade Debt Funds Category Average for the twelve-month period ended June 30, 2011. The Fund’s strong outperformance was mainly driven by our sector positioning, specifically overweights to CMBS, investment-grade corporate bonds and mortgage-backed securities. We emphasized these sectors because of our view that the economy would recover and expand at a modest pace and that corporate credit fundamentals would continue to be extremely supportive of valuations. Furthermore, we anticipated that the Fed’s balance sheet expansion would be successful in moving cash off the sidelines and into riskier asset classes.
We believed that positive bottom-up fundamentals and strong sector-specific technical factors would remain largely intact over the long run; however, as the final six months of the reporting period progressed, the combination of less attractive valuations and higher levels of macro uncertainty prompted us to reduce aggregate risk levels in the Fund. Specifically, we lowered the Fund’s exposure to corporate bonds by approximately 5% over the twelve-month period, mostly by trimming its exposure to the financial sector, which had enjoyed extremely strong performance. As of June 30, 2011, the Fund’s corporate credit exposure of approximately 46% was at its lowest level in several years. We increased the Fund’s exposure to CMBS during the fiscal year, ending with an approximately 11% weighting in the sector. Within that sector, however, we decreased the Fund’s overall risk by swapping into new-issue deals with stronger loan characteristics that came to market as the reporting period closed. The Fund’s allocations to the mortgage-backed securities and asset-backed securities sectors remained fairly unchanged, closing the fiscal year at approximately 16% and 15%, respectively. We continued to have only a small allocation to U.S. Treasuries (approximately 2% at the end of the period) because we saw more attractive opportunities in other asset classes.
Our duration policy, which focuses on the Fund’s sensitivity to interest rate changes, was close to neutral compared to its benchmark throughout most of the period. Therefore, it was not a major factor in the Fund’s performance.
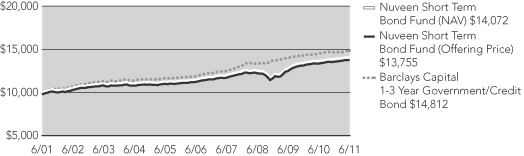
Nuveen Short Term Bond Fund (formerly known as First American Short Term Bond Fund)
The Fund’s Class A Shares at net asset value (NAV) outperformed both the Barclays Capital 1-3 Year Government/Credit Bond Index and the Lipper Short Investment-Grade Debt Funds Category Average for the twelve-month period ended June 30, 2011. The Fund’s outperformance relative to its peers and benchmark was driven by our sector positioning and security selection. From a sector perspective, our main investment theme was to position the Fund with an underweight to government-related bonds and a large overweight to short duration securities in the asset-backed security and corporate bond sectors. From a macro perspective, our view has been that the global expansion would continue at a pace that was fundamentally supportive of continued improvement in credit fundamentals for corporate bonds and some segments of the structured assets market. As loan performance stabilized and corporate earnings improved, this certainly proved true. At the same time, we expected that liquidity would improve after the late 2010 balance sheet expansion by the Fed and that supply/demand dynamics would also be quite supportive. This strategy paid off as many investors expressed a preference for short duration, higher credit quality securities while issuance in certain sectors was historically light.
Security selection was also a strong positive for the Fund. Our bias toward owning issues from the financial sector, which performed well, was beneficial to the Fund as was our addition of short duration, non-agency mortgage assets. Additionally, the investment policy of the Fund was expanded in early 2011 to allow for greater flexibility with regard to credit quality, raising the maximum limit for non-investment grade securities from 10% to 20% of assets. We took advantage of this increased flexibility by selectively adding slightly less than 5% in non-rated holdings from the asset-backed securities and tax-exempt sectors. These sectors periodically offer interesting opportunities for investors who have ratings flexibility and strong research capabilities. We expect a “bottom up” approach focused on in-depth research to be an important performance driver in the investment environment going forward.
Elsewhere in the Fund, we tactically managed risk exposure in the CMBS and high-yield sectors as valuations changed and the fundamental backdrop shifted. We increased the Fund’s weighting to CMBS and high yield in late 2010, and subsequently brought its high-yield weighting way down in April 2011. Late in the period, we took advantage of the subsequent sharp repricing in the high-yield segment to add slightly to the Fund’s weighting.
On a negative note, we positioned the Fund’s duration (its price sensitivity to interest-rate movements), toward the lower end of the one- to three-year policy range. This positioning was a drag on performance against both our peers and the benchmark as rates dropped and prices rose amid the global macro uncertainty in the second quarter of 2011.
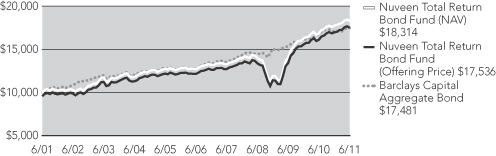
Nuveen Total Return Bond Fund (formerly known as First American Total Return Bond Fund)
The Fund’s Class A Shares at net asset value (NAV) outperformed both the Barclays Capital Aggregate Bond Index and the Lipper Intermediate Investment-Grade Debt Funds Category Average for the twelve-month period ended June 30, 2011. The largest
contributors to the Fund’s outperformance were its sector overweights in investment-grade and high-yield corporates as well as positions in foreign bonds and currencies. The Fund particularly benefited from positions in growth-sensitive currencies such as the Canadian and Australian dollars. The Fund’s overweights to CMBS also added value, as did credit selection within the corporate sector, particularly our overweight to financial issuers. The Fund’s positioning during the year was driven by our view that the economy would recover to expand at a modest pace and that corporate credit fundamentals would continue to be extremely supportive of valuations within the sector. Financial conditions were further supported by the Fed’s ongoing commitment to provide an extraordinary level of monetary accommodation through low rates and asset purchases. Heading into the period, we judged that valuations for non-government bond market sectors provided ample compensation to long-term investors.
During the period, we took advantage of market strength and strong valuations to reduce exposure to some of the Fund’s overweights, even though we believed that positive bottom-up fundamentals and strong sector-specific technical factors would remain largely intact over the long run. As 2011 progressed, the combination of less attractive valuations and higher levels of macro uncertainty also prompted us to reduce the Fund’s aggregate risk level. We lowered the Fund’s exposure to investment-grade corporate bonds (including financials) by approximately 9%, cut its high-yield weight and moderated foreign currency exposure. Although we generally maintained these lower overall exposures, we did take advantage of the subsequent sharp repricing in the high-yield segment to add slightly to the Fund’s weighting at the end of the period. The bulk of the proceeds from these sales went into mortgage-backed securities as that sector cheapened, bringing the Fund’s weighting to approximately 29%, which is closer to the index weight. We also continued to underweight U.S. Treasuries and agencies in the portfolio.
Our duration positioning, which focuses on the Fund’s sensitivity to interest rate changes, was generally neutral to defensive during the period, detracting marginally from performance.
Risk Considerations
Mutual fund investing involves risk; principal loss is possible. Debt or fixed income securities are subject to credit risk and interest rate risk. The value of, and income generated by debt securities will decrease or increase based on changes in market interest rates. As interest rates rise, bond prices fall. Credit risk refers to an issuer’s ability to make interest and principal payments when due. The guarantee provided by the U.S. government to treasury inflation protected securities (TIPS) relates only to the prompt payment of principal and interest and does not remove the market risks of investing in the fund shares. Below investment grade securities carry heightened credit risk and potential for default. Foreign investments involve additional risks, including currency fluctuation, political and economic instability, lack of liquidity and differing legal and accounting standards. Asset-backed and mortgage-backed securities are subject to additional risks such as prepayment risk, liquidity risk, default risk and adverse economic developments. The potential use of derivative instruments involves a high degree of financial risk, including the risk that the loss on a derivative may be greater than the principal amount invested.
[THIS PAGE INTENTIONALLY LEFT BLANK]
Fund Performance and Expense Ratios (Unaudited)
The Fund Performance and Expense Ratios for each Fund are shown on the following fourteen pages.
Returns quoted represent past performance, which not predictive of future results. Current performance may be higher or lower than the performance shown. Investment returns and principal value will fluctuate so that when shares are redeemed, they may be worth more or less than their original cost. Returns without sales charges would be lower if the sales charge were included. Returns do not reflect the deduction of taxes that a shareholder would pay on Fund distributions or the redemption of Fund shares.
Returns may reflect a contractual agreement between certain Funds and the investment adviser to waive certain fees and expenses; see Notes to Financial Statements, Footnote 7 — Management Fees and Other Transactions with Affiliates for more information. In addition, returns may reflect a voluntary expense limitation by the Funds’ investment adviser that may be modified or discontinued at any time without notice. For the most recent month-end performance visit www.nuveen.com or call (800) 257-8787.
Returns reflect differences in sales charges and expenses, which are primarily differences in distribution and service fees. Fund returns assume reinvestment of dividends and capital gains.
Comparative index and benchmark return information is provided for the Funds’ Class A Shares at net asset value (NAV) only.
Effective January 18, 2011, Class R Shares and Class Y Shares previously offered by FAF Advisors, Inc. were renamed Class R3 Shares and Class I Shares, respectively.
The expense ratios shown reflect the Funds’ total operating expenses (before fee waivers or expense reimbursements, if any) as shown in the Funds’ most recent prospectus. The expense ratios include management fees and other fees and expenses.
Fund Performance and Expense Ratios (Unaudited) (continued)
Nuveen Core Bond Fund
Refer to the first page of this Fund Performance and Expense Ratios Section for further explanation of the information included within this page.
Fund Performance
Average Annual Total Returns as of June 30, 2011
| | | | | | | | | | | | |
| | | Average Annual | |
| | | |
| | | 1-Year | | | 5-Year | | | 10-Year | |
Class A Shares at NAV | | | 5.73% | | | | 6.25% | | | | 5.16% | |
Class A Shares at maximum Offering Price | | | 1.22% | | | | 5.34% | | | | 4.70% | |
Barclays Capital Aggregate Bond Index* | | | 3.90% | | | | 6.52% | | | | 5.74% | |
Lipper Intermediate Investment Grade Debt Funds Category Average* | | | 5.10% | | | | 6.01% | | | | 5.25% | |
| | | |
Class B Shares w/o CDSC | | | 4.97% | | | | 5.45% | | | | 4.38% | |
Class B Shares w/CDSC | | | -0.03% | | | | 5.29% | | | | 4.38% | |
Class C Shares | | | 4.97% | | | | 5.46% | | | | 4.38% | |
Class I Shares | | | 6.09% | | | | 6.52% | | | | 5.43% | |
| | | | | | | | | | | | |
| | | |
| | | 1-Year | | | 5-Year | | | Since
Inception** | |
Class R3 Shares | | | 5.54% | | | | 6.04% | | | | 4.72% | |
Class A Shares have a maximum 4.25% sales charge (Offering Price). Class A Share purchases of $1 million or more are sold at net asset value without an upfront sales charge but may be subject to a contingent deferred sales charge (CDSC), also known as a back-end sales charge, if redeemed within eighteen months of purchase. Class B Shares have a CDSC that begins at 5% for redemptions during the first year and declines periodically until after six years when the charge becomes 0%. Class B Shares automatically convert to Class A Shares eight years after purchase. Class C Shares have a 1% CDSC for redemptions within less than twelve months, which is not reflected in the one-year total return. Class R3 Shares have no sales charge and are available only to certain retirement plans. Class I Shares have no sales charge and may be purchased under limited circumstances or by specified classes of investors.
Expense Ratios
| | | | |
| |
| Share Class | | Expense
Ratios | |
Class A | | | 0.96% | |
Class B | | | 1.71% | |
Class C | | | 1.71% | |
Class R3 | | | 1.21% | |
Class I | | | 0.71% | |
| * | Refer to the Glossary of Terms Used in the Report for definitions. |
| ** | Since inception returns for Class R3 Shares are from 9/24/01. |
Growth of an Assumed $10,000 Investment as of June 30, 2011
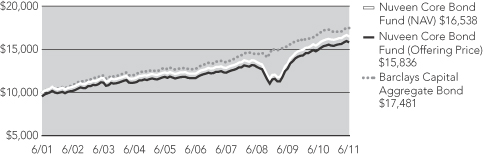
The graph does not reflect the deduction of taxes, that a shareholder may pay on Fund distributions or the redemption of Fund shares.
Fund Performance and Expense Ratios (Unaudited) (continued)
Nuveen High Income Bond Fund
Refer to the first page of this Fund Performance and Expense Ratios section for further explanation of the information included within this page.
Fund Performance
Average Annual Total Returns as of June 30, 2011
| | | | | | | | | | | | |
| | | Average Annual | |
| | | |
| | | 1-Year | | | 5-Year | | | Since
Inception* | |
Class A Shares at NAV | | | 17.61% | | | | 8.19% | | | | 7.21% | |
Class A Shares at maximum Offering Price | | | 12.06% | | | | 7.14% | | | | 6.68% | |
Barclays Capital High Yield 2% Issuer Capped Index** | | | 15.53% | | | | 9.42% | | | | 8.98% | |
Lipper High Current Yield Funds Category Average** | | | 14.96% | | | | 7.02% | | | | 7.19% | |
| | | |
Class B Shares w/o CDSC | | | 16.59% | | | | 7.35% | | | | 6.43% | |
Class B Shares w/CDSC | | | 11.59% | | | | 7.21% | | | | 6.43% | |
Class C Shares | | | 16.67% | | | | 7.39% | | | | 6.43% | |
Class R3 Shares | | | 17.28% | | | | 7.90% | | | | 7.59% | |
Class I Shares | | | 17.77% | | | | 8.43% | | | | 7.48% | |
Class A Shares have a maximum 4.75% sales charge (Offering Price). Class A Share purchases of $1 million or more are sold at net asset value without an up-front sales charge but may be subject to a contingent deferred sales charge (CDSC), also known as a back-end sales charge, if redeemed within eighteen months of purchase. Class B Shares have a CDSC that begins at 5% for redemptions during the first year and declines periodically until after six years when the charge becomes 0%. Class B Shares automatically convert to Class A Shares eight years after purchase. Class C Shares have a 1% CDSC for redemptions within less than twelve months, which is not reflected in the one-year total return. Class R3 Shares have no sales charge and are available only to certain retirement plans. Class I Shares have no sales charge and may be purchased under limited circumstances or by specified classes of investors.
| | | | | | | | |
| Expense Ratios | |
| Share Class | | Gross
Expense
Ratios | | | Net
Expense
Ratios | |
Class A | | | 1.27% | | | | 1.14% | |
Class B | | | 2.02% | | | | 1.89% | |
Class C | | | 2.02% | | | | 1.89% | |
Class R3 | | | 1.52% | | | | 1.39% | |
Class I | | | 1.02% | | | | 0.89% | |
The Fund’s adviser has contractually agreed to waive fees and reimburse other Fund expenses through March 31, 2012, so that total annual Fund operating expenses, after fee waivers and/or expense reimbursements and excluding acquired Fund fees and expenses, do not exceed 1.10%, 1.85%, 1.85%, 1.35%, and 0.85% for Class A, Class B, Class C, Class R3, and Class I Shares, respectively. Fee waivers and expense reimbursements will not be terminated prior to that time without the approval of the Fund’s Board of Directors.
| * | Since inception returns for Class A, B, C and I Shares, and for the comparative index and average, are from 8/30/01. Since inception return for Class R3 Shares is from 9/24/01. |
| ** | Refer to the Glossary of Terms Used in the Report for definitions. |
Growth of an Assumed $10,000 Investment as of June 30, 2011
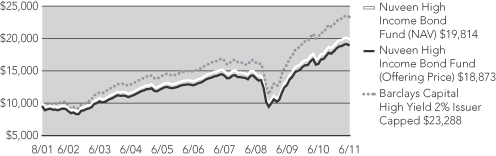
The graph does not reflect the deduction of taxes, that a shareholder may pay on Fund distributions or the redemption of Fund shares.
Fund Performance and Expense Ratios (Unaudited) (continued)
Nuveen Inflation Protected Securities Fund
Refer to the first page of this Fund Performance and Expense Ratios section for further explanation of the information included within this page.
Fund Performance
Average Annual Total Returns as of June 30, 2011
| | | | | | | | | | | | |
| | | Average Annual | |
| | | |
| | | 1-Year | | | 5-Year | | | Since
Inception* | |
Class A Shares at NAV | | | 7.30% | | | | 6.27% | | | | 5.10% | |
Class A Shares at maximum Offering Price | | | 2.73% | | | | 5.36% | | | | 4.43% | |
Barclays Capital U.S. TIPs Index** | | | 7.74% | | | | 6.91% | | | | 5.71% | |
Lipper Treasury Inflation Protected Securities Funds Category Average** | | | 7.03% | | | | 5.74% | | | | 5.07% | |
| | | |
Class C Shares | | | 6.59% | | | | 5.45% | | | | 4.29% | |
Class R3 Shares | | | 6.31% | | | | 5.85% | | | | 4.75% | |
Class I Shares | | | 7.62% | | | | 6.51% | | | | 5.35% | |
Class A Shares have a maximum 4.25% sales charge (Offering Price). Class A Share purchases of $1 million or more are sold at net asset value without an up-front sales charge but may be subject to a contingent deferred sales charge (CDSC), also known as a back-end sales charge, if redeemed within eighteen months of purchase. Class C Shares have a 1% CDSC for redemptions within less than twelve months, which is not reflected in the one-year total return. Class R3 Shares have no sales charge and are available only to certain retirement plans. Class I Shares have no sales charge and may be purchased under limited circumstances or by specified classes of investors.
Expense Ratios
| | | | | | | | |
| | |
| Share Class | | Gross
Expense
Ratios | | | Net
Expense
Ratios | |
Class A | | | 1.17% | | | | 0.86% | |
Class C | | | 1.92% | | | | 1.61% | |
Class R3 | | | 1.42% | | | | 1.11% | |
Class I | | | 0.92% | | | | 0.61% | |
The Fund’s adviser has contractually agreed to waive fees and reimburse other Fund expenses through March 31, 2012, so that total annual fund operating expenses, after fee waivers and/or expense reimbursements and excluding acquired Fund fees and expenses, do not exceed 0.85%, 1.60%, 1.10%, and 0.60% for Class A, Class C, Class R3, and Class I Shares, respectively. Fee waivers and expense reimbursements will not be terminated prior to that time without the approval of the Fund’s Board of Directors.
| * | Since inception returns are from 10/1/04. |
| ** | Refer to the Glossary of Terms Used in the Report for definitions. |
Growth of an Assumed $10,000 Investment as of June 30, 2011
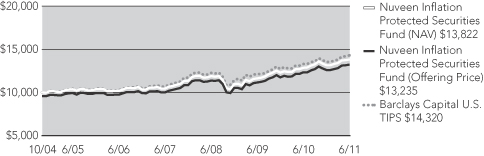
The graph does not reflect the deduction of taxes, that a shareholder may pay on Fund distributions or the redemption of Fund shares.
Fund Performance and Expense Ratios (Unaudited) (continued)
Nuveen Intermediate Government Bond Fund
Refer to the first page of this Fund Performance and Expense Ratios section for further explanation of the information included within this page.
Fund Performance
Average Annual Total Returns as of June 30, 2011
| | | | | | | | | | | | |
| | | Average Annual | |
| | | |
| | | 1-Year | | | 5-Year | | | Since
Inception* | |
Class A Shares at NAV | | | 3.10% | | | | 5.48% | | | | 3.82% | |
Class A Shares at maximum Offering Price | | | 0.02% | | | | 4.83% | | | | 3.46% | |
Barclays Capital Intermediate Government Bond Index** | | | 2.65% | | | | 5.85% | | | | 4.31% | |
Lipper Intermediate U.S. Government Funds Category Average** | | | 2.35% | | | | 5.58% | | | | 4.05% | |
| | | |
Class C Shares | | | 2.32% | | | | N/A | | | | 3.20% | |
Class R3 Shares | | | 2.75% | | | | N/A | | | | 3.65% | |
Class I Shares | | | 3.25% | | | | 5.64% | | | | 3.98% | |
Class A Shares have a maximum 3.00% sales charge (Offering Price). Class A Share purchases of $1 million or more are sold at net asset value without an up-front sales charge but may be subject to a contingent deferred sales charge (CDSC), also known as a back-end sales charge, if redeemed within eighteen months of purchase. Class C Shares have a 1% CDSC for redemptions within less than twelve months, which is not reflected in the one-year total return. Class R3 Shares have no sales charge and are available only to certain retirement plans. Class I Shares have no sales charge and may be purchased under limited circumstances or by specified classes of investors.
| | | | | | | | |
| Expense Ratios | |
| | |
| Share Class | | Gross
Expense
Ratios | | | Net
Expense
Ratios | |
Class A | | | 1.20% | | | | 0.75% | |
Class C | | | 1.95% | | | | 1.60% | |
Class R3 | | | 1.45% | | | | 1.10% | |
Class I | | | 0.95% | | | | 0.60% | |
The Fund’s adviser has contractually agreed to waive fees and reimburse other Fund expenses through March 31, 2012, so that total annual Fund operating expenses, after fee waivers and/or expense reimbursements and excluding acquired Fund fees and expenses, do not exceed 0.75%, 1.60%, 1.10%, and 0.60% for Class A, Class C, Class R3, and Class I Shares, respectively. Fee waivers and expense reimbursements will not be terminated prior to that time without the approval of the Fund’s Board of Directors. In addition, the Fund’s distributor has contractually agreed to limit its Class A Share 12b-1 fees to 0.15% of average daily net assets through March 31, 2012.
| * | Since inception returns for Class A and I Shares, and for the comparative index and average are from 10/25/02. Since inception returns for Class C and R3 Shares are from 10/28/09. |
| ** | Refer to the Glossary of Terms Used in the Report for definitions. |
Growth of an Assumed $10,000 Investment as of June 30, 2011
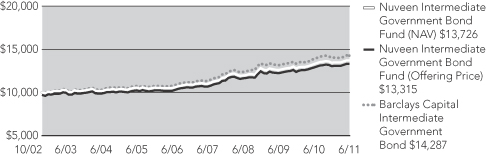
The graph does not reflect the deduction of taxes, that a shareholder may pay on Fund distributions or the redemption of Fund shares.
Fund Performance and Expense Ratios (Unaudited) (continued)
Nuveen Intermediate Term Bond Fund
Refer to the first page of this Fund Performance and Expense Ratios section for further explanation of the information included within this page.
Fund Performance
Average Annual Total Returns as of June 30, 2011
| | | | | | | | | | | | |
| | | Average Annual | |
| | | |
| | | 1-Year | | | 5-Year | | | 10-Year | |
Class A Shares at NAV | | | 4.70% | | | | 6.00% | | | | 4.91% | |
Class A Shares at maximum Offering Price | | | 1.55% | | | | 5.35% | | | | 4.59% | |
Barclays Capital Intermediate Government/Credit Bond Index* | | | 3.77% | | | | 6.08% | | | | 4.91% | |
Lipper Short-Intermediate Investment Grade Debt Funds Category Average* | | | 3.98% | | | | 5.08% | | | | 4.04% | |
| | | |
Class I Shares | | | 4.76% | | | | 6.13% | | | | 5.07% | |
| | | | |
| |
| | | Since
Inception** | |
Class C Shares | | | 1.76% | |
Class A Shares have a maximum 3.00% sales charge (Offering Price). Class A Share purchases of $1 million or more are sold at net asset value without an up-front sales charge but may be subject to a contingent deferred sales charge (CDSC), also known as a back-end sales charge, if redeemed within eighteen months of purchase. Class C Shares have a 1% CDSC for redemptions within less than twelve months, which is not reflected in the one-year total return. Class I Shares have no sales charge and may be purchased under limited circumstances or by specified classes of investors.
| | | | | | | | |
| Expense Ratios | |
| | |
| Share Class | | Gross
Expense
Ratios | | | Net
Expense
Ratios | |
Class A | | | 0.96% | | | | 0.86% | |
Class C | | | 1.71% | | | | 1.71% | |
Class I | | | 0.71% | | | | 0.71% | |
The Fund’s distributor has contractually agreed to limit its Class A Share 12b-1 fees to 0.15% of average daily net assets through March 31, 2012.
| * | Refer to the Glossary of Terms Used in the Report for definitions. |
| ** | Since inception return for Class C Shares is from 1/18/11. |
Growth of an Assumed $10,000 Investment as of June 30, 2011
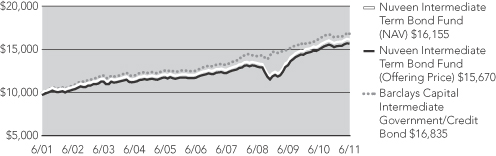
The graph does not reflect the deduction of taxes, that a shareholder may pay on Fund distributions or the redemption of Fund shares.
Fund Performance and Expense Ratios (Unaudited) (continued)
Nuveen Short Term Bond Fund
Refer to the first page of this Fund Performance and Expense Ratios section for further explanation of the information included within this page.
Fund Performance
Average Annual Total Returns as of June 30, 2011
| | | | | | | | | | | | |
| | | Average Annual | |
| | | |
| | | 1-Year | | | 5-Year | | | 10-Year | |
Class A Shares at NAV | | | 3.00% | | | | 4.17% | | | | 3.48% | |
Class A Shares at maximum Offering Price | | | 0.68% | | | | 3.69% | | | | 3.25% | |
Barclays Capital 1-3 Year Government/Credit Bond Index* | | | 1.90% | | | | 4.52% | | | | 4.01% | |
Lipper Short Investment-Grade Debt Funds Category Average* | | | 2.80% | | | | 3.84% | | | | 3.50% | |
| | | |
Class I Shares | | | 3.16% | | | | 4.34% | | | | 3.65% | |
| | | | | | | | |
| | |
| | | 1-Year | | | Since
Inception** | |
Class C Shares | | | 2.22% | | | | 2.47% | |
Class A Shares have a maximum 2.25% sales charge (Offering Price). Class A Share purchases of $250,000 or more are sold at net asset value without an up-front sales charge but may be subject to a contingent deferred sales charge (CDSC), also known as a back-end sales charge, if redeemed within eighteen months of purchase. Class C Shares have a 1% CDSC for redemptions within less than twelve months, which is not reflected in the one-year total return. Class I Shares have no sales charge and may be purchased under limited circumstances or by specified classes of investors.
Expense Ratios
| | | | |
| |
| Share Class | | Expense
Ratios | |
Class A | | | 0.84% | |
Class C | | | 1.59% | |
Class I | | | 0.59% | |
| * | Refer to the Glossary of Terms Used in the Report for definitions. |
| ** | Since inception return for Class C Shares is from 10/28/09. |
Growth of an Assumed $10,000 Investment as of June 30, 2011
The graph does not reflect the deduction of taxes, that a shareholder may pay on Fund distributions or the redemption of Fund shares.
Fund Performance and Expense Ratios (Unaudited) (continued)
Nuveen Total Return Bond Fund
Refer to the first page of this Fund Performance and Expense Ratios section for further explanation of the information included within this page.
Fund Performance
Average Annual Total Returns as of 6/30/11
| | | | | | | | | | | | |
| | | Average Annual | |
| | | |
| | | 1-Year | | | 5-Year | | | 10-Year | |
Class A Shares at NAV | | | 8.69% | | | | 7.58% | | | | 6.24% | |
Class A Shares at maximum Offering Price | | | 4.03% | | | | 6.64% | | | | 5.77% | |
Barclays Capital Aggregate Bond Index* | | | 3.90% | | | | 6.52% | | | | 5.74% | |
Lipper Intermediate Investment-Grade Debt Funds Category Average* | | | 5.10% | | | | 6.01% | | | | 5.25% | |
| | | |
Class B Shares w/o CDSC | | | 7.84% | | | | 6.76% | | | | 5.42% | |
Class B Shares w/CDSC | | | 2.84% | | | | 6.61% | | | | 5.42% | |
Class C Shares | | | 7.85% | | | | 6.77% | | | | 5.42% | |
Class I Shares | | | 8.99% | | | | 7.84% | | | | 6.49% | |
| | | | | | | | | | | | |
| | | |
| | | 1-Year | | | 5-Year | | | Since
Inception** | |
Class R3 Shares | | | 8.40% | | | | 7.27% | | | | 6.00% | |
Class A Shares have a maximum 4.25% sales charge (Offering Price). Class A Share purchases of $1 million or more are sold at net asset value without an upfront sales charge but may be subject to a contingent deferred sales charge (CDSC), also known as a back-end sales charge, if redeemed within eighteen months of purchase. Class B Shares have a CDSC that begins at 5% for redemptions during the first year and declines periodically until after six years when the charge becomes 0%. Class B Shares automatically convert to Class A Shares eight years after purchase. Class C Shares have a 1% CDSC for redemptions within less than twelve months, which is not reflected in the one-year total return. Class R3 Shares have no sales charge and are available only to certain retirement plans. Class I Shares have no sales charge and may be purchased under limited circumstances or by specified classes of investors.
Expense Ratios
| | | | | | | | |
| | |
| Share Class | | Gross
Expense
Ratios | | | Net
Expense
Ratios | |
Class A | | | 0.98% | | | | 0.90% | |
Class B | | | 1.73% | | | | 1.73% | |
Class C | | | 1.73% | | | | 1.73% | |
Class R3 | | | 1.23% | | | | 1.23% | |
Class I | | | 0.73% | | | | 0.73% | |
The Fund’s adviser has contractually agreed to reimburse Class A Share 12b-1 fees through March 31, 2012, to the extent necessary so that total annual Fund operating expenses, after fee waivers and/or expense reimbursement and excluding acquired Fund fees and expenses, do not exceed 0.89% for Class A Shares. Fee waivers and/or expense reimbursements will not be terminated prior to that time without the approval of the Fund’s Board of Directors.
| * | Refer to the Glossary of Terms Used in the Report for definitions. |
| ** | Since inception return for Class R3 Shares is from 9/24/01. |
Growth of an Assumed $10,000 Investment as of June 30, 2011
The graph does not reflect the deduction of taxes, that a shareholder may pay on Fund distributions or the redemption of Fund shares.
Yields (Unaudited) as of June 30, 2011
Dividend Yield is the most recent dividend per share (annualized) divided by the offering price per share.
The SEC 30-Day Yield is a standardized measure of a Fund’s yield that accounts for the future amortization of premiums or discounts of bonds held in the Fund’s portfolio. The SEC 30-Day Yield is computed under an SEC standardized formula and is based on the maximum offer price per share. Dividend Yield may differ from the SEC 30-Day Yield because the Fund may be paying out more or less than it is earning and it may not include the effect of amortization of bond premium.
Nuveen Core Bond Fund
| | | | | | | | |
| | |
| | | Dividend
Yield | | | SEC 30-Day
Yield | |
Class A Shares(1) | | | 3.51% | | | | 3.31% | |
Class B Shares | | | 2.91% | | | | 2.70% | |
Class C Shares | | | 2.95% | | | | 2.73% | |
Class R3 Shares | | | 3.44% | | | | 3.21% | |
Class I Shares | | | 3.91% | | | | 3.71% | |
Nuveen High Income Bond Fund
| | | | | | | | |
| | |
| | | Dividend
Yield | | | SEC 30-Day
Yield | |
Class A Shares(1) | | | 6.82% | | | | 7.32% | |
Class B Shares | | | 6.41% | | | | 6.92% | |
Class C Shares | | | 6.39% | | | | 6.94% | |
Class R3 Shares | | | 6.89% | | | | 7.44% | |
Class I Shares | | | 7.43% | | | | 7.94% | |
Nuveen Inflation Protected Securities Fund
| | | | | | | | |
| | |
| | | Dividend
Yield | | | SEC 30-Day
Yield | |
Class A Shares(1) | | | .79% | | | | 5.60% | |
Class C Shares | | | .11% | | | | 5.10% | |
Class R3 Shares | | | .61% | | | | 5.60% | |
Class I Shares | | | 1.09% | | | | 6.09% | |
Nuveen Intermediate Government Bond Fund
| | | | | | | | |
| | |
| | | Dividend
Yield | | | SEC 30-Day
Yield | |
Class A Shares(1) | | | 2.11% | | | | 1.66% | |
Class C Shares | | | 1.29% | | | | .87% | |
Class R3 Shares | | | 1.83% | | | | 1.37% | |
Class I Shares | | | 2.31% | | | | 1.87% | |
Nuveen Intermediate Term Bond Fund
| | | | | | | | |
| | |
| | | Dividend
Yield | | | SEC 30-Day
Yield | |
Class A Shares(1) | | | 3.11% | | | | 2.24% | |
Class C Shares | | | 2.36% | | | | 1.69% | |
Class I Shares | | | 3.34% | | | | 2.47% | |
Nuveen Short Term Bond Fund
| | | | | | | | |
| | |
| | | Dividend
Yield | | | SEC 30-Day
Yield | |
Class A Shares(1) | | | 2.16% | | | | 1.85% | |
Class C Shares | | | 1.37% | | | | 1.05% | |
Class I Shares | | | 2.38% | | | | 2.04% | |
Nuveen Total Return Bond Fund
| | | | | | | | |
| | |
| | | Dividend
Yield | | | SEC 30-Day
Yield | |
Class A Shares(1) | | | 3.75% | | | | 3.49% | |
Class B Shares | | | 3.15% | | | | 2.80% | |
Class C Shares | | | 3.15% | | | | 2.82% | |
Class R3 Shares | | | 3.62% | | | | 3.32% | |
Class I Shares | | | 4.12% | | | | 3.82% | |
| (1) | The SEC Yield for Class A Shares quoted in the table reflects the maximum sales load. Investors paying a reduced load because of volume discounts, investors paying no load because they qualify for one of the several exclusions from the load, and existing shareholders who previously paid a load but would like to know the SEC Yield applicable to their shares on a going-forward basis, should understand that the SEC Yield effectively applicable to them would be higher than the figure quoted in the table. |
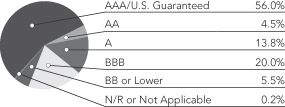
Holding Summaries (Unaudited) as of June 30, 2011
This data relates to the securities held in each Fund’s portfolio of investments. It should not be construed as a measure of performance for the Fund itself.
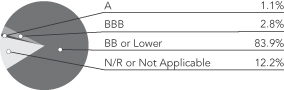
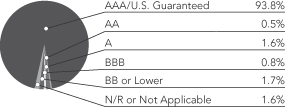
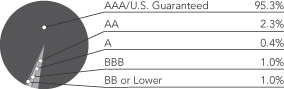
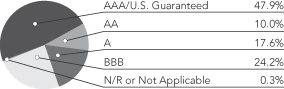
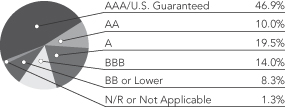
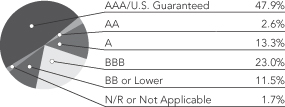
Ratings shown are the highest rating given by one of the following national rating agencies: Standard & Poor’s Group, Moody’s Investor Service, Inc. or Fitch, Inc. Credit ratings are subject to change. AAA, AA, A, and BBB are investment grade ratings; BB, B, CCC/CC/C and D are below-investment grade ratings. Bonds backed by U.S. Government or agency securities are given an implied rating equal to the rating of such securities. Holdings designated NR are not rated by a national rating agency.
Nuveen Core Bond Fund
Bond Credit Quality1
Nuveen High Income Bond Fund
Bond Credit Quality1
Nuveen Inflation Protected Securities Fund
Bond Credit Quality1
Nuveen Intermediate Government Bond Fund
Bond Credit Quality1
| | | | |
| Portfolio Composition1 | | | |
| Corporate Bonds | | | 30.3% | |
| U.S. Government Agency Mortgage-Backed Securities | | | 25.9% | |
| Commercial Mortgage-Backed Securities | | | 10.6% | |
| Money Market Funds2 | | | 10.1% | |
| Asset-Backed Securities | | | 7.5% | |
| Short-Term Investments | | | 5.4% | |
| Other | | | 10.2% | |
| | | | |
| Portfolio Composition1 | | | |
| High Yield Corporate Bond | | | 67.3% | |
| Money Market Funds2 | | | 22.5% | |
| Short-Term Investments | | | 1.2% | |
| Other | | | 9.0% | |
| | | | |
| Portfolio Composition1 | | | |
| U.S. Government & Agency Securities | | | 59.0% | |
| Money Market Funds2 | | | 31.7% | |
| Short-Term Investments | | | 0.9% | |
| Other | | | 8.4% | |
| | | | |
| Portfolio Composition1 | | | |
| U.S. Government & Agency Securities | | | 35.3% | |
| Money Market Funds2 | | | 19.3% | |
| U.S. Government Agency Mortgage-Backed Securities | | | 18.9% | |
| Collateralized Mortgage Obligation-U.S. Government Agency Mortgage-Backed Securities | | | 6.5% | |
| Short-Term Investments | | | 7.4% | |
| Other | | | 12.6% | |
| 1 | As a percentage of total investments (excluding investments in derivatives) as of June 30, 2011. Holdings are subject to change. |
| 2 | Represents investments purchased with proceeds from securities lending. |
Nuveen Intermediate Term Bond Fund
Bond Credit Quality1
Nuveen Short Term Bond Fund
Bond Credit Quality1
Nuveen Total Return Bond Fund
Bond Credit Quality1
| | | | |
| Portfolio Composition1 | | | |
| Corporate Bonds | | | 37.6% | |
| Money Market Funds2 | | | 14.8% | |
| Asset-Backed Securities | | | 12.4% | |
| Commercial Mortgage-Backed Securities | | | 9.4% | |
| U.S. Government & Agency Securities | | | 5.8% | |
| Collateralized Mortgage Obligation-U.S. Government Agency Mortgage-Backed Securities | | | 5.6% | |
| Short-Term Investments | | | 4.8% | |
| Other | | | 9.6% | |
| | | | |
| Portfolio Composition1 | | | |
| Corporate Bonds | | | 40.3% | |
| Asset-Backed Securities | | | 16.0% | |
| Commercial Mortgage-Backed Securities | | | 10.9% | |
| Money Markets Funds2 | | | 8.2% | |
| U.S. Government Agency Mortgage-Backed Securities | | | 6.7% | |
| Short-Term Investments | | | 4.8% | |
| Other | | | 13.1% | |
| | | | |
| Portfolio Composition1 | | | |
| Corporate Bonds | | | 39.6% | |
| U.S. Government Agency Mortgage-Backed Securities | | | 22.7% | |
| Commercial Mortgage-Backed Securities | | | 8.4% | |
| Money Market Funds2 | | | 7.6% | |
| Short-Term Investments | | | 11.9% | |
| Other | | | 9.8% | |
| 1 | As a percentage of total investments (excluding investments in derivatives) as of June 30, 2011. Holdings are subject to change. |
| 2 | Represents investments purchased with proceeds from securities lending. |
Expense Examples (Unaudited)
As a shareholder of one or more of the Funds, you incur two types of costs: (1) transaction costs, including up-front and back-end sales charges (loads) or redemption fees, where applicable; and (2) ongoing costs, including management fees; distribution and service (12b-1) fees, where applicable; and other Fund expenses. The Examples below are intended to help you understand your ongoing costs (in dollars) of investing in the Funds and to compare these costs with the ongoing costs of investing in other mutual funds. Since the expense examples for Class C Shares of Intermediate Term Bond reflect only the first 164 days of the Class’s operations they may not provide a meaningful understanding of the Class’s ongoing expenses.
The Examples below are based on an investment of $1,000 invested at the beginning of the period and held for the period.
The information under “Actual Performance,” together with the amount you invested, allows you to estimate actual expenses incurred over the reporting period. Simply divide your account value by $1,000 (for example, an $8,600 account value divided by $1,000 = 8.60) and multiply the result by the cost shown for your share class, in the row entitled “Expenses Incurred During Period” to estimate the expenses incurred on your account during this period.
The information under “Hypothetical Performance,” provides information about hypothetical account values and hypothetical expenses based on the respective Fund’s actual expense ratio and an assumed rate of return of 5% per year before expenses, which is not the Fund’s actual return. The hypothetical account values and expenses may not be used to estimate the actual ending account balance or expense you incurred for the period. You may use this information to compare the ongoing costs of investing in the Fund and other Funds. To do so, compare this 5% hypothetical example with the 5% hypothetical examples that appear in the shareholder reports of the other funds.
Please note that the expenses shown in the table are meant to highlight your ongoing costs only and do not reflect any transaction costs. Therefore, the hypothetical information is useful in comparing ongoing costs only, and will not help you determine the relative total costs of owning different funds or share classes. In addition, if these transaction costs were included, your costs would have been higher.
Nuveen Core Bond Fund
| | | | | | | | | | | | | | | | | | | | | | | | | | | | | | | | | | | | | | | | | | |
| | | Actual Performance | | | | | Hypothetical Performance
(5% annualized return before expenses) | |
| | | A Shares | | | B Shares | | | C Shares | | | R3 Shares | | | I Shares | | | | | A Shares | | | B Shares | | | C Shares | | | R3 Shares | | | I Shares | |
| Beginning Account Value (1/01/11) | | $ | 1,000.00 | | | $ | 1,000.00 | | | $ | 1,000.00 | | | $ | 1,000.00 | | | $ | 1,000.00 | | | | | $ | 1,000.00 | | | $ | 1,000.00 | | | $ | 1,000.00 | | | $ | 1,000.00 | | | $ | 1,000.00 | |
| Ending Account Value (6/30/11) | | $ | 1,026.60 | | | $ | 1,023.70 | | | $ | 1,023.80 | | | $ | 1,026.20 | | | $ | 1,028.80 | | | | | $ | 1,020.13 | | | $ | 1,016.36 | | | $ | 1,016.36 | | | $ | 1,018.84 | | | $ | 1,021.32 | |
| Expenses Incurred During Period | | $ | 4.77 | | | $ | 8.53 | | | $ | 8.53 | | | $ | 6.03 | | | $ | 3.52 | | | | | $ | 4.71 | | | $ | 8.50 | | | $ | 8.50 | | | $ | 6.01 | | | $ | 3.51 | |
For each class of the Fund, expenses are equal to the Fund’s annualized net expense ratio of .94%, 1.70%, 1.70%, 1.20%, and ..70% for Classes A, B, C, R3, and I, respectively, multiplied by the average account value over the period, multiplied by 181/365 (to reflect the one-half year period).
Nuveen High Income Bond Fund
| | | | | | | | | | | | | | | | | | | | | | | | | | | | | | | | | | | | | | | | | | |
| | | Actual Performance | | | | | Hypothetical Performance
(5% annualized return before expenses) | |
| | | A Shares | | | B Shares | | | C Shares | | | R3 Shares | | | I Shares | | | | | A Shares | | | B Shares | | | C Shares | | | R3 Shares | | | I Shares | |
| Beginning Account Value (1/01/11) | | $ | 1,000.00 | | | $ | 1,000.00 | | | $ | 1,000.00 | | | $ | 1,000.00 | | | $ | 1,000.00 | | | | | $ | 1,000.00 | | | $ | 1,000.00 | | | $ | 1,000.00 | | | $ | 1,000.00 | | | $ | 1,000.00 | |
| Ending Account Value (6/30/11) | | $ | 1,048.60 | | | $ | 1,044.90 | | | $ | 1,044.80 | | | $ | 1,048.00 | | | $ | 1,049.90 | | | | | $ | 1,019.34 | | | $ | 1,015.62 | | | $ | 1,015.62 | | | $ | 1,018.10 | | | $ | 1,020.58 | |
| Expenses Incurred During Period | | $ | 5.59 | | | $ | 9.38 | | | $ | 9.38 | | | $ | 6.91 | | | $ | 4.32 | | | | | $ | 5.51 | | | $ | 9.25 | | | $ | 9.25 | | | $ | 6.76 | | | $ | 4.26 | |
For each class of the Fund, expenses are equal to the Fund’s annualized net expense ratio of 1.10%, 1.85%, 1.85%, 1.35% and ..85% for Classes A, B, C, R3, and I, respectively, multiplied by the average account value over the period, multiplied by 181/365 (to reflect the one-half year period).
Nuveen Inflation Protected Securities Fund
| | | | | | | | | | | | | | | | | | | | | | | | | | | | | | | | | | |
| | | Actual Performance | | | | | Hypothetical Performance
(5% annualized return before expenses) | |
| | | A Shares | | | C Shares | | | R3 Shares | | | I Shares | | | | | A Shares | | | C Shares | | | R3 Shares | | | I Shares | |
| Beginning Account Value (1/01/11) | | $ | 1,000.00 | | | $ | 1,000.00 | | | $ | 1,000.00 | | | $ | 1,000.00 | | | | | $ | 1,000.00 | | | $ | 1,000.00 | | | $ | 1,000.00 | | | $ | 1,000.00 | |
| Ending Account Value (6/30/11) | | $ | 1,051.50 | | | $ | 1,048.00 | | | $ | 1,049.60 | | | $ | 1,053.70 | | | | | $ | 1,020.58 | | | $ | 1,016.86 | | | $ | 1,019.34 | | | $ | 1,021.82 | |
| Expenses Incurred During Period | | $ | 4.32 | | | $ | 8.12 | | | $ | 5.59 | | | $ | 3.06 | | | | | $ | 4.26 | | | $ | 8.00 | | | $ | 5.51 | | | $ | 3.01 | |
For each class of the Fund, expenses are equal to the Fund’s annualized net expense ratio of .85%, 1.60%, 1.10%, and .60% for Classes A, C, R3, and I, respectively, multiplied by the average account value over the period, multiplied by 181/365 (to reflect the one-half year period).
Nuveen Intermediate Government Bond Fund
| | | | | | | | | | | | | | | | | | | | | | | | | | | | | | | | | | |
| | | Actual Performance | | | | | Hypothetical Performance
(5% annualized return before expenses) | |
| | | A Shares | | | C Shares | | | R3 Shares | | | I Shares | | | | | A Shares | | | C Shares | | | R3 Shares | | | I Shares | |
| Beginning Account Value (1/01/11) | | $ | 1,000.00 | | | $ | 1,000.00 | | | $ | 1,000.00 | | | $ | 1,000.00 | | | | | $ | 1,000.00 | | | $ | 1,000.00 | | | $ | 1,000.00 | | | $ | 1,000.00 | |
| Ending Account Value (6/30/11) | | $ | 1,020.20 | | | $ | 1,016.80 | | | $ | 1,019.60 | | | $ | 1,020.90 | | | | | $ | 1,021.08 | | | $ | 1,016.86 | | | $ | 1,019.34 | | | $ | 1,021.82 | |
| Expenses Incurred During Period | | $ | 3.76 | | | $ | 8.00 | | | $ | 5.51 | | | $ | 3.01 | | | | | $ | 3.76 | | | $ | 8.00 | | | $ | 5.51 | | | $ | 3.01 | |
For each class of the Fund, expenses are equal to the Fund’s annualized net expense ratio of .75%, 1.60%, 1.10%, and .60% for Classes A, C, R3, and I, respectively, multiplied by the average account value over the period, multiplied by 181/365 (to reflect the one-half year period).
Nuveen Intermediate Term Bond Fund
| | | | | | | | | | | | | | | | | | | | | | | | | | |
| | | Actual Performance | | | | | Hypothetical Performance
(5% annualized return before expenses) | |
| | | A Shares | | | C Shares | | | I Shares | | | | | A Shares | | | C Shares | | | I Shares | |
| Beginning Account Value (1/01/11) | | $ | 1,000.00 | | | $ | 1,000.00 | | | $ | 1,000.00 | | | | | $ | 1,000.00 | | | $ | 1,000.00 | | | $ | 1,000.00 | |
| Ending Account Value (6/30/11) | | $ | 1,024.90 | | | $ | 1,017.60 | | | $ | 1,024.70 | | | | | $ | 1,020.58 | | | $ | 1,016.36 | | | $ | 1,021.32 | |
| Expenses Incurred During Period | | $ | 4.27 | | | $ | 8.50 | | | $ | 3.51 | | | | | $ | 4.26 | | | $ | 8.50 | | | $ | 3.51 | |
For each class of the Fund, expenses are equal to the Fund’s annualized net expense ratio of .85% and .70% for Classes A and I, respectively, multiplied by the average account value over the period, multiplied by 181/365 (to reflect the one-half year period). For Class C of the Fund, expenses are equal to the Fund’s annualized net expense ratio of 1.70% multiplied by the average account value over the period, multiplied by 164/365 (to reflect the 164 days in the period since class commencement of operations).
Nuveen Short Term Bond Fund
| | | | | | | | | | | | | | | | | | | | | | | | | | |
| | | Actual Performance | | | | | Hypothetical Performance
(5% annualized return before expenses) | |
| | | A Shares | | | C Shares | | | I Shares | | | | | A Shares | | | C Shares | | | I Shares | |
| Beginning Account Value (1/01/11) | | $ | 1,000.00 | | | $ | 1,000.00 | | | $ | 1,000.00 | | | | | $ | 1,000.00 | | | $ | 1,000.00 | | | $ | 1,000.00 | |
| Ending Account Value (6/30/11) | | $ | 1,015.10 | | | $ | 1,010.90 | | | $ | 1,016.00 | | | | | $ | 1,021.27 | | | $ | 1,017.06 | | | $ | 1,022.02 | |
| Expenses Incurred During Period | | $ | 3.55 | | | $ | 7.78 | | | $ | 2.80 | | | | | $ | 3.56 | | | $ | 7.80 | | | $ | 2.81 | |
For each class of the Fund, expenses are equal to the Fund’s annualized net expense ratio of .71%, 1.56%, and .56% for Classes A, C and I, respectively, multiplied by the average account value over the period, multiplied by 181/365 (to reflect the one-half year period).
Nuveen Total Return Bond Fund
| | | | | | | | | | | | | | | | | | | | | | | | | | | | | | | | | | | | | | | | | | |
| | | Actual Performance | | | | | Hypothetical Performance
(5% annualized return before expenses) | |
| | | A Shares | | | B Shares | | | C Shares | | | R3 Shares | | | I Shares | | | | | A Shares | | | B Shares | | | C Shares | | | R3 Shares | | | I Shares | |
| Beginning Account Value (1/01/11) | | $ | 1,000.00 | | | $ | 1,000.00 | | | $ | 1,000.00 | | | $ | 1,000.00 | | | $ | 1,000.00 | | | | | $ | 1,000.00 | | | $ | 1,000.00 | | | $ | 1,000.00 | | | $ | 1,000.00 | | | $ | 1,000.00 | |
| Ending Account Value (6/30/11) | | $ | 1,032.30 | | | $ | 1,029.40 | | | $ | 1,028.40 | | | $ | 1,031.70 | | | $ | 1,034.40 | | | | | $ | 1,020.38 | | | $ | 1,016.27 | | | $ | 1,016.27 | | | $ | 1,018.74 | | | $ | 1,021.22 | |
| Expenses Incurred During Period | | $ | 4.48 | | | $ | 8.65 | | | $ | 8.65 | | | $ | 6.15 | | | $ | 3.63 | | | | | $ | 4.46 | | | $ | 8.60 | | | $ | 8.60 | | | $ | 6.11 | | | $ | 3.61 | |
For each class of the Fund, expenses are equal to the Fund’s annualized net expense ratio of .89%, 1.72%, 1.72%, 1.22%, and ..72% for Classes A, B, C, R3, and I, respectively, multiplied by the average account value over the period, multiplied by 181/365 (to reflect the one-half year period).
Shareholder Meeting Report (Unaudited)
A special meeting of shareholders was held in the offices of FAF Advisors, Inc. on December 17, 2010; at this meeting the shareholders were asked to vote on the election of Board Members, the approval of an Investment Advisory Agreement and the approval of an Investment Sub-Advisory Agreement.
| | | | | | | | | | | | | | | | | | | | | | | | | | | | |
| | | Nuveen
Core Bond
Fund | | | Nuveen
High
Income Bond
Fund | | | Nuveen
Inflation
Protected
Securities
Fund | | | Nuveen
Intermediate
Government
Bond Fund | | | Nuveen
Intermediate
Term Bond
Fund | | | Nuveen
Short Term
Bond Fund | | | Nuveen
Total Return
Bond Fund | |
| To approve an investment advisory agreement with Nuveen Asset Management and an investment sub-advisory agreement between Nuveen Asset Management and Nuveen Asset Management, LLC. | | | | | | | | | | | | | | | | | |
For | | | 84,701,158 | | | | 39,254,456 | | | | 13,211,937 | | | | 14,025,405 | | | | 52,914,467 | | | | 50,401,541 | | | | 50,264,660 | |
Against | | | 167,783 | | | | 69,703 | | | | 48,188 | | | | 12,995 | | | | 110,514 | | | | 150,981 | | | | 74,869 | |
Abstain | | | 874,527 | | | | 68,372 | | | | 9,817 | | | | 15,586 | | | | 62,269 | | | | 86,129 | | | | 145,615 | |
Broker Non-Votes | | | 5,514,543 | | | | 3,527,657 | | | | 1,337,477 | | | | 1,281,497 | | | | 1,701,659 | | | | 5,907,413 | | | | 3,304,660 | |
Total | | | 91,258,011 | | | | 42,920,188 | | | | 14,607,419 | | | | 15,335,483 | | | | 54,788,909 | | | | 56,546,064 | | | | 53,789,804 | |
Approval of the Board Members was reached as follows: | | | | | | | | | | | | | | | | | | | | | | | | | | | | |
| | | | | | | |
John P. Amboian | | | | | | | | | | | | | | | | | | | | | | | | | | | | |
For | | | 90,308,630 | | | | 42,812,258 | | | | 14,584,473 | | | | 15,296,054 | | | | 54,573,090 | | | | 56,316,726 | | | | 53,714,191 | |
Withhold | | | 949,381 | | | | 107,930 | | | | 22,946 | | | | 39,429 | | | | 215,819 | | | | 229,338 | | | | 75,613 | |
Total | | | 91,258,011 | | | | 42,920,188 | | | | 14,607,419 | | | | 15,335,483 | | | | 54,788,909 | | | | 56,546,064 | | | | 53,789,804 | |
Robert P. Bremner | | | | | | | | | | | | | | | | | | | | | | | | | | | | |
For | | | 90,293,138 | | | | 42,823,479 | | | | 14,582,087 | | | | 15,298,205 | | | | 54,565,920 | | | | 56,297,504 | | | | 53,708,705 | |
Withhold | | | 964,873 | | | | 96,709 | | | | 25,332 | | | | 37,278 | | | | 222,989 | | | | 248,560 | | | | 81,099 | |
Total | | | 91,258,011 | | | | 42,920,188 | | | | 14,607,419 | | | | 15,335,483 | | | | 54,788,909 | | | | 56,546,064 | | | | 53,789,804 | |
Jack B. Evans | | | | | | | | | | | | | | | | | | | | | | | | | | | | |
For | | | 90,328,064 | | | | 42,775,323 | | | | 14,584,473 | | | | 15,263,028 | | | | 54,574,661 | | | | 56,340,828 | | | | 53,672,984 | |
Withhold | | | 929,947 | | | | 144,865 | | | | 22,946 | | | | 72,455 | | | | 214,248 | | | | 205,236 | | | | 116,820 | |
Total | | | 91,258,011 | | | | 42,920,188 | | | | 14,607,419 | | | | 15,335,483 | | | | 54,788,909 | | | | 56,546,064 | | | | 53,789,804 | |
William C. Hunter | | | | | | | | | | | | | | | | | | | | | | | | | | | | |
For | | | 90,333,839 | | | | 42,823,814 | | | | 14,584,473 | | | | 15,298,781 | | | | 54,579,109 | | | | 56,340,828 | | | | 53,672,984 | |
Withhold | | | 924,172 | | | | 96,374 | | | | 22,946 | | | | 36,702 | | | | 209,800 | | | | 205,236 | | | | 116,820 | |
Total | | | 91,258,011 | | | | 42,920,188 | | | | 14,607,419 | | | | 15,335,483 | | | | 54,788,909 | | | | 56,546,064 | | | | 53,789,804 | |
David J. Kundert | | | | | | | | | | | | | | | | | | | | | | | | | | | | |
For | | | 90,290,839 | | | | 42,828,452 | | | | 14,582,163 | | | | 15,298,205 | | | | 54,526,189 | | | | 56,283,360 | | | | 53,711,404 | |
Withhold | | | 967,172 | | | | 91,736 | | | | 25,256 | | | | 37,278 | | | | 262,720 | | | | 262,704 | | | | 78,400 | |
Total | | | 91,258,011 | | | | 42,920,188 | | | | 14,607,419 | | | | 15,335,483 | | | | 54,788,909 | | | | 56,546,064 | | | | 53,789,804 | |
William J. Schneider | | | | | | | | | | | | | | | | | | | | | | | | | | | | |
For | | | 90,295,443 | | | | 42,828,818 | | | | 14,582,087 | | | | 15,295,478 | | | | 54,528,051 | | | | 56,283,360 | | | | 53,711,404 | |
Withhold | | | 962,568 | | | | 91,370 | | | | 25,332 | | | | 40,005 | | | | 260,858 | | | | 262,704 | | | | 78,400 | |
Total | | | 91,258,011 | | | | 42,920,188 | | | | 14,607,419 | | | | 15,335,483 | | | | 54,788,909 | | | | 56,546,064 | | | | 53,789,804 | |
Judith M. Stockdale | | | | | | | | | | | | | | | | | | | | | | | | | | | | |
For | | | 90,363,785 | | | | 42,831,363 | | | | 14,586,428 | | | | 15,298,205 | | | | 54,572,582 | | | | 56,340,180 | | | | 53,674,679 | |
Withhold | | | 894,226 | | | | 88,825 | | | | 20,991 | | | | 37,278 | | | | 216,327 | | | | 205,884 | | | | 115,125 | |
Total | | | 91,258,011 | | | | 42,920,188 | | | | 14,607,419 | | | | 15,335,483 | | | | 54,788,909 | | | | 56,546,064 | | | | 53,789,804 | |
Carole E. Stone | | | | | | | | | | | | | | | | | | | | | | | | | | | | |
For | | | 90,354,616 | | | | 42,769,794 | | | | 14,586,352 | | | | 15,262,452 | | | | 54,572,431 | | | | 56,329,668 | | | | 53,675,683 | |
Withhold | | | 903,395 | | | | 150,394 | | | | 21,067 | | | | 73,031 | | | | 216,478 | | | | 216,396 | | | | 114,121 | |
Total | | | 91,258,011 | | | | 42,920,188 | | | | 14,607,419 | | | | 15,335,483 | | | | 54,788,909 | | | | 56,546,064 | | | | 53,789,804 | |
Virginia L. Stringer | | | | | | | | | | | | | | | | | | | | | | | | | | | | |
For | | | 90,071,779 | | | | 42,825,979 | | | | 14,584,118 | | | | 15,298,205 | | | | 54,203,402 | | | | 56,272,270 | | | | 53,711,404 | |
Withhold | | | 1,186,232 | | | | 94,209 | | | | 23,301 | | | | 37,278 | | | | 585,507 | | | | 273,794 | | | | 78,400 | |
Total | | | 91,258,011 | | | | 42,920,188 | | | | 14,607,419 | | | | 15,335,483 | | | | 54,788,909 | | | | 56,546,064 | | | | 53,789,804 | |
Terence J. Toth | | | | | | | | | | | | | | | | | | | | | | | | | | | | |
For | | | 90,308,890 | | | | 42,750,035 | | | | 14,584,473 | | | | 15,263,028 | | | | 54,572,582 | | | | 56,326,765 | | | | 53,708,349 | |
Withhold | | | 949,121 | | | | 170,153 | | | | 22,946 | | | | 72,455 | | | | 216,327 | | | | 219,299 | | | | 81,455 | |
Total | | | 91,258,011 | | | | 42,920,188 | | | | 14,607,419 | | | | 15,335,483 | | | | 54,788,909 | | | | 56,546,064 | | | | 53,789,804 | |
Report of Independent
Registered Public Accounting Firm
The Board of Directors and Shareholders
Nuveen Core Bond Fund (formerly known as First American Core Bond Fund)
Nuveen High Income Bond Fund (formerly known as First American High Income Bond Fund)
Nuveen Inflation Protected Securities Fund (formerly known as First American Inflation Protected Securities Fund)
Nuveen Intermediate Government Bond Fund (formerly known as First American Intermediate Government Bond Fund)
Nuveen Intermediate Term Bond Fund (formerly known as First American Intermediate Term Bond Fund)
Nuveen Short Term Bond Fund (formerly known as First American Short Term Bond Fund)
Nuveen Total Return Bond Fund (formerly known as First American Total Return Bond Fund)
We have audited the accompanying statements of assets and liabilities, including the portfolios of investments, of Nuveen Core Bond Fund (formerly known as First American Core Bond Fund), Nuveen High Income Bond Fund (formerly known as First American High Income Bond Fund), Nuveen Inflation Protected Securities Fund (formerly known as First American Inflation Protected Securities Fund), Nuveen Intermediate Government Bond Fund (formerly known as First American Intermediate Government Bond Fund), Nuveen Intermediate Term Bond Fund (formerly known as First American Intermediate Term Bond Fund), Nuveen Short Term Bond Fund (formerly known as First American Short Term Bond Fund) and Nuveen Total Return Bond Fund (formerly known as First American Total Return Bond Fund), (the “Funds”) as of June 30, 2011, and the related statements of operations for the year then ended, the statements of changes in net assets for each of the two years in the period then ended and the financial highlights for each of the periods indicated therein. These financial statements and financial highlights are the responsibility of the Funds’ management. Our responsibility is to express an opinion on these financial statements and financial highlights based on our audits.
We conducted our audits in accordance with the standards of the Public Company Accounting Oversight Board (United States). Those standards require that we plan and perform the audits to obtain reasonable assurance about whether the financial statements and financial highlights are free of material misstatement. We were not engaged to perform an audit of the Funds’ internal control over financial reporting. Our audits included consideration of internal control over financial reporting as a basis for designing audit procedures that are appropriate in the circumstances, but not for the purpose of expressing an opinion on the effectiveness of the Funds’ internal control over financial reporting. Accordingly, we express no such opinion. An audit also includes examining, on a test basis, evidence supporting the amounts and disclosures in the financial statements and financial highlights, assessing the accounting principles used and significant estimates made by management, and evaluating the overall financial statement presentation. Our procedures included confirmation of securities owned as of June 30, 2011, by correspondence with the custodian and brokers or by other appropriate auditing procedures where replies from brokers were not received. We believe that our audits provide a reasonable basis for our opinion.
In our opinion, the financial statements and financial highlights referred to above present fairly, in all material respects, the financial position of Nuveen Core Bond Fund (formerly known as First American Core Bond Fund), Nuveen High Income Bond Fund (formerly known as First American High Income Bond Fund), Nuveen Inflation Protected Securities Fund (formerly known as First American Inflation Protected Securities Fund), Nuveen Intermediate Government Bond Fund (formerly known as First American Intermediate Government Bond Fund), Nuveen Intermediate Term Bond Fund (formerly known as First American Intermediate Term Bond Fund), Nuveen Short Term Bond Fund (formerly known as First American Short Term Bond Fund) and Nuveen Total Return Bond Fund (formerly known as First American Total Return Bond Fund) at June 30, 2011, the results of their operations for the year then ended, the changes in their net assets for each of the two years in the period then ended, and the financial highlights for each of the periods indicated therein, in conformity with U.S. generally accepted accounting principles.
.
Chicago, Illinois
August 26, 2011
Portfolio of Investments
Nuveen Core Bond Fund
(formerly known as First American Core Bond Fund)
June 30, 2011
| | | | | | | | | | | | | | |
Principal
Amount (000) | | | Description p | | | | | | | | Value | |
| | | | | | | | | | | | | | |
| | | | CORPORATE BONDS – 36.8% | | | | | | | | | | |
| | | | | |
| | | | Banking – 5.9% | | | | | | | | | | |
| | | | | |
| | | | Ally Financial | | | | | | | | | | |
| $ | 1,650 | | | 7.500%, 09/15/2020 | | | | | | | | $ | 1,724,250 | |
| | | | | |
| | | | Banco Bradesco | | | | | | | | | | |
| | 1,910 | | | 4.125%, 05/16/2016 n q | | | | | | | | | 1,922,033 | |
| | | | | |
| | | | Bancolombia | | | | | | | | | | |
| | 2,900 | | | 5.950%, 06/03/2021 n | | | | | | | | | 2,943,500 | |
| | | | | |
| | | | Bank of America | | | | | | | | | | |
| | 3,725 | | | 5.750%, 12/01/2017 | | | | | | | | | 3,983,925 | |
| | 2,505 | | | 5.875%, 01/05/2021 | | | | | | | | | 2,628,934 | |
| | | | | |
| | | | BBVA Bancomer | | | | | | | | | | |
| | 1,425 | | | 4.500%, 03/10/2016 n q | | | | | | | | | 1,449,937 | |
| | | | | |
| | | | Citigroup | | | | | | | | | | |
| | 3,500 | | | 8.125%, 07/15/2039 q | | | | | | | | | 4,379,788 | |
| | | | | |
| | | | Citigroup Capital XXI | | | | | | | | | | |
| | 3,720 | | | 8.300%, 12/21/2077 D | | | | | | | | | 3,803,700 | |
| | | | | |
| | | | First National Bank of Chicago | | | | | | | | | | |
| | 1,106 | | | 8.080%, 01/05/2018 | | | | | | | | | 1,244,798 | |
| | | | | |
| | | | HSBC Holdings | | | | | | | | | | |
| | 4,030 | | | 6.800%, 06/01/2038 | | | | | | | | | 4,300,683 | |
| | | | | |
| | | | JPMorgan Chase | | | | | | | | | | |
| | 3,695 | | | 5.150%, 10/01/2015 | | | | | | | | | 3,990,766 | |
| | 4,330 | | | 4.400%, 07/22/2020 q | | | | | | | | | 4,241,963 | |
| | 2,750 | | | 4.250%, 10/15/2020 | | | | | | | | | 2,690,421 | |
| | 4,440 | | | 5.500%, 10/15/2040 q | | | | | | | | | 4,414,639 | |
| | | | | |
| | | | JPMorgan Chase Capital XX
Series T | | | | | | | | | | |
| | 1,410 | | | 6.550%, 09/29/2066 | | | | | | | | | 1,413,463 | |
| | | | | |
| | | | Lloyds TSB Bank | | | | | | | | | | |
| | 4,250 | | | 4.875%, 01/21/2016 q | | | | | | | | | 4,346,777 | |
| | | | | |
| | | | Sovereign Bank | | | | | | | | | | |
| | 3,675 | | | 8.750%, 05/30/2018 | | | | | | | | | 4,148,557 | |
| | | | | |
| | | | Wachovia Captial Trust III | | | | | | | | | | |
| | 3,500 | | | 5.570%, 03/29/2049 D | | | | | | | | | 3,202,500 | |
| | | | | |
| | | | Wells Fargo Capital X | | | | | | | | | | |
| | 2,760 | | | 5.950%, 12/15/2086 | | | | | | | | | 2,700,039 | |
| | 57,281 | | | Total Banking | | | | | | | | | 59,530,673 | |
| | | | Basic Industry – 2.9% | | | | | | | | | | |
| | | | | |
| | | | Alcoa | | | | | | | | | | |
| | 1,825 | | | 5.400%, 04/15/2021 q | | | | | | | | | 1,830,636 | |
| | | | | |
| | | | Arcelormittal | | | | | | | | | | |
| | 5,500 | | | 7.000%, 10/15/2039 | | | | | | | | | 5,561,017 | |
| | | | | |
| | | | Braskem Finance Limited | | | | | | | | | | |
| | 2,375 | | | 5.750%, 04/15/2021 n q | | | | | | | | | 2,389,962 | |
| | | | | |
| | | | Cliffs Natural Resources | | | | | | | | | | |
| | 1,000 | | | 6.250%, 10/01/2040 | | | | | | | | | 986,793 | |
| | | | | |
| | | | Georgia-Pacific | | | | | | | | | | |
| | 1,820 | | | 5.400%, 11/01/2020 n q | | | | | | | | | 1,854,820 | |
| | | | | |
| | | | Incitec Pivot Finance | | | | | | | | | | |
| | 3,830 | | | 6.000%, 12/10/2019 n | | | | | | | | | 4,102,053 | |
| | | | | |
| | | | International Paper | | | | | | | | | | |
| | 3,015 | | | 8.700%, 06/15/2038 | | | | | | | | | 3,750,754 | |
| | | | | | | | | | | | | | |
Principal
Amount (000) | | | Description p | | | | | | | | Value | |
| | | | | | | | | | | | | | |
| | | | Basic Industry (continued) | | | | | | | | | | |
| | | | | |
| | | | Plum Creek Timberlands | | | | | | | | | | |
| $ | 950 | | | 4.700%, 03/15/2021 | | | | | | | | $ | 936,279 | |
| | | | | |
| | | | Southern Copper | | | | | | | | | | |
| | 2,550 | | | 7.500%, 07/27/2035 | | | | | | | | | 2,670,003 | |
| | | | | |
| | | | Teck Resources Limited | | | | | | | | | | |
| | 1,440 | | | 6.250%, 07/15/2041 | | | | | | | | | 1,453,841 | |
| | | | | |
| | | | Vale Overseas | | | | | | | | | | |
| | 3,895 | | | 6.875%, 11/10/2039 | | | | | | | | | 4,233,008 | |
| | 28,200 | | | Total Basic Industry | | | | | | | | | 29,769,166 | |
| | | | Brokerage – 2.0% | | | | | | | | | | |
| | | | | |
| | | | Goldman Sachs Capital II | | | | | | | | | | |
| | 2,415 | | | 5.793%, 12/29/2049 D | | | | | | | | | 1,932,000 | |
| | | | | |
| | | | Goldman Sachs Group | | | | | | | | | | |
| | 4,640 | | | 6.000%, 06/15/2020 q | | | | | | | | | 4,992,584 | |
| | 3,685 | | | 6.750%, 10/01/2037 | | | | | | | | | 3,684,938 | |
| | | | | |
| | | | Morgan Stanley | | | | | | | | | | |
| | 6,250 | | | 5.500%, 07/24/2020 | | | | | | | | | 6,326,193 | |
| | 3,375 | | | 5.750%, 01/25/2021 q | | | | | | | | | 3,414,923 | |
| | 20,365 | | | Total Brokerage | | | | | | | | | 20,350,638 | |
| | | | Capital Goods – 0.4% | | | | | | | | | | |
| | | | | |
| | | | GE Capital Trust I | | | | | | | | | | |
| | 4,000 | | | 6.375%, 11/15/2067 D | | | | | | | | | 4,095,000 | |
| | | | Communications – 4.3% | | | | | | | | | | |
| | | | | |
| | | | American Tower | | | | | | | | | | |
| | 2,980 | | | 5.050%, 09/01/2020 | | | | | | | | | 2,935,217 | |
| | | | | |
| | | | AT&T | | | | | | | | | | |
| | 3,530 | | | 6.550%, 02/15/2039 q | | | | | | | | | 3,871,810 | |
| | | | | |
| | | | British Sky Broadcasting | | | | | | | | | | |
| | 3,450 | | | 6.100%, 02/15/2018 n | | | | | | | | | 3,858,842 | |
| | | | | |
| | | | DirecTV Holdings | | | | | | | | | | |
| | 3,215 | | | 5.200%, 03/15/2020 q | | | | | | | | | 3,401,753 | |
| | | | | |
| | | | Embarq | | | | | | | | | | |
| | 2,575 | | | 7.082%, 06/01/2016 q | | | | | | | | | 2,862,422 | |
| | | | | |
| | | | Frontier Communications | | | | | | | | | | |
| | 3,500 | | | 8.500%, 04/15/2020 | | | | | | | | | 3,815,000 | |
| | | | | |
| | | | NBC Universal | | | | | | | | | | |
| | 1,315 | | | 4.375%, 04/01/2021 n | | | | | | | | | 1,301,259 | |
| | 3,060 | | | 6.400%, 04/30/2040 n q | | | | | | | | | 3,288,720 | |
| | | | | |
| | | | News America | | | | | | | | | | |
| | 3,590 | | | 6.650%, 11/15/2037 | | | | | | | | | 3,847,399 | |
| | 1,275 | | | 6.150%, 02/15/2041 n | | | | | | | | | 1,263,061 | |
| | | | | |
| | | | Sprint Nextel | | | | | | | | | | |
| | 2,000 | | | 6.000%, 12/01/2016 | | | | | | | | | 1,997,500 | |
| | | | | |
| | | | Time Warner Cable | | | | | | | | | | |
| | 2,000 | | | 8.750%, 02/14/2019 | | | | | | | | | 2,548,420 | |
| | 2,410 | | | 5.875%, 11/15/2040 q | | | | | | | | | 2,378,586 | |
| | | | | |
| | | | Verizon Communications | | | | | | | | | | |
| | 5,870 | | | 6.900%, 04/15/2038 | | | | | | | | | 6,733,782 | |
| | 40,770 | | | Total Communications | | | | | | | | | 44,103,771 | |
| | | | Consumer Cyclical – 1.9% | | | | | | | | | | |
| | | | | |
| | | | Ingram Micro | | | | | | | | | | |
| | 2,000 | | | 5.250%, 09/01/2017 | | | | | | | | | 2,096,462 | |
Portfolio of Investments
Nuveen Core Bond Fund (continued)
June 30, 2011
| | | | | | | | | | | | | | |
Principal
Amount (000) | | | Description p | | | | | | | | Value | |
| | | | | | | | | | | | | | |
| | | | Consumer Cyclical (continued) | | | | | | | | | | |
| | | | | |
| | | | J.C. Penney | | | | | | | | | | |
| $ | 2,585 | | | 5.650%, 06/01/2020 | | | | | | | | $ | 2,559,150 | |
| | | | | |
| | | | Navistar International | | | | | | | | | | |
| | 2,210 | | | 8.250%, 11/01/2021 | | | | | | | | | 2,364,700 | |
| | | | | |
| | | | O’Reilly Automotive | | | | | | | | | | |
| | 3,200 | | | 4.875%, 01/14/2021 | | | | | | | | | 3,215,514 | |
| | | | | |
| | | | R.R. Donnelley & Sons | | | | | | | | | | |
| | 1,990 | | | 7.625%, 06/15/2020 q | | | | | | | | | 1,966,725 | |
| | | | | |
| | | | Time Warner | | | | | | | | | | |
| | 2,405 | | | 4.750%, 03/29/2021 q | | | | | | | | | 2,446,491 | |
| | | | | |
| | | | Viacom | | | | | | | | | | |
| | 4,105 | | | 6.875%, 04/30/2036 | | | | | | | | | 4,582,838 | |
| | 18,495 | | | Total Consumer Cyclical | | | | | | | | | 19,231,880 | |
| | | | Consumer Non Cyclical – 2.8% | | | | | | | | | | |
| | | | | |
| | | | Altria Group | | | | | | | | | | |
| | 2,100 | | | 4.750%, 05/05/2021 | | | | | | | | | 2,098,561 | |
| | 2,975 | | | 9.950%, 11/10/2038 | | | | | | | | | 4,180,012 | |
| | | | | |
| | | | Constellation Brands | | | | | | | | | | |
| | 1,000 | | | 7.250%, 05/15/2017 | | | | | | | | | 1,087,500 | |
| | | | | |
| | | | Express Scripts | | | | | | | | | | |
| | 3,255 | | | 3.125%, 05/15/2016 | | | | | | | | | 3,275,057 | |
| | | | | |
| | | | HCA | | | | | | | | | | |
| | 2,400 | | | 7.250%, 09/15/2020 | | | | | | | | | 2,577,000 | |
| | | | | |
| | | | Kraft Foods | | | | | | | | | | |
| | 2,605 | | | 6.500%, 02/09/2040 | | | | | | | | | 2,893,566 | |
| | | | | |
| | | | Lorillard Tobacco | | | | | | | | | | |
| | 3,350 | | | 8.125%, 06/23/2019 q | | | | | | | | | 3,901,919 | |
| | | | | |
| | | | Pernod-Ricard | | | | | | | | | | |
| | 2,275 | | | 5.750%, 04/07/2021 n q | | | | | | | | | 2,375,230 | |
| | | | | |
| | | | UnitedHealth Group | | | | | | | | | | |
| | 3,185 | | | 6.875%, 02/15/2038 | | | | | | | | | 3,641,844 | |
| | | | | |
| | | | Valeant Pharmaceuticals | | | | | | | | | | |
| | 2,080 | | | 6.875%, 12/01/2018 n q | | | | | | | | | 2,038,400 | |
| | 25,225 | | | Total Consumer Non Cyclical | | | | | | | | | 28,069,089 | |
| | | | Electric – 1.5% | | | | | | | | | | |
| | | | | |
| | | | Comision Federal De Electricidad | | | | | | | | | | |
| | 2,370 | | | 4.875%, 05/26/2021 n | | | | | | | | | 2,366,682 | |
| | | | | |
| | | | Constellation Energy Group | | | | | | | | | | |
| | 3,305 | | | 5.150%, 12/01/2020 | | | | | | | | | 3,387,027 | |
| | | | | |
| | | | FirstEnergy Solutions | | | | | | | | | | |
| | 3,690 | | | 6.050%, 08/15/2021 | | | | | | | | | 3,970,621 | |
| | | | | |
| | | | MidAmerican Energy Holdings | | | | | | | | | | |
| | 2,685 | | | 6.125%, 04/01/2036 | | | | | | | | | 2,891,449 | |
| | | | | |
| | | | NV Energy | | | | | | | | | | |
| | 2,725 | | | 6.250%, 11/15/2020 q | | | | | | | | | 2,860,926 | |
| | 14,775 | | | Total Electric | | | | | | | | | 15,476,705 | |
| | | | Energy – 4.3% | | | | | | | | | | |
| | | | | |
| | | | Anadarko Petroleum | | | | | | | | | | |
| | 3,230 | | | 6.200%, 03/15/2040 q | | | | | | | | | 3,273,592 | |
| | | | | |
| | | | Canadian Oil Sands | | | | | | | | | | |
| | 3,050 | | | 7.750%, 05/15/2019 n | | | | | | | | | 3,664,398 | |
| | | | | | | | | | | | | | |
Principal
Amount (000) | | | Description p | | | | | | | | Value | |
| | | | | | | | | | | | | | |
| | | | Energy (continued) | | | | | | | | | | |
| | | | | |
| | | | Chesapeake Energy | | | | | | | | | | |
| $ | 3,000 | | | 6.125%, 02/15/2021 q | | | | | | | | $ | 3,037,500 | |
| | | | | |
| | | | Diamond Offshore Drilling | | | | | | | | | | |
| | 3,280 | | | 5.700%, 10/15/2039 q | | | | | | | | | 3,239,285 | |
| | | | | |
| | | | Ensco | | | | | | | | | | |
| | 3,870 | | | 4.700%, 03/15/2021 | | | | | | | | | 3,909,408 | |
| | | | | |
| | | | Forest Oil | | | | | | | | | | |
| | 2,700 | | | 7.250%, 06/15/2019 q | | | | | | | | | 2,754,000 | |
| | | | | |
| | | | Lukoil International Finance | | | | | | | | | | |
| | 4,785 | | | 6.125%, 11/09/2020 n | | | | | | | | | 4,934,531 | |
| | | | | |
| | | | Nabors Industries | | | | | | | | | | |
| | 2,935 | | | 5.000%, 09/15/2020 q | | | | | | | | | 2,969,739 | |
| | | | | |
| | | | Nexen | | | | | | | | | | |
| | 3,475 | | | 6.400%, 05/15/2037 | | | | | | | | | 3,466,365 | |
| | | | | |
| | | | Petrobras International Finance | | | | | | | | | | |
| | 2,495 | | | 6.875%, 01/20/2040 | | | | | | | | | 2,656,579 | |
| | | | | |
| | | | Petro-Canada | | | | | | | | | | |
| | 2,255 | | | 6.800%, 05/15/2038 | | | | | | | | | 2,543,478 | |
| | | | | |
| | | | Valero Energy | | | | | | | | | | |
| | 3,290 | | | 6.125%, 02/01/2020 q | | | | | | | | | 3,615,499 | |
| | | | | |
| | | | Weatherford International | | | | | | | | | | |
| | 3,740 | | | 7.000%, 03/15/2038 | | | | | | | | | 4,065,982 | |
| | 42,105 | | | Total Energy | | | | | | | | | 44,130,356 | |
| | | | Finance – 4.1% | | | | | | | | | | |
| | | | | |
| | | | Anglogold Holdings | | | | | | | | | | |
| | 4,530 | | | 6.500%, 04/15/2040 | | | | | | | | | 4,320,886 | |
| | | | | |
| | | | Asciano Finance | | | | | | | | | | |
| | 3,800 | | | 5.000%, 04/07/2018 n | | | | | | | | | 3,900,643 | |
| | | | | |
| | | | Capital One Bank | | | | | | | | | | |
| | 2,790 | | | 8.800%, 07/15/2019 | | | | | | | | | 3,424,002 | |
| | | | | |
| | | | Countrywide Financial | | | | | | | | | | |
| | 4,390 | | | 6.250%, 05/15/2016 | | | | | | | | | 4,626,287 | |
| | | | | |
| | | | Discover Financial Services | | | | | | | | | | |
| | 3,690 | | | 10.250%, 07/15/2019 | | | | | | | | | 4,768,030 | |
| | | | | |
| | | | Fresenius U.S. Finance II | | | | | | | | | | |
| | 2,450 | | | 9.000%, 07/15/2015 n | | | | | | | | | 2,771,563 | |
| | | | | |
| | | | General Electric Capital | | | | | | | | | | |
| | 2,375 | | | 5.300%, 02/11/2021 q | | | | | | | | | 2,471,287 | |
| | | | Series MTN | | | | | | | | | | |
| | 4,915 | | | 6.875%, 01/10/2039 | | | | | | | | | 5,563,864 | |
| | | | | |
| | | | International Lease Finance | | | | | | | | | | |
| | 1,715 | | | 8.875%, 09/01/2017 | | | | | | | | | 1,886,500 | |
| | | | | |
| | | | TransCapitalinvest | | | | | | | | | | |
| | 4,995 | | | 5.670%, 03/05/2014 n | | | | | | | | | 5,319,675 | |
| | | | | |
| | | | WEA Finance | | | | | | | | | | |
| | 2,730 | | | 4.625%, 05/10/2021 n q | | | | | | | | | 2,649,348 | |
| | 38,380 | | | Total Finance | | | | | | | | | 41,702,085 | |
| | | | Information Technology – 0.3% | | | | | | | | | | |
| | | | | |
| | | | Applied Materials | | | | | | | | | | |
| | 2,915 | | | 4.300%, 06/15/2021 | | | | | | | | | 2,924,727 | |
| | | | Insurance – 3.9% | | | | | | | | | | |
| | | | | |
| | | | Aflac | | | | | | | | | | |
| | 3,975 | | | 6.450%, 08/15/2040 q | | | | | | | | | 3,944,202 | |
Portfolio of Investments
Nuveen Core Bond Fund (continued)
June 30, 2011
| | | | | | | | | | | | | | |
Principal
Amount (000) | | | Description p | | | | | | | | Value | |
| | | | | | | | | | | | | | |
| | | | Insurance (continued) | | | | | | | | | | |
| | | | | |
| | | | Allied World Assurance | | | | | | | | | | |
| $ | 4,805 | | | 7.500%, 08/01/2016 | | | | | | | | $ | 5,506,256 | |
| | | | | |
| | | | Catlin Insurance | | | | | | | | | | |
| | 2,970 | | | 7.249%, 12/31/2049 n q D | | | | | | | | | 2,828,925 | |
| | | | | |
| | | | Endurance Specialty Holding | | | | | | | | | | |
| | | | Series B | | | | | | | | | | |
| | 105 | | | 7.500%, 06/01/2016 | | | | | | | | | 2,614,610 | |
| | | | | |
| | | | Hartford Financial Services Group | | | | | | | | | | |
| | | | Series MTN | | | | | | | | | | |
| | 2,950 | | | 6.000%, 01/15/2019 | | | | | | | | | 3,150,606 | |
| | | | | |
| | | | Liberty Mutual Group | | | | | | | | | | |
| | 3,015 | | | 5.000%, 06/01/2021 n | | | | | | | | | 2,854,976 | |
| | | | | |
| | | | Lincoln National | | | | | | | | | | |
| | 2,295 | | | 8.750%, 07/01/2019 | | | | | | | | | 2,896,056 | |
| | 3,205 | | | 6.050%, 04/20/2067 | | | | | | | | | 3,084,812 | |
| | | | | |
| | | | MetLife Capital Trust IV | | | | | | | | | | |
| | 2,980 | | | 7.875%, 12/15/2067 n | | | | | | | | | 3,113,227 | |
| | | | | |
| | | | Pacific Life Insurance | | | | | | | | | | |
| | 1,640 | | | 6.000%, 02/10/2020 n | | | | | | | | | 1,758,605 | |
| | | | | |
| | | | Prudential Holdings | | | | | | | | | | |
| | | | Series B | | | | | | | | | | |
| | 4,000 | | | 7.245%, 12/18/2023 n | | | | | | | | | 4,660,120 | |
| | | | | |
| | | | ZFS Finance USA Trust V | | | | | | | | | | |
| | 2,755 | | | 6.500%, 05/09/2067 n D | | | | | | | | | 2,741,225 | |
| | 34,695 | | | Total Insurance | | | | | | | | | 39,153,620 | |
| | | | Natural Gas – 1.1% | | | | | | | | | | |
| | | | | |
| | | | Chesapeake Midstream Partners | | | | | | | | | | |
| | 3,215 | | | 5.875%, 04/15/2021 n q | | | | | | | | | 3,174,813 | |
| | | | | |
| | | | Energy Transfer Equity | | | | | | | | | | |
| | 2,665 | | | 7.500%, 10/15/2020 q | | | | | | | | | 2,824,900 | |
| | | | | |
| | | | Kinder Morgan Energy Partners | | | | | | | | | | |
| | | | Series MTN | | | | | | | | | | |
| | 3,060 | | | 6.950%, 01/15/2038 | | | | | | | | | 3,323,487 | |
| | | | | |
| | | | NGPL Pipeco | | | | | | | | | | |
| | 1,500 | | | 7.119%, 12/15/2017 n | | | | | | | | | 1,680,426 | |
| | 10,440 | | | Total Natural Gas | | | | | | | | | 11,003,626 | |
| | | | Real Estate – 0.8% | | | | | | | | | | |
| | | | | |
| | | | Health Care – REIT | | | | | | | | | | |
| | 2,145 | | | 5.250%, 01/15/2022 | | | | | | | | | 2,136,763 | |
| | | | | |
| | | | Prologis – REIT | | | | | | | | | | |
| | 2,995 | | | 6.875%, 03/15/2020 | | | | | | | | | 3,307,109 | |
| | | | | |
| | | | Vornado Realty – REIT | | | | | | | | | | |
| | 2,705 | | | 4.250%, 04/01/2015 | | | | | | | | | 2,807,566 | |
| | 7,845 | | | Total Real Estate | | | | | | | | | 8,251,438 | |
| | | | Transportation – 0.6% | | | | | | | | | | |
| | | | | |
| | | | Air Canada | | | | | | | | | | |
| | 1,950 | | | 9.250%, 08/01/2015 n q | | | | | | | | | 1,996,313 | |
| | | | | |
| | | | Northwest Airlines | | | | | | | | | | |
| | | | Series 2007-1, Class A | | | | | | | | | | |
| | 2,022 | | | 7.027%, 11/01/2019 | | | | | | | | | 2,062,524 | |
| | | | | | | | | | | | | | |
Principal
Amount (000) | | | Description p | | | | | | | | Value | |
| | | | | | | | | | | | | | |
| | | | Transportation (continued) | | | | | | | | | | |
| | | | | |
| | | | United Airlines | | | | | | | | | | |
| | | | Series 2007-1, Class A | | | | | | | | | | |
| $ | 2,405 | | | 6.636%, 01/02/2024 | | | | | | | | $ | 2,416,609 | |
| | 6,377 | | | Total Transportation | | | | | | | | | 6,475,446 | |
| $ | 351,868 | | | Total Corporate Bonds (cost $354,662,545) | | | | | | | | | 374,268,220 | |
| | | | | |
Principal
Amount (000) | | | Description p | | | | | | | | Value | |
| | | | U.S. GOVERNMENT AGENCY MORTGAGE-BACKED SECURITIES – 31.5% | | | | | | | | | | |
| | | | | |
| | | | Adjustable Rate D – 1.3% | | | | | | | | | | |
| | | | | |
| | | | Federal Home Loan Mortgage Corporation Pool | | | | | | | | | | |
| $ | 139 | | | 2.517%, 05/01/2025, #846757 | | | | | | | | $ | 145,589 | |
| | 749 | | | 2.441%, 04/01/2029, #847190 | | | | | | | | | 786,819 | |
| | 982 | | | 2.627%, 03/01/2030, #847180 | | | | | | | | | 1,037,141 | |
| | 1,280 | | | 2.421%, 07/01/2030, #847240 | | | | | | | | | 1,340,771 | |
| | 506 | | | 2.086%, 06/01/2031, #846984 | | | | | | | | | 523,105 | |
| | | | | |
| | | | Federal National Mortgage Association Pool | | | | | | | | | | |
| | 3,201 | | | 2.375%, 08/01/2030, #555843 | | | | | | | | | 3,354,598 | |
| | 212 | | | 2.531%, 03/01/2031, #545359 | | | | | | | | | 223,120 | |
| | 1,024 | | | 2.309%, 09/01/2033, #725553 | | | | | | | | | 1,069,298 | |
| | 4,576 | | | 5.240%, 11/01/2034, #735054 | | | | | | | | | 4,887,301 | |
| | | | | |
| | | | Government National Mortgage Association Pool | | | | | | | | | | |
| | 1 | | | 2.625%, 08/20/2023, #008259 | | | | | | | | | 1,045 | |
| | 12,670 | | | Total U.S. Government Agency Mortgage-Backed Securities | | | | | | | | | 13,368,787 | |
| | | | Fixed Rate – 30.2% | | | | | | | | | | |
| | | | | |
| | | | Federal Home Loan Mortgage Corporation Pool | | | | | | | | | | |
| | 922 | | | 4.500%, 03/01/2018, #P10023 | | | | | | | | | 966,537 | |
| | 2,364 | | | 4.500%, 05/01/2018, #P10032 | | | | | | | | | 2,485,221 | |
| | 481 | | | 6.500%, 01/01/2028, #G00876 | | | | | | | | | 548,656 | |
| | 964 | | | 6.500%, 11/01/2028, #C00676 | | | | | | | | | 1,092,124 | |
| | 736 | | | 6.500%, 12/01/2028, #C00689 | | | | | | | | | 834,147 | |
| | 417 | | | 6.500%, 04/01/2029, #C00742 | | | | | | | | | 472,594 | |
| | 1,434 | | | 6.500%, 07/01/2031, #A17212 | | | | | | | | | 1,625,463 | |
| | 1,357 | | | 6.000%, 11/01/2033, #A15521 | | | | | | | | | 1,506,363 | |
| | 1,069 | | | 7.000%, 08/01/2037, #H09059 | | | | | | | | | 1,225,038 | |
| | 4,048 | | | 5.816%, 09/01/2037, #1G2163 q | | | | | | | | | 4,336,059 | |
| | 436 | | | 7.000%, 09/01/2037, #H01292 | | | | | | | | | 500,109 | |
| | | | | |
| | | | Federal National Mortgage Association Pool | | | | | | | | | | |
| | 9,779 | | | 3.790%, 07/01/2013, #386314 | | | | | | | | | 10,143,289 | |
| | 436 | | | 5.500%, 02/01/2014, #440780 | | | | | | | | | 472,797 | |
| | 113 | | | 7.000%, 02/01/2015, #535206 | | | | | | | | | 118,736 | |
| | 268 | | | 7.000%, 08/01/2016, #591038 | | | | | | | | | 296,363 | |
| | 1,352 | | | 5.500%, 12/01/2017, #673010 | | | | | | | | | 1,468,329 | |
| | 1,624 | | | 6.000%, 10/01/2022, #254513 | | | | | | | | | 1,793,931 | |
| | 4,020 | | | 5.500%, 01/01/2025, #255575 | | | | | | | | | 4,381,278 | |
| | 131 | | | 7.000%, 04/01/2026, #340798 | | | | | | | | | 151,032 | |
| | 206 | | | 7.000%, 05/01/2026, #250551 | | | | | | | | | 238,052 | |
| | 3,514 | | | 6.000%, 08/01/2027, #256852 | | | | | | | | | 3,862,638 | |
| | 961 | | | 6.500%, 02/01/2029, #252255 | | | | | | | | | 1,093,706 | |
| | 1,880 | | | 6.500%, 12/01/2031, #254169 | | | | | | | | | 2,113,965 | |
| | 3,502 | | | 6.000%, 04/01/2032, #745101 | | | | | | | | | 3,817,301 | |
| | 1,358 | | | 7.000%, 07/01/2032, #254379 | | | | | | | | | 1,567,809 | |
| | 577 | | | 7.000%, 07/01/2032, #545813 | | | | | | | | | 668,081 | |
| | 349 | | | 7.000%, 07/01/2032, #545815 | | | | | | | | | 400,984 | |
| | 1,814 | | | 6.000%, 09/01/2032, #254447 | | | | | | | | | 2,012,318 | |
| | 3,452 | | | 6.000%, 03/01/2033, #688330 q | | | | | | | | | 3,829,594 | |
| | 3,566 | | | 5.500%, 04/01/2033, #694605 q | | | | | | | | | 3,883,051 | |
Portfolio of Investments
Nuveen Core Bond Fund (continued)
June 30, 2011
| | | | | | | | | | | | | | |
Principal
Amount (000) | | | Description p | | | | | | | | Value | |
| | | | | | | | | | | | | | |
| | | | Fixed Rate (continued) | | | | | | | | | | |
| $ | 2,611 | | | 6.500%, 05/01/2033, #555798 | | | | | | | | $ | 2,971,152 | |
| | 5,560 | | | 5.500%, 07/01/2033, #709446 | | | | | | | | | 6,054,789 | |
| | 2,708 | | | 5.500%, 10/01/2033, #555800 | | | | | | | | | 2,948,454 | |
| | 265 | | | 6.000%, 11/01/2033, #772130 | | | | | | | | | 293,601 | |
| | 624 | | | 6.000%, 11/01/2033, #772256 | | | | | | | | | 692,202 | |
| | 1,774 | | | 5.000%, 03/01/2034, #725248 | | | | | | | | | 1,896,168 | |
| | 3,239 | | | 5.000%, 03/01/2034, #725250 | | | | | | | | | 3,461,898 | |
| | 1 | | | 5.000%, 06/01/2034, #782909 | | | | | | | | | 959 | |
| | 4,546 | | | 6.500%, 06/01/2034, #735273 | | | | | | | | | 5,178,704 | |
| | 28,970 | | | 4.500%, 07/01/2034 (MDR)(WI/DD) | | | | | | | | | 29,970,363 | |
| | 710 | | | 6.000%, 10/01/2034, #781776 | | | | | | | | | 784,454 | |
| | 8,221 | | | 5.500%, 07/01/2036, #995112 | | | | | | | | | 8,947,102 | |
| | 1,832 | | | 6.000%, 08/01/2036, #885536 | | | | | | | | | 2,032,170 | |
| | 3,424 | | | 6.000%, 09/01/2036, #900555 q | | | | | | | | | 3,798,022 | |
| | 1,969 | | | 6.000%, 06/01/2037, #944340 | | | | | | | | | 2,166,015 | |
| | 1,145 | | | 6.500%, 08/01/2037, #256845 | | | | | | | | | 1,297,110 | |
| | 2,192 | | | 6.000%, 09/01/2037, #256890 | | | | | | | | | 2,393,562 | |
| | 9,057 | | | 5.500%, 01/01/2038, #968975 | | | | | | | | | 9,812,038 | |
| | 13,346 | | | 5.000%, 03/01/2038, #973241 | | | | | | | | | 14,203,605 | |
| | 1 | | | 5.000%, 05/01/2038, #983077 | | | | | | | | | 1,505 | |
| | 11,303 | | | 5.500%, 05/01/2038, #889618 | | | | | | | | | 12,244,318 | |
| | 395 | | | 6.000%, 06/01/2038, #889706 | | | | | | | | | 434,418 | |
| | 2 | | | 5.500%, 07/01/2038, #985344 | | | | | | | | | 1,961 | |
| | 2,620 | | | 6.000%, 08/01/2038, #257307 | | | | | | | | | 2,880,115 | |
| | 3,973 | | | 6.000%, 10/01/2038, #993138 | | | | | | | | | 4,379,926 | |
| | 9,605 | | | 5.000%, 06/01/2039 (WI/DD) | | | | | | | | | 10,205,313 | |
| | 8,426 | | | 4.500%, 09/01/2039, #AC1877 | | | | | | | | | 8,732,776 | |
| | 7,990 | | | 4.500%, 12/01/2039, #932323 | | | | | | | | | 8,281,212 | |
| | 2,069 | | | 5.000%, 12/01/2039, #932260 | | | | | | | | | 2,203,833 | |
| | 12,562 | | | 5.000%, 05/01/2040, #AD4375 | | | | | | | | | 13,372,914 | |
| | 22,120 | | | 4.000%, 07/01/2040 (WI/DD) | | | | | | | | | 22,120,000 | |
| | 9,500 | | | 5.500%, 07/01/2040 (MDR)(WI/DD) | | | | | | | | | 10,271,875 | |
| | 9,311 | | | 4.000%, 11/01/2040, #AE7723 | | | | | | | | | 9,324,179 | |
| | 9,569 | | | 4.000%, 12/01/2040, #AB1959 | | | | | | | | | 9,583,004 | |
| | 12,353 | | | 4.000%, 01/01/2041, #AE7265 | | | | | | | | | 12,370,289 | |
| | | | | |
| | | | Government National Mortgage Association Pool | | | | | | | | | | |
| | 260 | | | 7.500%, 11/15/2030, #537699 | | | | | | | | | 306,220 | |
| | 10,799 | | | 4.500%, 02/20/2041, #004946 | | | | | | | | | 11,389,267 | |
| | 11,500 | | | 4.500%, 07/15/2041 (MDR)(WI/DD) | | | | | | | | | 12,101,956 | |
| | 289,682 | | | Total Fixed Rate | | | | | | | | | 307,013,014 | |
| $ | 302,352 | | | Total U.S. Government Agency Mortgage-Backed Securities (cost $309,432,472) | | | | | | | | | 320,381,801 | |
| | | | | |
Principal
Amount (000) | | | Description p | | | | | | | | Value | |
| | | | | | | | | | | | | | |
| | | | COMMERCIAL MORTGAGE-BACKED SECURITIES – 12.9% | | | | | | | | | | |
| | | | | |
| | | | Americold Trust | | | | | | | | | | |
| | | | Series 2010-ARTA, Class C | | | | | | | | | | |
| $ | 6,125 | | | 6.811%, 01/14/2029 n | | | | | | | | $ | 6,343,204 | |
| | | | | |
| | | | Banc of America Commercial Mortgage | | | | | | | | | | |
| | | | Series 2004-5, Class A3 | | | | | | | | | | |
| | 4,918 | | | 4.561%, 11/10/2041 D | | | | | | | | | 4,942,550 | |
| | | | | |
| | | | Bear Stearns Commercial Mortgage Securities | | | | | | | | | | |
| | | | Series 2005-PW10, Class A4 | | | | | | | | | | |
| | 6,640 | | | 5.405%, 12/11/2040 D | | | | | | | | | 7,238,670 | |
| | | | | |
| | | | Citigroup/Deutsche Bank Commercial Mortgage Trust | | | | | | | | | | |
| | | | Series 2005-CD1, Class A4 | | | | | | | | | | |
| | 4,570 | | | 5.220%, 07/15/2044 | | | | | | | | | 4,969,291 | |
| | | | Series 2007-CD4, Class A2B | | | | | | | | | | |
| | 4,700 | | | 5.205%, 12/11/2049 | | | | | | | | | 4,799,343 | |
| | | | Series 2007-CD5, Class A4 | | | | | | | | | | |
| | 620 | | | 5.886%, 11/15/2044 | | | | | | | | | 676,057 | |
| | | | | | | | | | | | | | |
Principal
Amount (000) | | | Description p | | | | | | | | Value | |
| | | | | | | | | | | | | | |
| | | | COMMERCIAL MORTGAGE-BACKED SECURITIES (continued) | | | | | | | | | | |
| | | | | |
| | | | Commercial Mortgage Pass-Through Certificates | | | | | | | | | | |
| | | | Series 2006-CN2A, Class A2FX | | | | | | | | | | |
| $ | 4,225 | | | 5.449%, 02/05/2019 n | | | | | | | | $ | 4,234,713 | |
| | | | | |
| | | | Extended Stay America Trust | | | | | | | | | | |
| | | | Series 2010-ESHA, Class C | | | | | | | | | | |
| | 6,410 | | | 4.860%, 11/05/2027 n | | | | | | | | | 6,399,116 | |
| | | | | |
| | | | Fosse Master Issuer | | | | | | | | | | |
| | | | Series 2011-1A, Class A2 | | | | | | | | | | |
| | 4,315 | | | 1.619%, 10/18/2054 n D | | | | | | | | | 4,322,676 | |
| | | | | |
| | | | GS Mortgage Securities Trust | | | | | | | | | | |
| | | | Series 2007-GG10, Class A4 | | | | | | | | | | |
| | 12,415 | | | 5.992%, 08/10/2045 q D | | | | | | | | | 13,328,748 | |
| | | | | |
| | | | JPMorgan Chase Commercial Mortgage Securities | | | | | | | | | | |
| | | | Series 2010-C1, Class A1 | | | | | | | | | | |
| | 7,651 | | | 3.853%, 06/15/2043 n | | | | | | | | | 7,914,606 | |
| | | | Series 2010-C2, Class A3 | | | | | | | | | | |
| | 8,055 | | | 4.070%, 11/15/2043 n | | | | | | | | | 7,786,806 | |
| | | | Series 2011-C4, Class A3 | | | | | | | | | | |
| | 5,570 | | | 4.106%, 07/15/2046 n | | | | | | | | | 5,557,982 | |
| | | | Series 2011-C4, Class C | | | | | | | | | | |
| | 2,250 | | | 5.251%, 07/15/2046 n | | | | | | | | | 2,086,287 | |
| | | | | |
| | | | LB-UBS Commercial Mortgage Trust | | | | | | | | | | |
| | | | Series 2004-C2, Class A4 | | | | | | | | | | |
| | 6,000 | | | 4.367%, 03/15/2036 | | | | | | | | | 6,358,999 | |
| | | | Series 2005-C7, Class A2 | | | | | | | | | | |
| | 3,479 | | | 5.103%, 11/15/2030 | | | | | | | | | 3,478,016 | |
| | | | | |
| | | | Master Reperforming Loans Trust | | | | | | | | | | |
| | | | Series 2005-1, Class 1A4 | | | | | | | | | | |
| | 5,908 | | | 7.500%, 08/25/2034 n | | | | | | | | | 5,984,280 | |
| | | | | |
| | | | Morgan Stanley Capital I | | | | | | | | | | |
| | | | Series 2011-C1, Class C | | | | | | | | | | |
| | 2,325 | | | 5.256%, 09/15/2047 n | | | | | | | | | 2,210,564 | |
| | | | | |
| | | | Morgan Stanley Dean Witter Capital I | | | | | | | | | | |
| | | | Series 2002-TOP7, Class A2 | | | | | | | | | | |
| | 6,951 | | | 5.980%, 01/15/2039 | | | | | | | | | 7,142,032 | |
| | | | | |
| | | | OBP Depositor Trust | | | | | | | | | | |
| | | | Series 2010-OBP, Class A | | | | | | | | | | |
| | 5,590 | | | 4.646%, 07/15/2045 n | | | | | | | | | 5,801,644 | |
| | | | | |
| | | | Vendee Mortgage Trust | | | | | | | | | | |
| | | | Series 2011-1, Class DA | | | | | | | | | | |
| | 7,510 | | | 3.750%, 02/15/2035 | | | | | | | | | 7,850,733 | |
| | | | | |
| | | | Wachovia Bank Commerical Mortgage Trust | | | | | | | | | | |
| | | | Series 2007-WHL8, Class A1 | | | | | | | | | | |
| | 3,238 | | | 0.267%, 06/15/2020 n | | | | | | | | | 2,935,815 | |
| | | | | |
| | | | WF-RBS Commercial Mortgage Trust | | | | | | | | | | |
| | | | Series 2011-C2, Class C | | | | | | | | | | |
| | 2,300 | | | 5.392%, 02/15/2044 n | | | | | | | | | 2,160,280 | |
| | | | Series 2011-C3, Class A4 | | | | | | | | | | |
| | 5,000 | | | 4.375%, 03/15/2044 n | | | | | | | | | 4,942,578 | |
| | | | Series 2011-C3, Class C | | | | | | | | | | |
| | 2,250 | | | 5.335%, 03/15/2044 n | | | | | | | | | 2,091,949 | |
| $ | 129,015 | | | Total Commercial Mortgage-Backed Securities (cost $128,110,983) | | | | | | | | | 131,556,939 | |
Portfolio of Investments
Nuveen Core Bond Fund (continued)
June 30, 2011
| | | | | | | | | | | | | | |
Principal
Amount (000) | | | Description p | | | | | | | | Value | |
| | | | | | | | | | | | | | |
| | | | ASSET-BACKED SECURITIES – 9.1% | | | | | | | | | | |
| | | | | |
| | | | Automotive – 0.9% | | | | | | | | | | |
| | | | | |
| | | | Bank of America Auto Trust
Series 2010-2, Class A3 | | | | | | | | | | |
| $ | 4,680 | | | 1.310%, 07/15/2014 | | | | | | | | $ | 4,710,433 | |
| | | | | |
| | | | Volkswagen Auto Lease Trust
Series 2010-A, Class A2 | | | | | | | | | | |
| | 4,523 | | | 0.770%, 01/22/2013 | | | | | | | | | 4,525,904 | |
| | | | | |
| | | | World Omni Auto Receivables Trust
Series 2010-A, Class A2 | | | | | | | | | | |
| | 79 | | | 0.700%, 05/15/2011 | | | | | | | | | 78,899 | |
| | 9,282 | | | Total Automotive | | | | | | | | | 9,315,236 | |
| | | | Credit Cards – 1.1% | | | | | | | | | | |
| | | | | |
| | | | Cabela’s Master Credit Card Trust
Series 2011-2A, Class A2 | | | | | | | | | | |
| | 5,005 | | | 0.803%, 06/17/2019 n D | | | | | | | | | 5,005,000 | |
| | | | | |
| | | | Discover Card Master Trust
Series 2007-A1, Class A1 | | | | | | | | | | |
| | 5,185 | | | 5.650%, 03/16/2020 | | | | | | | | | 5,939,524 | |
| | 10,190 | | | Total Credit Cards | | | | | | | | | 10,944,524 | |
| | | | Home Equity – 3.8% | | | | | | | | | | |
| | | | | |
| | | | Amresco Residential Security Mortgage
Series 1997-3, Class A9 | | | | | | | | | | |
| | 24 | | | 6.960%, 03/25/2027 | | | | | | | | | 24,065 | |
| | | | | |
| | | | Bayview Financial Acquisition Trust
Series 2005-D, Class AF4 | | | | | | | | | | |
| | 1,250 | | | 5.500%, 12/28/2035 | | | | | | | | | 1,028,319 | |
| | | | | |
| | | | Countrywide Asset-Backed Certificates
Series 2003-SC1, Class M2 | | | | | | | | | | |
| | 766 | | | 2.437%, 09/25/2023 | | | | | | | | | 624,498 | |
| | | | Series 2007-7, Class 2A2 | | | | | | | | | | |
| | 3,580 | | | 0.347%, 10/25/2047 D | | | | | | | | | 2,897,219 | |
| | | | Series 2007-9, Class 2A2 | | | | | | | | | | |
| | 3,835 | | | 0.317%, 06/25/2047 D | | | | | | | | | 3,178,632 | |
| | | | | |
| | | | RBSSP Resecuritization Trust
Series 2009-8, Class 3A1 | | | | | | | | | | |
| | 855 | | | 0.334%, 03/26/2037 n | | | | | | | | | 839,664 | |
| | | | Series 2009-9, Class 9A1 | | | | | | | | | | |
| | 3,822 | | | 0.406%, 09/26/2037 n | | | | | | | | | 3,679,372 | |
| | | | Series 2009-11, Class 4A1 | | | | | | | | | | |
| | 918 | | | 1.944%, 12/26/2037 n | | | | | | | | | 918,736 | |
| | | | Series 2010-4, Class 1A1 | | | | | | | | | | |
| | 7,499 | | | 0.304%, 03/26/2036 n | | | | | | | | | 6,977,258 | |
| | | | Series 2010-4, Class 5A1 | | | | | | | | | | |
| | 4,922 | | | 0.354%, 02/26/2037 n | | | | | | | | | 4,720,648 | |
| | | | Series 2010-8, Class 4A1 | | | | | | | | | | |
| | 2,161 | | | 0.524%, 07/26/2036 n | | | | | | | | | 2,036,464 | |
| | | | Series 2010-10, Class 2A1 | | | | | | | | | | |
| | 3,979 | | | 0.324%, 09/26/2036 n | | | | | | | | | 3,567,706 | |
| | | | Series 2010-11, Class 2A1 | | | | | | | | | | |
| | 4,301 | | | 0.356%, 03/26/2037 n | | | | | | | | | 4,109,829 | |
| | | | | |
| | | | Renaissance Home Equity Loan Trust
Series 2005-3, Class AF4 | | | | | | | | | | |
| | 4,365 | | | 5.140%, 11/25/2035 | | | | | | | | | 3,617,725 | |
| | 42,277 | | | Total Home Equity | | | | | | | | | 38,220,135 | |
| | | | | | | | | | | | | | |
Principal
Amount (000) | | | Description p | | | | | | | | Value | |
| | | | | | | | | | | | | | |
| | | | Manufactured Housing – 0.1% | | | | | | | | | | |
| | | | | |
| | | | Green Tree Financial
Series 2008-MH1, Class A1 | | | | | | | | | | |
| $ | 1,147 | | | 7.000%, 04/25/2038 n | | | | | | | | $ | 1,172,413 | |
| | | | Other – 3.2% | | | | | | | | | | |
| | | | | |
| | | | AH Mortgage Advance Trust
Series 2010-ADV1, Class A1 | | | | | | | | | | |
| | 5,500 | | | 3.968%, 08/15/2022 n | | | | | | | | | 5,582,500 | |
| | | | Series SART-1, Class B1 | | | | | | | | | | |
| | 2,090 | | | 5.920%, 05/10/2043 n | | | | | | | | | 2,121,350 | |
| | | | | |
| | | | Fieldstone Mortgage Investment
Series 2005-1, Class M4 | | | | | | | | | | |
| | 4,351 | | | 1.267%, 03/25/2035 | | | | | | | | | 4,051,377 | |
| | | | | |
| | | | Henderson Receivables
Series 2010-3A, Class A | | | | | | | | | | |
| | 4,990 | | | 3.820%, 12/15/2048 n | | | | | | | | | 4,932,176 | |
| | | | | |
| | | | Ocwen Advance Receivables Backed Notes
Series 2009-3A, Class A | | | | | | | | | | |
| | 3,545 | | | 4.140%, 07/15/2023 n | | | | | | | | | 3,593,744 | |
| | | | | |
| | | | Small Business Administration
Series 2006-P10B, Class 1 | | | | | | | | | | |
| | 5,246 | | | 5.681%, 08/10/2016 | | | | | | | | | 5,698,287 | |
| | | | Series 2010-10A, Class 1 | | | | | | | | | | |
| | 6,884 | | | 4.108%, 03/10/2020 | | | | | | | | | 7,017,291 | |
| | 32,606 | | | Total Other | | | | | | | | | 32,996,725 | |
| $ | 95,502 | | | Total Asset-Backed Securities (cost $90,127,778) | | | | | | | | | 92,649,033 | |
| | | | | |
Principal
Amount (000) | | | Description p | | | | | | | | Value | |
| | | | COLLATERALIZED MORTGAGE OBLIGATION – U.S. GOVERNMENT AGENCY
MORTGAGE-BACKED SECURITIES – 4.5% | | | | | | | | | | |
| | | | | |
| | | | Adjustable Rate D – 2.6% | | | | | | | | | | |
| | | | | |
| | | | Federal Home Loan Mortgage Corporation
Series 2704, Class JF | | | | | | | | | | |
| $ | 2,719 | | | 0.737%, 05/15/2023 | | | | | | | | $ | 2,728,588 | |
| | | | Series 2755, Class FN | | | | | | | | | | |
| | 2,634 | | | 0.637%, 04/15/2032 | | | | | | | | | 2,637,011 | |
| | | | Series 3423, Class FA | | | | | | | | | | |
| | 11,872 | | | 0.687%, 06/15/2036 | | | | | | | | | 11,898,246 | |
| | | | Series 3591, Class FP | | | | | | | | | | |
| | 4,065 | | | 0.787%, 06/15/2039 | | | | | | | | | 4,086,952 | |
| | | | | |
| | | | Federal National Mortgage Association
Series 2005-59, Class DF | | | | | | | | | | |
| | 4,846 | | | 0.386%, 05/25/2035 | | | | | | | | | 4,826,669 | |
| | 26,136 | | | Total Adjustable Rate | | | | | | | | | 26,177,466 | |
| | | | Fixed Rate – 1.8% | | | | | | | | | | |
| | | | | |
| | | | Federal Home Loan Mortgage Corporation
Series 1022, Class J | | | | | | | | | | |
| | 17 | | | 6.000%, 12/15/2020 | | | | | | | | | 19,524 | |
| | | | Series 162, Class F | | | | | | | | | | |
| | 58 | | | 7.000%, 05/15/2021 | | | | | | | | | 64,669 | |
| | | | Series 1790, Class A | | | | | | | | | | |
| | 34 | | | 7.000%, 04/15/2022 | | | | | | | | | 36,515 | |
| | | | Series 188, Class H | | | | | | | | | | |
| | 114 | | | 7.000%, 09/15/2021 | | | | | | | | | 127,210 | |
| | | | Series 2901, Class UB | | | | | | | | | | |
| | 5,000 | | | 5.000%, 03/15/2033 | | | | | | | | | 5,379,531 | |
Portfolio of Investments
Nuveen Core Bond Fund (continued)
June 30, 2011
| | | | | | | | | | | | | | |
Principal
Amount (000) | | | Description p | | | | | | | | Value | |
| | | | | | | | | | | | | | |
| | | | Fixed Rate (continued) | | | | | | | | | | |
| | | | Series 6, Class C | | | | | | | | | | |
| $ | 11 | | | 9.050%, 06/15/2019 | | | | | | | | $ | 12,785 | |
| | | | | |
| | | | Federal National Mortgage Association
Series 1988-24, Class G | | | | | | | | | | |
| | 22 | | | 7.000%, 10/25/2018 | | | | | | | | | 24,913 | |
| | | | Series 1989-44, Class H | | | | | | | | | | |
| | 21 | | | 9.000%, 07/25/2019 | | | | | | | | | 24,239 | |
| | | | Series 1989-90, Class E | | | | | | | | | | |
| | 4 | | | 8.700%, 12/25/2019 | | | | | | | | | 4,085 | |
| | | | Series 1990-102, Class J | | | | | | | | | | |
| | 23 | | | 6.500%, 08/25/2020 | | | | | | | | | 25,373 | |
| | | | Series 1990-105, Class J | | | | | | | | | | |
| | 199 | | | 6.500%, 09/25/2020 | | | | | | | | | 219,991 | |
| | | | Series 1990-30, Class E | | | | | | | | | | |
| | 15 | | | 6.500%, 03/25/2020 | | | | | | | | | 17,698 | |
| | | | Series 1990-61, Class H | | | | | | | | | | |
| | 19 | | | 7.000%, 06/25/2020 | | | | | | | | | 20,810 | |
| | | | Series 1990-72, Class B | | | | | | | | | | |
| | 17 | | | 9.000%, 07/25/2020 | | | | | | | | | 19,355 | |
| | | | Series 1991-56, Class M | | | | | | | | | | |
| | 68 | | | 6.750%, 06/25/2021 | | | | | | | | | 73,305 | |
| | | | Series 1992-120, Class C | | | | | | | | | | |
| | 20 | | | 6.500%, 07/25/2022 | | | | | | | | | 21,780 | |
| | | | Series 2002-83, Class MD | | | | | | | | | | |
| | 766 | | | 5.000%, 09/25/2016 | | | | | | | | | 770,070 | |
| | | | Series 2003-30, Class AE | | | | | | | | | | |
| | 4,984 | | | 3.900%, 10/25/2017 | | | | | | | | | 5,110,863 | |
| | | | Series 2003-W1, Class B1 | | | | | | | | | | |
| | 1,492 | | | 5.750%, 12/25/2042 | | | | | | | | | 1,029,321 | |
| | | | Series 2005-44, Class PC | | | | | | | | | | |
| | 2,121 | | | 5.000%, 11/25/2027 | | | | | | | | | 2,138,895 | |
| | | | Series 2005-62, Class JE | | | | | | | | | | |
| | 2,940 | | | 5.000%, 06/25/2035 | | | | | | | | | 3,153,372 | |
| | 17,945 | | | Total Fixed Rate | | | | | | | | | 18,294,304 | |
| | | | | |
| | | | Z-Bonds x – 0.1% | | | | | | | | | | |
| | | | | |
| | | | Federal Home Loan Mortgage Corporation
Series 1118, Class Z | | | | | | | | | | |
| | 39 | | | 8.250%, 07/15/2021 | | | | | | | | | 44,840 | |
| | | | | |
| | | | Federal National Mortgage Association
Series 1991-134, Class Z | | | | | | | | | | |
| | 121 | | | 7.000%, 10/25/2021 | | | | | | | | | 134,172 | |
| | | | Series 1996-35, Class Z | | | | | | | | | | |
| | 576 | | | 7.000%, 07/25/2026 | | | | | | | | | 654,157 | |
| | 736 | | | Total Z-Bonds | | | | | | | | | 833,169 | |
| $ | 44,817 | | | Total Collateralized Mortgage Obligation – U.S. Government Agency Mortgage-Backed Securities (cost $44,176,128) | | | | | 45,304,939 | |
| | | | | |
Principal
Amount (000) | | | Description p | | | | | | | | Value | |
| | | | COLLATERALIZED MORTGAGE OBLIGATIONS-PRIVATE MORTGAGE-BACKED SECURITIES – 4.6% | | | | | | | | | | |
| | | | | |
| | | | Adjustable Rate D – 2.0% | | | | | | | | | | |
| | | | | |
| | | | Arkle Master Issuer | | | | | | | | | | |
| | | | Series 2010-1A, Class 2A | | | | | | | | | | |
| $ | 5,480 | | | 1.411%, 05/17/2060 n | | | | | | | | $ | 5,471,166 | |
| | | | | |
| | | | Countrywide Home Loans | | | | | | | | | | |
| | | | Series 2004-2, Class 2A1 | | | | | | | | | | |
| | 1,424 | | | 2.761%, 02/25/2034 | | | | | | | | | 1,390,828 | |
| | | | | | | | | | | | | | |
Principal
Amount (000) | | | Description p | | | | | | | | Value | |
| | | | | | | | | | | | | | |
| | | | Adjustable Rate D (continued) | | | | | | | | | | |
| | | | | |
| | | | FDIC Structured Sale Guaranteed Notes | | | | | | | | | | |
| | | | Series 2010-S1, Class 1A | | | | | | | | | | |
| $ | 5,611 | | | 0.736%, 02/25/2048 n | | | | | | | | $ | 5,616,026 | |
| | | | | |
| | | | Indymac Index Mortgage Loan Trust | | | | | | | | | | |
| | | | Series 2005-AR1, Class 4A1 | | | | | | | | | | |
| | 1,250 | | | 2.695%, 03/25/2035 | | | | | | | | | 1,118,735 | |
| | | | | |
| | | | JPMorgan Alternative Loan Trust | | | | | | | | | | |
| | | | Series 2007-S1, Class A1 | | | | | | | | | | |
| | 3,089 | | | 0.466%, 04/25/2047 | | | | | | | | | 2,317,032 | |
| | | | | |
| | | | JPMorgan Mortgage Trust | | | | | | | | | | |
| | | | Series 2006-A7, Class 3A4 | | | | | | | | | | |
| | 688 | | | 5.875%, 01/25/2037 | | | | | | | | | 72,157 | |
| | | | | |
| | | | Structured Adjustable Rate Mortgage Loan Trust | | | | | | | | | | |
| | | | Series 2004-11, Class A | | | | | | | | | | |
| | 322 | | | 2.653%, 08/25/2034 | | | | | | | | | 289,446 | |
| | | | | |
| | | | Wachovia Mortgage Loan Trust | | | | | | | | | | |
| | | | Series 2005-B, Class 1A1 | | | | | | | | | | |
| | 4,813 | | | 2.993%, 10/20/2035 | | | | | | | | | 3,977,110 | |
| | | | | |
| | | | Washington Mutual | | | | | | | | | | |
| | | | Series 2007-HY2, Class 3A2 | | | | | | | | | | |
| | 1,542 | | | 5.605%, 09/25/2036 | | | | | | | | | 216,793 | |
| | 24,219 | | | Total Adjustable Rate | | | | | | | | | 20,469,293 | |
| | | | Fixed Rate – 2.6% | | | | | | | | | | |
| | | | | |
| | | | Banc of America Funding | | | | | | | | | | |
| | | | Series 2007-4, Class 1A2 | | | | | | | | | | |
| | 1,388 | | | 5.500%, 06/25/2037 | | | | | | | | | 874,256 | |
| | | | | |
| | | | Countrywide Alternative Loan Trust | | | | | | | | | | |
| | | | Series 2004-J1, Class 1A1 | | | | | | | | | | |
| | 347 | | | 6.000%, 02/25/2034 | | | | | | | | | 356,118 | |
| | | | Series 2006-19CB, Class A15 | | | | | | | | | | |
| | 1,973 | | | 6.000%, 08/25/2036 | | | | | | | | | 1,629,820 | |
| | | | | |
| | | | Credit Suisse First Boston Mortgage Securities | | | | | | | | | | |
| | | | Series 2003-8, Class DB1 | | | | | | | | | | |
| | 3,789 | | | 6.240%, 04/25/2033 | | | | | | | | | 3,371,522 | |
| | | | | |
| | | | GMAC Mortgage Corporation Loan Trust | | | | | | | | | | |
| | | | Series 2010-1, Class A | | | | | | | | | | |
| | 565 | | | 4.250%, 07/25/2040 n | | | | | | | | | 567,889 | |
| | | | | |
| | | | GSMPS Mortgage Loan Trust | | | | | | | | | | |
| | | | Series 2003-1, Class B1 | | | | | | | | | | |
| | 678 | | | 6.776%, 03/25/2043 | | | | | | | | | 583,246 | |
| | | | Series 2005-RP2, Class 1A2 | | | | | | | | | | |
| | 809 | | | 7.500%, 03/25/2035 n | | | | | | | | | 823,511 | |
| | | | Series 2005-RP3, Class 1A2 | | | | | | | | | | |
| | 892 | | | 7.500%, 09/25/2035 n | | | | | | | | | 905,453 | |
| | | | | |
| | | | Lehman Brothers Mortgage Trust | | | | | | | | | | |
| | | | Series 2008-6, Class 1A1 | | | | | | | | | | |
| | 1,825 | | | 5.981%, 07/25/2047 | | | | | | | | | 1,737,453 | |
| | | | | |
| | | | Master Alternative Loans Trust | | | | | | | | | | |
| | | | Series 2004-1, Class 3A1 | | | | | | | | | | |
| | 958 | | | 7.000%, 01/25/2034 | | | | | | | | | 990,493 | |
| | | | | |
| | | | Mortgage Equity Conversion Asset Trust | | | | | | | | | | |
| | | | Series 2010-1A, Class A | | | | | | | | | | |
| | 4,118 | | | 4.000%, 07/25/2060 n | | | | | | | | | 4,121,368 | |
| | | | | |
| | | | NCUA Guaranteed Notes | | | | | | | | | | |
| | | | Series 2010-C1, Class A2 | | | | | | | | | | |
| | 4,185 | | | 2.900%, 10/29/2020 | | | | | | | | | 4,177,181 | |
| | | | | |
| | | | Sequoia Mortgage Trust | | | | | | | | | | |
| | | | Series 2011-1, Class A1 | | | | | | | | | | |
| | 4,349 | | | 4.125%, 02/25/2041 | | | | | | | | | 4,357,829 | |
Portfolio of Investments
Nuveen Core Bond Fund (continued)
June 30, 2011
| | | | | | | | | | | | | | |
Principal
Amount (000) | | | Description p | | | | | | | | Value | |
| | | | | | | | | | | | | | |
| | | | Fixed Rate (continued) | | | | | | | | | | |
| | | | | |
| | | | Wells Fargo Mortgage Backed Securities Trust | | | | | | | | | | |
| | | | Series 2007-2, Class 1A8 | | | | | | | | | | |
| $ | 1,696 | | | 5.750%, 03/25/2037 | | | | | | | | $ | 1,478,485 | |
| | 27,572 | | | Total Fixed Rate | | | | | | | | | 25,974,624 | |
| $ | 51,791 | | | Total Collateralized Mortgage Obligations – Private Mortgage-Backed Securities (cost $50,142,117) | | | | | | | | | 46,443,917 | |
| | | | | |
Principal
Amount (000) | | | Description p | | | | | | | | Value | |
| | | | U.S. GOVERNMENT & AGENCY SECURITIES – 2.7% | | | | | | | | | | |
| | | | | |
| | | | U.S. Treasuries – 2.7% | | | | | | | | | | |
| | | | | |
| | | | U.S. Treasury Bonds | | | | | | | | | | |
| $ | 2,065 | | | 3.875%, 08/15/2040 | | | | | | | | $ | 1,890,766 | |
| | 4,455 | | | 4.250%, 11/15/2040 q | | | | | | | | | 4,354,762 | |
| | 425 | | | 4.750%, 02/15/2041 q | | | | | | | | | 451,762 | |
| | | | | |
| | | | U.S. Treasury Notes | | | | | | | | | | |
| | 3,650 | | | 2.375%, 02/28/2015 q | | | | | | | | | 3,813,119 | |
| | 8,985 | | | 1.250%, 08/31/2015 q | | | | | | | | | 8,944,990 | |
| | 1,385 | | | 3.625%, 02/15/2020 q | | | | | | | | | 1,465,179 | |
| | 6,630 | | | 2.625%, 08/15/2020 q | | | | | | | | | 6,417,634 | |
| $ | 27,595 | | | Total U.S. Government & Agency Securities (cost $26,970,760) | | | | | | | | | 27,338,212 | |
| | | | | |
Principal
Amount (000) | | | Description p | | | | | | | | Value | |
| | | | Municipal Bonds 0.6% | | | | | | | | | | |
| | | | | |
| | | | Illinois | | | | | | | | | | |
| | 5,765 | | | 5.877%, 03/01/2019 | | | | | | | | $ | 5,949,192 | |
| | | | Total Municipal Bonds (cost $5,765,000) | | | | | | | | | 5,949,192 | |
| | | | | |
| Shares | | | Description p | | | | | | | | Value | |
| | | | PREFERRED STOCK – 0.0% | | | | | | | | | | |
| | | | | |
| | | | Sovereign – 0.0% | | | | | | | | | | |
| | | | | |
| | 218,000 | | | Fannie Mae
Series S • | | | | | | | | $ | 468,700 | |
| | | | Total Preferred Stock (cost $5,173,100) | | | | | | | | | 468,700 | |
| | | | | |
| Shares | | | Description p | | | | | | | | Value | |
| | | | INVESTMENTS PURCHASED WITH PROCEEDS FROM SECURITIES LENDING | | | | | | | | | | |
| | | | | |
| | | | Money Market Funds – 12.3% | | | | | | | | | | |
| | | | | |
| | 125,243,468 | | | Mount Vernon Securities Lending Prime Portfolio, 0.197% W † | | | | | | | | $ | 125,243,468 | |
| | | | Total Investments Purchased With Proceeds From Securities Lending (cost $125,243,468) | | | | | | | | | 125,243,468 | |
| | | | | |
Shares/
Principal
Amount (000) | | | Description p | | | | | | | | Value | |
| | | | SHORT-TERM INVESTMENTS – 6.6% | | | | | | | | | | |
| | | | | |
| | | | Money Market Funds – 6.1% | | | | | | | | | | |
| | | | | |
| | | | First American Prime Obligations Fund, Class Z | | | | | | | | | | |
| | 62,579,200 | | | 0.042% W | | | | | | | | $ | 62,579,200 | |
| | | | U.S. Treasury Obligations – 0.5% | | | | | | | | | | |
| | | | | |
| | | | U.S. Treasury Bills ¨ | | | | | | | | | | |
| $ | 2,200 | | | 0.020%, 07/21/2011 | | | | | | | | | 2,199,976 | |
| | 1,625 | | | 0.035%, 10/20/2011 | | | | | | | | | 1,624,825 | |
| | | | | | | | | | | | | | |
Shares/
Principal
Amount (000) | | | Description p | | | | | | | | Value | |
| | | | | | | | | | | | | | |
| | | | U.S. Treasury Obligations (continued) | | | | | | | | | | |
| $ | 1,000 | | | 0.055%, 11/17/2011 | | | | | | | | $ | 999,788 | |
| $ | 4,825 | | | Total U.S. Treasury Bills | | | | | | | | | 4,824,589 | |
| | | | Total Short-Term Investments (cost $67,403,092) | | | | | | | | | 67,403,789 | |
| | | | Total Investments (cost $1,207,207,443) – 121.6% | | | | | | | | | 1,237,008,210 | |
| | | | Other Assets Less Liabilities – (21.6)% ¯ | | | | | | | | | (219,590,750) | |
| | | | Net Assets – 100.0% | | | | | | | | $ | 1,017,417,460 | |
Investments in Derivatives
Futures Contracts outstanding at June 30, 2011:
| | | | | | | | | | | | | | | | | | | | |
| Type | | Contract
Position | | | Number of
Contracts | | | Contract
Expiration | | | Value | | | Unrealized
Appreciation
(Depreciation) | |
U.S. Treasury 2-Year Note | | | Long | | | | 532 | | | | 9/11 | | | $ | 116,690,880 | | | $ | 230,670 | |
U.S. Treasury 5-Year Note | | | Short | | | | (401 | ) | | | 9/11 | | | | (47,797,319 | ) | | | 260,403 | |
U.S. Treasury 10-Year Note | | | Short | | | | (323 | ) | | | 9/11 | | | | (39,511,986 | ) | | | 148,029 | |
U.S. Treasury Long Bond | | | Long | | | | 14 | | | | 9/11 | | | | 1,722,438 | | | | (40,939 | ) |
U.S. Treasury Ultra Bond | | | Short | | | | (164 | ) | | | 9/11 | | | | (20,705,000 | ) | | | 290,527 | |
| | | | | | | | | | | | | | | | | | | $ | 888,690 | |
Interest Rate Swaps outstanding at June 30, 2011:
| | | | | | | | | | | | | | | | | | | | | | | | | | | | |
| Counterparty | | Notional
Amount | | | Fund
Pay/Receive
Floating Rate | | | Floating Rate
Index | | | Fixed Rate* | | | Fixed Rate
Payment
Frequency | | | Termination
Date | | | Unrealized
Appreciation
(Depreciation) | |
JPMorgan | | $ | 33,000,000 | | | | Receive | | | | 3-Month LIBOR | | | | 1.255 | % | | | Semi-Annually | | | | 11/03/11 | | | $ | (157,879 | ) |
JPMorgan | | | 8,000,000 | | | | Receive | | | | 3-Month LIBOR | | | | 3.858 | | | | Semi-Annually | | | | 1/19/20 | | | | (651,097 | ) |
UBS | | | 35,000,000 | | | | Receive | | | | 3-Month LIBOR | | | | 1.358 | | | | Semi-Annually | | | | 9/25/11 | | | | (217,619 | ) |
UBS | | | 33,000,000 | | | | Receive | | | | 3-Month LIBOR | | | | 1.133 | | | | Semi-Annually | | | | 3/25/12 | | | | (289,779 | ) |
UBS | | | 33,000,000 | | | | Receive | | | | 3-Month LIBOR | | | | 1.048 | | | | Semi-Annually | | | | 6/25/12 | | | | (217,756 | ) |
UBS | | | 14,000,000 | | | | Receive | | | | 3-Month LIBOR | | | | 3.001 | | | | Semi-Annually | | | | 8/03/14 | | | | (942,355 | ) |
| | | | | | | | | | | | | | | | | | | | | | | | | | | $ | (2,476,485 | ) |
| | | | For Fund portfolio compliance purposes, the Fund’s industry classifications refer to any one or more of the industry sub-classifications used by one or more widely recognized market indexes or ratings group indexes, and/or as defined by Fund management. This definition may not apply for purposes of this report which may combine industry sub-classifications into sectors for reporting ease. |
| | p | | All Percentages shown in the Portfolio of Investments are based on net assets. |
| | n | | Investment is exempt from registration under Rule 144A of the Securities Act of 1933, as amended. These investments may only be resold in transactions exempt from registration, which are normally those transactions with qualified institutional buyers. |
| | q | | Investment, or a portion of investment, is out on loan for securities lending. |
| | D | | Variable Rate Security – The rate shown is the rate in effect as of June 30, 2011. |
| | x | | Z-Bonds – Represents securities that pay no interest or principal during their accrual periods, but accrue additional principal at specified rates. Interest rate shown represents current yield based upon the cost basis and estimated future cash flows. |
| | • | | Non-income producing; issuer has not declared a dividend within the past twelve months. |
| | W | | The rate shown is the annualized seven-day effective yield as of June 30, 2011. |
| | ¨ | | Investment, or portion of investment, segregated as collateral for investments in derivatives. Yield shown is effective yield as of June 30, 2011. |
| | † | | The Fund may loan securities representing up to one third of the fair value of its total assets (which includes collateral for securities on loan) to broker-dealers, banks, or other institutional borrowers of securities. The Fund maintains collateral equal to at least 102% of the fair value of the securities loaned. The adequacy of the collateral is monitored on a daily basis. The cash collateral received by the Fund is invested in this money market fund. |
| | ¯ | | Other Assets Less Liabilities includes the net Unrealized Appreciation (Depreciation) of derivatives instruments as listed within Investments in Derivatives. |
| | WI/DD | | Purchased on a when-issued or delayed delivery basis. |
| | LIBOR | | London Inter-Bank offered Rate |
| | MDR | | Denotes investment is subject to dollar roll transactions. |
| | REIT | | Real Estate Investment Trust |
See accompanying notes to financial statements.
Portfolio of Investments
Nuveen High Income Bond Fund
(formerly known as First American High Income Bond Fund)
June 30, 2011
| | | | | | | | | | | | | | |
Principal
Amount (000) | | | Description p | | | | | | | | Value | |
| | | | | | | | | | | | | | |
| | | | HIGH YIELD CORPORATE BONDS – 86.8% | | | | | | | | | | |
| | | | | |
| | | | Banking – 0.8% | | | | | | | | | | |
| | | | | |
| | | | ABN AMRO | | | | | | | | | | |
| $ | 2,000 | | | 6.523%, 12/29/2049 n q D | | | | | | | | $ | 1,850,000 | |
| | | | | |
| | | | Alfa Bank Issuance | | | | | | | | | | |
| | 1,500 | | | 7.750%, 04/28/2021 n | | | | | | | | | 1,513,200 | |
| | | | | |
| | | | Standard Bank | | | | | | | | | | |
| | 1,000 | | | 8.750%, 02/09/2016 D | | | | | | | | | 867,600 | |
| | 4,500 | | | Total Banking | | | | | | | | | 4,230,800 | |
| | | | Basic Industry – 19.6% | | | | | | | | | | |
| | | | | |
| | | | AbitibiBowater Escrow | | | | | | | | | | |
| | 1,317 | | | 10.250%, 10/15/2018 n | | | | | | | | | 1,425,653 | |
| | | | | |
| | | | AK Steel | | | | | | | | | | |
| | 2,250 | | | 7.625%, 05/15/2020 q | | | | | | | | | 2,306,250 | |
| | | | | |
| | | | Aleris International | | | | | | | | | | |
| | 1,000 | | | 10.000%, 12/15/2016 | | | | | | | | | 2,600 | |
| | | | | |
| | | | Alrosa Finance | | | | | | | | | | |
| | 1,000 | | | 7.750%, 11/03/2020 n q | | | | | | | | | 1,087,500 | |
| | | | | |
| | | | Aperam | | | | | | | | | | |
| | 1,500 | | | 7.750%, 04/01/2018 n q | | | | | | | | | 1,511,250 | |
| | | | | |
| | | | Appleton Papers | | | | | | | | | | |
| | 2,000 | | | 10.500%, 06/15/2015 n | | | | | | | | | 2,085,000 | |
| | | | | |
| | | | Atkore International | | | | | | | | | | |
| | 1,000 | | | 9.875%, 01/01/2018 n | | | | | | | | | 1,050,000 | |
| | | | | |
| | | | Berry Plastics | | | | | | | | | | |
| | 2,300 | | | 4.122%, 09/15/2014 D | | | | | | | | | 2,139,000 | |
| | 1,500 | | | 9.750%, 01/15/2021 | | | | | | | | | 1,451,250 | |
| | | | | |
| | | | Blue Merger Sub | | | | | | | | | | |
| | 1,000 | | | 7.625%, 02/15/2019 n q | | | | | | | | | 1,010,000 | |
| | | | | |
| | | | Building Materials | | | | | | | | | | |
| | 1,250 | | | 6.750%, 05/01/2021 n q | | | | | | | | | 1,256,250 | |
| | | | | |
| | | | Bumi Investment | | | | | | | | | | |
| | 1,850 | | | 10.750%, 10/06/2017 n | | | | | | | | | 2,101,970 | |
| | | | | |
| | | | Calumet Specialty Products | | | | | | | | | | |
| | 1,075 | | | 9.375%, 05/01/2019 n | | | | | | | | | 1,107,250 | |
| | | | | |
| | | | Cascades | | | | | | | | | | |
| | 2,500 | | | 7.750%, 12/15/2017 | | | | | | | | | 2,606,250 | |
| | | | | |
| | | | Catalyst Paper | | | | | | | | | | |
| | 1,750 | | | 11.000%, 12/15/2016 n q | | | | | | | | | 1,496,250 | |
| | | | | |
| | | | Cemex | | | | | | | | | | |
| | 1,000 | | | 9.000%, 01/11/2018 n | | | | | | | | | 1,017,500 | |
| | | | | |
| | | | Cleaver-Brooks | | | | | | | | | | |
| | 1,000 | | | 12.250%, 05/01/2016 n | | | | | | | | | 1,030,000 | |
| | | | | |
| | | | Corelogic | | | | | | | | | | |
| | 1,800 | | | 7.250%, 06/01/2021 n | | | | | | | | | 1,755,000 | |
| | | | | |
| | | | Delphi | | | | | | | | | | |
| | 750 | | | 5.875%, 05/15/2019 n q | | | | | | | | | 735,000 | |
| | | | | |
| | | | Dish DBS | | | | | | | | | | |
| | 1,750 | | | 6.750%, 06/01/2021 n q | | | | | | | | | 1,793,750 | |
| | | | | |
| | | | Drummond | | | | | | | | | | |
| | 1,750 | | | 9.000%, 10/15/2014 n | | | | | | | | | 1,841,875 | |
| | | | | |
| | | | Exopack Holding | | | | | | | | | | |
| | 750 | | | 10.000%, 06/01/2018 n | | | | | | | | | 744,375 | |
| | | | | | | | | | | | | | |
Principal
Amount (000) | | | Description p | | | | | | | | Value | |
| | | | | | | | | | | | | | |
| | | | Basic Industry (continued) | | | | | | | | | | |
| | | | | |
| | | | Geo Group | | | | | | | | | | |
| $ | 965 | | | 6.625%, 02/15/2021 n | | | | | | | | $ | 957,763 | |
| | | | | |
| | | | Graham Packaging | | | | | | | | | | |
| | 2,050 | | | 8.250%, 10/01/2018 q | | | | | | | | | 2,280,625 | |
| | | | | |
| | | | Hidili Industry | | | | | | | | | | |
| | 1,400 | | | 8.625%, 11/04/2015 n q | | | | | | | | | 1,375,500 | |
| | | | | |
| | | | Huntington Ingalls Industries | | | | | | | | | | |
| | 2,250 | | | 6.875%, 03/15/2018 n q | | | | | | | | | 2,306,250 | |
| | | | | |
| | | | Huntsman International | | | | | | | | | | |
| | 1,000 | | | 8.625%, 03/15/2021 q | | | | | | | | | 1,087,500 | |
| | | | | |
| | | | Ineos Group Holdings | | | | | | | | | | |
| | 2,000 | | | 8.500%, 02/15/2016 n q | | | | | | | | | 1,975,000 | |
| | | | | |
| | | | Intertape Polymer Group | | | | | | | | | | |
| | 2,615 | | | 8.500%, 08/01/2014 | | | | | | | | | 2,464,637 | |
| | | | | |
| | | | JMC Steel Group | | | | | | | | | | |
| | 2,000 | | | 8.250%, 03/15/2018 n | | | | | | | | | 2,030,000 | |
| | | | | |
| | | | K Hovnanian Enterprises | | | | | | | | | | |
| | 1,775 | | | 8.625%, 01/15/2017 q | | | | | | | | | 1,127,125 | |
| | | | | |
| | | | Longview Fibre Paper & Packaging | | | | | | | | | | |
| | 1,750 | | | 8.000%, 06/01/2016 n q | | | | | | | | | 1,758,750 | |
| | | | | |
| | | | Metinvest | | | | | | | | | | |
| | 1,250 | | | 10.250%, 05/20/2015 n | | | | | | | | | 1,360,875 | |
| | | | | |
| | | | Millar Western Forest | | | | | | | | | | |
| | 2,250 | | | 8.500%, 04/01/2021 n | | | | | | | | | 2,025,000 | |
| | | | | |
| | | | Momentive Performance | | | | | | | | | | |
| | 2,500 | | | 9.000%, 01/15/2021 | | | | | | | | | 2,550,000 | |
| | | | | |
| | | | Novelis | | | | | | | | | | |
| | 2,050 | | | 8.375%, 12/15/2017 | | | | | | | | | 2,188,375 | |
| | | | | |
| | | | Park Ohio Industries | | | | | | | | | | |
| | 3,300 | | | 8.125%, 04/01/2021 n | | | | | | | | | 3,300,000 | |
| | | | | |
| | | | Patriot Coal | | | | | | | | | | |
| | 2,250 | | | 8.250%, 04/30/2018 q | | | | | | | | | 2,328,750 | |
| | | | | |
| | | | Pittsburgh Glass Works | | | | | | | | | | |
| | 2,565 | | | 8.500%, 04/15/2016 n q | | | | | | | | | 2,635,538 | |
| | | | | |
| | | | Ply Gem Industries | | | | | | | | | | |
| | 1,000 | | | 8.250%, 02/15/2018 n q | | | | | | | | | 947,500 | |
| | | | | |
| | | | Polarcus Alima AS | | | | | | | | | | |
| | 2,300 | | | 12.500%, 10/29/2015 | | | | | | | | | 2,300,000 | |
| | | | | |
| | | | Polymer Group | | | | | | | | | | |
| | 1,800 | | | 7.750%, 02/01/2019 n q | | | | | | | | | 1,804,500 | |
| | | | | |
| | | | Polypore International | | | | | | | | | | |
| | 800 | | | 7.500%, 11/15/2017 | | | | | | | | | 846,000 | |
| | | | | |
| | | | Reynolds Group | | | | | | | | | | |
| | 4,800 | | | 8.750%, 05/15/2018 q | | | | | | | | | 4,716,000 | |
| | | | | |
| | | | RR Donnelley & Sons | | | | | | | | | | |
| | 1,300 | | | 7.250%, 05/15/2018 q | | | | | | | | | 1,300,000 | |
| | | | | |
| | | | Solo Cup | | | | | | | | | | |
| | 750 | | | 8.500%, 02/15/2014 q | | | | | | | | | 699,375 | |
| | | | | |
| | | | Speedy Cash | | | | | | | | | | |
| | 1,250 | | | 10.750%, 05/15/2018 n q | | | | | | | | | 1,278,125 | |
| | | | | |
| | | | Stora Enso | | | | | | | | | | |
| | 2,000 | | | 7.250%, 04/15/2036 n | | | | | | | | | 1,895,000 | |
Portfolio of Investments
Nuveen High Income Bond Fund (continued)
June 30, 2011
| | | | | | | | | | | | | | |
Principal
Amount (000) | | | Description p | | | | | | | | Value | |
| | | | | | | | | | | | | | |
| | | | Basic Industry (continued) | | | | | | | | | | |
| | | | | |
| | | | Taseko Mines | | | | | | | | | | |
| $ | 2,250 | | | 7.750%, 04/15/2019 | | | | | | | | $ | 2,266,875 | |
| | | | | |
| | | | Tembec Industries | | | | | | | | | | |
| | 2,300 | | | 11.250%, 12/15/2018 q | | | | | | | | | 2,406,375 | |
| | | | | |
| | | | Thompson Creek Metals | | | | | | | | | | |
| | 2,100 | | | 7.375%, 06/01/2018 n | | | | | | | | | 2,058,000 | |
| | | | | |
| | | | Tl Acquisitions | | | | | | | | | | |
| | 1,000 | | | 10.500%, 01/15/2015 n | | | | | | | | | 905,000 | |
| | | | | |
| | | | UCI International | | | | | | | | | | |
| | 1,575 | | | 8.625%, 02/15/2019 | | | | | | | | | 1,622,250 | |
| | | | | |
| | | | Vedanta Resources | | | | | | | | | | |
| | 905 | | | 9.500%, 07/18/2018 n q | | | | | | | | | 986,450 | |
| | | | | |
| | | | Verso Paper Holdings | | | | | | | | | | |
| | 1,577 | | | 11.500%, 07/01/2014 | | | | | | | | | 1,679,505 | |
| | 1,500 | | | 8.750%, 02/01/2019 n q | | | | | | | | | 1,335,000 | |
| | | | | |
| | | | West China Cement | | | | | | | | | | |
| | 2,000 | | | 7.500%, 01/25/2016 n q | | | | | | | | | 1,920,000 | |
| | | | | |
| | | | WPE International Cooperatief | | | | | | | | | | |
| | 2,000 | | | 10.375%, 09/30/2020 n | | | | | | | | | 2,120,000 | |
| | 99,269 | | | Total Basic Industry | | | | | | | | | 98,391,616 | |
| | | | Capital Goods – 3.7% | | | | | | | | | | |
| | | | | |
| | | | Abengoa Finance | | | | | | | | | | |
| | 2,675 | | | 8.875%, 11/01/2017 n q | | | | | | | | | 2,731,844 | |
| | | | | |
| | | | Columbus Mckinnon | | | | | | | | | | |
| | 1,550 | | | 7.875%, 02/01/2019 | | | | | | | | | 1,573,250 | |
| | | | | |
| | | | Commercial Vehicle Group | | | | | | | | | | |
| | 1,750 | | | 7.875%, 04/15/2019 n | | | | | | | | | 1,750,000 | |
| | | | | |
| | | | Ducommun | | | | | | | | | | |
| | 750 | | | 9.750%, 07/15/2018 n | | | | | | | | | 770,625 | |
| | | | | |
| | | | Global Rig Company | | | | | | | | | | |
| | 750 | | | 13.000%, 06/15/2015 | | | | | | | | | 754,027 | |
| | | | | |
| | | | Kratos Defense & Security Solutions | | | | | | | | | | |
| | 1,500 | | | 10.000%, 06/01/2017 | | | | | | | | | 1,582,500 | |
| | | | | |
| | | | Liberty Tire Recycling | | | | | | | | | | |
| | 1,000 | | | 11.000%, 10/01/2016 n | | | | | | | | | 1,045,000 | |
| | | | | |
| | | | Navistar International | | | | | | | | | | |
| | 1,250 | | | 8.250%, 11/01/2021 | | | | | | | | | 1,337,500 | |
| | | | | |
| | | | Neff Rental | | | | | | | | | | |
| | 1,500 | | | 9.625%, 05/15/2016 n | | | | | | | | | 1,426,875 | |
| | | | | |
| | | | Titan International | | | | | | | | | | |
| | 1,750 | | | 7.875%, 10/01/2017 n q | | | | | | | | | 1,828,750 | |
| | | | | |
| | | | United Rentals North America | | | | | | | | | | |
| | 2,300 | | | 8.375%, 09/15/2020 q | | | | | | | | | 2,328,750 | |
| | | | | |
| | | | Wyle Services | | | | | | | | | | |
| | 1,500 | | | 10.500%, 04/01/2018 n | | | | | | | | | 1,590,000 | |
| | 18,275 | | | Total Capital Goods | | | | | | | | | 18,719,121 | |
| | | | Communications – 10.6% | | | | | | | | | | |
| | | | | |
| | | | American Media | | | | | | | | | | |
| | 2,250 | | | 13.500%, 06/15/2018 n q | | | | | | | | | 2,424,375 | |
| | | | | |
| | | | Bakrie Telecom | | | | | | | | | | |
| | 1,500 | | | 11.500%, 05/07/2015 n | | | | | | | | | 1,537,500 | |
| | | | | | | | | | | | | | |
Principal
Amount (000) | | | Description p | | | | | | | | Value | |
| | | | | | | | | | | | | | |
| | | | Communications (continued) | | | | | | | | | | |
| | | | | |
| | | | Belo | | | | | | | | | | |
| $ | 1,500 | | | 7.750%, 06/01/2027 | | | | | | | | $ | 1,406,250 | |
| | | | | |
| | | | CCO Holdings | | | | | | | | | | |
| | 500 | | | 7.000%, 01/15/2019 n | | | | | | | | | 513,750 | |
| | 1,250 | | | 7.000%, 01/15/2019 q | | | | | | | | | 1,287,500 | |
| | | | | |
| | | | Citizens Communications | | | | | | | | | | |
| | 1,450 | | | 9.000%, 08/15/2031 | | | | | | | | | 1,486,250 | |
| | | | | |
| | | | Clear Channel Communications | | | | | | | | | | |
| | 2,100 | | | 10.750%, 08/01/2016 | | | | | | | | | 1,895,250 | |
| | 1,500 | | | 9.000%, 03/01/2021 n | | | | | | | | | 1,436,250 | |
| | | | | |
| | | | Clearwire Communications | | | | | | | | | | |
| | 1,750 | | | 12.000%, 12/01/2017 n q | | | | | | | | | 1,833,125 | |
| | | | | |
| | | | Cumulus Media | | | | | | | | | | |
| | 1,450 | | | 7.750%, 05/01/2019 n q | | | | | | | | | 1,399,250 | |
| | | | | |
| | | | Digicel Group | | | | | | | | | | |
| | 1,300 | | | 10.500%, 04/15/2018 n | | | | | | | | | 1,456,000 | |
| | | | | |
| | | | Earthlink | | | | | | | | | | |
| | 1,500 | | | 8.875%, 05/15/2019 n q | | | | | | | | | 1,361,250 | |
| | | | | |
| | | | FairPoint Communications
Series I | | | | | | | | | | |
| | 1,043 | | | 13.125%, 04/02/2018 q | | | | | | | | | 10,430 | |
| | | | | |
| | | | Frontier Communications | | | | | | | | | | |
| | 1,842 | | | 8.500%, 04/15/2020 | | | | | | | | | 2,007,780 | |
| | | | | |
| | | | Gannett | | | | | | | | | | |
| | 2,000 | | | 9.375%, 11/15/2017 | | | | | | | | | 2,200,000 | |
| | | | | |
| | | | Goodman Network | | | | | | | | | | |
| | 2,000 | | | 12.125%, 07/01/2018 n | | | | | | | | | 1,990,000 | |
| | | | | |
| | | | Insight Communications | | | | | | | | | | |
| | 1,000 | | | 9.375%, 07/15/2018 n | | | | | | | | | 1,097,500 | |
| | | | | |
| | | | Integra Telecom Holdings | | | | | | | | | | |
| | 2,075 | | | 10.750%, 04/15/2016 n | | | | | | | | | 2,095,750 | |
| | | | | |
| | | | Intelsat Bermuda | | | | | | | | | | |
| | 2,500 | | | 11.250%, 02/04/2017 | | | | | | | | | 2,684,375 | |
| | | | | |
| | | | Intelsat Jackson Holdings | | | | | | | | | | |
| | 2,015 | | | 7.250%, 04/01/2019 n q | | | | | | | | | 1,999,888 | |
| | | | | |
| | | | Level 3 Communications | | | | | | | | | | |
| | 2,500 | | | 11.875%, 02/01/2019 n q | | | | | | | | | 2,696,875 | |
| | | | | |
| | | | McClatchy | | | | | | | | | | |
| | 2,100 | | | 11.500%, 02/15/2017 | | | | | | | | | 2,231,250 | |
| | | | | |
| | | | Media General | | | | | | | | | | |
| | 2,100 | | | 11.750%, 02/15/2017 q | | | | | | | | | 2,042,250 | |
| | | | | |
| | | | Nextel Communications | | | | | | | | | | |
| | | | Series D | | | | | | | | | | |
| | 2,000 | | | 7.375%, 08/01/2015 q | | | | | | | | | 2,000,000 | |
| | | | | |
| | | | Sprint Capital | | | | | | | | | | |
| | 2,000 | | | 6.900%, 05/01/2019 q | | | | | | | | | 2,060,000 | |
| | | | | |
| | | | Syniverse Holdings | | | | | | | | | | |
| | 1,500 | | | 9.125%, 01/15/2019 n | | | | | | | | | 1,560,000 | |
| | | | | |
| | | | Trilogy International Partners | | | | | | | | | | |
| | 1,500 | | | 10.250%, 08/15/2016 n q | | | | | | | | | 1,522,500 | |
| | | | | |
| | | | UnityMedia Hessen | | | | | | | | | | |
| | 2,750 | | | 8.125%, 12/01/2017 n | | | | | | | | | 2,921,875 | |
Portfolio of Investments
Nuveen High Income Bond Fund (continued)
June 30, 2011
| | | | | | | | | | | | | | |
Principal
Amount (000) | | | Description p | | | | | | | | Value | |
| | | | | | | | | | | | | | |
| | | | Communications (continued) | | | | | | | | | | |
| | | | | |
| | | | Windstream | | | | | | | | | | |
| $ | 1,750 | | | 8.125%, 09/01/2018 | | | | | | | | $ | 1,855,000 | |
| | | | | |
| | | | XM Satellite Radio | | | | | | | | | | |
| | 2,000 | | | 7.625%, 11/01/2018 n | | | | | | | | | 2,090,000 | |
| | 52,725 | | | Total Communications | | | | | | | | | 53,102,223 | |
| | | | Consumer Cyclical – 9.1% | | | | | | | | | | |
| | | | | |
| | | | AMC Networks | | | | | | | | | | |
| | 800 | | | 7.750%, 07/15/2021 n | | | | | | | | | 836,000 | |
| | | | | |
| | | | Ameristar Casinos | | | | | | | | | | |
| | 2,100 | | | 7.500%, 04/15/2021 n q | | | | | | | | | 2,165,625 | |
| | | | | |
| | | | Beazer Homes USA | | | | | | | | | | |
| | 2,500 | | | 9.125%, 06/15/2018 | | | | | | | | | 2,156,250 | |
| | | | | |
| | | | Brunswick | | | | | | | | | | |
| | 1,000 | | | 7.125%, 08/01/2027 q | | | | | | | | | 870,000 | |
| | | | | |
| | | | Burlington Coat Factory | | | | | | | | | | |
| | 1,750 | | | 10.000%, 02/15/2019 n q | | | | | | | | | 1,732,500 | |
| | | | | |
| | | | Caesars Entertainment Operating | | | | | | | | | | |
| | 2,500 | | | 5.625%, 06/01/2015 q | | | | | | | | | 2,018,750 | |
| | 2,750 | | | 12.750%, 04/15/2018 q | | | | | | | | | 2,743,125 | |
| | | | | |
| | | | Casella Waste Systems | | | | | | | | | | |
| | 750 | | | 7.750%, 02/15/2019 n q | | | | | | | | | 751,875 | |
| | | | | |
| | | | Chukchansi Economic | | | | | | | | | | |
| | 1,500 | | | 8.000%, 11/15/2013 n | | | | | | | | | 1,222,500 | |
| | | | | |
| | | | CKE Restaurants | | | | | | | | | | |
| | 1,500 | | | 11.375%, 07/15/2018 | | | | | | | | | 1,638,750 | |
| | | | | |
| | | | Dana Holding | | | | | | | | | | |
| | 2,000 | | | 6.500%, 02/15/2019 q | | | | | | | | | 1,980,000 | |
| | | | | |
| | | | Fontainebleau Las Vegas | | | | | | | | | | |
| | 1,000 | | | 10.250%, 06/15/2015 n D | | | | | | | | | 500 | |
| | | | | |
| | | | Ford Motor | | | | | | | | | | |
| | 2,000 | | | 7.450%, 07/16/2031 q | | | | | | | | | 2,267,274 | |
| | | | | |
| | | | Giti Tire | | | | | | | | | | |
| | 700 | | | 12.250%, 01/26/2012 | | | | | | | | | 686,358 | |
| | | | | |
| | | | Hilton Hotels | | | | | | | | | | |
| | 2,000 | | | 4.761%, 11/15/2013 n D | | | | | | | | | 1,975,000 | |
| | | | | |
| | | | InVentiv Health Capital | | | | | | | | | | |
| | 1,500 | | | 10.000%, 08/15/2018 n | | | | | | | | | 1,470,000 | |
| | | | | |
| | | | Isle Of Capri Casinos | | | | | | | | | | |
| | 1,625 | | | 7.750%, 03/15/2019 n q | | | | | | | | | 1,641,250 | |
| | | | | |
| | | | Liz Claiborne | | | | | | | | | | |
| | 1,350 | | | 10.500%, 04/15/2019 n q | | | | | | | | | 1,377,000 | |
| | | | | |
| | | | Macy’s Retail Holdings | | | | | | | | | | |
| | 1,500 | | | 7.875%, 08/15/2036 | | | | | | | | | 1,607,282 | |
| | | | | |
| | | | Marina District Finance | | | | | | | | | | |
| | 1,700 | | | 9.875%, 08/15/2018 n | | | | | | | | | 1,763,750 | |
| | | | | |
| | | | MGM Mirage | | | | | | | | | | |
| | 1,750 | | | 6.875%, 04/01/2016 q | | | | | | | | | 1,640,625 | |
| | | | | |
| | | | MGM Resorts International | | | | | | | | | | |
| | 2,000 | | | 10.000%, 11/01/2016 n q | | | | | | | | | 2,120,000 | |
| | | | | |
| | | | Mohegan Tribal Gaming | | | | | | | | | | |
| | 1,750 | | | 6.125%, 02/15/2013 q | | | | | | | | | 1,452,500 | |
| | | | | | | | | | | | | | |
Principal
Amount (000) | | | Description p | | | | | | | | Value | |
| | | | | | | | | | | | | | |
| | | | Consumer Cyclical (continued) | | | | | | | | | | |
| | | | | |
| | | | National CineMedia | | | | | | | | | | |
| $ | 1,250 | | | 7.875%, 07/15/2021 n | | | | | | | | $ | 1,270,313 | |
| | | | | |
| | | | Nortek | | | | | | | | | | |
| | 1,500 | | | 8.500%, 04/15/2021 n q | | | | | | | | | 1,387,500 | |
| | | | | |
| | | | Regal Entertainment Group | | | | | | | | | | |
| | 1,100 | | | 9.125%, 08/15/2018 q | | | | | | | | | 1,138,500 | |
| | | | | |
| | | | Rite Aid | | | | | | | | | | |
| | 2,000 | | | 6.875%, 08/15/2013 q | | | | | | | | | 1,942,500 | |
| | 1,250 | | | 9.375%, 12/15/2015 q | | | | | | | | | 1,165,625 | |
| | | | | |
| | | | Standard Pacific | | | | | | | | | | |
| | 1,500 | | | 8.375%, 05/15/2018 q | | | | | | | | | 1,486,875 | |
| | | | | |
| | | | Trimas | | | | | | | | | | |
| | 1,000 | | | 9.750%, 12/15/2017 | | | | | | | | | 1,095,000 | |
| | | | | |
| | | | William Lyon Homes | | | | | | | | | | |
| | 750 | | | 10.750%, 04/01/2013 q | | | | | | | | | 388,125 | |
| | 48,375 | | | Total Consumer Cyclical | | | | | | | | | 45,991,352 | |
| | | | Consumer Non Cyclical – 10.3% | | | | | | | | | | |
| | | | | |
| | | | Albertsons | | | | | | | | | | |
| | 1,500 | | | 8.000%, 05/01/2031 | | | | | | | | | 1,278,750 | |
| | | | | |
| | | | Apria Healthcare Group I | | | | | | | | | | |
| | 1,000 | | | 11.250%, 11/01/2014 | | | | | | | | | 1,035,000 | |
| | | | | |
| | | | Aramark Holdings | | | | | | | | | | |
| | 1,100 | | | 8.625%, 05/01/2016 n | | | | | | | | | 1,119,250 | |
| | | | | |
| | | | Central Garden & Pet Company | | | | | | | | | | |
| | 2,250 | | | 8.250%, 03/01/2018 | | | | | | | | | 2,323,125 | |
| | | | | |
| | | | Community Health Systems | | | | | | | | | | |
| | 1,965 | | | 8.875%, 07/15/2015 q | | | | | | | | | 2,023,950 | |
| | | | | |
| | | | Constellation Enterprises | | | | | | | | | | |
| | 1,750 | | | 10.625%, 02/01/2016 n | | | | | | | | | 1,787,187 | |
| | | | | |
| | | | Darling International | | | | | | | | | | |
| | 1,900 | | | 8.500%, 12/15/2018 n | | | | | | | | | 2,052,000 | |
| | | | | |
| | | | Dyncorp International | | | | | | | | | | |
| | 2,150 | | | 10.375%, 07/01/2017 n q | | | | | | | | | 2,203,750 | |
| | | | | |
| | | | Endo Pharmaceuticals Holdings | | | | | | | | | | |
| | 750 | | | 7.000%, 07/15/2019 n q | | | | | | | | | 768,750 | |
| | | | | |
| | | | Fage Dairy | | | | | | | | | | |
| | 1,350 | | | 9.875%, 02/01/2020 n | | | | | | | | | 1,353,375 | |
| | | | | |
| | | | General Motors | | | | | | | | | | |
| | 250 | | | 6.750%, 06/01/2018 n q | | | | | | | | | 250,625 | |
| | | | | |
| | | | Harmony Foods | | | | | | | | | | |
| | 1,750 | | | 10.000%, 05/01/2016 n | | | | | | | | | 1,785,000 | |
| | | | | |
| | | | HCA Holdings | | | | | | | | | | |
| | 2,500 | | | 7.750%, 05/15/2021 n q | | | | | | | | | 2,593,750 | |
| | | | | |
| | | | HealthSouth Capital | | | | | | | | | | |
| | 1,850 | | | 7.750%, 09/15/2022 q | | | | | | | | | 1,949,438 | |
| | | | | |
| | | | Hertz | | | | | | | | | | |
| | 2,400 | | | 7.375%, 01/15/2021 n q | | | | | | | | | 2,442,000 | |
| | | | | |
| | | | Icon Health & Fitness | | | | | | | | | | |
| | 1,500 | | | 11.875%, 10/15/2016 n | | | | | | | | | 1,530,000 | |
| | | | | |
| | | | Ingles Markets | | | | | | | | | | |
| | 1,250 | | | 8.875%, 05/15/2017 | | | | | | | | | 1,337,500 | |
Portfolio of Investments
Nuveen High Income Bond Fund (continued)
June 30, 2011
| | | | | | | | | | | | | | |
Principal
Amount (000) | | | Description p | | | | | | | | Value | |
| | | | | | | | | | | | | | |
| | | | Consumer Non Cyclical (continued) | | | | | | | | | | |
| | | | | |
| | | | JBS USA | | | | | | | | | | |
| $ | 1,300 | | | 7.250%, 06/01/2021 n | | | | | | | | $ | 1,264,250 | |
| | | | | |
| | | | Kindred Healthcare | | | | | | | | | | |
| | 1,210 | | | 8.250%, 06/01/2019 n | | | | | | | | | 1,203,950 | |
| | | | | |
| | | | Land O Lakes Capital Trust I | | | | | | | | | | |
| | 2,000 | | | 7.450%, 03/15/2028 n | | | | | | | | | 1,905,000 | |
| | | | | |
| | | | Marfrig Overseas | | | | | | | | | | |
| | 1,500 | | | 9.500%, 05/04/2020 n | | | | | | | | | 1,522,500 | |
| | | | | |
| | | | Merge Healthcare | | | | | | | | | | |
| | 1,750 | | | 11.750%, 05/01/2015 | | | | | | | | | 1,872,500 | |
| | | | | |
| | | | MHP | | | | | | | | | | |
| | 1,250 | | | 10.250%, 04/29/2015 n | | | | | | | | | 1,335,875 | |
| | | | | |
| | | | National Mentor Holdings | | | | | | | | | | |
| | 1,710 | | | 12.500%, 02/15/2018 n | | | | | | | | | 1,710,000 | |
| | | | | |
| | | | Pinnacle Foods | | | | | | | | | | |
| | 2,550 | | | 8.250%, 09/01/2017 | | | | | | | | | 2,645,625 | |
| | | | | |
| | | | Res-care | | | | | | | | | | |
| | 2,100 | | | 10.750%, 01/15/2019 q | | | | | | | | | 2,194,500 | |
| | | | | |
| | | | STHI Holding | | | | | | | | | | |
| | 1,605 | | | 8.000%, 03/15/2018 n | | | | | | | | | 1,629,075 | |
| | | | | |
| | | | Supervalu | | | | | | | | | | |
| | 1,225 | | | 7.500%, 11/15/2014 q | | | | | | | | | 1,225,000 | |
| | | | | |
| | | | Symbion | | | | | | | | | | |
| | — | ¥ | | 11.000%, 08/23/2015 | | | | | | | | | 466 | |
| | | | | |
| | | | Tenet Healthcare | | | | | | | | | | |
| | 1,750 | | | 8.000%, 08/01/2020 | | | | | | | | | 1,778,438 | |
| | 1,500 | | | 6.875%, 11/15/2031 | | | | | | | | | 1,252,500 | |
| | | | | |
| | | | Valeant Pharmaceuticals | | | | | | | | | | |
| | 815 | | | 6.875%, 12/01/2018 n | | | | | | | | | 798,700 | |
| | | | | |
| | | | Viterra | | | | | | | | | | |
| | 1,575 | | | 5.950%, 08/01/2020 n | | | | | | | | | 1,601,614 | |
| | 51,055 | | | Total Consumer Non Cyclical | | | | | | | | | 51,773,443 | |
| | | | | |
| | | | Electric – 3.5% | | | | | | | | | | |
| | | | | |
| | | | AES | | | | | | | | | | |
| | 2,100 | | | 8.000%, 10/15/2017 q | | | | | | | | | 2,226,000 | |
| | | | | |
| | | | Calpine | | | | | | | | | | |
| | 2,785 | | | 7.875%, 07/31/2020 n q | | | | | | | | | 2,910,325 | |
| | | | | |
| | | | Dubai Electricity & Water | | | | | | | | | | |
| | 2,300 | | | 7.375%, 10/21/2020 n | | | | | | | | | 2,366,125 | |
| | | | | |
| | | | Edison Mission Energy | | | | | | | | | | |
| | 2,350 | | | 7.500%, 06/15/2013 q | | | | | | | | | 2,364,687 | |
| | | | | |
| | | | Energy Future Holdings | | | | | | | | | | |
| | 1,500 | | | 10.875%, 11/01/2017 q | | | | | | | | | 1,282,500 | |
| | | | | |
| | | | Midwest Generation
Series B | | | | | | | | | | |
| | 3,249 | | | 8.560%, 01/02/2016 | | | | | | | | | 3,330,316 | |
| | | | | |
| | | | Mirant Americas Generation | | | | | | | | | | |
| | 1,800 | | | 8.500%, 10/01/2021 | | | | | | | | | 1,845,000 | |
| | | | | |
| | | | Texas Competitive Electric Holdings | | | | | | | | | | |
| | 1,500 | | | 11.500%, 10/01/2020 n q | | | | | | | | | 1,473,750 | |
| | 17,584 | | | Total Electric | | | | | | | | | 17,798,703 | |
| | | | | | | | | | | | | | |
Principal
Amount (000) | | | Description p | | | | | | | | Value | |
| | | | | | | | | | | | | | |
| | | | Energy – 13.0% | | | | | | | | | | |
| | | | | |
| | | | Black Elk Energy | | | | | | | | | | |
| $ | 1,500 | | | 13.750%, 12/01/2015 n | | | | | | | | $ | 1,507,500 | |
| | | | | |
| | | | Bluewater Holding | | | | | | | | | | |
| | 1,500 | | | 3.276%, 07/17/2014 D | | | | | | | | | 1,185,000 | |
| | | | | |
| | | | Brigham Exploration
Series 1 | | | | | | | | | | |
| | 1,750 | | | 8.750%, 10/01/2018 | | | | | | | | | 1,907,500 | |
| | | | | |
| | | | Calfrac Holdings | | | | | | | | | | |
| | 2,250 | | | 7.500%, 12/01/2020 n q | | | | | | | | | 2,272,500 | |
| | | | | |
| | | | Carrizo Oil & Gas | | | | | | | | | | |
| | 2,750 | | | 8.625%, 10/15/2018 | | | | | | | | | 2,832,500 | |
| | | | | |
| | | | Concho Resources | | | | | | | | | | |
| | 2,050 | | | 8.625%, 10/01/2017 | | | | | | | | | 2,234,500 | |
| | | | | |
| | | | Connacher Oil & Gas | | | | | | | | | | |
| | 2,000 | | | 8.500%, 08/01/2019 n | | | | | | | | | 1,900,000 | |
| | | | | |
| | | | Copano Energy | | | | | | | | | | |
| | 850 | | | 7.125%, 04/01/2021 | | | | | | | | | 839,375 | |
| | | | | |
| | | | Empresa Distribuidora Norte | | | | | | | | | | |
| | 1,500 | | | 9.750%, 10/25/2022 n | | | | | | | | | 1,511,250 | |
| | | | | |
| | | | Energy XXI Gulf Coast | | | | | | | | | | |
| | 1,800 | | | 9.250%, 12/15/2017 n | | | | | | | | | 1,917,000 | |
| | | | | |
| | | | EnergySolutions | | | | | | | | | | |
| | 1,210 | | | 10.750%, 08/15/2018 | | | | | | | | | 1,276,550 | |
| | | | | |
| | | | Floatel Superior | | | | | | | | | | |
| | 1,500 | | | 13.000%, 09/02/2015 | | | | | | | | | 1,620,000 | |
| | | | | |
| | | | Forbes Energy Services | | | | | | | | | | |
| | 1,500 | | | 9.000%, 06/15/2019 n | | | | | | | | | 1,477,500 | |
| | | | | |
| | | | Golden Close Marit | | | | | | | | | | |
| | 2,000 | | | 11.000%, 12/09/2015 | | | | | | | | | 2,140,000 | |
| | | | | |
| | | | Inergy LP | | | | | | | | | | |
| | 1,400 | | | 7.000%, 10/01/2018 n | | | | | | | | | 1,414,000 | |
| | | | | |
| | | | Jasper Explorer | | | | | | | | | | |
| | 1,500 | | | 13.500%, 05/27/2016 | | | | | | | | | 1,477,095 | |
| | | | | |
| | | | Laredo Petroleum | | | | | | | | | | |
| | 2,250 | | | 9.500%, 02/15/2019 n | | | | | | | | | 2,373,750 | |
| | | | | |
| | | | Linn Energy | | | | | | | | | | |
| | 2,125 | | | 8.625%, 04/15/2020 | | | | | | | | | 2,305,625 | |
| | | | | |
| | | | Meg Energy | | | | | | | | | | |
| | 2,250 | | | 6.500%, 03/15/2021 n | | | | | | | | | 2,261,250 | |
| | | | | |
| | | | NRG Energy | | | | | | | | | | |
| | 1,480 | | | 7.625%, 05/15/2019 n | | | | | | | | | 1,472,600 | |
| | | | | |
| | | | Ocean Rig Underwater | | | | | | | | | | |
| | 2,000 | | | 9.500%, 04/27/2016 | | | | | | | | | 1,990,000 | |
| | | | | |
| | | | OGX Petroleo E Gas Participacoes | | | | | | | | | | |
| | 1,985 | | | 8.500%, 06/01/2018 n q | | | | | | | | | 2,041,572 | |
| | | | | |
| | | | Opti Canada | | | | | | | | | | |
| | 1,000 | | | 8.250%, 12/15/2014 q * | | | | | | | | | 415,000 | |
| | | | | |
| | | | Panoro Energy | | | | | | | | | | |
| | 2,000 | | | 12.000%, 11/15/2018 n | | | | | | | | | 2,040,000 | |
| | | | | |
| | | | Petrohawk Energy | | | | | | | | | | |
| | 500 | | | 7.250%, 08/15/2018 | | | | | | | | | 513,125 | |
Portfolio of Investments
Nuveen High Income Bond Fund (continued)
June 30, 2011
| | | | | | | | | | | | | | |
Principal
Amount (000) | | | Description p | | | | | | | | Value | |
| | | | | | | | | | | | | | |
| | | | Energy (continued) | | | | | | | | | | |
| | | | | |
| | | | Petroplus Finance | | | | | | | | | | |
| $ | 2,800 | | | 9.375%, 09/15/2019 n q | | | | | | | | $ | 2,814,000 | |
| | | | | |
| | | | QuadraFNX Mining | | | | | | | | | | |
| | 1,300 | | | 7.750%, 06/15/2019 n | | | | | | | | | 1,313,000 | |
| | | | | |
| | | | Range Resources | | | | | | | | | | |
| | 1,000 | | | 8.000%, 05/15/2019 | | | | | | | | | 1,085,000 | |
| | | | | |
| | | | RDS Ultra-Deepwater | | | | | | | | | | |
| | 1,210 | | | 11.875%, 03/15/2017 n | | | | | | | | | 1,355,200 | |
| | | | | |
| | | | Sandridge Energy | | | | | | | | | | |
| | 2,000 | | | 7.500%, 03/15/2021 n | | | | | | | | | 2,025,000 | |
| | | | | |
| | | | Seadrill | | | | | | | | | | |
| | 2,000 | | | 6.500%, 10/05/2015 | | | | | | | | | 1,940,000 | |
| | | | | |
| | | | Sevan Marine | | | | | | | | | | |
| | 500 | | | 12.000%, 08/10/2015 D | | | | | | | | | 410,000 | |
| | | | | |
| | | | SM Energy | | | | | | | | | | |
| | 2,150 | | | 6.625%, 02/15/2019 n | | | | | | | | | 2,155,375 | |
| | | | | |
| | | | Stone Energy | | | | | | | | | | |
| | 2,200 | | | 8.625%, 02/01/2017 | | | | | | | | | 2,266,000 | |
| | | | | |
| | | | United Refining | | | | | | | | | | |
| | 2,720 | | | 10.500%, 02/28/2018 | | | | | | | | | 2,720,000 | |
| | | | | |
| | | | W & T Offshore | | | | | | | | | | |
| | 1,500 | | | 8.500%, 06/15/2019 n | | | | | | | | | 1,518,750 | |
| | | | | |
| | | | Western Refining | | | | | | | | | | |
| | 2,715 | | | 11.250%, 06/15/2017 n | | | | | | | | | 3,054,375 | |
| | 64,745 | | | Total Energy | | | | | | | | | 65,581,892 | |
| | | | | |
| | | | Finance – 4.1% | | | | | | | | | | |
| | | | | |
| | | | Ace Cash Express | | | | | | | | | | |
| | 2,000 | | | 11.000%, 02/01/2019 n q | | | | | | | | | 2,005,000 | |
| | | | | |
| | | | AGFC Capital Trust I | | | | | | | | | | |
| | 2,000 | | | 6.000%, 01/15/2067 n D | | | | | | | | | 1,350,000 | |
| | | | | |
| | | | Credit Acceptance | | | | | | | | | | |
| | 1,250 | | | 9.125%, 02/01/2017 | | | | | | | | | 1,337,500 | |
| | | | | |
| | | | E*Trade Financial | | | | | | | | | | |
| | 1,500 | | | 6.750%, 06/01/2016 q | | | | | | | | | 1,470,000 | |
| | | | | |
| | | | Glen Meadow | | | | | | | | | | |
| | 3,500 | | | 6.505%, 02/12/2067 n D | | | | | | | | | 3,080,000 | |
| | | | | |
| | | | International Lease Finance | | | | | | | | | | |
| | 1,000 | | | 5.750%, 05/15/2016 q D | | | | | | | | | 984,717 | |
| | | | | |
| | | | Offshore Group Investment | | | | | | | | | | |
| | 2,250 | | | 11.500%, 08/01/2015 q | | | | | | | | | 2,446,875 | |
| | | | | |
| | | | Rare Restaurant Group | | | | | | | | | | |
| | 2,500 | | | 9.250%, 05/15/2014 n | | | | | | | | | 2,075,000 | |
| | | | | |
| | | | Servicios Corporativos Javer | | | | | | | | | | |
| | 2,822 | | | 9.875%, 04/06/2021 n | | | | | | | | | 2,941,935 | |
| | | | | |
| | | | Springleaf Finance
Series MTN | | | | | | | | | | |
| | 2,350 | | | 6.900%, 12/15/2017 | | | | | | | | | 2,156,125 | |
| | | | | |
| | | | Squaretwo Financial | | | | | | | | | | |
| | 1,000 | | | 11.625%, 04/01/2017 q | | | | | | | | | 1,045,000 | |
| | 22,172 | | | Total Finance | | | | | | | | | 20,892,152 | |
| | | | | | | | | | | | | | |
Principal
Amount (000) | | | Description p | | | | | | | | Value | |
| | | | | | | | | | | | | | |
| | | | Insurance – 2.6% | | | | | | | | | | |
| | | | | |
| | | | American International Group | | | | | | | | | | |
| $ | 2,300 | | | 6.250%, 03/15/2087 q D | | | | | | | | | $2,093,000 | |
| | | | | |
| | | | CNO Financial Group | | | | | | | | | | |
| | 2,750 | | | 9.000%, 01/15/2018 n | | | | | | | | | 2,915,000 | |
| | | | | |
| | | | Dai-Ichi Mutual Life | | | | | | | | | | |
| | 2,500 | | | 7.250%, 07/25/2021 n D | | | | | | | | | 2,498,532 | |
| | | | | |
| | | | Provincia De Buenos Aires | | | | | | | | | | |
| | 1,250 | | | 10.875%, 01/26/2021 n | | | | | | | | | 1,178,750 | |
| | | | | |
| | | | Provincia De Cordoba | | | | | | | | | | |
| | 2,000 | | | 12.375%, 08/17/2017 n | | | | | | | | | 2,090,000 | |
| | | | | |
| | | | XL Capital
Series E | | | | | | | | | | |
| | 2,500 | | | 6.500%, 12/29/2049 q | | | | | | | | | 2,293,750 | |
| | 13,300 | | | Total Insurance | | | | | | | | | 13,069,032 | |
| | | | Natural Gas – 1.2% | | | | | | | | | | |
| | | | | |
| | | | Holly Energy Partners | | | | | | | | | | |
| | 1,950 | | | 6.250%, 03/01/2015 | | | | | | | | | 1,950,000 | |
| | | | | |
| | | | Sabine Pass LNG | | | | | | | | | | |
| | 1,885 | | | 7.500%, 11/30/2016 | | | | | | | | | 1,932,125 | |
| | | | | |
| | | | Southern Union | | | | | | | | | | |
| | 2,100 | | | 7.200%, 11/01/2066 q D | | | | | | | | | 1,953,000 | |
| | 5,935 | | | Total Natural Gas | | | | | | | | | 5,835,125 | |
| | | | Real Estate – 2.2% | | | | | | | | | | |
| | | | | |
| | | | Central China Real Estate | | | | | | | | | | |
| | 1,375 | | | 12.250%, 10/20/2015 n q | | | | | | | | | 1,423,125 | |
| | | | | |
| | | | CNL Lifestyle Properties | | | | | | | | | | |
| | 1,500 | | | 7.250%, 04/15/2019 n | | | | | | | | | 1,357,500 | |
| | | | | |
| | | | Country Garden Holdings | | | | | | | | | | |
| | 1,750 | | | 11.125%, 02/23/2018 n q | | | | | | | | | 1,802,500 | |
| | | | | |
| | | | Fosun International | | | | | | | | | | |
| | 1,750 | | | 7.500%, 05/12/2016 n q | | | | | | | | | 1,732,500 | |
| | | | | |
| | | | Realogy | | | | | | | | | | |
| | 3,375 | | | 11.500%, 04/15/2017 | | | | | | | | | 3,425,625 | |
| | | | | |
| | | | Rouse | | | | | | | | | | |
| | 1,125 | | | 6.750%, 11/09/2015 | | | | | | | | | 1,160,156 | |
| | 10,875 | | | Total Real Estate | | | | | | | | | 10,901,406 | |
| | | | Sovereign – 0.3% | | | | | | | | | | |
| | | | | |
| | | | Republic of Argentina | | | | | | | | | | |
| | 1,250 | | | 8.750%, 06/02/2017 | | | | | | | | | 1,300,000 | |
| | | | Technology – 2.3% | | | | | | | | | | |
| | | | | |
| | | | First Data | | | | | | | | | | |
| | 2,349 | | | 12.625%, 01/15/2021 n q | | | | | | | | | 2,513,430 | |
| | 2,975 | | | 8.750%, 01/15/2022 n q | | | | | | | | | 2,908,063 | |
| | | | | |
| | | | Freescale Semiconductor | | | | | | | | | | |
| | 2,500 | | | 8.050%, 02/01/2020 n q | | | | | | | | | 2,512,500 | |
| | 22 | | | 10.750%, 08/01/2020 n | | | | | | | | | 24,860 | |
| | | | | |
| | | | Lawson Software | | | | | | | | | | |
| | 750 | | | 11.500%, 7/15/2018 n | | | | | | | | | 739,687 | |
| | | | | |
| | | | Seagate | | | | | | | | | | |
| | 2,850 | | | 6.875%, 05/01/2020 n | | | | | | | | | 2,828,625 | |
| | 11,446 | | | Total Technology | | | | | | | | | 11,527,165 | |
Portfolio of Investments
Nuveen High Income Bond Fund (continued)
June 30, 2011
| | | | | | | | | | | | | | |
Principal
Amount (000) | | | Description p | | | | | | | | Value | |
| | | | | | | | | | | | | | |
| | | | Transportation – 3.5% | | | | | | | | | | |
| | | | | |
| | | | Air Canada | | | | | | | | | | |
| $ | 2,500 | | | 12.000%, 02/01/2016 n q | | | | | | | | $ | 2,581,250 | |
| | | | | |
| | | | American Airlines Partner Trust
Series B | | | | | | | | | | |
| | 1,800 | | | 7.000%, 07/31/2019 q | | | | | | | | | 1,701,000 | |
| | | | | |
| | | | CDRT Merger Sub | | | | | | | | | | |
| | 500 | | | 8.125%, 06/01/2019 | | | | | | | | | 498,125 | |
| | | | | |
| | | | Chrysler Group | | | | | | | | | | |
| | 800 | | | 8.000%, 06/15/2019 n q | | | | | | | | | 786,000 | |
| | 2,750 | | | 8.250%, 06/15/2021 n q | | | | | | | | | 2,695,000 | |
| | | | | |
| | | | Marquette Transportation | | | | | | | | | | |
| | 1,000 | | | 10.875%, 01/15/2017 | | | | | | | | | 1,007,500 | |
| | | | | |
| | | | Martin Midstream Partners | | | | | | | | | | |
| | 2,090 | | | 8.875%, 04/01/2018 q | | | | | | | | | 2,194,500 | |
| | | | | |
| | | | Navios Maritime Acquisition | | | | | | | | | | |
| | 1,750 | | | 8.625%, 11/01/2017 q | | | | | | | | | 1,723,750 | |
| | | | | |
| | | | Sevan Marine | | | | | | | | | | |
| | 1,400 | | | 3.443%, 05/14/2013 | | | | | | | | | 1,120,000 | |
| | | | | |
| | | | United Air Lines | | | | | | | | | | |
| | 1,800 | | | 9.875%, 08/01/2013 n | | | | | | | | | 1,890,000 | |
| | | | | |
| | | | Western Express | | | | | | | | | | |
| | 1,250 | | | 12.500%, 04/15/2015 n q | | | | | | | | | 1,181,250 | |
| | 17,640 | | | Total Transportation | | | | | | | | | 17,378,375 | |
| $ | 439,146 | | | Total High Yield Corporate Bonds (cost $431,849,513) | | | | | | | | | 436,492,405 | |
| | | | | |
| Shares | | | Description p | | | | | | | | Value | |
| | | | PREFERRED STOCKS – 5.5% | | | | | | | | | | |
| | | | | |
| | | | Banking – 0.8% | | | | | | | | | | |
| | | | | |
| | | | Bank of America | | | | | | | | | | |
| | 151,000 | | | Series 5 q | | | | | | | | | 2,876,550 | |
| | 47,500 | | | Series MER | | | | | | | | | 1,251,625 | |
| | | | Total Banking | | | | | | | | | 4,128,175 | |
| | | | Consumer Cyclical – 0.1% | | | | | | | | | | |
| | | | | |
| | | | M/I Homes | | | | | | | | | | |
| | 462,500 | | | Series A — | | | | | | | | | 425,000 | |
| | | | Consumer Non Cyclical – 0.1% | | | | | | | | | | |
| | | | | |
| | | | Hersha Hospitality Trust | | | | | | | | | | |
| | 500,000 | | | Series B — | | | | | | | | | 494,200 | |
| | | | Finance – 2.6% | | | | | | | | | | |
| | | | | |
| | 2,000 | | | Ally Financial n | | | | | | | | | 1,879,625 | |
| | | | | |
| | 20,700 | | | American International Group | | | | | | | | | 518,742 | |
| | | | | |
| | 46,305 | | | Citigroup Cap IX — | | | | | | | | | 1,082,148 | |
| | | | | |
| | 44,879 | | | Citigroup Capital XI | | | | | | | | | 1,046,578 | |
| | | | | |
| | 37,100 | | | Citigroup Capital XII | | | | | | | | | 957,922 | |
| | | | | |
| | 50,000 | | | Cogdell Spencer – REIT, Series A | | | | | | | | | 1,255,000 | |
| | | | | |
| | 66,322 | | | Freddie Mac — | | | | | | | | | 152,541 | |
| | | | | |
| | | | Goldman Sachs Group | | | | | | | | | | |
| | 72,400 | | | Series A | | | | | | | | | 1,542,844 | |
| | | | | |
| | 613,799 | | | JPM Chase Capital XXVI q | | | | | | | | | 612,575 | |
| | | | | | | | | | | | | | |
| Shares | | | Description p | | | | | | | | Value | |
| | | | | | | | | | | | | | |
| | | | Finance (continued) | | | | | | | | | | |
| | | | | |
| | 101,700 | | | Morgan Stanley | | | | | | | | $ | 2,105,190 | |
| | | | | |
| | | | Royal Bank Scotland Group | | | | | | | | | | |
| | 64,000 | | | Series L | | | | | | | | | 1,169,280 | |
| | 47,060 | | | Series N — | | | | | | | | | 802,843 | |
| | | | Total Finance | | | | | | | | | 13,125,288 | |
| | | | Insurance – 0.5% | | | | | | | | | | |
| | | | | |
| | | | Aspen Insurance Holdings | | | | | | | | | | |
| | 45,000 | | | Series A | | | | | | | | | 1,123,200 | |
| | | | | |
| | | | Endurance Specialty Holding | | | | | | | | | | |
| | 40,000 | | | Series B — | | | | | | | | | 998,000 | |
| | | | | |
| | | | PartnerRe | | | | | | | | | | |
| | 21,000 | | | Series E — | | | | | | | | | 533,190 | |
| | | | Total Insurance | | | | | | | | | 2,654,390 | |
| | | | Real Estate – 0.9% | | | | | | | | | | |
| | | | | |
| | | | American Home Mortgage Investments – REIT | | | | | | | | | | |
| | 10,000 | | | Series B — [GRAPHIC]
| | | | | | | | | 1 | |
| | | | | |
| | | | Ashford Hospitality Trust – REIT | | | | | | | | | | |
| | 46,900 | | | Series D | | | | | | | | | 1,157,492 | |
| | | | | |
| | | | Commonwealth – REIT | | | | | | | | | | |
| | 30,000 | | | Series E q — | | | | | | | | | 749,700 | |
| | | | | |
| | 25,000 | | | Equity Lifestyle Properties | | | | | | | | | 633,250 | |
| | | | | |
| | | | First Potomac Realty Trust | | | | | | | | | | |
| | 20,000 | | | Series A | | | | | | | | | 506,800 | |
| | | | | |
| | | | LaSalle Hotel Properties | | | | | | | | | | |
| | 50,000 | | | Series H | | | | | | | | | 1,249,000 | |
| | | | Total Real Estate | | | | | | | | | 4,296,243 | |
| | | | Technology – 0.3% | | | | | | | | | | |
| | | | | |
| | 65,000 | | | Dupont Fabros | | | | | | | | | 1,644,500 | |
| | | | Transportation – 0.2% | | | | | | | | | | |
| | | | | |
| | 31,338 | | | Seaspan | | | | | | | | | 855,214 | |
| | | | Total Preferred Stocks (cost $26,661,366) | | | | | | | | | 27,623,010 | |
| | | | | |
| Shares | | | Description p | | | | | | | | Value | |
| | | | COMMON STOCKS – 1.5% | | | | | | | | | | |
| | | | | |
| | | | Basic Industry – 0.5% | | | | | | | | | | |
| | | | | |
| | 25,901 | | | AbitibiBowater q • | | | | | | | | $ | 525,791 | |
| | | | | |
| | 27,806 | | | Archer-Daniels-Midland | | | | | | | | | 838,351 | |
| | | | | |
| | 17,088 | | | Georgia Gulf q • | | | | | | | | | 412,504 | |
| | | | | |
| | 16,000 | | | Nortek • | | | | | | | | | 575,840 | |
| | | | Total Basic Industry | | | | | | | | | 2,352,486 | |
| | | | Communications – 0.2% | | | | | | | | | | |
| | | | | |
| | 14,007 | | | FairPoint Communications q • | | | | | | | | | 129,002 | |
| | | | | |
| | 8,300 | | | Nippon Telegraph & Telephone q | | | | | | | | | 200,694 | |
| | | | | |
| | 3,000 | | | Telefonica q | | | | | | | | | 73,470 | |
| | | | | |
| | 17,000 | | | Vodafone Group | | | | | | | | | 454,240 | |
| | | | Total Communications | | | | | | | | | 857,406 | |
Portfolio of Investments
Nuveen High Income Bond Fund (continued)
June 30, 2011
| | | | | | | | | | | | | | |
| Shares | | | Description p | | | | | | | | Value | |
| | | | | | | | | | | | | | |
| | | | Consumer Cyclical – 0.0% | | | | | | | | | | |
| | | | | |
| | 30,000 | | | Greektown • | | | | | | | | $ | — | |
| | | | Consumer Discretionary – 0.2% | | | | | | | | | | |
| | | | | |
| | 7,000 | | | Lear | | | | | | | | | 374,360 | |
| | | | | |
| | 17,800 | | | Target | | | | | | | | | 834,998 | |
| | | | Total Consumer Discretionary | | | | | | | | | 1,209,358 | |
| | | | Energy – 0.3% | | | | | | | | | | |
| | | | | |
| | 3,500 | | | ConocoPhillips | | | | | | | | | 263,165 | |
| | | | | |
| | 2,860 | | | Magnachip Semiconductor • | | | | | | | | | 32,947 | |
| | | | | |
| | 4,278 | | | Pace Oil and Gas q • | | | | | | | | | 32,684 | |
| | | | | |
| | 44,000 | | | Pengrowth Energy | | | | | | | | | 553,520 | |
| | | | | |
| | 38,000 | | | Provident Energy | | | | | | | | | 339,340 | |
| | | | Total Energy | | | | | | | | | 1,221,656 | |
| | | | Finance – 0.1% | | | | | | | | | | |
| | | | | |
| | 16,200 | | | Lincoln National | | | | | | | | | 461,538 | |
| | | | Real Estate – 0.2% | | | | | | | | | | |
| | | | | |
| | 7,700 | | | Macerich – REIT q | | | | | | | | | 411,950 | |
| | | | | |
| | 10,200 | | | Mid-America Apartment Communities – REIT q | | | | | | | | | 688,194 | |
| | | | Total Real Estate | | | | | | | | | 1,100,144 | |
| | | | Transportation – 0.0% | | | | | | | | | | |
| | | | | |
| | 19,158 | | | Delta Air Lines — | | | | | | | | | 175,679 | |
| | | | Total Common Stocks (cost $8,004,229) | | | | | | | | | 7,378,267 | |
| | | | | |
Principal
Amount (000) | | | Description p | | | | | | | | Value | |
| | | | INVESTMENT GRADE CORPORATE BONDS – 1.2% | | | | | | | | | | |
| | | | | |
| | | | Basic Industry – 0.6% | | | | | | | | | | |
| | | | | |
| | | | Vale Overseas Limited | | | | | | | | | | |
| $ | 1,100 | | | 6.551%, 10/13/2020 n | | | | | | | | $ | 1,345,720 | |
| | | | | |
| | | | VTB Capital | | | | | | | | | | |
| | | | | |
| | 1,500 | | | 8.250%, 01/17/2034 | | | | | | | | | 1,522,500 | |
| | 2,600 | | | Total Basic Industry | | | | | | | | | 2,868,220 | |
| | | | Energy – 0.2% | | | | | | | | | | |
| | | | | |
| | | | Valero Energy | | | | | | | | | | |
| | | | | |
| | 1,000 | | | 6.625%, 06/15/2037 q | | | | | | | | | 1,042,656 | |
| | | | Sovereigns – 0.4% | | | | | | | | | | |
| | | | | |
| | | | Republic of Poland | | | | | | | | | | |
| | | | | |
| | 1,950 | | | 6.375%, 07/15/2019 | | | | | | | | | 2,227,875 | |
| $ | 5,550 | | | Total Investment Grade Corporate Bonds (cost $6,007,700) | | | | | | | | | 6,138,751 | |
| | | | | |
Shares/
Principal
Amount (000) | | | Description p | | | | | | | | Value | |
| | | | CONVERTIBLE SECURITIES – 1.2% | | | | | | | | | | |
| | | | | |
| | | | Energy – 0.6% | | | | | | | | | | |
| | | | | |
| | 19,975 | | | Chesapeake Energy
Series 2005B | | | | | | | | | 1,972,531 | |
| | | | | | | | | | | | | | |
Shares/
Principal
Amount (000) | | | Description p | | | | | | | | Value | |
| | | | | | | | | | | | | | |
| | | | Energy (continued) | | | | | | | | | | |
| | | | | |
| | | | Evergreen Solar | | | | | | | | | | |
| | | | | |
| $ | 2,500 | | | 13.000%, 04/15/2015 | | | | | | | | $ | 943,750 | |
| | | | Total Energy | | | | | | | | | 2,916,281 | |
| | | | Real Estate – 0.2% | | | | | | | | | | |
| | | | | |
| | 35,000 | | | Pebblebrook Hotel Trust | | | | | | | | | 879,900 | |
| | | | Technology – 0.4% | | | | | | | | | | |
| | | | | |
| | | | Hutchinson Technology | | | | | | | | | | |
| | 1,164 | | | 3.250%, 01/15/2026 | | | | | | | | | 942,840 | |
| | 1,417 | | | 8.500%, 01/15/2026 q | | | | | | | | | 1,197,365 | |
| | | | Total Technology | | | | | | | | | 2,140,205 | |
| | | | Total Convertible Securities (cost $6,761,942) | | | | | | | | | 5,936,386 | |
| | | | | |
| Shares | | | Description p | | | | | | | | Value | |
| | | | CLOSED-END FUNDS – 0.9% | | | | | | | | | | |
| | | | | |
| | 32,000 | | | Alliance National Municipal Income Fund | | | | | | | | | 428,800 | |
| | | | | |
| | 114,000 | | | Blackrock Credit Allocation Income Trust | | | | | | | | | 1,426,140 | |
| | | | | |
| | 49,000 | | | Blackrock Global Opportunities Equity Trust q | | | | | | | | | 885,430 | |
| | | | | |
| | 5,000 | | | First Trust/Aberdeen Global Opportunities Income Fund | | | | | | | | | 87,150 | |
| | | | | |
| | 37,500 | | | Gabelli Global Gold Natural Resources & Income Trust | | | | | | | | | 666,375 | |
| | | | | |
| | 27,600 | | | ING Clarion Global Real Estate Income Fund | | | | | | | | | 231,012 | |
| | | | | |
| | 39,000 | | | Invesco Municipal Income Opportunities Trust | | | | | | | | | 246,090 | |
| | | | | |
| | 45,000 | | | Pimco Income Strategy Fund q | | | | | | | | | 582,300 | |
| | | | Total Closed-End Funds (cost $4,322,491) | | | | | | | | | 4,553,297 | |
| | | | | |
| Shares | | | Description p | | | | | | | | Value | |
| | | | EXCHANGE-TRADED FUNDS – 0.6% | | | | | | | | | | |
| | | | | |
| | 27,600 | | | SPDR DB International Government Inflation-Protected Bond Fund | | | | | | | | | 1,708,993 | |
| | | | | |
| | 27,100 | | | SPDR S&P Dividend | | | | | | | | | 1,465,027 | |
| | | | Total Exchange-Traded Funds (cost $2,820,555) | | | | | | | | | 3,174,020 | |
| | | | | |
Principal
Amount (000) | | | Description p | | | | | | | | Value | |
| | | | ASSET-BACKED SECURITIES – 0.4% | | | | | | | | | | |
| | | | | |
| | | | Manufactured Housing – 0.0% | | | | | | | | | | |
| | | | | |
| | | | Green Tree Financial
Series 1998-1, Class A4 | | | | | | | | | | |
| $ | 4 | | | 6.040%, 11/01/2029 | | | | | | | | | 4,325 | |
| | | | Transportation – 0.4% | | | | | | | | | | |
| | | | | |
| | | | Continental Airlines
Series Series RJ03 | | | | | | | | | | |
| | 2,295 | | | 7.875%, 01/02/2020 | | | | | | | | | 2,289,741 | |
| $ | 2,299 | | | Total Asset-Backed Securities (cost $2,294,651) | | | | | | | | | 2,294,066 | |
Portfolio of Investments
Nuveen High Income Bond Fund (continued)
June 30, 2011
| | | | | | | | | | | | | | |
| Shares | | | Description p | | | | | | | | Value | |
| | | | | | | | | | | | | | |
| | | | Warrants – 0.0% | | | | | | | | | | |
| | | | | |
| | | | FairPoint Communications | | | | | | | | | | |
| | 6,489 | | | 0.000%, 01/24/2018 — | | | | | | | | $ | 1,622 | |
| | | | Total Warrants (cost $0) | | | | | | | | | 1,622 | |
| | | | | |
| Shares | | | Description p | | | | | | | | Value | |
| | | | INVESTMENTS PURCHASED WITH PROCEEDS FROM SECURITIES LENDING | | | | | | | | | | |
| | | | | |
| | | | Money Market Funds – 28.9% | | | | | | | | | | |
| | | | | |
| | | | Mount Vernon Securities Lending Prime Portfolio | | | | | | | | | | |
| | 145,527,120 | | | 0.197% W † | | | | | | | | $ | 145,527,120 | |
| | | | Total Investments Purchased With Proceeds From Securities Lending (cost $145,527,120) | | | | | | | | | 145,527,120 | |
| | | | | |
Shares/
Principal
Amount (000) | | | Description p | | | | | | | | Value | |
| | | | SHORT-TERM INVESTMENTS – 1.5% | | | | | | | | | | |
| | | | | |
| | | | Money Market Funds – 1.5% | | | | | | | | | | |
| | | | | |
| | | | First American Prime Obligations Fund, Class Z | | | | | | | | | | |
| | 7,484,469 | | | 0.042% W | | | | | | | | $ | 7,484,469 | |
| | | | U.S. Treasury Obligations – 0.0% | | | | | | | | | | |
| | | | | |
| | | | U.S. Treasury Bills | | | | | | | | | | |
| $ | 5,000 | | | 0.094%, 07/21/2011 | | | | | | | | | 5,000 | |
| | | | Total Short-Term Investments (cost $7,489,469) | | | | | | | | | 7,489,469 | |
| | | | Total Investments (cost $641,739,036) – 128.5% | | | | | | | | | 646,608,413 | |
| | | | Other Assets Less Liabilities – (28.5)% | | | | | | | | | (143,452,977) | |
| | | | Net Assets – 100.0% | | | | | | | | $ | 503,155,436 | |
| | | | For Fund portfolio compliance purposes, the Fund’s industry classifications refer to any one or more of the industry sub-classifications used by one or more widely recognized market indexes or ratings group indexes, and/or as defined by Fund management. This definition may not apply for purposes of this report which may combine industry sub-classifications into sectors for reporting ease. |
| | p | | All Percentages shown in the Portfolio of Investments are based on net assets. |
| | n | | Investment is exempt from registration under Rule 144A of the Securities Act of 1933, as amended. These investments may only be resold in transactions exempt from registration, which are normally those transactions with qualified institutional buyers. |
| | q | | Investment, or a portion of investment, is out on loan for securities lending. |
| | D | | Variable Rate Security – The rate shown is the rate in effect as of June 30, 2011. |
| | | | For fair value measurement disclosure purposes, investment categorized as Level 3. See Notes to Financial Statements, Footnote 1 – General Information and Significant Accounting Policies, Investment Valuation for more information. |
| | — | | Non-income producing; issuer has not declared a dividend within the past twelve months. |
| | * | | The Fund’s Adviser has concluded this issue is not likely to meet its future interest payment obligations and has directed the Fund’s custodian to “write-off” any remaining accrued recorded balances on the Fund’s records. Subsequently, the Fund sold this security on July 14, 2011. |
| | ¥ | | Principal Amount (000) rounds to less than $1,000. |
| | W | | The rate shown is the annualized seven-day effective yield as of June 30, 2011. |
| | † | | The Fund may loan securities representing up to one third of the value of its total assets (which includes collateral for securities on loan) to broker-dealers, banks, or other institutional borrowers of securities. The Fund maintains collateral equal to at least 102% of the value of the securities loaned. The adequacy of the collateral is monitored on a daily basis. The cash collateral received by the Fund is invested in this money market fund. |
| | REIT | | Real Estate Investment Trust |
See accompanying notes to financial statements.
Portfolio of Investments
Nuveen Inflation Protected Securities Fund
(formerly known as First American Inflation Protected Securities Fund)
June 30, 2011
| | | | | | | | | | | | | | |
Principal
Amount (000) | | | Description p | | | | | | | | Value | |
| | | | | | | | | | | | | | |
| | | | U.S. GOVERNMENT & AGENCY SECURITIES – 86.5% | | | | | | | | | | |
| | | | | |
| | | | U.S. Treasuries – 85.6% | | | | | | | | | | |
| | | | | |
| | | | U.S. Treasury Bonds | | | | | | | | | | |
| $ | 1,225 | | | 8.750%, 08/15/2020 | | | | | | | | $ | 1,795,391 | |
| | 1,730 | | | 8.000%, 11/15/2021 q | | | | | | | | | 2,463,357 | |
| | 11,514 | | | 2.375%, 01/15/2025 q t | | | | | | | | | 13,233,897 | |
| | 6,601 | | | 2.000%, 01/15/2026 t | | | | | | | | | 7,212,247 | |
| | 6,078 | | | 2.375%, 01/15/2027 q t | | | | | | | | | 6,930,945 | |
| | 6,253 | | | 1.750%, 01/15/2028 t | | | | | | | | | 6,543,686 | |
| | 7,474 | | | 3.625%, 04/15/2028 t | | | | | | | | | 9,841,942 | |
| | 2,881 | | | 2.500%, 01/15/2029 q t | | | | | | | | | 3,345,703 | |
| | 8,174 | | | 3.875%, 04/15/2029 t | | | | | | | | | 11,200,837 | |
| | 8,923 | | | 2.125%, 02/15/2040 t | | | | | | | | | 9,709,820 | |
| | 9,808 | | | 2.125%, 02/15/2041 q t | | | | | | | | | 10,656,176 | |
| | | | | |
| | | | U.S. Treasury Notes | | | | | | | | | | |
| | 1,108 | | | 2.000%, 04/15/2012 t | | | | | | | | | 1,132,498 | |
| | 10,641 | | | 0.625%, 04/15/2013 q t | | | | | | | | | 10,953,998 | |
| | 4,837 | | | 1.875%, 07/15/2013 q t | | | | | | | | | 5,139,283 | |
| | 4,637 | | | 2.000%, 01/15/2014 q t | | | | | | | | | 4,996,176 | |
| | 10,590 | | | 1.250%, 04/15/2014 q t | | | | | | | | | 11,234,502 | |
| | 4,653 | | | 2.000%, 07/15/2014 q t | | | | | | | | | 5,074,668 | |
| | 5,477 | | | 1.625%, 01/15/2015 q t | | | | | | | | | 5,940,889 | |
| | 14,638 | | | 0.500%, 04/15/2015 q t | | | | | | | | | 15,267,304 | |
| | 2,070 | | | 1.875%, 07/15/2015 q t | | | | | | | | | 2,282,193 | |
| | 4,731 | | | 2.000%, 01/15/2016 q t | | | | | | | | | 5,257,998 | |
| | 11,402 | | | 0.125%, 04/15/2016 q t | | | | | | | | | 11,659,143 | |
| | 5,346 | | | 2.500%, 07/15/2016 q t | | | | | | | | | 6,117,334 | |
| | 5,387 | | | 2.375%, 01/15/2017 q t | | | | | | | | | 6,144,997 | |
| | 3,527 | | | 2.625%, 07/15/2017 q t | | | | | | | | | 4,102,625 | |
| | 4,885 | | | 1.625%, 01/15/2018 q t | | | | | | | | | 5,371,644 | |
| | 3,781 | | | 1.375%, 07/15/2018 q t | | | | | | | | | 4,105,084 | |
| | 4,106 | | | 2.125%, 01/15/2019 q t | | | | | | | | | 4,665,848 | |
| | 4,503 | | | 1.875%, 07/15/2019 q t | | | | | | | | | 5,035,955 | |
| | 6,927 | | | 1.375%, 01/15/2020 q t | | | | | | | | | 7,427,841 | |
| | 10,014 | | | 1.250%, 07/15/2020 q t | | | | | | | | | 10,592,642 | |
| | 19,668 | | | 1.125%, 01/15/2021 q t | | | | | | | | | 20,424,130 | |
| | | | | |
| | 213,589 | | | Total U.S. Treasuries | | | | | | | | | 235,860,753 | |
| | | | U.S. Agency Debentures – 0.9% | | | | | | | | | | |
| | | | | |
| | | | Federal National Mortgage Association | | | | | | | | | | |
| | 1,245 | | | 4.625%, 05/01/2013 | | | | | | | | | 1,329,005 | |
| | | | | |
| | | | Tennessee Valley Authority | | | | | | | | | | |
| | 1,055 | | | 3.875%, 02/15/2021 | | | | | | | | | 1,083,714 | |
| | | | | |
| | 2,300 | | | Total U.S. Agency Debentures | | | | | | | | | 2,412,719 | |
| $ | 215,889 | | | Total U.S. Government & Agency Securities (cost $229,194,956) | | | | | | | | | 238,273,472 | |
| | | | | |
Principal
Amount (000) | | | Description p | | | | | | | | Value | |
| | | | COMMERCIAL MORTGAGE-BACKED SECURITIES – 7.2% | | | | | | | | | | |
| | | | | |
| | | | Citigroup/Deutsche Bank Commercial Mortgage Trust | | | | | | | | | | |
| | | | Series 2005-CD1, Class A4 | | | | | | | | | | |
| $ | 1,255 | | | 5.220%, 07/15/2044 D | | | | | | | | $ | 1,364,652 | |
| | | | | |
| | | | Extended Stay America Trust | | | | | | | | | | |
| | | | Series 2010-ESHA, Class C | | | | | | | | | | |
| | 1,040 | | | 4.860%, 11/05/2027 n | | | | | | | | | 1,038,234 | |
Portfolio of Investments
Nuveen Inflation Protected Securities Fund (continued)
June 30, 2011
| | | | | | | | | | | | | | |
Principal
Amount (000) | | | Description p | | | | | | | | Value | |
| | | | | | | | | | | | | | |
| | | | COMMERCIAL MORTGAGE-BACKED SECURITIES (continued) | | | | | | | | | | |
| | | | | |
| | | | Greenwich Capital Commercial Funding | | | | | | | | | | |
| | | | Series 2007-GG11, Class A4 | | | | | | | | | | |
| $ | 2,300 | | | 5.736%, 12/10/2049 q | | | | | | | | $ | 2,468,015 | |
| | | | | |
| | | | GS Mortgage Securities Trust | | | | | | | | | | |
| | | | Series 2007-GG10, Class A4 | | | | | | | | | | |
| | 2,480 | | | 5.992%, 08/10/2045 q D | | | | | | | | | 2,662,529 | |
| | | | | |
| | | | JPMorgan Chase Commercial Mortgage Securities | | | | | | | | | | |
| | | | Series 2007-CB18, Class A4 | | | | | | | | | | |
| | 1,400 | | | 5.440%, 06/12/2047 | | | | | | | | | 1,496,263 | |
| | | | Series 2007-CBC20, Class A4 | | | | | | | | | | |
| | 2,000 | | | 5.794%, 02/12/2051 | | | | | | | | | 2,171,061 | |
| | | | Series 2010-C1, Class A1 | | | | | | | | | | |
| | 999 | | | 3.853%, 06/15/2043 n | | | | | | | | | 1,033,000 | |
| | | | Series 2011-C4, Class A3 | | | | | | | | | | |
| | 1,470 | | | 4.106%, 07/15/2046 D n | | | | | | | | | 1,466,829 | |
| | | | | |
| | | | LB-UBS Commerical Mortgage Trust | | | | | | | | | | |
| | | | Series 2008-C1, Class A2 | | | | | | | | | | |
| | 2,000 | | | 6.145%, 04/15/2041 D | | | | | | | | | 2,227,270 | |
| | | | | |
| | | | Merrill Lynch Mortgage Trust | | | | | | | | | | |
| | | | Series 2008-C1, Class A4 | | | | | | | | | | |
| | 380 | | | 5.690%, 02/12/2051 | | | | | | | | | 410,647 | |
| | | | | |
| | | | Morgan Stanley Capital I | | | | | | | | | | |
| | | | Series 2006-IQ12, Class A4 | | | | | | | | | | |
| | 500 | | | 5.332%, 12/15/2043 | | | | | | | | | 540,187 | |
| | | | Series 2011-C1, Class C | | | | | | | | | | |
| | 425 | | | 5.256%, 09/15/2047 D n | | | | | | | | | 404,081 | |
| | | | | |
| | | | OBP Depositor Trust | | | | | | | | | | |
| | | | Series 2010-OBP, Class A | | | | | | | | | | |
| | 700 | | | 4.646%, 07/15/2045 n | | | | | | | | | 726,503 | |
| | | | | |
| | | | WF-RBS Commercial Mortgage Trust | | | | | | | | | | |
| | | | | |
| | | | Series 2011-C2, Class C | | | | | | | | | | |
| | 450 | | | 5.392%, 02/15/2044 D n | | | | | | | | | 422,663 | |
| | | | Series 2011-C3, Class A4 | | | | | | | | | | |
| | 1,260 | | | 4.375%, 03/15/2044 D n | | | | | | | | | 1,239,419 | |
| | 18,659 | | | Total Commercial Mortgage-Backed Securities (cost $19,440,415) | | | | | | | | | 19,671,353 | |
| | | | | |
Principal
Amount (000) — | | | Description p | | | | | | | | Value | |
| | | | CORPORATE BONDS – 3.9% | | | | | | | | | | |
| | | | | |
| | | | Banking – 0.1% | | | | | | | | | | |
| | | | | |
| | | | Banco Do Nordeste Brasil | | | | | | | | | | |
| | 200 | | | 3.625%, 11/09/2015 n | | | | | | | | | 196,500 | |
| | | | Basic Industry – 0.7% | | | | | | | | | | |
| | | | | |
| | | | Alrosa Finance | | | | | | | | | | |
| | 150 | | | 7.750%, 11/03/2020 q n | | | | | | | | | 163,125 | |
| | | | | |
| | | | Georgia-Pacific | | | | | | | | | | |
| | 150 | | | 7.125%, 01/15/2017 n | | | | | | | | | 158,138 | |
| | | | | |
| | | | Reynolds Group | | | | | | | | | | |
| | 175 | | | 7.125%, 04/15/2019 n | | | | | | | | | 173,688 | |
| | | | | |
| | | | Sinochem Overseas Capital | | | | | | | | | | |
| | 150 | | | 4.500%, 11/12/2020 q n | | | | | | | | | 143,816 | |
| | | | | |
| | | | Southern Copper | | | | | | | | | | |
| | 1,000 | | | 7.500%, 07/27/2035 | | | | | | | | | 1,047,060 | |
| | | | | | | | | | | | | | |
Principal
Amount (000) — | | | Descriptionp | | | | | | | | Value | |
| | | | | | | | | | | | | | |
| | | | Basic Industry (continued) | | | | | | | | | | |
| | | | | |
| | | | Vedanta Resources | | | | | | | | | | |
| $ | 250 | | | 9.500%, 07/18/2018 q n | | | | | | | | $ | 272,500 | |
| | 1,875 | | | Total Basic Industry | | | | | | | | | 1,958,327 | |
| | | | Consumer Non Cyclical – 0.2% | | | | | | | | | | |
| | | | | |
| | | | HCA | | | | | | | | | | |
| | 360 | | | 7.250%, 09/15/2020 | | | | | | | | | 386,550 | |
| | | | Electric – 0.4% | | | | | | | | | | |
| | | | | |
| | | | AES | | | | | | | | | | |
| | 150 | | | 8.000%, 10/15/2017 q | | | | | | | | | 159,000 | |
| | | | | |
| | | | Calpine | | | | | | | | | | |
| | 250 | | | 7.875%, 07/31/2020 q n | | | | | | | | | 261,250 | |
| | | | | |
| | | | Comision Federal De Electric | | | | | | | | | | |
| | 570 | | | 4.875%, 05/26/2021 n | | | | | | | | | 569,202 | |
| | 970 | | | Total Electric | | | | | | | | | 989,452 | |
| | | | Energy – 0.5% | | | | | | | | | | |
| | | | | |
| | | | Carrizo Oil & Gas | | | | | | | | | | |
| | 130 | | | 8.625%, 10/15/2018 | | | | | | | | | 133,900 | |
| | | | | |
| | | | Concho Resources | | | | | | | | | | |
| | 200 | | | 8.625%, 10/01/2017 q | | | | | | | | | 218,000 | |
| | | | | |
| | | | Holly Energy Partners | | | | | | | | | | |
| | 200 | | | 6.250%, 03/01/2015 | | | | | | | | | 200,000 | |
| | | | | |
| | | | Linn Energy | | | | | | | | | | |
| | 175 | | | 8.625%, 04/15/2020 | | | | | | | | | 189,875 | |
| | | | | |
| | | | Range Resources | | | | | | | | | | |
| | 250 | | | 8.000%, 05/15/2019 | | | | | | | | | 271,250 | |
| | | | | |
| | | | Seadrill | | | | | | | | | | |
| | 200 | | | 6.500%, 10/05/2015 | | | | | | | | | 194,000 | |
| | | | | |
| | | | SM Energy | | | | | | | | | | |
| | 175 | | | 6.625%, 02/15/2019 n | | | | | | | | | 175,438 | |
| | 1,330 | | | Total Energy | | | | | | | | | 1,382,463 | |
| | | | Insurance – 0.4% | | | | | | | | | | |
| | | | | |
| | | | Pacific Life Global Funding | | | | | | | | | | |
| | 1,000 | | | 4.860%, 02/06/2016 D n | | | | | | | | | 1,009,900 | |
| | | | Materials – 0.1% | | | | | | | | | | |
| | | | | |
| | | | QuadraFNX Mining | | | | | | | | | | |
| | 200 | | | 7.750%, 06/15/2019 n | | | | | | | | | 202,000 | |
| | | | | |
| | | | Taseko Mines | | | | | | | �� | | | |
| | 150 | | | 7.750%, 04/15/2019 | | | | | | | | | 151,125 | |
| | 350 | | | Total Materials | | | | | | | | | 353,125 | |
| | | | Natural Gas – 0.1% | | | | | | | | | | |
| | | | | |
| | | | Energy Transfer Equity | | | | | | | | | | |
| | 350 | | | 7.500%, 10/15/2020 q | | | | | | | | | 371,000 | |
| | | | Real Estate – 0.1% | | | | | | | | | | |
| | | | | |
| | | | Country Garden Holdings | | | | | | | | | | |
| | 200 | | | 11.125%, 02/23/2018 q n | | | | | | | | | 206,000 | |
| | | | Sovereigns – 1.0% | | | | | | | | | | |
| | | | | |
| | | | Australian Government | | | | | | | | | | |
| | AUD 800,000 | | | 5.750%, 04/15/2012 | | | | | | | | | 864,833 | |
| | | | | |
| | | | Canadian Government | | | | | | | | | | |
| | CAD 800,000 | | | 1.500%, 03/01/2012 | | | | | | | | | 831,313 | |
| | CAD 750,000 | | | 3.500%, 06/01/2020 | | | | | | | | | 806,745 | |
Portfolio of Investments
Nuveen Inflation Protected Securities Fund (continued)
June 30, 2011
| | | | | | | | | | | | | | |
Principal
Amount (000) | | | Descriptionp | | | | | | | | Value | |
| | | | | | | | | | | | | | |
| | | | | |
| | | | Republic of Poland | | | | | | | | | | |
| $ | 300 | | | 6.375%, 07/15/2019 | | | | | | | | $ | 342,750 | |
| | | | Total Sovereigns | | | | | | | | | 2,845,641 | |
| | | | Transportation – 0.3% | | | | | | | | | | |
| | | | | |
| | | | Avis Budget Car Rental | | | | | | | | | | |
| | 150 | | | 7.750%, 05/15/2016 | | | | | | | | | 152,625 | |
| | | | | |
| | | | Chrysler Group | | | | | | | | | | |
| | 100 | | | 8.000%, 06/15/2019 | | | | | | | | | 98,119 | |
| | | | | |
| | | | Dana Holding | | | | | | | | | | |
| | 175 | | | 6.500%, 02/15/2019 q | | | | | | | | | 173,250 | |
| | | | | |
| | | | Hertz | | | | | | | | | | |
| | 175 | | | 7.375%, 01/15/2021 q n | | | | | | | | | 178,063 | |
| | | | | |
| | | | Navios Maritime Acquisition | | | | | | | | | | |
| | 150 | | | 8.625%, 11/01/2017 | | | | | | | | | 147,750 | |
| | | | | |
| | | | Viterra | | | | | | | | | | |
| | 175 | | | 5.950%, 08/01/2020 n | | | | | | | | | 177,957 | |
| | 925 | | | Total Transportation | | | | | | | | | 927,764 | |
| | 7,560 | | | Total Corporate Bonds (cost $10,149,897) | | | | | | | | | 10,626,722 | |
| | | | | |
Principal
Amount (000) | | | Descriptionp | | | | | | | | Value | |
| | | | Municipal Bonds – 0.4% | | | | | | | | | | |
| | | | | |
| | | | Illinois | | | | | | | | | | |
| | 1,130 | | | 5.877%, 03/01/2019 | | | | | | | | $ | 1,166,103 | |
| | | | Total Municipal Bonds (cost $1,130,000) | | | | | | | | | 1,166,103 | |
| | | | | |
| Shares | | | Description p | | | | | | | | Value | |
| | | | PREFERRED STOCKS – 0.4% | | | | | | | | | | |
| | | | | |
| | | | Banking – 0.1% | | | | | | | | | | |
| | | | | |
| | | | Goldman Sachs Group | | | | | | | | | | |
| | 13,000 | | | Series A q | | | | | | | | $ | 277,030 | |
| | | | Finance – 0.3% | | | | | | | | | | |
| | | | | |
| | | | Bank of America | | | | | | | | | | |
| | 15,000 | | | Series 5 q | | | | | | | | | 285,750 | |
| | | | | |
| | 5,000 | | | Citigroup Capital XI | | | | | | | | | 116,600 | |
| | | | | |
| | 2,000 | | | JPMorgan Chase Capital XXVI q | | | | | | | | | 52,920 | |
| | | | | |
| | 12,000 | | | Morgan Stanley | | | | | | | | | 248,400 | |
| | | | Total Finance | | | | | | | | | 703,670 | |
| | | | Sovereign – 0.0% | | | | | | | | | | |
| | | | | |
| | | | Fannie Mae | | | | | | | | | | |
| | 16,000 | | | Series S | | | | | | | | | 34,400 | |
| | | | Total Preferred Stocks (cost $1,325,120) | | | | | | | | | 1,015,100 | |
Principal
Amount (000) | | | Description p | | | | | | | | Value | |
| | | | COLLATERALIZED MORTGAGE OBLIGATION – PRIVATE MORTGAGE-BACKED SECURITIES – 0.3% | | | | | | | | | | |
| | | | | |
| | | | Fixed Rate – 0.3% | | | | | | | | | | |
| | | | | |
| | | | Sequoia Mortgage Trust | | | | | | | | | | |
| | | | Series 2011-1, Class A1 | | | | | | | | | | |
| $ | 836,695 | | | 4.125%, 02/25/2041 | | | | | | | | $ | 838,419 | |
| | | | Total Collateralized Mortgage Obligation – Private Mortgage-Banked Securities (cost $836,695) | | | | | | | | | 838,419 | |
| | | | | | | | | | | | | | |
| Shares | | | Description p | | | | | | | | Value | |
| | | | | | | | | | | | | | |
| | | | CONVERTIBLE SECURITIES – 0.1% | | | | | | | | | | |
| | | | | |
| | | | Energy – 0.1% | | | | | | | | | | |
| | | | | |
| | | | Chesapeake Energy | | | | | | | | | | |
| | 2,000 | | | Series 2005B | | | | | | | | $ | 197,500 | |
| | | | Total Convertible Securities (cost $170,000) | | | | | | | | | 197,500 | |
| | | | | |
| Shares | | | Description p | | | | | | | | Value | |
| | | | Closed-End Funds – 0.0% | | | | | | | | | | |
| | | | | |
| | 10,500 | | | Blackrock Credit Allocation Income Trust | | | | | | | | | 131,355 | |
| | | | Total Closed End Funds (cost $124,553) | | | | | | | | | 131,355 | |
| | | | | |
| Shares | | | Descriptionp | | | | | | | | Value | |
| | | | INVESTMENTS PURCHASED WITH PROCEEDS FROM SECURITIES LENDING | | | | | | | | | | |
| | | | | |
| | | | Money Market Funds – 46.5% | | | | | | | | | | |
| | | | | |
| | | | Mount Vernon Securities Lending Prime Portfolio | | | | | | | | | | |
| | 128,122,856 | | | 0.197% W † | | | | | | | | $ | 128,122,856 | |
| | | | Total Investments Purchased With Proceeds From Securities Lending (cost $128,122,856) | | | | | | | | | 128,122,856 | |
| | | | | |
Shares/
Principal
Amount (000) | | | Description p | | | | | | | | Value | |
| | | | SHORT-TERM INVESTMENTS – 1.4% | | | | | | | | | | |
| | | | | |
| | | | Money Market Funds – 1.2% | | | | | | | | | | |
| | | | | |
| | | | First American Prime Obligations Fund, Class Z | | | | | | | | | | |
| | 3,338,243 | | | 0.042% W | | | | | | | | | 3,338,243 | |
| | | | U.S. Treasury Obligations – 0.2% | | | | | | | | | | |
| | | | | |
| | | | U.S. Treasury Bills ¨ | | | | | | | | | | |
| $ | 70 | | | 0.035%, 10/20/2011 | | | | | | | | | 69,992 | |
| | 380 | | | 0.020%, 07/21/2011 | | | | | | | | | 379,996 | |
| $ | 450 | | | Total U.S. Treasury Obligations | | | | | | | | | 449,988 | |
| | | | Total Short-Term Investments (cost $3,788,203) | | | | | | | | | 3,788,231 | |
| | | | Total Investments (cost $394,282,695) – 146.7% | | | | | | | | | 403,831,111 | |
| | | | Other Assets Less Liabilities – (46.7)% ¯ | | | | | | | | | (128,492,050) | |
| | | | Net Assets – 100.0% | | | | | | | | $ | 275,339,061 | |
Investments in Derivatives
Futures Contracts outstanding at June 30, 2011:
| | | | | | | | | | | | | | | | | | | | |
| Type | | Contract
Position | | | Number of
Contracts | | | Contract
Expiration | | | Value | | | Unrealized
Appreciation
(Depreciation) | |
Canadian Dollar | | | Long | | | | 5 | | | | 9/11 | | | $ | 517,900 | | | $ | 6,483 | |
U.S. Treasury 2-Year Note | | | Short | | | | (58 | ) | | | 9/11 | | | | (12,721,938 | ) | | | (27,510 | ) |
U.S. Treasury 5-Year Note | | | Short | | | | (132 | ) | | | 9/11 | | | | (15,733,781 | ) | | | 65,453 | |
U.S. Treasury Ultra Bond | | | Short | | | | (8 | ) | | | 9/11 | | | | (1,010,000 | ) | | | 31,940 | |
| | | | | | | | | | | | | | | | | | | $ | 76,366 | |
Portfolio of Investments
Nuveen Inflation Protected Securities Fund (continued)
June 30, 2011
Interest Rate Swaps outstanding at June 30, 2011:
| | | | | | | | | | | | | | | | | | | | | | | | | | | | |
| Counterparty | | Notional
Amount | | | Fund
Pay/Receive
Floating Rate | | | Floating Rate
Index | | | Fixed Rate* | | | Fixed Rate
Payment
Frequency | | | Termination
Date | | | Unrealized
Appreciation
(Depreciation) | |
JPMorgan Chase | | $ | 4,000,000 | | | | Receive | | | | 3-Month LIBOR | | | | 1.255 | % | | | Semi-Annually | | | | 11/03/11 | | | $ | (19,137 | ) |
JPMorgan Chase | | | 1,000,000 | | | | Receive | | | | 3-Month LIBOR | | | | 3.858 | | | | Semi-Annually | | | | 1/19/20 | | | | (81,387 | ) |
UBS | | | 4,000,000 | | | | Receive | | | | 3-Month LIBOR | | | | 1.358 | | | | Semi-Annually | | | | 9/25/11 | | | | (24,871 | ) |
UBS | | | 2,000,000 | | | | Receive | | | | 3-Month LIBOR | | | | 1.133 | | | | Semi-Annually | | | | 3/25/12 | | | | (17,562 | ) |
UBS | | | 4,000,000 | | | | Receive | | | | 3-Month LIBOR | | | | 1.048 | | | | Semi-Annually | | | | 6/25/12 | | | | (26,395 | ) |
UBS | | | 2,000,000 | | | | Receive | | | | 3-Month LIBOR | | | | 3.001 | | | | Semi-Annually | | | | 8/03/14 | | | | (134,789 | ) |
| | | | | | | | | | | | | | | | | | | | | | | | | | | $ | (304,141 | ) |
| | | | For Fund portfolio compliance purposes, the Fund’s industry classifications refer to any one or more of the industry sub-classifications used by one or more widely recognized market indexes or ratings group indexes, and/or as defined by Fund management. This definition may not apply for purposes of this report which may combine industry sub-classifications into sectors for reporting ease. |
| | p | | All Percentages shown in the Portfolio of Investments are based on net assets. |
| | q | | Investment, or a portion of investment, is out on loan for securities lending. |
| | — | | Principal Amount (000) denominated in U.S. Dollars, unless otherwise noted. |
| | t | | U.S. Treasury inflation-protection securities (TIPS) are securities in which the principal amount is adjusted for inflation and the semiannual interest payments equal a fixed percentage of the inflation-adjusted principal amount. |
| | D | | Variable Rate Security – The rate shown is the rate in effect as of June 30, 2011. |
| | n | | Investment is exempt from registration under Rule 144A of the Securities Act of 1933, as amended. These investments may only be resold in transactions exempt from registration, which are normally those transactions with qualified institutional buyers. |
| | W | | The rate shown is the annualized seven-day effective yield as of June 30, 2011. |
| | ¨ | | Investment, or portion of investment, segregated as collateral for investments in derivatives. Yield shown is effective yield as of June 30, 2011. |
| | † | | The Fund may loan securities representing up to one third of the fair value of its total assets (which includes collateral for securities on loan) to broker-dealers, banks, or other institutional borrowers of securities. The Fund maintains collateral equal to at least 102% of the fair value of the securities loaned. The adequacy of the collateral is monitored on a daily basis. The cash collateral received by the Fund is invested in this money market fund. |
| | ¯ | | Other Assets Less Liabilities includes the net Unrealized Appreciation (Depreciation) of derivatives instruments as listed within Investments in Derivatives. |
| | LIBOR | | London Inter-Bank Offered Rate |
See accompanying notes to financial statements.
Portfolio of Investments
Nuveen Intermediate Government Bond Fund
(formerly known as First American Intermediate Government Bond Fund)
June 30, 2011
| | | | | | | | | | | | | | |
Principal
Amount (000) | | | Description p | | | | | | | | Value | |
| | | | | | | | | | | | | | |
| | | | U.S. GOVERNMENT & AGENCY SECURITIES – 45.4% | | | | | | | | | | |
| | | | | |
| | | | U.S. Agency Debentures – 41.2% | | | | | | | | | | |
| | | | | |
| | | | Federal Agricultural Mortgage Corporation | | | | | | | | | | |
| $ | 500 | | | 2.100%, 08/10/2012 | | | | | | | | $ | 510,240 | |
| | | | | |
| | | | Federal Farm Credit Bank | | | | | | | | | | |
| | 3,600 | | | 3.875%, 08/25/2011 q | | | | | | | | | 3,620,376 | |
| | 1,130 | | | 2.125%, 06/18/2012 | | | | | | | | | 1,149,324 | |
| | 565 | | | 4.500%, 10/17/2012 | | | | | | | | | 595,041 | |
| | 1,705 | | | 1.375%, 06/25/2013 | | | | | | | | | 1,736,207 | |
| | 1,350 | | | 3.875%, 10/07/2013 | | | | | | | | | 1,447,971 | |
| | 1,400 | | | 2.625%, 04/17/2014 | | | | | | | | | 1,467,394 | |
| | 700 | | | 3.000%, 09/22/2014 q | | | | | | | | | 742,145 | |
| | 845 | | | 1.500%, 11/16/2015 | | | | | | | | | 835,872 | |
| | | | | |
| | | | Federal Home Loan Bank | | | | | | | | | | |
| | 515 | | | 1.625%, 09/26/2012 | | | | | | | | | 522,970 | |
| | 2,000 | | | 1.500%, 01/16/2013 q | | | | | | | | | 2,032,508 | |
| | 850 | | | 1.625%, 03/20/2013 | | | | | | | | | 866,955 | |
| | 1,865 | | | 3.125%, 12/13/2013 q | | | | | | | | | 1,974,129 | |
| | 1,710 | | | 0.875%, 12/27/2013 q | | | | | | | | | 1,716,630 | |
| | 950 | | | 1.125%, 06/27/2014 | | | | | | | | | 948,542 | |
| | 1,080 | | | 4.125%, 03/13/2020 | | | | | | | | | 1,147,208 | |
| | | | | |
| | | | Federal Home Loan Mortgage Corporation | | | | | | | | | | |
| | 1,135 | | | 1.375%, 02/25/2014 q | | | | | | | | | 1,151,606 | |
| | 1,130 | | | 1.625%, 03/21/2014 | | | | | | | | | 1,132,966 | |
| | 1,825 | | | 2.500%, 04/23/2014 q | | | | | | | | | 1,905,871 | |
| | 780 | | | 1.000%, 07/30/2014 q | | | | | | | | | 779,057 | |
| | 1,925 | | | 1.750%, 09/10/2015 q | | | | | | | | | 1,933,002 | |
| | 2,000 | | | 0.750%, 07/05/2016 | | | | | | | | | 2,000,062 | |
| | 270 | | | 5.000%, 12/14/2018 q | | | | | | | | | 283,762 | |
| | 365 | | | 3.750%, 03/27/2019 q | | | | | | | | | 386,217 | |
| | | | | |
| | | | Federal National Mortgage Association | | | | | | | | | | |
| | 785 | | | 5.250%, 08/01/2012 | | | | | | | | | 825,804 | |
| | 580 | | | 4.625%, 05/01/2013 | | | | | | | | | 619,135 | |
| | 1,150 | | | 1.750%, 05/07/2013 q | | | | | | | | | 1,175,839 | |
| | 1,200 | | | 1.125%, 06/27/2014 | | | | | | | | | 1,206,661 | |
| | 1,650 | | | 2.375%, 07/28/2015 q | | | | | | | | | 1,698,728 | |
| | 1,700 | | | 1.875%, 10/15/2015 q | | | | | | | | | 1,704,105 | |
| | 550 | | | 4.375%, 10/15/2015 | | | | | | | | | 609,489 | |
| | 1,735 | | | 1.600%, 11/23/2015 q | | | | | | | | | 1,715,792 | |
| | | | | |
| | | | Tennessee Valley Authority | | | | | | | | | | |
| | 3,175 | | | 6.790%, 05/23/2012 | | | | | | | | | 3,357,369 | |
| | 2,725 | | | 6.000%, 03/15/2013 | | | | | | | | | 2,972,514 | |
| | 530 | | | 3.875%, 02/15/2021 | | | | | | | | | 544,425 | |
| | 45,975 | | | Total U.S. Agency Debentures | | | | | | | | | 47,315,916 | |
| | | | U.S. Treasuries – 4.2% | | | | | | | | | | |
| | | | | |
| | | | U.S. Treasury Bonds | | | | | | | | | | |
| | 635 | | | 9.000%, 11/15/2018 q | | | | | | | | | 915,739 | |
| | 1,105 | | | 8.125%, 08/15/2019 q | | | | | | | | | 1,546,568 | |
| | 430 | | | 8.500%, 02/15/2020 q | | | | | | | | | 617,856 | |
| | 695 | | | 8.750%, 08/15/2020 | | | | | | | | | 1,018,610 | |
| | 435 | | | 8.000%, 11/15/2021 q | | | | | | | | | 619,399 | |
| | | | | |
| | | | U.S. Treasury Note | | | | | | | | | | |
| | 105 | | | 2.250%, 03/31/2016 q | | | | | | | | | 107,995 | |
| | 3,405 | | | Total U.S. Treasuries | | | | | | | | | 4,826,167 | |
| $ | 49,380 | | | Total U.S. Government & Agency Securities (cost $50,796,158) | | | | | | | | | 52,142,083 | |
Portfolio of Investments
Nuveen Intermediate Government Bond Fund (continued)
June 30, 2011
| | | | | | | | | | | | | | |
Principal
Amount (000) | | | Description p | | | | | | | | Value | |
| | | | | | | | | | | | | | |
| | | | U.S. GOVERNMENT AGENCY MORTGAGE-BACKED SECURITIES – 24.3% | | | | | | | | | | |
| | | | | |
| | | | Adjustable Rate D – 7.0% | | | | | | | | | | |
| | | | | |
| | | | Federal Home Loan Mortgage Corporation Pool | | | | | | | | | | |
| $ | 875 | | | 2.574%, 09/01/2033, #780836 | | | | | | | | $ | 911,530 | |
| | 632 | | | 2.597%, 03/01/2036, #848193 | | | | | | | | | 665,600 | |
| | 931 | | | 5.508%, 05/01/2037, #1H1396 | | | | | | | | | 986,137 | |
| | | | | |
| | | | Federal National Mortgage Association Pool | | | | | | | | | | |
| | 1,567 | | | 2.545%, 04/01/2034, #AD0486 | | | | | | | | | 1,644,819 | |
| | 586 | | | 2.540%, 03/01/2035, #819652 | | | | | | | | | 617,089 | |
| | 245 | | | 2.180%, 12/01/2035, #848390 | | | | | | | | | 251,028 | |
| | 416 | | | 2.858%, 07/01/2036, #886034 | | | | | | | | | 436,543 | |
| | 334 | | | 2.639%, 09/01/2036, #995949 | | | | | | | | | 350,192 | |
| | 941 | | | 5.394%, 03/01/2037, #914224 | | | | | | | | | 998,466 | |
| | 737 | | | 5.684%, 04/01/2037, #913187 | | | | | | | | | 784,904 | |
| | 340 | | | 2.498%, 03/01/2038, #AD0706 | | | | | | | | | 357,508 | |
| | 7,604 | | | Total Adjustable Rate | | | | | | | | | 8,003,816 | |
| | | | Fixed Rate – 17.3% | | | | | | | | | | |
| | | | | |
| | | | Federal Home Loan Mortgage Corporation Pool | | | | | | | | | | |
| | — | ¥ | | 7.000%, 07/01/2011, #E20252 | | | | | | | | | 53 | |
| | 9 | | | 7.500%, 09/01/2012, #G10735 | | | | | | | | | 9,312 | |
| | 38 | | | 6.000%, 10/01/2013, #E72802 | | | | | | | | | 41,697 | |
| | 29 | | | 7.000%, 09/01/2014, #E00746 | | | | | | | | | 30,524 | |
| | 153 | | | 6.500%, 01/01/2028, #G00876 | | | | | | | | | 174,541 | |
| | 25 | | | 7.500%, 01/01/2030, #C35768 | | | | | | | | | 29,015 | |
| | 286 | | | 6.500%, 03/01/2031, #G01244 | | | | | | | | | 324,060 | |
| | | | | |
| | | | Federal National Mortgage Association Pool | | | | | | | | | | |
| | — | ¥ | | 7.000%, 11/01/2011, #250738 | | | | | | | | | 335 | |
| | — | ¥ | | 7.000%, 11/01/2011, #351122 | | | | | | | | | 178 | |
| | 21 | | | 6.000%, 04/01/2013, #425550 | | | | | | | | | 22,977 | |
| | 17 | | | 6.500%, 08/01/2013, #251901 | | | | | | | | | 17,876 | |
| | 29 | | | 6.000%, 11/01/2013, #556195 | | | | | | | | | 32,008 | |
| | 21 | | | 7.000%, 10/01/2014, #252799 | | | | | | | | | 22,509 | |
| | 1,867 | | | 3.120%, 01/01/2015, #464158 | | | | | | | | | 1,931,834 | |
| | 903 | | | 3.240%, 04/01/2016, #467749 | | | | | | | | | 928,148 | |
| | 185 | | | 5.500%, 04/01/2016, #580516 | | | | | | | | | 200,333 | |
| | 304 | | | 6.500%, 07/01/2017, #254373 | | | | | | | | | 332,590 | |
| | 302 | | | 7.000%, 07/01/2017, #254414 | | | | | | | | | 334,940 | |
| | 189 | | | 5.500%, 12/01/2017, #673010 | | | | | | | | | 205,566 | |
| | 266 | | | 5.500%, 04/01/2018, #695765 | | | | | | | | | 287,827 | |
| | 553 | | | 4.500%, 05/01/2018, #254720 | | | | | | | | | 591,529 | |
| | 649 | | | 5.500%, 09/01/2019, #725793 | | | | | | | | | 705,730 | |
| | 266 | | | 6.000%, 01/01/2022, #254179 | | | | | | | | | 293,818 | |
| | 260 | | | 6.500%, 06/01/2022, #254344 | | | | | | | | | 294,973 | |
| | 317 | | | 7.000%, 09/01/2031, #596680 | | | | | | | | | 361,024 | |
| | 376 | | | 6.500%, 12/01/2031, #254169 | | | | | | | | | 422,793 | |
| | 1,093 | | | 6.000%, 04/01/2032, #745101 | | | | | | | | | 1,191,606 | |
| | 863 | | | 6.500%, 06/01/2032, #596712 | | | | | | | | | 973,090 | |
| | 233 | | | 6.000%, 08/01/2032, #656269 | | | | | | | | | 253,730 | |
| | 553 | | | 6.500%, 08/01/2036, #887017 | | | | | | | | | 627,045 | |
| | 718 | | | 7.000%, 06/01/2037, #928519 | | | | | | | | | 826,330 | |
| | 987 | | | 4.000%, 12/01/2040, #AB1959 | | | | | | | | | 987,939 | |
| | 2,119 | | | 4.000%, 12/01/2040, #MA0583 (WI/DD) | | | | | | | | | 2,122,278 | |
| | 1,115 | | | 4.500%, 07/15/2041 (WI/DD) | | | | | | | | | 1,153,502 | |
| | 1,000 | | | 5.000%, 07/15/2041 (WI/DD) | | | | | | | | | 1,062,500 | |
| | | | | |
| | | | Government National Mortgage Association Pool | | | | | | | | | | |
| | 48 | | | 7.500%, 12/15/2022, #347332 | | | | | | | | | 56,865 | |
| | 7 | | | 7.000%, 09/15/2027, #455304 | | | | | | | | | 8,303 | |
| | 309 | | | 6.500%, 07/15/2028, #780825 | | | | | | | | | 353,247 | |
| | 113 | | | 6.500%, 08/20/2031, #003120 | | | | | | | | | 128,136 | |
| | 144 | | | 7.500%, 12/15/2031, #570134 | | | | | | | | | 169,351 | |
| | | | | | | | | | | | | | |
Principal
Amount (000) | | | Description p | | | | | | | | Value | |
| | | | | | | | | | | | | | |
| | | | Fixed Rate (continued) | | | | | | | | | | |
| | | | | |
| $ | 1,101 | | | 6.000%, 09/15/2034, #633605 | | | | | | | | $ | 1,239,096 | |
| | 1,101 | | | 4.500%, 02/20/2041, #004946 | | | | | | | | | 1,161,320 | |
| | 18,569 | | | Total Fixed Rate | | | | | | | | | 19,910,528 | |
| $ | 26,173 | | | Total U.S. Government Agency Mortgage-Backed Securities (cost $26,650,040) | | | | | | | | | 27,914,344 | |
| | | | | |
Principal
Amount (000) | | | Description p | | | | | | | | Value | |
| | | | COLLATERALIZED MORTGAGE OBLIGATION – U.S. GOVERNMENT AGENCY
MORTGAGE-BACKED SECURITIES – 8.3% | | | | | | |
| | | | | |
| | | | Fixed Rate – 8.3% | | | | | | | | | | |
| | | | | |
| | | | Federal Home Loan Mortgage Corporation
Series 2629, Class BO | | | | | | | | | | |
| $ | 570 | | | 3.250%, 03/15/2018 | | | | | | | | $ | 590,755 | |
| | | | Series 2843, Class BH | | | | | | | | | | |
| | 455 | | | 4.000%, 01/15/2018 | | | | | | | | | 465,115 | |
| | | | | |
| | | | Federal National Mortgage Association
Series 2002-W1, Class 2A | | | | | | | | | | |
| | 528 | | | 7.244%, 02/25/2042 | | | | | | | | | 609,602 | |
| | | | Series 2009-M1, Class A1 | | | | | | | | | | |
| | 889 | | | 3.400%, 07/25/2019 | | | | | | | | | 929,361 | |
| | | | Series 2010-M1, Class A1 | | | | | | | | | | |
| | 1,437 | | | 3.305%, 06/25/2019 | | | | | | | | | 1,495,114 | |
| | | | Series 2010-M4, Class A1 | | | | | | | | | | |
| | 1,440 | | | 2.520%, 06/25/2020 | | | | | | | | | 1,453,871 | |
| | | | | |
| | | | FHLMC Multifamily Structured Pass-Through Securities
Series K008, Class A1 | | | | | | | | | | |
| | 995 | | | 2.746%, 12/25/2019 | | | | | | | | | 995,561 | |
| | | | Series K010, Class A1 | | | | | | | | | | |
| | 812 | | | 3.320%, 07/25/2020 | | | | | | | | | 835,820 | |
| | | | Series K701, Class A1 | | | | | | | | | | |
| | 1,230 | | | 2.776%, 06/26/2017 | | | | | | | | | 1,265,679 | |
| | | | | |
| | | | FHLMC Structured Pass-Through Securities
Series T-45, Class A4 | | | | | | | | | | |
| | 851 | | | 4.520%, 08/27/2012 | | | | | | | | | 879,052 | |
| $ | 9,207 | | | Total Collateralized Mortgage Obligation – U.S. Government Agency Mortgage-Backed Securities (cost $9,295,526) | | | | | | | | | 9,519,930 | |
| | | | | |
Principal
Amount (000) | | | Description p | | | | | | | | Value | |
| | | | ASSET-BACKED SECURITIES – 5.5% | | | | | | | | | | |
| | | | | |
| | | | Home Equity – 0.0% | | | | | | | | | | |
| | | | | |
| | | | GRMT Mortgage Loan Trust
Series 2001-1A, Class M1 | | | | | | | | | | |
| $ | 34 | | | 8.272%, 07/20/2031 n | | | | | | | | $ | 31,965 | |
| | | | Manufactured Housing – 0.7% | | | | | | | | | | |
| | | | | |
| | | | Origen Manufactured Housing | | | | | | | | | | |
| | | | Series 2005-B, Class M1 | | | | | | | | | | |
| | 750 | | | 5.990%, 01/15/2037 D | | | | | | | | | 766,496 | |
| | | | Other – 4.8% | | | | | | | | | | |
| | | | | |
| | | | GMAC Mortgage Servicer Advance Funding | | | | | | | | | | |
| | | | Series 2011-1A, Class A | | | | | | | | | | |
| | 735 | | | 3.720%, 03/15/2023 n | | | | | | | | | 740,512 | |
| | | | | |
| | | | Henderson Receivables | | | | | | | | | | |
| | | | Series 2010-3A, Class A | | | | | | | | | | |
| | 852 | | | 3.820%, 12/15/2048 n | | | | | | | | | 841,847 | |
Portfolio of Investments
Nuveen Intermediate Government Bond Fund (continued)
June 30, 2011
| | | | | | | | | | | | | | |
Principal
Amount (000) | | | Description p | | | | | | | | Value | |
| | | | | | | | | | | | | | |
| | | | Other (continued) | | | | | | | | | | |
| | | | | |
| | | | Series 2010-1, Class A | | | | | | | | | | |
| $ | 919 | | | 5.560%, 07/15/2059 n | | | | | | | | $ | 984,724 | |
| | | | | |
| | | | Small Business Administration | | | | | | | | | | |
| | | | Series 2005-P10A, Class 1 | | | | | | | | | | |
| | 381 | | | 4.638%, 02/10/2015 | | | | | | | | | 406,013 | |
| | | | Series 2005-P10B, Class 1 | | | | | | | | | | |
| | 261 | | | 4.940%, 08/10/2015 | | | | | | | | | 277,329 | |
| | | | Series 2008-P10A, Class 1 | | | | | | | | | | |
| | 1,095 | | | 5.902%, 02/10/2018 | | | | | | | | | 1,223,141 | |
| | | | Series 2010-10A, Class 1 | | | | | | | | | | |
| | 983 | | | 4.108%, 03/10/2020 | | | | | | | | | 1,002,470 | |
| | 5,226 | | | Total Other | | | | | | | | | 5,476,036 | |
| $ | 6,010 | | | Total Asset-Backed Securities (cost $6,137,534) | | | | | | | | | 6,274,497 | |
| | | | | |
Principal
Amount (000) | | | Description p | | | | | | | | Value | |
| | | | COLLATERALIZED MORTGAGE OBLIGATION – PRIVATE MORTGAGE-BACKED SECURITIES – 5.3% | | | | |
| | | | | |
| | | | Fixed Rate – 5.3% | | | | | | | | | | |
| | | | | |
| | | | FDIC Structured Sale Guaranteed Notes | | | | | | | | | | |
| | | | Series 2010-S1, Class 2A | | | | | | | | | | |
| $ | 1,127 | | | 3.250%, 04/25/2038 n | | | | | | | | $ | 1,153,653 | |
| | | | | |
| | | | GSMPS Mortgage Loan Trust | | | | | | | | | | |
| | | | Series 2003-1, Class B1 | | | | | | | | | | |
| | 798 | | | 6.806%, 03/25/2043 | | | | | | | | | 686,172 | |
| | | | | |
| | | | GSR Mortgage Loan Trust | | | | | | | | | | |
| | | | Series 2005-4F, Class B1 | | | | | | | | | | |
| | 1,247 | | | 5.744%, 05/25/2035 | | | | | | | | | 730,476 | |
| | | | | |
| | | | Impac Secured Assets | | | | | | | | | | |
| | | | Series 2000-3, Class M1 | | | | | | | | | | |
| | 375 | | | 8.000%, 10/25/2030 | | | | | | | | | 343,251 | |
| | | | | |
| | | | Lehman Mortgage Trust | | | | | | | | | | |
| | | | Series 2008-6, Class 1A1 | | | | | | | | | | |
| | 439 | | | 6.108%, 07/25/2047 | | | | | | | | | 418,175 | |
| | | | | |
| | | | NCUA Guaranteed Notes | | | | | | | | | | |
| | | | Series 2010-C1, Class A1 | | | | | | | | | | |
| | 1,071 | | | 1.600%, 10/29/2020 | | | | | | | | | 1,068,355 | |
| | | | | |
| | | | Residential Accredit Loans | | | | | | | | | | |
| | | | Series 2003-QS12, Class M1 | | | | | | | | | | |
| | 521 | | | 5.000%, 06/25/2018 | | | | | | | | | 405,574 | |
| | | | | |
| | | | Sequoia Mortgage Trust | | | | | | | | | | |
| | | | Series 2011-1, Class A1 | | | | | | | | | | |
| | 443 | | | 4.125%, 02/25/2041 | | | | | | | | | 443,582 | |
| | | | | |
| | | | Vendee Mortgage Trust | | | | | | | | | | |
| | | | Series 2011-1, Class DA | | | | | | | | | | |
| | 773 | | | 3.750%, 02/15/2035 | | | | | | | | | 807,859 | |
| $ | 6,794 | | | Total Collateralized Mortgage Obligations – Private Mortgage-Backed Securities (cost $6,640,380) | | | | | | | | | 6,057,097 | |
| | | | | |
Principal
Amount (000) | | | Description p | | | | | | | | Value | |
| | | | COMMERCIAL MORTGAGE-BACKED SECURITIES – 4.5% | | | | | | | | | | |
| | | | | |
| | | | Bear Stearns Commercial Mortgage Securities | | | | | | | | | | |
| | | | Series 2005-T20, Class A4A | | | | | | | | | | |
| $ | 550 | | | 5.296%, 10/12/2042 D | | | | | | | | $ | 602,392 | |
| | | | | |
| | | | Commercial Mortgage Pass-Through Certificates | | | | | | | | | | |
| | | | Series 2005-LP5, Class A4 | | | | | | | | | | |
| | 550 | | | 4.982%, 05/10/2043 D | | | | | | | | | 592,650 | |
| | | | | | | | | | | | | | |
Principal
Amount (000) | | | Description p | | | | | | | | Value | |
| | | | | | | | | | | | | | |
| | | | COMMERCIAL MORTGAGE-BACKED SECURITIES (continued) | | | | | | | | | | |
| | | | | |
| | | | Extended Stay America Trust | | | | | | | | | | |
| | | | Series 2010-ESHA, Class A | | | | | | | | | | |
| $ | 870 | | | 2.951%, 11/05/2027 n | | | | | | | | $ | 865,598 | |
| | | | | |
| | | | FDIC Commercial Mortgage Trust | | | | | | | | | | |
| | | | Series 2011-C1, Class C1 | | | | | | | | | | |
| | 460 | | | 2.196%, 04/25/2031 | | | | | | | | | 461,675 | |
| | | | | |
| | | | Greenwich Capital Commercial Funding | | | | | | | | | | |
| | | | Series 2007-GG11, Class A4 | | | | | | | | | | |
| | 1,000 | | | 5.736%, 12/10/2049 q | | | | | | | | | 1,073,050 | |
| | | | | |
| | | | JPMorgan Chase Commercial Mortgage Securities Trust | | | | | | | | | | |
| | | | Series 2010-C2, Class A1 | | | | | | | | | | |
| | 939 | | | 2.749%, 07/15/2017 n | | | | | | | | | 934,386 | |
| | | | | |
| | | | Morgan Stanley Capital I | | | | | | | | | | |
| | | | Series 2006-IQ12, Class A4 | | | | | | | | | | |
| | 650 | | | 5.332%, 12/15/2043 | | | | | | | | | 702,243 | |
| $ | 5,019 | | | Total Commercial Mortgage-Backed Securities (cost $4,920,958) | | | | | | | | | 5,231,994 | |
| | | | | |
Principal
Amount (000) | | | Description p | | | | | | | | Value | |
| | | | CORPORATE BONDS – 0.8% | | | | | | | | | | |
| | | | | |
| | | | Finance – 0.8% | | | | | | | | | | |
| | | | | |
| | | | Private Export Funding | | | | | | | | | | |
| $ | 550 | | | 3.050%, 10/15/2014 | | | | | | | | $ | 583,179 | |
| | 345 | | | 2.125%, 07/15/2016 | | | | | | | | | 344,681 | |
| $ | 895 | | | Total Corporate Bonds (cost $894,079) | | | | | | | | | 927,860 | |
| | | | | |
| Shares | | | Description p | | | | | | | | Value | |
| | | | INVESTMENTS PURCHASED WITH PROCEEDS FROM SECURITIES LENDING | | | | | | | | | | |
| | | | | |
| | | | Money Market Funds – 24.8% | | | | | | | | | | |
| | | | | |
| | | | Mount Vernon Securities Lending Prime Portfolio | | | | | | | | | | |
| | 28,536,456 | | | 0.197% W † | | | | | | | | $ | 28,536,456 | |
| | | | Total Investments Purchased With Proceeds From Securities Lending (cost $28,536,456) | | | | | | | | | 28,536,456 | |
| | | | | |
Shares/
Principal
Amount (000) | | | Description p | | | | | | | | Value | |
| | | | SHORT-TERM INVESTMENTS – 9.5% | | | | | | | | | | |
| | | | | |
| | | | Money Market Funds – 9.4% | | | | | | | | | | |
| | | | | |
| | | | First American Government Obligations Fund, Class Z | | | | | | | | | | |
| | 9,724,292 | | | 0.000% W | | | | | | | | $ | 9,746,292 | |
| | | | | |
| | | | First American U.S. Treasury Money Market Fund, Class Z | | | | | | | | | | |
| | 1,024,248 | | | 0.000% W | | | | | | | | | 1,024,248 | |
| | | | Total Money Market Funds | | | | | | | | | 10,770,540 | |
| | | | U.S. Treasury Obligations – 0.1% | | | | | | | | | | |
| | | | | |
| | | | U.S. Treasury Bills ¨ | | | | | | | | | | |
| $ | 150 | | | 0.020%, 07/21/2011 | | | | | | | | | 149,998 | |
| | 10 | | | 0.060%, 11/10/2011 | | | | | | | | | 9,998 | |
| $ | 160 | | | Total U.S. Treasury Obligations | | | | | | | | | 159,996 | |
| | | | Total Short-Term Investments (cost $10,930,534) | | | | | | | | | 10,930,536 | |
| | | | Total Investments (cost $144,801,665) – 128.4% | | | | | | | | | 147,534,797 | |
| | | | Other Assets Less Liabilities – (28.4)% ¯ | | | | | | | | | (32,598,558) | |
| | | | Net Assets – 100.0% | | | | | | | | $ | 114,936,239 | |
Portfolio of Investments
Nuveen Intermediate Government Bond Fund (continued)
June 30, 2011
Investments in Derivatives
Futures Contracts outstanding at June 30, 2011:
| | | | | | | | | | | | | | | | | | | | |
| Type | | Contract
Position | | | Number of
Contracts | | | Contract
Expiration | | | Value | | | Unrealized
Appreciation
(Depreciation) | |
U.S. Treasury 2-Year Note | | | Long | | | | 97 | | | | 9/11 | | | $ | 21,276,345 | | | $ | 42,870 | |
U.S. Treasury 5-Year Note | | | Short | | | | (11 | ) | | | 9/11 | | | | (1,311,148 | ) | | | 2,804 | |
U.S. Treasury 10-Year Note | | | Long | | | | 34 | | | | 9/11 | | | | 4,159,156 | | | | (49,618 | ) |
U.S. Treasury Long Bond Futures | | | Long | | | | 2 | | | | 9/11 | | | | 246,063 | | | | (6,380 | ) |
| | | | | | | | | | | | | | | | | | | $ | (10,324 | ) |
| | | | For Fund portfolio compliance purposes, the Fund’s industry classifications refer to any one or more of the industry sub-classifications used by one or more widely recognized market indexes or ratings group indexes, and/or as defined by Fund management. This definition may not apply for purposes of this report which may combine industry sub-classifications into sectors for reporting ease. |
| | p | | All Percentages shown in the Portfolio of Investments are based on net assets. |
| | q | | Investment, or a portion of investment, is out on loan for securities lending. |
| | D | | Variable Rate Security – The rate shown is the rate in effect as of June 30, 2011. |
| | n | | Investment is exempt from registration under Rule 144A of the Securities Act of 1933, as amended. These investments may only be resold in transactions exempt from registration, which are normally those transactions with qualified institutional buyers. |
| | W | | The rate shown is the annualized seven-day effective yield as of June 30, 2011. |
| | ¨ | | Investment, or portion of investment, segregated as collateral for investments in derivatives. Yield shown is effective yield as of June 30, 2011. |
| | † | | The Fund may loan securities representing up to one third of the fair value of its total assets (which includes collateral for securities on loan) to broker-dealers, banks, or other institutional borrowers of securities. The Fund maintains collateral equal to at least 102% of the fair value of the securities loaned. The adequacy of the collateral is monitored on a daily basis. The cash collateral received by the Fund is invested in this money market fund. |
| | ¥ | | Principal Amount (000) rounds to less than $1,000. |
| | ¯ | | Other Assets Less Liabilities includes the net Unrealized Appreciation (Depreciation) of derivatives instruments as listed within Investments in Derivatives. |
| | (WI/DD) | | Purchased on a when-issued or delayed delivery basis. |
See accompanying notes to financial statements.
Portfolio of Investments
Nuveen Intermediate Term Bond Fund
(formerly known as First American Intermediate Term Bond Fund)
June 30, 2011
| | | | | | | | | | | | | | |
Principal
Amount (000) | | | Description p | | | | | | | | Value | |
| | | | | | | | | | | | | | |
| | | | CORPORATE BONDS – 44.5% | | | | | | | | | | |
| | | | | |
| | | | Banking – 7.9% | | | | | | | | | | |
| | | | | |
| | | | Banco Bradesco | | | | | | | | | | |
| $ | 1,245 | | | 4.125%, 05/16/2016 n q | | | | | | | | $ | 1,252,844 | |
| | | | | |
| | | | Bancolombia | | | | | | | | | | |
| | 1,910 | | | 5.950%, 06/03/2021 n | | | | | | | | | 1,938,649 | |
| | | | | |
| | | | Bank of America | | | | | | | | | | |
| | 2,500 | | | 5.750%, 12/01/2017 | | | | | | | | | 2,673,775 | |
| | 4,920 | | | 5.875%, 01/05/2021 | | | | | | | | | 5,163,416 | |
| | | | | |
| | | | BBVA Bancomer | | | | | | | | | | |
| | 925 | | | 4.500%, 03/10/2016 n q | | | | | | | | | 941,188 | |
| | | | | |
| | | | Citigroup | | | | | | | | | | |
| | 2,000 | | | 4.587%, 12/15/2015 | | | | | | | | | 2,103,218 | |
| | 2,090 | | | 6.125%, 11/21/2017 | | | | | | | | | 2,308,309 | |
| | | | | |
| | | | Comerica Bank | | | | | | | | | | |
| | 3,245 | | | 5.750%, 11/21/2016 | | | | | | | | | 3,622,163 | |
| | | | | |
| | | | Deutsche Bank | | | | | | | | | | |
| | 3,205 | | | 3.875%, 08/18/2014 | | | | | | | | | 3,368,763 | |
| | | | | |
| | | | ING Bank | | | | | | | | | | |
| | 1,470 | | | 4.000%, 03/15/2016 n | | | | | | | | | 1,487,696 | |
| | | | | |
| | | | JPMorgan Chase | | | | | | | | | | |
| | 3,290 | | | 5.150%, 10/01/2015 | | | | | | | | | 3,553,348 | |
| | 7,585 | | | 4.250%, 10/15/2020 | | | | | | | | | 7,420,670 | |
| | | | | |
| | | | Lloyds TSB Bank | | | | | | | | | | |
| | 1,000 | | | 4.375%, 01/12/2015 n | | | | | | | | | 1,014,904 | |
| | | | | |
| | | | Nordea Eiendomskreditt
Class A | | | | | | | | | | |
| | 3,500 | | | 1.875%, 04/07/2014 n | | | | | | | | | 3,535,459 | |
| | | | | |
| | | | North Fork Bancorp | | | | | | | | | | |
| | 3,130 | | | 5.875%, 08/15/2012 | | | | | | | | | 3,247,062 | |
| | | | | |
| | | | PNC Funding | | | | | | | | | | |
| | 3,300 | | | 3.625%, 02/08/2015 q | | | | | | | | | 3,475,745 | |
| | | | | |
| | | | Royal Bank of Scotland | | | | | | | | | | |
| | 1,000 | | | 6.400%, 10/21/2019 q | | | | | | | | | 1,027,162 | |
| | | | | |
| | | | Sovereign Bank | | | | | | | | | | |
| | 2,040 | | | 8.750%, 05/30/2018 | | | | | | | | | 2,302,872 | |
| | | | | |
| | | | Wachovia | | | | | | | | | | |
| | 1,450 | | | 5.750%, 06/15/2017 | | | | | | | | | 1,612,197 | |
| | | | | |
| | | | Wachovia Captial Trust III | | | | | | | | | | |
| | 2,220 | | | 5.570%, 03/29/2049 | | | | | | | | | 2,031,300 | |
| | 52,025 | | | Total Banking | | | | | | | | | 54,080,740 | |
| | | | Basic Industry – 3.0% | | | | | | | | | | |
| | | | | |
| | | | Alcoa | | | | | | | | | | |
| | 1,180 | | | 5.400%, 04/15/2021 q | | | | | �� | | | | 1,183,644 | |
| | | | | |
| | | | Arcelormittal | | | | | | | | | | |
| | 3,260 | | | 5.250%, 08/05/2020 q | | | | | | | | | 3,223,269 | |
| | | | | |
| | | | Celulosa Arauco Constitucion | | | | | | | | | | |
| | 2,000 | | | 5.625%, 04/20/2015 q | | | | | | | | | 2,155,580 | |
| | | | | |
| | | | Dow Chemical | | | | | | | | | | |
| | 2,680 | | | 2.500%, 02/15/2016 | | | | | | | | | 2,660,675 | |
| | | | | |
| | | | Incitec Pivot Finance | | | | | | | | | | |
| | 2,255 | | | 6.000%, 12/10/2019 n | | | | | | | | | 2,415,177 | |
Portfolio of Investments
Nuveen Intermediate Term Bond Fund (continued)
June 30, 2011
| | | | | | | | | | | | | | |
Principal
Amount (000) | | | Description p | | | | | | | | Value | |
| | | | | | | | | | | | | | |
| | | | Basic Industry (continued) | | | | | | | | | | |
| | | | | |
| | | | Rio Tinto Finance | | | | | | | | | | |
| $ | 1,970 | | | 3.500%, 11/02/2020 q | | | | | | | | $ | 1,885,304 | |
| | | | | |
| | | | Southern Copper | | | | | | | | | | |
| | 2,000 | | | 5.375%, 04/16/2020 | | | | | | | | | 2,048,602 | |
| | | | | |
| | | | Vale Overseas | | | | | | | | | | |
| | 1,940 | | | 4.625%, 09/15/2020 | | | | | | | | | 1,929,404 | |
| | | | | |
| | | | Waste Management | | | | | | | | | | |
| | 2,705 | | | 4.600%, 03/01/2021 | | | | | | | | | 2,760,044 | |
| | 19,990 | | | Total Basic Industry | | | | | | | | | 20,261,699 | |
| | | | Brokerage – 2.1% | | | | | | | | | | |
| | | | | |
| | | | Goldman Sachs Capital II | | | | | | | | | | |
| | 1,165 | | | 5.793%, 12/29/2049 D | | | | | | | | | 932,000 | |
| | | | | |
| | | | Goldman Sachs Group | | | | | | | | | | |
| | 3,845 | | | 6.150%, 04/01/2018 | | | | | | | | | 4,184,679 | |
| | 3,125 | | | 6.000%, 06/15/2020 q | | | | | | | | | 3,362,463 | |
| | | | | |
| | | | Morgan Stanley | | | | | | | | | | |
| | 3,750 | | | 5.500%, 07/24/2020 | | | | | | | | | 3,795,716 | |
| | 2,180 | | | 5.750%, 01/25/2021 q | | | | | | | | | 2,205,787 | |
| | 14,065 | | | Brokerage | | | | | | | | | 14,480,645 | |
| | | | Capital Goods – 0.7% | | | | | | | | | | |
| | | | | |
| | | | John Deere Captial | | | | | | | | | | |
| | 2,295 | | | 2.800%, 09/18/2017 | | | | | | | | | 2,312,286 | |
| | | | | |
| | | | Tyco International | | | | | | | | | | |
| | 2,405 | | | 3.375%, 10/15/2015 q | | | | | | | | | 2,473,300 | |
| | 4,700 | | | Total Capital Goods | | | | | | | | | 4,785,586 | |
| | | | Communications – 7.1% | | | | | | | | | | |
| | | | | |
| | | | American Tower | | | | | | | | | | |
| | 2,405 | | | 5.050%, 09/01/2020 | | | | | | | | | 2,368,858 | |
| | | | | |
| | | | AT&T | | | | | | | | | | |
| | 3,350 | | | 5.800%, 02/15/2019 q | | | | | | | | | 3,779,976 | |
| | | | | |
| | | | British Sky Broadcasting | | | | | | | | | | |
| | 1,845 | | | 6.100%, 02/15/2018 n | | | | | | | | | 2,063,642 | |
| | | | | |
| | | | CBS | | | | | | | | | | |
| | 3,125 | | | 5.750%, 04/15/2020 q | | | | | | | | | 3,386,990 | |
| | | | | |
| | | | Comcast | | | | | | | | | | |
| | 1,930 | | | 5.150%, 03/01/2020 q | | | | | | | | | 2,078,014 | |
| | | | | |
| | | | DirecTV Holdings | | | | | | | | | | |
| | 2,850 | | | 3.550%, 03/15/2015 | | | | | | | | | 2,977,703 | |
| | 2,800 | | | 5.200%, 03/15/2020 q | | | | | | | | | 2,962,646 | |
| | | | | |
| | | | Discovery Communications | | | | | | | | | | |
| | 1,460 | | | 5.050%, 06/01/2020 q | | | | | | | | | 1,545,990 | |
| | | | | |
| | | | Embarq | | | | | | | | | | |
| | 1,170 | | | 7.082%, 06/01/2016 q | | | | | | | | | 1,300,595 | |
| | | | | |
| | | | NBC Universal | | | | | | | | | | |
| | 3,895 | | | 5.150%, 04/30/2020 n | | | | | | | | | 4,112,738 | |
| | | | | |
| | | | News America | | | | | | | | | | |
| | 2,000 | | | 5.650%, 08/15/2020 q | | | | | | | | | 2,184,592 | |
| | 2,100 | | | 4.500%, 02/15/2021 n | | | | | | | | | 2,072,511 | |
| | | | | |
| | | | Telecom Italia Capital | | | | | | | | | | |
| | 2,570 | | | 7.175%, 06/18/2019 q | | | | | | | | | 2,837,501 | |
| | | | | | | | | | | | | | |
Principal
Amount (000) | | | Description p | | | | | | | | Value | |
| | | | | | | | | | | | | | |
| | | | Communications (continued) | | | | | | | | | | |
| | | | | |
| | | | Time Warner | | | | | | | | | | |
| $ | 3,000 | | | 4.700%, 01/15/2021 q | | | | | | | | $ | 3,039,529 | |
| | 1,730 | | | 4.750%, 03/29/2021 q | | | | | | | | | 1,759,846 | |
| | | | | |
| | | | Time Warner Cable | | | | | | | | | | |
| | 2,000 | | | 8.250%, 02/14/2014 | | | | | | | | | 2,326,298 | |
| | 2,025 | | | 6.750%, 07/01/2018 | | | | | | | | | 2,348,377 | |
| | | | | |
| | | | Verizon Communications | | | | | | | | | | |
| | 3,755 | | | 8.750%, 11/01/2018 | | | | | | | | | 4,885,650 | |
| | 44,010 | | | Total Communications | | | | | | | | | 48,031,456 | |
| | | | Consumer Cyclical – 0.4% | | | | | | | | | | |
| | | | | |
| | | | Ingram Micro | | | | | | | | | | |
| | 1,205 | | | 5.250%, 09/01/2017 | | | | | | | | | 1,263,118 | |
| | | | | |
| | | | R.R. Donnelley & Sons | | | | | | | | | | |
| | 1,195 | | | 7.625%, 06/15/2020 q | | | | | | | | | 1,181,023 | |
| | 2,400 | | | Total Consumer Cyclical | | | | | | | | | 2,444,141 | |
| | | | Consumer Non Cyclical – 4.2% | | | | | | | | | | |
| | | | | |
| | | | Altria Group | | | | | | | | | | |
| | 1,300 | | | 9.700%, 11/10/2018 | | | | | | | | | 1,708,357 | |
| | 1,365 | | | 4.750%, 05/05/2021 | | | | | | | | | 1,364,065 | |
| | | | | |
| | | | ConAgra Foods | | | | | | | | | | |
| | 2,595 | | | 5.875%, 04/15/2014 | | | | | | | | | 2,850,096 | |
| | | | | |
| | | | Express Scripts | | | | | | | | | | |
| | 2,120 | | | 3.125%, 05/15/2016 | | | | | | | | | 2,133,063 | |
| | | | | |
| | | | Genentech | | | | | | | | | | |
| | 1,650 | | | 4.750%, 07/15/2015 | | | | | | | | | 1,818,711 | |
| | | | | |
| | | | Kellogg | | | | | | | | | | |
| | 2,620 | | | 4.450%, 05/30/2016 | | | | | | | | | 2,858,355 | |
| | | | | |
| | | | Kraft Foods | | | | | | | | | | |
| | 1,225 | | | 6.500%, 08/11/2017 | | | | | | | | | 1,440,074 | |
| | 3,500 | | | 5.375%, 02/10/2020 q | | | | | | | | | 3,826,193 | |
| | | | | |
| | | | Lorillard Tobacco | | | | | | | | | | |
| | 1,815 | | | 8.125%, 06/23/2019 q | | | | | | | | | 2,114,025 | |
| | | | | |
| | | | Merck | | | | | | | | | | |
| | 3,330 | | | 2.250%, 01/15/2016 | | | | | | | | | 3,341,945 | |
| | | | | |
| | | | Reynolds American | | | | | | | | | | |
| | 1,480 | | | 6.750%, 06/15/2017 q | | | | | | | | | 1,708,774 | |
| | | | | |
| | | | Roche Holdings | | | | | | | | | | |
| | 2,100 | | | 6.000%, 03/01/2019 n | | | | | | | | | 2,419,538 | |
| | | | | |
| | | | UnitedHealth Group | | | | | | | | | | |
| | 1,295 | | | 3.875%, 10/15/2020 q | | | | | | | | | 1,266,970 | |
| | 26,395 | | | Total Consumer Non Cyclical | | | | | | | | | 28,850,166 | |
| | | | Electric – 1.1% | | | | | | | | | | |
| | | | | |
| | | | Constellation Energy Group | | | | | | | | | | |
| | 2,275 | | | 5.150%, 12/01/2020 q | | | | | | | | | 2,331,463 | |
| | | | | |
| | | | FirstEnergy Solutions | | | | | | | | | | |
| | 2,220 | | | 6.050%, 08/15/2021 | | | | | | | | | 2,388,829 | |
| | | | | |
| | | | Ohio Power
Series K | | | | | | | | | | |
| | 2,100 | | | 6.000%, 06/01/2016 q | | | | | | | | | 2,408,175 | |
| | 6,595 | | | Total Electric | | | | | | | | | 7,128,467 | |
Portfolio of Investments
Nuveen Intermediate Term Bond Fund (continued)
June 30, 2011
| | | | | | | | | | | | | | |
Principal
Amount (000) | | | Description p | | | | | | | | Value | |
| | | | | | | | | | | | | | |
| | | | Energy – 3.9% | | | | | | | | | | |
| | | | | |
| | | | Anadarko Petroleum | | | | | | | | | | |
| $ | 2,745 | | | 6.375%, 09/15/2017 q | | | | | | | | $ | 3,146,687 | |
| | | | | |
| | | | Applied Materials | | | | | | | | | | |
| | 1,855 | | | 4.300%, 06/15/2021 | | | | | | | | | 1,861,190 | |
| | | | | |
| | | | Ensco | | | | | | | | | | |
| | 2,765 | | | 4.700%, 03/15/2021 q | | | | | | | | | 2,793,156 | |
| | | | | |
| | | | EOG Resources | | | | | | | | | | |
| | 2,500 | | | 4.100%, 02/01/2021 | | | | | | | | | 2,469,157 | |
| | | | | |
| | | | Hess | | | | | | | | | | |
| | 2,750 | | | 8.125%, 02/15/2019 q | | | | | | | | | 3,479,565 | |
| | | | | |
| | | | Marathon Petroleum | | | | | | | | | | |
| | 1,685 | | | 5.125%, 03/01/2021 n q | | | | | | | | | 1,732,261 | |
| | | | | |
| | | | Nabors Industries | | | | | | | | | | |
| | 1,735 | | | 5.000%, 09/15/2020 q | | | | | | | | | 1,755,535 | |
| | | | | |
| | | | Petroleos Mexicanos | | | | | | | | | | |
| | 1,000 | | | 4.875%, 03/15/2015 q | | | | | | | | | 1,082,500 | |
| | | | | |
| | | | Suncor Energy | | | | | | | | | | |
| | 1,275 | | | 6.100%, 06/01/2018 q | | | | | | | | | 1,450,040 | |
| | | | | |
| | | | Teck Resources | | | | | | | | | | |
| | 1,760 | | | 4.750%, 01/15/2022 | | | | | | | | | 1,764,599 | |
| | | | | |
| | | | Valero Energy | | | | | | | | | | |
| | 1,315 | | | 4.500%, 02/01/2015 q | | | | | | | | | 1,403,770 | |
| | | | | |
| | | | Weatherford Bermuda | | | | | | | | | | |
| | 3,810 | | | 5.125%, 09/15/2020 q | | | | | | | | | 3,890,090 | |
| | 25,195 | | | Total Energy | | | | | | | | | 26,828,550 | |
| | | | Finance – 6.4% | | | | | | | | | | |
| | | | | |
| | | | American Express | | | | | | | | | | |
| | 1,725 | | | 7.250%, 05/20/2014 | | | | | | | | | 1,972,862 | |
| | | | | |
| | | | American Express Credit | | | | | | | | | | |
| | | | Series C | | | | | | | | | | |
| | 2,405 | | | 7.300%, 08/20/2013 | | | | | | | | | 2,676,739 | |
| | | | | |
| | | | Ameriprise Financial | | | | | | | | | | |
| | 3,330 | | | 5.300%, 03/15/2020 | | | | | | | | | 3,569,660 | |
| | | | | |
| | | | Asciano Finance | | | | | | | | | | |
| | 2,450 | | | 5.000%, 04/07/2018 n | | | | | | | | | 2,514,888 | |
| | | | | |
| | | | Capital One Bank | | | | | | | | | | |
| | 3,140 | | | 8.800%, 07/15/2019 | | | | | | | | | 3,853,537 | |
| | | | | |
| | | | Capital One Financial | | | | | | | | | | |
| | 1,775 | | | 6.150%, 09/01/2016 q | | | | | | | | | 1,958,216 | |
| | | | | |
| | | | Countrywide Financial | | | | | | | | | | |
| | 2,395 | | | 6.250%, 05/15/2016 | | | | | | | | | 2,523,908 | |
| | | | | |
| | | | Discover Financial Services | | | | | | | | | | |
| | 2,245 | | | 10.250%, 07/15/2019 | | | | | | | | | 2,900,874 | |
| | | | | |
| | | | General Electric Capital | | | | | | | | | | |
| | 4,770 | | | 2.100%, 01/07/2014 | | | | | | | | | 4,837,685 | |
| | 1,530 | | | 5.300%, 02/11/2021 q | | | | | | | | | 1,592,029 | |
| | 2,500 | | | Series A
3.750%, 11/14/2014 | | | | | | | | | 2,646,270 | |
| | 3,955 | | | Series MTN
5.625%, 09/15/2017 | | | | | | | | | 4,366,411 | |
| | | | | |
| | | | Lloyds TSB Bank | | | | | | | | | | |
| | 2,500 | | | 4.875%, 01/21/2016 q | | | | | | | | | 2,556,928 | |
| | | | | | | | | | | | | | |
Principal
Amount (000) | | | Description p | | | | | | | | Value | |
| | | | | | | | | | | | | | |
| | | | Finance (continued) | | | | | | | | | | |
| | | | | |
| | | | Private Export Funding | | | | | | | | | | |
| $ | 575 | | | 3.050%, 10/15/2014 | | | | | | | | $ | 609,687 | |
| | | | | |
| | | | Transcapitalinvest | | | | | | | | | | |
| | 2,990 | | | 5.670%, 03/05/2014 n | | | | | | | | | 3,184,350 | |
| | | | | |
| | | | WEA Finance | | | | | | | | | | |
| | 1,780 | | | 4.625%, 05/10/2021 n q | | | | | | | | | 1,727,413 | |
| | 40,065 | | | Total Finance | | | | | | | | | 43,491,457 | |
| | | | Industrial Other – 0.2% | | | | | | | | | | |
| | | | | |
| | | | Thermo Fisher Scientific | | | | | | | | | | |
| | 1,265 | | | 3.200%, 05/01/2015 | | | | | | | | | 1,314,983 | |
| | | | Insurance – 4.8% | | | | | | | | | | |
| | | | | |
| | | | Aflac | | | | | | | | | | |
| | 3,000 | | | 8.500%, 05/15/2019 q | | | | | | | | | 3,669,012 | |
| | | | | |
| | | | Allied World Assurance | | | | | | | | | | |
| | 2,860 | | | 7.500%, 08/01/2016 | | | | | | | | | 3,277,397 | |
| | | | | |
| | | | American International Group | | | | | | | | | | |
| | 3,000 | | | 8.250%, 08/15/2018 | | | | | | | | | 3,445,881 | |
| | | | | |
| | | | Catlin Insurance | | | | | | | | | | |
| | 1,650 | | | 7.249%, 12/31/2049 n q | | | | | | | | | 1,571,625 | |
| | | | | |
| | | | Hartford Financial Services Group | | | | | | | | | | |
| | | | Series MTN | | | | | | | | | | |
| | 3,055 | | | 6.000%, 01/15/2019 | | | | | | | | | 3,262,746 | |
| | | | | |
| | | | Liberty Mutual Group | | | | | | | | | | |
| | 1,985 | | | 5.000%, 06/01/2021 n | | | | | | | | | 1,879,644 | |
| | | | | |
| | | | Lincoln National | | | | | | | | | | |
| | 2,720 | | | 8.750%, 07/01/2019 | | | | | | | | | 3,432,363 | |
| | | | | |
| | | | Met Life Global Funding I | | | | | | | | | | |
| | 3,730 | | | 5.125%, 04/10/2013 n | | | | | | | | | 3,968,824 | |
| | | | | |
| | | | Pacific Life Global Funding | | | | | | | | | | |
| | 2,205 | | | 5.150%, 04/15/2013 n | | | | | | | | | 2,347,994 | |
| | | | | |
| | | | Pacific Life Insurance | | | | | | | | | | |
| | 965 | | | 6.000%, 02/10/2020 n q | | | | | | | | | 1,034,789 | |
| | | | | |
| | | | Prudential Financial | | | | | | | | | | |
| | | | Series MTNB | | | | | | | | | | |
| | 3,235 | | | 5.100%, 09/20/2014 | | | | | | | | | 3,517,024 | |
| | | | | |
| | | | ZFS Finance USA Trust V | | | | | | | | | | |
| | 1,530 | | | 6.500%, 05/09/2067 n D | | | | | | | | | 1,522,350 | |
| | 29,935 | | | Total Insurance | | | | | | | | | 32,929,649 | |
| | | | Natural Gas – 0.2% | | | | | | | | | | |
| | | | | |
| | | | Kinder Morgan Energy Partners | | | | | | | | | | |
| | 1,135 | | | 5.000%, 12/15/2013 q | | | | | | | | | 1,230,751 | |
| | | | Real Estate – 0.8% | | | | | | | | | | |
| | | | | |
| | | | Health Care – REIT | | | | | | | | | | |
| | 1,630 | | | 3.625%, 03/15/2016 | | | | | | | | | 1,640,300 | |
| | | | | |
| | | | Prologis – REIT | | | | | | | | | | |
| | 1,885 | | | 6.875%, 03/15/2020 | | | | | | | | | 2,081,436 | |
| | | | | |
| | | | Vornado Realty – REIT | | | | | | | | | | |
| | 1,730 | | | 4.250%, 04/01/2015 | | | | | | | | | 1,795,596 | |
| | | | | |
| | 5,245 | | | Total Real Estate | | | | | | | | | 5,517,332 | |
| | | | Sovereign – 0.2% | | | | | | | | | | |
| | | | | |
| | | | United Mexican States | | | | | | | | | | |
| | 1,400 | | | 5.625%, 01/15/2017 | | | | | | | | | 1,591,100 | |
Portfolio of Investments
Nuveen Intermediate Term Bond Fund (continued)
June 30, 2011
| | | | | | | | | | | | | | |
Principal
Amount (000) | | | Description p | | | | | | | | Value | |
| | | | | | | | | | | | | | |
| | | | Transportation – 0.6% | | | | | | | | | | |
| | | | | |
| | | | Union Pacific | | | | | | | | | | |
| $ | 3,320 | | | 5.750%, 11/15/2017 | | | | | | | | $ | 3,814,345 | |
| | | | Wireless Equipment – 0.9% | | | | | | | | | | |
| | | | | |
| | | | Motorola Solutions | | | | | | | | | | |
| | 5,445 | | | 6.000%, 11/15/2017 | | | | | | | | | 6,195,746 | |
| $ | 283,185 | | | Total Corporate Bonds (cost $285,014,433) | | | | | | | | | 302,976,813 | |
| | | | | |
Principal
Amount (000) | | | Description p | | | | | | | | Value | |
| | | | ASSET-BACKED SECURITIES – 14.6% | | | | | | | | | | |
| | | | | |
| | | | Automotive – 4.1% | | | | | | | | | | |
| | | | | |
| | | | Bank of America Auto Trust | | | | | | | | | | |
| | | | Series 2010-2, Class A3 | | | | | | | | | | |
| $ | 2,750 | | | 1.310%, 07/15/2014 | | | | | | | | | 2,767,882 | |
| | | | | |
| | | | DT Auto Owner Trust, Class A | | | | | | | | | | |
| | | | Series 2011-2A | | | | | | | | | | |
| | 2,151 | | | 0.960%, 11/15/2012 | | | | | | | | | 2,150,745 | |
| | | | | |
| | | | Ford Credit Auto Lease Trust | | | | | | | | | | |
| | | | Series 2010-B, Class A3 | | | | | | | | | | |
| | 4,015 | | | 0.910%, 07/15/2013 | | | | | | | | | 4,018,171 | |
| | | | | |
| | | | Ford Credit Auto Owner Trust | | | | | | | | | | |
| | | | Series 2009-A, Class A3A | | | | | | | | | | |
| | 1,433 | | | 3.960%, 05/15/2013 | | | | | | | | | 1,447,080 | |
| | | | | |
| | | | Hertz Vehicle Financing | | | | | | | | | | |
| | | | Series 2009-2A, Class A1 | | | | | | | | | | |
| | 5,000 | | | 4.260%, 03/25/2014 n | | | | | | | | | 5,224,702 | |
| | | | | |
| | | | Nissan Auto Receivables Owner Trust | | | | | | | | | | |
| | | | Series 2007-B, Class A4 | | | | | | | | | | |
| | 2,032 | | | 5.160%, 03/15/2014 | | | | | | | | | 2,065,306 | |
| | | | | |
| | | | Santander Drive Auto Receivables Trust | | | | | | | | | | |
| | | | Series 2010-1, Class A2 | | | | | | | | | | |
| | 3,902 | | | 1.360%, 03/15/2013 | | | | | | | | | 3,909,801 | |
| | | | | |
| | | | Smart Trust | | | | | | | | | | |
| | | | Series 2011-1USA, Class A3B | | | | | | | | | | |
| | 6,215 | | | 1.258%, 12/14/2013 n | | | | | | | | | 6,225,739 | |
| | | | | |
| | | | World Omni Auto Receivables Trust | | | | | | | | | | |
| | | | Series 2010-A, Class A2 | | | | | | | | | | |
| | 201 | | | 0.700%, 05/15/2011 | | | | | | | | | 200,859 | |
| | 27,699 | | | Total Automotive | | | | | | | | | 28,010,285 | |
| | | | Credit Cards – 3.5% | | | | | | | | | | |
| | | | | |
| | | | Bank of America Credit Card Trust | | | | | | | | | | |
| | | | Series 2007-A8, Class A8 | | | | | | | | | | |
| | 5,855 | | | 5.590%, 11/17/2014 | | | | | | | | | 6,141,052 | |
| | | | | |
| | | | Cabela’s Master Credit Card Trust | | | | | | | | | | |
| | | | Series 2010-1A, Class A2 | | | | | | | | | | |
| | 4,030 | | | 1.637%, 01/15/2018 n D | | | | | | | | | 4,169,335 | |
| | | | Series 2010-2A, Class A1 | | | | | | | | | | |
| | 4,340 | | | 2.290%, 09/17/2018 | | | | | | | | | 4,360,865 | |
| | | | | |
| | | | Capital One Multi-Asset Execution Trust | | | | | | | | | | |
| | | | Series 2008-A3, Class A3 | | | | | | | | | | |
| | 4,795 | | | 5.050%, 02/15/2016 | | | | | | | | | 5,155,874 | |
| | | | | |
| | | | Discover Card Master Trust | | | | | | | | | | |
| | | | Series 2007-A1, Class A1 | | | | | | | | | | |
| | 3,530 | | | 5.650%, 03/16/2020 | | | | | | | | | 4,043,687 | |
| | 22,550 | | | Total Credit Cards | | | | | | | | | 23,870,813 | |
| | | | | | | | | | | | | | |
Principal
Amount (000) | | | Description p | | | | | | | | Value | |
| | | | | | | | | | | | | | |
| | | | Home Equity – 2.4% | | | | | | | | | | |
| | | | | |
| | | | Amresco Residential Security Mortgage | | | | | | | | | | |
| | | | Series 1997-3, Class A9 | | | | | | | | | | |
| $ | 16 | | | 6.960%, 03/25/2027 | | | | | | | | $ | 16,423 | |
| | | | | |
| | | | Contimortgage Home Equity Loan Trust | | | | | | | | | | |
| | | | Series 1997-2, Class A9 | | | | | | | | | | |
| | 10 | | | 7.900%, 04/15/2028 | | | | | | | | | 9,518 | |
| | | | | |
| | | | RBSSP Resecuritization Trust | | | | | | | | | | |
| | | | Series 2009-11, Class 4A1 | | | | | | | | | | |
| | 540 | | | 1.994%, 12/26/2037 n D | | | | | | | | | 540,389 | |
| | | | Series 2009-13, Class 5A1 | | | | | | | | | | |
| | 2,839 | | | 0.294%, 11/26/2036 n D | | | | | | | | | 2,803,879 | |
| | | | Series 2009-8, Class 3A1 | | | | | | | | | | |
| | 468 | | | 0.334%, 03/26/2037 n D | | | | | | | | | 459,795 | |
| | | | Series 2009-9, Class 9A1 | | | | | | | | | | |
| | 2,073 | | | 0.486%, 09/26/2037 n D | | | | | | | | | 1,995,037 | |
| | | | Series 2010-10, Class 2A1 | | | | | | | | | | |
| | 2,356 | | | 0.386%, 09/26/2036 n D | | | | | | | | | 2,112,874 | |
| | | | Series 2010-4, Class 1A1 | | | | | | | | | | |
| | 4,505 | | | 0.323%, 03/26/2036 D | | | | | | | | | 4,191,906 | |
| | | | Series 2010-8, Class 4A1 | | | | | | | | | | |
| | 2,334 | | | 0.659%, 07/26/2036 n D | | | | | | | | | 2,199,446 | |
| | | | | |
| | | | Renaissance Home Equity Loan Trust
Series 2005-3, Class AF4 | | | | | | | | | | |
| | 2,590 | | | 5.140%, 11/25/2035 D | | | | | | | | | 2,146,600 | |
| | 17,731 | | | Total Home Equity | | | | | | | | | 16,475,867 | |
| | | | Manufactured Housing – 0.1% | | | | | | | | | | |
| | | | | |
| | | | Green Tree Financial
Series 1996-9, Class A5 | | | | | | | | | | |
| | 52 | | | 7.200%, 01/15/2028 | | | | | | | | | 54,683 | |
| | | | Series 2008-MH1, Class A1 | | | | | | | | | | |
| | 616 | | | 7.000%, 04/25/2038 n | | | | | | | | | 629,845 | |
| | 668 | | | Total Manufactured Housing | | | | | | | | | 684,528 | |
| | | | Other – 3.8% | | | | | | | | | | |
| | | | | |
| | | | AH Mortgage Advance Trust
Series 2010-ADV1, Class A1 | | | | | | | | | | |
| | 2,795 | | | 3.968%, 08/15/2022 n | | | | | | | | | 2,836,925 | |
| | | | Series SART-1, Class A2 | | | | | | | | | | |
| | 3,495 | | | 3.370%, 05/10/2043 n | | | | | | | | | 3,509,330 | |
| | | | | |
| | | | Fieldstone Mortgage Investment
Series 2005-1, Class M4 | | | | | | | | | | |
| | 2,839 | | | 1.266%, 03/25/2035 | | | | | | | | | 2,643,772 | |
| | | | | |
| | | | Henderson Receivables
Series 2010-3A, Class A | | | | | | | | | | |
| | 2,175 | | | 3.820%, 12/15/2048 n | | | | | | | | | 2,149,801 | |
| | | | | |
| | | | Ocwen Advance Receivables Backed Notes
Series 2009-3A, Class A | | | | | | | | | | |
| | 1,960 | | | 4.140%, 07/15/2023 n | | | | | | | | | 1,986,950 | |
| | | | | |
| | | | Small Business Administration
Series 2006-P10A, Class 1 | | | | | | | | | | |
| | 2,055 | | | 5.408%, 02/10/2016 | | | | | | | | | 2,221,324 | |
| | | | Series 2010-10B, Class A | | | | | | | | | | |
| | 5,271 | | | 4.000%, 09/10/2020 | | | | | | | | | 5,237,646 | |
| | | | | |
| | | | Vendee Mortgage Trust
Series 2011-1, Class DA | | | | | | | | | | |
| | 4,954 | | | 3.750%, 04/01/2031 | | | | | | | | | 5,178,584 | |
| | 25,544 | | | Total Other | | | | | | | | | 25,764,332 | |
Portfolio of Investments
Nuveen Intermediate Term Bond Fund (continued)
June 30, 2011
| | | | | | | | | | | | | | |
Principal
Amount (000) | | | Description p | | | | | | | | Value | |
| | | | | | | | | | | | | | |
| | | | Utilities – 0.7% | | | | | | | | | | |
| | | | | |
| | | | CenterPoint Energy Transition
Series 2008-A, Class A1 | | | | | | | | | | |
| $ | 4,569 | | | 4.192%, 02/01/2020 | | | | | | | | $ | 4,921,840 | |
| $ | 98,761 | | | Total Asset-Backed Securities (cost $96,505,366) | | | | | | | | | 99,727,665 | |
| | | | | |
Principal
Amount (000) | | | Description p | | | | | | | | Value | |
| | | | COMMERCIAL MORTGAGE-BACKED SECURITIES – 11.2% | | | | | | | | | | |
| | | | | |
| | | | Americold LLC Trust
Series 2010-ARTA, Class A2FL | | | | | | | | | | |
| $ | 4,415 | | | 2.500%, 01/17/2029 n D | | | | | | | | $ | 4,428,072 | |
| | | | | |
| | | | Bear Stearns Commercial Mortgage Securities
Series 2007-PW15, Class A2 | | | | | | | | | | |
| | 2,478 | | | 5.205%, 02/11/2044 | | | | | | | | | 2,515,043 | |
| | | | | |
| | | | Citigroup/Deutsche Bank Commercial Mortgage Trust
Series 2007-CD4, Class A2B | | | | | | | | | | |
| | 2,340 | | | 5.205%, 12/11/2049 | | | | | | | | | 2,389,460 | |
| | | | | |
| | | | Commercial Mortgage Pass-Through Certificates
Series 2006-CN2A, Class A2FX | | | | | | | | | | |
| | 2,430 | | | 5.449%, 02/05/2019 n | | | | | | | | | 2,435,587 | |
| | | | | |
| | | | Extended Stay America Trust
Series 2010-ESHA, Class A | | | | | | | | | | |
| | 7,216 | | | 2.951%, 11/05/2027 n | | | | | | | | | 7,175,613 | |
| | | | | |
| | | | Fosse Master Issuer
Series 2011-1A, Class A2 | | | | | | | | | | |
| | 2,835 | | | 1.619%, 10/19/2054 n | | | | | | | | | 2,840,043 | |
| | | | | |
| | | | GS Mortgage Securities II
Series 2006-GG6, Class A2 | | | | | | | | | | |
| | 2,370 | | | 5.506%, 04/10/2038 | | | | | | | | | 2,369,185 | |
| | | | Series 2010-C1, Class A1 | | | | | | | | | | |
| | 6,052 | | | 3.679%, 08/12/2043 n | | | | | | | | | 6,160,872 | |
| | | | | |
| | | | GS Mortgage Securities Trust
Series 2007-GG10, Class A4 | | | | | | | | | | |
| | 8,365 | | | 5.992%, 08/10/2045 q | | | | | | | | | 8,980,666 | |
| | | | | |
| | | | JPMorgan Chase Commercial Mortgage Securities Trust
Series 2010-C1, Class A1 | | | | | | | | | | |
| | 4,616 | | | 3.853%, 06/15/2043 n | | | | | | | | | 4,775,095 | |
| | | | Series 2011-C4, Class A3 | | | | | | | | | | |
| | 3,685 | | | 4.106%, 07/15/2046 n | | | | | | | | | 3,677,049 | |
| | | | | |
| | | | JPMorgan Chase Commercial Mortgage Securities Trust
Series 2010-C2, Class A1 | | | | | | | | | | |
| | 3,905 | | | 2.749%, 07/15/2017 n | | | | | | | | | 3,886,090 | |
| | | | | |
| | | | OBP Depositor Trust
Series 2010-OBP, Class A | | | | | | | | | | |
| | 3,200 | | | 4.646%, 07/15/2045 n | | | | | | | | | 3,321,156 | |
| | | | | |
| | | | Vornado DP
Series 2010-VN0, Class A2FX | | | | | | | | | | |
| | 6,000 | | | 4.004%, 09/14/2028 n | | | | | | | | | 5,843,741 | |
| | | | | |
| | | | Wachovia Bank Commercial Mortgage Trust | | | | | | | | | | |
| | | | Series 2007-C30, Class A3 | | | | | | | | | | |
| | 5,940 | | | 5.246%, 12/15/2043 | | | | | | | | | 6,080,783 | |
| | | | Series 2007-C34, Class A2 | | | | | | | | | | |
| | 3,830 | | | 5.569%, 05/15/2046 | | | | | | | | | 3,942,632 | |
| | | | Series 2007-WHL8, Class A1 | | | | | | | | | | |
| | 2,092 | | | 0.267%, 06/15/2020 n D | | | | | | | | | 1,896,645 | |
| | | | | | | | | | | | | | |
Principal
Amount (000) | | | Description p | | | | | | | | Value | |
| | | | | | | | | | | | | | |
| | | | COMMERCIAL MORTGAGE-BACKED SECURITIES (continued) | | | | | | | | | | |
| | | | | |
| | | | WF-RBS Commercial Mortgage Trust | | | | | | | | | | |
| | | | Series 2011-C3, Class A4 | | | | | | | | | | |
| $ | 3,220 | | | 4.375%, 03/15/2044 n | | | | | | | | $ | 3,167,403 | |
| $ | 74,989 | | | Total Commercial Mortgage-Backed Securities (cost $75,529,843) | | | | | | | | | 75,885,135 | |
| | | | | |
Principal
Amount (000) | | | Description p | | | | | | | | Value | |
| | | | U.S. GOVERNMENT & AGENCY SECURITIES – 6.9% | | | | | | | | | | |
| | | | | |
| | | | U.S. Agency Debentures – 5.1% | | | | | | | | | | |
| | | | | |
| | | | Federal Agricultural Mortgage Corporation | | | | | | | | | | |
| $ | 13,900 | | | 5.500%, 07/15/2011 n | | | | | | | | $ | 13,928,509 | |
| | | | | |
| | | | Federal Home Loan Mortgage Corporation | | | | | | | | | | |
| | 7,345 | | | 1.375%, 02/25/2014 q | | | | | | | | | 7,452,465 | |
| | 2,055 | | | 5.000%, 12/14/2018 q | | | | | | | | | 2,159,741 | |
| | | | | |
| | | | Federal National Mortgage Association | | | | | | | | | | |
| | 3,580 | | | 1.000%, 09/23/2013 q | | | | | | | | | 3,608,640 | |
| | 7,595 | | | 2.375%, 07/28/2015 q | | | | | | | | | 7,819,296 | |
| | 34,475 | | | Total U.S. Agency Debentures | | | | | | | | | 34,968,651 | |
| | | | U.S. Treasuries – 1.8% | | | | | | | | | | |
| | | | | |
| | | | U.S. Treasury Bond Loan | | | | | | | | | | |
| | 1,275 | | | 4.750%, 02/15/2041 | | | | | | | | | 1,355,285 | |
| | | | | |
| | | | U.S. Treasury Notes | | | | | | | | | | |
| | 1,085 | | | 1.375%, 01/15/2013 q | | | | | | | | | 1,101,784 | |
| | 1,375 | | | 2.375%, 02/28/2015 q | | | | | | | | | 1,436,449 | |
| | 2,160 | | | 1.250%, 08/31/2015 q | | | | | | | | | 2,150,381 | |
| | 6,065 | | | 2.625%, 11/15/2020 q | | | | | | | | | 5,841,353 | |
| | 11,960 | | | Total U.S. Treasuries | | | | | | | | | 11,885,252 | |
| $ | 46,435 | | | Total U.S. Government & Agency Securities (cost $46,333,696) | | | | | | | | | 46,853,903 | |
| | | | | |
Principal
Amount (000) | | | Description p | | | | | | | | Value | |
| | | | COLLATERALIZED MORTGAGE OBLIGATION – U.S. GOVERNMENT AGENCY MORTGAGE-BACKED SECURITIES – 6.7% | | | | | | | | | | |
| | | | | |
| | | | Adjustable Rate D – 2.1% | | | | | | | | | | |
| | | | | |
| | | | Federal Home Loan Mortgage Corporation | | | | | | | | | | |
| | | | Series 2755, Class FO | | | | | | | | | | |
| $ | 3,468 | | | 0.637%, 04/15/2032 | | | | | | | | $ | 3,472,079 | |
| | | | Series 2863 | | | | | | | | | | |
| | 2,233 | | | 0.687%, 02/15/2019 | | | | | | | | | 2,240,728 | |
| | | | | |
| | | | Federal National Mortgage Association | | | | | | | | | | |
| | | | Series 2003-52, Class NF | | | | | | | | | | |
| | 3,085 | | | 0.586%, 06/25/2023 | | | | | | | | | 3,089,118 | |
| | | | Series 2010-M6, Class A1 | | | | | | | | | | |
| | 5,130 | | | 2.210%, 09/25/2020 | | | | | | | | | 5,026,551 | |
| | 13,916 | | | Total Adjustable Rate | | | | | | | | | 13,828,476 | |
| | | | Fixed Rate – 4.6% | | | | | | | | | | |
| | | | | |
| | | | Federal Home Loan Mortgage Corporation | | | | | | | | | | |
| | | | Series 1167, Class E | | | | | | | | | | |
| | 13 | | | 7.500%, 11/15/2021 | | | | | | | | | 15,020 | |
| | | | Series 1286, Class A | | | | | | | | | | |
| | 32 | | | 6.000%, 05/15/2022 | | | | | | | | | 35,682 | |
| | | | Series 2750, Class HE | | | | | | | | | | |
| | 4,599 | | | 5.000%, 02/15/2019 | | | | | | | | | 4,930,441 | |
| | | | Series 2780, Class QC | | | | | | | | | | |
| | 97 | | | 4.500%, 03/15/2017 | | | | | | | | | 96,727 | |
| | | | Series 2795, Class CL | | | | | | | | | | |
| | 2,576 | | | 4.500%, 07/15/2017 | | | | | | | | | 2,616,141 | |
Portfolio of Investments
Nuveen Intermediate Term Bond Fund (continued)
June 30, 2011
| | | | | | | | | | | | | | |
Principal
Amount (000) | | | Description p | | | | | | | | Value | |
| | | | | | | | | | | | | | |
| | | | Fixed Rate (continued) | | | | | | | | | | |
| | | | Series 3555, Class DA | | | | | | | | | | |
| $ | 3,363 | | | 4.000%, 12/15/2014 | | | | | | | | $ | 3,464,854 | |
| | | | Series 3555, Class EA | | | | | | | | | | |
| | 2,382 | | | 4.000%, 12/15/2014 | | | | | | | | | 2,454,271 | |
| | | | Series T-47, Class A6 | | | | | | | | | | |
| | 4,888 | | | 4.159%, 08/27/2012 | | | | | | | | | 4,963,156 | |
| | | | | |
| | | | Federal National Mortgage Association | | | | | | | | | | |
| | | | Series 1990-89, Class K | | | | | | | | | | |
| | 11 | | | 6.500%, 07/25/2020 | | | | | | | | | 12,033 | |
| | | | Series 2003-30, Class AE | | | | | | | | | | |
| | 2,994 | | | 3.900%, 10/25/2017 | | | | | | | | | 3,070,013 | |
| | | | Series 2009-M1, Class A1 | | | | | | | | | | |
| | 3,554 | | | 3.400%, 07/25/2019 | | | | | | | | | 3,717,444 | |
| | | | Series 2010-M1, Class A1 | | | | | | | | | | |
| | 5,891 | | | 3.305%, 06/25/2019 | | | | | | | | | 6,130,827 | |
| | 30,400 | | | Total Fixed Rate | | | | | | | | | 31,506,609 | |
| $ | 44,316 | | | Total Collateralized Mortgage Obligation – U.S. Government Agency Mortgage-Backed Securities (cost $44,587,762) | | | | | | | | | 45,335,085 | |
| | | | | |
Principal
Amount (000) | | | Description p | | | | | | | | Value | |
| | | | U.S. GOVERNMENT AGENCY MORTGAGE-BACKED SECURITIES – 4.5% | | | | | | | | | | |
| | | | | |
| | | | Adjustable Rate D – 4.1% | | | | | | | | | | |
| | | | | |
| | | | Federal Home Loan Mortgage Corporation Pool | | | | | | | | | | |
| $ | 606 | | | 2.683%, 01/01/2028, #786281 | | | | | | | | $ | 639,091 | |
| | 701 | | | 2.441%, 04/01/2029, #847190 | | | | | | | | | 736,379 | |
| | 2,040 | | | 2.467%, 10/01/2030, #847209 | | | | | | | | | 2,137,663 | |
| | 668 | | | 2.502%, 05/01/2031, #847161 | | | | | | | | | 702,350 | |
| | 1,673 | | | 2.520%, 09/01/2033, #847210 | | | | | | | | | 1,759,048 | |
| | 3,044 | | | 2.660%, 01/01/2038, #848282 | | | | | | | | | 3,186,435 | |
| | | | | |
| | | | Federal National Mortgage Association Pool | | | | | | | | | | |
| | 1,004 | | | 2.510%, 09/01/2033, #725111 | | | | | | | | | 1,058,838 | |
| | 4,183 | | | 2.966%, 10/01/2033, #879906 | | | | | | | | | 4,405,058 | |
| | 3,896 | | | 2.540%, 03/01/2035, #819652 | | | | | | | | | 4,101,691 | |
| | 654 | | | 2.180%, 12/01/2035, #848390 | | | | | | | | | 669,409 | |
| | 2,911 | | | 2.599%, 07/01/2036, #AE0058 | | | | | | | | | 3,055,191 | |
| | 1,479 | | | 2.858%, 07/01/2036, #886034 | | | | | | | | | 1,552,793 | |
| | 1,274 | | | 2.639%, 09/01/2036, #995949 | | | | | | | | | 1,336,613 | |
| | 2,540 | | | 2.498%, 03/01/2038, #AD0706 | | | | | | | | | 2,669,126 | |
| | 26,673 | | | Total Adjustable Rate | | | | | | | | | 28,009,685 | |
| | | | Fixed Rate – 0.4% | | | | | | | | | | |
| | | | | |
| | | | Federal Home Loan Mortgage Corporation | | | | | | | | | | |
| | | | Series K001, Class A3 | | | | | | | | | | |
| | 171 | | | 5.469%, 01/25/2012 | | | | | | | | | 170,433 | |
| | | | | |
| | | | Federal National Mortgage Association Pool | | | | | | | | | | |
| | 2,600 | | | 3.131%, 01/01/2015, #464373 | | | | | | | | | 2,682,665 | |
| | 2,771 | | | Total Fixed Rate | | | | | | | | | 2,853,098 | |
| $ | 29,444 | | | Total U.S. Government Agency Mortgage-Backed Securities (cost $30,198,950) | | | | | | | | | 30,862,783 | |
| | | | | |
Principal
Amount (000) | | | Description p | | | | | | | | Value | |
| | | | COLLATERALIZED MORTGAGE OBLIGATION – PRIVATE MORTGAGE-BACKED SECURITIES – 5.3% | | | | | | | | | | |
| | | | | |
| | | | Adjustable Rate D – 3.2% | | | | | | | | | | |
| | | | | |
| | | | Arkle Master Issuer PLC, Class 2A | | | | | | | | | | |
| | | | Series 2010-1A | | | | | | | | | | |
| $ | 3,570 | | | 1.464%, 05/17/2060 n | | | | | | | | | 3,564,245 | |
| | | | | | | | | | | | | | |
Principal
Amount (000) | | | Description p | | | | | | | | Value | |
| | | | | | | | | | | | | | |
| | | | | |
| | | | Adjustable Rate D (continued) | | | | | | | | | | |
| | | | | |
| | | | NCUA Guaranteed Notes | | | | | | | | | | |
| | | | Series 2010-R2, Class 1A | | | | | | | | | | |
| $ | 6,885 | | | 0.560%, 11/06/2017 | | | | | | | | $ | 6,887,625 | |
| | | | Series 2010-R3, Class 2A | | | | | | | | | | |
| | 5,744 | | | 0.825%, 12/08/2020 | | | | | | | | | 5,776,880 | |
| | | | | |
| | | | Structured Mortgage Loan Trust | | | | | | | | | | |
| | | | Series 2004-11, Class A | | | | | | | | | | |
| | 222 | | | 2.653%, 08/25/2034 | | | | | | | | | 200,009 | |
| | | | | |
| | | | Wells Fargo Mortgage Backed Securities Trust | | | | | | | | | | |
| | | | Series 2003-J, Class 2A5 | | | | | | | | | | |
| | 1,800 | | | 4.419%, 10/25/2033 | | | | | | | | | 1,799,992 | |
| | | | | |
| | | | WF-RBS Commercial Mortgage Trust | | | | | | | | | | |
| | | | Series 2011-C2, Class A4 | | | | | | | | | | |
| | 3,275 | | | 5.000%, 02/15/2044 n q | | | | | | | | | 3,357,087 | |
| | 21,496 | | | Total Adjustable Rate | | | | | | | | | 21,585,838 | |
| | | | Fixed Rate – 2.1% | | | | | | | | | | |
| | | | | |
| | | | FDIC Structured Sale Guaranteed Notes | | | | | | | | | | |
| | | | Series 2010-S1, Class 2A | | | | | | | | | | |
| | 3,637 | | | 3.250%, 04/25/2038 n | | | | | | | | | 3,722,782 | |
| | | | | |
| | | | GMAC Mortgage Corporation Loan Trust | | | | | | | | | | |
| | | | Series 2010-1, Class A | | | | | | | | | | |
| | 338 | | | 4.250%, 07/25/2040 n | | | | | | | | | 339,163 | |
| | | | | |
| | | | Mortgage Equity Conversion Asset Trust | | | | | | | | | | |
| | | | Series 2010-1A, Class A | | | | | | | | | | |
| | 2,647 | | | 4.000%, 07/25/2060 n | | | | | | | | | 2,649,451 | |
| | | | | |
| | | | NCUA Guaranteed Notes | | | | | | | | | | |
| | | | Series 2010-C1, Class A1 | | | | | | | | | | |
| | 4,876 | | | 1.600%, 10/29/2020 | | | | | | | | | 4,866,426 | |
| | | | | |
| | | | Sequoia Mortgage Trust | | | | | | | | | | |
| | | | Series 2011-1, Class A1 | | | | | | | | | | |
| | 2,894 | | | 4.125%, 02/25/2041 | | | | | | | | | 2,900,345 | |
| | 14,392 | | | Total Fixed Rate | | | | | | | | | 14,478,167 | |
| $ | 35,888 | | | Total Collateralized Mortgage Obligation – Private Mortgage-Backed
Securities (cost $35,859,890) | | | | | | | | | 36,064,005 | |
| | | | | |
Principal
Amount (000) | | | Description p | | | | | | | | Value | |
| | | | MUNICIPAL BONDS – 1.5% | | | | | | | | | | |
| | | | | |
| | | | Illinois | | | | | | | | | | |
| $ | 3,735 | | | 5.877%, 03/01/2019 | | | | | | | | $ | 3,854,333 | |
| | | | | |
| | | | Louisiana Local Government Environmental Facilities, Community Development Authority | | | | | | | | | | |
| | | | Series A1 | | | | | | | | | | |
| | 6,500 | | | 1.520%, 02/01/2018 | | | | | | | | | 6,529,250 | |
| $ | 10,235 | | | Total Municipal Bonds (cost $10,233,661) | | | | | | | | | 10,383,583 | |
| | | | | |
| Shares | | | Description p | | | | | | | | Value | |
| | | | INVESTMENTS PURCHASED WITH PROCEEDS FROM SECURITIES LENDING | | | | | | | | | | |
| | | | | |
| | | | Money Market Funds – 17.4% | | | | | | | | | | |
| | | | | |
| | | | Mount Vernon Securities Lending Prime Portfolio | | | | | | | | | | |
| | 118,842,841 | | | 0.197% W † | | | | | | | | | 118,842,841 | |
| | | | Total Investments Purchased With Proceeds From Securities Lending (cost $118,842,841) | | | | | | | | | 118,842,841 | |
Portfolio of Investments
Nuveen Intermediate Term Bond Fund (continued)
June 30, 2011
| | | | | | | | | | | | | | |
Shares/
Principal
Amount (000) | | | Description p | | | | | | | | Value | |
| | | | SHORT-TERM INVESTMENTS – 5.7% | | | | | | | | | | |
| | | | | |
| | | | Money Market Fund – 5.4% | | | | | | | | | | |
| | | | | |
| | | | First American Prime Obligations Fund, Class Z | | | | | | | | | | |
| | 36,913,381 | | | 0.042% W | | | | | | | | $ | 36,913,381 | |
| | | | U.S. Treasury Obligations – 0.3% | | | | | | | | | | |
| | | | | |
| | | | U.S. Treasury Bills ¨ | | | | | | | | | | |
| $ | 850 | | | 0.035%, 10/20/2011 | | | | | | | | | 849,908 | |
| | 380 | | | 0.055%, 11/17/2011 | | | | | | | | | 379,919 | |
| | 400 | | | 0.018%, 07/21/2011 | | | | | | | | | 399,996 | |
| | 110 | | | 0.060%, 11/10/2011 | | | | | | | | | 109,976 | |
| $ | 1,740 | | | Total U.S. Treasury Obligations | | | | | | | | | 1,739,799 | |
| | | | Total Short-Term Investments (cost $38,652,815) | | | | | | | | | 38,653,180 | |
| | | | Total Investments (cost $781,759,257) – 118.3% | | | | | | | | | 805,584,993 | |
| | | | Other Assets Less Liabilities – (18.3)% ¯ | | | | | | | | | (124,801,899) | |
| | | | Net Assets – 100.0% | | | | | | | | $ | 680,783,094 | |
Investments in Derivatives
Futures Contracts outstanding at June 30, 2011:
| | | | | | | | | | | | | | | | | | | | |
| Type | | Contract
Position | | | Number of
Contracts | | | Contract
Expiration | | | Value | | | Unrealized
Appreciation
(Depreciation) | |
U.S. Treasury 2-Year Note | | | Long | | | | 186 | | | | 9/11 | | | $ | 40,797,939 | | | $ | 94,461 | |
U.S. Treasury 5-Year Note | | | Long | | | | 312 | | | | 9/11 | | | | 37,188,937 | | | | (16,327 | ) |
U.S. Treasury 10-Year Note | | | Short | | | | (52 | ) | | | 9/11 | | | | (6,361,063 | ) | | | (7,538 | ) |
U.S. Treasury Long Bond Futures | | | Short | | | | (32 | ) | | | 9/11 | | | | (3,937,000 | ) | | | 24,309 | |
| | | | | | | | | | | | | | | | | | | $ | 94,905 | |
Interest Rate Swaps outstanding at June 30, 2011:
| | | | | | | | | | | | | | | | | | | | | | | | | | | | |
| Counterparty | | Notional
Amount | | | Fund
Pay/Receive
Floating Rate | | | Floating Rate
Index | | | Fixed
Rate* | | | Fixed Rate
Payment
Frequency | | | Termination
Date | | | Unrealized
Appreciation
(Depreciation) | |
JPMorgan | | $ | 20,000,000 | | | | Receive | | | | 3-Month LIBOR | | | | 1.255 | % | | | Semi-Annually | | | | 11/03/11 | | | $ | (95,684 | ) |
JPMorgan | | | 5,000,000 | | | | Receive | | | | 3-Month LIBOR | | | | 3.858 | | | | Semi-Annually | | | | 1/19/20 | | | | (406,935 | ) |
UBS | | | 19,000,000 | | | | Receive | | | | 3-Month LIBOR | | | | 1.358 | | | | Semi-Annually | | | | 9/25/11 | | | | (118,136 | ) |
UBS | | | 19,000,000 | | | | Receive | | | | 3-Month LIBOR | | | | 1.133 | | | | Semi-Annually | | | | 3/25/12 | | | | (166,843 | ) |
UBS | | | 20,000,000 | | | | Receive | | | | 3-Month LIBOR | | | | 1.048 | | | | Semi-Annually | | | | 6/25/12 | | | | (131,973 | ) |
UBS | | | 8,000,000 | | | | Receive | | | | 3-Month LIBOR | | | | 3.001 | | | | Semi-Annually | | | | 8/03/14 | | | | (538,489 | ) |
| | | | | | | | | | | | | | | | | | | | | | | | | | | $ | (1,458,060 | ) |
| | | | For Fund portfolio compliance purposes, the Fund’s industry classifications refer to any one or more of the industry sub-classifications used by one or more widely recognized market indexes or ratings group indexes, and/or as defined by Fund management. This definition may not apply for purposes of this report which may combine industry sub-classifications into sectors for reporting ease. |
| | p | | All Percentages shown in the Portfolio of Investments are based on net assets. |
| | n | | Investment is exempt from registration under Rule 144A of the Securities Act of 1933, as amended. These investments may only be resold in transactions exempt from registration, which are normally those transactions with qualified institutional buyers. |
| | q | | Investment, or a portion of investment, is out on loan for securities lending. |
| | D | | Variable Rate Security – The rate shown is the rate in effect as of June 30, 2011. |
| | W | | The rate shown is the annualized seven-day effective yield as of June 30, 2011. |
| | ¨ | | Investment, or portion of investment, segregated as collateral for investments in derivatives. Yield shown is effective yield as of June 30, 2011. |
| | † | | The Fund may loan securities representing up to one third of the fair value of its total assets (which includes collateral for securities on loan) to broker-dealers, banks, or other institutional borrowers of securities. The Fund maintains collateral equal to at least 102% of the fair value of the securities loaned. The adequacy of the collateral is monitored on a daily basis. The cash collateral received by the Fund is invested in this money market fund. |
| | ¯ | | Other Assets Less Liabilities includes the net Unrealized Appreciation (Depreciation) of derivatives instruments as listed within Investments in Derivatives. |
| | LIBOR | | London Inter-Bank Offered Risk |
| | REIT | | Real Estate Investment Trust |
See accompanying notes to financial statements.
Portfolio of Investments
Nuveen Short Term Bond Fund
(formerly known as First American Short Term Bond Fund)
June 30, 2011
| | | | | | | | | | | | | | |
Principal
Amount (000) • | | | Description p | | | | | | | | Value | |
| | | | | | | | | | | | | | |
| | | | CORPORATE BONDS – 45.2% | | | | | | | | | | |
| | | | | |
| | | | Banking – 8.3% | | | | | | | | | | |
| | | | | |
| | | | Ally Financial | | | | | | | | | | |
| $ | 1,000 | | | 8.300%, 02/12/2015 | | | | | | | | $ | 1,117,500 | |
| | | | | |
| | | | Banco do Nordeste | | | | | | | | | | |
| | 800 | | | 3.625%, 11/09/2015 | | | | | | | | | 786,000 | |
| | | | | |
| | | | Bank of America
Series MTN | | | | | | | | | | |
| | 1,500 | | | 1.724%, 01/30/2014 D | | | | | | | | | 1,503,456 | |
| | | | | |
| | | | Barclays Bank | | | | | | | | | | |
| | 2,000 | | | 2.375%, 01/13/2014 q | | | | | | | | | 2,023,752 | |
| | | | | |
| | | | BB&T
Series MTN | | | | | | | | | | |
| | 1,910 | | | 3.200%, 03/15/2016 | | | | | | | | | 1,953,865 | |
| | | | | |
| | | | BBVA Bancomer | | | | | | | | | | |
| | 1,050 | | | 4.500%, 03/10/2016 n q | | | | | | | | | 1,068,375 | |
| | | | | |
| | | | Citigroup | | | | | | | | | | |
| | 1,000 | | | 5.850%, 07/02/2013 | | | | | | | | | 1,071,759 | |
| | 4,500 | | | 6.375%, 08/12/2014 | | | | | | | | | 4,975,762 | |
| | 3,000 | | | 4.587%, 12/15/2015 | | | | | | | | | 3,154,827 | |
| | | | | |
| | | | Credit Suisse New York | | | | | | | | | | |
| | 1,000 | | | 5.500%, 05/01/2014 q | | | | | | | | | 1,098,345 | |
| | | | | |
| | | | Deutsche Bank | | | | | | | | | | |
| | 2,000 | | | 2.375%, 01/11/2013 | | | | | | | | | 2,028,956 | |
| | 2,000 | | | 3.875%, 08/18/2014 | | | | | | | | | 2,102,192 | |
| | | | | |
| | | | Fifth Third Bancorp | | | | | | | | | | |
| | 1,755 | | | 6.250%, 05/01/2013 | | | | | | | | | 1,900,088 | |
| | 1,900 | | | 3.625%, 01/25/2016 | | | | | | | | | 1,916,505 | |
| | | | | |
| | | | ING Bank | | | | | | | | | | |
| | 1,675 | | | 4.000%, 03/15/2016 n | | | | | | | | | 1,695,164 | |
| | | | | |
| | | | JPMorgan Chase | | | | | | | | | | |
| | 3,830 | | | 5.125%, 09/15/2014 q | | | | | | | | | 4,138,882 | |
| | 2,000 | | | 3.700%, 01/20/2015 | | | | | | | | | 2,079,614 | |
| | | | Series MTN | | | | | | | | | | |
| | 1,750 | | | 1.103%, 01/24/2014 D | | | | | | | | | 1,754,461 | |
| | | | | |
| | | | Keycorp
Series MTN | | | | | | | | | | |
| | 1,000 | | | 6.500%, 05/14/2013 | | | | | | | | | 1,088,149 | |
| | | | | |
| | | | Lloyds TSB Bank | | | | | | | | | | |
| | 1,245 | | | 4.375%, 01/12/2015 n | | | | | | | | | 1,263,555 | |
| | | | | |
| | | | Nordea Bank | | | | | | | | | | |
| | 1,500 | | | 2.125%, 01/14/2014 n | | | | | | | | | 1,510,486 | |
| | | | | |
| | | | Nordea Eiendomskreditt
Class A | | | | | | | | | | |
| | 4,200 | | | 1.875%, 04/07/2014 n D q | | | | | | | | | 4,242,550 | |
| | | | | |
| | | | PNC Funding | | | | | | | | | | |
| | 1,500 | | | 3.625%, 02/08/2015 q | | | | | | | | | 1,579,884 | |
| | | | | |
| | | | Rabobank Nederland | | | | | | | | | | |
| | 1,400 | | | 3.200%, 03/11/2015 n | | | | | | | | | 1,448,349 | |
| | | | | |
| | | | Royal Bank of Scotland | | | | | | | | | | |
| | 1,900 | | | 4.875%, 08/25/2014 n | | | | | | | | | 1,977,453 | |
| | | | | |
| | | | Santander | | | | | | | | | | |
| | 2,000 | | | 2.485%, 01/18/2013 n | | | | | | | | | 1,980,378 | |
| | | | | |
| | | | Societe Generale | | | | | | | | | | |
| | 3,000 | | | 2.500%, 01/15/2014 n | | | | | | | | | 2,986,158 | |
Portfolio of Investments
Nuveen Short Term Bond Fund (continued)
June 30, 2011
| | | | | | | | | | | | | | |
Principal
Amount (000) • | | | Description p | | | | | | | | Value | |
| | | | | | | | | | | | | | |
| | | | Banking (continued) | | | | | | | | | | |
| | | | | |
| | | | UBS | | | | | | | | | | |
| $ | 1,000 | | | 3.875%, 01/15/2015 q | | | | | | | | $ | 1,043,809 | |
| | | | Series BKNT | | | | | | | | | | |
| | 2,650 | | | 2.250%, 08/12/2013 | | | | | | | | | 2,695,609 | |
| | | | Series FRN | | | | | | | | | | |
| | 3,000 | | | 1.304%, 01/28/2014 D | | | | | | | | | 3,012,930 | |
| | | | | |
| | | | Wells Fargo | | | | | | | | | | |
| | 3,080 | | | 5.200%, 06/15/2016 q | | | | | | | | | 3,164,204 | |
| | | | Series AI | | | | | | | | | | |
| | 2,000 | | | 4.750%, 02/09/2015 | | | | | | | | | 2,139,170 | |
| | | | Series I | | | | | | | | | | |
| | 2,000 | | | 3.750%, 10/01/2014 q | | | | | | | | | 2,107,816 | |
| | 66,145 | | | Total Banking | | | | | | | | | 68,610,003 | |
| | | | Basic Industry – 2.3% | | | | | | | | | | |
| | | | | |
| | | | Anglo American Capital | | | | | | | | | | |
| | 1,000 | | | 2.150%, 09/27/2013 n | | | | | | | | | 1,013,172 | |
| | | | | |
| | | | Arcelormittal | | | | | | | | | | |
| | 4,000 | | | 3.750%, 03/01/2016 | | | | | | | | | 4,044,700 | |
| | | | | |
| | | | Codelco | | | | | | | | | | |
| | 2,400 | | | 5.500%, 10/15/2013 n | | | | | | | | | 2,580,545 | |
| | | | | |
| | | | Dow Chemical | | | | | | | | | | |
| | 2,630 | | | 2.500%, 02/15/2016 | | | | | | | | | 2,611,035 | |
| | | | | |
| | | | Noble Holding International | | | | | | | | | | |
| | 1,825 | | | 3.450%, 08/01/2015 | | | | | | | | | 1,889,016 | |
| | | | | |
| | | | Potash Corporation of Saskatchewan | | | | | | | | | | |
| | 1,500 | | | 3.750%, 09/30/2015 | | | | | | | | | 1,593,640 | |
| | | | | |
| | | | PPG | | | | | | | | | | |
| | 1,000 | | | 1.900%, 01/15/2016 | | | | | | | | | 973,721 | |
| | | | | |
| | | | Rio Tinto Financial | | | | | | | | | | |
| | 1,000 | | | 8.950%, 05/01/2014 | | | | | | | | | 1,200,872 | |
| | | | | |
| | | | United States Steel | | | | | | | | | | |
| | 1,000 | | | 5.650%, 06/01/2013 q | | | | | | | | | 1,042,500 | |
| | | | | |
| | | | Valeant Pharmaceuticals | | | | | | | | | | |
| | 1,500 | | | 6.500%, 07/15/2016 n | | | | | | | | | 1,483,125 | |
| | | | | |
| | | | Vedanta Resources | | | | | | | | | | |
| | 420 | | | 9.500%, 07/18/2018 n q | | | | | | | | | 457,800 | |
| | 18,275 | | | Total Basic Industry | | | | | | | | | 18,890,126 | |
| | | | Brokerage – 2.2% | | | | | | | | | | |
| | | | | |
| | | | Goldman Sachs Group | | | | | | | | | | |
| | 3,900 | | | 1.311%, 02/07/2014 D q | | | | | | | | | 3,867,642 | |
| | 7,000 | | �� | 3.700%, 08/01/2015 | | | | | | | | | 7,127,876 | |
| | | | | |
| | | | Morgan Stanley | | | | | | | | | | |
| | 3,165 | | | 1.903%, 01/24/2014 D | | | | | | | | | 3,187,231 | |
| | 2,000 | | | 4.200%, 11/20/2014 | | | | | | | | | 2,077,022 | |
| | | | Series GMTN | | | | | | | | | | |
| | 1,645 | | | 4.100%, 01/26/2015 | | | | | | | | | 1,690,063 | |
| | | | | |
| | 17,710 | | | Total Brokerage | | | | | | | | | 17,949,834 | |
| | | | Capital Goods – 1.0% | | | | | | | | | | |
| | | | | |
| | | | Case New Holland | | | | | | | | | | |
| | 1,000 | | | 7.750%, 09/01/2013 | | | | | | | | | 1,082,500 | |
| | | | | |
| | | | Caterpillar Financial Services | | | | | | | | | | |
| | | | Series MTN | | | | | | | | | | |
| | 2,490 | | | 4.900%, 08/15/2013 | | | | | | | | | 2,681,479 | |
| | | | | | | | | | | | | | |
Principal
Amount (000) • | | | Description p | | | | | | | | Value | |
| | | | | | | | | | | | | | |
| | | | Capital Goods (continued) | | | | | | | | | | |
| | | | | |
| | | | ITT | | | | | | | | | | |
| $ | 1,779 | | | 4.900%, 05/01/2014 | | | | | | | | $ | 1,940,688 | |
| | | | | |
| | | | L-3 Communications | | | | | | | | | | |
| | | | Series B | | | | | | | | | | |
| | 1,000 | | | 6.375%, 10/15/2015 q | | | | | | | | | 1,027,500 | |
| | | | | |
| | | | Northrop Grumman | | | | | | | | | | |
| | 1,707 | | | 3.700%, 08/01/2014 | | | | | | | | | 1,811,376 | |
| | | | | |
| | 7,976 | | | Total Capital Goods | | | | | | | | | 8,543,543 | |
| | | | Communications – 5.1% | | | | | | | | | | |
| | | | | |
| | | | American Tower | | | | | | | | | | |
| | 2,000 | | | 4.625%, 04/01/2015 | | | | | | | | | 2,105,504 | |
| | | | | |
| | | | AT&T | | | | | | | | | | |
| | 2,000 | | | 6.700%, 11/15/2013 | | | | | | | | | 2,242,774 | |
| | 2,250 | | | 2.500%, 08/15/2015 q | | | | | | | | | 2,279,275 | |
| | | | | |
| | | | British Telecom | | | | | | | | | | |
| | 2,000 | | | 5.150%, 01/15/2013 | | | | | | | | | 2,120,430 | |
| | | | | |
| | | | CenturyLink | | | | | | | | | | |
| | | | Series L | | | | | | | | | | |
| | 1,900 | | | 7.875%, 08/15/2012 | | | | | | | | | 2,019,637 | |
| | | | | |
| | | | Comcast | | | | | | | | | | |
| | 1,000 | | | 5.300%, 01/15/2014 | | | | | | | | | 1,096,681 | |
| | | | | |
| | | | Deutsche Telekom | | | | | | | | | | |
| | 1,550 | | | 5.875%, 08/20/2013 | | | | | | | | | 1,696,390 | |
| | | | | |
| | | | DirecTV Holdings | | | | | | | | | | |
| | 1,700 | | | 3.550%, 03/15/2015 q | | | | | | | | | 1,776,174 | |
| | 2,000 | | | 3.125%, 02/15/2016 q | | | | | | | | | 2,029,008 | |
| | | | | |
| | | | Frontier Communications | | | | | | | | | | |
| | 1,500 | | | 6.625%, 03/15/2015 | | | | | | | | | 1,563,750 | |
| | | | | |
| | | | NBC Universal | | | | | | | | | | |
| | 2,000 | | | 3.650%, 04/30/2015 n | | | | | | | | | 2,099,826 | |
| | | | | |
| | | | News America | | | | | | | | | | |
| | 1,000 | | | 5.300%, 12/15/2014 q | | | | | | | | | 1,114,695 | |
| | | | | |
| | | | Sprint Capital | | | | | | | | | | |
| | 2,000 | | | 8.375%, 03/15/2012 q | | | | | | | | | 2,080,000 | |
| | | | | |
| | | | TCM Sub | | | | | | | | | | |
| | 1,000 | | | 3.550%, 01/15/2015 n | | | | | | | | | 1,044,953 | |
| | | | | |
| | | | Telecom Italia Capital | | | | | | | | | | |
| | 1,540 | | | 4.950%, 09/30/2014 | | | | | | | | | 1,605,709 | |
| | | | | |
| | | | Telefonica Emisiones | | | | | | | | | | |
| | 1,450 | | | 2.582%, 04/26/2013 | | | | | | | | | 1,464,999 | |
| | | | | |
| | | | Telefonica Moviles | | | | | | | | | | |
| | 1,000 | | | 2.875%, 11/09/2015 n | | | | | | | | | 982,238 | |
| | | | | |
| | | | Time Warner Cable | | | | | | | | | | |
| | 1,025 | | | 8.250%, 02/14/2014 | | | | | | | | | 1,192,228 | |
| | | | | |
| | | | Unitymedia Hessen | | | | | | | | | | |
| | 1,000 | | | 8.125%, 12/01/2017 n | | | | | | | | | 1,062,500 | |
| | | | | |
| | | | Verizon Wireless | | | | | | | | | | |
| | 3,750 | | | 5.550%, 02/01/2014 q | | | | | | | | | 4,133,363 | |
| | | | | |
| | | | Vodafone Group | | | | | | | | | | |
| | 2,500 | | | 5.000%, 09/15/2015 q | | | | | | | | | 2,755,862 | |
| | | | | |
| | | | Windstream | | | | | | | | | | |
| | 1,600 | | | 8.125%, 08/01/2013 | | | | | | | | | 1,736,000 | |
Portfolio of Investments
Nuveen Short Term Bond Fund (continued)
June 30, 2011
| | | | | | | | | | | | | | |
Principal
Amount (000) • | | | Description p | | | | | | | | Value | |
| | | | | | | | | | | | | | |
| | | | Communications (continued) | | | | | | | | | | |
| | | | | |
| | | | XM Satellite Radio | | | | | | | | | | |
| $ | 1,500 | | | 13.000%, 08/01/2014 | | | | | | | | $ | 1,758,750 | |
| | 39,265 | | | Total Communications | | | | | | | | | 41,960,746 | |
| | | | Consumer Cyclical – 0.7% | | | | | | | | | | |
| | | | | |
| | | | American Axle & Manufacturing | | | | | | | | | | |
| | 1,000 | | | 5.250%, 02/11/2014 | | | | | | | | | 987,500 | |
| | | | | |
| | | | Ford Motor Credit | | | | | | | | | | |
| | 1,500 | | | 7.000%, 10/01/2013 q | | | | | | | | | 1,603,015 | |
| | | | | |
| | | | Home Depot | | | | | | | | | | |
| | 2,000 | | | 5.400%, 03/01/2016 | | | | | | | | | 2,234,828 | |
| | | | | |
| | | | Viacom | | | | | | | | | | |
| | 1,000 | | | 4.375%, 09/15/2014 | | | | | | | | | 1,074,020 | |
| | 5,500 | | | Total Consumer Cyclical | | | | | | | | | 5,899,363 | |
| | | | Consumer Non Cyclical – 4.9% | | | | | | | | | | |
| | | | | |
| | | | Boston Scientific | | | | | | | | | | |
| | 2,000 | | | 4.500%, 01/15/2015 | | | | | | | | | 2,108,746 | |
| | | | | |
| | | | Bunge Limited Finance | | | | | | | | | | |
| | 2,000 | | | 5.875%, 05/15/2013 | | | | | | | | | 2,130,982 | |
| | | | | |
| | | | Cardinal Health | | | | | | | | | | |
| | 915 | | | 5.500%, 06/15/2013 q | | | | | | | | | 987,612 | |
| | | | | |
| | | | CKE Restaurants | | | | | | | | | | |
| | 950 | | | 11.375%, 07/15/2018 | | | | | | | | | 1,046,188 | |
| | | | | |
| | | | ConAgra Foods | | | | | | | | | | |
| | 1,950 | | | 5.875%, 04/15/2014 | | | | | | | | | 2,141,691 | |
| | | | | |
| | | | Constellation Brands | | | | | | | | | | |
| | 1,500 | | | 8.375%, 12/15/2014 | | | | | | | | | 1,706,250 | |
| | | | | |
| | | | Covidien International | | | | | | | | | | |
| | 3,750 | | | 1.875%, 06/15/2013 | | | | | | | | | 3,814,024 | |
| | | | | |
| | | | Dr. Pepper Snapple Group | | | | | | | | | | |
| | 1,360 | | | 2.900%, 01/15/2016 | | | | | | | | | 1,376,263 | |
| | | | | |
| | | | Genentech | | | | | | | | | | |
| | 2,000 | | | 4.750%, 07/15/2015 | | | | | | | | | 2,204,498 | |
| | | | | |
| | | | General Mills | | | | | | | | | | |
| | 2,590 | | | 1.550%, 05/16/2014 | | | | | | | | | 2,607,806 | |
| | | | | |
| | | | HCA | | | | | | | | | | |
| | 1,500 | | | 6.750%, 07/15/2013 | | | | | | | | | 1,563,750 | |
| | | | | |
| | | | Kraft Foods | | | | | | | | | | |
| | 1,500 | | | 6.000%, 02/11/2013 | | | | | | | | | 1,617,406 | |
| | | | | |
| | | | Merck | | | | | | | | | | |
| | 3,600 | | | 2.250%, 01/15/2016 | | | | | | | | | 3,612,913 | |
| | | | | |
| | | | Novartis Capital | | | | | | | | | | |
| | 1,000 | | | 2.900%, 04/24/2015 | | | | | | | | | 1,040,325 | |
| | | | | |
| | | | Omnicare | | | | | | | | | | |
| | 1,000 | | | 6.875%, 12/15/2015 q | | | | | | | | | 1,023,750 | |
| | | | | |
| | | | Smithfield Foods | | | | | | | | | | |
| | 1,500 | | | 10.000%, 07/15/2014 | | | | | | | | | 1,736,250 | |
| | | | | |
| | | | St. Jude Medical | | | | | | | | | | |
| | 2,000 | | | 2.200%, 09/15/2013 | | | | | | | | | 2,042,188 | |
| | 690 | | | 3.750%, 07/15/2014 | | | | | | | | | 734,109 | |
| | | | | |
| | | | Teva Pharmaceutical Finance III | | | | | | | | | | |
| | 2,105 | | | 1.700%, 03/21/2014 | | | | | | | | | 2,116,674 | |
| | | | | | | | | | | | | | |
Principal
Amount (000) • | | | Description p | | | | | | | | Value | |
| | | | | | | | | | | | | | |
| | | | Consumer Non Cyclical (continued) | | | | | | | | | | |
| | | | | |
| | | | Watson Pharmaceuticals | | | | | | | | | | |
| $ | 2,000 | | | 5.000%, 08/15/2014 | | | | | | | | $ | 2,172,346 | |
| | | | | |
| | | | Wyeth | | | | | | | | | | |
| | 2,455 | | | 5.500%, 02/01/2014 | | | | | | | | | 2,721,952 | |
| | | | | |
| | 38,365 | | | Total Consumer Non Cyclical | | | | | | | | | 40,505,723 | |
| | | | Electric – 1.2% | | | | | | | | | | |
| | | | | |
| | | | Commonwealth Edison | | | | | | | | | | |
| | 2,140 | | | 1.625%, 01/15/2014 q | | | | | | | | | 2,155,089 | |
| | | | | |
| | | | MidAmerican Energy | | | | | | | | | | |
| | 3,275 | | | 4.650%, 10/01/2014 | | | | | | | | | 3,589,813 | |
| | | | | |
| | | | National Rural Utilities Cooperative Finance | | | | | | | | | | |
| | 2,970 | | | 1.900%, 11/01/2015 | | | | | | | | | 2,927,767 | |
| | | | | |
| | | | Texas Competitive Electric Holdings | | | | | | | | | | |
| | 1,105 | | | 11.500%, 10/01/2020 | | | | | | | | | 1,087,740 | |
| | 9,490 | | | Total Electric | | | | | | | | | 9,760,409 | |
| | | | Energy – 3.2% | | | | | | | | | | |
| | | | | |
| | | | Anadarko Petroleum | | | | | | | | | | |
| | 1,000 | | | 6.375%, 09/15/2017 q | | | | | | | | | 1,146,334 | |
| | | | | |
| | | | Chesapeake Energy | | | | | | | | | | |
| | 1,650 | | | 9.500%, 02/15/2015 | | | | | | | | | 1,914,000 | |
| | | | | |
| | | | Concho Resources | | | | | | | | | | |
| | 500 | | | 8.625%, 10/01/2017 q | | | | | | | | | 545,000 | |
| | | | | |
| | | | El Paso Pipeline | | | | | | | | | | |
| | 2,000 | | | 4.100%, 11/15/2015 | | | | | | | | | 2,079,478 | |
| | | | | |
| | | | Encana | | | | | | | | | | |
| | 3,000 | | | 4.750%, 10/15/2013 | | | | | | | | | 3,228,048 | |
| | | | | |
| | | | Ensco | | | | | | | | | | |
| | 2,470 | | | 3.250%, 03/15/2016 | | | | | | | | | 2,507,927 | |
| | | | | |
| | | | Forest Oil | | | | | | | | | | |
| | 2,000 | | | 8.500%, 02/15/2014 q | | | | | | | | | 2,170,000 | |
| | | | | |
| | | | Husky Energy | | | | | | | | | | |
| | 2,500 | | | 5.900%, 06/15/2014 | | | | | | | | | 2,782,467 | |
| | | | | |
| | | | Marathon Petroleum | | | | | | | | | | |
| | 2,400 | | | 3.500%, 03/01/2016 n q | | | | | | | | | 2,460,257 | |
| | | | | |
| | | | Nabors Industries | | | | | | | | | | |
| | 1,850 | | | 5.375%, 08/15/2012 | | | | | | | | | 1,916,363 | |
| | | | | |
| | | | Petroleos Mexicanos | | | | | | | | | | |
| | 2,000 | | | 4.875%, 03/15/2015 q | | | | | | | | | 2,165,000 | |
| | | | | |
| | | | Shell International Finance | | | | | | | | | | |
| | 1,180 | | | 3.250%, 09/22/2015 | | | | | | | | | 1,240,875 | |
| | | | | |
| | | | Total Capital Canada | | | | | | | | | | |
| | 1,585 | | | 1.625%, 01/28/2014 | | | | | | | | | 1,607,967 | |
| | | | | |
| | | | Valero Energy | | | | | | | | | | |
| | 1,000 | | | 6.875%, 04/15/2012 | | | | | | | | | 1,045,734 | |
| | 25,135 | | | Total Energy | | | | | | | | | 26,809,450 | |
| | | | Finance – 6.4% | | | | | | | | | | |
| | | | | |
| | | | American Express Credit
Series C | | | | | | | | | | |
| | 2,450 | | | 7.300%, 08/20/2013 | | | | | | | | | 2,726,823 | |
| | | | | |
| | | | Bank of America | | | | | | | | | | |
| | 9,250 | | | 4.500%, 04/01/2015 | | | | | | | | | 9,670,875 | |
Portfolio of Investments
Nuveen Short Term Bond Fund (continued)
June 30, 2011
| | | | | | | | | | | | | | |
Principal
Amount (000) • | | | Description p | | | | | | | | Value | |
| | | | | | | | | | | | | | |
| | | | Finance (continued) | | | | | | | | | | |
| | | | | |
| | | | BP Capital Markets | | | | | | | | | | |
| $ | 2,000 | | | 0.910%, 03/11/2014 D | | | | | | | | $ | 2,009,800 | |
| | | | | |
| | | | Capital One Bank | | | | | | | | | | |
| | 3,000 | | | 6.500%, 06/13/2013 q | | | | | | | | | 3,272,172 | |
| | | | | |
| | | | CIT Group | | | | | �� | | | | | |
| | 892 | | | 7.000%, 05/01/2014 q | | | | | | | | | 903,428 | |
| | | | | |
| | | | Dupont Fabros Technology | | | | | | | | | | |
| | 1,500 | | | 8.500%, 12/15/2017 n | | | | | | | | | 1,638,750 | |
| | | | | |
| | | | Fresenius U.S. Finance II | | | | | | | | | | |
| | 1,830 | | | 9.000%, 07/15/2015 n q | | | | | | | | | 2,070,188 | |
| | | | | |
| | | | General Electric Capital | | | | | | | | | | |
| | 3,500 | | | 1.875%, 09/16/2013 | | | | | | | | | 3,539,953 | |
| | 5,000 | | | 2.100%, 01/07/2014 | | | | | | | | | 5,070,950 | |
| | 3,000 | | | Series A
3.750%, 11/14/2014 | | | | | | | | | 3,175,524 | |
| | | | | |
| | | | Goldman Sachs Group | | | | | | | | | | |
| | 1,625 | | | 5.150%, 01/15/2014 | | | | | | | | | 1,735,077 | |
| | | | | |
| | | | Household Finance | | | | | | | | | | |
| | 2,000 | | | 4.750%, 07/15/2013 q | | | | | | | | | 2,117,826 | |
| | | | | |
| | | | International Lease Finance | | | | | | | | | | |
| | 1,000 | | | 6.500%, 09/01/2014 n | | | | | | | | | 1,060,000 | |
| | | | | |
| | | | Lyondell Chemical | | | | | | | | | | |
| | 1,000 | | | 8.000%, 11/01/2017 n | | | | | | | | | 1,112,500 | |
| | | | | |
| | | | Lloyds TSB Bank | | | | | | | | | | |
| | 2,500 | | | 4.875%, 01/21/2016 q | | | | | | | | | 2,556,928 | |
| | | | | |
| | | | Petroplus Finance | | | | | | | | | | |
| | 1,500 | | | 7.000%, 05/01/2017 n | | | | | | | | | 1,410,000 | |
| | | | | |
| | | | TransCapitalInvest | | | | | | | | | | |
| | 2,500 | | | 7.700%, 08/07/2013 n | | | | | | | | | 2,775,195 | |
| | | | | |
| | | | Volkswagen International Finance | | | | | | | | | | |
| | 4,335 | | | 1.625%, 08/12/2013 n | | | | | | | | | 4,364,526 | |
| | | | | |
| | | | Willis Group Holdings | | | | | | | | | | |
| | 1,650 | | | 4.125%, 03/15/2016 q | | | | | | | | | 1,682,231 | |
| | 50,532 | | | Total Finance | | | | | | | | | 52,892,746 | |
| | | | Industrial Other – 1.6% | | | | | | | | | | |
| | | | | |
| | | | Agilent Technologies | | | | | | | | | | |
| | 2,000 | | | 2.500%, 07/15/2013 | | | | | | | | | 2,036,364 | |
| | | | | |
| | | | Arrow Electronics | | | | | | | | | | |
| | 1,990 | | | 6.875%, 07/01/2013 | | | | | | | | | 2,168,071 | |
| | | | | |
| | | | Pittsburgh Glass Works | | | | | | | | | | |
| | 1,500 | | | 8.500%, 04/15/2016 n | | | | | | | | | 1,541,250 | |
| | | | | |
| | | | Thermo Fisher Scientific | | | | | | | | | | |
| | 1,625 | | | 3.250%, 11/20/2014 | | | | | | | | | 1,713,210 | |
| | 1,250 | | | 3.200%, 05/01/2015 | | | | | | | | | 1,299,390 | |
| | | | | |
| | | | Tyco Electronics | | | | | | | | | | |
| | 2,430 | | | 6.000%, 10/01/2012 | | | | | | | | | 2,576,641 | |
| | | | | |
| | | | Verso Paper Holdings | | | | | | | | | | |
| | 1,500 | | | 11.500%, 07/01/2014 q | | | | | | | | | 1,597,500 | |
| | 12,295 | | | Total Industrial Other | | | | | | | | | 12,932,426 | |
| | | | Insurance – 2.0% | | | | | | | | | | |
| | | | | |
| | | | Aflac | | | | | | | | | | |
| | 2,835 | | | 3.450%, 08/15/2015 | | | | | | | | | 2,895,252 | |
| | | | | | | | | | | | | | |
Principal
Amount (000) • | | | Description p | | | | | | | | Value | |
| | | | | | | | | | | | | | |
| | | | Insurance (continued) | | | | | | | | | | |
| | | | | |
| | | | Allstate Life Global Funding Trust | | | | | | | | | | |
| | | | Series MTN | | | | | | | | | | |
| $ | 1,500 | | | 5.375%, 04/30/2013 | | | | | | | | $ | 1,616,555 | |
| | | | | |
| | | | American International Group | | | | | | | | | | |
| | 1,000 | | | 3.650%, 01/15/2014 | | | | | | | | | 1,019,090 | |
| | | | | |
| | | | Hartford Financial Services Group | | | | | | | | | | |
| | 2,000 | | | 4.000%, 03/30/2015 | | | | | | | | | 2,061,710 | |
| | | | | |
| | | | Lincoln National | | | | | | | | | | |
| | 2,000 | | | 4.300%, 06/15/2015 q | | | | | | | | | 2,106,070 | |
| | | | | |
| | | | Metropolitan Life Global Funding I | | | | | | | | | | |
| | 1,000 | | | 2.500%, 01/11/2013 n | | | | | | | | | 1,018,104 | |
| | | | | |
| | | | Prudential Financial | | | | | | | | | | |
| | | | Series MTNB | | | | | | | | | | |
| | 5,560 | | | 5.100%, 09/20/2014 | | | | | | | | | 6,044,715 | |
| | 15,895 | | | Total Insurance | | | | | | | | | 16,761,496 | |
| | | | Natural Gas – 0.4% | | | | | | | | | | |
| | | | | |
| | | | Duke Energy | | | | | | | | | | |
| | 1,500 | | | 3.950%, 09/15/2014 | | | | | | | | | 1,595,233 | |
| | | | | |
| | | | NGPL Pipeco | | | | | | | | | | |
| | 1,500 | | | 7.119%, 12/15/2017 n | | | | | | | | | 1,680,426 | |
| | | | | |
| | | | Ras Laffan | | | | | | | | | | |
| | 500 | | | 4.500%, 09/30/2012 n | | | | | | | | | 520,000 | |
| | 3,500 | | | Total Natural Gas | | | | | | | | | 3,795,659 | |
| | | | Real Estate – 1.4% | | | | | | | | | | |
| | | | | |
| | | | HCP – REIT | | | | | | | | | | |
| | 1,635 | | | 2.700%, 02/01/2014 q | | | | | | | | | 1,658,577 | |
| | | | Series MTN | | | | | | | | | | |
| | 1,000 | | | 5.625%, 02/28/2013 q | | | | | | | | | 1,061,091 | |
| | | | | |
| | | | Health Care REIT – REIT | | | | | | | | | | |
| | 1,920 | | | 3.625%, 03/15/2016 | | | | | | | | | 1,932,132 | |
| | | | | |
| | | | Nationwide Health Properties – REIT | | | | | | | | | | |
| | 2,000 | | | 6.250%, 02/01/2013 | | | | | | | | | 2,127,560 | |
| | | | | |
| | | | Rouse – REIT | | | | | | | | | | |
| | 1,500 | | | 6.750%, 11/09/2015 n | | | | | | | | | 1,546,875 | |
| | | | | |
| | | | Simon Property Group – REIT | | | | | | | | | | |
| | 2,000 | | | 4.200%, 02/01/2015 | | | | | | | | | 2,127,570 | |
| | | | | |
| | | | Vornado Realty – REIT | | | | | | | | | | |
| | 1,500 | | | 4.250%, 04/01/2015 | | | | | | | | | 1,556,875 | |
| | 11,555 | | | Total Real Estate | | | | | | | | | 12,010,680 | |
| | | | Sovereigns – 2.5% | | | | | | | | | | |
| | | | | |
| | | | Australian Government | | | | | | | | | | |
| | | | Series 123 | | | | | | | | | | |
| | 4,000,000 | AUD | | 5.750%, 04/15/2012 | | | | | | | | | 4,324,167 | |
| | | | | |
| | | | Canadian Government | | | | | | | | | | |
| | 8,000,000 | CAD | | 1.500%, 12/01/2012 | | | | | | | | | 8,303,510 | |
| | | | | |
| | | | Mexico Bonos Desarr | | | | | | | | | | |
| | | | Series MI10 | | | | | | | | | | |
| | 41,800,000 | MXN | | 9.500%, 12/18/2014 | | | | | | | | | 3,974,925 | |
| | | | | |
| | | | New Zealand | | | | | | | | | | |
| | | | Series 413 | | | | | | | | | | |
| | 5,000,000 | NZD | | 6.500%, 04/15/2013 | | | | | | | | | 4,377,423 | |
| | | | Total Sovereigns | | | | | | | | | 20,980,025 | |
Portfolio of Investments
Nuveen Short Term Bond Fund (continued)
June 30, 2011
| | | | | | | | | | | | | | |
Principal
Amount (000) • | | | Description p | | | | | | | | Value | |
| | | | | | | | | | | | | | |
| | | | Technology – 0.4% | | | | | | | | | | |
| | | | | |
| | | | National Semiconductor | | | | | | | | | | |
| $ | 100 | | | 3.950%, 04/15/2015 | | | | | | | | $ | 1,063,147 | |
| | | | | |
| | | | Seagate Technology International | | | | | | | | | | |
| | 193 | | | 10.000%, 05/01/2014 n | | | | | | | | | 2,242,280 | |
| | 293 | | | Total Technology | | | | | | | | | 3,305,427 | |
| | | | Transportation – 1.6% | | | | | | | | | | |
| | | | | |
| | | | Air Canada | | | | | | | | | | |
| | 1,390 | | | 9.250%, 08/01/2015 n q | | | | | | | | | 1,423,012 | |
| | | | | |
| | | | CSX | | | | | | | | | | |
| | 1,500 | | | 5.750%, 03/15/2013 | | | | | | | | | 1,613,918 | |
| | | | | |
| | | | Delta Airlines | | | | | | | | | | |
| | 1,500 | | | 12.250%, 03/15/2015 n | | | | | | | | | 1,661,250 | |
| | | | Series 11B, Class B | | | | | | | | | | |
| | 900 | | | 7.711%, 03/18/2013 | | | | | | | | | 909,000 | |
| | | | Series 2011-1, Class A | | | | | | | | | | |
| | 2,135 | | | 5.300%, 04/15/2019 q | | | | | | | | | 2,135,000 | |
| | | | | |
| | | | GATX | | | | | | | | | | |
| | 1,000 | | | 4.750%, 05/15/2015 | | | | | | | | | 1,060,969 | |
| | | | | |
| | | | Graham Packaging | | | | | | | | | | |
| | 1,375 | | | 8.250%, 10/01/2018 q n | | | | | | | | | 1,529,688 | |
| | | | | |
| | | | United Airlines | | | | | | | | | | |
| | 1,500 | | | 9.875%, 08/01/2013 n | | | | | | | | | 1,575,000 | |
| | | | Series 2009-1 | | | | | | | | | | |
| | 909 | | | 10.400%, 05/01/2018 | | | | | | | | | 1,030,670 | |
| | 12,209 | | | Total Transportation | | | | | | | | | 12,938,507 | |
| | | | Total Corporate Bonds (cost $364,317,228) | | | | | | | | | 374,546,163 | |
| | | | | |
Principal
Amount (000) | | | Description p | | | | | | | | Value | |
| | | | ASSET-BACKED SECURITIES – 17.9% | | | | | | | | | | |
| | | | | |
| | | | Automotive – 5.8% | | | | | | | | | | |
| | | | | |
| | | | Ally Auto Receivables Trust | | | | | | | | | | |
| | | | Series 2009-A, Class A3 | | | | | | | | | | |
| $ | 2,294 | | | 2.330%, 06/17/2013 n | | | | | | | | $ | 2,316,075 | |
| | | | | |
| | | | Bank of America Auto Trust | | | | | | | | | | |
| | | | Series 2008-1A, Class A3A | | | | | | | | | | |
| | 575 | | | 4.970%, 09/20/2012 n | | | | | | | | | 578,020 | |
| | | | Series 2010-2, Class A3 | | | | | | | | | | |
| | 2,525 | | | 1.310%, 07/15/2014 | | | | | | | | | 2,541,419 | |
| | | | | |
| | | | Capital Auto Receivables Asset Trust | | | | | | | | | | |
| | | | Series 2007-3, Class A4 | | | | | | | | | | |
| | 937 | | | 5.210%, 03/17/2014 | | | | | | | | | 950,058 | |
| | | | Series 2008-1, Class A3A | | | | | | | | | | |
| | 54 | | | 3.860%, 08/15/2012 | | | | | | | | | 54,568 | |
| | | | | |
| | | | Capital One Prime Auto Receivables Trust | | | | | | | | | | |
| | | | Series 2007-2, Class A4 | | | | | | | | | | |
| | 939 | | | 5.060%, 06/15/2014 | | | | | | | | | 943,664 | |
| | | | | |
| | | | Chrysler Financial Auto Securitization Trust | | | | | | | | | | |
| | | | Series 2009-A, Class A3 | | | | | | | | | | |
| | 139 | | | 2.820%, 01/15/2016 | | | | | | | | | 140,526 | |
| | | | | |
| | | | DT Auto Owner Trust | | | | | | | | | | |
| | | | Series 2011-2A, Class A | | | | | | | | | | |
| | 7,617 | | | 0.960%, 11/15/2012 | | | | | | | | | 7,616,057 | |
| | | | | | | | | | | | | | |
Principal
Amount (000) | | | Description p | | | | | | | | Value | |
| | | | | | | | | | | | | | |
| | | | Automotive (continued) | | | | | | | | | | |
| | | | | |
| | | | Ford Credit Auto Lease Trust | | | | | | | | | | |
| | | | Series 2010-B, Class A3 | | | | | | | | | | |
| $ | 3,985 | | | 0.910%, 07/15/2013 | | | | | | | | $ | 3,988,148 | |
| | | | Series 2011-A, Class A2 | | | | | | | | | | |
| | 4,570 | | | 0.740%, 09/15/2013 | | | | | | | | | 4,570,000 | |
| | | | | |
| | | | Ford Credit Auto Owner Trust | | | | | | | | | | |
| | | | Series 2009-A, Class A3A | | | | | | | | | | |
| | 627 | | | 3.960%, 05/15/2013 | | | | | | | | | 633,098 | |
| | | | Series 2009-C, Class A4 | | | | | | | | | | |
| | 3,000 | | | 4.430%, 11/15/2014 | | | | | | | | | 3,169,852 | |
| | | | | |
| | | | Hertz Vehicle Financing | | | | | | | | | | |
| | | | Series 2009-2A, Class A1 | | | | | | | | | | |
| | 3,000 | | | 4.260%, 03/25/2014 n | | | | | | | | | 3,134,821 | |
| | | | | |
| | | | Honda Auto Receivables Owner Trust | | | | | | | | | | |
| | | | Series 2010-2, Class A2 | | | | | | | | | | |
| | 688 | | | 0.820%, 06/18/2012 | | | | | | | | | 688,335 | |
| | | | | |
| | | | JPMorgan Auto Receivables Trust | | | | | | | | | | |
| | | | Series 2006-A, Class A4 | | | | | | | | | | |
| | 206 | | | 5.140%, 12/15/2014 n | | | | | | | | | 206,111 | |
| | | | | |
| | | | Nissan Auto Lease Trust | | | | | | | | | | |
| | | | Series 2009-B, Class A3 | | | | | | | | | | |
| | 764 | | | 2.070%, 01/15/2015 | | | | | | | | | 765,460 | |
| | | | | |
| | | | Santander Drive Auto Receivables Trust | | | | | | | | | | |
| | | | Series 2010-1, Class A2 | | | | | | | | | | |
| | 3,484 | | | 1.360%, 03/15/2013 D | | | | | | | | | 3,491,219 | |
| | | | Series 2011-1, Class A3 | | | | | | | | | | |
| | 4,250 | | | 1.280%, 01/15/2015 | | | | | | | | | 4,255,807 | |
| | | | | |
| | | | Smart Trust | | | | | | | | | | |
| | | | Series 2011-1USA, Class A3B | | | | | | | | | | |
| | 7,135 | | | 1.258%, 10/14/2014 n D | | | | | | | | | 7,147,330 | |
| | | | | |
| | | | Volkswagen Auto Lease Trust | | | | | | | | | | |
| | | | Series 2009-A, Class A3 | | | | | | | | | | |
| | 662 | | | 3.410%, 04/16/2012 | | | | | | | | | 663,728 | |
| | | | | |
| | | | World Omni Auto Receivables Trust | | | | | | | | | | |
| | | | Series 2010-A, Class A2 | | | | | | | | | | |
| | 151 | | | 0.700%, 05/15/2011 | | | | | | | | | 150,837 | |
| | 47,601 | | | Total Automotive | | | | | | | | | 48,005,133 | |
| | | | Credit Cards – 1.9% | | | | | | | | | | |
| | | | | |
| | | | Bank of America Credit Card Trust | | | | | | | | | | |
| | | | Series 2007-A9, Class A9 | | | | | | | | | | |
| | 4,500 | | | 0.238%, 11/15/2014 D q | | | | | | | | | 4,497,374 | |
| | | | | |
| | | | Cabela’s Master Credit Card Trust | | | | | | | | | | |
| | | | Series 2010-1A, Class A2 | | | | | | | | | | |
| | 3,970 | | | 1.637%, 01/16/2018 n D | | | | | | | | | 4,107,260 | |
| | | | Series 2010-2A, Class A1 | | | | | | | | | | |
| | 4,290 | | | 2.290%, 09/17/2018 n | | | | | | | | | 4,310,625 | |
| | | | | |
| | | | Capital One Multi-Asset Execution Trust | | | | | | | | | | |
| | | | Series 2008-A3, Class A3 | | | | | | | | | | |
| | 2,750 | | | 5.050%, 02/15/2016 | | | | | | | | | 2,956,966 | |
| | 15,510 | | | Total Credit Cards | | | | | | | | | 15,872,225 | |
| | | | Equipment Leases – 0.1% | | | | | | | | | | |
| | | | | |
| | | | CNH Equipment Trust | | | | | | | | | | |
| | | | Series 2008-A, Class A4A | | | | | | | | | | |
| | 1,240 | | | 4.930%, 08/15/2014 | | | | | | | | | 1,253,900 | |
Portfolio of Investments
Nuveen Short Term Bond Fund (continued)
June 30, 2011
| | | | | | | | | | | | | | |
Principal
Amount (000) | | | Description p | | | | | | | | Value | |
| | | | | | | | | | | | | | |
| | | | Home Equity – 4.6% | | | | | | | | | | |
| | | | | |
| | | | AH Mortgage Advance Trust | | | | | | | | | | |
| | | | Series SART-1, Class B1 | | | | | | | | | | |
| $ | 1,590 | | | 5.920%, 05/10/2043 n | | | | | | | | $ | 1,613,850 | |
| | | | | |
| | | | Ameriquest Mortgage Securities | | | | | | | | | | |
| | | | Series 2005-R9, Class A2B | | | | | | | | | | |
| | 1,615 | | | 0.416%, 11/25/2035 | | | | | | | | | 1,546,278 | |
| | | | | |
| | | | Countrywide Asset-Backed Certificates | | | | | | | | | | |
| | | | Series 2005-16, Class 2AF2 | | | | | | | | | | |
| | 748 | | | 5.382%, 05/25/2036 D | | | | | | | | | 608,700 | |
| | | | | |
| | | | Countrywide Asset-Backed Certificates | | | | | | | | | | |
| | | | Series 2006-25, Class 2A2 | | | | | | | | | | |
| | 3,565 | | | 0.306%, 12/25/2029 | | | | | | | | | 3,170,094 | |
| | | | Series 2007-7, Class 2A2 | | | | | | | | | | |
| | 2,770 | | | 0.346%, 06/25/2030 | | | | | | | | | 2,241,703 | |
| | | | Series 2007-9, Class 2A2 | | | | | | | | | | |
| | 2,930 | | | 0.316%, 06/25/2030 | | | | | | | | | 2,428,525 | |
| | | | | |
| | | | Equivantage Home Equity Loan Trust | | | | | | | | | | |
| | | | Series 1996-4, Class A | | | | | | | | | | |
| | 101 | | | 7.250%, 01/25/2028 | | | | | | | | | 96,947 | |
| | | | | |
| | | | IMC Home Equity Loan Trust | | | | | | | | | | |
| | | | Series 1998-3, Class A7 | | | | | | | | | | |
| | 1,093 | | | 7.060%, 08/20/2029 D | | | | | | | | | 1,029,276 | |
| | | | | |
| | | | Morgan Stanley Capital | | | | | | | | | | |
| | | | Series 2007-NC2, Class A2A | | | | | | | | | | |
| | 3,225 | | | 0.296%, 02/25/2037 D | | | | | | | | | 3,001,075 | |
| | | | | |
| | | | Morgan Stanley Capital | | | | | | | | | | |
| | | | Series 2006-NC2, Class A2C | | | | | | | | | | |
| | 1,868 | | | 0.366%, 02/25/2036 D | | | | | | | | | 1,646,358 | |
| | | | | |
| | | | RBSSP Resecuritization Trust | | | | | | | | | | |
| | | | Series 2009-10, Class 7A2 | | | | | | | | | | |
| | 2,723 | | | 0.360%, 03/26/2037 n D | | | | | | | | | 2,586,748 | |
| | | | Series 2009-11, Class 4A1 | | | | | | | | | | |
| | 326 | | | 1.994%, 12/26/2037 n D | | | | | | | | | 326,272 | |
| | | | Series 2009-13, Class 5A1 | | | | | | | | | | |
| | 1,955 | | | 0.294%, 11/26/2036 n D | | | | | | | | | 1,930,903 | |
| | | | Series 2009-8, Class 3A1 | | | | | | | | | | |
| | 243 | | | 0.334%, 03/26/2037 n D | | | | | | | | | 239,182 | |
| | | | Series 2009-9, Class 9A1 | | | | | | | | | | |
| | 1,124 | | | 0.486%, 09/26/2037 n D | | | | | | | | | 1,081,619 | |
| | | | Series 2010-10, Class 2A1 | | | | | | | | | | |
| | 2,294 | | | 0.386%, 09/26/2036 n D | | | | | | | | | 2,056,584 | |
| | | | Series 2010-11, Class 2A1 | | | | | | | | | | |
| | 2,683 | | | 0.423%, 03/26/2037 n D | | | | | | | | | 2,564,209 | |
| | | | Series 2010-4, Class 1A1 | | | | | | | | | | |
| | 4,030 | | | 0.323%, 03/26/2036 n D | | | | | | | | | 3,749,674 | |
| | | | Series 2010-4, Class 5A1 | | | | | | | | | | |
| | 2,559 | | | 0.373%, 02/26/2037 n D | | | | | | | | | 2,454,284 | |
| | | | Series 2010-8, Class 4A1 | | | | | | | | | | |
| | 1,611 | | | 0.659%, 07/26/2036 n D | | | | | | | | | 1,517,928 | |
| | | | | |
| | | | Renaissance Home Equity Loan Trust | | | | | | | | | | |
| | | | Series 2005-3, Class AF4 | | | | | | | | | | |
| | 2,425 | | | 5.140%, 11/25/2035 | | | | | | | | | 2,009,847 | |
| | 41,478 | | | Total Home Equity | | | | | | | | | 37,900,056 | |
| | | | Manufactured Housing – 0.4% | | | | | | | | | | |
| | | | | |
| | | | Green Tree Financial | | | | | | | | | | |
| | | | Series 2008-MH1, Class A1 | | | | | | | | | | |
| | 265 | | | 7.000%, 04/25/2038 n | | | | | | | | | 270,557 | |
| | | | | | | | | | | | | | |
Principal
Amount (000) | | | Description p | | | | | | | | Value | |
| | | | | | | | | | | | | | |
| | | | Manufactured Housing (continued) | | | | | | | | | | |
| | | | | |
| | | | Newcastle Investment Trust | | | | | | | | | | |
| | | | Series 2010-MH1, Class A | | | | | | | | | | |
| $ | 3,055 | | | 4.500%, 07/10/2035 n | | | | | | | | $ | 3,139,372 | |
| | | | | |
| | | | Origen Manufactured Housing | | | | | | | | | | |
| | | | Series 2005-B, Class A2 | | | | | | | | | | |
| | 14 | | | 5.247%, 12/15/2018 | | | | | | | | | 13,744 | |
| | 3,334 | | | Total Manufactured Housing | | | | | | | | | 3,423,673 | |
| | | | Other – 4.7% | | | | | | | | | | |
| | | | | |
| | | | American Home Mortgage Advance Trust | | | | | | | | | | |
| | | | Series 2010-ADV1, Class A1 | | | | | | | | | | |
| | 2,705 | | | 3.968%, 08/15/2022 n | | | | | | | | | 2,745,575 | |
| | | | | |
| | | | Citigroup Mortgage Loan Trust | | | | | | | | | | |
| | | | Series 2010-10, Class 7A1 | | | | | | | | | | |
| | 5,072 | | | 4.778%, 12/27/2032 n | | | | | | | | | 5,092,570 | |
| | | | | |
| | | | Crown Castle Towers | | | | | | | | | | |
| | | | Series 2010-1, Class A1 | | | | | | | | | | |
| | 2,000 | | | 4.523%, 01/15/2035 D n | | | | | | | | | 2,090,332 | |
| | | | | |
| | | | Fieldstone Mortgage Investment | | | | | | | | | | |
| | | | Series 2005-1, Class M4 | | | | | | | | | | |
| | 3,111 | | | 1.266%, 03/25/2035 D | | | | | | | | | 2,896,419 | |
| | | | | |
| | | | GMAC Mortgage Servicer Advance Funding | | | | | | | | | | |
| | | | Series 2011-1A, Class A | | | | | | | | | | |
| | 7,590 | | | 3.720%, 03/15/2023 n | | | | | | | | | 7,646,925 | |
| | | | | |
| | | | Nationstar Mortgage Advance Receivable Trust | | | | | | | | | | |
| | | | Series 2009-ADV1, Class A1 | | | | | | | | | | |
| | 2,539 | | | 3.194%, 12/26/2022 n D | | | | | | | | | 2,540,828 | |
| | | | | |
| | | | Nationstar Mortgage Advance Receivable Trust | | | | | | | | | | |
| | | | Series 2009-ADV1, Class B1 | | | | | | | | | | |
| | 2,650 | | | 11.686%, 12/26/2022 n D | | | | | | | | | 2,669,875 | |
| | | | | |
| | | | Ocwen Advance Receivables Backed Notes | | | | | | | | | | |
| | | | Series 2009-3A, Class A | | | | | | | | | | |
| | 2,000 | | | 4.140%, 07/15/2023 n | | | | | | | | | 2,027,500 | |
| | | | | |
| | | | Park Place Securities | | | | | | | | | | |
| | | | Series 2005-WCH1, Class M2 | | | | | | | | | | |
| | 4,795 | | | 0.706%, 01/25/2036 D | | | | | | | | | 4,509,947 | |
| | | | | |
| | | | Small Business Administration | | | | | | | | | | |
| | | | Series 2005-P10A, Class 1 | | | | | | | | | | |
| | 1,742 | | | 4.638%, 02/10/2015 | | | | | | | | | 1,853,978 | |
| | | | Series 2005-P10B, Class 1 | | | | | | | | | | |
| | 3,232 | | | 4.940%, 08/10/2015 | | | | | | | | | 3,430,205 | |
| | | | Series 2006-P10A, Class 1 | | | | | | | | | | |
| | 1,000 | | | 5.408%, 02/10/2016 | | | | | | | | | 1,080,644 | |
| | 38,436 | | | Total Other | | | | | | | | | 38,584,798 | |
| | | | Utilities – 0.4% | | | | | | | | | | |
| | | | | |
| | | | CenterPoint Energy | | | | | | | | | | |
| | | | Series 2005-A, Class A2 | | | | | | | | | | |
| | 1,606 | | | 4.970%, 08/01/2014 | | | | | | | | | 1,639,229 | |
| | | | | |
| | | | PG&E Energy Recovery Funding | | | | | | | | | | |
| | | | Series 2005-2, Class A2 | | | | | | | | | | |
| | 487 | | | 5.030%, 03/25/2014 | | | | | | | | | 496,723 | |
| | | | | |
| | | | PSE&G Transition Funding | | | | | | | | | | |
| | | | Series 2001-1, Class A6 | | | | | | | | | | |
| | 1,074 | | | 6.610%, 06/15/2015 | | | | | | | | | 1,143,161 | |
| | 3,167 | | | Total Utilities | | | | | | | | | 3,279,113 | |
| $ | 150,767 | | | Total Asset-Backed Securities (cost $146,593,642) | | | | | | | | | 148,318,898 | |
Portfolio of Investments
Nuveen Short Term Bond Fund (continued)
June 30, 2011
| | | | | | | | | | | | | | |
Principal
Amount (000) | | | Description p | | | | | | | | Value | |
| | | | | | | | | | | | | | |
| | | | COMMERCIAL MORTGAGE-BACKED SECURITIES – 12.3% | | | | | | | | | | |
| | | | | |
| | | | Americold | | | | | | | | | | |
| | | | Series 2010-ARTA, Class A2FL | | | | | | | | | | |
| $ | 4,770 | | | 2.500%, 01/17/2029 n D | | | | | | | | $ | 4,784,123 | |
| | | | | |
| | | | Bear Stearns Commercial Mortgage Securities
Series 2005-PW10, Class A4 | | | | | | | | | | |
| | 5,000 | | | 5.405%, 12/11/2040 D | | | | | | | | | 5,450,805 | |
| | | | | |
| | | | Citigroup/Deutsche Bank Commercial Mortgage Trust
Series 2005-CD1, Class A4 | | | | | | | | | | |
| | 4,000 | | | 5.394%, 07/15/2044 | | | | | | | | | 4,349,489 | |
| | | | Series 2007-CD4, Class A2B | | | | | | | | | | |
| | 1,385 | | | 5.205%, 12/11/2049 | | | | | | | | | 1,414,274 | |
| | | | | |
| | | | Commercial Mortgage Pass-Through Certificates
Series 2005-LP5, Class A4 | | | | | | | | | | |
| | 2,500 | | | 4.982%, 05/10/2043 D | | | | | | | | | 2,693,864 | |
| | | | | |
| | | | Extended Stay America Trust
Series 2010-ESHA, Class C | | | | | | | | | | |
| | 3,920 | | | 4.860%, 11/05/2027 n | | | | | | | | | 3,913,344 | |
| | | | | |
| | | | FDIC Commercial Mortgage
Series 2011-C1 | | | | | | | | | | |
| | 3,398 | | | 2.196%, 04/25/2031 | | | | | | | | | 3,408,931 | |
| | | | | |
| | | | Fosse Master Issuer
Series 2011-1A, Class A2 | | | | | | | | | | |
| | 3,325 | | | 1.619%, 10/19/2054 n | | | | | | | | | 3,330,915 | |
| | | | | |
| | | | GE Capital Commercial Mortgage Corporation
Series 2001-3, Class A2 | | | | | | | | | | |
| | 2,525 | | | 6.070%, 06/10/2038 | | | | | | | | | 2,538,627 | |
| | | | | |
| | | | GMAC Commercial Mortgage Securities
Series 2003-C2, Class A2 | | | | | | | | | | |
| | 3,500 | | | 5.654%, 05/10/2040 | | | | | | | | | 3,761,295 | |
| | | | | |
| | | | Greenwich Capital Commercial Funding
Series 2005-GG5, Class A2 | | | | | | | | | | |
| | 2,941 | | | 5.117%, 04/10/2037 | | | | | | | | | 2,967,884 | |
| | | | | |
| | | | GS Mortgage Securities II
Series 2010-C1, Class A1 | | | | | | | | | | |
| | 5,942 | | | 3.679%, 08/12/2043 n | | | | | | | | | 6,049,033 | |
| | | | Series 2011-ALF, Class A | | | | | | | | | | |
| | 5,675 | | | 2.716%, 02/10/2021 n | | | | | | | | | 5,742,533 | |
| | | | | |
| | | | GS Mortgage Securities Trust
Series 2007-GG10, Class A4 | | | | | | | | | | |
| | 3,000 | | | 5.992%, 08/10/2045 | | | | | | | | | 3,220,801 | |
| | | | | |
| | | | JPMorgan Chase Commercial Mortgage Securities Trust
Series 2001-CIB2, Class A3 | | | | | | | | | | |
| | 354 | | | 6.429%, 04/15/2035 | | | | | | | | | 353,417 | |
| | | | Series 2007-CB18, Class A3 | | | | | | | | | | |
| | 4,000 | | | 5.447%, 06/12/2047 | | | | | | | | | 4,201,379 | |
| | | | Series 2010-C1, Class A1 | | | | | | | | | | |
| | 4,215 | | | 3.853%, 06/15/2043 n | | | | | | | | | 4,359,869 | |
| | | | Series 2010-C2, Class A1 | | | | | | | | | | |
| | 3,842 | | | 2.749%, 11/15/2043 n | | | | | | | | | 3,823,798 | |
| | | | | |
| | | | Merrill Lynch Mortgage Trust
Series 2006-C1, Class A2 | | | | | | | | | | |
| | 2,786 | | | 5.818%, 05/12/2039 | | | | | | | | | 2,871,538 | |
| | | | | |
| | | | Morgan Stanley Capital I
Series 2003-IQ6, Class A4 | | | | | | | | | | |
| | 1,090 | | | 4.970%, 12/15/2041 | | | | | | | | | 1,160,325 | |
| | | | Series 2011-C1, Class A1 | | | | | | | | | | |
| | 2,825 | | | 2.499%, 09/15/2047 n | | | | | | | | | 2,889,191 | |
| | | | | | | | | | | | | | |
Principal
Amount (000) | | | Description p | | | | | | | | Value | |
| | | | | | | | | | | | | | |
| | | | Commercial Mortgage-Backed Securities (continued) | | | | | | | | | | |
| | | | | |
| | | | Morgan Stanley Dean Witter Capital I
Series 2002-TOP7, Class A2 | | | | | | | | | | |
| $ | 4,219 | | | 5.980%, 01/15/2039 | | | | | | | | $ | 4,334,704 | |
| | | | | |
| | | | Vornado DP
Series 2010-VN0, Class A1 | | | | | | | | | | |
| | 5,108 | | | 2.970%, 09/14/2028 n | | | | | | | | | 5,041,427 | |
| | | | | |
| | | | Wachovia Bank Commercial Mortgage Trust
Series 2007-C30, Class A3 | | | | | | | | | | |
| | 1,739 | | | 5.246%, 12/15/2043 | | | | | | | | | 1,780,216 | |
| | | | Series 2007-WHL8, Class A1 | | | | | | | | | | |
| | 2,433 | | | 0.267%, 06/15/2020 n D | | | | | | | | | 2,205,846 | |
| | | | | |
| | | | WF-RBS Commercial Mortgage Trust
Series 2011-C2, Class A1 | | | | | | | | | | |
| | 2,866 | | | 2.501%, 02/15/2044 n D | | | | | | | | | 2,926,576 | |
| | | | Series 2011-C3, Class A4 | | | | | | | | | | |
| | 4,000 | | | 4.375%, 03/15/2044 D | | | | | | | | | 3,954,080 | |
| | | | Series 2011-C3, Class A1 | | | | | | | | | | |
| | 8,035 | | | 1.988%, 03/15/2044 n D | | | | | | | | | 8,103,954 | |
| $ | 99,393 | | | Total Commercial Mortgage-Backed Securities (cost $99,139,893) | | | | | | | | | 101,632,238 | |
| | | | | |
Principal
Amount (000) | | | Description p | | | | | | | | Value | |
| | | | U.S. GOVERNMENT AGENCY MORTGAGE-BACKED SECURITIES – 7.5% | | | | | | | | | | |
| | | | | |
| | | | Adjustable Rate D – 5.4% | | | | | | | | | | |
| | | | | |
| | | | Federal Home Loan Mortgage Corporation Pool | | | | | | | | | | |
| $ | 336 | | | 2.790%, 12/01/2026, #786591 | | | | | | | | $ | 355,184 | |
| | 272 | | | 2.597%, 01/01/2029, #846946 | | | | | | | | | 285,679 | |
| | 241 | | | 2.510%, 10/01/2029, #786853 | | | | | | | | | 251,402 | |
| | 266 | | | 4.346%, 04/01/2030, #972055 | | | | | | | | | 282,435 | |
| | 190 | | | 2.230%, 05/01/2030, #847014 | | | | | | | | | 190,273 | |
| | 145 | | | 2.464%, 06/01/2031, #847367 | | | | | | | | | 151,212 | |
| | 2,055 | | | 2.409%, 08/01/2032, #847331 | | | | | | | | | 2,145,026 | |
| | 946 | | | 2.551%, 09/01/2032, #847652 | | | | | | | | | 992,476 | |
| | 160 | | | 2.628%, 10/01/2032, #847063 | | | | | | | | | 168,303 | |
| | 585 | | | 2.611%, 05/01/2033, #780456 | | | | | | | | | 612,060 | |
| | 1,287 | | | 2.470%, 10/01/2033, #780911 | | | | | | | | | 1,342,345 | |
| | 1,418 | | | 2.481%, 03/01/2034, #781296 | | | | | | | | | 1,486,826 | |
| | 2,542 | | | 4.720%, 03/01/2036, #848193 | | | | | | | | | 2,676,222 | |
| | 939 | | | 2.516%, 08/01/2036, #1L1462 | | | | | | | | | 982,254 | |
| | 2,768 | | | 2.660%, 01/01/2038, #848282 | | | | | | | | | 2,897,543 | |
| | | | | |
| | | | Federal National Mortgage Association Pool | | | | | | | | | | |
| | 431 | | | 2.382%, 11/01/2025, #433988 | | | | | | | | | 443,840 | |
| | 1,283 | | | 2.515%, 10/01/2030, #847241 | | | | | | | | | 1,345,811 | |
| | 202 | | | 3.110%, 06/01/2031, #625338 | | | | | | | | | 211,518 | |
| | 1,151 | | | 5.056%, 12/01/2031, #535363 | | | | | | | | | 1,232,454 | |
| | 24 | | | 4.352%, 03/01/2032, #545791 | | | | | | | | | 25,359 | |
| | 167 | | | 2.575%, 05/01/2032, #545717 | | | | | | | | | 174,451 | |
| | 134 | | | 2.665%, 05/01/2032, #634948 | | | | | | | | | 134,538 | |
| | 28 | | | 3.076%, 10/01/2032, #661645 | | | | | | | | | 29,046 | |
| | 186 | | | 2.379%, 12/01/2032, #671884 | | | | | | | | | 194,316 | |
| | 144 | | | 2.376%, 04/01/2034, #775389 | | | | | | | | | 150,392 | |
| | 2,495 | | | 2.558%, 04/01/2034, #AD0486 | | | | | | | | | 2,618,764 | |
| | 2,315 | | | 2.487%, 06/01/2034, #725721 | | | | | | | | | 2,429,738 | |
| | 1,700 | | | 2.050%, 07/01/2034, #795242 | | | | | | | | | 1,766,600 | |
| | 1,395 | | | 2.467%, 11/01/2034, #797182 | | | | | | | | | 1,459,106 | |
| | 1,637 | | | 2.688%, 11/01/2034, #841068 | | | | | | | | | 1,725,222 | |
| | 2,634 | | | 2.540%, 03/01/2035, #819652 | | | | | | | | | 2,773,525 | |
| | 1,326 | | | 2.684%, 07/01/2035, #745922 | | | | | | | | | 1,394,539 | |
| | 1,347 | | | 2.551%, 08/01/2035, #838958 | | | | | | | | | 1,418,568 | |
Portfolio of Investments
Nuveen Short Term Bond Fund (continued)
June 30, 2011
| | | | | | | | | | | | | | |
Principal
Amount (000) | | | Description p | | | | | | | | Value | |
| | | | | | | | | | | | | | |
| | | | Adjustable Rate D (continued) | | | | | | | | | | |
| | | | | |
| $ | 654 | | | 2.180%, 12/01/2035, #848390 | | | | | | | | $ | 669,409 | |
| | 2,856 | | | 2.758%, 07/01/2036, #AE0058 | | | | | | | | | 2,997,518 | |
| | 854 | | | 2.858%, 07/01/2036, #886034 | | | | | | | | | 896,897 | |
| | 205 | | | 2.686%, 08/01/2036, #555369 | | | | | | | | | 214,956 | |
| | 834 | | | 2.639%, 09/01/2036, #995949 | | | | | | | | | 875,479 | |
| | 1,857 | | | 2.593%, 08/01/2037, #AD0550 | | | | | | | | | 1,956,215 | |
| | 1,811 | | | 2.498%, 03/01/2038, #AD0706 | | | | | | | | | 1,902,461 | |
| | | | | |
| | | | Government National Mortgage Association Pool | | | | | | | | | | |
| | 113 | | | 2.625%, 08/20/2021, #008824 | | | | | | | | | 117,549 | |
| | 155 | | | 2.625%, 07/20/2022, #008006 | | | | | | | | | 161,090 | |
| | 86 | | | 2.625%, 09/20/2025, #008699 | | | | | | | | | 89,004 | |
| | 68 | | | 3.375%, 04/20/2026, #008847 | | | | | | | | | 70,867 | |
| | 25 | | | 3.625%, 08/20/2027, #080106 | | | | | | | | | 25,952 | |
| | 38 | | | 2.375%, 01/20/2028, #080154 | | | | | | | | | 39,433 | |
| | 100 | | | 3.375%, 05/20/2029, #080283 | | | | | | | | | 104,095 | |
| | 198 | | | 1.875%, 11/20/2030, #080469 | | | | | | | | | 204,135 | |
| | 62 | | | 3.375%, 04/20/2031, #080507 | | | | | | | | | 64,530 | |
| | 218 | | | 2.625%, 08/20/2031, #080535 | | | | | | | | | 226,148 | |
| | 49 | | | 3.500%, 02/20/2032, #080580 | | | | | | | | | 50,365 | |
| | 42,932 | | | Total Adjustable Rate | | | | | | | | | 45,013,130 | |
| | | | Fixed Rate – 2.1% | | | | | | | | | | |
| | | | | |
| | | | Federal Home Loan Mortgage Corporation
Series K001, Class A3 | | | | | | | | | | |
| | 95 | | | 5.469%, 01/25/2012 | | | | | | | | | 94,685 | |
| | | | Series K701, Class A1 | | | | | | | | | | |
| | 2,716 | | | 2.838%, 06/26/2017 | | | | | | | | | 2,794,620 | |
| | | | | |
| | | | Federal Home Loan Mortgage Corporation Pool | | | | | | | | | | |
| | 2,288 | | | 4.500%, 05/01/2018, #G11618 | | | | | | | | | 2,445,400 | |
| | 856 | | | 4.500%, 04/01/2022, #M30035 | | | | | | | | | 907,638 | |
| | | | | |
| | | | Federal National Mortgage Association Pool | | | | | | | | | | |
| | 72 | | | 5.500%, 05/01/2012, #254340 | | | | | | | | | 72,293 | |
| | 81 | | | 5.000%, 03/01/2013, #254682 | | | | | | | | | 85,470 | |
| | 792 | | | 4.000%, 12/01/2013, #255039 | | | | | | | | | 810,149 | |
| | 1,939 | | | 4.000%, 05/01/2020, #AD0107 | | | | | | | | | 2,051,998 | |
| | 3,964 | | | 3.500%, 06/01/2021, #MA0771 | | | | | | | | | 4,129,319 | |
| | 3,465 | | | 4.500%, 04/01/2024, #AA4312 | | | | | | | | | 3,694,053 | |
| | 16,268 | | | Total Fixed Rate | | | | | | | | | 17,085,625 | |
| $ | 59,200 | | | Total U.S. Government Agency Mortgage Backed Securities (cost $60,599,504) | | | | | | | | | 62,098,755 | |
| | | | | |
Principal
Amount (000) | | | Description p | | | | | | | | Value | |
| | | | COLLATERALIZED MORTGAGE OBLIGATION – U.S. GOVERNMENT AGENCY MORTGAGE-BACKED SECURITIES – 5.0% | | | | | | | | | | |
| | | | | |
| | | | Adjustable Rate D – 1.2% | | | | | | | | | | |
| | | | | |
| | | | FDIC Structured Sale Guaranteed Notes
Series 2010-S1, Class 1A | | | | | | | | | | |
| $ | 4,250 | | | 0.741%, 02/25/2048 n | | | | | | | | $ | 4,254,140 | |
| | | | | |
| | | | Federal National Mortgage Association
Series 2003-25, Class FN | | | | | | | | | | |
| | 2,961 | | | 0.644%, 04/25/2018 | | | | | | | | | 2,972,030 | |
| | | | Series 2004-90, Class GF | | | | | | | | | | |
| | 2,522 | | | 0.494%, 11/25/2034 | | | | | | | | | 2,517,962 | |
| | 9,733 | | | Total Adjustable Rate | | | | | | | | | 9,744,132 | |
| | | | Fixed Rate – 3.8% | | | | | | | | | | |
| | | | | |
| | | | FDIC Structured Sale Guaranteed Notes
Series 2010-S1, Class 2A | | | | | | | | | | |
| | 2,430 | | | 3.250%, 04/25/2038 n | | | | | | | | | 2,487,309 | |
| | | | | | | | | | | | | | |
Principal
Amount (000) | | | Description p | | | | | | | | Value | |
| | | | | | | | | | | | | | |
| | | | Fixed Rate (continued) | | | | | | | | | | |
| | | | Series A1 | | | | | | | | | | |
| $ | 2,000 | | | 0.000%, 10/25/2011, #2010-L1A | | | | | | | | $ | 1,998,820 | |
| | | | | |
| | | | Federal Home Loan Mortgage Corporation
Series 1022, Class J | | | | | | | | | | |
| | 17 | | | 6.000%, 12/15/2020 | | | | | | | | | 19,261 | |
| | | | Series 2629, Class BO | | | | | | | | | | |
| | 2,182 | | | 3.250%, 03/15/2018 | | | | | | | | | 2,259,639 | |
| | | | Series 2780, Class QC | | | | | | | | | | |
| | 47 | | | 4.500%, 03/15/2017 | | | | | | | | | 47,402 | |
| | | | Series 2795, Class CL | | | | | | | | | | |
| | 1,798 | | | 4.500%, 07/15/2017 | | | | | | | | | 1,826,519 | |
| | | | Series 2843, Class BH | | | | | | | | | | |
| | 1,822 | | | 4.000%, 01/15/2018 | | | | | | | | | 1,860,461 | |
| | | | Series 3555, Class DA | | | | | | | | | | |
| | 1,869 | | | 4.000%, 12/15/2014 | | | | | | | | | 1,925,659 | |
| | | | Series 3555, Class EA | | | | | | | | | | |
| | 759 | | | 4.000%, 12/15/2014 | | | | | | | | | 781,813 | |
| | | | Series 3591, Class NA | | | | | | | | | | |
| | 1,439 | | | 1.250%, 10/15/2012 | | | | | | | | | 1,450,416 | |
| | | | | |
| | | | Federal National Mortgage Association
Series 1992-150, Class MA | | | | | | | | | | |
| | 52 | | | 5.500%, 09/25/2022 | | | | | | | | | 56,776 | |
| | | | Series 2002-83, Class MD | | | | | | | | | | |
| | 305 | | | 5.000%, 09/25/2016 | | | | | | | | | 306,765 | |
| | | | Series 2003-122, Class AJ | | | | | | | | | | |
| | 3,553 | �� | | 4.500%, 02/25/2028 | | | | | | | | | 3,669,608 | |
| | | | Series 2003-68, Class QP | | | | | | | | | | |
| | 1,728 | | | 3.000%, 07/25/2022 | | | | | | | | | 1,763,570 | |
| | | | Series 2004-90, Class GA | | | | | | | | | | |
| | 1,521 | | | 4.350%, 03/25/2034 | | | | | | | | | 1,584,629 | |
| | | | Series 2010-M1, Class A1 | | | | | | | | | | |
| | 2,011 | | | 3.305%, 06/25/2019 | | | | | | | | | 2,092,301 | |
| | | | Series 2010-M6, Class A1 | | | | | | | | | | |
| | 1,912 | | | 2.210%, 09/25/2020 | | | | | | | | | 1,873,830 | |
| | | | | |
| | | | FHLMC Structured Pass-Through Securities
Series T-45, Class A4 | | | | | | | | | | |
| | 3,624 | | | 4.520%, 08/27/2012 | | | | | | | | | 3,742,250 | |
| | | | | |
| | | | Government National Mortgage Association
Series 2003-85, Class ZL | | | | | | | | | | |
| | 1,942 | | | 5.500%, 06/20/2028 | | | | | | | | | 1,995,309 | |
| | 31,011 | | | Total Fixed Rate | | | | | | | | | 31,742,337 | |
| $ | 40,744 | | | Total Collateralized Mortgage Obligation – U.S. Government Agency Mortgage-Backed Securities (cost $41,108,491) | | | | | | | | | 41,486,469 | |
| | | | | |
Principal
Amount (000) | | | Description p | | | | | | | | Value | |
| | | | U.S. GOVERNMENT & AGENCY SECURITIES – 2.6% | | | | | | | | | | |
| | | | | |
| | | | U.S. Agency Debentures – 2.6% | | | | | | | | | | |
| | | | | |
| | | | Federal Home Loan Bank | | | | | | | | | | |
| $ | 6,000 | | | 2.250%, 04/13/2012 | | | | | | | | $ | 6,091,242 | |
| | 5,400 | | | 1.500%, 01/16/2013 q | | | | | | | | | 5,487,772 | |
| | | | | |
| | | | Federal Home Loan Mortgage Corporation | | | | | | | | | | |
| | 2,000 | | | 1.625%, 04/15/2013 q | | | | | | | | | 2,041,294 | |
| | | | | |
| | | | Federal National Mortgage Association | | | | | | | | | | |
| | 7,500 | | | 1.000%, 04/04/2012 q | | | | | | | | | 7,539,637 | |
| $ | 20,900 | | | Total U.S. Government & Agency Securities (cost $20,877,114) | | | | | | | | | 21,159,945 | |
Portfolio of Investments
Nuveen Short Term Bond Fund (continued)
June 30, 2011
| | | | | | | | | | | | | | |
Principal
Amount (000) | | | Description p | | | | | | | | Value | |
| | | | | | | | | | | | | | |
| | | | COLLATERALIZED MORTGAGE OBLIGATIONS-PRIVATE MORTGAGE-BACKED SECURITIES – 5.2% | | | | | | |
| | | | | |
| | | | Adjustable Rate D – 3.5% | | | | | | | | | | |
| | | | | |
| | | | Arkle Master Issuer PLC
Series 2010-1A, Class 2A | | | | | | | | | | |
| $ | 4,200 | | | 1.464%, 05/17/2060 n | | | | | | | | $ | 4,193,230 | |
| | | | | |
| | | | Countrywide Home Loans
Series 2004-2, Class 2A1 | | | | | | | | | | |
| | 287 | | | 2.761%, 02/25/2034 | | | | | | | | | 279,912 | |
| | | | | |
| | | | GSR Mortgage Loan Trust
Series 2005-AR1, Class B1 | | | | | | | | | | |
| | 1,920 | | | 4.019%, 01/25/2035 n | | | | | | | | | 1,285,347 | |
| | | | | |
| | | | Indymac Index Mortgage Loan Trust
Series 2005-AR1, Class 4A1 | | | | | | | | | | |
| | 439 | | | 2.695%, 03/25/2035 | | | | | | | | | 393,228 | |
| | | | | |
| | | | JPMorgan Chase Commercial Mortgage Securities Trust
Series 2011-C4, Class A1 | | | | | | | | | | |
| | 7,100 | | | 1.525%, 07/15/2046 | | | | | | | | | 7,104,732 | |
| | | | | |
| | | | JPMorgan Mortgage Trust
Series 2006-A7, Class 3A4 | | | | | | | | | | |
| | 344 | | | 5.875%, 01/25/2037 | | | | | | | | | 36,079 | |
| | | | | |
| | | | Master Adjustable Rate Mortgages Trust
Series 2003-5, Class 4A1 | | | | | | | | | | |
| | 1,709 | | | 2.059%, 11/25/2033 | | | | | | | | | 1,403,764 | |
| | | | | |
| | | | NCUA Guaranteed Notes
Series 2010-R3, Class 2A | | | | | | | | | | |
| | 6,159 | | | 0.825%, 12/08/2020 | | | | | | | | | 6,193,966 | |
| | | | Series 2011-R1, Class 1A | | | | | | | | | | |
| | 5,833 | | | 0.711%, 01/08/2020 | | | | | | | | | 5,835,853 | |
| | | | | |
| | | | Sequoia Mortgage Trust
Series 2007-1, Class 2A1 | | | | | | | | | | |
| | 617 | | | 4.947%, 02/20/2047 | | | | | | | | | 505,511 | |
| | | | | |
| | | | Structured Mortgage Loan Trust
Series 2004-11, Class A | | | | | | | | | | |
| | 175 | | | 2.653%, 08/25/2034 | | | | | | | | | 157,736 | |
| | | | | |
| | | | Washington Mutual
Series 2007-HY2, Class 3A2 | | | | | | | | | | |
| | 625 | | | 5.634%, 09/25/2036 | | | | | | | | | 87,806 | |
| | | | | |
| | | | Wells Fargo Mortgage Backed Securities Trust
Series 2006-AR14, Class 2A3 | | | | | | | | | | |
| | 1,749 | | | 5.904%, 10/25/2036 | | | | | | | | | 1,395,818 | |
| | 31,157 | | | Total Adjustable Rate | | | | | | | | | 28,872,982 | |
| | | | Fixed Rate – 1.7% | | | | | | | | | | |
| | | | | |
| | | | Countrywide Alternative Loan Trust | | | | | | | | | | |
| | | | Series 2006-19CB, Class A15 | | | | | | | | | | |
| | 1,112 | | | 6.000%, 08/25/2036 | | | | | | | | | 918,208 | |
| | | | | |
| | | | GMAC Mortgage Corporation Loan Trust | | | | | | | | | | |
| | | | Series 2010-1, Class A | | | | | | | | | | |
| | 979 | | | 4.250%, 07/25/2040 n | | | | | | | | | 982,640 | |
| | | | | |
| | | | Master Alternative Loans Trust | | | | | | | | | | |
| | | | Series 2004-13, Class 10A1 | | | | | | | | | | |
| | 392 | | | 8.000%, 01/25/2035 | | | | | | | | | 405,924 | |
| | | | | |
| | | | Mortgage Equity Conversion Asset Trust | | | | | | | | | | |
| | | | Series 2010-1A, Class A | | | | | | | | | | |
| | 2,549 | | | 4.000%, 07/25/2060 n | | | | | | | | | 2,551,323 | |
| | | | | | | | | | | | | | |
Principal
Amount (000) | | | Description p | | | | | | | | Value | |
| | | | | | | | | | | | | | |
| | | | Fixed Rate (continued) | | | | | | | | | | |
| | | | | |
| | | | NCUA Guaranteed Notes | | | | | | | | | | |
| | | | Series 2010-R1, Class 2A | | | | | | | | | | |
| $ | 2,588 | | | 1.840%, 10/07/2020 | | | | | | | | $ | 2,616,158 | |
| | | | | |
| | | | Newcastle Investment Trust | | | | | | | | | | |
| | | | Series 2011-MH1, Class A | | | | | | | | | | |
| | 3,930 | | | 2.450%, 12/10/2033 n | | | | | | | | | 3,953,854 | |
| | | | | |
| | | | Thornburg Mortgage Securities Trust | | | | | | | | | | |
| | | | Series 2007-4, Class 3A1 | | | | | | | | | | |
| | 1,377 | | | 6.027%, 09/25/2037 | | | | | | | | | 1,367,966 | |
| | | | | |
| | | | Wells Fargo Mortgage Backed Securities Trust | | | | | | | | | | |
| | | | Series 2006-3, Class A1 | | | | | | | | | | |
| | 435 | | | 5.500%, 03/25/2036 | | | | | | | | | 434,230 | |
| | | | Series 2007-2, Class 1A8 | | | | | | | | | | |
| | 1,246 | | | 5.750%, 03/25/2037 | | | | | | | | | 1,085,791 | |
| | 14,608 | | | Total Fixed Rate | | | | | | | | | 14,316,094 | |
| $ | 45,765 | | | Total Collateralized Mortgage Obligations – Private Mortgage-Backed Securities
(cost $46,253,822) | | | | | | | | | 43,189,076 | |
| | | | | |
Principal
Amount (000) | | | Description p | | | | | | | | Value | |
| | | | Municipal Bonds – 2.0% | | | | | | | | | | |
| | | | | |
| | | | California, Various Purpose | | | | | | | | | | |
| $ | 855 | | | 5.750%, 03/01/2017 | | | | | | | | $ | 942,338 | |
| | | | | |
| | | | Dallas-Fort Worth Texas International Airport | | | | | | | | | | |
| | | | Series 2001-A-1 | | | | | | | | | | |
| | 1,235 | | | 6.150%, 01/01/2016 | | | | | | | | | 1,234,889 | |
| | | | | |
| | | | Florida Housing Financial Corporation, Multifamily Crossroads Apartments | | | | | | | | | | |
| | | | Series A-1 | | | | | | | | | | |
| | 780 | | | 6.750%, 02/15/2012 | | | | | | | | | 779,930 | |
| | | | | |
| | | | Louisiana Local Government Environmental Facilities, Community Development Authority | | | | | | | | | | |
| | | | Series A1 | | | | | | | | | | |
| | 6,285 | | | 1.520%, 02/01/2018 | | | | | | | | | 6,313,283 | |
| | | | | |
| | | | Massachusetts State Port Authority, Special Facilities Revenue, Contract Project | | | | | | | | | | |
| | | | Series B | | | | | | | | | | |
| | 2,680 | | | 1.910%, 07/01/2014 | | | | | | | | | 2,677,347 | |
| | 330 | | | 3.230%, 07/01/2015 | | | | | | | | | 330,369 | |
| | | | | |
| | | | Phoenix Arizona Civic Improvement, Excise Tax Revenue | | | | | | | | | | |
| | 2,400 | | | 2.302%, 07/01/2014 | | | | | | | | | 2,417,112 | |
| | 1,700 | | | 2.828%, 07/01/2015 | | | | | | | | | 1,712,716 | |
| $ | 16,265 | | | Total Municipal Bonds (cost $16,356,464) | | | | | | | | | 16,407,984 | |
| | | | | |
| Shares | | | Description p | | | | | | | | Value | |
| | | | INVESTMENTS PURCHASED WITH PROCEEDS FROM SECURITIES LENDING | | | | | | | | | | |
| | | | | |
| | | | Money Market Funds – 9.2% | | | | | | | | | | |
| | | | | |
| | | | Mount Vernon Securities Lending Prime Portfolio | | | | | | | | | | |
| | 76,374,950 | | | 0.197% W † | | | | | | | | $ | 76,374,950 | |
| | | | Total Investments Purchased With Proceeds From Securities Lending (cost $76,374,950) | | | | | | | | | 76,374,950 | |
| | | | | |
Shares/
Principal
Amount (000) | | | Description p | | | | | | | | Value | |
| | | | SHORT-TERM INVESTMENTS – 5.4% | | | | | | | | | | |
| | | | | |
| | | | Money Market Funds – 5.1% | | | | | | | | | | |
| | | | | |
| | 42,035,533 | | | First American Prime Obligations Fund, Class Z,
.042% W | | | | | | | | $ | 42,035,533 | |
Portfolio of Investments
Nuveen Short Term Bond Fund (continued)
June 30, 2011
| | | | | | | | | | | | | | |
Shares/
Principal
Amount (000) | | | Description p | | | | | | | | Value | |
| | | | | | | | | | | | | | |
| | | | U.S. Treasury Obligations – 0.3% | | | | | | | | | | |
| | | | | |
| | | | U.S. Treasury Bills ¨ | | | | | | | | | | |
| $ | 635 | | | 0.035%, 10/20/2011 | | | | | | | | $ | 634,931 | |
| | 475 | | | 0..055%, 11/17/2011 | | | | | | | | | 474,899 | |
| | 1,220 | | | 0.020%, 07/21/2011 | | | | | | | | | 1,219,987 | |
| $ | 2,330 | | | Total U.S. Treasury Obligations | | | | | | | | | 2,329,817 | |
| | | | Total Short-Term Investments (cost $44,365,205) | | | | | | | | | 44,365,350 | |
| | | | Total Investments (cost $915,986,313) – 112.3% | | | | | | | | | 929,579,828 | |
| | | | Other Assets Less Liabilities – (12.3)% ¯ | | | | | | | | | (101,582,520) | |
| | | | Net Assets – 100.0% | | | | | | | | $ | 827,997,308 | |
Investments in Derivatives
Credit Default Swaps outstanding at June 30, 2011:
| | | | | | | | | | | | | | | | | | | | | | | | | | | | | | |
| Counterparty | | Reference Index | | Buy/Sell
Protection (1) | | | Current
Credit
Spread (3) | | | Notional
Amount (2) | | | Received
Fixed Rate | | | Termination
Date | | | Value | | | Unrealized
Appreciation
(Depreciation) | |
JPMorgan | | Markit CDX NA HY16 Index | | | Sell | | | | 4.55 | % | | $ | 24,000,000 | | | | 5.00 | % | | | 6/20/16 | | | $ | 388,669 | | | $ | 370,948 | |
UBS | | Markit CDX NA HY16 Index | | | Sell | | | | 4.55 | | | | 5,000,000 | | | | 5.00 | | | | 6/20/16 | | | | 80,973 | | | | 82,362 | |
| | | | | | | | | | | | | | | | | | | | | | | | | $ | 469,642 | | | $ | 453,310 | |
| (1) | | The Fund entered into the credit default swaps to gain investment exposure to the referenced index. If the Fund is a seller of protection and a credit event occurs, as defined under the terms of that particular swap agreement, the Fund will either (i) pay to the buyer of protection an amount equal to the notional amount of the swap and take deliver of the reference entity or underlying securities comprising the reference index or (ii) pay a net settlement amount in the form of cash or securities equal to the notional amount of the swap less the recovery value of the reference entity or underlying securities comprising the reference index. |
| (2) | | The maximum potential amount the Fund could be required to pay as a seller of credit protection or receive as a buyer of credit protection if a credit event occurs as defined under the terms of that particular swap agreement. |
| (3) | | The credit spread generally serves as an indication of the current status of the payment/performance risk and therefore the likelihood of default of the credit derivative. The credit spread also reflects the cost of buying/selling protection and may include upfront payments required to be made to enter into a credit default swap contract. Higher credit spreads are indicative of a higher likelihood of performance by the seller of protection. |
Forward Foreign Currency Exchange Contracts outstanding at June 30, 2011:
| | | | | | | | | | | | | | | | | | | | | | |
| Counterparty | | Currency Contracts to Deliver | | Amount
(Local Currency) | | | In Exchange
For
Currency | | | Amount
(Local Currency) | | | Settlement Date | | | Unrealized
Appreciation
(Depreciation)
(U.S. Dollars) | |
Citibank N.A. | | New Zealand | | | 5,300,000 | | | | U.S. Dollar | | | | 4,309,536 | | | | 7/28/11 | | | $ | (72,967 | ) |
Citibank N.A. | | U.S. Dollar | | | 5,300,000 | | | | New Zealand | | | | 4,361,814 | | | | 7/28/11 | | | | (19,855 | ) |
| | | | | | | | | | | | | | | | | | | | | $ | (92,822 | ) |
Futures Contracts outstanding at June 30, 2011:
| | | | | | | | | | | | | | | | | | | | |
| Type | | Contract
Position | | | Number of
Contracts | | | Contract
Expiration | | | Value | | | Unrealized
Appreciation
(Depreciation) | |
U.S. Treasury 2-Year Note | | | Long | | | | 28 | | | | 9/11 | | | $ | 6,141,625 | | | $ | 14,373 | |
U.S. Treasury 5-Year Note | | | Short | | | | (676 | ) | | | 9/11 | | | | (80,576,030 | ) | | | (532,008 | ) |
U.S. Treasury 10-Year Note | | | Short | | | | (175 | ) | | | 9/11 | | | | (21,407,423 | ) | | | (122,757 | ) |
U.S. Treasury Long Bond | | | Short | | | | (17 | ) | | | 9/11 | | | | (2,091,531 | ) | | | 14,578 | |
| | | | | | | | | | | | | | | | | | | $ | (625,814 | ) |
Interest Rate Swaps outstanding at June 30, 2011:
| | | | | | | | | | | | | | | | | | | | | | | | | | | | |
| Counterparty | | Notional Amount | | | Floating Rate
Index | | | Fund
Pay/Receive
Floating Rate | | | Fixed Rate* | | | Fixed Rate
Payment
Frequency | | | Termination Date | | | Unrealized
Appreciation
(Depreciation) | |
JPMorgan Chase | | $ | 24,000,000 | | | | 3-Month LIBOR | | | | Receive | | | | 1.255 | % | | | Semi-Annually | | | | 11/03/11 | | | $ | (114,821 | ) |
JPMorgan Chase | | | 4,000,000 | | | | 3-Month LIBOR | | | | Receive | | | | 3.858 | | | | Semi-Annually | | | | 1/19/20 | | | | (325,548 | ) |
UBS | | | 11,000,000 | | | | 3-Month LIBOR | | | | Receive | | | | 1.358 | | | | Semi-Annually | | | | 9/25/11 | | | | (68,395 | ) |
UBS | | | 16,000,000 | | | | 3-Month LIBOR | | | | Receive | | | | 1.133 | | | | Semi-Annually | | | | 3/25/12 | | | | (140,499 | ) |
UBS | | | 18,000,000 | | | | 3-Month LIBOR | | | | Receive | | | | 1.048 | | | | Semi-Annually | | | | 6/25/12 | | | | (118,776 | ) |
UBS | | | 4,000,000 | | | | 3-Month LIBOR | | | | Receive | | | | 3.001 | | | | Semi-Annually | | | | 8/03/14 | | | | (269,244 | ) |
| | | | | | | | | | | | | | | | | | | | | | | | | | | $ | (1,037,283 | ) |
| | | | For Fund portfolio compliance purposes, the Fund’s industry classifications refer to any one or more of the industry sub-classifications used by one or more widely recognized market indexes or ratings group indexes, and/or as defined by Fund management. This definition may not apply for purposes of this report which may combine industry sub-classifications into sectors for reporting ease. |
| | p | | All Percentages shown in the Portfolio of Investments are based on net assets. |
| | — | | Principal Amount (000) denoted in U.S. Dollars, unless otherwise noted. |
| | q | | Investment, or a portion of investment, is out on loan for securities lending. |
| | n | | Investment is exempt from registration under Rule 144A of the Securities Act of 1933, as amended. These investments may only be resold in transactions exempt from registration, which are normally those transactions with qualified institutional buyers. |
| | D | | Variable Rate Security – The rate shown is the rate in effect as of June 30, 2011. |
| | W | | The rate shown is the annualized seven-day effective yield as of June 30, 2011. |
| | ¨ | | Investment, or portion of investment, segregated as collateral for investments in derivatives. Yield shown is effective yield as of June 30, 2011. |
| | † | | The Fund may loan securities representing up to one third of the fair value of its total assets (which includes collateral for securities on loan) to broker-dealers, banks, or other institutional borrowers of securities. The Fund maintains collateral equal to at least 102% of the fair value of the securities loaned. The adequacy of the collateral is monitored on a daily basis. The cash collateral received by the Fund is invested in this money market fund. |
| | ¯ | | Other Assets Less Liabilities includes the net Unrealized Appreciation (Depreciation) of derivatives instruments as listed within Investments in Derivatives. |
| | LIBOR | | London Inter-Bank Offered Rate |
| | REIT | | Real Estate Investment Trust |
See accompanying notes to financial statements.
Portfolio of Investments
Nuveen Total Return Bond Fund
(formerly known as First American Total Return Bond Fund)
June 30, 2011
| | | | | | | | | | | | | | |
Principal
Amount (000) — | | | Description p | | | | | | | | Value | |
| | | | | | | | | | | | | | |
| | | | CORPORATE BONDS – 49.9% | | | | | | | | | | |
| | | | | |
| | | | Banking – 6.1% | | | | | | | | | | |
| | | | | |
| | | | Ally Financial | | | | | | | | | | |
| $ | 910 | | | 7.500%, 09/15/2020 | | | | | | | | $ | 950,950 | |
| | | | | |
| | | | Banco Bradesco | | | | | | | | | | |
| | 1,155 | | | 4.125%, 05/16/2016 n q | | | | | | | | | 1,162,277 | |
| | | | | |
| | | | Bancolombia | | | | | | | | | | |
| | 1,790 | | | 5.950%, 06/03/2021 n | | | | | | | | | 1,816,850 | |
| | | | | |
| | | | Bank of America | | | | | | | | | | |
| | 2,615 | | | 5.750%, 12/01/2017 | | | | | | | | | 2,796,769 | |
| | 6,770 | | | 5.875%, 01/05/2021 | | | | | | | | | 7,104,945 | |
| | | | | |
| | | | Barclays Bank | | | | | | | | | | |
| | | | Series EMTN | | | | | | | | | | |
| | 1,140 | | | 4.750%, 03/15/2020 D | | | | | | | | | 1,177,907 | |
| | | | | |
| | | | BBVA Bancomer | | | | | | | | | | |
| | 850 | | | 4.500%, 03/10/2016 n q | | | | | | | | | 864,875 | |
| | | | | |
| | | | Citigroup | | | | | | | | | | |
| | 1,915 | | | 5.375%, 08/09/2020 q | | | | | | | | | 1,998,423 | |
| | 2,765 | | | 6.125%, 08/25/2036 | | | | | | | | | 2,657,312 | |
| | | | | |
| | | | Citigroup Capital XXI | | | | | | | | | | |
| | 2,735 | | | 8.300%, 12/21/2077 D | | | | | | | | | 2,796,538 | |
| | | | | |
| | | | HSBC Holdings | | | | | | | | | | |
| | 1,910 | | | 6.800%, 06/01/2038 | | | | | | | | | 2,038,289 | |
| | | | | |
| | | | JPMorgan Chase | | | | | | | | | | |
| | 1,350 | | | 4.250%, 10/15/2020 | | | | | | | | | 1,320,752 | |
| | 2,420 | | | 5.500%, 10/15/2040 | | | | | | | | | 2,406,177 | |
| | | | | |
| | | | JPMorgan Chase Capital XX | | | | | | | | | | |
| | | | Series T | | | | | | | | | | |
| | 2,060 | | | 6.550%, 09/29/2066 D | | | | | | | | | 2,065,059 | |
| | | | | |
| | | | Royal Bank of Scotland | | | | | | | | | | |
| | 2,100 | | | 6.400%, 10/21/2019 q | | | | | | | | | 2,157,040 | |
| | | | | |
| | | | Sovereign Bank | | | | | | | | | | |
| | 2,350 | | | 8.750%, 05/30/2018 | | | | | | | | | 2,652,819 | |
| | | | | |
| | | | UBS | | | | | | | | | | |
| | 1,410 | | | 4.875%, 08/04/2020 | | | | | | | | | 1,426,140 | |
| | | | | |
| | | | Wachovia Captial Trust III | | | | | | | | | | |
| | 2,175 | | | 5.570%, 03/29/2049 D | | | | | | | | | 1,990,125 | |
| | 38,420 | | | Total Banking | | | | | | | | | 39,383,247 | |
| | | | Basic Industry – 4.7% | | | | | | | | | | |
| | | | | |
| | | | Alcoa | | | | | | | | | | |
| | 1,100 | | | 5.400%, 04/15/2021 | | | | | | | | | 1,103,397 | |
| | | | | |
| | | | Alrosa Finance | | | | | | | | | | |
| | 1,315 | | | 7.750%, 11/03/2020 n q | | | | | | | | | 1,430,063 | |
| | | | | |
| | | | Arcelormittal | | | | | | | | | | |
| | 3,065 | | | 7.000%, 10/15/2039 | | | | | | | | | 3,099,003 | |
| | | | | |
| | | | Cliffs Natural Resources | | | | | | | | | | |
| | 2,725 | | | 4.800%, 10/01/2020 | | | | | | | | | 2,739,355 | |
| | | | | |
| | | | Hidili Industry International Development | | | | | | | | | | |
| | 725 | | | 8.625%, 11/04/2015 n q | | | | | | | | | 712,313 | |
| | | | | |
| | | | Incitec Pivot Finance | | | | | | | | | | |
| | 1,915 | | | 6.000%, 12/10/2019 n | | | | | | | | | 2,051,026 | |
| | | | | |
| | | | International Paper | | | | | | | | | | |
| | 1,680 | | | 8.700%, 06/15/2038 | | | | | | | | | 2,089,972 | |
| | | | | | | | | | | | | | |
Principal
Amount (000) — | | | Description p | | | | | | | | Value | |
| | | | | | | | | | | | | | |
| | | | Basic Industry (continued) | | | | | | | | | | |
| | | | | |
| | | | Metinvest | | | | | | | | | | |
| $ | 135 | | | 10.250%, 05/20/2015 n | | | | | | | | $ | 146,975 | |
| | 1,380 | | | 8.750%, 02/14/2018 n | | | | | | | | | 1,428,300 | |
| | | | | |
| | | | Plum Creek Timberlands | | | | | | | | | | |
| | 2,105 | | | 4.700%, 03/15/2021 | | | | | | | | | 2,074,597 | |
| | | | | |
| | | | Reynolds Group Issuer | | | | | | | | | | |
| | 1,500 | | | 7.125%, 04/15/2019 n | | | | | | | | | 1,488,750 | |
| | | | | |
| | | | Rhodia | | | | | | | | | | |
| | 1,500 | | | 6.875%, 09/15/2020 n | | | | | | | | | 1,756,875 | |
| | | | | |
| | | | Sinochem Overseas Capital | | | | | | | | | | |
| | 750 | | | 4.500%, 11/12/2020 n q | | | | | | | | | 719,082 | |
| | | | | |
| | | | Southern Copper | | | | | | | | | | |
| | 1,265 | | | 7.500%, 07/27/2035 | | | | | | | | | 1,324,531 | |
| | | | | |
| | | | Taseko Mines | | | | | | | | | | |
| | 1,250 | | | 7.750%, 04/15/2019 | | | | | | | | | 1,259,375 | |
| | | | | |
| | | | Teck Cominco Limited | | | | | | | | | | |
| | 1,575 | | | 6.125%, 10/01/2035 | | | | | | | | | 1,591,947 | |
| | | | | |
| | | | Teck Resources | | | | | | | | | | |
| | 905 | | | 6.250%, 07/15/2041 | | | | | | | | | 913,699 | |
| | | | | |
| | | | United Refining | | | | | | | | | | |
| | 990 | | | 10.500%, 02/28/2018 | | | | | | | | | 990,000 | |
| | | | | |
| | | | Vale Overseas | | | | | | | | | | |
| | 1,990 | | | 6.875%, 11/10/2039 | | | | | | | | | 2,162,692 | |
| | | | | |
| | | | Vedanta Resources | | | | | | | | | | |
| | 1,575 | | | 9.500%, 07/18/2018 n q | | | | | | | | | 1,716,750 | |
| | 29,445 | | | Total Basic Industry | | | | | | | | | 30,798,702 | |
| | | | Brokerage - 2.7% | | | | | | | | | | |
| | | | | |
| | | | Fosun International | | | | | | | | | | |
| | | | Series 144A | | | | | | | | | | |
| | 1,325 | | | 7.500%, 05/12/2016 n q | | | | | | | | | 1,311,750 | |
| | | | | |
| | | | Goldman Sachs Capital II | | | | | | | | | | |
| | 1,495 | | | 5.793%, 12/29/2049 D | | | | | | | | | 1,196,000 | |
| | | | | |
| | | | Goldman Sachs Group | | | | | | | | | | |
| | 9,075 | | | 6.000%, 06/15/2020 q | | | | | | | | | 9,764,591 | |
| | | | | |
| | | | Morgan Stanley | | | | | | | | | | |
| | 750 | | | 7.300%, 05/13/2019 q | | | | | | | | | 850,519 | |
| | 2,600 | | | 5.500%, 07/24/2020 | | | | | | | | | 2,631,697 | |
| | 1,960 | | | 5.750%, 01/25/2021 | | | | | | | | | 1,983,185 | |
| | 17,205 | | | Total Brokerage | | | | | | | | | 17,737,742 | |
| | | | Capital Goods – 0.3% | | | | | | | | | | |
| | | | | |
| | | | Abengoa Finance | | | | | | | | | | |
| | 1,150 | | | 8.875%, 11/01/2017 n q | | | | | | | | | 1,174,438 | |
| | | | | |
| | | | Martin Marietta Material | | | | | | | | | | |
| | 850 | | | 6.600%, 04/15/2018 | | | | | | | | | 944,441 | |
| | 2,000 | | | Total Capital Goods | | | | | | | | | 2,118,879 | |
| | | | Communications – 3.9% | | | | | | | | | | |
| | | | | |
| | | | American Tower | | | | | | | | | | |
| | 2,195 | | | 5.050%, 09/01/2020 | | | | | | | | | 2,162,014 | |
| | | | | |
| | | | AT&T | | | | | | | | | | |
| | 1,510 | | | 6.550%, 02/15/2039 q | | | | | | | | | 1,656,213 | |
Portfolio of Investments
Nuveen Total Return Bond Fund (continued)
June 30, 2011
| | | | | | | | | | | | | | |
Principal
Amount (000) — | | | Description p | | | | | | | | Value | |
| | | | | | | | | | | | | | |
| | | | Communications (continued) | | | | | | | | | | |
| | | | | |
| | | | British Sky Broadcasting | | | | | | | | | | |
| $ | 1,975 | | | 6.100%, 02/15/2018 n | | | | | | | | $ | 2,209,047 | |
| | | | | |
| | | | Comcast | | | | | | | | | | |
| | 1,630 | | | 6.400%, 05/15/2038 | | | | | | | | | 1,739,234 | |
| | | | | |
| | | | DirecTV Holdings | | | | | | | | | | |
| | 2,230 | | | 5.200%, 03/15/2020 q | | | | | | | | | 2,359,536 | |
| | | | | |
| | | | Embarq | | | | | | | | | | |
| | 1,545 | | | 7.082%, 06/01/2016 | | | | | | | | | 1,717,453 | |
| | | | | |
| | | | Frontier Communications | | | | | | | | | | |
| | 1,355 | | | 8.500%, 04/15/2020 | | | | | | | | | 1,476,950 | |
| | | | | |
| | | | NBC Universal | | | | | | | | | | |
| | 2,515 | | | 4.375%, 04/01/2021 n | | | | | | | | | 2,488,721 | |
| | | | | |
| | | | News America | | | | | | | | | | |
| | 1,600 | | | 6.650%, 11/15/2037 q | | | | | | | | | 1,714,718 | |
| | 825 | | | 6.150%, 02/15/2041 n | | | | | | | | | 817,275 | |
| | | | | |
| | | | Sprint Nextel | | | | | | | | | | |
| | 1,200 | | | 6.000%, 12/01/2016 | | | | | | | | | 1,198,500 | |
| | | | | |
| | | | TCM Sub | | | | | | | | | | |
| | 870 | | | 3.550%, 01/15/2015 n | | | | | | | | | 909,109 | |
| | | | | |
| | | | Telecom Italia Capital | | | | | | | | | | |
| | 2,250 | | | 7.175%, 06/18/2019 q | | | | | | | | | 2,484,194 | |
| | | | | |
| | | | Time Warner Cable | | | | | | | | | | |
| | 1,515 | | | 5.875%, 11/15/2040 q | | | | | | | | | 1,495,252 | |
| | | | | |
| | | | Verizon Communications | | | | | | | | | | |
| | 915 | | | 6.900%, 04/15/2038 | | | | | | | | | 1,049,644 | |
| | 24,130 | | | Total Communications | | | | | | | | | 25,477,860 | |
| | | | Consumer Cyclical – 2.3% | | | | | | | | | | |
| | | | | |
| | | | Ford Motor Credit | | | | | | | | | | |
| | 1,350 | | | 6.625%, 08/15/2017 | | | | | | | | | 1,435,105 | |
| | | | | |
| | | | Giti Tire | | | | | | | | | | |
| | 500 | | | 12.250%, 01/26/2012 | | | | | | | | | 490,256 | |
| | | | | |
| | | | Ingram Micro | | | | | | | | | | |
| | 1,090 | | | 5.250%, 09/01/2017 | | | | | | | | | 1,142,572 | |
| | | | | |
| | | | Isle Of Capri Casinos | | | | | | | | | | |
| | 1,000 | | | 7.750%, 03/15/2019 n q | | | | | | | | | 1,010,000 | |
| | | | | |
| | | | J.C. Penney | | | | | | | | | | |
| | 1,425 | | | 5.650%, 06/01/2020 | | | | | | | | | 1,410,750 | |
| | | | | |
| | | | Land O Lakes Capital Trust I | | | | | | | | | | |
| | | | Series 144A | | | | | | | | | | |
| | 1,125 | | | 7.450%, 03/15/2028 ¢ | | | | | | | | | 1,071,563 | |
| | | | | |
| | | | O’Reilly Automotive | | | | | | | | | | |
| | 1,940 | | | 4.875%, 01/14/2021 | | | | | | | | | 1,949,405 | |
| | | | | |
| | | | R.R. Donnelley & Sons | | | | | | | | | | |
| | 1,070 | | | 7.625%, 06/15/2020 q | | | | | | | | | 1,057,485 | |
| | | | | |
| | | | Time Warner | | | | | | | | | | |
| | 1,500 | | | 4.750%, 03/29/2021 | | | | | | | | | 1,525,878 | |
| | 1,750 | | | 6.100%, 07/15/2040 | | | | | | | | | 1,778,973 | |
| | | | | |
| | | | Viacom | | | | | | | | | | |
| | 1,975 | | | 6.875%, 04/30/2036 | | | | | | | | | 2,204,898 | |
| | 14,725 | | | Total Consumer Cyclical | | | | | | | | | 15,076,885 | |
| | | | | | | | | | | | | | |
Principal
Amount (000) — | | | Description p | | | | | | | | Value | |
| | | | | | | | | | | | | | |
| | | | Consumer Non Cyclical – 2.9% | | | | | | | | | | |
| | | | | |
| | | | Altria Group | | | | | | | | | | |
| $ | 1,270 | | | 4.750%, 05/05/2021 | | | | | | | | $ | 1,269,130 | |
| | 2,720 | | | 9.950%, 11/10/2038 | | | | | | | | | 3,821,725 | |
| | | | | |
| | | | CKE Restaurants | | | | | | | | | | |
| | 735 | | | 11.375%, 07/15/2018 | | | | | | | | | 809,419 | |
| | | | | |
| | | | CVS Caremark | | | | | | | | | | |
| | 1,810 | | | 6.302%, 06/01/2062 D | | | | | | | | | 1,762,487 | |
| | | | | |
| | | | HCA Holdings | | | | | | | | | | |
| | 1,125 | | | 7.750%, 05/15/2021 n q | | | | | | | | | 1,167,187 | |
| | | | | |
| | | | Lorillard Tobacco | | | | | | | | | | |
| | 1,590 | | | 8.125%, 06/23/2019 | | | | | | | | | 1,851,956 | |
| | | | | |
| | | | MHP | | | | | | | | | | |
| | 1,225 | | | 10.250%, 04/29/2015 n | | | | | | | | | 1,309,158 | |
| | | | | |
| | | | Pernod Ricard | | | | | | | | | | |
| | 1,365 | | | 5.750%, 04/07/2021 n | | | | | | | | | 1,425,138 | |
| | | | | |
| | | | STHI Holding | | | | | | | | | | |
| | 1,520 | | | 8.000%, 03/15/2018 n | | | | | | | | | 1,542,800 | |
| | | | | |
| | | | UnitedHealth Group | | | | | | | | | | |
| | 1,395 | | | 6.875%, 02/15/2038 | | | | | | | | | 1,595,093 | |
| | | | | |
| | | | Valeant Pharmaceuticals | | | | | | | | | | |
| | 2,330 | | | 6.875%, 12/01/2018 n q | | | | | | | | | 2,283,400 | |
| | 17,085 | | | Total Consumer Non Cyclical | | | | | | | | | 18,837,493 | |
| | | | Electric – 1.9% | | | | | | | | | | |
| | | | | |
| | | | Calpine | | | | | | | | | | |
| | 1,315 | | | 7.875%, 07/31/2020 n q | | | | | | | | | 1,374,175 | |
| | | | | |
| | | | Comision Federal De Electric | | | | | | | | | | |
| | 1,485 | | | 4.875%, 05/26/2021 n | | | | | | | | | 1,482,921 | |
| | | | | |
| | | | Constellation Energy Group | | | | | | | | | | |
| | 2,010 | | | 5.150%, 12/01/2020 q | | | | | | | | | 2,059,886 | |
| | | | | |
| | | | FirstEnergy Solutions | | | | | | | | | | |
| | 2,000 | | | 6.050%, 08/15/2021 | | | | | | | | | 2,152,098 | |
| | | | | |
| | | | MidAmerican Energy Holdings | | | | | | | | | | |
| | 2,630 | | | 6.125%, 04/01/2036 | | | | | | | | | 2,832,221 | |
| | | | | |
| | | | Midwest Generation | | | | | | | | | | |
| | | | Series 2000 | | | | | | | | | | |
| | 1,483 | | | 8.560%, 01/02/2016 | | | | | | | | | 1,519,658 | |
| | | | | |
| | | | Texas Competitive Electric Holdings | | | | | | | | | | |
| | | | Series 144A | | | | | | | | | | |
| | 860 | | | 11.500%, 10/01/2020 | | | | | | | | | 846,567 | |
| | 11,783 | | | Total Electric | | | | | | | | | 12,267,526 | |
| | | | Energy – 4.2% | | | | | | | | | | |
| | | | | |
| | | | Anadarko Petroleum | | | | | | | | | | |
| | 1,140 | | | 6.375%, 09/15/2017 | | | | | | | | | 1,306,821 | |
| | 1,675 | | | 6.200%, 03/15/2040 q | | | | | | | | | 1,697,606 | |
| | | | | |
| | | | Canadian Oil Sands | | | | | | | | | | |
| | 1,700 | | | 7.750%, 05/15/2019 n | | | | | | | | | 2,042,451 | |
| | | | | |
| | | | Carrizo Oil & Gas | | | | | | | | | | |
| | 1,150 | | | 8.625%, 10/15/2018 | | | | | | | | | 1,184,500 | |
| | | | | |
| | | | Connacher Oil And Gas | | | | | | | | | | |
| | | | Series 144A | | | | | | | | | | |
| | 800 | | | 8.750%, 08/01/2018 n | | | | | | | | | 821,193 | |
Portfolio of Investments
Nuveen Total Return Bond Fund (continued)
June 30, 2011
| | | | | | | | | | | | | | |
Principal
Amount (000) — | | | Description p | | | | | | | | Value | |
| | | | | | | | | | | | | | |
| | | | Energy (continued) | | | | | | | | | | |
| | | | | |
| | | | Diamond Offshore Drilling | | | | | | | | | | |
| $ | 1,775 | | | 5.700%, 10/15/2039 q | | | | | | | | $ | 1,752,967 | |
| | | | | |
| | | | Lukoil International Finance | | | | | | | | | | |
| | 2,625 | | | 6.125%, 11/09/2020 n | | | | | | | | | 2,707,031 | |
| | | | | |
| | | | Nabors Industries | | | | | | | | | | |
| | 1,590 | | | 5.000%, 09/15/2020 q | | | | | | | | | 1,608,819 | |
| | | | | |
| | | | Nexen | | | | | | | | | | |
| | 2,240 | | | 6.400%, 05/15/2037 | | | | | | | | | 2,234,434 | |
| | | | | |
| | | | OGX Petroleo E Gas Participacoes | | | | | | | | | | |
| | | | Series 144A | | | | | | | | | | |
| | 1,155 | | | 8.500%, 06/01/2018 n q | | | | | | | | | 1,187,918 | |
| | | | | |
| | | | Petrobras International Finance | | | | | | | | | | |
| | 1,770 | | | 6.875%, 01/20/2040 | | | | | | | | | 1,884,627 | |
| | | | | |
| | | | Petro-Canada | | | | | | | | | | |
| | 1,275 | | | 6.800%, 05/15/2038 | | | | | | | | | 1,438,108 | |
| | | | | |
| | | | Petroplus Finance | | | | | | | | | | |
| | 1,465 | | | 9.375%, 09/15/2019 n q | | | | | | | | | 1,472,325 | |
| | | | | |
| | | | Seadrill | | | | | | | | | | |
| | 1,600 | | | 6.500%, 10/05/2015 | | | | | | | | | 1,552,000 | |
| | | | | |
| | | | Valero Energy | | | | | | | | | | |
| | 2,200 | | | 6.125%, 02/01/2020 q | | | | | | | | | 2,417,659 | |
| | | | | |
| | | | Weatherford International | | | | | | | | | | |
| | 1,950 | | | 7.000%, 03/15/2038 | | | | | | | | | 2,119,964 | |
| | 26,110 | | | Total Energy | | | | | | | | | 27,428,423 | |
| | | | Finance – 5.8% | | | | | | | | | | |
| | | | | |
| | | | Anglogold Holdings | | | | | | | | | | |
| | 2,275 | | | 6.500%, 04/15/2040 | | | | | | | | | 2,169,982 | |
| | | | | |
| | | | Asciano Finance | | | | | | | | | | |
| | 2,250 | | | 5.000%, 04/07/2018 n | | | | | | | | | 2,309,591 | |
| | | | | |
| | | | Braskem Finance | | | | | | | | | | |
| | 1,425 | | | 5.750%, 04/15/2021 n q | | | | | | | | | 1,433,978 | |
| | | | | |
| | | | Bunge Limited Finance | | | | | | | | | | |
| | 3,010 | | | 4.100%, 03/15/2016 | | | | | | | | | 3,135,427 | |
| | | | | |
| | | | Capital One Financial q | | | | | | | | | | |
| | 2,265 | | | 6.150%, 09/01/2016 | | | | | | | | | 2,498,793 | |
| | | | | |
| | | | Country Garden Holdings | | | | | | | | | | |
| | 1,300 | | | 11.125%, 02/23/2018 n q | | | | | | | | | 1,339,000 | |
| | | | | |
| | | | Countrywide Financial | | | | | | | | | | |
| | 2,885 | | | 6.250%, 05/15/2016 | | | | | | | | | 3,040,282 | |
| | | | | |
| | | | Discover Financial Services | | | | | | | | | | |
| | 1,975 | | | 10.250%, 07/15/2019 | | | | | | | | | 2,551,994 | |
| | | | | |
| | | | GE Capital Trust I | | | | | | | | | | |
| | 3,600 | | | 6.375%, 11/15/2067 D | | | | | | | | | 3,685,500 | |
| | | | | |
| | | | General Electric Capital | | | | | | | | | | |
| | 1,400 | | | 5.300%, 02/11/2021 q | | | | | | | | | 1,456,759 | |
| | | | Series MTN | | | | | | | | | | |
| | 2,320 | | | 6.875%, 01/10/2039 | | | | | | | | | 2,626,279 | |
| | | | | |
| | | | International Lease Finance | | | | | | | | | | |
| | 985 | | | 8.875%, 09/01/2017 | | | | | | | | | 1,083,500 | |
| | 1,905 | | | 8.250%, 12/15/2020 q | | | | | | | | | 2,057,400 | |
| | | | | |
| | | | JBS Finance II | | | | | | | | | | |
| | 1,175 | | | 8.250%, 01/29/2018 n q | | | | | | | | | 1,198,500 | |
| | | | | |
| | | | RSHB Capital | | | | | | | | | | |
| | 2,120 | | | 7.750%, 05/29/2018 n | | | | | | | | | 2,411,394 | |
| | | | | | | | | | | | | | |
Principal
Amount (000) — | | | Description p | | | | | | | | Value | |
| | | | | | | | | | | | | | |
| | | | Finance (continued) | | | | | | | | | | |
| | | | | |
| | | | Transcapitalinvest | | | | | | | | | | |
| $ | 2,670 | | | 5.670%, 03/05/2014 n q | | | | | | | | $ | 2,843,550 | |
| | | | | |
| | | | WEA Finance | | | | | | | | | | |
| | 1,655 | | | 4.625%, 05/10/2021 n | | | | | | | | | 1,606,106 | |
| | 35,215 | | | Total Finance | | | | | | | | | 37,448,035 | |
| | | | Industrial Other – 0.3% | | | | | | | | | | |
| | | | | |
| | | | Huntington Ingalls Industries | | | | | | | | | | |
| | 1,810 | | | 7.125%, 03/15/2021 n q | | | | | | | | | 1,873,350 | |
| | | | Insurance – 4.5% | | | | | | | | | | |
| | | | | |
| | | | Aflac | | | | | | | | | | |
| | 2,185 | | | 6.450%, 08/15/2040 | | | | | | | | | 2,168,071 | |
| | | | | |
| | | | Allied World Assurance | | | | | | | | | | |
| | 2,510 | | | 7.500%, 08/01/2016 | | | | | | | | | 2,876,317 | |
| | | | | |
| | | | Catlin Insurance | | | | | | | | | | |
| | 1,750 | | | 7.249%, 12/31/2049 n q D | | | | | | | | | 1,666,875 | |
| | | | | |
| | | | Endurance Specialty Holding | | | | | | | | | | |
| | 65 | | | Series B | | | | | | | | | 1,625,243 | |
| | | | | |
| | | | Genworth Financial | | | | | | | | | | |
| | | | Series MTN | | | | | | | | | | |
| | 2,640 | | | 6.515%, 05/22/2018 | | | | | | | | | 2,624,910 | |
| | | | | |
| | | | Hartford Financial Services Group | | | | | | | | | | |
| | | | Series MTN | | | | | | | | | | |
| | 1,770 | | | 6.000%, 01/15/2019 | | | | | | | | | 1,890,363 | |
| | | | | |
| | | | Liberty Mutual Group | | | | | | | | | | |
| | 1,705 | | | 7.000%, 03/15/2037 n D | | | | | | | | | 1,629,136 | |
| | | | | |
| | | | Lincoln National | | | | | | | | | | |
| | 2,395 | | | 8.750%, 07/01/2019 | | | | | | | | | 3,022,246 | |
| | 1,620 | | | 6.050%, 04/20/2067 D | | | | | | | | | 1,559,250 | |
| | | | | |
| | | | MetLife | | | | | | | | | | |
| | 1,600 | | | 6.750%, 06/01/2016 | | | | | | | | | 1,862,328 | |
| | | | | |
| | | | MetLife Capital Trust IV | | | | | | | | | | |
| | 1,750 | | | 7.875%, 12/15/2067 n D | | | | | | | | | 1,828,237 | |
| | | | | |
| | | | Pacific Life Insurance | | | | | | | | | | |
| | 840 | | | 6.000%, 02/10/2020 n | | | | | | | | | 900,749 | |
| | | | | |
| | | | Prudential Financial | | | | | | | | | | |
| | 1,650 | | | 5.500%, 03/15/2016 | | | | | | | | | 1,796,099 | |
| | | | | |
| | | | Unum Group | | | | | | | | | | |
| | 1,830 | | | 5.625%, 09/15/2020 q | | | | | | | | | 1,916,338 | |
| | | | | |
| | | | ZFS Finance USA Trust V | | | | | | | | | | |
| | 1,860 | | | 6.500%, 05/09/2067 n D | | | | | | | | | 1,850,700 | |
| | 26,170 | | | Total Insurance | | | | | | | | | 29,216,862 | |
| | | | Natural Gas – 0.4% | | | | | | | | | | |
| | | | | |
| | | | Kinder Morgan Energy Partners | | | | | | | | | | |
| | | | Series MTN | | | | | | | | | | |
| | 1,920 | | | 6.950%, 01/15/2038 | | | | | | | | | 2,085,326 | |
| | | | | |
| | | | Southern Union | | | | | | | | | | |
| | 545 | | | 7.200%, 11/01/2066 | | | | | | | | | 506,850 | |
| | 2,465 | | | Total Natural Gas | | | | | | | | | 2,592,176 | |
| | | | Real Estate – 2.0% | | | | | | | | | | |
| | | | | |
| | | | Boston Properties | | | | | | | | | | |
| | 3,050 | | | 4.125%, 05/15/2021 | | | | | | | | | 2,913,211 | |
Portfolio of Investments
Nuveen Total Return Bond Fund (continued)
June 30, 2011
| | | | | | | | | | | | | | |
Principal
Amount (000) — | | | Description p | | | | | | | | Value | |
| | | | | | | | | | | | | | |
| | | | Real Estate (continued) | | | | | | | | | | |
| | | | | |
| | | | Central China Real Estate | | | | | | | | | | |
| $ | 825 | | | 12.250%, 10/20/2015 n | | | | | | | | $ | 853,875 | |
| | | | | |
| | | | Health Care - REIT | | | | | | | | | | |
| | 1,300 | | | 5.250%, 01/15/2022 | | | | | | | | | 1,295,008 | |
| | | | | |
| | | | Prologis - REIT | | | | | | | | | | |
| | 1,755 | | | 6.875%, 03/15/2020 | | | | | | | | | 1,937,888 | |
| | | | | |
| | | | Shimao Property Holdings | | | | | | | | | | |
| | 620 | | | 8.000%, 12/01/2016 n | | | | | | | | | 564,200 | |
| | | | | |
| | | | Simon Property Group - REIT | | | | | | | | | | |
| | 1,825 | | | 5.650%, 02/01/2020 | | | | | | | | | 1,971,728 | |
| | | | | |
| | | | Vornado Realty - REIT | | | | | | | | | | |
| | 2,975 | | | 4.250%, 04/01/2015 | | | | | | | | | 3,087,803 | |
| | 12,350 | | | Total Real Estate | | | | | | | | | 12,623,713 | |
| | | | Sovereign – 5.1% | | | | | | | | | | |
| | | | | |
| | | | Australian Government | | | | | | | | | | |
| | 5,810,000 | AUD | | 5.750%, 04/15/2012 | | | | | | | | | 6,280,852 | |
| | 7,350,000 | AUD | | 4.500%, 04/15/2020 | | | | | | | | | 7,499,939 | |
| | | | | |
| | | | Canadian Government | | | | | | | | | | |
| | 5,700,000 | CAD | | 1.500%, 03/01/2012 | | | | | | | | | 5,923,106 | |
| | 7,000,000 | CAD | | 3.750%, 06/01/2019 | | | | | | | | | 7,704,391 | |
| | | | | |
| | | | Republic of Argentina | | | | | | | | | | |
| | 1,150 | | | 8.750%, 06/02/2017 | | | | | | | | | 1,196,000 | |
| | | | | |
| | | | Republic of Indonesia | | | | | | | | | | |
| | 1,730 | | | 5.875%, 03/13/2020 n q | | | | | | | | | 1,920,300 | |
| | | | | |
| | | | Republic of Peru | | | | | | | | | | |
| | 1,430 | | | 6.550%, 03/14/2037 | | | | | | | | | 1,598,025 | |
| | | | | |
| | | | Ukraine Government | | | | | | | | | | |
| | 1,250 | | | 7.750%, 09/23/2020 n q | | | | | | | | | 1,296,875 | |
| | | | Total Sovereign | | | | | | | | | 33,419,488 | |
| | | | Technology – 0.4% | | | | | | | | | | |
| | | | | |
| | | | Avnet | | | | | | | | | | |
| | 845 | | | 5.875%, 06/15/2020 | | | | | | | | | 892,269 | |
| | | | | |
| | | | Seagate | | | | | | | | | | |
| | 1,360 | | | 6.875%, 05/01/2020 n | | | | | | | | | 1,349,800 | |
| | 2,205 | | | Total Technology | | | | | | | | | 2,242,069 | |
| | | | Transportation – 2.4% | | | | | | | | | | |
| | | | | |
| | | | Air Canada | | | | | | | | | | |
| | 1,105 | | | 9.250%, 08/01/2015 n q | | | | | | | | | 1,131,244 | |
| | | | | |
| | | | America West Air | | | | | | | | | | |
| | | | Series 2000-1 | | | | | | | | | | |
| | 1,305 | | | 8.057%, 01/02/2022 | | | | | | | | | 1,357,050 | |
| | | | | |
| | | | Avis Budget Car Rental | | | | | | | | | | |
| | 1,450 | | | 7.750%, 05/15/2016 | | | | | | | | | 1,475,375 | |
| | | | | |
| | | | Dana Holding | | | | | | | | | | |
| | 1,450 | | | 6.500%, 02/15/2019 q | | | | | | | | | 1,435,500 | |
| | | | | |
| | | | Delta Airlines | | | | | | | | | | |
| | | | Series 2011-1, Class A | | | | | | | | | | |
| | 1,700 | | | 5.300%, 04/15/2019 q | | | | | | | | | 1,700,000 | |
| | | | | |
| | | | Hertz | | | | | | | | | | |
| | 1,250 | | | 7.375%, 01/15/2021 n | | | | | | | | | 1,271,875 | |
| | | | | |
| | | | Martin Midstream Partners | | | | | | | | | | |
| | 1,150 | | | 8.875%, 04/01/2018 | | | | | | | | | 1,207,500 | |
| | | | | | | | | | | | | | |
Principal
Amount (000) — | | | Description p | | | | | | | | Value | |
| | | | | | | | | | | | | | |
| | | | Transportation (continued) | | | | | | | | | | |
| | | | | |
| | | | Navios Maritime Acquisition | | | | | | | | | | |
| $ | 1,350 | | | 8.625%, 11/01/2017 | | | | | | | | $ | 1,329,750 | |
| | | | | |
| | | | Northwest Airlines | | | | | | | | | | |
| | | | Series 2007-1, Class A | | | | | | | | | | |
| | 1,060 | | | 7.027%, 11/01/2019 | | | | | | | | | 1,081,276 | |
| | | | | |
| | | | Provincia De Buenos Aire | | | | | | | | | | |
| | 1,040 | | | 10.875%, 01/26/2021 n | | | | | | | | | 980,720 | |
| | | | | |
| | | | United Airlines | | | | | | | | | | |
| | | | Series 2007-1, Class A | | | | | | | | | | |
| | 1,272 | | | 6.636%, 01/02/2024 | | | | | | | | | 1,278,629 | |
| | | | Series 2009-1 | | | | | | | | | | |
| | 1,364 | | | 10.400%, 05/01/2018 | | | | | | | | | 1,546,005 | |
| | 15,496 | | | Total Transportation | | | | | | | | | 15,794,924 | |
| | | | Total Corporate Bonds (cost $306,633,078) | | | | | | | | | 324,337,374 | |
| | | | | |
Principal
Amount (000) | | | Description p | | | | | | | | Value | |
| | | | U.S. GOVERNMENT AGENCY MORTGAGE-BACKED SECURITIES – 28.6% | | | | | | | | | | |
| | | | | |
| | | | Adjustable Rate D – 1.0% | | | | | | | | | | |
| | | | | |
| | | | Federal Home Loan Mortgage Corporation Pool | | | | | | | | | | |
| $ | 598 | | | 2.788%, 10/01/2029, #1L0117 | | | | | | | | $ | 603,017 | |
| | 543 | | | 2.394%, 07/01/2030, #847240 | | | | | | | | | 568,425 | |
| | 401 | | | 2.269%, 05/01/2033, #847411 | | | | | | | | | 418,221 | |
| | 1,187 | | | 5.206%, 07/01/2036, #1K1238 | | | | | | | | | 1,232,913 | |
| | 2,707 | | | 2.608%, 05/01/2038, #84-8289 | | | | | | | | | 2,838,544 | |
| | | | | |
| | | | Federal National Mortgage Association Pool | | | | | | | | | | |
| | 214 | | | 2.309%, 09/01/2033, #725553 | | | | | | | | | 223,472 | |
| | 590 | | | 2.432%, 01/01/2035, #745548 | | | | | | | | | 618,586 | |
| | 6,240 | | | Total Adjustable Rate | | | | | | | | | 6,503,178 | |
| | | | Fixed Rate – 27.6% | | | | | | | | | | |
| | | | | |
| | | | Federal Home Loan Mortgage Corporation Pool | | | | | | | | | | |
| | 970 | | | 6.500%, 07/01/2031, #A17212 | | | | | | | | | 1,099,795 | |
| | 586 | | | 7.000%, 08/01/2037, #H09059 | | | | | | | | | 671,628 | |
| | | | | |
| | | | Federal National Mortgage Association Pool | | | | | | | | | | |
| | 1,161 | | | 5.500%, 02/01/2025, #255628 | | | | | | | | | 1,265,188 | |
| | 4,159 | | | 5.500%, 10/01/2025, #255956 | | | | | | | | | 4,532,132 | |
| | 333 | | | 6.000%, 04/01/2032, #745101 | | | | | | | | | 362,918 | |
| | 520 | | | 5.500%, 06/01/2033, #843435 | | | | | | | | | 566,750 | |
| | 4,053 | | | 5.000%, 11/01/2033, #725027 | | | | | | | | | 4,331,130 | |
| | 611 | | | 5.000%, 03/01/2034, #725205 | | | | | | | | | 653,262 | |
| | 524 | | | 5.000%, 03/01/2034, #725250 | | | | | | | | | 559,825 | |
| | 771 | | | 6.000%, 03/01/2034, #745324 | | | | | | | | | 854,916 | |
| | 36,270 | | | 4.500%, 07/01/2034 (MDR)(WI/DD) | | | | | | | | | 37,522,439 | |
| | 864 | | | 5.500%, 09/01/2034, #725773 | | | | | | | | | 939,932 | |
| | 698 | | | 6.500%, 04/01/2036, #831377 | | | | | | | | | 792,027 | |
| | 325 | | | 6.500%, 04/01/2036, #852909 | | | | | | | | | 368,560 | |
| | 886 | | | 6.500%, 08/01/2036, #893318 | | | | | | | | | 1,004,739 | |
| | 1,767 | | | 6.500%, 09/01/2036, #897129 | | | | | | | | | 2,003,733 | |
| | 758 | | | 5.500%, 04/01/2037, #918883 | | | | | | | | | 821,438 | |
| | 840 | | | 6.000%, 06/01/2037, #944340 | | | | | | | | | 924,518 | |
| | 1,011 | | | 6.000%, 09/01/2037, #256890 | | | | | | | | | 1,103,428 | |
| | 5,166 | | | 5.500%, 01/01/2038, #968975 | | | | | | | | | 5,596,726 | |
| | 1 | | | 5.500%, 05/01/2038, #889618 | | | | | | | | | 1,224 | |
| | 1 | | | 5.500%, 07/01/2038, #985344 | | | | | | | | | 1,535 | |
| | 1,202 | | | 6.000%, 08/01/2038, #257307 | | | | | | | | | 1,320,973 | |
| | 2,627 | | | 5.500%, 11/01/2038, #AA0005 | | | | | | | | | 2,843,469 | |
| | 3,080 | | | 5.500%, 12/01/2038, #AA0889 | | | | | | | | | 3,333,266 | |
| | 33,725 | | | 5.000%, 06/01/2039 (MDR)(WI/DD) | | | | | | | | | 35,832,812 | |
Portfolio of Investments
Nuveen Total Return Bond Fund (continued)
June 30, 2011
| | | | | | | | | | | | | | |
Principal
Amount (000) | | | Description p | | | | | | | | Value | |
| | | | | | | | | | | | | | |
| | | | Fixed Rate (continued) | | | | | | | | | | |
| $ | 6,025 | | | 6.000%, 07/01/2039 (WI/DD) | | | | | | | | $ | 6,618,089 | |
| | 4,878 | | | 4.500%, 09/01/2039, #AC1877 | | | | | | | | | 5,055,818 | |
| | 3,704 | | | 6.000%, 09/01/2039, #AD0205 | | | | | | | | | 4,075,152 | |
| | 5,563 | | | 4.500%, 12/01/2039, #932323 | | | | | | | | | 5,765,952 | |
| | 19,425 | | | 4.000%, 07/01/2040 (MDR)(WI/DD) | | | | | | | | | 19,425,000 | |
| | 10,244 | | | 4.000%, 11/01/2040, #MA0583 | | | | | | | | | 10,258,494 | |
| | 5,174 | | | 4.000%, 12/01/2040, #AB1959 | | | | | | | | | 5,181,738 | |
| | 13,666 | | | 4.000%, 01/01/2041, #AH1420 | | | | | | | | | 13,684,985 | |
| | 171,588 | | | Total Fixed Rate | | | | | | | | | 179,373,591 | |
| $ | 177,828 | | | Total U.S. Government Agency Mortgage-Backed Securities (cost $183,686,857) | | | | | | | | | 185,876,769 | |
| | | | | |
Principal
Amount (000) | | | Description p | | | | | | | | Value | |
| | | | Commercial Mortgage-Backed Securities – 10.6% | | | | | | | | | | |
| | | | | |
| | | | Americold Trust | | | | | | | | | | |
| | | | Series 2010-ARTA, Class C | | | | | | | | | | |
| $ | 3,470 | | | 6.811%, 01/14/2029 n | | | | | | | | $ | 3,593,619 | |
| | | | | |
| | | | Bear Stearns Commercial Mortgage Securities | | | | | | | | | | |
| | | | Series 2005-PW10, Class A4 | | | | | | | | | | |
| | 3,325 | | | 5.405%, 12/11/2040 D | | | | | | | | | 3,624,786 | |
| | | | | |
| | | | Citigroup/Deutsche Bank Commercial Mortgage Trust | | | | | | | | | | |
| | | | Series 2005-CD1, Class A4 | | | | | | | | | | |
| | 2,440 | | | 5.394%, 07/15/2044 D | | | | | | | | | 2,653,188 | |
| | | | Series 2007-CD4, Class A2B | | | | | | | | | | |
| | 1,360 | | | 5.205%, 12/11/2049 | | | | | | | | | 1,388,746 | |
| | | | Series 2007-CD5, Class A4 | | | | | | | | | | |
| | 5,650 | | | 5.886%, 11/15/2044 D | | | | | | | | | 6,163,072 | |
| | | | | |
| | | | Commercial Mortgage Pass-Through Certificates | | | | | | | | | | |
| | | | Series 2006-CN2A, Class A2FX | | | | | | | | | | |
| | 1,805 | | | 5.449%, 02/05/2019 n | | | | | | | | | 1,809,150 | |
| | | | | |
| | | | Extended Stay America Trust | | | | | | | | | | |
| | | | Series 2010-ESHA, Class C | | | | | | | | | | |
| | 3,630 | | | 4.860%, 11/05/2027 n | | | | | | | | | 3,623,836 | |
| | | | | |
| | | | Fosse Master | | | | | | | | | | |
| | | | Series 2011-1A, Class A2 | | | | | | | | | | |
| | 2,640 | | | 1.619%, 10/19/2054 n D | | | | | | | | | 2,644,697 | |
| | | | | |
| | | | Greenwich Capital Commercial Funding | | | | | | | | | | |
| | | | Series 2005-GG5, Class A2 | | | | | | | | | | |
| | 2,576 | | | 5.117%, 04/10/2037 | | | | | | | | | 2,599,033 | |
| | | | | |
| | | | GS Mortgage Securities II | | | | | | | | | | |
| | | | Series 2006-GG6, Class A2 | | | | | | | | | | |
| | 2,037 | | | 5.506%, 04/10/2038 | | | | | | | | | 2,036,452 | |
| | | | Series 2006-GG8, Class A4 | | | | | | | | | | |
| | 3,135 | | | 5.560%, 11/10/2039 | | | | | | | | | 3,397,228 | |
| | | | Series 2007-GG10, Class A4 | | | | | | | | | | |
| | 7,660 | | | 5.992%, 08/10/2045 q D | | | | | | | | | 8,223,778 | |
| | | | | |
| | | | JPMorgan Chase Commercial Mortgage Securities | | | | | | | | | | |
| | | | Series 2010-C1, Class A1 | | | | | | | | | | |
| | 4,078 | | | 3.853%, 06/15/2043 n | | | | | | | | | 4,218,085 | |
| | | | Series 2011-C4, Class A3 | | | | | | | | | | |
| | 3,445 | | | 4.106%, 07/15/2046 n | | | | | | | | | 3,437,567 | |
| | | | | |
| | | | LB-UBS Commercial Mortgage Trust | | | | | | | | | | |
| | | | Series 2004-C2, Class A4 | | | | | | | | | | |
| | 4,000 | | | 4.367%, 03/15/2036 | | | | | | | | | 4,239,332 | |
| | | | Series 2005-C7, Class A2 | | | | | | | | | | |
| | 1,557 | | | 5.103%, 11/15/2030 | | | | | | | | | 1,556,856 | |
| | | | | | | | | | | | | | |
Principal
Amount (000) | | | Description p | | | | | | | | Value | |
| | | | | | | | | | | | | | |
| | | | Commercial Mortgage-Backed Securities (continued) | | | | | | | | | | |
| | | | | |
| | | | Master Reporforming Loans Trust | | | | | | | | | | |
| | | | Series 2005-1, Class 1A4 | | | | | | | | | | |
| $ | 3,586 | | | 7.500%, 08/25/2034 n | | | | | | | | $ | 3,632,506 | |
| | | | | |
| | | | Morgan Stanley Capital I | | | | | | | | | | |
| | | | Series 2006-IQ12, Class A4 | | | | | | | | | | |
| | 4,025 | | | 5.332%, 12/15/2043 | | | | | | | | | 4,348,502 | |
| | | | | |
| | | | OBP Depositor Trust | | | | | | | | | | |
| | | | Series 2010-OBP, Class A | | | | | | | | | | |
| | 2,880 | | | 4.646%, 07/15/2045 n | | | | | | | | | 2,989,040 | |
| | | | | |
| | | | WF-RBS Commercial Mortgage Trust | | | | | | | | | | |
| | | | Series 2011-C3, Class A4 | | | | | | | | | | |
| | 2,900 | | | 4.375%, 03/15/2044 n | | | | | | | | | 2,852,630 | |
| $ | 66,199 | | | Total Commercial Mortgage-Backed Securities (cost $65,861,987) | | | | | | | | | 69,032,103 | |
| | | | | |
Principal
Amount (000) | | | Description p | | | | | | | | Value | |
| | | | ASSET-BACKED SECURITIES – 5.8% | | | | | | | | | | |
| | | | | |
| | | | Automotive – 1.1% | | | | | | | | | | |
| | | | | |
| | | | Chrysler Group | | | | | | | | | | |
| $ | 3,000 | | | 8.000%, 06/15/2019 n q | | | | | | | | $ | 2,947,500 | |
| | | | | |
| | | | Fifth Third Auto Trust | | | | | | | | | | |
| | | | Series 2008-1, Class A4A | | | | | | | | | | |
| | 1,026 | | | 4.810%, 01/15/2013 | | | | | | | | | 1,038,954 | |
| | | | | |
| | | | Santander Drive Auto Receivables Trust | | | | | | | | | | |
| | | | Series 2010-1, Class A2 | | | | | | | | | | |
| | 3,420 | | | 1.360%, 03/15/2013 D | | | | | | | | | 3,427,521 | |
| | | | | |
| | 7,446 | | | Total Automotive | | | | | | | | | 7,413,975 | |
| | | | Credit Cards – 1.7% | | | | | | | | | | |
| | | | | |
| | | | Chase Issuance Trust | | | | | | | | | | |
| | | | Series 2009-A2, Class A2 | | | | | | | | | | |
| | 3,195 | | | 1.737%, 04/15/2014 D | | | | | | | | | 3,233,441 | |
| | | | | |
| | | | Citibank Credit Card Issuance Trust | | | | | | | | | | |
| | | | Series 2009-A1, Class A1 | | | | | | | | | | |
| | 3,270 | | | 1.937%, 03/15/2014 D | | | | | | | | | 3,308,676 | |
| | | | | |
| | | | Discover Card Master Trust | | | | | | | | | | |
| | | | Series 2007-A1, Class A1 | | | | | | | | | | |
| | 3,655 | | | 5.650%, 03/16/2020 | | | | | | | | | 4,186,877 | |
| | | | | |
| | 10,120 | | | Total Credit Cards | | | | | | | | | 10,728,994 | |
| | | | Home Equity – 2.3% | | | | | | | | | | |
| | | | | |
| | | | AH Mortgage Advance Trust | | | | | | | | | | |
| | | | Series SART-1, Class B1 | | | | | | | | | | |
| | 1,270 | | | 5.920%, 05/10/2043 n | | | | | | | | | 1,289,050 | |
| | | | | |
| | | | Countrywide Asset-Backed Certificates | | | | | | | | | | |
| | | | Series 2006-25, Class 2A2 | | | | | | | | | | |
| | 1,805 | | | 0.306%, 12/25/2029 D | | | | | | | | | 1,605,055 | |
| | | | Series 2007-7, Class 2A2 | | | | | | | | | | |
| | 2,195 | | | 0.346%, 10/25/2047 D | | | | | | | | | 1,776,367 | |
| | | | Series 2007-9, Class 2A2 | | | | | | | | | | |
| | 2,325 | | | 0.316%, 06/25/2030 D | | | | | | | | | 1,927,072 | |
| | | | | |
| | | | GRMT Mortgage Loan Trust | | | | | | | | | | |
| | | | Series 2001-1A, Class M1 | | | | | | | | | | |
| | 101 | | | 8.272%, 07/20/2031 n D | | | | | | | | | 95,895 | |
| | | | | |
| | | | RBSSP Resecuritization Trust | | | | | | | | | | |
| | | | Series 2010-11, Class 2A1 | | | | | | | | | | |
| | 2,409 | | | 0.423%, 03/26/2037 n D | | | | | | | | | 2,302,004 | |
Portfolio of Investments
Nuveen Total Return Bond Fund (continued)
June 30, 2011
| | | | | | | | | | | | | | |
Principal
Amount (000) | | | Description p | | | | | | | | Value | |
| | | | | | | | | | | | | | |
| | | | Home Equity (continued) | | | | | | | | | | |
| | | | | |
| | | | Series 2010-4, Class 1A1 | | | | | | | | | | |
| $ | 3,983 | | | 0.323%, 03/26/2036 n D | | | | | | | | $ | 3,706,090 | |
| | | | | |
| | | | Renaissance Home Equity Loan Trust | | | | | | | | | | |
| | | | Series 2005-3, Class AF4 | | | | | | | | | | |
| | 2,495 | | | 5.140%, 11/25/2035 D | | | | | | | | | 2,067,864 | |
| | | | | |
| | 16,583 | | | Total Home Equity | | | | | | | | | 14,769,397 | |
| | | | Manufactured Housing – 0.1% | | | | | | | | | | |
| | | | | |
| | | | Green Tree Financial | | | | | | | | | | |
| | | | Series 1996-8, Class A7 | | | | | | | | | | |
| | 97 | | | 8.050%, 10/15/2027 D | | | | | | | | | 101,951 | |
| | | | Series 2008-MH1, Class A1 | | | | | | | | | | |
| | 818 | | | 7.000%, 04/25/2038 n | | | | | | | | | 836,399 | |
| | 915 | | | Total Manufactured Housing | | | | | | | | | 938,350 | |
| | | | | |
| | | | Other – 0.6% | | | | | | | | | | |
| | | | | |
| | | | Henderson Receivables
Series 2010-3A, Class A | | | | | | | | | | |
| | 1,958 | | | 3.820%, 12/15/2048 n D | | | | | | | | | 1,935,772 | |
| | | | | |
| | | | Ocwen Advance Receivables Backed Notes
Series 2009-3A, Class A | | | | | | | | | | |
| | 1,745 | | | 4.140%, 07/15/2023 n | | | | | | | | | 1,768,994 | |
| | 3,703 | | | Total Other | | | | | | | | | 3,704,766 | |
| $ | 38,767 | | | Total Asset-Backed Securities (cost $36,432,699) | | | | | | | | | 37,555,482 | |
| | | | | |
Principal
Amount (000) | | | Description p | | | | | | | | Value | |
| | | | COLLATERALIZED MORTGAGE OBLIGATIONS-PRIVATE MORTGAGE-BACKED
SECURITIES – 3.4% | | | | | | | | | | |
| | | | | |
| | | | Adjustable Rate D – 1.3% | | | | | | | | | | |
| | | | | |
| | | | Countrywide Home Loans
Series 2004-2, Class 2A1 | | | | | | | | | | |
| $ | 786 | | | 2.761%, 02/25/2034 | | | | | | | | $ | 766,960 | |
| | | | | |
| | | | FDIC Structured Sale Guaranteed Notes
Series 2010-S1, Class 1A | | | | | | | | | | |
| | 3,489 | | | 0.741%, 02/25/2048 n | | | | | | | | | 3,492,466 | |
| | | | | |
| | | | GSR Mortgage Loan Trust
Series 2005-AR1, Class B1 | | | | | | | | | | |
| | 1,963 | | | 4.019%, 01/25/2035 | | | | | | | | | 1,314,559 | |
| | | | | |
| | | | Indymac Index Mortgage Loan Trust
Series 2005-AR1, Class 4A1 | | | | | | | | | | |
| | 505 | | | 2.695%, 03/25/2035 | | | | | | | | | 452,213 | |
| | | | | |
| | | | JPMorgan Alternative Loan Trust
Series 2007-S1, Class A1 | | | | | | | | | | |
| | 1,842 | | | 0.466%, 04/25/2047 | | | | | | | | | 1,381,572 | |
| | | | | |
| | | | JPMorgan Mortgage Trust
Series 2006-A7, Class 3A4 | | | | | | | | | | |
| | 1,228 | | | 5.875%, 01/25/2037 | | | | | | | | | 128,800 | |
| | | | | |
| | | | Wachovia Mortgage Loan Trust
Series 2005-B, Class 1A1 | | | | | | | | | | |
| | 783 | | | 2.993%, 10/20/2035 | | | | | | | | | 647,360 | |
| | 10,596 | | | Total Adjustable Rate | | | | | | | | | 8,183,930 | |
| | | | | | | | | | | | | | |
Principal
Amount (000) | | | Description p | | | | | | | | Value | |
| | | | | | | | | | | | | | |
| | | | Fixed Rate – 2.1% | | | | | | | | | | |
| | | | | |
| | | | Bank of America Alternative Loan Trust
Series 2007-1, Class 2A2 | | | | | | | | | | |
| $ | 1,998 | | | 5.673%, 04/25/2037 | | | | | | | | $ | 191,818 | |
| | | | | |
| | | | Countrywide Alternative Loan Trust
Series 2004-24CB, Class 2A1 | | | | | | | | | | |
| | 793 | | | 5.000%, 11/25/2019 | | | | | | | | | 803,245 | |
| | | | Series 2006-19CB, Class A15 | | | | | | | | | | |
| | 1,037 | | | 6.000%, 08/25/2036 | | | | | | | | | 856,994 | |
| | | | | |
| | | | GMAC Mortgage Corporation Loan Trust
Series 2010-1, Class A | | | | | | | | | | |
| | 306 | | | 4.250%, 07/25/2040 n | | | | | | | | | 307,750 | |
| | | | | |
| | | | GSMPS Mortgage Loan Trust
Series 2003-1, Class B1 | | | | | | | | | | |
| | 2,408 | | | 6.776%, 03/25/2043 | | | | | | | | | 2,070,993 | |
| | | | | |
| | | | GSR Mortgage Loan Trust
Series 2005-4F, Class B1 | | | | | | | | | | |
| | 2,078 | | | 5.758%, 05/25/2035 | | | | | | | | | 1,217,459 | |
| | | | | |
| | | | Impac Secured Assets
Series 2000-3, Class M1 | | | | | | | | | | |
| | 2,183 | | | 8.000%, 10/25/2030 | | | | | | | | | 1,996,494 | |
| | | | | |
| | | | Lehman Mortgage Trust
Series 2008-6, Class 1A1 | | | | | | | | | | |
| | 1,926 | | | 5.981%, 07/25/2047 | | | | | | | | | 1,833,841 | |
| | | | | |
| | | | Residential Accredit Loans
Series 2005-QS12, Class A7 | | | | | | | | | | |
| | 868 | | | 5.500%, 08/25/2035 | | | | | | | | | 781,664 | |
| | | | | |
| | | | Sequoia Mortgage Trust
Series 2011-1, Class A1 | | | | | | | | | | |
| | 2,666 | | | 4.125%, 02/25/2041 | | | | | | | | | 2,671,242 | |
| | | | | |
| | | | Washington Mutual Mortgage Pass-Through Certificates
Series 2004-RA3, Class 2A | | | | | | | | | | |
| | 944 | | | 6.414%, 08/25/2038 | | | | | | | | | 988,330 | |
| | 17,207 | | | Total Fixed Rate | | | | | | | | | 13,719,830 | |
| $ | 27,803 | | | Total Collateralized Mortgage Obligations-Private Mortgage-Backed Securities (cost $27,001,051) | | | | | | | | | 21,903,760 | |
| | | | | |
Principal
Amount (000) | | | Description p | | | | | | | | Value | |
| | | | U.S. GOVERNMENT & AGENCY SECURITIES – 1.1% | | | | | | | | | | |
| | | | | |
| | | | U.S. Treasury – 1.1% | | | | | | | | | | |
| | | | | |
| | | | U.S. Treasury Note | | | | | | | | | | |
| $ | 6,879 | | | 1.250%, 07/15/2020 q | | | | | | | | $ | 7,276,305 | |
| | | | Total U.S. Government & Agency Securities (cost $7,378,372) | | | | | | | | | 7,276,305 | |
| | | | | |
Principal
Amount (000) | | | Description p | | | | | | | | Value | |
| | | | MUNICIPAL BONDS – 0.7% | | | | | | | | | | |
| | | | | |
| | | | Illinois | | | | | | | | | | |
| $ | 3,415 | | | 5.877%, 03/01/2019 | | | | | | | | $ | 3,524,109 | |
| | | | | |
| | | | Provincia De Cordoba | | | | | | | | | | |
| | 1,200 | | | 12.375%, 08/17/2017 n | | | | | | | | | 1,254,000 | |
| | 4,615 | | | Total Municipal Bonds (cost $4,673,901) | | | | | | | | | 4,778,109 | |
Portfolio of Investments
Nuveen Total Return Bond Fund (continued)
June 30, 2011
| | | | | | | | | | | | | | |
| Shares | | | Description p | | | | | | | | Value | |
| | | | | | | | | | | | | | |
| | | | PREFERRED STOCKS – 0.8% | | | | | | | | | | |
| | | | | |
| | | | Banking – 0.4% | | | | | | | | | | |
| | | | | |
| | | | Bank of America | | | | | | | | | | |
| | 6,000 | | | Series MER | | | | | | | | $ | 158,100 | |
| | | | | |
| | | | Bank of America | | | | | | | | | | |
| | 28,000 | | | Series 5 q | | | | | | | | | 533,400 | |
| | | | | |
| | 20,000 | | | Citigroup Capital XI | | | | | | | | | 466,400 | |
| | | | | |
| | 3,000 | | | Citigroup Capital XII | | | | | | | | | 77,460 | |
| | | | | |
| | | | Goldman Sachs Group | | | | | | | | | | |
| | 51,000 | | | Series A q | | | | | | | | | 1,086,810 | |
| | | | | |
| | | | Royal Bank of Scotland | | | | | | | | | | |
| | 10,000 | | | Series L | | | | | | | | | 182,700 | |
| | | | Total Banking | | | | | | | | | 2,504,870 | |
| | | | Finance – 0.0% | | | | | | | | | | |
| | | | | |
| | 5,000 | | | JPMorgan Chase Capital XXVI q | | | | | | | | | 132,300 | |
| | | | Insurance – 0.3% | | | | | | | | | | |
| | | | | |
| | | | Aspen Insurance Holdings | | | | | | | | | | |
| | 84,500 | | | Series A | | | | | | | | | 2,109,120 | |
| | | | Sovereign – 0.1% | | | | | | | | | | |
| | | | | |
| | | | Fannie Mae | | | | | | | | | | |
| | 217,000 | | | Series S | | | | | | | | | 466,550 | |
| | | | Total Preferred Stocks (cost $9,778,851) | | | | | | | | | 5,212,840 | |
| | | | | |
| Shares | | | Description p | | | | | | | | Value | |
| | | | ClOSED-END FUNDS – 0.3% | | | | | | | | | | |
| | | | | |
| | 15,000 | | | Alliance National Municipal Income Fund | | | | | | | | $ | 201,000 | |
| | | | | |
| | 36,000 | | | Blackrock Credit Allocation Income Trust | | | | | | | | | 450,360 | |
| | | | | |
| | 23,000 | | | Highland Credit Strategies Fund q | | | | | | | | | 176,640 | |
| | | | | |
| | 40,000 | | | ING Clarion Global Real Estate Income Fund q | | | | | | | | | 334,800 | |
| | | | | |
| | 20,000 | | | Invesco Municipal Income Opportunities Trust | | | | | | | | | 126,200 | |
| | | | | |
| | 2,000 | | | Pimco Income Strategy Fund q | | | | | | | | | 25,880 | |
| | | | | |
| | 16,000 | | | Pioneer Diversified High Income Trust | | | | | | | | | 337,600 | |
| | | | Total Closed-End Funds (cost $1,504,063) | | | | | | | | | 1,652,480 | |
| | | | | |
| Shares | | | Description p | | | | | | | | Value | |
| | | | CONVERTIBLE SECURITIES 0.1% | | | | | | | | | | |
| | | | | |
| | | | Energy – 0.1% | | | | | | | | | | |
| | | | | |
| | | | Chesapeake Energy | | | | | | | | | | |
| | 7,300 | | | Series 2005B | | | | | | | | $ | 720,875 | |
| | | | Total Convertible Securities (cost $620,500) | | | | | | | | | 720,875 | |
| | | | | |
| Shares | | | Description p | | | | | | | | Value | |
| | | | INVESTMENTS PURCHASED WITH PROCEEDS FROM SECURITIES LENDING | | | | | | | | | | |
| | | | | |
| | | | Money Market Funds – 9.6% | | | | | | | | | | |
| | | | | |
| | | | Mount Vernon Securities Lending Prime Portfolio | | | | | | | | | | |
| | 62,479,179 | | | 0.197% W † | | | | | | | | $ | 62,479,179 | |
| | | | Total Investments Purchased With Proceeds From Securities Lending (cost $62,479,179) | | | | | | | | | 62,479,179 | |
| | | | | | | | | | | | | | |
Shares/
Principal
Amount (000) | | | Description p | | | | | | | | Value | |
| | | | | | | | | | | | | | |
| | | | SHORT-TERM INVESTMENTS – 14.9% | | | | | | | | | | |
| | | | | |
| | | | Money Market Funds – 14.1% | | | | | | | | | | |
| | | | | |
| | | | First American Prime Obligations Fund, Class Z | | | | | | | | | | |
| | 91,965,101 | | | 0.042% W | | | | | | | | $ | 91,965,101 | |
| | | | U.S. Treasury Obligations – 0.8% | | | | | | | | | | |
| | | | | |
| | | | U.S. Treasury Bills ¨ | | | | | | | | | | |
| $ | 1,475 | | | 0.035%, 10/20/2011 | | | | | | | | | 1,474,841 | |
| | 2,500 | | | 0.020%, 07/21/2011 | | | | | | | | | 2,499,972 | |
| | 1,245 | | | 0.060%, 11/10/2011 | | | | | | | | | 1,244,726 | |
| | | | | |
| $ | 5,220 | | | Total U.S. Treasury Obligations | | | | | | | | | 5,219,539 | |
| | | | Total Short-Term Investments (cost $97,184,373) | | | | | | | | | 97,184,640 | |
| | | | Total Investments (cost $803,234,911) – 125.8% | | | | | | | | | 818,009,916 | |
| | | | Other Assets Less Liabilities – (25.8)% ¯ | | | | | | | | | (167,629,731) | |
| | | | Net Assets – 100.0% | | | | | | | | $ | 650,380,185 | |
Investments in Derivatives
Forward Foreign Currency Exchange Contracts outstanding at June 30, 2011:
| | | | | | | | | | | | | | | | | | | | | | |
| Counterparty | | Currency Contracts to
Deliver | | Amount
(Local Currency) | | | In Exchange
For Currency | | | Amount
(Local Currency) | | | Settlement Date | | | Unrealized
Appreciation
(Depreciation)
(U.S. Dollars) | |
JPMorgan Chase | | Australian Dollar | | | 6,600,000 | | | | U.S. Dollar | | | | 6,929,472 | | | | 7/15/11 | | | $ | (135,651 | ) |
Citibank N.A. | | Euro | | | 1,920,000 | | | | U.S. Dollar | | | | 2,764,819 | | | | 7/12/11 | | | | (18,630 | ) |
JPMorgan Chase | | U.S. Dollar | | | 7,031,442 | | | | Austrailian Dollar | | | | 6,600,000 | | | | 7/15/11 | | | | 33,681 | |
Citibank N.A. | | U.S. Dollar | | | 3,301,768 | | | | Brazilian Real | | | | 5,230,000 | | | | 8/02/11 | | | | 22,751 | |
Citibank N.A. | | U.S. Dollar | | | 5,627,549 | | | | Canadian Dollar | | | | 5,450,000 | | | | 7/15/11 | | | | 21,143 | |
Citibank N.A. | | U.S. Dollar | | | 1,360,559 | | | | Euro Dollar | | | | 960,000 | | | | 7/12/11 | | | | 31,166 | |
Citibank N.A. | | U.S. Dollar | | | 4,469,652 | | | | Mexican Peso | | | | 52,800,000 | | | | 10/05/11 | | | | (122 | ) |
Citibank N.A. | | U.S. Dollar | | | 6,337,254 | | | | New Zealand Dollar | | | | 7,700,000 | | | | 10/05/11 | | | | (278 | ) |
JPMorgan Chase | | U.S. Dollar | | | 3,212,591 | | | | South African Rand | | | | 21,800,000 | | | | 7/11/11 | | | | 6,265 | |
JPMorgan Chase | | U.S. Dollar | | | 3,610,675 | | | | South Korean Won | | | | 3,916,500,000 | | | | 7/18/11 | | | | 53,419 | |
| | | | | | | | | | | | | | | | | | | | | $ | 13,744 | |
Credit Default Swaps outstanding at June 30, 2011:
| | | | | | | | | | | | | | | | | | | | | | | | | | | | | | |
| Counterparty | | Reference Index | | Buy/Sell
Protection (1) | | | Current
Credit
Spread (3) | | | Notional
Amount (2) | | | Received
Fixed Rate | | | Termination
Date | | | Value | | | Unrealized
Appreciation
(Depreciation) | |
JPMorgan | | Markit CDX NA HY16 Index | | | Sell | | | | 4.55 | % | | $ | 5,600,000 | | | | 5.00 | % | | | 6/20/16 | | | $ | 90,690 | | | $ | 88,837 | |
UBS | | Markit CDX NA HY16 Index | | | Sell | | | | 4.55 | | | | 20,000,000 | | | | 5.00 | | | | 6/20/16 | | | | 139,273 | | | | 94,842 | |
| | | | | | | | | | | | | | | | | | | | | | | | | $ | 229,963 | | | $ | 183,679 | |
| (1) | The Fund entered into the credit default swaps to gain investment exposure to the referenced index. If the Fund is a seller of protection and a credit event occurs, as defined under the terms of that particular swap agreement, the Fund will either (i) pay to the buyer of protection an amount equal to the notional amount of the swap and take delivery of the reference entity or underlying securities comprising the reference index or (ii) pay a net settlement amount in the form of cash or securities equal to the notional amount of the swap less the recovery value of the reference entity or underlying securities comprising the reference index. |
| (2) | The maximum potential amount the Fund could be required to pay as a seller of credit protection or receive as a buyer of credit protection if a credit event occurs as defined under the terms of that particular swap agreement. |
| (3) | The credit spread generally serves as an indication of the current status of the payment/performance risk and therefore the likelihood of default of the credit derivative. The credit spread also reflects the cost of buying/selling protection and may include upfront payments required to be made to enter into a credit default swap contract. Higher credit spreads are indicative of a higher likelihood of performance by the seller of protection. |
Portfolio of Investments
Nuveen Total Return Bond Fund (continued)
June 30, 2011
Futures Contracts outstanding at June 30, 2011:
| | | | | | | | | | | | | | | | | | | | |
Type | | Contract
Position | | | Number of
Contracts | | | Contract
Expiration | | | Value | | | Unrealized
Appreciation
(Depreciation) | |
German 10-year Government Bond | | | Long | | | | 46 | | | | 9/11 | | | $ | 8,370,428 | | | $ | 44,833 | |
U.S. Treasury 5-Year Note | | | Short | | | | (519 | ) | | | 9/11 | | | | (61,862,366 | ) | | | 57,967 | |
U.S. Treasury 10-Year Note | | | Short | | | | (249 | ) | | | 9/11 | | | | (30,459,704 | ) | | | 2,890 | |
U.S. Treasury Long Bond | | | Short | | | | (120 | ) | | | 9/11 | | | | (14,763,750 | ) | | | 174,003 | |
U.S. Treasury Ultra Bond | | | Long | | | | 44 | | | | 9/11 | | | | 5,555,000 | | | | (81,227 | ) |
| | | | | | | | | | | | | | | | | | | $ | 198,466 | |
Interest Rate Swaps outstanding at June 30, 2011:
| | | | | | | | | | | | | | | | | | | | | | | | | | | | | | | | |
| Counterparty | | Notional Amount | | | Floating Rate
Index | | | Fund
Pay/Receive
Floating Rate | | | Fixed Rate
Payment
Frequency | | | Fixed Rate | | | Expiration
Date | | | Unrealized
Appreciation
(Depreciation) | |
Citigroup | | | 23,500,000 | | | | ZAR | | | | 3-Month JIBAR | | | | Pay | | | | Semi-Annually | | | | 7.655 | % | | | 1/07/21 | | | $ | (100,544 | ) |
UBS | | | 41,000,000 | | | | USD | | | | 3-Month LIBOR | | | | Receive | | | | Semi-Annually | | | | 2.056 | | | | 7/01/15 | | | | (1,118,625 | ) |
| | | | | | | | | | | | | | | | | | | | | | | | | | | | | | | $ | (1,219,169 | ) |
Call Options Written outstanding at June 30, 2011:
| | | | | | | | | | | | | | | | | | | | |
| Number of Contracts | | Type | | | Notional
Amount ¡ | | | Expiration
Date | | | Strike
Price | | | Value | |
(195) | | | U.S. 10-Year Note Futures | | | $ | (2,437,500 | ) | | | 8/26/11 | | | $ | 125.0 | | | $ | (82,266 | ) |
(325) | | | U.S. 10-Year Note Futures | | | | (4,095,000 | ) | | | 8/26/11 | | | | 126.0 | | | | (76,172 | ) |
(130) | | | U.S. 10-Year Note Futures | | | | (1,618,500 | ) | | | 8/26/11 | | | | 124.5 | | | | (71,094 | ) |
(650) | | | Total Call Options Written (premiums received $316,171) | | | $ | (229,532 | ) |
Put Options Written outstanding at June 30, 2011:
| | | | | | | | | | | | | | | | | | | | |
| Number of Contracts | | Type | | | Notional
Amount ¡ | | | Expiration
Date | | | Strike
Price | | | Value | |
(64) | | | U.S. 10-Year Note Futures | | | $ | (748,800 | ) | | | 8/26/15 | | | $ | 117.0 | | | $ | (15,000 | ) |
(197) | | | U.S. 10-Year Note Futures | | | | (2,314,750 | ) | | | 8/26/11 | | | | 117.5 | | | | (52,328 | ) |
(261) | | | Total Put Options Written (premiums received $94,650) | | | $ | (67,328 | ) |
| | | | For Fund portfolio compliance purposes, the Fund’s industry classifications refer to any one or more of the industry sub-classifications used by one or more widely recognized market indexes or ratings group indexes, and/or as defined by Fund management. This definition may not apply for purposes of this report which may combine industry sub-classifications into sectors for reporting ease. |
| | p | | All Percentages shown in the Portfolio of Investments are based on net assets. |
| | • | | Principal Amount (000) denominated in U.S. Dollars, unless otherwise noted. |
| | n | | Investment is exempt from registration under Rule 144A of the Securities Act of 1933, as amended. These investments may only be resold in transactions exempt from registration, which are normally those transactions with qualified institutional buyers. |
| | q | | Investment, or a portion of investment, is out on loan for securities lending. |
| | D | | Variable Rate Security-The rate shown is the rate in effect as of June 30, 2011. |
| | W | | The rate shown is the annualized seven-day effective yield as of June 30, 2011. |
| | ¨ | | Investment, or portion of investment, segregated as collateral for investments in derivatives. Yield shown is the annualized effective yield as of June 30, 2011. |
| | † | | The Fund may loan securities representing up to one third of the fair value of its total assets (which includes collateral for securities on loan) to broker dealers, banks, or other institutional borrowers of securities. The Fund maintains collateral equal to at least 102% of the fair value of the securities loaned. The adequacy of the collateral is monitored on a daily basis. The cash collateral received by the Fund is invested in this money market fund. |
| | ¯ | | Other Assets Less Liabilities includes Value of Options Written and the net Unrealized Appreciation (Depreciation) of other derivatives instruments as listed within Investments in Derivatives. |
| | ¡ | | For disclosure purposes, Notional Amount is calculated by multiplying the Number of Contracts by Strike Price by 100. |
| | WI/DD | | Purchased on a when-issued delayed delivery basis. |
| | JIBAR | | Johannesburg Inter-Bank Agreed Rate |
| | LIBOR | | London Inter-Bank Offered Rate |
| | MDR | | Denotes investment is subject to dollar roll transactions. |
| | REIT | | Real Estate Investment Trust |
See accompanying notes to financial statements.
Statement of Assets & Liabilities (all dollars and shares are rounded to thousands (000))
June 30, 2011
| | | | | | | | | | | | | | | | | | | | | | | | | | | | |
| | | Core
Bond | | | High
Income
Bond | | | Inflation
Protected
Securities | | | Intermediate
Government
Bond | | | Intermediate
Term Bond | | | Short
Term
Bond | | | Total
Return
Bond | |
Assets | | | | | | | | | | | | | | | | | | | | | | | | | | | | |
Investments, at value (cost $1,014,561, $488,723, $262,372, $105,334, $624,263, $795,246 and $643,572, respectively) | | $ | 1,044,361 | | | $ | 493,591 | | | $ | 271,920 | | | $ | 108,067 | | | $ | 648,089 | | | $ | 808,839 | | | $ | 658,346 | |
Investments purchased with proceeds from securities lending
(at cost, which approximates value) | | | 125,243 | | | | 145,527 | | | | 128,123 | | | | 28,536 | | | | 118,843 | | | | 76,375 | | | | 62,479 | |
Short-term investments (cost $67,403, $7,489, $3,788, $10,931, $38,653, $44,365 and $97,184, respectively) | | | 67,404 | | | | 7,490 | | | | 3,788 | | | | 10,931 | | | | 38,653 | | | | 44,366 | | | | 97,185 | |
Cash denominated in foreign currencies (cost $—, $—, $—, $—, $—, $— and $212, respectively) | | | — | | | | — | | | | — | | | | — | | | | — | | | | — | | | | 216 | |
Cash | | | 1 | | | | 64 | | | | 7 | | | | — | | | | — | | | | 365 | | | | — | |
Credit default swap premiums paid | | | — | | | | — | | | | — | | | | — | | | | — | | | | 61 | | | | 32 | |
Receivables: | | | | | | | | | | | | | | | | | | | | | | | | | | | | |
Dividends | | | — | | | | 177 | | | | 3 | | | | — | | | | — | | | | — | | | | 39 | |
Due from broker | | | 211 | | | | 39 | | | | 11 | | | | 9 | | | | 13 | | | | 7 | | | | 20 | |
Interest | | | 7,710 | | | | 9,926 | | | | 1,765 | | | | 588 | | | | 5,630 | | | | 5,998 | | | | 5,632 | |
Investments sold | | | 275 | | | | 3,039 | | | | 1,287 | | | | 72 | | | | 169 | | | | 790 | | | | 38 | |
Shares sold | | | 396 | | | | 704 | | | | 1,096 | | | | 135 | | | | 397 | | | | 3,071 | | | | 638 | |
Variation margin on futures contracts | | | 201 | | | | — | | | | 48 | | | | — | | | | — | | | | 305 | | | | 321 | |
Unrealized appreciation on: | | | | | | | | | | | | | | | | | | | | | | | | | | | | |
Credit default swaps | | | — | | | | — | | | | — | | | | — | | | | — | | | | 453 | | | | 184 | |
Forward foreign currency exchange contracts | | | — | | | | — | | | | — | | | | — | | | | — | | | | — | | | | 168 | |
Other assets | | | 23 | | | | 25 | | | | 39 | | | | 23 | | | | 17 | | | | 23 | | | | 27 | |
Total assets | | | 1,245,825 | | | | 660,582 | | | | 408,087 | | | | 148,361 | | | | 811,811 | | | | 940,653 | | | | 825,325 | |
Liabilities | | | | | | | | | | | | | | | | | | | | | | | | | | | | |
Cash overdraft | | | — | | | | — | | | | — | | | | 44 | | | | 50 | | | | — | | | | 204 | |
Options written, at value (premiums received $—, $—, $—, $—, $—, $— and $411, respectively) | | | — | | | | — | | | | — | | | | — | | | | — | | | | — | | | | 297 | |
Payables: | | | | | | | | | | | | | | | | | | | | | | | | | | | | |
Collateral from securities lending program | | | 125,243 | | | | 145,527 | | | | 128,123 | | | | 28,536 | | | | 118,843 | | | | 76,375 | | | | 62,479 | |
Dividends | | | 2,202 | | | | 2,618 | | | | 204 | | | | 133 | | | | 1,428 | | | | 1,189 | | | | 1,565 | |
Investments purchased | | | 95,531 | | | | 8,111 | | | | 2,673 | | | | 4,362 | | | | 7,325 | | | | 31,395 | | | | 107,975 | |
Shares redeemed | | | 2,077 | | | | 567 | | | | 1,174 | | | | 194 | | | | 1,231 | | | | 1,992 | | | | 504 | |
Variation margin on futures contracts | | | — | | | | — | | | | — | | | | 18 | | | | 107 | | | | — | | | | — | |
Unrealized depreciation on: | | | | | | | | | | | | | | | | | | | | | | | | | | | | |
Interest rate swaps | | | 2,476 | | | | — | | | | 304 | | | | — | | | | 1,458 | | | | 1,037 | | | | 1,219 | |
Forward foreign currency exchange contracts | | | — | | | | — | | | | — | | | | — | | | | — | | | | 93 | | | | 154 | |
Accrued expenses: | | | | | | | | | | | | | | | | | | | | | | | | | | | | |
Management fees | | | 531 | | | | 280 | | | | 92 | | | | 31 | | | | 336 | | | | 291 | | | | 325 | |
12b-1 distribution and service fees | | | 22 | | | | 16 | | | | 9 | | | | 3 | | | | 3 | | | | 14 | | | | 13 | |
Other | | | 326 | | | | 308 | | | | 169 | | | | 104 | | | | 247 | | | | 270 | | | | 210 | |
Total liablities | | | 228,408 | | | | 157,427 | | | | 132,748 | | | | 33,425 | | | | 131,028 | | | | 112,656 | | | | 174,945 | |
Net assets | | $ | 1,017,417 | | | $ | 503,155 | | | $ | 275,339 | | | $ | 114,936 | | | $ | 680,783 | | | $ | 827,997 | | | $ | 650,380 | |
See accompanying notes to financial statements.
Statement of Assets & Liabilities (all dollars and shares are rounded to thousands (000)) (continued)
June 30, 2011
| | | | | | | | | | | | | | | | | | | | | | | | | | | | |
| | | Core
Bond | | | High
Income
Bond | | | Inflation
Protected
Securities | | | Intermediate
Government
Bond | | | Intermediate
Term Bond | | | Short
Term
Bond | | | Total
Return
Bond | |
Class A Shares | | | | | | | | | | | | | | | | | | | | | | | | | | | | |
Net assets | | $ | 85,980 | | | $ | 30,984 | | | $ | 12,080 | | | $ | 14,086 | | | $ | 22,502 | | | $ | 80,927 | | | $ | 25,045 | |
Shares outstanding | | | 7,513 | | | | 3,424 | | | | 1,104 | | | | 1,593 | | | | 2,148 | | | | 8,042 | | | | 2,336 | |
Net asset value per share | | $ | 11.44 | | | $ | 9.05 | | | $ | 10.94 | | | $ | 8.84 | | | $ | 10.47 | | | $ | 10.06 | | | $ | 10.72 | |
Offering price per share (net asset value per share plus maximum sales charge of 4.25%, 4.75%, 4.25%, 3.00%, 3.00%, 2.25% and 4.25%, respectively, of offering price) | | $ | 11.95 | | | $ | 9.50 | | | $ | 11.43 | | | $ | 9.11 | | | $ | 10.79 | | | $ | 10.29 | | | $ | 11.20 | |
Class B Shares | | | | | | | | | | | | | | | | | | | | | | | | | | | | |
Net assets | | $ | 1,805 | | | $ | 1,285 | | | | N/A | | | | N/A | | | | N/A | | | | N/A | | | $ | 1,116 | |
Shares outstanding | | | 159 | | | | 143 | | | | N/A | | | | N/A | | | | N/A | | | | N/A | | | | 105 | |
Net asset value and offering price per share | | $ | 11.34 | | | $ | 8.98 | | | | N/A | | | | N/A | | | | N/A | | | | N/A | | | $ | 10.67 | |
Class C Shares | | | | | | | | | | | | | | | | | | | | | | | | | | | | |
Net assets | | $ | 3,711 | | | $ | 9,792 | | | $ | 8,043 | | | $ | 1,417 | | | $ | 1,152 | | | $ | 5,101 | | | $ | 8,092 | |
Shares outstanding | | | 326 | | | | 1,087 | | | | 742 | | | | 160 | | | | 110 | | | | 506 | | | | 760 | |
Net asset value and offering price per share | | $ | 11.40 | | | $ | 9.01 | | | $ | 10.84 | | | $ | 8.85 | | | $ | 10.44 | | | $ | 10.09 | | | $ | 10.65 | |
Class R3 Shares(1) | | | | | | | | | | | | | | | | | | | | | | | | | | | | |
Net assets | | $ | 380 | | | $ | 309 | | | $ | 33 | | | $ | 473 | | | | N/A | | | | N/A | | | $ | 1,020 | |
Shares outstanding | | | 33 | | | | 34 | | | | 3 | | | | 54 | | | | N/A | | | | N/A | | | | 95 | |
Net asset value and offering price per share | | $ | 11.50 | | | $ | 9.23 | | | $ | 10.84 | | | $ | 8.84 | | | | N/A | | | | N/A | | | $ | 10.77 | |
Class I Shares(1) | | | | | | | | | | | | | | | | | | | | | | | | | | | | |
Net assets | | $ | 925,541 | | | $ | 460,785 | | | $ | 255,183 | | | $ | 98,960 | | | $ | 657,129 | | | $ | 741,969 | | | $ | 615,107 | |
Shares outstanding | | | 80,908 | | | | 50,912 | | | | 23,290 | | | | 11,189 | | | | 62,987 | | | | 73,705 | | | | 57,408 | |
Net asset value and offering price per share | | $ | 11.44 | | | $ | 9.05 | | | $ | 10.96 | | | $ | 8.84 | | | $ | 10.43 | | | $ | 10.07 | | | $ | 10.71 | |
Net assets consist of: | | | | | | | | | | | | | | | | | | | | | | | | | | | | |
Capital paid-in | | $ | 1,003,278 | | | $ | 496,617 | | | $ | 272,022 | | | $ | 122,791 | | | $ | 661,949 | | | $ | 836,996 | | | $ | 695,487 | |
Undistributed (Over-distribution of) net investment income | | | 1,352 | | | | 506 | | | | 5,417 | | | | — | | | | (155 | ) | | | 553 | | | | 4,397 | |
Accumulated net realized gain (loss) | | | (15,426 | ) | | | 1,163 | | | | (11,421 | ) | | | (10,578 | ) | | | (3,474 | ) | | | (21,845 | ) | | | (63,575 | ) |
Net unrealized appreciation (depreciation) | | | 28,213 | | | | 4,869 | | | | 9,321 | | | | 2,723 | | | | 22,463 | | | | 12,293 | | | | 14,071 | |
Net assets | | $ | 1,017,417 | | | $ | 503,155 | | | $ | 275,339 | | | $ | 114,936 | | | $ | 680,783 | | | $ | 827,997 | | | $ | 650,380 | |
Authorized shares | | | 2 billion | | | | 2 billion | | | | 2 billion | | | | 2 billion | | | | 2 billion | | | | 2 billion | | | | 2 billion | |
Par value per share | | $ | 0.0001 | | | $ | 0.0001 | | | $ | 0.0001 | | | $ | 0.0001 | | | $ | 0.0001 | | | $ | 0.0001 | | | $ | 0.0001 | |
| | | | | | |
N/A | | | – | | | Inflation Protected Securities and Intermediate Government Bond do not offer Class B Shares. Intermediate Term Bond and Short Term Bond do not offer Class B Shares or Class R3 Shares. |
(1) | | | – | | | Effective January 18, 2011, Class R Shares and Class Y Shares previously offered by FAF Advisors, Inc. were renamed Class R3 Shares and Class I Shares, respectively. |
See accompanying notes to financial statements.
Statement of Operations (all dollars are rounded to thousands (000))
Year Ended June 30, 2011
| | | | | | | | | | | | | | | | | | | | | | | | | | | | |
| | | Core Bond | | | High
Income
Bond | | | Inflation
Protected
Securities | | | Intermediate
Government
Bond | | | Intermediate
Term Bond | | | Short
Term
Bond | | | Total
Return
Bond | |
Investment Income | | | | | | | | | | | | | | | | | | | | | | | | | | | | |
Dividend and interest income from unaffiliated investments (net of foreign tax withheld of $—, $27, $—, $—, $—, $— and $—, respectively) | | $ | 56,062 | | | $ | 40,376 | | | $ | 9,220 | | | $ | 4,086 | | | $ | 30,277 | | | $ | 24,728 | | | $ | 34,593 | |
Interest income from affiliated investments | | | 25 | | | | 6 | | | | 1 | | | | — | | | | 1 | | | | 2 | | | | 26 | |
Securities lending income | | | 182 | | | | 390 | | | | 70 | | | | 23 | | | | 110 | | | | 89 | | | | 80 | |
Total investment income | | | 56,269 | | | | 40,772 | | | | 9,291 | | | | 4,109 | | | | 30,388 | | | | 24,819 | | | | 34,699 | |
Expenses | | | | | | | | | | | | | | | | | | | | | | | | | | | | |
Management fees | | | 6,632 | | | | 3,541 | | | | 1,244 | | | | 782 | | | | 4,208 | | | | 3,895 | | | | 4,237 | |
12b-1 service fees – Class A | | | 230 | | | | 80 | | | | 26 | | | | 35 | | | | 51 | | | | 174 | | | | 76 | |
12b-1 distribution and service fees – Class B | | | 26 | | | | 16 | | | | N/A | | | | N/A | | | | N/A | | | | N/A | | | | 13 | |
12b-1 distribution and service fees – Class C | | | 38 | | | | 89 | | | | 75 | | | | 17 | | | | 1 | | | | 44 | | | | 78 | |
12b-1 distribution and service fees – Class R3(1) | | | 3 | | | | 2 | | | | 2 | | | | 3 | | | | N/A | | | | N/A | | | | 5 | |
Adminstration fees | | | 1,489 | | | | 521 | | | | 225 | | | | 204 | | | | 910 | | | | 918 | | | | 836 | |
Shareholders’ servicing agent fees and expenses | | | 338 | | | | 310 | | | | 175 | | | | 108 | | | | 179 | | | | 242 | | | | 192 | |
Custodian’s fees and expenses | | | 144 | | | | 66 | | | | 30 | | | | 32 | | | | 98 | | | | 110 | | | | 95 | |
Directors’ fees and expenses | | | 29 | | | | 22 | | | | 18 | | | | 17 | | | | 24 | | | | 26 | | | | 24 | |
Professional fees | | | 42 | | | | 36 | | | | 42 | | | | 38 | | | | 40 | | | | 42 | | | | 45 | |
Shareholders’ reports – printing and mailing expenses | | | 76 | | | | 50 | | | | 25 | | | | 15 | | | | 43 | | | | 53 | | | | 42 | |
Federal and state registration fees | | | 44 | | | | 55 | | | | 39 | | | | 38 | | | | 42 | | | | 44 | | | | 42 | |
Other expenses | | | 24 | | | | 19 | | | | 16 | | | | 16 | | | | 21 | | | | 21 | | | | 21 | |
Total expenses before expense
reimbursement | | | 9,115 | | | | 4,807 | | | | 1,917 | | | | 1,305 | | | | 5,617 | | | | 5,569 | | | | 5,706 | |
Expense reimbursement | | | (484 | ) | | | (584 | ) | | | (527 | ) | | | (423 | ) | | | (331 | ) | | | (760 | ) | | | (522 | ) |
Expense reimbursement from regulatory settlement | | | (102 | ) | | | — | | | | — | | | | (26 | ) | | | (15 | ) | | | — | | | | — | |
Net expenses | | | 8,529 | | | | 4,223 | | | | 1,390 | | | | 856 | | | | 5,271 | | | | 4,809 | | | | 5,184 | |
Net investment income (loss) | | | 47,740 | | | | 36,549 | | | | 7,901 | | | | 3,253 | | | | 25,117 | | | | 20,010 | | | | 29,515 | |
Realized and Unrealized Gain (Loss) | | | | | | | | | | | | | | | | | | | | | | | | | | | | |
Net realized gain (loss) from: | | | | | | | | | | | | | | | | | | | | | | | | | | | | |
Investments and foreign currency | | | 54,185 | | | | 24,993 | | | | 4,563 | | | | 3,115 | | | | 21,982 | | | | 8,063 | | | | 34,567 | |
Forward foreign currency exchange contracts | | | — | | | | — | | | | (51 | ) | | | — | | | | — | | | | (144 | ) | | | (71 | ) |
Futures contracts | | | (8,857 | ) | | | 439 | | | | (214 | ) | | | 77 | | | | (973 | ) | | | (5,004 | ) | | | (7,380 | ) |
Options written | | | — | | | | — | | | | — | | | | — | | | | — | | | | — | | | | (189 | ) |
Swaps | | | (2,009 | ) | | | — | | | | (206 | ) | | | — | | | | (1,226 | ) | | | 313 | | | | 2,289 | |
Change in net unrealized appreciation (depreciation) of: | | | | | | | | | | | | | | | | | | | | | | | | | | | | |
Investments and foreign currency | | | (22,473 | ) | | | 12,503 | | | | 4,336 | | | | (1,948 | ) | | | (9,945 | ) | | | 390 | | | | (1,254 | ) |
Forward foreign currency exchange contracts | | | — | | | | — | | | | — | | | | — | | | | — | | | | (93 | ) | | | 14 | |
Futures contracts | | | 3,006 | | | | (178 | ) | | | 210 | | | | (69 | ) | | | (165 | ) | | | 694 | | | | 2,407 | |
Options written | | | — | | | | — | | | | — | | | | — | | | | — | | | | — | | | | 114 | |
Swaps | | | 62 | | | | — | | | | 8 | | | | — | | | | 34 | | | | 488 | | | | (715 | ) |
Net realized and unrealized gain (loss) | | | 23,914 | | | | 37,757 | | | | 8,646 | | | | 1,175 | | | | 9,707 | | | | 4,707 | | | | 29,782 | |
Net increase (decrease) in net assets from operations | | $ | 71,654 | | | $ | 74,306 | | | $ | 16,547 | | | $ | 4,428 | | | $ | 34,824 | | | $ | 24,717 | | | $ | 59,297 | |
| N/A | – Inflation Protected Securities and Intermediate Government Bond do not offer Class B Shares. Intermediate Term Bond and Short Term Bond do not offer Class B Shares or Class R3 Shares. |
| (1) | – Effective January 18, 2011, Class R Shares and Class Y Shares previously offered by FAF Advisors, Inc. were renamed Class R3 Shares and Class I Shares, respectively. |
See accompanying notes to financial statements.
Statement of Changes in Net Assets (all dollars are rounded to thousands (000))
| | | | | | | | | | | | | | | | |
| | | Core Bond | | | High Income Bond | |
| | | Year Ended
6/30/11 | | | Year Ended
6/30/10 | | | Year Ended
6/30/11 | | | Year Ended
6/30/10 | |
Operations | | | | | | | | | | | | | | | | |
Net investment income (loss) | | $ | 47,740 | | | $ | 65,618 | | | $ | 36,549 | | | $ | 27,468 | |
Net realized gain (loss) from: | | | | | | | | | | | | | | | | |
Investments and foreign currency | | | 54,185 | | | | (1,797 | ) | | | 24,993 | | | | 23,740 | |
Forward foreign currency exchange contracts | | | — | | | | — | | | | — | | | | — | |
Futures contracts | | | (8,857 | ) | | | (2,773 | ) | | | 439 | | | | 52 | |
Options written | | | — | | | | — | | | | — | | | | — | |
Swaps | | | (2,009 | ) | | | 5,671 | | | | — | | | | — | |
Change in net unrealized appreciation (depreciation) of: | | | | | | | | | | | | | | | | |
Investments and foreign currency | | | (22,473 | ) | | | 157,451 | | | | 12,503 | | | | 13,991 | |
Forward foreign currency exchange contracts | | | — | | | | — | | | | — | | | | — | |
Futures contracts | | | 3,006 | | | | (967 | ) | | | (178 | ) | | | 187 | |
Options written | | | — | | | | — | | | | — | | | | — | |
Swaps | | | 62 | | | | (3,764 | ) | | | — | | | | — | |
Net increase (decrease) in net assets from operations | | | 71,654 | | | | 219,439 | | | | 74,306 | | | | 65,438 | |
Distributions to Shareholders | | | | | | | | | | | | | | | | |
From net investment income: | | | | | | | | | | | | | | | | |
Class A | | | (3,347 | ) | | | (4,290 | ) | | | (2,338 | ) | | | (2,599 | ) |
Class B | | | (76 | ) | | | (201 | ) | | | (104 | ) | | | (146 | ) |
Class C | | | (109 | ) | | | (150 | ) | | | (588 | ) | | | (447 | ) |
Class R3(1) | | | (17 | ) | | | (19 | ) | | | (27 | ) | | | (24 | ) |
Class I(1) | | | (42,654 | ) | | | (61,718 | ) | | | (33,009 | ) | | | (24,028 | ) |
From accumulated net realized gains: | | | | | | | | | | | | | | | | |
Class A | | | — | | | | — | | | | — | | | | — | |
Class B | | | — | | | | — | | | | — | | | | — | |
Class C | | | — | | | | — | | | | — | | | | — | |
Class R3(1) | | | — | | | | — | | | | — | | | | — | |
Class I(1) | | | — | | | | — | | | | — | | | | — | |
Return of capital: | | | | | | | | | | | | | | | | |
Class A | | | — | | | | — | | | | — | | | | — | |
Class B | | | — | | | | — | | | | — | | | | — | |
Class C | | | — | | | | — | | | | — | | | | — | |
Class R3(1) | | | — | | | | — | | | | — | | | | — | |
Class I(1) | | | — | | | | — | | | | — | | | | — | |
Decrease in net assets from distributions to shareholders | | | (46,203 | ) | | | (66,378 | ) | | | (36,066 | ) | | | (27,244 | ) |
Fund Share Transactions | | | | | | | | | | | | | | | | |
Fund merger | | | — | | | | — | | | | — | | | | — | |
Proceeds from sale of shares | | | 157,992 | | | | 237,261 | | | | 226,023 | | | | 217,030 | |
Proceeds from shares issued to shareholders due to reinvestment of distributions | | | 16,256 | | | | 22,173 | | | | 5,755 | | | | 3,888 | |
| | | 174,248 | | | | 259,434 | | | | 231,778 | | | | 220,918 | |
Cost of shares redeemed | | | (462,891 | ) | | | (503,627 | ) | | | (155,401 | ) | | | (85,781 | ) |
Net increase (decrease) in net assets from Fund share transactions | | | (288,643 | ) | | | (244,193 | ) | | | 76,377 | | | | 135,137 | |
Net increase (decrease) in net assets | | | (263,192 | ) | | | (91,132 | ) | | | 114,617 | | | | 173,331 | |
Net assets at the beginning of period | | | 1,280,609 | | | | 1,371,741 | | | | 388,538 | | | | 215,207 | |
Net assets at the end of period | | $ | 1,017,417 | | | $ | 1,280,609 | | | $ | 503,155 | | | $ | 388,538 | |
Undistributed (Over-distribution of) net investment income at the end of period | | $ | 1,352 | | | $ | 1,184 | | | $ | 506 | | | $ | 21 | |
See accompanying notes to financial statements.
| | | | | | | | | | | | | | | | |
| | | Inflation Protected Securities | | | Intermediate
Government Bond | |
| | | Year Ended
6/30/11 | | | Year Ended
6/30/10 | | | Year Ended
6/30/11 | | | Year Ended
6/30/10 | |
Operations | | | | | | | | | | | | | | | | |
Net investment income (loss) | | $ | 7,901 | | | $ | 4,972 | | | $ | 3,253 | | | $ | 3,209 | |
Net realized gain (loss) from: | | | | | | | | | | | | | | | | |
Investments and foreign currency | | | 4,563 | | | | (415 | ) | | | 3,115 | | | | 336 | |
Forward foreign currency exchange contracts | | | (51 | ) | | | — | | | | — | | | | — | |
Futures contracts | | | (214 | ) | | | 811 | | | | 77 | | | | 321 | |
Options written | | | — | | | | — | | | | — | | | | — | |
Swaps | | | (206 | ) | | | 15 | | | | — | | | | — | |
Change in net unrealized appreciation (depreciation) of: | | | | | | | | | | | | | | | | |
Investments and foreign currency | | | 4,336 | | | | 11,282 | | | | (1,948 | ) | | | 4,070 | |
Forward foreign currency exchange contracts | | | — | | | | — | | | | — | | | | — | |
Futures contracts | | | 210 | | | | (138 | ) | | | (69 | ) | | | 58 | |
Options written | | | — | | | | — | | | | — | | | | — | |
Swaps | | | 8 | | | | (169 | ) | | | — | | | | — | |
Net increase (decrease) in net assets from operations | | | 16,547 | | | | 16,358 | | | | 4,428 | | | | 7,994 | |
Distributions to Shareholders | | | | | | | | | | | | | | | | |
From net investment income: | | | | | | | | | | | | | | | | |
Class A | | | (126 | ) | | | (192 | ) | | | (383 | ) | | | (305 | ) |
Class B | | | N/A | | | | N/A | | | | N/A | | | | N/A | |
Class C | | | (48 | ) | | | (107 | ) | | | (24 | ) | | | (11 | ) |
Class R3(1) | | | (8 | ) | | | (33 | ) | | | (10 | ) | | | (5 | ) |
Class I(1) | | | (2,853 | ) | | | (3,966 | ) | | | (2,876 | ) | | | (2,949 | ) |
From accumulated net realized gains: | | | | | | | | | | | | | | | | |
Class A | | | — | | | | — | | | | — | | | | (149 | ) |
Class B | | | N/A | | | | N/A | | | | N/A | | | | N/A | |
Class C | | | — | | | | — | | | | — | | | | — | |
Class R3(1) | | | — | | | | — | | | | — | | | | — | |
Class I(1) | | | — | | | | — | | | | — | | | | (1,675 | ) |
Return of capital: | | | | | | | | | | | | | | | | |
Class A | | | — | | | | — | | | | — | | | | (2 | ) |
Class B | | | N/A | | | | N/A | | | | N/A | | | | N/A | |
Class C | | | — | | | | — | | | | — | | | | — | |
Class R3(1) | | | — | | | | — | | | | — | | | | — | |
Class I(1) | | | — | | | | — | | | | — | | | | (16 | ) |
Decrease in net assets from distributions to shareholders | | | (3,035 | ) | | | (4,298 | ) | | | (3,293 | ) | | | (5,112 | ) |
Fund Share Transactions | | | | | | | | | | | | | | | | |
Fund merger | | | — | | | | — | | | | — | | | | 97,457 | |
Proceeds from sale of shares | | | 153,222 | | | | 68,470 | | | | 33,044 | | | | 36,462 | |
Proceeds from shares issued to shareholders due to reinvestment of distributions | | | 487 | | | | 874 | | | | 1,416 | | | | 2,912 | |
| | | 153,709 | | | | 69,344 | | | | 34,460 | | | | 136,831 | |
Cost of shares redeemed | | | (64,764 | ) | | | (84,130 | ) | | | (94,342 | ) | | | (77,779 | ) |
Net increase (decrease) in net assets from Fund share transactions | | | 88,945 | | | | (14,786 | ) | | | (59,882 | ) | | | 59,052 | |
Net increase (decrease) in net assets | | | 102,457 | | | | (2,726 | ) | | | (58,747 | ) | | | 61,934 | |
Net assets at the beginning of period | | | 172,882 | | | | 175,608 | | | | 173,683 | | | | 111,749 | |
Net assets at the end of period | | $ | 275,339 | | | $ | 172,882 | | | $ | 114,936 | | | $ | 173,683 | |
Undistributed (Over-distribution of) net investment income at the end of period | | $ | 5,417 | | | $ | 614 | | | $ | — | | | $ | (185 | ) |
| N/A | – Inflation Protected Securities and Intermediated Government Bond do not offer Class B Shares. |
| (1) | – Effective January 18, 2011, Class R Shares and Class Y Shares previously offered by FAF Advisors, Inc. were renamed Class R3 Shares and Class I Shares, respectively. |
See accompanying notes to financial statements.
Statement of Changes in Net Assets (all dollars are rounded to thousands (000)) (continued)
| | | | | | | | | | | | | | | | |
| | | Intermediate Term Bond | | | Short Term Bond | |
| | | Year Ended
6/30/11 | | | Year Ended
6/30/10 | | | Year Ended
6/30/11 | | | Year Ended
6/30/10 | |
Operations | | | | | | | | | | | | | | | | |
Net investment income (loss) | | $ | 25,117 | | | $ | 33,185 | | | $ | 20,010 | | | $ | 17,985 | |
Net realized gain (loss) from: | | | | | | | | | | | | | | | | |
Investments and foreign currency | | | 21,982 | | | | (736 | ) | | | 8,063 | | | | (4,661 | ) |
Forward foreign currency exchange contracts | | | — | | | | — | | | | (144 | ) | | | — | |
Futures contracts | | | (973 | ) | | | 2,078 | | | | (5,004 | ) | | | (2,779 | ) |
Options written | | | — | | | | — | | | | — | | | | — | |
Swaps | | | (1,226 | ) | | | 402 | | | | 313 | | | | 514 | |
Change in net unrealized appreciation (depreciation) of: | | | | | | | | | | | | | | | | |
Investments and foreign currency | | | (9,945 | ) | | | 65,457 | | | | 390 | | | | 22,925 | |
Forward foreign currency exchange contracts | | | — | | | | — | | | | (93 | ) | | | — | |
Futures contracts | | | (165 | ) | | | 1,416 | | | | 694 | | | | (1,139 | ) |
Options written | | | — | | | | — | | | | — | | | | — | |
Swaps | | | 34 | | | | (1,311 | ) | | | 488 | | | | (866 | ) |
Net increase (decrease) in net assets from operations | | | 34,824 | | | | 100,491 | | | | 24,717 | | | | 31,979 | |
Distributions to Shareholders | | | | | | | | | | | | | | | | |
From net investment income: | | | | | | | | | | | | | | | | |
Class A | | | (786 | ) | | | (1,095 | ) | | | (1,859 | ) | | | (2,624 | ) |
Class B | | | N/A | | | | N/A | | | | N/A | | | | N/A | |
Class C | | | (2 | ) | | | — | | | | (58 | ) | | | (21 | ) |
Class R3(1) | | | N/A | | | | N/A | | | | N/A | | | | N/A | |
Class I(1) | | | (24,002 | ) | | | (32,180 | ) | | | (16,481 | ) | | | (15,745 | ) |
From accumulated net realized gains: | | | | | | | | | | | | | | | | |
Class A | | | — | | | | — | | | | — | | | | — | |
Class B | | | N/A | | | | N/A | | | | N/A | | | | N/A | |
Class C | | | — | | | | — | | | | — | | | | — | |
Class R3(1) | | | N/A | | | | N/A | | | | N/A | | | | N/A | |
Class I(1) | | | — | | | | — | | | | — | | | | — | |
Return of capital: | | | | | | | | | | | | | | | | |
Class A | | | — | | | | — | | | | — | | | | — | |
Class B | | | N/A | | | | N/A | | | | N/A | | | | N/A | |
Class C | | | — | | | | — | | | | — | | | | — | |
Class R3(1) | | | N/A | | | | N/A | | | | N/A | | | | N/A | |
Class I(1) | | | — | | | | — | | | | — | | | | — | |
Decrease in net assets from distributions to shareholders | | | (24,790 | ) | | | (33,275 | ) | | | (18,398 | ) | | | (18,390 | ) |
Fund Share Transactions | | | | | | | | | | | | | | | | |
Fund merger | | | — | | | | — | | | | — | | | | — | |
Proceeds from sale of shares | | | 149,972 | | | | 205,286 | | | | 524,866 | | | | 568,813 | |
Proceeds from shares issued to shareholders due to reinvestment of distributions | | | 6,311 | | | | 8,950 | | | | 4,910 | | | | 5,746 | |
| | | 156,283 | | | | 214,236 | | | | 529,776 | | | | 574,559 | |
Cost of shares redeemed | | | (246,799 | ) | | | (268,623 | ) | | | (427,991 | ) | | | (248,983 | ) |
Net increase (decrease) in net assets from Fund share transactions | | | (90,516 | ) | | | (54,387 | ) | | | 101,785 | | | | 325,576 | |
Net increase (decrease) in net assets | | | (80,482 | ) | | | 12,829 | | | | 108,104 | | | | 339,165 | |
Net assets at the beginning of period | | | 761,265 | | | | 748,436 | | | | 719,893 | | | | 380,728 | |
Net assets at the end of period | | $ | 680,783 | | | $ | 761,265 | | | $ | 827,997 | | | $ | 719,893 | |
Undistributed (Over-distribution of) net investment income at the end of period | | $ | (155 | ) | | $ | 45 | | | $ | 553 | | | $ | (640 | ) |
See accompanying notes to financial statements.
| | | | | | | | |
| | | Total Return Bond | |
| | | Year Ended
6/30/11 | | | Year Ended
6/30/10 | |
Operations | | | | | | | | |
Net investment income (loss) | | $ | 29,515 | | | $ | 36,869 | |
Net realized gain (loss) from: | | | | | | | | |
Investments and foreign currency | | | 34,567 | | | | (4,148 | ) |
Forward foreign currency exchange contracts | | | (71 | ) | | | — | |
Futures contracts | | | (7,380 | ) | | | (9,664 | ) |
Options written | | | (189 | ) | | | 1,331 | |
Swaps | | | 2,289 | | | | 6,235 | |
Change in net unrealized appreciation (depreciation) of: | | | | | | | | |
Investments and foreign currency | | | (1,254 | ) | | | 95,383 | |
Forward foreign currency exchange contracts | | | 14 | | | | — | |
Futures contracts | | | 2,407 | | | | (529 | ) |
Options written | | | 114 | | | | (88 | ) |
Swaps | | | (715 | ) | | | (677 | ) |
Net increase (decrease) in net assets from operations | | | 59,297 | | | | 124,712 | |
Distributions to Shareholders | | | | | | | | |
From net investment income: | | | | | | | | |
Class A | | | (1,234 | ) | | | (1,012 | ) |
Class B | | | (44 | ) | | | (75 | ) |
Class C | | | (253 | ) | | | (194 | ) |
Class R3(1) | | | (37 | ) | | | (22 | ) |
Class I(1) | | | (27,595 | ) | | | (36,239 | ) |
From accumulated net realized gains: | | | | | | | | |
Class A | | | — | | | | — | |
Class B | | | — | | | | — | |
Class C | | | — | | | | — | |
Class R3(1) | | | — | | | | — | |
Class I(1) | | | — | | | | — | |
Return of capital: | | | | | | | | |
Class A | | | — | | | | — | |
Class B | | | — | | | | — | |
Class C | | | — | | | | — | |
Class R3(1) | | | — | | | | — | |
Class I(1) | | | — | | | | — | |
Decrease in net assets from distributions to shareholders | | | (29,163 | ) | | | (37,542 | ) |
Fund Share Transactions | | | | | | | | |
Fund merger | | | — | | | | — | |
Proceeds from sale of shares | | | 141,915 | | | | 172,881 | |
Proceeds from shares issued to shareholders due to reinvestment of distributions | | | 8,496 | | | | 10,611 | |
| | | 150,411 | | | | 183,492 | |
Cost of shares redeemed | | | (222,393 | ) | | | (230,668 | ) |
Net increase (decrease) in net assets from Fund share transactions | | | (71,982 | ) | | | (47,176 | ) |
Net increase (decrease) in net assets | | | (41,848 | ) | | | 39,994 | |
Net assets at the beginning of period | | | 692,228 | | | | 652,234 | |
Net assets at the end of period | | $ | 650,380 | | | $ | 692,228 | |
Undistributed (Over-distribution of) net investment income at the end of period | | $ | 4,397 | | | $ | 1,957 | |
| N/A | – Intermediate Term Bond and Short Term Bond do not offer Class B Shares or Class R3 Shares. |
| (1) | – Effective January 18, 2011, Class R Shares and Class Y Shares previously offered by FAF Advisors, Inc. were renamed Class R3 Shares and Class I Shares, respectively. |
See accompanying notes to financial statements.
Financial Highlights
| | | | | | | | | | | | | | | | | | | | | | | | | | | | | | | | | | | | | | | | |
| Selected data for a share outstanding throughout each period: | | | | |
| | | | | | | | |
| Class (Commencement Date) | | | | | | | | | | | | | | | | | | | | | | | | | |
| | | | | | Investment Operations | | | Less Distributions | | | | | | | |
| | | | | | | | | |
| Core Bond | | | | | | | | | | | | | | | | | | | | | | | | | | | | |
Year Ended
June 30, | | Beginning
Net
Asset
Value | | | Net
Invest-
ment
Income
(Loss)(a) | | | Net
Realized/
Unrealized
Gain
(Loss) | | | Total | | | Net
Invest-
ment
Income | | | Capital
Gains(b) | | | Return
of
Capital | | | Total | | | Ending
Net
Asset
Value | | | Total
Return(c) | |
CLASS A (12/87) | | | | | | | | | | | | | | | | | | | | | | | | | | | | | |
2011 | | $ | 11.22 | | | $ | .43 | | | $ | .21 | | | $ | .64 | | | $ | (.42 | ) | | $ | — | | | $ | — | | | $ | (.42 | ) | | $ | 11.44 | | | | 5.73 | % |
2010 | | | 10.04 | | | | .51 | | | | 1.18 | | | | 1.69 | | | | (.51 | ) | | | — | | | | — | | | | (.51 | ) | | | 11.22 | | | | 17.11 | |
2009 | | | 10.86 | | | | .61 | | | | (.81 | ) | | | (.20 | ) | | | (.62 | ) | | | — | | | | — | | | | (.62 | ) | | | 10.04 | | | | (1.37 | ) |
2008 | | | 10.79 | | | | .51 | | | | .05 | | | | .56 | | | | (.49 | ) | | | — | | | | — | | | | (.49 | ) | | | 10.86 | | | | 5.24 | |
2007 | | | 10.71 | | | | .47 | | | | .09 | | | | .56 | | | | (.48 | ) | | | — | | | | — | | | | (.48 | ) | | | 10.79 | | | | 5.26 | |
CLASS B (8/94) | | | | | | | | | | | | | | | | | | | | | | | | | | | | | |
2011 | | | 11.12 | | | | .34 | | | | .21 | | | | .55 | | | | (.33 | ) | | | — | | | | — | | | | (.33 | ) | | | 11.34 | | | | 4.97 | |
2010 | | | 9.95 | | | | .43 | | | | 1.17 | | | | 1.60 | | | | (.43 | ) | | | — | | | | — | | | | (.43 | ) | | | 11.12 | | | | 16.31 | |
2009 | | | 10.77 | | | | .54 | | | | (.81 | ) | | | (.27 | ) | | | (.55 | ) | | | — | | | | — | | | | (.55 | ) | | | 9.95 | | | | (2.12 | ) |
2008 | | | 10.70 | | | | .42 | | | | .06 | | | | .48 | | | | (.41 | ) | | | — | | | | — | | | | (.41 | ) | | | 10.77 | | | | 4.50 | |
2007 | | | 10.63 | | | | .38 | | | | .09 | | | | .47 | | | | (.40 | ) | | | — | | | | — | | | | (.40 | ) | | | 10.70 | | | | 4.41 | |
CLASS C (2/99) | | | | | | | | | | | | | | | | | | | | | | | | | | | | | |
2011 | | | 11.18 | | | | .34 | | | | .21 | | | | .55 | | | | (.33 | ) | | | — | | | | — | | | | (.33 | ) | | | 11.40 | | | | 4.97 | |
2010 | | | 10.00 | | | | .42 | | | | 1.19 | | | | 1.61 | | | | (.43 | ) | | | — | | | | — | | | | (.43 | ) | | | 11.18 | | | | 16.32 | |
2009 | | | 10.83 | | | | .54 | | | | (.82 | ) | | | (.28 | ) | | | (.55 | ) | | | — | | | | — | | | | (.55 | ) | | | 10.00 | | | | (2.21 | ) |
2008 | | | 10.75 | | | | .43 | | | | .06 | | | | .49 | | | | (.41 | ) | | | — | | | | — | | | | (.41 | ) | | | 10.83 | | | | 4.57 | |
2007 | | | 10.67 | | | | .38 | | | | .10 | | | | .48 | | | | (.40 | ) | | | — | | | | — | | | | (.40 | ) | | | 10.75 | | | | 4.48 | |
CLASS R3 (9/01)(e) | | | | | | | | | | | | | | | | | | | | | | | | | | | | | |
2011 | | | 11.27 | | | | .40 | | | | .22 | | | | .62 | | | | (.39 | ) | | | — | | | | — | | | | (.39 | ) | | | 11.50 | | | | 5.54 | |
2010 | | | 10.09 | | | | .48 | | | | 1.19 | | | | 1.67 | | | | (.49 | ) | | | — | | | | — | | | | (.49 | ) | | | 11.27 | | | | 16.74 | |
2009 | | | 10.89 | | | | .59 | | | | (.79 | ) | | | (.20 | ) | | | (.60 | ) | | | — | | | | — | | | | (.60 | ) | | | 10.09 | | | | (1.43 | ) |
2008 | | | 10.81 | | | | .49 | | | | .05 | | | | .54 | | | | (.46 | ) | | | — | | | | — | | | | (.46 | ) | | | 10.89 | | | | 5.06 | |
2007 | | | 10.73 | | | | .44 | | | | .09 | | | | .53 | | | | (.45 | ) | | | — | | | | — | | | | (.45 | ) | | | 10.81 | | | | 4.99 | |
CLASS I (2/94)(e) | | | | | | | | | | | | | | | | | | | | | | | | | | | | | |
2011 | | | 11.21 | | | | .46 | | | | .22 | | | | .68 | | | | (.45 | ) | | | — | | | | — | | | | (.45 | ) | | | 11.44 | | | | 6.09 | |
2010 | | | 10.03 | | | | .54 | | | | 1.18 | | | | 1.72 | | | | (.54 | ) | | | — | | | | — | | | | (.54 | ) | | | 11.21 | | | | 17.42 | |
2009 | | | 10.86 | | | | .64 | | | | (.82 | ) | | | (.18 | ) | | | (.65 | ) | | | — | | | | — | | | | (.65 | ) | | | 10.03 | | | | (1.22 | ) |
2008 | | | 10.78 | | | | .54 | | | | .06 | | | | .60 | | | | (.52 | ) | | | — | | | | — | | | | (.52 | ) | | | 10.86 | | | | 5.60 | |
2007 | | | 10.70 | | | | .49 | | | | .10 | | | | .59 | | | | (.51 | ) | | | — | | | | — | | | | (.51 | ) | | | 10.78 | | | | 5.53 | |
| | | | | | | | | | | | | | | | | | | | | | |
| | | | | | | | | | | | | | | | | |
| | | | |
| | | | | | | | | | | | | | |
| Ratios/Supplemental Data | |
| | | | Ratios to Average
Net Assets Before
Reimbursement | | | Ratios to Average
Net Assets After
Reimbursement(d) | | | | |
Ending
Net
Assets
(000) | | | Expenses | | | Net
Invest-
ment
Income
(Loss) | | | Expenses | | | Net
Invest-
ment
Income
(Loss) | | | Portfolio
Turnover
Rate(f) | |
| | | | | | | | | | | | | | | | | | | | | | |
| $ | 85,980 | | | | .99 | % | | | 3.72 | % | | | .94 | % | | | 3.77 | % | | | 91 | % |
| | 93,374 | | | | 1.02 | | | | 4.58 | | | | .95 | | | | 4.65 | | | | 83 | |
| | 82,373 | | | | 1.02 | | | | 6.27 | | | | .95 | | | | 6.34 | | | | 160 | |
| | 94,571 | | | | 1.01 | | | | 4.57 | | | | .95 | | | | 4.63 | | | | 131 | |
| | 102,723 | | | | 1.01 | | | | 4.19 | | | | .95 | | | | 4.25 | | | | 137 | |
| | | | | | | | | | | | | | | | | | | | | | |
| | 1,805 | | | | 1.74 | | | | 2.97 | | | | 1.69 | | | | 3.02 | | | | 91 | |
| | 3,607 | | | | 1.77 | | | | 3.90 | | | | 1.70 | | | | 3.97 | | | | 83 | |
| | 5,780 | | | | 1.77 | | | | 5.52 | | | | 1.70 | | | | 5.59 | | | | 160 | |
| | 7,733 | | | | 1.76 | | | | 3.81 | | | | 1.70 | | | | 3.87 | | | | 131 | |
| | 9,634 | | | | 1.76 | | | | 3.44 | | | | 1.70 | | | | 3.50 | | | | 137 | |
| | | | | | | | | | | | | | | | | | | | | | |
| | 3,711 | | | | 1.74 | | | | 2.97 | | | | 1.69 | | | | 3.02 | | | | 91 | |
| | 3,796 | | | | 1.77 | | | | 3.84 | | | | 1.70 | | | | 3.91 | | | | 83 | |
| | 3,693 | | | | 1.77 | | | | 5.52 | | | | 1.70 | | | | 5.59 | | | | 160 | |
| | 4,383 | | | | 1.76 | | | | 3.83 | | | | 1.70 | | | | 3.89 | | | | 131 | |
| | 4,567 | | | | 1.76 | | | | 3.44 | | | | 1.70 | | | | 3.50 | | | | 137 | |
| | | | | | | | | | | | | | | | | | | | | | |
| | 380 | | | | 1.23 | | | | 3.47 | | | | 1.19 | | | | 3.52 | | | | 91 | |
| | 379 | | | | 1.27 | | | | 4.35 | | | | 1.20 | | | | 4.42 | | | | 83 | |
| | 406 | | | | 1.27 | | | | 6.04 | | | | 1.20 | | | | 6.11 | | | | 160 | |
| | 289 | | | | 1.26 | | | | 4.36 | | | | 1.20 | | | | 4.42 | | | | 131 | |
| | 65 | | | | 1.29 | | | | 3.92 | | | | 1.20 | | | | 4.01 | | | | 137 | |
| | | | | | | | | | | | | | | | | | | | | | |
| | 925,541 | | | | .74 | | | | 3.97 | | | | .69 | | | | 4.02 | | | | 91 | |
| | 1,179,453 | | | | .77 | | | | 4.86 | | | | .70 | | | | 4.93 | | | | 83 | |
| | 1,279,489 | | | | .77 | | | | 6.50 | | | | .70 | | | | 6.57 | | | | 160 | |
| | 1,468,599 | | | | .76 | | | | 4.82 | | | | .70 | | | | 4.88 | | | | 131 | |
| | 1,530,750 | | | | .76 | | | | 4.44 | | | | .70 | | | | 4.50 | | | | 137 | |
| (a) | Per share Net Investment Income (Loss) is calculated using the average daily shares method. |
| (b) | Distributions from Capital Gains include short-term capital gains, if any. |
| (c) | Total return is the combination of changes in net asset value without any sales charge, reinvested dividend income at net asset value and reinvested capital gains distributions at net asset value, if any. Total returns are not annualized. |
| (d) | After expense reimbursement from the Adviser, where applicable. Ratios do not reflect the effect of custodian fee credits earned on the Fund’s net cash on deposit with the custodian bank, where applicable. |
| (e) | Effective January 18, 2011, Class R Shares and Class Y Shares previously offered by FAF Advisors, Inc. were renamed Class R3 Shares and Class I Shares, respectively. |
| (f) | Excluding dollar roll transactions, where applicable. |
See accompanying notes to financial statements.
Financial Highlights (continued)
| | | | | | | | | | | | | | | | | | | | | | | | | | | | | | | | | | | | | | | | |
| Selected data for a share outstanding throughout each period: | | | | | | | | | | | | | | | | | | | |
| | | | | | | | | |
| Class (Commencement Date) | | | | | | | | | | | | | | | | | | | | | | | | | | | | |
| | | | | | Investment Operations | | | Less Distributions | | | | | | | |
| | | | | | | | | |
| High Income Bond | | | | | | | | | | | | | | | | | | | | | | | | | | | | |
Year Ended
June 30, | | Beginning
Net
Asset
Value | | | Net
Invest-
ment
Income
(Loss)(a) | | | Net
Realized/
Unrealized
Gain
(Loss) | | | Total | | | Net
Invest-
ment
Income | | | Capital
Gains(b) | | | Return
of
Capital | | | Total | | | Ending
Net
Asset
Value | | | Total
Return(c) | |
CLASS A (8/01) | | | | | | | | | | | | | | | | | | | | | | | | | | | | | | | | | | | | | |
2011 | | $ | 8.28 | | | $ | .67 | | | $ | .76 | | | $ | 1.43 | | | $ | (.66 | ) | | $ | — | | | $ | — | | | $ | (.66 | ) | | $ | 9.05 | | | | 17.61 | % |
2010 | | | 7.15 | | | | .67 | | | | 1.12 | | | | 1.79 | | | | (.66 | ) | | | — | | | | — | | | | (.66 | ) | | | 8.28 | | | | 25.47 | |
2009 | | | 8.65 | | | | .73 | | | | (1.47 | ) | | | (.74 | ) | | | (.76 | ) | | | — | | | | — | | | | (.76 | ) | | | 7.15 | | | | (7.26 | ) |
2008 | | | 9.61 | | | | .71 | | | | (.97 | ) | | | (.26 | ) | | | (.70 | ) | | | — | | | | — | | | | (.70 | ) | | | 8.65 | | | | (2.84 | ) |
2007 | | | 9.22 | | | | .65 | | | | .38 | | | | 1.03 | | | | (.64 | ) | | | — | | | | — | | | | (.64 | ) | | | 9.61 | | | | 11.46 | |
CLASS B (8/01) | | | | | | | | | | | | | | | | | | | | | | | | | | | | | | | | | | | | | |
2011 | | | 8.23 | | | | .60 | | | | .74 | | | | 1.34 | | | | (.59 | ) | | | — | | | | — | | | | (.59 | ) | | | 8.98 | | | | 16.59 | |
2010 | | | 7.11 | | | | .60 | | | | 1.12 | | | | 1.72 | | | | (.60 | ) | | | — | | | | — | | | | (.60 | ) | | | 8.23 | | | | 24.56 | |
2009 | | | 8.61 | | | | .68 | | | | (1.47 | ) | | | (.79 | ) | | | (.71 | ) | | | — | | | | — | | | | (.71 | ) | | | 7.11 | | | | (7.99 | ) |
2008 | | | 9.57 | | | | .63 | | | | (.96 | ) | | | (.33 | ) | | | (.63 | ) | | | — | | | | — | | | | (.63 | ) | | | 8.61 | | | | (3.57 | ) |
2007 | | | 9.18 | | | | .57 | | | | .39 | | | | .96 | | | | (.57 | ) | | | — | | | | — | | | | (.57 | ) | | | 9.57 | | | | 10.67 | |
CLASS C (8/01) | | | | | | | | | | | | | | | | | | | | | | | | | | | | | | | | | | | | | |
2011 | | | 8.25 | | | | .60 | | | | .75 | | | | 1.35 | | | | (.59 | ) | | | — | | | | — | | | | (.59 | ) | | | 9.01 | | | | 16.67 | |
2010 | | | 7.12 | | | | .60 | | | | 1.13 | | | | 1.73 | | | | (.60 | ) | | | — | | | | — | | | | (.60 | ) | | | 8.25 | | | | 24.67 | |
2009 | | | 8.62 | | | | .68 | | | | (1.47 | ) | | | (.79 | ) | | | (.71 | ) | | | — | | | | — | | | | (.71 | ) | | | 7.12 | | | | (7.98 | ) |
2008 | | | 9.58 | | | | .63 | | | | (.96 | ) | | | (.33 | ) | | | (.63 | ) | | | — | | | | — | | | | (.63 | ) | | | 8.62 | | | | (3.57 | ) |
2007 | | | 9.19 | | | | .57 | | | | .39 | | | | .96 | | | | (.57 | ) | | | — | | | | — | | | | (.57 | ) | | | 9.58 | | | | 10.66 | |
CLASS R3 (9/01)(e) | | | | | | | | | | | | | | | | | | | | | | | | | | | | | | | | | | | | | |
2011 | | | 8.44 | | | | .66 | | | | .77 | | | | 1.43 | | | | (.64 | ) | | | — | | | | — | | | | (.64 | ) | | | 9.23 | | | | 17.28 | |
2010 | | | 7.28 | | | | .66 | | | | 1.14 | | | | 1.80 | | | | (.64 | ) | | | — | | | | — | | | | (.64 | ) | | | 8.44 | | | | 25.12 | |
2009 | | | 8.79 | | | | .73 | | | | (1.49 | ) | | | (.76 | ) | | | (.75 | ) | | | — | | | | — | | | | (.75 | ) | | | 7.28 | | | | (7.49 | ) |
2008 | | | 9.75 | | | | .69 | | | | (.98 | ) | | | (.29 | ) | | | (.67 | ) | | | — | | | | — | | | | (.67 | ) | | | 8.79 | | | | (3.04 | ) |
2007 | | | 9.35 | | | | .62 | | | | .40 | | | | 1.02 | | | | (.62 | ) | | | — | | | | — | | | | (.62 | ) | | | 9.75 | | | | 11.12 | |
CLASS I (8/01)(e) | | | | | | | | | | | | | | | | | | | | | | | | | | | | | | | | | | | | | |
2011 | | | 8.29 | | | | .69 | | | | .75 | | | | 1.44 | | | | (.68 | ) | | | — | | | | — | | | | (.68 | ) | | | 9.05 | | | | 17.77 | |
2010 | | | 7.16 | | | | .69 | | | | 1.12 | | | | 1.81 | | | | (.68 | ) | | | — | | | | — | | | | (.68 | ) | | | 8.29 | | | | 25.75 | |
2009 | | | 8.66 | | | | .75 | | | | (1.47 | ) | | | (.72 | ) | | | (.78 | ) | | | — | | | | — | | | | (.78 | ) | | | 7.16 | | | | (7.01 | ) |
2008 | | | 9.62 | | | | .73 | | | | (.97 | ) | | | (.24 | ) | | | (.72 | ) | | | — | | | | — | | | | (.72 | ) | | | 8.66 | | | | (2.59 | ) |
2007 | | | 9.23 | | | | .67 | | | | .39 | | | | 1.06 | | | | (.67 | ) | | | — | | | | — | | | | (.67 | ) | | | 9.62 | | | | 11.73 | |
| | | | | | | | | | | | | | | | | | | | | | |
| | | | | | | | | | | | | | | | | |
| | | | |
| | | | | | | | | | | | | | |
| Ratios/Supplemental Data | |
| | | | Ratios to Average
Net Assets Before
Reimbursement | | | Ratios to Average
Net Assets After
Reimbursement(d) | | | | |
Ending
Net
Assets
(000) | | | Expenses | | | Net
Invest-
ment
Income
(Loss) | | | Expenses | | | Net
Invest-
ment
Income
(Loss) | | | Portfolio
Turnover
Rate | |
| | | | | | | | | | | | | | | | | | | | | | |
| $ | 30,984 | | | | 1.22 | % | | | 7.38 | % | | | 1.10 | % | | | 7.50 | % | | | 130 | % |
| | 29,532 | | | | 1.29 | | | | 7.93 | | | | 1.10 | | | | 8.12 | | | | 132 | |
| | 25,696 | | | | 1.36 | | | | 10.53 | | | | 1.10 | | | | 10.79 | | | | 108 | |
| | 24,420 | | | | 1.31 | | | | 7.53 | | | | 1.10 | | | | 7.74 | | | | 100 | |
| | 28,932 | | | | 1.30 | | | | 6.54 | | | | 1.10 | | | | 6.74 | | | | 101 | |
| | | | | | | | | | | | | | | | | | | | | | |
| | 1,285 | | | | 1.98 | | | | 6.64 | | | | 1.85 | | | | 6.76 | | | | 130 | |
| | 1,628 | | | | 2.04 | | | | 7.28 | | | | 1.85 | | | | 7.47 | | | | 132 | |
| | 2,157 | | | | 2.11 | | | | 9.66 | | | | 1.85 | | | | 9.92 | | | | 108 | |
| | 3,496 | | | | 2.06 | | | | 6.76 | | | | 1.85 | | | | 6.97 | | | | 100 | |
| | 4,814 | | | | 2.05 | | | | 5.80 | | | | 1.85 | | | | 6.00 | | | | 101 | |
| | | | | | | | | | | | | | | | | | | | | | |
| | 9,792 | | | | 1.97 | | | | 6.64 | | | | 1.85 | | | | 6.76 | | | | 130 | |
| | 6,969 | | | | 2.04 | | | | 7.22 | | | | 1.85 | | | | 7.41 | | | | 132 | |
| | 5,038 | | | | 2.11 | | | | 9.72 | | | | 1.85 | | | | 9.98 | | | | 108 | |
| | 6,490 | | | | 2.06 | | | | 6.76 | | | | 1.85 | | | | 6.97 | | | | 100 | |
| | 8,522 | | | | 2.05 | | | | 5.78 | | | | 1.85 | | | | 5.98 | | | | 101 | |
| | | | | | | | | | | | | | | | | | | | | | |
| | 309 | | | | 1.47 | | | | 7.12 | | | | 1.35 | | | | 7.25 | | | | 130 | |
| | 343 | | | | 1.54 | | | | 7.73 | | | | 1.35 | | | | 7.92 | | | | 132 | |
| | 265 | | | | 1.61 | | | | 10.46 | | | | 1.35 | | | | 10.72 | | | | 108 | |
| | 185 | | | | 1.56 | | | | 7.16 | | | | 1.35 | | | | 7.37 | | | | 100 | |
| | 186 | | | | 1.56 | | | | 6.17 | | | | 1.35 | | | | 6.38 | | | | 101 | |
| | | | | | | | | | | | | | | | | | | | | | |
| | 460,785 | | | | .97 | | | | 7.63 | | | | .85 | | | | 7.75 | | | | 130 | |
| | 350,066 | | | | 1.04 | | | | 8.19 | | | | .85 | | | | 8.38 | | | | 132 | |
| | 182,051 | | | | 1.11 | | | | 10.67 | | | | .85 | | | | 10.93 | | | | 108 | |
| | 204,164 | | | | 1.06 | | | | 7.78 | | | | .85 | | | | 7.99 | | | | 100 | |
| | 232,998 | | | | 1.05 | | | | 6.78 | | | | .85 | | | | 6.98 | | | | 101 | |
| (a) | Per share Net Investment Income (Loss) is calculated using the average daily shares method. |
| (b) | Distributions from Capital Gains include short-term capital gains, if any. |
| (c) | Total return is the combination of changes in net asset value without any sales charge, reinvested dividend income at net asset value and reinvested capital gains distributions at net asset value, if any. Total returns are not annualized. |
| (d) | After expense reimbursement from the Adviser, where applicable. Ratios do not reflect the effect of custodian fee credits earned on the Fund’s net cash on deposit with the custodian bank, where applicable. |
| (e) | Effective January 18, 2011, Class R Shares and Class Y Shares previously offered by FAF Advisors, Inc. were renamed Class R3 Shares and Class I Shares, respectively. |
See accompanying notes to financial statements.
Financial Highlights (continued)
| | | | | | | | | | | | | | | | | | | | | | | | | | | | | | | | | | | | | | | | |
| Selected data for a share outstanding throughout each period: | | | | | | | | | | | | | | | | | | | |
| | | | | | | | | |
| Class (Commencement Date) | | | | | | | | | | | | | | | | | | | | | | | | | | | | |
| | | | | | Investment Operations | | | Less Distributions | | | | | | | |
| | | | | | | | |
| Inflation Protected Securities | | | | | | | | | | | | | | | | | | | | | | | | | |
Year Ended
June 30, | | Beginning
Net
Asset
Value | | | Net
Invest-
ment
Income
(Loss)(a) | | | Net
Realized/
Unrealized
Gain
(Loss) | | | Total | | | Net
Invest-
ment
Income | | | Capital
Gains(b) | | | Return
of
Capital | | | Total | | | Ending
Net
Asset
Value | | | Total
Return(c) | |
CLASS A (10/04) | | | | | | | | | | | | | | | | | | | | | | | | | | | | | | | | | | | | | |
2011 | | $ | 10.33 | | | $ | .35 | | | $ | .40 | | | $ | .75 | | | $ | (.14 | ) | | $ | — | | | $ | — | | | $ | (.14 | ) | | $ | 10.94 | | | | 7.30 | % |
2010 | | | 9.59 | | | | .28 | | | | .73 | | | | 1.01 | | | | (.27 | ) | | | — | | | | — | | | | (.27 | ) | | | 10.33 | | | | 10.62 | |
2009 | | | 10.20 | | | | .14 | | | | (.37 | ) | | | (.23 | ) | | | (.26 | ) | | | — | | | | (.12 | ) | | | (.38 | ) | | | 9.59 | | | | (2.18 | ) |
2008 | | | 9.43 | | | | .54 | | | | .76 | | | | 1.30 | | | | (.53 | ) | | | — | | | | — | | | | (.53 | ) | | | 10.20 | | | | 14.01 | |
2007 | | | 9.54 | | | | .39 | | | | (.16 | ) | | | .23 | | | | (.34 | ) | | | — | | | | — | | | | (.34 | ) | | | 9.43 | | | | 2.41 | |
CLASS C (10/04) | | | | | | | | | | | | | | | | | | | | | | | | | | | | | | | | | | | | | |
2011 | | | 10.24 | | | | .26 | | | | .41 | | | | .67 | | | | (.07 | ) | | | — | | | | — | | | | (.07 | ) | | | 10.84 | | | | 6.59 | |
2010 | | | 9.53 | | | | .18 | | | | .75 | | | | .93 | | | | (.22 | ) | | | — | | | | — | | | | (.22 | ) | | | 10.24 | | | | 9.76 | |
2009 | | | 10.18 | | | | .11 | | | | (.43 | ) | | | (.32 | ) | | | (.21 | ) | | | — | | | | (.12 | ) | | | (.33 | ) | | | 9.53 | | | | (3.03 | ) |
2008 | | | 9.41 | | | | .48 | | | | .75 | | | | 1.23 | | | | (.46 | ) | | | — | | | | — | | | | (.46 | ) | | | 10.18 | | | | 13.20 | |
2007 | | | 9.53 | | | | .33 | | | | (.18 | ) | | | .15 | | | | (.27 | ) | | | — | | | | — | | | | (.27 | ) | | | 9.41 | | | | 1.53 | |
CLASS R3 (10/04)(e) | | | | | | | | | | | | | | | | | | | | | | | | | | | | | | | | | | | | | |
2011 | | | 10.31 | | | | .11 | | | | .54 | | | | .65 | | | | (.12 | ) | | | — | | | | — | | | | (.12 | ) | | | 10.84 | | | | 6.31 | |
2010 | | | 9.58 | | | | .26 | | | | .72 | | | | .98 | | | | (.25 | ) | | | — | | | | — | | | | (.25 | ) | | | 10.31 | | | | 10.32 | |
2009 | | | 10.20 | | | | .13 | | | | (.39 | ) | | | (.26 | ) | | | (.24 | ) | | | — | | | | (.12 | ) | | | (.36 | ) | | | 9.58 | | | | (2.43 | ) |
2008 | | | 9.43 | | | | .52 | | | | .75 | | | | 1.27 | | | | (.50 | ) | | | — | | | | — | | | | (.50 | ) | | | 10.20 | | | | 13.73 | |
2007 | | | 9.55 | | | | .33 | | | | (.13 | ) | | | .20 | | | | (.32 | ) | | | — | | | | — | | | | (.32 | ) | | | 9.43 | | | | 2.09 | |
CLASS I (10/04)(e) | | | | | | | | | | | | | | | | | | | | | | | | | | | | | | | | | | | | | |
2011 | | | 10.34 | | | | .40 | | | | .38 | | | | .78 | | | | (.16 | ) | | | — | | | | — | | | | (.16 | ) | | | 10.96 | | | | 7.62 | |
2010 | | | 9.59 | | | | .33 | | | | .71 | | | | 1.04 | | | | (.29 | ) | | | — | | | | — | | | | (.29 | ) | | | 10.34 | | | | 10.92 | |
2009 | | | 10.20 | | | | .23 | | | | (.45 | ) | | | (.22 | ) | | | (.27 | ) | | | — | | | | (.12 | ) | | | (.39 | ) | | | 9.59 | | | | (2.03 | ) |
2008 | | | 9.43 | | | | .56 | | | | .76 | | | | 1.32 | | | | (.55 | ) | | | — | | | | — | | | | (.55 | ) | | | 10.20 | | | | 14.29 | |
2007 | | | 9.55 | | | | .40 | | | | (.16 | ) | | | .24 | | | | (.36 | ) | | | — | | | | — | | | | (.36 | ) | | | 9.43 | | | | 2.56 | |
| | | | | | | | | | | | | | | | | | | | | | |
| | | | | | | | | | | | | | | | | |
| | | | |
| | | | | | | | | | | | | | |
| Ratios/Supplemental Data | |
| | | | Ratios to Average
Net Assets Before
Reimbursement | | | Ratios to Average
Net Assets After
Reimbursement(d) | | | | |
Ending
Net
Assets
(000) | | | Expenses | | | Net
Invest-
ment
Income
(Loss) | | | Expenses | | | Net
Invest-
ment
Income
(Loss) | | | Portfolio
Turnover
Rate | |
| | | | | | | | | | | | | | | | | | | | | | |
| $ | 12,080 | | | | 1.09 | % | | | 3.05 | % | | | .85 | % | | | 3.30 | % | | | 45 | % |
| | 7,894 | | | | 1.15 | | | | 2.46 | | | | .84 | | | | 2.77 | | | | 72 | |
| | 5,439 | | | | 1.10 | | | | 1.27 | | | | .85 | | | | 1.52 | | | | 24 | |
| | 3,294 | | | | 1.08 | | | | 5.17 | | | | .85 | | | | 5.40 | | | | 71 | |
| | 2,712 | | | | 1.06 | | | | 3.88 | | | | .85 | | | | 4.09 | | | | 90 | |
| | | | | | | | | | | | | | | | | | | | | | |
| | 8,043 | | | | 1.84 | | | | 2.19 | | | | 1.60 | | | | 2.44 | | | | 45 | |
| | 6,673 | | | | 1.91 | | | | 1.47 | | | | 1.60 | | | | 1.78 | | | | 72 | |
| | 1,406 | | | | 1.84 | | | | .94 | | | | 1.59 | | | | 1.19 | | | | 24 | |
| | 365 | | | | 1.83 | | | | 4.59 | | | | 1.60 | | | | 4.82 | | | | 71 | |
| | 348 | | | | 1.81 | | | | 3.23 | | | | 1.60 | | | | 3.44 | | | | 90 | |
| | | | | | | | | | | | | | | | | | | | | | |
| | 33 | | | | 1.38 | | | | .78 | | | | 1.10 | | | | 1.05 | | | | 45 | |
| | 1,332 | | | | 1.40 | | | | 2.33 | | | | 1.09 | | | | 2.64 | | | | 72 | |
| | 1,262 | | | | 1.35 | | | | 1.09 | | | | 1.10 | | | | 1.34 | | | | 24 | |
| | 1,175 | | | | 1.33 | | | | 4.98 | | | | 1.10 | | | | 5.21 | | | | 71 | |
| | 822 | | | | 1.31 | | | | 3.24 | | | | 1.10 | | | | 3.45 | | | | 90 | |
| | | | | | | | | | | | | | | | | | | | | | |
| | 255,183 | | | | .84 | | | | 3.49 | | | | .60 | | | | 3.74 | | | | 45 | |
| | 156,983 | | | | .90 | | | | 2.96 | | | | .59 | | | | 3.27 | | | | 72 | |
| | 167,501 | | | | .85 | | | | 2.23 | | | | .60 | | | | 2.48 | | | | 24 | |
| | 278,749 | | | | .83 | | | | 5.41 | | | | .60 | | | | 5.64 | | | | 71 | |
| | 273,312 | | | | .81 | | | | 4.00 | | | | .60 | | | | 4.21 | | | | 90 | |
| (a) | Per share Net Investment Income (Loss) is calculated using the average daily shares method. |
| (b) | Distributions from Capital Gains include short-term capital gains, if any. |
| (c) | Total return is the combination of changes in net asset value without any sales charge, reinvested dividend income at net asset value and reinvested capital gains distributions at net asset value, if any. Total returns are not annualized. |
| (d) | After expense reimbursement from the Adviser, where applicable. Ratios do not reflect the effect of custodian fee credits earned on the Fund’s net cash on deposit with the custodian bank, where applicable. |
| (e) | Effective January 18, 2011, Class R Shares and Class Y Shares previously offered by FAF Advisors, Inc. were renamed Class R3 Shares and Class I Shares, respectively. |
See accompanying notes to financial statements.
Financial Highlights (continued)
| | | | | | | | | | | | | | | | | | | | | | | | | | | | | | | | | | | | | | | | |
| Selected data for a share outstanding throughout each period: | | | | |
| | | | | | | | |
| Class (Commencement Date) | | | | | | | | | | | | | | | | | | | | | | | | | |
| | | | | | Investment Operations | | | Less Distributions | | | | | | | |
| | | | | | | | |
| Intermediate Government Bond | | | | | | | | | | | | | | | | | | | | | | | | | |
Year Ended
June 30, | | Beginning
Net
Asset
Value | | | Net
Invest-
ment
Income
(Loss)(a) | | | Net
Realized/
Unrealized
Gain
(Loss) | | | Total | | | Net
Invest-
ment
Income | | | Capital
Gains(b) | | | Return
of
Capital | | | Total | | | Ending
Net
Asset
Value | | | Total
Return(c) | |
CLASS A (10/02) | | | | | | | | | | | | | | | | | | | | | | | | | | | | | | | | | |
2011 | | $ | 8.77 | | | $ | .20 | | | $ | .07 | | | $ | .27 | | | $ | (.20 | ) | | $ | — | | | $ | — | | | $ | (.20 | ) | | $ | 8.84 | | | | 3.10 | % |
2010 | | | 8.67 | | | | .20 | | | | .27 | | | | .47 | | | | (.20 | ) | | | (.17 | ) | | | — | * | | | (.37 | ) | | | 8.77 | | | | 5.50 | |
2009 | | | 8.42 | | | | .19 | | | | .25 | | | | .44 | | | | (.19 | ) | | | — | | | | — | | | | (.19 | ) | | | 8.67 | | | | 5.30 | |
2008 | | | 8.00 | | | | .28 | | | | .43 | | | | .71 | | | | (.29 | ) | | | — | | | | — | | | | (.29 | ) | | | 8.42 | | | | 8.90 | |
2007 | | | 7.99 | | | | .31 | | | | .06 | | | | .37 | | | | (.33 | ) | | | — | | | | (.03 | ) | | | (.36 | ) | | | 8.00 | | | | 4.68 | |
CLASS C (10/09) | | | | | | | | | | | | | | | | | | | | | | | | | | | | | | | | | |
2011 | | | 8.77 | | | | .12 | | | | .08 | | | | .20 | | | | (.12 | ) | | | — | | | | — | | | | (.12 | ) | | | 8.85 | | | | 2.32 | |
2010(e) | | | 8.76 | | | | .09 | | | | .17 | | | | .26 | | | | (.08 | ) | | | (.17 | ) | | | — | * | | | (.25 | ) | | | 8.77 | | | | 3.00 | |
CLASS R3 (10/09)(f) | | | | | | | | | | | | | | | | | | | | | | | | | | | | | | | | | |
2011 | | | 8.77 | | | | .16 | | | | .08 | | | | .24 | | | | (.17 | ) | | | — | | | | — | | | | (.17 | ) | | | 8.84 | | | | 2.75 | |
2010(e) | | | 8.76 | | | | .09 | | | | .20 | | | | .29 | | | | (.11 | ) | | | (.17 | ) | | | — | * | | | (.28 | ) | | | 8.77 | | | | 3.34 | |
CLASS I (10/02)(f) | | | | | | | | | | | | | | | | | | | | | | | | | | | | | | | | | |
2011 | | | 8.77 | | | | .21 | | | | .07 | | | | .28 | | | | (.21 | ) | | | — | | | | — | | | | (.21 | ) | | | 8.84 | | | | 3.25 | |
2010 | | | 8.67 | | | | .21 | | | | .27 | | | | .48 | | | | (.21 | ) | | | (.17 | ) | | | — | * | | | (.38 | ) | | | 8.77 | | | | 5.66 | |
2009 | | | 8.42 | | | | .21 | | | | .25 | | | | .46 | | | | (.21 | ) | | | — | | | | — | | | | (.21 | ) | | | 8.67 | | | | 5.46 | |
2008 | | | 8.00 | | | | .30 | | | | .42 | | | | .72 | | | | (.30 | ) | | | — | | | | — | | | | (.30 | ) | | | 8.42 | | | | 9.07 | |
2007 | | | 7.99 | | | | .32 | | | | .06 | | | | .38 | | | | (.34 | ) | | | — | | | | (.03 | ) | | | (.37 | ) | | | 8.00 | | | | 4.84 | |
| | | | | | | | | | | | | | | | | | | | | | |
| | | | | | | | | | | | | | | | | |
| | | | |
| | | | | | | | | | | | | | |
| Ratios/Supplemental Data | |
| | | | Ratios to Average
Net Assets Before
Reimbursement | | | Ratios to Average
Net Assets After
Reimbursement(d) | | | | |
Ending
Net
Assets
(000) | | | Expenses | | | Net
Invest-
ment
Income
(Loss) | | | Expenses | | | Net
Invest-
ment
Income
(Loss) | | | Portfolio
Turnover
Rate | |
| | | | | | | | | | | | | | | | | | | | | | |
| $ | 14,086 | | | | 1.10 | % | | | 1.85 | % | | | .73 | % | | | 2.22 | % | | | 58 | % |
| | 19,003 | | | | 1.19 | | | | 1.89 | | | | .75 | | | | 2.33 | | | | 105 | |
| | 10,496 | | | | 1.15 | | | | 1.82 | | | | .75 | | | | 2.22 | | | | 133 | |
| | 6,504 | | | | 1.33 | | | | 2.74 | | | | .75 | | | | 3.32 | | | | 118 | |
| | 1,619 | | | | 1.46 | | | | 3.09 | | | | .75 | | | | 3.80 | | | | 84 | |
| | | | | | | | | | | | | | | | | | | | | | |
| | 1,417 | | | | 1.89 | | | | 1.05 | | | | 1.58 | | | | 1.37 | | | | 58 | |
| | 1,940 | | | | 1.94 | ** | | | 1.16 | ** | | | 1.60 | ** | | | 1.50 | ** | | | 105 | |
| | | | | | | | | | | | | | | | | | | | | | |
| | 473 | | | | 1.39 | | | | 1.56 | | | | 1.08 | | | | 1.87 | | | | 58 | |
| | 652 | | | | 1.44 | ** | | | 1.44 | ** | | | 1.10 | ** | | | 1.78 | ** | | | 105 | |
| | | | | | | | | | | | | | | | | | | | | | |
| | 98,960 | | | | .89 | | | | 2.05 | | | | .58 | | | | 2.36 | | | | 58 | |
| | 152,088 | | | | .94 | | | | 2.05 | | | | .60 | | | | 2.39 | | | | 105 | |
| | 101,253 | | | | .90 | | | | 2.11 | | | | .60 | | | | 2.41 | | | | 133 | |
| | 63,784 | | | | 1.08 | | | | 3.12 | | | | .60 | | | | 3.60 | | | | 118 | |
| | 37,705 | | | | 1.21 | | | | 3.33 | | | | .60 | | | | 3.94 | | | | 84 | |
| (a) | Per share Net Investment Income (Loss) is calculated using the average daily shares method. |
| (b) | Distributions from Capital Gains include short-term capital gains, if any. |
| (c) | Total return is the combination of changes in net asset value without any sales charge, reinvested dividend income at net asset value and reinvested capital gains distributions at net asset value, if any. Total returns are not annualized. |
| (d) | After expense reimbursement from the Adviser, where applicable. Ratios do not reflect the effect of custodian fee credits earned on the Fund’s net cash on deposit with the custodian bank, where applicable. |
| (e) | For the period October 28, 2009 (commencement of operations) through June 30, 2010. |
| (f) | Effective January 18, 2011, Class R Shares and Class Y Shares previously offered by FAF Advisors, Inc. were renamed Class R3 Shares and Class I Shares, respectively. |
| * | Rounds to less than $.01 per share. |
See accompanying notes to financial statements.
Financial Highlights (continued)
| | | | | | | | | | | | | | | | | | | | | | | | | | | | | | | | | | | | | | | | |
| Selected data for a share outstanding throughout each period: | | | | |
| | | | | | | | |
| Class (Commencement Date) | | | | | | | | | | | | | | | | | | | | | | | | | |
| | | | | | Investment Operations | | | Less Distributions | | | | | | | |
| | | | | | | | |
| Intermediate Term Bond | | | | | | | | | | | | | | | | | | | | | | | | | |
Year Ended
June 30, | | Beginning
Net
Asset
Value | | | Net
Invest-
ment
Income
(Loss)(a) | | | Net
Realized/
Unrealized
Gain
(Loss) | | | Total | | | Net
Invest-
ment
Income | | | Capital
Gains(b) | | | Return
of
Capital | | | Total | | | Ending
Net
Asset
Value | | | Total
Return(c) | |
CLASS A (1/95) | | | | | | | | | | | | | | | | | | | | | | | | | | | | | | | | | |
2011 | | $ | 10.33 | | | $ | .33 | | | $ | .14 | | | $ | .47 | | | $ | (.33 | ) | | $ | — | | | $ | — | | | $ | (.33 | ) | | $ | 10.47 | | | | 4.70 | % |
2010 | | | 9.47 | | | | .42 | | | | .86 | | | | 1.28 | | | | (.42 | ) | | | — | | | | — | | | | (.42 | ) | | | 10.33 | | | | 13.64 | |
2009 | | | 9.90 | | | | .48 | | | | (.40 | ) | | | .08 | | | | (.51 | ) | | | — | | | | — | | | | (.51 | ) | | | 9.47 | | | | 1.21 | |
2008 | | | 9.73 | | | | .44 | | | | .14 | | | | .58 | | | | (.41 | ) | | | — | | | | — | | | | (.41 | ) | | | 9.90 | | | | 6.02 | |
2007 | | | 9.68 | | | | .41 | | | | .05 | | | | .46 | | | | (.41 | ) | | | — | | | | — | | | | (.41 | ) | | | 9.73 | | | | 4.80 | |
CLASS C (1/11) | | | | | | | | | | | | | | | | | | | | | | | | | | | | | | | | | |
2011(e) | | | 10.37 | | | | .12 | | | | .06 | | | | .18 | | | | (.11 | ) | | | — | | | | — | | | | (.11 | ) | | | 10.44 | | | | 1.76 | |
CLASS I (1/93)(f) | | | | | | | | | | | | | | | | | | | | | | | | | | | | | | | | | |
2011 | | | 10.29 | | | | .35 | | | | .14 | | | | .49 | | | | (.35 | ) | | | — | | | | — | | | | (.35 | ) | | | 10.43 | | | | 4.76 | |
2010 | | | 9.43 | | | | .43 | | | | .86 | | | | 1.29 | | | | (.43 | ) | | | — | | | | — | | | | (.43 | ) | | | 10.29 | | | | 13.87 | |
2009 | | | 9.87 | | | | .49 | | | | (.40 | ) | | | .09 | | | | (.53 | ) | | | — | | | | — | | | | (.53 | ) | | | 9.43 | | | | 1.26 | |
2008 | | | 9.70 | | | | .45 | | | | .15 | | | | .60 | | | | (.43 | ) | | | — | | | | — | | | | (.43 | ) | | | 9.87 | | | | 6.20 | |
2007 | | | 9.65 | | | | .42 | | | | .06 | | | | .48 | | | | (.43 | ) | | | — | | | | — | | | | (.43 | ) | | | 9.70 | | | | 4.98 | |
| | | | | | | | | | | | | | | | | | | | | | |
| | | | | | | | | | | | | | | | | |
| | | | |
| | | | | | | | | | | | | | |
| Ratios/Supplemental Data | |
| | | | Ratios to Average
Net Assets Before
Reimbursement | | | Ratios to Average
Net Assets After
Reimbursement(d) | | | | |
Ending
Net
Assets
(000) | | | Expenses | | | Net
Invest- ment
Income
(Loss) | | | Expenses | | | Net
Invest-
ment
Income
(Loss) | | | Portfolio
Turnover
Rate | |
| | | | | | | | | | | | | | | | | | | | | | |
| $ | 22,502 | | | | .94 | % | | | 3.10 | % | | | .85 | % | | | 3.20 | % | | | 58 | % |
| | 26,341 | | | | 1.01 | | | | 3.96 | | | | .85 | | | | 4.12 | | | | 58 | |
| | 23,905 | | | | 1.01 | | | | 5.09 | | | | .85 | | | | 5.25 | | | | 41 | |
| | 28,364 | | | | 1.01 | | | | 4.22 | | | | .85 | | | | 4.38 | | | | 102 | |
| | 30,655 | | | | 1.01 | | | | 3.91 | | | | .85 | | | | 4.07 | | | | 110 | |
| | | | | | | | | | | | | | | | | | | | | | |
| | 1,152 | | | | 1.79 | * | | | 2.46 | * | | | 1.70 | * | | | 2.56 | * | | | 58 | |
| | | | | | | | | | | | | | | | | | | | | | |
| | 657,129 | | | | .74 | | | | 3.30 | | | | .70 | | | | 3.35 | | | | 58 | |
| | 734,924 | | | | .76 | | | | 4.22 | | | | .70 | | | | 4.28 | | | | 58 | |
| | 724,531 | | | | .76 | | | | 5.33 | | | | .70 | | | | 5.39 | | | | 41 | |
| | 766,932 | | | | .76 | | | | 4.47 | | | | .70 | | | | 4.53 | | | | 102 | |
| | 752,984 | | | | .76 | | | | 4.16 | | | | .70 | | | | 4.22 | | | | 110 | |
| (a) | Per share Net Investment Income (Loss) is calculated using the average daily shares method. |
| (b) | Distributions from Capital Gains include short-term capital gains, if any. |
| (c) | Total return is the combination of changes in net asset value without any sales charge, reinvested dividend income at net asset value and reinvested capital gains distributions at net asset value, if any. Total returns are not annualized. |
| (d) | After expense reimbursement from the Adviser, where applicable. Ratios do not reflect the effect of custodian fee credits earned on the Fund’s net cash on deposit with the custodian bank, where applicable. |
| (e) | For the period January 18, 2011 (commencement of operations) through June 30, 2011. |
| (f) | Effective January 18, 2011, Class Y Shares previously offered by FAF Advisors, Inc. were renamed Class I Shares. |
See accompanying notes to financial statements.
Financial Highlights (continued)
| | | | | | | | | | | | | | | | | | | | | | | | | | | | | | | | | | | | | | | | |
| Selected data for a share outstanding throughout each period: | | | | |
| | | | | | | | |
| Class (Commencement Date) | | | | | | | | | | | | | | | | | | | | | | | | | |
| | | | | | Investment Operations | | | Less Distributions | | | | | | | |
| | | | | | | | | |
| Short Term Bond | | | | | | | | | | | | | | | | | | | | | | | | | | | | |
Year Ended
June 30, | | Beginning
Net
Asset
Value | | | Net
Invest-
ment
Income
(Loss)(a) | | | Net
Realized/
Unrealized
Gain
(Loss) | | | Total | | | Net
Invest-
ment
Income | | | Capital
Gains(b) | | | Return
of
Capital | | | Total | | | Ending
Net
Asset
Value | | | Total
Return(c) | |
CLASS A (12/92) | | | | | | | | | | | | | | | | | | | | | | | | | | | | | | | | | |
2011 | | $ | 9.98 | | | $ | .24 | | | $ | .06 | | | $ | .30 | | | $ | (.22 | ) | | $ | — | | | $ | — | | | $ | (.22 | ) | | $ | 10.06 | | | | 3.00 | % |
2010 | | | 9.66 | | | | .31 | | | | .34 | | | | .65 | | | | (.33 | ) | | | — | | | | — | | | | (.33 | ) | | | 9.98 | | | | 6.77 | |
2009 | | | 9.89 | | | | .46 | | | | (.26 | ) | | | .20 | | | | (.43 | ) | | | — | | | | — | | | | (.43 | ) | | | 9.66 | | | | 2.22 | |
2008 | | | 9.90 | | | | .45 | | | | (.03 | ) | | | .42 | | | | (.43 | ) | | | — | | | | — | | | | (.43 | ) | | | 9.89 | | | | 4.30 | |
2007 | | | 9.83 | | | | .36 | | | | .09 | | | | .45 | | | | (.38 | ) | | | — | | | | — | | | | (.38 | ) | | | 9.90 | | | | 4.60 | |
CLASS C (10/09) | | | | | | | | | | | | | | | | | | | | | | | | | | | | | | | | | |
2011 | | | 10.00 | | | | .15 | | | | .07 | | | | .22 | | | | (.13 | ) | | | — | | | | — | | | | (.13 | ) | | | 10.09 | | | | 2.22 | |
2010(e) | | | 9.95 | | | | .13 | | | | .06 | | | | .19 | | | | (.14 | ) | | | — | | | | — | | | | (.14 | ) | | | 10.00 | | | | 1.90 | |
CLASS I (2/94)(f) | | | | | | | | | | | | | | | | | | | | | | | | | | | | | | | | | |
2011 | | | 9.99 | | | | .25 | | | | .06 | | | | .31 | | | | (.23 | ) | | | — | | | | — | | | | (.23 | ) | | | 10.07 | | | | 3.16 | |
2010 | | | 9.67 | | | | .32 | | | | .34 | | | | .66 | | | | (.34 | ) | | | — | | | | — | | | | (.34 | ) | | | 9.99 | | | | 6.92 | |
2009 | | | 9.89 | | | | .48 | | | | (.25 | ) | | | .23 | | | | (.45 | ) | | | — | | | | — | | | | (.45 | ) | | | 9.67 | | | | 2.48 | |
2008 | | | 9.91 | | | | .46 | | | | (.03 | ) | | | .43 | | | | (.45 | ) | | | — | | | | — | | | | (.45 | ) | | | 9.89 | | | | 4.35 | |
2007 | | | 9.83 | | | | .37 | | | | .10 | | | | .47 | | | | (.39 | ) | | | — | | | | — | | | | (.39 | ) | | | 9.91 | | | | 4.86 | |
| | | | | | | | | | | | | | | | | | | | | | |
| | | | | | | | | | | | | | | | | |
| | | | |
| | | | | | | | | | | | | | |
| Ratios/Supplemental Data | |
| | | | Ratios to Average
Net Assets Before
Reimbursement | | | Ratios to Average
Net Assets After
Reimbursement(d) | | | | |
Ending
Net
Assets
(000) | | | Expenses | | | Net
Invest-
ment
Income
(Loss) | | | Expenses | | | Net
Invest-
ment
Income
(Loss) | | | Portfolio
Turnover
Rate | |
| | | | | | | | | | | | | | | | | | | | | | |
| $ | 80,927 | | | | .87 | % | | | 2.22 | % | | | .73 | % | | | 2.37 | % | | | 58 | % |
| | 87,631 | | | | 1.04 | | | | 2.88 | | | | .75 | | | | 3.17 | | | | 44 | |
| | 65,704 | | | | 1.06 | | | | 4.55 | | | | .74 | | | | 4.87 | | | | 54 | |
| | 59,933 | | | | 1.05 | | | | 4.17 | | | | .74 | | | | 4.48 | | | | 55 | |
| | 66,722 | | | | 1.04 | | | | 3.32 | | | | .75 | | | | 3.61 | | | | 47 | |
| | | | | | | | | | | | | | | | | | | | | | |
| | 5,101 | | | | 1.66 | | | | 1.45 | | | | 1.58 | | | | 1.53 | | | | 58 | |
| | 3,111 | | | | 1.79 | * | | | 1.76 | * | | | 1.60 | * | | | 1.95 | * | | | 44 | |
| | | | | | | | | | | | | | | | | | | | | | |
| | 741,969 | | | | .67 | | | | 2.43 | | | | .58 | | | | 2.52 | | | | 58 | |
| | 629,151 | | | | .79 | | | | 3.07 | | | | .60 | | | | 3.26 | | | | 44 | |
| | 315,024 | | | | .81 | | | | 4.80 | | | | .59 | | | | 5.02 | | | | 54 | |
| | 257,403 | | | | .80 | | | | 4.41 | | | | .59 | | | | 4.62 | | | | 55 | |
| | 311,131 | | | | .79 | | | | 3.55 | | | | .60 | | | | 3.74 | | | | 47 | |
| (a) | Per share Net Investment Income (Loss) is calculated using the average daily shares method. |
| (b) | Distributions from Capital Gains include short-term capital gains, if any. |
| (c) | Total return is the combination of changes in net asset value without any sales charge, reinvested dividend income at net asset value and reinvested capital gains distributions at net asset value, if any. Total returns are not annualized. |
| (d) | After expense reimbursement from the Adviser, where applicable. Ratios do not reflect the effect of custodian fee credits earned on the Fund’s net cash on deposit with the custodian bank, where applicable. |
| (e) | For the period October 28, 2009 (commencement of operations) through June 30, 2010. |
| (f) | Effective January 18, 2011, Class Y Shares previously offered by FAF Advisors, Inc. were renamed Class I Shares. |
See accompanying notes to financial statements.
Financial Highlights (continued)
| | | | | | | | | | | | | | | | | | | | | | | | | | | | | | | | | | | | | | | | |
| Selected data for a share outstanding throughout each period: | | | | | | | | | | | | | | | | | | | |
| | | | | | | | | |
| Class (Commencement Date) | | | | | | | | | | | | | | | | | | | | | | | | | | | | |
| | | | | | Investment Operations | | | Less Distributions | | | | | | | |
| | | | | | | | | |
| Total Return Bond | | | | | | | | | | | | | | | | | | | | | | | | | | | | |
Year Ended
June 30, | | Beginning
Net
Asset
Value | | | Net
Invest-
ment
Income
(Loss)(a) | | | Net
Realized/
Unrealized
Gain
(Loss) | | | Total | | | Net
Invest-
ment
Income | | | Capital
Gains(b) | | | Return
of
Capital | | | Total | | | Ending
Net
Asset
Value | | | Total
Return(c) | |
CLASS A (2/00) | | | | | | | | | | | | | | | | | | | | | | | | | | | | | | | | | | | | | |
2011 | | $ | 10.27 | | | $ | .43 | | | $ | .45 | | | $ | .88 | | | $ | (.43 | ) | | $ | — | | | $ | — | | | $ | (.43 | ) | | $ | 10.72 | | | | 8.69 | % |
2010 | | | 9.01 | | | | .52 | | | | 1.28 | | | | 1.80 | | | | (.54 | ) | | | — | | | | — | | | | (.54 | ) | | | 10.27 | | | | 20.21 | |
2009 | | | 9.90 | | | | .64 | | | | (.74 | ) | | | (.10 | ) | | | (.63 | ) | | | (.16 | ) | | | — | | | | (.79 | ) | | | 9.01 | | | | .16 | |
2008 | | | 9.83 | | | | .49 | | | | .05 | | | | .54 | | | | (.47 | ) | | | — | | | | — | | | | (.47 | ) | | | 9.90 | | | | 5.51 | |
2007 | | | 9.86 | | | | .45 | | | | (.02 | ) | | | .43 | | | | (.46 | ) | | | — | | | | — | | | | (.46 | ) | | | 9.83 | | | | 4.36 | |
CLASS B (2/00) | | | | | | | | | | | | | | | | | | | | | | | | | | | | | | | | | | | | | |
2011 | | | 10.22 | | | | .35 | | | | .44 | | | | .79 | | | | (.34 | ) | | | — | | | | — | | | | (.34 | ) | | | 10.67 | | | | 7.84 | |
2010 | | | 8.97 | | | | .45 | | | | 1.26 | | | | 1.71 | | | | (.46 | ) | | | — | | | | — | | | | (.46 | ) | | | 10.22 | | | | 19.22 | |
2009 | | | 9.86 | | | | .58 | | | | (.74 | ) | | | (.16 | ) | | | (.57 | ) | | | (.16 | ) | | | — | | | | (.73 | ) | | | 8.97 | | | | (.58 | ) |
2008 | | | 9.80 | | | | .41 | | | | .05 | | | | .46 | | | | (.40 | ) | | | — | | | | — | | | | (.40 | ) | | | 9.86 | | | | 4.65 | |
2007 | | | 9.82 | | | | .38 | | | | (.02 | ) | | | .36 | | | | (.38 | ) | | | — | | | | — | | | | (.38 | ) | | | 9.80 | | | | 3.69 | |
CLASS C (2/00) | | | | | | | | | | | | | | | | | | | | | | | | | | | | | | | | | | | | | |
2011 | | | 10.20 | | | | .35 | | | | .44 | | | | .79 | | | | (.34 | ) | | | — | | | | — | | | | (.34 | ) | | | 10.65 | | | | 7.85 | |
2010 | | | 8.96 | | | | .43 | | | | 1.27 | | | | 1.70 | | | | (.46 | ) | | | — | | | | — | | | | (.46 | ) | | | 10.20 | | | | 19.13 | |
2009 | | | 9.84 | | | | .58 | | | | (.73 | ) | | | (.15 | ) | | | (.57 | ) | | | (.16 | ) | | | — | | | | (.73 | ) | | | 8.96 | | | | (.48 | ) |
2008 | | | 9.78 | | | | .42 | | | | .04 | | | | .46 | | | | (.40 | ) | | | — | | | | — | | | | (.40 | ) | | | 9.84 | | | | 4.66 | |
2007 | | | 9.80 | | | | .37 | | | | (.01 | ) | | | .36 | | | | (.38 | ) | | | — | | | | — | | | | (.38 | ) | | | 9.78 | | | | 3.70 | |
CLASS R3 (9/01)(e) | | | | | | | | | | | | | | | | | | | | | | | | | | | | | | | | | | | | | |
2011 | | | 10.31 | | | | .41 | | | | .45 | | | | .86 | | | | (.40 | ) | | | — | | | | — | | | | (.40 | ) | | | 10.77 | | | | 8.40 | |
2010 | | | 9.07 | | | | .42 | | | | 1.32 | | | | 1.74 | | | | (.50 | ) | | | — | | | | — | | | | (.50 | ) | | | 10.31 | | | | 19.47 | |
2009 | | | 9.95 | | | | .62 | | | | (.73 | ) | | | (.11 | ) | | | (.61 | ) | | | (.16 | ) | | | — | | | | (.77 | ) | | | 9.07 | | | | .02 | |
2008 | | | 9.88 | | | | .47 | | | | .05 | | | | .52 | | | | (.45 | ) | | | — | | | | — | | | | (.45 | ) | | | 9.95 | | | | 5.22 | |
2007 | | | 9.90 | | | | .43 | | | | (.02 | ) | | | .41 | | | | (.43 | ) | | | — | | | | — | | | | (.43 | ) | | | 9.88 | | | | 4.20 | |
CLASS I (2/00)(e) | | | | | | | | | | | | | | | | | | | | | | | | | | | | | | | | | | | | | |
2011 | | | 10.26 | | | | .46 | | | | .44 | | | | .90 | | | | (.45 | ) | | | — | | | | — | | | | (.45 | ) | | | 10.71 | | | | 8.99 | |
2010 | | | 9.01 | | | | .55 | | | | 1.25 | | | | 1.80 | | | | (.55 | ) | | | — | | | | — | | | | (.55 | ) | | | 10.26 | | | | 20.31 | |
2009 | | | 9.89 | | | | .66 | | | | (.73 | ) | | | (.07 | ) | | | (.65 | ) | | | (.16 | ) | | | — | | | | (.81 | ) | | | 9.01 | | | | .52 | |
2008 | | | 9.83 | | | | .52 | | | | .04 | | | | .56 | | | | (.50 | ) | | | — | | | | — | | | | (.50 | ) | | | 9.89 | | | | 5.67 | |
2007 | | | 9.85 | | | | .47 | | | | (.01 | ) | | | .46 | | | | (.48 | ) | | | — | | | | — | | | | (.48 | ) | | | 9.83 | | | | 4.73 | |
| | | | | | | | | | | | | | | | | | | | | | |
| | | | | | | | | | | | | | | | | |
| | | | |
| | | | | | | | | | | | | | |
| Ratios/Supplemental Data | |
| | | | Ratios to Average
Net Assets Before
Reimbursement | | | Ratios to Average
Net Assets After
Reimbursement(d) | | | | |
Ending
Net
Assets
(000) | | | Expenses | | | Net
Invest-
ment
Income
(Loss) | | | Expenses | | | Net
Invest-
ment
Income
(Loss) | | | Portfolio
Turnover
Rate(f) | |
| | | | | | | | | | | | | | | | | | | | | | |
| $ | 25,045 | | | | 1.05 | % | | | 3.93 | % | | | .88 | % | | | 4.10 | % | | | 98 | % |
| | 28,165 | | | | 1.13 | | | | 4.98 | | | | .92 | | | | 5.19 | | | | 96 | |
| | 13,948 | | | | 1.13 | | | | 7.45 | | | | 1.00 | | | | 7.58 | | | | 147 | |
| | 15,567 | | | | 1.11 | | | | 4.75 | | | | .99 | | | | 4.87 | | | | 124 | |
| | 13,198 | | | | 1.13 | | | | 4.35 | | | | 1.00 | | | | 4.48 | | | | 180 | |
| | | | | | | | | | | | | | | | | | | | | | |
| | 1,116 | | | | 1.80 | | | | 3.22 | | | | 1.73 | | | | 3.29 | | | | 98 | |
| | 1,413 | | | | 1.87 | | | | 4.35 | | | | 1.74 | | | | 4.48 | | | | 96 | |
| | 1,719 | | | | 1.88 | | | | 6.71 | | | | 1.75 | | | | 6.84 | | | | 147 | |
| | 2,384 | | | | 1.86 | | | | 4.01 | | | | 1.74 | | | | 4.13 | | | | 124 | |
| | 2,272 | | | | 1.88 | | | | 3.61 | | | | 1.75 | | | | 3.74 | | | | 180 | |
| | | | | | | | | | | | | | | | | | | | | | |
| | 8,092 | | | | 1.80 | | | | 3.22 | | | | 1.73 | | | | 3.29 | | | | 98 | |
| | 6,748 | | | | 1.88 | | | | 4.21 | | | | 1.75 | | | | 4.34 | | | | 96 | |
| | 2,778 | | | | 1.88 | | | | 6.64 | | | | 1.75 | | | | 6.77 | | | | 147 | |
| | 3,673 | | | | 1.86 | | | | 4.10 | | | | 1.74 | | | | 4.22 | | | | 124 | |
| | 1,792 | | | | 1.88 | | | | 3.60 | | | | 1.75 | | | | 3.73 | | | | 180 | |
| | | | | | | | | | | | | | | | | | | | | | |
| | 1,020 | | | | 1.29 | | | | 3.73 | | | | 1.23 | | | | 3.79 | | | | 98 | |
| | 601 | | | | 1.37 | | | | 4.06 | | | | 1.24 | | | | 4.19 | | | | 96 | |
| | 681 | | | | 1.38 | | | | 7.26 | | | | 1.25 | | | | 7.39 | | | | 147 | |
| | 293 | | | | 1.36 | | | | 4.54 | | | | 1.24 | | | | 4.66 | | | | 124 | |
| | 219 | | | | 1.44 | | | | 4.03 | | | | 1.25 | | | | 4.22 | | | | 180 | |
| | | | | | | | | | | | | | | | | | | | | | |
| | 615,107 | | | | .80 | | | | 4.22 | | | | .73 | | | | 4.29 | | | | 98 | |
| | 655,301 | | | | .87 | | | | 5.31 | | | | .74 | | | | 5.44 | | | | 96 | |
| | 633,108 | | | | .88 | | | | 7.64 | | | | .75 | | | | 7.77 | | | | 147 | |
| | 1,069,211 | | | | .86 | | | | 5.03 | | | | .74 | | | | 5.15 | | | | 124 | |
| | 851,513 | | | | .88 | | | | 4.58 | | | | .75 | | | | 4.71 | | | | 180 | |
| (a) | Per share Net Investment Income (Loss) is calculated using the average daily shares method. |
| (b) | Distributions from Capital Gains include short-term capital gains, if any. |
| (c) | Total return is the combination of changes in net asset value without any sales charge, reinvested dividend income at net asset value and reinvested capital gains distributions at net asset value, if any. Total returns are not annualized. |
| (d) | After expense reimbursement from the Adviser, where applicable. Ratios do not reflect the effect of custodian fee credits earned on the Fund’s net cash on deposit with the custodian bank, where applicable. |
| (e) | Effective January 18, 2011, Class R Shares and Class Y Shares previously offered by FAF Advisors, Inc. were renamed Class R3 Shares and Class I Shares, respectively. |
| (f) | Excluding dollar roll transactions, where applicable. |
See accompanying notes to financial statements.
Notes to Financial Statements (all dollars and shares are rounded to thousands (000))
1. General Information and Significant Accounting Policies
General Information
On July 28, 2010, U.S. Bancorp, the indirect parent company of FAF Advisors, Inc. (“FAF Advisors”) known as U.S. Bancorp Asset Management, Inc. (“USBAM”) effective January 1, 2011, entered into an agreement to sell a portion of FAF Advisors’ asset management business to Nuveen Investments, Inc. (“Nuveen”). Included in the sale was the part of FAF Advisors’ asset management business that advises the funds included in this report. The sale closed on December 31, 2010 (the “Sale”).
In connection with the Sale, the funds’ Board of Directors was asked to consider and approve new investment advisory agreements for the funds with Nuveen Asset Management, a wholly-owned subsidiary of Nuveen. The new investment advisory agreements for each fund were submitted to the funds’ shareholders for approval and took effect on January 1, 2011. Effective January 1, 2011, the funds’ adviser, Nuveen Asset Management, changed its name to Nuveen Fund Advisors, Inc. (“Nuveen Fund Advisors” or the “Adviser”). Concurrently, the Adviser formed a wholly-owned subsidiary, Nuveen Asset Management, LLC (the “Sub-Adviser”), to house its portfolio management capabilities and to serve as the funds’ sub-adviser, and the funds’ portfolio managers became employees of the Sub-Adviser. This allocation of responsibilities between the Adviser and the Sub-Adviser affects each of the funds. The Adviser will compensate the Sub-Adviser for the portfolio management services it provides to the funds from each fund’s management fee.
There was no change in the funds’ investment objectives or policies as a result of the Sale. The Sale did result in a change to each fund’s name effective January 1, 2011.
The funds’ Board of Directors also approved new distribution agreements with Nuveen Investments, LLC, a wholly-owned subsidiary of Nuveen. Effective April 30, 2011, Nuveen Investments, LLC changed its name to Nuveen Securities, LLC.
First American Investment Funds, Inc. known as Nuveen Investment Funds, Inc. effective April 4, 2011 (the “Trust”), is an open-end investment company registered under the Investment Company Act of 1940, as amended. The Trust is comprised of the Nuveen Core Bond Fund (“Core Bond”), formerly known as First American Core Bond Fund, Nuveen High Income Bond Fund (“High Income Bond”), formerly known as First American High Income Bond Fund, Nuveen Inflation Protected Securities Fund (“Inflation Protected Securities”), formerly known as First American Inflation Protected Securities Fund, Nuveen Intermediate Government Bond Fund (“Intermediate Government Bond”), formerly known as First American Intermediate Government Bond Fund, Nuveen Intermediate Term Bond Fund (“Intermediate Term Bond”), formerly known as First American Intermediate Term Bond Fund, Nuveen Short Term Bond Fund (“Short Term Bond”), formerly known as First American Short Term Bond Fund and Nuveen Total Return Bond Fund (“Total Return Bond”), formerly known as First American Total Return Bond Fund (each a “Fund” and collectively, the “Funds”), among others.
Core Bond’s investment objective is to provide high current income consistent with limited risk to capital. Under normal market conditions, the Fund invests primarily (at least 80% of its net assets, plus the amount of any borrowings for investment purposes) in debt securities such as U.S. government securities (securities issued or guaranteed by the U.S. government or its agencies or instrumentalities), including zero coupon securities, residential and commercial mortgage-backed securities, asset-backed securities and corporate debt obligations, including obligations issued by special-purpose entities that are backed by corporate debt obligations. Up to 10% of the Fund’s total assets may be invested collectively in debt securities rated lower than investment grade or unrated securities of comparable quality as determined by the Sub-Adviser (securities commonly referred to as “high yield” or “junk bonds”), non-dollar denominated debt obligations of foreign corporations and governments and debt obligations issued by governmental and corporate issuers that are located in emerging market countries. The Fund may invest up to 25% of its total assets in U.S. dollar denominated debt obligations of foreign corporations and governments that are not located in emerging market countries. To generate additional income, the Fund may invest up to 25% of its total assets in dollar roll transactions.
High Income Bond’s investment objective is to provide a high level of current income. Under normal market conditions, the Fund invests primarily (at least 80% of its net assets, plus the amount of any borrowings for investment purposes) in debt securities rated lower than investment grade at the time of purchase or in unrated securities of comparable quality (securities commonly referred to as “high-yield” securities of “junk bonds”). The Fund may invest in exchange-traded funds, closed-end funds, and other investment companies (“investment companies”). The Fund may invest up to 25% of its total assets in dollar denominated debt obligations of foreign corporations and governments. Up to 20% of the Fund’s total assets may be invested in dollar denominated debt obligations issued by governmental and corporate issuers that are located in emerging market countries.
Inflation Protected Securities Fund’s investment objective is to provide total return while providing protection against inflation. Under normal market conditions, the Fund invests primarily (at least 80% of its net assets, plus the amount of any borrowings for investment purposes) in inflation protected debt securities. These securities will be issued by the U.S. and non-U.S. governments, their agencies and instrumentalities, and domestic and foreign corporations. Up to 20% of the Fund’s assets may be invested in holdings that are not inflation protected. These holdings may include domestic and foreign corporate debt obligations, securities issued or guaranteed by the U.S. government or its agencies and instrumentalities, debt obligations of foreign governments, residential and commercial mortgage-backed securities and asset-backed securities. Up to 10% of the Fund’s net assets may be invested in securities that are rated lower than investment grade at the time of purchase or that are unrated and of comparable quality (securities commonly referred to as “high-yield” securities or “junk bonds”). The Fund may invest up to 20% of its net assets in non-dollar denominated securities, and may invest without limitation in U.S. dollar denominated securities of foreign corporations and governments.
Intermediate Government Bond’s investment objective is to provide current income to the extent consistent with the preservation of capital. Under normal market conditions, the Fund invests primarily (at least 80% of its net assets, plus the amount of any borrowings for investment purposes) in U.S. government securities. The Fund may invest up to 20% of its total assets, collectively, in non-U.S. government debt obligations, including asset-backed securities, residential and commercial mortgage-backed securities, corporate debt obligations, and municipal securities. To generate additional income, the Fund may invest up to 10% of its total assets in dollar roll transactions.
Intermediate Term Bond’s investment objective is to provide current income to the extent consistent with preservation of capital. Under normal market conditions, the Fund invests primarily (at least 80% of its net assets, plus the amount of any borrowings for investment purposes) in debt securities, such as U.S. government securities (securities issued or guaranteed by the U.S. government or its agencies or instrumentalities), including zero coupon securities, residential and commercial mortgage-backed securities, asset-backed securities, and corporate debt obligations, including obligations issued by special-purpose entities that are backed by corporate debt obligations. The Fund may invest up to 25% of its total assets in U.S. dollar denominated debt obligations of foreign corporations and governments. To generate additional income, the Fund may invest up to 25% of its total assets in dollar roll transactions.
Short Term Bond’s investment objective is to provide current income while maintaining a high degree of principal stability. Under normal market conditions, the Fund invests primarily (at least 80% of its net assets, plus the amount of any borrowings for investment purposes) in debt securities, such as residential and commercial mortgage-backed securities, asset-backed securities, corporate debt obligations, including obligations issued by special-purpose entities that are backed by corporate debt obligations, U.S. government securities, which are securities issued or guaranteed by the U.S. government or its agencies or instrumentalities and municipal securities. Up to 20% of the Fund’s total assets may be invested in securities that are rated lower than investment grade or unrated securities of comparable quality as determined by the Sub-Adviser (securities commonly referred to as “high yield” or “junk bonds”). The Fund may invest up to 25% of its total assets in U.S. dollar denominated debt obligations of foreign corporations and governments that are not located in emerging market countries.
Total Return Bond’s investment objective is to provide a high level of current income consistent with prudent risk to capital. While the Fund may realize some capital appreciation, the Fund primarily seeks to achieve total return through preserving capital and generating income. Under normal market conditions, the Fund invests primarily (at least 80% of its net assets, plus the amount of any borrowings for investment purposes) in debt securities such as U.S. government securities (securities issued or guaranteed by the U.S. government or its agencies or instrumentalities), residential and commercial mortgage-backed securities, asset-backed securities, domestic and foreign corporate debt obligations, including obligations issued by special-purpose entities that are backed by corporate debt obligations, and debt obligations of foreign governments. Up to 30% of the Fund’s total assets may be invested collectively in debt securities, provided that the Fund will not invest more than 20% of its total assets in any single category such as securities rated lower than investment grade or unrated securities of comparable quality as determined by the Sub-Adviser (securities commonly referred to as “high yield” or “junk bonds”), non-dollar denominated debt obligations of foreign corporations and governments and debt obligations issued by governmental and corporate issuers that are located in emerging market countries. To generate additional income, the Fund may invest up to 25% of its total assets in dollar roll transactions.
The Funds may invest in derivative financial instruments in an attempt to manage risk, manage the effective maturity or duration of securities in the Funds’ portfolios or for speculative purposes in an effort to increase the Funds’ yield or to enhance returns. The Funds that may invest in non-dollar denominated securities may also use derivatives to gain exposure to non-dollar denominated securities markets to the extent they do not do so through direct investments.
Each Fund’s most recent prospectus provides further descriptions of each Fund’s investment objective, principal investment strategies and principal risks.
Effective January 18, 2011, Class R Shares were renamed Class R3 Shares and Class Y Shares were renamed Class I Shares, and Intermediate Term Bond began offering Class C Shares. Class B Shares of Core Bond, High Income Bond and Total Return Bond are only available upon exchange of Class B Shares from another Nuveen mutual fund for which U.S. Bancorp Fund Services, LLC (“USBFS”) serves as transfer agent or for purposes of dividend reinvestment, but Class B Shares are not available for new accounts or for additional investment into existing accounts.
Significant Accounting Policies
The following is a summary of significant accounting policies followed by the Funds in the preparation of their financial statements in accordance with U.S. generally accepted accounting principles (“U.S. GAAP”).
Investment Valuation
Prices of fixed-income securities, forward foreign currency exchange contracts and swap contracts are provided by a pricing service approved by the Funds’ Board of Directors. These securities are generally classified as Level 2 for fair value measurement purposes. When price quotes are not readily available, the pricing service establishes a security’s fair value using methods that may include consideration of the following: yields or prices of investments of comparable quality, type of issue, coupon, maturity and rating, market quotes or indications of value from security dealers, evaluations of anticipated cash flows or collateral, general market conditions and other information and analysis, including the obligor’s credit characteristics considered relevant. In pricing certain
Notes to Financial Statements (all dollars and shares are rounded to thousands (000)) (continued)
securities, particularly less liquid and lower quality securities, the pricing service may consider information about a security, its issuer, or market activity provided by the Adviser. These securities are generally classified as Level 2 or Level 3 depending on the priority of the significant inputs.
Common stocks and other equity-type securities are valued at the last sales price on the securities exchange on which such securities are primarily traded and are generally classified as Level 1 for fair value measurement purposes. Securities primarily traded on the NASDAQ National Market (“NASDAQ”) are valued, except as indicated below, at the NASDAQ Official Closing Price and are generally classified as Level 1. However, securities traded on a securities exchange or NASDAQ for which there were no transactions on a given day or securities not listed on a securities exchange or NASDAQ are valued at the quoted bid price. Investments in investment companies are valued at their respective net asset value on valuation date. These investment vehicles are generally classified as Level 1.
If significant market events occur between the time of determination of the closing price of a foreign security on an exchange and the time that the Funds’ net asset value (NAV) is determined, or if under the Funds’ procedures, the closing price of a foreign security is not deemed to be reliable, the security would be valued at fair value as determined in accordance with procedures established in good faith by the Funds’ Board of Directors. These securities are generally classified as Level 2 or Level 3.
The value of exchange-traded options are based on the mean of the closing bid and ask prices. Futures contracts are valued using the closing settlement price or, in the absence of such a price, the last traded price. Exchange-traded options and futures contracts are generally classified as Level 1. Options traded in the over-the counter market are valued using an evaluated mean price and are generally classified as Level 2.
Certain securities may not be able to be priced by the pre-established pricing methods as described above. Such securities may be valued by the Funds’ Board of Directors or its designee at fair value. These securities generally include, but are not limited to, restricted securities (securities which may not be publicly sold without registration under the Securities Act of 1933, as amended) for which a pricing service is unable to provide a market price; securities whose trading has been formally suspended; debt securities that have gone into default and for which there is no current market quotation; a security whose market price is not available from a pre-established pricing source; a security with respect to which an event has occurred that is likely to materially affect the value of the security after the market has closed but before the calculation of a Fund’s net asset value (as may be the case in non-U.S. markets on which the security is primarily traded) or make it difficult or impossible to obtain a reliable market quotation; and a security whose price, as provided by the pricing service, is not deemed to reflect the security’s fair value. As a general principle, the fair value of a security would appear to be the amount that the owner might reasonably expect to receive for it in a current sale. A variety of factors may be considered in determining the fair value of such securities, which may include consideration of the following: yields or prices of investments of comparable quality, type of issue, coupon, maturity and rating, market quotes or indications of value from security dealers, evaluations of anticipated cash flows or collateral, general market conditions and other information and analysis, including the obligor’s credit characteristics considered relevant. These securities are generally classified as Level 2 or Level 3 depending on the priority of the significant inputs. Regardless of the method employed to value a particular security, all valuations are subject to review by the Funds’ Board of Directors or its designee.
Refer to Footnote 2 – Fair Value Measurements for further details on the leveling of securities held by the Funds as of the end of the reporting period.
Investment Transactions
Investment transactions are recorded on a trade date basis. Realized gains and losses from investment transactions are determined on the specific identification method, which is the same basis used for federal income tax purposes. Investments purchased on a when-issued/ delayed delivery basis may have extended settlement periods. Any investments so purchased are subject to market fluctuation during this period. The Funds have instructed the custodian to segregate assets with a current value at least equal to the amount of the when-issued/delayed delivery purchase commitments. At June 30, 2011, Core Bond, Intermediate Government Bond and Total Return Bond had outstanding when issued/delayed delivery purchase commitments of $85,144, $4,362 and $100,077, respectively. There were no such outstanding purchase commitments in any of the other Funds.
Investment Income
Interest income, which reflects the amortization of premiums and includes accretion of discounts for financial reporting purposes, is recorded on an accrual basis. Dividend income is recorded on the ex-dividend date or, for foreign securities, when information is available. Interest income also reflects pay down gains and losses, if any.
Income Taxes
Each Fund is a separate taxpayer for federal income tax purposes. Each Fund intends to distribute substantially all of its net investment income and net capital gains to shareholders and to otherwise comply with the requirements of Subchapter M of the Internal Revenue Code applicable to regulated investment companies. Therefore, no federal income tax provision is required.
For all open tax years and all major taxing jurisdictions, management of the Funds has concluded that there are no significant uncertain tax positions that would require recognition in the financial statements. Open tax years are those that are open for examination by taxing authorities (i.e., generally the last four tax year ends and the interim tax period since then). Furthermore, management of the Funds is also not aware of any tax positions for which it is reasonably possible that the total amounts of unrecognized tax benefits will significantly change in the next twelve months.
Dividends and Distributions to Shareholders
The Funds declare dividends from their net investment income daily and pay shareholders monthly. Fund shares begin to accrue dividends on the business day after the day when the monies used to purchase Fund shares are collected by the Funds’ transfer agent.
Net realized capital gains from investment transactions, if any, are declared and distributed to shareholders at least annually. Furthermore, capital gains are distributed only to the extent they exceed available capital loss carry forwards.
Distributions to shareholders are recorded on the ex-dividend date. The amount and timing of distributions are determined in accordance with federal income tax regulations, which may differ from U.S. GAAP.
Dollar Roll Transactions
A dollar roll (“dollar rolls”) is a transaction in which a Fund purchases or sells mortgage-backed securities (“MBS”) for delivery in the future and simultaneously contracts to sell or repurchase substantially similar (same type, coupon, and maturity) MBS on a different specified future date. Dollar rolls are identified in the Fund’s Portfolio of Investments as “MDR”, when applicable. During the roll period, the Fund foregoes principal and interest paid on the MBS. The Fund is compensated by fee income or the difference between the current sales price and the lower forward price for the future purchase. Such compensation is amortized over the life of the dollar rolls, which is recognized as a component of “Dividend and interest income from unaffiliated investments” on the Statement of Operations. Dollar rolls are valued daily. Core Bond and Total Return Bond entered into dollar roll transactions during the fiscal year ended June 30, 2011.
Dollar rolls involve the risk that the market value of the MBS the Fund is obligated to repurchase under an agreement may decline below the repurchase price. These transactions also involve some risk to the Fund if the other party should default on its obligation and the Fund is delayed or prevented from completing the transaction. In the event that the buyer of securities under a dollar roll files for bankruptcy or becomes insolvent, the Fund’s use of proceeds of the dollar roll may be restricted pending a determination by the other party, or its trustee or receiver, whether to enforce the Fund’s obligation to repurchase the securities.
Foreign Currency Transactions
To the extent a Fund invests in securities and/or contracts that are denominated in a currency other than U.S. dollars, the Fund will be subject to currency risk, which is the risk that an increase in the U.S. dollar relative to the foreign currency will reduce returns or portfolio value. Generally, when the U.S. dollar rises in value against a foreign currency, the Fund’s investments denominated in that currency will lose value because its currency is worth fewer U.S. dollars; the opposite effect occurs if the U.S. dollar falls in relative value. Investments and other assets and liabilities denominated in foreign currencies are converted into U.S. dollars on a spot (i.e. cash) basis at the spot rate prevailing in the foreign currency exchange market at the time of valuation. Purchases and sales of investments and income denominated in foreign currencies are translated into U.S. dollars on the respective dates of such transactions.
The books and records of the Funds are maintained in U.S. dollars. Foreign currencies, investments and other assets and liabilities are translated into U.S. dollars at 4:00 p.m. Eastern time. Investments, income and expenses are translated on the respective dates of such transactions. Net realized foreign currency gains and losses resulting from changes in exchange rates include foreign currency gains and losses between trade date and settlement date of the transactions, foreign currency transactions, and the difference between the amounts of interest and dividends recorded on the books of the Funds and the amounts actually received.
The realized gains and losses resulting from changes in foreign currency exchange rates and changes in foreign exchange rates associated with other assets and liabilities on investments, forward foreign currency exchange contracts and swaps are recognized as a component of “Net realized gain (loss) from investments and foreign currency” on the Statement of Operations, when applicable.
The unrealized gains and losses resulting from changes in foreign currency exchange rates and changes in foreign exchange rates associated with other assets and liabilities on investments are recognized as a component of “Change in net unrealized appreciation (depreciation) of investments and foreign currency” on the Statement of Operations, when applicable. The unrealized gains and losses resulting from changes in foreign exchange rates associated with forward foreign currency exchange contracts and swaps are recognized as a component of “Change in net unrealized appreciation (deprecation) of forward foreign currency exchange contracts, futures and swaps, respectively” on the Statement of Operations, when applicable.
Forward Foreign Currency Exchange Contracts
Each Fund that invests in non-dollar denominated securities is subject to foreign currency exchange rate risk in the normal course of pursuing its investment objectives and is authorized to enter into forward foreign currency exchange contracts in an attempt to manage such risk under two circumstances: (i) when a Fund enters into a contract for the purchase or sale of a security denominated in a foreign currency to “lock in” the U.S. exchange rate of the transaction, with such period being a short-dated contract covering the period between transaction date and settlement date; or (ii) when the Adviser, believes that the currency of a particular foreign country may experience a substantial movement against the U.S. dollar or against another foreign currency. Forward foreign currency exchange contracts are valued daily at the forward rate and are recognized as a component of “Unrealized appreciation or depreciation on forward foreign currency exchange contracts” on the Statement of Assets and Liabilities. The change in value of the contracts during the reporting period is recognized as a component of “Change in net unrealized appreciation (depreciation) of forward foreign currency exchange contracts” on the Statement of Operations. When the contract is closed or offset with the same counterparty, the Fund recognizes the difference between the value of the contract at the time it was entered and the value at the time it was closed or offset as a component of “Net realized gain (loss) from forward foreign currency exchange contracts” on the Statement of Operations.
Notes to Financial Statements (all dollars and shares are rounded to thousands (000)) (continued)
Forward foreign currency exchange contracts will generally not be entered into for terms greater than three months, but may have maturities of up to six months or more. The use of forward foreign currency exchange contracts does not eliminate fluctuations in the underlying prices of a Fund’s investment securities; however, it does establish a rate of exchange that can be achieved in the future. The use of forward foreign currency exchange contracts involves the risk that anticipated currency movements will not be accurately predicted. A forward foreign currency exchange contract would limit the risk of loss due to a decline in the value of a particular currency; however, it also would limit any potential gain that might result should the value of the currency increase instead of decrease. These contracts may involve market risk in excess of the unrealized gain or loss reflected on the Statement of Assets and Liabilities.
During the fiscal year ended June 30, 2011, Inflation Protected Securities, Short Term Bond and Total Return Bond invested in forward foreign currency exchange contracts to manage foreign currency exposure. To reduce unwanted currency exposure from the Fund’s portfolio of investments, the Fund acquired a short foreign currency forward.
The average number of forward foreign currency exchange contracts outstanding during the fiscal year ended June 30, 2011, was as follows:
| | | | | | | | | | | | |
| | | Inflation
Protected
Securities | | | Short Term
Bond | | | Total Return
Bond | |
Average number of forward foreign currency exchange contracts outstanding* | | | — | ** | | | — | ** | | | 3 | |
| * | The average number of outstanding contracts is calculated based on the outstanding contracts at the beginning of the fiscal year and at the end of each fiscal quarter within the current fiscal year. |
Refer to Footnote 3 – Derivative Instruments and Hedging Activities for further details on forward foreign currency exchange contract activity.
Futures Contracts
Each Fund is subject to interest rate risk in the normal course of pursuing its investment objectives and is authorized to invest in futures contracts in attempt to manage such risk. Upon entering into a futures contract, a Fund is required to deposit with the broker an amount of cash or liquid securities equal to a specified percentage of the contract amount. This is known as the “initial margin.” Cash held by the broker to cover initial margin requirements on open futures contracts, if any, is recognized as “Deposits with brokers for open futures contracts” on the Statement of Assets and Liabilities. Subsequent payments (“variation margin”) are made or received by a Fund each day, depending on the daily fluctuation of the value of the contract. Variation margin is recognized as a receivable or payable for “Variation margin on futures contracts” on the Statement of Assets and Liabilities, when applicable.
During the period the futures contract is open, changes in the value of the contract are recognized as an unrealized gain or loss by “marking-to-market” on a daily basis to reflect the changes in market value of the contract, which is recognized as “Change in net unrealized appreciation (depreciation) of futures contracts” on the Statement of Operations. When the contract is closed or expired, the Fund records a realized gain or loss equal to the difference between the value of the contract on the closing date and value of the contract when originally entered into, which is recognized as “Net realized gain (loss) from futures contracts” on the Statement of Operations.
Risks of investments in futures contracts include the possible adverse movement in the price of the securities or indices underlying the contracts, the possibility that there may not be a liquid secondary market for the contracts and/or that a change in the value of the contract may not correlate with a change in the value of the underlying securities or indices.
During the fiscal year ended June 30, 2011, all the Funds used long and short U.S. Treasury note and bond futures to manage portfolio duration and yield curve exposure. To increase the duration of the portfolio, a long U.S. Treasury note or bond futures position would be acquired.
The average number of futures contracts outstanding during the fiscal year ended June 30, 2011, was as follows:
| | | | | | | | | | | | | | | | |
| | | Core Bond | | | High Income
Bond | | | Inflation
Protected
Securities | | | Intermediate
Government
Bond | |
Average number of futures contracts outstanding* | | | 1,209 | | | | 64 | | | | 122 | | | | 165 | |
| | | | | | | | | | | | |
| | | Intermediate
Term Bond | | | Short Term
Bond | | | Total Return
Bond | |
Average number of futures contracts outstanding* | | | 698 | | | | 997 | | | | 1,083 | |
| * | The average number of outstanding contracts is calculated based on the outstanding contracts at the beginning of the fiscal year and at the end of each fiscal quarter within the current fiscal year. |
Refer to Footnote 3 – Derivative Instruments and Hedging Activities for further details on futures contract activity.
Options Transactions
Each Fund is subject to foreign currency risk and interest rate risk in the normal course of pursuing its investment objectives and with the exception of Intermediate Government Bond is authorized to purchase and write (sell) call and put options on securities, futures, swaps (“swaptions”) or currencies in an attempt to manage such risk. The purchase of options and/or swaptions involves the risk of loss of all or a part of the cash paid for the options (the premium). The market risk associated with purchasing options and/or swaptions is limited to the premium paid. The counterparty credit risk of purchasing options and/or swaptions, however, needs also to take into account the current value of the option, as this is the performance expected from the counterparty. When a Fund purchases an option and/or swaption, an amount equal to the premium paid (the premium plus commission) is recognized as a component of “Options and/or Swaptions purchased, at value” on the Statement of Assets and Liabilities. When a Fund writes an option and/ or swaption, an amount equal to the net premium received (the premium less commission) is recognized as a component of “Options and/or Swaptions written, at value” on the Statement of Assets and Liabilities and is subsequently adjusted to reflect the current value of the written option and/or swaption until the option and/or swaption is exercised or expires or the Fund enters into a closing purchase transaction. The changes in the value of options and/or swaptions purchased during the fiscal period are recognized as a component of “Change in net unrealized appreciation (depreciation) of Options and/or Swaptions purchased” on the Statement of Operations. The changes in the value of options and/or swaptions written during the fiscal period are recognized as a component of “Change in net unrealized appreciation (depreciation) of Options and/or Swaptions written” on the Statement of Operations. When an option and/or swaption is exercised or expires or the Fund enters into a closing purchase transaction, the difference between the net premium received and any amount paid at expiration or on executing a closing purchase transaction, including commission, is recognized as a component of “Net realized gain (loss) from Options and/or Swaptions purchased and/or written” on the Statement of Operations. The Fund, as a writer of an option and/or swaption has no control over whether the underlying instrument may be sold (called) or purchased (put) and as a result bears the risk of an unfavorable change in the market value of the instrument underlying the written option and/or swaption. There is also the risk the Fund may not be able to enter into a closing transaction because of an illiquid market.
During the fiscal year ended June 30, 2011, Total Return Bond invested in options contracts to express views on volatility; selling out-of-the-money calls or puts when implied volatility is high.
The average number of options contracts outstanding during the fiscal year ended June 30, 2011, was as follows:
| | | | |
| | | Total Return
Bond | |
Average number of options contracts outstanding* | | | 208 | ** |
| * | The average number of outstanding contracts is calculated based on the outstanding contracts at the beginning of the fiscal year and at the end of each fiscal quarter within the current fiscal year. |
| ** | Includes both calls and puts. |
Refer to Footnote 3 – Derivative Instruments and Hedging Activities and Footnote 5 – Investment Transactions for further details on options contract activity.
Swap Contracts
Each Fund with the exception of Intermediate Government Bond is authorized to enter into swap contracts consistent with their investment objectives and policies to reduce, increase or otherwise alter its risk profile or to alter its portfolio characteristics (i.e. duration, yield curve positioning and credit quality).
Interest Rate Swaps
Each Fund is subject to interest rate risk in the normal course of pursuing its investment objectives and policies in an attempt to obtain a desired return at a lower cost than if the Fund had invested directly in the asset that yielded the desired return. In connection with these contracts, securities in the Funds’ portfolios of investments may be identified as collateral in accordance with the terms of the respective swap contract. Interest rate swap contracts involve the exchange by a Fund with another party of their respective commitments to pay or receive interest (i.e., an exchange of floating rate payments for fixed rate payments with respect to a specified notional amount of principal). Interest rate swap contracts are valued daily. The Funds accrue daily the periodic payments expected to be paid and received on each interest rate swap contract and recognize the daily change in the market value of the Funds’ contractual rights and obligations under the contracts. The net amount recorded on these transactions for each counterparty is recognized on the Statement of Assets and Liabilities as a component of “Unrealized appreciation or depreciation on interest rate swaps” with the change during the fiscal period recognized on the Statement of Operations as a component of “Change in net unrealized appreciation (depreciation) of swaps” on the Statement of Operations. Income received or paid by the Funds is recognized as a component of “Net realized gain (loss) from swaps” on the Statement of Operations, in addition to the net realized gains or losses recognized upon the termination of an interest rate swap contract and are equal to the difference between the Funds’ basis in the interest rate swap and the proceeds from (or cost of) the closing transaction. The amount of the payment obligation is based on the notional amount of the interest rate swap contract. Payments received or made at the beginning of the measurement period are recognized as a component of “Interest rate swap premiums paid and/or received” on the Statement of Assets and Liabilities, when applicable. For tax purposes, periodic payments are treated as ordinary income or expense.
Notes to Financial Statements (all dollars and shares are rounded to thousands (000)) (continued)
During the fiscal year ended June 30, 2011, Core Bond, Inflation Protected Securities, Intermediate Term Bond, Short Term Bond and Total Return Bond invested in interest rate swap contracts to hedge against changes in rate spreads by taking a short interest rate swap position. The average number of interest rate swap contracts outstanding during the fiscal year ended June 30, 2011, were as follows:
| | | | | | | | | | | | | | | | | | | | |
| | | Core Bond | | | Inflation
Protected
Securities | | | Intermediate
Term Bond | | | Short Term
Bond | | | Total Return
Bond | |
Average number of interest rate swap contracts outstanding* | | | 6 | | | | 6 | | | | 6 | | | | 6 | | | | 1 | |
| * | The average number of outstanding contracts is calculated based on the outstanding contracts at the beginning of the fiscal year and at the end of each fiscal quarter within the current fiscal year. |
Credit Default Swaps
Each Fund is subject to credit risk in the normal course of pursuing its investment objectives. A Fund may enter into a credit default swap contract to seek to maintain a total return on a particular investment or portion of its portfolio, or to take an active long or short position with respect to the likelihood of a particular issuer’s default. Credit default swap contracts involve one party making a stream of payments to another party in exchange for the right to receive a specified return if/when there is a credit event by a third party. Generally, a credit event means bankruptcy, failure to pay, or restructuring. The specific credit events applicable for each credit default swap are stated in the terms of the particular swap agreement. As a purchaser of a credit default swap contract, the Fund pays to the counterparty a periodic interest fee based on the notional amount of the credit default swap. This interest fee is accrued daily and recognized with the daily change in the market value of the contract as a component of “Unrealized appreciation or depreciation on credit default swaps” on the Statement of Assets and Liabilities and is recorded as a realized loss upon payment. Upon occurrence of a specific credit event with respect to the underlying referenced entity, the Fund is obligated to deliver that security, or an equivalent amount of cash, to the counterparty in exchange for receipt of the notional amount from the counterparty. The difference between the value of the security delivered and the notional amount received is recorded as a realized gain. Payments received or made at the beginning of the measurement period are recognized as a component of “Credit default swap premiums paid and/or received” on the Statement of Assets and Liabilities, when applicable. As a seller of a credit default swap contract, the Fund generally receives from the counterparty a periodic interest fee based on the notional amount of the credit default swap. This interest fee is accrued daily as a component of unrealized appreciation or depreciation and is recorded as a realized gain upon payment. Upon occurrence of a specific credit event with respect to the underlying referenced entity, the Fund will either receive that security, or an equivalent amount of cash, from the counterparty in exchange for payment of the notional amount to the counterparty, or pay a net settlement amount of the credit default swap contract less the recovery value of the referenced obligation or underlying securities comprising the referenced index. The difference between the value of the security received and the notional amount paid is recorded as a realized loss. Changes in the value of a credit default swap during the fiscal period are recognized as a component of “Change in net unrealized appreciation (depreciation) of swaps”, and realized gains and losses are recognized as a component of “Net realized gain (loss) from swaps” on the Statement of Operations. The maximum potential amount of future payments the Fund could incur as a seller of protection in a credit default swap contract is limited to the notional amount of the contract. The maximum potential amount would be offset by the recovery value, if any, of the respective referenced entity.
During the fiscal year ended June 30, 2011, Core Bond, Intermediate Term Bond, Short Term Bond and Total Return Bond invested in credit default swap index positions to express a view on credit as part of an overall portfolio sector management strategy. To increase credit exposure to the high yield bond segment of the market, a long CDX High Yield Index swap would be acquired.
The average notional amount of credit default swap contracts outstanding during the fiscal year ended June 30, 2011, was as follows:
| | | | | | | | |
| | | Short Term
Bond | | | Total Return
Bond | |
Average notional amount of credit default swap contracts outstanding* | | $ | 15,720 | | | $ | 23,780 | |
| * | The average notional amount is calculated based on the outstanding notional at the beginning of the fiscal year and at the end of each fiscal quarter within the current fiscal year. |
Refer to Footnote 3 – Derivative Instruments and Hedging Activities for further details on swap contract activity.
Market and Counterparty Credit Risk
In the normal course of business each Fund may invest in financial instruments and enter into financial transactions where risk of potential loss exists due to changes in the market (market risk) or failure of the other party to the transaction to perform (counterparty credit risk). The potential loss could exceed the value of the financial assets recorded on the financial statements. Financial assets, which potentially expose each Fund to counterparty credit risk, consist principally of cash due from counterparties on forward, option and swap transactions, when applicable. The extent of each Fund’s exposure to counterparty credit risk in respect to these financial assets approximates their carrying value as recorded on the Statement of Assets and Liabilities. Futures contracts, when applicable, expose a Fund to minimal counterparty credit risk as they are exchange traded and the exchange’s clearinghouse, which is counterparty to all exchange traded futures, guarantees the futures contracts against default.
Each Fund helps manage counterparty credit risk by entering into agreements only with counterparties the Adviser believes have the financial resources to honor their obligations and by having the Adviser monitor the financial stability of the counterparties. Additionally, counterparties may be required to pledge collateral daily (based on the daily valuation of the financial asset) on behalf of each Fund with a value approximately equal to the amount of any unrealized gain above a predetermined threshold. Reciprocally, when each Fund has an unrealized loss, the Funds have instructed the custodian to pledge assets of the Funds as collateral with a value approximately equal to the amount of the unrealized loss above a pre-determined threshold. Collateral pledges are monitored and subsequently adjusted if and when the valuations fluctuate, either up or down, by at least the pre-determined threshold amount.
Inflation-Indexed Bonds
Inflation-indexed bonds are fixed income securities whose principal value is periodically adjusted to the rate of inflation. The interest rate on these bonds is generally fixed at issuance at a rate lower than typical bonds. Over the life of an inflation-indexed bond however, interest will be paid based on a principal value which is adjusted for inflation. Any increase in the principal amount of an inflation-indexed bond will be recognized as a component of “Dividend and interest income from unaffiliated investments” on the Statement of Operations, even though investors do not receive their principal until maturity.
Zero Coupon Securities
Each Fund is authorized to invest in zero coupon securities. A zero coupon security does not pay a regular interest coupon to its holders during the life of the security. Income to the holder of the security comes from accretion of the difference between the original purchase price of the security at issuance and the par value of the security at maturity and is effectively paid at maturity. The market prices of zero coupon securities generally are more volatile than the market prices of securities that pay interest periodically.
Multiclass Operations and Allocations
Income and expenses of the Funds that are not directly attributable to a specific class of shares are prorated among the classes based on the relative net assets of each class. Expenses directly attributable to a class of shares, which presently only include 12b-1 distribution and shareholder service fees, are recorded to the specific class.
Income, realized and unrealized capital gains and losses of the Funds are prorated among the classes based on the relative net assets of each class.
Interfund Lending Program
During the period July 1, 2010 through December 31, 2010, pursuant to an exemptive order issued by the Securities and Exchange Commission (“SEC”), the Funds, along with other registered investment companies in the First American Funds family, were allowed to participate in an interfund lending program. This program provided an alternative credit facility allowing the Funds to borrow from, or lend money to, other participating funds. The Funds did not have any interfund lending transactions during the period July 1, 2010 through December 31, 2010. The exemptive order terminated with respect to the Funds on December 31, 2010, in connection with the Sale.
Securities Lending
In order to generate additional income, each Fund may lend securities representing up to one-third of the value of its total assets (which includes collateral for securities on loan) to broker-dealers, banks, or other institutional borrowers of securities. Each Fund’s policy is to receive collateral from the borrower in the form of cash, U.S. government securities, or other high-grade debt obligations equal to at least 102% of the value of securities loaned. If the value of the securities on loan increases [such that the level of collateralization falls below 100%], additional collateral is received from the borrower, which is recognized as “Due from broker” on the Statement of Assets and Liabilities. As with other extensions of credit, there may be risks of delay in recovery of the securities or even loss of rights in the collateral should the borrower of the security fail financially.
U.S. Bank National Association (“U.S. Bank”) serves as the securities lending agent for the Funds in transactions involving the lending of portfolio securities on behalf of the Funds. U.S. Bank acts as the securities lending agent pursuant to, and subject to compliance with conditions contained in, an exemptive order issued by the SEC.
During the fiscal year ended June 30, 2011, U.S. Bank, as the securities lending agent, received fees that equaled up to 25% of each Fund’s net income from securities lending transactions through December 31, 2010, and 20% of such net income thereafter. U.S. Bank paid half of such fees to USBAM for certain securities lending services provided by USBAM. Collateral for securities on loan was invested in a money market fund administered by USBAM and USBAM received an administration fee equal to .02% of each Fund’s average daily net assets invested in the money market fund.
Income from securities lending, net of fees paid to U.S. Bank, is recognized on the Statement of Operations as “Securities lending income.” Securities lending fees paid to U.S. Bank by each Fund during the fiscal year ended June 30, 2011, were as follows:
| | | | |
| Fund | | Securities
Lending
Fees | |
Core Bond | | $ | 37 | |
High Income Bond | | | 112 | |
Inflation Protected Securities | | | 15 | |
Intermediate Government Bond | | | 4 | |
Intermediate Term Bond | | | 24 | |
Short Term Bond | | | 19 | |
Total Return Bond | | | 20 | |
Notes to Financial Statements (all dollars and shares are rounded to thousands (000)) (continued)
Indemnifications
Under the Trust’s organizational documents, its officers and directors are indemnified against certain liabilities arising out of the performance of their duties to the Trust. In addition, in the normal course of business, the Trust enters into contracts that provide general indemnifications to other parties. The Trust’s maximum exposure under these arrangements is unknown as this would involve future claims that may be made against the Trust that have not yet occurred. However, the Trust has not had prior claims or losses pursuant to these contracts and expects the risk of loss to be remote.
Use of Estimates
The preparation of financial statements in conformity with U.S. GAAP requires management to make estimates and assumptions that affect the reported amounts of assets and liabilities at the date of the financial statements and the reported amounts of increases and decreases in net assets from operations during the reporting period. Actual results may differ from those estimates.
2. Fair Value Measurements
Fair value is defined as the price that the Funds would receive upon selling an investment or transferring a liability in an orderly transaction to an independent buyer in the principal or most advantageous market for the investment. A three-tier hierarchy is used to maximize the use of observable market data and minimize the use of unobservable inputs and to establish classification of fair value measurements for disclosure purposes. Observable inputs reflect the assumptions market participants would use in pricing the asset or liability. Observable inputs are based on market data obtained from sources independent of the reporting entity. Unobservable inputs reflect the reporting entity’s own assumptions about the assumptions market participants would use in pricing the asset or liability. Unobservable inputs are based on the best information available in the circumstances. The three-tier hierarchy of inputs is summarized in the three broad levels listed below:
| | |
| Level 1 – | | Quoted prices in active markets for identical securities. |
| Level 2 – | | Other significant observable inputs (including quoted prices for similar securities, interest rates, prepayment speeds, credit risk, etc.). |
| Level 3 – | | Significant unobservable inputs (including management’s assumptions in determining the fair value of investments). |
The inputs or methodologies used for valuing securities are not an indication of the risk associated with investing in those securities. The following is a summary of each Fund’s fair value measurements as of June 30, 2011:
| | | | | | | | | | | | | | | | |
| Core Bond | | Level 1 | | | Level 2 | | | Level 3 | | | Total | |
Investments: | | | | | | | | | | | | | | | | |
Corporate Bonds | | $ | — | | | $ | 374,268 | | | $ | — | | | $ | 374,268 | |
U.S. Government Agency Mortgage-Backed Securities | | | — | | | | 320,382 | | | | — | | | | 320,382 | |
Commercial Mortgage-Backed Securities | | | — | | | | 131,557 | | | | — | | | | 131,557 | |
Asset-Backed Securities | | | — | | | | 92,649 | | | | — | | | | 92,649 | |
Collateralized Mortgage Obligation – U.S. Government Agency Mortgage-Backed Securities | | | — | | | | 45,305 | | | | — | | | | 45,305 | |
Collateralized Mortgage Obligation – Private Mortgage-Backed Securities | | | — | | | | 46,444 | | | | — | | | | 46,444 | |
U.S. Government & Agency Securities | | | — | | | | 27,338 | | | | — | | | | 27,338 | |
Municipal Bonds | | | — | | | | 5,949 | | | | — | | | | 5,949 | |
Preferred Stock | | | 469 | | | | — | | | | — | | | | 469 | |
Money Market Funds* | | | 125,243 | | | | — | | | | — | | | | 125,243 | |
Short-Term Investments | | | 62,579 | | | | 4,825 | | | | — | | | | 67,404 | |
Derivatives: | | | | | | | | | | | | | | | | |
Futures Contracts** | | | 889 | | | | — | | | | — | | | | 889 | |
Interest Rate Swaps** | | | — | | | | (2,476 | ) | | | — | | | | (2,476 | ) |
Total | | $ | 189,180 | | | $ | 1,046,241 | | | $ | — | | | $ | 1,235,421 | |
| | | | |
| High Income Bond | | Level 1 | | | Level 2 | | | Level 3 | | | Total | |
Investments: | | | | | | | | | | | | | | | | |
High Yield Corporate Bonds | | $ | — | | | $ | 436,489 | | | $ | 3 | | | $ | 436,492 | |
Preferred Stocks | | | 25,743 | | | | 1,880 | | | | — | *** | | | 27,623 | |
Common Stocks | | | 7,345 | | | | 33 | | | | — | | | | 7,378 | |
Investment Grade Corporate Bonds | | | — | | | | 6,139 | | | | — | | | | 6,139 | |
Convertible Securities | | | 2,852 | | | | 3,084 | | | | — | | | | 5,936 | |
Closed-End Funds | | | 4,553 | | | | — | | | | — | | | | 4,553 | |
Exchange-Traded Funds | | | 3,174 | | | | — | | | | — | | | | 3,174 | |
Asset-Backed Securities | | | — | | | | 2,294 | | | | — | | | | 2,294 | |
Warrants | | | 2 | | | | — | | | | — | | | | 2 | |
Money Market Funds* | | | 145,527 | | | | — | | | | — | | | | 145,527 | |
Short-Term Investments | | | 7,485 | | | | 5 | | | | — | | | | 7,490 | |
Total | | $ | 196,681 | | | $ | 449,924 | | | $ | 3 | | | $ | 646,608 | |
| * | Represents the Fund’s investments purchased with proceeds from securities lending. |
| ** | Represents net unrealized appreciation (depreciation) as reported in the Fund’s Portfolio of Investments. |
| *** | Rounds to less than $1,000. |
| | | | | | | | | | | | | | | | |
| Inflation Protected Securities | | Level 1 | | | Level 2 | | | Level 3 | | | Total | |
Investments: | | | | | | | | | | | | | | | | |
U.S. Government & Agency Securities | | $ | — | | | $ | 238,273 | | | $ | — | | | $ | 238,273 | |
Commercial Mortgage-Backed Securities | | | — | | | | 19,671 | | | | — | | | | 19,671 | |
Corporate Bonds | | | — | | | | 10,627 | | | | — | | | | 10,627 | |
Municipal Bonds | | | — | | | | 1,166 | | | | — | | | | 1,166 | |
Preferred Stocks | | | 1,015 | | | | — | | | | — | | | | 1,015 | |
Collateralized Mortgage Obligation – Private Mortgage-Backed Securities | | | — | | | | 839 | | | | — | | | | 839 | |
Convertible Securities | | | 198 | | | | — | | | | — | | | | 198 | |
Closed-End Funds | | | 131 | | | | — | | | | — | | | | 131 | |
Money Market Funds* | | | 128,123 | | | | — | | | | — | | | | 128,123 | |
Short-Term Investments | | | 3,338 | | | | 450 | | | | — | | | | 3,788 | |
Derivatives: | | | | | | | | | | | | | | | | |
Futures Contracts** | | | 76 | | | | — | | | | — | | | | 76 | |
Interest Rate Swaps** | | | — | | | | (304 | ) | | | — | | | | (304 | ) |
Total | | $ | 132,881 | | | $ | 270,722 | | | $ | — | | | $ | 403,603 | |
| | | | |
| Intermediate Government Bond | | Level 1 | | | Level 2 | | | Level 3 | | | Total | |
Investments: | | | | | | | | | | | | | | | | |
U.S. Government & Agency Securities | | $ | — | | | $ | 52,142 | | | $ | — | | | $ | 52,142 | |
U.S. Government Agency Mortgage-Backed Securities | | | — | | | | 27,914 | | | | — | | | | 27,914 | |
Collateralized Mortgage Obligation – U.S. Government Agency Mortgage-Backed Securities | | | — | | | | 9,520 | | | | — | | | | 9,520 | |
Asset-Backed Securities | | | — | | | | 6,274 | | | | — | | | | 6,274 | |
Collateralized Mortgage Obligation – Private Mortgage-Backed Securities | | | — | | | | 6,057 | | | | — | | | | 6,057 | |
Commercial Mortgage-Backed Securities | | | — | | | | 5,232 | | | | — | | | | 5,232 | |
Corporate Bonds | | | — | | | | 928 | | | | — | | | | 928 | |
Money Market Funds* | | | 28,536 | | | | — | | | | — | | | | 28,536 | |
Short-Term Investments | | | 10,771 | | | | 160 | | | | — | | | | 10,931 | |
Derivatives: | | | | | | | | | | | | | | | | |
Futures Contracts** | | | (10 | ) | | | — | | | | — | | | | (10 | ) |
Total | | $ | 39,297 | | | $ | 108,227 | | | $ | — | | | $ | 147,524 | |
| | | | |
| Intermediate Term Bond | | Level 1 | | | Level 2 | | | Level 3 | | | Total | |
Investments: | | | | | | | | | | | | | | | | |
Corporate Bonds | | $ | — | | | $ | 302,977 | | | $ | — | | | $ | 302,977 | |
Asset-Backed Securities | | | — | | | | 99,728 | | | | — | | | | 99,728 | |
Commercial Mortgage-Backed Securities | | | — | | | | 75,885 | | | | — | | | | 75,885 | |
U.S. Government & Agency Securities | | | — | | | | 46,854 | | | | — | | | | 46,854 | |
Collateralized Mortgage Obligation – U.S. Government Agency Mortgage-Backed Securities | | | — | | | | 45,335 | | | | — | | | | 45,335 | |
U.S. Government Agency Mortgage-Backed Securities | | | — | | | | 30,863 | | | | — | | | | 30,863 | |
Collateralized Mortgage Obligation – Private Mortgage-Backed Securities | | | — | | | | 36,064 | | | | — | | | | 36,064 | |
Municipal Bonds | | | — | | | | 10,383 | | | | — | | | | 10,383 | |
Money Market Funds* | | | 118,843 | | | | — | | | | — | | | | 118,843 | |
Short-Term Investments | | | 36,913 | | | | 1,740 | | | | — | | | | 38,653 | |
Derivatives: | | | | | | | | | | | | | | | | |
Futures Contracts** | | | 95 | | | | — | | | | — | | | | 95 | |
Interest Rate Swaps** | | | — | | | | (1,458 | ) | | | — | | | | (1,458 | ) |
Total | | $ | 155,851 | | | $ | 648,371 | | | $ | — | | | $ | 804,222 | |
| | | | |
| Short Term Bond | | Level 1 | | | Level 2 | | | Level 3 | | | Total | |
Investments: | | | | | | | | | | | | | | | | |
Corporate Bonds | | $ | — | | | $ | 374,546 | | | $ | — | | | $ | 374,546 | |
Asset-Backed Securities | | | — | | | | 148,319 | | | | — | | | | 148,319 | |
Commercial Mortgage-Backed Securities | | | — | | | | 101,632 | | | | — | | | | 101,632 | |
U.S. Government Agency Mortgage-Backed Securities | | | — | | | | 62,099 | | | | — | | | | 62,099 | |
Collateralized Mortgage Obligation – U.S. Government Agency Mortgage-Backed Securities | | | — | | | | 41,486 | | | | — | | | | 41,486 | |
U.S. Government & Agency Securities | | | — | | | | 21,160 | | | | — | | | | 21,160 | |
Collateralized Mortgage Obligation – Private Mortgage-Backed Securities | | | — | | | | 43,189 | | | | — | | | | 43,189 | |
Municipal Bonds | | | — | | | | 16,408 | | | | — | | | | 16,408 | |
Money Market Funds* | | | 76,375 | | | | — | | | | — | | | | 76,375 | |
Short-Term Investments | | | 42,036 | | | | 2,330 | | | | — | | | | 44,366 | |
Derivatives: | | | | | | | | | | | | | | | | |
Forward Foreign Currency Exchange Contracts* | | | — | | | | (93 | ) | | | — | | | | (93 | ) |
Credit Default Swaps** | | | — | | | | 453 | | | | — | | | | 453 | |
Futures Contracts** | | | (626 | ) | | | — | | | | — | | | | (626 | ) |
Interest Rate Swaps** | | | — | | | | (1,037 | ) | | | — | | | | (1,037 | ) |
Total | | $ | 117,785 | | | $ | 810,492 | | | $ | — | | | $ | 928,277 | |
| * | Represents the Fund’s investments purchased with proceeds from securities lending. |
| ** | Represents net unrealized appreciation (depreciation) as reported in the Fund’s Portfolio of Investments. |
Notes to Financial Statements (all dollars and shares are rounded to thousands (000)) (continued)
| | | | | | | | | | | | | | | | |
| Total Return Bond | | Level 1 | | | Level 2 | | | Level 3 | | | Total | |
Investments: | | | | | | | | | | | | | | | | |
Corporate Bonds | | $ | — | | | $ | 324,337 | | | $ | — | | | $ | 324,337 | |
U.S. Government Agency Mortgage-Backed Securities | | | — | | | | 185,877 | | | | — | | | | 185,877 | |
Commercial Mortgage-Backed Securities | | | — | | | | 69,032 | | | | — | | | | 69,032 | |
Asset-Backed Securities | | | — | | | | 37,555 | | | | — | | | | 37,555 | |
Collateralized Mortgage Obligation – Private Mortgage-Backed Securities | | | — | | | | 21,904 | | | | — | | | | 21,904 | |
U.S. Government & Agency Securities | | | — | | | | 7,276 | | | | — | | | | 7,276 | |
Municipal Bonds | | | — | | | | 4,778 | | | | — | | | | 4,778 | |
Preferred Stocks | | | 5,213 | | | | — | | | | — | | | | 5,213 | |
Closed-End Funds | | | 1,653 | | | | — | | | | — | | | | 1,653 | |
Convertible Securities | | | 721 | | | | — | | | | — | | | | 721 | |
Money Market Funds | | | 62,479 | | | | — | | | | — | | | | 62,479 | |
Short-Term Investments | | | 91,965 | | | | 5,220 | | | | — | | | | 97,185 | |
Derivatives: | | | | | | | | | | | | | | | | |
Call Options Written | | | (230 | ) | | | — | | | | — | | | | (230 | ) |
Put Options Written | | | (67 | ) | | | — | | | | — | | | | (67 | ) |
Forward Foreign Currency Exchange Contracts* | | | — | | | | 14 | | | | — | | | | 14 | |
Interest Rate Swaps* | | | — | | | | (1,219 | ) | | | — | | | | (1,219 | ) |
Credit Default Swaps* | | | — | | | | 184 | | | | — | | | | 184 | |
Futures Contracts* | | | 198 | | | | — | | | | — | | | | 198 | |
Total | | $ | 161,932 | | | $ | 654,958 | | | $ | — | | | $ | 816,890 | |
| * | Represents net unrealized appreciation (depreciation) as reported in the Fund’s Portfolio of Investments. |
The following is a reconciliation of each Fund’s Level 3 investments held at the beginning and end of the measurement period:
| | | | | | | | | | | | |
| Core Bond | | Level 3 Corporate
Bonds | | | Level 3 Collateralized
Mortgage
Obligation-
Private Mortgage-
Backed Securities | | | Level 3 Total | |
Balance at the beginning of year | | $ | 10,014 | | | $ | 18,461 | | | $ | 28,475 | |
Gains (losses): | | | | | | | | | | | | |
Net realized gains (losses) | | | — | | | | — | | | | — | |
Net change in unrealized appreciation (depreciation) | | | — | | | | — | | | | — | |
Purchases at cost | | | — | | | | — | | | | — | |
Sales at proceeds | | | — | | | | — | | | | — | |
Net discounts (premiums) | | | — | | | | — | | | | — | |
Transfers in to | | | — | | | | — | | | | — | |
Transfers out of | | | (10,014 | ) | | | (18,461 | ) | | | (28,475 | ) |
Balance at the end of year | | $ | — | | | $ | — | | | $ | — | |
Change in net unrealized appreciation (depreciation) during the fiscal year of Level 3
securities held as of June 30, 2011 | | $ | — | | | $ | — | | | $ | — | |
| | | | | | | | | | | | | | | | | | | | |
| High Income Bond | | Level 3 High Yield
Corporate
Bonds | | | Level 3 Preferred
Stocks | | | Level 3 Common
Stocks | | | Level 3 Asset-
Backed
Securities | | | Level 3 Total | |
Balance at the beginning of year | | $ | 7,215 | | | $ | 879 | | | $ | 22 | | | $ | 323 | | | $ | 8,439 | |
Gains (losses): | | | | | | | | | | | | | | | | | | | | |
Net realized gains (losses) | | | 621 | | | | — | | | | — | | | | (1,743 | ) | | | (1,122 | ) |
Net change in unrealized appreciation (depreciation) | | | (17 | ) | | | 184 | | | | 11 | | | | 1,832 | | | | 2,010 | |
Purchases at cost | | | 485 | | | | 480 | | | | — | | | | 18 | | | | 983 | |
Sales at proceeds | | | (6,404 | ) | | | — | | | | — | | | | (430 | ) | | | (6,834 | ) |
Net discounts (premiums) | | | 75 | | | | — | | | | — | | | | — | | | | 75 | |
Transfers in to | | | 3 | | | | — | ** | | | — | | | | — | | | | 3 | |
Transfers out of | | | (1,975 | ) | | | (1,543 | ) | | | (33 | ) | | | — | | | | (3,551 | ) |
Balance at the end of year | | $ | 3 | | | $ | — | ** | | $ | — | | | $ | — | | | $ | 3 | |
Change in net unrealized appreciation (depreciation) during the fiscal year of Level 3 securities held as of June 30, 2011 | | $ | (27 | ) | | $ | — | | | $ | — | | | $ | — | | | $ | (27 | ) |
| ** | Amount rounds to less than $1,000. |
| | | | | | | | | | | | |
| Inflation Protected Securities | | Level 3 Collateralized
Mortgage
Obligation-
Private Mortgage-
Backed Securities | | | Level 3 Preferred
Stocks | | | Level 3 Total | |
Balance at the beginning of year | | $ | 703 | | | $ | 180 | | | $ | 883 | |
Gains (losses): | | | | | | | | | | | | |
Net realized gains (losses) | | | — | | | | — | | | | — | |
Net change in unrealized appreciation (depreciation) | | | — | | | | — | | | | — | |
Purchases at cost | | | — | | | | — | | | | — | |
Sales at proceeds | | | — | | | | — | | | | — | |
Net discounts (premiums) | | | — | | | | — | | | | — | |
Transfers in to | | | — | | | | — | | | | — | |
Transfers out of | | | (703 | ) | | | (180 | ) | | | (883 | ) |
Balance at the end of year | | $ | — | | | $ | — | | | $ | — | |
Change in net unrealized appreciation (depreciation) during the fiscal year of Level 3
securities held as of June 30, 2011 | | $ | — | | | $ | — | | | $ | — | |
| | | | |
| Intermediate Term Bond | | Level 3
Collateralized
Mortgage
Obligation-
Private Mortgage-
Backed Securities | |
Balance at the beginning of year | | $ | 10,874 | |
Gains (losses): | | | | |
Net realized gains (losses) | | | — | |
Net change in unrealized appreciation (depreciation) | | | — | |
Purchases at cost | | | — | |
Sales at proceeds | | | — | |
Net discounts (premiums) | | | — | |
Transfers in to | | | — | |
Transfers out of | | | (10,874 | ) |
Balance at the end of year | | $ | — | |
Change in net unrealized appreciation (depreciation) during the fiscal year of Level 3
securities held as of June 30, 2011 | | $ | — | |
| | | | | | | | | | | | |
| Short Term Bond | | Level 3 Corporate
Bonds | | | Level 3 Collateralized
Mortgage
Obligation-
Private Mortgage-
Backed Securities | | | Level 3 Total | |
Balance at the beginning of year | | $ | 1,939 | | | $ | 6,864 | | | $ | 8,803 | |
Gains (losses): | | | | | | | | | | | | |
Net realized gains (losses) | | | — | | | | — | | | | — | |
Net change in unrealized appreciation (depreciation) | | | — | | | | — | | | | — | |
Purchases at cost | | | — | | | | — | | | | — | |
Sales at proceeds | | | — | | | | — | | | | — | |
Net discounts (premiums) | | | — | | | | — | | | | — | |
Transfers in to | | | — | | | | — | | | | — | |
Transfers out of | | | (1,939 | ) | | | (6,864 | ) | | | (8,803 | ) |
Balance at the end of year | | $ | — | | | $ | — | | | $ | — | |
Change in net unrealized appreciation (depreciation) during the fiscal year of Level 3
securities held as of June 30, 2011 | | $ | — | | | $ | — | | | $ | — | |
Notes to Financial Statements (all dollars and shares are rounded to thousands (000)) (continued)
| | | | | | | | | | | | | | | | |
| Total Return Bond | | Corporate
Bonds
Level 3 | | | Collateralized
Mortgage
Obligation-
Private Mortgage-
Backed Securities
Level 3 | | | Preferred
Stocks
Level 3 | | | Total
Level 3 | |
Balance at the beginning of year | | $ | 5,286 | | | $ | 6,020 | | | $ | 718 | | | $ | 12,024 | |
Gains (losses): | | | | | | | | | | | | | | | | |
Net realized gains (losses) | | | — | | | | — | | | | — | | | | — | |
Net change in unrealized appreciation (depreciation) | | | — | | | | — | | | | — | | | | — | |
Purchases at cost | | | — | | | | — | | | | — | | | | — | |
Sales at proceeds | | | — | | | | — | | | | — | | | | — | |
Net discounts (premiums) | | | — | | | | — | | | | — | | | | — | |
Transfers in to | | | — | | | | — | | | | — | | | | — | |
Transfers out of | | | (5,286 | ) | | | (6,020 | ) | | | (718 | ) | | | (12,024 | ) |
Balance at the end of year | | $ | — | | | $ | — | | | $ | — | | | $ | — | |
Change in net unrealized appreciation (depreciation) during the fiscal year of Level 3 securities held as of June 30, 2011 | | $ | — | | | $ | — | | | $ | — | | | $ | — | |
During the fiscal year ended June 30, 2011, the Funds recognized no significant transfers to or from Level 1 or Level 2. Transfers in and/or out of Level 3 are shown using end of period values.
3. Derivative Instruments and Hedging Activities
The Funds record derivative instruments at fair value, with changes in fair value recognized on the Statement of Operations, when applicable. Even though the Funds’ investments in derivatives may represent economic hedges, they are not considered to be hedge transactions for financial reporting purposes. For additional information on the derivative instruments in which each Fund was invested during and at the end of the reporting period, refer to the Portfolios of Investments, Financial Statements and Footnote 1 – General Information and Significant Accounting Policies.
The following tables present the fair value of all derivative instruments held by the Funds as of June 30, 2011, the location of these instruments on the Statement of Assets and Liabilities, and the primary underlying risk exposure.
| | | | | | | | | | | | | | |
| Core Bond | |
| | | | | Location on the Statements of Assets Liabilities | |
Underlying Risk Exposure | | Derivative Instrument | | Asset Derivatives | | | Liability Derivatives | |
| | | Location | | Value | | | Location | | Value | |
Interest Rate | | Futures
Contracts | | Deposits with brokers for open
futures contracts and
Receivable for variation margin
on futures contracts* | | $ | 930 | | | Deposits with brokers for
open futures contracts and
Payable for variation margin
on futures contracts* | | $ | 41 | |
Interest Rate | | Swaps | | Unrealized appreciation on
interest rate swap contracts** | | | — | | | Unrealized depreciation on
interest rate swap contracts** | | | 2,476 | |
Total | | | | | | $ | 930 | | | | | $ | 2,517 | |
| | | | | | | | | | | | | | |
| Inflation Protected Securities | |
| | | | | Location on the Statements of Assets Liabilities | |
Underlying Risk Exposure | | Derivative Instrument | | Asset Derivatives | | | Liability Derivatives | |
| | | Location | | Value | | | Location | | Value | |
Foreign Currency
Exchange Rate | | Futures
Contracts | | Deposits with brokers for open
futures contracts and
Receivable for variation margin
on futures contracts* | | $ | 6 | | | Deposits with brokers for
open futures contracts and
Payable for variation margin
on futures contracts* | | $ | — | |
Interest Rate | | Futures
Contracts | | Deposits with brokers for open
futures contracts and
Receivable for variation margin
on futures contracts* | | | 98 | | | Deposits with brokers for
open futures contracts and
Payable for variation margin
on futures contracts* | | | 28 | |
Interest Rate | | Swaps | | Unrealized appreciation on
interest rate swaps** | | | — | | | Unrealized depreciation on
interest rate swaps** | | | 304 | |
Total | | | | | | $ | 104 | | | | | $ | 332 | |
| * | Value represents cumulative gross unrealized appreciation (depreciation) of futures contracts as reported on the Fund’s Portfolio of Investments, and not the deposits with brokers, if any, or the receivable or payable for variation margin presented on the Statement of Assets and Liabilities. |
| ** | Value represents cumulative gross unrealized appreciation (depreciation) of swap contracts as reported on the Fund’s Portfolio of Investments. |
| | | | | | | | | | | | | | |
| Intermediate Government Bond | |
| | | Location on the Statements of Assets Liabilities | |
Underlying Risk Exposure | | Derivative Instrument | | Asset Derivatives | | | Liability Derivatives | |
| | | Location | | Value | | | Location | | Value | |
Interest Rate | | Futures
Contracts | | Deposits with brokers for open
futures contracts and
Receivable for variation margin
on futures contracts* | | $ | 46 | | | Deposits with brokers for open
futures contracts and
Payable for variation margin
on futures contracts* | | $ | 56 | |
| | | | | | | | | | | | | | |
| Intermediate Term Bond | |
| | | Location on the Statements of Assets Liabilities | |
Underlying Risk Exposure | | Derivative Instrument | | Asset Derivatives | | | Liability Derivatives | |
| | | Location | | Value | | | Location | | Value | |
Interest Rate | | Futures
Contracts | | Deposits with brokers for open
futures contracts and
Receivable for variation margin
on futures contracts* | | $ | 119 | | | Deposits with brokers for open
futures contracts and
Payable for variation margin
on futures contracts* | | $ | 24 | |
Interest Rate | | Swaps | | Unrealized appreciation on
interest rate swaps** | | | — | | | Unrealized depreciation on
interest rate swaps** | | | 1,458 | |
Total | | | | | | $ | 119 | | | | | $ | 1,482 | |
| | | | | | | | | | | | | | |
| Short Term Bond | |
| | | | | Location on the Statements of Assets Liabilities | |
Underlying Risk Exposure | | Derivative Instrument | | Asset Derivatives | | | Liability Derivatives | |
| | | Location | | Value | | | Location | | Value | |
Foreign Currency Exchange Rate | | Forward Foreign
Currency Exchange
Contracts | | Unrealized appreciation on
forward foreign currency
exchange contracts | | $ | — | | | Unrealized depreciation on
forward foreign currency
exchange contracts | | $ | 93 | |
Interest Rate | | Futures
Contracts | | Deposits with brokers for open
futures contracts and
Receivable for variation margin
on futures contracts* | | | 29 | | | Deposits with brokers for open
futures contracts and
Payable for variation margin
on futures contracts* | | | 655 | |
Interest Rate | | Swaps | | Unrealized appreciation on
interest rate swaps** | | | — | | | Unrealized depreciation on
interest rate swaps** | | | 1,037 | |
Credit | | Swaps | | Unrealized appreciation on
credit default swaps** | | | 453 | | | Unrealized depreciation on
credit default swaps** | | | — | |
Total | | | | | | $ | 482 | | | | | $ | 1,785 | |
| * | Value represents cumulative gross unrealized appreciation (depreciation) of futures contracts as reported on the Fund’s Portfolio of Investments, and not the deposits with brokers, if any, or the receivable or payable for variation margin presented on the Statement of Assets and Liabilities. |
| ** | Value represents cumulative gross unrealized appreciation (depreciation) of swap contracts as reported on the Fund’s Portfolio of Investments. |
Notes to Financial Statements (all dollars and shares are rounded to thousands (000)) (continued)
| | | | | | | | | | | | | | |
| Total Return Bond | |
| | | | | Location on the Statements of Assets Liabilities | |
Underlying
Risk Exposure | | Derivative
Instrument | | Asset Derivatives | | | Liability Derivatives | |
| | | Location | | Value | | | Location | | Value | |
Foreign Currency Exchange Rate | | Forward Foreign
Currency Exchange
Contracts | | Unrealized appreciation on
forward foreign currency
exchange contracts | | $ | 168 | | | Unrealized deppreciation on
forward foreign currency
exchange contracts | | $ | 154 | |
Foreign Currency Exchange Rate | | Futures
Contracts | | Deposits with brokers for open
futures contracts and
Receivable for variation margin
on futures contracts* | | | 45 | | | Deposits with brokers for open
futures contracts and
Payable for variation margin
on futures contracts* | | | — | |
Interest Rate | | Futures
Contracts | | Deposits with brokers for open
futures contracts and
Receivable for variation margin
on futures contracts* | | | 235 | | | Deposits with brokers for open
futures contracts and
Payable for variation margin
on futures contracts* | | | 81 | |
Interest Rate | | Options | | — | | | — | | | Options written, at value | | | 297 | |
Interest Rate | | Swaps | | Unrealized appreciation on
interest rate swaps** | | | — | | | Unrealized depreciation on
interest rate swaps** | | | 1,219 | |
Credit | | Swaps | | Unrealized appreciation on
credit default swaps** | | | 184 | | | Unrealized depreciation on
credit default swaps** | | | — | |
Total | | | | | | $ | 632 | | | | | $ | 1,751 | |
| * | Value represents cumulative gross unrealized appreciation (depreciation) of futures contracts as reported on the Fund’s Portfolio of Investments, and not the deposits with brokers, if any, or the receivable or payable for variation margin presented on the Statement of Assets and Liabilities. |
| ** | Value represents cumulative gross unrealized appreciation (depreciation) of swap contracts as reported on the Fund’s Portfolio of Investments. |
The following tables present the amount of net realized gain (loss) and change in net unrealized appreciation (depreciation) recognized for the fiscal year ended June 30, 2011, on derivative instruments, as well as the primary risk exposure associated with each.
| | | | | | | | | | | | |
| Net Realized Gain (Loss) from Forward Foreign Currency Exchange Contracts | | Inflation
Protected
Securities | | | Short Term
Bond | | | Total Return
Bond | |
Risk Exposure | | | | | | | | | | | | |
Foreign Currency Exchange Rate | | $ | (51 | ) | | $ | (144 | ) | | $ | (71 | ) |
| | | | | | | | | | | | | | | | | | | | | | | | | | | | |
Net Realized Gain (Loss) from
Futures Contracts | | Core Bond | | | High Income
Bond | | | Inflation
Protected
Securities | | | Intermediate
Government
Bond | | | Intermediate
Term Bond | | | Short Term
Bond | | | Total Return
Bond | |
Risk Exposure | | | | | | | | | | | | | | | | | | | | | | | | | | | | |
Interest Rate | | $ | (8,857 | ) | | $ | 439 | | | $ | (167 | ) | | $ | 77 | | | $ | (973 | ) | | $ | (5,004 | ) | | $ | (9,043 | ) |
Foreign Currency Exchange Rate | | | — | | | | — | | | | (47 | ) | | | — | | | | — | | | | — | | | | 1,663 | |
Total | | $ | (8,857 | ) | | $ | 439 | | | $ | (214 | ) | | $ | 77 | | | $ | (973 | ) | | $ | (5,004 | ) | | $ | (7,380 | ) |
| | | | | | | | |
| Net Realized Gain (Loss) from Options Written | | | | | | Total Return
Bond | |
Risk Exposure | | | | | | | | |
Interest Rate | | | | | | $ | (189 | ) |
| | | | | | | | | | | | | | | | | | | | |
| Net Realized Gain (Loss) from Swaps | | Core Bond | | | Inflation
Protected
Securities | | | Intermediate
Term Bond | | | Short Term
Bond | | | Total Return
Bond | |
Risk Exposure | | | | | | | | | | | | | | | | | | | | |
Interest Rate | | $ | (1,771 | ) | | $ | (206 | ) | | $ | (1,411 | ) | | $ | (816 | ) | | $ | 2,824 | |
Credit | | | (238 | ) | | | — | | | | 185 | | | | 1,129 | | | | (535 | ) |
Total | | $ | (2,009 | ) | | $ | (206 | ) | | $ | (1,226 | ) | | $ | 313 | | | $ | 2,289 | |
| | | | | | | | |
| Change in Net Unrealized Appreciation (Depreciation) of Forward Foreign Currency Exchange Contracts | | Short Term
Bond | | | Total Return
Bond | |
Risk Exposure | | | | | | | | |
Foreign Currency Exchange Rate | | $ | (93 | ) | | $ | 14 | |
| | | | | | | | | | | | | | | | | | | | | | | | | | | | |
Change in Net Unrealized
Appreciation (Depreciation) of
Futures Contracts | | Core Bond | | | High Income
Bond | | | Inflation
Protected
Securities | | | Intermediate
Government
Bond | | | Intermediate
Term Bond | | | Short Term
Bond | | | Total Return
Bond | |
Risk Exposure | | | | | | | | | | | | | | | | | | | | | | | | | | | | |
Interest Rate | | $ | 3,006 | | | $ | (178 | ) | | $ | 204 | | | $ | (69 | ) | | $ | (165 | ) | | $ | 694 | | | $ | 2,364 | |
Foreign Currency Exchange Rate | | | — | | | | — | | | | 6 | | | | — | | | | — | | | | — | | | | 43 | |
Total | | $ | 3,006 | | | $ | (178 | ) | | $ | 210 | | | $ | (69 | ) | | $ | (165 | ) | | $ | 694 | | | $ | 2,407 | |
| | | | |
| Change in Net Unrealized Appreciation (Depreciation) of Options Written | | Total Return
Bond | |
Risk Exposure | | | | |
Interest Rate | | $ | 114 | |
| | | | | | | | | | | | | | | | | | | | |
| Change in Net Unrealized Appreciation (Depreciation) of Swaps | | Core Bond | | | Inflation
Protected
Securities | | | Intermediate
Term Bond | | | Short Term
Bond | | | Total Return
Bond | |
Risk Exposure | | | | | | | | | | | | | | | | | | | | |
Interest Rate | | $ | 62 | | | $ | 8 | | | $ | 34 | | | $ | 35 | | | $ | (1,221 | ) |
Credit | | | — | | | | — | | | | — | | | | 453 | | | | 506 | |
Total | | $ | 62 | | | $ | 8 | | | $ | 34 | | | $ | 488 | | | $ | (715 | ) |
4. Fund Shares
Transactions in Fund shares were as follows:
| | | | | | | | | | | | | | | | |
| | | Core Bond | |
| | | Year Ended
6/30/11 | | | Year Ended
6/30/10 | |
| | | Shares | | | Amount | | | Shares | | | Amount | |
Shares sold: | | | | | | | | | | | | | | | | |
Class A | | | 740 | | | $ | 8,441 | | | | 1,069 | | | $ | 11,630 | |
Class B | | | 18 | | | | 203 | | | | 10 | | | | 110 | |
Class C | | | 86 | | | | 978 | | | | 81 | | | | 874 | |
Class R3(1) | | | 27 | | | | 314 | | | | 10 | | | | 108 | |
Class I(1) | | | 12,989 | | | | 148,056 | | | | 20,683 | | | | 224,539 | |
Shares issued to shareholders due to reinvestment of distributions: | | | | | | | | | | | | | | | | |
Class A | | | 225 | | | | 2,576 | | | | 303 | | | | 3,320 | |
Class B | | | 6 | | | | 72 | | | | 17 | | | | 186 | |
Class C | | | 8 | | | | 87 | | | | 12 | | | | 125 | |
Class R3(1) | | | 2 | | | | 17 | | | | 2 | | | | 19 | |
Class I(1) | | | 1,181 | | | | 13,504 | | | | 1,694 | | | | 18,523 | |
| | | | 15,282 | | | | 174,248 | | | | 23,881 | | | | 259,434 | |
Shares redeemed: | | | | | | | | | | | | | | | | |
Class A | | | (1,776 | ) | | | (20,295 | ) | | | (1,255 | ) | | | (13,714 | ) |
Class B | | | (190 | ) | | | (2,141 | ) | | | (284 | ) | | | (3,073 | ) |
Class C | | | (108 | ) | | | (1,229 | ) | | | (122 | ) | | | (1,307 | ) |
Class R3(1) | | | (29 | ) | | | (338 | ) | | | (18 | ) | | | (201 | ) |
Class I(1) | | | (38,436 | ) | | | (438,888 | ) | | | (44,709 | ) | | | (485,332 | ) |
| | | | (40,539 | ) | | | (462,891 | ) | | | (46,388 | ) | | | (503,627 | ) |
Net increase (decrease) | | | (25,257 | ) | | $ | (288,643 | ) | | | (22,507 | ) | | $ | (244,193 | ) |
| (1) | – Effective January 18, 2011, Class R Shares and Class Y Shares previously offered by FAF Advisors, Inc. were renamed Class R3 Shares and Class I Shares, respectively. |
Notes to Financial Statements (all dollars and shares are rounded to thousands (000)) (continued)
| | | | | | | | | | | | | | | | |
| |
| | | High Income Bond | |
| | | Year Ended
6/30/11 | | | Year Ended
6/30/10 | |
| | | Shares | | | Amount | | | Shares | | | Amount | |
Shares sold: | | | | | | | | | | | | | | | | |
Class A | | | 1,651 | | | $ | 14,839 | | | | 3,282 | | | $ | 27,146 | |
Class B | | | 19 | | | | 170 | | | | 25 | | | | 193 | |
Class C | | | 390 | | | | 3,433 | | | | 264 | | | | 2,167 | |
Class R3(1) | | | 13 | | | | 121 | | | | 12 | | | | 97 | |
Class I(1) | | | 23,260 | | | | 207,460 | | | | 23,104 | | | | 187,427 | |
Shares issued to shareholders due to reinvestment of distributions: | | | | | | | | | | | | | | | | |
Class A | | | 177 | | | | 1,586 | | | | 212 | | | | 1,743 | |
Class B | | | 9 | | | | 79 | | | | 13 | | | | 105 | |
Class C | | | 35 | | | | 310 | | | | 27 | | | | 226 | |
Class R3(1) | | | 1 | | | | 12 | | | | 1 | | | | 10 | |
Class I(1) | | | 419 | | | | 3,768 | | | | 218 | | | | 1,804 | |
| | | | 25,974 | | | | 231,778 | | | | 27,158 | | | | 220,918 | |
Shares redeemed: | | | | | | | | | | | | | | | | |
Class A | | | (1,969 | ) | | | (17,663 | ) | | | (3,521 | ) | | | (29,443 | ) |
Class B | | | (83 | ) | | | (738 | ) | | | (143 | ) | | | (1,157 | ) |
Class C | | | (182 | ) | | | (1,640 | ) | | | (154 | ) | | | (1,236 | ) |
Class R3(1) | | | (22 | ) | | | (199 | ) | | | (8 | ) | | | (72 | ) |
Class I(1) | | | (15,013 | ) | | | (135,161 | ) | | | (6,515 | ) | | | (53,873 | ) |
| | | | (17,269 | ) | | | (155,401 | ) | | | (10,341 | ) | | | (85,781 | ) |
Net increase (decrease) | | | 8,705 | | | $ | 76,377 | | | | 16,817 | | | $ | 135,137 | |
| |
| | | Inflation Protected Securities | |
| | | Year Ended
6/30/11 | | | Year Ended
6/30/10 | |
| | | Shares | | | Amount | | | Shares | | | Amount | |
Shares sold: | | | | | | | | | | | | | | | | |
Class A | | | 768 | | | $ | 8,151 | | | | 483 | | | $ | 4,852 | |
Class C | | | 362 | | | | 3,785 | | | | 550 | | | | 5,477 | |
Class R3(1) | | | 12 | | | | 121 | | | | 13 | | | | 137 | |
Class I(1) | | | 13,307 | | | | 141,165 | | | | 5,733 | | | | 58,004 | |
Shares issued to shareholders due to reinvestment of distributions: | | | | | | | | | | | | | | | | |
Class A | | | 9 | | | | 98 | | | | 15 | | | | 155 | |
Class C | | | 4 | | | | 39 | | | | 9 | | | | 94 | |
Class R3(1) | | | 1 | | | | 8 | | | | 3 | | | | 33 | |
Class I(1) | | | 32 | | | | 342 | | | | 58 | | | | 592 | |
| | | | 14,495 | | | | 153,709 | | | | 6,864 | | | | 69,344 | |
Shares redeemed: | | | | | | | | | | | | | | | | |
Class A | | | (437 | ) | | | (4,665 | ) | | | (300 | ) | | | (3,026 | ) |
Class C | | | (274 | ) | | | (2,898 | ) | | | (55 | ) | | | (556 | ) |
Class R3(1) | | | (139 | ) | | | (1,500 | ) | | | (19 | ) | | | (197 | ) |
Class I(1) | | | (5,231 | ) | | | (55,701 | ) | | | (8,068 | ) | | | (80,351 | ) |
| | | | (6,081 | ) | | | (64,764 | ) | | | (8,442 | ) | | | (84,130 | ) |
Net increase (decrease) | | | 8,414 | | | $ | 88,945 | | | | (1,578 | ) | | $ | (14,786 | ) |
| (1) | – Effective January 18, 2011, Class R Shares and Class Y Shares previously offered by FAF Advisors, Inc. were renamed Class R3 Shares and Class I Shares, respectively. |
| | | | | | | | | | | | | | | | |
| | | Intermediate Government Bond | |
| | | Year Ended
6/30/11 | | | Year Ended
6/30/10 | |
| | | Shares | | | Amount | | | Shares | | | Amount | |
Shares issued from merger(2): | | | | | | | | | | | | | | | | |
Class A | | | — | | | $ | — | | | | 1,538 | | | $ | 13,225 | |
Class C | | | — | | | | — | | | | 235 | | | | 2,023 | |
Class R3(1) | | | — | | | | — | | | | 102 | | | | 874 | |
Class I(1) | | | — | | | | — | | | | 9,456 | | | | 81,335 | |
Shares sold: | | | | | | | | | | | | | | | | |
Class A | | | 174 | | | | 1,525 | | | | 415 | | | | 3,604 | |
Class C | | | 12 | | | | 111 | | | | 10 | | | | 90 | |
Class R3(1) | | | 20 | | | | 176 | | | | 15 | | | | 134 | |
Class I(1) | | | 3,521 | | | | 31,232 | | | | 3,775 | | | | 32,634 | |
Shares issued to shareholders due to reinvestment of distributions: | | | | | | | | | | | | | | | | |
Class A | | | 36 | | | | 320 | | | | 47 | | | | 407 | |
Class C | | | 2 | | | | 17 | | | | 1 | | | | 8 | |
Class R3(1) | | | 1 | | | | 10 | | | | 1 | | | | 5 | |
Class I(1) | | | 121 | | | | 1,069 | | | | 288 | | | | 2,492 | |
| | | | 3,887 | | | | 34,460 | | | | 15,883 | | | | 136,831 | |
Shares redeemed: | | | | | | | | | | | | | | | | |
Class A | | | (783 | ) | | | (6,899 | ) | | | (1,044 | ) | | | (9,067 | ) |
Class C | | | (75 | ) | | | (663 | ) | | | (25 | ) | | | (219 | ) |
Class R3(1) | | | (42 | ) | | | (368 | ) | | | (44 | ) | | | (375 | ) |
Class I(1) | | | (9,790 | ) | | | (86,412 | ) | | | (7,857 | ) | | | (68,118 | ) |
| | | | (10,690 | ) | | | (94,342 | ) | | | (8,970 | ) | | | (77,779 | ) |
Net increase (decrease) | | | (6,803 | ) | | $ | (59,882 | ) | | | 6,913 | | | $ | 59,052 | |
| | | | | | | | | | | | | | | | |
| | | Intermediate Term Bond | |
| | | Year Ended
6/30/11 | | | Year Ended
6/30/10 | |
| | | Shares | | | Amount | | | Shares | | | Amount | |
Shares sold: | | | | | | | | | | | | | | | | |
Class A | | | 236 | | | $ | 2,473 | | | | 588 | | | $ | 5,909 | |
Class C | | | 110 | | | | 1,159 | | | | — | | | | — | |
Class I(1) | | | 14,006 | | | | 146,340 | | | | 19,865 | | | | 199,377 | |
Shares issued to shareholders due to reinvestment of distributions: | | | | | | | | | | | | | | | | |
Class A | | | 61 | | | | 638 | | | | 88 | | | | 890 | |
Class C | | | — | | | | — | | | | — | | | | — | |
Class I(1) | | | 543 | | | | 5,673 | | | | 799 | | | | 8,060 | |
| | | | 14,956 | | | | 156,283 | | | | 21,340 | | | | 214,236 | |
Shares redeemed: | | | | | | | | | | | | | | | | |
Class A | | | (698 | ) | | | (7,294 | ) | | | (651 | ) | | | (6,593 | ) |
Class C | | | — | | | | — | | | | — | | | | — | |
Class I(1) | | | (22,971 | ) | | | (239,505 | ) | | | (26,062 | ) | | | (262,030 | ) |
| | | | (23,669 | ) | | | (246,799 | ) | | | (26,713 | ) | | | (268,623 | ) |
Net increase (decrease) | | | (8,713 | ) | | $ | (90,516 | ) | | | (5,373 | ) | | $ | (54,387 | ) |
| (1) | – Effective January 18, 2011, Class R Shares and Class Y Shares previously offered by FAF Advisors, Inc. were renamed Class R3 Shares and Class I Shares, respectively. |
| (2) | – Refer to Footnote 9 – Fund Mergers for further details. |
Notes to Financial Statements (all dollars and shares are rounded to thousands (000)) (continued)
| | | | | | | | | | | | | | | | |
| | | Short Term Bond | |
| | | Year Ended
6/30/11 | | | Year Ended
6/30/10 | |
| | | Shares | | | Amount | | | Shares | | | Amount | |
Shares sold: | | | | | | | | | | | | | | | | |
Class A | | | 1,656 | | | $ | 16,622 | | | | 3,251 | | | $ | 32,250 | |
Class C | | | 373 | | | | 3,744 | | | | 345 | | | | 3,455 | |
Class I(1) | | | 50,236 | | | | 504,500 | | | | 53,506 | | | | 533,108 | |
Shares issued to shareholders due to reinvestment of distributions: | | | | | | | | | | | | | | | | |
Class A | | | 146 | | | | 1,472 | | | | 206 | | | | 2,045 | |
Class C | | | 4 | | | | 45 | | | | 2 | | | | 17 | |
Class I(1) | | | 337 | | | | 3,393 | | | | 370 | | | | 3,684 | |
| | | | 52,752 | | | | 529,776 | | | | 57,680 | | | | 574,559 | |
Shares redeemed: | | | | | | | | | | | | | | | | |
Class A | | | (2,540 | ) | | | (25,520 | ) | | | (1,476 | ) | | | (14,685 | ) |
Class C | | | (182 | ) | | | (1,832 | ) | | | (36 | ) | | | (359 | ) |
Class I(1) | | | (39,873 | ) | | | (400,639 | ) | | | (23,455 | ) | | | (233,939 | ) |
| | | | (42,595 | ) | | | (427,991 | ) | | | (24,967 | ) | | | (248,983 | ) |
Net increase (decrease) | | | 10,157 | | | $ | 101,785 | | | | 32,713 | | | $ | 325,576 | |
| |
| | | Total Return Bond | |
| | | Year Ended
6/30/11 | | | Year Ended
6/30/10 | |
| | | Shares | | | Amount | | | Shares | | | Amount | |
Shares sold: | | | | | | | | | | | | | | | | |
Class A | | | 1,110 | | | $ | 11,697 | | | | 1,622 | | | $ | 16,522 | |
Class B | | | 10 | | | | 106 | | | | 14 | | | | 138 | |
Class C | | | 254 | | | | 2,678 | | | | 408 | | | | 4,120 | |
Class R3(1) | | | 74 | | | | 795 | | | | 33 | | | | 337 | |
Class I(1) | | | 11,952 | | | | 126,639 | | | | 15,080 | | | | 151,764 | |
Shares issued to shareholders due to reinvestment of distributions: | | | | | | | | | | | | | | | | |
Class A | | | 82 | | | | 871 | | | | 76 | | | | 774 | |
Class B | | | 4 | | | | 39 | | | | 6 | | | | 63 | |
Class C | | | 16 | | | | 167 | | | | 14 | | | | 139 | |
Class R3(1) | | | 4 | | | | 36 | | | | 2 | | | | 22 | |
Class I(1) | | | 694 | | | | 7,383 | | | | 956 | | | | 9,613 | |
| | | | 14,200 | | | | 150,411 | | | | 18,211 | | | | 183,492 | |
Shares redeemed: | | | | | | | | | | | | | | | | |
Class A | | | (1,598 | ) | | | (17,009 | ) | | | (504 | ) | | | (5,066 | ) |
Class B | | | (48 | ) | | | (503 | ) | | | (74 | ) | | | (735 | ) |
Class C | | | (172 | ) | | | (1,812 | ) | | | (70 | ) | | | (710 | ) |
Class R3(1) | | | (41 | ) | | | (443 | ) | | | (52 | ) | | | (484 | ) |
Class I(1) | | | (19,091 | ) | | | (202,626 | ) | | | (22,465 | ) | | | (223,673 | ) |
| | | | (20,950 | ) | | | (222,393 | ) | | | (23,165 | ) | | | (230,668 | ) |
Net increase (decrease) | | | (6,750 | ) | | $ | (71,982 | ) | | | (4,954 | ) | | $ | (47,176 | ) |
| (1) | – Effective January 18, 2011, Class R Shares and Class Y Shares previously offered by FAF Advisors, Inc. were renamed Class R3 Shares and Class I Shares, respectively. |
Class B Shares converted to Class A Shares (recognized as a component of as Class A Shares issued and Class B Shares redeemed) during the fiscal years ended June 30, 2011 and June 30, 2010, were as follows:
| | | | | | | | |
| Fund | | Year Ended
6/30/2011 | | | Year Ended
6/30/2010 | |
Core Bond | | | 134 | | | $ | 197 | |
High Income Bond | | | 66 | | | | 60 | |
Total Return Bond | | | 35 | | | | 48 | |
5. Investment Transactions
Purchases and sales (including maturities but excluding short-term investments, derivative and dollar roll transactions, where applicable) during the fiscal year ended June 30, 2011, were as follows:
| | | | | | | | | | | | | | | | | | | | | | | | | | | | |
| | | Core
Bond | | | High Income
Bond | | | Inflation
Protected
Securities | | | Intermediate
Government
Bond | | | Intermediate
Term Bond | | | Short Term
Bond | | | Total Return
Bond | |
Purchases: | | | | | | | | | | | | | | | | | | | | | | | | | | | | |
Investment securities | | $ | 567,741 | | | $ | 673,228 | | | $ | 29,643 | | | $ | 8,989 | | | $ | 323,521 | | | $ | 532,525 | | | $ | 228,625 | |
U.S. Government and agency obligations | | | 505,905 | | | | 46 | | | | 153,976 | | | | 71,273 | | | | 98,819 | | | | 36,192 | | | | 429,748 | |
Sales and maturities: | | | | | | | | | | | | | | | | | | | | | | | | | | | | |
Investment securities | | | 583,690 | | | | 599,732 | | | | 14,890 | | | | 18,440 | | | | 381,277 | | | | 344,645 | | | | 315,441 | |
U.S. Government and agency obligations | | | 736,582 | | | | — | | | | 81,265 | | | | 122,879 | | | | 162,688 | | | | 105,582 | | | | 372,656 | |
Transactions in options written for Total Return Bond during the fiscal year ended June 30, 2011, were as follows:
| | | | | | | | |
| | | Total Return Bond | |
| | | Number of
Contracts | | | Premiums
Received | |
Outstanding, beginning of year | | | — | | | $ | — | |
Options written | | | 2,645 | | | | 914 | |
Options terminated in closing purchase transactions | | | (1,590 | ) | | | (454 | ) |
Options expired | | | (144 | ) | | | (49 | ) |
Outstanding, end of year | | | 911 | | | $ | 411 | |
6. Income Tax Information
The following information is presented on an income tax basis. Differences between amounts for financial statement and federal income tax purposes are primarily due to timing differences in recognizing certain gains and losses on investment transactions. To the extent that differences arise that are permanent in nature, such amounts are reclassified within the capital accounts as detailed below. Temporary differences do not require reclassification. Temporary and permanent differences do not impact the net asset values of the Funds.
At June 30, 2011, the cost and unrealized appreciation (depreciation) of investments (excluding investments in derivatives, where applicable), as determined on a federal income tax basis, were as follows:
| | | | | | | | | | | | | | | | |
| | | Core Bond | | | High Income
Bond | | | Inflation
Protected
Securities | | | Intermediate
Government
Bond | |
Cost of investments | | $ | 1,207,260 | | | $ | 642,500 | | | $ | 394,510 | | | $ | 144,818 | |
Gross unrealized: | | | | | | | | | | | | | | | | |
Appreciation | | | 43,649 | | | | 15,425 | | | | 10,269 | | | | 3,530 | |
Depreciation | | | (13,901 | ) | | | (11,316 | ) | | | (948 | ) | | | (813 | ) |
Net unrealized appreciation (depreciation) of investments | | $ | 29,748 | | | $ | 4,109 | | | $ | 9,321 | | | $ | 2,717 | |
| | | | | | | | | | | | |
| | | Intermediate
Term Bond | | | Short Term
Bond | | | Total Return
Bond | |
Cost of investments | | $ | 781,759 | | | $ | 915,986 | | | $ | 803,458 | |
Gross unrealized: | | | | | | | | | | | | |
Appreciation | | | 25,392 | | | | 16,805 | | | | 27,641 | |
Depreciation | | | (1,566 | ) | | | (3,212 | ) | | | (13,089 | ) |
Net unrealized appreciation (depreciation) of investments | | $ | 23,826 | | | $ | 13,593 | | | $ | 14,552 | |
Permanent differences, primarily due to tax equalization, treatment of notional principal contracts, paydown adjustments and foreign currency reclassifications resulted in reclassifications among the Funds’ components of net assets at June 30, 2011, the Funds’ tax year-end, as follows:
| | | | | | | | | | | | | | | | |
| | | Core Bond | | | High Income
Bond | | | Inflation
Protected
Securities | | | Intermediate
Government
Bond | |
Capital paid-in | | $ | — | | | $ | 245 | | | $ | — | | | $ | — | |
Undistributed (Over-distribution of) net investment income | | | (1,368 | ) | | | — | | | | (63 | ) | | | 226 | |
Accumulated net realized gain (loss) | | | 1,368 | | | | (245 | ) | | | 63 | | | | (226 | ) |
Notes to Financial Statements (all dollars and shares are rounded to thousands (000)) (continued)
| | | | | | | | | | | | |
| | | Intermediate
Term Bond | | | Short Term
Bond | | | Total Return
Bond | |
Capital paid-in | | $ | — | | | $ | — | | | $ | — | |
Undistributed (Over-distribution of) net investment income | | | (526 | ) | | | (419 | ) | | | 2,089 | |
Accumulated net realized gain (loss) | | | 526 | | | | 419 | | | | (2,089 | ) |
The tax components of undistributed net ordinary income and net long-term capital gains at June 30, 2011, the Funds’ tax year end, were as follows:
| | | | | | | | | | | | | | | | |
| | | Core Bond | | | High Income
Bond | | | Inflation
Protected
Securities | | | Intermediate
Government
Bond | |
Undistributed net ordinary income* | | $ | 4,720 | | | $ | 3,615 | | | $ | 5,662 | | | $ | 227 | |
Undistributed net long-term capital gains | | | — | | | | 1,923 | | | | — | | | | — | |
| | | | | | | | | | | | |
| | | Intermediate
Term Bond | | | Short Term
Bond | | | Total Return
Bond | |
Undistributed net ordinary income* | | $ | 1,762 | | | $ | 2,756 | | | $ | 7,135 | |
Undistributed net long-term capital gains | | | — | | | | — | | | | — | |
| * | Net ordinary income consists of net taxable income derived from dividends, interest and net short-term capital gains, if any. |
The tax character of distributions paid during the Funds’ tax years ended June 30, 2011 and June 30, 2010, was designated for purposes of the dividends paid deduction as follows:
| | | | | | | | | | | | | | | | |
| 2011 | | Core Bond | | | High Income
Bond | | | Inflation
Protected
Securities | | | Intermediate
Government
Bond | |
Distributions from net ordinary income* | | $ | 45,496 | | | $ | 35,278 | | | $ | 3,516 | | | $ | 3,253 | |
Distributions from net long-term capital gains | | | — | | | | — | | | | — | | | | — | |
Return of capital | | | — | | | | — | | | | — | | | | — | |
| | | | | | | | | | | | |
| 2011 | | Intermediate
Term Bond | | | Short Term
Bond | | | Total Return
Bond | |
Distributions from net ordinary income* | | $ | 24,425 | | | $ | 17,806 | | | $ | 28,967 | |
Distributions from net long-term capital gains | | | — | | | | — | | | | — | |
Return of capital | | | — | | | | — | | | | — | |
| | | | | | | | | | | | | | | | |
| 2010 | | Core Bond | | | High Income
Bond | | | Inflation
Protected
Securities | | | Intermediate
Government
Bond | |
Distributions from net ordinary income* | | $ | 67,866 | | | $ | 26,351 | | | $ | 3,582 | | | $ | 4,765 | |
Distributions from net long-term capital gains | | | — | | | | — | | | | — | | | | 256 | |
Return of capital | | | — | | | | — | | | | — | | | | 18 | |
| | | | | | | | | | | | |
| 2010 | | Intermediate
Term Bond | | | Short Term
Bond | | | Total Return
Bond | |
Distributions from net ordinary income* | | $ | 33,897 | | | $ | 18,434 | | | $ | 38,377 | |
Distributions from net long-term capital gains | | | — | | | | — | | | | — | |
Return of capital | | | — | | | | — | | | | — | |
| * | Net ordinary income consists of net taxable income derived from dividends, interest and net short-term capital gains, if any. |
At June 30, 2011, the Funds’ tax year end, the following Funds had unused capital loss carryforwards available for federal income tax purposes to be applied against future capital gains, if any. If not applied, the carryforwards will expire as follows:
| | | | | | | | | | | | | | | | | | | | | | | | |
| | | Core Bond | | | Inflation
Protected
Securities | | | Intermediate
Government
Bond | | | Intermediate
Term Bond | | | Short Term
Bond | | | Total Return
Bond | |
Expiration: | | | | | | | | | | | | | | | | | | | | | | | | |
June 30, 2014 | | $ | — | | | $ | — | | | $ | — | | | $ | — | | | $ | 7,245 | | | $ | — | |
June 30, 2015 | | | — | | | | 1,565 | | | | — | | | | — | | | | 7,433 | | | | — | |
June 30, 2016 | | | — | | | | 953 | | | | — | | | | — | | | | — | | | | — | |
June 30, 2017 | | | — | | | | 4,724 | | | | 10,454 | | | | — | | �� | | 839 | | | | 20,481 | |
June 30, 2018 | | | 8,450 | | | | 2,807 | | | | — | | | | 1,697 | | | | 2,980 | | | | 37,557 | |
Total | | $ | 8,450 | | | $ | 10,049 | | | $ | 10,454 | | | $ | 1,697 | | | $ | 18,497 | | | $ | 58,038 | |
During the Funds’ tax year ended June 30, 2011, the Funds utilized their capital loss carryforwards as follows:
| | | | | | | | | | | | | | | | |
| | | Core Bond | | | High Income
Bond | | | Inflation
Protected
Securities | | | Intermediate
Government
Bond | |
Utilized capital loss carryforwards | | $ | 34,779 | | | $ | 23,650 | | | $ | 4,619 | | | $ | 1,465 | |
| | | | | | | | | | | | |
| | | Intermediate
Term Bond | | | Short Term
Bond | | | Total Return
Bond | |
Utilized capital loss carryforwards | | $ | 18,351 | | | $ | 2,171 | | | $ | 20,821 | |
7. Management Fees and Other Transactions with Affiliates
Investment Advisory Fees
During the period July 1, 2010 through December 31, 2010, pursuant to an investment advisory agreement (the “Agreement”), FAF Advisors managed each Fund’s assets and furnished related office facilities, equipment, research, and personnel. The Agreement required each Fund to pay FAF Advisors a monthly advisory fee, on an annual basis, equal to each Fund’s average daily net assets as follows:
| | | | |
| Fund | | | |
Core Bond | | | .50 | % |
High Income Bond | | | .70 | |
Inflation Protection Securities | | | .50 | |
Intermediate Government Bond | | | .50 | |
Intermediate Term Bond | | | .50 | |
Short Term Bond | | | .50 | |
Total Return Bond | | | .60 | |
Effective January 1, 2011, pursuant to a new investment advisory agreement (the “New Agreement”), the Funds’ new investment adviser is Nuveen Fund Advisors. Under the New Agreement, each Fund’s management fee consists of two components – a fund-level fee, based only on the amount of assets within each individual Fund, and a complex-level fee, based on the aggregate amount of all eligible fund assets managed by Nuveen Fund Advisors. This pricing structure enables Fund shareholders to benefit from growth in the assets within their Fund as well as from growth in the amount of complex-wide assets managed by Nuveen Fund Advisors.
The annual fund-level fee for each Fund, payable monthly, is calculated according to the following schedule:
| | | | | | | | | | | | | | | | | | | | | | | | | | | | |
| Average Daily Net Assets | | Core Bond
Fund-Level
Fee Rate | | | High Income
Bond Fund-Level
Fee Rate | | | Inflation
Protected
Securities
Fund-Level
Fee Rate | | | Intermediate
Government
Bond
Fund-Level
Fee Rate | | | Intermediate
Term Bond
Fund-Level
Fee Rate | | | Short Term
Bond
Fund-Level
Fee Rate | | | Total Return
Bond
Fund-Level
Fee Rate | |
For the first $125 million | | | .4500 | % | | | .6000 | % | | | .4500 | % | | | .4500 | % | | | .4500 | % | | | .3000 | % | | | .4500 | % |
For the next $125 million | | | .4375 | | | | .5875 | | | | .4375 | | | | .4375 | | | | .4375 | | | | .2875 | | | | .4375 | |
For the next $250 million | | | .4250 | | | | .5750 | | | | .4250 | | | | .4250 | | | | .4250 | | | | .2750 | | | | .4250 | |
For the next $500 million | | | .4125 | | | | .5625 | | | | .4125 | | | | .4125 | | | | .4125 | | | | .2625 | | | | .4125 | |
For the next $1 billion | | | .4000 | | | | .5500 | | | | .4000 | | | | .4000 | | | | .4000 | | | | .2500 | | | | .4000 | |
For net assets over $2 billion | | | .3750 | | | | .5250 | | | | .3750 | | | | .3750 | | | | .3750 | | | | .2250 | | | | .3750 | |
Notes to Financial Statements (all dollars and shares are rounded to thousands (000)) (continued)
The annual complex-level fee for each Fund, payable monthly, is determined by taking the complex-level fee rate, which is based on the aggregate amount of “eligible assets” of all Nuveen funds as set forth in the schedule below, and making, as appropriate, an upward adjustment to that rate based upon the percentage of the particular fund’s assets that are not “eligible assets.” The complex-level fee schedule for each Fund is as follows:
| | | | |
| Complex-Level Asset Breakpoint Level* | | Effective Rate at Breakpoint Level | |
$55 billion | | | .2000 | % |
$56 billion | | | .1996 | |
$57 billion | | | .1989 | |
$60 billion | | | .1961 | |
$63 billion | | | .1931 | |
$66 billion | | | .1900 | |
$71 billion | | | .1851 | |
$76 billion | | | .1806 | |
$80 billion | | | .1773 | |
$91 billion | | | .1691 | |
$125 billion | | | .1599 | |
$200 billion | | | .1505 | |
$250 billion | | | .1469 | |
$300 billion | | | .1445 | |
| * | The complex-level fee is calculated based upon the aggregate daily “eligible assets” of all Nuveen Funds. Eligible assets do not include assets attributable to investments in other Nuveen Funds or assets in excess of $2 billion added to the Nuveen Fund complex in connection with Nuveen Fund Advisors’ assumption of the management of the former First American Funds effective January 1, 2011. Eligible assets include closed-end fund assets managed by Nuveen Fund Advisors that are attributable to financial leverage. For these purposes, financial leverage includes the closed-end funds’ use of preferred stock and borrowings and investments in the residual interest certificates (also called inverse floating rate securities) in tender option bond (TOB) trusts, including the portion of assets held by the TOB trust that has been effectively financed by the trust’s issuance of floating rate securities, subject to an agreement by Nuveen Fund Advisors as to certain funds to limit the amount of such assets for determining eligible assets in certain circumstances. |
| | As of June 30, 2011, the complex-level fee rate for each Fund was as follows: |
| | | | |
| Fund | | Complex-Level
Fee Rate | |
Core Bond | | | .2000 | % |
High Income Bond | | | .1971 | |
Inflation Protected Securities | | | .1924 | |
Intermediate Government Bond | | | .1986 | |
Intermediate Term Bond | | | .1997 | |
Short Term Bond | | | .1975 | |
Total Return Bond | | | .1982 | |
The management fee compensates Nuveen Fund Advisors for the overall investment advisory and administrative services and general office facilities it provides for the Funds. Effective January 1, 2011, Nuveen Fund Advisors has entered into sub-advisory agreements with the Sub-Adviser. The Sub-Adviser will be compensated for its services to the Funds from the management fees paid to Nuveen Fund Advisors.
During the period July 1, 2010 through December 31, 2010, the Funds may have invested in related money market funds that were series of First American Funds, Inc., subject to certain limitations. In order to avoid the payment of duplicative investment advisory fees to FAF Advisors, which acted as the investment advisor to both the investing Funds and the related money market funds, FAF Advisors reimbursed each investing Fund an amount equal to that portion of FAF Advisors’ investment advisory fee received from the related money market funds that was attributable to the assets of the investing Fund. This reimbursement, if any, is recognized as a component of “Expense Reimbursement” on the Statement of Operations and terminated with respect to the Funds on December 31, 2010, in connection with the Sale.
During the period July 1, 2010 through December 31, 2010, FAF Advisors agreed to waive fees and reimburse other Fund expenses through June 30, 2011, so that total Fund operating expenses, as a percentage of each Fund’s average daily net assets, did not exceed the following amounts:
| | | | | | | | | | | | | | | | | | | | |
| | | Share Class | |
| Fund | | A | | | B | | | C | | | R(1) | | | Y(1) | |
Core Bond | | | .95 | % | | | 1.70 | % | | | 1.70 | % | | | 1.20 | % | | | .70 | % |
High Income Bond | | | 1.10 | | | | 1.85 | | | | 1.85 | | | | 1.35 | | | | .85 | |
Inflation Protected Securities | | | .85 | | | | N/A | | | | 1.60 | | | | 1.10 | | | | .60 | |
Intermediate Government Bond | | | .75 | | | | N/A | | | | 1.60 | | | | 1.10 | | | | .60 | |
Intermediate Term Bond | | | .85 | | | | N/A | | | | N/A | | | | N/A | | | | .70 | |
Short Term Bond | | | .75 | | | | N/A | | | | 1.60 | | | | N/A | | | | .60 | |
Total Return Bond | | | .89 | | | | 1.75 | | | | 1.75 | | | | 1.25 | | | | .75 | |
| | |
N/A | | – Not applicable; Fund did not offer Class B, C or R Shares during the period July 1, 2010 through December 31, 2010. |
(1) | | – Effective January 18, 2011, Class R Shares and Class Y shares previously offered by FAF Advisors, Inc. were renamed Class R3 Shares and Class I Shares, respectively. |
Effective January 1, 2011, Nuveen Fund Advisors has contractually agreed to waive fees and reimburse other Fund expenses of each Fund so that total annual Fund operating expenses, after fee waivers and/or expense reimbursements and excluding acquired Fund fees and expenses, do not exceed the average daily net assets of any class of Fund shares in the amounts and for the time periods stated in the following table:
| | | | | | | | | | | | | | | | | | | | | | | | | | | | |
| | | Core Bond | | | High Income
Bond | | | Inflation
Protected
Securities | | | Intermediate
Government
Bond | | | Intermediate
Term Bond | | | Short Term
Bond | | | Total Return
Bond | |
Class A(1) | | | .95 | % | | | 1.10 | % | | | .85 | % | | | .75 | % | | | .85 | % | | | .75 | % | | | .89 | % |
Class B | | | 1.70 | | | | 1.85 | | | | N/A | | | | N/A | | | | N/A | | | | N/A | | | | 1.75 | |
Class C | | | 1.70 | | | | 1.85 | | | | 1.60 | | | | 1.60 | | | | 1.70 | | | | 1.60 | | | | 1.75 | |
Class R3(2) | | | 1.20 | | | | 1.35 | | | | 1.10 | | | | 1.10 | | | | N/A | | | | N/A | | | | 1.25 | |
Class I(2) | | | .70 | | | | .85 | | | | .60 | | | | .60 | | | | .70 | | | | .60 | | | | .75 | |
Expiration Date | | | March 31, 2012 | | | | March 31, 2012 | | | | March 31, 2012 | | | | March 31, 2012 | | | | March 31, 2012 | | | | March 31, 2012 | | | | March 31, 2012 | |
| | |
N/A | | – Not applicable. |
(1) | | – The Funds’ distributor, Nuveen Securities, LLC, has contractually agreed to limit Class A Share 12b-1 fees to 0.15% of average daily net assets through March 31, 2012, for Intermediate Government Bond, Intermediate Term Bond and Short Term Bond. |
(2) | | – Effective January 18, 2011, Class R Shares and Class Y Shares previously offered by FAF Advisors, Inc. were renamed Class R3 Shares and Class I Shares, respectively. |
During the period July 1, 2010 through December 31, 2010, independent directors of the Funds may have participated and elected to defer receipt of part or all of their annual compensation under a deferred compensation plan (the “Plan”). Deferred amounts were treated as though equivalent dollar amounts had been invested in shares of selected open-end funds as designated by each director. All amounts in the Plan were 100% vested and accounts under the Plan were obligations of the Funds. Deferred amounts remain in the Funds until distributed in accordance with the Plan.
Effective January 1, 2011, independent directors may elect to defer receipt of all or a portion of the annual compensation they are entitled to receive from certain funds advised by Nuveen Fund Advisors. Under the plan, deferred amounts are treated as though equal dollar amounts had been invested in shares of select funds advised by Nuveen Fund Advisors.
Administration Fees
During the period July 1, 2010 through December 31, 2010, FAF Advisors served as the Funds’ administrator pursuant to an administration agreement between FAF Advisors and the Funds. U.S. Bancorp Fund Services, LLC (“USBFS”) served as sub-administrator pursuant to a sub-administration agreement between USBFS and FAF Advisors. FAF Advisors is a subsidiary of U.S. Bank National Association (“U.S. Bank”). Both U.S. Bank and USBFS are direct subsidiaries of U.S. Bancorp. Under the administration agreement, FAF Advisors was compensated to provide, or compensated other entities to provide, services to the Funds. These services included various legal, oversight, and administrative and accounting services. The Funds paid FAF Advisors administration fees, which were calculated daily and paid monthly, equal to the Funds’ pro rata share of an amount equal, on an annual basis, to .25% of the aggregate average daily net assets of all open-end funds in the First American Funds family up to $8 billion, .235% on the next $17 billion of the aggregate average daily net assets, .22% on the next $25 billion of the aggregate average daily net assets, and .20% of the aggregate average daily net assets in excess of $50 billion. All fees paid to the sub-administrator were paid from the administration fee. In addition to these fees, the Funds may have reimbursed FAF Advisors and the sub-administrator for any out-of-pocket expenses incurred in providing administration services. Effective January 1, 2011, FAF Advisors and USBFS no longer serve as the Funds’ administrator and sub-administrator, respectively, and the Funds have not entered into any new administration or sub-administration agreements.
Transfer Agent Fees
USBFS serves as the Funds’ transfer agent pursuant to a transfer agent agreement with the Trust. The Funds are charged transfer agent fees on a per shareholder account basis, subject to a minimum fee per share class. These fees are charged to each Fund based upon the number of accounts within each Fund. In addition to these fees, the Funds may reimburse USBFS for out-of-pocket expenses incurred in providing transfer agent services.
Custodian Fees
U.S. Bank serves as the custodian for the Fund pursuant to a custodian agreement with the Trust. The custodian fee charged for each Fund is equal to an annual rate of .005% of average daily net assets. All fees are computed daily and paid monthly. Interest earned on un-invested cash balances is used to reduce a portion of each Fund’s custodian expenses. These credits, if any, are recognized as “Custodian fee credit” on the Statement of Operations. Conversely, the custodian charges a fee for any cash overdrafts incurred, which increases the Funds’ custodian expenses.
Distribution and Shareholder Servicing (12b-1) Fees
During the period July 1, 2010 through December 31, 2010, Quasar Distributors, LLC (“Quasar”), a subsidiary of U.S. Bancorp, served as the distributor of the Funds pursuant to a distribution agreement with the Trust. Under the distribution agreement, and pursuant to a plan adopted by each Fund under Rule 12b-1 of the Investment Company Act, the Funds paid Quasar a monthly distribution and/or
Notes to Financial Statements (all dollars and shares are rounded to thousands (000)) (continued)
shareholder servicing fee equal to an annual rate of .25% 1.00%, 1.00% and .50% of the Funds’ average daily net assets attributable to Class A, Class B, Class C and Class R Shares (renamed Class R3 Shares), respectively. No distribution or shareholder servicing fees were paid by Class Y Shares (renamed Class I Shares). These fees may have been used by Quasar to provide compensation for sales support, distribution activities, and/or shareholder servicing activities. During the period July 1, 2010 through December 31, 2010, Quasar waived a portion of its 12b-1 fees for Class A Shares, limiting its fees to 0.15% of average daily net assets for Intermediate Government Bond, Intermediate Term Bond and Short Term Bond, respectively.
Effective January 1, 2011, the Funds entered into a distribution agreement with Nuveen Securities, LLC, who now serves as the Funds’ distributor. Under the new agreement, Class A Shares continue to incur a .25% annual 12b-1 service fee. Class B and Class C Shares continue to incur a .75% annual 12b-1 distribution fee and a .25% annual 12b-1 service fee. Class R3 Shares continue to incur a .25% annual 12b-1 distribution fee and a .25% annual 12b-1 service fee. Class I Shares continue to not be subject to any sales charge or 12b-1 distribution or service fees. Annual distribution and service fees are based on average daily net assets.
Nuveen Securities, LLC has contractually agreed to limit its Class A Share 12b-1 fees to .15% of average daily net assets through March 31, 2012, for Intermediate Government Bond, Intermediate Term Bond and Short Term Bond.
During the fiscal year ended June 30, 2011, total distribution and service fees waived by Quasar and/or Nuveen Securities, LLC for the following Funds were as follows:
| | | | |
| Fund | | Amount | |
Intermediate Government Bond | | $ | 9 | |
Intermediate Term Bond | | | 13 | |
Short Term Bond | | | 44 | |
The remaining 12b-1 fees charged to the Funds were paid to compensate financial intermediaries for providing services to shareholders relating to their investments.
During the fiscal year ended June 30, 2011, Quasar and/or Nuveen Securities, LLC. collected sales charges on purchases of Class A Shares, the majority of which were paid out as concessions to financial intermediaries as follows:
| | | | | | | | | | | | | | | | |
| | | Core Bond | | | High Income
Bond | | | Inflation
Protected
Securities | | | Intermediate
Government
Bond | |
Sales charges collected (Unaudited) | | $ | 30 | | | $ | 76 | | | $ | 72 | | | $ | 2 | |
Paid to financial intermediaries (Unaudited) | | | 28 | | | | 69 | | | | 67 | | | | 2 | |
| | | | | | | | | | | | |
| | | Intermediate
Term Bond | | | Short
Term
Bond | | | Total
Return
Bond | |
Sales charges collected (Unaudited) | | $ | 13 | | | $ | 46 | | | $ | 55 | |
Paid to financial intermediaries (Unaudited) | | | 11 | | | | 41 | | | | 50 | |
Quasar and/or Nuveen Securities, LLC. also received 12b-1 service fees on Class A Shares, substantially all of which were paid to compensate financial intermediaries for providing services to shareholders relating to their investments.
During the fiscal year ended June 30, 2011, Quasar and/or Nuveen Securities, LLC. compensated financial intermediaries directly with commission advances at the time of purchase as follows:
| | | | | | | | | | | | | | | | |
| | | Core Bond | | | High Income
Bond | | | Inflation
Protected
Securities | | | Intermediate
Government
Bond | |
Commission advances (Unaudited) | | $ | 4 | | | $ | 17 | | | $ | 27 | | | $ | 1 | |
| | | | | | | | | | | | |
| | | Intermediate
Term Bond | | | Short Term
Bond | | | Total Return
Bond | |
Commission advances (Unaudited) | | $ | 1 | | | $ | 17 | | | $ | 9 | |
All 12b-1 service and distribution fees collected on Class B Shares and Class C Shares during the first year following a purchase were retained by Quasar and/or Nuveen Securities, LLC. to compensate for commissions advanced to financial intermediaries. During the fiscal year ended June 30, 2011, Quasar and/or Nuveen Securities, LLC. retained such 12b-1 fees as follows:
| | | | | | | | | | | | | | | | |
| | | Core Bond | | | High Income
Bond | | | Inflation
Protected
Securities | | | Intermediate
Government
Bond | |
12b-1 fees retained (Unaudited) | | $ | 82 | | | $ | 52 | | | $ | 49 | | | $ | 13 | |
| | | | | | | | | | | | |
| | | Intermediate
Term Bond | | | Short Term
Bond | | | Total Return
Bond | |
12b-1 fees retained (Unaudited) | | $ | 11 | | | $ | 63 | | | $ | 88 | |
Other Fees and Expenses
In addition to the investment advisory fees, administration fees, transfer agent fees, custodian fees, and distribution and shareholder servicing fees, each Fund is responsible for paying other operating expenses, including: legal, auditing, registration fees, postage and printing of shareholder reports, fees and expenses of independent directors, insurance, and other miscellaneous expenses. During the period July 1, 2010 through December 31, 2010, legal fees and expenses of $17 were paid to a law firm of which an Assistant Secretary of the Funds was a partner.
Contingent Deferred Sales Charges
During the period July 1, 2010 through January 17, 2011, Class A Shares of Intermediate Government Bond, Intermediate Term Bond and Short Term Bond were sold with an up-front sales charge of 2.25%. Class A Shares of Core Bond, High Income Bond, Inflation Protected Securities and Total Return Bond were sold with an up-front sales charge of 4.25%. Class B Shares were subject to a contingent deferred sales charge (“CDSC”) for six years and automatically converted to Class A after eight years. Class C Shares were subject to a CDSC of 1% for twelve months. Class R Shares (renamed Class R3 Shares) had no sales charge and were available to only certain retirement plans. Class Y Shares (renamed Class I Shares) had no sales charge and were offered only to qualifying institutional investors and certain other qualifying accounts.
Effective January 18, 2011, Class A Shares of the Funds are sold with an up-front sales charge of 4.25% for Core Bond, Inflation Protected Securities and Total Return Bond, 4.75% for High Income Bond, 3.00% for Intermediate Government Bond and Intermediate Term Bond and 2.25% for Short Term Bond. Class A Share purchases of the Funds, with the exception of Short Term Bond, of $1 million or more are sold at net asset value without an up-front sales charge. Class A Share purchases of Short Term Bond of $250,000 or more are sold at net asset value without an up-front sales charge. Class A Share purchases of the Funds may be subject to a CDSC if redeemed within eighteen months of purchase. Class B Shares have a CDSC that begins at 5% and for redemptions during the first year and declines periodically until after six years when the charge becomes 0%. Class B Shares automatically convert to Class A Shares eight years after purchase. Class C Shares are subject to a CDSC of 1% if redeemed within twelve months of purchase. Class R3 and Class I Shares are not subject to any sales charge and are offered only to certain qualifying accounts and qualifying institutional investors, respectively.
Quasar and/or Nuveen Securities, LLC collected and retained CDSC on share redemptions during the fiscal year ended June 30, 2011, as follows:
| | | | | | | | | | | | | | | | |
| | | Core Bond | | | High Income
Bond | | | Inflation
Protected
Securities | | | Intermediate
Government
Bond | |
CDSC retained (Unaudited) | | $ | 1 | | | $ | 3 | | | $ | 2 | | | $ | — | |
| | | | | | | | | | | | |
| | | Intermediate
Term Bond | | | Short Term
Bond | | | Total Return
Bond | |
CDSC retained (Unaudited) | | $ | — | | | $ | 6 | | | $ | 4 | |
8. Regulatory Settlement
On August 23, 2010, Core Bond, Intermediate Government Bond and Intermediate Term Bond received settlement payments from the SEC related to the BISYS Fair Fund Settlement. The settlement was paid to funds that had used BISYS from June 1999 through June 2004. The Mercantile Funds, which subsequently merged into Core Bond, Intermediate Bond and Intermediate Term Bond, had used BISYS as an administrator during this period. Because the settlement was for the overcharging of expenses to these Funds, the amounts are recognized as “Expense reimbursement from regulatory settlement” on the Statement of Operations.
9. Fund Mergers
Effective after the close of business on January 29, 2010, Intermediate Government Bond acquired the assets and assumed the liabilities of First American U.S. Government Mortgage Fund (“U.S. Government Mortgage”). Intermediate Government Bond was deemed to be the accounting survivor in the merger. Shareholders of U.S. Government Mortgage approved the merger on January 21, 2010.
The merger was accomplished by tax free exchanges as detailed below:
| | | | | | | | | | | | | | | | | | | | | | | | |
| | | Share Class | | | | |
| Intermediate Government Bond | | A | | | B | | | C | | | R | | | Y | | | Total | |
Net assets of U.S. Government Mortgage | | $ | 10,604 | | | $ | 2,621 | | | $ | 2,023 | | | $ | 874 | | | $ | 81,335 | | | $ | 97,457 | |
U.S. Government Mortgage shares exchanged | | | 1,045 | | | | 258 | | | | 200 | | | | 86 | | | | 8,012 | | | | 9,601 | |
Intermediate Government Bond shares issued | | | 1,538 | | | | — | | | | 235 | | | | 102 | | | | 9,456 | | | | 11,331 | |
Net assets of Intermediate Governement Bond immediately before the merger | | | 8,063 | | | | — | | | | 1 | | | | 1 | | | | 87,606 | | | | 95,671 | |
Net assets of Intermediate Governement Bond immediately after the merger | | | 21,289 | | | | — | | | | 2,024 | | | | 875 | | | | 168,940 | | | | 193,128 | |
Notes to Financial Statements (all dollars and shares are rounded to thousands (000)) (continued)
The components of U.S. Government Mortgage’s net assets prior to adjustments for any permanent book-to-tax differences at the merger date were as follows:
| | | | | | | | | | | | | | | | | | | | |
| | | Total
Net Assets | | | Portfolio
Capital | | | Undistributed
Net Investment
Income (Loss) | | | Accumulated
Net Realized
Gain (Loss) | | | Net Unrealized
Appreciation
(Depreciation) | |
U.S. Government Mortgage | | $ | 97,457 | | | $ | 111,558 | | | $ | (474) | | | $ | (13,746) | | | $ | 119 | |
10. New Accounting Pronouncements
Fair Value Measurements and Disclosures
On May 12, 2011, the Financial Accounting Standards Board (“FASB”) issued Accounting Standards Update (“ASU”) No. 2011-04 (“ASU No. 2011-04”) modifying Topic 820, Fair Value Measurements and Disclosures. At the same time, the International Accounting Standards Board (“IASB”) issued International Financial Reporting Standard (“IFRS”) 13, Fair Value Measurement. The objective of the FASB and IASB is convergence of their guidance on fair value measurements and disclosures. Specifically, ASU No. 2011-04 requires reporting entities to disclose i) the amounts of any transfers between Level 1 and Level 2, and the reasons for the transfers, ii) for Level 3 fair value measurements, a) quantitative information about significant unobservable inputs used, b) a description of the valuation processes used by the reporting entity and c) a narrative description of the sensitivity of the fair value measurement to changes in unobservable inputs if a change in those inputs might result in a significantly higher or lower fair value measurement. The effective date of ASU No. 2011-04 is for interim and annual periods beginning after December 15, 2011. At this time, management is evaluating the implications of this guidance and the impact it will have on the financial statement amounts and footnote disclosures, if any.
Trustees and Officers (Unaudited)
The management of the Funds, including general supervision of the duties performed for the Funds by the Adviser, is the responsibility of the Board of Trustees of the Funds. The number of trustees of the Funds is currently set at ten. None of the trustees who are not “interested” persons of the Funds (referred to herein as “independent trustees”) has ever been a director or employee of, or consultant to, Nuveen or its affiliates. The names and business addresses of the trustees and officers of the Funds, their principal occupations and other affiliations during the past five years, the number of portfolios each oversees and other directorships they hold are set forth below.
The Funds’ Statement of Additional Information (“SAI”) includes more information about the trustees. To request a free copy, call Nuveen Investments at (800) 257-8787 or visit the Funds’ website at www.nuveen.com.
| | | | | | | | |
Name, Birthdate and Address | | Position(s) Held with the Funds | | Year First Elected or Appointed (1) | | Principal Occupation(s) Including other Directorships During Past 5 Years | | Number of Portfolios in Fund Complex Overseen by Trustee |
| | |
| Independent Trustees: | | | | |
Robert P. Bremner (2) 8/22/40 333 W. Wacker Drive Chicago, IL 60606 | | Chairman of the Board and Trustee | | 1996 | | Private Investor and Management Consultant; Treasurer and Director, Humanities Council of Washington, D.C.; Board Member, Independent Directors Council affiliated with the Investment Company Institute. | | 245 |
Jack B. Evans 10/22/48 333 W. Wacker Drive Chicago, IL 60606 | | Trustee | | 1999 | | President, The Hall-Perrine Foundation, a private philanthropic corporation (since 1996); Director and Chairman, United Fire Group, a publicly held company; member of the Board of Regents for the State of Iowa University System; Director, Source Media Group; Life Trustee of Coe College and the Iowa College Foundation; formerly, Director, Alliant Energy; formerly, Director, Federal Reserve Bank of Chicago; formerly, President and Chief Operating Officer, SCI Financial Group, Inc., a regional financial services firm. | | 245 |
William C. Hunter 3/6/48 333 W. Wacker Drive Chicago, IL 60606 | | Trustee | | 2004 | | Dean, Tippie College of Business, University of Iowa (since 2006); Director (since 2004) of Xerox Corporation; Director (since 2005), Beta Gamma Sigma International Honor Society; Director of Wellmark, Inc. (since 2009); formerly, Dean and Distinguished Professor of Finance, School of Business at the University of Connecticut (2003-2006); previously, Senior Vice President and Director of Research at the Federal Reserve Bank of Chicago (1995-2003); formerly, Director (1997-2007), Credit Research Center at Georgetown University. | | 245 |
David J. Kundert (2) 10/28/42 333 W. Wacker Drive Chicago, IL 60606 | | Trustee | | 2005 | | Director, Northwestern Mutual Wealth Management Company; retired (since 2004) as Chairman, JPMorgan Fleming Asset Management, President and CEO, Banc One Investment Advisors Corporation, and President, One Group Mutual Funds; prior thereto, Executive Vice President, Banc One Corporation and Chairman and CEO, Banc One Investment Management Group; Member, Board of Regents, Luther College; member of the Wisconsin Bar Association; member of Board of Directors, Friends of Boerner Botanical Gardens; member of Board of Directors and Chair of Investment Committee, Greater Milwaukee Foundation. | | 245 |
William J. Schneider (2) 9/24/44 333 W. Wacker Drive Chicago, IL 60606 | | Trustee | | 1997 | | Chairman of Miller-Valentine Partners Ltd., a real estate investment company; formerly, Senior Partner and Chief Operating Officer (retired 2004) of Miller-Valentine Group; member, University of Dayton Business School Advisory Council; member, Mid-America Health System Board; formerly, member and chair, Dayton Philharmonic Orchestra Association; formerly, member, Business Advisory Council, Cleveland Federal Reserve Bank. | | 245 |
Judith M. Stockdale 12/29/47 333 W. Wacker Drive Chicago, IL 60606 | | Trustee | | 1997 | | Executive Director, Gaylord and Dorothy Donnelley Foundation (since 1994); prior thereto, Executive Director, Great Lakes Protection Fund (1990-1994). | | 245 |
Carole E. Stone (2) 6/28/47 333 W. Wacker Drive Chicago, IL 60606 | | Trustee | | 2007 | | Director, Chicago Board Options Exchange (since 2006); Director, C2 Options Exchange, Incorporated (since 2009); formerly, Commissioner, New York State Commission on Public Authority Reform (2005-2010); formerly, Chair, New York Racing Association Oversight Board (2005-2007). | | 245 |
Trustees and Officers (Unaudited) (continued)
| | | | | | | | |
Name, Birthdate and Address | | Position(s) Held with the Funds | | Year First Elected or Appointed (1) | | Principal Occupation(s) During Past Five Years | | Number of Portfolios in Fund Complex Overseen by Trustee |
Virginia L. Stringer 8/16/44 333 West Wacker Drive Chicago, IL 60606 | | Trustee | | 2011 | | Board Member, Mutual Fund Directors Forum; Member, Governing Board, Investment Company Institute’s Independent Directors Council; governance consultant and non-profit board member; former Owner and President, Strategic Management Resources, Inc. a management consulting firm; previously, held several executive positions in general management, marketing and human resources at IBM and The Pillsbury Company; Independent Director, First American Fund Complex (1987-2010) and Chair (1997-2010). | | 245 |
Terence J. Toth (2) 9/29/59 333 W. Wacker Drive Chicago, IL 60606 | | Trustee | | 2008 | | Director, Legal & General Investment Management America, Inc. (since 2008); Managing Partner, Promus Capital (since 2008); formerly, CEO and President, Northern Trust Global Investments (2004-2007); Executive Vice President, Quantitative Management & Securities Lending (2000-2004); prior thereto, various positions with Northern Trust Company (since 1994); member: Goodman Theatre Board (since 2004), Chicago Fellowship Board (since 2005) and Catalyst Schools of Chicago Board (since 2008); formerly, member: Northern Trust Mutual Funds Board (2005-2007), Northern Trust Global Investments Board (2004-2007), Northern Trust Japan Board (2004-2007), Northern Trust Securities Inc. Board (2003-2007) and Northern Trust Hong Kong Board (1997-2004). | | 245 |
| | |
| Interested Trustee: | | | | |
John P. Amboian (3) 6/14/61 333 W. Wacker Drive Chicago, IL 60606 | | Trustee | | 2008 | | Chief Executive Officer and Chairman (since 2007), and Director (since 1999) of Nuveen Investments, Inc., formerly, President (1999-2007); Chief Executive Officer (since 2007) of Nuveen Investments Advisers Inc.; Director (since 1998) formerly, Chief Executive Officer (2007-2010) of Nuveen Fund Advisors, Inc. | | 245 |
Name, Birthdate and Address | | Position(s) Held with the Funds | | Year First Elected or Appointed (4) | | Principal Occupation(s) During Past 5 Years | | Number of Portfolios in Fund Complex Overseen by Officer |
| | |
| Officers of the Funds: | | | | |
Gifford R. Zimmerman 9/9/56 333 W. Wacker Drive Chicago, IL 60606 | | Chief Administrative Officer | | 1988 | | Managing Director (since 2002), Assistant Secretary and Associate General Counsel of Nuveen Securities, LLC; Managing Director (since 2004) and Assistant Secretary (since 1994) of Nuveen Investments, Inc.; Managing Director (since 2002), Assistant Secretary (since 1997) and Co-General Counsel (since 2011) of Nuveen Fund Advisors, Inc.; Managing Director, Assistant Secretary and Associate General Counsel of Nuveen Asset Management, LLC (since 2011); Managing Director, Associate General Counsel and Assistant Secretary of Symphony Asset Management LLC (since 2003); Vice President and Assistant Secretary of NWQ Investment Management Company, LLC (since 2002), Nuveen Investments Advisers Inc. (since 2002), Tradewinds Global Investors LLC, and Santa Barbara Asset Management, LLC (since 2006), Nuveen HydePark Group LLC and Nuveen Investment Solutions, Inc. (since 2007) and of Winslow Capital Management Inc. (since 2010); Chief Administrative Officer and Chief Compliance Officer (since 2010) of Nuveen Commodities Asset Management, LLC; Chartered Financial Analyst. | | 245 |
Margo L. Cook 4/11/64 333 W. Wacker Drive Chicago, IL 60606 | | Vice President | | 2009 | | Executive Vice President (since 2008) of Nuveen Investments, Inc. and of Nuveen Fund Advisors, Inc. (since 2011); previously, Head of Institutional Asset Management (2007-2008) of Bear Stearns Asset Management; Head of Institutional Asset Management (1986-2007) of Bank of NY Mellon; Chartered Financial Analyst. | | 245 |
| | | | | | | | |
Name, Birthdate and Address | | Position(s) Held with the Funds | | Year First Elected or Appointed (4) | | Principal Occupation(s) During Past 5 Years | | Number of Portfolios in Fund Complex Overseen by Officer |
Lorna C. Ferguson 10/24/45 333 W. Wacker Drive Chicago, IL 60606 | | Vice President | | 1998 | | Managing Director (since 2005) of Nuveen Fund Advisors, Inc. | | 245 |
Stephen D. Foy 5/31/54 333 W. Wacker Drive Chicago, IL 60606 | | Vice President and Controller | | 1998 | | Senior Vice President (since 2010), formerly, Vice President (2005-2010) of Nuveen Securities, LLC and Funds Controller; Vice President of Nuveen; Certified Public Accountant. | | 245 |
Scott S. Grace 8/20/70 333 W. Wacker Drive Chicago, IL 60606 | | Vice President and Treasurer | | 2009 | | Managing Director, Corporate Finance & Development, Treasurer (since 2009) of Nuveen Securities, LLC; Managing Director and Treasurer (since 2009) of Nuveen Fund Advisors, Inc., Nuveen Investment Solutions, Inc., Nuveen Investments Advisers, Inc., Nuveen Investments Holdings Inc. and (since (2011) Nuveen Asset Management, LLC; Vice President and Treasurer of NWQ Investment Management Company, LLC, Tradewinds Global Investors, LLC, Symphony Asset Management LLC and Winslow Capital Management, Inc.; Vice President of Santa Barbara Asset Management, LLC; formerly, Treasurer (2006-2009), Senior Vice President (2008-2009), previously, Vice President (2006-2008) of Janus Capital Group, Inc.; formerly, Senior Associate in Morgan Stanley’s Global Financial Services Group (2000-2003); Chartered Accountant Designation. | | 245 |
Walter M. Kelly 2/24/70 333 W. Wacker Drive Chicago, IL 60606 | | Chief Compliance Officer and Vice President | | 2003 | | Senior Vice President (since 2008), Vice President (2006-2008) of Nuveen Securities, LLC; Senior Vice President (since 2008) and Assistant Secretary (since 2008) of Nuveen Fund Advisors, Inc. | | 245 |
Tina M. Lazar 8/27/61 333 W. Wacker Drive Chicago, IL 60606 | | Vice President | | 2002 | | Senior Vice President (since 2010), formerly, Vice President (2005-2010) of Nuveen Fund Advisors, Inc. | | 245 |
Larry W. Martin 7/27/51 333 West Wacker Drive Chicago, IL 60606 | | Vice President and Assistant Secretary | | 1997 | | Senior Vice President (since 2010), formerly, Vice President (1993-2010), Assistant Secretary and Assistant General Counsel of Nuveen Securities, LLC; Senior Vice President (since 2011) of Nuveen Asset Management, LLC: Senior Vice President (since 2010), formerly, Vice President (2005-2010), and Assistant Secretary of Nuveen Investments, Inc.; Senior Vice President (since 2010), formerly Vice President (2005-2010), and Assistant Secretary (since 1997) of Nuveen Fund Advisors, Inc.; Vice President and Assistant Secretary of Nuveen Investments Advisers, Inc. (since 2002), NWQ Investment Management Company, LLC, Symphony Asset Management LLC (since 2003), Tradewinds Global Investors, LLC, Santa Barbara Asset Management, LLC (since 2006), Nuveen HydePark Group, LLC and Nuveen Investment Solutions, Inc. (since 2007), and of Winslow Capital Management, Inc. (since 2010); Vice President and Assistant Secretary of Nuveen Commodities Asset Management, LLC (since 2010). | | 245 |
Trustees and Officers (Unaudited) (continued)
| | | | | | | | |
Name, Birthdate and Address | | Position(s) Held with the Funds | | Year First Elected or Appointed (4) | | Principal Occupation(s) Including other Directorships During Past 5 Years | | Number of Portfolios in Fund Complex Overseen by Officer |
Kevin J. McCarthy 3/26/66 333 W. Wacker Drive Chicago, IL 60606 | | Vice President and Secretary | | 2007 | | Managing Director (since 2008), formerly, Vice President (2007-2008), Nuveen Securities, LLC; Managing Director (since 2008), Assistant Secretary (since 2007) and Co-General Counsel (since 2011) of Nuveen Fund Advisors, Inc.; Managing Director, Assistant Secretary and Associate General Counsel (since 2011) of Nuveen Asset Management, LLC; Managing Director (since 2008), and Assistant Secretary, Nuveen Investment Holdings, Inc.; Vice President (since 2007) and Assistant Secretary of Nuveen Investments Advisers Inc., NWQ Investment Management Company, LLC, Tradewinds Global Investors LLC, NWQ Holdings, LLC, Symphony Asset Management LLC, Santa Barbara Asset Management, LLC, Nuveen HydePark Group, LLC, Nuveen Investment Solutions, Inc. (since 2007) and of Winslow Capital Management, Inc. (since 2010); Vice President and Secretary (since 2010) of Nuveen Commodities Asset Management, LLC; prior thereto, Partner, Bell, Boyd & Lloyd LLP (1997-2007). | | 245 |
Kathleen L. Prudhomme 3/30/53 800 Nicollet Mall Minneapolis, MN 55402 | | Vice President and Assistant Secretary | | 2011 | | Managing Director, Assistant Secretary and Co-General Counsel (since 2011) of Nuveen Fund Advisors, Inc.; Managing Director, Assistant Secretary and Associate General Counsel (since 2011) of Nuveen Asset Management, LLC; Managing Director and Assistant Secretary (since 2011) of Nuveen Securities, LLC; formerly, Deputy General Counsel, FAF Advisors, Inc. (2004-2010). | | 245 |
Jeffrey M. Wilson 3/13/56 333 West Wacker Drive Chicago, IL 60606 | | Vice President | | 2011 | | Senior Vice President of Nuveen Investments (since 2011), formerly, Senior Vice President of FAF Advisors, Inc. (2000-2010). | | 112 |
| (1) | Trustees serve an indefinite term until his/her successor is elected or appointed. The year first elected or appointed represents the year in which the trustee was first elected or appointed to any fund in the Nuveen Fund Complex. |
| (2) | Also serves as a trustee of the Nuveen Diversified Commodity Fund, an exchange-traded commodity pool managed by Nuveen Commodities Asset Management, LLC, an affiliate of the Adviser. |
| (3) | Mr. Amboian is an interested trustee because of his position with Nuveen Investments, Inc. and certain of its subsidiaries, which are affiliates of the Nuveen Funds. |
| (4) | Officers serve one year terms through August of each year. The year first elected or appointed represents the year in which the officer was first elected or appointed to any fund in the Nuveen Fund Complex. |
Annual Investment Management Agreement Approval Process
(Unaudited)
A. Background
Prior to January 1, 2011, FAF Advisors, Inc. (“FAF”), a wholly-owned subsidiary of U.S. Bank National Association (“U.S. Bank”), served as investment adviser to each Fund pursuant to an investment advisory agreement between First American Investment Funds, Inc. (the “Company”) and FAF (the “Prior Advisory Agreement”), and as administrator to each Fund pursuant to an administrative agreement between the Company and FAF (the “Prior Administrative Agreement”). On July 29, 2010, U.S. Bank and FAF entered into a definitive agreement with Nuveen Investments, Inc. (“Nuveen”), Nuveen Asset Management (“NAM”) and certain Nuveen affiliates, whereby NAM would acquire a portion of the asset management business of FAF (the “Transaction”). The acquired business included the assets of FAF used in providing investment advisory services, research, sales and distribution in connection with equity, fixed income, real estate, global infrastructure and asset allocation investment products (other than the money market business and closed-end funds advised by FAF), including the Funds. In connection with the Transaction, the Board of Directors (the “Prior Board”) serving the Funds as directors at that time (each a “Prior Director” and, collectively, the “Prior Directors”) considered a number of proposals designed to integrate the Funds into the Nuveen family of funds, including the appointment of NAM as investment adviser and Nuveen Investments, LLC as distributor to the Funds. The Prior Board also considered a proposal in connection with an internal restructuring of NAM (the “Restructuring”), for Nuveen Asset Management, LLC (“NAM LLC”), a wholly-owned subsidiary of NAM formed in anticipation of the Restructuring, to serve as sub-advisor for each Fund.
The Prior Board approved a new investment advisory agreement (the “New Advisory Agreement”) for each Fund with NAM and an investment sub-advisory agreement between NAM and NAM LLC (the “NAM Sub-Advisory Agreement”). At a meeting of the Funds’ stockholders held on December 17, 2010, stockholders of the Funds approved the New Advisory Agreement and the NAM Sub-Advisory Agreement. In addition, stockholders of the Company’s funds (including the Funds) elected ten directors, including one Prior Director, to the board of directors of the Company (the “New Board”).
On December 31, 2010, the Transaction closed and the New Board (which replaced the Prior Board) took effect. On January 1, 2011, the New Advisory Agreement and the NAM Sub-Advisory Agreement became effective. In addition, in connection with the Restructuring, NAM has changed its name to Nuveen Fund Advisors, Inc. (“NFA”). The following is a summary of the considerations of the Prior Board, which were set forth in a proxy statement dated November 10, 2010 (the “Proxy Statement”), in approving the New Advisory Agreement and the NAM Sub-Advisory Agreement for the Funds.
B. Prior Board Considerations
The New Advisory Agreement for each Fund was approved by the Prior Board after consideration of all factors determined to be relevant to its deliberations, including those discussed below. The Prior Board authorized the submission of the New Advisory Agreement for consideration by each Fund’s stockholders.
At meetings held in May and June of 2010, the Prior Board was apprised of the general terms of the Transaction and, as a result, began the process of considering the transition of services from FAF to NFA. In preparation for its September 21-23, 2010 meeting, the Prior Board received, in response to a written due diligence request prepared by the Prior Board and its independent legal counsel and provided to NFA and FAF, a significant amount of information covering a range of issues in advance of the meeting. To assist the Prior Board in its consideration of the New Advisory Agreement for each Fund, NFA provided materials and information about, among other things: (1) NFA and its affiliates, including their history and organizational structure, product lines, experience in providing investment advisory, administrative and other services, and financial condition, (2) the nature, extent and quality of services to be provided under the New Advisory Agreement, (3) proposed Fund fees and expenses and comparative information relating thereto, and (4) NFA’s compliance and risk management capabilities and processes. In addition, the Prior Board was provided with a memorandum from independent legal counsel outlining the legal duties of the Prior Board under the Investment Company Act of 1940, as amended (the “1940 Act”). In response to further requests from the Prior Board and its independent legal counsel, NFA and FAF provided additional information to the Prior Board following its September 21-23 meeting.
An additional in-person meeting of the Prior Board to consider the New Advisory Agreement was held on October 7, 2010, at which the members of the Prior Board in attendance, all of whom were not considered to be “interested persons” of the Company as defined in the 1940 Act (the “Independent Prior Directors”), approved the New Advisory Agreement with NFA for each Fund.
In considering the New Advisory Agreement for each Fund, the Prior Board, advised by independent legal counsel, reviewed and analyzed the factors it deemed relevant, including: (1) the nature, quality, and extent of services to be rendered to the Funds by NFA, (2) the cost of services to be provided, including Fund expense information, and (3) whether economies of scale may be realized as the Funds grow and whether fee levels are adjusted to enable Fund investors to share in these potential economies of scale.
In considering the New Advisory Agreement, the Prior Board did not identify any particular information that was all-important or controlling, and each Prior Director may have attributed different weights to the various factors discussed below. Where appropriate, the Prior Directors evaluated all information available to them regarding the Company’s funds on a fund-by-fund basis, and their determinations were made separately with respect to each such fund (including each of the Funds). The Prior Directors, all of whom were Independent Prior Directors, concluded that the terms of the New Advisory Agreement and the fee rates to be paid in light of the services to be provided to each Fund are in the best interests of each Fund, and that the New Advisory Agreement should be
Annual Investment Management Agreement Approval Process
(Unaudited) (continued)
approved and recommended to stockholders for approval. In voting to approve the New Advisory Agreement with respect to each Fund, the Prior Board considered in particular the following factors:
Nature, Extent and Quality of Services. In considering approval of the New Advisory Agreement, the Prior Board considered the nature, extent and quality of services to be provided by NFA, including advisory services and administrative services. The Prior Board reviewed materials outlining, among other things, NFA’s organizational structure and business; the types of services that NFA or its affiliates are expected to provide to the Funds; the performance record of the applicable Fund (as described in further detail below); and fund product lines offered by NFA. The Prior Board considered that affiliation with a larger fund complex and well-recognized sponsor may result in a broader distribution network, potential economies of scale with respect to other services or fees and broader shareholder services including exchange options.
With respect to personnel, the Prior Board considered information regarding retention plans for current FAF employees who would be offered employment by NFA, and the background and experience of NFA employees who would become portfolio managers as of the closing of the Transaction. The Prior Board also reviewed information regarding portfolio manager compensation arrangements to evaluate NFA’s ability to attract and retain high quality investment personnel.
In evaluating the services of NFA, the Prior Board also considered NFA’s ability to supervise the Funds’ other service providers and, given the importance of compliance, NFA’s compliance program. Among other things, the Prior Board considered the report of NFA’s chief compliance officer regarding NFA’s compliance policies and procedures.
In addition to advisory services, the Prior Board considered the quality of administrative services expected to be provided by NFA and its affiliates including product management, fund administration, oversight of service providers, shareholder services, administration of Board relations, regulatory and portfolio compliance and legal support.
The Prior Board considered that, based on representations from FAF and NFA, the Transaction would allow stockholders to continue their investment in each of the Company’s funds with the same investment objective and principal strategies and, in most cases, the same portfolio management team. In light of the continuity of investment personnel in most cases (with respect to the Company’s funds in the aggregate), the Prior Board considered the historical investment performance of each of the Company’s funds (including each Fund) previously provided during the annual contract renewal process.
Cost of Services Provided by NFA. In evaluating the costs of the services to be provided by NFA under the New Advisory Agreement, the Prior Board received a comparison of each Fund’s annual operating expenses as of June 30, 2010 under the Prior Advisory Agreement and under the New Advisory Agreement, in each case adjusted to reflect a decrease in net assets for certain of the Company’s funds from redemptions by the U.S. Bank 401(k) Plan expected to occur prior to the closing of the Transaction. The Prior Board considered, among other things, that the advisory fee rates and other expenses would change as a result of NFA serving as investment adviser to each Fund. The Prior Board noted that the services provided by NFA under the New Advisory Agreement would include certain administrative services, which services (along with other services) were provided pursuant to the Prior Administrative Agreement and were charged separately from the advisory fee. Accordingly, the Prior Board considered that the fee rates paid under the New Advisory Agreement include bundled investment advisory and administrative fees and thus are higher than the fee rates paid under the Prior Advisory Agreement for most of the Company’s funds, but lower than the combined fee rates paid under the Prior Advisory Agreement and the Prior Administrative Agreement. The Prior Board also noted that certain administrative services provided under the Prior Administrative Agreement would not be provided under the New Advisory Agreement and will be delegated to other service providers. Similarly, certain fees paid by FAF under the Prior Administrative Agreement will not be paid by NFA under the New Advisory Agreement and will be paid directly by the Funds. However, immediately following the closing of the Transaction, the net expense ratio of each Fund was expected to be the same or lower than the Fund’s net expense ratio as of June 30, 2010, adjusted (where applicable) to reflect a decrease in net assets resulting from redemptions by the U.S. Bank 401(k) Plan expected to occur prior to the closing of the Transaction, assuming the Fund’s net assets at the time of the closing of the Transaction were no lower than their adjusted June 30 level. In addition, the Prior Board noted that NFA has committed to certain undertakings to maintain current fee caps and/or to waive fees or reimburse expenses to maintain net management fees at certain levels and Nuveen has represented to the Prior Board that Nuveen and its affiliates will not take any action that imposes an “unfair burden” on any Fund as a result of the Transaction. The Prior Board also considered that fees payable under the New Advisory Agreement include both a fund-level fee and a complex-level fee, and that schedules for the fund-level and complex-level fees contain breakpoints that are based, respectively, on Fund assets and Nuveen complex-wide assets. The Prior Board considered that breakpoints in the fund-level fee allow for the possibility that this portion of the advisory fee could decline in the future if Fund assets were to increase or increase in the future if Fund assets were to decline. The Prior Board also considered that breakpoints in the complex-level fee allow for the possibility that this portion of the advisory fee could decline in the future if complex-wide assets were to increase or increase in the future if complex-wide assets were to decline, regardless, in each case, of whether assets of the particular Fund had increased or decreased.
In considering the compensation to be paid to NFA, the Prior Board also reviewed fee information regarding NFA-sponsored funds, to the extent such funds had similar investment objectives and strategies to the Funds. The Prior Board reviewed information provided by NFA regarding similar funds managed by NFA and noted that the fee rates payable by these funds were generally comparable to the fee rates proposed for the Company’s funds. The Prior Board also compared proposed fee and expense information to the median fees and expenses of comparable funds, using information provided by an independent data service.
In evaluating the compensation, the Prior Board also considered other amounts expected to be paid to NFA by the Funds as well as any indirect benefits (such as soft dollar arrangements, if any) NFA and its affiliates are expected to receive, that are directly attributable to the management of the Funds.
The Prior Board also considered that the Funds would not bear any of the costs relating to the Transaction, including the costs of preparing, printing and mailing the Proxy Statement.
Economies of Scale. The Prior Board reviewed information regarding potential economies of scale or other efficiencies that might result from the Funds’ potential association with Nuveen. The Prior Board noted that the New Advisory Agreement provides for breakpoints in the Funds’ fund-level and complex-level management fee rates as the assets of the Funds and the assets held by the various registered investment companies sponsored by Nuveen increase, respectively. The Prior Board concluded that the structure of the investment management fee rates, with the breakpoints for the Funds under the New Advisory Agreement, reflected sharing of potential economies of scale with the Funds’ stockholders.
Conclusion. After deliberating in executive session, the members of the Prior Board in attendance, all of whom were Independent Prior Directors, approved the New Advisory Agreement with respect to each Fund, concluding that the New Advisory Agreement was in the best interests of each Fund.
NAM Sub-Advisory Agreement. The Prior Board also approved the NAM Sub-Advisory Agreement between NFA and NAM LLC as a result of the Restructuring expected to occur with NFA. The Prior Board considered that the services to be provided by NAM LLC under the NAM Sub-Advisory Agreement would not result in any material change in the nature or level of investment advisory services or administrative services provided to the Funds. In addition, the portfolio managers will continue to manage the Funds in their capacity as employees of NAM LLC. The Prior Board considered that NFA will pay a portion of the advisory fee it receives from each Fund to NAM LLC for its services as sub-advisor. The Prior Board concluded, based upon the conclusions that the Prior Board reached in connection with the approval of the New Advisory Agreement and after determining that it need not reconsider all of the factors that it had considered in connection with the approval of the New Advisory Agreement, to approve the NAM Sub-Advisory Agreement.
Notes
Notes
Glossary of Terms Used in this Report
Average Annual Total Return: This is a commonly used method to express an investment’s performance over a particular, usually multi-year time period. It expresses the return that would have been necessary each year to equal the investment’s actual cumulative performance (including change in NAV or offer price and reinvested dividends and capital gains distributions, if any) over the time period being considered.
The Barclays Capital Aggregate Bond Index: is an unmanaged index that includes all investment-grade, publicly issued, fixed-rate, dollar denominated, nonconvertible debt issues and commercial mortgage backed securities with maturities of at least one year and out-standing par values of $150 million or more.
The Barclays Capital High-Yield 2% Issuer Capped Index: is an issuer-constrained version of the U.S. Corporate High-Yield Index that covers the U.S. dollar denominated, non-investment grade, fixed-rate, tax-able corporate bond market.
The Barclays Capital U.S. TIPs Index: is an unmanaged index that includes all publicly issued, U.S. Treasury inflation-protected securities that have at least one year remaining to maturity, are rated investment grade, and have $250 million or more of outstanding face value.
The Barclays Capital Intermediate Government Bond Index: is an unmanaged index that includes all publicly issued, U.S. Treasury securities that have a remaining maturity of greater than or equal to 1 year and less than 10 years, are rated investment grade, and have $250 million or more of outstanding face value.
The Barclays Capital Intermediate Government/Credit Bond Index: is an unmanaged index that measures the performance of U.S. dollar denominated U.S. Treasuries, government-rated and investment grade U.S. corporate fixed-rate, non-convertible securities having $250 million or more of outstanding face value and a remaining maturity of greater than or equal to 1 year and less than 10 years.
The Barclays Capital 1-3 Year Government/Credit Bond Index: is an unmanaged index that includes all medium and larger issues of U.S. government, investment-grade corporate, and investment-grade international dollar-denominated bonds that have maturities of between 1 and 3 years and are publicly issued. Index returns do not include the effects of any sales charges or management fees. It is not possible to invest directly in an index.
Lipper High Current Yield Funds Category Average: Represents the average annualized returns for all reporting funds in the Lipper High Current Yield Category. The Category contained 483 funds during the 1-year period ended June 30, 2011. For more information about Lipper category averages, please see your Fund’s web page at www.nuveen.com.
Lipper Intermediate Investment Grade Debt Funds Category Average: Represents the average annualized returns for all reporting funds in the Lipper Intermediate Investment Grade Debt Category. The Category contained 572 funds during the 1-year period ended June 30, 2011. For more information about Lipper category averages, please see your Fund’s web page at www.nuveen.com.
Lipper Intermediate U.S. Government Funds Category Average: Represents the average annualized returns for all reporting funds in the Lipper Intermediate U.S. Government Bond Category. The Category contained 73 funds during the 1-year period ended June 30, 2011. For more information about Lipper category averages, please see your Fund’s web page at www.nuveen.com.
Lipper Short-Intermediate Investment Grade Debt Funds Category Average: Represents the average annualized returns for all reporting funds in the Lipper Short-Intermediate Investment Grade Debt Category. The Category contained 145 funds during the 1-year period ended June 30, 2011. For more information about Lipper category averages, please see your Fund’s web page at www.nuveen.com.
Lipper Short Investment Grade Debt Funds Category Average: Represents the average annualized returns for all reporting funds in the Lipper Short Investment Grade Debt Category. The Category contained 243 funds during the 1-year period ended June 30, 2011. For more information about Lipper category averages, please see your Fund’s web page at www.nuveen.com.
Lipper Treasury Inflation Protected Securities Funds Category Average: Represents the average annualized returns for all reporting funds in the Lipper Treasury Inflation Protected Securities Category. The Category contained 156 funds during the 1-year period ended June 30, 2011. For more information about Lipper category averages, please see your Fund’s web page at www.nuveen.com.
Tax Equalization: The practice of treating a portion of the distribution made to a redeeming shareholder, which represents his proportionate part of undistributed net investment income and capital gain as a distribution for tax purposes. Such amounts are referred to as the equalization debits (or payments) and will be considered a distribution to the shareholder of net investment income and capital gain for calculation of the Fund’s dividends paid deduction.
Fund Information
Fund Manager
Nuveen Fund Advisors, Inc.
333 West Wacker Drive
Chicago, IL 60606
Sub-Adviser
Nuveen Asset Management, LLC
333 West Wacker Drive
Chicago, IL 60606
Legal Counsel
Chapman and Cutler LLP
Chicago, IL
Independent Registered Public Accounting Firm
Ernst & Young LLP
Chicago, IL
Custodian
U.S. Bank National Association
St. Paul, MN
Transfer Agent and Shareholder Services
U.S. Bancorp
Fund Services, LLC
615 E. Michigan Street
Milwaukee, WI 53202
Long-Term Capital Gain Distributions: Nuveen High Income Bond Fund designated as a long-term capital gain dividend, pursuant to Internal Revenue Code Section 852(b)(3), $244,442, or if greater the amount necessary to reduce earnings and profits of the Fund related to net capital gain to zero for the tax year ended June 30, 2011.
Quarterly Portfolio of Investments and Proxy Voting information: You may obtain (i) each Fund’s quarterly portfolio of investments, (ii) information regarding how the Funds voted proxies relating to portfolio securities held during the most recent twelve-month period ended June 30, and (iii) a description of the policies and procedures that the Funds used to determine how to vote proxies relating to portfolio securities without charge, upon request, by calling Nuveen Investments at (800) 257-8787 or on Nuveen’s website at www.nuveen.com.
You may also obtain this and other Fund information directly from the Securities and Exchange Commission (SEC). The SEC may charge a copying fee for this information. Visit the SEC on-line at http://www.sec.gov or in person at the SEC’s Public Reference Room in Washington, D.C. Call the SEC at (202) 942-8090 for room hours and operation. You may also request Fund information by sending an e-mail request to publicinfo@sec.gov or by writing to the SEC’s Public Reference Section at 100 F Street NE, Washington, D.C. 20549.
The Financial Industry Regulatory Authority (FINRA) provides a Public Disclosure Program which supplies certain information regarding the disciplinary history of FINRA members and their associated persons in response to either telephone inquiries at (800) 289-9999 or written inquiries at www.finra.org. FINRA also provides an investor brochure that includes information describing the Public Disclosure Program.
Nuveen Investments:
Serving Investors for Generations
Since 1898, financial advisors and their clients have relied on Nuveen Investments to provide dependable investment solutions through continued adherence to proven, long-term investing principles. Today, we offer a range of high quality equity and fixed-income solutions designed to be integral components of a well-diversified core portfolio.
Focused on meeting investor needs.
Nuveen Investments is a global investment management firm that seeks to help secure the long-term goals of institutions and high net worth investors as well as the consultants and financial advisors who serve them. We market our growing range of specialized investment solutions under the high-quality brands of HydePark, NWQ, Nuveen Asset Management, Santa Barbara, Symphony, Tradewinds and Winslow Capital. In total, Nuveen Investments managed approximately $210 billion of assets as of June 30, 2011.
Find out how we can help you.
To learn more about how the products and services of Nuveen Investments may be able to help you meet your financial goals, talk to your financial advisor, or call us at (800) 257-8787. Please read the information provided carefully before you invest. Investors should consider the investment objective and policies, risk considerations, charges and expenses of any investment carefully. Where applicable, be sure to obtain a prospectus, which contains this and other relevant information. To obtain a prospectus, please contact your securities representative or Nuveen Investments, 333 W. Wacker Dr., Chicago, IL 60606. Please read the prospectus carefully before you invest or send money.
Learn more about Nuveen Funds at: www.nuveen.com/mf
Nuveen makes things e-simple.
It only takes a minute to sign up for e-Reports. Once enrolled, you’ll receive an e-mail as soon as your Nuveen Fund information is ready — no more waiting for delivery by regular mail. Just click on the link within the e-mail to see the report and save it on your computer if you wish.
Free e-Reports right to your e-mail!
www.investordelivery.com
If you receive your Nuveen Fund distributions and statements from your financial advisor or brokerage account.
OR
www.nuveen.com/accountaccess
If you receive your Nuveen Fund distributions and statements directly from Nuveen.
| | |
Distributed by Nuveen Securities, LLC 333 West Wacker Drive Chicago, IL 60606 www.nuveen.com | | |
MAN-FINC-0611D
ITEM 2. CODE OF ETHICS.
As of the end of the period covered by this report, the registrant has adopted a code of ethics that applies to the registrant’s principal executive officer, principal financial officer, principal accounting officer or controller, or persons performing similar functions. There were no amendments to or waivers from the code during the period covered by this report. The registrant has posted the code of ethics on its website at www.nuveen.com/mf. (To view the code, click on the Shareholder Resources drop down menu box, click on Fund Governance and then click on Code of Conduct.)
ITEM 3. AUDIT COMMITTEE FINANCIAL EXPERT.
The registrant’s Board of Trustees determined that the registrant has at least one “audit committee financial expert” (as defined in Item 3 of Form N-CSR) serving on its Audit Committee. The registrant’s audit committee financial expert is Carole E. Stone, who is “independent” for purposes of Item 3 of Form N-CSR.
Ms. Stone served for five years as Director of the New York State Division of the Budget. As part of her role as Director, Ms. Stone was actively involved in overseeing the development of the State’s operating, local assistance and capital budgets, its financial plan and related documents; overseeing the development of the State’s bond-related disclosure documents and certifying that they fairly presented the State’s financial position; reviewing audits of various State and local agencies and programs; and coordinating the State’s system of internal audit and control. Prior to serving as Director, Ms. Stone worked as a budget analyst/examiner with increasing levels of responsibility over a 30 year period, including approximately five years as Deputy Budget Director. Ms. Stone has also served as Chair of the New York State Racing Association Oversight Board, as Chair of the Public Authorities Control Board, as a Commissioner on the New York State Commission on Public Authority Reform and as a member of the Boards of Directors of several New York State public authorities. These positions have involved overseeing operations and finances of certain entities and assessing the adequacy of project/entity financing and financial reporting. Currently, Ms. Stone is on the Board of Directors of CBOE Holdings, Inc., of the Chicago Board Options Exchange, and of C2 Options Exchange. Ms. Stone’s position on the boards of these entities and as a member of both CBOE Holdings’ Audit Committee and its Finance Committee has involved, among other things, the oversight of audits, audit plans and preparation of financial statements.
ITEM 4. PRINCIPAL ACCOUNTANT FEES AND SERVICES.
The following tables show the amount of fees that Ernst & Young LLP, the Trust’s auditor, billed to the Trust during the Trust’s last two full fiscal years. The Audit Committee approved in advance all audit services and non-audit services that Ernst & Young LLP provided to the Trust, except for those non-audit services that were subject to the pre-approval exception under Rule 2-01 of Regulation S-X (the “pre-approval exception”). The pre-approval exception for services provided directly to the Trust waives the pre-approval requirement for services other than audit, review or attest services if: (A) the aggregate amount of all such services provided constitutes no more than 5% of the total amount of revenues paid by the Trust during the fiscal year in which the services are provided; (B) the Trust did not recognize the services as non-audit services at the time of the engagement; and (C) the services are promptly brought to the Audit Committee’s attention, and the Committee (or its delegate) approves the services before the audit is completed.
The Audit Committee has delegated certain pre-approval responsibilities to its Chairman (or, in his absence, any other member of the Audit Committee).
SERVICES THAT THE TRUST’S AUDITOR BILLED TO THE TRUST
| | | | | | | | | | | | | | | | |
Fiscal Year Ended June 30, 2011 5 | | Audit Fees Billed
to Funds 1 | | | Audit-Related Fees
Billed to Funds 2 | | | Tax Fees
Billed to Funds 3 | | | All Other Fees
Billed to Funds 4 | |
Name of Series | | | | | | | | | | | | | | | | |
Core Bond Fund | | | 24,428 | | | | 0 | | | | 4,557 | | | | 0 | |
High Income Bond Fund | | | 24,429 | | | | 0 | | | | 1,056 | | | | 0 | |
Intermediate Government Bond Fund | | | 24,429 | | | | 0 | | | | 3,223 | | | | 0 | |
Inflation Protected Securities Fund | | | 24,429 | | | | 0 | | | | 3,681 | | | | 0 | |
Intermediate Term Bond Fund | | | 24,428 | | | | 0 | | | | 2,513 | | | | 0 | |
Short Term Bond Fund | | | 24,428 | | | | 0 | | | | 4,265 | | | | 0 | |
Total Return Bond Fund | | | 24,429 | | | | 0 | | | | 5,134 | | | | 0 | |
| | | | | | | | | | | | | | | | |
Total | | $ | 171,000 | | | $ | 0 | | | $ | 24,429 | | | $ | 0 | |
| 1 | | “Audit Fees” are the aggregate fees billed for professional services for the audit of the Fund’s annual financial statements and services provided in connection with statutory and regulatory filings or engagements. |
| 2 | | “Audit Related Fees” are the aggregate fees billed for assurance and related services reasonably related to the performance of the audit or review of financial statements and are not reported under “Audit Fees”. |
| 3 | | “Tax Fees” are the aggregate fees billed for professional services for tax advice, tax compliance, and tax planning. |
| 4 | | “All Other Fees” are the aggregate fees billed for products and services other than “Audit Fees”, “Audit Related Fees”, and “Tax Fees”. |
| 5 | | The Funds were acquired on December 31, 2010. |
| | | | | | | | | | | | | | | | |
| | | Percentage Approved Pursuant to Pre-approval Exception | |
| | | Audit Fees Billed
to Funds | | | Audit-Related Fees
Billed to Funds | | | Tax Fees
Billed to Funds | | | All Other Fees
Billed to Funds | |
Name of Series | | | | | | | | | | | | | | | | |
Core Bond Fund | | | 0 | % | | | 0 | % | | | 0 | % | | | 0 | % |
High Income Bond Fund | | | 0 | % | | | 0 | % | | | 0 | % | | | 0 | % |
Intermediate Government Bond Fund | | | 0 | % | | | 0 | % | | | 0 | % | | | 0 | % |
Inflation Protected Securities Fund | | | 0 | % | | | 0 | % | | | 0 | % | | | 0 | % |
Intermediate Term Bond Fund | | | 0 | % | | | 0 | % | | | 0 | % | | | 0 | % |
Short Term Bond Fund | | | 0 | % | | | 0 | % | | | 0 | % | | | 0 | % |
Total Return Bond Fund | | | 0 | % | | | 0 | % | | | 0 | % | | | 0 | % |
| | | | |
Fiscal Year Ended June 30, 2010 | | Audit Fees Billed
to Funds 1 | | | Audit-Related Fees
Billed to Funds 2 | | | Tax Fees
Billed to Funds 3 | | | All Other Fees
Billed to Funds 4 | |
Name of Series | | | | | | | | | | | | | | | | |
Core Bond Fund | | | 67,879 | | | | 215 | | | | 13,408 | | | | 0 | |
High Income Bond Fund | | | 67,879 | | | | 215 | | | | 13,408 | | | | 0 | |
Intermediate Government Bond Fund | | | 67,879 | | | | 215 | | | | 13,408 | | | | 0 | |
Inflation Protected Securities Fund | | | 67,879 | | | | 215 | | | | 13,408 | | | | 0 | |
Intermediate Term Bond Fund | | | 67,879 | | | | 215 | | | | 13,408 | | | | 0 | |
Short Term Bond Fund | | | 67,879 | | | | 215 | | | | 13,408 | | | | 0 | |
Total Return Bond Fund | | | 67,879 | | | | 215 | | | | 13,408 | | | | 0 | |
| | | | | | | | | | | | | | | | |
Total | | $ | 475,153 | | | $ | 1,505 | | | $ | 93,856 | | | $ | 0 | |
| 1 | | “Audit Fees” are the aggregate fees billed for professional services for the audit of the Fund’s annual financial statements and services provided in connection with statutory and regulatory filings or engagements. |
| 2 | | “Audit Related Fees” are the aggregate fees billed for assurance and related services reasonably related to the performance of the audit or review of financial statements and are not reported under “Audit Fees”. |
| 3 | | “Tax Fees” are the aggregate fees billed for professional services for tax advice, tax compliance, and tax planning. |
| 4 | | “All Other Fees” are the aggregate fees billed for products and services other than “Audit Fees”, “Audit Related Fees”, and “Tax Fees”. |
| | | | | | | | | | | | | | | | |
| | | Percentage Approved Pursuant to Pre-approval Exception | |
| | | Audit Fees Billed
to Funds | | | Audit-Related Fees
Billed to Funds | | | Tax Fees
Billed to Funds | | | All Other Fees
Billed to Funds | |
Name of Series | | | | | | | | | | | | | | | | |
Core Bond Fund | | | 0 | % | | | 0 | % | | | 0 | % | | | 0 | % |
High Income Bond Fund | | | 0 | % | | | 0 | % | | | 0 | % | | | 0 | % |
Intermediate Government Bond Fund | | | 0 | % | | | 0 | % | | | 0 | % | | | 0 | % |
Inflation Protected Securities Fund | | | 0 | % | | | 0 | % | | | 0 | % | | | 0 | % |
Intermediate Term Bond Fund | | | 0 | % | | | 0 | % | | | 0 | % | | | 0 | % |
Short Term Bond Fund | | | 0 | % | | | 0 | % | | | 0 | % | | | 0 | % |
Total Return Bond Fund | | | 0 | % | | | 0 | % | | | 0 | % | | | 0 | % |
| | | | | | | | | | | | |
Fiscal Year Ended June 30, 2011 | | Audit-Related Fees
Billed to Adviser and
Affiliated Fund
Service Providers | | | Tax Fees Billed to
Adviser and
Affiliated Fund
Service Providers | | | All Other Fees
Billed to Adviser
and Affiliated Fund
Service Providers | |
Nuveen Investment Funds, Inc. | | $ | 0 | | | $ | 0 | | | $ | 0 | |
| |
| | | Percentage Approved Pursuant to Pre-approval Exception | |
| | | Audit-Related Fees
Billed to Adviser and
Affiliated Fund
Service Providers | | | Tax Fees Billed to
Adviser and
Affiliated Fund
Service Providers | | | All Other Fees
Billed to Adviser
and Affiliated Fund
Service Providers | |
| | | 0 | % | | | 0 | % | | | 0 | % |
| | | |
Fiscal Year Ended June 30, 2010 | | Audit-Related Fees
Billed to Adviser and
Affiliated Fund
Service Providers | | | Tax Fees Billed to
Adviser and
Affiliated Fund
Service Providers | | | All Other Fees
Billed to Adviser
and Affiliated Fund
Service Providers | |
Nuveen Investment Funds, Inc. | | $ | 0 | | | $ | 0 | | | $ | 0 | |
| |
| | | Percentage Approved Pursuant to Pre-approval Exception | |
| | | Audit-Related Fees
Billed to Adviser and
Affiliated Fund
Service Providers | | | Tax Fees Billed to
Adviser and
Affiliated Fund
Service Providers | | | All Other Fees
Billed to Adviser
and Affiliated Fund
Service Providers | |
| | | 0 | % | | | 0 | % | | | 0 | % |
| | | | | | | | | | | | | | | | |
Fiscal Year Ended June 30, 2011 1 | | Total Non-Audit Fees
Billed to Trust | | | Total Non-Audit Fees
billed to Adviser and
Affiliated Fund Service
Providers (engagements
related directly to the
operations and financial
reporting of the Trust) | | | Total Non-Audit Fees
billed to Adviser and
Affiliated Fund Service
Providers (all other
engagements) | | | Total | |
Name of Series | | | | | | | | | | | | | | | | |
Core Bond Fund | | | 4,557 | | | | 0 | | | | 0 | | | | 4,557 | |
High Income Bond Fund | | | 1,056 | | | | 0 | | | | 0 | | | | 1,056 | |
Intermediate Government Bond Fund | | | 3,223 | | | | 0 | | | | 0 | | | | 3,223 | |
Inflation Protected Securities Fund | | | 3,681 | | | | 0 | | | | 0 | | | | 3,681 | |
Intermediate Term Bond Fund | | | 2,513 | | | | 0 | | | | 0 | | | | 2,513 | |
Short Term Bond Fund | | | 4,265 | | | | 0 | | | | 0 | | | | 4,265 | |
Total Return Bond Fund | | | 5,134 | | | | 0 | | | | 0 | | | | 5,134 | |
| | | | | | | | | | | | | | | | |
Total | | $ | 24,429 | | | $ | 0 | | | $ | 0 | | | $ | 24,429 | |
“Non-Audit Fees Billed to Trust” represent “Tax Fees” and “All Other Fees” billed to each Fund in their respective amounts from the previous table.
| 1 | | The Funds were acquired on December 31, 2010. |
| | | | | | | | | | | | | | | | |
Fiscal Year Ended June 30, 2010 | | Total Non-Audit Fees
Billed to Trust | | | Total Non-Audit Fees
billed to Adviser and
Affiliated Fund Service
Providers (engagements
related directly to the
operations and financial
reporting of the Trust) | | | Total Non-Audit Fees
billed to Adviser and
Affiliated Fund Service
Providers (all other
engagements) | | | Total | |
Name of Series | | | | | | | | | | | | | | | | |
Core Bond Fund | | | 13,408 | | | | 0 | | | | 0 | | | | 13,408 | |
High Income Bond Fund | | | 13,408 | | | | 0 | | | | 0 | | | | 13,408 | |
Intermediate Government Bond Fund | | | 13,408 | | | | 0 | | | | 0 | | | | 13,408 | |
Inflation Protected Securities Fund | | | 13,408 | | | | 0 | | | | 0 | | | | 13,408 | |
Intermediate Term Bond Fund | | | 13,408 | | | | 0 | | | | 0 | | | | 13,408 | |
Short Term Bond Fund | | | 13,408 | | | | 0 | | | | 0 | | | | 13,408 | |
Total Return Bond Fund | | | 13,408 | | | | 0 | | | | 0 | | | | 13,408 | |
| | | | | | | | | | | | | | | | |
Total | | $ | 93,856 | | | $ | 0 | | | $ | 0 | | | $ | 93,856 | |
“Non-Audit Fees Billed to Trust” represent “Tax Fees” and “All Other Fees” billed to each Fund in their respective amounts from the previous table.
Audit Committee Pre-Approval Policies and Procedures. Generally, the Audit Committee must approve (i) all non-audit services to be performed for the Trust by the Trust’s independent accountants and (ii) all audit and non-audit services to be performed by the Trust’s independent accountants for the Affiliated Fund Service Providers with respect to the operations and financial reporting of the Trust. Regarding tax and research projects conducted by the independent accountants for the Trust and Affiliated Fund Service Providers (with respect to operations and financial reports of the Trust), such engagements will be (i) pre-approved by the Audit Committee if they are expected to be for amounts greater than $10,000; (ii) reported to the Audit Committee Chairman for his verbal approval prior to engagement if they are expected to be for amounts under $10,000 but greater than $5,000; and (iii) reported to the Audit Committee at the next Audit Committee meeting if they are expected to be for an amount under $5,000.
ITEM 5. AUDIT COMMITTEE OF LISTED REGISTRANTS
Not applicable to this registrant.
ITEM 6. SCHEDULE OF INVESTMENTS
| a) | | See Portfolio of Investments in Item 1. |
ITEM 7. DISCLOSURE OF PROXY VOTING POLICIES AND PROCEDURES FOR CLOSED-END
MANAGEMENT INVESTMENT COMPANIES
Not applicable to this registrant.
ITEM 8. PORTFOLIO MANAGERS OF CLOSED-END MANAGEMENT INVESTMENT COMPANIES
Not applicable to this registrant.
ITEM 9. PURCHASES OF EQUITY SECURITIES BY CLOSED-END MANAGEMENT INVESTMENT COMPANY AND AFFILIATED PURCHASERS
Not applicable to this registrant.
ITEM 10. SUBMISSION OF MATTERS TO A VOTE OF SECURITY HOLDERS
There have been no material changes to the procedures by which shareholders may recommend nominees to the registrant’s Board of Trustees implemented after the registrant last provided disclosure in response to this Item.
ITEM 11. CONTROLS AND PROCEDURES.
| | (a) | | The registrant’s principal executive and principal financial officers, or persons performing similar functions, have concluded that the registrant’s disclosure controls and procedures (as defined in Rule 30a-3(c) under the Investment Company Act of 1940, as amended (the “1940 Act”) (17 CFR 270.30a-3(c))) are effective, as of a date within 90 days of the filing date of this report that includes the disclosure required by this paragraph, based on their evaluation of the controls and procedures required by Rule 30a-3(b) under the 1940 Act (17 CFR 270.30a-3(b)) and Rules 13a-15(b) or 15d-15(b) under the Securities Exchange Act of 1934, as amended (the “Exchange Act”) (17 CFR 240.13a-15(b) or 240.15d-15(b)). |
| | (b) | | There were no changes in the registrant’s internal control over financial reporting (as defined in Rule 30a-3(d) under the 1940 Act (17 CFR 270.30a-3(d)) that occurred during the second fiscal quarter of the period covered by this report that has materially affected, or is reasonably likely to materially affect, the registrant’s internal control over financial reporting. |
ITEM 12. EXHIBITS
File the exhibits listed below as part of this Form.
| | |
| (a)(1) | | Any code of ethics, or amendment thereto, that is the subject of the disclosure required by Item 2, to the extent that the registrant intends to satisfy the Item 2 requirements through filing of an exhibit: Not applicable because the code is posted on registrant’s website at www.nuveen.com/mf and there were no amendments during the period covered by this report. (To view the code, click on the Shareholder Resources drop down menu box, click on Fund Governance and then Code of Conduct.) |
| |
| (a)(2) | | A separate certification for each principal executive officer and principal financial officer of the registrant as required by
Rule 30a-2(a) under the 1940 Act (17 CFR 270.30a-2(a)) in the exact form set forth below: See EX-99.CERT attached hereto. |
| |
| (a)(3) | | Any written solicitation to purchase securities under Rule 23c-1 under the 1940 Act (17 CFR 270.23c-1) sent or given during the period covered by the report by or on behalf of the registrant to 10 or more persons: Not applicable to this registrant. |
| |
| (b) | | If the report is filed under Section 13(a) or 15(d) of the Exchange Act, provide the certifications required by Rule 30a-2(b) under the 1940 Act (17 CFR 270.30a-2(b)), Rule 13a-14(b) or Rule 15d-14(b) under the Exchange Act (17 CFR 240.13a-14(b) or 240.15d-14(b)), and Section 1350 of Chapter 63 of Title 18 of the United States Code (18 U.S.C. 1350) as an Exhibit. A certification furnished pursuant to this paragraph will not be deemed “filed” for purposes of Section 18 of the Exchange Act (15 U.S.C. 78r), or otherwise subject to the liability of that section. Such certification will not be deemed to be incorporated by reference into any filing under the Securities Act of 1933 or the Exchange Act, except to the extent that the registration specifically incorporates it by reference: See EX-99.906 CERT attached hereto. |
SIGNATURES
Pursuant to the requirements of the Securities Exchange Act of 1934 and the Investment Company Act of 1940, the registrant has duly caused this report to be signed on its behalf by the undersigned, thereunto duly authorized.
(Registrant) Nuveen Investment Funds, Inc.
| | |
| |
By (Signature and Title) | | /s/ Kevin J. McCarthy |
| | Kevin J. McCarthy |
| | Vice President and Secretary |
Date September 6, 2011
Pursuant to the requirements of the Securities Exchange Act of 1934 and the Investment Company Act of 1940, this report has been signed below by the following persons on behalf of the registrant and in the capacities and on the dates indicated.
| | |
| |
By (Signature and Title) | | /s/ Gifford R. Zimmerman |
| | Gifford R. Zimmerman |
| | Chief Administrative Officer |
| | (principal executive officer) |
Date September 6, 2011
| | |
| |
| By (Signature and Title) | | /s/ Stephen D. Foy |
| | Stephen D. Foy |
| | Vice President and Controller |
| | (principal financial officer) |
Date September 6, 2011